International Rules and Institutions for Trade Policy - Sites at ...
Upload
khangminh22Category
view
0download
0
GENERAL AGREEMENT
ON TARIFFS AND TRADE
RESTRICTED C/RM/G/40 17 September 1993 Limited Distribution
COUNCIL
TRADE POLICY REVIEW MECHANISM
INDIA
Report by the Government
In pursuance of the CONTRACTING PARTIES' Decision of 12 April 1989 concerning the Trade Policy Review Mechanism (BISD 36S/403), the initial full report by India for the review by the Council is attached.
4
NOTE TO ALL DELEGATIONS Until further notice, this document is subject to a press embargo.
93-1503


India C/RM/G/40 Page i
CONTENTS
Page
1. Introduction: an Overview 1
2. Objectives of Trade Policies 2
3. Description of the Import and Export System 3
4. The Trade Policy Framework 4
4.1 Domestic Laws & regulations governing application of Trade Policies 4
4.2 Description of the process of Trade Policy Formulation 5
4.3 Multilateral Trading Arrangement 5
4.4 Preferential Trading Agreements 5
4.5 Bilateral Trading Agreements 6
5. The Implementation of Trade Policies 6
5.1 Trade Measures 6
5.2 Prospective Changes in Trade Policies 11
6. Wider Economic and Development Needs 12
7. The External Economic Environment 16
8. Major Trends in Imports and Exports 17
9. Problems in External Markets 18

C/RM/G/40 Trade Policy Review Mechanism Page ii
APPENDIX
Statement 1 : Statement 2 : Statement 3 : Statement 4 : Statement 5 : Statement 6 : Statement 7 : Statement 8 : Statement 9 : Statement 10
Statement 11
Statement 12 Statement 13
Statement 14
Key Macro Economic Indicators Sectoral Growth in Gross Domestic Product Sectoral Distribution in Gross Domestic Product Exports, Imports and Trade Balance (1980-81 to 1992-93) Direction of Trade: Sources of Imports (1987-88 to 1991-92) Direction of Trade: Export (1987-88 to 1991-92) India's Imports by Principal Commodities (1987-88 to 1992-93) India's Exports by Principal Commodities (1987-88 to 1992-93) India's Trade Indices (1980-81 to 1991-92) Estimated realised rates of Customs duties for major product group imports (1988-89 to 1991-92) Import Licensing: Classified by major categories (1989-90 to 1992-93) Performance of Export Processing Zones Trade Performance and Counter trade exports of State Trading Enterprises India's external debt
Page
19 19 20 20 21 21 22 23 24
25
26 26
27 27
India C/RM/G/40 Page 1
1. INTRODUCTION : AN OVERVIEW
i. The First Five Year Plan (1951-56) initiated a process of development aimed at raising the standard of living. This is sought to be achieved by planning for growth, modernisation, self-reliance and social justice. Currently, the Eight Plan is under way. While the broad objectives of planning have remained same, each Plan involved some directional changes to take into account new constraints and new possibilities.
ii. The Indian economy, which was stagnant during the first half of this century, started growing after the Five Year Plans were launched. The growth rate of Gross Domestic Product (GDP) hovered around 3.5 per cent per annum for the first three decades of the development phase though targets had usually been higher. In the eighties the growth rate accelerated to 5.5 per cent per annum. This change was accompanied by a perceptible rise in the growth in agricultural income, a significant increase in the rate of growth of per capita consumption and decline in capital output ratio indicating more efficient use of capital.
iii. The growth in national income has been influenced largely by trends in agricultural production. The reason is that agriculture is the largest component of GDP and has overall impact on other sectors through input linkages, employment and incomes. The average performance of the agriculture sector showed improvements in the eighties. The share of agriculture in GDP is currently about 33 percent as against about 55 per cent in the early fifties. There has been a corresponding increase in the share of the services and industrial sectors, the increase being greater in the former.
iv. In the manufacturing sector, after a good start in the Second and Third Plan (1956-57 to 1965-66), the growth performance declined during the late sixties and the seventies but picked up again during the eighties. The performance during the eighties was supported by initiatives towards liberalization in import and industrial policies. Somewhat better performance in the infrastructure sectors, particularly energy and transport also contributed. Due to the balance-of-payments crisis, the consequential curbs on imports and the general constraints, the manufacturing sector has experienced a recession in 1991-92 and 1992-93.
v. The economy has undergone a structural change during the last four decades. There has been a shift in the sectoral composition of production, diversification of activities, advancement of technology and the gradual transformation of a stagnant colonial economy into a dynamic economy with a modern industrial base.
Trade Expansion
vi. India's foreign trade has been subject to unforseen internal and external pressures, such as sudden and sharp deterioration of the terms of trade, droughts, fluctuations in oil prices and other internal supply problems of varying intensity. The pull of domestic demand and high costs have been factors inhibiting rapid growth of exports.
vii. The export performance has not been commensurate with the potential. India's share of world exports declined from 1.94 per cent in 1950 to 0.52 per cent in 1990. The overall growth of exports since 1950-51 to 1989-90 has been about 7 percent.

C/RM/G/40 Page 2
Trade Policy Review Mechanism
viii. The composition of exports has changed significantly over this period, most of the change coming after the middle of 1960s with the emergence of new items of exports. The share of traditional exports such as jute, cotton and tea declined, while there was an increase in the exports of oilcakes, cashew kernels,marine products, textiles, leather manufactures, steel products and engineering items.
ix. Indian imports increased rapidly during 1950s and grew steadily till 1966. During the period 1966 to 1972-73 there was substantial decline in imports. Thereafter imports grew at an annual rate of over 13 per cent until 1990-91.
x. The import basket has comprised mainly of capital goods, raw materials and fuel. The share of capital goods which was around 32 per cent in 1960 decreased to 25 per cent in 1989. Petroleum and fertilizers which accounted for 7 per cent in 1960 increased to 23 per cent in 1989. Share of export related imports (pearls and precious stones, chemicals, textile yarns, raw cashew nuts) increased from 13 per cent to 19 per cent during the period.
xi. Over the past two years, the Government has taken a number of initiatives aimed at basic economic re-structuring and reform with the objective of putting the Indian Economy on a sustainable path of high growth. Along with the macro-economic stabilisation a programme of structural reforms of trade, industrial and public sector policies has been initiated.
xii. The objective of the reform programmes is to evolve an industrial and trade policy framework which would promote efficiency, reduce the bias in favour of excessive capital intensity and encourage an employment oriented pattern of industrialisation. The adjustments that have been carried out in trade and industrial policies have broadly been aimed to increase the efficiency of Indian industry by providing a competitive environment.
xiii. The policy changes implemented in the last two years of the reform programme constitute a major effort at redirecting and reorienting policy in several areas. Overall the economy has responded positively to the policy measures.
2 OBJECTIVES OF TRADE POLICIES
1. The general trade policy objective is to make Indian industry competitive and efficient by exposing it to greater competition, and to integrate it with the global economy. It is a specific policy objective to increase the contribution of foreign trade to the GDP
2. Trade policy objectives are being pursued in the context of the structural reforms and macro-economic stabilization policies being implemented by the Government of India. Substantial liberalization of the foreign trade and investment régimes has been carried out, and tariffs are being brought down. The exchange rate has been modified to make the rupee competitive vis a vis other currencies.
3. The viability of the liberalized trade policy, and its further liberalization are contingent, to a large extent, upon the openness, the stability and predictability of the global trading régime. India's exports have been encountering protectionist measures in some of their major markets. The continuation of such measures - or worse, intensification - could put serious road blocks in the path of economic liberalization.

India C/RM/G/40 Page 3
4. Consequently, Government of India is desirous of an early and successful conclusion of the Uruguay Round with balanced results, particularly with reference to the trade and technological needs of the developing countries.
3 DESCRIPTION OF THE IMPORT AND EXPORT SYSTEM
5. The import and export system is governed by the Export and Import Policy 1992-97 which come into effect from 1 April, 1992. Its principal objectives are:
(a) to establish the framework for globalization of India's foreign trade; (b) to promote the productivity, modernisation and competitiveness of the Indian industry,
agriculture and services and thereby to enhance their export capabilities; (c) to encourage the attainment of high and internationally accepted standards of quality
and thereby enhance the image of India's products abroad: u (d) to augment India's exports by facilitating access to raw-materials, intermediates,
components, consumables and capital goods from the international market; (e) to promote efficient and internationally competitive import substitution and self-reliance
and a deregulated framework for foreign trade. (f) to eliminate or minimise quantitative, licensing and other discretionary controls in the
framework of India's foreign trade; (g) to foster the country's Research and Development (R&D) and technological capabilities;
and (h) to simplify and streamline the procedures governing exports and imports.
6. The import régime has been substantially liberalized and simplified even though balance of payments problems remain. All items are freely importable save for consumer goods and a small negative list. The number of products canalized through State Trading Organization for imports has also been substantially reduced.
7. The export régime has also been similarly liberalized and simplified.
8. The liberalization of the foreign trade régime is a continuing process and the policy is to continue 0 to prune the negative lists, to bring down tariffs and to create an environment for making exports
attractive.
9. The present trade policy has to be seen in the perspective that until the middle of 1970s trade policy resulted from the strategy of import substitution. This strategy relied on encouraging domestic production for the domestic market behind a high degree of effective protection to domestic industry. Imports were regulated through a set of restrictions covering investments, foreign exchange transactions and international trade. However as domestic production expanded, there was a growing requirement of raw-materials, components and capital goods which could not be met indigenously. The requirement of petroleum and fertilizers, indigenous production of which was limited, was also increasing. This resulted in a significant pressure on the need for imports.
10. From the middle of 1970s, it was recognised that an import substitution policy by itself could not bring about a viability in the balance of payment situation. As the need of the economy for petroleum, fertilizers, steel, non-ferrous metals and other inputs grew, it was felt that there was a need for a vigorous export promotion policy. The import policy was gradually relaxed for import of raw

C/RM/G/40 Page 4
Trade Policy Review Mechanism
materials and components for domestic production. Simplified procedures were introduced for import of technology, raw materials and capital goods needed for export production. Export processing zones were established and agencies set up to promote exports. Financial incentives for exports were enhanced and exchange rate policy used in support of exports. An important change in the trade policy was introduced in 1978-79 when all items not specifically restricted or banned were listed under Open General Licence (OGL) category and were importable without any licensing for domestic production. Liberalisation in trade policy has been pursued during the eighties to promote technological upgradation in the industrial sector. In the exchange rate management the periodic currency adjustments were carried to facilitate faster exports.
11. The comprehensive economic reforms announced from the middle of 1991 are a departure from the earlier régime. Important features of the trade reforms include a greater reliance on exchange rate management, elimination of product specific export incentives, reduction in tariffs, substantial elimination of licensing and other restrictions.
12. Trade reforms undertaken since 1991 have been aimed at (a) removing licensing in respect of most imports of raw materials, intermediates and capital goods; (b) broadening and simplifying export incentives and removing restrictions on exports; (c) eliminating most of the trade monopolies of the state trading agencies (canalising agencies); (d) simplification and increasing transparency of the trade régime; (e) reducing the level and the dispersion of tariffs, and (f) making the rupee convertible on trade account.
4 THE TRADE POLICY FRAMEWORK
4.1 Domestic Laws & Regulations governing application of Trade Policies
13. The Foreign Trade (Development and Regulation) Act. 1992. which empowers the Union Government to prohibit, restrict or otherwise regulate imports or exports, is the basic trade law of India. The Export and Import Policy is formulated under authority of this Act Tht present poiic>, in effect from 1 April 1992, is valid for a period of five years.
14. The Customs Act governs the levying of tariffs on imports and exports into and from India and rules for customs valuation are framed under this Act. Tne Customs Tariff Ac: specifies the tariff rates. It also provides for the imposition of anti-dumping and countervailing duties
15. The Export-Import Poiicy contains, apart from the negative lists of imports ano exports, ah measures in force for augmenting export production and exports, the prescrinec procedures or conditions (where applicable) for exports and imports, and the performance requirements for dut\ free or reaucec duty imports for export production. The Policy is published in two parts, namel) tne Poiicy anc the Handbook of Procedures, which also contains the input-output norms in respect of imports at concessiona, tariffs for export production.
16. Various provisions of the Policy are under constant review to carry forward the process of liberalization in light of the domestic and global economic environment

India C/RM/G/40 Page 5
4.2 Description of the process of Trade Policy formulation
17. Economic and trade policies are formulated through a process of broad ranging consultations. The views of the private sector are ascertained through the apex chambers of Commerce and Industry, the Export Promotion Councils and through the representations of individual industries and special interest groups. Academicians and journalists are also consulted. Decisions are taken through interministerial consultations in which the Ministries of Finance and Commerce and other relevant ministries are involved.
18. The administration of trade policies vests primarily with the Ministry of Commerce. The Director General of Foreign Trade is responsible for the administration of licensing regulations for imports and exports. Tariffs have been, in the recent past, primarily a revenue raising device and are administered by the Ministry of Finance.
4.3 Multilateral Trading Arrangement
19. India is one of the original contracting parties to GATT. India believes that a set of transparent, equitable and multilaterally agreed rules of trade are necessary for the stability, security and expansion of world trade. To this purpose India has been participating constructively in the Uruguay round negotiations.
20. India is a signatory to the Tokyo Round Agreements on Technical Barriers to Trade, Customs Valuation, Anti-dumping, Subsidies and Countervailing Duties.
4.4 Preferential Trading Agreements
21. India is a member of the Global System of Trade Preferences (GSTP). In the first round of negotiations which concluded in 1988 India offered tariff concessions on 31 products. The second round of negotiations under this agreement is in progress. India is working towards strengthening of the GSTP by seeking enhanced trade coverage and greater participation of the G-77 countries.
22. The First Agreement on Trade Negotiations among Developing Member Countries of ESCAP was negotiated in 1975. India, Bangladesh, South Korea and Sri Lanka have ratified the Agreement. Trade coverage under this preferential trading arrangement is small.
23. Preferences extended to erstwhile British colonies under the provisions of the Indo-UK Trade Agreement of 1939 survive in the case of three island countries, namely, Mauritius, Seychelles and Tonga. Trade coverage is not significant.
24. The South Asian Association for Regional Cooperation (SAARC) member countries (Bangladesh, Bhutan, India, Maldives, Nepal, Pakistan and Sri Lanka) have agreed to the establishment of a SAARC Preferential Trading Arrangement (SAPTA) as a first step towards higher levels of trade and economic cooperation in the region. Initially negotiations are expected to follow a product by product approach.
25. India had been a member of Trade Expansion and Economic Cooperation Agreement along with Yugoslavia and Egypt. Upon its expiry on 31 March 1993, the Agreement was not renewed. India had also been a member of the Protocol Relating to Trade Negotiations among Developing

C/RM/G/40 Page 6
Trade Policy Review Mechanism
Countries (the GATT Protocol). India withdrew from this agreement with effect from 29 March 1993 as the agreement no longer reflected the changed patterns of trade.
4.5 Bilateral Trading Agreements
26. Bilateral trade between India and Nepal is governed by the Indo-Nepal Treaty of 1991. Under the Treaty industrial products manufactured in Nepal which contain not less than fifty percent Nepalese material are allowed duty free access into India on a non-reciprocal basis. Specified primary products are also accorded duty free access on reciprocal basis. Save for an annually negotiated list of products all goods of Indian or Nepalese origin destined to the other territory are free of quantitative restrictions.
27. Indo-Bhutan Trade is governed by the Trade Agreement between the two countries signed in 1990. It provides, inter alia, for free trade and commerce between the two countries. All commercial transactions are conducted in Indian rupees or Bhutanese Ngultrums which are inter-changeable at par.
28. Certain preferences extended to Burma continue to survive from the pre-1947 period.
29. Apart from the special arrangements with Nepal and Bhutan, India has bilateral agreements covering trade with a number of countries. These latter agreements essentially provide for trade on a Most Favoured Nation basis. The rupee trade arrangements with the erstwhile Soviet Union and some East European countries have come to an end and trade is now conducted in convertible currencies. Repayment of debt to Russia will be denominated in rupees and repaid in Indian goods also denominated in rupees.
5 THE IMPLEMENTATION OF TRADE POLICIES
5.1 Trade Measures
30. Government undertook a comprehensive review of the existing export and import policy and announced major reforms on July 4, and August 13, 1991. These reforms aimed at reduction of import licensing, export promotion and optimal import saving. The Cash Compensatory Support (CCS) which accounted for over Rs 24 billion in Central Government Budget in 1991-92. was abolished and replenishment licenses were replaced by a new instrument named Eximscnp which was freely tradeable and amounted to 30-40 per cent of fob value of exports.
31. An increase in reserves provided the underpinning for further reforms in February and March 1992. namely the liberalisation of trade and relaxations of import licensing, reduction in customs duties, liberalisation of export-import credit policy, foreign investment policy and introduction of a liberalised Foreign Exchange Rate Management System (LERMS).
32. The import licensing system had been characterised by user-specific import restrictions which involved considerable administrative action and surveillance by the Chief Controller of Imports and Exports (now called the Director General of Foreign Trade), the Directorate General of Technical Development, and the Customs. A step towards its simplification was taken in July 1991 with the introduction of Eximscrips, which were essentially tradeable import licences. However, Eximscrips like other import licences had to be issued case by case, required physical handling, and required surveillance. In 1992-93 a liberalised exchange rate management system was introduced which created
India C/RM/G/40 Page 7
an open market in foreign exchange and hence an automatic mechanism to allocate foreign exchange. Detailed allocation of foreign exchange through import licensing was thus made redundant.
33. Import licensing has undergone substantial reduction. Except for the negative list of imports, all items (capital goods, raw materials, components, spares etc) are freely importable. Restriction on imports are maintained for reasons of balance of payments, and for compliance with obligations under international conventions. Social considerations are also taken into account while determining the negative list.
34. Negative list of imports consists of (i) Prohibited items (ii) Restricted items and (iii) Canalised items.
35. Import of prohibited items, namely tallow, animal fat, rennet and ivory is not allowed due to social considerations and international conventions.
36. Imports of consumer goods, certain drugs and chemicals and some miscellaneous items are restricted for reasons of balance-of-payment. Safety and security related items ; seeds, plants and animals and some miscellaneous items are restricted due to domestic regulations. Restricted items are not permitted except against a licence or in accordance with the general scheme laid down for import of specific items.
37. Petroleum products, fertilizers, edible and non-edible oils, oil seeds and cereals are imported through designated agencies for obtaining better terms of trade.
38. Import of raw materials, components etc ( whether freely importable or in the negative list) is allowed duty free against licences for registered exporters subject to published value addition norms under the Duty Exemption Scheme. Import of capital goods,generally importable without restrictions at normal rates of duty, are permitted at a concessional duty rate of 15 per cent, against licences for export production under the Export Promotion Capital Goods Scheme.
39. To carry forward the process of liberalisation government announced a number of changes in the Export Import Policy with effect from 1st April 1993. The negative list of imports and exports were pruned. These changes give special attention to the agriculture and services sectors by permitting imports of capital goods at concessional duty.
40. Data on number and value of import licences issued since 1989-90 are appended. The value of import licences issued as a proportion of total imports declined from 44.5 per cent during 1990-91 to 37.8 per cent during 1991-92. The share of value of licences issued to registered exporter rose to 68.4 per cent in 1991-92 from 54.1 per cent in 1990-91. For the first six months of 1992-93 this proportion reached 80 per cent.
41. In July 1991, over 4,000 of the 5,021 tariff lines in the Harmonized system were subject to import licensing restrictions. The remaining 1,000 lines were often subject to actual user conditions. As a result of the measures carried out since then more than 3,000 tariff lines covering raw materials, intermediates and capital goods are free of import licensing requirements. A negative list comprising consumer goods (around 1,500 tariff lines) and other specified items (around 300 tariff lines) only are subject to quantitative restrictions.

C/RM/G/40 Page 8
Trade Policy Review Mechanism
42. The tariff hitherto had comprised of three components the basic duty; auxiliary duty and additional duty which is also referred to as countervailing duty and is equal to the amount of the excise duty leviable on the like article produced domestically.Identical items were subject to various rates of duty depending on end uses. Tariff rates and tariff dispersion were high and the duty structure was anomalous in certain cases.
43. As a part of rationalisation of tariffs initiated in 1991-92, general tariff rates were reduced and the maximum rate was reduced to 150 per cent. Even after these changes the tariff rates were high by international standards and a committee on Tariff Policy Reforms was set up by the Government to formulate measures for rationalisation and reduction of tariffs progressively to provide Indian industry with an appropriate environment to develop international competitiveness. The major recommendations of the Committee were:-
(i) Tariff on finished goods should be higher than on basic raw materials and those on components and machinery should be in between;
(ii) Agricultural imports should be subject to some import duty;
(iii) Import duty structure for 1997-98 (excluding CVD) should be zero rate for essential agricultural goods; 10 per cent for other agricultural goods (e.g. oilseeds). 15 per cent fortin, pig iron, aluminium and nickel; 20 per cent for agricultural equipment, organic and inorganic chemicals, lead, zinc and machinery; 25 per cent for polymers, textiles, fibres and yarn; 30 per cent for articles of non-ferrous metals and of iron and steel; and 50 per cent for non-essential agricultural goods.
44. The recommendations of the Committee have been accepted in principle by the government. The ceiling rates of tariffs have been reduced in three stages from 150 per cent in 1991-92 to 110 per cent in 1992-93 and 85 per cent in 1993-94. Auxiliary duty has been merged with basic duty to simplify the tariff. The number of end use exemption notifications has been substantially reduced, though not eliminated. To reduce the cost of new investment, the duty on general machinery has been reduced to 35 per cent. The especially reduced tariff rates have been made applicable on the import of Capital goods used for fertilizers (10 per cent), coal mining, petroleum refining and electronic projects (25 per cent) and power projects (20 per cent). Tariff dispersion has also been reduced.
45. The revenue from Custom duties accounts for about one third of total Government tax revenue. Because of the dependence on customs revenue and the imperatives of reducing the fiscal deficit, it is not possible to undertake precipitate tariff reductions. It is the intention of Government that tariffs would be gradually reduced over a period of 4 to 5 years to an average of 25-30 per cent and to a maximum of 50 per cent on consumer goods.
46. India does not maintain tariff-quotas or tariff surcharges.
47. India does not maintain any mixing requirements or variable levies.
48. India is a signatory to the GATT Agreement on the implementation of Article VII.
49. For preferential trade under GSTP, Bangkok Agreement etc. the rules of origin are specified in those agreements. They generally follow a percentage criterion.

India C/RM/G/40 Page 9
50. India is not a member of the agreement on Government procurement.
51. India is a signatory to the agreement on Technical Barriers to Trade.
52. India has never had occasion to invoke safeguard provisions because imports had been subject to licensing requirements due to balance-of-payments reasons and the high tariffs.
53. India has imposed provisional anti-dumping duties in one case only on imports of PVC resin from Argentina, Brazil, Korea, Mexico and the United States, in 1992.
54. India has not invoked countervailing duty provisions.
55. The Government has over the years, been undertaking several export promotion measures aimed at encouraging a rapid growth in exports. The most important incentive prior to the initiation of reform programme in 1991 was in the form of Cash Compensatory Scheme (CCS). The scheme provided for product-specific reimbursement of indirect taxes other than Customs and excise duties as also compensation for other handicaps such as freight disadvantage. This scheme was abolished in 1991 when the rupee was devalued. The major export incentive programmes in the present context are:-
(i) Banks are provided export credit refinance to meet export credit requirements. Refinance with an accelerator is made available at less than the peak rate (11 per cent) of interest. Post-shipment credit is available in dollar denomination at 6.5 per cent rate of interest,
(ii) 100 per cent exemption from income tax is available on the earnings from exports. For the earnings from exports of projects and consultancy services the exemption limit is 50 per cent,
(iii) Customs and excise duties borne by exported products are refundable through the Duty Drawback Scheme,
(iv) Exporters are entitled to import capital goods at concessional rates of import duty. The scheme allows exporters to import capital goods at import duty of 15 per cent subject to an export obligation of four times the value of imports. The obligation is to be fulfilled in five years,
(v) Under Duty Exemption Scheme exporters are eligible to import raw materials duty free with an obligations to export with minimum value addition of 33 per cent,
(vi) The difference between domestic price and international price of certain categories of iron and steel and other basic metals like copper are reimbursed to the exporters under the International Price Reimbursement Scheme (IPRS).
56. To enable Indian exports to be more competitive six Export Processing Zones have been set up at Kandla in Gujarat, Santa Cruz in Bombay, Falta in West Bengal, NOIDA in Uttar Pradesh, Cochin in Kerala and Madras in Tamil Nadu. A seventh export processing zone at Vishakapatnam is under development. The operating units in all EPZs broadly fall under the product groups of electronics, engineering, chemicals and allied products, gems and jewellery, textiles, garments, leather products, plastics and rubber products. EPZs are provided with the incentives and concessions as indicated below :
a) Duty free import of capital goods, raw materials, components, consumables and spares ; and duty drawback of excise duties if raw materials are procured from indigenous sources;

C/RM/G/40 Page 10
Trade Policy Review Mechanism
b) Corporate tax holiday for a continuous block of five years during the first eight years of operations;
c) Foreign equity is permissible upto 100 per cent . d) Remittance of profits and dividends earned by foreign investors are allowed freely after
payment of taxes; e) Facility to sell upto 25 per cent or 15 per cent of the production in the domestic market
depending upon the level of indigenous inputs used in production; f) Special dispensation and relaxation in municipal tax, octroi, sales tax and property
tax.
57. While the units are free to source their requirements of capital goods, raw materials, components and spares etc. either from abroad or indigenously, they are required to adhere to the minimum value addition stipulated in their Letter of Approval or Letter of Intent. Although the minimum value addition is 20 per cent, the Board of Approvals has fixed industry-specific value addition norms.
58. The number of units in the 6 EPZs along with figures of their exports, are appended.
59. EPZ units have limitations due to fixed location and the small areas available. In the export of manufactured products from the country the share of EPZs is about 4 per cent. With the setting up of more units under the scheme and growth in export of existing units, the contribution of EPZs in the overall exports from the country is expected to grow significantly in the coming years.
60. The scheme for 100 per cent Export Oriented Unit was introduced in 1980 to generate additional export capacity. These units are allowed to import machinery, raw materials, components and consumables free of customs duties, and if procured indigenously, full remission of excise duty is available. These units operate under customs bond and have to achieve specified levels of value addition.
61. So far 225 units have reported commencement of production as EOU and the cumulative exports from these units by the end of March, 1992 have amounted to Rs 36,000 million.
62. Export restrictions are in place through negative list of exports. India has not entered into any VER or OMA. In the textiles and clothing sector export restraints are applied in accordance with the agreements under Multi-Fibre Arrangement.
63. Negative list of exports consists of (i) prohibited items (ii) canalised items and (iii) restricted items which are permitted against licences.
64. Prohibited items of export such as wild life, wild flora and fauna, wood and wood products, beef etc. are not allowed for exports on environmental and social considerations.
65. Petroleum products, Gum Karaya, Mica waste, powder milk certain rare earth minerals and ores etc. are allowed for exports only through the designated agencies.
66. For restricted items such as hides and skins, certain mineral ores, vegetable oils etc. the exports can be undertaken only against a licence. In case of items like black pepper, cotton yarn, coir, rice, groundnuts etc. export is allowed without licence but subject to the fulfilment of specified conditions such as minimum export price, quantitative ceilings etc.

India C/RM/G/40 Page 11
67. In the export sector, the 1992 Export-Import Policy reduced the number of items subject to export controls from 439 to 296. Through the amendments in Policy in March, 1993 the items under export restrictions were further reduced to 215. Exports of many of these 215 items are restricted for security, environmental and social considerations.
68. Other than the measures described in paragraphs 55 and 56 no government assistance, subsidies or tax exemptions are available for exports.
69. State Trading Corporation of India Ltd. (STC), The Project and Equipment Corporation of India Ltd. (PEC) and the Minerals and Metals Trading Corporation of India Ltd (MMTC) and Indian Oil Corporation (IOC) are the four major State Trading enterprises. STC and MMTC have played a significant rôle as canalising agencies for exports and imports. Following the liberalisation of controls since 1991, most items have been decanalized which has prompted these agencies to emerge as trading houses. Currently STC is the canalising agency mainly for import of oilseeds and edible oils. MMTC is canalising agency for import of fertilizers (except DAP) and export of mica waste and certain types of iron ore.
70. The trade performance of these agencies in the last 3 years is appended.
71. Apart from the STC, MMTC and PEC, the major state agency involved in trading activity is the Indian Oil Corporation (IOC). IOC has been the designated agency for import and export of petroleum and petroleum products. Since this sector accounts for more than 25 per cent of total imports IOC has been given the exclusive right to import and obtain better terms of trade. The production refining and distribution of petroleum products is largely in the public sector. However, the import of kerosene and natural gas has been decanalized. Refining has also been opened to the private sector as part of the new industrial policy.
72. As of March 1993, there are no foreign exchange restrictions on export and import operations. Exporters and importers are free to buy and sell currency at market determined rates through authorised foreign exchange dealers.
73. There is no legislation on counter trade in India. However, counter trade is sought to be obtained primarily against government purchases of large magnitude. This is effected by incorporation of a clause in the tender documents specifying that offers of off-set exports or counter trade would be considered an advantage, other things being equal. The counter trade exports generally take place through STC, MMTC or PEC. These public sector undertakings also try and obtain counter-trade commitments on the strength of their bulk commercial purchasing power. No special flexibility in Export Import Policy is provided for the purpose.
74. The total countertrade exports performed by STC, MMTC, and PEC (inclusive of counter-trade on their own imports) during the last five years is appended. Estimates of net additions to exports due to counter-trade operations are not possible.
5.2 Prospective changes in Trade Policies
75. The economic reforms initiated in 1991-92 were a combination of measures aimed at economic stabilisation as well as structural reforms. Stabilisation was necessary in the short run to restore balance of payments equilibrium and to control inflation. The policy measures initiated in the past three years

C/RM/G/40 Page 12
Trade Policy Review Mechanism
have helped in achieving economic stabilisation and the base now exists for deepening and widening the scope of trade reforms so that the economy gets better integrated with the rest of the world. The exchange rate régime has already been unified since March, 1993 and rupee has become convertible on trade account. The key areas in which further reforms would be undertaken are:-
(i) Further pruning of the "negative" lists of imports and exports and (ii) A gradual reduction in both the level and dispersion of tariff rates.
76. With the overall improvements in the policy framework greater attention would be given to correcting specific distortions. As a broad guideline as the foreign exchange position improves and the economy becomes more resilient, the objective would be to remove raw-materials and components from the negative list of imports.
77. In the later phase manufactured items would also be removed from the negative list. It would be the endeavour that by 1997 the negative list of imports should contain only items which would be banned for reasons such as environment and safety. Much would, however, depend on the external economic environment and the extent to which it allows India to export products in which it is competitive and the extent to which trade distorting measures on agricultural products are reduced by major economies. Any protection deemed necessary for domestic industry would basically be given through tariffs.
6 WIDER ECONOMIC AND DEVELOPMENT NEEDS
78. The objectives of fulfilling the social and human aspirations of the people, meeting the essential requirements of living, raising income levels and improving the quality of life are central to the development efforts in the long run. These are sought to be achieved through expansion of employment. maintenance of food security and upgradation of technology.
79. With these objectives in view the Eighth Plan aims at an average annual growth rate of 5.6 percent and an average industrial growth rate of about 7.5 percent. These growth targets are planned to be achieved with relative price stability and a substantial improvement in the country's balance of payments position. It is envisaged that there will be a reasonable degree of price stability and that the ratio of current account deficit to GDP will be brought down to about 1 percent by the end of the VHIth Five Year Plan.
80. In general the following macro economic policies have had the focus of Government attention:
(a) The policy régime governing trade, technology and transborder capital flows, (b) Industrial deregulation and administered price policy, (c) Financial sector reforms, and (d) Monetary and Fiscal policies.
81. India initiated a programme of macro-economic stabilization and structural reforms in July 1991 against a backdrop of a severe balance-of-payments crisis and serious inflationary pressures.
82. Energetic action was taken to redress the imbalances which had emerged both in external and domestic financial conditions. A programme of macroeconomic stabilization was initiated in July,

India C/RM/G/40 Page 13
1991. It brought down the level of the fiscal deficit, and a longer term policy of reducing the fiscal deficit as percentage of GDP in subsequent years was announced. The rate of growth of money supply was checked. The exchange rate of the rupee was adjusted downwards to a level which can be sustained in the light of the country's balance-of-payments situation and the state of the domestic economy. Exceptional financing was mobilized both from multilateral and bilateral sources to relieve the pressures of immediate debt servicing on the Balance-of- Payments and to build up foreign exchange reserves.
83. As a result of these macro-economic measures the annual rate of inflation, which had peaked at nearly 17 per cent in August 1991 came down to 7 per cent by the end of 1992-93. Foreign currency reserves, which had fallen to just above $ 1 billion recovered, and stood at above over $ 6.4 billion at the end of 1992-93. By July, 1993, inflation came down to 5.4 per cent and foreign currency reserves had been builtupto $6.6billion.Overall economic growth, whichhad dipped to 1.2 per cent in 1991-92, recovered to about 4 per cent in 1992-93. Industrial growth recovered in the first eight months of 1992-93, registering growth of about 4 per cent over the corresponding period of 1991-92. However, performance over the next few months deteriorated, mainly because of social unrest in some parts of the country.
84. These macro-economic outcomes were a product of both the economic stabilisation measures undertaken by Government and the initiation of a medium-term strategy for consolidating macro-economic stability and undertaking structural reforms in the foreign trade régime, the tax system, industrial policy and financial and other sectors. The objective was to improve the underlying strength of the economy, attempt to insure against future crises and further the fundamental development objectives of growth with equity and self-reliance.
85. An element in the reform package was the reversal of the trend of growing fiscal imbalances. They had led to high level of borrowing by the Government from the Reserve Bank, with an expansionary impact on money supply leading directly to high rates of inflation. High fiscal deficits contributed directly to the large current account deficits in the balance of payments and thus aggravated the problem of external indebtedness.
86. Recognising these problems, the medium term strategy of the Government included, as a key element, a programme of gradually reducing the Central Government fiscal deficit from 8.4 per cent of GDP in 1990-91 to 6.5 per cent in 1991-92 and further to 5.0 per cent in 1992-93. In 1991-92, the fiscal deficit reduction, to 6 per cent, bettered the target. But, the loss of customs and excise revenues, because of social unrest and shortfall in realisation from the sale of government equity in public enterprises led to an overshooting of the 1992-93 target by 0.6 per cent of GDP. However, the process of fiscal consolidation is being continued further in 1993-94, with the fiscal deficit targeted at 4.7 per cent of GDP.
87 A priority area for economic reform was industrial policy. The industrial policy frame work had come to be characterised by extensive controls. Licenses were needed to establish new units as well as to undertake substantial expansion in capacity in almost all sectors. The larger houses (MRTP houses) needed separate permission to invest or expand; this was aimed at preventing the concentration of economic power. A substantial area of industrial activity, including several critical infrastructure sectors, was reserved for the public sector. Access to foreign technology by domestic entrepreneurs also required government permission.

C/RM/G/40 Page 14
Trade Policy Review Mechanism
88. These controls had, over time become inefficient. They led to delays in decision making and frequently led to inefficient choices of scale, location and technology. Very often the system served only to protect established producers from competition by new entrants, thus encouraging inefficiency and high costs. With the growing maturity of the industrial sector and especially the need to become competitive, it was necessary to restructure the system to eliminate bureaucratic control and allow greater play to entrepreneurial decision making, subject to the normal disciplines of market competition. Accordingly, the Government took a number of steps to dismantle the control structure.
* Industrial licensing was abolished for all except a select list of hazardous and environmentally sensitive industries.
* The separate permission needed by MRTP houses for investment and expansion was abolished.
* The list of industries reserved for the public sector was reduced from 17 to 6. In addition, private sector participation was allowed even in industries in the reserved list.
* Access to foreign technology was made much freer.
These changes have introduced a more competitive environment in Indian industry in which entrepreneurs are free to invest, expand and modernise in response to market conditions.
89. As already described changes have been made in the trade and exchange rate policies in the past two years. Trade policies have been amended to reduce direct administrative control over imports through licensing. Tariffs have also been brought down.
90. The new exchange rate system is an incentive for exports including services exports and remittances. It has greatly reduced the incentive for inward remittances flowing through the illegal market. It has permitted abolition of product-specific export incentives. It has especially helped agricultural and agro-based exports which earlier did not receive any supports.
91. Foreign investment was always allowed in large areas of the economy. However, the rules and procedures in place were unable to attract large volumes of foreign investment. Net foreign investment inflows into India during the late eighties and early 1990s were around $ 100-200 million per year.
92. A new policy was announced, designed to attract foreign investments in larger volumes, by simplifying rules and procedures and making the terms offered to foreign investors more in line with current practice all over the world.
* Foreign investment approvals up to 51 per cent of equity in a specified list of 34 priority industries was made automatic, subject only to a registration procedure with the Reserve Bank of India.
* Investment above 51 percent equity was also permitted on the basis of case by case approvals given by specially constituted Foreign Investment Promotion Board (FIPB) charged with expeditious processing of governmental approvals.
* The procedure for Indian companies to invest abroad and develop global linkages in this way was also streamlined and made easier.

India C/RM/G/40 Page 15
* The Foreign Exchange Regulation Act (FERA) was amended to remove a number of constraints earlier applicable to firms with foreign equity operating in India and also to make it easier for Indian business to operate abroad.
* India signed the Multilateral Investment Guarantee Agency (MIGA) Convention and became a member of MIGA along with many other developing countries interested in promoting foreign investment.
* Foreign investors can invest in Indian companies through Global Deposit Receipts Mechanism.
93. These changes have succeeded in attracting considerable interest on the part of foreign investors. Since the announcement of the new policy, foreign investment proposals approved through the automatic route as well as the FIPB total up to almost $ 3 billion. The bulk of the investment proposals is in areas such as power generation, petroleum refining, electronics and also a variety of sectors with substantial export potential.
94. The Government has announced a number of reform initiatives in the financial sector. These include, inter alia:
* New accounting and prudential norms related to income recognition, provisioning and capital adequacy, in line with accepted international standards, have been implemented in the course of 1992-93.
* The proportion of bank funds pre-empted through the Statutory Liquidity Ratio (SLR) has begun to be reduced. This process will be continued further, lowering the average SLR to 25 per cent over the next three years. This will greatly increase the volume of funds available for industry, trade and agriculture.
* Existing private sector banks will be allowed to expand and new private banks will be allowed to be set up subject to RBI guidelines.
* The regulated interest rate structure is being rationalised and simplified. Bank deposit rates have been deregulated subject to a ceiling rate. The number of lending rates has been reduced from six prevailing two years ago to three rates today, with two concessional rates and a floor rate for all advances above Rs.200,000.
* Parallel with these developments the Government has also increased the rates of interest offered on its own market borrowing to levels which are closer to market rates. This will help to reduce the burden that such borrowing otherwise imposes on the banks and will also smoothen the transition to creating an active market for Government debt.
95. In the Capital Market the direct government control over the volume and pricing of issues has been abolished. Number of steps have been taken to improve the functioning of the Capital market.
* Securities and Exchange Board of India (SEBI) as an statutory independent authority has been given freedom to regulate the capital market.
* Private Sector Mutual Funds have been allowed to operate subject to SEBI rules and regulations.
* A National Stock Exchange is being set up to serve as a model exchange providing nationwide screen based trading, electronic clearing and settlement systems.
* Foreign Institutional investors such as pension funds, mutual funds etc., have been allowed to invest in the capital markets subject to SEBI registrations.

C/RM/G/40 Trade Policy Review Mechanism Page 16
96. The Government has taken a number of steps to reform the public sector.
* Budgetary support in the form of loans to loss making PSUs is being phased out after 1994-95.
* Public sector equity is being disinvested upto 49 percent in selected profit making enterprises, partly to mobilise non-inflationary resources for the Budget but partly also to broad base ownership and create a greater commercial orientation in the management of PSUs.
* Public sector enterprises are being allowed to form joint ventures and also to raise fresh equity from the market to finance their expansion plans.
* The Sick Industrial Companies Act (SICA) has been amended to bring public sector undertakings within the jurisdiction of the Board for Industrial & Financial Reconstruction (BIFR), which will now have to decide whether these units can be effectively restructured or whether they should close down.
* In order to overcome the problem of losses forced on PSUs because of inability to make timely price adjustments, the price policy now envisages that an increase in costs attributable to unproductive cost elements should be absorbed by the industry through improvements in efficiency and the rest through an increase in the selling price.
97. The impact of the series of reforms, including those in the trade sector, has been encouraging. The inflow of non-resident deposits has turned positive. Exports during 1992-93 reached a level of $18.9 billion indicating a growth rate of 3.6 per cent over the previous year. If the performance of exports during the three months of December 92, January and February 93 (export during these months were adversely affected because of abnormal situation in the country) are excluded, the growth of export to GCA countries improves to the level of 13.5 per cent over the corresponding period of previous year.
7. THE EXTERNAL ECONOMIC ENVIRONMENT
98. As a result of the series of measures to correct the external balance, the BOP position stabilized during 1992-93. The current account deficit at $5.7 billion is well below the level in 1989-90 and 1990-91. With the removal of import compression measures imposed in the latter half of 1990 and in 1990-91, imports increased in 1992-93 by 10.1 per cent. At US $22 billion, imports in 1992-93 were below the level in 1989-90 and 1990-91, when they were $23 billion and 24.8 billion respectively. Exports registered an increase of 3.6 per cent despite a 62 per cent decline in export to Russia, other CIS nations and East European countries which were earlier covered under rupee payment arrangements.
99. Besides merchandise trade there has been improvement with regard to the inflow of NRI deposits during 1992-93 which is estimated at $964 million as against net outflow of $758 million during 1991-92. The gross drawal from IMF under the stand-by arrangement amounted to $1623 million. Other capital inflow under various schemes, like global depository receipts ($250 million), non-resident non-repatriable deposits ($500 million), foreign currency (bank and other) deposits ($750 million including $400 million brought in by foreign banks), and overseas remittances ($400 million) had a favourable impact on BOP situation. Above all, the BOP situation during 1992-93 improved substantially.
100. From relatively modest levels in the first half of 1980s, India's stock of external debt grew from US $23.5 billion at the end of 1980-81 to US $37.3 billion at the end of 1985-86 and to $ 67.56 billion at the end of 1991.92.

India C/RM/G/40 Page 17
101. As a proportion of GDP, India's external debt as reclassified (US $67.56 billion) had been 27.9 per cent of GDP in 1991-92. This excludes India's defence debt to GCA countries (US $1.62 billion) defence debt owed to former Soviet Union (US $9.22 billion), civilian Rupee debt (US $1.18 billion, and short-term trade debt of 0.17 billion). Including these items, the aggregate debt stood at US $79.75 billion at the end of 1991-92 which constituted about 32.3 per cent of GDP. Debt service as a percentage of current receipts stood at 24.6 per cent in 1991-92.
102. The concessional component of India's debt although declining over the 1980s, is still high (42 per cent in 1991) in comparison with most countries. It may also be noted that short-term debt constitutes only a small portion (6.3 per cent at the end of 1992) of India's total debt.
103. As a part of the stabilization policy, the government has been maintaining strict monetary discipline to curb the overall demand and liquidity. The bank rate was increased from 10 per cent to 11 per cent with effect from July 4, 1991 and to 12 per cent with effect from October 9, 1991. Consequently, the lending rates on both term loans and working capital ranged in between 11.5 per cent to 20 per cent (minimum) as against 10 per cent to 18.5 per cent (minimum). On March 1992 the floor rate of 20 per cent for loans exceeding Rs 200,000 was reduced from 20 per cent to 19 per cent and subsequently to 18 per cent on October 9, 1992 and consequent upon general fall in the rate of inflation lending and term deposit rates were reduced by a one percentage point across the board with effect from October 9, 1992.
8. MAJOR TRENDS IN IMPORTS & EXPORTS
104. The momentum of export growth withnessed during 1986-87 to 1989-90 could not be sustained during subsequent years. Exports during 1990-91 at $18142 recorded an increase of 9.1 per cent in contrast to a sharp rise of 19 percent in 1989-90. In 1991-92 exports showed a negative growth rate of 1.5 per cent.
105. Imposition of severe import compression measures as well as tight monetary policy during 1990-91 had an important bearing on exports. The external environment reflected in declining trend in world exports, Gulf war and disintegeration of USSR and East European market affected the exports adversely .
106. Manufactured goods account for over 70 per cent of total exports. Bulk of manufactured exports consist of six commodities, namely, leather and leather manufactures, chemicals and allied products; engineering goods; readymade garments; cotton yarn, fabrics, and madeups and gems and jewellery.
107. Amongst agricultural products which account for around 17 per cent of exports tea, coffee, spices, marine products, oil meals, meat and processed foods are important.
108. The impact of import compression measures taken by the government is reflected in steep decline of 19.4 per cent in 1991-92 at $1.9 billion in contrast toariseof 13.2 per cent in previous year. Imports to India can be categorised in three broad groupings, namely bulk imports (Petroleum, fertilizers, newsprint, ores and metal scrap, iron and steel etc.) capital goods and raw materials and intermediates. Bulk imports account for around 45 per cent, and capital goods for around 20 per cent of total imports.

C/RM/G/40 Page 18
Trade Policy Review Mechanism
109. OECD countries account for more than 50 per cent of trade followed by developing countries with a share of around 20 percent. The share of OPEC countries in foreign trade has increased in recent years.
9 PROBLEMS IN EXTERNAL MARKETS
110. India's exports has been adversely affected by wide spread recessionary conditions in OECD economies which are India's major trading partners. The collapse of the markets of the erstwhile Soviet Union and loss of exports to rupee payment areas resulted in a massive decline in exports to these areas during the past two years.
111. Out of the major constraint on India's exports continues to be the discriminatory MFA régime in case of textiles. This is particularly onerous as textiles sector accounts for a quarter of India's exports.
112. Subsidization of agricultural exports by major developed countries has had a restricting influence on India's entry into the international markets.
113. Indian exports have several anti-dumping and countervailing duty proceedings in important markets. These proceedings, sometimes initiated on insubstantial grounds, have affected India's exports in several sectors.
India C/RM/G/40 Page 19
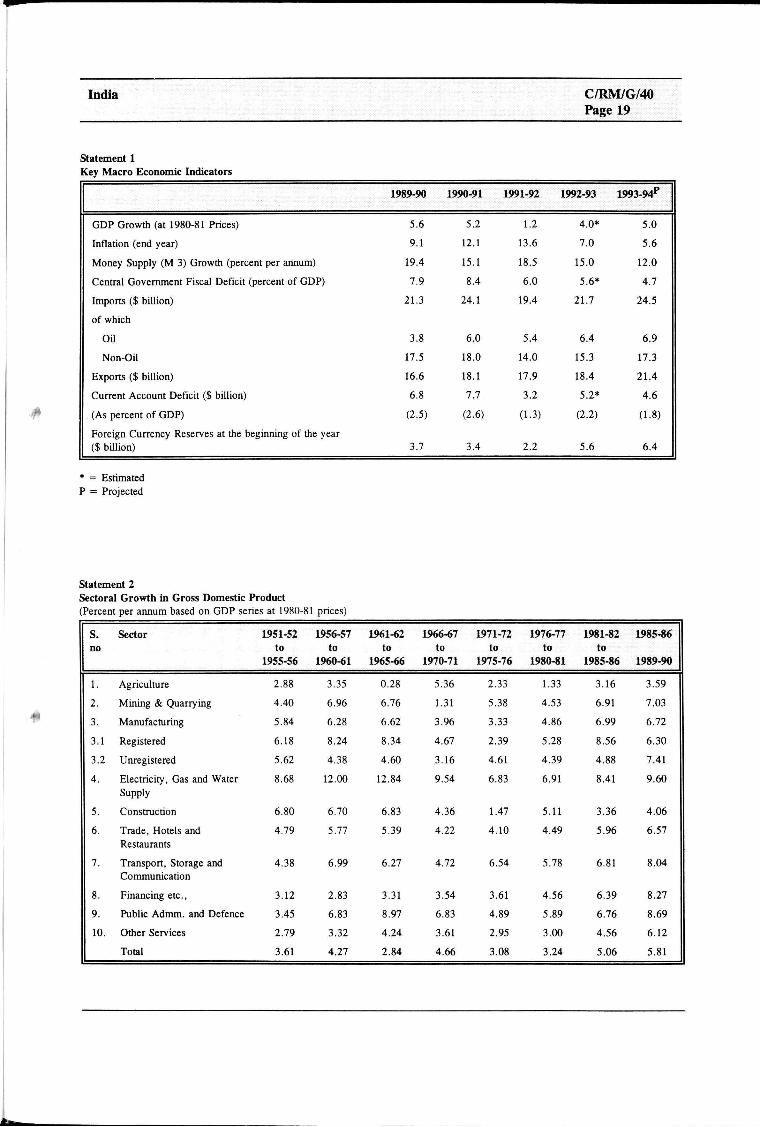
Statement 1 Key Macro Economic Indicators
GDP Growth (at 1980-81 Prices)
Inflation (end year)
Money Supply (M 3) Growth (percent per annum)
Central Government Fiscal Deficit (percent of GDP)
Imports ($ billion)
of which
Oil
Non-Oil
Exports ($ billion)
Current Account Deficit ($ billion)
(As percent of GDP)
Foreign Currency Reserves at the beginning of the year ($ billion)
1989-90
5.6
9.1
19.4
7.9
21.3
3.8
17.5
16.6
6.8
(2.5)
3.7
1990-91
5.2
12.1
15.1
8.4
24.1
6.0
18.0
18.1
7.7
(2.6)
3.4
1991-92
1.2
13.6
18.5
6.0
19.4
5.4
14.0
17.9
3.2
(1.3)
2.2
1992-93
4.0*
7.0
15.0
5.6*
21.7
6.4
15.3
18.4
5.2*
(2.2)
5.6
1993-94p
5.0
5.6
12.0
4.7
24.5
6.9
17.3
21.4
4.6
(1.8)
6.4
* = Estimated P = Projected
Statement 2 Sectoral Growth in Gross Domestic Product (Percent per annum based on GDP series at 1980-81 prices)
s. no
1.
2.
3.
3.1
3.2
4.
5.
6.
7.
8.
9.
10.
Sector
Agriculture
Mining & Quarrying
Manufacturing
Registered
Unregistered
Electricity, Gas and Water Supply
Construction
Trade, Hotels and Restaurants
Transport, Storage and Communication
Financing etc.,
Public Admm. and Defence
Other Services
Total
1951-52 to
1955-56
2.88
4.40
5.84
6.18
5.62
8.68
6.80
4.79
4.38
3.12
3.45
2.79
3.61
1956-57 to
1960-61
3.35
6.96
6.28
8.24
4.38
12.00
6.70
5.77
6.99
2.83
6.83
3.32
4.27
1961-62 to
1965-66
0.28
6.76
6.62
8.34
4.60
12.84
6.83
5.39
6.27
3.31
8.97
4.24
2.84
1966-67 to
1970-71
5.36
1.31
3.96
4.67
3.16
9.54
4.36
4.22
4.72
3.54
6.83
3.61
4.66
1971-72 to
1975-76
2.33
5.38
3.33
2.39
4.61
6.83
1.47
4.10
6.54
3.61
4.89
2.95
3.08
1976-77 to
1980-81
1.33
4.53
4.86
5.28
4.39
6.91
5.11
4.49
5.78
4.56
5.89
3.00
3.24
1981-82 to
1985-86
3.16
6.91
6.99
8.56
4.88
8.41
3.36
5.96
6.81
6.39
6.76
4.56
5.06
1985-86
1989-90
3.59
7.03
6.72
6.30
7.41
9.60
4.06
6.57
8.04
8.27
8.69
6.12
5.81
C/RM/G/40 Trade Policy Review Mechanism Page 20
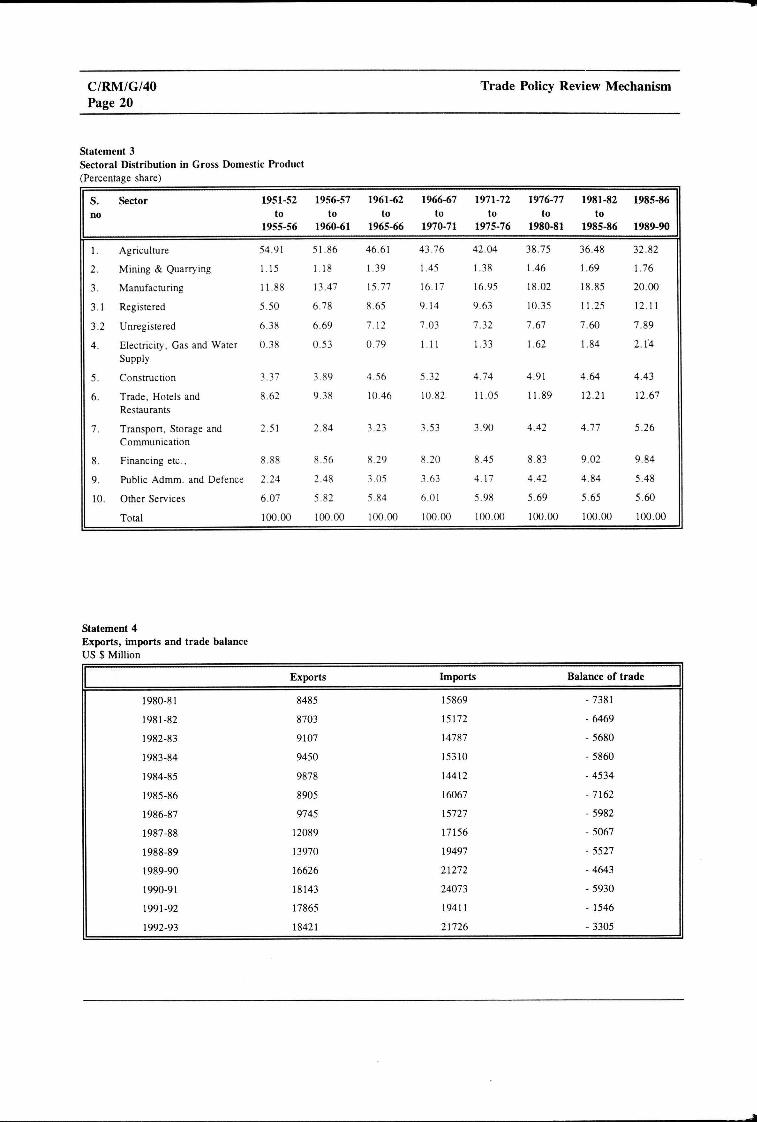
Statement 3 Sectoral Distribution in Gross Domestic Product (Percentage share)
s. no
1.
2.
3.
3.1
3.2
4.
5.
6.
7.
8.
9.
10.
Sector
Agriculture
Mining & Quarrying
Manufacturing
Registered
Unregistered
Electricity. Gas and Water Supply
Construction
Trade, Hotels and Restaurants
Transport, Storage and Communication
Financing etc..
Public Admm. and Defence
Other Services
Total
1951-52 to
1955-56
54.91
1.15
11.88
5.50
6.38
0.38
3.37
8.62
2.51
8.88
2.24
6.07
100.00
1956-57 to
1960-61
51.86
1.18
13.47
6.78
6.69
0.53
3.89
9.38
2.84
8.56
2.48
5.82
100.00
1961-62 to
1965-66
46.61
1.39
15.77
8.65
7.12
0.79
4.56
10.46
3.23
8.29
3.05
5.84
100.00
1966-67 to
1970-71
43.76
1.45
16.17
9.14
7.03
1 11
5.32
10.82
3.53
8.20
3.63
6.01
100.00
1971-72 to
1975-76
42.04
1.38
16.95
9.63
7.32
1.33
4.74
11.05
3.90
8.45
4.17
5.98
100.00
1976-77 to
1980-81
38.75
1.46
18.02
10.35
7.67
1.62
4.91
11.89
4.42
8.83
4.42
5.69
100.00
1981-82 to
1985-86
36.48
1.69
18.85
11.25
7.60
1.84
4.64
12.21
4.77
9.02
4.84
5.65
100.00
1985-86
1989-90
32.82
1.76
20.00
12.11
7.89
2.14
4.43
12.67
5.26
9.84
5.48
5.60
100.00
Statement 4 Exports, imports and trade balance US $ Million
1980-81
1981-82
1982-83
1983-84
1984-85
1985-86
1986-87
1987-88
1988-89
1989-90
1990-91
1991-92
1992-93
Exports
8485
8703
9107
9450
9878
8905
9745
12089
13970
16626
18143
17865
18421
Imports
15869
15172
14787
15310
14412
16067
15727
17156
19497
21272
24073
19411
21726
Balance of trade
-7381
-6469
-5680
- 5860
-4534
-7162
-5982
- 5067
- 5527
-4643
-5930
- 1546
- 3305

India C/RM/G/40 Page 21
Statement S Direction of trade: sources of imports US$ Million
I
1.1
1.2
1.3
1.4
1.5
II.
III.
III. 1
IV.
DECD of v.
EEC
Canada
USA
Australia
Japan
OPEC
hich
Eastern Europe
USSR
Developing
TOTAL
Countries
1987-88
9548 (55.7)
5707 (33.3)
231 (1.3)
1544 (9.0)
388 (2.3)
1640 (9.6)
2278 (13.3)
1640 (9.6)
1240 (7.2)
2931 (17.1)
17156
1988-89
11089(56.9)
6218(31.9)
296 (1.5)
2237 (11.5)
488 (2.5)
1817 (9.3)
2609 (13.4)
1344 (6.9)
869 (4.5)
3632 (18.6)
19497
1989-90
12147 (57.1)
7049 (33.1)
273 (1.3)
2557 (12.0)
533 (2.5)
1694 (8.0)
3048 (14.3)
1796 (8.4)
1224 (5.8)
3622 (17.0)
21272
1990-91
12991 (54.0)
7067 (29.4)
312 (1.3)
2923 (12.1)
816 (3.4)
1809 (7.5)
3924 (16.3)
1882 (7.8)
1420 (5.9)
4439 (18.4)
24072
1991-92
10599 (54.2)
5706 (29.2)
282 (1.4)
2009 (10.3)
590(3.0)
1379 (7.1)
3849 (19.7)
999 (5.1)
734 (3.8)
3035 (15.5)
19552
Statement 6 Direction of trade: export US$ Million
I
1.1
1.2
1.3
1.4
1.5
II.
III.
III. 1
IV.
DECD of which
EEC
Canada
USA
Australia
Japan
OPEC
Eastern Europe
USSR
Developing Countries
TOTAL
1987-88
6818 (56.4)
3034(25.1)
128 (1.1)
2252 (18.6)
139(1.1)
1245 (10.3)
742 (6.1)
2001 (16.6)
1514 (12.5)
1700 (14.1)
12089
1988-89
7803 (55.9)
3401 (24.3)
136 (1.0)
2574 (18.4)
183 (1.3)
1487 (10.6)
824 (5.9)
2317 (16.6)
1802 (12.9)
2289 (16.4)
13970
1989-90
8855 (53.3)
4148 (24.9)
159 (1.0)
2687 (16.2)
201 (1.2)
1638 (9.9)
1106(6.6)
3205 (19.3)
2681 (16.1)
2550 (15.3)
16626
1990-91
9713 (53.5)
4989 (27.5)
157 (0.9)
2673 (14.7)
179 (1.0)
1694 (9.3)
1020 (5.6)
3243 (17.9)
2929(16.1)
3046 (16.8)
18142
1991-92
10412 (57.9)
4862 (27.0)
190(1.1)
2942 (16.4)
204 (1.1)
1663 (9.2)
1573 (8.7)
1967 (10.9)
1652 (9.2)
2901 (16.1)
17995

C/RM/G/40 Trade Policy Review Mechanism Page 22
Statement 7 India's imports by principal commodities (Value : US $ Million)
Commodities
I. Bulk
1.
2.
3.
4.
5.
6.
7.
8.
9.
10
11.
II. Pearl
III. Mad
1.
2.
3.
4.
mports
Cereals
Fertilizers
Edible oil
Pulp & W. Paper
Paperboard & mfrs.
Newsprint
Crude rubber
Nonferrous mils
Mtl. Ores & Scrap
Iron & Steel
Petroleum
s, precious and semi. Pr. Stones
inery
Machine Tools
Machinery
Elec. machinery
Trans, equipment
IV. Project goods
V. Othe
1.
2.
3.
4.
5.
6.
7.
8.
9
10.
11.
12.
13.
14.
15.
16.
17.
Grand total
rs
Cashew nuts
Fruits & nuts
Wool raw
Silk raw
Synth & reg. fbrs
Pulses
Crude minerals
Coal, Coke & brqts
Organic cmls and Inorganic cmls
Dyeng. tan, mtis
Med & Phrma mtls
Artfl. resins
Chem. mtl & prds
Txtlyarn, fbrc
Mfrs of metals
Non-mtlc mfrs
Profl. instrms
1989-90
8536
226
1067
127
183
139
135
103
753
651
1384
3768
2548
4192
192
1930
1154
917
949
5045
46
54
103
52
39
137
92
338
1283
88
163
598
133
210
163
101
532
21270
1990-91
10645
101
984
182
255
167
159
126
614
852
1178
6028
2083
4242
263
2100
949
931
1422
5678
75
59
101
57
31
268
101
440
1276
94
261
610
159
247
168
113
591
24072
1991-92
8486
70
944
101
121
99
139
74
340
477
799
5323
1957
2619
173
1452
624
371
1469
4879
108
41
80
60
20
104
86
420
1377
63
221
568
136
137
130
88
404
19411
1992-93
9539
319
976
60
138
128
111
89
386
619
791
5922
2421
2119
163
1680
814
461
1195
5452
124
69
106
78
24
109
76
476
1465
69
246
417
155
144
149
86
512
21726

India C/RM/G/40 Page 23
Statement 8 India's exports by principal commodities (Value : US $ Million)
Commodities
I.
II.
III.
rv.
v. VI.
vn. VIII.
IX.
X.
XI.
XII.
XIII.
xrv. XV.
XVI.
Plantations
1. Tea
2. Coffee
Agricultural commodities
1. Cereals
2. Tobacco
3. Spices
4. Cashew
5. Oilmeals
6. Process goods
7. Meat & preps
Marine prods.
Ores & minerals
1. Iron Ore
2. Process mnls.
3. Others
Leather & mfrs
Gems & jewellery
Sports goods
Chemicals
Engg. Goods
Elecs. & C.S. Ware
Textiles
1. Cotton fabrics
2. Silk fabrics
3. Manmade fabs.
4. Woollen fabrics
5. Ready mades
6. Coir
7. Jute
Cotton raw
Handicrafts
1. Carpets
2. Handicrafts
Petro. Products
Projects goods
Others
Grand total
1989-90
759
551
208
1604
259
105
166
221
366
247
68
413
1031
557
249
225
1171
3181
49
1604
1667
309
3373
905
123
187
17
1938
25
178
77
196
502
223
419
22
350
16626
1990-91
737
596
140
1611
276
147
130
249
339
237
78
535
970
585
171
215
1430
2924
48
1777
1919
241
3969
1170
131
227
12
2236
27
166
471
197
531
224
523
90
300
18142
1991-92
493
493
135
1860
361
153
151
274
374
219
94
585
930
582
146
181
1269
2738
32
1921
1956
278
4191
1299
142
333
30
2199
28
159
124
242
374
407
415
19
177
17865
1992-93
336
336
126
1904
343
167
127
259
531
206
89
602
741
381
139
195
1275
3052
35
1871
2232
219
4445
1356
139
366
39
2389
32
124
68
267
373
427
476
14
228
18420

C/RM/G/40 Trade Policy Review Mechanism Page 24
Statement 9 India's trade indices (1978-79 = 100)
Year
1980-81
1981-82
1982-83
1983-84
1984-85
1985-86
1986-87
1987-88
1988-89
1989-90
1990-91
1991-92
Export Prices
108.5
124.1
132.0
151.0
169.8
170.8
179.4
195.4
232.2
-292.5
369.5
Export Quantities
108.1
110.1
116.7
113.0
120.8
111.3
121.3
140.0
152.1
194.1
208.6
Import Prices
134.2
133.1
136.3
125.8
161.7
158.8
139.4
160.0
185.5
267.7
309.1
Import Quantities
137.9
150.6
154.6
185.4
156.1
182.3
212.3
204.8
224.2
-237.7
228.0
Terms of Trade
80.8
93.2
96.8
120.0
105.0
107.6
128.6
122.1
125.2
-109.3
119.5
Capacity to Import
87.30
102.6
113.0
135.6
126.8
119.8
156.0
170.9
150.4
-212.2
249.3

India C/RM/G/40 Page 25
Statement 10 Estimated Realised Average Rates of Custom duties during last 5 years for major product group imports (percentage ad-valorem)
Product Group
Fruits, dried & fresh
Animal or vegetable fats and oils
Mineral Substances
Inorganic chemicals
Organic chemicals
Pharmaceutical products
Photographic and Cinematographic goods
Miscellaneous chemical products
Plastics & articles thereof.
Rubber & Articles thereof.
Pulp, paper, paperboard and articles thereof
Wool and other animal hair
Man-made filaments
Man-made staple fibres
Ceramic products
Primary materials of Iron & Steel, Iron and non-alloy steel, stainless steel
Articles of Iron & Steel
Non-ferrous metals
Non-electricals machinery
Electrical machinery
Motor Vehicles and parts
Optical, photographic, cinematographic, measuring medical and surgical instruments
Projects imports
Total imports
1988-89
61
80
21
32
96
11
no 110
103
78
22
23
140
82
56
67
54
85
95
72
76
29
73
60
1989-90
46
99
21
29
94
05
114
101
95
81
26
16
157
87
63
66
49
55
85
84
78
36
61
55
1990-91
39
118
25
30
92
05
123
116
116
89
24
17
155
60
66
66
56
59
57
90
67
37
51
50
1991-92
27
43
22
21
90
04
134
104
123
123
38
22
80
34
73
83
72
67
57
91
61
34
52
47

C/RM/G/40 Page 26
Trade Policy Review Mechanism
Statement 11 Import Licensing: Classified by major categories 1989-90 to 1992-93 Value in US $ million
Category
Actual User (Industrial)
Actual User (Non-Industnal)
Registered Exporters
Capital Goods
Heavy Electrical Plants
State Trading Agencies
Total
1989-90
No.
6619
608
88484
2140
96
57
116094
Value
1731
17
6328
982
605
36
11192
1990-91
No.
5256
480
87415
2072
62
12
114553
Value
1218
17
5793
1705
709
12
10701
1991-92
No.
4158
301
84401
1735
22
18
972509
Value
521
8
5047
1419
124
8
7381
1992-93 upto Sept.1992
No.
411
115
33203
752
1
-36166
Value
93
3
2767
383
neg-
-3363
Statement 12 Performance of Export Processing Zones
Zones
1.
2.
3.
4.
5.
6
Total
Kandla
Santakruz
Madras
Noida
Falta
Cochin
No. of Units
(31.12.92)
107
115
107
71
12
23
435
1989-90
3383
2904
296
519
164
110
7376
Exports (Rs. Million)
1990-91
4566
3890
613
447
250
54
9820
1991-92
4272
5002
1225
722
279
286
11786

India C/RM/G/40 Page 27
Statement 13 Trade Performance (Rs. Million) of State Trading Enterprises
1989-90 1990-91 1991-92
Imp. Exp. Imp. Exp. Imp. Exp.
STC
i) Canalised 10450
ii) Non-canalised 250
MMTC
i) Canalised 38149
ii) Non-canalised 997
PEC
Counter Trade Exports by State Trading Enterprises Rs in million
STC
MMTC
PEC
1988-89
2218
2134
-
1989-90
4285
1907
-
1990-91
1184
3717
-
1991-92
1268
4700
250
1992-93 *
2360
4500
680
* Provisional
Statement 14 India's External Debt
Category
Official Creditors (Multilateral & Bilateral)
IMF
Commercial Borrowing
NRI Deposits
Short-term
Total
US $ Million
35,437
2,623
13,626
10,548
4,800
67,034
Projected Debt Service Payments on the basis of outstanding debt (31.3.1991) US$ million
Category
Principal
Interest
Total
1991-92
7002
3631
10633
1992-93
6303
3542
9845
1993-94
5437
3514
8951
1994-95
6014
3226
9240
1995-96
5616
2900
8516
1350
2620
6231
5252
13090
230
40700
1960
1130
2560
6300
6950
5980
110
60920
1490
44
2340
3910
8370
9490
18881
Copyright © 2022 FDOKUMEN