Multiple Perspectives: The Ford Model T - Marshall Steam ...
Upload
khangminh22Category
view
0download
0
i
The Trade Policy for the Republic of the
Marshall Islands
BY
THE MINISTRY OF RESOURCES AND DEVELOPMENT
DIVISION OF TRADE AND INVESTMENT
MAY 2012

i
EXECUTIVE SUMMARY
The Republic of the Marshall Islands (RMI) requested for assistance from the Pacific Islands
Forum Secretariat to formulate its National Trade Policy. In November 2009, the Ministry of
Resources and Development (R&D) convened a National Trade Policy Consultative Meeting,
where all the stakeholders from the National Government, private sector and non-state actors
were invited. The purpose of the meeting was to brainstorm and consider the key elements and
priorities of a Trade Policy. This meeting was followed by one-on-one consultations with the
various Government Ministries, the private sector, non-governmental organizations and
academia.
The recommendations from the consultative meeting and one-on-one consultations were used as
a basis for formulating the first draft Trade Policy. The draft Trade Policy Framework was
circulated to all the stakeholders for further comments before it was presented at the Second
National Trade Policy Consultative Meeting that was held in May 2010. The meeting endorsed
the draft Trade Policy Framework and agreed that the draft be finalized and submitted to Cabinet
for consideration. The Second National Trade Policy Consultative Meeting also agreed to revive
the National Trade Facilitation Committee (NTFC) and the NTFC was formally established by
Cabinet in 2010. The Trade Policy was endorsed by the NTFC on 3 May 2012 and submitted to
Cabinet for endorsement.
The key objective of the Trade Policy is to enhance the participation of the private sector in the
economy and promote export-led sustainable economic growth and self reliance with the
ultimate objective of creating employment, alleviating hardship and raising the living standards
of Marshallese citizens.
The Trade Policy Framework is divided into ten chapters. Chapter one gives the background
including the rationale for a Trade Policy Framework, its vision and sets the context in which the
Trade Policy Framework is being formulated.
Chapter two details how the RMI economy has been performing and what needs to be done to
ensure that trade is fully mainstreamed into the national development plan to promote sustainable
and inclusive economic growth and development. In particular, the Trade Policy provides some
recommendations on what needs to be done to promote private sector development and export-
led economic growth. This is very important in light of the fact that economic growth is
primarily driven by a large public sector, which depends heavily on declining Compact grants.
The Trade Policy will also assist RMI to cope with changes in the global economy.
Chapter three deals with trade policy by sector and examines how the three priority sectors
(agriculture, fisheries and tourism) have been performing and what needs to be done to improve
trade in these sectors. It is clear that the fisheries sector as well as the tourism sector have
potential for further growth, while the agricultural sector has a number of well-known challenges
that need to be addressed. If these challenges are addressed, RMI will be able to increase
production of agricultural products for the local market and export a few niche agricultural
products such as value added coconut products, nin and pandanus products.
ii
Chapter four deals with RMI‘s participation in international trade. According to available
statistics, it is clear that RMI has a huge trade deficit and imports continue to increase while
exports are still very small. The Trade Policy recommends a number of measures that could be
taken to promote exports of goods and services. As mentioned in chapter three, fisheries and
tourism have potential to boost exports and should be prioritized and supported. RMI also needs
to improve its human resources, including vocational skills that are required to promote trade and
turn the economy around. Improving vocational skills could also help RMI to fully utilize the
preferential arrangement it has with the U.S. on labour mobility and to improve the flow of
remittances to RMI.
Chapter five deals with the investment climate in RMI. Investment has been identified as a key
sector that needs comprehensive reform in order for RMI to be able to produce goods and
services that can be traded competitively. The Trade Policy makes it clear that without some bold
reforms on relevant laws governing investment including immigration, labour, land and taxation
laws, it will be very difficult for RMI to participate meaningfully and benefit from international
trade and foreign direct investment. The key issues that have been identified in the World Bank‘s
report on the ease of doing business need to be reviewed carefully and implemented accordingly
to improve the investment climate in RMI.
Chapter six highlights the importance of trade in services and what needs to be done for RMI to
participate actively in trade in services. It also recommends RMI to take urgent measures to
improve the efficiency and quality of services provided as this is critical to ensure
competitiveness in the global economy. Services such as transportation, communications,
education, business services, financial services, energy and health play a vital role in the
production of goods and services for the local as well as the export market. The Government will
work with all the stakeholders to provide the key infrastructure and undertake the necessary
reforms in the services sector to enhance the capacity of the private sector to participate in trade
in services. This will also contribute to reducing the cost of doing business in RMI and enable
the private sector to produce goods and services that can be traded in a competitive manner. To
this end, policies and laws dealing with services reforms including liberalization of trade in
goods and services will be addressed simultaneously in order to maximize the benefits of reform
and trade liberalization.
Chapter seven identifies some of the trade-related issues such as taxation, competition,
Government procurement, intellectual property rights (especially traditional knowledge and
biodiversity), corporate governance that need to be addressed in order to create a good business
environment for trade and investment. The chapter also focuses on the need for RMI to ensure
that trade is undertaken in a manner that does not undermine the environment. The issues
pertaining to trade and environment, including climate change will also be taken into account.
There is also a need for RMI to ensure that trade benefits the Marshallese people, including the
vulnerable and disadvantaged groups such as women and unemployed youths.
Chapter eight is one of the most important sections dealing with ongoing trade negotiations and
market access. It provides some recommendations and guidelines on what needs to be done in
the various trade negotiations. In particular, RMI is urged to participate in regional integration
through the Pacific Island Countries Trade Agreement (PICTA), which is now being extended to
iii
trade in services and labor mobility as directed by the Leaders under the Pacific Plan. The Trade
Policy also recommends RMI to participate actively in the Economic Partnership Agreement
(EPA) negotiations with the European Union (EU) and consider signing the comprehensive EPA
to promote its fisheries exports to the EU. However, assistance will be required from the
Government as well as the EU to enable RMI to establish a Competent Authority and to comply
with other export requirements including the EU Illegal Unreported and Unregulated (IUU)
regulation that entered into force in 2010.
The Trade Policy also recommends that RMI should ensure that its trade interests are also
included in PACER Plus negotiations with Australia and New Zealand. RMI must work with all
the national and regional stakeholders to ensure that EPA does not set a bad precedent for
PACER Plus or any future trade negotiations.
Most importantly, RMI is required to consult with the U.S. under the most favored nation clause
in its Compact with the U.S. before it concludes a free trade agreement with non-PICTA parties
(e.g. EU, Australia and New Zealand). The consultations should be undertaken as a matter of
urgency under the Micronesian Trade Committee. RMI should also use this opportunity to
improve its trade and investment relations with the U.S. including the removal of tariffs that are
being levied on its fisheries exports to the U.S.
Chapter nine deals with Aid for Trade. The Trade Policy identifies RMI‘s national Aid for Trade
needs and priorities that should be supported by the Government, donors and trading partners in
order to ensure that trade promotes sustainable development in RMI. RMI will improve its
coordination of donor funds and ensure that all the Aid for Trade into RMI is coordinated
effectively and channeled towards the priorities identified in the Implementation Matrix.
Chapter ten provides key recommendations on how the Trade Policy should be implemented.
The Government is urged to allocate funding to priority sectors identified in the Trade Policy,
undertake the necessary reforms and work with trade and development partners to secure Aid for
Trade to implement its Trade Policy Framework. This section identifies the agencies that are
responsible for implementing the Trade Policy, the timeframe involved, the funding required and
the annual progress reports for the Government to be able to assess whether the objectives of the
Trade Policy are being achieved and what needs to be done to improve its implementation.
The ten chapters cover the key issues that need to be addressed in order to promote trade and
sustainable development in RMI. It is clear that a lot of work was done to produce the National
Trade Policy and in this context, I would like to take this opportunity to thank the Minister for
Resources and Development, the Chairman of the NTFC, non-state actors, the National
Government and the members of the NTFC who have participated actively in the formulation of
the Trade Policy. I would like to thank the many citizens of the RMI who participated in
formulating the Trade Policy and the business community for their valuable input in the process.
I would also like to thank the Ministry of Resources and Development, especially, the Division
of Trade and Investment which worked very hard with all the stakeholders to produce our first
National Trade Policy. Lastly, I would like to express my appreciation to the Pacific Islands
Forum Secretariat, especially the Hub and Spokes Project, which is jointly funded by the EU and
iv
the Commonwealth Secretariat, for providing the technical and financial assistance which
enabled us to formulate our first National Trade Policy.
The Trade Policy will help us to identify our trade priorities and focus our attention on
addressing the supply-side constraints that are inhibiting us from producing goods and services
that RMI has the potential to export competitively on the global market. The ultimate objective is
to ensure that trade is fully mainstreamed into our national development plans and used as an
engine to promote inclusive and sustainable economic growth and development, with the
ultimate objective of raising the living standards of our people.
The adoption of this Trade Policy shows the importance that the Government places on private
sector development. I strongly believe that trade is the engine for sustainable economic growth
and development and the role of the Government should be to facilitate the participation of the
private sector in trade. I am fully committed to working with all of you, especially the private
sector and our trading partners and donors to ensure that the Trade Policy is fully implemented
for the benefit of the Marshallese people.
……………………………………………………………………………….
H.E. President Christopher Loeak
President of Republic of the Marshall Islands
v
TABLE OF CONTENTS
EXECUTIVE SUMMARY ............................................................................................................. i 1 BACKGROUND AND INTRODUCTION ........................................................................... 1
1.1 What is a Trade Policy? ................................................................................................... 3 1.2 The rationale for a Trade Policy ....................................................................................... 4
1.3 Vision ............................................................................................................................... 6 1.4 The Legal and Institutional Framework ........................................................................... 7
1.4.1 General Duties and Responsibilities of the Members of the National Trade
Facilitation Committee.......................................................................................................... 10 1.5 Schedule of Work ........................................................................................................... 15
1.6 Structure of the Trade Policy ......................................................................................... 15 2 THE MACRO-ECONOMIC ENVIRONMENT .................................................................. 16
2.1 RMI‘s Strategic Development Plan Framework ............................................................ 16 2.1.1 The Ministry of Resources and Development Strategy and Action Plan 2005-2010
20 2.2 Economic Growth .......................................................................................................... 22
2.3 The Structure of the RMI Economy ............................................................................... 26 2.4 Employment ................................................................................................................... 30
2.5 Balance of Payments ...................................................................................................... 34 2.6 External Debt.................................................................................................................. 38 2.7 Fiscal Policy ................................................................................................................... 41
3 TRADE POLICY BY SECTOR ........................................................................................... 51 3.1 Agriculture ..................................................................................................................... 51
3.1.1 The Copra Industry in RMI..................................................................................... 52
3.1.2 The Global Trend in the Coconut Industry ............................................................. 58
3.1.3 RMI‘s Exports of Coconut Products and the Future of the Coconut Industry........ 59 3.1.4 Other Agricultural Products .................................................................................... 61 3.1.5 Recommendations ................................................................................................... 64
3.2 Fisheries ......................................................................................................................... 65 3.2.1 Treaties Governing the Fishing Activities in RMI ................................................. 65
3.2.2 Who is fishing in RMI‘s EEZ? ............................................................................... 69 3.2.3 Maximizing the Returns from Tuna Resources ...................................................... 79 3.2.4 General Conclusion and Recommendations ........................................................... 84
3.3 Tourism .......................................................................................................................... 88 3.3.1 RMI‘s key Tourism Resources ............................................................................... 93 3.3.2 Marketing RMI Tourism ......................................................................................... 94 3.3.3 Key Challenges affecting Tourism in RMI ............................................................. 95
3.3.4 Recommendations ................................................................................................... 96 4 PARTICIPATION OF RMI IN MERCHANDISE TRADE ................................................ 97
4.1 Trade in Goods ............................................................................................................... 98 4.1.1 Classification of Imports ......................................................................................... 99 4.1.2 Import Markets...................................................................................................... 100
4.1.3 RMI‘s Import regime ............................................................................................ 101 4.2 Export Performance...................................................................................................... 102
4.2.1 Measures to promote Exports ............................................................................... 103
vi
4.2.2 Trade Facilitation .................................................................................................. 105
4.3 Domestic Trade Policies and Instruments .................................................................... 106 5 THE MARSHALL ISLANDS INVESTMENT REGIME ................................................. 109
5.1 General Laws Regulating Investment in RMI.............................................................. 109
5.2 The Ease of Doing Business in RMI ............................................................................ 117 5.2.1 Top reformers........................................................................................................ 125
6 PARTICIPATION OF RMI IN TRADE IN SERVICES ................................................... 126 6.1 The General Agreement on Trade in Services ............................................................. 127 6.2 Basic rules when Liberalizing Trade in Services ......................................................... 130
6.3 Regulations Governing Trade in Services in RMI ....................................................... 134 6.3.1 Communications ................................................................................................... 134 6.3.2 Financial Services ................................................................................................. 137 6.3.3 Transportation ....................................................................................................... 139
6.3.4 Business Services .................................................................................................. 142 6.3.5 Distribution Services ............................................................................................. 142
6.3.6 Tourism ................................................................................................................. 142 6.3.7 Energy ................................................................................................................... 143
6.3.8 Construction and related engineering services. .................................................... 144 6.3.9 Recreational, Cultural and Sporting Services ....................................................... 144 6.3.10 Educational Services ............................................................................................. 144
6.3.11 Environmental Services ........................................................................................ 144 6.3.12 Health Related and Social Services ...................................................................... 144
6.4 Temporary Movement of Natural Persons and Remittances ....................................... 145 6.4.1 General Conclusion and Recommendations ......................................................... 145 6.4.2 Recommendations ................................................................................................. 146
7 TRADE-RELATED ISSUES ............................................................................................. 146
7.1 Taxation ........................................................................................................................ 147 7.2 Competition Policy ....................................................................................................... 150 7.3 Government Procurement ............................................................................................ 151
7.4 Corporate Governance.................................................................................................. 152 7.5 Intellectual Property Rights (IPRs) .............................................................................. 152
7.6 Trade and Environment ................................................................................................ 153 7.7 Trade and Gender ......................................................................................................... 154
7.8 Recommendations ........................................................................................................ 154 8 MARKET ACCESS AND TRADE NEGOTIATIONS ..................................................... 155
8.1 The Pacific Island Countries Trade Agreement (PICTA) ............................................ 155 8.1.1..................................................................................................................................... 156 8.1.2 Extension of PICTA to Trade in Services............................................................. 161
8.1.3 PICTA and Temporary Movement of Labor ........................................................ 161 8.1.4 PICTA and Government Procurement (GP) ......................................................... 165
8.1.5 Recommendations ................................................................................................. 167 8.2 The US Market ............................................................................................................. 167
8.2.1 RMI Access to the US Market .............................................................................. 168 8.2.2 RMI‘s Major Competitors in the US Market ........................................................ 171
8.3 How to Improve Market Access into the US ............................................................... 174 8.3.1 Compensation for lost Tax and Trade Preferences ............................................... 177
vii
8.3.2 Recommendations ................................................................................................. 181
8.4 The Pacific Agreement on Closer Economic Relations ............................................... 181 8.4.1 Recommendations ................................................................................................. 186
8.5 Japanese Market ........................................................................................................... 186
8.5.1 Recommendations ................................................................................................. 190 8.6 Economic Partnership Agreement (EPA) .................................................................... 191
8.6.1 Trade in Goods ...................................................................................................... 192 8.6.2 Services ................................................................................................................. 194 8.6.3 Fisheries ................................................................................................................ 194
8.6.4 Investment ............................................................................................................. 196 8.6.5 Aid for Trade......................................................................................................... 196 8.6.6 Recommendations ................................................................................................. 197
8.7 Micronesian Trade Committee ..................................................................................... 198
8.7.1 Recommendations ................................................................................................. 198 8.8 The World Trade Organization (WTO) ....................................................................... 198
8.8.1 Recommendations ................................................................................................. 199 8.9 Guidelines for Trade Negotiations ............................................................................... 199
9 AID FOR TRADE .............................................................................................................. 200 10 RECOMMENDATIONS AND IMPLEMENTATION ..................................................... 203
List of tables and illustrations
Table 1: Objectives outlined in the SDPF ..................................................................................... 17
Table 2: Real GDP and GDP annual growth and GDP per Capita ............................................... 23
Table 3: RMI GDP by industry, FY2000 – FY2010 .................................................................... 27 Table 4: Current price GDP by institutional sector, FY2000-FY2010 ......................................... 28 Table 5: Public enterprise value added, FY1997 – FY2006, USD 000s ...................................... 29
Table 6: Public and private sectors employment FY2000-FY2011 .............................................. 31 Table 7: Employment by industrial sector (numbers) FY2000-FY2011 ...................................... 31
Table 8: Employment by Industrial Sector, wage costs, 2000 - 2011 .......................................... 32 Table 9: Employment by institutional sector, average wage and salary rates, FY2000 – FY 2011
....................................................................................................................................................... 33 Table 10: RMI‘s Balance of Payment FY2000-FY2010 .............................................................. 36 Table 11: External debt, original value and outstanding principal by loan .................................. 38 Table 12: External debt and debt servicing................................................................................... 40 Table 13: U.S. Annual Compact Grants and Contributions to the Trust Fund, FY04-FY23 ....... 41
Table 14: RMI Government Finances, revenue and expenditure: 2000 – 2010 ........................... 43 Table 16: National Government wage costs (by department), FY2000 – FY2011 ...................... 48
Table 17: Subsidies to public sector enterprises (current and capital), FY2000 –FY2010, $000 49 Table 18: Situation of copra and shipping subsidies, FY02-FY06 ............................................... 55 Table 19: Copra production, average producer price and income to producers: 1951-2010 ....... 56 Table 20: Gross Domestic Product and Copra Production ........................................................... 57 Table 21: World market prices in USD/T in 2010 ........................................................................ 59 Table 22: Total Allowable Effort in PNA States (FFA 2008) ...................................................... 66
viii
Table 23: EEZ size of other Pacific island nations and the four categories. ................................ 67
Table 24: Number of Foreign Long-line vessels licensed to fish in the Marshall Islands EEZ, by
year and flag .................................................................................................................................. 70 Table 25: Total unloaded catch (mt) for domestically - based long-line vessels, 2007 ................ 70
Table 26: Annual catches (mt) by foreign long line fleets in the Marshall Islands EEZ, by flag
and species, 2003 - 2007 ............................................................................................................... 71 Table 27: Number of purse seine vessels licensed to fish in the Marshall Islands EEZ, by year
and flag.......................................................................................................................................... 72 Table 28: Annual catch and effort estimates for the Marshall Islands purse - seine fleet, by
species in the WCPFC Convention Area, 2003 - 2007. ................................................................ 72 Table 29: Annual catches by purse seine fleets in the Marshall Islands EEZ, by flag and species,
2003 – 2009................................................................................................................................... 73 Table 30: Number of Japanese pole- and - line vessels licensed to fish in the Marshall Islands
EEZ, by year and flag ................................................................................................................... 74 Table 31: Annual catches (mt) by foreign pole- and -line fleets in the Marshall Islands EEZ, by
flag and species, 2003 - 2010. ....................................................................................................... 74 Table 32: Total fish catch in RMI EEZ, by method, and fishing license fees received: 2000-2010
....................................................................................................................................................... 75 Table 33: The total catch in FFA waters and PNA waters respectively, FY2000 to FY2009 ...... 76 Table 34: Summary Table for value of catch................................................................................ 77
Table 35: Catch by national fleet .................................................................................................. 78 Table 36: Total catch by Marshall Islands and domestically based vessels1 (long-line, 2001-2010
....................................................................................................................................................... 79 Table 37: Extracts from 2010 BOP Statistics ............................................................................... 79 Table 38: Total Arrivals in the Pacific .......................................................................................... 89
Table 39: Visitors to Majuro, by year and purpose of visit: 2001 - 2010 ..................................... 90
Table 40: Visitors to Majuro, by year, length of stay and by purpose of visit: 2001- 2010 ......... 91 Table 41: RMI‘s major tourism markets (2000-2010) .................................................................. 91 Table 42: RMI;s balance of trade in goods, FY00-FY10 ............................................................. 98
Table 43: US Trade with Marshall Islands ................................................................................... 98 Table 44: Imports to RMI by product category and value: 2009 - 2010 ...................................... 99
Table 45: Import by trading partner (c.i.f USD'000) in RMI:2002 - 2005 and 2009 - 2010 ...... 100 Table 46: RMI's Tariff structure for food stuff ........................................................................... 101
Table 47: Contribution to the College of Marshall Islands ......................................................... 102 Table 48: RMI merchandise export, FY00 to FY10 ................................................................... 102 Table 49: RMI's reserved occupational list ................................................................................. 116 Table 50: RMI's performance in individual indicators of Ease of Doing Business ranking, 2012
..................................................................................................................................................... 118
Table 51: Summary of Ease of Doing Business indicators......................................................... 119 Table 52: Procedure for registering business in RMI ................................................................. 120
Table 53: Paying Taxes in RMI .................................................................................................. 122 Table 54: RMI's performance in trading across borders, FY08-FY10 ....................................... 123 Table 55: Procedure for Trading Across the Borders in RMI .................................................... 124 Table 56: RMI services balance, FY 2000 to FY 2010. ............................................................. 129 Table 57: Sample schedule of Horizontal (Services) commitments ........................................... 132 Table 58: Sample of Sector Specific Commitments ................................................................... 132
ix
Table 59: Main taxes paid in RMI and their rates. ..................................................................... 147
Table 60: RMI's Tax Revenue, 2006–08 .................................................................................... 148 Table 61: FICs own revenue as a % of GDP .............................................................................. 149 Tables 62 (a – h): Timetable for tariff cuts under PICTA .......................................................... 156
Table 63: The Potential Impact of Revenue Loss under PICTA ................................................ 158 Table 64: Revenue loss as % of total tax revenue from FTA‘s .................................................. 159 Table 65: RMI /Fiji import ratios................................................................................................ 159 Table 66: Proposed minimum quota for FICS (for tier 2 only) .................................................. 163 Table 67: Government and Government Procurement expenditure as a percentage of GDP .... 165
Table 68: US import duties on major fisheries products ............................................................ 168 Table 69: Interpretation notes ..................................................................................................... 169 Table 70: US Top 10 Imports in 2010, by value. ........................................................................ 171 Table 71: RMI‘s Estimated Revenue loss resulting from the MFN obligation .......................... 177
Table 72: Impact of bond Issue Payments .................................................................................. 179 Table 73: Tax, Finance and Trade changes overall impact on the RMI ..................................... 179
Table 74: Compensatory adjustments realized by the RMI, 1987 - 2001 .................................. 179 Table 75: Top 10 Yellow fin Tuna (Fresh or chilled) exporters to Japan, 2005-2007 ............... 186
Table 76: Bigeye Tunas(Fresh or Chilled) : Top Ten Exporters to Japan(2005~2007) ......... 187
Table 77: Strip-bellied Bonito(Frozen) : Top Ten Exporters to Japan (2005~2007) ............ 188
Table 78: Japan's Import from Marshall Islands (USD 000s) .................................................... 189 Table 79: Japan's Export to Republic of Marshall Islands, 2003 - 2007 .................................... 189
Table 80: Revenue loss as % of total revenue from FTA's ......................................................... 193 Table 81: Selected AFT regional projects. ................................................................................. 201
Table 82: Illustration of TPF implementation ............................................................................ 203
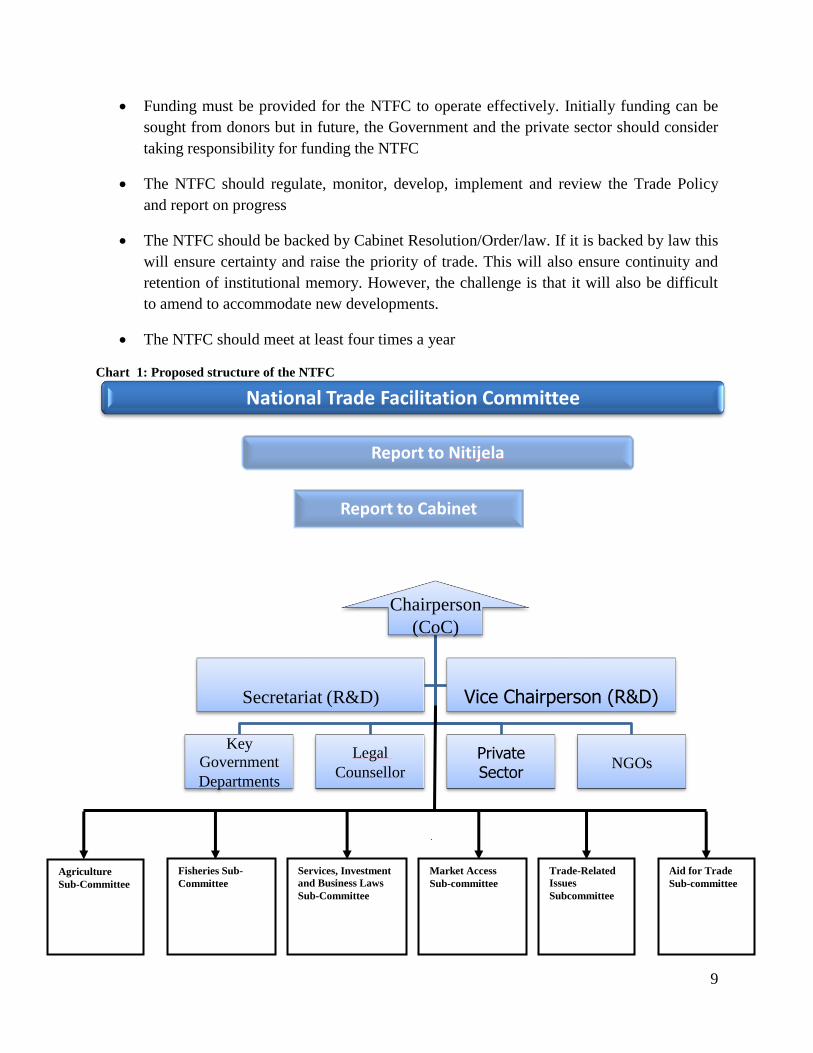
Chart 1: Proposed structure of the NTFC ...................................................................................... 9
Chart 2: RMI GDP based on current methodology, FY2000 to FY2010 (USD Millions) .......... 23 Chart 3: Real GDP annual growth, 2000-2010 ............................................................................ 24 Chart 5: Government revenue and expenditure, FY2000 - 2010 ................................................. 46
Chart 7: RMI Inflation 2004-2008 ............................................................................................... 50
Chart 9: RMI and some FICs Ease of Doing Business ranking, 2012 ....................................... 118 Chart 10: RMI's performance in 'protecting investors' ranking ................................................. 121 Chart 11: Ranking of the Marshall Islands in Paying Taxes ..................................................... 122 Chart 12: Trading across borders; RMI‘s Ranking, 2012 .......................................................... 124 Chart 13: Number of commitments undertaken by Developed and Developing Countries ...... 133
Chart 14: 2010 Imports of Fish into the US ............................................................................... 172 Chart 15: Countries from which the US imports seafood, 2010 ................................................ 173
Chart 16: Top places from which the US import of canned tuna (by volume), 2010 ................ 173
Figure 1: RMI's group of atolls ....................................................................................................... 1
x
LIST OF ACRONYMS
ACP: African, Caribbean and Pacific
CA: Cotonou Agreement
Compact: Compact of Free Association
DC: Developed Countries
R&D: Ministry of Resources and Development
T&C Ministry of Transport, Communication
EPA: Economic Partnership Agreement
EC: European Community
EU: European Union
EDF: European Development Funding
EEZ: Exclusive Economic Zone
FFA: Foreign Fisheries Agency
FTA: Free Trade Agreement
FAS: Freely Associated States
FDI: Foreign Direct Investment
GDP: Gross Domestic Product
GSP: Generalised System of Preferences
IPR: Intellectual Property Rights
LDCs: Least Developed Countries
MFN: Most Favoured Nation
NTFC: National Trade Facilitation Committee
MIMRA: Marshall Islands Maritime Resources Authority
MIVA: Marshall Islands Visitors Authority
NSA: Non State Actors
OCO: Oceania Customs Organization
PIFs Pacific Island Forum Secretariat
PACP Pacific ACP
SPC: Secretariat of the Pacific Community
SPS: Sanitary and Phytosanitary Measures
SPARTECA: South Pacific Regional Trade and Economic Cooperation Agreement
TBT: Technical Barriers to Trade
UNCTAD: United Nations Conference on Trade and Development
WTO: World Trade Organisation

1
1 BACKGROUND AND INTRODUCTION
The Republic of the Marshall Islands (RMI) consists of two groups of 29 atolls and five raised
coral islands extending 750 miles (1, 200 km) north-south and 800 miles (1, 300 km) east-west,
with the capital Majuro located 2, 000 miles (3, 200 km) from both Honolulu and Tokyo1. The
land area is about 181 km² but the Exclusive Economic Zone (EEZ) covers about 2 million
square kilometers. According to the 1999 census, the total population in RMI was 50,840. The
current population is estimated at 58, 291 and about 51% of the population live in Majuro, 20%
live in Ebeye (Kwajalein atoll) and about 30% in outer islands. The estimated annual population
growth rate varies depending on the source of the data, but according to the World Bank it was
2.29 in 2008. This growth rate is considered to be too high when compared to other Pacific
Islands and may not be sustainable2.
Figure 1: RMI's group of atolls
The RMI became independent in 1986 but maintained a special relationship with the US under
the Compact of Free Association Agreement from 1986 to 2001. The Compact was amended and
renewed in 2004 and Compact funding is expected to end in 2023. Under the Amended
Compact, the US has the right of strategic denial, while RMI benefits from annual payments as
well as the right for its citizens to live and work in the US. The US also has exclusive military
access into RMI and in return RMI benefits from a guarantee of defence against third parties.
1 About 4000 km north-east of Australia.
2 For example, the average annual population growth rate for 2005-2010 according to World Stat. Info, RMI was
ranked as the fourth highest growth in the Pacific with 2.23% and Vanuatu had the highest growth at 2.54%,
followed by Solomon Islands at 2.46% and PNG at 2.37%. [Accessed on 21/02/11
http://worldstat.info/?cat=7CQddgrowth].
2
The Compact also allows the US to lease most parts of Kwajalein for military and defence
purposes through to 2066 with an option to extend to 2086.
The Compact provides for a Trust Fund where the US and RMI are making annual contributions,
and this is expected to be the main source of funding from 2024 onwards. With regards to trade,
the Compact provides for duty free access to the US market for most goods. However, RMI has
not fully utilised this market access opportunity. This is partly because of lack of productive
capacity in RMI as well as import duties that are imposed by the US on tuna loins without a clear
legal basis.
The RMI economy is a Small Island State (SIS), which is largely dependent on foreign aid,
foreign goods (imports), foreign labor and foreign investment. It receives an average of $70
million in grants annually, or about 45% of gross domestic product (GDP). On average, about
70% of fiscal revenue comes from the Compact of Free Association with the USA (76% and
72.5% of 2009 and 2010 revenue respectively).
In 1999, the Human Development Index (HDI) was 0.563 and RMI was ranked number 10 out of
15 Pacific Island Forum members. Palau was ranked number 1 with a HDI of 0.86 while PNG
was number 15 with an index of 0.314. These criteria are based on life expectancy, literacy level
and average gross domestic product (GDP). In terms of Human Poverty Index (HPI)3, RMI was
ranked number 11 out of 15 with an index of 19.5. Niue was ranked number 1 with an index of
4.8 and PNG was number 15 with an index of 52.2. In terms of the Vulnerability Index (VI)4,
RMI is considered to be vulnerable to coastal flooding, moderate cyclones, droughts and rise in
sea level.
RMI needs to conduct a census and provide the latest data on the HDI, HPI and the vulnerability
index. However, despite the lack of recent data, anecdotal evidence suggests that many children
suffer from malnutrition and many adults suffer from obesity and overweight. There are
challenges in terms of the quality of education at all levels as well as the healthcare system. All
these issues need to be addressed in order to enable RMI to have a healthy and educated work
force which can contribute effectively to trade and sustainable economic development.
Like many other small islands, RMI is a very small economy, with a small population and
landmass, narrow resource base, limited economic opportunities and weak institutional capacity.
It lacks adequate and cheap financial capital, lacks economies of scale, faces severe
transportation problems and is far away from major commercial markets. The island is also
vulnerable to external (global) shocks and natural disasters. Climate change is one major
challenge affecting RMI and comprehensive solutions need to be found urgently to ensure that
3 HPI measures the number of people who will die before the age of 40, the number of underweight children who are
less than 5 years, the number of people who do not have access to safe drinking water and health services, 4 VI provides a quantitative measure on external environmental and economic shocks,
3
trade and economic development is not undermined. This is the broader setting in which a Trade
Policy is being formulated.
1.1 What is a Trade Policy?
It is important to note that there is no universally agreed definition of a Trade Policy. According
to WiseGeek5, Trade policy is a collection of rules and regulations which pertain to trade and, the
purpose of trade policy is to help a nation's international trade run more smoothly, by setting
clear standards and goals which can be understood by potential trading partners.
Many countries are involved in the formulation of trade policies on a national, bilateral or
multilateral level. There are best practices on Trade Policy that are recommended by regional
and international organisations. Experiences from other countries that have formulated Trade
Policies also play a vital role in shaping the key elements of a Trade Policy. It is interesting to
note that even before the key elements of a Trade Policy were discussed, participants and
stakeholders in RMI already had a good idea of what they wanted to be included in the Trade
Policy and their views are incorporated in this document. Some of the issues that were
highlighted during the consultation include the following:
Trade Policy should deal with bilateral, regional and multilateral trade agreements
Trade must not be a one way street. The Trade Policy should deal with trade negotiations,
imports and exports. It must bring mutual gains to trading partners and help RMI to get
the best deal from trade negotiations. The Trade Policy must bring benefits to RMI and
focus on development aspects
The Trade Policy should incorporate gender equality, development of women, protection
of indigenous community and the environment
The Trade Policy should deal with trade in goods as well as trade in services
The Trade Policy should identify the key goals and priorities and set guidelines or a road
map for promoting trade and investment. It should also include best trade policy
practices and ―do‘s and don‘ts‖.
In simple terms, trade involves the buying and selling of goods and services. A Trade Policy is a
collection of basic principles or rules which can be used by the Government to promote trade
(goods and services) for the benefit of the nation. It should be used as a guide to stimulate private
sector development and sustainable economic growth and development. The World Trade
Organization (WTO) is the key global institution that is responsible for setting global rules and
best practices on trade policy. The World Bank and the International Monetary Fund as well as
other specialised agencies of the United Nations, including the United Nations Conference on
Trade and Development (UNCTAD), the International Trade Centre (ITC), and major trading
5 http://www.wisegeek.com. What is Trade Policy? (Accessed 28 February 2011).

4
countries as well as regional institutions also play a vital role in shaping Trade Policy.
Developing Countries and Least Developed Countries (LDCs) also play a vital role in defining
Trade Policy and the issues of their interest are also being considered at the regional or global
level.
It should be noted that free trade agreements (FTAs) play a vital role in shaping Trade Policy.
There are other studies that have an influence on trade policy matters including, the Diagnostic
Trade Integration Studies (DTIS), which are conducted under the Enhanced Integrated
Framework (EIF) for LDCs. The Integrated Framework (IF) was inaugurated in October 1997 at
the WTO High Level Meeting on Integrated Initiatives for Least-Developed Countries' Trade
Development by the IMF, ITC, UNCTAD, UNDP, World Bank and the WTO. The key
objectives of the IF include:
to "mainstream" (integrate) trade into the national development plans of LDCs
to assist in the co-ordinated delivery of trade-related technical assistance in response to
needs identified by the LDCs
The ultimate objective is to assist LDCs to play an active role in trade and enable them to use
trade to alleviate poverty and raise their standards of living. From the above discussion, it is clear
that there is no ‗one-size-fits-all‘ when it comes to the definition of a Trade Policy. All the
policies, practices, laws and regulations that are recommended by various institutions have to be
looked at critically to assess whether they are appropriate for a particular country. The Trade
Policy should also help a country to make a link between the national, regional and global trade
issues. Most importantly, the Trade Policy should assist a country to come up with a clear legal
and institutional mechanism that can be used to deal with trade issues.
Traditionally, the definition of Trade Policy used to be limited mainly to trade in goods, and
border issues such as customs rules and procedures, tariffs, rules of origin amongst other things.
However, Trade Policy has evolved and now covers behind the border issues such as trade in
services, investment, plant and animal health standards, the food safety, technical barriers to
trade, intellectual property rights, Government Procurement, competition, and trade and the
environment amongst other things.
1.2 The rationale for a Trade Policy
When RMI attained independence in 1986, it did not formulate a comprehensive Trade Policy to
guide the nation on how to conduct trade with third parties and to identify the role of a Trade
Policy in its development planning. Aside from a number of policies and trade-related laws
developed by specific sectors, RMI did not have a comprehensive Trade Policy to guide the
nation on trade matters.
5
The first and main rationale of having a Trade Policy is to mainstream trade into the national
development plan. The Strategic Development Plan Framework (SDPF) has some references to
trade issues. However, there are no direct linkages between the SDPF and trade, in particular,
how trade will contribute towards the achievement of national development goals. The Ministry
of Resources and Development (R&D) Strategy and Action Plan attempts to address some trade-
related issues, but since it was never designed as a Trade Policy, it is not surprising that it does
not address trade issues in a comprehensive manner.
The second rationale is to improve coordination and consultation between the Government, the
private sector and civil society. One of the issues hampering RMI‘s effective participation in
regional and international trade is the fact that there is poor coordination between Government
departments, the private sector and the civil society. The institutional support for trade is very
weak. This hinders the, negotiation and implementation of trade agreements. A comprehensive
Trade Policy and an effective institutional mechanism shall guide the nation on regional and
international trade matters.
The third rational of having a Trade Policy is to create a transparent, consistent, coherent and
predictable trading environment. A trading environment where rules are unclear, where sectoral
policies (e.g. agriculture, fisheries, tourism, investment, and environment) are conflicting with
one another will discourage trade and investment. The Trade Policy will help to address these
issues and avoid ad hoc decision making and sometimes conflicting rules and policies. In order
for RMI to create a good trade and investment climate, it needs a comprehensive Trade Policy,
which is applied consistently to ensure certainty, predictability and credibility among its trading
partners. Frequent Trade Policy changes or reversals are inimical to free and fair trade and
hampers development.
The fourth rationale is to articulate a clear negotiating strategy that would be applied consistently
in trade negotiations to promote and protect RMI‘s offensive and defensive interests. The global
trading system is undergoing enormous change and RMI needs to formulate a Trade Policy to
protect its interests in trade. RMI needs to develop a position and strategy with regard to the
Pacific Island Countries Trade Agreement (PICTA), the Pacific Agreement on Closer Economic
Relations (PACER) Plus, the Economic Partnership Agreements (EPAs), the US and the WTO.
A Trade Policy helps the country to be proactive in international trade negotiations rather than
being reactive.
The fifth rationale is to develop a holistic solution to trade problems. Most of the products that
are produced by RMI fall under various agencies, and the supporting services that are needed to
develop production capacity and export competitiveness fall under different agencies or sectors.
There is a need for a clear Trade Policy that ‗connects all the dots‘ and identify strengths,
weaknesses and opportunities in the ‗trade policy chain‘ (production, handling, processing,

6
transportation, marketing, exporting and distribution) to ensure that all the trade-related problems
are addressed in a holistic manner.
The Trade policy will also help with identifying the constraints in the production of products in
agriculture, fisheries, tourism, manufacturing, handicraft and other services including labor
mobility. The pre-eminent objective of a Trade Policy should be to create an environment that is
conducive for private sector development, to identify and address supply and demand-side
constraints inhibiting trade in goods and services. The long-term objective of the Trade Policy
should be value addition, diversification of the export basket, addressing product standards,
consolidation of the existing markets, finding new markets and assisting exporters to access these
markets.
The Trade Policy Framework should not be drafted in a vacuum but must take into account other
social, cultural and environmental goals. Trade is not an end in itself, but a means to achieve
export-led economic growth, which in turn should lead to employment, increased standards of
living and poverty alleviation. This is borne in mind in the formulation of the present Trade
Policy.
Further, the Trade Policy should encourage private sector development, and the Government
should not compete with the private sector but facilitate private sector development and promote
investment. RMI needs to develop a long term vision on trade to guide the nation in exploiting its
full potential in trade and participate effectively in the global trading system. It is in this context,
and in pursuance of the abovementioned objectives, that the Trade Policy is being formulated.
1.3 Vision
The vision for the present Trade Policy takes into account the vision for the nation that is
articulated in the SDPF. Some of the key goals of the SDPF include inter-dependence, socio-
economic self-reliance, educated, healthy and productive people, protection of culture and the
need for development which takes into account environmental sustainability.
The vision also draws upon some of the key issues that are included in the 2005-2010 R&D
Strategy and Action Plan. Some of these issues include the need to:
take into account the environment and traditional lifestyles when considering modern
development
promote food security and encourage people to eat healthy and locally produced food
create business and job opportunities for local people
ensure that RMI is free from pests and disease
ensure that Marshallese products are successfully exported around the world
7
enhance economic self-reliance.
During the National Trade Policy Consultative Meeting that was held in November 2009, the
participants also indicated that the vision of the Trade Policy should be:
To promote balance of trade, economic growth and sustainable development, self
sufficiency in finance, gender equality, environment and the needs of indigenous
communities without making others worse off. The end result should be good quality of
living for all, and all the stakeholders must participate in and benefit from trade
To assist RMI to accede to trade agreements that will benefit the nation and also to ensure
that temporary movement of natural persons is included in these agreements. The Trade
Policy should also seek to promote exports and imports, improvement in shipping,
competition (regulate monopoly) and an environmentally sound economy
To close the gap in trade balance, promote self-reliance, maximize the returns from
natural resources without depleting them. It must promote sustainable development and
growth and promote political, social, economic and cultural development.
Based on the above elements the Vision of the Trade Policy is:
To mainstream trade into the national development plan, create an environment conducive
for trade and investment, secure Aid for Trade to build capacity on trade and address
supply-side constraints and infrastructural services to enable the private sector to produce
quality and competitive goods and services that can be traded globally, thereby enhancing
the capacity of RMI to participate effectively in, and benefit from trade, and stimulate
sustainable economic growth and development; with the ultimate objective of achieving
fiscal sustainability, creating employment, alleviating poverty and raising the standards of
living for the Marshallese people.
1.4 The Legal and Institutional Framework
The President is elected by the Nitijela (parliament), and he has executive power. The Speaker
appoints the President elect. After his election to power, the President nominates to the Speaker
for appointment as Ministers not less than 6 and not more than 10 other members of the Nitijela.
The President, will allocate among the members of the Cabinet (including himself if he so
desires) the portfolios of Ministers of Finance, Minister of Foreign Affairs, Minister of Transport
and Communication, Minister of Resources and Development, Minister of Social Welfare,
Minister of Public Works and such other portfolios as may be necessary or desirable for giving to
a member of the Cabinet the primary responsibility for any Department or function of
government.
8
Legislative power resides in the Nitijela, the lower house of the Marshall Islands bicameral
parliament. The Nitijela has seven committees, namely Appropriation, Ways and Means, Foreign
Affairs and Trade, Health, Education and Social Affairs, Public Accounts, Judicial and
Governmental Relations and Resources and Development.
The judicial power vests with the courts. The courts are independent of the legislative and
executive. RMI has the following courts: the Supreme Court, a High Court, a Traditional Rights
Court, and such District Courts, Community Courts and other subordinate courts as are created
by law. The arms of the Government must act in accordance with the constitution.
For any Trade Policy initiative to be successful, it is important for the Cabinet and the Nitijela to
be involved in Trade Policy formulation at an early stage. It is very critical for the Nitijela to be
briefed regularly on trade matters since it will be responsible for ratifying trade agreements. The
Nitijela also needs to be sensitised on the importance of amending trade-related laws in order to
create an environment that is conducive for trade and investment. In this context, it is also
important for the Cabinet and Nitijela to be sensitised on the need to review all the trade-related
laws6 to ensure that they promote trade, investment and private sector development. There is also
a need to ensure that these laws are fully applied and enforced by the relevant institutions
(police, AG, courts).
In order to ensure that the Cabinet and the Nitijela are given the best advice on trade policy, it is
important to revive and formalise the National Trade Facilitation Committee (NTFC). The NTFC
played a vital role in revising labor laws, however, it was noted that very few people were aware
of its existence and its effectiveness.
During the 2009 National Trade Policy Consultative Meeting, all the participants agreed that the
NTFC should be revived and formalised with slight amendments7. Some of the common issues
that were discussed include the following:
The NTFC should be composed of R&D, MIMRA, MIVA, AG, CoC, MOFA, Farmers
Association, Handicrafts Association, MoF, Immigration, Labour, EPPSO, EPA,
WUTMI, Parliament Committee on R&D/Foreign Affairs and Trade and T&C, MIBA,
business representatives from PRC and RoC, CMI, MIMA, MICS.
At least 50% of its representatives must be women and at least 50% must also be from
the private sector
The NTFC can be chaired by the Minister for R&D, Chief Secretary or Chamber of
Commerce/private sector. There should be a vice chair. R&D must be the Secretariat
6 Most of the trade-related laws will be discussed under the chapter on services, trade-related issues and other
relevant chapters. 7 A list of participants in the meeting is appended.
9
Funding must be provided for the NTFC to operate effectively. Initially funding can be
sought from donors but in future, the Government and the private sector should consider
taking responsibility for funding the NTFC
The NTFC should regulate, monitor, develop, implement and review the Trade Policy
and report on progress
The NTFC should be backed by Cabinet Resolution/Order/law. If it is backed by law this
will ensure certainty and raise the priority of trade. This will also ensure continuity and
retention of institutional memory. However, the challenge is that it will also be difficult
to amend to accommodate new developments.
The NTFC should meet at least four times a year
Chart 1: Proposed structure of the NTFC
National Trade Facilitation Committee
Report to Nitijela
Report to Cabinet
Chairperson
(CoC)
Key
Government
Departments
Legal
Counsellor
Private Sector
NGOs
Secretariat (R&D) Vice Chairperson (R&D)
Agriculture
Sub-Committee
Fisheries Sub-
Committee Services, Investment
and Business Laws
Sub-Committee
Market Access
Sub-committee
Trade-Related
Issues
Subcommittee
Aid for Trade
Sub-committee
10
1.4.1 General Duties and Responsibilities of the Members of the National Trade
Facilitation Committee
a) Ministry of Resources and Development (R&D)
The Ministry of Resources and Development was established in 1979 under the Constitution of
the Marshall Islands. The responsibilities of the Ministry have undergone several changes. The
Ministry is responsible for development of the economy through promoting agriculture, fisheries,
tourism, trade, investment and energy development. In 1997, the Marshall Islands Marine
Resources Authority (MIMRA) was established by an Act and mandated with the management
of all marine resources in the RMI. The Marshall Islands Visitors Authority (MIVA) was also
created in 1997 to focus on development of the tourism industry. Fisheries and tourism remain
the two greatest opportunities for economic development and export. Therefore these two
institutions, including the Department of Agriculture are key components of R&D. Another
department under the R&D is the Energy Authority
The Ministry of R&D will serve as the Secretariat to the NTFC and it will coordinate
development and Trade Policy issues relating to marine, agriculture and tourism, the three key
priority sectors. The Ministry is in charge of international trade and facilitates trade and
investment matters in RMI. The Directors for MIMRA, MIVA, Agriculture, Trade and
Investment could serve as chairpersons for the sub-committees on Fisheries, Tourism,
Agriculture, Market Access, Services and Investment.
b) Ministry of Justice
The Ministry of Justice is responsible for looking at the legal issues pertaining to trade
agreements such as PICTA, PACER, EPA, and US (Compact). It also oversees the registration of
businesses, enforcement of contracts and upholding the rule of law to create a good environment
for business. It should also ensure that the laws relating to labor and immigration are not more
trade restrictive than is necessary. The Ministry should also participate effectively in trade
negotiations and develop the capacity to deal with trade issues. It should work with R&D and
incorporate training and capacity building in trade as part of its human resources development.
c) Ministry of Foreign Affairs (MOFA)
The Ministry should assist with mobilizing Aid for Trade from RMI‘s trade and development
partners to implement the Trade Policy, promote commercial diplomacy and ensure that its
overseas missions are staffed with officials who are knowledgeable on trade, investment, tourism
and Aid for Trade. The Ministry should focus on finding markets for goods and services that are
produced in RMI. There is also a need for the Ministry to assist RMI producers and exporters
with joining organizations that will assist exporters to access export markets.
11
The Ministry of Foreign Affairs, Finance, R&D and EPPSO need to work together to secure Aid
for Trade from RMI‘s trade and development partners to support trade and investment activities
identified in the Trade Policy. The Office responsible for Compact management must ensure that
trade and investment activities are prioritized in Compact funding and there is also a need to
improve the trade preferences that were given to RMI because these preferences have been
eroded.
MOFA is the key ministry that deals with the international community and should also be
actively involved in trade. The RMI Ambassadors must also strengthen their role in promoting
trade and investment.
d) Ministry of Finance
The Ministry needs to ensure that the tax reform goes ahead smoothly to ensure that the negative
effects of trade liberalization are minimized. The Ministry is also responsible for reviewing the
customs legislation to comply with international trade obligations including tariff reduction
schedules, import and export procedures, and rules of origin amongst other things. It is also the
responsibility of the Customs Department to facilitate trade and to ensure that all the red tape that
is inhibiting imports and exports is removed. The Customs Department needs to work with the
World Customs Organization, Oceania Customs Organization (OCO) and WTO to upgrade
customs procedures and standards in order to facilitate trade. All the issues relating to smuggling
of goods should also be addressed.
RMI has just adopted the Harmonised Commodity Description and Coding System (HS) 2007
and should be ready to adopt the 2012 HS and future amendments. This will be very important to
enable RMI to effectively participate in trade negotiations. RMI also needs to adopt a customs
automation system which can be used to capture trade data. The current system where trade data
is captured manually is hindering trade and also makes it difficult to retrieve and analyse trade
data.
The Customs Department also needs to work with other agencies including quarantine, health
and immigration to ensure that there is smooth movement of goods, services suppliers and
people to facilitate trade and investment.
The budget allocation must be sensitive to projects that are aimed at facilitating trade in tourism,
fisheries and agriculture. Local revenue as well as donor funding, including Compact funding in
general should be used to support priority trade projects.
e) Ministry of Health
The Ministry must assist in ensuring that RMI has a healthy population which can contribute
effectively to the economy. The Ministry can also play a vital role in advising the nation on the
12
effects of unsafe imports of food, drugs and other products. The Ministry should also advise the
NTFC on all issues pertaining to trade in health services, including the number of foreign
medical personnel or private hospitals that should be allowed in RMI, restrictions that may need
to be put in place on trade in goods or movement of people especially after an outbreak of a
pandemic like swine flu, as well as training of local people in this sector.
f) Ministry of Education
Education plays a vital role in trade and its role is rarely acknowledged in economic
development. For any nation to prosper in trade there must be a good education system
especially the production of relevant skills that are needed to turn the economy around. Areas
such as mathematics, science and ICT are some of the areas that warrant attention. There is also
a need to prioritize Technical and Vocational Education Training Centres (TVET) to enable the
nation to develop the skills that are needed in the economy and also export the surplus skills and
earn remittances. The poor education system in RMI is another factor that is slowing trade and
economic growth. This issue needs to be tackled at all levels, from the elementary level to
tertiary level.
g) The Ministry of Transportation and Communications
Transportation is a key issue in RMI, particularly for exporters, importers, consumers and
tourists. The Ministry of T&C needs to work with all the stakeholders to address the
transportation (air, maritime) problems. Telecommunication is another issue that affects the RMI
business environment and the relevant policies need to be put in place to address these shortfalls
in order to promote trade and investment. RMI needs to ensure that the regulatory framework
governing transportation and communication is adequate. The Government must adopt measures
to facilitate the participation of the private sector in these sectors. The RMI should explore the
possibility of public-private sector partnership in providing infrastructure services in the
transport sector. The transportation and telecommunication sector has a huge impact on the costs
of doing business in RMI and affect any activity that will take place in tourism, fisheries and
agriculture. For this reason, the Government needs to ensure that the right policies are adopted
to address these issues.
h) Economic Policy, Planning and Statistics Office (EPPSO)
According to the Act establishing the Economic Policy, Planning and Statistics Office (EPPSO),
the Office comprises of the Policy and Strategy Development Unit; Performance Monitoring,
Evaluation and Aid Coordination Unit and the Statistics and Analysis Unit. The Policy and
Strategic Development Unit is responsible for providing advice on general economic policy,
including periodic review of overall national development goals and strategies to Cabinet
through the National Policy Coordinating Committee; providing advice on general economic
policy and planning in order to assist the Ministry of Finance in the budget preparation and
preparing the five-year rolling Economic Policy Statements to be updated annually. The
Economic Policy Statement will identify the main economic goals and objectives and be
13
supported by brief sector strategies. EPPSO is also responsible for conducting economic and
social studies, reviews and assessments as required.
The Performance Monitoring, Evaluation and Aid Coordination Unit is responsible for providing
advice on general economic policy in order to assist the Ministry of Finance in negotiations with
external sources and lending institutions on programs and projects of assistance. It is also
responsible for the monitoring and evaluation of the Compact and related agreements, acting as
the Secretariat for the RMI-US Joint Economic Review Board. It is charged with preparing and
updating the performance score card, and preparing quarterly monitoring reports on budget and
major projects and programs for submission to the National Planning and Coordination
Committee.
The Statistics Collection and Analysis Unit is responsible for the collection, compilation,
analysis and publication of certain statistical data and information, and for matters incidental
thereto.
It is clear that EPPSO plays a major role in economic development and trade. The Office must be
given more resources to ensure that all the policies and plans that are developed are coherent and
contribute towards achieving the goals that are stipulated in the SDPF. EPPSO should play a
vital role in ensuring that trade is mainstreamed into the SDPF or any subsequent development
plans.
The Statistical Unit must ensure that disaggregated national statistics including those relating to
GDP, BOP, trade in goods, trade in services, remittances and investment are improved to enable
RMI to monitor progress and take the necessary remedial action. Statistics is vital for guiding
policy makers as well as in measuring progress either under the SDPF or under the Trade Policy.
i) Environment Protection Agency (EnPA)
Development in RMI is prone to natural disasters and global shocks including climate change
and the rise in sea level as a result of global warming. These are serious challenges and the office
of EnPA needs to be vigilant in protecting the environment to ensure that development is
sustainable. There is a clear link between trade and environment and this theme is gaining
prominence at the global level and the EnPA needs to monitor these developments to ensure that
trade and economic endeavour is undertaken in a sustainable manner.
j) Non-Governmental Organizations
WUTMI and MICNGOs should also play a vital role in coordinating all the input and comments
from the NGOs and defending these interests in the NTFC.
k) Nitijela

14
In order to improve understanding of key trade issues, it is recommended that the R&D
Committee or the Committee for Foreign Affairs and Trade be actively involved in the
formulation and implementation of the Trade Policy. This is important because the Nitijela will
be responsible for approving the ratification of various trade agreements and allocating funding
that is needed to implement the Trade Policy. It will be important to ensure that the Nitijela is
briefed and updated regularly on major trade policy developments to avoid a situation where they
will only be asked to ratify trade agreements that they have never been involved in.
l) Sub-Committees
In order to advance discussions at the technical level, the Chairman of the NTFC should be
empowered to establish specialized sub-committees to deal with sectoral issues and formulate
plans on issues such as agriculture, fisheries, tourism, services, investment, market access, trade-
related issues and Aid for Trade. The Chairman of the sub-committee can work closely with
interested stakeholders and present their recommendations to the NTFC for consideration.
Recommendations of the National Trade Policy Meeting:
The National Trade Policy Consultative Meeting agreed that:
i. The NTFC be revived with improvements.
ii. The NTFC be composed of R&D (MIMRA, MIVA, Agriculture), AG (Immigration),
CoC, MOFA (Compact, Labor), Farmers Association, Handicrafts Association, MoF,
EPPSO, EPA, T&C, MIMA, Ministry of Internal Affairs, NGOs (WUTMI/MICNGOs),
Parliamentary Committee on R&D/Legislative Counsellor, MIBA, business
representatives from PRC and RoC, CMI, MICS.
iii. The chair be empowered to establish technical sub-committees to deal with technical
trade issues relating to fisheries, tourism, agriculture, market access, trade in services and
investment, trade-related issues and Aid for Trade.
iv. The Chair of the NTFC should report to Cabinet and Nitijela.
v. At least 50% of the members of the NTFC must be women.
vi. At least 50% of the members must be from the private sector.
vii. The Government must provide adequate funding to enable the NTFC to operate
effectively. Assistance should also be sought from donors and the private sector to fund
NTFC activities.
viii. The NTFC will be chaired by the President of the Chamber of Commerce and the Vice
Chair will be from R&D, which will also serve as the Secretariat
15
1.5 Schedule of Work
The Ministry of Resources and Development organised the first National Trade Policy
Consultative Meeting in November 2009. The purpose of the Meeting was to gather views from
all the stakeholders. Consultations were also held with key Government ministries, the private
sector, farmers, major operators in tourism, and non-governmental organisations. The list of
participants is attached. Based on these consultations, a first draft Trade Policy was prepared and
presented during the second National Trade Policy Consultative Meeting that was held in May
2010. The draft was circulated in July 2010 to all the relevant stakeholders for comments and the
comments were incorporated into the Final draft which was submitted to the Ministry of R&D.
The draft was updated and circulated in April 2012 and presented to the NTFC on 03 May and
submitted to Cabinet immediately thereafter. This exercise was transparent and inclusive in order
to allow all the stakeholders to participate freely and contribute to the Trade Policy.
1.6 Structure of the Trade Policy
The Trade Policy Framework is structured as follows: Section One looks at RMI and the Trade
Policy Framework covering the introduction, the definition, the rationale, the vision of the Trade
Policy, the legal and institutional framework, the schedule of work and the structure of the Trade
Policy.
Section Two reviews the state of RMI‘s macro-economic environment with a focus on the
Strategic Development Plan Framework (SDPF) and the R&D Strategy and Action Plan and
assesses whether these documents have contributed towards economic growth or not. The SDPF
is critically important because the Trade Policy must be mainstreamed into the overall
development framework. The section also recommends measures that need to be taken to
promote economic growth, employment and how to reduce trade deficit and fiscal imbalances. It
is important to have sound economic fundamentals and clear economic targets to enable trade
and investment to flourish.
Section three deals with trade policy by sector and assesses how agriculture, fisheries and
tourism have been performing including the contribution of these sectors to economic growth
and development.
Section four looks at the participation of RMI in merchandise trade including the import and
export trends as well as other measures that are required to facilitate trade. This is followed by
section five which deals with investment and the general laws that are affecting investment in
RMI. It also reviews RMI‘s performance in the Ease of Doing Business and recommends the key
actions that must be taken to improve the trade and investment environment.
A full description of the key laws and regulations affecting trade in services in RMI including
recommendations on how RMI can reform these laws is provided in section six. The section also
16
highlights the importance of labour mobility and the need for RMI to strengthen its capacity in
this area to supply the skills that are required locally and export surplus skills and earn
remittances.
Section seven deals with a number of trade-related issues such as taxation, competition policy,
Government Procurement, corporate governance, intellectual property rights, trade and
environment and trade and gender. The section provides recommendations on how to build
capacity in these areas and reform the relevant laws, thus creating a more conducive business
environment.
Section eight deals with market access and trade negotiations and discusses the key issues
pertaining to regional and international markets, including the ongoing and/or potential trade
negotiations. The section provides recommendations on how to improve the existing market
access as well as how to diversify export markets. It also provides general guiding principles that
RMI should adhere to when undertaking trade negotiations.
Most importantly, sections nine and ten deal respectively with Aid for Trade and
implementation. Section nine makes it clear that Aid for Trade is required to assist RMI to
implement the priorities that are set out in the implementation Matrix. The ultimate objective is
to use Aid for Trade to build the capacity of RMI to use trade as a tool to fuel economic growth,
create jobs, fight poverty and contribute towards meeting the national development goals
including the Millennium Development Goals (MDGs).
2 THE MACRO-ECONOMIC ENVIRONMENT
This section gives a brief overview of the SDPF, the R&D Strategy and Action Plan, RMI‘s
economic performance, the structure of the economy, the fiscal policy and employment. This
will set the context in which the Trade Policy is being formulated. The main objective is to
mainstream trade into the national development plan and ensure that trade will play a vital role in
promoting export-led sustainable economic growth and development.
The ultimate objective is to ensure that trade and investment contribute to the achievement of the
goals that are set in the national development plan including the MDGs. Trade should not be an
end in itself, but must be used as a tool to fight poverty, create employment, stimulate private
sector development and raise the living standards of the Marshallese people.
2.1 RMI’s Strategic Development Plan Framework
17
In June 2001, the RMI adopted the Strategic Development Plan Framework (SDPF) 2003-2018,
which is commonly known as Vision 2018. The SDPF is complimented by Master Plans
focusing on major policy areas as well as Action Plans of Ministries and statutory agencies,
which show the relevant programs, projects and costs. The overall vision of the SDPF is:
― to become a country within an inter-dependent world, with an enhanced socio-economic self-
reliance, and educated, healthy, productive, law abiding and God-loving people in which
individual freedom and fundamental human rights are protected and culture and traditions are
respected and development and environmental sustainability are in harmony”.
Goal 1 deals with operating in an interdependent world, in particular, RMI‘s Foreign Policy and
climate change.The Foreign Policy seeks to assist RMI to develop the capacity to implement
national sustainable development policies to maximise national benefits and foster international
relations, recognising the limits and opportunities offered by political and economic ties with the
rest of the world, globalisation and technological advances. On climate change, RMI seeks to
cooperate with regional and international organisations to minimise the adverse impact of global
warming and climate change.
Goal 2 deals with enhanced socio-economic self-reliance. The first part deals with the macro-
economic framework and seeks to achive a level of quality development such that dependence on
foreign technical and financial assistance and skills as well as the dependence of the private
sector and households on Government expenditure is reduced. The second part deals with
partnership and coordination and seeks a partnership with all important decision makers at all
levels. The third one is directly relevant to trade because it deals with food security and import
substitution to the best extent possible, and the development of exports. The fourth one deals
with infrastructure development to assit the nation to achieve the goal of sustainable
development and enhance self-reliance with minimum impact on the environment. The table
below summarises some of the key issues that are still relevant for the Trade Policy.
Table 1: Objectives outlined in the SDPF
Macroeconomic
Framework
The Productive Sectors Infrastructure
Objective 1 – Developing,
diversifying and strengthening our
economic base so as to generate
maximum income and domestically
generated Government revenues
Objective 2 – Achieving fiscal
stability in Government
Objective 3 – Achieving a more
balanced structure in the economy
with a greater reliance on foreign
exchange earning / import substitution
sector
Objective 4 – Ensuring optimal
accessibility to opportunities to ensure
fuller participation of women in the
Agriculture
Objective 1 – Increase output of local
foods and agricultural exports
Objective 2 – Achieve healthy and
balanced diet to minimize both
malnutrition and obesity
Objective 3 – Increase output of
locally processed foods and
supplements :
Objective 4- Minimize the
percentage of underutilized land for
agricultural purposes
Objective 1 – To provide reliable and
affordable infrastructure in the areas
of communication, transportation,
water & sewage, and energy
Objective 2 – Establish a sustainable
and continuous maintenance program
for all infrastructure
Objective 3 – Establish and foster a
complementary, efficient and secure
land tenure framework for the smooth
development of infrastructure which
also takes into account for any foreign
investment
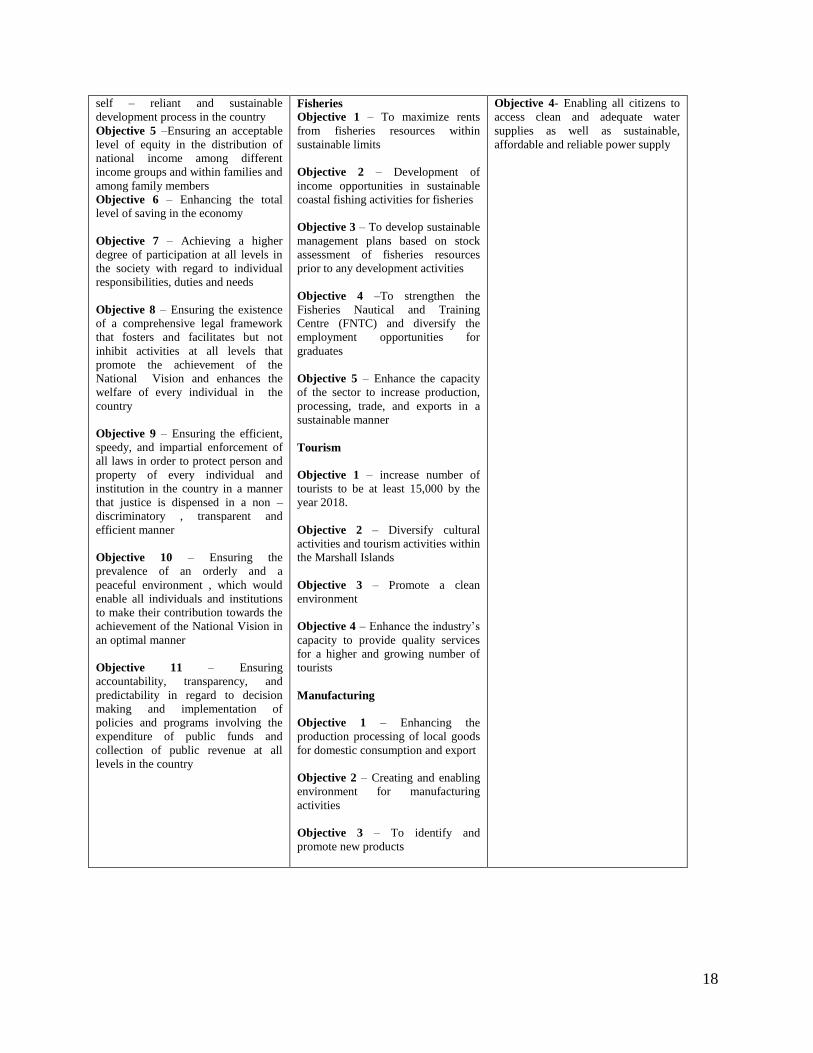
18
self – reliant and sustainable
development process in the country
Objective 5 –Ensuring an acceptable
level of equity in the distribution of
national income among different
income groups and within families and
among family members
Objective 6 – Enhancing the total
level of saving in the economy
Objective 7 – Achieving a higher
degree of participation at all levels in
the society with regard to individual
responsibilities, duties and needs
Objective 8 – Ensuring the existence
of a comprehensive legal framework
that fosters and facilitates but not
inhibit activities at all levels that
promote the achievement of the
National Vision and enhances the
welfare of every individual in the
country
Objective 9 – Ensuring the efficient,
speedy, and impartial enforcement of
all laws in order to protect person and
property of every individual and
institution in the country in a manner
that justice is dispensed in a non –
discriminatory , transparent and
efficient manner
Objective 10 – Ensuring the
prevalence of an orderly and a
peaceful environment , which would
enable all individuals and institutions
to make their contribution towards the
achievement of the National Vision in
an optimal manner
Objective 11 – Ensuring
accountability, transparency, and
predictability in regard to decision
making and implementation of
policies and programs involving the
expenditure of public funds and
collection of public revenue at all
levels in the country
Fisheries
Objective 1 – To maximize rents
from fisheries resources within
sustainable limits
Objective 2 – Development of
income opportunities in sustainable
coastal fishing activities for fisheries
Objective 3 – To develop sustainable
management plans based on stock
assessment of fisheries resources
prior to any development activities
Objective 4 –To strengthen the
Fisheries Nautical and Training
Centre (FNTC) and diversify the
employment opportunities for
graduates
Objective 5 – Enhance the capacity
of the sector to increase production,
processing, trade, and exports in a
sustainable manner
Tourism
Objective 1 – increase number of
tourists to be at least 15,000 by the
year 2018.
Objective 2 – Diversify cultural
activities and tourism activities within
the Marshall Islands
Objective 3 – Promote a clean
environment
Objective 4 – Enhance the industry‘s
capacity to provide quality services
for a higher and growing number of
tourists
Manufacturing
Objective 1 – Enhancing the
production processing of local goods
for domestic consumption and export
Objective 2 – Creating and enabling
environment for manufacturing
activities
Objective 3 – To identify and
promote new products
Objective 4- Enabling all citizens to
access clean and adequate water
supplies as well as sustainable,
affordable and reliable power supply

19
Goal 3 deals with education and seeks to establish a knowledge-based economy by equipping
Marshallese citizens with internationally competitive skills, qualities and positive attitudes to
work and society.
Goal 4 deals with health and seeks to build the capacity of RMI citizens to care for their own
health through primary health care program and to provide high quality, effective and affordable
and efficient healthcare services.
Goal 5 seeks to develop a productive people capable of contributing in the sustainable
development of the nation. Goal 6 deals with obediance to the law and good governance. Goal 7
ackonwledges the spirituality of the Marshallese people and the right to religion.
Goal 8 deals with individual freedom and fundamental human rights. Goal 9 deals with the need
to respect culture and tradition. Goal 10 focuses on environmental sustainabilty and the need to
develop a regulatory system that can be enforced to achieve sustainable developemnt of natural
resources, while protecting the environment from any adverse impacts. It also places emphasis
on the need to minimise the impact of climate change.
To realise this overall vision the SDPF has set out ten goals, which together seek to contribute to
sustainable ecoconmic developmnet. Some of the specific trade issues that are included in the
SDPF especially under goal two include the following:
to attain food security for all people at all times and to substitute imports to the best
extent possible and develop exports
to increase output of local foods and agricultural exports
to enhance the capacity of the fisheries sector to increase production, processing, trade
and exports in a sustainable manner
to increase the number of tourists, to at least by 15 000 by year 2018
to enhance the production and processing of local goods for domestic consumption and
export
to achieve a more balanced structure in the economy with a greater reliance on foreign
exchange earnings and import substitution.
The section dealing with Foreign Affairs and Trade requires RMI to put in place policies that
will assist in implementing the SDPF, including creating an good environment for investment,
obtaining tariff concession for RMI‘s products in major markets such as the US and benefiting
from opportunities in the information technology industry, for employment creation and trade.
One of the goals (Goal 2) also makes reference to other infrastructural services such as
communication, transportation, water and energy, which are relevant sectors when trade in
services is concerned. It is clear that provision of infrastructure is hampered by lack of
economies of scale and limited landmass. However, poor policies also hinder the private sector

20
from providing some of the infrastructural services, thus contributing to the existing poor quality
of infrastructure. The Government needs to establish and implement adequate and effecive
policies in these areas to improve trade-related infrastructure.
The SDPF attempts to address trade-related issues, however, it is not detailed enough. There is a
need for a comprehensive Trade Policy to supplement the SDPF, and which will fully
mainstream trade into the development plan and link this to the budget process, including the
technical and financial assiatance that is provided by donors and trading partners, as well as
measurable performance indicators.
2.1.1 The Ministry of Resources and Development Strategy and Action Plan
2005-2010
The Marshall Islands Resources and Development Strategy and Action Plan 2005-2010
complements the SDPF and provides specific strategies and activities that must be implemented
to achieve some of the development goals that directly fall under the Ministry of Resources and
Development (R&D). The vision for the Ministry of Resources and Development Strategy and
Action Plan 2005-2010 provides for a future where:
Modern development and urbanization co-exists with the environment and traditional
lifestyles
Physically active people eat locally grown and processed healthy foods, and have secure
supplies of food
There are business and job opportunities for the people
Each outer-island household has access to electricity
RMI‘s beautiful islands are safeguarded from pests and disease
The unique Marshallese products are being successfully exported around the world
RMI‘s traditions are alive, and the country is economically self-reliant
The R&D Strategy provides for an integrated approach to development, geared towards primary
production, value-added production and market development. Some of the issues that were
recommended in the R&D Strategy and Action Plan include the need to establish a farmers
market where people can come together and sell their local fruits and vegetables, fresh fish,
preserved pandanus, roasted breadfruit, handicrafts or clothes. In the past, an attempt was made
to establish a farmers‘ market and a building was established several years ago near the building
of the Ministry of R&D but it was subsequently appropriated for other uses. The Bank of
Marshall Islands established a farmers market but it was not being fully utilized mainly because
of low levels of production, high transportation costs to bring the produce to the market and high
rentals ($5 per day) for using the market.

21
The other program that was recommended in the R&D Strategy is the Coconut ―Tree of Life‖
Development project. The objectives of this project are to increase the value of coconut and
coconut products to the Marshall Islands, reduce dependence of outer islands on imported fuel
and copra subsidies and develop value-added coconut products for export. This project has not
been implemented and there is a need to assess the best ways of implementing it.
The atolls have many coconut trees which are underutilized. RMI could derive more benefits if it
adopts an integrated approach to the development of coconut resources. Rather than
concentrating on copra-exports, RMI needs to focus on value added products. Value addition
will contribute to improving the living standards of local people and also reduce the Government
subsidies for copra.
It is also recommended that the extraction of coconut oil could be decentralized and carried out
on outer islands at a relatively low cost. The oil can then be used to run electricity generators (at
a significantly lower cost than solar power), diesel vehicles and outboard motors. Coconut oil
can also be used directly for cooking or to develop value-added products such as beauty creams,
oils and livestock feed. Parts of the coconut tree are already being used for handicrafts, and
senile plants can be used for timber while the coconut shell can be used to produce charcoal.
Another project focuses on increasing domestic food production and some measures have been
taken to implement this project, but more still need to be done.
The other objectives include the need to replant trees including coconut plants to ensure that
there will be adequate raw materials for handicrafts, medicine, coconut products and other non-
food production.
The R&D strategy also calls for RMI to take the necessary measures to prevent the introduction
and spread of injurious pests and diseases into and within the Marshall Islands.
Another component of the R&D Strategy deals with product and market development, including
product development services, domestic marketing services, international marketing services and
trade facilitation services. It also deals with export requirements and labeling. However, there is
a need to provide training and relevant information to encourage the development of new
products and to improve the production of existing ones. Some of these products include
handicrafts, processed foods, preserved fish, pandanus, nin juice and other products made from
local raw materials. This will help to increase consumption of domestic products, thus decreasing
dependence on imports. Targeted technical assistance should be provided towards the production
of a few products and if successful, this can be expanded gradually to other products.
The R&D Strategy also focuses on developing products for the local and export market. The
current major export products include copra oil and fish. There is also potential in handicraft and
22
nin. The R&D Strategy also recommends the Government to improve access to credit through
micro-finance schemes. Furthermore, it calls for the development of Trade and Investment
Policies to contribute to the economic development of the RMI. The Trade Policy is therefore
key to achieving the goals on the SDPF and the R&D Strategy.
Recommendations:
i. RMI must assess the results of the SDPF and use the lessons learnt to develop a new
National Development Plan which will take into account Vision 2018, the existing
reports, plans and, policies, and introduce performance based budget and realistic and
measurable indicators.
ii. The Ministry of Finance/Cabinet must allocate adequate resources that are required to
implement the Trade Policy.
iii. RMI must also assess and refresh the R&D Strategy to ensure that trade is fully
mainstreamed into the strategy.
iv. The Division responsible for trade and investment needs to be strengthened and staffed
by at least three trade experts.
v. There is a need to sensitize the Cabinet on the importance of trade and the need to
provide the necessary support for trade and private sector development.
2.2 Economic Growth
The section above described briefly RMI‘s Strategic Development Plan Framework and the
R&D Strategy. The common trend that could be seen in both documents is the need to enhance
sustainable economic growth, self-sustenance and improve the standard of living for Marshallese
people. This section on its part, will review RMI‘s economic growth and assess RMI‘s economic
performance and its impact on development. This review will help to assess the trade and
investment measures that need to be introduced to boost export-led economic growth and
sustainable development.
According to chart 2 below, the current GDP increased from $110.9 million in 2000 to $162.9
million in 2010.
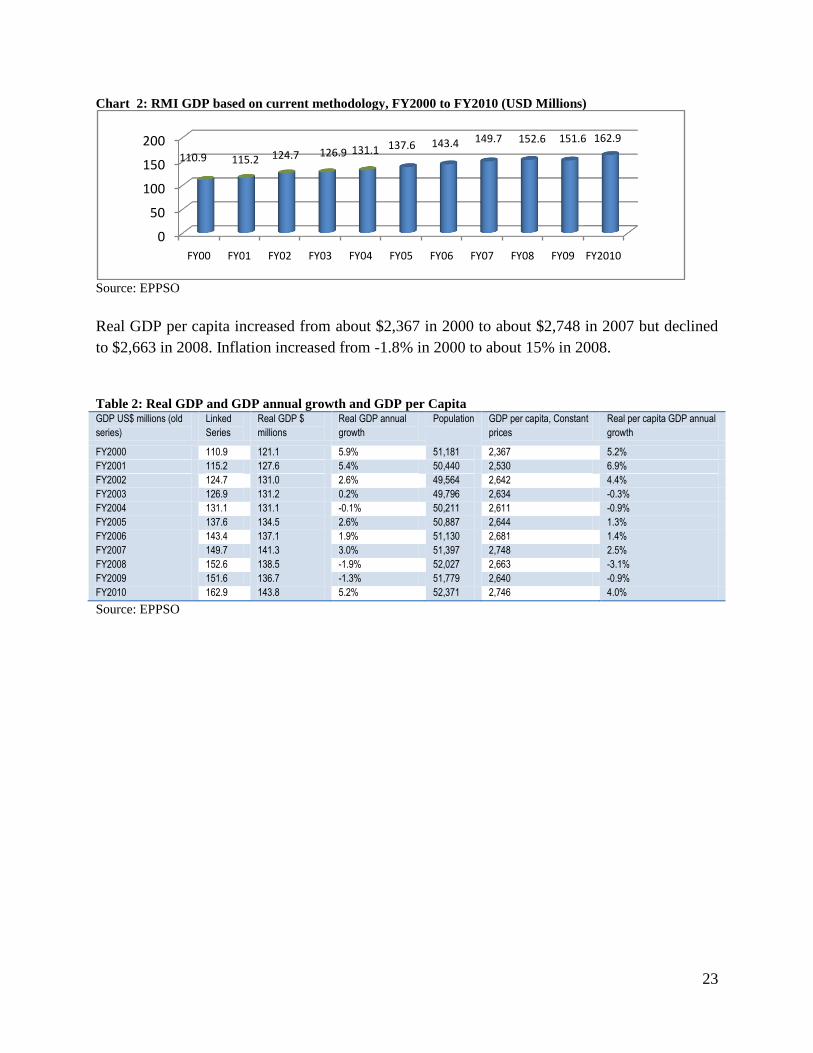
23
Chart 2: RMI GDP based on current methodology, FY2000 to FY2010 (USD Millions)
Source: EPPSO
Real GDP per capita increased from about $2,367 in 2000 to about $2,748 in 2007 but declined
to $2,663 in 2008. Inflation increased from -1.8% in 2000 to about 15% in 2008.
Table 2: Real GDP and GDP annual growth and GDP per Capita GDP US$ millions (old
series)
Linked
Series
Real GDP $
millions
Real GDP annual
growth
Population GDP per capita, Constant
prices
Real per capita GDP annual
growth
FY2000 110.9 121.1 5.9% 51,181 2,367 5.2%
FY2001 115.2 127.6 5.4% 50,440 2,530 6.9%
FY2002 124.7 131.0 2.6% 49,564 2,642 4.4%
FY2003 126.9 131.2 0.2% 49,796 2,634 -0.3%
FY2004 131.1 131.1 -0.1% 50,211 2,611 -0.9%
FY2005 137.6 134.5 2.6% 50,887 2,644 1.3%
FY2006 143.4 137.1 1.9% 51,130 2,681 1.4%
FY2007 149.7 141.3 3.0% 51,397 2,748 2.5%
FY2008 152.6 138.5 -1.9% 52,027 2,663 -3.1%
FY2009 151.6 136.7 -1.3% 51,779 2,640 -0.9%
FY2010 162.9 143.8 5.2% 52,371 2,746 4.0%
Source: EPPSO
0
50
100
150
200
FY00 FY01 FY02 FY03 FY04 FY05 FY06 FY07 FY08 FY09 FY2010
110.9 115.2 124.7 126.9 131.1 137.6 143.4 149.7 152.6 151.6 162.9
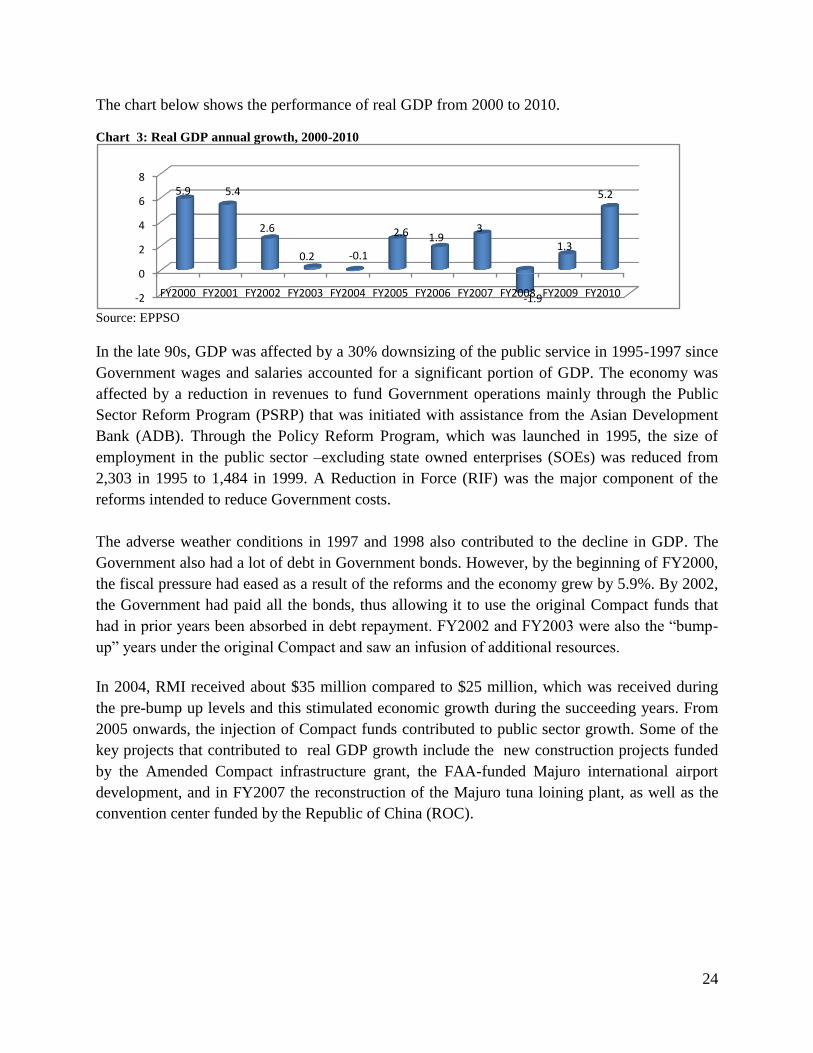
24
The chart below shows the performance of real GDP from 2000 to 2010.
Chart 3: Real GDP annual growth, 2000-2010
Source: EPPSO
In the late 90s, GDP was affected by a 30% downsizing of the public service in 1995-1997 since
Government wages and salaries accounted for a significant portion of GDP. The economy was
affected by a reduction in revenues to fund Government operations mainly through the Public
Sector Reform Program (PSRP) that was initiated with assistance from the Asian Development
Bank (ADB). Through the Policy Reform Program, which was launched in 1995, the size of
employment in the public sector –excluding state owned enterprises (SOEs) was reduced from
2,303 in 1995 to 1,484 in 1999. A Reduction in Force (RIF) was the major component of the
reforms intended to reduce Government costs.
The adverse weather conditions in 1997 and 1998 also contributed to the decline in GDP. The
Government also had a lot of debt in Government bonds. However, by the beginning of FY2000,
the fiscal pressure had eased as a result of the reforms and the economy grew by 5.9%. By 2002,
the Government had paid all the bonds, thus allowing it to use the original Compact funds that
had in prior years been absorbed in debt repayment. FY2002 and FY2003 were also the ―bump-
up‖ years under the original Compact and saw an infusion of additional resources.
In 2004, RMI received about $35 million compared to $25 million, which was received during
the pre-bump up levels and this stimulated economic growth during the succeeding years. From
2005 onwards, the injection of Compact funds contributed to public sector growth. Some of the
key projects that contributed to real GDP growth include the new construction projects funded
by the Amended Compact infrastructure grant, the FAA-funded Majuro international airport
development, and in FY2007 the reconstruction of the Majuro tuna loining plant, as well as the
convention center funded by the Republic of China (ROC).
-2
0
2
4
6
8
FY2000 FY2001 FY2002 FY2003 FY2004 FY2005 FY2006 FY2007 FY2008 FY2009 FY2010
5.9 5.4
2.6
0.2 -0.1
2.6 1.93
-1.9
1.3
5.2
25
However, contrary to earlier reports that indicated that the initial period of the Amended
Compact FY2003-FY2007, had been a period of sustained fiscal expansion and public sector led
growth, with overall GDP growing by an annual average of 2.6%, the revised GDP data shows
that the average growth during this period was only 1.9%. RMI experienced negative growth in
FY2008 and FY 2009 mainly because of the global recession. Growth bounced back to in 2010
mainly as a result of a reduction in inflation and expansion in the fisheries sector. In order for
RMI to generate sufficient activities to fuel economic growth and development, there is a need to
adopt positive trade measures. These measures are elaborated in the Trade Policy under various
sections.
It is important to note that GDP is often positively correlated with the standard of living,
however, its use as a stand-in for measuring the standard of living has come under increasing
criticism and many countries are actively exploring alternative measures to GDP for that
purpose. For example, the French President, Sarkorzy called for a "great revolution" in the way
national wealth is measured and supported a report by Joseph Stiglitz and Amartya8 which
criticizes "GDP fetishism" and prioritizes the quality of life over financial growth. He said
governments should do away with the "religion of statistics" in which financial prowess was the
sole indicator of a country's state of health. He argued that GDP – the standard means of
measuring a country's economic growth – ignores other factors vital to the well-being of its
population.
Joseph Stiglitz and Amartya9 recommended that a new indicator which would be calculated with
GDP but taking into account issues such as environmental protection and work/life balance as
well as economic output to rate a country's ability to maintain the "sustainable" happiness of its
inhabitants should be considered. Stiglitz argued that ―GDP statistics were introduced to measure
market economic activity. But they are increasingly thought of as a measure of societal well-
being, which they are not."
RMI should also consider taking into account socio-economic issues - such as environmental
protection, life balance a sound economic output at a level to ensure sustainable societal
happiness (or ‗good life‘ as referred to in the SDPF) - in measuring societal well being10
.
However, RMI needs to gather disaggregated data on GDP to actually see how much agriculture,
fisheries, tourism and other services contribute to GDP. EPPSO should be given more resources
to improve its statistics.
10
Joseph Stiglitz and Amartya (Stiglitz, Joseph E. (2009) “GDP Fetishism,” The Economists’ Voice: Vol. 6: Iss.8,
Article 5).
26
Recommendations:
(i) EPPSO should be given enough resources to be able to compile base-line data and
disaggregated statistics on GDP and contribution of agriculture, fisheries, services to
GDP to enable RMI to use verifiable indicators to measure economic progress and the
implementation of the Trade Policy. Such information should be regularly shared
with the department of trade and investment of the Ministry of R&D.
(ii) RMI should adopt measures that will stimulate trade and private sector development
in order to enhance sustainable economic growth and development.
(iii) EPPSO should be given more resources to continue working with the Secretariat of
the Pacific Community (SPC), Pacific Financial Technical Assistance Centre
(PFTAC) and IMF to improve its statistics.
2.3 The Structure of the RMI Economy
The RMI economy is largely influenced by the financial provisions of the Compact of Free
Association with the United States. The structure of the original Compact economic assistance
was front-loaded with two step-downs after 5 and 10 years entailing a 15 and 14 percent
reduction in base grant funding respectively. This also affected economic performance. The
Compact funding also contributed in creating a large public sector and a very small private
sector.
Public sector activities mainly consist of compensation of Government employees at the national
and local levels, and various public agencies and enterprises. The performance of the private
sector has been volatile, and influenced by large projects that were implemented in RMI. The
private sector activities have been focused on non-foreign exchange earning activities such as
wholesale and retail of imported goods, construction, hotels and restaurants, banking and
insurance and transport services. There has been little growth in foreign exchange earning
activities. The private sector is heavily dependent on the public sector and it produces largely
non-traded goods and provides services to the Government and its employees. Aside from the
fisheries sector, establishments producing goods and services for the domestic market dominate
the private sector. The developments in the private sector basically follow the rise and fall in
public expenditure, and this influences the demand for private sector services.
Table 3 below shows that in 2010 agriculture contributed about 3.4% to GDP, whilst fisheries
contributed about 10.9%, and hotels and restaurants contributed 1.5%. Wholesale and retail had
the highest contribution of about 13.6%, which is followed by public administration and
education. These trends show that the key sectors of agriculture and tourism do not contribute
much to trade and the RMI economy is largely driven by the public sector and the private sector
which supplies goods and services to the Government and its employees.
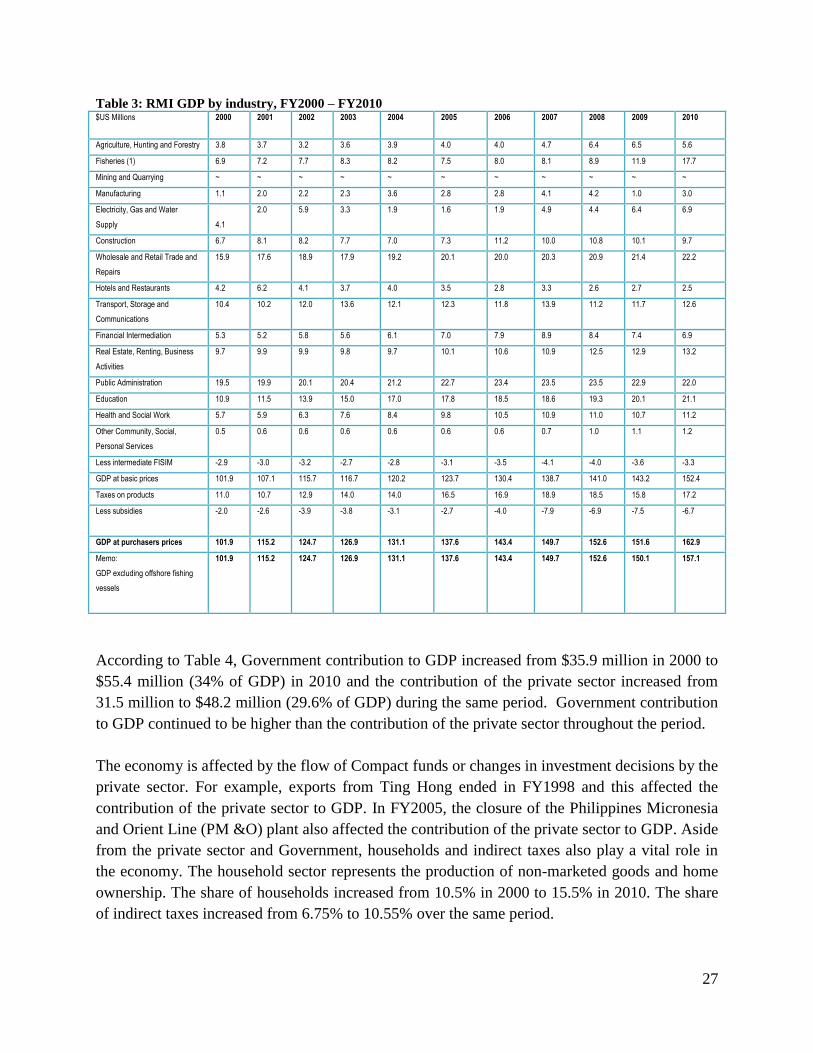
27
Table 3: RMI GDP by industry, FY2000 – FY2010 $US Millions 2000 2001 2002 2003 2004 2005 2006 2007 2008 2009 2010
Agriculture, Hunting and Forestry 3.8 3.7 3.2 3.6 3.9 4.0 4.0 4.7 6.4 6.5 5.6
Fisheries (1) 6.9 7.2 7.7 8.3 8.2 7.5 8.0 8.1 8.9 11.9 17.7
Mining and Quarrying ~ ~ ~ ~ ~ ~ ~ ~ ~ ~ ~
Manufacturing 1.1 2.0 2.2 2.3 3.6 2.8 2.8 4.1 4.2 1.0 3.0
Electricity, Gas and Water
Supply
4.1
2.0 5.9 3.3 1.9 1.6 1.9 4.9 4.4 6.4 6.9
Construction 6.7 8.1 8.2 7.7 7.0 7.3 11.2 10.0 10.8 10.1 9.7
Wholesale and Retail Trade and
Repairs
15.9 17.6 18.9 17.9 19.2 20.1 20.0 20.3 20.9 21.4 22.2
Hotels and Restaurants 4.2 6.2 4.1 3.7 4.0 3.5 2.8 3.3 2.6 2.7 2.5
Transport, Storage and
Communications
10.4 10.2 12.0 13.6 12.1 12.3 11.8 13.9 11.2 11.7 12.6
Financial Intermediation 5.3 5.2 5.8 5.6 6.1 7.0 7.9 8.9 8.4 7.4 6.9
Real Estate, Renting, Business
Activities
9.7 9.9 9.9 9.8 9.7 10.1 10.6 10.9 12.5 12.9 13.2
Public Administration 19.5 19.9 20.1 20.4 21.2 22.7 23.4 23.5 23.5 22.9 22.0
Education 10.9 11.5 13.9 15.0 17.0 17.8 18.5 18.6 19.3 20.1 21.1
Health and Social Work 5.7 5.9 6.3 7.6 8.4 9.8 10.5 10.9 11.0 10.7 11.2
Other Community, Social,
Personal Services
0.5 0.6 0.6 0.6 0.6 0.6 0.6 0.7 1.0 1.1 1.2
Less intermediate FISIM -2.9 -3.0 -3.2 -2.7 -2.8 -3.1 -3.5 -4.1 -4.0 -3.6 -3.3
GDP at basic prices 101.9 107.1 115.7 116.7 120.2 123.7 130.4 138.7 141.0 143.2 152.4
Taxes on products 11.0 10.7 12.9 14.0 14.0 16.5 16.9 18.9 18.5 15.8 17.2
Less subsidies
-2.0 -2.6 -3.9 -3.8 -3.1 -2.7 -4.0 -7.9 -6.9 -7.5 -6.7
GDP at purchasers prices 101.9 115.2 124.7 126.9 131.1 137.6 143.4 149.7 152.6 151.6 162.9
Memo:
GDP excluding offshore fishing
vessels
101.9 115.2 124.7 126.9 131.1 137.6 143.4 149.7 152.6 150.1 157.1
According to Table 4, Government contribution to GDP increased from $35.9 million in 2000 to
$55.4 million (34% of GDP) in 2010 and the contribution of the private sector increased from
31.5 million to $48.2 million (29.6% of GDP) during the same period. Government contribution
to GDP continued to be higher than the contribution of the private sector throughout the period.
The economy is affected by the flow of Compact funds or changes in investment decisions by the
private sector. For example, exports from Ting Hong ended in FY1998 and this affected the
contribution of the private sector to GDP. In FY2005, the closure of the Philippines Micronesia
and Orient Line (PM &O) plant also affected the contribution of the private sector to GDP. Aside
from the private sector and Government, households and indirect taxes also play a vital role in
the economy. The household sector represents the production of non-marketed goods and home
ownership. The share of households increased from 10.5% in 2000 to 15.5% in 2010. The share
of indirect taxes increased from 6.75% to 10.55% over the same period.
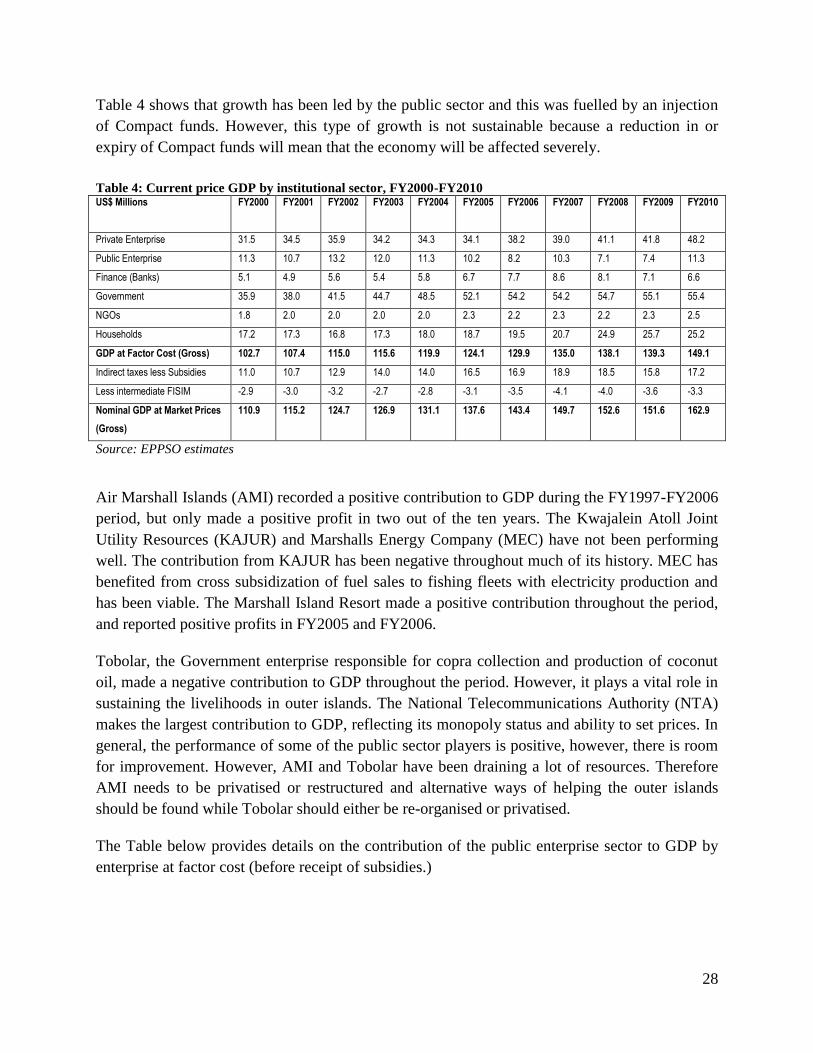
28
Table 4 shows that growth has been led by the public sector and this was fuelled by an injection
of Compact funds. However, this type of growth is not sustainable because a reduction in or
expiry of Compact funds will mean that the economy will be affected severely.
Table 4: Current price GDP by institutional sector, FY2000-FY2010 US$ Millions FY2000 FY2001
FY2002 FY2003 FY2004 FY2005 FY2006 FY2007 FY2008 FY2009 FY2010
Private Enterprise 31.5 34.5 35.9 34.2 34.3 34.1 38.2 39.0 41.1 41.8 48.2
Public Enterprise 11.3 10.7 13.2 12.0 11.3 10.2 8.2 10.3 7.1 7.4 11.3
Finance (Banks) 5.1 4.9 5.6 5.4 5.8 6.7 7.7 8.6 8.1 7.1 6.6
Government 35.9 38.0 41.5 44.7 48.5 52.1 54.2 54.2 54.7 55.1 55.4
NGOs 1.8 2.0 2.0 2.0 2.0 2.3 2.2 2.3 2.2 2.3 2.5
Households 17.2 17.3 16.8 17.3 18.0 18.7 19.5 20.7 24.9 25.7 25.2
GDP at Factor Cost (Gross) 102.7 107.4 115.0 115.6 119.9 124.1 129.9 135.0 138.1 139.3 149.1
Indirect taxes less Subsidies 11.0 10.7 12.9 14.0 14.0 16.5 16.9 18.9 18.5 15.8 17.2
Less intermediate FISIM -2.9 -3.0 -3.2 -2.7 -2.8 -3.1 -3.5 -4.1 -4.0 -3.6 -3.3
Nominal GDP at Market Prices
(Gross)
110.9 115.2 124.7 126.9 131.1 137.6 143.4 149.7 152.6 151.6 162.9
Source: EPPSO estimates
Air Marshall Islands (AMI) recorded a positive contribution to GDP during the FY1997-FY2006
period, but only made a positive profit in two out of the ten years. The Kwajalein Atoll Joint
Utility Resources (KAJUR) and Marshalls Energy Company (MEC) have not been performing
well. The contribution from KAJUR has been negative throughout much of its history. MEC has
benefited from cross subsidization of fuel sales to fishing fleets with electricity production and
has been viable. The Marshall Island Resort made a positive contribution throughout the period,
and reported positive profits in FY2005 and FY2006.
Tobolar, the Government enterprise responsible for copra collection and production of coconut
oil, made a negative contribution to GDP throughout the period. However, it plays a vital role in
sustaining the livelihoods in outer islands. The National Telecommunications Authority (NTA)
makes the largest contribution to GDP, reflecting its monopoly status and ability to set prices. In
general, the performance of some of the public sector players is positive, however, there is room
for improvement. However, AMI and Tobolar have been draining a lot of resources. Therefore
AMI needs to be privatised or restructured and alternative ways of helping the outer islands
should be found while Tobolar should either be re-organised or privatised.
The Table below provides details on the contribution of the public enterprise sector to GDP by
enterprise at factor cost (before receipt of subsidies.)
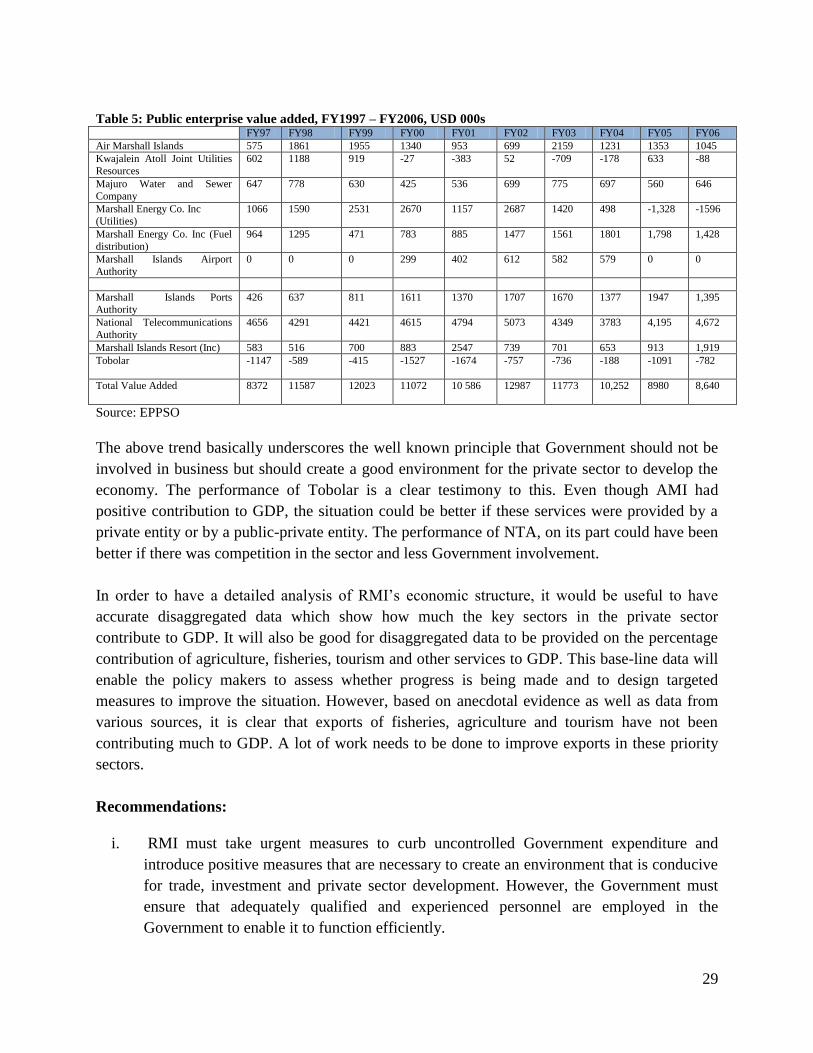
29
Table 5: Public enterprise value added, FY1997 – FY2006, USD 000s FY97 FY98 FY99 FY00 FY01 FY02 FY03 FY04 FY05 FY06
Air Marshall Islands 575 1861 1955 1340 953 699 2159 1231 1353 1045
Kwajalein Atoll Joint Utilities
Resources
602 1188 919 -27 -383 52 -709 -178 633 -88
Majuro Water and Sewer
Company
647 778 630 425 536 699 775 697 560 646
Marshall Energy Co. Inc
(Utilities)
1066 1590 2531 2670 1157 2687 1420 498 -1,328 -1596
Marshall Energy Co. Inc (Fuel
distribution)
964 1295 471 783 885 1477 1561 1801 1,798 1,428
Marshall Islands Airport
Authority
0 0 0 299 402 612 582 579 0 0
Marshall Islands Ports Authority
426 637 811 1611 1370 1707 1670 1377 1947 1,395
National Telecommunications
Authority
4656 4291 4421 4615 4794 5073 4349 3783 4,195 4,672
Marshall Islands Resort (Inc) 583 516 700 883 2547 739 701 653 913 1,919
Tobolar
-1147 -589 -415 -1527 -1674 -757 -736 -188 -1091 -782
Total Value Added
8372 11587 12023 11072 10 586 12987 11773 10,252 8980 8,640
Source: EPPSO
The above trend basically underscores the well known principle that Government should not be
involved in business but should create a good environment for the private sector to develop the
economy. The performance of Tobolar is a clear testimony to this. Even though AMI had
positive contribution to GDP, the situation could be better if these services were provided by a
private entity or by a public-private entity. The performance of NTA, on its part could have been
better if there was competition in the sector and less Government involvement.
In order to have a detailed analysis of RMI‘s economic structure, it would be useful to have
accurate disaggregated data which show how much the key sectors in the private sector
contribute to GDP. It will also be good for disaggregated data to be provided on the percentage
contribution of agriculture, fisheries, tourism and other services to GDP. This base-line data will
enable the policy makers to assess whether progress is being made and to design targeted
measures to improve the situation. However, based on anecdotal evidence as well as data from
various sources, it is clear that exports of fisheries, agriculture and tourism have not been
contributing much to GDP. A lot of work needs to be done to improve exports in these priority
sectors.
Recommendations:
i. RMI must take urgent measures to curb uncontrolled Government expenditure and
introduce positive measures that are necessary to create an environment that is conducive
for trade, investment and private sector development. However, the Government must
ensure that adequately qualified and experienced personnel are employed in the
Government to enable it to function efficiently.
30
ii. The role of Government must be limited to providing basic infrastructure, essential
services, regulation and adopting measures that enhance and facilitate private sector
development rather, than venturing into direct commercial operations in competition with
the private sector.
iii. The Government must set targets on economic growth as well as other socio-economic
goals.
iv. RMI must reform and/or privatise public enterprises to enhance efficiency in service
delivery, promote competitiveness and lower the cost of doing business in RMI.
v. The Government must adopt trade measures that will enhance private sector development
and stimulate the production of goods and services that can be traded competitively in the
local market and in major export markets.
2.4 Employment
One of the objectives of the SDPF, which is also the ultimate goal of the Trade Policy, is to use
trade to enhance private sector development, create jobs and raise the living standards of the
Marshallese people. This section reviews the employment situation in RMI and recommends
actions that need to be taken to ensure that trade plays a vital role in creating quality jobs and
decent income for workers, especially the vulnerable groups such as women.
RMI‘s population is relatively young and has also been affected by emigration to the US.
Between 1990 to 2007, over 15,000 Marshallese are estimated to have emigrated to the US. The
labor force (15 to 64 who are able to work) is estimated to be between 14,000 - 15,000 persons.
About 10, 216 people were formally employed in 2009 and more than 5,000 people are either
informally employed or not employed whatsoever. The RMI‘s official unemployment rate based
on the 1999 census stood at 30.9%.
Since the majority of the population lives in Majuro and Ebeye urban areas, subsistence activities
are very limited for most people. This means that formal, cash‐earning employment activities are
needed for the survival of most Marshallese today. Only around 40 percent of adults in the RMI
have completed high school and about 5% have completed college level (bachelor level degree).
These rates are very low compared to other Pacific Islands.
Employment increased from 7,940 in FY1997 to 10,709 in 2011. The opening of PM&O in FY
2000 and its subsequent closure in 2004 contributed to the fluctuation in the employment
numbers in the private sector. Compared to the 2004 figures, in 2005, employment in the private
sector fell by about 14.3%. However, the private sector employment increased significantly from
2,525 in FY97 to 4,440 in FY 2011 mainly as a result of the developments in the fisheries sector.
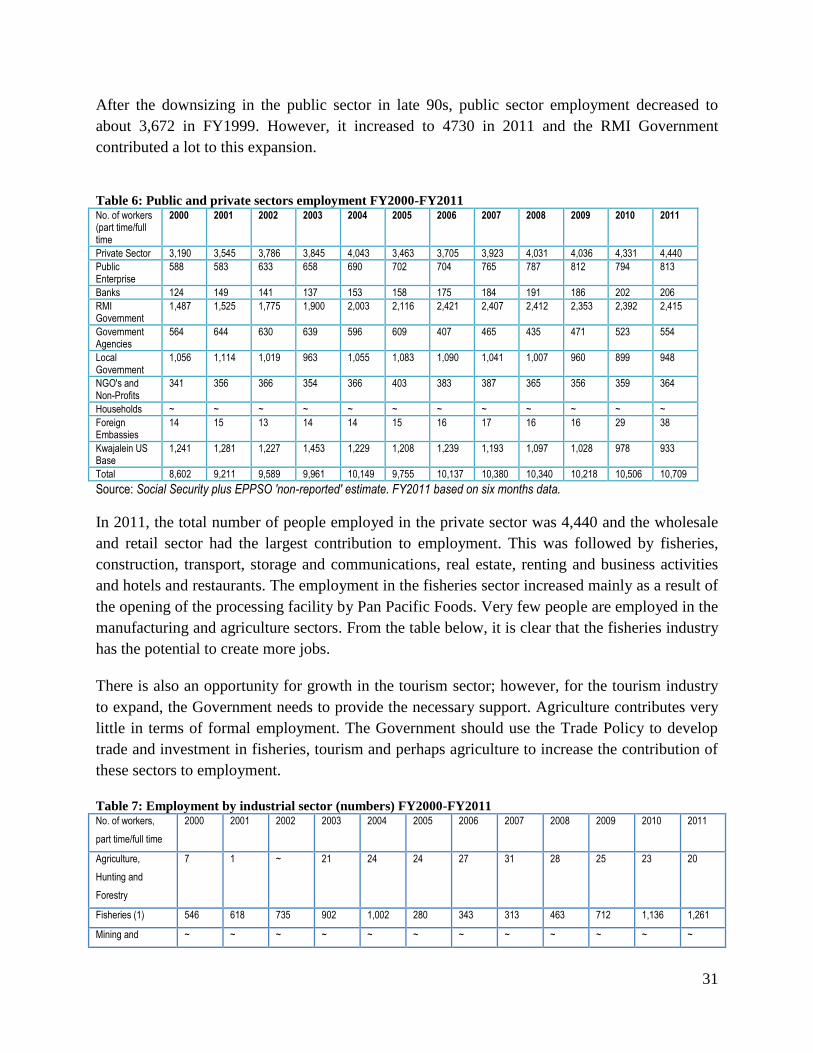
31
After the downsizing in the public sector in late 90s, public sector employment decreased to
about 3,672 in FY1999. However, it increased to 4730 in 2011 and the RMI Government
contributed a lot to this expansion.
Table 6: Public and private sectors employment FY2000-FY2011 No. of workers (part time/full time
2000 2001 2002 2003 2004 2005 2006 2007 2008 2009 2010 2011
Private Sector 3,190 3,545 3,786 3,845 4,043 3,463 3,705 3,923 4,031 4,036 4,331 4,440
Public Enterprise
588 583 633 658 690 702 704 765 787 812 794 813
Banks 124 149 141 137 153 158 175 184 191 186 202 206
RMI Government
1,487 1,525 1,775 1,900 2,003 2,116 2,421 2,407 2,412 2,353 2,392 2,415
Government Agencies
564 644 630 639 596 609 407 465 435 471 523 554
Local Government
1,056 1,114 1,019 963 1,055 1,083 1,090 1,041 1,007 960 899 948
NGO's and Non-Profits
341 356 366 354 366 403 383 387 365 356 359 364
Households ~ ~ ~ ~ ~ ~ ~ ~ ~ ~ ~ ~
Foreign Embassies
14 15 13 14 14 15 16 17 16 16 29 38
Kwajalein US Base
1,241 1,281 1,227 1,453 1,229 1,208 1,239 1,193 1,097 1,028 978 933
Total 8,602 9,211 9,589 9,961 10,149 9,755 10,137 10,380 10,340 10,218 10,506 10,709
Source: Social Security plus EPPSO 'non-reported' estimate. FY2011 based on six months data.
In 2011, the total number of people employed in the private sector was 4,440 and the wholesale
and retail sector had the largest contribution to employment. This was followed by fisheries,
construction, transport, storage and communications, real estate, renting and business activities
and hotels and restaurants. The employment in the fisheries sector increased mainly as a result of
the opening of the processing facility by Pan Pacific Foods. Very few people are employed in the
manufacturing and agriculture sectors. From the table below, it is clear that the fisheries industry
has the potential to create more jobs.
There is also an opportunity for growth in the tourism sector; however, for the tourism industry
to expand, the Government needs to provide the necessary support. Agriculture contributes very
little in terms of formal employment. The Government should use the Trade Policy to develop
trade and investment in fisheries, tourism and perhaps agriculture to increase the contribution of
these sectors to employment.
Table 7: Employment by industrial sector (numbers) FY2000-FY2011 No. of workers,
part time/full time
2000 2001 2002 2003 2004 2005 2006 2007 2008 2009 2010 2011
Agriculture,
Hunting and
Forestry
7 1 ~ 21 24 24 27 31 28 25 23 20
Fisheries (1) 546 618 735 902 1,002 280 343 313 463 712 1,136 1,261
Mining and ~ ~ ~ ~ ~ ~ ~ ~ ~ ~ ~ ~
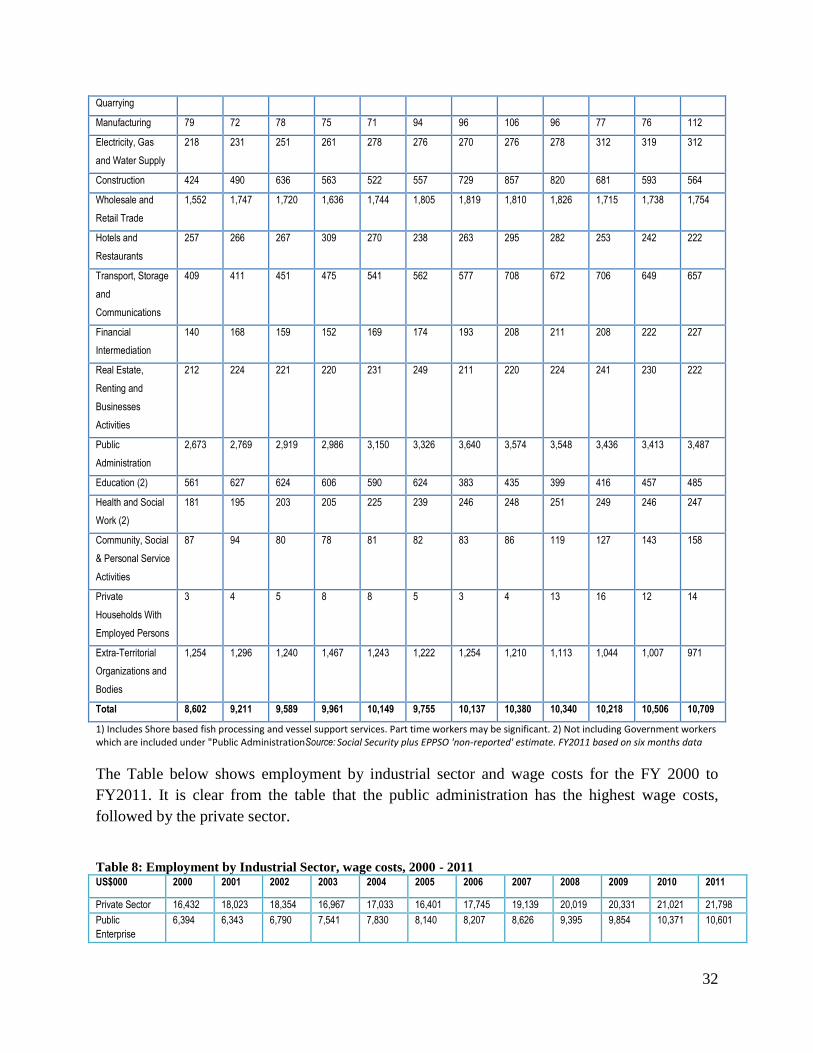
32
Quarrying
Manufacturing 79 72 78 75 71 94 96 106 96 77 76 112
Electricity, Gas
and Water Supply
218 231 251 261 278 276 270 276 278 312 319 312
Construction 424 490 636 563 522 557 729 857 820 681 593 564
Wholesale and
Retail Trade
1,552 1,747 1,720 1,636 1,744 1,805 1,819 1,810 1,826 1,715 1,738 1,754
Hotels and
Restaurants
257 266 267 309 270 238 263 295 282 253 242 222
Transport, Storage
and
Communications
409 411 451 475 541
562 577 708 672 706 649 657
Financial
Intermediation
140 168 159 152 169 174 193 208 211 208 222 227
Real Estate,
Renting and
Businesses
Activities
212 224 221 220 231 249 211 220 224 241 230 222
Public
Administration
2,673 2,769 2,919 2,986 3,150 3,326 3,640 3,574 3,548 3,436 3,413 3,487
Education (2) 561 627 624 606 590 624 383 435 399 416 457 485
Health and Social
Work (2)
181 195 203 205 225 239 246 248 251 249 246 247
Community, Social
& Personal Service
Activities
87 94 80 78 81 82 83 86 119 127 143 158
Private
Households With
Employed Persons
3 4 5 8 8 5 3 4 13 16 12 14
Extra-Territorial
Organizations and
Bodies
1,254 1,296 1,240 1,467 1,243 1,222 1,254 1,210 1,113 1,044 1,007 971
Total 8,602 9,211 9,589 9,961 10,149 9,755 10,137 10,380 10,340 10,218 10,506 10,709
1) Includes Shore based fish processing and vessel support services. Part time workers may be significant. 2) Not including Government workers which are included under "Public AdministrationSource: Social Security plus EPPSO 'non-reported' estimate. FY2011 based on six months data
The Table below shows employment by industrial sector and wage costs for the FY 2000 to
FY2011. It is clear from the table that the public administration has the highest wage costs,
followed by the private sector.
Table 8: Employment by Industrial Sector, wage costs, 2000 - 2011 US$000 2000 2001 2002 2003 2004 2005 2006 2007 2008 2009 2010 2011
Private Sector 16,432 18,023 18,354 16,967 17,033 16,401 17,745 19,139 20,019 20,331 21,021 21,798
Public
Enterprise
6,394 6,343 6,790 7,541 7,830 8,140 8,207 8,626 9,395 9,854 10,371 10,601
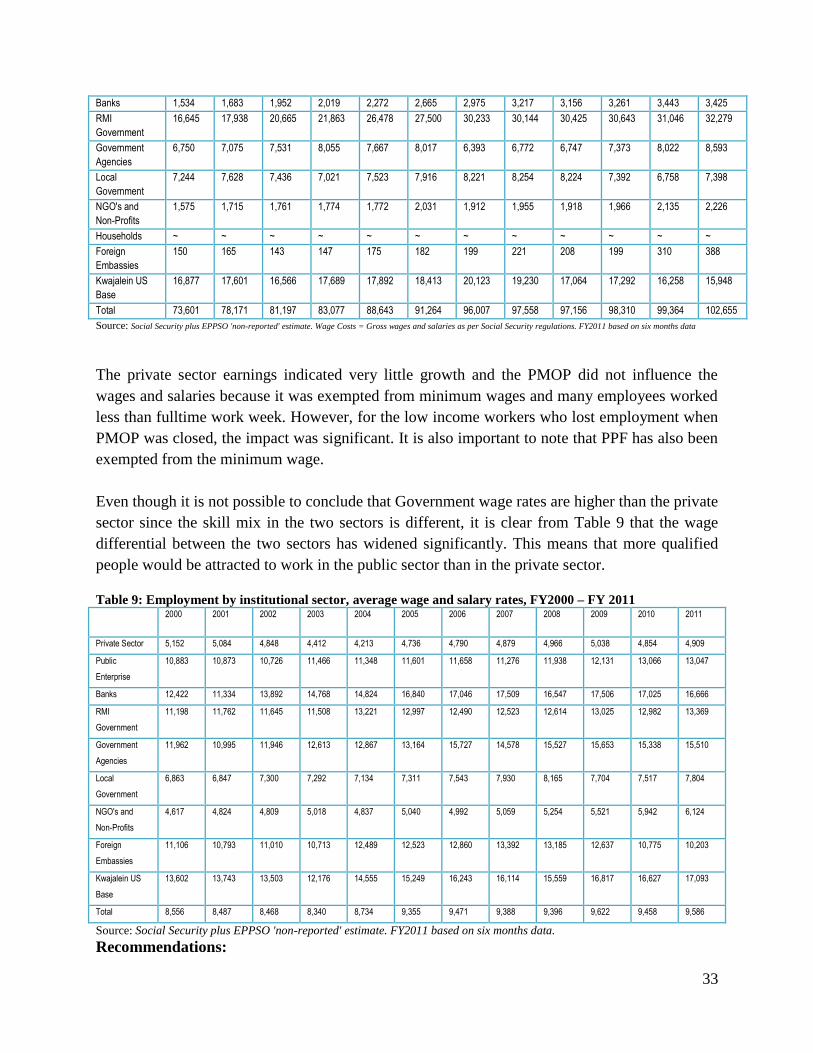
33
Banks 1,534 1,683 1,952 2,019 2,272 2,665 2,975 3,217 3,156 3,261 3,443 3,425
RMI
Government
16,645 17,938 20,665 21,863 26,478 27,500 30,233 30,144 30,425 30,643 31,046 32,279
Government
Agencies
6,750 7,075 7,531 8,055 7,667 8,017 6,393 6,772 6,747 7,373 8,022 8,593
Local
Government
7,244 7,628 7,436 7,021 7,523 7,916 8,221 8,254 8,224 7,392 6,758 7,398
NGO's and
Non-Profits
1,575 1,715 1,761 1,774 1,772 2,031 1,912 1,955 1,918 1,966 2,135 2,226
Households ~ ~ ~ ~ ~ ~ ~ ~ ~ ~ ~ ~
Foreign
Embassies
150 165 143 147 175 182 199 221 208 199 310 388
Kwajalein US
Base
16,877 17,601 16,566 17,689 17,892 18,413 20,123 19,230 17,064 17,292 16,258 15,948
Total 73,601 78,171 81,197 83,077 88,643 91,264 96,007 97,558 97,156 98,310 99,364 102,655
Source: Social Security plus EPPSO 'non-reported' estimate. Wage Costs = Gross wages and salaries as per Social Security regulations. FY2011 based on six months data
The private sector earnings indicated very little growth and the PMOP did not influence the
wages and salaries because it was exempted from minimum wages and many employees worked
less than fulltime work week. However, for the low income workers who lost employment when
PMOP was closed, the impact was significant. It is also important to note that PPF has also been
exempted from the minimum wage.
Even though it is not possible to conclude that Government wage rates are higher than the private
sector since the skill mix in the two sectors is different, it is clear from Table 9 that the wage
differential between the two sectors has widened significantly. This means that more qualified
people would be attracted to work in the public sector than in the private sector.
Table 9: Employment by institutional sector, average wage and salary rates, FY2000 – FY 2011 2000 2001 2002 2003 2004 2005 2006 2007 2008 2009 2010 2011
Private Sector 5,152 5,084 4,848 4,412 4,213 4,736 4,790 4,879 4,966 5,038 4,854 4,909
Public
Enterprise
10,883 10,873 10,726 11,466 11,348 11,601 11,658 11,276 11,938 12,131 13,066 13,047
Banks 12,422 11,334 13,892 14,768 14,824 16,840 17,046 17,509 16,547 17,506 17,025 16,666
RMI
Government
11,198 11,762 11,645 11,508 13,221 12,997 12,490 12,523 12,614 13,025 12,982 13,369
Government
Agencies
11,962 10,995 11,946 12,613 12,867 13,164 15,727 14,578 15,527 15,653 15,338 15,510
Local
Government
6,863 6,847 7,300 7,292 7,134 7,311 7,543 7,930 8,165 7,704 7,517 7,804
NGO's and
Non-Profits
4,617 4,824 4,809 5,018 4,837 5,040 4,992 5,059 5,254 5,521 5,942 6,124
Foreign
Embassies
11,106 10,793 11,010 10,713 12,489 12,523 12,860 13,392 13,185 12,637 10,775 10,203
Kwajalein US
Base
13,602 13,743 13,503 12,176 14,555 15,249 16,243 16,114 15,559 16,817 16,627 17,093
Total 8,556 8,487 8,468 8,340 8,734 9,355 9,471 9,388 9,396 9,622 9,458 9,586
Source: Social Security plus EPPSO 'non-reported' estimate. FY2011 based on six months data.
Recommendations:

34
i. The Government must create a good trade and investment environment to enhance
private sector development, trade and employment particularly in the productive sectors
of fisheries, agriculture, tourism, handicraft, manufacturing and services.
ii. RMI must adopt best practices on labor as recommended by the International Labor
Organization, to ensure that the rights of workers including decent work program, basic
conditions of employment and the freedom to organize are fully implemented.
iii. Education and training from elementary to tertiary levels should include entrepreneurship
skills and, the vocational training and other training by the College of Marshall Islands,
the National Training Council (NTC) should focus on skills that are in short supply in
RMI and abroad.
2.5 Balance of Payments
In simple terms, the balance of payment measures the amount of money coming into the country
from abroad less all the money going out of the country during the same period. It is normally
broken into the current account and the capital account. The current account includes:
visible trade (merchandise trade)
invisible trade which is receipts and payments for services and other intangible goods
such as intellectual property, cross border dividends and interest payments
private transfers (e.g. remittances)
official transfers (e.g. international aid).
The capital account includes long-term capital flows, such as funds invested in foreign firms, and
the profits made by selling those investments and bringing the money home. It also covers short-
term capital flows. This section gives a brief overview of RMI‘s balance of payment statistics.
(a) The current account
According to the data provided by EPPSO, the RMI‘s current account balance improved from $-
22.8 million in 2000 to $-3.9 million in 2008 and fell sharply to $-26.4 in 2009 and $-40.7 in
2010. The total exports in 2000 were $15.5 million and increased to $32.3 million in 2010.
Imports increased from $77.9 million in 2000 to $94.1 (f.o.b) million in 2009, then rose sharply
to 125.5 in 2010. Exports from RMI consist mainly of fuel re-exports, coconut products, fish,
and a few other small items. The RMI has a large trade account deficit which is matched by
substantial inflows on the primary and secondary income accounts. The imports of goods and
services are financed mainly by earnings of Marshallese workers at the Kwajalein U.S. base, rent
of the base and Compact current transfers. RMI is not generating its own foreign exchange to
pay for its imports.
35
The service account on the receipt side includes transhipment fees of fishing fleets restocking in
the RMI, port facilities, telecommunications, travel expenses of visitors to the RMI, and local
expenses of Continental airlines. The payment side includes freight and insurance for imported
items (estimated), payments for passenger services, in particular air travel expenses overseas for
Government officials and private individuals. The other items include small payments for
pension services, business and financial services etc.
The primary income account consists mainly of compensation of Marshallese employees on the
Kwajalein military base, the receipts for rent received by the Kwajalein landowners and ship
registration fees which have been increasing over the years. However, since most Kwajalein
landowners live in the U.S., only the transactions related to residents are included in the flows.
The other category includes fishing licence fees, as well as the interest earnings of the various
Trust Funds (including Compact Trust Fund), the MISSA social security funds and commercial
bank off-shore investments. On the payments side, primary income flows are mostly represented
by interest payments on external debt, payment for non-resident Kwajalein land owners and
compensation of employees.
The secondary income account includes budget grants, Compact current grants and other
transfers received from the ROC and U.S. federal programs. Other receipts include inward
remittance flows to households, but there is no reliable data. The College of the Marshall Islands
also receives relatively large transfers from Pell grants and other U.S. Federal grants. Remittance
outflows mainly consists of household transfers and are estimated to be larger than remittances
that are sent home by Marshallese living in the U.S. Outward transfers consists of payments
from Marshallese families to relatives in the US as well as Chinese and other Asian communities
living in the Marshall Islands.
(b) The Capital Account
The capital account includes Compact capital grants, and before FY2004 these were represented
by the original Compact I CIP funds and mainly Compact infrastructure sector grant. Now RMI
has improved its capacity to use Compact capital grants. The receipt of funds for the Compact
Trust Fund is also included in the capital account and matched by a contrary entry in the
financing account. The capital account is always positive, reflecting receipt of capital transfers
from the U.S. and ROC.
(c) The financial account
The financing account shows that direct investment flows have generally been small, but
increased to $7.0 million in FY2007 because of the re-construction of the fish loining plant by
Pan Pacific. However, it decreased to $5.7 million in FY2008. Portfolio investment represents
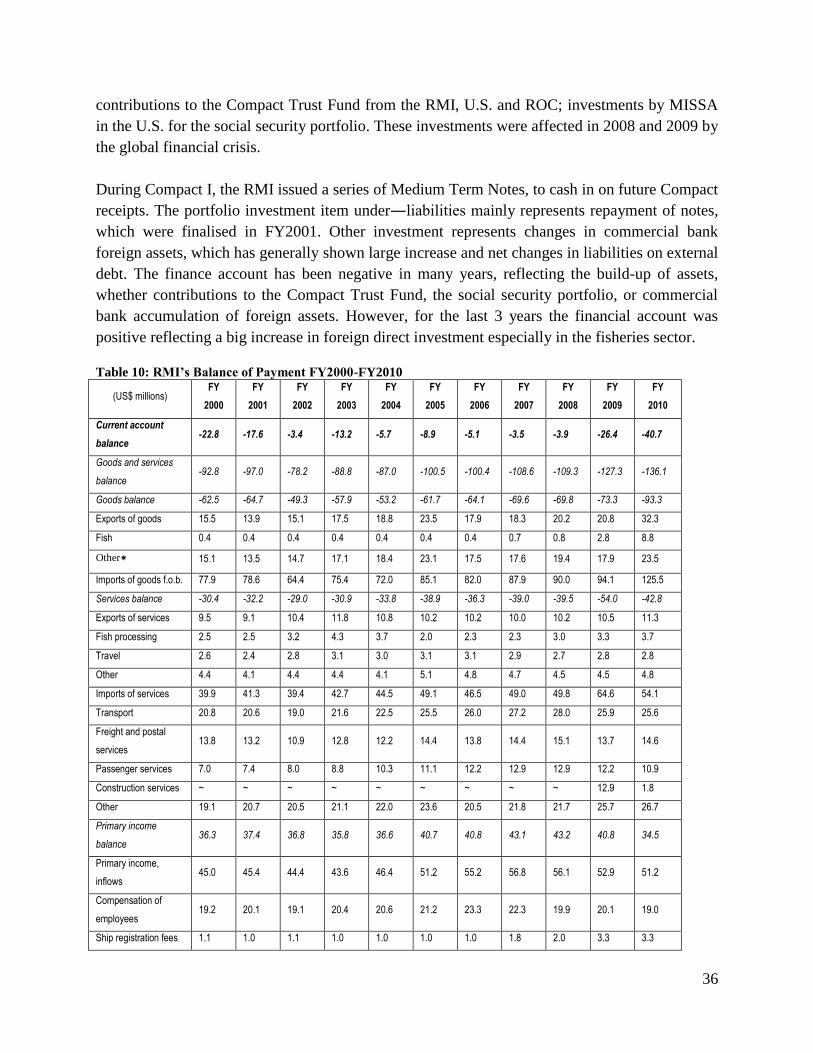
36
contributions to the Compact Trust Fund from the RMI, U.S. and ROC; investments by MISSA
in the U.S. for the social security portfolio. These investments were affected in 2008 and 2009 by
the global financial crisis.
During Compact I, the RMI issued a series of Medium Term Notes, to cash in on future Compact
receipts. The portfolio investment item under―liabilities mainly represents repayment of notes,
which were finalised in FY2001. Other investment represents changes in commercial bank
foreign assets, which has generally shown large increase and net changes in liabilities on external
debt. The finance account has been negative in many years, reflecting the build-up of assets,
whether contributions to the Compact Trust Fund, the social security portfolio, or commercial
bank accumulation of foreign assets. However, for the last 3 years the financial account was
positive reflecting a big increase in foreign direct investment especially in the fisheries sector.
Table 10: RMI’s Balance of Payment FY2000-FY2010
(US$ millions) FY
2000
FY
2001
FY
2002
FY
2003
FY
2004
FY
2005
FY
2006
FY
2007
FY
2008
FY
2009
FY
2010
Current account
balance -22.8 -17.6 -3.4 -13.2 -5.7 -8.9 -5.1 -3.5 -3.9 -26.4 -40.7
Goods and services
balance -92.8 -97.0 -78.2 -88.8 -87.0 -100.5 -100.4 -108.6 -109.3 -127.3 -136.1
Goods balance -62.5 -64.7 -49.3 -57.9 -53.2 -61.7 -64.1 -69.6 -69.8 -73.3 -93.3
Exports of goods 15.5 13.9 15.1 17.5 18.8 23.5 17.9 18.3 20.2 20.8 32.3
Fish 0.4 0.4 0.4 0.4 0.4 0.4 0.4 0.7 0.8 2.8 8.8
Other* 15.1 13.5 14.7 17.1 18.4 23.1 17.5 17.6 19.4 17.9 23.5
Imports of goods f.o.b. 77.9 78.6 64.4 75.4 72.0 85.1 82.0 87.9 90.0 94.1 125.5
Services balance -30.4 -32.2 -29.0 -30.9 -33.8 -38.9 -36.3 -39.0 -39.5 -54.0 -42.8
Exports of services 9.5 9.1 10.4 11.8 10.8 10.2 10.2 10.0 10.2 10.5 11.3
Fish processing 2.5 2.5 3.2 4.3 3.7 2.0 2.3 2.3 3.0 3.3 3.7
Travel 2.6 2.4 2.8 3.1 3.0 3.1 3.1 2.9 2.7 2.8 2.8
Other 4.4 4.1 4.4 4.4 4.1 5.1 4.8 4.7 4.5 4.5 4.8
Imports of services 39.9 41.3 39.4 42.7 44.5 49.1 46.5 49.0 49.8 64.6 54.1
Transport 20.8 20.6 19.0 21.6 22.5 25.5 26.0 27.2 28.0 25.9 25.6
Freight and postal
services 13.8 13.2 10.9 12.8 12.2 14.4 13.8 14.4 15.1 13.7 14.6
Passenger services 7.0 7.4 8.0 8.8 10.3 11.1 12.2 12.9 12.9 12.2 10.9
Construction services ~ ~ ~ ~ ~ ~ ~ ~ ~ 12.9 1.8
Other 19.1 20.7 20.5 21.1 22.0 23.6 20.5 21.8 21.7 25.7 26.7
Primary income
balance 36.3 37.4 36.8 35.8 36.6 40.7 40.8 43.1 43.2 40.8 34.5
Primary income,
inflows 45.0 45.4 44.4 43.6 46.4 51.2 55.2 56.8 56.1 52.9 51.2
Compensation of
employees 19.2 20.1 19.1 20.4 20.6 21.2 23.3 22.3 19.9 20.1 19.0
Ship registration fees 1.1 1.0 1.1 1.0 1.0 1.0 1.0 1.8 2.0 3.3 3.3
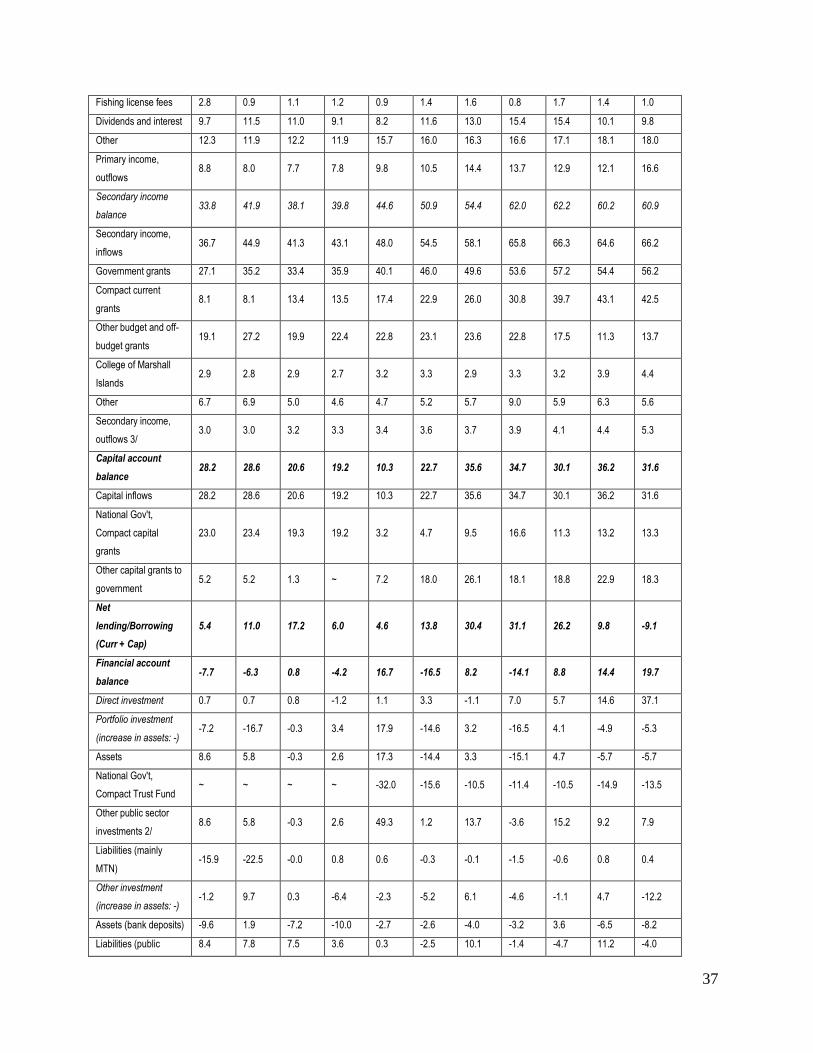
37
Fishing license fees 2.8 0.9 1.1 1.2 0.9 1.4 1.6 0.8 1.7 1.4 1.0
Dividends and interest 9.7 11.5 11.0 9.1 8.2 11.6 13.0 15.4 15.4 10.1 9.8
Other 12.3 11.9 12.2 11.9 15.7 16.0 16.3 16.6 17.1 18.1 18.0
Primary income,
outflows 8.8 8.0 7.7 7.8 9.8 10.5 14.4 13.7 12.9 12.1 16.6
Secondary income
balance 33.8 41.9 38.1 39.8 44.6 50.9 54.4 62.0 62.2 60.2 60.9
Secondary income,
inflows 36.7 44.9 41.3 43.1 48.0 54.5 58.1 65.8 66.3 64.6 66.2
Government grants 27.1 35.2 33.4 35.9 40.1 46.0 49.6 53.6 57.2 54.4 56.2
Compact current
grants 8.1 8.1 13.4 13.5 17.4 22.9 26.0 30.8 39.7 43.1 42.5
Other budget and off-
budget grants 19.1 27.2 19.9 22.4 22.8 23.1 23.6 22.8 17.5 11.3 13.7
College of Marshall
Islands 2.9 2.8 2.9 2.7 3.2 3.3 2.9 3.3 3.2 3.9 4.4
Other 6.7 6.9 5.0 4.6 4.7 5.2 5.7 9.0 5.9 6.3 5.6
Secondary income,
outflows 3/ 3.0 3.0 3.2 3.3 3.4 3.6 3.7 3.9 4.1 4.4 5.3
Capital account
balance 28.2 28.6 20.6 19.2 10.3 22.7 35.6 34.7 30.1 36.2 31.6
Capital inflows 28.2 28.6 20.6 19.2 10.3 22.7 35.6 34.7 30.1 36.2 31.6
National Gov't,
Compact capital
grants
23.0 23.4 19.3 19.2 3.2 4.7 9.5 16.6 11.3 13.2 13.3
Other capital grants to
government 5.2 5.2 1.3 ~ 7.2 18.0 26.1 18.1 18.8 22.9 18.3
Net
lending/Borrowing
(Curr + Cap)
5.4 11.0 17.2 6.0 4.6 13.8 30.4 31.1 26.2 9.8 -9.1
Financial account
balance -7.7 -6.3 0.8 -4.2 16.7 -16.5 8.2 -14.1 8.8 14.4 19.7
Direct investment 0.7 0.7 0.8 -1.2 1.1 3.3 -1.1 7.0 5.7 14.6 37.1
Portfolio investment
(increase in assets: -) -7.2 -16.7 -0.3 3.4 17.9 -14.6 3.2 -16.5 4.1 -4.9 -5.3
Assets 8.6 5.8 -0.3 2.6 17.3 -14.4 3.3 -15.1 4.7 -5.7 -5.7
National Gov't,
Compact Trust Fund ~ ~ ~ ~ -32.0 -15.6 -10.5 -11.4 -10.5 -14.9 -13.5
Other public sector
investments 2/ 8.6 5.8 -0.3 2.6 49.3 1.2 13.7 -3.6 15.2 9.2 7.9
Liabilities (mainly
MTN) -15.9 -22.5 -0.0 0.8 0.6 -0.3 -0.1 -1.5 -0.6 0.8 0.4
Other investment
(increase in assets: -) -1.2 9.7 0.3 -6.4 -2.3 -5.2 6.1 -4.6 -1.1 4.7 -12.2
Assets (bank deposits) -9.6 1.9 -7.2 -10.0 -2.7 -2.6 -4.0 -3.2 3.6 -6.5 -8.2
Liabilities (public 8.4 7.8 7.5 3.6 0.3 -2.5 10.1 -1.4 -4.7 11.2 -4.0
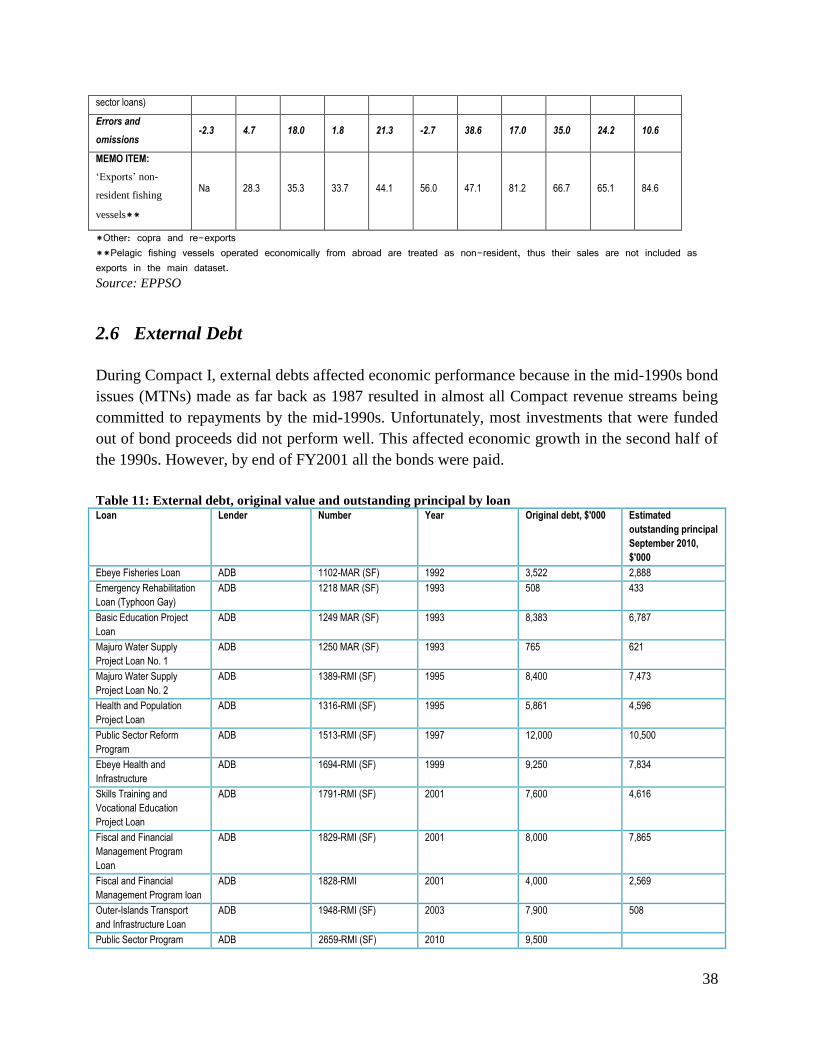
38
sector loans)
Errors and
omissions -2.3 4.7 18.0 1.8 21.3 -2.7 38.6 17.0 35.0 24.2 10.6
MEMO ITEM:
‗Exports‘ non-
resident fishing
vessels**
Na 28.3 35.3 33.7 44.1 56.0 47.1 81.2 66.7 65.1 84.6
*Other: copra and re-exports **Pelagic fishing vessels operated economically from abroad are treated as non-resident, thus their sales are not included as exports in the main dataset. Source: EPPSO
2.6 External Debt
During Compact I, external debts affected economic performance because in the mid-1990s bond
issues (MTNs) made as far back as 1987 resulted in almost all Compact revenue streams being
committed to repayments by the mid-1990s. Unfortunately, most investments that were funded
out of bond proceeds did not perform well. This affected economic growth in the second half of
the 1990s. However, by end of FY2001 all the bonds were paid.
Table 11: External debt, original value and outstanding principal by loan Loan Lender Number Year Original debt, $'000 Estimated
outstanding principal
September 2010,
$'000
Ebeye Fisheries Loan ADB 1102-MAR (SF) 1992 3,522 2,888
Emergency Rehabilitation
Loan (Typhoon Gay)
ADB 1218 MAR (SF) 1993 508 433
Basic Education Project
Loan
ADB 1249 MAR (SF) 1993 8,383 6,787
Majuro Water Supply
Project Loan No. 1
ADB 1250 MAR (SF) 1993 765 621
Majuro Water Supply
Project Loan No. 2
ADB 1389-RMI (SF) 1995 8,400 7,473
Health and Population
Project Loan
ADB 1316-RMI (SF) 1995 5,861 4,596
Public Sector Reform
Program
ADB 1513-RMI (SF) 1997 12,000 10,500
Ebeye Health and
Infrastructure
ADB 1694-RMI (SF) 1999 9,250 7,834
Skills Training and
Vocational Education
Project Loan
ADB 1791-RMI (SF) 2001 7,600 4,616
Fiscal and Financial
Management Program
Loan
ADB 1829-RMI (SF) 2001 8,000 7,865
Fiscal and Financial
Management Program loan
ADB 1828-RMI 2001 4,000 2,569
Outer-Islands Transport
and Infrastructure Loan
ADB 1948-RMI (SF) 2003 7,900 508
Public Sector Program ADB 2659-RMI (SF) 2010 9,500
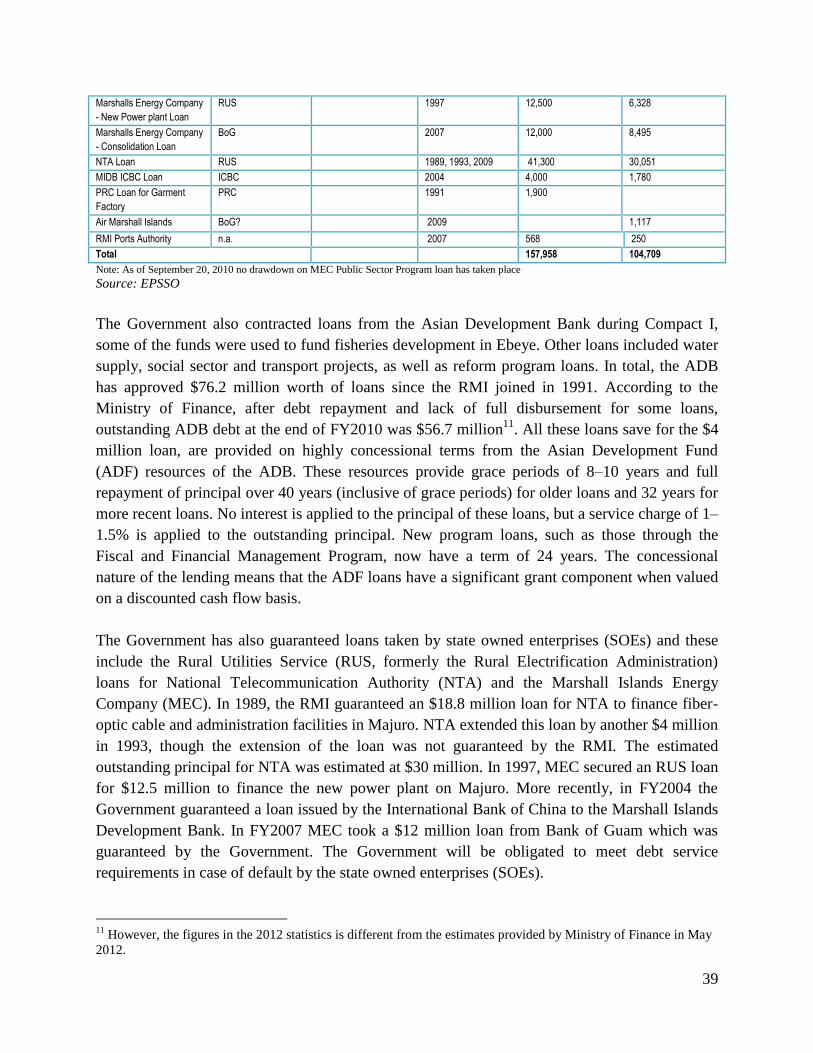
39
Marshalls Energy Company
- New Power plant Loan
RUS 1997 12,500 6,328
Marshalls Energy Company
- Consolidation Loan
BoG 2007 12,000 8,495
NTA Loan RUS 1989, 1993, 2009 41,300 30,051
MIDB ICBC Loan ICBC 2004 4,000 1,780
PRC Loan for Garment
Factory
PRC 1991 1,900
Air Marshall Islands BoG? 2009 1,117
RMI Ports Authority n.a. 2007 568 250
Total 157,958 104,709
Note: As of September 20, 2010 no drawdown on MEC Public Sector Program loan has taken place
Source: EPSSO
The Government also contracted loans from the Asian Development Bank during Compact I,
some of the funds were used to fund fisheries development in Ebeye. Other loans included water
supply, social sector and transport projects, as well as reform program loans. In total, the ADB
has approved $76.2 million worth of loans since the RMI joined in 1991. According to the
Ministry of Finance, after debt repayment and lack of full disbursement for some loans,
outstanding ADB debt at the end of FY2010 was $56.7 million11
. All these loans save for the $4
million loan, are provided on highly concessional terms from the Asian Development Fund
(ADF) resources of the ADB. These resources provide grace periods of 8–10 years and full
repayment of principal over 40 years (inclusive of grace periods) for older loans and 32 years for
more recent loans. No interest is applied to the principal of these loans, but a service charge of 1–
1.5% is applied to the outstanding principal. New program loans, such as those through the
Fiscal and Financial Management Program, now have a term of 24 years. The concessional
nature of the lending means that the ADF loans have a significant grant component when valued
on a discounted cash flow basis.
The Government has also guaranteed loans taken by state owned enterprises (SOEs) and these
include the Rural Utilities Service (RUS, formerly the Rural Electrification Administration)
loans for National Telecommunication Authority (NTA) and the Marshall Islands Energy
Company (MEC). In 1989, the RMI guaranteed an $18.8 million loan for NTA to finance fiber-
optic cable and administration facilities in Majuro. NTA extended this loan by another $4 million
in 1993, though the extension of the loan was not guaranteed by the RMI. The estimated
outstanding principal for NTA was estimated at $30 million. In 1997, MEC secured an RUS loan
for $12.5 million to finance the new power plant on Majuro. More recently, in FY2004 the
Government guaranteed a loan issued by the International Bank of China to the Marshall Islands
Development Bank. In FY2007 MEC took a $12 million loan from Bank of Guam which was
guaranteed by the Government. The Government will be obligated to meet debt service
requirements in case of default by the state owned enterprises (SOEs).
11
However, the figures in the 2012 statistics is different from the estimates provided by Ministry of Finance in May
2012.

40
RMI‘s debt in 1995 was $138 million, which represented about 115% of GDP. It finished paying
the bond debt in FY2002 and the debt had declined to $87 million. In FY2008, outstanding
external debt was $99.1 millionbut rose $104.7 million in 2010, representing 64.3% of GDP12
.
Table 12 shows RMI‘s external debt and debt servicing trends. Even though the debt servicing
has fallen significantly, the increasing trend since FY2002 represents the expiration of grace
periods and could pose problems for RMI.
Table 12: External debt and debt servicing (US$ millions) FY2000 FY2001 FY2002 FY2003 FY2004 FY2005 FY2006 FY2007 FY2008 FY2009 FY2010
External Debt Total
New 10.1 10.4 9.2 5.0 6.1 1.0 9.8 12.0 - 17.0 3.1
Outstanding 100.5 94.5 78.9 86.2 94.1 92.8 101.9 111.7 99.1 95.6 106.8
Debt Service 22.0 27.8 3.5 3.2 3.7 4.5 6.4 16.8 7.5 7.8 9.2
Principal 18.3 25.0 1.6 1.2 1.4 2.0 3.1 13.2 4.2 4.7 5.6
Interest 3.7 2.8 2.0 2.1 2.3 2.5 3.3 3.6 3.3 3.0 3.6
Principal balance 93.3 78.9 87.1 90.0 94.7 92.1 99.7 99.1 94.6 106.8 104.7
External debt
(adjusted) as % of
GDP
84.1% 68.6% 69.8% 70.9% 72.2% 66.9% 69.6% 66.2% 62.0% 70.4% 64.3%
Debt service as %
of general fund
revenues*
80.0% 96.2% 10.1% 8.8% 11.7% 14.1% 19.9% 48.7% 21.7% 23.1% 26.3%
Memorandum of items
Debt to ADB (all
concessional)
37.5 46.8 56.0 60.9 62.6 63.1 63.0 61.7 60.6 58.8 56.7
ADB Debt
Servicing
0.3 0.4 0.5 0.6 1.1 1.4 1.1 2.2 1.9 2.6 2.9
Interest 0.3 0.4 0.4 0.5 0.9 0.9 0.8 0.8 0.8 0.8 0.8
Principal - 0.0 0.0 0.1 0.2 0.5 0.3 1.3 1.1 1.8 2.1
General Fund
Revenues
27.5 28.9 35.0 36.8 31.5 31.9 32.2 34.5 34.7 33.7 34.9
ADB Share of
General Fund
1.0% 1.4% 1.4% 1.7% 3.5% 4.4% 3.5% 6.3% 5.6% 7.7% 8.4%
GDP 110.9 115.2 124.7 126.9 131.1 137.6 143.4 149.7 152.6 151.6 162.9
Export of Goods
and Services
25.0 23.0 25.5 29.3 29.6 33.7 28.1 28.3 30.4 31.3 43.5
*General Fund revenue = uncommitted Governmentrevenue available for debt service Source: Department of Finance and Administration and EPPSO estimates
12
This lower proportion of external debt to GDP is explained by the steady rise of GDP over the period. According
to EPPSO projections, RMI shall pay off the totality of its debts by 2038.
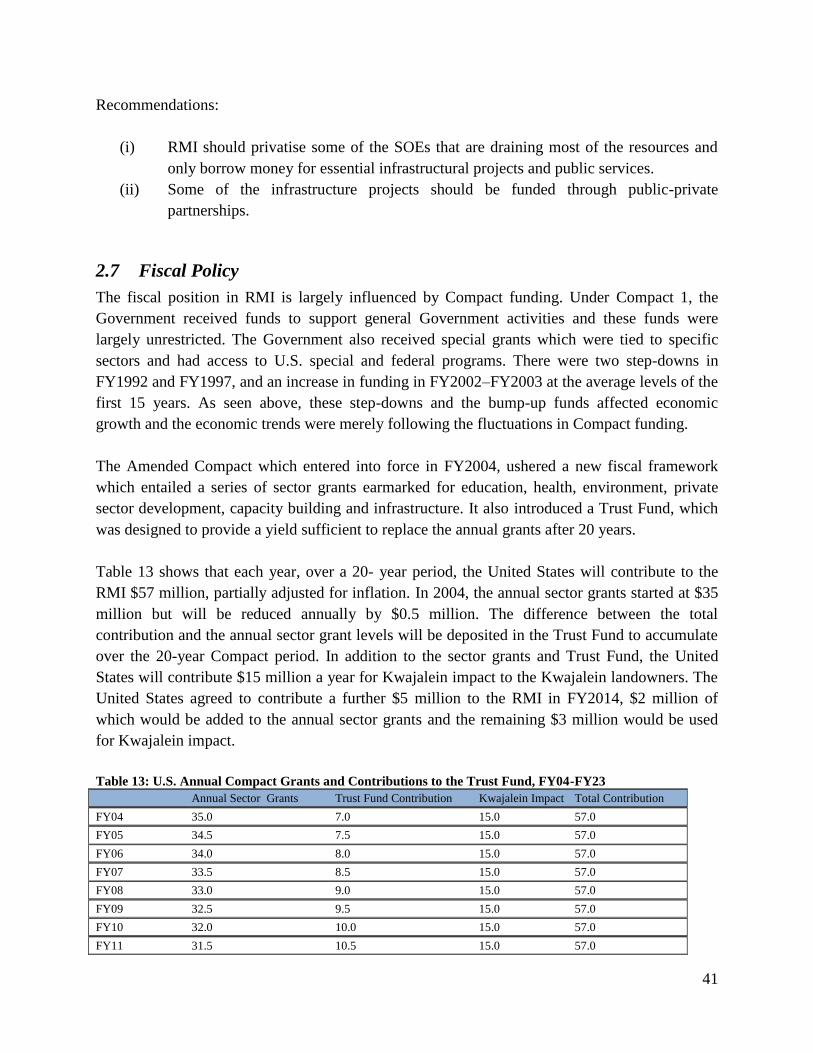
41
Recommendations:
(i) RMI should privatise some of the SOEs that are draining most of the resources and
only borrow money for essential infrastructural projects and public services.
(ii) Some of the infrastructure projects should be funded through public-private
partnerships.
2.7 Fiscal Policy
The fiscal position in RMI is largely influenced by Compact funding. Under Compact 1, the
Government received funds to support general Government activities and these funds were
largely unrestricted. The Government also received special grants which were tied to specific
sectors and had access to U.S. special and federal programs. There were two step-downs in
FY1992 and FY1997, and an increase in funding in FY2002–FY2003 at the average levels of the
first 15 years. As seen above, these step-downs and the bump-up funds affected economic
growth and the economic trends were merely following the fluctuations in Compact funding.
The Amended Compact which entered into force in FY2004, ushered a new fiscal framework
which entailed a series of sector grants earmarked for education, health, environment, private
sector development, capacity building and infrastructure. It also introduced a Trust Fund, which
was designed to provide a yield sufficient to replace the annual grants after 20 years.
Table 13 shows that each year, over a 20- year period, the United States will contribute to the
RMI $57 million, partially adjusted for inflation. In 2004, the annual sector grants started at $35
million but will be reduced annually by $0.5 million. The difference between the total
contribution and the annual sector grant levels will be deposited in the Trust Fund to accumulate
over the 20-year Compact period. In addition to the sector grants and Trust Fund, the United
States will contribute $15 million a year for Kwajalein impact to the Kwajalein landowners. The
United States agreed to contribute a further $5 million to the RMI in FY2014, $2 million of
which would be added to the annual sector grants and the remaining $3 million would be used
for Kwajalein impact.
Table 13: U.S. Annual Compact Grants and Contributions to the Trust Fund, FY04-FY23
Annual Sector Grants Trust Fund Contribution Kwajalein Impact Total Contribution
FY04 35.0 7.0 15.0 57.0
FY05 34.5 7.5 15.0 57.0
FY06 34.0 8.0 15.0 57.0
FY07 33.5 8.5 15.0 57.0
FY08 33.0 9.0 15.0 57.0
FY09 32.5 9.5 15.0 57.0
FY10 32.0 10.0 15.0 57.0
FY11 31.5 10.5 15.0 57.0
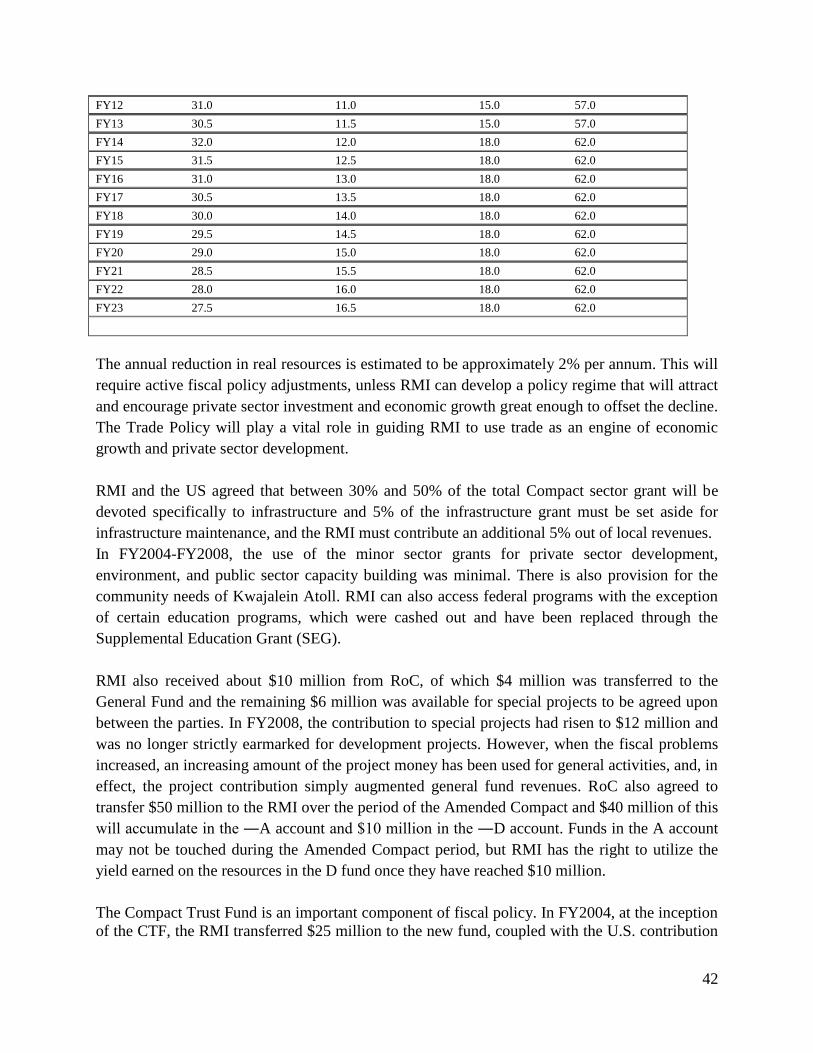
42
FY12 31.0 11.0 15.0 57.0
FY13 30.5 11.5 15.0 57.0
FY14 32.0 12.0 18.0 62.0
FY15 31.5 12.5 18.0 62.0
FY16 31.0 13.0 18.0 62.0
FY17 30.5 13.5 18.0 62.0
FY18 30.0 14.0 18.0 62.0
FY19 29.5 14.5 18.0 62.0
FY20 29.0 15.0 18.0 62.0
FY21 28.5 15.5 18.0 62.0
FY22 28.0 16.0 18.0 62.0
FY23 27.5 16.5 18.0 62.0
The annual reduction in real resources is estimated to be approximately 2% per annum. This will
require active fiscal policy adjustments, unless RMI can develop a policy regime that will attract
and encourage private sector investment and economic growth great enough to offset the decline.
The Trade Policy will play a vital role in guiding RMI to use trade as an engine of economic
growth and private sector development.
RMI and the US agreed that between 30% and 50% of the total Compact sector grant will be
devoted specifically to infrastructure and 5% of the infrastructure grant must be set aside for
infrastructure maintenance, and the RMI must contribute an additional 5% out of local revenues.
In FY2004-FY2008, the use of the minor sector grants for private sector development,
environment, and public sector capacity building was minimal. There is also provision for the
community needs of Kwajalein Atoll. RMI can also access federal programs with the exception
of certain education programs, which were cashed out and have been replaced through the
Supplemental Education Grant (SEG).
RMI also received about $10 million from RoC, of which $4 million was transferred to the
General Fund and the remaining $6 million was available for special projects to be agreed upon
between the parties. In FY2008, the contribution to special projects had risen to $12 million and
was no longer strictly earmarked for development projects. However, when the fiscal problems
increased, an increasing amount of the project money has been used for general activities, and, in
effect, the project contribution simply augmented general fund revenues. RoC also agreed to
transfer $50 million to the RMI over the period of the Amended Compact and $40 million of this
will accumulate in the ―A account and $10 million in the ―D account. Funds in the A account
may not be touched during the Amended Compact period, but RMI has the right to utilize the
yield earned on the resources in the D fund once they have reached $10 million.
The Compact Trust Fund is an important component of fiscal policy. In FY2004, at the inception
of the CTF, the RMI transferred $25 million to the new fund, coupled with the U.S. contribution
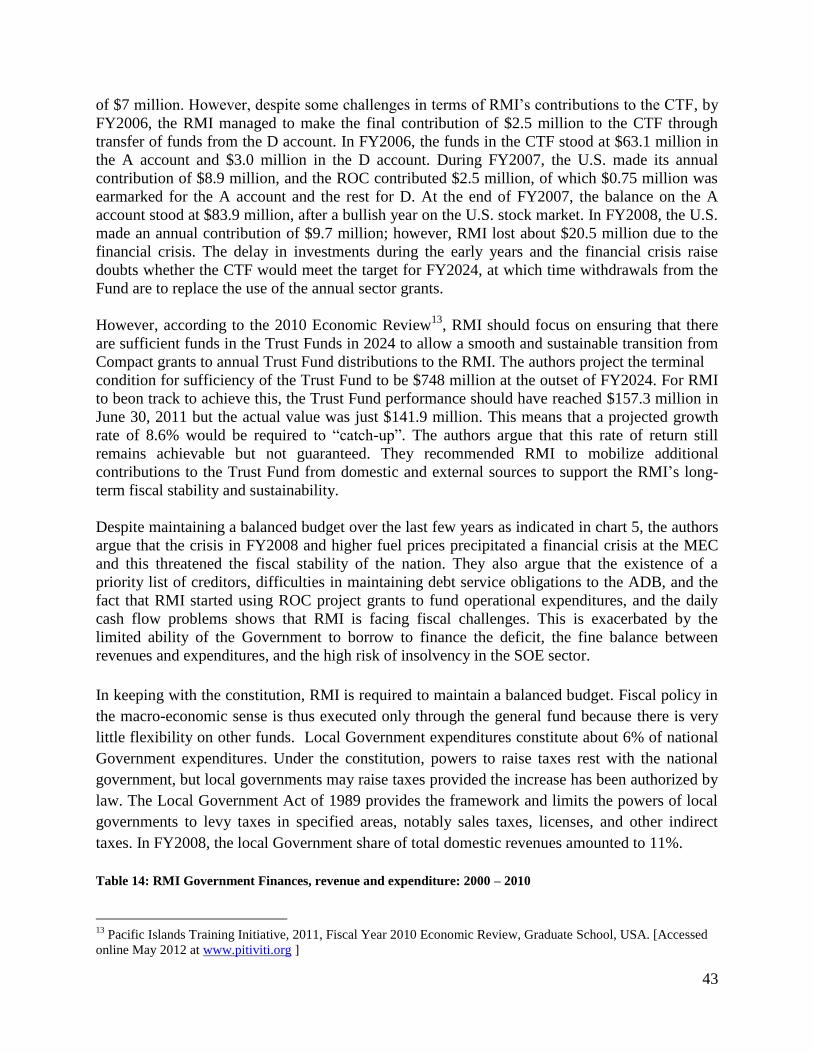
43
of $7 million. However, despite some challenges in terms of RMI‘s contributions to the CTF, by
FY2006, the RMI managed to make the final contribution of $2.5 million to the CTF through
transfer of funds from the D account. In FY2006, the funds in the CTF stood at $63.1 million in
the A account and $3.0 million in the D account. During FY2007, the U.S. made its annual
contribution of $8.9 million, and the ROC contributed $2.5 million, of which $0.75 million was
earmarked for the A account and the rest for D. At the end of FY2007, the balance on the A
account stood at $83.9 million, after a bullish year on the U.S. stock market. In FY2008, the U.S.
made an annual contribution of $9.7 million; however, RMI lost about $20.5 million due to the
financial crisis. The delay in investments during the early years and the financial crisis raise
doubts whether the CTF would meet the target for FY2024, at which time withdrawals from the
Fund are to replace the use of the annual sector grants.
However, according to the 2010 Economic Review13
, RMI should focus on ensuring that there
are sufficient funds in the Trust Funds in 2024 to allow a smooth and sustainable transition from
Compact grants to annual Trust Fund distributions to the RMI. The authors project the terminal
condition for sufficiency of the Trust Fund to be $748 million at the outset of FY2024. For RMI
to beon track to achieve this, the Trust Fund performance should have reached $157.3 million in
June 30, 2011 but the actual value was just $141.9 million. This means that a projected growth
rate of 8.6% would be required to ―catch-up‖. The authors argue that this rate of return still
remains achievable but not guaranteed. They recommended RMI to mobilize additional
contributions to the Trust Fund from domestic and external sources to support the RMI‘s long-
term fiscal stability and sustainability.
Despite maintaining a balanced budget over the last few years as indicated in chart 5, the authors
argue that the crisis in FY2008 and higher fuel prices precipitated a financial crisis at the MEC
and this threatened the fiscal stability of the nation. They also argue that the existence of a
priority list of creditors, difficulties in maintaining debt service obligations to the ADB, and the
fact that RMI started using ROC project grants to fund operational expenditures, and the daily
cash flow problems shows that RMI is facing fiscal challenges. This is exacerbated by the
limited ability of the Government to borrow to finance the deficit, the fine balance between
revenues and expenditures, and the high risk of insolvency in the SOE sector.
In keeping with the constitution, RMI is required to maintain a balanced budget. Fiscal policy in
the macro-economic sense is thus executed only through the general fund because there is very
little flexibility on other funds. Local Government expenditures constitute about 6% of national
Government expenditures. Under the constitution, powers to raise taxes rest with the national
government, but local governments may raise taxes provided the increase has been authorized by
law. The Local Government Act of 1989 provides the framework and limits the powers of local
governments to levy taxes in specified areas, notably sales taxes, licenses, and other indirect
taxes. In FY2008, the local Government share of total domestic revenues amounted to 11%.
Table 14: RMI Government Finances, revenue and expenditure: 2000 – 2010
13
Pacific Islands Training Initiative, 2011, Fiscal Year 2010 Economic Review, Graduate School, USA. [Accessed
online May 2012 at www.pitiviti.org ]
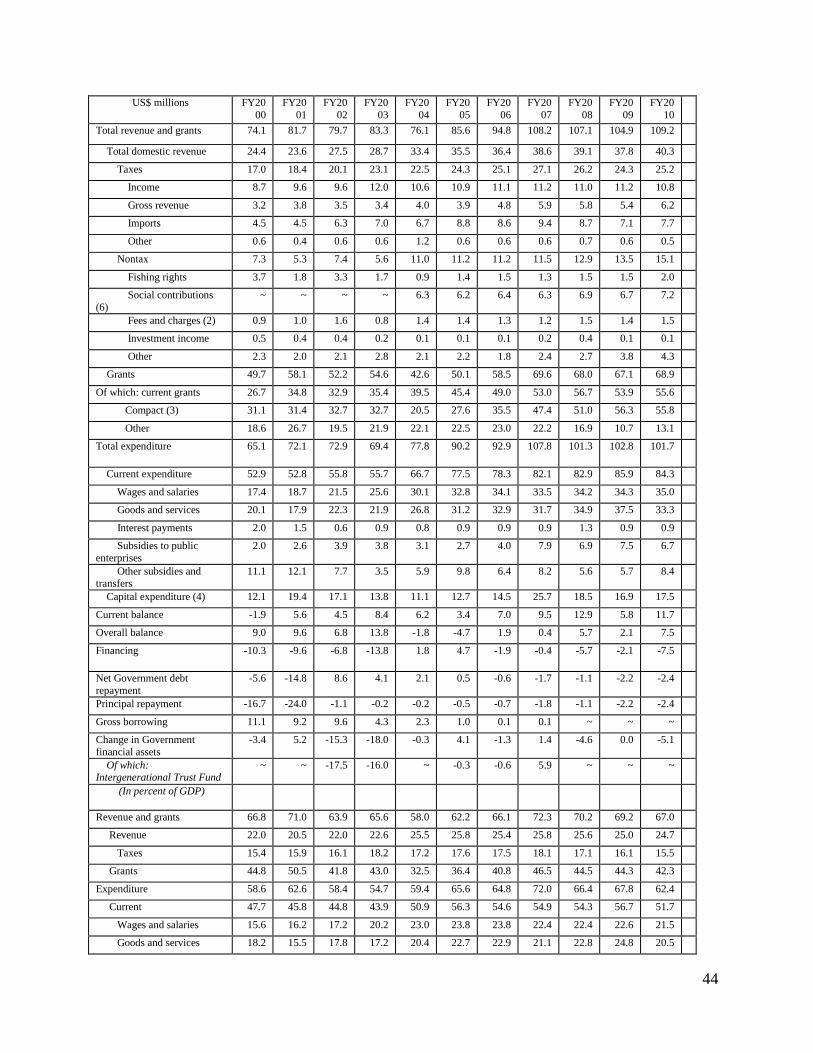
44
US$ millions FY20
00
FY20
01
FY20
02
FY20
03
FY20
04
FY20
05
FY20
06
FY20
07
FY20
08
FY20
09
FY20
10
Total revenue and grants 74.1 81.7 79.7 83.3 76.1 85.6 94.8 108.2 107.1 104.9 109.2
Total domestic revenue 24.4 23.6 27.5 28.7 33.4 35.5 36.4 38.6 39.1 37.8 40.3
Taxes 17.0 18.4 20.1 23.1 22.5 24.3 25.1 27.1 26.2 24.3 25.2
Income 8.7 9.6 9.6 12.0 10.6 10.9 11.1 11.2 11.0 11.2 10.8
Gross revenue 3.2 3.8 3.5 3.4 4.0 3.9 4.8 5.9 5.8 5.4 6.2
Imports 4.5 4.5 6.3 7.0 6.7 8.8 8.6 9.4 8.7 7.1 7.7
Other 0.6 0.4 0.6 0.6 1.2 0.6 0.6 0.6 0.7 0.6 0.5
Nontax 7.3 5.3 7.4 5.6 11.0 11.2 11.2 11.5 12.9 13.5 15.1
Fishing rights 3.7 1.8 3.3 1.7 0.9 1.4 1.5 1.3 1.5 1.5 2.0
Social contributions
(6)
~ ~ ~ ~ 6.3 6.2 6.4 6.3 6.9 6.7 7.2
Fees and charges (2) 0.9 1.0 1.6 0.8 1.4 1.4 1.3 1.2 1.5 1.4 1.5
Investment income 0.5 0.4 0.4 0.2 0.1 0.1 0.1 0.2 0.4 0.1 0.1
Other 2.3 2.0 2.1 2.8 2.1 2.2 1.8 2.4 2.7 3.8 4.3
Grants 49.7 58.1 52.2 54.6 42.6 50.1 58.5 69.6 68.0 67.1 68.9
Of which: current grants 26.7 34.8 32.9 35.4 39.5 45.4 49.0 53.0 56.7 53.9 55.6
Compact (3) 31.1 31.4 32.7 32.7 20.5 27.6 35.5 47.4 51.0 56.3 55.8
Other 18.6 26.7 19.5 21.9 22.1 22.5 23.0 22.2 16.9 10.7 13.1
Total expenditure 65.1 72.1 72.9 69.4 77.8 90.2 92.9 107.8 101.3 102.8 101.7
Current expenditure 52.9 52.8 55.8 55.7 66.7 77.5 78.3 82.1 82.9 85.9 84.3
Wages and salaries 17.4 18.7 21.5 25.6 30.1 32.8 34.1 33.5 34.2 34.3 35.0
Goods and services 20.1 17.9 22.3 21.9 26.8 31.2 32.9 31.7 34.9 37.5 33.3
Interest payments 2.0 1.5 0.6 0.9 0.8 0.9 0.9 0.9 1.3 0.9 0.9
Subsidies to public
enterprises
2.0 2.6 3.9 3.8 3.1 2.7 4.0 7.9 6.9 7.5 6.7
Other subsidies and
transfers
11.1 12.1 7.7 3.5 5.9 9.8 6.4 8.2 5.6 5.7 8.4
Capital expenditure (4) 12.1 19.4 17.1 13.8 11.1 12.7 14.5 25.7 18.5 16.9 17.5
Current balance -1.9 5.6 4.5 8.4 6.2 3.4 7.0 9.5 12.9 5.8 11.7
Overall balance 9.0 9.6 6.8 13.8 -1.8 -4.7 1.9 0.4 5.7 2.1 7.5
Financing -10.3 -9.6 -6.8 -13.8 1.8 4.7 -1.9 -0.4 -5.7 -2.1 -7.5
Net Government debt
repayment
-5.6 -14.8 8.6 4.1 2.1 0.5 -0.6 -1.7 -1.1 -2.2 -2.4
Principal repayment -16.7 -24.0 -1.1 -0.2 -0.2 -0.5 -0.7 -1.8 -1.1 -2.2 -2.4
Gross borrowing 11.1 9.2 9.6 4.3 2.3 1.0 0.1 0.1 ~ ~ ~
Change in Government
financial assets
-3.4 5.2 -15.3 -18.0 -0.3 4.1 -1.3 1.4 -4.6 0.0 -5.1
Of which: Intergenerational Trust Fund
~ ~ -17.5 -16.0 ~ -0.3 -0.6 5.9 ~ ~ ~
(In percent of GDP)
Revenue and grants 66.8 71.0 63.9 65.6 58.0 62.2 66.1 72.3 70.2 69.2 67.0
Revenue 22.0 20.5 22.0 22.6 25.5 25.8 25.4 25.8 25.6 25.0 24.7
Taxes 15.4 15.9 16.1 18.2 17.2 17.6 17.5 18.1 17.1 16.1 15.5
Grants 44.8 50.5 41.8 43.0 32.5 36.4 40.8 46.5 44.5 44.3 42.3
Expenditure 58.6 62.6 58.4 54.7 59.4 65.6 64.8 72.0 66.4 67.8 62.4
Current 47.7 45.8 44.8 43.9 50.9 56.3 54.6 54.9 54.3 56.7 51.7
Wages and salaries 15.6 16.2 17.2 20.2 23.0 23.8 23.8 22.4 22.4 22.6 21.5
Goods and services 18.2 15.5 17.8 17.2 20.4 22.7 22.9 21.1 22.8 24.8 20.5
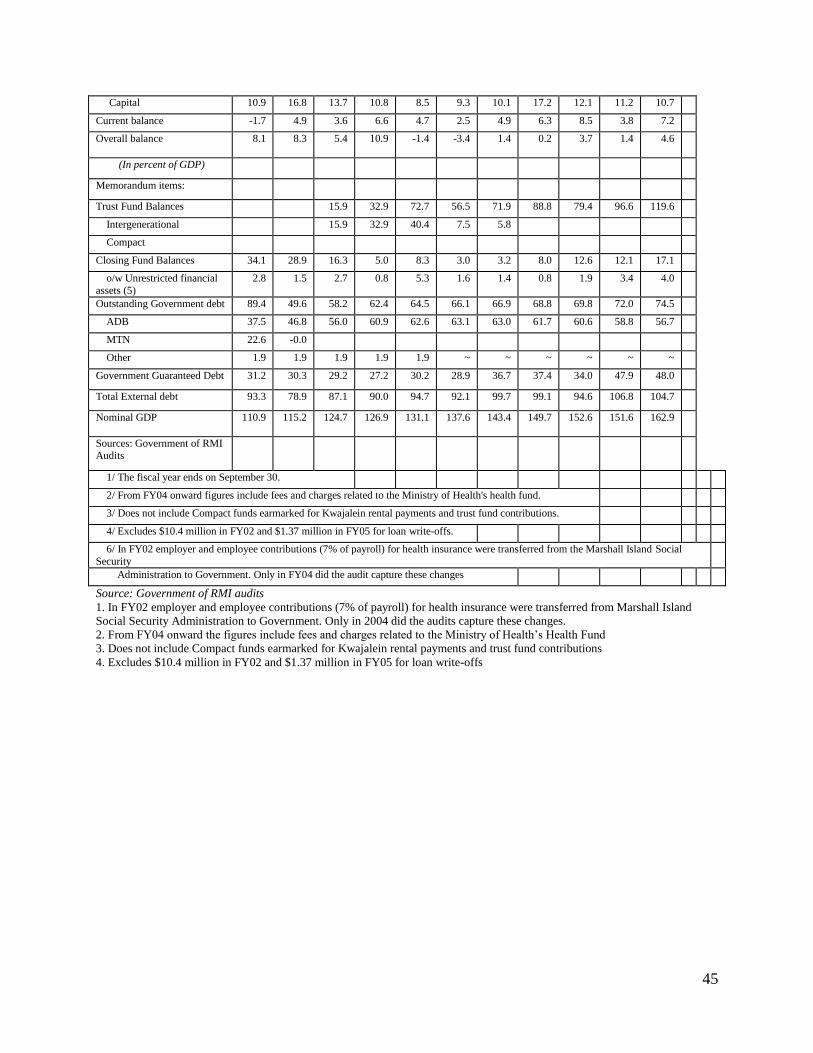
45
Capital 10.9 16.8 13.7 10.8 8.5 9.3 10.1 17.2 12.1 11.2 10.7
Current balance -1.7 4.9 3.6 6.6 4.7 2.5 4.9 6.3 8.5 3.8 7.2
Overall balance 8.1 8.3 5.4 10.9 -1.4 -3.4 1.4 0.2 3.7 1.4 4.6
(In percent of GDP)
Memorandum items:
Trust Fund Balances 15.9 32.9 72.7 56.5 71.9 88.8 79.4 96.6 119.6
Intergenerational 15.9 32.9 40.4 7.5 5.8
Compact
Closing Fund Balances 34.1 28.9 16.3 5.0 8.3 3.0 3.2 8.0 12.6 12.1 17.1
o/w Unrestricted financial
assets (5)
2.8 1.5 2.7 0.8 5.3 1.6 1.4 0.8 1.9 3.4 4.0
Outstanding Government debt 89.4 49.6 58.2 62.4 64.5 66.1 66.9 68.8 69.8 72.0 74.5
ADB 37.5 46.8 56.0 60.9 62.6 63.1 63.0 61.7 60.6 58.8 56.7
MTN 22.6 -0.0
Other 1.9 1.9 1.9 1.9 1.9 ~ ~ ~ ~ ~ ~
Government Guaranteed Debt 31.2 30.3 29.2 27.2 30.2 28.9 36.7 37.4 34.0 47.9 48.0
Total External debt 93.3 78.9 87.1 90.0 94.7 92.1 99.7 99.1 94.6 106.8 104.7
Nominal GDP 110.9 115.2 124.7 126.9 131.1 137.6 143.4 149.7 152.6 151.6 162.9
Sources: Government of RMI Audits
1/ The fiscal year ends on September 30.
2/ From FY04 onward figures include fees and charges related to the Ministry of Health's health fund.
3/ Does not include Compact funds earmarked for Kwajalein rental payments and trust fund contributions.
4/ Excludes $10.4 million in FY02 and $1.37 million in FY05 for loan write-offs.
6/ In FY02 employer and employee contributions (7% of payroll) for health insurance were transferred from the Marshall Island Social
Security
Administration to Government. Only in FY04 did the audit capture these changes
Source: Government of RMI audits
1. In FY02 employer and employee contributions (7% of payroll) for health insurance were transferred from Marshall Island
Social Security Administration to Government. Only in 2004 did the audits capture these changes.
2. From FY04 onward the figures include fees and charges related to the Ministry of Health‘s Health Fund
3. Does not include Compact funds earmarked for Kwajalein rental payments and trust fund contributions
4. Excludes $10.4 million in FY02 and $1.37 million in FY05 for loan write-offs
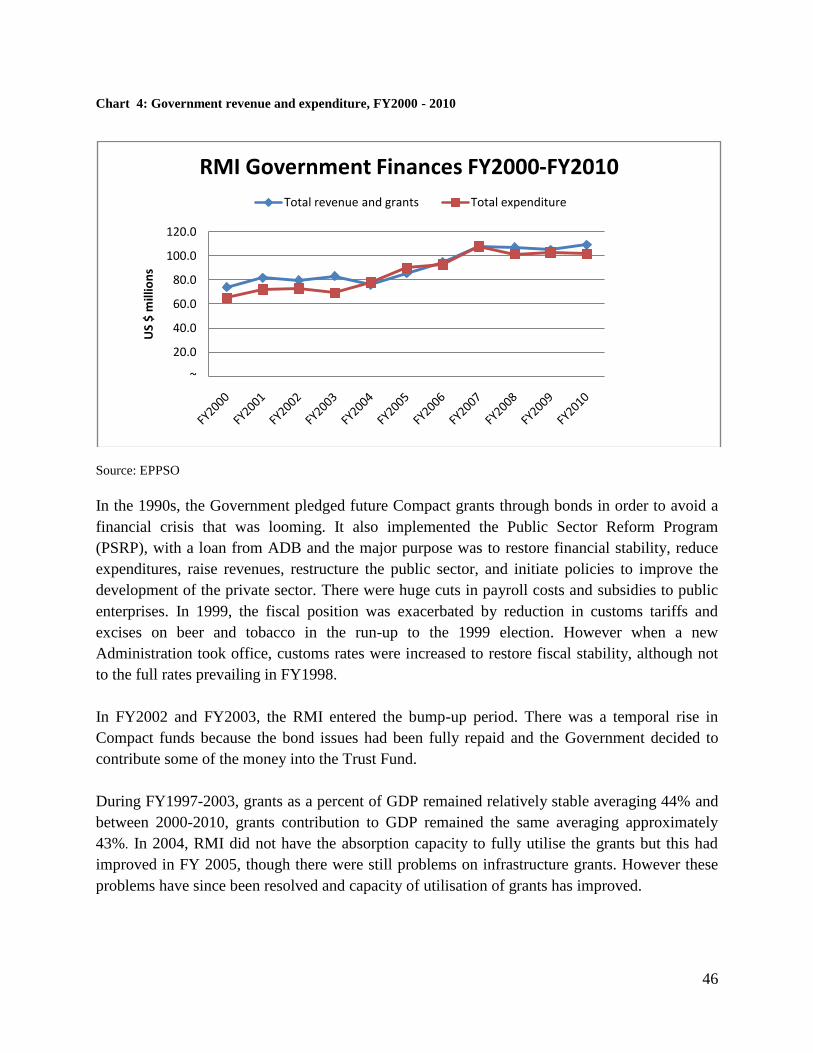
46
Chart 4: Government revenue and expenditure, FY2000 - 2010
Source: EPPSO
In the 1990s, the Government pledged future Compact grants through bonds in order to avoid a
financial crisis that was looming. It also implemented the Public Sector Reform Program
(PSRP), with a loan from ADB and the major purpose was to restore financial stability, reduce
expenditures, raise revenues, restructure the public sector, and initiate policies to improve the
development of the private sector. There were huge cuts in payroll costs and subsidies to public
enterprises. In 1999, the fiscal position was exacerbated by reduction in customs tariffs and
excises on beer and tobacco in the run-up to the 1999 election. However when a new
Administration took office, customs rates were increased to restore fiscal stability, although not
to the full rates prevailing in FY1998.
In FY2002 and FY2003, the RMI entered the bump-up period. There was a temporal rise in
Compact funds because the bond issues had been fully repaid and the Government decided to
contribute some of the money into the Trust Fund.
During FY1997-2003, grants as a percent of GDP remained relatively stable averaging 44% and
between 2000-2010, grants contribution to GDP remained the same averaging approximately
43%. In 2004, RMI did not have the absorption capacity to fully utilise the grants but this had
improved in FY 2005, though there were still problems on infrastructure grants. However these
problems have since been resolved and capacity of utilisation of grants has improved.
~
20.0
40.0
60.0
80.0
100.0
120.0
US
$ m
illio
ns
RMI Government Finances FY2000-FY2010
Total revenue and grants Total expenditure
47
In 2010, grants as a percent of total revenues accounted for about 63%. There has been a little
change in the level of dependency on external transfers as a percentage of both total revenue and
GDP. The dependency on U.S. grants has fallen, but this has been offset by increased funding
from the RoC. Tax revenues have averaged 17% of GDP since FY1997. Tax effort is above that
of the FSM but below that of the majority of other Pacific Island economies and below the rate
prevailing in the United States.
As indicated on Table 14 above, public expenditure averaged 65% of GDP during Compact II.
The public sector in RMI plays a dominant role in the economy and this is supported by external
assistance.
With regards to revenue, a major source of tax revenue is a tax on wages, accounting for $10.8
million out of a total tax yield of $25.2 million in FY2010, down from 11.2 out of a total tax
yield of $24.3 million in 2009. Wage earners pay 8%, up to a threshold of $10,400, and above
that, 12%. Those earning less than $4,160 are exempted from the income tax.
Customs duties are the second major source of tax revenue. In FY1998, $7.8 million of customs
taxes were collected, and the general rate was 12% on merchandise. There were varying but
lower rates on food products and high rates on alcohol and tobacco. The general rate of 12% was
reduced to 5% in the run-up to the elections in FY 1999 and the rates on sin goods were also
reduced. Tax revenue fell to $4.5 million in FY2000. However, tariff rates were adjusted by the
new Administration to 8% and the rates on sin goods were also raised. In FY2003, customs
taxes reached $7.0 million. New higher rates were imposed on sin goods in FY 2005 with the
additional revenues earmarked for the College of the Marshall Islands (CMI).
However, the Government eliminated tariffs on certain basic foods, including rice, in response to
the increase in world food prices in FY 2008. Duties on diesel used by MEC were also
eliminated as part of the assistance and subsidy package to the ailing enterprise. Total customs
collections reached $8.6 million in FY2006 and rose to $9.4 million in FY2007 but slid back to
$7.1 million in FY2009 and 7.7 million in 2010, as the economy suffered the effects of the world
recession.
The third major contributor to local revenue is gross receipts tax (GRT) which is levied at 3% of
business turnover and is intended as a proxy income tax, although the incidence is comparable to
that of a sales tax. Each sale from one business to another multiplies the tax yield and distorts
resource allocation. In 2010 GRT was $6.2 million. Fish and fish products have been exempted
from the GRT to enable the fishing sector to remain competitive on international markets.
RMI also imposes taxes on fuel and hotels but these do not contribute much to revenue. In FY
2002, the rate of contribution to the health care fund was increased from 2.5% of gross pay to
3.5% for both employers and employees, bringing the total to 7%. In FY2004, the funds were
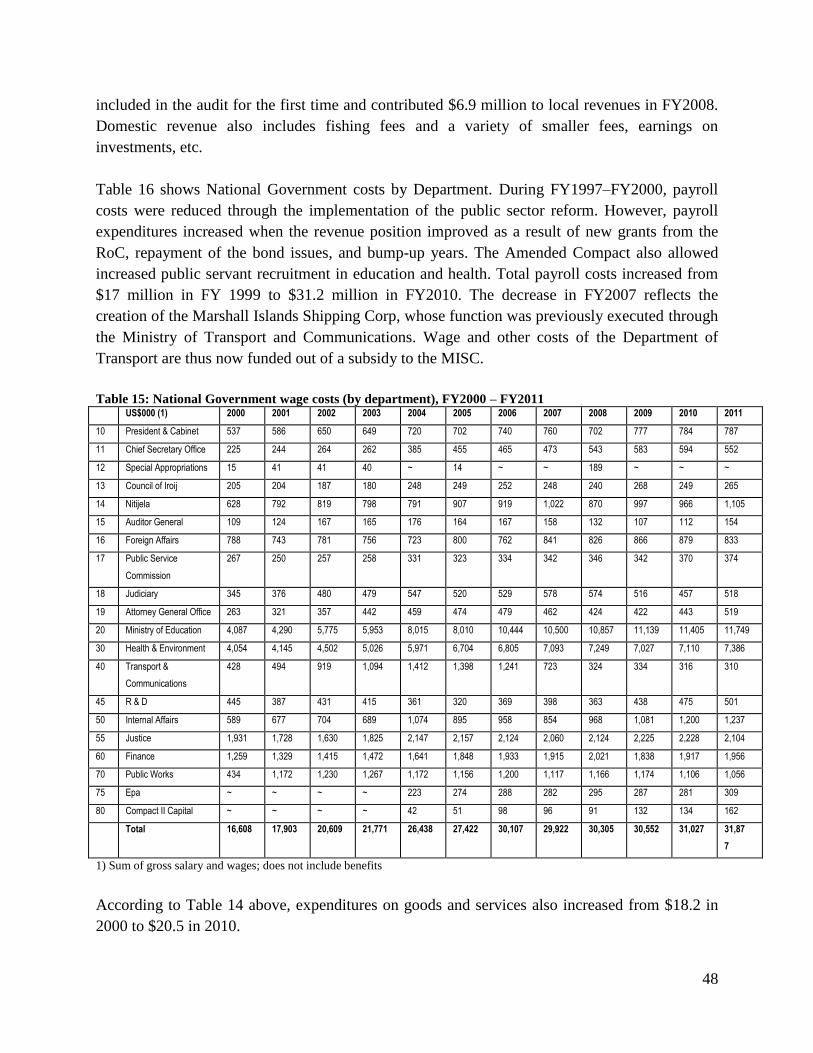
48
included in the audit for the first time and contributed $6.9 million to local revenues in FY2008.
Domestic revenue also includes fishing fees and a variety of smaller fees, earnings on
investments, etc.
Table 16 shows National Government costs by Department. During FY1997–FY2000, payroll
costs were reduced through the implementation of the public sector reform. However, payroll
expenditures increased when the revenue position improved as a result of new grants from the
RoC, repayment of the bond issues, and bump-up years. The Amended Compact also allowed
increased public servant recruitment in education and health. Total payroll costs increased from
$17 million in FY 1999 to $31.2 million in FY2010. The decrease in FY2007 reflects the
creation of the Marshall Islands Shipping Corp, whose function was previously executed through
the Ministry of Transport and Communications. Wage and other costs of the Department of
Transport are thus now funded out of a subsidy to the MISC.
Table 15: National Government wage costs (by department), FY2000 – FY2011 US$000 (1) 2000 2001 2002 2003 2004 2005 2006 2007 2008 2009 2010 2011
10 President & Cabinet 537 586 650 649 720 702 740 760 702 777 784 787
11 Chief Secretary Office 225 244 264 262 385 455 465 473 543 583 594 552
12 Special Appropriations 15 41 41 40 ~ 14 ~ ~ 189 ~ ~ ~
13 Council of Iroij 205 204 187 180 248 249 252 248 240 268 249 265
14 Nitijela 628 792 819 798 791 907 919 1,022 870 997 966 1,105
15 Auditor General 109 124 167 165 176 164 167 158 132 107 112 154
16 Foreign Affairs 788 743 781 756 723 800 762 841 826 866 879 833
17 Public Service
Commission
267 250 257 258 331 323 334 342 346 342 370 374
18 Judiciary 345 376 480 479 547 520 529 578 574 516 457 518
19 Attorney General Office 263 321 357 442 459 474 479 462 424 422 443 519
20 Ministry of Education 4,087 4,290 5,775 5,953 8,015 8,010 10,444 10,500 10,857 11,139 11,405 11,749
30 Health & Environment 4,054 4,145 4,502 5,026 5,971 6,704 6,805 7,093 7,249 7,027 7,110 7,386
40 Transport &
Communications
428 494 919 1,094 1,412 1,398 1,241 723 324 334 316 310
45 R & D 445 387 431 415 361 320 369 398 363 438 475 501
50 Internal Affairs 589 677 704 689 1,074 895 958 854 968 1,081 1,200 1,237
55 Justice 1,931 1,728 1,630 1,825 2,147 2,157 2,124 2,060 2,124 2,225 2,228 2,104
60 Finance 1,259 1,329 1,415 1,472 1,641 1,848 1,933 1,915 2,021 1,838 1,917 1,956
70 Public Works 434 1,172 1,230 1,267 1,172 1,156 1,200 1,117 1,166 1,174 1,106 1,056
75 Epa ~ ~ ~ ~ 223 274 288 282 295 287 281 309
80 Compact II Capital ~ ~ ~ ~ 42 51 98 96 91 132 134 162
Total 16,608 17,903 20,609 21,771 26,438 27,422 30,107 29,922 30,305 30,552 31,027 31,87
7
1) Sum of gross salary and wages; does not include benefits
According to Table 14 above, expenditures on goods and services also increased from $18.2 in
2000 to $20.5 in 2010.
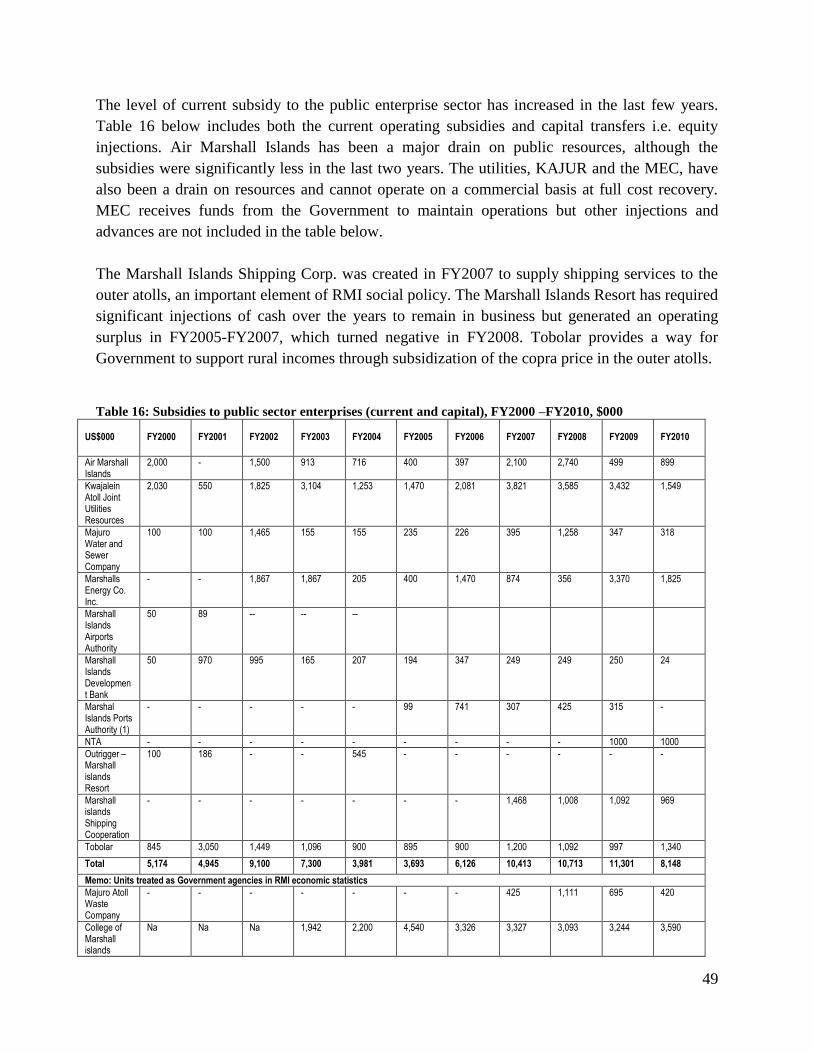
49
The level of current subsidy to the public enterprise sector has increased in the last few years.
Table 16 below includes both the current operating subsidies and capital transfers i.e. equity
injections. Air Marshall Islands has been a major drain on public resources, although the
subsidies were significantly less in the last two years. The utilities, KAJUR and the MEC, have
also been a drain on resources and cannot operate on a commercial basis at full cost recovery.
MEC receives funds from the Government to maintain operations but other injections and
advances are not included in the table below.
The Marshall Islands Shipping Corp. was created in FY2007 to supply shipping services to the
outer atolls, an important element of RMI social policy. The Marshall Islands Resort has required
significant injections of cash over the years to remain in business but generated an operating
surplus in FY2005-FY2007, which turned negative in FY2008. Tobolar provides a way for
Government to support rural incomes through subsidization of the copra price in the outer atolls.
Table 16: Subsidies to public sector enterprises (current and capital), FY2000 –FY2010, $000 US$000
FY2000
FY2001
FY2002
FY2003
FY2004
FY2005
FY2006
FY2007
FY2008
FY2009
FY2010
Air Marshall Islands
2,000 - 1,500 913 716 400 397 2,100 2,740 499 899
Kwajalein Atoll Joint Utilities Resources
2,030 550 1,825 3,104 1,253 1,470 2,081 3,821 3,585 3,432 1,549
Majuro Water and Sewer Company
100 100 1,465 155 155 235 226 395 1,258 347 318
Marshalls Energy Co. Inc.
- - 1,867 1,867 205 400 1,470 874 356 3,370 1,825
Marshall Islands Airports Authority
50 89 -- -- --
Marshall Islands Development Bank
50 970 995 165 207 194 347 249 249 250 24
Marshal Islands Ports Authority (1)
- - - - - 99 741 307 425 315 -
NTA - - - - - - - - - 1000 1000
Outrigger – Marshall islands Resort
100 186 - - 545 - - - - - -
Marshall islands Shipping Cooperation
- - - - - - - 1,468 1,008 1,092 969
Tobolar 845 3,050 1,449 1,096 900 895 900 1,200 1,092 997 1,340
Total 5,174 4,945 9,100 7,300 3,981 3,693 6,126 10,413 10,713 11,301 8,148
Memo: Units treated as Government agencies in RMI economic statistics
Majuro Atoll Waste Company
- - - - - - - 425 1,111 695 420
College of Marshall islands
Na Na Na 1,942 2,200 4,540 3,326 3,327 3,093 3,244 3,590
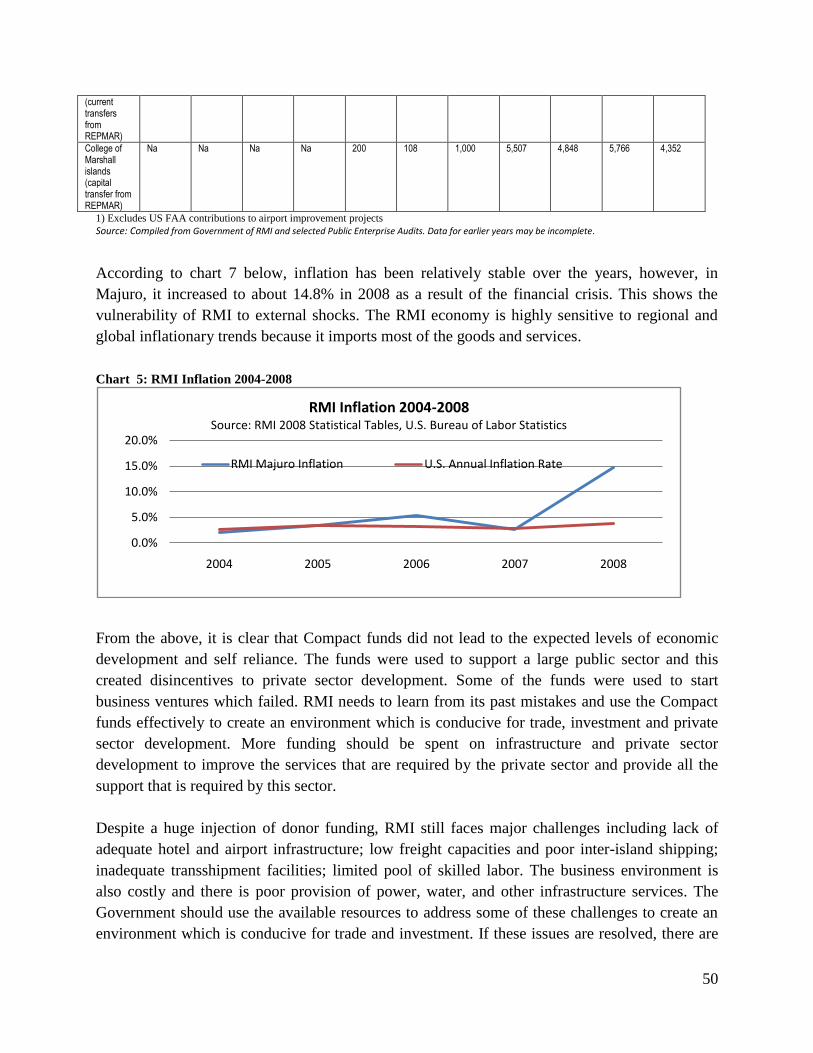
50
(current transfers from REPMAR)
College of Marshall islands (capital transfer from REPMAR)
Na Na Na Na 200 108 1,000 5,507 4,848 5,766 4,352
1) Excludes US FAA contributions to airport improvement projects
Source: Compiled from Government of RMI and selected Public Enterprise Audits. Data for earlier years may be incomplete.
According to chart 7 below, inflation has been relatively stable over the years, however, in
Majuro, it increased to about 14.8% in 2008 as a result of the financial crisis. This shows the
vulnerability of RMI to external shocks. The RMI economy is highly sensitive to regional and
global inflationary trends because it imports most of the goods and services.
Chart 5: RMI Inflation 2004-2008
From the above, it is clear that Compact funds did not lead to the expected levels of economic
development and self reliance. The funds were used to support a large public sector and this
created disincentives to private sector development. Some of the funds were used to start
business ventures which failed. RMI needs to learn from its past mistakes and use the Compact
funds effectively to create an environment which is conducive for trade, investment and private
sector development. More funding should be spent on infrastructure and private sector
development to improve the services that are required by the private sector and provide all the
support that is required by this sector.
Despite a huge injection of donor funding, RMI still faces major challenges including lack of
adequate hotel and airport infrastructure; low freight capacities and poor inter-island shipping;
inadequate transshipment facilities; limited pool of skilled labor. The business environment is
also costly and there is poor provision of power, water, and other infrastructure services. The
Government should use the available resources to address some of these challenges to create an
environment which is conducive for trade and investment. If these issues are resolved, there are
0.0%
5.0%
10.0%
15.0%
20.0%
2004 2005 2006 2007 2008
RMI Inflation 2004-2008Source: RMI 2008 Statistical Tables, U.S. Bureau of Labor Statistics
RMI Majuro Inflation U.S. Annual Inflation Rate
51
potential opportunities in agriculture, fisheries and tourism, especially the specialized niche
markets such as high-end tourism, dock services and value adding in the fisheries industry.
3 TRADE POLICY BY SECTOR
As indicated above, the Compact funding has not led to the desired levels of economic growth
and self-reliance. Performance in the priority sectors of agriculture, fisheries and tourism has
been very weak. For RMI to achieve sustainable economic growth and development, it is vital to
develop export competitiveness in agriculture, fisheries and tourism and the private sector must
play a critical role in this process. This section reviews the developments in the three sectors and
analyses the challenges that have inhibited trade in these sectors with a view towards rectifying
the errors of the past and finding lasting solutions aimed at increasing production both for the
local and export market.
3.1 Agriculture
Agriculture plays a vital role in terms of sustaining the living standards of people, particularly in
the outer islands. The contribution of agriculture to GDP decreased from 4.5% in 1997 to 3.5%
in 2010, while the contribution of fisheries increased from 4.5% to 10.8% over the same period.
The contribution of tourism to GDP decreased from 5.4% in 2001 to 1.6% in 2010. A household
survey conducted by EPPSO in 2006 showed that a large portion of rural households continue to
rely on home production for own consumption (of 244 homes surveyed in Wotje, Jaluit, Arno
and Likiep, around 80% kept and relied on home-grown crops such as breadfruit and pandanus),
and well over half relied on copra as a source of income. The high prices of imported rice and
other staple foods prompted the Government to reconsider and refocus efforts on strengthening
basic food security.
However, the nature of agriculture activities in RMI is limited by the system of land ownership,
where most of the land is owned traditionally and there is no large scale commercial farming.
The land size is also too small to allow large scale commercial farming. The soil type, and the
fact that RMI is prone to natural disasters does not allow mono-cropping. Very little has been
done in terms of livestock production because of a number of constraints including lack of
technical knowhow and the challenge of getting livestock feed amongst other things.
The main commercial agricultural activity has been copra, which is run by Tobolar with huge
subsidies from the Government. There has been very little success in terms of value addition and
Tobolar‘s performance has been very weak. However, RMI has been able to produce some
vegetables for the local market and also some pigs and poultry on a small scale.
52
RMI has been importing more food products than it exports and this widened the trade deficit,
which was largely financed by Compact grants and other grants. The consumption of less
nutritious imported foods has contributed to life style diseases such as diabetes, gout, obesity and
high blood pressure. RMI needs to promote the production of local foods to address some of
these problems and also to ensure food security and export the surplus. Support should also be
provided to develop new exports.
RMI should consider promoting the value addition in agriculture and produce items like nin
juice, pandanus juice, breadfruit chips, flour and coconut cooking oil amongst other things. The
Government should assist outer islands with the necessary infrastructure, education and training
in food processing technology. Copra can also be processed into a number of products which will
be discussed below.
3.1.1 The Copra Industry in RMI
The Tobolar Copra Processing Authority Act of 1992 provides for the establishment of a
Statutory Authority to engage in copra processing and related purposes – specifically the
management, operation and maintenance of all aspects of copra processing for the Marshall
Islands. Tobolar is responsible for ―all aspects of copra processing services for the Republic‖.
The first objective of Tobolar is to perform in a manner that will best meet the social, economic
and political needs of the people of the Republic and to do so efficiently and economically. The
second objective is to assure a continuing market for copra from the Republic and make it an
economically productive commodity upon which the Republic can rely. The third one is to
encourage private sector participation in Tobolar. Some of these objectives are beyond the
control of Tobolar and it cannot realistically be expected to meet them. For example, Tobolar has
no control over the price of copra or other products from copra and cannot assure a market for
copra.
The 1992 Act establishes Tobolar as a statutory monopoly so that no other person or enterprise
can engage in copra production, processing and marketing. The law requires all the producers to
sell copra to Tobolar. The Licensing of Copra Trade Act, Chapter 1, Title 20 Business
Regulations and Practice provides for the licensing of copra businesses in the Republic for the
purchase of copra for export, and a license is required to export copra. However, a license is not
required for the purchase of copra that is to be processed into products destined for export. RMI
has not been exporting copra for a number of years because of the decline in world prices.
Pacific International Inc. (PII) used to manage Tobolar since 1970 and the Government was
paying a management fee of $50 000 per year. However, in December 2009, the management of
Tobolar reverted back to government. Some of the products that it produces include crude
53
coconut oil and copra cake. Copra from outer islands is brought by Government ship and Tobolar
pays price of copra, commission for getting copra and stevedore charges. In 2010, the price of
copra in the outer islands was 15 cents per pound and 16.5 cents in Majuro. In the past, it used to
be 22 cents per pound and 26 cents respectively, but was affected by a global decline in oil
prices. According to an ADB report on copra trade in RMI14
(2005), a copra price of at least 20-
22 cents per lb would be needed to double copra production in the outer islands. A copra price of
25 cents per lb could see people leave their jobs in Majuro and return to the outer atolls and
islands to make copra.
Tobolar has been receiving about $1.2 million in subsidies per year, but in 2009, it only received
$500.000 and this led to a big drop in the price of copra. Tobolar received a loan of $1 million
from the bank of Guam to sustain the price of copra.
According to the ADB report, it is clear that the copra industry has not been performing well.
Copra trade is essentially a commodity trade that is vulnerable to the vicissitudes of the
fluctuations in the global market. RMI has very small production of copra and does not have
economies of scale when it comes to the copra business. Like all commodities, the international
copra trade has been declining and the returns to producers in the outer islands have also been
decreasing forcing some people to migrate to Majuro or Ebeye. The Government has been
subsidizing the price producers receive for copra purchased by Tobolar and the transportation
costs in order to promote development in the outer islands.
Despite all the subsidies that are provided to the copra industry, in 2005, copra production
contributed about 1% to GDP, averaging about 4,244 tonnes per annum (2000-2005). This is a
very tiny contribution to world copra trade or crude coconut oil trade. Copra production
decreased from 7,182 short tonnes in 2008 to 5405 short tonnes in 2010.The other problem is
that RMI has no adequate quality standards on copra and the quality of RMI products is low
compared to other countries. In the past, exports of copra cake to the US were rejected because
of poor quality, however, a new market has been found in Australia.
The world prices for copra have been declining for the past 50 years and continue to do so. The
price of coconut oil also fluctuates and competes with other edible oils. Production of copra in
RMI also depends on the price and the efficiency of the shipping services. According to the 2005
ADB report, production levels can be relatively easily increased to 8,500 tons but for this to
occur, a copra price of 20-22 cents per lb will be needed along with a much improved shipping
service. Tobolar normally runs below capacity because of shortage of copra.
From FY 2000-2010 the average income from export sales of coconult oil and copra cake
averaged $2 million per year. Tobolar‘s total costs of production average about $1.7 million
before product inventory valuation adjustments of minus $0.5 million. The average annual copra
14
ADB 2005, Conduct of the Copra Trade and Outer Island Shipping Services in the Marshall Islands. Report done
by Mcgregor and Company
54
price stabilisation subsidy has been $1.2 million over the same period. The outer island shipping
subsidy has averaged $125,000 in recent years and the annual cost of the Marshall Islands
Shipping Corporation from 2007 to 2010 has been about $1.1 million.
The Government provides a direct subsidy towards the shipping of copra from the outer atolls
and islands to Majuro. General cargo receives this subsidy too. According to the 2005 ADB
report, the subsidy payment was, and still is not linked to cargo or even copra carried. So vessels
with a copra cargo capacity of 101 tons would receive $30,000 per voyage, regardless of the
amount carried. If only 50 tons were carried, the effective freight carried or the freight subsidy
will be $600 per ton. Similarly, a vessel with a 250 ton capacity (like the Mercy K) would
receive $30,000 per voyage regardless of where the ship sailed and the quantity of copra cargo
carried. If, for example, the ship loaded 150 tons of copra this will be equal to a freight subsidy
of $200 per ton. The less cargo carried the greater the subsidy on a $ per ton basis.
According to the ADB report (2005), the RMI Government subsidizes the copra industry and
shipping to the tune of $2.9 million per year. This is the equivalent to 34 cents per lb, which is
almost three times the outer islands posted price for copra of 12 cents per lb. The main
beneficiary of these subsidies was the Sea Transport Division and its employees, suppliers,
which, spread across the whole copra industry, amounts to 21.8 cents per lb (i.e. on every ton of
copra produced). The next major beneficiaries are the outer island copra producers who receive
8.2 cents per lb. The third class of beneficiaries are the employees of and suppliers to Tobolar,
who receive the equivalent of 5.9 cents per lb. Private ship operators are the fourth class of
beneficiaries and altogether (and spread across the industry) receive 1.5 cents per lb.
The ADB report noted that neither the copra seller nor the buyer (Tobolar) is directly involved in
determining shipping arrangements. However, the Tobolar Board sets the copra freight rate that
bears no resemblance to ship operating costs. The outcome is that the domestic shipping service
is not a consequence of copra trading requirements and so does not satisfactorily support the
copra trade. The other problem that affected Tobolar is that there were cash flow problems that
appear to be the result of the tardy administration of subsidies on the part of the Ministry of
Finance. In the past, there have been delays in the Ministry of Finance in paying the Ministry of
Transport and Communication –STD and Tobolar has been slow in providing funds to onboard
merchants to purchase copra because the subsidy for price stabilization would not have been paid
to the company.
The report recommended that copra sales must be conducted on a proper f.o.b or c.i.f. basis that
includes a sea freight rate reflecting private sector ship operating costs. It also recommended that
the shipping subsidy be terminated. The argument was that, subsidies make it difficult for non-
subsidized operators to compete with subsidized operators. The main issue however is that there
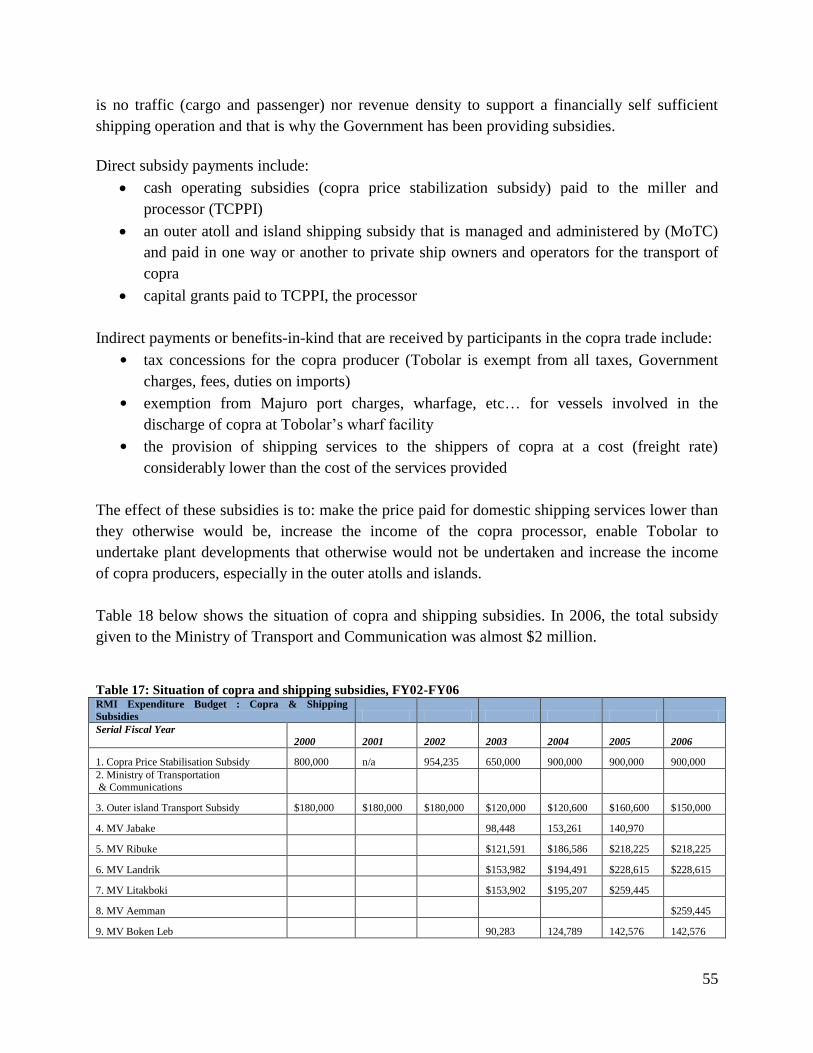
55
is no traffic (cargo and passenger) nor revenue density to support a financially self sufficient
shipping operation and that is why the Government has been providing subsidies.
Direct subsidy payments include:
cash operating subsidies (copra price stabilization subsidy) paid to the miller and
processor (TCPPI)
an outer atoll and island shipping subsidy that is managed and administered by (MoTC)
and paid in one way or another to private ship owners and operators for the transport of
copra
capital grants paid to TCPPI, the processor
Indirect payments or benefits-in-kind that are received by participants in the copra trade include:
• tax concessions for the copra producer (Tobolar is exempt from all taxes, Government
charges, fees, duties on imports)
• exemption from Majuro port charges, wharfage, etc… for vessels involved in the
discharge of copra at Tobolar‘s wharf facility
• the provision of shipping services to the shippers of copra at a cost (freight rate)
considerably lower than the cost of the services provided
The effect of these subsidies is to: make the price paid for domestic shipping services lower than
they otherwise would be, increase the income of the copra processor, enable Tobolar to
undertake plant developments that otherwise would not be undertaken and increase the income
of copra producers, especially in the outer atolls and islands.
Table 18 below shows the situation of copra and shipping subsidies. In 2006, the total subsidy
given to the Ministry of Transport and Communication was almost $2 million.
Table 17: Situation of copra and shipping subsidies, FY02-FY06 RMI Expenditure Budget : Copra & Shipping
Subsidies
Serial Fiscal Year
2000 2001 2002 2003 2004 2005 2006
1. Copra Price Stabilisation Subsidy 800,000 n/a 954,235 650,000 900,000 900,000 900,000
2. Ministry of Transportation
& Communications
3. Outer island Transport Subsidy $180,000 $180,000 $180,000 $120,000 $120,600 $160,600 $150,000
4. MV Jabake
98,448 153,261 140,970
5. MV Ribuke
$121,591 $186,586 $218,225 $218,225
6. MV Landrik
$153,982 $194,491 $228,615 $228,615
7. MV Litakboki
$153,902 $195,207 $259,445
8. MV Aemman
$259,445
9. MV Boken Leb
90,283 124,789 142,576 142,576
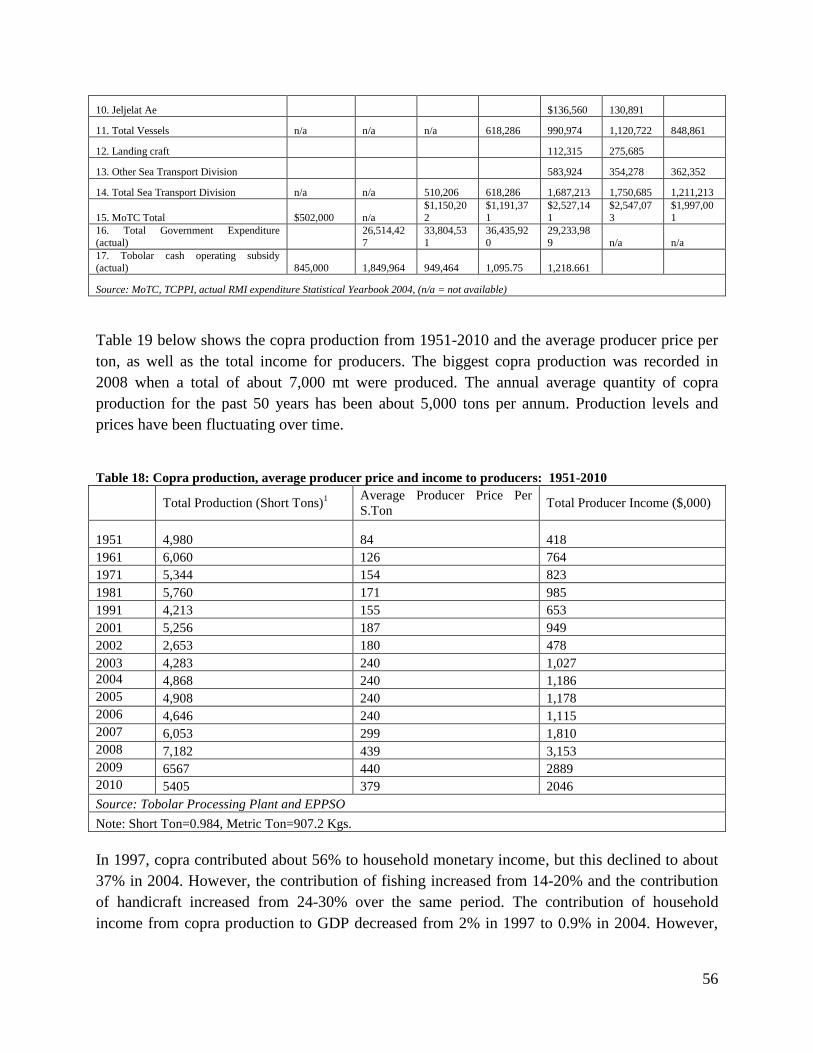
56
10. Jeljelat Ae $136,560 130,891
11. Total Vessels n/a n/a n/a 618,286 990,974 1,120,722 848,861
12. Landing craft
112,315 275,685
13. Other Sea Transport Division
583,924 354,278 362,352
14. Total Sea Transport Division n/a n/a 510,206 618,286 1,687,213 1,750,685 1,211,213
15. MoTC Total $502,000 n/a
$1,150,20
2
$1,191,37
1
$2,527,14
1
$2,547,07
3
$1,997,00
1
16. Total Government Expenditure
(actual)
26,514,42
7
33,804,53
1
36,435,92
0
29,233,98
9 n/a n/a
17. Tobolar cash operating subsidy
(actual) 845,000 1,849,964 949,464 1,095.75 1,218.661
Source: MoTC, TCPPI, actual RMI expenditure Statistical Yearbook 2004, (n/a = not available)
Table 19 below shows the copra production from 1951-2010 and the average producer price per
ton, as well as the total income for producers. The biggest copra production was recorded in
2008 when a total of about 7,000 mt were produced. The annual average quantity of copra
production for the past 50 years has been about 5,000 tons per annum. Production levels and
prices have been fluctuating over time.
Table 18: Copra production, average producer price and income to producers: 1951-2010
Total Production (Short Tons)1
Average Producer Price Per
S.Ton Total Producer Income ($,000)
1951 4,980 84 418
1961 6,060 126 764
1971 5,344 154 823
1981 5,760 171 985
1991 4,213 155 653
2001 5,256 187 949
2002 2,653 180 478
2003 4,283 240 1,027
2004 4,868 240 1,186
2005 4,908 240 1,178
2006 4,646 240 1,115
2007 6,053 299 1,810
2008 7,182 439 3,153
2009 6567 440 2889
2010 5405 379 2046
Source: Tobolar Processing Plant and EPPSO
Note: Short Ton=0.984, Metric Ton=907.2 Kgs.
In 1997, copra contributed about 56% to household monetary income, but this declined to about
37% in 2004. However, the contribution of fishing increased from 14-20% and the contribution
of handicraft increased from 24-30% over the same period. The contribution of household
income from copra production to GDP decreased from 2% in 1997 to 0.9% in 2004. However,
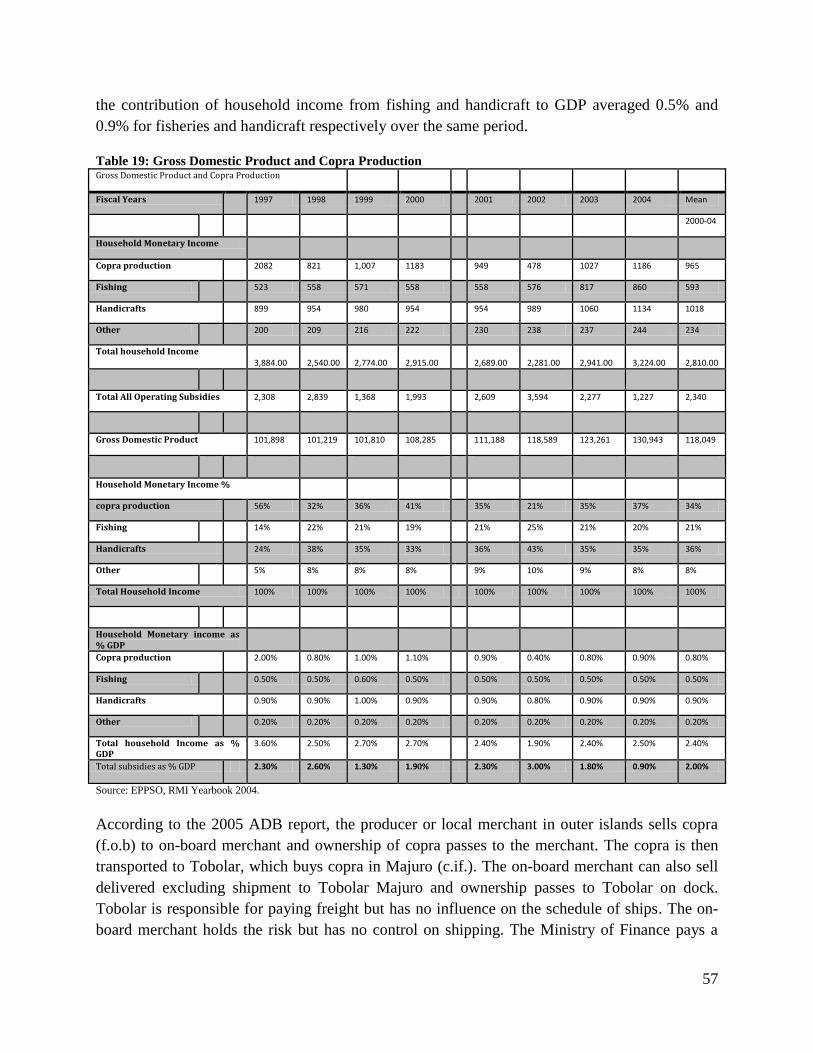
57
the contribution of household income from fishing and handicraft to GDP averaged 0.5% and
0.9% for fisheries and handicraft respectively over the same period.
Table 19: Gross Domestic Product and Copra Production Gross Domestic Product and Copra Production
Fiscal Years 1997 1998 1999 2000 2001 2002 2003 2004 Mean
2000-04
Household Monetary Income
Copra production 2082 821 1,007 1183 949 478 1027 1186 965
Fishing 523 558 571 558 558 576 817 860 593
Handicrafts 899 954 980 954 954 989 1060 1134 1018
Other 200 209 216 222 230 238 237 244 234
Total household Income 3,884.00
2,540.00
2,774.00
2,915.00
2,689.00
2,281.00
2,941.00
3,224.00
2,810.00
Total All Operating Subsidies 2,308 2,839 1,368 1,993 2,609 3,594 2,277 1,227 2,340
Gross Domestic Product 101,898 101,219 101,810 108,285 111,188 118,589 123,261 130,943 118,049
Household Monetary Income %
copra production 56% 32% 36% 41% 35% 21% 35% 37% 34%
Fishing 14% 22% 21% 19% 21% 25% 21% 20% 21%
Handicrafts 24% 38% 35% 33% 36% 43% 35% 35% 36%
Other 5% 8% 8% 8% 9% 10% 9% 8% 8%
Total Household Income 100% 100% 100% 100% 100% 100% 100% 100% 100%
Household Monetary income as % GDP
Copra production 2.00% 0.80% 1.00% 1.10% 0.90% 0.40% 0.80% 0.90% 0.80%
Fishing 0.50% 0.50% 0.60% 0.50% 0.50% 0.50% 0.50% 0.50% 0.50%
Handicrafts 0.90% 0.90% 1.00% 0.90% 0.90% 0.80% 0.90% 0.90% 0.90%
Other 0.20% 0.20% 0.20% 0.20% 0.20% 0.20% 0.20% 0.20% 0.20%
Total household Income as % GDP
3.60% 2.50% 2.70% 2.70% 2.40% 1.90% 2.40% 2.50% 2.40%
Total subsidies as % GDP 2.30% 2.60% 1.30% 1.90% 2.30% 3.00% 1.80% 0.90% 2.00%
Source: EPPSO, RMI Yearbook 2004.
According to the 2005 ADB report, the producer or local merchant in outer islands sells copra
(f.o.b) to on-board merchant and ownership of copra passes to the merchant. The copra is then
transported to Tobolar, which buys copra in Majuro (c.if.). The on-board merchant can also sell
delivered excluding shipment to Tobolar Majuro and ownership passes to Tobolar on dock.
Tobolar is responsible for paying freight but has no influence on the schedule of ships. The on-
board merchant holds the risk but has no control on shipping. The Ministry of Finance pays a
58
copra stabilization subsidy directly to Tobolar as an operating subsidy. If Tobolar does not have
the cash flow to pay the freight or advance funds to on-board merchants no ship sails. The
Ministry of Finance also pays a shipping subsidy after the voyage is completed.
Lack of scheduled shipping hinders the copra trade and other aspects of outer island life because
growers would prefer to have six annual visits that are on-time rather than eight annual random
visits. The freight rate is presently $56.25 per ton. It is understood that the freight rate is set by
the Tobolar Board and not the ship operator in negotiations with the shipper. Shipping is now
controlled by Marshall Islands Shipping Company, which has three big boats, and the situation
has reportedly improved.
It is important to note that Tobolar has the capacity to process 13,728 tons per year, more than
three times current production levels. The problem is a shortage of copra and random and
unreliable shipping. Tobolar‘s output indicates that about 60% of its copra intake is converted to
crude oil, 33% is converted into copra cake, about 1% is presently distilled into bio fuel and
about 1% is turned into soap. Tobolar also lacks new technology and has not been able to
innovate and add value. These are some of the issues that have affected the performance of the
company.
3.1.2 The Global Trend in the Coconut Industry
The Asian and Pacific Coconut Community (APCC) is an intergovernmental organisation of 17
member countries, including the Marshall Islands, established in 1969 to promote, coordinate
and harmonise all activities in the coconut industry15
. More than 90 countries produce coconut
and the main producers are Indonesia, the Philippines and India. PNG is the largest producer in
the Pacific, while Brazil is a major grower in Latin America and Tanzania a major grower in
Africa.
In 2003, APCC members accounted for about 84% of copra production representing about 11.3
million tonnes and world production was about 13.5 million tons. The top copra producers were
India (25%), Indonesia (24%) and Philippines (21%), accounting for about 70% of total world
production. The Pacific region produced about 559,000 tons, accounting for only 4% of total
world production and half of that was supplied by PNG.
According to 1998/9 data from the APCC, the main producers of crude coconut oil were the
Philippines, Indonesia and India together accounting for 74% of production. The only significant
producer in the Pacific region is PNG (2% of world total). India is not a major exporter but the
Philippines and Indonesia export about 75% of their coconut oil and this account for over 80% of
15
The APCC member countries include: Federated States of Micronesia, Fiji, India, Indonesia, Jamaica, Kiribati,
Malaysia, Marshall Islands, Papua New Guinea, Philippines, Samoa, Solomon Islands, Sri Lanka, Thailand, Tonga,
Vanuatu, and Vietnam. Jamaica is an associate member of the APCC. http://www.apccsec.org

59
world export volumes. In 1998-99, export volumes of coconut oil were about 2 million tons and
the export market was completely dominated by the Philippines and Indonesia. The bumper
crops and oil production volumes have a significant effect on export market prices and this
affects the viability of small producing countries, like the Marshall Islands, to successfully
export (crude) coconut oil.
The EU and US are the major consumers of coconut oil16
. Copra meal (cake) is used mainly for
agricultural feedstock.
The international prices for all coconut based products has been decreasing over the years mainly
as a result of a combination of oversupply and substitute (competing) products – for coconut oil
such as palm oil, soybean oil, sunflower oil and rapeseed oil17
.
Table 20: World market prices in USD/T in 2010
March 30 March 29
Sun oil, EU. Fob 930 Ap 930 Ap
Rapeseed, EU, cif. Hbg. 419 Ap/Je 419 Ap/Je
Rape meal, Hbg. ex-mill 212 Ap 213 Ap
Palm oil, crude, cif Eur. 822 Ap 822 Ap
Coconut oil, cif Rdm. 890 Ap/My 880 Ap/
According to the UN Food and Agricultural Organisation (FAO), the decline in copra prices has
not been limited to the coconut industry only but has also been a feature of the cocoa, coffee,
rubber, sugar and rice trades. The drop in the price of copra trade led to a switch from copra
trading to coconut oil trading. By 1990 copra prices were so low that the anticipated return from
copra was lower than labour and other costs so that coconut was no longer considered a
remunerative cash crop in many small Pacific nations. The prices for coconut oil and copra meal
have also been fluctuating. RMI was also affected by these prices swings.
3.1.3 RMI’s Exports of Coconut Products and the Future of the Coconut
Industry
The above section highlighted that the RMI copra industry is very complicated and is heavily
dependent on subsidies for both the copra prices and transportation. Even though when the
industry was run by a private operator, it has been difficult for it to be competitive because of the
fluctuation in the global prices of coconut products. This section looks at RMI‘s exports of
coconut products and assesses how the country has been performing, including challenges
affecting the survival of the industry.
16
http://www.foodmarketexchange.com/datacenter/product/fruit/coconut/detail/dc_pi_ft_coconut0902.htm 17
The latest prices of coconut oil can be found on the oil world website http://www.oilworld.biz/. In April 2010, the
price for coconut oil was $890/MT (c.i.f Rdm).
60
It should be noted that Tobolar (through TCPPI) has been exporting coconut crude oil and copra
cake. In 2008, exports of crude coconut oil and copra cake were about $4.4 million. Copra meal,
used for animal feed (especially horses), goes to Australia at $160 per metric ton (mt). Copra
meal is also sold to farmers locally18
. The export revenue from the sale of crude coconut oil and
copra cake is lower than the cost of supplies to Tobolar, and without a price stabilisation subsidy
would provide a gross return to growers of less than 5 cents per lb.
By August 2009, Tobolar had exported about 3,200 mt and the price was $635 per mt (c.i.f) and
the total amount was about $2 million. In 2008, Tobolar exported 2,000 mt of oil at $1,450 per
mt (f.o.b) amounting to $2,8 million. The exports for 2007 were about 2,400 mt of crude coconut
oil at $765 per mt (c.i.f) and the total received was $1.8 million. Export of coconut oil is also
facing stiff competition from soya and peanut oil. As indicated above, India, Indonesia and
Philippines are major producers of coconut oil and they often hold their oil in large volumes and
sell it when the price is good following which the price drops suddenly. However, Tobolar has
no capacity to store large volumes of oil and sell when the prices are good because it can only
store 3,000 mt per year.
With regards to the future of the industry, the Government is looking at a bio-fuel project and the
coconut oil is expected to be used to run the generator and vehicles, with the ultimate objective
of reducing diesel imports. The Government believes that the bio-fuel project may allow it to
maintain the price of copra regardless of global market prices. Coconut oil can be mixed with
diesel to avoid clogging or wearing the engine. The ratio is normally 70 percent diesel and 30%
coconut oil. Vanuatu‘s power plant for instance runs on diesel oil, however, when the electricity
consumption reaches more than 75 kilo watts, the coconut oil kicks in. The Government of
Vanuatu is trying to save money for power generation through this arrangement and the savings
are used to reward the farmers. The farmers are contracted to supply copra per year in order to
reduce carbon emissions and import of diesel by the government.
RMI should consider adopting some of the practices that Vanuatu is using to produce power so
as to cut the import of diesel and provide more income to the producers. Furthermore, Guam is in
the process of introducing a charge/tax on all liquid fuel that is transhipped through its territory
to neighbouring Micronesian countries and this might have some consequences on the price of
fuel in RMI, further impacting on other costs. This further stresses the need for increased
production of, and reliance on coconut fuel as a means to circumvent additional costs.
The price of coconut fuel in 2010 was $2.95 per gallon, and Tobolar has the capacity to produce
about 15 000 gallons of coconut fuel per month. However, Tobolar is still facing cash- flow
problems and this makes it difficult for it to buy copra in outer islands. To this end, the
18
However, the data on copra meal exports was not readily available from Tobolar.
61
Government is planning to put a mobile bank on the ship and the Bank of Marshall Islands is
willing to facilitate this arrangement.
It was also noted that Tobolar wants to focus on adding value to coconut products and adopt a
zero waste coconut processing strategy. For example, the husk can be used to produce fibres for
ropes, rags, bags and coconut peat. Other products that can be manufactured include charcoal,
fuel, carbon for filtering water, bottled coconut water, vinegar, and coconut sugar. The meat of
fresh coconut can be used to manufacture virgin coconut oil. Senile coconut plants can also be
used for construction timbers for housing, high quality furniture, and high quality flooring
especially in the export markets.
Some of these activities can be done in the outer islands and the Government can facilitate
private sector participation through a pilot project. Interested individuals in the private sector can
use their own machines to produce oil to run their boats. Excess oil can be sold to Tobolar. The
Government needs to look for a grant to undertake the pilot project on coconut value addition
and once it is successful; it can be run on a commercial basis and be used as a model in other
outer islands.
RMI can also benefit from what other countries are doing in the coconut industry. For example,
in FSM, the Coconut Development Authority (CDA) in Pohnpei is running a pilot virgin coconut
oil project. The CDA also produces jam, coconut milk, virgin oil and ice cakes. In Fiji there are a
number of private companies that process coconut products into a number of different products.
The US is a lucrative market for virgin coconut oil. The other potential markets are Japan and
Germany. Coconut oil is special because it is healthy and can also be used for body massage and
as a fragrance.
However, before any projects are undertaken, it would be crucial to first assess the viability and
sustainability of the project to avoid a situation where the Government will end up channelling
money into a project that has no prospects of success as is the case with Tobolar.
3.1.4 Other Agricultural Products
Aside from the coconut industry, RMI has potential to produce small quantities of other
vegetables as well as nin and pandanus products. However, the R&D has not done much on
livestock because it has been concentrating on crop production. The objective of the Agricultural
Division is to assist farmers to manage soil fertility and increase crop production. The Laura
Farmers Association has about 102 farmers but only 82 are active. The Association has been
conducting workshops on farming.
62
The Republic of China (RoC) has been assisting RMI to grow vegetables. It has four extensions
and distributes seeds, fertilizer, sprayers and recordings. However, some farmers have been
complaining that the Taiwanese farmers are now competing with local farmers instead of
teaching the locals to grow vegetables. It was noted that when the Taiwanese farmers bring
products to the market, the prices drop suddenly and this affects other small farmers.
Farmers also face marketing constraints and need support in terms of post harvest handling of
products. However, some of the farmers have been selling their products to some restaurants and
fishing boats. For example, Marshall Islands Resort (MIR) was willing to buy vegetables from
farmers every month but there were problems in terms of consistency in supply and quality of the
products. Some local citizens expressed concerns that instead of supplying seedlings and
assisting farmers, the Taiwanese farmers were keeping the seedlings to themselves because they
also want to grow vegetables and supply MIR. However, others were concerned that if the
Taiwanese farmers go back, farmers will face problems in terms of accessing seedlings.
Some of the vegetables/crops that are produced include cabbage, radish, cucumbers, water
melons, egg plants, corn, papayas and green beans. Cucumbers and tomatoes have better returns.
Other crops and vegetables including noni and pandanus are also being produced mainly for
local consumption. The average price for local vegetables is about $1.00 per pound but imported
vegetables cost about $2.00 per pound. However, there is no accurate data on the quantity and
value of vegetables that are produced.
The other problem in RMI is that about 30% of the population have basic education with most
farmers needing assistance to apply for grants and loans. Furthermore, the loans that are provided
are too small ($800-1000) and farmers are not able to do much with such amounts. It was also
noted that some of the people leave for the US without paying back their loans. The other
challenge is that most of the farmers do not engage in farming as a business. They do not re-
invest in business and they easily become bankrupt because of lack of the relevant skills to
manage finances. This is exacerbated by too many social obligations.
Farming in RMI is challenging mainly because the soil is not fertile and even though composting
has been introduced, the pH level is very high (7) and not good for plant nutrients. The
Environmental Protection Agency law also prohibits farmers from using commercial fertilizer.
However, it was pointed out that the Taiwanese farmers use fertilizer and spraying. Some
farmers have tried to use copra cake to produce compost but it takes about three months to get
the compost ready. Farmers are also using organic manure, which is being sold at $1.00 per bag
but a small amount of fertilizer is needed even if organic manure is used. Chicken manure is also
being used.
63
Although it is estimated that agriculture contributes about 3.5% to GDP, there is no
disaggregated data on this. In addition to the other issues highlighted above, the key challenges
include logistics, marketing, lack of farming skills, lack of economies of scale, limited arable
land and lack of coordinated policies. All these factors make it difficult for RMI to produce its
own agricultural food products. It is estimated that agricultural products constitute about 20% of
total imports. Anecdotal evidence suggests that many people are moving away from local foods
and prefer imported products, some of which are not good for health. Some of the measures that
were taken to improve food security include the annual leadership meeting with local
government, outreach programs, ROC technical mission to provide free seedlings and assistance
to farmers as well as subsidies.
The Government needs to support farmers to grow local food products to ensure food security
and address some of the health problems that are associated with the consumption of unhealthy
imports. There is also a need to gather data on agricultural production, as well as imports and
exports of agricultural products to assess the scope for import substitution, where feasible.
RMI needs to develop the capacity to supply the local markets first and consider supplying niche
overseas markets. Investments in agriculture should be encouraged and the cargo services for
export of agricultural produce must also be improved. Quarantine issues need to be addressed to
ensure that no injurious pests and diseases are introduced. Exporters also need assistance to
comply with export requirements. There is also a need to improve the training facilities and
research in agriculture. The Government should encourage synergies in agricultural production
and ensure that the vessels collecting copra can also collect nin and bring it to a central place for
processing. The Government also needs to assist farmers to form associations and work together
to be able to produce products in reasonable quantities and in a consistent manner. The
Government should also promote foreign investment in agriculture and explore the possibilities
of contract farming. It was also noted that the Japanese market needs most agricultural products
in good quantities and on a regular basis but RMI does not have the capacity to supply.
The other reason why commercial agriculture is not developed is because farmers perceive the
returns from agriculture to be very low and slow to materialize compared with other activities
such as fishing, tourism, handicraft and non-traded services and Government employment.
Skewed wages in the public sector which are inflated by Compact assistance has turned the terms
of trade against agriculture and makes agricultural production less attractive. Lack of interest in
agriculture and the land tenure system have also adversely affected commercial farming.
The other limitations to increasing agricultural exports include infrequent transportation links,
insufficient freight space in air-transport (priority is given to passengers) and high freight costs,
uncertainty in shipment schedules, low volume of locally produced goods, inconsistency in the
supply of these goods, and the limited knowledge and skills of local producers. Some of the
constraints to agricultural production and exports include disconnections between producers and
buyers, lack of meaningful incentives to stimulate investment in the agriculture sector, stringent
64
quarantine and standards requirements from the importing countries and inadequate local
consumption attitude.
It was also noted that commercial agriculture is a high risk business due to variations in climate
and markets, and many farmers are denied loans because of the high risk involved in the
business. Reliable access to inputs especially seed and fertilizer is a problem and people lack
business and farming skills. All the problems identified above, need to be addressed urgently in
order to promote agricultural production.
3.1.5 Recommendations
(i) The Government must improve the transportation infrastructure and services and
facilitate the participation of the private sector in the business by creating a transparent
regulatory regime and level playing field in the sector.
(ii) The Ministry of Resources and Development, Tobolar and producer representatives must
establish quality standards for all post harvest activities and copra specifications.
(iii)The Government must explore possibilities of restructuring or privatizing Tobolar to
ensure that it is run on a commercial basis without draining public resources. However,
other ways of meeting the needs of the people in the outer islands must be explored.
(iv) The Government must promote the establishment of farmers associations to enable them
to produce products in a consistent manner.
(v) The Government must promote investment in agriculture and explore the possibility of
contract farming.
(vi) The Government must facilitate access to cheap loans, and the amount of loans must be
increased to a reasonable level and the procedures simplified.
(vii) R&D should facilitate value addition and decentralization of the coconut oil
extraction. The Government needs to secure donor funding to run a pilot project on value
addition to coconut products in the outer islands.
(viii) RMI must increase domestic food production and consumption and
establish/strengthen new farmers‘ markets to reduce the import bill and address the
health concerns.
(ix) RMI must re-plant coconuts plants as well as other plants that are used as raw materials
for handicraft, medicine, and other non-food products.
(x) The Government must strengthen measures to protect the country against the introduction
and spread of injurious pests and diseases.
(xi) RMI must take measures to increase exports of niche and value-added products
particularly noni and pandanus products and handicraft.
(xii) Technical and financial services should be provided to improve technical analysis,
testing and certification (including organic certification) of local products to ensure that
they meet domestic and international standards.
65
(xiii) RMI should promote consumption of local farm produce in the local schools,
hospitals, jails, cargo and passenger vessels and related state public functions serving
foods.
(xiv) Regulatory measures should be streamlined to promote conservation,
development of the natural resources and exports of local products from safe and feasible
projects.
3.2 Fisheries
This section will look at the major regional and international treaties governing the fisheries
industry in the Pacific, the major fishing nations in RMI‘s EEZ and RMI‘s efforts to develop
onshore industries and the measures that RMI needs to take to maximise the benefits from its
resources.
The marine resources of RMI are contained within an Exclusive Economic Zone (EEZ) covering
around 2 million square kilometres. The Marshall Islands Marine Resources Authority (MIMRA)
is responsible for the management and development of the tuna fishery in the EEZ. RMI is
located in the equatorial belt of the Western and Central Pacific Ocean, which is rich in tuna
resources, especially skipjack. However, in some years, the pole and line and purse seine surface
of skipjack are less rich due to oceanographic effects on water temperatures. RMI also hosts
many longline companies; however, yellowfin and bigeye from RMI do not fetch the highest
prices in the Japanese sashimi market due to the warm water temperatures. Many longline
fishermen from Japan prefer cold-water areas which are rich in higher value bluefin species as
well as yellowfin and bigeye with higher body-fat context and good flesh quality. Therefore, it is
not surprising that the tuna fishery in RMI is dominated by purse seine fishery, predominantly
distant water fleets catching mainly skipjack. Other fishing activities include long line and pole-
and line vessels fishing under various access arrangements.
3.2.1 Treaties Governing the Fishing Activities in RMI
The RMI is a party to regional and international fisheries management arrangements such as the
Parties to the Nauru Agreement19
(PNA), the United Nations Fish Stocks Agreement (UNFSA),
the Convention for the Conservation and Management of Highly Migratory Fish Stocks in the
Western and Central Pacific Ocean (WCPO), the Pacific Islands Forum Fisheries Agency (FFA),
the Multilateral Treaty on Fisheries Between Certain Governments of the Pacific Island States
and the Government of the United States of America (commonly referred to as the "U.S.
19
Solomon Islands, Tuvalu, Kiribati, Marshall Islands, Papua New Guinea, Nauru, Federated States of Micronesia
and Palau.
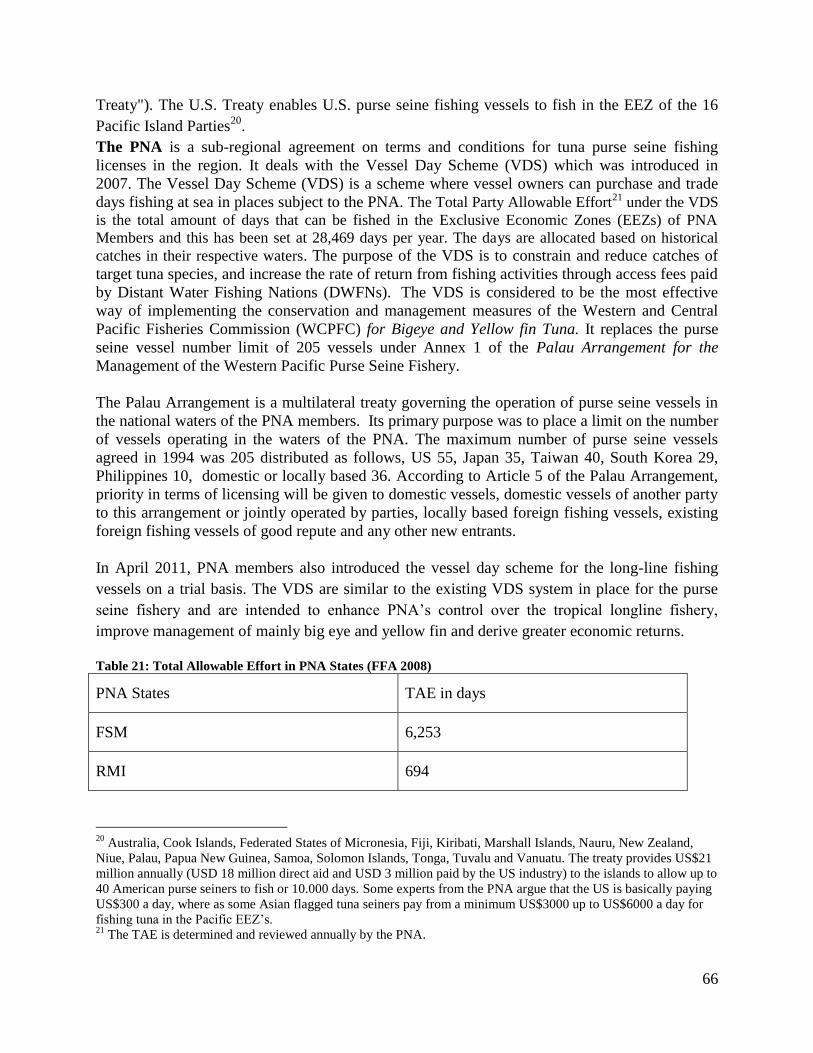
66
Treaty"). The U.S. Treaty enables U.S. purse seine fishing vessels to fish in the EEZ of the 16
Pacific Island Parties20
.
The PNA is a sub-regional agreement on terms and conditions for tuna purse seine fishing
licenses in the region. It deals with the Vessel Day Scheme (VDS) which was introduced in
2007. The Vessel Day Scheme (VDS) is a scheme where vessel owners can purchase and trade
days fishing at sea in places subject to the PNA. The Total Party Allowable Effort21 under the VDS
is the total amount of days that can be fished in the Exclusive Economic Zones (EEZs) of PNA
Members and this has been set at 28,469 days per year. The days are allocated based on historical
catches in their respective waters. The purpose of the VDS is to constrain and reduce catches of
target tuna species, and increase the rate of return from fishing activities through access fees paid
by Distant Water Fishing Nations (DWFNs). The VDS is considered to be the most effective
way of implementing the conservation and management measures of the Western and Central
Pacific Fisheries Commission (WCPFC) for Bigeye and Yellow fin Tuna. It replaces the purse
seine vessel number limit of 205 vessels under Annex 1 of the Palau Arrangement for the
Management of the Western Pacific Purse Seine Fishery.
The Palau Arrangement is a multilateral treaty governing the operation of purse seine vessels in
the national waters of the PNA members. Its primary purpose was to place a limit on the number
of vessels operating in the waters of the PNA. The maximum number of purse seine vessels
agreed in 1994 was 205 distributed as follows, US 55, Japan 35, Taiwan 40, South Korea 29,
Philippines 10, domestic or locally based 36. According to Article 5 of the Palau Arrangement,
priority in terms of licensing will be given to domestic vessels, domestic vessels of another party
to this arrangement or jointly operated by parties, locally based foreign fishing vessels, existing
foreign fishing vessels of good repute and any other new entrants.
In April 2011, PNA members also introduced the vessel day scheme for the long-line fishing
vessels on a trial basis. The VDS are similar to the existing VDS system in place for the purse
seine fishery and are intended to enhance PNA‘s control over the tropical longline fishery,
improve management of mainly big eye and yellow fin and derive greater economic returns.
Table 21: Total Allowable Effort in PNA States (FFA 2008)
PNA States TAE in days
FSM 6,253
RMI 694
20
Australia, Cook Islands, Federated States of Micronesia, Fiji, Kiribati, Marshall Islands, Nauru, New Zealand,
Niue, Palau, Papua New Guinea, Samoa, Solomon Islands, Tonga, Tuvalu and Vanuatu. The treaty provides US$21
million annually (USD 18 million direct aid and USD 3 million paid by the US industry) to the islands to allow up to
40 American purse seiners to fish or 10.000 days. Some experts from the PNA argue that the US is basically paying
US$300 a day, where as some Asian flagged tuna seiners pay from a minimum US$3000 up to US$6000 a day for
fishing tuna in the Pacific EEZ‘s. 21
The TAE is determined and reviewed annually by the PNA.
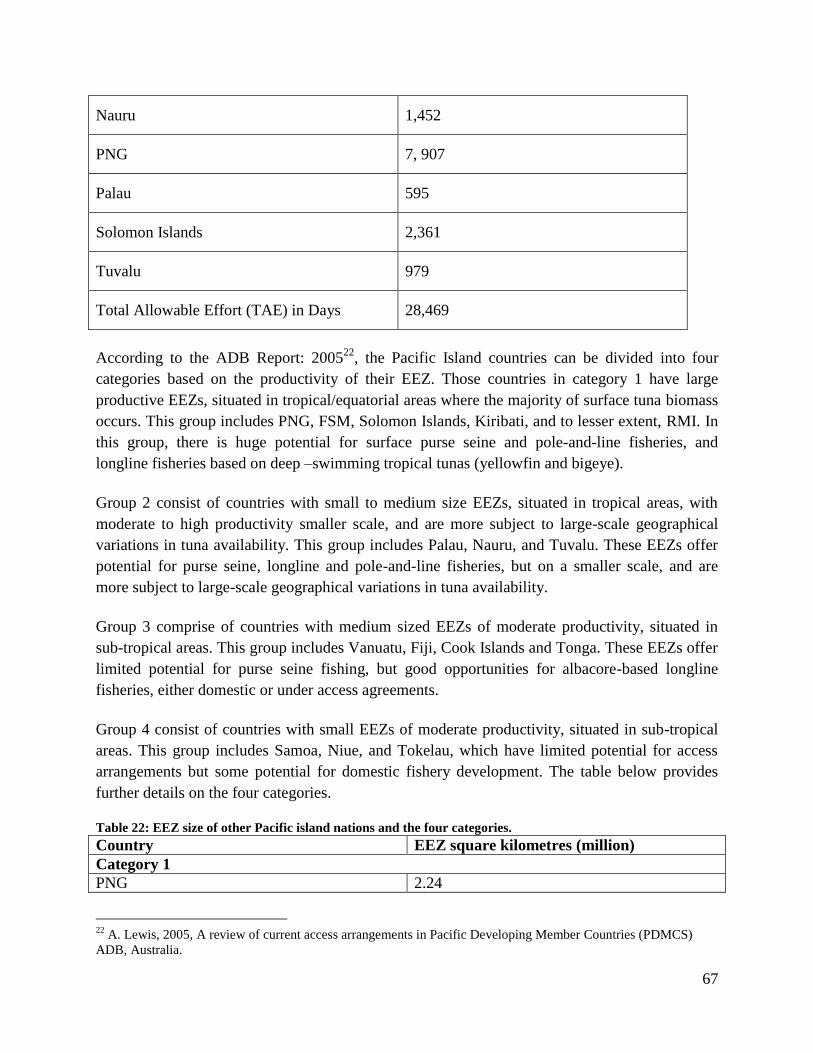
67
Nauru 1,452
PNG 7, 907
Palau 595
Solomon Islands 2,361
Tuvalu 979
Total Allowable Effort (TAE) in Days 28,469
According to the ADB Report: 200522
, the Pacific Island countries can be divided into four
categories based on the productivity of their EEZ. Those countries in category 1 have large
productive EEZs, situated in tropical/equatorial areas where the majority of surface tuna biomass
occurs. This group includes PNG, FSM, Solomon Islands, Kiribati, and to lesser extent, RMI. In
this group, there is huge potential for surface purse seine and pole-and-line fisheries, and
longline fisheries based on deep –swimming tropical tunas (yellowfin and bigeye).
Group 2 consist of countries with small to medium size EEZs, situated in tropical areas, with
moderate to high productivity smaller scale, and are more subject to large-scale geographical
variations in tuna availability. This group includes Palau, Nauru, and Tuvalu. These EEZs offer
potential for purse seine, longline and pole-and-line fisheries, but on a smaller scale, and are
more subject to large-scale geographical variations in tuna availability.
Group 3 comprise of countries with medium sized EEZs of moderate productivity, situated in
sub-tropical areas. This group includes Vanuatu, Fiji, Cook Islands and Tonga. These EEZs offer
limited potential for purse seine fishing, but good opportunities for albacore-based longline
fisheries, either domestic or under access agreements.
Group 4 consist of countries with small EEZs of moderate productivity, situated in sub-tropical
areas. This group includes Samoa, Niue, and Tokelau, which have limited potential for access
arrangements but some potential for domestic fishery development. The table below provides
further details on the four categories.
Table 22: EEZ size of other Pacific island nations and the four categories.
Country EEZ square kilometres (million)
Category 1
PNG 2.24
22
A. Lewis, 2005, A review of current access arrangements in Pacific Developing Member Countries (PDMCS)
ADB, Australia.
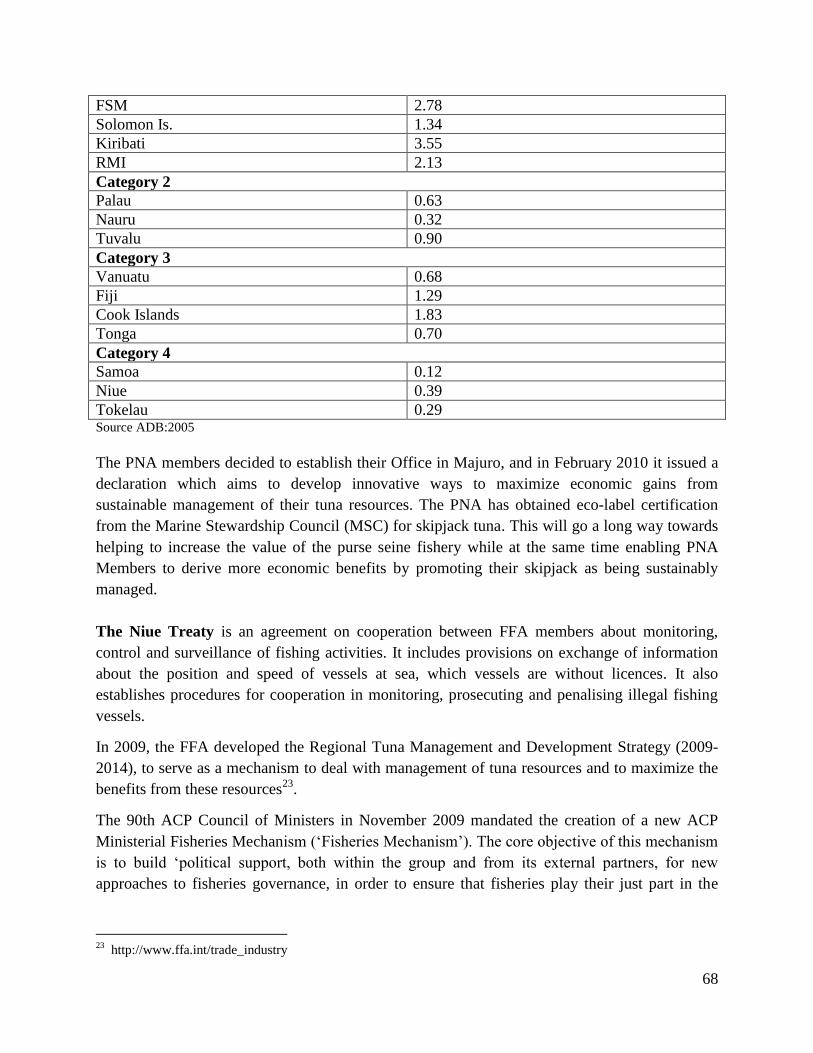
68
FSM 2.78
Solomon Is. 1.34
Kiribati 3.55
RMI 2.13
Category 2
Palau 0.63
Nauru 0.32
Tuvalu 0.90
Category 3
Vanuatu 0.68
Fiji 1.29
Cook Islands 1.83
Tonga 0.70
Category 4
Samoa 0.12
Niue 0.39
Tokelau 0.29 Source ADB:2005
The PNA members decided to establish their Office in Majuro, and in February 2010 it issued a
declaration which aims to develop innovative ways to maximize economic gains from
sustainable management of their tuna resources. The PNA has obtained eco-label certification
from the Marine Stewardship Council (MSC) for skipjack tuna. This will go a long way towards
helping to increase the value of the purse seine fishery while at the same time enabling PNA
Members to derive more economic benefits by promoting their skipjack as being sustainably
managed.
The Niue Treaty is an agreement on cooperation between FFA members about monitoring,
control and surveillance of fishing activities. It includes provisions on exchange of information
about the position and speed of vessels at sea, which vessels are without licences. It also
establishes procedures for cooperation in monitoring, prosecuting and penalising illegal fishing
vessels.
In 2009, the FFA developed the Regional Tuna Management and Development Strategy (2009-
2014), to serve as a mechanism to deal with management of tuna resources and to maximize the
benefits from these resources23
.
The 90th ACP Council of Ministers in November 2009 mandated the creation of a new ACP
Ministerial Fisheries Mechanism (‗Fisheries Mechanism‘). The core objective of this mechanism
is to build ‗political support, both within the group and from its external partners, for new
approaches to fisheries governance, in order to ensure that fisheries play their just part in the
23
http://www.ffa.int/trade_industry
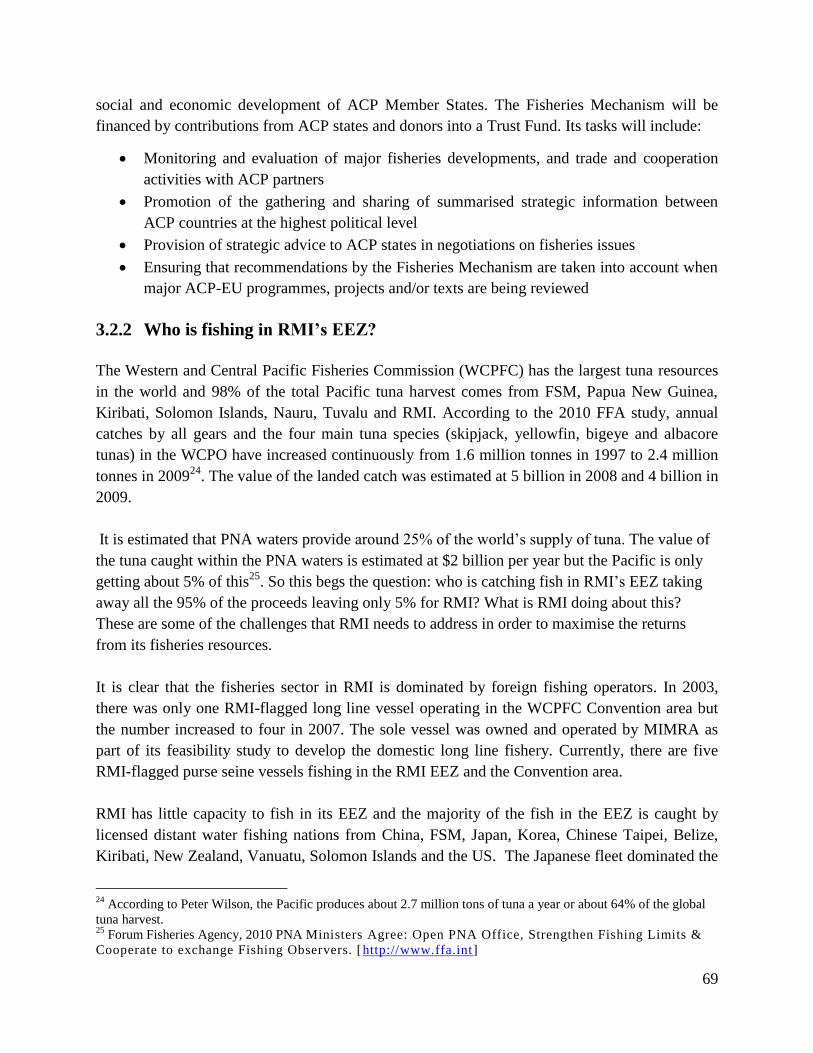
69
social and economic development of ACP Member States. The Fisheries Mechanism will be
financed by contributions from ACP states and donors into a Trust Fund. Its tasks will include:
Monitoring and evaluation of major fisheries developments, and trade and cooperation
activities with ACP partners
Promotion of the gathering and sharing of summarised strategic information between
ACP countries at the highest political level
Provision of strategic advice to ACP states in negotiations on fisheries issues
Ensuring that recommendations by the Fisheries Mechanism are taken into account when
major ACP-EU programmes, projects and/or texts are being reviewed
3.2.2 Who is fishing in RMI’s EEZ?
The Western and Central Pacific Fisheries Commission (WCPFC) has the largest tuna resources
in the world and 98% of the total Pacific tuna harvest comes from FSM, Papua New Guinea,
Kiribati, Solomon Islands, Nauru, Tuvalu and RMI. According to the 2010 FFA study, annual
catches by all gears and the four main tuna species (skipjack, yellowfin, bigeye and albacore
tunas) in the WCPO have increased continuously from 1.6 million tonnes in 1997 to 2.4 million
tonnes in 200924
. The value of the landed catch was estimated at 5 billion in 2008 and 4 billion in
2009.
It is estimated that PNA waters provide around 25% of the world‘s supply of tuna. The value of
the tuna caught within the PNA waters is estimated at $2 billion per year but the Pacific is only
getting about 5% of this25
. So this begs the question: who is catching fish in RMI‘s EEZ taking
away all the 95% of the proceeds leaving only 5% for RMI? What is RMI doing about this?
These are some of the challenges that RMI needs to address in order to maximise the returns
from its fisheries resources.
It is clear that the fisheries sector in RMI is dominated by foreign fishing operators. In 2003,
there was only one RMI-flagged long line vessel operating in the WCPFC Convention area but
the number increased to four in 2007. The sole vessel was owned and operated by MIMRA as
part of its feasibility study to develop the domestic long line fishery. Currently, there are five
RMI-flagged purse seine vessels fishing in the RMI EEZ and the Convention area.
RMI has little capacity to fish in its EEZ and the majority of the fish in the EEZ is caught by
licensed distant water fishing nations from China, FSM, Japan, Korea, Chinese Taipei, Belize,
Kiribati, New Zealand, Vanuatu, Solomon Islands and the US. The Japanese fleet dominated the
24
According to Peter Wilson, the Pacific produces about 2.7 million tons of tuna a year or about 64% of the global
tuna harvest. 25
Forum Fisheries Agency, 2010 PNA Ministers Agree: Open PNA Office, Strengthen Fishing Limits &
Cooperate to exchange Fishing Observers. [http://www.ffa.int]
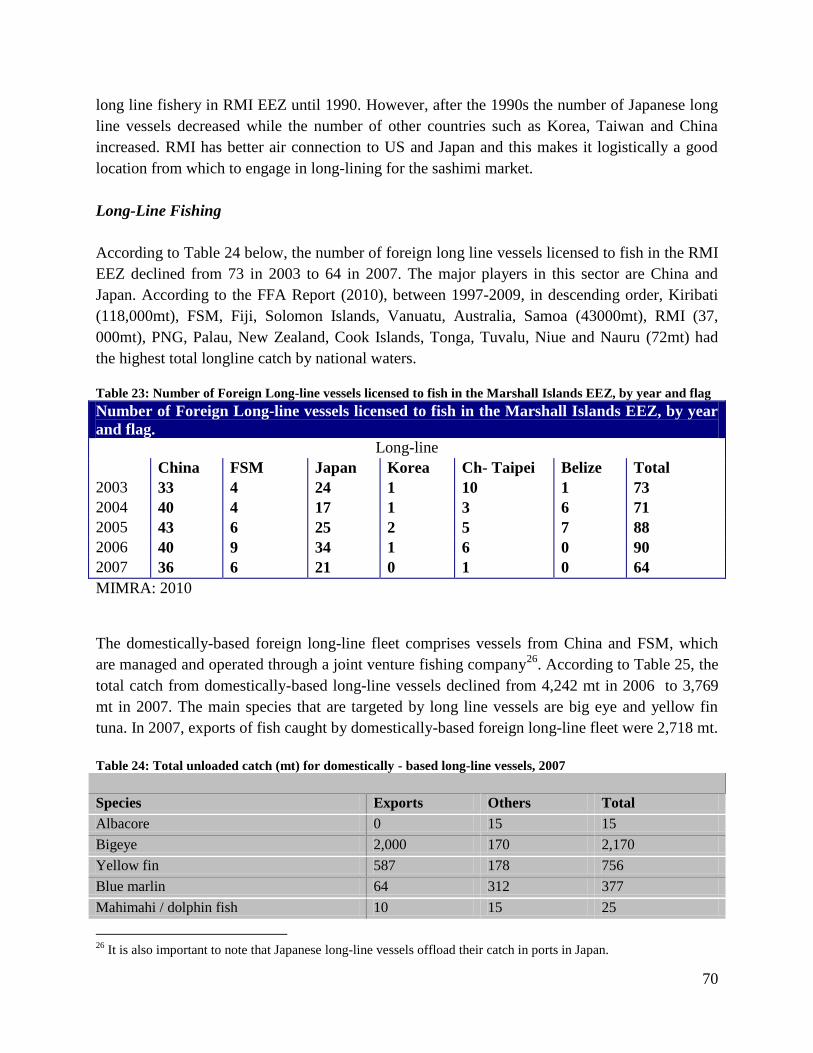
70
long line fishery in RMI EEZ until 1990. However, after the 1990s the number of Japanese long
line vessels decreased while the number of other countries such as Korea, Taiwan and China
increased. RMI has better air connection to US and Japan and this makes it logistically a good
location from which to engage in long-lining for the sashimi market.
Long-Line Fishing
According to Table 24 below, the number of foreign long line vessels licensed to fish in the RMI
EEZ declined from 73 in 2003 to 64 in 2007. The major players in this sector are China and
Japan. According to the FFA Report (2010), between 1997-2009, in descending order, Kiribati
(118,000mt), FSM, Fiji, Solomon Islands, Vanuatu, Australia, Samoa (43000mt), RMI (37,
000mt), PNG, Palau, New Zealand, Cook Islands, Tonga, Tuvalu, Niue and Nauru (72mt) had
the highest total longline catch by national waters.
Table 23: Number of Foreign Long-line vessels licensed to fish in the Marshall Islands EEZ, by year and flag
Number of Foreign Long-line vessels licensed to fish in the Marshall Islands EEZ, by year
and flag.
Long-line
China FSM Japan Korea Ch- Taipei Belize Total
2003 33 4 24 1 10 1 73
2004 40 4 17 1 3 6 71
2005 43 6 25 2 5 7 88
2006 40 9 34 1 6 0 90
2007 36 6 21 0 1 0 64
MIMRA: 2010
The domestically-based foreign long-line fleet comprises vessels from China and FSM, which
are managed and operated through a joint venture fishing company26
. According to Table 25, the
total catch from domestically-based long-line vessels declined from 4,242 mt in 2006 to 3,769
mt in 2007. The main species that are targeted by long line vessels are big eye and yellow fin
tuna. In 2007, exports of fish caught by domestically-based foreign long-line fleet were 2,718 mt.
Table 24: Total unloaded catch (mt) for domestically - based long-line vessels, 2007
Species Exports Others Total
Albacore 0 15 15
Bigeye 2,000 170 2,170
Yellow fin 587 178 756
Blue marlin 64 312 377
Mahimahi / dolphin fish 10 15 25
26
It is also important to note that Japanese long-line vessels offload their catch in ports in Japan.
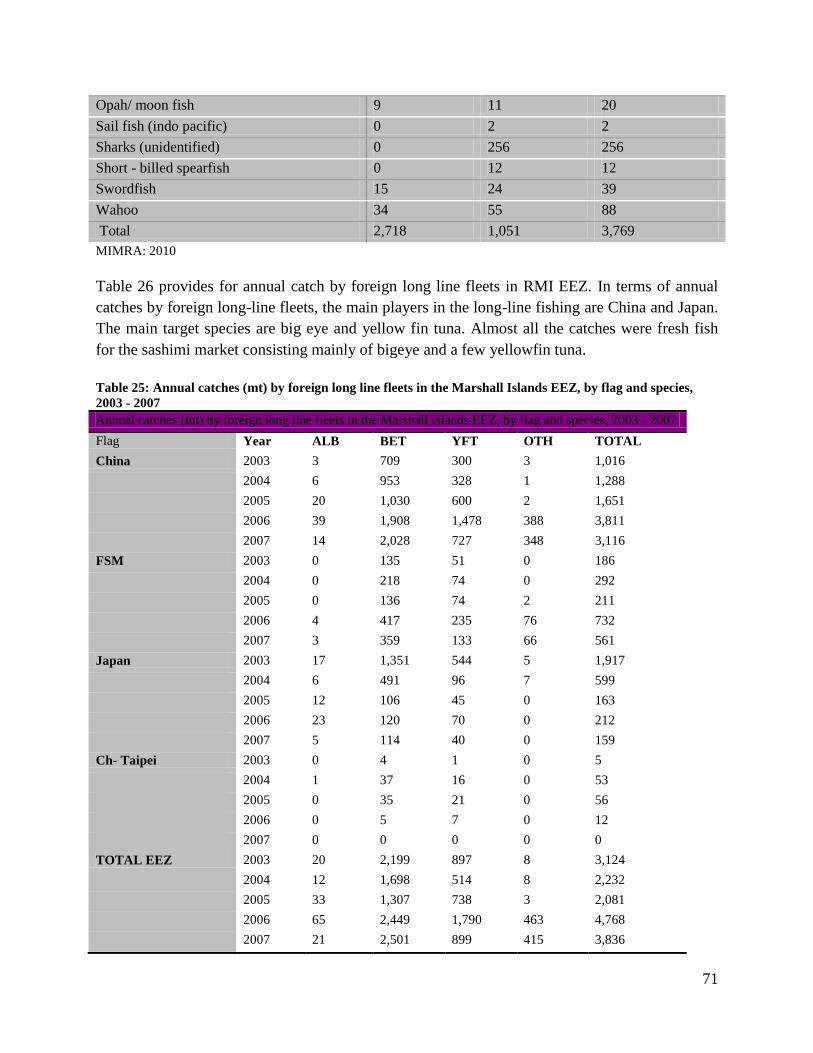
71
Opah/ moon fish 9 11 20
Sail fish (indo pacific) 0 2 2
Sharks (unidentified) 0 256 256
Short - billed spearfish 0 12 12
Swordfish 15 24 39
Wahoo 34 55 88
Total 2,718 1,051 3,769
MIMRA: 2010
Table 26 provides for annual catch by foreign long line fleets in RMI EEZ. In terms of annual
catches by foreign long-line fleets, the main players in the long-line fishing are China and Japan.
The main target species are big eye and yellow fin tuna. Almost all the catches were fresh fish
for the sashimi market consisting mainly of bigeye and a few yellowfin tuna.
Table 25: Annual catches (mt) by foreign long line fleets in the Marshall Islands EEZ, by flag and species,
2003 - 2007
Annual catches (mt) by foreign long line fleets in the Marshall Islands EEZ, by flag and species, 2003 - 2007.
Flag Year ALB BET YFT OTH TOTAL
China 2003 3 709 300 3 1,016
2004 6 953 328 1 1,288
2005 20 1,030 600 2 1,651
2006 39 1,908 1,478 388 3,811
2007 14 2,028 727 348 3,116
FSM 2003 0 135 51 0 186
2004 0 218 74 0 292
2005 0 136 74 2 211
2006 4 417 235 76 732
2007 3 359 133 66 561
Japan 2003 17 1,351 544 5 1,917
2004 6 491 96 7 599
2005 12 106 45 0 163
2006 23 120 70 0 212
2007 5 114 40 0 159
Ch- Taipei 2003 0 4 1 0 5
2004 1 37 16 0 53
2005 0 35 21 0 56
2006 0 5 7 0 12
2007 0 0 0 0 0
TOTAL EEZ 2003 20 2,199 897 8 3,124
2004 12 1,698 514 8 2,232
2005 33 1,307 738 3 2,081
2006 65 2,449 1,790 463 4,768
2007 21 2,501 899 415 3,836
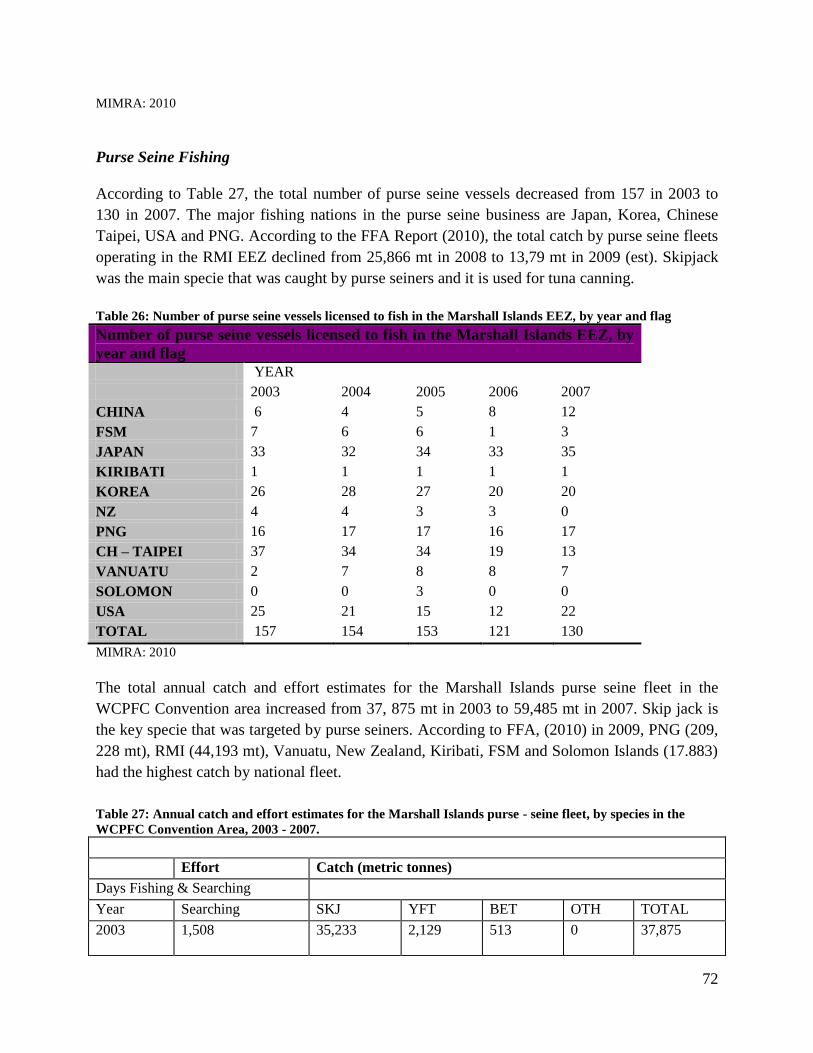
72
MIMRA: 2010
Purse Seine Fishing
According to Table 27, the total number of purse seine vessels decreased from 157 in 2003 to
130 in 2007. The major fishing nations in the purse seine business are Japan, Korea, Chinese
Taipei, USA and PNG. According to the FFA Report (2010), the total catch by purse seine fleets
operating in the RMI EEZ declined from 25,866 mt in 2008 to 13,79 mt in 2009 (est). Skipjack
was the main specie that was caught by purse seiners and it is used for tuna canning.
Table 26: Number of purse seine vessels licensed to fish in the Marshall Islands EEZ, by year and flag
Number of purse seine vessels licensed to fish in the Marshall Islands EEZ, by
year and flag
YEAR
2003 2004 2005 2006 2007
CHINA 6 4 5 8 12
FSM 7 6 6 1 3
JAPAN 33 32 34 33 35
KIRIBATI 1 1 1 1 1
KOREA 26 28 27 20 20
NZ 4 4 3 3 0
PNG 16 17 17 16 17
CH – TAIPEI 37 34 34 19 13
VANUATU 2 7 8 8 7
SOLOMON 0 0 3 0 0
USA 25 21 15 12 22
TOTAL 157 154 153 121 130
MIMRA: 2010
The total annual catch and effort estimates for the Marshall Islands purse seine fleet in the
WCPFC Convention area increased from 37, 875 mt in 2003 to 59,485 mt in 2007. Skip jack is
the key specie that was targeted by purse seiners. According to FFA, (2010) in 2009, PNG (209,
228 mt), RMI (44,193 mt), Vanuatu, New Zealand, Kiribati, FSM and Solomon Islands (17.883)
had the highest catch by national fleet.
Table 27: Annual catch and effort estimates for the Marshall Islands purse - seine fleet, by species in the
WCPFC Convention Area, 2003 - 2007.
Effort Catch (metric tonnes)
Days Fishing & Searching
Year Searching SKJ YFT BET OTH TOTAL
2003 1,508
35,233 2,129 513 0 37,875
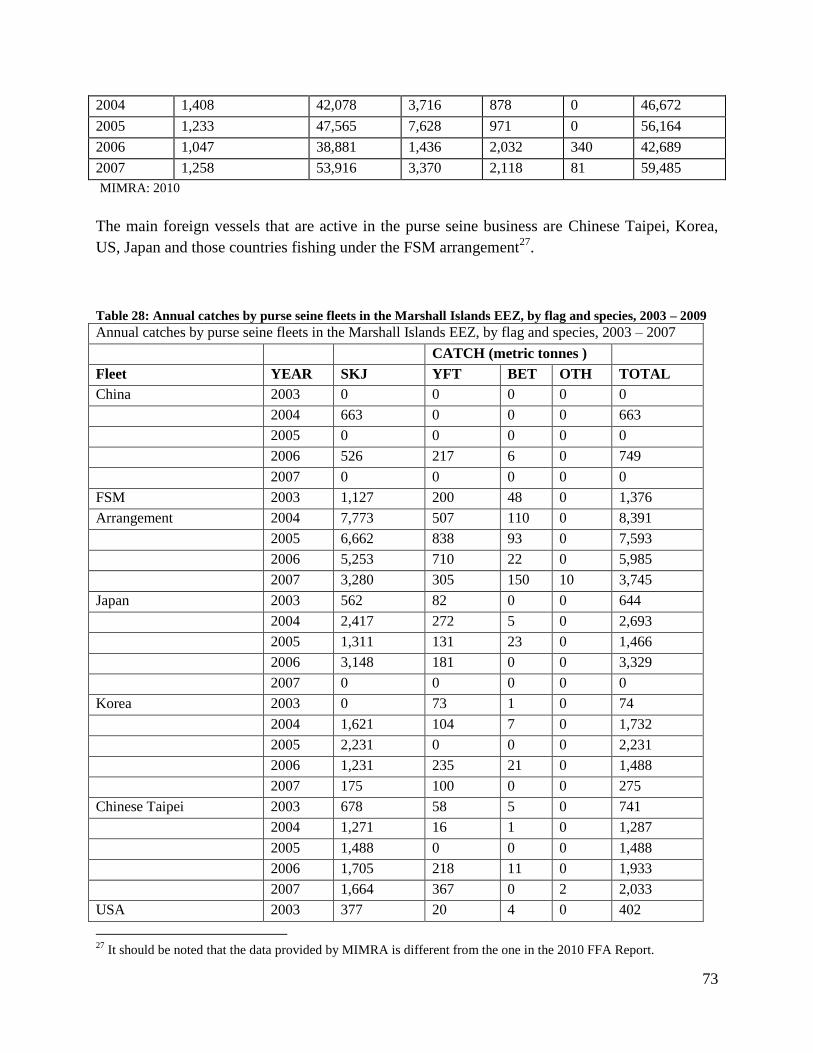
73
2004 1,408 42,078 3,716 878 0 46,672
2005 1,233 47,565 7,628 971 0 56,164
2006 1,047 38,881 1,436 2,032 340 42,689
2007 1,258 53,916 3,370 2,118 81 59,485
MIMRA: 2010
The main foreign vessels that are active in the purse seine business are Chinese Taipei, Korea,
US, Japan and those countries fishing under the FSM arrangement27
.
Table 28: Annual catches by purse seine fleets in the Marshall Islands EEZ, by flag and species, 2003 – 2009
Annual catches by purse seine fleets in the Marshall Islands EEZ, by flag and species, 2003 – 2007
CATCH (metric tonnes )
Fleet YEAR SKJ YFT BET OTH TOTAL
China 2003 0 0 0 0 0
2004 663 0 0 0 663
2005 0 0 0 0 0
2006 526 217 6 0 749
2007 0 0 0 0 0
FSM 2003 1,127 200 48 0 1,376
Arrangement 2004 7,773 507 110 0 8,391
2005 6,662 838 93 0 7,593
2006 5,253 710 22 0 5,985
2007 3,280 305 150 10 3,745
Japan 2003 562 82 0 0 644
2004 2,417 272 5 0 2,693
2005 1,311 131 23 0 1,466
2006 3,148 181 0 0 3,329
2007 0 0 0 0 0
Korea 2003 0 73 1 0 74
2004 1,621 104 7 0 1,732
2005 2,231 0 0 0 2,231
2006 1,231 235 21 0 1,488
2007 175 100 0 0 275
Chinese Taipei 2003 678 58 5 0 741
2004 1,271 16 1 0 1,287
2005 1,488 0 0 0 1,488
2006 1,705 218 11 0 1,933
2007 1,664 367 0 2 2,033
USA 2003 377 20 4 0 402
27
It should be noted that the data provided by MIMRA is different from the one in the 2010 FFA Report.
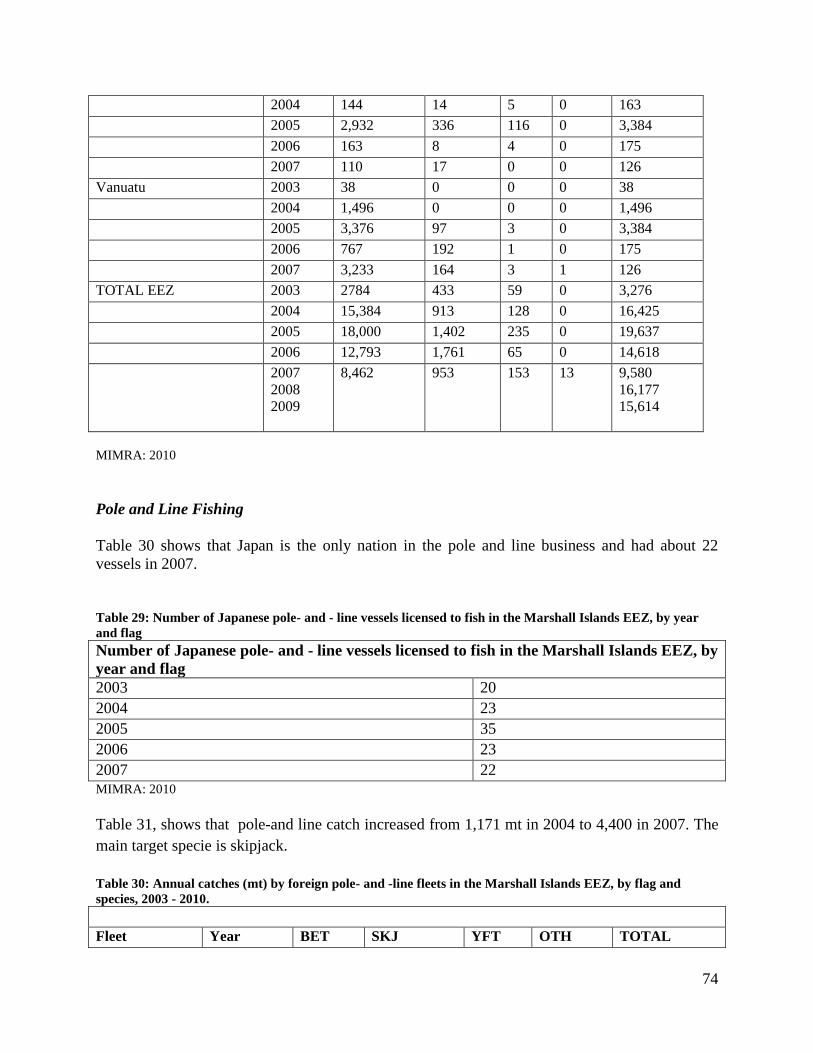
74
2004 144 14 5 0 163
2005 2,932 336 116 0 3,384
2006 163 8 4 0 175
2007 110 17 0 0 126
Vanuatu 2003 38 0 0 0 38
2004 1,496 0 0 0 1,496
2005 3,376 97 3 0 3,384
2006 767 192 1 0 175
2007 3,233 164 3 1 126
TOTAL EEZ 2003 2784 433 59 0 3,276
2004 15,384 913 128 0 16,425
2005 18,000 1,402 235 0 19,637
2006 12,793 1,761 65 0 14,618
2007
2008
2009
8,462 953 153 13 9,580
16,177
15,614
MIMRA: 2010
Pole and Line Fishing
Table 30 shows that Japan is the only nation in the pole and line business and had about 22
vessels in 2007.
Table 29: Number of Japanese pole- and - line vessels licensed to fish in the Marshall Islands EEZ, by year
and flag
Number of Japanese pole- and - line vessels licensed to fish in the Marshall Islands EEZ, by
year and flag
2003 20
2004 23
2005 35
2006 23
2007 22
MIMRA: 2010
Table 31, shows that pole-and line catch increased from 1,171 mt in 2004 to 4,400 in 2007. The
main target specie is skipjack.
Table 30: Annual catches (mt) by foreign pole- and -line fleets in the Marshall Islands EEZ, by flag and
species, 2003 - 2010.
Fleet Year BET SKJ YFT OTH TOTAL

75
JAPAN 2003 0 92 2 0 94
2004 0 1,152 9 11 1,171
2005 0 653 1 1 655
2006 0 978 8 1 987
2007 0 4,400 1 0 4,400
2008 2,467 2,467
2009 419 419
2010 2,056 2,056
Source: MIMRA: 2010
Fishing Access Fees
From all the fishing activities that are taking place in the RMI EEZ, RMI is getting very little in
terms of access fees. According to Table 32 fishing rights fees declined from $2, 7 million in
2000 to $1.38 million in 2009. However, the access fees is estimated to have increased
significantly in 2010 and 2011 as a result of the implementation of the VDS.
Table 31: Total fish catch in RMI EEZ, by method, and fishing license fees received: 2000-2010 Method of catch (Metric tons)
Long line Purse seine Pole and line Total Fishing license (US$)
2000 2,110 20,403 8,208 30,721 2,750,700
2001 4,176 36,324 16,243 56,743 898,400
2002 2,090 28,915 7,316 38,321 1,086,018
2003 3,100 3,381 94 6,575 1,178,802
2004 2,232 16,425 1,171 19,828 855,340
2005 4,526 19,637 655 24,818 1,354,000
2006 4,768 14,618 987 20,373 1,614,222
2007 3,836 9,580 4,400 17,816 751,799
2008 4,473 16,177 2,467 23,117 1,730,986
2009 4,930 15,614 419 20,963 1,382,000
2010 1 4,960 8,867 2,056 15,883 1,029,152
1. 2010 data are provisional
Total Catch and Value of fish caught in RMI EEZ
According to the FFA 2010 Report28
, the total amount of tuna that was caught in the waters of
FFA members increased from 773,918 metric tonnes in 2000 to 1,137,248 metric tonnes in 2009
but about 1,098,280mt (96.6%) were caught in PNA waters. About 728, 697mt were caught in
other countries such as American Samoa, French Polynesia, Indonesia, Japan, Mathew and
28
The report aims to provide estimates of the value of catches of the four main commercial species caught in the
Western and Central Pacific Fisheries Commission (WCPFC) Convention Area, that is, albacore (Thunnus
alalunga), bigeye (Thunnus obesus), skipjack (Katsuwonus pelamis) and yellowfin (Thunnus albacares). Caution
should be used in interpreting the statistics presented; in particular, catch estimates for
2009 are preliminary in particular for the longlines.

76
Hunter, New Caledonia, Philippines, Pitcairn, Taiwan, US + territories (ex Am Sam), Wallis
and Futuna in 2009. About 564, 430mt were caught in the surrounding high seas29
. The total
tuna that was caught in FFA members, other countries fishing in the WCPO and the surrounding
high seas was 2, 430, 370 mt. Full details are indicated below on Table 33.
In 2009, the following PNA members had the biggest catch in their national waters: PNG,
Kiribati, FSM, Solomon Islands, Tuvalu, Nauru, RMI and Palau.
Table 32: The total catch in FFA waters and PNA waters respectively, FY2000 to FY2009
Catch by national waters
All values in metric tonnes
2000 2001 2002 2003 2004 2005 2006 2007 2008 2009
All gears
FFA members
FSM 146,476 106,616 84,734 229,800 150,946 237,212 215,871 162,267 90,669 110,360
Kiribati 148,161 272,850 362,824 89,962 114,606 211,932 174,986 179,770 233,378 323,036
Marshall Islands 34,727 62,885 41,904 7,008 20,506 23,307 19,448 20,368 29,835 17,842
Nauru 66,958 61,606 129,514 21,519 68,919 51,730 58,747 67,030 59,181 55,398
PNG 278,520 160,100 171,618 394,284 331,192 304,844 436,499 476,188 471,539 424,095
Palau 2,374 1,731 800 4,430 7,050 4,885 8,687 3,804 7,809 1,894
Solomon Islands 9,061 37,145 24,708 68,916 111,626 101,121 123,581 113,922 120,408 98,113
Tuvalu 40,889 23,549 30,496 3,901 20,975 15,680 15,400 45,138 40,937 67,541
PNA Sub Total
727,166 726,481 846,597 819,820 825,820 950,711 1,053,219 1,068,487 1,053,756 1,098,280
Australia 6,885 5,100 5,061 5,256 3,821 2,737 4,850 4,264 3,940 2,977
Cook Islands 394 1,495 4,719 1,954 2,827 3,012 2,372 2,453 3,151 5,571
Fiji 8,169 11,445 9,391 7,661 16,767 5,931 7,324 5,631 8,573 6,322
New Zealand 17,489 10,711 10,942 11,061 16,583 14,569 8,522 12,880 12,621 6,488
Samoa 3,224 5,749 4,392 1,799 1,824 1,486 2,307 3,326 2,761 3,370
Tokelau 5,626 1,241 6,862 34 982 5,101 1,109 967 4,081 6,674
Tonga 1,186 1,514 1,338 1,187 420 610 816 878 597 323
29
High Seas Codes: I1 Doughnut hole between PNG and FSM, I2 Doughnut hole between FSM, Solomon Islands,
Kiribati, Marshall Is. Nauru, Tuvalu, I3 International waters east of the Philippines to Guam, above FSM, around
Marshalls, up to 20°N and west of 175°E (not including areas I1, I2 and I8), I4 International waters east of Marshall
Islands and Kiribati, from the equator up to 20°N and east of 175°E to 170°W, I5 International waters around Line
Group from the equator up to 20°N, east of 170°W to 150°W, and south of the equator to 20°S from 155°W-130°W,
I6 The reminder of International waters not covered above in the Northern hemisphere of the WCP-CA, I7 The
reminder of International waters not covered above in the Southern hemisphere of the WCP-CA, I8 International
waters bordered by Fiji, Solomon Is and Vanuatu, I9 International waters between the Cook Islands and French
Polynesia, H4 International waters between Tuvalu, Phoenix and Tokelau, from the equator down to 10°S and east
of 175°E to 170°W, H5 International waters between Phoenix and Line Groups, from the equator down to 10°S, east
of 170°W to 155°W (excludes IW between CK and PF = Area "I9")
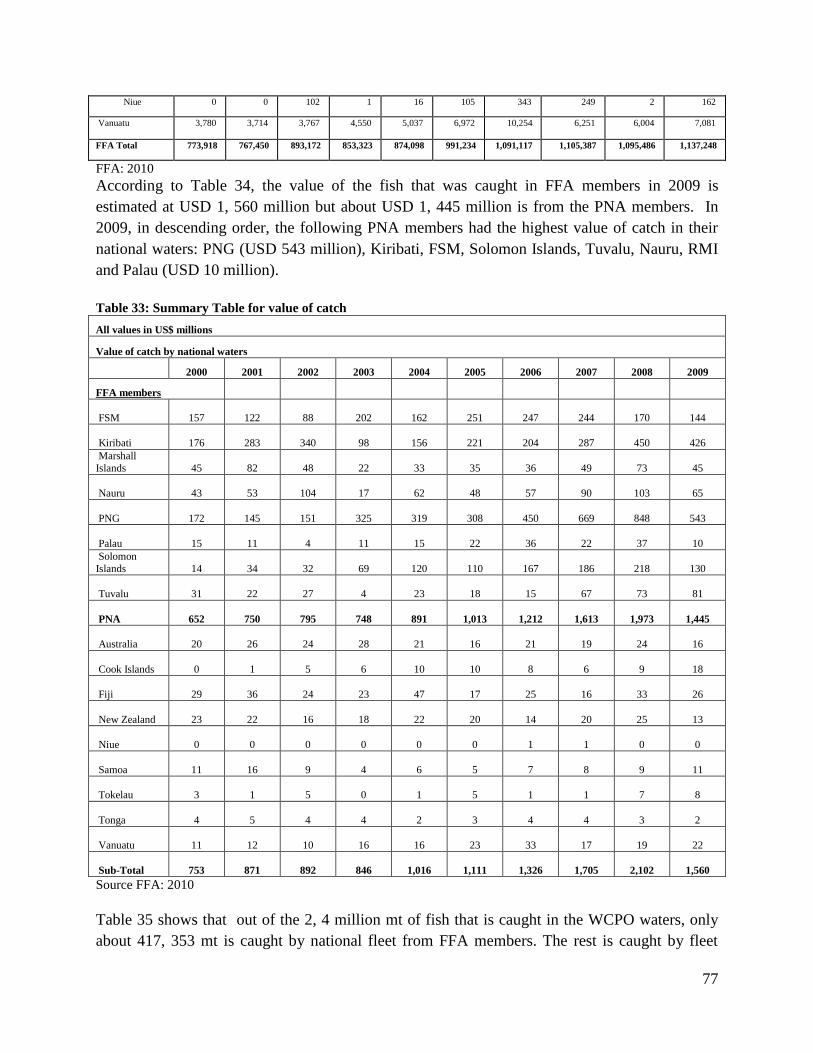
77
Niue 0 0 102 1 16 105 343 249 2 162
Vanuatu
3,780 3,714 3,767 4,550 5,037 6,972 10,254 6,251 6,004 7,081
FFA Total 773,918 767,450 893,172 853,323 874,098 991,234 1,091,117 1,105,387 1,095,486 1,137,248
FFA: 2010
According to Table 34, the value of the fish that was caught in FFA members in 2009 is
estimated at USD 1, 560 million but about USD 1, 445 million is from the PNA members. In
2009, in descending order, the following PNA members had the highest value of catch in their
national waters: PNG (USD 543 million), Kiribati, FSM, Solomon Islands, Tuvalu, Nauru, RMI
and Palau (USD 10 million).
Table 33: Summary Table for value of catch
All values in US$ millions
Value of catch by national waters
2000 2001 2002 2003 2004 2005 2006 2007 2008 2009
FFA members
FSM
157
122
88
202
162
251
247
244
170
144
Kiribati
176
283
340
98
156
221
204
287
450
426
Marshall
Islands
45
82
48
22
33
35
36
49
73
45
Nauru
43
53
104
17
62
48
57
90
103
65
PNG
172
145
151
325
319
308
450
669
848
543
Palau
15
11
4
11
15
22
36
22
37
10
Solomon
Islands
14
34
32
69
120
110
167
186
218
130
Tuvalu
31
22
27
4
23
18
15
67
73
81
PNA
652
750
795
748
891
1,013
1,212
1,613
1,973
1,445
Australia
20
26
24
28
21
16
21
19
24
16
Cook Islands
0
1
5
6
10
10
8
6
9
18
Fiji
29
36
24
23
47
17
25
16
33
26
New Zealand
23
22
16
18
22
20
14
20
25
13
Niue
0
0
0
0
0
0
1
1
0
0
Samoa
11
16
9
4
6
5
7
8
9
11
Tokelau
3
1
5
0
1
5
1
1
7
8
Tonga
4
5
4
4
2
3
4
4
3
2
Vanuatu
11
12
10
16
16
23
33
17
19
22
Sub-Total
753
871
892
846
1,016
1,111
1,326
1,705
2,102
1,560
Source FFA: 2010
Table 35 shows that out of the 2, 4 million mt of fish that is caught in the WCPO waters, only
about 417, 353 mt is caught by national fleet from FFA members. The rest is caught by fleet
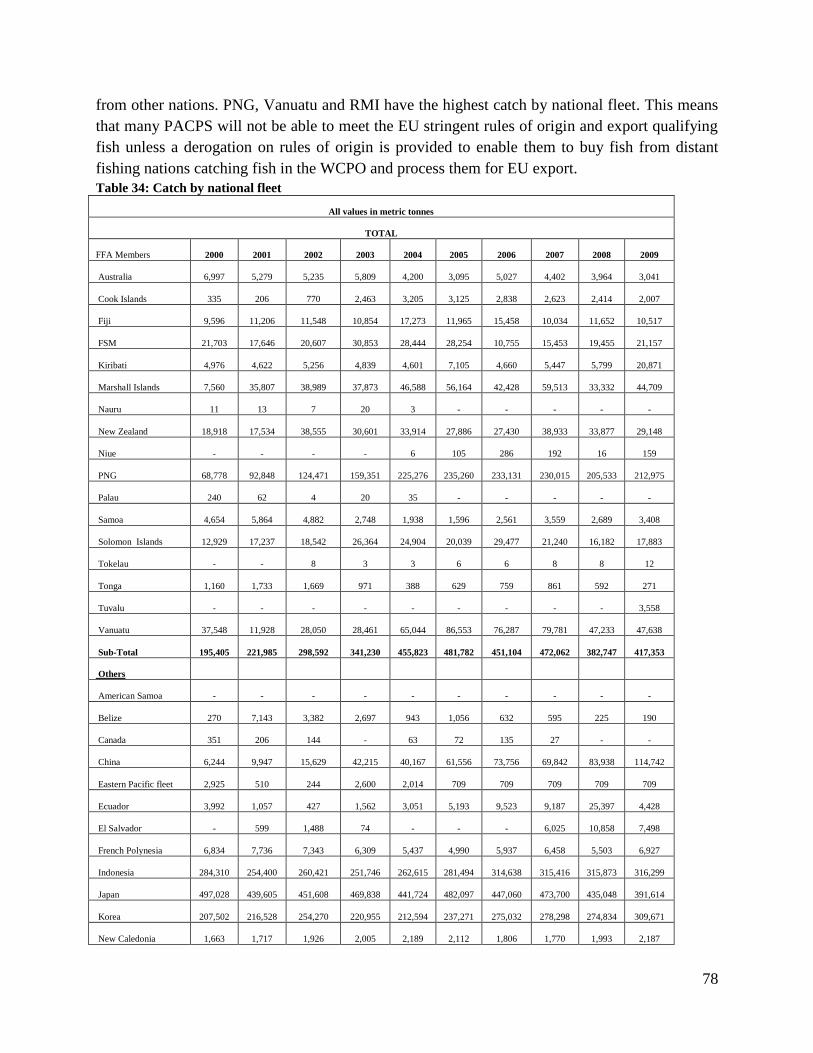
78
from other nations. PNG, Vanuatu and RMI have the highest catch by national fleet. This means
that many PACPS will not be able to meet the EU stringent rules of origin and export qualifying
fish unless a derogation on rules of origin is provided to enable them to buy fish from distant
fishing nations catching fish in the WCPO and process them for EU export.
Table 34: Catch by national fleet
All values in metric tonnes
TOTAL
FFA Members 2000 2001 2002 2003 2004 2005 2006 2007 2008 2009
Australia
6,997
5,279
5,235
5,809
4,200
3,095
5,027
4,402
3,964
3,041
Cook Islands
335
206
770
2,463
3,205
3,125
2,838
2,623
2,414
2,007
Fiji
9,596
11,206
11,548
10,854
17,273
11,965
15,458
10,034
11,652
10,517
FSM
21,703
17,646
20,607
30,853
28,444
28,254
10,755
15,453
19,455
21,157
Kiribati
4,976
4,622
5,256
4,839
4,601
7,105
4,660
5,447
5,799
20,871
Marshall Islands
7,560
35,807
38,989
37,873
46,588
56,164
42,428
59,513
33,332
44,709
Nauru
11
13
7
20
3
-
-
-
-
-
New Zealand
18,918
17,534
38,555
30,601
33,914
27,886
27,430
38,933
33,877
29,148
Niue
-
-
-
-
6
105
286
192
16
159
PNG
68,778
92,848
124,471
159,351
225,276
235,260
233,131
230,015
205,533
212,975
Palau
240
62
4
20
35
-
-
-
-
-
Samoa
4,654
5,864
4,882
2,748
1,938
1,596
2,561
3,559
2,689
3,408
Solomon Islands
12,929
17,237
18,542
26,364
24,904
20,039
29,477
21,240
16,182
17,883
Tokelau
-
-
8
3
3
6
6
8
8
12
Tonga
1,160
1,733
1,669
971
388
629
759
861
592
271
Tuvalu
-
-
-
-
-
-
-
-
-
3,558
Vanuatu
37,548
11,928
28,050
28,461
65,044
86,553
76,287
79,781
47,233
47,638
Sub-Total
195,405
221,985
298,592
341,230
455,823
481,782
451,104
472,062
382,747
417,353
Others
American Samoa
-
-
-
-
-
-
-
-
-
-
Belize
270
7,143
3,382
2,697
943
1,056
632
595
225
190
Canada
351
206
144
-
63
72
135
27
-
-
China
6,244
9,947
15,629
42,215
40,167
61,556
73,756
69,842
83,938
114,742
Eastern Pacific fleet
2,925
510
244
2,600
2,014
709
709
709
709
709
Ecuador
3,992
1,057
427
1,562
3,051
5,193
9,523
9,187
25,397
4,428
El Salvador
-
599
1,488
74
-
-
-
6,025
10,858
7,498
French Polynesia
6,834
7,736
7,343
6,309
5,437
4,990
5,937
6,458
5,503
6,927
Indonesia
284,310
254,400
260,421
251,746
262,615
281,494
314,638
315,416
315,873
316,299
Japan
497,028
439,605
451,608
469,838
441,724
482,097
447,060
473,700
435,048
391,614
Korea
207,502
216,528
254,270
220,955
212,594
237,271
275,032
278,298
274,834
309,671
New Caledonia
1,663
1,717
1,926
2,005
2,189
2,112
1,806
1,770
1,993
2,187
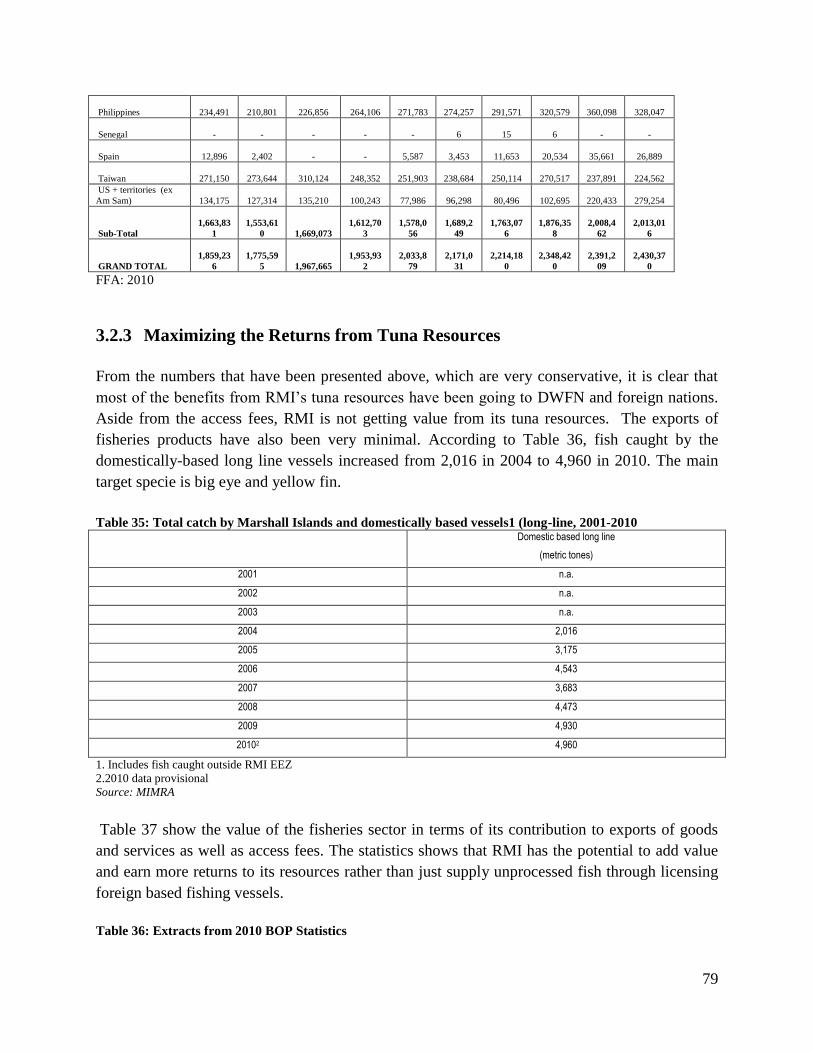
79
Philippines
234,491
210,801
226,856
264,106
271,783
274,257
291,571
320,579
360,098
328,047
Senegal
-
-
-
-
-
6
15
6
-
-
Spain
12,896
2,402
-
-
5,587
3,453
11,653
20,534
35,661
26,889
Taiwan
271,150
273,644
310,124
248,352
251,903
238,684
250,114
270,517
237,891
224,562
US + territories (ex
Am Sam)
134,175
127,314
135,210
100,243
77,986
96,298
80,496
102,695
220,433
279,254
Sub-Total
1,663,83
1
1,553,61
0
1,669,073
1,612,70
3
1,578,0
56
1,689,2
49
1,763,07
6
1,876,35
8
2,008,4
62
2,013,01
6
GRAND TOTAL
1,859,23
6
1,775,59
5
1,967,665
1,953,93
2
2,033,8
79
2,171,0
31
2,214,18
0
2,348,42
0
2,391,2
09
2,430,37
0
FFA: 2010
3.2.3 Maximizing the Returns from Tuna Resources
From the numbers that have been presented above, which are very conservative, it is clear that
most of the benefits from RMI‘s tuna resources have been going to DWFN and foreign nations.
Aside from the access fees, RMI is not getting value from its tuna resources. The exports of
fisheries products have also been very minimal. According to Table 36, fish caught by the
domestically-based long line vessels increased from 2,016 in 2004 to 4,960 in 2010. The main
target specie is big eye and yellow fin.
Table 35: Total catch by Marshall Islands and domestically based vessels1 (long-line, 2001-2010 Domestic based long line
(metric tones)
2001 n.a.
2002 n.a.
2003 n.a.
2004 2,016
2005 3,175
2006 4,543
2007 3,683
2008 4,473
2009 4,930
20102 4,960
1. Includes fish caught outside RMI EEZ
2.2010 data provisional
Source: MIMRA
Table 37 show the value of the fisheries sector in terms of its contribution to exports of goods
and services as well as access fees. The statistics shows that RMI has the potential to add value
and earn more returns to its resources rather than just supply unprocessed fish through licensing
foreign based fishing vessels.
Table 36: Extracts from 2010 BOP Statistics
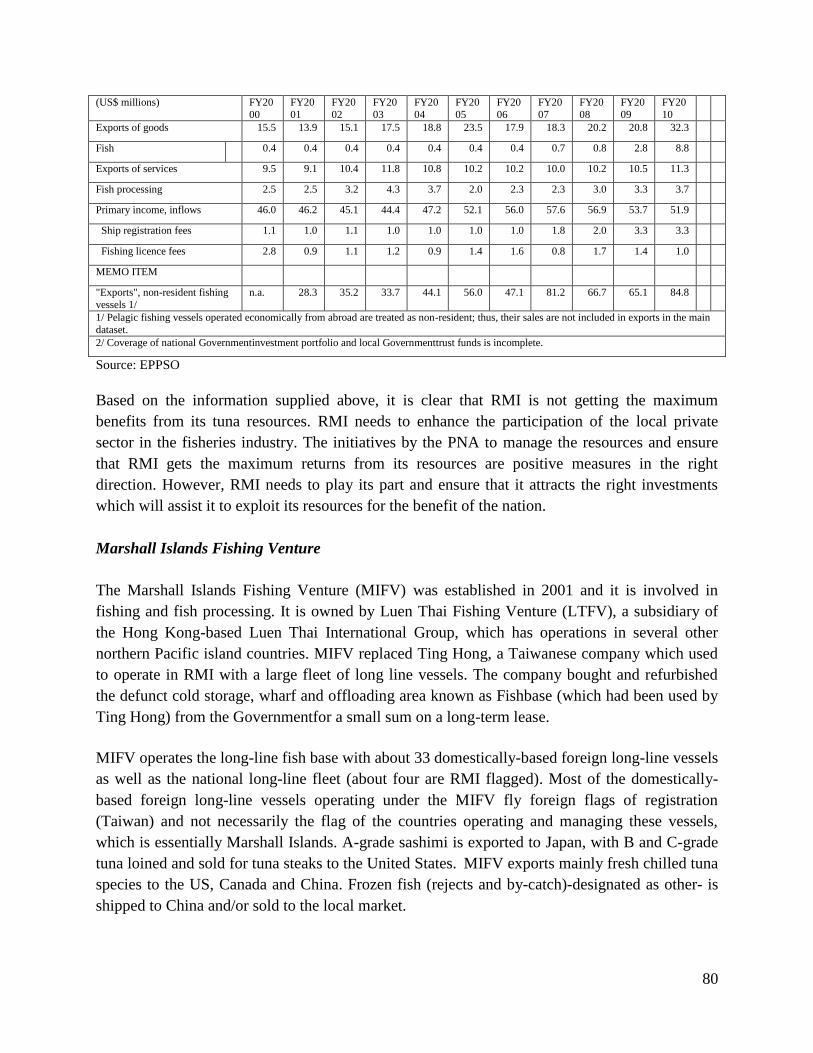
80
(US$ millions) FY20
00
FY20
01
FY20
02
FY20
03
FY20
04
FY20
05
FY20
06
FY20
07
FY20
08
FY20
09
FY20
10
Exports of goods 15.5 13.9 15.1 17.5 18.8 23.5 17.9 18.3 20.2 20.8 32.3
Fish 0.4 0.4 0.4 0.4 0.4 0.4 0.4 0.7 0.8 2.8 8.8
Exports of services 9.5 9.1 10.4 11.8 10.8 10.2 10.2 10.0 10.2 10.5 11.3
Fish processing 2.5 2.5 3.2 4.3 3.7 2.0 2.3 2.3 3.0 3.3 3.7
Primary income, inflows 46.0 46.2 45.1 44.4 47.2 52.1 56.0 57.6 56.9 53.7 51.9
Ship registration fees 1.1 1.0 1.1 1.0 1.0 1.0 1.0 1.8 2.0 3.3 3.3
Fishing licence fees 2.8 0.9 1.1 1.2 0.9 1.4 1.6 0.8 1.7 1.4 1.0
MEMO ITEM
"Exports", non-resident fishing
vessels 1/
n.a. 28.3 35.2 33.7 44.1 56.0 47.1 81.2 66.7 65.1 84.8
1/ Pelagic fishing vessels operated economically from abroad are treated as non-resident; thus, their sales are not included in exports in the main
dataset.
2/ Coverage of national Governmentinvestment portfolio and local Governmenttrust funds is incomplete.
Source: EPPSO
Based on the information supplied above, it is clear that RMI is not getting the maximum
benefits from its tuna resources. RMI needs to enhance the participation of the local private
sector in the fisheries industry. The initiatives by the PNA to manage the resources and ensure
that RMI gets the maximum returns from its resources are positive measures in the right
direction. However, RMI needs to play its part and ensure that it attracts the right investments
which will assist it to exploit its resources for the benefit of the nation.
Marshall Islands Fishing Venture
The Marshall Islands Fishing Venture (MIFV) was established in 2001 and it is involved in
fishing and fish processing. It is owned by Luen Thai Fishing Venture (LTFV), a subsidiary of
the Hong Kong-based Luen Thai International Group, which has operations in several other
northern Pacific island countries. MIFV replaced Ting Hong, a Taiwanese company which used
to operate in RMI with a large fleet of long line vessels. The company bought and refurbished
the defunct cold storage, wharf and offloading area known as Fishbase (which had been used by
Ting Hong) from the Governmentfor a small sum on a long-term lease.
MIFV operates the long-line fish base with about 33 domestically-based foreign long-line vessels
as well as the national long-line fleet (about four are RMI flagged). Most of the domestically-
based foreign long-line vessels operating under the MIFV fly foreign flags of registration
(Taiwan) and not necessarily the flag of the countries operating and managing these vessels,
which is essentially Marshall Islands. A-grade sashimi is exported to Japan, with B and C-grade
tuna loined and sold for tuna steaks to the United States. MIFV exports mainly fresh chilled tuna
species to the US, Canada and China. Frozen fish (rejects and by-catch)-designated as other- is
shipped to China and/or sold to the local market.
81
Fresh tuna is processed into fillets or loins and the whole fish is exported to Canada, US, and
Japan. Frozen steak also goes to the US, Philippines or China and frozen mahi-mahi goes to
China. MIFV has a sales branch in the US, which receives products from RMI every week. The
frozen products do not fetch much money because the prices are very low.
Fuel prices, especially in 2008 had a huge impact on the fishing industry. Since the fuel price as
of November 2009 was down, the fishing costs as well as freight charges for MIFV also went
down. Another major factor that has an impact on the business is the cost of electricity. At one
point, the company paid about $140 000 per month to MEC for electricity but the amount has
been reduced to an average of about $80 000 per month. MIFV wanted to install its own
generator but there is no space for this. These issues need to be addressed to enable the company
to operate efficiently.
The company also indicated that it needs assistance from the Government to deal with the
stringent EU export requirements. MIFV expressed interest in accessing the EU market and to
this end, requested the Government to establish a Competent Authority. The company also
indicated that the price for tuna in Europe is good. To this end, MIFV is willing to work with the
Government and PPF to establish a laboratory. It was also noted that the business projection for
the company depends on international market, fuel price amongst other things. For this reason, it
is very important to diversify the export markets and provide the necessary assistance to MIFV
to enable it to expand its exports.
MIFV also indicated that it was facing import duties on packing material of about 8%. Some of
the packing materials come from the US but frozen boxes come from Taiwan. The company also
imports bait from Japan and it‘s taxed at 5% at the border. The company recommended that since
it is producing for export and does not sell in the local market, it should be exempted from these
taxes. Originally the company was given a 5 year tax exemption but this has expired and it‘s now
paying GRT at 3% per quarter.
MIFV does not plan to venture into canning because this will need a bigger space, which is not
available in Majuro. The company has been looking for more land to operate. As at November
2009, the company employed about 140 local workers mainly for offloading and processing, 20
Chinese in the office, and 11 plant operators from the Philippines. The company has also been
training workers but most of these workers leave for the US after training. The workers are paid
about $2-25 per hour but $8 per hour in the US.
With regards to transportation, MIFV relies on Asia Pacific Air (APA), another subsidiary of the
Luen Thai International Group to transport sashimi to Japan and the United States. The company
also needs air transportation to outer islands. For example, APA has a new base in Kosrae,
Christmas Island.
82
Koo’s Fishing Company (KFC).
MIMRA has a Joint venture with Koo‘s Fishing Company (KFC). In May 2008, Marshall Islands
Fishing Company (MIFCO) formally opened its permanent offices within KFC‘s new office
building adjacent to MIMRA. KFC has 5 purse seine vessels but one is owned through joint
venture with the Governmentthrough MIMRA (51%/49%). In 2007, Koos vessels caught about
53 916 mt of skipjack in the WCPFC Convention area. KFC catch is mainly for canneries in
Bangkok, Philippines, Pago Pago, Japan and China. They also sell to local processors such as
PPF but Japan is their key market. The company is also planning to have a small market to
process by-catch.
KFC also wanted assistance to deal with the EU‘s IUU regulations and SPS issues. Assistance
from FFA and other regional organisations to deal with these issues will be required. The
company indicated that the EU is a lucrative market and KFC normally sells its fish through
brokers-FCF and Tri Marine. Tri-Marine then sells to the EU and South America. These brokers
have contracts with canneries. Tri- Marine also insists on compliance with the new EU
regulations.
KFC proposed that there should be a tax holiday for investments that are worth more than $10
million. The company also encouraged RMI to have its own fishing vessels. In the 80s, RMI had
2 vessels. However, the Government should not be involved in the day to day operations of the
vessels. KFC supports the PNA initiative to maximize the benefits from fishing. Under this
arrangement, it is proposed that each PNA member can sponsor investment in their domestic
vessels. The foreign investors on their part must meet the minimum criteria, for example they
must have minimum onshore investment, generate Governmentrevenue, allow a certain
percentage of equity to be owned by locals, be RMI flagged, purchase fuel locally (e.g. 25%) and
have at least five RMI citizens on each vessel. If the investors agree to these conditions, then
they can be given a regional license to fish in PNA.
One vessel per load of fresh tuna (about 950 tonnes) fetches about $1 million but if frozen it
fetches about $600 per metric tonne. In 2008 the price was as high as $1800 per metric tonne.
KFC has two carriers but these are not enough and sometimes the company uses FCF and Tri-
Marine.
Pan Pacific Foods (PPF)
In 2006, Shanghai Deep Sea Fisheries Co Ltd signed an MOU with MIMRA to reactivate the
loining plant with the endorsement to add four (4) purse seine vessels to associate with the plant
so as to secure the supply of raw fish. PPF has one purse seine and argues that this arrangement
will ensure that if there are losses on processing, they could be compensated through fishing.
83
PPF was registered in 2006, started constructing the plant from January 2007 and completed the
construction in December 2007. Processing started in April 2008, In that year, PPF processed
about 425 mt of raw fish and exported 149 mt of loins, 24 mt flakes and 28 mt of fish meal.
According to the evaluation in commissioning, PPF suspended the processing from January to
June, 2009 to install new machineries and equipment to fully support the production. PPF
resumed production in June 2009 and has 1,600 local workers but only about 400 show up. Since
the resumption of production on June 22, 2009, PPF has increased the daily production to 35 mt
and day-shift is fully operational. As such, the total benefit package per month is about $ 140
000 payroll plus free transportation, meal and water.
PPF has exported over 400 mt of loins and 200 mt of fish meal. Currently, PPF is the biggest
exporter and about 435 mt or 80% of PPF production is tuna loins for the US market while 75 mt
goes to Bangkok. For the year 2010, PPF will process over 15,000 mt of fish and export 5,000
mt of loins and 800 mt of fish meal, provided that it could get more workers and space.
It was also noted that the labor cost in RMI is too high. The minimum wage is $2 per hour but
can be exempted for $1.50 per hour. In Philippines, the wages can be as low as 10 cents per hour
and in Bangkok it‘s even cheaper.
Some of the products that are produced include pre-cooked loins from skipjack or big-eye and
pre-cooked flakes. Exporting to China is difficult because there are many problems involved, but
exporting to Taiwan is easier. The EU market is very important because EU prices are always
higher, and this also gives PPF more choices. About 10% of PPF‘s catch is yellow-fin but there
is no ready market for this. If RMI signs the EPA, this will allow PPF to export yellow-fin to the
EU market under favourable terms. PPF needs an alternative market. The prices in the US have
been fluctuating from $4,000 per mt at the beginning of 2009 to $2,700 in November 2009.
Canned tuna was also affected.
American Samoa used to supply the army and RMI should try to tap into that market because the
prices are very good. However, the food safety requirements are very strict.
PPF indicated that canning is very costly and some of the cost includes importing the cans and
other raw materials. However, PPF will try to do simple things such as tuna sausage. They also
have a lot of flakes but there is no ready market.
PPF already has one lab which was assessed by FFA. It is willing to work with the Government
to support water testing amongst other things. PPF has a place, facility and workers who can
provide support to the Competent Authority.
It was noted that Solomon Islands spent about $4 million which was donated by the EU to
establish a Competent Authority. Fiji uses USP facilities. It was recommended that the

84
Competent Authority can be established in R&D under MIMRA. PPF also indicated that Tri-
Marine was willing to send an expert to set up the lab.
The company urged RMI to control access to their fisheries resources. It also recommended that
there be one policy document for foreign investment. There should be clear steps on what the
investors need to do and the approval steps must be set out clearly. There should be an
exemption permit for tax holiday. The other agencies must coordinate with the AG‘s Office to
ensure that foreign workers are treated fairly. The Government should monitor the excessive
charges that are charged by the stevedoring company, which at one point wanted to charge a fee
equivalent to 10% of the value of fish. There was also an issue of discrimination because the
Government is allowed to offload copra without the services of a stevedore, but fishing
companies are not allowed to offload their own fish on their own.
The other issue is that PPF is RMI flagged but when they come to the port they are classified as
foreign and they pay a foreign entry fee of $100. There should be no need for the services of a
pilot for domestic vessels. The pilot charges about $3,000 per trip.
The Government should assist PPF to have free access to the US market for Vacuumed
Precooked Tuna Loins as PPF has to slit the vacuum bags to meet the requirement of free-
access. If you slit, it becomes duty free, but this is costly to the company. It was noted that South
American countries can ship vacuum packed pre-cooked loins to the US under the free trade
Agreement with the US.
The key issues that PPF wanted to be addressed are:
Access to the US Army food market and to have duty free access to the EU market for
vacuumed pre-cooked tuna loins.
Assistance to establish a Competent Authority.
Incentives to encourage fishing companies to develop the local market and training
workers on marine issues.
Improve port services and ensure fair treatment of domestically based vessels-they should
not be required to pay pilotage; they should not be required to use stevedoring services,
and should not pay foreign entry fee each time they come to the port.
Assistance to get the US to honour the requirements under the compact, as the US is still
imposing tariffs of up to 6% on some PPF products exported to its market, even when slit
according to US requirements.
3.2.4 General Conclusion and Recommendations
Through the early 1990s, the perception in RMI and throughout most of the Pacific was that the
Government should directly be involved in the fishing industry by owning and operating fishing
85
vessels, processing plants, and other facilities. Local participation in fisheries was strongly
favored over foreign involvement and investment. However, a number of government-led
fisheries projects failed (including a major ADB-financed fisheries venture in the RMI) and by
mid 90s it was clear that Government involvement in business was not working. This prompted
the RMI to rethink its policy, and with additional support from the ADB, a new direction was
taken. RMI established the first National Fisheries Development Plan (NFDP 1997) which seeks
to create an environment more conducive to private-sector–led fisheries development.
RMI also developed a Tuna Management Plan (TMP) which was revised in 2004. The TMP was
subsequently reviewed in March 2008. MIMRA intends to phase out foreign fishing licenses in
order to allow RMI domestic fleets to enter into fishery and maximize economic benefits from its
tuna resources.
RMI needs to create an environment which is conducive for trade and investment. There are
conflicting laws or regulations governing the fisheries sector and these need to be streamlined.
Some of these laws pertain to investment. RMI needs to ensure that all the factors that are
necessary to attract investors are taken into account. RMI should establish a transparent
Investment Board which looks at foreign investment applications to screen the investments. As a
small nation, RMI is constrained by its location and it‘s also competing with other countries.
Some of the companies that are operating in RMI have created employment and other related
benefits. However, they have concerns that there is no transparency on the exemptions that are
granted to foreign companies. There is a waiver on export income however, the customs
regulations requires them to pay GRT. The law stipulates that if the investment is more than 1
million dollars, the tax is waived, however, it is not clear who is responsible for issuing the
waiver. The process for issuing the waiver is also not transparent.
It was also noted that foreign licensed vessels do not pay GRT, however, domestically registered
vessels pay GRT. Distant Fishing Nations get a license to fish but they are based in their
respective countries. Domestic-based foreign vessels are foreign vessels that are based in RMI
and they offload fish in RMI and export. Their activities have direct benefits to the economy.
It was noted that the RMI Development Authority has also been defunct. However, in order to
develop the fisheries industry, the Government needs to identify atolls that can be earmarked for
development and put in place the relevant infrastructure such as roads, ports, electricity. This is
very important because there is now very little space for a major development in Majuro.
It should be noted that the supply of tuna for canning from purse seine fishing is essentially a
commodity trade and is thus subject to significant market price variations. The very high
regional catch levels of the late 1990‘s saw bulk tuna prices reduced to as little as $350 per mt in
1999 and 2000. Prices have subsequently stabilized but have been fluctuating. The fishing
industry is highly competitive and involves high-risk as it is subject to the vicissitudes of the

86
volatile global market. It operates on small margins of profit and requires large economies of
scale. The fishing fleets must be flexible and mobile, always ready to move when circumstances
demand. Another problem is that local workers may not be willing to serve on fishing boats for
longer periods than their counterparts in Asia. For the private sector to enter into this risky
industry, the Government must put in place all the required supporting facilities and incentives.
However, lessons from the past experiences must be used to develop working fisheries
development plans.
RMI needs to promote foreign investment and value addition in this sector. The Government
should work with all the relevant stakeholders and make it easy for foreign investors to invest in
the fisheries sector. The government‘s role should be limited to resource management, creating
an environment which is conducive for private sector development, provide hard infrastructure
and facilities such as adequate supply of power, potable water, sanitary waste disposal, good port
facilities and shipping terminals, access roads and docking facilities. The private sector must be
responsible for all commercial fisheries investments and operations. Once the supporting
facilities and trained personnel are available, there is a good chance that successful fishing
ventures can be established.
It should be noted that RMI will be competing with other well established Asian countries such
as Thailand which is the main supplier of the US market. RMI should not focus on large fishing
operations but the private sector should focus on niche products.
RMI has another advantage in the form of duty free access to the US, which gives it a 12%
marketing advantage over Asian processors. If it signs the Economic Partnership Agreement
(EPA), it can also export to the EU duty free with a 20.5% -24% marketing advantage over some
Asian competitors. Since labor costs are 6-8% of the total costs of a case of tuna, RMI has the
potential to compete with Asian countries. In principle, Island based canneries have the potential
to obtain the raw product 10-20% cheaper than distant processors as it costs about $100-120 a
ton to deliver the tuna to distant plants. This is a huge advantage because the costs of tuna are
about 60% of the total cost of a case of tuna.
However, in the long run, the Pacific industries must be competitive and not depend solely on
preferences. There is a need to ensure that the tuna industry remains competitive even after the
preferences are gone. This requires an objective assessment of the sufficiency of major factors of
production such as suitable land, water, labor, electricity, transportation infrastructure and
accessibility to year-round fishing grounds.
RMI needs to establish a Competent Authority to assist the processors to meet export
requirements. The Competent Authority must have food and fish scientists and a laboratory. The
87
workers need to be trained on hygiene standards. If RMI wants to export to the EU it has to make
sure that the Competent Authority complies with the EU sanitary and phyto-sanitary standards
(SPS) and the technical barriers to trade (TBT) requirements. RMI boats and processing plants
are also required to meet the EU requirements and all the product processing methods must
comply with the EU sanitary requirements.
MIMRA should provide the necessary infrastructure in order to maximise revenue generation
and associated economic benefits from fishing vessels transhipping in Majuro.
RMI should also consider expanding its aquaculture business, focusing on high-value export
products such as pearls30
, aquarium life, sponges and perhaps organisms with pharmaceutical
properties. There is potential to produce clams and crabs for the US, EU (UK, Netherlands, and
Germany) and Chinese markets.
Recommendations:
(i) RMI must take positive measures in line with the PNA initiative to maximize the
value of its tuna resources, including through obtaining eco-labeling certification and
encouraging domestication of the fisheries industry.
(ii) RMI must reform its laws and regulations to create an environment which is friendly
for foreign investment in the fisheries sector.
(iii) Procedures on incentives must be transparent and streamlined and the Ministry of
Finance should issue an exemption permit to qualifying investors.
(iv) RMI must work with outer islands and set aside land for fisheries development in
outer islands and develop the necessary infrastructure.
(v) RMI must focus more on value addition to its fisheries products rather than relying
mainly on access fees. Positive measures must be put in place to support the
participation of the local private sector in the fishing industry.
(vi) The Government should consider introducing targeted incentives for investors in the
fisheries industry. These may include removing duties on raw materials required for
fish processing.
30
In the past the Marshall Islands Marine Resources Authority, Robert Reimers Enterprises (RRE), University of
Hawaii‘s Sea Grant, and pilot projects by Dr. Manoj Nair, a former CMI Aquaculture Researcher worked very hard
to develop the black pearl industry. RRE opened the first pearl oyster farm in Arno and Jaluit in the 1990s. Black
Pearl Farms, a privately owned entity as well as other local governments followed suit. The major challenge for
these operators was lack of spat (baby oysters). There was no proper hatchery. However, the Aquaculture Hatchery
located in the College of Marshall Islands Arrak Campus has helped to revive the industry by producing enough
spat. In 2010, the local governments of Rongelap and Namdrik atolls held their first action and sales of pearl.
Various products including pearl necklaces, earrings, and rings raked in a net profit of over $31,000. This is a vital
sector with potential to grow and should be fully supported to enable the sector to expand and tap into the export
markets.
88
(vii) The Government must improve its access into the US market, in particular access for
vacuum packed pre-cooked tuna loins and access to the US military market.
(viii) RMI must establish the Competent Authority and consider signing the EPA to have
preferential access into the EU fisheries market.
(ix) There should be targeted training on fisheries and other skills relating to the fisheries
industry.
(x) RMI flagged vessels must be exempted from paying entry fees each time they enter
the port and they should not be required to use pilotage. They should also be allowed
to handle their own fish at port and not use expensive stevedoring services.
(xi) RMI must improve the statistics on fisheries including fisheries exports as well as
those that are caught by DWFN.
(xii) R&D must work together with outer islands in promoting foreign investment in
integrated catching and processing and facilitating exports of value added fisheries
products.
(xiii) Technical and financial assistance must be provided for the development of
aquaculture (e.g. black pearls, tilapia, giant clams, sea cucumbers, trochus, lapu-lapu,
salt processing, ornamental reef industry, sea weed processing, fish caging, and
hatchery.
3.3 Tourism
The Marshall Islands Visitors Authority (MIVA) falls under the Ministry of R&D and is
governed by the MIVA Act of 1997. It is the key agency that is responsible for developing the
tourism industry. The MIVA was established with technical assistance from ADB and the
Department of Interior. The RoC has also been supporting MIVA. It receives about $150 000
from the Government General Fund on an annual basis, however, this amount is inadequate to
allow MIVA to perform its functions effectively.
As seen above, the opportunities in agriculture and fisheries are not adequate to provide the
desired employment opportunities to RMI citizens, and for this reason, it is important for the
Government to support the tourism industry. The RMI is geographically, culturally and
historically unique. It is one of just a few coral atoll nations in the world and the vast majority of
its land and sea environment is still pristine. This includes an abundance of uninhabited coral
atolls, islands and their terrestrial and marine areas and resources. If managed properly, tourism
has the potential to spur developments in other sectors.
The National Tourism Development Plan (NTDP) outlines a number of goals and objectives that,
if fully implemented, can help the RMI develop into a truly successful and sustainable
destination. However, for this to occur, RMI needs to improve the basic services and
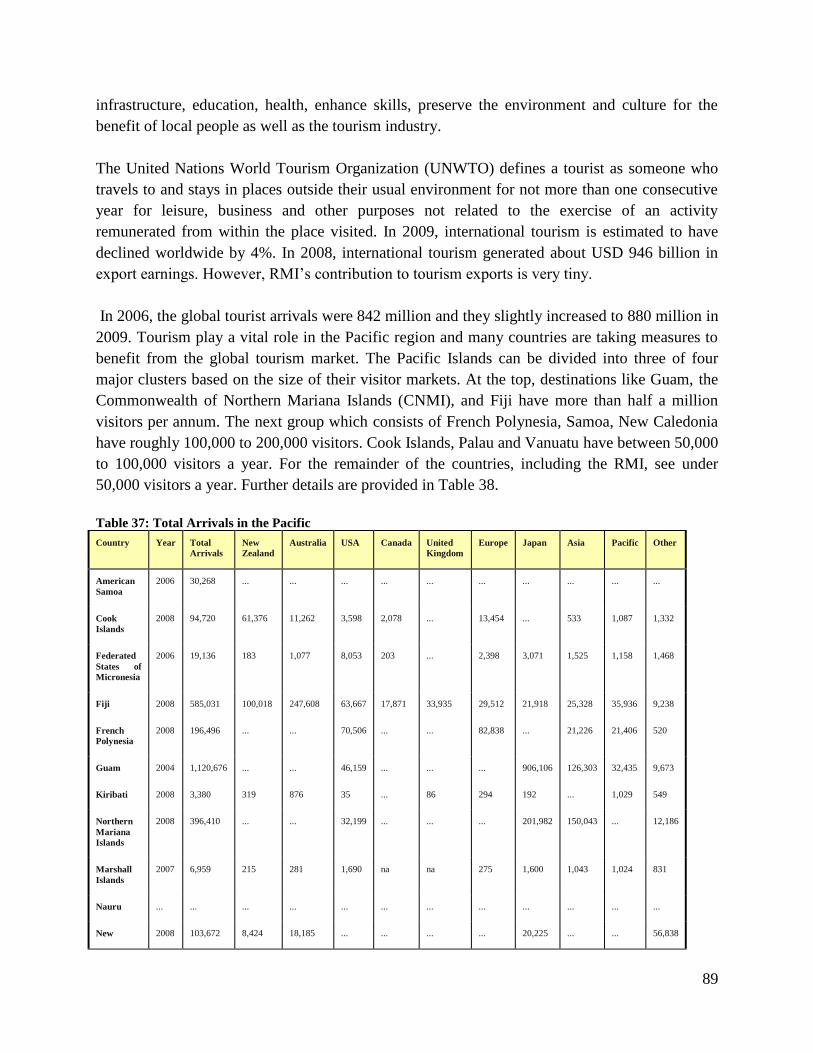
89
infrastructure, education, health, enhance skills, preserve the environment and culture for the
benefit of local people as well as the tourism industry.
The United Nations World Tourism Organization (UNWTO) defines a tourist as someone who
travels to and stays in places outside their usual environment for not more than one consecutive
year for leisure, business and other purposes not related to the exercise of an activity
remunerated from within the place visited. In 2009, international tourism is estimated to have
declined worldwide by 4%. In 2008, international tourism generated about USD 946 billion in
export earnings. However, RMI‘s contribution to tourism exports is very tiny.
In 2006, the global tourist arrivals were 842 million and they slightly increased to 880 million in
2009. Tourism play a vital role in the Pacific region and many countries are taking measures to
benefit from the global tourism market. The Pacific Islands can be divided into three of four
major clusters based on the size of their visitor markets. At the top, destinations like Guam, the
Commonwealth of Northern Mariana Islands (CNMI), and Fiji have more than half a million
visitors per annum. The next group which consists of French Polynesia, Samoa, New Caledonia
have roughly 100,000 to 200,000 visitors. Cook Islands, Palau and Vanuatu have between 50,000
to 100,000 visitors a year. For the remainder of the countries, including the RMI, see under
50,000 visitors a year. Further details are provided in Table 38.
Table 37: Total Arrivals in the Pacific
Country Year Total
Arrivals
New
Zealand
Australia USA Canada United
Kingdom
Europe Japan Asia Pacific Other
American
Samoa
2006 30,268 ... ... ... ... ... ... ... ... ... ...
Cook
Islands
2008 94,720 61,376 11,262 3,598 2,078 ... 13,454 ... 533 1,087 1,332
Federated
States of
Micronesia
2006 19,136 183 1,077 8,053 203 ... 2,398 3,071 1,525 1,158 1,468
Fiji 2008 585,031 100,018 247,608 63,667 17,871 33,935 29,512 21,918 25,328 35,936 9,238
French
Polynesia
2008 196,496 ... ... 70,506 ... ... 82,838 ... 21,226 21,406 520
Guam 2004 1,120,676 ... ... 46,159 ... ... ... 906,106 126,303 32,435 9,673
Kiribati 2008 3,380 319 876 35 ... 86 294 192 ... 1,029 549
Northern
Mariana
Islands
2008 396,410 ... ... 32,199 ... ... ... 201,982 150,043 ... 12,186
Marshall
Islands
2007 6,959 215 281 1,690 na na 275 1,600 1,043 1,024 831
Nauru ... ... ... ... ... ... ... ... ... ... ... ...
New 2008 103,672 8,424 18,185 ... ... ... ... 20,225 ... ... 56,838
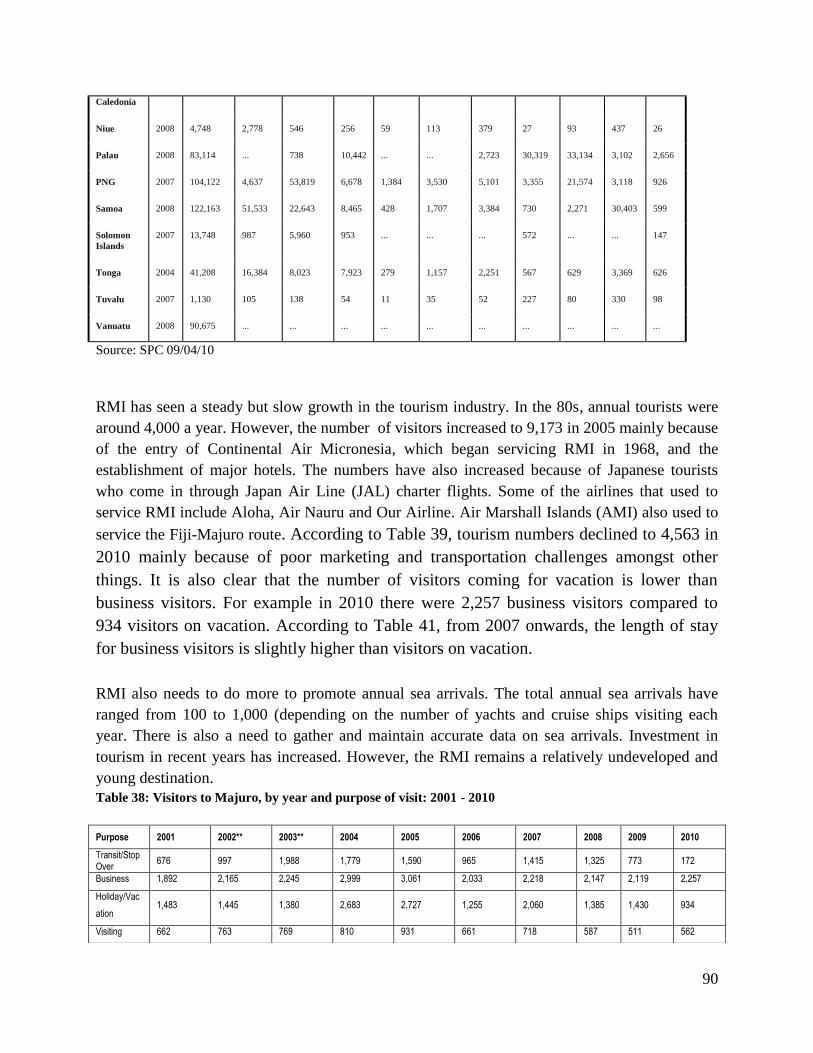
90
Caledonia
Niue 2008 4,748 2,778 546 256 59 113 379 27 93 437 26
Palau 2008 83,114 ... 738 10,442 ... ... 2,723 30,319 33,134 3,102 2,656
PNG 2007 104,122 4,637 53,819 6,678 1,384 3,530 5,101 3,355 21,574 3,118 926
Samoa 2008 122,163 51,533 22,643 8,465 428 1,707 3,384 730 2,271 30,403 599
Solomon
Islands
2007 13,748 987 5,960 953 ... ... ... 572 ... ... 147
Tonga 2004 41,208 16,384 8,023 7,923 279 1,157 2,251 567 629 3,369 626
Tuvalu 2007 1,130 105 138 54 11 35 52 227 80 330 98
Vanuatu 2008 90,675 ... ... ... ... ... ... ... ... ... ...
Source: SPC 09/04/10
RMI has seen a steady but slow growth in the tourism industry. In the 80s, annual tourists were
around 4,000 a year. However, the number of visitors increased to 9,173 in 2005 mainly because
of the entry of Continental Air Micronesia, which began servicing RMI in 1968, and the
establishment of major hotels. The numbers have also increased because of Japanese tourists
who come in through Japan Air Line (JAL) charter flights. Some of the airlines that used to
service RMI include Aloha, Air Nauru and Our Airline. Air Marshall Islands (AMI) also used to
service the Fiji-Majuro route. According to Table 39, tourism numbers declined to 4,563 in
2010 mainly because of poor marketing and transportation challenges amongst other
things. It is also clear that the number of visitors coming for vacation is lower than
business visitors. For example in 2010 there were 2,257 business visitors compared to
934 visitors on vacation. According to Table 41, from 2007 onwards, the length of stay
for business visitors is slightly higher than visitors on vacation.
RMI also needs to do more to promote annual sea arrivals. The total annual sea arrivals have
ranged from 100 to 1,000 (depending on the number of yachts and cruise ships visiting each
year. There is also a need to gather and maintain accurate data on sea arrivals. Investment in
tourism in recent years has increased. However, the RMI remains a relatively undeveloped and
young destination.
Table 38: Visitors to Majuro, by year and purpose of visit: 2001 - 2010
Purpose 2001 2002** 2003** 2004 2005 2006 2007 2008 2009 2010
Transit/Stop Over
676 997 1,988 1,779 1,590 965 1,415 1,325 773 172
Business 1,892 2,165 2,245 2,999 3,061 2,033 2,218 2,147 2,119 2,257
Holiday/Vac
ation 1,483 1,445 1,380 2,683 2,727 1,255 2,060 1,385 1,430 934
Visiting 662 763 769 810 931 661 718 587 511 562
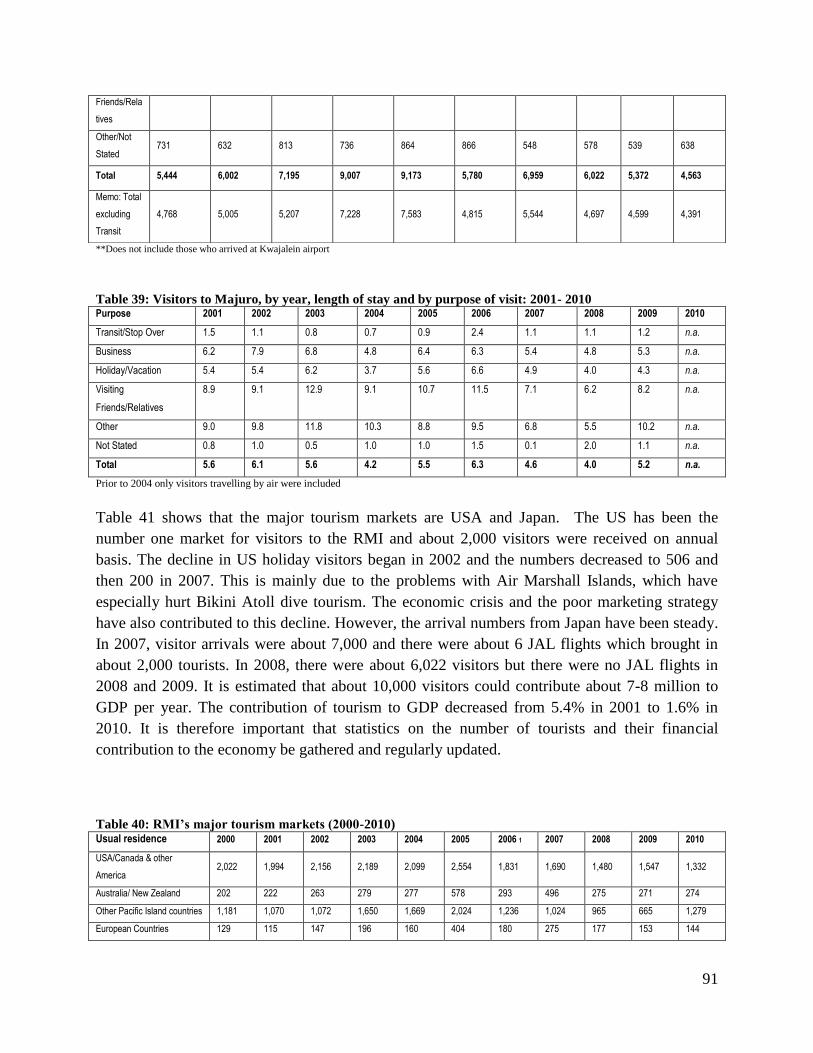
91
**Does not include those who arrived at Kwajalein airport
Table 39: Visitors to Majuro, by year, length of stay and by purpose of visit: 2001- 2010 Purpose 2001 2002 2003 2004 2005 2006 2007 2008 2009 2010
Transit/Stop Over 1.5 1.1 0.8 0.7 0.9 2.4 1.1 1.1 1.2 n.a.
Business 6.2 7.9 6.8 4.8 6.4 6.3 5.4 4.8 5.3 n.a.
Holiday/Vacation 5.4 5.4 6.2 3.7 5.6 6.6 4.9 4.0 4.3 n.a.
Visiting
Friends/Relatives
8.9 9.1 12.9 9.1 10.7 11.5 7.1 6.2 8.2 n.a.
Other 9.0 9.8 11.8 10.3 8.8 9.5 6.8 5.5 10.2 n.a.
Not Stated 0.8 1.0 0.5 1.0 1.0 1.5 0.1 2.0 1.1 n.a.
Total 5.6 6.1 5.6 4.2 5.5 6.3 4.6 4.0 5.2 n.a.
Prior to 2004 only visitors travelling by air were included
Table 41 shows that the major tourism markets are USA and Japan. The US has been the
number one market for visitors to the RMI and about 2,000 visitors were received on annual
basis. The decline in US holiday visitors began in 2002 and the numbers decreased to 506 and
then 200 in 2007. This is mainly due to the problems with Air Marshall Islands, which have
especially hurt Bikini Atoll dive tourism. The economic crisis and the poor marketing strategy
have also contributed to this decline. However, the arrival numbers from Japan have been steady.
In 2007, visitor arrivals were about 7,000 and there were about 6 JAL flights which brought in
about 2,000 tourists. In 2008, there were about 6,022 visitors but there were no JAL flights in
2008 and 2009. It is estimated that about 10,000 visitors could contribute about 7-8 million to
GDP per year. The contribution of tourism to GDP decreased from 5.4% in 2001 to 1.6% in
2010. It is therefore important that statistics on the number of tourists and their financial
contribution to the economy be gathered and regularly updated.
Table 40: RMI’s major tourism markets (2000-2010) Usual residence 2000 2001 2002 2003 2004 2005 2006 1 2007 2008 2009 2010
USA/Canada & other
America 2,022 1,994 2,156 2,189 2,099 2,554 1,831 1,690 1,480 1,547 1,332
Australia/ New Zealand 202 222 263 279 277 578 293 496 275 271 274
Other Pacific Island countries 1,181 1,070 1,072 1,650 1,669 2,024 1,236 1,024 965 665 1,279
European Countries 129 115 147 196 160 404 180 275 177 153 144
Friends/Rela
tives
Other/Not
Stated 731 632 813 736 864 866 548 578 539 638
Total 5,444 6,002 7,195 9,007 9,173 5,780 6,959 6,022 5,372 4,563
Memo: Total
excluding
Transit
4,768 5,005 5,207 7,228 7,583 4,815 5,544 4,697 4,599 4,391
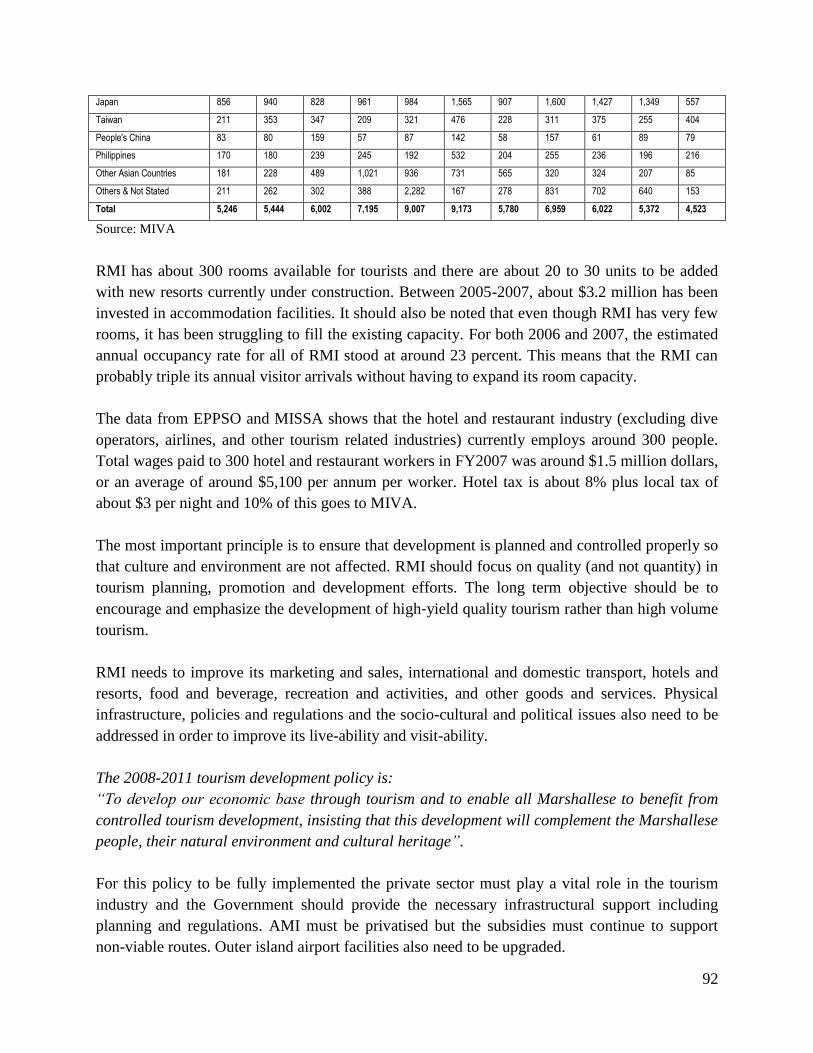
92
Japan 856 940 828 961 984 1,565 907 1,600 1,427 1,349 557
Taiwan 211 353 347 209 321 476 228 311 375 255 404
People's China 83 80 159 57 87 142 58 157 61 89 79
Philippines 170 180 239 245 192 532 204 255 236 196 216
Other Asian Countries 181 228 489 1,021 936 731 565 320 324 207 85
Others & Not Stated 211 262 302 388 2,282 167 278 831 702 640 153
Total 5,246 5,444 6,002 7,195 9,007 9,173 5,780 6,959 6,022 5,372 4,523
Source: MIVA
RMI has about 300 rooms available for tourists and there are about 20 to 30 units to be added
with new resorts currently under construction. Between 2005-2007, about $3.2 million has been
invested in accommodation facilities. It should also be noted that even though RMI has very few
rooms, it has been struggling to fill the existing capacity. For both 2006 and 2007, the estimated
annual occupancy rate for all of RMI stood at around 23 percent. This means that the RMI can
probably triple its annual visitor arrivals without having to expand its room capacity.
The data from EPPSO and MISSA shows that the hotel and restaurant industry (excluding dive
operators, airlines, and other tourism related industries) currently employs around 300 people.
Total wages paid to 300 hotel and restaurant workers in FY2007 was around $1.5 million dollars,
or an average of around $5,100 per annum per worker. Hotel tax is about 8% plus local tax of
about $3 per night and 10% of this goes to MIVA.
The most important principle is to ensure that development is planned and controlled properly so
that culture and environment are not affected. RMI should focus on quality (and not quantity) in
tourism planning, promotion and development efforts. The long term objective should be to
encourage and emphasize the development of high‐yield quality tourism rather than high volume
tourism.
RMI needs to improve its marketing and sales, international and domestic transport, hotels and
resorts, food and beverage, recreation and activities, and other goods and services. Physical
infrastructure, policies and regulations and the socio-cultural and political issues also need to be
addressed in order to improve its live-ability and visit-ability.
The 2008-2011 tourism development policy is:
“To develop our economic base through tourism and to enable all Marshallese to benefit from
controlled tourism development, insisting that this development will complement the Marshallese
people, their natural environment and cultural heritage”.
For this policy to be fully implemented the private sector must play a vital role in the tourism
industry and the Government should provide the necessary infrastructural support including
planning and regulations. AMI must be privatised but the subsidies must continue to support
non-viable routes. Outer island airport facilities also need to be upgraded.
93
3.3.1 RMI’s key Tourism Resources
The principal resources include beaches, marine life, historic sites and annual events. Support
resources include transportation, accommodation, food and beverage, tour operations, basic
business services and other goods and services.
The natural resources offered by RMI include flora, fauna, landscapes, seascapes,
climate, marine resources and physical conditions and features. RMI has a mild climate
(with no consistent typhoon season), unique coral atoll geography, abundance of pristine
coral islands, rich marine life and various species of fish, corals, and other resources,
strong and consistent windy season, surf breaks, unique ecosystems and species, beaches
and expansive uninhabited/isolated areas.
RMI also has several potential World Heritage sites that can serve as strong tourist attractions.
These include the atolls of Bikini, Ailinginae, Rongelap and Rongerik, which have both natural
and historic significance.
Cultural resources in the RMI include canoes and navigation traditions, traditional and locally
made arts and crafts, Marshallese foods, local products, culturally significant sites
(bwebwenato), Alele Museum and archives. In addition to these, the RMI also has
culturally‐based events throughout the year that can serve as cultural tourism resources, such as
the Manit (culture) Day activities and the annual traditional canoe races.
Historic resources include the various World War II relics and wrecks both on land and
underwater (e.g. Wotje, Mili, Maloelap, Kwajalein, Bikini), as well as other site such as the
deBrum house in Likiep and other pre‐WWII sites in other atolls. Bikini Atoll itself is an
excellent example of a historic resource with global significance and uniqueness.
The key activity resources include SCUBA diving; free diving, snorkeling, sport
fishing, surfing, windsurfing, sailing, kayaking, and camping. The main event resources include
fishing tournaments, traditional canoe races, the activities surrounding Manit Day, and sporting
events (regional tournaments, etc.). Majuro also plays host to occasional international, regional
and sub‐regional conferences, workshops and seminars every year. The new International
Conference Center should help in promoting these events.
Visitors include SCUBA divers (both general recreational divers as well as more technical and
wreck divers) and snorkelers, sport fishermen, including free divers, private yacht cruisers,
commercial cruise ship visitors, military ship visitors, surfers, general interest adventure
travelers, business visitors and other special interest visitors (like researchers and religious
visitors).
94
3.3.2 Marketing RMI Tourism
MIVA has also been trying to market RMI through TV shows, radio personalities, targeting the
US, Japan and Australia. It was acknowledged that internet is the best in terms of marketing but
more training may be needed. There used to be a trade show booth in Europe for 4 months under
the International Travel Bureau in Berlin at a cost of about US$ 12 000. There were different
shows in China but it was very expensive to translate the adverts to Chinese ($3, 500). Japan and
Taiwan have been willing to assist with marketing at their own cost but charging about $5,000
each excluding printing.
RMI sometimes utilizes the Pacific Islands Trade and Investment Commission (PITIC) offices
but they were concerned that these offices do not concentrate on tourism. Some of the services
offered by PITIC include support to Forum Island Countries National Tourism Offices (NTO) to
develop and promote their tourism industries, production of tourism statistics, supports
marketing activities of NTOs based in the respective PITIC Offices and partnering with NGOs to
develop rural based tourism activities. RMI is more active with the Pacific Asia Travel
Association (PATA) because of the Micronesian charter. RMI is also participating in the
Shangai Expo and has received $7 500 from MoFA for this purpose.
The major challenge for RMI is to improve its competitiveness in the tourism industry to be able
to compete with other countries in the region. The capacity to compete depends on the
investments made to create an attractive and safe product, enhance its quality and provide a
friendly and encouraging environment. Competitiveness brings the tourism enterprise into the
picture and hence trade in tourism services. The products that RMI offers should be a quality
―tourism product‖ and both the Government and private sector must work together to develop
this product. The issue of safety of the product should also be taken into account. There should
be an appropriate and transparent regulatory framework, as well as the establishment and
recognition of mandatory or voluntary standards, best practices and minimum requirements.
The NTDP recommends that the marketing strategy should focus on North American and Asian
markets as primary source markets and Australia/New Zealand and EU markets as secondary
markets.
In 2008, RMI became a Government member of the region‘s mandated inter-governmental body
for tourism development and marketing – the South Pacific Tourism Organisation (SPTO).
SPTO‘s mission is to ―Market and Develop Tourism in the South Pacific‖. SPTO is also the
implementing agency for the ―Pacific Regional Tourism Capacity Building Programme
(PRTCBP)‖, which is funded by the European Union under the 10th European Development
Fund and will be carried out over 36 months from January 2012 to December 2014. The
PRTCBP will focus on the development of sustainable tourism by supporting a more conducive
enabling environment for regional tourism growth through enhanced policy and capacity
development as well as increased productive capacity and improved market access.
95
3.3.3 Key Challenges affecting Tourism in RMI
Some of the key problems that have been identified in the NTDP include the following.
i) Most Marshallese, including policy makers do not support tourism because they do not
understand the potential of tourism. There is a need for awareness campaigns involving
all the stakeholders. RMI must show commitment in supporting tourism in terms of
funding before it goes out to seek donor funding.
ii) The environmental challenges: There should be effective mechanism for protecting
natural resources and managing waste. Littering and the dirty environments in Majuro
were highlighted as key concerns. Majuro is littered and unattractive. Key facilities at the
air port, roads, public places need to be upgraded, beautified or cleaned.
iii) Tourism development must be more inclusive. Local people should be involved in
developing the tourism sector and enjoying the benefits.
iv) The domestic transportation system is dire. Transportation infrastructure must be
improved including AMI services. Domestic sea transportation has improved a little bit
with the establishment of Marshall Island Shipping Company.
v) Lack of activities-other than water sports. There is a need for more local products.
vi) The cost of doing business in RMI: The key concerns highlighted include abrupt policy
changes, taxes, land issues, access to credit, and immigration policies on foreign workers.
vii) Tourism workers need better training. Some of the issues include poor customer services,
poor language skills –English/Japanese/Chinese.
viii) Substandard infrastructure and facilities: The key issues include lack of quality
accommodation, transportation infrastructure, power, water and sewer, cruise ship
facilities in outer islands and docking facilities, inconvenient and costly long distant calls,
no internationally recognised rating system, inadequate wireless internet system.
ix) Insufficient visitor information
x) Safety for visitors.
xi) Flying to RMI is costly and cumbersome.
xii) Lack of facilities to support sea based tourism. There are limited cruise ship facilities,
lack of marketing and advertising to yachts, cumbersome outer islands permit system and
lack of safe mooring.
xiii) Poor policy and planning. The key issues include visa policy, zoning and poor
incentives.
xiv) Need to improve on international marketing: MIVA needs to do more to market the
country to the world.
96
3.3.4 Recommendations
The NTDP sets out the broad goals, objectives and the action that must be taken to develop the
tourism industry. Some of the key recommendations include the following:
i. RMI must identify products with the strongest tourism and export appeal through
‗niche market research‘ and seek technical and financial assistance to support their
growth.
ii. RMI needs to fully utilize the grants that are provided by JICA ($8-12 million) per
year to develop tourism. However, the Government must show commitment to
tourism before it goes out to seek donor funding.
iii. RMI should liberalize the tourism industry but reserve the small business operations
for Marshallese citizens.
iv. The Government must immediately privatize AMI and pursue options to allow the
entry of private investors into the domestic sea passenger business to outer islands.
v. The Government must push for dramatic improvements to outer island runways,
especially in key atolls with greatest tourism potential.
vi. The Government must engage with Continental Airlines on options for better pricing,
scheduling, and service options. It must also capitalize on RMI‘s existing landing
rights in Honolulu and Fiji to facilitate better air transport services and restore and
sustain airline services to the south, connecting the RMI with Australia and Fiji. The
Government must strongly support continuation and increase of JAL charter business
and work on the airline information package.
vii. The Government should take urgent measures to utilize the initiative by Continental
Airlines to introduce 3 flights from Japan.
viii. The Government must take measures to improve access to finance.
ix. All tourism stakeholders must engage RMI to improve overall business and economic
policies to encourage growth of private sector and start ups.
x. Policies such as taxation, immigration, labor and others must be reformed to enable
business growth.
xi. The Government must reformulate the National Investment Policy Statement.
xii. The Government must identify islands and regions with best suitability for
small‐scale, sustainable tourism resort development. It must establish an inventory of
97
suitable and free‐and‐clear islands and areas (non disputed) for investment promotion
and facilitation.
xiii. The Government must begin aggressive investment promotion campaign targeting
high‐end resort developments and investors.
xiv. The Government must re‐consider tax holiday for hotel and related investors.
xv. The Government must improve the basic infrastructure and services: airports, sea
ports, roads, telecommunications, water, power and sewer.
xvi. MIVA must work with the Registrar of Corporations, review and comment on foreign
investment business license applications that propose tourism‐related investments, to
ensure that proposed investments meet the minimum standards.
xvii. MIVA, immigration, labor and EPPSO should work together to improve tourism
statistics.
xviii. The Airport Authority should allow MIVA to conduct exits surveys at the airport.
xix. Import procedures must be streamlined to avoid a situation where importing goods
requires going through many offices.
xx. The Government must increase the marketing funds to MIVA. This should be seen as
an investment and not a loss to the Government.
xxi. More effort should be put on product development, because if you cannot dive or fish
there is very little to do.
xxii. Enforce environment laws (waste management) to ensure that all public places are
well maintained.
xxiii. RMI should adopt international hotel standards.
xxiv. Technical and financial assistance must be provided to promote existing strengths in
tourism resources and link it to various local agricultural and fisheries products.
xxv. RMI should promote high end low, impact tourism and put adequate regulatory
measures in place to protect the environment and encourage sustainable tourism.
4 PARTICIPATION OF RMI IN MERCHANDISE TRADE
This section covers RMI‘s performance in merchandise trade, classification of imports, import
markets, RMI‘s tariff structure, export performance, composition of exports, export markets and
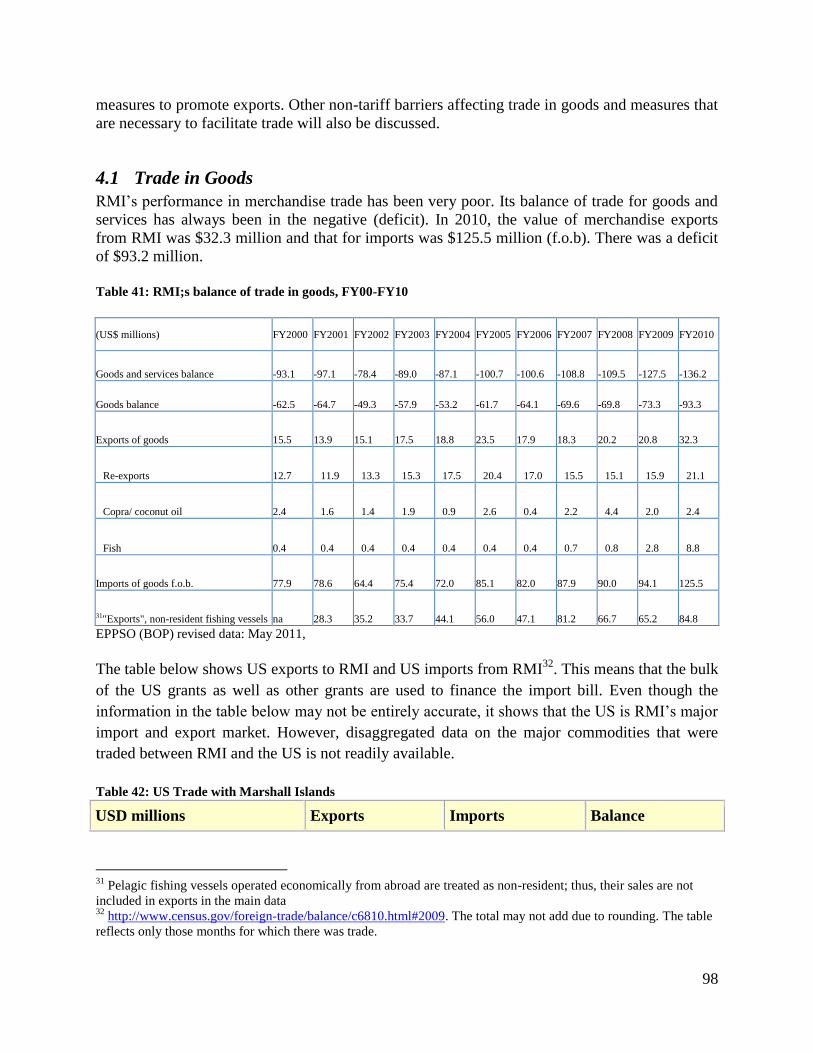
98
measures to promote exports. Other non-tariff barriers affecting trade in goods and measures that
are necessary to facilitate trade will also be discussed.
4.1 Trade in Goods
RMI‘s performance in merchandise trade has been very poor. Its balance of trade for goods and
services has always been in the negative (deficit). In 2010, the value of merchandise exports
from RMI was $32.3 million and that for imports was $125.5 million (f.o.b). There was a deficit
of $93.2 million.
Table 41: RMI;s balance of trade in goods, FY00-FY10
(US$ millions) FY2000 FY2001 FY2002 FY2003 FY2004 FY2005 FY2006 FY2007 FY2008 FY2009 FY2010
Goods and services balance -93.1 -97.1 -78.4 -89.0 -87.1 -100.7 -100.6 -108.8 -109.5 -127.5 -136.2
Goods balance -62.5 -64.7 -49.3 -57.9 -53.2 -61.7 -64.1 -69.6 -69.8 -73.3 -93.3
Exports of goods 15.5 13.9 15.1 17.5 18.8 23.5 17.9 18.3 20.2 20.8 32.3
Re-exports 12.7 11.9 13.3 15.3 17.5 20.4 17.0 15.5 15.1 15.9 21.1
Copra/ coconut oil 2.4 1.6 1.4 1.9 0.9 2.6 0.4 2.2 4.4 2.0 2.4
Fish 0.4 0.4 0.4 0.4 0.4 0.4 0.4 0.7 0.8 2.8 8.8
Imports of goods f.o.b. 77.9 78.6 64.4 75.4 72.0 85.1 82.0 87.9 90.0 94.1 125.5
31"Exports", non-resident fishing vessels na 28.3 35.2 33.7 44.1 56.0 47.1 81.2 66.7 65.2 84.8
EPPSO (BOP) revised data: May 2011,
The table below shows US exports to RMI and US imports from RMI32
. This means that the bulk
of the US grants as well as other grants are used to finance the import bill. Even though the
information in the table below may not be entirely accurate, it shows that the US is RMI‘s major
import and export market. However, disaggregated data on the major commodities that were
traded between RMI and the US is not readily available.
Table 42: US Trade with Marshall Islands
USD millions Exports Imports Balance
31
Pelagic fishing vessels operated economically from abroad are treated as non-resident; thus, their sales are not
included in exports in the main data 32
http://www.census.gov/foreign-trade/balance/c6810.html#2009. The total may not add due to rounding. The table
reflects only those months for which there was trade.

99
2009 77.6 13.7 63.933
2008 25.1 19.3 5.9
2007 22.9 11.7 11.2
2006 15.5 14.4 1.0
2005 75.5 17.2 58.3
2004 18.8 12.1 6.7
2003 28.2 27.1 1.1
2002 28.8 9.5 19.3
2001 26.5 5.5 21.0
2000 60.4 5.2 55.2
SOURCE: U.S. Census Bureau, Foreign Trade Division, Data Dissemination Branch, Washington, D.C. 20233
4.1.1 Classification of Imports
The RMI‘s import bill is largely dominated by fuel, food and beverages. In effect, RMI‘s
classification of imports for 2009 and 2010 shows that foodstuff imports account for about
30% of the import bill. The major items in this category include meat and fish imports
especially poultry, canned meat, canned fish, beef meat, pork meat, fish, non-fish seafood.
Other major food items imported include rice, fruit and vegetables, sugar and confectionary,
bread, cakes, biscuits, ramen, noodles, pasta, milk and cream and ice cream. Beverages
including, soft drinks, beer, spirits, water, and wine also constitute a significant portion of the
import bill. It is clear that a huge chunk of RMI‘s funds are spent on food and beverages
rather than importation of industrial and capital goods that can be used for production of
value added goods and services34
.
Table 43: Imports to RMI by product category and value: 2009 - 2010
COMODITY/HS SECTION VALUE ($) 2009
Share % VALUE ($) 2010 Share %
I : ANIMALS & ANIMAL PRODUCTS 4,958,179 7% 5,929,037.77 8.1%
II : VEGETABLE PRODUCTS 5,662,145 8% 4,516,096.18 6.2%
III : ANIMAL OR VEGETABLE FATS 600,398 1% 468,949.48 0.6%
IV : PREPARED FOODSTUFFS 11,550,403 15% 11,076,028.27 15.1%
33
Data from RMI Customs however indicate as follows: 2009 imports from US (including Guam and Hawaii) = $
49,473,300; 2010 imports from US = $ 49,055,589.
34
Information on fuel imports is not available, thus possibility of substantial gap in the data
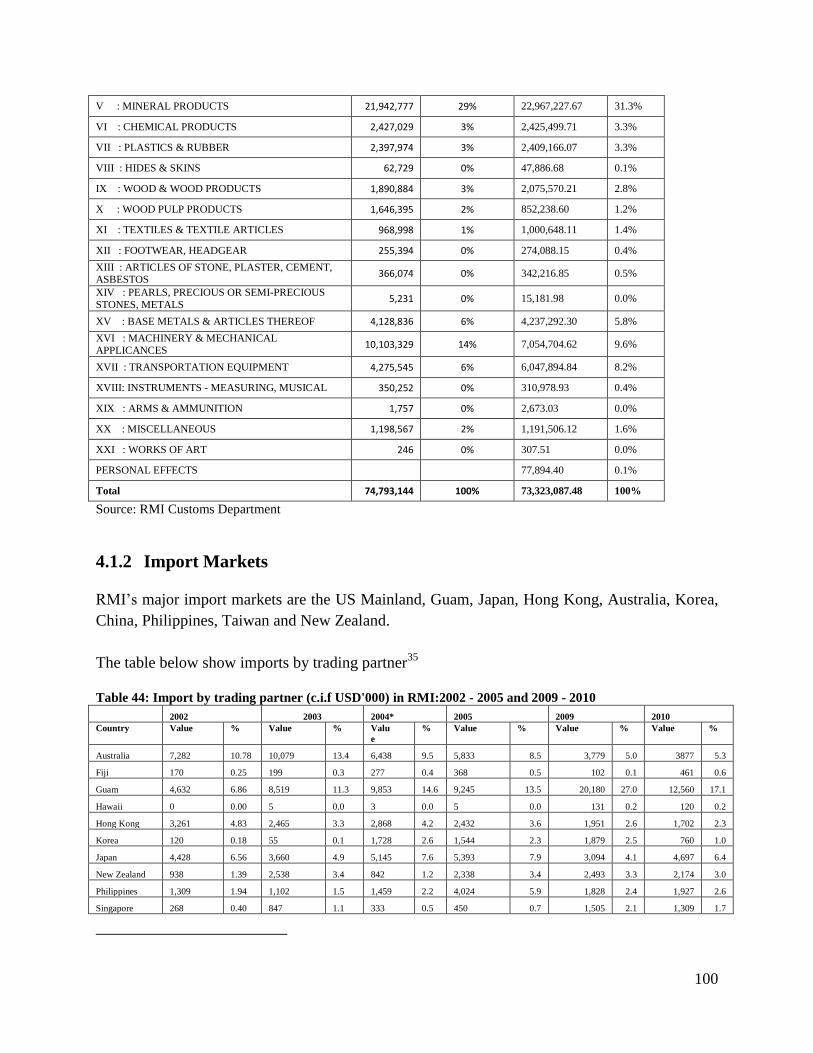
100
V : MINERAL PRODUCTS 21,942,777 29% 22,967,227.67 31.3%
VI : CHEMICAL PRODUCTS 2,427,029 3% 2,425,499.71 3.3%
VII : PLASTICS & RUBBER 2,397,974 3% 2,409,166.07 3.3%
VIII : HIDES & SKINS 62,729 0% 47,886.68 0.1%
IX : WOOD & WOOD PRODUCTS 1,890,884 3% 2,075,570.21 2.8%
X : WOOD PULP PRODUCTS 1,646,395 2% 852,238.60 1.2%
XI : TEXTILES & TEXTILE ARTICLES 968,998 1% 1,000,648.11 1.4%
XII : FOOTWEAR, HEADGEAR 255,394 0% 274,088.15 0.4%
XIII : ARTICLES OF STONE, PLASTER, CEMENT, ASBESTOS
366,074 0% 342,216.85 0.5%
XIV : PEARLS, PRECIOUS OR SEMI-PRECIOUS
STONES, METALS 5,231 0% 15,181.98 0.0%
XV : BASE METALS & ARTICLES THEREOF 4,128,836 6% 4,237,292.30 5.8%
XVI : MACHINERY & MECHANICAL
APPLICANCES 10,103,329 14% 7,054,704.62 9.6%
XVII : TRANSPORTATION EQUIPMENT 4,275,545 6% 6,047,894.84 8.2%
XVIII: INSTRUMENTS - MEASURING, MUSICAL 350,252 0% 310,978.93 0.4%
XIX : ARMS & AMMUNITION 1,757 0% 2,673.03 0.0%
XX : MISCELLANEOUS 1,198,567 2% 1,191,506.12 1.6%
XXI : WORKS OF ART 246 0% 307.51 0.0%
PERSONAL EFFECTS
77,894.40 0.1%
Total 74,793,144 100% 73,323,087.48 100%
Source: RMI Customs Department
4.1.2 Import Markets
RMI‘s major import markets are the US Mainland, Guam, Japan, Hong Kong, Australia, Korea,
China, Philippines, Taiwan and New Zealand.
The table below show imports by trading partner35
Table 44: Import by trading partner (c.i.f USD'000) in RMI:2002 - 2005 and 2009 - 2010
2002 2003 2004* 2005 2009 2010
Country Value % Value % Valu
e
% Value % Value % Value %
Australia 7,282 10.78 10,079 13.4 6,438 9.5 5,833 8.5 3,779 5.0 3877 5.3
Fiji 170 0.25 199 0.3 277 0.4 368 0.5 102 0.1 461 0.6
Guam 4,632 6.86 8,519 11.3 9,853 14.6 9,245 13.5 20,180 27.0 12,560 17.1
Hawaii 0 0.00 5 0.0 3 0.0 5 0.0 131 0.2 120 0.2
Hong Kong 3,261 4.83 2,465 3.3 2,868 4.2 2,432 3.6 1,951 2.6 1,702 2.3
Korea 120 0.18 55 0.1 1,728 2.6 1,544 2.3 1,879 2.5 760 1.0
Japan 4,428 6.56 3,660 4.9 5,145 7.6 5,393 7.9 3,094 4.1 4,697 6.4
New Zealand 938 1.39 2,538 3.4 842 1.2 2,338 3.4 2,493 3.3 2,174 3.0
Philippines 1,309 1.94 1,102 1.5 1,459 2.2 4,024 5.9 1,828 2.4 1,927 2.6
Singapore 268 0.40 847 1.1 333 0.5 450 0.7 1,505 2.1 1,309 1.7
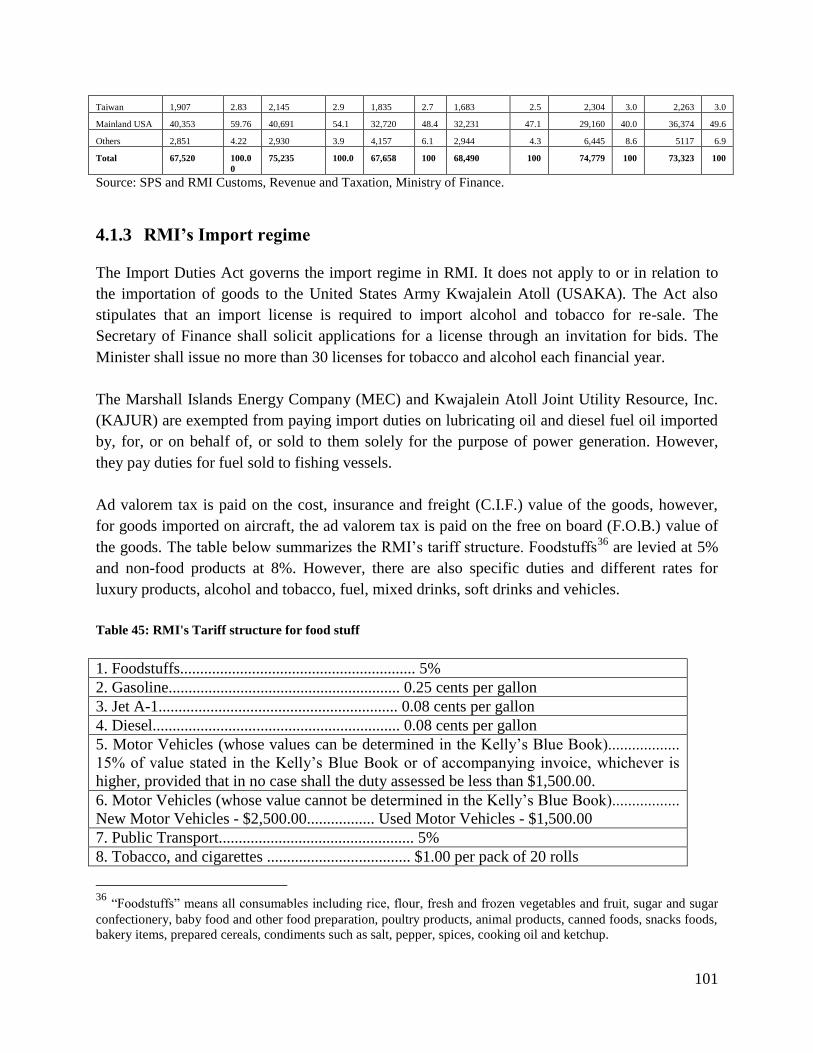
101
Taiwan 1,907 2.83 2,145 2.9 1,835 2.7 1,683 2.5 2,304 3.0 2,263 3.0
Mainland USA 40,353 59.76 40,691 54.1 32,720 48.4 32,231 47.1 29,160 40.0 36,374 49.6
Others 2,851 4.22 2,930 3.9 4,157 6.1 2,944 4.3 6,445 8.6 5117 6.9
Total 67,520 100.0
0
75,235 100.0 67,658 100 68,490 100 74,779 100 73,323 100
Source: SPS and RMI Customs, Revenue and Taxation, Ministry of Finance.
4.1.3 RMI’s Import regime
The Import Duties Act governs the import regime in RMI. It does not apply to or in relation to
the importation of goods to the United States Army Kwajalein Atoll (USAKA). The Act also
stipulates that an import license is required to import alcohol and tobacco for re-sale. The
Secretary of Finance shall solicit applications for a license through an invitation for bids. The
Minister shall issue no more than 30 licenses for tobacco and alcohol each financial year.
The Marshall Islands Energy Company (MEC) and Kwajalein Atoll Joint Utility Resource, Inc.
(KAJUR) are exempted from paying import duties on lubricating oil and diesel fuel oil imported
by, for, or on behalf of, or sold to them solely for the purpose of power generation. However,
they pay duties for fuel sold to fishing vessels.
Ad valorem tax is paid on the cost, insurance and freight (C.I.F.) value of the goods, however,
for goods imported on aircraft, the ad valorem tax is paid on the free on board (F.O.B.) value of
the goods. The table below summarizes the RMI‘s tariff structure. Foodstuffs36
are levied at 5%
and non-food products at 8%. However, there are also specific duties and different rates for
luxury products, alcohol and tobacco, fuel, mixed drinks, soft drinks and vehicles.
Table 45: RMI's Tariff structure for food stuff
1. Foodstuffs........................................................... 5%
2. Gasoline.......................................................... 0.25 cents per gallon
3. Jet A-1............................................................ 0.08 cents per gallon
4. Diesel.............................................................. 0.08 cents per gallon
5. Motor Vehicles (whose values can be determined in the Kelly‘s Blue Book)..................
15% of value stated in the Kelly‘s Blue Book or of accompanying invoice, whichever is
higher, provided that in no case shall the duty assessed be less than $1,500.00.
6. Motor Vehicles (whose value cannot be determined in the Kelly‘s Blue Book).................
New Motor Vehicles - $2,500.00................. Used Motor Vehicles - $1,500.00
7. Public Transport................................................. 5%
8. Tobacco, and cigarettes .................................... $1.00 per pack of 20 rolls
36
―Foodstuffs‖ means all consumables including rice, flour, fresh and frozen vegetables and fruit, sugar and sugar
confectionery, baby food and other food preparation, poultry products, animal products, canned foods, snacks foods,
bakery items, prepared cereals, condiments such as salt, pepper, spices, cooking oil and ketchup.
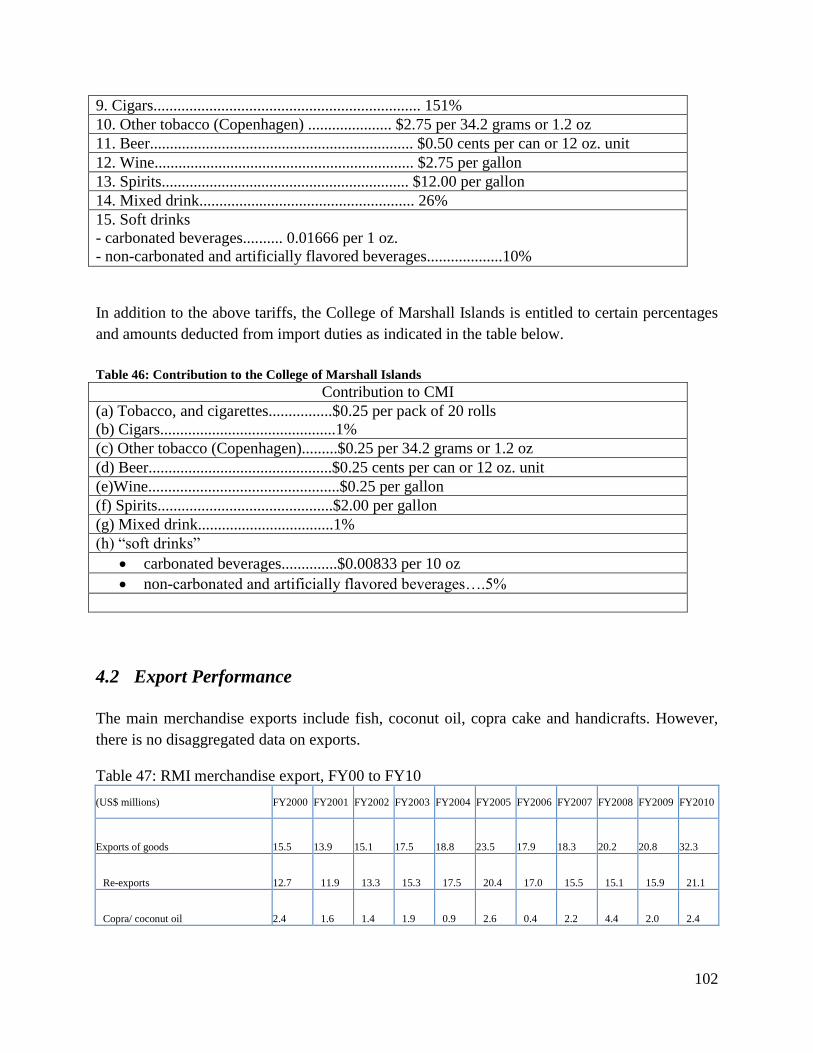
102
9. Cigars................................................................... 151%
10. Other tobacco (Copenhagen) ..................... $2.75 per 34.2 grams or 1.2 oz
11. Beer.................................................................. $0.50 cents per can or 12 oz. unit
12. Wine................................................................. $2.75 per gallon
13. Spirits.............................................................. $12.00 per gallon
14. Mixed drink...................................................... 26%
15. Soft drinks
- carbonated beverages.......... 0.01666 per 1 oz.
- non-carbonated and artificially flavored beverages...................10%
In addition to the above tariffs, the College of Marshall Islands is entitled to certain percentages
and amounts deducted from import duties as indicated in the table below.
Table 46: Contribution to the College of Marshall Islands
Contribution to CMI
(a) Tobacco, and cigarettes................$0.25 per pack of 20 rolls
(b) Cigars............................................1%
(c) Other tobacco (Copenhagen).........$0.25 per 34.2 grams or 1.2 oz
(d) Beer..............................................$0.25 cents per can or 12 oz. unit
(e)Wine................................................$0.25 per gallon
(f) Spirits............................................$2.00 per gallon
(g) Mixed drink..................................1%
(h) ―soft drinks‖
carbonated beverages..............$0.00833 per 10 oz
non-carbonated and artificially flavored beverages….5%
4.2 Export Performance
The main merchandise exports include fish, coconut oil, copra cake and handicrafts. However,
there is no disaggregated data on exports.
Table 47: RMI merchandise export, FY00 to FY10
(US$ millions) FY2000 FY2001 FY2002 FY2003 FY2004 FY2005 FY2006 FY2007 FY2008 FY2009 FY2010
Exports of goods 15.5 13.9 15.1 17.5 18.8 23.5 17.9 18.3 20.2 20.8 32.3
Re-exports 12.7 11.9 13.3 15.3 17.5 20.4 17.0 15.5 15.1 15.9 21.1
Copra/ coconut oil 2.4 1.6 1.4 1.9 0.9 2.6 0.4 2.2 4.4 2.0 2.4
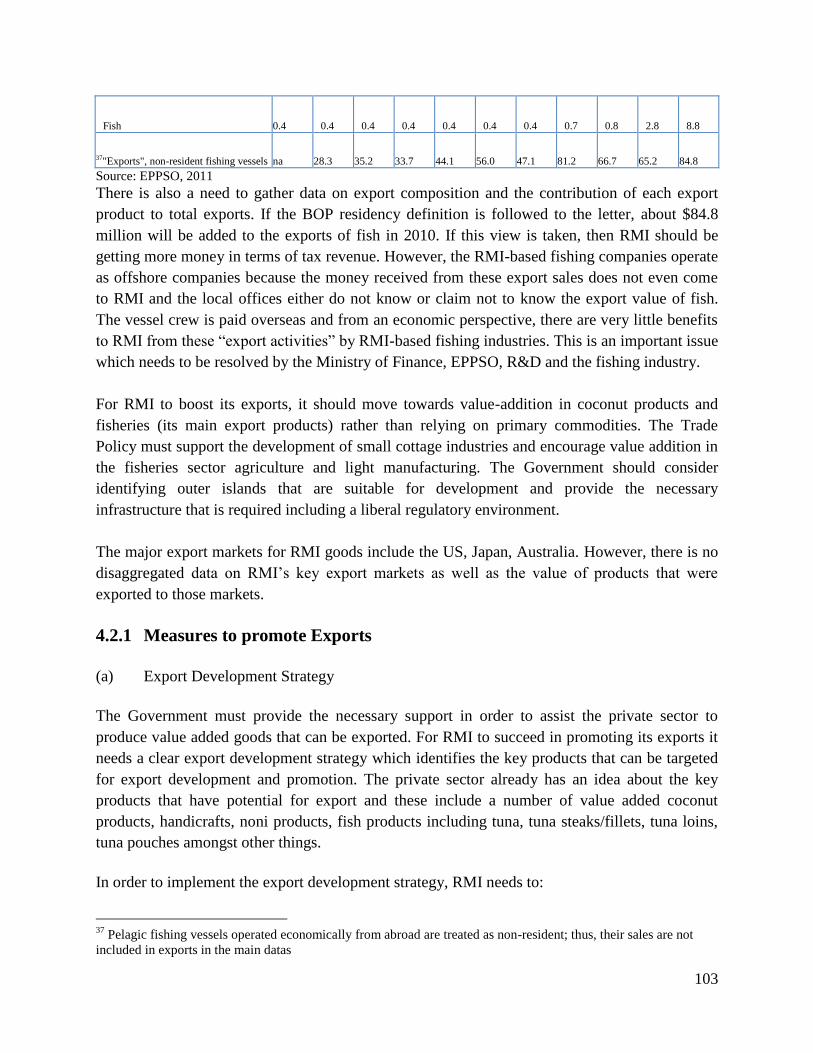
103
Fish 0.4 0.4 0.4 0.4 0.4 0.4 0.4 0.7 0.8 2.8 8.8
37"Exports", non-resident fishing vessels na 28.3 35.2 33.7 44.1 56.0 47.1 81.2 66.7 65.2 84.8
Source: EPPSO, 2011 There is also a need to gather data on export composition and the contribution of each export
product to total exports. If the BOP residency definition is followed to the letter, about $84.8
million will be added to the exports of fish in 2010. If this view is taken, then RMI should be
getting more money in terms of tax revenue. However, the RMI-based fishing companies operate
as offshore companies because the money received from these export sales does not even come
to RMI and the local offices either do not know or claim not to know the export value of fish.
The vessel crew is paid overseas and from an economic perspective, there are very little benefits
to RMI from these ―export activities‖ by RMI-based fishing industries. This is an important issue
which needs to be resolved by the Ministry of Finance, EPPSO, R&D and the fishing industry.
For RMI to boost its exports, it should move towards value-addition in coconut products and
fisheries (its main export products) rather than relying on primary commodities. The Trade
Policy must support the development of small cottage industries and encourage value addition in
the fisheries sector agriculture and light manufacturing. The Government should consider
identifying outer islands that are suitable for development and provide the necessary
infrastructure that is required including a liberal regulatory environment.
The major export markets for RMI goods include the US, Japan, Australia. However, there is no
disaggregated data on RMI‘s key export markets as well as the value of products that were
exported to those markets.
4.2.1 Measures to promote Exports
(a) Export Development Strategy
The Government must provide the necessary support in order to assist the private sector to
produce value added goods that can be exported. For RMI to succeed in promoting its exports it
needs a clear export development strategy which identifies the key products that can be targeted
for export development and promotion. The private sector already has an idea about the key
products that have potential for export and these include a number of value added coconut
products, handicrafts, noni products, fish products including tuna, tuna steaks/fillets, tuna loins,
tuna pouches amongst other things.
In order to implement the export development strategy, RMI needs to:
37
Pelagic fishing vessels operated economically from abroad are treated as non-resident; thus, their sales are not
included in exports in the main datas
104
Set aside land in outer islands that can be used for industrial development and provide
all the relevant infrastructure
promote investment and development
promote value addition and enhance exports
consolidate existing markets and diversify into non-traditional markets
enhance the competitiveness of its products on the regional and international markets
develop an export culture and positive change of attitude among the business
entrepreneurs ; and
exploit its comparative advantages and develop new products.
(b) Trade promotion officers
RMI needs to have trade promotion officers in its major trading partners and strategic markets to
promote its products and services. The RMI embassies must play a vital role in promoting trade,
investment and tourism. The NTFC should assist with promoting exports, consolidating existing
markets and opening new markets. This body should be responsible for information gathering
and dissemination, research as well as assisting exporters, particularly SMEs in exporting to new
markets. FSM, RMI and Palau should consider establishing an FAS Trade and Investment Centre
in the US to market and promote goods and services from the three countries. This could be
modelled on PITIC offices but adjusted to suit the US and FAS requirements. A similar initiative
can be explored in Europe as well.
(c) Participation in international fairs and expos
RMI should participate actively in international fairs and expos and the Government should
assist by securing space in certain strategic international trade fairs, where specific products from
small and medium scale companies will be exhibited. The space can be offered to these
companies at concessionary rates in order to make them cost effective. Small and medium scale
industries will have the opportunity to promote their products and be exposed to international
trends in quality and technology. There should be export promotion mission in key markets such
as US, Japan, Australia, EU, China and New Zealand, and ambassadors and trade officials
should actively market RMI products and services. The Government has been assisting traders
with subsidised transportation to take their products to Ebeye for trade shows. There should be a
regular assessment of the benefits of such promotion activities to identify ways in which the
services can be improved.
(d) Export incentives
The Government should place great emphasis on export enhancement and put various export
incentives to assist exporters. The main objective of incentives should be to create an enabling
operational business environment for exporters. Export incentives should be put in place after

105
consultation with all stakeholders. Some of the incentives that may be considered include tax
incentives, targeted and time bound transport subsidies, free trade zones, promotion and
marketing assistance and freight subsidy schemes to diversify exports.
(e) Trade Website
A trade website must also be created to allow information sharing and discussion of problems
affecting producers, importers and exporters. A database of potential investments, importers and
exporters must also be maintained.
4.2.2 Trade Facilitation
In order to facilitate trade, RMI needs to reform its customs procedures and adopt the state-of-
the-art software for customs business being recommended by the World Customs Organisation
and the Oceania Customs Organisation (OCO). There is a need to standardize and harmonize
import and export procedures and documents to ensure swift movement of goods. According to
the 2012, World Bank Report on the Ease of Doing Business, it takes 21 days to export and 33
days to import goods. Fees, formalities connected with importation and exportation must also be
standardized and the trade regulations must be published regularly. All the red tape that is
associated with clearing goods at customs must be reduced to a minimum and RMI should
consider adopting a single window system for clearing imports rather that requiring the importers
to go to various agencies. This wastes time and resources and the costs incurred will be passed
onto the consumers who in the final analysis will bear the brunt of the customs red tape. The
amount of time that is taken to clear goods should be reduced to a minimum.
Streamlining and reforming customs can also minimize corruption and smuggling of goods at the
borders and also ensure efficient collection of revenue. A number of developing countries that
have reformed their customs and utilized the latest technologies have actually witnessed an
increase in the amount of customs revenue collected.
There is also a need for capacity building and provision of the necessary facilities to enable the
customs officials to implement trade facilitation regulations and measures, and at the same time
monitor imports and exports. Customs officials need to be trained on other technical issues such
as rules of origin, customs surveillance and how to combat customs fraud and irregularities. This
is crucial for RMI to access the benefits under the Economic Partnership Agreement that is being
negotiated with the European Union. A comprehensive review of the customs code is warranted
in order to facilitate trade in the RMI. Some of the issues relating to trade facilitation can be
addressed through regional cooperation and assistance from the donors in this area is much
needed.
106
RMI also needs to establish a Competent Authority to deal with EU export standards including
the sanitary and phytosanitary measures (SPS). Food safety laws need to be reviewed and RMI
should cooperate with regional and international institutions to get assistance to build its capacity
in this area. The Ministry of R&D –MIMRA should cooperate with fisheries exporters and
address all the standards that are required for RMI products to qualify for the export markets.
RMI should fully utilize any successor programme to the Regional Trade Facilitation Programme
(RTFP) that is provided under PACER. All the issues pertaining to standards and conformance
need to be addressed through sub-regional or regional cooperation.
The Animal and Plant Inspection Act requires the Chief of Agriculture (within the Ministry of
R&D) to issue regulations pertaining to quarantine, and to monitor and enforce those regulations
and the Act. The ―Export Meat Inspection Act‖ requires the Chief of Agriculture to inspect all
meat for export. The ―Endangered Species Act‖ requires the Secretary of Resources and
Development to promulgate, monitor and enforce regulations regarding endangered species in
the RMI. The implementation of this act is critical to the conservation of the Marshall Islands‘
biodiversity. RMI Quarantine laws also need to be reviewed and aligned with international
practices and standards. The quarantine department also needs to be strengthened and endowed
with the capacity to ensure that imports or exports are safe and free from any disease that may
pose a threat to animal, plant and human life and health.
It should be noted that RMI does not allow imports of agricultural products from any other
nation except the US. However, if food products come from other Asian countries via the US
they can be accepted.
4.3 Domestic Trade Policies and Instruments
The major problem in RMI is that the private sector is too small and does not have capacity to
produce goods and services that can be exported globally. In order to boost production, RMI
needs to introduce measures to address the supply-side constraints. The main focus should be on
promoting production and value addition in a few niche agricultural products and fisheries. The
Government needs to put in place quality infrastructure and services to promote trade and
investment, including tourism. The Trade Policy contributes to achieving the goals in the SDPF
and resources must be prioritized to boost domestic production in priority sectors. There is also a
need to align the Compact funding to build infrastructure needed to support the private sector
and also to fund trade-related projects.
RMI needs to build its capacity to produce and supply the export markets. Building capacity to
trade should be a key national priority and assistance from donor agencies and its major trading
partners is needed for this purpose. RMI should also consider developing a comprehensive
national export strategy to strengthen its export capacity. The strategy should identify products
and sectors that should be targeted and prioritized for export development. It should also target
107
the products that can be produced locally to substitute imports. A lot of emphasis should be put
on value addition to local resources. Other organisations like the UNDP, ITC and
Commonwealth have also assisted developing countries in this area.
A comprehensive Skills Development Initiative is needed in order to develop the necessary skills
that are required in the relevant sectors of the economy. There is a need to identify skills and the
institutions which can be targeted for developing these skills. Vocational training schools in
tourism, fisheries and agriculture, construction, nursing, science and technology amongst other
things are vital in this initiative. In areas where RMI has no capacity to produce relevant skills, it
should partner with regional and institutional organisations.
Policies relating to research and development, competitiveness, industry protection policy,
subsidies, incentives, market regulation of key export sectors need to be reviewed and updated to
address the changing global needs.
The tariff structure needs to be adjusted in order to identify products that must be liberalised and
those that need to be protected in the context of international trade negotiations. RMI needs to
identify those industries that it has potential to develop in future and this should be reflected in
the tariff structure. Some agricultural, fisheries and textiles products may also need to be
exempted from trade liberalisation. It is also important to note that due to global changes, it is
difficult to identify industries that will need to be protected in future and the Government does
not have a good track record in picking winners, hence the need for private sector consultation.
RMI does not depend much on other levies and charges for revenue. Local governments charge
other forms of taxes such as sales tax. RMI also has a few non-tariff measures that are applied to
imports and these include import licenses on alcohol and tobacco, license for copra export,
quarantine regulations on agricultural products and those that seek to protect health and safety of
plants, animal and human beings.
RMI does not impose export taxes. However, there were arguments from certain ministries in
favour of levying export taxes on export of unprocessed fish.
The Government provides a lot of subsidies to the copra industry and also to the transportation
sector. This support is necessary to compensate for low commodity prices and improve product
quality. Freight subsides are needed to compensate for high transportation costs and also to
provide services to outer island routes which may not be viable. However, these subsidies must
be reviewed to ensure that they are transparent, targeted, reaching the intended beneficiaries and
achieving the ultimate Government goals.
The Government also needs to provide assistance for agricultural research and development.
Funding can be given to institutions to support the development of three or four products with
108
export potential. The Marshall Island Development Bank should play a vital role in supporting
the private sector with credit.
RMI should put in place contingency measures to protect its industries against unfair practices
such as dumping, subsidized products and the sudden influx of imports. In order to use these
measures in a least trade restrictive manner, RMI should introduce legislation and mechanisms
for imposing anti-dumping duties, countervailing measures and safeguard measures.
Recommendations
i. RMI must build its capacity to produce food products and other products where feasible,
in order to reduce the import bill and promote exports.
ii. RMI must work with SPC and other regional organisations to improve the sanitary and
phytosanitary measures (SPS) and technical barriers to trade (TBT) laws.
iii. The Government should identify domestic measures and policies to boost production
capacity, protect sensitive sectors, enhance transparency on subsidies and ensure that the
subsidies are targeted; time bound and do not distort resource allocation and hinder
participation of the private sector in the economy.
iv. RMI must reform its customs laws to simplify, harmonise and streamline import and
export procedures to facilitate the movement of goods.
v. RMI need to develop a comprehensive export strategy and adopt measures that will
facilitate exports. The private sector should be supported to focus on adding value to
fisheries products, coconut products, noni and handicraft.
vi. RMI must take measures to assist the private sector to fully utilise the existing market
access and to diversify into other markets.
vii. RMI should establish a vibrant trade website that will provide relevant information to
traders and investors.
viii. The Government must prioritise human resources development and develop skills that are
needed to enhance trade in agriculture, fisheries, tourism, manufacturing and handicraft.
ix. RMI must adopt the 2007 Harmonized System that is fully compatible with the World
Customs Organization (WCO) rules and gather the latest trade data (disaggregated by
tariff line and trading partner, quantity, and import duty) for the recent three years (2008-
2010).
x. RMI must amend the customs legislation to require exporters to complete export
declarations for statistical purposes.
109
xi. RMI should introduce a regulation requiring importers to submit their trade data in
electronic format, so as to stem the perennial problem of missing or poor handling of
files, among other benefits. This will require training (e.g. through seminars) of the staff
of these importers prior to the introduction of legislation to this effect.
xii. RMI must take concrete measures to ensure that information on import activities by all
enterprises are provided as and when required.
5 THE MARSHALL ISLANDS INVESTMENT REGIME
This section discusses the general laws regulating investment in RMI, the investment trends in
RMI and the country‘s performance on the World Bank Ranking on the Ease of Doing Business.
Recommendations on how to create a friendly trade and investment environment are also
addressed here. Additionally, this section will address a number of laws and regulations that are
also relevant for the section on trade in services.
5.1 General Laws Regulating Investment in RMI
Investment in RMI is currently regulated by the 2004/2005 National Investment Policy
Statement (NIPS). There is also a 2006 Revised Draft National Investment Policy Statement
(NIPS) which seeks to introduce certain amendments. However, these documents need to be
updated.
The Investment Policy encourages private sector development in fisheries, tourism,
manufacturing and agriculture in order to meet development goals. However, the 2006 Draft
NIPS recognises that fisheries and tourism hold the most comparative advantage.
According to the current NIPS, the Trade and Investment Division of the Ministry of R&D is
responsible for facilitating and promoting investment and providing policy advice to
Government. Under the Foreign Investment Business License Act of 1990 [10 MIRC Ch 5], non-
citizen investments are required to obtain a Foreign Investment Business License (FIBL) from
the Ministry of Finance. The FIBL Act defines a non-citizen investment as ―any person who is
not a citizen of the Republic, or any corporation, joint venture, association, partnership or other
legal entity in which a person or persons who are not citizens of the Republic own an equity
interest‖.
The RMI uses the United States dollar as its national currency and there are no restrictions on the
exchange of foreign currency, or the repatriation of profits, dividends or investment capital.
110
The current NIPS provides that if investments do not fall within the reserved list, every effort is
made to issue the FIBL within 7 working days of application. If it is not clear whether the
investment falls within the reserve list or not, a decision can be made within 15 days.
According to the NIPS, the only factor that is taken into consideration before the FIBL is
approved is whether the proposed investment falls within the reserve list or not. However, the
2006 Draft amendment proposes to add another requirement that investors must not have a
criminal record involving dishonesty, or must not be considered undesirable according to RMI
law.
The investor must also apply for an Employer Identification Number (EIN) for tax purposes and
for making employee health and social security contributions. The EIN can be issued within a
day. A foreign investor can incorporate as a domestic limited company or register as a foreign
entity under the Business Corporations Act [52 MIRC Part I]. Investors must register with the
Registrar of Companies in the Office of the Attorney General (AG). According to the Draft NIPS
the initial cost of registering a domestic company and the annual fee are $ 250 and $100
respectively. The initial cost of registering a foreign entity and the annual fee are $1,000 and
$500 respectively.
(a) Labor and Immigration
The Ministry of Foreign Affairs is responsible for dealing with all the issues pertaining to work
permits under the Labor (Non-Resident Workers) Act, 2006. The employer can apply for a
permit to the Secretary of Foreign Affairs who will consider the application. All applications
must be submitted by prospective employers between 01 July to 01 September and a penalty is
charged for any applications outside this period. The Secretary shall make a decision within 21
days. Except for a foreign investor and family work permit, all applications for work permits
must be submitted by the employer while the non-resident worker is outside RMI.
In order to obtain a work permit, the foreign investor must have a foreign business license,
police and health clearance, clearance from the Ministry of Finance, MISSA and local
government. No bond is required.
Under the occupational shortage list (OSL) work permit, if the employer is a foreign investor, he
has to produce the FIBL, proof that no resident worker meets the requirements of the
occupational category specified in the Occupational Shortage List, provide a valid police and
health clearance, the prescribed fee and bond payment. In 2006, RMI developed a list of
occupations that were in short supply e.g. health, accountants, lawyers and other professionals.
For those that do not fall under the OSL, they can apply for a general work permit. If the
employer is a foreign investor, an FIBL will be required. In addition, there must be proof that the
111
position has been advertised in the local media for 30 days, evidence that there was no suitably
qualified citizen worker, evidence of minimum education and experience, and payment of the
prescribed fee and bond.
A temporary work permit can be provided for up to 6 months. The foreign investor needs to
produce an FIBL and a letter stating the reason why the worker is required and the contract. On
arrival, the non-resident worker must produce a valid return air ticket and a letter. A bond is not
required in this case.
The Non-Resident Workers (Fee) Amendment Act of 2009 requires employers to pay $250 per
foreign worker per quarter but this may be exempted by Cabinet for qualified export projects. An
employer who is a not a Marshallese citizen is required to pay $250 if he or she receives any
remuneration for such a position. Only a foreign employer who is also receiving remuneration is
required to pay $250 but a Marshallese employer is not required to pay this amount. The
National Training Fund was established under the Industries Development Act of 1991. It is
administered by NTC and Secretary of Finance for the purposes of training Marshallese citizens.
The Labor Act requires all employers to ensure that at least 50% of the workforce is Marshallese
(quota). All employers are required give first preference to employment of Marshallese. Non-
resident workers may be recruited only to supplement local labor and if there are no qualified
citizens. The Federal Agencies, US contractors and local contractors shall give employment
preference to US and RMI citizens, nationals and permanent residents of the United States.
Citizens from Freely Associated States (FAS) are not required to apply for work permits.
Upon approval of an application for a work permit, the Chief of Labor shall make a request to
the Immigration Division to for the issuance of a work visa. The Immigration Act, 2006 provides
for a residence visa (R-1) for up to 5 years; diplomatic visa (D-1) up to 2 years; business visa (B-
1) up to 2 years; general visa (G-1) up to 2 years; work visa (E-1); student visa (S-1) up to 1
year; visitor‘s visa (V-1) up to 3 months and transit visa (T-1) up to 3 days. The cost of a visa is
$200. In addition to the work permit and visa an entry permit will be issued on arrival.
The application should be submitted 30 days after the local advertisement. The employer must
produce a police and health clearance which show that the person does not have a criminal
record and communicable diseases. An effort will be made to make a decision within 21 days
and a permit may be issued for a year subject to renewal on annual basis38
. However, the permit
can only be renewed if the employer shows that there are no suitable citizens available to fill the
position.
According to the Labour Act (2006), the employers are required to bear the costs of repatriating
non-resident workers; the application fee for a permit is $ 100 within the period and $150 outside
the period. If the application is approved, the employer will be required to pay a bond of about
38
After screening the application the Labor department will send the papers to immigration for processing.
112
$1000 if the applicant is from the Forum Island Countries; $1500 if from Asia and Philippines;
$,500 if from Europe; and $2000 if from the U.S. However, the U.S., Palau and FSM citizens are
exempted from paying the bond and do not need work permits39
.
Foreign investors with a FIBL can get an automatic work permit. All non-citizen investors and
non-resident workers and their immediate families must obtain entry permits and alien
registration cards from the Immigration Office at $250 per person. The entry permits and
registration cards are issued for a year but can be renewed annually thereafter. Foreign investors
can enter the country under a 30 day visitor‘s entry permit and convert to a non-resident work
permit then obtain alien registration once in the country. However, non-resident workers must
obtain the entry permits and alien registration cards prior to arrival in the country. Applicants
must be free from AIDS, medically fit and have no criminal record and a decision may be made
within 30 days from submission date.
According to the Minimum Wage Act 1986, the minimum wage is $2.00 per hour. Non-citizen
employees employed by a private employer authorized to invest or conduct any industry or
business in RMI shall be exempt from minimum wage. Qualified export oriented projects may be
exempted by Cabinet.
It is important to note that RMI has been facing a lot of problems with people coming in as
visitors but overstaying, especially those from Asia. The Immigration Act was amended in 2006
and illegal immigrants are trying to legalize their stay. There is also a need to have a synergy
between immigration and labour. A regulation along this line is currently being drafted. Under
the new Act, only dependents under 18 will be allowed into the country.
All non-resident workers pay bond but visitors from the Forum Island Countries can come in
without visas and stay for up to 3 months. However, visitors from Forum Island countries have to
apply for entry permits within 14 working days. The entry permit fee is $200. It was noted that
an entry permit fee of $50 is being charged on an annual basis. This should be discouraged.
There is also a fee of about $180 for the work permit. Business visitors are currently limited to
stays of up to 2 years and pay $250. Only the Director can approve immigration permits.
The immigration department must also monitor the number of RMI citizens going out of the
country as well as those returning to RMI. Currently, there is no stamping requirement when
RMI citizens come back. The sea port is also another area that poses some immigration
challenges as many people are also coming in through the ports. There is also no provision in the
immigration Act to monitor migration under the Compact.
39
The RMI requested the other FAS to reciprocate and this issue was also raised during the Micronesian Summit
and subsequent MTC meetings.
113
It was also noted that the Government offers jobs to tourists but when the private sector wants to
hire them, they are told that they must go back to their respective countries before they can apply
for work permit.
(b) Taxation
The National Government and Local Governments have authority to levy tax to raise revenues
for Government operations. Both levels of Government treat non-citizen investments and
workers the same as their citizen counterparts in terms of taxation. Investors are required to pay
Gross Revenue Tax (GRT), and make mandatory contributions on behalf of each worker they
employ in order to support the social security and the health insurance system.
The Government requires all investors to pay tax on the gross revenues they earn from their
operations in the Republic of the Marshall Islands (Gross Revenue Tax). The GRT is paid
quarterly and includes a minimum payment of $80 on the first $10, 000 earned plus 3% of gross
revenues earned in excess of this minimum amount. There is no corporate tax on business
profits.
Employers must withhold and pay a tax imposed on employee wages and salaries, and personal
income tax for workers is 8% on the first $10, 400 of gross wages and salaries earned and 12%
for income above this threshold. Employees with gross annual wages less than $5,200 are
allowed an exemption of $1,560 per year.
All employers are also required to make mandatory quarterly contributions on behalf of each
worker they employ in order to support the country‘s social security and health insurance
systems. Both payments are calculated based on employee‘s covered earnings which are defined
as the compensation paid up to $5,000 per quarter. The social security tax amounts to a total of
14% of an employee‘s covered earnings, with the employee and employer contributing 7% each.
The health fund amounts to a total of 7% of covered earnings, with employee and employer
contributing 3.5% each. Investors are required to apply to the Social Security Administration to
register their business and obtain a Tax Identification Number.
RMI has not signed double taxation treaties with any country. However, under the Compact,
United States citizens may be relieved of their liability to pay tax in the United States on income
earned in the Republic of the Marshall Islands. To be eligible they must have resided in the
Marshall Islands for at least 183 days of the taxation year.
114
Local governments have the authority to levy sales taxes. They also issue business licenses for
businesses operating in their areas of jurisdiction. Each local Government determines its own
rates and administration procedures. Non-citizen investors are also required to obtain an FIBL
before applying for a local Government business license.
Both foreign and local investors can apply to the Minister of Finance for exemptions from
paying taxes and duties. The exemptions are available to both non-citizen and citizen investors
and can be applied for by submitting a letter to the Minister of Finance.
Investors intending to establish in the following export-oriented sectors can be exempted from
paying GRT for a five-year period:
off-shore or deep sea fishing
manufacturing for export, or for both export and local use
agriculture
hotel and resort facilities
In order to qualify for an exemption, the investor must make an investment of at least US$ 1
million, or provide employment and wages in excess of US$ 150,000 per annum to citizen
workers.
Those who invest in seabed hard mineral mining in the EEZ can be exempted from paying all
taxes, duties and other charges except taxes on wages and salaries, individual income tax and
social security contributions. In order to qualify for the exemption, investors must pay the
Government a royalty, production charge or combination of production charge and a share of net
proceeds accruing from the mining activity.
(c) Foreign Exchange
The Government does not impose any restrictions on non-citizen investors borrowing
domestically or on citizen investors borrowing from abroad. The Government does not impose
any restrictions on domestically based banks making foreign exchange available to their
customers.
The Government encourages all investors to re-invest capital and profits in the country. All
investors are allowed to repatriate profits, dividends and investment capital acquired through the
operation or disposal of their investment. However, all banks must report transfers of funds from
the country over a 24-hour period that is in excess of US$10,000. This requirement is a result of
the Government‘s international money laundering commitments.
115
(d) Access to Land
Most of the land in RMI is customary. Though some alienated private land exists, no land is
available for purchase by non-citizens under the Real and Personal Property Act [24MIRC Ch
1]). However, private and customary land can be leased and the Government places no limits on
the term of a lease. Lease rental values are negotiated and agreed by the parties involved. A
standard leasing agreement has been created and a land register established under the Land
Recording and Registration Act 2003 [24 MIRC Ch 4].
Non-citizen investors wishing to access land for development must negotiate lease agreements
directly with customary groups, or in the case of alienated land, with Marshallese citizens that
own the land. The investor can contact the Land Registration Authority for all relevant
information40
. The Authority is responsible for creating a voluntary register of customary land
and establishing an effective legal framework for recording all documents related to land, and
registering ownership rights, leases, easements and mortgages. The Government has expanded
the land interests that may be mortgaged to include the ownership interest in land, as well as
leaseholds.
(e) Environmental Protection Agency
The Environmental Protection Agency is responsible for protecting the environment including
marine water, environmental impact regulations, solid waste management and ozone depleting
substances. The Government requires environmental impact assessments (EIA) of all new
development projects that may have a significant impact on the environment. The National
Environmental Protection Act 1984 [35 MIRC Ch 1] applies to both national and foreign
investment projects. The Government also requires all investors to obtain permits to move earth
and dispose of solid waste. In addition, investors are required to obtain approvals for how they
intend to manage their trash41
.
It was noted that it is very expensive (about 11% of the total cost of the project) to conduct an
Environmental Impact Assessment. The EIA will be conducted by the investor and the EnPA
will be responsible for reviewing it. It is a requirement that the developer should be independent
from the consultant doing the EIA. It takes not more than 30 days to review the business
proposal and determine whether the EIA is required. If the EIA is not required, a decision can be
made within 2-3 weeks. However, if the EIA is required, it could take about 6 months because
this also involves consulting the public42
.
40
Land Registration Authority was established in March 2003 41
The 2006 Draft has more details on earthmoving permits in the construction sector.
42
Some of the projects that have potential environmental impact included the EIA for the dry dock which had to be
re-done. There were also concerns on disposal of waste from the first loining plant into the ocean. Some of the
waste is now being used to produce fish meal but the sites are also smelly. Another issue that was raised concerns
the disposal of raw sewage into the ocean.

116
The EnPA compliance task force visits companies every week on random basis to check those
selling water or food to ensure that they comply with the law. RMI is striving to comply with
international environmental standards and capacity building is required to enforce environmental
laws.
While it is clear that the objective to protect environment is paramount, it should not be pursued
in a vacuum. A practical approach to this issue as opposed to arm chair criticism is likely to be
successful. All the approaches to environmental actions should be grounded in fact and scientific
justification. This must also take into account the costs of the measure on the general public,
especially the poor. The measure must be necessary to protect the environment and that it must
not be more trade restrictive than is necessary. For example, in 2009, a Bill proposing to ban the
use of plastic products that were polluting the atmosphere did not go through because this was
going to raise the costs for the poor.
(f) Protection of Investment
The Government guarantees that it will not expropriate non-citizen investments or take measures
that will have a similar effect, except for a public interest purpose and on a non-discriminatory
basis, and against the prompt payment of adequate and effective compensation. This guarantee
for the protection of persons and their property is enshrined in the Constitution. It forms an
integral part of the Government‘s assurance to all investors that their investments are protected
within the limits of the laws of the country. The Foreign Investment Business License Act of
1990 [10 MIRC Ch 5] also provides that if an activity is added to the reserve list after the FIBL
has been issued, the license cannot be revoked or cancelled.
The table below provides a list of economic sectors and business activities that are reserved
solely for citizen investors43
.
Table 48: RMI's reserved occupational list
Reserve List
1. Small scale agriculture for local markets
2. Small scale mariculture for local markets
3. Bakeries and pastry shops
4. Motor garages and fuel filling stations
5. Land Taxi Operations, not including airport taxis used by hotels
6. Rental of all types of motor vehicles
7. Small retail shops with a quarterly turnover of less than US$ 1,000.00 (including mobile
43
The reserved list is under review and a revised list is expected to be published in 2012.
117
retail shops and/or open-air vendors/take-outs)
8. Laundromat and dry cleaning, other than service provided by hotels/motels
9. Tailor / sewing shop
10. Video rental
11. Handicraft shop
12. Delicatessen, Deli Shop or Food take-out
5.2 The Ease of Doing Business in RMI
This section looks at RMI‘s investment regime and the assessment that was undertaken by the
World Bank Report on the Ease of Doing Business. The objective is to use these
recommendations, where appropriate, to improve RMI‘s business environment.
The major problem in RMI is that there is no disaggregated data on the source of investment, the
key sectors where investment is going into and the annual value of investment. This information
is necessary in order to formulate a comprehensive investment policy and to decide which
sectors to liberalize and which ones to reserve for the local citizens.
From the outset, it is important to note that the RMI business environment is not conducive for
business for a number of reasons. Some of the issues relate to its location and other natural
factors that cannot be changed by human beings. However, other factors relate to practices,
policies, laws, attitudes that can be changed. This section focuses on some of the key issues that
have been highlighted by the World Bank report on the ease of doing business that need to be
addressed44
.
From the chart below, RMI was ranked number 106 out of 183 countries in the 2012 Report on
the Ease of Doing Business45
. In the Eastern and Asian region, RMI was ranked number 16 out
of 24.
44
It is also important to point out that the methodology that is being used by the World Bank has its own
weaknesses because it does not take into account issues such as an economy‘s proximity to large markets, the
quality of its infrastructure services (other than those related to trading across borders), the security of property from
theft and looting, the transparency of Government procurement, macroeconomic conditions or the underlying
strength of institutions.
45
This represents a backward move from 2010 and 2011 ranking when RMI was ranked 98 and 102 respectively.
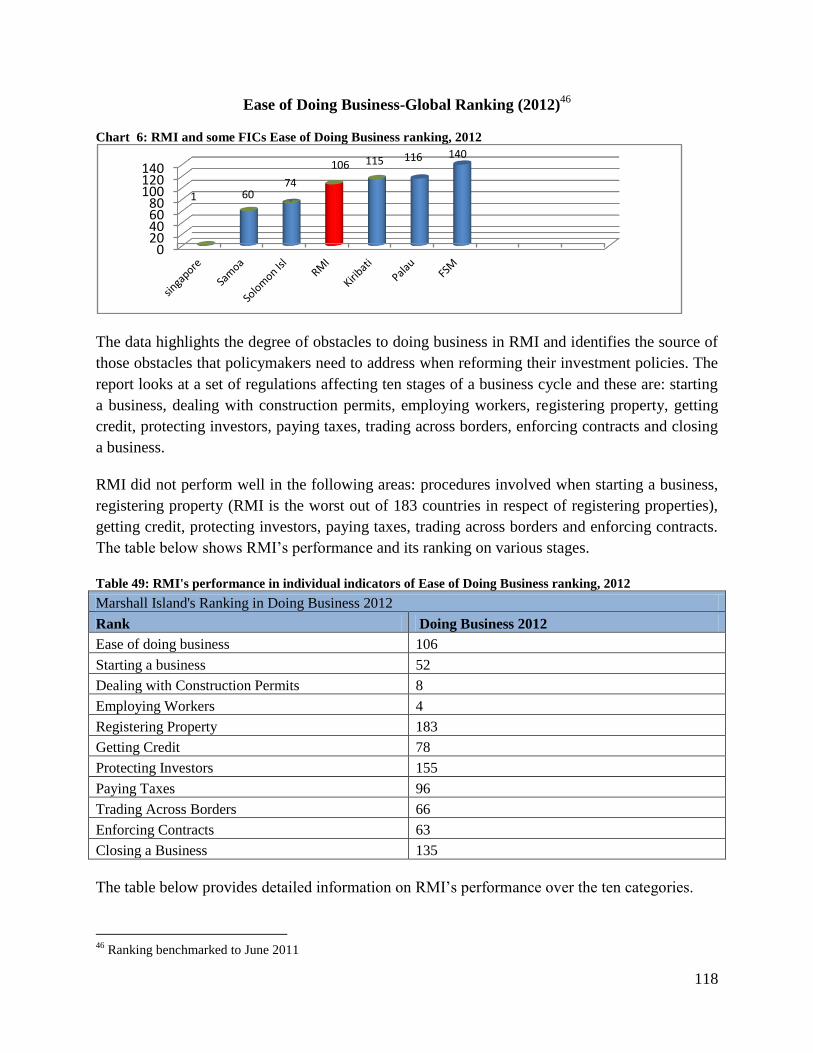
118
Ease of Doing Business-Global Ranking (2012)46
Chart 6: RMI and some FICs Ease of Doing Business ranking, 2012
The data highlights the degree of obstacles to doing business in RMI and identifies the source of
those obstacles that policymakers need to address when reforming their investment policies. The
report looks at a set of regulations affecting ten stages of a business cycle and these are: starting
a business, dealing with construction permits, employing workers, registering property, getting
credit, protecting investors, paying taxes, trading across borders, enforcing contracts and closing
a business.
RMI did not perform well in the following areas: procedures involved when starting a business,
registering property (RMI is the worst out of 183 countries in respect of registering properties),
getting credit, protecting investors, paying taxes, trading across borders and enforcing contracts.
The table below shows RMI‘s performance and its ranking on various stages.
Table 49: RMI's performance in individual indicators of Ease of Doing Business ranking, 2012
Marshall Island's Ranking in Doing Business 2012
Rank Doing Business 2012
Ease of doing business 106
Starting a business 52
Dealing with Construction Permits 8
Employing Workers 4
Registering Property 183
Getting Credit 78
Protecting Investors 155
Paying Taxes 96
Trading Across Borders 66
Enforcing Contracts 63
Closing a Business 135
The table below provides detailed information on RMI‘s performance over the ten categories.
46
Ranking benchmarked to June 2011
020406080
100120140
1 6074
106 115 116 140
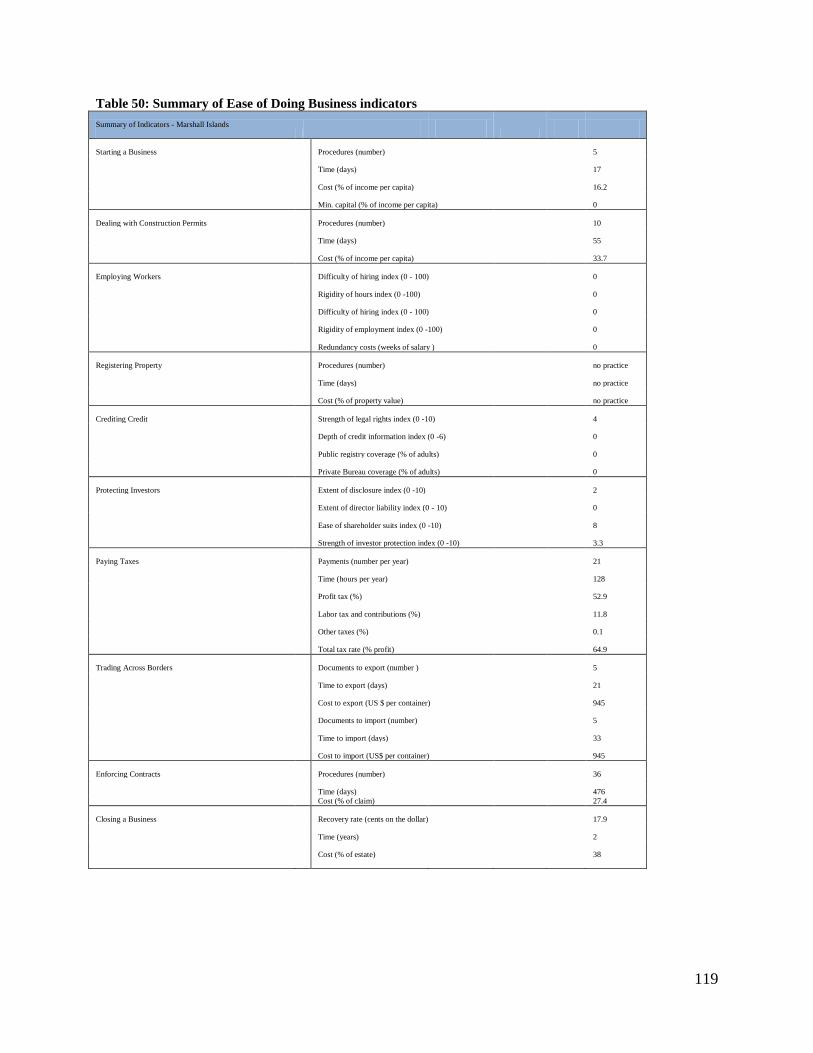
119
Table 50: Summary of Ease of Doing Business indicators
Summary of Indicators - Marshall Islands
Starting a Business Procedures (number) 5
Time (days)
17
Cost (% of income per capita)
16.2
Min. capital (% of income per capita) 0
Dealing with Construction Permits Procedures (number)
10
Time (days)
55
Cost (% of income per capita) 33.7
Employing Workers Difficulty of hiring index (0 - 100) 0
Rigidity of hours index (0 -100)
0
Difficulty of hiring index (0 - 100)
0
Rigidity of employment index (0 -100)
0
Redundancy costs (weeks of salary ) 0
Registering Property Procedures (number) no practice
Time (days)
no practice
Cost (% of property value) no practice
Crediting Credit Strength of legal rights index (0 -10) 4
Depth of credit information index (0 -6)
0
Public registry coverage (% of adults)
0
Private Bureau coverage (% of adults) 0
Protecting Investors Extent of disclosure index (0 -10) 2
Extent of director liability index (0 - 10)
0
Ease of shareholder suits index (0 -10)
8
Strength of investor protection index (0 -10) 3.3
Paying Taxes Payments (number per year) 21
Time (hours per year)
128
Profit tax (%)
52.9
Labor tax and contributions (%)
11.8
Other taxes (%)
0.1
Total tax rate (% profit) 64.9
Trading Across Borders Documents to export (number ) 5
Time to export (days)
21
Cost to export (US $ per container)
945
Documents to import (number)
5
Time to import (days)
33
Cost to import (US$ per container) 945
Enforcing Contracts Procedures (number) 36
Time (days)
476
Cost (% of claim) 27.4
Closing a Business
Recovery rate (cents on the dollar)
17.9
Time (years)
2
Cost (% of estate)
38
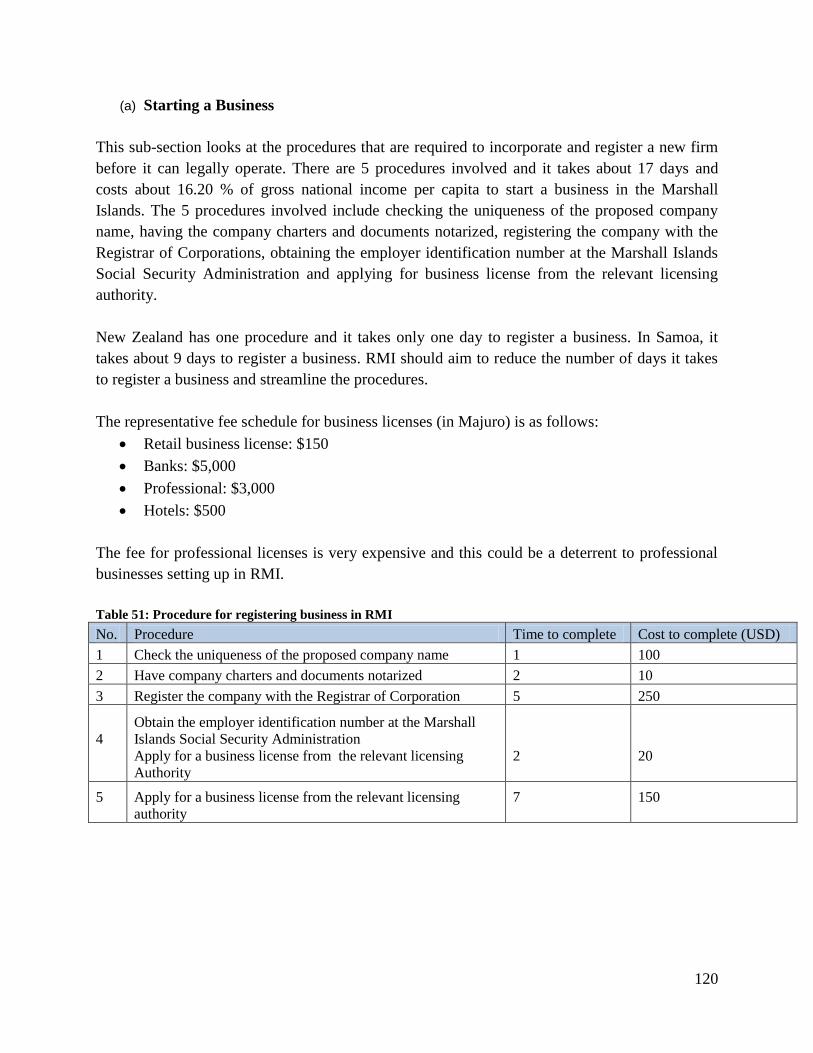
120
(a) Starting a Business
This sub-section looks at the procedures that are required to incorporate and register a new firm
before it can legally operate. There are 5 procedures involved and it takes about 17 days and
costs about 16.20 % of gross national income per capita to start a business in the Marshall
Islands. The 5 procedures involved include checking the uniqueness of the proposed company
name, having the company charters and documents notarized, registering the company with the
Registrar of Corporations, obtaining the employer identification number at the Marshall Islands
Social Security Administration and applying for business license from the relevant licensing
authority.
New Zealand has one procedure and it takes only one day to register a business. In Samoa, it
takes about 9 days to register a business. RMI should aim to reduce the number of days it takes
to register a business and streamline the procedures.
The representative fee schedule for business licenses (in Majuro) is as follows:
Retail business license: $150
Banks: $5,000
Professional: $3,000
Hotels: $500
The fee for professional licenses is very expensive and this could be a deterrent to professional
businesses setting up in RMI.
Table 51: Procedure for registering business in RMI
No. Procedure Time to complete Cost to complete (USD)
1 Check the uniqueness of the proposed company name 1 100
2 Have company charters and documents notarized 2 10
3 Register the company with the Registrar of Corporation 5 250
4
Obtain the employer identification number at the Marshall
Islands Social Security Administration
Apply for a business license from the relevant licensing
Authority
2
20
5
Apply for a business license from the relevant licensing
authority
7
150

121
(b) Registering Property
RMI ranks very poorly on the aspect of registering property because the practice does not exist.
That is why it is ranked the last on this category. However, Palau is ranked number 5 out of 183
and this shows that RMI can learn one or two things from Palau and improve access to land.
(c) Getting Credit.
This focuses mainly on access to information on credit and protection of legal rights for lenders
and borrowers through collateral and bankruptcy laws. RMI is ranked number 78 out of 183 in
this category. RMI‘s score is low on access to credit information and very poor on the legal
rights index. FSM is doing better on the strength of legal rights index and RMI can learn
something from its neighbour.
(d) Protecting Investors
RMI is ranked number 155 out of 183 in this category. RMI‘s investment laws are not adequate
to protect investors. In the Pacific, Samoa (ranked number 27) is a good example of a country
that is doing better in terms of protecting investors. According to the World Bank Report, the
presence of legal and regulatory protections for investors explains up to 73% of the decision to
invest.
Chart 7: RMI's performance in 'protecting investors' ranking
* The higher the score, the greater the investor protection
(e) Paying Taxes
RMI is ranked number 96 out of 183 with regards to paying taxes. One way to enhance tax
compliance is to ease and simplify the process of paying taxes. An average business has to pay
0
1
2
3
4
5
6
7
8
9
10
New Zealand Samoa Kiribati Solomon Is Marshall Islands
Fed. Sts of Micronesia
Palau
9.7
6.3 6 5.7
3.32.7 2.7
Ranking in protecting investors
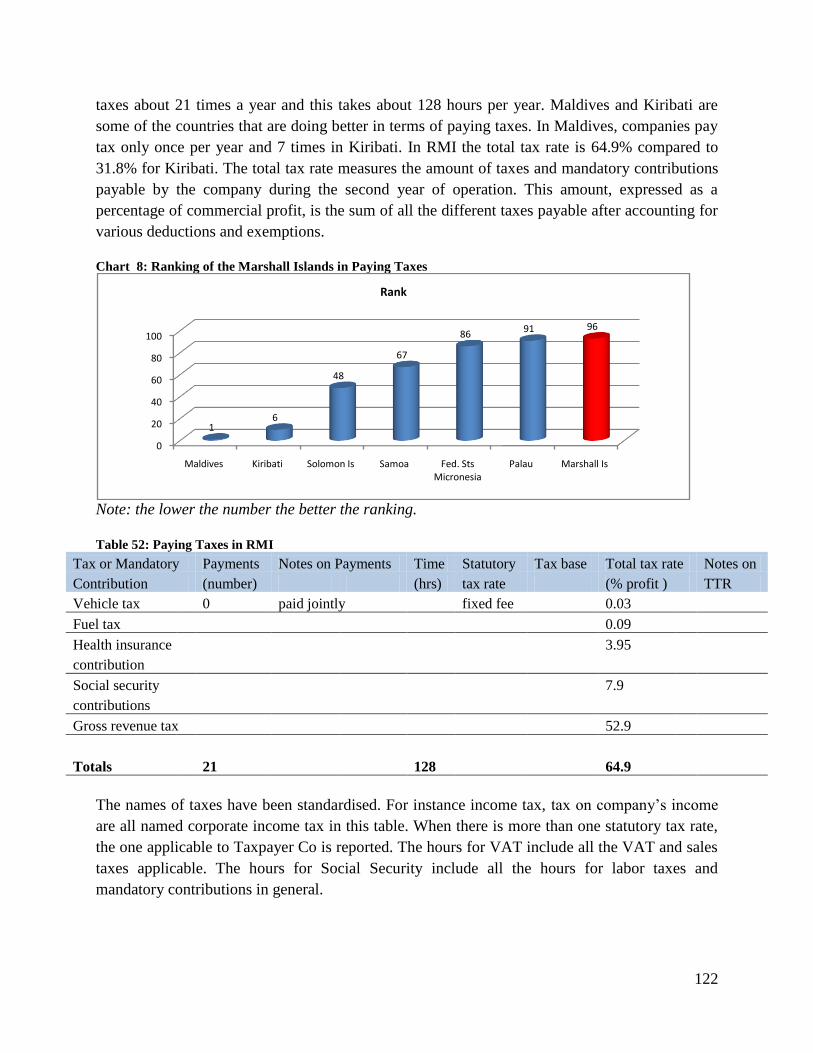
122
taxes about 21 times a year and this takes about 128 hours per year. Maldives and Kiribati are
some of the countries that are doing better in terms of paying taxes. In Maldives, companies pay
tax only once per year and 7 times in Kiribati. In RMI the total tax rate is 64.9% compared to
31.8% for Kiribati. The total tax rate measures the amount of taxes and mandatory contributions
payable by the company during the second year of operation. This amount, expressed as a
percentage of commercial profit, is the sum of all the different taxes payable after accounting for
various deductions and exemptions.
Chart 8: Ranking of the Marshall Islands in Paying Taxes
Note: the lower the number the better the ranking.
Table 52: Paying Taxes in RMI
Tax or Mandatory Payments Notes on Payments Time Statutory Tax base Total tax rate Notes on
Contribution (number) (hrs) tax rate (% profit ) TTR
Vehicle tax 0 paid jointly fixed fee 0.03
Fuel tax 0.09
Health insurance
3.95
contribution
Social security 7.9
contributions
Gross revenue tax 52.9
Totals 21 128 64.9
The names of taxes have been standardised. For instance income tax, tax on company‘s income
are all named corporate income tax in this table. When there is more than one statutory tax rate,
the one applicable to Taxpayer Co is reported. The hours for VAT include all the VAT and sales
taxes applicable. The hours for Social Security include all the hours for labor taxes and
mandatory contributions in general.
0
20
40
60
80
100
Maldives Kiribati Solomon Is Samoa Fed. Sts Micronesia
Palau Marshall Is
16
48
67
8691 96
Rank
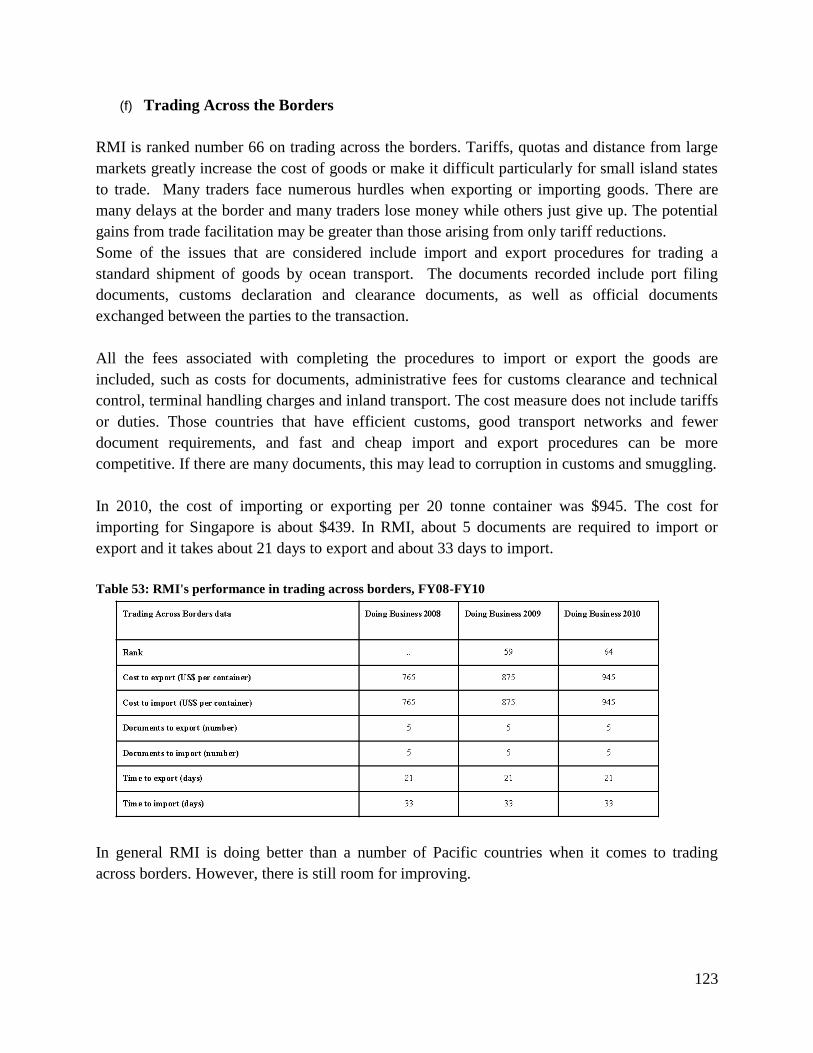
123
(f) Trading Across the Borders
RMI is ranked number 66 on trading across the borders. Tariffs, quotas and distance from large
markets greatly increase the cost of goods or make it difficult particularly for small island states
to trade. Many traders face numerous hurdles when exporting or importing goods. There are
many delays at the border and many traders lose money while others just give up. The potential
gains from trade facilitation may be greater than those arising from only tariff reductions.
Some of the issues that are considered include import and export procedures for trading a
standard shipment of goods by ocean transport. The documents recorded include port filing
documents, customs declaration and clearance documents, as well as official documents
exchanged between the parties to the transaction.
All the fees associated with completing the procedures to import or export the goods are
included, such as costs for documents, administrative fees for customs clearance and technical
control, terminal handling charges and inland transport. The cost measure does not include tariffs
or duties. Those countries that have efficient customs, good transport networks and fewer
document requirements, and fast and cheap import and export procedures can be more
competitive. If there are many documents, this may lead to corruption in customs and smuggling.
In 2010, the cost of importing or exporting per 20 tonne container was $945. The cost for
importing for Singapore is about $439. In RMI, about 5 documents are required to import or
export and it takes about 21 days to export and about 33 days to import.
Table 53: RMI's performance in trading across borders, FY08-FY10
In general RMI is doing better than a number of Pacific countries when it comes to trading
across borders. However, there is still room for improving.
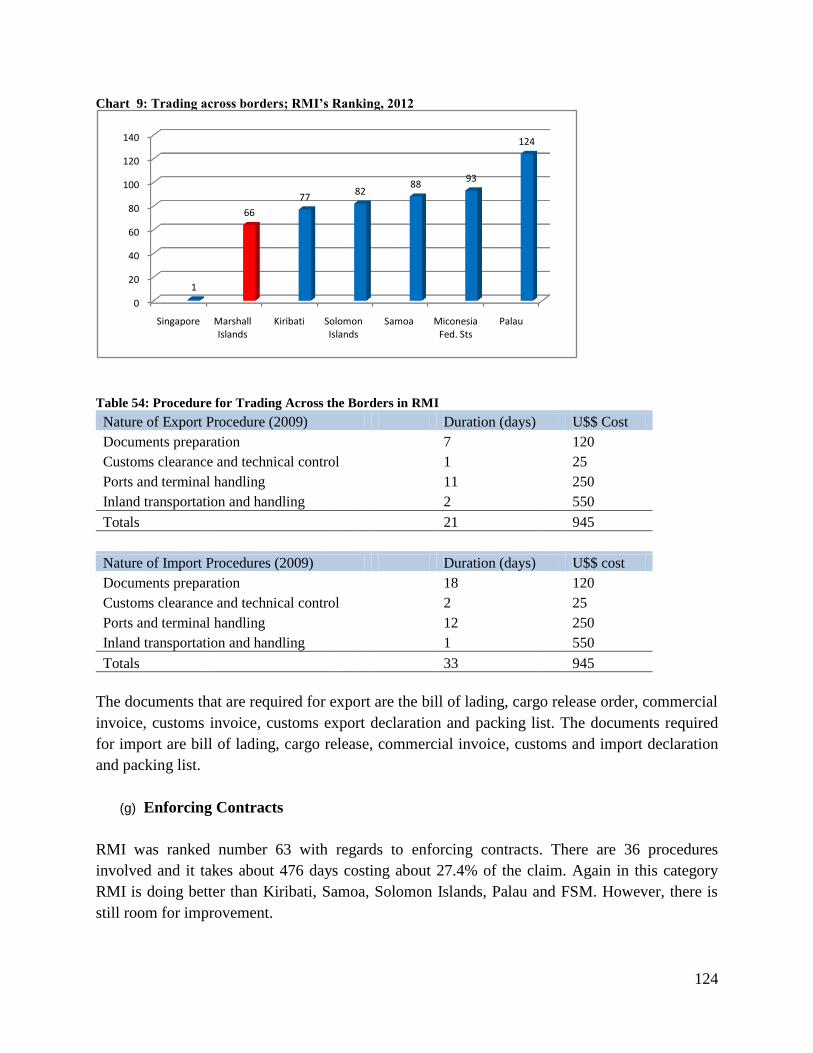
124
Chart 9: Trading across borders; RMI’s Ranking, 2012
Table 54: Procedure for Trading Across the Borders in RMI
Nature of Export Procedure (2009) Duration (days) U$$ Cost
Documents preparation
7
120
Customs clearance and technical control
1
25
Ports and terminal handling
11
250
Inland transportation and handling 2 550
Totals 21 945
Nature of Import Procedures (2009) Duration (days) U$$ cost
Documents preparation
18
120
Customs clearance and technical control
2
25
Ports and terminal handling
12
250
Inland transportation and handling 1 550
Totals 33 945
The documents that are required for export are the bill of lading, cargo release order, commercial
invoice, customs invoice, customs export declaration and packing list. The documents required
for import are bill of lading, cargo release, commercial invoice, customs and import declaration
and packing list.
(g) Enforcing Contracts
RMI was ranked number 63 with regards to enforcing contracts. There are 36 procedures
involved and it takes about 476 days costing about 27.4% of the claim. Again in this category
RMI is doing better than Kiribati, Samoa, Solomon Islands, Palau and FSM. However, there is
still room for improvement.
0
20
40
60
80
100
120
140
Singapore Marshall Islands
Kiribati Solomon Islands
Samoa Miconesia Fed. Sts
Palau
1
66
7782
8893
124
125
(h) Closing a business
RMI is ranked number 135 out of 183 and it takes about 2 years to close a business costing
about 38% of the estate and only 17.9 cents on every dollar can be recovered. Palau ranks
number 59 and is doing better than many pacific countries in this category. Bankruptcy systems
help to reorganize viable companies and close down unviable ones. If bankruptcy law is
inefficient, unviable businesses linger for years, keeping assets and human capital from being
reallocated to more productive uses. This affects the amount claimants can recover and this can
be deterrent to investment.
5.2.1 Top reformers
Some of the key reforms that were undertaken globally which may be relevant to RMI include
the following:
i) Belarus: Tax payments were made more convenient through increased use of electronic
systems—reducing tax compliance times. Business start-up was eased by simplifying
registration formalities and abolishing the minimum capital requirement.
ii) Colombia: Access to credit improved because of the new credit information law that
guarantees the right of borrowers to inspect their own data and new rules that make it
mandatory for credit providers to consult and share information with credit bureaus. The
tax burden on businesses was eased with the introduction of electronic tax filing and
payment, and some payments were reduced. An amendment to the Company Law
strengthened investor protections by making it easier to sue directors in cases of
prejudicial transactions between interested parties. Implementation of an electronic
declaration system has expedited customs clearance.
iii) Egypt, Arab Rep: Access to credit information has expanded with the addition of
retailers to the database of the private credit bureau. Company start-up was eased by the
removal of the minimum capital requirement.
iv) Kyrgyz Republic: Access to credit was enhanced by making secured lending more
flexible and allowing general descriptions of encumbered assets and of debts and
obligations. The tax burden on businesses was eased by reducing the rates for several
taxes and the number of payments. Business start-up was eased by eliminating the
minimum capital requirement, reducing the registration time, and abolishing various post-
registration fees and the need to open a bank account before registration. The elimination
of six previously required documents and the simplification of inspection procedures
have sped up trading across borders.
v) Liberia: The trade process was expedited by creating a one-stop shop bringing together
various ministries and agencies and streamlining the inspection regime.
vi) Macedonia, FYR: Investor protections were increased by regulating the approval of
transactions between interested parties, increasing disclosure requirements in annual
126
reports, and making it easier to sue directors in cases of prejudicial transactions between
interested parties. Business start-up was simplified by integrating procedures at a one-
stop shop.
vii) Rwanda: Getting credit was made easier with a new secured transactions law and
insolvency act to make secured lending more flexible, allowing a wider range of assets to
be used as collateral and a general description of debts and obligations. In addition, out of
court enforcement of collateral has become available to secured creditors, who also now
have top priority within bankruptcy. A new company law has strengthened investor
protections by requiring greater corporate disclosure, director liability, and shareholder
access to information. By implementing administrative changes—such as increased
operating hours and enhanced cooperation at the border, along with the removal of some
documentation requirements for importers and exporters—Rwanda has improved trading
times.
viii) Samoa-eased business start-up by passing a new company act that removed the
minimum capital requirement and simplified other various procedures. The act cut 26
days, 4 procedures, and three-quarters of the cost of starting a company. Samoa also
enacted a new corporate law and a law introducing receivership, easing the process of
closing a business.
Recommendations
(i) RMI must adopt the recommendations that are contained in the World Bank Report on
the Ease of Doing Business and use them to make the necessary reforms.
(ii) The Government must reform its labor and immigration laws to make them more
transparent, friendlier to foreign investment.
(iii)RMI must monitor what the other countries including those in the Pacific are doing in
terms of investment reforms and use the best practices to reform its laws.
(iv) RMI must gather disaggregated statistics on annual foreign investment by year, origin,
sector, equity composition.
(v) RMI needs to review its reserve list to ensure that it reflects the nature of the RMI
economy and only reserve those activities where Marshallese have capacity to participate
in.
6 PARTICIPATION OF RMI IN TRADE IN SERVICES
Most of the issues identified under the section on investment are very relevant for trade because
foreign investment plays a vital role in promoting trade in goods and services. It is clear that all
the export activities on the fisheries industry that have been successful in RMI have been led by

127
foreign investors. Foreign investment also plays a critical part in providing various
infrastructural services such as transportation, telecommunication and tourism amongst others.
It is clear that for any industry to be competitive in the production of goods, all the infrastructural
services including transportation, energy, water, telecommunication, ports and distribution must
be improved. These issues as well as the regulatory reforms recommended by the World Bank
Report on the Ease of Doing Business need to be addressed in order to create an environment
that is conducive for trade in goods and services, enhance competitiveness of industries and
reduce the cost of doing business in RMI. This section provides information on the relevant laws
governing trade in services in RMI, analyses these laws and provides recommendations on how
to improve these laws to promote trade in services.
6.1 The General Agreement on Trade in Services
This sub-section looks at the four modes of supply and the classification of trade in services. The
General Agreement on Trade in Services (GATS) is the most comprehensive multilateral
agreement regulating trade in services at the World Trade Organisation (WTO). It defines
services by the mode in which they are delivered. Mode one is cross-border supply and just as in
the case with goods, the service crosses the border. The suppliers of services in one country
supply services to consumers in another country without either supplier or consumer moving into
the territory of the other. An example of this is where a user in RMI receives services from
abroad (US) through its telecommunications (internet) or postal infrastructure. Such supplies
may include consultancy or market research reports, tele-medical advice, distance training or
architectural drawings, freight transport services. The delivery of the service can be effected, by
telephone, fax, internet or other computer mediated links, television or the sending of documents,
disks, tapes, etc. by mail or courier.
Mode two is consumption abroad. In this case, the consumer goes abroad to consume the service.
For example, if a US citizen travels to RMI to enjoy the diving tourism facilities, RMI is
exporting its tourism services to the US. Conversely, RMI nationals can move abroad as students
or patients to consume services in the US. This also covers ship repair abroad, where only the
property of the consumer moves or is situated abroad.
Mode three is commercial presence. For example, the service is provided in RMI by a locally-
established affiliate, subsidiary, or representative office of a foreign-owned and controlled
company (e.g. bank, hotel group or construction company). An example of this is Bank of Guam
which has a branch in Majuro.
Mode four refers to the temporary movement of natural persons abroad to supply a service. An
individual moves to the country of the consumer in order to provide a service, whether on his or
128
her own behalf or on behalf of his or her employer. For example, a Marshallese moves to Guam
temporarily to provide a service within the US as an independent supplier (e.g., consultant) or
employee of a service supplier (e.g. consultancy firm, hospital, construction company). Other
examples include an auditor from a US company coming to RMI to audit Compact reports, or
provision of entertainment services by a self-employed professional foreign entertainer who is
temporarily on tour in the host economy.
Presence of natural persons covers only non-permanent employment in the country of the
consumer. However, GATS provides no definition of ―non-permanent‖ employment. Mode four
covers short-term employment of foreign doctors or teachers, intra-corporate staff transfers and
short-term employment of construction workers or paid domestic helpers.
One sector can involve all the four modes of services, for example, under the health sector, a
patient in RMI can receive tele-dignosis from a doctor in US (mode 1), and if the condition
becomes worse, the patient in RMI will have to go to the US and be treated in a hospital (mode
2), then when the patient gets better, he will be sent back to RMI to a private hospital in Majuro
owned and operated by a US firm (mode 3). Then the doctor from the US comes to RMI once a
month to check the patient (mode 4).
The Services Sectoral Classification list - GNS/W/120 (negotiating list and not a statistical
classification) classifies services into twelve categories and these are:
1. Business services: These include professional services, computer and related services,
research and development services, real estate services, rental or
leasing services without operators and other business services.
2. Communication services: These include postal services, courier services,
telecommunication services, audiovisual services and other.
3. Construction and related engineering services: These include general construction
work for buildings,general construction work for civil engineering, installation
and assembly work, building completion and finishing work and other.
4. Distribution Services: These include commission agents' services, wholesale
trade services, retailing services, franchising and other.
5. Educational Services: These consist of primary education services, secondary education
services, higher education services, adult education, other education services
6. Environmental Services include sewage services, refuse disposal services, sanitation and
similar services and other.
7. Financial Services include all insurance and insurance-related services,
banking and other financial services (excl. insurance) and other.
8. Health Related and Social Services include hospital services, other human health services,
social services and other.

129
9. Tourism and Travel Related Services include hotels and restaurants (incl. catering),
travel agencies and tour operators services, tourist guides services and other.
10. Recreational, Cultural and Sporting Services (other than audiovisual services) include
entertainment services (including theatre, live bands and circus services), news agency
services, libraries, archives, museums and other cultural services, sporting and other
recreational services and other.
11. Transport Services include maritime transport services, internal waterways transport,
air transport services, space transport, rail transport services, road transport services,
pipeline transport, services auxiliary to all modes of transport and other transport services
12. Other Services not included elsewhere.
According to the WTO, services account for about 30 to over 70 per cent of production and
employment, depending on resource structure and level of development of an economy. The
share of services trade in total world trade is about 20 percent, on a BOP-basis. However, this
does not count the full value of trade through commercially present foreign suppliers. In 1995,
the total export of commercial services for developing countries (WTO members) was 24%
compared to 76% for developed countries. In 2008, the figures were estimated to be 28% and
72%, respectively and developing countries had slightly improved their participation in exports
of commercial services.
The major sectors that contributed to exports in 1995 were travel (34%), transport 26% and other
commercial services (40%). However, in 2008, the structure had changed and travel had
decreased to 26%, transport to 23% and other commercial services had increased to 51%. Under
others, the sectors that saw a rapid growth in exports between 2000-2006 are computer and
information services, which had an annual average growth of 17%, followed by insurance (16%),
financial services (14%) and communication (13%).
In RMI, the services balance deteriorated from - $30.4 million in 2000 to -$42.8 million in 2010.
The major exports of services include transport related services, fish processing, travel, and
telecommunications. The total exports of services were around $11.3 million in 2010. The value
for services imports increased from $39.9 million in 2000 to $54.1 million in 2010. The major
services imported by RMI are transport, passenger services (mainly airline), freight and postal
services, travel and business services47
.
Table 55: RMI services balance, FY 2000 to FY 2010. (US$ millions) FY2000 FY2001 FY2002 FY2003 FY2004 FY2005 FY2006 FY2007 FY2008 FY2009 FY2010
47
It is important to note that statistics on trade in services are always difficult to compile and there is no readily
available disaggregated data on imports and exports of services and how much trade in services contribute to GDP.
Furthermore, it is difficult to get statistics on trade in services based on the four modes of supply as described above.
However, these statistics are normally found in the balance of payments and
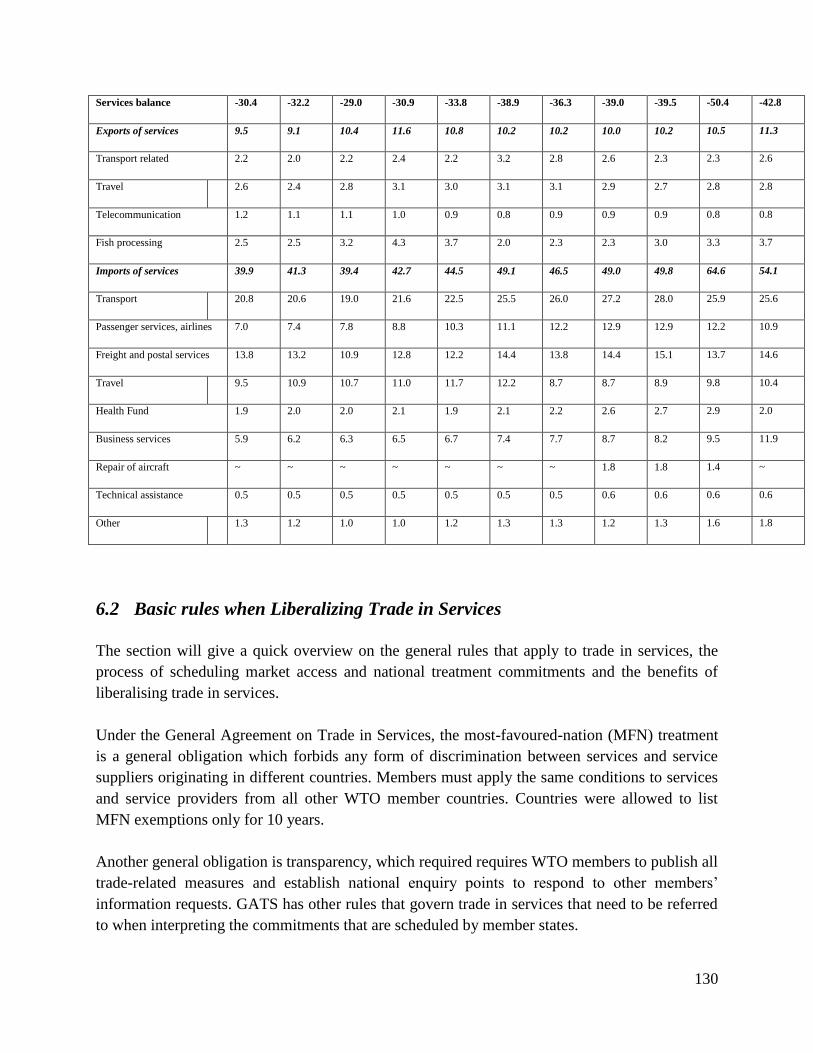
130
Services balance -30.4 -32.2 -29.0 -30.9 -33.8 -38.9 -36.3 -39.0 -39.5 -50.4 -42.8
Exports of services 9.5 9.1 10.4 11.6 10.8 10.2 10.2 10.0 10.2 10.5 11.3
Transport related 2.2 2.0 2.2 2.4 2.2 3.2 2.8 2.6 2.3 2.3 2.6
Travel
2.6 2.4 2.8 3.1 3.0 3.1 3.1 2.9 2.7 2.8 2.8
Telecommunication 1.2 1.1 1.1 1.0 0.9 0.8 0.9 0.9 0.9 0.8 0.8
Fish processing 2.5 2.5 3.2 4.3 3.7 2.0 2.3 2.3 3.0 3.3 3.7
Imports of services 39.9 41.3 39.4 42.7 44.5 49.1 46.5 49.0 49.8 64.6 54.1
Transport
20.8 20.6 19.0 21.6 22.5 25.5 26.0 27.2 28.0 25.9 25.6
Passenger services, airlines 7.0 7.4 7.8 8.8 10.3 11.1 12.2 12.9 12.9 12.2 10.9
Freight and postal services 13.8 13.2 10.9 12.8 12.2 14.4 13.8 14.4 15.1 13.7 14.6
Travel
9.5 10.9 10.7 11.0 11.7 12.2 8.7 8.7 8.9 9.8 10.4
Health Fund 1.9 2.0 2.0 2.1 1.9 2.1 2.2 2.6 2.7 2.9 2.0
Business services 5.9 6.2 6.3 6.5 6.7 7.4 7.7 8.7 8.2 9.5 11.9
Repair of aircraft ~ ~ ~ ~ ~ ~ ~ 1.8 1.8 1.4 ~
Technical assistance 0.5 0.5 0.5 0.5 0.5 0.5 0.5 0.6 0.6 0.6 0.6
Other
1.3 1.2 1.0 1.0 1.2 1.3 1.3 1.2 1.3 1.6 1.8
6.2 Basic rules when Liberalizing Trade in Services
The section will give a quick overview on the general rules that apply to trade in services, the
process of scheduling market access and national treatment commitments and the benefits of
liberalising trade in services.
Under the General Agreement on Trade in Services, the most-favoured-nation (MFN) treatment
is a general obligation which forbids any form of discrimination between services and service
suppliers originating in different countries. Members must apply the same conditions to services
and service providers from all other WTO member countries. Countries were allowed to list
MFN exemptions only for 10 years.
Another general obligation is transparency, which required requires WTO members to publish all
trade-related measures and establish national enquiry points to respond to other members‘
information requests. GATS has other rules that govern trade in services that need to be referred
to when interpreting the commitments that are scheduled by member states.
131
In addition to the general rules there are also specific commitments dealing with market access,
national treatment and any additional undertakings that are negotiated by members and inscribed
in national schedules. Article XVI deals with market access restrictions and Article XVII with
national treatment and Article XVIII deals with additional commitments48
. Measures
inconsistent with both Art. XVI and XVII must be listed in the market access column only.
The limitations listed in Article XVI are:
i) the number of service suppliers, e.g. only 3 licences for commercial banks.
ii) the value of transactions or assets, e.g. foreign banks limited to 30 percent of total
domestic assets of all banks.
iii) the number of operations or quantity of output, e.g. restrictions on broadcasting time
available for foreign films.
iv) the total number of natural persons, e.g. in any investment in tourism the number of local
employees shall not be less than 80%.
v) the type of legal entity or joint venture, e.g. foreign companies need to establish
subsidiaries.
vi) foreign capital participation, e.g. foreign companies shall hold up to 49% of capital.
The economic needs test can be applied on the first four limitations, e.g. distribution: ―the
number of and impact on existing stores, population density, geographic spread, impact on traffic
conditions and creation of new employment‖. A limitation can be based on the number of new
hotels based on past arrivals. The ENTs should not refer to the quality of service or ability of
supplier. The focus should be on measures limiting market access rather than on implementation
mechanisms (e.g. licensing requirements) or relevant laws and regulations.
Unlike Article XVI which provides an exhaustive list, Article XVII provides an open ended
definition on national treatment. The requirement is to provide treatment that is ―no less
favourable than accorded to own like services and services suppliers‖. The treatment can either
be formally identical or formally different treatment. The relevant benchmark is that there should
be no modification of ―the conditions of competition‖ in favour of own like services or service
suppliers49
. The following can be used as guidelines:
i) discriminatory subsidies and other fiscal measures.
ii) nationality and residency requirements on mode 3, e.g. for you to open real estate
business you must have resided in the country for 5 years.
iii) discriminatory licensing/registration/qualification/training requirements.
iv) technology transfer requirements.
v) prohibitions on land/property ownership.
vi) limitations on insurance portability, education grants.
48
See also S/CSC/W/34). 49
Further guidelines can be found in S/L/92.
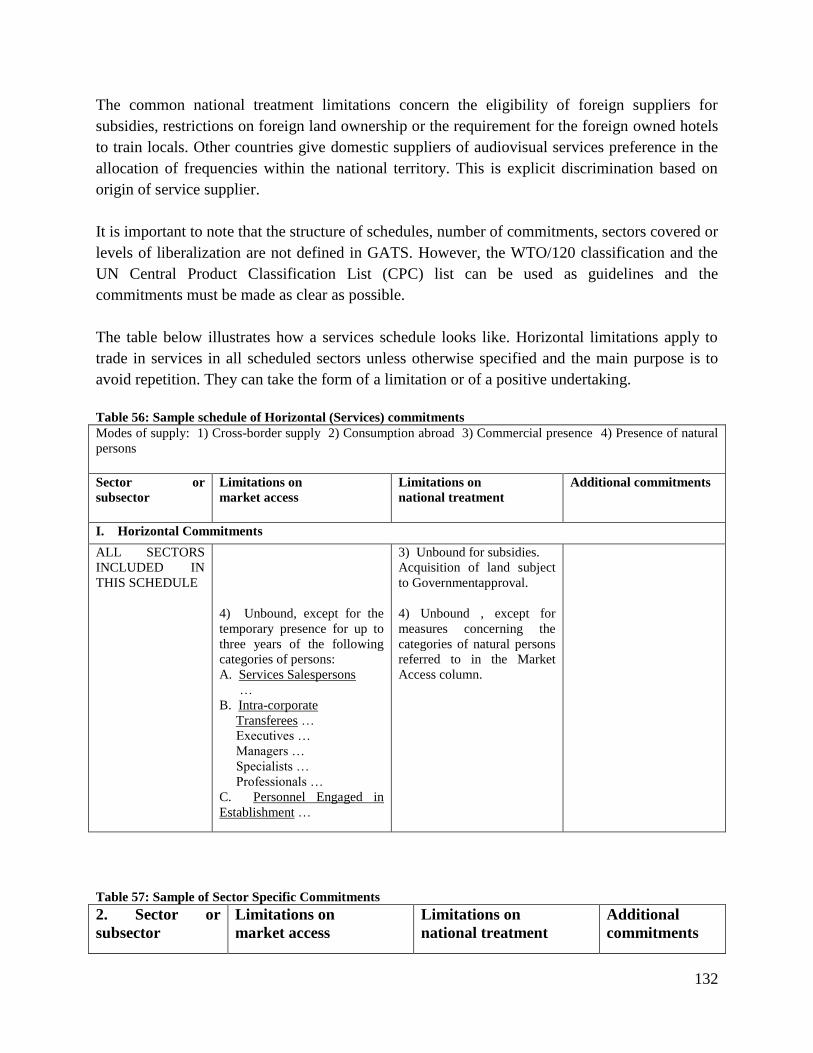
132
The common national treatment limitations concern the eligibility of foreign suppliers for
subsidies, restrictions on foreign land ownership or the requirement for the foreign owned hotels
to train locals. Other countries give domestic suppliers of audiovisual services preference in the
allocation of frequencies within the national territory. This is explicit discrimination based on
origin of service supplier.
It is important to note that the structure of schedules, number of commitments, sectors covered or
levels of liberalization are not defined in GATS. However, the WTO/120 classification and the
UN Central Product Classification List (CPC) list can be used as guidelines and the
commitments must be made as clear as possible.
The table below illustrates how a services schedule looks like. Horizontal limitations apply to
trade in services in all scheduled sectors unless otherwise specified and the main purpose is to
avoid repetition. They can take the form of a limitation or of a positive undertaking.
Table 56: Sample schedule of Horizontal (Services) commitments
Modes of supply: 1) Cross-border supply 2) Consumption abroad 3) Commercial presence 4) Presence of natural
persons
Sector or
subsector
Limitations on
market access
Limitations on
national treatment
Additional commitments
I. Horizontal Commitments
ALL SECTORS
INCLUDED IN
THIS SCHEDULE
4) Unbound, except for the
temporary presence for up to
three years of the following
categories of persons:
A. Services Salespersons
…
B. Intra-corporate
Transferees …
Executives …
Managers …
Specialists …
Professionals …
C. Personnel Engaged in
Establishment …
3) Unbound for subsidies.
Acquisition of land subject
to Governmentapproval.
4) Unbound , except for
measures concerning the
categories of natural persons
referred to in the Market
Access column.
Table 57: Sample of Sector Specific Commitments
2. Sector or
subsector
Limitations on
market access
Limitations on
national treatment
Additional
commitments
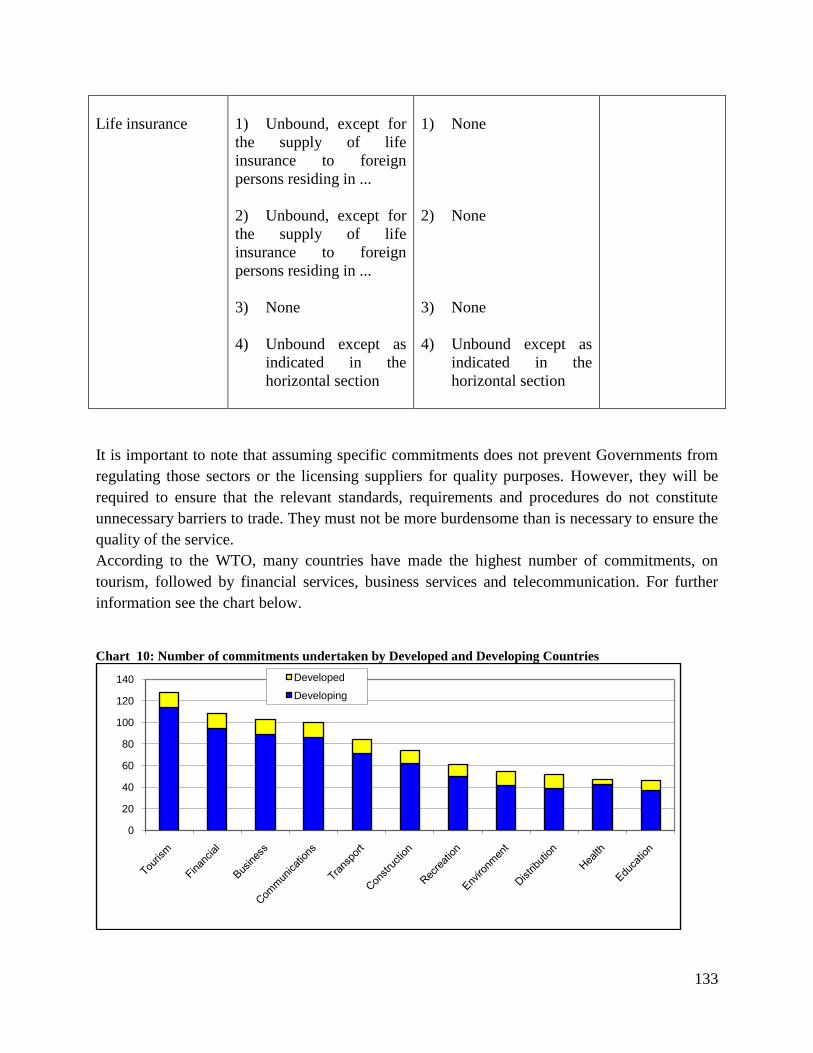
133
Life insurance
1) Unbound, except for
the supply of life
insurance to foreign
persons residing in ...
2) Unbound, except for
the supply of life
insurance to foreign
persons residing in ...
3) None
4) Unbound except as
indicated in the
horizontal section
1) None
2) None
3) None
4) Unbound except as
indicated in the
horizontal section
It is important to note that assuming specific commitments does not prevent Governments from
regulating those sectors or the licensing suppliers for quality purposes. However, they will be
required to ensure that the relevant standards, requirements and procedures do not constitute
unnecessary barriers to trade. They must not be more burdensome than is necessary to ensure the
quality of the service.
According to the WTO, many countries have made the highest number of commitments, on
tourism, followed by financial services, business services and telecommunication. For further
information see the chart below.
Chart 10: Number of commitments undertaken by Developed and Developing Countries
0
20
40
60
80
100
120
140 Developed
Developing

134
Aside from exports, the other benefits of making commitments on trade in services include
enhancing transparency and binding of autonomous reforms thereby enhancing credibility.
Liberalising trade in services enhances competition and curtails private-rent seeking behaviour. It
also allows the country to regulate its services properly to protect public policy. Services
improve the overall infrastructure support that is required to produce goods, thus enhances the
competitiveness of a country.
6.3 Regulations Governing Trade in Services in RMI
Most of the horizontal regulations applying to trade in services have been discussed on the
section dealing with investment under foreign investment, labour and immigration and land
issues. This section will deal with restrictions that apply to specific sectors.
6.3.1 Communications
a) Postal services
The Postal Service Act 1983 [38 MIRC Ch 1] provides that the Marshall Islands Postal Service
has exclusive privilege over the distribution of mail.
b) Telecommunications
The Telecommunications Authority Act 1990 [40 MIRC Ch 1] provides that the National
Telecommunications Authority (NTA) has ‗the exclusive right to engage in the erection,
construction, installation, maintenance, operation, and management of domestic and international
telecommunications services in the Republic, subject to the authority that has been granted to
others by the Republic to engage in such activities or that may be granted; provided that any such
future grant of authority:
i) does not adversely affect the financial ability of the Authority to serve the outer islands
ii) shall not permit the operation of a public switch system.
The NTA is by law a private corporation and 70% of its shares are owned by the Government,
20% by Treasury and 10% by RMI citizens as provided for by law. The NTA is run by an 8
member board 7 of whom are appointed by the Government. Currently, it employs about 142
local workers and 3 expatriates. The NTA is the sole provider of telecommunication services in
the RMI. It has been operating profitably and has declared dividends about six times.
In 2006, the Government introduced a Telecommunications Policy - which was endorsed by
Cabinet - to allow phased in competition in the mobile and internet sector. However, the
135
legislation required to give effect to this Policy has not yet been passed by the Nitijela50
. The
key recommendations were to open the ISP, mobile sector, TV and radio, regulate tariffs and e-
government.
Some of the key challenges facing the telecommunications sector include the fact that the market
is very small. In this context, NTA urged the Government to exercise caution when introducing
competition. NTA also indicated that the internet and mobile sectors are the most lucrative parts
of the telecommunication industry and if competition is allowed, it may be difficult for the
Government to operate the other costly sectors such as the land line and also to provide services
to outer islands.
Currently, the quality of internet services, mobile phones especially international calls is not
good. There is no roaming facility. However, NTA is trying its best to improve services to the
nation. For example, when GSM technology was introduced, subscription in the mobile sector
increased from 1000 subscribers to 13000 subscribers in less than 3 years. However, NTA is not
yet commercially viable. Its coverage of outer islands is very low. It has 70 sites in the outer
islands and there are about 1200 outer islands that need to be covered. It is very difficult to
provide services to these outer islands because about 70% of the population resides in the urban
islands (Majuro and Ebeye). The best way to provide services to outer islands would be through
satellite technology, but it is very expensive.
Another issue which makes it difficult for the telecommunication sector to be liberalised is the
fact that NTA has an RUS loan of about $52 million. The issue is further complicated by the fact
the Government also guaranteed the RUS loan. Part of the loan is for infrastructure and about
$21.5 million is for the fiber optic. The fibre optic was put in place in April 2010 and the
capacity will increase to 2.5 billion gigabytes.
RMI also needs an IT Policy to maximize the benefits of the increase in bandwidth. The
education and health sectors need to be looked at to see how they can maximize the benefits of
an increase in bandwidth.
Notwithstanding the challenges that NTA will face when subjected to competition, there is a
need to look at the telecommunication sector objectively. NTA has been providing services for
years and there has been a slow uptake in technological developments. The overall goal in the
telecommunications sector should be to provide quality services to the general public and the
business community. Without competition, merely having the fiber optic does not guarantee
efficient and quality services. For the benefits of the fiber cable to be fully utilized, there should
be competition in the mobile and internet sector to fully utilise the excess bandwidth.
50
A Bill was filed in 2008 for the second time to introduce phased competition but it was rejected by the Nitijela.
The Bill was endorsed by ITU and PIFs. It was revived in 2009 but senators were urged not to support it.
136
The Government should carefully monitor the developments in the telecommunication sector and
consider introducing phased in competition in the internet and mobile sector. It was observed
that Digicel has been successful in providing telecommunications services in the Pacific as well
as the Caribbean region. However, it was noted that some of the countries have also experienced
some problems with Digicel. For this reason, it is important for RMI to conduct a detailed study
on the impact of liberalizing this sector in light of the RUS loan, the size of the market and the
implications of introducing competition. A lack of competitive pressure in the
telecommunications sector has not only resulted in the slow uptake of technological progress but
has also led to limited efficiency gains. Trade in this sector is affected by the monopoly of NTA
and this scares away potential investors. The monopoly, also affects the tourism industry because
most tourists would want quality telephone and internet services to communicate with their home
countries. Liberalisation of internet and mobile phones should be considered but the basic
telecommunication services (public switch) may remain closed.
Trade liberalization is important because it brings internal efficiency. One of the concerns that
has been raised is that competition may hinder NTA from fulfilling other social goals such as
providing services to the outer islands and the poor through a system of cross-subsidization -
using revenues from segments like urban areas or international calls. However, while this is a
genuine concern, it cannot be used as the reason not to introduce competition and the potential
benefits that the whole nation will get. If liberalization is sequenced properly, and the right
regulatory framework, which amongst other things guarantees universal access, is put in place,
liberalization will pay dividends and improve performance.
Other countries in the Pacific including Fiji, Vanuatu, PNG and Samoa have incorporated this
universal obligation when Digicel was given a license. The liberalization of this sector will help
in facilitating the transfer of new technology and create an environment which is conducive for
investment and private sector development. This sub-sector plays a vital role in business as
indicated by the increasing trade through mode one and investment under mode three. Most
trade is now taking place via the internet. Many people prefer to buy goods online, pay bills,
taxes, and perform other banking transaction online. Tourism services can be advertised online.
Education, health and can be provided via the internet or telephone. Marketing of products as
well as information on market trends can be provided within seconds via the internet. In order for
RMI to be fully prepared for this revolution in the ICT sector, some revolution in its
telecommunication sector is warranted. The introduction of the fiber cable alone without
effective competition and a good regulatory framework will not deliver the benefits. RMI should
consider seeking assistance from the World Bank or other institutions to introduce a good
regulatory regime and consider gradual introduction of competition in this sector. This will
contribute to trade and investment and reduce the costs of doing business in RMI.
Due to its location, RMI has the potential to develop other business in the telecommunication
sector including call centers. However, for this to happen proper planning and human resources
137
development will be required in order to take advantage of the potential that will be offered by
the fiber cable.
c) Audiovisual services
The Radio Communication Act 1993 [40 MIRC Ch 3] establishes the Ministry of Transportation and
Communications as the spectrum manager. It was also noted that the Telecommunications Act
does not cover radio and television.
6.3.2 Financial Services
Insurance and insurance-related services
There are no evident restrictions on the licensing and operation of insurance service providers.
There are at present two foreign and one domestic insurance provider in RMI.
Banking and other financial services
There are at present two commercial banks operating in RMI and the Marshall Islands
Development Bank. The Banking Act 1987 [17 MIRC Ch 1] regulates the conditions and
procedures for the granting of banking licenses. A ―domestic bank‖ is defined as a bank
established or incorporated in the Republic and a ―foreign bank‖ means a bank established or
incorporated outside the Republic. There are separate and distinct licensing regulations, capital
requirements and operational restrictions on domestic and foreign banks. There are few
regulations applying to foreign banks and if a foreign bank is of international repute the
insurance requirement can be waived.
Both a domestic bank and a foreign bank must apply for a banking license. Some of the
requirements when applying for a license for a domestic bank include the following:
the amounts of authorized capital and paid-up capital
a letter or document from the Federal Deposit Insurance Corporation (FDIC) of the
United States of America, or other approved body indicating the current insurance
covering deposits held
an initial non-refundable application fee of $500
Some of the information that is required when applying for a license for a foreign bank include:
the latest annual report and audited financial statements of the bank, which
financial statements shall provide figures for two (2) years and show that the bank‘s
capital complies with the requirements of either Section 120 or 124 dealing with capital
requirements and reserve funds
evidence of insurance by FDIC or other approved body relating to deposits in the
Republic. However, the Commissioner may, with the approval of the Cabinet, waive the
138
requirement of such insurance, in the case of any bank of international repute, if there is
no such requirement under the law of the country where such bank is incorporated51
A domestic bank licensed to do local banking business shall at all times maintain
capital stock in an amount not less than one million dollars originally paid up in
cash. Every domestic bank licensed to do banking business shall maintain a reserve fund. The
bank will be required to contribute not less than twenty-five percent (25%) of its profits until the
amount of reserve fund is equal to the paid-up capital52
. As seen above, a foreign bank must
either have the required capital or a reserve fund. The Federal Deposit Insurance Corporation
(FDIC) plays a critical role in supervising the banking system and ensuring a sound and stable
financial system. The banking system is also regulated by the RMI Banking Commissioner who
heads the Banking Commission.
The Bank of Marshall Islands started with $1 million but it now has about $26 million. It only
makes short term investments. There are only two commercial banks in RMI and the market is
too small. According to the Bank of Marshall Islands, the Bank of Hawaii withdrew in 2002 and
there is no room for a third bank. It was recommended that the Government should put in place
measures to ensure that foreign banks are responsive to customer needs. They should not take all
the deposits out of the country without re-investing. They should also be required to maintain a
certain percentage of their capital locally.
It was noted that most consumers do not qualify to get loans, while businesses qualify only if
they have assets as collateral. However, the introduction of the secured transaction law is
expected to improve the situation. Small businesses with past problems of repaying their loans
can be given loans if guaranteed by the Marshall Islands Development Bank.
The loans for consumers are pegged at 15% and business at 11%. There are plans to lower
commercial rates to make it easy for the private sector to access credit. The major loans are
consumer loans but the bank has been encouraging micro-loans. About $800 000 was given
under the micro-lending scheme within 2008 to 2010 and the bank wants to give more. It has
also introduced the micro-loan scheme to the outer-islands. The Bank is also collecting produce
from the outer-islands and selling it in major centres. The future plans include extending this
scheme to 3 ships to cover more outer-islands.
Tobolar has a problem of paying for freight and they give tickets and not cash. Tobolar is
planning to open an account with the bank, which will in-turn authorize the ship to pay cash.
51
Presently, only the Bank of Guam has obtained such insurance.
52
Money in the capital reserve cannot be used by the bank without permission from the Banking Commission
139
The bank is also planning to buy a freezer to be able to buy fish from outer islands and sell it in
Majuro. Currently, the bank has only one ship which buys produce. The Bank also has the
Marketing Services Corporation which will be responsible for marketing.
The Micro-loan facility has about $300 000 and the maximum that can be borrowed is $10 000.
The interest rate is 8% for 2 years. The payment rate has been good. The facility funds
fishermen-boats engines, pigs and chicken farming, outer-islands copra collection and handicraft.
The major success stories in-terms of lending are the handicraft, fishing, sewing (dress making)
and bakery. ROC has been assisting small businesses with financial services to buy fuel from
Majuro and sell it to outer-islands.
The Bank is trying to open a branch in Hawaii to help the private sector to do business in Hawaii
because the bank does not issue credit cards. There are also limited wire services and for this
reason many people moved their money to bank of Guam.
The bank has plans to venture into purse seine fishing and plans to raise public funds and buy
boats. The Bank of Marshall Islands also suggested that it has the capacity to run Tobolar, and
even to venture into tourism. It is interested in entering into a joint venture with the local private
sector.
It was also noted that even though the IMF recommended that the MIDB should not be involved
in lending because it will be competing with commercial banks, the reality on the ground is that
MIDB is not competing but supplementing the lending market. Bank of Marshall Islands cannot
fill the market. MIDB gives consumer loans at 14% mainly for housing. The MIDB also
provides guarantee, but they do not have a strong capital base. 90% is from bank of Marshall
Islands.
The bank welcomes competition, but indicated that the Government needs to help the local bank
first. For example, the Government does not bank with the Bank of Marshall Islands because of
Compact requirements (FIDC). The Bank also needs access to the US central payment system.
6.3.3 Transportation
The Ministry of Transport and Communication (T&C) is mainly responsible for regulatory
oversight of various agencies. The operational functions have been transferred to the various
agencies. The Ministry of T&C is responsible for regulating ports, airports, the Micronesian
Shipping Commission (MSC), cruise ships and air transportation. Some of the key laws
regulating the transportation sector include the Ports of Entry Act, Civil Aviation Act, Port
Authority Act and Maritime Act.
(i) International Maritime Transport

140
The Republic of the Marshall Islands is a member of the Micronesian Shipping Commission
(MSC) which regulates International Maritime Transportation among FSM, RMI and Palau. The
MSC arrangement dates back to the Trust Territory days and was formalized in 1997. The three
states have different interests but have realized that the MSC is for the good of all. The MSC
Board consists of Ministers of Transport from RMI and FSM and the Minister of Public
Infrastructure Industries and Commercial Development in Palau.
The MSC is responsible for issuing license routes, managing competition and administering
entry into the international shipping services of FSM, Palau and the Republic of the Marshall
Islands. Licences of 5-year duration are issued, but subject to annual review. Route licensing
and ―competition management‖ may act as restrictions to market access, possibly national
treatment depending on how the licensing system is applied.
Operators pay an entry assurance fee of $5000, reduced from a previous fee of $10 000, but
could be increased again. In 2009, MSC issued licenses to about 12 companies among many
applications. All companies are free to apply for licenses but there is a grading system. The
tariffs cannot change without approval from MSC. The new room for operators and the number
of vessels allowed depends on volume. According to the Government agencies, despite a few
political issues, the MSC has worked in most parts.
While the Government understands that increasing the number of shipping lines calling on the
country will bring about competition, other important factors need to be carefully considered and
weighed. One of such factors is the country‘s limited customer base. Being included with the
other members of the Micronesian region increases the potential volume of cargo available to a
company. The MSC, therefore, ensures that shipping lines operating within the region are
committed to meeting the interests of all its member countries.
It should be noted that a US company-PMNO-which used to operate the Pacific Micronesia line
went bankrupt because of cut throat competition. It should also be noted that simply opening up
the market does not mean that operators will come or that prices will go down or that the quality
of services will improve. Nauru and Kiribati, for example, opened up their transport shipping
sector but nobody came in. Kiribati, Tuvalu, Nauru, Wallis and Futuna are considering
establishing an arrangement similar to MSC in order to protect the interests of carriers as well as
consumers. Carriers need assurance that there is volume and this is reviewed on an annual basis
to see if there is a room for a new operator. This also addresses the problem of fly-by night
operators who disrupt the services.
(ii) Domestic shipping
The Government currently owns and operates most shipping services within the country. The
Government established the Marshall Islands Shipping Corporation (MISC) which is responsible
141
for providing services between Majuro and outer-islands for both cargo and passengers. The
MISC is a Government company run by a 5 member board. Its main business is transporting
copra from the outer islands. The company has 4 ships and the Government still provides
subsidies to the tune of $1 million per year. The Government subsidises some routes and
contracts are awarded on an annual basis through a tender process.
The Ministry of Transport and Communication gives a certificate of registry for safety purposes.
Foreign investors are not allowed to operate inter-island boats. The Domestic Watercraft Act
90/92 and the relevant regulations provide further details. The Ministry of Finance controls the
entry into the domestic shipping sector. Sometimes MISC operates on charter basis to FSM and
Kiribati, and FSM also brings its own boats.
The Government encourages private investment and greater competition in the transportation
sector, where feasible.
(iii) Air Transportation
There are poor transportation services to the outer islands mainly because there is no competition
on inter-island air transportation. Air Marshal Islands is the only Airline that is servicing the
domestic market, although it is not a statutory monopoly. Air Marshall Islands has 2 planes and
is sole provider of domestic air services. Foreign investors are interested in this market but the
Government does not seem to have plans to open the sector. There are also poor international air
transportation services because Continental Airlines is the sole airline that is servicing
international routes.
(iv) Land Transportation
There are a number of concerns that were raised by local citizens with regard to land transport.
Land transportation business is limited to RMI citizens only. The Government is developing
regulations for land taxi.
(v) Port Authority
The Port Authority is a monopoly agency that controls all port operations. The Port Authority
was established in 1996 under the 1994 Act. It was merged with the Airport in 2003. The Port
Authority is a statutory agency of the government. It is semi-autonomous and does not receive
subsidies from Government.
There is only 5% assistance on airport but the Port Authority has to come up with a matching
fee. The Airport Improvement Project which is a $40 million project, aims at improving the
airport for the next 3 years. The US Federal Aviation Authority assistance used to be included in
the Compact under the TT days but has been excluded. The Government is trying to make it a
permanent feature.
142
The Port Authority also controls all sea-port operations, and the private sector is not allowed to
operate sea-port services except stevedoring services which are currently being provided by a
private company. All foreign boats and all commercial vessels require pilotage to ensure that
they are brought to the port safely. However, there was a concern that PPF boats are RMI
flagged and should not be subjected to this requirement. Every boat passing through RMI is
subjected to wharfage fees which are very expensive. The cost depends on volume or weight of
cargo, whichever is greater. International wharfage is $3 per revenue tonne and domestic
wharfage is $2 per tonne. The vessels are also charged for bunkering –water and anchorage.
Domestic vessels are charged about $60 for all the services per month. Dockage is allowed for a
maximum of 1 day at 6 cents per gross tone. The Cabinet sets the fees for the Port Authority.
It would be good for RMI to assess the effectiveness of the Port Authority and how its services,
including pricing structure affect trade and investment. The Government should also allow more
competition in this sector and improve transparency of regulations.
6.3.4 Business Services
RMI does not have adequate regulations on business services and many professional services are
open to foreign services suppliers. For example, lawyers are only required to pass the local bar
exams. However, RMI needs to strengthen its legal and institutional framework to be able to
ensure that the people coming in as professional services suppliers have genuine qualifications.
6.3.5 Distribution Services
The RMI wholesale and retail sector is one of the sectors that contributes a lot to GDP,
employment and economic development. This is a sector where many local citizens have the
capacity to participate in. The Government needs to recognise the role of foreign operators in this
sector to ensure that there is a consistent supply of quality goods and services. However, the
reserve list needs to be reviewed to allow Marshallese citizens to participate actively in this
sector and close existing loopholes.
It was noted that the reserve list does not make a distinction between naturalized Marshallese
and indigenous Marshallese citizens. Some businesses are registered under the names of
indigenous Marshallese although in practice they are owned and operated by foreigners. It was
recommended that the AG should review some of the matters related to the reserved list and
ensure that there is proper enforcement of the law.
6.3.6 Tourism
Tourism is one of the priority sectors in RMI. The key services in RMI include hotels and
restaurants, travel agencies, diving, tour guides and fishing. The Government needs to introduce
laws to deal with monopoly, anti-competitive practices and restrictive business practices
143
affecting this sector. Existing laws should be reviewed to allow foreign investors to participate in
this sector, especially in the high end tourism services where the local people do not have
capacity to invest in. Some tourism services such as boat chartering, tour guides, charter boats,
bed and breakfast should be reserved for the local people. Foreign investors should be required to
hire and train local people.
The other services that support tourism, including air transportation (both inter-island and
international), telecommunication (mobile and internet), should be improved or liberalised.
Tourism should bring mutual benefits to the visitors and the nation. To this end, there is a need to
promote natural pride, eco- tourism, cultural and environmental awareness. The Government
should give more incentives to environment friendly tourism investments (e.g. green resorts).
6.3.7 Energy
The Energy section falls under the Ministry of R&D and is responsible for coordinating,
planning and implementing mainly renewable energy projects. The Marshall Islands Energy
Company is a 100% Government owned and is the sole supplier of electricity in RMI. Most rates
are subsidized by the Government. MEC is also responsible for managing sewer and water. The
company has been struggling to supply power to the whole nation. MEC is currently
implementing a robust reform plan to streamline operations and ensure that the company is fully
accountable. It also wants to make fuel sales a profitable business.
The company imports its diesel from South Korea and the bulk of it is used to generate
electricity while the excess is sold to the public and fishing vessels.
MEC has an RUS loan of about $7 million. The company only makes money from fuel sales and
the rates it charges to its customers are not sustainable. These rates are regulated by the
Government. The company is also responsible for supplying renewable energy especially solar
power in outer-islands. The company has about 4 000 customers, which is a very small market
and some of them do not pay in time. However, MEC will install a new cash power meter to
solve some of these problems. If the tourism industry grows, this could also broaden the
customer base for MEC.
The Government is trying to provide solar power to outer islands and about 58% of the outer-
islands have been covered. It is now expanding to cover schools, health establishments, the
Ministry of T&C and outer-islands. The Energy Unit has an MOU with MEC which is
responsible for installation and maintenance. Individuals pay $100 for installation and $5 per
month for maintenance but the payment rate is about 40%. The EU provided about $4.2 million
under the 9th
European Development Fund (EDF) of which 80% went to solar projects and 20%
to MEC (for fuel) when the Government declared a state of emergency.
144
Japan has also agreed to assist with solar - a project worth about $4 million - and the power will
be supplied to Majuro hospital. This could be expanded to other Government buildings.
The Government adopted the Energy Policy in 2009, which targets electrification of urban
households by 2015. MEC will be introducing pre-paid meters and improving the distribution of
power. There will also be a study on bio-fuel and mixing coconut oil with gas. Some of the
challenges include transportation to bring copra from outer islands. Further, there is no
equipment to check moisture. It was also noted that most businesses are not selling energy
efficient light bulbs or refrigerators. There is a proposal to impose a fine on businesses that will
charge exorbitant prices on energy efficient products. The Government was urged to consider a
tax on non-energy efficient product and to remove taxes on energy efficient products.
An option that could be considered is a regional initiative on bulk fuel purchasing. It is however
highly likely that such an initiative may face some challenges because at the end of the day,
market forces will dictate the prices. Logistical costs will also make it expensive because of
geographical location.
The Government was also urged not to take over the fuel facility from Mobil as was done by
FSM; because there could be problems of quality and reliability. There is also a need to ensure
that the pipes are safe, and do not pollute the environment.
6.3.8 Construction and related engineering services.
These are regulated by the Ministry of Public Works, and include all forms of civil engineering
services, construction of roads, culverts, ports, houses and others.
6.3.9 Recreational, Cultural and Sporting Services
These exclude audiovisual services but include entertainment services (including theatre, live
bands and circus services), news agency services, libraries, archives, museums and other cultural
services, sporting and other recreational services and other.
6.3.10 Educational Services
These consist of primary education services, secondary education services, higher education
services, adult education, and other education services.
6.3.11 Environmental Services
These include sewage services, refuse disposal services, sanitation and similar services and others.
6.3.12 Health Related and Social Services

145
These include hospital services, other human health services, social services and other.
6.4 Temporary Movement of Natural Persons and Remittances
RMI has a large section of its citizens living in Guam, US main land and other US territories.
However, data on the actual number of the RMI citizens living abroad and the amount of
remittances that they send to RMI is not readily available. This issue is complicated by the fact
that RMI does not have laws on out migration and it‘s very difficult to monitor workers
migrating abroad.
According to the 2006 General Accounting Office Report, it was estimated that about 15,000
Marshallese had migrated to the United States. Although there is no reliable data on remittances,
the 2002 household survey suggests that RMI citizens send more money out to RMI emigrants
than they receive in remittances. This is mainly because RMI emigrants work mainly in low
skilled jobs because of inadequate education and vocational skills. The 2003 U.S. census of
FSM and RMI migrants in Hawaii, Guam, and the Commonwealth of the Northern Marianas
Islands (CNMI) confirms this characterization, showing that almost half of the emigrants live
below the poverty line.
There is also a need for a framework to deal with companies that come to RMI to hire workers to
work in the US. RMI also needs to consult the training institutions to update them on the relevant
skills that that are in short supply abroad, e.g. construction in Guam.
RMI is interested in participating in a number of labor mobility schemes including the
Recognised Seasonal Employer scheme offered by New Zealand. However, RMI‘s request to
participate in the scheme was not accepted. RMI, together with other PACPS have also requested
the EU to provide a comprehensive offer on temporary movement of natural persons to Europe.
In order to benefit from the labor mobility schemes, RMI needs technical and financial assistance
to be able to train its people and provide them with required skills. As aforementioned the major
reason why RMI is not benefiting more from remittances despite its favourable access into the
US labor market is that most of its citizens do not have the relevant qualifications. It was noted
that most people go to Arkansas without basic English language skills and end up being ill
treated. To this end, it was recommended that the Government should consider screening out
people going abroad. The AG could ensure that the citizens get basic language training before
they can be issued a passport.
6.4.1 General Conclusion and Recommendations
It is clear that when investors are looking for places to invest they look at a number of factors
including the availability of resources, labor, transportation, market access, the cost of doing
business amongst other things. Investors will be looking at different locations and the
competition for investment becomes very tight especially in small Pacific countries that have a
146
lot of natural disadvantages. While small island nations cannot change their geography or their
size, there are certain things that they can do that will influence investors‘ decisions to invest in
their countries. One thing that clearly needs to be addressed is the institutional and regulatory
business environment. In this context, RMI needs to reform its trade and investment laws to
make them more business friendly.
The need to improve the regulatory laws was also identified by the PDP Australia entitled
Stocktaking of Limitations and Restrictions Applying to Trade in Services in the Pacific (2007).
It concluded that the regulatory environment is constraining foreign investment in the Pacific and
in RMI in particular. There are inadequate laws regulating trade and investment and in many
instances laws are changed frequently thereby creating uncertainty for trade and investment.
Furthermore, there is lack of transparency and widespread use of administrative discretion in the
awarding of various licenses.
6.4.2 Recommendations
(i) RMI should review its trade-related laws and ensure that there are adequate
regulations before trade in services is liberalized.
(ii) RMI should consider liberalizing trade in services and making commitments on
tourism, transportation including domestic air transportation, services provided by
port authorities, telecommunication especially the mobile and internet sector,
business services and environmental services.
(iii) The Government must allocate sufficient resources on education and vocational
training to produce the relevant skills that are needed to develop the economy and
also fully utilize the labor market access that RMI has with the US, as well as other
markets.
(iv) RMI should consider giving three year work permits to managers, specialists as well
as other skilled workers rather than requiring them to renew the permit on annual
basis. The permits and alien registration cards for non-residents need to be
streamlined and be renewed after three years rather than being renewed annually.
(v) The Government must review the reserve list and identify the activities that should be
reserved for the local citizens especially boat chartering, tour guides, charter boats,
bed and breakfast as well as close loopholes in wholesale and retail.
7 TRADE-RELATED ISSUES
This section looks at RMI‘s trade-related issues including, taxation, competition, Government
policy, corporate governance, intellectual property, trade and environment and trade and gender.
Trade-related issues play a vital role in creating a conducive business environment.
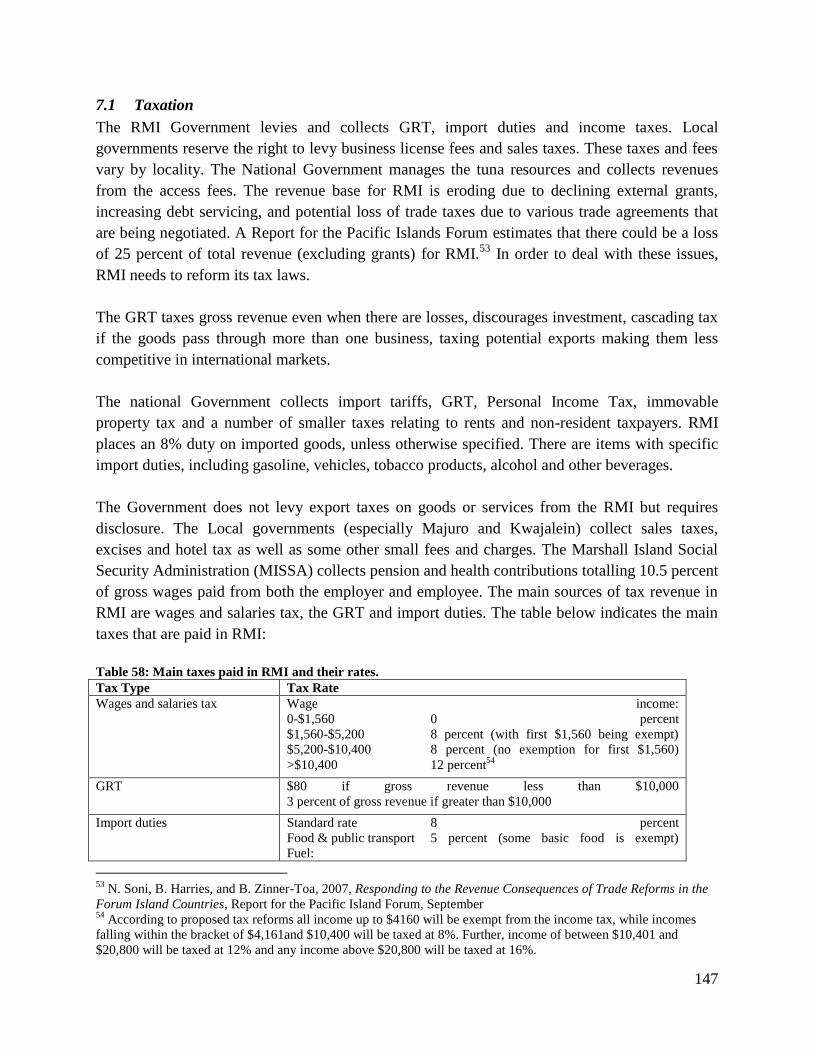
147
7.1 Taxation
The RMI Government levies and collects GRT, import duties and income taxes. Local
governments reserve the right to levy business license fees and sales taxes. These taxes and fees
vary by locality. The National Government manages the tuna resources and collects revenues
from the access fees. The revenue base for RMI is eroding due to declining external grants,
increasing debt servicing, and potential loss of trade taxes due to various trade agreements that
are being negotiated. A Report for the Pacific Islands Forum estimates that there could be a loss
of 25 percent of total revenue (excluding grants) for RMI.53
In order to deal with these issues,
RMI needs to reform its tax laws.
The GRT taxes gross revenue even when there are losses, discourages investment, cascading tax
if the goods pass through more than one business, taxing potential exports making them less
competitive in international markets.
The national Government collects import tariffs, GRT, Personal Income Tax, immovable
property tax and a number of smaller taxes relating to rents and non-resident taxpayers. RMI
places an 8% duty on imported goods, unless otherwise specified. There are items with specific
import duties, including gasoline, vehicles, tobacco products, alcohol and other beverages.
The Government does not levy export taxes on goods or services from the RMI but requires
disclosure. The Local governments (especially Majuro and Kwajalein) collect sales taxes,
excises and hotel tax as well as some other small fees and charges. The Marshall Island Social
Security Administration (MISSA) collects pension and health contributions totalling 10.5 percent
of gross wages paid from both the employer and employee. The main sources of tax revenue in
RMI are wages and salaries tax, the GRT and import duties. The table below indicates the main
taxes that are paid in RMI:
Table 58: Main taxes paid in RMI and their rates.
Tax Type Tax Rate
Wages and salaries tax Wage income:
0-$1,560 0 percent
$1,560-$5,200 8 percent (with first $1,560 being exempt)
$5,200-$10,400 8 percent (no exemption for first $1,560)
>$10,400 12 percent54
GRT $80 if gross revenue less than $10,000
3 percent of gross revenue if greater than $10,000
Import duties Standard rate 8 percent
Food & public transport 5 percent (some basic food is exempt)
Fuel:
53
N. Soni, B. Harries, and B. Zinner-Toa, 2007, Responding to the Revenue Consequences of Trade Reforms in the
Forum Island Countries, Report for the Pacific Island Forum, September 54
According to proposed tax reforms all income up to $4160 will be exempt from the income tax, while incomes
falling within the bracket of $4,161and $10,400 will be taxed at 8%. Further, income of between $10,401 and
$20,800 will be taxed at 12% and any income above $20,800 will be taxed at 16%.

148
Gasoline 0.25 cents per gallon
Jet and Diesel 0.08 cents per gallon
Motor vehicles Greater of $1,500 or 15 percent of Kelly‘s
Blue Book value (if no Blue Book value then
$2,500 for new and $1,500 for used vehicles)
Tobacco:
Cigarettes $1 per pack of 20 rolls
Cigars 151 percent
Other $2.75 per 34.2 grams
Alcohol:
Beer $0.50 per can or 12oz unit
Wine $2.75 per gallon
Spirits $12 per gallon
Mixed drinks 26 percent
Immovable property tax 3 percent of gross income from leased property
Hotel and resort tax 8 percent of the daily room rate
Non-resident gross income tax 10 percent of the gross income earned on non-resident contracts
Local Governmentsales taxes
(the local governments also raise
revenue from business license
fees and other minor taxes and
fees)
Majuro Local Government (MALGOV):
General sales tax 4 percent
Sales tax on alcohol 25 percent of c.i.f. value
Sales tax on tobacco 25 percent of c.i.f. value
Fuel tax 4 percent
Hotel room tax $3 per room per day
Kwajalein Atoll Local Government (KALGOV):
Wholesale sales tax 10 percent
Sales tax on alcohol Specific rates
Gross rent tax 4 percent
Fuel tax $0.06 per gallon
Hotel room tax $2 per room per day
Retirement fund contribution Employer 7 percent of gross wage and salary
Employee 7 percent of gross wage and salary
Self Employed 14 percent of presumed wage (twice highest
paid employee or if no employees, 70 percent
of gross turnover)
Health fund contribution Employer 3.5 percent of gross wage and salary
Employee 3.5 percent of gross wage and salary
Self Employed 7 percent of presumed wage
In RMI, income tax represents the biggest own-source revenue item for the Government,
estimated at around $10.8 million in 2010 while GRT was revenue was $6.2 million, and import
duties was $7.7 million in the same year. Tax compliance in RMI is reportedly very low,
especially for import duties (40-60%).
Table 59: RMI's Tax Revenue, 2006–08
2006 2007 2008
(US$ million)
Taxes 25.1 27.1 26.0
Income Tax 11.0 11.2 11.0

149
Gross Revenue Tax 4.9 5.9 5.8
Import Taxes 7.8 8.5 7.8
Fuel Tax 0.8 0.9 0.9
Other Taxes 0.5 0.5 0.6
(Percent of GDP)
Taxes 17.3 17.9 17.1
Income Tax 7.6 7.4 7.2
Gross Revenue Tax 3.4 3.9 3.8
Import Taxes 5.4 5.6 5.1
Fuel Tax 0.6 0.6 0.6
Other Taxes 0.3 0.3 0.4
Source: Ministry of Finance Table 60: FICs own revenue as a % of GDP
REVENUE GDP (milns
% GDP USD
PAPUA NEW GUINEA 33% 4908
FIJI 24% 2711
SAMOA 27% 418
VANUATU 20% 358
SOLOMON ISLANDS 28% 298
FEDERATED STATES OF MICRONESIA 11% 237
COOK ISLANDS 30% 176
TONGA 38% 160
PALAU 27% 142
REPUBLIC OF THE MARSHALL ISLANDS 23% 138
KIRIBATI 91% 79
TUVALU 96% 20
NIUE 90% 12
NAURU n.a. n.a.
Source: 2007 study by Nik
RMI is in the process of undertaking a substantial tax reform with a view to strengthening the tax
administration and enforcement, as well as provide ways and means to ensure fiscal
sustainability and promote sustainable private sector growth. It is also hoped that the tax base
shall be broadened and the system would be made fair and equitable and be more attractive to
foreign investors.
According to a study by Nikunj Soni (2007) on Responding to the Revenue Consequences of
Trade Reforms in the Forum Island Countries, it was clear that a resident team of tax experts will
be required for several years for there to be successful implementation. It is estimated that tax
reform and introduction of a VAT takes a minimum of two years. However, a detailed study by
Baunsgaard and Keen (2005) suggests that in the most extreme circumstances, low-income
150
countries may take up to 10 years to fully implement tax reforms such that the tax revenue-to-
GDP ratio reach pre-liberalization rates.
The tax reform is even more necessary at this moment when RMI is contemplating entering into
various trade agreements. It is important for the tax reform to be sequenced properly with trade
liberalisation to avoid revenue losses. RMI should also consider the option of reserving some
sensitive import duties for tariff revenue or industry protection in future and these issues need to
be taken into account in trade liberalisation.
In a country like RMI, which is dominated by the service industry, the most appropriate tax
regime would be one based on a mix of consumption and income taxes rather than on trade taxes.
Minimal tax incentives and exemptions will avoid rent-seeking behaviour on the part of tax
payers, increase Government revenue collection activities, and facilitate more simple, efficient
and trustworthy collections agencies. Providing tax incentives to promote investment is unlikely
to be cost effective. The best strategy for sustained investment promotion is to provide a stable
and transparent legal and regulatory framework and to put in place a tax system in line with
international norms. Tax holidays and investment subsidies are among the least meritorious.
The study by the Nikunj Soni (2007) on Responding to the Revenue Consequences of Trade
Reforms in the Forum Island Countries indicates that an effective customs administration should
have:
a clear separation between the setting of tax policy and its administration
simple and transparent laws and regulations
protection of confidentiality of taxpayer‘s information
a performance criteria, including revenue targets and service expectations, and the
resources required to meet them
professional customs administrators who are well trained and well paid
a code of conduct for the staff that clearly spells out expectations and consequences of
non-performance
an effective internal audit function; and a clear and effective appeals procedure and, more
generally, an atmosphere that encourages taxpayers to raise issues of interpretation of the
tax laws and their administration (for example, through discussions with industry
associations).
The Ministry of Finance should gather data on the number or value of exemptions given and set clear
and transparent procedures for exemptions
7.2 Competition Policy
RMI has a patchwork of legislation dealing with competition-policy issues but there is no
comprehensive regulatory and institutional regime to deal with this issue. Some of the laws
151
include the Unfair Business Practices Act which deals with some matters that are normally
addressed under the competition law. The Consumer Protection Act is another related law that
seeks to protect the interests of consumers.
RMI needs to put in place a competition policy to promote and manage competition in the
economy and address all the anti-competitive or trade restrictive practices which may
disadvantage the local producers and consumers. A competition policy can be used to create an
environment where the monopolistic tendencies of big companies in RMI can be addressed.
Competition is good because it can promote efficiency and effective delivery of quality goods
and services. The competition policy should be framed in such a way that it allows foreign
competition, but at the same time giving due regard to the local sensitivities. Some of the anti-
competitive practices can best be addressed at a regional level and RMI must participate actively
in any of these initiatives.
7.3 Government Procurement
Government procurement constitutes a major part in international trade and billions of dollars
worth of goods and services are traded by governments worldwide. Even though it is normally
exempted from major trade agreements, there is a need to ensure that the Government
procurement procedures meet international procurement standards. This is good from an
accounting and reporting point of view especially from those countries that rely on donor
funding. Furthermore, transparent and competitive procurement procedures ensure that the
citizens have access to quality goods and services at reasonably cheap prices. Procurement
procedures can also be designed in such a way that preferential treatment can be given to small
and medium enterprises to ensure that they also benefit from the Government tendering
procedures. This can be done by giving preference to domestic companies below a certain
threshold.
RMI has a fairly comprehensive Procurement Act of 1988, revised in 2003. However, there will
be merit in reviewing the Act to incorporate best procurement standards and strengthen the
regulatory and institutional mechanism. Clearly laid down procurement rules and standards will
go a long way in curbing corruption and conflict of interest and this enhances the value of the
taxpayer‘s money and more importantly, it will raise RMI‘s image with the donors. There is also
a need to put in place deterrent penalties for those flouting the procurement rules. The private
sector and the judicial system need to be vigilant in this respect to ensure that the rules are
enforced.

152
7.4 Corporate Governance
RMI also needs to adopt a comprehensive Corporate Governance Framework to ensure that
public companies, Government enterprises and departments are run according to the best
corporate practices. It has been proven that for private or public companies to be effective, there
should be an effective and independent board of directors and relevant committees. The process
for selecting office holders or board members should be transparent and only skilled and
experienced people should be allowed to take such positions of responsibility. There should be a
system in place to ensure financial accountability and responsibility, ethics, risk management,
performance evaluation and succession planning. All these issues can be best addressed in a
corporate governance framework. If a country does not adhere to sound corporate governance
practices investment will flow elsewhere. It is also believed that poor corporate governance
practices contributed significantly to the demise of public fishing companies in RMI and other
projects.
7.5 Intellectual Property Rights (IPRs)
Aside from the Unauthorized Copies of Recorded Materials Act, 1991, RMI does not have
adequate laws dealing with intellectual property rights. In order to promote investment and
encourage innovation, RMI needs to adopt comprehensive laws to protect copy rights, patents,
trademarks, geographical indications and designs. There have been frequent adverts in the press
giving trademark cautionary notices, but this is an ineffective way of protecting trademarks. IPR
legislation need to be supported by strong implementing institutions and regimes and the
judiciary must play a vital role in upholding and enforcing IPRs. IPR is not only for big
companies but even SMEs can develop their products, license them, improve the quality of their
products and services, brand their products and market them effectively.
There is also a need to establish a sui generis system to protect traditional knowledge, bio-
diversity and genetic resources. The Pacific Island Forum Secretariat is already running a pilot
project that seeks to establish international rights to protect Traditional Knowledge and Cultural
Expressions and this project should be extended to include RMI.
Protection of IPR is also important for health and safety reasons. In 2005, total world goods
exports amounted to $10.3 trillion (IMF: 2005) and total counterfeit goods exports constituted
about $0.2 trillion. By value, the OECD estimates the counterfeit goods trade at roughly $200
billion in 2005. About 70% of the counterfeits, based on the origin of seized pirate products,
originated in East Asia, above all China. Some of the items that are pirated include knockoff
rolexes, designer luggage, ray-bans, lower-priced medicines, food and household goods. Specific
examples include foods like instant coffees, butter, and alcoholic drinks; personal products like
tampons, toothpaste, razor blades and medicines- from cough syrup to HIV treatments. RMI
153
needs to include a provision in its Customs Act empowering customs officials to seize imported
IPR infringed goods. The customs must also be well trained and strengthened to fulfil this task.
7.6 Trade and Environment
In an effort to develop and promote exports in agriculture, fisheries and tourism care must be
taken to protect the environment to ensure that economic growth boosted by exports in these
sectors is sustainable. Positive measures must be taken to ensure that there is balance between
trade interests and environmental interests. If the environment is not protected, this may have
enormous consequences in future, not only on economic development but also on social lives of
many people. At the global level, efforts are being made to take urgent and targeted measures to
protect the environment and minimize the impact of climate change and RMI should participate
fully in this process.
It is heartening to note that RMI has adopted the Micronesian Challenge, which is a commitment
by RMI, CNMI, Guam, Palau and FSM to effectively conserve at least 30% of the near-shore
marine resources and 20% of the terrestrial resources across Micronesia by 2020. This challenge
exceeds the goals set by international treaties, which call for countries to conserve 10% of
terrestrial and marine resources by 2010 and 2020 respectively. It calls for Micronesian leaders
to work together at the regional level to confront environmental and sustainable development
issues.
There is also a need to conserve offshore fisheries to ensure sustainable trade and clean
investments in the fisheries sector. This becomes crucial when RMI is considering promoting
more investments in fish processing. A thorough environment impact assessment should be
conducted and plans must be made on how to dispose the waste.
The relationship between trade and environment should be examined closely to ensure that the
quest to promote trade does not lead to depletion of natural resources, pollution of the land, air
and water. Agricultural production must not lead to deforestation, soil erosion and land
degradation. The harvesting of marine resources must be monitored and managed properly to
ensure that there is no over-exploitation. Even though there are costs involved RMI should
endeavour to use clean technology in any form of business or manufacturing venture. Assistance
must be sought from the developed countries to assist RMI to have access to clean development
mechanisms.
There are also proposals at the WTO to eliminate duties on ―environmental products‖ and to
remove restrictions on ―environmental services‖, thus offering greater opportunities for
environmentally friendly goods worldwide. RMI should also consider promoting trade in goods
and services that are environmentally friendly and impose high taxes on and regulate those
products or services that cause harm to the environment. However, other considerations such as
revenue loss and the cost of goods and services to the poor should also be taken into account.
154
7.7 Trade and Gender
It should be noted that women in RMI have been marginalised for a long time and they have not
been playing an active role in politics, trade as well as in other domains. In line with
international conventions and best practices that seek to mainstream gender into development, it
is very important to ensure that the Trade Policy includes measures that promote the participation
of women in trade. Women are normally involved in labour intensive sectors such as agriculture,
handicraft and fish processing, therefore there should be some positive measures to ensure that
the interests of women are fully taken into account. The Government must also ensure that issues
affecting women are reflected in trade agreements so that women‘s interests are not left out or
affected negatively by these agreements.
WUTMI and the MICNGOs have been playing a vital role in RMI to ensure that the issues of
particular interest to women are addressed fully. For example, when it was realised that most
local handicraft shops were overstocked, WUTMI started buying the handicrafts from the outer
islands. Before 9/11/2001, transit passengers used to be allowed to enter Majuro freely and buy
handicraft. However, they are no longer allowed to come in and buy these products thus
restricting the selling of handicrafts. Most crafters are in the outer islands and when there is no
ship they cannot bring their products to Majuro. AMI is unreliable, and there are only 3 ships
servicing the outer islands. Some people from the outer-islands do not know where to sell the
handicrafts and have fallen victim to thieves and conmen. Most of the women are breadwinners
and therefore need a market for their goods.
The other small businesses include the selling of salt fish and breadfruit from outer islands.
There is a special pandanus tree that is also used for weaving and there is a therefore need to
grow more of these trees and sell to other islands.
When the price of copra fell, men also joined the handicraft industry. The FAO project on
sustainable livelihoods is supporting women to plant all kinds of crops including water melons,
pumpkin and pandanus. They were in addition supported in the producing of pandanus juice. The
women were also successful in collecting data for the turtle conservation project. WUTMI has
been getting support from New Zealand and UNICEF to promote gender equality and deal with
other social problems affecting women such as early pregnancies and substance abuse amongst
other things.
7.8 Recommendations
The following recommendations need to be implemented in order to improve RMI‘s trading
environment:
155
(i) RMI should reform its tax system and adopt a consumption tax and other
recommendations that have been proposed by the tax reform task force to enable RMI
to participate in trade negotiations without losing revenue
(ii) RMI should also consider identifying a list of sensitive products that should be
exempted from trade agreements
(iii)The Ministry of Finance should gather data on the number or value of exemptions
given and set clear and transparent procedures for exemptions
(iv) The Government should consider reviewing its Government procurement laws and
incorporate recent best practices on Government procurement while protecting the
interests of local citizens.
(v) The Government should work with the Forum Secretariat, WIPO as well as other
agencies and introduce a comprehensive regulatory and institutional framework
dealing with intellectual property rights as well as bio-diversity, traditional
knowledge and cultural expressions.
(vi) RMI should introduce a code of corporate governance and adopt best practices on
public and private corporate governance
(vii) The Government should take measures to ensure that trade and investment is
undertaken in a manner which does not undermine the environment.
(viii) The Government should take measures to promote and facilitate trade in
environmental goods and services and restrict trade on products that harm the
environment.
(ix) The Government should ensure that the interests of women and other disadvantaged
groups are included in trade-policy making and trade negotiations
8 MARKET ACCESS AND TRADE NEGOTIATIONS
This section looks at the trade agreements that are already in place or those that RMI is
negotiating. These trade agreements should enhance market access for RMI‘s goods and services
and provide Aid for Trade to enable RMI to build its capacity to produce goods and services in
an efficient manner and supply the global market. Some of the agreements that are covered
include the Pacific Island Countries Trade Agreement (PICTA), the Economic Partnership
Agreement (EPA), the Pacific Agreement on Closer Economic Relations (PACER) Plus, the
Compact Agreement with the US and the World Trade Organisation (WTO).
8.1 The Pacific Island Countries Trade Agreement (PICTA)
The main objective of PICTA is to promote regional integration among the fourteen Forum
Island Countries (FICs). It was supposed to serve as a stepping stone for FICs to participate in
the increasingly liberalized global economy. The original rationale for PICTA is that it was
supposed to serve as a ‗training ground‘ before FICs negotiate free trade agreements with other
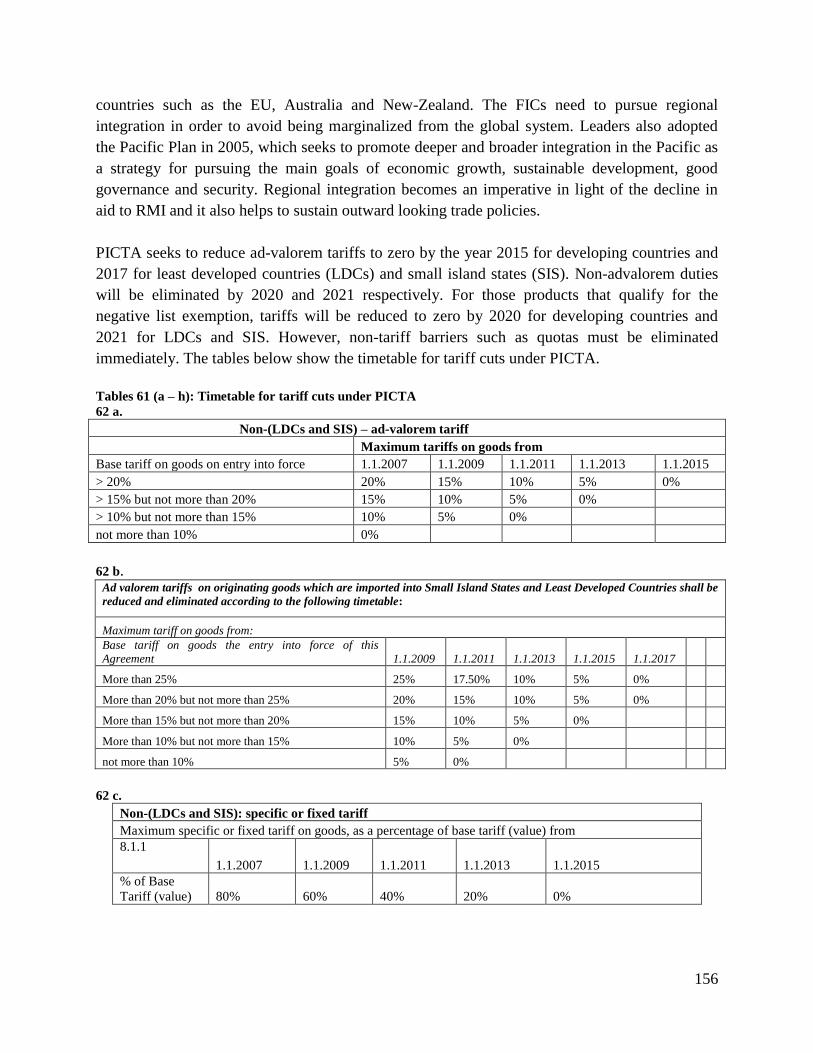
156
countries such as the EU, Australia and New-Zealand. The FICs need to pursue regional
integration in order to avoid being marginalized from the global system. Leaders also adopted
the Pacific Plan in 2005, which seeks to promote deeper and broader integration in the Pacific as
a strategy for pursuing the main goals of economic growth, sustainable development, good
governance and security. Regional integration becomes an imperative in light of the decline in
aid to RMI and it also helps to sustain outward looking trade policies.
PICTA seeks to reduce ad-valorem tariffs to zero by the year 2015 for developing countries and
2017 for least developed countries (LDCs) and small island states (SIS). Non-advalorem duties
will be eliminated by 2020 and 2021 respectively. For those products that qualify for the
negative list exemption, tariffs will be reduced to zero by 2020 for developing countries and
2021 for LDCs and SIS. However, non-tariff barriers such as quotas must be eliminated
immediately. The tables below show the timetable for tariff cuts under PICTA.
Tables 61 (a – h): Timetable for tariff cuts under PICTA
62 a.
Non-(LDCs and SIS) – ad-valorem tariff
Maximum tariffs on goods from
Base tariff on goods on entry into force 1.1.2007 1.1.2009 1.1.2011 1.1.2013 1.1.2015
> 20% 20% 15% 10% 5% 0%
> 15% but not more than 20% 15% 10% 5% 0%
> 10% but not more than 15% 10% 5% 0%
not more than 10% 0%
62 b. Ad valorem tariffs on originating goods which are imported into Small Island States and Least Developed Countries shall be
reduced and eliminated according to the following timetable:
Maximum tariff on goods from:
Base tariff on goods the entry into force of this
Agreement 1.1.2009 1.1.2011 1.1.2013 1.1.2015 1.1.2017
More than 25% 25% 17.50% 10% 5% 0%
More than 20% but not more than 25% 20% 15% 10% 5% 0%
More than 15% but not more than 20% 15% 10% 5% 0%
More than 10% but not more than 15% 10% 5% 0%
not more than 10% 5% 0%
62 c.
Non-(LDCs and SIS): specific or fixed tariff
Maximum specific or fixed tariff on goods, as a percentage of base tariff (value) from
8.1.1
1.1.2007 1.1.2009 1.1.2011 1.1.2013 1.1.2015
% of Base
Tariff (value) 80% 60% 40% 20% 0%
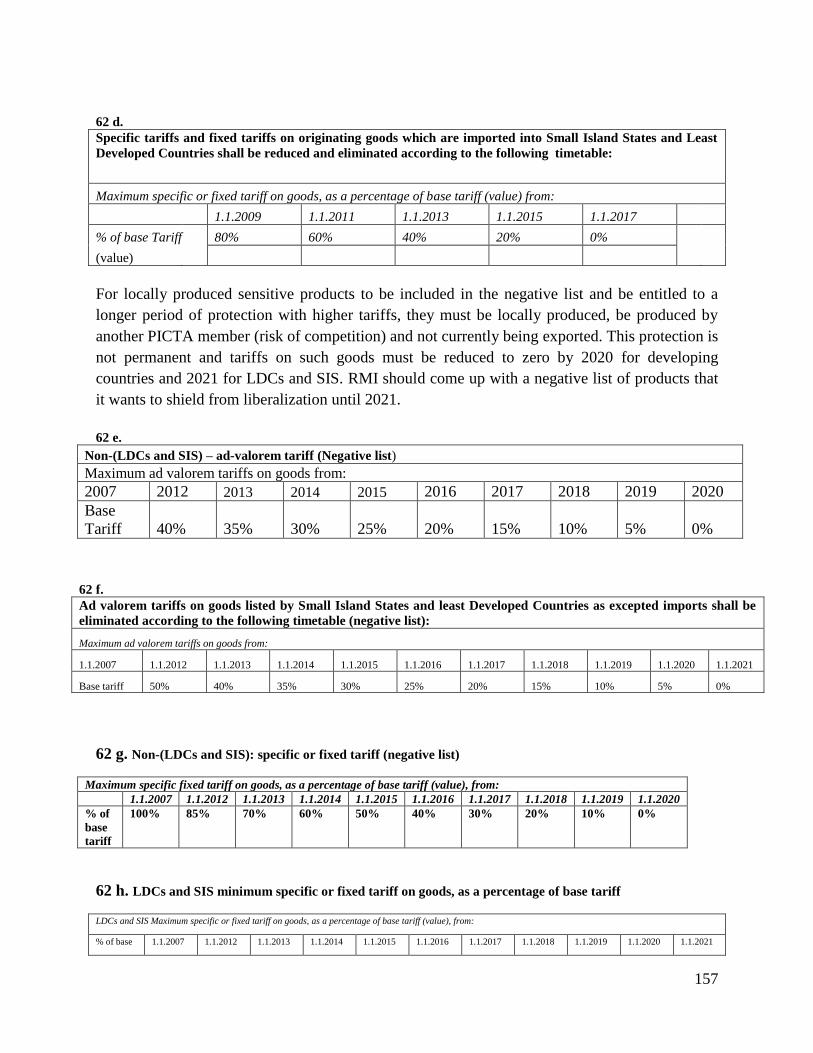
157
62 d.
Specific tariffs and fixed tariffs on originating goods which are imported into Small Island States and Least
Developed Countries shall be reduced and eliminated according to the following timetable:
Maximum specific or fixed tariff on goods, as a percentage of base tariff (value) from:
1.1.2009 1.1.2011 1.1.2013 1.1.2015 1.1.2017
% of base Tariff 80% 60% 40% 20% 0%
(value)
For locally produced sensitive products to be included in the negative list and be entitled to a
longer period of protection with higher tariffs, they must be locally produced, be produced by
another PICTA member (risk of competition) and not currently being exported. This protection is
not permanent and tariffs on such goods must be reduced to zero by 2020 for developing
countries and 2021 for LDCs and SIS. RMI should come up with a negative list of products that
it wants to shield from liberalization until 2021.
62 e.
Non-(LDCs and SIS) – ad-valorem tariff (Negative list)
Maximum ad valorem tariffs on goods from:
2007 2012 2013 2014 2015 2016 2017 2018 2019 2020
Base
Tariff 40% 35% 30% 25% 20% 15% 10% 5% 0%
62 f.
Ad valorem tariffs on goods listed by Small Island States and least Developed Countries as excepted imports shall be
eliminated according to the following timetable (negative list):
Maximum ad valorem tariffs on goods from:
1.1.2007 1.1.2012 1.1.2013 1.1.2014 1.1.2015 1.1.2016 1.1.2017 1.1.2018 1.1.2019 1.1.2020 1.1.2021
Base tariff 50% 40% 35% 30% 25% 20% 15% 10% 5% 0%
62 g. Non-(LDCs and SIS): specific or fixed tariff (negative list)
Maximum specific fixed tariff on goods, as a percentage of base tariff (value), from:
1.1.2007 1.1.2012 1.1.2013 1.1.2014 1.1.2015 1.1.2016 1.1.2017 1.1.2018 1.1.2019 1.1.2020
% of
base
tariff
100% 85% 70% 60% 50% 40% 30% 20% 10% 0%
62 h. LDCs and SIS minimum specific or fixed tariff on goods, as a percentage of base tariff
LDCs and SIS Maximum specific or fixed tariff on goods, as a percentage of base tariff (value), from:
% of base 1.1.2007 1.1.2012 1.1.2013 1.1.2014 1.1.2015 1.1.2016 1.1.2017 1.1.2018 1.1.2019 1.1.2020 1.1.2021
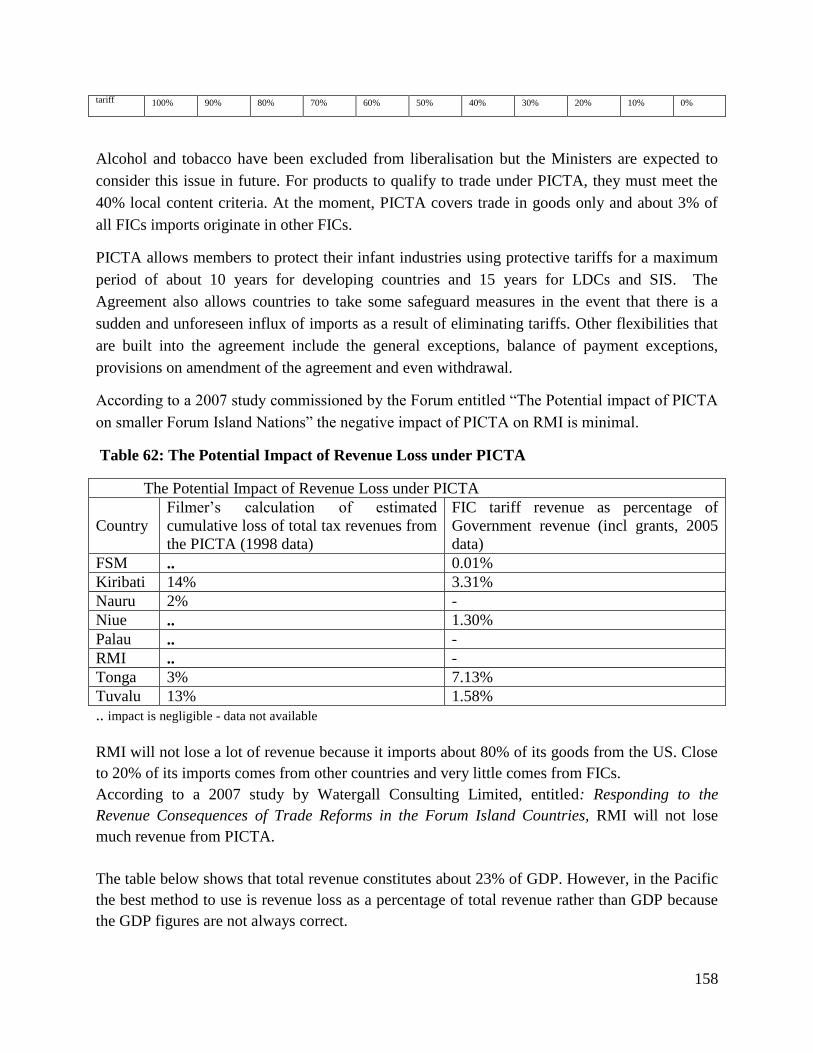
158
tariff 100% 90% 80% 70% 60% 50% 40% 30% 20% 10% 0%
Alcohol and tobacco have been excluded from liberalisation but the Ministers are expected to
consider this issue in future. For products to qualify to trade under PICTA, they must meet the
40% local content criteria. At the moment, PICTA covers trade in goods only and about 3% of
all FICs imports originate in other FICs.
PICTA allows members to protect their infant industries using protective tariffs for a maximum
period of about 10 years for developing countries and 15 years for LDCs and SIS. The
Agreement also allows countries to take some safeguard measures in the event that there is a
sudden and unforeseen influx of imports as a result of eliminating tariffs. Other flexibilities that
are built into the agreement include the general exceptions, balance of payment exceptions,
provisions on amendment of the agreement and even withdrawal.
According to a 2007 study commissioned by the Forum entitled ―The Potential impact of PICTA
on smaller Forum Island Nations‖ the negative impact of PICTA on RMI is minimal.
Table 62: The Potential Impact of Revenue Loss under PICTA
The Potential Impact of Revenue Loss under PICTA
Country
Filmer‘s calculation of estimated
cumulative loss of total tax revenues from
the PICTA (1998 data)
FIC tariff revenue as percentage of
Government revenue (incl grants, 2005
data)
FSM .. 0.01%
Kiribati 14% 3.31%
Nauru 2% -
Niue .. 1.30%
Palau .. -
RMI .. -
Tonga 3% 7.13%
Tuvalu 13% 1.58%
.. impact is negligible - data not available
RMI will not lose a lot of revenue because it imports about 80% of its goods from the US. Close
to 20% of its imports comes from other countries and very little comes from FICs.
According to a 2007 study by Watergall Consulting Limited, entitled: Responding to the
Revenue Consequences of Trade Reforms in the Forum Island Countries, RMI will not lose
much revenue from PICTA.
The table below shows that total revenue constitutes about 23% of GDP. However, in the Pacific
the best method to use is revenue loss as a percentage of total revenue rather than GDP because
the GDP figures are not always correct.
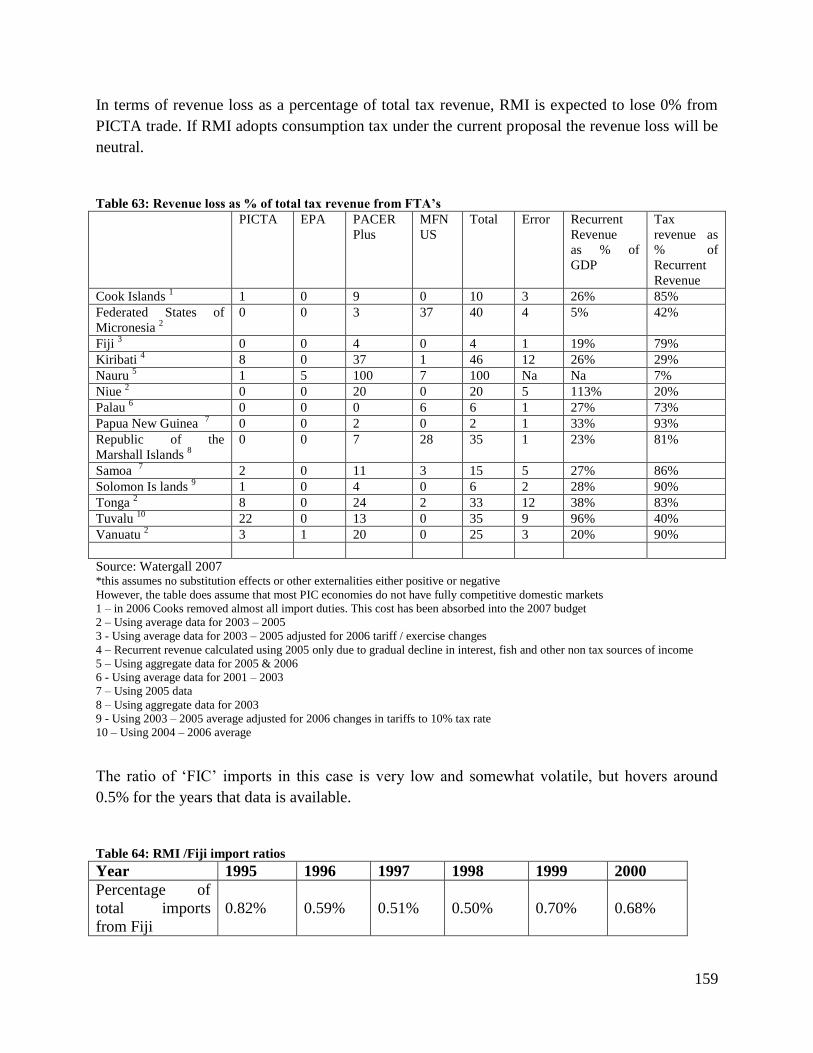
159
In terms of revenue loss as a percentage of total tax revenue, RMI is expected to lose 0% from
PICTA trade. If RMI adopts consumption tax under the current proposal the revenue loss will be
neutral.
Table 63: Revenue loss as % of total tax revenue from FTA’s
PICTA
EPA
PACER
Plus
MFN
US
Total Error Recurrent
Revenue
as % of
GDP
Tax
revenue as
% of
Recurrent
Revenue
Cook Islands 1 1 0 9 0 10 3 26% 85%
Federated States of
Micronesia 2
0 0 3 37 40 4 5% 42%
Fiji 3 0 0 4 0 4 1 19% 79%
Kiribati 4 8 0 37 1 46 12 26% 29%
Nauru 5 1 5 100 7 100 Na Na 7%
Niue 2 0 0 20 0 20 5 113% 20%
Palau 6 0 0 0 6 6 1 27% 73%
Papua New Guinea 7 0 0 2 0 2 1 33% 93%
Republic of the
Marshall Islands 8
0 0 7 28 35 1 23% 81%
Samoa 7 2 0 11 3 15 5 27% 86%
Solomon Is lands 9 1 0 4 0 6 2 28% 90%
Tonga 2 8 0 24 2 33 12 38% 83%
Tuvalu 10
22 0 13 0 35 9 96% 40%
Vanuatu 2
3 1 20 0 25 3 20% 90%
Source: Watergall 2007 *this assumes no substitution effects or other externalities either positive or negative
However, the table does assume that most PIC economies do not have fully competitive domestic markets
1 – in 2006 Cooks removed almost all import duties. This cost has been absorbed into the 2007 budget
2 – Using average data for 2003 – 2005
3 - Using average data for 2003 – 2005 adjusted for 2006 tariff / exercise changes
4 – Recurrent revenue calculated using 2005 only due to gradual decline in interest, fish and other non tax sources of income
5 – Using aggregate data for 2005 & 2006
6 - Using average data for 2001 – 2003
7 – Using 2005 data
8 – Using aggregate data for 2003
9 - Using 2003 – 2005 average adjusted for 2006 changes in tariffs to 10% tax rate
10 – Using 2004 – 2006 average
The ratio of ‗FIC‘ imports in this case is very low and somewhat volatile, but hovers around
0.5% for the years that data is available.
Table 64: RMI /Fiji import ratios
Year 1995 1996 1997 1998 1999 2000
Percentage of
total imports
from Fiji
0.82%
0.59%
0.51%
0.50%
0.70%
0.68%
160
Assuming that Fiji will be the major import source in FICs, the impact of PICTA will be very
small.
Quantifiable economic benefits from PICTA are not expected to be huge because intra-regional
trade volume is currently very low. However, some of the benefits expected from PICTA include
a big domestic market of about nine million people thereby increasing their export chances, and
this is also good for attracting investors. PICTA can also lead to improved efficiency as
industries exploit economies of scale due to expanded "local" market. More exports may lead to
increase in output which in turn leads to employment and more income. Lowering tariffs is
expected to lead to lower prices and a wider product choice for consumers. PICTA promotes
regional integration as an initial step towards more extensive liberalization and it provides
experience in negotiating FTAs. It also creates the basis for negotiating FTAs with other regions.
Like any other trade agreement there may be costs associated with PICTA and measures need to
be put in place to minimize the costs and maximize the benefits to ensure that in the final
analysis, the agreement will result in a win - win situation. Some of the costs involved include
adverse social impacts arising from ―adjustment costs‖ associated with removal of tariff barriers;
administrative operational costs; small revenue loss through tariff reductions (only serious in
Tuvalu and Kiribati); introduction of consumption-based taxes (to replace lost tariff revenue).
The RMI has been granted a waiver on PICTA and this allows it to ratify PICTA without being
obliged to offer the same trade preferences to U.S.
There are five FICs that are already trading under PICTA with effect from 01 January 2007,
namely Cook Islands, Fiji and Samoa and August 2007 for Vanuatu and Niue. Tuvalu in April
2010 also announced its readiness to trade under PICTA. Kiribati, Nauru, PNG, Solomon
Islands and Tonga have completed notification, but yet to announce readiness to trade. RMI and
Palau have not yet signed PICTA. FSM signed but has not yet ratified PICTA.
It is clear that RMI is already lagging behind. For the country to benefit from PICTA there is a
need to boost production and export capacity, and transportation links with the other island
countries must also be improved.
RMI needs to expedite the ratification process and start trading under PICTA. After ratification,
RMI should notify other PICTA members and inform them about the specific issues related to
PICTA trading. Some of the issues involved and steps required include: providing information
on the MFN tariff schedules; information on any conversions of specific rates; information on
the existence of any trade distorting measures; any other information relating to PICTA trading,
for example, status on the endorsement of changes to the Agreement; negative lists; PICTA tariff
reduction dates; details of legislative changes to trade under PICTA; thoughts on inclusion of
alcohol and tobacco, and Government procurement; requests for PICTA technical assistance,
legislative and procedural changes; announcement of PICTA readiness and trading.
161
8.1.2 Extension of PICTA to Trade in Services
The Forum Trade Ministers have agreed that PICTA be extended to trade in services. According
to the studies that were commissioned by PIFS, FICs were recommended to initially liberalize a
minimum of four out of the seven sectors that were identified for liberalization55
. Some of the
sectors make sense to liberalize regionally, while others should be liberalized with a multilateral
framework in mind – due to economic efficiency and scale.
It is recommended that telecommunications and financial services be liberalized multilaterally,
on MFN basis and air services be liberalized among the Forum Island members. Air Services are
covered by the Pacific Islands Air Services Agreement (PIASA). Inter-FIC and Intra-FIC
shipping services for all FIC shipping companies must also be liberalized regionally. Health and
education services may also be included in FIC free trade in services arrangements (subject to
limitations due to social and public-good nature of these services). Certain sub-sectors of the
tourism industry may also be included in the free trade in services agreement.
It is recommended, just as Trade Ministers have urged, that FICs should ensure that liberalization
commitments that they enter into with third countries do not supersede the commitments they
give to PICTA parties.
8.1.3 PICTA and Temporary Movement of Labor
The proposal to broaden PICTA to include Temporary Movement of Natural Persons (TMNP)
was considered in 2001. The objective of the TMNP scheme is to draw from labor surpluses
within the region to meet national skill shortages and stimulate skills development. In 2008,
Pacific ACP (PACP) Trade Ministers agreed to develop a framework for a TMNP scheme that:
considers using a two tier approach, whereby recognized professionals could move freely
amongst FICs, and semi-skilled / trades professionals would be subject to a mechanism
based on minimum quotas
benefits should extend to FIC nationals and persons with the right of permanent residence
in a FIC, irrespective of their place of residency
The 2009 Report tilted, Study on the Pacific Island Countries Trade Agreement (PICTA)
Temporary Movement of Natural Persons (TMNP)scheme by, Eco-Consult Pacific Limited,
defines Tier 1 as professionals who have acquired a minimum of a bachelors degree from a
recognized university with three years work experience and if required, a license to practice.
Tier 2 is defined as semi-skilled/trades professionals with a minimum qualification of a diploma,
55
The seven sectors are financial services, telecommunication, transport (air and maritime), tourism & travel,
educational service, health services and professional services.
162
or a certificate with three years of experience or certificate with five years experience and a
license to practice if required.
The national Labor and Immigration offices will have to play a vital role in implementing this
scheme. In RMI the Immigration Department is responsible for border control, ports of entry
frontline management, passports and visa issuance, compliance and citizenship. The department
would facilitate operations of the scheme. The Labor Division should play a facilitating role in
policy formulation and implementation and issuance of work permits. The Labor Division is
responsible for labor market monitoring and the identification of sectors where labor shortages
exist. It developed the OSL in 2006. The Division will also be responsible for determining
quotas if they are required under the scheme as well as monitoring compliance and enforcement.
The South Pacific Board for Educational Assessment (SPBEA) will play a vital role in
developing a Pacific Regional Qualifications Register (PRQR) and the National Qualification
Authorities (NQAs) in the assessment and recognition of qualifications for the purpose of the
scheme.
For the scheme to be useful, it must be simple to administer and offer easier employment
opportunities into other FICs than any other schemes or arrangements.
RMI need to gather data on expatriate workers and labor market data and use it as a basis of
economic needs tests, where appropriate.
The 2009 report recommends initiating implementation of the TMNP scheme with a first phase
of 2-5 years‘ duration that uses the two tier approach. It also proposes minimum quotas for
TMNP tier 2 workers that are unlikely to impact domestic labour markets and overburden FICs
immigration authorities. The lessons learnt during the first phase will be used to improve the
scheme.
FIC nationals, permanent residents in FICs, and any persons who have the right of
permanent residence in a FIC, regardless of whether or not they are resident there, are eligible to
participate in the TMNP scheme.
Whilst awaiting the completion of the PRQR by SPBEA, FICs should negotiate
Mutual Recognition Agreements (MRAs) to ascertain the minimum qualifications and work
experience required for the two tiers.
National or regional bodies should be responsible for licensing, however, for immigration
purposes, it is proposed that acquiring a license to practice should be a post-entry requirement
subject to enforcement by the appropriate authority in the country. If there is no licensing
authority for a specific trade or profession, FICs could consider the issue of temporary licenses
until such time they are able to develop their respective licensing authorities. Regional licenses
can be developed in future and considered.
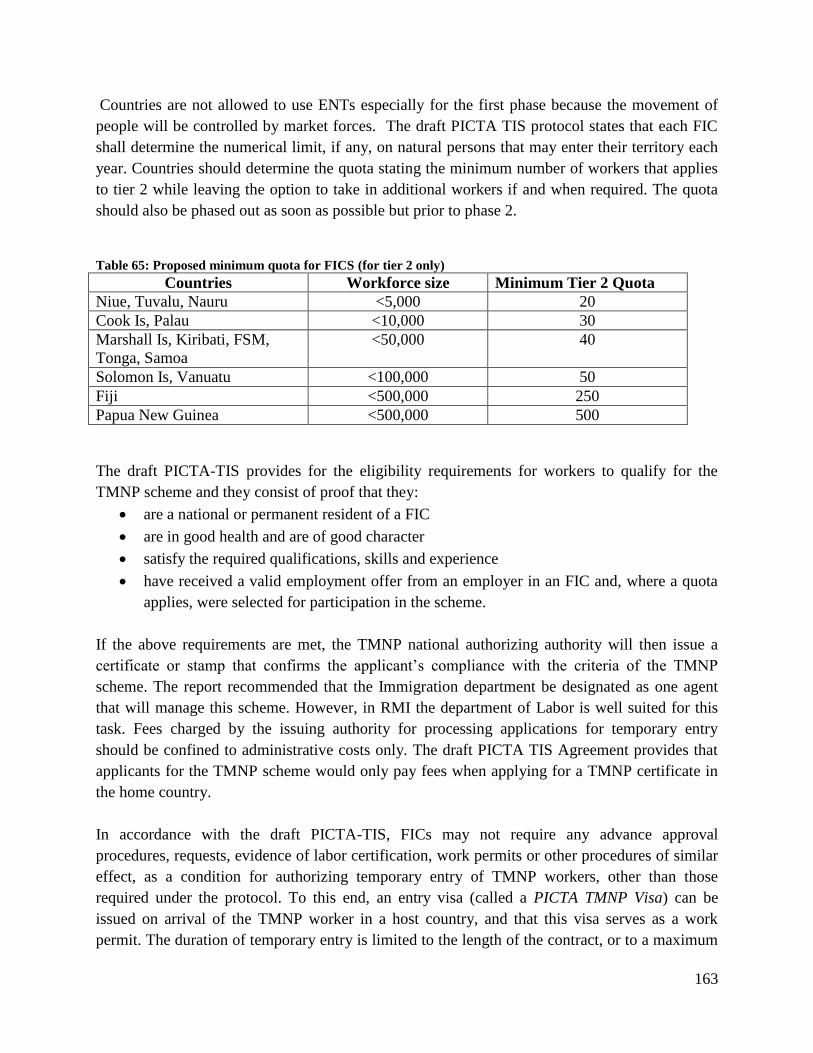
163
Countries are not allowed to use ENTs especially for the first phase because the movement of
people will be controlled by market forces. The draft PICTA TIS protocol states that each FIC
shall determine the numerical limit, if any, on natural persons that may enter their territory each
year. Countries should determine the quota stating the minimum number of workers that applies
to tier 2 while leaving the option to take in additional workers if and when required. The quota
should also be phased out as soon as possible but prior to phase 2.
Table 65: Proposed minimum quota for FICS (for tier 2 only)
Countries Workforce size Minimum Tier 2 Quota
Niue, Tuvalu, Nauru <5,000 20
Cook Is, Palau <10,000 30
Marshall Is, Kiribati, FSM,
Tonga, Samoa
<50,000 40
Solomon Is, Vanuatu <100,000 50
Fiji <500,000 250
Papua New Guinea <500,000 500
The draft PICTA-TIS provides for the eligibility requirements for workers to qualify for the
TMNP scheme and they consist of proof that they:
are a national or permanent resident of a FIC
are in good health and are of good character
satisfy the required qualifications, skills and experience
have received a valid employment offer from an employer in an FIC and, where a quota
applies, were selected for participation in the scheme.
If the above requirements are met, the TMNP national authorizing authority will then issue a
certificate or stamp that confirms the applicant‘s compliance with the criteria of the TMNP
scheme. The report recommended that the Immigration department be designated as one agent
that will manage this scheme. However, in RMI the department of Labor is well suited for this
task. Fees charged by the issuing authority for processing applications for temporary entry
should be confined to administrative costs only. The draft PICTA TIS Agreement provides that
applicants for the TMNP scheme would only pay fees when applying for a TMNP certificate in
the home country.
In accordance with the draft PICTA-TIS, FICs may not require any advance approval
procedures, requests, evidence of labor certification, work permits or other procedures of similar
effect, as a condition for authorizing temporary entry of TMNP workers, other than those
required under the protocol. To this end, an entry visa (called a PICTA TMNP Visa) can be
issued on arrival of the TMNP worker in a host country, and that this visa serves as a work
permit. The duration of temporary entry is limited to the length of the contract, or to a maximum
164
of 3 years, whichever the soonest. However, bonds will still be required and workers will not be
allowed to switch employers.
The spouse and dependent children should be given permission to enter and reside in line with
permissions granted to the TMNP worker and, if the spouse qualifies under either tier, he or she
must be allowed to work in the host country, subject to fulfillment of the requirements for
registration under the scheme.
During the PICTA Meeting that was held in March 2010, some of the issues that were raised
include:
i. The need to ensure adequate monitoring and compliance of immigration
dimensions of the PICTA TMNP Scheme, and that immigration departments be
adequately resourced to facilitate the scheme.
ii. The scheme must simplify existing administration requirements and increase employment
opportunities. The scheme must improve on current arrangements and must offer an
easier route into employment within the region.
iii. The need to consider qualifications rather than occupations-based tiers
iv. Countries need to be cautious in imposing conditions on qualifications which may
act as a deterrent to the temporary movement of skilled and semi-skilled workers.
v. The need for the PICTA TMNP Scheme to recognize qualification acquired by
Pacific workers outside the region
vi. The quota proposed in the study represented a guaranteed minimum for
Countries to commit to should they choose to participate in the PICTA TMNP
Scheme
vii. The need for careful drafting of the TIS legal text to accommodate overlaps
between Mode 4 commitments and TMNP
viii. The need to ensure that the PICTA TMNP Scheme promotes labor mobility
among Countries and does not impose unnecessary burden on Pacific workers
intending to participate in the scheme
ix. The need to exercise caution on including Tier 3 in the PICTA TMNP scheme
as lower skilled labor mobility arrangements are often bilaterally agreed
among sending and receiving Countries
x. The absence of an established and liberal labor mobility scheme among
Countries could disadvantage them in their labor mobility negotiations with
other partners
xi. PICTA TMNP Scheme should aim to offer benefits above and beyond
arrangements with other partners
xii. The impact of labor mobility scheme such as the PICTA TMNP scheme on
those Countries that have special arrangements with USA, New Zealand and
Australia
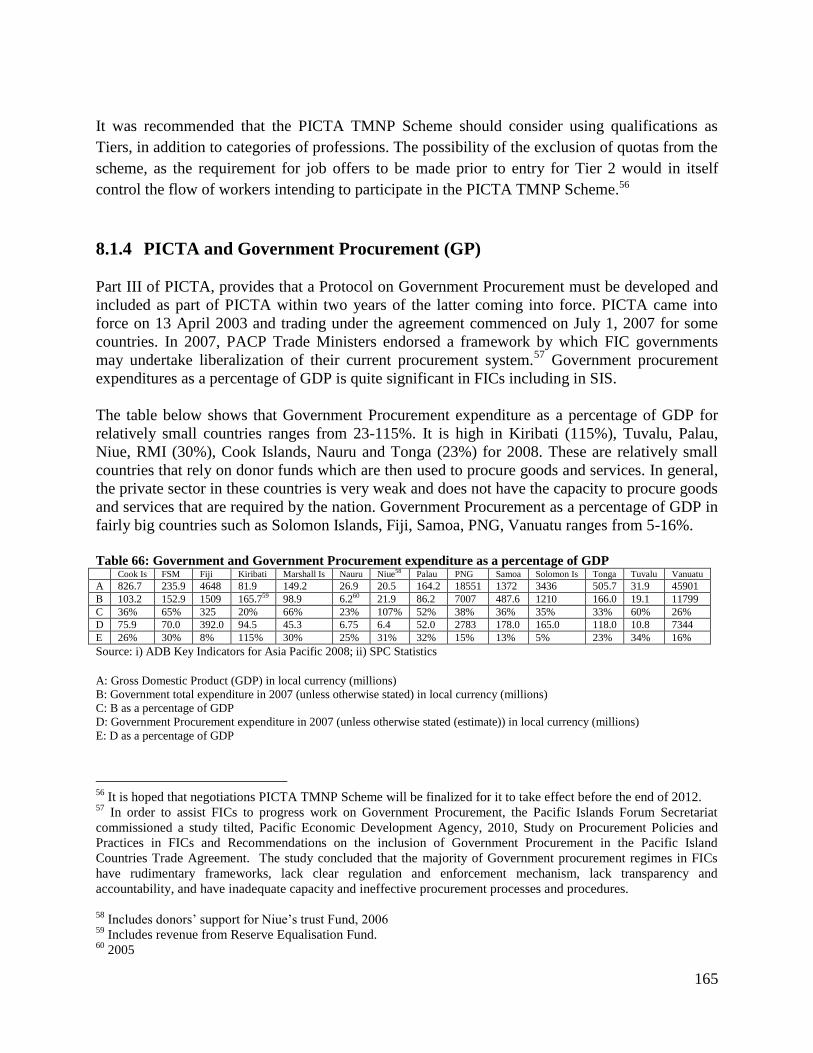
165
It was recommended that the PICTA TMNP Scheme should consider using qualifications as
Tiers, in addition to categories of professions. The possibility of the exclusion of quotas from the
scheme, as the requirement for job offers to be made prior to entry for Tier 2 would in itself
control the flow of workers intending to participate in the PICTA TMNP Scheme.56
8.1.4 PICTA and Government Procurement (GP)
Part III of PICTA, provides that a Protocol on Government Procurement must be developed and
included as part of PICTA within two years of the latter coming into force. PICTA came into
force on 13 April 2003 and trading under the agreement commenced on July 1, 2007 for some
countries. In 2007, PACP Trade Ministers endorsed a framework by which FIC governments
may undertake liberalization of their current procurement system.57
Government procurement
expenditures as a percentage of GDP is quite significant in FICs including in SIS.
The table below shows that Government Procurement expenditure as a percentage of GDP for
relatively small countries ranges from 23-115%. It is high in Kiribati (115%), Tuvalu, Palau,
Niue, RMI (30%), Cook Islands, Nauru and Tonga (23%) for 2008. These are relatively small
countries that rely on donor funds which are then used to procure goods and services. In general,
the private sector in these countries is very weak and does not have the capacity to procure goods
and services that are required by the nation. Government Procurement as a percentage of GDP in
fairly big countries such as Solomon Islands, Fiji, Samoa, PNG, Vanuatu ranges from 5-16%.
Table 66: Government and Government Procurement expenditure as a percentage of GDP Cook Is FSM Fiji Kiribati Marshall Is Nauru Niue58 Palau PNG Samoa Solomon Is Tonga Tuvalu Vanuatu
A 826.7 235.9 4648 81.9 149.2 26.9 20.5 164.2 18551 1372 3436 505.7 31.9 45901
B 103.2 152.9 1509 165.759 98.9 6.260 21.9 86.2 7007 487.6 1210 166.0 19.1 11799
C 36% 65% 325 20% 66% 23% 107% 52% 38% 36% 35% 33% 60% 26%
D 75.9 70.0 392.0 94.5 45.3 6.75 6.4 52.0 2783 178.0 165.0 118.0 10.8 7344
E 26% 30% 8% 115% 30% 25% 31% 32% 15% 13% 5% 23% 34% 16%
Source: i) ADB Key Indicators for Asia Pacific 2008; ii) SPC Statistics
A: Gross Domestic Product (GDP) in local currency (millions)
B: Government total expenditure in 2007 (unless otherwise stated) in local currency (millions)
C: B as a percentage of GDP
D: Government Procurement expenditure in 2007 (unless otherwise stated (estimate)) in local currency (millions)
E: D as a percentage of GDP
56
It is hoped that negotiations PICTA TMNP Scheme will be finalized for it to take effect before the end of 2012. 57
In order to assist FICs to progress work on Government Procurement, the Pacific Islands Forum Secretariat
commissioned a study tilted, Pacific Economic Development Agency, 2010, Study on Procurement Policies and
Practices in FICs and Recommendations on the inclusion of Government Procurement in the Pacific Island
Countries Trade Agreement. The study concluded that the majority of Government procurement regimes in FICs
have rudimentary frameworks, lack clear regulation and enforcement mechanism, lack transparency and
accountability, and have inadequate capacity and ineffective procurement processes and procedures.
58
Includes donors‘ support for Niue‘s trust Fund, 2006 59
Includes revenue from Reserve Equalisation Fund. 60
2005
166
Government procurement is defined as ―the contractual transaction process initiated by a
Government agency to purchase, rent, lease or hire purchase with or without the option to buy, a
good, service or construction work from national, regional and global suppliers for the sole
benefit or use of government. Some of the issues that have been proposed to be covered under
PICTA include:
All goods, services and construction acquired for the sole benefit or use of Government
and not to be procured with the view to commercially resell that procurement to a third
party
Procurements by local governments, State Owned Enterprises, central Government and
all other organs of the state and non-Government organizations procuring goods, services
or construction work with public funds
De-jure preferences favouring domestic suppliers, but such discriminatory policies to be
gradually dismantled according to the liberalization timetable agreed upon by PICTA
parties
Exception of some type of procurements, especially those related to national security and
other procurements of national interest, from the requirement of open tendering and
transparency
Joint procurement or bulk purchasing as an alternative mechanism that will bring cost
savings and value for money.
Some of the benefits expected from increased transparency and the liberalization of Government
Procurement include increased specialization, competition efficiency or value for money
procurement and accountability.
RMI should assess the costs and benefits of participating in Government procurement under
PICTA including the impact of these policies on its affirmative procurement policies and
preferences that are given to locals.
It is proposed that FICs retain their own national thresholds but the regional threshold for goods
and services could be SDR 75,000 (or US$119,000) and SDR 2.5m (US$4m) for construction,
and the global threshold to be SDR 150,000 for goods and services and SDR 6.5m for
construction. As a SIS RMI, should consider asking for special and differential treatment. Some
of the recommendations for inclusion of GP in PICTA, and for which RMI should advocate
include:
i. PICTA liberalization be done in two phases. Phase I (minimum 6 years) will focus on
enhancing transparency in FICs GP systems and development of PICTA GP rules. Phase
II should focus on liberalization actions and this can commence two years before Phase I
is completed.
ii. PICTA parties adopt a common definition for GP, and cover the procurement of goods,
services and construction by all levels of government, and state owned entities where GP

167
above the regional and global thresholds will have to be advertised regionally and
globally respectively.
iii. There be exemptions for national security, and other specific procurements requested and
approved by PICTA parties.
iv. The regional and global thresholds, and the advert must be open for a minimum of 40
days for open tendering and 25 days for limited tendering for all tenders advertised
regionally and globally.
v. It is recommended that technical specifications for tenders follow international standards
and/or acceptable national standards, and should be written not to create unnecessary
obstacles to international trade and competition, save where agreements have been
reached on certain specification that are unique to Pacific Island Countries.
vi. There must be a right to challenge the bidding process.
8.1.5 Recommendations
i. RMI should consider acceding to PICTA after the tax reform is finalized
ii. RMI must table draft trade in services offers under the PICTA Trade in Services
Agreement on business services, tourism and transportation (air and maritime) including
domestic air services before end of 2010.
iii. The Government, in particular, R&D, Labor and Immigration Department must work
together to analyze the proposed PICTA Temporary Movement of Natural Person
initiative and submit recommendations to the NTFC.
iv. RMI should analyze the proposal to include Government Procurement under PICTA and
make recommendations to the NTFC.
v. RMI should utilize the marketing services that are provided by the Pacific Islands Forum
Secretariat (PIFS) under the Pacific Islands Trade and Investment Commission (PITIC)
Offices based in Auckland, Sydney, Beijing, and Tokyo.
8.2 The US Market
As was highlighted above, the US is RMI‘s major trading partner and RMI has a special
preferential trade arrangement under the Compact. It is important to note that the US as a WTO
Member is prohibited by the MFN obligation from giving special preferences to a special group
of countries without extending the same benefits to WTO Members. Thus the US had to obtain a
waiver from the MFN obligation to be able to grant preferences to FAS and this waiver was
extended in 2006 to 2016. This section will look at the Compact provisions providing for
preferential access to the US market, the major competitors into the US market, the
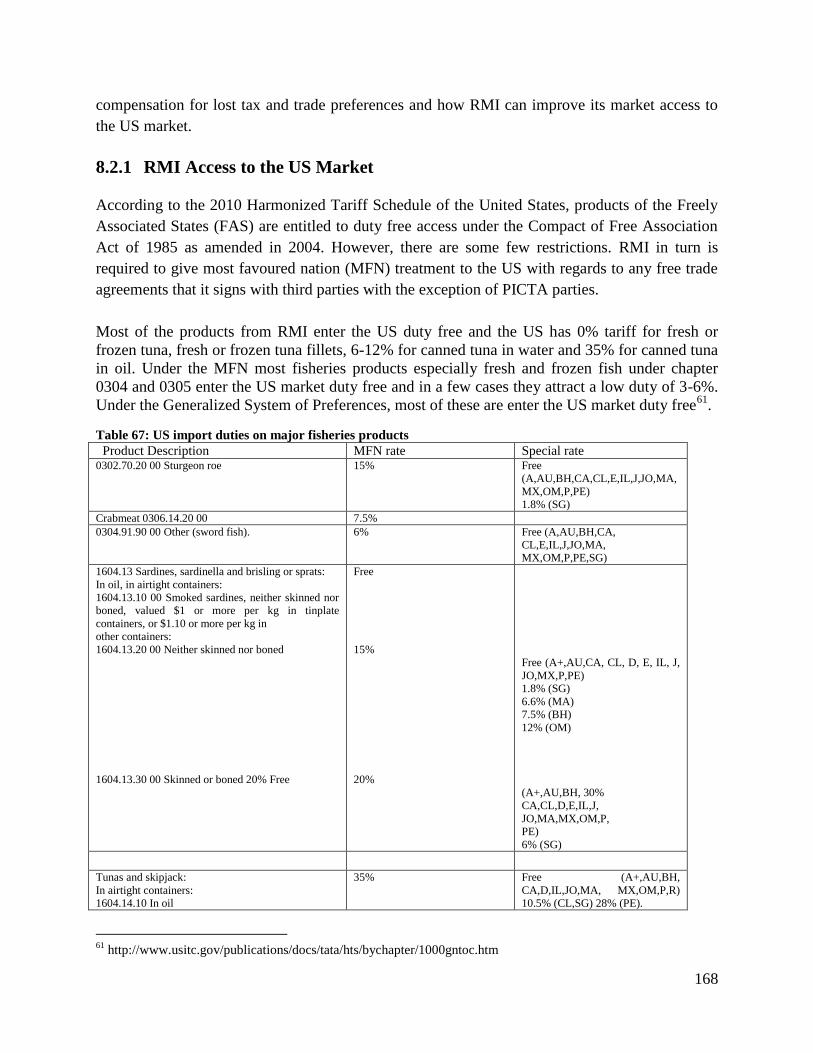
168
compensation for lost tax and trade preferences and how RMI can improve its market access to
the US market.
8.2.1 RMI Access to the US Market
According to the 2010 Harmonized Tariff Schedule of the United States, products of the Freely
Associated States (FAS) are entitled to duty free access under the Compact of Free Association
Act of 1985 as amended in 2004. However, there are some few restrictions. RMI in turn is
required to give most favoured nation (MFN) treatment to the US with regards to any free trade
agreements that it signs with third parties with the exception of PICTA parties.
Most of the products from RMI enter the US duty free and the US has 0% tariff for fresh or
frozen tuna, fresh or frozen tuna fillets, 6-12% for canned tuna in water and 35% for canned tuna
in oil. Under the MFN most fisheries products especially fresh and frozen fish under chapter
0304 and 0305 enter the US market duty free and in a few cases they attract a low duty of 3-6%.
Under the Generalized System of Preferences, most of these are enter the US market duty free61
.
Table 67: US import duties on major fisheries products
Product Description MFN rate Special rate 0302.70.20 00 Sturgeon roe 15% Free
(A,AU,BH,CA,CL,E,IL,J,JO,MA,
MX,OM,P,PE)
1.8% (SG)
Crabmeat 0306.14.20 00 7.5%
0304.91.90 00 Other (sword fish).
6% Free (A,AU,BH,CA,
CL,E,IL,J,JO,MA,
MX,OM,P,PE,SG)
1604.13 Sardines, sardinella and brisling or sprats:
In oil, in airtight containers:
1604.13.10 00 Smoked sardines, neither skinned nor
boned, valued $1 or more per kg in tinplate
containers, or $1.10 or more per kg in
other containers:
1604.13.20 00 Neither skinned nor boned
1604.13.30 00 Skinned or boned 20% Free
Free
15%
20%
Free (A+,AU,CA, CL, D, E, IL, J,
JO,MX,P,PE)
1.8% (SG)
6.6% (MA)
7.5% (BH)
12% (OM)
(A+,AU,BH, 30%
CA,CL,D,E,IL,J,
JO,MA,MX,OM,P,
PE)
6% (SG)
Tunas and skipjack:
In airtight containers:
1604.14.10 In oil
35% Free (A+,AU,BH,
CA,D,IL,JO,MA, MX,OM,P,R)
10.5% (CL,SG) 28% (PE).
61
http://www.usitc.gov/publications/docs/tata/hts/bychapter/1000gntoc.htm
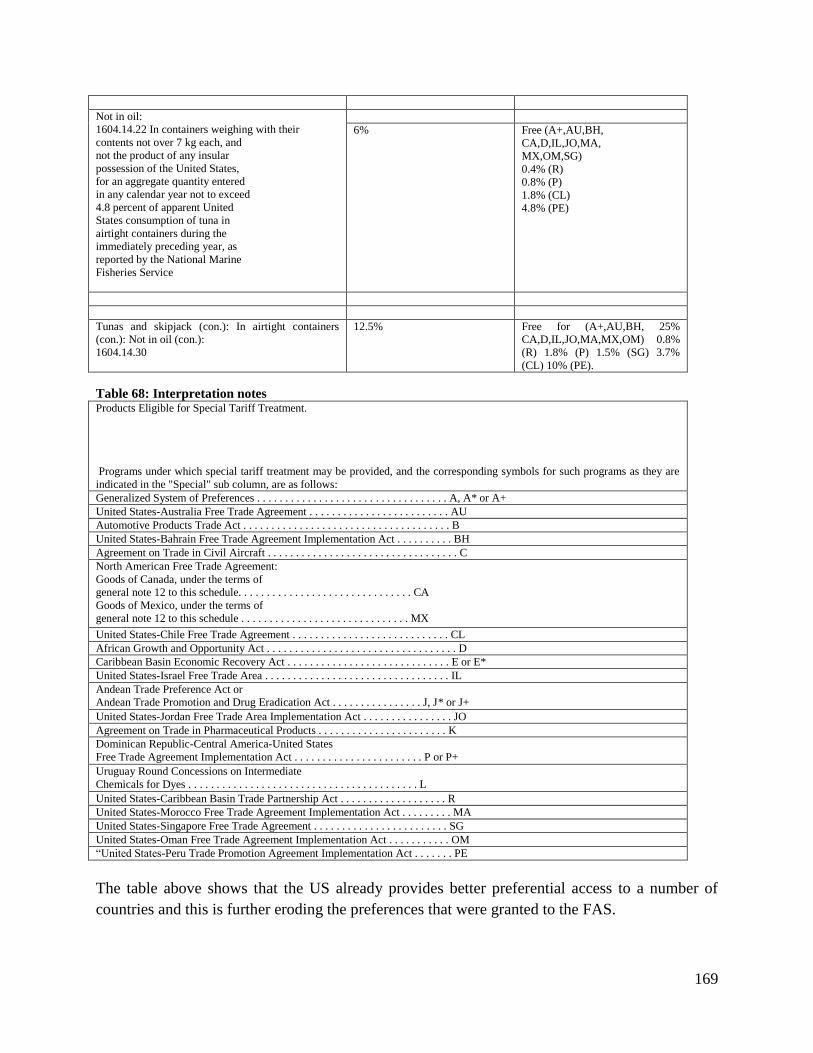
169
Not in oil:
1604.14.22 In containers weighing with their
contents not over 7 kg each, and
not the product of any insular
possession of the United States,
for an aggregate quantity entered
in any calendar year not to exceed
4.8 percent of apparent United
States consumption of tuna in
airtight containers during the
immediately preceding year, as
reported by the National Marine
Fisheries Service
6% Free (A+,AU,BH,
CA,D,IL,JO,MA,
MX,OM,SG)
0.4% (R)
0.8% (P)
1.8% (CL)
4.8% (PE)
Tunas and skipjack (con.): In airtight containers
(con.): Not in oil (con.):
1604.14.30
12.5% Free for (A+,AU,BH, 25%
CA,D,IL,JO,MA,MX,OM) 0.8%
(R) 1.8% (P) 1.5% (SG) 3.7%
(CL) 10% (PE).
Table 68: Interpretation notes Products Eligible for Special Tariff Treatment.
Programs under which special tariff treatment may be provided, and the corresponding symbols for such programs as they are
indicated in the "Special" sub column, are as follows:
Generalized System of Preferences . . . . . . . . . . . . . . . . . . . . . . . . . . . . . . . . . . A, A* or A+
United States-Australia Free Trade Agreement . . . . . . . . . . . . . . . . . . . . . . . . . AU
Automotive Products Trade Act . . . . . . . . . . . . . . . . . . . . . . . . . . . . . . . . . . . . . B
United States-Bahrain Free Trade Agreement Implementation Act . . . . . . . . . . BH
Agreement on Trade in Civil Aircraft . . . . . . . . . . . . . . . . . . . . . . . . . . . . . . . . . . C
North American Free Trade Agreement:
Goods of Canada, under the terms of
general note 12 to this schedule. . . . . . . . . . . . . . . . . . . . . . . . . . . . . . . CA
Goods of Mexico, under the terms of
general note 12 to this schedule . . . . . . . . . . . . . . . . . . . . . . . . . . . . . . MX
United States-Chile Free Trade Agreement . . . . . . . . . . . . . . . . . . . . . . . . . . . . CL
African Growth and Opportunity Act . . . . . . . . . . . . . . . . . . . . . . . . . . . . . . . . . . D
Caribbean Basin Economic Recovery Act . . . . . . . . . . . . . . . . . . . . . . . . . . . . . E or E*
United States-Israel Free Trade Area . . . . . . . . . . . . . . . . . . . . . . . . . . . . . . . . . IL
Andean Trade Preference Act or
Andean Trade Promotion and Drug Eradication Act . . . . . . . . . . . . . . . . J, J* or J+
United States-Jordan Free Trade Area Implementation Act . . . . . . . . . . . . . . . . JO
Agreement on Trade in Pharmaceutical Products . . . . . . . . . . . . . . . . . . . . . . . K
Dominican Republic-Central America-United States
Free Trade Agreement Implementation Act . . . . . . . . . . . . . . . . . . . . . . . P or P+
Uruguay Round Concessions on Intermediate
Chemicals for Dyes . . . . . . . . . . . . . . . . . . . . . . . . . . . . . . . . . . . . . . . . . L
United States-Caribbean Basin Trade Partnership Act . . . . . . . . . . . . . . . . . . . R
United States-Morocco Free Trade Agreement Implementation Act . . . . . . . . . MA
United States-Singapore Free Trade Agreement . . . . . . . . . . . . . . . . . . . . . . . . SG
United States-Oman Free Trade Agreement Implementation Act . . . . . . . . . . . OM
―United States-Peru Trade Promotion Agreement Implementation Act . . . . . . . PE
The table above shows that the US already provides better preferential access to a number of
countries and this is further eroding the preferences that were granted to the FAS.
170
It should be noted that for the products from RMI to qualify for duty free treatment, they must
comply with the US rules of origin. This means that exporters in RMI must ensure that the value
of the local content that is included in any products that are exported to the US must be 35%. In
order to meet this 35% requirement, RMI is allowed to use about 15% of the value materials
from the US. However, for RMI to be able to fully utilise these preferences, the tolerance rule
must also apply to other neighbouring countries including Asia.
Tunas and skipjack, prepared or preserved, not in oil, in airtight containers (1604. 14.22)
weighing with their contents not over 7 kilograms each, in an aggregate quantity entered in any
calendar year from the FAS not exceeding 10 percent of United States consumption of canned
tuna during the immediately preceding calendar year will enter the US duty free. The
consumption level will be determined by National Marine Fisheries Service.
The following products do not qualify for duty free:
tunas and skipjack, prepared or preserved, not in oil, in airtight containers weighing with
their contents not over 7 kilograms each, in excess of the quantity afforded duty-free entry
textile and apparel articles which are subject to textile agreements
footwear, handbags, luggage, flat goods, work gloves and leather wearing apparel, the
foregoing which were not eligible articles for purposes of the Generalized System of
Preferences on April 1, 1984
watches, clocks and timing apparatus of chapter 91 (except such articles incorporating an
optoelectronic display and no other type of display)
buttons of subheading 9606.21.40 or 9606.29.20
any agricultural product of chapters 2 through 52, inclusive, that is subject to a tariff-rate
quota, if entered in a quantity in excess of the in-quota quantity for such product
The US Tariff Act also imposes graduation criteria, which is not found in the Compact
agreement. The Compact states that duty free may be limited by section 503 (b) of title v of the
Trade Act of 1974 (19 U.S.C. 2463 (b)). This section sets out the articles that may be considered
import sensitive; they are similar to those enumerated in section 242 (c) of the Compact.
However, the 2010 US Tariff Schedule imposes further restrictions which are not stipulated in
the Compact. It provides that: Whenever a freely associated state—
(A) has exported (directly or indirectly) to the United States during a calendar year a
quantity of such article having an appraised value in excess of an amount which bears
the same ratio to $25,000,000 as the gross national product of the United States for the
preceding calendar year (as determined by the Department of
Commerce) bears to the gross national product of the United States for calendar year
1974 (as determined for purposes of sections 503(c)(2)(A)(i)(I) and 503(c)(2)(A)(ii) of
the Trade Act of 1974 (19 U.S.C.2463(c)(2)(A)(i)(I) and 2463(c)(2)(A)(ii)); or
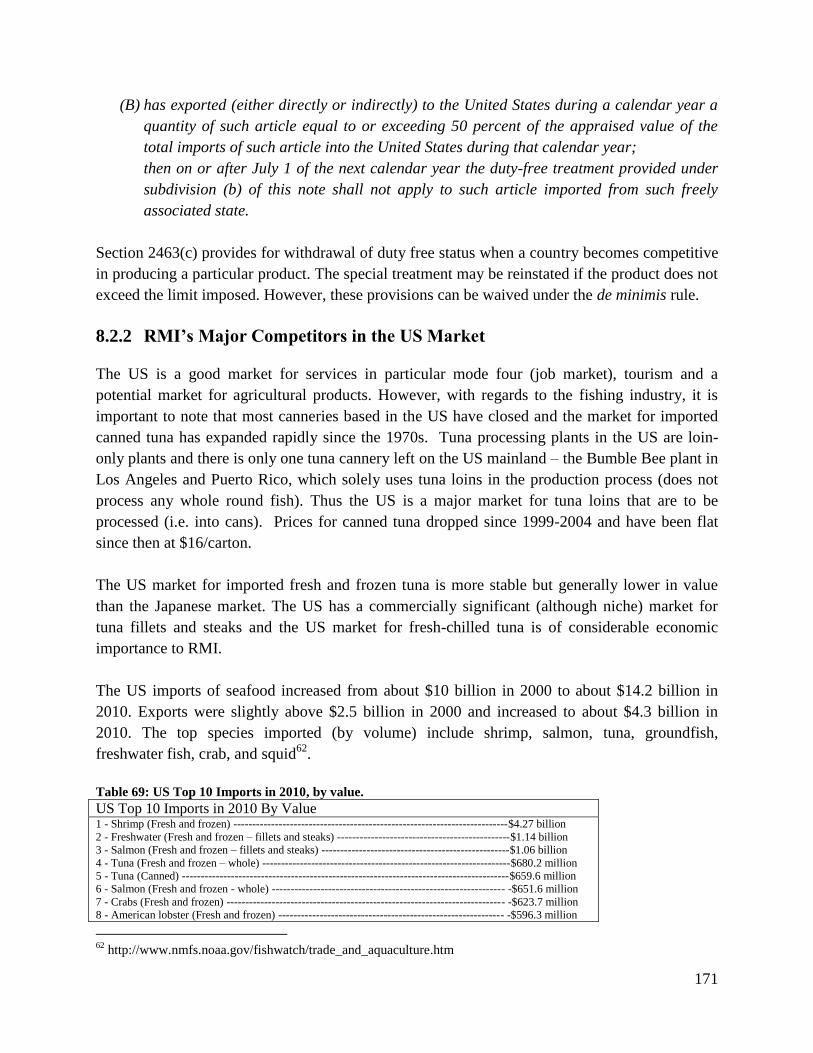
171
(B) has exported (either directly or indirectly) to the United States during a calendar year a
quantity of such article equal to or exceeding 50 percent of the appraised value of the
total imports of such article into the United States during that calendar year;
then on or after July 1 of the next calendar year the duty-free treatment provided under
subdivision (b) of this note shall not apply to such article imported from such freely
associated state.
Section 2463(c) provides for withdrawal of duty free status when a country becomes competitive
in producing a particular product. The special treatment may be reinstated if the product does not
exceed the limit imposed. However, these provisions can be waived under the de minimis rule.
8.2.2 RMI’s Major Competitors in the US Market
The US is a good market for services in particular mode four (job market), tourism and a
potential market for agricultural products. However, with regards to the fishing industry, it is
important to note that most canneries based in the US have closed and the market for imported
canned tuna has expanded rapidly since the 1970s. Tuna processing plants in the US are loin-
only plants and there is only one tuna cannery left on the US mainland – the Bumble Bee plant in
Los Angeles and Puerto Rico, which solely uses tuna loins in the production process (does not
process any whole round fish). Thus the US is a major market for tuna loins that are to be
processed (i.e. into cans). Prices for canned tuna dropped since 1999-2004 and have been flat
since then at $16/carton.
The US market for imported fresh and frozen tuna is more stable but generally lower in value
than the Japanese market. The US has a commercially significant (although niche) market for
tuna fillets and steaks and the US market for fresh-chilled tuna is of considerable economic
importance to RMI.
The US imports of seafood increased from about $10 billion in 2000 to about $14.2 billion in
2010. Exports were slightly above $2.5 billion in 2000 and increased to about $4.3 billion in
2010. The top species imported (by volume) include shrimp, salmon, tuna, groundfish,
freshwater fish, crab, and squid62
.
Table 69: US Top 10 Imports in 2010, by value.
US Top 10 Imports in 2010 By Value 1 - Shrimp (Fresh and frozen) -------------------------------------------------------------------------$4.27 billion
2 - Freshwater (Fresh and frozen – fillets and steaks) ----------------------------------------------$1.14 billion
3 - Salmon (Fresh and frozen – fillets and steaks) --------------------------------------------------$1.06 billion
4 - Tuna (Fresh and frozen – whole) ------------------------------------------------------------------$680.2 million
5 - Tuna (Canned) ---------------------------------------------------------------------------------------$659.6 million
6 - Salmon (Fresh and frozen - whole) -------------------------------------------------------------- -$651.6 million
7 - Crabs (Fresh and frozen) -------------------------------------------------------------------------- -$623.7 million
8 - American lobster (Fresh and frozen) ------------------------------------------------------------ -$596.3 million
62
http://www.nmfs.noaa.gov/fishwatch/trade_and_aquaculture.htm
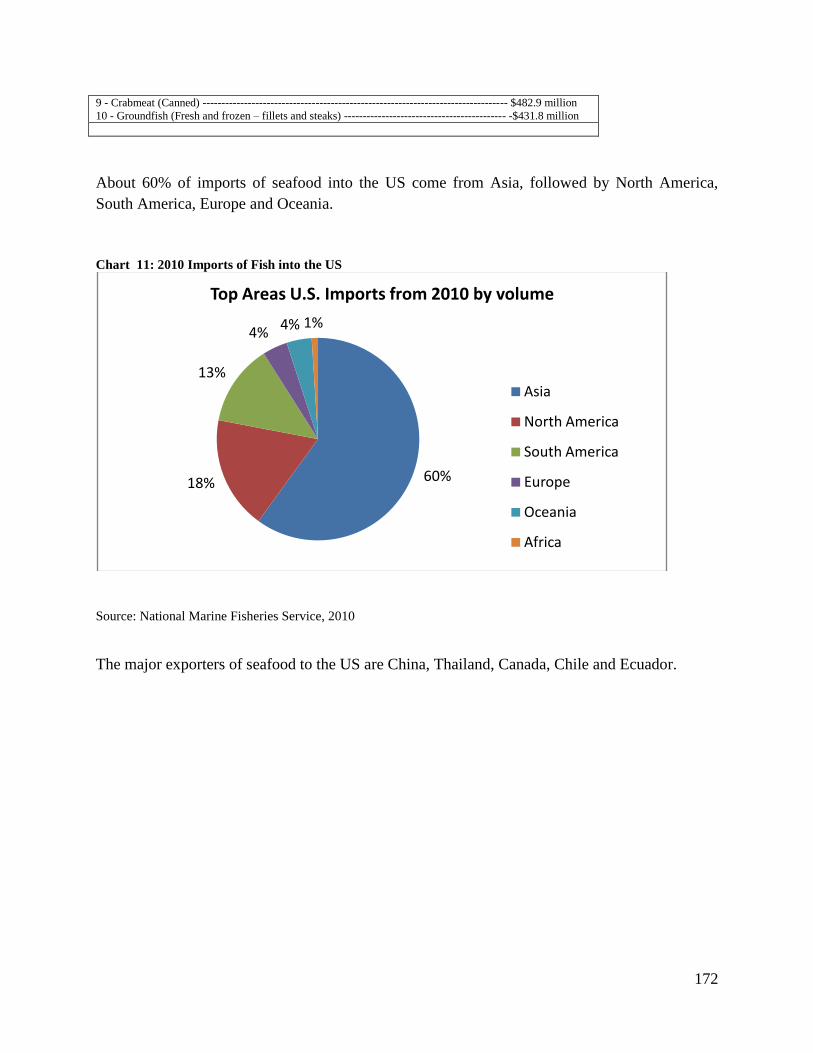
172
9 - Crabmeat (Canned) --------------------------------------------------------------------------------- $482.9 million
10 - Groundfish (Fresh and frozen – fillets and steaks) ------------------------------------------- -$431.8 million
About 60% of imports of seafood into the US come from Asia, followed by North America,
South America, Europe and Oceania.
Chart 11: 2010 Imports of Fish into the US
Source: National Marine Fisheries Service, 2010
The major exporters of seafood to the US are China, Thailand, Canada, Chile and Ecuador.
60%18%
13%
4%4% 1%
Top Areas U.S. Imports from 2010 by volume
Asia
North America
South America
Europe
Oceania
Africa
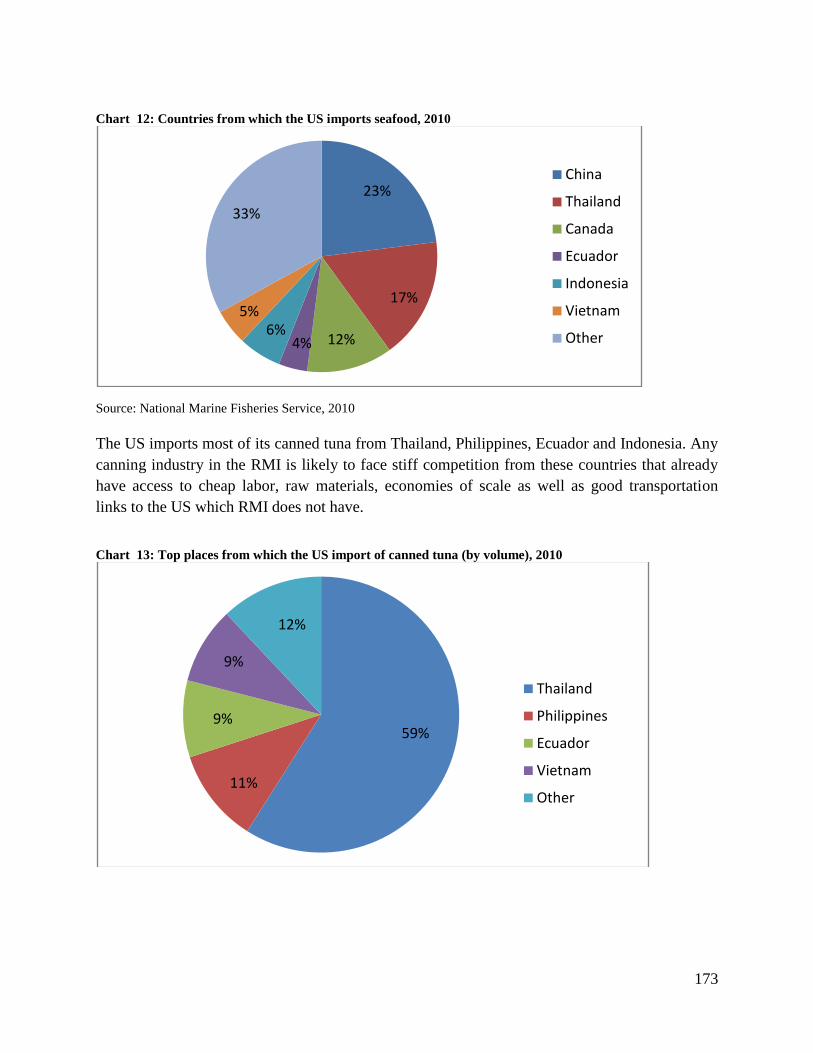
173
Chart 12: Countries from which the US imports seafood, 2010
Source: National Marine Fisheries Service, 2010
The US imports most of its canned tuna from Thailand, Philippines, Ecuador and Indonesia. Any
canning industry in the RMI is likely to face stiff competition from these countries that already
have access to cheap labor, raw materials, economies of scale as well as good transportation
links to the US which RMI does not have.
Chart 13: Top places from which the US import of canned tuna (by volume), 2010
23%
17%
12%4%6%
5%
33%
China
Thailand
Canada
Ecuador
Indonesia
Vietnam
Other
59%
11%
9%
9%
12%
Thailand
Philippines
Ecuador
Vietnam
Other
174
8.3 How to Improve Market Access into the US
As noted above, RMI has preferential access into the US market; however, it is unfortunate that
these preferences have not been fully utilized. This is mainly because the private sector in RMI
does not have adequate capacity to produce and supply products to the US market. Aside from
the natural disadvantages that affect the private sector in the RMI, the efforts by the private
sector to export to the US are further hampered by:
infrequent, inadequate and expensive transportation to the US market
the fuel prices that are on an upward spiral
Continental Airlines, which has imposed stringent restrictions on cargo
non-tariff barriers such as technical barriers to trade, sanitary and phytosanitary standards
unfavourable rules of origin- 35% value addition (15% allowance).
With respect to tuna and skipjack that is ‗prepared or preserved‘ in airtight containers and
not in oil, exports cannot exceed 10% of US consumption of canned tuna during the
immediately preceding calendar year‘ which was 45.8 million cases in 2005
Preference erosion
According to several industry interviewees, consulted by the Forum Fisheries Agency (FFA), the
major factors accounting for the failure of offshore tuna investment in RMI include governance
issues, dependency on US grants and slow or non-utilisation of preferences. The FFA study
recommends that the FAS ‗need to move away from mass consumer/mass market and shift to
boutique production‘. They ‗need to stay focused and be less greedy, and look at quality issues
and niche markets‘. It was suggested that tuna in pouches were a key potential, despite
competition from Ecuador.
One US industry representative also suggested that ‗the Compact states should go for duty free
status to be competitive‘.
In order to improve its market access into the US, RMI should try to negotiate better trade terms
similar to those that were given to American Samoa, which receives zero-duty on exports of
canned tuna to the US market compared to 35% on tuna in oil which is imposed on products
from RMI. Furthermore, American Samoa has access to section 936 of the Internal Revenue Act
which provides tax credit to US companies investing in American Samoa.
The US law states that production for US military and other Government contracts must be
undertaken on US soil and use fish from the US fleet. Canneries in Pago Pago also benefit from
this captive market. RMI should negotiate with the US and be allowed to supply this market.
The preferences that were given to RMI by the US have been eroded because the US has
extended even better tuna preferences to other countries under the Andean Trade Preference Act
(ATPA 1991 reviewed in 2004) which covers Bolivia, Colombia, Ecuador and Peru. The
175
Caribbean Basin Economic Recovery Act (CBERA) was renegotiated in the early 2000s and
preferential treatment was extended to canned tuna. This scheme extends duty-free access for
canned tuna to the US market to Haiti, Costa Rica, Netherlands Antilles, Panama and Trinidad &
Tobago. Trinidad & Tobago is a major supplier of albacore loins to Bumble Bee‘s cannery in
Puerto Rico. CBERA has a potential duty preference higher than those in ATPA. There is also a
threat from the Thai-US FTA. All these factors point to the fact that RMI is under pressure from
the global tuna producers and any industries that are established in RMI will have to face this
competition especially when the preferences are gone.
Some positive measures must be taken to assist the RMI private sector to fully utilize the trade
preferences. Lack of utilization of preferences has been a major problem affecting many
preferential schemes including those that are granted to the Africa, Caribbean and Pacific Sates
by the European Union (EU). Poor countries are granted market access but no adequate technical
and financial assistance is provided to assist the private sector to fully utilize these trade
preferences.
For RMI to benefit fully from the labour agreement that it has with the US, there is a need for
increased technical and financial assistance to develop technical and vocational training
institutions in areas such as health, tourism and construction. Compact funding should be fully
utilised to improve these services. This will facilitate the movement of people to the US and
enable them to take skilled jobs and earn remittances. These remittances can be used to develop
the RMI economy and this has the potential to fuel private sector growth and development. RMI
needs to put in place measures to collect data on remittances and to encourage the use of
remittances for productive purposes.
In order to promote private sector development and export capacity, some of the issues raised
above need to be addressed urgently. There is a need for the US to provide technical and
financial assistance in the form of Aid for Trade. Some of the technical assistance can be
provided into RMI directly and other assistance can be provided by institutions that can be based
in one of the Freely Associated States; hence the need to talk to Palau, FSM and other US
territories to enhance cooperation on trade and private sector development. Arrangements to set
up a proper legal framework for the Micronesian Trade Committee (MTC) should be sped up so
that the MTC can serve as platform for collaborative action in this respect, while other
arrangements, if necessary, are being sought.
Consequently trade relations with the US should be strengthened to include the Aid for Trade
component which will assist the RMI to develop its production and export capacity. The key
issues that need to be addressed and funded under the Aid for Trade funding mechanism include:
technical and financial assistance to implement the Trade Policy
176
assistance to develop trade in agriculture, tourism and fisheries with a focus on value
addition
technical and financial assistance to upgrade the tourism infrastructure and market
tourism
o assisting local operators to meet demands and needs of US tourists, including
product development and training to required standards of service provision;
o training in the management of environmental impact of new tourism products
developed for the US market;
technical and financial assistance to upgrade vocational education training institutions,
targeting those sectors with a potential for exports such as health, construction and
tourism
assisting RMI to negotiate better transportation arrangements with Continental or other
US Airlines to ease transportation problems
entering into arrangements with the US including its territories to assist exporters to
meet technical standards and requirements such as SPS and TBTs
assisting the private sector to address supply side constraints and to build their capacity
to trade
providing loans to SMEs at reasonably affordable rates
establishing export promotion agencies that are responsible for assisting exporters to
meet standards and other technical requirements in export markets
assisting RMI to carry out regulatory reforms that are required as preconditions for
opening up the services sectors and also to enhance competition and effective delivery of
quality services
strengthening competition and intellectual property regimes to avoid trade restrictive
practices and promote foreign investment
assistance to supply institutional markets in the US (e.g. the military where RMI citizens
are serving)
deepening the US-RMI trade relations by removing restriction on canned tuna in oil and
textiles through relaxing rules of origin
All the activities listed above require an injection of financial and technical assistance in order to
promote private sector development.
Another equally important issue is the need for RMI to discuss the Most Favored Nation (MFN)
treatment provision in the Compact Agreement and assess its impact on RMI if it decides to sign
a goods agreement with the EU or under PACER Plus with Australia and New Zealand.
According to a study that was done by Watergall in 2007, RMI is expected to lose about $4,961
million from the MFN obligation.
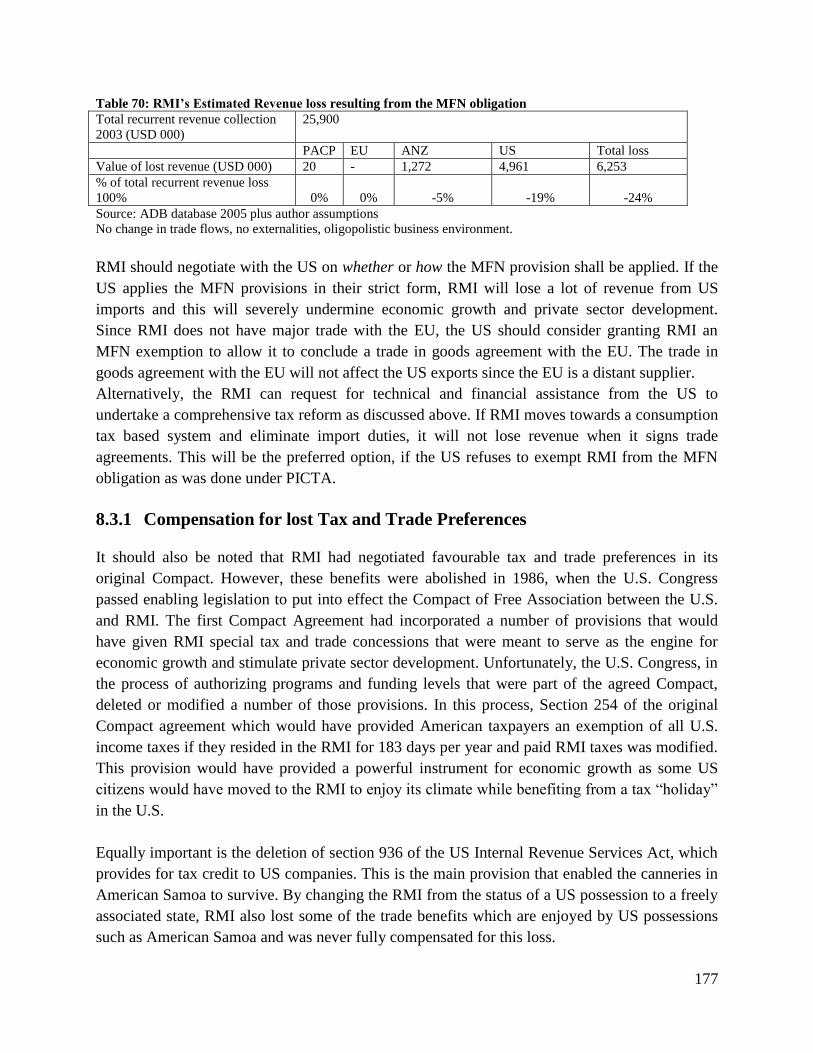
177
Table 70: RMI’s Estimated Revenue loss resulting from the MFN obligation
Total recurrent revenue collection
2003 (USD 000)
25,900
PACP EU ANZ US Total loss
Value of lost revenue (USD 000) 20 - 1,272 4,961 6,253
% of total recurrent revenue loss
100%
0%
0%
-5%
-19%
-24%
Source: ADB database 2005 plus author assumptions
No change in trade flows, no externalities, oligopolistic business environment.
RMI should negotiate with the US on whether or how the MFN provision shall be applied. If the
US applies the MFN provisions in their strict form, RMI will lose a lot of revenue from US
imports and this will severely undermine economic growth and private sector development.
Since RMI does not have major trade with the EU, the US should consider granting RMI an
MFN exemption to allow it to conclude a trade in goods agreement with the EU. The trade in
goods agreement with the EU will not affect the US exports since the EU is a distant supplier.
Alternatively, the RMI can request for technical and financial assistance from the US to
undertake a comprehensive tax reform as discussed above. If RMI moves towards a consumption
tax based system and eliminate import duties, it will not lose revenue when it signs trade
agreements. This will be the preferred option, if the US refuses to exempt RMI from the MFN
obligation as was done under PICTA.
8.3.1 Compensation for lost Tax and Trade Preferences
It should also be noted that RMI had negotiated favourable tax and trade preferences in its
original Compact. However, these benefits were abolished in 1986, when the U.S. Congress
passed enabling legislation to put into effect the Compact of Free Association between the U.S.
and RMI. The first Compact Agreement had incorporated a number of provisions that would
have given RMI special tax and trade concessions that were meant to serve as the engine for
economic growth and stimulate private sector development. Unfortunately, the U.S. Congress, in
the process of authorizing programs and funding levels that were part of the agreed Compact,
deleted or modified a number of those provisions. In this process, Section 254 of the original
Compact agreement which would have provided American taxpayers an exemption of all U.S.
income taxes if they resided in the RMI for 183 days per year and paid RMI taxes was modified.
This provision would have provided a powerful instrument for economic growth as some US
citizens would have moved to the RMI to enjoy its climate while benefiting from a tax ―holiday‖
in the U.S.
Equally important is the deletion of section 936 of the US Internal Revenue Services Act, which
provides for tax credit to US companies. This is the main provision that enabled the canneries in
American Samoa to survive. By changing the RMI from the status of a US possession to a freely
associated state, RMI also lost some of the trade benefits which are enjoyed by US possessions
such as American Samoa and was never fully compensated for this loss.
178
It is patently clear that RMI has suffered major losses as a result of the deletion or modification
of trade and tax provisions. According to a study that was conducted by KPMG in 1994, tilted
Economic and Financial Impact of section 11(d) of the Compact of Free Association with the
Republic of the Marshall Islands, it is estimated that the loss that RMI suffered as a result of this
is about $210 million and the US has provided only $10 million to the Investment Development
Fund (IDF) to compensate for the loss and a few Federal programs63
. This amount has already
been exhausted; however, the US indicated that upon a showing of additional adverse financial
and economic impact, an additional $20 million could be provided.
The report argues that the section 936 incentives were beneficial for pharmaceutical industries
mainly because of the huge benefits in terms of tax exemption that applied to intangible assets
that were mainly as a result of research and development. It can also be argued that the
incentives could have been effective also in attracting the fishing industries as in American
Samoa. Another potential industry then was the textiles industry.
In September 2009, RMI submitted a report claiming compensation for the lost, trade and tax
incentives and in addition to the issues that were highlighted in the KPMG report, RMI argued
that it was deprived of the special municipality rates for the bonds it issued. RMI issued bonds to
pay past, mainly high interest foreign currency denominated debts that accrued during the
protracted Compact negotiations and Congressional approval process, as well as new
development financing for the Marshall Islands Development Authority (MIDA). This bond
issue obligated Compact funds to its payment and this was allowed by the U.S. Departments of
State and Interior.
Under the original Compact, Section 255 allowed the RMI to be treated as a possession of the
United States. The modification of this section as stipulated in (Title IV 403(b)) removed this
designation as of 31 December 1986. This modification of RMI‘s status meant that it was no
longer eligible for a municipal rate type (tax exempt) financing for its bond issues. RMI ended
up paying commercial rates even though the bond payments were backed by the US Government
grant payments and the ―full faith and credit‖ of the US Government. The table below shows the
amount of losses that the RMI incurred as a result of these changes.
63 The adjustment includes providing additional services (Section 111(a)) to include:
a. Federal Deposit Insurance Corporation,
b. Small Business Administration,
c. Economic Development Administration,
d. Rural Electrification Administration/Rural Utilities Service,
e. Job Partnership Act,
f. Job Corps, and
g. U.S. Department of Commerce programs and services relating to tourism and marine resource development.

179
Table 71: Impact of bond Issue Payments
Table 1: Impact of Bond Issue Payments
Municipal of Compact Backed Bonds vs Municipal Rate Differential, 1987-2001
Bond 1 Bond 2 Bond 3
Type General Obligation General Obligation General Obligation
Amount $65,000,00 $20,000,000 $38,000,000
Actual Duration 7/21/87-10/1/93 6/23/89-7/30/93 9/30/91-12/93
Actual Rate & Interest Paid 8.96% $56,916,667 10.44% $7,885,258 9.53% $6,634,233
Muny Rate & Indicative Interest Paid 6.20% $13,288,667 6.60% $4,984,932 5.80% $4,040,667
Difference $43,628,000 $2,900,325 $2,593,566
Bond 4 Bond 5 Bond 6
Type General Obligation Limited Obligation Limited Obligation
Amount $99,960,000 $30,000,000 $5,320,000
Actual Duration 8/10/93-7/30-01 7/23/94-12/31/99 9/27/99-12/31/01
Actual Rate & Interest Paid 5.46% $23,442,563 7.60% $7,631,033 6.50% $378,459
Muny Rate & Indicative Interest Paid 4.30% $19,143,816 5.30% $5,596,005 5.00% $225,781
Difference $4,298,747 $2,035,028 $152,678
Total Impact on RMI $55,608,344
Source: Please see attachment B for breakdown of each bond issue. The municipal Bond Rate for each bond was provided by
Moody‘s Analytic Services based on a 10-year Aaa Municipal Bond estimate for the same month and year of each of the RMI
bond issues.
Table 72: Tax, Finance and Trade changes overall impact on the RMI
Category Amount
1 Actual Impact of Bond Issue Payments $55,608.344
2 Section 936 Tax Changes (base case) $210,000,000
3 Garment Industry Impact $15,000,000
Subtotal $280,608,344
4 Total Compensatory Adjustment Provided by USG $36,340,000
5 Total Impact on RMI $244,268,344
The table below shows the total amount that RMI received under the IDF as well as the US
Federal Programs. From this table, it is clear that the compensation received under the IDF and
other Federal Programs is inadequate to address the adverse impact that RMI suffered as a result
of the withdrawal of the trade and tax benefits.
Table 73: Compensatory adjustments realized by the RMI, 1987 - 2001
Program/Service Description Total Contribution Investment Development Fund The IDF was placed within the Marshall Islands
Development Bank to fund development-related
$10 million

180
projects and investments.
Federal deposit Insurance
Corporation (FDIC)
No RMI registered bank has qualified for FDIC
coverage. No FDIC programs or services were
provided.
0
Small Business Administration
(SBA)
The RMI has received the following disaster loans:
Typhoon Zelda (November 1991), $221,400 home
loans and $143,300 business loans;
Typhoon Storm Axel (February 1992), $199,700
home loans and $72,500 business loans;
Typhoon Gay (November 1992), $185,400 business
loans.
The loan funds are not counted as contribution since
they were paid back with interest.
%40,000.
Program/Service Description Total
contribution The RMI‘s Small Business Development Center received
$200,000/year since 2000 to help fund activities (and is matched
with RMI Government funding). SBA awards the funds to the Small
Business Development Center of the University of Guam. Thus the
estimated contribution during the original Compact term is $40,000.
Economic Development
Administration
No known application of EDA programs to the RMI 0
Rural Electrification
Administration (REA)/Rural
Utilities Service (RUS)
Has supplied finances to the Marshall Islands National
telecommunication Authority with a loan of $18,8 million in 1989
(still being paid back) and a supplemental loan of $3.9 million in
1993 (paid back); a loan to the Marshall Islands Energy Company
(MEC) in 1987 of $12,5 million (still being paid back) is guaranteed
by the RUS. Since these are loans there is no net compensation to
the RMI, since financing could have been sourced from other
development finance institutions.
0
Job partnership Act/Job Corps The estimated compensation is per the Annual RMI Audit Report for
federal programs (1987-2001)
%26,3 million
US Department of Commerce
Programs and services related
to tourism
No known services have been provided to the RMI 0
US Department of Commerce
Programs and Services related
to marine resource
development
The National Marine Fisheries Service provides loans for two
private US-related fishing company investments both of which are
now defunct. The RMI has taken a significant loss on both ventures
0
RMI submitted that it also lost preferential treatment in the garment industry, and this injured
economic opportunities and growth. The RMI claimed that this loss cost RMI workers an annual
payroll of approximately $1 million per year or $15 million over the life of the original Compact.
Since the money is aimed at compensating the losses that RMI suffered as a result of the deletion
of the trade and tax benefits, it should be used for trade-related activities which are meant to
support private sector development and building their capacity to trade, and to attract foreign
investment. These activities include securing the investments needed to expand the country‘s
capacities to produce competitively traded goods and services and to market them internationally
as provided in the RMI Trade Policy as briefly articulated above. This could be accomplished
through the promotion of small and medium scale joint venture undertakings between private
181
RMI and U.S. business firms and through the establishment of trade-related, technical training
institutions in the tourism, fisheries, and agricultural sectors.
If the above actions are taken, they can go a long way in promoting private sector development
and the capacity of RMI producers to produce goods and services that can compete effectively in
the global market. This will assist RMI to meet its ultimate objective of sustainable economic
growth, development and self reliance.
8.3.2 Recommendations
i. RMI must consult with the US to improve its access into the US market through
relaxation of rules of origin, removal of duties on canned tuna in oil, removal of quotas
on tuna in airtight containers, and access the US institutional market including the
military.
ii. RMI should work with Palau and FSM under the Micronesian Trade Committee to
address the MFN issue as well as other matters relating to compensation for lost trade and
tax preferences.
iii. The Government should assist the fisheries industry to have free access to the US market
for Vacuumed Precooked Tuna Loins. The requirement to slit the vacuum bag to meet the
requirement of free-access is too costly for RMI.
iv. The US should provide technical and financial assistance to support RMI to implement
the Trade Policy.
v. RMI Government should enhance inter-agency collaboration on trade policy issues,
including on trade-related issues in the Compact with the US. With respect to the
Compact there should be a permanent arrangement for collaboration between the RMI
Compact office and the department of trade, on all trade-related issues arising under the
Compact.
8.4 The Pacific Agreement on Closer Economic Relations
The South Pacific Regional Trade and Economic Cooperation Agreement (SPARTECA) which
was signed on 14 July 1980 and entered into force in 1982 provides duty and quota free access to
the Australian and New Zealand markets for all products originating in Forum Island Countries
(FICs). It is a non-reciprocal agreement, which means that the FICs are not required to provide
duty free access to Australia and New Zealand.
The Pacific Agreement on Closer Economic Relations (PACER) is an arrangement between the
FICs on one hand and Australia and New Zealand on the other. It is not a free trade agreement,
182
but provides technical and financial assistance under the Regional Trade Facilitation Programme
(RTFP). The RTFP provides assistance on customs, standards and conformance and sanitary and
phytosanitary measures. RMI has signed PACER but it has not yet ratified the Agreement.
PACER also contains provisions for future trade negotiations between FICs and Australia and
New Zealand (ANZ) including economic and technical assistance to help FICs implement trade
liberalisation measures and facilitate "adjustment".
The overall goal of PACER plus is to facilitate sustainable development in FICs. The parties
seek to gradually and progressively establish a single regional market, which includes Australia
and New Zealand. This will assist the FICs to integrate into the global economy. PACER
envisages the negotiation of Forum-wide trade arrangements 8 years after PICTA enters into
force (2011). However, if FICs enter into free trade negotiations with developed countries (e.g.
EPA) they are required to enter into consultations or free trade negotiations with ANZ. It should
be noted that Fiji and PNG have already signed an Interim EPA Agreement and this has triggered
PACER consultations.
The Forum Leaders agreed to launch negotiations in August 2009 and several meetings have
been held to progress PACER Plus negotiations.
RMI does not have much trade with Australia and New Zealand. Australian exports to RMI in
2010-11 totalled $2.3 million (composed essentially of medicaments and meat). Australia's
imports from RMI in the same period totalled $485 000 (principally animal feed).64
. RMI has
also been exporting copra cake to Australia. Exports from New Zealand in 2009 (July) were
NZ$3.95 million and the main exports were wood and aluminum windows. There were no
imports from RMI65
.
According to the study that was conducted by Watergal in 2007, RMI may lose about 1,272
million dollars from the PACER Plus agreement. RMI needs to conduct a study on the costs and
benefits of participating in PACER Plus. If the benefits outweigh the costs it would be good for
RMI to sign the agreement.
However, it should be noted that exports to ANZ have been negligible mainly because of
transportation, lack of production capacity, strict SPARTECA rules of origin. It should be noted
that Australia‘s MFN rates on fish products are already low (5%) and the preference margin is
very low. The preferences granted to RMI have also been eroded because of the free trade
agreements that ANZ have entered into.
64
http://www.dfat.gov.au/geo/marshall_islands/marshall_islands_brief.html 65
http://www.mfat.govt.nz/Countries/Pacific/Marshall-Islands.php
183
At the moment it appears as if the major obstacles to trade between RMI and Australia and New
Zealand are the capacity to produce quality goods in the required quantity and in a consistent
manner. There are a number of supply-side constraints that need to be addressed. PACER plus
should provide technical and financial assistance to assist both the Government and the private
sector to address these supply-side constraints and build the capacity of the private sector to
produce goods and services that can be exported competitively.
Another issue that needs to be tackled is the transportation arrangements between north and
south. For RMI to be able to export to Australia and New Zealand there must be reliable and
reasonably priced transport.
If the supply-side constraints and the transport issues are addressed, then the other issues that
need to be addressed are SPS and TBT issues. There will be a need to provide technical and
financial assistance to the Government as well as the traders to be able to meet the export
requirements in Australia and New Zealand. Another equally important issue is the need to relax
the rules of origin from the value added approach to change in tariff classification. The overall
idea is to make it easy for RMI exporters to source raw materials from cheap sources and be able
to undertake substantial transformation which will result in change in tariff classification of non-
originating materials.
Rules of origin can also play a vital role in attracting investors in RMI, especially if they are
simple and predictable. The rules of origin should also not impose unnecessary burden on
traders. RMI needs to identify the products that are being affected by the SPARTECA rules of
origin which requires 50% value addition and suggest possible changes.
The 2007 SPARTECA ROO Review paper suggested that a Change of Tariff Classification
(CTC) approach could significantly ease access of FICs‘ exports to the Australian and New
Zealand markets. FICs are already in the process of adopting the 2007 HS and this will assist
them to use the CTC approach. Australia has used this approach in a number of FTAs. However,
in a few cases where substantial transformation of materials and products cannot be
demonstrated through the CTC, then product specific rules or the value addition approach has
been used.
Australia and New Zealand have provided derogations to Fiji and Samoa. The SPARTECA (TCF
Provisions) Scheme (S-TCF) allows firms to utilise Excess Local Area Content (ELAC) points
accrued from the manufacture of certain TCF products qualifying under SPARTECA to help
meet the content requirements for otherwise non-qualifying goods. When Fiji complied with
productivity, training and audit and compliance requirements, Australia reduced the Minimum
Local Area Content (MLAC) under S-TCF from 35% to 25% in 2008 on textiles, clothing and
184
footwear products imported into Australia. The SPARTECA-TCF Scheme will expire on 31
December 2011.
RMI should support the CTH method as opposed to the value-added methodology which
requires that originating materials and processing in the parties to the FTA to contain a minimum
percentage of the cost of the exported product. The major problems of the vaue-added
methodology include the following:
the calculation of costs can be time-consuming and administratively burdensome for RMI
and traders (record keeping)
using a single value-added threshold for all goods does not take account of the different
proportions of materials, labor and capital which are used in production in different
industries. Goods with high capital or labor content can easily meet the value-added
threshold and those with lower labor and capital content will be penalized
uncertainty due to shifts in exchange rates and fluctuations in international prices of
materials
The CTC method has been adopted in the Australia‘s agreement with the United States (includes
a PSR), Thailand-Australia Free Trade Agreement (TAFTA) but PSR and value-added
requirements have been used mainly in the textiles and apparel area. The FTA with Chile, the
ASEAN group of countries and its agreement with New Zealand uses a PSR based on a CTC
approach. The CTC approach is objective because there is a single, clear rule for each tariff line.
It is predictable, easy to administer and understand for small and medium-sized enterprises
(SMEs) in RMI and does not require extensive calculations and record keeping. The non-
preferential ROO negotiations within the WTO have also recommended the CTC approach.
CTC can also be used with Specific Product Processing method which requires non-originating
materials to undergo a specified production process prior to export. It is normally used in
chemical and plastics products. For example, if a chemical reaction results from the combination
of materials produced in an FTA party with those originating from outside the FTA parties then
the good produced from the reaction is eligible for preferential duty rates without having to meet
the requirements of a CTC test.
Goods that are wholly obtaining automatically qualify as originating without any need to satisfy
an additional test. However, if imported materials from third parties are used, the materials must
undergo substantial transformation.
Aside from trade in goods, RMI should also explore opportunities on human resources
development, vocational training in key sectors and labor mobility. In terms of labor mobility,
PACER Plus must contain a legally binding chapter on labor mobility to allow RMI citizens to
move to Australia and New Zealand for employment purposes and provide the level of access
185
that is comparable to what RMI has under the Compact or to what Australia provides to New
Zealand and vice versa. For the agreement to be beneficial, Australia and New Zealand must
provide assistance to RMI to upgrade its educational services, especially the vocational training
institutions to allow RMI citizens to develop the relevant skills that are needed in promoting
trade and investment and export the surplus skills to Australia and New Zealand.
With regards to services, Australia and New Zealand must provide technical and financial
assistance to assist RMI to introduce the relevant laws and institutional mechanisms required to
regulate services. As highlighted under the section dealing with services, RMI does not have
adequate laws regulating services and should be allowed time to address this before opening up
its services sectors. PACER Plus must adopt the GATS positive list approach and allow RMI to
select the sectors that it wants to liberalise and impose the relevant restrictions. It should also
contain effective and operational provisions on special and differential treatment. The Agreement
must contain an enhanced mode four proposal which will allow RMI citizens to move to
Australia and New Zealand to supply services easily. This should be accompanied by mutual
recognition agreements to facilitate trade in services between the parties.
Australia and New Zealand must also provide technical and financial assistance to RMI to
develop its tourism sector and to facilitate tourism between ANZ and RMI. In this context, it will
be important for ANZ to work with RMI and all the relevant industry people to address
transportation issues affecting the tourism industry.
On trade related issues, since there is already work ongoing on intellectual property and
traditional knowledge, PACER Plus should focus on building the capacity of RMI on intellectual
property, bio-diversity, traditional knowledge and cultural expressions rather than adopting
onerous rules that are beyond RMI‘s capacity. During the national consultations it was clear that
RMI is not ready to adopt rules on IPR but the focus should rather be on capacity building in this
area.
Assistance must also be provided to build regulatory and institutional capacity on competition
policy, trade facilitation, transparency in Government procurement and investment. Initially, the
focus should be on capacity building and institutional strengthening and not adopting legally
binding rules that are subject to the dispute settlement system. Positive measures to promote
investment in FICs must also be considered including relevant tax incentives.
The Agreement must also contain a predictable, legally binding chapter on development
cooperation to ensure that there are sufficient resources to implement the agreement.
The agreement must be flexible enough to allow RMI to decide whether to participate in trade in
goods or not.
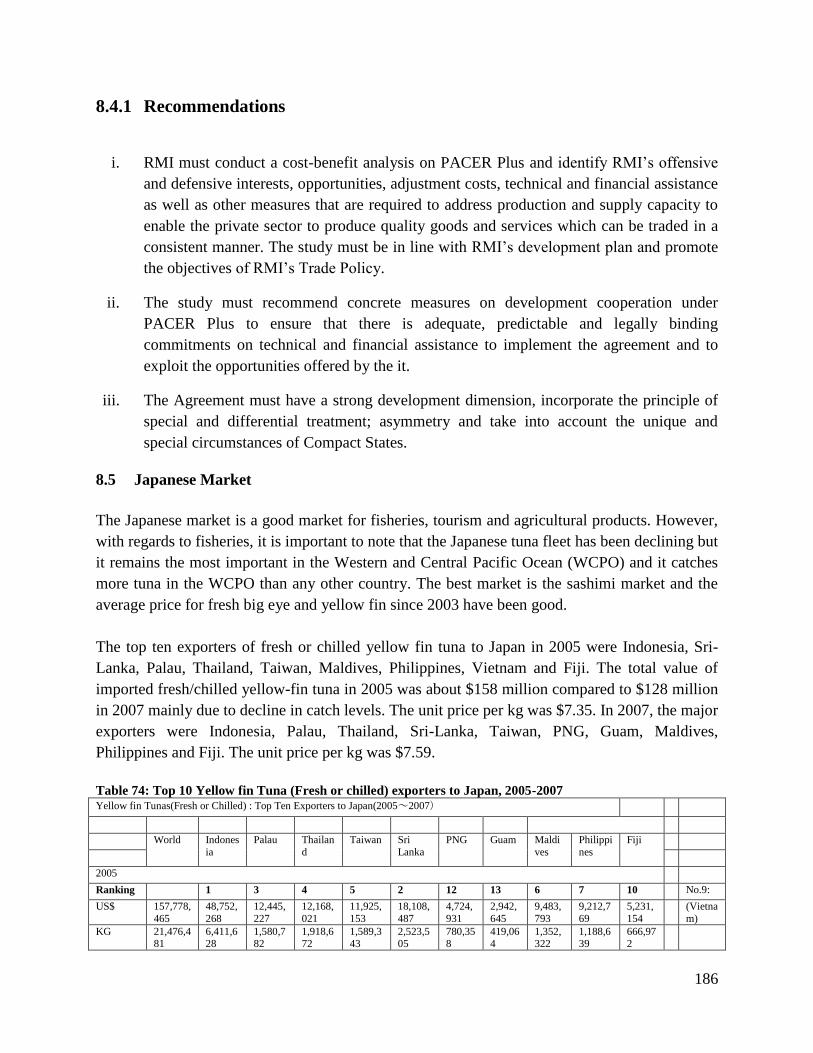
186
8.4.1 Recommendations
i. RMI must conduct a cost-benefit analysis on PACER Plus and identify RMI‘s offensive
and defensive interests, opportunities, adjustment costs, technical and financial assistance
as well as other measures that are required to address production and supply capacity to
enable the private sector to produce quality goods and services which can be traded in a
consistent manner. The study must be in line with RMI‘s development plan and promote
the objectives of RMI‘s Trade Policy.
ii. The study must recommend concrete measures on development cooperation under
PACER Plus to ensure that there is adequate, predictable and legally binding
commitments on technical and financial assistance to implement the agreement and to
exploit the opportunities offered by the it.
iii. The Agreement must have a strong development dimension, incorporate the principle of
special and differential treatment; asymmetry and take into account the unique and
special circumstances of Compact States.
8.5 Japanese Market
The Japanese market is a good market for fisheries, tourism and agricultural products. However,
with regards to fisheries, it is important to note that the Japanese tuna fleet has been declining but
it remains the most important in the Western and Central Pacific Ocean (WCPO) and it catches
more tuna in the WCPO than any other country. The best market is the sashimi market and the
average price for fresh big eye and yellow fin since 2003 have been good.
The top ten exporters of fresh or chilled yellow fin tuna to Japan in 2005 were Indonesia, Sri-
Lanka, Palau, Thailand, Taiwan, Maldives, Philippines, Vietnam and Fiji. The total value of
imported fresh/chilled yellow-fin tuna in 2005 was about $158 million compared to $128 million
in 2007 mainly due to decline in catch levels. The unit price per kg was $7.35. In 2007, the major
exporters were Indonesia, Palau, Thailand, Sri-Lanka, Taiwan, PNG, Guam, Maldives,
Philippines and Fiji. The unit price per kg was $7.59.
Table 74: Top 10 Yellow fin Tuna (Fresh or chilled) exporters to Japan, 2005-2007 Yellow fin Tunas(Fresh or Chilled) : Top Ten Exporters to Japan(2005~2007)
World Indones
ia
Palau Thailan
d
Taiwan Sri Lanka
PNG Guam Maldi
ves
Philippi
nes
Fiji
2005
Ranking 1 3 4 5 2 12 13 6 7 10 No.9:
US$ 157,778,
465
48,752,
268
12,445,
227
12,168,
021
11,925,
153
18,108,
487
4,724,
931
2,942,
645
9,483,
793
9,212,7
69
5,231,
154
(Vietna
m)
KG 21,476,481
6,411,628
1,580,782
1,918,672
1,589,343
2,523,505
780,358
419,064
1,352,322
1,188,639
666,972
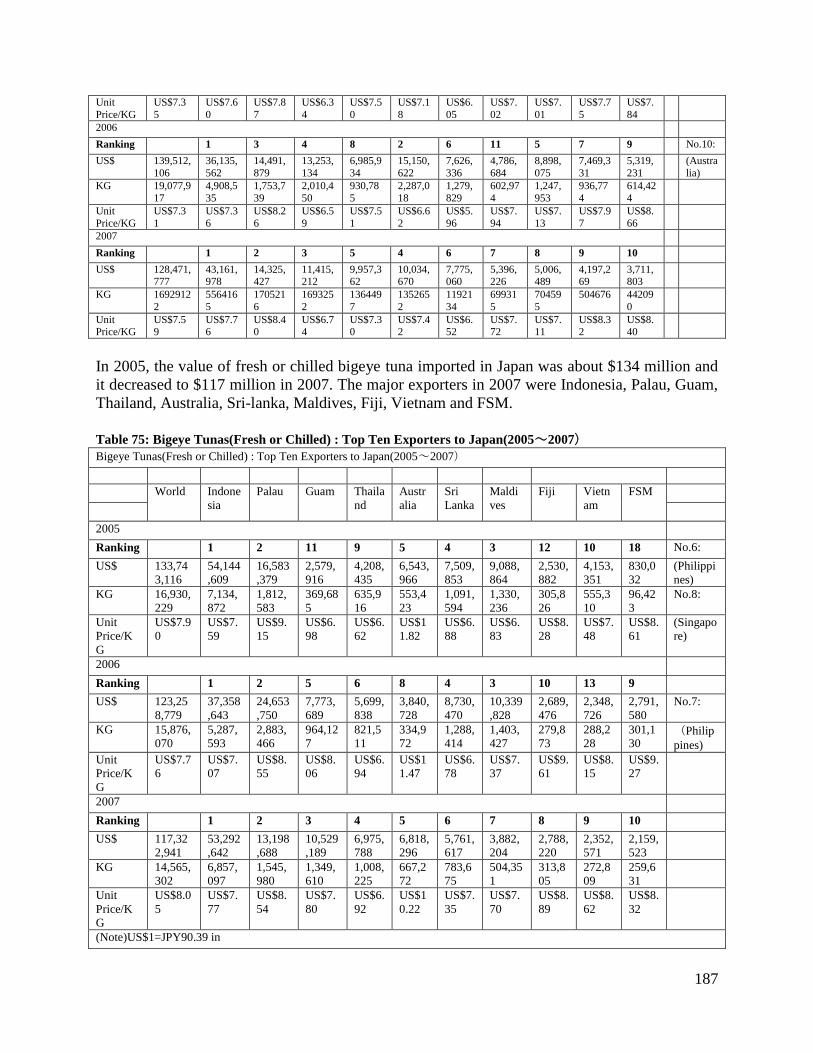
187
Unit
Price/KG
US$7.3
5
US$7.6
0
US$7.8
7
US$6.3
4
US$7.5
0
US$7.1
8
US$6.
05
US$7.
02
US$7.
01
US$7.7
5
US$7.
84
2006
Ranking 1 3 4 8 2 6 11 5 7 9 No.10:
US$ 139,512,
106
36,135,
562
14,491,
879
13,253,
134
6,985,9
34
15,150,
622
7,626,
336
4,786,
684
8,898,
075
7,469,3
31
5,319,
231
(Austra
lia)
KG 19,077,9
17
4,908,5
35
1,753,7
39
2,010,4
50
930,78
5
2,287,0
18
1,279,
829
602,97
4
1,247,
953
936,77
4
614,42
4
Unit
Price/KG
US$7.3
1
US$7.3
6
US$8.2
6
US$6.5
9
US$7.5
1
US$6.6
2
US$5.
96
US$7.
94
US$7.
13
US$7.9
7
US$8.
66
2007
Ranking 1 2 3 5 4 6 7 8 9 10
US$ 128,471,777
43,161,978
14,325,427
11,415,212
9,957,362
10,034,670
7,775,060
5,396,226
5,006,489
4,197,269
3,711,803
KG 1692912
2
556416
5
170521
6
169325
2
136449
7
135265
2
11921
34
69931
5
70459
5
504676 44209
0
Unit Price/KG
US$7.59
US$7.76
US$8.40
US$6.74
US$7.30
US$7.42
US$6.52
US$7.72
US$7.11
US$8.32
US$8.40
In 2005, the value of fresh or chilled bigeye tuna imported in Japan was about $134 million and
it decreased to $117 million in 2007. The major exporters in 2007 were Indonesia, Palau, Guam,
Thailand, Australia, Sri-lanka, Maldives, Fiji, Vietnam and FSM.
Table 75: Bigeye Tunas(Fresh or Chilled) : Top Ten Exporters to Japan(2005~2007)
Bigeye Tunas(Fresh or Chilled) : Top Ten Exporters to Japan(2005~2007)
World Indone
sia
Palau Guam Thaila
nd
Austr
alia
Sri
Lanka
Maldi
ves
Fiji Vietn
am
FSM
2005
Ranking 1 2 11 9 5 4 3 12 10 18 No.6:
US$ 133,74
3,116
54,144
,609
16,583
,379
2,579,
916
4,208,
435
6,543,
966
7,509,
853
9,088,
864
2,530,
882
4,153,
351
830,0
32
(Philippi
nes)
KG 16,930,
229
7,134,
872
1,812,
583
369,68
5
635,9
16
553,4
23
1,091,
594
1,330,
236
305,8
26
555,3
10
96,42
3
No.8:
Unit
Price/K
G
US$7.9
0
US$7.
59
US$9.
15
US$6.
98
US$6.
62
US$1
1.82
US$6.
88
US$6.
83
US$8.
28
US$7.
48
US$8.
61
(Singapo
re)
2006
Ranking 1 2 5 6 8 4 3 10 13 9
US$ 123,25
8,779
37,358
,643
24,653
,750
7,773,
689
5,699,
838
3,840,
728
8,730,
470
10,339
,828
2,689,
476
2,348,
726
2,791,
580
No.7:
KG 15,876,
070
5,287,
593
2,883,
466
964,12
7
821,5
11
334,9
72
1,288,
414
1,403,
427
279,8
73
288,2
28
301,1
30 (Philip
pines)
Unit
Price/K
G
US$7.7
6
US$7.
07
US$8.
55
US$8.
06
US$6.
94
US$1
1.47
US$6.
78
US$7.
37
US$9.
61
US$8.
15
US$9.
27
2007
Ranking 1 2 3 4 5 6 7 8 9 10
US$ 117,32
2,941
53,292
,642
13,198
,688
10,529
,189
6,975,
788
6,818,
296
5,761,
617
3,882,
204
2,788,
220
2,352,
571
2,159,
523
KG 14,565,
302
6,857,
097
1,545,
980
1,349,
610
1,008,
225
667,2
72
783,6
75
504,35
1
313,8
05
272,8
09
259,6
31
Unit
Price/K
G
US$8.0
5
US$7.
77
US$8.
54
US$7.
80
US$6.
92
US$1
0.22
US$7.
35
US$7.
70
US$8.
89
US$8.
62
US$8.
32
(Note)US$1=JPY90.39 in
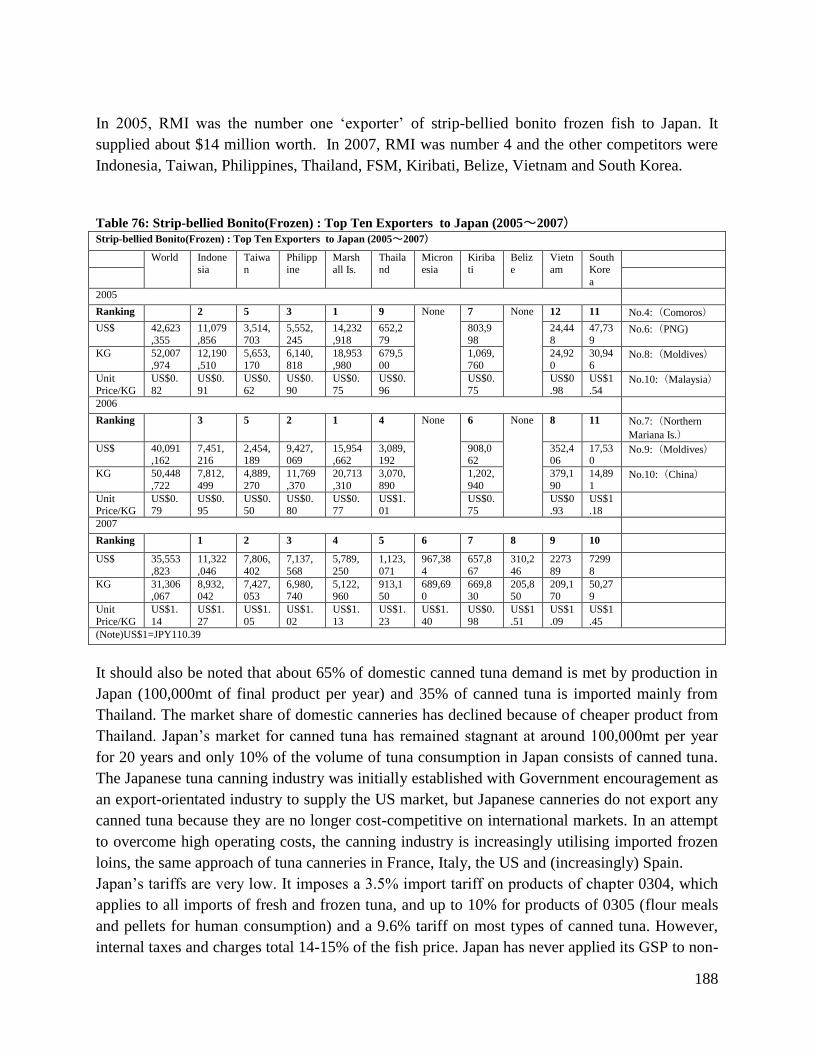
188
In 2005, RMI was the number one ‗exporter‘ of strip-bellied bonito frozen fish to Japan. It
supplied about $14 million worth. In 2007, RMI was number 4 and the other competitors were
Indonesia, Taiwan, Philippines, Thailand, FSM, Kiribati, Belize, Vietnam and South Korea.
Table 76: Strip-bellied Bonito(Frozen) : Top Ten Exporters to Japan (2005~2007)
Strip-bellied Bonito(Frozen) : Top Ten Exporters to Japan (2005~2007)
World Indonesia
Taiwan
Philippine
Marshall Is.
Thailand
Micronesia
Kiribati
Belize
Vietnam
South Kore
a
2005
Ranking 2 5 3 1 9 None 7 None 12 11 No.4:(Comoros)
US$ 42,623
,355
11,079
,856
3,514,
703
5,552,
245
14,232
,918
652,2
79
803,9
98
24,44
8
47,73
9 No.6:(PNG)
KG 52,007,974
12,190,510
5,653,170
6,140,818
18,953,980
679,500
1,069,760
24,920
30,946
No.8:(Moldives)
Unit
Price/KG
US$0.
82
US$0.
91
US$0.
62
US$0.
90
US$0.
75
US$0.
96
US$0.
75
US$0
.98
US$1
.54 No.10:(Malaysia)
2006
Ranking 3 5 2 1 4 None 6 None 8 11 No.7:(Northern
Mariana Is.)
US$ 40,091,162
7,451,216
2,454,189
9,427,069
15,954,662
3,089,192
908,062
352,406
17,530
No.9:(Moldives)
KG 50,448
,722
7,812,
499
4,889,
270
11,769
,370
20,713
,310
3,070,
890
1,202,
940
379,1
90
14,89
1 No.10:(China)
Unit Price/KG
US$0.79
US$0.95
US$0.50
US$0.80
US$0.77
US$1.01
US$0.75
US$0.93
US$1.18
2007
Ranking 1 2 3 4 5 6 7 8 9 10
US$ 35,553
,823
11,322
,046
7,806,
402
7,137,
568
5,789,
250
1,123,
071
967,38
4
657,8
67
310,2
46
2273
89
7299
8
KG 31,306,067
8,932,042
7,427,053
6,980,740
5,122,960
913,150
689,690
669,830
205,850
209,170
50,279
Unit
Price/KG
US$1.
14
US$1.
27
US$1.
05
US$1.
02
US$1.
13
US$1.
23
US$1.
40
US$0.
98
US$1
.51
US$1
.09
US$1
.45
(Note)US$1=JPY110.39
It should also be noted that about 65% of domestic canned tuna demand is met by production in
Japan (100,000mt of final product per year) and 35% of canned tuna is imported mainly from
Thailand. The market share of domestic canneries has declined because of cheaper product from
Thailand. Japan‘s market for canned tuna has remained stagnant at around 100,000mt per year
for 20 years and only 10% of the volume of tuna consumption in Japan consists of canned tuna.
The Japanese tuna canning industry was initially established with Government encouragement as
an export-orientated industry to supply the US market, but Japanese canneries do not export any
canned tuna because they are no longer cost-competitive on international markets. In an attempt
to overcome high operating costs, the canning industry is increasingly utilising imported frozen
loins, the same approach of tuna canneries in France, Italy, the US and (increasingly) Spain.
Japan‘s tariffs are very low. It imposes a 3.5% import tariff on products of chapter 0304, which
applies to all imports of fresh and frozen tuna, and up to 10% for products of 0305 (flour meals
and pellets for human consumption) and a 9.6% tariff on most types of canned tuna. However,
internal taxes and charges total 14-15% of the fish price. Japan has never applied its GSP to non-
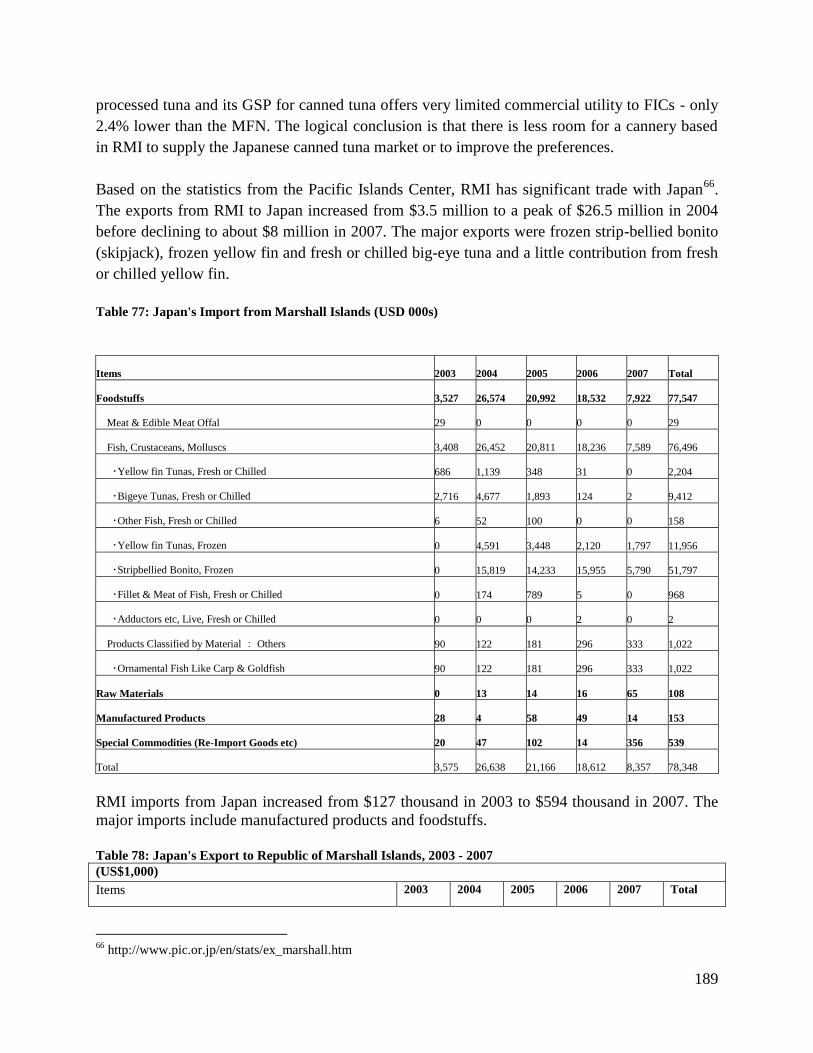
189
processed tuna and its GSP for canned tuna offers very limited commercial utility to FICs - only
2.4% lower than the MFN. The logical conclusion is that there is less room for a cannery based
in RMI to supply the Japanese canned tuna market or to improve the preferences.
Based on the statistics from the Pacific Islands Center, RMI has significant trade with Japan66
.
The exports from RMI to Japan increased from $3.5 million to a peak of $26.5 million in 2004
before declining to about $8 million in 2007. The major exports were frozen strip-bellied bonito
(skipjack), frozen yellow fin and fresh or chilled big-eye tuna and a little contribution from fresh
or chilled yellow fin.
Table 77: Japan's Import from Marshall Islands (USD 000s)
Items 2003 2004 2005 2006 2007 Total
Foodstuffs 3,527 26,574 20,992 18,532 7,922 77,547
Meat & Edible Meat Offal 29 0 0 0 0 29
Fish, Crustaceans, Molluscs 3,408 26,452 20,811 18,236 7,589 76,496
・Yellow fin Tunas, Fresh or Chilled 686 1,139 348 31 0 2,204
・Bigeye Tunas, Fresh or Chilled 2,716 4,677 1,893 124 2 9,412
・Other Fish, Fresh or Chilled 6 52 100 0 0 158
・Yellow fin Tunas, Frozen 0 4,591 3,448 2,120 1,797 11,956
・Stripbellied Bonito, Frozen 0 15,819 14,233 15,955 5,790 51,797
・Fillet & Meat of Fish, Fresh or Chilled 0 174 789 5 0 968
・Adductors etc, Live, Fresh or Chilled 0 0 0 2 0 2
Products Classified by Material : Others 90 122 181 296 333 1,022
・Ornamental Fish Like Carp & Goldfish 90 122 181 296 333 1,022
Raw Materials 0 13 14 16 65 108
Manufactured Products 28 4 58 49 14 153
Special Commodities (Re-Import Goods etc) 20 47 102 14 356 539
Total 3,575 26,638 21,166 18,612 8,357 78,348
RMI imports from Japan increased from $127 thousand in 2003 to $594 thousand in 2007. The
major imports include manufactured products and foodstuffs.
Table 78: Japan's Export to Republic of Marshall Islands, 2003 - 2007
(US$1,000)
Items 2003 2004 2005 2006 2007 Total
66
http://www.pic.or.jp/en/stats/ex_marshall.htm
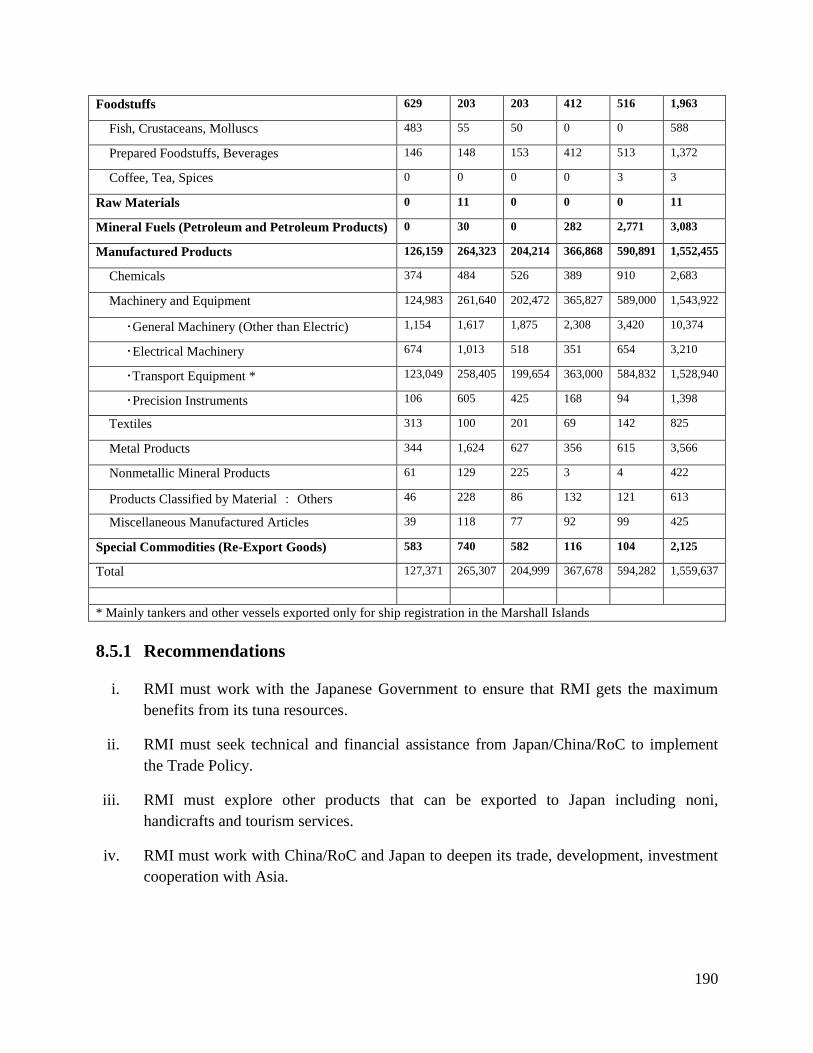
190
Foodstuffs 629 203 203 412 516 1,963
Fish, Crustaceans, Molluscs 483 55 50 0 0 588
Prepared Foodstuffs, Beverages 146 148 153 412 513 1,372
Coffee, Tea, Spices 0 0 0 0 3 3
Raw Materials 0 11 0 0 0 11
Mineral Fuels (Petroleum and Petroleum Products) 0 30 0 282 2,771 3,083
Manufactured Products 126,159 264,323 204,214 366,868 590,891 1,552,455
Chemicals 374 484 526 389 910 2,683
Machinery and Equipment 124,983 261,640 202,472 365,827 589,000 1,543,922
・General Machinery (Other than Electric) 1,154 1,617 1,875 2,308 3,420 10,374
・Electrical Machinery 674 1,013 518 351 654 3,210
・Transport Equipment * 123,049 258,405 199,654 363,000 584,832 1,528,940
・Precision Instruments 106 605 425 168 94 1,398
Textiles 313 100 201 69 142 825
Metal Products 344 1,624 627 356 615 3,566
Nonmetallic Mineral Products 61 129 225 3 4 422
Products Classified by Material : Others 46 228 86 132 121 613
Miscellaneous Manufactured Articles 39 118 77 92 99 425
Special Commodities (Re-Export Goods) 583 740 582 116 104 2,125
Total 127,371 265,307 204,999 367,678 594,282 1,559,637
* Mainly tankers and other vessels exported only for ship registration in the Marshall Islands
8.5.1 Recommendations
i. RMI must work with the Japanese Government to ensure that RMI gets the maximum
benefits from its tuna resources.
ii. RMI must seek technical and financial assistance from Japan/China/RoC to implement
the Trade Policy.
iii. RMI must explore other products that can be exported to Japan including noni,
handicrafts and tourism services.
iv. RMI must work with China/RoC and Japan to deepen its trade, development, investment
cooperation with Asia.
191
8.6 Economic Partnership Agreement (EPA)
The Cotonou Partnership Agreement which was signed in 2000 is an international agreement
between 27 members of the European Union (EU) and 79 members of the African, Caribbean
and Pacific (ACP) group. The agreement covers development cooperation, trade and political
relations between the EU and ACP countries. The relationship between the EU and ACP
countries dates back to 1963, however, the ACP group was formalised in 1975 and this
relationship was governed by a series of Lome Conventions. The Lome Conventions provided
non-reciprocal trade preferences to ACP countries and were found to be inconsistent with WTO
rules because they discriminated against other non-ACP developing countries.
In order to maintain the non-reciprocal trade preferences, the EC and ACP countries secured a
WTO waiver, which expired on 31 December 2007. The Cotonou Agreement seeks to usher in a
new trade relationship based on reciprocity and WTO compatibility, while giving the desired
flexibilities to ACP countries. The new trade arrangement is the Economic Partnership
Agreement that is currently being negotiated. At the all-ACP level, negotiations on EPAs started
in September 2002 and the Agreement was expected to enter into force on 01. January 2008.
The first objective of EPAs is to foster smooth and gradual integration of ACP states into the
world economy, taking into account their development priorities. The ultimate goal is to promote
sustainable development and eradicate poverty. The second one is to enable ACP states to play a
full part in international trade, especially in multilateral negotiations and to help them manage
the challenges of globalization thereby facilitating their transition to the liberalized global
economy. The third objective is to enhance the production, supply and trading capacity of ACP
sates and their capacity to attract investment thereby creating new trading dynamics;
strengthening trade and investment policies and the capacity of these countries to deal with trade-
related issues. The fourth one is to ensure that the economic and trade cooperation is
implemented in full conformity with WTO rules, including special and differential treatment
taking into account the different levels of economic development. The Cotonou Agreement also
makes it clear that EPAs must promote regional integration. RMI needs to assess the final EPA
agreement to ensure that these objectives are met.
At the beginning of the negotiations, the PACPS wanted the EPA to cover trade in goods,
services, investment, fisheries and development. The EU is also pushing for the inclusion of
other trade-related issues such as competition policy, intellectual property rights, Government
procurement and trade facilitation. The PACPS agree that these issues are important but they
want the EU to provide technical and financial capacity to enable them to build their regulatory
and institutional capacity on these issues first before they undertake legally binding
commitments. The PACPS do not want binding rules on these trade-related issues as they may
pose enormous administrative costs. Furthermore, some of the rules that are being proposed by

192
the EU go beyond the WTO rules and they will constrain policy space and limit development
options in PACPS.
The PACPS also see very little benefits in signing a trade in services agreement if the EU does
not agree to the comprehensive PACP proposal on Temporary Movement of Natural Persons and
the related technical and financial assistance required to assist the PACPS to fully utilise
opportunities arising from such a scheme. PACPS also wanted assistance to upgrade their
vocational schools.
8.6.1 Trade in Goods
A trade in goods agreement will cover agricultural, forestry, fisheries and manufactured
products. Currently, RMI does not export major products to the EU and its imports are also very
minimal. If RMI wants to benefit from the liberal rules of origin, especially the global sourcing
provisions in fisheries (e.g. tuna loins and canned fish), it will be required to submit a market
access offer liberalising 80 percent of its trade by value and tariff lines and sign a trade in goods
agreement. The advantage of signing a goods agreement is that RMI will have an opportunity to
venture into value addition in the fisheries industry and export to the EU market under
favourable rules of origin. This will allow the processors in RMI to have a wide choice of
markets.
However, RMI will be required to sign onto to the legal text which contains rules that go well
beyond the WTO and constrain policy space. These issues include the prohibition of export taxes
and the most favoured nation (MFN) clause which requires RMI to give the EU whatever
benefits it gives to major third economies. The MFN restricts RMI from negotiating favourable
deals with such major economies because those countries will be fully aware that whatever
concessions they get from RMI will also be given to the EU. The other contentious issues
include stringent requirements on substantially all the trade (80% of trade value and tariff lines),
strict rules on infant industry protection, stringent rules of origin on fresh and frozen fish (0304
and 0305), the non-execution clause which will allow the EU to suspend trade preferences if
RMI violates human rights and other principles of democracy and good governance.
Despite the above contentious issues, the EU has relaxed rules of origin for some fisheries
products but not for those products that may be important to small islands states like RMI. For
fisheries products from RMI to be eligible for the preferential rules under EPA, they must either
be ‗wholly obtained‘ or be ‗sufficiently worked or processed‘ in RMI. Under the Interim EPA,
for fish to be wholly obtained, they must be caught by a vessel which is 50 per cent owned by
nationals or companies of the parties to the agreement. The owners of vessels must hold EU or
ACP country passports and the vessels must be flagged and registered by one of the parties.
With regards to the concept ‗sufficiently worked or processed products‘, it should be noted that
there has been a slight change on the value tolerance (or de minimis) provision of 15 per cent. If
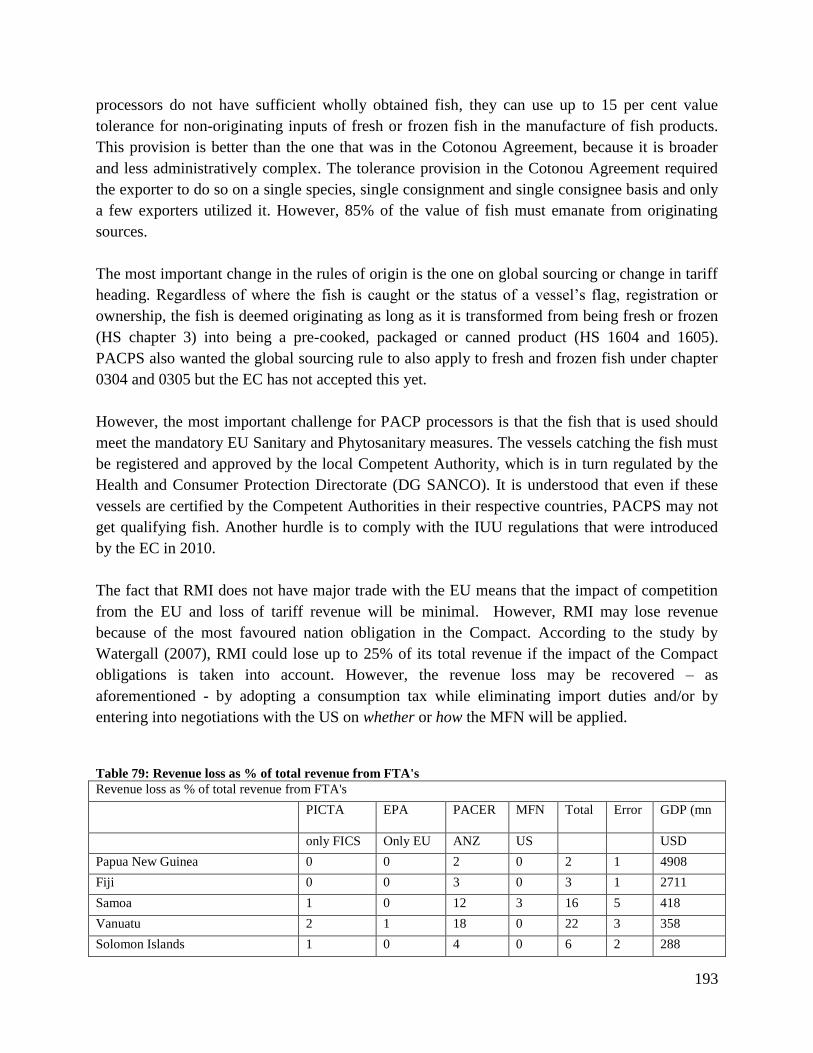
193
processors do not have sufficient wholly obtained fish, they can use up to 15 per cent value
tolerance for non-originating inputs of fresh or frozen fish in the manufacture of fish products.
This provision is better than the one that was in the Cotonou Agreement, because it is broader
and less administratively complex. The tolerance provision in the Cotonou Agreement required
the exporter to do so on a single species, single consignment and single consignee basis and only
a few exporters utilized it. However, 85% of the value of fish must emanate from originating
sources.
The most important change in the rules of origin is the one on global sourcing or change in tariff
heading. Regardless of where the fish is caught or the status of a vessel‘s flag, registration or
ownership, the fish is deemed originating as long as it is transformed from being fresh or frozen
(HS chapter 3) into being a pre-cooked, packaged or canned product (HS 1604 and 1605).
PACPS also wanted the global sourcing rule to also apply to fresh and frozen fish under chapter
0304 and 0305 but the EC has not accepted this yet.
However, the most important challenge for PACP processors is that the fish that is used should
meet the mandatory EU Sanitary and Phytosanitary measures. The vessels catching the fish must
be registered and approved by the local Competent Authority, which is in turn regulated by the
Health and Consumer Protection Directorate (DG SANCO). It is understood that even if these
vessels are certified by the Competent Authorities in their respective countries, PACPS may not
get qualifying fish. Another hurdle is to comply with the IUU regulations that were introduced
by the EC in 2010.
The fact that RMI does not have major trade with the EU means that the impact of competition
from the EU and loss of tariff revenue will be minimal. However, RMI may lose revenue
because of the most favoured nation obligation in the Compact. According to the study by
Watergall (2007), RMI could lose up to 25% of its total revenue if the impact of the Compact
obligations is taken into account. However, the revenue loss may be recovered – as
aforementioned - by adopting a consumption tax while eliminating import duties and/or by
entering into negotiations with the US on whether or how the MFN will be applied.
Table 79: Revenue loss as % of total revenue from FTA's
Revenue loss as % of total revenue from FTA's
PICTA EPA PACER MFN Total Error GDP (mn
only FICS Only EU ANZ US USD
Papua New Guinea 0 0 2 0 2 1 4908
Fiji 0 0 3 0 3 1 2711
Samoa 1 0 12 3 16 5 418
Vanuatu 2 1 18 0 22 3 358
Solomon Islands 1 0 4 0 6 2 288
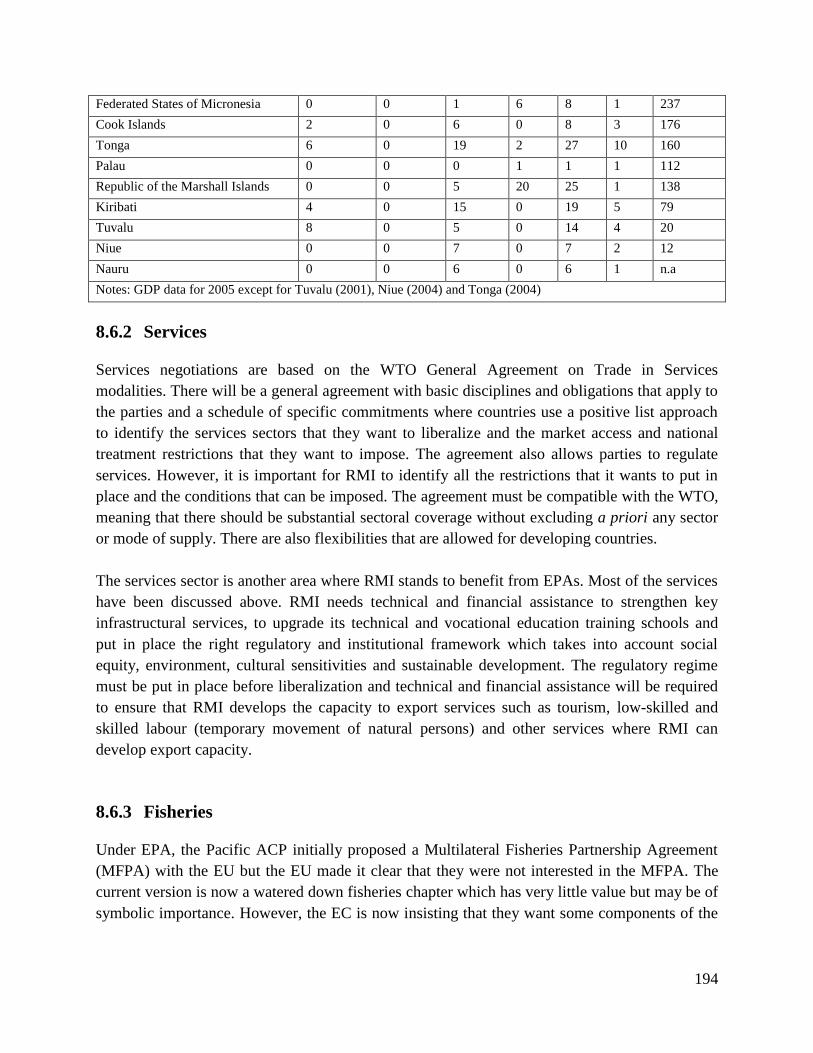
194
Federated States of Micronesia 0 0 1 6 8 1 237
Cook Islands 2 0 6 0 8 3 176
Tonga 6 0 19 2 27 10 160
Palau 0 0 0 1 1 1 112
Republic of the Marshall Islands 0 0 5 20 25 1 138
Kiribati 4 0 15 0 19 5 79
Tuvalu 8 0 5 0 14 4 20
Niue 0 0 7 0 7 2 12
Nauru 0 0 6 0 6 1 n.a
Notes: GDP data for 2005 except for Tuvalu (2001), Niue (2004) and Tonga (2004)
8.6.2 Services
Services negotiations are based on the WTO General Agreement on Trade in Services
modalities. There will be a general agreement with basic disciplines and obligations that apply to
the parties and a schedule of specific commitments where countries use a positive list approach
to identify the services sectors that they want to liberalize and the market access and national
treatment restrictions that they want to impose. The agreement also allows parties to regulate
services. However, it is important for RMI to identify all the restrictions that it wants to put in
place and the conditions that can be imposed. The agreement must be compatible with the WTO,
meaning that there should be substantial sectoral coverage without excluding a priori any sector
or mode of supply. There are also flexibilities that are allowed for developing countries.
The services sector is another area where RMI stands to benefit from EPAs. Most of the services
have been discussed above. RMI needs technical and financial assistance to strengthen key
infrastructural services, to upgrade its technical and vocational education training schools and
put in place the right regulatory and institutional framework which takes into account social
equity, environment, cultural sensitivities and sustainable development. The regulatory regime
must be put in place before liberalization and technical and financial assistance will be required
to ensure that RMI develops the capacity to export services such as tourism, low-skilled and
skilled labour (temporary movement of natural persons) and other services where RMI can
develop export capacity.
8.6.3 Fisheries
Under EPA, the Pacific ACP initially proposed a Multilateral Fisheries Partnership Agreement
(MFPA) with the EU but the EU made it clear that they were not interested in the MFPA. The
current version is now a watered down fisheries chapter which has very little value but may be of
symbolic importance. However, the EC is now insisting that they want some components of the

195
fisheries chapter, especially the 5% guarantee access to the purse seine fisheries sector for them
to relax rules of origin on fresh and frozen fish (0304 and 0305).
RMI together with the other PACPS has requested assistance to develop the fisheries industry to
enable RMI to maximise the benefits from its tuna resources. Rather than relying on access fees,
RMI should move towards value addition to its tuna resources and export them to the EU market
as well as other markets. RMI also requires assistance to establish a Competent Authority to be
able to meet the EU SPS requirements. Assistance will also be required to comply with the EU
IUU regulations.
The EU is one of the biggest single markets for tuna. It is important to note that the US market is
stagnant and the Japanese market is in decline. Around 90% of total tuna catch by the EU is from
Spanish and French vessels but only a few Spanish purse seine fleets are active in the WCPO.
The most important tuna canning countries in the EU are Spain, Italy and France and production
in France and Italy has been relatively stable since the mid-1970s. However, canneries in Spain
have experienced considerable growth. Spain supplies most of the tuna but imports a marginal
amount of canned tuna.
The canneries in the EU survive mainly because of tariff protection. The tariff for fresh/chilled
fish fillets (0304) is 15% (GSP 14.5%) and frozen fish fillets is 18 % (GSP 14.5). For prepared
and preserved tuna in oil (1604), not in oil, in pouches, tuna loins for use under 1604, the MFN
tariff is 24% whilst the GSP rate is 20.5%. These tariffs offer huge preferential margins for ACP
countries that are party to the EPA. The current negotiations at the WTO as well as free trade
agreements that are being negotiated by the EU with non-ACP countries threaten to erode such
preferences.
It should also be noted that the EU production of tuna is declining but there is a booming market
in the EU for tuna loins classified under the HS code as ‗for further processing under 1604‘ (i.e.
to be canned- 0% universally), which are categorized under a different tariff chapter heading
than tuna fillets for direct human consumption. In general terms, exporting tuna to the EU
remains a viable economic endeavour because the market volume is very large and it is
continually growing. In fact, canned tuna consumption in the EU is the driver for the global
purse seine and tuna canning industries as consumption is stagnant in Japan and has declined in
the US. Compared to the US, canned tuna is a relatively high value product in the EU and has
consistently fetched a higher aggregated retail price than in the US. There is also a growing
(albeit niche) market in the EU for tuna fillets and steaks for direct human consumption, partial
reprocessing or even simple repackaging under tariff headings other than Chapter 1604 (i.e. tuna
imported as frozen or fresh fillets under tariff heading 0304).
196
Despite declining demand by EU-based canneries, the average price for imported frozen tuna in
the EU has risen significantly since 2000. However, the export of whole round fresh chilled tuna
from RMI to markets in the EU is unlikely to ever prove a fruitful avenue because of high
airfreight costs and poor connections.
From the discussion above, it is clear that the canning industry in Japan is no longer exporting,
there is only one canning plant left in the US and the EU canneries are facing high operational
costs and are shifting towards importation of loins rather than whole tuna. The tariffs which
protect these industries are being threatened by the WTO negotiations and free trade agreements
and the preferences that are given to ACP countries are also facing inevitable erosion. This
raises an important question for RMI; in light of the fact that canneries in major developed
countries are losing competitiveness to Thailand and other low cost producers in South America;
will RMI be able to develop long-term competitiveness and survive after the preferences are
gone? This is a question that RMI should bear in mind when assessing potential investors to
ensure that genuine investors are allowed to operate and develop long-term competitiveness to
avoid what happened in the garment industry in a number of preference-receiving countries
when textiles preferences expired.
8.6.4 Investment
RMI needs a lot of assistance to improve the investment climate and its ranking on the Ease of
Doing Business as discussed above. The investment regime must focus on protecting the rights
of investors and their investments and this needs to be balanced with the right of the Government
to regulate investment to meet public policy objectives. The need to reform EU investment
institutions to make them more friendly and accessible to SMEs is also a key issue for the RMI.
The European Investment Bank (EIB) and the EU Centre for Development of Enterprises (CDE)
are essential for supporting SME development. However, the EU is not interested in negotiating
a separate investment agreement and wants investment to be included under trade in services.
8.6.5 Aid for Trade
Aid for Trade will be required to assist RMI to adjust to the liberalisation shocks and also to
implement the various obligations and make the necessary regulatory reforms. Technical and
financial assistance is also required to assist RMI to address its production and supply side
constraints. Without a comprehensive package on Aid for Trade, EPA would be a meaningless
agreement. All the stakeholders must identify their needs and priorities to ensure that their
requests for technical and financial assistance are included in the EPA negotiations. RMI should
also ensure that the commitments on Aid for Trade are couched in legally binding language and
implementation of the agreements should be contingent on provision of such assistance. If
technical and financial assistance is not forthcoming, RMI should not be required to implement
the agreement.
197
Several studies were conducted to assess the adjustment costs that may be required under EPA.
The first one was a Commonwealth Secretariat study by Milner in 2005, which estimated that the
ACP wide adjustment costs would be 9 billion Euros and the PACPs costs were estimated to be
642 million Euros. Another United Nations Economic and Social Commission for Asia and the
Pacific (UNESCAP) study by Smith estimated the adjustment costs over a five year period to be
about 170 million Euros for the Pacific. The Scollay report (2007) estimated the PACP costs to
be about €159,621,250. Now that the agreement is almost complete, it would be good to assess
the actual costs of EPA and the necessary reforms that need to be undertaken.
The EU indicated that funding for EPA will come from the Pacific Regional Indicative
Programme (PRIP)-EDF 10 and the National Indicative Programme. The two focal sectors that
have been identified for funding under EDF 1067
are Regional Economic Integration (€45
million) and Sustainable Management of Natural Resources (€40 million). The other funding is
earmarked for a non-focal sector. This will bring the total amount of funding available under the
EDF to €95 million. The EC member states have also agreed to provide additional resources
under the Aid for Trade Strategy, and PACP requested that they be given at least their historic
share of aid which translates to about €25 million per year. However, given the amount of
resources needed to implement EPA and to enable RMI to benefit from the agreement, more
resources will be required. The EU has also indicated that all the funding will come through
under the EDF and no additional funding will be provided.
It is important to note that in 2009, only 35 million was allocated to fund Aid for Trade projects.
8.6.6 Recommendations
i. RMI must sign the comprehensive EPA to allow the fisheries industry to benefit from the
liberal rules of origin that have been offered by the EU.
ii. MIMRA must establish the Competent Authority to enable RMI to export fisheries
products to the EU.
iii. RMI/MIMRA must work with the PNA/FFA/PACPS to address the trade/fisheries issues
in the EPA negotiations to ensure that RMI‘s objectives of maximizing its return from its
resources are realized.
67
Other sectors such as fisheries, tourism, ICT, environment, human resource development etc… were considered to
be cross-cutting issues and would form part of the two focal areas.
198
8.7 Micronesian Trade Committee
The Micronesian Trade Committee (MTC) was established in Pohnpei in 2008 by the trade
Ministers from FSM, RMI and Palau following the recommendations from the Micronesian
President‘s Summit in 2007. The MTC provides for a platform for the Freely Associated States
to discuss trade issues of common interest including those arising from the Compact agreement,
trade among the three countries and to develop common positions on other trade negotiations
such as PICTA, PACER Plus and EPA.
Some of the issues that are currently being addressed by the MTC include the compensation for
lost trade and tax preferences as a result of the amendment of the original Compact by the US
Congress. The MTC is also working on formalising the MTC Secretariat and is also discussing
other issues on how to promote trade among the three countries.
8.7.1 Recommendations
i. RMI must work with FSM and Palau under the MTC to address trade issues that are
common to FAS.
ii. RMI should support the establishment of the MTC Secretariat and seek funding for the
operation of the Secretariat.
iii. The FAS should consider having a trade and investment mission in the US to promote
trade, investment , tourism and linking the FAS producers of goods and services with the
buyers in the US market.
8.8 The World Trade Organization (WTO)
RMI is not a WTO member but other island countries such as Fiji, Papua New Guinea, Solomon
Islands and Tonga are WTO members. Other countries that are acceding to the WTO are
Vanuatu (since 1995) and Samoa (since 1998).
The advantages of joining the WTO include:
benefiting from the technical and financial assistance programmes for small and
vulnerable economies
participating in multilateral negotiations and shaping global trade rules to suit the needs
of small islands
trade policy review mechanism, which reviews trade policies and practices for WTO
members
locking in commitments, which gives certainty and predictability to traders
market access to WTO members.
In general, the costs of WTO membership will include:
199
adjustment costs
regulatory reform to comply with WTO rules
administrative burden on RMI in terms of implementing the agreements
very little benefits in terms of market access
Given that the potential benefits from WTO membership are likely to be outweighed by the
costs, it may appear to be premature for RMI to consider joining the WTO. RMI‘s trading
partners are already WTO members and have already adopted trade policies that in one way or
the other influence RMI even though RMI is not a WTO member. RMI is also represented at the
WTO by the Forum Geneva Office.
8.8.1 Recommendations
(i) RMI should work closely with the PIFS Office in Geneva to address any issues affecting
RMI including fisheries subsidies, preference erosion, non-tariff barriers as well as other
relevant issues.
(ii) RMI should work with the US to ensure that the waiver on Compact is extended beyond
2016.
8.9 Guidelines for Trade Negotiations
During the consultations it was clear that the trade negotiations should bring development
benefits to RMI and assist the nation to address the key supply-side constraints and shortcomings
in infrastructural services hindering trade and development. Some of the key guidelines and
recommendations that were raised by the participants as key principles that should be followed
during trade negotiations include the following:
i. RMI must be given the option to opt out of the trade in goods agreement, until the MFN
issues with the US are addressed.
ii. In the event that RMI decides to participate in the trade in goods agreement, the
agreement must be asymmetric and incorporate special and differential treatment,
allowing RMI to liberalize not more than 80% of its trade value or tariff lines.
iii. Rules of origin must be improved and be based on change in tariff heading.
iv. RMI must be given maximum flexibilities and policy space in order to protect its infant
industries, impose export taxes and use trade defence measures.
v. Trade Agreements must include a chapter on development cooperation providing
predictable, adequate and legally binding Aid for Trade based on the five categories
identified by the WTO task force on Aid for Trade.
200
vi. Technical and financial assistance must assist RMI to address the supply-side constraints,
build production capacity, and address transportation and marketing issues. Assistance
must be also be provided to address SPS, TBT, customs issues, tax reform, adjustment
costs amongst other things.
vii. RMI must be allowed to use the GATS positive list when participating in trade in
services negotiations.
viii. Assistance must be provided to assist RMI to participate effectively in the tourism sector
and to address issues relating to transportation, telecommunication and the financial
sector.
ix. Technical and financial assistance must be provided to enable RMI to introduce the
necessary regulatory and institutional framework before opening up trade in services.
x. Technical and financial assistance must also be provided to assist RMI to upgrade its
education system including the vocational training institutions.
xi. Trade Agreements must provide predictable and legally binding access on labor market
that is comparable to what RMI has under the Compact.
xii. RMI must reform its tax policy first before signing onto trade agreements.
9 AID FOR TRADE
In 2005, the Sixth WTO Ministerial Conference that was held in Hong Kong highlighted the
importance of Aid for Trade as essential in assisting developing countries to implement trade
agreements and to exploit the market access arising from trade liberalisation. Paragraph 57 of the
Hong Kong Ministerial Declaration provides that Aid for Trade should aim to help developing
countries, particularly LDCs, to build the supply-side capacity and trade-related
infrastructure [emphasis] that they need to assist them to implement and benefit from WTO
Agreements and more broadly to expand their trade.
Furthermore, the Ministers recognised that Aid for Trade cannot be a substitute for the
development benefits that will result from a successful conclusion to the DDA, particularly on
market access. However, it can be a valuable complement to the DDA. They requested the
Director-General of the WTO to create a task force that shall provide recommendations on how
to operationalise Aid for Trade. The Task Force was requested to provide recommendations to
the General Council by July 2006 on how Aid for Trade might contribute most effectively to the
development dimension of the DDA. The Ministers also requested the Director-General to
consult with Members as well as with the IMF and World Bank, relevant international
organisations and the regional development banks with a view to reporting to the General
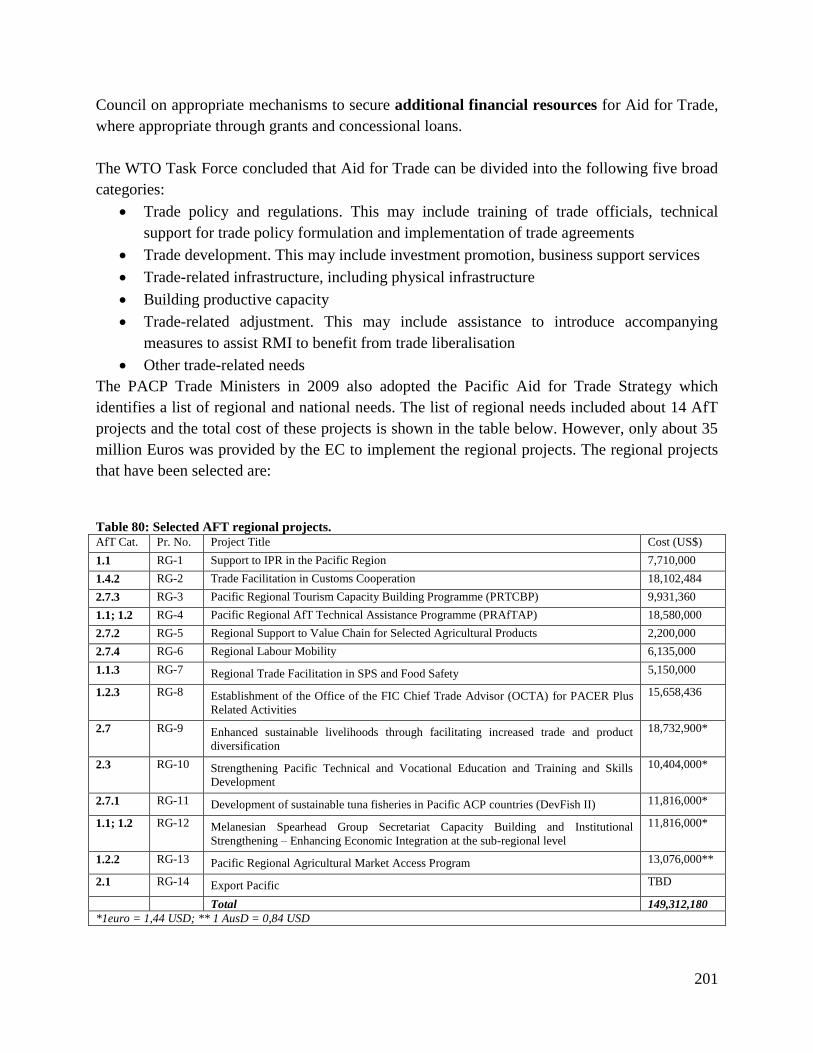
201
Council on appropriate mechanisms to secure additional financial resources for Aid for Trade,
where appropriate through grants and concessional loans.
The WTO Task Force concluded that Aid for Trade can be divided into the following five broad
categories:
Trade policy and regulations. This may include training of trade officials, technical
support for trade policy formulation and implementation of trade agreements
Trade development. This may include investment promotion, business support services
Trade-related infrastructure, including physical infrastructure
Building productive capacity
Trade-related adjustment. This may include assistance to introduce accompanying
measures to assist RMI to benefit from trade liberalisation
Other trade-related needs
The PACP Trade Ministers in 2009 also adopted the Pacific Aid for Trade Strategy which
identifies a list of regional and national needs. The list of regional needs included about 14 AfT
projects and the total cost of these projects is shown in the table below. However, only about 35
million Euros was provided by the EC to implement the regional projects. The regional projects
that have been selected are:
Table 80: Selected AFT regional projects. AfT Cat. Pr. No. Project Title Cost (US$)
1.1 RG-1 Support to IPR in the Pacific Region 7,710,000
1.4.2 RG-2 Trade Facilitation in Customs Cooperation 18,102,484
2.7.3 RG-3 Pacific Regional Tourism Capacity Building Programme (PRTCBP) 9,931,360
1.1; 1.2 RG-4 Pacific Regional AfT Technical Assistance Programme (PRAfTAP) 18,580,000
2.7.2 RG-5 Regional Support to Value Chain for Selected Agricultural Products 2,200,000
2.7.4 RG-6 Regional Labour Mobility 6,135,000
1.1.3 RG-7 Regional Trade Facilitation in SPS and Food Safety 5,150,000
1.2.3 RG-8 Establishment of the Office of the FIC Chief Trade Advisor (OCTA) for PACER Plus
Related Activities
15,658,436
2.7 RG-9 Enhanced sustainable livelihoods through facilitating increased trade and product
diversification
18,732,900*
2.3 RG-10 Strengthening Pacific Technical and Vocational Education and Training and Skills
Development
10,404,000*
2.7.1 RG-11 Development of sustainable tuna fisheries in Pacific ACP countries (DevFish II) 11,816,000*
1.1; 1.2 RG-12 Melanesian Spearhead Group Secretariat Capacity Building and Institutional
Strengthening – Enhancing Economic Integration at the sub-regional level
11,816,000*
1.2.2 RG-13 Pacific Regional Agricultural Market Access Program 13,076,000**
2.1 RG-14 Export Pacific TBD
Total 149,312,180
*1euro = 1,44 USD; ** 1 AusD = 0,84 USD
202
However, in adopting the Pacific AfT Strategy, PACP Trade Ministers noted that a lot of work
was still required to identify and prioritise national AfT projects. The Trade Policy will assist
RMI to identify the priority AfT projects that will be submitted to RMI‘s trading partners and
donors.
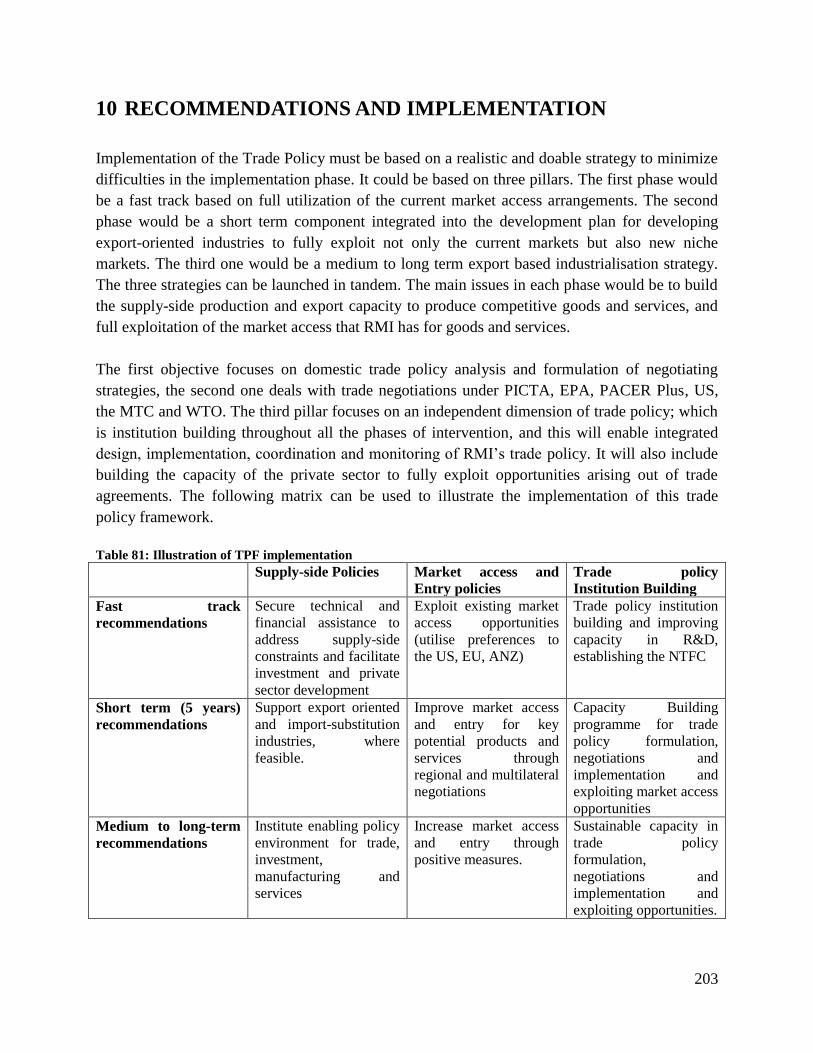
203
10 RECOMMENDATIONS AND IMPLEMENTATION
Implementation of the Trade Policy must be based on a realistic and doable strategy to minimize
difficulties in the implementation phase. It could be based on three pillars. The first phase would
be a fast track based on full utilization of the current market access arrangements. The second
phase would be a short term component integrated into the development plan for developing
export-oriented industries to fully exploit not only the current markets but also new niche
markets. The third one would be a medium to long term export based industrialisation strategy.
The three strategies can be launched in tandem. The main issues in each phase would be to build
the supply-side production and export capacity to produce competitive goods and services, and
full exploitation of the market access that RMI has for goods and services.
The first objective focuses on domestic trade policy analysis and formulation of negotiating
strategies, the second one deals with trade negotiations under PICTA, EPA, PACER Plus, US,
the MTC and WTO. The third pillar focuses on an independent dimension of trade policy; which
is institution building throughout all the phases of intervention, and this will enable integrated
design, implementation, coordination and monitoring of RMI‘s trade policy. It will also include
building the capacity of the private sector to fully exploit opportunities arising out of trade
agreements. The following matrix can be used to illustrate the implementation of this trade
policy framework.
Table 81: Illustration of TPF implementation
Supply-side Policies
Market access and
Entry policies
Trade policy
Institution Building
Fast track
recommendations
Secure technical and
financial assistance to
address supply-side
constraints and facilitate
investment and private
sector development
Exploit existing market
access opportunities
(utilise preferences to
the US, EU, ANZ)
Trade policy institution
building and improving
capacity in R&D,
establishing the NTFC
Short term (5 years)
recommendations
Support export oriented
and import-substitution
industries, where
feasible.
Improve market access
and entry for key
potential products and
services through
regional and multilateral
negotiations
Capacity Building
programme for trade
policy formulation,
negotiations and
implementation and
exploiting market access
opportunities
Medium to long-term
recommendations
Institute enabling policy
environment for trade,
investment,
manufacturing and
services
Increase market access
and entry through
positive measures.
Sustainable capacity in
trade policy
formulation,
negotiations and
implementation and
exploiting opportunities.

204
The first pillar focuses on supply-side policies under the fast track section and seeks to
strengthen production and trade performance by finding new or expanding existing markets for
key export products in agriculture, fisheries and tourism. The idea is to concentrate on quality
and produce products consistently to maintain the market and enough volume to fill the
containers. Tourism potential can also be expanded with a focus on the high end market.
Technical and financial assistance will be needed to assist the private sector to improve
production efficiency and outputs, and to conduct negotiations and marketing to find new
markets. Most exporters are too small in scale or they are just starting and will need initial
assistance from donors and trading partners. RMI can also work with the Pacific Islands Trade
and Investment Commission in Auckland, Beijing, Sydney and Tokyo. RMI should consider
having an FAS trade mission in the US and the EU.
The second pillar is embedded in the development plan which seeks to promote the agriculture,
fisheries and tourism sectors. Promoting agriculture will contribute towards addressing health
issues and food security, and there are small opportunities for export of niche products. The main
service sector is tourism and export of skilled and lower skilled labor. Policies must be put in
place to boost production capacity and good quality products to ensure that the products become
competitive in international markets. However, for RMI to develop competitiveness, the other
infrastructure related services also need to be improved. RMI needs to boost its negotiating
capacity to derive meaningful benefits from trade negotiations. There is a need to put in place
mechanism for national consultations (NTFC) and follow up of trade issues and training of
skilled trade negotiators. Support is also needed for import substitution industries. The
continued existence of these industries is important because they provide employment and pay
tax.
The third pillar can be implemented simultaneously with the first two. This focuses on creating
an enabling policy environment for manufacturing and semi-manufacturing industries including
SMEs, prioritizing value addition of many RMI products. Incentives must be made available to
those industries using a substantial portion of local inputs. The main focus is on identifying and
developing manufacturing base in RMI for the domestic and export markets. The development of
the services sector is also important especially infrastructural services and tourism.
The trade policy must be implemented within a wider development policy and all the other social
issues need to be taken into account because these may derail even the limited development that
may have taken place. It is important for the trade policy to be integrated into a wider
development strategy. Issues such as population growth, environment and health need to be
addressed. Trade facilitation, especially supporting transportation networks, financing facilities
for SMEs, small cottage industries and agricultural extension to improve production and output
should be encouraged. Other non-tariff barriers as well as the SPS and TBT issues also need to
be addressed.
205
RMI needs to take stock of the skills that it needs and address the labor supply issues affecting
production. The trade policy must also be linked to the Millennium Development Goals (MDGs).
The public sector reform must continue to ensure that RMI develops trade policy formulation
capacity. Other issues such as unemployment problems affecting mainly the youths and women
should also be prioritized.
A monitoring mechanism should be established at the official‘s level and at the highest policy
level. There is a need to assess progress on an annual basis and propose remedial action. RMI
should mobilise international support for the endogenous capacity building project on trade. The
capacity of the Trade and Investment Division to function effectively must be strengthened.
Support may be sought from donors to develop institutional and human resources in order to
enhance institutional capacity in trade analysis, trade policy formulation, trade negotiations and
supply capacities and exploiting market access opportunities. Government personnel handling
trade should be trained in trade negotiations and such training must also be conducted in selected
tertiary institutions. Full recommendations and matrix of implementation are contained in Annex
2.
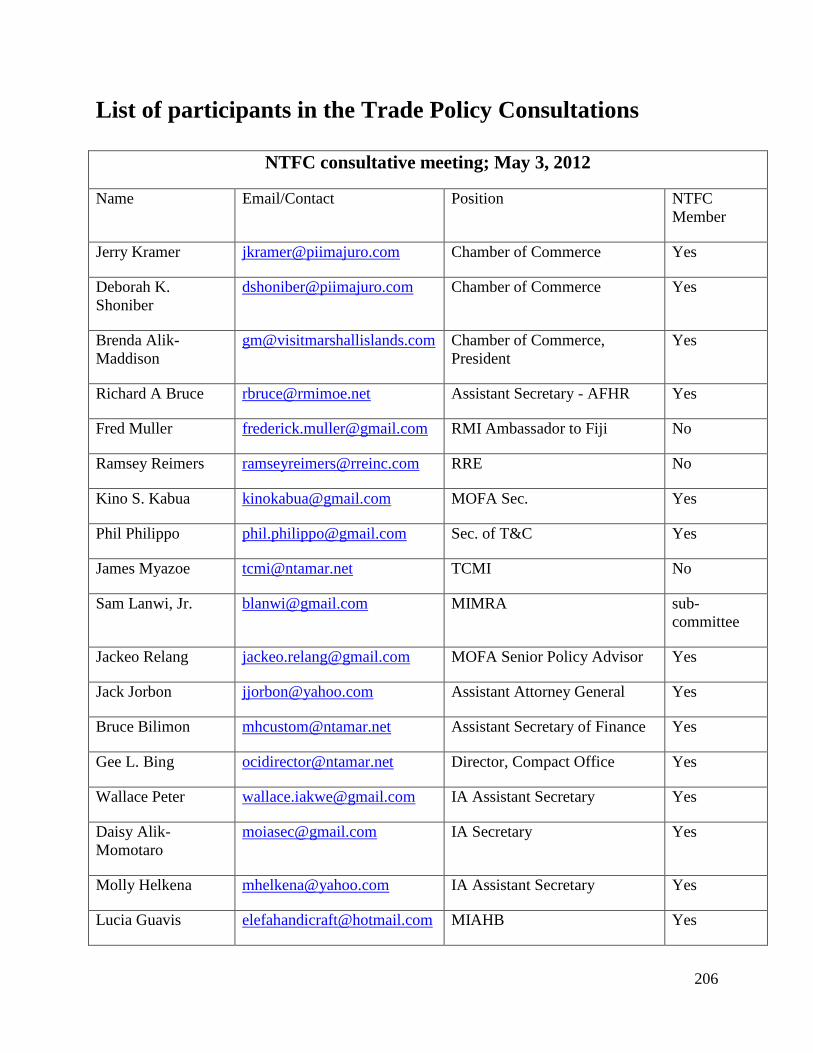
206
List of participants in the Trade Policy Consultations
NTFC consultative meeting; May 3, 2012
Name Email/Contact Position NTFC
Member
Jerry Kramer [email protected] Chamber of Commerce Yes
Deborah K.
Shoniber
[email protected] Chamber of Commerce Yes
Brenda Alik-
Maddison
[email protected] Chamber of Commerce,
President
Yes
Richard A Bruce [email protected] Assistant Secretary - AFHR Yes
Fred Muller [email protected] RMI Ambassador to Fiji No
Ramsey Reimers [email protected] RRE No
Kino S. Kabua [email protected] MOFA Sec. Yes
Phil Philippo [email protected] Sec. of T&C Yes
James Myazoe [email protected] TCMI No
Sam Lanwi, Jr. [email protected] MIMRA sub-
committee
Jackeo Relang [email protected] MOFA Senior Policy Advisor Yes
Jack Jorbon [email protected] Assistant Attorney General Yes
Bruce Bilimon [email protected] Assistant Secretary of Finance Yes
Gee L. Bing [email protected] Director, Compact Office Yes
Wallace Peter [email protected] IA Assistant Secretary Yes
Daisy Alik-
Momotaro
[email protected] IA Secretary Yes
Molly Helkena [email protected] IA Assistant Secretary Yes
Lucia Guavis [email protected] MIAHB Yes
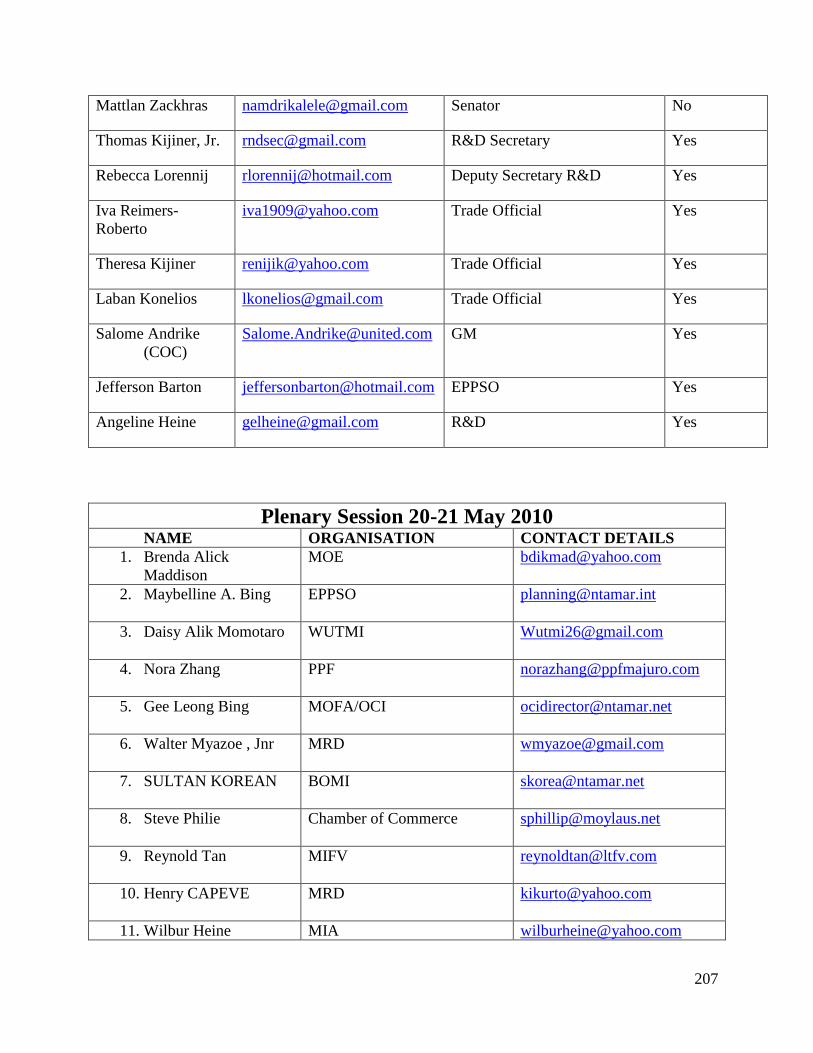
207
Mattlan Zackhras [email protected] Senator No
Thomas Kijiner, Jr. [email protected] R&D Secretary Yes
Rebecca Lorennij [email protected] Deputy Secretary R&D Yes
Iva Reimers-
Roberto
[email protected] Trade Official Yes
Theresa Kijiner [email protected] Trade Official Yes
Laban Konelios [email protected] Trade Official Yes
Salome Andrike
(COC)
[email protected] GM Yes
Jefferson Barton [email protected] EPPSO Yes
Angeline Heine [email protected] R&D Yes
Plenary Session 20-21 May 2010
NAME ORGANISATION CONTACT DETAILS
1. Brenda Alick
Maddison
2. Maybelline A. Bing EPPSO [email protected]
3. Daisy Alik Momotaro WUTMI [email protected]
4. Nora Zhang
5. Gee Leong Bing MOFA/OCI [email protected]
6. Walter Myazoe , Jnr MRD [email protected]
7. SULTAN KOREAN BOMI [email protected]
8. Steve Philie Chamber of Commerce [email protected]
9. Reynold Tan MIFV [email protected]
10. Henry CAPEVE MRD [email protected]
11. Wilbur Heine MIA [email protected]

208
12. Divine Waiti Nitijela [email protected]
13. Anjanette M Kattil MOFA [email protected]
14. Itibo. P. Tofinga MOF [email protected]
15. Bruce B MOF [email protected]
16. Rebecca L R & D
17. Katina A. Peter Frank ‗R‘ [email protected]
18. Melissa Kramer PIL [email protected]
19. Sam Lamui, Jnr MIMRA [email protected]
20. Paul Toryakwe drmmigration
21. Daniel Timothy
customs [email protected]
22. Kathryn Relang WUTMI Wutmi26@gmail
23. Nora Zhang PPF [email protected]
24. Kayo Yamaguchi .
kotton
25. Bonny Taggart MICNGOS [email protected]
26. Miram Jebraum wutmi [email protected]
27. Mr Kramer Private Sector
Plenary 11-12 November 2009
NAME ORGANISATION CONTACT DETAILS
1. Katie Relang WUTMI [email protected]
2. Evelyn Lanki MALOG [email protected]
3. Carmen Bigler WUTMI
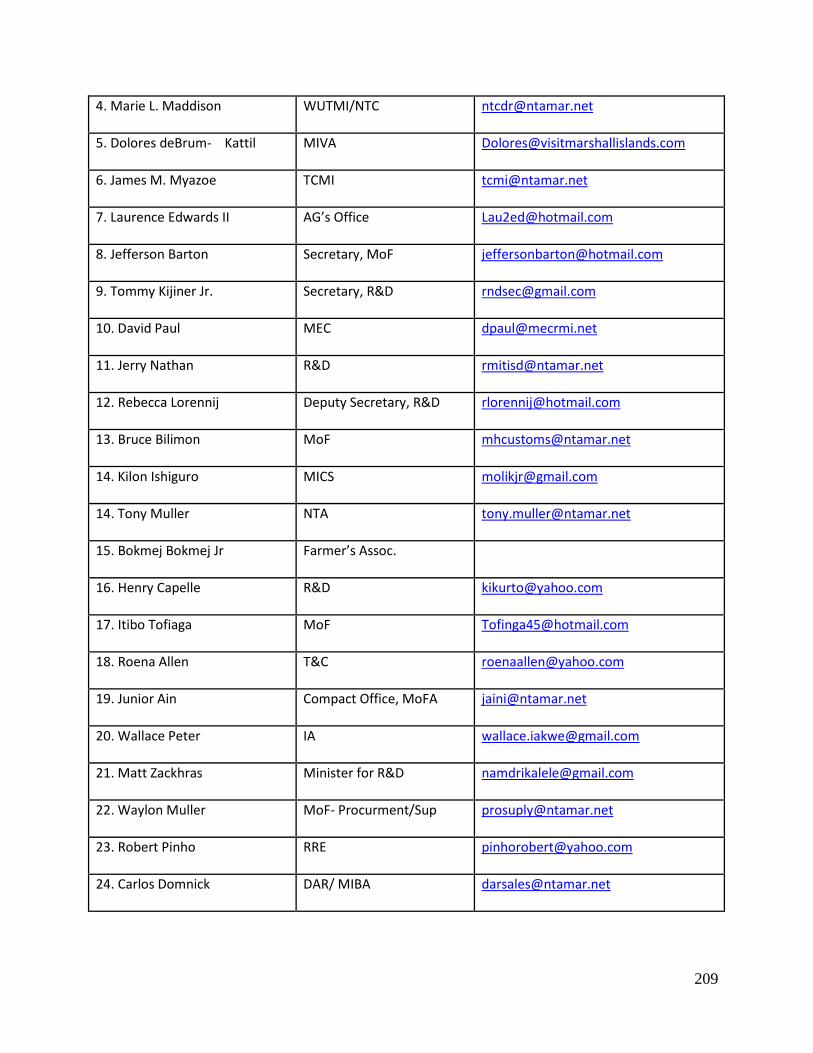
209
4. Marie L. Maddison WUTMI/NTC [email protected]
5. Dolores deBrum- Kattil MIVA [email protected]
6. James M. Myazoe TCMI [email protected]
7. Laurence Edwards II AG’s Office [email protected]
8. Jefferson Barton Secretary, MoF [email protected]
9. Tommy Kijiner Jr. Secretary, R&D [email protected]
10. David Paul MEC [email protected]
11. Jerry Nathan R&D [email protected]
12. Rebecca Lorennij Deputy Secretary, R&D [email protected]
13. Bruce Bilimon MoF [email protected]
14. Kilon Ishiguro MICS [email protected]
14. Tony Muller NTA [email protected]
15. Bokmej Bokmej Jr Farmer’s Assoc.
16. Henry Capelle R&D [email protected]
17. Itibo Tofiaga MoF [email protected]
18. Roena Allen T&C [email protected]
19. Junior Ain Compact Office, MoFA [email protected]
20. Wallace Peter IA [email protected]
21. Matt Zackhras Minister for R&D [email protected]
22. Waylon Muller MoF- Procurment/Sup [email protected]
23. Robert Pinho RRE [email protected]
24. Carlos Domnick DAR/ MIBA [email protected]

210
List of Participants who were consulted during the sector-specific consultations (9-20 Nov 2009)
Date Organization Contact person Time Contact Details
9-Nov Economic and Policy Planning Office (EPPSO)
Carl Hacker, Director 8-10am [email protected]
9-Nov Attorney General Mr. Frederick Canavor Jr., Attorney General
10-11am
10-Nov
Customs, Revenue & Taxation
Mr. Bruce Bilimon, Assistant Secretary of MOF
9-11am [email protected]
10-Nov
Resources and Development
Mr. Thomas Kijiner, Jr., Secretary, Ms. Rebecca Lorennij, Deputy Secretary
2-4pm [email protected]/[email protected]
13-Nov
Ministry of Foreign Affairs (MOFA)
Ms. Kino Kabua, Secretary of MOFA
10-12pm
13-Nov
Marshall Islands Marine Resources Authority (MIMRA),
Mr. Glen Joseph, Director 2-3pm
13-Nov
Marshall Islands Energy Company
Mr. David Paul, General Manager
3-4pm [email protected]
13-Nov
National Telecommunications Authority (NTA)
Mr. Anthony Muller, General Manager
4-5pm [email protected]
16-Nov
EPA Mrs. Deborah Manesse, General Manager
1-11am
16-Nov
Immigration Mrs. Tanga Lanwi, Acting Chief
11-12pm rmiimmig@ntamar
16-Nov
Marshall Islands Visitors Authority (MIVA)
Mrs. Dolores Debrum Kattil 2-3pm [email protected]
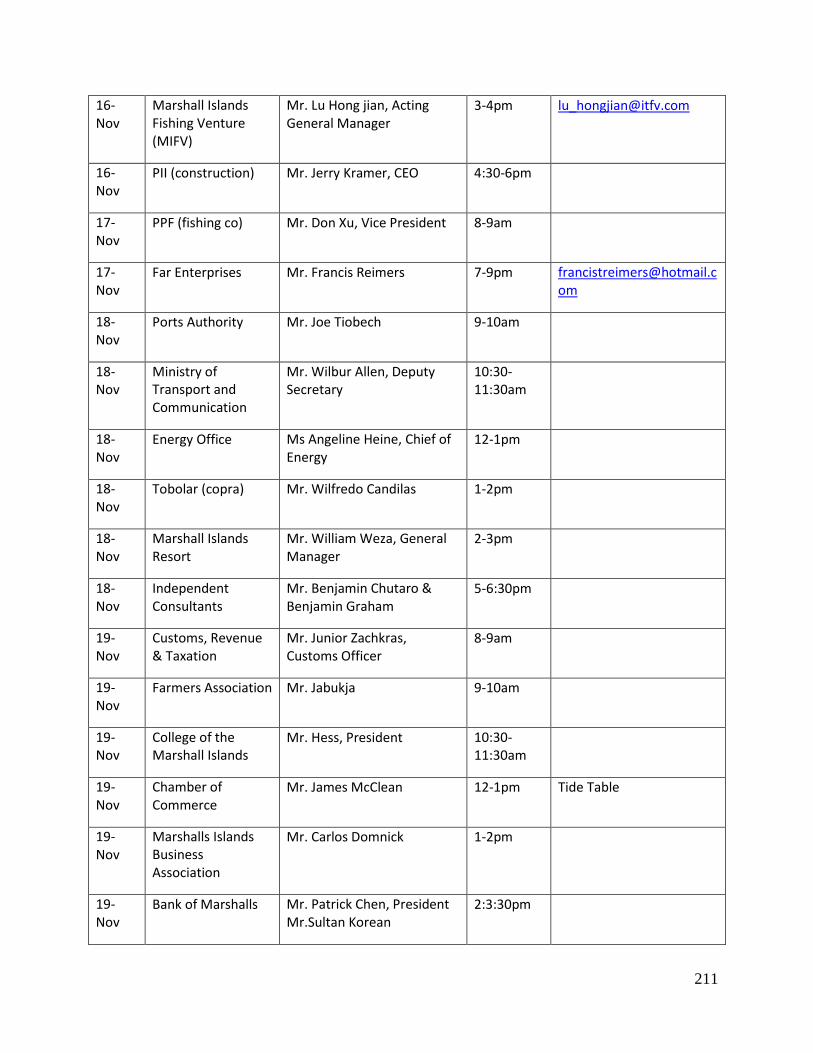
211
16-Nov
Marshall Islands Fishing Venture (MIFV)
Mr. Lu Hong jian, Acting General Manager
3-4pm [email protected]
16-Nov
PII (construction) Mr. Jerry Kramer, CEO 4:30-6pm
17-Nov
PPF (fishing co) Mr. Don Xu, Vice President 8-9am
17-Nov
Far Enterprises Mr. Francis Reimers 7-9pm [email protected]
18-Nov
Ports Authority Mr. Joe Tiobech 9-10am
18-Nov
Ministry of Transport and Communication
Mr. Wilbur Allen, Deputy Secretary
10:30-11:30am
18-Nov
Energy Office Ms Angeline Heine, Chief of Energy
12-1pm
18-Nov
Tobolar (copra) Mr. Wilfredo Candilas 1-2pm
18-Nov
Marshall Islands Resort
Mr. William Weza, General Manager
2-3pm
18-Nov
Independent Consultants
Mr. Benjamin Chutaro & Benjamin Graham
5-6:30pm
19-Nov
Customs, Revenue & Taxation
Mr. Junior Zachkras, Customs Officer
8-9am
19-Nov
Farmers Association Mr. Jabukja 9-10am
19-Nov
College of the Marshall Islands
Mr. Hess, President 10:30-11:30am
19-Nov
Chamber of Commerce
Mr. James McClean 12-1pm Tide Table
19-Nov
Marshalls Islands Business Association
Mr. Carlos Domnick 1-2pm
19-Nov
Bank of Marshalls Mr. Patrick Chen, President Mr.Sultan Korean
2:3:30pm
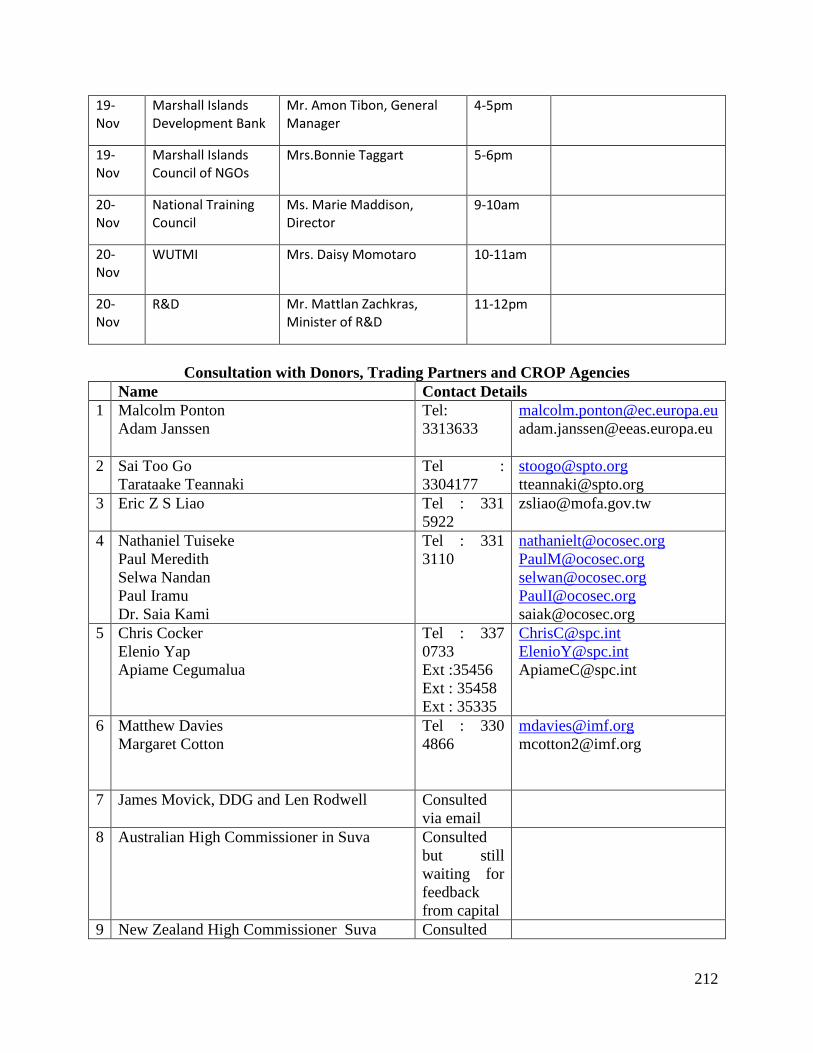
212
19-Nov
Marshall Islands Development Bank
Mr. Amon Tibon, General Manager
4-5pm
19-Nov
Marshall Islands Council of NGOs
Mrs.Bonnie Taggart 5-6pm
20-Nov
National Training Council
Ms. Marie Maddison, Director
9-10am
20-Nov
WUTMI Mrs. Daisy Momotaro 10-11am
20-Nov
R&D Mr. Mattlan Zachkras, Minister of R&D
11-12pm
Consultation with Donors, Trading Partners and CROP Agencies
Name Contact Details
1 Malcolm Ponton
Adam Janssen
Tel:
3313633
2 Sai Too Go
Tarataake Teannaki
Tel :
3304177
3 Eric Z S Liao Tel : 331
5922
4 Nathaniel Tuiseke
Paul Meredith
Selwa Nandan
Paul Iramu
Dr. Saia Kami
Tel : 331
3110
5 Chris Cocker
Elenio Yap
Apiame Cegumalua
Tel : 337
0733
Ext :35456
Ext : 35458
Ext : 35335
6 Matthew Davies
Margaret Cotton
Tel : 330
4866
7 James Movick, DDG and Len Rodwell Consulted
via email
8 Australian High Commissioner in Suva Consulted
but still
waiting for
feedback
from capital
9 New Zealand High Commissioner Suva Consulted

213
but still
waiting for
feedback
from capital
Copyright © 2022 FDOKUMEN