Locomotion in some small to medium-sized mammals: a geometricmorphometric analysis of the...
16
Zoology 116 (2013) 356–371 Contents lists available at ScienceDirect Zoology jou r n al hom epa ge: www . els ev ier.com/locate/zool Locomotion in some small to medium-sized mammals: a geometric morphometric analysis of the penultimate lumbar vertebra, pelvis and hindlimbs Alicia Álvarez ∗ , Marcos D. Ercoli, Francisco J. Prevosti División Mastozoología, Museo Argentino de Ciencias Naturales “Bernardino Rivadavia”, Av. Ángel Gallardo 470, Buenos Aires C1405DJR, Argentina a r t i c l e i n f o Article history: Received 2 July 2012 Received in revised form 25 June 2013 Accepted 3 August 2013 Available online 5 October 2013 Keywords: Functional anatomy Locomotor types Mammalian locomotion Postcranial morphology Speed a b s t r a c t We assessed the influence of a variety of aspects of locomotion and ecology including gait and locomotor types, maximal running speed, home range, and body size on postcranial shape variation in small to medium-sized mammals, employing geometric morphometric analysis and phylogenetic comparative methods. The four views analyzed, i.e., dorsal view of the penultimate lumbar vertebra, lateral view of the pelvis, posterior view of the proximal femur and proximal view of the tibia, showed clear phylogenetic signal and interesting patterns of association with movement. Variation in home range size was related to some tibia shape changes, while speed was associated with lumbar vertebra, pelvis and tibia shape changes. Femur shape was not related to any locomotor variables. In both locomotor type and high-speed gait analyses, locomotor groups were distinguished in both pelvis and tibia shape analyses. These results suggest that adaptations to both typical and high-speed gaits could explain a considerable portion of the shape of those elements. In addition, lumbar vertebra and tibia showed non-significant relationships with body mass, which suggests that they might be used in morpho-functional analyses and locomotor inferences on fossil taxa, with little or no bias for body size. Lastly, we observed morpho-functional convergences among several mammalian taxa and detected some taxa that achieve similar locomotor features following different morphological paths. © 2013 Elsevier GmbH. All rights reserved. 1. Introduction Locomotion imposes demands on the animal skeleton in terms of mechanical stress, which affect bone morphology as well as the architecture and organization of the attached musculature (Biewener, 1983a). The evolution of locomotion in mammals is characterized by the use of unique step sequences (i.e., asymmet- rical gaits) that do not occur in other tetrapod lineages and the regionalization of the vertebral column into thoracic and lum- bar regions, the latter being an actively dorsoventral flexor of the body axis (Gambaryan, 1974; Hildebrand, 1988; Schilling and Hackert, 2006). Exploiting this innovation, mammals have devel- oped a diversity of locomotor strategies. Locomotor variants can be associated with size, and the necessity of high speed or long dis- tance movement, which impose particular demands on the axial and appendicular skeleton and musculature. The diversity of locomotor styles has traditionally been divided into two principal categories: symmetrical and asymmetrical gaits, distinguished by the sequence of successive support phases. ∗ Corresponding author. Tel.: +54 1149820306x208. E-mail address: [email protected] (A. Álvarez). Symmetrical gaits include sequences in which the movement of a limb of one pair (e.g., forelimb) is followed by movement of a limb of the other pair (e.g., hindlimb) and, consequently, feet of the same pair land alternatively, evenly spaced in time. Symmetri- cal gaits include walk, pace and trot. Asymmetrical gaits are those in which footfalls of a pair of feet are unevenly spaced in time, such as bound, half-bound, pronk and gallop. In bipedal locomotion the hindlimbs entirely support the body (Slijper, 1946; Gambaryan, 1974; Hildebrand, 1988). Several factors can be associated with locomotor variation in mammals. For example, animals with large body mass tend to have an upright posture and more robust limbs in relation to allo- metric changes (Biewener, 1983a), while animals with lower body mass tend to maintain a crouched posture (e.g., Biewener, 1983b; Hildebrand, 1988). On the other hand, large mammals tend to have a more rigid and straight vertebral column to more efficiently support their body mass, which in turn limits their locomotor repertoire (Slijper, 1946; Hildebrand, 1988; Biewener, 1983a,b; Schilling and Hackert, 2006). Home range and speed represent other dimensions of the diversity of locomotion, and are also related to the ecological requirements of each species. Many small mam- mals, which exploit resources that are little spread in space, have smaller home ranges (Gregory, 1912; Janis and Wilhelm, 1993; 0944-2006/$ – see front matter © 2013 Elsevier GmbH. All rights reserved. http://dx.doi.org/10.1016/j.zool.2013.08.007
-
Upload
conicet-ar -
Category
Documents
-
view
2 -
download
0
Transcript of Locomotion in some small to medium-sized mammals: a geometricmorphometric analysis of the...
Lma
AD
a
ARRAA
KFLMPS
1
ot(crrbtHoata
ig
0h
Zoology 116 (2013) 356– 371
Contents lists available at ScienceDirect
Zoology
jou r n al hom epa ge: www . els ev ie r .com/ locate / zool
ocomotion in some small to medium-sized mammals: a geometricorphometric analysis of the penultimate lumbar vertebra, pelvis
nd hindlimbs
licia Álvarez ∗, Marcos D. Ercoli, Francisco J. Prevostiivisión Mastozoología, Museo Argentino de Ciencias Naturales “Bernardino Rivadavia”, Av. Ángel Gallardo 470, Buenos Aires C1405DJR, Argentina
r t i c l e i n f o
rticle history:eceived 2 July 2012eceived in revised form 25 June 2013ccepted 3 August 2013vailable online 5 October 2013
eywords:unctional anatomyocomotor typesammalian locomotion
a b s t r a c t
We assessed the influence of a variety of aspects of locomotion and ecology including gait and locomotortypes, maximal running speed, home range, and body size on postcranial shape variation in small tomedium-sized mammals, employing geometric morphometric analysis and phylogenetic comparativemethods. The four views analyzed, i.e., dorsal view of the penultimate lumbar vertebra, lateral view ofthe pelvis, posterior view of the proximal femur and proximal view of the tibia, showed clear phylogeneticsignal and interesting patterns of association with movement. Variation in home range size was relatedto some tibia shape changes, while speed was associated with lumbar vertebra, pelvis and tibia shapechanges. Femur shape was not related to any locomotor variables. In both locomotor type and high-speedgait analyses, locomotor groups were distinguished in both pelvis and tibia shape analyses. These results
ostcranial morphologypeed
suggest that adaptations to both typical and high-speed gaits could explain a considerable portion ofthe shape of those elements. In addition, lumbar vertebra and tibia showed non-significant relationshipswith body mass, which suggests that they might be used in morpho-functional analyses and locomotorinferences on fossil taxa, with little or no bias for body size. Lastly, we observed morpho-functionalconvergences among several mammalian taxa and detected some taxa that achieve similar locomotorfeatures following different morphological paths.
. Introduction
Locomotion imposes demands on the animal skeleton in termsf mechanical stress, which affect bone morphology as well ashe architecture and organization of the attached musculatureBiewener, 1983a). The evolution of locomotion in mammals isharacterized by the use of unique step sequences (i.e., asymmet-ical gaits) that do not occur in other tetrapod lineages and theegionalization of the vertebral column into thoracic and lum-ar regions, the latter being an actively dorsoventral flexor ofhe body axis (Gambaryan, 1974; Hildebrand, 1988; Schilling andackert, 2006). Exploiting this innovation, mammals have devel-ped a diversity of locomotor strategies. Locomotor variants can bessociated with size, and the necessity of high speed or long dis-ance movement, which impose particular demands on the axialnd appendicular skeleton and musculature.
The diversity of locomotor styles has traditionally been dividednto two principal categories: symmetrical and asymmetricalaits, distinguished by the sequence of successive support phases.
∗ Corresponding author. Tel.: +54 1149820306x208.E-mail address: [email protected] (A. Álvarez).
944-2006/$ – see front matter © 2013 Elsevier GmbH. All rights reserved.ttp://dx.doi.org/10.1016/j.zool.2013.08.007
© 2013 Elsevier GmbH. All rights reserved.
Symmetrical gaits include sequences in which the movement ofa limb of one pair (e.g., forelimb) is followed by movement of alimb of the other pair (e.g., hindlimb) and, consequently, feet ofthe same pair land alternatively, evenly spaced in time. Symmetri-cal gaits include walk, pace and trot. Asymmetrical gaits are thosein which footfalls of a pair of feet are unevenly spaced in time,such as bound, half-bound, pronk and gallop. In bipedal locomotionthe hindlimbs entirely support the body (Slijper, 1946; Gambaryan,1974; Hildebrand, 1988).
Several factors can be associated with locomotor variation inmammals. For example, animals with large body mass tend tohave an upright posture and more robust limbs in relation to allo-metric changes (Biewener, 1983a), while animals with lower bodymass tend to maintain a crouched posture (e.g., Biewener, 1983b;Hildebrand, 1988). On the other hand, large mammals tend tohave a more rigid and straight vertebral column to more efficientlysupport their body mass, which in turn limits their locomotorrepertoire (Slijper, 1946; Hildebrand, 1988; Biewener, 1983a,b;Schilling and Hackert, 2006). Home range and speed represent
other dimensions of the diversity of locomotion, and are also relatedto the ecological requirements of each species. Many small mam-mals, which exploit resources that are little spread in space, havesmaller home ranges (Gregory, 1912; Janis and Wilhelm, 1993;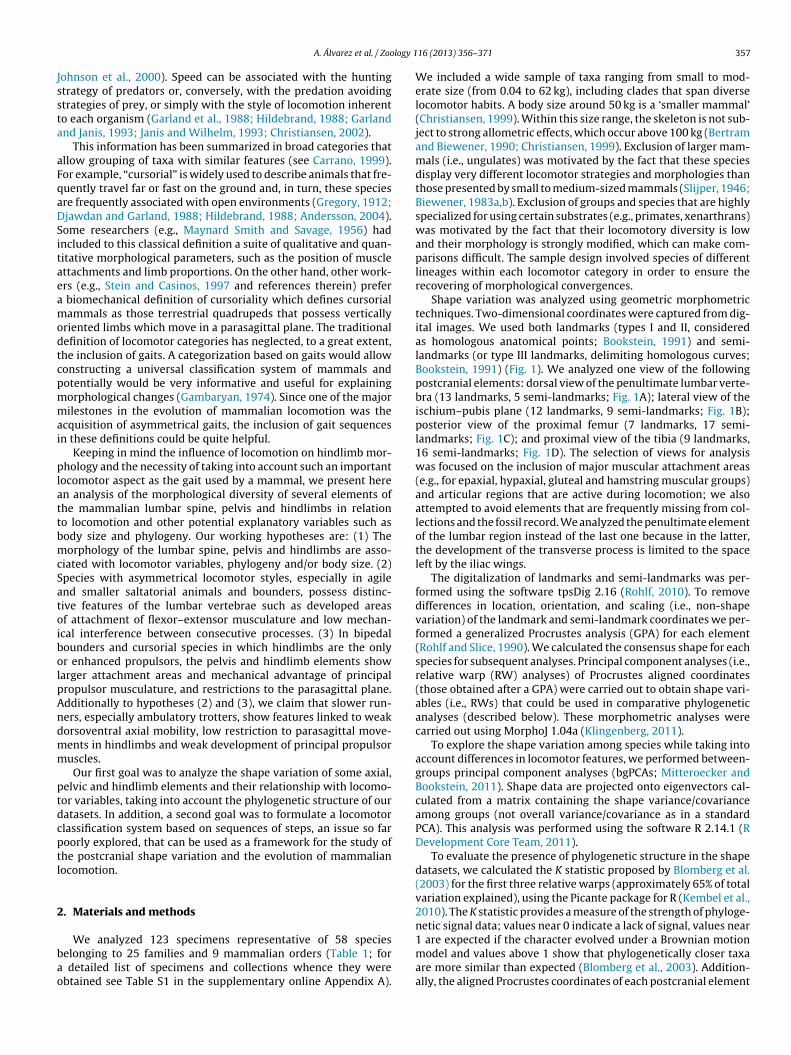
logy 1
Jssta
aFqaDSitaeamodtcpmmai
plattbmcSatoibolpAndmm
ptdcptl
2
bao
A. Álvarez et al. / Zoo
ohnson et al., 2000). Speed can be associated with the huntingtrategy of predators or, conversely, with the predation avoidingtrategies of prey, or simply with the style of locomotion inherento each organism (Garland et al., 1988; Hildebrand, 1988; Garlandnd Janis, 1993; Janis and Wilhelm, 1993; Christiansen, 2002).
This information has been summarized in broad categories thatllow grouping of taxa with similar features (see Carrano, 1999).or example, “cursorial” is widely used to describe animals that fre-uently travel far or fast on the ground and, in turn, these speciesre frequently associated with open environments (Gregory, 1912;jawdan and Garland, 1988; Hildebrand, 1988; Andersson, 2004).ome researchers (e.g., Maynard Smith and Savage, 1956) hadncluded to this classical definition a suite of qualitative and quan-itative morphological parameters, such as the position of musclettachments and limb proportions. On the other hand, other work-rs (e.g., Stein and Casinos, 1997 and references therein) prefer
biomechanical definition of cursoriality which defines cursorialammals as those terrestrial quadrupeds that possess vertically
riented limbs which move in a parasagittal plane. The traditionalefinition of locomotor categories has neglected, to a great extent,he inclusion of gaits. A categorization based on gaits would allowonstructing a universal classification system of mammals andotentially would be very informative and useful for explainingorphological changes (Gambaryan, 1974). Since one of the majorilestones in the evolution of mammalian locomotion was the
cquisition of asymmetrical gaits, the inclusion of gait sequencesn these definitions could be quite helpful.
Keeping in mind the influence of locomotion on hindlimb mor-hology and the necessity of taking into account such an important
ocomotor aspect as the gait used by a mammal, we present heren analysis of the morphological diversity of several elements ofhe mammalian lumbar spine, pelvis and hindlimbs in relationo locomotion and other potential explanatory variables such asody size and phylogeny. Our working hypotheses are: (1) Theorphology of the lumbar spine, pelvis and hindlimbs are asso-
iated with locomotor variables, phylogeny and/or body size. (2)pecies with asymmetrical locomotor styles, especially in agilend smaller saltatorial animals and bounders, possess distinc-ive features of the lumbar vertebrae such as developed areasf attachment of flexor–extensor musculature and low mechan-cal interference between consecutive processes. (3) In bipedalounders and cursorial species in which hindlimbs are the onlyr enhanced propulsors, the pelvis and hindlimb elements showarger attachment areas and mechanical advantage of principalropulsor musculature, and restrictions to the parasagittal plane.dditionally to hypotheses (2) and (3), we claim that slower run-ers, especially ambulatory trotters, show features linked to weakorsoventral axial mobility, low restriction to parasagittal move-ents in hindlimbs and weak development of principal propulsoruscles.Our first goal was to analyze the shape variation of some axial,
elvic and hindlimb elements and their relationship with locomo-or variables, taking into account the phylogenetic structure of ouratasets. In addition, a second goal was to formulate a locomotorlassification system based on sequences of steps, an issue so faroorly explored, that can be used as a framework for the study ofhe postcranial shape variation and the evolution of mammalianocomotion.
. Materials and methods
We analyzed 123 specimens representative of 58 specieselonging to 25 families and 9 mammalian orders (Table 1; for
detailed list of specimens and collections whence they werebtained see Table S1 in the supplementary online Appendix A).
16 (2013) 356– 371 357
We included a wide sample of taxa ranging from small to mod-erate size (from 0.04 to 62 kg), including clades that span diverselocomotor habits. A body size around 50 kg is a ‘smaller mammal’(Christiansen, 1999). Within this size range, the skeleton is not sub-ject to strong allometric effects, which occur above 100 kg (Bertramand Biewener, 1990; Christiansen, 1999). Exclusion of larger mam-mals (i.e., ungulates) was motivated by the fact that these speciesdisplay very different locomotor strategies and morphologies thanthose presented by small to medium-sized mammals (Slijper, 1946;Biewener, 1983a,b). Exclusion of groups and species that are highlyspecialized for using certain substrates (e.g., primates, xenarthrans)was motivated by the fact that their locomotory diversity is lowand their morphology is strongly modified, which can make com-parisons difficult. The sample design involved species of differentlineages within each locomotor category in order to ensure therecovering of morphological convergences.
Shape variation was analyzed using geometric morphometrictechniques. Two-dimensional coordinates were captured from dig-ital images. We used both landmarks (types I and II, consideredas homologous anatomical points; Bookstein, 1991) and semi-landmarks (or type III landmarks, delimiting homologous curves;Bookstein, 1991) (Fig. 1). We analyzed one view of the followingpostcranial elements: dorsal view of the penultimate lumbar verte-bra (13 landmarks, 5 semi-landmarks; Fig. 1A); lateral view of theischium–pubis plane (12 landmarks, 9 semi-landmarks; Fig. 1B);posterior view of the proximal femur (7 landmarks, 17 semi-landmarks; Fig. 1C); and proximal view of the tibia (9 landmarks,16 semi-landmarks; Fig. 1D). The selection of views for analysiswas focused on the inclusion of major muscular attachment areas(e.g., for epaxial, hypaxial, gluteal and hamstring muscular groups)and articular regions that are active during locomotion; we alsoattempted to avoid elements that are frequently missing from col-lections and the fossil record. We analyzed the penultimate elementof the lumbar region instead of the last one because in the latter,the development of the transverse process is limited to the spaceleft by the iliac wings.
The digitalization of landmarks and semi-landmarks was per-formed using the software tpsDig 2.16 (Rohlf, 2010). To removedifferences in location, orientation, and scaling (i.e., non-shapevariation) of the landmark and semi-landmark coordinates we per-formed a generalized Procrustes analysis (GPA) for each element(Rohlf and Slice, 1990). We calculated the consensus shape for eachspecies for subsequent analyses. Principal component analyses (i.e.,relative warp (RW) analyses) of Procrustes aligned coordinates(those obtained after a GPA) were carried out to obtain shape vari-ables (i.e., RWs) that could be used in comparative phylogeneticanalyses (described below). These morphometric analyses werecarried out using MorphoJ 1.04a (Klingenberg, 2011).
To explore the shape variation among species while taking intoaccount differences in locomotor features, we performed between-groups principal component analyses (bgPCAs; Mitteroecker andBookstein, 2011). Shape data are projected onto eigenvectors cal-culated from a matrix containing the shape variance/covarianceamong groups (not overall variance/covariance as in a standardPCA). This analysis was performed using the software R 2.14.1 (RDevelopment Core Team, 2011).
To evaluate the presence of phylogenetic structure in the shapedatasets, we calculated the K statistic proposed by Blomberg et al.(2003) for the first three relative warps (approximately 65% of totalvariation explained), using the Picante package for R (Kembel et al.,2010). The K statistic provides a measure of the strength of phyloge-netic signal data; values near 0 indicate a lack of signal, values near
1 are expected if the character evolved under a Brownian motionmodel and values above 1 show that phylogenetically closer taxaare more similar than expected (Blomberg et al., 2003). Addition-ally, the aligned Procrustes coordinates of each postcranial element
358A
. Á
lvarez et
al. /
Zoology 116 (2013) 356– 371
Table 1Data set compiled for each species, indicating numerical code used in shape analyses (n◦), taxonomic group (order, family), shape analyses in which each species was included (dorsal view of penultimate lumbar vertebrae (L),lateral view of ischio-pubic plate of pelvis (P), posterior view of proximal femur (F), and proximal view of tibia (T)), body mass (BM), maximal running speed (MRS), home range (HR), locomotor type (type), and gait at fast speed(gait). For bibliographic sources see Table S2 in the supplementary online Appendix.
n◦ Species Family Shape analyses BM (kg) MRS (km h−1) HR (km2) Type Gait
Scientific name Common name L P F T
Order Rodentia1 Abrocoma cinerea Ashy chinchilla rat Abrocomidae x x 0.25 ? ? ? ?2 Cavia aperea Brazilian guinea pig Caviidae x x x x 0.8 8 0.0008 Ambulatory Bound3 Dolichotis patagonum Patagonian mara Caviidae x x x x 12 80 1 Cursorial Bound4 Dolichotis salinicola Chacoan mara Caviidae x x 2.05 ? 9.79 Cursorial ?5 Galea musteloides Yellow-toothed cavy Caviidae x x x x 0.235 4.68 ? ? Bound6 Hydrochoerus hydrochaeris Capybara Caviidae x x x x 48.9 12.74 0.19 Cursorial Bound7 Microcavia australis Southern mountain cavy Caviidae x x x x 0.38 ? 0.0045 ? ?8 Chinchilla brevicaudata Chinchilla Chinchillidae x x x x 0.75 ? ? Bounder Bound9 Lagidium viscacia Southern viscacha Chinchillidae x x x x 2.5 ? ? Bounder Bound10 Lagostomus maximus Plain viscacha Chinchillidae x x x x 5.01 ? 0.032 Bounder Bound11 Cuniculus paca Lowland paca Cuniculidae x x x x 9 ? 0.034 ? Bound12 Dasyprocta azarae Azara’ agouti Dasyproctidae x x x 2.5 60 0.034 Cursorial Bound13 Dipodomys sp. Kangaroo rat Heteromyidae x x x x 0.046 26.5 0.005 Ricochetal Bip.hop14 Octodon degus Degu Octodontidae x x 0.18 20.52 0.0071 Bounder Bound15 Pedetes capensis Spring hare Pedetidae x x x x 3 10.1 0.5 Bounder Bip.hop16 Callosciurus erythraeus Palla’ squirrel Sciuridae x x x x 0.385 ? 0.0097 Bounder Bound17 Sciurus vulgaris Eurasian red squirrel Sciuridae x x x x 0.4 20 0.075 Bounder Bound
Order Lagomorpha18 Lepus callotis White-sided jackrabbit Leporidae x x x x 5 50 0.25 Cursorial Gallop19 Oryctolagus cuniculus European rabbit Leporidae x x x x 2 56 0.0136 Bounder Bound20 Sylvilagus brasiliensis Tapeti Leporidae x x x x 1.5 40 0.04 Bounder Bound
Order Carnivora21 Canis lupus Gray wolf Canidae x 35.3 67 394 Cursorial Gallop22 Canis lupus familiaris Dog Canidae x x x x 25 54.95 394 Cursorial Gallop23 Chrysocyon brachyurus Maned wolf Canidae x x x x 25 ? 57 Cursorial ?24 Lycalopex culpaeus Culpeo Canidae x x x x 15.9 ? 4 Cursorial ?25 Lycalopex gymnocercus Pampas fox Canidae x x x x 5 ? 2.63 Cursorial ?26 Nyctereutes procyonoides Raccoon dog Canidae x x x 6 ? 1.5 Ambulatory Gallop27 Acinonyx jubatus Cheetah Felidae x x x x 37.5 110 62.1 Cursorial Gallop28 Felis catus Cat Felidae x x x 3 ? 0.32 Ambulatory Bound29 Leopardus geoffroyi Geoffroy’ cat Felidae x x x x 4.3 ? 5 Ambulatory Bound30 Leopardus pajeros Pampas cat Felidae x x x 5 ? 19.47 Ambulatory Bound31 Leopardus pardalis Ocelot Felidae x x x x 13.55 ? 26 Ambulatory Bound32 Puma concolor Cougar Felidae x 59.4 ? 129 Ambulatory Bound33 Crocuta crocuta Spotted hyena Hyaenidae x x x 61.75 65 25 Cursorial Gallop34 Hyaena hyaena Striped hyena Hyaenidae x x 45 50 152.8 Cursorial Gallop35 Proteles cristata Aardwolf Hyaenidae x 8.5 ? 1.5 ? ?36 Conepatus chinga Molina’ hog-nosed skunk Mephitidae x x x x 1.9 ? 0.194 Ambulatory Gallop37 Spilogale gracilis Western spotted skunk Mephitidae x x x x 4.45 ? 0.45 Ambulatory Bound38 Eira barbara Tayra Mustelidae x x x x 4.62 19.44 12.5 Ambulatory Bound39 Galictis cuja Lesser grison Mustelidae x x x x 1.9 ? ? Ambulatory Bound40 Gulo gulo Wolverine Mustelidae x x x 12.7 45 405 Ambulatory Gallop41 Lyncodon patagonicus Patagonian weasel Mustelidae x x x x 0.225 ? ? ? ?42 Meles anakuma Japanese badger Mustelidae x x x 5.1 ? 1 Ambulatory Gallop43 Meles meles Eurasian badger Mustelidae x x x x 11.6 30 0.87 Ambulatory Gallop44 Mellivora capensis Honey badger Mustelidae x x 9 ? 333 Ambulatory Gallop45 Mustela sp. Weasel Mustelidae x x x x 0.94 ? 0.1425 Bounder Bound46 Procyon cancrivorus Crab-eating raccoon Procyonidae x x x x 10.1 10.91 2.87 Ambulatory Gallop47 Civettictis civetta African civet Viverridae x x x x 10.65 ? ? Ambulatory Gallop
A. Álvarez et al. / Zoology 116 (2013) 356– 371 359
Ord
er
Eri
nac
eom
orp
ha
48
Ate
leri
x
fron
talis
Sou
ther
n
Afr
ican
hed
geh
og
Erin
acei
dae
x
x
x
0.46
8
7
0.28
3
Am
bula
tory
Trot
49
Erin
aceu
s
euro
paeu
s
Wes
tern
Euro
pea
n
hed
geh
og
Erin
acei
dae
x
x
x
x
1.19
1
?
0.15
8
Am
bula
tory
Trot
Ord
er
Hyr
aco
idea
50
Proc
avia
cape
nsis
Roc
k
hyr
ax
Proc
avii
dae
x
x
x
x
3.1
?
0.00
42
Bou
nd
er
Bou
nd
Ord
er
Mac
rosc
elid
ea51
Mac
rosc
elid
es
prob
osci
deus
Shor
t-ea
red
elep
han
t-sh
rew
Mac
rosc
elid
idae
x
x
x
x
0.04
20
0.01
Cu
rsor
ial
Bou
nd
52
Petr
odro
mus
tetr
adac
tylu
s
Fou
r-to
ed
elep
han
t-sh
rew
Mac
rosc
elid
idae
x
x
x
0.22
?
0.01
2
Cu
rsor
ial
Bou
nd
Ord
er
Per
amel
emo
rph
ia53
Isoo
don
mac
rour
us
Nor
ther
n
brow
n
ban
dic
oot
Pera
mel
idae
x
x
x
x
1.8
14.1
0.02
5 B
oun
der
Bou
nd
Ord
er
Das
yuro
mo
rph
ia54
Das
yuru
s
hallu
catu
s
Nor
ther
n
quol
l
Das
yuri
dae
x
x
x
x
0.25
?
0.03
5
Am
bula
tory
Bou
nd
55
Sarc
ophi
lus
harr
isii
Tasm
ania
n
dev
il
Das
yuri
dae
x
6.85
10
13.3
Am
bula
tory
Gal
lop
56
Thyl
acin
us
cyno
ceph
alus
Tasm
ania
n
wol
f
Thyl
acin
idae
x
22.5
? 60
Cu
rsor
ial
Gal
lop
Ord
er
Dip
roto
do
nti
a57
Mac
ropu
s
sp.
Kan
garo
o
Mac
rop
odid
ae
x
x
x
x
33.5
65
2,14
5
Ric
och
etal
Bip
.hop
58
Vom
batu
s
ursi
nus
Coa
rse-
hai
red
wom
bat
Vom
bati
dae
x
x
x
x
26
?
0.17
7
Am
bula
tory
Trot
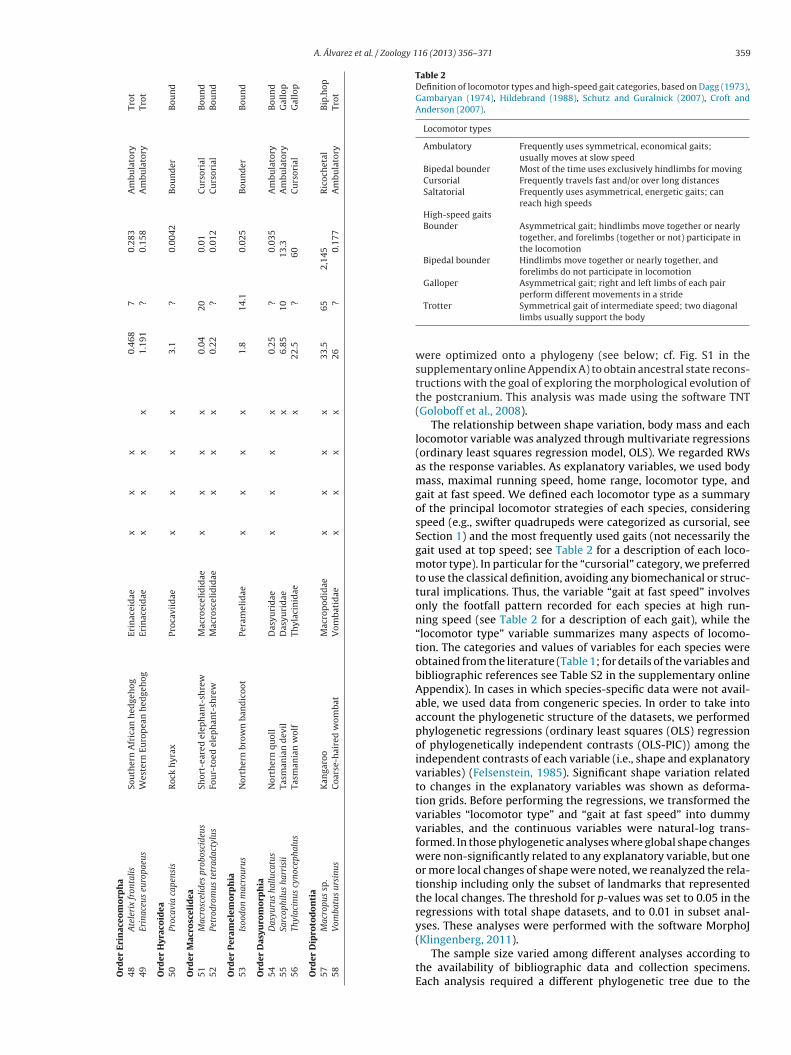
Table 2Definition of locomotor types and high-speed gait categories, based on Dagg (1973),Gambaryan (1974), Hildebrand (1988), Schutz and Guralnick (2007), Croft andAnderson (2007).
Locomotor types
Ambulatory Frequently uses symmetrical, economical gaits;usually moves at slow speed
Bipedal bounder Most of the time uses exclusively hindlimbs for movingCursorial Frequently travels fast and/or over long distancesSaltatorial Frequently uses asymmetrical, energetic gaits; can
reach high speedsHigh-speed gaitsBounder Asymmetrical gait; hindlimbs move together or nearly
together, and forelimbs (together or not) participate inthe locomotion
Bipedal bounder Hindlimbs move together or nearly together, andforelimbs do not participate in locomotion
Galloper Asymmetrical gait; right and left limbs of each pairperform different movements in a stride
Trotter Symmetrical gait of intermediate speed; two diagonallimbs usually support the body
were optimized onto a phylogeny (see below; cf. Fig. S1 in thesupplementary online Appendix A) to obtain ancestral state recons-tructions with the goal of exploring the morphological evolution ofthe postcranium. This analysis was made using the software TNT(Goloboff et al., 2008).
The relationship between shape variation, body mass and eachlocomotor variable was analyzed through multivariate regressions(ordinary least squares regression model, OLS). We regarded RWsas the response variables. As explanatory variables, we used bodymass, maximal running speed, home range, locomotor type, andgait at fast speed. We defined each locomotor type as a summaryof the principal locomotor strategies of each species, consideringspeed (e.g., swifter quadrupeds were categorized as cursorial, seeSection 1) and the most frequently used gaits (not necessarily thegait used at top speed; see Table 2 for a description of each loco-motor type). In particular for the “cursorial” category, we preferredto use the classical definition, avoiding any biomechanical or struc-tural implications. Thus, the variable “gait at fast speed” involvesonly the footfall pattern recorded for each species at high run-ning speed (see Table 2 for a description of each gait), while the“locomotor type” variable summarizes many aspects of locomo-tion. The categories and values of variables for each species wereobtained from the literature (Table 1; for details of the variables andbibliographic references see Table S2 in the supplementary onlineAppendix). In cases in which species-specific data were not avail-able, we used data from congeneric species. In order to take intoaccount the phylogenetic structure of the datasets, we performedphylogenetic regressions (ordinary least squares (OLS) regressionof phylogenetically independent contrasts (OLS-PIC)) among theindependent contrasts of each variable (i.e., shape and explanatoryvariables) (Felsenstein, 1985). Significant shape variation relatedto changes in the explanatory variables was shown as deforma-tion grids. Before performing the regressions, we transformed thevariables “locomotor type” and “gait at fast speed” into dummyvariables, and the continuous variables were natural-log trans-formed. In those phylogenetic analyses where global shape changeswere non-significantly related to any explanatory variable, but oneor more local changes of shape were noted, we reanalyzed the rela-tionship including only the subset of landmarks that representedthe local changes. The threshold for p-values was set to 0.05 in theregressions with total shape datasets, and to 0.01 in subset anal-yses. These analyses were performed with the software MorphoJ
(Klingenberg, 2011).The sample size varied among different analyses according tothe availability of bibliographic data and collection specimens.Each analysis required a different phylogenetic tree due to the
360 A. Álvarez et al. / Zoology 116 (2013) 356– 371
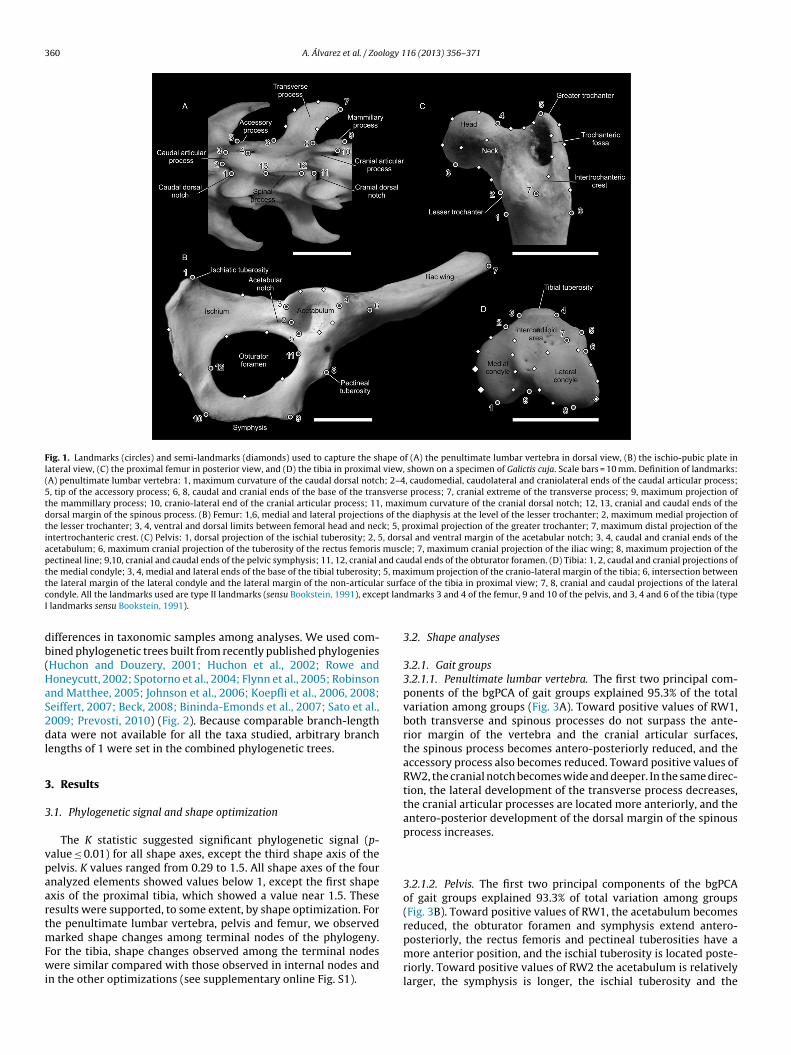
Fig. 1. Landmarks (circles) and semi-landmarks (diamonds) used to capture the shape of (A) the penultimate lumbar vertebra in dorsal view, (B) the ischio-pubic plate inlateral view, (C) the proximal femur in posterior view, and (D) the tibia in proximal view, shown on a specimen of Galictis cuja. Scale bars = 10 mm. Definition of landmarks:(A) penultimate lumbar vertebra: 1, maximum curvature of the caudal dorsal notch; 2–4, caudomedial, caudolateral and craniolateral ends of the caudal articular process;5, tip of the accessory process; 6, 8, caudal and cranial ends of the base of the transverse process; 7, cranial extreme of the transverse process; 9, maximum projection ofthe mammillary process; 10, cranio-lateral end of the cranial articular process; 11, maximum curvature of the cranial dorsal notch; 12, 13, cranial and caudal ends of thedorsal margin of the spinous process. (B) Femur: 1,6, medial and lateral projections of the diaphysis at the level of the lesser trochanter; 2, maximum medial projection ofthe lesser trochanter; 3, 4, ventral and dorsal limits between femoral head and neck; 5, proximal projection of the greater trochanter; 7, maximum distal projection of theintertrochanteric crest. (C) Pelvis: 1, dorsal projection of the ischial tuberosity; 2, 5, dorsal and ventral margin of the acetabular notch; 3, 4, caudal and cranial ends of theacetabulum; 6, maximum cranial projection of the tuberosity of the rectus femoris muscle; 7, maximum cranial projection of the iliac wing; 8, maximum projection of thepectineal line; 9,10, cranial and caudal ends of the pelvic symphysis; 11, 12, cranial and caudal ends of the obturator foramen. (D) Tibia: 1, 2, caudal and cranial projections ofthe medial condyle; 3, 4, medial and lateral ends of the base of the tibial tuberosity; 5, maximum projection of the cranio-lateral margin of the tibia; 6, intersection betweent r surfac pt lanI
db(HaS2dl
3
3
vpaartmFwi
he lateral margin of the lateral condyle and the lateral margin of the non-articulaondyle. All the landmarks used are type II landmarks (sensu Bookstein, 1991), exce
landmarks sensu Bookstein, 1991).
ifferences in taxonomic samples among analyses. We used com-ined phylogenetic trees built from recently published phylogeniesHuchon and Douzery, 2001; Huchon et al., 2002; Rowe andoneycutt, 2002; Spotorno et al., 2004; Flynn et al., 2005; Robinsonnd Matthee, 2005; Johnson et al., 2006; Koepfli et al., 2006, 2008;eiffert, 2007; Beck, 2008; Bininda-Emonds et al., 2007; Sato et al.,009; Prevosti, 2010) (Fig. 2). Because comparable branch-lengthata were not available for all the taxa studied, arbitrary branch
engths of 1 were set in the combined phylogenetic trees.
. Results
.1. Phylogenetic signal and shape optimization
The K statistic suggested significant phylogenetic signal (p-alue ≤ 0.01) for all shape axes, except the third shape axis of theelvis. K values ranged from 0.29 to 1.5. All shape axes of the fournalyzed elements showed values below 1, except the first shapexis of the proximal tibia, which showed a value near 1.5. Theseesults were supported, to some extent, by shape optimization. Forhe penultimate lumbar vertebra, pelvis and femur, we observed
arked shape changes among terminal nodes of the phylogeny.or the tibia, shape changes observed among the terminal nodesere similar compared with those observed in internal nodes and
n the other optimizations (see supplementary online Fig. S1).
ce of the tibia in proximal view; 7, 8, cranial and caudal projections of the lateraldmarks 3 and 4 of the femur, 9 and 10 of the pelvis, and 3, 4 and 6 of the tibia (type
3.2. Shape analyses
3.2.1. Gait groups3.2.1.1. Penultimate lumbar vertebra. The first two principal com-ponents of the bgPCA of gait groups explained 95.3% of the totalvariation among groups (Fig. 3A). Toward positive values of RW1,both transverse and spinous processes do not surpass the ante-rior margin of the vertebra and the cranial articular surfaces,the spinous process becomes antero-posteriorly reduced, and theaccessory process also becomes reduced. Toward positive values ofRW2, the cranial notch becomes wide and deeper. In the same direc-tion, the lateral development of the transverse process decreases,the cranial articular processes are located more anteriorly, and theantero-posterior development of the dorsal margin of the spinousprocess increases.
3.2.1.2. Pelvis. The first two principal components of the bgPCAof gait groups explained 93.3% of total variation among groups(Fig. 3B). Toward positive values of RW1, the acetabulum becomesreduced, the obturator foramen and symphysis extend antero-
posteriorly, the rectus femoris and pectineal tuberosities have amore anterior position, and the ischial tuberosity is located poste-riorly. Toward positive values of RW2 the acetabulum is relativelylarger, the symphysis is longer, the ischial tuberosity and the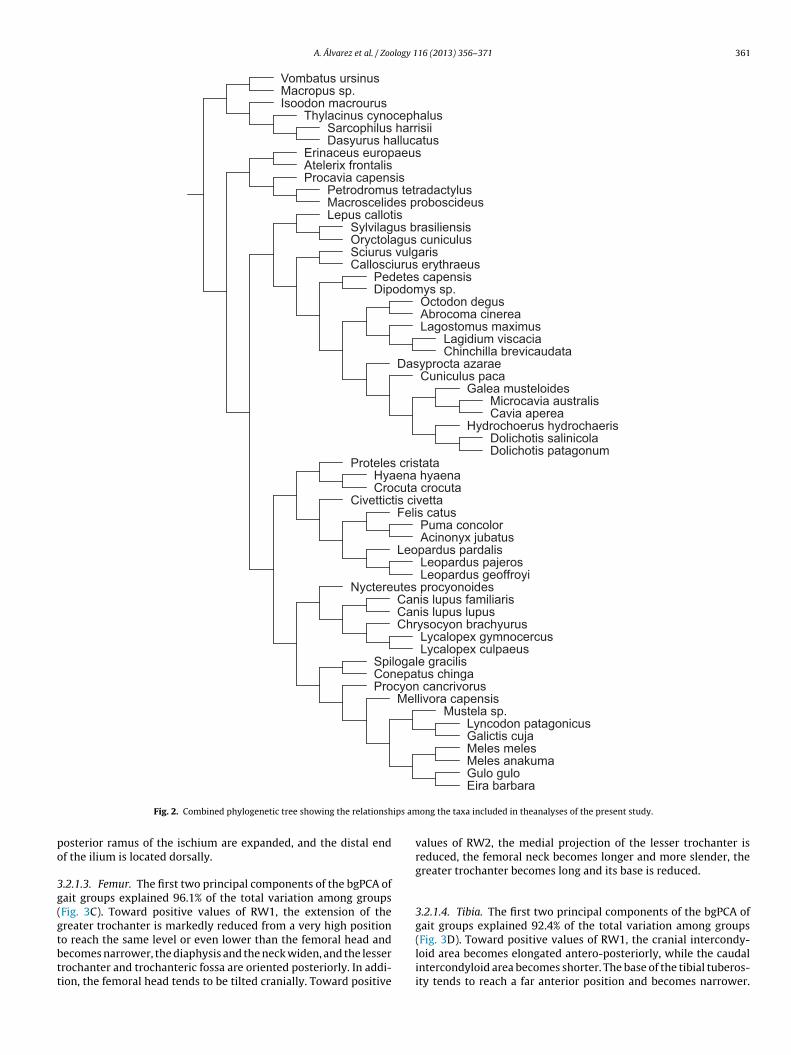
A. Álvarez et al. / Zoology 116 (2013) 356– 371 361
Vom batus ur sinus
Thylacinus cynocephalus
Sylvilagus brasiliensis
Spilogale gracilis
Sciurus vulgaris
Sarcophilus harrisii
Puma concolor
Proteles cristata
Procyon cancrivorus
Procavia capensisPetrodromus tetradactylus
Pedetes capensi s
Oryctolagus cuniculus
Octodon degus
Nyctereutes procyonoides
Mustel a sp.
Microcavia australis
Mellivora capensi s
Meles melesMeles anakuma
Macroscelides proboscideus
Macropus sp.
Lyncodon patagonicus
Lycalopex gymnocercusLycalopex culpaeus
Lepus callotis
Leopardus pardalisLeopardus pajerosLeopardus geoffroyi
Lagostomus maximusLagidium viscacia
Isoodon macrourus
Hydrochoerus hydrochaeris
Hyaena hyaena
Gulo gul o
Galictis cuj a
Galea musteloides
Felis catus
Erinaceus europaeus
Dolichotis salinicol aDolichotis patagonum
Dipodomys sp.
Dasyurus hallucatus
Dasyprocta azaraeCuniculus paca
Crocuta crocut a
Conepatus chinga
Civettictis civetta
Chrysocyon brachyurus
Chinchilla brevicaudata
Cavia aperea
Canis lupus familiarisCanis lupus lupus
Callosciurus erythraeus
Atelerix frontalis
Acinonyx jubatus
Abrocoma cinerea
ips am
po
3g(gtbtt
Fig. 2. Combined phylogenetic tree showing the relationsh
osterior ramus of the ischium are expanded, and the distal endf the ilium is located dorsally.
.2.1.3. Femur. The first two principal components of the bgPCA ofait groups explained 96.1% of the total variation among groupsFig. 3C). Toward positive values of RW1, the extension of thereater trochanter is markedly reduced from a very high position
o reach the same level or even lower than the femoral head andecomes narrower, the diaphysis and the neck widen, and the lesserrochanter and trochanteric fossa are oriented posteriorly. In addi-ion, the femoral head tends to be tilted cranially. Toward positiveEira barbara
ong the taxa included in theanalyses of the present study.
values of RW2, the medial projection of the lesser trochanter isreduced, the femoral neck becomes longer and more slender, thegreater trochanter becomes long and its base is reduced.
3.2.1.4. Tibia. The first two principal components of the bgPCA ofgait groups explained 92.4% of the total variation among groups
(Fig. 3D). Toward positive values of RW1, the cranial intercondy-loid area becomes elongated antero-posteriorly, while the caudalintercondyloid area becomes shorter. The base of the tibial tuberos-ity tends to reach a far anterior position and becomes narrower.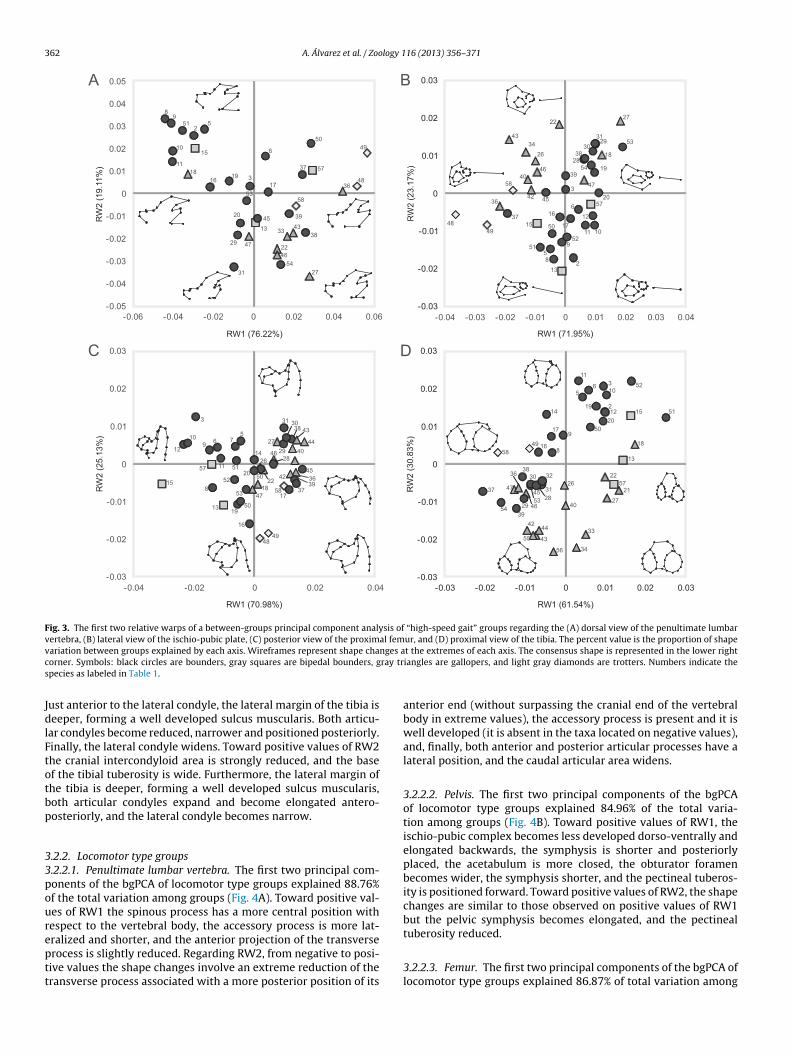
362 A. Álvarez et al. / Zoology 116 (2013) 356– 371
-0.03
-0.02
-0.01
0
0.01
0.02
0.03
-0.04 -0.02 0 0.02 0.04
RW
2(2
5.13
%)
RW1 (70.98%)
-0.03
-0.02
-0.01
0
0.01
0.02
0.03
RW
2(2
3.17
%)
RW1 (71.95%)
RW
2 (1
9.1 1
%)
RW1 (76.22%)
-0.03
-0.02
-0.01
0
0.01
0.02
0.03
-0.03 -0.02 -0.01 0 0.01 0.02 0.03
RW
2(3
0.83
%)
RW1 (61.54%)
A B
C D
-0.06 -0.04 -0.02 0 0.02 0.04 0.06-0.05
-0.04
-0.03
-0.02
-0.01
0
0.01
0.02
0.03
0.04
0.05
-0.04 -0.03 -0.02 -0.01 0 0.01 0.02 0.03 0.04
89
52
15 6
5049
51
10
11
4836
37 57
16 31918
58
17
5431 27
4622
384333
39
134520
29 47
53
3 31
12
10 769
1157 51
14 46 402927
3038 43
44
28
4536
20 50
26
22528
53 4718 58
17
15
501913
16
4948
3739
42
5
2722
3129
301838
2854 19
47
39
2057
26
46
34
4058
42 45
3
36
43
37
4948 15
16
17
6
50
52951
5
2813
11 10
12
53
58
11
52365 10
1419 2
1220
15 51
50179
1849 168
13
2238
37
5439
4027
2157
33
3456
42
4355
44
32
47
36
29 4653
30
452831
26
Fig. 3. The first two relative warps of a between-groups principal component analysis of “high-speed gait” groups regarding the (A) dorsal view of the penultimate lumbarvertebra, (B) lateral view of the ischio-pubic plate, (C) posterior view of the proximal femur, and (D) proximal view of the tibia. The percent value is the proportion of shapev nges ac ray trs
JdlFtotbp
33poureptt
ariation between groups explained by each axis. Wireframes represent shape chaorner. Symbols: black circles are bounders, gray squares are bipedal bounders, gpecies as labeled in Table 1.
ust anterior to the lateral condyle, the lateral margin of the tibia iseeper, forming a well developed sulcus muscularis. Both articu-
ar condyles become reduced, narrower and positioned posteriorly.inally, the lateral condyle widens. Toward positive values of RW2he cranial intercondyloid area is strongly reduced, and the basef the tibial tuberosity is wide. Furthermore, the lateral margin ofhe tibia is deeper, forming a well developed sulcus muscularis,oth articular condyles expand and become elongated antero-osteriorly, and the lateral condyle becomes narrow.
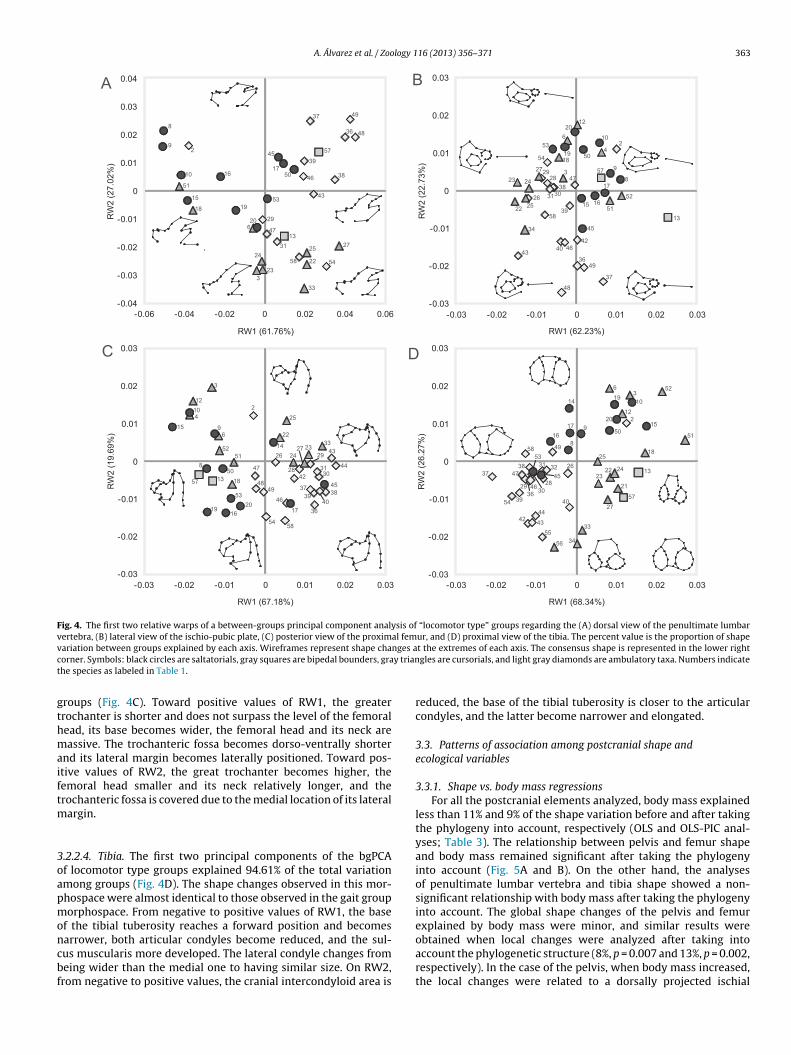
.2.2. Locomotor type groups
.2.2.1. Penultimate lumbar vertebra. The first two principal com-onents of the bgPCA of locomotor type groups explained 88.76%f the total variation among groups (Fig. 4A). Toward positive val-es of RW1 the spinous process has a more central position withespect to the vertebral body, the accessory process is more lat-
ralized and shorter, and the anterior projection of the transverserocess is slightly reduced. Regarding RW2, from negative to posi-ive values the shape changes involve an extreme reduction of theransverse process associated with a more posterior position of itst the extremes of each axis. The consensus shape is represented in the lower rightiangles are gallopers, and light gray diamonds are trotters. Numbers indicate the
anterior end (without surpassing the cranial end of the vertebralbody in extreme values), the accessory process is present and it iswell developed (it is absent in the taxa located on negative values),and, finally, both anterior and posterior articular processes have alateral position, and the caudal articular area widens.
3.2.2.2. Pelvis. The first two principal components of the bgPCAof locomotor type groups explained 84.96% of the total varia-tion among groups (Fig. 4B). Toward positive values of RW1, theischio-pubic complex becomes less developed dorso-ventrally andelongated backwards, the symphysis is shorter and posteriorlyplaced, the acetabulum is more closed, the obturator foramenbecomes wider, the symphysis shorter, and the pectineal tuberos-ity is positioned forward. Toward positive values of RW2, the shapechanges are similar to those observed on positive values of RW1but the pelvic symphysis becomes elongated, and the pectineal
tuberosity reduced.3.2.2.3. Femur. The first two principal components of the bgPCA oflocomotor type groups explained 86.87% of total variation among
A. Álvarez et al. / Zoology 116 (2013) 356– 371 363
-0.03
-0.02
-0.01
0
0.01
0.02
0.03
-0.03 -0.02 -0.01 0 0.01 0.02 0.03
RW
2(1
9.69
%)
RW1 (67.18%)
-0.03
-0.02
-0.01
0
0.01
0.02
0.03
-0.03 -0.02 -0.01 0 0.01 0.02 0.03
RW
2(2
2.73
%)
RW1 (62.23%)
RW
2 (2
7.02
%)
RW1 (61.76%)
-0.03
-0.02
-0.01
0
0.01
0.02
0.03
-0.03 -0.02 -0.01 0 0.01 0.02 0.03
RW
2(2
6.27
%)
RW1 (68.34%)
A B
C D
-0.06 -0.04 -0.02 0 0.02 0.04 0.06-0.04
-0.03
-0.02
-0.01
0
0.01
0.02
0.03
0.04
8
92
37 49
4836
574539
1750 46 3810
51
16
15
18 1953 43
29620
4713
31 2725
5824
22 5423
333
1220
6 10
42
1953
1854
9
8572729
23 24
2526
22
313038
473
3915 16
17
52
5158
4534
43
4240 46
3649
48
37
13
28
50
3
12104
2
25
2233
23 4352 14
96
15
518
50
57 13 18
47 28
26 24
4849
423130
2927
4537
44
3940
38
3617
4653
20
5458
1916
6 523
1910
1220 2
15
5150
14
1716
1884958
2538
3724 1322
2321
5727
403954
47
3629 46 30
5331 32
4528
44
4342
55
56 34
33
26
9
Fig. 4. The first two relative warps of a between-groups principal component analysis of “locomotor type” groups regarding the (A) dorsal view of the penultimate lumbarvertebra, (B) lateral view of the ischio-pubic plate, (C) posterior view of the proximal femur, and (D) proximal view of the tibia. The percent value is the proportion of shapev nges ac y triant
gthmaiftm
3oapmoncbf
ariation between groups explained by each axis. Wireframes represent shape chaorner. Symbols: black circles are saltatorials, gray squares are bipedal bounders, grahe species as labeled in Table 1.
roups (Fig. 4C). Toward positive values of RW1, the greaterrochanter is shorter and does not surpass the level of the femoralead, its base becomes wider, the femoral head and its neck areassive. The trochanteric fossa becomes dorso-ventrally shorter
nd its lateral margin becomes laterally positioned. Toward pos-tive values of RW2, the great trochanter becomes higher, theemoral head smaller and its neck relatively longer, and therochanteric fossa is covered due to the medial location of its lateral
argin.
.2.2.4. Tibia. The first two principal components of the bgPCAf locomotor type groups explained 94.61% of the total variationmong groups (Fig. 4D). The shape changes observed in this mor-hospace were almost identical to those observed in the gait grouporphospace. From negative to positive values of RW1, the base
f the tibial tuberosity reaches a forward position and becomes
arrower, both articular condyles become reduced, and the sul-us muscularis more developed. The lateral condyle changes fromeing wider than the medial one to having similar size. On RW2,rom negative to positive values, the cranial intercondyloid area ist the extremes of each axis. The consensus shape is represented in the lower rightgles are cursorials, and light gray diamonds are ambulatory taxa. Numbers indicate
reduced, the base of the tibial tuberosity is closer to the articularcondyles, and the latter become narrower and elongated.
3.3. Patterns of association among postcranial shape andecological variables
3.3.1. Shape vs. body mass regressionsFor all the postcranial elements analyzed, body mass explained
less than 11% and 9% of the shape variation before and after takingthe phylogeny into account, respectively (OLS and OLS-PIC anal-yses; Table 3). The relationship between pelvis and femur shapeand body mass remained significant after taking the phylogenyinto account (Fig. 5A and B). On the other hand, the analysesof penultimate lumbar vertebra and tibia shape showed a non-significant relationship with body mass after taking the phylogenyinto account. The global shape changes of the pelvis and femurexplained by body mass were minor, and similar results were
obtained when local changes were analyzed after taking intoaccount the phylogenetic structure (8%, p = 0.007 and 13%, p = 0.002,respectively). In the case of the pelvis, when body mass increased,the local changes were related to a dorsally projected ischial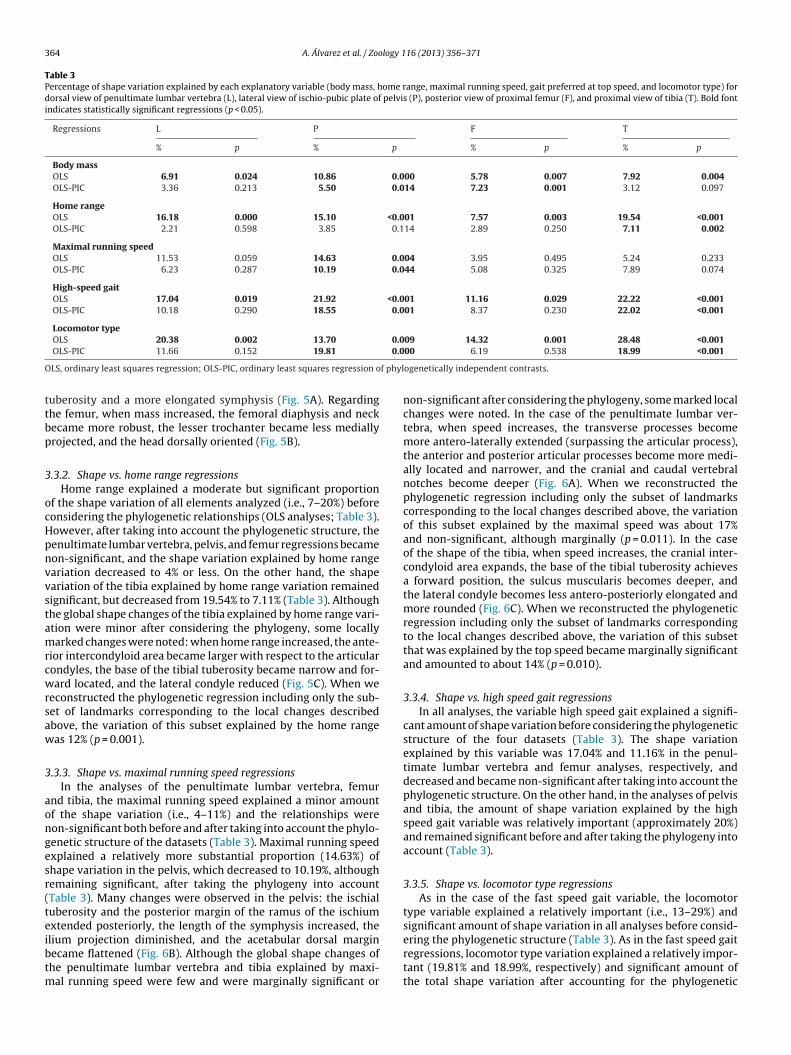
364 A. Álvarez et al. / Zoology 116 (2013) 356– 371
Table 3Percentage of shape variation explained by each explanatory variable (body mass, home range, maximal running speed, gait preferred at top speed, and locomotor type) fordorsal view of penultimate lumbar vertebra (L), lateral view of ischio-pubic plate of pelvis (P), posterior view of proximal femur (F), and proximal view of tibia (T). Bold fontindicates statistically significant regressions (p < 0.05).
Regressions L P F T
% p % p % p % p
Body massOLS 6.91 0.024 10.86 0.000 5.78 0.007 7.92 0.004OLS-PIC 3.36 0.213 5.50 0.014 7.23 0.001 3.12 0.097
Home rangeOLS 16.18 0.000 15.10 <0.001 7.57 0.003 19.54 <0.001OLS-PIC 2.21 0.598 3.85 0.114 2.89 0.250 7.11 0.002
Maximal running speedOLS 11.53 0.059 14.63 0.004 3.95 0.495 5.24 0.233OLS-PIC 6.23 0.287 10.19 0.044 5.08 0.325 7.89 0.074
High-speed gaitOLS 17.04 0.019 21.92 <0.001 11.16 0.029 22.22 <0.001OLS-PIC 10.18 0.290 18.55 0.001 8.37 0.230 22.02 <0.001
Locomotor typeOLS 20.38 0.002 13.70 0.009 14.32 0.001 28.48 <0.001
0.0
O f phyl
ttbp
3
ocHpnvvstamrcwrsaw
3
aongesr(teibtm
OLS-PIC 11.66 0.152 19.81
LS, ordinary least squares regression; OLS-PIC, ordinary least squares regression o
uberosity and a more elongated symphysis (Fig. 5A). Regardinghe femur, when mass increased, the femoral diaphysis and neckecame more robust, the lesser trochanter became less mediallyrojected, and the head dorsally oriented (Fig. 5B).
.3.2. Shape vs. home range regressionsHome range explained a moderate but significant proportion
f the shape variation of all elements analyzed (i.e., 7–20%) beforeonsidering the phylogenetic relationships (OLS analyses; Table 3).owever, after taking into account the phylogenetic structure, theenultimate lumbar vertebra, pelvis, and femur regressions becameon-significant, and the shape variation explained by home rangeariation decreased to 4% or less. On the other hand, the shapeariation of the tibia explained by home range variation remainedignificant, but decreased from 19.54% to 7.11% (Table 3). Althoughhe global shape changes of the tibia explained by home range vari-tion were minor after considering the phylogeny, some locallyarked changes were noted: when home range increased, the ante-
ior intercondyloid area became larger with respect to the articularondyles, the base of the tibial tuberosity became narrow and for-ard located, and the lateral condyle reduced (Fig. 5C). When we
econstructed the phylogenetic regression including only the sub-et of landmarks corresponding to the local changes describedbove, the variation of this subset explained by the home rangeas 12% (p = 0.001).
.3.3. Shape vs. maximal running speed regressionsIn the analyses of the penultimate lumbar vertebra, femur
nd tibia, the maximal running speed explained a minor amountf the shape variation (i.e., 4–11%) and the relationships wereon-significant both before and after taking into account the phylo-enetic structure of the datasets (Table 3). Maximal running speedxplained a relatively more substantial proportion (14.63%) ofhape variation in the pelvis, which decreased to 10.19%, althoughemaining significant, after taking the phylogeny into accountTable 3). Many changes were observed in the pelvis: the ischialuberosity and the posterior margin of the ramus of the ischiumxtended posteriorly, the length of the symphysis increased, the
lium projection diminished, and the acetabular dorsal marginecame flattened (Fig. 6B). Although the global shape changes ofhe penultimate lumbar vertebra and tibia explained by maxi-al running speed were few and were marginally significant or
00 6.19 0.538 18.99 <0.001
ogenetically independent contrasts.
non-significant after considering the phylogeny, some marked localchanges were noted. In the case of the penultimate lumbar ver-tebra, when speed increases, the transverse processes becomemore antero-laterally extended (surpassing the articular process),the anterior and posterior articular processes become more medi-ally located and narrower, and the cranial and caudal vertebralnotches become deeper (Fig. 6A). When we reconstructed thephylogenetic regression including only the subset of landmarkscorresponding to the local changes described above, the variationof this subset explained by the maximal speed was about 17%and non-significant, although marginally (p = 0.011). In the caseof the shape of the tibia, when speed increases, the cranial inter-condyloid area expands, the base of the tibial tuberosity achievesa forward position, the sulcus muscularis becomes deeper, andthe lateral condyle becomes less antero-posteriorly elongated andmore rounded (Fig. 6C). When we reconstructed the phylogeneticregression including only the subset of landmarks correspondingto the local changes described above, the variation of this subsetthat was explained by the top speed became marginally significantand amounted to about 14% (p = 0.010).
3.3.4. Shape vs. high speed gait regressionsIn all analyses, the variable high speed gait explained a signifi-
cant amount of shape variation before considering the phylogeneticstructure of the four datasets (Table 3). The shape variationexplained by this variable was 17.04% and 11.16% in the penul-timate lumbar vertebra and femur analyses, respectively, anddecreased and became non-significant after taking into account thephylogenetic structure. On the other hand, in the analyses of pelvisand tibia, the amount of shape variation explained by the highspeed gait variable was relatively important (approximately 20%)and remained significant before and after taking the phylogeny intoaccount (Table 3).
3.3.5. Shape vs. locomotor type regressionsAs in the case of the fast speed gait variable, the locomotor
type variable explained a relatively important (i.e., 13–29%) andsignificant amount of shape variation in all analyses before consid-
ering the phylogenetic structure (Table 3). As in the fast speed gaitregressions, locomotor type variation explained a relatively impor-tant (19.81% and 18.99%, respectively) and significant amount ofthe total shape variation after accounting for the phylogenetic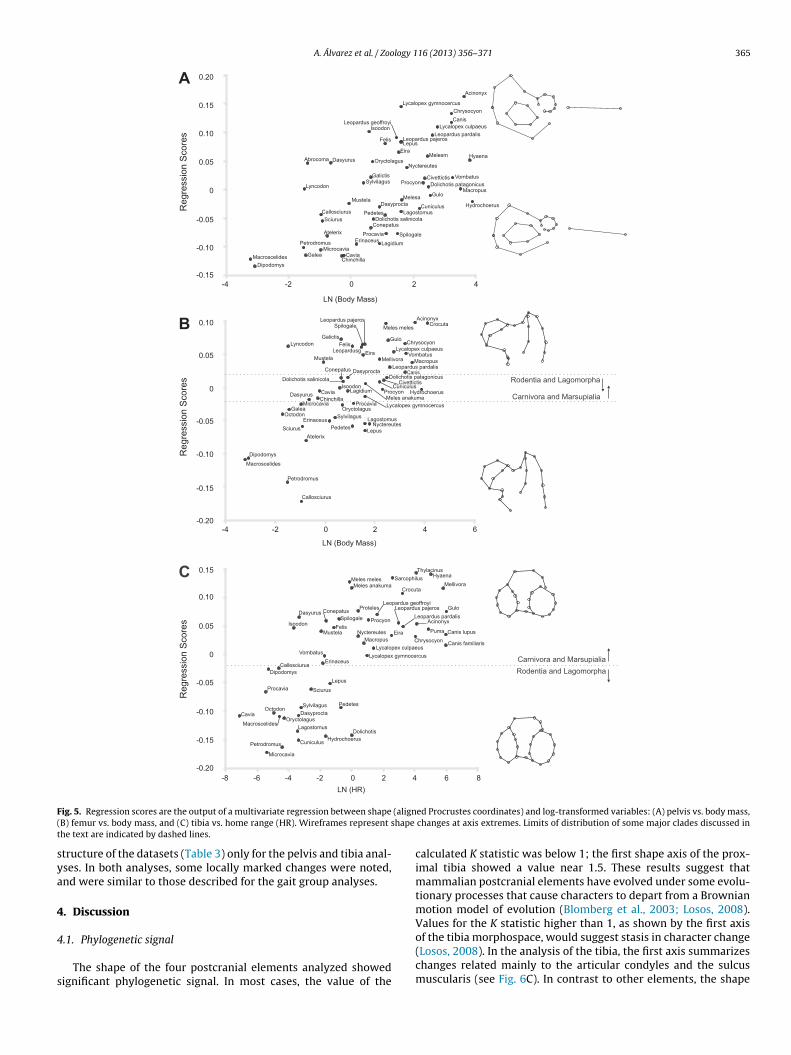
A. Álvarez et al. / Zoology 116 (2013) 356– 371 365
F (align( hape
t
sya
4
4
s
ig. 5. Regression scores are the output of a multivariate regression between shapeB) femur vs. body mass, and (C) tibia vs. home range (HR). Wireframes represent she text are indicated by dashed lines.
tructure of the datasets (Table 3) only for the pelvis and tibia anal-ses. In both analyses, some locally marked changes were noted,nd were similar to those described for the gait group analyses.
. Discussion
.1. Phylogenetic signal
The shape of the four postcranial elements analyzed showedignificant phylogenetic signal. In most cases, the value of the
ed Procrustes coordinates) and log-transformed variables: (A) pelvis vs. body mass,changes at axis extremes. Limits of distribution of some major clades discussed in
calculated K statistic was below 1; the first shape axis of the prox-imal tibia showed a value near 1.5. These results suggest thatmammalian postcranial elements have evolved under some evolu-tionary processes that cause characters to depart from a Brownianmotion model of evolution (Blomberg et al., 2003; Losos, 2008).Values for the K statistic higher than 1, as shown by the first axis
of the tibia morphospace, would suggest stasis in character change(Losos, 2008). In the analysis of the tibia, the first axis summarizeschanges related mainly to the articular condyles and the sulcusmuscularis (see Fig. 6C). In contrast to other elements, the shape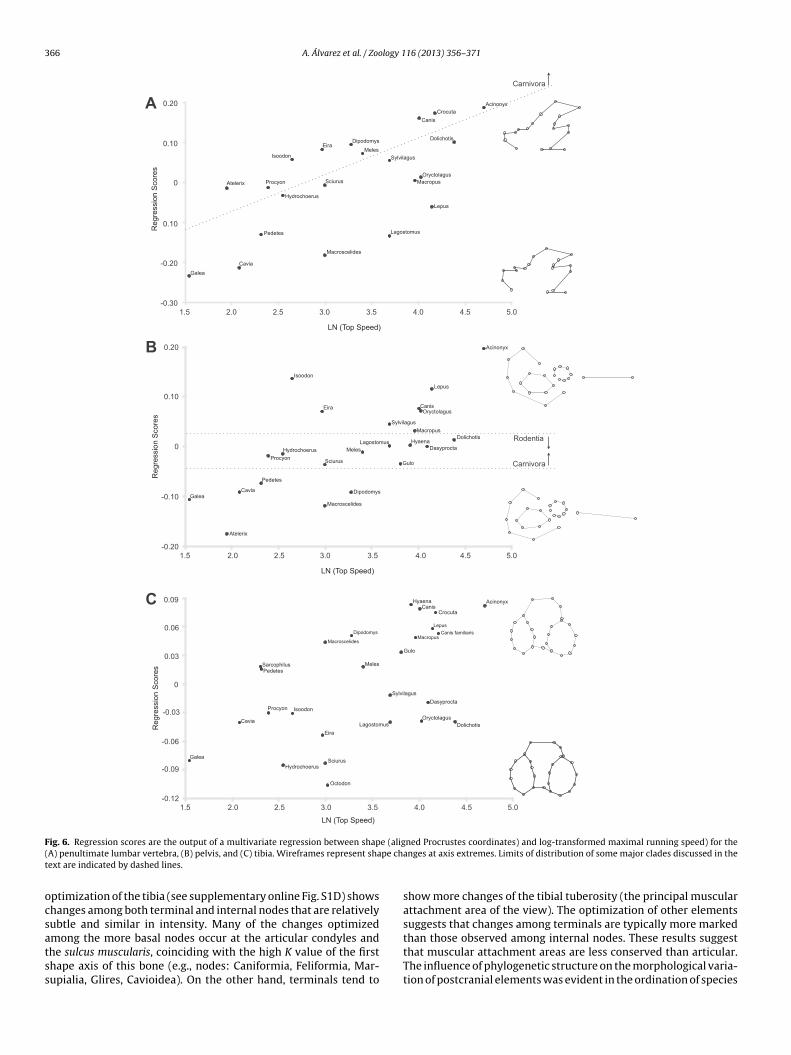
366 A. Álvarez et al. / Zoology 116 (2013) 356– 371
F e (alig( pe cht
ocsatss
ig. 6. Regression scores are the output of a multivariate regression between shapA) penultimate lumbar vertebra, (B) pelvis, and (C) tibia. Wireframes represent shaext are indicated by dashed lines.
ptimization of the tibia (see supplementary online Fig. S1D) showshanges among both terminal and internal nodes that are relativelyubtle and similar in intensity. Many of the changes optimized
mong the more basal nodes occur at the articular condyles andhe sulcus muscularis, coinciding with the high K value of the firsthape axis of this bone (e.g., nodes: Caniformia, Feliformia, Mar-upialia, Glires, Cavioidea). On the other hand, terminals tend toned Procrustes coordinates) and log-transformed maximal running speed) for theanges at axis extremes. Limits of distribution of some major clades discussed in the
show more changes of the tibial tuberosity (the principal muscularattachment area of the view). The optimization of other elementssuggests that changes among terminals are typically more marked
than those observed among internal nodes. These results suggestthat muscular attachment areas are less conserved than articular.The influence of phylogenetic structure on the morphological varia-tion of postcranial elements was evident in the ordination of species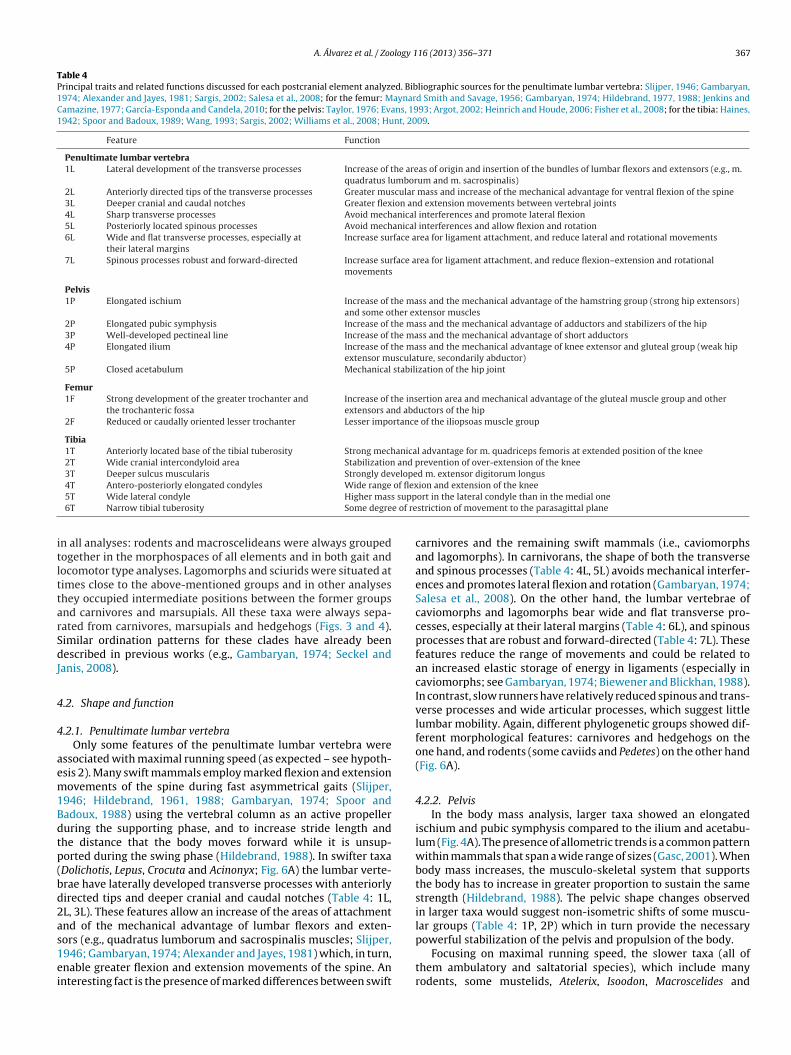
A. Álvarez et al. / Zoology 116 (2013) 356– 371 367
Table 4Principal traits and related functions discussed for each postcranial element analyzed. Bibliographic sources for the penultimate lumbar vertebra: Slijper, 1946; Gambaryan,1974; Alexander and Jayes, 1981; Sargis, 2002; Salesa et al., 2008; for the femur: Maynard Smith and Savage, 1956; Gambaryan, 1974; Hildebrand, 1977, 1988; Jenkins andCamazine, 1977; García-Esponda and Candela, 2010; for the pelvis: Taylor, 1976; Evans, 1993; Argot, 2002; Heinrich and Houde, 2006; Fisher et al., 2008; for the tibia: Haines,1942; Spoor and Badoux, 1989; Wang, 1993; Sargis, 2002; Williams et al., 2008; Hunt, 2009.
Feature Function
Penultimate lumbar vertebra1L Lateral development of the transverse processes Increase of the areas of origin and insertion of the bundles of lumbar flexors and extensors (e.g., m.
quadratus lumborum and m. sacrospinalis)2L Anteriorly directed tips of the transverse processes Greater muscular mass and increase of the mechanical advantage for ventral flexion of the spine3L Deeper cranial and caudal notches Greater flexion and extension movements between vertebral joints4L Sharp transverse processes Avoid mechanical interferences and promote lateral flexion5L Posteriorly located spinous processes Avoid mechanical interferences and allow flexion and rotation6L Wide and flat transverse processes, especially at
their lateral marginsIncrease surface area for ligament attachment, and reduce lateral and rotational movements
7L Spinous processes robust and forward-directed Increase surface area for ligament attachment, and reduce flexion–extension and rotationalmovements
Pelvis1P Elongated ischium Increase of the mass and the mechanical advantage of the hamstring group (strong hip extensors)
and some other extensor muscles2P Elongated pubic symphysis Increase of the mass and the mechanical advantage of adductors and stabilizers of the hip3P Well-developed pectineal line Increase of the mass and the mechanical advantage of short adductors4P Elongated ilium Increase of the mass and the mechanical advantage of knee extensor and gluteal group (weak hip
extensor musculature, secondarily abductor)5P Closed acetabulum Mechanical stabilization of the hip joint
Femur1F Strong development of the greater trochanter and
the trochanteric fossaIncrease of the insertion area and mechanical advantage of the gluteal muscle group and otherextensors and abductors of the hip
2F Reduced or caudally oriented lesser trochanter Lesser importance of the iliopsoas muscle group
Tibia1T Anteriorly located base of the tibial tuberosity Strong mechanical advantage for m. quadriceps femoris at extended position of the knee2T Wide cranial intercondyloid area Stabilization and prevention of over-extension of the knee3T Deeper sulcus muscularis Strongly developed m. extensor digitorum longus
of flex supp
e of re
itlttarSdJ
4
4
aem1Bdtp(bd2as1ei
4T Antero-posteriorly elongated condyles Wide range5T Wide lateral condyle Higher mass6T Narrow tibial tuberosity Some degre
n all analyses: rodents and macroscelideans were always groupedogether in the morphospaces of all elements and in both gait andocomotor type analyses. Lagomorphs and sciurids were situated atimes close to the above-mentioned groups and in other analyseshey occupied intermediate positions between the former groupsnd carnivores and marsupials. All these taxa were always sepa-ated from carnivores, marsupials and hedgehogs (Figs. 3 and 4).imilar ordination patterns for these clades have already beenescribed in previous works (e.g., Gambaryan, 1974; Seckel and
anis, 2008).
.2. Shape and function
.2.1. Penultimate lumbar vertebraOnly some features of the penultimate lumbar vertebra were
ssociated with maximal running speed (as expected – see hypoth-sis 2). Many swift mammals employ marked flexion and extensionovements of the spine during fast asymmetrical gaits (Slijper,
946; Hildebrand, 1961, 1988; Gambaryan, 1974; Spoor andadoux, 1988) using the vertebral column as an active propelleruring the supporting phase, and to increase stride length andhe distance that the body moves forward while it is unsup-orted during the swing phase (Hildebrand, 1988). In swifter taxaDolichotis, Lepus, Crocuta and Acinonyx; Fig. 6A) the lumbar verte-rae have laterally developed transverse processes with anteriorlyirected tips and deeper cranial and caudal notches (Table 4: 1L,L, 3L). These features allow an increase of the areas of attachmentnd of the mechanical advantage of lumbar flexors and exten-
ors (e.g., quadratus lumborum and sacrospinalis muscles; Slijper,946; Gambaryan, 1974; Alexander and Jayes, 1981) which, in turn,nable greater flexion and extension movements of the spine. Annteresting fact is the presence of marked differences between swiftion and extension of the kneeort in the lateral condyle than in the medial onestriction of movement to the parasagittal plane
carnivores and the remaining swift mammals (i.e., caviomorphsand lagomorphs). In carnivorans, the shape of both the transverseand spinous processes (Table 4: 4L, 5L) avoids mechanical interfer-ences and promotes lateral flexion and rotation (Gambaryan, 1974;Salesa et al., 2008). On the other hand, the lumbar vertebrae ofcaviomorphs and lagomorphs bear wide and flat transverse pro-cesses, especially at their lateral margins (Table 4: 6L), and spinousprocesses that are robust and forward-directed (Table 4: 7L). Thesefeatures reduce the range of movements and could be related toan increased elastic storage of energy in ligaments (especially incaviomorphs; see Gambaryan, 1974; Biewener and Blickhan, 1988).In contrast, slow runners have relatively reduced spinous and trans-verse processes and wide articular processes, which suggest littlelumbar mobility. Again, different phylogenetic groups showed dif-ferent morphological features: carnivores and hedgehogs on theone hand, and rodents (some caviids and Pedetes) on the other hand(Fig. 6A).
4.2.2. PelvisIn the body mass analysis, larger taxa showed an elongated
ischium and pubic symphysis compared to the ilium and acetabu-lum (Fig. 4A). The presence of allometric trends is a common patternwithin mammals that span a wide range of sizes (Gasc, 2001). Whenbody mass increases, the musculo-skeletal system that supportsthe body has to increase in greater proportion to sustain the samestrength (Hildebrand, 1988). The pelvic shape changes observedin larger taxa would suggest non-isometric shifts of some muscu-lar groups (Table 4: 1P, 2P) which in turn provide the necessary
powerful stabilization of the pelvis and propulsion of the body.Focusing on maximal running speed, the slower taxa (all ofthem ambulatory and saltatorial species), which include manyrodents, some mustelids, Atelerix, Isoodon, Macroscelides and
3 logy 1
PeArtohoaproeesir
se(attS1earieii5(algrirrtbhe(m(ccgaeciThora
bb(m
68 A. Álvarez et al. / Zoo
rocyon, showed a wide range of shapes (Figs. 4B and 6B), fromxtremely short ischium and symphysis, and elongated ilium (e.g.,telerix) to extremely well developed ischium and symphysis, andeduced ilium (e.g., Isoodon). This great variation could be relatedo other variables, such as phylogeny and gaits, or simply to a lackf selection. The pelvic shapes exhibited by species able to reachigher maximal running speeds converge to a more restricted rangef shapes (Figs. 4B and 6B). Although they belong to different cladesnd locomotor groups, they share an elongated ischium and sym-hysis (Table 4: 1P, 2P) that can be related to the capability ofeaching higher running speeds and to the necessary high powerutput to accelerate and to control direction (Table 4: 1P; Williamst al., 2007). Acinonyx takes this form–function relationship to thextreme (Fig. 6B). This pattern, in which the relationship betweenhape and speed was strong only at higher speeds, highlights hownformative the pelvic shape is, even beyond the non-significantelationship considering the whole range.
In the gait type analysis, the bipedal bounder and bounderpecies, such as Procavia, macroscelideans and rodents, share anlongated ilium and ischium and a well-developed pectineal lineFig. 3B and Table 4: 1P, 3P, 4P) that can be related to the greatmount of energy needed at the hip and knee joint for suppor-ing and moving the body upward with the hindlimbs pushingogether during the propulsive phase of bounding gaits (Maynardmith and Savage, 1956; Gambaryan, 1974; Hildebrand, 1977,988; García-Esponda and Candela, 2010). Another trait is the pres-nce of a moderated or elongated symphysis which, along with
well developed pectineal tuberosity (Table 4: 2P, 3P), can beelated to a marked extension and stabilization of the hip dur-ng bounds and rapid changes of direction in running (Williamst al., 2007). Furthermore, an elongated symphysis could assistn the resistance against the strain on the pelvis induced by thempact after each footfall. Lastly, a closed acetabulum (Table 4:P) suggests mechanical stabilization of the hip during hoppingJenkins and Camazine, 1977; Polly, 2007). Carnivoran, marsupialnd lagomorph bounders, together with bipedal bounders, showedess marked adaptations to jumping than rodents of the same gaitroup (Fig. 3B). Gallopers (Lepus and some carnivores) share aelatively open acetabulum and weak pectineal tuberosity (sim-lar to trotters; Fig. 3B, Table 4: opposed to 3P, 5P) that may beelated to the wide range and independent excursion of the limbselative to the hip required in gallop (compared with bound). Fur-hermore, muscular or mechanical stabilization is less necessaryecause the gallop is a more stable gait than the bound, due to theigher number of independent footfalls at each strike (Van de Graafft al., 1982; Hildebrand, 1988), resulting in reduced strain on bonesGambaryan, 1974; Jenkins and Camazine, 1977). However, the
ore agile galloper species (e.g., Lepus, Acinonyx) shared featuresTable 4: 1P, 2P, opposed to 4P) similar to those of the bounders. Thisonvergence is due to the fact that these mammals run with markedhanges of direction and acceleration and frequently use boundingaits (Hildebrand, 1961; Williams et al., 2007), in the same ways bounders. Trotters such as hedgehogs and Vombatus showed anxtremely reduced symphysis and ischium body, high ischio-pubicomplex, open acetabulum, elongated ilium, and forward-directedschial tuberosity (Fig. 3B and Table 4: 4P, opposed to 1P, 2P, 5P).hese traits are associated with the presence of rapid but weakip extensor and abductor muscles and an increase of the speedf movement generated by the latter muscular groups, since slowunning diminishes the need for strong hip stabilization (Jenkinsnd Camazine, 1977).
In the locomotor type analysis, the saltatorial taxa and bipedal
ounders were grouped together and their space was sharedy some cursorial and ambulatory taxa that bound at speede.g., Dasyurus, Eira, Galictis, feliforms, some caviomorphs andacroscelideans). Similarly to the shape changes observed for
16 (2013) 356– 371
bounders in the gait analysis, the shape that characterizes salta-torial taxa (e.g., elongated ilium and ischio-pubic complex; Fig. 3Band Table 4: 1P, 2P, 4P) is linked to strong propulsion of the bodyand stabilization of the hip (Maynard Smith and Savage, 1956;Jenkins and Camazine, 1977). Cursorials showed a disjunct distri-bution: those that use gallops at top speed (carnivorans) clusteredwith ambulatory species, while those cursorials that use bound orhalf-bound at top speed (many caviomorphs and macroscelideans)clustered with saltatorials or bipedal bounders (Fig. 4B), showingdifferent kinds of cursorial adaptations and capabilities. However,all these species share some features (e.g., elongated ilium, widevertical ramus of the ischium, and a reduced pectineal tuberos-ity; Table 4: 1P, 2P, 4P, opposed to 3P), many of them linked withboth rapid and powerful hip extensor muscles that provide thepossibility of reaching and sustaining fast running. Most ambu-latory species were grouped together (Fig. 4B), showing an openacetabulum, moderate to short symphysis and ischio-pubic com-plex, and a moderate to elongated ilium (Table 4: 4P, opposed to 1P,2P, 5P). These traits suggest a generalized condition with moderateor weak propulsion of the hindlimbs and a wide range of possiblemovements of the hip. As in the penultimate lumbar vertebra anal-ysis, skunks and hedgehogs also converged in a pelvic shape thatsuggests weak and ample movements at the hip.
4.2.3. FemurThe shape changes of the femur related to body mass were
mostly subtle (Fig. 5B). Larger taxa showed a major developmentof the greater trochanter and the trochanteric fossa (Table 4: 1F)in association with an increase of muscular mass and mechani-cal advantage of hip extensor and abductor muscles (Evans, 1993;Argot, 2002; Fisher et al., 2008). These traits together with themore robust femoral neck, also observed in larger taxa, might bea response to the requirements imposed by the increase of bodymass (Hildebrand, 1988), as was also inferred in the analysis ofthe pelvis. The reduction and/or caudal orientation of the lessertrochanter (Table 4: 2F) in larger forms suggest restricted rotationand movements out of the parasagittal plane (Taylor, 1976; Argot,2002; Heinrich and Houde, 2006).
In contrast to many other studies and contrary to what weexpected (hypothesis 3), locomotion variables were not signif-icantly related to the shape variation of the femur (Table 3).Supporting this, the principal component analyses (Figs. 3 and 4)showed a wide superposition of locomotor groups. Some authors(e.g., Elissamburu and Vizcaíno, 2004; Croft and Anderson, 2007;Osbahr et al., 2009; García-Esponda and Candela, 2010), throughdifferent methods, established a functional relationship betweenthe shape of the proximal femur and speed. In our study, phylogenyseems to be a more important factor for understanding the shapevariation of the proximal femur than other factors, even speed orcursoriality. This discrepancy might be due to differences in samplesize. The pattern observed within a wide taxonomic range as shownhere does not exclude the possibility that within some specificclades or functional groups the relation between these variablesand femur shape variation may be significant.
4.2.4. TibiaIn the home range analysis, all the taxa with wider home
ranges were carnivores and dasyuromorphs of medium or largesize, including most canids, felids, large mustelids, hyaenids, Sar-cophilus and Thylacinus. Features observed in these taxa (e.g., widecranial intercondyloid area and anteriorly located base of the tibial
tuberosity; Fig. 5C and Table 4: 1T, 2T) allow strong extension ofthe knee when the hindlimb is extended. This feature seems to beemphasized in cursorial species that travel long distances and useeconomical gaits.
logy 1
rsieavm(fmt1cscgaGm(eb
M(FcahAtolawHsL(ahslo1TtsrmfNp1
mgtoha(tmf
A. Álvarez et al. / Zoo
In maximal running speed analysis, swifter taxa, including manyodents, lagomorphs, canids, felids, hyaenids, Macropus and Gulo,hared a moderately to highly anterior location of the tibial tuberos-ty (Fig. 6C). As mentioned above (Table 4: 1T), this favors strongxtension of the knee and promotes the propulsion and acceler-tion of the body. However, swifter taxa display a wide shapeariation. Within the faster taxa, some caviomorphs and lago-orphs share a moderately anterior location of the tibial tuberosity
Fig. 6C). This feature may be related to the locomotion styles pre-erred by these lineages, including bound and half-bound gaits with
ore crouched postures in which sustaining an extended posi-ion of the knee plays a minor role during propulsion (Gambaryan,974). A typical but not exclusive feature of swifter taxa (e.g.,aviomorphs, lagomorphs, felids, canids) is the presence of a deeperulcus muscularis protecting the extensor digitorum longus mus-le (Wang, 1993; Table 4: 3T), possibly in relation to the use ofaits with strong flexion and extension of the knee such as boundnd swifter half-bound and gallop. Some traits that differentiateulo and hyaenids (Table 4: 2T, absence of the sulcus muscularis)ay provide stabilization and prevent over-extension of the knee
Haines, 1942). Slower taxa showed features converse to thosexhibited by swift taxa, but at the same time were differentiatedy locomotor styles and phylogenetic affinities (Fig. 6C).
In the gait analysis, bounders showed a wide range of shapes.any rodents, lagomorphs, and macroscelideans share many traits
Table 4: 4T, opposed to 1T, sub-equally sized articular condyles;ig. 3D) related to a typically crouched posture. On the other hand,arnivoran bounders showed other traits (e.g., rounded condylesnd a wide lateral one; Table 4: 1T, 5T) that suggest a more extendedabitual posture (Sargis, 2002; Williams et al., 2008; Hunt, 2009).
wide lateral condyle might be related to the importance of theransmission of body mass to the lateral condyle and the degreef fusion between tibia and fibula. Conversely, in many rodents,agomorphs and macroscelideans, the fibula and tibia are fusedt the level of the medial shaft, as an adaptation to swift jumps,hile this does not occur in carnivores (Barnett and Napier, 1953;ildebrand, 1988). Many gallopers, including canids, hyaenids,
ome larger dasyuromorphs (Sarcophilus and Thylacinus), Acinonyx,epus, and larger mustelids (Gulo, Meles and Mellivora), shared traitsTable 4: 1T, 2T, 6T; Fig. 3D) that relate to parasagittal movementsnd attainment of an extended position of the knee. On the otherand, Conepatus, Civettictis, and Procyon showed a more generalizedhape of the tibia, which may be related to the infrequent use of gal-oping in the first two taxa, and arboreal adaptations in the latterne (Azara, 1802; Cabrera and Yepes, 1940; Ewer and Wemmer,974; Taylor, 1976). Hyaenids, Meles, Mellivora, Sarcophilus, andhylacinus shared features (Table 4: 2T, 5T, absence or reduction ofhe sulcus muscularis) related with the enhancement of the weightupport function over speed and range of movements at the knee,esulting in moderate or slower running. These features might beagnified in species in which hindlimb support is enhanced by dif-
erent factors: forelimb digging (Meles and Mellivora; Heptner andaumov, 1967; Van de Graaff et al., 1982), transportation of largerey (hyaenids; Spoor and Belterman, 1986; Turner and Antón,996), or phylogeny (Ercoli et al., 2012).
Finally, trotters, represented by Erinaceus and Vombatus, had aorphology similar to that of the more generalized bounders and
allopers (e.g., sciurids; Fig. 3D). They present a posteriorly locatedibial tuberosity, rounded condyles, a wide lateral one, and absencef the sulcus muscularis. These traits might be related to a crouchedabitual posture with limited flexion and extension movements,nd a wide range of movements outside of the parasagittal plane
Argot, 2002; Sargis, 2002). These features are compatible with trot-ing, but they do not represent a requirement since many otherammals can trot at intermediate speed without possessing theseeatures.
16 (2013) 356– 371 369
In the locomotor type analysis, the distribution of species in themorphospace was very similar to the one observed in the gait anal-ysis (Figs. 3D and 4D). The saltatorials showed a wide distribution inthe morphospace and shared traits (e.g., Table 4: opposed to 1T) andrelated functions similar to those described for bounders in the gaitanalysis. In the same way, the distribution of cursorial species wasvery similar to the one described for gallopers, due to the fact thatmany cursorials are also gallopers (canids, felids, hyaenids, and Thy-lacinus). However, cursorials that use bounding gaits when runningat top speed (cavioids and macroscelideans) together with bipedalbounders were located close to, or overlapping with, saltatorials(Fig. 4D). They shared features that suggest rapid and wide-rangeflexion and extension of the knee, and, as in other cursorial species,powerful extension of the limb at an extended posture (Sargis,2002; Williams et al., 2008; Hunt, 2009). Most ambulatory mam-mals shared rounded and antero-posteriorly short condyles, with amore or less ample lateral condyle, and a reduced or absent sulcusmuscularis (Fig. 4D), in association with a wide range of movementsout of the parasagittal plane.
4.3. Evolutionary trends in mammalian locomotion
We were able to distinguish, in part, the major taxonomiclocomotor groups proposed by Gambaryan (1974): carnivores andsciurids, other rodents such as caviomorphs, and lagomorphs.
Morphological traits that characterize macroscelideans,caviomorphs, and some other rodents (see supplementary onlineFig. S1) are related to relatively rigid backs, wide flexion–extensionon the parasagittal plane of the knee, and a typically crouchedposture of the hindlimb. Lagomorphs are similar but with a moremobile (semi-rigid) back and with strong lumbar flexion thatis marked in Lepus (see also Williams et al., 2007). It has beenproposed that this might be an adaptation to avoiding obstacles,asymmetrical gaits, and to jumping on rocks and other discontin-uous substrates (Gambaryan, 1974; Hildebrand, 1977; Seckel andJanis, 2008), and, in particular for lagomorphs, for landing in smallareas (Gambaryan, 1974).
Carnivores, hedgehogs and marsupials showed a very widerange of functional adaptations. Lumbar mobility and strengthrange from reduced to very high (from mephitids and hedgehogsto some canids and felids) and there exists a wide variation inthe strength of the proximal hindlimb musculature. Carnivores,hedgehogs and marsupials have an adaptive history more linkedto symmetrical gaits at low to moderate speeds, selecting gallopsor secondarily bounding gaits (for carnivores and marsupials) athigher speeds (Dagg, 1973; Hildebrand, 1977, 1988). The relativehigh mobility of the hindlimbs outside of the parasagittal planeobserved in hedgehogs, and in some marsupials and carnivores,was also observed in scansorial rodents such as sciurids, and is asso-ciated with a well developed fibula and considered an adaptationto discontinuous substrates, but may also represent the retentionof a primitive condition in some cases (Barnett and Napier, 1953;Hildebrand, 1988; Argot, 2002).
Furthermore, some cases of convergence between speciesbelonging to different lineages but with similar functional demandsmust be emphasized. Many cursorial species that are not close phy-logenetically, such as some caviomorphs, Lepus, Thylacinus, canids,hyaenids, and felids, share many convergent features (see supple-mentary online Fig. S1) which have frequently been mentionedin the literature (e.g., restrictions to the parasagittal plane, anextended posture, and powerful proximal hindlimb musculature)(Maynard Smith and Savage, 1956; Gambaryan, 1974; Hildebrand,
1988; Garland and Janis, 1993). It is necessary to point out thatthe penultimate lumbar vertebra and femur retain many featureslinked with phylogeny, suggesting different evolutionary ways toreach sustained or swift locomotion. Skunks and hedgehogs, and
3 logy 1
stgFi1atns2
4
litlltptet
iicetim
aemrme
A
u(NawgiNCcC
A
t
R
A
70 A. Álvarez et al. / Zoo
econdarily Vombatus, which present extremely slow running androt as preferred or exclusive swifter gait, showed many conver-ent features in all analyzed elements (see supplementary onlineig. S1), including indicators of weak musculature and/or mobil-ty of the penultimate lumbar vertebra (for a review see Slijper,946), weak development of the hamstring and adductor of the hip,nd a wide range of hindlimb movements outside of the parasagit-al plane. These traits are related to the fact that these species doot need to pursue their prey and present alternative defensivetrategies instead of swift running (Azara, 1802; Nowak, 1991; Caro,009).
.4. Conclusions
In the present study we were able to identify both overall andocal shape changes of several postcranial elements. In addition, thenclusion of several potentially explanatory variables allowed us toake a broader view of the interaction between shape and key eco-ogical factors. The gait-based classification proposed in this studyed to a locomotor group segregation as clear as that obtained withhe traditional classification scheme. Studies that delve into theerformance of both schemes are pending. Our results highlighthe importance of phylogenetic control, given the marked differ-nces in the results obtained before and after taking into accounthe phylogenetic structure of the data.
Body mass was, in some cases, a significant factor for explain-ng shape variation. When allometric relationships are significant,t is crucial to identify associated shape changes because theyould mask purely morpho-functional relationships. Among thelements analyzed here, the penultimate lumbar vertebra and theibia showed a non-significant relationship with body mass; thust might be advisable to preferably use those two elements in
orpho-functional analyses.The significance and intensity of the relationship between shape
nd each locomotor variable was very variable among the differ-nt elements studied. Phylogenetic and allometric interference canake it difficult to establish a simple or direct morpho-functional
elationship. Our results suggest that the studied postcranial ele-ents might be relevant when studying these variables in fossil or
xtant taxa with poorly known ecological traits.
cknowledgments
We want to thank the curators who provided access to materialnder their care, David Flores (MACN), Diego Verzi and Itatí OlivaresMLP), Ricardo and Agustina Ojeda (CRICYT), Damián Romero andatalia Martino (MMP), Rubén Bárquez and Mónica Díaz (CML),nd Walter Joyce (YPMPU). We thank two anonymous reviewershose comments greatly improved this work. We are especially
rateful to Adriá Casinos, Miriam Morales and Ivan Perez for theirnvaluable help with early versions of the manuscript. We thankéstor Toledo for allowing us to use unpublished photographs, andecilia Morgan for help with the English version. This paper is aontribution to projects ANPCyT PICT-2011-309, CONICET PIP 1054,ONICET PIP 0164, and CONICET PIP 0270.
ppendix A. Supplementary data
Supplementary data associated with this article can be found, inhe online version, at http://dx.doi.org/10.1016/j.zool.2013.08.007.
eferences
lexander, R.M., Jayes, A.S., 1981. Estimates of the bending moments exerted by thelumbar and abdominal muscles of some mammals. J. Zool. Lond. 194, 291–303.
16 (2013) 356– 371
Andersson, K., 2004. Elbow-joint morphology as a guide to forearm function andforaging behaviour in mammalian carnivores. Zool. J. Linn. Soc. 142, 91–104.
Argot, C., 2002. Functional-adaptive anatomy of the hindlimb in the Didelphidae, andthe paleobiology of the Paleocene marsupials Mayulestes ferox and Pucadelphysandinus. J. Morphol. 253, 76–108.
Azara, F.D., 1802. Apuntamientos para la Historia Natural de los Quadrúpedos delParaguay y Río de la Plata. Viuda de Ibarra, Madrid.
Barnett, C.H., Napier, J.R., 1953. The rotatory mobility of the fibula in eutherianmammals. J. Anat. 87, 11–21.
Beck, R., 2008. A dated phylogeny of marsupials using a molecular supermatrix andmultiple fossil constraints. J. Mammal. 89, 175–189.
Bertram, J.E.A., Biewener, A.A., 1990. Differential scaling of the long bones in theterrestrial Carnivora and other mammals. J. Morphol. 204, 157–169.
Biewener, A.A., 1983a. Locomotory stresses in the limb bones of two small mammals:the ground squirrel and chipmunk. J. Exp. Biol. 103, 131–154.
Biewener, A.A., 1983b. Allometry of quadrupedal locomotion: the scaling of dutyfactor, bone curvature and limb orientation to body size. J. Exp. Biol. 105,147–171.
Biewener, A.A., Blickhan, R., 1988. Kangaroo rat locomotion: design for elastic energystorage or acceleration? J. Exp. Biol. 140, 243–255.
Bininda-Emonds, O.R.P., Jeffery, J.E., Sánchez-Villagra, M.R., Hanken, J., Colbert, M.W.,Pieau, C., Selwood, L., ten Cate, C.J., Raynaud, A., Osabutey, C.K., Richardson,M.K., 2007. Forelimb–hindlimb developmental timing differences across tetra-pod phylogeny. BMC Evol. Biol. 7, 182.
Blomberg, S.P., Garland Jr., T., Ives, A.R., 2003. Testing for phylogenetic signal incomparative data: behavioral traits are more labile. Evolution 57, 171–745.
Bookstein, F.L., 1991. Morphometric Tolos for Landmark Data: Geometry and Biol-ogy. Cambridge University Press, Cambrigde, Great Bretain.
Cabrera, A., Yepes, J., 1940. Mamíferos Sudamericanos. Vida, Costumbres y Descrip-ción. Companía Argentina de Editores, Buenos Aires, Argentina.
Caro, T., 2009. Contrasting coloration in terrestrial mammals. Phil. Trans. R. Soc. B364, 537–548.
Carrano, M.T., 1999. What, if anything, is a cursor? Categories versus continua fordetermining locomotor habit in mammals and dinosaurs. J. Zool. Lond. 247,29–42.
Christiansen, P., 1999. Scaling of mammalian long bones: small and large mammalscompared. J. Zool. Lond. 247, 333–348.
Christiansen, P., 2002. Mass allometry of the appendicular skeleton in terrestrialmammals. J. Morphol. 251, 195–209.
Croft, D.A., Anderson, L.C., 2007. Locomotion in the extinct notoungulate Proty-potherium. Palaeontol. Electron. 11, 1–20.
Dagg, A.I., 1973. Gaits in mammals. Mamm. Rev. 3, 135–154.Djawdan, M., Garland Jr., T., 1988. Maximal running speeds of bipedal and
quadrupedal rodents. J. Mammal. 69, 765–772.Elissamburu, A., Vizcaíno, S.F., 2004. Limb proportions and adaptations in
caviomorph rodents (Rodentia: Caviomorpha). J. Zool. Lond. 262, 145–159.Ercoli, M.D., Prevosti, F.J., Álvarez, A., 2012. Form and function within a phylo-
genetic framework: locomotor habits of extant predators and some MioceneSparassodonta (Metatheria). Zool. J. Linn. Soc. 165, 224–251.
Evans, H.E., 1993. Miller’s Anatomy of the Dog. W.B. Saunders Co., Philadelphia.Ewer, R.F., Wemmer, C., 1974. The behaviour in captivity of the African civet, Civet-
tictis civetta (Schreber, 1776). Z. Tierpsychol. 34, 359–394.Felsenstein, J., 1985. Phylogenies and the comparative method. Am. Nat. 125, 1–15.Fisher, R.E., Adrian, B., Elrod, C., Hicks, M., 2008. The phylogeny of the red panda
(Ailurus fulgens): evidence from the hindlimb. J. Anat. 213, 607–628.Flynn, J.J., Finarelli, J.A., Zehr, S., Hsu, J., Bedbal, M.A., 2005. Molecular phylogeny
of the Carnivora (Mammalia): assessing the impact of increased sampling onresolving enigmatic relationships. Syst. Biol. 54, 317–337.
Gambaryan, P.P., 1974. How Mammals Run. Wiley, New York.García-Esponda, C.M., Candela, A.M., 2010. Anatomy of the hindlimb musculature
in the cursorial caviomorph Dasyprocta azarae Lichtenstein, 1823 (Roden-tia, Dasyproctidae): functional and evolutionary significance. Mammalia 74,407–422.
Garland Jr., T., Janis, C.M., 1993. Does metatarsal/femur ratio predict maximal run-ning speed in cursorial mammals? J. Zool. Lond. 229, 133–151.
Garland Jr., T., Geiser, F., Baudinette, R.V., 1988. Comparative performance of mar-supial and placental mammals. J. Zool. Lond. 215, 505–522.
Gasc, J.-P., 2001. Comparative aspects of gait, scaling and mechanics in mammals.Comp. Biochem. Physiol. A 131, 121–133.
Goloboff, P.A., Farris, J.S., Nixon, K.C., 2008. TNT, a free program for phylogeneticanalysis. Cladistics 24, 774–786.
Gregory, W.K., 1912. Notes on the principles of quadrupedal locomotion. Ann. N.Y.Acad. Sci. 22, 267–296.
Haines, R.W., 1942. The tetrapod knee joint. J. Anat. 76, 270–301.Heinrich, R.E., Houde, P., 2006. Postcranial anatomy of Viverravus (Mammalia, Car-
nivora) and implications for substrate use in basal Carnivora. J. Vert. Paleont. 26,422–435.
Heptner, V.G., Naumov, N.P., 1967. Sea Cows and Carnivores. Mammals of the SovietUnion, vol. 11. Vysshaya Shkola Publishers, Moscow.
Hildebrand, M., 1961. Further studies on locomotion of the cheetah. J. Mammal. 42,84–91.
Hildebrand, M., 1977. Analysis of asymmetrical gaits. J. Mammal. 58, 131–156.Hildebrand, M., 1988. Analysis of Vertebrate Structure. John Wiley & Sons, New York.Huchon, D., Douzery, E.J.P., 2001. From the Old World to the New World: a molecular
chronicle of the phylogeny and biogeography of hystricognath rodents. Mol.Phylogenet. Evol. 20, 238–251.
logy 1
H
H
J
J
J
J
K
K
K
K
L
M
M
N
O
P
P
R
R
R
A. Álvarez et al. / Zoo
uchon, D., Madsen, O., Sibbald, M.J.J.B., Ament, K., Stanhope, M.J., Catzeflis, F., deJong, W.W., Douzery, E.J.P., 2002. Rodent phylogeny and a timescale for the evo-lution of Glires: evidence from an extensive taxon sampling using three nucleargenes. Mol. Biol. Evol. 19, 1053–1065.
unt Jr., M.R., 2009. Long-legged pursuit carnivorans (Amphicyonidae, Daphoeni-nae) from the early Miocene of North America. Bull. Am. Mus. Nat. Hist. 318,1–95.
anis, C.M., Wilhelm, P.B., 1993. Were there mammalian pursuit predators in thetertiary? Dances with wolf avatars. J. Mamm. Evol. 1, 103–125.
enkins, F.A., Camazine, S.M., 1977. Hip structure and locomotion in ambulatory andcursorial carnivores. J. Zool. Lond. 181, 351–370.
ohnson, D.D.P., Macdonald, D.W., Dickman, A.J., 2000. An analysis and review ofmodels of the sociobiology of the Mustelidae. Mammal. Rev. 30, 171–196.
ohnson, W.E., Eizirik, E., Pecon-Slattery, J., Murphy, W.J., Antunes, A., Teeling, E.,O’Brien, S.J., 2006. The Late Miocene radiation of modern Felidae: a geneticassessment. Science 311, 73–77.
embel, S.W., Cowan, P.D., Helmus, M.R., Cornwell, W.K., Morlon, H., Ackerly, D.D.,Blomberg, S.P., Webb, C.O., 2010. Picante: R tools for integrating phylogeniesand ecology. Bioinformatics 6, 1463–1464.
lingenberg, C.P., 2011. MorphoJ. Faculty of Life Sciences. University of Manchester,Manchester.
oepfli, K.-P., Jenks, S.M., Eizirik, E., Zahirpour, T., Van Valkenburgh, B., Wayne, R.K.,2006. Molecular systematic of the Hyaenidae: relationships of a relictual lineageresolved by a molecular supermatrix. Mol. Phylogenet. Evol. 38, 603–620.
oepfli, K.-P., Deere, K.A., Slater, G.J., Begg, C., Begg, K., Grassman, L., Lucherini, M.,Veron, G., Wayne, R.K., 2008. Multigene phylogeny of the Mustelidae: resolv-ing relationships, tempo and biogeographic history of a mammalian adaptiveradiation. BMC Biol. 6, 10.
osos, J.B., 2008. Phylogenetic niche conservatism, phylogenetic signal and the rela-tionship between phylogenetic relatedness and ecological similarity amongspecies. Ecol. Lett. 11, 995–1007.
aynard Smith, J., Savage, R.C., 1956. Some locomotory adaptations in mammals.Zool. J. Linn. Soc. 42, 603–622.
itteroecker, P., Bookstein, F., 2011. Linear discrimination, ordination, and thevisualization of selection gradients in modern morphometrics. Evol. Biol. 38,100–114.
owak, R.M., 1991. Walker’s Mammals of the World, 5th ed. Johns Hopkins Univer-sity Press, Baltimore.
sbahr, K., Acevedo, P., Villamizar, A., Espinosa, D., 2009. Comparación de laestructura y de la función de los miembros anterior y posterior de Cuniculustaczanowskii y Dinomys branickii. Rev. U. D. C. A. Act. Div. Cient. 6, 37–51.
olly, D., 2007. Limbs in mammalian evolution. In: Hall, B.K. (Ed.), Fins intoLimbs: Evolution, Development and Transformation. University of Chicago Press,Chicago, pp. 245–268.
revosti, F.J., 2010. Phylogeny of the large extinct South American canids (Mammalia,Carnivora, Canidae) using a ‘total evidence’ approach. Cladistics 26, 456–481.
Development Core Team, 2011. R: A Language and Environment for Statisti-cal Computing. R Foundation for Statistical Computing, Vienna, Available at:http://www.r-project.org
obinson, T.J., Matthee, C.A., 2005. Phylogeny and evolutionary origins of the Lep-oridae: a review of cytogenetics, molecular analyses and a supermatrix analysis.Mammal. Rev. 35, 231–247.
ohlf, F.J., 2010. TpsDig 2.16. State University of New York at Stony Brook. StonyBrook, New York, USA, Available at http://life.bio.sunysb.edu/morph/
16 (2013) 356– 371 371
Rohlf, F.J., Slice, D.E., 1990. Extensions of the Procrustes method for the optimalsuperimposition of landmarks. Syst. Zool. 39, 40–59.
Rowe, D.L., Honeycutt, R.L., 2002. Phylogenetic relationships, ecological correlates,and molecular evolution within the Cavioidea (Mammalia, Rodentia). Mol. Biol.Evol. 19, 263–277.
Salesa, M.J., Antón, M., Peigné, S., Morales, J., 2008. Functional anatomy andbiomechanics of the postcranial skeleton of Simocyon batalleri (Viret, 1929)(Carnivora, Ailuridae) from the Late Miocene of Spain. Zool. J. Linn. Soc. 152,593–621.
Sargis, E.J., 2002. Functional morphology of the hindlimb of tupaiids (Mam-malia, Scandentia) and its phylogenetic implications. J. Morphol. 245,149–185.
Sato, J.J., Wolsan, M., Minami, S., Hosoda, T., Shinaga, M.H., Hiyama, K., Yamaguchi,Y., Suzuki, H., 2009. Deciphering and dating the red panda’s ancestry and earlyadaptive radiation of Musteloidea. Mol. Phylogenet. Evol. 53, 907–922.
Schilling, N., Hackert, R., 2006. Sagittal spine movements of small therian mammalsduring asymmetrical gaits. J. Exp. Biol. 209, 3925–3939.
Schutz, H., Guralnick, P.R., 2007. Postcranial element shape and function: assessinglocomotor mode in extant and extinct mustelid carnivorans. Zool. J. Linn. Soc.150, 895–914.
Seckel, L., Janis, C., 2008. Convergences in scapula morphology among small curso-rial mammals: an osteological correlate for locomotory specialization. J. Mamm.Evol. 5, 261–279.
Seiffert, E.R., 2007. A new estimate of afrotherian phylogeny based on simulta-neous analysis of genomic, morphological, and fossil evidence. BMC Evol. Biol.7, 224–237.
Slijper, E.J., 1946. Comparative biologic–anatomical investigations on the verte-bral column and spinal musculature of mammals. Verh. Kon. Ned. Akad. Wet.(Tweede Sectie) 42, 1–128.
Spoor, C.F., Badoux, D.M., 1988. Descriptive and functional myology of the back andhindlimb of the striped hyena (Hyaena hyaena. L. 1758). Anat. Anz. 167, 313–321.
Spoor, C.F., Badoux, D.M., 1989. Descriptive and functional morphology of the loco-motory apparatus of the spotted hyaena (Crocuta crocuta. Erxleben, 1777). Anat.Anz. 168, 261–266.
Spoor, C.F., Belterman, T.H., 1986. Locomotion in Hyaenidae. Contrib. Zool. 56, 24–28.Spotorno, A.E., Valladares, J.P., Marin, J.C., Palma, E., Zuleta, C.R., 2004. Molecular
divergence and phylogenetic relationships of chinchillids (Rodentia: Chinchill-idae). J. Mammal. 85, 384–388.
Stein, B.R., Casinos, A., 1997. What is a cursorial mammal? J. Zool. Lond. 242, 185–192.Taylor, M.E., 1976. The functional anatomy of the hindlimb of some African Viverri-
dae (Carnivora). J. Morphol. 148, 227–254.Turner, A., Antón, M., 1996. The giant hyaena, Pachycrocuta brevirostris (Mammalia,
Carnivora, Hyaenidae). Geobios 29, 455–468.Van de Graaff, K.M., Harper, J., Goslow Jr., G.E., 1982. Analysis of posture and gait
selection during locomotion in the striped skunk (Mephitis mephitis). J. Mammal.63, 582–590.
Wang, X., 1993. Transformation from plantigrady to digitigrady: functional mor-phology of locomotion in Hesperocyon (Canidae: Carnivora). Am. Mus. Novit.3069, 1–23.
Williams, S.B., Payne, R.C., Wilson, A.M., 2007. Functional specialisation of the pelviclimb of the hare (Lepus europeus). J. Anat. 210, 472–490.
Williams, S.B., Wilson, A.M., Rhodes, L., Andrews, J., Payne, R.C., 2008. Functionalanatomy and muscle moment arms of the pelvic limb of an elite sprinting ath-lete: the racing greyhound (Canis familiaris). J. Anat. 213, 361–372.