
Micro and nanoscale domain engineering in lithium niobate and lithium tantalate
Upload
khangminh22Category
view
3download
0
Lithium and S
odium Insertion in N
anostructured Titanates K
un Shen

1
Lithium and Sodium Insertion in
Nanostructured Titanates
Experiments and Simulations
PROEFSCHRIFT
ter verkrijging van de graad van doctor
aan de Technische Universiteit Delft,
op gezag van de Rector Magnificus prof. ir. K. C. A. M. Luyben,
voorzitter van het College voor Promoties,
in het openbaar te verdedigen op maandag 17 november 2014 om 10:00 uur
door
Kun Shen
Master of Engineering in Materials Physics and Chemistry
Central South University, Changsha, China
geboren te Harbin, China

2
Dit proefschrift is goedgekeurd door de promotor:
Prof. dr. F. M. Mulder
Copromotor:
Dr. ir. M. Wagemaker
Samenstelling promotiecommissie:
Rector Magnificus, Voorzitter
Prof. dr. F. M. Mulder Technische Universiteit Delft, promotor
Dr. ir. M. Wagemaker Technische Universiteit Delft, copromotor
Prof. dr. E. H. Brück Technische Universiteit Delft
Dr. E. M. Kelder Technische Universiteit Delft
Prof. dr. P.H.L.Notten Technische Universiteit Eindhoven
Prof. dr. ir. J. E. ten Elshof Universiteit Twente
Prof. dr. A. Schmidt-‐Ott Technische Universiteit Delft
Prof. dr. S. J. Picken Technische Universiteit Delft, Reservelid
Copyright©2014 by Kun Shen
All rights reserved. No part of the material protected by this copyright notice may be produced or utilized in any form or by any means, electronic or mechanical, including photocopying, recording or by any information storage and retrieval system, without written permission from the author.
Printed in The Netherlands by Ipskamp Drukkers
ISBN: 978-‐94-‐6259-‐437-‐1

3
To my parents and Hao

4

5
Contents
Chapter 1 Introduction ...................................................................................................... 7 1.1 General introduction ................................................................................................................. 7 1.2 Lithium ion batteries ................................................................................................................. 8 1.3 Sodium ion battery .................................................................................................................. 11 References .................................................................................................................................... 16
Chapter 2 Methods ......................................................................................................... 19 2.1 Experimental techniques ......................................................................................................... 20
2.1.1 Materials synthesis ......................................................................................................................... 20 2.1.2 Electrode preparation ..................................................................................................................... 20 2.1.3 Electrochemical tests ...................................................................................................................... 21 2.1.4 X-‐ray powder diffraction ................................................................................................................. 23
2.2 DFT calculation ........................................................................................................................ 27 2.2.1 DFT theory ...................................................................................................................................... 27 2.2.2 Average voltage calculation ............................................................................................................ 28 2.2.3 Surface calculation .......................................................................................................................... 30 2.2.4 Cluster expansion ............................................................................................................................ 31
References .................................................................................................................................... 36
Part I Lithium ion insertion in TiO2 anatase ...................................................................... 39 Chapter 3 Impact of particle size on the non-‐equilibrium phase transition of lithium inserted anatase TiO2 .............................................................................................................................. 41
3.1 Introduction ............................................................................................................................ 42 3.2 Methods .................................................................................................................................. 43 3.3 Results and Discussion ............................................................................................................ 45
3.3.1 Size effect on the equilibrium voltage ............................................................................................ 45 3.3.2 In-‐situ x-‐ray diffraction measurements .......................................................................................... 48 3.3.3 Proof of the existence of non-‐equilibrium transformation ............................................................. 57 3.3.4 Summary of the phase transformation stages. .............................................................................. 61
3.4 Conclusions ............................................................................................................................. 64 References .................................................................................................................................... 65
Chapter 4 Thermodynamic study of Li intercalation into LixTiO2 ................................................ 69 4.1 Introduction ............................................................................................................................ 70 4.2 Methods .................................................................................................................................. 71 4.3 Result and discussion .............................................................................................................. 73
4.3.1 Surface termination ........................................................................................................................ 73 4.3.2 Formation energy ............................................................................................................................ 76 4.3.3 Voltage comparison ........................................................................................................................ 81
4.4 Conclusions ............................................................................................................................. 86 References .................................................................................................................................... 87
Part II Sodium ion insertion in sodium titanate and TiO2 anatase .................................... 89 Chapter 5 Na2+xTi6O13 as potential negative electrode material for Na-‐ion batteries .................. 91
5.1 Introduction ............................................................................................................................ 92

6
5.2 Preparation and Methods ....................................................................................................... 93 5.3 Result and discussion .............................................................................................................. 97
5.3.1Electrochemistry .............................................................................................................................. 97 5.3.2 X-‐ray diffraction .............................................................................................................................. 99 5.3.3 DFT ................................................................................................................................................ 102 5.3.4 Discussion ..................................................................................................................................... 106
5.4 Conclusion ............................................................................................................................. 109 References .................................................................................................................................. 110 Appendix ..................................................................................................................................... 112
Chapter 6 Na insertion in TiO2 anatase, bulk versus surface storage ........................................ 117 6.1 Introduction .......................................................................................................................... 118 6.2 Experimental technique ........................................................................................................ 120 6.3 Results and discussion ........................................................................................................... 123 6.4 Conclusions ........................................................................................................................... 133 References .................................................................................................................................. 134
Summary ........................................................................................................................ 137
Samenvatting .................................................................................................................. 141
Acknowledgements ......................................................................................................... 147
Curriculum Vitae ............................................................................................................. 151

7
Chapter 1
Introduction
1.1 General introduction
The energy transition is an enormous challenge confronting humanity in this century.
Energy resources are the foundation of all activity of human beings, and have a very important
strategic position in the development of the economy. However, the strong dependence on the
consumption of fossil fuel leads to serious environmental issues and degradation. Although the
large-‐scale application of fossil fuels has brought tremendous progress in social productivity,
nowadays most countries share the view that the severe environmental pollution caused by the
fossil fuel has a high price for both economy and society. In the United states, the combustion
of fossil fuel results in more than 90% of the greenhouse gas emissions,1-‐3 which is also the
main cause of global warming. Combustion of fossil fuel also produces air pollutants, including
sulfur dioxides and nitrogen oxides, which fall to earth as acid rain, causing severe ecological
damage (e.g. soil acidification).4 In addition to the environmental issues, the growing scarcity
of fossil fuel resources has traditionally been associated with civil unrest, such as the Middle
East oil crisis in the 1970’s. Nuclear energy remains one of the major choices for most countries
8
in tackling global energy shortage, but the nuclear safety remains cause for concern, especially
after the catastrophe at Japan’s Fukushima plant. Against this background, sustainable
energies are providing an alternative energy supply which is appealing and of growing
significance. Based on the information available now sustainable energies cannot only satisfy
the future energy demand but they are also able to reduce the pollution to a minimum.
Normally, more sustainable use of energy is promoted by two approaches: i) development of
renewable energy technologies, replacing or reducing dependence on fossil fuel. Main
renewable energy generation methods include solar energy, wind energy, geothermal energy
and tidal power; ii) enhancement of energy efficiency, reducing the energy consumption and
delivery losses. The intermittent nature of renewables makes that the stability of energy supply
and also the efficient use of renewable electricity demand new energy technology
developments including the efficient large scale storage of electricity5. Due o the excellent
performance for storing electricity Li ion battery received extensive interest in the past decades.
The attention was at first mainly in the electricity storage for mobile applications, but recently
also for static energy storage.
1.2 Lithium ion batteries
The investigation on the electronic storage can be tracked back to the eighteenth century.
Dutch scientist Pieter van Musschenbroek invented the“Leiden jar”, which could store static
electricity between electrodes on two sides of a glass jar. After that, the Lead-‐acid battery, the
first type of recharge battery, was invented by French scientist Gaston Planté in 1859. 6,7 During
the following century, many other types of secondary rechargeable batteries had been
developed, including Ni-‐Cd, and Nickel Metal Hydride (Ni-‐MH) batteries. Since the 1970s, the
rapid development of science and technology has given rise to escalating demands for the
performance of power supplies, getting smaller, cleaner, more efficient and sustainable. The

9
first real lithium ion battery was proposed Whittingham in 1976, reporting a reversible
electrochemical reaction of layered titanium disulfide with lithium metal reaching a 2 Volt
output potential at room temperature.8,9 Since then, many electrode compounds have been
showing excellent reversibility upon lithium intercalation and high lithium storage densities at
suitable potentials, such as graphite,1,3,10 layered MoO3 bronzes,7 TiO2 anatase,8 manganese
spinels,11 Fe(SO4)3,12 and FePO4.13 In the early 90’s, the first commercial lithium ion battery
was developed by Sony and Asahi Kaser.14 Ever since, thanks to its superior energy density,
environmental benign character, and portability compared with other conventional
rechargeable batteries, the lithium ion battery has become the most prevalent power source in
most modern mobile devices, such as cell phone, digital camera, laptop etc.15
How does lithium battery work?
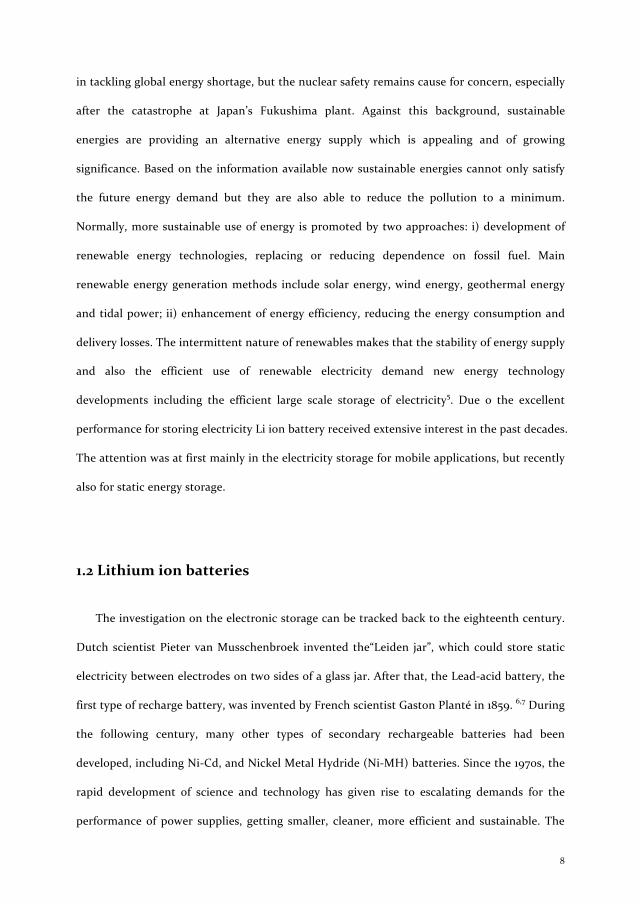
The Lithium ion battery is a secondary battery device, which consists of two kinds of
intercalation compounds/materials, separated by a lithium ion conducting electrolyte. The
operating principle is presented in figure 1.1. During discharge the difference in chemical
potential for lithium between the negative and positive electrode drives the Li-‐ions from the
negative electrode through the electrolyte to intercalate in the positive electrode. To ensure
electric neutrality, the same amount of electrons compensating the Li-‐ion charges has to be
transported through the external circuit because the electrolyte is electronically insulating.
10
Figure 1.1 schematic picture of lithium ion battery discharge
The Li ion battery is one of the most important breakthroughs in energy storage in the last
century, exhibiting many superior features compared with other secondary battery
technologies (including Ni-‐Cd battery, Lead-‐acid battery etc.). The most striking advantage is
the high energy density, which is closely linked to the chemical reaction in both electrodes.16
This feature makes Li ion batteries suitable to power small and mobile electric devices, up to
date occupying more than a 60% share of the portable batteries market16.
However, mobile devices and (hybrid) electrical-‐vehicles demand increasing
charge/discharge rates and energy densities, with the additional demands of high safety, long
cycle life and low material costs. The charge/discharge rate is determined by the intrinsic
diffusivity of Li ion in the electrode materials and the energy density by the capacity and
potential difference of the electrode materials. Nanosizing has been proven to be a powerful
strategy to improve battery performance. It reduces the transport distances within the solid
state particles for both ions and electronic charges15. In addition the shorter reaction pathways
often facilitate new types of reactions and in many materials also lead to higher capacities. 15,17
Other potential advantages include better accommodation of the strain associated with the Li

11
ion intercalation due to relatively free surface expansions, and the more efficient Li exchange
with electrolyte caused by the larger surface areas.15,18 However, the nano sword is double
edged as the larger surface area of nano sized materials both increases undesirable side
reactions between electrode and electrolyte and can decrease the volumetric energy densities
by reduced packing densities of the nanoparticles15,18.
1.3 Sodium ion battery
Lithium ion batteries exhibit excellent performance not only on the high energy density,
but also with respect to long lifetimes and good cycle rate capabilities. However, the scarcity of
lithium and its high cost form a potential constraint for the extensive application of Li-‐ion
batteries technology in electric vehicles and household appliances. Sodium ion batteries were
originally studied at the same time as lithium ion batteries, as Na and Li are in the same series
of alkali metal elements. Owing to the huge success of lithium batteries, the attention for
sodium ion batteries faded in the past decades. In the recent years, motivated by the
increasingly demand for energy storage and relative scarcity of lithium resources, sodium ion
batteries have however been attracting increasing attention again. The most distinct advantage
of sodium ion batteries is the virtually unlimited source and low costs, as illustrated by table 1.
Moreover, although the operating voltage of sodium ion batteries is approximately 0.4V lower
than lithium ion batteries19 resulting in a somewhat lower energy and power density, this low
voltage operation could make sodium ion electrode materials suitable for operation using
aqueous electrolytes. This may be considered as a promising cheap, environmentally friendly
battery concept for static energy storage. In this context Na0.44MnO2 has been reported to work
as a potential positive electrode for aqueous electrolytes (with Na2SO4 as salt) demonstrating
excellent cycling stability for 1000 cycles20.In addition, compared to non-‐aqueous systems,
aqueous systems are cheaper, non-‐flammable, less toxic, and have higher ionic conductivities.21

12
Compared with lithium ions (0.76 Å), Na ions have a larger ionic radius (1.02 Å), which
upon insertion generally results in larger structural distortions of the host structure and larger
diffusion barriers. This might be the prominent cause of the scarcity of reported insertion
electrode materials for sodium ion batteries, especially negative electrode materials.
Table 1 Characteristics of Na and Li metals21
a Purity:98.8-‐99.2%min.; b Battery grade 99.9%; c S.H.E.: standard Hydrogen Electrode.
Characteristics Na Li
Price 0.07-‐0.37a€kg-‐1 4.11-‐4.49b€kg-‐1
Specific Capacity 1.16Ahg-‐1 3.86 Ahg-‐1
Voltage vs S.H.E.c -‐2.7V -‐3.0V
Ionic radius 0.98Å 0.69Å
Melting point 97.7℃ 180.5℃
Atomic mass 22.990u 6.94u
1.4 Motivation and research questions.
This thesis is divided into two parts. First, the particle size dependent phase transition of
lithium inserted anatase TiO2 is investigated both experimentally and theoretically. Secondly,
the Na-‐ion storage in titanate compounds (Na2Ti6O13 and nanocystalline TiO2 anatase) is
studied as potential Na-‐ion negative electrodes.

13
Part I
Anatase TiO2 has been reported as a promising negative electrode for Li-‐ion batteries due to its
ability to reversibly store a large amount of Li ions resulting in excellent gravimetric and
volumetric storage capacities, its chemical stability, abundance and environmental friendly
properties. In the early stage the electrochemistry of bulk anatase TiO2 was intensively studied,
reporting several disadvantages, including poor ionic and electronic conductivity, and low rate
capacity15,18. Recently, nano-‐structuring was found to be a successful strategy to improve these
drawbacks and provide a variety of favorable properties for energy storage15,18,22,23 motivating
the exploration of the impact of nano sizing in anatase TiO2.24-‐27 One of the most striking
features is the large impact of nano-‐sizing on the thermodynamics and kinetics of lithium ion
insertion into anatase TiO2. Compared with micro sized materials, the voltage profile of
nanosized anatase TiO2 displays a much shorter plateau region. 25,28,29 In addition, the phase
transition behavior was found to depend strongly on size30 indicating that the mechanism of
the phase transition in nano TiO2 anatase varies significantly from that in bulk anatase TiO2.
This has motivated formulation of the following two questions:
(1) How does the particle size affect the phase transition behavior?
In chapter 3, a real-‐time characterization technique, in-‐situ X-‐ray diffraction was applied to
monitor the detailed structure changes upon lithiation of different anatase TiO2 particle sizes.
The results from Rietveld refinement of the XRD patters give insight in the two phase
transition behavior, indicating a non-‐equilibrium process existing even at extremely low
lithiation rates. Quasi-‐equilibrium electrochemistry measurements using the galvanostatic
intermittent titration technique (GITT) was applied to study the equilibrium voltage, revealing
a systematic dependence on particle size.
(2) What factors explain systematic thermodynamic property changes, that include the
changing Li insertion phase behavior and decreasing equilibrium voltage when the particle

14
size is reduced? Is this a consequence of the increasing surface/bulk ratio, or an intrinsic
phenomenon related to nanosizing?
In order to gain fundamental understanding of the the nanosizing effects first-‐principle
calculations were performed. The results are presented in chapter 4. Nanosized TiO2 was
modeled by surface slabs having the two thermodynamically stable orientations {101} and {001}.
By using a surface cluster expansion, the phase stability at each Li composition is compared
between different Li arrangements giving insight in the phase transition behavior upon particle
size reduction and the impact of surfaces on the electrochemical performance.
Part II
Based on the low costs of sodium, the renewed interest in Na-‐ion batteries has lead to an
exploration of suitable positive and negative electrode materials. In particular for the latter
only few good materials have been reported, which is mainly attributed to the larger ionic size
of Na ions. The use of Sodium metal as a negative electrode introduces complications such as
dendrite formation, low melting point, high toxicity and interface aging.21 Carbon based
materials, including the extensively investigated graphite and hard carbons, accommodate less
Na-‐ions compared to Li-‐ions and results in high capacity fading.31 In addition the capacitive
storage of Na-‐ions at the graphite surface has the disadvantage of a linear drop in the battery
voltage lowering the energy density.32,33 Due to the competition between inversion and
conversion reactions, only the 3d metal (Ti and V) oxides appear promising to achieve low
voltage Na-‐ion insertion as required for negative electrodes.34 Several promising materials have
been identified including NaxVO2, Na2Ti3O7, anatase TiO2 and Na2Ti6O13.
Particularly, Rudola et al. explored Na-‐ion storage in Na2Ti6O13 demonstrating excellent rate
capacity and cycling stability. Recently, also anatase TiO2 shows promising capacities in

15
particular at the nano-‐sized form35-‐37. Motivated by the promising features of Na2Ti6O13 and
anatase TiO2 two questions form the basis of part II of the thesis.
(3) Is it possible to reversibly (de)insert sodium ion in Na2Ti6O13 at low voltages to increase the
capacity? And more fundamental questions, what are the structural changes and where does
the inserting sodium ion go in Na2Ti6O13?
In chapter 5, the electrochemistry of Na-‐ion storage in Na2Ti6O13 is explored for different
voltage windows. In-‐situ and ex-‐situ X-‐ray diffraction in combination with Density Functional
Theory calculations reveal the intercalation mechanism and structural evolution, giving a
consistent picture of the structural changes and electrochemical performance.
(4) What is the performance of very small nano crystalline TiO2, and what is the structural
evolution and reversibility upon Na insertion? And how does the particle size influence that?
In chapter 6, the Na-‐ion storage in three different particle sizes increasing from 7nm to 130nm
was prepared. Both experiment and calculations are performed to improve the understanding
of the particle size effect on the Na insertion behavior in TiO2 anatase. Distinct increase of the
reversible capacity and fast degradation of the cycling stability was found when the particle
size of TiO2 anatase is reduced. X-‐ray diffraction on the electrode after discharge shows
negligible changes on the crystalline lattice parameters, combined with overall loss of
crystallinity and crystalline domain reduction. The result suggests that unlike the case for Li,
for Na no solid solution nor a reversible crystalline phase transition proceed upon Na
(de)insertion, but rather a severe surface restructuring occurs that enable reversible Na
insertion in the resulting amorphous surface layer on the particles. DFT energy and diffusion
barrier calculation are applied to model the crystalline structure and to estimate the
intercalation voltage and Na ion migration barrier for a crystalline anatase.

16
References
(1) Besenhard, J. O.; Fritz, H. P. Journal of Electroanalytical Chemistry 1974, 53, 329–333.
(2) US EPA, C. C. D. Inventory of U.S. Greenhouse Gas Emissions and Sinks: 1990-‐1998; United states Environmental Protection Agency, 1998.
(3) Guerard, D.; Herold, A. Carbon 1975, 13, 337–345.
(4) Berresheim, H.; Whine, P. H.; D, D. D. Chemistry and Climate of the Atmosphere; Singh, H. B.; Van Nostrand Rheingold, Eds.; 1995.
(5) Mulder, F. M. Journal of Renewable and Sustainable Energy 2014, 6, 033105.
(6) en.wikipedia.org.
(7) Schöllhorn, R.; Kuhlmann, R.; Besenhard, J. O. Materials Research Bulletin 1976, 11, 83–90.
(8) Murphy, D. W.; Cava, R. J.; Zahurak, S. M.; Santoro, A. Solid State Ionics 1983, 9-‐10, 413–417.
(9) Whittingham, M. S. Science 1976, 192, 1126–1127.
(10) Whittingham, M. S. Progress in Solid State Chemistry 1978, 12, 44–99.
(11) Thackeray, M. M.; David, W.; Bruce, P. G.; Goodenough, J. B. Materials Research Bulletin 1983, 18, 461–472.
(12) Manthiram, A.; Goodenough, J. B. Journal of power sources 1989, 26, 403–408.
(13) Padhi, A. K.; Nanjundaswamy, K. S.; Goodenough, J. B. Journal of the Electrochemical Society 1997, 144, 1188–1194.
(14) Lithium-‐ion battery http://en.wikipedia.org/wiki/Lithium-‐ion_battery (accessed Dec 8, 2013).
(15) Bruce, P. G.; Scrosati, B.; Tarascon, J.-‐M. Angewandte Chemie-‐International Edition 2008, 47, 2930–2946.
(16) Tarascon, J. M.; Armand, M. Nature 2001, 414, 359–367.
(17) Jiao, F.; Bruce, P. G. Advanced Materials 2007, 19, 657–660.
(18) Aricò, A. S.; Bruce, P.; Scrosati, B.; Tarascon, J.-‐M.; van Schalkwijk, W. Nature Materials 2005, 4, 366–377.
(19) Ong, S. P.; Chevrier, V. L.; Hautier, G.; Jain, A.; Moore, C.; Kim, S.; Ma, X.; Ceder, G. Energy & Environmental Science 2011, 4, 3680–3688.

17
(20) Whitacre, J. F.; Tevar, A.; Sharma, S. Electrochemistry Communications 2010, 12, 463–466.
(21) Palomares, V.; Serras, P.; Villaluenga, I.; Hueso, K. B.; Carretero-‐Gonz a lez, J.; Rojo, T. O. F. Energy & Environmental Science 2012, 5, 5884–5901.
(22) MAIER, J. Solid State Ionics 2002, 154-‐155, 291–301.
(23) MAIER, J. Nature Materials 2005, 4, 805–815.
(24) Kavan, L.; Grätzel, M.; Rathousky, J.; Zukal, A. Journal of Electrochemistry Society 1996, 143, 394–400.
(25) Sudant, G.; Baudrin, E.; Larcher, D.; Tarascon, J.-‐M. Journal of Materials Chemistry 2005, 15, 1263–1269.
(26) Subramanian, V.; Karki, A.; Gnanasekar, K. I.; Eddy, F. P.; Rambabu, B. Journal of power sources 2006, 159, 186–192.
(27) Kubiak, P.; Fr o schl, T.; H u sing, N.; H o rmann, U.; Kaiser, U.; Schiller, R.; Weiss, C. K.; Landfester, K.; Wohlfahrt-‐Mehrens, M. Small (Weinheim an der Bergstrasse, Germany) 2011, 7, 1690–1696.
(28) Yamada, A.; Koizumi, H.; Nishimura, S.-‐I.; Sonoyama, N.; Kanno, R.; Yonemura, M.; Nakamura, T.; Kobayashi, Y. Nature Materials 2006, 5, 357–360.
(29) Kobayashi, G.; Nishimura, S.-‐I.; Park, M.-‐S.; Kanno, R.; Yashima, M.; Ida, T.; Yamada, A. Advanced Functional Materials 2009, 19, 395–403.
(30) Wagemaker, M.; Borghols, W. J. H.; Mulder, F. M. Journal of the American Chemical Society 2007, 129, 4323–4327.
(31) Doeff, M. M.; Ma, Y.; Visco, S. J.; De Jonghe, C. J. Electrochem. Soc. 1993, 140, L169–L170.
(32) Alcántara, R.; Jiménez-‐Mateos, J. M.; Lavela, P.; Tirado, J. L. Electrochemistry Communications 2001, 3, 639–642.
(33) Alcántara, R.; Lavela, P.; Ortiz, G. F.; Tirado, J. L. Electrochemical and Solid State Letters 2005, 8, A222.
(34) Cabana, J.; Monconduit, L.; Larcher, D.; Palacin, M. R. Advanced Materials 2010, 22, E170–E192.
(35) Xu, Y.; Memarzadeh Lotfabad, E.; Wang, H.; Farbod, B.; Xu, Z.; Kohandehghan, A.; Mitlin, D. Chemical communications (Cambridge, England) 2013, 49, 8973–8975.
(36) Wu, L.; Buchholz, D.; Bresser, D.; Gomes Chagas, L.; Passerini, S. Journal of power sources 2014, 251, 379–385.
(37) Kim, K.-‐T.; Ali, G.; Chung, K. Y.; Yoon, C. S.; Yashiro, H.; Sun, Y.-‐K.; Lu, J.; Amine, K.; Myung, S.-‐T. Nano Letters 2014, 14, 416–422.

18

19
Chapter 2
Methods
In this chapter, the experimental and theoretical approaches used in the thesis will be briefly
described. The main techniques applied in this thesis can be divided into two types:
experimental and computational. These two groups of techniques serve the same goal, and
they are necessarily linked to the same topic of research in a complementary manner, which is
shown in the following chapters. For instance in-‐situ X-‐ray diffraction was applied to different
particle sizes TiO2 anatase upon electrochemical lithiation to probe the phase transition
mechanism. Using Density Functional Theory (DFT) calculations the phase stability and
structural changes on the atomic scale in bulk structures and surface structures were revealed.
The relative stability of Li configurations at different Li compositions resulted in substantial
new insights regarding the particle size effects on the phase transformation that occurs upon
electrochemical lithiation. In part II, the same approach applying in-‐ and ex-‐situ X-‐ray
diffraction and DFT was used to characterize the structural evolution upon Na insertion in
Na2Ti6O13 and anatase TiO2.

20
2.1 Experimental techniques
2.1.1 Materials synthesis
In part I, the pristine material used in the research is commercially available. TiO2 anatase
crystalline particles with three different dimensions (15 nm, 41 nm and 130 nm) were obtained
from Aldrich.
In part II, the pristine material Na2Ti6O13 was prepared from Na2CO3 and TiO2 anatase (Aldrich)
in a mass ratio 0.22:1 by ball milling in a silicon carbide crucible applying the rate of 250 rpm
for 120 minutes. Subsequently, this precursor mixture was heated at 800℃ in open air for 12
hours, applying a heating and cooling ramp rate of 5℃ /min. X-‐ray diffraction analysis
confirmed the presence of the crystalline Na2Ti6O13 phase with less than 10% of unreacted TiO2
anatase in the end product.
2.1.2 Electrode preparation
Electrode preparation for electrochemistry
Electrodes for the electrochemistry measurements were prepared by mixing 80 wt% active
materials (TiO2 anatase or Na2Ti6O13) with 10 wt% conducting carbon black additive (ENSAQO)
and 10wt% polyyinylidene fluoride (PVDF) binder in N-‐methylpyrrolidinone (NMP) solvent.
When the well-‐mixed slurry achieved the appropriate viscosity, it was casted on carbon coated
aluminum foil current collector using the “doctor blade” method. The casted electrodes were
dried in a vacuum furnace at approximately 100℃ for several days.
21
Electrode preparation for in-‐situ XRD
Self-‐supporting thin film electrodes were prepared for the in-‐situ XRD measurements. Firstly,
30 wt% polyvinylidene fluoride (Kynar Power-‐flex binder) and approximately same amount of
dibutyl-‐phthalate (DBP plasticizer) were mixed in acetone. In the final step the DBP plasticizer
was extracted by washing with diethyl ether. The composition mentioned in this recipe is
given by assuming all DBP has been washed out. The solution was stirred until all the materials
were dissolved. Secondly, 50 wt% TiO2 anatase and 20 wt% carbon black were well mixed by 20
times ball milling for 4 minutes at 130 rpm. Thirdly, the ball-‐milled sample was added to the
acetone solution and stirred for several hours until it reached the appropriate viscosity.
Subsequently, the slurry was casted on glass by the “doctor blade” method. In the end, the
prepared film was washed with diethyl ether to extract DBP plasticizer. The coated film was
also dried in a vacuum furnace at around 100℃ for several days.
2.1.3 Electrochemical tests
A Swagelok type cell or vacuum O-‐ring flange cell was used in the electrochemical
measurements. The electrodes were mounted under Argon atmosphere (H2O and O2 <0.1ppm).
The prepared electrodes with a diameter of 13 mm served as positive electrode, and the same
size lithium metal foil served as the negative electrode. The two electrodes were separated by
glass microfiber filter (Whatman) with a few droplets of 1mol/liter LiPF6 (EC:DMC=1:1,
Novolyte) electrolyte.

22
For the in-‐situ XRD measurement, a dedicated airtight electrochemical cell with a
Beryllium window on top was designed and applied for the in-‐situ X-‐ray diffraction
measurements (see figure 2.1). The Beryllium window serves as X-‐ray transparent window and
current collector. A thin aluminum foil (2µm) was used to separate the electrode from the
beryllium window to avoid possible corrosion of the Beryllium. Al can be used at potentials
higher than about 0.2V since at lower voltages Li will also react with the Al. The electrodes
were mounted under Argon atmosphere (H2O and O2 < 0.1 ppm). The prepared self-‐supporting
film was used as positive electrode, and the lithium metal foil was used as the negative
electrode. The two electrodes were separated by glass microfiber filter (Whatman) with a few
droplets of 1mol/liter LiPF6(EC:DMC 1:1, Novolyte) electrolyte.
Figure2.1 the schematic picture of the in-‐situ cell vertical cross-‐section
All the electrochemical characterization was performed by a Maccor 4300 battery cycler.
For the Galvanostatic Intermittent Titration Technique (GITT), aiming at determining the
equilibrium voltage profile, the cells were intermittently discharged at a rate of C/20 (here 1C
is defined as the current required to fully discharge/charge the TiO2 electrode in 1 hour
assuming the maximum composition is Li1Ti1O2)for 30 minutes with relaxation periods
maintained until the voltage variation was lower than 3 mV/h or until the relaxation time
exceeded 20 hours.

23
2.1.4 X-‐ray powder diffraction
In this thesis, X-‐ray diffraction is applied to characterize the materials structures.
Diffraction of an incident X-‐ray beam on the crystal lattice of the sample material results in a
diffracted pattern as a function of diffraction angle. By analyzing the angles, intensities, and
broadening of the diffracted intensities, the unit cell dimensions and symmetry as well as the
atomic positions can be determined, in this case using the Rietveld refinement implemented in
GSAS1. In addition, if the data quality allows also crystalline size and strain can be probed.
In the present research powder x-‐ray diffraction was applied to determine crystalline
phases in battery electrodes consisting of powder particles. A powder can be considered as a
polycrystalline solid, containing a large number of small crystallites, for which the powder
diffraction exhibits an orientation average of all the crystallites in the detected region. All the
X-‐ray diffractions in this thesis were performed using a Panalytical X’pert Pro X-‐ray
diffractometer employing Cu-‐Kα radiation.
For the ex-‐situ X-‐ray diffraction experiments, the air-‐sensitive electrode samples was
removed from the cell and assembled in a Kapton covered airtight X-‐ray diffraction sample
holder. All these operations were performed in a glove box under Argon atmosphere (O2 < 0.1
ppm and H2O < 0.1 ppm).
For the in-‐situ X-‐ray diffraction the cell preparation is described in the electrochemical
section.
Basic theory
When X-‐rays are incident on the lattice planes of the crystal, the scattered waves will be
generated from the elastic scattering interaction between the incoming X-‐rays and the electron
24
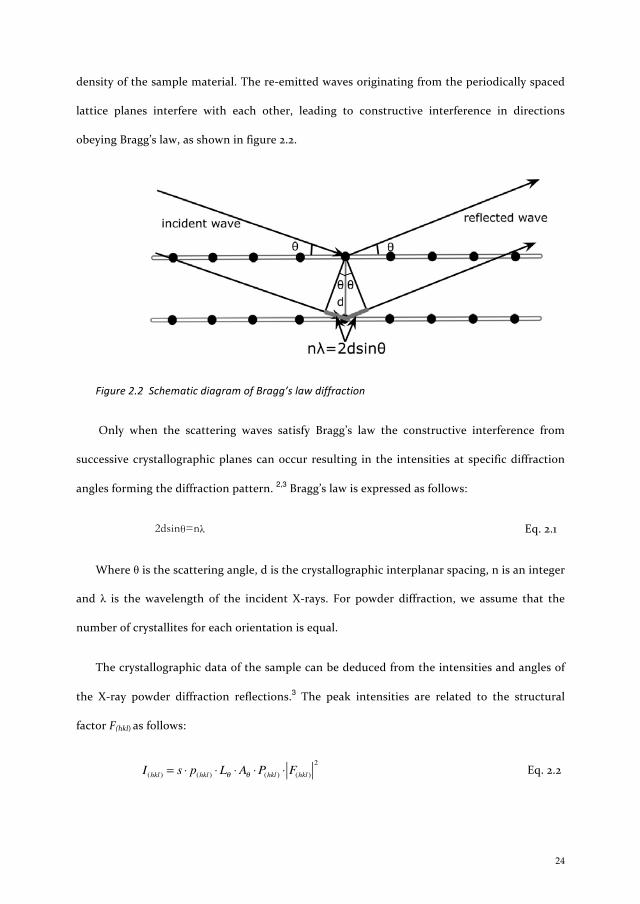
density of the sample material. The re-‐emitted waves originating from the periodically spaced
lattice planes interfere with each other, leading to constructive interference in directions
obeying Bragg’s law, as shown in figure 2.2.
Figure 2.2 Schematic diagram of Bragg’s law diffraction
Only when the scattering waves satisfy Bragg’s law the constructive interference from
successive crystallographic planes can occur resulting in the intensities at specific diffraction
angles forming the diffraction pattern. 2,3 Bragg’s law is expressed as follows:
2dsinθ=nλ Eq. 2.1
Where θ is the scattering angle, d is the crystallographic interplanar spacing, n is an integer
and λ is the wavelength of the incident X-‐rays. For powder diffraction, we assume that the
number of crystallites for each orientation is equal.
The crystallographic data of the sample can be deduced from the intensities and angles of
the X-‐ray powder diffraction reflections.3 The peak intensities are related to the structural
factor F(hkl) as follows:
I(hkl ) = s ⋅ p(hkl ) ⋅Lθ ⋅Aθ ⋅P(hkl ) ⋅ F(hkl )
2 Eq. 2.2

25
Where s is a scale factor, L is the Lorentz-‐polarization, p is the multiplicity, A is the
absorption correction, and P is preferred orientation. Besides the structure factor all other are
independent from the diffraction angle and the sample material, so the peak intensity is
directly proportional to the square of the structural factor. The structural factor is defined as;
F(hkl ) = f j exp[2π i(hxj + kyj + lz j )]exp[−Bj sin
2θ / λ 2 ]j∑ Eq. 2.3
Where f j is the form factor, characterizing the strength and distribution of the scattering
species; the second item of the function is the contents of the unit cell, which determines if a
reflection is allowed or forbidden; the third item of the function is the temperature factor,
which reflect the impact of the thermal motion of the atoms. 3,4
Diffraction peak profile
The shape of the diffraction peaks is determined by instrument and powder specimen
induced broadening. The origin of the instrumental broadening includes non-‐ideal optics of
the diffractometer, wavelength dispersion, sample transparency, axial divergence, flat sample
effects and detector resolution. The contribution from the specimen is mainly caused by the
deviations from ideal crystallinity, such as finite crystallite size and micro stain. The properties
of the powder sample can be extracted by analyzing this broadening.5
No perfect crystal exists in the real world due to its finite size. Diffraction peak broadening
is partly caused by this deviation from the perfect crystallinity. The Scherrer equation
describes the relationship between the crystallite size and the line broadening6 and is as
follows:
L(2θ ) =Kλ
Bcosθ Eq. 2.4

26
Where K is the Scherrer constant, λ is the wavelength of the incident radiation, B is the
integral breadth of the reflection at 2θ and L represents the volume weighted crystallite size.
The crystallite size L is inversely proportional to peak width B.7,8
The lattice strain, generally produced by phase boundaries and dislocations, is a common
phenomenon observed in nanocrystalline materials. Stokes and Wilson first proposed the
strain could give rise to line broadening, which can be described as followed:9
ε(2θ ) =B
4 tanθ Eq. 2.5
Where ε represents the weighted average strain. It is worth mentioning that both
crystallite size and strain vary with the diffraction angle θ, but with a different dependence,
which makes it possible to discriminate the two effects by analysing the resulting angular
dependence of the broadening.
Rietveld refinement
In this thesis Rietveld refinement as implemented in GSAS was applied to extract the
crystal structure details from the diffraction patterns. Rietveld refinement is a method firstly
proposed by Hugo Rietveld when working at the High Flux Reactor in Petten, The Netherlands.
By varying parameters of the theoretical line profile, the difference between the calculated
pattern and the experimental measured pattern can be minimized.
GSAS (General Structure Analysis System) is a comprehensive software package for fitting
both X-‐ray and neutron diffraction patterns with structural models1. With this tool, the
structural details of the crystalline materials including lattice parameters, crystal phase

27
fractions, and domain size broadening of each phases of the sample material can be directly
obtained.
2.2 DFT calculation
In this thesis, several theoretical methods have been applied to determine the
thermodynamic properties of titanium oxides materials upon lithium and sodium insertion.
Determination of thermodynamic properties requires the energetics of the titanium materials
as a function of lithium and sodium insertion. Corresponding First-‐principles calculations use
pseudo potentials to represent the nuclear charges and the valence electrons as input to
predict the quantum state of the valence electrons by solving the electronic Schrödinger
equation
Eq. 2.6
In practice, the physical solution of Schrödinger equation can only be quantitatively estimated
by employing physical approximations. Currently, Density Functional Theory (DFT) has been
considered as the preferred means of the first-‐principles energy calculations. 10,11
2.2.1 DFT theory
DFT is a quantum mechanical modeling method to calculate accurate solutions of
Schrödinger equation by employing a series of physical approximations. It has proved powerful
in energy prediction and electronic structure investigation of a vast class of materials, such as
solid crystal phases and molecules. The main difficulty of DFT is to describe the functional of
exchange and correlation (which is not exact except for a free electron gas). The Local Density

28
Approximation(LDA) 12,13 and the Generalized Gradient Approximation(GGA) 14,15 are the two
most widely used approximations in DFT, making the accurate calculation of physical
quantities become possible.
LDA and GGA provided successful approximations for materials properties prediction, giving
excellent agreement with the experimental data. However, these two approximations do not
work well in all cases. Because LDA and GGA are based on the assumption of homogeneous
electron gas, large error occurs in transition metal oxides which exhibit strong electron
localization16,17. It directly leads to underestimation of the potential of titanate oxides
compounds, which have a strong electron self-‐interaction in the d-‐orbitals 18,19(see chapter 4
and 5).
2.2.2 Average voltage calculation
The average intercalation voltage calculation is mainly based on a paper published in 1997
by M.K.Aydinol and co-‐workers.20 Upon battery (dis)charging the cell voltage varies due to the
interaction of Li-‐ions with the solid state electrode materials. For the lithium half-‐cell, the
equilibrium voltage is determined by the Li chemical potential difference between the positive
electrode and Li metal, as shown in eq 2.720
V (x) = − µLicathod (x)− µLi
anode
zF Eq. 2.7
Where z is the electron charge transported by every lithium ion (z=1 for Li), and F is the
Faraday’s constant. The chemical potential of the Li metal anode is constant. So in the lithium
half-‐cell, the cell voltage directly depends on the chemical potential of the interstitial
compound. We assume that all the transported charge is the result of Li (de)intercalation,

29
. The electrical energy as a function of Li composition (from x1 to x2) can be
estimated by the integral of the voltage times the transferred charge: 20
Eq2.8
Then the average intercalation voltage is
Eq2.9
Where is the chemical potential of Li metal, is the chemical potential of Li in the
interstitial compound and e is the electronic charge.
Therefore, eq 2.9 indicates that the average intercalation voltage can be calculated if the Gibbs
free energy difference between Li compositions is known.
However, the ground state free energy for each Li composition is not easy to obtain due to the
site disorder of lithium ions. The energy dependence on Li disorder can be parameterized by
the cluster expansion method, which will be introduced in section 2.2.4. Besides the
configurational disorder, the entropy effects caused by lattice vibrations and electronic
excitations also add to the Free energy, but are considered to be small and are thus neglected
in the energy calculation in this thesis. 21
According to thermodynamics
Eq. 2.10

30
where is the total energy changes, and are the volume and entropy changes upon
Li (de)intercalation respectively. The contribution from the latter two items of eq. 2.10 can be
neglected, since the term PΔVr and TΔSr is several orders of magnitude smaller than ΔEr .
The average intercalation voltage can therefore be approximated by calculating the total
energies difference ΔEr between two compositions.
2.2.3 Surface calculation
Surface structure construction
In the chapter 4, nanosized lithiated LixTiO2 was modeled by constructing surface slabs.
The periodically repeated crystal atomic structure was separated by vacuum layers around 20 Å.
The thickness of the vacuum layer is varied until the changes on surface energy are lower than
5% compared with the adjacent calculated value. In the VASP calculations, a set of infinite
atomic layers separated by vacuum becomes the periodically repeated unit along the surface
normal, which is schematically presented in figure 2.3. During the ionic relaxation stage, all the
atoms in the system are allowed to move but the cell volume of the supercell is fixed.
Figure2.3 Stacking of the surface slab structure of Li1TiO2 structure along the {001} direction. The
blank area represents the vacuum, light blue polyhedral represents the Li octahedral, and the pink
polyhedral represents the Ti octahedral, and the red atoms represents oxygen.

31
Wulff construction
The Wulff construction enables the determination of the equilibrium particle shape of a
given crystal.22 The equilibrium shape requires that the total surface energy must be
minimized at a fixed volume. For this the surface energies of various crystallographic
orientations need to be calculated. The polar plot of the surface energies is performed by
drawing a vector along the corresponding orientation, the length of which equals to
. Then a plane perpendicular to the orientation, passing through the end point of , is
draw . The Wulff construction is formed by the inner envelop of all these planes. In this thesis,
the “Wulffman” software is used to generate the Wulff shape of crystals.
2.2.4 Cluster expansion
Surface cluster expansion
For the generally known Li ordering phase, the ground state energy calculation (DFT) is
sufficient to determine some properties, such as the band structure and redox voltage etc. But
for the LixMO2 that deviates from stoichiometry, the uncertainty of Li distribution over the
possible lithium sites in the host leads to a degree of disorder and a number of different
energies. Besides that, at non-‐zero temperature, the thermal energy in the system will also
result in continous changes of the Li-‐vacancy arrangements in the host structure, potentially
different from the ground state. It means that the energies of all possible Li-‐vacancy
configurations need to be calculated by DFT calculation, which is practically limited by the
computational time.

32
In the past decade, methods to solve this problem have been well developed by, among
others, Ceder’s group, namely cluster expansion.23-26 Cluster expansion is a powerful tool to
construct an accurate extrapolation of total energy of any possible Li-‐vacancy configuration in
the system based on first-‐principles energy calculations of a few ordered configurations. The
main approach can be summarized as followed27:
i) A variety of symmetry inequivalent Li-‐vacancy configurations over the well-‐defined
interstitial sites of host structure are enumerated by cluster expansion formalism(see figure
2.4), the total energies of which are calculated with DFT using VASP code.
ii) By parameterizing cluster expansion over the relevant configurations with the energetic
data obtained in the first step, the total energies of arbitrary Li-‐vacancy configurations can be
accurately and rapidly extrapolated by this converged cluster expansion.
iii) This cluster expansion is then evaluated as input in the Monte Carlo simulation to
calculated the thermodynamic properties of the system, such as free energy, chemical potential
and phase diagram etc.
It is worthy to note that in the cluster expansion, we only consider the configurational
degree of freedom associated with lithium ions hopping (Li-‐vacancy arrangements), but
neglect the fluctuations from lattice vibration and electronic excitations, which occur in much
shorter time scale.

33
Figure 2.4 Occupation of Li sites in analogy to spin variables in the LixTiO2 structure. Pink polyhedral is
the TiO6 octahedral, red atoms are oxygen and blue atoms are the lithium ions. The yellow atom
represents the spin variables, the value of which is varied between +1 and -‐1 when this site is
occupied by lithium or vacancy.
According to Ising model, we introduce a configurational variables , which is analogous
to a spin variable representing whether the site is occupied (+1) or not (-‐1), as shown in figure
2.4. Then
Eq2.11
can be defined to uniquely represent a specific configuration. In practice, the called cluster
function enables a more manageable way to specifies configurations with a polynomials
function of the discrete configurational variables belonging to clusters Φα of sites
Eq2.12
where represents the sites within the cluster Φα. Then the configurational energy can be expanded in
the form of

34
Eq2.13
Where the and are the Effective Cluster Interactions (ECI). The cluster functions
form a complete and orthonormal basis set in configuration space, so in principle the
cluster expansion is capable of describing the configurational dependence of the total energies
of the whole host crystal. However, only if the rapid convergence of Eq2.13 is guaranteed, can
the cluster expansion of the energies in the host structure be of practical significance. The
cluster expansion in Eq2.13 can be truncated at a cluster size limit, exceeding which the
contribution on the total energy from clusters can be neglected. ECIs are then determined by
fitting energetic data obtained from DFT calculations on the selected ordered configurations.
Generally, the ECIs fitting is performed by implementing a linear programming technique to
minimize the least squares sum28
Eq 2.14
For the surface structure of LixTiO2 anatase, called surface cluster expansion is performed
in a and b axes, excluding the c axis along which the vacuum layers periodically repeat. A
shortened set of ECI coefficients are fit to 142({101}) and 138 ({001}) accurate energies of ordered
configurations by first-‐principle calculation, which makes it possible to rapidly calculate the
total energy of any Li configuration in the host.
Thermodynamic properties
Formation energies are defined for a given Li-‐vacancy arrangement upon the varied x in
LixMO2 as follows:

35
Eq2.15
Where is the total energy of the Li-‐vacancy arrangements at the LixMO2 composition ,
is the total energy of fully occupied Li configuration, and is the total energy of the
empty host structure. Compared to these total energies, formation energies bring forward the
relative phase stability 19,27.
The intercalation voltages of the ground states structure at 0 kelvin can be calculated by
DFT as described in the previous section. However, for the structures away from the
stoichiometry of the ordered ground states or at elevated temperature (not 0 K), the energetic
data cannot be estimated solely based on DFT. This can be achieved by Monte Carlo
simulations based on the cluster expansion approach, which enables the calculation of
thermodynamic properties at finite temperatures, including the chemical potential, free energy
and the phase diagram.
It is important to note that in Cluster expansion fitting, the energetic data are fitted to
formation energies, which choose LiMO2 and MO2 as the reference states. While the reference
states need to be changed back to the original reference states (Li in Li metal or Na in Na metal
chemical potential) when we calculate the voltage curves. This can be done as follows:
Eq2.16
Where is the chemical potential obtained from the Monte Carlo simulations, ,
and have the same meaning as described above.

36
References
(1) Larson, A. C. GSAS; Los Alamos National Laboratory, 1994.
(2) Bragg, W. L.; Bragg, W. H. Proceedings of the Cambridge Philosophical Society 1913, 17, 43–57.
(3) W, M. Crystal Structure determination; Springer: Berlin, 2004.
(4) Brent, F.; Howe, J. M. Transmission electron microscopy and diffractometry of materials; 3rd ed.; Springer: Heidelberg, 2007.
(5) Klug, H. P.; Alexander, L. E. X-‐Ray Diffraction Procedures for Polycrystalline and Amorphous Materials; 2nd ed.; John Wiley & Sons, 1974.
(6) Patterson, A. Physical Review 1939, 56, 978–982.
(7) Scherrer, P. Nachr. Ges. Wiss. 1918, 26, 98–100.
(8) Langford, J. I.; Wilson, A. J. C. Journal of Applied Crystallography 1978, 11, 102–113.
(9) Stokes, A. R.; Wilson, A. J. C. Proceedings of the Physical Society 1944, 56, 174–181.
(10) Hohenberg, P.; Kohn, W. Physical Review 1964, 136, B864.
(11) Kohn, W.; Sham, L. J. Physical Review 1965, 140, A1133.
(12) Ceperley, D. M. Physical Review Letters 1980, 45, 566–569.
(13) Perdew, J. P.; Wang, Y. Physical Review B 1992, 45, 13244–13249.
(14) Perdew, J. P.; Burke, K.; Ernzerhof, M. Physical Review Letters 1996, 77, 3865–3868.
(15) Perdew, J.; Burke, K.; Wang, Y. Physical Review B 1996, 54, 16533–16539.
(16) Jones, R. O. The Li intercalation potential of LiMPO4 and LiMSiO4 olivines with M=Fe, Mn, Co, Ni 1989, 61, 689–746.
(17) Pickett, W. The Li intercalation potential of LiMPO4 and LiMSiO4 olivines with M=Fe, Mn, Co, Ni 1989, 61, 433–512.
(18) Zhou, F.; Cococcioni, M.; Kang, K.; Ceder, G. Electrochemistry Communications 2004, 6, 1144–1148.
(19) Wagemaker, M.; Van der Ven, A.; Morgan, D.; Ceder, G.; Mulder, F. M.; Kearley, G. J. Chem. Phys. 2005, 317, 130–136.
(20) Aydinol, M. K.; Kohan, A. F.; Ceder, G.; Cho, K. Physical Review B 1997, 56, 1354–1365.
(21) Asta, M.; McCormack, R.; de Fontaine, D. Physical Review B 1993, 48, 748–766.
(22) Wulff, G.; Kristallogr, Z. Mineral 1901, 34, 449.
(23) Van der Ven, A.; Marianetti, C.; Morgan, D.; Ceder, G. Solid State Ionics 2000, 135, 21–32.

37
(24) Van der Ven, A.; Ceder, G. Physical Review B 1999, 59, 742–749.
(25) Ceder, G.; Van der Ven, A. Electrochim. Acta 1999, 45, 131–150.
(26) Van der Ven, A.; Aydinol, M. K.; Ceder, G.; Kresse, G.; Hafner, J. Physical Review B 1998, 58, 2975–2987.
(27) Ven, der, A. V. Doctoral Thesis 2000.
(28) Garbulsky, G.; Ceder, G. Physical Review B 1995, 51, 67–72.

38

39
Part I
Lithium ion insertion in TiO2 anatase

40

41
Chapter 3
Impact of particle size on the non-‐equilibrium
phase transition of lithium inserted anatase TiO2
Based on paper
“Impact of Particle size on the Non-‐equilibrium Phase Transition of Lithium Inserted Anatase TiO2” K. Shen, H.Chen, F. Klaver, F. Mulder and M. Wagemaker; Chemistry of Materials, 2014, 26(4), 1608-‐1615
Abstract
The phase transformation behavior of anase TiO2 in Li-‐ion battery electrodes is critical for its
electrode kinetics and cycle life. Here we reveal unexpected particle size dependent phase
transformation behavior in TiO2 anatase by in-‐situ X-‐ray diffraction. The equilibrium voltage
measured by GITT decreases progressively with reducing the particle size which can attributed
to the difference in surface energy of the pristine and lithiated phases. Based on the evolution
of domain size and phase fraction of the two phases, it is concluded that the first order phase
transition proceeds by continuous nucleation upon lithium insertion. For all particle sizes the
phase boundary is found to migrate under non-‐equilibrium conditions even during very slow
(dis)charge conditions, as reflected by a distinct deviation from the Li solubility limit during
the phase transformation. Remarkably, the degree of non-‐equilibrium condition increases with
decreasing particle size, rationalized by the difference in the observed phase transition
42
behavior between small and large particles. The absence of phase coexistence in smaller
particles in combination with the sluggish ionic transport rationalizes the better
electrochemical performance of the nano structured anatase TiO2 as compared to the micro
sized material. These results suggest a very low nucleation barrier for the formation and
movement of the phase boundary in combination with sluggish ionic migration. Therefore
strategies to improve the rate performance of nano structured anatase TiO2 should concentrate
on improving the interstitial diffusion, for instance by appropriate doping.
3.1 Introduction
Anatase TiO2 is a promising negative electrode for Li-‐ion batteries due to its ability to
store a large amount of Li-‐ions reversibly,1-‐4 its excellent gravimetric and volumetric
storage capacities,5,6 its chemical safety and environmental friendly properties. In the
last decades the electrochemistry of bulk anatase TiO2 has been widely studied,
reporting disadvantages, such as poor ionic and electronic conductivity, and low
capacity retention upon high rate (dis)charge.7,8 Recently, nanostructured materials
are found to be very promising, mitigating the disadvantages in bulk materials and
providing a variety of favorable properties for electrochemical energy storage
phenomena7-‐9 that are also explored in nano-‐sized anatase TiO2.10-‐13 One of the most
striking features is the large impact of nano-‐sizing on the thermodynamics and
kinetics of Li-‐ion insertion reactions in anatase TiO2. Nano-‐sizing anatase TiO2 results
in a curved open cell voltage profile with a much shorter plateau region in comparison
with that of micron sized materials.11,14,15 The miscibility gap shifts and shrinks with
decreasing particle size16 which has been suggested to be the result of interfacial strain,

43
the diffuse interface17,18 as well as surface energy effects.14,15 In addition it was found
that the phase transformation behavior in nano anatase TiO2 is size dependent, and its
mechanism is significantly different from that in bulk anatase TiO2. During the first
order phase transition the phases appear not to coexist in nanosized particles, whereas
they coexist in particles larger than 40 nm.16
The aim of this paper is to gain insight in the particle size dependent phase transition
mechanism under realistic in-‐situ conditions. Quasi-‐equilibrium electrochemistry
measurement using galvanostatic intermittent titration technique (GITT) was applied
to study the equilibrium voltage revealing a systematic dependence on the particle size.
Detailed structural changes observed by in-‐situ X-‐ray diffraction indicate a non-‐
equilibrium condition, which explains the difference in the observed phase transition
behavior between small and large particles sizes as a kinetic rather than a
thermodynamic effect.
3.2 Methods
Materials.
TiO2 anatase crystalline particles with three different dimensions (15nm, 41nm and
130nm) were obtained from Aldrich. The particle sizes were confirmed by analyzing the
particle size broadening of the X-‐ray diffraction reflections.
Sample preparation and GITT measurements
Electrodes for the GITT measurements were prepared by mixing the TiO2 anatase
(80wt%) with conducting carbon black additive (ENSAQO, 10wt%) and polyvinylidene
fluoride (PVDF) binder (10wt%) in N-‐Methyl-‐pyrrolidone (NMP). When the well-‐

44
mixed slurry achieved the appropriate viscosity, it was casted on a carbon coated
aluminum foil current collector using the ‘doctor blade’ method. The casted electrodes
were dried in a vacuum furnace at approximately 100 oC for several days. A Swagelok
type cell was used for GITT measurements. The electrodes were mounted under Argon
(H2O and O2 <0.1 ppm). The prepared TiO2 anatase electrodes with a diameter of 13mm
served as positive electrode, and a similar size lithium metal foil as the negative
electrode. The two electrodes were separated by glass microfiber filters (Whatman)
with a few droplets of 1 mol/liter LiPF6 (EC:DMC 1:1, Novolyte) electrolyte.
Galvanostatic Intermittent Titration Technique (GITT) experiments were performed
using a Maccor 4300 battery cycler. In order to obtain the equilibrium voltage
evolution the cells were intermittently discharged at the rate of C/20 for 30 minutes
with relaxation periods maintained until the voltage variation was lower than 3 mV/h
or until the relaxation time exceeded 20 hours.
Sample preparation and in-‐situ X-‐ray diffraction
Self-‐supporting film electrodes were prepared for the in-‐situ XRD measurements.
Firstly, 0.34g dibutyl-‐phthalate (DBP plasticizer) and 0.4g Kynar Power-‐flex (binder)
were mixed in acetone. The solution was stirred until all the materials were dissolved.
Secondly, 0.77g TiO2 anatase and 0.17g Carbon Black (ENSAQO) were mixed by 20
times ball milling for 4 minutes at 130 rpm. Thirdly, the ball-‐milled sample was added
to the acetone solution and stirred for several hours until it reached the appropriate
viscosity. In the next step the slurry was casted on glass by doctor blading. The
prepared film was washed with diethyl ether to extract the plasticizer. The amount of
TiO2 anatase active material was 54% of the total electrode weight, assuming all DBP
has been washed out. The coated film was dried in a vacuum furnace around 100 oC for

45
several days. A dedicated airtight electrochemical cell with a Beryllium window on top
was designed and applied for the in-‐situ X-‐ray diffraction measurements. A thin
aluminum foil (2μm) was used to separate the anatase electrode from the beryllium
window to avoid possible corrosion of the Beryllium. The electrodes were mounted
under Argon (H2O and O2 < 0.1 ppm), the prepared self-‐supporting TiO2 anatase
electrodes as positive electrode, and the lithium metal foil as the negative electrode.
The two electrodes were separated by glass microfiber filters (Whatman) with a few
droplets of 1 Molair LiPF6 (EC:DMC 1:1, Novolyte) electrolyte.
The in-‐situ cell was placed in a Panalytical X’pert Pro X-‐ray diffractometer employing
Cu-‐Kα radiation. The electrochemistry tests during in-‐situ XRD were performed on a
Maccor 4300 battery cycler. For all particle sizes the in-‐situ cell was discharged at
C/120. X-‐ray diffraction patterns were collected between 22 and 64 degrees every one
hour during discharge. The refinement was performed using the Rietveld method as
implemented in GSAS.19,20 The patterns were corrected for the X-‐ray absorption
introduced by the Beryllium window and the Aluminum foil. The fitting parameters
included the lattice parameters, crystal phase fractions, domain size broadening of
each phases, and the background.
3.3 Results and Discussion
3.3.1 Size effect on the equilibrium voltage
The GITT measurements in Figure 3.1 illustrate the evolution of quasi-‐equilibrium
voltage for the different particle sizes. A constant voltage plateau, resulting from the

46
well-‐known phase transformation from anatase to Li-‐titanate, is observed for different
particle dimensions (130nm and 15nm), which is in good agreement with previous
studies11,21. Here we use α-‐LixαTiO2 to denote Li-‐poor anatase TiO2 (xα ~ 0.026 in micro
anatase TiO2 in equilibrium)6, and β-‐Li-‐titanate to denote the Li-‐rich Li-‐titanate phase
(xβ ~ 0.55 in micro Li-‐titanate in equilibrium)6.
Figure 3.1. Voltage-‐composition profile obtained with Galvanostatic Intermittent
Titration Tests (GITT) during discharge for different particle sizes. Inset: Comparison of
the voltage plateau between different particle sizes; note the higher voltage for the larger
particles.
There are three obvious differences in the voltage behavior between different particle
sizes: (i) the onset of a second voltage plateau is observed in the 15 nm GITT voltage
curve. Similar observations were reported for 7 nm anatase particles and for micro-‐
sized anatase at elevated temperature22,23. This second plateau reflects a second phase
transition between orthorhombic β-‐Li-‐titanate and tetragonal Li1TiO2,16,24 reaching the
theoretical capacity of anatase TiO2. Only particles smaller than 10 nm can be

47
converted to the tetragonal Li1TiO2 phase at room temperature16,25 unless the insertion
proceeds at elevated temperatures.26 This indicates that the formation of the Li1TiO2
phase is kinetically hindered, most likely forming at the first 3-‐4 nm of the surface of
the particles, as also indicated by surface sensitive XAFS,27 and can be only detected for
very small particle sizes16,25; (ii) The Li solubility limit of α-‐LixαTiO2 anatase and β-‐Li-‐
titanate, at which the voltage plateau starts and ends, increases with decreasing
particle as shown in Figure 3.1 consistent with previous studies11,16. The distribution of
larger voltages before the voltage plateau is reached that is observed for the smaller
particles can be explained by the presence of surface sites having a lower energy, hence
a higher voltage. A recent first principles study quantified the surface effects of Li
intercalation in spinel lithium titanium oxides.28 This study reveals that, depending on
the surface orientation, the near surface region provides a distribution of surface sites
resulting in a distribution of voltages. Consistent with the observation in the figure
these sites are responsible for the curved voltage profile in nano Li insertion storage
materials; (iii) The equilibrium voltage plateau decreases with decreasing particle size,
as shown in the inset of Figure 3.1 (average value 1.82V for 130 nm, and 1.807V for 15nm).
This small, but interesting experimental phenomenon can be attributed to the surface
energy, which contributes increasingly in the thermodynamics upon particle size
reduction.29 Following the prediction of Van der Ven et al.30 the increase of the plateau
voltage with increasing particle size indicates that the surface energy of the β-‐Li-‐
titanate is larger than that of the α-‐LixαTiO2 phase. It can also be explained by the
capillary effects in nano-‐crystalline insertion materials formulated by Maier et al.,29
predicting that upon particle size reduction the growing capillary pressure increases
the chemical potential of the crystallite and thereby reducing the voltage versus Li/Li+.

48
3.3.2 In-‐situ x-‐ray diffraction measurements
The observed particle size dependent electrochemical behavior suggests that also the
structural evolution may depend on the particle size. To study the particle size effect
on the structural changes during the phase transformation from α-‐LixαTiO2 to β-‐Li-‐
titanate upon lithiation, in-‐situ X-‐ray diffraction is performed for three particle sizes
(130 nm, 41 nm and 15 nm).
To trace the details of the structural evolution a low discharge rate of C/120 was
applied to the pristine anatase TiO2 electrodes. Figure 3.2 shows the X-‐ray diffraction
patterns of the different particle sizes TiO2 anatase upon lithiation. As expected the β-‐
Li titanate phase develops at the expense of the α-‐LixαTiO2 phase, consistent with
previous studies. 31-‐34 Although the time evolution of the diffraction patterns appears
visually very similar for the different particle sizes, analysis of the Rietveld refined
structure parameters reveals a number of distinct differences which will be discussed
in the following sections.
The evolution of domain size and phase fraction upon lithiation
Figure 3.3a-‐c shows the domain size evolution of both phases for the three different
particle sizes resulting from Rietveld refinement, and assuming peak broadening is
solely due to the domain size. In 130 nm particles the domain size of α-‐LixαTiO2
decreases significantly upon lithiation (~30% decrease), while for smaller particles the
decrease in α-‐LixαTiO2 domain size is much less pronounced being 16% and 6.4% for 41
nm and 15 nm particles, respectively. In 130 nm particles the domain size of the newly
forming β-‐Li-‐titanate starts at ~ 100 nm at the very early stage of lithiation, and

49
gradually increases upon further lithiation. For the smaller particles (15 nm and 41 nm),
the domain size of β-‐Li-‐titanate starts at a value even closer to the particle size and
remains almost constant upon further lithiation. For all particle sizes, the maximum
domain size of the β-‐Li-‐titanate phase is smaller than the pristine anatase particle size,
even when the particles are completely transformed to the β-‐Li-‐titanate phase (at the
end of discharge, the domain size of the β phase is 108 nm for 130 nm, 39 nm for 41 nm,
12 nm for 15 nm). We attribute this to a small amount of strain broadening in the β-‐Li-‐
titanate phase, resulting in a slightly smaller apparent domain size, that may be the
result of disorder on the Li-‐sub-‐lattice. The domain size evolution in 130 nm particles
qualitatively follows the expected behavior, indicating that upon lithiation the Li-‐rich
β phase grows at the expense of the Li-‐poor α phase within each particle.
However, smaller particle sizes display smaller changes in the domain size evolution,
being practically constant for the smallest particle size (15 nm), see Figure 3.3a. This
implies that smaller particles transform particle by particle, not allowing phase
coexistence within a single crystallite, in contrast to the 130 nm particles where the
domain size evolution indicates that the phases coexist. However, even in the 130 nm
particles the growth of the β-‐Li-‐titanate phase is restricted as illustrated by the starting
domain size, ~ 100 nm, which is close to the pristine particle size.

50
Figure 3.2. In-‐situ X-‐ray diffraction patterns of LixTiO2 obtained at different states of first
discharge for three particle sizes. (a) 15 nm; (b) 41 nm; (c) 130 nm.
To analyze this observation further we determined the number of β-‐Li-‐titanate nuclei
as a function of the overall composition. Assuming that the β-‐Li-‐titanate phase grows
as spherical domains in the anatase phase, and that the total volume of the active

51
material Vtotal remains constant, the number of β-‐Li-‐titanate nuclei N in the electrode
can be estimated by the following equation:
N =PFβ ⋅Vtotal43π
rβ2
⎛⎝⎜
⎞⎠⎟3
Eqation3.1
Where PFβ is the β phase fraction and rβ is the domain size of β-‐Li-‐titanate, both of
which are determined by the Rietveld refinement of the diffraction patterns. Figure
3.3d-‐f shows both the resulting number of β-‐Li-‐titanate nuclei and the β-‐Li-‐titanate
phase fraction as a function of Li composition for the three particle sizes.

52
Figure 3.3. Domain size evolution of the two phases deduced from the in-‐situ X-‐ray
diffraction line broadening as a function of overall lithium composition. (a)15 nm; (b) 41
nm; (c) 130 nm. Comparison on the β phase fraction with the calculated number of β
nuclei. (d) 15 nm; (e) 41 nm; (f) 130 nm
A linear increase of both the number of nuclei and the phase fraction with lithium
fraction is observed for all particle sizes. This reveals that for all particle sizes the phase
fraction of β-‐Li-‐titanate increases mainly via continuous nucleation of new particles
rather than concurrent domain growth of the β-‐Li-‐titanate within the particles. The
large initial domain size of the nucleating β-‐Li-‐titanate phase indicates that nucleation
is followed by an instantaneous (on the time scale of the experiment) boundary
movement. For small particles this results in an initial phase boundary movement that
covers approximately the complete particle. This nucleation mechanism is sketched in
Figure 3.4. This is consistent with our earlier finding that small particles avoid the
presence of phase boundaries and consequently either have the α-‐anatase or the β-‐Li-‐
titanate phase.16 Consistently, upon lithiation the phase fraction can only grow by
nucleation in the multi-‐particle ensemble, rather than through phase boundary
migration. Interestingly, increasing the particle size up to 130 nm does not
fundamentally change this phase transition mechanism; the difference being that in
the 130 nm particles the initial phase boundary movement, the growth of the β-‐Li-‐
titanate phase, is smaller than the particle size resulting in phase coexistence.
Apparently, the initial phase boundary movement is independent of the particle size,
the origin of which is unclear at this stage. Upon further lithiation this is followed by
growth of the β-‐Li-‐titanate phase until the complete particle is transformed. These
results indicate that the observed size dependent phase transition mechanisms, single

53
domain particles for small particles and two phase coexistence for larger particles, is a
consequence of the length scale of the initial phase boundary movement.
Figure 3.4. Schematic view of the sequential nucleation mechanism in TiO2 electrodes
during discharge for different particle sizes. White indicates the α-‐LixTiO2 phase and the
green indicates the β-‐Li-‐titanate phase.
Evolution of Li content upon lithiation
The evolution of the b-‐lattice parameters of the α and β phases for three particle sizes
is presented in Figure 3.5a and 3.5b. Assuming the validity of Vegard’s law, the Li
content is linearly related to the changes in the b-‐lattice parameter and the real-‐time Li
content of the α-‐LixαTiO2 and β-‐Li-‐titanate phases are deduced, as shown in Figure 3.5c
and 3.5d. Compared to the unit cell volume, the b-‐lattice parameter (a=b in the α phase
due to the tetragonal symmetry) is more sensitive to the Li composition for the reason

54
that upon lithium ion insertion the Ti-‐O bonds are elongated and Ti-‐Ti bonds are
shortened, which mainly affects the b-‐lattice parameter.6
Bulk thermodynamics of first order phase transitions predicts two stages in the
evolution of the Li content. (i) In the single phase region, outside the miscibility gap
the lithium content linearly increases with the overall composition and (ii) in the
miscibility gap the two phases coexist and the lithium content remains constant.
Indeed Figures 3.5c and 3.5d suggest the existence of two distinct stages in the
evolution of the Li content in the α-‐LixαTiO2 phase. (i) The first stage (below the
solubility limit) displays an approximately linear increase of the Li content in α-‐
LixαTiO2 phase for all the three particle sizes. This represents the solid solution region
before the first order phase transition sets in, consistent with bulk thermodynamics. (ii)
In the second stage, an approximate constant Li content in the α phase is observed for
130 nm particles within the miscibility gap, also consistent with bulk thermodynamics.
However, for the 41 nm and 15 nm particle sizes a significant increase in the Li content
in the α-‐phase is observed in the miscibility gap.
Deviating even more from bulk thermodynamics is the evolution of the Li content in
the β phase demonstrating a distinct increase of the Li content in β phase for all
particle sizes. Least deviating from bulk thermodynamics is again the 130 nm particle
size where the Li content in the β-‐Li-‐titanate starts at a value close to the expected
bulk Li solubility limit reaching a constant solubility limit at slightly larger overall
composition. However, for the 41 nm and 15 nm particles, an initial steep increase in Li
content of β phase is observed, never reaching a constant value with increasing
composition. Figure 3.5d also demonstrates that the steep increase in Li content of β
phase is detected over a wider composition range in smaller particle sizes.

55
Figure 3.5(a) Lattice parameter a of α-‐LixαTiO2 as function of overall lithium composition
for three particle sizes deduced from in-‐situ X-‐ray diffraction. (b) Lattice parameter b of
β-‐Li-‐titanate as a function of overall lithium composition for three particle sizes deduced
from in-‐situ X-‐ray diffraction. (c) lithium content of α phase as a function of overall Li
composition deduced from the a-‐lattice parameters assuming Vegard’s law for three
particle sizes. (d) lithium content of β Phase as a function of overall Li composition
deduced from the b-‐lattice parameters assuming Vegard’s law for three particle sizes.
The observed increased Li solubility limits with decreasing particle size is consistent
with the LixTiO2 size-‐phase diagram determined previously.16 The dependence of the
solubility limits on the overall composition, in particular observed for smaller particle
sizes, is very similar to what was recently observed in LiFePO4.18 In LiFePO4 this was
explained by the size confinement of the lithium concentration gradient at the phase
boundary (diffuse interface), which competes energetically favorable bulk
compositions when particle sizes approach nano-‐dimensions. This leads to solubility
limits that change when the phase boundary moves, and hence when the overall
56
composition is changed.18 However, as concluded from the largely absent domain size
evolution of the β phase, Figure 3.3a-‐c, the phase fraction mainly increases due to the
sequential nucleation of the β phase, during which the growth of the domain appears
instant. Such instant domain size growth would lead to instant confinement of the
diffuse interface, and hence an instant change in solubility limits and not the gradual
change as observed in Figure 3.5d. We conclude that in addition to the diffusion
interface confinement that may be partially responsible for the increase in lithium
content, another mechanism must be present in TiO2 anatase causing the large
increase in solubility limits. A possible explanation for the observed change in lithium
content is that the experiments proceed under non-‐equilibrium conditions, which at
first appears as non-‐intuitive given the very low discharge rate applied (C/120).
However, the instant phase boundary movement indicates an interface controlled
rather than Li+ ion diffusion controlled movement. This picture is consistent with a
recent theoretical study on the thermodynamics and kinetics of lithiated anatase
LixTiO2 electrodes,35 predicting that Li diffusion in the β phase is mainly parallel to the
reaction front plane, suggesting that the Li ion diffusion between the two phases does
not contribute to the growth of the β-‐Li-‐titanate phase. If the phase boundary
movement is much faster than the supply of Li-‐ions due to diffusion, the local Li
composition in the β phase will run behind the equilibrium value creating a non-‐
equilibrium condition. Therefore, we suggest the material to be in a non-‐equilibrium
condition in the concentration range where the lithium content in β Li-‐titanate
increases steeply, namely 0.14 < x < 0.22 for 130 nm, 0.20 < x < 0.26 for 41 nm and 0.25 <
x < 0.38 for 15 nm. Upon further lithiation both phases reach their equilibrium Li-‐
solubility values.
57
3.3.3 Proof of the existence of non-‐equilibrium transformation
Relaxation experiments were performed to prove the existence of a non-‐equilibrium
condition in the phase transition mechanisms. For two particle sizes, 15 and 130 nm,
cells were discharged at a C/120 rate to reach an overall composition and then start to
rest. There are two criteria for the rest starting point determination: i) The peak of new
phase (Li-‐titanate phase) must be clearly visible allowing the peak intensity evolution
to be observed during the rest period. ii) The non-‐equilibrium condition is expected to
occur before the Li content in Li-‐titanate phase reaches the equilibrium solubility limit
as determined from Figure 3.5(b). Hence the starting time of the relaxation should be
not later than the inflection point of Li content in Li-‐titanate phase. Based on these
criteria x=0.16 for 130 nm and 0.34 for 15 nm were selected as starting point for the
relaxation. After reaching these compositions the current was set to zero and in-‐situ X-‐
ray diffraction was performed while relaxing towards equilibrium. If the non-‐
equilibrium condition indeed exists at this composition, it is expected that the under-‐
lithiated β-‐Li-‐titanate phase fraction should shrink and the α-‐LixαTiO2 phase fraction
should grow during the relaxation period to be able to reach the equilibrium solid
solution compositions. At the same time the solid solution in the β-‐Li-‐titanate phase
should increase towards the equilibrium value, which should be reflected by the b-‐
lattice parameter evolution. Based on the overall compositions at the start of the
relaxation experiment, the equilibrium Li solubility limits indicate that in equilibrium
the phase fractions of α and β phases should reach approximately 81% and 19% for
15nm, and 91% and 9% for 130nm particles, respectively. Figures 3.6a and 3.6b show the
X-‐ray diffraction patterns in the beginning of discharge, when the discharge is stopped

58
and finally at the end of the relaxation. For both particle sizes the intensities of main
reflections and the corresponding voltage reach a stasis after 15 hours (15nm) and 7
hours (130 nm). For both particle sizes the intensity of the β-‐Li-‐titanate Bragg
reflections decrease as expected upon relaxation, and consistently the α-‐LixαTiO2 Bragg
reflections grow. In particular, for 15 nm particles, the very small amount of β-‐Li-‐
titanate (19%) is very difficult to detect by X-‐ray diffraction and almost disappears at
the end of relaxation due to the large line broadening, as observed in Figure 3.6b.
Applying Vegard’s law to the b-‐lattice parameter of the α-‐LixαTiO2 and β-‐Li-‐titanate
phases results in the expected evolution of the Li content towards the equilibrium
values as observed in Figure 3.7a and 3.7b.

59
Figure 3.6. In-‐situ X-‐ray diffraction patterns of LixTiO2 at different stages of discharge
and relaxation (a) 130 nm and (b) 15 nm. In both Figure 3.6a and 3.6b, ii and v are Li-‐
titanate phase, iii and iv are anatase phase. The black line represents the diffraction
pattern at the initial stage of discharge;the red line represents the last scan collected
during discharge (Li0.158333TiO2 for 130 nm and Li0.341667TiO2 for 15 nm, deduced from the
electrochemistry); the blue line is the scan collected when the cells stop discharge and
relax for 10 hours (130 nm) and 20 hours (15 nm) respectively. In the bottom Figures the
circled regions are enlarged showing the Li-‐titanate phase in ii and v and the anatase
phase in iii and iv.
The relaxation experiments prove that the formation of the β phase proceeds under
non-‐equilibrium conditions, even under very slow C/120 discharge conditions. The
variation of the phase fractions during relaxation in the 15 nm particles is significantly
larger compared to that in 130 nm particles, indicating that the 15 nm particle electrode
is further out of equilibrium. This is in line with the larger Li content variations in
smaller particles, which are observed in Figure 3.5, indicative for the non-‐equilibrium
condition.
Based on the smaller diffusion distances it is against intuition that smaller particles
are further away from their equilibrium condition, in particular at these very slow
discharge rates. There are several explanations for this. (i) The main reason is the
absence of phase coexistence within a single particle for the small particle sizes as
opposed to larger particle sizes as illustrated by Figure 3.4. In larger particles intra
particle transport (phase boundary movement) can reestablish the equilibrium
conditions. However, the absence of phase coexistence in small particles infers that
inter particle lithium transport and nucleation of the phase is required to reach the

60
equilibrium phase fractions and solid solution compositions. This is supported by the
evolution of the domain sizes during the relaxation experiments, Figure 3.7a and 3.7b,
where in 15 nm particles the domain sizes are constant whereas the anatase phase in
micron particles displays a significant growth. The inter particle Li ion transport
(transport over the electrode-‐electrolyte interface) and nucleation can be expected to
require much more time36 compared to intra particle transport.37 (ii) Also the lower
self-‐diffusion coefficients in smaller particle sizes, due to weaker interaction with the
conduction electrons and a strongly concentration dependent diffusion coefficient34,
will slow down the establishment of equilibrium.
Figure 3.7. Results of Rietveld refinements of the in-‐situ XRD pattern collected during
discharge and subsequent relaxation. (a) 130nm; (b) 15nm.

61
Other possible explanations include (iii) the higher solubility limit of the β phase for
smaller particles and (iv) the formation of the Li1TiO2 phase. Starting at a specific
overall composition, the larger lithium content in the β phase in smaller particles
requires more Li-‐ion redistribution compared to larger particles. In addition, the
Li1TiO2 phase observed in nanosized particles, is expected to form at the surface of the
β-‐Li-‐titanate phase.25 A small amount of Li1TiO2 at the β-‐Li-‐titanate surface will block
further Li-‐ion insertion due to its poor reported Li-‐ion conductivity. 16,25 Hence, it will
take more time for the Li concentration in the β phase reaching its equilibrium value.
A counter intuitive observation in Figure 3.7a is small phase fraction of the β phase
(~0.08) yet having a larger domains size compared to the α phase, the latter
constituting more than 90% of the total phase volume. This is the consequence of X-‐
ray diffraction probing the average domain size of the α and β phases in all particles.
For the α phase this includes the non reacted particles, for which the domain size is
equal to the pristine particle size, and the small α phase domains in the reacted
particles. The average of the latter leads to a smaller average particle size that the β
phase in the reacted particles that covers almost the complete particles explaining the
observation.
3.3.4 Summary of the phase transformation stages.
The phase transformation in anatase LixTiO2 upon lithiation can be categorized into
three stages, schematically illustrated in Figure 3.8. (i) The solid solution stage, during
which the Li content in α-‐LixαTiO2 increases until it reaches the solubility limit of α-‐
LixαTiO2 anatase phase, which depends on the particle size; (ii) The non-‐equilibrium

62
stage. In this stage, the β phase starts to form, and the migration of the α/β phase
boundary is much faster than the diffusion of the Li-‐ions. Consequently, the Li
concentration in the newly formed β phase is below the equilibrium value, causing the
non-‐equilibrium conditions. Both the time-‐resolved Li content evolution upon
lithiation and the relaxation experiments indicate that in smaller particles this leads to
a larger deviation from equilibrium over a wider composition range. (iii) The final
stage is the equilibrium phase transformation stage, during which the Li concentration
in α and β phase equals the solubility limits and the diffusion-‐controlled equilibrium
phase transformation proceeds in the electrode system until the whole particle is
transformed.
Figure 3.8. Schematic view of the phase transformation in LixTiO2 upon lithiation.
Roman numbers correspond to the phase transformation stages mentioned in the text;
the blocks represent the individual reacted particles in the electrode. The vertical black
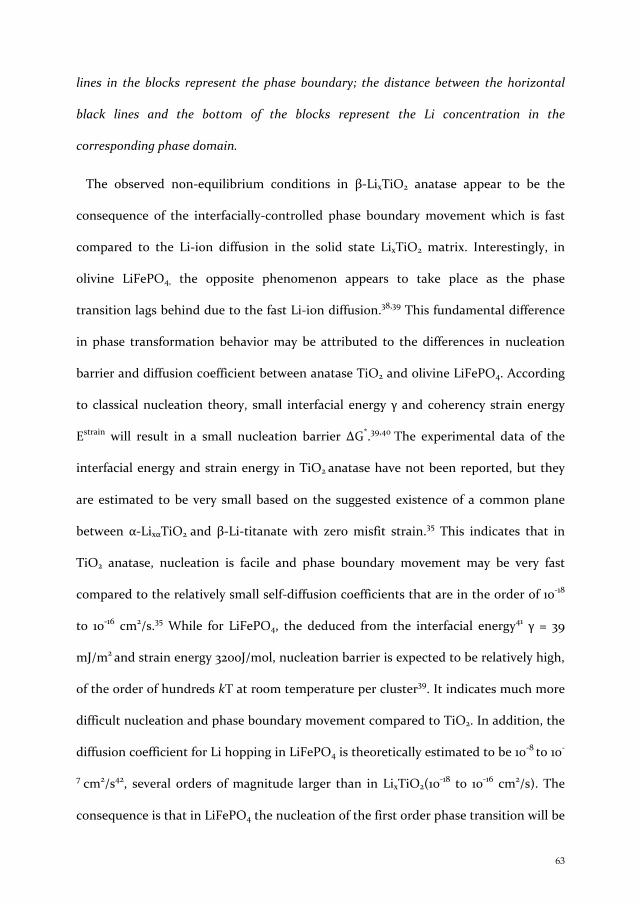
63
lines in the blocks represent the phase boundary; the distance between the horizontal
black lines and the bottom of the blocks represent the Li concentration in the
corresponding phase domain.
The observed non-‐equilibrium conditions in β-‐LixTiO2 anatase appear to be the
consequence of the interfacially-‐controlled phase boundary movement which is fast
compared to the Li-‐ion diffusion in the solid state LixTiO2 matrix. Interestingly, in
olivine LiFePO4, the opposite phenomenon appears to take place as the phase
transition lags behind due to the fast Li-‐ion diffusion.38,39 This fundamental difference
in phase transformation behavior may be attributed to the differences in nucleation
barrier and diffusion coefficient between anatase TiO2 and olivine LiFePO4. According
to classical nucleation theory, small interfacial energy γ and coherency strain energy
Estrain will result in a small nucleation barrier ∆G*.39,40 The experimental data of the
interfacial energy and strain energy in TiO2 anatase have not been reported, but they
are estimated to be very small based on the suggested existence of a common plane
between α-‐LixαTiO2 and β-‐Li-‐titanate with zero misfit strain.35 This indicates that in
TiO2 anatase, nucleation is facile and phase boundary movement may be very fast
compared to the relatively small self-‐diffusion coefficients that are in the order of 10-‐18
to 10-‐16 cm2/s.35 While for LiFePO4, the deduced from the interfacial energy41 γ = 39
mJ/m2 and strain energy 3200J/mol, nucleation barrier is expected to be relatively high,
of the order of hundreds kT at room temperature per cluster39. It indicates much more
difficult nucleation and phase boundary movement compared to TiO2. In addition, the
diffusion coefficient for Li hopping in LiFePO4 is theoretically estimated to be 10-‐8 to 10-‐
7 cm2/s42, several orders of magnitude larger than in LixTiO2(10-‐18 to 10-‐16 cm2/s). The
consequence is that in LiFePO4 the nucleation of the first order phase transition will be

64
delayed with respect to the overall composition due to the fast diffusion,38 or can be
even avoided at high rates.39,43
3.4 Conclusions
A systematical study is presented on the particle size dependent phase transformation
behavior in anatase TiO2 upon lithiation. The equilibrium voltage depends on the
particle size rationalized by the surface energy contribution in the Li chemical
potential of LixTiO2. The growing phase fraction of β-‐Li-‐titanate upon lithiation is
mainly caused by the sequential nucleation of particles, rather than a phase reaction
front movement within the particles. Remarkably, the size dependent evolution of the
Li content in both phases upon lithiation indicates that the phase transition in anatase
TiO2 is a non-‐equilibrium process even at very slow discharge rates. This is rationalized
by initially fast phase boundary movement of the Li-‐rich phase compared to the
relatively slow Li-‐ion diffusion in the solid state. This is proven by relaxation
experiments, which demonstrate the evolution of the phase fractions and Li content
towards equilibrium. With these experiments the complex size dependent, non-‐
equilibrium phase behavior in nanosized anatase TiO2 is revealed. The absence of
phase coexistence in smaller particles in combination with the sluggish ionic transport
are the origin of the better electrochemical performance of nano structured as
compared to micro sized anatase TiO2 materials. It also suggests that strategies to
improve the rate performance of anatase TiO2 should concentrate on improving the
interstitial diffusion, for instance by doping with Nb44-‐46 or Zn47.

65
References
(1) Bonino, F.; Busani, L.; Lazzari, M.; Manstretta, M.; Rivolta, B.; Scrosati, B. Journal of power sources 1981, 6, 261–270.
(2) Cava, R. J.; Murphy, D. W.; Zahurak, S.; Santoro, A.; Roth, R. S. J. Solid State Chem. 1984, 53, 64–75.
(3) Wagemaker, M.; L u tzenkirchen-‐Hecht, D.; Keil, P.; van Well, A. A.; Frahm, R. Physica B: Condensed Matter 2003, 336, 118–123.
(4) Jamnik, J.; MAIER, J. Phys. Chem. Chem. Phys. 2003, 5, 5215–5220.
(5) Deng, D.; Kim, M. G.; Lee, J. Y.; Cho, J. Energy & Environmental Science 2009, 2, 818–837.
(6) Wagemaker, M.; Kearley, G. J.; Van Well, A. A.; Mutka, H.; Mulder, F. M. J. AM. Chem. Soc. 2003, 125, 840–848.
(7) Aricò, A. S.; Bruce, P.; Scrosati, B.; Tarascon, J.-‐M.; van Schalkwijk, W. Nature Materials 2005, 4, 366–377.
(8) Bruce, P. G.; Scrosati, B.; Tarascon, J.-‐M. Angewandte Chemie-‐International Edition 2008, 47, 2930–2946.
(9) MAIER, J. Nature Materials 2005, 4, 805–815.
(10) Kavan, L.; Grätzel, M.; Rathousky, J.; Zukal, A. J. Electrochem. Soc. 1996, 143, 394–400.
(11) Sudant, G.; Baudrin, E.; Larcher, D.; Tarascon, J.-‐M. Journal of Materials Chemistry 2005, 15, 1263–1269.
(12) Subramanian, V.; Karki, A.; Gnanasekar, K. I.; Eddy, F. P.; Rambabu, B. Journal of power sources 2006, 159, 186–192.
(13) Kubiak, P.; Fr o schl, T.; H u sing, N.; H o rmann, U.; Kaiser, U.; Schiller, R.; Weiss, C. K.; Landfester, K.; Wohlfahrt-‐Mehrens, M. Small (Weinheim an der Bergstrasse, Germany) 2011, 7, 1690–1696.
(14) Yamada, A.; Koizumi, H.; Nishimura, S.-‐I.; Sonoyama, N.; Kanno, R.; Yonemura, M.; Nakamura, T.; Kobayashi, Y. Nature Materials 2006, 5, 357–360.
(15) Kobayashi, G.; Nishimura, S.-‐I.; Park, M.-‐S.; Kanno, R.; Yashima, M.; Ida, T.; Yamada, A. Advanced Functional Materials 2009, 19, 395–403.
(16) Wagemaker, M.; Borghols, W. J. H.; Mulder, F. M. Journal of the American Chemical Society 2007, 129, 4323–4327.
(17) Burch, D.; Bazant, M. Z. Nano Letters 2009, 9, 3795–3800.

66
(18) Wagemaker, M.; Singh, D. P.; Borghols, W. J. H.; Lafont, U.; Haverkate, L.; Peterson, V. K.; Mulder, F. M. Journal of the American Chemical Society 2011, 133, 10222–10228.
(19) Larson, A. C. GSAS; Los Alamos National Laboratory, 1994.
(20) Toby, B. H. Journal of Applied Crystallography 2001, 34, 210–213.
(21) Ohzuku, T.; Kodama, T.; Hirai, T. J. Power Sources 1985, 14, 153–166.
(22) Zachau-‐Christiansen, B.; West, K.; Jacobsen, T.; Atlung, S. Solid State Ionics 1988, 28-‐30, 1176–1182.
(23) Watson, B. J. M.; W, G. Physical Review B 2010, 53-‐6, 694–700.
(24) Wagemaker, M.; Simon, D. R.; Kelder, E. M.; Schoonman, J.; Mulder, F. M. Physica B: Condensed Matter 2004, 350, E995–E998.
(25) Borghols, W. J. H.; L u tzenkirchen-‐Hecht, D.; Haake, U.; van Eck, E. R. H.; Mulder, F. M.; Wagemaker, M. Physical chemistry chemical physics : PCCP 2009, 11, 5742.
(26) Macklin, W. J.; Neat, R. J. Solid State Ionics 1992, 53-‐56, 694–700.
(27) Wagemaker, M.; Lutzenkirchen-‐Hecht, D.; van Well, A. A.; Frahm, R. J. Phys. Chem. B 2004, 108, 12456–12464.
(28) Ganapathy, S.; Wagemaker, M. ACS NANO 2012, 6, 8702–8712.
(29) Maier, J. Angewandte Chemie-‐International Edition 2013, 52, 4998–5026.
(30) Van der Ven, A.; Wagemaker, M. Electrochemistry Communications 2009, 11, 881–884.
(31) Wagemaker, M.; van de Krol, R.; Kentgens, A. P. M.; Van Well, A. A.; Mulder, F. M. Journal of the American Chemical Society 2001, 123, 11454–11461.
(32) Krol, R. V. D.; Goossens, A.; Meulenkamp, E. A. J. Electrochem. Soc. 1999, 146, 3150–3154.
(33) Murphy, D. W.; Cava, R. J.; Zahurak, S. M.; Santoro, A. Solid State Ionics 1983, 9-‐10, 413–417.
(34) Wagemaker, M.; Borghols, W. J. H.; van Eck, E. R. H.; Kentgens, A. P. M.; Kearley, G. J.; Mulder, F. M. Chemistry (Weinheim an der Bergstrasse, Germany) 2007, 13, 2023–2028.
(35) Belak, A. A.; Wang, Y.; Van der Ven, A. Chemistry of Materials 2012, 24, 2894–2898.
(36) Ganapathy, S.; van Eck, E. R.; Kentgens, A. P.; Mulder, F. M.; Wagemaker, M. Chemistry-‐a European Journal 2011, 17, 14811–14816.
(37) Wagemaker, M.; Kentgens, A. P. M.; Mulder, F. M. Nature 2002, 418, 397–399.
(38) Sharma, N.; Guo, X.; Du, G.; Guo, Z.; Wang, J.; Wang, Z.; Peterson, V. K. Journal of the American Chemical Society 2012, 134, 7867–7873.

67
(39) Malik, R.; Zhou, F.; Ceder, G. Nature Materials 2011, 10, 587–590.
(40) Porter, D. A.; Easterling, K. E.; Sherif, M. Y. Phase Transformation in Metals and Alloys; 3rd ed.; CRC Press, 2009.
(41) Cogswell, D. A.; Bazant, M. Z. ACS NANO 2012, 6, 2215–2225.
(42) Morgan, D.; Van der Ven, A.; Ceder, G. Electrochemical and Solid State Letters 2004, 7, A30–A32.
(43) Bai, P.; Cogswell, D. A.; Bazant, M. Z. Nano Letters 2011, 11, 4890–4896.
(44) Sheppard, L. R.; Bak, T.; Nowotny, J. J. Phys. Chem. B 2006, 110, 22447–22454.
(45) Archana, P. S.; Jose, R.; Jin, T. M.; Vijila, C.; Yusoff, M. M.; Ramakrishna, S. Journal of the American Ceramic Society 2010, 93, 4096–4102.
(46) Fehse, M.; Cavaliere, S.; Lippens, P. E.; Savych, I.; Iadecola, A.; Monconduit, L.; Jones, D. J.; Rozière, J.; Fischer, F.; Tessier, C.; Stievano, L. J. Phys. Chem. C 2013, 117, 13827–13835.
(47) Ali, Z.; Cha, S. N.; Sohn, J. I.; Shakir, I.; Yan, C.; Kim, J. M.; Kang, D. J. Journal of Materials Chemistry 2012, 22, 17625–17629.

68

69
Chapter 4
Thermodynamic study of Li intercalation into LixTiO2
The role of surface orientation and particle size
Abstract
Using DFT first-‐principles calculations and applying a surface cluster expansions the impact of
particle size and surface orientation on the lithium ion insertion in anatase TiO2 is studied.
The calculated formation energies for bulk and surface structures suggest that the energetic
favorable Li sites in Li0.5TiO2 titanate phase depend significantly on the surface orientation.
For Li compositions below Li0.5TiO2, the calculated equilibrium voltage curves upon Li-‐ion
insertion have a good agreement with the experimental results. The results show that the
difference in voltage between the different surface orientations is due to the Li-‐O and Ti-‐O
bond length in the surface region. For Li compositions above Li0.5TiO2 the calculated voltages
are not consistent with experimental observations, which is suggested to be the consequence
of using stochiometric surface slabs. The presence of excess oxygen at the surface termination
results in a distinct increase of the intercalation voltage for small particles, consistent with
experimental observations.

70
4.1 Introduction
Over the past two decades, nano-‐structured materials have been of great interest in the field of
electrochemical energy storage owing to their potentially better properties such as energy and
power density compared to their bulk equivalents[1-‐3] The origin of the difference in storage
properties between bulk and nanosized electrode materials is due to the changes in
thermodynamic properties, i.e. miscibility gap, [4-‐6] chemical potentials, [7] and phase transition
mechanism[8].
In particular nano-‐structured anatase has been subjected to size dependent studies revealing
significant changes in electrochemical and thermodynamic properties: (i) Nanosizing brings
significant improvement in the capacity (reaching the theoretically maximum LiTiO2
composition for nanostructured TiO2 compared to Li0.5TiO2 for bulk TiO2) due to formation of
the LiTiO2 phase suggested to occur at the near surface region[8,9]; (ii) Nanosizing results in a
curved open cell voltage profile with a much smaller plateau region in comparison with bulk
materials, indicating a reduced miscibility gap[5,7] and/or surface storage effects[5] [6,10,11] (iii) The
equilibrium voltage decreases progressively with the reduction of particle size, which is
explained by the larger role of surface energies upon nanosizing[12,13](see chapter 3).
In addition to size, also the particle shape appears to be relevant for the electrochemical
performance. Recent experimental studies show that the {001} facets of anatase TiO2 exhibit
much better rate performance compared to the thermodynamically more stable {101} facets.[14]
Aiming at understanding of these particle size and shape dependent properties, a first
principles study of the surface effect on the thermodynamic properties of lithiated anatase
TiO2 is presented. Nanosized TiO2 is modeled by surface slabs with the two most stable surface
orientations {101} and {001} applying periodic boundary conditions. The phase stability is
compared between different Li arrangements in nanosized and bulk TiO2 anatase as function

71
of composition. This achieved by applying a cluster expansion fit to a finite number of
formation energies determined by DFT calculations. Based on the cluster expansion fit the
lithium configuration and composition can be determined given a fixed chemical potential and
temperature as implemented in Monte Carlo simulations. In this way the impact of the surface
on the Li-‐ion insertion is investigated by first-‐principle calculations.
4.2 Methods
The energies of the different Li configurations were minimized to the ground state by fully
relaxing the atomic positions, unit cell dimensions and shape in the gradient-‐corrected
exchange correlation functional (GGA) approximation in density functional theory calculations
as implemented in the plane wave code VASP. A cut-‐off energy of 400 eV was chosen for the
energy calculation. In order to ensure the total energies converged within 10-‐4 eV per formula
unit, we used a 5x7x1 k-‐point mesh for the (101) surface slab, and 7x3x1 k-‐point mesh for (001)
surface slab. For the supercell configurations, the k-‐point meshes were automatically
transformed to ensure an equivalent density in reciprocal space as for the unit cell of the
corresponding slabs. All calculations were performed non-‐magnetically because spin polarized
calculations introduce negligible changes in the energies.
In order to determine the phase stability of different phases at a finite temperature, accurate
free energies are required of all Li-‐vacancy configurations over the octahedral interstitial sites
of anatase TiO2. In this study, we neglect the entropy contribution from lattice vibrations and
electronic excitations, and only consider the configurational degree of freedom associated with
Li-‐vacancy configurations. The cluster expansion approach is a powerful tool to construct an
accurate extrapolation of the total energy of any possible Li-‐vacancy configuration in the
system based on first principle energy calculation of relatively few ordered configurations. We

72
constructed cluster expansions for Li configurations for {101} two unit cell slabs and {001} two
unit cell slabs to describe the configuration dependence of ground state energies over the Li
concentration between 0 and 1. The occupation variables are assigned to be +1 or 0 when the
site is occupied by Li or vacant respectively. Subsequently, the configuration freedom can be
described by cluster functions defined as the products of occupation variables. In principle, the
cluster functions are capable of describing all the possible configurations in the host system
based on a complete and orthonormal basis in the configuration space. Finally the
configurational energy is rigorously expanded in terms of these cluster functions.
E(σ ) = C0 + Cαφα (
σ )α∑ Equation 4.1
Where the coefficient C0 and Cα is the Effective Cluster Interactions (ECI), which are a series
of constants to describe the dependence of the energy of a specific structure on the Li-‐
configurations. In practice, the equation can be truncated by neglecting contributions from
larger, less frequent occurring clusters. Therefore a restricted set of ECI coefficients is fitted to
the energies of 84 bulk, 142 {101} and 138 {001} Li configurations determined by DFT. This
makes it possible to rapidly evaluate the total energy of any Li configuration in the host within
a good approximation, as is required to determine the thermodynamics of Li insertion. For the
fit, the root mean square deviation from the DFT energies is 56meV for bulk LixTiO2, 30 meV
for the {101} direction and 60 meV for the {001} direction per TiO2 formula unit.
Thermodynamic properties at finite temperatures (such as free energy, chemical potential,
and the phase diagram) are predicted by applying Monte Carlo simulations on the cluster
expansion as described in chapter 2. For the bulk and both surface orientations, we used a
6x6x6 supercell for the Monte Carlo simulations. For each temperature and chemical potential,
500 Monte Carlo passes are performed, the first 100 of which are equilibration steps performed
before averaging.

73
4.3 Result and discussion
4.3.1 Surface termination
Previous first-‐principle studies on surface energies, reveal that the Wulff shape of TiO2 anatase
exists two facet orientations {001} and {101} [15]. More than 94% of the Wulff shape comprises
the {101} facet consistent with the experimental observations[16](see figure 4.1) .
Figure 4.1 the wulff shape of TiO2 anatase cystal, based on the calculated surface energy data
from ref. [15]
Figure 4.2 The structure of the tetragonal LiTiO2 unit cell. Light blue atoms are lithium, red
atoms are oxygen, and purple atoms are titanium.
Figure 4.2 shows the fully relaxed LiTiO2 anatase structure, with lattice parameters a=b=4.074Å,
c=8.498Å, which differ 1% from the experimental values[9]. For a given Miller index, the surface

74
structures are constructed by cleaving the fully relaxed LiTiO2 anatase. The surface
termination is determined by the following criteria. i) the stoichiometry should be preserved
after cleaving. For both {101} and {001} surfaces, the stoichiometry is always preserved in a slab
having twice the thickness of a unit cell, independent of the position of the surface termination;
ii) The stacking of the Ti-‐O plane should symmetrical with respect to a plane parallel to the
slab positioned in the middle of the slab[4]. Thereby, the surfaces on both sides of the slab are
equivalent. The surface terminations that meet this criteria belong to “type 2” according to the
definition from Tasker,[17] which have no dipole moment along the normal direction of the
surface.
Based on the above two criteria, the number of potential planes for the surface termination is
significantly reduced. For the {101} orientation, both surface termination planes (0.5,y,z) and
(0,y,z) meet the above criteria (see Figure 4.3a and b respectively), the difference being that the
(0.5,y,z) plane breaks 2 Li-‐O bonds and one Ti-‐O6 octahedra while the (0,y,z) plane breaks five
Ti-‐O octahedra. The surface structure cleaved at (0.5,y,z) is expected to give a lower surface
energy[4], which is confirmed by the calculation results, and is therefore selected. Applying the
same criteria for the {001} orientation leads to one possible surface termination due to the
tetragonal symmetry in this direction, as shown in figure 4.3.
Figure 4.3 (a) and (b) The two possible surface terminations of relaxed structures of bulk LiTiO2
along the {101} direction; (c) The only possible surface termination of the relaxed structure of bulk
LiTiO2 along the {001} direction. Purple atoms represent lithium, red oxygen and grey titanium.

75
With the selected surface terminations thin periodic slabs are built by introducing a vacuum
layer (20 Å) to eliminate the spurious interaction between the repeated slabs in the periodic
models.
In principle, the thickness of the atomic layers should be determined by the convergence test
on the surface energies. However, since the surface cluster expansion will be applied on the
slabs in the subsequent step, the total number of possible Li-‐vacancy configurations should be
restricted to a practical amount. Under this criterion, the maximum number of the repeated
unit cells is 2 for the {101} direction and 1 for the {001} direction. For both orientations, the
lattice parameters of the cells are fixed while all atoms in the slab are allowed to relax due to
the limited thickness of the atomic layers, see Figure 4.4.
Figure 4.4 Fully relaxed structures that serve as the primitive cells for the surface cluster
expansion. (a) bulk LiTiO2 anatase.(b) {101} LiTiO2 anatase surface slab. (c) {001} of LiTiO2
anatase surface slab.
To compare the stability of the different Li-‐vacancy configurations over the octahedral Li
interstitial sites of LixTiO2 anatase the surface cluster expansion is performed for both the {101}
and {001} slabs. In addition, the bulk cluster expansion of LixTiO2 anatase is also performed,

76
the results of which are consistent with published work from Belak et al.[18] The latter work
demonstrates that for bulk TiO2 anatase the single unit cell does not represent the energetics
of the system correctly due to the high symmetry. [18,19] Therefore, the maximum primitive cell
for the surface cluster expansions is also chosen to be a double unit cell in the a and b
directions, while for the bulk cluster expansion, doubling the unit cell in three dimensions was
applied.
4.3.2 Formation energy
For bulk and the two surface orientations the formation energies of all the symmetry
inequivalent Li-‐vacancies configurations are calculated using DFT. As for bulk anatase[5,6,18,20], a
strong long-‐range interaction was found in the initial stage of Li intercalation into the TiO2
anatase surface slabs. Therefore, it is necessary to include Li configurations at dilute
compositions into the phase stability comparison (For {101} at Li0.0625TiO2 and for {001} at
Li0.03125TiO2 and Li0.0625TiO2). This determines the maximum cluster size in the expansion used.
The formation energy of different Li configurations referenced to the energies of the empty
(TiO2) and fully occupied (LiTiO2) slabs are shown in Figure 4.5. The convex hull was
constructed by connecting the configurations with the lowest formation energies. The
formation energy calculation of bulk LixTiO2 confirms the stability of the specific Li ordering at
Li0.5TiO2 composition (see figure 4.6a), which has been recently.[18,19] This configuration is
characterized by edge-‐sharing pairs of LiO6 octahedra, which is indicated by the translucent
blue octahedra in the center of the structure shown in Figure 4.5(a). Also the surface slabs with
the {101} and {001} orientations display the lowest formation energy for the Li0.5TiO2
composition, [7,18,19] but different Li configuration was observed in {101} surface slab.

77
Figure 4.5 (a) The formation energy based on the VASP calculations of different Li-‐vacancy
configurations over the octahedral sites of LixTiO2 in (a) bulk anatase, (b) {101} surface slab, and
(c) the {001} surface slab.

78
Figure 4.6(b) shows surface slabs of various Li-‐vacancy configurations in the 1x1 and 2x1x1
supercell of Li0.5TiO2 along the {101} direction with increasing formation energies. The structure
xxii, in which all Li atoms are located in the center of the slab, has the highest formation
energy, while the structure i, with all Li at surface layers has the lowest formation energy. This
indicates that the Li0.5TiO2 {101} surface slab is most stable segregation of Li ions into surface
layers in such a way that the Li ions are two-‐fold coordinated to oxygen atoms by Coulomb
interaction. In the most stable Li0.5TiO2 {101} surface configuration along the {101} direction, the
fully coordinated Ti1 and O2 display the most distinct outward relaxation, also observed in the
{101} surface structure of pure TiO2 anatase[8,15]. This triggers shorter Ti-‐O and Li-‐O bond
lengths along the surface normal and a larger angle of the O-‐Ti-‐O and O-‐Li-‐O bonds.
Furthermore, the four-‐fold coordinated Li1 moves inward by 0.044 Å resulting in a larger angle
of the O-‐Li-‐O bond (107.08˚).
For the {001} orientation the two similar configurations at Li0.5TiO2, shown in Figure 4.6(c),
have a comparable lowest formation energy These two configurations have a similar Li-‐vacancy
ordering as compared to the bulk ordered Li0.5TiO2 phase as predicted by Belak[18] and
Morgan.[19] In the 2x1x1 super cell of this configuration one Li ion resides in every OAOB plane.
This allows paired Li ions to be located in adjacent edge sharing O6 octahedra, resulting in an
energy favorable Li-‐O coordination[19].

79
Figure 4.6. (a) The ordered Li configuration of the Li0.5TiO2 compositions having the lowest
formation energy. (b) Li configurations in the {101} slab with increasing formation energies from

80
left to right. (c) The two Li configurations in the {001} slab with increasing formation energies
from left to right. Lithium atoms and lithium octahedra: light blue, oxygen atoms: red, titanium
atoms and titanium octahedraa : purple. In (a) oxygen atoms are not displayed for clarity .
Because only one Ti-‐O and one Li-‐O bond are interrupted by the vacuum layers, the Li-‐O
Coulomb interaction between the adjacent Li octahedra’s plays a dominant role in the phase
stability[14,19]. However, the discontinuity of the crystal structure caused by the vacuum still has
influence on the atomic relaxation. Compared with the Li-‐ordered phase of Li0.5TiO2 in bulk
anatase, the five-‐fold coordinated Li at the surface layer of the {001} surface structure displays
less contraction along <010> direction and more expansion along <001> direction in the Li-‐O
distance, which is due to the outward relaxation of the under-‐coordinated Li ions. This leads to
a larger Li-‐Li distance between the neighboring Li occupied octahedra in the {001} surface
structure. To counteract such Li-‐Li expansion, similar as the bulk Li0.5TiO2 ordered phase[15,19],
the Li-‐O bonds for the fully coordinated Li along both <010> and <001> undergo contraction,
but change less. The finding that the two most stable {001} Li0.5TiO2 configurations have a
comparable formation energy indicates that the Li arrangement has a marginal impact on the
magnitude of formation energy. This may indicate that in practice the Li arrangement may be
disordered in the {001} surface slab. For compositions x < 0.5 in LixTiO2 only the dilute
composition x = 0.0625 is located on the convex hull for both surface orientations {101} and
{001}. This suggests that for compositions between x = 0.0625 and 0.5 the formation energy can
be minimized by phase separating into the dilute composition Li0.0625TiO2 and the Li0.5TiO2
titanate structures. For Li composition compositions x > 0.5 in LixTiO2, additional ground state
structures are identified at x = 0.75, again for both {101} and {001} surface orientations. The
Li0.75TiO2 {101} ground state is realized by adding one Li ion in each middle layer(the 2nd and 3rd
layers) of the ground state Li0.5TiO2 {101} surface slab, while the Li0.75TiO2 {001} ground state is
realized by adding one Li ion in each surface layers (the 1st and 4th layers) of the ground state
81
Li0.5TiO2 {001} structure. As a consequence, the ground state structures of the Li0.75TiO2 slabs in
{101} and {001} directions have very similar Li arrangements.
4.3.3 Voltage comparison
The first approach to predict the voltage profile is to use the differences between the ground
state structures positioned on the convex hull referenced to metallic Li[16,21]. This implies that
entropy contributions are neglected resulting in a 0 K voltage profile. Calculated voltage
profiles for both bulk and the LixTiO2 surface slabs are shown in Figure 4.7 (a). With the
temperature increasing, the configurational entropy arising from long or short range disorder
of lithium ions cannot be disregarded. To model this a cluster expansion is performed on bulk
and surface slab configurations providing an effective approach to parameterize the
dependence of the Free energy on the site disorder. Using a Monte Carlo approach the Free
energy of the possible configurations can be evaluated at each chemical potential, which
reference to Li-‐metal gives the voltage profile. The cluster expansion based calculated voltage
profiles at 10 K and 300 K are shown in figure 4.6 (b) and 4.6 (c) The dilute structures could
not be fitted accurately in the cluster expansion, leading to the absence of the fast drop of the
voltage curve in the low Li composition range. This is responsible for the appearance of small
voltage steps at x = 0.25 at 10K representing the relative stability of these ordered phases in the
bulk and the surface slabs. With increasing temperature the shape of voltage the small distinct
steps are smoothened.
82
Figure 4.7 (a) The calculated voltage profile based on the ground state energies as a function of
lithium composition for both surface slabs and bulk anatase; the calculated voltage profile based
on the Monte Carlo cluster expansion simulation vs lithium composition at (b)10k and (c)300k

83
The surface slabs not only allow to study the influence of surface orientation on the
equilibrium intercalation voltage, it also gives insight in the impact of particle size on the
lithium insertion in anatase TiO2. Being the most dominating facet of the equilibrium TiO2
anatase (more than 94% according to Wulff construction[9,15,22]), the {101} surface slab
properties will increasingly become apparent with decreasing particle sizes.
As indicated above the voltage calculation based on the cluster expansion does is unable to
represent the energetics at dilute concentrations. For this reason we focus on the voltage curve
based on the ground state energies (Figure 4.5) as shown in Figure 4.7 (a).
The evolution of the voltage with composition in Figure 4.7 (a) can be divided into three stages:
i) 0<x<0.0625. The dilute composition region where both surface orientations {001} and {101}
display a higher voltage compared to that of bulk anatase. This is consistent with GITT
experimental findings where it was observed that smaller particles have slightly higher voltage
at dilute lithium compositions (Figure 3.1, Chapter three). The origin of this is the lower energy
of lithium sites at the surface allowing more relaxation compared to bulk sites, initiating the
lithiation at the surface.[10]
ii) 0.0625 < x < 0.5. The absence of ground states outside the convex hull in this composition
range for bulk and surface slabs results in a constant voltage plateau, reflecting the well-‐known
phase transition from tetragonal lithium poor LixTiO2 to the orthorhombic Li0.5TiO2 Li-‐titanate
phase. The larger voltage calculated for bulk anatase compared to the 6 Å {101} surface slab is
qualitatively in a good agreement with GITT measurements (see chapter 3). The atomic
structures of the Li0.5TiO2 compositions in bulk, the {101} slab, and in the {001} slab relax during
the DFT calculations such that the Li-‐O and Ti-‐O bond length of the Li and adjacent Ti
occupied octahedras have a linear relationship with the voltage, as observed when comparing
Figure 4.6 (a) with Table 1.

84
Table 1 Bond length variation within the ground state relaxed structures at the composition of
Li0.5TiO2 of bulk, {101} surface and {001} surface. Atom labels refer to Figure 3.
Bond Bond length bulk(Å) Bond length {101}(Å) Bond length {001}(Å)
Li1-‐O1 2.614 2.059 3.112
Ti1-‐O3 2.063 2.036 2.184
Ti1-‐O2 1.963 2.004 1.951
Ti2-‐O1 1.964 2.03 1.943
iii) 0.5 <x < 1. Additional voltage steps are observed at x = 0.75 for both surface slabs, caused by
the ground state at this composition. In this stage, both the {101} and {001} surface slabs have a
lower voltage than the bulk structure up to the end composition LiTiO2. This calculation result
indicates that the LiTiO2 phase is thermodynamically is more stable to form in bulk compared
the surface of the {101} surface slab. This is in contrast to what has been suggested based on
experiments where the LiTiO2 was suggested to occur at the surface of nano sized particles.[4,8,9]
Moreover, although with large kinetic barriers to reach equilibrium also in chapter three
higher Li insertion potentials are found for smaller particles at the composition range of
0.5<x<1, as shown in figure 3.1.
A potential explanation of this discrepancy may be the influence of the surface termination on
the surface energetics of the surface slabs. As described above, the lowest surface energy was
found for the {101} TiO2 anatase surface slab with a corrugated oxygen-‐rich arrangement (see
figure 4.4 (b)). It suggests that oxygen contributes to the stability of the surface, leading to
lower energy and hence higher voltage according to the Nernst equation, which is also
confirmed by a recent theoretical study in the surface lithium insertion into spinel Li4Ti5O12.[10]

85
Further, oxygen addition at this surface is possible at the under-‐coordinated Ti atoms (Ti2)
exposed to vacuum. Adding oxygen at these surface sites results in a large increase in voltage
of 4.4 V vs Li/Li+ for the Li4Ti4O10 composition of the {101} surface slab. The origin of this
excessively high voltage may be the large over stoichiometry resulting from the oxygen
addition at the surface slabs (Li4Ti4O10 versus Li4Ti4O8). To model smaller over stoichiometry
cell thicker {101} surface slabs were constructed (approximately 6.5 Å versus 20 Å). This results
in an over stoichiometry of Li48Ti48O104 versus stoichiometric Li48Ti48O96 and an insertion
voltage of 1.918 V, indeed smaller than for over stoichiometric Li4Ti4O10 but still larger than the
experimentally observed result of approximately 1.5 V in chapter 3. This indicates that even
thicker surface slabs, comparable to the experimental particle sizes, which becomes
computationally challenging, may result in a voltage larger than the bulk insertion voltage in
closer agreement with the experimental results. At present we conclude that the oxygen
termination may be responsible for the larger stability of the LiTiO2 composition at the {101}
surface potentially explaining the observed larger Li insertion voltage for smaller particles
(Figure 3.1, chapter 3) In addition as the voltage at LiTiO2 is increasing the oxygen over
stoichiometry will also lead to distinct rise on the voltage at the second stage (0.0625<x<0.5),
which has risen to 1.918V for {101} Li48Ti48O104 surface slab.
To neutralize the charge from the over stoichiometric oxygen, extra Li capacity will be
produced. With the higher voltage at the low Li content region (1st stage) more preferable Li
sites are created at such composition region than after the voltage plateau starts (the 2nd and
3rd stage). Furthermore, the proportion of the excess Li should increase when the particles
become smaller due to the larger over stoichiometry (Li1+0.333Ti1O2+0.1667 for 20Å cell, Li1+1Ti1O2+0.5
for 6.5Å cell). Therefore, the voltage plateaus are expected to shift towards higher Li
composition with particle size decreasing, which has a good agreement with the previous
investigation [2,7] and the evolution of the equilibrium for different particle sizes studied in
chapter three.

86
In addition, kinetic factors may play a role in the LiTiO2 phase formation in nano LixTiO2
particles. Experimental[8,9] and theoretical studies[18] indicate that the formation of the LiTiO2
phase at the surface of the particles hinders Li-‐ion diffusion, as discussed in Chapter 3.
Thermodynamically, bulk LixTiO2 particles may be able to convert completely to the LiTiO2
phase, but the poor diffusivity through the LiTiO2 could limit the transformation to the a few
nanometer at the surface of the particles.[18] In nano the materials this leads to a detectable
fraction of LiTiO2, however, in bulk material the fraction of the few nanometer LiTiO2 surface
layers is difficult to detect.
4.4 Conclusions
In this chapter the Li intercalation in bulk and surface structures of LixTiO2 are systematically
investigated by DFT and thermodynamic calculations. We find that i) the formation energy of
all symmetry non-‐equivalent Li configurations in both {101} and {001} surface orientations is
minimal at x=0.5. The Li configuration of the ground state structures of the {001} surface at
x=0.5 are similar to that in bulk Li0.5TiO2. In contrast, for the {101} surface, segregation of Li
ions is predicted at the surface, which is attributed to the under coordinated oxygen
enrichment in the surface layers. ii) The difference in voltage, based on the ground state
formation energies, between bulk and the surface slabs, assuming the latter is representative
for nano-‐sized materials, is qualitatively consistent with experimental observations. The origin
for this phenomenon is the Li-‐O and Ti-‐O distances in the surface layers. iii) When the Li
composition exceeds Li0.5TiO2, the calculations qualitatively deviate from experimental
observations. The DFT prediction is that the formation of the LiTiO2 is favorable in bulk
anatase, rather than at the surface. To reconcile the experimentally observed higher potentials
for smaller particles an explanation based on non-‐stoichiometric oxygen rich surface slabs are
suggested.

87
References
[1] P. Kubiak, T. Froschl, N. Husing, U. Hormann, U. Kaiser, R. Schiller, C. K. Weiss, K. Landfester, M. Wohlfahrt-‐Mehrens, Small (Weinheim an der Bergstrasse, Germany) 2011, 7, 1690.
[2] J.-‐Y. Shin, D. Samuelis, J. Maier, Advanced Functional Materials 2011, 21, 3464.
[3] J.-‐H. Kim, K. Zhu, J. Y. Kim, A. J. Frank, Electrochimica Acta 2013, 88, 123.
[4] L. Wang, F. Zhou, Y. S. Meng, G. Ceder, Physical Review B 2007, 76, DOI 165435 10.1103/PhysRevB.76.165435.
[5] A. Yamada, H. Koizumi, S.-‐I. Nishimura, N. Sonoyama, R. Kanno, M. Yonemura, T. Nakamura, Y. Kobayashi, Nature Materials 2006, 5, 357.
[6] G. Kobayashi, S.-‐I. Nishimura, M.-‐S. Park, R. Kanno, M. Yashima, T. Ida, A. Yamada, Advanced Functional Materials 2009, 19, 395.
[7] G. Sudant, E. Baudrin, D. Larcher, J.-‐M. Tarascon, Journal of Materials Chemistry 2005, 15, 1263.
[8] M. Wagemaker, W. J. H. Borghols, F. M. Mulder, Journal of the American Chemical Society 2007, 129, 4323.
[9] W. J. H. Borghols, D. L u tzenkirchen-‐Hecht, U. Haake, E. R. H. van Eck, F. M. Mulder, M. Wagemaker, Physical chemistry chemical physics : PCCP 2009, 11, 5742.
[10] S. Ganapathy, M. Wagemaker, ACS NANO 2012, 6, 8702.
[11] M. Wagemaker, F. M. Mulder, Accounts of chemical research 2013, 46, 1206.
[12] J. Maier, Angewandte Chemie-‐International Edition 2013, 52, 4998.
[13] A. Van der Ven, M. Wagemaker, Electrochemistry Communications 2009, 11, 881.
[14] C. H. Sun, X. H. Yang, J. S. Chen, Z. Li, X. W. Lou, C. Li, S. C. Smith, G. Q. M. Lu, H. G. Yang, Chemical communications (Cambridge, England) 2010, 46, 6129.
[15] M. Lazzeri, A. Vittadini, A. Selloni, Physical Review B 2001, 63, 155409.
[16] L. Kavan, M. Grätzel, S. E. Gilbert, C. Klemenz, H. J. Scheel, J. AM. Chem. Soc. 1997, 118, 6716.
[17] P. W. Tasker, Journal of Physics C: Solid State Physics 1979, 12, 4977.
[18] A. A. Belak, Y. Wang, A. Van der Ven, Chemistry of Materials 2012, 24, 2894.
[19] B. J. Morgan, G. W. Watson, The Journal of Physical Chemistry Letters 2011, 2, 1657.
[20] B. J. Morgan, G. W. Watson, Physical Review B 2010, 82, 144119.

88
[21] M. K. Aydinol, A. F. Kohan, G. Ceder, K. Cho, Physical Review B 1997, 56, 1354.
[22] H. G. Yang, C. H. Sun, S. Z. Qiao, J. Zou, G. Liu, S. C. Smith, H. M. Cheng, G. Q. Lu, Nature 2008, 453, 638.
89
Part II
Sodium ion insertion in sodium titanate and
TiO2 anatase

90

91
Chapter 5
Na2+xTi6O13 as potential negative electrode
material for Na-‐ion batteries
Based on paper
“Na2+xTi6O13 as Potential Negative Electrode Material for Na-‐ion Batteries”, K. Shen and M. Wagemaker; Inorganic Chemistry, 2014, 53(16), 8250-‐8256
Abstract
Na-‐ion batteries provide one of the most promising alternatives for Li-‐ion batteries due to the
high abundance and low cost of Na. The strongly electro positive character of Na enables
almost comparable cell potentials. Here we show that by lowering the cut-‐off voltage from 0.3
V to 0 V vs Na/Na+ the capacity of the Na2Ti6O13 negative electrode material can be enhanced
from 49.5 mAh/g (Na2+1Ti6O13) to a promising 196 mAh/g (Na2+4Ti6O13) for at least 10 cycles,
after which it gradually reduces. To understand the structural changes in-‐situ X-‐ray diffraction
is performed and compared with Density Functional Theory calculations. A consistent picture
of the evolution in lattice parameters and Na-‐ion positions is presented. The results show that
Na-‐ion intercalation in the Na2+xTi6O13 host structure is limited to Na2+2Ti6O13 and proceeds
through a solid solution reaction. Only small changes in lattice parameters promote that the
insertion reaction is highly reversible. Further increasing the Na composition below 0.3 V

92
appears to lead to loss in crystallinity, which in combination with Solid Electrolyte Interface
formation is suggested to be the origin of the gradually reducing reversible capacity.
Keywords: Na-‐ion batteries, Na-‐intercalation, Na2Ti6O12, solid solution
5.1 Introduction
The demand for renewable energy resources has initiated the search for high performance and
cost effective battery systems. Li-‐ion batteries have the highest energy densities making them
in particular suitable for mobile devices. However, considering applications where energy
density is less important, for instance in static storage devices, the high cost of lithium ion
batteries is an important concern. This has resulted in a growing interest in other battery
systems such as Na-‐ion batteries. The Na-‐ion battery is one of the most promising alternatives
due to its high abundance, low cost, and high cell potential. In the past decades, research on
Na-‐ion batteries has been initiated in parallel with Li-‐ion battery research,1-‐6 however the
success of the later has largely diverted attention away from Na-‐ion batteries. Renewed interest
in Na-‐ion batteries is motivated by the virtually unlimited Na resources and low costs.7,8 In
general, the operating voltage of Na-‐ion batteries is about 0.4 V lower compared to Li-‐ions
batteries, resulting in a somewhat lower but still large energy and power density.9 Compared
with Li-‐ions (0.76 Å), the larger ionic radius of Na-‐ions (1.02 Å) often leads to larger structural
distortions and barriers for diffusion in host structures.9 This is most likely the reason why
only a few insertion electrode materials are reported displaying reversible Na-‐ion uptake,
negative electrode materials being in particular scarce. Sodium metal as a negative electrode
introduces complications such as dendrite formation, low melting point and interface aging.8
Graphite and hard carbons, extensively investigated as a negative electrode, have much lower
specific capacities and result in larger capacity fading compared to application in Li-‐ion

93
batteries.10-‐12 In addition, the capacitive storage of Na-‐ions at the graphite surface has the
disadvantage of a linear drop in the battery voltage lowering the energy density.13 Due to the
competition between inversion and conversion reactions only the 3d metal (Ti,V) oxides
appear promising for low voltage Na-‐ion insertion.14 NaxVO2 was found to react reversibly
around 1.5V.15,16 At the same potential, amorphous TiO2 nanotubes and nanocrystalline TiO2
anatase demonstrated a specific capacity of ~150mAh/g.17-‐20 A reversible storage capacity of 200
mAh/g was achieved in Na2Ti3O7 applying a cutoff voltage 0 V vs Na/Na+ 21. Recently, Rudola et
al. explored Na-‐ion storage in the structurally similar Na2Ti6O13 compound, demonstrating a
reversibly uptake of 1 Na-‐ion per formula unit (49.5 mAh/g) by a solid solution mechanism at
an average potential of 0.8 V when Na2Ti6O13 vs Na/Na+ is cycled between 2.5 V and 0.5 V.22
Motivated by the higher storage capacities of the similar Na2Ti3O7 material, the present study
explores Na-‐ion storage in Na2Ti6O13 at low voltages. In-‐situ and ex-‐situ X-‐ray diffraction in
combination with Density Functional Theory (DFT) calculations reveal the intercalation
mechanism, giving a consistent picture of the structural changes and electrochemical
performance of this promising Na-‐ion negative electrode.
5.2 Preparation and Methods
Materials synthesis
Na2Ti6O13 was prepared by ball milling Na2CO3 (Aldrich) and TiO2 anatase (Aldrich) in a mass
ratio 0.22:1 in a silicon carbide crucible applying a 250 rpm rate for 120 minutes. Subsequently,
this precursor mixture was heated at 800 oC in open air for 12 hours, applying a heating and
cooling ramp rate of 5 oC /min. X-‐ray diffraction analysis confirmed the crystalline Na2Ti6O13
phase indexed with the monoclinic C2/m space group and a crystallite size of approximately 80

94
nm. Additionally a small amount of approximately 5%, of unreacted TiO2 anatase and trace
amounts (less than 1%) of Na2Ti3O7 and Na2CO3 were identified, the latter explaining the
presence of unreacted TiO2.
Electrode preparation
For the electrochemical tests and ex-‐situ X-‐ray diffraction measurements electrodes were
prepared by mixing the active Na2Ti6O13 material with the Polyvinylidene fluoride (PVDF)
binder (Aldrich) and carbon black (ENSAQO) in the weight ratio 8:1:1 using N-‐Methyl-‐2-‐
pyrrolidone (NMP) (Aldrich) as solvent. The well-‐mixed slurry was coated on carbon coated
aluminum foil by doctor blading followed by 100 ℃ overnight drying .
For the in-‐situ X-‐ray diffraction measurements self-‐supporting electrode films were prepared.
PVDF (0.42g) and DBP (Di Butyl Phthalate) (0.34g) were dissolved in acetone. The active
material Na2Ti6O13 (0.7g) and conductive additive carbon black (ENSAQO)(0.28g) were well
mixed and added in the PVDF and DBP solution. The slurry was casted on glass by doctor
blading. After drying the electrode film was washed with diethyl ether in order to dissolve DBP.
Finally the coatings were dried at 100℃ overnight.
Electrochemistry
Electrochemical tests were carried out in Swagelok type electrochemical cells. The Na2Ti6O13
electrodes were (dis)charged versus Sodium metal with 1M NaClO4 in propylene carbonate
serving as electrolyte and a cotton micro fiber separator (Whatman). The cells were assembled
in a glove box under Argon atmosphere (O2 < 0.1 ppm and H2O < 0.1 ppm). The (dis)charge
cycling tests were performed at C/10 rate (4 mA/g) at room temperature with a MACCOR
S4000 cycler.

95
X-‐ray diffraction
In-‐situ and ex-‐situ X-‐ray diffraction was performed using a Panalytical X’pert Pro X-‐ray
diffractometer employing Cu-‐Kα radiation in the range 10-‐130 degree and 10-‐100 degree
respectively. For the ex-‐situ X-‐ray diffraction characterization, the Na2Ti6O13 vs Na/Na+ cell was
discharged to 0V and the positive electrode was removed from the cell and assembled in a
Kapton covered airtight X-‐ray diffraction sample holder. All these operations were performed
in a glove box under Argon atmosphere (O2 < 0.1 ppm and H2O < 0.1 ppm).
In-‐situ X-‐ray diffraction was performed in a home designed airtight electrochemical cell with a
Beryllium window acting as current collector largely transparent for X-‐rays. The airtight
electrochemical cell was assembled in a glove box under Argon atmosphere (O2 < 0.1 ppm and
H2O < 0.1 ppm) with sodium metal as negative electrode, cotton micro fiber as separator
(Whatman) and 1M NaClO4 in propylene carbonate serving as electrolyte. A thin aluminum
foil (2 μm) was used to restrict X-‐ray absorption losses and to separate the Na2Ti6O13 electrode
from the Beryllium foil window to avoid potential corrosion of the Beryllium. In-‐situ XRD data
was restricted to a cutoff voltage of 0.3 V because cycling to ~0V in the in-‐situ cell leads, even
of the presence of the 2mm Al foil, to corrosion of the Be and potential leaking of the cell. For
this reason ex-‐situ XRD experiments were performed below 0.3 V. Compared to conventional
electrodes, this special in-‐situ configuration leads to no significant changes in the voltage and
capacity at the low currents applied, indicating the diffraction data collected from this in-‐situ
cells represents the electrochemistry of the conventional electrodes. For in-‐situ measurement
diffraction patterns were collected during the galvanostatic (dis)charge using a MACCOR
S4000 cycler. For the C/10 (dis)charge rate a collection time of 1 hour was used to obtain
reasonable time resolution following the structural evolution at C/10 rate in combination with
patterns having enough statistics to be refined. The consequence is that each pattern

96
represents an average of the structural evolution during 1 hour. The X-‐ray diffraction patterns
were refined using the Rietveld refinement method as implemented in GSAS.23
DFT calculations
The Na2+xTi6O13 structures were geometrically optimized by applying the gradient-‐corrected
exchange correlation functional (GGA) to density functional theory calculations as
implemented in the plane wave code VASP24-‐26. Spin-‐polarization was not considered. All
structures were fully relaxed to the ground state. A cut-‐off energy of 400 eV and appropriate k-‐
point grid was chosen to ensure that total energies converged within 10-‐4 eV per formula unit.
DFT Molecular dynamics simulations were performed on Na2+4Ti6O13 unit cell for 3 ps with
time step of 2 fs at two temperatures (300 K and 400 K).

97
5.3 Result and discussion
5.3.1Electrochemistry
Figure 5.1. Electrochemical characterization of Na2Ti6O13 vs Na/Na+. (a) First three cycles and the
30th cycle of the Galvanostatic (dis)charging of Na2Ti6O13 at C/10 rate (0.005 A/g) down to 0.3V vs

98
Na/Na+. (b) First three cycles and the 30th cycle of the Galvanostatic (dis)charging of Na2Ti6O13 at
C/10 rate (0.005 A/g) down to 0.0V vs Na/Na+. (c) Specific capacity as a function of the number
of cycles at C/10 rate.
Figure 5.1a and b illustrate the impact of the cutoff voltage on the voltage-‐capacity profile of
Na2Ti6O13 versus sodium metal at C/10 rate (1C is defined as the current required to fully
discharge/charge the Na2Ti6O13 electrode in 1 hour assuming the maximum composition is
Na3Ti6O13). Upon reducing the cutoff voltage from 0.3 V to 0 V three distinct changes are
observed: (i) When a cutoff voltage of 0.3 V is applied a reversible voltage plateau-‐like feature
appears around 0.8 V. This is replaced by a more gradual voltage decrease when the cut-‐off
voltage is set to 0 V. (ii) Both the first discharge capacity and the initial reversible capacity at a
cutoff voltage of 0 V are four times larger compared to that at 0.3 V cutoff voltage. To rule out
the contribution of carbon black and PVDF additive to the capacity, blank cells containing
only carbon black and PVDF were prepared. Comparison with the Galvanostatic tests of the
blank cells demonstrates that for the first discharge, carbon and PVDF contribute in total 75%
to the capacity for both cut-‐off voltages, which is mainly irreversible as it contributes less than
10% to the reversible capacity for the subsequent cycles. Besides, the effect of the small residual
TiO2 anatase on the capacity is also evaluated by the electrochemistry test (see appendix).
Therefore, based on the electrochemical measurements, we conclude that Galvanostatic
cycling between 2.5 V and 0.3 V leads to the reversible intercalation of one additional sodium
ion in the structure (Na3Ti6O13), while Galvanostatic cycling between 2.5 V and 0 V leads to the
reversible reaction of four additional sodium ions in the structure (Na6Ti6O13). (iii) Figure 5.1c
shows that cycling between 2.5 V and 0.3 V leads to excellent capacity retention after 30 cycles
amounting to more than 95% of the initial charge capacity (disregarding the first cycle). By
lowering the cutoff voltage to 0 V the capacity is larger but the reversible capacity retention

99
drops to approximately 75% over 30 cycles. To reveal the origin of the larger capacity and poor
capacity retention when the material is cycled down to 0 V cutoff voltage, in-‐situ, ex-‐situ
diffraction and DFT calculations were performed.
5.3.2 X-‐ray diffraction
In-‐situ X-‐ray diffraction measurements have been performed to investigate the structural
changes of the Na2Ti6O13 electrode material upon cycling between 2.5 and 0.3 V. In addition ex-‐
situ XRD patterns were collected at 2.5 V, 0.3 V and 0 V to reveal the structural changes in the
low potential region (0 V cutoff). Excellent reversibility of the structural changes above 0.3 V is
confirmed by the reversible evolution of the Bragg peaks recorded during the charge, shown in
Figure 5.2. The irreversible capacity observed during the in-‐situ diffraction measurement in
Figure 5.2 is due to the first cycle irreversible capacity loss of the carbon and PVDF present in
the electrodes discussed above.
Figure 5.2. The evolution of in-‐situ X-‐ray diffraction patterns as a function of Na composition.
The yellow line represents the voltage profile down to 0.3 V, as function of intercalated Na

100
composition. The sodium composition x in Na2+xTi6O13 is estimated by the capacity measured by
the galvanostatic electrochemistry.
X-‐ray diffraction of the prepared Na2Ti6O13 material confirms the monoclinic C2/m space group
having a 3-‐D tunnel structure in which the initially present Na-‐ions reside, as shown in Figure
5.3. The lattice parameters of the structure are a=15.10Å, b=3.75Å, c=9.16Å and β=99.15˚
consistent with previous studies27-‐29. In-‐situ X-‐ray diffraction patterns collected at various
sodium compositions between x=0 and x=1 in Na2+xTi6O13 are shown in Figure 5.4a. The
continuous shift of the original Na2Ti6O13 {60-‐1} and {40-‐4} reflections indicate a gradual
change in lattice parameters, which is consistent with the structural study on sodium
intercalation into Na2Ti6O13.22 The {020} reflection splits into two reflections indexed as {020}
and {80-‐1} where the {020} reflection intensity weakens. The same phenomenon is observed for
the {402} reflection at lower angle. Remaining in the same space group this is the consequence
of the significant increase of the c lattice parameter and β.
Figure 5.3. The monoclinic crystal structure of Na2Ti6O13 displaying the tunnels in which the Na-‐
ions reside. Purple spheres represent sodium ions, red spheres represent oxygen, and cyan
polyhedrons represent the Ti-‐O octahedra.
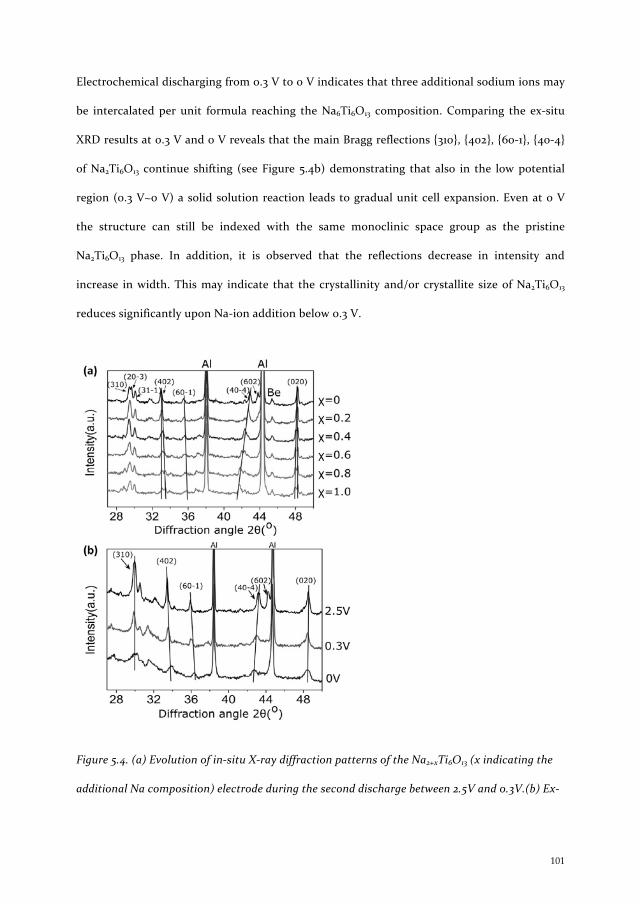
101
Electrochemical discharging from 0.3 V to 0 V indicates that three additional sodium ions may
be intercalated per unit formula reaching the Na6Ti6O13 composition. Comparing the ex-‐situ
XRD results at 0.3 V and 0 V reveals that the main Bragg reflections {310}, {402}, {60-‐1}, {40-‐4}
of Na2Ti6O13 continue shifting (see Figure 5.4b) demonstrating that also in the low potential
region (0.3 V~0 V) a solid solution reaction leads to gradual unit cell expansion. Even at 0 V
the structure can still be indexed with the same monoclinic space group as the pristine
Na2Ti6O13 phase. In addition, it is observed that the reflections decrease in intensity and
increase in width. This may indicate that the crystallinity and/or crystallite size of Na2Ti6O13
reduces significantly upon Na-‐ion addition below 0.3 V.
Figure 5.4. (a) Evolution of in-‐situ X-‐ray diffraction patterns of the Na2+xTi6O13 (x indicating the
additional Na composition) electrode during the second discharge between 2.5V and 0.3V.(b) Ex-‐

102
situ X-‐ray diffraction patterns at 2.5 V, 0.3 V and 0 V for the Na2+xTi6O13 cycling between 2.5 V
and 0 V.
5.3.3 DFT
X-‐ray diffraction reveals a solid solution reaction, however, not the Na-‐ion positions and
occupancy in the Na2+xTi6O13 structure. Density Functional Theory calculations were used to
predict the structure and average voltage of reduced phases at various compositions.
Figure 5.5. The DFT predicted monoclinic crystal structures of Na2+xTi6O13. (a) Na2Ti6O13, (b)
Na2+1Ti6O13, (c) Na2+2Ti6O13, (d) Na2+3Ti6O13, (e) Na2+4Ti6O13. Yellow spheres represent sodium ions
4i sites, red spheres represent sodium 2d sites, dark blue spheres represent sodium 2c sites and
cyan polyhedrons represent the Ti-‐O octahedra.
By evaluating the ground state energy of all possible sodium configurations in the Na2+xTi6O13
unit cell at every composition (x=0,1,2,3 and 4), insight can be gained in the structural

103
evolution. Potential Na-‐ion sites were identified using DFT molecular dynamics simulations
and Fourier density difference maps from the diffraction. Using DFT all potential positions
were relaxed to the ground state and subsequently the total energies were calculated. The
configuration with the lowest energy at each concentration is expected to occur upon actual
Na intercalation, thereby only considering the configurational degree of freedom associated
with Na-‐vacancy configurations in a single unit cell and neglecting the entropy contribution
from lattice vibrations and electronic excitations. The DFT determined structures are shown in
Figure 5.5, the structural details of which are listed in table S.I.1.
Compared to Na2Ti6O13, the lowest energy configuration of Na2+1Ti6O13, shown in Figure 5.5b,
has in very small changes in the Ti-‐O structure. The inserting Na-‐ions are located on the 2d
sites in the middle of the tunnel next to the already present Na-‐ions occupying the 4i sites.
This position leads to a smaller nearest Na-‐Na distances (decreasing from 3.745 Å to 2.878 Å).
This sodium insertion of the tunnels also shortens the nearest Na-‐O distance from 2.632 Å to
2.469 Å. Increasing the composition from Na2+1Ti6O13 to Na2+2Ti6O13 is realized by migration of
the Na-‐ions from the 2d sites to adjacent 4i sites in the same plane as the already occupied 4i
positions, further decreasing the nearest Na-‐Na distance to 2.482 Å and nearest Na-‐O distances
to 2.241 Å. Upon further sodium intercalation, exceeding Na2+2Ti6O13, the original intercalated
sodium ions migrate from close to the center of the tunnels towards the edge of the Ti-‐O
tunnel, forming half “Na-‐O octahedral” units, and the new Na-‐ions insert into 2c sites located
in the center of the tunnel as shown in Figure 5.5d and 5.5e. The nearest Na-‐O distance
continuously decreases as the Na composition increases, from 2.149 Å to 2.130 Å and as a
consequence, the original nearest Na-‐Na distance is increased 2.607 Å in Na2+3Ti6O13 to 2.649 Å
in Na2+4Ti6O13 indicating that the Na-‐Na distance is becoming too small leading to increasing
repulsive Coulomb forces. The evolution of the lattice parameters suggests a variation of the
shape of the 3D Ti-‐O tunnel upon Na insertion, resulting from the competition between the

104
attractive Coulomb force (between the Na-‐ions and oxygen forming the tunnels) and the
repulsive Coulomb force (between the inserted Na-‐ions).
A Bond Valence Sum (BVS) analysis30 was performed to evaluate the structural stability of the
predicted Na inserted structures. The BVS value is estimated by V = vi∑ and the individual
bond valences vi are calculated from the observed bond lengths Ri by vi = exp(R0 − Rib
)where
R0=1.803 and b=0.37 was used for the Na-‐O bond30, the results of which are added to Table S.I.1.
If the BVS value of the insertion site is significantly larger than the formal valence of the Na-‐
ion this indicates that the Na-‐ion is too large to fit the interstitial site. Only one Na-‐ion, 2c site
in Na2+3Ti6O13, results in a significantly larger BVS value (+1.5169) compared to the formal
valence (+1) of the Na-‐ion. R0 and b are empirically determined constants, depending on the
local coordination shell, especially for mobile ions in alkali chalcogenides31. Considering this,
the BVS value possibly reduces to +1.1668 using a modified R0 and b31.We therefore conclude
that all Na-‐ions in the DFT modeled structures are potentially chemically stable.
For comparison with the experimental electrochemical results, the intercalation voltages at
different Na compositions are estimated based on the ground state energy of the most stable
configurations according to:
Equation. 5.1

105
Figure 5.6. Calculated insertion voltage profile based on the DFT ground state energies as
function of the sodium composition.
The calculated average voltages in Figure 5.6 show that, as expected, increasing the Na
compositions lowers the voltage (in this case referenced to Na-‐metal Na/Na+) which is
correlated to the evolution of the Na-‐O distance. The calculated average intercalation voltage
of 0.728 V between x=0 and x=1 in Na2+xTi6O13 is in good agreement with the experimentally
observed reversible voltage of approximately 0.8 V for these compositions, see Figure 5.1a. The
underestimation of the potential by GGA is typical for transition metal oxides and the result of
the self-‐interaction in the d-‐orbitals32. The predicted average voltage between the x=1 and x=2
compositions is approximately 0.15 V indicating that these compositions are not formed above
0.3 V, consistent with the observations in Figure 5.1a. The DFT results in Figure 5.6 predict that
the maximum composition that can be achieved at 0 V vs Na/Na+ is Na2+2Ti6O13. Increasing the
composition from x=3 to 4 results in negative voltages implying that these compositions will
not be formed in practice and that Na2+2Ti6O13 is the upper limit for sodium insertion in bulk
Na2+xTi6O13. However, electrochemical cycling down to 0 V after the first cycle, shown in Figure
5.1b, suggests a reversible composition up to x=4 (~200 mAh/g), albeit degrading over several
cycles, see Figure 5.1c. This capacity is not due to carbon and PVDF because this does
contribute significantly to the total capacity after the first cycle (see Figure S.I.1). The x=4
composition is in contradiction with the DFT calculations that predict the maximum

106
composition (leading to positive voltages vs Na/Na+) of x=2. Apparently, at these low voltages a
different storage mechanism sets in as discussed below.
5.3.4 Discussion
Using the most stable Na2+1Ti6O13 configuration from DFT as input for the Rietveld refinement
of the XRD pattern results in a good fit, shown in Figure 5.7, implying minimal changes in the
atomic positions and lattice parameters indicating that DFT predicts the structure accurately.
The unit cell dimensions of Na2+1Ti6O13 determined from the Rietveld refinement are shown in
Table 5.1 and the atomic positions are given in table S.I.1. The small volume expansion (1%)
between the original Na2Ti6O13 and the Na2+1Ti6O13 compositions suggests that mechanical
failure of the material will not play a significant role, which is consistent with the excellent
cycling stability observed above 0.3 V in Figure 5.1.
Figure 5.7. Rietveld refinement of the in-‐situ X-‐ray diffraction pattern of Na2+1Ti6O13 after the
second discharge. Red symbols represent the experimental data, the solid line represents the
Rietveld refinement, and at the bottom the difference between observed and calculated intensities
is shown. The refined parameters include lattice parameters, atomic positions, a broadening

107
parameter and the temperature factor. The peaks from aluminium and beryllium have been
excluded. The average agreement index parameters are Rp=4.1% and Rwp=5.5%.
Due to the severe broadening of the diffraction reflections in the low potential region, it is
difficult to obtain a satisfying fit of the XRD patterns below 0.3 V. Nevertheless, the lattice
parameters can be accurately determined by the positions of diffraction peaks. The results
indicate that the unit cell expansion continues in the low potential region between 0.3 V to 0 V
(see Table 5.1). Assuming Vegard’s law, the intercalated sodium composition is calculated for
the material cycled to 0 V. The resulting sodium composition at 0 V is Na2+2.11Ti6O13 consistent
with the upper limit determined by DFT (Na2+2Ti6O13). The comparison between the observed
XRD pattern at 0V and the simulated diffraction patterns using the DFT structures at x=2,3,4
in Na2+xTi6O13, presented in Figure S.I.2, indicates best agreement with the x=2 DFT predicted
structure. This is consistent with the bulk composition x=2.11 derived from the lattice
parameters using Vegard’s law, indicating that at 0 V vs Na/Na+ the bulk composition is close
to x=2.
Table 5.1. Lattice parameters of Na2+xTi6O13 collected at various sodium compositions. The
composition for the sample A is estimated by the capacity resulting from the electrochemistry in
Figure 5.1, and the composition of sample B is estimated assuming Vegard’s law between x=0 and
x=1.
a b c β Cell volume
x in Na2+xTi6O13
Original 15.11 3.746 9.175 99.037 512.74 0
Sample A at x=1 14.88 3.757 9.415 100.587 517.35 1
Sample B at 0V 15.00 3.778 9.364 100.056 522.51 2.11

108
Comparing the Na2+1Ti6O13 and Na2+2Ti6O13 structures in Figure 5.5b and 5.5c Na addition leads
to migration of the 2d site towards the adjacent 4i site resulting in minor lattice changes
(0.98 %), also in good agreement with the XRD results in Table 5.1 (0.99 %).
Upon further sodium insertion (exceeding Na2+2Ti6O13) the BVS value (see table S.1 in appendix)
increases significantly from Na2+2Ti6O13 to Na2+3Ti6O13 implying a lack of space in the 3D tunnel
structure for the inserted Na-‐ions making these structures unlikely to form in reality,
consistent with DFT that predicts a negative voltage vs Na/Na+. When the cell is charged to ~0
V, the diffraction peaks irreversibly decrease in intensity and increase in width. This may be a
sign of effective loss in particle size and/or crystallinity, potentially responsible for the poor
reversibility at low voltages. This may indicate that part of the total capacity at 0 V is due to a
reaction of Na at the surface of Na2Ti6O13. For instance higher Na insertion compositions at the
surface may lead to strain or structural disorder, factors that both lead to diffraction line
broadening. In addition, the poor reversibility could be the result of side reactions. Several
comprehensive studies on structural evolution and electrochemical behavior of Na-‐inserted
hard carbon cycled to 0 V demonstrate the formation of the solid electrode/electrolyte
interface (SEI) on the surface of the electrode13,33. The continuous growing SEI on the surface of
hard carbon, caused by the continuous decomposition of the NaClO4-‐PC electrolyte upon
cycling, is suggested to be the main reason of the capacity fading in carbonaceous materials
with NaClO4-‐PC after 30 cycles34. Although the study of SEI formed on transition metal oxides
materials is absent up to date, we anticipate that electrolyte reduction and decomposition may
also take place at the Na2Ti6O13 surface. Further efforts should be directed towards optimizing
the electrolyte as was recently achieved for Na insertion in anatase using NaPF6 in EC:PC34.
Also in the similar Na2Ti3O7 structure reported recently21 two thirds of the Ti4+ states are
converted to the Ti3+ states in the same voltage window (from 2.5V to 0V) resulting in a similar
reversible capacity (~200mAh/g). In addition, the cycling stability of Na2Ti3O7 is excellent
109
when the cut-‐off voltage is increased from 0.01V to 0.1V 35. However, as the sodium 2e sites in
Na2Ti3O7 have already been fully occupied in the pristine Na2Ti3O7 structure, more structural
rearrangements are required to accommodate additional sodium in Na2Ti3O7 compared to
Na2Ti6O13. Most likely this is the reason why, upon sodium intercalation in Na2Ti3O7, new
reflections appear at the expense of the original main reflections, indicating a phase transition,
while in Na2Ti6O13 a solid solution mechanism is observed.
5.4 Conclusion
In conclusion, by lowering the cutoff voltage Na2Ti6O13 to 0 V a promising reversible capacity
of nearly 200 mAh/g is found accompanied with minor structural changes following a
predominantly solid solution mechanism. This makes Na2Ti6O13 a promising negative electrode
material for Na-‐ion batteries as compared to other titanium oxide materials such as TiO2
anatase 19,20,22,32,36 and Na4Ti5O1237. However, the challenge is to extend the reversible capacity
over more cycles which may be achieved by electrolytes resulting in a more stable SEI. DFT
predicts that the voltage region around 0.8 V vs Na/Na+ corresponds to the intercalation of the
sodium ions at the 2d sites in the tunnel and that only two sodium ions are able to intercalate
in the structure of Na2Ti6O13 above 0 V vs Na/Na+. Further Na addition is suggested to be react
at the surface of Na2Ti6O13 potentially responsible for the observed loss in crystallinity and/or
decrease in particle size.

110
References
(1) Whittingham, M. S. Progress in Solid State Chemistry 1978, 12, 44–99.
(2) Nagelberg, A. S.; Worrell, W. L. Journal of Solid State Chemistry 1979, 29, 345–354.
(3) Molenda, J.; Delmas, C.; Hagenmuller, P. Solid State Ionics 1983, 9&10, 431–436.
(4) Delmas, C.; Braconnier, J.-‐J.; Fouassier, C.; Hagenmuller, P. Solid State Ionics 1981, 3-‐4, 165–169.
(5) Tarascon, J. M.; Hull, G. W. Solid State Ionics 1986, 22, 85–96.
(6) Abraham, K. M. Solid State Ionics 1982, 7, 199–212.
(7) Chevrier, V. L.; Ceder, G. Journal of the Electrochemical Society 2011, 158, A1011–A1014.
(8) Palomares, V.; Serras, P.; Villaluenga, I.; Hueso, K. B.; Carretero-‐Gonz a lez, J.; Rojo, T. O. F. Energy & Environmental Science 2012, 5, 5884–5901.
(9) Ong, S. P.; Chevrier, V. L.; Hautier, G.; Jain, A.; Moore, C.; Kim, S.; Ma, X.; Ceder, G. Energy & Environmental Science 2011, 4, 3680–3688.
(10) Alcántara, R.; Jiménez-‐Mateos, J. M.; Lavela, P.; Tirado, J. L. Electrochemistry Communications 2001, 3, 639–642.
(11) Stevens, D. A.; Dahn, J. R. Journal of the Electrochemical Society 2000, 147, 1271–1273.
(12) Wenzel, S.; Hara, T.; Janek, J. U. R.; Adelhelm, P. Energy & Environmental Science 2011, 4, 3342–3345.
(13) Komaba, S.; Murata, W.; Ishikawa, T.; Yabuuchi, N.; Ozeki, T.; Nakayama, T.; Ogata, A.; Gotoh, K.; Fujiwara, K. Advanced Functional Materials 2011, 21, 3859–3867.
(14) Cabana, J.; Monconduit, L.; Larcher, D.; Palacin, M. R. Advanced Materials 2010, 22, E170–E192.
(15) Didier, C.; Guignard, M.; Denage, C.; Szajwaj, O.; Ito, S.; Saadoune, I.; Darriet, J.; Delmas, C. Electrochemical and Solid State Letters 2011, 14, A75–A78.
(16) Hamani, D.; Ati, M.; Tarascon, J.-‐M.; Rozier, P. Electrochemistry Communications 2011, 13, 938–941.
(17) Xiong, H.; Slater, M. D.; Balasubramanian, M.; Johnson, C. S.; Rajh, T. The Journal of Physical Chemistry Letters 2011, 2, 2560–2565.
(18) Xu, Y.; Memarzadeh Lotfabad, E.; Wang, H.; Farbod, B.; Xu, Z.; Kohandehghan, A.; Mitlin, D. Chemical communications (Cambridge, England) 2013, 49, 8973–8975.

111
(19) Wu, L.; Buchholz, D.; Bresser, D.; Gomes Chagas, L.; Passerini, S. Journal of power sources 2014, 251, 379–385.
(20) Kim, K.-‐T.; Ali, G.; Chung, K. Y.; Yoon, C. S.; Yashiro, H.; Sun, Y.-‐K.; Lu, J.; Amine, K.; Myung, S.-‐T. Nano Letters 2014, 14, 416–422.
(21) Senguttuvan, P.; Rousse, G.; Seznec, V.; Tarascon, J.-‐M.; Palacin, M. R. Chem. Mater. 2011, 23, 4109–4111.
(22) Rudola, A.; Saravanan, K.; Devaraj, S.; Gong, H.; Balaya, P. Chemical communications (Cambridge, England) 2013, 49, 7451–7453.
(23) Larson, A. C. GSAS; Los Alamos National Laboratory, 1994.
(24) Blöchl, P. E. Physical Review B 1994, 50, 17953–17979.
(25) Kresse, G.; Furthmüller, J. Physical Review B 1996, 54, 11169–11186.
(26) Kresse, G.; Joubert, D. Physical Review B 1999, 59, 1758–1775.
(27) Pérez-‐Flores, J. C.; García-‐Alvarado, F.; Hoelzel, M.; Sobrados, I.; Sanz, J.; Kuhn, A. Dalton Transactions 2012, 41, 14633–14642.
(28) Torres-‐Martínez, L. M.; Juárez-‐Ramírez, I.; Del Ángel-‐Sánchez, K.; Garza-‐Tovar, L.; Cruz-‐López, A.; Del Ángel, G. Journal of Sol-‐Gel Science and Technology 2008, 47, 158–164.
(29) Andersson, S.; Wadsley, A. D. Acta Crystallographica 1962, 15, 194–201.
(30) Brown, I. D.; Altermatt, D. Acta Crystallogr B Struct Sci 1985, 41, 244–247.
(31) Adams, S. Acta Crystallogr B Struct Sci 2001, 57, 278–287.
(32) Zhou, F.; Cococcioni, M.; Kang, K.; Ceder, G. Electrochemistry Communications 2004, 6, 1144–1148.
(33) Gotoh, K.; Ishikawa, T.; Shimadzu, S.; Yabuuchi, N.; Komaba, S.; Takeda, K.; Goto, A.; Deguchi, K.; Ohki, S.; Hashi, K.; Shimizu, T.; Ishida, H. Journal of power sources 2013, 225, 137–140.
(34) Ponrouch, A.; Marchante, E.; Courty, M.; Tarascon, J.-‐M.; Palacin, M. R. Energy & Environmental Science 2012, 5, 8572–8583.
(35) Rudola, A.; Saravanan, K.; Mason, C. W.; Balaya, P. Journal of Materials Chemistry A 2013, 1, 2653–2662.
(36) Lindström, H.; Södergren, S.; Solbrand, A.; Rensmo, H.; Hjelm, J.; Hagfeldt, A.; Lindquist, S.-‐E. J. Phys. Chem. B 1997, 101, 7710–7716.
(37) Woo, S. H.; Park, Y.; Choi, W. Y.; Choi, N. S.; Nam, S.; Park, B.; Lee, K. T. Journal of the Electrochemical Society 2012, 159, A2016–A2023.

112
Appendix
Figure S.I.1. Black symbols: Electrodes with only conductive carbon and PVDF were prepared demonstrating that the fractional contribution from carbon and PVDF to the capacity drops below 10 after a few cycles. Red points indicate the capacity contribution from the residual TiO2 anatase upon cycling.
Figure S.I.2 Comparison between the observed XRD pattern at 0V (electrochemically x=4, structurally x=2 in Na2+xTi6O13) and the simulated patterns using the DFT determined
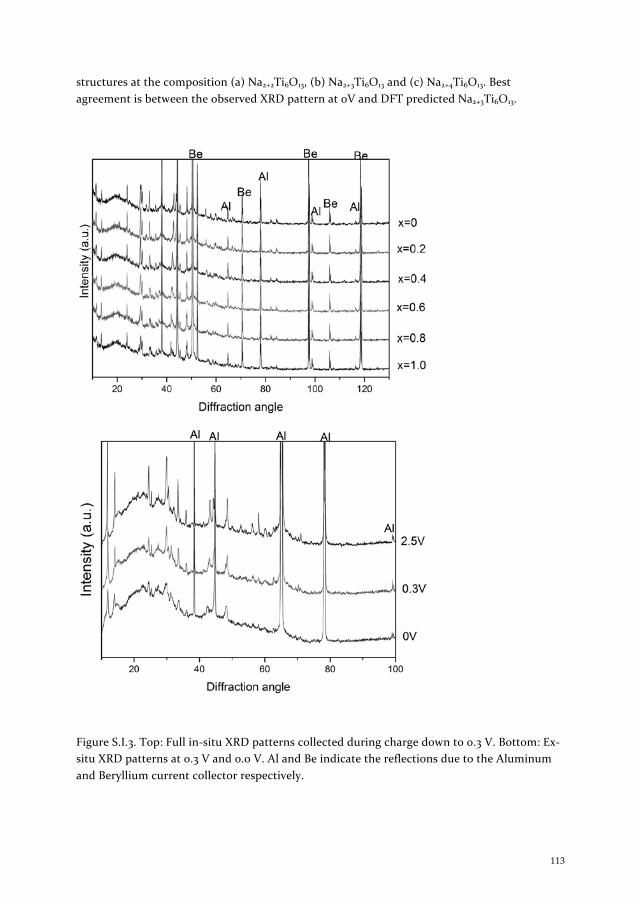
113
structures at the composition (a) Na2+2Ti6O13, (b) Na2+3Ti6O13 and (c) Na2+4Ti6O13. Best agreement is between the observed XRD pattern at 0V and DFT predicted Na2+3Ti6O13.
Figure S.I.3. Top: Full in-‐situ XRD patterns collected during charge down to 0.3 V. Bottom: Ex-‐situ XRD patterns at 0.3 V and 0.0 V. Al and Be indicate the reflections due to the Aluminum and Beryllium current collector respectively.

114
Table S.I.1. Na2+1Ti6O13 structure data determined from Rietveld refinement of the XRD pattern. The Na2+2Ti6O13, Na2+3Ti6O13 and Na2+4Ti6O13 structures are DFT predicted. The BVS values are the results from the bond valence sum calculations.
Na2+1Ti6O13, a=14.880077Å, b=3.756987Å, c=9.414455Å, β=100.587˚, space group c12/m1. The average agreement index parameters are Rp=4.1% and Rwp=5.5%. The refined isotropic thermal parameter Uiso=0.012.
Atom Wkckoff X Y Z Multiplicity BVS occupancy
Na 4i 0.471714 0 0.189316 4 0.4468 1
Na 2d 0.5 0 0.5 2 0.3613 1
Ti 4i 0.119377 0 0.090748 4 1
Ti 4i 0.157138 0 0.436824 4 1
Ti 4i 0.223410 0 0.759997 4 1
O 4i 0.267934 0 0.278369 4 1
O 4i 0.071513 0 0.298388 4 1
O 4i 0.316272 0 0.583704 4 1
O 4i 0.110748 0 0.63282 4 1
O 4i 0.35545 0 0.88871 4 1
O 4i 0.16508 0 0.91469 4 1
O 2a 0 0 0 2 1
Na2+2Ti6O13 a=14.997621Å, b=3.777726Å, c=9.36428Å, β=100.0562˚, space group c12/m1
Atom Wyckoff X Y Z Multiplicity BVS Occupancy
Na 4i 0.39985 0 0.10096 4 0.4945 1
Na 4i 0.48686 0 0.35214 4 0.5470 1
Ti 4i 0.11119 0 0.13091 4 1
Ti 4i 0.17046 0 0.45888 4 1
Ti 4i 0.24572 0 0.78124 4 1
O 4i 0.24291 0 0.24899 4 1

115
O 4i 0.06391 0 0.33062 4 1
O 4i 0.30781 0 0.55833 4 1
O 4i 0.12736 0 0.64296 4 1
O 4i 0.3859 0 0.85395 4 1
O 4i 0.18233 0 0.9461 4 1
O 2a 0 0 0 2 1
Na2+3Ti6O13 a=14.588Å, b=4.061Å, c=9.207Å, β=95.62˚, space group c12/m1
Atom Wyckoff X Y Z Multiplicity BVS Occupancy
Na 4i 0.37237 0 0.11524 4 1.0087 1
Na 4i 0.52434 0 0.28964 4 0.8653 1
Na 2c 0.5 0.5 0.5 2 1.5169 1
Ti 4i 0.11743 0 0.11 4 1
Ti 4i 0.18658 0 0.4433 4 1
Ti 4i 0.24563 0 0.75719 4 1
Ti 4i 0.24477 0 0.76777 4 1
O 4i 0.24666 0 0.24304 4 1
O 4i 0.07323 0 0.30852 4 1
O 4i 0.31204 0 0.56707 4 1
O 4i 0.133750 0 0.6272 4 1
O 4i 0.37361 0 0.87396 4 1
O 4i 0.18135 0 0.9348 4 1
O 2a 0 0 0 2 1
Na2+4Ti6O13 a=15.96Å, b=4.006Å, c=9.336Å, β=104.16˚, space group c12/m1
Atom Wyckoff X Y Z Multiplicity BVS Occupancy
Na 4i 0.50979 0 0.14589 4 0.6966 1

116
Na 4i 0.59395 0 0.53331 4 0.7916 1
Na 4i 0.44976 0.5 0.27757 4 1.1547 1
Ti 4i 0.12978 0 0.079 4 1
Ti 4i 0.186 0 0.41638 4 1
Ti 4i 0.24395 0 0.7765 4 1
O 4i 0.24628 0 0.23852 4 1
O 4i 0.08293 0 0.27569 4 1
O 4i 0.30321 0 0.58517 4 1
O 4i 0.1446 0 0.5934 4 1
O 4i 0.36449 0 0.9199 4 1
O 4i 0.16849 0 0.90194 4 1
O 2a 0 0 0 2 1

117
Chapter 6
Na insertion in TiO2 anatase, bulk versus
surface storage
Abstract
The particle size dependent electrochemical Na-‐ion storage in TiO2 anatase is investigated by
electrochemistry and X-‐ray diffraction. Reducing the particle size from 130 to 40 and 7 nm
results in an increase in reversible capacity leading to 170 mAh/g for 7 nm particles during the
first cycles reducing thereafter. X-‐ray diffraction on the reduced (Na-‐ion inserted) electrodes
after several discharge and charge cycles shows negligible changes in lattice parameters
suggesting Na-‐ion insertion does not occur significantly. In contrast, DFT calculations predict
that the maximum composition NaTiO2 (capacity 334mAh/g) should be achieved at an average
voltage of approximately 0.3 V vs Na/Na+. However, the high energy barrier for Na diffusion
between sites (~0.84 eV) appears to prevent Na-‐ion insertion. This indicates that the
electrochemical observed Na-‐ion storage is due an X-‐ray diffraction amorphous surface
formation reaction, consistent with the higher capacities of smaller particle sizes. Therefore
strategies to improve the electrochemical performance of Na storage in nano structured TiO2
anatase should focus on the phase resulting after the surface reconstruction, and also
electrolyte stability.

118
6.1 Introduction
Na-‐ion batteries provide one of the most promising alternatives for Li-‐ion batteries due to the
high abundance and low cost of Na. The strongly electro positive character of Na enables
almost comparable cell potentials. In the past decades, research on Na-‐ion batteries has been
initiated in parallel with Li-‐ion battery research,1-‐6 however the success of the later has largely
diverted attention away from Na-‐ion batteries. Renewed interest in Na-‐ion batteries is
motivated by the virtually unlimited Na resources and associated low costs.7,8 In general, the
operating voltage of Na-‐ion batteries is about 0.4 V lower compared to Li-‐ions batteries,
resulting in a somewhat lower but still large energy and power density.9 In addition, compared
with Li-‐ions (0.76 Å), the larger ionic radius of Na-‐ions (1.02 Å) often leads to larger structural
distortions and barriers for diffusion in host structures.9 This is most likely the reason why
only a few insertion electrode materials are reported displaying reversible Na-‐ion uptake,
negative electrode materials being in particular scarce. Sodium metal as a negative electrode
introduces complications such as dendrite formation, low melting point and interface aging.8
Graphite and hard carbons, extensively investigated as a negative electrode, have much lower
specific capacities and result in larger capacity fading compared to Li-‐ions. 10-‐12 In addition, the
capacitive storage of Na-‐ions at the graphite surface has the disadvantage of a linear drop in
the battery voltage lowering the energy density.13 Due to the competition between inversion
and conversion reactions the 3d metal (Ti,V) oxides appear promising for low voltage Na-‐ion
insertion.14 NaxVO2 was found to react reversibly around 1.5V.15,16 A reversible storage capacity
of 200 mAh/g was achieved in Na2Ti3O7 at an insertion voltage close to 0.3 V and cutoff voltage
0 V vs Na/Na+ 17. The structurally similar Na2Ti6O13 compound demonstrates a highly reversibly
uptake of 1 Na ion per formula unit (49.5 mAh/g) 18 which can be increased to almost 200
mAh/g by lowering to voltage towards 0 V vs Na/Na+ albeit with a degrading capacity over
ten’s of cycles (see chapter 5).

119
Anatase TiO2 is an extensively investigated negative electrode material for lithium ion
batteries, exhibiting large reversible capacity19-‐21 and excellent gravimetric and volumetric
storage capacities22,23, with the disadvantage of having a relatively high potential versus Li/Li+
as negative electrode. Na storage in TiO2 anatase materials has been reported in different
nanostructured morphology types, including amorphous nanotubes24, nanocrystals 25 and
carbon coated nanorods26. High rate capacity (104 mAh/g at 10C rate)26 and good reversibility
(150nmAh/g after 100 cycles) 26 have been obtained. These capacities are well below that
obtained for lithium insertion nano-‐structured TiO2 anatase19-‐23 and unlike Li-‐ion storage,
substantial Na-‐ion storage is mainly reported in nanostructured anatase TiO2 suggesting bulk
Na-‐ion storage is limited. An early study, combining electrochemistry and quantum chemical
calculations, however, report comparable diffusion barriers for Li and Na-‐ions in bulk
anatase.27
To resolve this discrepancy and gain more insight in the possibilities to use anatase
TiO2 materials as negative electrode in Na-‐ion batteries we study the impact of particle size on
the Na-‐ion insertion in TiO2 anatase. Galvanostatic cycling tests are performed on three TiO2
anatase particle sizes, 7, 40 and 130 nm, and ex-‐situ X-‐ray diffraction is applied on fully reduced
electrodes to characterize the structure changes upon Na insertion. DFT energy and activation
barrier calculation are applied to model the reduced structure and estimate the intercalation
voltage and Na ion migration barriers. This combination of techniques gives insight in the role
of surface versus bulk Na storage and the potential use of anatase TiO2 as negative electrode
for Na-‐ion batteries.

120
6.2 Experimental technique
Materials preparation
130 nm, and 40 nm TiO2 particles were obtained from Aldrich. For 7 nm TiO2 anatase
particles, deionized water was added to the mixture of titanium isopropoxide and anhydrous
acetone under stirring in an ice bath as reported by Borghols et al28. The resulting white
precipitate, amorphous TiO2, was filtered out and washed multiple times with anhydrous
acetone before drying overnight at 50 oC. To obtain nanocystalline anatase the amorphous TiO2
anatase was heated to 250 oC in 10 minutes in open air and annealed for 4 hours. The material
was further dried in a vacuum furnace at 80 oC for a week. The crystalline structure and
particle size of the final product was confirmed using TEM (see figure 6.1) and X-‐ray diffraction,
revealing tetragonal anatase with a crystalline size of approximately 7 nm.
Figure 6.1 High resolution TEM micrograph of nano-‐cyrstalline TiO2 anatase

121
Electrode preparation
For 130 nm and 40 nm anatase TiO2, the electrodes used for electrochemistry measurements
and X-‐ray diffraction were prepared from a mixture of 80 wt% TiO2 anatase, 10 wt%
polyvinylidene fluoride binder (Aldrich) and 10 wt% carbon black (ENSAQO, Aldrich) using N-‐
Methyl-‐pyrrolidone (Aldrich) as solvent. For the 7 nm particles, the weight ratio was revised to
70:20:10 respectively. The well-‐mixed slurries were doctor bladed on carbon coated aluminum
foil and dried in a fume hood overnight and then placed in a vacuum furnace at approximately
100 oC for several days.
Electrochemical experiments
Galvanostatic charge-‐discharge cycling tests were performed at C/10 rate using a
MACCOR S4000 cycler. Sodium metal was used as counter electrode for the anatase TiO2
electrode. The two electrodes were separated by a porous cotton microfiber (Whatman). 1M
NaClO4 in propylene carbonate was served as electrolyte. All cells were assembled with air
tight flange cells in a glove box under argon atmosphere (H2O<0.1 ppm and O2<0.1 ppm).
X-‐ray diffraction
X-‐ray diffraction characterization was carried out using a Panalytical X’pert Pro
diffractometer equipped with a Cu-‐Kα tube. The diffraction patterns were collected on TiO2
electrodes that were reduced to 0 V vs Na/Na+ and on electrodes that were oxidized after
reduction to 2.8V. The electrodes were placed in Kapton airtight sample holders designed to
perform XRD. All sample preparations were carried out in argon atmosphere in glove box
(H2O<0.1 ppm and O2<0.1 ppm) to prevent reactions with air and moisture.

122
Density Functional Theory
The NaxTiO2 structures were geometrically optimized to their ground state by relaxing
the unit cell size, shape and the atom positions. The structural relaxation and total energy
calculations were performed using the gradient-‐corrected exchange correlation functional to
density functional theory simulations, as implemented in the VASP ab-‐initio calculations
package. A cut-‐off energy of 400 eV and appropriate k-‐point grid was determined by a
convergence test on the total energies, the criterium of which was set to reach energy changes
less than 10-‐4 eV per formula unit. The nudged elastic band (NEB) method as implemented in
the VASP code was used to estimate the activation energy barriers for Na hopping between
adjacent octahedral interstitial sites. A 2x2x1 supercell of pure TiO2 anatase (doubling along
both the a and the b directions) was applied for the energy barrier calculation, where first the
end-‐states were relaxed to the ground state. All the energy barrier calculations were performed
with constant unit cell dimensions and shape. The negligible changes on the NEB calculation
results for a larger supercell (2x2x2) confirms that the size of the supercell (2x2x1) is sufficiently
adequate to remove the Na-‐Na self interaction effect from the periodically repeated cells on
the activation barrier.

123
6.3 Results and discussion
Figure 6.2 Electrochemical characterization of TiO2 anatase vs Na/Na+. First three cycles and the
25th cycle of the Galvanostatic (dis)charging at C/10 rate (0.005 A/g) for TiO2 electrodes with (a)
7 nm, (b) 40 nm, (c)130 nm particles (d)7nm particles with EC/PC electrolyte . (e) Specific

124
(dis)charge capacity as a function of the number of cycles at C/10 rate for the different particle
sizes.
Figure 6.2a-‐c show the voltage-‐capacity profiles collected for different particle sizes of
TiO2 anatase vs Na/Na+ cycling at c/10. The almost linear decrease in voltage for all three
particle sizes is consistent with previous studies on Na storage in nanostructured TiO2
anatase.25,26 The continued decrease in voltage appears to be a common feature in several
negative Na-‐ion electrode materials, such as Na2Ti6O13,18 Na4Ti5O12,29 amorphous TiO224 and
carbon13. Both a solid solution reaction, as observed in Na2Ti6O1318 and capacitive storage, as
observed for hard carbons13, may explain this voltage behavior. It suggests that Na insertion in
TiO2 anatase does not cause the first order phase transition that is well known to occur upon
Li insertion
30,31. The most striking difference in the electrochemistry between the different particle sizes is
the evolution of the specific capacities upon cycling, as shown in Figure 6.2d. The largest TiO2
anatase particles (130 nm) achieve the lowest reversible capacity, 42 mAh/g, while it shows the
best capacity retention, amounting more than 98% of the initial charge capacity after 25 cycles.
The smallest TiO2 particles (7 nm) exhibit a much higher initial reversible capacity, 170 mAh/g,
during the first five cycles, however, decreasing dramatically to 58% after 25 cycles. A previous
study about the influence of the electrolyte on the electrochemical behavior suggested that an
EC:PC mixture is able to offer better cycling stability32-‐34. This is apparently because a more
stable SEI can be formed in the EC:PC electrolyte as deduced from the electrochemical
impedance spectroscopy study33. Hence, 7nm TiO2 particles are also tested in this electrolyte.
The result shows that the capacity stability for the cell employing the EC:PC electrolyte is
distinctly better than the cell with the pure PC electrolyte, but the reversible capacity is
slightly lower, especially the first few cycles(see figure 6.2 d and e).

125
Ex-‐situ X-‐ray diffraction patterns on the pristine electrodes and the electrodes reduced to 0 V
after 25 cycles are shown for the different particle sizes in Figure 6.3. For 130 nm and 40 nm
particles, before and after cycling, the reflections hardly shift, whereas the anatase reflections
of the 7 nm particles are significantly depressed after cycling. In addition, the intensities
(compared to the background) of the main reflections of TiO2 anatase significantly decrease
after 25th discharge, especially for 130nm and 7nm particles. The lattice parameters and the
domain sizes of the different particle sizes resulting from Rietveld refinement of the X-‐ray
diffraction patterns collected at the end of the 25th discharge (Sodiated state, assuming all
broadening is due to size broadening) are given in Table 1. Assuming the Na-‐ions intercalate,
potentially via a solid solution reaction, the considerable reversible capacity in combination
with the large ionic size of Na-‐ions is expected to lead to larger changes in unit cell parameters.
In contrast, only very small changes in lattice parameters are observed in the XRD fitting
results. This finding has a good agreement with the structural changes on anatase nanorod
TiO2 at the first cycle sodiation and desodiation35. The magnitudes of variation on cell volumes
and crystalline size in 7nm particles is much larger than 40nm and 130nm particles. In addition,
a noticeable decrease on domain sizes of TiO2 anatase is also shown in Table 1. Further
structural characterizations with better resolution (like XPS, TEM) are required to study the
interface reaction and sodium insertion mechanism.

126
Figure 6.3. Ex-‐situ X-‐ray diffraction patterns of the pristine electrodes and the electrodes
reduced to 0V after 25 cycles. Pristine particle sizes (a) 130 nm, (b) 40 nm, (c) 7 nm.

127
Table 1. Lattice parameters and domain size determined from Rietveld refinement for the
pristine electrodes and the electrodes that were reduced to 0V after 25 cycles
materials pristine 25th discharged Volume
change
domai
n size
change
a [Å] c [Å] domain
size [nm]
a [Å] c [Å] domain
size
[nm]
130 nm 3.785 9.514 130 3.798 9.538 67.69 0.93% 50.7%
40 nm 3.787 9.516 38.1 3.801 9.515 36.1 0.76% 5.25%
7 nm 3.781 9.395 7.12 3.826 9.411 2.67 2.59% 62.5%
To investigate the thermodynamics of Na-‐ion insertion in anatase TiO2 Density Functional
Theory simulations were performed for the different Na-‐ion compositions within the unit cell.
Quantum chemical calculations have indicated that like Li-‐ions, Na-‐ions occupy interstitial
octahedral positions27. At present the ground state structures at different Na compositions are
identified by evaluating the formation energies (see figure 6.5) of all possible Na configurations
over the octahedral interstitial sites in NaxTiO2 unit cell the results of which are shown in
Figure 6.4. The only stable ground state structure is at x=0.5, with a formation energy of 5.56
meV only slightly more stable than a combination of the TiO2 and NaTiO2 end members. This
may suggest that similar to LixTiO236,37 the Na0.5TiO2 is relative stable, displaying two first order
phase transitions, between TiO2 and Na0.5TiO2 and between Na0.5TiO2 and NaTiO2. However,
many more Na-‐ion configurations, in super cells of NaxTiO2 are required to establish this.
Nevertheless, these calculations do give first insight in the thermodynamics and the structural
changes of TiO2 upon Na-‐ion insertion.

128
Figure 6.4. Ground state structures of (a) TiO2, (b) Na0.5TiO2 and (c) Na1TiO2. Purple:
Titanium, red: Oxygen, yellow: Sodium.
Figure 6.5 The formation energies of the different Na-‐ion configurations over the octahedral sites
in the TiO2 unit cell calculated by DFT.
Based on the ground state energies the average intercalation voltages between TiO2 and
Na0.5TiO2 and between Na0.5TiO2 and Na1TiO2 can be estimated38:
V (x) = −ENaxTiO2
− ETiO2− x ⋅ENa
x ⋅e Equation 6.1

129
Where ENaxTiO2 , ETiO2 and ENa are the DFT calculated total energy of NaxTiO2, TiO2 and
Na metal respectively. The result, referenced versus Na/Na+, is shown in Figure 6.6, indicating
that thermodynamically Na-‐ion insertion can occur at a positive insertion potential (vs Na/Na+)
from x = 0 to x = 1 in NaxTiO2. Therefore, the DFT energy calculations indicate that the Na
storage in TiO2 anatase is possible up to Na1TiO2 (334mAh/g). However, this theoretical
capacity, and close to constant insertion voltage, are not observed applying galvanostatic
(dis)charging as shown in Figure 6.2.
Figure 6.6 The calculated voltage profile based on the ground state energies as a function of
sodium composition for NaxTiO2.
In addition DFT predicts that the Na-‐ion insertion in TiO2 leads to significant changes
in lattice parameters (DV=10.08% TiO2 to Na0.5TiO2 ), not reflected by the ex-‐situ XRD results,
see Table 1. In fact, there appears to be no experimental proof that a significant concentration
of Na-‐ions is inserted into the TiO2 anatase lattice. This would imply that the electrochemical
capacities, Figure 6.2, are solely due to storage of Na near the crystallite surface, and leading to
X-‐ray amorphous surface area’s on a reduced crystalline anatase core. Na insertion in the
crystalline anatase core is further kinetically hindered by high diffusion barriers, in contrast
with quantum chemical calculations that suggest that the diffusion barriers for Na-‐ions in
anatase TiO2 are comparable to that of Li-‐ions.27

130
To investigate the kinetic properties of Na ions in bulk anatase, the nudged elastic
band calculations, as implemented in VASP, are applied to calculate the energy barriers for Na
diffusion in the dilute NaxTiO2 anatase structure. Based on the assumption that Na ions occupy
the same octahedral sites as lithium ions, all the available Na interstitial sites and all Na ion
hops between the adjacent octahedral sites are symmetrically equivalent. Similar to lithium
diffusion in anatase TiO2, the strong electrostatic repulsion between sodium and the adjacent
Ti force Na to travel through the shared octahedron edges.39 In the 2x2x1 (axbxc) supercell the
two Na-‐O6 octahedrons suffer distinct distortion to allow the Na hops between the two
adjacent octahedral sites, the shared edge of which varies between 3.56 Å to 4.02 Å (see Figure
6.7). This distortion causes the energy barrier upon Na diffusion shown in Figure 6.8. The large
energy barrier for Na-‐ion diffusion compared to Li-‐ion diffusion 39,40 indicates that Na-‐ion
diffusion in Na0.0625TiO2 is kinetically hindered at room temperature, consistent with the
experimental results that show no evidence for Na-‐ion insertion. Apparently, the high capacity,
close to 170mAh/g, in the smallest particle size (7 nm) is due to a surface storage mechanism.
Figure 6.7 Schematic of the Na-‐O6 octahedra. Yellow atoms are sodium, and red atoms are
oxygen.

131
Figure 6.8 The energy barrier for Na-‐ion diffusion between neighboring octahedral positions in
dilute NaxTiO2 (Na0.0625TiO2) calculated from Nudged Elastic Band calculations in a 2x2x1 (axbxc)
unit cell.
The only significant structural change observed by X-‐ray diffraction is the broadening
of the TiO2 reflections after 25 cycles as shown in Table 1. The potential origin for this is strain
broadening or effective reduction of the crystalline domain size, induced by the loss of
crystallinity of the outer shells of the TiO2 anatase particles. Because the lattice parameters
hardly change, which should happen upon Na-‐ion insertion as indicated by DFT, the
broadening is most likely due to such partial loss of crystallinity. Futhermore, such crystallinity
loss results in the loss of intensities of the anatase TiO2 reflection proportional with the third
power of the remaining observed crystalline domain size, which is excellent consistent with
the observations in figure 6.3 for 130nm and 7nm particles. As the capacity increases with
decreasing particle size, and Na-‐ion insertion is excluded, we suggest that the loss of
crystallinity occurs at the surface of the particles due to large distortions initiated by the Na-‐

132
ion storage at the surface, although further structural characterizations with better resolution
(like XPS, TEM) are required to further investigate this.
Partial loss of crystallinity indicates large structural changes at the surface which may
also be the origin of the capacity fading that is much larger for smaller particles, as observed in
Figure 6.2d. Another origin for the capacity fading may be electrolyte decomposition at the
electrode electrolyte interface, which in lithium ion batteries is well known to result in the
formation of a Solid Electrolyte Interface (SEI). This has been observed for hard carbon cycled
to 0 V vs Na/Na+.13,41 In chapter 5, a continuous growing SEI by NaClO4-‐PC electrolyte
decomposition is suggested to be the main reason for the observed capacity fading in Na2Ti6O13.
Electrochemical study in this chapter exhibits that better cycling capacity stability can be
obtained by employing the EC:PC mixture as electrolyte solvent than employing NaClO4-‐PC
electrolyte, because for negative Na-‐ion battery electrodes the mixture of EC and PC results in
more stable SEI formation compared to PC.33
The NEB calculation of the Na-‐ion energy barrier of diffusion indicates that poor
kinetics of the Na insertion in TiO2 anatase may be a main factor that is preventing the
energetically achievable capacity of bulk TiO2 to be useable, if it would be structurally stable.
Although carbon coating and nanoarchitecturing are two powerful strategies to facilitate the
kinetics of electrode materials in general, it is questionable whether this can compensate for
the high intrinsic barrier for Na-‐ion diffusion through the anatase TiO2 lattice. Nevertheless, a
recent study reports carbon coated TiO2 anatase nanorods demonstrating higher rate
capacities for sodium ions insertion.26 Another possibility to improve the reaction kinetics of
TiO2 by synthesis of materials with a higher surface area having more reactive surface facets. In
this way the kinetics of lithium insertion in TiO2 anatase were significantly enhanced by
synthesis of crystalline anatase having a large fraction of {001} reactive facets.42

133
6.4 Conclusions
Na-‐ion electrochemistry of anatase TiO2 strongly depends on particle size. Particle size
reduction leads to distinct increase in the reversible capacity at the expense of the cycling
stability. 7 nm TiO2 anatase particles exhibit the initially highest specific reversible capacity of
170 mAh/g reported for a transition metal oxide negative Na-‐ion battery electrode. DFT
calculations predict that thermodynamically the theoretical capacity associated with the
NaTiO2 composition, 334 mAh/g, can be reached at approximately 0.3 V vs Na/Na+. However,
structural characterization by XRD of reduced electrodes suggests that Na ions do not
intercalate in the bulk TiO2 anatase lattice, but instead appear to react at the surface of the
particles, leading to a loss of crystallinity. Such surface reconstruction reaction is consistent
with the increasing capacity with decreasing particle size. The absence of capacity based on
bulk Na-‐ion insertion is suggested to be the consequence of the relatively high activation
barrier for the Na ion diffusion through the TiO2 anatase lattice as predicted by NEB
calculations. Therefore, improvement of the reversible Na-‐ion capacity in anatase TiO2 should
focus on the stability of the surface and SEI formation.

134
References
(1) Whittingham, M. S. Progress in Solid State Chemistry 1978, 12, 44–99.
(2) Nagelberg, A. S.; Worrell, W. L. Journal of Solid State Chemistry 1979, 29, 345–354.
(3) Molenda, J.; Delmas, C.; Hagenmuller, P. Solid State Ionics 1983, 9&10, 431–436.
(4) Delmas, C.; Braconnier, J.-‐J.; Fouassier, C.; Hagenmuller, P. Solid State Ionics 1981, 3-‐4, 165–169.
(5) Tarascon, J. M.; Hull, G. W. Solid State Ionics 1986, 22, 85–96.
(6) Abraham, K. M. Solid State Ionics 1982, 7, 199–212.
(7) Chevrier, V. L.; Ceder, G. Journal of the Electrochemical Society 2011, 158, A1011–A1014.
(8) Palomares, V.; Serras, P.; Villaluenga, I.; Hueso, K. B.; Carretero-‐Gonz a lez, J.; Rojo, T. O. F. Energy & Environmental Science 2012, 5, 5884–5901.
(9) Ong, S. P.; Chevrier, V. L.; Hautier, G.; Jain, A.; Moore, C.; Kim, S.; Ma, X.; Ceder, G. Energy & Environmental Science 2011, 4, 3680–3688.
(10) Alcántara, R.; Jiménez-‐Mateos, J. M.; Lavela, P.; Tirado, J. L. Electrochemistry Communications 2001, 3, 639–642.
(11) Stevens, D. A.; Dahn, J. R. Journal of the Electrochemical Society 2000, 147, 1271–1273.
(12) Wenzel, S.; Hara, T.; Janek, J. U. R.; Adelhelm, P. Energy & Environmental Science 2011, 4, 3342–3345.
(13) Komaba, S.; Murata, W.; Ishikawa, T.; Yabuuchi, N.; Ozeki, T.; Nakayama, T.; Ogata, A.; Gotoh, K.; Fujiwara, K. Advanced Functional Materials 2011, 21, 3859–3867.
(14) Cabana, J.; Monconduit, L.; Larcher, D.; Palacin, M. R. Advanced Materials 2010, 22, E170–E192.
(15) Didier, C.; Guignard, M.; Denage, C.; Szajwaj, O.; Ito, S.; Saadoune, I.; Darriet, J.; Delmas, C. Electrochemical and Solid State Letters 2011, 14, A75–A78.
(16) Hamani, D.; Ati, M.; Tarascon, J.-‐M.; Rozier, P. Electrochemistry Communications 2011, 13, 938–941.
(17) Senguttuvan, P.; Rousse, G.; Seznec, V.; Tarascon, J.-‐M.; Palacin, M. R. Chem. Mater. 2011, 23, 4109–4111.

135
(18) Rudola, A.; Saravanan, K.; Devaraj, S.; Gong, H.; Balaya, P. Chemical communications (Cambridge, England) 2013, 49, 7451–7453.
(19) Bonino, F.; Busani, L.; Lazzari, M.; Manstretta, M.; Rivolta, B.; Scrosati, B. Journal of power sources 1981, 6, 261–270.
(20) Cava, R. J.; Murphy, D. W.; Zahurak, S.; Santoro, A.; Roth, R. S. J. Solid State Chem. 1984, 53, 64–75.
(21) Jamnik, J.; MAIER, J. Phys. Chem. Chem. Phys. 2003, 5, 5215–5220.
(22) Deng, D.; Kim, M. G.; Lee, J. Y.; Cho, J. Energy & Environmental Science 2009, 2, 818–837.
(23) Wagemaker, M.; Kearley, G. J.; Van Well, A. A.; Mutka, H.; Mulder, F. M. J. AM. Chem. Soc. 2003, 125, 840–848.
(24) Xiong, H.; Slater, M. D.; Balasubramanian, M.; Johnson, C. S.; Rajh, T. The Journal of Physical Chemistry Letters 2011, 2, 2560–2565.
(25) Xu, Y.; Memarzadeh Lotfabad, E.; Wang, H.; Farbod, B.; Xu, Z.; Kohandehghan, A.; Mitlin, D. Chemical communications (Cambridge, England) 2013, 49, 8973–8975.
(26).
(27) Lunell, S.; Stashans, A.; Ojamae, L.; Lindstrom, H.; Hagfeldt, A. J. AM. Chem. Soc. 1997, 119, 7374–7380.
(28) Borghols, W. J. H.; L u tzenkirchen-‐Hecht, D.; Haake, U.; van Eck, E. R. H.; Mulder, F. M.; Wagemaker, M. Physical chemistry chemical physics : PCCP 2009, 11, 5742.
(29) Woo, S. H.; Park, Y.; Choi, Y.; Choi, N.-‐S.; Nam, S.; Tae, K. J. Electrochem. Soc. 2012, 200, A2016–A2023.
(30) Tarascon, J. M.; Poizot, P.; Laruelle, S.; Grugeon, S.; Dupont, L. Nature 2000, 407, 496–499.
(31) Tarascon, J. M.; Armand, M. Nature 2001, 414, 359–367.
(32) Wu, L.; Buchholz, D.; Bresser, D.; Gomes Chagas, L.; Passerini, S. Journal of power sources 2014, 251, 379–385.
(33) Ponrouch, A.; Marchante, E.; Courty, M.; Tarascon, J.-‐M.; Palacin, M. R. Energy & Environmental Science 2012, 5, 8572–8583.
(34) Ponrouch, A.; Dedryvère, R.; Monti, D.; Demet, A. E.; Ateba Mba, J. M.; Croguennec, L.; Masquelier, C.; Johansson, P.; Palacin, M. R. Energy & Environmental Science 2013, 6, 2361.
(35) Kim, K.-‐T.; Ali, G.; Chung, K. Y.; Yoon, C. S.; Yashiro, H.; Sun, Y.-‐K.; Lu, J.; Amine, K.; Myung, S.-‐T. Nano Letters 2014, 14, 416–422.

136
(36) Macklin, W. J.; Neat, R. J. Solid State Ionics 1992, 53-‐56, 694–700.
(37) Wagemaker, M.; Borghols, W. J. H.; Mulder, F. M. Journal of the American Chemical Society 2007, 129, 4323–4327.
(38) Aydinol, M. K.; Kohan, A. F.; Ceder, G.; Cho, K. Physical Review B 1997, 56, 1354–1365.
(39) Belak, A. A.; Wang, Y.; Van der Ven, A. Chemistry of Materials 2012, 24, 2894–2898.
(40) Morgan, D.; Van der Ven, A.; Ceder, G. Electrochemical and Solid State Letters 2004, 7, A30–A32.
(41) Gotoh, K.; Ishikawa, T.; Shimadzu, S.; Yabuuchi, N.; Komaba, S.; Takeda, K.; Goto, A.; Deguchi, K.; Ohki, S.; Hashi, K.; Shimizu, T.; Ishida, H. Journal of power sources 2013, 225, 137–140.
(42) Sun, C. H.; Yang, X. H.; Chen, J. S.; Li, Z.; Lou, X. W.; Li, C.; Smith, S. C.; Lu, G. Q. M.; Yang, H. G. Chemical communications (Cambridge, England) 2010, 46, 6129–6131.

137
Summary
Nanostructured materials are featured by providing a variety of favourable electrical
properties, as the reduced ion and electron transport paths enable significant
enhancement on (de)intercalation rates and hence high power. For TiO2 anatase,
nano-‐sizing results in a curved open cell voltage profile with a much shorter plateau
region in comparison with that of micron sized materials. The main objective of this
thesis is to gain insight in the impact of particle size on the Li-‐ion storage and Na-‐ion
storage in anatase TiO2 using a combined experimental, theoretical approach. In
addition a novel Na-‐ion titanium oxide storage compound is tested and characterized.
Nanostructuring has a striking influence on the thermodynamics and kinetics of Li-‐ion
insertion reactions in anatase TiO2. The particle size dependent phase transformations
in anatase TiO2 upon lithiation are systematically studied. The equilibrium voltage
measured by galvanostatic intermittent titration technique decreases progressively
with particle size reduction, which is attributed to the difference in surface energy of
the pristine and lithiated phases. Based on the evolution of domain size and phase
fraction of the two phases, it is concluded that the first-‐order phase transition proceeds
by continuous nucleation upon lithium insertion. For all particle sizes the phase
boundary is found to migrate under non-‐equilibrium conditions even under very slow

138
(dis)charge conditions. Remarkably, the degree of non-‐equilibrium condition increases
with particle size decreasing, which is rationalized by the difference in the observed
phase transition behaviour between small and large particles. The absence of phase
coexistence in smaller particles in combination with the sluggish ionic transport
rationalizes the better electrochemical performance of the nano-‐structured anatase
TiO2 as compared to the micro sized material. These results suggest a very low
nucleation barrier for the formation of new phases and a sluggish ionic migration
during phase boundary movement. Therefore strategies to improve the rate
performance of nano structured anatase TiO2 should concentrate on improving the
interstitial diffusion, for instance by appropriate doping with Nb or Zn.
Based on the experimental study on the particle size dependent phase transition
behaviour, the impact of particle size and surface orientation on the lithium ion
insertion in anatase TiO2 is systematically investigated by using DFT first-‐principles
calculations and surface cluster expansion. Nano-‐sized TiO2 is modelled by surface
slabs with two thermodynamically stable orientations {101} and {001}. The calculated
formation energies for bulk and surface structures suggest that the stable Li
configuration of Li0.5TiO2 titanate phase depends on the surface orientation. For the Li
composition below Li0.5TiO2, the calculated size dependent voltage curves are in
qualitative agreement with the experimental results. The calculations show that the
voltage difference between the different surface orientations is due to the different Li-‐
O and Ti-‐O bond length in the surface region. For the Li composition above Li0.5TiO2,
the relative magnitudes of the voltage profiles between different surface directions and
particle sizes are not consistent with the experimental observations. This is suggested
to be the consequence of the stoichiometric surface slabs. A surface excess of oxygen is
139
shown to explain the larger intercalation voltages in smaller particles with the
composition above Li0.5TiO2.
The demand for renewable energy resources has initiated the search for high
performance and cost effective battery systems. Na-‐ion as a charge carrier is one of the
most promising alternatives to Li-‐ions due to its high abundance, low cost, and
comparable high cell potential. Rudola et al. explored Na-‐ion storage in a novel
compound Na2Ti6O13, demonstrating a reversibly uptake of 1 Na ion per formula unit
(49.5 mAh/g) by a solid solution mechanism at an average potential of 0.8 V In this
thesis it is shown that by lowering the cut-‐off voltage from 0.3 V to 0 V vs Na/Na+ the
capacity of the layered Na2Ti6O13 negative electrode material can be enhanced from
49.5 mAh/g (Na2+1Ti6O13) to a promising 196 mAh/g (Na2+4Ti6O13) for at least 10 cycles,
after which it gradually reduces. To understand the structural changes in-‐situ X-‐ray
diffraction is performed and compared with Density Functional Theory calculations. A
consistent evolution of the lattice parameters and Na-‐ion positions is observed. The
results show that Na-‐ion intercalation in the Na2+xTi6O13 host structure is limited to
Na2+2Ti6O13 in a solid solution reaction. Only small changes in lattice parameters
indicate that the insertion reaction is highly reversible. Further increasing the Na
composition below 0.3 V appears to lead to loss in crystallinity, which in combination
with solid electrolyte interface formation is suggested to be the origin of the gradually
reducing reversible capacity.
The promising Li-‐ion storage properties of TiO2 anatase provide the motivation to
embark on the study of Na-‐ion insertion in anatase TiO2. Electrochemical and X-‐ray
experiments and DFT calculations are performed to improve the understanding about

140
the particle size dependent electrochemical Na-‐ion storage in the TiO2 anatase.
Reducing the particle size results in a distinct increase of the reversible capacity, also
introducing stronger degradation of the cycling stability. The highest specific
reversible capacity (210mAh/g) was found for 7 nm TiO2 anatase, which is among the
largest reported in literature. Although bulk storage is generally assumed, X-‐ray
diffraction on the electrodes after discharge and charge shows negligible changes on
the lattice parameters, indicating that Na-‐ion insertion in the TiO2 lattice does not
occur significantly. Nevertheless DFT calculation predicts that the fully occupied
Na1TiO2 (capacity 334mAh/g) can be thermodynamically achieved at a positive voltage
(0.3V). The fact that Na-‐ion insertion does not occur is most likely due to the large
energy barrier for Na-‐ion diffusion which is calculated to be ~0.84eV at the dilute limit.
These results indicate that the inserted sodium ions are mainly accommodated at the
surface region. Therefore strategies to improve the electrochemical performance of Na
storage by TiO2 anatase should focus on improving the surface and electrolyte stability.

141
Samenvatting
Materialen met een nanostructuur kenmerken zich door een verscheidenheid aan
gunstige elektrische eigenschappen, zoals de kortere transportpaden voor ionen en
elektronen die een significante toename van de (de)intercalatiesnelheden toelaten en
daarmee een groot elektrisch vermogen. Voor TiO2 in de anatase vorm, resulteren
nano-‐afmetingen in een gebogen open-‐cel spanningsprofiel met een veel korter
plateau in vergelijking tot dat van materialen van microafmeting. Het hoofddoel van
dit proefschrift is het verwerven van inzicht in de invloed, die de grootte van de
deeltjes heeft op de opslag van Li-‐ionen en Na-‐ionen in anatase TiO2 met een aanpak
die bestaat uit een combinatie van experimentele en theoretische methoden.
Bovendien is een nieuw titaniumoxide materiaal voor opslag van Na-‐ionen getest en
gekarakteriseerd.
Nanostructurering heeft een frappante invloed op de thermodynamica en kinetica van
Li-‐ion insertiereacties in anatase TiO2. De deeltjesgrootte afhankelijke
faseveranderingen in anatase TiO2 na lithiering zijn systematisch bestudeerd. Het
evenwichtsvoltage gemeten met een galvanostatische intermitterende titratietechniek
neemt progressief af met de verkleining van de deeltjesgrootte, wat wordt
toegeschreven aan het verschil in oppervlakte-‐energie tussen de maagdelijke en de
gelithieerde fase. Op grond van de evolutie van domeingrootte en fasefractie van de

142
twee fasen, wordt geconcludeerd dat de eerste-‐orde faseovergang zich voltrekt door
continue nucleatie na lithiumopname. Voor alle deeltjesgrootten wordt gevonden dat
de fasegrens migreert onder niet-‐evenwicht condities zelfs bij zeer trage
(ont)ladingscondities. Opmerkelijk is dat de mate van niet-‐evenwicht toeneemt als de
deeltjesgrootte afneemt, wat begrepen kan worden uit het verschil in het
waargenomen faseovergangsgedrag tussen kleine en grote deeltjes. De afwezigheid van
fase-‐coexistentie in kleinere deeltjes in combinatie met het trage ionentransport
verklaart de betere elektrochemische prestatie van anatase TiO2 met nanostructuur in
vergelijking tot het materiaal op microgrootte. Deze resultaten suggereren een zeer
lage nucleatiedrempel voor de vorming van nieuwe fasen en een trage ionenmigratie
gedurende de beweging van de fasegrens. Daarom zouden strategieën om de
snelheidsprestatie van anatase TiO2 met nanostructuur te verbeteren zich moeten
concentreren op het verbeteren van de interstitiële diffusie, bij voorbeeld door
geschikte doping met Nb of Zn.
Op basis van de experimentele studie van de afhankelijkheid van deeltjesgrootte voor
het faseovergangsgedrag, is de invloed van deeltjesgrootte en oppervlakte-‐oriëntatie op
de lithium-‐ion insertie in anatase TiO2 systematisch onderzocht met DFT first-‐
principles berekeningen en oppervlakte clusterexpansie. TiO2 van nano-‐afmetingen is
gemodelleerd met oppervlaktelagen met twee thermodynamisch stabiele oriëntaties
{101} en {001}. De berekende vormingsenergieën voor bulk en oppervlaktestructuren
suggereren dat de stabiele Li configuratie van de Li0.5TiO2 titanaatfase afhangt van de
oppervlakteoriëntatie. Als het Li gehalte beneden dat van Li0.5TiO2 ligt, komen de
berekende grootteafhankelijke spanningskrommen kwalitatief overeen met de
experimentele resultaten. De berekeningen tonen aan dat het spanningsverschil tussen

143
de verschillende oppervlakteoriëntaties te danken is aan de verschillen in Li-‐O en Ti-‐O
bindingslengte nabij het oppervlak. Voor het Li gehalte boven dat van Li0.5TiO2, zijn de
relatieve grootten van de spanningsprofielen tussen verschillende
oppervlakterichtingen en deeltjesgrootten niet consistent met de experimentele
waarnemingen. Dit wordt verondersteld het gevolg te zijn van de stoichiometrische
oppervlaklagen. Een verhoogde concentratie van zuurstof aan het oppervlak verklaart
de grotere intercalatievoltages in kleinere deeltjes met het gehalte boven dat van
Li0.5TiO2.
De vraag naar bronnen van hernieuwbare energie en energieopslag heeft de aanzet
gegeven voor de zoektocht naar hoog presterende kosteneffectieve batterijsystemen.
Het Na-‐ion als ladingsdrager is een van de meest belovende alternatieven voor Li-‐
ionen dankzij zijn hoge abundantie, lage kosten, en vergelijkbaar hoge cel potentiaal.
Rudola et al. onderzochten de opslag van Na-‐ionen in een nieuwe stof Na2Ti6O13,
waarbij zij een reversibele opname aantoonden van 1 Na ion per formule eenheid (49,5
mAh/g) via een mechanisme van oplossing in de vaste stof bij een gemiddelde
potentiaal van 0,8 V. In dit proefschrift wordt aangetoond dat door het
afsnijdingsvoltage te verlagen van 0,3 V naar 0 V vs Na/Na+ de capaciteit van het
gelaagde Na2Ti6O13 materiaal voor de negatieve electrode verhoogd kan worden van
49,5 mAh/g (Na2+1Ti6O13) tot een veelbelovend 196 mAh/g (Na2+4Ti6O13) gedurende
tenminste 10 cycli, waarna dit langzaam afneemt. Om de structurele veranderingen te
begrijpen is in-‐situ Röntgenverstrooiing uitgevoerd en de resultaten zijn vergeleken
met berekeningen met Density Functional Theory. Een consistente verandering van de
roosterparameters en Na-‐ion posities is waargenomen. De resultaten laten zien dat
intercalatie van Na-‐ionen in de Na2+xTi6O13 gastheerstructuur beperkt is tot Na2+2Ti6O13

144
in een vaste-‐stof oplossingsreactie. De zeer kleine veranderingen in de
roosterparameters wijzen er op dat de insertiereactie in hoge mate reversibel is. Verder
verhogen van het Na gehalte beneden 0,3 V lijkt tot een verlies van kristalliniteit te
leiden, wat in samenhang met de vorming van het interface tussen vaste-‐stof en
elektrolyt is voorgesteld als oorzaak voor de geleidelijk afnemende reversibele
capaciteit.
De veelbelovende opslageigenschappen voor Li-‐ionen van TiO2 anatase verschaffen de
motivatie om de studie van Na-‐ion insertie in anatase TiO2 aan te vangen.
Elektrochemische en Röntgen experimenten en DFT berekeningen zijn uitgevoerd om
het begrip van de afhankelijkheid van deeltjesgrootte voor de elektrochemische opslag
van Na-‐ionen in TiO2 anatase te vergroten. Verkleining van de grootte van de deeltjes
resulteert in een markante toename van de reversibele capaciteit, waarbij een sterkere
vermindering van de stabiliteit onder herhaling van cycli wordt geïntroduceerd. De
hoogste specifieke reversibele capaciteit (210 mAh/g) werd gevonden voor 7 nm TiO2
anatase, wat behoort tot de grootste onder de waarden, die in de literatuur worden
gerapporteerd. Hoewel opslag in de bulk algemeen wordt aangenomen, laat
Röntgenverstrooiing aan de electroden na ontlading en lading verwaarloosbaar kleine
veranderingen in de roosterparameters zien, wat een aanwijzing is dat Na-‐ion insertie
in het TiO2 rooster niet significant plaats vindt. Desalniettemin voorspelt berekening
met DFT dat het volledig bezette Na1TiO2 (capaciteit 334 mAh/g) thermodynamisch
bereikt kan worden bij een positief voltage (0,3 V). Het feit dat Na-‐ion insertie niet
plaatsvindt is hoogstwaarschijnlijk te wijten aan de hoge energiebarrière voor Na-‐ion
diffusie die is berekend als ~0,84 eV in de verdunde limiet. Deze resultaten wijzen er
op dat de opgenomen natriumionen hoofdzakelijk ondergebracht worden nabij het

145
oppervlak. Daarom zouden strategieën om de elektrochemische prestatie van Na
opslag door TiO2 anatase te verhogen zich moeten toespitsen op de verbetering van
oppervlak en elektrolyt stabiliteit.

146

147
Acknowledgements
In the past 5 years, I have a lot of good memories in Delft.
First of all, I would like to thank my daily supervisor, Dr. Marnix Wagemaker, for his
remarkable support and guidance throughout my Ph.D study. Besides you always
giving valuable suggestion and encouragements for research, I have been inspired by
your vision and rigorous attitude in scientific pursuit. Thank you Marnix!
I would like to express my gratitude to my promotor Prof. Fokko. M. Mulder for
stimulating discussion in progress meeting and many helpful advice in experiments.
I am very grateful to people in battery group: Dr. Swapna Ganapathy, Dr. Deepak Singh,
Xiaoyu Zhang, Alexandros, Frits Klaver, Chuang Yu. Most of work in this thesis would
not be possible without your contributions. Three members in particular, Swapna is
very friendly and supportive to me! You always provide indispensable advice and
guidance on both calculation and experimental work at the critical stage of my
research. I really benefited a lot. Xiaoyu is always very kind to give me help for both
research and life. I also would like to acknowledge Alexandros (who joined the group
in my last year) for the great contribution in chapter 6.

148
A special thanks goes to Dr. Jouke Heringa. He was an invaluable resource for his
coding expertise. He always gave me a hand when I need help, not only for work, but
also for some problems in life. He was also very kind to help me translate the summary
and propositions. Thank you very much Jouke!
I would like to thank Michel Steenvoorden, Kees Goubitz, and Anton Lefering for their
technical support. I am also grateful to Nicole and Ilse for their constant support and
help in the past five years.
I would like to take this opportunity to thank Dr. Peter Klaver for his help in VASP
calculation. I am also grateful to Dr. Anton van der Ven for providing us the cluster
expansion code and very helpful suggestions.
My sincere acknowledgement also goes to other colleagues in FAME group. This is a
wonderful group, and everyone here is always nice and helpful. For my three year
officemate, Anca Anastasopol, and Dr. Anna Grzech, the time we spent with is pleasant
and memorable. Thank you for creating such nice work atmosphere! And in my last
year, Fengjiao, Chuang and Alexander moved in the office, bringing a nice period of
hard work and laughter. Thank you guys! I also would like to thank Dr. Zhiqiang Ou,
Thang Nguyen, Shasha Zhang, Zhou Zhou, Wenqin Shi, Romain Blonde, Yibole,
Bouwer Huang, Lei Ma, Yaolin Xu, Dr. Luana Caron, Xuefei Miao and all other current
members and alumni of FAME for making my PhD life fun and interesting.
Special thanks go to Dr. Jie Yang and Dr. Ming Ding, who gave a lot of help and
encouragement to me in the life.
Over the past five years, my parents are always there to care my health and encourage
whatever I do. Mum and Dad, thank you for your love and support!

149
Finally I would like to thank my beloved husband, Hao Chen, for always being there
with me in all the happy and hard days. Your love, understanding and encouragement
are the source of my energy and inspiration forever.
Vancouver, September, 2014

150

151
Curriculum Vitae
Kun Shen was born on 20th of February 1984 in Harbin, China. Her family moved to
Langfang when she was one. In 2003, She graduated high school in Langfang and
entered Central South University, majored in Materials Science and Engineering and
minored in Applied Physics. In 2007, she obtained her Bachelor degree with honor.
Due to the good performance on her grades, she was admitted to graduate school
without entrance examination. She started her Master study in Materials Physics. In
June of 2009, she graduated on microstructure and properties study of copper matrix
composite. Then she moved to The Netherlands, to start PhD study at the group of
Fundamental Aspects of Materials and Energy (FAME) at Delft University of
Technology from which this thesis resulted.

152


Lithium and S
odium Insertion in N
anostructured Titanates K
un Shen
Copyright © 2022 FDOKUMEN