Lisle Community Unit School District AFR 6/2021
108
LISLE COMMUNITY UNIT SCHOOL DISTRICT NO. 202 ANNUAL FINANCIAL REPORT FOR THE FISCAL YEAR ENDED JUNE 30, 2021
-
Upload
khangminh22 -
Category
Documents
-
view
0 -
download
0
Transcript of Lisle Community Unit School District AFR 6/2021

LISLE COMMUNITY UNIT SCHOOL DISTRICT NO. 202
ANNUAL FINANCIAL REPORT
FOR THE FISCAL YEAR ENDEDJUNE 30, 2021

PAGE
FINANCIAL SECTION
INDEPENDENT AUDITORS' REPORT 1
MANAGEMENT’S DISCUSSION AND ANALYSIS 4
BASIC FINANCIAL STATEMENTSGovernment-Wide Financial Statements
Statement of Net Position 15Statement of Activities 17
Fund Financial StatementsBalance Sheet - Governmental Funds 18Reconciliation of Total Governmental Fund Balance to the
Statement of Net Position - Governmental Activities 19Statement of Revenues, Expenditures and Changes in
Fund Balances - Governmental Funds 20Reconciliation of the Statement of Revenues, Expenditures and Changes in
Fund Balances to the Statement of Activities - Governmental Activities 21Notes to Financial Statements 22
REQUIRED SUPPLEMENTARY INFORMATION
Schedule of Changes in the Employer's Total OPEB Liability Retirement Health Program 61
Schedule of Employer ContributionsTeacher's Health Insurance Security Fund 62
Notes to the Schedule of Employer ContributionsTeacher's Health Insurance Security Fund 63
Schedule of the Employer's Proportionate Share of the Collective Net OPEB LiabilityTeacher's Health Insurance Security Fund 64
Schedule of the Employer's Proportionate Share of the Net Pension Liability and Employer ContributionsTeachers' Retirement System 66
Schedule of Employer ContributionsIllinois Municipal Retirement Fund 68
Schedule of Changes in the Employer’s Net Pension LiabilityIllinois Municipal Retirement Fund 70
Schedule of Revenues, Expenditures and Changes in Fund Balance - Budget and ActualGeneral Fund 72
LISLE COMMUNITY UNIT SCHOOL DISTRICT NO. 202
TABLE OF CONTENTS

PAGE
FINANCIAL SECTION - Continued
OTHER SUPPLEMENTARY INFORMATION
Combining Balance Sheet - General Fund - By Accounts 75Combining Statement of Revenues, Expenditures and Changes in Fund Balances
General Fund - by Accounts 76Schedule of Revenues, Expenditures and Changes in Fund Balance - Budget and Actual
Educational Accounts 77Operations and Maintenance Accounts 89Working Cash Accounts 91
Schedule of Revenues, Expenditures and Changes in Fund Balance - Budget and ActualMajor Governmental Fund
Capital Projects Fund 92Combining Balance Sheet - Nonmajor Governmental Funds 93Combining Statement of Revenues, Expenditures and Changes in Fund Balances
Nonmajor Governmental Funds 94Schedule of Revenues, Expenditures and Changes in Fund Balance - Budget and Actual
Nonmajor Governmental FundsTransportation - Special Revenue Fund 95Municipal Retirement/Social Security - Special Revenue Fund 97Tort Immunity - Special Revenue Fund 98Debt Service Fund 99
Consolidated Year-End Financial Report 100
SUPPLEMENTAL SCHEDULES
Summary of Assessed Valuations, Tax Rates and Extensions - Last Five Tax Levy Years 102Long-Term Debt Requirements
General Obligation Limited Tax School Bonds of 2019 103
LISLE COMMUNITY UNIT SCHOOL DISTRICT NO. 202
TABLE OF CONTENTS

FINANCIAL SECTION
This section includes:
Independent Auditors’ Report
Management’s Discussion and Analysis
Basic Financial Statements
Required Supplementary Information
Other Supplementary Information
Supplemental Schedules

INDEPENDENT AUDITORS’ REPORT
This section includes the opinion of the District’s independent auditing firm.

INDEPENDENT AUDITORS' REPORT
November 15, 2021
Members of the Board of EducationLisle Community Unit School District No. 202Lisle, Illinois
We have audited the accompanying financial statements of the governmental activities, each major fund, and the aggregate remaining fund information of the Lisle Community Unit School District No. 202, Illinois, as of and for the year ended June 30, 2021, and the related notes to the financial statements, which collectively comprise the District’s basic financial statements as listed in the table of contents.
Management’s Responsibility for the Financial Statements
Management is responsible for the preparation and fair presentation of these financial statements in accordance with accounting principles generally accepted in the United States of America; this includes the design, implementation, and maintenance of internal control relevant to the preparation and fair presentation of financial statements that are free from material misstatement, whether due to fraud or error.
Auditor’s Responsibility
Our responsibility is to express opinions on these financial statements based on our audit. We conducted our audit in accordance with auditing standards generally accepted in the United States of America. Those standards require that we plan and perform the audit to obtain reasonable assurance about whether the financial statements are free of material misstatement.
An audit involves performing procedures to obtain audit evidence about the amounts and disclosures in the financial statements. The procedures selected depend on the auditor’s judgment, including the assessment of the risks of material misstatement of the financial statements, whether due to fraud or error. In making those risk assessments, the auditor considers internal control relevant to the District’s preparation and fair presentation of the financial statements in order to design audit procedures that are appropriate in the circumstances, but not for the purpose of expressing an opinion on the effectiveness of the District’s internal control. Accordingly, we express no such opinion. An audit also includes evaluating the appropriateness of accounting policies used and the reasonableness of significant accounting estimates made by management, as well as evaluating the overall presentation of the financial statements.
We believe that the audit evidence we have obtained is sufficient and appropriate to provide a basis for our audit opinions.
Opinions
In our opinion, the financial statements referred to above present fairly, in all material respects, the respective financial position of the governmental activities, each major fund, and the aggregate remaining fund information of the Lisle Community Unit School District No. 202, Illinois, as of June 30, 2021, and the respective changes in financial position for the year then ended in accordance with accounting principles generally accepted in the United States of America.
1

Lisle Community Unit School District No. 202, IllinoisNovember 15, 2021Page 2
Other Matters
Required Supplementary Information
Accounting principles generally accepted in the United States of America require that the management’s discussion and analysis as listed in the table of contents and budgetary information reported in the required supplementary information as listed in the table of contents, be presented to supplement the basic financial statements. Such information, although not part of the basic financial statements, is required by the Governmental Accounting Standards Board, who considers it to be an essential part of financial reporting for placing the basic financial statements in an appropriate operational, economic, or historical context. We have applied certain limited procedures to the required supplementary information in accordance with auditing standards generally accepted in the United States of America, which consisted of inquiries of management about the methods of preparing the information and comparing the information for consistency with management’s responses to our inquiries, the basic financial statements, and other knowledge we obtained during our audit of the basic financial statements. We do not express an opinion or provide any assurance on the information because the limited procedures do not provide us with sufficient evidence to express an opinion or provide any assurance.
Other Information
Our audit was conducted for the purpose of forming opinions on the financial statements that collectively comprise the Lisle Community Unit School District No. 202, Illinois’, basic financial statements. The other supplementary information and supplemental schedules are presented for purposes of additional analysis and are not a required part of the basic financial statements.
The other supplementary information and supplemental schedules are the responsibility of management and were derived from and relate directly to the underlying accounting and other records used to prepare the basic financial statements. Such information has been subjected to the auditing procedures applied in the audit of the basic financial statements and certain additional procedures, including comparing and reconciling such information directly to the underlying accounting and other records used to prepare the basic financial statements or to the basic financial statements themselves, and other additional procedures in accordance with auditing standards generally accepted in the United States of America. In our opinion, the other supplementary information and supplemental schedules are fairly stated, in all material respects, in relation to the basic financial statements as a whole.
Other Reporting Required by Government Auditing Standards
In accordance with Government Auditing Standards, we have also issued our report dated November 15, 2021, on our consideration of the District’s internal control over financial reporting and on our tests of its compliance with certain provision of laws, regulations, contracts, and grant agreements and other matters. The purpose of that report is to describe the scope of our testing of internal control over financial reporting and compliance and the results of that testing, and not to provide an opinion on the effectiveness of the District’s internal control over financial reporting or on compliance. That report is an integral part of an audit performed in accordance with Government Auditing Standards in considering the District’s internal control over financial reporting and compliance.
LAUTERBACH & AMEN, LLP
2

MANAGEMENT'S DISCUSSION AND ANALYSIS
3

The discussion and analysis of Lisle Community Unit School District No. 202’s (the "District") financial performance provides an overall review of the District’s financial activities as of and for the year ended June 30, 2021. The management of the District encourages readers to consider the information presented herein in conjunction with the basic financial statements to enhance their understanding of the District’s financial performance. Certain comparative information between the current year and the prior is required to be presented in the Management’s Discussion and Analysis (the “MD&A”).
FINANCIAL HIGHLIGHTS
• In total, net position increased by $1,738,473. This represents a 4.5% increase from 2020.• General revenues of $33,537,424 accounted for 67.8% of all revenues. Program specific revenues in the
form of charges for services and fees and grants accounted for $15,926,385 or 32.2% of total revenues of $49,463,809.
• The District had $47,725,336 in expenses related to government activities. However, only $15,926,385 of these expenses were offset by program specific charges and grants.
• Revenues for fiscal year 2021 (FY21), as reported on the Statement of Revenues, Expenditures and Changes in Fund Balances, were $35,857,349, exclusive of on‑behalf payments to the Teacher’s Retirement System. Expenditures for FY21 were $34,438,183, also exclusive of State of Illinois payments to the Teachers Retirement System.
• The Illinois Teacher’s Retirement System receives on‑behalf pension and post‑retirement health insurance payments from the State of Illinois for District 202 certified staff. In FY21, $13,451,993 was included in the total revenues and expenditures of District 202 representing the State of Illinois contributions.
• Actual revenues received in FY21 for the General Fund, exclusive of the State of Illinois on‑behalf payment to the Teachers Retirement System, was $31,982,391. Actual expenditures for the General Fund, exclusive of on‑behalf contributions, were $30,225,376 in FY21.
• The District made payments of $930,000 on its long‑term bond principal. The District did not issue any long-term debt in the current fiscal year. As of June 30, 2021, total outstanding long-term debt was $11,540,000.
• Beginning net position and fund balances were restated due to the implementation of GASB Statement No. 84 and correcting the bond and interest payments from the previous fiscal years..
USING THIS ANNUAL REPORT
This annual report consists of a series of financial statements. The Statement of Net Position and the Statement of Activities provide information about the activities of the District as a whole and present a longer-term view of the District’s finances. For governmental activities, these statements tell how these services were financed in the short term as well as what remains for future spending. Fund financial statements also report the District’s operations in more detail than the government-wide statements by providing information about the District’s most significant funds.
The government-wide financial statements provide readers with a broad overview of the District’s finances, in a matter similar to a private-sector business.
The Statement of Net Position reports information on all of the District’s assets and liabilities, with the difference between the two reported as net position. Over time, increases or decreases in net position may serve as a useful indicator of whether the financial position of the District is improving or deteriorating. Consideration of other nonfinancial factors, such as changes in the District’s property tax base and the condition of the District’s infrastructure, is needed to assess the overall health of the District.
LISLE COMMUNITY UNIT SCHOOL DISTRICT NO. 202
Management's Discussion and AnalysisJune 30, 2021
4

USING THIS ANNUAL REPORT - Continued
Government-Wide Financial Statements
The Statement of Activities presents information showing how the government’s net position changed during the most recent fiscal year.
Fund Financial Statements
A fund is a grouping of related accounts that is used to maintain control over resources that have been segregated for specific activities or objectives. The District, like other local governments, uses fund accounting to ensure and demonstrate compliance with finance-related legal requirements. All of the funds of the District are governmental funds.
Governmental Funds
Governmental funds are used to account for essentially the same functions reported as governmental activities in the government-wide financial statements. However, governmental fund financial statements focus on near-term inflows and outflows of spendable resources, as well as on balances of spendable resources available at the end of the fiscal year. Such information may be useful in evaluating the District’s near-term financing requirements.
Because the focus of governmental funds is narrower than that of the government-wide financial statements, it is useful to compare the information presented for governmental funds with similar information presented for governmental activities in the government-wide financial statements. By doing so, readers may better understand the long-term impact of the government’s near-term financing decisions. Both the governmental fund balance sheet and the governmental fund statement of revenues, expenditures, and changes in fund balances provide a reconciliation to facilitate the comparison between governmental funds and governmental activities.
The District maintains six individual governmental funds. Information is presented separately in the governmental fund balance sheet and in the governmental fund statement of revenues, expenditures, and changes in fund balances for the General Fund and Capital Projects Fund, both of which are considered a major fund.
The District adopts an annual appropriated budget for all of the governmental funds. A budgetary comparison schedule for these funds has been provided to demonstrate compliance with this budget.
Notes to the Financial Statements
The notes provide additional information that is essential to a full understanding of the data provided in the government-wide and fund financial statements.
Other Information
In addition to the basic financial statements and accompanying notes, this report also presents certain required supplementary information concerning the District’s Post-Retirement Health Plan, Teacher’s Health Insurance Security Fund, Teacher’s Retirement and I.M.R.F employee pension obligations and budgetary comparison schedules for the General Fund.
LISLE COMMUNITY UNIT SCHOOL DISTRICT NO. 202
Management's Discussion and AnalysisJune 30, 2021
5

GOVERNMENT-WIDE FINANCIAL ANALYSIS
Net position may serve over time as a useful indicator of a government’s financial position. The following tables show that in the case of the District, assets/deferred outflows exceeded liabilities/deferred inflows by $40,192,655.
Net Position2021 2020
Current Assets $ 54,085,410 51,706,848 Capital Assets 58,479,454 59,206,929
Total Assets 112,564,864 110,913,777 Deferred Outflows 1,828,506 2,064,037
Total Assets/Deferred Outflows 114,393,370 112,977,814
Long-Term Debt 33,588,794 36,838,220 Other Liabilities 3,456,705 3,239,727
Total Liabilities 37,045,499 40,077,947 Deferred Inflows 37,155,216 34,824,866
Total Liabilities/Deferred Inflows 74,200,715 74,902,813
Net PositionNet Investment in Capital Assets 45,664,562 45,320,382 Restricted 8,963,215 6,935,766 Unrestricted (Deficit) (14,435,122) (14,181,147)
Total Net Position 40,192,655 38,075,001
A large portion of the District’s net position, $45,664,562 or 113.6%, reflects its investment in capital assets (for example, land, construction in progress, land improvements buildings and improvements, and equipment), less any related debt used to acquire those assets that is still outstanding. The District uses these capital assets to provide services to citizens; consequently, these assets are not available for future spending. Although the District’s investment in its capital assets is reported net of related debt, it should be noted that the resources needed to repay this debt must be provided from other sources, since the capital assets themselves cannot be used to liquidate these liabilities.
An additional portion, $8,963,215 or 22.3%, of the District’s net position represents resources that are subject to external restrictions on how they may be used. The remaining deficit, $14,435,122, represents unrestricted net position and may be used to meet the government’s ongoing obligations to citizens and creditors.
LISLE COMMUNITY UNIT SCHOOL DISTRICT NO. 202
Management's Discussion and AnalysisJune 30, 2021
6

GOVERNMENT-WIDE FINANCIAL ANALYSIS - Continued
Change in Net Position2021 2020
RevenuesProgram Revenues
Charges for Services $ 51,841 518,822 Operating Grants/Contributions 15,874,544 14,090,359
General RevenuesProperty Taxes 31,291,850 29,938,693 Personal Property Replacement 476,882 375,973 Evidence Based Funding Formula 1,254,018 1,254,018 Other General Revenues 514,674 1,524,589
Total Revenues 49,463,809 47,702,454
ExpensesInstructional 19,738,479 19,727,841 Support Services 12,521,450 12,446,866 Community Services 218,035 227,736 Payments to Other Districts/Govts. 1,369,334 1,292,394 State Retirement Contributions 13,451,993 12,276,265 Interest on Long-Term Debt 426,045 441,374
Total Expenses 47,725,336 46,412,476
Change in Net Position 1,738,473 1,289,978
Net Position - Beginning as Restated 38,454,182 36,785,023
Net Position - Ending 40,192,655 38,075,001
Net position of the District’s governmental activities increased by 4.5% ($40,192,655 in 2021 compared to a restated balance of $38,454,182 in 2020).
LISLE COMMUNITY UNIT SCHOOL DISTRICT NO. 202
Management's Discussion and AnalysisJune 30, 2021
7

GOVERNMENT-WIDE FINANCIAL ANALYSIS - Continued
District-Wide Revenues by Source
Charges for Services, 0.1%
Operating Grants/Contributions, 32.1%
Property Taxes, 63.3%
Personal PropertyReplacement Taxes,1.0%
Evidence BasedFunding Formula, 2.5%
Other General Revenues, 1.0%
District-Wide Expenses by Function
Instructional, 41.2%
Support Services, 26.3%
Community Services, 0.5%
Payments to OtherDistricts/ Governments,2.9%
State RetirementContributions, 28.2%
Interest on Long-TermDebt, 0.9%
Revenues for governmental activities totaled $49,463,809, while the cost of all governmental functions totaled $47,725,336. This results in a surplus of $1,738,473. In 2020, revenues of $47,702,454 exceeded expenses of $46,412,476, resulting in a surplus of $1,289,978.
LISLE COMMUNITY UNIT SCHOOL DISTRICT NO. 202
Management's Discussion and AnalysisJune 30, 2021
8

FINANCIAL ANALYSIS OF THE GOVERNMENT’S FUNDS
As noted earlier, the District uses fund accounting to ensure and demonstrate compliance with finance-related legal requirements.
Governmental Funds
The focus of the District’s governmental funds is to provide information on near-term inflows, outflows, and balances of spendable resources. In particular, unassigned fund balance may serve as a useful measure of a government’s net resources available for spending at the end of the fiscal year.
The District’s governmental funds reported combining ending fund balances of $19,863,448, which is an increase of $1,428,091, or 7.7%, from last year’s total of $18,435,357. Of the $19,863,448 total, $10,640,108, or 53.6%, of the fund balance constitutes unassigned fund balance.
Actual revenues, excluding on‑behalf payments, for FY21 were $35,857,349. Actual expenditures, excluding on-behalf payments, totaled $34,438,183 representing approximately 96.0% of the total FY21 actual revenues. Expenditures were monitored during the year and below budget in all funds. Property taxes accounted for one of the largest portion of the District’s revenues, contributing 87.3% of total revenues. The remainder of revenues came from other local, state, and federal grant sources.
The total cost of all the District’s programs was $34,438,183, excluding on-behalf payments, with the majority (91.0%) of expenditures dedicated to instructing and caring for the students and student transportation. The remaining amount of District expenditures was split among community services, building operation and non‑operational support such as debt service, pension and other payroll taxes, capital improvements, and tort liability.
Over the course of the fiscal year, the District did not amend the original fiscal year 2021 budget. District 202 currently supports one long‑term debt issue. The District has issued no short‑term debt.
GENERAL FUND BUDGETARY HIGHLIGHTS
The General Fund is the District’s largest budgeted fund and consists of the Educational, Operations and Maintenance and Working Cash Accounts. The General Fund's actual revenues of $31,982,391 were over budgeted revenues by $344,847, excluding on-behalf payments. Actual expenditures of $30,225,376 were under budgeted expenditures of $31,561,437 by $1,336,061, excluding on-behalf payments.
Within these accounts the Educational Account is the most significant budgeted fund. In the Educational Account revenues were over budget by $270,957, excluding on-behalf payments. Expenditures in the Educational Account were under budget by $905,989, excluding on-behalf payments.
LISLE COMMUNITY UNIT SCHOOL DISTRICT NO. 202
Management's Discussion and AnalysisJune 30, 2021
9

CAPITAL ASSETS AND DEBT ADMINISTRATION
Capital Assets
The District’s investment in capital assets for its governmental activities as of June 30, 2021 was $58,479,454 (net of accumulated depreciation). This investment in capital assets includes land, construction in progress, land improvements, buildings and equipment.
Capital Assets - Net of Depreciation
2021 2020
Land $ 1,272,506 1,272,506 Construction in Progress 252,309 — Land Improvements 1,288,408 1,368,859 Buildings 53,608,003 54,419,661 Equipment 2,058,228 2,145,903
Totals 58,479,454 59,206,929
This year’s major additions included:
Construction in Progress $ 252,309 Land Improvements 23,655 Buildings 71,725 Equipment 127,392
475,081
Additional information on the District’s capital assets can be found in Note 3 of this report.
Debt Administration
The District retired $930,000 in long-term debt and no new long-term debt was issued in the fiscal year, resulting in a long-term principal liability of $11,540,000 as of June 30, 2021. At the end of FY21, the District had a debt limit of $91,217,113.
Long-Term Debt2021 2020
General Obligation Bonds $ 11,540,000 12,470,000
Additional information on the District’s long-term debt can be found in Note 3 of this report.
LISLE COMMUNITY UNIT SCHOOL DISTRICT NO. 202
Management's Discussion and AnalysisJune 30, 2021
10

ECONOMIC FACTORS BEARING ON THE DISTRICT’S FUTURE
At the time these financial statements were prepared and audited, the District was aware of the following circumstances that may affect financial operations in the future:
COVID-19: The financial implications of the coronavirus pandemic are still being determined. Additional operating costs under the new normal will need to be accounted for in the District’s annual operating budget. Commercial property assessments may decline as retail establishments continue to face new challenges and more employees work from home. These increased vacancies, and lower assessments, may shift more of the tax burden to residential taxpayers in the community and increase pressure for a property tax freeze. Fortunately, the District’s healthy fund balance reserves will allow some time to adapt to the crisis.
Property Tax Caps: Local property taxes are a major revenue source for the District. The Property Tax Extension Limitation Law, also known as Tax Caps, limits the levy increase to the lesser of the consumer price index (CPI) or 5 percent. The tax caps will continue to affect the District’s future levies for all non-debt related purposes.
Interest Rates: Interest rates are at historically low levels. Lower rates limit the Districts investment earnings making it difficult to supplement revenues using its cash and investment balances.
School Funding Reform: In August of 2017, Senate Bill 1947 was signed into law. The new law puts in place an Evidence Based Funding Formula (EBF) that prioritizes equity and allocates state funding to school districts based on student need. The formula maintains a Base Funding Minimum (BFM) for all districts based on their prior year funding. This provision helps ensure that the District will receive at least the same amount in state funds as received during FY2017. However, the District is not anticipating any new state dollars moving forward because of the new funding model
State Fiscal Outlook: Many areas of the District’s finances are affected by the fiscal challenges in the State of Illinois. The District’s portion of state-based revenue continues to be affected by these economic conditions as many state reimbursements and programs have been reduced or eliminated entirely. While not currently a problem, the State of Illinois has a history of becoming delinquent in paying their obligations to the District.
Unfunded Mandates: The District continues to face the ongoing problem of how to implement and pay for mandates issued by the Illinois State Board of Education that lack funding from the State of Illinois. The costs of these mandates must be carved out of local resources at the expense of other programs. If this trend continues, and these mandates are not funded by additional revenues, this could result in a strain on the District’s financial position.
Pension Reform: While no formal proposal is on the table, shifting the pension costs from the State onto local school districts has been discussed by some of the legislative leaders in the past. Shifting the burden of teacher retirement costs to the local taxpayers would have a significant impact on the District’s financial situation.
Contract Negotiations: The Board of Education entered into a two-year agreement with the Lisle Education Association for the 2020-2021 and 2021-2022 school years with average annual salary increases of 3.3% and 3% respectively. The Board of Education also entered into a collective bargaining agreement with the Classified Employees Association of Lisle for the 2021-2022 school year. The agreement includes an annual salary increase of 3%. Negotiations for new agreements with both of the bargaining units will occur during the spring of 2022.
LISLE COMMUNITY UNIT SCHOOL DISTRICT NO. 202
Management's Discussion and AnalysisJune 30, 2021
11

ECONOMIC FACTORS BEARING ON THE DISTRICT’S FUTURE - Continued
Facility Needs: The District recently completed construction of a new elementary school building in August 2019. A contract to sell Tate Woods Elementary School for $2.5 million is already in place, contingent on the completion of zoning approval requirements and a successful building inspection. The future of Schiesher Elementary School will be determined by a Facilities Planning Committee. Basic capital improvements at Lisle Senior High and Lisle Junior High will continue to be addressed during the next 5-10 years. Additional costs related to roofs, HVAC units, and other life safety projects will require the Board of Education to use annual operating expenses and fund balances to complete the work.
Long-term Financial Planning: The District annually updates its 5-year financial projection to assess future needs in all areas of its operations and enable the development of a multi-year budget projection. With careful planning and monitoring of our finances, the District seeks to provide a quality education for its students and a secure financial future for the school district.
REQUESTS FOR INFORMATION
This financial report is designed to provide a general overview of the District’s finances for all those with an interest in the government’s finances. Questions concerning any of the information provided in this report or requests for additional information should be directed to: Director of Finance, Lisle Community Unit School District No. 202, 5211 Center Avenue, Lisle, Illinois 60532.
LISLE COMMUNITY UNIT SCHOOL DISTRICT NO. 202
Management's Discussion and AnalysisJune 30, 2021
12

BASIC FINANCIAL STATEMENTS
The basic financial Statements include integrated sets of financial statements as required by the GASB. The sets of statements include:
• Government-Wide Financial Statements
• Fund Financial Statements
Governmental Funds
In addition, the notes to the financial statements are included to provide information that is essential to a user’s understanding of the basic financial statements.
13

See Following Page
LISLE COMMUNITY UNIT SCHOOL DISTRICT NO. 202
Statement of Net PositionJune 30, 2021
14

GovernmentalActivities
ASSETS
Current AssetsCash and Investments $ 36,994,325Deposit 7,468Receivables - Net of Allowances
Property Taxes 16,338,286Intergovernmental 485,206
Prepaid Expense 260,125 Total Current Assets 54,085,410
Noncurrent AssetsCapital Assets
Nondepreciable 1,524,815Depreciable 82,280,317Accumulated Depreciation (25,325,678)
Total Noncurrent Assets 58,479,454Total Assets 112,564,864
DEFERRED OUTFLOWS OF RESOURCES
Deferred Items - RHP 326,398Deferred Items - THIS 825,918Deferred Items - TRS 227,741Deferred Items - IMRF 448,449
Total Deferred Outflows of Resources 1,828,506Total Assets and Deferred Outflows of Resources 114,393,370
LISLE COMMUNITY UNIT SCHOOL DISTRICT NO. 202
Statement of Net PositionJune 30, 2021
The notes to the financial statements are an integral part of this statement. 15

GovernmentalActivities
LIABILITIESCurrent Liabilities
Accounts Payable $ 184,486Salaries and Benefits Payable 2,190,179Deposits Payable 66,516Current Portion of Long-Term Debt 1,015,524
Total Current Liabilities 3,456,705
Noncurrent LiabilitiesCompensated Absences 142,097Total OPEB Liability - RHP 2,229,190Total OPEB Liability - THIS 16,267,986Net Pension Liability - TRS 1,588,274Net Pension Liability - IMRF 1,526,355General Obligation Bonds Payable - Net 11,834,892
Total Noncurrent Liabilities 33,588,794Total Liabilities 37,045,499
DEFERRED INFLOWS OF RESOURCESProperty Taxes 31,596,816Deferred Items - RHP 100,716Deferred Items - THIS 3,935,686Deferred Items - TRS 184,117Deferred Items - IMRF 1,337,881
Total Deferred Inflows of Resources 37,155,216Total Liabilities and Deferred Inflows of Resources 74,200,715
NET POSITIONNet Investment in Capital Assets 45,664,562Restricted
Operations and Maintenance 1,108,229Working Cash 809,212Transportation 2,409,079Retirement Benefits 512,520Debt Service 918,947Capital Projects 3,205,228
Unrestricted (Deficit) (14,435,122)
Total Net Position 40,192,655
The notes to the financial statements are an integral part of this statement. 16

Program Revenues (Expenses)/Charges Operating Revenues
for Grants/ GovernmentalExpenses Services Contributions Activities
Governmental ActivitiesInstruction $ 19,738,479 22,037 1,619,021 (18,097,421)Support Services 12,521,450 29,804 803,530 (11,688,116)Community Services 218,035 — — (218,035)Payments to Other Districts/Govts. 1,369,334 — — (1,369,334)Interest on Long-Term Debt 426,045 — — (426,045)State Retirement Contributions 13,451,993 — 13,451,993 —
Total Governmental Activities 47,725,336 51,841 15,874,544 (31,798,951)
General RevenuesTaxes
Property Taxes 31,291,850Personal Property Replacement Taxes 476,882
Evidence Based Funding Formula 1,254,018Earnings on Investments 97,165Miscellaneous 417,509
33,537,424
Change in Net Position 1,738,473
Net Position - Beginning as Restated 38,454,182
Net Position - Ending 40,192,655
LISLE COMMUNITY UNIT SCHOOL DISTRICT NO. 202
Statement of ActivitiesFor the Fiscal Year Ended June 30, 2021
The notes to the financial statements are an integral part of this statement. 17

CapitalGeneral Projects Nonmajor Totals
ASSETS
Cash and Investments $ 28,891,138 3,214,280 4,888,907 36,994,325Deposit — 7,468 — 7,468Receivables - Net of Allowances
Property Taxes 15,091,432 — 1,246,854 16,338,286Grants Receivable 321,611 — 163,595 485,206
Prepaid Expense — — 260,125 260,125
Total Assets 44,304,181 3,221,748 6,559,481 54,085,410
LIABILITIES
Accounts Payable 120,462 16,520 47,504 184,486Salaries and Benefits Payable 2,190,179 — — 2,190,179Deposits Payable 66,516 — — 66,516
Total Liabilities 2,377,157 16,520 47,504 2,441,181
DEFERRED INFLOWS OF RESOURCES
Property Taxes 29,185,510 — 2,411,306 31,596,816Other Deferred Revenues 183,965 — — 183,965
Total Deferred Inflows of Resources 29,369,475 — 2,411,306 31,780,781
Total Liabilities and DeferredInflows of Resources 31,746,632 16,520 2,458,810 34,221,962
FUND BALANCES
Nonspendable — — 260,125 260,125Restricted 1,917,441 3,205,228 3,840,546 8,963,215Unassigned 10,640,108 — — 10,640,108
Total Fund Balances 12,557,549 3,205,228 4,100,671 19,863,448
Total Liabilities, Deferred Inflows ofResources and Fund Balances 44,304,181 3,221,748 6,559,481 54,085,410
LISLE COMMUNITY UNIT SCHOOL DISTRICT NO. 202
Balance Sheet - Governmental FundsJune 30, 2021
The notes to the financial statements are an integral part of this statement.18

Total Governmental Fund Balances $ 19,863,448
Amounts reported for Governmental Activities in the Statement of Net Positionare different because:
Capital assets used in Governmental Activities are not financialresources and therefore, are not reported in the funds. 58,479,454
Certain grants receivable are not available to pay for current period expendituresand therefore are deferred in the governmental funds. 183,965
Deferred Outflows/Inflows of Resources related to the retirement plans not reported in the funds.
Deferred Items - RHP 225,682Deferred Items - THIS (3,109,768)Deferred Items - TRS 43,624Deferred Items - IMRF (889,432)
Long-term liabilities are not due and payable in the currentperiod and therefore are not reported in the funds.
Compensated Absences Payable (177,621)Total OPEB Liability - RHP (2,229,190)Total OPEB Liability - THIS (16,267,986)Net Pension Liability - TRS (1,588,274)Net Pension Liability - IMRF (1,526,355)General Obligation Bonds - Net (12,814,892)
Net Position of Governmental Activities 40,192,655
LISLE COMMUNITY UNIT SCHOOL DISTRICT NO. 202
Reconciliation of the Total Governmental Fund Balance to the Statement of Net Position - Governmental ActivitiesJune 30, 2021
The notes to the financial statements are an integral part of this statement.19

CapitalGeneral Projects Nonmajor Totals
RevenuesLocal Sources
Property Taxes $ 28,154,338 — 3,137,512 31,291,850Personal Property Replacement Taxes 447,461 — 29,421 476,882Earnings on Investments 76,896 7,208 13,061 97,165Other Revenue from Local Sources 378,816 — 29,768 408,584
State SourcesEvidence Based Funding Formula 1,254,018 — — 1,254,018Grants-In-Aid 260,656 — 657,988 918,644
Federal SourcesGrants-In-Aid 1,410,206 — — 1,410,206
On-Behalf Payments - State of Illinois 13,451,993 — — 13,451,993Total Revenues 45,434,384 7,208 3,867,750 49,309,342
ExpendituresInstruction 18,175,528 — 372,399 18,547,927Support Services 10,616,339 225,602 1,963,246 12,805,187Community Services 64,175 — 153,860 218,035
Payments to Other Districts andGovernments 1,369,334 — — 1,369,334
Debt ServicePrincipal Retirement — — 930,000 930,000Interest and Fiscal Charges — — 566,750 566,750Other — — 950 950
On-Behalf Expenditures 13,451,993 — — 13,451,993Total Expenditures 43,677,369 225,602 3,987,205 47,890,176
Excess (Deficiency) of RevenuesOver (Under) Expenditures 1,757,015 (218,394) (119,455) 1,419,166
Other Financing Sources (Uses)Disposal of Capital Asset 8,925 — — 8,925Transfers In 2,224 750,000 1,000,000 1,752,224Transfers Out (1,752,224) — — (1,752,224)
(1,741,075) 750,000 1,000,000 8,925
Net Change in Fund Balances 15,940 531,606 880,545 1,428,091
Fund Balances - Beginning as Restated 12,541,609 2,673,622 3,220,126 18,435,357
Fund Balances - Ending 12,557,549 3,205,228 4,100,671 19,863,448
LISLE COMMUNITY UNIT SCHOOL DISTRICT NO. 202
Statement of Revenues, Expenditures and Changes in Fund Balances - Governmental FundsFor the Fiscal Year Ended June 30, 2021
The notes to the financial statements are an integral part of this statement.20

Net Change in Fund Balances - Total Governmental Funds $ 1,428,091
Amounts reported for Governmental Activities in the Statement of Activitiesare different because:
Governmental Funds report capital outlays as expenditures. However, in theStatement of Activities the cost of those assets is allocated over their estimateduseful lives and reported as depreciation expense.
Capital Outlays 475,081Depreciation Expense (1,192,423)Disposal - Cost (524,576)Disposal - Accumulated Depreciation 514,443
Changes in grant revenues not collected for several months after the closeof the fiscal year were not considered to be available and are not reportedas revenue in the governmental funds. 145,542
Changes in Deferred Items Related to PensionsRHP 22,958THIS (1,522,179)TRS 28,595IMRF (830,873)
The issuance of long-term debt provides current financial resources toGovernmental Funds, while the repayment of the principal on long-termdebt consumes the current financial resources of the governmental funds.
Change in Compensated Absences Payable (28,061)Change in Total OPEB Liability - RHP (50,880)Change in Total OPEB Liability - THIS 1,137,910Change in Net Pension Liability - TRS (24,370)Change in Net Pension Liability - IMRF 1,087,560Retirement of Long-Term Debt 930,000Amortization on Bond Premium 141,655
Changes in Net Position of Governmental Activities 1,738,473
LISLE COMMUNITY UNIT SCHOOL DISTRICT NO. 202
Reconciliation of the Statement of Revenues, Expenditures and Changes in Fund Balances of the Governmental Funds to the Statement of Activities - Governmental ActivitiesFor the Fiscal Year Ended June 30, 2021
The notes to the financial statements are an integral part of this statement.21

NOTE 1 - SUMMARY OF SIGNIFICANT ACCOUNTING POLICIES
Lisle Community Unit School District No. 202 (the “District”) operates as a public school system governed by a seven-member board. The District is organized under the School Code of the State of Illinois, as amended.
The government-wide financial statements are prepared in accordance with generally accepted accounting principles (GAAP). The Governmental Accounting Standards Board (GASB) is responsible for establishing GAAP for state and local governments through its pronouncements (Statements and Interpretations). The more significant of the District’s accounting policies established under GAAP and used by the District are described below.
REPORTING ENTITY
In determining the financial reporting entity, the District complies with the provisions of GASB Statement No. 61, “The Financial Reporting Omnibus - an Amendment of GASB Statements No. 14 and No. 34” and includes all component units that have a significant operational or financial relationship with the District. Based upon the criteria set forth in the GASB Statement No. 61, there are no component units included in the reporting entity.
Government-Wide Statements
The District’s basic financial statements include both government-wide (reporting the District as a whole) and fund financial statements (reporting the District’s major funds). Both the government-wide and fund financial statements categorize primary activities as either governmental or business-type. The District’s operating activities are all considered governmental activities, that is, activities normally supported by taxes and intergovernmental revenues. The District has no operating activities that would be considered business-type activities. The District first utilizes restricted resources to finance qualifying activities.
The government-wide Statement of Activities reports both the gross and net cost of each of the District’s functions (instruction, support services, community services, etc.). The functions are supported by general government revenues (property and personal property replacement taxes, interest income, etc.). The Statement of Activities reduces gross expenses (including depreciation) by related program revenues, which include 1) charges to customers or applicants who purchase, use or directly benefit from goods, services or privileges provided by a given function or segment and 2) grants and contributions that are restricted to meeting the operational or capital requirements of a particular function or segment.
The net costs (by function) are normally covered by general revenue (property and personal property replacement taxes, interest income, etc.).
This government-wide focus is more on the sustainability of the District as an entity and the change in the District’s net position resulting from the current year’s activities.
LISLE COMMUNITY UNIT SCHOOL DISTRICT NO. 202
Notes to the Financial StatementsJune 30, 2021
22

NOTE 1 - SUMMARY OF SIGNIFICANT ACCOUNTING POLICIES - Continued
BASIS OF PRESENTATION
Fund Financial Statements
The financial transactions of the District are reported in individual funds in the fund financial statements. Each fund is accounted for by providing a separate set of self-balancing accounts that comprise its assets/deferred outflows, liabilities/deferred inflows, fund equity, revenues and expenditures/expenses. An emphasis is placed on major funds within the governmental category. A fund is considered major if it is the primary operating fund of the District or meets the following criteria:
Total assets/deferred outflows, liabilities/deferred inflows, revenues, or expenditures/expenses of that individual governmental fund are at least 10 percent of the corresponding total for all funds of that category or type.
The various funds are reported by generic classification within the financial statements. The following fund types are used by the District:
Governmental Funds
The focus of the governmental funds’ measurement (in the fund statements) is upon determination of financial position and changes in financial position (sources, uses, and balances of financial resources) rather than upon net income. The following is a description of the governmental funds of the District:
General Fund is the general operating fund of the District. It accounts for all financial resources except those required to be accounted for in another fund. This fund is primarily used for most of the instructional and administrative aspects of the District’s operations. Revenues consist largely of local property taxes and state government aid. The General Fund is a major fund and is comprised of the Educational, the Operations and Maintenance, and the Working Cash Accounts.
Special revenue funds are used to account for the proceeds of specific revenue sources that are legally restricted or committed to expenditures for specified purposes, other than those accounted for in the Debt Service Fund or Capital Projects Funds. The District maintains three nonmajor special revenue funds.
Debt Service Fund is used to account for the accumulation of resources that are restricted, committed, or assigned for, and the payment of, long-term debt principal, interest and related costs. The primary revenue source is local property taxes levied specifically for debt service. The Debt Services Fund is a nonmajor fund.
Capital projects funds are used to account for the financial resources that are restricted, committed, or assigned to be used for the acquisition or construction of, and/or additions to, major capital facilities. The Capital Projects Fund, a major fund, is used to account for financial resources to be used for the acquisition or construction of major capital facilities. Revenues are derived from transfers from other funds.
LISLE COMMUNITY UNIT SCHOOL DISTRICT NO. 202
Notes to the Financial StatementsJune 30, 2021
23

NOTE 1 - SUMMARY OF SIGNIFICANT ACCOUNTING POLICIES - Continued
MEASUREMENT FOCUS AND BASIS OF ACCOUNTING
Measurement focus is a term used to describe “which” transactions are recorded within the various financial statements. Basis of accounting refers to “when” transactions are recorded, regardless of the measurement focus applied.
In the fund financial statements, the “current financial resources” measurement focus or the “economic resources” measurement focus is used as appropriate.
Measurement Focus
On the government-wide Statement of Net Position and the Statement of Activities, the governmental activities are presented using the economic resources measurement focus as defined below. In the fund financial statements, the “current financial resources” measurement focus is used.
All governmental funds utilize a “current financial resources” measurement focus. Only current financial assets/deferred outflows and liabilities/deferred inflows are generally included on their balance sheets. Their operating statements present sources and uses of available spendable financial resources during a given period. These funds use fund balance as their measure of available spendable financial resources at the end of the period.
Basis of Accounting
In the government-wide Statement of Net Position and Statement of Activities, the governmental activities are presented using the accrual basis of accounting. Under the accrual basis of accounting, revenues are recognized when earned and expenses are recorded when the liability/deferred inflow is incurred or economic asset used. Revenues, expenses, gains, losses, assets/deferred outflows, and liabilities/deferred inflows resulting from exchange and exchange-like transactions are recognized when the exchange takes place.
In the fund financial statements, governmental funds are presented on the modified accrual basis of accounting. Under this modified accrual basis of accounting, revenues are recognized when “measurable and available.” Measurable means that the amount of the transaction can be determined, and “available” means collectible within the current period or soon enough thereafter to pay liabilities of the current period. For this purpose, the District considers all revenues available if they are collected within 60 days after year-end, except for state aid. State aid payments received after 60 days are being considered as available as historically, state aid collected within 60 days has represented all state aid expected to be collected. The state is currently behind on payments to local government agencies, resulting in current year state aid collections after 60 days of year-end. Expenditures are recorded when the related fund liability is incurred. However, expenditures for unmatured principal and interest on general long-term debt are recognized when due; and certain compensated absences, claims and judgments are recognized when the obligations are expected to be liquidated with expendable available financial resources.
On-behalf payments (payments made by a third party for the benefit of the District, such as payments made by the state to the Teachers’ Retirement System) have been recognized in the financial statements. Property taxes, replacement taxes, certain state and federal aid, and interest on investments are susceptible to accrual. Other receipts become measurable and available when cash is received by the District and are recognized as revenue at that time. Grant funds are considered to be earned to the extent of expenditures made under the provisions of the grant. Accordingly, when such funds are received, they are recorded as unearned revenues until earned.
LISLE COMMUNITY UNIT SCHOOL DISTRICT NO. 202
Notes to the Financial StatementsJune 30, 2021
24

NOTE 1 - SUMMARY OF SIGNIFICANT ACCOUNTING POLICIES - Continued
ASSETS/DEFERRED OUTFLOWS, LIABILITIES/DEFERRED INFLOWS, AND NET POSITION OR EQUITY
Cash and Investments
For the purpose of the Statement of Net Position, cash and cash equivalents are considered to be cash on hand, demand deposits, and cash with fiscal agent.
Investments are generally reported at fair value. Short-term investments are reported at cost, which approximates fair value. For investments, the District categorizes its fair value measurements within the fair value hierarchy established by generally accepted accounting principles. The hierarchy is based on the valuation inputs used to measure the fair value of the asset. Level 1 inputs are quoted prices in active markets for identical assets; Level 2 inputs are significant other observable inputs; Level 3 inputs are significant unobservable inputs.
Interfund Receivables, Payables and Activity
Interfund activity is reported as loans, services provided, reimbursements or transfers. Loans are reported as interfund receivables and payables as appropriate and are subject to elimination upon consolidation. Services provided, deemed to be at market or near market rates, are treated as revenues and expenditures/expenses. Reimbursements are when one fund incurs a cost, charges the appropriate benefiting fund and reduces its related cost as a reimbursement. All other interfund transactions are treated as transfers.
Capital Assets
Capital assets purchased or acquired with an original cost of more than $5,000 for furniture, equipment and land improvements and $25,000 for buildings and building improvements or estimated historical cost. Contributed assets are reported at acquisition value as of the date received. Additions, improvements and other capital outlays that significantly extend the useful life of an asset are capitalized. Other costs incurred for repairs and maintenance are expenses as incurred.
The accounting and financial reporting treatment applied to a fund is determined by its measurement focus. General capital assets are long-lived assets of the District as a whole. When purchased, such assets are recorded as expenditures in the governmental funds and capitalized. The valuation basis for general capital assets are historical cost, or where historical cost is not available, estimated historical cost based on replacement costs.
Depreciation on all assets is computed and recorded using the straight-line method of depreciation over the following estimated useful lives:
Land Improvements 20 YearsBuildings and Improvements 10 - 50 YearsEquipment 5 - 20 Years
LISLE COMMUNITY UNIT SCHOOL DISTRICT NO. 202
Notes to the Financial StatementsJune 30, 2021
25

NOTE 1 - SUMMARY OF SIGNIFICANT ACCOUNTING POLICIES - Continued
ASSETS/DEFERRED OUTFLOWS, LIABILITIES/DEFERRED INFLOWS, AND NET POSITION OR EQUITY - Continued
Compensated Absences
District employees earn vacation days and these vacation days may be taken at any time during the year in which they were earned or a subsequent one-year period. The number of vacation days earned is dependent on the type of position, collective bargaining agreement and length of service. The General Fund liquidates the liabilities pertaining to their employees.
All full-time employees receive various numbers of sick days per year based on the collective bargaining agreements or policies in place. These days may accumulate based on type of position and collective bargaining agreement. Sick leave does not vest and, therefore, is recognized only when used.
Long-Term Obligations
In the government-wide financial statements, long-term debt and other long-term obligations are reported as liabilities in the Statement of Net Position. Bond premiums and discounts are deferred and amortized over the life of the bonds using the effective interest method. Bonds payable are reported net of the applicable bond premium or discount. Bond issuance costs are reported as expenses at the time of issuance.
In the fund financial statements, governmental fund types recognize bond premiums and discounts, as well as bond issuance costs, during the current period. The face amount of debt issued is reported as other financing sources. Premiums received on debt issuances are reported as other financing sources while discounts on debt issuances are reported as other financing uses. Issuance costs, whether or not withheld from the actual debt proceeds received, are reported as debt service expenditures.
Net Position
In the government-wide financial statements, equity is classified as net position and displayed in three components:
Net Investment in Capital Assets - Consists of capital assets, including restricted capital assets, net of accumulated depreciation, and reduced by the outstanding balances of any bonds, mortgages, notes or other borrowings that are attributable to the acquisition, construction, or improvement of those assets.
Restricted - Consists of net position with constraints placed on the use either by (1) external groups such as creditors, grantors, contributors, or laws or regulations of other governments; or (2) law through constitutional provisions or enabling legislation.
Unrestricted - All other net position balances that do not meet the definition of “restricted” or “net investment in capital assets.”
LISLE COMMUNITY UNIT SCHOOL DISTRICT NO. 202
Notes to the Financial StatementsJune 30, 2021
26

NOTE 2 - STEWARDSHIP, COMPLIANCE AND ACCOUNTABILITY
BUDGETARY INFORMATION
The Board of Education follows these procedures in establishing the budgetary data reflected in the general purpose financial statements:
1. The Administration submits to the Board of Education a proposed operating budget for the fiscal year commencing July 1. The operating budget includes proposed expenditures and the means of financing them.
2. Public hearings are conducted and the proposed budget is available for inspection to obtain taxpayer comments.
3. Prior to September 30, the budget is legally adopted through passage of a resolution. By the last Tuesday in December, a tax resolution is filed with the county clerk to obtain tax revenues.
4. The Board of Education, authorizes the Superintendent, or their designee to transfer up to a legal level of 10% of the total budget between functions within any fund; however, any revisions that alter the total expenditures of any fund must be approved by the Board of Education, after following the public hearing process mandated by law. There were no budget amendments during the year ended June 30, 2021.
5. Formal budgetary integration is employed as a management control device during the year for all governmental funds.
6. The District has adopted a legal budget for all its governmental funds. Total actual expenditures for the governmental funds may not legally exceed the total budgeted for such funds. However, under the State
Budget Act expenditures may exceed the budget if additional resources are available to finance such expenditures.
7. All budget appropriations lapse at the end of the fiscal year.
EXCESS OF ACTUAL EXPENDITURES OVER BUDGET IN INDIVIDUAL FUNDS
The following funds had an excess of actual expenditures over budget as of the date of this report:
Fund Excess
Tort Immunity $ 16Debt Service 23,200
LISLE COMMUNITY UNIT SCHOOL DISTRICT NO. 202
Notes to the Financial StatementsJune 30, 2021
27

NOTE 3 - DETAIL NOTES ON ALL FUNDS
DEPOSITS AND INVESTMENTS Under State law, limits are imposed as to investments in commercial paper, corporate bonds, and mutual funds in which the District may invest, as well as the Illinois School District Liquid Asset Fund Plus (ISDLAF+).
The ISDLAF+ is a non-profit investment trust formed pursuant to the Illinois Municipal Code and managed by a Board of Trustees elected from participating members. It is not registered with the SEC as an investment company. Investments are sold valued at share price, which is the price for which the investment could be sold.
Interest Rate Risk, Credit Risk, Custodial Credit Risk, and Concentration Risk
Deposits. At year-end, the carrying amount of the District’s deposits for governmental activities totaled $10,851,683 and the bank balances totaled $10,853,481.
Investments. At year-end, the District has the following investments and maturities:
Investment Maturities (in Years)Fair Less Than More Than
Investment Type Value 1 1-5 6-10 10
ISDLAF+ $ 26,150,110 26,150,110 — — —
The District has the following recurring fair value measurements as of June 30, 2021:
• ISDLAF+ of $26,150,110 are measured at the net asset value per share as determined by the pool.
Interest Rate Risk. Interest rate risk is the risk that changes in interest rates will adversely affect the value of an investment. The District’s investment policy does not limit investment maturities as a means of managing its exposure to fair value losses arising from increasing interest rates. However, the policy requires the District’s investment portfolio to be sufficiently liquid to enable the District to meet all operating requirements as they come due.
Custodial Credit Risk – Deposits. With respect to deposits, custodial credit risk refers to the risk that, in the event of a bank failure, the District’s deposits may not be returned to it. The District’s investment policy limits the exposure to deposit custodial credit risk by requiring all deposits in excess of FDIC insurable limits to be secured by collateral in the event of default or failure of the financial institution holding the funds. As of June 30, 2021, the bank balance of the District’s deposits with financial institutions totaled $10,853,481; this entire amount was insured through FDIC insurance and additional letter of credit.
LISLE COMMUNITY UNIT SCHOOL DISTRICT NO. 202
Notes to the Financial StatementsJune 30, 2021
28

NOTE 3 - DETAIL NOTES ON ALL FUNDS - Continued
DEPOSITS AND INVESTMENTS - Continued Interest Rate Risk, Credit Risk, Custodial Credit Risk, and Concentration Risk - Continued
Custodial Credit Risk – Investments. For an investment, this is the risk that in the event of the failure of the counterparty, the District will not be able to recover the value of its investments or collateral securities that are in the possession of an outside party. The District’s investment policy limits the exposure to investment custodial credit risk by requiring all investments be with financial institutions in excess of any insurance limit shall be collateralized in accordance with the Public Funds Investment Act, 30 ILCS 235. At year end, the District 's investment in ISDLAF+ was not subject to custodial credit risk.
Credit Risk. Credit risk is the risk that an issuer or other counterparty to an investment will not fulfill its obligations. To limit its exposure, the District’s investment policy prefers investments shall be undertaken in a manner that seeks to ensure the preservation of capital in the overall portfolio. At year- and, the District’s investment in the ISDLAF+ was rated AAAm from Standard & Poor's.
Concentration of Credit Risk. Concentration of credit risk is the risk of loss attributed to the magnitude of the District’s investment in a single issuer. The District’s investment policy requires that the portfolio is diversified as to materials and investments, as appropriate to the nature, purpose, and amount of the funds. Investments in any one depository will not exceed 25% of District funds at any time. At year-end, the District has investments over 5 percent of the total cash and investment portfolio (other than investments issued or explicitly guaranteed by the U.S. government and investments in mutual funds, external investment pools, and other pooled investments) in Customers Bank - LOC of $4,249,800 and Bank of China (ICS - DDA) of $4,001,634.
ON-BEHALF PAYMENTS The Statement of Revenues, Expenditures and Changes in Fund Balances – Governmental Funds includes “on-behalf” payments received and made for the amounts contributed by the State of Illinois for the employer’s share of the Teachers Retirement System pension. The District does budget for these amounts in the Educational Account of the General Fund.
PERSONAL PROPERTY REPLACEMENT TAXES
Personal property replacement taxes are first allocated to the Municipal Retirement/Social Security Fund, and the balance is allocated to the General Fund - Education Account at the discretion of the District.
LISLE COMMUNITY UNIT SCHOOL DISTRICT NO. 202
Notes to the Financial StatementsJune 30, 2021
29

NOTE 3 - DETAIL NOTES ON ALL FUNDS - Continued
PROPERTY TAXES
The District must file its tax levy resolution by the last Tuesday in December of each year. The District's 2020 levy resolution was approved during the December 14, 2020 board meeting. The District's property tax is levied each year on all taxable real property located in the District and it becomes a lien on the property on January 1 of that year. The owner of the real property on January 1 in any years is liable for taxes of that year.
Property taxes are collected by the County Treasurer, who remits to the District its share of collections. Taxes levied in one year become due and payable in two equal installments the following year: the first due on June 1 and the second due on September 1. Property taxes are normally collected by the District within 30 days of the respective installment dates. Revenue is recognized on the current year’s levy in conjunction with the amount budgeted by the Board for the current year with the unrecognized amount being recorded as a deferred inflow of resources.
INTERFUND TRANSFERS
Interfund transfers for the year consisted of the following:
Transfer In Transfer Out Amount
Capital Projects General - Operations and Maintenance Account $ 750,000 (3)
General - Educational Account General - Working Cash Account 2,224 (1)
Nonmajor Governmental General - Educational Account 1,000,000 (2)
1,752,224
Transfers are used to (1) move excess interest earned out of the Working Cash Account to other funds, (2) move receipts restricted to debt service from the funds collecting the receipts to the Debt Service Fund as debt service payments become due, and (3) use unrestricted revenues collected in the General Fund to finance various programs accounted for in other funds in accordance with budgetary authorizations.
LISLE COMMUNITY UNIT SCHOOL DISTRICT NO. 202
Notes to the Financial StatementsJune 30, 2021
30

NOTE 3 - DETAIL NOTES ON ALL FUNDS - Continued CAPITAL ASSETS Governmental Activities Governmental capital asset activity for the year was as follows:
Beginning EndingBalances Increases Decreases Balances
Nondepreciable Capital AssetsLand $ 1,272,506 — — 1,272,506Construction in Progress — 252,309 — 252,309
1,272,506 252,309 — 1,524,815
Depreciable Capital AssetsLand Improvements 2,810,942 23,655 12,554 2,822,043Buildings and Improvements 74,736,290 71,725 — 74,808,015Equipment 5,034,889 127,392 512,022 4,650,259
82,582,121 222,772 524,576 82,280,317
Less Accumulated DepreciationLand Improvements 1,442,083 95,684 4,132 1,533,635Buildings and Improvements 20,316,629 883,383 — 21,200,012Equipment 2,888,986 213,356 510,311 2,592,031
24,647,698 1,192,423 514,443 25,325,678
Total Net Depreciable Capital Assets 57,934,423 (969,651) 10,133 56,954,639
Total Net Capital Assets 59,206,929 (717,342) 10,133 58,479,454
Depreciation expense was charged to governmental activities as follows:
Instructional $ 1,011,212Support Services 181,211
1,192,423
LISLE COMMUNITY UNIT SCHOOL DISTRICT NO. 202
Notes to the Financial StatementsJune 30, 2021
31

NOTE 3 - DETAIL NOTES ON ALL FUNDS - Continued
LONG-TERM DEBT
General Obligation Bonds
General Obligation bonds are direct obligations and pledge the full faith and credit of the District. General obligation bonds currently outstanding are as follows:
Beginning EndingIssue Balances Issuances Retirements Balances
General Obligation Limited Tax School Bonds of 2019 - Due in annual installments of $170,000 to $1,420,000 plus semi-annual interest at 3.00% to 5.00% through December 30, 2030. $ 12,470,000 — 930,000 11,540,000
Debt Service Requirements to Maturity
The annual debt service requirements to maturity, including principal and interest, are as follows:
GeneralFiscal Obligation BondsYear Principal Interest
2022 $ 980,000 495,7502023 1,025,000 445,6252024 1,080,000 393,0002025 1,130,000 337,7502026 1,190,000 279,7502027 1,250,000 218,7502028 1,310,000 161,3002029 1,365,000 107,8002030 1,420,000 52,1002031 790,000 11,850
Totals 11,540,000 2,503,675
LISLE COMMUNITY UNIT SCHOOL DISTRICT NO. 202
Notes to the Financial StatementsJune 30, 2021
32

NOTE 3 - DETAIL NOTES ON ALL FUNDS - Continued
LONG-TERM DEBT - Continued
Long-Term Liabilities Activity
Changes in long-term liabilities during the fiscal year were as follows:
AmountsBeginning Ending Due within
Type of Debt Balances Additions Deductions Balances One Year
Governmental ActivitiesCompensated Absences $ 149,560 56,122 28,061 177,621 35,524Total OPEB Liability - RHP 2,178,310 50,880 — 2,229,190 —Total OPEB Liability - THIS 17,405,896 — 1,137,910 16,267,986 —Net Pension Liability - TRS 1,563,904 24,370 — 1,588,274 —Net Pension Liability - IMRF 2,613,915 — 1,087,560 1,526,355 —General Obligation Bonds 12,470,000 — 930,000 11,540,000 980,000Plus: Unamortized Premium 1,416,547 — 141,655 1,274,892 —
37,798,132 131,372 3,325,186 34,604,318 1,015,524
The obligations for the compensated absences, the total OPEB liabilities and the net pension liability for TRS will be repaid from the General Fund (Educational Accounts). The net pension liability for IMRF is being liquidated from the Municipal Retirement/Social Security Fund. The general obligation bonds are being liquidated from the Debt Service Fund.
Legal Debt Margin
The District is subject to the Illinois School Code, which limits the amount of certain indebtedness to 13.8% of the most recent available equalized assessed valuation of the District. At year-end the legal debt margin is as follows:
Assessed Valuation - 2020 $ 660,993,571
Legal Debt Limit - 13.8% of Assessed Value 91,217,113
Amount of Debt Applicable to Limit (11,540,000)
Legal Debt Margin 79,677,113
LISLE COMMUNITY UNIT SCHOOL DISTRICT NO. 202
Notes to the Financial StatementsJune 30, 2021
33

NOTE 3 - DETAIL NOTES ON ALL FUNDS - Continued
NET POSITION CLASSIFICATIONS
Net investment in capital assets was comprised of the following as of June 30, 2021:
Governmental ActivitiesCapital Assets - Net of Accumulated Depreciation $ 58,479,454
Less Capital Related Debt:General Obligation Limited Tax School Bonds of 2019 (11,540,000)Unamortized Premium (1,274,892)
Net Investment in Capital Assets 45,664,562
FUND BALANCE CLASSIFICATIONS
In the governmental fund financial statements, the District considers restricted amounts to have been spent when an expenditure is incurred for purposes for which both restricted and unrestricted fund balance is available. The District first utilizes committed, then assigned and then unassigned fund balance when an expenditure is incurred for purposes for which all three unrestricted fund balances are available.
Nonspendable Fund Balance. Consists of resources that cannot be spent because they are either: a) not in a spendable form; or b) legally or contractually required to be maintained intact.
Restricted Fund Balance. Consists of resources that are restricted to specific purposes, that is, when constraints placed on the use of resources are either: a) externally imposed by creditors (such as through debt covenants), grantors, contributors, or laws or regulations of other governments; or b) imposed by law through constitutional provisions or enabling legislation.
Committed Fund Balance. Consists of resources constrained (issuance of an ordinance) to specific purposes by the government itself, using its highest level of decision-making authority, the Board of Education; to be reported as committed, amounts cannot be used for any other purpose unless the government takes the same highest-level action to remove or change the constraint.
Assigned Fund Balance. Consists of amounts that are constrained by the Board of Education’ intent to be used for specific purposes but are neither restricted nor committed. Intent is expressed by a) the Board of Education itself or b) a body or official to which the Board of Education has delegated the authority to assign amounts to be used for specific purposes. The District’s highest level of decision-making authority is the Board of Education, who is authorized to assign amounts to a specific purpose.
Unassigned Fund Balance. Consists of residual net resources of a fund that has not been restricted, committed, or assigned within the General Fund and deficit fund balances of other governmental funds.
LISLE COMMUNITY UNIT SCHOOL DISTRICT NO. 202
Notes to the Financial StatementsJune 30, 2021
34

NOTE 3 - DETAIL NOTES ON ALL FUNDS - Continued
FUND BALANCE CLASSIFICATIONS - Continued
Minimum Fund Balance Policy. The District's policy manual states that the General Fund and Transportation Fund should maintain a minimum fund balance equal to 25% of the combined expenditures.
The following is a schedule of fund balance classifications for the governmental funds as of the date of this report:
CapitalGeneral Projects Nonmajor Totals
Fund BalancesNonspendable
Prepaid Expense $ — — 260,125 260,125Restricted
Operations and Maintenance 1,108,229 — — 1,108,229Working Cash 809,212 — — 809,212Transportation — — 2,409,079 2,409,079Retirement Benefits — — 512,520 512,520Debt Service — — 918,947 918,947Capital Projects — 3,205,228 — 3,205,228
1,917,441 3,205,228 3,840,546 8,963,215
Unassigned 10,640,108 — — 10,640,108
Total Fund Balances 12,557,549 3,205,228 4,100,671 19,863,448
NET POSITION/FUND BALANCE RESTATEMENTS
Beginning net position was restated due to the implementation of GASB Statement No. 84 and correcting the bond and interest payments from the previous fiscal years.
The following is a summary of the net position/fund balance as originally reported and as restated:
Net Position/Fund Balance As Reported As Restated Increase
Governmental Activities $ 38,075,001 38,454,182 379,181General 12,445,803 12,541,609 95,806
General - Educational Account 11,120,410 11,216,216 95,806Debt Service 183,150 466,525 283,375
LISLE COMMUNITY UNIT SCHOOL DISTRICT NO. 202
Notes to the Financial StatementsJune 30, 2021
35

NOTE 4 - OTHER INFORMATION
RISK MANAGEMENT
The District is exposed to various risks of loss related to employee health benefits; workers' compensation claims; theft of, damage to, and destruction of assets; and natural disasters. To protect from such risks, the District participates in the following public entity risk pools: the Educational Benefit Cooperative (EBC) for health benefit claims, the Suburban School Cooperative Insurance Pool (SSCIP) for property damage and injury claims, and the School Employees Loss Fund (SELF) for workers' compensation claims. The District pays annual premiums to the pools for insurance coverage. The arrangements with the pools provide that the pools will be self-sustaining through member premiums and will reinsure through commercial companies for claims in excess of certain levels established by the pools.
Complete financial statements for EBC can be obtained from its Treasurer, 1105 North Hunt Club Road, Gurnee, Illinois 60031.
Complete financial statements for SSCIP can be obtained from its Treasurer, 5540 Arlington Drive, Hanover Park, Illinois 60103.
Complete financial statements for SELF can be obtained from their accountant, 2850 West Golf Road, Rolling Meadows, Illinois 60008.
Settled claims have not exceeded commercial insurance coverage for the past three fiscal years.
CONTINGENT LIABILITIES
Litigation
The District is a defendant in various lawsuits. Although the outcome of these lawsuits is not presently determinable, in the opinion of the District's attorney, the resolution of these matters will not have a material adverse effect on the financial condition of the District.
State and Federal Contingencies
The District has received federal and state grants for specific purposes that are subject to review and audit by the grantor agencies. Such audits could lead to requests for reimbursements to the grantor agency for expenditures disallowed under the terms of the grant. Management believes such disallowance, if any, would be immaterial.
Financial Impact from COVID-19
In March 2020, the World Health Organization declared the COVID-19 virus a public health emergency. As of the date of this report, the extent of the impact of COVID-19 on the District’s operations and financial position cannot be determined.
LISLE COMMUNITY UNIT SCHOOL DISTRICT NO. 202
Notes to the Financial StatementsJune 30, 2021
36

NOTE 4 - OTHER INFORMATION - Continued
JOINT VENTURES
School Association for Special Education in DuPage County (SASED)
The District entered into a joint agreement to provide special education programs and services to the students enrolled. Each member district has a financial responsibility for annual and special assessments as established by the Board of Directors.
Complete financial statements for SASED can be obtained from the Business Office at 2900 Ogden Ave., Lisle, Illinois 60532.
DuPage Area Occupational Education System (DAOES)
The District entered into a joint agreement to provide vocational education programs and services to the students enrolled. Each member district has a financial responsibility for annual and special assessments as established by the Board of Directors.
Complete financial statements for DAOES can be obtained from the Administrative Office at the Technology Center of DuPage at 301 South Swift Road, Addison, Illinois 60101-1499.
OTHER POST-EMPLOYMENT BENEFITS
Retiree Health Program
General Information about the OPEB Plan
Plan Description. The District administers a single-employer defined benefit healthcare plan (the “Retiree Health Plan”). Eligible administrators that retire from the District may continue their health care coverage for up to ten years, depending on length of service, with the Board paying the monthly premium. IMRF employees that retire from the District may elect to continue their health care coverage by paying the monthly premium. The District subsidizes a portion of the cost for hospital and medical coverage for retired IMRF employees and their dependents. The subsidy is an implied age related cost differential based upon the expected higher cost of coverage for retired employees versus the average cost for the entire group. The District also reimburses eligible retirees for a portion of the cost of health coverage at established rates. Benefit provisions are established through contractual agreements and may only be amended through negotiations with the Board. The plan does not issue a separate, publicly available report. All insurance benefits cease when the retired employee begins receiving Medicare coverage, or attains age 65, whichever comes first.
LISLE COMMUNITY UNIT SCHOOL DISTRICT NO. 202
Notes to the Financial StatementsJune 30, 2021
37

NOTE 4 - OTHER INFORMATION - Continued
OTHER POST-EMPLOYMENT BENEFITS - Continued
Retiree Health Program - Continued
General Information about the OPEB Plan - Continued
Eligibility: Non-Bargaining Unit Support Staff, Classified Employees and Level I Administrators eligible to retire from the District and continue their health coverage after meeting the age and service requirements for retirement.
Level II Administrators and Teachers are eligible to retire from the District and receive reimbursement toward the cost of medical coverage after meeting the age and service requirements.
Non-Certified PersonnelNon-Bargaining Unit Support Staff must be age 55, have at least 10 years of service, and qualifyfor a pension with the Illinois Municipal Retirement Fund (“IMRF”). Classified Staff must have15 years or more of full-time service to the District. Participation requirements for the IMRF areas follows:
Regular Plan Tier 1 (Enrolled in IMRF prior to January 1, 2011)▪ At least 55 years old and at least 8 years of credited service (reduced pension)▪ At least 60 years old and at least 8 years of credited service (full pension)
Regular Plan Tier 2 (Enrolled in IMRF on or After January 1, 2011)▪ At least 62 years old and at least 10 years of credited service (reduced pension)▪ At least 67 years old and at least 10 years of credited service (full pension)
Certified PersonnelLevel II Administrators and Teachers must be at least age 55, have 12 total years of full-time service and qualify for an Illinois Teachers’ Retirement System (“TRS”) pension. Level 1 Administrators must have completed at least 5 years of full-time continuous service and qualify for a TRS pension. Participation requirements for the TRS are as follows:
Tier I Members (First Contributed Prior to January 1, 2011)▪ Age 62 with 5 years of service; or▪ Age 60 with 10 years of service; or▪ Age 55 with 20 years of service (reduced pension)▪ Age 55 with 35 years of service (full pension)
Tier II Members (First Contributed On or After January 1, 2011)▪ 62 years old with 10 years of service (reduced pension)▪ 67 years old with 10 years of service (full pension)
LISLE COMMUNITY UNIT SCHOOL DISTRICT NO. 202
Notes to the Financial StatementsJune 30, 2021
38

NOTE 4 - OTHER INFORMATION - Continued
OTHER POST-EMPLOYMENT BENEFITS - Continued
Retiree Health Program - Continued
Total OPEB Liability - Continued
Plan Membership. As of June 30, 2021, the measurement date, the following employees were covered by the benefit terms:
Inactive Plan Members Currently Receiving Benefits 28Inactive Plan Members Entitled to but not yet Receiving Benefits —Active Plan Members 254
Total 282
Total OPEB Liability
The District’s total OPEB liability was measured as of June 30, 2021, and was determined by an actuarial valuation as of that date.
Actuarial assumptions and other inputs. The total OPEB liability in the June 30, 2021 actuarial valuation was determined using the following actuarial assumptions and other inputs, applied to all periods included in the measurement, unless otherwise specified:
Inflation 3.00%
Salary Increases 4.00%
Discount Rate 2.18%
Healthcare Cost Trend Rates 4.5% per year
Retirees' Share of Benefit-Related Costs Not Available
The discount rate was based on the S&P Municipal Bond 20 Year High- Grade Rate Index as of June 30, 2021.
The mortality projection assumption is based off of retirees' rates from December 31, 2019 IMRF actuarial valutaion report.
LISLE COMMUNITY UNIT SCHOOL DISTRICT NO. 202
Notes to the Financial StatementsJune 30, 2021
39

NOTE 4 - OTHER INFORMATION - Continued
OTHER POST-EMPLOYMENT BENEFITS - Continued
Retiree Health Program - Continued
Change in the Total OPEB Liability
TotalOPEB
Liability
Balance at June 30, 2020 $ 2,178,310
Changes for the Year:Service Cost 120,988Interest on the Total OPEB Liability 55,616Changes of Benefit Terms —Difference Between Expected and Actual Experience —Changes of Assumptions or Other Inputs 49,275Benefit Payments (174,999)Other —
Net Changes 50,880
Balance at June 30, 2021 2,229,190
Sensitivity of the Total OPEB Liability to Changes in the Discount Rate
The following presents the total OPEB liability, calculated using a Single Discount Rate of 2.18%, while the prior valuation used 2.66%. The following presents the total OPEB liability, calculated using the discount rate, as well as what the total OPEB liability would be if it were calculated using a Single Discount Rate that is one percentage point lower or one percentage point higher:
Current 1% Decrease Discount Rate 1% Increase
(1.18%) (2.18%) (3.18%)
Total OPEB Liability $ 2,348,524 2,229,190 2,114,566
LISLE COMMUNITY UNIT SCHOOL DISTRICT NO. 202
Notes to the Financial StatementsJune 30, 2021
40

NOTE 4 - OTHER INFORMATION - Continued
OTHER POST-EMPLOYMENT BENEFITS - Continued
Retiree Health Program - Continued
Sensitivity of the Total OPEB Liability to Changes in the Healthcare Cost Trend Rates
The following presents the total OPEB liability of the District, as well as what the District's total OPEB liability would be if it were calculated using variable healthcare cost trend rate that is one percentage point lower or one percentage point higher than the current healthcare cost rate:
HealthcareCost Trend
1% Decrease Rates 1% Increase(Varies) (Varies) (Varies)
Total OPEB Liability $ 2,128,548 2,229,190 2,345,231
OPEB Expense and Deferred Outflows of Resources and Deferred Inflows of Resources Related to OPEB
For the year ended June 30, 2021, the District recognized OPEB expense of $202,921. At June 30, 2021, the District reported deferred outflows of resources and deferred inflows of resources related to OPEB from the following sources:
Deferred DeferredOutflows of Inflows ofResources Resources Totals
Difference Between Expected and Actual Experience $ — (69,334) (69,334)Change in Assumptions 326,398 (31,382) 295,016Net Difference Between Projected and Actual
Earnings on Pension Plan Investments — — —
Total Deferred Amounts Related to OPEB 326,398 (100,716) 225,682
LISLE COMMUNITY UNIT SCHOOL DISTRICT NO. 202
Notes to the Financial StatementsJune 30, 2021
41

NOTE 4 - OTHER INFORMATION - Continued
OTHER POST-EMPLOYMENT BENEFITS - Continued
Retiree Health Program - Continued
OPEB Expense and Deferred Outflows of Resources and Deferred Inflows of Resources Related to OPEB - Continued
Amounts reported as deferred outflows of resources and deferred inflows of resources related to OPEB will be recognized in OPEB expense as follows:
Net DeferredFiscal OutflowsYear of Resources
2022 $ 26,3192023 26,3192024 26,3192025 26,3192026 26,319
Thereafter 94,087
Total 225,682
Teachers’ Health Insurance Security (THIS) Fund
Plan Description
The District participates in the Teacher Health Insurance Security (THIS) Fund, a cost-sharing, multiple-employer defined benefit post-employment healthcare plan that was established by the Illinois legislature for the benefit of retired Illinois public school teachers employed outside the City of Chicago. THIS health coverage includes provisions for medical, prescription drug, and behavioral health benefits, but does not provide vision, dental, or life insurance benefits. Annuitants not enrolled in Medicare may participate in the state-administered participating provider option plan or choose from several managed care options. Beginning February 1, 2015, annuitants who were enrolled in Medicare Parts A and B may be eligible to enroll in Medicare Advantage Plans.
Benefits Provided. The State Employees Group Insurance Act of 1971 (5 ILCS 375) outlines the benefit provisions of the THIS Fund and amendments to the plan can be made only by legislative action with the Governor’s approval. The plan is administered by Illinois Department of Central Management Services (CMS) with the cooperation of TRS. Section 6.6 of the State Employees Group Insurance Act of 1971 required all active contributors to TRS, who are not employees of the State, to contribute to the THIS Fund.
The percentage of employer required contributions in the future will not exceed 105 percent of the percentage of salary actually required to be paid in the previous fiscal year.
LISLE COMMUNITY UNIT SCHOOL DISTRICT NO. 202
Notes to the Financial StatementsJune 30, 2021
42

NOTE 4 - OTHER INFORMATION - Continued
OTHER POST-EMPLOYMENT BENEFITS - Continued
Teachers’ Health Insurance Security (THIS) Fund - Continued
Plan Description - Continued
On Behalf Contributions to THIS Fund. The State of Illinois makes employer retiree health insurance contributions on behalf of the District. State contributions are intended to match contributions to THIS Fund from active members which were 1.24 percent of pay during the year ended June 30, 2021. State of Illinois contributions were $203,111, and the District recognized revenues and expenditures of this amount during the year. State contributions intended to match active member contributions during the years ended June 30, 2020 was 1.24 percent of pay. State contributions on behalf of the District’s employees were $191,715.
Employer Contributions to THIS Fund. The District also makes contributions to THIS Fund. The employer THIS Fund contribution was 0.92 percent during the year ended June 30, 2021. For the year ended June 30, 2021 the District paid $150,695 to the THIS Fund, which was 100 percent of the required contribution. For the year ended June 30, 2020 the employer THIS Fund Contribution was 0.92 and the District paid $142,240 to the THIS Fund, which was 100 percent of the required contribution.
Further Information on the THIS Fund. The publicly available financial report of the THIS Fund may be found on the website of the Illinois Auditor General: https://www.auditor.illinois.gov/Audit-Reports/ABC-List.aspThe current reports are listed under “Central Management Services.” Prior reports are available under “Healthcare and Family Services.”
Actuarial Assumptions. The total OPEB liability was determined by an actuarial valuation as of June 30, 2019, using the following actuarial assumptions, applied to all periods included in the measurement, unless otherwise specified.
Inflation: 2.50%
Salary Increases: Depends on service and ranges from 9.50% at 1 year of service to 4.00% at 20 or more years of service. Salary increase includes a 3.25% wage inflation assumption.
Investment Rate of Return: 0%, net of OPEB plan investment expense, including inflation, for all plan years.
Healthcare Cost Trend Rates: Actual trend used for fiscal year 2020. For fiscal years on and after 2021, trend starts at 8.25% for non‑Medicare cost and Medicare costs, respectively, and gradually decreases to an ultimate trend of 4.25%. There is no additional trend rate adjustment due to the repeal of the Excise Tax.
LISLE COMMUNITY UNIT SCHOOL DISTRICT NO. 202
Notes to the Financial StatementsJune 30, 2021
43

NOTE 4 - OTHER INFORMATION - Continued
OTHER POST-EMPLOYMENT BENEFITS - Continued
Teachers’ Health Insurance Security (THIS) Fund - Continued
Plan Description - Continued
Actuarial Assumptions - Continued. Mortality rates for retirement and beneficiary annuitants were based on the RP-2014 White Collar Annuitant Mortality Table, adjusted for TRS experience. For disabled annuitant, mortality rates were based on the RP-2014 Disabled Annuitant table. Mortality rates for pre-retirement were based on the RP-2014 White Collar Table. All tables reflect future mortality improvements using Projection Scale MP-2017.
The actuarial assumptions used in the June 30, 2019 valuation were based on the results of an actuarial experience study for the period July 1, 2014 through June 30, 2017.
Single Discount Rate
Projected benefit payments are required to be discounted to their actuarial present values using a Single Discount Rate that reflects (1) a long-term expected rate of return on OPEB plan investments (to the extent that the plan’s fiduciary net position is projected to be sufficient to pay benefits), and (2) tax-exempt municipal bond rate based on an index of 20-year general obligation bonds with an average AA credit rating as of the measurement date (to the extent that the contributions for use with the long-term expected rate of return are not met).
Since the THIS fund is financed on a pay-as-you-go basis, the sponsor has selected a discount rate consistent with the 20-year general obligation bond index described above. The discount rates are 3.13 percent as of June 30, 2019, and 2.45 percent as of June 30, 2020.
Sensitivity of the Employer’s Proportionate Share of the Collective Net OPEB Liability to Changes in the Discount Rate
The following presents the District’s proportionate share of the collective net OPEB liability, as well as what the District’s proportionate share of the collective net OPEB liability would be if it were calculated using a discount rate that is one percentage point lower or one percentage point higher than the current discount rate:
Current1% Decrease Discount Rate 1% Increase
(3.45%) (2.45%) (1.45%)
Employer's Proportionate Shareof the OPEB Liability $ 19,551,833 16,267,986 13,666,379
LISLE COMMUNITY UNIT SCHOOL DISTRICT NO. 202
Notes to the Financial StatementsJune 30, 2021
44

NOTE 4 - OTHER INFORMATION - Continued
OTHER POST-EMPLOYMENT BENEFITS - Continued
Teachers’ Health Insurance Security (THIS) Fund - Continued
Sensitivity of the Employer’s Proportionate Share of the Collective Net OPEB Liability to Changes in the Healthcare Cost Trend Rates
The following presents the District’s proportionate share of the collective net OPEB liability, using current trend rates and sensitivity trend rates that are either one percentage point higher or lower. The key trend rates are 8.25% in 2021 decreasing to an ultimate trend rate of 4.25% in 2037.
HealthcareCost Trend
1% Decrease Rates 1% Increase
Employer's Proportionate Shareof the OPEB Liability $ 13,084,428 16,267,986 20,571,592
OPEB Liabilities, OPEB Expense, and Deferred Outflows of Resources and Deferred Inflows of Resources Related to OPEB
At June 30, 2021, the District reported a liability for its proportionate share of the net OPEB liability that reflected a reduction for State OPEB support provided to the District. The collective net OPEB liability was measured as of June 30, 2020, and the total OPEB liability used to calculate the collective net OPEB liability was determined by an actuarial valuation as of that date. The District’s proportion of the collective net OPEB liability was based on a projection of the District’s long-term share of contributions to the OPEB plan relative to the projected contributions of the District, actuarially determined. At June 30, 2020, the District’s proportion was 0.060847 percent, which was a decrease of 0.002041 from its proportion measured as of June 30, 2019. The State’s support and total are for disclosure purposes only. The amount recognized by the District as its proportionate share of the net OPEB liability, the related State support, and the total portion of the net OPEB liability that was associated with the District were as follow:
Employer's Proportionate Share of the Net OPEB Liability $ 16,267,986 State's Proportionate Share of the Net OPEB Liability Associated with the Employer 22,038,713
Total 38,306,699
LISLE COMMUNITY UNIT SCHOOL DISTRICT NO. 202
Notes to the Financial StatementsJune 30, 2021
45

NOTE 4 - OTHER INFORMATION - Continued
OTHER POST-EMPLOYMENT BENEFITS - Continued
Teachers’ Health Insurance Security (THIS) Fund - Continued
OPEB Liabilities, OPEB Expense, and Deferred Outflows of Resources and Deferred Inflows of Resources Related to OPEB - Continued
For the year ending June 30, 2021, the District recognized OPEB revenue and expense of $203,111 for support provided by the State. For the year ending June 30, 2021, the District recognized OPEB expense of $534,964. At June 30, 2021, the District reported deferred outflows of resources and deferred inflows of resources related to OPEB from the following sources:
Deferred DeferredOutflows of Inflows ofResources Resources Totals
Differences Between Expected and Actual Experience $ — (432,223) (432,223) Net Difference Between Projected and Actual Earnings on Pension Investments 5,509 (2,683,384) (2,677,875) Changes of Assumptions — (463) (463) Changes in Proportion and Differences Between Employer Contributions
and Proportionate Share of Contributions 669,714 (819,616) (149,902) Total Pension Expense to be Recognized in Future Periods 675,223 (3,935,686) (3,260,463)
Employer Contributions Subsequent to the Measurement Date 150,695 — 150,695
Totals 825,918 (3,935,686) (3,109,768)
$150,695 reported as deferred outflows of resources related to OPEB resulting from District contributions subsequent to the measurement date and before the end of the fiscal year will be included as a reduction of the collective net OPEB liability in the year ending June 30, 2022. Other amounts reported as deferred outflows of resources and deferred inflows of resources related to OPEB will be recognized in the District’s OPEB expense as follows:
Net DeferredFiscal (Inflows)Year of Resources
2022 $ (658,429) 2023 (658,384) 2024 (658,289) 2025 (509,212) 2026 (284,586)
Thereafter (491,563)
Total (3,260,463)
LISLE COMMUNITY UNIT SCHOOL DISTRICT NO. 202
Notes to the Financial StatementsJune 30, 2021
46

NOTE 4 - OTHER INFORMATION - Continued
RETIREMENT SYSTEMS
The retirement plans of the District include the Teachers’ Retirement System of the State of Illinois (TRS) and the Illinois Municipal Retirement Fund (IMRF). Most funding for TRS is provided through payroll withholdings of certified employees and contributions made by the State of Illinois on-behalf of the District. IMRF is funded through property taxes and a perpetual lien of the District’s corporate personal property replacement tax. Each retirement system is discussed below.
Teachers’ Retirement System (TRS)
Plan Descriptions, Provisions and Funding Policies
The District participates in the Teachers’ Retirement System of the State of Illinois (TRS). TRS is a cost-sharing multiple-employer defined benefit pension plan that was created by the Illinois legislature for the benefit of Illinois public school teachers employed outside the City of Chicago. TRS members include all active non-annuitants who are employed by a TRS-covered employer to provide services for which teacher licensure is required. The Illinois Pension Code outlines the benefit provisions of TRS, and amendments to the plan can only be made by legislative action with the Governor’s approval. The TRS Board of Trustees is responsible for TRS’s administration. TRS issues a publicly available financial report that can be obtained at https://www.trsil.org/financial/cafrs/fy2020; by writing to TRS at 2815 W. Washington, PO Box 19253, Springfield, IL 62794; or by calling 888-678-3675, option 2.
Benefits Provided
TRS provides retirement, disability, and death benefits. Tier 1 members have TRS or reciprocal system service prior to January 1, 2011. Tier 1 members qualify for retirement benefits at age 62 with five years of service, at age 60 with 10 years, or age 55 with 20 years. The benefit is determined by the average of the four highest years of creditable earnings within the last 10 years of creditable service and at the percentage of average salary to which the member is entitled. Most members retire under a formula that provides 2.2 percent of final average salary up to a maximum of 75 percent with 34 years of service. Disability and death benefits are also provided.
Tier 2 members qualify for retirement benefits at age 67 with 10 years of service, or a discounted annuity can be paid at age 62 with 10 years of service. Creditable earnings for retirement purposes are capped and the final average salary is based on the highest consecutive eight years of creditable service rather than the last four. Disability provisions for Tier 2 are identical to those of Tier 1. Death benefits are payable under a formula that is different from Tier 1.
Essentially all Tier 1 retirees receive an annual 3 percent increase in the current retirement beginning January 1 following the attainment of age 61 or on January 1 following the members’ first anniversary in retirement, whichever is later. Tier 2 annual increases will be the lesser of 3 percent of the original benefit or one-half percent of the rate of inflation beginning January 1 following attainment of age 67 or on January 1 following the members’ first anniversary in retirement, whichever is later.
LISLE COMMUNITY UNIT SCHOOL DISTRICT NO. 202
Notes to the Financial StatementsJune 30, 2021
47

NOTE 4 - OTHER INFORMATION - Continued
RETIREMENT SYSTEMS - Continued
Teachers’ Retirement System (TRS) - Continued
Benefits Provided - Continued
Public Act 100-0023, enacted in 2017, creates an optional Tier 3 hybrid retirement plan, but it has not yet gone into effect. Public Act 100-0587, enacted in 2018, requires TRS to offer two temporary benefit buyout programs that expire on June 30, 2021. One program allows retiring Tier 1 members to receive a partial lump-sum payment in exchange for accepting a lower, delayed annual increase. The other allows inactive vested Tier 1 and 2 members to receive a partial lump-sum payment in lieu of a retirement annuity. Both programs will begin in 2019 and will be funded by bonds issued by the State of Illinois.
Contributions
The State of Illinois maintains the primary responsibility for funding TRS. The Illinois Pension Code, as amended by Public Act 88-0593 and subsequent acts, provides that for years 2010 through 2045, the minimum contribution to the System for each fiscal year shall be an amount determined to be sufficient to bring the total assets of the System up to 90 percent of the total actuarial liabilities of the System by the end of fiscal year 2045.
Contributions from active members and TRS contributing employers are also required by the Illinois Pension Code. The contributions rates are specified by the pension code. The active member contribution rate for the year ended June 30, 2020, was 9.0 percent of creditable earnings. The member contribution, which may be paid on behalf of employees by the employer, is submitted to TRS by the employer.
On Behalf Contributions to TRS. The State of Illinois makes employer pension contributions on behalf of the employer. For the year ended June 30, 2021, State of Illinois contributions recognized by the employer were based on the State’s proportionate share of the collective net pension liability associated with the employer, and the employer recognized revenue and expenditures of $13,248,882 in pension contributions from the State. For the year ended June 30, 2020, the employer recognized revenue and expenditures of $12,084,550 in pension contributions from the State.
2.2 Formula Contributions. Employers contribute 0.58 percent of total creditable earnings for the 2.2 formula change. The contribution rate is specified by statute. Contributions for the year ended June 30, 2021 were $95,004 and are deferred because they were paid after the June 30, 2020 measurement date.
Federal and Special Trust Fund Contributions. When TRS members are paid from federal and special trust funds administered by the employer, there is a statutory requirement for the employer to pay an employer pension contribution from those funds. Under Public Act 100-0340, the federal and special trust fund contribution rate is the total employer normal cost beginning with the year ended June 30, 2018.
Previously, employer contributions for employees paid from federal and special trust funds were at the same rate as the state contribution rate to TRS and were much higher.
LISLE COMMUNITY UNIT SCHOOL DISTRICT NO. 202
Notes to the Financial StatementsJune 30, 2021
48

NOTE 4 - OTHER INFORMATION - Continued
RETIREMENT SYSTEMS - Continued
Teachers’ Retirement System (TRS) - Continued
Contributions - Continued
Federal and Special Trust Fund Contributions - Continued. For the fiscal year ended June 30, 2021, the employer pension contribution was 9.41 percent of salaries paid from federal and special trust funds. For the fiscal year ended June 30, 2020, the employer pension contribution was 10.66 percent of salaries paid from those funds. For the fiscal year ended June 30, 2021, salaries totaling $251,010 were paid from federal and special trust funds that required employer contributions of $26,130, which was equal to the District’s actual contributions. These contributions are deferred because they were paid after the June 30, 2020 measurement date.
Employer Retirement Cost Contributions. Under GASB Statement No. 68, contributions that an employer is required to pay because of a TRS member retiring are categorized as specific liability payments. The employer is required to make a one-time contribution to TRS for members granted salary increases over 6 percent if those salaries are used to calculate a retiree’s final average salary.
A one-time contribution is also required for members granted sick leave days in excess of the normal annual allotment if those days are used as TRS service credit. For the year ended June 30, 2021, the employer paid $0 to TRS for employer contributions due on salary increases in excess of 6 percent, $7,886 for contributions on salaries in excess of the Governor’s statutory salary and $0 for sick leave days granted in excess of the normal annual allotment. For the year ended June 30, 2020, the District paid $8,948 to TRS for employer contributions due on salary increases in excess of 6 percent, $5,934 for contributions on salaries in excess of the Governor’s statutory salary and $0 for sick leave days granted in excess of the normal annual allotment.
Pension Liabilities, Pension Expense, and Deferred Outflows of Resources and Deferred Inflows of Resources Related to Pensions
At June 30, 2020, the employer reported a liability for its proportionate share of the net pension liability (first amount shown below) that reflected a reduction for state pension support provided to the employer. The state’s support and total are for disclosure purposes only. The amount recognized by the employer as its proportionate share of the net pension liability, the related state support, and the total portion of the net pension liability that was associated with the employer were as follows:
Employer's Proportionate Share of the Net Pension Liability $ 1,588,274 State's Proportionate Share of the Net Pension Liability Associated with the Employer 124,401,882
Total 125,990,156
The net pension liability was measured as of June 30, 2020, and the total pension liability used to calculate the net pension liability was determined by an actuarial valuation as of June 30, 2019, and rolled forward to June 30, 2020. The employer’s proportion of the net pension liability was based on the employer’s share of contributions to TRS for the measurement year ended June 30, 2020, relative to the contributions of all participating TRS employers and the state during that period. At June 30, 2021, the employer’s proportion was 0.0018% , which was a decrease of 0.0001% from its proportion measured as of June 30, 2019.
LISLE COMMUNITY UNIT SCHOOL DISTRICT NO. 202
Notes to the Financial StatementsJune 30, 2021
49

NOTE 4 - OTHER INFORMATION - Continued
RETIREMENT SYSTEMS - Continued
Teachers’ Retirement System (TRS) - Continued
Pension Liabilities, Pension Expense, and Deferred Outflows of Resources and Deferred Inflows of Resources Related to Pensions - Continued
For the year ended June 30, 2021, the employer recognized pension expense of $13,248,882 and revenue of $13,248,882 for support provided by the state. At June 30, 2021, the employer reported deferred outflows of resources and deterred inflows of resources related to pension from the following sources:
Deferred DeferredOutflows of Inflows ofResources Resources Totals
Differences Between Expected and Actual Experience $ 15,392 (424) 14,968 Net Difference Between Projected and Actual Earnings on Pension
Investments 47,423 — 47,423 Changes of Assumptions 6,508 (16,665) (10,157) Changes in Proportion and Differences Between Employer Contributions
and Proportionate Share of Contributions 37,284 (167,028) (129,744) Total Pension Expense to be Recognized in Future Periods 106,607 (184,117) (77,510)
Employer Contributions Subsequent to the Measurement Date 121,134 — 121,134
Totals 227,741 (184,117) 43,624
$121,134 reported as deferred outflows of resources related to pensions resulting from employer contributions subsequent to the measurement date will be recognized as a reduction of the net pension liability in the reporting year ended June 30, 2022. Other amounts reported as deferred outflows of resources and deferred inflows of resources related to pensions will be recognized in pension expense as follows:
Net DeferredFiscal (Inflows)Year of Resources
2022 $ (30,307) 2023 (12,310) 2024 (17,206) 2025 (12,359) 2026 (5,328)
Thereafter —
Total (77,510)
LISLE COMMUNITY UNIT SCHOOL DISTRICT NO. 202
Notes to the Financial StatementsJune 30, 2021
50

NOTE 4 - OTHER INFORMATION - Continued
RETIREMENT SYSTEMS - Continued
Teachers’ Retirement System (TRS) - Continued
Actuarial Assumptions
The total pension liability in the June 30, 2020 actuarial valuation was determined using the following actuarial assumptions, applied to all periods included in the measurement:
Inflation: 2.50 Percent
Salary Increases: Varies by Amount of Service Credit
Investment Rate of Return: 7.00 Percent, Net of Pension Plan Investment Expense, Including Inflation
In the June 30, 2020 actuarial valuation, mortality rates were based on the RP-2014 White Collar Table with appropriate adjustments for TRS experience. The rates are based on a fully-generational basis using projection table MP-2017. In the June 30, 2019 actuarial valuation, mortality rates were also based on the RP-2014 White Collar Table with appropriate adjustments for TRS experience. The rates were used on a fully-generational basis using projection table MP-2014.
The long-term (20-year) expected rate of return on pension plan investments was determined using a building-block method in which best-estimate ranges of expected future real rates of return (expected returns, net of pension plan investment expense and inflation) are developed for each major asset class. These ranges are combined to produce the long-term expected rate of return by weighting the expected future real rates of return by the target asset allocation percentage and by adding expected inflation. The target allocation and best estimates of arithmetic real rates of return for each major asset class that were used by the actuary are summarized in the following table:
LISLE COMMUNITY UNIT SCHOOL DISTRICT NO. 202
Notes to the Financial StatementsJune 30, 2021
51

NOTE 4 - OTHER INFORMATION - Continued
RETIREMENT SYSTEMS - Continued
Teachers’ Retirement System (TRS) - Continued
Actuarial Assumptions - Continued
Long-TermTarget Expected Real
Asset Class Allocatio Rate of Return
U.S. Large Cap 16.5% 6.1%U.S. Small/Mid Cap 2.3% 7.2%International Equities Developed 12.2% 7.0%Emerging Market Equities 3.0% 9.4%U.S. Bonds Core 7.0% 2.2%U.S. Bonds High Yield 2.5% 4.1%International Debt Developed 3.1% 1.5%Emerging International Debt 3.2% 4.5%Real Estate 16.0% 5.7%Real Return 5.2% 6.3%Absolute Return 10.0% 4.3%Private Equity 15.0% 10.5%Infrastructure 4.0% 6.2%
Total 100.0%
Discount Rate
At June 30, 2020, the discount rate used to measure the total pension liability was 7.0 percent, which was the same as the June 30, 2019 rate. The projection of cash flows used to determine the discount rate assumed that employee contributions, employer contributions and state contributions will be made at the current statutorily-required rates.
Based on those assumptions, TRS’s fiduciary net position at June 30, 2020 was projected to be available to make all projected future benefit payments to current active and inactive members and all benefit recipients. Tier 1’s liability is partially funded by Tier 2 members, as the Tier 2 member contribution is higher than the cost of Tier 2 benefits. Due to this subsidy, contributions from future members in excess of the service cost are also included in the determination of the discount rate. All projected future payments were covered, so the long-term expected rate of return on TRS investments was applied to all periods of projected benefit payments to determine the total pension liability.
LISLE COMMUNITY UNIT SCHOOL DISTRICT NO. 202
Notes to the Financial StatementsJune 30, 2021
52

NOTE 4 - OTHER INFORMATION - Continued
RETIREMENT SYSTEMS - Continued
Teachers’ Retirement System (TRS) - Continued
Sensitivity of the Employer’s Proportionate Share of the Net Pension Liability to Changes in the Discount Rate
The following presents the employer’s proportionate share of the net pension liability calculated using the discount rate of 7.00 percent, as well as what the employer’s proportionate share of the net pension liability would be if it were calculated using a discount rate that is one percentage-point lower or one percentage-point higher than the current rate.
Current1% Decrease Discount Rate 1% Increase
(8.00%) (7.00%) (6.00%)
Employer's Proportionate Shareof the OPEB Liability $ 1,927,876 1,588,274 1,308,684
TRS Fiduciary Net Position
Detailed information about the TRS’s fiduciary net position as of June 30, 2020 is available in the separately issued TRS Comprehensive Annual Financial Report.
Illinois Municipal Retirement Fund (IMRF)
The District contributes to the Illinois Municipal Retirement Fund (IMRF), a defined benefit agent multiple-employer public employee retirement system. IMRF issues a publicly available financial report that includes financial statements and required supplementary information for the plan as a whole, but not by individual employer. That report may be obtained online at www.imrf.org. The benefits, benefit levels, employee contributions, and employer contributions are governed by Illinois Compiled Statutes (ILCS) and can only be amended by the Illinois General Assembly.
Plan Descriptions
Plan Administration. All employees (other than those covered by the Teachers Retirement Plan) hired in positions that meet or exceed the prescribed annual hourly standard must be enrolled in IMRF as participating members. The plan is accounted for on the economic resources measurement focus and the accrual basis of accounting. Employer and employee contributions are recognized when earned in the year that the contributions are required, benefits and refunds are recognized as an expense and liability when due and payable.
Benefits Provided. IMRF has three benefit plans. The vast majority of IMRF members participate in the Regular Plan (RP). The Sheriff’s Law Enforcement Personnel (SLEP) plan is for sheriffs, deputy sheriffs, and selected police chiefs. Counties could adopt the Elected County Official (ECO) plan for officials elected prior to August 8, 2011 (the ECO plan was closed to new participants after that date).
LISLE COMMUNITY UNIT SCHOOL DISTRICT NO. 202
Notes to the Financial StatementsJune 30, 2021
53

NOTE 4 - OTHER INFORMATION - Continued
RETIREMENT SYSTEMS - Continued
Illinois Municipal Retirement Fund (IMRF) - Continued
Plan Descriptions - Continued
All three IMRF benefit plans have two tiers. Employees hired before January 1, 2011, are eligible for Tier 1 benefits. Tier 1 employees are vested for pension benefits when they have at least eight years of qualifying service credit. Tier 1 employees who retire at age 55 (at reduced benefits) or after age 60 (at full benefits) with eight years of service are entitled to an annual retirement benefit, payable monthly for life, in an amount equal to 1-2/3% of the final rate of earnings for the first 15 years of service credit, plus 2% for each year of service credit after 15 years to a maximum of 75% of their final rate of earnings. Final rate of earnings is the highest total earnings during any consecutive 48 months within the last 10 years of service, divided by 48. Under Tier 1, the pension is increased by 3% of the original amount on January 1 every year after retirement.
Employees hired on or after January 1, 2011, are eligible for Tier 2 benefits. For Tier 2 employees, pension benefits vest after ten years of service. Participating employees who retire at age 62 (at reduced benefits) or after age 67 (at full benefits) with ten years of service are entitled to an annual retirement benefit, payable monthly for life, in an amount equal to 1-2/3% of the final rate of earnings for the first 15 years of service credit, plus 2% for each year of service credit after 15 years to a maximum of 75% of their final rate of earnings. Final rate of earnings is the highest total earnings during any 96 consecutive months within the last 10 years of service, divided by 96. Under Tier 2, the pension is increased on January 1 every year after retirement, upon reaching age 67, by the lesser of:
• 3% of the original pension amount, or • 1/2 of the increase in the Consumer Price Index of the original pension amount.
Plan Membership. As of December 31, 2020, the measurement date, the following employees were covered by the benefit terms:
Inactive Plan Members Currently Receiving Benefits 135 Inactive Plan Members Entitled to but not yet Receiving Benefits 114 Active Plan Members 93
Total 342
Contributions. As set by statute, the District’s Regular Plan Members are required to contribute 4.50% of their annual covered salary. The statute requires employers to contribute the amount necessary, in addition to member contributions, to finance the retirement coverage of its own employees. For the year-ended June 30, 2021, the District’s contribution was 14.07% of covered payroll.
Net Pension Liability. The District’s net pension liability was measured as of December 31, 2020. The total pension liability used to calculate the net pension liability was determined by an actuarial valuation as of that date.
LISLE COMMUNITY UNIT SCHOOL DISTRICT NO. 202
Notes to the Financial StatementsJune 30, 2021
54

NOTE 4 - OTHER INFORMATION - Continued
RETIREMENT SYSTEMS - Continued
Illinois Municipal Retirement Fund (IMRF) - Continued
Plan Descriptions - Continued
Actuarial Assumptions. The total pension liability was determined by an actuarial valuation performed, as of December 31, 2020, using the following actuarial methods and assumptions:
Actuarial Cost Method Entry AgeNormal
Asset Valuation Method Fair Value
Actuarial AssumptionsInvestment Rate of Return 7.25%
Salary Increases 2.85% to 13.75%
Inflation 2.25%
For nondisabled retirees, the Pub-2010, Amount-Weighted, below-median income, General, Retiree, Male (adjusted 106%) and Female (adjusted 105%) tables, and future mortality improvements projected using scale MP-2020. For disabled retirees, the Pub-2010, Amount-Weighted, below-median income, General, Disabled Retiree, Male and Female (both unadjusted) tables, and future mortality improvements projected using scale MP-2020. For active members, the Pub-2010, Amount-Weighted, below-median income, General, Employee, Male and Female (both unadjusted) tables, and future mortality improvements projected using scale MP-2020.
The long-term expected rate of return on pension plan investments was determined using a building-block method in which best-estimate ranges of expected future real rates of return (expected returns, net of pension plan investment expense, and inflation) are developed for each major asset class. These ranges are combined to produce the long-term expected rate of return by weighting the expected future real rates of return to the target asset allocation percentage and adding expected inflation. The target allocation and best estimates of geometric real rates of return for each major asset class are summarized in the following table:
LISLE COMMUNITY UNIT SCHOOL DISTRICT NO. 202
Notes to the Financial StatementsJune 30, 2021
55

NOTE 4 - OTHER INFORMATION - Continued
RETIREMENT SYSTEMS - Continued
Illinois Municipal Retirement Fund (IMRF) - Continued
Plan Descriptions - Continued
Actuarial Assumptions - Continued.
Long-TermExpected Real
Asset Class Target Rate of Return
Fixed Income 28.00% 1.30%Domestic Equities 37.00% 5.00%International Equities 18.00% 6.00%Real Estate 9.00% 6.20%Blended 7.00% 2.85% - 6.95%Cash and Cash Equivalents 1.00% 0.70%
Discount Rate
The discount rate used to measure the total pension liability was 7.25%, the same as the prior valuation. The projection of cash flows used to determine the discount rate assumed that member contributions will be made at the current contribution rate and that District contributions will be made at rates equal to the difference between the actuarially determined contribution rates and the member rate. Based on those assumptions, the Fund’s fiduciary net position was projected to be available to make all project future benefit payments of current plan members. Therefore, the long-term expected rate of return on pension plan investments was applied to all period of projected benefit payments to determine the total pension liability.
Discount Rate Sensitivity
The following is a sensitivity analysis of the net pension liability/(asset) to changes in the discount rate. The table below presents the net pension liability/(asset) of the District calculated using the discount rate as well as what the District’s net pension liability/(asset) would be if it were calculated using a discount rate that is one percentage point lower or one percentage point higher than the current rate:
Current1% Decrease Discount Rate 1% Increase
(6.25%) (7.25%) (8.25%)
Net Pension Liability/(Asset) $ 3,412,822 1,526,355 (33,326)
LISLE COMMUNITY UNIT SCHOOL DISTRICT NO. 202
Notes to the Financial StatementsJune 30, 2021
56

NOTE 4 - OTHER INFORMATION - Continued
RETIREMENT SYSTEMS - Continued
Illinois Municipal Retirement Fund (IMRF) - Continued
Changes in the Net Pension Liability
TotalPension Plan Fiduciary Net PensionLiability Net Position Liability
(A) (B) (A) - (B)
Balances at December 31, 2019 $ 17,269,930 14,656,015 2,613,915
Changes for the Year:Service Cost 322,917 — 322,917Interest on the Total Pension Liability 1,226,588 — 1,226,588Changes of Benefit Terms — — —Difference Between Expected and Actual
Experience of the Total Pension Liability 265,199 — 265,199Changes of Assumptions (117,498) — (117,498)Contributions - Employer — 444,438 (444,438)Contributions - Employees — 141,541 (141,541)Net Investment Income — 2,108,635 (2,108,635)Benefit Payments, Including Refunds
of Employee Contributions (1,025,860) (1,025,860) —Other (Net Transfer) — 90,152 (90,152)
Net Changes 671,346 1,758,906 (1,087,560)
Balances at December 31, 2020 17,941,276 16,414,921 1,526,355
Pension Expense, Deferred Outflows of Resources, and Deferred Inflows of Resources Related to Pensions
For the year ended June 30, 2021, the District recognized pension expense of $200,497. At June 30, 2021, the District reported deferred outflows or resources and deferred inflows of resources related to pensions from the following sources:
LISLE COMMUNITY UNIT SCHOOL DISTRICT NO. 202
Notes to the Financial StatementsJune 30, 2021
57

NOTE 4 - OTHER INFORMATION - Continued
RETIREMENT SYSTEMS - Continued
Illinois Municipal Retirement Fund (IMRF) - Continued
Pension Expense, Deferred Outflows of Resources, and Deferred Inflows of Resources Related to Pensions - Continued
Deferred DeferredOutflows of Inflows ofResources Resources Totals
Differences Between Expected and Actual Experience $ 211,974 — 211,974Changes of Assumptions — (67,730) (67,730)Net Difference Between Projected and Actual
Earnings on Pension Plan Investments — (1,270,151) (1,270,151)Total Pension Expense to be Recognized
in Future Periods 211,974 (1,337,881) (1,125,907)Pension Contributions Made Subsequent
to the Measurement Date 236,475 — 236,475
Total Deferred Amounts Related to Pensions 448,449 (1,337,881) (889,432)
$236,475 reported as deferred outflows of resources related to pensions resulting from employer contributions subsequent to the measurement date will be recognized as a reduction of the net pension liability in the reporting year ended June 30, 2022. Amounts reported as deferred outflows of resources and deferred inflows of resources related to pensions will be recognized in pension expense in future periods as follows:
Net DeferredFiscal (Inflows)Year of Resources
2022 $ (277,147) 2023 (131,012) 2024 (505,996) 2025 (211,752) 2026 —
Thereafter —
Total (1,125,907)
LISLE COMMUNITY UNIT SCHOOL DISTRICT NO. 202
Notes to the Financial StatementsJune 30, 2021
58

NOTE 4 - OTHER INFORMATION - Continued
SUBSEQUENT EVENT
On June 25, 2018, the Board of Education of Lisle Community Unit School District No. 202 (“Seller”) entered into a sale contract with Kindi Academy (“Purchaser”) for the sale of Tate Woods Elementary School building located at 1736 Middleton Ave., Lisle, DuPage County, Illinois. The purchase price was $2,555,000 with the Purchaser making a one-time payment of $51,100 as earnest money at the time of bid submission. The closing was tentatively set for August 1, 2019 which has been extended to October 31, 2021. The closing has not occurred as of the opinion date.
LISLE COMMUNITY UNIT SCHOOL DISTRICT NO. 202
Notes to the Financial StatementsJune 30, 2021
59

REQUIRED SUPPLEMENTARY INFORMATION
Required supplementary information includes financial information and disclosures that are required by the GASB but are not considered a part of the basic financial statements. Such information includes:
• Schedule of Changes in the Employer's Total OPEB Liability Retiree Health Program
• Schedule Employer Contributions Teacher's Health Insurance Security Fund
• Schedule of Employer’s Proportionate Share of the Collective Net OPEB Liability Teacher's Health Insurance Security Fund
• Schedule of Employer’s Proportionate Share of the Net Pension Liability and Employer Contributions Teachers’ Retirement System
• Schedule Employer Contributions Illinois Municipal Retirement Fund
• Schedule of Changes in the Employer’s Net Pension Liability Illinois Municipal Retirement Fund
• Budgetary Comparison SchedulesGeneral Fund
Notes to the Required Supplementary Information
Budgetary information - budgets are adopted on a basis consistent with generally accepted accounting principles.
60

6/30/18 6/30/19 6/30/20 6/30/21
Total OPEB LiabilityService Cost $ 96,981 101,459 116,663 120,988Interest 63,908 52,559 48,616 55,616Changes in Benefit Terms (206,069) — 112,964 —Differences Between Expected and Actual
Experience (45,693) — (53,885) —Change of Assumptions or Other Inputs 4,972 16,228 287,976 49,275Benefit Payments (162,128) (170,938) (210,100) (174,999)Other (25,625) (945) 28,516 —Net Change in Total OPEB Liability (273,654) (1,637) 330,750 50,880Total OPEB Liability - Beginning 2,122,851 1,849,197 1,847,560 2,178,310
Total OPEB Liability - Ending 1,849,197 1,847,560 2,178,310 2,229,190
Covered-Employee Payroll $ 14,436,333 N/A 15,081,937 N/A
Total OPEB Liability as a Percentage ofCovered-Employee Payroll 12.81 % N/A 14.44 % N/A
Notes:This schedule is intended to show information for ten years. Information for additional years will be displayed as it becomes available.
Changes of Assumptions. Changes in assumptions related to the discount rate were made in 2018 - 2021.
N/A - Not Available
LISLE COMMUNITY UNIT SCHOOL DISTRICT NO. 202
Retirement Health PlanSchedule of Changes in the Employer's Total OPEB LiabilityJune 30, 2021
61

Contributionsin Relation to
Actuarially the Actuarially Contribution Contributions asFiscal Determined Determined Excess/ Covered a Percentage ofYear Contribution Contribution (Deficiency) Payroll Covered Payroll
2018 $ 121,148 $ 121,208 $ 60 $ 14,422,385 0.84%2019 140,056 140,056 — 15,223,491 0.92%2020 142,240 142,240 — 15,460,907 0.92%2021 150,695 150,695 — 16,379,935 0.92%
Note:This schedule is intended to show information for ten years. Information for additional years will be displayed as it becomes available.
LISLE COMMUNITY UNIT SCHOOL DISTRICT NO. 202
Teacher's Health Insurance Security FundSchedule of Employer ContributionsJune 30, 2021
62

Notes to the Schedule of Employer Contributions
Valuation Date 6/30/2019Measurement Date 6/30/2020Sponsor's Fiscal Year End 6/30/2021
Methods and Assumptions Used to Determine Actuarial Liability and Contributions:
Actuarial Cost Method Entry Age Normal, used to measure the Total OPEB Liability
Contribution Policy Benefits are financed on a pay-as-you-go basis. Contribution rates are defined by statute. For fiscal year end June 30, 2020, contribution rates are 1.24% of pay for active members, 0.92% of pay for school districts, and 1.24% of pay for the State. Retired members contribute a percentage of premium rates. The goal of the policy is to finance current year costs plus a margin for incurred but not paid plan costs.
Asset Valuation Method Market Value
Investment Rate of Return 0%, net of OPEB plan investment expense, including inflation, for all plan years.
Inflation 2.50%
Salary Increases Depends on service and ranges from 9.50% at 1 year of service to 4.00% at 20 or more years of service. Salary increase includes a 3.25% wage inflation assumption.
Retirement Age Experience-based table of rates that are specific to the type of eligibility condition. Last updated for the June 30, 2018 actuarial valuation.
Mortality Retirement and Beneficiary Annuitants: RP-2014 White Collar Annuitant Mortality Table, adjusted for TRS experience. Disabled Annuitants: RP-2014 Disabled Annuitant Table. Pre-Retirement: RP-2014 White Collar Table. All tables reflect future mortality improvements using Projection Scale MP-2017.
Healthcare Cost Trend Rates Actual trend used for fiscal year 2020. For fiscal years on and after 2021, trend starts at 8.25% for non-Medicare cost and Medicare costs, respectively, and gradually decreases to an ultimate trend of 4.25%. There is no additional trend rate adjustment due to the repeal of the Excise Tax.
Aging Factors Based on the 2013 SOA Study “Health Care Costs - From Birth to Death”.
Expenses Health administrative expenses are included in the development of the per capita claims costs. Operating expenses are included as a component of the Annual OPEB Expense.
LISLE COMMUNITY UNIT SCHOOL DISTRICT NO. 202
Teacher's Health Insurance Security FundSchedule of Employer Contributions - ContinuedJune 30, 2021
63

6/30/18 6/30/19 6/30/20 6/30/21
Employer's Proportion of the Net OPEB Liability 0.0627% 0.0640% 0.0629% 0.0608%
Employer's Proportionate Share of the Net OPEB Liability $ 16,276,762 16,857,625 17,405,896 16,267,986
State's Proportionate Share of the Net OPEB LiabilityAssociated with the Employer 21,375,433 22,636,204 22,124,259 22,038,713
Total 37,652,195 39,493,829 39,530,155 38,306,699
Employer's Covered Payroll $ 14,422,385 15,223,491 15,460,907 16,379,935
Employer's Proportionate Share of the Net OPEB Liabilityas a % of its Covered Payroll 112.86% 110.73% 112.58% 99.32%
Plan Fiduciary Net Position as a Percentage of theTotal OPEB Liability (0.17%) (0.07%) 0.25% 0.70%
Notes:The amounts presented were determined as of the prior fiscal-year end.
This schedule is intended to show information for ten years. Information for additional years will be displayed as it becomes available.
LISLE COMMUNITY UNIT SCHOOL DISTRICT NO. 202
Teachers' Health Insurance Security FundSchedule of the Employer's Proportionate Share of the Collective Net OPEB LiabilityJune 30, 2021
64

See Following Page
LISLE COMMUNITY UNIT SCHOOL DISTRICT NO. 202
Teachers' Retirement SystemSchedule of the Employer's Proportionate Share of the Net Pension Liability and Employer ContributionsJune 30, 2021
65

6/30/15 6/30/16
Employer's Proportion of the Net Pension Liability 0.0021 % 0.2200 %Employer's Proportionate Share of the Net Pension Liability $ 1,248,181 1,447,395State's Proportionate Share of the Net Pension LiabilityAssociated with the Employer 77,837,814 86,428,445
Total 79,085,995 87,875,840
Employer's Covered Payroll $ 12,623,410 13,294,254Employer's Proportionate Share of the Net Pension Liability
as a % of its Covered-Employee Payroll 9.89 % 10.89 %Plan Fiduciary Net Position as a Percentage of theTotal Pension Liability 43.00 % 41.50 %
Contractually-Required Contribution $ 77,107 83,768Contributions in Relation to the ContractuallyRequired Contribution 77,366 79,980
Contribution Deficiency (Excess) (259) 3,788
Employer's Covered Payroll $ 13,294,254 14,442,741
Contributions as a % of Covered Payroll 0.58 % 0.55 %
Notes:The amounts presented were determined as of the prior fiscal year.
This schedule is intended to show information for ten years. Information for additional years will be displayed as it becomes available.
For the 2020 - 2016 measurement years, the assumed investment rate of return was of 7.0 percent, including an inflation rate of 2.5 percent and a real return of 4.5 percent. Salary increases were assumed to vary by service credit and were consistent in 2019 and 2020. These actuarial assumptions were based on an experience study dated September 18, 2018.
For the 2015 measurement year, the assumed investment rate of return was 7.5 percent, including an inflation rate of 3.0 percent and a real return of 4.5 percent. Salary increases were assumed to vary by service credit. Various other changes in assumptions were adopted based on the experience analysis for the three year period ending June 30, 2014.
For the 2014 measurement year, the assumed investment rate of return was also 7.5 percent, including an inflation rate of 3.0 percent and a real return of 4.5 percent. However, salary increases were assumed to vary by age.
LISLE COMMUNITY UNIT SCHOOL DISTRICT NO. 202
Teachers' Retirement SystemSchedule of the Employer's Proportionate Share of the Net Pension Liability and Employer ContributionsJune 30, 2021
66

6/30/17 6/30/18 6/30/19 6/30/20 6/30/21
0.0021 % 0.0020 % 0.0021 % 0.0019 % 0.0018 %1,631,526 1,548,859 1,669,001 1,563,904 1,588,274
109,543,584 106,626,644 114,333,595 111,301,337 124,401,882
111,175,110 108,175,503 116,002,596 112,865,241 125,990,156
14,442,741 14,422,385 15,223,491 15,460,907 16,379,935
11.30 % 10.74 % 10.96 % 10.12 % 9.70 %
36.40 % 39.30 % 40.00 % 39.60 % 37.80 %
83,650 88,250 88,464 93,724 121,134
83,675 88,967 88,183 93,467 121,053
(25) (717) 281 257 81
14,422,385 15,215,524 15,223,491 15,460,907 16,379,935
0.58 % 0.58 % 0.58 % 0.60 % 0.74 %
67

Contributionsin Relation to
Actuarially the Actuarially Contribution Contributions asFiscal Determined Determined Excess/ Covered a Percentage ofYear Contribution Contribution (Deficiency) Payroll Covered Payroll
2015 $ 373,862 $ 373,862 $ — $ 2,800,467 13.35%2016 388,175 388,175 — 2,875,368 13.50%2017 414,094 414,094 — 2,916,155 14.20%2018 403,065 403,065 — 3,023,743 13.33%2019 397,866 397,866 — 3,120,597 12.75%2020 415,021 415,021 — 3,151,627 13.17%2021 457,184 457,184 — 3,248,769 14.07%
Notes to the Required Supplementary Information:
Actuarial Cost Method Entry Age NormalAmortization Method Level % Pay (Closed)Remaining Amortization Period 23 YearsAsset Valuation Method 5-Year Smoothed Fair ValueInflation 2.50%Salary Increases 3.35% - 14.25%Investment Rate of Return 7.25%Retirement Age See the Notes to the Financial Statements
Mortality IMRF specific mortality table was used with fully generational projection scale MP-2017 (base year 2015).
Note:This schedule is intended to show information for ten years. Information for additional years will be displayed as it becomes available.
LISLE COMMUNITY UNIT SCHOOL DISTRICT NO. 202
Illinois Municipal Retirement FundSchedule of Employer ContributionsJune 30, 2021
68

See Following Page
LISLE COMMUNITY UNIT SCHOOL DISTRICT NO. 202
Illinois Municipal Retirement FundSchedule of Changes in the Employer's Net Pension LiabilityJune 30, 2021
69

12/31/14
Total Pension LiabilityService Cost $ 322,092Interest 907,195Changes in Benefit Terms —Differences Between Expected and Actual Experience 271,995Change of Assumptions 625,274Benefit Payments, Including Refunds
of Member Contributions (679,150)Net Change in Total Pension Liability 1,447,406Total Pension Liability - Beginning 12,306,801
Total Pension Liability - Ending 13,754,207
Plan Fiduciary Net PositionContributions - Employer $ 373,863Contributions - Members 128,548Net Investment Income 644,918Benefit Payments, Including Refunds
of Member Contributions (679,150)Other (Net Transfer) 114,085Net Change in Plan Fiduciary Net Position 582,264Plan Net Position - Beginning 10,660,799
Plan Net Position - Ending 11,243,063
Employer's Net Pension Liability $ 2,511,144
Plan Fiduciary Net Position as a Percentageof the Total Pension Liability 81.74 %
Covered Payroll $ 2,669,171
Employer's Net Pension Liability as a Percentage ofCovered Payroll 94.08 %
Note: This schedule is intended to show information for ten years. Information for additional years will be displayed as it becomes available.
LISLE COMMUNITY UNIT SCHOOL DISTRICT NO. 202
Illinois Municipal Retirement FundSchedule of Changes in the Employer's Net Pension Liability June 30, 2021
70

12/31/15 12/31/16 12/31/17 12/31/18 12/31/19 12/31/20
310,331 329,554 329,788 315,592 328,823 322,9171,010,599 1,061,878 1,096,123 1,117,831 1,164,563 1,226,588
— — — — — —101,464 (180,877) 176,797 202,664 323,197 265,19915,658 (80,082) (473,133) 403,707 — (117,498)
(724,938) (757,397) (780,642) (885,416) (890,361) (1,025,860)713,114 373,076 348,933 1,154,378 926,222 671,346
13,754,207 14,467,321 14,840,397 15,189,330 16,343,708 17,269,930
14,467,321 14,840,397 15,189,330 16,343,708 17,269,930 17,941,276
388,174 414,094 403,065 415,004 385,599 444,438129,716 135,037 139,236 151,087 141,588 141,54155,698 781,545 2,091,033 (763,414) 2,370,550 2,108,635
(724,938) (757,397) (780,642) (885,416) (890,361) (1,025,860)282,422 (135,339) (321,387) 262,601 125,397 90,152131,072 437,940 1,531,305 (820,138) 2,132,773 1,758,906
11,243,063 11,374,135 11,812,075 13,343,380 12,523,242 14,656,015
11,374,135 11,812,075 13,343,380 12,523,242 14,656,015 16,414,921
3,093,186 3,028,322 1,845,950 3,820,466 2,613,915 1,526,355
78.62 % 79.59 % 87.85 % 76.62 % 84.86 % 91.49 %
2,875,368 2,916,155 3,023,743 3,068,045 3,142,619 3,145,354
107.58 % 103.85 % 61.05 % 124.52 % 83.18 % 48.53 %
71

2021Budget Variance with 2020
Original Final Actual Final Budget ActualRevenues
Local SourcesProperty Taxes $ 28,139,400 28,139,400 28,154,338 14,938 26,240,607Personal Property
Replacement Taxes 281,000 281,000 447,461 166,461 350,817Earnings on Investments 67,800 67,800 76,896 9,096 648,340Other Revenue from Local Sources 420,800 420,800 378,816 (41,984) 656,861
State SourcesGeneral State Aid 1,254,018 1,254,018 1,254,018 — 1,254,018Grants-in-Aid 225,528 225,528 260,656 35,128 485,939
Federal SourcesGrants-in-Aid 1,248,998 1,248,998 1,410,206 161,208 1,003,192
Total Direct Revenues 31,637,544 31,637,544 31,982,391 344,847 30,639,774
On-Behalf Payments - State of Illinois 12,905,000 12,905,000 13,451,993 546,993 12,276,265Total Revenues 44,542,544 44,542,544 45,434,384 891,840 42,916,039
ExpendituresCurrent
Instruction 18,352,217 18,352,217 18,175,528 176,689 16,769,718Support Services 11,451,492 11,451,492 10,616,339 835,153 10,239,555Community Services 122,612 122,612 64,175 58,437 98,076
Payments to Other Districts andGovernment Units 1,635,116 1,635,116 1,369,334 265,782 1,292,394
Total Direct Expenditures 31,561,437 31,561,437 30,225,376 1,336,061 28,399,743
On Behalf Expenditures 12,905,000 12,905,000 13,451,993 (546,993) 12,276,265Total Expenditures 44,466,437 44,466,437 43,677,369 789,068 40,676,008
Excess (Deficiency) of RevenuesOver (Under) Expenditures 76,107 76,107 1,757,015 1,680,908 2,240,031
Other Financing Sources (Uses)Disposal of Capital Assets — — 8,925 8,925 —Transfers In 1,900 1,900 2,224 324 20,375Transfers Out (751,900) (751,900) (1,752,224) (1,000,324) (2,838,963)
(750,000) (750,000) (1,741,075) (991,075) (2,818,588)
Net Change in Fund Balances (673,893) (673,893) 15,940 689,833 (578,557)
Fund Balances - Beginning as Restated 12,541,609 13,024,360
Fund Balances - Ending 12,557,549 12,445,803
LISLE COMMUNITY UNIT SCHOOL DISTRICT NO. 202
General FundSchedule of Revenues, Expenditures and Changes in Fund Balance - Budget and ActualFor the Fiscal Year Ended June 30, 2021(with Comparative Actual Amounts for the Fiscal Year Ended June 30, 2020)
72

OTHER SUPPLEMENTARY INFORMATION
Other supplementary information includes financial statements and schedules not required by the GASB, nor a part of the basic financial statements, but are presented for purposes of additional analysis.
Such statements and schedules include:
• Combining Statements - General Fund - by Accounts
• Budgetary Comparison Schedules - General Fund Accounts
• Budgetary Comparison Schedule - Major Governmental Fund
• Combining Statements - Nonmajor Governmental Funds
• Budgetary Comparison Schedules - Nonmajor Governmental Funds
• Consolidated Year-End Financial Report
73

INDIVIDUAL FUND DESCRIPTIONS
GENERAL FUND
The General Fund is used to account for all financial resources except those required to be accounted for in another fund. The General Fund includes the Educational, Operations and Maintenance, and Working Cash Accounts.
SPECIAL REVENUE FUNDS
The Special Revenue Funds are used to account for the proceeds of specific revenue sources (other than capital project funds) that are legally restricted to expenditure for specified purposes.
Transportation Fund
The Transportation Fund is used to account for all revenue and expenditures made for student transportation. Revenue is derived primarily from local property taxes and state reimbursement grants.
Municipal Retirement/Social Security
The Municipal Retirement/Social Security Fund is used to account for the District’s portion of pension contributions to the Illinois Municipal Retirement Fund, payments to Medicare, and payments to the Social Security System for non-certified employees. Revenue to finance the contributions is derived primarily from local property taxes and personal property replacement taxes.
Tort Immunity Fund
The Tort Fund is used to account for activity relating to risk management and loss prevention
DEBT SERVICE FUND
The Debt Service Fund is used to account for the accumulation of resources that are restricted, committed, or assigned for, and the payment of, long-term debt principal, interest and related costs. The primary revenue source is local property taxes levied specifically for debt service.
CAPITAL PROJECTS FUND
The Capital Projects Fund is used to account for financial resources that are restricted, committed, or assigned to be used for the acquisition or construction of, and/or additions to, major capital facilities.
74

Operationsand Working
Educational Maintenance Cash Totals
ASSETS
Cash and Investments $ 25,534,135 2,545,557 811,446 28,891,138 Receivables - Net of Allowances
Property Taxes 13,640,871 1,448,168 2,393 15,091,432 Grants Receivable 321,611 — — 321,611
Total Assets 39,496,617 3,993,725 813,839 44,304,181
LIABILITIES
Accounts Payable 95,696 24,766 — 120,462 Salaries and Benefits Payable 2,190,179 — — 2,190,179 Deposits Payable 6,416 60,100 — 66,516
Total Liabilities 2,292,291 84,866 — 2,377,157
DEFERRED INFLOWS OF RESOURCES
Property Taxes 26,380,253 2,800,630 4,627 29,185,510 Other Deferred Revenues 183,965 — — 183,965
Total Deferred Inflows of Resources 26,564,218 2,800,630 4,627 29,369,475
Total Liabilities and DeferredInflows of Resources 28,856,509 2,885,496 4,627 31,746,632
FUND BALANCES
Restricted — 1,108,229 809,212 1,917,441 Unassigned 10,640,108 — — 10,640,108
Total Fund Balances 10,640,108 1,108,229 809,212 12,557,549
Total Liabilities, Deferred Inflows of Resources and Fund Balances 39,496,617 3,993,725 813,839 44,304,181
LISLE COMMUNITY UNIT SCHOOL DISTRICT NO. 202
General Fund - by AccountsCombining Balance SheetJune 30, 2021
75

Operations and WorkingEducational Maintenance Cash Totals
RevenuesLocal Sources
Property Taxes $ 24,259,103 3,890,819 4,416 28,154,338Personal Property Replacement Taxes 447,461 — — 447,461Earnings on Investments 67,237 7,432 2,227 76,896Other Revenue from Local Sources 181,778 197,038 — 378,816
State SourcesEvidence Based Funding Formula 1,254,018 — — 1,254,018Grants-In-Aid 260,656 — — 260,656
Federal SourcesGrants-In-Aid 1,377,648 32,558 — 1,410,206
Total Direct Revenues 27,847,901 4,127,847 6,643 31,982,391On-Behalf Payments - State of Illinois 13,451,993 — — 13,451,993
Total Revenues 41,299,894 4,127,847 6,643 45,434,384
ExpendituresCurrent
Instruction 18,175,528 — — 18,175,528Support Services 7,826,091 2,790,248 — 10,616,339Community Services 64,175 — — 64,175
Payments to Other Districts andGovernment Units 1,369,334 — — 1,369,334
Total Direct Expenditures 27,435,128 2,790,248 — 30,225,376On-Behalf Expenditures 13,451,993 — — 13,451,993
Total Expenditures 40,887,121 2,790,248 — 43,677,369
Excess (Deficiency) of RevenuesOver (Under) Expenditures 412,773 1,337,599 6,643 1,757,015
Other Financing Sources (Uses)Disposal of Capital Assets 8,895 30 — 8,925Transfers In 2,224 — — 2,224Transfers Out (1,000,000) (750,000) (2,224) (1,752,224)
(988,881) (749,970) (2,224) (1,741,075)
Net Change in Fund Balance (576,108) 587,629 4,419 15,940
Fund Balances - Beginning as Restated 11,216,216 520,600 804,793 12,541,609
Fund Balances - Ending 10,640,108 1,108,229 809,212 12,557,549
LISLE COMMUNITY UNIT SCHOOL DISTRICT NO. 202
General Fund - by AccountsCombining Statement of Revenues, Expenditures and Changes in Fund Balances For the Fiscal Year Ended June 30, 2021
76

2021Original Final Variance with 2020Budget Budget Actual Final Budget Actual
RevenuesLocal Sources
General Levy $ 19,261,600 19,261,600 19,271,763 10,163 18,274,083Special Education Levy 4,984,700 4,984,700 4,987,340 2,640 4,867,680Personal Property
Replacement Taxes 281,000 281,000 447,461 166,461 350,817Summer School Tuition — — 240 240 —Earnings on Investments 59,800 59,800 67,237 7,437 584,411Food Service 112,700 112,700 36 (112,664) 204,517Pupil Activities 53,700 53,700 7,856 (45,844) 78,609Textbooks — — 6,595 6,595 183,028Contributions and Donations
from Private Sources 500 500 1,751 1,251 15,466Refund of Prior Year Expenses 70,000 70,000 79,518 9,518 23,592Drivers Education Fees 15,000 15,000 24,119 9,119 14,994Payments from Other Districts 10,000 10,000 7,586 (2,414) 12,515Student Activity Fund — — 53,235 53,235 —Other Revenue from Local Sources — — 842 842 91
Total Local Sources 24,849,000 24,849,000 24,955,579 106,579 24,609,803
State SourcesEvidence Based Funding Formula 1,254,018 1,254,018 1,254,018 — 1,254,018Special Education
Private Facility Tuition 139,000 139,000 160,045 21,045 235,525Orphanage - Individual 53,000 53,000 72,594 19,594 166,955Orphanage - Summer Individual 4,950 4,950 8,761 3,811 4,405Summer School — — — — —
Vocational Education 6,843 6,843 7,261 418 6,298State Fee Lunch and Breakfast 1,700 1,700 631 (1,069) 1,435Drivers Education 19,000 19,000 10,330 (8,670) 20,274Other 1,035 1,035 1,034 (1) 1,047
Total State Sources 1,479,546 1,479,546 1,514,674 35,128 1,689,957
LISLE COMMUNITY UNIT SCHOOL DISTRICT NO. 202
Educational Account - General FundSchedule of Revenues, Expenditures and Changes in Fund Balance - Budget and ActualFor the Fiscal Year Ended June 30, 2021(with Comparative Actual Amounts for the Fiscal Year Ended June 30, 2020)
77

2021Original Final Variance with 2020Budget Budget Actual Final Budget Actual
Revenues - ContinuedFederal Sources
National School Lunch Program $ 75,000 75,000 379 (74,621) 121,382Summer Food Service Program 25,000 25,000 299,292 274,292 20,891Title I - Low Income 200,000 200,000 257,958 57,958 143,743Title IV - Student Support
and Academic Enrichment 14,500 14,500 14,810 310 3,939Federal - Special Education
Preschool Flow-Through 15,900 15,900 11,856 (4,044) 12,792Federal - Special Education
IDEA Flow-Through 599,000 599,000 546,508 (52,492) 529,434Federal - Special Education
IDEA Room and Board — — 5,426 5,426 3,529CTE - Perkins
Title IIIE - Tech Prep 5,780 5,780 5,632 (148) 5,780McKinney Education for
Homeless Children 7,000 7,000 7,589 589 4,701Title II - Teacher Quality 50,000 50,000 17,005 (32,995) 34,298Medicaid Matching Funds
Administrative Outreach 31,000 31,000 39,660 8,660 31,314Fee-For-Service Program 84,000 84,000 61,947 (22,053) 88,175
Other Restricted Revenuefrom Federal Sources 141,218 141,218 109,586 (31,632) 3,214
Total Federal Sources 1,248,398 1,248,398 1,377,648 129,250 1,003,192
Total Direct Revenues 27,576,944 27,576,944 27,847,901 270,957 27,302,952
On-Behalf Payments 12,905,000 12,905,000 13,451,993 546,993 12,276,265
Total Revenues 40,481,944 40,481,944 41,299,894 817,950 39,579,217
LISLE COMMUNITY UNIT SCHOOL DISTRICT NO. 202
Educational Account - General FundSchedule of Revenues, Expenditures and Changes in Fund Balance - Budget and Actual - ContinuedFor the Fiscal Year Ended June 30, 2021(with Comparative Actual Amounts for the Fiscal Year Ended June 30, 2020)
78

2021Original Final Variance with 2020Budget Budget Actual Final Budget Actual
ExpendituresInstruction
Regular ProgramsSalaries $ 8,330,100 8,330,100 8,397,513 (67,413) 8,058,466Employee Benefits 2,458,800 2,458,800 2,358,400 100,400 2,343,453Purchased Services 225,366 225,366 155,234 70,132 134,050Supplies and Materials 618,630 618,630 528,867 89,763 254,594Capital Outlay 0 0 15,456 (15,456) 0Other Objects 20,300 20,300 7,954 12,346 12,368Non-Capital Equipment 95,500 95,500 68,031 27,469 13,043
11,748,696 11,748,696 11,531,455 217,241 10,815,974
Pre-K ProgramsSalaries 165,000 165,000 176,464 (11,464) 160,977Employee Benefits 57,330 57,330 54,621 2,709 49,803Purchased Services 1,900 1,900 868 1,032 1,557Supplies and Materials 16,000 16,000 16,863 (863) 617
240,230 240,230 248,816 (8,586) 212,954
Special Education ProgramsSalaries 2,004,672 2,004,672 1,996,246 8,426 1,890,596Employee Benefits 760,240 760,240 733,396 26,844 720,512Purchased Services 46,000 46,000 23,956 22,044 33,102Supplies and Materials 33,000 33,000 39,833 (6,833) 12,742Non-Capital Equipment 7,200 7,200 5,652 1,548 0
2,851,112 2,851,112 2,799,083 52,029 2,656,952
Special Education Programs Pre-K
Salaries 67,106 67,106 67,017 89 64,201Employee Benefits 24,620 24,620 23,326 1,294 26,631Supplies and Materials 700 700 1,552 (852) 0
92,426 92,426 91,895 531 90,832
LISLE COMMUNITY UNIT SCHOOL DISTRICT NO. 202
Educational Account - General FundSchedule of Revenues, Expenditures and Changes in Fund Balance - Budget and Actual - ContinuedFor the Fiscal Year Ended June 30, 2021(with Comparative Actual Amounts for the Fiscal Year Ended June 30, 2020)
79

2021Original Final Variance with 2020Budget Budget Actual Final Budget Actual
Expenditures - ContinuedInstruction - Continued
Remedial and Supplemental Programs K-12Salaries $ 334,240 334,240 348,674 (14,434) 322,185Employee Benefits 121,210 121,210 125,981 (4,771) 116,096Purchased Services 35,600 35,600 35,043 557 —Supplies and Materials 87,050 87,050 43,783 43,267 24,353
578,100 578,100 553,481 24,619 462,634
CTE ProgramsSalaries 251,800 251,800 259,328 (7,528) 246,990Employee Benefits 76,110 76,110 71,965 4,145 72,804Purchased Services 2,600 2,600 4,294 (1,694) 12,030Supplies and Materials 26,398 26,398 23,010 3,388 15,441Non-Capitalized Equipment 2,795 2,795 1,333 1,462 568
359,703 359,703 359,930 (227) 347,833
Interscholastic ProgramsSalaries 552,800 552,800 517,550 35,250 521,239Employee Benefits 55,580 55,580 52,940 2,640 54,580Purchased Services 124,550 124,550 61,504 63,046 100,574Supplies and Materials 73,900 73,900 79,851 (5,951) 57,628Capital Outlay 6,500 6,500 — 6,500 —Other Objects 29,500 29,500 8,380 21,120 21,718Non-Capital Equipment 7,000 7,000 5,040 1,960 6,720
849,830 849,830 725,265 124,565 762,459
Summer School ProgramsSalaries 27,000 27,000 35,114 (8,114) 14,940Employee Benefits 3,100 3,100 1,781 1,319 2,633Purchased Services — — — — 2,289Supplies and Materials 1,500 1,500 — 1,500 —
31,600 31,600 36,895 (5,295) 19,862
Gifted ProgramsSalaries 32,200 32,200 25,968 6,232 48,344Employee Benefits 3,670 3,670 3,412 258 5,799Supplies and Materials 1,000 1,000 — 1,000 1,273
36,870 36,870 29,380 7,490 55,416
LISLE COMMUNITY UNIT SCHOOL DISTRICT NO. 202
Educational Account - General FundSchedule of Revenues, Expenditures and Changes in Fund Balance - Budget and Actual - ContinuedFor the Fiscal Year Ended June 30, 2021(with Comparative Actual Amounts for the Fiscal Year Ended June 30, 2020)
80

2021Original Final Variance with 2020Budget Budget Actual Final Budget Actual
Expenditures - ContinuedInstruction - Continued
Driver's Education ProgramsSalaries $ 85,500 85,500 89,255 (3,755) 79,381Employee Benefits 25,320 25,320 20,298 5,022 24,453Purchased Services 2,275 2,275 643 1,632 890Supplies and Materials 4,500 4,500 1,523 2,977 2,152Other Objects 125 125 — 125 —Non-Capitalized Equipment — — 3,993 (3,993) —
117,720 117,720 115,712 2,008 106,876
Bilingual ProgramsSalaries 241,400 241,400 265,420 (24,020) 241,149Employee Benefits 88,200 88,200 81,663 6,537 78,240Purchased Services 6,900 6,900 6,051 849 5,157Supplies and Materials 1,500 1,500 546 954 1,003Non-Capitalized Equipment 1,600 1,600 1,588 12 —
339,600 339,600 355,268 (15,668) 325,549
Truants Alternative & Optional ProgramsSalaries 86,800 86,800 84,612 2,188 —Employee Benefits 7,530 7,530 33,607 (26,077) —Purchased Services 8,000 8,000 7,930 70 —
102,330 102,330 126,149 (23,819) —
Special Education Programs K-12 Private TuitionOther Objects 1,000,000 1,000,000 1,132,038 (132,038) 896,257
Truants Alternative/Optional EdPrograms - Private Tuition
Other Objects 4,000 4,000 500 3,500 16,120
Student Activity FundOther Objects — — 69,661 (69,661) —
Total Instruction 18,352,217 18,352,217 18,175,528 176,689 16,769,718
LISLE COMMUNITY UNIT SCHOOL DISTRICT NO. 202
Educational Account - General FundSchedule of Revenues, Expenditures and Changes in Fund Balance - Budget and Actual - ContinuedFor the Fiscal Year Ended June 30, 2021(with Comparative Actual Amounts for the Fiscal Year Ended June 30, 2020)
81

2021Original Final Variance with 2020Budget Budget Actual Final Budget Actual
Expenditures - ContinuedSupport Services
PupilsAttendance and Social Work Services
Salaries $ 376,500 376,500 365,941 10,559 303,607Employee Benefits 116,170 116,170 123,869 (7,699) 104,323Purchased Services 4,600 4,600 6,533 (1,933) 10,148Supplies and Materials 3,600 3,600 56 3,544 184Non-Capitalized Equipment 1,600 1,600 1,588 12 —
502,470 502,470 497,987 4,483 418,262
Guidance ServicesSalaries 257,800 257,800 261,124 (3,324) 253,351Employee Benefits 55,650 55,650 52,373 3,277 53,373Purchased Services 5,650 5,650 3,959 1,691 3,930Supplies and Materials 3,000 3,000 1,718 1,282 1,249Other Objects 500 500 95 405 80
322,600 322,600 319,269 3,331 311,983
Health ServicesSalaries 238,300 238,300 227,643 10,657 332,592Employee Benefits 48,610 48,610 42,657 5,953 72,688Purchased Services 100,450 100,450 71,360 29,090 1,207Supplies and Materials 11,500 11,500 4,893 6,607 3,786Non-Capital Equipment 5,000 5,000 2,922 2,078 —
403,860 403,860 349,475 54,385 410,273
Psychological ServicesSalaries 342,400 342,400 341,517 883 258,748Employee Benefits 80,780 80,780 97,029 (16,249) 74,729Purchased Services 5,500 5,500 2,450 3,050 3,115Supplies and Materials 4,550 4,550 5,752 (1,202) 2,564Non-Capitalized Equipment 1,600 1,600 1,588 12 —
434,830 434,830 448,336 (13,506) 339,156
LISLE COMMUNITY UNIT SCHOOL DISTRICT NO. 202
Educational Account - General FundSchedule of Revenues, Expenditures and Changes in Fund Balance - Budget and Actual - ContinuedFor the Fiscal Year Ended June 30, 2021(with Comparative Actual Amounts for the Fiscal Year Ended June 30, 2020)
82

2021Original Final Variance with 2020Budget Budget Actual Final Budget Actual
Expenditures - ContinuedSupport Services - Continued
Pupils - ContinuedSpeech Pathology and Audiology Services
Salaries $ 258,300 258,300 258,203 97 258,273Employee Benefits 82,570 82,570 77,154 5,416 80,155Purchased Services 8,500 8,500 4,619 3,881 58,815Supplies and Materials 1,150 1,150 2,253 (1,103) 1,270Non-Capitalized Equipment 2,400 2,400 2,381 19 —
352,920 352,920 344,610 8,310 398,513
Other Support ServicesSalaries 137,600 137,600 125,070 12,530 160,122Employee Benefits 32,400 32,400 31,053 1,347 27,150Purchased Services 2,750 2,750 4,647 (1,897) —Supplies and Materials 3,800 3,800 1,447 2,353 760
176,550 176,550 162,217 14,333 188,032
Total Pupils 2,193,230 2,193,230 2,121,894 71,336 2,066,219
Instructional StaffImprovement of Instructional Services
Salaries 328,200 328,200 299,146 29,054 267,643Employee Benefits 99,580 99,580 71,178 28,402 82,124Purchased Services 126,272 126,272 34,619 91,653 32,134Supplies and Materials 19,300 19,300 1,214 18,086 2,182
573,352 573,352 406,157 167,195 384,083
Educational Media ServicesSalaries 282,300 282,300 259,513 22,787 271,629Employee Benefits 84,060 84,060 75,123 8,937 88,992Purchased Services 51,100 51,100 40,712 10,388 38,041Supplies and Materials 66,235 66,235 62,890 3,345 50,219Other Objects 465 465 150 315 274Non-Capital Equipment 2,800 2,800 2,601 199 —
486,960 486,960 440,989 45,971 449,155
LISLE COMMUNITY UNIT SCHOOL DISTRICT NO. 202
Educational Account - General FundSchedule of Revenues, Expenditures and Changes in Fund Balance - Budget and Actual - ContinuedFor the Fiscal Year Ended June 30, 2021(with Comparative Actual Amounts for the Fiscal Year Ended June 30, 2020)
83

2021Original Final Variance with 2020Budget Budget Actual Final Budget Actual
Expenditures - ContinuedSupport Services - Continued
Instructional Staff - ContinuedAssessment and Testing
Purchased Services $ 22,000 22,000 9,041 12,959 18,455Supplies and Materials 5,500 5,500 970 4,530 2,559
27,500 27,500 10,011 17,489 21,014
Total Instructional Staff 1,087,812 1,087,812 857,157 230,655 854,252
General AdministrationBoard of Education Services
Salaries 35,400 35,400 34,836 564 33,625Employee Benefits 7,580 7,580 7,462 118 8,028Purchased Services 49,200 49,200 43,939 5,261 42,530Supplies and Materials 5,500 5,500 1,299 4,201 1,078Other Objects 12,000 12,000 12,635 (635) 12,198Non-Capital Outlay 1,000 1,000 — 1,000 —
110,680 110,680 100,171 10,509 97,459
Executive Administration ServicesSalaries 254,200 254,200 254,085 115 248,197Employee Benefits 66,620 66,620 73,388 (6,768) 72,533Purchased Services 3,500 3,500 1,225 2,275 2,311Supplies and Materials 5,500 5,500 4,499 1,001 6,715Other 2,000 2,000 1,995 5 2,056Non-Capital Outlay 2,000 2,000 645 1,355 —
333,820 333,820 335,837 (2,017) 331,812
Special Area Administration ServicesSalaries 202,900 202,900 206,336 (3,436) 188,966Employee Benefits 49,960 49,960 81,950 (31,990) 69,096Purchased Services 5,300 5,300 2,856 2,444 3,185Supplies and Materials 2,000 2,000 1,276 724 738Other Objects 750 750 — 750 410Termination Benefits — — — — 2,531
260,910 260,910 292,418 (31,508) 264,926
LISLE COMMUNITY UNIT SCHOOL DISTRICT NO. 202
Educational Account - General FundSchedule of Revenues, Expenditures and Changes in Fund Balance - Budget and Actual - ContinuedFor the Fiscal Year Ended June 30, 2021(with Comparative Actual Amounts for the Fiscal Year Ended June 30, 2020)
84

2021Original Final Variance with 2020Budget Budget Actual Final Budget Actual
Expenditures - ContinuedSupport Services - Continued
General Administration - ContinuedTort Immunity Services
Purchased Services $ 281,000 281,000 247,649 33,351 236,512
Total General Administration 986,410 986,410 976,075 10,335 930,709
School AdministrationOffice of the Principal Services
Salaries 1,516,000 1,516,000 1,519,108 (3,108) 1,497,245Employee Benefits 603,260 603,260 601,715 1,545 587,672Purchased Services 48,700 48,700 24,497 24,203 26,340Supplies and Materials 24,500 24,500 10,493 14,007 19,971Other Objects 4,800 4,800 3,271 1,529 3,067Non-Capital Outlay 23,800 23,800 16,914 6,886 12,522Termination Benefits — — — — 3,642
2,221,060 2,221,060 2,175,998 45,062 2,150,459
BusinessDirection of Business Support Services
Salaries 118,900 118,900 120,055 (1,155) 117,349Employee Benefits 22,370 22,370 21,378 992 20,857Purchased Services 2,100 2,100 1,642 458 1,498Supplies and Materials 1,000 1,000 197 803 55Other Objects 600 600 580 20 570
144,970 144,970 143,852 1,118 140,329
Fiscal ServicesSalaries 168,200 168,200 167,493 707 176,150Employee Benefits 58,030 58,030 60,042 (2,012) 52,178Purchased Services 32,800 32,800 24,103 8,697 28,831Supplies and Materials 9,500 9,500 5,377 4,123 4,287Other Objects 500 500 474 26 150Non-Capitalized Equipment 1,000 1,000 — 1,000 —Termination Benefits — — — — 3,139
270,030 270,030 257,489 12,541 264,735
LISLE COMMUNITY UNIT SCHOOL DISTRICT NO. 202
Educational Account - General FundSchedule of Revenues, Expenditures and Changes in Fund Balance - Budget and Actual - ContinuedFor the Fiscal Year Ended June 30, 2021(with Comparative Actual Amounts for the Fiscal Year Ended June 30, 2020)
85

2021Original Final Variance with 2020Budget Budget Actual Final Budget Actual
Expenditures - ContinuedSupport Services - Continued
Business - ContinuedFood Services
Purchased Services $ 202,500 202,500 246,743 (44,243) 286,459Supplies and Materials 6,000 6,000 4,758 1,242 3,990Non-Capital Equipment 5,000 5,000 — 5,000 6,654
213,500 213,500 251,501 (38,001) 297,103
Total Business 628,500 628,500 652,842 (24,342) 702,167
CentralInformation Services
Salaries 90,300 90,300 103,953 (13,653) 86,482Employee Benefits 860 860 1,030 (170) 830Purchased Services 49,400 49,400 39,236 10,164 32,288Supplies and Materials 1,250 1,250 450 800 716Other Objects 320 320 320 — 320
142,130 142,130 144,989 (2,859) 120,636
Staff ServicesSalaries 142,100 142,100 151,079 (8,979) 136,159Employee Benefits 46,850 46,850 47,863 (1,013) 44,355Purchased Services 24,200 24,200 24,641 (441) 21,830Supplies and Materials 2,500 2,500 485 2,015 1,784Other Objects 1,000 1,000 500 500 675
216,650 216,650 224,568 (7,918) 204,803
Data Processing ServicesSalaries 267,300 267,300 267,231 69 254,129Employee Benefits 81,280 81,280 88,834 (7,554) 82,519Purchased Services 355,500 355,500 287,125 68,375 301,038Supplies and Materials 30,500 30,500 26,547 3,953 22,788Capital Outlay 20,000 20,000 — 20,000 54,170Non-Capital Equipment 800 800 2,831 (2,031) —
755,380 755,380 672,568 82,812 714,644
Total Central 1,114,160 1,114,160 1,042,125 72,035 1,040,083
Total Support Services 8,231,172 8,231,172 7,826,091 405,081 7,743,889
LISLE COMMUNITY UNIT SCHOOL DISTRICT NO. 202
Educational Account - General FundSchedule of Revenues, Expenditures and Changes in Fund Balance - Budget and Actual - ContinuedFor the Fiscal Year Ended June 30, 2021(with Comparative Actual Amounts for the Fiscal Year Ended June 30, 2020)
86

2021Original Final Variance with 2020Budget Budget Actual Final Budget Actual
Expenditures - ContinuedCommunity Services
Salaries $ 36,575 36,575 36,575 — 38,269Employee Benefits 8,607 8,607 8,607 — 9,219Purchased Services 32,850 32,850 9,269 23,581 30,975Supplies and Materials 44,580 44,580 8,738 35,842 19,613Non-Capitalized Equipment — — 986 (986) —
Total Community Services 122,612 122,612 64,175 58,437 98,076
Payments to Other Districts andGovernmental Units
Payments for Special Education ProgramsPurchased Services 243,316 243,316 221,448 21,868 234,229
Payments for CTE ProgramsPurchased Services 3,000 3,000 2,789 211 2,793Other Objects 2,300 2,300 1,700 600 1,600
5,300 5,300 4,489 811 4,393
Other Payments to In-StateGovernmental Units
Purchased Services — — 2,850 (2,850) —
Payments for Regular Programs - TuitionOther Objects 13,000 13,000 17,779 (4,779) 29,090
Payments for Special EducationPrograms - Tuition
Other Objects 1,283,500 1,283,500 1,036,891 246,609 935,798
Payments for CTE Programs - TuitionOther Objects 90,000 90,000 85,877 4,123 88,884
Total Payments to Other Districtsand Governmental Units 1,635,116 1,635,116 1,369,334 265,782 1,292,394
Total Direct Expenditures 28,341,117 28,341,117 27,435,128 905,989 25,904,077
LISLE COMMUNITY UNIT SCHOOL DISTRICT NO. 202
Educational Account - General FundSchedule of Revenues, Expenditures and Changes in Fund Balance - Budget and Actual - ContinuedFor the Fiscal Year Ended June 30, 2021(with Comparative Actual Amounts for the Fiscal Year Ended June 30, 2020)
87

2021Original Final Variance with 2020Budget Budget Actual Final Budget Actual
Expenditures - ContinuedOn Behalf Payments $ 12,905,000 12,905,000 13,451,993 (546,993) 12,276,265
Total Expenditures 41,246,117 41,246,117 40,887,121 358,996 38,180,342
Excess (Deficiency) of RevenuesOver (Under) Expenditures (764,173) (764,173) 412,773 1,176,946 1,398,875
Other Financing Sources (Uses)Disposal of Capital Assets — — 8,895 8,895 —Transfers In 1,900 1,900 2,224 324 20,375Transfers Out — — (1,000,000) (1,000,000) (1,818,588)
1,900 1,900 (988,881) (990,781) (1,798,213)
Net Change in Fund Balance (762,273) (762,273) (576,108) 186,165 (399,338)
Fund Balance - Beginning as Restated 11,216,216 11,503,628
Fund Balance - Ending 10,640,108 11,104,290
LISLE COMMUNITY UNIT SCHOOL DISTRICT NO. 202
Educational Account - General FundSchedule of Revenues, Expenditures and Changes in Fund Balance - Budget and Actual - ContinuedFor the Fiscal Year Ended June 30, 2021(with Comparative Actual Amounts for the Fiscal Year Ended June 30, 2020)
88

2021Original Final Variance with 2020Budget Budget Actual Final Budget Actual
RevenuesLocal Sources
General Levy $ 3,888,700 3,888,700 3,890,819 2,119 3,094,542Earnings on Investments 6,100 6,100 7,432 1,332 43,554Rentals 148,000 148,000 138,146 (9,854) 113,470Refund of Prior Year Expenses 10,900 10,900 58,892 47,992 10,579
Total Local Sources 4,053,700 4,053,700 4,095,289 41,589 3,262,145
State SourcesSchool Infrastructure
Maintenance Project — — — — 50,000
Federal SourcesOther Restricted Revenue from
Federal Sources 600 600 32,558 31,958 —
Total Revenues 4,054,300 4,054,300 4,127,847 73,547 3,312,145Expenditures
Support ServicesBusiness
Facilities Acquisition and Construction Services
Capital Outlay 75,000 75,000 125,301 (50,301) —
Operation and Maintenance of Plant Services
Salaries 1,277,900 1,277,900 1,050,396 227,504 1,021,745Employee Benefits 310,920 310,920 238,557 72,363 204,636Purchased Services 608,500 608,500 558,838 49,662 420,455Supplies and Materials 803,000 803,000 737,857 65,143 625,684Capital Outlay 55,000 55,000 — 55,000 95,593Non-Capitalized Equipment 90,000 90,000 79,299 10,701 120,369Termination Benefits — — — — 7,184
Total Expenditures 3,220,320 3,220,320 2,790,248 430,072 2,495,666
Excess (Deficiency) of RevenuesOver (Under) Expenditures 833,980 833,980 1,337,599 503,619 816,479
LISLE COMMUNITY UNIT SCHOOL DISTRICT NO. 202
Operations and Maintenance Account - General FundSchedule of Revenues, Expenditures and Changes in Fund Balance - Budget and ActualFor the Fiscal Year Ended June 30, 2021(with Comparative Actual Amounts for the Fiscal Year Ended June 30, 2020)
89
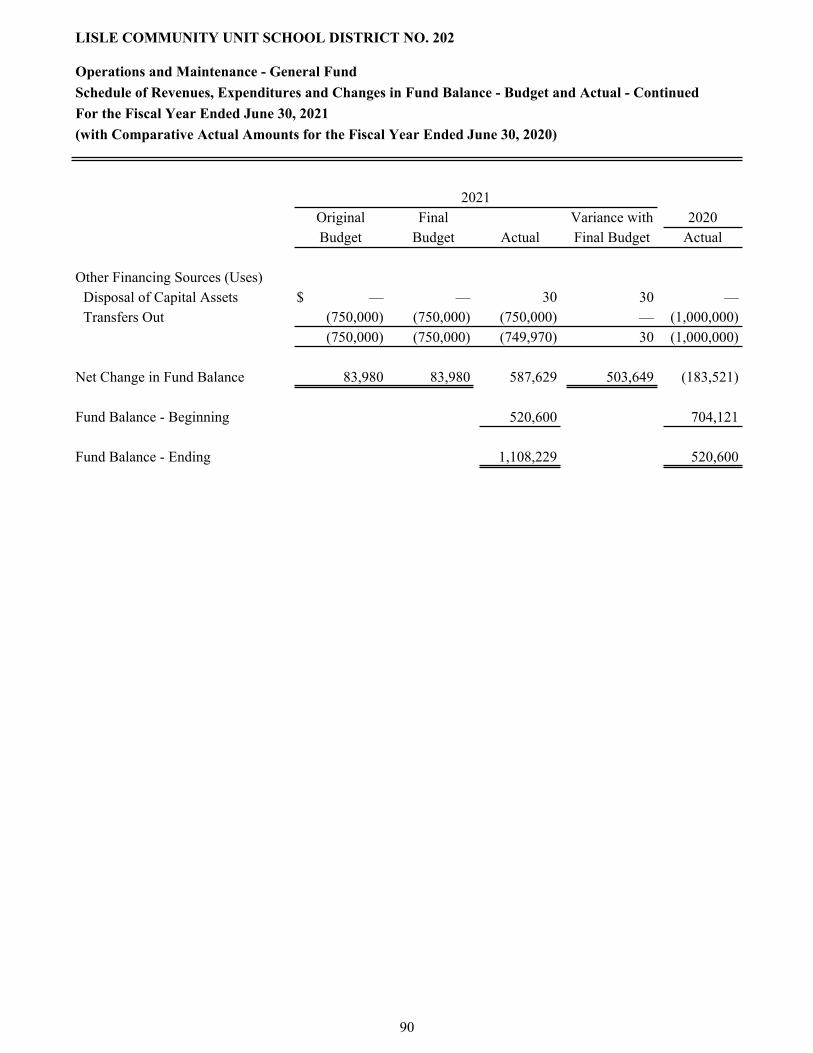
2021Original Final Variance with 2020Budget Budget Actual Final Budget Actual
Other Financing Sources (Uses)Disposal of Capital Assets $ — — 30 30 —Transfers Out (750,000) (750,000) (750,000) — (1,000,000)
(750,000) (750,000) (749,970) 30 (1,000,000)
Net Change in Fund Balance 83,980 83,980 587,629 503,649 (183,521)
Fund Balance - Beginning 520,600 704,121
Fund Balance - Ending 1,108,229 520,600
LISLE COMMUNITY UNIT SCHOOL DISTRICT NO. 202
Operations and Maintenance - General FundSchedule of Revenues, Expenditures and Changes in Fund Balance - Budget and Actual - ContinuedFor the Fiscal Year Ended June 30, 2021(with Comparative Actual Amounts for the Fiscal Year Ended June 30, 2020)
90

2021Original Final Variance with 2020Budget Budget Actual Final Budget Actual
RevenuesLocal Sources
General Levy $ 4,400 4,400 4,416 16 4,302 Earnings on Investments 1,900 1,900 2,227 327 20,375
Total Revenues 6,300 6,300 6,643 343 24,677
Expenditures — — — — —
Excess (Deficiency) of RevenuesOver (Under) Expenditures 6,300 6,300 6,643 343 24,677
Other Financing (Uses)Transfers Out (1,900) (1,900) (2,224) (324) (20,375)
Net Change in Fund Balance 4,400 4,400 4,419 19 4,302
Fund Balance - Beginning 804,793 800,491
Fund Balance - Ending 809,212 804,793
LISLE COMMUNITY UNIT SCHOOL DISTRICT NO. 202
Working Cash Account - General FundSchedule of Revenues, Expenditures and Changes in Fund Balance - Budget and ActualFor the Fiscal Year Ended June 30, 2021(with Comparative Actual Amounts for the Fiscal Year Ended June 30, 2020)
91

2021Original Final Variance with 2020Budget Budget Actual Final Budget Actual
RevenuesLocal Sources
Earnings on Investments $ 6,100 6,100 7,208 1,108 71,408
ExpendituresSupport Services
BusinessFacilities Acquisition
and ConstructionPurchased Services 24,000 24,000 3,213 20,787 70,320Non-Capitalized Equipment — — — — 120,746Capital Outlay 515,000 515,000 222,389 292,611 5,886,965
Total Expenditures 539,000 539,000 225,602 313,398 6,078,031
Excess (Deficiency) of RevenuesOver (Under) Expenditures (532,900) (532,900) (218,394) 314,506 (6,006,623)
Other Financing SourcesTransfers In 750,000 750,000 750,000 — 2,500,000
Net Change in Fund Balance 217,100 217,100 531,606 314,506 (3,506,623)
Fund Balance - Beginning 2,673,622 6,180,245
Fund Balance - Ending 3,205,228 2,673,622
LISLE COMMUNITY UNIT SCHOOL DISTRICT NO. 202
Capital Projects FundSchedule of Revenues, Expenditures and Changes in Fund Balance - Budget and ActualFor the Fiscal Year Ended June 30, 2021(with Comparative Actual Amounts for the Fiscal Year Ended June 30, 2020)
92

Special RevenueMunicipal
Retirement/ Tort DebtTransportation Social Security Immunity Service Totals
ASSETS
Cash and Investment $ 2,776,261 947,274 2,235 1,163,137 4,888,907 Receivables - Net of Allowances
Property Taxes 517,471 465,520 2,393 261,470 1,246,854 Grants Receivable 163,595 — — — 163,595
Prepaid Expense — — — 260,125 260,125
Total Assets 3,457,327 1,412,794 4,628 1,684,732 6,559,481
LIABILITIES
Accounts Payable 47,504 — — — 47,504
DEFERRED INFLOWS OF RESOURCES
Property Taxes 1,000,744 900,274 4,628 505,660 2,411,306
Total Liabilities and DeferredInflows of Resources 1,048,248 900,274 4,628 505,660 2,458,810
FUND BALANCES
Nonspendable — — — 260,125 260,125 Restricted 2,409,079 512,520 — 918,947 3,840,546
Total Fund Balance 2,409,079 512,520 — 1,179,072 4,100,671
Total Liabilities, Deferred Inflows ofResources, and Fund Balances 3,457,327 1,412,794 4,628 1,684,732 6,559,481
LISLE COMMUNITY UNIT SCHOOL DISTRICT NO. 202
Nonmajor Governmental FundsCombining Balance SheetJune 30, 2021
93
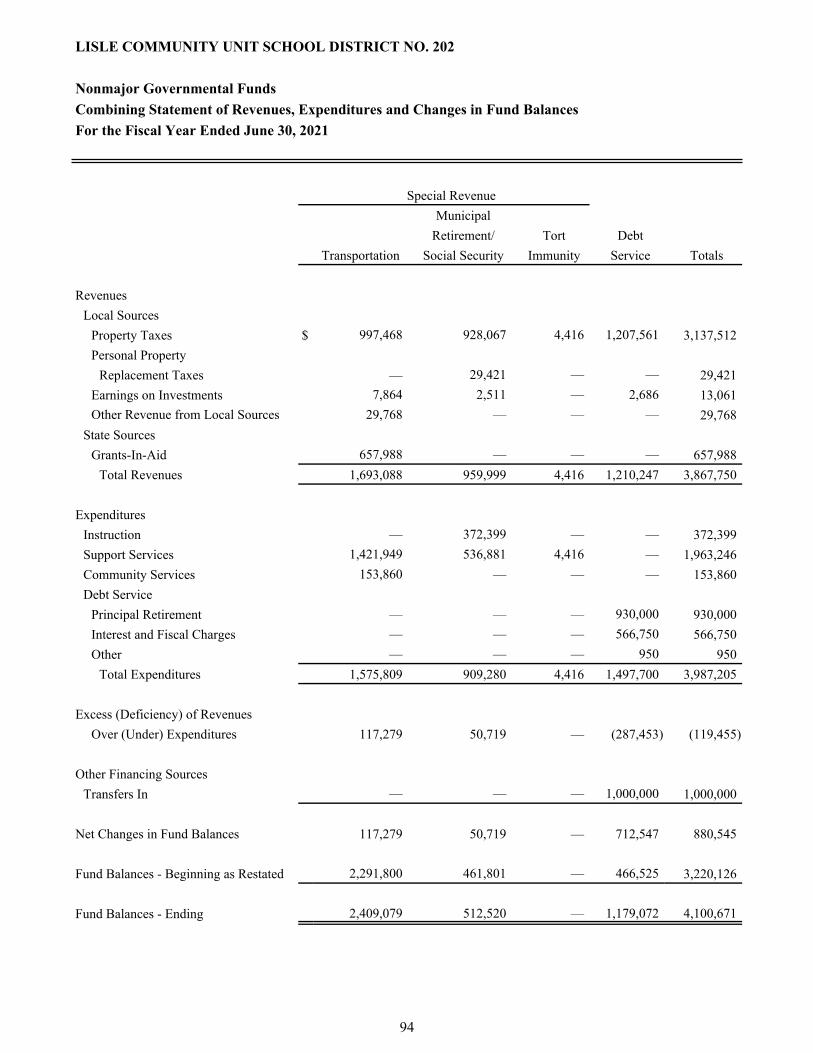
Special RevenueMunicipal
Retirement/ Tort DebtTransportation Social Security Immunity Service Totals
RevenuesLocal Sources
Property Taxes $ 997,468 928,067 4,416 1,207,561 3,137,512 Personal Property
Replacement Taxes — 29,421 — — 29,421 Earnings on Investments 7,864 2,511 — 2,686 13,061 Other Revenue from Local Sources 29,768 — — — 29,768
State SourcesGrants-In-Aid 657,988 — — — 657,988
Total Revenues 1,693,088 959,999 4,416 1,210,247 3,867,750
ExpendituresInstruction — 372,399 — — 372,399 Support Services 1,421,949 536,881 4,416 — 1,963,246 Community Services 153,860 — — — 153,860 Debt Service
Principal Retirement — — — 930,000 930,000 Interest and Fiscal Charges — — — 566,750 566,750 Other — — — 950 950
Total Expenditures 1,575,809 909,280 4,416 1,497,700 3,987,205
Excess (Deficiency) of RevenuesOver (Under) Expenditures 117,279 50,719 — (287,453) (119,455)
Other Financing SourcesTransfers In — — — 1,000,000 1,000,000
Net Changes in Fund Balances 117,279 50,719 — 712,547 880,545
Fund Balances - Beginning as Restated 2,291,800 461,801 — 466,525 3,220,126
Fund Balances - Ending 2,409,079 512,520 — 1,179,072 4,100,671
LISLE COMMUNITY UNIT SCHOOL DISTRICT NO. 202
Nonmajor Governmental FundsCombining Statement of Revenues, Expenditures and Changes in Fund BalancesFor the Fiscal Year Ended June 30, 2021
94

2021Original Final Variance with 2020Budget Budget Actual Final Budget Actual
RevenuesLocal Sources
General Levy $ 996,900 996,900 997,468 568 1,796,494Transportation Fees
Regular Transportation Fees from Other Districts 30,000 30,000 19,673 (10,327) 33,494
Special Education TransportationFees from Other Districts 10,000 10,000 10,095 95 6,659
Earnings on Investments 6,100 6,100 7,864 1,764 58,851Total Local Sources 1,043,000 1,043,000 1,035,100 (7,900) 1,895,498
State SourcesSpecial Education
Orphanage - Individual 22,000 22,000 — (22,000) 29,705Orphanage - Summer 550 550 — (550) 952
Transportation - Regular/Vocational 182,000 182,000 244,644 62,644 348,574Transportation - Special Education 398,000 398,000 413,344 15,344 426,131
Total State Sources 602,550 602,550 657,988 55,438 805,362
Total Revenues 1,645,550 1,645,550 1,693,088 47,538 2,700,860
ExpendituresSupport Services
BusinessPupil Transportation Services
Salaries 43,300 43,300 23,580 19,720 45,584Employee Benefits 1,530 1,530 978 552 956Purchased Services 1,837,000 1,837,000 1,285,152 551,848 1,454,654Supplies and Materials 2,000 2,000 303 1,697 2,691Capital Outlay 100,000 100,000 111,936 (11,936) —
Total Support Services 1,983,830 1,983,830 1,421,949 561,881 1,503,885
LISLE COMMUNITY UNIT SCHOOL DISTRICT NO. 202
Transportation - Special Revenue FundSchedule of Revenues, Expenditures and Changes in Fund Balance - Budget and Actual For the Fiscal Year Ended June 30, 2021(with Comparative Actual Amounts for the Fiscal Year Ended June 30, 2020)
95

2021Original Final Variance with 2020Budget Budget Actual Final Budget Actual
Expenditures - ContinuedCommunity Services
Purchased Services $ 159,000 159,000 153,860 5,140 129,655
Total Expenditures 2,142,830 2,142,830 1,575,809 567,021 1,633,540
Excess (Deficiency) of RevenuesOver (Under) Expenditures (497,280) (497,280) 117,279 614,559 1,067,320
Other Financing (Uses)Transfers Out (100,000) (100,000) — 100,000 —
Net Change in Fund Balance (597,280) (597,280) 117,279 714,559 1,067,320
Fund Balance - Beginning 2,291,800 1,224,480
Fund Balance - Ending 2,409,079 2,291,800
LISLE COMMUNITY UNIT SCHOOL DISTRICT NO. 202
Transportation - Special Revenue FundSchedule of Revenues, Expenditures and Changes in Fund Balance - Budget and Actual - ContinuedFor the Fiscal Year Ended June 30, 2021(with Comparative Actual Amounts for the Fiscal Year Ended June 30, 2020)
96

2021Original Final Variance with 2020Budget Budget Actual Final Budget Actual
RevenuesLocal Sources
General Levy $ 428,800 428,800 429,018 218 359,545FICA/Medicare Levy 498,700 498,700 499,049 349 798,988Personal Property
Replacement Taxes 29,000 29,000 29,421 421 25,156Earnings on Investments 2,100 2,100 2,511 411 19,767
Total Revenues 958,600 958,600 959,999 1,399 1,203,456
ExpendituresInstruction - Employee Benefits
Regular Programs 152,860 152,860 145,228 7,632 140,199Special Education Programs 194,940 194,940 181,345 13,595 163,664Other Programs 43,500 43,500 45,826 (2,326) 44,342
Total Instruction 391,300 391,300 372,399 18,901 348,205
Support Services - Employee BenefitsPupil 42,550 42,550 39,717 2,833 42,247Instructional Staff 20,580 20,580 16,362 4,218 17,934General Administration 31,220 31,220 30,853 367 27,016School Administration 72,450 72,450 71,013 1,437 73,325Business 344,440 344,440 287,279 57,161 276,112Central 82,780 82,780 91,657 (8,877) 76,208
Total Support Services 594,020 594,020 536,881 57,139 512,842
Community Services — — — — 5
Total Expenditures 985,320 985,320 909,280 76,040 861,052
Net Change in Fund Balance (26,720) (26,720) 50,719 77,439 342,404
Fund Balance - Beginning 461,801 119,397
Fund Balance - Ending 512,520 461,801
LISLE COMMUNITY UNIT SCHOOL DISTRICT NO. 202
Municipal Retirement/Social Security - Special Revenue FundSchedule of Revenues, Expenditures and Changes in Fund Balance - Budget and ActualFor the Fiscal Year Ended June 30, 2021(with Comparative Actual Amounts for the Fiscal Year Ended June 30, 2020)
97

2021Original Final Variance with 2020Budget Budget Actual Final Budget Actual
RevenuesLocal Sources
General Levy $ 4,400 4,400 4,416 16 4,302Earnings on Investments — — — — 2
Total Revenues 4,400 4,400 4,416 16 4,304
ExpendituresSupport Services
Purchased Services 4,400 4,400 4,416 (16) 2,180
Net Change in Fund Balance — — — — 2,124
Fund Balance - Beginning — (2,124)
Fund Balance - Ending — —
LISLE COMMUNITY UNIT SCHOOL DISTRICT NO. 202
Tort Immunity - Special Revenue FundSchedule of Revenues, Expenditures and Changes in Fund Balance - Budget and ActualFor the Fiscal Year Ended June 30, 2021(with Comparative Actual Amounts for the Fiscal Year Ended June 30, 2020)
98

2021Original Final Variance with 2020Budget Budget Actual Final Budget Actual
RevenuesLocal Sources
General Levy $ 1,206,900 1,206,900 1,207,561 661 738,757Earnings on Investments 1,800 1,800 2,686 886 29,207
Total Revenues 1,208,700 1,208,700 1,210,247 1,547 767,964
ExpendituresDebt Service
Principal Retirement 930,000 930,000 930,000 — 1,472,958Interest and Fiscal Charges 543,500 543,500 566,750 (23,250) 585,394Other 1,000 1,000 950 50 1,250
Total Expenditures 1,474,500 1,474,500 1,497,700 (23,200) 2,059,602
Excess (Deficiency) of RevenuesOver (Under) Expenditures (265,800) (265,800) (287,453) (21,653) (1,291,638)
Other Financing SourcesTransfers In 100,000 100,000 1,000,000 900,000 318,588
Net Change in Fund Balance (165,800) (165,800) 712,547 878,347 (973,050)
Fund Balance - Beginning as Restated 466,525 1,156,200
Fund Balance - Ending 1,179,072 183,150
LISLE COMMUNITY UNIT SCHOOL DISTRICT NO. 202
Debt Service FundSchedule of Revenues, Expenditures and Changes in Fund Balance - Budget and ActualFor the Fiscal Year Ended June 30, 2021(with Comparative Actual Amounts for the Fiscal Year Ended June 30, 2020)
99

CSFA # Program Name State Federal Other Totals
478-00-0251 Medical Assistance Program $ — 39,660 — 39,660 586-18-0407 National School Lunch Program — 379 — 379 586-44-0414 Title I - Low Income — 257,958 — 257,958 586-44-1588 Title IVA - Student Support and
Academic Enrichment — 14,810 — 14,810 586-47-0430 Title II - Teacher Quality — 17,005 — 17,005 586-69-0418 Career and Technical Ed Improvement
(CTIE) 7,261 5,632 — 12,893 586-18-0410 Summer Food Service Program — 299,292 — 299,292 586-57-0420 Fed - Sp Ed - Pre School Flow Through — 11,856 — 11,856 586-64-0417 Fed - Sp Ed - Flow Through — 546,508 — 546,508 586-82-1466 Fed - Sp Ed - Room and Board — 5,426 — 5,426 586-48-0422 McKinney Education for Homeless
Children — 7,589 — 7,589 586-62-2402 Federal Programs - Emergency Relief — 142,144 — 142,144
Other Grant Programs and Activities — 11,921 — 11,921 All Other Costs Not Allocated — — 46,357,895 46,357,895
Totals 7,261 1,360,180 46,357,895 47,725,336
LISLE COMMUNITY UNIT SCHOOL DISTRICT NO. 202
Consolidated Year-End Financial ReportJune 30, 2021
100

SUPPLEMENTAL SCHEDULES
101

2016 2017 2018 2019 2020
Assessed Valuation $ 586,428,685 599,211,843 615,726,142 631,727,771 660,993,571
Tax RatesEducational 3.5562 3.1812 2.9733 3.0546 3.2043Operations and Maintenance 0.5080 0.5191 0.5035 0.6167 0.4237Debt Service 0.2580 0.2530 0.1202 0.1914 0.0765Transportation 0.0848 0.1340 0.2923 0.1581 0.1514Municipal Retirement 0.0611 0.0603 0.0585 0.0680 0.0666Working Cash 0.0005 0.0006 0.0007 0.0007 0.0007Social Security 0.0677 0.0670 0.1300 0.0791 0.0696Tort Immunity 0.0005 0.0006 0.0007 0.0007 0.0007Special Education 0.4657 0.7946 0.7920 0.7905 0.7867
Total Tax Rates 5.0025 5.0104 4.8712 4.9598 4.7802
Tax ExtensionsEducational $ 20,854,577 19,062,127 18,307,385 19,296,756 21,180,217Operations and Maintenance 2,979,058 3,110,509 3,100,181 3,895,865 2,800,630Debt Service 1,512,986 1,516,006 740,103 1,209,127 505,660Transportation 497,292 802,944 1,799,768 998,762 1,000,744Municipal Retirement 358,308 361,325 360,200 429,575 440,222Working Cash 2,932 3,595 4,310 4,422 4,627Social Security 397,012 401,472 800,444 499,697 460,052Tort Immunity 2,932 3,595 4,310 4,422 4,627Special Education 2,730,998 4,761,337 4,876,551 4,993,808 5,200,036
Total Tax Extensions 29,336,095 30,022,910 29,993,252 31,332,434 31,596,815
Total Tax Collections $ 29,295,902 29,182,905 29,936,681 31,286,230 15,258,530
Percentage Collected 99.86 % 97.20 % 99.81 % 99.85 % 48.29 %
LISLE COMMUNITY UNIT SCHOOL DISTRICT NO. 202
Summary of Assessed Valuations, Tax Rates and Extensions - Last Five Tax Levy YearsJune 30, 2021
102

Date of Issue March 22, 2019Date of Maturity December 30, 2030Authorized Issue $12,640,000Denomination of Bonds $5,000Interest Rates 3.00% - 5.00%Interest Dates December 30 and June 30Principal Maturity Date December 30Payable at Wells Fargo Bank, National Association
CURRENT AND LONG-TERM PRINCIPAL AND INTEREST REQUIREMENTS
FiscalYear Principal Interest Totals
2022 $ 980,000 495,750 1,475,7502023 1,025,000 445,625 1,470,6252024 1,080,000 393,000 1,473,0002025 1,130,000 337,750 1,467,7502026 1,190,000 279,750 1,469,7502027 1,250,000 218,750 1,468,7502028 1,310,000 161,300 1,471,3002029 1,365,000 107,800 1,472,8002030 1,420,000 52,100 1,472,1002031 790,000 11,850 801,850
11,540,000 2,503,675 14,043,675
LISLE COMMUNITY UNIT SCHOOL DISTRICT NO. 202
Long-Term Debt RequirementsGeneral Obligation Limited Tax School Bonds of 2019June 30, 2021
103