Links between bacterial communities in marine sediments and trace metal geochemistry as measured by...
10
Links between bacterial communities in marine sediments and trace metal geochemistry as measured by in situ DET/DGT approaches David C. Gillan a,g,⇑ , Willy Baeyens b , Rafeh Bechara c , Gabriel Billon d , Kevin Denis e , Philippe Grosjean e , Martine Leermakers b , Ludovic Lesven d , Annelies Pede f , Koen Sabbe f , Yue Gao b a Proteomics and Microbiology Laboratory, Mons University, Mons, Belgium b ANCH Laboratory, Vrije Universiteit van Brussel, Belgium c Catalysis and Solid Chemistry Laboratory (UCCS), Université Lille 1, France d Geosystems Laboratory, Université Lille 1, France e Numerical Ecology of Aquatic Systems, Mons University, Belgium f Protistology & Aquatic Ecology, Ghent University, Belgium g Marine Biology Laboratory, Université Libre de Bruxelles, Bruxelles, Belgium article info Keywords: Sediment Porewater Metals Bacteria Biomass Diversity abstract Our current view about the relationship between metals and bacteria in marine sediments might be biased because most studies only use ex situ approaches to quantify metals. The aim of the present research was to compare ex situ and in situ methods of metal measurement (DET and DGT – diffusive equilibration or diffusive gradients in thin-films) and relate the results with two commonly used micro- biological variables (bacterial biomass and bacterial diversity as revealed by DGGE). No previous studies have used such in situ approaches in microbial ecology. For biomass and most of the investigated trace metals (Ag, Cd, Sn, Cr, Ni, Cu, Pb, and Al) no significant correlations were found. The exceptions were Fe, Mn, Co, and As which behave like micronutrients. For bacterial diversity, no relevant relationships were found. We conclude that in situ methods are more adapted tools for microbial ecologists but that ex situ approaches are still necessary. Ó 2011 Elsevier Ltd. All rights reserved. 1. Introduction Metal pollution of ecosystems is a widespread environmental problem due to the persistent and non-biodegradable properties of these contaminants (e.g., QSR, 2000; Clark, 2001; Peñuelas and Filella, 2002; Zhou et al., 2008). Trace metals like Cd, Cr, Ni, Cu, Zn, and Hg are usually accumulated in soils and sediments and are readily transferred along food chains, thus threatening human health (Calmano and Förstner, 1996; Newman and Clements, 2008). Monitoring and prevention of trace metal mobility is conse- quently one of the hot topics in environmental research (Zhou et al., 2008). In aquatic sediments, trace metals can be found in porewaters, adsorbed on large mineral and organic particles, or inside these particles (Stumm and Morgan, 1995). After a few centimeters (or millimeters for muddy sediments) sediments become anoxic and several metals are therefore chemically and/or biologically reduced (Böttcher et al., 2000; Gao et al., 2009). As a result, permanently anoxic sediments must be sampled and treated properly, otherwise biases are introduced and total dissolved metal concentrations as well as metal speciation may change drastically. To avoid or at least limit this problem, geochemists usually manipulate sediment cores inside nitrogen glove boxes and subsequently extract pore- waters by centrifugation followed by a filtration under nitrogen (e.g., Böttcher et al., 2000). Metal speciation in sediments is an important factor to take into account as it is linked to bioavailabil- ity (e.g., Lu et al., 2005). Microbial communities in soils and sediments are key players involved in metal mobility (Ford and Ryan, 1995). Consequently, relationships between metals and microbial variables such as total biomass, bacterial diversity and activity have been investigated in various sedimentary environments. However, it is very difficult to draw general conclusions and it seems that each microbial community is unique and reacts in a different way (Supplementary Table 1). For instance, in some environments trace metals were shown to negatively affect microbial biomass (Brookes and McGrath, 1984; Frostegard et al., 1993; McGrath et al., 1995; Aoyama and Nagumo, 1997; Fabiano et al., 1994; Gillan et al., 2005), microbial diversity (Rasmussen and Sorensen, 2001; Ganguly and Jana, 2002) or microbial activities (Irha et al., 2003; Wong et al., 2005; Magalhães et al., 2007). However, for other envi- ronments, microbial communities were found to be relatively 0025-326X/$ - see front matter Ó 2011 Elsevier Ltd. All rights reserved. doi:10.1016/j.marpolbul.2011.11.001 ⇑ Corresponding author at: Proteomics and Microbiology Laboratory, Mons University, 6 av du Champ de Mars, B-7000 Mons, Belgium. Tel.: +32 65 37 33 11. E-mail address: [email protected] (D.C. Gillan). Marine Pollution Bulletin 64 (2012) 353–362 Contents lists available at SciVerse ScienceDirect Marine Pollution Bulletin journal homepage: www.elsevier.com/locate/marpolbul
Transcript of Links between bacterial communities in marine sediments and trace metal geochemistry as measured by...
Marine Pollution Bulletin 64 (2012) 353–362
Contents lists available at SciVerse ScienceDirect
Marine Pollution Bulletin
journal homepage: www.elsevier .com/locate /marpolbul
Links between bacterial communities in marine sediments and trace metalgeochemistry as measured by in situ DET/DGT approaches
David C. Gillan a,g,⇑, Willy Baeyens b, Rafeh Bechara c, Gabriel Billon d, Kevin Denis e, Philippe Grosjean e,Martine Leermakers b, Ludovic Lesven d, Annelies Pede f, Koen Sabbe f, Yue Gao b
a Proteomics and Microbiology Laboratory, Mons University, Mons, Belgiumb ANCH Laboratory, Vrije Universiteit van Brussel, Belgiumc Catalysis and Solid Chemistry Laboratory (UCCS), Université Lille 1, Franced Geosystems Laboratory, Université Lille 1, Francee Numerical Ecology of Aquatic Systems, Mons University, Belgiumf Protistology & Aquatic Ecology, Ghent University, Belgiumg Marine Biology Laboratory, Université Libre de Bruxelles, Bruxelles, Belgium
a r t i c l e i n f o
Keywords:SedimentPorewaterMetalsBacteriaBiomassDiversity
0025-326X/$ - see front matter � 2011 Elsevier Ltd. Adoi:10.1016/j.marpolbul.2011.11.001
⇑ Corresponding author at: Proteomics and MicUniversity, 6 av du Champ de Mars, B-7000 Mons, Be
E-mail address: [email protected] (D.C. Gi
a b s t r a c t
Our current view about the relationship between metals and bacteria in marine sediments might bebiased because most studies only use ex situ approaches to quantify metals. The aim of the presentresearch was to compare ex situ and in situ methods of metal measurement (DET and DGT – diffusiveequilibration or diffusive gradients in thin-films) and relate the results with two commonly used micro-biological variables (bacterial biomass and bacterial diversity as revealed by DGGE). No previous studieshave used such in situ approaches in microbial ecology. For biomass and most of the investigated tracemetals (Ag, Cd, Sn, Cr, Ni, Cu, Pb, and Al) no significant correlations were found. The exceptions wereFe, Mn, Co, and As which behave like micronutrients. For bacterial diversity, no relevant relationshipswere found. We conclude that in situ methods are more adapted tools for microbial ecologists but thatex situ approaches are still necessary.
� 2011 Elsevier Ltd. All rights reserved.
1. Introduction
Metal pollution of ecosystems is a widespread environmentalproblem due to the persistent and non-biodegradable propertiesof these contaminants (e.g., QSR, 2000; Clark, 2001; Peñuelas andFilella, 2002; Zhou et al., 2008). Trace metals like Cd, Cr, Ni, Cu,Zn, and Hg are usually accumulated in soils and sediments andare readily transferred along food chains, thus threatening humanhealth (Calmano and Förstner, 1996; Newman and Clements,2008). Monitoring and prevention of trace metal mobility is conse-quently one of the hot topics in environmental research (Zhouet al., 2008).
In aquatic sediments, trace metals can be found in porewaters,adsorbed on large mineral and organic particles, or inside theseparticles (Stumm and Morgan, 1995). After a few centimeters (ormillimeters for muddy sediments) sediments become anoxic andseveral metals are therefore chemically and/or biologically reduced(Böttcher et al., 2000; Gao et al., 2009). As a result, permanentlyanoxic sediments must be sampled and treated properly, otherwise
ll rights reserved.
robiology Laboratory, Monslgium. Tel.: +32 65 37 33 11.llan).
biases are introduced and total dissolved metal concentrations aswell as metal speciation may change drastically. To avoid or atleast limit this problem, geochemists usually manipulate sedimentcores inside nitrogen glove boxes and subsequently extract pore-waters by centrifugation followed by a filtration under nitrogen(e.g., Böttcher et al., 2000). Metal speciation in sediments is animportant factor to take into account as it is linked to bioavailabil-ity (e.g., Lu et al., 2005).
Microbial communities in soils and sediments are key playersinvolved in metal mobility (Ford and Ryan, 1995). Consequently,relationships between metals and microbial variables such as totalbiomass, bacterial diversity and activity have been investigated invarious sedimentary environments. However, it is very difficult todraw general conclusions and it seems that each microbialcommunity is unique and reacts in a different way (SupplementaryTable 1). For instance, in some environments trace metals wereshown to negatively affect microbial biomass (Brookes andMcGrath, 1984; Frostegard et al., 1993; McGrath et al., 1995;Aoyama and Nagumo, 1997; Fabiano et al., 1994; Gillan et al.,2005), microbial diversity (Rasmussen and Sorensen, 2001;Ganguly and Jana, 2002) or microbial activities (Irha et al., 2003;Wong et al., 2005; Magalhães et al., 2007). However, for other envi-ronments, microbial communities were found to be relatively

Fig. 1. Map of the Belgian continental zone with the nine sampling stations (120,130, 140, 230, 330, 435, 700, DCG, ZG03). N, north.
354 D.C. Gillan et al. / Marine Pollution Bulletin 64 (2012) 353–362
insensitive to high metal loads. This was the case for biomass(Knight et al., 1997; Bååth et al., 1998; Shi et al., 2002; Feriset al., 2003), bacterial diversity (Sorci et al., 1999; Gillan et al.,2005; Bouskill et al., 2010; Pringault et al., 2010) and microbialactivity (Barajas-Aceves, 2005; Magalhães et al., 2007). The authorsof these studies have concluded that the unaffected communitiesmay have become tolerant due to individual acclimation, geneticor physiological adaptation and loss of sensitive species due tolong-term exposure (Gillan et al., 2005; Ogilvie and Grant, 2008;Bouskill et al., 2010). In addition, it was concluded that some ofthese unaffected communities were possibly protected by highconcentrations of organic substances or clays which are knownto complex metals and reduce their bioavailability (Sorci et al.,1999; Bouskill et al., 2010). In some studies, communities withinpolluted environments were even more active, with higher bacte-rial abundances or higher diversities, than the correspondingreference ecosystems (e.g., Feris et al., 2003; Bouskill et al., 2010).
Although the differences observed in the previous studies mightbe explained by differences in methodologies, metal levels and or-ganic complexing substances it is very surprising that for almost allof the mentioned reports, only ex situ approaches have been usedto quantify sediment metals, i.e., approaches in which sedimentsamples were taken in the field and treated in the laboratory. Inaddition, for most of these studies, sediments were not manipu-lated inside nitrogen glove boxes and strong acids were used todetermine total metals. As a result, oxidation artefacts may havebeen present during sampling and the effect of metal speciationwas almost never taken into account. Oxidation artefacts are prob-lematic especially for permanently anaerobic sediments and metalspeciation is important as metals may be found in particles butalso in porewaters. Consequently, our current view about the rela-tionship between metals and microbial communities in sedimentsmight be biased and some of the previously found relationships arepossibly artefactual. This might explain the difficulty to find gen-eral trends in all the above mentioned studies.
Today, in situ approaches are available to quantify dissolvedmetals in sediments. For instance, the DET (diffusive equilibrationin thin-films; Davison et al., 1991) and the DGT (diffusive gradientsin thin-films; Davison and Zhang, 1994) approaches are gel basedtechniques that allow in situ sampling of porewaters while limitingdisturbance of sediments and oxidation artefacts. The DET and DGTprobes are flat plastic devices that are inserted vertically into thesediments and left in place for several hours. The devices containa gel that equilibrates with the adjacent porewater so that concen-trations in the gel and porewater become equal and oxidation arte-facts are minimized (Zhang and Davison, 1999; Stockdale et al.,2009). The gel of the probes is usually constrained within smallcompartments in order to prevent vertical diffusion of the trappedmetals. After the incubation period, probes are removed from sed-iments and metals trapped into the gel are analyzed. A DET probemeasures total dissolved species (free ions, colloids, organic andinorganic complexes). A DGT probe is like a DET probe but a Chelexbinding layer is placed behind the diffusive gel. As a consequence,the DGT approach only measures dissolved species which are suf-ficiently labile to be complexed by the Chelex resin, such as freemetal ions, but does not measures colloids. For both approaches(DET and DGT) the in situ technique only measures dissolved spe-cies with molecular sizes sufficiently smaller than the pore size ofthe hydrogel to allow them to diffuse freely through it (Stockdaleet al., 2009; Gao et al., 2009). Although it’s difficult to determinethe pore size of hydrogels, it is estimated at ±20 nm for DET and±5 nm for DGT (Zhang and Davison, 1999). These gel-based tech-niques give information on ‘‘instantaneous’’ metal levels in pore-waters (i.e., metals at the time of measurement). To quantifymetals inside large particles (i.e., potentially available to organisms
over long periods of time) ex situ methods with strong acid treat-ments are still necessary.
The aim of the present research was to quantify trace metals inporewaters of subtidal marine sediments using direct in situmethods, DET and DGT, and look for possible relationships withtwo frequently used community variables: total bacterial biomass(determined by DAPI counts) and bacterial diversity (taxonomicrichness estimated with the popular DGGE approach). For compar-ison purposes metals were also quantified using two classical exsitu approaches (HCl treatment and porewater extraction bycentrifugation). Our hypothesis is that significant differences willbe observed between the selected ex situ and in situ approaches,at least for some metals, and that in situ approaches will produceresults that are more biologically relevant (for instance, dependingon the concentration level, some metals in porewaters like Mn areessential micronutrients and should therefore be positively corre-lated to biomass, contrary to Cd or Ag which are not known tobe involved in metalloenzymes). In situ approaches are less proneto oxidation artefacts and do not measure metals inside large par-ticles (Stockdale et al., 2009; Gao et al., 2009). As most bacteriaform biofilms on sediment grains or live in porewaters (Epsteinand Rossel, 1995; Gillan and Pernet, 2007), metals inside particlesare not expected to directly influence microbial processes, at leaston the short term and in a stable environment. Consequently,in situ methods might be superior to reveal truer relationshipsbetween dissolved metals and microbial variables in sediments.To our best knowledge, it is the first time that in situ approachesof metal measurement are used in microbial ecology to study bac-terial communities in marine sediments.
2. Materials and methods
2.1. Sediment sampling
Nine subtidal stations were considered in the North Sea on theBelgian Continental Zone (BCZ) on the basis of previous reports(Gillan and Pernet, 2007; Gao et al., 2009) (Fig. 1). Metal contami-nated and relatively unpolluted stations were selected. The coordi-nates of the stations were as follows: 51�11.10N–02�42.07E (120),51�16.25N–02�54.30E (130), 51�19.57N–03�02.93E (140), 51�18.50N–02�51.00E (230), 51�26.00N–02�48.50E (330), 51�34.84N–
D.C. Gillan et al. / Marine Pollution Bulletin 64 (2012) 353–362 355
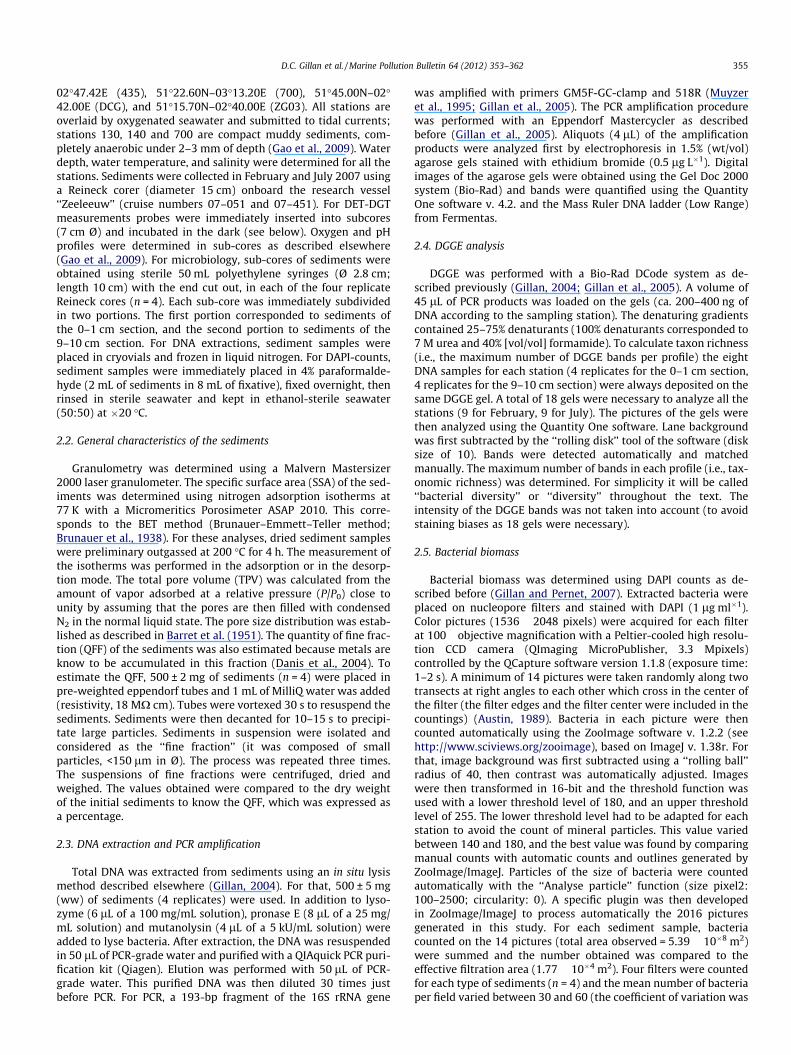
02�47.42E (435), 51�22.60N–03�13.20E (700), 51�45.00N–02�42.00E (DCG), and 51�15.70N–02�40.00E (ZG03). All stations areoverlaid by oxygenated seawater and submitted to tidal currents;stations 130, 140 and 700 are compact muddy sediments, com-pletely anaerobic under 2–3 mm of depth (Gao et al., 2009). Waterdepth, water temperature, and salinity were determined for all thestations. Sediments were collected in February and July 2007 usinga Reineck corer (diameter 15 cm) onboard the research vessel‘‘Zeeleeuw’’ (cruise numbers 07–051 and 07–451). For DET-DGTmeasurements probes were immediately inserted into subcores(7 cm Ø) and incubated in the dark (see below). Oxygen and pHprofiles were determined in sub-cores as described elsewhere(Gao et al., 2009). For microbiology, sub-cores of sediments wereobtained using sterile 50 mL polyethylene syringes (Ø 2.8 cm;length 10 cm) with the end cut out, in each of the four replicateReineck cores (n = 4). Each sub-core was immediately subdividedin two portions. The first portion corresponded to sediments ofthe 0–1 cm section, and the second portion to sediments of the9–10 cm section. For DNA extractions, sediment samples wereplaced in cryovials and frozen in liquid nitrogen. For DAPI-counts,sediment samples were immediately placed in 4% paraformalde-hyde (2 mL of sediments in 8 mL of fixative), fixed overnight, thenrinsed in sterile seawater and kept in ethanol-sterile seawater(50:50) at �20 �C.
2.2. General characteristics of the sediments
Granulometry was determined using a Malvern Mastersizer2000 laser granulometer. The specific surface area (SSA) of the sed-iments was determined using nitrogen adsorption isotherms at77 K with a Micromeritics Porosimeter ASAP 2010. This corre-sponds to the BET method (Brunauer–Emmett–Teller method;Brunauer et al., 1938). For these analyses, dried sediment sampleswere preliminary outgassed at 200 �C for 4 h. The measurement ofthe isotherms was performed in the adsorption or in the desorp-tion mode. The total pore volume (TPV) was calculated from theamount of vapor adsorbed at a relative pressure (P/P0) close tounity by assuming that the pores are then filled with condensedN2 in the normal liquid state. The pore size distribution was estab-lished as described in Barret et al. (1951). The quantity of fine frac-tion (QFF) of the sediments was also estimated because metals areknow to be accumulated in this fraction (Danis et al., 2004). Toestimate the QFF, 500 ± 2 mg of sediments (n = 4) were placed inpre-weighted eppendorf tubes and 1 mL of MilliQ water was added(resistivity, 18 MX cm). Tubes were vortexed 30 s to resuspend thesediments. Sediments were then decanted for 10–15 s to precipi-tate large particles. Sediments in suspension were isolated andconsidered as the ‘‘fine fraction’’ (it was composed of smallparticles, <150 lm in Ø). The process was repeated three times.The suspensions of fine fractions were centrifuged, dried andweighed. The values obtained were compared to the dry weightof the initial sediments to know the QFF, which was expressed asa percentage.
2.3. DNA extraction and PCR amplification
Total DNA was extracted from sediments using an in situ lysismethod described elsewhere (Gillan, 2004). For that, 500 ± 5 mg(ww) of sediments (4 replicates) were used. In addition to lyso-zyme (6 lL of a 100 mg/mL solution), pronase E (8 lL of a 25 mg/mL solution) and mutanolysin (4 lL of a 5 kU/mL solution) wereadded to lyse bacteria. After extraction, the DNA was resuspendedin 50 lL of PCR-grade water and purified with a QIAquick PCR puri-fication kit (Qiagen). Elution was performed with 50 lL of PCR-grade water. This purified DNA was then diluted 30 times justbefore PCR. For PCR, a 193-bp fragment of the 16S rRNA gene
was amplified with primers GM5F-GC-clamp and 518R (Muyzeret al., 1995; Gillan et al., 2005). The PCR amplification procedurewas performed with an Eppendorf Mastercycler as describedbefore (Gillan et al., 2005). Aliquots (4 lL) of the amplificationproducts were analyzed first by electrophoresis in 1.5% (wt/vol)agarose gels stained with ethidium bromide (0.5 lg L�1). Digitalimages of the agarose gels were obtained using the Gel Doc 2000system (Bio-Rad) and bands were quantified using the QuantityOne software v. 4.2. and the Mass Ruler DNA ladder (Low Range)from Fermentas.
2.4. DGGE analysis
DGGE was performed with a Bio-Rad DCode system as de-scribed previously (Gillan, 2004; Gillan et al., 2005). A volume of45 lL of PCR products was loaded on the gels (ca. 200–400 ng ofDNA according to the sampling station). The denaturing gradientscontained 25–75% denaturants (100% denaturants corresponded to7 M urea and 40% [vol/vol] formamide). To calculate taxon richness(i.e., the maximum number of DGGE bands per profile) the eightDNA samples for each station (4 replicates for the 0–1 cm section,4 replicates for the 9–10 cm section) were always deposited on thesame DGGE gel. A total of 18 gels were necessary to analyze all thestations (9 for February, 9 for July). The pictures of the gels werethen analyzed using the Quantity One software. Lane backgroundwas first subtracted by the ‘‘rolling disk’’ tool of the software (disksize of 10). Bands were detected automatically and matchedmanually. The maximum number of bands in each profile (i.e., tax-onomic richness) was determined. For simplicity it will be called‘‘bacterial diversity’’ or ‘‘diversity’’ throughout the text. Theintensity of the DGGE bands was not taken into account (to avoidstaining biases as 18 gels were necessary).
2.5. Bacterial biomass
Bacterial biomass was determined using DAPI counts as de-scribed before (Gillan and Pernet, 2007). Extracted bacteria wereplaced on nucleopore filters and stained with DAPI (1 lg ml�1).Color pictures (1536 � 2048 pixels) were acquired for each filterat 100� objective magnification with a Peltier-cooled high resolu-tion CCD camera (QImaging MicroPublisher, 3.3 Mpixels)controlled by the QCapture software version 1.1.8 (exposure time:1–2 s). A minimum of 14 pictures were taken randomly along twotransects at right angles to each other which cross in the center ofthe filter (the filter edges and the filter center were included in thecountings) (Austin, 1989). Bacteria in each picture were thencounted automatically using the ZooImage software v. 1.2.2 (seehttp://www.sciviews.org/zooimage), based on ImageJ v. 1.38r. Forthat, image background was first subtracted using a ‘‘rolling ball’’radius of 40, then contrast was automatically adjusted. Imageswere then transformed in 16-bit and the threshold function wasused with a lower threshold level of 180, and an upper thresholdlevel of 255. The lower threshold level had to be adapted for eachstation to avoid the count of mineral particles. This value variedbetween 140 and 180, and the best value was found by comparingmanual counts with automatic counts and outlines generated byZooImage/ImageJ. Particles of the size of bacteria were countedautomatically with the ‘‘Analyse particle’’ function (size pixel2:100–2500; circularity: 0). A specific plugin was then developedin ZooImage/ImageJ to process automatically the 2016 picturesgenerated in this study. For each sediment sample, bacteriacounted on the 14 pictures (total area observed = 5.39 � 10�8 m2)were summed and the number obtained was compared to theeffective filtration area (1.77 � 10�4 m2). Four filters were countedfor each type of sediments (n = 4) and the mean number of bacteriaper field varied between 30 and 60 (the coefficient of variation was
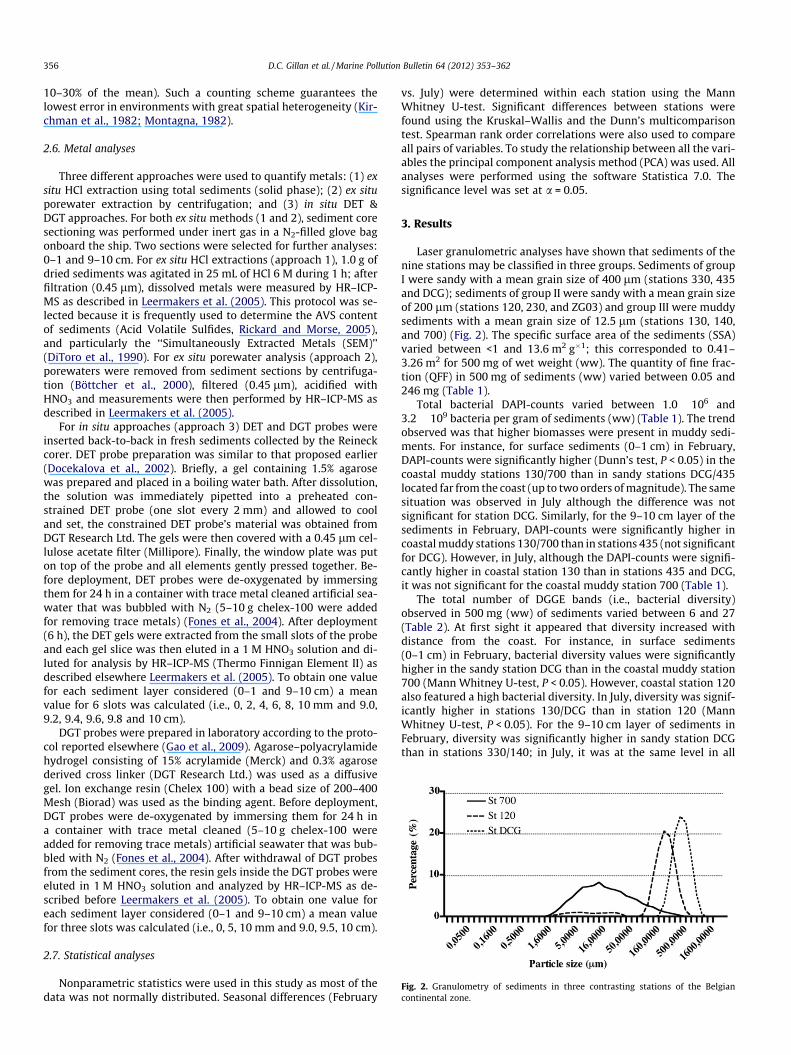
Fig. 2. Granulometry of sediments in three contrasting stations of the Belgiancontinental zone.
356 D.C. Gillan et al. / Marine Pollution Bulletin 64 (2012) 353–362
10–30% of the mean). Such a counting scheme guarantees thelowest error in environments with great spatial heterogeneity (Kir-chman et al., 1982; Montagna, 1982).
2.6. Metal analyses
Three different approaches were used to quantify metals: (1) exsitu HCl extraction using total sediments (solid phase); (2) ex situporewater extraction by centrifugation; and (3) in situ DET &DGT approaches. For both ex situ methods (1 and 2), sediment coresectioning was performed under inert gas in a N2-filled glove bagonboard the ship. Two sections were selected for further analyses:0–1 and 9–10 cm. For ex situ HCl extractions (approach 1), 1.0 g ofdried sediments was agitated in 25 mL of HCl 6 M during 1 h; afterfiltration (0.45 lm), dissolved metals were measured by HR–ICP-MS as described in Leermakers et al. (2005). This protocol was se-lected because it is frequently used to determine the AVS contentof sediments (Acid Volatile Sulfides, Rickard and Morse, 2005),and particularly the ‘‘Simultaneously Extracted Metals (SEM)’’(DiToro et al., 1990). For ex situ porewater analysis (approach 2),porewaters were removed from sediment sections by centrifuga-tion (Böttcher et al., 2000), filtered (0.45 lm), acidified withHNO3 and measurements were then performed by HR–ICP-MS asdescribed in Leermakers et al. (2005).
For in situ approaches (approach 3) DET and DGT probes wereinserted back-to-back in fresh sediments collected by the Reineckcorer. DET probe preparation was similar to that proposed earlier(Docekalova et al., 2002). Briefly, a gel containing 1.5% agarosewas prepared and placed in a boiling water bath. After dissolution,the solution was immediately pipetted into a preheated con-strained DET probe (one slot every 2 mm) and allowed to cooland set, the constrained DET probe’s material was obtained fromDGT Research Ltd. The gels were then covered with a 0.45 lm cel-lulose acetate filter (Millipore). Finally, the window plate was puton top of the probe and all elements gently pressed together. Be-fore deployment, DET probes were de-oxygenated by immersingthem for 24 h in a container with trace metal cleaned artificial sea-water that was bubbled with N2 (5–10 g chelex-100 were addedfor removing trace metals) (Fones et al., 2004). After deployment(6 h), the DET gels were extracted from the small slots of the probeand each gel slice was then eluted in a 1 M HNO3 solution and di-luted for analysis by HR–ICP-MS (Thermo Finnigan Element II) asdescribed elsewhere Leermakers et al. (2005). To obtain one valuefor each sediment layer considered (0–1 and 9–10 cm) a meanvalue for 6 slots was calculated (i.e., 0, 2, 4, 6, 8, 10 mm and 9.0,9.2, 9.4, 9.6, 9.8 and 10 cm).
DGT probes were prepared in laboratory according to the proto-col reported elsewhere (Gao et al., 2009). Agarose–polyacrylamidehydrogel consisting of 15% acrylamide (Merck) and 0.3% agarosederived cross linker (DGT Research Ltd.) was used as a diffusivegel. Ion exchange resin (Chelex 100) with a bead size of 200–400Mesh (Biorad) was used as the binding agent. Before deployment,DGT probes were de-oxygenated by immersing them for 24 h ina container with trace metal cleaned (5–10 g chelex-100 wereadded for removing trace metals) artificial seawater that was bub-bled with N2 (Fones et al., 2004). After withdrawal of DGT probesfrom the sediment cores, the resin gels inside the DGT probes wereeluted in 1 M HNO3 solution and analyzed by HR–ICP-MS as de-scribed before Leermakers et al. (2005). To obtain one value foreach sediment layer considered (0–1 and 9–10 cm) a mean valuefor three slots was calculated (i.e., 0, 5, 10 mm and 9.0, 9.5, 10 cm).
2.7. Statistical analyses
Nonparametric statistics were used in this study as most of thedata was not normally distributed. Seasonal differences (February
vs. July) were determined within each station using the MannWhitney U-test. Significant differences between stations werefound using the Kruskal–Wallis and the Dunn’s multicomparisontest. Spearman rank order correlations were also used to compareall pairs of variables. To study the relationship between all the vari-ables the principal component analysis method (PCA) was used. Allanalyses were performed using the software Statistica 7.0. Thesignificance level was set at a = 0.05.
3. Results
Laser granulometric analyses have shown that sediments of thenine stations may be classified in three groups. Sediments of groupI were sandy with a mean grain size of 400 lm (stations 330, 435and DCG); sediments of group II were sandy with a mean grain sizeof 200 lm (stations 120, 230, and ZG03) and group III were muddysediments with a mean grain size of 12.5 lm (stations 130, 140,and 700) (Fig. 2). The specific surface area of the sediments (SSA)varied between <1 and 13.6 m2 g�1; this corresponded to 0.41–3.26 m2 for 500 mg of wet weight (ww). The quantity of fine frac-tion (QFF) in 500 mg of sediments (ww) varied between 0.05 and246 mg (Table 1).
Total bacterial DAPI-counts varied between 1.0 � 106 and3.2 � 109 bacteria per gram of sediments (ww) (Table 1). The trendobserved was that higher biomasses were present in muddy sedi-ments. For instance, for surface sediments (0–1 cm) in February,DAPI-counts were significantly higher (Dunn’s test, P < 0.05) in thecoastal muddy stations 130/700 than in sandy stations DCG/435located far from the coast (up to two orders of magnitude). The samesituation was observed in July although the difference was notsignificant for station DCG. Similarly, for the 9–10 cm layer of thesediments in February, DAPI-counts were significantly higher incoastal muddy stations 130/700 than in stations 435 (not significantfor DCG). However, in July, although the DAPI-counts were signifi-cantly higher in coastal station 130 than in stations 435 and DCG,it was not significant for the coastal muddy station 700 (Table 1).
The total number of DGGE bands (i.e., bacterial diversity)observed in 500 mg (ww) of sediments varied between 6 and 27(Table 2). At first sight it appeared that diversity increased withdistance from the coast. For instance, in surface sediments(0–1 cm) in February, bacterial diversity values were significantlyhigher in the sandy station DCG than in the coastal muddy station700 (Mann Whitney U-test, P < 0.05). However, coastal station 120also featured a high bacterial diversity. In July, diversity was signif-icantly higher in stations 130/DCG than in station 120 (MannWhitney U-test, P < 0.05). For the 9–10 cm layer of sediments inFebruary, diversity was significantly higher in sandy station DCGthan in stations 330/140; in July, it was at the same level in all
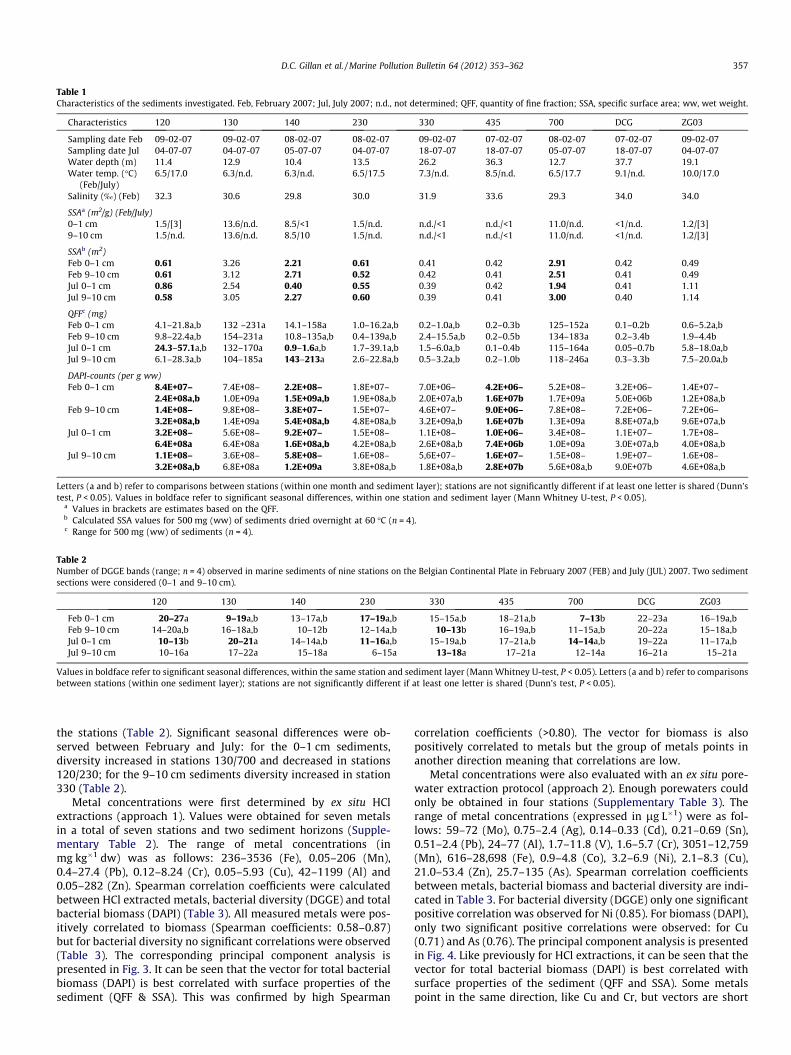
Table 1Characteristics of the sediments investigated. Feb, February 2007; Jul, July 2007; n.d., not determined; QFF, quantity of fine fraction; SSA, specific surface area; ww, wet weight.
Characteristics 120 130 140 230 330 435 700 DCG ZG03
Sampling date Feb 09-02-07 09-02-07 08-02-07 08-02-07 09-02-07 07-02-07 08-02-07 07-02-07 09-02-07Sampling date Jul 04-07-07 04-07-07 05-07-07 04-07-07 18-07-07 18-07-07 05-07-07 18-07-07 04-07-07Water depth (m) 11.4 12.9 10.4 13.5 26.2 36.3 12.7 37.7 19.1Water temp. (�C)
(Feb/July)6.5/17.0 6.3/n.d. 6.3/n.d. 6.5/17.5 7.3/n.d. 8.5/n.d. 6.5/17.7 9.1/n.d. 10.0/17.0
Salinity (‰) (Feb) 32.3 30.6 29.8 30.0 31.9 33.6 29.3 34.0 34.0
SSAa (m2/g) (Feb/July)0–1 cm 1.5/[3] 13.6/n.d. 8.5/<1 1.5/n.d. n.d./<1 n.d./<1 11.0/n.d. <1/n.d. 1.2/[3]9–10 cm 1.5/n.d. 13.6/n.d. 8.5/10 1.5/n.d. n.d./<1 n.d./<1 11.0/n.d. <1/n.d. 1.2/[3]
SSAb (m2)Feb 0–1 cm 0.61 3.26 2.21 0.61 0.41 0.42 2.91 0.42 0.49Feb 9–10 cm 0.61 3.12 2.71 0.52 0.42 0.41 2.51 0.41 0.49Jul 0–1 cm 0.86 2.54 0.40 0.55 0.39 0.42 1.94 0.41 1.11Jul 9–10 cm 0.58 3.05 2.27 0.60 0.39 0.41 3.00 0.40 1.14
QFFc (mg)Feb 0–1 cm 4.1–21.8a,b 132 –231a 14.1–158a 1.0–16.2a,b 0.2–1.0a,b 0.2–0.3b 125–152a 0.1–0.2b 0.6–5.2a,bFeb 9–10 cm 9.8–22.4a,b 154–231a 10.8–135a,b 0.4–139a,b 2.4–15.5a,b 0.2–0.5b 134–183a 0.2–3.4b 1.9–4.4bJul 0–1 cm 24.3–57.1a,b 132–170a 0.9–1.6a,b 1.7–39.1a,b 1.5–6.0a,b 0.1–0.4b 115–164a 0.05–0.7b 5.8–18.0a,bJul 9–10 cm 6.1–28.3a,b 104–185a 143–213a 2.6–22.8a,b 0.5–3.2a,b 0.2–1.0b 118–246a 0.3–3.3b 7.5–20.0a,b
DAPI-counts (per g ww)Feb 0–1 cm 8.4E+07–
2.4E+08a,b7.4E+08–1.0E+09a
2.2E+08–1.5E+09a,b
1.8E+07–1.9E+08a,b
7.0E+06–2.0E+07a,b
4.2E+06–1.6E+07b
5.2E+08–1.7E+09a
3.2E+06–5.0E+06b
1.4E+07–1.2E+08a,b
Feb 9–10 cm 1.4E+08–3.2E+08a,b
9.8E+08–1.4E+09a
3.8E+07–5.4E+08a,b
1.5E+07–4.8E+08a,b
4.6E+07–3.2E+09a,b
9.0E+06–1.6E+07b
7.8E+08–1.3E+09a
7.2E+06–8.8E+07a,b
7.2E+06–9.6E+07a,b
Jul 0–1 cm 3.2E+08–6.4E+08a
5.6E+08–6.4E+08a
9.2E+07–1.6E+08a,b
1.5E+08–4.2E+08a,b
1.1E+08–2.6E+08a,b
1.0E+06–7.4E+06b
3.4E+08–1.0E+09a
1.1E+07–3.0E+07a,b
1.7E+08–4.0E+08a,b
Jul 9–10 cm 1.1E+08–3.2E+08a,b
3.6E+08–6.8E+08a
5.8E+08–1.2E+09a
1.6E+08–3.8E+08a,b
5,6E+07–1.8E+08a,b
1.6E+07–2.8E+07b
1.5E+08–5.6E+08a,b
1.9E+07–9.0E+07b
1.6E+08–4.6E+08a,b
Letters (a and b) refer to comparisons between stations (within one month and sediment layer); stations are not significantly different if at least one letter is shared (Dunn’stest, P < 0.05). Values in boldface refer to significant seasonal differences, within one station and sediment layer (Mann Whitney U-test, P < 0.05).
a Values in brackets are estimates based on the QFF.b Calculated SSA values for 500 mg (ww) of sediments dried overnight at 60 �C (n = 4).c Range for 500 mg (ww) of sediments (n = 4).
Table 2Number of DGGE bands (range; n = 4) observed in marine sediments of nine stations on the Belgian Continental Plate in February 2007 (FEB) and July (JUL) 2007. Two sedimentsections were considered (0–1 and 9–10 cm).
120 130 140 230 330 435 700 DCG ZG03
Feb 0–1 cm 20–27a 9–19a,b 13–17a,b 17–19a,b 15–15a,b 18–21a,b 7–13b 22–23a 16–19a,bFeb 9–10 cm 14–20a,b 16–18a,b 10–12b 12–14a,b 10–13b 16–19a,b 11–15a,b 20–22a 15–18a,bJul 0–1 cm 10–13b 20–21a 14–14a,b 11–16a,b 15–19a,b 17–21a,b 14–14a,b 19–22a 11–17a,bJul 9–10 cm 10–16a 17–22a 15–18a 6–15a 13–18a 17–21a 12–14a 16–21a 15–21a
Values in boldface refer to significant seasonal differences, within the same station and sediment layer (Mann Whitney U-test, P < 0.05). Letters (a and b) refer to comparisonsbetween stations (within one sediment layer); stations are not significantly different if at least one letter is shared (Dunn’s test, P < 0.05).
D.C. Gillan et al. / Marine Pollution Bulletin 64 (2012) 353–362 357
the stations (Table 2). Significant seasonal differences were ob-served between February and July: for the 0–1 cm sediments,diversity increased in stations 130/700 and decreased in stations120/230; for the 9–10 cm sediments diversity increased in station330 (Table 2).
Metal concentrations were first determined by ex situ HClextractions (approach 1). Values were obtained for seven metalsin a total of seven stations and two sediment horizons (Supple-mentary Table 2). The range of metal concentrations (inmg kg�1 dw) was as follows: 236–3536 (Fe), 0.05–206 (Mn),0.4–27.4 (Pb), 0.12–8.24 (Cr), 0.05–5.93 (Cu), 42–1199 (Al) and0.05–282 (Zn). Spearman correlation coefficients were calculatedbetween HCl extracted metals, bacterial diversity (DGGE) and totalbacterial biomass (DAPI) (Table 3). All measured metals were pos-itively correlated to biomass (Spearman coefficients: 0.58–0.87)but for bacterial diversity no significant correlations were observed(Table 3). The corresponding principal component analysis ispresented in Fig. 3. It can be seen that the vector for total bacterialbiomass (DAPI) is best correlated with surface properties of thesediment (QFF & SSA). This was confirmed by high Spearman
correlation coefficients (>0.80). The vector for biomass is alsopositively correlated to metals but the group of metals points inanother direction meaning that correlations are low.
Metal concentrations were also evaluated with an ex situ pore-water extraction protocol (approach 2). Enough porewaters couldonly be obtained in four stations (Supplementary Table 3). Therange of metal concentrations (expressed in lg L�1) were as fol-lows: 59–72 (Mo), 0.75–2.4 (Ag), 0.14–0.33 (Cd), 0.21–0.69 (Sn),0.51–2.4 (Pb), 24–77 (Al), 1.7–11.8 (V), 1.6–5.7 (Cr), 3051–12,759(Mn), 616–28,698 (Fe), 0.9–4.8 (Co), 3.2–6.9 (Ni), 2.1–8.3 (Cu),21.0–53.4 (Zn), 25.7–135 (As). Spearman correlation coefficientsbetween metals, bacterial biomass and bacterial diversity are indi-cated in Table 3. For bacterial diversity (DGGE) only one significantpositive correlation was observed for Ni (0.85). For biomass (DAPI),only two significant positive correlations were observed: for Cu(0.71) and As (0.76). The principal component analysis is presentedin Fig. 4. Like previously for HCl extractions, it can be seen that thevector for total bacterial biomass (DAPI) is best correlated withsurface properties of the sediment (QFF and SSA). Some metalspoint in the same direction, like Cu and Cr, but vectors are short
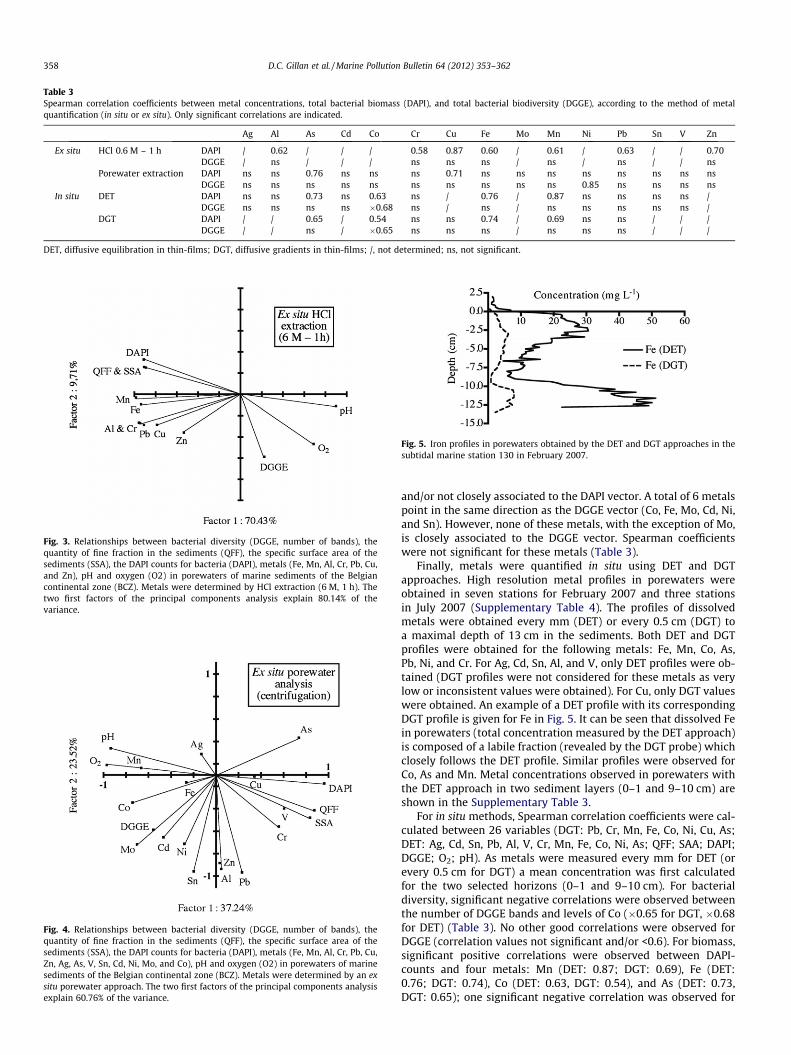
Table 3Spearman correlation coefficients between metal concentrations, total bacterial biomass (DAPI), and total bacterial biodiversity (DGGE), according to the method of metalquantification (in situ or ex situ). Only significant correlations are indicated.
Ag Al As Cd Co Cr Cu Fe Mo Mn Ni Pb Sn V Zn
Ex situ HCl 0.6 M – 1 h DAPI / 0.62 / / / 0.58 0.87 0.60 / 0.61 / 0.63 / / 0.70DGGE / ns / / / ns ns ns / ns / ns / / ns
Porewater extraction DAPI ns ns 0.76 ns ns ns 0.71 ns ns ns ns ns ns ns nsDGGE ns ns ns ns ns ns ns ns ns ns 0.85 ns ns ns ns
In situ DET DAPI ns ns 0.73 ns 0.63 ns / 0.76 / 0.87 ns ns ns ns /DGGE ns ns ns ns �0.68 ns / ns / ns ns ns ns ns /
DGT DAPI / / 0.65 / 0.54 ns ns 0.74 / 0.69 ns ns / / /DGGE / / ns / �0.65 ns ns ns / ns ns ns / / /
DET, diffusive equilibration in thin-films; DGT, diffusive gradients in thin-films; /, not determined; ns, not significant.
Fig. 3. Relationships between bacterial diversity (DGGE, number of bands), thequantity of fine fraction in the sediments (QFF), the specific surface area of thesediments (SSA), the DAPI counts for bacteria (DAPI), metals (Fe, Mn, Al, Cr, Pb, Cu,and Zn), pH and oxygen (O2) in porewaters of marine sediments of the Belgiancontinental zone (BCZ). Metals were determined by HCl extraction (6 M, 1 h). Thetwo first factors of the principal components analysis explain 80.14% of thevariance.
Fig. 4. Relationships between bacterial diversity (DGGE, number of bands), thequantity of fine fraction in the sediments (QFF), the specific surface area of thesediments (SSA), the DAPI counts for bacteria (DAPI), metals (Fe, Mn, Al, Cr, Pb, Cu,Zn, Ag, As, V, Sn, Cd, Ni, Mo, and Co), pH and oxygen (O2) in porewaters of marinesediments of the Belgian continental zone (BCZ). Metals were determined by an exsitu porewater approach. The two first factors of the principal components analysisexplain 60.76% of the variance.
Fig. 5. Iron profiles in porewaters obtained by the DET and DGT approaches in thesubtidal marine station 130 in February 2007.
358 D.C. Gillan et al. / Marine Pollution Bulletin 64 (2012) 353–362
and/or not closely associated to the DAPI vector. A total of 6 metalspoint in the same direction as the DGGE vector (Co, Fe, Mo, Cd, Ni,and Sn). However, none of these metals, with the exception of Mo,is closely associated to the DGGE vector. Spearman coefficientswere not significant for these metals (Table 3).
Finally, metals were quantified in situ using DET and DGTapproaches. High resolution metal profiles in porewaters wereobtained in seven stations for February 2007 and three stationsin July 2007 (Supplementary Table 4). The profiles of dissolvedmetals were obtained every mm (DET) or every 0.5 cm (DGT) toa maximal depth of 13 cm in the sediments. Both DET and DGTprofiles were obtained for the following metals: Fe, Mn, Co, As,Pb, Ni, and Cr. For Ag, Cd, Sn, Al, and V, only DET profiles were ob-tained (DGT profiles were not considered for these metals as verylow or inconsistent values were obtained). For Cu, only DGT valueswere obtained. An example of a DET profile with its correspondingDGT profile is given for Fe in Fig. 5. It can be seen that dissolved Fein porewaters (total concentration measured by the DET approach)is composed of a labile fraction (revealed by the DGT probe) whichclosely follows the DET profile. Similar profiles were observed forCo, As and Mn. Metal concentrations observed in porewaters withthe DET approach in two sediment layers (0–1 and 9–10 cm) areshown in the Supplementary Table 3.
For in situ methods, Spearman correlation coefficients were cal-culated between 26 variables (DGT: Pb, Cr, Mn, Fe, Co, Ni, Cu, As;DET: Ag, Cd, Sn, Pb, Al, V, Cr, Mn, Fe, Co, Ni, As; QFF; SAA; DAPI;DGGE; O2; pH). As metals were measured every mm for DET (orevery 0.5 cm for DGT) a mean concentration was first calculatedfor the two selected horizons (0–1 and 9–10 cm). For bacterialdiversity, significant negative correlations were observed betweenthe number of DGGE bands and levels of Co (�0.65 for DGT, �0.68for DET) (Table 3). No other good correlations were observed forDGGE (correlation values not significant and/or <0.6). For biomass,significant positive correlations were observed between DAPI-counts and four metals: Mn (DET: 0.87; DGT: 0.69), Fe (DET:0.76; DGT: 0.74), Co (DET: 0.63, DGT: 0.54), and As (DET: 0.73,DGT: 0.65); one significant negative correlation was observed for
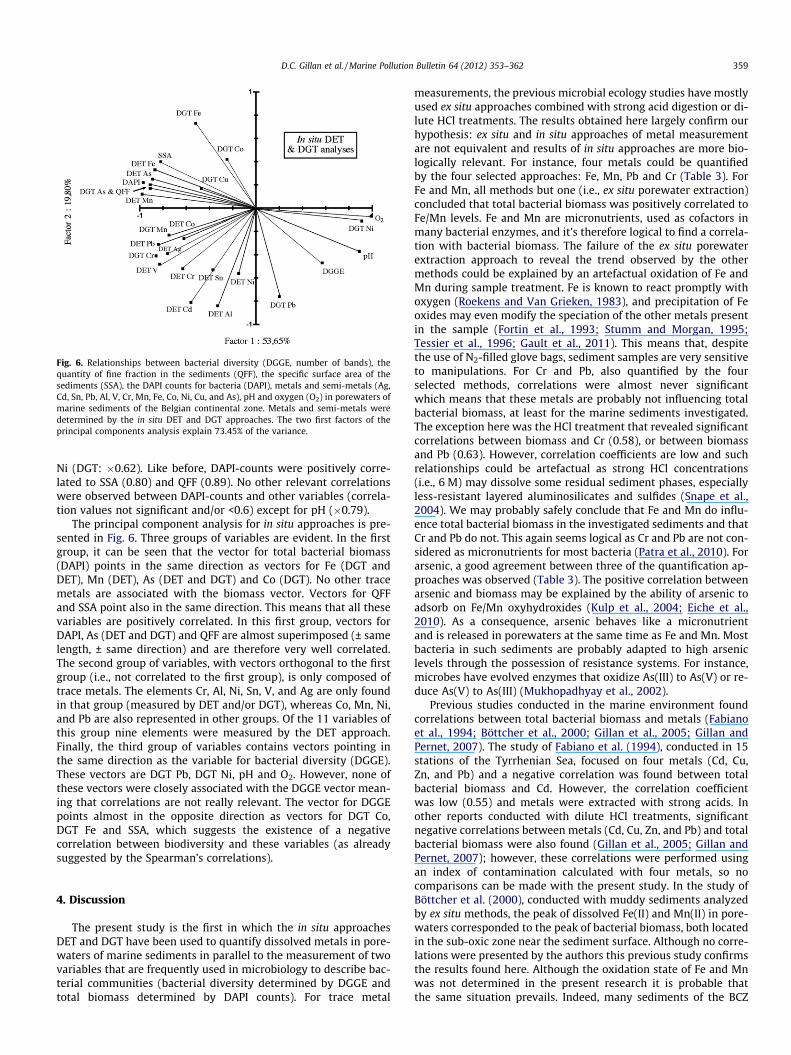
Fig. 6. Relationships between bacterial diversity (DGGE, number of bands), thequantity of fine fraction in the sediments (QFF), the specific surface area of thesediments (SSA), the DAPI counts for bacteria (DAPI), metals and semi-metals (Ag,Cd, Sn, Pb, Al, V, Cr, Mn, Fe, Co, Ni, Cu, and As), pH and oxygen (O2) in porewaters ofmarine sediments of the Belgian continental zone. Metals and semi-metals weredetermined by the in situ DET and DGT approaches. The two first factors of theprincipal components analysis explain 73.45% of the variance.
D.C. Gillan et al. / Marine Pollution Bulletin 64 (2012) 353–362 359
Ni (DGT: �0.62). Like before, DAPI-counts were positively corre-lated to SSA (0.80) and QFF (0.89). No other relevant correlationswere observed between DAPI-counts and other variables (correla-tion values not significant and/or <0.6) except for pH (�0.79).
The principal component analysis for in situ approaches is pre-sented in Fig. 6. Three groups of variables are evident. In the firstgroup, it can be seen that the vector for total bacterial biomass(DAPI) points in the same direction as vectors for Fe (DGT andDET), Mn (DET), As (DET and DGT) and Co (DGT). No other tracemetals are associated with the biomass vector. Vectors for QFFand SSA point also in the same direction. This means that all thesevariables are positively correlated. In this first group, vectors forDAPI, As (DET and DGT) and QFF are almost superimposed (± samelength, ± same direction) and are therefore very well correlated.The second group of variables, with vectors orthogonal to the firstgroup (i.e., not correlated to the first group), is only composed oftrace metals. The elements Cr, Al, Ni, Sn, V, and Ag are only foundin that group (measured by DET and/or DGT), whereas Co, Mn, Ni,and Pb are also represented in other groups. Of the 11 variables ofthis group nine elements were measured by the DET approach.Finally, the third group of variables contains vectors pointing inthe same direction as the variable for bacterial diversity (DGGE).These vectors are DGT Pb, DGT Ni, pH and O2. However, none ofthese vectors were closely associated with the DGGE vector mean-ing that correlations are not really relevant. The vector for DGGEpoints almost in the opposite direction as vectors for DGT Co,DGT Fe and SSA, which suggests the existence of a negativecorrelation between biodiversity and these variables (as alreadysuggested by the Spearman’s correlations).
4. Discussion
The present study is the first in which the in situ approachesDET and DGT have been used to quantify dissolved metals in pore-waters of marine sediments in parallel to the measurement of twovariables that are frequently used in microbiology to describe bac-terial communities (bacterial diversity determined by DGGE andtotal biomass determined by DAPI counts). For trace metal
measurements, the previous microbial ecology studies have mostlyused ex situ approaches combined with strong acid digestion or di-lute HCl treatments. The results obtained here largely confirm ourhypothesis: ex situ and in situ approaches of metal measurementare not equivalent and results of in situ approaches are more bio-logically relevant. For instance, four metals could be quantifiedby the four selected approaches: Fe, Mn, Pb and Cr (Table 3). ForFe and Mn, all methods but one (i.e., ex situ porewater extraction)concluded that total bacterial biomass was positively correlated toFe/Mn levels. Fe and Mn are micronutrients, used as cofactors inmany bacterial enzymes, and it’s therefore logical to find a correla-tion with bacterial biomass. The failure of the ex situ porewaterextraction approach to reveal the trend observed by the othermethods could be explained by an artefactual oxidation of Fe andMn during sample treatment. Fe is known to react promptly withoxygen (Roekens and Van Grieken, 1983), and precipitation of Feoxides may even modify the speciation of the other metals presentin the sample (Fortin et al., 1993; Stumm and Morgan, 1995;Tessier et al., 1996; Gault et al., 2011). This means that, despitethe use of N2-filled glove bags, sediment samples are very sensitiveto manipulations. For Cr and Pb, also quantified by the fourselected methods, correlations were almost never significantwhich means that these metals are probably not influencing totalbacterial biomass, at least for the marine sediments investigated.The exception here was the HCl treatment that revealed significantcorrelations between biomass and Cr (0.58), or between biomassand Pb (0.63). However, correlation coefficients are low and suchrelationships could be artefactual as strong HCl concentrations(i.e., 6 M) may dissolve some residual sediment phases, especiallyless-resistant layered aluminosilicates and sulfides (Snape et al.,2004). We may probably safely conclude that Fe and Mn do influ-ence total bacterial biomass in the investigated sediments and thatCr and Pb do not. This again seems logical as Cr and Pb are not con-sidered as micronutrients for most bacteria (Patra et al., 2010). Forarsenic, a good agreement between three of the quantification ap-proaches was observed (Table 3). The positive correlation betweenarsenic and biomass may be explained by the ability of arsenic toadsorb on Fe/Mn oxyhydroxides (Kulp et al., 2004; Eiche et al.,2010). As a consequence, arsenic behaves like a micronutrientand is released in porewaters at the same time as Fe and Mn. Mostbacteria in such sediments are probably adapted to high arseniclevels through the possession of resistance systems. For instance,microbes have evolved enzymes that oxidize As(III) to As(V) or re-duce As(V) to As(III) (Mukhopadhyay et al., 2002).
Previous studies conducted in the marine environment foundcorrelations between total bacterial biomass and metals (Fabianoet al., 1994; Böttcher et al., 2000; Gillan et al., 2005; Gillan andPernet, 2007). The study of Fabiano et al. (1994), conducted in 15stations of the Tyrrhenian Sea, focused on four metals (Cd, Cu,Zn, and Pb) and a negative correlation was found between totalbacterial biomass and Cd. However, the correlation coefficientwas low (0.55) and metals were extracted with strong acids. Inother reports conducted with dilute HCl treatments, significantnegative correlations between metals (Cd, Cu, Zn, and Pb) and totalbacterial biomass were also found (Gillan et al., 2005; Gillan andPernet, 2007); however, these correlations were performed usingan index of contamination calculated with four metals, so nocomparisons can be made with the present study. In the study ofBöttcher et al. (2000), conducted with muddy sediments analyzedby ex situ methods, the peak of dissolved Fe(II) and Mn(II) in pore-waters corresponded to the peak of bacterial biomass, both locatedin the sub-oxic zone near the sediment surface. Although no corre-lations were presented by the authors this previous study confirmsthe results found here. Although the oxidation state of Fe and Mnwas not determined in the present research it is probable thatthe same situation prevails. Indeed, many sediments of the BCZ
360 D.C. Gillan et al. / Marine Pollution Bulletin 64 (2012) 353–362
are anaerobic after a few mm; consequently, peaks of Fe and Mnobserved at ca. �2.5 cm (Fig. 5) probably represent reduced species(Gao et al., 2009). Porewaters are known to mirror the biogeo-chemical pathways of the sediments. Organic matter is degradedin marine sediments by microorganisms using oxygen and otherelectron acceptors such as Mn(IV) and Fe(III) oxyhydroxides(Burdige, 1993). The anaerobic respiration of the organic matterleads to the production of soluble Mn(II) and Fe(II) in porewaters.The reduction of these oxides also liberates co-precipitated metalslike As and Co. Indeed, Fe/Mn oxyhydroxides are important sor-bents for a range of metal(loid)s and often play a critical role inregulating the dissolved concentration of such elements in naturalwaters (Fortin et al., 1993; Stumm and Morgan, 1995; Tessier et al.,1996; Gault et al., 2011). For instance, Mn oxide phases are knownto be enriched in Co (Moffett and Ho, 1996). The porewaterconcentration of Co may thus be increased when bacteria activelyreduce Fe and Mn oxyhydroxides. And this was observed in thisstudy: As and Co were both positively correlated with total bacte-rial biomass (Table 3). A close correspondence between dissolvedMn and Co profiles in sediments has also been observed in otherstudies (Fones et al., 2004). In addition, Co is an essential micronu-trient for many bacteria, for example as a cofactor in vitamin B12and at trace concentrations Co is also acting as a growth stimulant(Gikas, 2008). As mentioned above, arsenic is known to be enrichedin Fe oxyhydroxide coatings (Kulp et al., 2004; Eiche et al., 2010). Inaddition, microbial redox transformations of arsenic between theAs(V) and As(III) species are known (Mukhopadhyay et al., 2002)and many prokaryotes are able to gain energy for growth frommetabolic reactions involving arsenic (Oremland and Stolz,2003). As a result, it’s again not surprising to find high bacterialbiomasses with high dissolved arsenic levels in porewaters ofmarine sediments. Once in porewaters, Mn, Co, and As may evendiffuse out of the sediments into the overlying waters, for instanceduring the mineralization of freshly deposited phytodetritus onmuddy sediments (Fones et al., 2004; Sullivan and Aller, 1996;Gillan et al., submitted for publication).
The relationship between dissolved Mn and total bacterial bio-mass is different according to the considered in situ approach (DETor DGT). Labile Mn (i.e., free Mn(II) ions) measured by DGT was lesscorrelated to total bacterial biomass than total dissolved Mnmeasured by DET (i.e., mostly Mn(IV) colloids or large organic com-plexes) which displayed the highest correlation coefficient found inthis study (0.87). This finding is in agreement with many previousreports pointing out to the ability of microorganisms to bind sur-faces and particularly Fe/Mn oxyhydroxide colloids (e.g., Ehrlich,1990; Mills et al., 1994; Gillan and De Ridder, 2001; Chan et al.,2009). This was also noted in the study of Böttcher et al. (2000)where a positive relationship seemed to exist between theabundance of bacteria and the amount of phyllosilicates. This rela-tionship indicates that solid interfaces may play a role in determin-ing the abundance of bacteria in the sediments, probably via theavailability of organic compounds and their fermentation products,and of iron and manganese compounds (Böttcher et al. 2000). Inthe present study, Fe was positively correlated to bacterial biomassboth with DET and DGT approaches. This indicates that bacterialbiomass may be controlled by labile Fe(II) ions but also by Fe(III)oxyhydroxide colloids in porewaters.
For bacterial diversity, no significant relationships were foundwith metals quantified by the four approaches (i.e., Fe, Mn, Cr,and Pb). On the contrary, significant relationships were found forCo and Ni, quantified by only two approaches, and differencesbetween these two approaches were observed. For instance, Comeasured by DET/DGT displayed a significant negative correlationwith diversity but the relationship was not significant for ex situporewater extraction. Similarly, Ni measured by the ex situporewater extraction approach displayed a significant positive
correlation with diversity but no significant relationship was foundby the DET/DGT approach (Table 3). A negative relationship withCo might reflect its toxicity in porewaters at high concentrationsfor most bacteria. Like all essential elements, Co often stimulatemicrobial growth at relatively low concentrations and is toxic athigh concentrations (Gikas, 2008). However, care should be takenas correlation coefficients were moderate (–0.65 for DGT, –0.68for DET). In addition, Co levels observed in the BCZ porewatersare low (max. 11 lg L�1, i.e., 180 nM) and well below the level atwhich toxic effects were observed in some cultivated bacteria(Antony et al. 2011). In other words it’s possible that the DET/DGT approach was unsuccessful to reveal an existing positive cor-relation with Co. If true, this might be related to the fact that DET/DGT approach is not taking large colloids into account. However,before concluding other environments should be examined withthe same methods. In the case of Ni differences were also observedbetween the DET/DGT approach and the ex situ method used (Table3). A first possibility is that the significant relationship observed isartefactual. Indeed, although Ni2+ is relatively stable to oxidation(Petersen et al., 1996) it may be complexed during sample prepa-ration by freshly formed Fe/Mn oxides and Ni concentration is alsodependent on the ionic force, organic matter and pH (Doig andLiber, 2006; Tertre et al., 2005). All these factors may be affectedduring ex situ sediment manipulations which means that in thiscase the DET/DGT approach is superior to in situ approaches. Onthe other hand, Ni levels observed in porewaters of the BCZ arelow (i.e., 0.05–0.6 lM) and other studies have highlighted thestimulatory effect of Ni at low concentrations, i.e., <10 lM (Sujithet al. 2010). Therefore, the relationship between Ni and bacterialdiversity might represent a true relationship that was possiblymissed by the DET/DGT approach. As again, these results shouldbe confirmed by other studies. Future studies should focus on otherareas of the marine environment and should investigate the effectof gel porosity in the DET/DGT approach.
Finally, it must be noted that the DGGE approach used in thepresent research to evaluate bacterial diversity has a low resolu-tion and is not free from biases (Nocker et al., 2007). However,DGGE is a fast approach, inexpensive, and able to study multiplesamples in parallel. As a consequence it is still widely used inmicrobial ecology (e.g., Tang et al., 2011; Moreno et al., 2011; Berdjebet al., 2011). A previous study conducted in marine sedimentsconcluded that the relationship between community patterns ob-tained by DGGE and contaminants (metals, petroleum) was notvery strong and that pollution was just one of a number of factorsaffecting the microbial community composition (Powell et al.,2003). Similarly, in Mediterranean sediments, another reportconcluded that bacterial diversity measured by DGGE was not cor-related to petroleum contamination of the sediments (Poly-menakou et al., 2005). Results of the present study combined tothose of the previous reports, suggest that the bacterial diversitydetermined with the DGGE approach is probably not a variablewhich may simply be correlated with dissolved trace metals inporewaters. The relationships with Co and Ni should be confirmedby the analysis of other environments and the use of other meth-ods such as cloning-sequencing of the 16S rRNA or metagenomicanalyses. Although metals may have a negative impact on manybacterial species, bacterial communities are able to recoverthrough the exchange of resistance factors, even between distantspecies (e.g., Top et al., 1995; Nies, 1992). As a result, diversitiesof polluted areas may be as elevated as those observed in controllocations (Gillan et al., 2005; Bouskill et al., 2007). The stage ofadaptation of microbial communities may be evaluated usingmethods such as the PICT approach (pollution induced communitytolerance, Ogilvie and Grant, 2008). If DGGE is used in futuremicrobial ecology studies to investigate effects of metals, morespecific microbial groups must probably be targeted and
D.C. Gillan et al. / Marine Pollution Bulletin 64 (2012) 353–362 361
approaches should be more focused on the active members of thecommunity. Another solution is to target specific bacteria or resis-tance genes and measure their abundance using quantitative PCR(e.g., Bouskill et al., 2007).
5. Conclusions
(1) In marine sediments of the Belgian continental zone, withthe exception of micronutrients (Fe, Mn, and Co), no specificrelationships were found between dissolved trace metals inporewaters (Pb, Cr, Cu, Ni, Ag, Cd, Sn, Al, and V) and totalbacterial biomass. Relationships suggested previously areprobably artefactual. Arsenic behaves like a micronutrientbecause it is associated to Fe/Mn oxyhydroxides.
(2) For most metals in the considered area, including Fe and Mn,no specific relationships were found between bacterialdiversity (as measured by the DGGE approach) and metallevels. The exception here are Co and Ni, but the relation-ships should be confirmed in other environments. Futurestudies should focus more closely to individual species orparticular groups and microbial activity is probably a bestindicator of metal contamination than diversity.
(3) Dissolved metals in porewaters are important for bacteriallife and are best studied using in situ methods. When pore-waters are treated without any consideration on metalspeciation (i.e., when oxidation artefacts are present), para-mount relationships between trace metals geochemistryand benthic microbial life are hampered. In this respect,the DET and DGT techniques are very powerful tools. Thesein situ techniques give ‘‘instantaneous’’ metal levels, are notinfluenced by oxidation or preparation artefacts, and areable to differentiate free metal ions from the colloidal frac-tion. However, classical ex situ approaches are still necessaryto complement the picture and assess the total quantity oftrace metals in the considered environment.
Acknowledgements
This research was supported by a Belgian Federal ResearchProgram (Science for a Sustainable Development, SSD, contractMICROMET No. SD/NS/04A and SD/NS/04B). A.P. and K.S. acknowl-edge financial support from BOF-GOA Projects 01GZ0705 and ofGhent University (Belgium). Contribution of the ‘‘Centre Interuni-versitaire de Biologie Marine’’ (CIBIM). Many thanks to AndréCattrijsse and all the crew of the RV Zeeleeuw. Many thanks alsoto the reviewers who considerably improved the manuscript.
Appendix A. Supplementary data
Supplementary data associated with this article can be found, inthe online version, at doi:10.1016/j.marpolbul.2011.11.001.
References
Antony, R., Sujith, P.P., Fernandes, S.O., Verma, P., Khedekar, V.D., Loka Bharathi, P.A.,2011. Cobalt immobilization by manganese oxidizing bacteria from the Indianridge system. Current Microbiol. 62, 840–849.
Aoyama, M., Nagumo, T., 1997. Effects of heavy metal accumulation in appleorchard soils on microbial biomass and microbial activities. Soil. Sci. Plant Nutr.43, 601–612.
Austin, B., 1989. Methods in Aquatic Bacteriology. John Wiley & Sons, Chichester,United Kingdom.
Bååth, E., Diaz-Ravina, M., Frostegard, A., Campbell, C.D., 1998. Effect of metal-richsludge amendments on the soil microbial community. Appl. Environ. Microbiol.64, 238–245.
Barajas-Aceves, M., 2005. Comparison of different microbial biomass and activitymeasurement methods in metal-contaminated soils. Bioresour. Technol. 96,1405–1414.
Barret, E.P., Joyner, L.G., Halenda, P.H., 1951. The determination of pore volume andarea distributions in pure substances. J. Am. Chem. Soc. 73, 373–380.
Berdjeb, L., Ghiglione, J.F., Jacquet, S., 2011. Bottom-up versus top-down control ofhypo- and epilimnion free-living bacterial community structures in twoneighboring freshwater lakes. Appl. Environ. Microbiol. 77, 3591–3599.
Böttcher, M.E., Hespenheide, B., Llobet-Brossa, E., Beardsley, C., Larsen, O., Schramm,A., Wieland, A., Böttcher, G., Berninger, U.G., Amann, R., 2000. Thebiogeochemistry, stable isotope geochemistry, and microbial communitystructure of a temperate intertidal mudflat: an integrated study. Cont. ShelfRes. 20, 1749–1769.
Bouskill, N.J., Barnhart, E.P., Galloway, T.S., Handy, R.D., Ford, T.E., 2007.Quantification of changing Pseudomonas aeruginosa soda, htpX and mt geneabundance in response to trace metal toxicity: a potential in situ biomarker ofenvironmental health. FEMS Microbiol. Ecol. 60, 276–286.
Bouskill, N.J., Barker-Finkel, J., Galloway, T.S., Handy, R.D., Ford, T.E., 2010. Temporalbacterial diversity associated with metal-contaminated river sediments.Ecotoxicology 19, 317–328.
Brookes, P.C., McGrath, S.P., 1984. Effects of metal toxicity on the size of the soilmicrobial biomass. J. Soil Sci. 35, 341–346.
Brunauer, S., Emmett, P.H., Teller, E., 1938. Adsorption of gases in multimolecularlayers. J. Am. Chem. Soc. 60, 309–319.
Burdige, D.J., 1993. Biogeochemistry of manganese and iron reduction in marinesediments. Earth Sci. Rev. 35, 249–284.
Calmano, W., Förstner, U., 1996. Sediments and Toxic Substances. Springer, Berlin,p. 335.
Chan, C.S., Fakra, S.C., Edwards, D.C., Emerson, D., Banfield, J.F., 2009. Ironoxyhydroxide mineralization on microbial extracellular polysaccharides.Geochim. Cosmochim. Acta 73, 3807–3818.
Clark, R., 2001. Marine Pollution. Oxford University Press, Oxford, UK, p. 248.Danis, B., Wantier, P., Dutrieux, S., Flammang, R., Dubois, Ph., Warnau, M., 2004.
Contaminant levels in sediments and asteroids (Asterias rubens L.,Echinodermata) from the Belgian coast and Scheldt estuary: polychlorinatedbiphenyls and heavy metals. Sci. Tot. Environ. 333, 149–165.
Davison, W., Grime, G.W., Morgen, J.A.W., Clarke, K., 1991. Distribution of dissolvediron in sediment pore waters at submillimetre resolution. Nature 352,323–324.
Davison, W., Zhang, H., 1994. In situ speciation measurements of trace componentsin natural waters using thin film technique. Nature 367, 546–548.
DiToro, D.M., Mahony, J.D., Hansen, D.J., Scott, K.J., Hicks, M.B., Mayr, S.M., Redmond,M.S., 1990. Toxicity of cadmium in sediments: the role of acid volatile sulphide.Environ. Toxicol. Chem. 9, 1487–1502.
Docekalova, H., Clarisse, O., Salomon, S., Wartel, M., 2002. Use of constrained DETprobe for a high-resolution determination of metals and anions distribution inthe sediment pore water. Talanta 57, 145–155.
Doig, L.E., Liber, K., 2006. Nickel partitioning in formulated and natural freshwatersediments. Chemosphere 62, 968–979.
Ehrlich, H.L., 1990. Geomicrobiology of iron. In: Ehrlich, H.L. (Ed.), Geomicrobiology,second ed. Marcel Dekker Inc., New York, pp. 283–346.
Eiche, E., Kramar, U., Berg, M., Berner, Z., Norra, S., Neumann, T., 2010. Geochemicalchanges in individual sediment grains during sequential arsenic extractions.Water Res. 44, 5545–5555.
Epstein, S.S., Rossel, J., 1995. Enumeration of sandy sediment bacteria: search foroptimal protocol. Mar. Ecol. Prog. Ser. 117, 289–298.
Fabiano, M., Danovaro, R., Magi, E., Mazzucotelli, A., 1994. Effects of heavy metals onbenthic bacteria in coastal marine sediments: a field result. Mar. Pollut. Bull. 28,18–23.
Feris, K., Ramsey, P., Frazar, C., Moore, J.N., Gannon, J.E., Holben, W.E., 2003.Differences in hyporheic-zone microbial community structure along a heavy-metal contamination gradient. Appl. Environ. Microbiol. 69, 5563–5573.
Fortin, D., Leppard, G.G., Tessier, A., 1993. Characteristics of lacustrine diageneticiron oxyhydroxides. Geochim. Cosmochim. Acta 57, 4391–4404.
Fones, G.R., Davison, W., Hamilton-Taylor, J., 2004. The fine-scale remobilization ofmetals in the surface sediment of the North-East Atlantic. Cont. Shelf Res. 24,1485–1504.
Ford, T., Ryan, D., 1995. Toxic metals in aquatic ecosystems: a microbiologicalperspective. Environ. Health Perspect. 103 (Suppl 1), 25–28.
Frostegard, A., Tunlid, A., Bååth, E., 1993. Phospholipid fatty acid composition,biomass, and activity of microbial communities from two soil typesexperimentally exposed to different heavy metals. Appl. Environ. Microbiol.59, 3605–3617.
Ganguly, S., Jana, B.B., 2002. Cadmium induced adaptive responses of certainbiogeochemical cycling bacteria in an aquatic system. Water Res. 36, 1667–1676.
Gao, Y., Lesven, L., Gillan, D., Sabbe, K., Billon, G., De Galan, S., Elskens, M., Baeyens,W., Leermakers, M., 2009. Geochemical behavior of trace elements in sub-tidalmarine sediments of the Belgian coast. Mar. Chem. 117, 88–96.
Gault, A.G., Ibrahim, A., Langley, S., Renaud, R., Takahashi, Y., Boothman, C., Lloyd,J.R., Clark, I.D., Ferris, F.G., Fortin, D., 2011. Microbial and geochemical featuressuggest iron redox cycling within bacteriogenic iron oxide-rich sediments.Chem. Geol. 281, 41–51.
Gikas, P., 2008. Single and combined effects of nickel (Ni(II)) and cobalt (Co(II)) ionson activated sludge and on other aerobic microorganisms: A review. J. Hazard.Mater. 159, 187–203.
Gillan, D.C., 2004. The effect of an acute copper exposure on the diversity of amicrobial community in North Sea sediments as revealed by DGGE analysis –the importance of the protocol. Mar. Pollut. Bull. 49, 504–513.
362 D.C. Gillan et al. / Marine Pollution Bulletin 64 (2012) 353–362
Gillan, D.C., De Ridder, C., 2001. Accumulation of a ferric mineral in the biofilm ofMontacuta ferruginosa (Mollusca, Bivalvia). Biomineralization, bioaccumulation,and inference of paleoenvironments. Chem. Geol. 177, 371–379.
Gillan, D.C., Danis, B., Pernet, P., Joly, G., Dubois, P., 2005. Structure of sediment-associated microbial communities along a heavy metal contamination gradientin the marine environment. Appl. Environ. Microbiol. 71, 679–690.
Gillan, D.C., Pernet, P., 2007. Adherent bacteria in heavy metal contaminated marinesediments. Biofouling 23, 1–13.
Gillan, D.C., Pede, A., Sabbe, K., Gao, Y., Leermakers, M., Baeyens, W., Louriño Cabana,B., Billon, G., submitted for publication. Effect of bacterial mineralisation ofphytoplankton-derived phytodetritus on the release of arsenic, cobalt andmanganese from muddy sediments in the Southern North Sea. MicrocosmStudy. Sci. Tot. Environ.
Irha, N., Slet, J., Petersell, V., 2003. Effect of heavy metals and PAH on soil assessedvia dehydrogenase assay. Environ. Int. 28, 779–782.
Kirchman, D., Sigda, J., Kapuscinski, R., Mitchell, R., 1982. Statistical analysis of thedirect count method for enumerating bacteria. Appl. Environ. Microbiol. 44,376–382.
Knight, B.P., McGrath, S.P., Chaudri, A.M., 1997. Biomass carbon measurements andsubstrate utilization patterns of microbial populations from soils amended withcadmium, copper, or zinc. Appl. Environ. Microbiol. 63, 39–43.
Kulp, T.R., Hoeft, S.E., Oremland, R.S., 2004. Redox transformations of arsenicoxyanions in periphyton communities. Appl. Environ. Microbiol. 70, 6428–6434.
Leermakers, M., Gao, Y., Gabelle, C., Lojen, S., Ouddane, B., Wartel, M., Baeyens, W.,2005. Determination of high resolution pore water profiles of trace metals insediments of the Rupel river (Belgium) using DET (diffusive equilibrium in thinfilms) and DGT (diffusive gradients in thin films) techniques. Water Air SoilPollut. 166, 265–286.
Lu, X.Q., Werner, I., Young, T.M., 2005. Geochemistry and bioavailability of metals insediments from northern San Francisco Bay. Environ. Int. 31, 593–602.
Magalhães, C., Costa, J., Teixeira, C., Bordalo, A.A., 2007. Impact of trace metals ondenitrification in estuarine sediments of the Douro River estuary. Portugal Mar.Chem. 107, 332–341.
McGrath, S.P., Chaudri, A.M., Giller, K.E., 1995. Long-term effects of land applicationof sewage sludge: soils, microorganisms and plants. J. Ind. Microbiol. 14,94–104.
Mills, A.L., Herman, J.S., Hornberger, G.M., DeJesus, T.H., 1994. Effect of solutionionic strength and iron coatings on mineral grains on the sorption of bacterialcells to quartz sand. Appl. Environ. Microbiol. 60, 3300–3306.
Moffett, J.W., Ho, J., 1996. Oxidation of cobalt and manganese in seawater via acommon microbially catalyzed pathway. Geochim. Cosmochim. Acta 60,3415–3424.
Montagna, P.A., 1982. Sampling design and enumeration statistics for bacteriaextracted from marine sediments. Appl. Environ. Microbiol. 43, 1366–1372.
Moreno, B., Nogales, R., Macci, C., Masciandaro, G., Benitez, E., 2011. Microbialeco-physiological profiles to estimate the biological restoration of atrichloroethylene-contaminated soil. Ecol. Indicators 11, 1563–1571.
Mukhopadhyay, R., Rosen, B.P., Phung, L.T., Silver, S., 2002. Microbial arsenic: fromgeocycles to genes and enzymes. FEMS Microbiol. Rev. 26, 311–325.
Muyzer, G., Teske, A., Wirsen, C.O., Jannasch, H.W., 1995. Phylogenetic relationshipsof Thiomicrospira species and their identification in deep-sea hydrothermal ventsamples by denaturing gradient gel electrophoresis of 16S rDNA fragments.Arch. Microbiol. 164, 165–172.
Newman, M.C., Clements, W.H., 2008. Ecotoxicology, a Comprehensive Treatment.CRC Press, Boca Raton, Florida, USA, p. 880.
Nies, D.H., 1992. Resistance to cadmium, cobalt, zinc and nickel in microbes.Plasmid 27, 17–28.
Nocker, A., Burr, M., Camper, A.K., 2007. Genotypic microbial community profiling:a critical technical review. Microb. Ecol. 54, 276–289.
Ogilvie, L.A., Grant, A., 2008. Linking pollution induced community tolerance (PICT)and microbial community structure in chronically metal polluted estuarinesediments. Mar. Environ. Res. 65, 187–198.
Oremland, R.S., Stolz, J.F., 2003. The ecology of arsenic. Science 299, 939–944.Patra, R.C., Malik, S., Beer, M., Megharaj, M., Naidu, R., 2010. Molecular
characterization of chromium (VI) reducing potential in Gram positivebacteria isolated from contaminated sites. Soil Biol. Biochem. 42, 1857–1863.
Peñuelas, J., Filella, I., 2002. Metal pollution in Spanish terrestrial ecosystems duringthe twentieth century. Chemosphere 46, 501–505.
Petersen, W., Wallmann, K., Li, P., Schroeder, F., Knauth, H.D., 1996. The influence ofdiagenetic processes on the exchange of trace contaminants at the sediment–water interface. In: Calmano, W., Förstner, U. (Eds.), Sediments and ToxicSubstances. Springer, Berlin, pp. 37–50.
Polymenakou, P.N., Bertilsson, S., Tselepides, A., Stephanou, E.G., 2005. Linksbetween geographic location, environmental factors, and microbial communitycomposition in sediments of the Eastern Mediterranean Sea. Microb. Ecol. 49,367–378.
Powell, S.M., Bowman, J.P., Snape, I., Stark, J.S., 2003. Microbial community variationin pristine and polluted nearshore Antarctic sediments. FEMS Microbiol. Ecol.45, 135–145.
Pringault, O., Viret, H., Duran, R., 2010. Influence of microorganisms on the removalof nickel in tropical marine sediments (New Caledonia). Mar. Pollut. Bull. 61,530–541.
QSR, 2000. Quality Status Report 2000, Region II-Greater North Sea. OSPARCommission, London, p. 136.
Rasmussen, L.D., Sorensen, S.J., 2001. Effects of mercury contamination on theculturable heterotrophic, functional and genetic diversity of the bacterialcommunity in soil. FEMS Microbiol. Ecol. 36, 1–9.
Rickard, D., Morse, J.W., 2005. Acid volatile sulfide (AVS). Mar. Chem. 97, 141–197.Roekens, E.J., Van Grieken, R.E., 1983. Kinetics of iron (II) oxidation in seawater of
various pH. Mar. Chem. 13, 195–202.Shi, W., Becker, J., Bischoff, M., Turco, R.F., Konopka, A.E., 2002. Association of
microbial community composition and activity with lead, chromium, andhydrocarbon contamination. Appl. Environ. Microbiol. 68, 3859–3866.
Snape, I., Scouller, R.C., Stark, S.C., Stark, J., Riddle, M.J., Gore, D.B., 2004.Characterisation of the dilute HCl extraction method for the identification ofmetal contamination in Antarctic marine sediments. Chemosphere 57,491–504.
Sorci, J.J., Paulauskis, J.D., Ford, T.E., 1999. 16S rRNA Restriction fragment lengthpolymorphism analysis of bacterial diversity as a biomarker of ecological healthin polluted sediments from New Bedford Harbor, Massachusetts. USA Mar.Pollut. Bull. 38, 663–675.
Stockdale, A., Davison, W., Zhang, H., 2009. Micro-scale biogeochemicalheterogeneity in sediments: a review of available technology and observedevidence. Earth Sci. Rev. 92, 81–97.
Stumm, W., Morgan, J.J., 1995. Aquatic Chemistry: Chemical Equilibria and Rates inNatural Waters. John Wiley & Sons Inc., 1040 pp.
Sujith, P.P., Khedekar, V.D., Girish, A.P., Loka Bharathi, P.A., 2010. Immobilization ofnickel by bacterial isolates from the Indian ridge system and the chemicalnature of the accumulated metal. Geomicrobiol. J. 27, 424–434.
Sullivan, K.A., Aller, R.C., 1996. Diagenetic cycling of arsenic in Amazon shelfsediments. Geochim. Cosmochim. Acta 60, 1465–1477.
Tang, Y., Wang, L., Jia, J., Li, Y., Zhang, W., Wang, H., Sun, Y., 2011. Response of soilmicrobial respiration of tidal wetlands in the Yangtze River Estuary to differentartificial disturbances. Ecol. Eng. 37, 1638–1646.
Tertre, E., Berger, G., Castet, S., Loubet, M., Giffaut, E., 2005. Experimental sorption ofNi2+, Cs+ and Ln3+ onto a montmorillonite up to 150 �C. Geochim. Cosmochim.Acta 69, 4937–4948.
Tessier, A., Fortin, D., Belzile, N., DeVitre, R.R., Leppard, G.G., 1996. Metal sorption todiagenetic iron and manganese oxyhydroxides and associated organic matter:narrowing the gap between field and laboratory measurements. Geochim.Cosmochim. Acta 60, 387–404.
Top, E.M., De Rore, H., Collard, J.M., Gellens, V., Slobodkina, G., Verstraete, W.,Mergeay, M., 1995. Retromobilization of heavy metal resistance genes inunpolluted and heavy metal polluted soil. FEMS Microbiol. Ecol. 18, 191–203.
Wong, K.W., Toh, B.A., Ting, Y.P., Obbard, J.P., 2005. Biodegradation of phenanthreneby the indigenous microbial biomass in a zinc amended soil. Lett. Appl.Microbiol. 40, 50–55.
Zhang, H., Davison, W., 1999. Diffusional characteristics of hydrogels used in DGTand DET techniques. Anal. Chim. Acta 398, 329–340.
Zhou, Q., Zhang, J., Fu, J., Shi, J., Jiang, G., 2008. Biomonitoring: an appealing tool forassessment of metal pollution in the aquatic ecosystem. Anal. Chim. Acta 606,135–150.

![arXiv:2002.04864v2 [physics.ins-det] 3 Mar 2020](https://static.fdokumen.com/doc/165x107/6323729b3a06c6d45f061f4a/arxiv200204864v2-physicsins-det-3-mar-2020.jpg)
![arXiv:2207.12982v1 [physics.ins-det] 26 Jul 2022](https://static.fdokumen.com/doc/165x107/63365cf162e2e08d490374a5/arxiv220712982v1-physicsins-det-26-jul-2022.jpg)


![arXiv:2006.01519v1 [physics.ins-det] 2 Jun 2020](https://static.fdokumen.com/doc/165x107/6334781b3108fad7760f866f/arxiv200601519v1-physicsins-det-2-jun-2020.jpg)