Limitation of irregular structure for seismic response
12
INTERNATIONAL JOURNAL OF CIVIL AND STRUCTURAL ENGINEERING Volume 3, No 3, 2013 © Copyright by the authors - Licensee IPA- Under Creative Commons license 3.0 Research article ISSN 0976 – 4399 Received on January 2013 Published on March 2013 579 Limitation of irregular structure for seismic response Arun Solomon A 1 , Hemalatha G 2 1- Post Graduate Student, School of Civil Engineering, Karunya University, Coimbatore 2- Associate Professor, School of Civil Engineering, Karunya University, Coimbatore [email protected] doi:10.6088/ijcser.201203013053 ABSTRACT Structural engineer's greatest challenge in today’s scenario is constructing seismic resistant structure. Uncertainties involved and behaviour studies are vital for all civil engineering structures. To understand and find accurate result in provisions of drift, deflection and hinge of structure under seismic force, non Linear Static Analysis is commonly employed and this method of analysis is called Pushover Analysis. This method of analysis shows the base shear carrying capacity of a structure and performance level of each component of structure under various zones or different intensity of seismic force. The present study incorporates the non linear behaviour of irregular structures. Because of the constraints some of the structures are highly irregular as too long, and too tall. This study aims to identify the limitations of the too long and too tall structures using the software SAP 2000. Keyword: Inter storey drift, nonlinear static analysis, pushover curve, too long structure, too tall structure. 1. Introduction Modern construction demands the architect to plan the buildings which are irregular in plan and elevation. The structural engineer on the other hand has the major responsibility to make the structure safe against all external forces. When such irregular buildings are placed in a high seismic zone, the structural engineer’s role becomes further challenging. So ideal and clear understanding of the behaviour of irregular structures during earthquake is significant for structural engineers. This paper is an effort to study the limits upto which these irregular structures can be constructed for safety against seismic forces. Increased length and enormous plan area of any structure or building will not perform well for seismic force. General calculation of seismic force assumes that the ground moves as a rigid mass over the bas of the building but this is a reasonable assumption only for a small area. In addition to that, the ground is assumed to be elastic and the propagation of seismic waves is not instantaneous. If different parts of the building are shaken, additional stresses are being imposed and this effect increases with size. Thus buildings that are too long (Figure 1(a)) in plan may be subjected to different earthquake movements simultaneously at the two ends, leading to disastrous results. In tall buildings with large height to base ratio (Figure 1(b)) (slenderness ratio >4), the horizontal movement of the floors during ground shaking is large. For buildings with slenderness ratio less than 4, the movement is reasonable. The more slender a building, the worse the overturning effects of the earthquake. The axial column force due to overturning moment in such buildings tends to become unmanageably large. Also, the compressive and pull out forces acting on the foundation increase tremendously.
Transcript of Limitation of irregular structure for seismic response

INTERNATIONAL JOURNAL OF CIVIL AND STRUCTURAL ENGINEERING
Volume 3, No 3, 2013
© Copyright by the authors - Licensee IPA- Under Creative Commons license 3.0
Research article ISSN 0976 – 4399
Received on January 2013 Published on March 2013 579
Limitation of irregular structure for seismic response Arun Solomon A
1, Hemalatha G
2
1- Post Graduate Student, School of Civil Engineering, Karunya University, Coimbatore
2- Associate Professor, School of Civil Engineering, Karunya University, Coimbatore
doi:10.6088/ijcser.201203013053
ABSTRACT
Structural engineer's greatest challenge in today’s scenario is constructing seismic resistant
structure. Uncertainties involved and behaviour studies are vital for all civil engineering
structures. To understand and find accurate result in provisions of drift, deflection and hinge
of structure under seismic force, non Linear Static Analysis is commonly employed and this
method of analysis is called Pushover Analysis. This method of analysis shows the base shear
carrying capacity of a structure and performance level of each component of structure under
various zones or different intensity of seismic force. The present study incorporates the non
linear behaviour of irregular structures. Because of the constraints some of the structures are
highly irregular as too long, and too tall. This study aims to identify the limitations of the too
long and too tall structures using the software SAP 2000.
Keyword: Inter storey drift, nonlinear static analysis, pushover curve, too long structure, too
tall structure.
1. Introduction
Modern construction demands the architect to plan the buildings which are irregular in plan
and elevation. The structural engineer on the other hand has the major responsibility to make
the structure safe against all external forces. When such irregular buildings are placed in a
high seismic zone, the structural engineer’s role becomes further challenging. So ideal and
clear understanding of the behaviour of irregular structures during earthquake is significant
for structural engineers. This paper is an effort to study the limits upto which these irregular
structures can be constructed for safety against seismic forces.
Increased length and enormous plan area of any structure or building will not perform well for
seismic force. General calculation of seismic force assumes that the ground moves as a rigid
mass over the bas of the building but this is a reasonable assumption only for a small area. In
addition to that, the ground is assumed to be elastic and the propagation of seismic waves is
not instantaneous. If different parts of the building are shaken, additional stresses are being
imposed and this effect increases with size. Thus buildings that are too long (Figure 1(a)) in
plan may be subjected to different earthquake movements simultaneously at the two ends,
leading to disastrous results.
In tall buildings with large height to base ratio (Figure 1(b)) (slenderness ratio >4), the
horizontal movement of the floors during ground shaking is large. For buildings with
slenderness ratio less than 4, the movement is reasonable. The more slender a building, the
worse the overturning effects of the earthquake. The axial column force due to overturning
moment in such buildings tends to become unmanageably large. Also, the compressive and
pull out forces acting on the foundation increase tremendously.

Limitation of irregular structure for seismic response
Arun Solomon A, Hemalatha G
International Journal of Civil and Structural Engineering 580
Volume 3 Issue 3 2013
Devesh P. Soni (2006) deals with Mass, Set-back, Stiffness, strength and Vertical Irregular
structures. It was concluded that the drift demand is increased for the tower portion of the set-
back structures, the effect of strength irregularity has been found to be larger than the effect of
stiffness irregularity. Rucha S. Banginwar (2012) explains the consequence of earthquake of
varies geometrical configuration by Response Spectrum Method. This study is based on the
damage of the building by the past earthquake and concluded that, displacement, storey drift,
storey shear has increased for large plan c configuration and irregular configuration of the
structure when compared to the regular structure. Zeynep Yesim Harmankaya (2012) studied
the failure of structures in Turkey by earthquake and concluded that there was a strong
relationship between architectural design and building resistance. Architects should
understand the dynamic behavior of the structure.
1.1 Objective
In tall buildings with large height-to-base size ratio (Figure 1(a)), the horizontal movement of
the floors during ground shaking is large. In short but very long buildings (Figure 1(b)), the
damaging effects during earthquake shaking are many. Analytical investigation carried out
using SAP 2000 to determine the limitation of the aspect ratio for too long and too tall
structure are presented in this paper.
Figure 1: Typical Too Long and Too Tall Structures
2. Analytical investigation
2.1 Pushover analysis
In SAP 2000, Non Linear Static Analysis can be performed called Push over analysis. In this
Pushover analysis FEMA 356 and ATC 40 graph will be obtained. FEMA 356 (Federal
Emergency Management Agency) gives the graph developed between base shear and
displacement. From this graph one may understand the damage level of structural and non
structural elements. ATC 40 (Applied Technology Council) gives the graph between spectral
acceleration and spectral displacement. This graph shows, the demand spectrum of a structure
and required capacity spectrum of structure, from this graph one may understand wheather
the structure meets the seismic demand or not. Pushover analysis is simplified approach for
nonlinear static procedure to evaluate seismic structural deformation and inter storey drift.
Force-Displacement relationship or capacity curve for a structure or element of structure shall
be determined from this analysis. This analysis uses the incremental static analysis.
In the pushover analysis, horizontal loads are applied to the structure with prescribed pattern
incrementally, that means it pushes the structure until collapse condition and simultaneously

Limitation of irregular structure for seismic response
Arun Solomon A, Hemalatha G
International Journal of Civil and Structural Engineering 581
Volume 3 Issue 3 2013
it plots the applied shear force and coupled lateral displacement. The sequence of cracks
development, plastic hinge formation, yielding and failure of various structural elements are
recorded with respect to the horizontal load increment. The structural deficiencies are
recorded in a serious of iteration process, so that deficiencies are rectified in one iteration
after another. The progression of iteration of analysis and design continues until all the
elements of structure satisfy mandatory performance criteria. The performance criteria of
Pushover analysis are commonly shown in terms of spectral displacement amplitude of
respective floors of the structure.
Pushover analysis performs the approximate analysis on the basis of increasing lateral force
in different height of the structure until the predefined displacement is obtained. In SAP 2000
the model is created with proper support specification and gravity loads are applied as per the
codel provision with respect to the requirement of building. According to the past earthquake
data’s and as per the zonal requirement of the building, predefined lateral load is applied to
the structure. This predefined lateral force is successively augmented until some member of
structure gets yielded. Then the element of the yielded section of the structure is revised
according to reduced stiffness and lateral load is increased until the entire member gets
yielded. This process of iteration is continued until permissible displacement is attained at
roof floor. Finally, curve is plotted between roof displacement and base shear called global
capacity curve.
2.2 Elements of force-displacement curve
Figure 2 explains the characteristics of structure in terms of force-displacement. This is the
model graph obtained all for structures while analyzing in SAP2000. This graph shows the
nonlinear force-displacement characteristics of the structure. In the figure 2 the terms of IO,
LS and CP are explained in the figure 3.
Figure 2: Force-deformation for pushover hinge
Point A refers to the unloaded state of the structure, in this stage applied force is zero and its
coupled displacement is also zero. Ordinate B indicates yielding of any member of the
structure, in this stage mild and clear changes happens in force displacement graph. The
intersection C refers to deformation changing abruptly at which the structure begins to lose its
strength. The line falls from C showing the initial failure of element of structure.
Theoretically it is impossible to carry further lateral load analysis beyond the point C. The

Limitation of irregular structure for seismic response
Arun Solomon A, Hemalatha G
International Journal of Civil and Structural Engineering 582
Volume 3 Issue 3 2013
ordinate D represents, the state of structure to resist further gravity loads. Beyond the point E,
the structure attains its maximum deformation, and the structure will not carry any more
loads.
Figure 3: Performance Chart of Structure
3. Modelling of structure
3.1 Description of buildings
The details of buildings modelled for analysis are displayed in table 1, table 2. For too long
structures and table 3 for too tall structures.
Table 1: Too long Type - I structure
Structure
No.
Length
M
Breadth
m
Height
m
No of bays
in Length
Direction
No of bays in
Breadth
Direction
No. of
storeys
L1 65 15 12 13 3 3
L2 70 15 12 14 3 3
L3 75 15 12 15 3 3
L4 80 15 12 16 3 3
L5 85 15 12 17 3 3

Limitation of irregular structure for seismic response
Arun Solomon A, Hemalatha G
International Journal of Civil and Structural Engineering 583
Volume 3 Issue 3 2013
Table 2: Too long Type II Structure
Table 3: Too tall structure
Structure
No
Length
m
Breadth
m
Height
m
No of bays
in Length
Direction
No of bays in
Breadth
Direction
No. of
storeys
T10 15 15 80 3 3 20
T11 15 15 84 3 3 21
T12 15 15 88 3 3 22
T13 15 15 92 3 3 23
3.2 Materials and member properties
The basic material properties used are as follows:
Modulus of Elasticity of steel, Es = 21, 0000 Mpa
Modulus of Elasticity of concrete, EC = 22,360.68 MPa
Characteristic strength of concrete, fck = 25 MPa
Yield stress for steel, fy = 415 MPa
Poisson’s Ratio = 0.2
Co efficient of thermal expansion = 9.9 x 10⁻⁶
Concrete cube compressive strength = 27.579 MPa
Bending Yield Stress of Rein. = 413.685 MPa
Depth of Slab = 0.15m
Size of Beam = 0.3 x 0.75 m
Size of column
Too long structure = 0.5 x 0.5 m
Too tall structure = 0.7 x 0.7 m
The stress - strain relationship is followed as per IS 456:2000. The dimensions of the beams
and columns are designed as per the codel provisions.
3.3 Loading details
The following loads are applied in the models of the structure.
Self Weight : SW of the Beam, Column, and Slab
Dead Load : 2 kN /m2
Floor Finish : 0.2 kN/ m2
Live Load : 2 kN/ m2
Structure
No
Length
M
Breadth
m
Height
m
No of bays
in Length
Direction
No of bays in
Breadth
Direction
No. of
storeys
L6 130 25 12 26 5 3
L7 135 25 12 27 5 3
L8 140 25 12 28 5 3
L9 145 25 12 29 5 3
Limitation of irregular structure for seismic response
Arun Solomon A, Hemalatha G
International Journal of Civil and Structural Engineering 584
Volume 3 Issue 3 2013
Lateral loads as specified in SAP 2000
3.4 Model of structure
Figure 4(a) and 4(b) shows the typical model of too long and too tall structure. The length,
breadth, height of the structure and the bay specifications are listed in the table 1 and 2. The
modeling and analysis is done using SAP 2000 software, then the push over curve and inter
storey limit has been obtained as the result of analysis.
Figure 4(a): Typical Too long Structure model (b): Typical too tall structures model
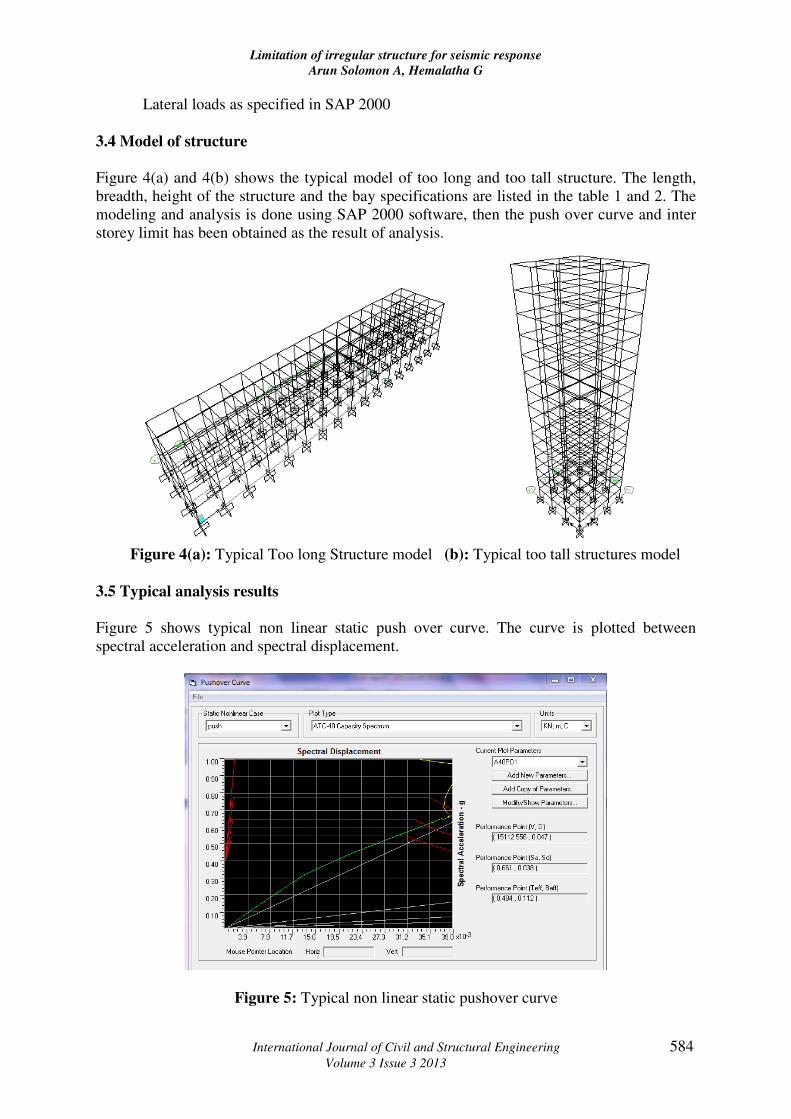
3.5 Typical analysis results
Figure 5 shows typical non linear static push over curve. The curve is plotted between
spectral acceleration and spectral displacement.
Figure 5: Typical non linear static pushover curve

Limitation of irregular structure for seismic response
Arun Solomon A, Hemalatha G
International Journal of Civil and Structural Engineering 585
Volume 3 Issue 3 2013
In this graph green line indicates the capacity curve, the red line indicate demand spectrum
and the yellow line shows the push over curve. The right side of the push over graph indicates
the performance point. If the performance point is achieved, the structure meets the demand
to resist the lateral force and vice versa.
4. Analysis results
The structures mentioned in table 1 to 3 are modelled and analysed using SAP 2000 software
and the Pushover curve is obtained. Table 4 to 6 gives the analysis results.
Table 4 shows the results of too long type I structure. The performance point is obtained for
L1 to L4 structures and the performance point is not obtained for the L5 structure, That
means, the structure meets the seismic demand when the aspect ratio is (80/15)=5.33 and the
structure does not meet the seismic demand when the aspect ratio is (85/15)=5.66.
Table 5 explains the results of too long type II structure. The performance point is obtained
for L6 to L8 structures and the performance point is not obtained for the L9 structure. That
means, the structure meets the seismic demands when the aspect ratio is (140/25) =5.6 and
the structure does not meet the seismic demand when the aspect ratio is (145/25) =5.8.
Table 6 summarizes the results of too tall structure. The performance point is available for
structures numbers T10 to T12 and the performance point is not available for the T13
structure. That means, the structure meets the seismic demand when the aspect ratio is
(88/15) =5.86 and the structure does not meet the seismic demand when the aspect ratio is
(92/15) =6.13.
4.1 Check for storey drift limitation
4.1.1 Storey drifts
As per IS 1893 (Part I):2002 storey drift is defined as, the displacement of one level relative
to the other level above or below the floor under consideration Earthquake-induced
deformations may be quantified by the roof displacement ∆roof as well as the interstorey
displacement ∆i as shown in figure 5 Inter-storey drift ratio at the ith
floor can be defined as

Limitation of irregular structure for seismic response
Arun Solomon A, Hemalatha G
International Journal of Civil and Structural Engineering 586
Volume 3 Issue 3 2013
where hi is the storey height.
Figure 5: Roof displacement and inter-storey displacement
Past earthquake demonstrates that the extent of damage to buildings is closely related to the
inter-storey drift demand. Excessive inter-storey drift could cause damage to both the
structural and non structural components. Collapse of buildings is often resulted from the
local concentration of deformation at a particular “weak storey”. So check of the inter storey
drift limit of structure is an important aspect.
4.2 Storey drift limitation
As per the IS 1893:2000 storey drift in any storey due to minimum specified design lateral
force with partial load factor of 1.0, shall not exceed 0.004 times the storey height.
4.3 Storey drift for too long Type I structure
As mentioned above, Displacement is arrived from the analysis results of SAP 2000 for too
long structure as described in the table 1. Then Storey drift is calculated, as the difference of
displacements of one storey with respect to the adjacent storey.
The maximum value of storey drift = 0.004 x 4 = 0.016
Storey Drift for L4 Structure = 0.0155
Storey Drift for L5 Structure = 0.0205
Hence the structure L5 exceeded the limiting value of storey drift when compared to the
structure L4. These results are explained in figure 6.
4.4 Storey drift for too tall structure
Displacement is arrived from the analysis results of SAP 2000 for too tall structures as
mentioned in the table 3. Then Storey drift is calculated, as the difference of displacements of
one storey with respect to the adjacent storey.
The maximum limited value of storey drift = 0.004 x 4 = 0.016
Storey Drift for T12 Structure = 0.01268

Limitation of irregular structure for seismic response
Arun Solomon A, Hemalatha G
International Journal of Civil and Structural Engineering 587
Volume 3 Issue 3 2013
Storey Drift for T13 Structure = 0.01928
Therefore, the structure T13 exceeds the limiting value of storey drift when compared to the
structure T12. These results are explained in figure 7.
4.5 Maximum base shear
The maximum base shear of the too long structures and too tall structure are shown in table 7
and 8. Figure 8 shows the typical base shear, displacement curve arrived from the SAP 2000.
In the tables, the point C is the maximum base shear carrying capacity (refer section 2.2).
From the calculation of maximum base shear capacity the structure can be altered to resist the
lateral load carrying capacity according to the seismic vulnerability.
Figure 6: Comparison of Inter Storey Drift of Too Long Type I Structure
Figure 7: Comparison of Inter Storey Drift of Too Tall Structure

Limitation of irregular structure for seismic response
Arun Solomon A, Hemalatha G
International Journal of Civil and Structural Engineering 588
Volume 3 Issue 3 2013
Figure 8: Typical Base Reaction-Displacement curve
Table 7: Elements of displacement- force of too long structure
Ele
men
ts
A
B
C
D
E
Dis
pla
cem
ent
Ba
se
Rea
ctio
n
Dis
pla
cem
ent
Ba
se
Rea
ctio
n
Dis
pla
cem
ent
Ba
se
Rea
ctio
n
Dis
pla
cem
ent
Ba
se
Rea
ctio
n
Dis
pla
cem
ent
Ba
se
Rea
ctio
n
Str
uct
ure
No
: L
4
0.0
14
62
87
.71
0.0
18
76
78
.48
0.0
28
10
772
.6
0.0
35
12
431
.2
0.0
4
13
507
.3
Str
uct
ure
No
: L
5
0.0
14
65
43
.16
0.0
18
80
07
.16
0.0
29
11
213
.4
0.0
36
12
973
0.0
41
14
210
.3

Limitation of irregular structure for seismic response
Arun Solomon A, Hemalatha G
International Journal of Civil and Structural Engineering 589
Volume 3 Issue 3 2013
Table 8: Elements of force- displacement of too tall structure
Ele
men
ts
A
B
C
D
E
Dis
pla
cem
ent
Ba
se
Rea
ctio
n
Dis
pla
cem
ent
Ba
se
Rea
ctio
n
Dis
pla
cem
ent
Ba
se
Rea
ctio
n
Dis
pla
cem
ent
Ba
se
Rea
ctio
n
Dis
pla
cem
ent
Ba
se
Rea
ctio
n
Str
uct
ure
No
: T
12
0.0
82
48
33
.18
8
0.1
03
60
41
.46
9
0.1
65
96
63
.70
8
0.2
06
12
024
.712
0.3
3
15
590
.415
Str
uct
ure
No
: T
13
0.0
87
49
12
.15
4
0.1
09
61
39
.99
1
0.1
74
97
84
.74
6
0.2
17
12
096
.232
0.3
4
13
394
.871
5. Conclusions
From the investigation carried out, too long and too tall structures are modeled, loads are
applied and a pushover analysis was carried out. The results of the pushover curve and inter
storey drift are obtained to study the performance of the building.
5.1 Conclusion for Too Long Structures
From the investigation on the two types of too long structures the following results are
obtained. The aspect ratio of the building is
1. Type I Building aspect Ratio (85/15) = 5.66.
2. Type II Building aspect Ratio (145/25) = 5.8
Hence it may be concluded that in too long structures if one dimension of the structure
exceeds 5.6 times the other dimension, the structure does not meet the performance limit.
Hence these types of the structures should be avoided while constructing in earthquake prone
areas.
5.2 Conclusion for Too Tall Structures
From the investigation on too tall structure the following result is obtained. The aspect ratio
of the building is (92/15) = 6.13 > 5.6. Hence it may conclude that, a too tall structure does
not meet the performance limit if the structure’s aspect ratio exceeds 5.6 times the other
dimension
6. References
1. Devesh P. Soni and Bharat B. Mistry, (2006), Qualitative review of seismic response
of vertically irregular building frames, ISET Journal of Earthquake Technology,
Technical Note, 43(4), pp 121-132.

Limitation of irregular structure for seismic response
Arun Solomon A, Hemalatha G
International Journal of Civil and Structural Engineering 590
Volume 3 Issue 3 2013
2. Zeynep Yesim Harmankaya and Asena Soyluk (2012), Architectural Design of
Irregular Buildings in Turkey, International Journal of Civil and Environmental
Engineering, 12(1), pp 42-48.
3. Kalkan and Kunnath (2009), Adaptive Modal Combination Procedure for Predicting
Seismic Response of Vertically Irregular Structural Systems, The 14th World
Conference on Earthquake Engineering.
4. Earthquake Tips, Learning Earthquake Design and Construction, IITK-bmtbc.
5. Dubey and Sangamnerkar, (2011), Seismic Behaviour of Assymetric RC Buildings,
International Journal of Advanced Engineering Technology, 2(4), pp 296-301.
6. Men Jinjie, Shi Qingxuan and Zhou Qi, (2008), Method Of Performance Based
Seismic Evaluation For Irregular Plane Reinforced Concrete Frame Structures, The
14th World Conference on Earthquake Engineering.
7. A.D’Ambrisi, M. De Stefano and S. Viti, (2008), Seismic performance of irregular 3d
RC frames, The 14th
World conference on earthquake engineering.