Life Cycle Assessment and Cost Analysis of Membrane ... - EPA
27
Life Cycle Assessment and Cost Analysis of Membrane Bioreactor Systems: Influence of Scale, Population Density, Climate, and Methane Recovery Office of Research and Development National Exposure Research Laboratory National Risk Management Research Laboratory 3/27/18 Sarah Cashman, Eastern Research Group, Inc. Cissy (Xin) Ma, U.S. EPA Janet Mosley, Eastern Research Group, Inc. Brian Crone, University of Cincinnati Xiaobo Xue, State University of New York at Albany Jay Garland, U.S. EPA Ben Morelli, Eastern Research Group, Inc.
-
Upload
khangminh22 -
Category
Documents
-
view
3 -
download
0
Transcript of Life Cycle Assessment and Cost Analysis of Membrane ... - EPA
Life Cycle Assessment and Cost Analysis of Membrane Bioreactor Systems:Influence of Scale, Population Density, Climate, and Methane Recovery
Office of Research and DevelopmentNational Exposure Research LaboratoryNational Risk Management Research Laboratory
3/27/18
Sarah Cashman, Eastern Research Group, Inc.Cissy (Xin) Ma, U.S. EPAJanet Mosley, Eastern Research Group, Inc.Brian Crone, University of CincinnatiXiaobo Xue, State University of New York at AlbanyJay Garland, U.S. EPABen Morelli, Eastern Research Group, Inc.
The Challenge
• Aging infrastructure and costs associated with upgrading or expanding of centralized treatment systems and distribution systems
• Water scarcity and challenges in meeting water system demands
• Meeting green building and net-zero development goals
1
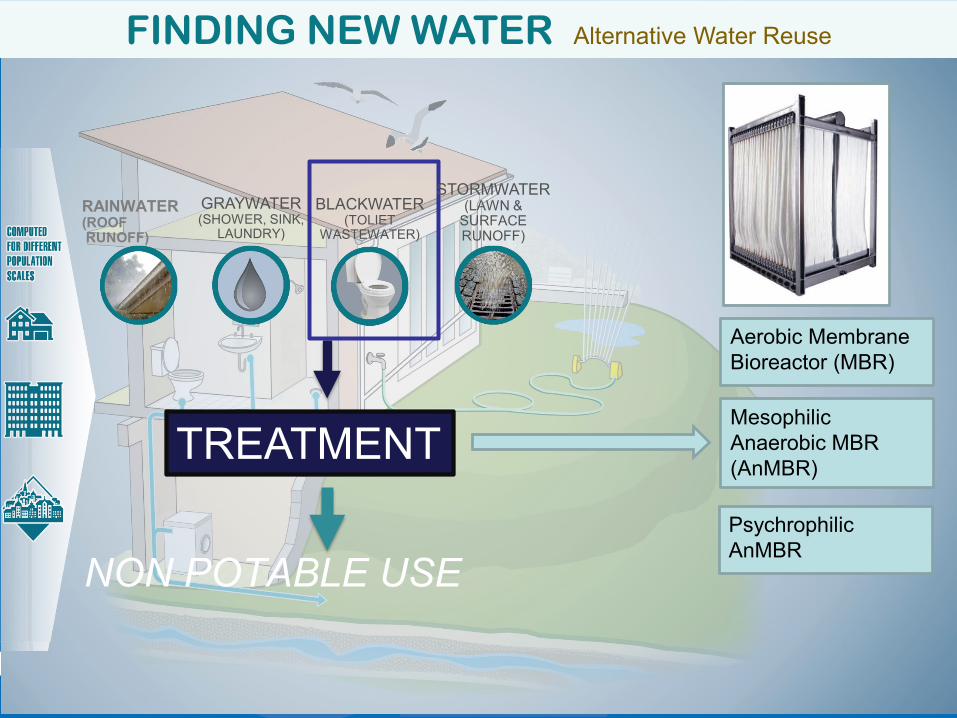
FINDING NEW WATER Alternative Water Reuse
RAINWATER(ROOFRUNOFF)
GRAYWATER(SHOWER, SINK,
LAUNDRY)
BLACKWATER(TOLIET
WASTEWATER)
STORMWATER(LAWN &
SURFACE RUNOFF)
TREATMENT
Aerobic Membrane Bioreactor (MBR)
Mesophilic Anaerobic MBR (AnMBR)
Psychrophilic AnMBR
NON POTABLE USE
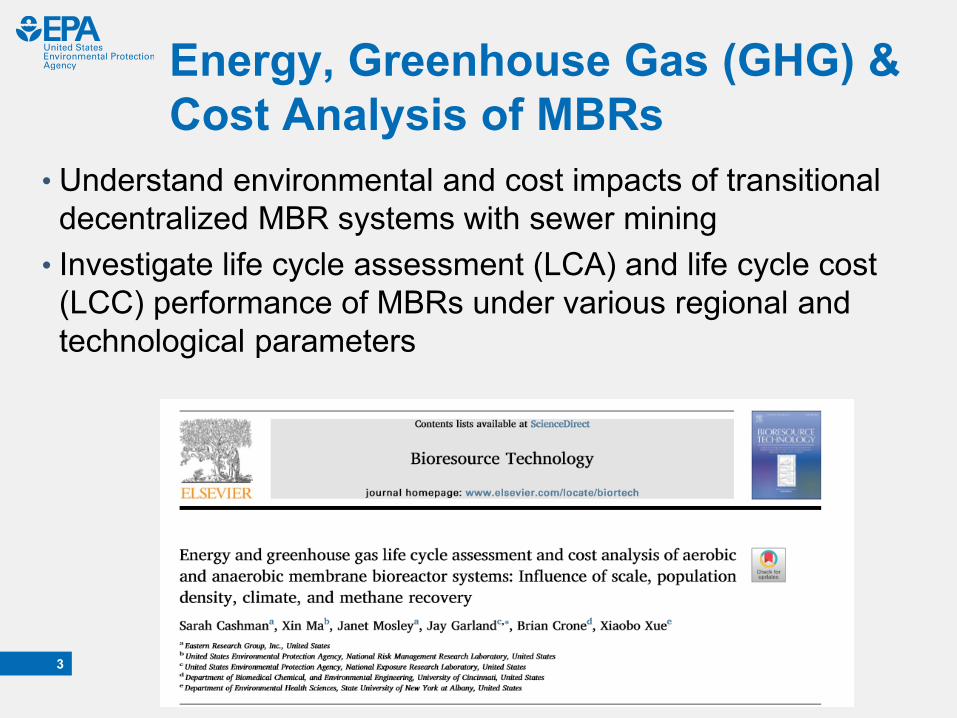
Energy, Greenhouse Gas (GHG) & Cost Analysis of MBRs
• Understand environmental and cost impacts of transitional decentralized MBR systems with sewer mining
• Investigate life cycle assessment (LCA) and life cycle cost (LCC) performance of MBRs under various regional and technological parameters
3
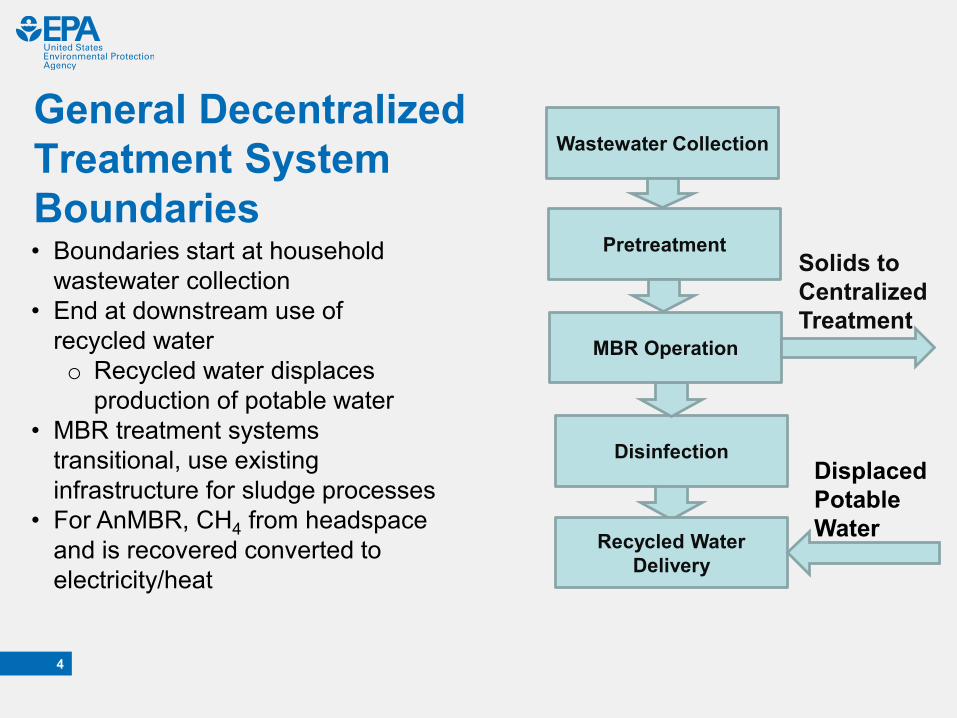
General Decentralized Treatment System Boundaries• Boundaries start at household
wastewater collection• End at downstream use of
recycled watero Recycled water displaces
production of potable water• MBR treatment systems
transitional, use existing infrastructure for sludge processes
• For AnMBR, CH4 from headspace and is recovered converted to electricity/heat
Wastewater Collection
Pretreatment
MBR Operation
Disinfection
Recycled Water Delivery
Solids to Centralized Treatment
Displaced Potable Water
4

MBR Operation
Plug Flow Activated
Sludge Diffused Aeration
Purchased Electricity AeMBRScouring
Permeate Pumping
AeMBR Subprocesses
Influent Heating
AnMBR Electrical Microturbine
Natural Gas
Purchased Electricity
Permeate Pumping
Heat Exchanger
Biogas Recirculation
Pump
Methane
Electricity
Heat LossControl
Heat
AnMBR Subprocesses
Electricity
5
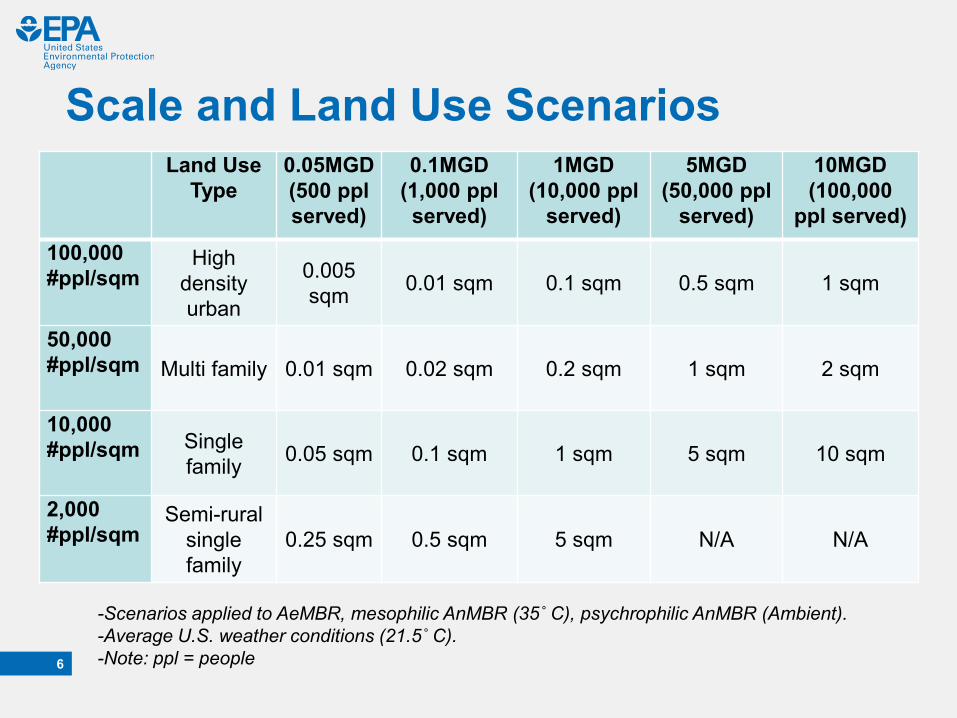
Scale and Land Use Scenarios
6
Land Use Type
0.05MGD (500 ppl served)
0.1MGD(1,000 ppl served)
1MGD(10,000 ppl
served)
5MGD(50,000 ppl
served)
10MGD(100,000
ppl served)100,000 #ppl/sqm
High density urban
0.005 sqm 0.01 sqm 0.1 sqm 0.5 sqm 1 sqm
50,000 #ppl/sqm Multi family 0.01 sqm 0.02 sqm 0.2 sqm 1 sqm 2 sqm
10,000 #ppl/sqm Single
family 0.05 sqm 0.1 sqm 1 sqm 5 sqm 10 sqm
2,000 #ppl/sqm
Semi-rural single family
0.25 sqm 0.5 sqm 5 sqm N/A N/A
-Scenarios applied to AeMBR, mesophilic AnMBR (35˚ C), psychrophilic AnMBR (Ambient). -Average U.S. weather conditions (21.5˚ C).-Note: ppl = people
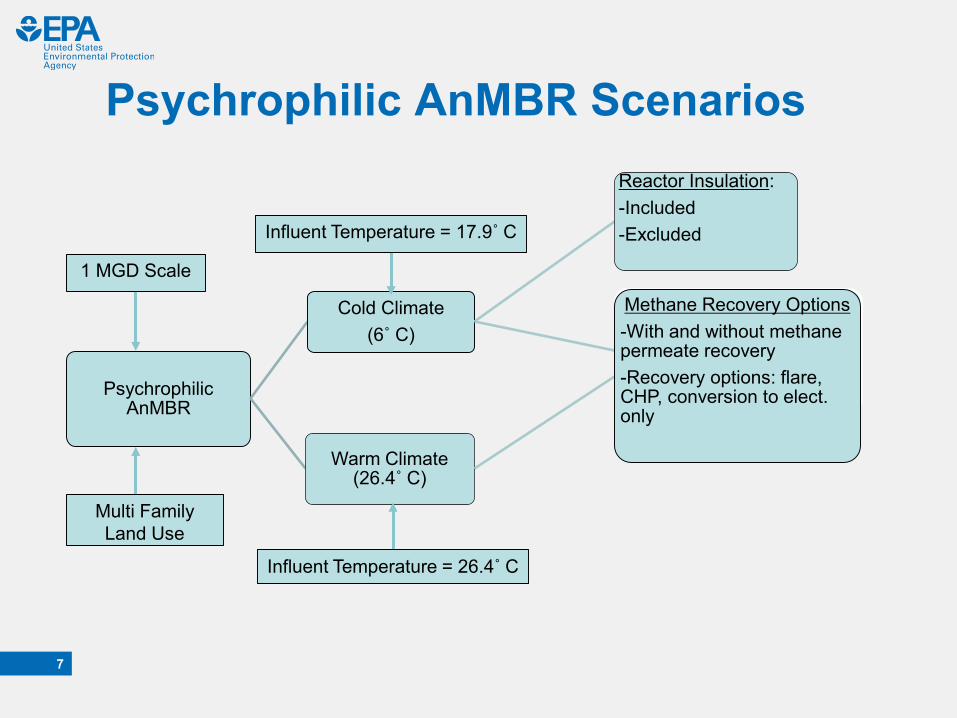
Psychrophilic AnMBR Scenarios
7
Influent Temperature = 17.9˚ C
Cold Climate (6˚ C)
Reactor Insulation:-Included-Excluded
Methane Recovery Options-With and without methane permeate recovery-Recovery options: flare, CHP, conversion to elect. only
Warm Climate (26.4˚ C)
1 MGD Scale
Psychrophilic AnMBR
Multi Family Land Use
Influent Temperature = 26.4˚ C
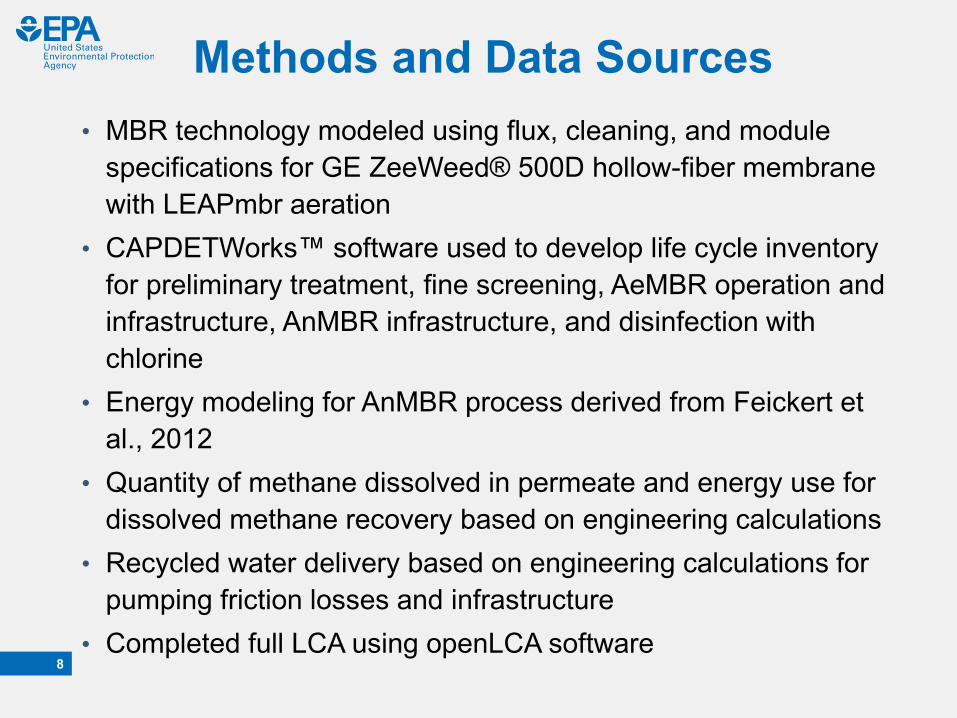
Methods and Data Sources• MBR technology modeled using flux, cleaning, and module
specifications for GE ZeeWeed® 500D hollow-fiber membrane with LEAPmbr aeration
• CAPDETWorks™ software used to develop life cycle inventory for preliminary treatment, fine screening, AeMBR operation and infrastructure, AnMBR infrastructure, and disinfection with chlorine
• Energy modeling for AnMBR process derived from Feickert et al., 2012
• Quantity of methane dissolved in permeate and energy use for dissolved methane recovery based on engineering calculations
• Recycled water delivery based on engineering calculations for pumping friction losses and infrastructure
• Completed full LCA using openLCA software8

Influence of Population Density and Scale on Global Warming Potential (GWP)
-0.50
-0.25
0.00
0.25
0.50
0.75
1.00
AeM
BR
AnM
BR, 3
5 ˚C
AnM
BR, 2
0 ˚C
AeM
BR
AnM
BR, 3
5 ˚C
AnM
BR, 2
0 ˚C
AeM
BR
AnM
BR, 3
5 ˚C
AnM
BR, 2
0 ˚C
AeM
BR
AnM
BR, 3
5 ˚C
AnM
BR, 2
0 ˚C
AeM
BR
AnM
BR, 3
5 ˚C
AnM
BR, 2
0 ˚C
0.05 MGD 0.1 MGD 1 MGD 5 MGD 10 MGD
kg C
O2
eq./
m3
was
tew
ater
trea
ted
semi rural single family single family multi family high density urbanLand Use Type
9 Same General Trends for Cumulative Energy Demand
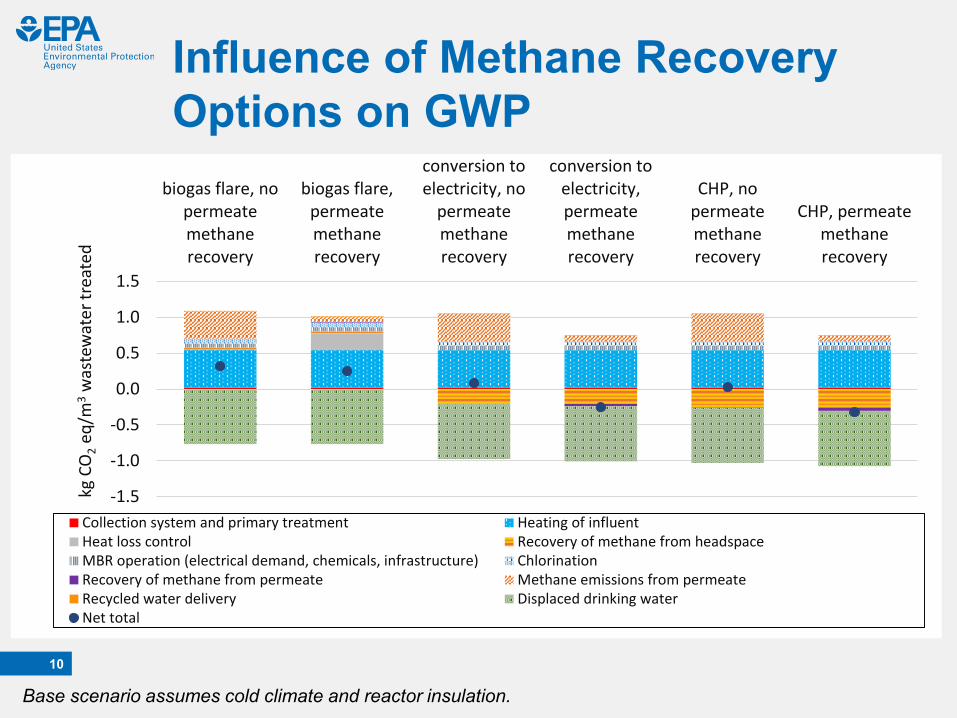
Influence of Methane Recovery Options on GWP
10
biogas flare, nopermeatemethanerecovery
biogas flare,permeatemethanerecovery
conversion toelectricity, no
permeatemethanerecovery
conversion toelectricity,permeatemethanerecovery
CHP, nopermeatemethanerecovery
CHP, permeatemethanerecovery
kg C
O2
eq/m
3w
aste
wat
er tr
eate
d
Collection system and primary treatment
-1.5
-1.0
-0.5
0.0
0.5
1.0
1.5
Heating of influentHeat loss control Recovery of methane from headspaceMBR operation (electrical demand, chemicals, infrastructure) ChlorinationRecovery of methane from permeate Methane emissions from permeateRecycled water delivery Displaced drinking waterNet total
Base scenario assumes cold climate and reactor insulation.
11
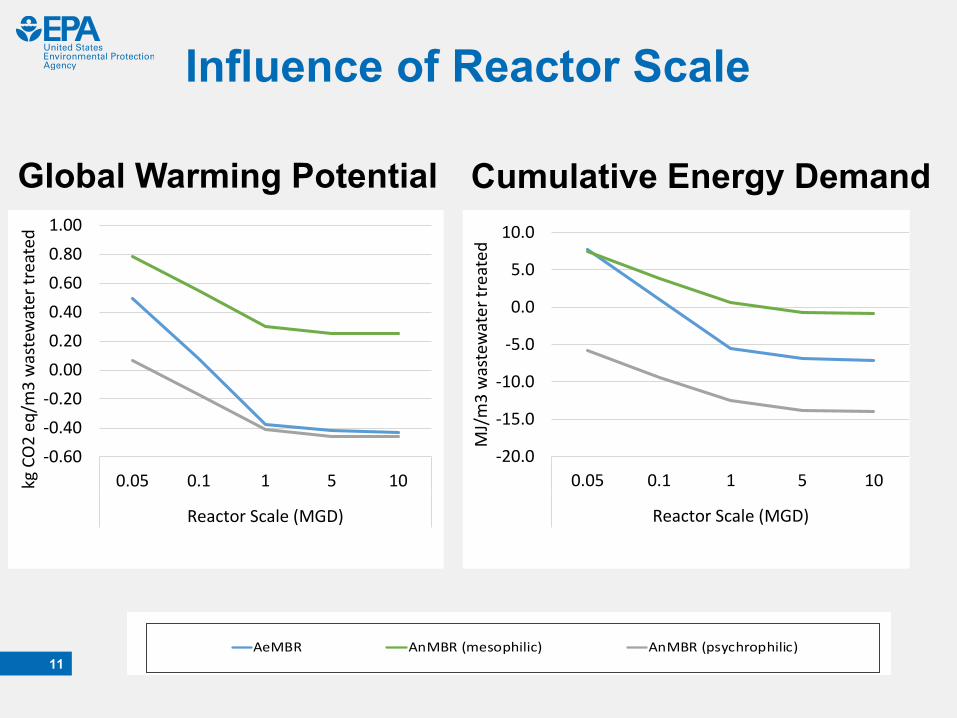
Influence of Reactor Scale
Global Warming Potential Cumulative Energy Demand
-0.60-0.40-0.200.000.200.400.600.801.00
0.05 0.1 1 5 10
Reactor Scale (MGD)
kg C
O2
eq/m
3 w
aste
wat
er tr
eate
d
-20.0
-15.0
-10.0
-5.0
0.0
5.0
10.0
0.05 0.1 1 5 10
Reactor Scale (MGD)
MJ/
m3
was
tew
ater
trea
ted
AeMBR AnMBR (mesophilic) AnMBR (psychrophilic)
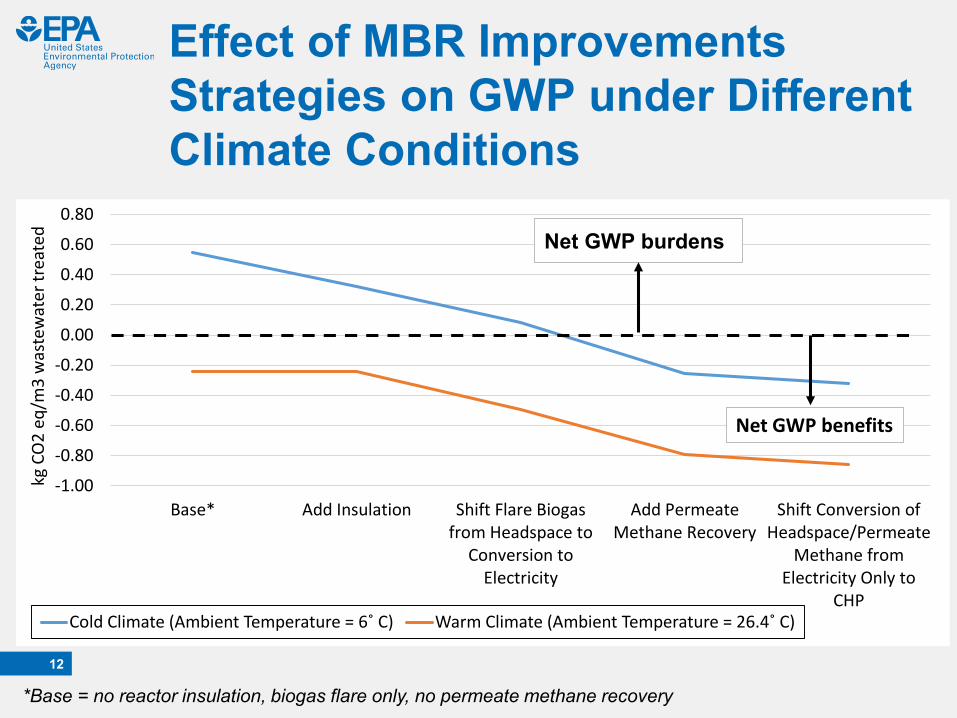
Effect of MBR Improvements Strategies on GWP under Different Climate Conditions
12
-1.00
-0.80
-0.60
-0.40
-0.20
0.00
0.20
0.40
0.60
0.80
Base* Add Insulation Shift Flare Biogasfrom Headspace to
Conversion toElectricity
Add PermeateMethane Recovery
Shift Conversion ofHeadspace/Permeate
Methane fromElectricity Only to
CHP
kg C
O2
eq/m
3 w
aste
wat
er tr
eate
d
Cold Climate (Ambient Temperature = 6˚ C) Warm Climate (Ambient Temperature = 26.4˚ C)
Net GWP burdens
Net GWP benefits
*Base = no reactor insulation, biogas flare only, no permeate methane recovery
13
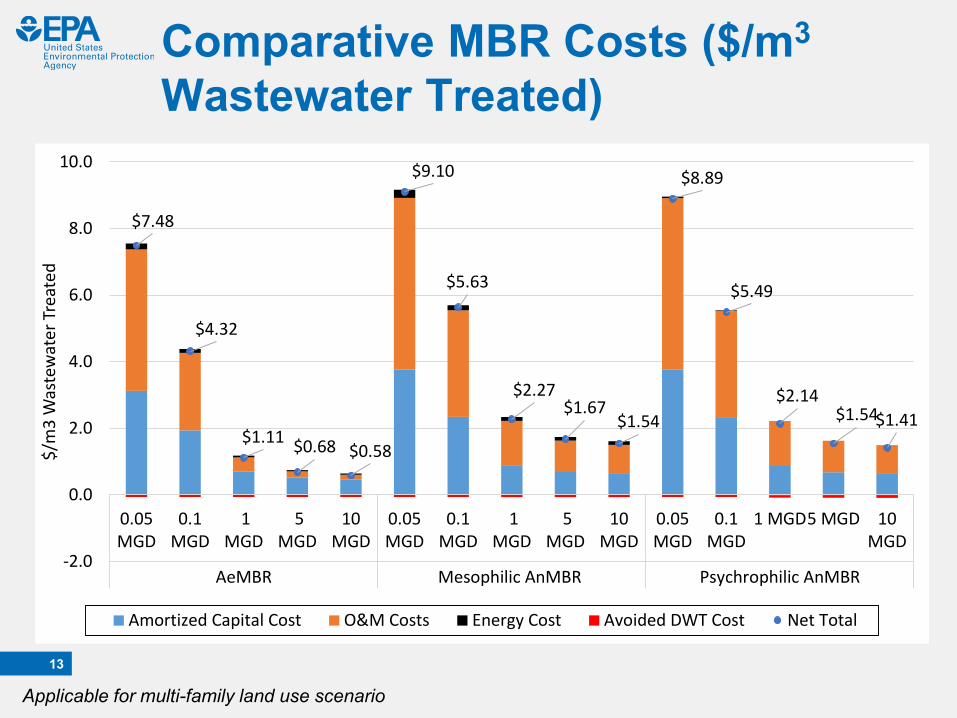
$7.48
$4.32
$1.11 $0.68 $0.58
$9.10
$5.63
$2.27$1.67
$1.54
$8.89
$5.49
$2.14$1.54$1.41
-2.0
0.0
2.0
4.0
6.0
8.0
10.0
0.05MGD
0.1MGD
1MGD
5MGD
10MGD
0.05MGD
0.1MGD
1MGD
5MGD
10MGD
0.05MGD
0.1MGD
1 MGD5 MGD 10MGD
AeMBR Mesophilic AnMBR Psychrophilic AnMBR
$/m
3 W
aste
wat
er T
reat
ed
Amortized Capital Cost O&M Costs Energy Cost Avoided DWT Cost Net Total
Comparative MBR Costs ($/m3
Wastewater Treated)
Applicable for multi-family land use scenario
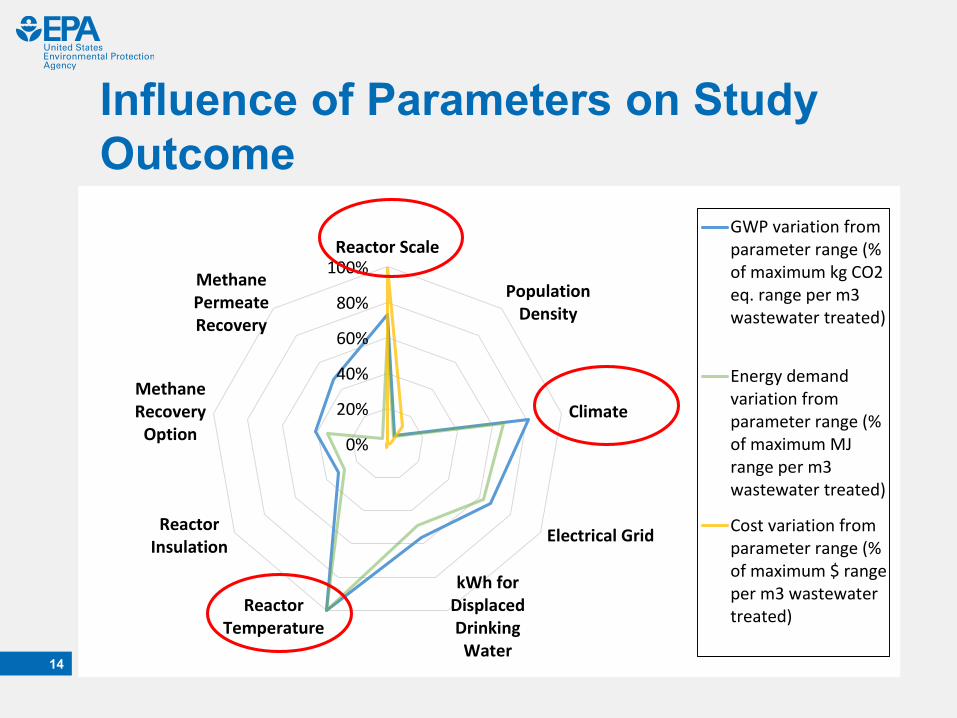
Influence of Parameters on Study Outcome
14
80%
60%
40%
20%
0%
Reactor Scale100%
PopulationDensity
Climate
Electrical Grid
kWh forDisplacedDrinkingWater
ReactorTemperature
MethanePermeateRecovery
MethaneRecovery
Option
ReactorInsulation
GWP variation fromparameter range (%of maximum kg CO2eq. range per m3wastewater treated)
Energy demandvariation fromparameter range (%of maximum MJrange per m3wastewater treated)
Cost variation fromparameter range (%of maximum $ rangeper m3 wastewatertreated)

FINDING NEW WATER – Urban Case Study
RAINWATER(ROOFRUNOFF)
GRAYWATER(SHOWER, SINK,
LAUNDRY)
BLACKWATER(TOLIET
WASTEWATER)
STORMWATER(LAWN &
SURFACE RUNOFF)
TREATMENT
NON POTABLE USE
Aerobic MBR
Psychrophilic Anaerobic MBR
MBR with Thermal Recovery
Recirculating Vertical Flow Wetland
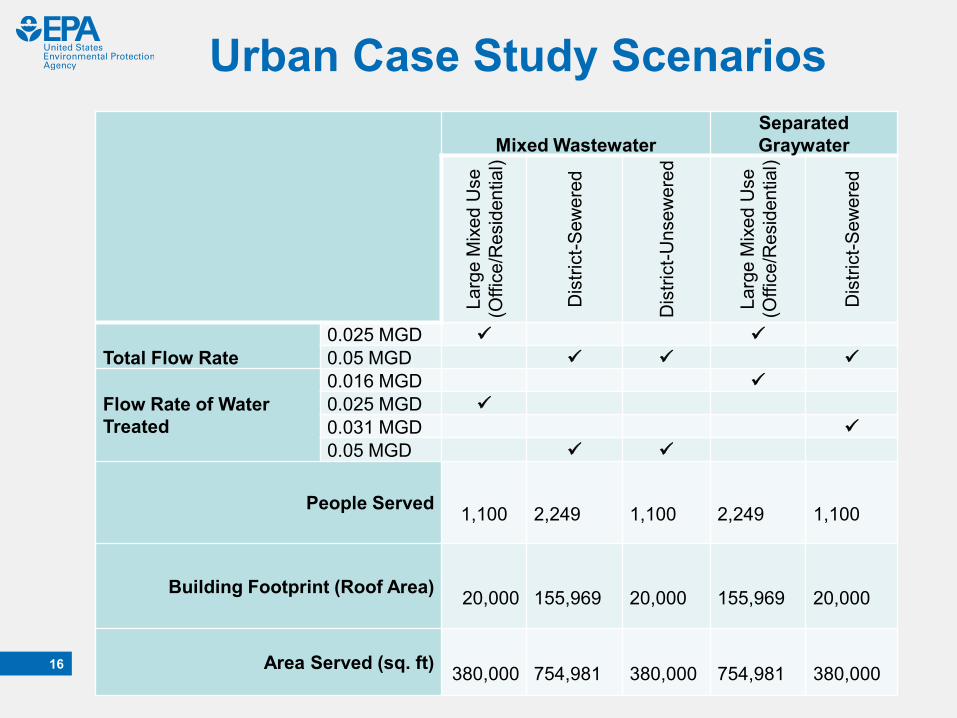
Urban Case Study Scenarios
16
Mixed WastewaterSeparated Graywater
Larg
e M
ixed
Use
(O
ffice
/Res
iden
tial)
Dis
trict
-Sew
ered
Dis
trict
-Uns
ewer
ed
Larg
e M
ixed
Use
(O
ffice
/Res
iden
tial)
Dis
trict
-Sew
ered
Total Flow Rate0.025 MGD 0.05 MGD
Flow Rate of Water Treated
0.016 MGD 0.025 MGD 0.031 MGD 0.05 MGD
People Served 1,100 2,249 1,100 2,249 1,100
Building Footprint (Roof Area) 20,000 155,969 20,000 155,969 20,000
Area Served (sq. ft) 380,000 754,981 380,000 754,981 380,000

AeMBR System Boundaries
17
Key
End Use
Influent Mixed
Wastewater
Influent Graywater
Fine Screening and Grit Removal
Aerobic Membrane Bioreactor
Screening and Grit to Landfill Sludge to Municipal
Wastewater Treatment
ChlorinationUV
Disinfection
Recycled Water
Pumping
Irrigation
Showers and Baths
Dishwasher and Kitchen
Sink
Graywater Collection Gravity System
Wastewater Collection Gravity System
StorageToilet Flushing
Bathroom Sinks
Laundry
Displaced Potable Water Treatment and Delivery
Or gate (multiple inputs)
Or gate (multiple outputs)
Unit process within system
boundary
Unit process outside system
boundary
Displaced unit process
Demanded Drinking Water Treatment and
Delivery
Dewateringa
Sludge Transporta
Windrow Compostinga
Notesa Unsewered scenario only considered for district-level analysis treating mixed wastewater.
Flow within system boundaries
Flow outside system boundaries
Displaced product flow
Displaced Fertilizer
Productiona
Land Application of Composta
Water from dewatering stepa
Conclusions and Next Steps• MBR LCA and cost impacts decrease as the scale increases due to economies of scales, scale strongly influences overall impacts esp. cost
• All assessed impacts decrease in both AeMBR and AnMBR as population density increases, but population density does not drive results
• In warmer climate, AnMBR results in notable energy and GHG benefits compared to the AeMBR
• Significant energy, GHG benefits from displaced drinking water and energy recovery (in case of AnMBR)
• Communities can adapt LCA/LCC model framework for specific technological and regional conditions
18

Acknowledgements and DisclaimerThis research was part of the U.S. Environmental Protection Agency (U.S. EPA) Office of Research and Development’s Safe and Sustainable Water Resources (SSWR) Program. The research was supported by U.S. EPA contracts to EP-C-12-021 and EP-C-16-0015 to Eastern Research Group, Inc. Although the information in this document has been funded by the U.S. EPA, it does not necessarily reflect the views of the Agency and no official endorsement should be inferred.
19

Contact Information
20
Xin (Cissy) Ma Ph.D, [email protected]
513-569-7828
Sarah [email protected]
781-674-7233

5
ADDITIONAL SLIDES
5
LCA database development
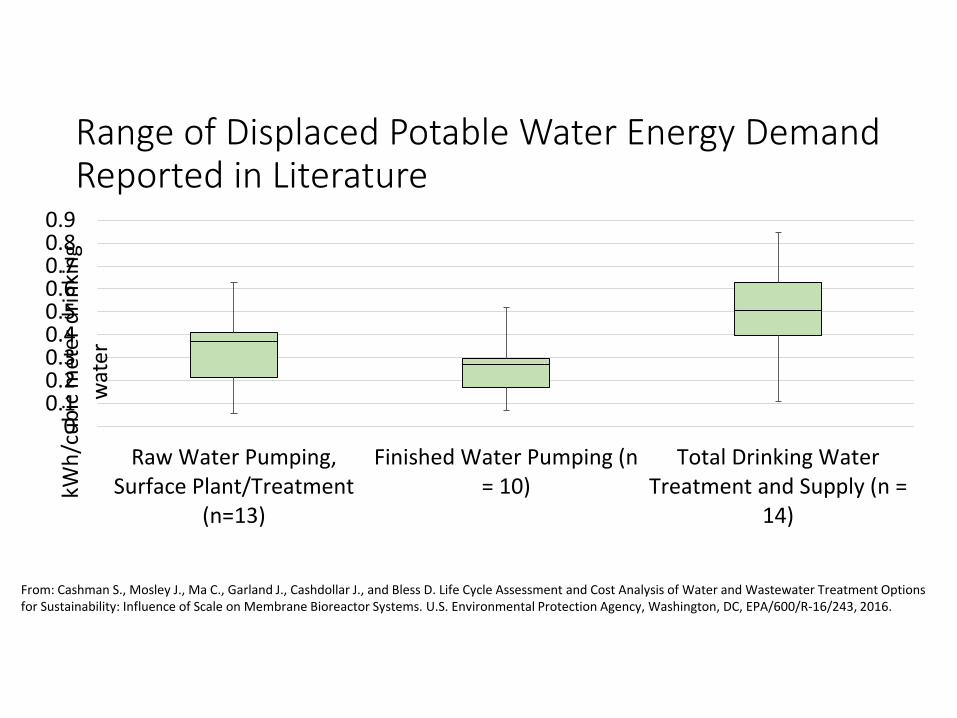
Range of Displaced Potable Water Energy Demand Reported in Literature
00.10.20.30.40.50.60.70.80.9
Raw Water Pumping,Surface Plant/Treatment
(n=13)
Finished Water Pumping (n= 10)
Total Drinking WaterTreatment and Supply (n =
14)
kWh/
cubi
c m
eter
drin
king
w
ater
From: Cashman S., Mosley J., Ma C., Garland J., Cashdollar J., and Bless D. Life Cycle Assessment and Cost Analysis of Water and Wastewater Treatment Options for Sustainability: Influence of Scale on Membrane Bioreactor Systems. U.S. Environmental Protection Agency, Washington, DC, EPA/600/R-16/243, 2016.
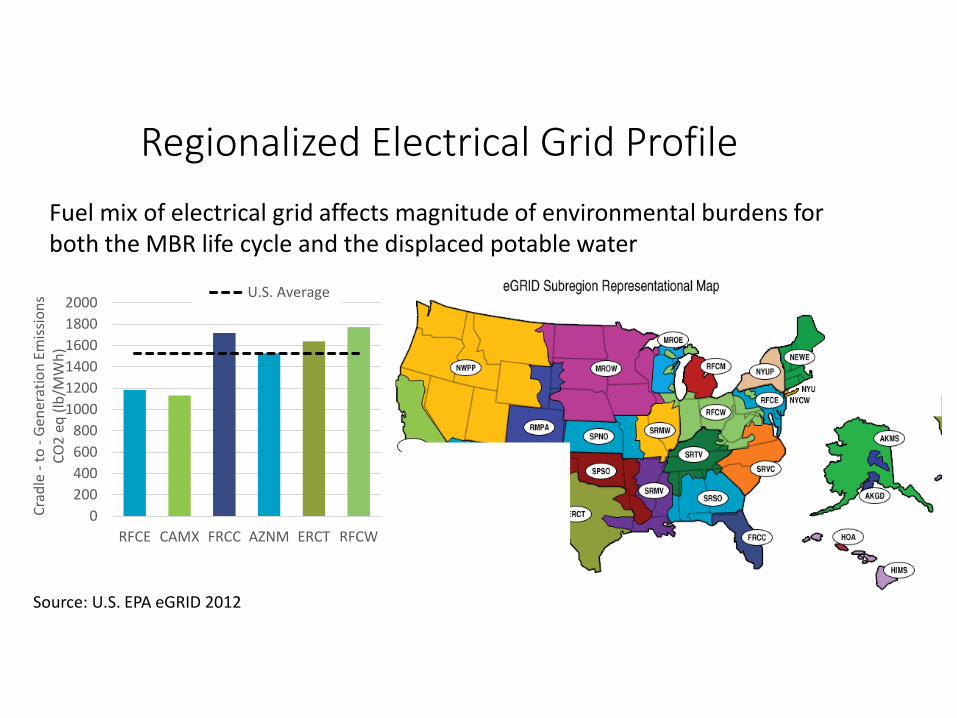
Regionalized Electrical Grid ProfileFuel mix of electrical grid affects magnitude of environmental burdens for both the MBR life cycle and the displaced potable water
0200400600800
100012001400160018002000
RFCE CAMX FRCC AZNM ERCT RFCW
Crad
le -
to -
Gene
ratio
n Em
issio
nsCO
2 eq
(lb/
MW
h)
U.S. Average
Source: U.S. EPA eGRID 2012
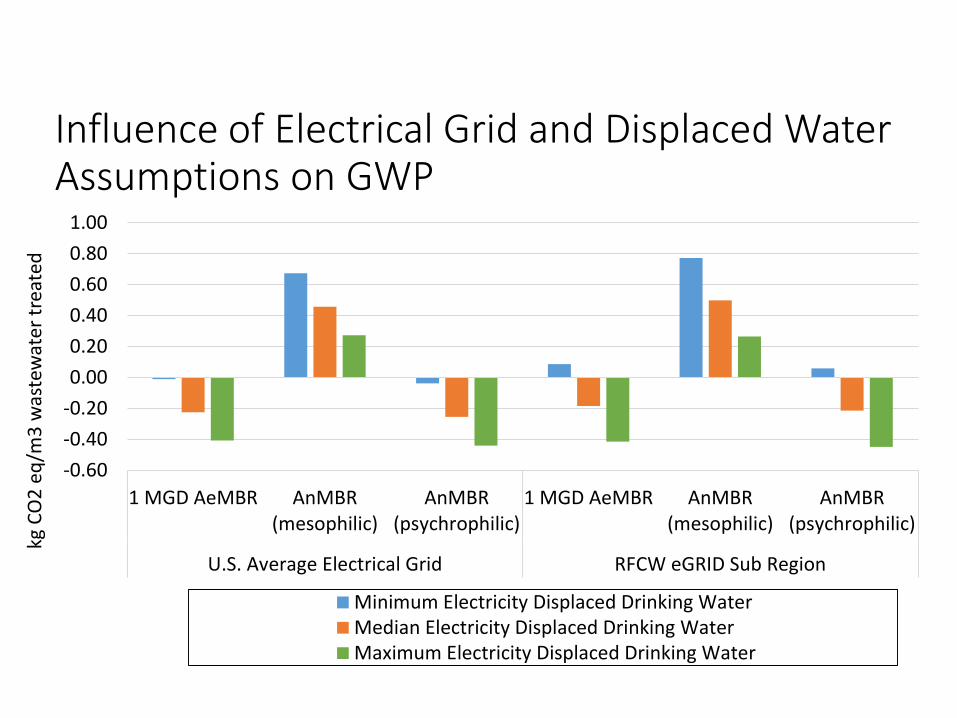
Influence of Electrical Grid and Displaced Water Assumptions on GWP
kg C
O2
eq/m
3 w
aste
wat
er tr
eate
d
-0.60-0.40-0.200.000.200.400.600.801.00
1 MGD AeMBR AnMBR(mesophilic)
AnMBR(psychrophilic)
1 MGD AeMBR AnMBR(mesophilic)
AnMBR(psychrophilic)
U.S. Average Electrical Grid RFCW eGRID Sub Region
Minimum Electricity Displaced Drinking WaterMedian Electricity Displaced Drinking WaterMaximum Electricity Displaced Drinking Water

Effect of MBR Improvements Strategies on Energy Demand under Different Climate Conditions
-18.0-16.0-14.0-12.0-10.0
-8.0-6.0-4.0-2.00.02.04.0
MJ/
m3
was
tew
ater
trea
ted
Cold Climate (Ambient Temperature = 6˚ C)
Net CED burdens
Net CED benefits
Base* Add Insulation Shift Flare Biogas fromHeadspace toConversion to
Electricity
Add Permeate MethaneRecovery
Shift Conversion ofHeadspace/Permeate
Methane fromElectricity Only to CHP
Warm Climate (Ambient Temperature = 26.4˚ C)
*Base = no reactor insulation, biogas flare only, no permeate methane