EnviroAtlas Interactive Map User Guide - EPA
47
May 2017 1 EnviroAtlas Interactive Map User Guide As of December 1, 2018, the map interface has changed from what is described in this help document. The EnviroAtlas team is working on updating the help document to reflect those changes. This PDF can assist with some of the tools, though the placement on the map application interface may be in different locations than are depicted in this document.
-
Upload
khangminh22 -
Category
Documents
-
view
0 -
download
0
Transcript of EnviroAtlas Interactive Map User Guide - EPA
May 2017 1
EnviroAtlas Interactive Map
User Guide
As of December 1, 2018, the map interface has changed from what is described in this helpdocument. The EnviroAtlas team is working on updating the help document to reflect thosechanges. This PDF can assist with some of the tools, though the placement on the map applicationinterface may be in different locations than are depicted in this document.

EnviroAtlas Interactive Map User Guide 2
ContentsContents ........................................................................................................................................................................ 2
About EnviroAtlas .......................................................................................................................................................... 4
Interactive Map Layers – National and Communities ............................................................................................... 4
Interactive Map Disclaimer ............................................................................................................................................ 4
Interactive Map Functionality Overview ....................................................................................................................... 5
Quick Guide to Using the Layer Filter/Search Panel ................................................................................................. 6
Quick Guide to Using the Map Panel ........................................................................................................................ 7
Selecting Layers and Making Layers Operational .......................................................................................................... 9
Selecting Layers Using the Layer Filter/Search Panel ................................................................................................ 9
Ecosystem Services and Biodiversity Layers ......................................................................................................... 9
People and Built Spaces Layers ........................................................................................................................... 12
Boundaries and Natural Features Layers ............................................................................................................ 13
Selecting Community Layers ................................................................................................................................... 13
Continue to View Combined Communities ......................................................................................................... 14
Narrow the Focus to a Single Community .......................................................................................................... 14
Making Selected Layers Operational in the Map Panel .......................................................................................... 17
Layer List Functionality ................................................................................................................................................ 17
Interacting with the Layer List ................................................................................................................................. 18
Layer/Legend Viewer .......................................................................................................................................... 18
Checkbox ............................................................................................................................................................. 19
Layer Function Menu Dropdown ........................................................................................................................ 20
Change Appearance ................................................................................................................................................ 21
Identify Map Features ............................................................................................................................................. 21
Attribute Table ........................................................................................................................................................ 22
Attribute Table Options ...................................................................................................................................... 24
Attribute Table Plus Button (+) ........................................................................................................................... 24
Attribute Table Filter ........................................................................................................................................... 25
Map Panel Tools .......................................................................................................................................................... 26
Location Search Box ................................................................................................................................................ 26
Basemap Gallery ...................................................................................................................................................... 27
Community Selection .............................................................................................................................................. 27
Mapping Tools ......................................................................................................................................................... 28
Enhanced Bookmarks .......................................................................................................................................... 28
Print .................................................................................................................................................................... 28
Draw and Measure.............................................................................................................................................. 29
Legend ................................................................................................................................................................. 31
Analytical Tools ....................................................................................................................................................... 32

EnviroAtlas Interactive Map User Guide 3
EnviroAtlas Change Analysis Tool (ECAT) ............................................................................................................ 32
Raindrop.............................................................................................................................................................. 34
Elevation Profile .................................................................................................................................................. 36
Time Series Viewer.............................................................................................................................................. 37
HUC Navigation ................................................................................................................................................... 40
Add Data Tools ........................................................................................................................................................ 41
Add Online Data .................................................................................................................................................. 42
Upload Data ........................................................................................................................................................ 44
Failed Layers ....................................................................................................................................................... 45
Help/Tour ................................................................................................................................................................ 46
Overview Map ......................................................................................................................................................... 46
Additional EnviroAtlas Notes ....................................................................................................................................... 47

EnviroAtlas Interactive Map User Guide 4
About EnviroAtlas
EnviroAtlas is a collection of tools and resources to provide data, research, and analysis on the relationships between nature, people, health, and the economy.
EnviroAtlas is designed for use by government, professional, academic, and community users as well as members of the public with an interest in ecosystem services, clean air, water resources, hazard mitigation, recreation, wildlife, conservation, climate, transportation, land use, health, and sustainable and healthy communities.
Interactive Map Layers – National and Communities
The EnviroAtlas interactive map provides over 300 spatial data layers to explore. Many data layers are mapped at a national extent, displaying spatial information for the entire conterminous United States. In addition, highly detailed data layers for select communities are included. New communities along with additional community and national layers are continually created and added to EnviroAtlas.
These data layers depict environmental metrics calculated or modeled by EPA and its partners, and may be referred to as “metrics” or "layers" in EnviroAtlas documentation. Map layer exploration is facilitated by the navigation tools, bookmarks to commonly used locations, feature identification, and a locator (overview) map.
EnviroAtlas provides multiple tools and GIS toolboxes, including the interactive map. This User Guide is specific to the interactive mapping application, its tools, and functionality. For additional information about EnviroAtlas, including a current list of EnviroAtlas communities, please see the EnviroAtlas home page.
Interactive Map Disclaimer
The EnviroAtlas interactive map initially shows the EnviroAtlas use disclaimer pop-up with an opportunity to read and accept the terms and conditions for using the interactive map.
Click the button at the bottom of the pop-up to proceed to the map. If desired, check the Do not show the disclaimer again box to bypass the disclaimer pop-up on subsequent visits to EnviroAtlas (bypass remains until the browser cookies and history are cleared).

EnviroAtlas Interactive Map User Guide 5
Interactive Map Functionality Overview
The EnviroAtlas interactive map is split into two sections: Layer Filter/Search Panel and the Map Panel. Follow this general workflow when using the interactive map:
1. Use the Layer Filter/Search Panel to select layers and make them available in the Map Panel. 2. Use the tools in the Map Panel to explore and analyze the selected map layers.
This section provides an overview of the features of the two panels. Additional detailed instructions on using the features are included in subsequent sections of this document.
Map Panel Layer Filter/ Search Panel

EnviroAtlas Interactive Map User Guide 6
Quick Guide to Using the Layer Filter/Search Panel
The Layer Filter/Search Panel contains buttons, toggle switches, and a search box to assist in browsing data layers or targeting specific layers to add to the map.
The three buttons at the top of the Layer Filter/Search Panel each correspond to the type of data to browse or locate.
1. Ecosystem Services and Biodiversity Panel – provides a selection of Ecosystem Services data layers at the national level and for select communities. 2. People and Built Spaces Panel – provides a selection of national and community demographic data and data related to the built environment. 3. Boundaries and Natural Features Panel – provides a selection of political boundaries and hydrologic features.
Details on using each of these Layer Filter/Search Panels are available later in this document.
Additional functions in the Layer Filter/Search Panel are:
4. Toggle switches – organized by geography and data theme. Toggling a switch “on” reveals the layers that belong to that geography and theme. 5. Search box – allows for a targeted search of layers across all Ecosystem Services and Biodiversity themes that correspond to the word or phrase entered into the box. 6. Filter/search results – layers that correspond to the filter and search parameters appear in this area and are available to add to the Map Panel.
4
5
6
3 2 1

EnviroAtlas Interactive Map User Guide 7
Quick Guide to Using the Map Panel
The Map Panel contains the map, map elements, a location search box, and several buttons that provide tools for map navigation, display, and analysis.
TIP: The Interactive Map adapts to different devices and screen sizes, therefore, the exact location of the panels and widgets may vary depending on the screen size and resolution. All tools are remain available, but may utilize a majority of the screen and need to be minimized to see other functions or the map.
Note: The Map Panel displays the name of the selected community or indicates “Combined Communities” in the upper-left corner. Pay attention to the selected community text as the community selection controls other elements of the map, such as the symbology and resulting legend. Methods to select a community are detailed in the Selecting Community Layers section of this document.

EnviroAtlas Interactive Map User Guide 8
1. Zoom in button zooms the map in to the center incrementally. 2. Zoom out button zooms the map out from the center incrementally when clicked. 3. Home button zooms the map out to the full extent (conterminous U.S.). 4. My location button zooms the map to the user’s location (based on internet protocol address). 5. Location Search Box navigates the map to a location by entering the location name or address. 6. Basemap Gallery button allows the basemap to be changed to one of several alternative basemaps. 7. Community Selection button focuses the map extent and community layer symbology on a single community
or all EnviroAtlas communities. 8. Mapping Tools button provides tools to bookmark locations, print, and draw and measure on the map. 9. Analytical Tools button provides tools that facilitate geospatial analysis and visualization of EnviroAtlas and
related data. 10. Add Data Tools button provides tools to add multiple formats of external data to the EnviroAtlas web map. 11. Help/Tour button provides a brief, interactive tour of EnviroAtlas mapping tools as well as help documentation
for specific functions. 12. Layer List button opens a pop-up listing all operational layers currently in the map. Each layer includes a set of
actions that may be taken to change the appearance or obtain information about the layer. 13. Show/Hide Map Overview arrow provides an overview map with an inset box showing the current geographic
extent of the main map. 14. Open/Hide Attribute Table button provides a tabular view of the data in the map’s operational layers. 15. Map coordinates (latitude, longitude) display for the location where the cursor hovers over the map. Move the
mouse to see the coordinates change. Click the icon to the left of the coordinate values to activate a tool to get coordinates for a specific map location by clicking on the map at that location. Select coordinate text to copy it.
16. Scalebar shows distance on the map. The scalebar adjusts based on the zoom level.
15 16
4
3
2
1 5
6 7 8 9 10 11 12
1314

EnviroAtlas Interactive Map User Guide 9
Selecting Layers and Making Layers Operational
The general workflow for using the EnviroAtlas interactive map is to 1) Select map layers from the appropriate filter/search panel, then 2) Choose which layers may become operational in the Map Panel.
Note: Selecting a community layer automatically prompts an additional workflow option to select a specific community to zoom to and view. This is explained in detail in the Selecting Community Layers section.
Selecting Layers Using the Layer Filter/Search Panel
There are three Layer Filter/Search Panels in EnviroAtlas. Click the button to limit the search to a particular data type:
1. Ecosystem Services and Biodiversity 2. People and Built Spaces 3. Boundaries and Natural Features
Ecosystem Services and Biodiversity Layers The Ecosystem Services and Biodiversity panel provides tools to search and filter National and Community summarized layers developed specifically for EnviroAtlas and additional non summarized layers created by EnviroAtlas or others. These layers correspond to the geography and topics listed in the top half of the panel.
Most of the National layers are summarized by 12-digit hydrological unit code (HUC) for the conterminous 48 United States. EPA and EnviroAtlas partners have developed these layers to help governments, researchers, and other interested parties understand the status and impacts of Ecosystem Services within a watershed or region.
Community layers are summarized by US Census Bureau block group and are designed to be used in conjunction with the National layers. The defined boundaries for the community are based on selected block groups within the 2010 US Census Bureau Urban Area boundary for the community. New community layers are regularly created and added to EnviroAtlas.
Non-summarized data layers are available in many National and Community topics such as Ecosystem Markets, Land Cover: Type, Landscape Patterns, or Impaired Waters.
Click the toggle switch next to the geography or topic to the “on” position to view corresponding layers. Click a switch “off” to exclude layers. Toggle switches may be turned on or off at any time to include or exclude layers.
The geography toggle switches (National and EnviroAtlas Communities) are in the “on” position when the interactive map is opened. When a geography toggle is switched off, some topic toggle switches below become grayed out, indicating that no layers in that topic correspond to the geography selected.
All topic toggle switches are off by default when the interactive map is opened. Switch a topic toggle to the “on” position to display a list of layers corresponding to that topic in the results at the bottom of the panel.
3 2 1

EnviroAtlas Interactive Map User Guide 10
The example on the left shows the Carbon Storage topic toggle switched to the “on” position. The layers that correspond with that topic are displayed in the results. There are six layers, as indicated by the layer count in the status bar above the results.
If desired, the search box below the toggle switches may be used instead of the toggle switches for searching and filtering EnviroAtlas layers. Enter a search term or phrase (such as “forest” or “tree cover”) in the search box.
Note: Using the search option overrides the toggle switch settings and displays all ecosystem services and biodiversity layers that match the search terms. Once the search key word is deleted, the selected toggles will be restored.
Layer information found in the results The results provide information about the layers in the list:
Layer count – number of layers in the results that correspond to the topics/geography selected.
Topic name
Layer name
Geographic extent icon
Ecosystem services category icons
Layer description
Layer count
Layer name with units selection
Hide icons checkbox
Data type icon

EnviroAtlas Interactive Map User Guide 11
Topic name – name of the topic from the toggle above. Each topic toggle switched on will display.
Layer name (some with units selection) – name of the layer. Some layers have a selection of units that provide different ways to visualize the data layer. For example, “Carbon stored by tree cover” may be viewed in the map as total volume in metric tonnes per year, as a value in U.S. dollars per year, or both. Hover the mouse cursor over the name of the layer in the results to view a short description of the layer.
Ecosystem services category icons – indicate to which of the seven EnviroAtlas ecosystem services benefit categories the layer belongs. A layer belongs to an ecosystem services category when the icon is colored, otherwise the icon is grayed. Some layers are associated with multiple ecosystem service categories. The categories represented by the icons are (left to right):
o Clean Air o Clean and Plentiful Water o Climate Stabilization o Natural Hazard Mitigation o Recreation, Culture, and Aesthetics o Food, Fuel, and Materials o Biodiversity Conservation
In the example on the previous page, the layers visible all belong to the Climate Stabilization ecosystem services category, as indicated by the orange coloration on the Climate Stabilization icon. Note: Clicking on a category icon opens a graphic and text describing the specific category.
Data type icon – indicates the type or format of the layer as displayed in the map. The types/formats represented by the icons are (left to right):
o Data summarized by census block group o Data summarized by 12-digit HUCs o Non-summarized grid data o Point, line, or polygon data
Geographic extent icon – indicates whether the layer is a national layer (“N”) or a community layer (“C”). When selected, community layers prompt a workflow option to select an EnviroAtlas community. This is explained in detail in the Selecting Community Layers section.
Hide icons checkbox – the ecosystem services category icons below the layer name may be hidden by checking the “Hide Icons” checkbox in the status bar above the results. This compresses the layer list to make more layer names visible.
Layer description and link to the EnviroAtlas Data Fact Sheet, represented by the circled “i” – click this link to open a pop-up with a short description of the layer and a link to the layer’s Data Fact Sheet with considerable details about the layer.
TIP: The layer list in the results may be compressed by clicking the topic name (i.e., “Carbon Storage”). This collapses all layers within the topic category. Click the topic category name to reveal the list. Similarly, to see a longer list of filtered names, clicking the “Filter EnviroAtlas Data by Geography|Topic” name can be collapsed to allow only the filtered layers to be visible.
EnviroAtlas Interactive Map User Guide 12
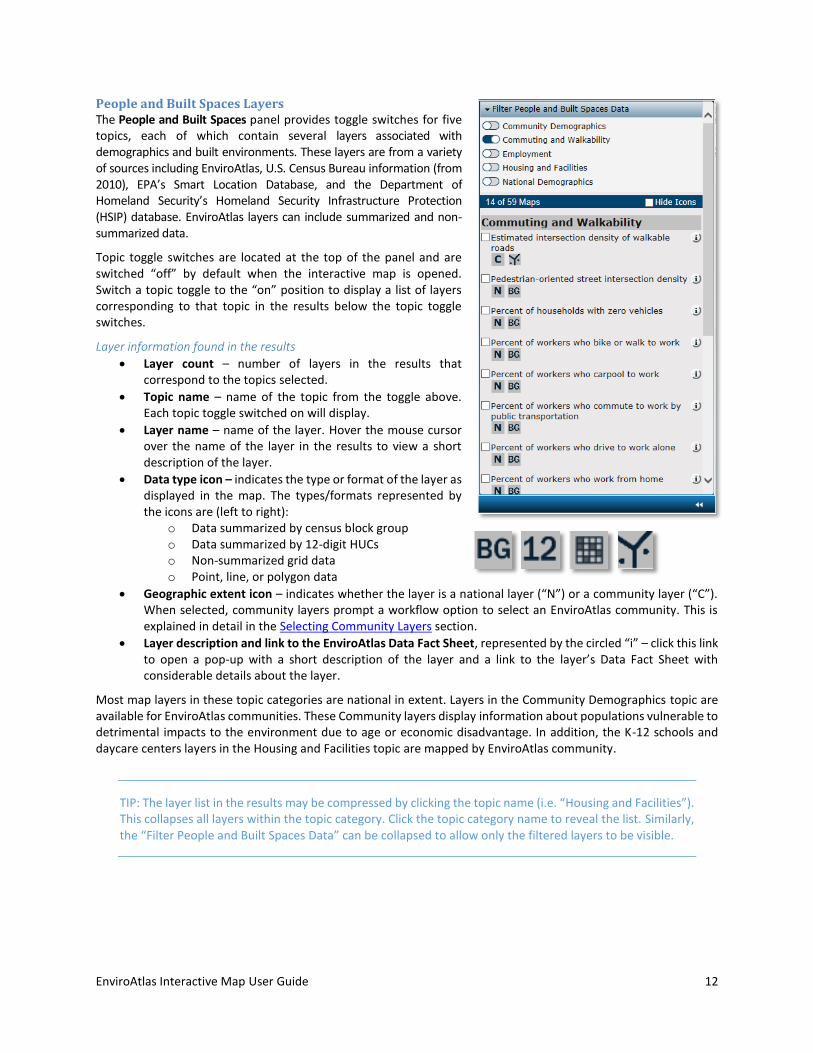
People and Built Spaces Layers The People and Built Spaces panel provides toggle switches for five topics, each of which contain several layers associated with demographics and built environments. These layers are from a variety of sources including EnviroAtlas, U.S. Census Bureau information (from 2010), EPA’s Smart Location Database, and the Department of Homeland Security’s Homeland Security Infrastructure Protection (HSIP) database. EnviroAtlas layers can include summarized and non-summarized data.
Topic toggle switches are located at the top of the panel and are switched “off” by default when the interactive map is opened. Switch a topic toggle to the “on” position to display a list of layers corresponding to that topic in the results below the topic toggle switches.
Layer information found in the results
Layer count – number of layers in the results that correspond to the topics selected.
Topic name – name of the topic from the toggle above. Each topic toggle switched on will display.
Layer name – name of the layer. Hover the mouse cursor over the name of the layer in the results to view a short description of the layer.
Data type icon – indicates the type or format of the layer as displayed in the map. The types/formats represented by the icons are (left to right):
o Data summarized by census block group o Data summarized by 12-digit HUCs o Non-summarized grid data o Point, line, or polygon data
Geographic extent icon – indicates whether the layer is a national layer (“N”) or a community layer (“C”). When selected, community layers prompt a workflow option to select an EnviroAtlas community. This is explained in detail in the Selecting Community Layers section.
Layer description and link to the EnviroAtlas Data Fact Sheet, represented by the circled “i” – click this link to open a pop-up with a short description of the layer and a link to the layer’s Data Fact Sheet with considerable details about the layer.
Most map layers in these topic categories are national in extent. Layers in the Community Demographics topic are available for EnviroAtlas communities. These Community layers display information about populations vulnerable to detrimental impacts to the environment due to age or economic disadvantage. In addition, the K-12 schools and daycare centers layers in the Housing and Facilities topic are mapped by EnviroAtlas community.
TIP: The layer list in the results may be compressed by clicking the topic name (i.e. “Housing and Facilities”). This collapses all layers within the topic category. Click the topic category name to reveal the list. Similarly, the “Filter People and Built Spaces Data” can be collapsed to allow only the filtered layers to be visible.

EnviroAtlas Interactive Map User Guide 13
Boundaries and Natural Features Layers The Boundaries and Natural Features panel contains layers that provide context and additional information for exploring Ecosystem Services along with natural and human-altered landscape features. Layers include political boundaries, ecological boundaries, and hydrologic features. All layers are national in extent.
Layer information found in the results
Topic name – name of the topic.
Layer name – name of the layer. Hover the mouse cursor over the name of the layer to view a short description of the layer.
Layer description and link to the EnviroAtlas Data Fact Sheet, represented by the circled “i” – click this link to open a pop-up with a short description of the layer and a link to the layer’s Data Fact Sheet with considerable details about the layer.
Selecting Community Layers
Community layers are indicated in the Layer Filter/Search Panel results area by a geographic extent icon marked with a “C.” Selecting a community layer from the results area prompts an option to choose a specific EnviroAtlas community before exploring the layers in the map.
In the example above, “Acute respiratory symptoms avoided due to Ozone removed by tree cover” has been selected, as indicated by the checkmark in the checkbox to the left of the layer name. This is a community layer as noted by the “C” icon. Two actions occur when this layer is selected:
1. The Layer List pop-up appears, listing the operational layers. One of the operational layers is the selected layer (“Acute respiratory…”). The other operational layer is the “EnviroAtlas Community Boundaries.”
EnviroAtlas Interactive Map User Guide 14
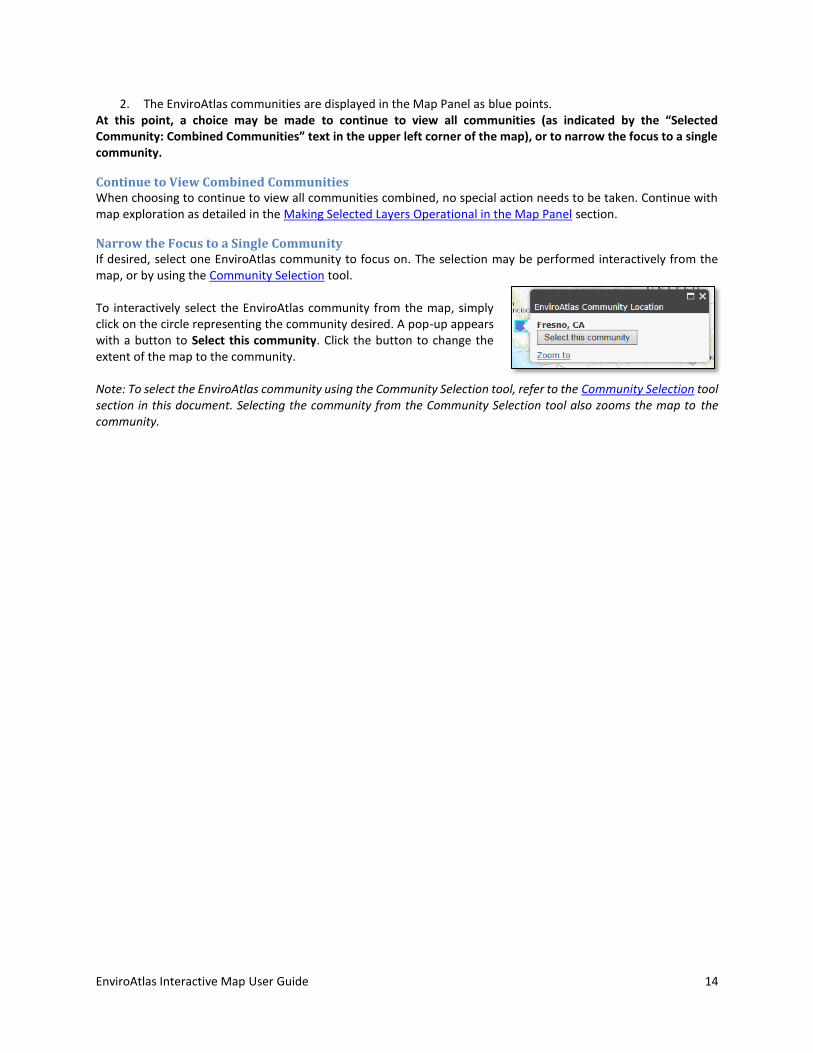
2. The EnviroAtlas communities are displayed in the Map Panel as blue points. At this point, a choice may be made to continue to view all communities (as indicated by the “Selected Community: Combined Communities” text in the upper left corner of the map), or to narrow the focus to a single community.
Continue to View Combined Communities When choosing to continue to view all communities combined, no special action needs to be taken. Continue with map exploration as detailed in the Making Selected Layers Operational in the Map Panel section.
Narrow the Focus to a Single Community If desired, select one EnviroAtlas community to focus on. The selection may be performed interactively from the map, or by using the Community Selection tool. To interactively select the EnviroAtlas community from the map, simply click on the circle representing the community desired. A pop-up appears with a button to Select this community. Click the button to change the extent of the map to the community. Note: To select the EnviroAtlas community using the Community Selection tool, refer to the Community Selection tool section in this document. Selecting the community from the Community Selection tool also zooms the map to the community.

EnviroAtlas Interactive Map User Guide 15
Once a community is selected, map symbology and the legend are tailored to display the data classifications for the selected community only, the name of which is displayed prominently in the upper left corner of the Map Panel.
When a single EnviroAtlas community is selected, the symbology and appearance for all subsequent community layers selected are tailored to that community. To select a new community, open the Community Selection tool and choose a different community or select “Combined Communities” to return to viewing the symbology for all communities.
Symbology tailored to Fresno, CA

EnviroAtlas Interactive Map User Guide 16
Selecting “Combined Communities” changes the map symbology and the legend back to representing all communities, as indicated by the text in the upper left corner of the Map Panel.
Symbology representing all EnviroAtlas communities combined

EnviroAtlas Interactive Map User Guide 17
Making Selected Layers Operational in the Map Panel
Layers selected in the three Layer Filter/Search Panels may be made operational by clicking the checkbox to the left of the layer name. When a layer becomes operational, it is displayed in the Layer List pop-up in the Map Panel. Operational layers may be visualized, queried, and analyzed in the Map Panel.
In the example above, three layers have been made operational and appear in the Layer List:
“Domestic water use (million gallons/day)” from the Ecosystem Services and Biodiversity panel
“Number of households” from the People and Built Spaces panel
“Hydrologic Unit Code (HUC) Boundaries and labels” from the Boundaries and Natural Features panel
Note: To move most pop-up windows in EnviroAtlas, simply click and drag the title bar.
If desired, minimize the Layer Filter/Search Panel by clicking the double left arrow at the bottom of the panel. This maximizes the map size within the browser. The Panel may be restored at any point by clicking on the double right arrows.
Layer List Functionality
The EnviroAtlas interactive map includes a variety of functions which act upon the map layers. These functions range from simple tasks such as turning layers on and off, to more complex functions such as modifying the symbols or coloration of a layer in the map (also called “Change Appearance”). In addition, detailed information about the contents of individual layers may be obtained. Much of this functionality is accessible through the Layer List.

EnviroAtlas Interactive Map User Guide 18
Interacting with the Layer List
Layers are arranged by the order in which they were added to the Layer List from the Ecosystem Services and Biodiversity Layer Filter/Search Panel or the People and Built Spaces Layer Filter Panel. Layers added from the Boundaries and Natural Features Panel always display near the bottom of the list, but some layers are drawn on top despite their order in the Layer List. An explanation of how to change the order of the layers is provided in the Layer Function Menu Dropdown section of this document.
To remove all layers from the Layer List, click the Remove All button. Use the Layer Filter/Search Panels to add new layers or re-add the removed layers.
Users may interact with the layers via the layer/legend viewer, the checkbox, and the layer function menu dropdown.
Layer/Legend Viewer Most often when the layer/legend viewer caret is clicked it reveals the legend for the layer. Click again to close the legend.
In cases in which the named layer represents a layer group, clicking on the layer/legend viewer caret reveals the layers within that group. Each layer has its own layer/legend viewer caret, which may be clicked to reveal that layer’s legend.
TIP: The Legend tool provides an alternative to using the layer/legend viewer to display the legend. The Legend tool activates a pop-up with a simplified legend showing only layers currently displayed in the map. More information on the Legend tool may be found later in this document.
Checkbox Layer Function Menu Dropdown
Layer/ Legend Viewer

EnviroAtlas Interactive Map User Guide 19
Checkbox The checkbox controls whether the layer is displayed in the Map Panel. Click the checkbox to display a layer on the map. Multiple layers may be displayed simultaneously by clicking the checkbox for each layer to be displayed.
To dismiss the Layer List pop-up, click the "_" in the upper right corner of the pop-up. To reopen the pop-up, click the Layer List icon on the upper right side of the Map Panel.
Open Layer List
Dismiss Layer List

EnviroAtlas Interactive Map User Guide 20
Layer Function Menu Dropdown The layer function menu dropdown to the right of the layer name provides a set of display modification tools and links to supporting information for the layer or category. Clicking the caret reveals these possible choices:
Transparency – provides a slider bar to set transparency for the layer. Note: not available for every layer.
Draw Layer On Top – reorders only the drawing order of layers in the Layer List so that the selected layer is drawn on top of all other features.
Change Appearance – displays the Dynamic Symbology pop-up with options for changing map symbols on the selected layer. This option is explained in greater detail in the Change Appearance section. Note: not available for every layer.
Enable (or Disable) ID Pop-up – allows or disallows the appearance of a pop-up with feature information when a feature in the map is clicked. Feature pop-ups are explained in greater detail in the Identify Map Features section. Note: not available for every layer.
Remove Layer – removes the layer from the Layer List.
Map Description – provides a short description of the layer or category.
Data Fact Sheet – displays the layer’s EnviroAtlas Fact Sheet PDF (if one is available) in a new browser window or tab.
Access Web Service – opens a new browser window showing the layer’s web service REST page.
Metadata/Download – opens a new browser window to the EPA Environmental Dataset Gateway (EDG) metadata for the layer (if a metadata record is available). A download link is available on this page.
Open Attribute Table – opens the table for the layer at the bottom of the Map Panel. This option is explained in greater detail in the Attribute Table section. Note: not available for every layer.
Move up – reorders the layers in the Layer List so that the selected layer is moved up once in the list.
Move down – reorders the layers in the Layer List so that the selected layer is moved down once in the list.
TIP: Move up and Move down are limited to moving layers within the list based on customary map drawing order and how the data are added to the map. If a layer is not visible after moving the layer up as far as is possible, try selecting the “Draw Layer On Top” to see the layer on top.

EnviroAtlas Interactive Map User Guide 21
Change Appearance
For many layers, the Change Appearance tool is available to modify the appearance of the map layers (see Note, below). The tool provides options to reclassify the map layer and adjust its transparency of the reclassified map. The tool is accessed by clicking on the layer function menu dropdown to the right of the layer name in the Layer List. The Dynamic Symbology pop-up menu displays the following setting options for the layer:
Symbology – provides several options for polygon fills, outline colors and styles, and point symbol types for point layers.
Classification – provides five classification methods: equal-interval – classes are split into equal value ranges
based on the minimum and maximum values. natural-breaks – classes are based on natural groupings
in the data, maximizing differences between classes. quantile – classes are created by assigning an equal
number of features per class. The default EnviroAtlas layer classification uses five-class quantile (also called “quintile”) classification.
standard-deviation – classes are separated by standard deviations from the mean value.
manual – classes may be manually created.
# of classes – sets the number of classes in the classification.
Opaque to Transparent slider bar – assigns a transparency of the layer from 0% (opaque) to 100% (transparent).
Changed symbology persists until the Reset button in the Dynamic Symbology pop-up is clicked. The Reset button reverts the layer appearance back to the default.
Note: EnviroAtlas data layers displayed beyond a regional scale will show a warning that “Changing the appearance of national layers is not possible when you are zoomed out beyond a multi-county area. Zoom in to view data with customized appearance or use the reset button to return to the default appearance.” When the scale bar in the lower left is below “30mi”, the national map appearance will change as defined in the tool.
Identify Map Features
For most Ecosystem Services and Biodiversity, People and Built Spaces, and Boundaries layers, clicking a feature on the map provides a pop-up identifying the layer’s data value for that feature. For layers not displaying an identifying value pop-up, check if the pop-up is enabled by clicking the layer function menu dropdown to the right of the layer name in the Layer List. If the menu indicates Disable ID Pop-up, then the pop-up is already enabled. Enable ID Pop-up indicates that the pop-up is disabled; click Enable ID Pop-up to activate this option.
Note: some layers do not have identifying values pop-ups. In this case, Enable or Disable ID Pop-up will be greyed out or not present in the layer function menu dropdown.
When more than one feature is selected, information about each feature is returned in the pop-up. The top bar of the pop-up indicates how many features are selected. For example, in the graphic to the right, “(1 of 3)” indicates that three features have been selected. Data values for each layer’s selected feature may be viewed by clicking on the forward and backward arrows in the top bar. Dismiss the pop-up for all pages by clicking the "X" in the upper right corner.

EnviroAtlas Interactive Map User Guide 22
Attribute Table
Display the attribute table for a layer in the map by clicking the layer function menu dropdown to the right of the layer name in the Layer List and selecting Open Attribute Table. The attribute table lists information for features in the map layer in tabular format. Attribute tables are available for most Ecosystem Services and Biodiversity, People and Built Spaces, and Boundaries layers.
The attribute table displays below the Map Panel. Attribute table field names appear above the feature values.
The attribute table may be resized to reveal more rows of feature values. Hover over the divider between the table and the Map Panel until the mouse cursor turns into a double (up/down) arrow, grab the divider, and pull it up.
Field Names
Feature Values

EnviroAtlas Interactive Map User Guide 23
Note: When the attribute table is opened for national data layers, the table is limited to display only features that are visible in the map extent. As the map extent changes, (by zooming or panning), the table changes to show features in the new extent. The attribute table for community data layers, however, displays ALL rows for the community regardless of the map extent.
There are several options available to interact with the attribute table.
1. Options provides a dropdown menu with tools to adjust table filtering, available data, and export table values. This option is explained in greater detail in the Attribute Table Options section.
2. Zoom to allows for zooming the map to the extent of features selected in the table. 3. Clear Selection removes all selected map features and their corresponding table rows from the selection. 4. Refresh allows for refreshing the table. 5. Selected Community Only filters the features and table rows to only one community when a community is
selected (for EnviroAtlas Community layers only). 6. Plus button (+) provides a pop-up listing all fields in the table with an opportunity to adjust which fields are
visible. This option is explained in greater detail in the Attribute Table Plus Button (+) section. 7. X dismisses the attribute table. 8. Left/right and up/down scroll bars and arrows allow for scrolling through the table when the table extends
past the visible area.
1 2 3 4 5 7 6
8
8

EnviroAtlas Interactive Map User Guide 24
Note: Features selected in the map using the Identify Map Features function are also selected in the attribute table and appear highlighted.
Rows may also be selected directly in the attribute table by clicking anywhere in the desired row. Features in the map that correspond with the selected table row become highlighted. To select multiple table rows, use the Shift key and click on each desired row.
Attribute Table Options Click Options for a dropdown list of functions that may be performed on the attribute table.
Show Selected Records – displays only the selected records in the attribute table. Unselected records are hidden.
Show Related Records – displays records in a separate table that has been related to the attribute table via a common field.
Filter – displays records in the attribute table that meet specific criteria based on an expression applied to the table values. This option is explained in greater detail in the Attribute Table Filter section.
Filter by Map Extent – displays records that correspond to map features partially or wholly displayed in the current map extent. This is automatically checked on for national data layers.
Show/Hide Columns – limits the visibility of columns (fields) in the attribute table (see Attribute Table Plus Button (+) section).
Export to CSV – exports rows displayed in the attribute table to a comma-separated value (CSV) file.
Attribute Table Plus Button (+)
The Plus Button in the upper right corner of the attribute table opens a pop-up with a list of table columns (fields), each with a checkbox. Use the checkboxes to hide or show columns in the attribute table.

EnviroAtlas Interactive Map User Guide 25
Attribute Table Filter The attribute table Filter may be used to limit the records returned in the attribute table based on an expression applied using the table field values. To open the filter tool, click the attribute table Options dropdown and click Filter. This opens the Filter pop-up with two options:
1. Add a filter expression – filters the table based on the values in one field.
2. Add an expression set – filters the table based on the values in multiple fields.
To filter the attribute table on values in a single field, click Add a filter expression. Use the dropdown to select the field on which to filter. The type of field (number or string) dictates the options available in the operator dropdown. A number field provides operators that function with numerical values (greater than, less than, equal to, etc.), while a string field’s operators function with text values (starts with, ends with, contains, etc.). Both the field and operator dictate the options presented in the method. Once these are entered, click OK to run the filter.
In the example at left, the expression is set to filter the table on rows (in this layer, HUCs) in which Agricultural water use (million gallons/day) is greater than 100.
Additional expressions may be added to this expression by clicking Add a filter expression again.
Field Operator
Method

EnviroAtlas Interactive Map User Guide 26
In the example at left, the second expression is set to filter the table on HUCs in which Percent agriculture is less than 35.
When an additional filter expression is added, an option is presented near the top of the pop-up to match all expressions or any expression. In this example, when set to “All”, the filter will return table rows in which agricultural water use is greater than 100 million gallons/day AND agricultural land occupies less than 35% of the HUC.
When set to “Any” of the expressions, the filter will return table rows in which agricultural water use is greater than 100 million
gallons/day OR agricultural land occupies less than 35% of the HUC.
The above example shows expressions being added to the filter iteratively. Alternatively, a multi-expression filter may be added by clicking Add an expression set. This permits a filter with two expressions to be configured. Add more expressions by clicking the expression “+” button, or remove expressions by clicking the “x” button.
Note: A filter continues to be active until it is removed. Remove the filter by clicking the “x” button(s) at the right end of each filter expression, then click OK.
Map Panel Tools
EnviroAtlas provides several tools in the Map Panel that allow for multiple ways to interact with the map to navigate, modify the display, save locations and perform analysis.
Location Search Box
The location search box located in the upper left corner of the Map Panel allows for navigation of the map to a location by entering the place name, street address, city and state, or ZIP Code.
For common place names, several choices are displayed. The scroll bar or scroll arrows may be used to find the exact location needed.

EnviroAtlas Interactive Map User Guide 27
Basemap Gallery
Click the Basemap Gallery button to view several options for changing the base map, which is the underlying map image for all EnviroAtlas layers. Different sources of aerial imagery, topographic, and street maps are available. Click a base map to select it.
Two base maps may be blended so that features in each base map are visible. To blend two base maps, select one base map and display it in the Map Panel, then locate the desired base map in the list, hover over it, and click the green plus symbol (+). This opens a slider bar in the Basemap Gallery pop-up that allows blending of the two base maps together.
Dismiss the Basemap Gallery pop-up by clicking the “_” symbol in the upper right corner.
Community Selection
Click the Community Selection button to reveal a list of EnviroAtlas Communities for which summarized and non-summarized community map layers are available. Select one of the communities in the list and the map extent will zoom directly to that community. When map layers with EnviroAtlas Community block group data are displayed, layer legends are tailored to show the symbology using only the census block groups for the selected community.
Modifying the map extent to another EnviroAtlas community without using the community selection widget will not change the specialized display, but will display the other communities with symbology based on the selected community. For example, selecting Green Bay, WI and panning the map to either Milwaukee, WI or Minneapolis-St.Paul, MN will not change the classification on the map from Green Bay, WI unless one of these communities is selected in the Community Selection.
Click the “Combined Communities” option in the list to zoom the map back out to the conterminous United States. Legends for EnviroAtlas Community block group layers revert back to the default, which is calculated to show data across all communities combined.
Additional information may be found in the Selecting Community Layers section.

EnviroAtlas Interactive Map User Guide 28
Mapping Tools
The Mapping Tools drawer provides additional map functions and interactions:
1. Enhanced Bookmarks 2. Print 3. Draw and Measure 4. Legend
Enhanced Bookmarks The Enhanced Bookmarks tool provides the ability to move to a location on the map. Several geographic areas are pre-configured in the Enhanced Bookmarks pop-up. Click a geographic location name to reposition the map at the location, scaled to the extent of the location.
Bookmarks may be added to quickly navigate to a map location. To add a bookmark, zoom and/or pan to the desired area, enter a bookmark name into the text box at the top of the pop-up, and click the plus symbol (+). The new bookmark is added to the bottom of the bookmark list and is stored locally in the browser cache (in the user’s browser settings).
Note: if the browser cache is cleared, any newly created bookmarks will not be saved.
To delete a bookmark, click the red “x” button next to the bookmark name. Pre-configured bookmarks cannot be deleted.
Note: clicking a bookmark to an EnviroAtlas community does not select the community as it does in the Community Selection widget but merely zooms the map to the community extent.
Print The Print tool provides the ability to export a simple map in multiple graphics formats for saving and printing. Add a map title, select a layout (portrait or landscape in several paper sizes, and choose a graphics format. Click Print to create the map graphic. Click the name of the newly created graphic in the Print pop-up to open, save, and print it.
The Advanced button in the Print pop-up provides additional settings for the output map graphic:
Choose to preserve the map scale or extent or set a specific scale for the map graphic
Add author and copyright text
Turn off the legend
Adjust the export output size and quality

EnviroAtlas Interactive Map User Guide 29
Draw and Measure The Draw and Measure tools allow points, lines, polygons, and text to be placed on the map. Use these tools to measure features on the map or to mark up the map with graphical features and annotations. Graphics and text persist in the map until they are deleted or the browser cache is cleared. Graphics and annotation are included in the map when printed.
Measurement values for the drawings are automatically displayed: lengths for lines, and areas and perimeters for polygons. Measurement display may be disabled, if desired.
Hover the mouse over a tool to see text describing the function of each tool.
Add a Drawing to the Map To add a drawing, click on the desired drawing creation tool. The Draw and Measure pop-up provides several tools for adding annotation to the drawing being created as well as configuring the drawing’s appearance. Note that line and polygon drawings include options for capturing and displaying measurement values in the map along with the drawing. The Show Measurements check box is checked on by default. Check the box off to turn off this functionality.
Once the annotation and appearance have been set in the Draw and Measure pop-up, the drawing may be added to the map. To add a point drawing, click the map at the desired location. To add line or polygon drawings, follow the on-screen instructions to define the drawing extent within the map.
Polygon Line Point

EnviroAtlas Interactive Map User Guide 30
Add Text to the Map
To add text, click on the text tool. The Draw and Measure pop-up includes parameters to specify the text string, its appearance, and its placement in relation to an anchor on the map. Click the map at the location to place the anchor. The anchor will not be visible.
The graphic below shows a polygon (with area and perimeter measurements) and text added to the map.

EnviroAtlas Interactive Map User Guide 31
Managing Drawings and Text The Drawings list appears in the Draw and Measure pop-up when drawings and text are created. This is a list of all drawings, measurements, and text that have been added to the map via the Draw and Measure tool. The Drawings list provides tools to interact with the drawings and text:
Hide drawings checkbox – hides the drawings in the map when checked. Check off to show the drawings.
Update this drawing – edit the drawing or text.
Delete this drawing – delete the drawing or text.
Zoom on this drawing – zoom the map to the drawing extent.
Copy selected drawings – copy and paste selected drawings.
Export selected drawings – export the drawing and/or text and save as a JSON file.
Import draws – import a saved JSON file of a drawing and/or text.
Tools at the bottom of the Drawings list perform the selected function for all layers checked in the list.
Note: Drawings and text are stored locally in the browser cache (in the user’s browser settings). If the browser cache is cleared, the drawings and text created will no longer be saved. To prevent their permanent deletion, export the drawings and text using the Export selected drawings tool described above to save as a JSON file. The file may be imported back into the EnviroAtlas interactive map using the Import draws tool.
Legend The Legend tool opens a dynamic legend pop-up that shows only operational layers that are displayed in the map. This legend pop-up provides a convenient alternative to viewing the legend for each layer in the Layer List.
Note: Basemaps and drawings are not shown in the Legend.

EnviroAtlas Interactive Map User Guide 32
Analytical Tools
The Analytical Tools drawer provides tools to assist in exploring and analyzing the data:
1. EnviroAtlas Change Analysis Tool (ECAT) 2. Raindrop 3. Elevation Profile 4. Time Series Viewer 5. HUC Navigation
EnviroAtlas Change Analysis Tool (ECAT) The EnviroAtlas Change Analysis Tool allows a selected climate variable (maximum temperature, minimum temperature, potential evapotranspiration, or precipitation) to be compared between time periods. The calculations result in a map layer displaying in the EnviroAtlas map that depicts the change in the variable between the two time periods. Acceptable entries for the time periods are the years from 1950 to 2099 and include historic data as well as modeled future scenarios.
ECAT Functionality The ECAT pop-up contains several adjustable parameters. Selections for each parameter provide the variables that control the climate comparison displayed on the map. The parameters are as follows:
1. Climate Scenario – select the climate model to map a scenario. 2. Starting year for baseline – the “baseline” is the year or period
of consecutive years that will be compared to a comparison year (or period) to reveal changes in the climate variable over time. If the baseline is a period of multiple consecutive years, this should be the first year of the baseline period.
3. Ending year for baseline – select the year that marks the end of the baseline period. The ending year must be equal to or later than the starting year. If the baseline is only one year, select the same year as the starting year.
4. Starting year for comparison – the “comparison” is the year or period of consecutive years that will be compared to the baseline year (or period). If the comparison is a period of multiple consecutive years, this should be the first year of the comparison period.
1
2
3
4

EnviroAtlas Interactive Map User Guide 33
5. Ending year for comparison – select the year that marks the end of the comparison period. The ending year must be equal to or later than the starting year. If the comparison is only one year, select the same year as the starting year.
6. Climate variable – select the metric (temperature, precipitation, etc.) to be mapped.
7. Season or Annual – select the season to be displayed on the map, or “Annual” for annual mean values.
The circular “i” icon to the right of some parameters indicates that supporting information is available for the parameter. Click the icon to reveal detailed information about the available selections for each parameter (Described in the Data Fact Sheet).
Once the parameters have been selected, click the Calculate Change button in the ECAT pop-up.
Note: The calculation may take several minutes to complete. While calculations run in the background, other aspects of the EnviroAtlas interactive map may continue to be used.
Once complete, the map displays a layer of grid cells (800-meter resolution) detailing the change in the climate variable selected between the baseline year or period and the comparison year or period. The example above depicts the change in maximum temperature in summer when comparing the baseline period of 1950-1954 to the comparison period of 2049-2053. Clicking on a location on the map provides a pop-up that identifies the amount of change at the location. This example shows that the clicked location will experience an estimated maximum temperature increase of 4.16° F in 2049-53 versus the baseline period of 1950-1954.
Open the Legend from the Mapping Tools drawer to view the ranges of values that each color represents in the ECAT map. If desired, use the transparency slider bar to adjust the transparency of the new layer so that features below the layer are visible.
5
6
7

EnviroAtlas Interactive Map User Guide 34
To remove the ECAT change results from the map, click the Clear Layers button in the ECAT pop-up. Alternatively, open the Layer List and remove the ECAT layer from there.
The Download HUC12 average values (CSV) button creates a comma-separated value (CSV) file with the average of all ECAT values within each USGS 12-digit HUC in the conterminous U.S. When the button is clicked, a pop-up opens to save the CSV file. The resulting CSV may be viewed in a text editor or in a spreadsheet. The file contains the following fields:
OID – identifier used for processing.
HUC_12 – 12-digit HUC identifier.
ZONE_CODE – identifier used for processing.
COUNT – the number of ECAT layer grid cells within the HUC used to calculate the mean value.
AREA – area of the HUC.
MEAN –average value of the climate variable grid cells within the HUC.
Note: ECAT tool parameters used to generate the CSV are not stored in the CSV output. It is recommended that the tool parameters be captured (i.e. by adding a written description in the CSV or via screen capture) to record the scenario selected.
Raindrop The Raindrop tool generates a flow path and calculates the distance from an interactively selected point on the map to the nearest water feature in the National Hydrography Dataset Plus (NHDPlus). The flow path follows topographical features in an underlying digital elevation model (DEM). The tool pop-up window includes three tabs: About, Results, and Settings.
Note: Consider displaying the NHDPlus V2 features layer group while using this tool to provide context about the hydrologic network. The NHD layers are in the Boundaries and Natural Features panel.
This tool is built using nationally available 30-meter DEM data. The data does not account for buildings or engineered stormwater infrastructure (such as culverts and pipes) and is not for use in heavily engineered locations.
To use the Raindrop tool with default settings, click the Activate Tool button, move the mouse pointer over the location of interest on the map and click. The tool returns a red point at the location of interest and a line showing the flow path of water from the location of interest to the nearest NHDPlus V2 water body or flowline.
Note: Select Point(s) remains active until the button is clicked again, at which point the tool is deactivated.

EnviroAtlas Interactive Map User Guide 35
Click the Results tab to find the path distance from the selected point to the nearest NHDPlus water body.
To remove the graphic features from the map, click the Clear button.
Raindrop tool settings may be adjusted to improve results. Click on the Settings tab to access these:
Max Distance (km): Use the slider bar to set the maximum distance the raindrop will travel along the flow path, from 0 to 5 kilometers. Once the flowline reaches the Max Distance, the line snaps to the nearest NHD feature (within the Snap Distance tolerance). The default is 5 kilometers.
Snap Distance (km): Use the slider bar to set the distance the raindrop tool will search for the nearest NHD feature after traveling the Max Distance. The line will snap to the nearest NHD feature within the Snap Distance. The default snap distance is 5 kilometers.
Line Thickness and Color: Use the slider bar to set the line thickness. Click the color box to select the line color. The default is a 1-point dashed red line.
Once the settings are adjusted, use the Select Raindrop Point button and click on the location of interest. If the Max Distance and Snap Distance criteria are met, the flowline displays on the map with a red circle indicating the starting point.
Note: When finished with the Raindrop tool, remove the graphic features from the map by clicking the Clear button and dismiss the tool by clicking the "_" in the upper right corner of the pop-up.
EnviroAtlas Interactive Map User Guide 36
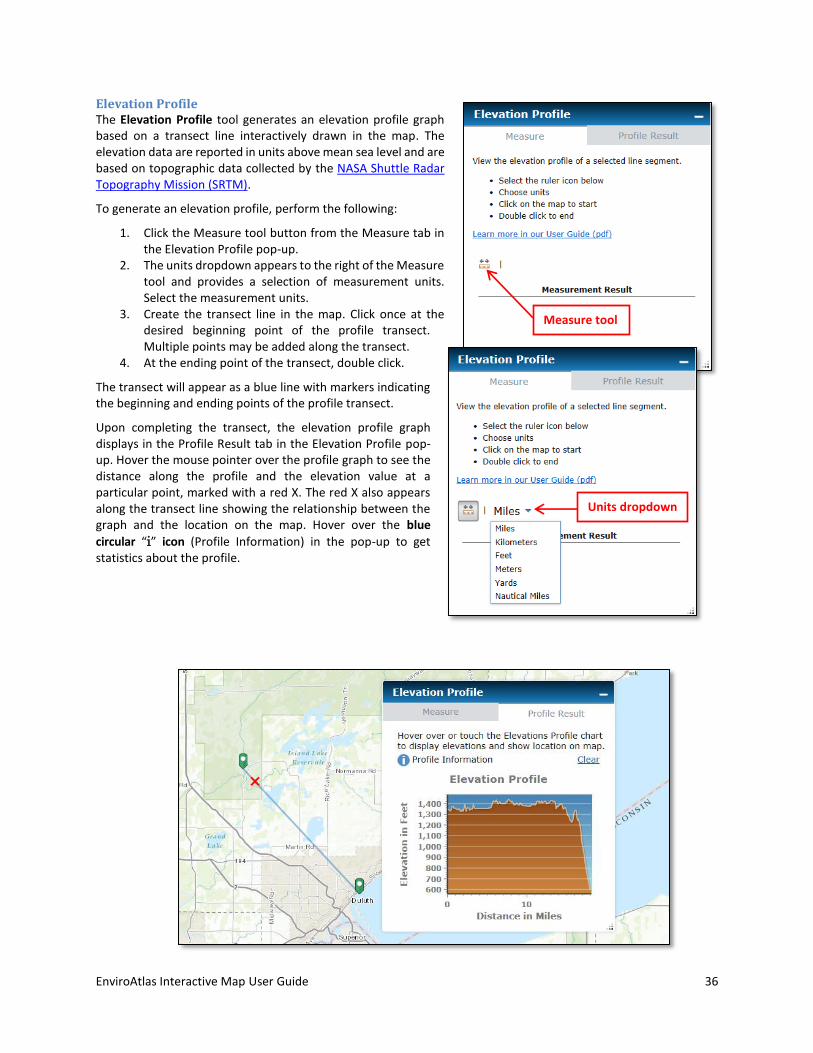
Elevation Profile The Elevation Profile tool generates an elevation profile graph based on a transect line interactively drawn in the map. The elevation data are reported in units above mean sea level and are based on topographic data collected by the NASA Shuttle Radar Topography Mission (SRTM).
To generate an elevation profile, perform the following:
1. Click the Measure tool button from the Measure tab in the Elevation Profile pop-up.
2. The units dropdown appears to the right of the Measure tool and provides a selection of measurement units. Select the measurement units.
3. Create the transect line in the map. Click once at the desired beginning point of the profile transect. Multiple points may be added along the transect.
4. At the ending point of the transect, double click.
The transect will appear as a blue line with markers indicating the beginning and ending points of the profile transect.
Upon completing the transect, the elevation profile graph displays in the Profile Result tab in the Elevation Profile pop-up. Hover the mouse pointer over the profile graph to see the distance along the profile and the elevation value at a particular point, marked with a red X. The red X also appears along the transect line showing the relationship between the graph and the location on the map. Hover over the blue
circular “i” icon (Profile Information) in the pop-up to get statistics about the profile.
Measure tool
Units dropdown

EnviroAtlas Interactive Map User Guide 37
Time Series Viewer Selecting the Time Series Viewer opens a pop-up with an invitation to Open Time Series Viewer in new tab. Click the button to open the EnviroAtlas Time Series Viewer application (separate from the EnviroAtlas interactive map). The Time Series Viewer provides
historical and modeled future climate data for a single year or a date range.
The Time Series Viewer initially displays a use disclaimer pop-up. After reading the terms and conditions for use of the Viewer, click the accept button to proceed to the map.
Time Series Viewer Functionality The Time Series Viewer contains a menu which allows for exploration of historic climate data and modeled future climate scenarios. Selections and/or entries for each menu item provide the variables that control the climate scenario displayed on the map. The variables are as follows:
1. Select Scenario or Historical – select the climate model to map a future scenario, or select “Historic Data.” 2. Select Variable – select the variable (maximum or minimum temperature, precipitation, or potential
evapotranspiration) to be mapped. 3. Select Season or Annual – select the season to be displayed on the map, or “Annual” for annual mean values. 4. Or, select specific year to display – enter a specific year to view future or historic climate data.
The blue circular “i” icon to the right of each menu item indicates that supporting information is available for the item. Click the icon to reveal detailed information about the available selections or acceptable entries for each menu item.
3
2
1
4

EnviroAtlas Interactive Map User Guide 38
Once the Model, Metric, and Season have been selected, historic or modeled future climate data that corresponds with those entries may be displayed for either one single year of data or for a sequence of years of data.
Displaying Time Series Viewer Data for a Single Year When climate data for a specific year is desired, enter the desired year in the Or, select specific year to display text box, then click the Show single year button.
Note: Acceptable entries for the specific year vary depending on what is entered into the Select Scenario or Historical menu item as follows:
Modeled future climate scenarios: When Select Scenario or Historical = “Scenario I”, ”Scenario II”, “Scenario III”, or “Scenario IV”, enter one year from 2006-2099.
Historic climate data: When Select Scenario or Historical = “Historic Data”, enter one year from 1950-2005.
Future Scenario
Single Year
2006 to 2099
Historic Data
Single Year
1950 to 2005

EnviroAtlas Interactive Map User Guide 39
The climate data for the specific year is displayed as a single map layer. The interactive map contains a legend, zoom/pan capabilities, and layer information returned when a location on the map is clicked.
To remove the time series data from the map, click on the Clear Map button.
At any time, the width of the legend can be reduced or enlarged by hovering in the space between the two panels until the pointer changes to a slider icon and sliding this to the left or right to increase or decrease the right-hand panel size.
Displaying Time Series Viewer Data for a Sequence of Years The Time Series Viewer menu may be configured to return climate data for a sequence of years in order to view changes in historic or modeled future climate data over time. When a sequence of years is desired, select the desired Scenario, Variable, and Season and then click the Show scenario button. Note: The range of years displayed in the map varies depending on what is entered into the Select Scenario or Historical menu item as follows:
Modeled future climate scenarios: When Select Scenario or Historical = “Scenario I”, ”Scenario II”, “Scenario III”, or “Scenario IV”, the range displayed is from 2006-2009.
Historic climate data: When Select Scenario or Historical = “Historic Data”, the range displayed is from 1950-2005.
Future Scenario
Historic Data

EnviroAtlas Interactive Map User Guide 40
When displaying climate data for a sequence of years, a time slider appears at the top of the map. The time slider contains tools that facilitate viewing specific years in the sequence or playing an animation of part or all of the sequence of years.
Play/Pause – plays an animation of climate maps through the sequence of years in the timeline.
Year Selector – slide to select a specific year to view in the map.
Previous – move backward to the previous year in the timeline.
Next – move ahead to the next year in the timeline.
To remove the climate change scenario from the map, click on the Clear Map button.
Note: The timeline is incremented to display maps for every fifth year (2010, 2015, 2020, etc.). To view a map of a climate metric that is in between the increments, refer to the previous section in this document, Displaying Time Series Viewer Data for a Single Year.
HUC Navigation The HUC Navigation tool allows users to click on any location in the conterminous US, navigate to the nearest stream, and select 12-digit HUC (hydrologic unit code) subwatersheds within the stream network. Either upstream or downstream HUCs may be selected, and selected HUCs may be limited by distance (stream kilometers) from the interactively-selected point and/or a maximum number of HUCs.
To select HUCs within the stream network, perform the following:
1. Click the Settings tab. 2. Select Up or Down stream. 3. Using the slider, select the maximum Distance (km) to travel
in stream kilometers. Upstream or downstream HUCs that lie beyond this set value will not be selected. The maximum value allowed is 250 km.
4. Using the slider, select the Maximum number of 12-digit HUCs to select. The maximum value allowed is 100 HUCs.
5. Optional: Check the box to Select to Save HUC Shapefile. 6. Click the Results tab.
7. Click Activate Tool, move the mouse crosshairs (+) to the desired map location to begin the HUC selection,
and click on the map. 8. Optional: If the option to save the shapefile was selected in Step 5, a Download HUC Shapefile button
appears in the Results tab after the HUCs have been generated in the map. Click to obtain a GIS shapefile of selected HUCs.
The status of the query is displayed in the white text box in the Results tab while the HUCs are generating. Please note, the further the distance or the greater number of HUCs selected increases processing time. The query results display in the map as shaded HUC polygons along the stream course.
Note: The selection tool remains active while the mouse pointer shows the crosshairs. To return to EnviroAtlas map functions, click the Select Point button to deactivate the selection tool. The mouse pointer reverts to a pointer arrow.

EnviroAtlas Interactive Map User Guide 41
Save and Download HUC Shapefile To save the selected HUC boundaries and export to a shapefile format, click the Select to Save HUC Shapefile checkbox in the Settings tab before interactively selecting a search point. Web browser pop-ups must be enabled. With the checkbox selected, after the tool has run and the HUCs display on the map, the Download HUC Shapefile button appears in the Results tab. Click this button to download a compressed shapefile to a local drive. The shapefile will only include the HUCs selected after each point is analyzed and must be saved as separate files for each query.
Add Data Tools
The Mapping Tools drawer provides utilities for additional map interactions:
1. Add Online Data 2. Upload Data 3. Failed Layers

EnviroAtlas Interactive Map User Guide 42
Add Online Data The Add Online Data tool allows data from online sources to be added to the map. The two tabs in the Add Online Data pop-up provide two different ways to add online data to the EnviroAtlas map:
Search – provides the capability to search for data layers in ArcGIS Online, Esri’s collaborative cloud environment and add them to the EnviroAtlas interactive map.
Enter A URL – provides the capability to add dynamic map services, image services, feature services, tiled services along with Open Source WMS and KML services to the EnviroAtlas interactive map from a known URL.
Search ArcGIS Online The Search tab in the Add Online Data pop-up provides the capability to search ArcGIS Online. ArcGIS Online is Esri’s cloud-based collaborative content management system, in which organizations publish and share geographic information. ArcGIS Online map layers may be added to the EnviroAtlas web map through the Add Online Data tool.
Browsing ArcGIS Online map layers using the forward and backward arrows and the scroll in the pop-up is possible but not practical due to the volume of layers available. Instead, consider using the search function and filtering capabilities within the Add Online Data tool.
The search function in the Add Online Data tool is marked by a magnifying glass which, when clicked, turns into a text box. Enter a search phrase or word into the text box to limit the ArcGIS Online search to layers that contain that phrase or word. For example, when “Tampa” is entered into the text box, the number of returned items greatly reduces (from over 370,000 to just 525).
Click DETAILS to obtain information about the online data.
To add the data to the EnviroAtlas web map, click ADD.
Filter/sort options
Geographic filtering
Search

EnviroAtlas Interactive Map User Guide 43
Click on the filter/sort options (the “hamburger” icon) to access the Type filter. The Type filter allows for limiting the layers visible in the list to particular ArcGIS Online content types (Map Service, Feature Service, etc.). This is useful when searching for a particular kind of layer—for example, imagery. The Sort By: dropdown adjusts the sort order of the returned list based on criteria—sorting by name or by date, for example.
Geographic filtering can be enabled by clicking the Within map area toggle switch “on”. This limits the browse or search to only layers that intersect with the extent of the map in the EnviroAtlas Map Panel. This is very useful when searching for map layers in a specific geographic area as it eliminates layers outside of the area. For example, if the EnviroAtlas map is zoomed to Chesapeake Bay, data that pertains to Wyoming will not be returned.
Add Data from a URL To add a map layer from an online resource into EnviroAtlas, click the Enter a URL tab in the Add Online Data pop-up. The Type dropdown provides a list of five types of online resources that may be added to the EnviroAtlas web map. Click the Sample URL(s) link to see examples of the structure of each online resource type’s URL.
Note: The Enter a URL functionality is not a searching environment—the precise URL for the online resource must be known.
Follow these steps to add an online resource to the EnviroAtlas map:
1. Select the appropriate Type of URL from the dropdown:
ArcGIS Server Web Service
WMS OGC Web Service (Note: WMS services will not overlay well if the service does not have a Web Mercator projection)
online KML File
GeoRSS File
online CSV File 2. Enter the URL into the URL text box. Add an optional Layer Name for
the online resource which will appear as a layer (or layer group) in the EnviroAtlas Layer List. Edit the text to create a custom name for the layer here or use the default name.
3. Click the Add button to add the web service or file to the EnviroAtlas map.
Once added, the online resource is loaded into the EnviroAtlas Layer List. The Layer List is the location to view the added layers, modify them, obtain information about them, and remove them from the map. Some configurations (such as symbology) for online resources are set at the source and cannot be modified in EnviroAtlas. Review the Layer Function Menu Dropdown section to view options that are available. Remove added web services using the Remove Layer function from the Layer Function Menu Dropdown.

EnviroAtlas Interactive Map User Guide 44
Upload Data The Upload Data tool allows the uploading of a GIS shapefile dataset or a comma-separated value (CSV) file into the EnviroAtlas interactive map. Symbols and pop-up identifiers for the layer features are configurable in the tool.
For best performance, the shapefile or CSV must have no more than 1,000 features. Browser instability is a problem with uploaded layers that contain more than 1,000 features.
Shapefile The following preliminary steps must be taken before the shapefile is uploaded:
1. Review the shapefile to ensure that the .shp and .dbf component files are present.
2. Verify the shapefile projection is defined.
A projection must be accurately defined so EnviroAtlas can re-project into the native map projection (Web Mercator Auxiliary Sphere, WGS 1984, units in meters).
A shapefile with a defined projection will include a .prj component file. While not essential to loading a shapefile in EnviroAtlas, the .prj component file is highly recommended to avoid unexpected results.
3. Compress (zip) the shapefile component files (including the .shp, .dbf, .prj and any other component files) using a file compression application that results in a .zip file output. The zip file should contain only one shapefile and must contain one .shp file and one .dbf file.
To upload the zipped shapefile into the EnviroAtlas map, click Add File. The Choose File to Upload window opens. Navigate to the zipped shapefile and click Open.
The Upload Data pop-up indicates that it is loading the data. When loaded, the EnviroAtlas map zooms to the extent of the newly-added shapefile.
CSV File Before a CSV file is uploaded, ensure that the file contains fields with geographic coordinates for each site. The coordinates should be Latitude and Longitude in decimal degrees. The example at right shows a CSV file (viewed in MS Excel®) with appropriate coordinates for each site (row).

EnviroAtlas Interactive Map User Guide 45
To upload the CSV file into the EnviroAtlas map, click Add File. The Choose File to Upload window opens. Navigate to the CSV file and click Open.
The Upload Data pop-up provides dropdowns to select the fields in the CSV file that represent the Longitude and Latitude coordinates. In the CSV example above, these fields are called “Longitude” and “Latitude”. Choose the appropriate fields from the CSV and click Add Data.
The Upload Data pop-up indicates that it is loading the data. When loaded, the EnviroAtlas map zooms to the extent of the newly-added CSV file points.
Modifying Uploaded Data Once a zipped shapefile or CSV file is uploaded, the layer appears in the EnviroAtlas Layer List. The Layer List is the location to view the uploaded layers, modify them, and remove them from the map. Review the Layer Function Menu Dropdown section to view options that are available. Remove uploaded layers using the Remove Layer function from the Layer Function Menu Dropdown.
Failed Layers At times, layers may fail to load in the EnviroAtlas Map Panel. This could be for a variety of reasons, but problems with map layers are typically temporary and related to layer maintenance on hosting servers.
If layers fail to load, the name is added to the Failed Layers tool. This tool provides a pop-up with a listing of layers that did not add to the map. Layers maintained by EnviroAtlas are continually monitored and should be resolved quickly. EnviroAtlas is not responsible for layers from external partners and these are provided as is, however, EnviroAtlas will work with partners to maintain accessibility to data layers.
If problems occur repeatedly with particular layers, please report the problems to EnviroAtlas using the Report EnviroAtlas Map Issues form.

EnviroAtlas Interactive Map User Guide 46
Help/Tour
The EnviroAtlas Help/Tour offers two options to assist in navigating the EnviroAtlas interactive map.
Start Tour – provides a quick tour of the basic functionality of the map, from use of the Layer Filter/Search Panel through options available in the Map Panel.
User Guide (pdf) – provides a link to this EnviroAtlas Interactive Map User guide.
Overview Map
The arrow at the bottom-right corner of the EnviroAtlas Map Panel provides access to an overview map. Click the arrow to open the overview map which shows a dark gray shaded inset box defining the geographic extent of the main map. To pan to a different area in the main map, move the shaded inset box within the overview map to the desired area. Clicking the arrow on the lower-right side again hides the overview map.

EnviroAtlas Interactive Map User Guide 47
Additional EnviroAtlas Notes
For additional comments or information about EnviroAtlas, please see the EnviroAtlas home page.
For accessing EnviroAtlas Fact Sheets:
https://www.epa.gov/enviroatlas/enviroatlas-fact-sheets
For frequently asked questions about EnviroAtlas:
https://www.epa.gov/enviroatlas/frequently-asked-questions-enviroatlas
EnviroAtlas may be best viewed in a desktop or laptop browser window (for example Internet Explorer, Google Chrome, Firefox, or Safari).