Lidar survey of ancient Maya settlement in the Puuc region of ...
54
RESEARCH ARTICLE Lidar survey of ancient Maya settlement in the Puuc region of Yucatan, Mexico William M. Ringle ID 1 *, Toma ´ s Gallareta Negro ´n 2 , Rossana May Ciau 3 , Kenneth E. Seligson 4 , Juan C. Fernandez-Diaz 5 , David Ortego ´ n Zapata 3 1 Dept. of Anthropology (Emeritus), Davidson College, Davidson, North Carolina, United States of America, 2 Centro Regional Yucata ´ n, Instituto Nacional de Antropologı ´a e Historia, Me ´ rida, Yucata ´ n, Me ´ xico, 3 Bolonchen Regional Archaeological Project, Oxkutzcab, Yucata ´ n, Me ´ xico, 4 Department of Anthropology, California State University Dominguez Hills, Carson, California, United States of America, 5 National Center for Airborne Laser Mapping, University of Houston, Houston, Texas, United States of America * [email protected] Abstract The application of lidar remote-sensing technology has revolutionized the practice of settle- ment and landscape archaeology, perhaps nowhere more so than in the Maya lowlands. This contribution presents a substantial lidar dataset from the Puuc region of Yucatan, Mexico, a cultural subregion of the ancient Maya and a distinct physiographic zone within the Yucatan peninsula. Despite the high density of known sites, no large site has been fully surveyed, and little is known about intersite demography. Lidar technology allows determi- nation of settlement distribution for the first time, showing that population was elevated but nucleated, although without any evidence of defensive features. Population estimates sug- gest a region among the most densely settled within the Maya lowlands, though hinterland levels are modest. Lacking natural bodies of surface water, the ancient Puuc inhabitants relied upon various storage technologies, primarily chultuns (cisterns) and aguadas (natural or modified reservoirs for potable water). Both are visible in the lidar imagery, allowing calcu- lation of aguada capacities by means of GIS software. The imagery also demonstrates an intensive and widespread stone working industry. Ovens visible in the imagery were proba- bly used for the production of lime, used for construction purposes and perhaps also as a softening agent for maize. Quarries can also be discerned, including in some cases sub- stantial portions of entire hills. With respect to agriculture, terrain classification permits iden- tification of patches of prime cultivable land and calculation of their extents. Lidar imagery also provides the first unequivocal evidence for terracing in the Puuc, indeed in all northern Yucatan. Finally, several types of civic architecture and architectural complexes are visible, including four large acropolises probably dating to the Middle Formative period (700–450 B. C.). Later instances of civic architecture include numerous Early Puuc Civic Complexes, suggesting a common form of civic organization at the beginning of the Late Classic demo- graphic surge, (A.D. 600–750). PLOS ONE PLOS ONE | https://doi.org/10.1371/journal.pone.0249314 April 28, 2021 1 / 54 a1111111111 a1111111111 a1111111111 a1111111111 a1111111111 OPEN ACCESS Citation: Ringle WM, Gallareta Negro ´n T, May Ciau R, Seligson KE, Fernandez-Diaz JC, Ortego ´n Zapata D (2021) Lidar survey of ancient Maya settlement in the Puuc region of Yucatan, Mexico. PLoS ONE 16(4): e0249314. https://doi.org/10.1371/journal. pone.0249314 Editor: Andrea Zerboni, Universita degli Studi di Milano, ITALY Received: November 20, 2020 Accepted: March 16, 2021 Published: April 28, 2021 Copyright: © 2021 Ringle et al. This is an open access article distributed under the terms of the Creative Commons Attribution License, which permits unrestricted use, distribution, and reproduction in any medium, provided the original author and source are credited. Data Availability Statement: Lidar data were collected by the National Center for Airborne Lidar Mapping (NCALM), funded by a grant to the authors from the National Science Foundation. Due to considerations concerning cultural heritage preservation, Lidar data are currently under embargo and awaiting a general policy on the distribution of such imagery from the Instituto Nacional de Antropologı ´a e Historia, Mexico. Once distribution policies are developed, our data will be available through the OpenTopography website (https://opentopography.org/). Qualified
-
Upload
khangminh22 -
Category
Documents
-
view
3 -
download
0
Transcript of Lidar survey of ancient Maya settlement in the Puuc region of ...
RESEARCH ARTICLE
Lidar survey of ancient Maya settlement in the
Puuc region of Yucatan, Mexico
William M. RingleID1*, Tomas Gallareta Negron2, Rossana May Ciau3, Kenneth
E. Seligson4, Juan C. Fernandez-Diaz5, David Ortegon Zapata3
1 Dept. of Anthropology (Emeritus), Davidson College, Davidson, North Carolina, United States of America,
2 Centro Regional Yucatan, Instituto Nacional de Antropologıa e Historia, Merida, Yucatan, Mexico,
3 Bolonchen Regional Archaeological Project, Oxkutzcab, Yucatan, Mexico, 4 Department of Anthropology,
California State University Dominguez Hills, Carson, California, United States of America, 5 National Center
for Airborne Laser Mapping, University of Houston, Houston, Texas, United States of America
Abstract
The application of lidar remote-sensing technology has revolutionized the practice of settle-
ment and landscape archaeology, perhaps nowhere more so than in the Maya lowlands.
This contribution presents a substantial lidar dataset from the Puuc region of Yucatan,
Mexico, a cultural subregion of the ancient Maya and a distinct physiographic zone within
the Yucatan peninsula. Despite the high density of known sites, no large site has been fully
surveyed, and little is known about intersite demography. Lidar technology allows determi-
nation of settlement distribution for the first time, showing that population was elevated but
nucleated, although without any evidence of defensive features. Population estimates sug-
gest a region among the most densely settled within the Maya lowlands, though hinterland
levels are modest. Lacking natural bodies of surface water, the ancient Puuc inhabitants
relied upon various storage technologies, primarily chultuns (cisterns) and aguadas (natural
or modified reservoirs for potable water). Both are visible in the lidar imagery, allowing calcu-
lation of aguada capacities by means of GIS software. The imagery also demonstrates an
intensive and widespread stone working industry. Ovens visible in the imagery were proba-
bly used for the production of lime, used for construction purposes and perhaps also as a
softening agent for maize. Quarries can also be discerned, including in some cases sub-
stantial portions of entire hills. With respect to agriculture, terrain classification permits iden-
tification of patches of prime cultivable land and calculation of their extents. Lidar imagery
also provides the first unequivocal evidence for terracing in the Puuc, indeed in all northern
Yucatan. Finally, several types of civic architecture and architectural complexes are visible,
including four large acropolises probably dating to the Middle Formative period (700–450 B.
C.). Later instances of civic architecture include numerous Early Puuc Civic Complexes,
suggesting a common form of civic organization at the beginning of the Late Classic demo-
graphic surge, (A.D. 600–750).
PLOS ONE
PLOS ONE | https://doi.org/10.1371/journal.pone.0249314 April 28, 2021 1 / 54
a1111111111
a1111111111
a1111111111
a1111111111
a1111111111
OPEN ACCESS
Citation: Ringle WM, Gallareta Negron T, May Ciau
R, Seligson KE, Fernandez-Diaz JC, Ortegon Zapata
D (2021) Lidar survey of ancient Maya settlement
in the Puuc region of Yucatan, Mexico. PLoS ONE
16(4): e0249314. https://doi.org/10.1371/journal.
pone.0249314
Editor: Andrea Zerboni, Universita degli Studi di
Milano, ITALY
Received: November 20, 2020
Accepted: March 16, 2021
Published: April 28, 2021
Copyright: © 2021 Ringle et al. This is an open
access article distributed under the terms of the
Creative Commons Attribution License, which
permits unrestricted use, distribution, and
reproduction in any medium, provided the original
author and source are credited.
Data Availability Statement: Lidar data were
collected by the National Center for Airborne Lidar
Mapping (NCALM), funded by a grant to the
authors from the National Science Foundation. Due
to considerations concerning cultural heritage
preservation, Lidar data are currently under
embargo and awaiting a general policy on the
distribution of such imagery from the Instituto
Nacional de Antropologıa e Historia, Mexico. Once
distribution policies are developed, our data will be
available through the OpenTopography website
(https://opentopography.org/). Qualified
Introduction
Since the pioneering explorations of John Lloyd Stephens and Frederick Catherwood in the
1840s [1], the Puuc has been recognized as a regional variant of ancient Maya civilization, pri-
marily on the basis of a common architectural style (Fig 1). Hundreds of sites are now known
from archaeological and architectural surveys over the succeeding 175 years [2–7], marking
this as one of the most densely settled regions of the Maya lowlands in terms of known sites,
although most are relatively modest in size, rarely more than a few square kilometers in extent
(Fig 2). The overwhelming majority (well over 90%) of visible Puuc archaeological features
date to the Late-Terminal Classic periods (c. AD 600–950), although communities over a mil-
lennium older are known. Despite this long history of scholarship, fine-grained settlement
studies are rare, while assessments of intersite population densities are virtually unknown.
The Puuc is also a distinct physiographic zone of the Yucatan peninsula, whose northern
limit is marked by a low escarpment known as the Sierrita de Ticul, a ridge of hills rarely more
than 110–120 m above the plains to the north (Fig 3). To the south of the escarpment is an
uplifted wedge of rolling terrain (Duch Gary’s [9] lomerío bajo con llanuras). Often the swales
between higher ground are filled with soil, resulting in the formation of “flats” of relatively
deep soils that are today favored for agriculture (referred to as planadas herein). This zone
widens from east to west and is known as the Valle de Sta. Elena, after the largest town within
it. Within the Valle de Sta. Elena (VSE) is a shallow basin known locally as the Valle de Yax-
hom, important to the study that follows. Finally, a dense zone of kegelkarst or conekarst hills
(Duch Gary’s lomerío alto con llanuras), known as the Distrito de Bolonchen (DBC), lies to the
south of the VSE. Thousands of such hills divide the landscape, although they hardly ever rise
more than 90 m above the surrounding terrain. Bordering the DBC to the south is a zone of
seasonal swamps (ak’alches) whose archaeology is understudied [10]. It is important to note
that there are basins of varying sizes and uplifted areas bordering them in each of these broad
zones, and that soil cover in uplifted areas is usually relatively shallow, enhancing the visibility
of archaeological features.
This paper is an initial report on the results of a lidar (airborne light detection and ranging)
mission flown over a portion of the Puuc in 2017, the first such sample from the region col-
lected specifically for archaeological purposes and one of the few that have been flown over
northern Yucatan [11–15]. These data were collected in support of the Proyecto Arqueologico
Regional de Bolonchen (PARB), co-directed by Gallareta Negron, Ringle, and Dr. George Bey
of Millsaps College. Since 2000 we have been examining Puuc settlement from a variety of per-
spectives and at a number of sites, though the addition of lidar data has vastly enlarged our
frame of reference, from less than 15 km2 to over twenty times that. An overarching question
we hoped to address by means of lidar data is whether the regionalism evident in architecture
could also be detected in its settlement patterns. Could settlement differences be attributed, at
least in part, to the distinctive landscape in which they arose, and at a finer level, could differ-
ences be detected between the two major physiographic zones of the Puuc, the VSE and DBC,
given the impediments to settlement within the hill district? Was the extreme site density men-
tioned above also true at the household level, or were sites mainly small clusters of elite build-
ings, such as has been observed in the Rio Bec subregion [16], an area sometimes considered
to be ancestral to the Puuc. Clearly the Puuc style spread to other parts of Yucatan, such as Chi-
chen Itza, Ek Balam, Kuluba, and elsewhere, but might the remarkably homogenous Puuc
architecture reflect a common form of civic organization?
We also address a number of sub-themes. What was the carrying capacity of the area, given
what we know of contemporary farming practices, and how might land have been managed?
What do settlement data indicate regarding population levels? What use was made of the hills,
PLOS ONE Lidar survey of ancient maya settlement in the puuc region of Yucatan, Mexico
PLOS ONE | https://doi.org/10.1371/journal.pone.0249314 April 28, 2021 2 / 54
investigators with relevant research interest can
then contact the corresponding author to request
access to the dataset. Data access requests can
then also be made to OpenTopography with
contact information here https://opentopography.
org/about/people.
Funding: Lidar data acquisition and subsequent
fieldwork were funded by Award 1660503 from the
National Science Foundation (www.nsf.gov),
Division Of Behavioral and Cognitive Sciences, to
W Ringle, T Gallareta Negron, and GJ Bey III.
Competing interests: The authors have declared
that no competing interests exist.
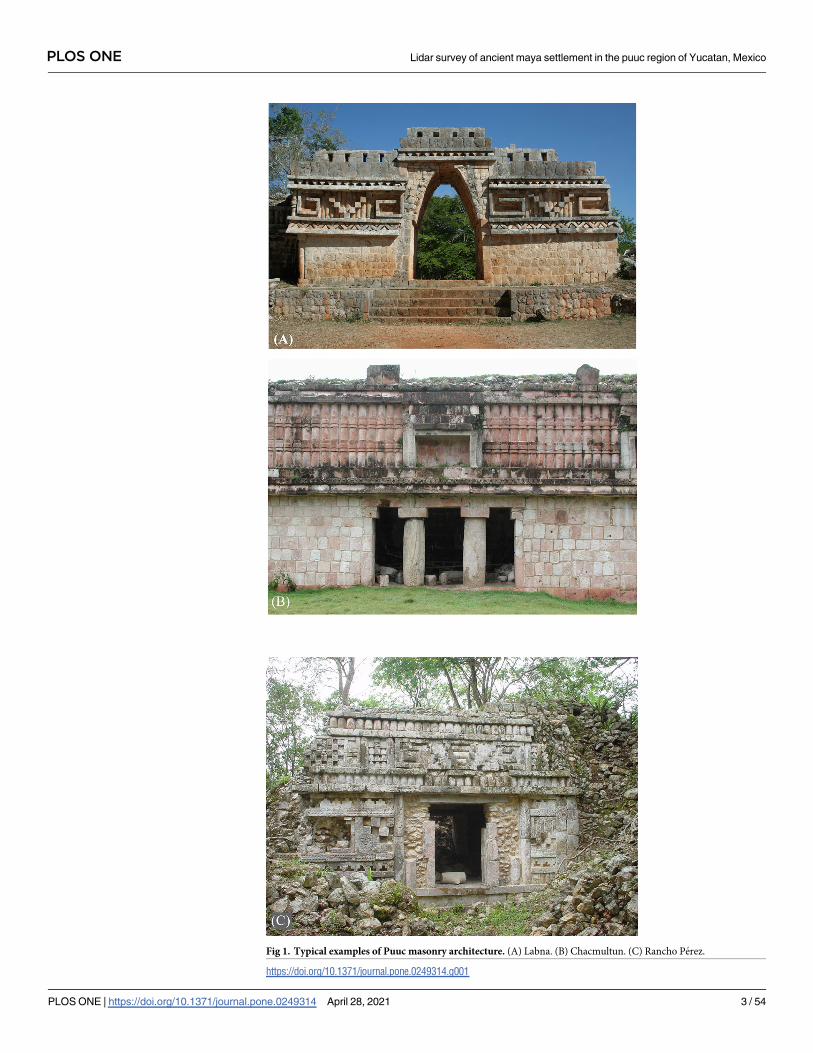
Fig 1. Typical examples of Puuc masonry architecture. (A) Labna. (B) Chacmultun. (C) Rancho Perez.
https://doi.org/10.1371/journal.pone.0249314.g001
PLOS ONE Lidar survey of ancient maya settlement in the puuc region of Yucatan, Mexico
PLOS ONE | https://doi.org/10.1371/journal.pone.0249314 April 28, 2021 3 / 54
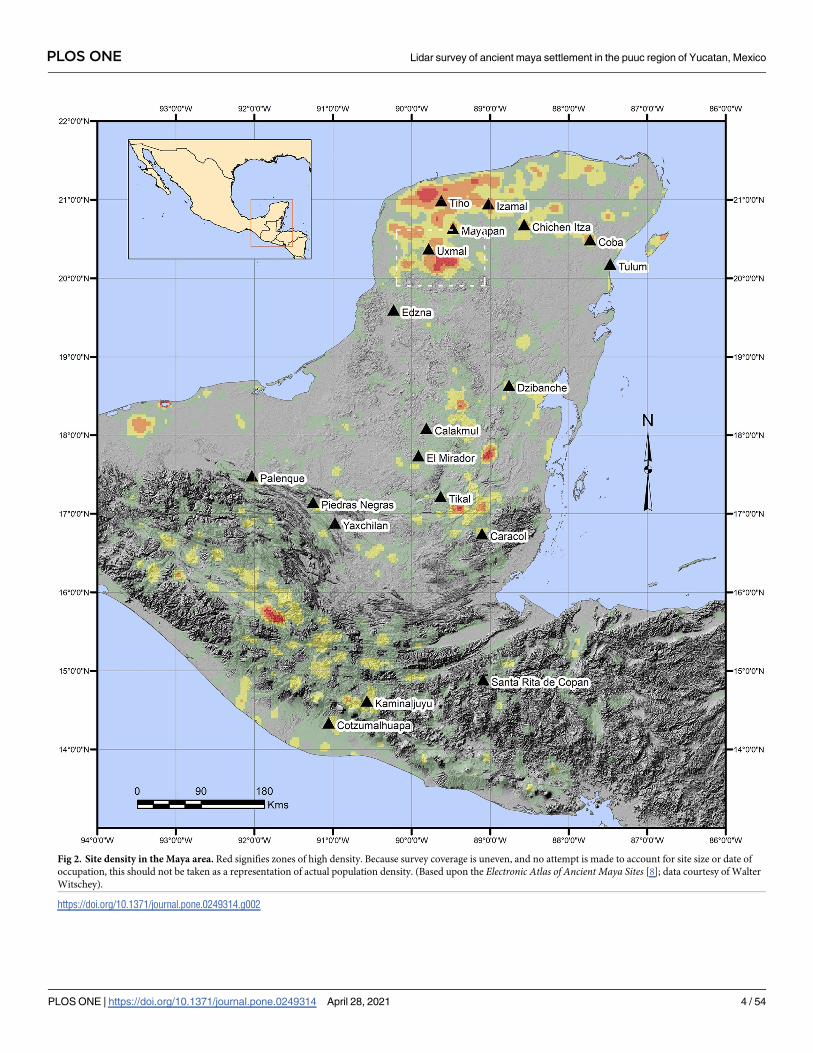
Fig 2. Site density in the Maya area. Red signifies zones of high density. Because survey coverage is uneven, and no attempt is made to account for site size or date of
occupation, this should not be taken as a representation of actual population density. (Based upon the Electronic Atlas of Ancient Maya Sites [8]; data courtesy of Walter
Witschey).
https://doi.org/10.1371/journal.pone.0249314.g002
PLOS ONE Lidar survey of ancient maya settlement in the puuc region of Yucatan, Mexico
PLOS ONE | https://doi.org/10.1371/journal.pone.0249314 April 28, 2021 4 / 54

both as a resource and locus of settlement? How did people move between and communicate
across this complex karst landscape? The availability of a large, statistically significant sample
of the Puuc landscape allows such themes to be addressed quantitatively for the first time by
means of GIS analyses of digital lidar elevation imagery.
Methods: The lidar dataset
Lidar data collection and fieldwork were carried out under the auspices of the Proyecto
Arqueologico Regional de Bolonchen. Permission to work was obtained from the Consejo de
Fig 3. Map of the Puuc region, Yucatan, Mexico.
https://doi.org/10.1371/journal.pone.0249314.g003
PLOS ONE Lidar survey of ancient maya settlement in the puuc region of Yucatan, Mexico
PLOS ONE | https://doi.org/10.1371/journal.pone.0249314 April 28, 2021 5 / 54
Arqueologıa of the Instituto Nacional de Antropologıa e Historia (Oficio 401.1S.3-2017/650
for the lidar collection and Oficios 401.1S.-2017/1387, 401.1S.3-2018/1256, and 401.1S.3-2019/
1222 for fieldwork in 2017, 2018, and 2019 respectively). The lidar dataset was collected by the
National Center for Airborne Lidar Mapping (NCALM) on May 5 and 7, 2017, employing the
Teledyne Optech Titan multispectral lidar sensor [17]. The sensor was flown on a Piper PA-31
twin engine aircraft at an altitude of 600 m above ground level and an average ground speed of
70 m/s. The sensor was configured with a total pulse repetition frequency of 450 kHz (150 kHz
per channel) and the scanner running at 25 Hz with a ± 28˚ scan angle. Early May is usually
one of the hottest and driest times of the year in Yucatan, and 2017 was no exception. Today
the Puuc is largely covered by medium-height deciduous tropical forest (selva mediana caduci-folia [18]), hence most of the foliage had fallen and visibility was generally excellent. The flight
resulted in a total of 237.23 km2 of usable data, although coverage of the fringes beyond the
requested 185 km2 does contain several minor gaps and is not at the nominal lidar densities
carefully controlled within the main survey area. Although point cloud accuracy was not
directly assessed for the project area, it is estimated than the vertical precision of the returns is
better than 8 cm and the horizontal precision better than 20 cm. Other general technical spe-
cifics of our dataset are provided in Table 1.
NCALM supplied the data in the form of DTM and DSM rasters with a resolution of .5 m,
as well as the classified point cloud dataset. (DTM refers to a digital terrain model, often
referred to as a “bare earth” raster. A DSM is a digital surface model usually created from lidar
first returns and hence reflects the tops of the tallest features, such as treetops or the tops of
crops or scrub vegetation but bare earth where there is no ground cover. We employ DEM,
digital elevation model, to refer to any raster elevation surface.) We found that the supplied
point classification, done with TerraScan software, yielded significantly more ground points
than several others we created using alternative software, among them ArcGIS 10.5 and LAS-
Tools. Experiments with regenerating rasters at a finer resolution showed no measurable
improvement. A “problem” common to all these packages is that the points corresponding to
some ancient standing buildings, like their modern equivalents, were classified as “6-building”
and so were not part of the DTM. These, however, could be manually reclassified and inserted
as patches to the master DTM, although because they almost always rest on a basal platform,
this did not affect their inclusion in the feature count.
Table 1. Lidar data collection parameters�.
Collection Dates: Two Flights flown on May 04 and 05, 2017 (DOY 124 and 125), Flight 1: Lines 1–47,
Flight 2: Lines 48–64
Sensor: Teledyne Optech Titan MW (14SEN/CON340)
Flight parameters: Flying height: 600 m AGL, Swath width: 300 m, Overlap: 50%, Line spacing: 600 m
Equipment parameters: PRF: 150 kHz per channel (450 kHz total), Scan Frequency: 25 Hz, Scan Angle: ±28˚, 2˚ cutoff in processing.
Nominal Laser Pulse (Shot)
Density:
21 pulses/m2.
Requested/Collected Area: 185.0/237.2 km2
Reference Station Summary: 20.2958356722 N, 89.41093833888 W, 24.438 m (Ellipsoid), used for flights 1 and 2
Horizontal and Vertical
Datum:
IGS08 (EPOCH:2010.0000) / WGS84 Ellipsoid Heights
LAS format: 1.4
DTM/DEM resolution 0.5 m
� Data provided by NCALM as part of the project metadata report.
https://doi.org/10.1371/journal.pone.0249314.t001
PLOS ONE Lidar survey of ancient maya settlement in the puuc region of Yucatan, Mexico
PLOS ONE | https://doi.org/10.1371/journal.pone.0249314 April 28, 2021 6 / 54

The generally favorable conditions for lidar collection in the Puuc are supported by point
cloud classification statistics (Table 2). By way of comparison, about 62.3% of our pulses pro-
duced ground returns, and 27.1% of our returns were classified as ground returns, versus
14.2% of the pulses and 10.3% of the points for the initial data gathered over Chichen Itza and
Yaxuna in 2014 [14]. Values for the 2016 Pacunam campaign over northern Guatemala are
15.4% and 8.7% respectively [19]. Puuc ground return density was about 10.6/m2, versus 2.4/
m2 for the Guatemalan campaign and about 2 for the 2014 Chichen Itza-Yaxuna dataset (this
last is not stated directly; the value given is the number of ground returns divided by the area
covered). Stanton et al. [15] do not report pulse statistics for the most recent Coba-Chichen
Itza dataset, but because it was collected with the same sensor as our project, their values are
presumably comparable. Ground return density at Mayapan [10] was higher, 11.4/ m2, but it
was also collected at a much higher pulse density (> 40 pulses/m2) specifically to enhance
imagery definition.
Two other lidar datasets, both collected for forestry and ecology purposes, partially overlap
our study area. In 2013, as part of its AMIGA-Carbproject, NASA use its G-LiHT sensor suite
to fly three narrow transects that partially impinged on our study area [20–22]. About 21 km2
extend beyond the limits of the NCALM dataset. A second dataset, which we only became
aware of while completing this manuscript, dates from the following year and was collected by
the Alianza MexicoREDD+, a group of organizations carrying out forestry and carbon storage
research in Mexico (ereddplus.com). This dataset totals 174.2 km2, 116.8 km2 of which extends
beyond the bounds of our dataset to the south and southeast and completely subsumes the
G-LiHT transects. Thus, we have a total of 354.1 km2 of lidar coverage, although since we have
only begun examination of the Alianza dataset, this discussion will deal almost exclusively with
our original NCALM data. Any reference to the Alianza dataset concerns only the 116.8 km2
exterior to the NCALM boundaries.
Although the horizontal alignment of the three datasets is excellent, their elevations differ
non-uniformly because they were processed with different references (geoids & ellipsoids) and
because of the vagaries of the point clouds (i.e., it is not simply a matter of applying a uniform
elevation offset to a given dataset). The NASA and Alianza DTMs also had to be reclassified
and resampled, since they were imaged at 1 m resolution, and visual inspection indicated that
several peaks had been truncated during classification. Reclassification was done by the senior
author using the ArcGIS 10.5 tool “Classify LAS Ground” in two passes, using the Conserva-
tive and Aggressive settings, the latter with the “Reuse Existing Ground” option. Although we
are just beginning analysis, it is evident that both the Alianza and NASA datasets have
Table 2. Lidar point cloud statistics.
Classification Returns (Points) Return % Return Density/m2�
unclassified (1) 12,754,856 0.14% 0.1
ground (2) 2,506,150,080 27.10% 10.6
low vegetation (3) 372,649,902 4.03% 1.6
medium vegetation (4) 2,317,106,211 25.05% 9.8
high vegetation (5) 4,040,215,215 43.68% 17.0
building (6) 112,672 0.00% 0.0
noise (7) 23,982 0.00% 0.0
Totals 9,249,012,918 100.00% 39.0
Total laser pulses 4,017,097,894
�Total lidar coverage: 237.2 km2.
https://doi.org/10.1371/journal.pone.0249314.t002
PLOS ONE Lidar survey of ancient maya settlement in the puuc region of Yucatan, Mexico
PLOS ONE | https://doi.org/10.1371/journal.pone.0249314 April 28, 2021 7 / 54
considerably more noise than the NCALM data, probably due to the newer sensor utilized by
NCALM. NCALM has also started the reprocessing of these datasets using their procedures
and software to better match our 2017 dataset.
Features were identified by the senior author, who has considerable field experience in
Puuc settlement archaeology. The imagery was examined at a scale of approximately 1:1000,
less if necessary, and features were registered by a central point. The data were completely
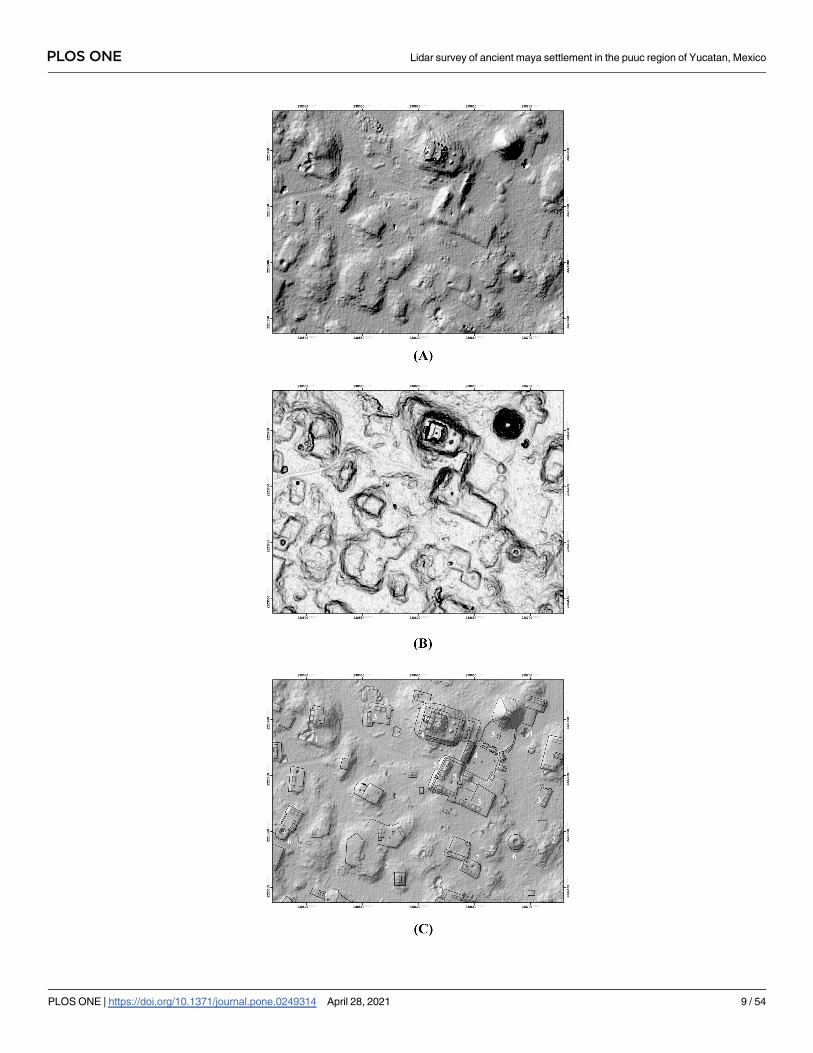
rechecked in preparation for this article. Standard hillshade images (315˚ Azimuth, 45˚ Eleva-
tion) were our primary method for visualizing the data. These were paired with “slope shade”
surfaces based upon slope and colored with a gray-scale color ramp. Whereas the unidirec-
tional illumination of standard hillshades can sometimes obscure features, the slope filter
essentially highlights the sloping outline of structures with dark coloration, while conversely
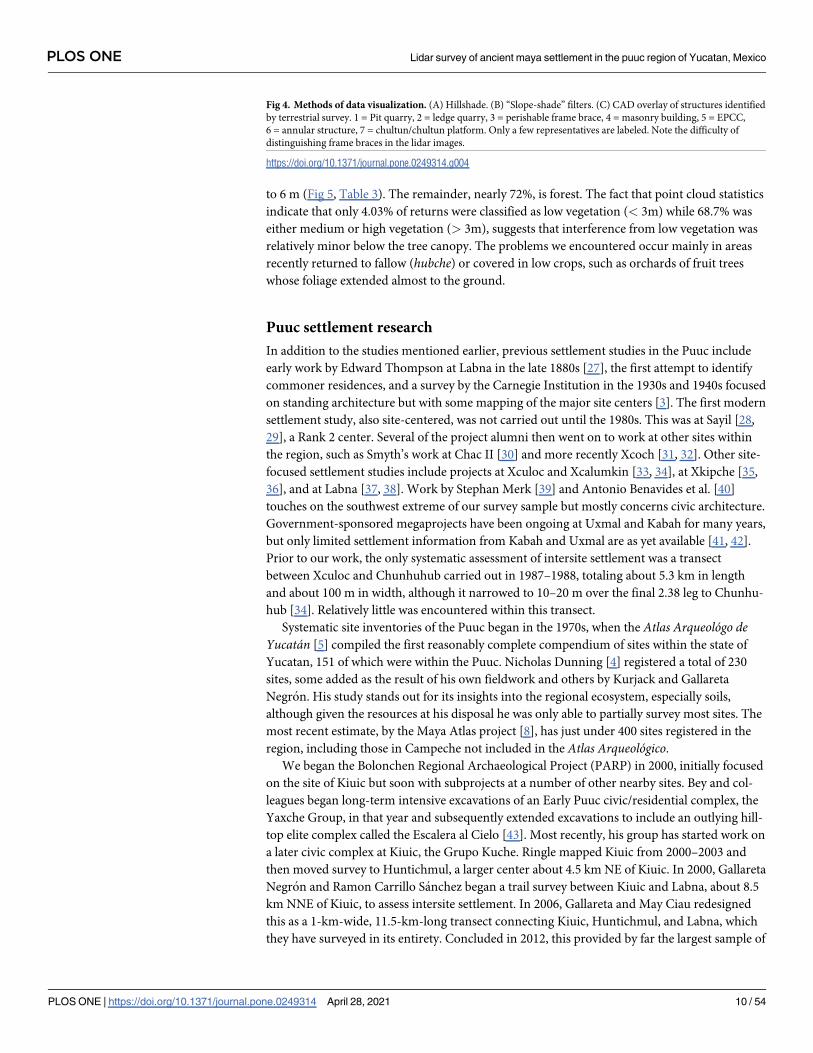
flat surfaces, such as the tops of platforms, are lighter (Fig 4). In doubtful cases, toggling
between the two helped us decide whether to include features, which were then recorded by
means of a point shapefile.
Architectural terminology can vary within Maya archaeology and is sometimes loosely
applied. For consistency, “structure,” when unmodified, is used herein as the general term
encompassing platforms, buildings (defined as a roofed area), and annular structures. The fea-
tures used in our analysis are those platforms and buildings resting directly upon the ground
(annular structures, described later in this article, were tallied separately). The great majority
of these features are basal platforms built of stone rubble, which may in turn support addi-
tional buildings, secondary platforms, or other types of construction (which are not tallied).
Basal platforms range in size from a few to over a hundred meters on a side, and given the thin-
ness of soil cover, are usually readily visible in the imagery.
In some cases, buildings rest directly on the ground, without a basal platform, and thus
potentially form part of the tally. Buildings with walls and roofs of masonry construction, espe-
cially if they had stone vaulted roofs, are relatively easy to identify in the imagery, since they
collapse into mounds 1–4 m high and 5–20+ m in length. (Though buildings on platforms are
not included in the feature tally, we have found the open negative filter of the Sky-View Factor
Lidar toolkit [23, 24] to be useful to identifying these mounds, while the open positive filter
highlights standing walls and rooms within partially collapsed masonry buildings.) In contrast,
those buildings primarily of pole and thatch construction survive only as foundation walls at
most a few courses high. These cannot be consistently distinguished in the imagery (Fig 4C),
hence our choice of basal features as the unit of analysis. Admittedly, some small buildings
resting on the ground cannot be identified in the lidar and are thus missed in our tally, but the
percentage of such features is much less than if we had made buildings, on or off platforms,
our fundamental unit of analysis. For similar reasons, the Caracol project in central Belize also
used basal structures, again mostly platforms, as the fundamental unit in studies of its lidar
imagery [25], as have most of the projects in northern Yucatan [13, 14].
Earlier lidar projects in northern Yucatan experienced some difficulty recognizing features
where scrub vegetation predominates [12, 14]. As Fernandez-Diaz et al. [26] states, this occurs
when vegetation height is less than the lidar range resolution. Stanton et al. [15] noted a
marked improvement in a second lidar dataset collected with the newer Titan MW sensor at
the height of the dry season, due in part to its shorter range resolution. Our dataset was col-
lected during the same campaign, and we too have had relatively few problems with lower
growth, although this has as much to do with the nature of the ground cover. As noted, decid-
uous tropical forest predominates, but today fields are increasingly being cleared for commer-
cial agriculture. A calculation of ground cover height, made by subtracting our DTM raster
from the DSM raster and then smoothing to a grid of 5m, reveals about 5.5% of the area is
essentially bare earth, 5.1% is vegetation 2 m or less in height, and a further 17.5% is between 2
PLOS ONE Lidar survey of ancient maya settlement in the puuc region of Yucatan, Mexico
PLOS ONE | https://doi.org/10.1371/journal.pone.0249314 April 28, 2021 8 / 54
PLOS ONE Lidar survey of ancient maya settlement in the puuc region of Yucatan, Mexico
PLOS ONE | https://doi.org/10.1371/journal.pone.0249314 April 28, 2021 9 / 54
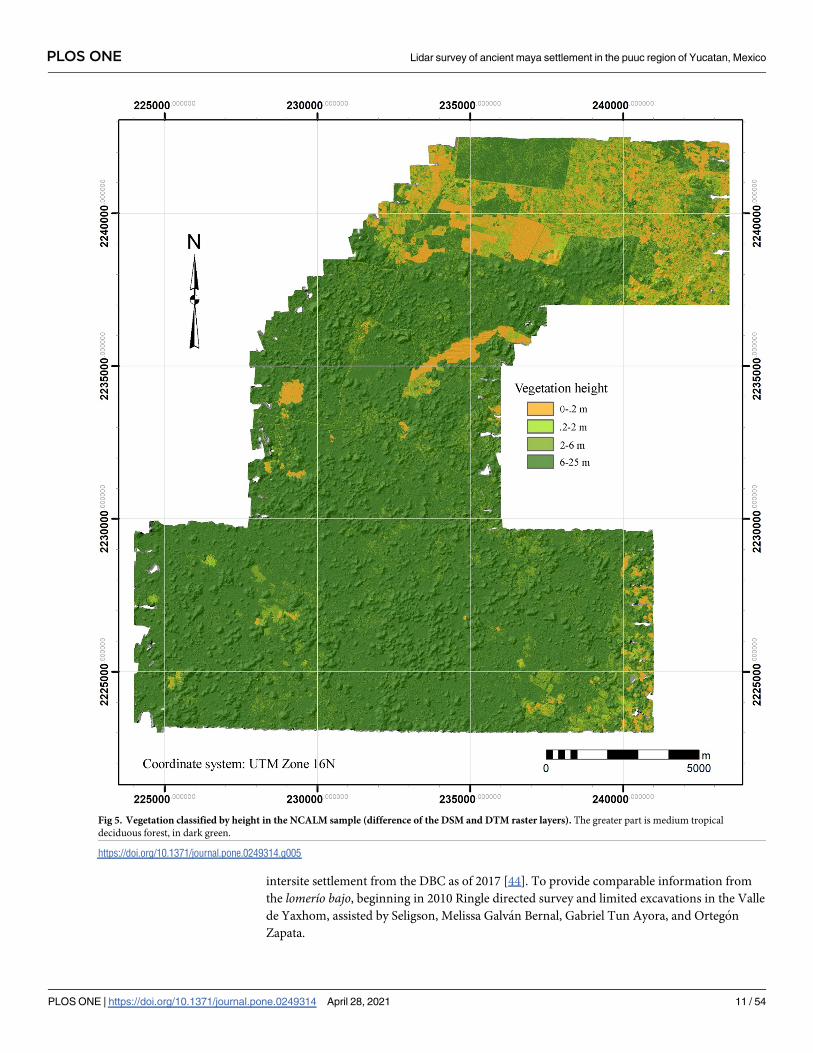
to 6 m (Fig 5, Table 3). The remainder, nearly 72%, is forest. The fact that point cloud statistics
indicate that only 4.03% of returns were classified as low vegetation (< 3m) while 68.7% was
either medium or high vegetation (> 3m), suggests that interference from low vegetation was
relatively minor below the tree canopy. The problems we encountered occur mainly in areas
recently returned to fallow (hubche) or covered in low crops, such as orchards of fruit trees
whose foliage extended almost to the ground.
Puuc settlement research
In addition to the studies mentioned earlier, previous settlement studies in the Puuc include
early work by Edward Thompson at Labna in the late 1880s [27], the first attempt to identify
commoner residences, and a survey by the Carnegie Institution in the 1930s and 1940s focused
on standing architecture but with some mapping of the major site centers [3]. The first modern
settlement study, also site-centered, was not carried out until the 1980s. This was at Sayil [28,
29], a Rank 2 center. Several of the project alumni then went on to work at other sites within
the region, such as Smyth’s work at Chac II [30] and more recently Xcoch [31, 32]. Other site-
focused settlement studies include projects at Xculoc and Xcalumkin [33, 34], at Xkipche [35,
36], and at Labna [37, 38]. Work by Stephan Merk [39] and Antonio Benavides et al. [40]
touches on the southwest extreme of our survey sample but mostly concerns civic architecture.
Government-sponsored megaprojects have been ongoing at Uxmal and Kabah for many years,
but only limited settlement information from Kabah and Uxmal are as yet available [41, 42].
Prior to our work, the only systematic assessment of intersite settlement was a transect
between Xculoc and Chunhuhub carried out in 1987–1988, totaling about 5.3 km in length
and about 100 m in width, although it narrowed to 10–20 m over the final 2.38 leg to Chunhu-
hub [34]. Relatively little was encountered within this transect.
Systematic site inventories of the Puuc began in the 1970s, when the Atlas Arqueológo deYucatán [5] compiled the first reasonably complete compendium of sites within the state of
Yucatan, 151 of which were within the Puuc. Nicholas Dunning [4] registered a total of 230
sites, some added as the result of his own fieldwork and others by Kurjack and Gallareta
Negron. His study stands out for its insights into the regional ecosystem, especially soils,
although given the resources at his disposal he was only able to partially survey most sites. The
most recent estimate, by the Maya Atlas project [8], has just under 400 sites registered in the
region, including those in Campeche not included in the Atlas Arqueológico.
We began the Bolonchen Regional Archaeological Project (PARP) in 2000, initially focused
on the site of Kiuic but soon with subprojects at a number of other nearby sites. Bey and col-
leagues began long-term intensive excavations of an Early Puuc civic/residential complex, the
Yaxche Group, in that year and subsequently extended excavations to include an outlying hill-
top elite complex called the Escalera al Cielo [43]. Most recently, his group has started work on
a later civic complex at Kiuic, the Grupo Kuche. Ringle mapped Kiuic from 2000–2003 and
then moved survey to Huntichmul, a larger center about 4.5 km NE of Kiuic. In 2000, Gallareta
Negron and Ramon Carrillo Sanchez began a trail survey between Kiuic and Labna, about 8.5
km NNE of Kiuic, to assess intersite settlement. In 2006, Gallareta and May Ciau redesigned
this as a 1-km-wide, 11.5-km-long transect connecting Kiuic, Huntichmul, and Labna, which
they have surveyed in its entirety. Concluded in 2012, this provided by far the largest sample of
Fig 4. Methods of data visualization. (A) Hillshade. (B) “Slope-shade” filters. (C) CAD overlay of structures identified
by terrestrial survey. 1 = Pit quarry, 2 = ledge quarry, 3 = perishable frame brace, 4 = masonry building, 5 = EPCC,
6 = annular structure, 7 = chultun/chultun platform. Only a few representatives are labeled. Note the difficulty of
distinguishing frame braces in the lidar images.
https://doi.org/10.1371/journal.pone.0249314.g004
PLOS ONE Lidar survey of ancient maya settlement in the puuc region of Yucatan, Mexico
PLOS ONE | https://doi.org/10.1371/journal.pone.0249314 April 28, 2021 10 / 54
intersite settlement from the DBC as of 2017 [44]. To provide comparable information from
the lomerío bajo, beginning in 2010 Ringle directed survey and limited excavations in the Valle
de Yaxhom, assisted by Seligson, Melissa Galvan Bernal, Gabriel Tun Ayora, and Ortegon
Zapata.
Fig 5. Vegetation classified by height in the NCALM sample (difference of the DSM and DTM raster layers). The greater part is medium tropical
deciduous forest, in dark green.
https://doi.org/10.1371/journal.pone.0249314.g005
PLOS ONE Lidar survey of ancient maya settlement in the puuc region of Yucatan, Mexico
PLOS ONE | https://doi.org/10.1371/journal.pone.0249314 April 28, 2021 11 / 54

Research in the region has shown that the basic unit of settlement was a stone platform
delimited by retaining walls ranging from a single course to several meters in height and
varying greatly in area. The majority can be identified as supporting extended households,
although some supported civic-ceremonial structures. Others bear no superstructures or
secondary platforms and may instead have been production loci. Both masonry and perish-
able pole-and-thatch buildings rested on these platforms (Fig 6). As noted, masonry build-
ings, especially those with vaulted roofs, can usually be discerned in the lidar imagery, but
the foundations of perishable buildings are much more difficult to identify (Fig 6B and
6C). The numbers of buildings and secondary platforms on basal platforms are highly vari-
able, but often they are arranged at right angles to each other, forming the sides of a rectan-
gular courtyard.
Households resident on basal platforms dominate settlement across the north (e.g., Dzibil-
chaltun and Chunchucmil [45, 46]), but contrast with some areas of the central lowlands,
where more often the basic unit is an elongated mound, often arranged with other such
mounds to form the edges of a patio or courtyard group. (A similar contrast has been noted
between the residential units of Caracol, Belize, also primarily basal platforms, and those of the
central Peten [25].) Such mounds result from the collapse of buildings and often ground plans
can only be determined by excavation. In contrast, the number and dimensions of rooms in a
Puuc building are usually evident upon visual inspection, so that we have a detailed settlement
record in those areas where we have carried out terrestrial survey. An important point is that
in the central lowlands, building mounds are usually the basic unit of lidar analysis, whereas
we use basal platform counts. Therefore, settlement statistics from the north are not easily
compared to those from the south when demographic questions arise, since a basal platform is
often the equivalent of a courtyard group, and thus a count of basal platforms substantially
underestimates the number of actual buildings.
We have currently registered 7902 basal structures by means of lidar imagery alone, as well
as 1232 annular structures, of which more below. We have not yet systematically tried to iden-
tify buildings and secondary platforms except in those areas where we also have ground cover-
age (Fig 7). An example of one such survey area is the large site of Muluchtzekel, which
provides some sense of the accuracy of tallies arrived at by visual inspection of the lidar data
alone. At Muluchtzekel, 418 basal structures were identified in the imagery prior to ground
survey (a further 237 lie outside the limits of our ground survey and await future verification).
We have intentionally not registered secondary platforms and buildings at this stage of our
analysis.
Table 3. Current land cover of the survey area.
Vegetation Height� 5 m Raster Cells Area (Km2) % of Total Land Cover
0-.1 510,460 12.762 5.50%
.1–2 472,703 11.818 5.09%
2–6 1,622,921 40.573 17.49%
6–10 4,116,851 102.921 44.37%
10–15 2,464,137 61.603 26.56%
15–20 89,979 2.249 0.97%
above 20 1,096 0.027 0.01%
9,278,147 231.954
� Calculated by subtracting the regional DTM (bare earth) raster from the DSM (canopy surface) and then
generalizing to 5 m cells.
https://doi.org/10.1371/journal.pone.0249314.t003
PLOS ONE Lidar survey of ancient maya settlement in the puuc region of Yucatan, Mexico
PLOS ONE | https://doi.org/10.1371/journal.pone.0249314 April 28, 2021 12 / 54
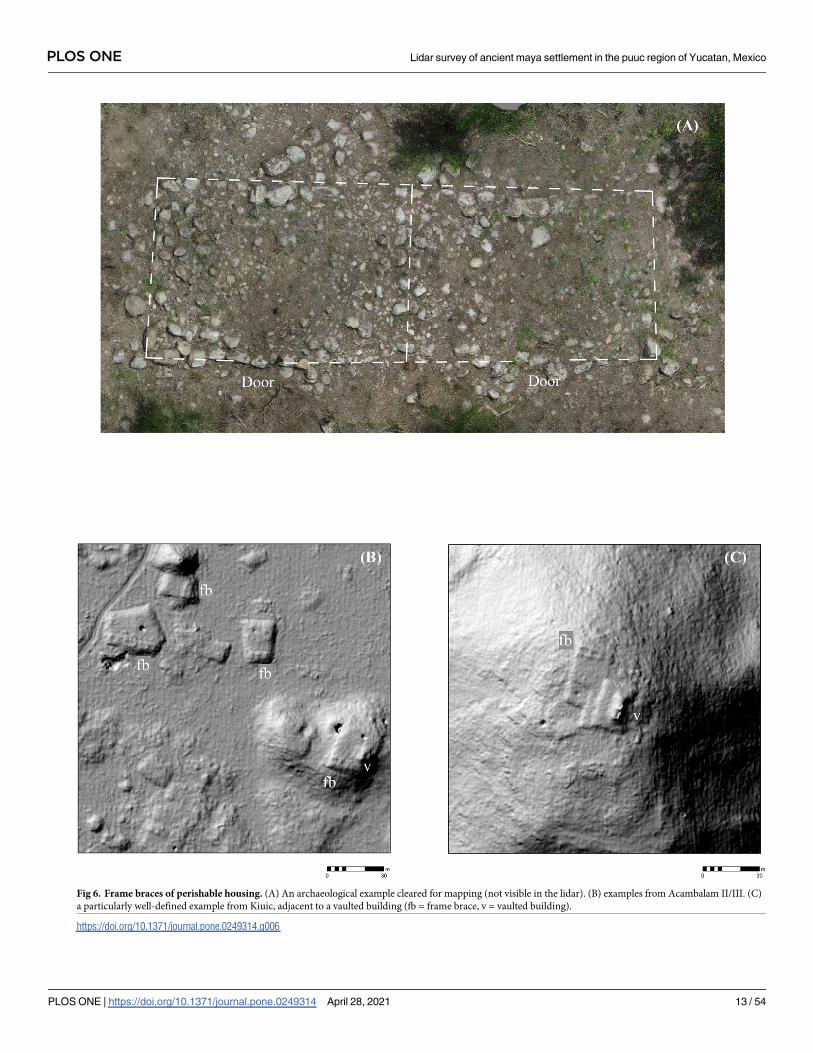
Fig 6. Frame braces of perishable housing. (A) An archaeological example cleared for mapping (not visible in the lidar). (B) examples from Acambalam II/III. (C)
a particularly well-defined example from Kiuic, adjacent to a vaulted building (fb = frame brace, v = vaulted building).
https://doi.org/10.1371/journal.pone.0249314.g006
PLOS ONE Lidar survey of ancient maya settlement in the puuc region of Yucatan, Mexico
PLOS ONE | https://doi.org/10.1371/journal.pone.0249314 April 28, 2021 13 / 54
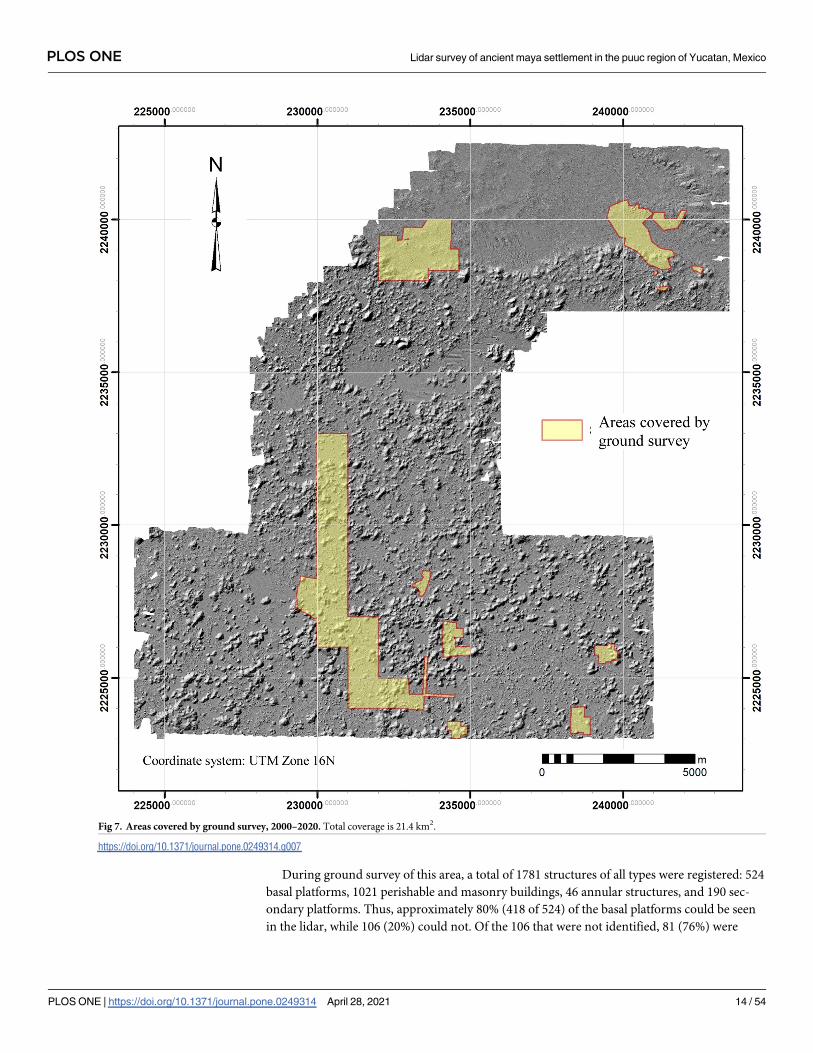
During ground survey of this area, a total of 1781 structures of all types were registered: 524
basal platforms, 1021 perishable and masonry buildings, 46 annular structures, and 190 sec-
ondary platforms. Thus, approximately 80% (418 of 524) of the basal platforms could be seen
in the lidar, while 106 (20%) could not. Of the 106 that were not identified, 81 (76%) were
Fig 7. Areas covered by ground survey, 2000–2020. Total coverage is 21.4 km2.
https://doi.org/10.1371/journal.pone.0249314.g007
PLOS ONE Lidar survey of ancient maya settlement in the puuc region of Yucatan, Mexico
PLOS ONE | https://doi.org/10.1371/journal.pone.0249314 April 28, 2021 14 / 54
small platforms lacking any building foundations. Of the remaining 25, 14 had a single frame
brace, 8 had two, and 3 had three foundations, 39 buildings in all. Only one was a possible
masonry building. In contrast, the 418 basal platforms visible in the lidar supported 874 build-
ings, versus the 39 buildings on the 106 platforms that were not visible, a ratio of 95.7% to
4.3%. (In addition to these 913 buildings, a further 108 were basal buildings, resting directly on
the ground.) Thus, while a significant number of platforms could not be identified in the lidar,
nearly all platforms supporting buildings were. Put another way, while we may not be able to
identify all platforms and buildings in the imagery, we can be confident of identifying virtually
all residential platforms.
We used the ArcGIS Kernel point density function, using a 250-m search radius, to approx-
imate settlement density within the regional survey zone. Experimentation with search radii
showed that 250 provided the best balance between resolution of settlement limits and connec-
tivity. Lower values tended to isolate individual features while higher values overextended site
limits and decreased site resolution. The resultant density gradient was then subdivided into
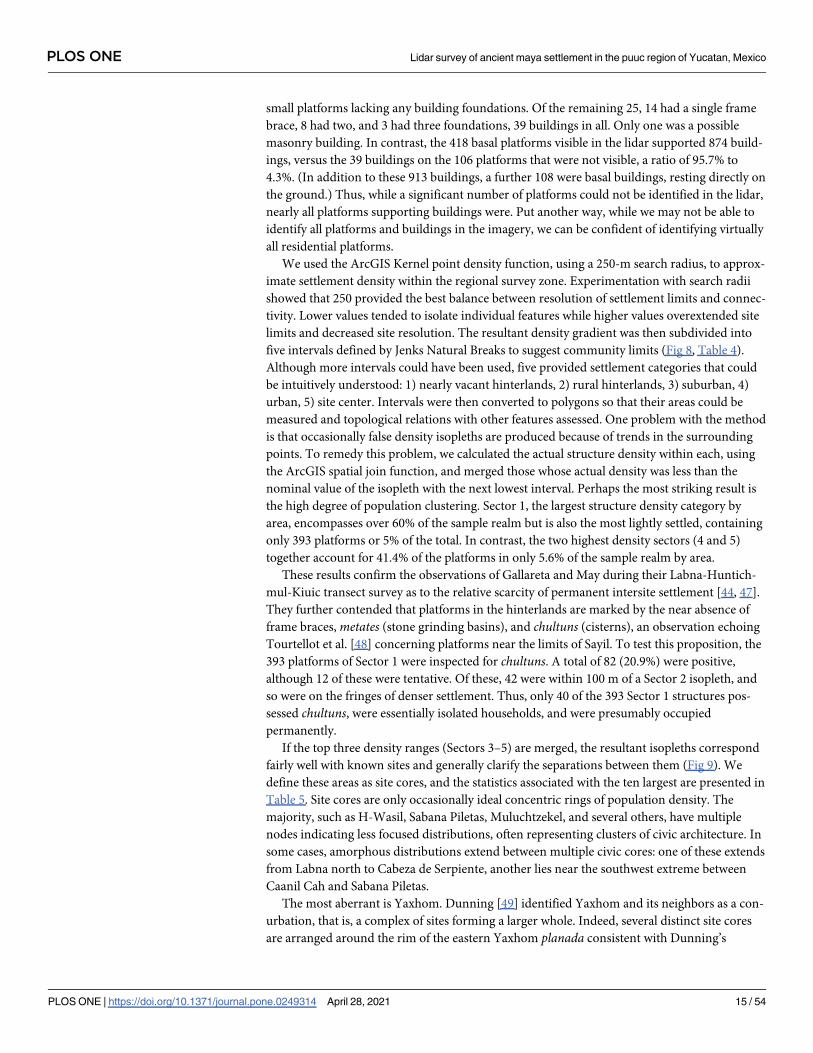
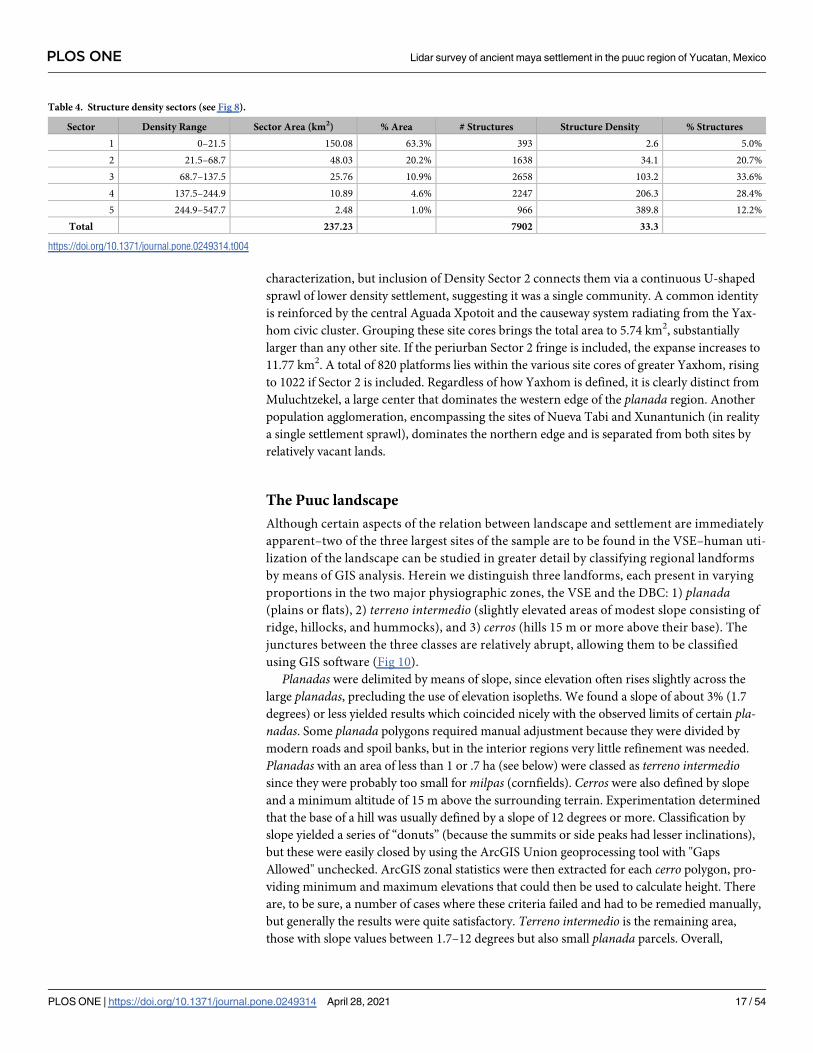
five intervals defined by Jenks Natural Breaks to suggest community limits (Fig 8, Table 4).
Although more intervals could have been used, five provided settlement categories that could
be intuitively understood: 1) nearly vacant hinterlands, 2) rural hinterlands, 3) suburban, 4)
urban, 5) site center. Intervals were then converted to polygons so that their areas could be
measured and topological relations with other features assessed. One problem with the method
is that occasionally false density isopleths are produced because of trends in the surrounding
points. To remedy this problem, we calculated the actual structure density within each, using
the ArcGIS spatial join function, and merged those whose actual density was less than the
nominal value of the isopleth with the next lowest interval. Perhaps the most striking result is
the high degree of population clustering. Sector 1, the largest structure density category by
area, encompasses over 60% of the sample realm but is also the most lightly settled, containing
only 393 platforms or 5% of the total. In contrast, the two highest density sectors (4 and 5)
together account for 41.4% of the platforms in only 5.6% of the sample realm by area.
These results confirm the observations of Gallareta and May during their Labna-Huntich-
mul-Kiuic transect survey as to the relative scarcity of permanent intersite settlement [44, 47].
They further contended that platforms in the hinterlands are marked by the near absence of
frame braces, metates (stone grinding basins), and chultuns (cisterns), an observation echoing
Tourtellot et al. [48] concerning platforms near the limits of Sayil. To test this proposition, the
393 platforms of Sector 1 were inspected for chultuns. A total of 82 (20.9%) were positive,
although 12 of these were tentative. Of these, 42 were within 100 m of a Sector 2 isopleth, and
so were on the fringes of denser settlement. Thus, only 40 of the 393 Sector 1 structures pos-
sessed chultuns, were essentially isolated households, and were presumably occupied
permanently.
If the top three density ranges (Sectors 3–5) are merged, the resultant isopleths correspond
fairly well with known sites and generally clarify the separations between them (Fig 9). We
define these areas as site cores, and the statistics associated with the ten largest are presented in
Table 5. Site cores are only occasionally ideal concentric rings of population density. The
majority, such as H-Wasil, Sabana Piletas, Muluchtzekel, and several others, have multiple
nodes indicating less focused distributions, often representing clusters of civic architecture. In
some cases, amorphous distributions extend between multiple civic cores: one of these extends
from Labna north to Cabeza de Serpiente, another lies near the southwest extreme between
Caanil Cah and Sabana Piletas.
The most aberrant is Yaxhom. Dunning [49] identified Yaxhom and its neighbors as a con-
urbation, that is, a complex of sites forming a larger whole. Indeed, several distinct site cores
are arranged around the rim of the eastern Yaxhom planada consistent with Dunning’s
PLOS ONE Lidar survey of ancient maya settlement in the puuc region of Yucatan, Mexico
PLOS ONE | https://doi.org/10.1371/journal.pone.0249314 April 28, 2021 15 / 54
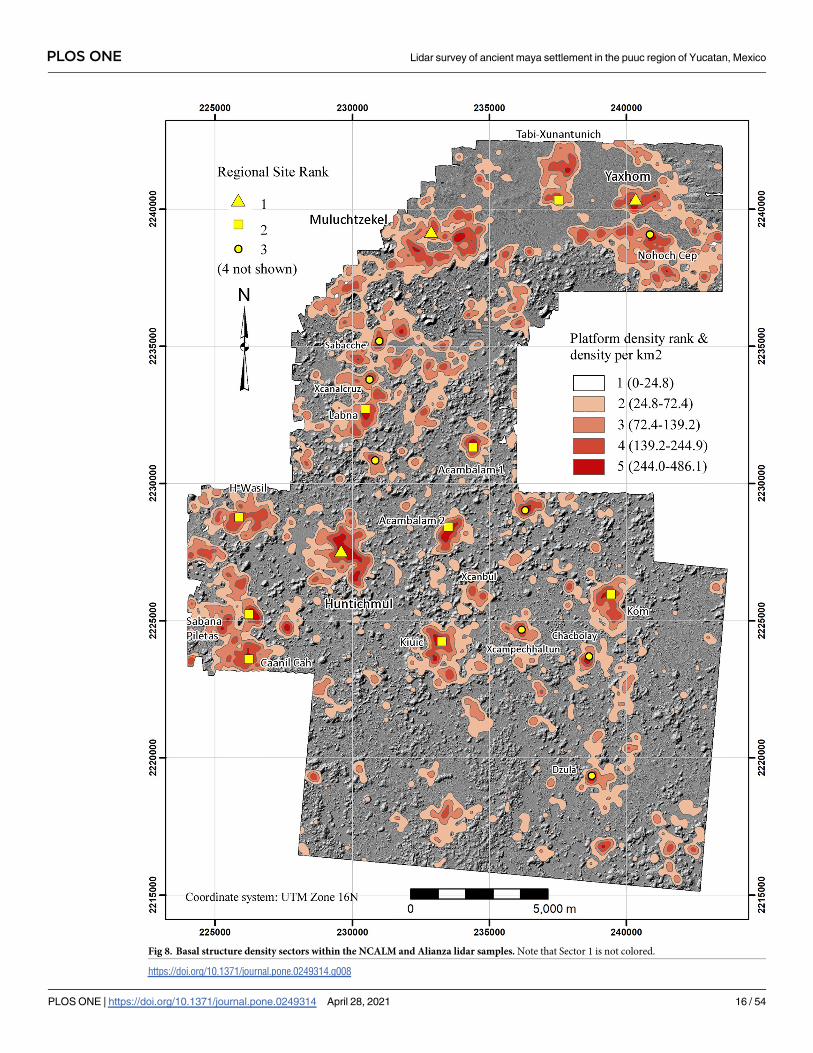
Fig 8. Basal structure density sectors within the NCALM and Alianza lidar samples. Note that Sector 1 is not colored.
https://doi.org/10.1371/journal.pone.0249314.g008
PLOS ONE Lidar survey of ancient maya settlement in the puuc region of Yucatan, Mexico
PLOS ONE | https://doi.org/10.1371/journal.pone.0249314 April 28, 2021 16 / 54
characterization, but inclusion of Density Sector 2 connects them via a continuous U-shaped
sprawl of lower density settlement, suggesting it was a single community. A common identity
is reinforced by the central Aguada Xpotoit and the causeway system radiating from the Yax-
hom civic cluster. Grouping these site cores brings the total area to 5.74 km2, substantially
larger than any other site. If the periurban Sector 2 fringe is included, the expanse increases to
11.77 km2. A total of 820 platforms lies within the various site cores of greater Yaxhom, rising
to 1022 if Sector 2 is included. Regardless of how Yaxhom is defined, it is clearly distinct from
Muluchtzekel, a large center that dominates the western edge of the planada region. Another
population agglomeration, encompassing the sites of Nueva Tabi and Xunantunich (in reality
a single settlement sprawl), dominates the northern edge and is separated from both sites by
relatively vacant lands.
The Puuc landscape
Although certain aspects of the relation between landscape and settlement are immediately
apparent–two of the three largest sites of the sample are to be found in the VSE–human uti-
lization of the landscape can be studied in greater detail by classifying regional landforms
by means of GIS analysis. Herein we distinguish three landforms, each present in varying
proportions in the two major physiographic zones, the VSE and the DBC: 1) planada(plains or flats), 2) terreno intermedio (slightly elevated areas of modest slope consisting of
ridge, hillocks, and hummocks), and 3) cerros (hills 15 m or more above their base). The
junctures between the three classes are relatively abrupt, allowing them to be classified
using GIS software (Fig 10).
Planadas were delimited by means of slope, since elevation often rises slightly across the
large planadas, precluding the use of elevation isopleths. We found a slope of about 3% (1.7
degrees) or less yielded results which coincided nicely with the observed limits of certain pla-nadas. Some planada polygons required manual adjustment because they were divided by
modern roads and spoil banks, but in the interior regions very little refinement was needed.
Planadas with an area of less than 1 or .7 ha (see below) were classed as terreno intermediosince they were probably too small for milpas (cornfields). Cerros were also defined by slope
and a minimum altitude of 15 m above the surrounding terrain. Experimentation determined
that the base of a hill was usually defined by a slope of 12 degrees or more. Classification by
slope yielded a series of “donuts” (because the summits or side peaks had lesser inclinations),
but these were easily closed by using the ArcGIS Union geoprocessing tool with "Gaps
Allowed" unchecked. ArcGIS zonal statistics were then extracted for each cerro polygon, pro-
viding minimum and maximum elevations that could then be used to calculate height. There
are, to be sure, a number of cases where these criteria failed and had to be remedied manually,
but generally the results were quite satisfactory. Terreno intermedio is the remaining area,
those with slope values between 1.7–12 degrees but also small planada parcels. Overall,
Table 4. Structure density sectors (see Fig 8).
Sector Density Range Sector Area (km2) % Area # Structures Structure Density % Structures
1 0–21.5 150.08 63.3% 393 2.6 5.0%
2 21.5–68.7 48.03 20.2% 1638 34.1 20.7%
3 68.7–137.5 25.76 10.9% 2658 103.2 33.6%
4 137.5–244.9 10.89 4.6% 2247 206.3 28.4%
5 244.9–547.7 2.48 1.0% 966 389.8 12.2%
Total 237.23 7902 33.3
https://doi.org/10.1371/journal.pone.0249314.t004
PLOS ONE Lidar survey of ancient maya settlement in the puuc region of Yucatan, Mexico
PLOS ONE | https://doi.org/10.1371/journal.pone.0249314 April 28, 2021 17 / 54
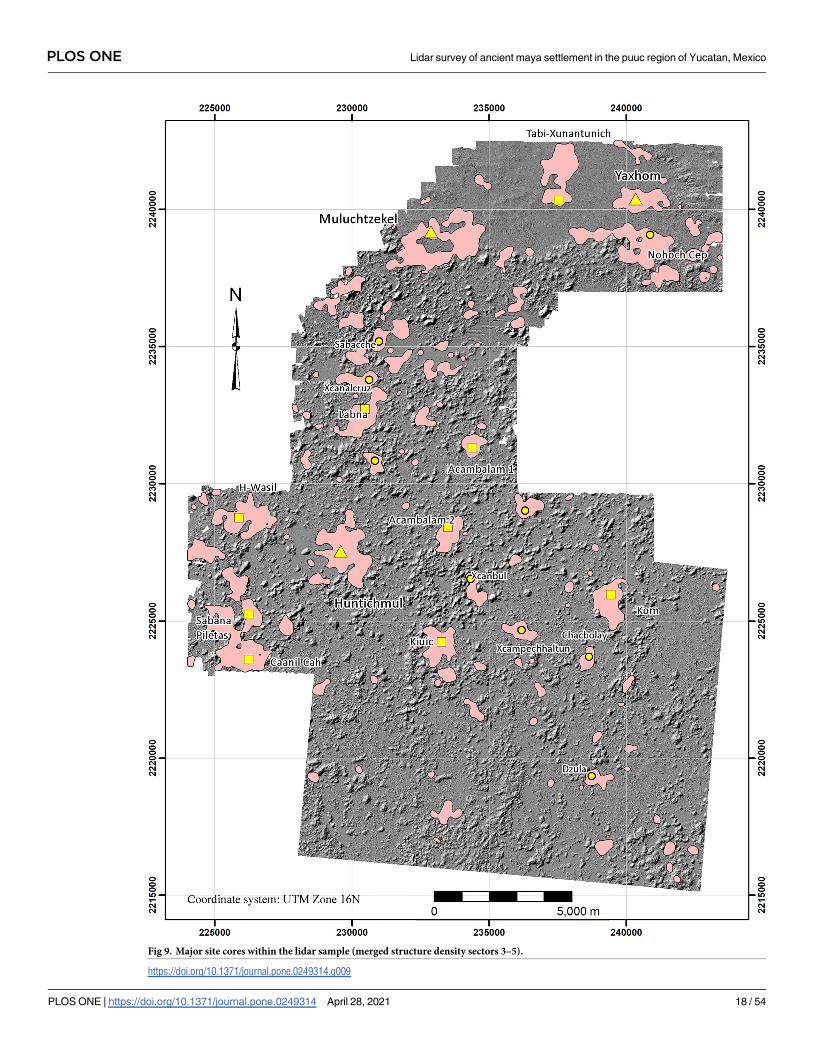
Fig 9. Major site cores within the lidar sample (merged structure density sectors 3–5).
https://doi.org/10.1371/journal.pone.0249314.g009
PLOS ONE Lidar survey of ancient maya settlement in the puuc region of Yucatan, Mexico
PLOS ONE | https://doi.org/10.1371/journal.pone.0249314 April 28, 2021 18 / 54
planadas, terreno intermedio, and cerros occupy 25.6%, 46.8%, and 27.6% respectively of our
study region (Table 6).
Terrain elevation ranges from 28–155 m above sea level within the 19.5 km north-south
extension of our survey sample. Locally, however, only 17% of the peaks are more than 50 m
above the surrounding planadas, and the highest rises less than 90 m. (Heights were deter-
mined by means of GIS zonal statistics for each cerro polygon.) The hills are also relatively
small, with an average circumference about 1250 m, often making them easier to walk around
than to climb. The planadas likewise are of relatively modest extent. Most could have been eas-
ily crossed in less than an hour and the largest in just a few. Conversely, the smaller size of
such features means they are more numerous: nearly 900 peaks and several hundred planadasover 1 ha fall within our survey limits.
In the past, the Puuc has sometimes been called the “granary of Yucatan” for its importance
in selling maize to Merida during the colonial period [50–52], although these mostly refer to
sales by towns at the foot of the Sierrita. GIS analysis of Puuc landforms can provide some
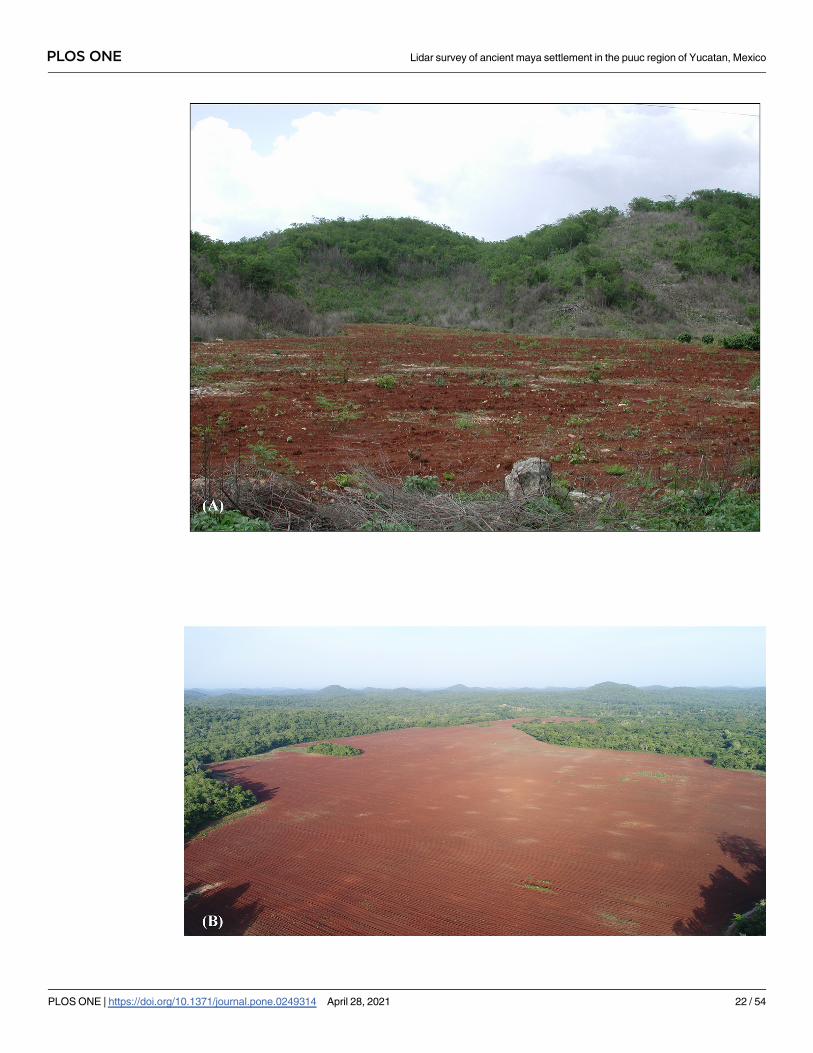
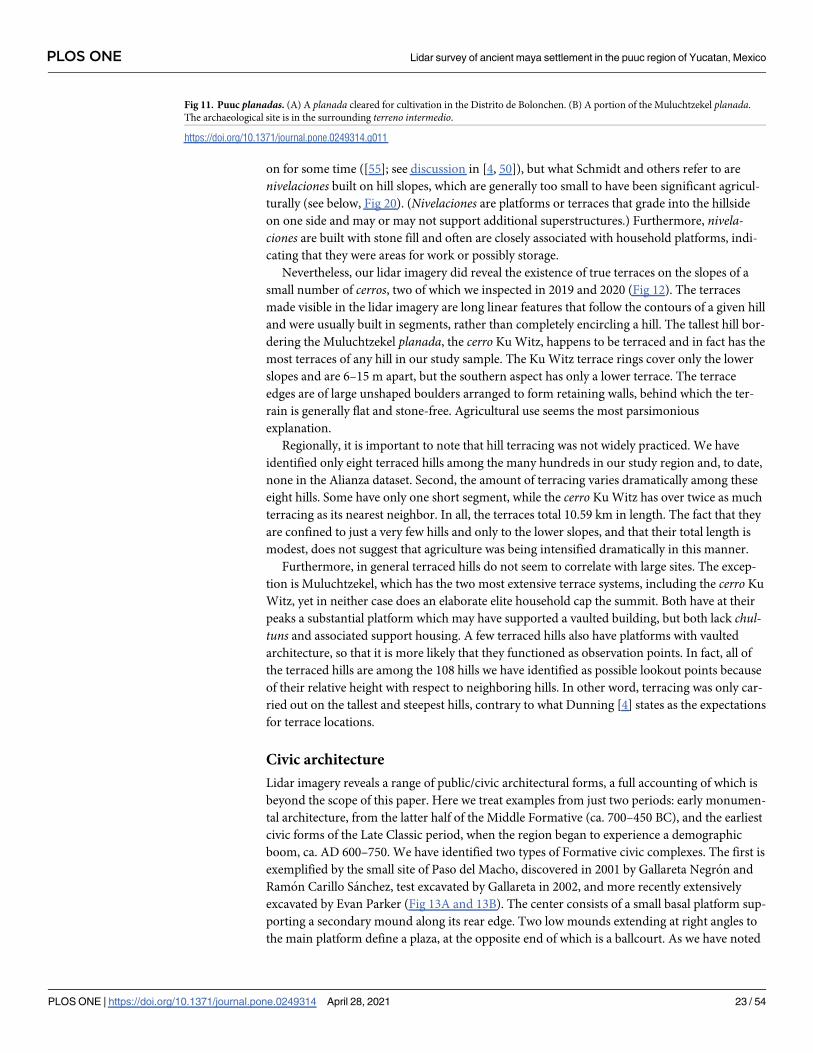
insights into whether this may have been true during the Late-Terminal Classic. Puuc farmers
today heavily favor cultivation in the planadas, where soils are deep and relatively fertile (Fig
11). The outstanding planada is the shallow basin known as the Valle de Yaxhom, with an
approximate area of 15.14 km2 (13.46 km2 of which is within our survey bounds). This basin is
exceptional in having deep deposits of fertile ek luum soils which today support intensive citrus
cultivation. The Yaxhom site core overlooks this basin. Some modern cultivation is also car-
ried out on the terreno intermedio, either because of an insufficiency of planada parcels or
because certain insect pests are less bothersome in better-drained areas. The stony tzekel hill
slope soils are a poor third option.
Our workers, who are mostly local subsistence farmers, generally cite a figure of around 1
ha as sufficient to feed a family for a year. This agrees well with field sizes recorded in the eth-
nographic and ethnohistorical literature (see [53] for a review of the literature). Steggerda [54],
for instance, recorded an average milpa size of .99 ha based upon 638 milpas recorded over a
five-year period across three towns in Yucatan, one at the foot of the Puuc. However, this
included feed for domestic animals, estimated at about 44% of annual consumption, indicating
about .7–1.0 hectares suffices for a single nuclear family.
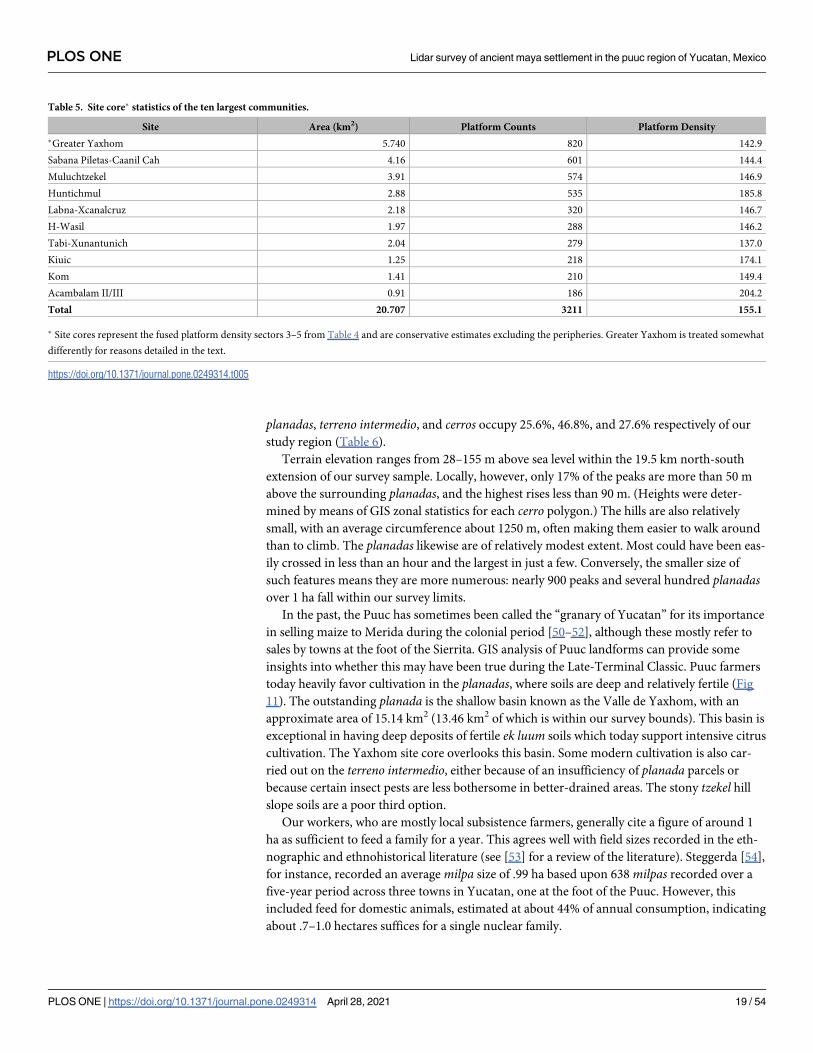
Table 5. Site core� statistics of the ten largest communities.
Site Area (km2) Platform Counts Platform Density
�Greater Yaxhom 5.740 820 142.9
Sabana Piletas-Caanil Cah 4.16 601 144.4
Muluchtzekel 3.91 574 146.9
Huntichmul 2.88 535 185.8
Labna-Xcanalcruz 2.18 320 146.7
H-Wasil 1.97 288 146.2
Tabi-Xunantunich 2.04 279 137.0
Kiuic 1.25 218 174.1
Kom 1.41 210 149.4
Acambalam II/III 0.91 186 204.2
Total 20.707 3211 155.1
� Site cores represent the fused platform density sectors 3–5 from Table 4 and are conservative estimates excluding the peripheries. Greater Yaxhom is treated somewhat
differently for reasons detailed in the text.
https://doi.org/10.1371/journal.pone.0249314.t005
PLOS ONE Lidar survey of ancient maya settlement in the puuc region of Yucatan, Mexico
PLOS ONE | https://doi.org/10.1371/journal.pone.0249314 April 28, 2021 19 / 54

In our study area, if parcels are limited to a minimum area of 1 ha, planada lands comprise
a total of 60.754 km2 divided into 684 parcels of contiguous land, or 25.61% of the total study
area. This was not distributed uniformly: the largest, a series of connected planadas covering
much of the Valle de Yaxhom and environs, extends over 19.02 km2 (1902 ha), 31.30% of the
Fig 10. Map of the major classified landforms within the NCALM lidar sample.
https://doi.org/10.1371/journal.pone.0249314.g010
PLOS ONE Lidar survey of ancient maya settlement in the puuc region of Yucatan, Mexico
PLOS ONE | https://doi.org/10.1371/journal.pone.0249314 April 28, 2021 20 / 54
total planada extent. When the second largest planada is added, a large expanse just to the
south of the Valle de Yaxhom, the total reaches 39.16%. The five largest planadas, all substan-
tially larger than the rest, constitute 47.84% of the total. In contrast, the median size of the 684
planadas is just 2.17 ha, strongly indicating a highly fractionated landscape.
These statistics allow a rough estimation of study area carrying capacity. If every 1+ ha pla-nada parcel was under cultivation, approximately 6075 families could have been provided for.
If a five-year fallow rotation schedule was in effect, with fields being cultivated for two years
(the first newly cleared, the second replanted), two-sevenths (28.5%) of the planada land
would be under cultivation, maximally supporting about 1735 families. A10-year fallow cycle
could have been fed about 1010 families. If a value of 5 persons/nuclear family is used, a five-
year fallow cycle could have maximally supported about 8675 people, for an overall density of
36.6 people/km2. If average milpa size is set to .7 ha, these figures can be multiplied by approxi-
mately 150%, since additional smaller parcels would be added to the total of cultivable land. In
either case, the number of families is less than the number of basal structures (7902) and far
less than the number of buildings they would have supported. Production must therefore have
been increased by means of a reorganization of labor, by cultivation of additional lands, or
both.
To estimate the potential of the terreno intermedio, nearly half the available terrain but also
the most densely populated, we first approximated the size of a solar (house lot) by determin-
ing the average distance between platforms that were not isolated, defined as within 100 m of
another platform, using the ArcGIS “Nearest” function. The average distance of the 6803 plat-
forms so classified was 41.8 m, with a median value of 37.4 m, so a buffer 20 m in radius was
calculated for each platform point as an approximation. We then excluded all of the land clas-
sified as site core (Sectors 3–5) and all of the “solares” in the remaining terreno intermedio,
leaving a total area of 87.62 km2, or 79.5% of its total area. Since the terreno intermedio snakes
along the edges of cerros and planadas, it was not possible to divide it into parcels as we did for
planadas.Using the parameters just mentioned, and estimating a productivity rate 80% that of plana-
das, an additional 7,030 families could have been sustained by annual cropping and 2,000 by a
5-year fallow rotation. Soils of this zone may have been more easily exhausted, however, so
that a longer fallow estimate may be more appropriate. In sum, and recognizing the many
caveats, approximately 3,740 (5-year fallow) -13,100 families (no fallow) could have been sup-
ported if both planada and terreno intermedio land was incorporated into a managed system.
If the size of a nuclear family is estimated at 5 persons, this would translate to a population of
between 18,700 to 65,500, or an average population density of 79–276 people per square kilo-
meter. Again, if smaller milpas were the norm, these figures could be as much as 150% higher.
Such figures, varying as they do by a factor of 3.5 or more, and subject to various other caveats,
demonstrate the difficulty of approaching actual population levels by means of carrying capac-
ity estimates alone.
Production may also have been enhanced through multicropping [49] and infrastructure
(landesque) improvements. The existence of Puuc agricultural terracing has been speculated
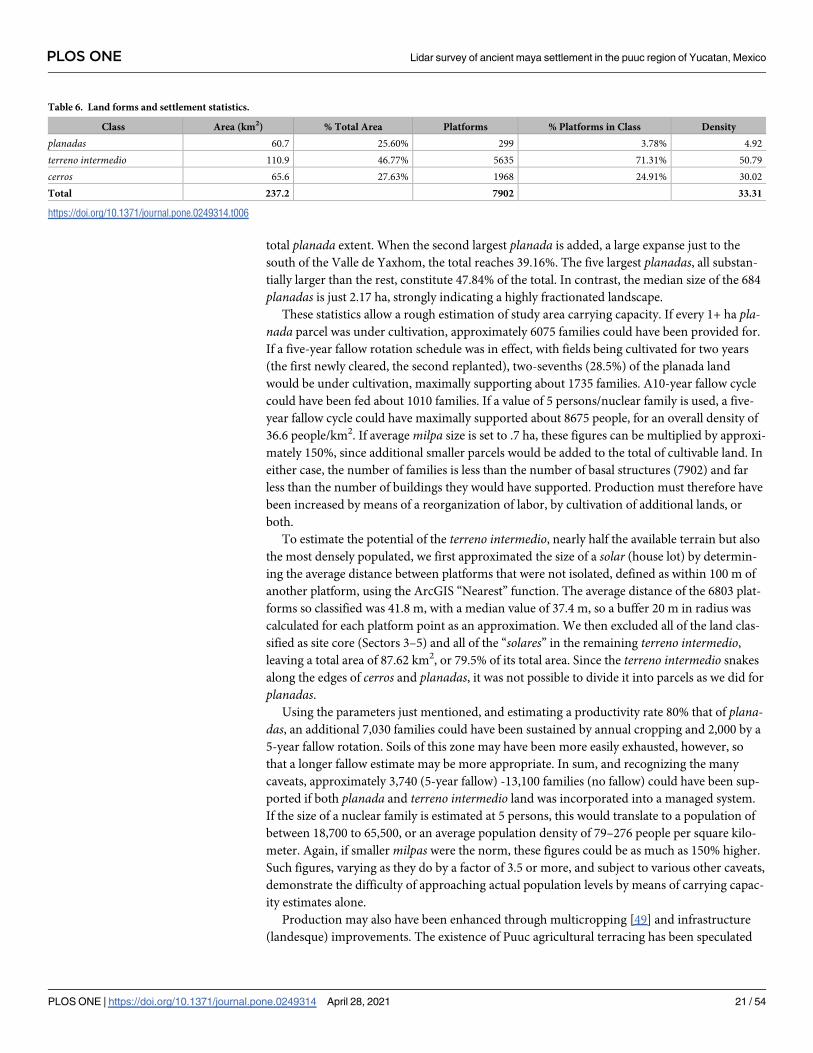
Table 6. Land forms and settlement statistics.
Class Area (km2) % Total Area Platforms % Platforms in Class Density
planadas 60.7 25.60% 299 3.78% 4.92
terreno intermedio 110.9 46.77% 5635 71.31% 50.79
cerros 65.6 27.63% 1968 24.91% 30.02
Total 237.2 7902 33.31
https://doi.org/10.1371/journal.pone.0249314.t006
PLOS ONE Lidar survey of ancient maya settlement in the puuc region of Yucatan, Mexico
PLOS ONE | https://doi.org/10.1371/journal.pone.0249314 April 28, 2021 21 / 54
PLOS ONE Lidar survey of ancient maya settlement in the puuc region of Yucatan, Mexico
PLOS ONE | https://doi.org/10.1371/journal.pone.0249314 April 28, 2021 22 / 54
on for some time ([55]; see discussion in [4, 50]), but what Schmidt and others refer to are
nivelaciones built on hill slopes, which are generally too small to have been significant agricul-
turally (see below, Fig 20). (Nivelaciones are platforms or terraces that grade into the hillside
on one side and may or may not support additional superstructures.) Furthermore, nivela-ciones are built with stone fill and often are closely associated with household platforms, indi-
cating that they were areas for work or possibly storage.
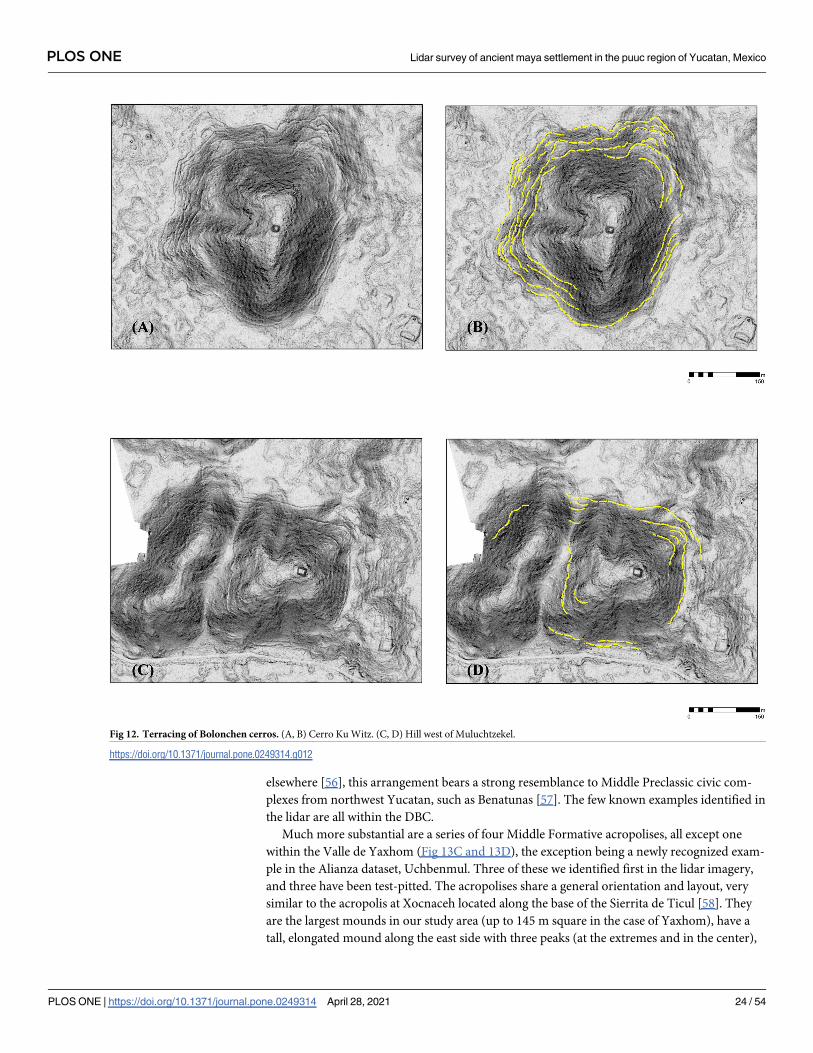
Nevertheless, our lidar imagery did reveal the existence of true terraces on the slopes of a
small number of cerros, two of which we inspected in 2019 and 2020 (Fig 12). The terraces
made visible in the lidar imagery are long linear features that follow the contours of a given hill
and were usually built in segments, rather than completely encircling a hill. The tallest hill bor-
dering the Muluchtzekel planada, the cerro Ku Witz, happens to be terraced and in fact has the
most terraces of any hill in our study sample. The Ku Witz terrace rings cover only the lower
slopes and are 6–15 m apart, but the southern aspect has only a lower terrace. The terrace
edges are of large unshaped boulders arranged to form retaining walls, behind which the ter-
rain is generally flat and stone-free. Agricultural use seems the most parsimonious
explanation.
Regionally, it is important to note that hill terracing was not widely practiced. We have
identified only eight terraced hills among the many hundreds in our study region and, to date,
none in the Alianza dataset. Second, the amount of terracing varies dramatically among these
eight hills. Some have only one short segment, while the cerro Ku Witz has over twice as much
terracing as its nearest neighbor. In all, the terraces total 10.59 km in length. The fact that they
are confined to just a very few hills and only to the lower slopes, and that their total length is
modest, does not suggest that agriculture was being intensified dramatically in this manner.
Furthermore, in general terraced hills do not seem to correlate with large sites. The excep-
tion is Muluchtzekel, which has the two most extensive terrace systems, including the cerro Ku
Witz, yet in neither case does an elaborate elite household cap the summit. Both have at their
peaks a substantial platform which may have supported a vaulted building, but both lack chul-tuns and associated support housing. A few terraced hills also have platforms with vaulted
architecture, so that it is more likely that they functioned as observation points. In fact, all of
the terraced hills are among the 108 hills we have identified as possible lookout points because
of their relative height with respect to neighboring hills. In other word, terracing was only car-
ried out on the tallest and steepest hills, contrary to what Dunning [4] states as the expectations
for terrace locations.
Civic architecture
Lidar imagery reveals a range of public/civic architectural forms, a full accounting of which is
beyond the scope of this paper. Here we treat examples from just two periods: early monumen-
tal architecture, from the latter half of the Middle Formative (ca. 700–450 BC), and the earliest
civic forms of the Late Classic period, when the region began to experience a demographic
boom, ca. AD 600–750. We have identified two types of Formative civic complexes. The first is
exemplified by the small site of Paso del Macho, discovered in 2001 by Gallareta Negron and
Ramon Carillo Sanchez, test excavated by Gallareta in 2002, and more recently extensively
excavated by Evan Parker (Fig 13A and 13B). The center consists of a small basal platform sup-
porting a secondary mound along its rear edge. Two low mounds extending at right angles to
the main platform define a plaza, at the opposite end of which is a ballcourt. As we have noted
Fig 11. Puuc planadas. (A) A planada cleared for cultivation in the Distrito de Bolonchen. (B) A portion of the Muluchtzekel planada.
The archaeological site is in the surrounding terreno intermedio.
https://doi.org/10.1371/journal.pone.0249314.g011
PLOS ONE Lidar survey of ancient maya settlement in the puuc region of Yucatan, Mexico
PLOS ONE | https://doi.org/10.1371/journal.pone.0249314 April 28, 2021 23 / 54
elsewhere [56], this arrangement bears a strong resemblance to Middle Preclassic civic com-
plexes from northwest Yucatan, such as Benatunas [57]. The few known examples identified in
the lidar are all within the DBC.
Much more substantial are a series of four Middle Formative acropolises, all except one
within the Valle de Yaxhom (Fig 13C and 13D), the exception being a newly recognized exam-
ple in the Alianza dataset, Uchbenmul. Three of these we identified first in the lidar imagery,
and three have been test-pitted. The acropolises share a general orientation and layout, very
similar to the acropolis at Xocnaceh located along the base of the Sierrita de Ticul [58]. They
are the largest mounds in our study area (up to 145 m square in the case of Yaxhom), have a
tall, elongated mound along the east side with three peaks (at the extremes and in the center),
Fig 12. Terracing of Bolonchen cerros. (A, B) Cerro Ku Witz. (C, D) Hill west of Muluchtzekel.
https://doi.org/10.1371/journal.pone.0249314.g012
PLOS ONE Lidar survey of ancient maya settlement in the puuc region of Yucatan, Mexico
PLOS ONE | https://doi.org/10.1371/journal.pone.0249314 April 28, 2021 24 / 54
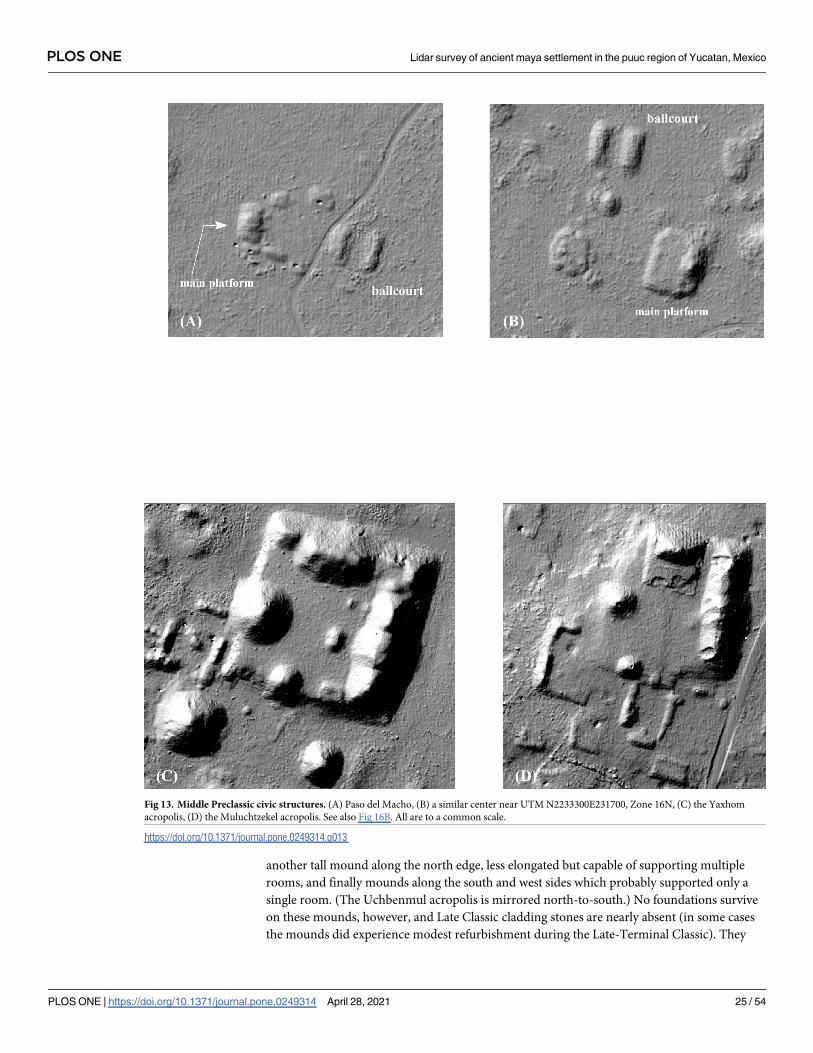
another tall mound along the north edge, less elongated but capable of supporting multiple
rooms, and finally mounds along the south and west sides which probably supported only a
single room. (The Uchbenmul acropolis is mirrored north-to-south.) No foundations survive
on these mounds, however, and Late Classic cladding stones are nearly absent (in some cases
the mounds did experience modest refurbishment during the Late-Terminal Classic). They
Fig 13. Middle Preclassic civic structures. (A) Paso del Macho, (B) a similar center near UTM N2233300E231700, Zone 16N, (C) the Yaxhom
acropolis, (D) the Muluchtzekel acropolis. See also Fig 16B. All are to a common scale.
https://doi.org/10.1371/journal.pone.0249314.g013
PLOS ONE Lidar survey of ancient maya settlement in the puuc region of Yucatan, Mexico
PLOS ONE | https://doi.org/10.1371/journal.pone.0249314 April 28, 2021 25 / 54
may be the regional equivalents of E-groups, an early form of monumental architecture best
known from the central Maya lowlands continuing into the Late Classic. These bespeak poli-
ties of a different order than the smaller centers of the DBC, probably financed by the extensive
agricultural planadas they looked upon.
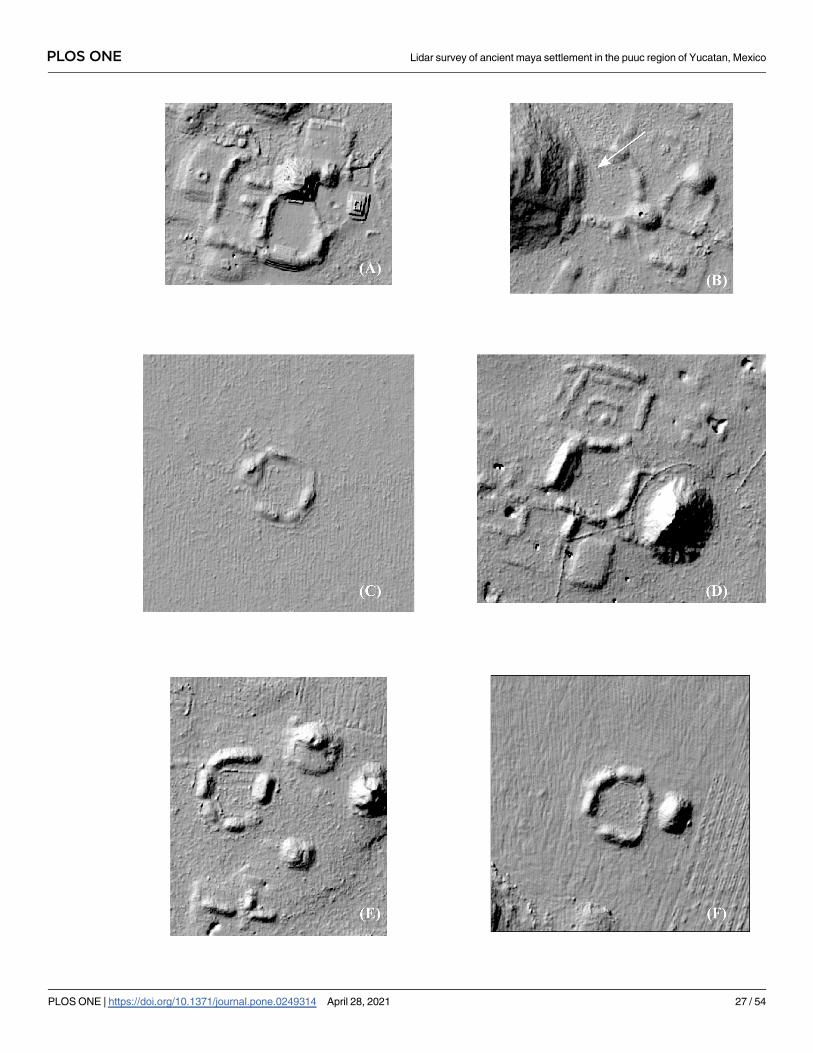
Regarding the Late Classic, in previous work we have identified an architectural complex
which we refer to as the Early Puuc Civic Complex (EPCC) (Fig 14; [59]). The EPCC is quite
different from other regional elite architectural complexes in that instead of being built on a
platform, it consists of several buildings enclosing an interior plaza often built at ground level.
EPCCs are either rectangular or sub-rectangular and often have connecting platforms crossed
by means of ramps rather than stairs. One constant is a long hall with multiple entrances and a
broad fronting stairway. The hall is usually just a single room, although sometimes small end
rooms are attached. This is almost certainly what is called a popol nah, or council house [60].
Occasionally a picota (an uncarved columnar monument) was placed at the center of the patio.
Buildings have little or no carved stone decoration apart from vertically faced moldings (often
the medial molding is “broken”), and vaults are sometimes absent, or may be of slabs or small
veneer stones. In short, the architecture is typical of Andrews’s [6, 7] Early Puuc Style.
Interestingly, such complexes are often linked to later palaces or other concentrations of pub-
lic architecture by sacbes (causeways), as is the case at Labna, Kom, and Kiuic. Fig 23 shows this
pattern at the newly identified site of Caanil Cah, near the southwest corner of our sample. One
sacbe leads from a peripheral group located on a hill to the edge of a planada about 325 m dis-
tant, the purpose of which is unclear (not visible in Fig 23). The other two extend from an EPCC
to what appear to be palaces or very large elite vaulted buildings. During a brief field reconnais-
sance, we verified these were stylistically later than the EPCC. Often earlier EPCCs seem to have
been kept up and occupied even after larger palaces were built and in some cases were renovated
by the addition of later rooms and/or buildings. Sometimes small stepped pyramids were built
over one of the original vaulted buildings [61]. The intent was to legitimate later seats of power
by means of a physical link to these earlier expressions of civic authority.
Forty-two EPCCs have been identified so far in the NCALM imagery, ten of which we have
visited, mapped, or excavated (Fig 15). All consistently display Early Puuc architecture, including
a popol na. Every major center in the study region has an EPCC, sometimes two, but since there
are more EPCCs than major centers, over time some EPCCs were probably absorbed by more
successful and expansive neighbors. Thus, if we could better control for chronology during the
Late-Terminal Classic, the pattern of nucleation observed in the distribution of settlement might
be even more pronounced. We have identified only five EPCCs in the Alianza dataset, a further
indication of the diminution of settlement intensity to the south and southeast.
EPCCs also mark ownership or administrative authority over land differently than in later
periods. Later palaces tend to be built on low eminences, at the base of hills, or sometimes even
on top of cerros, such as at Huntichmul. In contrast, and despite the generally low level of set-
tlement in the planadas, 55% of the 42 EPCCs are within planadas and another 15% are at
their edges (e.g., Fig 14C and 14F). The remaining 30% are located within the terreno interme-dio, while none are known from cerros. A striking example of this distinctive settlement pat-
tern is the several EPCCs along the interface between the Valle de Yaxhom and surrounding
higher ground, probably a series of small polities, each with a claim to the immediately adja-
cent planada. Another example is the five EPCCs associated with the Sabacche planada. Three
are positioned near the midpoint of major expanses within the planada, suggesting they too
divided the optimal plots between them. Two further EPCCs are positioned at the north and
south extremes of the western subdivision and are embedded within a larger community,
while the first three EPCCs are isolated. (However, the eastern EPCC is closely associated with
the largest aguada of the basin.)
PLOS ONE Lidar survey of ancient maya settlement in the puuc region of Yucatan, Mexico
PLOS ONE | https://doi.org/10.1371/journal.pone.0249314 April 28, 2021 26 / 54
PLOS ONE Lidar survey of ancient maya settlement in the puuc region of Yucatan, Mexico
PLOS ONE | https://doi.org/10.1371/journal.pone.0249314 April 28, 2021 27 / 54
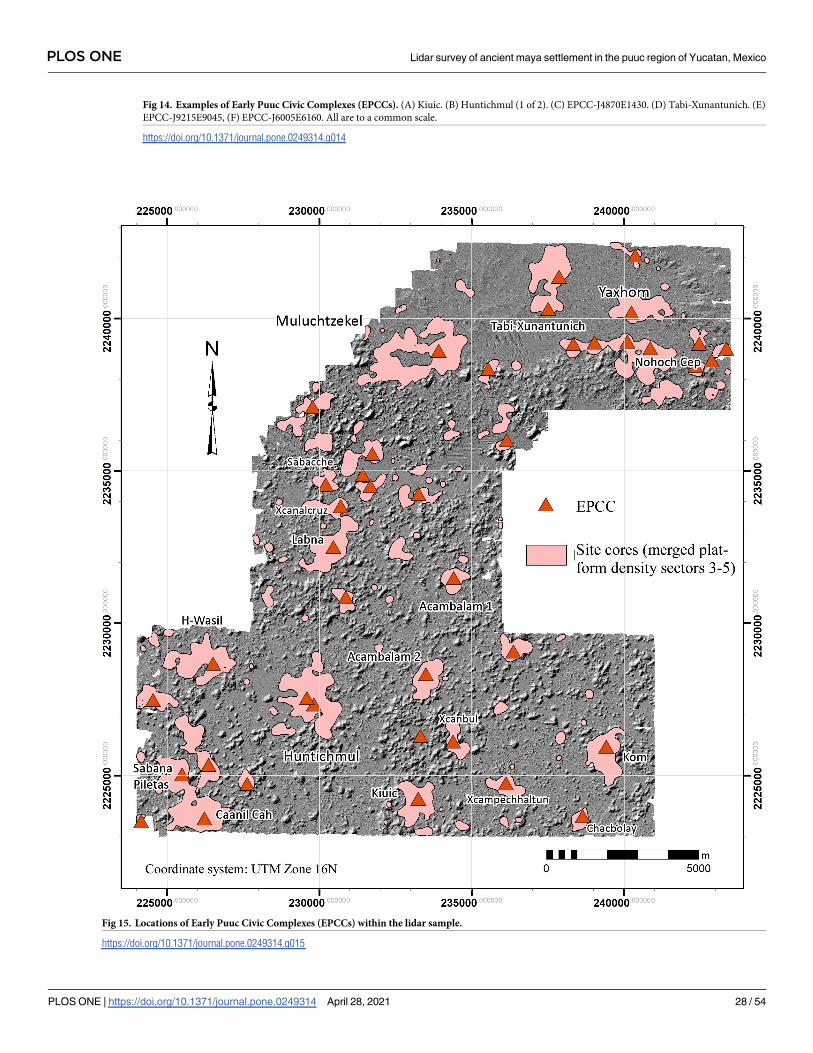
Fig 14. Examples of Early Puuc Civic Complexes (EPCCs). (A) Kiuic. (B) Huntichmul (1 of 2). (C) EPCC-J4870E1430. (D) Tabi-Xunantunich. (E)
EPCC-J9215E9045, (F) EPCC-J6005E6160. All are to a common scale.
https://doi.org/10.1371/journal.pone.0249314.g014
Fig 15. Locations of Early Puuc Civic Complexes (EPCCs) within the lidar sample.
https://doi.org/10.1371/journal.pone.0249314.g015
PLOS ONE Lidar survey of ancient maya settlement in the puuc region of Yucatan, Mexico
PLOS ONE | https://doi.org/10.1371/journal.pone.0249314 April 28, 2021 28 / 54
To give an approximate idea of the territories surrounding each EPCC, we calculated Thies-
sen polygons around each example, recognizing the limits of the method (in cases with two
EPCCs, we selected only one). Edge effects were significant in those EPCCs near the limits of
the sample, leading to overestimates of their size. When these were eliminated, only 13 cases
remained, but the results are illuminating. The average realm was only 5.2 km2 (median 4.9
km2), with a maximum of 12.5 km2 in the case of Huntichmul and less than a square kilometer
around Sabacche. Although suffering from edge effects, clearly EPCC realms were especially
small around the eastern end of the Valle de Yaxhom and the Sabacche planada. Another illus-
trative statistic is the distance to the nearest neighboring EPCC. Ignoring edge effects, the max-
imum distance was only 3.28 km and the mean distance was only 1.49 km (median 1.368 km),
again pointing to the small size of these polities.
Finally, we have identified several ballcourts in the lidar imagery (Fig 16). Ballcourts are
generally considered to be rare in the Puuc region [62], and our survey work has shown that
some claims of Puuc ballcourts are unfounded, as for instance at Huntichmul. The Middle
Formative ballcourt at Paso de Macho has already been mentioned, as has a possibly parallel
site (Fig 13A and 13B), but another possibly early ballcourt lies next to the recently identified
acropolis in the Alianza dataset mentioned above (Fig 16B). The date of the acropolis is cur-
rently unknown, but formally is likely to be Middle Formative, as thus may the ballcourt.
Another substantial ballcourt, almost certainly Late-Terminal Classic in date, is located at the
center of Sabana Piletas, near one of its palaces (Fig 16C). A final group of about 10 examples
consists of two long, parallel mounds, oriented either NS or NE-SW (Fig 16D and 16E). Exca-
vation will be necessary to determine whether these are in fact small ballcourts.
Stone procurement and processing
The frequency and quality of Puuc masonry construction attests to an important sector of the
economy whose aspects remain poorly understood [37, 63, 64]. In the 1980s, mapping at the
nearby site of Sayil had encountered 24 rubble mounds they dubbed “ring structures” [28],
referred to as annular structures herein. These rubble rings, about 10 m or so in diameter and
about 1–1.5 m tall, surround a central depression which often has signs of burning (Fig 17A),
leading to speculation they may have been used to fire ceramics, make fertilizer [65], or to pro-
duce lime. Excavation of several of these by our project found almost no ceramics, leaving lime
production as the most likely alternative. Experiments by Seligson, Gallareta, and May [64, 66]
showed that annular structures were indeed efficient at producing lime, an essential ingredient
in making mortar and stucco for construction, but also for the process of nixtamalization, the
soaking of maize in lime water to soften kernels and enhance their nutrients.
Annular structures are quite visible in the lidar imagery, and to date we have identified
1232 of them (Fig 17B). Given the apparent scale of lime production, we might ask whether
this was an urban activity, carried out in proximity to residences and building sites, or whether
lime was produced in the countryside, nearer to raw material sources and fuel. Examining the
distribution of annular structures with respect to our platform density sectors demonstrates a
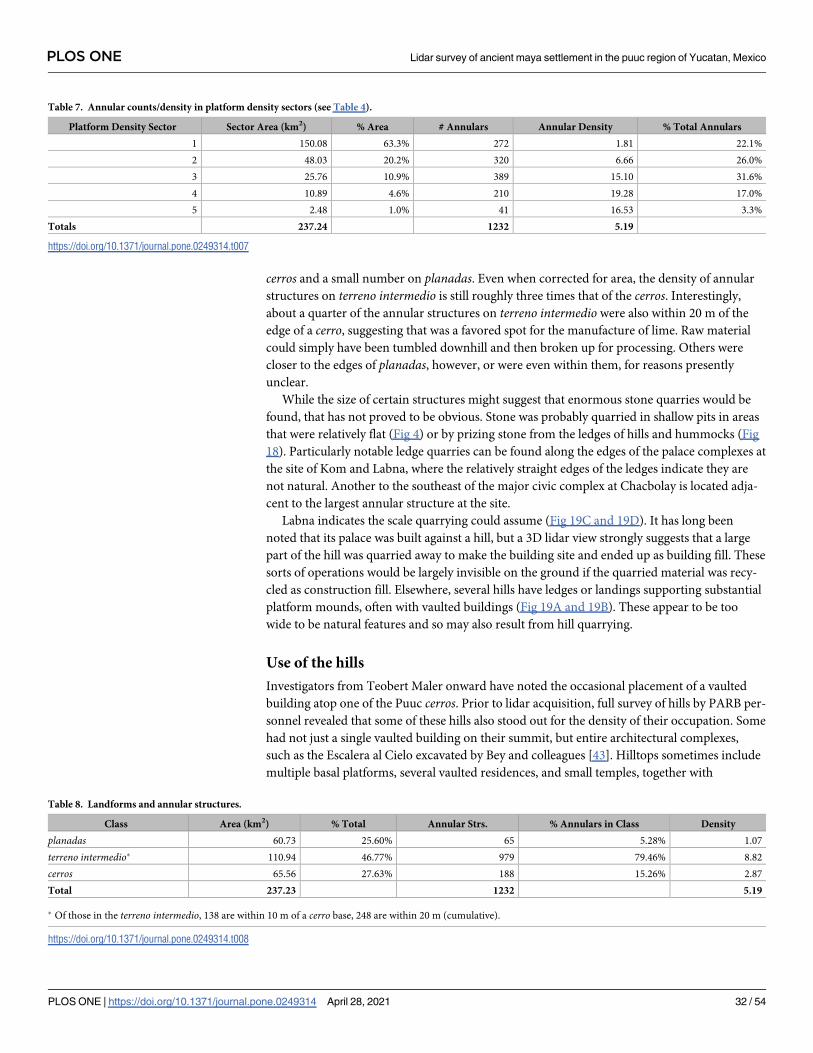
strong correlation between the two distributions (Table 7). Although 48.1% of the annular
structures are located in the lowest two density intervals, the site core intervals, containing
about 74% of the population, encompass 51.9% of the annulars. If they are looked at in terms
of density, the hinterland (Sector 1) annular density is only about one-tenth the density of Sec-
tor 4, the densest, and overall annular density in the site cores (Sectors 3–5) is over five times
that within the lowest two population isopleths.
With respect to our three classes of landforms, annular structures are found overwhelm-
ingly on terreno intermedio (Table 8), with over 79% being present in this sector, vs. 16% on
PLOS ONE Lidar survey of ancient maya settlement in the puuc region of Yucatan, Mexico
PLOS ONE | https://doi.org/10.1371/journal.pone.0249314 April 28, 2021 29 / 54

Fig 16. Ballcourts within the lidar sample. (A) a probable Middle Preclassic example near UTM N2233300E231700. (B) a
newly identified acropolis, Uchbenmul, possibly dating to the Middle Preclassic. (C) Late-Terminal Classic period example
from Sabana Piletas. (D, E) possible small ballcourts.
https://doi.org/10.1371/journal.pone.0249314.g016
PLOS ONE Lidar survey of ancient maya settlement in the puuc region of Yucatan, Mexico
PLOS ONE | https://doi.org/10.1371/journal.pone.0249314 April 28, 2021 30 / 54
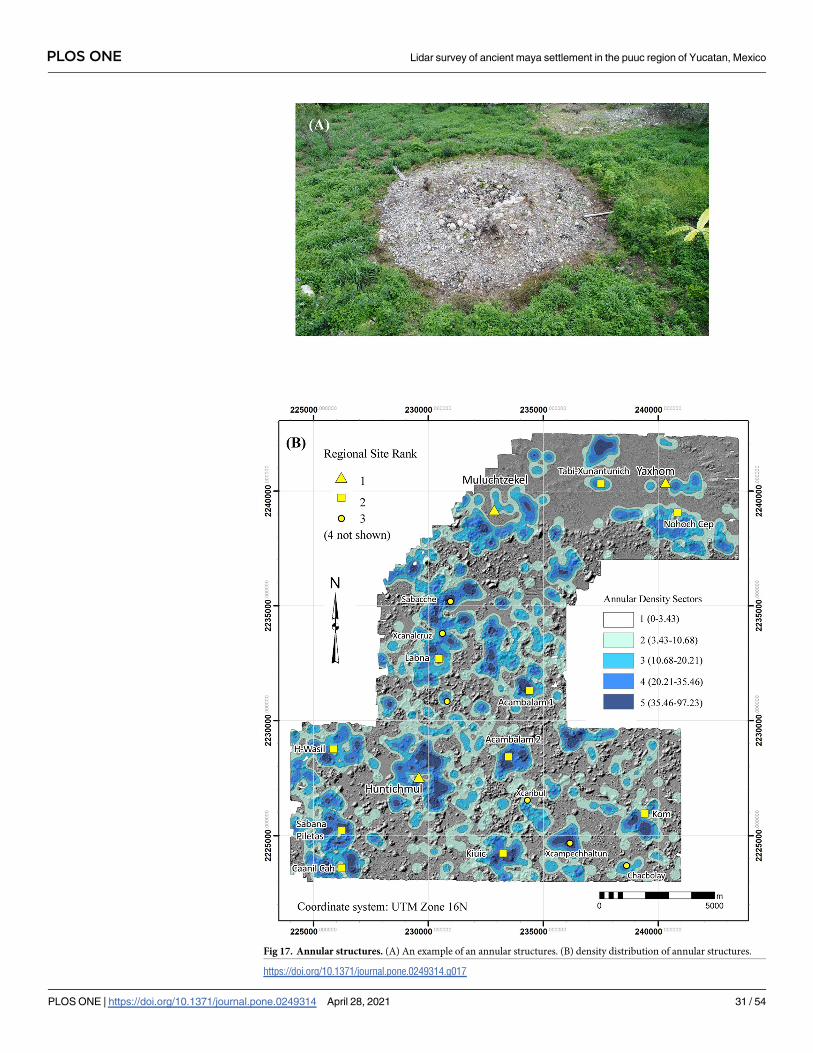
Fig 17. Annular structures. (A) An example of an annular structures. (B) density distribution of annular structures.
https://doi.org/10.1371/journal.pone.0249314.g017
PLOS ONE Lidar survey of ancient maya settlement in the puuc region of Yucatan, Mexico
PLOS ONE | https://doi.org/10.1371/journal.pone.0249314 April 28, 2021 31 / 54
cerros and a small number on planadas. Even when corrected for area, the density of annular
structures on terreno intermedio is still roughly three times that of the cerros. Interestingly,
about a quarter of the annular structures on terreno intermedio were also within 20 m of the
edge of a cerro, suggesting that was a favored spot for the manufacture of lime. Raw material
could simply have been tumbled downhill and then broken up for processing. Others were
closer to the edges of planadas, however, or were even within them, for reasons presently
unclear.
While the size of certain structures might suggest that enormous stone quarries would be
found, that has not proved to be obvious. Stone was probably quarried in shallow pits in areas
that were relatively flat (Fig 4) or by prizing stone from the ledges of hills and hummocks (Fig
18). Particularly notable ledge quarries can be found along the edges of the palace complexes at
the site of Kom and Labna, where the relatively straight edges of the ledges indicate they are
not natural. Another to the southeast of the major civic complex at Chacbolay is located adja-
cent to the largest annular structure at the site.
Labna indicates the scale quarrying could assume (Fig 19C and 19D). It has long been
noted that its palace was built against a hill, but a 3D lidar view strongly suggests that a large
part of the hill was quarried away to make the building site and ended up as building fill. These
sorts of operations would be largely invisible on the ground if the quarried material was recy-
cled as construction fill. Elsewhere, several hills have ledges or landings supporting substantial
platform mounds, often with vaulted buildings (Fig 19A and 19B). These appear to be too
wide to be natural features and so may also result from hill quarrying.
Use of the hills
Investigators from Teobert Maler onward have noted the occasional placement of a vaulted
building atop one of the Puuc cerros. Prior to lidar acquisition, full survey of hills by PARB per-
sonnel revealed that some of these hills also stood out for the density of their occupation. Some
had not just a single vaulted building on their summit, but entire architectural complexes,
such as the Escalera al Cielo excavated by Bey and colleagues [43]. Hilltops sometimes include
multiple basal platforms, several vaulted residences, and small temples, together with
Table 7. Annular counts/density in platform density sectors (see Table 4).
Platform Density Sector Sector Area (km2) % Area # Annulars Annular Density % Total Annulars
1 150.08 63.3% 272 1.81 22.1%
2 48.03 20.2% 320 6.66 26.0%
3 25.76 10.9% 389 15.10 31.6%
4 10.89 4.6% 210 19.28 17.0%
5 2.48 1.0% 41 16.53 3.3%
Totals 237.24 1232 5.19
https://doi.org/10.1371/journal.pone.0249314.t007
Table 8. Landforms and annular structures.
Class Area (km2) % Total Annular Strs. % Annulars in Class Density
planadas 60.73 25.60% 65 5.28% 1.07
terreno intermedio� 110.94 46.77% 979 79.46% 8.82
cerros 65.56 27.63% 188 15.26% 2.87
Total 237.23 1232 5.19
� Of those in the terreno intermedio, 138 are within 10 m of a cerro base, 248 are within 20 m (cumulative).
https://doi.org/10.1371/journal.pone.0249314.t008
PLOS ONE Lidar survey of ancient maya settlement in the puuc region of Yucatan, Mexico
PLOS ONE | https://doi.org/10.1371/journal.pone.0249314 April 28, 2021 32 / 54
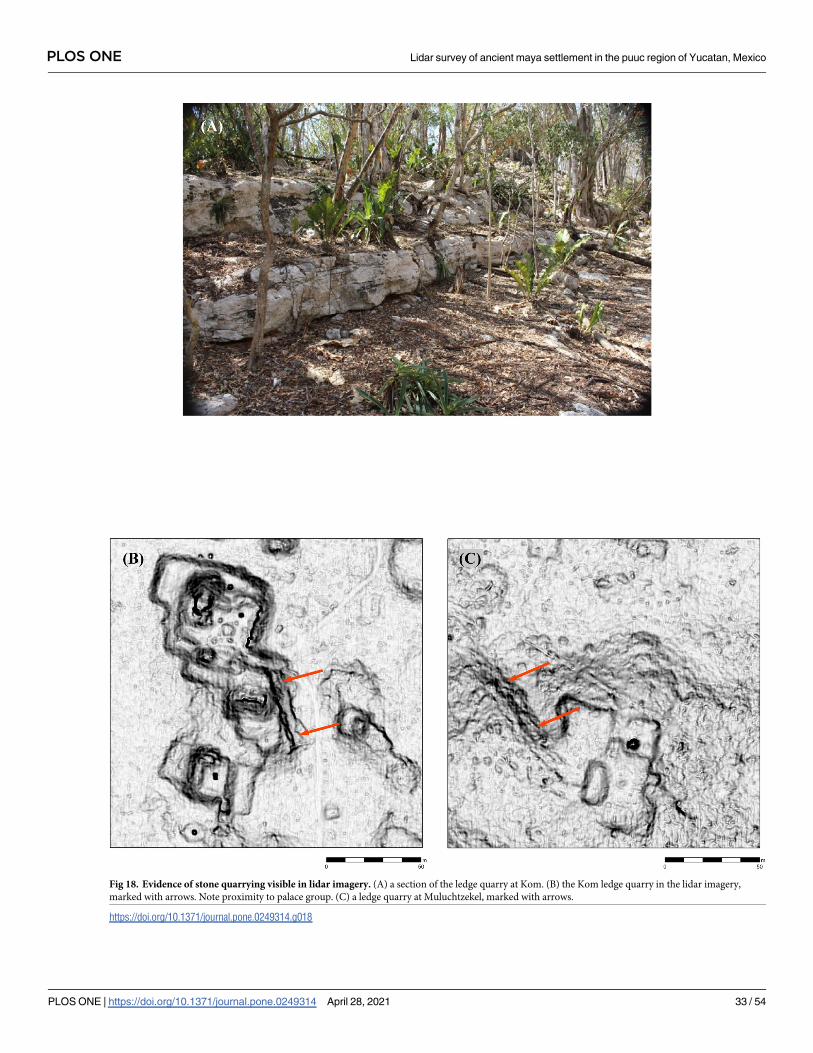
Fig 18. Evidence of stone quarrying visible in lidar imagery. (A) a section of the ledge quarry at Kom. (B) the Kom ledge quarry in the lidar imagery,
marked with arrows. Note proximity to palace group. (C) a ledge quarry at Muluchtzekel, marked with arrows.
https://doi.org/10.1371/journal.pone.0249314.g018
PLOS ONE Lidar survey of ancient maya settlement in the puuc region of Yucatan, Mexico
PLOS ONE | https://doi.org/10.1371/journal.pone.0249314 April 28, 2021 33 / 54
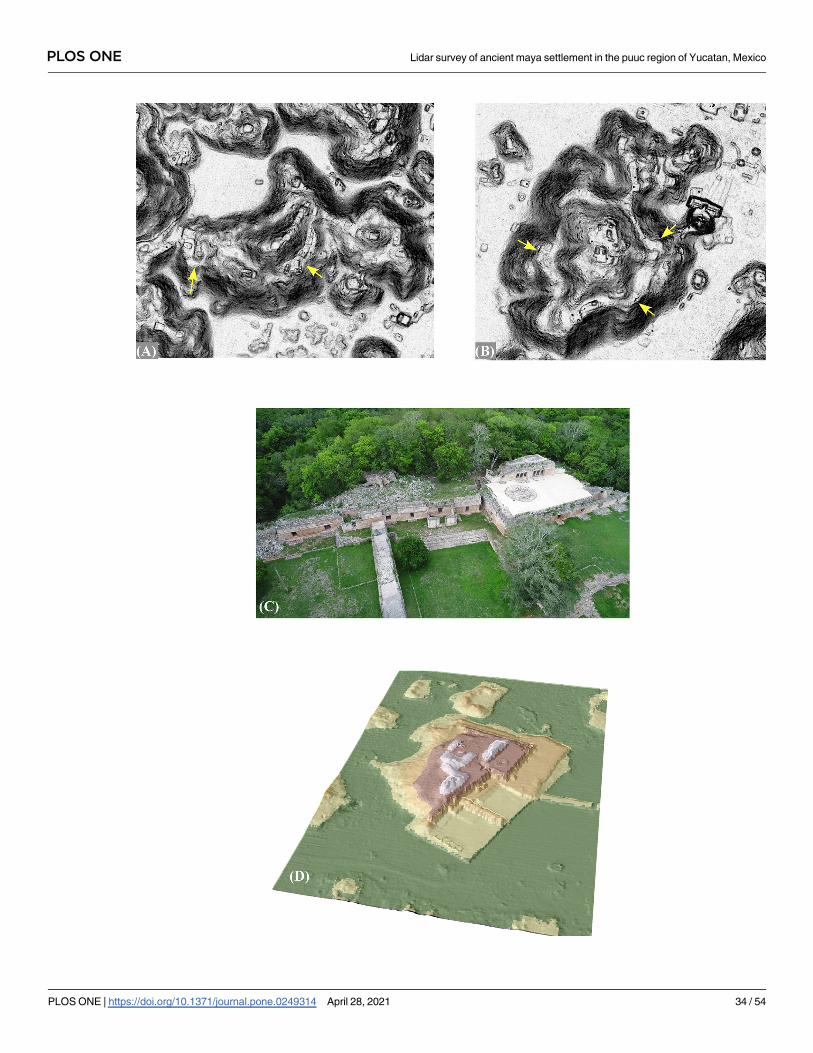
PLOS ONE Lidar survey of ancient maya settlement in the puuc region of Yucatan, Mexico
PLOS ONE | https://doi.org/10.1371/journal.pone.0249314 April 28, 2021 34 / 54
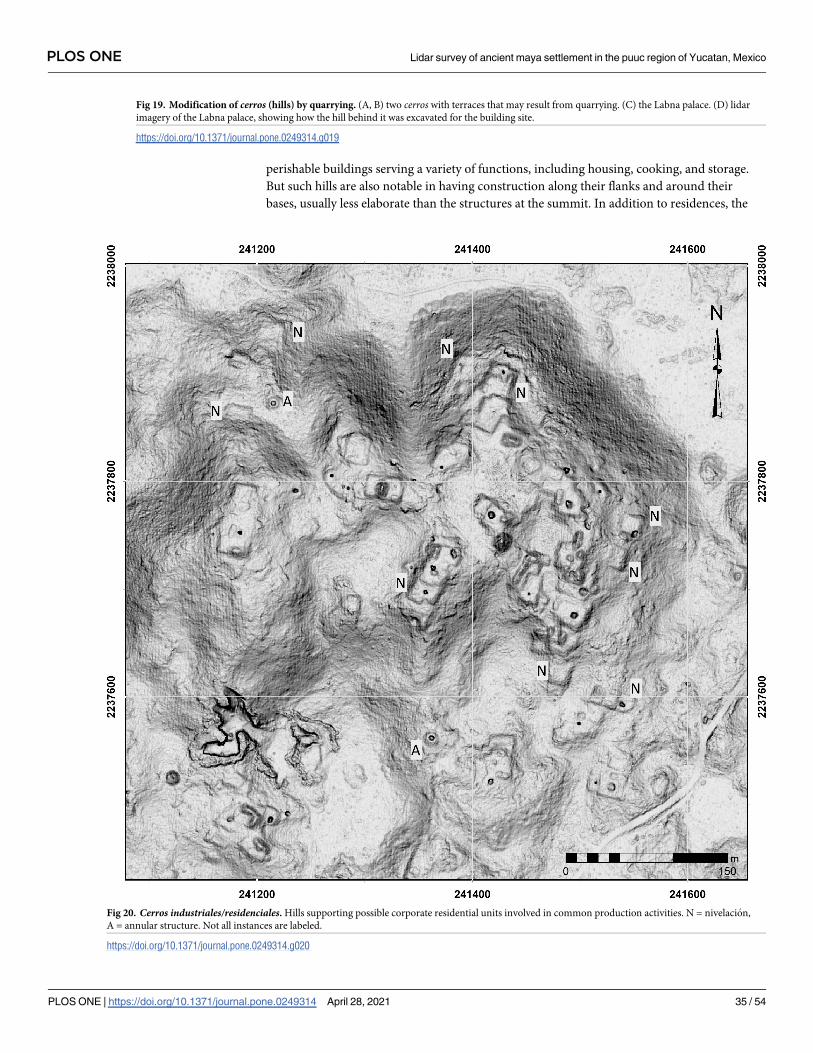
perishable buildings serving a variety of functions, including housing, cooking, and storage.
But such hills are also notable in having construction along their flanks and around their
bases, usually less elaborate than the structures at the summit. In addition to residences, the
Fig 19. Modification of cerros (hills) by quarrying. (A, B) two cerros with terraces that may result from quarrying. (C) the Labna palace. (D) lidar
imagery of the Labna palace, showing how the hill behind it was excavated for the building site.
https://doi.org/10.1371/journal.pone.0249314.g019
Fig 20. Cerros industriales/residenciales. Hills supporting possible corporate residential units involved in common production activities. N = nivelacion,
A = annular structure. Not all instances are labeled.
https://doi.org/10.1371/journal.pone.0249314.g020
PLOS ONE Lidar survey of ancient maya settlement in the puuc region of Yucatan, Mexico
PLOS ONE | https://doi.org/10.1371/journal.pone.0249314 April 28, 2021 35 / 54
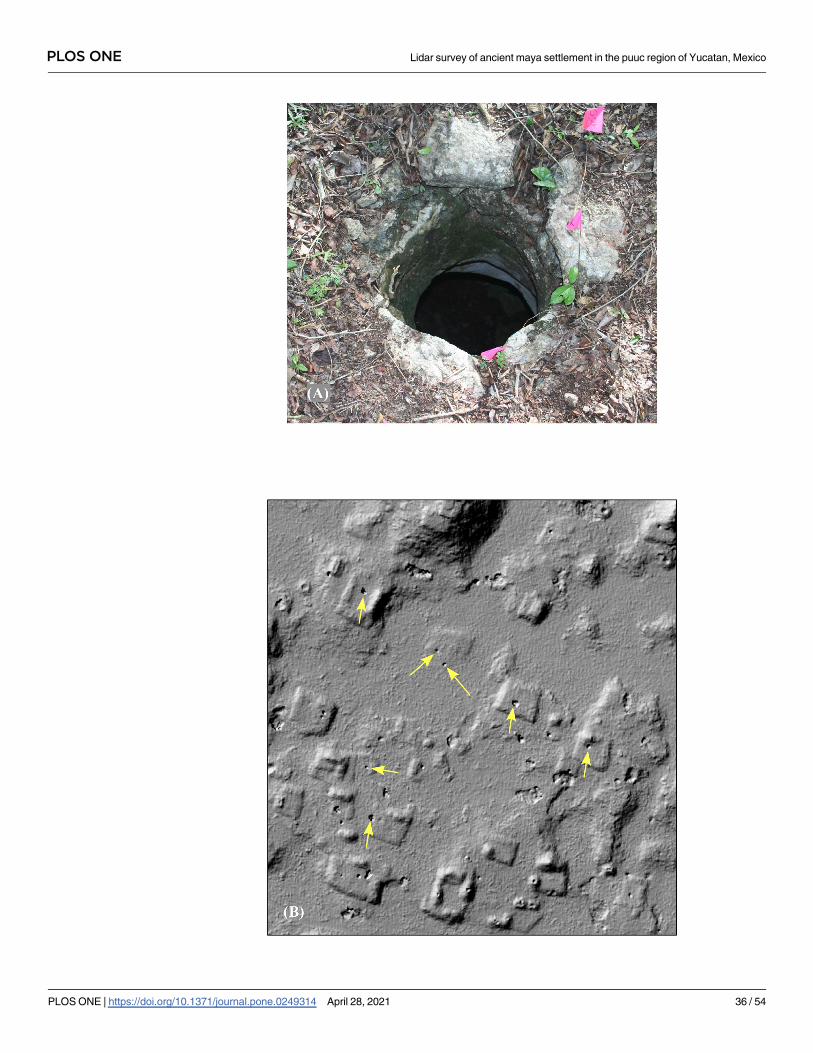
PLOS ONE Lidar survey of ancient maya settlement in the puuc region of Yucatan, Mexico
PLOS ONE | https://doi.org/10.1371/journal.pone.0249314 April 28, 2021 36 / 54

flanks of hills often support nivelaciones perhaps used for some type of production, such as
stone working [63, 67]. This clustering of occupation suggests that densely occupied hills can
be considered as corporate groups of some sort, perhaps associated with particular parcels of
farmland nearby or involvement in some type of production. For these reasons, we have
dubbed them “cerros residenciales” or “cerros industriales” (Fig 20) whose economic focus in
some cases may have shifted seasonally between cultivation, forest management, and stone
processing.
Our analysis of such hills is ongoing, but the platform data and our classification of land-
forms can provide some preliminary insights. One question is the frequency of such hills. An
initial hypothesis was that the larger planadas would have one or more associated cerros resi-denciales providing the workforce and management responsible for its cultivation. Our GIS
analysis indicates that while about a quarter of the platforms are located on hills (Table 6), only
52.87% of the 892 cerros defined by GIS analysis were occupied, and only 11.7% had more
than four buildings. Thus, cerros residenciales/industriales are rather infrequent. On the other
hand, several of the highest structure density isopleths were located on hills, including 73 of
the 78 isopleths with a density over 100. The isopleth with the highest density occurred on a
hill near Sabana Piletas, enclosing 133 structures. Not surprisingly, most of the dense hilltop
patches were also adjacent to planadas.The locational constraints of cerros industriales are less clear, but if they were involved with
stone working, it would be expected that several annular structures would be present among
the other structures. Only 119 (13.41%) of the hill polygons contained an annular structure.
All but 17 of these also contained a basal structure, but only 40 hill polygons had more than a
single annular structure. A hill to the west of Caanil Cah had the most annular structures (10),
with another 3 on an adjacent hill and several more on the terreno intermedio and planada.
Given that the planadas around that site are relatively small, stone processing was probably its
principal activity. Overall, cerros industriales appear to be infrequent, however.
Water procurement
Because geological uplift of the Puuc rendered the water table too deep to tap with premodern
technology, and because surface bodies of water and deep caves were virtually non-existent,
residents of the Puuc relied almost completely upon water storage facilities fed by rainwater.
Household cisterns, or chultuns–bell or beaker-shaped cavities lined with stucco to render
them impermeable–were one solution. Chultuns were common during the Late-Terminal
Classic period, although earlier settlement is too poorly known to definitively state when they
were first used. Chultuns were excavated into the platforms of house compounds or into plat-
forms especially made for the purpose [68, 69]. The upper surfaces of such platforms were
stuccoed and slightly inclined so as to drain rain into the chultuns. The narrow chultun neck,
about 50–70 cm in diameter and probably capped most of the time, prevented too much evap-
oration or the entry of debris. What is astounding is that 90–95% of the mouths of chultuns in
areas that have been ground checked can also be seen in the lidar imagery (Fig 21). Others,
having collapsed, are even more apparent.
Another, perhaps older, technique of water storage was the construction or modification of
communal aguadas, depressions modified for water storage by the construction of berms
around their peripheries (Fig 22). We have identified fourteen of these in our regional sample
and tentatively nine in the Alianza dataset. The dendritic forms of the larger examples result
Fig 21. Water storage cisterns (chultuns). (A) chultun neck. (B) chultun openings visible in lidar. Larger pits are
collapsed chultuns. Not all instances are marked with arrows.
https://doi.org/10.1371/journal.pone.0249314.g021
PLOS ONE Lidar survey of ancient maya settlement in the puuc region of Yucatan, Mexico
PLOS ONE | https://doi.org/10.1371/journal.pone.0249314 April 28, 2021 37 / 54
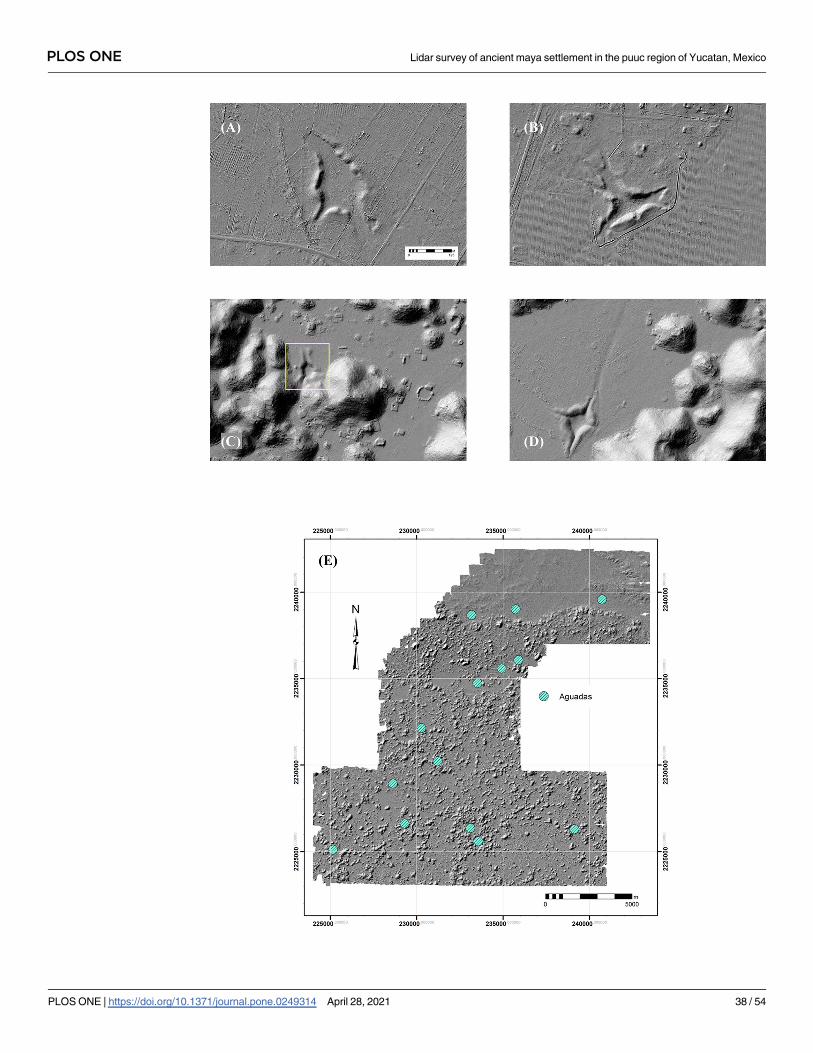
PLOS ONE Lidar survey of ancient maya settlement in the puuc region of Yucatan, Mexico
PLOS ONE | https://doi.org/10.1371/journal.pone.0249314 April 28, 2021 38 / 54
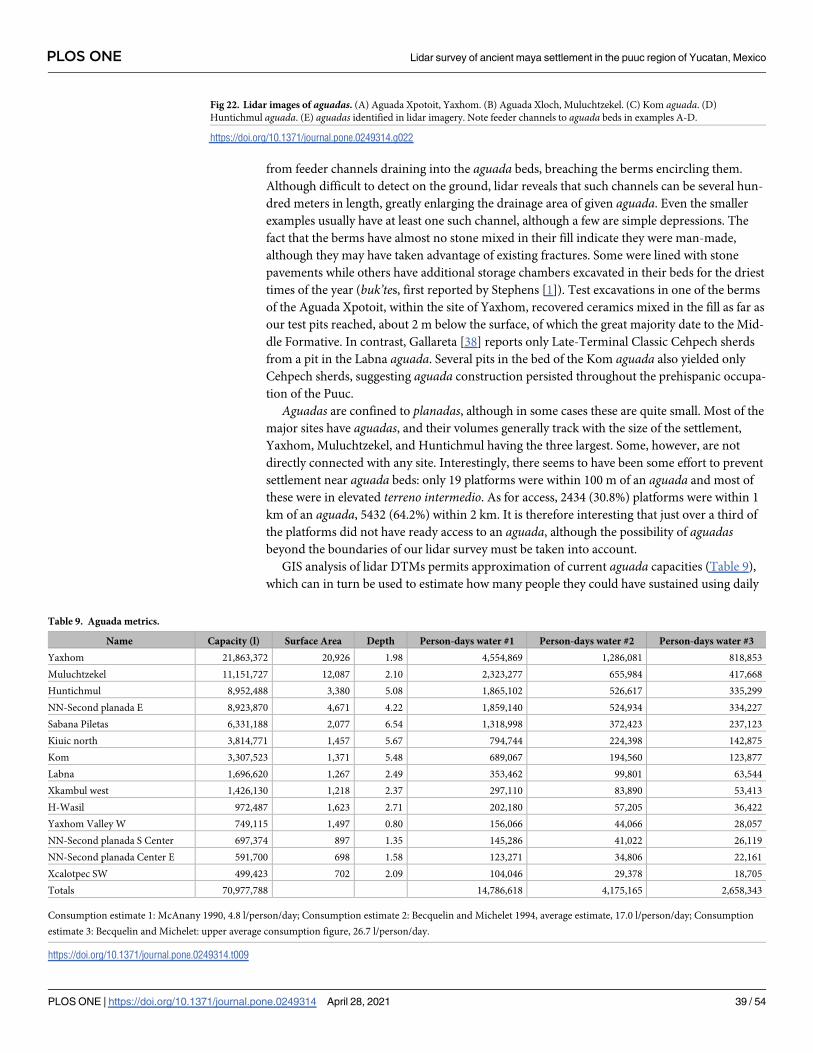
from feeder channels draining into the aguada beds, breaching the berms encircling them.
Although difficult to detect on the ground, lidar reveals that such channels can be several hun-
dred meters in length, greatly enlarging the drainage area of given aguada. Even the smaller
examples usually have at least one such channel, although a few are simple depressions. The
fact that the berms have almost no stone mixed in their fill indicate they were man-made,
although they may have taken advantage of existing fractures. Some were lined with stone
pavements while others have additional storage chambers excavated in their beds for the driest
times of the year (buk’tes, first reported by Stephens [1]). Test excavations in one of the berms
of the Aguada Xpotoit, within the site of Yaxhom, recovered ceramics mixed in the fill as far as
our test pits reached, about 2 m below the surface, of which the great majority date to the Mid-
dle Formative. In contrast, Gallareta [38] reports only Late-Terminal Classic Cehpech sherds
from a pit in the Labna aguada. Several pits in the bed of the Kom aguada also yielded only
Cehpech sherds, suggesting aguada construction persisted throughout the prehispanic occupa-
tion of the Puuc.
Aguadas are confined to planadas, although in some cases these are quite small. Most of the
major sites have aguadas, and their volumes generally track with the size of the settlement,
Yaxhom, Muluchtzekel, and Huntichmul having the three largest. Some, however, are not
directly connected with any site. Interestingly, there seems to have been some effort to prevent
settlement near aguada beds: only 19 platforms were within 100 m of an aguada and most of
these were in elevated terreno intermedio. As for access, 2434 (30.8%) platforms were within 1
km of an aguada, 5432 (64.2%) within 2 km. It is therefore interesting that just over a third of
the platforms did not have ready access to an aguada, although the possibility of aguadasbeyond the boundaries of our lidar survey must be taken into account.
GIS analysis of lidar DTMs permits approximation of current aguada capacities (Table 9),
which can in turn be used to estimate how many people they could have sustained using daily
Fig 22. Lidar images of aguadas. (A) Aguada Xpotoit, Yaxhom. (B) Aguada Xloch, Muluchtzekel. (C) Kom aguada. (D)
Huntichmul aguada. (E) aguadas identified in lidar imagery. Note feeder channels to aguada beds in examples A-D.
https://doi.org/10.1371/journal.pone.0249314.g022
Table 9. Aguada metrics.
Name Capacity (l) Surface Area Depth Person-days water #1 Person-days water #2 Person-days water #3
Yaxhom 21,863,372 20,926 1.98 4,554,869 1,286,081 818,853
Muluchtzekel 11,151,727 12,087 2.10 2,323,277 655,984 417,668
Huntichmul 8,952,488 3,380 5.08 1,865,102 526,617 335,299
NN-Second planada E 8,923,870 4,671 4.22 1,859,140 524,934 334,227
Sabana Piletas 6,331,188 2,077 6.54 1,318,998 372,423 237,123
Kiuic north 3,814,771 1,457 5.67 794,744 224,398 142,875
Kom 3,307,523 1,371 5.48 689,067 194,560 123,877
Labna 1,696,620 1,267 2.49 353,462 99,801 63,544
Xkambul west 1,426,130 1,218 2.37 297,110 83,890 53,413
H-Wasil 972,487 1,623 2.71 202,180 57,205 36,422
Yaxhom Valley W 749,115 1,497 0.80 156,066 44,066 28,057
NN-Second planada S Center 697,374 897 1.35 145,286 41,022 26,119
NN-Second planada Center E 591,700 698 1.58 123,271 34,806 22,161
Xcalotpec SW 499,423 702 2.09 104,046 29,378 18,705
Totals 70,977,788 14,786,618 4,175,165 2,658,343
Consumption estimate 1: McAnany 1990, 4.8 l/person/day; Consumption estimate 2: Becquelin and Michelet 1994, average estimate, 17.0 l/person/day; Consumption
estimate 3: Becquelin and Michelet: upper average consumption figure, 26.7 l/person/day.
https://doi.org/10.1371/journal.pone.0249314.t009
PLOS ONE Lidar survey of ancient maya settlement in the puuc region of Yucatan, Mexico
PLOS ONE | https://doi.org/10.1371/journal.pone.0249314 April 28, 2021 39 / 54
consumption rates based upon ethnographic data [68, 70]. We developed a custom tool utiliz-
ing ArcGIS’s hydrology toolbox, especially its cut-fill tool, to estimate aguada capacities.
(Briefly, rectangular shapefiles each large enough to entirely cover a given aguada are created
to limit the extent of volume calculations. The cut-fill tool, in conjunction with the fill tool, cal-
culates volume by detecting depressions, filling them, and subtracting the difference. The rest
of the tool involves adapting it for cycling through multiple aguadas, converting raster outlines
of aguadas to polygons for areal determinations, and then attaching statistics to these by
means of zonal statistics.)
Because of siltation and erosion, aguada capacities are probably underestimates, but are
nevertheless informative. Comparative statistics indicate they are by no means equal, the
Aguada Xpotoit (Yaxhom) far surpassing its neighbors at nearly 22,000 m3 while the smallest
range closer to 500 m3. (By comparison, the volume of the Palace Reservoir of Tikal is about
31,000 m3 [19].) Overall, regional aguada capacity is estimated at about 71,000 m3 or 71 mil-
lion liters. The Aguada Xpotoit, almost 300 m in length, accounts for about 31% of this total,
and cumulatively the top four aguadas have 72% of total capacity.
Both McAnany [68] and Becquelin and Michelet [70] have used estimates of daily per capita
water consumption and the number and capacity of chultuns to provide insights into popula-
tion levels. McAnany used a figure of 4.8 l/day/person of any age, derived from a doubling of
the world-wide estimate for minimum daily water consumption. In contrast, Becquelin and
Michelet proposed an average minimum consumption of 17 l/day/person of any age and an
upper estimate of 26.7 l/day/person of any age, based upon ethnographic observations. McA-
nany’s population estimates are therefore 3.5–5.5 times that of Becquelin and Michelet. Appli-
cation of these estimates to our aguada capacities is provided in Table 9. Overall regional
capacity would be 14.8 million person-days of water by McAnany’s estimate or from 2.7–4.2
million person-days using Becquelin and Michelet’s more conservative estimates, in either
case a substantial amount. Supposing that the aguadas were the sole source of water for a
160-day dry season and neglecting evaporation (though clearly non-negligible), regionally a
total of 92,400 people could have been supported using the 4.8/l/day rate or 16,600–26,100
using the 17–26.7 l/day figures.
Clearly, these are crude figures, and a more sophisticated model would track the rate of
refilling of the aguada during the rainy season as well as evaporation rates, but they do provide
a rough indication of the number of people who could have been sustained by aguadas alone.
Rounding up the average chultun capacities analyzed by Becquelin and Michelet to 36 m3/chul-tun, regional aguada capacity would be the equivalent of around 1970 chultuns.
Movement
Landscapes are experienced dynamically, so an interesting question concerns the choices peo-
ple made in moving through the various subregions of the Puuc. Stone causeways, or sacbes,are direct indicators of movement but generally Puuc sacbes are internal to sites, relatively
short, and linear in bearing (the Uxmal-Nohpat-Kabah sacbe being the major intersite excep-
tion). Lidar proved quite capable of detecting linear features such as sacbes, despite the fact
that in some cases they were almost invisible during field reconnaissance (Fig 23). As might be
expected, the causeways in our sample are internal and relatively short given the terrain–men-
tion has already been made of sacbes connected to EPCCs. Yaxhom is the exception proving
the point, for although it was the terminus for a number of longer intersite causeways, most
crossed relatively flat terrain. We found evidence of sacbes extending to the south, east, and
north, in all cases leading to a civic group terminus (to the east, for instance, is the Middle Pre-
classic Acropolis Lakin). A further two causeways lead from Nohoch Cep, the southern
PLOS ONE Lidar survey of ancient maya settlement in the puuc region of Yucatan, Mexico
PLOS ONE | https://doi.org/10.1371/journal.pone.0249314 April 28, 2021 40 / 54
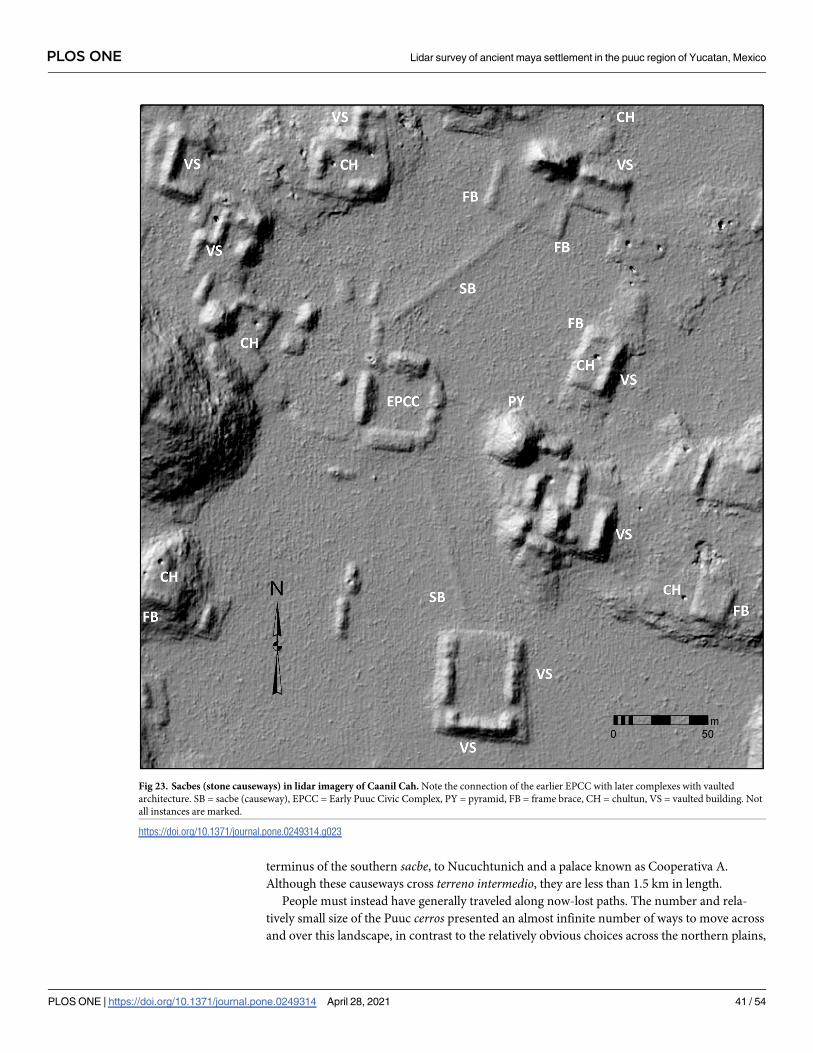
terminus of the southern sacbe, to Nucuchtunich and a palace known as Cooperativa A.
Although these causeways cross terreno intermedio, they are less than 1.5 km in length.
People must instead have generally traveled along now-lost paths. The number and rela-
tively small size of the Puuc cerros presented an almost infinite number of ways to move across
and over this landscape, in contrast to the relatively obvious choices across the northern plains,
Fig 23. Sacbes (stone causeways) in lidar imagery of Caanil Cah. Note the connection of the earlier EPCC with later complexes with vaulted
architecture. SB = sacbe (causeway), EPCC = Early Puuc Civic Complex, PY = pyramid, FB = frame brace, CH = chultun, VS = vaulted building. Not
all instances are marked.
https://doi.org/10.1371/journal.pone.0249314.g023
PLOS ONE Lidar survey of ancient maya settlement in the puuc region of Yucatan, Mexico
PLOS ONE | https://doi.org/10.1371/journal.pone.0249314 April 28, 2021 41 / 54
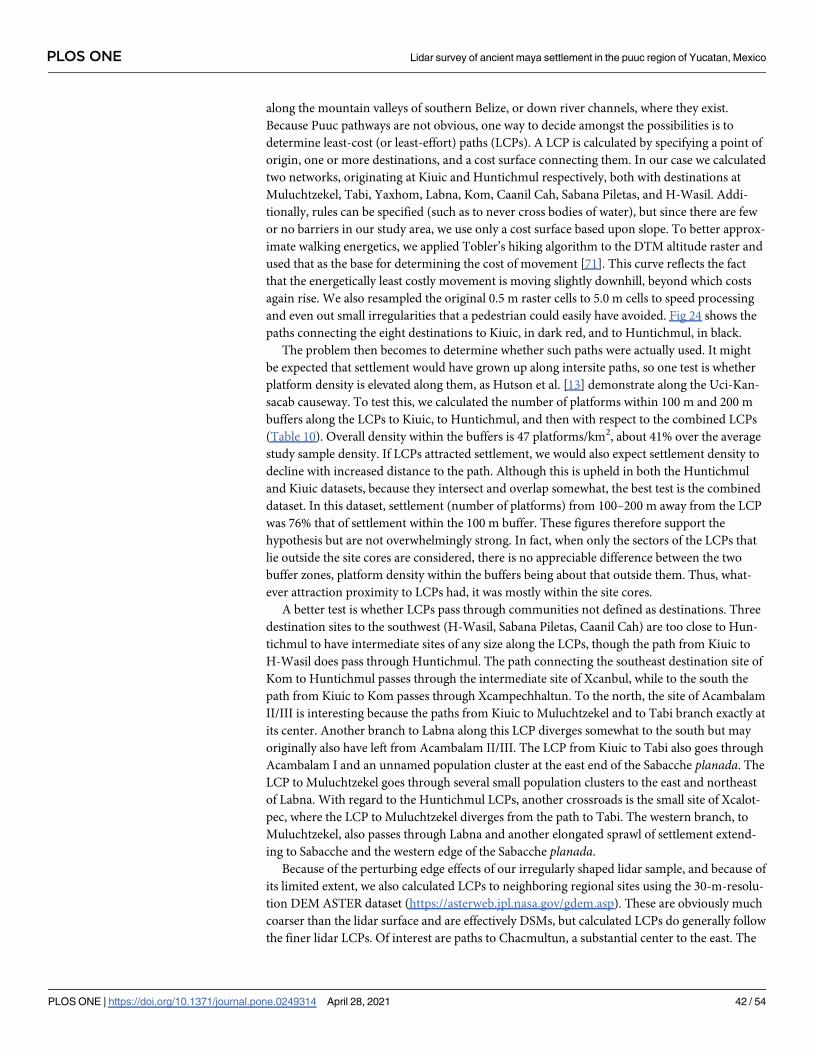
along the mountain valleys of southern Belize, or down river channels, where they exist.
Because Puuc pathways are not obvious, one way to decide amongst the possibilities is to
determine least-cost (or least-effort) paths (LCPs). A LCP is calculated by specifying a point of
origin, one or more destinations, and a cost surface connecting them. In our case we calculated
two networks, originating at Kiuic and Huntichmul respectively, both with destinations at
Muluchtzekel, Tabi, Yaxhom, Labna, Kom, Caanil Cah, Sabana Piletas, and H-Wasil. Addi-
tionally, rules can be specified (such as to never cross bodies of water), but since there are few
or no barriers in our study area, we use only a cost surface based upon slope. To better approx-
imate walking energetics, we applied Tobler’s hiking algorithm to the DTM altitude raster and
used that as the base for determining the cost of movement [71]. This curve reflects the fact
that the energetically least costly movement is moving slightly downhill, beyond which costs
again rise. We also resampled the original 0.5 m raster cells to 5.0 m cells to speed processing
and even out small irregularities that a pedestrian could easily have avoided. Fig 24 shows the
paths connecting the eight destinations to Kiuic, in dark red, and to Huntichmul, in black.
The problem then becomes to determine whether such paths were actually used. It might
be expected that settlement would have grown up along intersite paths, so one test is whether
platform density is elevated along them, as Hutson et al. [13] demonstrate along the Uci-Kan-
sacab causeway. To test this, we calculated the number of platforms within 100 m and 200 m
buffers along the LCPs to Kiuic, to Huntichmul, and then with respect to the combined LCPs
(Table 10). Overall density within the buffers is 47 platforms/km2, about 41% over the average
study sample density. If LCPs attracted settlement, we would also expect settlement density to
decline with increased distance to the path. Although this is upheld in both the Huntichmul
and Kiuic datasets, because they intersect and overlap somewhat, the best test is the combined
dataset. In this dataset, settlement (number of platforms) from 100–200 m away from the LCP
was 76% that of settlement within the 100 m buffer. These figures therefore support the
hypothesis but are not overwhelmingly strong. In fact, when only the sectors of the LCPs that
lie outside the site cores are considered, there is no appreciable difference between the two
buffer zones, platform density within the buffers being about that outside them. Thus, what-
ever attraction proximity to LCPs had, it was mostly within the site cores.
A better test is whether LCPs pass through communities not defined as destinations. Three
destination sites to the southwest (H-Wasil, Sabana Piletas, Caanil Cah) are too close to Hun-
tichmul to have intermediate sites of any size along the LCPs, though the path from Kiuic to
H-Wasil does pass through Huntichmul. The path connecting the southeast destination site of
Kom to Huntichmul passes through the intermediate site of Xcanbul, while to the south the
path from Kiuic to Kom passes through Xcampechhaltun. To the north, the site of Acambalam
II/III is interesting because the paths from Kiuic to Muluchtzekel and to Tabi branch exactly at
its center. Another branch to Labna along this LCP diverges somewhat to the south but may
originally also have left from Acambalam II/III. The LCP from Kiuic to Tabi also goes through
Acambalam I and an unnamed population cluster at the east end of the Sabacche planada. The
LCP to Muluchtzekel goes through several small population clusters to the east and northeast
of Labna. With regard to the Huntichmul LCPs, another crossroads is the small site of Xcalot-
pec, where the LCP to Muluchtzekel diverges from the path to Tabi. The western branch, to
Muluchtzekel, also passes through Labna and another elongated sprawl of settlement extend-
ing to Sabacche and the western edge of the Sabacche planada.
Because of the perturbing edge effects of our irregularly shaped lidar sample, and because of
its limited extent, we also calculated LCPs to neighboring regional sites using the 30-m-resolu-
tion DEM ASTER dataset (https://asterweb.jpl.nasa.gov/gdem.asp). These are obviously much
coarser than the lidar surface and are effectively DSMs, but calculated LCPs do generally follow
the finer lidar LCPs. Of interest are paths to Chacmultun, a substantial center to the east. The
PLOS ONE Lidar survey of ancient maya settlement in the puuc region of Yucatan, Mexico
PLOS ONE | https://doi.org/10.1371/journal.pone.0249314 April 28, 2021 42 / 54
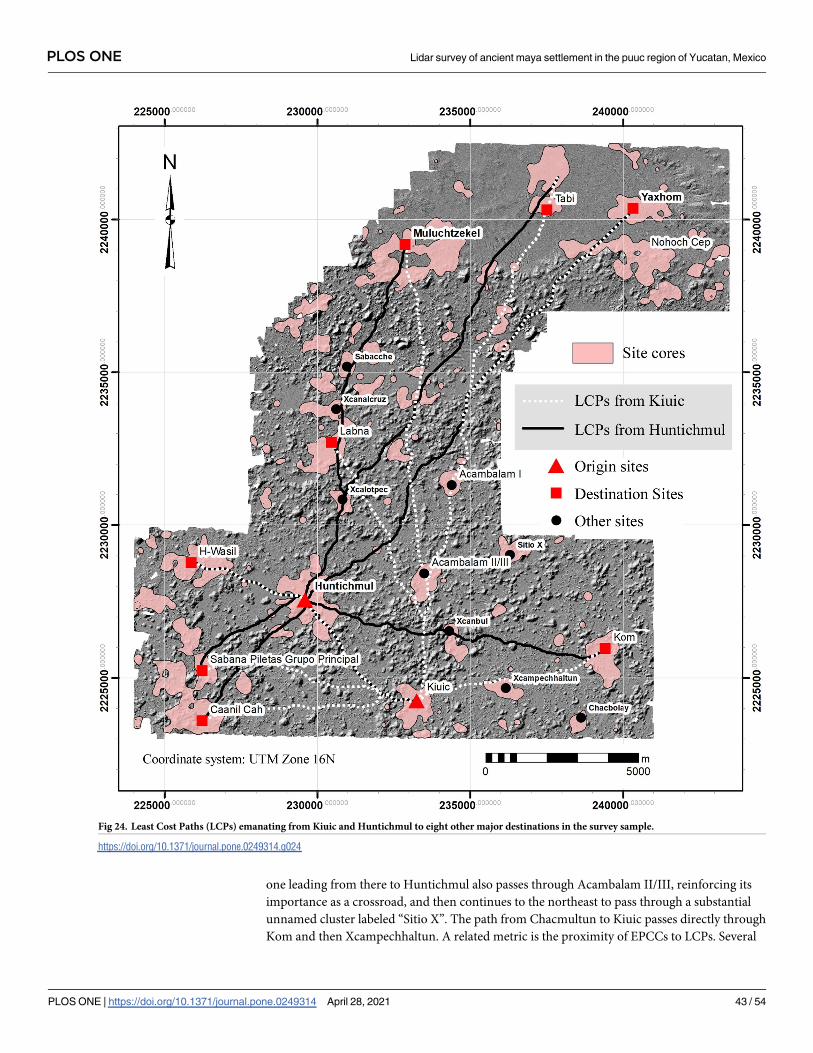
one leading from there to Huntichmul also passes through Acambalam II/III, reinforcing its
importance as a crossroad, and then continues to the northeast to pass through a substantial
unnamed cluster labeled “Sitio X”. The path from Chacmultun to Kiuic passes directly through
Kom and then Xcampechhaltun. A related metric is the proximity of EPCCs to LCPs. Several
Fig 24. Least Cost Paths (LCPs) emanating from Kiuic and Huntichmul to eight other major destinations in the survey sample.
https://doi.org/10.1371/journal.pone.0249314.g024
PLOS ONE Lidar survey of ancient maya settlement in the puuc region of Yucatan, Mexico
PLOS ONE | https://doi.org/10.1371/journal.pone.0249314 April 28, 2021 43 / 54
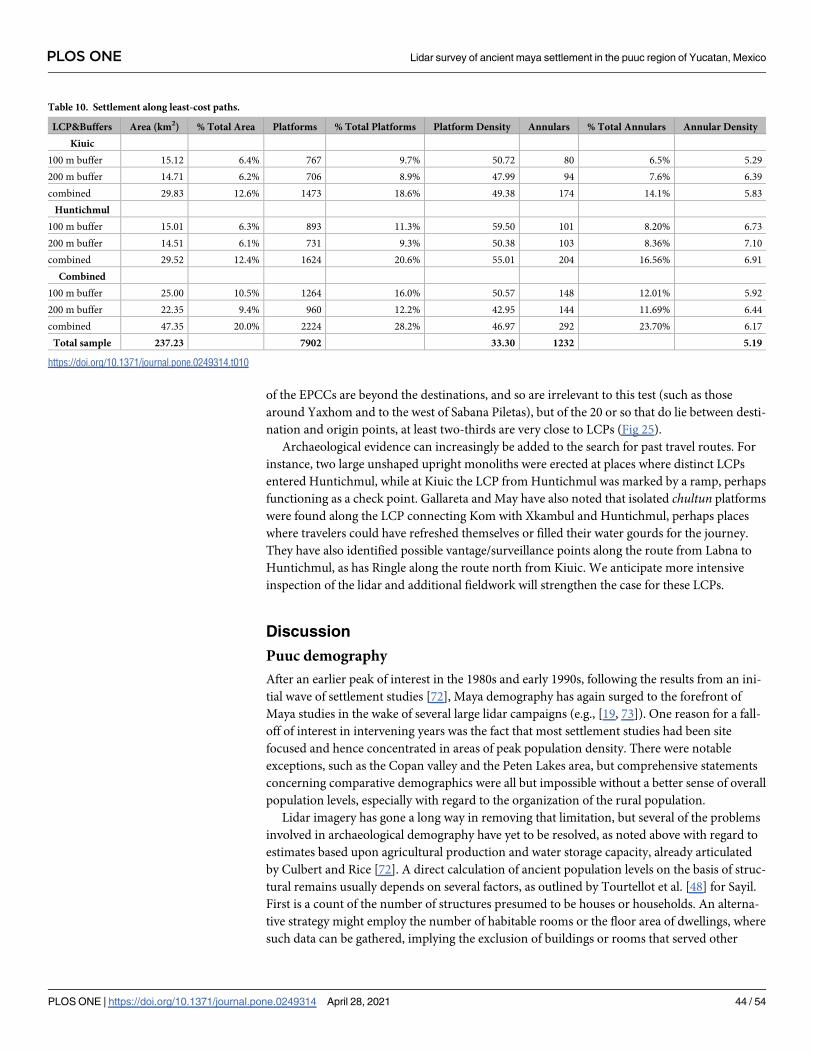
of the EPCCs are beyond the destinations, and so are irrelevant to this test (such as those
around Yaxhom and to the west of Sabana Piletas), but of the 20 or so that do lie between desti-
nation and origin points, at least two-thirds are very close to LCPs (Fig 25).
Archaeological evidence can increasingly be added to the search for past travel routes. For
instance, two large unshaped upright monoliths were erected at places where distinct LCPs
entered Huntichmul, while at Kiuic the LCP from Huntichmul was marked by a ramp, perhaps
functioning as a check point. Gallareta and May have also noted that isolated chultun platforms
were found along the LCP connecting Kom with Xkambul and Huntichmul, perhaps places
where travelers could have refreshed themselves or filled their water gourds for the journey.
They have also identified possible vantage/surveillance points along the route from Labna to
Huntichmul, as has Ringle along the route north from Kiuic. We anticipate more intensive
inspection of the lidar and additional fieldwork will strengthen the case for these LCPs.
Discussion
Puuc demography
After an earlier peak of interest in the 1980s and early 1990s, following the results from an ini-
tial wave of settlement studies [72], Maya demography has again surged to the forefront of
Maya studies in the wake of several large lidar campaigns (e.g., [19, 73]). One reason for a fall-
off of interest in intervening years was the fact that most settlement studies had been site
focused and hence concentrated in areas of peak population density. There were notable
exceptions, such as the Copan valley and the Peten Lakes area, but comprehensive statements
concerning comparative demographics were all but impossible without a better sense of overall
population levels, especially with regard to the organization of the rural population.
Lidar imagery has gone a long way in removing that limitation, but several of the problems
involved in archaeological demography have yet to be resolved, as noted above with regard to
estimates based upon agricultural production and water storage capacity, already articulated
by Culbert and Rice [72]. A direct calculation of ancient population levels on the basis of struc-
tural remains usually depends on several factors, as outlined by Tourtellot et al. [48] for Sayil.
First is a count of the number of structures presumed to be houses or households. An alterna-
tive strategy might employ the number of habitable rooms or the floor area of dwellings, where
such data can be gathered, implying the exclusion of buildings or rooms that served other
Table 10. Settlement along least-cost paths.
LCP&Buffers Area (km2) % Total Area Platforms % Total Platforms Platform Density Annulars % Total Annulars Annular Density
Kiuic
100 m buffer 15.12 6.4% 767 9.7% 50.72 80 6.5% 5.29
200 m buffer 14.71 6.2% 706 8.9% 47.99 94 7.6% 6.39
combined 29.83 12.6% 1473 18.6% 49.38 174 14.1% 5.83
Huntichmul
100 m buffer 15.01 6.3% 893 11.3% 59.50 101 8.20% 6.73
200 m buffer 14.51 6.1% 731 9.3% 50.38 103 8.36% 7.10
combined 29.52 12.4% 1624 20.6% 55.01 204 16.56% 6.91
Combined
100 m buffer 25.00 10.5% 1264 16.0% 50.57 148 12.01% 5.92
200 m buffer 22.35 9.4% 960 12.2% 42.95 144 11.69% 6.44
combined 47.35 20.0% 2224 28.2% 46.97 292 23.70% 6.17
Total sample 237.23 7902 33.30 1232 5.19
https://doi.org/10.1371/journal.pone.0249314.t010
PLOS ONE Lidar survey of ancient maya settlement in the puuc region of Yucatan, Mexico
PLOS ONE | https://doi.org/10.1371/journal.pone.0249314 April 28, 2021 44 / 54
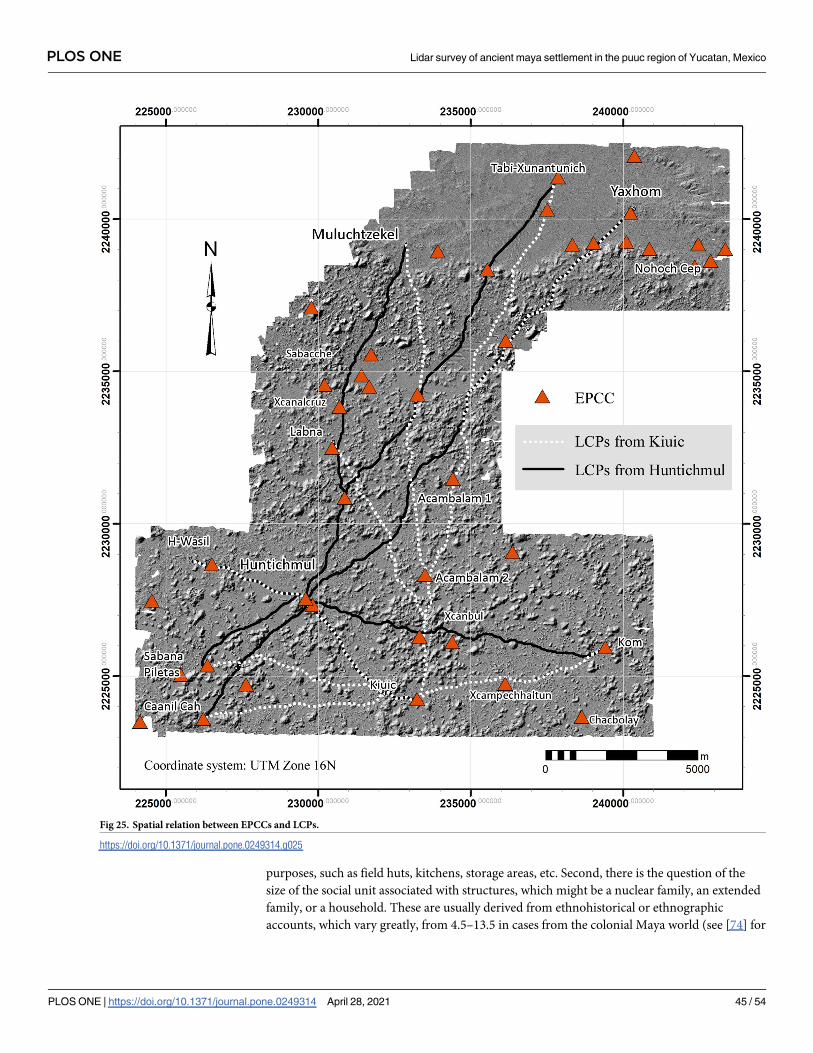
purposes, such as field huts, kitchens, storage areas, etc. Second, there is the question of the
size of the social unit associated with structures, which might be a nuclear family, an extended
family, or a household. These are usually derived from ethnohistorical or ethnographic
accounts, which vary greatly, from 4.5–13.5 in cases from the colonial Maya world (see [74] for
Fig 25. Spatial relation between EPCCs and LCPs.
https://doi.org/10.1371/journal.pone.0249314.g025
PLOS ONE Lidar survey of ancient maya settlement in the puuc region of Yucatan, Mexico
PLOS ONE | https://doi.org/10.1371/journal.pone.0249314 April 28, 2021 45 / 54
a list). The third necessary parameter is an estimate of how many structures were being occu-
pied contemporaneously. This is perhaps the most difficult to determine archaeologically,
since even if dwellings are dated by pottery, it cannot be assumed they were inhabited for the
full length of a given ceramic phase. Furthermore, buildings were not infrequently enlarged
during their life history, a process which usually can be established only by excavation. In lieu
of that, buildings are usually tallied in their final form.
This has led to estimates which are inflated, in our view. For instance, Tourtellot et al. [48]
estimated the population of the nearby Puuc site of Sayil at 10,858, in general agreement with
McAnany’s [68] estimate of water capacity, which, as noted, has been criticized for using very
low estimates of daily personal consumption. Tourtellot et al.’s estimate can also be criticized
on a number of levels. They assume that settlement density in the non-mapped portions of the
site was equivalent to that of the site center, most probably resulting in an overestimate. Sec-
ond, about 34% of the estimated population is argued to have resided on gravel mounds with
no frame brace foundations (chiches). Chich mounds have never been conclusively demon-
strated to be domestic features, and it is likely that many or most of the bare platforms were
just that, loci for work activities. Since frame brace construction depends on gathering a mod-
est number of small boulders that are everywhere available, it is difficult to believe that a sub-
stantial fraction of the population were too poor to make this most minimal investment in
house construction.
Third, Tourtellot et al. elected to utilize room counts, assuming that each was occupied by
something close to a small nuclear family (4 individuals/ room), whether perishable or of
masonry. Using the average number of rooms per building type, perishable buildings were
argued to have 6.6 residents on average and masonry buildings 13.52, because of their greater
number of rooms. Our excavations of the Escalera al Cielo complex [43, 67], which was aban-
doned rapidly, demonstrates that rooms often were given over to storage and that small struc-
tures were probably outbuildings.
It seems more likely that each building of two or three rooms housed a single nuclear fam-
ily, as perhaps did some of the larger one-room buildings, with platforms generally represent-
ing a single extended household (in fairness, an option also considered by Tourtellot et al.).
Buildings with more rooms may have housed multiple nuclear (or extended) families, but they
are relatively few in number. A calculation on this basis reduces the Sayil estimate to around
3000 people. The Sayil project also registered a total of 296 basal platforms. If we assume that
each supported a single household, assumed to be equivalent to what is referred to as an
extended family in the anthropological literature, and then employ a figure of 10 people/house-
hold, about midway in the range of values in the ethnohistorical literature, we arrive at much
the same figure. Finally, Tourtellot et al. argue that Sayil was a single component site, so they
made no adjustment for contemporary occupancy. This is almost certainly unwarranted, as
they note, but it is also almost impossible to provide an accurate alternative. Even so, it seems
that a population estimate closer to one-half (or less) of their total is more likely.
Another problem is that most lidar projects are focused around one or more known centers
of significant size, whose structure densities may exceed by a significant amount random sam-
ples of settlement. This seems to be the case with the Pacunam datasets [19] (Canuto et al.
2018: Tables 1 and 4). The Tikal and Naachtun datasets, covering 146.9 and 135.3 km2 respec-
tively, exceed 80 structures/km2. Five of the remaining survey blocks are of roughly compara-
ble size, between 90–165 km2, and are also focused around known sites of substantial size,
resulting in structure densities of around 30-45/km2. In contrast, three unnamed datasets to
the west, taken as samples of unknown territory, cover a total 502.2 km2 with an average struc-
ture density of only 2.56/km2. The remaining two datasets, Corona and Holmul, are the two
largest, covering 432 and 309 km2 respectively, but significantly their densities are only 8 and
PLOS ONE Lidar survey of ancient maya settlement in the puuc region of Yucatan, Mexico
PLOS ONE | https://doi.org/10.1371/journal.pone.0249314 April 28, 2021 46 / 54
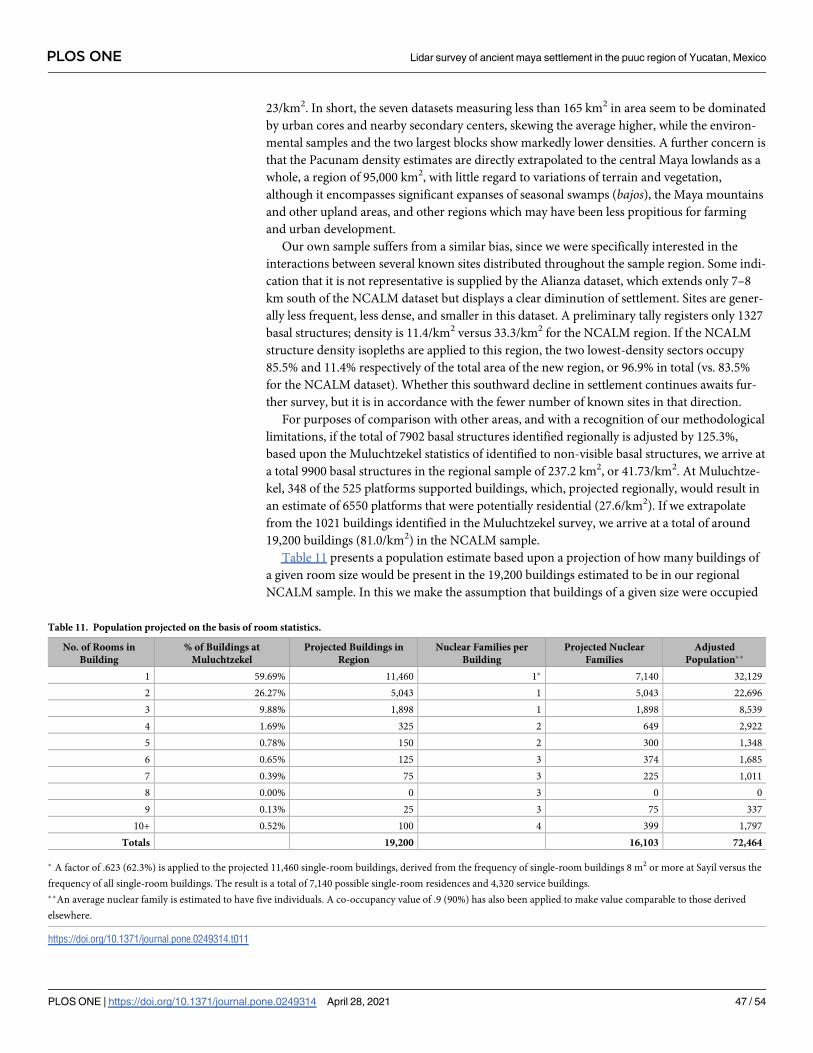
23/km2. In short, the seven datasets measuring less than 165 km2 in area seem to be dominated
by urban cores and nearby secondary centers, skewing the average higher, while the environ-
mental samples and the two largest blocks show markedly lower densities. A further concern is
that the Pacunam density estimates are directly extrapolated to the central Maya lowlands as a
whole, a region of 95,000 km2, with little regard to variations of terrain and vegetation,
although it encompasses significant expanses of seasonal swamps (bajos), the Maya mountains
and other upland areas, and other regions which may have been less propitious for farming
and urban development.
Our own sample suffers from a similar bias, since we were specifically interested in the
interactions between several known sites distributed throughout the sample region. Some indi-
cation that it is not representative is supplied by the Alianza dataset, which extends only 7–8
km south of the NCALM dataset but displays a clear diminution of settlement. Sites are gener-
ally less frequent, less dense, and smaller in this dataset. A preliminary tally registers only 1327
basal structures; density is 11.4/km2 versus 33.3/km2 for the NCALM region. If the NCALM
structure density isopleths are applied to this region, the two lowest-density sectors occupy
85.5% and 11.4% respectively of the total area of the new region, or 96.9% in total (vs. 83.5%
for the NCALM dataset). Whether this southward decline in settlement continues awaits fur-
ther survey, but it is in accordance with the fewer number of known sites in that direction.
For purposes of comparison with other areas, and with a recognition of our methodological
limitations, if the total of 7902 basal structures identified regionally is adjusted by 125.3%,
based upon the Muluchtzekel statistics of identified to non-visible basal structures, we arrive at
a total 9900 basal structures in the regional sample of 237.2 km2, or 41.73/km2. At Muluchtze-
kel, 348 of the 525 platforms supported buildings, which, projected regionally, would result in
an estimate of 6550 platforms that were potentially residential (27.6/km2). If we extrapolate
from the 1021 buildings identified in the Muluchtzekel survey, we arrive at a total of around
19,200 buildings (81.0/km2) in the NCALM sample.
Table 11 presents a population estimate based upon a projection of how many buildings of
a given room size would be present in the 19,200 buildings estimated to be in our regional
NCALM sample. In this we make the assumption that buildings of a given size were occupied
Table 11. Population projected on the basis of room statistics.
No. of Rooms in
Building
% of Buildings at
Muluchtzekel
Projected Buildings in
Region
Nuclear Families per
Building
Projected Nuclear
Families
Adjusted
Population��
1 59.69% 11,460 1� 7,140 32,129
2 26.27% 5,043 1 5,043 22,696
3 9.88% 1,898 1 1,898 8,539
4 1.69% 325 2 649 2,922
5 0.78% 150 2 300 1,348
6 0.65% 125 3 374 1,685
7 0.39% 75 3 225 1,011
8 0.00% 0 3 0 0
9 0.13% 25 3 75 337
10+ 0.52% 100 4 399 1,797
Totals 19,200 16,103 72,464
� A factor of .623 (62.3%) is applied to the projected 11,460 single-room buildings, derived from the frequency of single-room buildings 8 m2 or more at Sayil versus the
frequency of all single-room buildings. The result is a total of 7,140 possible single-room residences and 4,320 service buildings.
��An average nuclear family is estimated to have five individuals. A co-occupancy value of .9 (90%) has also been applied to make value comparable to those derived
elsewhere.
https://doi.org/10.1371/journal.pone.0249314.t011
PLOS ONE Lidar survey of ancient maya settlement in the puuc region of Yucatan, Mexico
PLOS ONE | https://doi.org/10.1371/journal.pone.0249314 April 28, 2021 47 / 54
by an integral number of nuclear families (e.g., one nuclear family for a two- or three-room
building). We also assume that only 62.3% of the single-room buildings housed a nuclear fam-
ily. This is based upon the assumption that a minimum floor space of 8 m2 was necessary for a
single-family house; the adjustment represents the ratio at Sayil for single-room buildings of
this size versus all single-room buildings. (Thus, 77.5% of all buildings are projected to have
been residences, for a density of 62.7/km2.) Finally, to arrive at people, we assume a nuclear
family size of 5 and a 90% co-occupation ratio, mostly for compatibility with other estimates.
The result is about 72,500 people. Some buildings of the final class were probably civic, rather
than residential, structures, so rounding the estimate to 70,000 would yield about 295 people/
km2.
Another approach is to assume that a platform was occupied by a single household, thus the
maximum population would equal the number of residential platforms multiplied by an aver-
age value for household size. Using the estimate of 6550 possible residential structures, an esti-
mate of 10 people per household, and a co-occupation ratio of 90%, a total population of
around 59,000 is indicated, about 20% less than the previous calculation. Obviously, the
parameters used in both calculations can be disputed: some have used values of 4 for a nuclear
family, others a value as high as 6. Similarly, household size estimates run as high as 13.5. The
co-occupation ratio is also little more than an educated guess but does not differ greatly from
other recent demographic estimates. A reasonable compromise range would be ±20%, or
56,000–84,000 people within our sample boundaries.
Other caveats warrant consideration. First, Muluchtzekel, given its urban character, is prob-
ably not representative in terms of the number and ratios of building types elsewhere; a better
estimate will take into account other areas that have been ground verified. In other words,
community size may ultimately need to be considered, since different extrapolation factors
may be necessary for sites of different ranks. Second is the problem of buried structures, espe-
cially in the planadas where soils are deeper. Determining whether this was the case will
require extensive (and costly) excavation programs. However, we note that the terreno inter-medio does not differ greatly in the types of structures present, i.e., we did not encounter large
numbers of modest structures of the type that might be buried in the planadas. Furthermore,
some rather modest structures do appear in the planadas. Although few in number, they do
indicate soil deposition was not excessive. Undoubtedly some structures are buried, but we
argue on these grounds that the number is low. Completely perishable buildings are almost
impossible to detect without a large investment in advanced methodologies, but we believe
these two were a minor component of settlement, if indeed they existed.
This estimate is near the maximum calculated carrying capacity discussed above, indicating
either that our direct estimate of population is too high, our estimate of carrying capacity is
too low, or a combination of the two. Alternatively, the area may have been supplied from less
densely settled regions nearby. With regard to water, aguada and chultun capacity appears to
comfortably accommodate a population of around 70,000. This suggests the area was well-
buffered again droughts, at least for household needs; watering crops is another story.
Projections to the Puuc region as a whole are equally problematic. If we take the line
N2207000 as an arbitrary southern limit to the Puuc, it covers approximately 5275 km2, 3350
km2 of which belongs to the Bolonchen District, 1800 km2 to the Valle de Sta. Elena and about
125 km2 to the Sierrita de Ticul. In our regional sample, there is a marked difference in plat-
form density between the VSE and DBC sectors, 40.7 vs. 25.8 platforms/km2. However, the
former is dominated by the Valle de Yaxhom basin and its neighboring planadas, which are
largely vacant, and we at present have no way of determining how typical this is of the remain-
der of the Valle de Sta. Elena. Similarly, our sample of the Bolonchen Hills may also be skewed.
PLOS ONE Lidar survey of ancient maya settlement in the puuc region of Yucatan, Mexico
PLOS ONE | https://doi.org/10.1371/journal.pone.0249314 April 28, 2021 48 / 54
On the one hand, it lies in a hotspot of known sites (Fig 2), and, on the other, settlement appar-
ently falls off to the south (Figs 8 and 9).
With regards to the lowlands as a whole, Ceibal provides a useful comparison of a central
Peten site with similar settlement units to ours [75]. There 1041.7 platforms and 15,380.5 resi-
dential buildings are projected within the study area of 470 km2, resulting in densities of 2.21
platforms and 32.7 residential buildings per square kilometer. Our overall platform density is
41.7/km2, reduced to 27.6/km2 if only residential platforms are considered. Our building den-
sity is 81.0/km2 unadjusted or 62.7 residences/km2. Canuto et al. [19] cite an average structure
density of 28.67 structures/km2 for the Pacunam Central Peten sample and estimate popula-
tion density as roughly 80–120 persons/km2, but uncertainty over the basic units in these sur-
veys makes comparisons difficult. However, this is eventually resolved, and whatever the error
of our parameter estimates, it seems clear that our sample of the Puuc enjoyed a significantly
higher population density than their Peten neighbors. With more refined projection factors,
greater stratification of projection classes, and additional lidar sampling of the Puuc, even
greater precision in population estimates can be expected.
Conclusions
Returning to the questions raised at the beginning of this article, Lidar imagery reveals a land-
scape that was densely but unevenly occupied. Perhaps the most notable aspect of regional set-
tlement distribution is the relatively sparse use of the hinterlands, including some areas of
considerable size. Some are to be expected, such as the cluster of hills north of Kiuic and south
of Acambalam II/III, but others are less easily explained, such as the large expanse west of
Kom, or that south of Huntichmul and west of Kiuic. Most intriguing is the mid-central pla-nada where Sabacche is located. Although the planadas of the Valle de Yaxhom are the most
densely settled areas of our study region, the eastern half of the planada is very lightly settled
and has relatively few civic structures, despite its apparent fertility, judging from modern
cultivation.
At the other extreme are the many communities dotting the landscape. Thirty-one of the
106 site cores (Sectors 3–5) have 38 or more basal structures and a minimum size of 27 ha (if
Yaxhom is treated as a single extended conurbation, the number of site cores declines to 28).
This would translate to an average realm covering only 7.7 km2, which, if they were packed
hexagons, would have centers just under 3 km apart. This agrees well with the actual distances
between cores and their nearest neighbor, which do not exceed 4 km, even if restricted only to
the largest 31. Distances are often half that, reflecting the fact that 16 core areas have a hundred
or more platforms and so were many times larger than their neighbors. Below the 31 largest
site cores, there is a significant break both in the size of and the number of platforms within
core boundaries.
A model of discrete civic domains, with relatively concentric settlement gradients, can only
be sustained in some cases. In other cases, the amorphous distribution of Sector 2 settlement
envelopes multiple civic complexes, hinting at a more complex form of urban organization.
The largest such distribution is Yaxhom, discussed earlier, but the areas around Muluchtzekel,
Labna, and Sabana Piletas are similar. The latter is particularly unusual in having not only sev-
eral lobes of settlement but also at least two civic complexes. Settlement extends continuously
to encompass Caanil Cah as well, which has its own well-developed civic center. The settle-
ment extending north from Labna includes the smaller centers of Xcanalcruz and Chuncatzim,
and then extends to the sites around Sabacche. This suggests that settlement fall-off alone can-
not be used to define sites.
PLOS ONE Lidar survey of ancient maya settlement in the puuc region of Yucatan, Mexico
PLOS ONE | https://doi.org/10.1371/journal.pone.0249314 April 28, 2021 49 / 54
The significant differences in the distribution of settlement most probably reflect con-
straints on settlement choice. These may have been the result of agreements between adjacent
centers concerning the cultivation of planadas and other resources, perhaps similar to the
indigenous agreements described in sixteenth-century native documents such as the LandTreat of Mani [76] and the Codice de Calkini [77]. Limited settlement around the planadas and
in the hinterlands implies that population growth had not yet reached a demographic crisis
when the region was abandoned during the tenth century, also supported by the very limited
use of agricultural terraces. The cause for this abandonment remains contested, but interne-
cine warfare does not seem to be the proximate cause, given the close packing of communities
and the absence of defensive works. Settlement does drop off significantly to the south, how-
ever, perhaps because it was more contested territory.
The low level of settlement on cerros also indirectly suggests that considerable areas
remained forested. It is true that about half of the annular structures, presumably stoked with
wood from nearby forests, do lie within the two lowest platform density sectors (Table 8), yet the
density of annular structures is quite low, given that these two sectors comprise 83.5% of the
study area. In fact, annular density within the lowest platform density sector, Sector 1, compris-
ing 63.3% of the study area, is less than a third of Sector 2. Although the use of a fuel-efficient
lime pit-kiln technology suggests some concern with forestry management [64, 66], nearly half
the annular structures were within communities, suggesting fuel was available nearby.
As to the question whether the Puuc had a distinctive civic arrangement, the frequency of
EPCCs throughout our study region suggest that regional complexity grew out of a series of
small centers that were remarkably similar. Only one EPCC does not fall within a site core as
defined by settlement density isopleths, and 37 (88%) are located within the 31 largest site
cores, although four of these cores lack an EPCC. Six site cores had more than one EPCC,
reflecting later settlement consolidation. EPCCs probably reflect the initial importance of
councils in early Puuc governance, a trend we argue continued throughout the Classic period
[78]. With regard to later civic complexes, while it is clear that civic organization took a variety
of forms during the Terminal Classic, some unique to particular sites, it is also clear that pal-
aces often assumed a relatively limited set of forms, but that is a topic of future discussion.
The influx of new data stemming from the lidar revolution has clearly enhanced our ability
to address fundamental questions concerning Puuc settlement and urbanism, sometimes con-
firming past arguments but in others presenting entirely new vistas [79]. With regard to com-
parisons elsewhere, although we generally agree with Stanton et al. [15] that the volume and
area of platforms “have the potential to be more easily comparable to other datasets based on
structure density,” thus avoiding the problem “that one large pyramid ‘counts’ the same as one
small ancillary building in a domestic group,” it is clear that multiple, multi-factor lidar classi-
fications will ultimately be necessary, since a small house may indeed outweigh a large non-
domestic structure if demography is the question. Our review of the imagery continues and
will eventually employ a structure typology developed by Gallareta and May, allowing better
estimates of the number of buildings and hence an improved idea of Classic-period demogra-
phy. We also expect a more precise assessment of the accuracy of feature identification from
the lidar imagery alone, allowing better extrapolation into unsurveyed areas. Finally, we are in
the process of applying additional GIS techniques, particularly to help us model visual commu-
nication within and between sites.
Acknowledgments
We first of all thank Dr. Ramesh Shrestha of the National Center for Airborne Lidar Mapping
(NCLAM) for his help during the initial stages of grant preparation. Charles Golden invited us
PLOS ONE Lidar survey of ancient maya settlement in the puuc region of Yucatan, Mexico
PLOS ONE | https://doi.org/10.1371/journal.pone.0249314 April 28, 2021 50 / 54
to participate in an earlier AIRSAR campaign and then guided us to NASA’s G-LiHT dataset.
Dr. Wayne Walker of the Woodwell Climate Research Center (formerly Woods Hole Research
Center) kindly granted us access to the Alianza radar dataset, and Walter Witschey provided
the coordinates of Puuc sites from his Maya Atlas. We also thank Davidson College and Mill-
saps College for their continuing support, and the Consejo de Arqueologıa del Instituto Nacio-
nal de Antropologıa e Historia for guidance. Finally, a general thanks to all the members of the
Bolonchen Regional Archaeological Project past and present for their contributions to the
archaeology of the Puuc.
Author Contributions
Conceptualization: William M. Ringle, Tomas Gallareta Negron.
Formal analysis: William M. Ringle, Tomas Gallareta Negron, Juan C. Fernandez-Diaz.
Funding acquisition: William M. Ringle, Tomas Gallareta Negron.
Investigation: William M. Ringle, Tomas Gallareta Negron, Rossana May Ciau, Kenneth E.
Seligson, Juan C. Fernandez-Diaz, David Ortegon Zapata.
Methodology: William M. Ringle, Tomas Gallareta Negron, Rossana May Ciau, Kenneth E.
Seligson, Juan C. Fernandez-Diaz.
Project administration: William M. Ringle.
Software: William M. Ringle, Juan C. Fernandez-Diaz.
Supervision: William M. Ringle, Tomas Gallareta Negron, Rossana May Ciau, Kenneth E.
Seligson.
Validation: Juan C. Fernandez-Diaz.
Visualization: Tomas Gallareta Negron, Rossana May Ciau, Kenneth E. Seligson.
Writing – original draft: William M. Ringle.
Writing – review & editing: William M. Ringle, Tomas Gallareta Negron, Kenneth E. Selig-
son, Juan C. Fernandez-Diaz.
References1. Stephens JL. Incidents of Travel in Yucatan. New York: Dover Press; 1963.
2. Maler T. Penınsula Yucatan. Berlin: Gebr. Mann Verlag; 1997.
3. Pollock HED. The Puuc. Cambridge: Peabody Museum of Archaeology and Ethnology, Harvard Uni-
versity; 1980.
4. Dunning NP. Lords of the Hills: Ancient Maya Settlement in the Puuc Region, Yucatan, Mexico.
Madison: Prehistory Press; 1992.
5. Garza Tarazona de Gonzalez S, Kurjack EB. Atlas Arqueologico del Estado de Yucatan. Mexico, D.F.:
Instituto Nacional de Antropologıa e Historia; 1980.
6. Andrews GF. Los estilos arquitectonicos del Puuc; una nueva apreciacion. Mexico, D.F.: Instituto
Nacional de Antropologıa e Historia; 1986.
7. Andrews GF. Pyramids and Palaces, Monsters and Masks: the Golden Age of Maya Architecture. Vol.
1: Architecture of the Puuc Region and the Northern Plains. Lancaster, Calif.: Labyrinthos; 1995.
8. Witschey WRT, Brown CT. 5,000 Sites and Counting: The Inspiration of Maya Settlement Studies. In:
Braswell GE, editor. The Ancient Maya of Mexico: Reinterpreting the Past of the Northern Maya Low-
lands. Sheffield: Equinox Press; 2012. p. 170–90.
9. Duch Gary J. Fisiografıa del Estado de Yucatan: Su Relacion con la Agricultura. Merida: Universidad
Autonoma Chapingo, Centro Regional de la Penınsula de Yucatan; 1991.
PLOS ONE Lidar survey of ancient maya settlement in the puuc region of Yucatan, Mexico
PLOS ONE | https://doi.org/10.1371/journal.pone.0249314 April 28, 2021 51 / 54

10. Kurjack EB, Garza S. Una vision de la geografıa humana en la region serrana de Yucatan. In: Schmidt
PJ, Benavides C, editors. Memoria del Congreso Interno 1979. Mexico, D.F., Mexico1981. p. 39–54.
11. Hare T, Masson M, Russell B. High-Density LiDAR Mapping of the Ancient City of Mayapan. Remote
Sensing. 2014; 6(9):9064–85.
12. Hutson SR. Adapting LiDAR data for regional variation in the tropics: A case study from the Northern
Maya Lowlands. Journal of Archaeological Science: Reports. 2015; 4:252–63.
13. Hutson SR, Kidder B, Lamb C, Vallejo-Caliz D, Welch J. Small Buildings and Small Budgets: Making
Lidar Work in Northern Yucatan, Mexico. Advances in Archaeological Practice. 2016; 4(3):268–83.
14. Magnoni A, Stanton TW, Barth N, Fernandez-Diaz JC, Osorio Leon JF, Perez Ruız F, et al. Detection
Thresholds of Archaeological Features in Airborne Lidar Data from Central Yucatan. Advances in
Archaeological Practice. 2016; 4(3):232–48.
15. Stanton TW, Ardren T, Barth NC, Fernandez-Diaz JC, Rohrer P, Meyer D, et al. ’Structure’ density,
area, and volume as complementary tools to understand Maya Settlement: An analysis of lidar data
along the great road between Coba and Yaxuna. Journal of Archaeological Science: Reports. 2020;
29:102178.
16. Nondedeo P, Arnauld MC, Michelet D. Rıo Bec Settlement Patterns and Local Sociopolitical Organiza-
tion. Ancient Mesoamerica. 2013; 24:373–96.
17. Fernandez-Diaz JC, Carter WE, Glennie C, Shrestha RL, Pan Z, Ekhtari N, et al. Capability Assessment
and Performance Metrics for the Titan Multispectral Mapping Lidar. Remote Sensing. 2016; 8(11):936.
18. May Ciau RB. El paisaje prehispanico en el distrito de Bolonchen, Yucatan. La mirada de Kiuic y sus
alrededores. 2018.
19. Canuto MA, Estrada-Belli F, Garrison TG, Houston SD, Acuña MJ, Kovach M, et al. Ancient lowland
Maya complexity as revealed by airborne laser scanning of northern Guatemala. Science. 2018; 361
(6409):eaau0137. https://doi.org/10.1126/science.aau0137 PMID: 30262469
20. Cook BD, Corp LA, Nelson RF, Middleton EM, Morton DC, McCorkel JT, et al. NASA Goddard’s LiDAR,
Hyperspectral and Thermal (G-LiHT) Airborne Imager. Remote Sensing. 2013; 5(8):4045–66.
21. Golden C, Murtha T, Cook B, Shaffer DS, Schroder W, Hermitt EJ, et al. Reanalyzing environmental
lidar data for archaeology: Mesoamerican applications and implications. Journal of Archaeological Sci-
ence: Reports. 2016; 9:293–308.
22. Schroder W, Murtha T, Golden C, Anaya Hernandez A, Scherer A, Morell-Hart S, et al. The lowland
Maya settlement landscape: Environmental LiDAR and ecology. Journal of Archaeological Science:
Reports. 2020; 33:102543.
23. Kokalj Z, Zaksek K, Ostir K. Application of Sky-View Factor for the Visualization of Historic Landscape
Features in Lidar-Derived Relief Models. Antiquity. 2020; 85:263–73.
24. Zaksek K, Ostir K, Kokalj Z. Sky-View Factor as a Relief Visualization Technique. Remote Sensing.
2011; 3:398–415.
25. Chase AF, Chase DZ, Weishampel JF, Drake JB, Shrestha RL, Slatton KC, et al. Airborne LiDAR,
archaeology, and the ancient Maya landscape at Caracol, Belize. Journal of Archaeological Science.
2011; 38(2):387–98.
26. Fernandez-Diaz J, Carter W, Shrestha R, Glennie C. Now You See It. . . Now You Don’t: Understanding
Airborne Mapping LiDAR Collection and Data Product Generation for Archaeological Research in
Mesoamerica. Remote Sensing. 2014; 6(10):9951–10001.
27. Thompson EH. Ancient Structures of Yucatan Not Communal Dwellings. Proceedings of the American
Antiquarian Society. 1892; 8(2):262–9.
28. Sabloff JA, Tourtellot G. The Ancient Maya City of Sayil: The Mapping of a Puuc Region Center. New
Orleans1991.
29. Tourtellot G, Sabloff JA. Community Structure at Sayil: A Case Study of Puuc Settlement. In: Prem HJ,
editor. Hidden among the Hills. Acta Mesoamericana, Vol. 7. Mockmuhl: Verlag Von Flemming; 1994.
p. 71–92.
30. Smyth MP. Early Maya Urbanism in the Puuc Region: Archaeological Research at Chac II (1995–
2000). In: Prem H, J., editor. Escondido en la selva. Bonn/ Mexico, D.F.: Universidad de Bonn/ Instituto
Nacional de Antropologıa e Historia; 2003. p. 97–118.
31. Smyth MP, Dunning NP, Weaver EM, van Beynen P, Ortegon Zapata D. An Enigmatic Maya Center:
Climate Change, Settlement Systems, and Water Adaptations at Xcoch, Puuc Region, Yucatan. In:
Rubenstein M, editor. Recent Investigations in the Puuc Region of Yucatan. Archaeopress Precolum-
bian Archaeology 8. Oxford: Archaeopress Publishing Ltd.; 2017. p. 3–24.
PLOS ONE Lidar survey of ancient maya settlement in the puuc region of Yucatan, Mexico
PLOS ONE | https://doi.org/10.1371/journal.pone.0249314 April 28, 2021 52 / 54
32. Smyth MP, Ortegon Zapata D, Dunning NP, Weaver E. Settlement Dynamics, Climate Change, and
Human Response at Xcoch in the Puuc Region of Yucatan, Mexico. In: Stanton TW, editor. The Archae-
ology of Yucatan. Archaeopress Pre-Columbian Archaeology 1. Oxford2014. p. 45–64.
33. Becquelin P, Michelet D. Xcalumkın: del establecimiento de secuencias arquitectonica y ceramica a
preguntas sobre la naturaleza del sitio. In: Prem H, J., editor. Escondido en la selva. Bonn/ Mexico, D.
F.: Universidad de Bonn/ Instituto Nacional de Antropologıa e Historia; 2003. p. 137–57.
34. Michelet D, Becquelin P, Arnauld M-C. Mayas del Puuc: Arqueologıa de la region de Xculoc, Campe-
che. Mexico, D.F.: Gobierno del Estado de Campeche/Centre Francais d’Etudes Centroamericaines;
2000.
35. Prem HJ. Aspectos de los patrones de asentamiento en la region Puuc central. In: Prem H, J., editor.
Escondido en la selva. Bonn/ Mexico, D.F.: Universidad de Bonn/ Instituto Nacional de Antropologıa e
Historia; 2003. p. 273–308.
36. Prem HJ. Xkipche: una ciudad maya en el corazon del Puuc: Vol.1. El asientamiento. Mexico, D.F.:
Universidad de Bonn/ Instituto Nacional de Antropologıa e Historia; 2003.
37. Gallareta Negron T. Analisis de un centro Puuc: el caso de Labna. In: Prem H, J., editor. Escondido en
la selva. Bonn/ Mexico, D.F.: Universidad de Bonn/ Instituto Nacional de Antropologıa e Historia;
2003. p. 119–36.
38. Gallareta Negron T. The Social Organization of Labna, a Classic Maya Community in the Puuc Region
of Yucatan, Mexico 2013.
39. Merk S. The Long Silence: Sabana Piletas and its Neighbors. Norderstedt, Germany: Books on
Demand; 2016.
40. Benavides C. A, Novelo O. S, Grube N, Pallan G. C. Nuevos hallazgos en la region Puuc. Sabana Pile-
tas y su escalinata jeroglıfica. Arqueologıa Mexicana. 2009; 17:77–83.
41. Pantoja Dıaz LR. Un Acercamiento al Patron de Asentamiento de Kabah, Yucatan. In: Rubenstein M,
editor. Recent Investigations in the Puuc Region of Yucatan. Archaeopress Precolumbian Archaeology
8. Oxford: Archaeopress Publishing Ltd.; 2017. p. 59–70.
42. Barrera Rubio A. Settlement Patterns in Uxmal Area, Yucatan, Mexico. Indiana. 1982; 10:227–35.
43. Simms SR, Parker E, Bey GJ III, Gallareta Negron T. Evidence from Escalera Al Cielo: Abandonment
of a Terminal Classic Puuc Maya Hill Complex in Yucatan, Mexico. Journal of Field Archaeology. 2012;
37(4):270–88.
44. Gallareta Negron T. Capıtulo 7.3: Conclusiones. el transecto intersitios. Proyecto Arqueologico
Regional de Bolonchen, Temporada de Campo 2012–2013. Mexico, D.F.: Informe Tecnico al Consejo
de Arqueologıa del Instituto Nacional de Antropologıa e Historia; 2014.
45. Kurjack EB. Prehistoric Lowland Maya Community and Social Organization: A Case Study at Dzibilchal-
tun, Yucatan, Mexico. New Orleans: Tulane University; 1974.
46. Hutson SR. Ancient Maya Commerce: Multidisciplinary Research at Chunchucmil. Boulder: University
Press of Colorado; 2017.
47. Gallareta Negron T, May Ciau R, Seligson KE, Ringle WM. Capıtulo 3: El Reconocimiento Labna-Kiuic.
Proyecto Arqueologico Regional de Bolonchen, Temporada de Campo 2012–2013. Mexico, D.F.:
Informe Tecnico al Consejo de Arqueologıa del Instituto Nacional de Antropologıa e Historia; 2014.
48. Tourtellot G, Sabloff JA, Smyth MP. Room Counts and Population Estimation for Terminal Classic Sayil
in the Puuc Region, Yucatan, Mexico. In: Culbert TP, Rice DS, editors. Precolumbian Population History
in the Maya Lowlands. Albuquerque: University of New Mexico Press; 1990. p. 245–62.
49. Dunning N. The Yaxhom Conurbation. Mexicon. 1988; 10(1):16–9.
50. Barrera Rubio A. Tierra y Productividad Agricola en la Region Puuc. Mayab. 1990; 6:29–37.
51. Patch RW. Maya and Spaniard in Yucatan, 1648–1812. Stanford, CA: Stanford University Press;
1993.
52. Restall M. The Maya World: Yucatec Culture and Society, 1550–1850. Stanford: Stanford University
Press; 1997.
53. Ringle WM. The Settlement Patterns of Komchen, Yucatan, Mexico. New Orleans1985.
54. Steggerda M. Maya Indians of Yucatan. Washington, D.C.: Carnegie Institution of Washington; 1941.
55. Schmidt PJ. La produccion agrıcola prehistorica de los Mayas. Yucatan: Historia y Economıa. 1981; 4
(23):38–54.
56. Gallareta Negron T, Ringle WM, editors. The Earliest Occupation of the Puuc Region, Yucatan, Mexico:
New Perspectives from Xocnaceh and Paso del Macho. SAA, Atlanta 2004.
57. Medina Castillo E, Lawton C. El juego de pelota: nuevos hallazgos en el noroeste de Yucatan. Los
Investigadores de la Cultura Maya. 2002; 10: 2:279–84.
PLOS ONE Lidar survey of ancient maya settlement in the puuc region of Yucatan, Mexico
PLOS ONE | https://doi.org/10.1371/journal.pone.0249314 April 28, 2021 53 / 54

58. Gallareta Negron T. At the Foot of the Hills: Early Monumentality at Xocnaceh, Yucatan, Mexico. In:
Brown MK, Bey GJ, editors. Pathways to Complexity: A View from the Maya Lowlands. Gainesville:
University Press of Florida,; 2018. p. 276–91.
59. Ringle WM, editor The 2001 Field Season of the Labna-Kiuic Archaeological Project. Report submitted
to the Foundation for the Advancement of Mesoamerican Studies, Inc. Crystal River, FL2005. https://
doi.org/10.2214/ajr.184.3_supplement.0184s129 PMID: 15728005
60. Bey GJ III, May Ciau R. The Role and Realities of Popol Nahs in Northern Maya Archaeology. In: Braswell
GE, editor. The Maya and Their Central American Neighbors: Settlement Patterns, Architecture, Hiero-
glyphic Texts, and Ceramics. London and New York: Routledge/Taylor & Francis Group; 2014. p. 335–55.
61. Gallareta Cervera T. The Archaeology of Monumental Architecture and the Social Construction of
Authority at the Northern Maya Puuc Site of Kiuic. UNC-Chapel Hill, 2016.
62. Kurjack EB, Maldonado Cardenas R, Robertson MG. Ballcourts of the Northern Maya Lowlands. In:
Scarborough VL, Wilcox DR, editors. The Mesoamerican Ballgame. Tucson: University of Arizona
Press; 1991. p. 145–59.
63. Ringle WM, Gallareta Negron T, Bey GJ III. Stone for My House: The Economics of Stoneworking and
Elite Housing in the Puuc Hills of Yucatan. In: Masson MA, Freidel DA, Demarest AA, editors. The Real
Business of Ancient Maya Economies: From Farmers’ Fields to Rulers’ Realms. Gainesville: University
Press of Florida; 2020. p. 98–116.
64. Seligson KE, Gallareta Negron T, May Ciau R, Bey GJ III. Using Multiple Lines of Evidence to Identify
Prehispanic Maya Burnt-lime Kilns in the Northern Yucatan Peninsula. Latin American Antiquity. 2017;
28(4):558–76.
65. Dunning NP. Appendix 1: Soils and Settlement in the Sayil Valley: A Preliminary Assessment. In: Sabl-
off JA, Tourtellot G, editors. The Ancient Maya City of Sayil: The Mapping of a Puuc Region Center.
Middle American Research Institute, Publication 60. New Orleans: Tulane University; 1991. p. 20–7.
66. Seligson KE. The Prehispanic Maya Burnt Lime Industry: Socio-Economy and Environmental Resource
Management in the Late and Terminal Classic Period Northern Maya Lowlands (650–950 CE): Univer-
sity of Wisconsin-Madison; 2016.
67. Parker E, Bey GJ III, Gallareta Negron T. Organization of Masonry Technology in the Eastern Puuc:
Evidence from Escalera al Cielo, Yucatan. The Mayanist. 2019; 1(1):21–36.
68. McAnany PA. Water Storage in the Puuc Region of the Northern Maya Lowlands: A Key to Population
Estimates and Architectural Variability. In: Culbert TP, Rice DS, editors. Precolumbian Population His-
tory in the Maya Lowlands. Albuquerque: University of New Mexico Press; 1990. p. 263–84.
69. Thompson EH. The Chultunes of Labna, Yucatan. Cambridge: Peabody Museum of Archaeology and
Ethnology, Harvard University; 1897.
70. Becquelin P, Michelet D. Demografıa en la zona puuc: EI recurso del metodo. Latin American Antiquity.
1994; 5(4):289–311.
71. White DA. The Basics of Least Cost Analysis for Archaeological Applications. Advances in Archaeolog-
ical Practice. 2016; 3(4):407–14.
72. Culbert TP, Rice DS. Precolumbian Population History in the Maya Lowlands. Albuquerque: University
of New Mexico Press; 1990. https://doi.org/10.1007/978-3-642-74643-7_37 PMID: 2182412
73. Chase A, Chase D, Awe J, Weishampel J, Iannone G, Moyes H, et al. Ancient Maya Regional Settle-
ment and Inter-Site Analysis: The 2013 West-Central Belize LiDAR Survey. Remote Sensing. 2014; 6
(9):8671–95.
74. Ringle WM, Andrews V. The Demography of Komchen, an Early Maya Town in Northern Yucatan. In:
Culbert TP, Rice DS, editors. Precolumbian Population History in the Maya Lowlands. Albuquerque:
University of New Mexico Press; 1990. p. 215–44.
75. Inomata T, Triadan D, Pinzon F, Burham M, Ranchos JL, Aoyama K, et al. Archaeological Application
of Airborne LiDAR to Examine Social Changes in the Ceibal region of the Maya Lowlands. PLoS ONE.
2018; 13(2):e0191619. https://doi.org/10.1371/journal.pone.0191619 PMID: 29466384
76. Roys RL. The Indian Background of Colonial Yucatan. Washington, D.C.: Carnegie Institution of
Washington; 1943.
77. Okoshi Harada T. Codice de Calkinı. Mexico, D.F.: Universidad Nacional de Autonoma de Mexico;
2009.
78. Ringle WM, Gallareta Negron T, Bey GJ III. Stranger-Kings in Northern Yucatan. In: Okoshi, Chase AF,
Nondedeo P, Arnauld MC, editors. Maya Kingship: Rupture and Transformation from Classic to Post-
classic Times. Gainesville: University Press of Florida; 2021. p. 249–68.
79. Chase AF, Chase DZ, Fisher CT, Leisz SJ, Weishampel JF. Geospatial revolution and remote sensing
LiDAR in Mesoamerican archaeology. Proceedings of the National Academy of Sciences. 2012; 109
(32):12916–21. https://doi.org/10.1073/pnas.1205198109 PMID: 22802623
PLOS ONE Lidar survey of ancient maya settlement in the puuc region of Yucatan, Mexico
PLOS ONE | https://doi.org/10.1371/journal.pone.0249314 April 28, 2021 54 / 54