Letter of Introduction to the Biologically Important Areas Issue
128
Aquatic Mammals 2015, 41(1), 1, DOI 10.1578/AM.41.1.2015.1 Letter of Introduction to the Biologically Important Areas Issue Guest Editor: Sofie M. Van Parijs, Ph.D. NOAA Northeast Fisheries Science Center This special issue on Biologically Important Areas (BIAs) has been a long time in the making. It has taken considerable effort from all of the authors involved, in addition to a large body of diverse reviewers, to produce these papers. This issue originated as a side bar to the Cetacean Density and Distribution Mapping (CetMap) Working Group, a part of the National Oceanic and Atmospheric Administration’s (NOAA) CetSound program (http://cetsound.noaa. gov). The CetMap Working Group created a mapping tool that provides cetacean density and distribution maps that are time-, region-, and species-specific. Additionally, our CetMap tool highlights areas, sea- sons, and species for which there are clear data gaps. The CetMap Working Group recognized the necessity of creating BIAs to incorporate addi- tional information into the mapping tool by identi- fying areas where cetacean species or populations are known to concentrate for specific behaviors, or are range-limited, but for which there are insuf- ficient data for their importance to be reflected in the quantitative mapping effort. The result of the BIA assessment process includes narratives, maps, and tables that provide additional context within which to examine potential interactions between cetaceans and human activities. Our aim for this assessment is to combine expert judgment with available data (published or unpublished) to delineate BIAs for each species and each region. Our goal is not to define marine protected areas. Rather, we are identifying sites where cetaceans engage in activities at certain times that contrib- ute to an individual’s health and fitness and, ulti- mately, to the fecundity and survivorship of the population. During the conservation and manage- ment decision-making process, BIAs should be considered in addition to existing density esti- mates, range-wide distribution data, information on population trends and life history parameters, known threats to the population, and other rele- vant information. The review process for these BIA chapters was extensive and thorough. Dr. Kathleen Dudzinski served as the main editor and I as guest editor for this issue. Prior to submission, each chapter was reviewed by between 12 to 30 regional experts from within and outside NOAA (both scientists and managers), including some of the CetMap Working Group members. Upon submission to Aquatic Mammals, Dr. Dudzinski reviewed all manuscripts with an eye to promoting consistency and accuracy across all the BIAs, in addition to soliciting reviews from two to three external reviewers for each chapter through the journal’s review process. There are eight chapters in this special issue, an introduction and seven regional manuscripts cov- ering the U.S. East Coast, Gulf of Mexico, U.S. West Coast, Hawai‘i, Gulf of Alaska, Aleutian Islands and Bering Sea, and the Arctic. There are a total of 131 BIAs covering 24 species. Each chapter was written by scientific experts who have a thorough knowledge of the species and region in question. Although a common theme unites all chapters, there are regional variations in the amount and type of information available to undertake the assessment and the number and types of species covered. It was not feasible to create BIAs for every species due to either the lack of information to support the delineation or, in some cases, simply due to the time available for this effort. However, these BIAs are meant to be living documents that should be routinely reviewed and revised to expand the number of species covered and to update the existing BIAs as new information becomes available. In that light, it is critical to start this special issue where all good things should start, at the beginning. The BIA special issue begins with an introductory chapter that highlights the rationale and decisions made during this inaugural BIA assessment process. This is a MUST read before you delve further into a regional chapter. The “Overview and Rationale” includes all the BIA criteria and caveats and summarizes these in a digestible series of tables. We hope that this BIA special issue will be of use to scientists and man- agers alike and will assist with planning, analyses, and decisions regarding how to reduce adverse impacts to cetaceans resulting from human activities.
-
Upload
khangminh22 -
Category
Documents
-
view
3 -
download
0
Transcript of Letter of Introduction to the Biologically Important Areas Issue

Aquatic Mammals 2015, 41(1), 1, DOI 10.1578/AM.41.1.2015.1
Letter of Introduction to the Biologically Important Areas IssueGuest Editor: Sofie M. Van Parijs, Ph.D.
NOAA Northeast Fisheries Science Center
This special issue on Biologically Important Areas (BIAs) has been a long time in the making. It has taken considerable effort from all of the authors involved, in addition to a large body of diverse reviewers, to produce these papers. This issue originated as a side bar to the Cetacean Density and Distribution Mapping (CetMap) Working Group, a part of the National Oceanic and Atmospheric Administration’s (NOAA) CetSound program (http://cetsound.noaa.gov). The CetMap Working Group created a mapping tool that provides cetacean density and distribution maps that are time-, region-, and species-specific. Additionally, our CetMap tool highlights areas, sea-sons, and species for which there are clear data gaps.
The CetMap Working Group recognized the necessity of creating BIAs to incorporate addi-tional information into the mapping tool by identi-fying areas where cetacean species or populations are known to concentrate for specific behaviors, or are range-limited, but for which there are insuf-ficient data for their importance to be reflected in the quantitative mapping effort. The result of the BIA assessment process includes narratives, maps, and tables that provide additional context within which to examine potential interactions between cetaceans and human activities. Our aim for this assessment is to combine expert judgment with available data (published or unpublished) to delineate BIAs for each species and each region. Our goal is not to define marine protected areas. Rather, we are identifying sites where cetaceans engage in activities at certain times that contrib-ute to an individual’s health and fitness and, ulti-mately, to the fecundity and survivorship of the population. During the conservation and manage-ment decision-making process, BIAs should be considered in addition to existing density esti-mates, range-wide distribution data, information on population trends and life history parameters, known threats to the population, and other rele-vant information.
The review process for these BIA chapters was extensive and thorough. Dr. Kathleen Dudzinski served as the main editor and I as guest editor for this issue. Prior to submission, each chapter was reviewed by between 12 to 30 regional experts
from within and outside NOAA (both scientists and managers), including some of the CetMap Working Group members. Upon submission to Aquatic Mammals, Dr. Dudzinski reviewed all manuscripts with an eye to promoting consistency and accuracy across all the BIAs, in addition to soliciting reviews from two to three external reviewers for each chapter through the journal’s review process.
There are eight chapters in this special issue, an introduction and seven regional manuscripts cov-ering the U.S. East Coast, Gulf of Mexico, U.S. West Coast, Hawai‘i, Gulf of Alaska, Aleutian Islands and Bering Sea, and the Arctic. There are a total of 131 BIAs covering 24 species. Each chapter was written by scientific experts who have a thorough knowledge of the species and region in question. Although a common theme unites all chapters, there are regional variations in the amount and type of information available to undertake the assessment and the number and types of species covered. It was not feasible to create BIAs for every species due to either the lack of information to support the delineation or, in some cases, simply due to the time available for this effort. However, these BIAs are meant to be living documents that should be routinely reviewed and revised to expand the number of species covered and to update the existing BIAs as new information becomes available.
In that light, it is critical to start this special issue where all good things should start, at the beginning. The BIA special issue begins with an introductory chapter that highlights the rationale and decisions made during this inaugural BIA assessment process. This is a MUST read before you delve further into a regional chapter. The “Overview and Rationale” includes all the BIA criteria and caveats and summarizes these in a digestible series of tables. We hope that this BIA special issue will be of use to scientists and man-agers alike and will assist with planning, analyses, and decisions regarding how to reduce adverse impacts to cetaceans resulting from human activities.

Aquatic Mammals 2015, 41(1), 2-16, DOI 10.1578/AM.41.1.2015.2
1. Biologically Important Areas for Cetaceans Within U.S. Waters – Overview and Rationale
Megan C. Ferguson,1 Corrie Curtice,2 Jolie Harrison,3 and Sofie M. Van Parijs4
1NOAA Fisheries, Alaska Fisheries Science Center, National Marine Mammal Laboratory, 7600 Sand Point Way NE F/AKC3, Seattle, WA 98115-6349, USA
E-mail: [email protected] 2Marine Geospatial Ecology Lab, Duke University, Beaufort, NC 28516, USA
3NOAA Fisheries, Office of Protected Resources, 1315 East-West Highway, Silver Spring, MD 20910, USA 4NOAA Fisheries, Northeast Fisheries Science Center, 166 Water Street, Woods Hole, MA 02543, USA
Abstract
We outline the rationale and process used by the Cetacean Density and Distribution Mapping (CetMap) Working Group to identify Biologically Important Areas (BIAs) for 24 cetacean species, stocks, or populations in seven regions within U.S. waters. BIAs are reproductive areas, feeding areas, migratory corridors, and areas in which small and resident populations are concentrated. BIAs are region-, species-, and time-specific. Information provided for each BIA includes the following: (1) a written narrative describing the information, assumptions, and logic used to delineate the BIA; (2) a map of the BIA; (3) a list of references used in the assessment; and (4) a metadata table that concisely details the type and quantity of informa-tion used to define a BIA, providing transparency in how BIAs were designated in a quick reference table format. BIAs were identified through an expert elicitation process. The delineation of BIAs does not have direct or immediate regulatory consequences. Rather, the BIA assessment is intended to provide the best available science to help inform regulatory and management decisions under existing authori-ties about some, though not all, important cetacean areas in order to minimize the impacts of anthropo-genic activities on cetaceans and to achieve conser-vation and protection goals. In addition, the BIAs and associated information may be used to identify information gaps and prioritize future research and modeling efforts to better understand cetaceans, their habitat, and ecosystems.
Key Words: anthropogenic activity, anthropogenic sound, CetMap, BIA, distribution, behavior, con-servation, management, Arctic, Aleutian Islands, Bering Sea, North Pacific Ocean, Gulf of Alaska, Washington, Oregon, California, Hawaiian Islands, Gulf of Mexico, Northwest Atlantic Ocean
Introduction
Anthropogenic activities in the marine environ-ment are increasing in number, geographic extent, and often duration, resulting in increased potential risk to marine ecosystems worldwide (Hooker & Gerber, 2004; Convention on Biological Diversity [CBD], 2009; Reeves et al., 2013). Activities of concern for the conservation and management of marine species are diverse and include energy development (e.g., wind farm installation; oil and gas exploration, development, and production), military testing and training (e.g., sonar exercises and equipment prototyping), shipping, fishing, tourism, and coastal construction, among others. This special issue focuses on the potential effects of human activities on cetaceans. Several compo-nents of the activities mentioned above have the potential to adversely affect cetaceans, including the possibility of vessel strike; bycatch or entan-glement; alteration of habitat through physical changes, chemical pollution, or introduction of alien invasive species; and indirect effects related to prey distribution and abundance. However, one common component of these activities is under-water noise, which is present to some degree in almost every marine activity and can affect large areas over long periods of time.
Sound is critical to cetaceans for communicat-ing, detecting predators and prey, navigating, and sensing other important environmental cues. A soundscape is comprised of all of the sounds in a place, including geophysical, biological, and man-made contributions. When examined from the per-spective of the animals experiencing and using it, a soundscape may also be referred to as an “acous-tic habitat” (Clark et al., 2009, p. 203). Increased anthropogenic sound from single or multiple sources can have deleterious effects on cetaceans’ acoustic habitats, reducing their ability to detect

3 BIAs for Cetaceans: Overview and Rationale
critical sounds, often across large areas and long periods of time. In addition to these more chronic acoustic habitat impacts, anthropogenic noise can cause direct, or acute, effects ranging from alter-ing important behaviors and threshold shifts in hearing, to injury, or even death, in certain circum-stances. The probability, nature, and extent of an animal’s response to sound depends on a variety of contextual factors, including the activity or behav-ior in which the animal is engaged at the time of sound exposure (e.g., feeding, breeding, resting, migrating, nursing), the nature and novelty of the sound, and the location of the sound source rela-tive to the animal (Ellison et al., 2012). However, both chronic and acute effects of noise have the potential to negatively affect an individual’s health and fitness in certain circumstances, ultimately leading to effects on a population’s fecundity or survivorship.
Following on the earlier work of a U.S. National Research Council (NRC) (2005) com-mittee, New et al. (2014), in an effort termed the Potential Consequences of Disturbance, outlined an updated conceptual model of the relationships linking disturbance to changes in behavior, physi-ology, health, vital rates, and population dynam-ics. Further, New et al. created an energetic model for southern elephant seals (Mirounga leonina) to study links between disturbance and population-level effects. Based on extensive morphological, environmental, and tag data, and biological sam-ples, the model predicts the quantitative transfer functions (i.e., mathematical relationships) among reduced foraging success (potentially the result of context-specific disturbance events), adult mass, pup wean mass, and pup survival. It is clear that understanding the behaviors and activities ani-mals are involved in when exposed to stressors may affect both their immediate response and the ultimate effect of that response. Ellison et al. (2012) suggested that federal agencies responsible for regulating entities producing sound with the potential to affect marine mammals should incor-porate behavioral context where possible into their impact assessments.
In the United States, the National Oceanic and Atmospheric Administration (NOAA) is charged with implementing multiple federal statutes, including the Marine Mammal Protection Act (MMPA) (16 USC § 1361 et seq.), the Endangered Species Act (ESA) (16 USC § 1531 et seq.), and the National Marine Sanctuaries Act (NMSA) (16 U.S.C. § 1431 et seq.), which contain pro-visions for the protection and conservation of marine mammals. These statutes all have sections that address federal or public activities with the potential for disturbing or harming marine mam-mals, their populations, or their habitat, and in
many cases necessitate a consultation or coordi-nation between NOAA and the entity planning to conduct the activity. Additionally, the entities seeking approvals from NOAA pursuant to these statutes are required to provide information and impact analyses with their requests. Separately, the National Environmental Policy Act (NEPA) (42 USC § 4321 et seq.) requires all federal agen-cies to analyze the potential impacts of their activities on the environment, including marine mammals, and to consider enacting mitigation measures.
NOAA must ultimately reach conclusions, spe-cific to each statute, regarding the scope and sig-nificance of the anticipated impacts of a proposed activity to the affected individuals and their habitat, and how the effects to individual marine mammals may impact populations. The analyses inform the development and requirement of appropriate miti-gation and monitoring measures. The conclusions can affect whether the entities conducting the activ-ities can proceed with their activities as planned or need to modify their activities. These processes typically culminate in the issuance or denial of an authorization, permit, exemption, or recommen-dation letter from NOAA or other agencies with jurisdiction over specific activities. As noted above, the ability to characterize cetacean behaviors or activities in given areas or times is important in the assessment of likely impacts of a proposed activ-ity and the development of appropriate mitigation strategies. Furthermore, this ability would be valu-able to both regulators and regulated entities.
The focus of this issue largely relates to under-standing activities in which cetaceans, in particular, are likely to be engaged at a certain time and place, which is indicative of an area’s biological impor-tance for purposes of impact analysis and manage-ment. The idea for this undertaking was conceived in 2011 when NOAA convened the Cetacean Density and Distribution Mapping (CetMap) Working Group (http://cetsound.noaa.gov) to map cetacean den-sity and distribution within U.S. waters. CetMap members were affiliated with government agencies, nongovernmental organizations, academic institu-tions, and private research or environmental consult-ing firms. CetMap members brought a diversity of experience in cetacean ecology, conservation, and management to the project, ranging from policy to modeling to field work. The primary goal of CetMap was to create and compile comprehensive and easily accessible regional cetacean density and distribu-tion maps that are time- and species-specific, ideally using survey data and models that estimate density using predictive environmental factors. CetMap con-sidered predictive habitat-based density (HD) models to be the best tool for addressing spatially and tem-porally explicit questions on cetacean abundance,

4 Ferguson et al.
density, or distribution; however, HD models require a considerable amount of relatively high-quality data, which is available for only a limited number of species, regions, and time periods (Kot et al., 2010; Kaschner et al., 2012). Furthermore, HD models typically do not provide direct information on activ-ity state, nor do they provide information on animal distribution at the relevant time and space scales that can be obtained from primary information sources such as acoustic, sighting, genetic, and tagging data and expert knowledge. Therefore, it is important to supplement areas that might be identified through HD models with additional information.
To augment CetMap’s quantitative density and distribution mapping effort and to provide additional context for cetacean impact analyses, CetMap undertook a process to identify, through expert consultation, Biologically Important Areas (BIAs). BIAs are reproductive areas, feeding areas, migratory corridors, and areas in which small and resident populations are concentrated. Similar to other products on the CetMap website, the cetacean BIAs are region-, species-, and time-specific. Although all products on the CetMap website are restricted to cetaceans, the tools could be extended to include other marine mammals such as pinnipeds (seals, sea lions, fur seals, and walruses), sirenians (manatees and dugongs), and fissipeds (sea otters and polar bears).
BIAs were created to aid NOAA, other fed-eral agencies, and the public in the analyses and planning that are required under multiple U.S. statutes to characterize and minimize the impacts of anthropogenic activities on cetaceans and to achieve conservation and protection goals. In addition, the BIAs and associated information may be used to identify information gaps and prioritize future research and modeling efforts to better understand cetaceans, their habitat, and ecosystems. Because this is a scientific effort, the identification of BIAs does not have direct or immediate regulatory consequences. Rather, the BIA assessment is intended to provide the best available science to help inform regulatory and management decisions under existing authorities about some, though not all, important cetacean areas. For decision-making purposes, the BIAs identified here should be evaluated in combina-tion with areas identified as having high cetacean density; the present effort is meant to augment, not displace, cetacean density analyses.
Herein, we describe the process that CetMap implemented to delineate BIAs; summarize the resulting BIAs; discuss strengths and limitations of the existing BIAs and assessment process; and suggest ways in which this BIA assessment can be improved in the future. Furthermore, we compare CetMap’s BIA assessment to similar international
assessments such as the International Union for Conservation of Nature’s (IUCN) Key Biodiversity Areas (KBAs) and Important Marine Mammal Areas (IMMAs), Convention on Biological Diversity’s Ecologically or Biologically Significant Areas (EBSAs), Pacific WildLife Foundation’s (PWLF) Important Cetacean Areas (ICAs), and Australia’s Biologically Important Areas.
The final products of CetMap’s BIA assess-ment comprise the subsequent articles in this special issue that are presented as seven chapters, separated based on regional divisions that reflect Large Marine Ecosystem delineations (Sherman & Alexander, 1986) (Figure 1.1). These regions are comprised of the U.S. East Coast, Gulf of Mexico, West Coast, Hawai‘i, Gulf of Alaska, Aleutian Islands and Bering Sea, and the Arctic (encompassing the northeastern Chukchi and western Beaufort Seas). The abbreviations used in this special issue are defined in Table 1.1.
Methods
The CetMap BIA assessment is a species-focused, science-based process that is restricted to U.S. waters. Areas are delineated based on their impor-tance to specific species, stocks, or populations. (Hereafter, “species” will be used to represent species, stocks, and populations, unless a sub-specific unit is essential for interpretation.) This inaugural BIA assessment is not comprehensive in the species evaluated. Rather, it incorporates a large number of species representing a range of habitats, foraging methods, social structures, movement patterns, life history strategies, and population sizes. This strategy of completing a trial assessment with a limited suite of representa-tive species is similar to some of the international assessments described below. The best available science is used to evaluate candidate species and areas according to the BIA criteria listed below. The assessment is free from legal, socioeconomic, and political constraints, with the exception that it is limited to U.S. waters for practical purposes. Any use of these BIAs in regulatory decisions will be subject to the standard processes of analysis and review under the applicable statutes. CetMap defines “U.S. waters” as the region shoreward of the offshore boundary of the U.S. Exclusive Economic Zone (EEZ); therefore, U.S. waters under this definition include state waters.
CetMap BIA CriteriaThe BIA criteria are guidelines for delineating areas of biological importance for cetaceans. The criteria allow the flexibility to assess ecologically diverse species using the information available, which spans a wide range in quality, quantity,

BIAs for Cetaceans: Overview and Rationale 5
and type. The criteria are not based on thresh-olds. CetMap considers an area to be biologically important for cetacean species, stocks, or popu-lations (denoted by “species” in the criteria) if it meets at least one of the following four criteria (see also Table 1.2):
1. Reproductive Areas – Areas and times within which a particular species selectively mates, gives birth, or is found with neonates or calves
2. Feeding Areas – Areas and times within which aggregations of a particular species
preferentially feed. These either may be per-sistent in space and time or associated with ephemeral features that are less predictable but are located within a larger area that can be delineated.
3. Migratory Corridors – Areas and times within which a substantial portion of a species is known to migrate; the corridor is spatially restricted.
4. Small and Resident Population – Areas and times within which small and resident popula-tions occupy a limited geographic extent
1
Figure 1.1. Overview of study area, showing the seven regions within which Biologically
Important Areas (BIAs) were assessed. All BIAs were delineated solely within the US waters,
which we define as the region shoreward of the offshore boundary of the US Exclusive
Economic Zone, including state waters. The seven regions are labeled from east to west/north: A.
East Coast (Section 2 in this issue); B. Gulf of Mexico (Section 3 in this issue); C. West Coast
(Section 4 in this issue); D. Hawaiian Islands (Section 5 in this issue); E. Gulf of Alaska
50°W60°W70°W80°W90°W100°W110°W120°W130°W140°W40
°N30
°N20
°N
Canada
AtlanticOcean
MexicoGulfof
Mexico
PacificOcean
140°W150°W160°W170°W180°
60°N
50°N
40°N
150°W160°W170°W180°
30°N
20°N
10°N
Canada
Russia
PacificOcean
Gulf ofAlaska
PacificOcean
Main HawaiianIslands
BeringSea
ChukchiSea Beaufort
Sea
0 1,200600Kilometers
A
B
C
D
E
F
G
United States
Alaska
ArcticOceanNorthwestern
HawaiianIslands
0 1,000500Kilometers
0 1,000500Kilometers
US EEZ Boundary
Figure 1.1. Overview of study area, showing the seven regions within which Biologically Important Areas (BIAs) were assessed. All BIAs were delineated solely within the U.S. waters, which we define as the region shoreward of the offshore boundary of the U.S. Exclusive Economic Zone (EEZ), including state waters. The seven regions are labeled clockwise starting in the east: A. East Coast (Chapter 2 in this issue); B. Gulf of Mexico (Chapter 3 in this issue); C. West Coast (Chapter 4 in this issue); D. Hawai‘i (Chapter 5 in this issue); E. Gulf of Alaska (Chapter 6 in this issue); F. Aleutian Islands and Bering Sea (Chapter 7 in this issue); and G. Arctic (Chapter 8 in this issue).

6 Ferguson et al.
U.S
. sta
te a
bbre
viat
ions
Ala
bam
aC
alifo
rnia
Con
nect
icut
ashi
ngto
n, D
CW D
elaw
are
ork
Ala
ska
Flor
ida gia Y
gini
a
Geo
r
Haw
ai‘i
Loui
sian
aM
assa
chus
etts
Mar
ylan
dM
aine
Mis
siss
ippi
Nor
th C
arol
ina
New
Ham
pshi
reN
ew Je
rsey
New
O
rego
nR
hode
Isla
ndSo
uth
Car
olin
aex
asir
T V Was
hing
ton
AK
AL
CA
CT
DC
DE
FL GA
HI
LA MA
MD
ME
MS
NC
NH
NJ
NY
OR
RI
SC TX VA WA
udy A
bund
ance
and
Sta
tus o
f
Wha
le a
nd E
cosy
stem
Res
earc
h -Pre
y
Inte
rnat
iona
l Uni
on fo
r Con
serv
atio
n of
Nat
ure
Com
mis
sion
and
Atm
osph
eric
Adm
inis
tratio
n
Ape
x Pr
edat
or
Abb
revi
atio
ns u
sed
in th
is sp
ecia
l iss
ue; t
he st
ate
abbr
evia
tions
are
use
d in
man
y of
the
figur
es.
Mar
ine
Mam
mal
Pro
tect
ion
Act
Min
eral
s Man
agem
ent S
ervi
ce
Nor
thea
st F
ishe
ries S
cien
ce C
ente
rN
atio
nal E
nviro
nmen
tal P
olic
y A
ctN
atio
nal M
arin
e Fi
sher
ies S
ervi
ce
Nat
iona
l Mar
ine
Mam
mal
Lab
orat
ory
Nat
iona
l Mar
ine
Sanc
tuar
ies A
ct
Wha
ling
Inte
rnat
iona
l
Key
M
eter
(s)
Nor
ther
n N
orth
Car
olin
a Es
tuar
ine
Syst
em
Prov
ince
tow
n C
ente
r for
Coa
stal
Stu
dies
Ala
ska
Coa
stal
Sys
tem
Paci
fic C
oast
Fee
ding
Gro
upPa
cific
RIg
ht w
hale
Eco
logy
ST
Foun
datio
nR
epor
t
Ala
ska
Fairb
anks
Gul
f
IWC
-Pac
ific
Oce
an
Bio
dive
rsity
Are
as
Mito
chon
dria
l DN
A
Nau
tical
mile
(s)
Oce
anic
ildLi
fe
Nat
iona
l
Paci
fic W
Stoc
k A
sses
smen
t St
udy
of N
orth
ern
Sout
hern
Nor
th C
arol
ina
Estu
arin
e Sy
stem
SOun
d SU
rvei
llanc
e Sy
stem
Stru
ctur
e of
Pop
ulat
ions
, Lev
els o
f H
umpb
acks
Uni
vers
ity o
f Pr
ojec
tW
este
rn N
orth
Pac
ific
Abb
revi
atio
ns
IUC
N A
IWC
IWC
-PO
WER
KB
Am M
MP
MM
Sm
tDN
A
NEF
SC AN
EPN
MFS
nmi
NM
ML
NM
SAN
NC
ESN
OA
APC
CS
PCFG
PRIE
STPW
LFSA
RSN
AC
SSN
CES
SOSU
SSP
LASH
UA
F G
AP
WN
P
Arc
tic M
arin
e M
amm
als
gy M
anag
emen
tIm
porta
nt A
rea
Wha
le F
eedi
ng E
colo
gy S
tudy
Cal
iforn
ia C
oope
rativ
e O
cean
ic F
ishe
ries A
rea
urtle
Inve
stig
atio
nsC
onve
ntio
n on
Bio
logi
cal D
iver
sity
Ass
essm
ent P
rogr
amT
Cas
cadi
a R
esea
rch
Col
lect
ive
aria
tion
of V
Envi
ronm
enta
l Im
pact
Sta
tem
ent
Spec
ies A
ct
ficie
nt
Ecol
ogic
ally
or B
iolo
gica
lly S
igni
fican
t
Ala
ska
Line
-tran
sect
Sur
vey
Are
as
Ber
ing-
Chu
kchi
-Bea
ufor
tB
iolo
gica
lly
Bow
head
Bay
s, So
unds
, Est
uarie
s
Are
as
Aer
ial S
urve
ys o
f
Bur
eau
of O
cean
Ene
r
Bea
ufor
t Sto
ck
Cet
acea
n an
d C
ook
Inle
t Bel
ugas
Coe
fD
eoxy
ribon
ucle
ic a
cid
Dis
tinct
Pop
ulat
ion
Segm
ent
East
ern
Chu
ckch
i Sea
Excl
usiv
e Ec
onom
ic Z
one
East
ern
Nor
th P
acifi
cEn
dang
ered
Fe
dera
l Reg
iste
rG
eo-M
arin
e, In
c.
Hab
itat-b
ased
den
sity
Cet
acea
n
Gul
f of
Impo
rtant
Impo
rtant
Mar
ine
Mam
mal
ab
le 1
.1.
AP
T ASA
MM
BC
BB
IAB
OEM
BO
WFE
STB
SB
SEC
alC
OFI
CB
DC
eTC
IBC
RC
CV
DN
AD
PSEB
SAEC
SEE
ZEI
SEN
PES
AFR G
MI
GO
ALS
HD
ICA
IMM
A

BIAs for Cetaceans: Overview and Rationale 7
Certain qualifying statements are included in the BIA criteria. For example, the migratory corridor crite-rion designates a “substantial portion of a species” that migrates in a “spatially restricted” area. Within the context of informing conservation and manage-ment decisions, it is less useful to know that a small portion of a species might regularly use a 1,000-km swath of the Pacific Ocean to travel from California to Hawai‘i than it is to know that 100% of a spe-cies migrates through the waters of the Bering Strait (~80 km wide) twice each year. Additionally, CetMap restricts the fourth type of BIA to “small and resi-dent” populations “that occupy a limited geographic extent” because NOAA’s Marine Mammal Stock Assessment Reports already cite the range and abun-dance of all recognized U.S. marine mammal species or populations, including small or resident popula-tions whose range is either unknown or relatively large. The North Pacific right whale is an example of a small population that did not qualify for a small and resident BIA because their range is relatively large. The Gulf of Mexico resident sperm whale is an example of a resident population whose overall spatial extent was too large to be defined as a BIA. While CetMap does not explicitly define “small” and “limited geographic extent,” we delineate BIAs for populations or stocks whose range spans only a bay, an area around one or several islands, or a portion of what CetMap defines as a region. Each regional chapter provides an explicit definition of “resident” for each small and resident BIA delineated.
Areas that NOAA has officially designated as Critical Habitat are included as BIAs, either in part or whole, only if they meet at least one of the BIA criteria stated above. The development of Critical Habitat considers a complex combination
of factors that do not always match the simple definition of BIAs; therefore, not everything iden-tified as Critical Habitat will meet the BIA criteria and vice versa. Where BIAs have been designated in regions for species that have Critical Habitat, the Critical Habitat is identified, and its relation-ship to the BIA is described (i.e., completely, par-tially, or not overlapping) and mapped.
BIAs are delineated at the minimum spatial and temporal scales that available information can support. Coastal BIA assessments were con-ducted using GSHHS, Version 2.2.4 (full resolution, level L1) (Wessel & Smith, 1996). Most BIAs were defined by month, but some could only be identi-fied by a particular season, which was typically a 3- to 4-mo period. For each region, species, and time period with delineated areas of biological impor-tance, four products were created and compiled into the regional chapters in this issue: (1) a written narrative describing the information, assumptions, and logic used to delineate the BIA; (2) a map of the BIA; (3) a list of references used in the assess-ment (see the “Literature Cited” section at the end of the issue); and (4) a metadata table (see online supplemental tables associated with each region). The metadata table concisely details the type and quantity of information used to define a BIA, pro-viding transparency in how BIAs were designated in a quick reference table format. In addition, the metadata table allows an efficient way to update a BIA as new information becomes available.
Early in the BIA assessment process, CetMap considered defining a ranked categorical scale for BIAs based on the strength of supporting infor-mation. One obstacle to creating a single ordinal categorization scheme is that the collection of
Table 1.2. The criteria defined below are guidelines for delineating Biologically Important Areas (BIAs) in U.S. waters for cetaceans. The criteria are not based on quantitative thresholds. CetMap considers an area to be biologically important for a cetacean species, stock, or population (denoted by “species” in the criteria) if it meets at least one of these four criteria.
Criteria Definition Map color1
Reproductive Area Areas and times within which a particular species selectively mates, gives birth, or is found with neonates or calves
Feeding Area Areas and times within which aggregations of a particular species preferentially feed. These either may be persistent in space and time or associated with ephemeral features that are less predictable but are located within a larger area that can be delineated.
Migratory Corridor Areas and times within which a substantial portion of a species is known to migrate; the corridor is spatially restricted.
Small and Resident Population
Areas and times within which small and resident populations occupy a limited geographic extent
1 same color scheme is used with horizontal or vertical lines. All depths shown are in meters, unless otherwise noted. The U.S. Exclusive Economic Zone (EEZ) is represented as a dashed line ( ) in maps where it is visible.
In figures where there is more than one BIA of the same type, or where multiple BIAs are included and overlapping, the

8 Ferguson et al.
all potential applications for BIAs is broad, and a single scheme is unlikely to weight each con-tributing factor appropriately for all scenarios. Additionally, due to limited understanding of the linkages between individual- and population-level effects, CetMap did not rank the BIAs based on relative importance inferred from known or assumed impacts associated with disruption of specific behaviors or other threats to the species. The Working Group concluded that information would be lost in a simple ranking process, and that it is better to document the assumptions and rea-soning in each BIA narrative, and to compile the relevant detailed information in associated meta-data tables and the list of references.
Expert Elicitation and Review ProcessesThe data that can be used to characterize BIAs varies considerably in availability, quality, quan-tity, and type (i.e., sampling methodology used to collect it); therefore, expert interpretation and integration of existing information, based on broad and detailed knowledge of regions, spe-cies, and the assumptions associated with dif-ferent datasets, is needed to characterize these areas. The elicitation process was designed based on an expert panel approach to foster pooling of knowledge. CetMap defined a regional expert as an individual or research group that was actively conducting scientific research (field work and analyses) in the region, was internationally rec-ognized, and had a large body of peer-reviewed publications on the species in question and/or the region. The experts were affiliated with a range of institutions, including academic institutions, governmental agencies, and nongovernmental organizations, including a nonprofit research con-sortium. The amount of experience in cetacean ecology that each expert who led the drafting of the BIAs brought to the panel ranged from one to over three decades. These regional experts were asked to compile the best available information (e.g., sighting, acoustic, tagging, genetic, photo-identification) from scientific literature (including books, peer-reviewed articles, and government or contract reports), unpublished data, personal experience, and other experts’ knowledge to delineate the BIAs and create the associated nar-ratives, maps, and metadata tables.
CetMap sought additional review of the BIAs. CetMap recognized the need for support of the BIA assessment process by other scientists, managers, and relevant experts. The scientific community has accepted the peer-review process conducted by scientific journals as a way to evaluate science and syntheses. The review process also helped to ensure that the BIA narratives, maps, and metadata tables were accurate, based on the best available
science, presented consistently across regions, and supported by the references cited. BIA drafts were reviewed by CetMap members and by other sci-entific experts external to the process with experi-ence in particular species and regions, including individuals able to convey traditional ecological knowledge and reviewers who operated under the established guidelines of this journal.
In total, from drafting the original BIA narra-tives, maps, and metadata tables through the end of the journal’s peer-review process, each BIA was reviewed by approximately 7 to 20 experts. The entire assessment was conducted by experts communicating and exchanging information online, over the telephone, or in person.
Assessment Summary
This inaugural assessment identified 131 BIAs for 24 species (including multiple stocks for some spe-cies) within the seven regions. These BIAs were based on extensive review and synthesis of pub-lished and unpublished information by upwards of 70 experts. To put this assessment into perspec-tive, NOAA Fisheries’ Marine Mammal Stock Assessment Reports recognize approximately 34 large whale, 61 small whale, and 76 dolphin and porpoise stocks in U.S. waters. A summary of the BIAs identified by region, species, BIA type, and area is provided in Table 1.3. The geo-graphic extent of the BIAs in all regions ranges from 117 km2 for one Gulf of Mexico bottlenose dolphin small and resident BIA (see LaBrecque et al., 2015) to 373,000 km2 for the fin whale feed-ing BIA in the Bering Sea (see Ferguson et al., 2015c). The best estimates of abundance for the small and resident populations identified across all regions range from 10 (belugas in Yakutat Bay, Gulf of Alaska; Ferguson et al., 2015a) to ~2,500 to 3,000 (belugas in Bristol Bay, Alaska; Ferguson et al., 2015c). The spatial extent of the small and resident populations’ overall ranges is on the order of 4,000 km2, though were as small as 117 km2 for the Gulf of Mexico bottlenose dolphin stock mentioned above and as large as 31,500 km2 for the Bristol Bay belugas.
There was insufficient available information or time to identify BIAs for the species listed by region below. These species should be considered in subsequent BIA assessments. In the East Coast, common dolphin (Delphinus delphis), long- and short-finned pilot whales (Globicephala melas and G. macrorhynchus, respectively), Risso’s dolphin (Grampus griseus), Atlantic white-sided dolphin (Lagenorhynchus acutus), Atlantic spot-ted dolphin (Stenella frontalis), and several stocks of bottlenose dolphins (Tursiops truncatus) did not have enough information to be assessed. The

BIAs for Cetaceans: Overview and Rationale 9
possibility of a minke whale migratory corridor in the East Coast region should be considered in the future as more acoustic data are evaluated.
There was not enough information for most of the cetacean species in the Gulf of Mexico to eval-uate whether BIAs should be delineated. Future BIA assessments for the Gulf of Mexico should evaluate potential residency patterns of the sperm whale (Physeter macrocephalus) and other deep diving cetaceans that utilize the canyons and shelf break. In the Gulf of Mexico, several stocks of bottlenose dolphin also were not evaluated.
For the West Coast region, fin whales (Balaenoptera physalus) were discussed but no BIAs defined due to limited or conflicting information. Other species found in the West Coast region but not evaluated were the minke whale (Balaenoptera acutorostrata), killer whale (Orcinus orca), beaked whales (family Ziphiidae), and sperm whale.
The main information gaps in the Hawai‘i region were most species within the Northwestern Hawaiian Islands, and some species within the western half or along the windward sides of the main Hawaiian Islands.
Species inhabiting the Gulf of Alaska and Aleutian Islands and Bering Sea regions but not evaluated include Dall’s porpoise (Phocoenoides dalli), Pacific white-sided dolphin (Lagenorhynchus obliquidens), killer whale, beaked whales, sperm whale, minke whale, sei whale (Balaenoptera bore-alis), and harbor porpoise (Phocoena phocoena). Additional information gaps identified during the assessment of the Gulf of Alaska region include (1) reproductive areas for fin, gray (Eschrichtius robustus), and North Pacific right (Eubalaena japonica) whales; (2) detailed information on the migration routes of all species; (3) detailed infor-mation on the migratory timing of all species except humpback whales (Megaptera novaeangliae); and (4) cetacean distribution, density, and behavior in U.S. Gulf of Alaska waters off the continen-tal shelf. Information gaps identified during the assessment of the Aleutian Islands and Bering Sea region include (1) reproductive areas for all species; (2) detailed information on the migration routes and timing of all species; and (3) cetacean distribution, density, and behavior in U.S. Bering Sea waters off the continental shelf.
For the Arctic region, species lacking suf-ficient information for assessment include fin, humpback, minke, and killer whales, and harbor porpoise. Other information gaps that were iden-tified during the Arctic BIA process include (1) bowhead whale use of the western Beaufort Sea in summer (e.g., feeding, migration timing, movement rates); (2) the existence or extent of a bowhead whale fall migratory corridor in the Chukchi Sea; (3) the extent and nature of beluga
use of outer continental shelf and slope habitat in the Beaufort Sea; (4) the existence or location of gray whale migratory corridors in spring and fall; and (5) the degree to which gray whales move between known feeding hotspots.
Strengths and Limitations of CetMap BIAs
CaveatsCetMap made every effort to minimize biases in the BIAs by requiring that the information used to identify each BIA was fully documented in the references and metadata tables and by undertak-ing multiple levels of review by qualified experts. Nevertheless, it is the responsibility of the user to understand and keep in mind the following cave-ats when using the BIAs in planning and decision-making (see also Table 1.4):
• Only U.S. waters were evaluated as part ofthe BIA assessment; however, available infor-mation for non-U.S. areas was considered in identifying BIAs. Therefore, absence of BIA designations outside U.S. waters should not be interpreted as an absence of BIAs in those waters.
• Only areas and periods for which sufficientinformation was available to determine biolog-ical importance, under the criteria established above, were considered for BIA delineation. Therefore, other areas of biological importance to cetaceans exist within U.S. waters but were not included due to insufficient information because data collection and analyses to identify such areas are ongoing or because of time limi-tations of the assessment process.
• The quantity and type of information used to delineate BIAs within U.S. waters were spatially and temporally heterogeneous and included data derived from visual sightings, passive acoustic monitoring, tagging, genetic samples, photo-identification, and expert knowledge.
• TheBIAnarrativesandmetadatatablesshouldbe consulted to determine which regions and periods were considered, what data support the designations, and where and when information is lacking.
• TheBIAdesignationisnotequivalenttohabi-tat or range. BIAs do not identify the physical and biological factors that characterize a spe-cies’ habitat. Feeding, migration, and repro-duction BIAs highlight specific locations and periods within which critical behaviors occur and likely represent only a fraction of a species’ overall range. BIAs may represent only the period when a peak number of individuals use an area. A small and resident population BIA may encompass all or most of the population’s

10 Ferguson et al.
Table 1.3. Count and total area (in km2) of BIAs by region, species, and BIA type. A total of 131 BIAs (58 feeding, 15 migration, 10 reproduction, and 48 small and resident) were defined for 24 species across seven regions in U.S. waters, resulting in a total area of 2,798,466 km2.
Species’ scientific name
Species’ common name
BIA type
# of BIAs
Total BIA size (km2)
East Coast Balaenoptera acutorostrata Minke whale Feeding 2 56,597 Balaenoptera borealis Sei whale Feeding 1 56,609 Balaenoptera physalus Fin whale Feeding 3 27,094 Eubalaena glacialis North Atlantic right whale Feeding 3 16,098 Eubalaena glacialis North Atlantic right whale Migration 1 269,448 Eubalaena glacialis North Atlantic right whale Reproduction 2 51,997 Megaptera novaeangliae Humpback whale Feeding 1 47,701 Phocoena phocoena Harbor porpoise Small and resident 1 12,211 Tursiops truncatus Bottlenose dolphin Small and resident 10 13,867 Total 24 551,622
Gulf of Mexico Balaenoptera edeni Bryde’s whale Small and resident 1 23,559 Tursiops truncatus Bottlenose dolphin Small and resident 11 6,507 Total 12 30,066
West Coast Balaenoptera musculus Blue whale Feeding 9 16,438 Eschrichtius robustus Gray whale Feeding 6 1,927 Eschrichtius robustus Gray whale Migration 4 263,860 Megaptera novaeangliae Humpback whale Feeding 7 23,098 Phocoena phocoena Harbor porpoise Small and resident 2 4,941 Total 28 310,264
Hawai‘i Feresa attenuata Pygmy killer whale Small and resident 1 2,265 Globicephala macrorhynchus Short-finned pilot whale Small and resident 1 2,968 Kogia sima Dwarf sperm whale Small and resident 1 2,675 Megaptera novaeangliae Humpback whale Reproduction 1 5,846 Mesoplodon densirostris Blainville’s beaked whale Small and resident 1 7,442 Peponocephala electra Melon-headed whale Small and resident 1 1,753 Pseudorca crassidens False killer whale Small and resident 1 5,430 Stenella attenuata Pantropical spotted dolphin Small and resident 3 7,252 Stenella longirostris Spinner dolphin Small and resident 5 38,040 Steno bredanensis Rough-toothed dolphin Small and resident 1 7,175 Tursiops truncatus Common bottlenose dolphin Small and resident 4 21,920 Ziphius cavirostris Cuvier’s beaked whale Small and resident 1 23,583 Total 21 126,349
Gulf of Alaska Balaenoptera physalus Fin whale Feeding 1 44,975 Delphinapterus leucas Beluga Small and resident 2 9,209 Eschrichtius robustus Gray whale Feeding 2 7,374 Eschrichtius robustus Gray whale Migration 1 176,921 Eubalaena japonica North Pacific right whale Feeding 1 28,019 Megaptera novaeangliae Humpback whale Feeding 6 93,920 Total 13 360,418
Aleutian Islands and Bering Sea
Balaena mysticetus Bowhead whale Feeding 1 2,130 Balaena mysticetus Bowhead whale Migration 1 19,861 Balaenoptera physalus Fin whale Feeding 1 372,961 Delphinapterus leucas Beluga Feeding 1 61,675 Delphinapterus leucas Beluga Migration 1 22,332 Delphinapterus leucas Beluga Small and resident 1 31,567 Eschrichtius robustus Gray whale Feeding 3 47,866 Eschrichtius robustus Gray whale Migration 3 69,599 Eubalaena japonica North Pacific right whale Feeding 1 92,667 Megaptera novaeangliae Humpback whale Feeding 2 109,619 Total 15 830,278

BIAs for Cetaceans: Overview and Rationale 11
entire known range, or may represent high den-sity areas within a larger known range.
• ThisBIAassessment focusedoncertainceta-cean species. It will be necessary, using other resources, to supplement the areas identified herein with those having high densities of these and other marine mammal species. A similar process could be established for the cetacean, pinniped, sirenian, and fissiped species that were not addressed by this effort.
No ThresholdsTo maximize the number of species, areas, and times that could be evaluated under CetMap’s BIA
criteria, CetMap chose to not incorporate thresholds (quantitative values) into the criteria. The imple-mentation of thresholds into assessment processes requires a considerable amount of data of a certain type and quality, and those data standards are dif-ficult to meet in most regions. The variability in the geographic extent of BIAs in this assessment (Table 1.3) is partially due to the heterogeneity in the type and quality of data used; however, each BIA is substantiated by an associated narrative, map, and metadata table, allowing transparency into the delineation process. Furthermore, CetMap encourages users to incorporate information from multiple sources, including BIAs and HD models
Table 1.3. Count and total area of BIAs by region, species, and BIA type (continued)
# of Total BIA Species’ scientific name Species’ common name BIA type BIAs size (km2)
Arctic Balaena mysticetus Bowhead whale Feeding 3 32,998 Balaena mysticetus Bowhead whale Migration 2 193,742 Balaena mysticetus Bowhead whale Reproduction 4 142,755 Delphinapterus leucas Beluga Feeding 1 1,527 Delphinapterus leucas Beluga Migration 2 171,231 Delphinapterus leucas Beluga Reproduction 1 1,527 Eschrichtius robustus Gray whale Feeding 3 27,391 Eschrichtius robustus Gray whale Reproduction 2 18,298 Total 18 589,469
Grand total 131 2,798,466
Table 1.4. The caveats below should be considered when using BIAs in planning or decision-making processes.
1 Only U.S. waters were evaluated as part of the BIA assessment; however, available information for non-U.S. areas was considered in identifying BIAs. Therefore, absence of BIA designations outside U.S. waters should not be inter-preted as an absence of BIAs in those waters.
2 Only areas and periods for which sufficient information was available to determine biological importance under the criteria established above were considered for BIA delineation. Therefore, other areas of biological importance to cetaceans exist within U.S. waters but were not included due to insufficient information because data collection and analyses to identify such areas are ongoing or because of time limitations of the assessment process.
3 The quantity and type of information used to delineate BIAs within U.S. waters were spatially and temporally het-erogeneous and included data derived from visual sightings, passive acoustic monitoring, tagging, genetic samples, photo-identification, and expert knowledge.
4 The BIA narratives and metadata tables should be consulted to determine which regions and periods were consid-ered, what data support the designations, and where and when information is lacking.
5 The BIA designation is not equivalent to habitat or range. BIAs do not identify the physical and biological factors that characterize a species’ habitat. Feeding, migration, and reproduction BIAs highlight specific locations and peri-ods within which critical behaviors occur and likely represent only a fraction of a species’ overall range. BIAs may represent only the period when a peak number of individuals use an area. A small and resident population BIA may encompass all or most of the population’s entire known range, or may represent high density areas within a larger known range.
6 This BIA assessment focused on certain cetacean species. It will be necessary, using other resources, to supplement the areas identified here with those having high densities of these and other marine mammal species. A similar pro-cess could be established for the cetacean, pinniped, sirenian, and fissiped species that were not addressed by this effort.

12 Ferguson et al.
or stratified density estimates, to inform conserva-tion and management decisions.
Expert ElicitationThe expert elicitation process used in this BIA assessment is both a strength and a limitation. There is an urgent need for input into decisions regarding conservation and management and a lack of data for quantitative analyses (Kot et al., 2010; Kaschner et al., 2012). Managers are asked to make decisions given the best available information (or limitations thereof), and scientists are asked to provide input (professional judgments and interpretations) even when information is limited. Expert elicitation allows for the interpretation and synthesis of vari-ous sources of information, such as empirical data, scientific literature, and personal field experience, to make existing knowledge directly applicable to management (Teck et al., 2010).
Expert elicitation is not purely objective, but neither are empirical data collection and analysis methods in general. All science requires judgments to be made at multiple points in the scientific pro-cess: defining the question; choosing the study area; creating the study design; deciding on and implementing data collection methods; analyzing data, including the identification and treatment of outliers; deciding on the analytical spatial and tem-poral extent and scale; subsetting data; identifying and computing parameters of interest; choosing an overall analytical paradigm (e.g., frequentist, Bayesian, or likelihood statistical approaches); and presenting and interpreting results.
CetMap incorporated safeguards into several steps of the expert elicitation process: (1) enlist-ing experts with knowledge about cetaceans in particular regions, acquired through personal experience conducting research (field work and analyses); (2) facilitating transparency of the BIA assessment process by providing details about methodology, assumptions, and rationale in the narratives, and providing details about the infor-mation used in the narratives, metadata tables, and references; (3) fostering support for the BIAs by undertaking an extensive expert review phase for narratives, maps, and metadata tables, including reviewers designated by the journal and those who were external to the journal’s official peer-review process; and (4) recognizing that this is a first step in an iterative process, and encouraging these inaugural BIAs to be reviewed and revised in the future as new information becomes available.
Future Directions for CetMap BIAs
CetMap’s BIA assessment process should be con-sidered an iterative process. As noted above, BIAs are limited by available knowledge, and they are
not intended to provide a complete list of areas of biological importance for all cetacean species. NOAA regards the information presented on the CetMap website, including the BIAs, to be living resources, which will be maintained and updated as new information becomes available. This inaugural set of BIAs represents a snapshot in time. As new empirical data are gathered, these BIAs can be cali-brated to determine how closely they correspond to reality, and they can be updated as necessary. Future assessments should consider methods for incorporating uncertainty into the BIA delineation process. In addition, the number of cetacean species (within a given region and time period) represented in the BIA library is likely to expand as knowledge accumulates. Furthermore, decisionmakers and the scientific community might find it helpful to have information about BIAs for pinnipeds, sirenians, and fissipeds. When planning future BIA assess-ments, it will be important to account for the time required to undertake the process. This entire elici-tation process, starting with CetMap’s initial work-shop in January 2011 and finishing with publication in March 2015, took approximately four years.
Comparison to International Assessments
The CetMap BIA assessment is part of a growing international effort to delineate areas of biological or ecological importance to inform decisions or promote actions in the conservation and manage-ment realm. Herein, we compare CetMap BIAs to IUCN KBAs and IMMAs, CBD EBSAs, PWLF ICAs, and Australian BIAs (Table 1.5). Although IMMAs are still in development (Corrigan et al., 2014), and KBA criteria are in revision (IUCN, 2013b), sufficient information exists to compare the proposed assessment to the collection of exist-ing assessments. It should be noted that other detailed regional assessments exist, including the Bering Strait Marine Life and Subsistence Use Data Synthesis (Oceana & Kawerak, Inc., 2014) and the Arctic Synthesis compiled by Audubon Alaska and Oceana (Smith, 2010). We chose to focus on the assessments in Table 1.5 because they are most similar to the CetMap BIA process.
The suite of assessments listed above and sum-marized in Table 1.5 share a collection of common characteristics. First, all of these examples are proac-tive efforts to identify important areas. They are not responses to specific actions or developments; rather, they address multiple existing and growing environ-mental concerns in the marine, freshwater, or terres-trial environment. Second, all efforts are based on the best available science and rely on expert judgment to shape the criteria and conduct the assessment. Third, they are all iterative processes. Recognizing that our understanding of the marine environment is under

BIAs for Cetaceans: Overview and Rationale 13
Hab
itats
ge
ted
tar
erre
stria
l, , an
d m
arin
e6
Mar
ine
T fres
hwat
er
Po
litic
al
Reg
iona
l , R
egio
nal6
scal
e
natio
nal,
inte
rnat
iona
l
Geo
grap
hic
scop
e
Uni
ted
Stat
es
Glo
bal6
Ecol
ogic
al u
nit
asse
ssed
Popu
latio
ns,
stoc
ks, s
peci
es
Gen
e,
popu
latio
n,
spec
ies,
or
ecos
yste
m4,
6
Thre
shol
ds.
= Q
uant
itativ
e axa
T
Cet
acea
ns
Unr
estri
cted
5 s e
ass
essm
ent t
o fiv
e si
mila
r int
erna
tiona
l ass
essm
ents
; QT Q
T
No
Y
ger
esid
ent
and Mig
rato
ry
Feed
ing
Are
as
Smal
l and
r
eas:
Thes
e eith
er m
ay b
e
: (1)
Site
s con
tribu
ting
oduc
tive
ar
Are
as an
d tim
es w
ithin
Are
as an
d tim
es w
ithin
whi
ch
5
Crit
eria
Repr A
reas
and
times
with
in w
hich
eas:
(1)
times
with
in w
hich
a pa
rticu
lar s
peci
es
sele
ctiv
ely
mat
es, g
ives
birt
h, o
r is f
ound
w
ith n
eona
tes o
r cal
ves.
(2)
aggr
egat
ions
of a
par
ticul
ar sp
ecie
s pr
efer
entia
lly fe
ed.
pers
isten
t in
spac
e and
tim
e or a
ssoc
iate
d w
ith ep
hem
eral
feat
ures
that
are l
ess
pred
icta
ble b
ut ar
e loc
ated
with
in a
lar
area
that
can
be d
elin
eate
d. (3
) co
rrid
ors:
whi
ch a
subs
tant
ial p
ortio
n of
a sp
ecie
s is
know
n to
mig
rate
; the
corri
dor i
s
opos
ed c
rite
ria
ar spat
ially
restr
icte
d. (4
) po
pula
tion:
smal
l and
resid
ent p
opul
atio
ns o
ccup
y a
limite
d ge
ogra
phic
exte
nt
Pr signi
fican
tly to
the
glob
al p
ersis
tenc
e of
thre
aten
ed b
iodi
vers
ity; (
2) S
ites
cont
ribut
ing
signi
fican
tly to
the
glob
al
pers
isten
ce o
f geo
grap
hica
lly re
stric
ted
biod
iver
sity;
(3) S
ites c
ontri
butin
g sig
nific
antly
to th
e gl
obal
per
siste
nce
of
biod
iver
sity
beca
use
they
are
exc
eptio
nal
exam
ples
of e
colo
gica
l int
egrit
y an
d na
tura
lnes
s; (4
) Site
s con
tribu
ting
signi
fican
tly to
the
glob
al p
ersis
tenc
e of
ou
tstan
ding
bio
logi
cal p
roce
sses
; and
(5
) Site
s con
tribu
ting
signi
fican
tly to
th
e gl
obal
per
siste
nce
of b
iodi
vers
ity
as id
entif
ied
thro
ugh
a co
mpr
ehen
sive
quan
titat
ive
anal
ysis
of ir
repl
acea
bilit
y
s BIA
Def
initi
on
BIA
s are
repr
oduc
tive
area
s, fe
edin
g ar
eas,
mig
rato
ry c
orrid
ors,
and
area
s in
whi
ch
smal
l and
resi
dent
po
pula
tions
are
co
ncen
trate
d.
Are
as th
at c
ontri
bute
si
gnifi
cant
ly to
the
glob
al p
ersi
sten
ce o
f bi
odiv
ersi
ty6
Com
paris
on o
f Cet
Map
’
F
ishe
ries
Ove
rsig
ht b
ody
NO
AA
Cet
acea
n D
ensi
ty
and
Dis
tribu
tion
orki
ng
Map
ping
W orld
W
Gro
up
IUC
N
Com
mis
sion
on
Pro
tect
ed
Are
as a
nd
Spec
ies S
urvi
val
Com
mis
sion
Join
t Ta
sk F
orce
on
Bio
dive
rsity
and
Pr
otec
ted
Are
as
able
1.5
.
T Cet
Map
B
IAs
KB
A

14 Ferguson et al.
Hab
itats
ge
ted 2,
3
tar
Mar
ine
Mar
ine
Po
litic
al 2,
3R
egio
nal,
natio
nal,
scal
e
inte
rnat
iona
l
Reg
iona
l, in
tern
atio
nal
Geo
grap
hic
2, 3
scop
e
Glo
bal
Brit
ish
Col
umbi
a an
d So
uthe
ast
Ala
ska
Thre
shol
ds. (
cont
inue
d)
Ecol
ogic
al u
nit
Popu
latio
n,
spec
ies,
or
ecos
yste
m2
asse
ssed
Popu
latio
n,
subs
peci
es,
spec
ies
= Q
uant
itativ
e axa
T
Unr
estri
cted
Cet
acea
ns
QT
No se
ass
essm
ent t
o fiv
e si
mila
r int
erna
tiona
l ass
essm
ents
; QT Y
(1) U
niqu
enes
s or r
arity
; (2)
Spe
cial
im
porta
nce
for l
ife h
isto
ry st
ages
of
spec
ies;
(3) I
mpo
rtanc
e fo
r thr
eate
ned,
en
dang
ered
, or d
eclin
ing
spec
ies
and/
or h
abita
ts; (
4) V
ulne
rabi
lity,
, o
r slo
w
, sen
sitiv
ityre
cove
ry; (
5) B
iolo
gica
l pro
duct
ivity
; B
iolo
gica
l div
ersi
ty; a
nd
Nat
ural
ness
2
Crit
eria
frag
ility
(1) E
ndan
gere
d, th
reat
ened
, or
vuln
erab
le sp
ecie
s; (2
) Fee
ding
co
ncen
tratio
ns; (
3) B
reed
ing
area
or
nurs
ery;
(4) M
igra
tion
corr
idor
s; a
nd
Spec
ies d
iver
sity
(6)
(7)
(5)
s BIA
Def
initi
on
Ecol
ogic
ally
an
d bi
olog
ical
ly
sign
ifica
nt a
reas
are
ge
ogra
phic
ally
or
ocea
nogr
aphi
cally
di
scre
te a
reas
that
pr
ovid
e im
porta
nt
serv
ices
to o
ne
or m
ore
spec
ies/
popu
latio
ns o
f an
ecos
yste
m o
r to
the
ecos
yste
m a
s a
who
le, c
ompa
red
to
othe
r sur
roun
ding
ar
eas o
r are
as o
f si
mila
r eco
logi
cal
char
acte
ristic
s, or
ot
herw
ise
mee
t the
cr
iteria
as i
dent
ified
in
Ann
ex I
to d
ecis
ion
2IX
/20.
Impo
rtant
Cet
acea
n A
reas
(IC
As)
are
di
scre
te a
reas
of
ocea
n th
at a
re
of im
porta
nce
to
ceta
cean
s for
feed
ing,
br
eedi
ng, a
nd
mig
ratio
n ac
tiviti
es.
Com
paris
on o
f Cet
Map
’
Ove
rsig
ht b
ody
Con
fere
nce
of th
e Pa
rties
(CO
P) to
th
e C
onve
ntio
n on
Bio
logi
cal
ildLi
fe
Div
ersi
ty
Paci
fic W
Foun
datio
n (P
WLF
)
Tabl
e 1.
5.
EBSA 9
ICA

BIAs for Cetaceans: Overview and Rationale 15
,
Hab
itats
ge
ted
tar Mar
ine
Mar
ine,
fr
eshw
ater
terr
estri
al
Po
litic
al
scal
e
Reg
iona
l, na
tiona
l
Reg
iona
l,1
natio
nal,
inte
rnat
iona
l
Geo
grap
hic
scop
e
Aus
tralia
Glo
bal
Thre
shol
ds. (
cont
inue
d)
Ecol
ogic
al u
nit
asse
ssed
Spec
ies
Popu
latio
n,
spec
ies1
1
11
= Q
uant
itativ
e axa
T
Seab
irds,
ceta
cean
s, pi
nnip
eds,
sire
nian
s, m
arin
e tu
rtles
, fis
hes
Cet
acea
ns,
pinn
iped
s, si
reni
ans,
fissi
peds
ass
essm
ent t
o fiv
e si
mila
r int
erna
tiona
l ass
essm
ents
; QT Q
T
No 1 seY
, Pop
ulat
ion,
and
Com
mun
ities
(DSE
WPa
C) (
2012
)
(1) B
reed
ing;
(2) F
orag
ing;
(3) R
estin
g;
and
(4) M
igra
tion10 : (
1) R
epro
duct
ive
, siz
e of
pop
ulat
ions
, and
Crit
eria
opos
ed c
rite
ria1
Smal
ler o
r res
iden
t pop
ulat
ions
; A
bund
ance
est
imat
es a
nd p
opul
atio
n
, uni
quen
ess,
gene
tic is
olat
ion,
ater
Pr area
s and
tim
es; (
2) F
eedi
ng a
reas
an
d tim
es; (
3) M
igra
tion
corr
idor
s;
(4)
(5)
stru
ctur
e (w
ith c
onsi
dera
tion
of
rarit
yirr
epla
ceab
ility
tem
pora
l agg
rega
tions
); (6
) 3-D
hab
itat
feat
ures
; and
(7) C
onsi
dera
tions
of
vuln
erab
ility
and
resi
lienc
e
, Env
ironm
ent,
W
10
Def
initi
on
Bio
logi
cally
im
porta
nt a
reas
ar
e ar
eas t
hat a
re
parti
cula
rly im
porta
nt
for t
he c
onse
rvat
ion
of p
rote
cted
sp
ecie
s and
whe
re
aggr
egat
ions
of
indi
vidu
als d
ispl
ay
biol
ogic
ally
impo
rtant
be
havi
our s
uch
as
bree
ding
, for
agin
g,
rest
ing,
or m
igra
tion.
Site
s tha
t con
tribu
te
sign
ifica
ntly
to th
e gl
obal
per
sist
ence
of
mar
ine
mam
mal
bi
odiv
ersi
ty1
s BIA
Thes
e ar
e pr
opos
ed c
riter
ia.
Com
paris
on o
f Cet
Map
’
ask
Forc
e
Ove
rsig
ht b
ody
Aus
tralia
n G
over
nmen
t D
epar
tmen
t of t
he
Envi
ronm
ent
IUC
N M
arin
e M
amm
al
Prot
ecte
d A
reas
T
able
1.5
.T A
ustra
lian
ces
BIA
IMM
A
Sour
Cor
rigan
et a
l. (2
014)
.
Aus
tralia
n G
over
nmen
t Dep
artm
ent o
f Sus
tain
abili
tyA
ustra
lian
Gov
ernm
ent D
epar
tmen
t of t
he E
nviro
nmen
t (20
14)
1 CB
D (2
008)
2 CB
D (2
010)
3 IUC
N (2
013a
)4 IU
CN
(201
3b)
5 IUC
N (2
012)
6 PWLF
(201
3)9 10 11

16 Ferguson et al.
continual revision and to ensure that the areas identi-fied under each assessment continue to represent the best available science, it is necessary to review and revise the areas on a cycle that tracks the acquisition of new information.
There are several noteworthy differences among the assessments, which are highlighted in Table 1.5. For example, the ecological units assessed to delineate KBAs and EBSAs range from genes (for KBAs) or populations (both) to ecosystems and consider all taxa and habitats (CBD, 2008; IUCN, 2012, 2013a). ICAs (PWLF, 2013), Australian BIAs (DSEWPaC, 2012), IMMAs (Corrigan et al., 2014), and CetMap BIAs are based on populations, stocks, or species. Australian BIAs are restricted to marine habitats and include seabirds, cetaceans, pinnipeds, sirenians, marine turtles, and fishes (DSEWPaC, 2012). IMMAs will include all species of cetaceans, pinnipeds, sirenians, and fissipeds, and will encompass terrestrial, marine, and fresh-water habitats (Corrigan et al., 2014). ICAs (PWLF, 2013) and CetMap BIAs currently include only cetaceans. The geographic scope and political scale vary among the efforts. The KBA (IUCN, 2012), EBSA (CBD, 2008, 2010), and IMMA (Corrigan et al., 2014) efforts are global, and areas are identi-fied at geographic scales ranging from regional (a portion of a nation), national (at the level of a single nation), or international (crossing national bound-aries). ICAs are restricted to waters off British Columbia and Southeast Alaska (PWLF, 2013). ICA boundaries can cross national borders but are also identified at the regional scale (PWLF, 2013). Australian (DSEWPaC, 2012) and CetMap BIAs are restricted to national waters but are delineated at the regional scale. In general, KBAs tend to be smaller than EBSAs, and IMMAs are expected to be similar in size to KBAs (Hoyt & Notarbartolo di Sciara, 2014).
Understanding the goals and the intended use of the designated sites is critical to understanding whether and how the different types of areas can be integrated or nested. KBAs are defined as “areas that contribute significantly to the global persis-tence of biodiversity” (IUCN, 2012, p. 10). KBA delineation is meant to “help national government agencies, decision makers, resource managers, local communities, the private sector, donor agen-cies, and others to target the implementation of site conservation standards” (IUCN, 2013a, p. 3). KBA size and the location of their boundaries “should be based on actual or potential manage-ability for conservation or biodiversity” (IUCN, 2012, p. 21). Therefore, KBA delineation is some-what constrained by political, socioeconomic, and legal factors. Furthermore, the proposed KBA cri-teria are based on quantitative thresholds (IUCN, 2013b).
In the EBSA delineation process, there is less focus on management and more emphasis on ecology and biology. EBSAs are defined as “geo-graphically or oceanographically discrete areas that provide important services to one or more species/populations of an ecosystem or to the eco-system as a whole, compared to other surrounding areas or areas of similar ecological characteristics” (CBD, 2008, p. 181). Furthermore, the Conference of the Parties to the CBD (2010) noted that “the application of the ecologically or biologically sig-nificant areas (EBSAs) criteria is a scientific and technical exercise” (p. 234) and that “areas found to meet the criteria may require enhanced con-servation and management measures” (p. 234). EBSA delineation does not require the evalua-tion of quantitative thresholds. Criteria for KBAs (IUCN, 2013b) and EBSAs (CBD, 2008) include vulnerability to disturbances, which ultimately involves assessment of threats, risks, and, poten-tially, cumulative effects analyses. Although still in development, IMMAs are anticipated to “nest fully within what would constitute an EBSA, and either fully or to at least a large degree within KBAs” (Corrigan et al., 2014, p. 181; see also Hoyt & Notarbartolo di Sciara, 2014). KBAs (IUCN, 2013b), EBSAs (CBD, 2008), and ICAs (PWLF, 2013) all include a criterion regarding endangered, threatened, or vulnerable species. In addition, ICAs include some quantitative thresh-olds (PWLF, 2013). The Australian (DSEWPaC, 2012) and CetMap BIAs are more similar to each other than to the other assessments because they are not based on thresholds, and they do not directly incorporate vulnerability criteria; rather, they can be considered purely behavior or activ-ity “layers” that can be input into management decisions, cumulative effects models, or other assessment processes (i.e., KBAs, EBSAs, and/or IMMAs), along with other factors relevant to the particular issue at hand.
Conclusions
The CetMap BIAs are one in a growing interna-tional collection of tools created to assist multiple stakeholders in the characterization, analysis, and minimization of anthropogenic impacts on ceta-ceans, other taxa, and ecosystems. All of the tools require regular review and revision to track emerg-ing knowledge and understanding about the spe-cies and ecosystems of concern. Communication among those overseeing each assessment process will be critical in order to share limited resources (i.e., time, money, and knowledge) and to enhance understanding of how the products from each assessment can be integrated.

Aquatic Mammals 2015, 41(1), 17-29, DOI 10.1578/AM.41.1.2015.17
2. Biologically Important Areas for Cetaceans Within U.S. Waters – East Coast RegionErin LaBrecque,1 Corrie Curtice,1 Jolie Harrison,2
Sofie M. Van Parijs,3 and Patrick N. Halpin4
1Marine Geospatial Ecology Lab, Duke University, Beaufort, NC 28516, USA E-mail: [email protected]
2National Marine Fisheries Service, Office of Protected Resources, Silver Spring, MD 20910, USA 3Passive Acoustic Research Group, Northeast Fisheries Science Center, Woods Hole, MA 02543, USA
4Marine Geospatial Ecology Lab, Duke University, Durham, NC 27708, USA
Abstract
In this review, we merge existing published and unpublished information along with expert judg-ment to identify and support the delineation of 18 Biologically Important Areas (BIAs) in U.S. waters along the East Coast for minke whales, sei whales, fin whales, North Atlantic right whales, humpback whales, harbor porpoises, and bottle-nose dolphins. BIAs are delineated for feeding areas, reproductive areas, migratory corridors, and small and resident populations to enhance existing information already available to scientists, man-agers, policymakers, and the public. BIAs ranged in size from approximately 152 to 270,000 km2. They are intended to provide synthesized infor-mation in a transparent format that can be readily used toward the analyses and planning under U.S. statutes that require the characterization and mini-mization of impacts of anthropogenic activities on marine mammals. BIAs are not intended to repre-sent all important areas for consideration in plan-ning processes; in particular, areas of high marine mammal density, typically identified based on a combination of systematic visual and/or acoustic detections coupled with quantitative modeling, are very important to consider, where available, in any assessment. To maintain their utility, East Coast BIAs should be re-evaluated and revised, if necessary, as new information becomes available.
Key Words: feeding area, migratory corridor, reproductive area, resident population, anthro-pogenic sound, Northwest Atlantic Ocean, East Coast
Introduction
This assessment coalesces existing published and unpublished information to define Biologically
Important Areas (BIAs) in U.S. East Coast waters (shoreward of the Exclusive Economic Zone [EEZ]) for cetacean species that meet the criteria for migratory areas, feeding areas, reproductive areas, and small and resident populations defined in Table 1.2 of Ferguson et al. (2015b) within this issue. A comprehensive overview of the BIA delin-eation process; its caveats (Table 1.4), strengths, and limitations; and its relationship to interna-tional assessments also can be found in Ferguson et al. Table 1.3 provides a summary of all BIAs identified, including species, region, geographic location within the region, BIA type, month(s), and total area (in km2). A summary also can be found at http://cetsound.noaa.gov/important. Table 1.1 defines all abbreviations used in this special issue. Metadata tables that concisely detail the type and quantity of information used to define each BIA are available as an online supplement.
Within the East Coast region, one species—North Atlantic right whale (Eubalaena glacia-lis)—was evaluated and found to meet the criteria for reproductive, feeding, and migratory corridor BIAs; four species—minke whale (Balaenoptera acutorostrata), sei whale (B. borealis), fin whale (B. physalus), and humpback whale (Megaptera novaeangliae)—met the criteria for feeding BIAs; and two species—bottlenose dolphin (Tursiops truncatus) and harbor porpoise (Phocoena pho-coena)—met the criteria for small and resident populations. Several other cetacean species are found in this region but do not meet the BIA cri-teria. These species include sperm whale (Physeter macrocephalus), dwarf sperm whale (Kogia sima), pygmy sperm whale (K. breviceps), Cuvier’s beaked whale (Ziphius cavirostris), Blainville’s beaked whale (Mesoplodon densirostris), Gervais’ beaked whale (M. europaeus), Sowerby’s beaked whale (M. bidens), True’s beaked whale (M. mirus), Risso’s dolphin (Grampus griseus), long-finned pilot whale

18 LaBrecque et al.
(Globicephala melas), short-finned pilot whale (G. macrorhynchus), common dolphin (Delphinus delphis), white-sided dolphin (Lagenorhynchus acutus), Atlantic spotted dolphin (Stenella fron-talis), and striped dolphin (S. coeruleoalba). Infrequently sighted cetacean species include blue whale (B. musculus), North Atlantic bottlenosed whale (Hyperoodon ampullatus), false killer whale (Pseudorca crassidens), killer whale (Orcinus orca), melon-headed whale (Peponocephala elec-tra), rough-toothed dolphin (Steno bredanensis), Fraser’s dolphin (Lagenodelphis hosei), white-beaked dolphin (Lagenorhynchus albirostris), pantropical spotted dolphin (S. attenuata), spin-ner dolphin (S. longirostris), and Clymene dol-phin (S. clymene). Common dolphins, long and short-finned pilot whales, Risso’s dolphin, Atlantic white-sided dolphin, and Atlantic spotted dolphin should be evaluated in future efforts to create BIAs for these species in this region as new information becomes available.
Information pertaining to East Coast BIAs was synthesized primarily from published data from systematic ship-based surveys, systematic aerial surveys, opportunistic whale-watching sur-veys, tagging studies, photo-identification studies, genetic analysis, acoustic recordings, and stranding and whaling records. The East Coast BIA assess-ment benefitted from the inputs and insights of ten experts familiar with East Coast cetacean species.
Species-Specific Biologically Important Areas
Minke Whale (Balaenoptera acutorostrata)General—Minke whales in the U.S. East Coast waters are recognized as part of the Canadian East Coast stock (Donovan, 1991; Waring et al., 2014) and are found throughout the waters off the East Coast of the U.S., with the greatest number of sight-ings in northeastern waters (Cetacean and Turtle Assessment Program [CeTAP], 1982; Waring et al., 2014). Like other balaenopterids, there appears to be a strong seasonal division in minke whale distribution. They migrate between high latitudes in summer and low latitudes in winter. From May through September, minke whales are most abundant in New England waters, including the Gulf of Maine, Cape Cod Bay, the Great South Channel, and Georges Bank (Pittman et al., 2006; Waring et al., 2014). Year-round acoustic record-ings from Stellwagen Bank detected minke whale vocalizations from August to November with a few detections from March to June (Risch et al., 2013). Minke whales are mostly absent from New England waters in winter. Although sight-ing data have not provided evidence of a migra-tion corridor, year-round acoustic monitoring from the Gulf of St. Lawrence to Saba Bank in
the Caribbean suggest minke whales migrate in the deeper waters offshore of the U.S. continen-tal shelf, and in winter they are spread out at low latitudes from the Mid-Atlantic Ridge to the U.S. continental shelf (Risch et al., 2014). No minke whale mating or calving grounds have been found in U.S. Atlantic waters. Mitchell (1991) specu-lated that offshore waters of the southeast U.S. and the West Indies might be important winter calving grounds. Recent records show minke whale mom/calf pairs offshore of the continental shelf near Florida and North Carolina (Nilsson et al., 2011) supporting possible winter calving grounds in the southeast U.S. Atlantic or further south.
Feeding—Minke whales have been observed feeding in the Great South Channel and adjacent waters from March through November. During ves-sel-based humpback whale surveys from 1988 to 2011, the Provincetown Center for Coastal Studies (PCCS) recorded 19 sightings of individual minke whales feeding along the northern edge of Georges Bank, Great South Channel, Stellwagen Bank, and off Race Point, Massachusetts (PCCS, unpub. data, 1988-2011) in waters less than 150 m. From 1998 to 2009, the Northeast Fisheries Science Center (NEFSC) aerial survey team recorded 15 sightings of minke whales feeding (NEFSC, unpub. data, 1998-2009) during all survey months (March to July, October) in waters less than 200 m. Twenty-one observations of surface or apparent surface feeding of minke whales were recorded from March through September during the CeTAP (1982) sur-veys within the 100-m isobath in the Great South Channel, along Cape Anne, and at Jeffreys Ledge. Between 1979 and 1992, Murphy (1995) con-firmed 27 sightings of minke whale feeding at the surface Cape Cod Bay, Massachusetts Bay, and on Stellwagen Bank. These sightings were recorded during dedicated marine mammal research cruises and on whale-watching vessels. Feeding group size was recorded in 24 of the 27 sightings; two sight-ings were of pairs of individuals, one sighting was of three individuals, and single individuals account for the rest of the 24 sightings recorded with group size. From these published and unpublished sight-ings of minke whale feeding activity, we define the minke whale feeding BIA in waters less than 200 m in the southern and southwestern section of the Gulf of Maine, including Georges Bank, the Great South Channel, Cape Cod Bay and Massachusetts Bay, Stellwagen Bank, Cape Anne, and Jeffreys Ledge (Figure 2.1; Table S2.1). We include areas of the central Gulf of Maine to incorporate sight-ings of minke whale feeding in the shallow water around Parker Ridge and Cashes Ledge.

19 BIAs for Cetaceans: East Coast Region
Sei Whale (Balaenoptera borealis)General—Sei whales in U.S. East Coast waters are recognized as part of the Nova Scotia Stock (Donovan, 1991; Waring et al., 2014). Like other balaenopterids, sei whales migrate between high-latitude summer feeding areas and low-latitude winter breeding areas, but sei whales tend to occur in a more restricted range of latitudes in temper-ate waters (Mizroch et al., 1984a). Sightings from the 1978 to 1982 CeTAP surveys and data from the National Oceanic and Atmospheric Administration (NOAA) Fisheries shipboard surveys (Waring et al., 2014) show peak abun-dance of sei whales in U.S. Atlantic waters occurs in spring, particularly along the shelf break of Georges Bank, into the Northeast Channel, and southwest to Hydrographer Canyon. However, they are also present in winter months and were the most common large whale sighted during aerial surveys conducted from January through March 2011 (Palka, 2012). Sei whales are gener-ally associated with the deeper waters off the shelf break edge (Hain et al., 1985); however, Newhall et al. (2012) provide new insights into sei whale presence in shallower waters (also see “Feeding” section for another exception).
Sei whale conception occurs during a 5-mo period centering on the winter months, with ges-tation approximately 12 mo long (Mizroch et al., 1984a). No known mating or calving grounds have been found in U.S. Atlantic waters. Although a sei whale stranding in December 1972 on the coast of South Carolina (Mead, 1977) lends some evidence to a migratory corridor, no migratory corridor for sei whales has been identified in
U.S. Atlantic waters. Mitchell (1975) described a migration of sei whales from south of Cape Cod along the eastern coast of Canada in June and July with a return migration in September and October. This migration remains unverified and probably describes local seasonal movements.
Feeding—Known from whaling records (Jonsgård & Darling, 1977) and observed feeding behavior, sei whales in the North Atlantic feed pri-marily on copepods and secondarily on euphausi-ids (CeTAP, 1982; Mizroch et al., 1984a; Kenney & Winn, 1986; Baumgartner et al., 2011). During the CeTAP surveys, sei whales were observed feeding from April through July in the deeper waters off the southwestern and eastern edge of Georges Banks and into the southwestern section of the Gulf of Maine (CeTAP, 1982; Kenny & Winn, 1986). This has been shown to change in response to prey availability. In 1986, sei whales were reported feeding in the shallow waters of Stellwagen Bank from April through October in response to increased copepod availability (Payne et al., 1990; Schilling et al., 1992; Kenney et al., 1996). Waring et al. (2014) reported that sei whales feed at more inshore locations, such as the Great South Channel (in 1987 and 1989), when copepod abundance is elevated. During their vessel-based surveys from 1994 through 2011, PCCS recorded 58 instances of sei whale feeding activity from May through November around the shelf break areas of the southwestern section of Gulf of Maine and the eastern edges of Georges Bank (PCCS, unpub. data, 1994-2011). From these reports, publications, and unpublished PCCS data, the sei whale feeding BIA extends from the 25-m contour
1
East Coast Figures 1
2
Figure 2.1. Two minke whale feeding BIAs from March – November in the northeast Atlantic 3
substantiated through vessel based survey data and expert judgment. 4
5
Figure 2.2. Sei whale feeding BIA from May – November in the northeast Atlantic substantiated 6
through vessel based survey data and expert judgment. 7
8
9
66°W68°W70°W72°W
44°N
42°N
0 10050Kilometers
MA
NH
ME
RI
AtlanticOcean
CT
NY
-25
-100
-2000
-20066°W68°W70°W
44°N
42°N
40°N
MA
NH
ME
RI
Canada
AtlanticOcean
0 10050Kilometers
Figure 2.1. Two minke whale (Balaenoptera acutorostrata) feeding Biologically Important Areas (BIAs) from March through November in the northeast Atlantic substantiated through vessel-based survey data and expert judgment

20 LaBrecque et al.
off coastal Maine and Massachusetts west to the 200-m contour in central Gulf of Maine, includ-ing the northern shelf break area of Georges Bank (Figure 2.2; Table S2.2). The sei whale feeding BIA also includes the southern shelf break area of Georges Bank from 100 to 2,000 m and the Great South Channel. Their feeding activity in the U.S. Atlantic waters is concentrated from May through November with a peak in July and August.
Fin Whale (Balaenoptera physalus)General—Fin whales in U.S. Atlantic waters were first recognized as part of the Nova Scotia Stock (Donovan, 1991) but are now called the Western North Atlantic Stock (Waring et al., 2014). The Western North Atlantic Stock of fin whales are widely distributed over the U.S. continental shelf and shelf break from Cape Hatteras through the Gulf of Maine (Geo-Marine, Inc. [GMI], 2010; Waring et al., 2014), although rarely sighted in the deep basin of the Gulf of Maine and the shallow banks of Georges Bank (Hain et al., 1992). Fin whales were the most frequently sighted large whale species in the nearshore waters off New Jersey during GMI’s (2010) 24-mo survey (37 sightings, mostly of indi-vidual whales). The majority of these sightings occurred during winter (18 December to 9 April) and spring (10 April to 21 June) months. The most abundant sightings of fin whales occur in New England waters during spring and summer (CeTAP, 1982; Waring et al., 2014). Scattered sightings over the northeast shelf in winter and fall indicate that some fin whales are present during the non-feeding
season (Hain et al., 1992). In addition, acoustic data from Massachusetts Bay (Morano et al., 2012) indicate fin whale presence throughout the winter months. Acoustic data from the U.S. Navy’s Sound Surveillance System (SOSUS) arrays suggest that animals that do undertake southward migrations in the fall generally travel south past Bermuda and into the West Indies (Clark, 1995); however, a migration corridor for fin whales in the U.S. Atlantic EEZ is not known. Based on stranding data of neonates and observations of mother-calf pairs, Hain et al. (1992) suggest fin whale calv-ing occurs off the coast of the mid-Atlantic U.S. between October and January. Calving has not been verified in this area.
Feeding—Fin whales feed in higher latitude areas from March through October when primary production is high (Mizroch et al., 1984b). Fin whales feed primarily on euphausiids and small schooling fish such as capelin (Mallotus villosus) and sand lance (Ammodytes spp.) (Mizroch et al., 1984b; Pauly et al., 1998; Perry et al., 1999a). Reporting from the CeTAP (1982) surveys and additional data from University of Rhode Island aerial and shipboard surveys, Manoment Bird Observatory surveys, and NOAA Fisheries ship-board surveys from 1980 through 1988, Hain et al. (1992) noted a particular spring and summer feeding concentration “in an arc that begins in the Great South Channel southeast of Nantucket, runs northwestward along the 40-50 m con-tour to the east of Chatham, continues from the Provincetown area north across Stellwagen Bank, passes east of Cape Ann and ends at the north-east tip of Jeffreys Ledge” (p. 657). This area composed the largest feeding area reported for fin whales in the CeTAP study area. A second major fin whale feeding area was reported directly east of Montauk Point between the 15- and 50-m con-tours (Hain et al., 1992). Fin whale feeding during spring and summer was also observed as far south as the Delmarva Peninsula and north to the Bay of Fundy (Hain et al., 1992) but not at concentra-tions comparable to the Great South Channel area (Figure 2.3; Table S2.3).
Photo-identification records collected from 1974 to 1988 from the Gulf of Maine show that individual female fin whales exhibit feed-ing site fidelity in areas of the northern (lower Bay of Fundy, Seal Island, and Mt. Desert Rock, Maine) or the southern (Great South Channel, Jeffreys Ledge, and Stellwagen Bank) Gulf of Maine (Agler et al., 1993). From 1980 through 1987, 156 fin whales were individually identified through photo-identification techniques within the Massachusetts Bay area feeding grounds (Seipt et al., 1990). During this period, approximately 62% of the 156 individuals were observed in more
1
East Coast Figures 1
2
Figure 2.1. Two minke whale feeding BIAs from March – November in the northeast Atlantic 3
substantiated through vessel based survey data and expert judgment. 4
5
Figure 2.2. Sei whale feeding BIA from May – November in the northeast Atlantic substantiated 6
through vessel based survey data and expert judgment. 7
8
9
66°W68°W70°W72°W
44°N
42°N
0 10050Kilometers
MA
NH
ME
RI
AtlanticOcean
CT
NY
-25
-100
-2000
-200
66°W68°W70°W
44°N
42°N
40°N
MA
NH
ME
RI
Canada
AtlanticOcean
0 10050Kilometers
Figure 2.2. Sei whale (Balaenoptera borealis) feeding BIA from May through November in the northeast Atlantic, substantiated through vessel-based survey data and expert judgment

BIAs for Cetaceans: East Coast Region 21
than 1 y; and in some cases, individually known fin whales were observed within the Massachusetts Bay feeding grounds in as many as 8 y (Seipt et al., 1990). Clapham & Seipt (1991) suggest that these rates of return are evidence that site fidel-ity for the Western North Atlantic fin whale stock may be maternally determined. Fin whales were seen in the southern Gulf of Maine from March to October, while fin whales in the northern Gulf of Maine were seen only from June to October (Agler et al., 1993).
Unpublished sighting data of feeding fin whales from the PCCS spatially coincide with previously published data. Temporally, PCCS sightings of feeding occurred in all months in southwestern Gulf of Maine, extending the seasonal feeding BIA period to year-round in areas of the Gulf of Maine (PCCS, unpub. data, 1984-2011).
North Atlantic Right Whale (Eubalaena glacialis)General—North Atlantic right whales are season-ally distributed throughout East Coast U.S. waters. They are listed as endangered under the U.S. Endangered Species Act (ESA) and are one of the most critically endangered large whale species in the world (Best et al., 2001). Research conducted by various groups, including the New England Aquarium, NOAA Fisheries, PCCS, U.S. Fish and Wildlife Service, Georgia Department of Natural Resources, and Florida Fish and Wildlife Conservation Commission, suggest six major
habitat or congregation areas for the North Atlantic right whale: (1) coastal waters of the southeastern U.S., (2) the Great South Channel, (3) Georges Bank/Gulf of Maine, (4) Cape Cod Bay and Massachusetts Bay, (5) the Bay of Fundy, and (6) the Scotian Shelf (Waring et al., 2014).
Critical Habitat for the North Atlantic right whale was federally designated by NOAA Fisheries in 1994 for the Great South Channel, Cape Cod Bay and a section of Stellwagen Bank, and the waters adjacent to the coast of Georgia and the east coast of Florida (Federal Register [FR] 59[226], 28805-28835). Although we include the federally mandated Critical Habitat areas as refer-ence, calving, feeding, and mating BIAs for North Atlantic right whales expand beyond these areas.
Feeding—North Atlantic right whales primar-ily feed on copepods of the genus Calanus in New England, Bay of Fundy, and Scotian Shelf waters from late February through December (Kenney et al., 1986; Weinrich et al., 2000; Baumgartner & Mate, 2003; Baumgartner et al., 2003). Direct observations of feeding behavior from numerous boat-based and aerial surveys in New England and Canadian waters suggest four well-known, high-use feeding habitats in north-ern U.S. Atlantic waters: (1) Cape Cod Bay and Massachusetts Bay, (2) the Great South Channel, (3) Georges Bank/Gulf of Maine, and (4) the lower Bay of Fundy (Kenney et al., 2001; Waring et al., 2014; Figure 2.4; Table S2.4). Locations of North Atlantic right whale feeding activity com-piled from CeTAP (1982), commercial whale-watching trips, and the North Atlantic right whale sighting database also suggest that North Atlantic right whales feed at Jeffreys Ledge in the western Gulf of Maine (Weinrich et al., 2000).
Generally, North Atlantic right whales arrive and start feeding in Cape Cod Bay and Massachusetts Bay in late February with peak occurrence in March and April (Hamilton & Mayo, 1990). The primary spring feeding ground for the majority of the population is the Great South Channel (Kenney et al., 1995), and to a lesser extent, the northern edge of Georges Bank (Waring et al., 2014), from April through June with a peak in May (CeTAP, 1982; Kenney et al., 1995). Individuals and mother-calf pairs leave the Great South Channel and head to the Bay of Fundy in June and July. During their travels to the Bay of Fundy, North Atlantic right whales have been observed feeding at Jeffreys Ledge (Weinrich et al., 2000). Although individuals move among the feeding grounds during summer and fall (Mate et al., 1997), many right whales feed outside of U.S. waters in the Bay of Fundy, including the lower Bay of Fundy, east of Grand Manan Island, from July through September (Kenney et al., 2001). Of the known
2
10
Figure 2.3. Fin whale feeding BIAs in the northeast Atlantic: (1) June to October in the northern 11
Gulf of Maine; (2) year round in the southern Gulf of Maine; and (3) March to October east of 12
Montauk Point, substantiated through vessel based survey data, photo identification data, and 13
expert judgment. Also shown are the 15 m (solid line) and 50 m (dashed line) depth contours. 14
15
66°W68°W70°W72°W74°W44°N
42°N
40°N
MA
NH
ME
CT RI
Canada
AtlanticOcean
NY -50
-15
3
2
1
0 15075Kilometers
Figure 2.3. Fin whale (Balaenoptera physalus) feeding BIAs in the northeast Atlantic: (1) June to October in the northern Gulf of Maine; (2) year-round in the southern Gulf of Maine; and (3) March to October east of Montauk Point, substantiated through vessel-based survey data, photo-identification data, and expert judgment; also shown are the 15-m (solid line) and 50-m (dashed line) depth contours.

22 LaBrecque et al.
North Atlantic right whale feeding areas, only the Great South Channel and Cape Cod Bay have been designated Critical Habitat areas (FR 59[226], 28805-28835; Figure 2.4).
Reproduction—North Atlantic right whales have a gestation period of approximately 1 y. From mid-December through late March, preg-nant North Atlantic right whales give birth in the Critical Habitat calving grounds off Georgia and northeastern Florida (Knowlton et al., 1994). Although only one birth of a North Atlantic right whale has been observed in the Critical Habitat calving grounds (Zani et al., 2008), and one right whale birth was observed offshore of the defined shallow water calving habitat off north-ern Florida (Foley et al., 2011), most neonates and calves are first observed during dedicated North Atlantic right whale aerial surveys in the coastal waters of Georgia and northeast Florida during winter months. An outlier to these observations was the sighting of a newborn North Atlantic right whale mother-calf pair off Plymouth harbor, New England, in January 2013.
The currently designated Critical Habitat calv-ing grounds encompass waters from the shore out to 15 nmi from Altamaha River, Georgia, to Jacksonville, Florida, and the shore out to 5 nmi from Jacksonville to Sebastian Inlet, Florida (FR 59[226], 28805-28835; Figure 2.5). This habitat
boundary was based on annual observations of calv-ing female North Atlantic right whales during the 1980s and early 1990s, and descriptions of local habitat features, including the presence of cooler water temperatures occurring in nearshore, shallow habitats (FR 59[226], 28805-28835). Spatial cover-age of annual aerial surveys beyond the core Critical Habitat demonstrated that calving female North Atlantic right whales routinely use a broader habitat than that defined by the current Critical Habitat des-ignation. Habitat models indicated that peak calving North Atlantic right whale sighting rates occurred at sea surface temperatures between 13° to 15° C and in water depths between 10 to 20 m. Projecting these habitat features spatially indicated that calv-ing habitats occur over continental shelf waters as far north as Cape Lookout, North Carolina (Good, 2008; Keller et al., 2012). Calving North Atlantic right whales have been observed in waters off of South Carolina during aerial surveys conducted since 2004 (e.g., Schulte & Taylor, 2012), and North Atlantic right whales have been observed in low numbers north off Cape Lookout, North Carolina, during winter aerial surveys, including at least one calving female (McLellan et al., 2004). Calving North Atlantic right whales also occur as far south as Cape Canaveral, Florida, during winter with a restricted distribution in shallower waters close to shore (Keller et al., 2006). On their return from the winter calving grounds, the majority of mother-calf pairs use the lower section of the Bay of Fundy feed-ing grounds, north of U.S. waters, as a summer nurs-ery; however, some females consistently take their calves to unknown nursery areas (Schaeff et al., 1993; Malik et al., 1999).
Based upon these habitat analyses and calving North Atlantic right whale aerial sightings data, we describe the reproductive calving BIA for North Atlantic right whales in the southeastern U.S. to encompass waters from the shoreline to 25-m water depth between Cape Canaveral, Florida, and Cape Lookout, North Carolina (Figure 2.5; Table S2.5). This definition of the calving BIA does not spatially include the sighting by Foley et al. (2011); however, we expect the definition of calving BIA to expand and include the southern U.S. continental shelf as more survey data become available. Calving North Atlantic right whales use these habitats each year between mid-November and mid-April.
From November to January, non-calving North Atlantic right whales appear to use the central Gulf of Maine, including Outer Falls and Cashes Ledge, as a potential mating area (Cole et al., 2013; Figure 2.6; Table S2.5). This area was part of a demographic comparison of North Atlantic right whale habitats. The mating BIA was drawn to incorporate the greatest amount of sightings
3
16
Figure 2.4. North Atlantic right whale feeding BIAs in the northeast Atlantic: (1) June and July, 17
October – December on Jeffreys Ledge; (2) February to April on Cape Cod Bay and 18
Massachusetts Bay; and (3) April to June in the Great South Channel and on the northern edge of 19
Georges Bank substantiated through extensive vessel and aerial based survey data, photo 20
identification data, radio tracking data, and expert judgment. NOAA Critical Habitat designation 21
outlines are shown within areas 2 & 3. 22
23
66°W68°W70°W72°W44°N
42°N
40°N
MA
NH
ME
AtlanticOcean1
23
RI
0 10050Kilometers
CT
Figure 2.4. North Atlantic right whale (Eubalaena glacialis) feeding BIAs in the northeast Atlantic: (1) June and July, October to December on Jeffreys Ledge; (2) February to April on Cape Cod Bay and Massachusetts Bay; and (3) April to June in the Great South Channel and on the northern edge of Georges Bank, substantiated through extensive vessel- and aerial-based survey data, photo-identification data, radio-tracking data, and expert judgment; NOAA Critical Habitat designation outlines are shown within areas 2 and 3.

BIAs for Cetaceans: East Coast Region 23
in the central Gulf of Maine while following bathymetry contours to include Outer Falls and Cashes Ledge.
Migration—Although individual North Atlantic right whales move among the feeding grounds during the summer and can travel hundreds of miles within a month (Mate et al., 1997; Baumgartner & Mate, 2005), their true migration occurs in the
late autumn and late winter. In November and December, North Atlantic right whales leave the feeding grounds of the Bay of Fundy and Scotian shelf (non-U.S. waters) and migrate along the U.S. continental shelf to either the calving grounds in the southeastern U.S. or to unknown winter areas (Brown et al., 2001; Kenney et al., 2001; Whitt et al., 2013; Figure 2.7; Table S2.6). By late March, most right whales have left the calving grounds and traveled up the U.S. continental shelf to Cape Cod Bay (Kenney et al., 2001; Knowlton et al., 2002). Although North Atlantic right whales are known to travel along the continental shelf of the U.S. (Schick et al., 2009; Whitt et al., 2013), it is unknown if they use the entire shelf area during migration or restrict their movements to nearshore waters.
4
24
Figure 2.5. North Atlantic right whale calving ground BIA in the southeast Atlantic from mid-25
November to late April substantiated through extensive vessel and aerial based survey data, 26
photo identification data, radio tracking data, genetic analyses and expert judgment. NOAA 27
Critical Habitat designation is outlined within the area. 28
29
80°W 76°W34°N
30°N
FL
Atlantic
Ocean
GA
SC
NC
0 250125Kilometers
Figure 2.5. North Atlantic right whale calving BIA in the southeast Atlantic from mid-November to late April, substantiated through extensive vessel- and aerial-based survey data, photo-identification data, radio-tracking data, genetic analyses, and expert judgment; NOAA Critical Habitat designation is outlined within the area.
5
30
31
Figure 2.6. North Atlantic right whale mating BIA in the central Gulf of Maine from November 32
- January described from a demographic study of North Atlantic right whale habitats. 33
34
66°W68°W70°W72°W
44°N
42°N
MA
NH
ME
AtlanticOcean
0 10050Kilometers
RICT
Figure 2.6. North Atlantic right whale mating BIA in the central Gulf of Maine from November to January, described from a demographic study of North Atlantic right whale habitats
6
35
Figure 2.7. North Atlantic right whale migratory corridor BIA along the US east coast 36
substantiated through vessel and aerial based survey data, photo identification data, radio 37
tracking data, and expert judgment. Right whales migrate south to the calving grounds in 38
November and December, and migrate north to the feeding areas, the Bay of Fundy and 39
unknown areas in March and April. 40
41
42
70°W80°W 75°W
40°N
35°N
30°N
25°N
MANH
FL
CT
Canada
AtlanticOcean
0 400200Kilometers
GA
SC
NC
VA
NJ
DE
NY
MD
RI
Figure 2.7. North Atlantic right whale migratory corri-dor BIA along the U.S. East Coast, substantiated through vessel- and aerial-based survey data, photo-identification data, radio-tracking data, and expert judgment; right whales migrate south to the calving grounds in November and December, and migrate north to the feeding areas, the Bay of Fundy, and unknown areas in March and April.

24 LaBrecque et al.
Humpback Whale (Megaptera novaeangliae)General—The Gulf of Maine feeding stock is the predominant subpopulation of humpback whales in U.S. Atlantic waters (Waring et al., 2014). Other areas of feeding subpopulations in the North Atlantic include Iceland-Denmark, Southwest Greenland, Southern Labrador and east of Newfoundland, and the Gulf of the St. Lawrence (Katona & Beard, 1990; Perry et al., 1999b). Humpbacks from all the North Atlantic feeding areas migrate to calving and breeding grounds off the West Indies in winter (Mattila et al., 1989, 1994). Most sightings in the Gulf of Maine occur between May and October, with peaks in July and August (Robbins, 2007). In late October, most humpbacks start leaving the Gulf of Maine feed-ing grounds for the West Indies calving grounds. However, small numbers of animals have been sighted throughout the winter months (Robbins, 2007), and acoustic data demonstrate that some animals remain through early winter (Mattila et al., 1987; Vu et al., 2012). Little is known about the actual migratory path. It is thought that most hump-backs migrate both north and south in the open ocean, but some have been seen on the continental shelf off the mid-Atlantic U.S. during migration periods (Swingle et al., 1993; Barco et al., 2002; GMI, 2010). Visual (Department of Navy, 2011) and acoustic (Hodge, 2011) surveys near Onslow Bay, North Carolina, and Jacksonville, Florida, provide evidence of humpbacks along or near the continental shelf. Winter aerial surveys conducted by NOAA Fisheries have documented humpbacks off the coasts of North Carolina and Florida (Palka, 2012), and 17 sightings of humpback whales were recorded in all seasons during year-round visual surveys in the nearshore waters of New Jersey (GMI, 2010). Gulf of Maine humpbacks leave the calving grounds in early spring to return to the feed-ing grounds. Northbound migrants have been doc-umented in the feeding areas as early as late March, though encounter rates during visual surveys begin to increase substantially by May (Robbins, 2007). Humpback mating and calving grounds are not within the continental U.S. Atlantic waters.
Feeding—Humpback whales show strong, maternally directed feeding site fidelity (Clapham & Mayo, 1987). Humpbacks feed in the Gulf of Maine from March through December, with most feeding activity observed in June and July (PCCS, unpub. data, 1984-2011; Figure 2.8; Table S2.7). Studies of humpback whale ecology in the Gulf of Maine have been ongoing since the mid-1970s (Payne et al., 1986; Clapham & Mayo, 1987, 1990; Weinrich, 1991; Weinrich & Kuhlberg, 1991; Clapham et al., 1993; Weinrich et al., 1997; Friedlaender et al., 2009; Hazen et al., 2009) and have shown a link between the spatial and temporal
distributions of humpbacks in the Gulf of Maine and their prey, Atlantic herring (Clupea harengus) and sand lance (Ammodytes spp.). Payne et al. (1986) showed that humpbacks shifted from their primary feeding grounds on Georges Bank and the northern Gulf of Mexico to Stellwagen Bank and the Great South Channel in response to shifts in sand lance distribution.
Humpbacks have been observed in the waters off the U.S. mid-Atlantic (New Jersey to North Carolina) in all months of the year (Swingle et al., 1993; Wiley et al., 1995; Barco et al., 2002; GMI, 2010). Notably, most records are from January through March when whales are tradition-ally assumed to be in the breeding grounds (Barco et al., 2002). Swingle et al. (1993) and Wiley et al. (1995) suggest U.S. mid-Atlantic waters repre-sent a supplemental winter feeding ground used by juvenile and mature humpback whales of U.S. and Canadian North Atlantic stocks.
Harbor Porpoise (Phocoena phocoena) Small and Resident PopulationBased on genetic analyses of summer breed-ing populations (Rosel et al., 1999), there are four known populations of harbor porpoises in the western North Atlantic: (1) the Gulf of Maine/Bay of Fundy, (2) Gulf of St. Lawrence, (3) Newfoundland, and (4) Greenland populations (Gaskin, 1984, 1992; Read & Hohn, 1995). Harbor porpoises in U.S. Atlantic waters are distributed from the Bay of Fundy to North Carolina (Waring
7
43
Figure 2.8. Humpback whale feeding BIA, March through December, in the Gulf of Maine, 44
Stellwagen Bank and the Great South Channel substantiated through vessel and aerial based 45
survey data, photo identification data, radio tracking data and expert judgment. 46
47
66°W68°W70°W72°W44°N
42°N
MA
NH
ME
CT RI
Canada
AtlanticOcean
0 15075Kilometers
Figure 2.8. Humpback whale (Megaptera novaeangliae) feeding BIA, March through December, in the Gulf of Maine, Stellwagen Bank, and the Great South Channel, substantiated through vessel- and aerial-based survey data, photo-identification data, radio-tracking data, and expert judgment

BIAs for Cetaceans: East Coast Region 25
et al., 2014). All harbor porpoises seen in the Gulf of Maine and Bay of Fundy are part of the Gulf of Maine/Bay of Fundy population, but harbor por-poises sighted off the mid-Atlantic states during winter include porpoises from other western North Atlantic populations (Rosel et al., 1999).
Sightings have been documented by NOAA Fisheries ship and aerial surveys, strandings, and animals taken incidental to fishing reported by NOAA Fisheries observers. From July to September, harbor porpoises in U.S. waters (Gulf of Maine/Bay of Fundy) are concentrated in waters less than 150 m deep in the northern Gulf of Maine and southern Bay of Fundy (Gaskin, 1977; Kraus et al., 1983; Palka, 1995; Figure 2.9; Table S2.8). Lower densities have been observed in the upper Bay of Fundy and northern edge of Georges Bank during this time frame (Palka, 2000).
From October through December and April through June, harbor porpoises are broadly dis-persed from Maine to New Jersey with the major-ity of the population located on the continental shelf (Waring et al., 2014), although they have been tracked in waters greater than 1,800 m deep (Westgate et al., 1998).
From January through March, intermediate densities of harbor porpoises are found in waters off New Jersey to North Carolina, and lower den-sities are found in waters off New York (Waring et al., 2014). Fifty-one sightings of harbor por-poise were recorded in the nearshore waters of New Jersey from January to March during a 24-mo
period between January 2008 and December 2009 (GMI, 2010). No migratory corridor between the Bay of Fundy and North Carolina is known.
Bottlenose Dolphin (Tursiops truncatus) Small and Resident PopulationsBottlenose dolphins in the U.S. East Coast waters range from Long Island, New York, to the Florida peninsula and inhabit estuarine coastal, conti-nental shelf, and continental slope waters. There are two genetically distinct ecotypes—nearshore (also referred to as coastal) and offshore (Mead & Potter, 1995; Hoelzel et al., 1998; Torres et al., 2003); however, studies support the existence of small and resident populations in several estuarine systems along the East Coast of the U.S. All of the small and resident populations of bottlenose dol-phins summarized here are described in the stock assessment reports produced by NOAA Fisheries. We do not present information on migratory popu-lations even though some of the small and resident populations are migratory during parts of the year.
Northern North Carolina Estuarine System Population (NNCES)—Photo-identification stud-ies, satellite telemetry data, and a stable isotope study suggest a small and resident population of bottlenose dolphins in the estuarine waters of North Carolina from Beaufort Inlet to the North Carolina/Virginia border (Urian et al., 1999; Cortese, 2000; Read et al., 2003). Satellite telemetry data (Waring et al., 2014) and photo-identification data indicate that the NNCES pop-ulation occupies the waters of Pamlico Sound, North Carolina, and adjacent nearshore coastal waters (< 1 km from shore) from July through October (Figure 2.10; Table S2.9). Since Beaufort Inlet is the southern boundary of NNCES dol-phins and the northern boundary of Southern North Carolina Estuarine (SNCES) dolphins, individuals from these two groups likely overlap there in summer months. In the late fall and winter, November through March, the NNCES bottle-nose dolphins move out of Pamlico Sound and into the adjacent nearshore waters (Figure 2.10; Table S2.9), likely overlapping with the Northern Migratory Stock of bottlenose dolphins (Waring et al., 2014). The geographical boundaries for this resident population are based on ongoing photo-identification studies and are subject to change upon further study of dolphin residency patterns in North Carolina.
Southern North Carolina Estuarine System Population (SNCES)—Long-term photo-iden-tification studies, satellite telemetry data, and recent genetic analysis suggest a small and resi-dent population of bottlenose dolphins in estua-rine and nearshore (< 3 km from shore) waters of North Carolina from Beaufort Inlet to the
8
48
49
Figure 2.9. Harbor porpoise small and resident population in the Gulf of Maine, July to 50
September, substantiated through vessel and aerial based survey data, genetic analyses and 51
expert judgment. 52
53
68°W70°W
45°N
44°N
43°N
MA
NH
ME
AtlanticOcean
0 10050Kilometers
Figure 2.9. Harbor porpoise (Phocoena phocoena) small and resident population in the Gulf of Maine, July to September, substantiated through vessel- and aerial-based survey data, genetic analyses, and expert judgment

26 LaBrecque et al.
North Carolina/South Carolina border, includ-ing the Cape Fear River (Urian et al., 1999; Read et al., 2003; Rosel et al., 2009; Waring et al., 2014). Limited data from satellite telemetry stud-ies (Waring et al., 2014), along with photo-identi-fication studies, suggest that bottlenose dolphins in the SNCES population occupy Bogue Sound and the estuarine and nearshore waters south to the Cape Fear River from July through October (Figure 2.11; Table S2.10). Since Beaufort Inlet is the northern boundary of SNCES dolphins and the southern boundary of NNCES dolphins, indi-viduals from these two groups likely overlap there during summer months. In late fall through spring, SNCES dolphins move to Cape Fear and its near-shore waters, likely overlapping with the Southern Migratory Stock (Waring et al., 2014). The geo-graphical boundaries for this resident population are based on ongoing photo-identification studies and are subject to change upon further study of dolphin residency patterns in North Carolina.
Charleston Estuarine System Population—High site fidelity of bottlenose dolphins sug-gests a year-round resident population centered in Charleston Harbor, South Carolina, and rang-ing from Price Inlet to the North Edisto River, including the Ashley, Cooper, and Wando Rivers (Waring et al., 2014; Figure 2.12; Table S2.11). Speakman et al. (2006) reviewed photo-identifi-cation, remote biopsy, capture-release, and radio-tracking data collected from 1994 through 2003
from these geographic areas. Eight-hundred and thirty-nine dolphins were individually identified, with 115 (14%) sighted more than 10 times. Of the 115 individuals who were resighted on mul-tiple occasions, 81% were sighted over a period greater than 5 y, and 44% were sighted over a period of 7.7 to 9.8 y.
9
54
55
Figure 2.10. Small and resident bottlenose dolphins in the Northern North Carolina Estuarine 56
System substantiated through vessel based survey data, photo identification data, radio tracking 57
data and expert judgment. Striped and solid area active July through October; solid area also 58
active November through March. 59
60
75°W76°W77°W78°W79°W36°N
35°N
34°N
NC
Atlantic
Ocean
VA
Pamlico
Sound
0 10050Kilometers
SC
Figure 2.10. Small and resident bottlenose dolphins (Tursiops truncatus) in the Northern North Carolina Estuarine System, substantiated through vessel-based survey data, photo-identification data, radio-tracking data, and expert judgment. Striped and solid area active July through October; solid area also active November through March.
10
61
Figure 2.11. Small and resident bottlenose dolphin BIA in the Southern North Carolina 62
Estuarine System from July through October substantiated through vessel based survey data, 63
photo identification data, radio tracking data and expert judgment. 64
65
77°W78°W79°W
35°N
34°N
NC
Bogue
Sound
Atlantic
Ocean 0 5025Kilometers
SC
Figure 2.11. Small and resident bottlenose dolphin BIA in the Southern North Carolina Estuarine System from July through October, substantiated through vessel-based survey data, photo-identification data, radio-tracking data, and expert judgment
11
66
67
Figure 2.12. Small and resident bottlenose dolphin year round population from Prince Inlet, SC 68
to the North Edisto River, centered on Charleston Harbor, substantiated through vessel based 69
survey data, photo identification data and expert judgment. 70
71
^
^
Charleston
Prince Inlet
80°W
33°N
32°3
0'N
0 2010Kilometers
SC
Atlantic
Ocean
Figure 2.12. Small and resident bottlenose dolphin year-round population from Prince Inlet to the North Edisto River, South Carolina, centered on Charleston Harbor, substantiated through vessel-based survey data, photo-identification data, and expert judgment

BIAs for Cetaceans: East Coast Region 27
Northern Georgia/Southern South Carolina Estuarine System Population—Photo-identification studies from 1994 to 1998 suggest a year-round resident population of bottlenose dolphins from St. Helena Sound, South Carolina, to Ossabaw Sound, Georgia, including the estuarine waters associated with the sounds and rivers of this area (Gubbins, 2002a, 2002b, 2002c; Figure 2.13; Table S2.12). Resident dolphins were observed 10 to 116 times during this study. Although the northern area of this population abuts the Charleston Harbor population, no photo-identification matches have been made between the two populations (Urian et al., 1999). The geographical boundaries for this resident population are subject to change upon further study of dolphin residency patterns in South Carolina and Georgia.
Southern Georgia Estuarine System Population—Genetic analysis of bottlenose dolphins biopsied from the estuarine and intercoastal waterways from Altamaha Sound, Georgia, to the Cumberland River, and including the Turtle/Brunswick River estuarine system (Figure 2.14; Table S2.13), shows a signifi-cant differentiation from animals biopsied in north-ern Georgia and southern South Carolina (Waring et al., 2014). Bottlenose dolphins from the Turtle/Brunswick River Estuarine System also exhibit con-taminate loads consistent with long-term site fidelity (Pulster & Maruya, 2008).
Jacksonville Estuarine System Population—The Jacksonville Estuarine System bottlenose dolphin population has been defined as a resident
population based on photo-identification and genetic studies conducted during 1994 through 1997 (Caldwell, 2001; Waring et al., 2014). The geographic boundaries from the Cumberland River, Georgia, to Jacksonville Beach, Florida (Figure 2.15; Table S2.14), are based on the delineation of a photo-identification study area (Caldwell, 2001), which is also used by the NOAA Fisheries stock assessment report for this popula-tion (Waring et al., 2014). Within the Jacksonville Estuarine System, behavioral, photo-identifi-cation, and genetic analyses described two resi-dency patterns of bottlenose dolphins, northern and southern (Caldwell, 2001). Dolphins in the northern and southern sections of the study area had significantly different mitochondrial DNA haplotype and microsatellite allele frequencies (Caldwell, 2001). Dolphins in both the northern and southern sections of the study area showed strong site fidelity; however, dolphins from both groups were photographed outside their preferred areas. Because the geographic boundaries of this resident population are based on a pre-defined study area, the boundaries are subject to change upon further studies.
Indian River Lagoon Estuarine System Population—Bottlenose dolphins in the Indian River Lagoon estuarine system range from Ponce de Leon Inlet to Jupiter Inlet, Florida (Waring et al., 2014; Figure 2.16; Table S2.15). The geographic boundary is based on multiple studies of bottle-nose dolphins from 1979 to 2005. During a 4-y monitoring period from 1979 to 1982, none of 133 freeze-branded dolphins were observed outside of the Indian River Lagoon estuarine system (Odell
12
72
73
Figure 2.13. Northern Georgia / Southern South Carolina Estuarine System year round 74
bottlenose dolphin resident population BIA substantiated through vessel and aerial based survey 75
data, photo identification data, radio tracking data and expert judgment. Area spans from St. 76
Helena Sound, SC to Ossabaw Sound, GA. 77
78
^
^Savannah
Hilton Head Island
80°30'W81°W
32°3
0'N
32°N
0 3015
Kilometers
SC
GA
Atlantic
Ocean
Figure 2.13. Northern Georgia/Southern South Carolina Estuarine System year-round bottlenose dolphin resident population BIA, substantiated through vessel- and aerial-based survey data, photo-identification data, radio-tracking data, and expert judgment; area spans from St. Helena Sound, South Carolina, to Ossabaw Sound, Georgia.
13
79
Figure 2.14. Southern Georgia year round bottlenose dolphin resident population BIA 80
substantiated through vessel based survey data, genetic analyses and expert judgment. 81
82
^Brunswick
81°W81°30'W
31°N
0 2010Kilometers
FL
GA
Atlantic
Ocean
Figure 2.14. Southern Georgia year-round bottlenose dol-phin resident population BIA, substantiated through vessel-based survey data, genetic analyses, and expert judgment

28 LaBrecque et al.
& Asper, 1990). Photo-identification studies from 1996 to 2001 indicate long-term site fidelity within the Indian River Lagoon estuarine system (Mazzoil et al., 2005, 2008b). Radio-tracks of two stranded and rehabilitated bottlenose dolphins from the Indian River Lagoon estuarine system indicate that neither dolphin left the system after their release (Mazzoil et al., 2008a).
Biscayne Bay Population—Bottlenose dol-phins in Biscayne Bay, Florida, have been the sub-ject of an ongoing photo-identification study since 1990 (Waring et al., 2014). Approximately 80% of individual bottlenose dolphins sighted in Biscayne Bay are considered long-term residents with multiple sightings over the study period (Waring et al., 2014). Genetic analysis and analysis of dol-phin associations indicate two overlapping social
14
83
84
Figure 2.15. Jacksonville, FL year round bottlenose dolphin resident population BIA 85
substantiated through vessel based survey data, photo identification data and expert judgment. 86
87
Jacksonville
81°30'W30°30'N
0 105Kilometers
FL
Atlantic
Ocean
Figure 2.15. Jacksonville, Florida, year-round bottlenose dolphin resident population BIA, substantiated through vessel-based survey data, photo-identification data, and expert judgment
15
88
89
Figure 2.16. Indian River Lagoon Estuarine System Population year round resident population 90
BIA for bottlenose dolphins substantiated through vessel and aerial based survey data, photo 91
identification data, radio tracking data and expert judgment. 92
93
^Melbourne, FL
80°W81°W
29°N
28°N
27°N
FL
Atlantic
Ocean
0 5025Kilometers
Figure 2.16. Indian River Lagoon estuarine system year-round resident population BIA for bottlenose dolphins, substantiated through vessel- and aerial-based survey data, photo-identification data, radio-tracking data, and expert judgment
16
94
95
Figure 2.17. Bottlenose dolphin year round small and resident population BIA in Biscayne Bay, 96
FL substantiated through vessel based survey data, photo identification data, genetic analyses 97
and expert judgment. 98
99
^Miami, FL
80°30'W 80°W
25°3
0'N
0 2010Kilometers
FL
Atlantic
Ocean
Figure 2.17. Bottlenose dolphin year-round small and resi-dent population BIA in Biscayne Bay, Florida, substantiated through vessel-based survey data, photo-identification data, genetic analyses, and expert judgment
17
100
101
Figure 2.18. Florida Bay bottlenose dolphin year round resident population BIA substantiated 102
through vessel and aerial based survey data, photo identification data, genetic analyses and 103
expert judgment. 104
105
106
107
^80°30'W81°W
25°30'N
25°N
FL
Atlantic
Ocean
Gulf
of
Mexico
0 4020Kilometers
Figure 2.18. Florida Bay bottlenose dolphin year-round resident population BIA, substantiated through vessel- and aerial-based survey data, photo-identification data, genetic analyses, and expert judgment

BIAs for Cetaceans: East Coast Region 29
groups within Biscayne Bay (Litz, 2007; Litz et al., 2012). The boundaries of the Biscayne Bay resident population, Hannover Inlet to the north and Card Sound Bridge to the south (Figure 2.17; Table S2.16), are subject to change upon compari-son of the Biscayne Bay photo-identification cata-log to the photo-identification catalog for Florida Bay (Waring et al., 2014).
Florida Bay Population—Dolphins in Florida Bay have been the subjects of an ongoing photo-identification study since 1999 by various groups, including the Dolphin Ecology Project, NOAA Fisheries, and Duke University (Engleby et al., 2002; Torres & Read, 2009; Waring et al., 2014). Approximately 577 unique individuals have been photographed in Florida Bay. These dolphins have been sighted throughout the Bay, are present year-round (Engleby et al., 2002), and demonstrate high site fidelity through the use of specialized foraging tactics (Torres & Read, 2009). Genetic analysis of bottlenose dolphins from Florida Bay and Biscayne Bay reveal a significant genetic dif-ferentiation between these locations (Litz et al., 2012). The boundaries of the Florida Bay resident population coincide with the geographic bound-aries of Florida Bay and fall within the Gulf of Mexico-side portion of the Florida Keys National Marine Sanctuary (Figure 2.18; Table S2.17).
Summary
In conclusion, 18 BIAs were identified for seven cetacean species within the East Coast region based on extensive expert review and synthesis of published and unpublished information. Identified BIAs included feeding for humpback, minke, sei, fin, and North Atlantic right whales; migratory for North Atlantic right whales; reproductive for North Atlantic right whales; and small and resident populations for harbor porpoise and several stocks of bottlenose dolphins. The geographic extent of the BIAs in the East Coast region ranged from 152 to 270,000 km2. The best estimates of abundance for the small and resident populations identified here ranged from approximately 61,000 to 80,000 for harbor porpoise (Waring et al., 2014), and approximately 120 to 1,000 for the various stocks of bottlenose dolphins (Waring et al., 2014); how-ever, some bottlenose dolphin stock abundance estimates are greater than 8 y old and deemed unreliable. The spatial extent of their overall ranges was on the order of 500 km2, though the NNCES Stock occupied over 8,000 km2. Although several cetacean species are known to have strong links to bathymetric features—for example, pilot whales and Risso’s dolphins aggregate at the shelf break in U.S. Atlantic waters, and Atlantic spotted dolphins occupy the shelf region from southern
Virginia to Florida—there is currently insufficient information to identify these areas as specific BIAs. Passive acoustic recorders have provided baseline evidence that minke whales (Risch et al., 2014) possibly migrate through U.S. waters off-shore of the shelf break, and that sei whales aggre-gate near meandering frontal eddies over the con-tinental shelf in the Mid-Atlantic Bight (Newhall et al., 2012). These types of data, in addition to new information on other species, should be con-sidered in future efforts to update and identify cetacean BIAs in the East Coast U.S. waters.
BIAs are not a regulatory designation and have no direct implications for regulatory processes. These BIAs represent the best available informa-tion about the activities in which cetaceans are likely to be engaged at a certain time and place. This information is essential to characterize, ana-lyze, and minimize anthropogenic impacts on cetaceans. Furthermore, BIAs may be used to identify information gaps and prioritize future research to better understand cetaceans, their hab-itat, and ecosystem.

Aquatic Mammals 2015, 41(1), 30-38, DOI 10.1578/AM.41.1.2015.30
3. Biologically Important Areas for Cetaceans Within U.S. Waters – Gulf of Mexico Region
Erin LaBrecque,1 Corrie Curtice,1 Jolie Harrison,2 Sofie M. Van Parijs,3 and Patrick N. Halpin4
1Marine Geospatial Ecology Lab, Duke University, Beaufort, NC 28516, USA E-mail: [email protected]
2 National Marine Fisheries Service, Office of Protected Resources, Silver Spring, MD 20910, USA 3Passive Acoustic Research Group, Northeast Fisheries Science Center, Woods Hole, MA 02543, USA
4Marine Geospatial Ecology Lab, Duke University, Durham, NC 27708, USA
Abstract
In this review, we merge existing published and unpublished information along with expert judg-ment to identify and support the delineation of 12 Biologically Important Areas (BIAs) in U.S. waters of the Gulf of Mexico for Bryde’s whales and bottlenose dolphins. BIAs are delineated for small and resident populations to enhance existing information already available to scientists, manag-ers, policymakers, and the public. BIAs ranged in size from approximately 117 to over 23,000 km2. BIAs are intended to provide synthesized infor-mation in a transparent format that can be readily used toward the analyses and planning under U.S. statutes that require the characterization and mini-mization of impacts of anthropogenic activities on marine mammals. BIAs are not intended to repre-sent all important areas for consideration in plan-ning processes; in particular, areas of high marine mammal density, typically identified based on a combination of systematic visual and/or acous-tic detections coupled with quantitative model-ing, are very important to consider, where avail-able, in any assessment. To maintain their utility, Gulf of Mexico BIAs should be re-evaluated and revised, if necessary, as new information becomes available.
Key Words: resident population, anthropogenic sound, species distribution, Bryde’s whale, Balaenoptera edeni, bottlenose dolphin, Tursiops truncatus, Gulf of Mexico
Introduction
This assessment coalesces existing published and unpublished information to define Biologically Important Areas (BIAs) in the U.S. waters of the Gulf of Mexico (shoreward of the Exclusive
Economic Zone [EEZ]) for cetacean species that meet the criteria for migratory areas, feeding areas, reproductive areas, and small and resident populations defined in Table 1.2 of Ferguson et al. (2015b) within this issue. A comprehensive over-view of the BIA delineation process; its caveats (Table 1.4), strengths, and limitations; and its relationship to international assessments also can be found in Ferguson et al. Table 1.3 provides a summary of all BIAs identified, including species, region, geographic location within the region, BIA type, month(s), and total area (in km2). A summary can also be found at http://cetsound.noaa.gov/important. Table 1.1 defines all abbre-viations used in this special issue. Metadata tables that concisely detail the type and quantity of infor-mation used to define each BIA are available as an online supplement.
Unlike the other regions discussed in this special issue, the waters of the Gulf of Mexico are enclosed by land on all sides. The only openings lead to the Northwest Atlantic Ocean through the Straits of Florida and to the Caribbean Sea through the Yucatan Channel. Within the U.S. Gulf of Mexico region, two species—Bryde’s whale (Balaenoptera edeni) and bottlenose dolphins (Tursiops trunca-tus)—meet the criteria for small and resident popu-lations. Several other cetacean species are found in the Gulf of Mexico, but these species do not meet the BIA criteria for small and resident populations nor do they meet the BIA criteria for reproductive areas, feeding areas, or migratory corridors. These species include sperm whale (Physeter macroceph-alus), dwarf sperm whale (Kogia sima), pygmy sperm whale (Kogia breviceps), Cuvier’s beaked whale (Ziphius cavirostris), Blainville’s beaked whale (Mesoplodon densirostris), Gervais’ beaked whale (M. europaeus), Risso’s dolphin (Grampus griseus), short-finned pilot whale (Globicephala macrorhynchus), false killer whale (Pseudorca

31 BIAs for Cetaceans: Gulf of Mexico Region
crassidens), pygmy killer whale (Feresa attenu-ata), killer whale (Orcinus orca), melon-headed whale (Peponocephala electra), rough-toothed dolphin (Steno bredanensis), pantropical spotted dolphin (Stenella attenuata), Atlantic spotted dol-phin (S. frontalis), spinner dolphin (S. longirostris), Clymene dolphin (S. clymene), and striped dolphin (S. coeruleoalba). Infrequently sighted cetacean species include Fraser’s dolphin (Lagenodelphis hosei), North Atlantic right whale (Eubalaena gla-cialis), and humpback whale (Megaptera novae-angliae). There are a few sightings and stranding reports of blue whale (Balaenoptera musculus), minke whale (B. acutorostrata), fin whale (B. phy-salus), and sei whale (B. borealis) from the Gulf of Mexico (Jefferson & Schiro, 1997), but these are most likely extralimital, occasional migrants, or strays from migration (Mullin & Fulling, 2004). Additional stocks of bottlenose dolphins should be evaluated in future efforts to create BIAs for these species in this region as new information becomes available.
Information pertaining to Gulf of Mexico BIAs was synthesized primarily from published data from systematic ship-based surveys, systematic aerial surveys, tagging studies, photo-identifica-tion studies, genetic analyses, and acoustic record-ings. Whaling records provided useful historical data but were not directly used in this synthesis. The Gulf of Mexico BIA assessment benefit-ted from the inputs and insights of eight experts familiar with Gulf of Mexico cetacean species.
Biologically Important Areas in the Gulf of Mexico Region
Bryde’s Whale (Balaenoptera edeni) Small and Resident PopulationBryde’s whales are the only baleen whale known to occur year-round in the Gulf of Mexico (Jefferson & Schiro, 1997; Waring et al., 2013). Bryde’s whales inhabit the world’s temperate and tropical waters, but there is continued discus-sion over the taxonomy of species in the Bryde’s whale complex. Presently, the Society for Marine Mammalogy’s Committee on Taxonomy (2014) recognizes two subspecies of Bryde’s whale: (1) B. e. edeni (Eden’s whale) and (2) B. e. brydei (offshore Bryde’s whale). Eden’s whale is a smaller form that primarily inhabits coastal and continental shelf waters of the northern Indian Ocean and the western Pacific Ocean (Rice, 1998). Bryde’s whale is a larger form and inhab-its tropical and warm temperate waters worldwide (Rice, 1998).
Most sightings of Bryde’s whales in the U.S. Gulf of Mexico are from shipboard and aerial line-transect surveys conducted by NOAA Fisheries
(Waring et al., 2013). These surveys were con-ducted at various times throughout all seasons and covered waters from the 20-m isobath to the sea-ward extent of the U.S. EEZ (Fulling et al., 2003; Mullin & Fulling, 2004; Maze-Foley & Mullin, 2006; Waring et al., 2013). Although survey effort covered all of the oceanic waters of the U.S. Gulf of Mexico, Bryde’s whales were only observed between the 100- and 300-m isobaths (max. depth 302 m; Maze-Foley & Mullin, 2006) in the east-ern Gulf of Mexico from south of Pensacola (head of DeSoto Canyon) to northwest of Tampa Bay, Florida (Waring et al., 2013; Rosel & Wilcox, 2014; Figure 3.1; Table S3.1). Additionally, Rice et al. (2014) deployed several autonomous record-ing units south of Panama City, Florida, from June through October 2010 and recorded three types of sounds putatively associated with Bryde’s whales over the entire period.
Rosel & Wilcox (2014) compared 23 indi-vidual Bryde’s whale genetic samples obtained in the Gulf of Mexico from 1992 to 2011 and two genetic samples from Bryde’s whales that stranded in North Carolina and South Carolina to genetic sequences of Eden’s whale and Bryde’s whale reported by Sasaki et al. (2006). Rosel & Wilcox (2014) found that the Gulf of Mexico Bryde’s whale population has a unique lineage and appears to be phylogenetically most closely related to Eden’s whale (B. e. edeni), the smaller form found in coastal and continental shelf waters of the northern Indian Ocean and the western Pacific Ocean. Bryde’s whales in the Gulf of Mexico are genetically distinct from other Bryde’s whales and
1
Gulf of Mexico Figure Legends 1
2
Figure 3.1. The year-round BIA for the small, resident Bryde’s whale population in the Gulf of 3
Mexico. Also shown are the 100 m and 300 m isobaths. 4
5
82°W84°W86°W88°W90°W
32°N
30°N
28°N
26°N
FL
GAAL
Gulf ofMexico
-100m
-300m
-300m-100m
0 200100Kilometers
MS
Figure 3.1. The year-round Biologically Important Area (BIA) for the small, resident Bryde’s whale (Balaenoptera edeni) population in the Gulf of Mexico; also shown are the 100- and 300-m isobaths.

32 LaBrecque et al.
not genetically diverse within the Gulf of Mexico (Rosel & Wilcox, 2014). The best estimate of Bryde’s whale abundance in the Gulf of Mexico is 33 individuals (Waring et al., 2013).
Bottlenose Dolphin (Tursiops truncatus) Small and Resident PopulationsBottlenose dolphins are distributed throughout the U.S. Gulf of Mexico from the bays, sounds, and estuaries to the deep, open waters. They are categorized as oceanic; continental shelf; coastal; or inhabiting bays, sounds, or estuaries (BSE). Of these categories, only the BSE dolphins are known to have small and resident populations that fulfill the BIA criteria. Residency patterns of BSE dolphins range from transient to seasonally migratory to stable resident communities. Year-round residency patterns of some individual BSE bottlenose dolphins have been reported for almost every survey area where photo-identification or tagging studies have been conducted (e.g., Irvine & Wells, 1972; Irvine et al., 1981; Wells, 1986a, 1986b, 1991, 2003; Wells et al., 1987, 1996a, 1996b, 1997; Scott et al., 1990; Shane, 1990, 2004; Bräger, 1993; Bräger et al., 1994; Fertl, 1994; Weller, 1998; Maze & Würsig, 1999; Lynn & Würsig, 2002; Hubard et al., 2004; Irwin & Würsig, 2004; Balmer et al., 2008; Urian et al., 2009; Tyson et al., 2011; Bassos-Hull et al., 2013). However, most of the resident populations also mix with seasonal migratory and transient individ-uals. Recent abundance estimates for most of the BSE populations are unavailable, but most popula-tions are thought to be small (< 150 individuals)
(Waring et al., 2013). More recent genetic studies utilizing microsatellite and mitochondrial DNA (mtDNA) markers identified significant genetic differentiation and, therefore, limited interbreed-ing between distant BSE populations and adjacent BSE populations and between BSE populations and adjacent coastal populations (Sellas et al., 2005). In addition, evidence for separate genetic population structure among coastal, continental shelf, and oceanic populations has also been found (Vollmer, 2011).
Photo-identification, tagging, and genetic stud-ies of bottlenose dolphins in the Gulf of Mexico provide baseline data for the existence of small, resident populations in the bays, sounds, and estu-aries of the Gulf of Mexico. Many of these stud-ies, along with the regional Gulf of Mexico aerial surveys conducted in 1984-1985 and 1993-1994 (Blaylock & Hoggard, 1994), formed the basis for the 32 distinct bottlenose dolphin stocks des-ignated by NOAA Fisheries for the contiguous, enclosed, or semi-enclosed bodies of water adja-cent to the northern Gulf of Mexico (Waring et al., 2013; Figure 3.2; Table 3.1).
Herein, we summarize the published data for the bottlenose dolphin BIAs. Many of these regions are defined by the boundaries of past survey efforts and may not reflect true population boundaries. In addition, not every BSE environment in the Gulf of Mexico has been surveyed. Additional research is needed in many of these areas to accurately define geographic boundaries for these bottlenose dolphin populations.
2
6
Figure 3.2. Gulf of Mexico bays, sounds and estuaries bottlenose dolphin stocks designated by 7
the NOAA Fisheries (Waring et al. 2013). Thirty-two areas are delineated and numbered, and 8
each represents a separate stock. 9
10
1
9
43
6
5
1614
22
24
10
7
11
8
13
1220
2
21
32
15
27
1817
19
23
30
28
31
26
25
29
80°W85°W90°W95°W
30°N
25°N
Mexico
FL
TX
LAMS
ALGA
Gulf
of
Mexico
0 300150Kilometers
Atlantic
Ocean
Figure 3.2. Gulf of Mexico bays, sounds, and estuaries (BSE) to which bottlenose dolphin (Tursiops truncatus) stocks were designated by NOAA Fisheries (Waring et al., 2013); 32 areas are delineated and numbered, and each represents a separate stock.

BIAs for Cetaceans: Gulf of Mexico Region 33
Aransas Pass Area, Texas—Multiple seasonal sightings of a few identifiable bottlenose dolphins in the Aransas Pass area suggest that some animals use this area year-round. Shane (1980) reported on the seasonal occurrence, daily movements, and individual distribution patterns of 21 bottlenose dolphins in the Aransas Pass area from June 1976 to May 1977. Of the 21 individuals, only seven were sighted in the area during each season, likely constituting year-round residents. Weller (1998) conducted a photo-identification study in the Aransas Pass area from 1991 to 1994 and identi-fied 782 individual bottlenose dolphins. Of these 782 dolphins, 35 were sighted during each year of the study, and 46 individuals were sighted during all four seasons. Although these studies provide evidence of year-round use of the Aransas Pass area, these dolphins may be part of a larger popu-lation consisting of individuals moving into and out of the area regularly (Weller, 1998).
The total geographic area utilized by bottlenose dolphins seen year-round is unknown because the field studies were spatially limited (Figure 3.3; Table S3.2). Currently, the dolphins in this area are considered to belong to the Redfish Bay, Aransas Bay, Copano Bay, San Antonio Bay, Espiritu Santo Bay Stock (Waring et al., 2013). The geographical boundaries for this stock are subject to change based on future studies of resi-dency patterns in the bays, sounds, and estuaries along the Texas coast.
Matagorda Bay/Espiritu Santo Bay Area, Texas—Information on movement and site fidel-ity of bottlenose dolphins from radio-tracking and photo-identification studies suggest a small, resident population of bottlenose dolphins in Matagorda Bay and Espiritu Santo Bay in Texas (Lynn & Würsig, 2002) (Figure 3.3; Table S3.3). Genetic analyses also indicate that dolphins in Matagorda Bay are a separate population from the
Table 3.1. Gulf of Mexico bays, sounds, and estuaries (BSE) bottlenose dolphin (Tursiops truncatus) stocks designated by NOAA Fisheries (Waring et al., 2013)
Stock designation Area number
Laguna Madre 1Nueces Bay, Corpus Christi Bay 2Copano Bay, Aransas Bay, San Antonio Bay, Redfish Bay, Espiritu Santo Bay 3Matagorda Bay, Tres Palacios Bay, Lavaca Bay 4West Bay 5Galveston Bay, East Bay, Trinity Bay 6Sabine Lake 7Calcasieu Lake 8Vermillion Bay, West Cote Blanche Bay, Atchafalaya Bay 9Terrebonne Bay, Timbalier Bay 10Barataria Bay 11Mississippi River Delta 12Bay Boudreau, Mississippi Sound , Lake Borgne 13Mobile Bay, Bonsecour Bay 14Perdido Bay 15Pensacola Bay, East Bay 16Choctawhatchee Bay 17St. Andrew Bay 18St. Joseph Bay 19St. Vincent Sound, Apalachicola Bay, St. George Sound 20Apalachee Bay 21Waccasassa Bay, Withlacoochee Bay, Crystal Bay 22St. Joseph Sound, Clearwater Harbor 23Tampa Bay 24Sarasota Bay, Little Sarasota Bay 25Lemon Bay 26Pine Island Sound, Charlotte Harbor, Gasparilla Sound 27Caloosahatchee River 28Estero Bay 29Chokoloskee Bay, Ten Thousand Islands, Gullivan Bay 30Whitewater Bay 31Florida Keys (Bahia Honda to Key West) 32

34 LaBrecque et al.
dolphins on the west coast of Florida (Sellas et al., 2005). During the NOAA Fisheries-sponsored dol-phin captures in July 1992, 35 bottlenose dolphins in southwestern Matagorda Bay and Espiritu Santo Bay were freeze branded. Of those 35 freeze-branded individuals, 10 were also fitted with radio transmitters and tracked from July through September (Lynn & Würsig, 2002). Seven of the 10 radio-tagged animals remained within approxi-mately 17 km from the capture area and stayed within the western portion of Matagorda Bay and eastern portion of Espiritu Santo Bay, except on three occasions when individuals were tracked 1 km offshore. The remaining three individuals stayed within the bay system but traveled farther (up to 35 km) from their capture sites and spent time in the western part of Espiritu Santo Bay. Similar results were documented based on resight-ing data of the freeze-branded dolphins collected during photo-identification surveys from May 1992 through June 1993. Some individual dolphins showed a strong preference for specific regions within the bays, and any overlap in the ranges of individuals occurred only at the range boundaries (Lynn & Würsig, 2002). At least 12 of the branded dolphins were thought to be resident to the area during the study period (Lynn & Würsig, 2002). Currently, Matagorda Bay and Espiritu Santo Bay are considered to harbor different bottlenose dol-phin stocks (Waring et al., 2013). Individuals in this study may belong to the Matagorda Bay Stock or the Copano Bay, Aransas Bay, San Antonio Bay, Redfish Bay, Espiritu Santo Bay Stock depend-ing on where they spend the majority of their time. Until more studies, especially genetic stud-ies, are conducted, individuals in the southwest-ern Matagorda Bay area and Espiritu Santo Bay should be considered year-round residents of the area.
San Luis Pass Area, Texas—Resightings from photo-identification studies (Maze & Würsig, 1999; Henderson, 2004; Irwin & Würsig, 2004) indicate the presence of resident bottlenose dol-phins in San Luis Pass, a relatively undisturbed area at the southwestern end of the Galveston Bay Estuary in Texas (Figure 3.3; Table S3.4). During an annual study in the mid-1990s, 37 individuals were identified in San Luis Pass and compared to individuals observed during surveys conducted in the area in 1990. Fourteen individuals were sighted during both survey periods, indicating some long-term site fidelity (Maze & Würsig, 1999). Irwin & Würsig (2004) also found evidence of residency based on 28 to 34 individuals from mark-recapture surveys conducted in San Luis Pass from 1997 to 2001. In all three studies, several individuals were also reported in the nearshore area of the Gulf of Mexico and in Galveston Bay, which suggests that
residents also travel through adjacent waterways. The geographical boundaries for these residents are based on photo-identification studies and are subject to change upon further studies of dolphin residency patterns in the bays, sounds, and estuar-ies of the Texas coast. The animals in these stud-ies would currently be considered members of the West Bay Stock (Waring et al., 2013).
Galveston Bay Area, Texas—Galveston Bay and the Galveston Ship Channel have been the study area for sporadic bottlenose photo-iden-tification studies since the mid-1980s (Bräger, 1993; Bräger et al., 1994; Fertl, 1994). Over 1,000 individuals in the bay have been identified, and approximately 200 have been resighted over the years (Bräger, 1993; Fertl, 1994), although some have not been seen during all seasons. Like the residents of San Luis Pass, bottlenose dolphins in Galveston Bay (Figure 3.3; Table S3.5) have also been sighted in the nearshore waters of the Gulf of Mexico. The geographical boundaries for this res-ident population are based on photo-identification studies and may change based on future studies of dolphin residency patterns in the bays, sounds, and estuaries of the Texas coast. The dolphins in this region are currently considered members of the Galveston Bay, East Bay, Trinity Bay Stock (Waring et al., 2013).
Caminada Bay and Southwest Barataria Bay Area, Louisiana—Year-round photo-identification studies were conducted from June 1999 to May 2002 in Caminada Bay and the southwest por-tion of Barataria Bay in Louisiana (Miller, 2003). During these surveys, 133 individual bottlenose dolphins were identified, and mark-recapture esti-mates suggested an abundance estimate between 138 and 238 individuals in this area (Miller, 2003). Although an estimate of resident individuals is unknown, Miller (2003) suggests the population in Barataria Basin is relatively closed with evidence of site fidelity (Figure 3.3; Table S3.6). The geo-graphical boundaries for this resident population are based on photo-identification studies and may change based on future studies of dolphin resi-dency patterns in the bays, sounds, and estuaries of the Louisiana coast. The dolphins in this area are currently considered members of the Barataria Bay Estuarine System Stock (Waring et al., 2013).
Mississippi Sound Area, Mississippi—Bottlenose dolphin research in Mississippi Sound has included freeze-branding/mark-recapture, photo-identification, and site fidelity and association pattern studies since the mid-1980s (Solangi & Dukes, 1983; Lohoefener et al., 1990; Hubard et al., 2004; Mackey, 2010). Between June 1982 and June 1983, 57 bottlenose dolphins were captured and freeze-branded in the Mississippi Sound as part of a mark-recapture study (Solangi & Dukes, 1983; Lohoefener et al., 1990).

BIAs for Cetaceans: Gulf of Mexico Region 35
Site fidelity analyses were not conducted, but due to the long-lasting nature of the freeze branding, Hubard et al. (2004) resighted two freeze-branded individu-als during a photo-identification study conducted from May 1995 to September 1996. By comparing the photo-identification catalogue of individual bot-tlenose dolphins sighted in the Mississippi Sound to photographs taken from previous surveys in the area, Hubard et al. also found that at least three more indi-vidual dolphins were sighted over multiple years, sug-gesting a resident population in the Mississippi Sound (Figure 3.3; Table S3.7). Using photo-identification data collected between May 2004 and April 2007 during a site fidelity and association pattern study, Mackey (2010) suggested a year-round resident popu-lation of approximately 71 individuals and a seasonal resident population of approximately 109 individu-als. A recent study by Miller et al. (2013) suggests a population abundance of 2,225 bottlenose dolphins in the Mississippi Sound, with the population larger in the summer than in the winter. This study was a dedicated line-transect abundance survey through a larger area of the sound, and it did not address dol-phin residency patterns or site fidelity; however, it did produce a density estimate (1.1 dolphin/km2) similar to the density estimate given by Hubard et al. (2004) (1.3 dolphin/km2), suggesting that abundance esti-mates of resident dolphins are underestimates. The geographical boundaries for this resident population are based on photo-identification studies and may change based on future studies of dolphin residency patterns in the bays, sounds, and estuaries of the Mississippi coast. The bottlenose dolphins in these studies are currently considered to be members of the Bay Boudreau, Mississippi Sound, Lake Borgne Stock (Waring et al., 2013).
St. Joseph Bay Area, Florida—Photo-identification and radio-tracking studies indicate a resident popula-tion of 78 to 152 bottlenose dolphins in St. Joseph Bay (Balmer et al., 2008; Figure 3.3; Table S3.8). The photo-identification studies were conducted across multiple seasons from February 2005 through July 2007 in nearshore waters of the Gulf of Mexico from Cape San Blas northwest to and including Crooked Island Sound and St. Joseph Bay (Balmer et al., 2008). In April 2005, nine bottlenose dolphins were outfitted with radio transmitters during a dolphin health assessment study and tracked until July. In July 2006, an additional 15 dolphins were tracked via radio transmitters until October. Individuals tagged in April ranged more than 40 km from the area, while individuals tagged in July tended to stay within or near St. Joseph Bay (Balmer et al., 2008). Photo-identification results support a similar trend in that there is an influx of bottlenose dolphins in St. Joseph Bay during the spring and autumn (Balmer et al., 2008). The dolphins in these studies are cur-rently considered members of the St. Joseph Bay
Stock; however, several individuals moved into the nearshore area and the mouth of St. Andrew Bay on multiple occasions, so dolphins may mix with or be members of the St. Andrew Bay Stock.
St. Vincent Sound and Apalachicola Bay Area, Florida—Photo-identification and mark-recapture analyses indicate a small and resident population of bottlenose dolphins in St. Vincent Sound and Apalachicola Bay (Figure 3.3; Table S3.9). Tyson et al. (2011) developed a photo-identification cat-alogue of bottlenose dolphins in this area based on data collected from boat-based surveys from May 2004 to October 2006. These studies were followed by a mark-recapture study in June 2007 and January/February 2008 to assess the distribu-tion and estimate the abundance of dolphins in this area. The survey area also included Alligator Harbor, but individuals were infrequently sighted there. Between May 2004 and February 2008, 624 distinctive individuals were sighted with 374 individuals seen more than once throughout the survey region. According to Tyson et al. (2011), St. Vincent Sound and Apalachicola Bay support a population of bottlenose dolphins that exhibits higher site fidelity patterns than St. George Sound and Alligator Harbor. However, the low sighting rates of individuals limit quantitative statements regarding site fidelity patterns in both regions. The geographical boundaries for this resident population are based on photo-identification stud-ies and may change based on future studies of dol-phin residency patterns in the bays, sounds, and estuaries of the Florida coast. Individuals in these studies are currently considered members of the St. Vincent Sound, Apalachicola Bay, St. George Sound Stock (Waring et al., 2013).
Tampa Bay, Florida—Bottlenose dolphins in Tampa Bay have been studied since the 1970s (Wells, 1986a, 1986b; Wells et al., 1996b). Urian et al. (2009) examined the distribution and associa-tion patterns of bottlenose dolphins in Tampa Bay from photo-identification studies conducted from 1988 to 1993 and identified 858 individual dolphins of which 102 dolphins were sighted 10 or more times. Over the course of the study, fewer new dol-phins were sighted suggesting a relatively closed population. Sellas et al. (2005) found evidence of population differentiation between Tampa Bay dolphins and those from the adjacent Sarasota Bay and coastal waters based on both mtDNA control region sequence data and nine microsatellite loci. Based on the findings of Urian et al. (2009), resi-dent dolphins of Tampa Bay can be further divided into five communities with significant differences in their association patterns and mean location. The geographic boundaries for this resident population are based on the cluster analyses of community membership presented by Urian et al. (2009) and
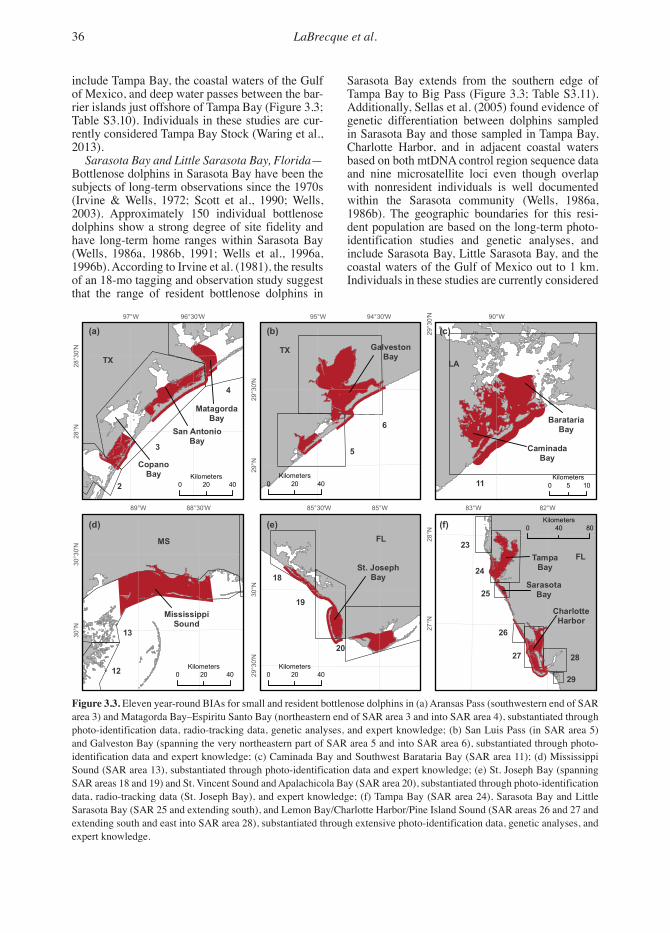
36 LaBrecque et al.
include Tampa Bay, the coastal waters of the Gulf of Mexico, and deep water passes between the bar-rier islands just offshore of Tampa Bay (Figure 3.3; Table S3.10). Individuals in these studies are cur-rently considered Tampa Bay Stock (Waring et al., 2013).
Sarasota Bay and Little Sarasota Bay, Florida—Bottlenose dolphins in Sarasota Bay have been the subjects of long-term observations since the 1970s (Irvine & Wells, 1972; Scott et al., 1990; Wells, 2003). Approximately 150 individual bottlenose dolphins show a strong degree of site fidelity and have long-term home ranges within Sarasota Bay (Wells, 1986a, 1986b, 1991; Wells et al., 1996a, 1996b). According to Irvine et al. (1981), the results of an 18-mo tagging and observation study suggest that the range of resident bottlenose dolphins in
Sarasota Bay extends from the southern edge of Tampa Bay to Big Pass (Figure 3.3; Table S3.11). Additionally, Sellas et al. (2005) found evidence of genetic differentiation between dolphins sampled in Sarasota Bay and those sampled in Tampa Bay, Charlotte Harbor, and in adjacent coastal waters based on both mtDNA control region sequence data and nine microsatellite loci even though overlap with nonresident individuals is well documented within the Sarasota community (Wells, 1986a, 1986b). The geographic boundaries for this resi-dent population are based on the long-term photo-identification studies and genetic analyses, and include Sarasota Bay, Little Sarasota Bay, and the coastal waters of the Gulf of Mexico out to 1 km. Individuals in these studies are currently considered
3
11
Figure 3.3. Eleven year-round BIAs for small and resident bottlenose dolphins in (a) Aransas 12
Pass (southwestern end of SAR area 3) and Matagorda Bay – Espiritu Santo Bay (northeastern 13
end of SAR area 3 and into SAR area 4) substantiated through photo-identification data, radio-14
tracking data, genetic analyses, and expert knowledge; (b) San Luis Pass (in SAR area 5) and 15
Galveston Bay (spanning the very northeastern part of SAR area 5 and into SAR area 6) 16
substantiated through photo-identification data and expert knowledge; (c) Caminada Bay and 17
Southwest Barataria Bay (SAR area 11) ; (d) Mississippi Sound (SAR area 13) substantiated 18
through photo-identification data and expert knowledge; (e) St. Joseph Bay (spanning SAR areas 19
18 and 19) and St. Vincent Sound and Apalachicola Bay (SAR area 20) substantiated through 20
96°30'W97°W
28°30'N
28°N
TX
2
3
4
94°30'W95°W
29°30'N
29°N
90°W
29°30'N
88°30'W89°W
30°30'N
30°N
85°W85°30'W
30°N
29°30'N
82°W83°W
28°N
27°N
TX
5
6
11
13
12
18
19
20
23
24
26
27 28
29
25
0 4020Kilometers
0 4020Kilometers
0 105Kilometers
0 4020Kilometers
0 4020Kilometers
0 8040Kilometers
LA
MS FL
FL
(a) (b) (c)
(d) (e) (f)
Copano
Bay
San Antonio
Bay
Galveston
Bay
Caminada
Bay
Barataria
Bay
Mississippi
Sound
St. Joseph
Bay
Tampa
Bay
Sarasota
Bay
Charlotte
Harbor
Matagorda
Bay
Figure 3.3. Eleven year-round BIAs for small and resident bottlenose dolphins in (a) Aransas Pass (southwestern end of SAR area 3) and Matagorda Bay–Espiritu Santo Bay (northeastern end of SAR area 3 and into SAR area 4), substantiated through photo-identification data, radio-tracking data, genetic analyses, and expert knowledge; (b) San Luis Pass (in SAR area 5) and Galveston Bay (spanning the very northeastern part of SAR area 5 and into SAR area 6), substantiated through photo-identification data and expert knowledge; (c) Caminada Bay and Southwest Barataria Bay (SAR area 11); (d) Mississippi Sound (SAR area 13), substantiated through photo-identification data and expert knowledge; (e) St. Joseph Bay (spanning SAR areas 18 and 19) and St. Vincent Sound and Apalachicola Bay (SAR area 20), substantiated through photo-identification data, radio-tracking data (St. Joseph Bay), and expert knowledge; (f) Tampa Bay (SAR area 24), Sarasota Bay and Little Sarasota Bay (SAR 25 and extending south), and Lemon Bay/Charlotte Harbor/Pine Island Sound (SAR areas 26 and 27 and extending south and east into SAR area 28), substantiated through extensive photo-identification data, genetic analyses, and expert knowledge.

37 BIAs for Cetaceans: Gulf of Mexico Region
members of the Sarasota Bay, Little Sarasota Bay Stock (Waring et al., 2013).
Lemon Bay/Charlotte Harbor/Pine Island Sound Area, Florida—Photo-identification stud-ies and genetic analyses have been conducted on bottlenose dolphins in Lemon Bay, Charlotte Harbor and Pine Island Sound, Florida (Shane, 1990, 2004; Wells et al., 1996a, 1997; Sellas et al., 2005; Bassos-Hull et al., 2013). Shane (2004) identified 385 individual dolphins from 1985 to 1998. A total of 60 dolphins sighted at the beginning of the study period were observed again in later years. However, new individu-als were still being identified at the end of the 16-y study period. Shane (2004) concluded that there are both seasonal and year-round residents in the Lemon Bay/Charlotte Harbor/Pine Island Sound Area (Figure 3.7; Table S3.12). Building on the surveys of Wells et al. (1996a, 1997), Bassos-Hull et al. (2013) conducted multi-week, multi-boat photo-identification surveys in the Lemon Bay/Charlotte Harbor/Pine Island Sound Area from September 2001 to September 2006 during summer (September-October) and winter (February) months. Nine-hundred and thirty-seven individuals (81.2% of the photo-identifi-cation catalog) met the study’s residency criteria (sighted in more than 1 y). Of these, 332 individu-als were sighted over 2 to 4 y, 261 individuals were sighted over 5 to 9 y, and 344 individuals were sighted over 10+ y. Based on both mtDNA control region sequence data and nine microsat-ellite loci, significant genetic differentiation was seen between Charlotte Harbor dolphins and those sampled in Tampa and Sarasota Bays, as well as those sampled in adjacent coastal waters, suggest-ing limited interbreeding among these popula-tions (Sellas et al., 2005) even though interactions with nonresident individuals are well documented within the Charlotte Harbor and Pine Island Sound communities (Wells et al., 1996a, 1997). Although NOAA Fisheries designates Lemon Bay dolphins as a separate stock, unpublished data suggest this stock should be combined with the Charlotte Harbor/Pine Island Sound Stock (Waring et al., 2013). The geographic boundaries for this resident population are based on the long-term photo-identification studies and genetic anal-yses and include Lemon Bay, Charlotte Harbor, and Pine Island Sound.
Additional Evaluation
Possible Small and Resident Populations that Do Not Meet BIA CriteriaNOAA Fisheries currently recognizes 32 stocks of bottlenose dolphins in the bays, sounds, and estuaries of the Gulf of Mexico (Waring et al.,
2013). The 11 stocks listed above meet our cri-teria for small and resident populations. Of the remaining 21 listed stocks, three have published data suggesting small and resident populations but do not meet the BIA criteria. These areas are Wolf Bay, Alabama, and Choctawhatchee Bay and Cedar Key, Florida.
During a photo-identification study from April 2006 through July 2007 in Wolf Bay, Alabama, 88 bottlenose dolphins were distinctly identified, 16 of which were identified as resident dolphins because they were sighted during the 12 core months of the study (Pabody, 2008). Although this study suggests a small and resident population in Wolf Bay, surveys over multiple years are needed to determine year-round and seasonal resident populations. The resident population described in Pabody (2008) does not meet the criteria for a small and resident bottlenose dolphin BIA.
Conn et al. (2011) utilized a novel mark-recap-ture modeling technique to estimate population levels of resident and transient bottlenose dol-phins in Choctawhatchee Bay, Florida. Although they provide abundance estimates for resident and transient populations of bottlenose dolphins, data to build the models were only collected over 1 y and do not meet the criteria for a small and resi-dent bottlenose dolphin BIA.
During a year-long study of bottlenose dolphin resightings and association patterns in the coastal waters around Cedar Key, Florida, 217 indi-vidual dolphins were classified into one of four categories based on the number of months they were sighted (Quintana-Rizzo & Wells, 2001). Seven percent (15 individuals) were sighted in either 5 or 6 mo, and 12 of the 15 were sighted on 10 occasions. This study suggests a small and resident population in waters around Cedar Key; however, surveys over multiple years are needed to determine year-round and seasonal resident populations. Therefore, the resident population described in Quintana-Rizzo & Wells (2001) does not meet the criteria for a small and resident bot-tlenose dolphin BIA.
Summary
In conclusion, 12 BIAs were identified for two cetacean species within the Gulf of Mexico region based on extensive expert review and synthesis of published and unpublished information. Only small and resident population BIAs were identi-fied for several of the BSE stocks of bottlenose dolphins and for the Bryde’s whale. The geo-graphic extent of the BIAs in the Gulf of Mexico region ranged from 117 to over 23,000 km2. The best estimate of abundance for the small and resi-dent population of Bryde’s whale is 33 (Waring

38 LaBrecque et al.
et al., 2013). The best estimates for the small and resident populations of bottlenose dolphins in the bays, sounds, and estuaries ranged from 42 to 2,225 (Miller et al., 2013; Waring et al., 2013); however, some bottlenose dolphin stock abun-dance estimates are greater than 8 y old and are deemed unreliable. The spatial extent of their overall ranges was on the order of 600 km2.
BIAs are not a regulatory designation and have no direct implications for regulatory processes. These BIAs represent the best available informa-tion about the activities in which cetaceans are likely to be engaged at a certain time and place. This information is essential to characterize, ana-lyze, and minimize anthropogenic impacts on cetaceans. Furthermore, BIAs may be used to identify information gaps and prioritize future research to better understand cetaceans, their hab-itats, and the ecosystem.

Aquatic Mammals 2015, 41(1), 39-53, DOI 10.1578/AM.41.1.2015.39
4. Biologically Important Areas for Selected Cetaceans Within U.S. Waters – West Coast Region
John Calambokidis,1 Gretchen H. Steiger,1 Corrie Curtice,2 Jolie Harrison,3 Megan C. Ferguson,4 Elizabeth Becker,5 Monica DeAngelis,6 and Sofie M. Van Parijs7
1Cascadia Research, Olympia, WA 98501, USA E-mail: [email protected]
2Marine Geospatial Ecology Lab, Duke University, Beaufort, NC 28516, USA 3 National Marine Fisheries Service, Office of Protected Resources, Silver Spring, MD 20910, USA
4National Marine Mammal Laboratory, Alaska Fisheries Science Center, National Marine Fisheries Service, NOAA, Seattle, WA 98115, USA
5Southwest Fisheries Science Center, Marine Mammal and Turtle Division, Santa Cruz, CA 95060, USA 6NOAA Fisheries West Coast Region, Long Beach, CA 90802, USA
7Passive Acoustic Research Group, Northeast Fisheries Science Center, Woods Hole, MA 02543, USA
Abstract
In this review, we combine existing published and unpublished information along with expert judg-ment to identify and support the delineation of 28 Biologically Important Areas (BIAs) in U.S. waters along the West Coast for blue whales, gray whales, humpback whales, and harbor porpoises. BIAs for blue whales and humpback whales are based on high concentration areas of feeding animals observed from small boat surveys, ship surveys, and opportunistic sources. These BIAs compare favorably to broader habitat-based density models. BIAs for gray whales are based on their migratory corridor as they transit between primary feeding areas located in northern latitudes and breeding areas off Mexico. Additional gray whale BIAs are defined for the primary feeding areas of a smaller resident population. Two small and resident popu-lation BIAs defined for harbor porpoises located off California encompass the populations’ pri-mary areas of use. The size of the individual BIAs ranged from approximately 171 to 138,000 km2. The BIAs for feeding blue, gray, and humpback whales represent relatively small portions of the overall West Coast area (< 5%) but encompass a large majority (77 to 89%) of the thousands of sightings documented and evaluated for each spe-cies. We also evaluate and discuss potential feed-ing BIAs for fin whales, but none are delineated due to limited or conflicting information. The intent of identifying BIAs is to synthesize existing biological information in a transparent format that is easily accessible to scientists, managers, poli-cymakers, and the public for use during the plan-ning and design phase of anthropogenic activities
for which U.S. statutes require the characterization and minimization of impacts on marine mammals. To maintain their utility, West Coast region BIAs should be re-evaluated and revised, if necessary, as new information becomes available.
Key Words: feeding area, migratory corridor, resident population, anthropogenic sound, species distribution, U.S. West Coast, North Pacific Ocean
Introduction
This review document coalesces existing published and unpublished information to define Biologically Important Areas (BIAs) in U.S. waters of the West Coast region (shoreward of the offshore boundary of the U.S. Exclusive Economic Zone [EEZ]) for cetacean species that meet the criteria for feeding areas, migratory corridors, and small and resident populations defined in Table 1.2 of Ferguson et al. (2015b) within this issue. A comprehensive over-view of the BIA delineation process; its caveats (Table 1.4), strengths, and limitations; and its rela-tionship to international assessments also can be found in Ferguson et al. Table 1.3 provides a sum-mary of all BIAs identified, including region, spe-cies, BIA type, and total area (in km2). A summary also can be found at http://cetsound.noaa.gov/important. Table 1.1 defines all abbreviations used in this special issue. Metadata tables that concisely detail the type and quantity of information used to define many of these BIAs are available as an online supplement. Our intent is to delineate BIAs by synthesizing information that is not publicly available from existing sources, is only partially represented through peer-reviewed publications,

40 Calambokidis et al.
or is not evident in habitat-based density (HD) models. The goal of identifying BIAs is to synthe-size existing biological information in a transpar-ent format that is easily accessible to scientists, managers, policymakers, and the public for use during the planning and design phase of anthropo-genic activities for which U.S. statutes require the characterization and minimization of impacts on marine mammals.
Within the West Coast region, three species—blue whale (Balaenoptera musculus), gray whale (Eschrichtius robustus), and humpback whale (Megaptera novaeangliae)—were evaluated and found to meet the criteria for feeding or migra-tory corridor BIAs. Fin whale (B. physalus) feed-ing BIAs are discussed, but no BIAs were defined due to limited or conflicting information. Small and resident population BIAs were created for harbor porpoises (Phocoena phocoena). BIAs for reproductive areas were not evaluated in this ini-tial exercise but should be considered in the future. Although none of the focal species included in this chapter have dedicated reproductive areas within U.S. waters, some are found with calves and, there-fore, might warrant designating BIAs for repro-ductive areas. Other species found in this region, including minke whale (B. acutorostrata), killer whale (Orcinus orca), beaked whales (Ziphiidae), and sperm whale (Physeter macrocephalus), were not evaluated during this initial BIA exercise; these species should be evaluated in future efforts to create or revise BIAs for cetaceans in this region.
The feeding BIA boundaries for the U.S. West Coast were based on two considerations: (1) direct observation of feeding or surfacing patterns and associated species strongly suggestive of feed-ing (and in some cases documented with archival tag data), and (2) presence of concentrations and repeat sightings of animals in multiple years in an area and a time of year where feeding is known to occur. The area boundaries were based on expert judgment, outlining areas of high sighting con-centrations from multiple years. The heterogene-ity in survey effort across the West Coast region was subjectively factored in to decrease the degree to which results were biased by areas searched, although allocating greater survey effort in areas where sightings had been documented in the past could also introduce bias. In addition, bathymet-ric features were considered in defining the BIAs when sightings were associated with a specific habitat, but the BIAs were restricted to the areas where the highest concentrations of sightings were documented in multiple years. The exact BIA boundaries for feeding blue, humpback, and gray whales were initially drawn to encompass sighting concentrations documented in multiple years and then processed in ArcGIS (ESRI, Redlands, CA,
USA), using the Buffer tool applied to the original polygon with a 5-km buffer distance for blue and humpback whales (with a 1 km from shore exclu-sion) and a 3-km buffer distance for gray whales (excluding any direct overlap with shoreline).
We compared the BIAs determined here with the mean predicted densities from the HD models generated from the Southwest Fisheries Science Center’s line-transect data collected since the 1990s (Becker et al., 2012a; Forney et al., 2012), the results of which are available to view on the CetMap website (http://cetsound.noaa.gov/cetsound). In those models, functional relation-ships between cetacean density and a variety of static and dynamic habitat variables were derived from the multi-year data and subsequently used to estimate two types of parameters: (1) annual densities that take into account each year’s oce-anic conditions and (2) multi-year average densi-ties (and variation therein) within the study area (Becker et al., 2012a). The data used to delineate the BIAs were predominantly based on coastal (< 50 nmi offshore), nonsystematic small boat surveys conducted to maximize encounters with target species (i.e., blue, fin, humpback, and gray whales) for photo-identification and tagging stud-ies. In contrast, the HD models were based on sys-tematic line-transect survey effort conducted from large ships at 3- to 5-y intervals in summer and fall that extended out to 300 nmi offshore. Due to their broad geographic area, coverage in each year is a course with lines spaced about 80 nmi apart. The two datasets provide complementary informa-tion on the occurrence of blue, fin, and humpback whales: the small boat surveys were better able to resolve nearshore, fine-scale patterns of occur-rence, whereas the HD models provided a system-atic assessment of broad-scale patterns of occur-rence throughout nearshore and offshore waters. We identify where the results of the BIA exercise and the HD models are concordant, complemen-tary, or subject to differing potential biases. It is our hope that this overview will aid the reader in gaining an understanding of the strengths, limita-tions, and combined implications of the informa-tion presented herein.
Biologically Important Areas in the West Coast Region
Blue Whale (Balaenoptera musculus)General—The blue whale, the largest of all ani-mals, is an endangered species of baleen whale that feeds almost exclusively on krill. With the advent of modern whaling ships, blue whales became a primary target of modern commercial whalers. Worldwide populations were reduced in the 20th century from over 200,000 to well under

41 BIAs for Cetaceans: West Coast Region
10,000 individuals, with most of those killed from the southern oceans (Gambell, 1976, 1979). Blue whales in the North Pacific Ocean are thought to consist of at least a western/central and an east-ern population based on distribution and vocal-izations, although historically there may have been as many as five populations in the North Pacific Ocean (National Marine Fisheries Service [NMFS], 1998). The eastern North Pacific blue whales are now known to range from the Costa Rica Dome to the Gulf of Alaska (Calambokidis et al., 2009a, 2009b, 2009c).
Since the 1970s, large concentrations of blue whales have been documented feeding off California each summer and fall (Calambokidis et al., 1990). Relatively low numbers of blue whales were taken by whalers off the U.S. West Coast (Rice, 1963, 1974), so it was initially unclear how the animals feeding off the U.S. West Coast were related to those from the primary areas where they had been taken farther north (NMFS, 1998). Shifts in blue whale distribu-tion that occurred since the late 1990s, including doc-umented movements of blue whales from California northward to areas off British Columbia and Alaska, have shown that blue whales inhabit a broad and shifting feeding area throughout the eastern North Pacific (Calambokidis et al., 2009a). These changes in blue whale distribution appear related to decadal oceanographic variations because the timing coin-cided with shifts in the Pacific Decadal Oscillation (Calambokidis et al., 2009a).
Unlike other baleen whale species in the eastern North Pacific whose populations have increased, such as fin, humpback, and gray whales, blue whales have not shown signs of recovery from whaling over the last 20 y. Blue whale population size from capture-recapture of photo-identified individuals has stayed relatively unchanged at around 2,000 since the early 1990s (Calambokidis
& Barlow, 2004, 2013), and average abundance of animals from line-transect surveys off the U.S. West Coast has declined from close to 2,000 in the 1990s to 500 to 800 in the 2000s (Barlow & Forney, 2007; Barlow, 2010). These two methodologies provided different measures of abundance: data from line-transect surveys estimated the number of animals in the region during the survey period, whereas the photo-identification data provided estimates of the total population size (Calambokidis & Barlow, 2004). Part of the reason for the divergence in the estimates from capture-recapture and line-transect density appears to be the switch in distribution related to oceanographic conditions and related prey abundance mentioned above. The most recent stock assessment report (Carretta et al., 2013) reports blue whale abundance for the Eastern North Pacific Stock to be 2,497 (CV = 0.24) based on the capture-recapture of photographically identified whales from 2005 to 2008 (Calambokidis et al., 2009a), although new estimates using an alternate and more promising capture-recapture model have indicated an estimate closer to 1,500 based on data through 2011 (Calambokidis & Barlow, 2013).
Feeding Area BIAs—Blue whales are not evenly distributed along the West Coast; rather, they are found in aggregations, especially on the continental shelf edge (Croll et al., 2005; Keiper et al., 2011), with greater tendency to aggregate off California than Oregon and Washington. Based on 9,054 visual sightings of 17,178 blue whales, primarily from small boat surveys con-ducted from 1986 to 2011 by Cascadia Research (www.cascadiaresearch.org) and collaborators along the U.S. West Coast, nine common feeding areas of high blue whale concentration have been identified (Table 4.1; Figure 4.1). Additionally, feeding by blue whales on krill has also been documented in eight of the nine BIAs using
Table 4.1. Blue whale (Balaenoptera musculus) BIAs with map references (see Figure 4.1), primary months, area (km2), number of sightings, and number of years for which the sightings have been documented
Map ref #
BIA name
Primary occurrence
Area (km2)
# of sightings
# years of sightings
1 Point Arena to Fort Bragg Aug-Nov 1,419 170 42 Gulf of the Farallones July-Nov 5,243 1,565 243 Monterey Bay to Pescadero July-Oct 2,378 801 164 Point Conception/Arguello June-Oct 1,743 151 105 Santa Barbara Channel and San Miguel June-Oct 1,981 3,117 186 Santa Monica Bay to Long Beach June-Oct 1,187 764 57 San Nicolas Island June-Oct 427 105 58 Tanner-Cortez Bank June-Oct 1,076 52 59 San Diego June-Oct 984 443 10
Total blue whale BIA areas and sightings 16,438 7,168 Total EEZ area and sightings 820,809 8,244
Percentages 2% 87%

42 Calambokidis et al.
suction-cup attached multi-sensor archival tags (Calambokidis et al., 2008b; Goldbogen et al., 2011, 2013; Friedlaender et al., 2014; Cascadia Research, unpub. data). Six of these areas are in or near the Southern California Bight.
Feeding BIAs for blue whales may extend farther north and for longer time periods than we currently are able to delineate. Despite lim-ited effort in winter, two of the three known blue whale sightings off Washington in the last 50 y have been in December and January; one of these, made in December 2011, consisted of at least five blue whales with other unidentified whales (Cascadia Research, unpub. data, 2011; see also Figure 4.1). Satellite-tag data from blue whales also show animals that were thought to be feed-ing offshore of Washington in the winter (Bailey et al., 2010; Irvine et al., 2014). Unlike many other mysticete whales, blue whales appear to continue feeding through their winter breeding season, both in northern latitudes and in productive offshore
lower latitude areas (Calambokidis et al., 2009c; Bailey et al., 2010).
Of the nine blue whale BIAs identified here, six overlap with areas of highest density identified in the HD model and the rest falling within areas of moderately high mean density (Figure 4.1). The areas of agreement occur in two regions: (1) the Southern California Bight, which represents the largest area of high density in the HD models and also is where a majority of the BIAs we identified occur; and (2) the Gulf of the Farallones where the BIA we identify (encompassing the area north including Cordell Bank and waters west of Bodega Bay) and where the HD model also predicts a high-density area. The BIAs are more centered along areas near the shelf edge as opposed to the mean density maps that show highest densities continuing all the way to shore, reflecting the HD models’ lack of resolution at finer spatial scales. The three BIAs not shown in the HD model as areas of highest mean density do agree with predicted areas of moderately
West Coast Region Figures 1
2
Figure 4.1. Nine blue whale Biologically Important Areas (BIAs), overlaid with all sightings and 3 predicted mean densities of blue whales from habitat-based density models generated from 4 Southwest Fisheries Science Center ship surveys (see Becker et al., 2012b). Panels a and b show 5 more detail for the areas where the BIAs are located. The BIAs are (from north to south): (1) Pt. 6 Arena to Fort Bragg, August – November; (2) Gulf of the Farallones, July – November; (3) 7 Monterey Bay to Pescadero, July – October; (4) Pt. Conception/Arguello, June – October; (5) 8 Santa Barbara Channel and San Miguel, June – October; (6) Santa Monica Bay to Long Beach, 9 June – October; (7) San Nicholas Island, June – October; (8) Tanner-Cortez Bank, June – 10 October; (9) San Diego, June – October (See Table 4.1 for details). 11
Seattle
Monterey
Portland
Santa Barbara
San Francisco
115°W120°W125°W130°W45
°N40
°N35
°N30
°N
Monterey
San Francisco
122°W124°W
39°N
38°N
37°N
San Diego
Los Angeles
Santa Barbara
118°W120°W
35°N
34°N
33°N
Feeding BIA
Sighting
Predicted mean density
whales/km2
0.0074 - 0.0102
0.0059 - 0.0073
0.0046 - 0.0058
0.0036 - 0.0045
0.0027 - 0.0035
0.0020 - 0.0026
0.0014 - 0.0019
0.0010 - 0.0013
0.0006 - 0.0009
0.0002 - 0.0005(a)
(a)
(b)
(b)
1
2
3
4
56
7
8
9
0 400200Kilometers
0 11055Kilometers
0 10050Kilometers
WA
OR
CA
CA
CA
Pacific
Ocean
Figure 4.1. Nine blue whale (Balaenoptera musculus) Biologically Important Areas (BIAs), overlaid with all sightings and predicted mean densities of blue whales from habitat-based density (HD) models generated from Southwest Fisheries Science Center ship surveys (see Becker et al., 2012a). Panels a and b show more detail for the areas where the BIAs are located. The BIAs are (from north to south) (1) Point Arena to Fort Bragg, August-November; (2) Gulf of the Farallones, July-November; (3) Monterey Bay to Pescadero, July-October; (4) Point Conception/Arguello, June-October; (5) Santa Barbara Channel and San Miguel, June-October; (6) Santa Monica Bay to Long Beach, June-October; (7) San Nicholas Island, June-October; (8) Tanner-Cortez Bank, June-October; and (9) San Diego, June-October (see Table 4.1 for details).

BIAs for Cetaceans: West Coast Region 43
high density and also encompass areas predicted to have highest densities in some of the annual HD models. These three BIAs include the following:
1. An area along the shelf edge from Point Arena north to Fort Bragg, which is located farther north than any of the highest density areas from the mean HD models but is predicted to be a high-density area in some of the annual models
2. The Monterey Bay area north to Pescadero Point, which borders areas of highest mean den-sity and which also is predicted to be a high-density area in some of the annual HD models
3. An area near Tanner and Cortez Banks where we have seen large blue whale concentrations on a number of surveys despite our low effort in this region
The six BIAs that we identified in the Southern California Bight represent only a fraction of the total area within the bight that the HD models predict to have high densities of blue whales. Our BIAs represent 2% of U.S. waters in the West Coast region but encompass 87% of the sightings
we document within U.S. waters. While there is some evidence of annual variation in blue whale occurrence in both sighting locations and in the annual HD models (Figure 4.2), the areas iden-tified represent those with the more consistent occurrence year to year.
Gray Whale (Eschrichtius robustus)General—Gray whales were historically distrib-uted in both the North Pacific and North Atlantic Oceans, although only the populations in the North Pacific Ocean remain today. In the North Pacific Ocean, two primary populations have been recognized: (1) an eastern (ENP) and (2) a west-ern (WNP) population. More recently, the dis-tinction between these two populations has been debated due to evidence that gray whales from the western feeding area are coming to breeding areas in the eastern North Pacific (Weller et al., 2012). These data suggest that animals from both eastern and western feeding areas migrate along the U.S. West Coast. Additionally, there is recent genetic evidence supporting the existence of a more distinct local subpopulation of ENP gray whales
12 Figure 4.2. Predicted mean densities and sightings (black dots) of blue whales from habitat-13 based density models generated from Southwest Fisheries Science Center ship surveys (see 14 Becker et al., 2012b) for individual years. US EEZ boundary (Pacific Coast) is also shown. 15 16
!!
!
!
!!!!
!! !
!!!
!
!!
!
!
!!
!
!!
120°W130°W
50°N
45°N
40°N
35°N
30°N Pacific
Ocean
!!!!!!!!!!!!
!!!
!!!!
!
!
!
!
!!!!!
!!
!!!!!
!!!
!!
!!
!
!
!
120°W130°W
50°N
45°N
40°N
35°N
30°N
!!!!!!!
!
!!!!
!
!
!
!!!!!!!!!!!!!
!
!
!! !!!
!
!!!
!!!! !!!!
!!
!!!!!
!
!!!
!!!!!
!
120°W130°W
50°N
45°N
40°N
35°N
30°N
!
!
!
!
!
!
!
!
!
120°W130°W
50°N
45°N
40°N
35°N
30°N
!
!!
!
!
!!
!
!
!
!!
!!!
!
!
!!!
!!!
!
120°W130°W
50°N
45°N
40°N
35°N
30°N
!
!
!
!
!
!
!
!
!
!
!
!
!
120°W130°W
50°N
45°N
40°N
35°N
30°N
Pacific
Ocean
Pacific
Ocean
Pacific
Ocean
Pacific
Ocean
Pacific
Ocean
CA
OR
WA
CA
OR
WA
CA
OR
WA
CA
OR
WA
CA
OR
WA
CA
OR
WA
0 1,000500Kilometers
1991 1993 1996
2001 2005 2008
Predicted density of
blue whales by year
(whales/km2 )
0.0000
0.0014
0.0090
0.0071
0.0057
0.0043
0.0029
Figure 4.2. Predicted mean densities and sightings (black dots) of blue whales from HD models generated from Southwest Fisheries Science Center ship surveys (see Becker et al., 2012a) for individual years; U.S. EEZ boundary (Pacific Coast) is also shown.

44 Calambokidis et al.
called the Pacific Coast Feeding Group (PCFG) (Frasier et al., 2011; Weller et al., 2012; Lang et al., 2014). The PCFG is a trans-boundary subgroup shared by the U.S. and Canada, and PCFG whales are observed almost year-round, though primarily from spring to fall. During the migration, PCFG whales are intermixed with the larger overall ENP population, but from June to November, they are the only gray whales within the region between northern California and northern Vancouver Island (from 41° N to 52° N) (Calambokidis et al., 2002, 2010, 2014; International Whaling Commission [IWC], 2011c). PCFG gray whales are also occasionally seen in waters farther north during summer and autumn, including off Kodiak Island, Alaska (Gosho et al., 2011). The primary feeding areas for ENP gray whales are thought to be in the Bering and Beaufort Seas, while WNP gray whales are thought to feed primarily near Sakhalin Island, Russia, in the Okhotsk Sea. Therefore, proposed feeding BIAs in this region focus on the feeding PCFG gray whales.
Gray whales in the PCFG likely mate with ani-mals from the ENP population. Although earlier work had not revealed significant genetic dif-ferences between PCFG and ENP gray whales (Ramakrishnan et al., 2001; Steeves et al., 2001), a later study of mitochondrial DNA (mtDNA) haplotypes (classification of maternally inherited mtDNA) using a larger sample size found signifi-cant differences between gray whales that were part of the PCFG and those from the overall ENP population (Frasier et al., 2011). This information is considered sufficient to represent the PCFG gray whales separately for the BIA exercise. Currently, PCFG whales are not treated as a distinct stock in the NMFS stock assessment reports, but this may change in the future based on the recently pub-lished genetic information mentioned above.
Photo-identification studies from 1998 through 2012 conducted between northern California
and northern British Columbia estimate that the PCFG comprises approximately 200 animals (Calambokidis et al., 2002, 2010, 2014) compared to the population of close to 20,000 gray whales for the overall eastern North Pacific. The photo-identification data suggest that the range of at least some of the PCFG whales exceeds the pre-defined 41°N to 52°N boundaries that have previ-ously been used in abundance estimates.
Feeding Area BIAs—Information from nonsys-tematic, visual boat-based surveys (4,907 sight-ings of 8,556 animals from 1991 to 2011) and tag-ging data collected by Cascadia Research (www.cascadiaresearch.org) and other collaborators (see Calambokidis et al., 2004, 2010, 2014; Moore et al., 2007) support the existence of five PCFG feeding aggregations within the West Coast region (Figure 4.3; Table 4.2).
Additionally, we designate a BIA in northern Puget Sound, around the south end of Whidbey and Camano Islands. Gray whales come to this area for 2 to 3 mo in the spring (typically begin-ning in March) to feed, but then generally leave the area before 1 June and, therefore, are not treated as PCFG gray whales (Calambokidis et al., 1992, 2002). While this area is not used by a large number of individuals, the same animals have been documented returning to this relatively small area for over 20 y, and it may, therefore, be impor-tant for this group (Calambokidis et al., 2014).
Most of the PCFG feed and are found in coastal nearshore waters, and our BIAs correspondingly are close to shore. Our BIAs encompass a rela-tively small portion of U.S. waters (0.2%) but con-tain 77% of the sightings we document. A dense aggregation of feeding gray whales was seen 20 to 25 km off the Washington coast in 2007 (Oleson et al., 2009), but it is unclear if this is a consistent feeding area, so it is not included as a BIA.
Migration—Gray whales migrate annually between their winter breeding grounds in the
Table 4.2. Gray whale (Eschrichtius robustus) BIAs with map references (see Figure 4.3), primary months, area (km2), number of sightings, and number of years for which the sightings have been documented
Map ref #
BIA name
Primary occurrence
Area (km2)
# of sightings
# years of sightings
1 Northern Puget Sound March-May 326 263 152 Northwest Washington May-Nov 515 744 143 Grays Harbor area, Washington April-Nov 298 183 174 Depoe Bay, Oregon June-Nov 199 92 95 Cape Blanco & Orford Reef, Oregon June-Nov 171 126 96 Point St. George, California June-Nov 418 110 10
Total PCFG gray whale BIA areas and sightings
1,927 1,518
Total EEZ area and sightings 820,809 1,968 Percentages 0.2% 77.1%

BIAs for Cetaceans: West Coast Region 45
lagoons of Baja California, Mexico, and their summer feeding grounds in North Pacific and Arctic waters. This migration is comprised of ENP, PCFG, and at least some of the gray whales that feed in the western North Pacific (Perryman & Lynn, 2002; Shelden et al., 2004; Weller et al., 2012). The spatial and temporal parameters of the gray whale migratory corridor that is found nearshore along the U.S. West Coast are relatively well defined based on tagging studies, dedicated line-transect ship and aerial surveys for marine mammals, land-based counts, infrared technology
to investigate nighttime passage rate, “coupled” aerial- and land-based visual surveys, and obser-vations from whale-watching operations and rec-reational and commercial fishermen (Daily et al., 1993; Rugh et al., 2001, 2006; Mate & Urbán-Ramirez, 2003).
The gray whale migration along the U.S. West Coast (Figure 4.4; Table S4.1) can be loosely categorized into three phases (Rugh et al., 2001, 2006). The Southbound Phase includes all age classes as they migrate to the lagoons in Mexico (October-March, peaking in December-March).
17 Figure 4.3. Six gray whale feeding Biologically Important Areas (BIAs) shown in four panels 18 a,b,c,d that span the West Coast Region from Washington to California. The BIAs are, from 19 north to south: (1) Northern Puget Sound, March – May;) (2) Northwestern WA, May – 20 November (3) Grays Harbor, April - November; (4) Depoe Bay, June – November; (5) Cape 21 Blanco & Orford Reef, June – November, (6) Point St. George, June – November (See Table 4.2 22 for details). Also shown are sightings primarily from small boat surveys for photographic 23 identification. 24
122°W48°N
California
Washington
California
Pacific
Ocean
Pacific
Ocean
Oregon
Puget
Sound
(a)
123°W124°W125°W
45°N
44°N
123°W124°W125°W
48°N
47°N
Pacific
Ocean
OR
WA
0 5025
Kilometers
0 2010
Kilometers
0 5025
Kilometers
(c)
1
2
3
4
124°W125°W
43°N
42°N
(d)
OR
CA
5
6
0 5025
Kilometers
Sighting
Feeding BIA
(b)
WA
Figure 4.3. Six gray whale (Eschrichtius robustus) feeding BIAs shown in four panels a, b, c, and d that span the West Coast region from Washington to California. The BIAs are, from north to south, (1) Northern Puget Sound, March-May; (2) Northwestern Washington, May-November; (3) Grays Harbor, April-November; (4) Depoe Bay, June-November; (5) Cape Blanco & Orford Reef, June-November; and (6) Point St. George, June-November (see Table 4.2 for details). Also shown are sightings primarily from small boat surveys for photographic identification.

46 Calambokidis et al.
Northbound Phase A consists mainly of adults and juveniles that lead the beginning of the north-bound migration (late January-July, peaking in April-July). Cow-calf pairs generally begin their northward migration later (March-July) and are referred to as Northbound Phase B. The three phases are not always distinct, and the sea ice cover in the Bering Sea may influence migration dates (Perryman & Lynn, 2002). Historical gray whale land-based counts suggest that the migra-tion rate (number of individuals/d) begins with a rapid spike, followed by moderate numbers over a few weeks before slowly tapering off (Rugh et al., 2006). The migration corridors used by most gray whales are within 10 km of the U.S. West Coast. The following breakdown by phase of distance from shore was used to define the three BIAs for the gray whale migration in this region based on the detailed information highlighted above and substantiated by expert judgment (Mate & Perryman, pers. comm., 2011):
1. Southbound Phase – 10 km2. Northbound Phase A – 8 km 3. Northbound Phase B – 5 km
Some gray whales may take a migration path far-ther offshore, so an additional potential presence buffer extending 47 km from the coastline was added to the BIAs. Although gray whales typi-cally tightly follow the coastline near the main-land, they have been observed taking a more direct route across larger bodies of water in California (Rice & Wolman, 1971; Mate & Urbán-Ramirez, 2003). Particularly during the northbound migra-tion, gray whales with calves migrate closer inside the bay than adults and juveniles. In the Southern California Bight, migrating gray whales may deviate farther from the mainland as some are rou-tinely seen near the Channel Islands (Daily et al., 1993).
Humpback Whale (Megaptera novaeangliae)General—Humpback whales occur widely in the world’s oceans and, although they remain endan-gered from hunting during the modern era of com-mercial whaling, many populations have made strong recoveries in the last 50 y (Calambokidis & Barlow, 2004; Barlow et al., 2011). In the North Pacific Ocean, humpback whales tend to alternate between winter breeding areas, including those in the western North Pacific Ocean, Hawai‘i, Mexico, and Central America, and more coastal feeding areas in spring, summer, and fall that range from California, north into Alaskan waters, and west to waters off Russia (Calambokidis et al., 2001, 2008a). Both photo-identification and genetic data indicate that, in the North Pacific Ocean, humpback
whales remain loyal to specific feeding and winter-ing areas, although their migrations between these areas reveal a mixed stock structure (Calambokidis et al., 2008a; Barlow et al., 2011; Baker et al., 2013).
Humpback whales are most abundant off the U.S. West Coast from spring through fall, with most migrating to low-latitude areas located pri-marily off Mexico and Central America in winter (Calambokidis et al., 2000). However, sightings and passive acoustic detections off the U.S. West Coast in winter and spring indicate a portion of the population can be in northern waters even in winter (Forney & Barlow, 1998; Oleson et al., 2009). There are also indications of seasonal shifts in occurrence both up and down the coast as well as inshore and offshore. During small boat surveys taken off the Washington coast in 2004 through 2008, humpback whales were seen farther offshore (along the shelf edge) and in lower densi-ties in winter and spring than during the remainder of the year (Oleson et al., 2009).
There is little interchange between the humpback whale feeding aggregation off California/southern Oregon and the feeding aggregation off Washington/
!
!
!
!
!San Diego
Yaquina Head
Point Vicente
Granite Canyon
Piedras Blancas
110°W115°W120°W125°W
45°N
40°N
35°N
WA
CA
OR
Southbound - All animals
Northbound Phase A
Northbound Phase B
Potential presence
! Whale survey station
Note: all 3 phasespotentially use this same lowermigration area.
(a)
(b)
(c)
San Francisco
Monterey
PacificOcean
0 300150Kilometers
0 2512.5Kilometers
0 2512.5Kilometers
Figure 4.4. BIAs for the three phases (Southbound, Northbound Phase A, and Northbound Phase B) and for the potential presence area of the gray whale migratory corridor (a) along the West Coast of the U.S. from California to Washington, (b) keeping just outside of San Francisco Bay, and (c) keeping just outside of Monterey Bay; substantiated through vessel-, aerial-, and land-based survey data, satellite-tag data, and expert judgment.

BIAs for Cetaceans: West Coast Region 47
southern British Columbia (Calambokidis et al., 1996, 2000, 2001, 2004, 2008a); this apparent seg-regation is not represented in the population units currently being considered by NMFS in the stock assessment reports. Genetic (mtDNA) studies have confirmed the distinctness of these Washington/British Columbia animals (Baker et al., 2008), and their abundance has been roughly estimated at about 200 animals in 2004-2005 (Calambokidis et al., 2008a).
Humpback whales that feed off the U.S. West Coast migrate primarily to wintering grounds off mainland Mexico and Central America (Calambokidis et al., 2000). The proportion of humpback whales going to different breeding grounds varies by latitude along the U.S. West Coast, with the highest proportions migrating to Central America from southern California feeding areas, in contrast to whales that feed in areas far-ther north that tend to migrate to areas off Mexico (Calambokidis et al., 2000, 2008a; Rasmussen et al., 2011). Humpback whales wintering off Central America have significant differences in mtDNA haplotypes from other North Pacific win-tering areas, including mainland Mexico (Baker et al., 2008). The Central American wintering ground is inhabited by the smallest number of whales that occur in the North Pacific wintering grounds, consisting of just a few hundred whales (Calambokidis et al., 2008a; Rasmussen et al., 2011).
Feeding Area BIAs—Based on 11,757 visual sightings of 27,224 humpback whales, primar-ily from small boat surveys conducted from 1986 to 2011 by Cascadia Research (www.cascadiaresearch.org) and collaborators along the U.S. West Coast, seven areas where humpback whales are commonly sighted feeding in high concentrations have been identified (Figure 4.5; Table 4.3).
Humpback whale distribution on feeding areas off California, Oregon, and Washington is clumped and concentrated in coastal waters from the con-tinental shelf to the shelf edge. HD models built on broad-scale line-transect survey data (extending 300 nmi offshore) capture coast-wide habitat rela-tionships (Becker et al., 2012b). Effort-corrected sighting rates from coastal photo-identification surveys (1991 to 2010; Calambokidis et al., 2009b) off central California reveal high concentrations of humpback whales along the continental shelf edge, with densities generally decreasing inshore of those areas (Keiper et al., 2011). Humpback whales have also been documented feeding on both krill and small fish in three of the BIAs off California based on data from suction-cup attached multisensor archival tags (Goldbogen et al., 2008; Cascadia Research, unpub. data). Localized coastal boat-based photo-identification surveys conducted in the West Coast region by Cascadia Research reveal a high degree of variation in some areas of humpback whale concentration across years, whereas other areas appear to be used fairly con-sistently (Calambokidis et al., 2009b). Inter-annual variations are apparent in the annual HD models (Figure 4.6).
Of the seven BIAs identified for humpback whales, by far the largest encompasses the broad area extending south from west of Bodega Bay to and including Monterey Bay and encompass-ing Cordell Bank and the Gulf of the Farallones. This region agreed closely with the single region of highest density in the mean HD model (Figure 4.6). Another broad area of agreement between our BIA delineations and the mean HD model is the absence of BIAs south of the northern Channel Islands, where the HD model similarly showed mean densities declining. While the BIA off northern Washington appeared as a moder-ately high-density area in the mean HD model, the
Table 4.3. Humpback whale (Megaptera novaeangliae) BIAs with map references (see Figure 4.5), primary months, area (km2), number of sightings, and number of years for which the sightings have been documented
Map ref #
BIA name
Primary occurrence
Area (km2)
# of sightings
# years of sightings
1 Northern Washington May-Nov 3,393 298 172 Stonewall and Heceta Bank May-Nov 2,573 62 73 Point St. George July-Nov 1,233 283 124 Fort Bragg to Point Arena July-Nov 1,591 184 85 Gulf of the Farallones–Monterey Bay July-Nov 9,761 5,196 256 Morro Bay to Point Sal April-Nov 1,908 472 147 Santa Barbara Channel–San Miguel March-Sept 2,639 2,250 18
Total humpback whale BIA areas and sightings
23,098 8,745
Total EEZ area and sightings 820,809 9,850 Percentages 3% 89%

48 Calambokidis et al.
33
Figure 4.5. Seven humpback whale feeding Biologically Important Areas (BIAs) overlaid with 34 all sightings and predicted mean densities of humpback whales from habitat-based density 35 models generated from Southwest Fisheries Science Center ship surveys (see Becker et al., 36 2012b). Panels a,b,c show more detail in the areas where the BIAs are located. The BIAs are 37 (from north to south): (1) Northern WA, May – November; (2) Stonewall and Heceta Bank, May 38 – November; (3) Point St. George, July – November; (4) Fort Bragg to Pt. Arena, July – 39 November; (5) Gulf of the Farallones – Monterey Bay, July - November; (6) Morro Bay to Pt. 40 Sal, April – November; (7) Santa Barbara Channel – San Miguel, March – September (See Table 41 4.3 for details). 42
110°W120°W130°W
45°N
40°N
35°N
30°N
122°W124°W
44°N
42°N
Monterey
San Francisco
Los AngelesSanta Barbara
118°W120°W122°W124°W
38°N
36°N
34°N
Feeding BIASighting
Predicted mean density
whales/km2
0.012412 - 0.0173350.008107 - 0.0124110.005330 - 0.008106
0.003835 - 0.0053290.002693 - 0.0038340.001802 - 0.0026920.001109 - 0.0018010.000573 - 0.0011080.000196 - 0.0005720.000002 - 0.000195
(a)
(b)
(b)
WA
OR
CA
CA
OR
Pacific
Ocean
Seattle
122°W123°W124°W125°W126°W
49°N
48°N
47°N
(a)
(c)
(c)
0 450225Kilometers
0 8040Kilometers
0 12562.5Kilometers
0 8040Kilometers
2
3
4
5
6
7
1
Figure 4.5. Seven humpback whale (Megaptera novaeangliae) feeding BIAs overlaid with all sightings and predicted mean densities of humpback whales from HD models generated from Southwest Fisheries Science Center ship surveys (see Becker et al., 2012a). Panels a, b, and c show more detail in the areas where the BIAs are located. The BIAs are (from north to south) (1) Northern Washington, May-November; (2) Stonewall and Heceta Bank, May-November; (3) Point St. George, July-November; (4) Fort Bragg to Point Arena, July-November; (5) Gulf of the Farallones–Monterey Bay, July-November; (6) Morro Bay to Point Sal, April-November; and (7) Santa Barbara Channel–San Miguel, March-September (see Table 4.3 for details).

BIAs for Cetaceans: West Coast Region 49
annual HD model results for 2001 and 2008 (2 of the 3 y this region was covered) showed high den-sities in this area (Figure 4.6). This represented the area used by a smaller feeding aggregation of humpback whales that is distinct from those feeding off California and Oregon (Calambokidis et al., 1996, 2001, 2004), and it meets the crite-ria of a feeding BIA. The BIA located west and southwest of San Miguel Island, although not in the highest density area in the HD model, is an area of high density in some of the annual HD model predictions. These annual predictions agree with our observations that, similar to blue whales in this region, it is an area inhabited intermittently by some of the highest concentrations of hump-back whales that have been observed in southern California.
The seven BIAs for humpback whales repre-sented only 3% of U.S. waters in the West Coast region, but the areas we identified encompassed 89% of the sightings documented. Along with the good agreement with the areas identified by the HD model, these BIAs effectively identify the most critical areas for humpback whales.
Harbor Porpoise (Phocoena phocoena) Small and Resident PopulationsHarbor porpoises in the northeastern Pacific Ocean range from Point Conception, California, through waters of British Columbia, and around the coast of Alaska to Point Barrow. They inhabit both coastal and inland waters, and are known to be particularly sensitive to anthropogenic impacts such as bycatch in fisheries and disturbance by vessel traffic or underwater noise. BIAs for this species are also designated for populations in the East Coast region (see LaBrecque et al., 2015, in this issue).
Several lines of evidence indicate segregation of separate harbor porpoise populations within the West Coast region. Early work showed regional differences in pollutant residues indicating that harbor porpoises do not move extensively along the U.S. West Coast (Calambokidis & Barlow, 1991). Based on more recent genetic studies and aerial surveys along the U.S. West Coast (Chivers et al., 2002, 2007; Carretta et al., 2009), NOAA Fisheries recognizes six distinct harbor porpoise populations in this region. Two of these popula-tions (the Northern California/Southern Oregon
43
Figure 4.6. Predicted mean densities and sightings (black dots) of humpback whales from 44 habitat-based density models generated from Southwest Fisheries Science Center ship surveys 45 (see Becker et al., 2012b) for individual years. US EEZ boundary (Pacific Coast) is also shown. 46
!
!
!
120°W130°W
50°N
45°N
40°N
35°N
30°N Pacific
Ocean
!
!!!
!!!!
!!!
!
!!!
!
!
!
120°W130°W
50°N
45°N
40°N
35°N
30°N
!!!!!!
!!!!!!!!!!!!!
!
!!
!!!
!!!! !!!!!!
!
!
!
!!!!
120°W130°W
50°N
45°N
40°N
35°N
30°N
!
!!!
!
!
!!
!
!!
!
!!!!!
!!!!
120°W130°W
50°N
45°N
40°N
35°N
30°N
!
!!!!
!! !!
! !!!!!!!!!
!
!
!
!
!!!
!!
!
!
120°W130°W
50°N
45°N
40°N
35°N
30°N
!!
!
!!
!!
!
!!
!!!!!!!!
!!
!
! !
!
!!
!!
!
120°W130°W
50°N
45°N
40°N
35°N
30°N
Pacific
Ocean
Pacific
Ocean
Pacific
Ocean
Pacific
Ocean
Pacific
Ocean
CA
OR
WA
CA
OR
WA
CA
OR
WA
CA
OR
WA
CA
OR
WA
CA
OR
WA
0 1,000500Kilometers
1991 1993 1996
2001 2005 2008
Predicted density of
humpback whales by year
(whales/km2 )
0.0000
0.0014
0.0108
0.0071
0.0060
0.0043
0.0029
Figure 4.6. Predicted mean densities and sightings (black dots) of humpback whales from HD models generated from Southwest Fisheries Science Center ship surveys (see Becker et al., 2012a) for individual years; U.S. EEZ boundary (Pacific Coast) is also shown.

50 Calambokidis et al.
Stock and the Northern Oregon/Washington Coast Stock) number in the tens of thousands of animals. The San Francisco/Russian River Stock and the Washington Inland Waters Stock are esti-mated at 9,189 (Carretta et al., 2009) and 10,682 animals (Laake, unpub. data, as cited in Carretta et al., 2013), respectively. The remaining two pop-ulations are located along the coast of California near Morro Bay and Monterey Bay. Due to their relatively small abundance estimates of just a few thousand animals (see below) and restricted geographic ranges, the Morro Bay Stock and the Monterey Bay Stock meet CetMap’s definition of a small and resident population, and BIAs were created for each stock (Figure 4.7). Stock boundar-ies were delineated based on (1) molecular genetic differences (Chivers et al., 2002), (2) differences in pollutant concentrations (Calambokidis & Barlow, 1991), and (3) density minima observed from aerial surveys (Forney et al., 1991; Forney, 1995, 1999; Carretta et al., 2009). All populations are described in the U.S. Pacific Marine Mammal Stock Assessments (Carretta et al., 2013).
Harbor porpoises are found primarily in waters shallower than about 200 m and are most abun-dant from shore to about the 92 m (50-fathom) iso-bath (Barlow, 1988; Forney et al., 1991; Carretta et al., 2001, 2009). Since 1999, aerial surveys off California have included coverage of lower den-sity areas to provide a more complete abundance estimate, extending offshore to the 200-m isobath, or a minimum distance from shore of 10 nmi south of Point Sur and 15 nmi north of Point Sur. Off Oregon and Washington, where the shelf extends farther offshore, abundance has been estimated based on aerial surveys extending offshore to about the 200-m isobath (Laake, unpub. data, as cited in Carretta et al., 2013).
Morro Bay Small Resident Population—The southernmost population, called the Morro Bay Stock, extends from Point Conception to Point Sur and from land to the 200-m isobath (Figure 4.7; Table S4.2). The most recent aerial surveys (2002 to 2007), conducted by the Southwest Fisheries Science Center (NMFS/NOAA), yielded an abun-dance estimate of 2,044 animals for this population (Carretta et al., 2009). Aerial surveys have consis-tently indicated a core area of higher density near the center of the population’s range between Point Arguello and Point Estero, with density decreas-ing toward the edges of the range (Forney et al., 1991; Forney, 1995, 1999; Carretta et al., 2009). The small core range of this small and resident harbor porpoise population makes this population particularly vulnerable to anthropogenic impacts.
Monterey Bay Small and Resident Population—The small and resident Monterey Bay population of harbor porpoises ranges from just south of
Point Sur to Pigeon Point and out to the 200-m isobath (Figure 4.7; Table S4.3). The most recent aerial surveys (2002 to 2007) yielded an abun-dance estimate of 1,492 animals for this popula-tion (Carretta et al., 2009). The greatest densities are generally found in the northern portions of Monterey Bay (Forney et al., 1991; Forney, 1995). The small geographic range makes this population particularly vulnerable to anthropogenic impacts.
Additional Evaluation
Fin whales (Balaenoptera physalus), the second largest of all the whales, are considered endan-gered under the U.S. Endangered Species Act (ESA) and occur widely in the world’s oceans (NMFS, 2010). Along with blue whales, they were heavily hunted in the 20th century during the modern era of commercial whaling. The popula-tion structure of fin whales is not well understood
47
Figure 4.7. Two harbor porpoise small and resident Biologically Important Areas (Monterey 48 Bay and Morro Bay) in California, substantiated through aerial survey data, genetic analyses and 49 expert judgment. Also shown is the 200 m isobath. 50
120°W122°W
38°N
36°N
34°N
Pigeon Point
Monterey
Point Sur
Point
Conceptio
n
CA
0 10050
Kilometers
Monterey Bay
Morro Bay
Pacific
Ocean
-200
-200
Figure 4.7. Two harbor porpoise (Phocoena phocoena) small and resident BIAs (Morro Bay and Monterey Bay) in California, substantiated through aerial survey data, genetic analyses, and expert judgment. Also shown is the 200-m isobath.

BIAs for Cetaceans: West Coast Region 51
in most areas, including the North Pacific Ocean. They occur in both nearshore and pelagic waters, and they feed on both krill and fish.
A number of factors complicate our under-standing of fin whales in the North Pacific Ocean, primarily because of uncertainties in their stock structure and movements along the U.S. West
51
Figure 4.8. Predicted mean densities of fin whales from habitat-based density models generated 52 from Southwest Fisheries Science Center ship surveys (see Becker et al., 2012b), overlaid with 53 all sightings (including from Cascadia Research small boat and opportunistic surveys). 54
Seattle
Monterey
Portland
San Diego
Los Angeles
San Francisco
115°W120°W125°W130°W
45°N
40°N
35°N
30°N
0 400200Kilometers
WA
OR
CA
Pacific
Ocean
Predicted mean density
whales per km2
0.0115 - 0.0136
0.0097 - 0.0114
0.0080 - 0.0096
0.0064 - 0.0079
0.0049 - 0.0063
0.0037 - 0.0048
0.0028 - 0.0036
0.0020 - 0.0027
0.0013 - 0.0019
0.0004 - 0.0012
Figure 4.8. Predicted mean densities of fin whales (Balaenoptera physalus) from HD models generated from Southwest Fisheries Science Center ship surveys (see Becker et al., 2012a), overlaid with all sightings (including from Cascadia Research small boat and opportunistic surveys)

52 Calambokidis et al.
Coast. Long-range movements along the entire U.S. West Coast do occur as shown by satellite and discovery tags (Mizroch et al., 2009; Falcone et al., 2011b); however, recent data demonstrate that not all fin whales undergo these long-range seasonal migrations. Photo-identification stud-ies of fin whales off the U.S. West Coast show short-range seasonal movements in spring and fall (Falcone et al., 2011a, 2011b). In addition, photo-identification studies off southern California show that within-region movements are more common than inter-regional movements, suggesting that regional subpopulations may exist. Carretta et al. (1995) and Forney & Barlow (1998) also indicate a year-round presence of fin whales off southern California. These relatively recent changes in fin whale distribution in the West Coast region are thought likely to be from post-whaling local population growth, combined with shifts in the overall distribution of fin whales throughout their range (Moore & Barlow, 2011).
Coastal photo-identification surveys (1991 to 2010), in addition to satellite tagging off California and Washington, suggest that the greatest densi-ties of fin whales occur near the continental shelf
and slope (Schorr et al., 2010). The behavioral states of these satellite-tagged fin whales could be inferred by their movements over time. Tagged individuals appear to move between likely feeding areas, demonstrating patterns of rapid movement between slopes and plateaus, where they remain for longer periods of time to feed (Schorr et al., 2010). Fin whales feeding on krill in both offshore and coastal areas in the Southern California Bight were also documented via suction-cup attached multisensor archival tags (Goldbogen et al., 2006; Friedlaender et al., 2014).
We considered 1,243 visual boat-based sight-ings of 2,638 fin whales mostly from nonsystem-atic surveys collected by Cascadia Research (www.cascadiaresearch.org) and collaborators, conducted primarily in coastal waters from 1991 to 2011 (Figure 4.8). There were areas of concentration of sightings, including (from south to north) Tanner and Cortez Banks area, San Clemente Basin, the shelf edge west of San Nicolas Island, waters off the Palos Verdes Peninsula, waters south and west of San Miguel Island, Santa Lucia Bank, and Guide and Grays Canyons off Washington.
55 Figure 4.9. Predicted mean densities and sightings (black dots) of fin whales from habitat-based 56 density models generated from Southwest Fisheries Science Center ship surveys (see Becker et 57 al., 2012b) for individual years. US EEZ boundary (Pacific Coast) is also shown. 58 59
!
!
!!!!!!!
!
!!!
!
120°W130°W
50°N
45°N
40°N
35°N
30°N Pacific
Ocean
!
!!!
!!
!!!!!!
!!!
!!!
!!!!!!!
!!!
!
!!!!
120°W130°W
50°N
45°N
40°N
35°N
30°N
!!!
!!!!
!!!
!!
!
!
!
!!!!!
!!!!!
!
!!!
!!!!!
!!!!
!
!
!!
!!
!!
!
!
!!!
120°W130°W
50°N
45°N
40°N
35°N
30°N
!
!!
!!
!
!
!!!!
!!!!!
!
!!
!!
!
!
!
!!
!
!
!!
120°W130°W
50°N
45°N
40°N
35°N
30°N
!!
!!
!!! !!
!
!
!
!
!
! !
!!
!
!
!!!
!!!!!!!!
!!!!!
!!
!!!!!!
!!!
!
!!
!!!!!!!!!!!!!
!!!
!
!!!
!
!
!
!
120°W130°W
50°N
45°N
40°N
35°N
30°N
!
!
!
!
!
! !! !!!!
!
!
!
!
!!!
!
!
!!
!
!!
!
!!!!!!!!!
!
!!
!!!!!
!
!
!!!!!!!!!
!
!!
!
!
!!!!!!
120°W130°W
50°N
45°N
40°N
35°N
30°N
Pacific
Ocean
Pacific
Ocean
Pacific
Ocean
Pacific
Ocean
Pacific
Ocean
CA
OR
WA
CA
OR
WA
CA
OR
WA
CA
OR
WA
CA
OR
WA
CA
OR
WA
0 1,000500Kilometers
1991 1993 1996
2001 2005 2008
Predicted density of
fin whales by year
(whales/km2 )
0.0000
0.0040
0.0080
0.0120
0.0160
0.0200
0.0240
0.0280
Figure 4.9. Predicted mean densities and sightings (black dots) of fin whales from HD models generated from Southwest Fisheries Science Center ship surveys (see Becker et al., 2012a) for individual years; U.S. EEZ boundary (Pacific Coast) is also shown.

BIAs for Cetaceans: West Coast Region 53
While most of these areas fall within predicted moderately high or highest densities based on the mean HD model (Figure 4.8), there are some significant differences that largely stem from the generally offshore distribution of fin whales and the more coastal and island-specific bias in our small boat-based sightings. The HD model, which is based on surveys that include offshore waters, predicts high densities primarily in off-shore waters outside the geographic range of most of our coastal surveys, including offshore waters centered about 100 nmi west of the Gulf of the Farallones and Monterey Bay (central California), and waters west of Point Buchon, from the coast to about 100 nmi offshore. While this latter area includes the Santa Lucia Bank, the predicted high-density area covers a much broader region. One factor that explains some of the discrepancy with the mean density model is the seasonal variation in fin whale distribution. Although fin whales are present year-round off California, their dis-tribution appears to shift somewhat seasonally. Sightings from California Cooperative Oceanic Fisheries Investigations (CalCOFI) surveys off southern California that were conducted during all seasons show fin whales closer to shore in winter and spring and farther offshore in summer and fall (Douglas et al., 2014), coinciding with the survey period for the data used in the HD models. There were also apparent annual differences in fin whale occurrence off the U.S. West Coast and this was somewhat apparent in the annual habitat density models for fin whales (Figure 4.9).
BIAs for fin whales were difficult to determine at this time for a number of reasons, including their offshore distribution (in comparison to our primarily more coastal effort), the poor knowl-edge of their population structure, and the poor agreement between our areas of concentration from the overall sightings and the HD models. BIAs are therefore not designated here but likely should include offshore areas identified in the HD models as well as occasional concentrations in more coastal areas as documented in our small boat surveys.
Conclusion
In conclusion, 28 BIAs were identified for four cetacean species within the West Coast region based on expert review and synthesis of pub-lished and unpublished information. Identified BIAs included feeding areas for blue whales, gray whales, and humpback whales; migratory corridors for gray whales; and small and resident popula-tions for harbor porpoises. The size of the individ-ual BIAs in this region ranged from approximately 171 km2 for a gray whale feeding area to over
138,000 km2 for the potential presence migratory corridor BIA for gray whales. The BIAs for feed-ing blue, gray, and humpback whales represent a relatively small portion of the overall West Coast area (< 5%) but encompass a large majority (77 to 89%) of the thousands of sightings documented and evaluated for each species. This BIA assess-ment did not include minke whales (Balaenoptera acutorostrata), killer whales (Orcinus orca), beaked whales (Ziphiidae), and sperm whales (Physeter macrocephalus); however, these species should be considered in future efforts to identify BIAs. Also, the species considered herein—blue whales, gray whales, and humpback whales—should be considered for reproductive BIAs.

Aquatic Mammals 2015, 41(1), 54-64, DOI 10.1578/AM.41.1.2015.54
5. Biologically Important Areas for Cetaceans Within U.S. Waters – Hawai‘i Region
Robin W. Baird,1 Danielle Cholewiak,2 Daniel L. Webster,1 Gregory S. Schorr,1 Sabre D. Mahaffy,1 Corrie Curtice,3 Jolie Harrison,4 and Sofie M. Van Parijs2
1Cascadia Research Collective, 218½ W. 4th Avenue, Olympia, WA 98501, USA E-mail: [email protected]
2Passive Acoustic Research Group, Northeast Fisheries Science Center, Woods Hole, MA 02543, USA 3Marine Geospatial Ecology Lab, Duke University, Beaufort, NC 28516, USA
4National Marine Fisheries Service, Office of Protected Resources, Silver Spring, MD 20910, USA
Abstract
Of the 18 species of odontocetes known to be pres-ent in Hawaiian waters, small resident populations of 11 species—dwarf sperm whales, Blainville’s beaked whales, Cuvier’s beaked whales, pygmy killer whales, short-finned pilot whales, melon-headed whales, false killer whales, pantropical spotted dolphins, spinner dolphins, rough-toothed dolphins, and common bottlenose dolphins—have been identified, based on two or more lines of evi-dence, including results from small-boat sightings and survey effort, photo-identification, genetic anal-yses, and satellite tagging. In this review, we merge existing published and unpublished information along with expert judgment for the Hawai‘i region of the U.S. Exclusive Economic Zone and territorial waters in order to identify and support the delinea-tion of 20 Biologically Important Areas (BIAs) for these small and resident populations, and one repro-ductive area for humpback whales. The geographic extent of the BIAs in Hawaiian waters ranged from approximately 700 to 23,500 km2. BIA designation enhances existing information already available to scientists, managers, policymakers, and the public. They are intended to provide synthesized informa-tion in a transparent format that can be readily used toward analyses and planning under U.S. statutes that require the characterization and minimization of impacts of anthropogenic activities on marine mammals. Odontocete BIAs in Hawai‘i are biased toward the main Hawaiian Islands and populations off the island of Hawai‘i, reflecting a much greater level of research effort and thus certainty regarding the existence and range of small resident popula-tions off that island. Emerging evidence of similar small resident populations off other island areas in Hawaiian waters suggest that further BIA designa-tions may be necessary as more detailed informa-tion becomes available.
Key Words: Hawai‘i, reproductive area, resident population, anthropogenic sound, species distribution
Introduction
This review document coalesces existing pub-lished and unpublished information in Hawaiian waters (shoreward of the Exclusive Economic Zone [EEZ] boundary) to define Biologically Important Areas (BIAs) for specific cetacean spe-cies that meet the criteria for reproductive areas or small and resident populations defined in Table 1.2 of Ferguson et al. (2015b) within this issue. A comprehensive overview of the BIA delineation process; its caveats (Table 1.4), strengths, and limitations; and its relationship to international assessments also can be found in Ferguson et al. Table 1.3 provides a summary of all BIAs iden-tified, including region, species, BIA type, and total area (in km2). A summary also can be found at http://cetsound.noaa.gov/important. Table 1.1 defines all abbreviations used in this special issue. Metadata tables that concisely detail the type and quantity of information used to define each BIA are available as an online supplement.
In Hawai‘i, the low density of most species of cetaceans, combined with high species diversity, the presence of many cryptic or difficult-to-iden-tify species, and a limited amount of large vessel or aerial survey effort to estimate density, results in a limited ability to determine high-use areas for most species. Additional areas of biological impor-tance to cetaceans likely exist within the Hawai‘i region (e.g., for most species within the northwest-ern Hawaiian Islands and for some species within the western half of the main Hawaiian Islands and on the windward sides of the islands) but are not included due to insufficient information or because data collection and analyses to identify such areas are ongoing.

55 BIAs for Cetaceans: Hawai‘i Region
The quantity and type of data used to define BIAs within U.S. waters in general, and in Hawaiian waters in particular, were spatially and temporally heterogeneous and included data derived from visual sightings and effort data from small-boat surveys (see Baird et al., 2013a), photo-identification, satellite-tagging data, and genetic analyses. Although sighting and effort data are available for Hawaiian waters from both aerial surveys (e.g., Mobley et al., 2000) and large-vessel surveys (e.g., Barlow, 2006), and help inform spe-cies distributions, among other things, these data-sets were generally not informative for delineating small and resident populations of odontocetes.
Within the Hawai‘i region, 11 of the 18 spe-cies of odontocetes are known to have populations resident to either the main Hawaiian Islands or the northwestern Hawaiian Islands. Populations of all 11 species—dwarf sperm whale (Kogia sima), Blainville’s beaked whale (Mesoplodon densiros-tris), Cuvier’s beaked whale (Ziphius cavirostris), pygmy killer whale (Feresa attenuata), short-finned pilot whale (Globicephala macrorhynchus), melon-headed whale (Peponocephala electra), false killer whale (Pseudorca crassidens), pantrop-ical spotted dolphin (Stenella attenuata), spinner dolphin (Stenella longirostris), rough-toothed dol-phin (Steno bredanensis), and common bottlenose dolphin (Tursiops truncatus)—met the criteria for small and resident populations, and BIAs were created accordingly for these. A reproductive BIA was created for one migratory species—humpback whales (Megaptera novaeangliae).
Biologically Important Areas in the Hawai‘i Region
Dwarf Sperm Whales (Kogia sima) Small and Resident PopulationDwarf sperm whales are found throughout tropi-cal, subtropical, and warm temperate waters worldwide. They were one of the most abun-dant cetaceans documented in a 2002 survey of Hawaiian waters (Barlow, 2006). Currently, only a single EEZ wide stock is recognized within Hawaiian waters (Carretta et al., 2014).
Results from analyses of depths at sightings in relation to effort and photo-identification data both suggest there is a small resident population of dwarf sperm whales off the island of Hawai‘i (Mahaffy et al., 2009; Baird et al., 2013a). Analyses of sighting rates (sightings/100 survey hours) by depth, corrected for effort, indicate the highest sighting rates of dwarf sperm whales off the island of Hawai‘i are between 500 and 1,000 m in depth (Baird et al., 2013a). Sighting rates drop by more than two-thirds in waters > 1,000 m, suggesting a strongly island-associated population that uses relatively nearshore slope habitats. Despite the
infrequent encounters with this species (Baird, 2005; Baird et al., 2013a), a number of individuals documented off the island of Hawai‘i have been seen in more than 1 y, with one individual docu-mented in seven different years over a 9-y span (Cascadia Research Collective [CRC], unpub. data, 2004-2013). Neonates and small calves are regularly documented, suggesting it is an area used for calving as well as feeding. No individuals of this species have been satellite tagged, so knowl-edge of the range of the population is limited to sighting locations from boat-based visual surveys off the west side of the island of Hawai‘i. The area identified as the BIA (Figure 5.1; Table S5.1) is a minimum convex polygon around 55 sightings of dwarf sperm whales from small-boat surveys (CRC, unpub. data, 2002-2012). Whether there are one or more resident populations of this spe-cies elsewhere in the main Hawaiian Islands is not known, primarily due to the relatively small amount of survey and photo-identification effort in areas of suitable habitat (Baird et al., 2013a), and the difficulty in detecting and identifying this species in anything other than ideal sea conditions. Assessment of potential genetic differentiation of dwarf sperm whales off the island of Hawai‘i from other areas has not been undertaken due to insuf-ficient genetic sample sizes. Oleson et al. (2013) proposed recognition of “a prospective island-associated stock of dwarf sperm whales around” (p. 28) the island of Hawai‘i, although this pro-posal was not incorporated into the 2013 stock
1
Hawai‘i Region Figure Legends 1
2
Figure 5.1. The year round BIA for dwarf sperm whales residing within the Hawai‘i region, 3
substantiated through photo-identification data, extensive vessel based survey data and expert 4
judgment. Note dwarf sperm whales are also found in other areas among the main Hawaiian 5
Islands. 6
7
156°W 155°W157°W
21°N
20°N
19°N
Hawai`i
PacificOcean
0 10050Kilometers
Maui
-1000
-1000
Figure 5.1. The year-round Biologically Important Area (BIA) for dwarf sperm whales (Kogia sima) residing within the Hawai‘i region, substantiated through photo-identification data, extensive vessel-based survey data, and expert judgment; note dwarf sperm whales are also found in other areas among the main Hawaiian Islands.

56 Baird et al.
assessment report for this population (Carretta et al., 2014).
Blainville’s Beaked Whales (Mesoplodon densirostris) Small and Resident PopulationBlainville’s beaked whales are distributed in deep oceanic waters throughout the tropics and subtropics worldwide, and they typically only approach nearshore around oceanic islands. They have been documented in deep waters off most of the main Hawaiian Islands (Mobley et al., 2000; Baird et al., 2013a). Currently, only a single EEZ wide stock is recognized within Hawaiian waters (Carretta et al., 2014), although off the island of Hawai‘i a small resident population of Blainville’s beaked whales has been identified (McSweeney et al., 2007; Schorr et al., 2009a). Analyses of sightings in relation to effort by depth show the highest density of groups in water between 500 and 1,500 m in depth, with density decreasing further offshore, then peaking again in depths of 4,000 to 4,500 m, which may reflect sampling of an offshore population (Baird et al., 2011b, 2013a). Long-term photo-identification has indicated high site fidelity, with individuals using the area over periods of at least 15 y, although there is evidence that adult females may exhibit a greater degree of site fidelity than adult males (McSweeney et al., 2007). Mark-recapture analyses of photo-identi-fication data suggest the population is relatively small (Baird et al., 2009c). Baird et al. (2009c) estimated 125 individual Blainville’s beaked whales (CV = 0.30) used the area off the west side of the island of Hawai‘i from 2003 to 2006, although this estimate included individuals from both the resident population and from an offshore population (Baird et al., 2011b), suggesting the resident population is smaller. Ten individuals from this population (including four adult males) were satellite tagged in four different years from 2006 to 2011, with over 1,800 satellite-derived locations available to assess range and habitat use. Location information from satellite tags was available for periods of 15 to 71 d (median = 44 d, n = 10). All 10 individuals remained associated with the island of Hawai‘i for the duration of tag attachments, with locations generally restricted to the west side of the island (Schorr et al., 2009a). The delineation of the known range of the popula-tion (Figure 5.2; Table S5.2) is based on a mini-mum convex polygon (with smoothed edges and excluding land) around 1,809 locations from 10 individuals satellite tagged through 2011 (CRC, unpub. data, 2009-2011; Schorr et al., 2009a; Baird et al., 2010a). Whether there are one or more resident populations of this species else-where in the main Hawaiian Islands is not known, primarily due to the relatively small amount of
survey, photo-identification, and tagging effort in areas of suitable habitat elsewhere among the islands (Baird et al., 2013a). Assessment of poten-tial genetic differentiation of Blainville’s beaked whales off the island of Hawai‘i from other areas has not been undertaken due to insufficient genetic sample sizes. Oleson et al. (2013) proposed rec-ognition of a “prospective stock of Blainville’s beaked whales within the main Hawaiian Islands with a range of 50 km from the islands” (p. 21), but this proposal was not incorporated into the 2013 stock assessment report for this population (Carretta et al., 2014).
Cuvier’s Beaked Whales (Ziphius cavirostris) Small and Resident PopulationCuvier’s beaked whales are distributed world-wide in deep oceanic waters except for high-latitude polar regions. They were one of the most abundant cetaceans in a 2002 survey of Hawaiian waters, with sightings throughout the EEZ (Barlow, 2006). Currently, only a single EEZ wide stock is recognized within Hawaiian waters (Carretta et al., 2014). Around the main Hawaiian Islands, there have been occasional sightings off Kaua‘i and Ni‘ihau (Mobley et al., 2000), but the majority of sightings of this spe-cies have been off the island of Hawai‘i. Off that island, a small resident population of Cuvier’s
2
8
9
Figure 5.2. The year round BIA for Blainville’s beaked whales residing within the Hawai‘i 10
region, substantiated through satellite tag data, photo-identification data, extensive vessel based 11
survey data and expert judgment. Note Blainville’s beaked whales are also found elsewhere 12
among the Hawaiian Islands, but this area represents the known range for individuals thought to 13
be resident to Hawaiʻi Island. 14
15
156°W 155°W157°W
21°N
20°N
19°N
Hawai`i
PacificOcean
0 10050Kilometers
Maui
-1000
-1000
Figure 5.2. The year-round BIA for Blainville’s beaked whales (Mesoplodon densirostris) residing within the Hawai‘i region, substantiated through satellite-tag data, photo-identification data, extensive vessel-based survey data, and expert judgment; note Blainville’s beaked whales are also found elsewhere among the Hawaiian Islands, but this area represents the known range for individuals thought to be resident to Hawaiʻi Island.

BIAs for Cetaceans: Hawai‘i Region 57
beaked whales has been identified based on a combination of photo-identification data, satel-lite-tagging data, and analyses of sightings and survey effort. Analyses of sightings in relation to effort by depth show the highest density of groups in water between 1,500 and 4,000 m in depth along the slope of the island, with density decreas-ing in deeper waters further offshore (Baird et al., 2013a). Long-term photo-identification has indi-cated high site-fidelity, with individuals using the area over periods of at least 21 y, although there is evidence that adult females may exhibit a greater degree of site fidelity than adult males (CRC, unpub. data, 2006-2014; McSweeney et al., 2007). Mark-recapture analyses of photo-identi-fication data suggest the population is relatively small; Baird et al. (2009c) estimated that 55 indi-vidual Cuvier’s beaked whales (CV = 0.26) used the area off the west side of the island of Hawai‘i from 2003 to 2006.
Nine individuals from this population (includ-ing two adult males) have been satellite tagged in five different years, with movement data for peri-ods of from 2 to 45 d (median = 22 d). Satellite tag data show the population is generally restricted to the slope of the island of Hawai‘i (Schorr et al., 2008; Baird et al., 2009a, 2010), with the majority of individuals spending most of their time off the west and southeast side of the island. The BIA is based on the delineation of the known range of the population (Figure 5.3; Table S5.3), generated as a minimum convex polygon (excluding land and locations in shallow water with steep bathym-etry, thus likely due to Argos error) around 581 locations from nine satellite-tagged individuals (Schorr et al., 2008; Baird et al., 2009a, 2010). Although the number of individuals tagged is relatively large, the shorter attachment durations yet greater range documented than Blainville’s beaked whales suggest that the range of individu-als from this population is likely to increase as additional satellite-tag data become available.
Whether there are one or more resident popu-lations of this species elsewhere in the main Hawaiian Islands is not known due to the rela-tively small amount of survey effort in deep-water habitats elsewhere among the islands (Baird et al., 2013a). Assessment of potential genetic differen-tiation of Cuvier’s beaked whales off the island of Hawai‘i from other areas has not been undertaken due to insufficient genetic sample sizes. Oleson et al. (2013) proposed recognition of a “prospec-tive island-associated stock of Cuvier’s beaked whales within the Hawaiian Archipelago out to 70 km from shore” (p. 24), but this proposal was not incorporated into the 2013 stock assessment report for this population (Carretta et al., 2014).
Pygmy Killer Whales (Feresa attenuata) Small and Resident PopulationPygmy killer whales are distributed throughout tropical oceanic waters worldwide and generally do not approach close to shore except around oce-anic islands. This species is naturally rare and one of the least known of the small cetaceans. There are sightings of this species from throughout Hawaiian waters, and currently, only a single EEZ wide stock is recognized (Carretta et al., 2014).
There are high resighting rates of photo-identified pygmy killer whales off both O‘ahu and Hawai‘i Island, suggesting small resident populations off each island (McSweeney et al., 2009; Mahaffy et al., 2013). Individuals have been documented over spans of up to 27 y off the island of Hawai‘i (CRC, unpub. data, 2008-2014; McSweeney et al., 2009), suggesting they are long-term residents. Two indi-viduals that were satellite tagged off Hawai‘i Island (in two different years) remained strongly associ-ated with the island slope during the periods of tag attachment (10 and 22 d; Baird et al., 2011a). One group of five individuals known to be resident to O‘ahu were documented off Hawai‘i Island but were not observed with any of the known resident indi-viduals there (Mahaffy et al., 2013). Only one other individual documented off the island of Hawai‘i also has been documented off another island (O‘ahu) and that individual had only been seen on a single occa-sion off the island of Hawai‘i (Mahaffy et al., 2013). 3
16
17
Figure 5.3. The year round BIA for Cuvier’s beaked whales residing within the Hawai‘i region, 18
substantiated through satellite tag data, photo-identification data, extensive vessel based survey 19
data and expert judgment. This species is found elsewhere among the Hawaiian Islands, but this 20
represents the known range of individuals that appear to be resident to Hawaiʻi Island. 21
22
156°W
20°N
18°N
Hawai`i
PacificOcean
0 10050Kilometers
-1000 -1000
Figure 5.3. The year-round BIA for Cuvier’s beaked whales (Ziphius cavirostris) residing within the Hawai‘i region, substantiated through satellite-tag data, photo-identification data, extensive vessel-based survey data, and expert judg-ment; this species is found elsewhere among the Hawaiian Islands, but this represents the known range of individuals that appear to be resident to Hawaiʻi Island.
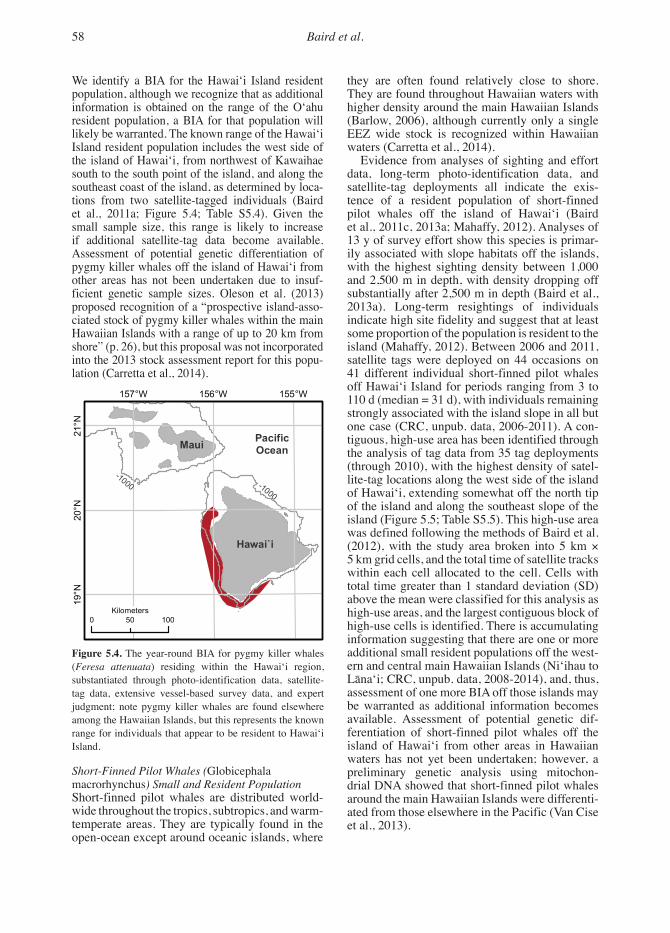
58 Baird et al.
We identify a BIA for the Hawai‘i Island resident population, although we recognize that as additional information is obtained on the range of the O‘ahu resident population, a BIA for that population will likely be warranted. The known range of the Hawai‘i Island resident population includes the west side of the island of Hawai‘i, from northwest of Kawaihae south to the south point of the island, and along the southeast coast of the island, as determined by loca-tions from two satellite-tagged individuals (Baird et al., 2011a; Figure 5.4; Table S5.4). Given the small sample size, this range is likely to increase if additional satellite-tag data become available. Assessment of potential genetic differentiation of pygmy killer whales off the island of Hawai‘i from other areas has not been undertaken due to insuf-ficient genetic sample sizes. Oleson et al. (2013) proposed recognition of a “prospective island-asso-ciated stock of pygmy killer whales within the main Hawaiian Islands with a range of up to 20 km from shore” (p. 26), but this proposal was not incorporated into the 2013 stock assessment report for this popu-lation (Carretta et al., 2014).
Short-Finned Pilot Whales (Globicephala macrorhynchus) Small and Resident PopulationShort-finned pilot whales are distributed world-wide throughout the tropics, subtropics, and warm-temperate areas. They are typically found in the open-ocean except around oceanic islands, where
they are often found relatively close to shore. They are found throughout Hawaiian waters with higher density around the main Hawaiian Islands (Barlow, 2006), although currently only a single EEZ wide stock is recognized within Hawaiian waters (Carretta et al., 2014).
Evidence from analyses of sighting and effort data, long-term photo-identification data, and satellite-tag deployments all indicate the exis-tence of a resident population of short-finned pilot whales off the island of Hawai‘i (Baird et al., 2011c, 2013a; Mahaffy, 2012). Analyses of 13 y of survey effort show this species is primar-ily associated with slope habitats off the islands, with the highest sighting density between 1,000 and 2,500 m in depth, with density dropping off substantially after 2,500 m in depth (Baird et al., 2013a). Long-term resightings of individuals indicate high site fidelity and suggest that at least some proportion of the population is resident to the island (Mahaffy, 2012). Between 2006 and 2011, satellite tags were deployed on 44 occasions on 41 different individual short-finned pilot whales off Hawai‘i Island for periods ranging from 3 to 110 d (median = 31 d), with individuals remaining strongly associated with the island slope in all but one case (CRC, unpub. data, 2006-2011). A con-tiguous, high-use area has been identified through the analysis of tag data from 35 tag deployments (through 2010), with the highest density of satel-lite-tag locations along the west side of the island of Hawai‘i, extending somewhat off the north tip of the island and along the southeast slope of the island (Figure 5.5; Table S5.5). This high-use area was defined following the methods of Baird et al. (2012), with the study area broken into 5 km × 5 km grid cells, and the total time of satellite tracks within each cell allocated to the cell. Cells with total time greater than 1 standard deviation (SD) above the mean were classified for this analysis as high-use areas, and the largest contiguous block of high-use cells is identified. There is accumulating information suggesting that there are one or more additional small resident populations off the west-ern and central main Hawaiian Islands (Ni‘ihau to Lāna‘i; CRC, unpub. data, 2008-2014), and, thus, assessment of one more BIA off those islands may be warranted as additional information becomes available. Assessment of potential genetic dif-ferentiation of short-finned pilot whales off the island of Hawai‘i from other areas in Hawaiian waters has not yet been undertaken; however, a preliminary genetic analysis using mitochon-drial DNA showed that short-finned pilot whales around the main Hawaiian Islands were differenti-ated from those elsewhere in the Pacific (Van Cise et al., 2013).
4
23
24
Figure 5.4. The year round BIA for pygmy killer whales residing within the Hawai‘i region, 25
substantiated through photo-identification data, satellite tag data, extensive vessel based survey 26
data and expert judgment. Note pygmy killer whales are found elsewhere among the Hawaiian 27
Islands, but this represents the known range for individuals that appear to be resident to the 28
island of Hawaiʻi. 29
30
156°W 155°W157°W
21°N
20°N
19°N
Hawai`i
PacificOcean
0 10050Kilometers
Maui
-1000 -1000
Figure 5.4. The year-round BIA for pygmy killer whales (Feresa attenuata) residing within the Hawai‘i region, substantiated through photo-identification data, satellite-tag data, extensive vessel-based survey data, and expert judgment; note pygmy killer whales are found elsewhere among the Hawaiian Islands, but this represents the known range for individuals that appear to be resident to Hawaiʻi Island.
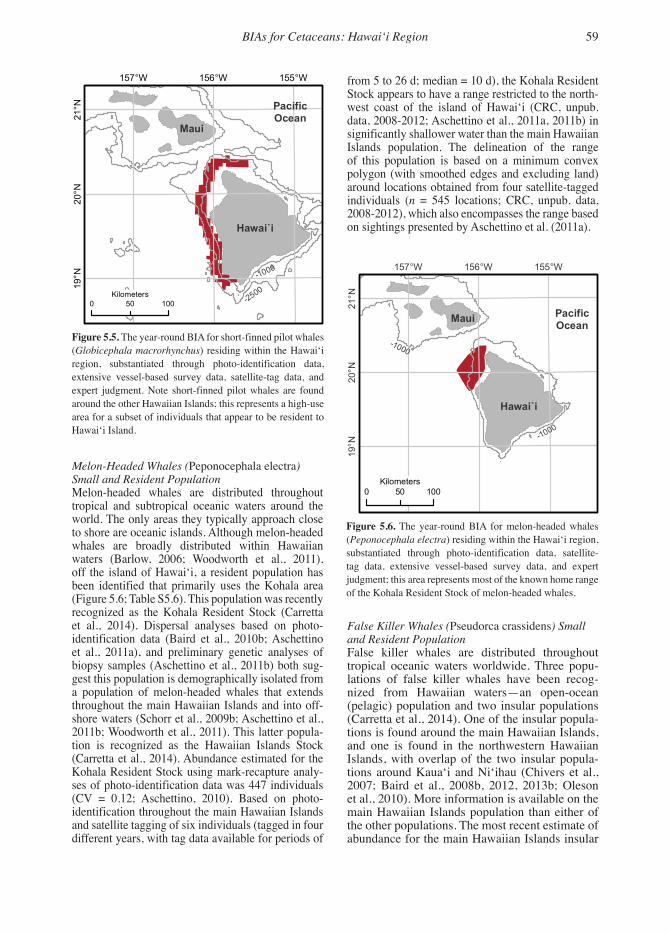
BIAs for Cetaceans: Hawai‘i Region 59
Melon-Headed Whales (Peponocephala electra) Small and Resident PopulationMelon-headed whales are distributed throughout tropical and subtropical oceanic waters around the world. The only areas they typically approach close to shore are oceanic islands. Although melon-headed whales are broadly distributed within Hawaiian waters (Barlow, 2006; Woodworth et al., 2011), off the island of Hawai‘i, a resident population has been identified that primarily uses the Kohala area (Figure 5.6; Table S5.6). This population was recently recognized as the Kohala Resident Stock (Carretta et al., 2014). Dispersal analyses based on photo-identification data (Baird et al., 2010b; Aschettino et al., 2011a), and preliminary genetic analyses of biopsy samples (Aschettino et al., 2011b) both sug-gest this population is demographically isolated from a population of melon-headed whales that extends throughout the main Hawaiian Islands and into off-shore waters (Schorr et al., 2009b; Aschettino et al., 2011b; Woodworth et al., 2011). This latter popula-tion is recognized as the Hawaiian Islands Stock (Carretta et al., 2014). Abundance estimated for the Kohala Resident Stock using mark-recapture analy-ses of photo-identification data was 447 individuals (CV = 0.12; Aschettino, 2010). Based on photo-identification throughout the main Hawaiian Islands and satellite tagging of six individuals (tagged in four different years, with tag data available for periods of
from 5 to 26 d; median = 10 d), the Kohala Resident Stock appears to have a range restricted to the north-west coast of the island of Hawai‘i (CRC, unpub. data, 2008-2012; Aschettino et al., 2011a, 2011b) in significantly shallower water than the main Hawaiian Islands population. The delineation of the range of this population is based on a minimum convex polygon (with smoothed edges and excluding land) around locations obtained from four satellite-tagged individuals (n = 545 locations; CRC, unpub. data, 2008-2012), which also encompasses the range based on sightings presented by Aschettino et al. (2011a).
False Killer Whales (Pseudorca crassidens) Small and Resident PopulationFalse killer whales are distributed throughout tropical oceanic waters worldwide. Three popu-lations of false killer whales have been recog-nized from Hawaiian waters—an open-ocean (pelagic) population and two insular populations (Carretta et al., 2014). One of the insular popula-tions is found around the main Hawaiian Islands, and one is found in the northwestern Hawaiian Islands, with overlap of the two insular popula-tions around Kaua‘i and Ni‘ihau (Chivers et al., 2007; Baird et al., 2008b, 2012, 2013b; Oleson et al., 2010). More information is available on the main Hawaiian Islands population than either of the other populations. The most recent estimate of abundance for the main Hawaiian Islands insular 5
31
32
Figure 5.5. The year round BIA for short-finned pilot whales residing within the Hawai‘i region, 33
substantiated through photo-identification data, extensive vessel based survey data, satellite tag 34
data, and expert judgment. Note short-finned pilot whales are found around the other Hawaiian 35
Islands – this represents a high-use area for a sub-set of individuals that appear to be resident to 36
Hawaiʻi Island. 37
38
156°W 155°W157°W21°N
20°N
19°N
Hawai`i
PacificOcean
0 10050Kilometers
Maui
-2500
-1000
Figure 5.5. The year-round BIA for short-finned pilot whales (Globicephala macrorhynchus) residing within the Hawai‘i region, substantiated through photo-identification data, extensive vessel-based survey data, satellite-tag data, and expert judgment. Note short-finned pilot whales are found around the other Hawaiian Islands; this represents a high-use area for a subset of individuals that appear to be resident to Hawaiʻi Island.
6
39
40
Figure 5.6. The year round BIA for melon-headed whales residing within the Hawai‘i region, 41
substantiated through photo-identification data, satellite tag data, extensive vessel based survey 42
data and expert judgment. This area represents most of the known home range of the Kohala 43
resident population of melon-headed whales. 44
45
156°W 155°W157°W
21°N
20°N
19°N
Hawai`i
PacificOcean
0 10050Kilometers
Maui
-1000
-1000
Figure 5.6. The year-round BIA for melon-headed whales (Peponocephala electra) residing within the Hawai‘i region, substantiated through photo-identification data, satellite-tag data, extensive vessel-based survey data, and expert judgment; this area represents most of the known home range of the Kohala Resident Stock of melon-headed whales.

60 Baird et al.
Stock of false killer whales is 151 individuals (CV = 0.20; model average of four mark-recap-ture models from 2006-2009; Oleson et al., 2010), and this population was listed as Endangered under the U.S. Endangered Species Act (ESA) in 2012 (77 FR 70915). The known range of this population based on satellite-tagging data extends from west of Ni‘ihau to east of Hawai‘i, with the furthest extent at 122 km offshore (Baird et al., 2012). Within this range, it is possible to delineate high-use areas based on density of location data obtained from satellite tags. To aid in identifying Critical Habitat for this population, Baird et al. (2012) identified several high-use areas based on grid cells that were greater than 2 SD above the mean for density of locations. Baird et al. note a variety of limitations of their sample, including a seasonal bias in tag data and having telemetry data from only two of the three large social groupings within the population when spatial use is known to vary between social groups. For this assess-ment, grid cells with density of locations greater than 1 SD above the mean are considered high-use areas and mapped accordingly to identify the BIA (Figure 5.7). While we have not identified a BIA for the northwestern Hawaiian Islands population, consideration of one or more BIAs would be war-ranted as more information becomes available.
Pantropical Spotted Dolphins (Stenella attenuata) Small and Resident PopulationPantropical spotted dolphins are found world-wide throughout tropical waters. Genetic evidence suggests that there are three demographically isolated populations of this species around the main Hawaiian Islands (Figure 5.8; Table S5.8), with significant genetic differentiation between populations off O‘ahu, in the four-island area (i.e., Maui, Lāna‘i, Moloka‘i, and Kaho‘olawe), and off Hawai‘i Island (Courbis et al., 2014). The levels of genetic differentiation are similar to those found among stocks of spinner dolphins and common bottlenose dolphins within the Hawaiian archipelago (Andrews et al., 2010; Martien et al., 2011; Carretta et al., 2014; Courbis et al., 2014). Three insular stocks were recognized in 2014 cor-responding to these island areas (Carretta et al., 2014). The boundaries of these populations are not known due to biased survey effort off the lee-ward sides of the islands (Baird et al., 2013a) and lack of satellite-tag data. The known ranges of pantropical spotted dolphins off each island based on sighting data from small-boat surveys (Baird et al., 2013a) was used to delineate three BIAs—one off each of the three island areas (Figure 5.8), corresponding to one BIA for each of the three recognized insular stocks. There are sightings of spotted dolphins elsewhere among the main
7
46
47
Figure 5.7. The year round BIA for false killer whales residing within the Hawai‘i region, 48
substantiated through satellite tag data and expert judgment. This represents the high use areas 49
for the main Hawaiian Islands insular population of false killer whales, although this population 50
ranges from east of Hawaiʻi Island to west of Niʻihau, and two other populations of false killer 51
whales have ranges that partially overlap. 52
53
156°W158°W
22°N
20°N
Hawai`i
PacificOcean
0 10050Kilometers
Maui
-1000
-1000
O'ahu
Figure 5.7. The year-round BIA for false killer whales (Pseudorca crassidens) residing within the Hawai‘i region, substantiated through satellite-tag data and expert judgment; this represents the high-use areas for the main Hawaiian Islands insular population of false killer whales, although this population ranges from east of Hawaiʻi Island to west of Niʻihau, and two other populations of false killer whales have ranges that partially overlap.
8
54
55
Figure 5.8. The year round BIAs for pantropical spotted dolphins residing within the Hawai‘i 56
region, substantiated through extensive vessel based survey data, genetic analyses, and expert 57
judgment. Each of these BIAs corresponds to part of the stock range for the three recognized 58
insular stocks of pantropical spotted dolphins in Hawaiian waters. Note pantropical spotted 59
dolphins are also found elsewhere among the islands. 60
61
156°W158°W
22°N
20°N
Hawai`i
PacificOcean
0 10050Kilometers
Maui
-1000
-1000
O'ahu
Figure 5.8. The year-round BIAs for pantropical spotted dolphins (Stenella attenuata) residing within the Hawai‘i region, substantiated through extensive vessel-based survey data, genetic analyses, and expert judgment; each of these BIAs corresponds to part of the stock range for the three recognized insular stocks of pantropical spotted dolphins in Hawaiian waters. Note pantropical spotted dolphins are also found elsewhere among the islands.

BIAs for Cetaceans: Hawai‘i Region 61
Hawaiian Islands (e.g., Mobley et al., 2000), how-ever, and boundaries for these BIAs should be re-assessed as more information becomes available.
Spinner Dolphins (Stenella longirostris) Small and Resident PopulationSpinner dolphins are distributed worldwide through-out the tropics, with populations often found near-shore around oceanic islands. Genetic evidence suggests that there are five demographically iso-lated populations of spinner dolphins throughout the Hawaiian archipelago (Andrews et al., 2010; Figure 5.9; Table S5.9). These five populations have recently been recognized as distinct stocks by NOAA Fisheries (Carretta et al., 2014). The boundaries of these stocks as currently recognized are from shore out to 10 nmi from shore around Kure and Midway Atolls, Pearl and Hermes Reef, Kaua‘i and Ni‘ihau, O‘ahu and the four-island area, and Hawai‘i Island (Carretta et al., 2014); these boundaries were used as boundaries for the BIAs.
Rough-Toothed Dolphins (Steno bredanensis) Small and Resident PopulationRough-toothed dolphins are distributed throughout tropical and subtropical oceanic waters worldwide.
In the Pacific, this species typically is found close to shore only around oceanic islands. Currently, only a single EEZ wide stock is recognized within Hawaiian waters (Carretta et al., 2014), and a small demographically isolated resident popula-tion of rough-toothed dolphins has been identi-fied off the island of Hawai‘i (Baird et al., 2008a; Albertson, 2015). A mark-recapture estimate of distinctive photo-identified individuals from 2003 to 2006 off the island of Hawai‘i was 198 indi-viduals (CV = 0.12; Baird et al., 2008a). Two indi-viduals were documented moving from Kaua‘i to Hawai‘i but were not seen with any of the dolphins known to be part of the resident social network off Hawai‘i (Baird et al., 2008a). Both individuals have been subsequently documented back off of Kaua‘i (Baird et al., 2013c), and, thus, these move-ments do not appear to represent dispersal between the populations. An analysis of dispersal rates between these populations indicated that observed movements were consistent with, at most, a 2%/y dispersal rate between the two areas (Baird et al., 2008a). Genetic analyses of samples collected from Kaua‘i and Hawai‘i indicated strong genetic differentiation between the two areas (Albertson, 2015), further supporting that the Hawai‘i Island
9
62
Figure 5.9. The year round BIAs for spinner dolphins residing within the Hawai‘i region in (a) 63
the Northwestern Hawaiian Islands and (b) the Main Hawaiian Islands. These BIAs were 64
substantiated through extensive vessel based survey data, genetic analyses and expert judgment. 65
Areas outlined represent the stock boundaries for the five recognized insular stocks of spinner 66
dolphins in Hawaiian waters. Also shown is the 1000 m depth contour. Inset shows extent of US 67
EEZ around the Hawaiian Archipelago, with frames around extent for boxes (a) and (b). 68
69
176°W178°W
30°N
28°N
26°N
PacificOcean
O'ahu
MidwayAtoll
156°W158°W160°W
24°N
22°N
20°N
18°N
16°N
Hawai`i
PacificOcean
(a) (b)
KureAtoll
Pearl & HermesReef
0 300150Kilometers
0 15075Kilometers
Figure 5.9. The year-round BIAs for spinner dolphins (Stenella longirostris) residing within the Hawai‘i region in (a) the northwestern Hawaiian Islands and (b) the main Hawaiian Islands; these BIAs were substantiated through extensive vessel-based survey data, genetic analyses, and expert judgment. Areas outlined represent the stock boundaries for the five recog-nized insular stocks of spinner dolphins in Hawaiian waters. Also shown is the 1,000-m depth contour. Inset shows extent of U.S. EEZ around the Hawaiian Archipelago, with frames around extent for boxes (a) and (b).

62 Baird et al.
resident population is demographically isolated. No individuals off the island of Hawai‘i have been satellite tagged, so information on range is restricted to sighting locations from long-term small-boat survey effort restricted to the west side of the island (CRC, unpub. data, 2002-2014). The BIA represents a minimum convex polygon around all sighting locations of this species off the island of Hawai‘i (Figure 5.10; Table S5.10).
Resighting rates of rough-toothed dolphins off Kaua‘i and Ni‘ihau also indicate a resident population off those islands (Baird et al., 2008a), although there was no significant genetic differ-entiation between Kaua‘i/Ni‘ihau and animals sampled in the northwestern Hawaiian Islands or off O‘ahu (Albertson, 2015). Ongoing research utilizing satellite tags is beginning to identify high-use areas off Kaua‘i and Ni‘ihau (Baird et al., 2014), and recognition of a BIA there may be warranted as more information becomes avail-able. Furthermore, sightings of rough-toothed dolphins have been documented elsewhere among the islands (e.g., Mobley et al., 2000), and bound-aries for these BIAs should be re-assessed as more information becomes available.
Common Bottlenose Dolphins (Tursiops truncatus) Small and Resident PopulationCommon bottlenose dolphins (hereafter bottlenose dolphins) are distributed in coastal and oceanic
waters throughout the tropics, subtropics, and in some warm temperate areas. In Hawaiian waters, they are found both in offshore and nearshore areas (Barlow, 2006), but around the main Hawaiian Islands they are primarily found in depths of less than 1,000 m (Baird et al., 2013a). Photo-identification data from the main Hawaiian Islands revealed high resighting rates around each island area, and analysis of move-ment rates suggested that dispersal among island areas is less than 2%/y (Baird et al., 2009b). Genetic analyses of biopsy samples indicate there are four demographically isolated insular populations in the main Hawaiian Islands (Martien et al., 2011) as well as an offshore (pelagic) population. These popula-tions have been recognized as stocks (Carretta et al., 2014), with boundaries delineated by the 1,000 m depth contour around Niʻihau and Kauaʻi, Hawaiʻi Island, and Oʻahu and the four-island area, with the latter two separated by a line in the deepest water approximately equidistant between Oʻahu and Penguin Bank/Molokaʻi (Figure 5.11; Table S5.11). These stock boundaries were used as boundaries for the BIAs. Satellite-tag data from nine individuals, representing three of the four insular stocks, sup-port the recognition of these four insular stocks (Gorgone et al., 2013). Estimates of the abundance of the marked individuals for each island area are available from mark-recapture analysis of photo-identification data and indicate that populations off Hawaiʻi Island, in the four-island area, and off Kauaʻi and Niʻihau are all relatively small—that is, likely < 250 marked individuals in each area (Baird et al., 2009b).
Humpback Whales (Megaptera novaeangliae) General—Humpback whales are a migratory spe-cies with a worldwide distribution. Within the North Pacific, three main breeding populations have been recognized based on photo-identifi-cation and genetic data, including Asia, Hawai‘i, and Mexico/Central America (Calambokidis et al., 1997; Baker et al., 1998). While the overall pat-tern of movements between breeding and feeding areas is complex, a high degree of population struc-ture exists, and the combination of these breeding populations with their respective feeding grounds has led to the designation of three main stocks of humpback whales in the North Pacific (Baker et al., 2008; Calambokidis et al., 2008a; Allen & Angliss, 2012). The Central North Pacific Stock is comprised of animals that winter primarily in the Hawaiian Islands and feed in British Columbia/Southeast Alaska, the Gulf of Alaska, and the Aleutian Islands/Bering Sea. Recent work, how-ever, has suggested that a greater degree of popula-tion structure exists in the North Pacific than has previously been recognized (Baker et al., 2013), suggesting that there are five distinct population
10
70
Figure 5.10. The year round BIA for rough-toothed dolphins residing within the Hawai‘i region, 71
substantiated through photo-identification data, extensive vessel based survey data, genetic 72
analyses and expert judgment. This species is found elsewhere around the Hawaiian Islands, but 73
this area represents the known range of individuals from an apparently resident population off 74
Hawaiʻi Island. 75
76
156°W158°W
22°N
20°N
Hawai`i
PacificOcean
0 10050Kilometers
Maui
-1000
-1000
O'ahu
Figure 5.10. The year-round BIA for rough-toothed dol-phins (Stenella bredanensis) residing within the Hawai‘i region, substantiated through photo-identification data, extensive vessel-based survey data, genetic analyses, and expert judgment; this species is found elsewhere around the Hawaiian Islands, but this area represents the known range of individuals from an apparently resident population off Hawaiʻi Island.

BIAs for Cetaceans: Hawai‘i Region 63
segments (DPSs) among the breeding grounds in the North Pacific. This changes the traditional view of stock structure. Within this framework, the Hawaiian Islands population comprises one DPS.
Reproduction—The Hawaiian archipelago comprises the largest breeding area for humpback whales in the North Pacific, with over 50% of the population migrating to this region during winter months. Current population estimates for this region range from approximately 7,000 to 10,000 animals, with an estimated annual growth rate between 5.5 to 6.0% (Calambokidis et al., 2008a). Migratory timing varies, with peak abundance generally from February through March (Mobley et al., 1999). Animals are highly concentrated on Penguin Bank and in the waters between Maui, Moloka‘i, Lāna‘i, and Kaho‘olawe (Mobley et al., 2001; Office of National Marine Sanctuaries, 2010) (Figure 5.12; Table S5.12). However, den-sities have also increased substantially around other islands, particularly in the Kaua‘i/Ni‘ihau region (Mobley et al., 1999; Figure 5.12). Most animals are found in higher densities in areas with water depths less than 200 m (Herman et al., 1980; Frankel et al., 1995; Mobley et al., 2001).
Females with calves appear to exhibit prefer-ential habitat selection, historically favoring the
protected waters of the Au‘au Channel (Craig & Herman, 2000; Cartwright et al., 2012), though they are found throughout the island chain (Mobley et al., 1999). Movement of individuals between the main Hawaiian Islands is considered to be extensive, based both on photo-identification and satellite-tag studies, with high rates of interchange between Kaua‘i and Hawai‘i Island (Cerchio et al., 1998), as well as between these two islands and Maui (Calambokidis et al., 2008a) and Penguin Bank (Mate et al., 1998). The BIA boundaries rep-resent the highest density areas within the main Hawaiian Islands. While peak densities are from February through March, the breeding season typically spans December through April, during which time humpbacks may be found in lower densities throughout the region. The occurrence of humpback whales in the northwestern Hawaiian Islands, now part of the Papahānaumokuākea Marine National Monument, has been documented in recent years (Johnston et al., 2007; Lammers et al., 2011), and habitat modeling suggests that there may be over 14,000 km2 of suitable wintering habitat in that region (Johnston et al., 2007). These studies suggest that the northwestern Hawaiian Islands may now represent an extension of hump-back whale wintering habitat beyond the main
11
77
Figure 5.11. The year round BIAs for bottlenose dolphins residing within the Hawai‘i region, 78
substantiated through satellite tag data, photo-identification data, extensive vessel based survey 79
data, genetic analyses and expert judgment. Areas outlined represent the stock boundaries for the 80
four insular stocks of bottlenose dolphins in Hawaiian waters. This species is also found 81
elsewhere among the Hawaiian Islands. 82
83
156°W158°W160°W22°N
20°N
Hawai`i
PacificOcean
0 15075Kilometers
Maui
O`ahu
Ni`ihauKaua`i
-1000
-1000
-1000O`ahu / 4-IslandRegion Boundary
Figure 5.11. The year-round BIAs for bottlenose dolphins (Tursiops truncatus) residing within the Hawai‘i region, substan-tiated through satellite-tag data, photo-identification data, extensive vessel-based survey data, genetic analyses, and expert judgment; areas outlined represent the stock boundaries for the four insular stocks of bottlenose dolphins in Hawaiian waters. This species is also found elsewhere among the Hawaiian Islands.

64 Baird et al.
island chain, though there are not yet enough data to delineate a BIA in that region.
Summary
We designate 20 BIAs for small and resident popu-lations of all 11 species of odontocetes known to be resident around the Hawaiian islands, and one BIA representing a reproductive area for one spe-cies of baleen whale. With the exception of spin-ner dolphins, all of our BIAs are located among the main Hawaiian Islands. This reflects research efforts for most species, which have been concen-trated in the main Hawaiian Islands. Among the main Hawaiian Islands, for three species that have had extensive photo-identification and/or genetic studies (i.e., common bottlenose dolphin, spin-ner dolphin, and pantropical spotted dolphin), for humpback whales, and for one species of odonto-cete with a large sample size of satellite tag data
showing extensive movements among the islands (i.e., false killer whales), BIAs have been identi-fied throughout the islands. For other species of odontocetes, however, the BIAs are further biased toward areas near the island of Hawai‘i. This reflects the much greater level of research effort in deep waters off the leeward side of that island (Baird et al., 2013a) and, thus, certainty about the existence of small resident populations and their approximate ranges for some of the rarer and more difficult-to-study species around that island (e.g., dwarf sperm whales, and Blainville’s and Cuvier’s beaked whales). It is clear, however, that there are small resident populations of some of the deeper-water species off other islands (e.g., rough-toothed dolphins off Kaua‘i and Ni‘ihau, pygmy killer whales off O‘ahu, and short-finned pilot whales from Lāna‘i to Ni‘ihau), and BIA designations for those populations should be considered as addi-tional information becomes available.
12
84
Figure 5.12. The BIA for breeding humpback whales within the Hawai‘i region around (a) 85
Kaua‘i and Ni‘ihau, (b) O‘ahu, Moloka‘i, Lāna‘i, and Maui, and (c) Hawai‘i. The breeding 86
season typically spans December through April, with highest densities of animals in February – 87
March. This BIA was substantiated through extensive survey data, satellite tag data, and expert 88
judgment. Also shown is the boundary for the Hawaiian Island Humpback Whale National 89
Marine Sanctuary (solid black line) and the 1000 m depth contour (light gray line). 90
91
92
159°W160°W161°W22°N
21°N
Kaua`i
156°W157°W158°W
22°N
21°N
155°W156°W
20°N
19°N
0 5025Kilometers
Maui
O`ahu
Hawai`i
(a) (b)
(c)
PacificOcean
PacificOcean
PacificOcean
-1000
-1000
-1000
Figure 5.12. The BIA for breeding humpback whales (Megaptera novaeangliae) within the Hawai‘i region around (a) Kaua‘i and Ni‘ihau, (b) O‘ahu, Moloka‘i, Lāna‘i, and Maui, and (c) Hawai‘i; the breeding season typically spans December through April, with highest densities of animals in February through March. This BIA was substantiated through extensive survey data, satellite-tag data, and expert judgment. Also shown is the boundary for the Hawaiian Island Humpback Whale National Marine Sanctuary (solid black line) and the 1,000-m depth contour (light gray line).

Aquatic Mammals 2015, 41(1), 65-78, DOI 10.1578/AM.41.1.2015.65
6. Biologically Important Areas for Cetaceans Within U.S. Waters – Gulf of Alaska Region
Megan C. Ferguson,1 Corrie Curtice,2 and Jolie Harrison3
1Cetacean Assessment and Ecology Program, National Marine Mammal Laboratory, Alaska Fisheries Science Center, NOAA Fisheries, Seattle, WA 98115, USA
E-mail: [email protected] 2Marine Geospatial Ecology Lab, Duke University, Beaufort, NC 28516, USA
3NOAA Fisheries Office of Protected Resources, Silver Spring, MD 20910, USA
Abstract
We integrated existing published and unpublished information to delineate Biologically Important Areas (BIAs) for fin, gray, North Pacific right, and humpback whales, and belugas in U.S. waters of the Gulf of Alaska. BIAs are delineated for feeding, migratory corridors, and small and resident popula-tions. Supporting evidence for these BIAs came from aerial-, land-, and vessel-based surveys; satellite-tagging data; passive acoustic monitoring; traditional ecological knowledge; photo- and genetic-identifica-tion data; whaling data, including catch and sighting locations and stomach contents; prey studies; and anecdotal information from fishermen. The geo-graphic extent of the BIAs in this region ranged from approximately 900 to 177,000 km2. Information gaps identified during this assessment include (1) repro-ductive areas for fin, gray, and North Pacific right whales; (2) detailed information on the migration routes of all species; (3) detailed information on the migratory timing of all species except humpback whales; and (4) cetacean distribution, density, and behavior in U.S. Gulf of Alaska waters off the con-tinental shelf. To maintain their utility, these BIAs should be re-evaluated and revised, if necessary, as new information becomes available.
Key Words: Gulf of Alaska, Alaska, feeding area, migratory corridor, small and resident population, fin whale, Balaenoptera physalus, gray whale, Eschrichtius robustus, North Pacific right whale, Eubalaena japonica, humpback whale, Megaptera novaeangliae, beluga, Delphinapterus leucas
Introduction
This assessment synthesizes existing published and unpublished information for U.S. waters of the Gulf of Alaska region (shoreward of the U.S. Exclusive Economic Zone [EEZ]) to define
Biologically Important Areas (BIAs) for cetacean species that meet the criteria for feeding areas, migratory corridors, and small and resident pop-ulations defined in Table 1.2 of Ferguson et al. (2015b) within this issue. A comprehensive over-view of the BIA delineation process; its caveats (Table 1.4), strengths, and limitations; and its relationship to international assessments also can be found in Ferguson et al. Table 1.3 provides a summary of all BIAs identified, including region, species, BIA type, and total area (in km2). A sum-mary also can be found at http://cetsound.noaa.gov/important. Table 1.1 defines all abbreviations used in this special issue. Metadata tables that concisely detail the type and quantity of informa-tion used to define each BIA are available as an online supplement.
Within the Gulf of Alaska Region, BIAs were delineated for four baleen whale species and one toothed whale species. The four species for which feeding or migratory corridor BIAs were defined were the fin (Balaenoptera physalus), gray (Eschrichtius robustus), North Pacific right (Eubalaena japonica), and humpback (Megaptera novaeangliae) whales. Small and resident popula-tion BIAs were also created for two populations of belugas (Delphinapterus leucas). Other ceta-cean species found in the Gulf of Alaska region but not evaluated during this initial BIA exercise include Dall’s porpoise (Phocoenoides dalli), Pacific white-sided dolphin (Lagenorhynchus obliquidens), killer whale (Orcinus orca), beaked whales (family Ziphiidae), sperm whale (Physeter macrocephalus), minke whale (B. acutorostrata), sei whale (B. borealis), and harbor porpoise (Phocoena phocoena). These species should be evaluated in future efforts to create or revise BIAs for cetaceans in this region.
The primary sources of information for delin-eating BIAs in this region were aerial-, land-, and vessel-based surveys; satellite-tagging data;

66 Ferguson et al.
passive acoustic monitoring; traditional ecologi-cal knowledge; photo- and genetic-identification data; whaling data, including catch and sighting locations and stomach contents; prey studies; and anecdotal information from fishermen. A popula-tion was considered “small” if the best estimate of abundance was at most ~3,000 individuals.
Biologically Important Areas in the Gulf of Alaska Region
Fin Whale (Balaenoptera physalus)Background Information—The fin whale is listed as endangered under the U.S. Endangered Species Act (ESA) of 1973. Fin whales are ubiquitous in the Gulf of Alaska, from the outer waters of Southeast Alaska and pelagic waters of the Gulf of Alaska, to the coastal waters of the Kodiak Archipelago and Alaska Peninsula, to inland waters of Southeast Alaska (Andrews, 1909; University of Alaska Fairbanks Gulf Apex Predator-Prey Project [UAF GAP], unpub. data, 1999-2013; Wynne & Witteveen, 2005, 2013; Moore et al., 2006; Zerbini et al., 2006; Stafford et al., 2007; Dahlheim et al., 2009; Mizroch et al., 2009; National Marine Mammal Laboratory [NMML], unpub. data, August 2009 through January 2010; Rone et al., 2010; Clapham et al., 2012; Matsuoka et al., 2012; Straley, pers. comm., 8 January 2015). Evidence from historical whal-ing data suggests that the Gulf of Alaska, including pelagic waters hundreds to thousands of kilometers offshore (outside the U.S. EEZ), was a productive feeding area for fin whales in June through August from the late 1940s until whaling ceased in that area in the early 1970s (Mizroch et al., 2009). Recent visual surveys in those offshore waters are scarce, so relatively little is known about pelagic fin whale density, and there was insufficient information to designate any pelagic BIAs. The inside waters of Southeast Alaska was a significant whaling ground for fin whales at the turn of the 20th century (Andrews, 1909). Today, few whales are found in the eastern and central Gulf of Alaska inside waters (Straley, pers. comm., 8 January 2015). The same fin whale was identified near Juneau and twice near Sitka in the early 2000s (Straley, pers. comm., 8 January 2015). In Prince William Sound (central Gulf of Alaska), four fin whales were observed feeding in Montague Strait in July 2014 (Straley, pers. comm., 8 January 2015). Recent ship-based and aerial visual surveys have documented areas of fin whale concentration from the Kenai Peninsula to the Shumagin Islands, with highest concentra-tions near the Semidi Islands and Kodiak Island in summer (Zerbini et al., 2006; Witteveen, pers. comm., 12 January 2015; Figure 6.1).
Fin whales are found year-round in at least some areas in the region. Passive acoustic monitoring by
moored hydrophones located in Umnak (August 2009 through January 2010) and Unimak (August 2009 through August 2010) passes in the Aleutian Archipelago detected fin whale calls year-round, with peak calling rates occurring at Umnak Pass from mid-October to November, and consistently low rates in all months at Unimak Pass (NMML, unpub. data, August 2009 through January 2010; Clapham et al., 2012; Figure 6.1). Opportunistic aerial surveys conducted by the UAF GAP Project year-round during every year from 1999 to 2013 in the Kodiak Archipelago detected fin whales in every month, with the greatest mean number of whales/mo sighted from June through August (Witteveen, pers. comm., 12 January 2015). From October 1999 to May 2002, fin whales were detected throughout the year by passive acous-tic monitoring from six moored hydrophones located hundreds to thousands of kilometers from shore in the Gulf of Alaska (Moore et al., 2006; Stafford et al., 2007). The highest call occurrence rates from these six moorings were detected from August through December, and the lowest occur-rence rates were detected from February through July (Stafford et al., 2007). There were no obvious geographic differences in seasonal patterns and percent occurrence of calls among hydrophones located closer to the coast compared to the mid-Gulf hydrophones (Stafford et al., 2007).
There was insufficient information available to evaluate migratory corridor and reproductive BIAs for fin whales in the Gulf of Alaska.
Feeding—Stomach contents data from fin whales captured during whaling operations between 1952 and 1958 in the northern part of the North Pacific Ocean and Bering Sea suggest that euphausiids were the most common prey in the Aleutian Islands and Gulf of Alaska, whereas schooling fishes predomi-nated in the northern Bering Sea and off Kamchatka (Nemoto, 1959; Mizroch et al., 2009). This is sup-ported by recent stable isotope analyses of fin and humpback whale samples collected by the UAF GAP project off Kodiak Island in summer (June-August) 2010, which indicate that fin whales are likely feed-ing on a lower trophic level than humpback whales, with the fin whale diet comprised of more zooplank-ton than fish (Wynne & Witteveen, 2013).
Evidence of important fin whale feeding areas comes from recent ship-based and aerial visual sur-veys ranging from the coastal waters of the Aleutian Islands, Alaska Peninsula, Kodiak Archipelago, and Kenai Peninsula offshore to 40º N. During the summer (July-August) of 2001 through 2003, NMML conducted vessel-based line-transect surveys for ceta-ceans in the coastal waters of the Aleutian Islands, Alaska Peninsula, and Kenai Peninsula (Zerbini et al., 2006). These summer cruises encountered very large concentrations of fin whales on the southern

67 BIAs for Cetaceans: Gulf of Alaska Region
side of the Alaska Peninsula around the Semidi Islands and in Shelikof Strait each year, and a high concentration of fin whales in Marmot Bay (north-eastern Kodiak Island) in 2002 (Zerbini et al., 2006). The 2011 IWC-Pacific Ocean Whale and Ecosystem Research (IWC-POWER) cruise was conducted from the Aleutian Islands to the Kenai Peninsula and south to 40º N in the Gulf of Alaska from July to September (Matsuoka et al., 2012). During the IWC-POWER cruise, high densities of fin whales were observed west and southwest of Kodiak Island compared to the lower densities observed from the U.S. EEZ to 40º N
(Matsuoka et al., 2012). During April 2009, NMML conducted the Gulf of Alaska Line-transect Survey (GOALS) in the U.S. Navy training area located to the northeast of Kodiak Island. Higher densities of fin whales were observed in the GOALS inshore stratum (encompassing the continental shelf and slope region) compared to the offshore stratum that comprised the pelagic zone (Rone et al., 2010). The fin whale density estimates east of Kodiak Island (in Marmot Bay) and west/southwest of Kodiak Island (down to the Semidi Islands), derived from the 2001 through 2003 NMML surveys, are two to four times
1
Gulf of Alaska Figure Legends 1
2
Figure 6.1. (a) Fin whale feeding Biologically Important Area (BIA), with the US Exclusive 3
Economic Zone shown as dashed line. (b) BIA close-up around the northern end of Kodiak 4
Island. Greatest densities of fin whales are found in this feeding BIA during June through 5
August, based on boat-based and aerial survey data. 6
7
145°W150°W155°W160°W165°W170°W
60°N
58°N
56°N
54°N
52°N
50°N
48°N
46°N
(a)
Alaska
BeringSea
Alaska
Peninsu
laKodiakIsland
Gulfof
Alaska
SemidiIslands
Sheliko
f Stra
it
KenaiPeninsula
0 280140Kilometers
152°W153°W154°W
58°30'N
58°N
57°30'N
(b)
0 4020Kilometers
AlaskaPeninsula
MarmotBay
KupreanofStraits
ViekodaBay
UganikBay
UyakBay
KodiakIsland
Sheliko
f Stra
it
UmnakPass
UnimakPass
ShumaginIslands
Figure 6.1. (a) Fin whale (Balaenoptera physalus) feeding Biologically Important Area (BIA), with the U.S. Exclusive Economic Zone (EEZ) shown as a dashed line; (b) BIA close-up around the northern end of Kodiak Island. The greatest densities of fin whales are found in this feeding BIA during June through August, based on boat- and aerial-based survey data.

68 Ferguson et al.
higher than those from the GOALS survey, although seasonal differences in abundance may be a con-founding factor when comparing densities in these two areas. The UAF GAP opportunistic aerial surveys conducted monthly around the Kodiak Archipelago from 1999 to 2013 sighted fin whales during every month of the year, with the greatest number of whales observed along the west coast of Kodiak Island, including Uyak Bay, Uganik Bay, and Kupreanof Straits, in addition to Marmot Bay (Witteveen, pers. comm., 12 January 2015). The greatest mean number of fin whale sightings per month during the 15-y UAF GAP time series occurred from June through August, moderate numbers occurred from September through November, and very few sightings occurred from December through May (Witteveen, pers. comm., 12 January 2015).
Based on the density of fin whales observed each year and the consistency in annual local con-centrations of fin whales east, west, and southwest of Kodiak Island (Figure 6.1; Table S6.1), this area is considered a BIA for feeding fin whales; the months with the highest number of whales sighted during the 15-y time series of UAF GAP aerial surveys were June through August (Witteveen, pers. comm., 12 January 2015). The feeding area boundary in Figure 6.1 encompasses the highest density of sightings from Wynne & Witteveen (2005, 2013), Zerbini et al. (2006), and Witteveen (pers. comm., 12 January 2015).
Beluga (Delphinapterus leucas) Small and Resident PopulationsBackground Information—NOAA Fisheries rec-ognizes five stocks of belugas in U.S. waters (Allen & Angliss, 2014). The stocks are named after areas in Alaska where they are found for at least part of the year: (1) Cook Inlet, (2) Bristol Bay, (3) eastern Bering Sea, (4) eastern Chukchi Sea, and (5) Beaufort Sea (O’Corry-Crowe et al., 1997, 2002; Allen & Angliss, 2014). In addition, there is genetic evidence that the small number of belugas living in Yakutat Bay, Southeast Alaska, comprise a resident population (O’Corry-Crowe et al., 2006, 2009). Only the Cook Inlet and Yakutat belugas are known to occur in the Gulf of Alaska (Laidre et al., 2000).
Cook Inlet—The Cook Inlet belugas (CIB) comprise a population of year-round residents (Laidre et al., 2000; Rugh et al., 2000; Hobbs et al., 2005; Goetz et al., 2012b). CIB distribu-tion may be influenced by access to prey, preda-tor avoidance, historical distribution, and physical barriers presented by sea ice and extreme tidal fluctuations (Huntington, 2000; Moore et al., 2000; Rugh et al., 2000, 2010; Hobbs et al., 2005; Goetz et al., 2007, 2012a, 2012b). They are most often found in Chickaloon Bay, Turnagain Arm,
Knik Arm, Susitna River delta, Trading Bay, and north of Kalgin Island (Rugh et al., 2000, 2005b, 2010; Hobbs et al., 2005; Goetz et al., 2012a, 2012b; Figure 6.2a). Evidence from photo-iden-tification studies suggests that individual animals do not exhibit site fidelity to any single area in upper Cook Inlet (McGuire et al., 2011). Satellite-tagging studies and aerial surveys indicate that seasonal shifts exist in CIB distribution, with the whales spending a greater percentage of time in coastal areas during the summer and early autumn (June through October or November), and dis-persing to larger ranges that extend to the middle of the inlet in winter and spring (November or December through May) (Hansen & Hubbard, 1999; Rugh et al., 2004; Hobbs et al., 2005; Goetz et al., 2012b). During summer and fall, they feed primarily on anadromous eulachon and salmon located in coastal areas and estuaries (Huntington, 2000; Moore et al., 2000). In winter and spring, their distribution farther offshore implies that the whales are consuming alternate prey resources using foraging strategies in the middle or bottom of the water column (Hobbs et al., 2005).
Goetz et al. (2012a) used habitat-based den-sity models to determine where CIB frequently occur and where they occasionally occur in large numbers during the summer (June and July). Specifically, Goetz et al. identified that the prob-ability of CIB occurrence increased in association with proximity to chinook salmon runs, rivers with medium flow accumulation, tidal flats, and sandy coastlines. Furthermore, Goetz et al. found that larger CIB groups were found closer to rivers with high flow accumulation and closer to tidal flats. Based on the habitat model results, Goetz et al. concluded that CIB currently occupy a frac-tion of suitable summer habitat within Cook Inlet. This is substantiated by their historical distribu-tion within the inlet, which is known to be much larger than their present distribution (Rugh et al., 2010).
The abundance of the CIB declined by nearly 50% between 1994 and 1998, from estimates of 653 (CV = 0.43) to 347 (CV = 0.29) whales (Hobbs et al., 2000). This decline is consistent with mor-talities from the Native subsistence hunt between 1993 and 1999, estimated to range between 30 to more than 100 animals per year (Mahoney & Shelden, 2000). Initial evidence for the decline came from aerial surveys for belugas in Cook Inlet, which showed a range contraction toward the northeastern portion of the inlet, resulting in a reduction in area from > 7,000 to < 3,000 km2 from the 1970s to the 2000s (Rugh et al., 2010). The stock has not shown signs of recovery despite the implementation of hunting regulations in 1999 (Rugh et al., 2010; Hobbs et al., 2012a, 2012b;

BIAs for Cetaceans: Gulf of Alaska Region 69
Allen & Angliss, 2014). The three most recent abundance estimates for this stock were 340 (CV = 0.11) in 2010, 284 (CV = 0.16) in 2011, and 312 (CV = 0.13) in 2012 (Hobbs et al., 2012a; Allen & Angliss, 2014).
In 1999, NOAA Fisheries determined that the Cook Inlet Stock of belugas was below its Optimum Sustainable Population levels and, therefore, des-ignated it as depleted under the Marine Mammal Protection Act (MMPA). In 2008, NOAA Fisheries listed the CIB distinct population segment (DPS) as endangered under the U.S. ESA, as amended (73 FR 62919). In 2011, NOAA Fisheries desig-nated two areas encompassing 7,800 km2 of Cook Inlet as Critical Habitat for CIB (76 FR 20180) (Figure 6.2a; Table S6.2).
To identify the geographic extent of the CIB and, therefore, delineate the boundaries for the
CIB small and resident BIA, we used the habi-tat model results from Goetz et al. (2012a) and the CIB Critical Habitat area boundaries (76 FR 20180). The BIA boundaries include the Critical Habitat exclusion area off Anchorage and Joint Base Elmendorf-Richardson (76 FR 20180). This is a year-round BIA.
Yakutat Bay—The belugas in Yakutat Bay repre-sent a small (10 to 12 individuals) group of whales thought to comprise a discrete reproductive group that are year-round residents of the bay (O’Corry-Crowe et al., 2006, 2009). NOAA Fisheries regu-lations under the MMPA (50 CFR 216.15) include the belugas occupying Yakutat Bay as part of the Cook Inlet Stock (75 FR 12498), but the Yakutat belugas are not considered part of the Cook Inlet DPS (ESA, 73 FR 62919). Therefore, Yakutat Bay belugas are not listed under the ESA, but they are
2
8
Figure 6.2. Two beluga small and resident population Biologically Important Areas (BIAs) in 9
(a) Cook Inlet and (b) Yakutat Bay. These BIAs were substantiated through boat-based and 10
aerial survey data, acoustic recordings, satellite tagging data (Cook Inlet only), traditional 11
ecological knowledge, photo-identification data, and genetic analyses. Both areas are considered 12
BIAs during the entire year. 13
14
140°W145°W150°W155°W
60°N
58°N
Alaska
CookInlet
Gulfof
Alaska
Canada
150°W152°W154°W
61°3
0'N
60°N
139°W140°W
60°N
59°3
0'N
CookInlet Yakutat
Bay
(a) (b)
0 200100Kilometers
0 10050Kilometers
0 4020Kilometers
YakutatBay
KalginIsland
TurnagainArm
Trading Bay
Knik Arm
ChickaloonBay
Susitna RiverDelta
Alaska
Figure 6.2. Two beluga (Delphinapterus leucas) small and resident population BIAs in (a) Cook Inlet and (b) Yakutat Bay. These BIAs were substantiated through boat-based and aerial survey data, acoustic recordings, satellite-tagging data (Cook Inlet only), traditional ecological knowledge, photo-identification data, and genetic analyses. Both areas are considered BIAs during the entire year.

70 Ferguson et al.
defined as depleted under the MMPA (Allen & Angliss, 2014).
Reported sightings of this small and resi-dent population of belugas have been scattered throughout Yakutat Bay (Laidre et al., 2000; O’Corry-Crowe et al., 2006, 2009). Therefore, the boundary for this BIA includes all of Yakutat Bay (Figure 6.2b; Table S6.3). This is a year-round BIA.
Gray Whale (Eschrichtius robustus) Background Information—Gray whales migrate between summer/fall feeding grounds in northern latitudes and winter/spring breeding grounds in southern latitudes (Pike, 1962; Lang et al., 2011a). Three types of gray whales are recognized in the North Pacific Ocean: (1) the western North Pacific (WNP) population, (2) eastern North Pacific (ENP) population, and (3) Pacific Coast Feeding Group (PCFG). Genetic analyses using both mitochon-drial and nuclear DNA suggest that WNP and ENP populations are distinct (Lang et al., 2011b). Mitochondrial DNA analyses suggest that PCFG gray whales are a subgroup of the ENP population; furthermore, there may be multiple ENP feeding aggregations north of the Aleutian Islands that are genetically differentiated by mtDNA (Lang et al., 2011a). The observed genetic structure within the ENP gray whale population is consistent with a scenario in which matrilineal fidelity to feeding areas exists (Lang et al., 2011a).
WNP gray whales are thought to feed primar-ily near Sakhalin Island, Russia, in the Okhotsk Sea (Weller et al., 1999, 2008; LeDuc et al., 2002; Lang et al., 2010). Genetic (Lang, 2010), satellite-tagging (Mate et al., 2011), and photo-identifica-tion (Weller et al., 2011; Urbán et al., 2012) data have shown that individual gray whales migrate between Sakhalin Island and the west coast of North America. However, contemporary records of gray whales off Japan and, to a lesser extent, China during winter and spring (reviewed in Weller & Brownell, 2012) suggest that some gray whales remain in the WNP year-round and may represent a distinct, “relic” WNP population. The non-calf population size of WNP gray whales was estimated to be approximately 130 animals in 2008 (Cooke et al., 2008), although evidence from genetic data, sightings, and strandings sug-gests that the population size may be substantially smaller (Lang et al., 2011b; Weller & Brownell, 2012). The WNP gray whale population is cur-rently listed as endangered under the U.S. ESA.
The majority of ENP gray whales migrate along the west coast of North America between summer feeding areas located primarily in the Bering and Chukchi Seas and wintering areas in coastal waters of Baja Mexico (Lang et al.,
2011a). Original analyses of southbound gray whale migration data suggested that the ENP pop-ulation increased by 2.5%/y between 1967-1968 and 1995-1996, and then the growth rate slowed (Buckland & Breiwick, 2002), with the popula-tion reaching its peak in 1997-1998 and declin-ing steeply in the following years (Rugh et al., 2005a). However, a recent re-analysis of these data using improved analytical methods resulted in a new time series of abundance estimates for the ENP population (Laake et al., 2012). The new ENP abundance estimates for 1967 to 1987 were generally larger than the corresponding previous abundance estimates, whereas the new estimates for 1992 to 2006 were generally smaller, with an estimated ~19,000 animals in 2006-2007. (No surveys were conducted between 1987 and 1992.) As a result, Laake et al. (2012) inferred that the peak in ENP abundance occurred in the mid- to late 1980s, and the population trajectory has remained flat and relatively constant since 1980. This population was removed from the U.S. List of Endangered and Threatened Wildlife in 1994 (59 FR 31095).
The PCFG are a subgroup of the ENP popula-tion, defined as having been observed in two or more years between 1 June and 30 November on feeding areas within the region between northern California and northern Vancouver Island (from 41º N to 52º N) (International Whaling Commission [IWC], 2011a, 2011b, 2011c; Lang et al., 2011a). PCFG animals also have been photo-identified near Sitka and the southern coast of Kodiak Island, Alaska (Calambokidis et al., 2002, 2010; Gosho et al., 2011; Straley, pers. comm., 8 January 2015). Photo-identification (Calambokidis et al., 2002, 2010; Gosho et al., 2011) and genetic (Lang et al., 2011a) studies of gray whales on PCFG feeding areas located from northern California to Kodiak Island show that individuals move within and between feeding areas both within and across years, with some matrilineal site fidelity to par-ticular feeding areas.
There was insufficient information available to evaluate reproductive BIAs for gray whales in this region.
Feeding—Gray whales are considered general-ist feeders, demonstrating considerable flexibility in their diet. They can use three different feeding mechanisms: (1) benthic foraging, (2) surface skim-ming, and (3) engulfing (Nerini, 1984). ENP gray whales feed along their entire range from subarctic and arctic waters offshore of Alaska to subtropical waters off Mexico (e.g., Nerini, 1984; Weller et al., 1999; Moore et al., 2007). Prey from a diversity of invertebrate taxonomic orders have been found in gray whale stomachs; however, benthic foraging on a few species is thought to be the gray whale’s

BIAs for Cetaceans: Gulf of Alaska Region 71
primary feeding mode. Nerini (1984) summarized the contents of 324 gray whale stomachs caught by Soviet whalers in the northern Bering Sea as com-prising six dominant amphipod genera from four families: (1) Ampeliscidae (Ampelisca macroceph-ala, A. eschricti, Byblis gaimardi, and Haploops sp.), (2) Atylidae (Atylus), (3) Lysianassidae (Anonyx), and (4) Haustoriidae (Pontoporeia).
Once considered only a migratory pathway, the Gulf of Alaska is now known to provide forag-ing and overwintering habitat for PCFG and other ENP gray whales (Moore et al., 2007; Wynne & Witteveen, 2013; Straley, pers. comm., 8 January 2015). Gray whales have been observed along the outer coast of northern Southeast Alaska since the 1940s and are still sighted from May through November, although numbers fluctuate from year to year (Straley, pers. comm., 8 January 2015). In the 1980s, gray whales began to utilize Sitka Sound as a feeding area (Figure 6.3b). Gray whales in this area have been documented feeding on ben-thic amphipods, cumaceans, and unknown mid-water column zooplankton, often associating with humpback whales (Straley, pers. comm., 8 January 2015). In total, less than 100 whales use the outer coast of northern Southeast Alaska (Straley, pers. comm., 8 January 2015). These data were con-firmed by other biologists who have reported gray whale feeding in Southeast Alaska during the summer and fall (June-November) since the mid-1990s (Moore et al., 2007; Calambokidis et al., 2010).
In addition, during monthly opportunistic aerial surveys conducted by the UAF GAP Project every year from 1999 to 2013, gray whales were seen year-round along the eastern side of Kodiak Archipelago, specifically in and near Ugak Bay (Wynne & Witteveen, 2005, 2013; Moore et al., 2007; Witteveen, pers. comm., 12 January 2015; Figure 6.3a; Table S6.4). During the 15-y UAF GAP surveys (1999 to 2013), the mean number of gray whales sighted per month was lowest from February to March, started increasing in April and May, peaked in June, was relatively high from July to August, and remained at moderate levels from September through January (Witteveen, pers. comm., 12 January 2015). Although cumaceans are generally considered a relatively poor food source for gray whales, benthic prey samples collected during the summer from nine stations located in the vicinity of feeding gray whales near the mouth of Ugak Bay in 2002, 2008, and 2010 were dominated by cumaceans, exhibiting a decline in density across the years sampled (Moore et al., 2007; Wynne & Witteveen, 2013). Furthermore, gray whale fecal samples collected from the area in August 2002 contained large numbers of cumaceans from the Diastylidae family (Moore et al., 2007; Wynne &
Witteveen, 2013). Amphipods were found in the Ugak Bay benthic prey samples in relatively low densities (Moore et al., 2007; Wynne & Witteveen, 2013).
Based on the regular occurrence of feeding gray whales (including repeat sightings of indi-viduals across years) off Southeast Alaska and near the mouth of Ugak Bay on Kodiak Island, these areas are designated as BIAs (Figure 6.3a & b; Table S6.4). The boundaries for the Southeast Alaska BIA were identified by Straley (pers. comm., 8 January 2015) and support the information pre-sented in Calambokidis et al. (2002, 2010). The greatest densities of gray whales on the feeding area in Southeast Alaska occur from May to November (Straley, pers. comm., 8 January 2015). The BIA feeding area boundaries off Kodiak Island were based on sighting data from the UAF GAP aerial surveys (1999 to 2013) (Witteveen, pers. comm., 12 January 2015). Near Kodiak Island, the greatest densities of gray whales occur from June through August (Witteveen, pers. comm., 12 January 2015)
Migration—Gray whales undertake one of the longest known migrations of any species. Most individuals in the ENP population move from the arctic and subarctic waters of Alaska and Russia to Mexico, a distance of 8,000 to 10,000 km one way (Rugh et al., 2001). During their annual migration, most gray whales pass through the Gulf of Alaska in the fall (November through January; south-bound) (Rugh, 1984; Rugh et al., 2001) and again in the spring (March through May; northbound) (Braham, 1984) (Figure 6.4; Table S6.5). From the Bering Sea, some enter Gulf waters during the fall migration through Aleutian Island passes such as Unimak Pass (Rugh, 1984). This species is known to follow the continental shelf along most of the migration route (Braham, 1984; Swartz et al., 2006), although there is limited information for the offshore waters of the Gulf of Alaska. Gray whales from the western North Pacific that were tagged with satellite transmitters crossed through the offshore waters of the Gulf of Alaska after passing through the Aleutian Archipelago rather than following the coast during their southbound migration (Mate et al., 2011).
Because the majority of gray whales migrating through the Gulf of Alaska region are thought to take a coastal route, the BIA boundaries for the migratory corridor in this region were defined by the extent of the continental shelf (Figure 6.4; Table S6.5). The greatest densities of gray whales are found in this BIA from November through January (southbound) and March through May (northbound). Additional research is needed to determine what proportion of the migrating gray whales traverse offshore waters of the Gulf of

72 Ferguson et al.
Alaska and to confirm whether a distinct migra-tory corridor exists offshore.
North Pacific Right Whale (Eubalaena japonica)Background Information—In 2000, the North Pacific right whale was recognized as a spe-cies separate from the right whales in the North Atlantic (Eubalaena glacialis) (Rosenbaum et al., 2000). In April 2008, NOAA Fisheries recognized the North Pacific right whale as an endangered species (73 FR 12024; 6 March 2008). The migra-tory movements of North Pacific right whales inferred from whaling data support the hypoth-esis of two largely discrete populations—in the western and eastern North Pacific (Clapham et al., 2004). BIAs are presented below for the eastern
Pacific population of North Pacific right whales. The relationship between North Pacific right whales in the Gulf of Alaska and Bering Sea is unknown (Wade et al., 2006, 2011a), although they are all currently considered part of the east-ern population (Brownell et al., 2001; Clapham et al., 2004). Despite small sample sizes, two whales photographed in the Gulf of Alaska in 2005 and 2006 have not been seen in the Bering Sea; furthermore, the genotype of a single right whale biopsied near Kodiak Island in 2005 did not match any Bering Sea whales or any possible Bering Sea offspring (Wade et al., 2011a).
North Pacific right whales were heavily exploited by the whaling industry in the Gulf of Alaska, including extensive illegal catches by the
3
15
Figure 6.3. Two gray whale feeding Biologically Important Areas (BIAs) occur in the Gulf of 16
Alaska. These areas were substantiated through boat and aerial survey data, photo-identification 17
studies, genetics, fecal samples, and direct prey sampling. (a) Kodiak Island BIA (greatest 18
densities from June through August). (b) Southeast Alaska BIA (greatest densities from May to 19
November).. The US Exclusive Economic Zone is shown in the overview panel as a dashed line. 20
21
151°W152°W153°W154°W155°W
59°N
58°N
57°N
AlaskaPeninsula
KodiakIsland Sitka
134°W135°W136°W137°W138°W
58°N
57°N
130°W135°W140°W145°W150°W155°W
60°N
58°N
56°N
Alaska Canada
Gulf ofAlaska
(a) (b)
Sh e l i
k o fS
t r a i t
Ugak Bay
SitkaSound
0 200100Kilometers
0 6030Kilometers
0 6030Kilometers
Figure 6.3. Two gray whale (Eschrichtius robustus) feeding BIAs were delineated in the Gulf of Alaska. These areas were substantiated through boat and aerial survey data, photo-identification studies, genetics, fecal samples, and direct prey sampling. (a) Kodiak Island BIA (greatest densities from June through August); (b) Southeast Alaska BIA (greatest densities from May through November). The U.S. EEZ is shown in the overview panel as a dashed line.

BIAs for Cetaceans: Gulf of Alaska Region 73
USSR in the early 1960s (Ivashchenko & Clapham, 2012). Recent research on the North Pacific right whale suggests that there are only approximately 30 whales remaining in the eastern population (Wade et al., 2011b). Due to their small population size, the rarity of their detections, and the minimal survey coverage in the region in recent years, cur-rent information about North Pacific right whales is extremely limited (Waite et al., 2003; Shelden et al., 2005; Wade et al., 2011a).
The distribution and migratory patterns of North Pacific right whales can be inferred from historical whaling data and recent sightings and acoustic detections, although understanding of historical and current distribution and movements is incomplete. Their historical and current win-tering and calving areas are unknown (Clapham et al., 2004). Historically, North Pacific right whales are thought to have had high concentra-tions above 40º N during summer and migrate southward in autumn (Clapham et al., 2004). Data on illegal Soviet whaling from the 1960s show that the majority of right whale catches and sight-ings in the Gulf of Alaska occurred during June and July (Ivashchenko & Clapham, 2012). This seasonality in the occurrence of North Pacific
right whales in Alaskan waters is supported by passive acoustic data from long-term bottom-mounted hydrophones deployed on the Bering Sea shelf from October 2000 to January 2006, which detected right whale calls only from May to December, with more detections from July through October than May-June or November-December (Munger et al., 2008). During the 19th and 20th centuries, catches of North Pacific right whales showed an extensive distribution in offshore waters, including the Gulf of Alaska, from March through September (Townsend, 1935; Clapham et al., 2004; Shelden et al., 2005; Ivashchenko & Clapham, 2012). These offshore areas have received little or no sighting coverage in recent years. Geographic biases in search effort and the rarity of the species potentially confound inferences into their current distribution.
There was insufficient information available to evaluate migratory corridor and reproductive area BIAs for North Pacific right whales in this region.
Feeding—North Pacific right whales feed on macrozooplankton, primarily copepods but also euphausiids, based on analysis of stomach contents from whales caught in the 1950s and 1960s, and zooplankton caught near right whale
4
22
Figure 6.4. Gray whale migratory corridor Biologically Important Area (BIA), substantiated 23
through satellite tagging and boat- and land-based survey data. Highest densities of gray whales 24
occur in the southbound BIA from November through January, and in the northbound BIA from 25
March through May. The US Exclusive Economic Zone is also shown as a dashed line 26
27
130°W140°W150°W160°W170°W60°N
55°N
50°N
Alaska Peninsula
KodiakIsland
BeringSea
Gulfof
Alaska
Alaska
Canada
UnimakPassUmnak
Pass
0 400200Kilometers
Figure 6.4. Gray whale migratory corridor BIA, substantiated through satellite-tagging and boat- and land-based survey data. Highest densities of gray whales occur in the BIA from November through January (southbound) and from March through May (northbound). The U.S. EEZ is also shown as a dashed line.

74 Ferguson et al.
sightings (Shelden et al., 2005; Gregr & Coyle, 2009; Wade et al., 2011a). Since illegal whal-ing of North Pacific right whales ceased in the 1960s, right whale visual and acoustic detections have been rare, but they have been consistently reported in one area in the Gulf of Alaska, located south of Kodiak Island in the waters of and near Barnabas Trough and Albatross Bank (Waite et al., 2003; Mellinger et al., 2004; Wade et al., 2011a). The four new North Pacific right whale sightings reported by Wade et al. (2011a) were observed in association with dense zooplankton layers in Barnabas Trough, and fecal samples were obtained from one animal, suggesting that the area is an important feeding habitat.
Based on the repeated detections of right whales in the Barnabas Trough and Albatross Bank area, including animals that are known to have been recently feeding due to the observation of feces, this area is considered a BIA for feed-ing (Figure 6.5; Table S6.6). The BIA bound-ary was based on the location of North Pacific right whale sightings and acoustic detections since 1998 documented in Wade et al. (2011a) and encompasses the North Pacific right whale Critical Habitat area (71 FR 38277, 73 FR 19000; Figure 6.5; Table S6.6). Although recent sighting
and acoustic data on North Pacific right whales in this area are limited to the months of August and September, there are few if any data avail-able from other months. June through September is the time period when the majority of North Pacific right whales were caught and seen in this area by Soviet whalers in the 1960s (Ivashchenko & Clapham, 2012) and when the sightings and acoustic detections occurred from 1998 to 2006 (Waite et al., 2003; Mellinger et al., 2004; Wade et al., 2011a).
Humpback Whale (Megaptera novaeangliae)Background Information—The humpback whale is listed as an endangered species under the U.S. ESA. Humpback whales are found in all major ocean basins and typically undergo annual migra-tions between high latitude feeding and low latitude breeding areas (Mackintosh, 1946). The humpback whale is among the most common mysticetes found in the Gulf of Alaska.
Characteristics of humpback whale migration in the Gulf of Alaska are known from visual sur-veys, photo-identification studies, and satellite-tagging. Photo-identification data have shown that humpback whales from the Gulf of Alaska and northern British Columbia/Southeast Alaska
5
28
Figure 6.5. North Pacific right whale feeding Biologically Important Area, where the highest 29
densities of animals are thought to occur from June through September. This BIA was 30
substantiated through opportunistic sighting data, acoustic recordings, fecal samples, and 31
historical whaling data. Also shown is the NOAA designated Critical Habitat area (solid black 32
line), and the 100-, 200-, 500- and 1000-m isobaths. The US Exclusive Economic Zone is shown 33
as a dashed line. 34
35
AlbatrossBank
BarnabasTrough
-1000m
-500m
-200m-10
0m
150°W155°W
59°N
58°N
57°N
56°N
AlaskaPeninsula
KodiakIsland
Gulf ofAlaska
0 15075Kilometers
Figure 6.5. North Pacific right whale (Eubalaena japonica) feeding BIA, where the highest densities of animals are thought to occur from June through September. This BIA was substantiated through opportunistic sighting data, acoustic recordings, fecal samples, and historical whaling data. Also shown is the NOAA designated Critical Habitat area (solid black line) and the 100-, 200-, 500-, and 1,000-m isobaths. The U.S. EEZ is shown as a dashed line.

BIAs for Cetaceans: Gulf of Alaska Region 75
migrate to breeding areas off Mexico (mainland, Baja California, and Revillagigados Islands) and the Hawaiian Islands, and to the western Pacific Ocean (Darling & Jurasz, 1983; Baker et al., 1985, 1986; Darling & McSweeney, 1985; Barlow et al., 2011). The transit from Southeast Alaska to Hawaii takes about a month as documented from photo-identification (Gabriele et al., 1996) and satellite-tag data (Mate et al., 1998). Humpback whales in Southeast Alaska have a staggered migratory departure from and arrival at the Alaskan feeding grounds (Straley, 1994; Straley et al., 1995). Some whales depart early and return early to the feeding grounds, while others leave late and return late. Therefore, there is the appearance of many whales foregoing migration. Although some whales have been documented with sufficient frequency to not have made two oceanic migrations between sight-ings (given month transit time) and truly overwin-tered in Alaskan waters, most do migrate (Straley et al., 1995).
During this initial assessment, BIAs were not evaluated for humpback whale migratory cor-ridors or reproductive areas in the region, or for humpback whale feeding areas in Prince William Sound in summer. There was insufficient informa-tion available about the exact routes that humpback whales transit in the region to delineate migratory corridors. Future assessments should evaluate the considerable information that exists on humpback whale cow-calf associations in certain areas in the Gulf of Alaska to determine which areas qualify as reproductive BIAs. Similarly, future assess-ments should evaluate existing unpublished infor-mation on humpback whales in Prince William Sound in summer to determine whether feeding BIAs should be defined.
Feeding—Humpback whales are top-level gener-alist predators, which are known to eat zooplankton and pelagic schooling fishes (Nemoto & Kawamura, 1977; Witteveen et al., 2011a, 2011b). Four BIAs for humpback whale feeding were identified in the Gulf of Alaska based on feeding aggregations that have persisted through time (Andrews, 1909; Baker et al., 1986; Straley et al., 1994; Calambokidis et al., 1997, 2008a; Waite et al., 1999; Witteveen et al., 2007, 2011b; Wynne & Witteveen, 2013; Allen & Angliss, 2014) (Figures 6.6 & 6.7; Table S6.7): (1) Southeast Alaska, (2) Prince William Sound, (3) Kodiak Island, and (4) Shumagin Islands. All four areas are located in the coastal waters of the Gulf of Alaska, reflect-ing the coastal concentration of recent survey effort. Much less is known about humpback whale distri-bution in the offshore waters of the Gulf of Alaska where extensive catches were made in the 1960s by the USSR (Ivashchenko et al., 2013). Witteveen et al. (2007) documented movements by photographically identifying humpback whales between the Shumagin
Islands and Kodiak Island. Witteveen et al. also found significant differences in the frequencies of mitochondrial DNA (mtDNA) haplogroups from humpback whales in the Shumagins compared to California, Southeast Alaska, and Prince William Sound. Photo-identification data collected during the Structure of Populations, Levels of Abundance and Status of Humpbacks (SPLASH) project from six subregions defined by the inshore and offshore habitats in Southeast Alaska, Prince William Sound, and Kodiak Island provide additional evidence of
6
36
Figure 6.6. Seasonal humpback whale feeding Biologically Important Areas (BIAs) in Southeast 37
Alaska for (a) spring, March – May; (b) summer, June – August; and (c) fall, September – 38
November. These BIAs were substantiated through boat-based survey data. The US Exclusive 39
Economic Zone is shown as a dashed line. 40
41
130°W135°W140°W
58°N
56°N
58°N
56°N
130°W135°W140°W
58°N
56°N
Gulfof
Alaska
Gulfof
Alaska
(a)
(b)
(c)
Gulfof
Alaska
Canada
Canada
Canada
0 200100Kilometers
0 200100Kilometers
0 200100Kilometers
Figure 6.6. Seasonal humpback whale (Megaptera novaeangliae) feeding BIAs in Southeast Alaska for (a) spring, March-May; (b) summer, June-August; and (c) fall, September-November. These BIAs were substantiated through boat-based survey data. The U.S. EEZ is shown as a dashed line.

76 Ferguson et al.
7
42
Figure 6.7. Seasonal humpback whale feeding Biologically Important Areas (BIAs) for: (a) 43
Prince William Sound (greatest densities September – December), substantiated through boat-44
based survey data, genetics, prey consumption studies, and photo-identification data; (b) Kodiak 45
Island (greatest densities July - September), substantiated through aerial survey data; and (c) the 46
Shumigan Islands (greatest densities July – August), substantiated through boat-based survey 47
data and anecdotal information from fishermen. Area overview with US Exclusive Economic 48
Zone shown as a dashed line. 49
150°W160°W
60°N
55°N
50°N
Alaska
Gulf of
Alaska
158°W160°W162°W
57°N
56°N
55°N
54°N
Shumagin
Islands
144°W146°W148°W150°W
62°N
61°N
60°N
59°N
Prince William
Sound
Alaska
^
150°W152°W154°W
59°N
58°N
57°N
56°N
Alaska
Peninsula
Kodiak
Island
Sh
elik
of
Stra
it
(a)
(b)
Kenai
Fjords
Cook
Inlet
Barren
Islands
Albatross
Bank
Portlock
Bank
Port
Hobron
(c)
0 15075Kilometers
0 400200Kilometers
0 15075Kilometers
0 15075Kilometers
Cook
Inlet
(c)
(b)
(a)
Figure 6.7. Seasonal humpback whale feeding BIAs for (a) Prince William Sound (greatest densities September-December), substantiated through boat-based survey data, genetics, prey consumption studies, and photo-identification data; (b) Kodiak Island (greatest densities July-September), substantiated through aerial survey data; and (c) the Shumigan Islands (greatest densities July-August), substantiated through boat-based survey data and anecdotal information from fishermen. Area overview with U.S. EEZ shown as a dashed line.

BIAs for Cetaceans: Gulf of Alaska Region 77
site fidelity to feeding grounds, with the greatest resighting rates generally within subregions (e.g., sighted more than once in Prince William Sound inshore) and between subregions within the same “region” (e.g., Southeast Alaska inshore to Southeast Alaska offshore), and minimal movement between “regions” (Witteveen et al., 2011b). Furthermore, Witteveen et al. (2011b) found significant differences in mtDNA haplotypes among the regions defined in their study area, and significant differences between the Prince William Sound inshore mtDNA haplo-types compared to all other subregions. Due to the spatial resolution of this BIA exercise, each “region” from Witteveen et al. (2011b) is considered a single BIA for humpback whale feeding.
The coastal and inland waters of Southeast Alaska attract thousands of humpback whales each year, and it is firmly established in the scien-tific literature that this is an important humpback whale feeding area (e.g., Andrews, 1909; Baker et al., 1985; Straley, 1990; Dahlheim et al., 2009). Humpback whales occur year-round in Southeast Alaska (Straley, 1990), with greatest densities in summer and fall (June-October) (Baker et al., 1986). Stable nitrogen isotope ratios indicate that humpback whales found in Southeast Alaska in summer (June-August) feed on a greater propor-tion of zooplankton than fish (Witteveen et al., 2011b). In contrast, during the fall and winter (September-March) of 2007-2008 and 2008-2009, humpback whales in Prince William Sound and Lynn Canal, Alaska, were strongly associated with large shoals of Pacific herring (Clupea pal-lasii) (Moran et al., 2011). Hendrix et al. (2012) used sight-resight methods based on photo-iden-tification data to estimate that 1,585 humpback whales were found in northern Southeast Alaska (including Frederick Sound, Glacier Bay, Lynn Canal, and Sitka Sound) in 2008. SPLASH pho-tographically identified 1,115 unique individuals in Southeast Alaska during the 2004 and 2005 feeding seasons; the resulting abundance esti-mates ranged from 2,883 to 6,414 individuals for Southeast Alaska and northern British Columbia combined (Calambokidis et al., 2008a). The humpback whale feeding BIAs were derived from the sighting data published in Dahlheim et al. (2009) and unpublished hotspot analyses based on SPLASH sighting data collected during opportunistic and line-transect boat-based sur-veys for cetaceans conducted from 2004-2009 by the Alaska Fisheries Science Center (NMML and Auke Bay Laboratory), Southwest Fisheries Science Center, Glacier Bay National Park, Cascadia Research Collective, and University of Alaska Southeast. Data for the hotspot maps were analyzed separately for each season, spring (March-May; Figure 6.6a; Table S6.7), summer
(June-August; Figure 6.6b; Table S6.7), and fall (September-November; Figure 6.6c; Table S6.7).
Based on photo-identification (von Ziegesar et al., 2001; Moran et al., 2011; Rice et al., 2011), prey consumption (Moran et al., 2011; Rice et al., 2011), and genetics (Witteveen et al., 2011b) studies, Prince William Sound is another area recognized as an important area for humpback whale feeding. Humpback whales are found in Prince William Sound year-round (Moran et al., 2011; Rice et al., 2011). During boat-based sur-veys conducted from September through March 2007-2008 and 2008-2009, humpback whales were found in particularly high densities from September through December (Moran et al., 2011; Rice et al., 2011). Over the course of those surveys, four photographically identified whales overwintered in Prince William Sound; this repre-sents less than 2% of the late-season whales iden-tified during the study (Rice et al., 2011). Stable nitrogen isotope ratios indicate that humpback whales found during the feeding season (May through December) in the offshore waters adja-cent to Prince William Sound (including Lower Cook Inlet, Kenai Fjords, and the Barren Islands) tended to have a diet higher in fish than zooplank-ton, whereas the animals located in Prince William Sound fed almost exclusively on fish (Witteveen et al., 2011b; Figure 6.7a). The greatest propor-tion of humpback whale groups observed in the area in the fall and winter (September-March) of 2007-2008 and 2008-2009 were feeding on Pacific herring (Rice et al., 2011). Furthermore, Rice et al. (2011) estimated that humpback whales in this area consumed enough Pacific herring bio-mass (equivalent to that lost to natural mortality) to be considered the dominant top-down force on Pacific herring mortality, at least for the observed time period. The boundary for this BIA encom-passes the majority of the September through December sightings reported by Rice et al. (2011; Moran, pers. comm., 29 May 2013; Figure 6.7a; Table S6.7).
The third BIA for humpback whale feeding in the Gulf of Alaska region encompasses the waters east of Kodiak Island (Albatross and Portlock Banks), a target of historical commercial whaling based out of Port Hobron, Alaska (Reeves et al., 1985; Witteveen et al., 2007; Figure 6.7b). This BIA also includes waters along the southeastern side of Shelikof Strait and in the bays along the north-western shore of Kodiak Island. Opportunistic aerial surveys conducted by the UAF GAP Project year-round from 1999 to 2013 in the Kodiak Archipelago detected humpback whales in every month, with the greatest mean number of whales/mo sighted from July through September, mod-erate numbers from October through December,
78 Ferguson et al.
and extremely few whales from January through June (Witteveen, pers. comm., 12 January 2015). During a 3-y study from 2004 to 2006, Witteveen et al. (2011a) used stable isotope analyses to infer that humpback whales in this area fed heavily on euphausiids but also ate juvenile walleye pollock, capelin, and Pacific sand lance, with annual dif-ferences in diet due to either individual prey pref-erences or prey availability. The boundary for this BIA is based on unpublished UAF GAP sighting data (Witteveen, pers. comm., 12 January 2015; Figure 6.7b; Table S6.7).
The fourth important area in the Gulf of Alaska known for persistent aggregations of feed-ing humpback whales is the Shumagin Islands (Witteveen et al., 2004; Wynne & Witteveen, 2013). This area has not been surveyed as exten-sively as the other areas; however, humpback whale density in the Shumagin Islands peaks from late July through August. Fishermen report whales in the area from June through mid-September (B. Witteveen, University of Alaska Fairbanks, pers. comm., 13 May 2013). The geographic boundary for this BIA was based on drawing a polygon around the Shumagin Islands (Figure 6.7c; Table S6.7).
Summary
In summary, 13 BIAs were identified for five cetacean species within the Gulf of Alaska region, based on extensive expert review and synthesis of published and unpublished information. Identified BIAs included feeding areas for fin, North Pacific right, and humpback whales; feeding areas and migratory corridors for gray whales; and two small and resident population BIAs—one for Cook Inlet belugas and one for Yakutat Bay belugas. The geo-graphic extent of the BIAs in this region ranged from approximately 900 to 177,000 km2. This BIA assessment did not include the Dall’s porpoise, Pacific white-sided dolphin, killer whale, beaked whales, sperm whale, minke whale, sei whale, and harbor porpoise; however, these species should be considered in future efforts to identify BIAs. Other information gaps that were identified during this BIA process include (1) reproductive areas for fin, gray, and North Pacific right whales; (2) detailed information on the migration routes of all species; (3) detailed information on the migratory timing of all species except humpback whales; and (4) cetacean distribution, density, and behavior in U.S. Gulf of Alaska waters off the continental shelf. To maintain their utility, these BIAs should be re-evaluated and revised, if necessary, as new information becomes available.

Aquatic Mammals 2015, 41(1), 79-93, DOI 10.1578/AM.41.1.2015.79
7. Biologically Important Areas for Cetaceans Within U.S. Waters – Aleutian Islands and Bering Sea Region
Megan C. Ferguson,1 Janice M. Waite,1 Corrie Curtice,2 Janet T. Clarke,3 and Jolie Harrison4
1Cetacean Assessment and Ecology Program, National Marine Mammal Laboratory, Alaska Fisheries Science Center, NOAA Fisheries, Seattle, WA 98115, USA
E-mail: [email protected] 2Marine Geospatial Ecology Lab, Duke University, Beaufort, NC 28516, USA
3Leidos, 4001 N Fairfax Drive, Arlington, VA 22203, USA 4NOAA Fisheries Office of Protected Resources, Silver Spring, MD 20910, USA
Abstract
We integrated existing published and unpublished information to delineate Biologically Important Areas (BIAs) for bowhead, fin, gray, North Pacific right, and humpback whales and belugas in U.S. waters of the Aleutian Islands and Bering Sea. Supporting evidence for these BIAs came from aerial-, land-, and vessel-based surveys; satellite-tagging data; passive acoustic monitor-ing; traditional ecological knowledge; photo- and genetic-identification data; and whaling data, including catch and sighting locations and stom-ach contents. The geographic extent of the BIAs in this region ranged from approximately 1,200 to 373,000 km2. Information gaps identified during this assessment include (1) reproductive areas for all species; (2) detailed information on the migration routes and timing of all species; and (3) cetacean distribution, density, and behavior in U.S. Bering Sea waters off the continental shelf. To maintain their utility, these BIAs should be re-evaluated and revised, if necessary, as new infor-mation becomes available.
Key Words: Aleutian Islands, Bering Sea, Alaska, feeding area, migratory corridor, small and resident population, bowhead whale, Balaena mysticetus, fin whale, Balaenoptera physalus, gray whale, Eschrichtius robustus, North Pacific right whale, Eubalaena japonica, humpback whale, Megaptera novaeangliae, beluga, Delphinapterus leucas
Introduction
This assessment synthesizes existing published and unpublished information for U.S. waters of the Aleutian Islands and Bering Sea region (shoreward
of the U.S. Exclusive Economic Zone [EEZ]) to define Biologically Important Areas (BIAs) for cetacean species that meet the criteria for feed-ing areas, migratory corridors, and small and resi-dent populations defined in Table 1.2 of Ferguson et al. (2015b) within this issue. A comprehensive overview of the BIA delineation process; its cave-ats (Table 1.4), strengths, and limitations; and its relationship to international assessments also can be found in Ferguson et al. Table 1.3 provides a summary of all BIAs identified, including region, species, BIA type, and total area (in km2). A sum-mary also can be found at http://cetsound.noaa.gov/important. Table 1.1 defines all abbreviations used in this special issue. Metadata tables that con-cisely detail the type and quantity of information used to define each BIA are available as an online supplement.
Within the Aleutian Islands and Bering Sea region, five baleen whale and one toothed whale species met the BIA criteria based on identifica-tion of feeding areas and migratory corridors, and one small and resident population was identi-fied. The six species for which BIAs were iden-tified were the bowhead whale (Balaena mysti-cetus), fin whale (Balaenoptera physalus), gray whale (Eschrichtius robustus), North Pacific right whale (Eubalaena japonica), humpback whale (Megaptera novaeangliae), and beluga (Delphinapterus leucas). The other cetacean spe-cies inhabiting this region were excluded from the assessment largely due to insufficient infor-mation. Cetacean species excluded from this initial BIA exercise included Dall’s porpoise (Phocoenoides dalli), Pacific white-sided dol-phin (Lagenorhynchus obliquidens), killer whale (Orcinus orca), beaked whales (family Ziphiidae), sperm whale (Physeter macrocephalus), harbor porpoise (Phocoena phocoena), minke whale

80 Ferguson et al.
(B. acutorostrata), and sei whale (B. borealis). These species should be evaluated in future efforts to create BIAs for cetaceans in this region.
The primary sources of information for delin-eating BIAs in this region were aerial-, vessel-, and land-based surveys; satellite-tagging data; passive acoustic monitoring; traditional ecologi-cal knowledge; photo- and genetic-identification data; and whaling data, specifically, catch and sighting locations and stomach contents. A popu-lation was considered “small” if the best estimate of abundance was at most ~3,000 individuals.
Biologically Important Areas in the Aleutian Islands and Bering Sea Region
Bowhead Whale (Balaena mysticetus)Background Information—Bowhead whales are endemic to arctic waters. The five recognized stocks include (1) the Bering-Chukchi-Beaufort (BCB) or Western Arctic, (2) Sea of Okhotsk, (3) Spitsbergen, (4) Davis Strait, and (5) Hudson Bay Stocks (Rugh et al., 2003). All bowhead whale stocks are currently listed as endangered under the U.S. Endangered Species Act (ESA). The BCB stock winters in the northern Bering Sea on both sides of the International Dateline and migrates north each spring (March-June) to feed in the Canadian Beaufort Sea, western Beaufort Sea, and elsewhere (Moore & Reeves, 1993). These whales return to the northern Bering Sea in late fall (November-December) and overwinter in annual sea ice. Notably, despite the geographical proxim-ity of wintering bowhead whales from the BCB Stock in the northern Bering Sea to those from the Sea of Okhotsk Stock, there is no evidence of any geographical or temporal overlap of these stocks (Ivashchenko & Clapham, 2010).
The winter and early spring distribution of BCB bowhead whales in the Bering Sea has not been well documented. Due to the logistical chal-lenges of the harsh winter conditions, available data are limited to a small number of studies with aerial surveys, passive acoustic recorders, tradi-tional ecological knowledge, and satellite-tagged individuals. Several aerial and vessel surveys conducted during winter in the 1970s and 1980s indicated that bowhead whales do not occur south of the marginal ice zone (e.g., Brueggeman, 1982; Ljungblad, 1986). During winter, most BCB bowhead whales appear to concentrate primarily in the northwestern Bering Sea (Braham et al., 1980), generally over relatively shallow conti-nental shelf waters (< 200 m depth) (Quakenbush et al., 2010a; Citta et al., 2012). However, in exceptionally heavy ice years, bowhead whales occur as far south as the Pribilof Islands. Several annually forming polynyas in the northern Bering
Sea likely provide wintering habitat for the BCB Stock. A polynya is an area of open water within sea ice, located downwind of land masses. The St. Lawrence and St. Matthew Island polyn-yas, and other large polynyas near the Chukotka Peninsula, are believed to be used during winter. However, habitat use in the northern Bering Sea may vary markedly between years based on results from satellite-tagging studies during winter 2008-2009 and 2009-2010 (Citta et al., 2012). Although sample sizes were limited (11 whales in 2008-2009 and 10 whales in 2009-2011), tagged whales were fairly well represented by both sexes and several different sizes and ages. During winter 2008-2009, most tagged whales were distributed from Bering Strait to Cape Navarin, Russia. In contrast, during winter 2009-2010, the distribution shifted 100 to 200 km south of St. Lawrence Island, extending from Cape Navarin to St. Matthew Island. These data indicated that bowhead whales spent most of their time in relatively heavy ice, even when open water polynyas were nearby (Citta et al., 2012). Available data indicate that very few bowhead whales are seen east of St. Lawrence Island, based on satellite-tagging studies and whaler observa-tions from the villages of Gambell and Savoonga on St. Lawrence Island (Noongwook et al., 2007).
During spring, limited available data from April and May 1979 through 1984 aerial surveys show that BCB bowhead whales concentrate in open water lead areas north of St. Lawrence Island (Moore & Reeves, 1993). During summer, although the vast majority of BCB bowhead whales migrate to the Chukchi and Beaufort Seas, a few individuals may remain in the Bering Sea (Rugh et al., 2003).
Reproductive BIAs were not delineated for bowhead whales in the Aleutian Islands and Bering Sea region due to lack of information.
Feeding—Bowhead whales in the BCB Stock were once thought to feed predominantly in the Canadian Beaufort Sea (Lowry, 1993); how-ever, increasing evidence indicates that they feed opportunistically in several areas along the migra-tion route (Lowry et al., 2004; Moore et al., 2010b; Mocklin et al., 2011; Clarke et al., 2013a). In the northern Bering Sea during December, whalers reported that bowhead whales feed near shorefast ice on the northern side of St. Lawrence Island, with spring feeding reported near Southwest Cape (Noongwook et al., 2007). Additional evi-dence indicates that BCB bowhead whales feed on euphausiids and copepods in the Bering Sea in spring and late fall based on stomach con-tent analyses obtained via subsistence hunts off St. Lawrence Island (Sheffield & George, 2009). Furthermore, satellite-tagged bowhead whales in the Bering Sea often dove to bottom depths of 25

81 BIAs for Cetaceans: Aleutian Islands and Bering Sea Region
to 300 m, which suggests that they are feeding on overwintering layers of copepods or euphausiids (Quakenbush et al., 2012).
Review of available information from tradi-tional ecological knowledge, stomach contents, and satellite-tagging data indicates one BIA com-prised of two areas near St. Lawrence Island, where bowhead whales are known to feed from November to April (Figure 7.1; Table S7.1).
Migration—Based on available information, a migratory corridor BIA is designated for BCB bowhead whales in the northern Bering Sea in spring but not fall. Migration routes of bowhead whales elsewhere in the region are not well known.
The Bering Strait is the only pathway for BCB bowhead whales migrating annually between Bering Sea wintering grounds and summer-ing grounds in the Chukchi and Beaufort Seas (Figure 7.2). During the spring (March-June) northward migration, whalers reported that bow-head whales near St. Lawrence Island follow two paths (Noongwook et al., 2007). One migration path remains offshore between Southeast Cape and Southwest Cape, then turns northeastward past Gambell toward Bering Strait (Noongwook et al., 2007). Evidence for part of this distribution
BIAs for Cetaceans: Aleutian Islands and Bering Sea Region
1
Figure Legends 1
2
Figure 7.1. Bowhead whale feeding Biologically Important Area near St. Lawrence Island, 3
substantiated through traditional ecological knowledge, stomach content analysis, and satellite 4
tagging data. Highest densities of bowhead whales occur in these areas from November through 5
April. 6
7
169°W170°W171°W172°W173°W63°N
62°N
0 8040Kilometers
St. Lawrence Island
BeringSea
SouthwestCape
SoutheastCape
Figure 7.1. Bowhead whale (Balaena mysticetus) feeding Biologically Important Area (BIA) near St. Lawrence Island, substantiated through traditional ecological knowledge, stomach content analysis, and satellite-tagging data. Highest densities of bowhead whales occur in these areas from November through April. BIAs for Cetaceans: Aleutian Islands and Bering Sea Region
2
8
Figure 7.2. Bowhead whale Biologically Important Area for the spring (northbound) migratory 9
corridor through the Bering Sea. Highest densities are from March through June, substantiated 10
through aerial surveys, traditional ecological knowledge, and satellite tagging data. 11
12
13
165°W170°W175°W180°175°E
64°N
62°N
60°N
Alaska
ChukchiSea
St. Lawrence Island
Chukotka
BeringSea
SoutheastCape
SouthwestCape
Gambell Savoonga
LittleDiomede Island
0 200100Kilometers St. Matthew Island
CapeNavarin
Bering
Strait
Figure 7.2. Bowhead whale BIA for the spring (northbound) migratory corridor through the Bering Sea; highest densities are from March through June, substantiated through aerial surveys, traditional ecological knowledge, and satellite-tagging data.
82 Ferguson et al.
is supported by high densities of bowhead whales north of St. Lawrence Island observed during aerial surveys in April and May, 1979 through 1984, that spanned from the northern Bering Sea to the western Beaufort Sea (Moore & Reeves, 1993; see also Figure 8.3 in Clarke et al., 2015). The second migration path is close to shore near Southwest Cape, but then turns northwestward toward the Chukotka Peninsula. Farther north in Bering Strait, most of the northbound satellite-tagged bowhead whales passed east of Little Diomede Island, only two tagged whales migrated west of Big Diomede Island, and none migrated between the two islands (Citta et al., 2012; Figure 7.2; Table S7.2).
During fall (approximately early November to December), most southward migrating bowhead whales pass through the western Bering Strait and remain west of St. Lawrence Island into the north-ern Bering Sea (Braham et al., 1980; Noongwook et al., 2007; Citta et al., 2012). This portion of the fall migratory corridor is not considered a BIA because it is located outside the U.S. EEZ.
Fin Whale (Balaenoptera physalus) Background Information—Fin whales are cur-rently listed as endangered under the U.S. ESA. Current information on fin whale occurrence throughout the Bering Sea is based on sighting data from cetacean line-transect surveys con-ducted aboard fisheries research vessels (Friday et al., 2012, 2013), passive acoustic monitor-ing from moored hydrophones (National Marine Mammal Laboratory [NMML], unpub. data, May 2007-May 2011; Stafford et al., 2010; Clapham et al., 2012), and commercial whaling data (peak catches 1952 to 1971) (Springer et al., 1996; Mizroch et al., 2009). However, no current data are available for fin whale distribution, density, or behavior in U.S. Bering Sea waters off the conti-nental shelf.
Fin whale distribution along the eastern Bering Sea shelf can be generally described based on three hydrographic domains separated by two oceanographic fronts (Coachman, 1986): (1) the Coastal domain (shore to inner front), (2) Middle Shelf domain (inner front to middle front), and (3) Outer Shelf domain (middle front to 1,000-m isobath). The inner and middle fronts are dynamic features, but they can be approximated by the 50- and 100-m isobaths, respectively (Figure 7.3; Table S7.3). During ship-based cetacean line-transect surveys conducted in June and July 1999, 2000 (June only), 2002, 2004 (June only), 2008, and 2010, fin whales were commonly sighted along the slope and Outer Shelf domain in every year except 2004, when survey effort in this domain was low (Tynan, 2004; Friday et al., 2012,
2013). In the Middle Shelf domain, fin whale sightings were scattered in 2002 and 2010 and clustered in 2000 and 2008 (Friday et al., 2012, 2013). Historical whaling data provide further evidence that fin whales are strongly associated with the shelf edge (Springer et al., 1996).
During summer (June-September), fin whales migrate into the Bering Sea from the North Pacific Ocean, with peak density in August (Mizroch et al., 2009). Fin whales have been sighted farther north in the southern Chukchi Sea in July, August, and September (Mizroch et al., 2009; Clarke et al., 2013b). It was previously believed that during winter, all fin whales migrate south, with sightings reported as far south as 23º N (Mizroch et al., 2009). However, fin whales have been seen during winter in the Bering Sea (Mizroch et al., 2009). Furthermore, acoustic data from May 2007 to May 2011 demonstrate that fin whales inhabit the southeastern Bering Sea year-round, although it is unknown whether any individuals remain year-round (NMML, unpub. data, May 2007-May 2011; Clapham et al., 2012). In the Aleutian archi-pelago, passive acoustic monitoring by moored hydrophones located in Umnak (August 2009 through January 2010) and Unimak (August 2009 through August 2010) passes detected fin whale calls year-round. Fin whale calling rates peaked in mid-October to November at Umnak Pass and were consistently lower in all months at Unimak Pass (NMML, unpub. data, August 2009-August 2010; Clapham et al., 2012).
Insufficient information about fin whale migra-tory routes and reproductive behavior in this region precluded delineating migratory corridor and reproductive BIAs.
Feeding—A feeding BIA for fin whales was delineated in the Bering Sea during summer, based primarily on sightings from vessel-based line-transect surveys, passive acoustic monitor-ing, and fin whale catch and stomach contents data from commercial whaling. In the Aleutian Islands and Gulf of Alaska, euphausiids were the most common prey in stomachs from fin whales hunted during whaling operations between 1952 and 1958 in the northern part of the North Pacific Ocean and Bering Sea, whereas schooling fishes predominated in the northern Bering Sea and off Kamchatka (Nemoto, 1959; Mizroch et al., 2009). Because the distribution of presumed feed-ing fin whales in the Bering Sea is widespread, a wide region from the Middle Shelf domain to the slope is considered a BIA for feeding (Figure 7.3; Table S7.3). The boundaries for the feeding area presented in Figure 7.3 are based on the hydro-graphic domains (defined above) in which fin whales have been sighted during vessel-based cetacean line-transect surveys (Moore et al., 2002;

BIAs for Cetaceans: Aleutian Islands and Bering Sea Region 83
Tynan, 2004; Friday et al., 2012, 2013). The high-est densities of feeding fin whales in the Bering Sea likely occur from June through September, based on the timing of dedicated cetacean line-transect surveys in the region when high con-centrations of fin whales were observed (Tynan, 2004; Friday et al., 2012, 2013). Acoustic record-ings from 2009 also show that peak calling begins in mid-October (and, presumably, the peak of the southbound migration) in Umnak Pass (Aleutian archipelago) (NMML, unpub. data, August 2009-August 2010; Clapham et al., 2012). This time period also coincides with high catches of fin whales by commercial whalers (Mizroch et al., 2009). Although the eastern Kamchatka coast was historically a productive fin whale feeding ground (Mizroch et al., 2009), it was not included as a BIA because it is located outside the U.S. EEZ.
Gray Whale (Eschrichtius robustus) Background Information—Gray whales migrate between summer/fall feeding grounds in northern latitudes and winter/spring breeding grounds in southern latitudes (Pike, 1962; Lang et al., 2011a). Two stocks of gray whales are recognized in the North Pacific Ocean: (1) the western North Pacific (WNP) population and (2) the eastern North Pacific (ENP) population, with the Pacific Coast Feeding
Group (PCFG) comprising a subunit of the ENP (Carretta et al., 2014). Genetic analyses suggest that the WNP and ENP populations are distinct, based on both mitochondrial and nuclear DNA data (Lang et al., 2011b). Mitochondrial DNA (mtDNA) analyses suggest that PCFG gray whales are a sub-group of the ENP population; furthermore, mul-tiple ENP feeding aggregations may exist north of the Aleutian Islands that are genetically differenti-ated by mtDNA (Lang et al., 2011a). The observed genetic structure within the ENP gray whale popu-lation is consistent with a scenario of matrilineal fidelity to feeding areas (Lang et al., 2011a).
WNP gray whales are thought to feed primarily near Sakhalin Island, Russia, in the Okhotsk Sea (Weller et al., 1999, 2008; LeDuc et al., 2002; Lang et al., 2010). Genetic (Lang, 2010), satellite-tagging (Mate et al., 2011), and photo-identification (Weller et al., 2011; Urbán et al., 2012) data have shown that individual gray whales migrate between Sakhalin Island and the coast of North America. However, contemporary records of gray whales off Japan and, to a lesser extent, China, during winter and spring (reviewed in Weller & Brownell, 2012) suggest that some gray whales remain in the western North Pacific year-round and may represent a distinct, “relic” WNP population. The non-calf population size of WNP gray whales was estimated to be
BIAs for Cetaceans: Aleutian Islands and Bering Sea Region
3
14
Figure 7.3. Fin whale feeding Biologically Important Area in the Bering Sea. Highest densities 15
are from June through September, substantiated through ship-based surveys, acoustic recordings, 16
and whaling data. Also shown are the 50-, 100- and 1000-m isobaths, which were used to 17
delineate the hydrographic domains in the region. 18
19
155°W 150°W160°W165°W170°W175°W180°175°E170°E
60°N
58°N
56°N
54°N
52°N
50°N
(a)
BeringSea
Alaska
Russia
0 400200Kilometers
-50
-100
-1000
St. LawrenceIsland
Gulf ofAlaska
Umnak PassUnimak Pass
Figure 7.3. Fin whale (Balaenoptera physalus) feeding BIA in the Bering Sea; highest densities are from June through September, substantiated through ship-based surveys, acoustic recordings, and whaling data. Also shown are the 50-, 100-, and 1,000-m isobaths, which were used to delineate the hydrographic domains in the region.

84 Ferguson et al.
approximately 130 animals in 2008 (Cooke et al., 2008), although evidence from genetics, sightings, and strandings suggests that the population size may be substantially smaller (Lang et al., 2011b; Weller & Brownell, 2012). The WNP gray whale population is currently listed as endangered under the U.S. ESA.
The majority of ENP gray whales migrate along the west coast of North America between summer feeding areas located primarily in the Bering and Chukchi Seas, and wintering areas in coastal waters of Baja Mexico (Lang et al., 2011a). Original analyses of southbound gray whale migration data suggested that the ENP pop-ulation increased by 2.5%/y between 1967-1968 and 1995-1996, followed by a slowed growth rate (Buckland & Breiwick, 2002), with the popula-tion reaching its peak in 1997-1998, and declin-ing steeply in the following years (Rugh et al., 2005a). However, a recent re-analysis of these data using improved analytical methods resulted in a new time series of abundance estimates for the ENP population (Laake et al., 2012). These new estimates for 1967 to 1987 were generally larger than the corresponding previous abundance estimates. In contrast, the new estimates for 1992 to 2006 were generally smaller than the previ-ous estimates, with an estimated ~19,000 animals in 2006-2007. As a result, Laake et al. (2012) inferred that peak ENP abundance occurred in the mid- to late-1980s, and the population trajectory has remained flat and relatively constant since 1980. This population was removed from the U.S. List of Endangered and Threatened Wildlife in 1994 (59 FR 31095).
The PCFG subgroup is defined by having been observed in two or more years between 1 June and 30 November on feeding areas between northern California and northern Vancouver Island (from 41º N to 52º N) (International Whaling Commission [IWC], 2011a, 2011b, 2011c; Lang et al., 2011a). PCFG animals also have been photo-identified near Sitka and the southern coast of Kodiak Island, Alaska (Straley, pers. comm., 8 January 2015; Calambokidis et al., 2002, 2010; Gosho et al., 2011). PCFG whales rarely enter the Aleutian Islands and Bering Sea region (Calambokidis et al., 2012), so they are not considered any further here.
Insufficient information existed to delineate reproductive BIAs for gray whales in this region.
Feeding—Gray whale feeding areas are diverse and extensive, ranging from calving lagoons in Baja Mexico; throughout the migratory corridor along western North America; and into the north-ern Bering, Chukchi, and Beaufort Seas (Nerini, 1984). Two gray whale feeding BIAs were delineated in the northern Bering Sea and one
was delineated north of the Aleutian Islands and Alaska Peninsula, as detailed below.
Gray whales are considered generalist feeders and exhibit considerable diet plasticity. They employ three feeding mechanisms: (1) benthic foraging, (2) surface skimming, and (3) engulfing (Nerini, 1984). Prey from a multitude of invertebrate taxonomic orders have been found in gray whale stomachs, including Porifera, Hydrozoa, Anthozoa, Polychaeta, Priapulida, Echiura, Sipuncula, Isopoda, Amphipoda, Mysidacea, Cirripedia, Cumacea, Euphausiacea, Decapoda, Gastro poda, Bivalvia, Holothuroidea, and Ascidiacea, in addition to various fishes (Nerini, 1984). However, benthic foraging on a few species is thought to be the gray whale’s primary feeding mode. Nerini (1984) summarized the contents of 324 gray whale stomachs caught by Soviet whalers in the northern Bering Sea as comprising six dominant amphipod genera from four families: (1) Ampeliscidae (Ampelisca macrocephala, A. eschricti, Byblis gaimardi, and Haploops sp.), (2) Atylidae (Atylus), (3) Lysianassidae (Anonyx), and (4) Haustoriidae (Pontoporeia).
Within the Aleutian Islands and Bering Sea region, feeding gray whales were found in high densities in the Chirikov Basin and along the northwest and southeast coasts of St. Lawrence Island during aerial surveys conducted in October and November 1980, May through August 1981, and July 1982 through 1985 (Moore et al., 1986, 2003; Figure 7.4; Table S7.4). However, in July 2002, similar aerial surveys detected a 3- to 17-fold decrease in gray whale sighting rates in the Chirikov Basin (Moore et al., 2003). Concurrently, from the 1980s to the early 2000s, ampeliscid amphipod biomass declined by 60 to 90% in the Chirikov Basin (this species is thought to be an important gray whale prey resource) (Moore et al., 2003; Grebmeier et al., 2006; Coyle et al., 2007). These amphipod declines were mainly due to the absence of larger age classes based on changes in measured amphipod length (Coyle et al., 2007). The two leading hypotheses explaining changes in ampeliscid amphipods and the apparent decline in gray whale use of the area were (1) climate change, inducing sea ice loss and other oceanographic and atmospheric changes that adversely affected primary producers and the benthic community, with cascading effects on marine mammals; and (2) overexploitation of the prey resource by the growing gray whale population (Moore et al., 2003; Grebmeier et al., 2006; Coyle et al., 2007).
The sighting of a large aggregation of gray whales during cetacean line-transect shipboard surveys in the northeastern Bering Sea in September 2014 pro-vides evidence that the Chirikov Basin remains an important feeding area for this species. Specifically, on one day, visual observers confirmed 31 sightings of 50 total gray whales and detected an additional

85 BIAs for Cetaceans: Aleutian Islands and Bering Sea Region
18 sightings of 19 total large whales that could not be identified to species but were most likely gray whales (NMML, unpub. data, 20 September 2014). The Chirikov Basin and the northwestern and southeastern coasts of St. Lawrence Island are considered BIAs for gray whale feeding, given the high regional densities, which occurred from May through November (Moore et al., 2003; NMML, unpub. data, 20 September 2014). Boundaries for these BIAs were based on the extent of gray whale sightings shown in Moore et al. (2003) and encom-pass the sightings made by shipboard observers in 2014 (NMML, unpub. data, 20 September 2014).
Gray whales have also been sighted feeding in nearshore and estuarine waters along the northern Alaska Peninsula from April through November, 1976 to 2008. Sources include shipboard line-transect surveys of the Bering Sea shelf (June-July 1999, 2000, and 2008 [Moore et al., 2002; Friday et al., 2012, 2013]) and opportunistic land, vessel, and aerial surveys along the southeastern Bering Sea coast (April-November 1976-1982 [Gill & Hall, 1983]). During spring (April-May), 50 to 80% of gray whales seen within 1 km of shore between Unimak Pass and Naknek were appar-ently feeding, based on observations of whales with mud plumes or lying on their sides, behav-ior associated with feeding (Gill & Hall, 1983). Furthermore, from May through November, gray whales nearly continuously exhibited character-istic feeding behavior in Nelson Lagoon (Gill & Hall, 1983). These whales were likely feeding on sand shrimp (Crangon septemspinosa) based on epibenthic samples and stomach samples from Bonaparte’s Gulls (Larus philadelphia) and Mew Gulls (L. canus) feeding at or below the surface of water disturbances created by apparent actively feeding gray whales (Gill & Hall, 1983). Other estuaries in the southeastern Bering Sea that Gill & Hall (1983) reported to be apparently impor-tant habitat for gray whales in spring and early summer (possibly throughout summer and fall) include Ilnik, Port Heiden, Cinder River, Ugashik Bay, and Egegik Bay.
Based on synthesis of the aforementioned stud-ies, one additional gray whale feeding BIA was delineated north of the Aleutian Islands and Alaska Peninsula. This feeding BIA consists of coastal and estuarine waters north of the Alaska Peninsula from Unimak Pass to Naknek. It encompasses the overwhelming majority of gray whale sighting locations from available data (Gill & Hall, 1983; Moore et al., 2002; Friday et al., 2012, 2013). The northeastern boundary of this BIA was defined by the 14- to 25-m isobaths, reflecting the shallow distribution of gray whales in lower Kvichak Bay where sightings occurred from April through July (Gill & Hall, 1983). Additional survey effort over
a longer sampling window might warrant length-ening the temporal duration of this BIA.
Migration—In the Aleutian Islands and Bering Sea region, two BIAs were defined for the north-bound gray whale migration and one for the southbound migration, as described below.
The majority of gray whales migrate north-ward through Unimak Pass from the Gulf of Alaska to feeding grounds in the Bering Sea and Arctic (Braham, 1984; Figure 7.5; Table S7.5). Some animals migrate through False Pass at the eastern end of Unimak Island, where they are particularly vulnerable to transient killer whale predation (Barrett-Lennard et al., 2011). Although gray whale arrival in the Bering Sea is not well documented, Braham (1984) reported the early migrants arrive in late March. In May and June, transient killer whales feed on gray whales near Unimak Island (Barrett-Lennard et al., 2011). The majority of the gray whale migration has passed through the Unimak Island area by early summer (Barrett-Lennard et al., 2011).
In the southern Bering Sea, most northbound gray whales remain nearshore from Unimak Pass to approximately Egegik Bay; after this point, the migration veers west across Bristol Bay to waters 5 to 8 km offshore (Gill & Hall, 1983; Braham, 1984; Moore et al., 2002; Friday et al., 2012, 2013). The migration corridor remains nearshore from Cape Constantine to Nunivak Island, where the migration shifts considerably farther offshore past St. Lawrence Island into the Chirikov Basin, with some whales continuing to the Arctic (Braham, 1984). Some gray whales have been observed near the Pribilof and St. Matthew Islands, suggesting that the northbound migration across the southern Bering Sea is not strictly coastal (Braham, 1984).
Gray whale sightings in the Chirikov Basin occur as early as May, based on aerial surveys conducted from April to November in 1980 through 1985 and 2002 in the northern Bering Sea (Moore et al., 2003). Sightings continued in the Bering Strait area from June through the end of the survey season in November (Moore et al., 2003). Feeding gray whales occurred far-ther northward in the northeastern Chukchi Sea from mid-June through October, with the high-est encounter rates in July or August, based on 2008 through 2012 aerial surveys (i.e., Aerial Surveys of Arctic Marine Mammals [ASAMM] project: Clarke et al., 2011c, 2012, 2013b). In the northeastern Chukchi Sea, gray whale sightings declined through the ASAMM survey’s comple-tion in October, reflecting the whales’ south-ward migration. Rugh et al. (2001) calculated the median departure date southbound from the Chirikov Basin to be 1 December.

86 Ferguson et al. BIAs for Cetaceans: Aleutian Islands and Bering Sea Region
4
20
Figure 7.4. Gray whale feeding Biologically Important Areas (BIAs) (a) around St. Lawrence 21
Island and in the Chirikov Basin (highest densities from May through November), and (b) along 22
the northern side of the Alaska Peninsula (highest densities from April through July). Areas were 23
substantiated through land-based, vessel-based, and aerial surveys. The northeastern boundary of 24
this BIA was defined by the 14 – 25-m isobaths, a subset of which are shown on the northern 25
side of the Alaska Peninsula. 26
155°W160°W165°W
58°N
56°N
54°N
Gulf of
Alaska
Nelson
Lagoon
Bering
Sea
Ala
ska Penin
sula
Naknek
Kvichak
Bay
Port
Moller
Ilnik
Port Heiden
Cinder River
Ugashik
Bay
Egegik Bay
Unimak
Island
165°W170°W175°W64°N
(a)
(b)
Bering
Sea
Chukotka
Alaska
St. Lawrence
Island
Chirikov
Basin
0 11055Kilometers
0 200100Kilometers
Unimak Pass
-25
-14
Figure 7.4. Gray whale (Eschrichtius robustus) feeding BIAs (a) around St. Lawrence Island and in the Chirikov Basin (highest densities from May through November), and (b) along the northern side of the Alaska Peninsula (highest densities from April through July); areas were substantiated through aerial-, land-, and vessel-based surveys. The northeastern boundary of this BIA was defined by the 14- to 25-m isobaths, a subset of which are shown on the northern side of the Alaska Peninsula.

BIAs for Cetaceans: Aleutian Islands and Bering Sea Region 87
Relatively little is known or documented about the southbound migration in the southern Bering Sea. In a 1977-1979 census at Unimak Pass, Rugh (1984) documented southbound migrating gray whales from late October to early January. Most migrants passed through in November and December, with all whales seen within 3.7 km from shore. Around 1980, a temporal shift occurred to the southbound migration cycle (Rugh et al., 2001). This was evident in an apparent 1-wk delay in the annual median sighting date at Granite Canyon, California, where southbound migrating gray whales have been monitored almost annually since 1967-1968.
Due to the lack of information regarding exact migration routes that gray whales follow through-out the region, delineation of gray whale migratory corridor BIAs was limited to the following three areas: (1) the northbound (March through June) migration from Unimak Pass to Nunivak Island in the southern Bering Sea (Braham, 1984; Barrett-Lennard et al., 2011; Figure 7.5a; Table S7.5), (2) the geographically constricted northbound
migration corridor in the Chirikov Basin and Bering Strait (applicable June through December) (Ljungblad et al., 1985, 1986; Rugh et al., 2001; Moore et al., 2003; Figure 7.5a; Table S7.5), and (3) the southbound migration through Unimak Pass (November through January, to account for the shift in migration timing that occurred around 1980) (Rugh et al., 2001; Figure 7.5b; Table S7.5). The boundaries for the first migratory corridor BIA are similar to the feeding BIA described above, although it extends northward to Nunivak Island. The boundaries for the Chirikov Basin migratory corridor BIA are based on the extent of the gray whale sightings shown in Moore et al. (2003). The boundaries for the southbound migra-tory corridor were defined to extend 3.7 km from shore, based on the offshore limits of sightings from Rugh (1984).
North Pacific Right Whale (Eubalaena japonica) Background Information—North Pacific right whales were extensively exploited by commer-cial whaling during the 19th and 20th centuries
BIAs for Cetaceans: Aleutian Islands and Bering Sea Region
5
27
28
Figure 7.5. (a) Gray whale northbound migratory corridor Biologically Important Areas (BIAs) 29
from Unimak Pass to Nunivak Island (March through June) and in the Chirikov Basin and 30
Bering Strait (June through December). These BIAs were substantiated through land-based, 31
vessel-based, and aerial survey data. (b) Gray whale southbound migratory corridor BIA through 32
Unimak Pass (November through January), substantiated through land-based, vessel-based, and 33
aerial surveys. 34
Gulf of Alaska
UnimakIsland
155°W160°W165°W170°W175°W
64°N
62°N
60°N
58°N
56°N
54°N 0 300150
Kilometers
(a)
BeringSea
Alaska
St. Lawrence Island
ChirikovBasin
Russia
BristolBay
AlaskaPeninsula
164°W55°N
54°N
(b)
UnimakIsland
BeringSea
0 7035Kilometers
EgegikBay
NunivakIsland
Cape Constantine
FalsePass
St. MatthewIsland
PribilofIslands
BeringStrait
Figure 7.5. (a) Gray whale northbound migratory corridor BIAs from Unimak Pass to Nunivak Island (March through June) and in the Chirikov Basin and Bering Strait (June through December); these BIAs were substantiated through aerial-, land-, and vessel-based survey data. (b) Gray whale southbound migratory corridor BIA through Unimak Pass (November through January), substantiated through aerial-, land-, and vessel-based surveys.

88 Ferguson et al.
(Clapham et al., 2004), including large illegal catches by the USSR in the Bering Sea and Gulf of Alaska in the 1960s (Ivashchenko & Clapham, 2012). In 2000, the North Pacific right whale was recognized as a species separate from the right whales in the North Atlantic (Eubalaena gla-cialis) (Rosenbaum et al., 2000). In April 2008, NOAA Fisheries recognized the North Pacific right whale as an endangered species (73 FR 12024, 6 March 2008). The migratory movements of North Pacific right whales inferred from whal-ing data support the hypothesis of two largely dis-crete populations in the western and eastern North Pacific (Clapham et al., 2004). Recent research on North Pacific right whales in the Bering Sea and Aleutian Islands concluded that only about 30 whales remained in the eastern population (Wade et al., 2011b). It is, therefore, probably the smallest whale population in the world for which an abundance estimate exists; its status is thus extremely precarious. Current information about this species is extremely limited given its small population size, the rarity of North Pacific right whale detections, and the minimal survey cover-age in the region in recent years (Clapham et al., 2012; Ivashchenko & Clapham, 2012).
North Pacific right whale distribution and migratory patterns were inferred from historical whaling data, recent sightings, and passive acous-tic detections, although understanding of historical and current distribution and movements is incom-plete. Their historical and current migration routes, including wintering and calving areas, are unknown (Clapham et al., 2004); therefore, no BIAs were delineated for migratory corridors or reproduction. The species was distributed throughout the conti-nental shelf (< 200 m) and slope (200 to 2,000 m) waters of the southeastern Bering Sea through the late 1960s, based on all available sighting and catch records from the 19th and 20th centuries (Shelden et al., 2005). Since 1980, the only area in the southeastern Bering Sea where they have been consistently detected (Goddard & Rugh, 1998; LeDuc et al., 2001; LeDuc, 2004; Tynan, 2004; Shelden et al., 2005; Shelden & Clapham, 2006; Wade et al., 2006; Kennedy et al., 2011; Clapham et al., 2012; Friday et al., 2012) is the Middle Shelf (50 to 100 m; Coachman, 1986); however, most research has been focused in this area. One exception is a single whale that was tagged on the Middle Shelf in August 2004; over a 40-d period, this individual traveled to the Outer Shelf (Wade et al., 2006). Clapham et al. (2012) presented two hypotheses to explain why North Pacific right whales occur in relatively high concentrations in the Middle Shelf area: (1) prey availability and biomass; and (2) maternally driven site fidelity inferred from resightings of photo- and genetically
identified individuals (Kennedy et al., 2011; Wade et al., 2011a, 2011b). In 2007, NOAA Fisheries established a right whale Critical Habitat bound-ary on the Middle Shelf of the southeastern Bering Sea based on sighting data (Figure 7.6; Table S7.6) (71 FR 38277, 6 July 2006; 73 FR 19000, 8 April 2008).
Historically, during summer, North Pacific right whales apparently concentrated north of 40º N, migrating southward in autumn (Clapham et al., 2004). From April through October in the 19th and 20th centuries, North Pacific right whales were sighted and caught in the southeastern Bering Sea, with the majority of records from June through August (Clapham et al., 2004; Shelden et al., 2005; Ivaschenko & Clapham, 2012). In recent years (1979 through 2011), most survey effort occurred during summer, and most sightings occurred in July and August (Shelden et al., 2005; Clapham et al., 2012). In June 1999, one whale was sighted during shipboard line-transect surveys for ceta-ceans in the southeastern Bering Sea (Tynan et al., 2001). Acoustic detections from May through December during a long-term passive acoustic monitoring study expanded the overall time period during which North Pacific right whales are known to be present in the area, with the peak number of calls detected from July through October (Munger et al., 2008). In addition, long-term passive acous-tic recordings detected potential right whale calls (both upsweep and gunshot calls) every month from May 2009 to March 2010 using subsurface autonomous moorings associated with the Pacific RIght whale Ecology STudy (PRIEST); how-ever, further analyses are required to determine whether any of those calls may be bowhead whales (NMML, unpub. data, May 2009-March 2010; Clapham et al., 2012).
BIAs are presented below for the eastern Pacific population of North Pacific Right whales. The relationship between North Pacific right whales in the Gulf of Alaska and Bering Sea is unknown (Wade et al., 2006, 2011a), although they are all currently considered part of the eastern popula-tion (Brownell et al., 2001; Clapham et al., 2004). Although sample sizes are small, two whales pho-tographed in the Gulf of Alaska in 2005 and 2006 have not been seen in the Bering Sea; furthermore, the genotype of a single right whale biopsied near Kodiak Island in 2005 did not match any Bering Sea whales or any possible Bering Sea offspring (Wade et al., 2011a).
Feeding—North Pacific right whales feed in Middle Shelf waters where their copepod prey species (e.g., Calanus marshallae and Neocalanus spp.) are among the most abundant zooplankton (Cooney & Coyle, 1982; Shelden et al., 2005; Clapham et al., 2012). Satellite-tagging data from

BIAs for Cetaceans: Aleutian Islands and Bering Sea Region 89
four right whales in 2008 and 2009 emphasized the importance of the Critical Habitat area as a feeding ground for this species (Clapham et al., 2012; Zerbini, pers. comm., 9 January 2015). The Critical Habitat area was used as the feeding BIA for North Pacific right whales in the Bering Sea. North Pacific right whales have been detected in this area during the months of May through October through the use of passive acoustic moni-toring (Munger et al., 2008), aerial and shipboard visual surveys (Tynan et al., 2001; Clapham et al., 2012), and tagging data (Clapham et al., 2012; Zerbini, pers. comm., 9 January 2015) (Figure 7.6; Table S7.6).
Humpback Whale (Megaptera novaeangliae) Background Information—The humpback whale is listed as an endangered species under the U.S. ESA. Humpback whales occur in all major ocean basins and typically undergo annual migrations between high-latitude feeding and low-latitude breeding areas (Mackintosh, 1946). During summer, they occur throughout the Aleutian Islands and eastern Bering Sea region (Zerbini et al., 2006; Barlow et al., 2011; Clapham et al., 2012; Friday et al., 2012, 2013). They are also occasionally encoun-tered in very low densities up to 71.5º N in the northeastern Chukchi Sea (Clarke et al., 2014). Photo-identification data from the Structure of Populations, Levels of Abundance and Status of Humpbacks (SPLASH) study conducted from 2004 to 2006 show that humpback whales from
the Aleutian Islands and Bering Sea feeding area migrate south to three breeding areas: (1) off Mexico (mainland, Baja California, and Revillagigados Islands), (2) the Hawaiian Islands, and (3) in the western Pacific Ocean (Barlow et al., 2011). In the Aleutian Islands and Bering Sea region, consider-able variability in movement patterns exists among individual humpback whales. In 2007 to 2011, NMML scientists tagged eight humpback whales from early August to mid-September on the north-ern side of Unalaska Island. Seven of these whales stayed in and around the eastern Aleutian Islands; another individual immediately left the area, travel-ing north through the Bering Sea along the Outer Shelf (100 to 200 m) and to the Russian coastline, then back to Navarin Canyon (northern Bering Sea shelf), where the tag stopped transmitting (Kennedy et al., 2014).
Insufficient information existed to delineate migratory corridor or reproductive BIAs for humpback whales in this region.
Feeding—Humpback whales are considered top-level generalist predators (Witteveen et al., 2011a). Stomach content analyses from 458 humpback whales commercially hunted in the North Pacific Ocean between 1952 and 1971 showed that most (77.3%) non-empty stomachs contained only euphausiids; 17.2% contained only fishes; and a small percentage of the remaining non-empty stomachs contained combinations of euphausiids, fishes, copepods, and squids (Nemoto & Kawamura, 1977). Similarly, in a 2004 to 2006 study, humpback whales near Kodiak, Alaska, in summer fed heavily on euphausiids but also juve-nile walleye pollock (Theragra chalcogramma), capelin (Mallotus villosus), and Pacific sand lance (Ammodytes hexapterus), with annual differences in diet due to either individual prey preferences or prey availability (Witteveen et al., 2011a). In contrast, during the fall and winter (September-March) of 2007-2008 and 2008-2009, humpback whales in Prince William Sound and Lynn Canal, Alaska, were strongly associated with large shoals of Pacific herring (Clupea pallasii) (Moran et al., 2011).
Since at least the early 1900s, large aggregations of feeding humpback whales have been seen along the northern side of the eastern Aleutian Islands and Alaska Peninsula, where they were hunted commer-cially (Reeves et al., 1985). In more recent years, high densities were again seen in these historically high-density areas from June through September during aerial (2008 to 2009) and shipboard (1999 to 2004, 2007 to 2011) visual and acoustic surveys; they were also seen where Bristol Bay meets the Bering Sea (Zerbini et al., 2006; Barlow et al., 2011; Clapham et al., 2012; Friday et al., 2012, 2013; Figure 7.7; Table S7.7). Humpback whale
BIAs for Cetaceans: Aleutian Islands and Bering Sea Region
6
35
Figure 7.6. North Pacific right whale feeding Biologically Important Area (BIA) (whales 36
detected from May through October). This BIA was substantiated through satellite tagging data, 37
aerial and vessel-based surveys, acoustic recordings, photo identification, and genetic analyses. 38
The BIA area matches the NOAA Critical Habitat designated area. 39
40
155°W160°W165°W170°W175°W
60°N
58°N
56°N
54°N
52°N
50°N
BeringSea
Alaska
0 300150Kilometers
Alaska Peninsula
Gulf ofAlaska
Figure 7.6. North Pacific right whale (Eubalaena japonica) feeding BIA (whales detected from May through October); this BIA was substantiated through satellite-tagging data, aerial- and vessel-based surveys, acoustic recordings, photo-identification, and genetic analyses. The BIA area matches the NOAA Critical Habitat designated area.

90 Ferguson et al.
feeding BIA boundaries in Figure 7.7 were drawn to encompass reported high-density sightings based on the June through September systematic line-transect surveys reported in Zerbini et al. (2006), Clapham et al. (2012), and Friday et al. (2012, 2013).
Beluga (Delphinapterus leucas) Background Information—Belugas are toothed whales that are distributed in arctic and sub-arctic waters, occupying estuarine, continental shelf and slope, and deep ocean habitats (Laidre et al., 2008). They occur in open water, loose sea ice, and heavy pack ice conditions (Laidre et al., 2008). Some populations undertake large-scale (thou-sands of kilometers) annual migrations between summering and wintering areas (Richard et al., 2001; Suydam et al., 2001, 2005; Hauser et al., 2014). Nonmigratory populations may undertake smaller (< 100 km) seasonal shifts in distribution (e.g., Hansen & Hubbard, 1999; Rugh et al., 2004; Hobbs et al., 2005; O’Corry-Crowe et al., 2006; Goetz et al., 2012b).
Substantial levels of genetic subdivision exist among the five major beluga summering areas in Alaska and northwestern Canada: (1) eastern Beaufort Sea, (2) eastern Chukchi Sea, (3) eastern
Bering Sea (Norton Sound and the Yukon River Delta), (4) Bristol Bay, and (5) Cook Inlet (O’Corry-Crowe et al., 1997, 2002). Furthermore, there is evidence of genetic structure within the eastern Chukchi Sea area, with whales from Kotzebue Sound significantly differentiated from Kasegaluk Lagoon (O’Corry-Crowe et al., 2002). NOAA Fisheries recognizes five stocks of belugas in U.S. waters, named after the five major sum-mering areas (Allen & Angliss, 2014). The belu-gas in Cook Inlet comprise a population of year-round residents (Laidre et al., 2000; Rugh et al., 2000; Hobbs et al., 2005; Goetz et al., 2012b), and also comprise the only beluga stock listed as endangered under the U.S. ESA. In addition, there is evidence that the small number of belugas (10 to 12 individuals) living in Yakutat Bay, Southeast Alaska, comprise a discrete reproductive group and are year-round residents of the bay (O’Corry-Crowe et al., 2006, 2009). Ferguson et al. (2015a) delineated small and resident BIAs for the Cook Inlet and Yakutat Bay belugas.
Beluga stocks distributed in the Aleutian Island and Bering Sea region during at least part of the year include the Eastern Beaufort Sea, Eastern Chukchi Sea, Eastern Bering Sea, and Bristol Bay Stocks. The first three stocks are relatively large, with
BIAs for Cetaceans: Aleutian Islands and Bering Sea Region
7
41
Figure 7.7. Humpback whale feeding Biologically Important Areas (BIAs), with highest 42
densities from June through September. These BIAs were substantiated through satellite tagging 43
data, aerial and vessel-based surveys, acoustic recordings, and photo identification. 44
155°W160°W165°W170°W175°W
58°N
56°N
54°N
52°N
Gulf of Alaska
0 300150Kilometers
BeringSea
Alaska Peninsula
UnalaskaIsland
BristolBay
Aleutian Islands
Figure 7.7. Humpback whale (Megaptera novaeangliae) feeding BIAs, with highest densities from June through September; these BIAs were substantiated through satellite-tagging data, aerial- and vessel-based surveys, acoustic recordings, and photo-identification.

BIAs for Cetaceans: Aleutian Islands and Bering Sea Region 91
abundances estimated at ~3,700 whales (Eastern Chukchi Sea Stock), ~28,400 whales (Eastern Bering Sea Stock), and ~39,300 whales (Eastern Beaufort Sea Stock), although the data upon which these estimates were based are one to two decades old (Allen & Angliss, 2014). The Eastern Beaufort Sea and Eastern Chukchi Sea Stocks undertake long-distance seasonal migrations between winter areas in the Bering Sea and summer areas in the Chukchi and Beaufort Seas and Arctic Ocean basin (Richard et al., 2001; Suydam et al., 2001, 2005; Citta et al., 2013; Hauser et al., 2014). The Eastern Bering Sea beluga stock spends spring, summer, and fall (~March-November) in Norton Sound and the Yukon-Kuskokwim Delta area (Figure 7.8; Table S7.8) (Frost & Lowry, 1990; Huntington et al., 1999; DeMaster et al., 2001). Belugas occur in Norton Sound until freezeup (Seaman et al., 1985; Frost & Lowry, 1990). Little is known about their movements during winter months. Satellite-tagging data from December 2012 through April 2013 provide evidence for offshore movements in winter and early spring (www.north-slope.org/departments/wildlife-management/co-management-organizations/alaska-beluga-whale-committee/abwc-research-projects/satellite-maps-of-tagged-alaskan-beluga-stocks, accessed 5 January 2015), where they potentially overlap with the Eastern Chukchi and Eastern Beaufort Sea Stocks (Burns & Seaman, 1985; O’Corry-Crowe et al., 1997). The Bristol Bay Stock is relatively small, geographically confined, and nonmigratory, qualifying for a small and resident population BIA, as detailed below.
No reproductive BIAs were delineated for belugas in this region due to lack of informa-tion. In addition, coastal BIA boundaries at river mouths, inlets, and lagoons are approximate due to lack of detailed information on beluga distribu-tion nearshore.
Feeding—Norton Sound and the Yukon-Kuskokwim Delta (hereafter, “Norton Sound area”) is a feeding BIA for the Eastern Bering Sea Stock, and possibly other beluga stocks, based on stomach analyses, opportunistic sightings, tradi-tional ecological knowledge, and aerial line-tran-sect surveys. Each line of evidence is summarized below.
Belugas feed on a variety of fishes and inver-tebrates (Seaman et al., 1982; Quakenbush et al., in press). Beluga diets in Alaska vary by stock, based on analysis of 365 beluga stomachs col-lected between March and November (1954 to 2012) from subsistence hunts and belugas found dead and collected for research (Quakenbush et al., in press). The study included samples from the Eastern Beaufort Sea, Eastern Chukchi Sea, Eastern Bering Sea, Bristol Bay, and Cook Inlet Stocks and from Kotzebue Sound. In addition to
34 species of fishes, Quakenbush et al. (in press) identified polychaetes, gastropods, cephalopods, isopods, amphipods, shrimp, echiurids, and tuni-cates in the beluga stomachs that were likely ingested directly as prey.
The Eastern Bering Sea Stock had the most diverse stomach contents of all Alaskan beluga stocks (Quakenbush et al., in press), and the findings largely agree with what is known about beluga foraging ecology from traditional eco-logical knowledge. The Eastern Bering Sea stomachs were collected from Norton Sound to the Kuskokwim River Delta between 1993 and 2012, during May (n = 17), June (n = 7), July (n = 1), September (n = 2), and October (n = 9), and three samples were from unknown months. The dominant fish species in the Eastern Bering Sea stomachs (based on frequency of occur-rence, [number of fish species X]/[total number of fish]) were saffron cod (Eleginus gracilis), rainbow smelt (Osmerus mordax), several species of sculpin (family Cottidae) and flatfish (family Pleuronectidae), and Arctic cod (Boreogadus saida). Other fish species included walleye pol-lock, capelin, Pacific herring, and two salmon species (coho, Oncorhynchus kisutch; and chum, O. keta). The Norton Sound area is known for large multispecies salmon runs in summer. The authors speculated that the relative lack of salmon in the beluga stomachs may be due to the timing of the beluga hunts and the importance of com-mercial salmon fishing in the area, as the hunters might be fishing for salmon rather than hunting belugas when salmon are an important beluga prey item. The dominant invertebrates in the Eastern Bering Sea beluga stomachs included shrimp, polychaetes, isopods, bivalves, amphi-pods, and echiurids.
Belugas occur in the Norton Sound area during the entire ice-free period from breakup in early spring to freezeup in late autumn (Seaman et al., 1985; Huntington et al., 1999). Based on tradi-tional ecological knowledge, belugas arrive in Norton Sound in April and May, and occasionally March (Huntington et al., 1999). The timing and direction of their arrival is primarily influenced by sea ice cover, arriving later in years with heavy ice. More belugas come to Norton Sound during years when passage through the Bering Strait is blocked by sea ice than in years when the migra-tion into the Chukchi Sea is unimpeded. This suggests that additional beluga stocks, such as the Eastern Chukchi Sea and Eastern Beaufort Sea Stocks, may feed in the Norton Sound area (Seaman et al., 1985). During spring (March-May), belugas in the area feed on Pacific her-ring located under the ice and on saffron cod and capelin (Seaman et al., 1985; Huntington et al.,

92 Ferguson et al.
1999). During summer (June-September), belugas are located throughout Norton Sound and near the mouth of the Yukon River (DeMaster et al., 2001), where they feed on salmon (Seaman et al., 1985; Huntington et al., 1999). They also feed on saf-fron cod from midsummer to freezeup (Seaman et al., 1985; Huntington et al., 1999). Migratory stocks of belugas also feed on the abundant forage fishes nearshore in the Norton Sound area during summer and autumn (Seaman et al., 1985; Quakenbush et al., in press). Belugas leave the area when sea ice forms, producing an extensive and nearly unbroken cover. The timing of freez-eup varies annually, ranging from late September to November (Seaman et al., 1985; Huntington et al., 1999).
In summary, the Norton Sound area from Cape Prince of Wales to the Yukon-Kuskokwim River Delta is an important feeding area, and there-fore a BIA, for belugas from the spring breakup of sea ice (~April) through the autumn freezeup (~November) (Figure 7.8; Table S7.8).
Migration—Bering Strait is a narrow passage-way (82 km wide at its narrowest point) that all cetaceans migrating between the Bering Sea and northern latitudes of the Chukchi Sea, Beaufort Sea, and Arctic Ocean must transit twice yearly. Belugas begin migrating northward through Bering Strait in March or April and continue into May, based on aerial surveys (Moore et al., 1993), opportunis-tic sightings, and traditional ecological knowledge
(Seaman et al., 1985). Belugas occur in the area in June, July, and August, although most of the Eastern Beaufort Sea and Eastern Chukchi Sea Stocks have migrated to more northerly waters by June (Seaman et al., 1985; Clarke et al., 2015). Coastal residents of Bering Strait have reported belugas migrating south in advance of sea ice in October, with sightings peaking in November and December and continu-ing into midwinter (Seaman et al., 1985). Satellite-tagging data show belugas from both the Eastern Chukchi Sea and Eastern Beaufort Sea Stocks migrating southward through the area in November (Richard et al., 2001; Suydam et al., 2005; Hauser et al., 2014). Belugas from the Eastern Beaufort Sea Stock appear to cross on the western side of the Strait, whereas the Eastern Chukchi Sea Stock crosses on the eastern side, although sample sizes are small (Citta et al., 2013; Hauser et al., 2014). Belugas have been sighted in the area from January through April (Seaman et al., 1985).
Based on the information summarized above, the Bering Strait area (Cape Nome to 66º N) is a migratory corridor BIA for belugas, with highest densities of animals from October through May (Figure 7.9; Table S7.9). See Clarke et al. (2015) for further details about the beluga migratory cor-ridor in the Arctic region.
Small and Resident Population—The best esti-mate of abundance for the Bristol Bay beluga stock ranges from 2,455 to 3,299 animals (Allen & Angliss, 2014), based on aerial surveys conducted in 2004
BIAs for Cetaceans: Aleutian Islands and Bering Sea Region
8
45
Figure 7.8. Beluga feeding Biologically Important Area (BIA), with highest densities from the 46
spring breakup of sea ice (~April) through the autumn freezeup (~November). This BIA was 47
substantiated through stomach analyses, opportunistic sightings, traditional ecological 48
knowledge, and aerial line-transect surveys. 49
155°W160°W165°W170°W175°W
66°N
64°N
62°N
60°N
58°N
Alaska
ChukchiSeaChukotka
BeringSea
0 310155Kilometers
CapeNewenham
Cape Princeof Wales
Yukon–KuskokwimDelta
NortonSoundSt. Lawrence
Island
Figure 7.8. Beluga (Delphinapterus leucas) feeding BIA, with highest densities from the spring breakup of sea ice (~April) through the autumn freezeup (~November); this BIA was substantiated through stomach analyses, opportunistic sightings, traditional ecological knowledge, and aerial line-transect surveys.
BIAs for Cetaceans: Aleutian Islands and Bering Sea Region
9
50
Figure 7.9. Beluga migratory corridor Biologically Important Area (BIA), with highest densities 51
from October through May. This BIA was substantiated through aerial line-transect surveys, 52
opportunistic sightings, traditional ecological knowledge, and satellite tagging data. See Clarke 53
et al. (2015) for the continuation of the migratory corridor into the Arctic. 54
160°W165°W170°W175°W180°
66°N
64°N
62°N
Alaska
ChukchiSea
Chukotka
BeringSea
0 250125Kilometers
CapeNome
BeringStrait
Shishmaref
Figure 7.9. Beluga migratory corridor BIA, with highest densities from October through May; this BIA was substan-tiated through aerial line-transect surveys, opportunistic sightings, traditional ecological knowledge, and satellite-tagging data. See Clarke et al. (2015) for the continuation of the migratory corridor into the Arctic.

BIAs for Cetaceans: Aleutian Islands and Bering Sea Region 93
and 2005 (Lowry et al., 2008). Belugas from this stock are found almost exclusively in the Kvichak and Nushagak bays of northeastern Bristol Bay (Figure 7.10; Table S7.10) and are especially numer-ous from April through August (Frost et al., 1984; Frost & Lowry, 1990). Satellite-tagging studies have found that belugas stay within the two bays throughout the summer and fall (Quakenbush, 2003; Quakenbush & Citta, 2006), moving offshore only a short distance from the bays in the winter and spring (www.adfg.alaska.gov/index.cfm?adfg=marinemammalprogram.bristolbaybeluga; www.north-slope.org/departments/wildlife-management/co-management-organizations/alaska-beluga-whale-committee/abwc-research-projects/satellite-maps-of-tagged-alaskan-beluga-stocks).
The Bristol Bay beluga stock meets the qualifica-tions of a small and resident population BIA based on its relatively small population size, restricted geographic range, and genetic differentiation from belugas in other summering areas (O’Corry-Crowe et al., 1997). The geographic boundaries for this BIA extend shoreward from Cape Newenham to Port Heiden, encompassing the existing satellite tracks for this stock (Figure 7.10).
Summary
In conclusion, 15 BIAs were identified for six cetacean species within the Aleutian Islands and Bering Sea region, based on extensive expert review and synthesis of published and unpublished information. Identified BIAs included feeding
areas and migratory corridors for bowhead and gray whales; feeding areas for fin, North Pacific right, and humpback whales and belugas; migra-tory corridors for belugas; and a small and resident population BIA for Bristol Bay belugas. The geo-graphic extent of the BIAs in this region ranged from approximately 1,200 to 373,000 km2. This BIA assessment did not include Dall’s porpoise, Pacific white-sided dolphin, killer whale, beaked whales, sperm whale, harbor porpoise, minke whale, and sei whale; however, these species should be considered in future efforts to identify BIAs. Other information gaps that were identified during this BIA process include (1) reproductive areas for all species; (2) detailed information on the migration routes and timing of all species; and (3) cetacean distribution, density, and behavior in U.S. Bering Sea waters off the continental shelf. To maintain their utility, these BIAs should be re-evaluated and revised, if necessary, as new infor-mation becomes available.
155°W160°W165°W
60°N
58°N
56°N
Alaska
PortHeiden
BeringSea
0 200100Kilometers
CapeNewenham
Gulf ofAlaskaAlaska Peninsula
BristolBay
Figure 7.10. Beluga BIA for the Bristol Bay small and resident population; this is a year-round BIA. This BIA was substantiated through aerial surveys, satellite-tagging data, and genetic analyses.

Aquatic Mammals 2015, 41(1), 94-103, DOI 10.1578/AM.41.1.2015.94
8. Biologically Important Areas for Cetaceans Within U.S. Waters – Arctic Region
Janet T. Clarke,1 Megan C. Ferguson,2 Corrie Curtice,3 and Jolie Harrison4
1Leidos, 4001 N. Fairfax Drive, Arlington, VA 22203, USA E-mail: [email protected]
2Cetacean Assessment and Ecology Program, National Marine Mammal Laboratory, Alaska Fisheries Science Center, NOAA Fisheries, Seattle, WA 98115, USA
3Marine Geospatial Ecology Lab, Duke University, Beaufort, NC 28516, USA 4NOAA Fisheries Office of Protected Resources, Silver Spring, MD 20910, USA
Abstract
In this assessment, we combined published and unpublished information to identify 16 Biologically Important Areas (BIAs) for bow-head whales, gray whales, and belugas in the U.S. Arctic. BIAs for bowhead whales and belugas were based on high-density areas used recurrently for reproduction, feeding, and migration, docu-mented by visual surveys (aerial-, vessel-, and ice-based), bioacoustic monitoring, and satellite telemetry. BIAs for gray whales were based on high-density areas used recurrently for reproduc-tion and feeding, documented primarily by aerial and vessel surveys. The geographic extent of the BIAs in the Arctic region ranged from approxi-mately 1,500 to 135,000 km2. Information gaps identified during the Arctic BIA assessment pro-cess include (1) bowhead whale use of the west-ern Beaufort Sea in summer (e.g., feeding, migra-tion timing, movement rates); (2) the existence or extent of a bowhead whale fall migratory corridor in the Chukchi Sea; (3) the extent and nature of beluga use of outer continental shelf and slope habitat in the Beaufort Sea; (4) the existence or location of gray whale migratory corridors in spring and fall; (5) the degree to which gray whales move between known feeding hotspots; and (6) the distribution, density, and activities of fin, humpback, minke, and killer whales and harbor porpoises in this region. To maintain their utility, the Arctic BIAs should be re-evaluated and revised, if necessary, as new information becomes available.
Key Words: feeding area, migratory corridor, reproductive area, bowhead whale, Balaena mysticetus, beluga, Delphinapterus leucas, gray whale, Eschrichtius robustus, Arctic, anthropogenic sound, species distribution
Introduction
This assessment coalesces existing published and unpublished information in U.S. Arctic waters (shoreward of the Exclusive Economic Zone [EEZ]) to define Biologically Important Areas (BIAs) for cetacean species that meet the criteria for feeding areas, reproductive areas, or migra-tory corridors defined in Table 1.2 of Ferguson et al. (2015b) within this issue. A comprehensive overview of the BIA delineation process; its cave-ats (Table 1.4), strengths, and limitations; and its relationship to international assessments also can be found in Ferguson et al. Table 1.3 provides a summary of all BIAs identified, including region, species, BIA type, and total area (in km2). A sum-mary also can be found at http://cetsound.noaa.gov/important. Table 1.1 defines all abbreviations used in this special issue. Metadata tables that concisely detail the type and quantity of informa-tion used to define each BIA are available as an online supplement.
Within the Arctic region, two species—bow-head whale (Balaena mysticetus) and beluga (Delphinapterus leucas)—were evaluated and found to meet the criteria for reproductive, feeding, and migratory corridor BIAs, and one species—gray whale (Eschrichtius robustus)—met the crite-ria for reproductive and feeding BIAs. Other ceta-cean species found in this region, including killer whale (Orcinus orca), fin whale (Balaenoptera physalus), humpback whale (Megaptera novae-angliae), harbor porpoise (Phocoena phocoena), and minke whale (Balaenoptera acutorostrata), are sighted infrequently (Clarke et al., 2013b) and are rarely detected by passive acoustic monitoring. These rare or infrequently detected species were not evaluated during this initial BIA assessment. These species should be evaluated in future efforts to create or revise BIAs for cetaceans in this region.

95 BIAs for Cetaceans: Arctic Region
Information pertaining to bowhead whale, gray whale, and beluga BIAs was synthesized primarily from visual sighting data collected during aerial surveys conducted from summer (June-August) through fall (September-October) in the northeast-ern Chukchi and western Beaufort Seas under the auspices of the Aerial Surveys of Arctic Marine Mammals (ASAMM) project from 1982 to 2012 (e.g., Clarke et al., 2013a). Although temporal and spatial variation in effort occurred over the course of the ASAMM study, no other single research project in the Alaskan Arctic compares with the scope of the ASAMM project. ASAMM data were augmented with data from other small-scale aerial survey projects (e.g., Mocklin et al., 2012), ice-based observations (e.g., George et al., 2004), passive acoustic monitoring (e.g., Blackwell et al., 2007; Hannay et al., 2013), and satellite teleme-try (e.g., Quakenbush et al., 2010a, 2010b). The Arctic BIA assessment benefitted from the inputs and insights of nine experts familiar with Arctic cetacean species.
Biologically Important Areas in the Arctic Region
Bowhead Whale (Balaena mysticetus)Background Information—The information pre-sented below is assumed to represent the Bering-Chukchi-Beaufort (BCB) or Western Arctic Stock (Allen & Angliss, 2014) only. BCB bowhead whales are migratory, ranging from sub-Arctic to Arctic waters (Moore & Reeves, 1993). The BCB Stock winters in the Bering Sea. It migrates annu-ally in spring (April-May) through the Chukchi Sea, traveling through nearshore leads (linear openings in sea ice) that develop each year north and east of Barrow, Alaska. Many animals spend the summer on feeding grounds in the Canadian Beaufort Sea, although some are also found in the Alaskan Beaufort Sea and northeastern Chukchi Sea in summer. In the fall, BCB bowhead whales return through the western Beaufort and northern Chukchi Seas to the Bering Sea to overwinter. In fall 2010, a satellite-tagged bowhead whale from the BCB Stock overlapped spatially and nearly temporally (within 2 d) with a satellite-tagged bowhead whale from the Baffin Bay-Davis Strait Stock in Viscount Melville Sound in the Northwest Passage of the Canadian Arctic before each whale returned to its normal seasonal range (Heide-Jørgensen et al., 2011). With the observed declining trend of Arctic sea ice extent since 2000, it is possible that bowhead whale stocks may overlap seasonally more often in the future.
Reproductive Areas—Bowhead whales calve primarily from April to early June, and as late as August (Koski et al., 1993). BIAs for bowhead whale reproduction in spring and early summer
(April-June) were based on neonate (recently born) calf sightings collected near Barrow during two studies (Figure 8.1a; Table S8.1). In the first study, calves were photographed in leads in the sea ice north and northeast of Point Barrow during aerial surveys conducted by the North Slope Borough and NOAA Fisheries in 2011 for the purposes of abundance estimation (Mocklin et al., 2012). These surveys started on 19 April, but the first cow-calf pair was not sighted until 9 May. In the second study, neonate calf sightings were recorded during ice-based counts conducted by the North Slope Borough and others from 1978 to 2001 (George et al., 2004). Segregation of size classes during the spring bowhead whale migra-tion near Point Barrow has been documented, with cow-calf pairs generally the later migrants (Zeh et al., 1993; George et al., 2004). Bowhead whale cow-calf pairs are found in greatest density in this reproductive BIA from late May to early June.
Bowhead whale reproductive BIAs for summer and fall (July-October) were based on locations of cow-calf sightings made during ASAMM surveys from 1982 to 2012 (Clarke et al., 1987, 2012, 2013a; Clarke & Ferguson, 2010a, 2010b). ASAMM sur-veys encompassed a large geographic area, with fairly consistent temporal coverage within and between years, and these data were considered the best representation of bowhead whale calf distribu-tion in the western Beaufort Sea. Bowhead whales were recorded as calves when they were noticeably smaller, particularly in comparison to a nearby adult, with which they were usually in close associ-ation. Bowhead whale calves are often, though not always, light gray in color. Calves grow quickly in the first year, increasing in length from 3.6 to 5.5 m at birth to > 8 m by August (Koski et al., 1993). This rapid growth during the first year makes dif-ferentiating calves from yearlings difficult, particu-larly in September and October. The reproductive BIAs (Figure 8.1b, c & d; Table S8.1) encompass areas where the majority of bowhead whales iden-tified as calves were observed each season (Clarke et al., 2013a). Bowhead whale cow-calf pairs were observed in the eastern Alaskan Beaufort Sea in summer (July through August) and in the west-ern Beaufort Sea in fall (September and October). They were seen in the northeastern Chukchi Sea only in October.
Feeding Areas—Bowhead whales feed on a vari-ety of zooplankton, including copepods, euphausi-ids, mysids, and amphipods (Lowry, 1993), taking advantage of food sources near the seafloor, in the water column, and at the water surface. Feeding behavior is likely under-represented in aerial survey data due to the difficulty of identifying feeding behavior in the brief periods of time when whales

96 Clarke et al.
are observed. Some indications of feeding can be observed during initial sightings, including open mouth at the surface, mud on the rostrum, and echelon “V” formation (Lowry, 1993). Milling, or whales moving very slowly at the surface with various headings, is also indicative of feeding even when direct evidence of feeding is not observed. Other behaviors that might be indicative of feed-ing, however, such as synchronous diving, flukes-up diving, and defecation, may not be apparent unless the whales are circled upon for extended periods. Several factors affect the survey aircraft’s ability to circle sightings, including weather, visibil-ity, and fuel reserves. Aerial photographs also have been used to detect bowhead whale feeding events as a bowhead whale with mud on its dorsal surface was assumed to have recently fed near the seafloor (Mocklin et al., 2011).
The BIA for bowhead whale feeding in May was based on aerial photographs of muddy whales taken in 1985, 1986, 2003, and 2004 (Mocklin et al., 2011) during the annual bowhead whale spring migration past Barrow (Figure 8.2; Table S8.2).
In most years, the area from Smith Bay to Point Barrow (Figure 8.2) is the most consistent feeding area for bowhead whales from August to October (Table S8.2). Bowhead whale feeding in this area was documented by ASAMM (Clarke & Ferguson, 2010a, 2010b; Clarke et al., 2011a, 2011b, 2012, 2013a), the Study of Northern Alaska Coastal System (SNACS) program (Moore et al., 2010b), and the Bowhead Whale Feeding Ecology Study (BOWFEST) (Goetz et al., 2008, 2009, 2010, 2011; Moore et al., 2010b). It is thought that this feeding area is supported by the occurrence of upwelling-favorable winds from the east or southeast, fol-lowed by weak or southerly winds, which produce conditions that trap aggregations of krill at the west-ern end of the Beaufort shelf near Barrow (Ashjian et al., 2010). Bowhead whales in this feeding area, which is identified as a BIA, are generally seen in shallow depths (≤ 20 m) or near Barrow Canyon.
In other areas of the western Beaufort Sea, bow-head whales may feed on the continental shelf, out to approximately the 50-m isobath, in September and October (Figure 8.2). Information on bowhead whale feeding in the eastern Alaskan Beaufort Sea
BIAs for Cetaceans: Arctic Region
1
Arctic Figure Legends 1
2
Figure 8.1. Biologically Important Areas for bowhead whale reproduction during (a) spring 3
(April and May); (b) summer (June through August); and fall (c) September; (d) October, 4
determined from calf sightings collected during aerial and ice-based surveys. Also shown are the 5
20 m, 50 m, and 200 m depth contours. 6
7
8
_
140°W150°W160°W70°N
Beaufort Sea
Alaska
_
140°W150°W160°W
70°N
_
140°W150°W160°W
70°N
_
140°W150°W160°W
70°N
0 250125Kilometers
Beaufort Sea
Alaska
Beaufort Sea
Alaska
Beaufort Sea
Alaska
(a) (b)
(c) (d)
Chukchi
Sea
Chukchi
SeaChukchi
Sea
Chukchi
Sea
Hanna
Shoal
Barrow
Canyon
Barrow
Hanna
Shoal
Barrow
Canyon
Barrow
Hanna
Shoal
Barrow
Canyon
Barrow
Hanna
Shoal
Barrow
Canyon
Barrow
-20
-50-200
-20
-50
-200
-20
-50-200
-20
-50-200
Figure 8.1. Bowhead whale (Balaena mysticetus) reproduction Biologically Important Areas (BIAs) during (a) spring and early summer (April through early June); (b) summer (July and August); and fall (c) September and (d) October, determined from calf sightings collected during aerial- and ice-based surveys. Also shown are the 20-, 50-, and 200-m depth contours.

BIAs for Cetaceans: Arctic Region 97
in fall was available from ASAMM data (Clarke et al., 2013a) and a review of several studies, including site-specific industry-sponsored stud-ies and feeding studies sponsored by the Minerals Management Service (MMS), that took place in the 1980s and 1990s (Richardson & Thomson, 2002). Although observations indicate that bow-head whale feeding in this area is variable and ephemeral with intra- and inter-year variability (Clarke et al., 2013a), those observations are likely indicative of more extensive feeding activity that is not observed due to the limitations of the visual aerial survey methodology mentioned above. Therefore, this area is considered a feeding BIA (Figure 8.2; Table S8.2).
Feeding behavior has been observed in summer in the western Beaufort Sea (Clarke et al., 2012, 2013a), but there are not enough data to define a feeding BIA for this time period. In the northeast-ern Chukchi Sea, in spite of considerable visual survey effort during summer and fall, not enough bowhead whales have been observed feeding to define BIAs (Clarke et al., 2011c, 2012, 2013a).
Migratory Corridor—In spring, most bowhead whales migrate north within the lead system that occurs annually in the Chukchi Sea along the Alaska coast. One satellite-tagged whale migrated
north in the western Chukchi Sea in May along the Chukotka coast (Quakenbush et al., 2013). This whale did not use the spring lead system and sum-mered in the northern Chukchi Sea (Quakenbush et al., 2013). In the northeastern Chukchi Sea, the lead system is relatively well defined due to the warm water transported from the Pacific Ocean, high percentage of first-year ice compared to multi-year ice, and variable surface winds that move ice toward and away from the coastline (Mahoney, 2012).
The bowhead whale spring migration continues past Point Barrow before turning east to cross the Beaufort Sea in continental slope waters. Leads in the Beaufort Sea are fewer and more isolated, due to the movement of sea ice parallel to the coast-line (under the influence of the Beaufort Gyre) and the higher percentage of multi-year ice (Mahoney, 2012). Bowhead whales are capable of breaking ice up to 18-cm thick to create breathing holes (George et al., 1989), and they have been detected acous-tically (Clark et al., 1986) and satellite tracked in areas of very heavy ice (Quakenbush et al., 2010a). Based on data from aerial surveys conducted from 1979 to 1984 (Ljungblad et al., 1985); ice-based studies from 1978 to 2001 (George et al., 2004); and satellite-tagged whales (n = 16) in 2006, 2009,
BIAs for Cetaceans: Arctic Region
2
9
Figure 8.2. Biologically Important Areas (BIAs) for bowhead whale feeding during: 1) eastward 10
spring migration in May near Barrow Canyon; 2) westward fall migration from September 11
through October, which is generally shoreward of the 50 m isobath; and 3) August through 12
October from Smith Bay to Point Barrow, generally shoreward of the 20 m isobath. BIAs were 13
determined using aerial survey data. Also shown are the 20 m, 50 m, and 200 m depth contours. 14
15
16
17
_
_
__
_
_
_
_
140°W145°W150°W155°W
72°N
70°N
Beaufort Sea
Alaska
Barrow
Canyon
-200
-50
-20
0 10050
Kilometers
Barrow
Smith
Bay
Harrison
BayDeadhorse Camden
Bay
Kaktovik
May feeding
August - October feeding
September - October feeding
Figure 8.2. Bowhead whale feeding BIAs during the eastward spring migration in May near Barrow Canyon; from Smith Bay to Point Barrow in August through October, generally shoreward of the 20-m isobaths; and during the westward fall migration from September through October, generally shoreward of the 50-m isobath. BIAs were determined using aerial survey data. Also shown are the 20-, 50-, and 200-m depth contours.

98 Clarke et al.
and 2010 (Quakenbush et al., 2010a, 2010b), the spring migratory corridor BIA was delineated by the Chukchi Sea lead system and the continental slope area of the western Alaskan Beaufort Sea (Figure 8.3; Table S8.3).
Bowhead whale distribution in summer months is primarily in the Canadian Beaufort Sea (Moore & Reeves, 1993), although this area was not iden-tified as a BIA because it is outside U.S. waters. Bowhead whale distribution in and use of U.S. waters in the northeastern Chukchi and west-ern Beaufort Seas in summer months is not well understood, in part because there has been less survey effort during summer months (Clarke et al., 2013a; Quakenbush et al., 2013). A few bowhead whales have been sighted in June in the north-eastern Chukchi Sea, mainly nearshore between Wainwright and Point Barrow, and may repre-sent whales that do not migrate to the Canadian Beaufort Sea (Moore, 1992; Moore et al., 2010a; Clarke et al., 2011c). In July and August, bow-head whales have been seen during ASAMM aerial surveys from nearshore to the continental slope in the eastern Alaskan Beaufort Sea, on the outer continental shelf and slope in the western Alaskan Beaufort Sea, and nearshore between Point Barrow and Wainwright in the northeastern Chukchi Sea (Clarke et al., 2012, 2013a).
Four bowhead whales have been tracked using satellite tagging during summer months in and through the Beaufort Sea. Two of these tagged whales left the Canadian Beaufort Sea in June 2008 and traveled offshore to an area north of Barrow, returning to the Canadian Beaufort Sea before the stereotypical fall westward migra-tion (Quakenbush et al., 2010a). A third tagged whale left in late August 2010 and passed Barrow through the Chukchi Sea to the Russian coast of Chukotka (Quakenbush et al., 2013). The fourth tagged whale left in June 2012, passed Barrow and traveled to 78º N, well north of Wrangel Island, Russia (Quakenbush et al., 2013). Due to the relative lack of information, no migratory corridor BIAs are defined for bowhead whales during summer months in the Chukchi or western Beaufort Seas.
The bowhead whale fall migratory corridor BIA in the western Beaufort Sea was determined from ASAMM annual aerial surveys conducted from 1982 through 2012 (Ljungblad et al., 1988; Clarke & Ferguson, 2010a; Clarke et al., 2011a, 2011b, 2012, 2013a), augmented by passive acoustic monitoring (Blackwell et al., 2007, 2010; Hannay et al., 2013) and results from satellite tagging (Quakenbush et al., 2010a, 2010b, 2013). These data indicate that bowhead whales actively migrate across the western
_
_
__
_
_
_
_
155°W 140°W145°W150°W160°W165°W170°W175°W180°
72°N
70°N
68°N
66°N
Beaufort Sea
Alaska
0 200100Kilometers
April - May migration
September - October migration
Point Hope
Cape Lisburne
Point LayKasegaluk Lagoon
Icy CapeWainwright
Barrow
SmithBay
HarrisonBay Deadhorse Camden
BayKaktovik
BarrowCanyon
HannaShoal
ChukchiSea
Russia
-200-50
-200-50
-50
-50
-50
Figure 8.3. Bowhead whale migratory corridor BIAs for spring (April-May) and fall (September-October), determined from aerial- and ice-based surveys, satellite telemetry, and passive acoustic monitoring; also shown are the 50- and 200-m depth contours.

BIAs for Cetaceans: Arctic Region 99
Beaufort Sea primarily on the shelf, at depths less than 50 m, with some whales migrating across the outer shelf (Figure 8.3; Table S8.4). In most years, the majority of whales in the western Beaufort Sea are swimming, with a swim direction that is gen-erally west-northwest (e.g., Clarke et al., 2012, 2013a). In the northeastern Chukchi Sea, ASAMM aerial survey sightings (Clarke & Ferguson, 2010b; Clarke et al., 2011c, 2012, 2013a), satellite telem-etry (Quakenbush et al., 2010a, 2010b, 2013), and passive acoustic data (Hannay et al., 2013) indicate that the migration route in September and October is geographically broad (from the coast to > 400 km offshore); therefore, the northeastern Chukchi Sea does not meet the criteria for a migratory corridor BIA.
In winter (November-December), the bow-head whale migration progresses farther west and south. During this time period, aerial surveys have rarely been conducted due to diminishing daylight and consistently poor weather. In the northern Chukchi Sea, data from passive acoustic monitor-ing (Hannay et al., 2013) and satellite telemetry (Quakenbush et al., 2010a, 2010b, 2013) indicate that the bowhead whale migration route is geo-graphically broad (up to 450 km from shore) and well offshore; some bowhead whales head west across the Chukchi Sea toward Wrangel Island while others head southwest toward Chukotka (Quakenbush et al., 2010a, 2010b, 2013). Near Bering Strait, which is 82 km wide at its nar-rowest point, the migratory corridor narrows due to geography. Most of the tagged whales whose tracks could be specifically determined entered the Bering Sea west of the International Date Line (169º W) between Chukotka and Big Diomede Island; few entered within the U.S. EEZ (Quakenbush et al., 2010b; Citta et al., 2012). Due to the geographically broad nature of the migration through the Chukchi Sea and the location of the migratory corridor outside the U.S. EEZ in Bering Strait, no migratory corridor BIA was established for this late time period for bowhead whales.
Bowhead whale distribution in mid- to late winter is primarily in the Bering Sea. BIAs for this time period are described in Ferguson et al. (2015c).
Beluga (Delphinapterus leucas)Background Information—Two stocks of belugas are found in the northeastern Chukchi and west-ern Beaufort Seas: (1) the Beaufort Sea (BS) or Mackenzie Stock and (2) the Eastern Chukchi Sea (ECS) Stock (Allen & Angliss, 2014). Both stocks winter in the Bering and southern Chukchi Seas. Migration north through the Chukchi Sea and east through the Beaufort Sea is stock-specific, occur-ring in spring (BS) and summer (ECS). Satellite
telemetry data indicate that BS belugas tagged in the Mackenzie River Delta stayed in the Canadian Beaufort Sea for the entire month of July and most of August, in an area from the delta east into Amundsen Gulf and north to Viscount Melville Sound (Richard et al., 2001). ECS belugas tagged in Kasegaluk Lagoon have been tracked in July through November from 130º W to 176.5º W and north to 81º N (Suydam et al., 2001, 2005; Citta et al., 2013). These limited datasets suggest that belugas sighted during aerial surveys in the north-eastern Chukchi Sea and western Beaufort Sea from June through August are likely ECS belugas (Hauser et al., 2014). However, during the return migration in September and October, BS belugas overlap with ECS belugas in the western Beaufort Sea (Hauser et al., 2014).
Reproductive and Feeding Areas—Belugas in the ECS Stock calve, feed, and molt in June and July near Kasegaluk Lagoon, between Cape Lisburne and Icy Cape, Alaska (Frost et al., 1993; Suydam et al., 2001). Feeding and molting were inferred from belugas sighted during aerial surveys that were milling without noticeable movement in any direction. Diet of the ECS beluga stock is known primarily from stomach contents obtained from subsistence harvests in Point Lay and Barrow, Alaska, between 1983 and 2010, and includes fish (especially saffron cod [Eleginus gracilis]), cepha-lopods, and shrimp (Quakenbush et al., in press). Fish move along the shore and into the inlets of Kasegaluk Lagoon when the tide is going out (Huntington et al., 1999). Based on ASAMM aerial survey and satellite-tag data (Suydam et al., 2001,
BIAs for Cetaceans: Arctic Region
4
25
Figure 8.4. Biologically Important Area for the Eastern Chukchi Stock (ECS) of belugas for 26
reproduction and feeding in summer (June and July), determined from aerial surveys and satellite 27
telemetry. 28
29
_
_
165°W
70°N
Chukchi Sea
Alaska
0 5025Kilometers
Point Lay
Kasegaluk Lagoon
Icy Cape
Figure 8.4. Eastern Chukchi Sea (ECS) beluga (Delphinapterus leucas) stock BIA for reproduction and feeding in summer (June and July), determined from aerial surveys and satellite telemetry

100 Clarke et al.
2005), the Kasegaluk Lagoon area was designated as a reproductive and feeding BIA for ECS belu-gas, with highest densities in June and July (Clarke et al., 2013a) (Figure 8.4; Table S8.5).
Dive data from ECS belugas (n = 23) tagged near Point Lay between 1998 and 2007 suggest feeding also occurs near the continental shelf and slope and in the Arctic Basin in summer (Citta et al., 2013). Colder Pacific water overlying warmer Atlantic water may provide ideal conditions for Arctic cod (Boreogadus saida), which is the predominant prey species of belugas in other Arctic regions. Belugas from the ECS Stock may be feeding on Arctic cod within the warmer layer of Atlantic water at depths ranging from 200 to 1,000 m throughout the Beaufort Sea Basin (Figure 9 in Citta et al., 2013). Due to the limited information available and large geographic area, a feeding BIA was not identified at this time. However, this region should be inves-tigated further to determine if it meets the criteria for a BIA.
Belugas from the BS Stock calve, feed, and molt during summer in Canada in the Mackenzie River estuary (Yukon Territory) (Department of Fisheries and Oceans, 2000; Richard et al., 2001). Because this area is not in U.S. waters, no BIAs were defined.
Migratory Corridor—The spring migration of some belugas from the Bering Sea is gener-ally similar to that of bowhead whales in that they use nearshore leads in the sea ice (Ljungblad et al., 1985; Mocklin et al., 2012). Acoustic data from overwintered recorders in the northeastern Chukchi Sea indicated that belugas also migrate farther offshore (Delarue et al., 2011). Most belu-gas sighted during this time period are heading northeast in the Chukchi Sea and east in the west-ern Beaufort Sea, suggesting these early migrants are likely the BS Stock (Ljungblad et al., 1985). Based on these data, a migratory BIA for BS belu-gas in April and May was defined in the Chukchi and Beaufort Seas (Figure 8.5; Table S8.6).
During summer, belugas are found in the north-eastern Chukchi and western Beaufort Seas. There is limited information available on beluga migra-tion in the Chukchi Sea in summer. ECS belugas are found in the highest densities and in the largest groups along the outer coast and near the passes between islands that form Kasegaluk Lagoon (Ljungblad et al., 1986; Clarke et al., 2012, 2013a). Belugas also are found south of Kasegaluk Lagoon in Omalik Lagoon, presumably after migrating from the Bering Sea (Frost et al., 1993). Their route to these areas and their association with the spring migration is unknown. One beluga tagged near Point Lay in early July 2007 was tracked through July 2008 (http://alaskafisheries.noaa.gov/protectedresources/whales/beluga/ptlay.htm).
This whale (tag 22149) migrated north in mid-June 2008 to Barrow Canyon, about 240 km north of Kasegaluk Lagoon, before returning to the lagoon in late June 2008 (Suydam, 2009), indicating that activity near Kasegaluk Lagoon may be post-migration and related to summer molting, calving, and feeding. In August, there are few sightings of belugas in the northeastern Chukchi Sea even though aerial surveys have been flown there since 2008 (Clarke et al., 2012, 2013a). There are few detections of belugas on acoustic recorders during June and July in the northeastern Chukchi Sea; however, detections increase in August close to Point Barrow (Delarue et al., 2011). In the west-ern Beaufort Sea during July and August, sight-ings of belugas from ASAMM aerial surveys are mainly offshore on the outer continental shelf and slope, with scattered sightings nearshore (Clarke et al., 2013a). Because of the limited information available on belugas in the northeastern Chukchi Sea and their broad geographic distribution in the western Beaufort Sea in summer, no migratory corridor BIAs were delimited for this time period.
Sightings of belugas from aerial surveys in the western Beaufort Sea in fall are primarily on the continental slope, with relatively few sightings on the shelf; most belugas in the fall are swim-ming west-northwest (Clarke et al., 1993, 2011a, 2011b, 2012, 2013a). Satellite telemetry data show a strong preference for the slope (Richard et al., 2001; Suydam et al., 2001, 2005; Citta et al., 2013; Hauser et al., 2014). Although tagging data indicate that belugas from the BS Stock appear to use the shelf more and migrate out of the western Beaufort Sea earlier than belugas from the ECS Stock (Richard et al., 2001; Suydam et al., 2001, 2005; Hauser et al., 2014), sightings from aerial surveys in the western Beaufort Sea during fall may be either the BS or ECS Stock. The fall migratory corridor BIA for belugas in the western Beaufort Sea was based on these aerial survey and tagging data (Figure 8.5; Table S8.7, see also Figure 7.9 in Ferguson et al., 2015c, within this issue).
Sightings from aerial surveys indicate that belugas are typically found broadly distributed in low densities in the northeastern Chukchi Sea in fall (Ljungblad et al., 1986; Clarke et al., 2011c, 2012, 2013a). Few belugas were detected on two passive acoustic recorders located in the north-eastern Chukchi Sea, offshore of Icy Cape, Alaska (~64 and ~193 km from shore), in September and October (Garland et al., 2015). Delarue et al. (2011) also recorded few detections on passive acoustic recorders located approximately 10 to 250 km offshore between Cape Lisburne and Point Barrow in September and October 2007. The lack of beluga sightings during aerial surveys in September and October may indicate a fall
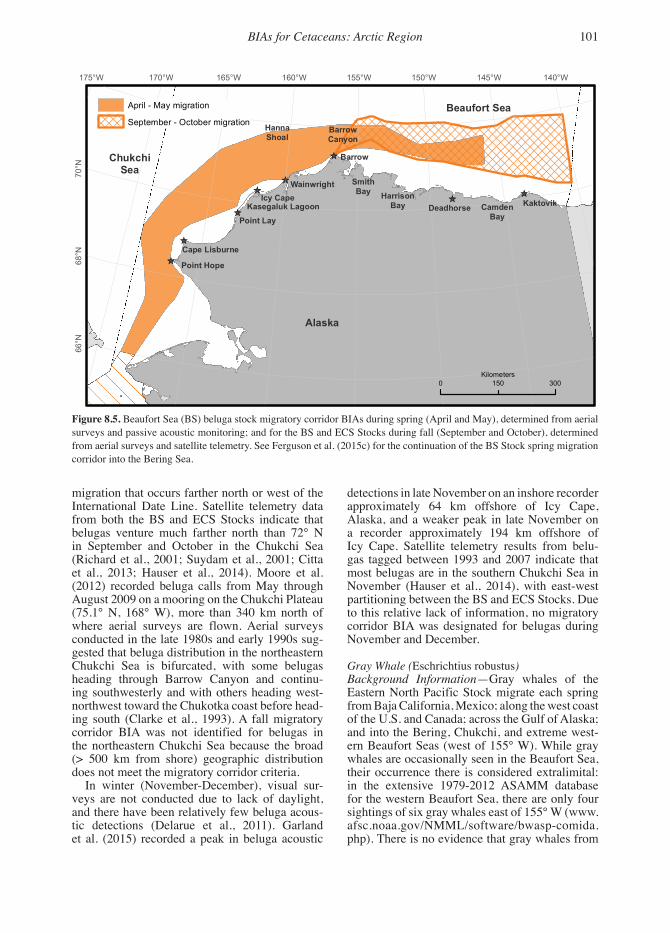
BIAs for Cetaceans: Arctic Region 101
migration that occurs farther north or west of the International Date Line. Satellite telemetry data from both the BS and ECS Stocks indicate that belugas venture much farther north than 72° N in September and October in the Chukchi Sea (Richard et al., 2001; Suydam et al., 2001; Citta et al., 2013; Hauser et al., 2014). Moore et al. (2012) recorded beluga calls from May through August 2009 on a mooring on the Chukchi Plateau (75.1° N, 168° W), more than 340 km north of where aerial surveys are flown. Aerial surveys conducted in the late 1980s and early 1990s sug-gested that beluga distribution in the northeastern Chukchi Sea is bifurcated, with some belugas heading through Barrow Canyon and continu-ing southwesterly and with others heading west-northwest toward the Chukotka coast before head-ing south (Clarke et al., 1993). A fall migratory corridor BIA was not identified for belugas in the northeastern Chukchi Sea because the broad (> 500 km from shore) geographic distribution does not meet the migratory corridor criteria.
In winter (November-December), visual sur-veys are not conducted due to lack of daylight, and there have been relatively few beluga acous-tic detections (Delarue et al., 2011). Garland et al. (2015) recorded a peak in beluga acoustic
detections in late November on an inshore recorder approximately 64 km offshore of Icy Cape, Alaska, and a weaker peak in late November on a recorder approximately 194 km offshore of Icy Cape. Satellite telemetry results from belu-gas tagged between 1993 and 2007 indicate that most belugas are in the southern Chukchi Sea in November (Hauser et al., 2014), with east-west partitioning between the BS and ECS Stocks. Due to this relative lack of information, no migratory corridor BIA was designated for belugas during November and December.
Gray Whale (Eschrichtius robustus)Background Information—Gray whales of the Eastern North Pacific Stock migrate each spring from Baja California, Mexico; along the west coast of the U.S. and Canada; across the Gulf of Alaska; and into the Bering, Chukchi, and extreme west-ern Beaufort Seas (west of 155° W). While gray whales are occasionally seen in the Beaufort Sea, their occurrence there is considered extralimital: in the extensive 1979-2012 ASAMM database for the western Beaufort Sea, there are only four sightings of six gray whales east of 155° W (www.afsc.noaa.gov/NMML/software/bwasp-comida.php). There is no evidence that gray whales from
_
_
__
_
_
_
_
155°W 140°W145°W150°W160°W165°W170°W175°W70
°N68
°N66
°N
Beaufort Sea
Alaska
0 300150Kilometers
ChukchiSea
Point Hope
Cape Lisburne
Point LayKasegaluk Lagoon
Icy CapeWainwright
Barrow
SmithBay Harrison
Bay Deadhorse CamdenBay
Kaktovik
BarrowCanyon
HannaShoal
April - May migration
September - October migration
Figure 8.5. Beaufort Sea (BS) beluga stock migratory corridor BIAs during spring (April and May), determined from aerial surveys and passive acoustic monitoring; and for the BS and ECS Stocks during fall (September and October), determined from aerial surveys and satellite telemetry. See Ferguson et al. (2015c) for the continuation of the BS Stock spring migration corridor into the Bering Sea.

102 Clarke et al.
the Western North Pacific Stock summer in the U.S. Arctic. Gray whales remain in the U.S. Arctic throughout summer and early fall before making a return migration south. Migratory corridors for gray whales to and from the northeastern Chukchi Sea are not well known; therefore, no migratory corridor BIA for gray whales in the Arctic was delineated.
Reproductive Area—Most gray whale calves are born from early January through mid-February in the lagoons of Baja California (Rice et al., 1984). Gray whale calves grow quickly in the first year, increasing in length from ~4.5 m at birth to ~7 m at weaning, which occurs at 7 to 9 mo (Sumich, 1986). Because growth slows considerably after weaning, 2-y-old gray whales may be only 8 m in length, which makes differentiating them from yearlings difficult. For that reason, calves are recorded during ASAMM aerial surveys when a relatively small gray whale is seen in close asso-ciation with an adult gray whale.
BIAs for gray whale reproduction were based on gray whale calf sightings from the ASAMM aerial surveys conducted in 1980-1991 and 2008-2012 (Clarke et al., 2013a). The relative abundance of gray whale calves in the northeastern Chukchi Sea appears to be variable. In most years, the number of calves seen annually was either one (6 y) or none (5 y) (Clarke et al., 1989, 2012). The highest total for 1 y occurred in 2012 when 67 calves were seen (Clarke et al., 2013a). Although individual gray whales can be identified through photo-iden-tification research conducted from vessels (e.g., Calambokidis et al., 2002; Bradford et al., 2011), identification during systematic aerial surveys is more difficult, particularly when photographs are not regularly collected. Therefore, the number of calf sightings per year in the ASAMM database does not necessarily represent the number of indi-vidual calves present. Despite this, patterns in gray whale calf distribution can be inferred.
Gray whale calf distribution in the northeastern Chukchi Sea overlaps the distribution of the gray whale population in general, with the exception that calves are rarely found offshore (e.g., Hanna Shoal and west of Point Hope) (Moore et al., 1986; Clarke et al., 2012, 2013a). The nearshore, shal-low habitat may provide some refuge from poten-tial predators (e.g., killer whales), or it may rep-resent habitat more suited to the faster respiratory rate of calves (Krupnik et al., 1983). Most (98%) calves observed during ASAMM aerial surveys were within the gray whale feeding area BIAs described below (Figure 8.6; Table S8.8). Calves were seen from June through September, with the greatest number reported during July, which is also the peak month for gray whale sightings overall (Clarke et al., 2013a). July calves also had the most
widespread distribution, extending from slightly east of Point Barrow to south of Point Hope. No calves were seen in the southern Chukchi Sea; however, there has been far less aerial survey effort in that area (Moore et al., 1986, 2003).
Feeding Area—Gray whales have been docu-mented feeding in the northeastern Chukchi Sea from summer through fall with little variabil-ity in location within these seasons. Gray whale feeding is identified during ASAMM aerial sur-veys as whales associated with mud plumes that are produced when whales surface after feeding on benthic or epibenthic species (Nerini, 1984). Gray whales are generalist feeders, however, and are not limited to benthic or epibenthic prey (e.g., Bluhm et al., 2007); therefore, mud plumes may not always accompany gray whale feeding events. Consequently, gray whale feeding activity is likely underreported, although to a lesser extent than with bowhead whales. Gray whale BIAs for feeding (Figure 8.7; Table S8.9) were derived pri-marily from data collected during aerial surveys (Clarke & Moore, 2002; Goetz et al., 2008, 2009, 2010, 2011; Clarke & Ferguson, 2010b; Clarke et al., 2011c, 2012, 2013a), augmented by infor-mation from oceanographic and benthic investiga-tions (e.g., Moore et al., 2003; Bluhm et al., 2007).
Feeding BIAs for gray whales include areas where gray whales have been observed feeding consistently during summer and fall, and con-sist of three principal areas. In the northeastern Chukchi Sea, gray whales have been observed feeding between Point Barrow and Point Lay, within approximately 90 km of shore. Feeding gray whales have also been sighted nearshore
BIAs for Cetaceans: Arctic Region
6
41
Figure 8.6. Biologically Important Areas for gray whale reproduction during summer and fall 42
(June through September), determined from calf sightings collected during aerial surveys. 43
44
_
_
_
_
160°W170°W
72°N
70°N
68°N
Chuckchi
Sea
Alaska
0 15075Kilometers
Point Hope
Cape Lisburne
Point Lay
Hanna
Shoal
Barrow
Figure 8.6. Gray whale (Eschrichtius robustus) reproduction BIAs during summer and fall (June through September), determined from calf sightings collected during aerial surveys

BIAs for Cetaceans: Arctic Region 103
from east of Cape Lisburne (Ledyard Bay) to south of Point Hope in most months from June to October. Finally, in the southern Chukchi Sea, gray whales have been documented feeding off-shore from approximately 66.5° N to 68.5° N in most months from June to October (Clarke & Moore, 2002; Bluhm et al., 2007). This southern-most feeding area extends across the International Date Line and may be even more extensive along the Chukotka coast (Anonymous, 2010). Gray whales were consistently seen feeding in September and October near Hanna Shoal (72° N, 160° W) in the late 1980s and early 1990s (Clarke & Moore, 2002), but they have been seen there infrequently since aerial surveys recommenced in 2008. Therefore, Hanna Shoal was not included as a BIA for gray whale feeding (Clarke et al., 2013a).
Summary
In conclusion, 18 BIAs were identified for three species within the Arctic region based on extensive expert review and synthesis of published and unpub-lished information. Identified BIAs included repro-ductive areas, feeding areas, and migratory corridors for bowhead whales and belugas, and reproductive areas and feeding areas for gray whales. No small or resident populations were identified in the Arctic region. The geographic extent of the BIAs in the Arctic region ranged from approximately 1,500 to 135,000 km2. At this time, there is insufficient infor-mation to identify BIAs for fin, humpback, minke, and killer whales and harbor porpoises; however, these species should be considered in future efforts
to identify BIAs. Other information gaps that were identified during the Arctic BIA process include (1) bowhead whale use of the western Beaufort Sea in summer (e.g., feeding, migration timing, move-ment rates), (2) the existence or extent of a bowhead whale fall migratory corridor in the Chukchi Sea, (3) the extent and nature of beluga use of outer con-tinental shelf and slope habitat in the Beaufort Sea, (4) the existence or location of gray whale migra-tory corridors in spring and fall, and (5) the degree to which gray whales move between known feed-ing hotspots. To maintain their utility, these BIAs should be re-evaluated and revised, if necessary, as new information becomes available.
BIAs for Cetaceans: Arctic Region
7
45
Figure 8.7. Biologically Important Areas for gray whale feeding during summer and fall (June to 46
October), determined from aerial and vessel based surveys. 47
48
49
_
_
_
_
160°W170°W
70°N
68°N
66°N
ChuckchiSea
Alaska
0 15075Kilometers
Point Hope
Cape Lisburne
Point Lay
Hanna
Shoal
Barrow
Figure 8.7. Gray whale feeding BIAs during summer and fall (June through October), determined from aerial- and vessel-based surveys

Aquatic Mammals 2015, 41(1), 104-105, DOI 10.1578/AM.41.1.2015.104
Acknowledgments
The production of these BIAs has involved many decisions about the process and approach that would be taken. These decisions were largely agreed upon within the Cetacean Density and Distribution Mapping (CetMap) Working Group that forms part of the National Oceanic and Atmospheric Administration (NOAA) CetSound program (http://cetsound.noaa.gov). CetMap is comprised of Jay Barlow, Elizabeth Becker, Danielle Cholewiak, Jesse Cleary, Megan Ferguson, Karin Forney, Lance Garrison, Jolie Harrison, Tim Haverland, Anu Kumar, Sue Moore, Daniel Palacios, Jessica Redfern, and Sofie Van Parijs. Additionally, regional and species experts provided detailed review com-ments. Funding for CetMap was provided by the NOAA, the Bureau for Ocean Energy Management, and the U.S. Navy.
Overview and RationaleThe NOAA Alaska Regional Office provided detailed review comments. We are grateful to Giuseppe Notarbartolo di Sciara, Kathleen Dudzinski, one anonymous reviewer, and all the reviewers of the regional manuscripts for improvements to the “Overview and Rationale” and the collection of manuscripts.
East CoastWe are grateful to Danielle Cholewiak, Lance Garrison, Elizabeth Josephson, Anu Kumar, Keith Mullen, Debi Palka, and Denise Risch for provid-ing internal reviews; to Jooke Robbins for pro-viding a review and unpublished Provincetown Center for Coastal Studies (PCCS) sighting data of feeding baleen whales; to Allison Henry for providing Northeast Fisheries Science Center (NEFSC) data; and to Tim Cole for providing the boundaries of the demographic study of poten-tial North Atlantic right whale mating in the Gulf of Maine. The Duke and University of North Carolina Wilmington (UNCW) monitoring teams provided us with useful discussion on unusual spe-cies sightings off Cape Hatteras, and potential resi-dency patterns of delphinids in Onslow Bay and at the shelf break. We also thank William McLellan, Kathleen Dudzinski, and one anonymous reviewer for improvements to the manuscript.
Gulf of MexicoWe are grateful to Lance Garrison, Keith Mullen, Patty Rosel, and Randy Wells for providing inter-nal reviews for the Gulf of Mexico region. We also thank Kathleen Dudzinski and two anonymous reviewers for improvements to the manuscript.
West CoastWe are grateful to Jay Barlow, Karin Forney, Jessica Redfern, Greg Schorr, and an anonymous reviewer for providing valuable comments. Maps and comparison to habitat-based density (HD) models were made with the help of Karin Forney, Jessica Redfern, and T.J. Moore. Funding for the development and validation of the U.S. West Coast HD models was provided by Chip Johnson, Julie Rivers (U.S. Pacific Fleet, U.S. Navy), and Sean Hanser (Naval Facilities Engineering Command Pacific, U.S. Navy), with additional funding pro-vided by the Southwest Fisheries Science Center. We also thank all of the researchers, photograph contributors, and funders who contributed to the West Coast studies.
Hawaiian IslandsCollection of the unpublished data summarized herein was funded by a variety of sources, includ-ing the Pacific Islands Fisheries Science Center, the U.S. Navy (Office of Naval Research and N45), and Dolphin Quest, and was undertaken under National Marine Fisheries Service (NMFS) Scientific Research Permits No. 15330 and 731-1774. We thank Erin Oleson, Karin Forney, and several anonymous reviewers for reviews of vari-ous versions of the manuscript.
Gulf of AlaskaWe are grateful to Catherine Berchok, Manuel Castellote, Phil Clapham, Marilyn Dahlheim, Chris Gabriele, Amy Kennedy, Sally Mizroch, Kim Shelden, Jan Straley, Bree Witteveen, and Alex Zerbini for providing information and reviews for the Gulf of Alaska region. We also thank Kathleen Dudzinski and three anonymous reviewers for their in-depth reviews, and Jim Lee for providing a thorough technical review of the manuscript.

105 Acknowledgments
Aleutian Islands and Bering SeaWe are grateful for the detailed review com-ments provided by the following Aleutian Islands and Bering Sea regional and species experts: Catherine Berchok, Phil Clapham, Nancy Friday, Ellen Garland, Amy Kennedy, Sally Mizroch, and Kim Shelden. We also thank Kathleen Dudzinski, Brenda Rone, and Mari Smultea for their in-depth reviews and helpful comments, and Gary Duker for his technical review of the manuscript.
ArcticWe are grateful to Lisanne Aerts, Cynthia Christman, the NMFS Alaska Regional Office, and Sue Moore for providing reviews for the Arctic region. We also thank Gary Duker for pro-viding a technical review of the manuscript. We are grateful to Kathleen Dudzinski, Lori Quakenbush, and one anonymous reviewer for improvements to the manuscript. The Aerial Surveys of Arctic Marine Mammals (ASAMM) project was funded by the U.S. Department of the Interior, Bureau of Ocean Energy Management (BOEM, for-merly MMS), Alaska Outer Continental Shelf Region, Anchorage, Alaska, through Interagency Agreement No. M11PG00033 with the Alaska Fisheries Science Center, NOAA Fisheries.

Aquatic Mammals 2015, 41(1), 106-128, DOI 10.1578/AM.41.1.2015.106
Literature Cited
Agler, B. A., Schooley, R. L., Frohock, S. E., Katona, S. K., & Seipt, I. E. (1993). Reproduction of photographically identified fin whales (Balaenoptera physalus) from the Gulf of Maine. Journal of Mammalogy, 74(3), 577-587. http://dx.doi.org/10.2307/1382276
Albertson, G. R. (2015). Worldwide phylogeography and local population structure of the rough-toothed dol-phin (Steno bredanensis) (Ph.D. thesis). Oregon State University, Corvallis.
Allen, B. M., & Angliss, R. P. (2012). Alaska marine mammal stock assessments, 2011 (NOAA Technical Memorandum NMFS-AFSC-234). Washington, DC: U.S. Department of Commerce.
Allen, B. M., & Angliss, R. P. (2014). Alaska marine mammal stock assessments, 2013 (NOAA Technical Memorandum NMFS-AFSC-277). Washington, DC: U.S. Department of Commerce. 294 pp.
Andrews, K. R., Karczmarski, L., Au, W. W. L., Rickards, S. H., Vanderlip, C. A., Bowen, B. W., . . . Toonen, R. J. (2010). Rolling stones and stable homes: Social structure, habitat diversity and population genetics of the Hawaiian spinner dolphin (Stenella longirostris). Molecular Ecology, 19, 732-748. http://dx.doi.org/10. 1111/j.1365-294X.2010.04521.x
Andrews, R. C. (1909). Observations on the habits of the finback and humpback whales of the eastern North Pacific. Bulletin of the American Museum of Natural History, 26, 213-226.
Anonymous. (2010). Report on the execution of marine research in the Bering Strait, East Siberian and the Chukchi Sea by the Russian-American Expedition under the pro-gram of “RUSALCA” during the period from 23 August through 30 September, 2009. Retrieved 5 February 2015 from http://epic.awi.de/31281/1/RUSALCA_2009_report.pdf.
Aschettino, J. M. (2010). Population size and structure of melon-headed whales (Peponocephala electra) around the main Hawaiian Islands: Evidence of multiple popu-lations based on photographic data (Master of Science dissertation). Hawai‘i Pacific University, Honolulu.
Aschettino, J. M., Baird, R. W., McSweeney, D. J., Webster, D. L., Schorr, G. S., Huggins, J. L., . . . West, K. L. (2011a). Population structure of melon-headed whales (Peponocephala electra) in the Hawaiian Archipelago: Evidence of multiple populations based on photo-identification. Marine Mammal Science, 28, 666-689. http://dx.doi.org/10.1111/j.1748-7692.2011.00517.x
Aschettino, J. M., Baird, R. W., Schorr, G. S., Martien, K. K., McSweeney, D. J., Webster, D. L., . . . West, K. L. (2011b). Photo-identification, genetic, and telemetry data show evidence of two populations of melon-headed
whales (Peponocephala electra) in Hawai‘i. Talk at the Workshop on Science and Conservation of Hawaiian Odontocetes, Tampa, FL.
Ashjian, C. J., Braund, S. R., Campbell, R. G., George, J. C., Kruse, J., Maslowski, W., . . . Spitz, Y. H. (2010). Climate variability, oceanography, bowhead whale distribution, and Inupiat subsistence whaling near Barrow, Alaska. Arctic, 63(2), 179-194. http://dx.doi.org/10.14430/arctic973
Australian Government Department of Sustainability, Environment, Water, Population and Communities (DSEWPaC). (2012). Marine bioregional plan for the north-west marine region. Canberra: DSEWPaC. Retrieved 2 February 2015 from www.environment.gov.au/topics/marine/marine-bioregional-plans/north-west.
Australian Government Department of the Environment (AU DOE). (2014). National conservation values atlas. Retrieved 2 February 2015 from www.environment.gov.au/webgis-framework/apps/ncva/ncva.jsf.
Bailey, H., Mate, B. R., Palacios, D. M., Irvine, L., Bograd, S. J., & Costa, D. P. (2010). Behavioral estimate of blue whale movements in the Northeast Pacific from state-space model analysis of satellite tracks. Endangered Species Research, 10, 93-106. http://dx.doi.org/10.3354/esr00239
Baird, R. W. (2005). Sightings of dwarf (Kogia sima) and pygmy (K. breviceps) sperm whales from the main Hawaiian Islands. Pacific Science, 59, 461-466. http://dx.doi.org/10.1353/psc.2005.0031
Baird, R. W. (2009). Preliminary revised mark-recapture population estimates for insular stock false killer whales. Presentation to the Pacific Scientific Review Group.
Baird, R. W., Webster, D. L., Aschettino, J. M., Schorr, G. S., & McSweeney, D. J. (2013a). Odontocete ceta-ceans around the main Hawaiian Islands: Habitat use and relative abundance from small-boat sighting sur-veys. Aquatic Mammals, 39(3), 253-269. http://dx.doi.org/10.1578/AM.39.3.2013.253
Baird, R. W., Oleson, E. M., Barlow, J., Ligon, A. D., Gorgone, A. M., & Mahaffy, S. D. (2013b). Evidence of an island-associated population of false killer whales (Pseudorca crassidens) in the Northwestern Hawaiian Islands. Pacific Science, 57, 513-521. http://dx.doi.org/10.2984/67.4.2
Baird, R. W., Schorr, G. S., Webster, D. L., McSweeney, D. J., Hanson, M. B., & Andrews, R. D. (2010a). Movements and habitat use of Cuvier’s and Blainville’s beaked whales in Hawai‘i: Results from satellite tagging in 2009/2010. Report prepared under Order No. AB133F09SE4843 from the Southwest Fisheries Science Center, La Jolla, CA.

107 Literature Cited
Baird, R. W., Schorr, G. S., Webster, D. L., McSweeney, D. J., Hanson, M. B., & Andrews, R. D. (2011a). Movements of two satellite-tagged pygmy killer whales (Feresa attenuata) off the island of Hawai‘i. Marine Mammal Science, 27, E332-E337. http://dx.doi.org/10.1111/j.1748-7692.2010.00458.x
Baird, R. W., Webster, D. L., Mahaffy, S. D., McSweeney, D. J., Schorr, G. S., & Ligon, A. D. (2008a). Site fidelity and association patterns in a deep-water dolphin: Rough-toothed dolphins (Steno bredanensis) in the Hawaiian Archipelago. Marine Mammal Science, 24, 535-553. http://dx.doi.org/10.1111/j.1748-7692.2008.00201.x
Baird, R. W., Webster, D. L., Mahaffy, S. D., Schorr, G. S., Aschettino, J. M., & Gorgone, A. M. (2013c). Movements and spatial use of odontocetes in the west-ern main Hawaiian Islands: Results of a three-year study off O‘ahu and Kaua‘i. Final report under Grant No. N00244-10-1-0048 from the Naval Postgraduate School.
Baird, R.W., Aschettino, J. M., McSweeney, D.J. , Webster, D.L., Schorr, G.S., Baumann-Pickering, S., & Mahaffy, S. D. (2010b). Melon-headed whales in the Hawaiian archipelago: An assessment of population structure and long-term site fidelity based on photo-identification. Report prepared under Order No. JG133F09SE4440 to Cascadia Research Collective from the Southwest Fisheries Science Center, National Marine Fisheries Service, La Jolla, CA.
Baird, R. W., Schorr, G. S., Webster, D. L., Mahaffy, S. D., McSweeney, D. J., Hanson, M. B., & Andrews, R. D. (2009a). Movements of satellite-tagged Cuvier’s and Blainville’s beaked whales in Hawai‘i: Evidence for an offshore population of Blainville’s beaked whales. Report prepared under Contract No. AB133F-08-SE-4534 from the Southwest Fisheries Science Center, National Marine Fisheries Service, La Jolla, CA.
Baird, R. W., Schorr, G. S., Webster, D. L., Mahaffy, S. D., McSweeney, D. J., Hanson, M. B., & Andrews, R. D. (2011b). Open-ocean movements of a satellite-tagged Blainville’s beaked whale (Mesoplodon densirostris): Evidence for an offshore population in Hawai‘i? Aquatic Mammals, 37(4), 506-511. http://dx.doi.org/10.1578/AM.37.4.2011.506
Baird, R. W., Schorr, G. S., Webster, D. L., McSweeney, D. J., Mahaffy, S. D., Hanson, M. B., & Andrews, R. D. (2011c). Movements of satellite-tagged short-finned pilot whales in the Hawaiian Islands: Evidence for multiple populations within the Hawaiian archipelago. Talk at the Workshop on Science and Conservation of Hawaiian Odontocetes, Tampa, FL.
Baird, R. W., Gorgone, A. M., McSweeney, D. J., Ligon, A. D., Deakos, M. H., Webster, D. L., . . . Mahaffy, S. D. (2009b). Population structure of island-asso-ciated dolphins: Evidence from photo-identification of common bottlenose dolphins (Tursiops trunca-tus) in the main Hawaiian Islands. Marine Mammal Science, 25, 251-274. http://dx.doi.org/10.1111/j.1748-7692.2008.00257.x
Baird, R. W., Gorgone, A. M., McSweeney, D. J., Webster, D. L., Salden, D. R., Deakos, M. H., . . . Mahaffy, S. D. (2008b). False killer whales (Pseudorca crassidens) around the main Hawaiian Islands: Long-term site fidel-ity, inter-island movements, and association patterns. Marine Mammal Science, 24, 591-612.
Baird, R. W., Hanson, M. B., Schorr, G. S., Webster, D. L., McSweeney, D. J., Gorgone, A. M., . . . Andrews, R. D. (2012). Range and primary habitats of Hawaiian insular false killer whales: Informing determination of critical habitat. Endangered Species Research, 18, 47-61. http://dx.doi.org/10.3354/esr00435
Baird, R. W., Jarvis, S. M., Webster, D. L., Rone, B. K., Shaffer, J. A., Mahaffy, S. D., . . . Moretti, D. J. (2014). Odontocete studies on the Pacific Missile Range Facility in July/August 2013: Satellite-tagging, photo-identifi-cation, and passive acoustic monitoring. Prepared for U.S. Pacific Fleet, submitted to NAVFAC PAC by HDR Environmental, Operations and Construction, Inc.
Baird, R. W., McSweeney, D. J., Schorr, G. S., Mahaffy, S. D., Webster, D. L., Barlow, J., . . . Andrews, R. D. (2009c). Studies of beaked whales in Hawai‘i: Population size, movements, trophic ecology, social organization and behaviour. European Cetacean Society Special Publication 51, 23-25.
Baker, C. S., Herman, L. M., Perry, A., Lawton, W. S., Straley, J. M., & Straley, J. H. (1985). Population char-acteristics and migration of summer and late-season humpback whales (Megaptera novaeangliae) in south-eastern Alaska. Marine Mammal Science, 1, 304-323. http://dx.doi.org/10.1111/j.1748-7692.1985.tb00018.x
Baker, C. S., Herman, L. M., Perry, A., Lawton, W. S., Straley, J. M., Wolman, A. A., . . . Östman, J. (1986). Migratory movement and population structure of humpback whales (Megaptera novaeangliae) in the central and eastern North Pacific. Marine Ecology Progress Series, 31, 105-119. http://dx.doi.org/10.3354/meps031105
Baker, C. S., Medrano-Gonzalez, L., Calambokidis, J., Perry, A., Pichler, F., Rosenbaum, H., . . . Von Ziegesar, O. (1998). Population structure of nuclear and mito-chondrial DNA variation among humpback whales in the North Pacific. Molecular Ecology, 6, 695-707. http://dx.doi.org/10.1046/j.1365-294x.1998.00384.x
Baker, C. S., Steel, D., Calambokidis, J., Barlow, J., Burdin, A. M., Clapham, P. J., . . . Yamaguchi, M. (2008). GeneSPLASH: An initial, ocean-wide survey of mito-chondrial (mt) DNA diversity and population structure among humpback whales in the North Pacific (Final report for Contract 2006-0093-008). Washington, DC: National Fish and Wildlife Foundation.
Baker, C. S., Steel, D., Calambokidis, J., Falcone, E. A., González-Peral, U., Barlow, J., . . . Yamaguchi, M. (2013). Strong maternal fidelity and natal philopa-try shape genetic structure in North Pacific humpback whales. Marine Ecology Progress Series, 494, 291-306. http://dx.doi.org/10.3354/meps10508

108 Literature Cited
Balmer, B. C., Wells, R. S., Nowacek, S. M., Nowacek, D. P., Schwacke, L. H., McLellan, W. A., . . . Pabst, D.A. (2008). Seasonal abundance and distribution patterns of common bottlenose dolphins (Tursiops truncatus) near St. Joseph Bay, Florida, USA. Journal of Cetacean Research and Management, 10(2), 157-167.
Barco, S. G., McLellan, W. A., Allen, J. M., Asmutis-Silvia, R. A., Mallon-Day, R., Meagher, E., . . . Clapham, P. J. (2002). Population identity of humpback whales (Megaptera novaeangliae) in the waters of the U.S. mid-Atlantic states. Journal of Cetacean Research and Management, 4(2), 135-141.
Barlow, J. (1988). Harbor porpoise (Phocoena phocoena) abun-dance estimation in California, Oregon and Washington: I. Ship surveys. Fishery Bulletin, 86, 417-432.
Barlow J. (2006). Cetacean abundance in Hawaiian waters estimated from a summer/fall survey in 2002. Marine Mammal Science, 22, 446-464. http://dx.doi.org/10.1111/j.1748-7692. 2006.00032.x
Barlow, J. (2010). Cetacean abundance in the California Current estimated from a 2008 ship based line-tran-sect survey (NOAA Technical Memorandum NMFS-SWFSC-456). La Jolla, CA: Southwest Fisheries Science Center.
Barlow, J., & Forney, K. A. (2007). Abundance and popula-tion density of cetaceans in the California Current eco-system. Fishery Bulletin, 105, 509-526.
Barlow, J., Calambokidis, J., Falcone, E. A., Baker, C. S., Burdin, A. M., Clapham, P. J., . . . Yamaguchi, M. (2011). Humpback whale abundance in the North Pacific esti-mated by photographic capture-recapture with bias correction from simulation studies. Marine Mammal Science, 27(4), 793-818. http://dx.doi.org/10.1111/j.1748-7692.2010.00444.x
Barrett-Lennard, L. G., Matkin, C. O., Durban, J. W., Saulitis, E. L., & Ellifrit, D. (2011). Predation on gray whales and prolonged feeding on submerged carcasses by transient killer whales at Unimak Island, Alaska. Marine Ecology Progress Series, 421, 229-241. http://dx.doi.org/10.3354/meps08906
Bassos-Hull, K., Perrtree, R. M., Shepard, C. C., Schilling, S., Barleycorn, A. A., Allen, J. B., . . . Wells, R. S. (2013). Long-term site fidelity and seasonal abundance estimates of common bottlenose dolphins (Tursiops truncatus) along the southwest coast of Florida and responses to natural perturbations. Journal of Cetacean Research and Management, 13(1), 19-30.
Baumgartner, M. F., & Mate, B. R. (2003). Summertime foraging ecology of North Atlantic right whales. Marine Ecology Progress Series, 264, 123-135. http://dx.doi.org/10.3354/meps264123
Baumgartner, M. F., & Mate, B. R. (2005). Summer and fall habitat of North Atlantic right whales (Eubalaena glacialis) inferred from satellite telemetry. Canadian Journal of Fisheries and Aquatic Sciences, 62(3), 527-543. http://dx.doi.org/10.1139/f04-238
Baumgartner, M. F., Cole, T. V., Campbell, R. G., Teegarden, G. J., & Durbin, E. G. (2003). Associations
between North Atlantic right whales and their prey, Calanus finmarchicus, over diel and tidal time scales. Marine Ecology Progress Series, 264, 155-166. http://dx.doi.org/10.3354/meps264155
Baumgartner, M. F., Lysiak, N. S., Schuman, C., Urban-Rich, J., & Wenzel, F. W. (2011). Diel vertical migration behavior of Calanus finmarchicus and its influence on right and sei whale occurrence. Marine Ecology Progress Series, 423, 167-184. http://dx.doi.org/10.3354/meps08931
Becker, E. A., Forney, K. A., Ferguson, M. C., Barlow, J., & Redfern, J. V. (2012a). Predictive modeling of cetacean densities in the California Current ecosystem based on summer/fall ship surveys in 1991-200 (NOAA Technical Memorandum). La Jolla, CA: Southwest Fisheries Science Center.
Becker, E. A., Foley, D. G., Forney, K. A., Barlow, J., Redfern, J. V., & Genteman, C. L. (2012b). Forecasting cetacean abundance patterns to enhance management. Endangered Species Research, 16, 97-112. http://dx.doi.org/10.3354/esr00390
Best, P. B., Bannister, J. L., Brownell, R. L., Jr., & Donovan, G. P. (Eds.). (2001). Right whales: Worldwide status. Journal of Cetacean Research and Management (Special Issue 2).
Blackwell, S. B., Richardson, W. J., Greene, C. R., Jr., & Streever, B. (2007). Bowhead whale (Balaena mysti-cetus) migration and calling behaviour in the Alaskan Beaufort Sea, autumn 2001-04: An acoustic localization study. Arctic, 60(3), 255-270.
Blaylock, R. A., & Hoggard, W. (1994). Preliminary esti-mates of bottlenose dolphin abundance in southern U.S. Atlantic and Gulf of Mexico continental shelf waters. Washington, DC: U.S. Department of Commerce, National Oceanic and Atmospheric Administration, National Marine Fisheries Service, Southeast Fisheries Science Center.
Bluhm, B., Coyle, K. O., Konar, B., & Highsmith, R. (2007). High gray whale relative abundances associated with an oceanographic front in the south-central Chukchi Sea. Deep-Sea Research, Part II, 54(23-26), 2919-2933. http://dx.doi.org/10.1016/j.dsr2.2007.08.015
Bradford, A. L., Weller, D. W., Burdin, A. M., & Brownell, R. L., Jr. (2011). Using barnacle and pigmentation char-acteristics to identify gray whale calves on their feed-ing grounds. Marine Mammal Science, 27(3), 644-651. http://dx.doi.org/10.1111/j.1748-7692.2010.00413.x
Bräger, S. (1993). Diurnal and seasonal behavior pat-terns of bottlenose dolphins (Tursiops truncatus). Marine Mammal Science, 9(4), 434-438. http://dx.doi.org/10.1111/j.1748-7692.1993.tb00477.x
Bräger, S., Würsig, B., Acevedo, A., & Henningsen, T. (1994). Association patterns of bottlenose dolphins (Tursiops trun-catus) in Galveston Bay, Texas. Journal of Mammalogy, 431-437. http://dx.doi.org/10.2307/1382564
Braham, H. W. (1984). Distribution and migration of gray whales in Alaska. In M. L. Jones, S. L. Swartz, & S. Leatherwood (Eds.), The gray whale, Eschrichtius

Literature Cited 109
robustus (pp. 249-266). New York: Academic Press. http://dx.doi.org/10.1016/B978-0-08-092372-7.50017-0
Braham, H. W., Fraker, M., & Krogman, B. D. (1980). Spring migration of the western Arctic population of bowhead whales. Marine Fisheries Review, 42(9-10), 36-46.
Brown, M. W., Brault, S., Hamilton, P. K., Kenney, R. D., Knowlton, A. R., Marx, M. K., . . . Kraus, S. D. (2001). Sighting heterogeneity of right whales in the western North Atlantic: 1980-1992. Journal of Cetacean Research and Management (Special Issue 2), 245-250.
Brownell, R. L., Jr., Clapham, P. J., Miyashita, T., & Kasuya, T. (2001). Conservation status of North Pacific right whales. Journal of Cetacean Research and Management, 2, 269-286.
Brueggeman, J. J. (1982). Early spring distribution of bowhead whales in the Bering Sea. The Journal of Wildlife Management, 46, 1036-1044. http://dx.doi.org/ 10.2307/3808236
Buckland, S. T., & Breiwick, J. M. (2002). Estimated trends in abundance of eastern Pacific gray whales from shore counts, 1967/68 to 1995/96. Journal of Cetacean Research Management, 4, 41-48.
Burns, J. J., & Seaman, G. A. (1985). Investigations of belukha whales in coastal waters of western and north-ern Alaska. II. Biology and ecology. OCSEAP Final Report (U.S. Department of Commerce, NOAA), 56(1988), 221-357.
Calambokidis, J., & Barlow, J. (1991). Chlorinated hydrocarbon concentrations and their use for describ-ing population discreteness in harbor porpoises from Washington, Oregon, and California. In J. E. Reynolds III & D. K. Odell (Eds.), Marine mammal strandings in the United States (NOAA Technical Report NMFS 98, pp. 101-110). Washington, DC: National Oceanic and Atmospheric Administration.
Calambokidis, J., & Barlow, J. (2004). Abundance of blue and humpback whales in the eastern North Pacific esti-mated by capture-recapture and line-transect methods. Marine Mammal Science, 20(1), 63-85. http://dx.doi.org/10.1111/j.1748-7692.2004.tb01141.x
Calambokidis, J., & Barlow, J. (2013). Updated abundance estimates of blue and humpback whales off the U.S. West Coast incorporating photo-identifications from 2010 and 2011 (Final Report to the Pacific Scientific Review Group for Contract AB-133F-10-RP-0106 PSRG-2013-13R). La Jolla, CA: Southwest Fisheries Science Center.
Calambokidis, J., Laake, J. L., & Klimek, A. (2010). Abundance and population structure of seasonal gray whales in the Pacific Northwest, 1998-2008 (Paper SC/62/BRG32). Presented to the International Whaling Commission Scientific Committee.
Calambokidis, J., Laake, J. L., & Klimek, A. (2012). Updated analysis of abundance and population struc-ture of seasonal gray whales in the Pacific Northwest, 1998-2010. Paper SC/M12/AWMP2-Rev submitted to the IWC Scientific Committee. 65 pp.
Calambokidis, J., Laake, J., & Perez, A. (2014). Updated analysis of abundance and population structure of seasonal gray whales in the Pacific Northwest, 1996-2012 (Final Report). Seattle, WA: National Marine Mammal Laboratory.
Calambokidis, J., Evenson, J. R., Chandler, T. E., & Steiger, G. H. (1992). Individual identification of gray whales in Puget Sound in 1991. Puget Sound Notes, 28, 1-4.
Calambokidis, J., Barlow, J., Ford, J. K. B., Chandler, T. E., & Douglas, A. B. (2009a). Insights into the population structure of blue whales in the eastern North Pacific from recent sightings and photographic identifications. Marine Mammal Science, 25, 816-832. http://dx.doi.org/10.1111/j.1748-7692.2009.00298.x
Calambokidis, J., Falcone, E., Douglas, A., Schlender, L., & Huggins, J. (2009b). Photographic identification of humpback and blue whales off the U.S. West Coast: Results and updated abundance estimates from 2008 field season (Final Report for Contract AB133F08SE2786). La Jolla, CA: Southwest Fisheries Science Center.
Calambokidis, J., Steiger, G. H., Ellifrit, D. K., Troutman, B. L., & Bowlby, C. E. (2004). Distribution and abun-dance of humpback whales and other marine mammals off the northern Washington coast. Fishery Bulletin, 102(4), 563-580.
Calambokidis, J., Mate, B., Oleson, E., Irvine, L., Hayslip, C., & Douglas, A. (2009c). The Costa Rica Dome as a winter feeding and breeding area for North Pacific blue whales. Proceedings of the 18th Biennial Conference on the Biology of Marine Mammals, Quebec City, Quebec.
Calambokidis, J., Darling, J. D., Deecke, V., Gearin, P., Gosho, M., Megill, W., . . . Gisborne, B. (2002). Abundance, range and movements of a feeding aggre-gation of gray whales (Eschrichtius robustus) from California to southeastern Alaska in 1998. Journal of Cetacean Research and Management, 4(3), 267-276.
Calambokidis, J., Falcone, E. A., Quinn, T. J., Burdin, A. M., Clapham, P. J., Ford, J. K. B., . . . Wade, P. R. (2008a). SPLASH: Structure of Populations, Levels of Abundance and Status of Humpback Whales in the North Pacific (Final Report for Contract AB133F-03-RP-00078 prepared by Cascadia Research). Seattle, WA: U.S. Department of Commerce.
Calambokidis, J., Schorr, G. S., Steiger, G. H., Francis, J., Bakhtiari, M., Marshall, G., . . . Robertson, K. (2008b). Insights into the underwater diving, feeding, and calling behavior of blue whales from a suction-cup attached video-imaging tag (CRITTERCAM). Marine Technology Society Journal, 41, 19-29. http://dx.doi.org/10.4031/002533207787441980
Calambokidis, J., Steiger, G. H., Cubbage, J. C., Balcomb, K. C., Ewald, C., Kruse, S., . . . Sears, R. (1990). Sightings and movements of blue whales off central California 1986-88 from photo-identification of individ-uals. Reports of the International Whaling Commission, Special Issue 12, 343-348.
Calambokidis, J., Steiger, G. H., Evenson, J. R., Flynn, K. R., Balcomb, K. C., Claridge, D. E., . . . Green, G. A.

110 Literature Cited
(1996). Interchange and isolation of humpback whales off California and other North Pacific feeding grounds. Marine Mammal Science, 12, 215-226. http://dx.doi.org/10.1111/j.1748-7692.1996.tb00572.x
Calambokidis, J., Steiger, G. H., Rasmussen, K., Urbán R., J., Balcomb, K. C., Ladron de Guevara, P., . . . Darling, J. D. (2000). Migratory destinations of humpback whales that feed off California, Oregon and Washington. Marine Ecology Progress Series, 192, 295-304. http://dx.doi.org/10.3354/meps192295
Calambokidis, J., Steiger, G. H., Straley, J. M., Herman, L. M., Cerchio, S., Salden, D. R., . . . Quinn II, T. J. (2001). Movements and population structure of humpback whales in the North Pacific. Marine Mammal Science, 17, 769-794. http://dx.doi.org/10.1111/j.1748-7692.2001.tb01298.x
Calambokidis, J., Steiger, G. H., Straley, J., Quinn II, T. J., Herman, L. M., Cerchio, S., . . . Rasmussen, K. (1997). Abundance and population structure of humpback whales in the North Pacific Basin. Final Report to Southwest Fisheries Science Center, National Marine Fisheries Service, La Jolla, CA, for Contract #50ABNF500113.
Caldwell, M. (2001). Social and genetic structure of bot-tlenose dolphin (Tursiops truncatus) in Jacksonville, Florida (Doctoral dissertation). University of Miami, Miami, Florida.
Carretta, J. V., Forney, K. A., & Barlow, J. (1995). Report of 1993-1994 marine mammal aerial surveys conducted within the U.S. Navy outer sea test range off Southern California (NOAA Technical Memorandum NOAA-TM-NMFSSWFSC-217). La Jolla, CA: Southwest Fisheries Science Center.
Carretta, J. V., Forney, K. A., & Benson, S. R. (2009). Preliminary estimates of harbor porpoise abundance in California waters from 2002 to 2007 (NOAA Technical Memorandum NOAA-TM-NMFSSWFSC-435). La Jolla, CA: Southwest Fisheries Science Center.
Carretta, J. V., Taylor, B. L., & Chivers, S. J. (2001). Abundance and depth distribution of harbor porpoise (Phocoena phocoena) in northern California determined from a 1995 ship survey. Fishery Bulletin, 99, 29-39.
Carretta, J. V., Oleson, E., Weller, D. W., Lang, A. R., Forney, K. A., Baker, J., . . . Hill, M. C. (2013). U.S. Pacific marine mammal stock assessments: 2012 (NOAA Technical Memorandum NOAA-TM-NMFS-SWFSC-504). La Jolla, CA: Southwest Fisheries Science Center, U.S. Department of Commerce.
Carretta, J. V., Oleson, E., Weller, D. W., Lang, A. R., Forney, K. A., Baker, J., . . . Mattila, D. K. (2014) U.S. Pacific marine mammal stock assessments, 2013 (NOAA Technical Memorandum NOAA-TM-NMFS-SWFSC-532). Washington, DC: U.S. Department of Commerce,
Cartwright, R., Gillespie, B., Labonte, K., Mangold, T., Venema, A., Eden, K., & Sullivan, M. (2012). Between a rock and a hard place: Habitat selection in female-calf humpback whale (Megaptera novaeangliae) pairs on
the Hawaiian breeding grounds. PLOS ONE, 7, e38004. http://dx.doi.org/10.1371/journal.pone.0038004
Cerchio, S., Gabriele, C. M., Norris, T. F., & Herman, L. M. (1998). Movements of humpback whales between Kauai and Hawaii: Implications for population structure and abundance estimation in the Hawaiian Islands. Marine Ecology Progress Series, 175, 13-22. http://dx.doi.org/ 10.3354/meps175013
Cetacean and Turtle Assessment Program (CeTAP). (1982). A characterization of marine mammals and turtles in the mid- and north Atlantic areas of the U.S. outer continen-tal shelf (Final Report of CeTAP to the U.S. Department of Interior under Contract AA551-CT8-48. H. E. Winn, Scientific Director). Kingston: University of Rhode Island.
Chivers, S. J., Dizon, A. E., Gearin, P. J., & Robertson, K. M. (2002). Small-scale population structure of east-ern North Pacific harbour porpoises (Phocoena pho-coena) indicated by molecular genetic analyses. Journal of Cetacean Research and Management, 4(2), 111-122.
Chivers, S. J., Hanson, B., Laake, J., Gearin, P., Muto, M. M., Calambokidis, J., . . . Hancock, B. (2007). Additional genetic evidence for population structure of Phocoena phocoena off the coasts of California, Oregon, and Washington (SWFSC Administrative Report LJ-07-08). La Jolla, CA: Southwest Fisheries Science Center.
Citta, J. J., Suydam, R. S., Quakenbush, L. T., Frost, K. J., & O’Corry-Crowe, G. M. (2013). Dive behavior of eastern Chukchi beluga whales (Delphinapterus leucas), 1998-2008. Arctic, 66(4), 389-406. http://dx.doi.org/10.14430/arctic4326
Citta, J. J., Quakenbush, L. T., George, J. C., Small, R. J., Heide-Jørgensen, M. P., Brower, H., . . . Brower, L. (2012). Winter movements of bowhead whales (Balaena mysticetus) in the Bering Sea. Arctic, 65(1), 13-34. http://dx.doi.org/10.14430/arctic4162
Clapham, P. J., & Mayo, C. A. (1987). Reproduction and recruitment of individually identified humpback whales, Megaptera novaeangliae, observed in Massachusetts Bay, 1979-1985. Canadian Journal of Zoology, 65(12), 2853-2863. http://dx.doi.org/10.1139/z87-434
Clapham, P. J., & Mayo, C. A. (1990). Reproduction of humpback whales (Megaptera novaeangliae) observed in the Gulf of Maine. Reports of the International Whaling Commission, Special Issue 12, 171-175.
Clapham, P. J., & Seipt, I. E. (1991). Resightings of inde-pendent fin whales, Balaenoptera physalus, on maternal summer ranges. Journal of Mammalogy, 72(4), 788-790. http://dx.doi.org/10.2307/1381844
Clapham, P. J., Good, C., Quinn, S. E., Reeves, R. R., Scarff, J. E., & Brownell, R. L., Jr. (2004). Distribution of North Pacific right whales (Eubalaena japonica) as shown by 19th and 20th century whaling catch and sighting records. Journal of Cetacean Research Management, 6(1), 1-6.
Clapham, P. J., Kennedy, A. S., Rone, B. K., Berchok, C. L., Crance, J. L., & Zerbini, A. N. (2012). North Pacific right whales (Eubalaena japonica) in the southeastern

Literature Cited 111
Bering Sea (Final Report, OCS Study BOEM 2012-074). Seattle, WA: National Marine Mammal Laboratory, Alaska Fisheries Science Center, National Oceanic and Atmospheric Administration.
Clapham, P. J., Baraff, L. S., Carlson, C. A., Christian, M. A., Mattila, D. K., Mayo, C. A., . . . Pittman, S. (1993). Seasonal occurrence and annual return of humpback whales, Megaptera novaeangliae, in the southern Gulf of Maine. Canadian Journal of Zoology, 71(2), 440-443. http://dx.doi.org/10.1139/z93-063
Clark, C. W. (1995). Application of U.S. Navy underwa-ter hydrophone arrays for scientific research on whales. Reports of the International Whaling Commission, 45, 210-212.
Clark, C. W., Ellison, W. T., & Beeman, K. (1986). A preliminary account of the acoustic study conducted during the 1985 spring bowhead whale, Balaena mys-ticetus, migration off Point Barrow, AK. Reports of the International Whaling Commission, 36, 311-317.
Clark, C. W., Ellison, W. T., Southall, B. L., Hatch, L., Van Parijs, S. M., Frankel, A., & Ponirakis, D. (2009). Acoustic masking in marine ecosystems: Intuitions, analysis, and implication (“Acoustics in marine ecology” Theme Section). Marine Ecology Progress Series, 395, 201-222. http://dx.doi.org/10.3354/meps08402
Clarke, J. T., & Ferguson, M. C. (2010a). Aerial surveys for bowhead whales in the Alaskan Beaufort Sea: BWASP update 2000-2009 with comparisons to histori-cal data (IWC Paper SC/62/BRG14). Presented at the 2010 Annual Meeting of the IWC Scientific Committee, Agadir, Morocco.
Clarke, J. T., & Ferguson, M. C. (2010b). Aerial surveys of large whales in the northeastern Chukchi Sea, 2008-2009, with review of 1982-91 data (IWC Paper SC/62/BRG13). Presented at the 2010 Annual Meeting of the IWC Scientific Committee, Agadir, Morocco.
Clarke, J. T., & Moore, S. E. (2002). A note on observations of gray whales in the southern Chukchi and northern Bering Seas, August-November, 1980-89. Journal of Cetacean Research Management, 4(3), 283-288.
Clarke, J. T., Moore, S. E., & Johnson, M. M. (1993). Observations on beluga fall migration in the Alaskan Beaufort Sea, 1982-87, and northeastern Chukchi Sea, 1982-91. Reports of the International Whaling Commission, 43, 387-396.
Clarke, J. T., Moore, S. E., & Ljungblad, D. K. (1987). Observations of bowhead whale (Balaena mysticetus) calves in the Alaskan Beaufort Sea during the autumn migration, 1982-85. Reports of the International Whaling Commission, 37, 287-293.
Clarke, J. T., Moore, S. E., & Ljungblad, D. K. (1989). Observations on gray whale (Eschrichtius robustus) uti-lization patterns in the northeastern Chukchi Sea, July-October 1982-87. Canadian Journal of Zoology, 67, 2646-2654. http://dx.doi.org/10.1139/z89-374
Clarke, J. T., Brower, A. A., Christman, C. L., & Ferguson, M. C. (2014). Distribution and relative abundance of marine mammals in the northeastern Chukchi and
western Beaufort Seas, 2013 (Annual Report, OCS Study BOEM 2014-018). Seattle, WA: National Marine Mammal Laboratory, Alaska Fisheries Science Center, National Marine Fisheries Service, National Oceanic and Atmospheric Administration.
Clarke, J. T., Christman, C. L., Brower, A. A., & Ferguson, M. C. (2012). Distribution and relative abundance of marine mammals in the Alaskan Chukchi and Beaufort Seas, 2011 (Annual Report, OCS Study BOEM 2012-009). Seattle, WA: National Marine Mammal Laboratory, Alaska Fisheries Science Center, National Marine Fisheries Service, National Oceanic and Atmospheric Administration.
Clarke, J. T., Christman, C. L., Brower, A. A., & Ferguson, M. C. (2013a). Distribution and relative abundance of marine mammals in the northeastern Chukchi and west-ern Beaufort seas, 2012 (Annual Report, OCS Study BOEM 2013-0017). Seattle, WA: National Marine Mammal Laboratory, Alaska Fisheries Science Center, National Marine Fisheries Service, National Oceanic and Atmospheric Administration.
Clarke, J. T., Christman, C. L., Ferguson, M. C., & Grassia, S. L. (2011a). Aerial surveys of endangered whales in the Beaufort Sea, fall 2006-2008 (OCS Study BOEMRE 2010-042). Report from National Marine Mammal Laboratory, Alaska Fisheries Science Center, National Marine Fisheries Service, National Oceanic and Atmospheric Administration for U.S. Bureau of Ocean Energy Management, Regulation and Enforcement.
Clarke, J. T., Ferguson, M. C., Curtice, C., & Harrison, J. (2015). 8. Biologically Important Areas for cetaceans within U.S. waters – Arctic region. In S. M. Van Parijs, C. Curtice, & M. C. Ferguson (Eds.), Biologically Important Areas for cetaceans within U.S. waters (pp. 94-103). Aquatic Mammals (Special Issue), 41(1). 128 pp.
Clarke, J. T., Christman, C. L., Brower, A. A., Ferguson, M. C., & Grassia, S. L. (2011b). Aerial surveys of endan-gered whales in the Beaufort Sea, fall 2010 (Annual Report, OCS Study BOEMRE 2011-035). Seattle, WA: National Marine Mammal Laboratory.
Clarke, J. T., Ferguson, M. C., Christman, C. L., Grassia, S. L., Brower, A. A., & Morse, L. J. (2011c). Chukchi offshore monitoring in drilling area (COMIDA) distribu-tion and relative abundance of marine mammals: Aerial surveys (Final Report, OCA Study BOEMRE 2011-06). Seattle, WA: National Marine Mammal Laboratory.
Clarke, J. T., Stafford, K., Moore, S. E., Rone, B., Aerts, L., & Crance, J. (2013b). Subarctic cetaceans in the south-ern Chukchi Sea: Evidence of recovery or response to a changing ecosystem. Oceanography, 26(4), 136-149. http://dx.doi.org/10.5670/oceanog.2013.81
Coachman, L. K. (1986). Circulation, water masses, and fluxes on the southeastern Bering Sea shelf. Continental Shelf Research, 5, 23-108. http://dx.doi.org/10.1016/0278-4343(86)90011-7
Cole, T. V. N., Hamilton, P., Henry, A. G., Duley, P., Pace III, R. M., White, B. N., & Frasier, T. (2013). Evidence

112 Literature Cited
of a North Atlantic right whale Eubalaena glacialis mating ground. Endangered Species Research, 21(1), 55-64. http://dx.doi.org/10.3354/esr00507
Committee on Taxonomy. (2014). List of marine mammal species and subspecies (Society for Marine Mammalogy). Retrieved 2 February 2015 from www.marinemammalscience.org.
Conn, P. B., Gorgone, A. M., Jugovich, A. R., Byrd, B. L., & Hansen, L. J. (2011). Accounting for transients when estimating abundance of bottlenose dolphins in Choctawhatchee Bay, Florida. The Journal of Wildlife Management, 75(3), 569-579. http://dx.doi.org/10.1002/jwmg.94
Convention on Biological Diversity (CBD). (2008). Report of the Conference of the Parties to the Convention on Biological Diversity (UNEP/CBD/COP/9/29). Convention on Biological Diversity on the Work of its Ninth Meeting. Bonn. Retrieved 2 February 2015 from www.cbd.int/doc/meetings/cop/cop-09/official/cop-09-29-en.pdf.
CBD. (2009). Azores scientific criteria and guidance for identifying ecologically or biologically significant marine areas and designing representative networks of marine protected areas in open ocean waters and deep sea habitats. Retrieved 2 February 2015 from https://www.cbd.int/doc/meetings/mar/ebsaws-2014-01/other/ebsaws-2014-01-azores-brochure-en.pdf.
CBD. (2010). Report of the Tenth Meeting of the Conference of the Parties to the Convention on Biological Diversity (UNEP/CBD/COP/10/27). Convention on Biological Diversity, Nagoya, Japan. Retrieved 2 February 2015 from www.cbd.int/doc/meetings/cop/cop-10/official/cop-10-27-en.pdf.
Cooke, J. G., Weller, D. W., Bradford, A. L., Burdin, A. M., & Brownell, R. L., Jr. (2008). Population assessment of western gray whales in 2008 (Paper SC/60/BRG11). Presented to the International Whaling Commission Scientific Committee.
Cooney, R. T., & Coyle, K. O. (1982). Trophic implications of cross-shelf copepod distributions in the south-eastern Bering Sea. Marine Biology, 70, 187-196. http://dx.doi.org/10.1007/BF00397684
Corrigan, C. M., Ardron, J. A., Comeros-Raynal, M. T., Hoyt, E., Notarbartolo di Sciara, G., & Carpenter, K. (2014). Developing Important Marine Mammal Area criteria: Learning from Ecologically or Biologically Significant Areas and Key Biodiversity Areas. Aquatic Conservation: Marine and Freshwater Ecosystems, 24(Supp. 2), 166-183. http://dx.doi.org/10.1002/aqc.2513
Cortese, N. A. (2000). Delineation of bottlenose dolphin populations in the western Atlantic Ocean using stable isotopes (Master’s dissertation). University of Virginia, Charlottesville.
Courbis, S. S., Baird, R. W., Cipriano, F., & Duffield, D. (2014). Multiple populations of pantropical spotted dolphins in Hawaiian waters. Journal of Heredity, 105, 627-641. http://dx.doi.org/10.1093/jhered/esu046
Coyle, K. O., Bluhm, B., Konar, B., Blanchard, A., & Highsmith, R. C. (2007). Amphipod prey of gray whales
in the northern Bering Sea: Comparison of biomass and distribution between 1980s and 2002-2003. Deep-Sea Research Part II, 54, 2906-2918. http://dx.doi.org/10. 1016/j.dsr2.2007.08.026
Craig, A. S., & Herman, L. M. (2000). Habitat preferences of female humpback whales Megaptera novaeangliae in the Hawaiian Islands are associated with reproductive status. Marine Ecology Progress Series, 193, 209-216. http://dx.doi.org/10.3354/meps193209
Croll, D. A., Marinovic, B., Benson, S., Chavez, F. P., Black, N., Ternullo, R., & Tershy, B. R. (2005). From wind to whales: Trophic links in a coastal upwelling system. Marine Ecology Progress Series, 289, 117-130. http://dx.doi.org/10.3354/meps289117
Dahlheim, M. E., White, P. A., & Waite, J. M. (2009). Cetaceans of Southeast Alaska: Distribution and sea-sonal occurrence. Journal of Biogeography, 36, 410-426. http://dx.doi.org/10.1111/j.1365-2699.2008.02007.x
Daily, M. D., Reish, D. J., & Anderson, J. A. (1993). Ecology of Southern California Bight: A synthesis and interpretation. Berkeley: University of California Press.
Darling, J. D., & Jurasz, C. M. (1983). Migratory destinations of North Pacific humpback whales (Megaptera novaean-gliae). In R. Payne (Ed.), Communication and behavior of whales (pp. 359-368). Boulder, CO: Westview Press.
Darling, J. D., & McSweeney, D. J. (1985). Observations on the migrations of North Pacific humpback whales (Megaptera novaeangliae). Canadian Journal of Zoology, 63, 308-314. http://dx.doi.org/10.1139/z85-047
Delarue, J., Laurinolli, M., & Martin, B. (2011). Acoustic detections of beluga whales in the northeastern Chukchi Sea, July 2007 to July 2008. Arctic, 64(1), 15-24. http://dx.doi.org/10.14430/arctic4076
DeMaster, D. P., Lowry, L. F., Frost, K. J., & Bengtson, R. A. (2001). The effect of sea state on estimates of abundance for beluga whales (Delphinapterus leucas) in Norton Sound, Alaska. Fishery Bulletin, U.S., 99, 197-201.
Department of Fisheries and Oceans. (2000). Eastern Beaufort Sea beluga whales (Stock Status Report E5-38).
Department of Navy. (2011). Marine species monitor-ing for the U.S. Navy’s Atlantic Fleet Active Sonar Training (AFAST) – Annual report 2010. Norfolk, VA: Department of Navy, U.S.Fleet Forces Command.
Donovan, G. P. (1991). A review of IWC stock boundar-ies. Reports of the International Whaling Commission, Special Issue 13, 39-68.
Douglas, A. B., Calambokidis, J., Munger, L. M., Soldevilla, M. S., Ferguson, M. C., Havron, A. M., . . . Hildebrand, J. A. (2014). Seasonal distribution and abundance of ceta-ceans off southern California estimated from CalCOFI cruise data from 2004 to 2008. Fishery Bulletin, 112, 197-220.
Duffield, D. A., & Wells, R. S. (1986). Population structure of bottlenose dolphins: Genetic studies of bottlenose dol-phins along the central west coast of Florida (Contract Report to National Marine Fisheries Service, Southeast Fisheries Center, Contract No. 45-WCNF-5-00366:16).
Literature Cited 113
Ellison, W. T., Southall, B. L., Clark, C. W., & Frankel, A. (2012). A new context-based paradigm to assess behavioral responses of marine mammals to sound. Conservation Biology, 26, 21-28. http://dx.doi.org/ 10.1111/j.1523-1739.2011.01803.x
Engleby, L., Read, A. J., Waples, D. M., & Torres, L. G. (2002). Habitat use of bottlenose dolphins (Tursiops truncatus) in Florida Bay (Final Report to the Southeast Fisheries Science Center, National Marine Fisheries Service).
Falcone, E. A., Diehl, B., Douglas, A. B., & Calambokidis, J. (2011a). Photo-identification of fin whales (Balaeanoptera physalus) along the U.S. West Coast, Baja California, and Canada (Final Report for Order number JFI 3F09SE 516). La Jolla, CA: Southwest Fisheries Science Center.
Falcone, E. A., Schorr, G. S., Diehl, B., Douglas, A. B., Calambokidis, J., Barlow, J., . . . Andrews, R. D. (2011b). The wayward ways of the white-jawed whale: Following fin whales (Balaenoptera physalus) along the U.S. West Coast with photo-identification and satellite telemetry. Proceedings of the 19th Biennial Conference on the Biology of Marine Mammals, Tampa, FL.
Ferguson, M. C., Curtice, C., & Harrison, J. (2015a). 6. Biologically Important Areas for cetaceans within U.S. waters – Gulf of Alaska region. In S. M. Van Parijs, C. Curtice, & M. C. Ferguson (Eds.), Biologically Important Areas for cetaceans within U.S. waters (pp. 65-78). Aquatic Mammals (Special Issue), 41(1). 128 pp.
Ferguson, M. C., Harrison, J., & Van Parijs, S. M. (2015b). 1. Biologically Important Areas for ceta-ceans within U.S. waters – Overview and rationale. In S. M. Van Parijs, C. Curtice, & M. C. Ferguson (Eds.), Biologically Important Areas for cetaceans within U.S. waters (pp. 2-16). Aquatic Mammals (Special Issue), 41(1). 128 pp.
Ferguson, M. C., Waite, J. M., Curtice, C., Clarke, J. T., & Harrison, J. (2015c). 7. Biologically Important Areas for cetaceans within U.S. waters – Aleutian Islands and Bering Sea region. In S. M. Van Parijs, C. Curtice, & M. C. Ferguson (Eds.), Biologically Important Areas for cetaceans within U.S. waters (pp. 79-93). Aquatic Mammals (Special Issue), 41(1). 128 pp.
Fertl, D. (1994). Occurrence patterns and behavior of bot-tlenose dolphins (Tursiops truncatus) in the Galveston ship channel, Texas. Texas Journal of Science, 46(4), 299-318.
Foley, H. J., Holt, R. C., Hardee, R. E., Nilsson, P. B., Jackson, K. A., Read, A. J., . . . McLellan, W. A. (2011). Observations of a western North Atlantic right whale (Eubalaena gla-cialis) birth offshore of the protected southeast U.S. criti-cal habitat. Marine Mammal Science, 27(3), E234-E240. http://dx.doi.org/10.1111/j.1748-7692.2010.00452.x
Forney, K. A. (1995). A decline in the abundance of harbor porpoise, Phocoena phocoena, in nearshore waters off California, 1986-93. Fishery Bulletin, 93, 741-748.
Forney, K. A. (1999). The abundance of California harbor porpoise estimated from 1993-97 aerial line transect
surveys (Administrative Report LJ-99-02). La Jolla, CA: Southwest Fisheries Science Center.
Forney, K. A., & Barlow, J. (1998). Seasonal patterns in the abundance and distribution of California cetaceans, 1991-1992. Marine Mammal Science, 14(3), 460-489. http://dx.doi.org/10.1111/j.1748-7692.1998.tb00737.x
Forney, K. A., Hanan, D. A., & Barlow, J. (1991). Detecting trends in harbor porpoise abundance from aerial surveys using analysis of covariance. Fishery Bulletin, 89, 367-377.
Forney, K. A., Ferguson, M. C., Becker, E. A., Fiedler, P. C., Redfern, J. V., Barlow, J., . . . Balance, L. T. (2012). Habitat-based spatial models of cetacean density in the eastern Pacific Ocean. Endangered Species Research, 16, 113-133. http://dx.doi.org/10.3354/esr00393
Frankel, A. S., Clark, C. W., Herman, L. M., & Gabriele, C. M. (1995). Spatial distribution, habitat utilization, and social interactions of humpback whales, Megaptera novaeangliae, off Hawaii, determined using acoustic and visual techniques. Canadian Journal of Zoology, 73, 1134-1146.
Frasier, T., Koroscil, S., White, B., & Darling, J. (2011). Assessment of population structure in relation to summer feeding ground use in the eastern North Pacific gray whale. Endangered Species Research, 14, 39-48. http://dx.doi.org/10.3354/esr00340
Friday, N. A., Waite, J. M., Zerbini, A. N., & Moore, S. E. (2012). Cetacean distribution and abundance in relation to oceanographic domains on the eastern Bering Sea shelf: 1999-2004. Deep-Sea Research Part II, 65-70, 260-272.
Friday, N. A., Zerbini, A. N., Waite, J. M., Moore, S. E., & Clapham, P. J. (2013). Cetacean distribution and abundance in relation to oceanographic domains on the eastern Bering Sea shelf, June and July of 2002, 2008, and 2010. Deep-Sea Research Part II, 94, 244-256. http://dx.doi.org/10.1016/j.dsr2.2013.03.011
Friedlaender, A. S., Goldbogen, J. A., Hazen, E. L., Calambokidis, J., & Southall, B. L. (2014). Feeding per-formance of sympatric blue and fin whales exploiting a common prey resource. Marine Mammal Science, 31(1), 345-354. http://dx.doi.org/10.1111/mms.12134
Friedlaender, A. S., Hazen, E. L., Nowacek, D. P., Halpin, P. N., Ware, C., Weinrich, M. T., . . . Wiley, D. (2009). Diel changes in humpback whale Megaptera novae-angliae feeding behavior in response to sand lance Ammodytes spp. behavior and distribution. Marine Ecology Progress Series, 395, 91-100. http://dx.doi.org/10.3354/meps08003
Frost, K. J., & Lowry, L. F. (1990). Distribution, abundance and movements of beluga whales, Delphinapterus leucas, in coastal waters of western Alaska. In T. G. Smith, D. J. St. Aubin, & J. R. Geraci (Eds.), Advances in research on the beluga whale, Delphinapterus leucas (pp. 39-57). Canadian Bulletin of Fisheries and Aquatic Sciences, 224.
Frost, K. J., Lowry, L. F., & Carroll, G. (1993). Beluga whale and spotted seal use of a coastal lagoon system in

114 Literature Cited
the northeastern Chukchi Sea. Arctic, 46(1), 8-16. http://dx.doi.org/10.14430/arctic1316
Frost, K. J., Lowry, L. F., & Nelson, R. R. (1984). Beluga whale studies in Bristol Bay, Alaska. In Proceedings of the Workshop on Biological Interactions Among Marine Mammals and Commercial Fisheries in the Southeastern Bering Sea (University of Alaska Sea Grant Report 84-1, pp. 187-200).
Fulling, G. L., Mullin, K. D., & Hubard, C. W. (2003). Abundance and distribution of cetaceans in outer continental shelf waters of the U.S. Gulf of Mexico. Fishery Bulletin, 101(4), 923-932.
Gabriele, C. M., Straley, J. M., Herman, L. M., & Coleman, R. J. (1996). Fastest documented migration of a North Pacific humpback whale. Marine Mammal Science, 12(3), 457-464. http://dx.doi.org/10.1111/j.1748-7692. 1996.tb00599.x
Gambell, R. (1976). World whale stocks. Mammal Review, 6, 41-53. http://dx.doi.org/10.1111/j.1365-2907.1976.tb00200.x
Gambell, R. (1979). The blue whale. Biologist, 26, 209-215.
Garland, E. C., Berchok, C. L., & Castellote, M. (2015). Temporal peaks in beluga whale (Delphinapterus leucas) acoustic detections in the northern Bering, northeastern Chukchi, and western Beaufort Seas: 2010-2011. Polar Biology. http://dx.doi.org/10.1007/s00300-014-1636-1.
Gaskin, D. E. (1977). Harbour porpoise, Phocoena pho-coena (L.), in the western approaches to the Bay of Fundy 1969-75. Reports of the International Whaling Commission, 27, 487-492.
Gaskin, D. E. (1984). The harbour porpoise Phocoena phocoena (L.): Regional populations, status, and information on direct and indirect catches. Reports of the International Whaling Commission, 34, 569-586.
Gaskin, D. E. (1992). Status of the harbour porpoise, Phocoena phocoena, in Canada. Canadian Field-Naturalist. Ottawa ON, 106(1), 36-54.
Geo-Marine, Inc. (GMI). (2010). Ocean/wind power eco-logical baseline studies, January 2008 – December 2009 (Final Report). Trenton, NJ: Department of Environmental Protection, Office of Science. Retrieved 5 January 2015 from www.nj.gov/dep/dsr/ocean-wind/report.htm.
George, J. C., Clark, C., Carroll, G. M., & Ellison, W. T. (1989). Observations on the ice-breaking behavior of migrating bowhead whales (Balaena mysticetus) near Point Barrow, Alaska, spring 1985. Arctic, 42(1), 24-30. http://dx.doi.org/10.14430/arctic1636
George, J. C., Zeh, J., Suydam, R., & Clark, C. (2004). Abundance and population trend (1978-2001) of western Arctic bowhead whales surveyed near Barrow, Alaska. Marine Mammal Science, 20(4), 755-773. http://dx.doi.org/10.1111/j.1748-7692.2004.tb01191.x
Gill, R. E., & Hall, J. D. (1983). Use of nearshore and estua-rine areas of the southeastern Bering Sea by gray whales (Eschrichtius robustus). Arctic, 38(3), 275-281.
Goddard, P. D., & Rugh, D. J. (1998). A group of right whales seen in the Bering Sea in July 1996. Marine Mammal Science, 14, 344-349. http://dx.doi.org/10.1111/j.1748-7692.1998.tb00725.x
Goetz, K. T., Rugh, D. J., & Mocklin, J. A. (2008). Aerial surveys of bowhead whales in the vicinity of Barrow, Alaska, August-September 2007. In Bowhead Whale Feeding Ecology Study (BOWFEST) in the western Beaufort Sea, 2007 annual report (pp. 2-26). Seattle, WA: National Marine Mammal Laboratory.
Goetz, K., Rugh, D., & Mocklin, J. (2009). Aerial surveys of bowhead whales in the vicinity of Barrow, Alaska, August-September 2008. In Bowhead Whale Feeding Ecology Study (BOWFEST) in the western Beaufort Sea, 2008 annual report (pp. 4-26). Seattle, WA: National Marine Mammal Laboratory.
Goetz, K., Rugh, D., & Mocklin, J. (2010). Aerial surveys of bowhead whales in the vicinity of Barrow, Alaska August-September 2009. In Bowhead Whale Feeding Ecology Study (BOWFEST) in the western Beaufort Sea, 2009 annual report (pp. 4-21). Seattle, WA: National Marine Mammal Laboratory.
Goetz, K. T., Rugh, D. J., Read, A. J., & Hobbs, R. C. (2007). Habitat use in a marine ecosystem: Beluga whales Delphinapterus leucas in Cook Inlet, Alaska. Marine Ecology Progress Series, 330, 247-256. http://dx.doi.org/10.3354/meps330247
Goetz, K., Rugh, D., Vate Brattström, L., & Mocklin, J. (2011). Aerial surveys of bowhead whales near Barrow Alaska in late summer 2010. In Bowhead Whale Feeding Ecology Study (BOWFEST) in the western Beaufort Sea, 2010 annual report (pp. 2-19). Seattle, WA: National Marine Mammal Laboratory.
Goetz, K. T., Montgomery, R. A., Ver Hoef, J. M., Hobbs, R. C., & Johnson, D. S. (2012a). Identifying essential summer habitat of the endangered beluga whale Delphinapterus leucas in Cook Inlet, Alaska. Endangered Species Research, 16, 135-147. http://dx.doi.org/10.3354/esr00394
Goetz, K. T., Robinson, P. W., Hobbs, R. C., Laidre, K. L., Huckstadt, L. A., & Shelden, K. E. W. (2012b). Movement and dive behavior of belugas (Delphinapterus leucas) in Cook Inlet, Alaska (AFSC Processed Report 2012-03). Seattle, WA: Alaska Fisheries Science Center, National Marine Fisheries Service, National Oceanic and Atmospheric Administration.
Goldbogen, J. A., Calambokidis, J., Shadwick, R. E., Oleson, E. M., & McDonald, M. A. (2006). Kinematics of diving and lunge-feeding in fin whales. Journal of Experimental Biology, 209, 1231-1244. http://dx.doi.org/10.1242/jeb.02135
Goldbogen, J. A., Calambokidis, J., Croll, D. A., Harvey, J. T., Newton, K. M., Oleson, E. M., . . . Shadwick, R. E. (2008). Foraging behavior of humpback whales: Kinematic and respiratory patterns suggest a high cost for a lunge. Journal of Experimental Biology, 211, 3712-3719. http://dx.doi.org/10.1242/jeb.023366

Literature Cited 115
Goldbogen, J. A., Calambokidis, J., Croll, D. A., McKenna, M. F., Oleson, E., Potvin, . . . Tershy, B. R. (2012). Scaling of lunge-feeding performance in rorqual whales: Mass-specific energy expenditure increases with body size and progressively limits diving capacity. Functional Ecology, 26(1), 216-226.
Goldbogen, J. A., Southall, B. L., DeRuiter, S. L., Calambokidis, J., Friedlaender, A. S., Hazen, E. L., . . . Tyack, P. L. (2013). Blue whales respond to simulated mid-frequency military sonar. Proceedings of the Royal Society of London. Series B: Biological Sciences, 280, http://dx.doi.org/10.1098/rspb.2013.0657
Good, C. P. (2008). Spatial ecology of the North Atlantic right whale (Eubalaena glacialis) (Doctoral dissertation). Duke University, Durham, North Carolina. Retrieved 5 January 2015 from hdl.handle.net/10161/588.
Gorgone, A. M., Baird, R. W., Webster, D. L., Schorr, G. S., McSweeney, D. J., & Cullins, T. (2013). Satellite-tagging and photo-ID provide further evidence of multiple island-associated populations of common bot-tlenose dolphins in the main Hawaiian Islands. Talk pre-sented at the 20th Biennial Conference on the Biology of Marine Mammals, Dunedin, New Zealand.
Gosho, M., Gearin, P., Jenkinson, R., Laake, J., Mazzuca, L., Kubiak, D., . . . Deecke, V. (2011). Movements and diet of gray whales (Eschrichtius robustus) off Kodiak Island, Alaska, 2002-2005 (Paper SC/M11/AWMP2). Presented to the International Whaling Commission Scientific Committee.
Grebmeier, J. M., Overland, J. E., Moore, S. E., Farley, E. V., Carmack, E. C., Cooper, L. W., . . . McNutt, S. L. (2006). A major ecosystem shift in the northern Bering Sea. Science, 311, 1461-1464. http://dx.doi.org/10.1126/science.1121365
Gregr, E. J., & Coyle, K. O. (2009). The biogeography of the North Pacific right whale (Eubalaena japonica). Progress in Oceanography, 80, 188-198. http://dx.doi.org/10.1016/j.pocean.2008.12.004
Gubbins, C. (2002a). Association patterns of resident bottlenose dolphins (Tursiops truncatus) in a South Carolina estuary. Aquatic Mammals, 28(1), 24-31.
Gubbins, C. (2002b). The dolphins of Hilton Head: Their natural history. Columbia: University of South Carolina Press.
Gubbins, C. (2002c). Use of home ranges by resident bottle-nose dolphins (Tursiops truncatus) in a South Carolina estuary. Journal of Mammalogy, 83(1), 178-187. http://dx.doi.org/10.1644/1545-1542(2002)083<0178:UOHRBR>2.0.CO;2; http://dx.doi.org/10.1093/jmammal/83.1. 178
Hain, J. H., Hyman, M. A., Kenney, R. D., & Winn, H. E. (1985). The role of cetaceans in the shelf-edge region of the northeastern United States. Marine Fisheries Review, 47(1), 13-17.
Hain, J. H., Ratnaswamy, M. J., Kenney, R. D., & Winn, H. E. (1992). The fin whale, Balaenoptera physalus, in waters of the northeastern United States continental
shelf. Reports of the International Whaling Commission, 42, 653-669.
Hamilton, P. K., & Mayo, C. A. (1990). Population charac-teristics of right whales (Eubalaena glacialis) observed in Cape Cod and Massachusetts Bays, 1978-1986. Reports of the International Whaling Commission, Special 12, 203-208.
Hannay, D. E., Delarue, J., Mouy, X., Martin, B. S., Leary, D., Oswald, J. N., & Vallarta, J. (2013). Marine mammal acoustic detections in the northeastern Chukchi Sea, September 2007-July 2011. Continental Shelf Research, 67, 127-146. http://dx.doi.org/10.1016/j.csr.2013.07.009
Hansen, D. J., & Hubbard, J. D. (1999). Distribution of Cook Inlet beluga whales (Delphinapterus leucas) in winter (Final Report OCS Study, MMS 99-0024). Anchorage: U.S. Department of the Interior, Mineral Management Service Alaska, OCS Region.
Hauser, D. W., Laidre, K. L., Suydam, R. S., & Richard, P. R. (2014). Population-specific home ranges and migration timing of Pacific Arctic beluga whales (Delphinapterus leucas). Polar Biology, 37, 1171-1183. http://dx.doi.org/10.1007/s00300-014-1510-1
Hazen, E. L., Friedlaender, A. S., Thompson, M. A., Ware, C. R., Weinrich, M. T., Halpin, P. N., & Wiley, D. N. (2009). Fine-scale prey aggregations and foraging ecol-ogy of humpback whales Megaptera novaeangliae. Marine Ecology Progress Series, 395, 75-89. http://dx.doi.org/10.3354/meps08108
Heide-Jørgensen, M. P., Laidre, K. L., Quakenbush, L. T., & Citta, J. J. (2011). The Northwest Passage opens for bowhead whales. Biology Letters, 8(2), 270-273. http://dx.doi.org/10.1098/rsbl.2011.0731
Henderson, E. E. (2004). Behavior, association patterns and habitat use of a small community of bottlenose dolphins in San Luis Pass, Texas (Master’s thesis). Texas A&M University, College Station. Retrieved 12 January 2015 from http://repository.tamu.edu/handle/1969.1/2807.
Hendrix, A. N., Straley, J., Gabriele, C. M., & Gende, S. M. (2012). Bayesian estimation of humpback whale (Megaptera novaeangliae) population abundance and movement patterns in southeastern Alaska. Canadian Journal of Fisheries and Aquatic Sciences, 69, 1783-1797. http://dx.doi.org/10.1139/f2012-101
Herman, L. M., Hancock, J. M., Forestell, P. H., & Antinoja, R. C. (1980). The 1976/77 migration of humpback whales into Hawaiian waters: Composite description (Marine Mammal Commission Report MMC-77/19). Washington, DC: Marine Mammal Commission.
Hobbs, R. C., Rugh, D. J., & DeMaster, D. P. (2000). Abundance of belugas, Delphinapterus leucas, in Cook Inlet, Alaska, 1994-2000. Marine Fisheries Review, 62(3), 37-45.
Hobbs, R. C., Sims, C. L., & Shelden, K. E. W. (2012a). Estimated abundance of belugas in Cook Inlet, Alaska, from aerial surveys conducted in June 2012. Seattle, WA: Alaska Fisheries Science Center, National Marine Mammal Laboratory.

116 Literature Cited
Hobbs, R. C., Laidre, K. L., Vos, D. J., Mahoney, B. A., & Eagleton, M. (2005). Movements and area use of belu-gas, Delphinapterus leucas, in a subarctic Alaskan estu-ary. Arctic, 58(4), 331-340.
Hobbs, R., Sims, C., Shelden, K., Vate Brattstrom, L., & Rugh, D. (2012b). Annual calf indices for beluga whales (Delphinapterus leucas) in Cook Inlet, Alaska 2006-2010 (AFSC Processed Report 2012-05). Seattle, WA: Alaska Fisheries Science Center, National Marine Mammal Laboratory.
Hodge, L. E. (2011). Monitoring marine mammals in Onslow Bay, North Carolina, using passive acoustics (Doctoral dissertation). Duke University, Durham, North Carolina. Retrieved 5 January 2015 from hdl.handle.net/10161/4988.
Hoelzel, A. R., Potter, C. W., & Best, P. B. (1998). Genetic differentiation between parapatric “nearshore” and “offshore” populations of the bottlenose dolphin. Proceedings of the Royal Society of London. Series B: Biological Sciences, 265(1402), 1177-1183. http://dx.doi.org/10.1098/rspb.1998.0416
Hooker, S. K., & Gerber, L. R. (2004). Marine reserves as a tool for ecosystem-based management: The potential importance of megafauna. BioScience, 54(1), 27-39. http://dx.doi.org/10.1641/0006-3568(2004)054[0027: MRAATF]2.0.CO;2
Hoyt, E., & Notarbartolo di Sciara, G. (Eds.). (2014). Report of the Workshop for the Development of Important Marine Mammal Area (IMMA) Criteria. IUCN Marine Mammal Protected Areas Task Force and International Committee on Marine Mammal Protected Areas, Marseille, France.
Hubard, C. W., Maze-Foley, K., Mullin, K. D., & Schroeder, W. W. (2004). Seasonal abundance and site fidelity of bottlenose dolphins (Tursiops truncatus) in Mississippi Sound. Aquatic Mammals, 30(2), 299-310. http://dx.doi.org/10.1578/AM.30.2.2004.299
Huntington, H. P. (2000). Traditional knowledge of the ecology of belugas, Delphinapterus leucas, in Cook Inlet, Alaska. Marine Fisheries Review, 62(3), 134-140.
Huntington, H. P., & the communities of Buckland, Elim, Koyuk, Point Lay, and Shaktoolik. (1999). Traditional knowledge on the ecology of beluga whales (Delphinapterus leucas) in the eastern Chukchi and northern Bering Seas, Alaska. Arctic, 52(1), 49-61.
International Union for Conservation of Nature (IUCN). (2012). Consolidating the standards for identifying sites that contribute significantly to the global persistence of biodiversity: The results of a framing workshop. Gland, Switzerland: IUCN.
IUCN. (2013a). Identifying sites that contribute significantly to the global persistence of biodiversity (Key Biodiversity Areas): Criteria and delineation technical workshop report. Gland, Switzerland: IUCN. Retrieved 11 February 2015 from https://cmsdata.iucn.org/downloads/criteria_and_delineation_workshop_report_final_28january2014.pdf.
IUCN. (2013b). Development of the standard for identifi-cation of sites contributing significantly to the global persistence of biodiversity (Key Biodiversity Areas): Recommendations from the Thresholds Workshop. Gland, Switzerland: IUCN.
International Whaling Commission (IWC). (2011a). Report of the Scientific Committee, Annex E and F. Report of the Sub-Committee on Bowhead, Right and Gray Whales, Tromso, Norway.
IWC. (2011b). Report of the 2011 AWMP workshop with a focus on eastern gray whales (Report SC/63/Rep.2). Presented to the International Whaling Commission Scientific Committee.
IWC. (2011c). Report of the Standing Working Group on the Aboriginal Whaling Management Procedure (AWMP) (Report of the Scientific Committee, Annex E). Journal of the Cetacean Research and Management (Supp.), 143-167.
Irvine, B., & Wells, R. S. (1972). Results of attempts to tag Atlantic bottlenosed dolphins (Tursiops truncatus). Cetology, 13, 1-5.
Irvine, A. B., Scott, M. D., Wells, R. S., & Kaufmann, J. H. (1981). Movements and activities of the Atlantic bottle-nose dolphin, Tursiops truncatus, near Sarasota, Florida. Fishery Bulletin, 79(4), 671-688.
Irvine, L., Mate, B., Winsor, M., Palacios, D. M., Bograd, S. J., Costa, D. P., & Bailey, H. (2014). Spatial and temporal occurrence of blue whales off the U.S. West Coast, with implications for management. PLOS ONE, 9(7). http://dx.doi.org/10.1371/journal.pone.0102959
Irwin, L. J., & Würsig, B. (2004). A small resident com-munity of bottlenose dolphins, Tursiops truncatus, in Texas: Monitoring recommendations. Gulf of Mexico Science.
Ivashchenko, Y. V., & Clapham, P. (2010). Bowhead whales Balaena mysticetus in the Okhotsk Sea. Mammal Review, 40(1), 65-89. http://dx.doi.org/10.1111/j.1365-2907.2009.00152.x
Ivashchenko, Y. V., & Clapham, P. J. (2012). Soviet catches of bowhead (Balaena mysticetus) and right whales (Eubalaena japonica) in the North Pacific and Okhotsk Sea. Endangered Species Research, 18, 201-217. http://dx.doi.org/10.3354/esr00443
Ivashchenko, Y. V., Brownell, R. L., Jr., & Clapham, P. J. (2013). Soviet whaling in the North Pacific: Revised catch totals. Journal of Cetacean Research Management, 13, 59-71.
Jefferson, T. A., & Schiro, A. J. (1997). Distribution of ceta-ceans in the offshore Gulf of Mexico. Mammal Review, 27(1), 27-50. http://dx.doi.org/10.1111/j.1365-2907.1997.tb00371.x
Johnston, D. W., Chapla, M. E., Williams, L. E., & Mattila, D. K. (2007). Identification of humpback whale Megaptera novaeangliae wintering habitat in the Northwestern Hawaiian Islands using spatial habitat modeling. Endangered Species Research, 3, 249-257.
Jonsgård, A., & Darling, K. (1977). On the biology of the Eastern North Atlantic sei whale, Balaenoptera

Literature Cited 117
borealis Lesson. Reports of the International Whaling Commission, Special Issue 1, 124-129.
Kaschner, K., Quick, N. J., Jewell, R., Williams, R., & Harris, C. M. (2012). Global coverage of cetacean line-transect surveys: Status quo, data gaps and future challenges. PLOS ONE, 7(9), e44075. http://dx.doi.org/10.1371/journal.pone.0044075
Katona, S. K., & Beard, J. A. (1990). Population size, migrations and feeding aggregations of the humpback whale (Megaptera novaeangliae) in the western North Atlantic Ocean. Reports of the International Whaling Commission, Special Issue 12, 295-305.
Keiper, C., Calambokidis, J., Ford, G., Casey, J., Miller, C., & Kieckhefer, T. R. (2011). Risk assessment of vessel traffic on endangered blue and humpback whales in the Gulf of the Farallones and Cordell Bank National Marine Sanctuaries. Bolinas, CA: Oikonos.
Keller, C. A., Garrison, L., Baumstark, R., Ward-Geiger, L. I., & Hines, E. (2012). Application of a habitat model to define calving habitat of the North Atlantic right whale in the southeastern United States. Endangered Species Research, 18(1), 73-87. http://dx.doi.org/10.3354/esr00413
Keller, C. A., Ward-Geiger, L. I., Brooks, W. B., Slay, C. K., Taylor, C. R., & Zoodsma, B. J. (2006). North Atlantic right whale distribution in relation to sea-surface temper-ature in the southeastern United States calving grounds. Marine Mammal Science, 22(2), 426-445. http://dx.doi.org/10.1111/j.1748-7692.2006.00033.x
Kennedy, A. S., Salden D. R., & Clapham P. J. (2011). First high- to low-latitude match of an eastern North Pacific right whale (Eubalaena japonica). Marine Mammal Science, 28(4), E539-E544. http://dx.doi.org/10.1111/j.1748-7692.2011.00539.x
Kennedy, A. S., Zerbini, A. N., Rone, B. K., & Clapham, P. J. (2014). Individual variation in movements of hump-back whales (Megaptera novaeangliae) satellite-tracked in the eastern Aleutian Islands and Bering Sea during summer. Endangered Species Research, 23, 187-195. http://dx.doi.org/10.3354/esr00570
Kenney, R. D., & Winn, H. E. (1986). Cetacean high-use habitats of the northeast United States continental shelf. Fishery Bulletin, 84(2), 345-357.
Kenney, R. D., Mayo, C. A., & Winn, H. E. (2001). Migration and foraging strategies at varying spatial scales in western North Atlantic right whales: A review of hypotheses. Journal of Cetacean Research and Management, 2, 251-260.
Kenney, R. D., Winn, H. E., & Macaulay, M. C. (1995). Cetaceans in the Great South Channel, 1979-1989: Right whale (Eubalaena glacialis). Continental Shelf Research, 15(4-5), 385-414. http://dx.doi.org/10.1016/0278-4343(94)00053-P
Kenney, R. D., Payne, P. M., Heinemann, D. W., & Winn, H. E. (1996). Shifts in Northeast Shelf cetacean distribu-tions relative to trends in Gulf of Maine/Georges Bank finfish abundance. In K. Sherman, N. A. Jaworski, & T. J. Smayda (Eds.), The Northeast Shelf ecosystem: Assessment, sustainability, and management (pp. 169-196). Cambridge, MA: Blackwell Science.
Kenney, R. D., Hyman, M. A. M., Owen, R. E., Scott, G. P., & Winn, H. E. (1986). Estimation of prey den-sities required by western North Atlantic right whales. Marine Mammal Science, 2(1), 1-13. http://dx.doi.org/10.1111/j.1748-7692.1986.tb00024.x
Knowlton, A. R., Kraus, S. D., & Kenney, R. D. (1994). Reproduction in North Atlantic right whales (Eubalaena glacialis). Canadian Journal of Zoology, 72(7), 1297-1305. http://dx.doi.org/10.1139/z94-173
Knowlton, A. R., Ring, J. B., & Russell, B. (2002). Right whale sightings and survey effort in the Mid Atlantic Region: Migratory corridor, time frame, and proximity to port entrances. A report submitted to the NMFS Ship Strike Working Group.
Koski, W. R., Davis, R. A., Miller, G. W., & Withrow, D. E. (1993). Reproduction. In J. J. Burns, J. J. Montague, & C. J. Cowles (Eds.), The bowhead whale (Special Publication Number 2, pp. 409-489). Lawrence, KS: The Society for Marine Mammalogy.
Kot, C. Y., Fujioka, E., Hazen, L. J., Best, B., Read, A. J., & Halpin, P. N. (2010). Spatio-temporal gap analy-sis of OBIS-SEAMAP project data: Assessment and way forward. PLOS ONE, 5(9), e12990. http://dx.doi.org/10.1371/journal.pone.0012990
Kraus, S. D., Prescott, J. H., & Stone, G. S. (1983). Harbour porpoise, Phocoena phocoena, in the U.S. coastal waters of the Gulf of Maine: A survey to deter-mine seasonal distribution and abundance. Report to the Director, National Marine Fisheries Service, Northeast Region, Woods Hole, Massachusetts. 15 pp.
Krupnik, I. I., Bogoslovskaya, L. S., & Votrogov, L. M. (1983). Gray whaling off the Chukotka Peninsula: Past and present status. Reports of the International Whaling Commission, 33, 557-562.
Laake, J. L., Punt, A. E., Hobbs, R., Ferguson, M., Rugh, D., & Breiwick, J. (2012). Gray whale southbound migration surveys 1967-2006: An integrated re-analysis. Journal of Cetacean Research and Management, 12(3), 287-306.
LaBrecque, E., Curtice, C., Harrison, J., Van Parijs, S. M., & Halpin, P. N. (2015). 3. Biologically Important Areas for cetaceans within U.S. waters – Gulf of Mexico region. In S. M. Van Parijs, C. Curtice, & M. C. Ferguson (Eds.), Biologically Important Areas for cetaceans within U.S. waters (pp. 30-38). Aquatic Mammals (Special Issue), 41(1). 128 pp.
Laidre, K. L., Shelden, K. E., Rugh, D. J., & Mahoney, B. (2000). Beluga, Delphinapterus leucas, distribution and survey effort in the Gulf of Alaska. Marine Fisheries Review, 62(3), 27-36.
Laidre, K. L., Stirling, I., Lowry, L. F., Wiig, Ø., Heide-Jørgensen, M. P., & Ferguson, S. H. (2008). Quantifying the sensitivity of arctic marine mammals to climate-induced habitat change. Ecological Applications, 18(2) Supp., S97-S125. http://dx.doi.org/10.1890/06-0546.1
Lammers, M. O., Fisher-Pool, P. I., Au, W. L. L., Meyer, C. G., Wong, K. B., & Brainard, R. E. (2011). Humpback whale Megaptera novaeangliae song reveals wintering

118 Literature Cited
activity in the Northwestern Hawaiian Islands. Marine Ecological Progress Series, 423, 261-268. http://dx.doi.org/10.3354/meps08959
Lang, A. R. (2010). The population genetics of gray whales (Eschrichtius robustus) in the North Pacific (Ph.D. dis-sertation). University of California, San Diego.
Lang, A. R., Weller, D. W., LeDuc, R. G., Burdin, A. M., & Brownell, R. L., Jr. (2010). Genetic differentiation between western and eastern (Eschrichtius robustus) gray whale populations using microsatellite markers (Paper SC/62/BRG11). Presented to the International Whaling Commission Scientific Committee (Unpublished).
Lang, A. R., Calambokidis, J., Scordino, J., Pease, V. L., Klimek, A., Burkanov, V. N., . . . Taylor, B. L. (2014). Assessment of genetic structure among eastern North Pacific gray whales on their feeding grounds. Marine Mammal Science, 30(4), 1473-1493. http://dx.doi.org/ 10.1111/mms.12129
Lang, A. R., Taylor, B. L., Calambokidis, J. C., Pease, V. L., Klimek, A., Scordino, J., . . . Mate, B. (2011a). Assessment of stock structure among gray whales uti-lizing feeding grounds in the Eastern North Pacific (Report of the International Whaling Commission SC/M11/ AWMP4).
Lang, A. R., Weller, D. W., LeDuc, R., Burdin, A. M., Pease, V. L., Litovka, D., . . . Brownell, R. L., Jr. (2011b). Genetic analysis of stock structure and movements of gray whales in the eastern and western North Pacific (Paper SC/63/BRG10). Presented to the International Whaling Commission Scientific Committee.
LeDuc, R. G. (2004). Report of the results of the 2002 survey for North Pacific right whales (NOAA Technical Memorandum NMFS-SWFSC-357). Washington, DC: National Oceanic and Atmospheric Administration.
LeDuc, R. G., Perryman, W. L., Gilpatrick, J. W., Jr., Hyde, J., Stinchcomb, C., Carretta, J. V., & Brownell, R. L., Jr. (2001). A note on recent surveys for right whales in the southeastern Bering Sea. Journal of Cetacean Research and Management, Special Issue 2, 287-289.
LeDuc, R. G., Weller, D. W., Hyde, J., Burdin, A. M., Rosel, P. E., Brownell, R. L., Jr., . . . Dizon, A. E. (2002). Genetic differences between western and eastern gray whales (Eschrichtius robustus). Journal of Cetacean Research and Management, 4(1), 1-5.
Litz, J. A. (2007). Social structure, genetic structure, and persistent organohalogen pollutants in bottlenose dol-phins (Tursiops truncatus) in Biscayne Bay, Florida (Doctoral dissertation). University of Miami, Florida. Retrieved 5 January 2015 from scholarlyrepository.miami.edu/dissertations/2548.
Litz, J. A., Hughes, C. R., Garrison, L. P., Fieber, L. A., & Rosel, P. E. (2012). Genetic structure of common bottle-nose dolphins (Tursiops truncatus) inhabiting adjacent South Florida estuaries—Biscayne Bay and Florida Bay. Journal of Cetacean Research and Management, 12(1), 107-117.
Ljungblad, D. K. (1986). Endangered whale aerial surveys in the Navarin Basin and St. Matthew Hall Planning Areas,
Alaska. In D. K. Ljungblad, S. E. Moore, J. T. Clarke, & J. C. Bennett (Eds.), Aerial surveys of endangered whales in the northern Bering, eastern Chukchi, and Alaskan Beaufort seas, 1985: With a seven year review, 1979-1985 (Naval Ocean Systems Center Technical Report 1111, Appendix E, pp. E-1–E-50).
Ljungblad, D. K., Moore, S. E., Clarke, J. T., & Bennett, J C. (1986). Aerial surveys of endangered whales in the northern Bering, eastern Chukchi, and Alaskan Beaufort seas, 1985: With a seven-year review, 1979-1985 (Naval Ocean Systems Center Technical Report 1111).
Ljungblad, D. K., Moore, S. E., Clarke, J. T., & Bennett, J. C. (1988). Distribution, abundance, behavior and bio-acoustics of endangered whales in the western Beaufort and northeastern Chukchi Seas, 1979-87 (Naval Ocean Systems Center Technical Report 1232).
Ljungblad, D. K., Moore, S. E., Clarke, J. T., Van Schoik, D. R., & Bennett, J. C. (1985). Aerial surveys of endan-gered whales in the northern Bering, eastern Chukchi, and Alaskan Beaufort seas, 1984: With a six-year review, 1979-84. Naval Ocean Systems Center Technical Report 1046.
Lohoefener, R., Hoggard, W., Ford, R., & Benigo, J. (1990). Studies of Mississippi Sound bottlenose dol-phins: Assessing the effects of the removal of 30 bottle-nose dolphins from Mississippi Sound (Part 1 of the Final report to the U.S. Marine Mammal Commission No. MM2910909-2). Pascagoula, MS: National Marine Fisheries Service.
Lowry, L. F. (1993). Foods and feeding ecology In J. J. Burns, J. J. Montague, & C. J. Cowles (Eds.), The bowhead whale (Special Publication Number 2, pp. 409-489). Lawrence, KS: The Society for Marine Mammalogy.
Lowry, L. F., Sheffield, G., & George, J. C. (2004). Bowhead whale feeding in the Alaskan Beaufort Sea, based on stomach contents analyses. Journal of Cetacean Research and Management, 6(3), 215-223.
Lowry, L. F., Frost, K., Zerbini, A., DeMaster, D., & Reeves, R. (2008). Trend in aerial counts of beluga or white whales (Delphinapterus leucas) in Bristol Bay, 1993-2005. Journal of Cetacean Research and Management, 10, 201-207.
Lynn, S. K., & Würsig, B. (2002). Summer movement patterns of bottlenose dolphins in a Texas bay. Gulf of Mexico Science, 20(1), 25-37.
Mackey, A. D. (2010). Site fidelity and association pat-terns of bottlenose dolphins (Tursiops truncatus) in the Mississippi Sound (Master’s thesis). University of Southern Mississippi, Hattiesburg.
Mackintosh, N. A. (1946). The natural history of whale-bone whales. Biological Reviews, 21(2), 60-74. http://dx.doi.org/10.1111/j.1469-185X.1946.tb00453.x
Mahaffy, S. D. (2012). Site fidelity, associations and long-term bonds of short-finned pilot whales off the island of Hawai‘i (Master of Science dissertation). Portland State University, Portland, OR.

Literature Cited 119
Mahaffy, S. D., Baird, R. W., McSweeney, D. J., Webster, D. L., & Schorr, G. S. (2009). Individual photo-identifi-cation of dwarf sperm whales off the island of Hawai‘i; Evidence of site fidelity and a small population size. 18th Biennial Conference on the Biology of Marine Mammals, Quebec City, Quebec.
Mahaffy, S. D., Baird, R. W., Cullins, T., Schorr, G. S., Webster, D. L., & McSweeney, D. J. (2013). A small res-ident social group of pygmy killer whales off the island of O‘ahu: Photo-identification and satellite tagging reveal differences in social patterns of this species in the Hawaiian archipelago. 20th Biennial Conference on the Biology of Marine Mammals, Dunedin, New Zealand.
Mahoney, A. R. (2012). Sea ice conditions in the Chukchi and Beaufort Seas. Washington, DC: Pew Charitable Trusts, U.S. Arctic Program.
Mahoney, B. A., & Shelden, K. E. W. (2000). Harvest his-tory of belugas, Delphinapterus leucas, in Cook Inlet, Alaska. Marine Fisheries Review, 62(3), 124-140.
Malik, S., Brown, M. W., Kraus, S. D., Knowlton, A. R., Hamilton, P. K., & White, B. N. (1999). Assessment of mitochondrial DNA structuring and nursery use in the North Atlantic right whale (Eubalaena glacialis). Canadian Journal of Zoology, 77(8), 1217-1222. http://dx.doi.org/10.1139/z99-073
Martien, K. K., Baird, R. W., Hedrick, N. M., Gorgone, A. M., Thieleking, J. L., McSweeney, D. J., . . . Webster, D. L. (2011). Population structure of island-associated dolphins: Evidence from mitochondrial and micro-satellite markers for common bottlenose dolphins (Tursiops truncatus) around the main Hawaiian Islands. Marine Mammal Science, 28, E208-E232. http://dx.doi.org/10.1111/j.1748-7692.2011.00506.x
Martien, K. K., Chivers, S. J., Baird, R. W., Archer, F. I., Gorgone, A. M., Hancock-Hanser, B. L., . . . Taylor, B. L. (2014). Nuclear and mitochondrial patterns of population structure in North Pacific false killer whales (Pseudorca crassidens). Journal of Heredity, 105, 611-626. http://dx.doi.org/10.1093/jhered/esu029
Mate, B., & Urbán-Ramirez, J. (2003). A note on the route and speed of a gray whale on its northern migration from Mexico to central California, tracked by satellite-monitored radio tag. Journal of Cetacean Research Management, 5, 155-157.
Mate, B. R., Gisiner, R., & Mobley, J. (1998). Local and migratory movements of Hawaiian humpback whales tracked by satellite telemetry. Canadian Journal of Zoology, 76, 863-868. http://dx.doi.org/10.1139/z98-008
Mate, B. R., Sharon L. Nieukirk, & Kraus, S. D. (1997). Satellite-monitored movements of the northern right whale. The Journal of Wildlife Management, 61(4), 1393-1405. http://dx.doi.org/10.2307/3802143
Mate, B., Bradford, A. L., Tsidulko, G., Vertyankin, V., & Ilyashenko, V. (2011). Late-feeding season movements of a western North Pacific gray whale off Sakhalin Island, Russia and subsequent migration into the Eastern North Pacific (Paper SC/63/BRG23). Presented
to the International Whaling Commission Scientific Committee.
Matsuoka, K., Mizroch, S., & Komiya, H. (2012). Cruise report of the 2011 IWC-Pacific Ocean Whale and Ecosystem Research (IWC-POWER) (International Whaling Commission Scientific Committee Report SC/64/IA5).
Mattila, D. K., Guinee, L. N., & Mayo, C. A. (1987). Humpback whale songs on a North Atlantic feeding ground. Journal of Mammalogy, 68(4), 880-883. http://dx.doi.org/10.2307/1381574
Mattila, D. K., Clapham, P. J., Katona, S. K., & Stone, G. S. (1989). Population composition of humpback whales, Megaptera novaeangliae, on Silver Bank, 1984. Canadian Journal of Zoology, 67(2), 281-285. http://dx.doi.org/10.1139/z89-041
Mattila, D. K., Clapham, P. J., Vásquez, O., & Bowman, R. S. (1994). Occurrence, population composition, and habitat use of humpback whales in Samana Bay, Dominican Republic. Canadian Journal of Zoology, 72(11), 1898-1907. http://dx.doi.org/10.1139/z94-258
Maze, K. S., & Würsig, B. (1999). Bottlenosed dolphins of San Luis Pass, Texas: Occurrence patterns, site-fidelity, and habitat use. Aquatic Mammals, 25(2), 91-103.
Maze-Foley, K., & Mullin, K. D. (2006). Cetaceans of the oceanic northern Gulf of Mexico: Distributions, group sizes and interspecific associations. Journal of Cetacean Research and Management, 8(2), 203-213.
Mazzoil, M. S., McCulloch, S. D., & Defran, R. H. (2005). Observations on the site fidelity of bottlenose dolphins (Tursiops truncatus) in the Indian River Lagoon, Florida. Florida Scientist, 68(4), 217.
Mazzoil, M. S., McCulloch, S. D., Youngbluth, M. J., Kilpatrick, D. S., Murdoch, M. E., Mase-Guthrie, B., . . . Bossart, G. D. (2008a). Radio-tracking and survivor-ship of two rehabilitated bottlenose dolphins (Tursiops truncatus) in the Indian River Lagoon, Florida. Aquatic Mammals, 34(1), 54-64. http://dx.doi.org/10.1578/AM. 34.1.2008.54
Mazzoil, M. S., Reif, J., Youngbluth, M., Murdoch, M., Bechdel, S., Howells, E., . . . Bossart, G. D. (2008b). Home ranges of bottlenose dolphins (Tursiops truncatus) in the Indian River Lagoon, Florida: Environmental correlates and implications for management strategies. EcoHealth, 5(3), 278-288. http://dx.doi.org/10.1007/s10393-008-0194-9
McGuire, T. L., Blees, M. K., & Bourdon, M. L. (2011). The development of a catalog of left-side digital images of individually-identified Cook Inlet beluga whales Delphinapterus leucas (North Pacific Research Board Final Report 910).
McLellan, W. A., Meagher, E., Torres, L., Lovewell, G., Harper, C., Irish, K., . . . Pabst, A. D. (2004, December). Winter right whale sightings from aerial surveys of the coastal waters of the U.S. mid-Atlantic. Proceedings of the Fifteenth Biennial Conference on the Biology of Marine Mammals, Greensboro, NC.
McSweeney, D. J., Baird, R. W., & Mahaffy, S. D. (2007). Site fidelity, associations and movements of Cuvier’s

120 Literature Cited
(Ziphius cavirostris) and Blainville’s (Mesoplodon densirostris) beaked whales off the island of Hawai‘i. Marine Mammal Science, 23, 666-687. http://dx.doi.org/10.1111/j.1748-7692.2007.00135.x
McSweeney, D. J., Baird, R. W., Mahaffy, S. D., Webster, D. L., & Schorr, G. S. (2009). Site fidelity and asso-ciation patterns of a rare species: Pygmy killer whales (Feresa attenuata) in the main Hawaiian Islands. Marine Mammal Science, 25, 557-572. http://dx.doi.org/10.1111/j.1748-7692.2008.00267.x
Mead, J. G. (1977). Records of sei and Bryde’s whales from the Atlantic coast of the United States, the Gulf of Mexico, and the Caribbean. Reports of the International Whaling Commission, Special Issue 1, 113-116.
Mead, J. G., & Potter, C. W. (1995). Recognizing two popu-lations of the bottlenose dolphin (Tursiops truncatus) off the Atlantic coast of North America – Morphologic and ecologic considerations (International Marine Biology Research Institute, IRB Reports, [5], pp. 31-44). Retrieved 3 February 2015 from si-pddr.si.edu/dspace/handle/10088/4735.
Mellinger, D. K., Stafford, K. M., Moore, S. E., Munger, L., & Fox, C. G. (2004). Detection of North Pacific right whale (Eubalaena japonica) calls in the Gulf of Alaska. Marine Mammal Science, 20(4), 872-887. http://dx.doi.org/10.1111/j.1748-7692.2004.tb01198.x
Miller, C. E. (2003). Abundance trends and environmental habitat usage patterns of bottlenose dolphins (Tursiops truncatus) in lower Barataria and Caminada bays, Louisiana (Doctoral dissertation). Louisiana State University and Agricultural & Mechanical College, Baton Rouge. Retrieved 3 February 2015 from http://etd.lsu.edu/docs/available/etd-1113103-134239/unrestricted/Miller_dis.pdf.
Miller, L. J., Mackey, A. D., Solangi, M., & Kuczaj II, S. A. (2013). Population abundance and habitat utilization of bottlenose dolphins in the Mississippi Sound. Aquatic Conservation: Marine and Freshwater Ecosystems, 23(1), 145-151. http://dx.doi.org/10.1002/aqc.2278
Mitchell, E. (1975). Preliminary report on Nova Scotia fishery for sei whales (Balaenoptera borealis). Reports of the International Whaling Commission, 25, 218-225.
Mitchell, E. D. (1991). Winter records of the minke whale (Balaenoptera acutorostrata Lacepede 1804) in the southern North Atlantic. Reports of the International Whaling Commission, 41, 455-457.
Mizroch, S. A., Rice, D. W., & Breiwick, J. M. (1984a). The fin whale, Balaenoptera physalus. Marine Fisheries Review, 46(4), 20-24.
Mizroch, S. A., Rice, D. W., & Breiwick, J. M. (1984b). The sei whale, Balaenoptera borealis. Marine Fisheries Review, 46(4), 25-29.
Mizroch, S. A., Rice, D.W., Zwiefelhofer, D., Waite, J., & Perryman,W. L. (2009). Distribution and movements of fin whales in the North Pacific Ocean. Mammalian Review, 39, 193-227. http://dx.doi.org/10.1111/j.1365-2907.2009.00147.x
Mobley, J. R., Jr., Bauer, G. B., & Herman, L. M. (1999). Changes over a ten-year interval in the distribution and relative abundance of humpback whales (Megaptera novaeangliae) wintering in Hawaiian waters. Aquatic Mammals, 25(2), 63-72.
Mobley, J. R., Jr., Spitz, S., & Grotefendt, R. (2001). Abundance of humpback whales in Hawaiian waters: Results of 1993-2000 aerial surveys. Report prepared for the Hawaiian Islands Humpback Whale National Marine Sanctuary.
Mobley, J. R., Jr., Spitz, S. S ., Forney, K. A., Grotefendt, R. A., & Forestell, P. H. (2000). Distribution and abundance of odontocete species in Hawaiian waters: Preliminary results of 1993-98 aerial surveys (National Marine Fisheries Service, Southwest Fisheries Science Center Administrative Report LJ-00-14C). Washington, DC: National Oceanic and Atmospheric Administration.
Mocklin, J. A., Rugh, D. J., Moore, S. E., & Angliss, R. P. (2011). Using aerial photography to investigate evi-dence of feeding by bowhead whales. Marine Mammal Science, 28(3), 602-619. http://dx.doi.org/10.1111/j.1748-7692.2011.00518.x
Mocklin, J. A., George, J. C., Ferguson, M. C., Vate Brattström, L., Beaver, V., Rone, B., . . . Accardo, C. (2012). Aerial photography of bowhead whales near Barrow, Alaska, during the 2011 spring migration. Report prepared for the North Slope Borough by the Alaska Fisheries Science Center, National Marine Fisheries Service, National Oceanic and Atmospheric Administration, Seattle, WA.
Moore, J. E., & Barlow, J. (2011). Bayesian state-space model of fin whale abundance trends from a 1991-2008 time series of line-transect surveys in the California Current. Journal of Applied Ecology, 48, 1195-1205. http://dx.doi.org/10.1111/j.1365-2664.2011.02018.x
Moore, S. E. (1992). Summer records of bowhead whales in the northeastern Chukchi Sea. Arctic, 45(4), 398-400. http://dx.doi.org/10.14430/arctic1419
Moore, S. E., & Reeves, R. R. (1993). Distribution and movement. In J. J. Burns, J. J. Montague, & C. J. Cowles (Eds.), The bowhead whale (Special Publication Number 2, pp. 409-489). Lawrence, KS: The Society for Marine Mammalogy.
Moore, S. E., Clarke, J. T., & Johnson, M. M. (1993). Beluga distribution and movements offshore northern Alaska in spring and summer, 1980-1984. Reports of the International Whaling Commission, 43, 375-386.
Moore, S. E., Grebmeier, J. M., & Davies, J. R. (2003). Gray whale distribution relative to forage habitat in the northern Bering Sea: Current conditions and retrospec-tive summary. Canadian Journal of Zoology, 81, 734-742. http://dx.doi.org/10.1139/z03-043
Moore, S. E., Ljungblad, D. K., & Van Schoik, D. R. (1986). Annual patterns of gray whale (Eschrichtius robustus) distribution, abundance and behavior in the northern Bering and eastern Chukchi Seas, July 1980-83. Reports of the International Whaling Commission, Special Issue 8, 231-242.

Literature Cited 121
Moore, S. E., Stafford, K. M., & Munger, L. M. (2010a). Acoustic and visual surveys for bowhead whales in the western Beaufort and far northeastern Chukchi seas. Deep-Sea Research Part II, 57, 153-157. http://dx.doi.org/10.1016/j.dsr2.2009.08.013
Moore, S. E., Stafford, K. M., Mellinger, K. D., & Hildebrand, J. A. (2006). Listening for large whales in the offshore waters of Alaska. BioScience, 56(1), 49-55. http://dx.doi.org/10.1641/0006-3568(2006)056[0049:LFLWIT]2.0.CO;2
Moore, S. E., Waite, J. M., Friday, N. A., & Honkalehto, T. (2002). Cetacean distribution and relative abundance on the central-eastern and the southeastern Bering Sea shelf with reference to oceanographic domains. Progress Oceanography, 55, 249-261. http://dx.doi.org/10.1016/S0079-6611(02)00082-4
Moore, S. E., Wynne, K. M., Kinney, J. C., & Grebmeier, J. M. (2007). Gray whale occurrence and forage south-east of Kodiak Island, Alaska. Marine Mammal Science, 23(2), 419-428. http://dx.doi.org/10.1111/j.1748-7692. 2007.00102.x
Moore, S. E., George, J. C., Sheffield, G., Bacon, J., & Ashjian, C. J. (2010b). Bowhead whale distribution and feeding near Barrow, Alaska, in late summer 2005-06. Arctic, 63(2), 195-205. http://dx.doi.org/10.14430/arctic974
Moore, S. E., Shelden, K. E. W., Litzky, L. K., Mahoney, B. A., & Rugh, D. J. (2000). Beluga, Delphinapterus leucas, habitat associations in Cook Inlet, Alaska. Marine Fisheries Review, 62(3), 60-80.
Moore, S. E., Stafford, K. M., Melling, H., Berchok, C., Wiig, O., Kovacs, K. M., . . . Richter-Menge, J. (2012). Comparing marine mammal acoustic habitats in Atlantic and Pacific sectors of the High Arctic: Year-long records from Fram Strait and the Chukchi Plateau. Polar Biology, 35, 475-480. http://dx.doi.org/10.1007/s00300-011-1086-y
Moran, J., Straley, J., Rice, S., Heintz, R., Quinn II, T. J., & Teerlink, S. (2011). Late-season abundance and sea-sonal trends of humpback whales on three important wintering grounds for Pacific herring in the Gulf of Alaska. Poster presented at the 19th Biennial Conference of The Society for Marine Mammalogy, Tampa, FL.
Morano, J. L., Salisbury, D. P., Rice, A. N., Conklin, K. L., Falk, K. L., & Clark, C. W. (2012). Seasonal and geo-graphical patterns of fin whale song in the western North Atlantic Ocean. The Journal of the Acoustical Society of America, 132(2), 1207-1212. http://dx.doi.org/10.1121/1.4730890
Mullin, K. D., & Fulling, G. L. (2004). Abundance of ceta-ceans in the oceanic northern Gulf of Mexico, 1996-2001. Marine Mammal Science, 20(4), 787-807. http://dx.doi.org/10.1111/j.1748-7692.2004.tb01193.x
Munger, L. M., Wiggins, S. M., Moore, S. E., & Hildebrand, J. A. (2008). North Pacific right whale (Eubalaena japonica) seasonal and diel calling patterns from long-term acoustic recordings in the southeastern Bering Sea, 2000-2006. Marine Mammal Science, 24(4), 795-814.
Murphy, M. A. (1995). Occurrence and group character-istics of minke whales, Balaenoptera acutorostrata, in Massachusetts Bay and Cape Cod Bay. Fishery Bulletin, 93(3), 577-585.
National Marine Fisheries Service (NMFS). (1998). Recovery plan for the blue whale (Balaenoptera musculus) (R. R. Reeves, P. J. Clapham, R. L. Brownell, & G. K. Silber, Eds.). Silver Spring, MD: NMFS.
NMFS. (2010). Recovery plan for the fin whale (Balaenoptera physalus). Silver Spring, MD: NMFS.
National Research Council (NRC). (2005). Marine mammal populations and ocean noise. Washington, DC: National Academies Press.
Nemoto, T. (1959). Food of baleen whales with reference to whale movements. Scientific Reports of the Whale Research Institute, 14, 149-290.
Nemoto, T., & Kawamura, A. (1977). Characteristics of food habits and distribution of baleen whales with spe-cial reference to the abundance of North Pacific sei and Bryde’s whales. Reports of the International Whaling Institution, Special Issue 1, 80-87.
Nerini, M. (1984). A review of gray whale feeding ecology. In M. L. Jones, S. L. Swartz, & S. Leatherwood (Eds.), The gray whale, Eschrichtius robustus (pp. 423-450). New York: Academic Press. http://dx.doi.org/10.1016/B978-0-08-092372-7.50024-8
New, L. F., Clark, J. S., Costa, D. P., Fleishman, E., Hindell, M. A., Klanjšek, T., . . . Harwood, J. (2014). Using short-term measures of behaviour to estimate long-term fit-ness of southern elephant seals. “Tracking fitness in marine vertebrates” Theme Section. Marine Ecology Progress Series, 469, 99-108. http://dx.doi.org/10.3354/meps10547
Newhall, A. E., Lin, Y-T., Lynch, J. F., Baumgartner, M. F., & Gawarkiewicz, G. G. (2012). Long distance passive localization of vocalizing sei whales using an acoustic normal mode approach. The Journal of the Acoustical Society of America, 131(2), 1814-1825. http://dx.doi.org/10.1121/1.3666015
Nilsson, P., Cummings, E., Foley, H., Hardee, R., McAlarney, R., McLellan, W. A., . . . Read, A. J. (2011, November). Recent winter sightings of minke whales (Balaenoptera acutorostrata) in the South Atlantic Bight. Proceedings of the Nineteenth Biennial Conference on the Biology of Marine Mammals, Tampa, FL.
Noongwook, G., the Native village of Savoonga, the Native village of Gambell, Huntington, H, P., & George, J. C. (2007). Traditional knowledge of the bowhead whale (Balaena mysticetus) around St. Lawrence Island, Alaska. Arctic, 60(1), 47-54.
O’Corry-Crowe, G. M., Dizon, A. E., Suydam, R. S., & Lowry, L. F. (2002). Molecular genetics studies of pop-ulation structure and movement patterns in a migratory species: The beluga whale, Delphinapterus leucas, in the western neoarctic. In C. J. Pfeiffer (Ed.), Molecular and cell biology of marine mammals (pp. 53-64). Malabar, FL: Kreiger Publishing Company.

122 Literature Cited
O’Corry-Crowe, G., Lucey, W., Castellote, M., & Stafford, K. (2009). Abundance, habitat use and behavior of beluga whales in Yakutat Bay, May 2008; as revealed by passive acoustic monitoring, visual observations and photo-ID. Final Report to the National Marine Fisheries Service’s Alaska Regional Office.
O’Corry-Crowe, G., Lucey, W., Bonin, C., Henniger, E., & Hobbs, R. (2006). The ecology, status, and stock identity of beluga whales, Delphinapterus leucas, in Yakutat Bay, Alaska. Report to the Marine Mammal Commission.
O’Corry-Crowe, G. M., Suydam, R. S., Rosenberg, A., Frost, K. J., & Dizon, A. E. (1997). Phylogeography, popula-tion structure and dispersal patterns of the beluga whale Delphinapterus leucas in the western Nearctic revealed by mitochondrial DNA. Molecular Ecology, 6(10), 955-970. http://dx.doi.org/10.1046/j.1365-294X.1997.00267.x
Oceana & Kawerak, Inc. (2014). Bering Strait marine life and subsistence use data synthesis. Juneau, AK: Oceana and Kawerak, Inc. Retrieved 3 February 2015 from https://www.google.com/url?q=http://oceana.org/sites/default/files/reports/REDUCED%2520FILE_Final%2520PDF_Bering%2520Strait%2520Synthesis_July%252030,%25202014%2520-%2520Copy.pdf&sa=U&ei=u-V5VPS1PIPUoATsvILoBQ&ved= 0CAYQFjAB&cl ien t= in te rna l -uds -cse&usg= AFQjCNGEbvZqn01HzMWAdTn-OxcbIIAkOg.
Odell, D. K., & Asper, E. D. (1990). Distribution and movements of freeze-branded bottlenose dolphins in the Indian and Banana Rivers, Florida. In S. Leatherwood & R. R. Reeves (Eds.), The bottlenose dolphin (pp. 515-540). San Diego: Academic Press. http://dx.doi.org/10.1016/B978-0-12-440280-5.50034-2
Office of National Marine Sanctuaries. (2010). Hawaiian Islands Humpback Whale National Marine Sanctuary condition report, 2010. Silver Spring, MD: U.S. Department of Commerce, National Oceanic and Atmospheric Administration, Office of National Marine Sanctuaries. 63 pp.
Oleson, E. M., Baird, R. W., Martien, K. K., & Taylor, B. L. (2013). Island-associated stocks of odontocetes in the main Hawaiian Islands: A synthesis of available infor-mation to facilitate evaluation of stock structure (PIFSC Working Paper WP-13-003).
Oleson, E. M., Calambokidis, J., Falcone, E., Schorr, G., & Hildebrand, J. A. (2009). Acoustic and visual moni-toring of cetaceans along the outer Washington coast (Report NPS-OC-09-001). Monterey, CA: Naval Post-Graduate School.
Oleson, E. M., Boggs, C. H., Forney, K. A., Hanson, M. B., Kobayashi, D. R., Taylor, B. L., . . . Ylitalo, G. M. (2010). Status review of Hawaiian insular false killer whales (Pseudorca crassidens) under the Endangered Species Act (NOAA Technical Memorandum NOAA-TM-NMFS-PIFSC-22). Washington, DC: U.S. Department of Commerce.
Pabody, C. (2008). Occurrence, distribution and behavioral patterns of bottlenose dolphins, Tursiops truncatus, in
Wolf Bay, AL (Master’s thesis). University of Alabama, Tuscaloosa.
Pacific Wildlife Foundation [PWLF]. (2013). Important cetacean areas – A primer. Retrieved 3 February 2015 from www.pwlf.org/ica.
Palka, D. (1995). Abundance estimate of the Gulf of Maine harbor porpoise. Reports of the International Whaling Commission, 16, 27-50.
Palka, D. (2000). Abundance of the Gulf of Maine/Bay of Fundy harbor porpoise based on shipboard and aerial surveys during 1999 (Northeast Fisheries Science Center Reference Document 00-7).
Palka, D. (2012). A comprehensive assessment of marine mammal, marine turtle, and seabird abundance and spatial distribution in U.S. waters of the western North Atlantic Ocean (2011 Annual Report to the Inter-Agency Agreement M10PG00075/0001).
Pauly, D., Trites, A. W., Capuli, E., & Christensen, V. (1998). Diet composition and trophic levels of marine mammals. ICES Journal of Marine Science: Journal Du Conseil, 55(3), 467-481. http://dx.doi.org/10.1006/jmsc.1997.0280
Payne, P. M., Nicolas, J. R., O’Brien, L., & Powers, K. D. (1986). The distribution of the humpback whale, Megaptera novaeangliae, on Georges Bank and in the Gulf of Maine in relation to densities of the sand eel, Ammodytes americanus. Fishery Bulletin, 84(2), 271-278.
Payne, P. M., Wiley, D. N., Young, S. B., Pittman, S., Clapham, P. J., & Jossi, J. W. (1990). Recent fluctuations in the abundance of baleen whales in the southern Gulf of Maine in relation to changes in selected prey. Fishery Bulletin, 88(4), 687-696.
Perry, S. L., DeMaster, D. P., & Silber, G. K. (1999a). The fin whale. Marine Fisheries Review, 61(1), 44-51.
Perry, S. L., DeMaster, D. P., & Silber, G. K. (1999b). The humpback whale. Marine Fisheries Review, 61(1), 24-37.
Perryman, W. L., & Lynn, M. S. (2002). Evaluation of nutritive condition and reproductive status of migrating gray whales (Eschrichtius robustus) based on analysis of photogrammetric data. Journal of Cetacean Research and Management, 4(2), 155-164.
Pike, G. C. (1962). Migration and feeding of the gray whale (Eschrichtius gibbosus). Journal of the Fisheries Research Board of Canada, 19, 815-838. http://dx.doi.org/10.1139/f62-051
Pittman, S., Costa, B., Kot, C., Wiley, D., & Kenney, R. D. (2006). Cetacean distribution and diversity. In T. Battista, R. Clark, & S. Pittman (Eds.), An ecological characteriza-tion of the Stellwagen Bank National Marine Sanctuary Region: Oceanographic, biogeographic, and contaminants assessment (NOAA Technical Memorandum NCCOS, 45, pp. 265-326). Silver Spring, MD: National Centers for Coastal Ocean Science.
Pulster, E. L., & Maruya, K. A. (2008). Geographic specificity of Aroclor 1268 in bottlenose dolphins (Tursiops truncatus) frequenting the Turtle/Brunswick River Estuary, Georgia

Literature Cited 123
(USA). Science of the Total Environment, 393(2-3), 367-375. http://dx.doi.org/10.1016/j.scitotenv.2007.12.031
Quakenbush, L. (2003). Summer movements of beluga whales captured in the Kvichak River in May 2002 and 2003 (Alaska Beluga Whale Committee Report 03-03, 15).
Quakenbush, L., & Citta, J. (2006). Fall movements of beluga whales captured in the Nushagak River, in September 2006 (Alaska Beluga Whale Committee Report, 9).
Quakenbush, L. T., Small, R. J., & Citta, J. J. (2010a). Satellite tracking of western Arctic bowhead whales (OCS Study BOEMRE 2010-033). Final Report pre-pared by the Alaska Department of Fish and Game for the Bureau of Ocean Energy Management, Regulation and Enforcement.
Quakenbush, L. T., Small, R. J., & Citta, J. J. (2013). Satellite tracking of bowhead whales: Movements and analysis from 2006 to 2012 (Final Report to BOEM, OCS Study BOEM 2013-01110). 72 pp.
Quakenbush, L. T., Citta, J. J., George, J. C., Small, R. J., & Heide-Jørgensen, M. P. (2010b). Fall and winter movements of bowhead whales (Balaena mysticetus) in the Chukchi Sea and within a potential petroleum development area. Arctic, 63(3), 289-307. http://dx.doi.org/10.14430/arctic1493
Quakenbush, L. T., Suydam, R. S., Bryan, A. L., Lowry, L. F., Frost, K. J., & Mahoney, B. A. (In press). Diet of beluga whales (Delphinapterus leucas) in Alaska from stomach contents, March-November. Marine Fisheries Review.
Quakenbush, L., Citta, J., George, J. C., Heide-Jørgensen, M. P., Small, R. J., Browers, H., . . . Pokiak, J. (2012). Seasonal movements of the Bering-Chukchi-Beaufort stock of bowhead whales: 2006-2011 satellite telem-etry results (Paper SC/64/BRG1). Presented to the International Whaling Commission Scientific Committee.
Quintana-Rizzo, E., & Wells, R. S. (2001). Resighting and association patterns of bottlenose dolphins (Tursiops truncatus) in the Cedar Keys, Florida: Insights into social organization. Canadian Journal of Zoology, 79(3), 447-456. http://dx.doi.org/10.1139/cjz-79-3-447; http://dx.doi.org/10.1139/z00-223
Ramakrishnan, U., LeDuc, R., Darling, J., Taylor, B. L., Gearin, P., Gosho, M., . . . Steeves, T. E. (2001). Are the southern feeding group of eastern Pacific gray whales a maternal genetic isolate? (Report SC/53/SD8). Prepared for the International Whaling Commission. (Unpublished)
Rasmussen, K., Calambokidis, J., & Steiger, G. H. (2011). Distribution and migratory destinations of humpback whales off the Pacific coast of Central America during the boreal winters of 1996-2003. Marine Mammal Science, 28(3), E267-E279. http://dx.doi.org/10.1111/j.1748-7692.2011.00529.x
Read, A. J., & Hohn, A. A. (1995). Life in the fast lane: The life history of harbor porpoises from the Gulf of Maine.
Marine Mammal Science, 11(4), 423-440. http://dx.doi.org/10.1111/j.1748-7692.1995.tb00667.x
Read, A. J., Urian, K. W., Wilson, B., & Waples, D. M. (2003). Abundance of bottlenose dolphins in the bays, sounds, and estuaries of North Carolina. Marine Mammal Science, 19(1), 59-073. http://dx.doi.org/10.1111/j.1748-7692.2003.tb01092.x
Reeves, R. R., Leatherwood, S., Karl, S. A., & Yohe, E. R. (1985). Whaling results at Akutan (1912-39) and Port Hobron (1926-37), Alaska. Reports of the International Whaling Commission, 35, 441-457.
Reeves, R. R., Ewins, P. J., Agbayani, S., Heide-Jørgensen, M. P., Kovacs, K. M., Lydersen, C., . . . Blijleven, R. (2013). Distribution of endemic cetaceans in relation to hydrocarbon development and commercial shipping in a warming Arctic. Marine Policy, 44, 375-389. http://dx.doi.org/10.1016/j.marpol.2013.10.005
Rice, A. N., Palmer, K. J., Tielens, J. T., Muirhead, C. A., & Clark, C. W. (2014). Potential Bryde’s whale (Balaenoptera edeni) calls recorded in the north-ern Gulf of Mexico. The Journal of the Acoustical Society of America, 135(5), 3066-3076. http://dx.doi.org/10.1121/1.4870057
Rice, D. W. (1963). Progress report on biological studies of the larger cetacea in the waters off California. Norsk Hvalfangst-Tidende, 7, 181-187.
Rice, D. W. (1974). Whales and whale research in the eastern North Pacific. In W. E. Schevill, D. G. Ray, & K. S. Norris (Eds.), The whale problem (pp. 170-195). Cambridge, MA: Harvard University Press. http://dx. doi.org/10.4159/harvard.9780674367128.c9
Rice, D. W. (1998). Marine mammals of the world: Systematics and distribution (The Society for Marine Mammalogy Special Publication Number 4). Lawrence, KS: Allen Press, Inc.
Rice, D. W., & Wolman, A. W. (1971). The life history and ecology of the gray whale (Eschrichtius robustus) (American Society of Mammalogists, Special Publication 3). 142 pp.
Rice, D. W., Wolman, A. A., & Braham, H. W. (1984). The gray whale, Eschrichtius robustus. Marine Fisheries Review, 46(4), 7-14.
Rice, S. D., Moran, J. R., Straley, J. M., Boswell, K. M., & Heintz, R. A. (2011). Significance of whale predation on natural mortality rate of Pacific herring in Prince William Sound, Exxon Valdez Oil Spill Restoration Project Final Report (Restoration Project: 100804). Juneau, AK: National Marine Fisheries Service.
Richard, P. R., Martin, A. R., & Orr, J. R. (2001). Summer and autumn movements of belugas of the eastern Beaufort Sea stock. Arctic, 54(3), 223-236. http://dx.doi.org/10.14430/arctic783
Richardson, W. J., & Thomson, D. H. (Eds.). (2002). Bowhead whale feeding in the eastern Alaskan Beaufort Sea: Update of scientific and traditional information (OCS Study MMS 2002-012). Report prepared by LGL Ltd., King City, Ontario, Canada.

124 Literature Cited
Risch, D., Clark, C. W., Dugan, P. J., Popescu, M., Siebert, U., & Van Parijs, S. M. (2013). Minke whale acoustic behavior and multi-year seasonal and diel vocaliza-tion patterns in Massachusetts Bay, USA. Marine Ecology Progress Series, 489, 279-295. http://dx.doi.org/10.3354/meps10426
Risch, D., Castellote, M., Clark, C. W., Davis, G. E., Dugan, P. J., Hodge, L. E., . . . Van Parijs, S. M. (2014). Seasonal migrations of North Atlantic minke whales: Novel insights from large-scale passive acoustic monitoring networks. Movement Ecology, 2(24), 17. http://dx.doi.org/10.1186/s40462-014-0024-3
Robbins, J. (2007). Structure and dynamics of the Gulf of Maine humpback whale population (Doctoral dissertation). University of St. Andrews, Fife, UK. Retrieved 5 January 2015 from hdl.handle.net/10023/328.
Rone, B. K., Douglas, A. B., Zerbini, A. N., Morse, L., Martinez, A., Clapham, P. J., & Calambokidis, J. (2010). Results from the April 2009 Gulf of Alaska Line Transect Survey (GOALS) in the Navy training exercise area (NOAA Technical Memorandum NMFS-AFSC-209). Washington, DC: U.S. Department of Commerce.
Rosel, P. E., & Wilcox, L. A. (2014). Genetic evidence reveals a unique lineage of Bryde’s whales in the north-ern Gulf of Mexico. Endangered Species Research, 25(1), 19-34. http://dx.doi.org/10.3354/esr00606
Rosel, P. E., Hansen, L., & Hohn, A. A. (2009). Restricted dispersal in a continuously distributed marine species: Common bottlenose dolphins Tursiops truncatus in coastal waters of the western North Atlantic. Molecular Ecology, 18(24), 5030-5045. http://dx.doi.org/10.1111/j.1365-294X.2009.04413.x
Rosel, P. E., France, S. C., Wang, J. Y., & Kocher, T. D. (1999). Genetic structure of harbour porpoise Phocoena phocoena populations in the northwest Atlantic based on mitochon-drial and nuclear markers. Molecular Ecology, 8, S41-S54. http://dx.doi.org/10.1046/j.1365-294X.1999.00758.x
Rosenbaum, H. C., Brownell, R. L., Jr., Brown, M. W., Schaeff, C., Portway, V., White, B. N., . . . DeSalle, R. (2000). World-wide genetic differentiation of Eubalaena: Questioning the number of right whale species. Molecular Ecology, 9, 1793-1802. http://dx.doi.org/10.1046/j.1365-294x.2000.01066.x
Rugh, D. J. (1984). Census of gray whales at Unimak Pass, Alaska: November-December 1977-1979. In M. L. Jones, S. L. Swartz, & S. Leatherwood (Eds.), The gray whale, Eschrichtius robustus (pp. 225-247). New York: Academic Press. http://dx.doi.org/10.1016/B978-0-08-092372-7.50016-9
Rugh, D. J., Mahoney, B. A., & Smith, B. K. (2004). Aerial surveys of beluga whales in Cook Inlet, Alaska, between June 2001 and June 2002 (NOAA Technical Memorandum NMFS-AFSC-145). Washington, DC: U.S. Department of Commerce.
Rugh, D. J., Shelden, K. E. W., & Hobbs, R. C. (2010). Range contraction in a beluga whale population. Endangered Species Research, 12, 69-75. http://dx.doi.org/10.3354/esr00293
Rugh, D. J., Shelden, K. E., & Mahoney, B. (2000). Distribution of beluga whales in Cook Inlet, Alaska, during June/July, 1993 to 1999. Marine Fisheries Review, 62(3), 6-21.
Rugh, D., Shelden, K. E. W., & Schulman-Janiger, A. (2001). Timing of the gray whale southbound migration (Eschrichtius robustus). Journal of Cetacean Research and Management, 3, 31-39.
Rugh, D. J., Hobbs, R. C., Lerczak, J. A., & Breiwick, J. M. (2005a). Estimates of abundance of the eastern North Pacific stock of gray whales 1997-2002. Journal of Cetacean Research and Management, 7(1), 1-12.
Rugh, D., DeMaster, D., Rooney, A., Breiwick, J., Shelden, K., & Moore, S. (2003). A review of bowhead whale (Balaena mysticetus) stock identity. Journal of Cetacean Research and Management, 5(3), 267-279.
Rugh, D. J., Shelden, K. E. W., Sims, C. L., Mahoney, B. A., Smith, B. K., Hoberecht, L. K., & Hobbs, R. C. (2005b). Aerial surveys of belugas in Cook Inlet, Alaska, June 2001, 2002, 2003, and 2004 (NOAA Technical Memorandum NMFS-AFSC-149). Washington, DC: U.S. Department of Commerce.
Rugh, D. J., Muto, M., Hobbs, R., Shelden, K., D’Vincent, C., Laursen, I. M., . . . Nilson, S. (2006). Field report of the 2006/07 census of the Eastern North Pacific stock of gray whales (Paper SC/59/BRG1). Prepared for the International Whaling Commission Scientific Committee.
Sasaki, T., Nikaido, M., Wada, S., Yamada, T. K., Cao, Y., Hasegawa, M., & Okada, N. (2006). Balaenoptera omurai is a newly discovered baleen whale that rep-resents an ancient evolutionary lineage. Molecular Phylogenetics and Evolution, 41(1), 40-52. http://dx. doi.org/10.1016/j.ympev.2006.03.032
Schaeff, C. M., Kraus, S. D., Brown, M. W., & White, B. N. (1993). Assessment of the population structure of west-ern North Atlantic right whales (Eubalaena glacialis) based on sighting and mtDNA data. Canadian Journal of Zoology, 71, 339-339. http://dx.doi.org/10.1139/z93-047
Schick, R. S., Halpin, P. N., Read, A. J., Slay, C. K., Kraus, S. D., Mate, B. R., . . . Clark, J. S. (2009). Striking the right balance in right whale conservation. Canadian Journal of Fisheries and Aquatic Sciences, 66(9), 1399-1403. http://dx.doi.org/10.1139/F09-115
Schilling, M. R., Seipt, I., Weinrich, M. T., Frohock, S. E., Kuhlberg, A. E., & Clapham, P. J. (1992). Behavior of individually-identified sei whales Balaenoptera borea-lis during an episodic influx into the southern Gulf of Maine in 1986. Fishery Bulletin, 90, 749-755.
Schorr, G. S., Falcone, E. A., Calambokidis, J., & Andrews, R. D. (2010). Satellite tagging of fin whales off California and Washington in 2010 to identify movement patterns, habitat use, and possible stock boundaries (Report prepared under Order No. JG133F09SE4477). La Jolla, CA: Southwest Fisheries Science Center.
Schorr, G. S., Baird, R. W., Hanson, M. B., Webster, D L., McSweeney, D. J., & Andrews, R. D. (2008).

Literature Cited 125
Movements of the first satellite-tagged Cuvier’s and Blainville’s beaked whales in Hawai‘i. Report prepared under Contract No. AB133F-07-SE-3706 to Cascadia Research Collective, Olympia, WA, from the Southwest Fisheries Science Center, National Marine Fisheries Service, La Jolla, CA.
Schorr, G. S., Baird, R. W., Hanson, M. B., Webster, D. L., McSweeney, D. J., & Andrews, R. D. (2009a). Movements of satellite-tagged Blainville’s beaked whales off the island of Hawai‘i. Endangered Species Research, 10, 203-213. http://dx.doi.org/10.3354/esr00229
Schorr, G. S., Baird, R. W., Webster, D. L., McSweeney, D. J., Hanson, M. B., Polovina, J., & Andrews, R. D. (2009b). Satellite tagging of melon-headed whales in Hawai‘i reveals widely dispersed movement patterns. 18th Biennial Conference on the Biology of Marine Mammals, Quebec City, Quebec.
Schulte, D., & Taylor, C. R. (2012). Documenting spatial and temporal distribution of North Atlantic right whales off South Carolina and Northern Georgia 2011-2012 (Final Report to National Oceanic and Atmospheric Administration, Contract No. WC113F-11-CN-0144).
Scott, M. D., Wells, R. S., & Irvine, A. B. (1990). A long-term study of bottlenose dolphins on the west coast of Florida. In S. Leatherwood & R. R. Reeves (Eds.), The bottlenose dolphin (pp. 235-244). San Diego: Academic Press. http://dx.doi.org/10.1016/B978-0-12-440280-5.50015-9
Seaman, G. A., Lowry, L. F., & Frost, K. J. (1982). Foods of belukha whales (Dephinapterus leucas) in western Alaska. Cetology, 44, 1-19.
Seaman, G., Lowry, L. F., & Frost, K. J. (1985). Investigation of belukha whales in coastal waters of western and northern Alaska. I. Distribution, abundance, and move-ments (OCSEAP Final Report, 56[1988], 153-220). Washington, DC: U.S. Department of Commerce, National Oceanic and Atmospheric Administration.
Seipt, I. E., Clapham, P. J., Mayo, C. A., & Hawvermale, M. P. (1990). Population characteristics of individu-ally identified fin whales Balaenoptera physalus in Massachusetts Bay. Fishery Bulletin, 88(2), 271-278.
Sellas, A. B., Wells, R. S., & Rosel, P. E. (2005). Mitochondrial and nuclear DNA analyses reveal fine scale geographic structure in bottlenose dolphins (Tursiops truncatus) in the Gulf of Mexico. Conservation Genetics, 6(5), 715-728. http://dx.doi.org/10.1007/s10592-005-9031-7
Shane, S. H. (1980). Occurrence, movements, and distribu-tion of bottlenose dolphin, Tursiops truncatus, in south-ern Texas. Fishery Bulletin, 78(3), 593-601.
Shane, S. H. (1990). Behavior and ecology of the bottlenose dolphin at Sanibel Island, Florida. In S. Leatherwood & R. R. Reeves (Eds.), The bottlenose dolphin (pp. 245-265). San Diego: Academic Press. http://dx.doi.org/10.1016/B978-0-12-440280-5.50016-0; http://dx.doi.org/10.1016/B978-0-12-440280-5.50035-4
Shane, S. H. (2004). Residence patterns, group characteris-tics, and association patterns of bottlenose dolphins near Sanibel Island, Florida. Gulf of Mexico Science, 22(1), 1-12.
Sheffield, G., & George, J. C. (2009). Bowhead whale feed-ing in the northern Bering Sea near Saint Lawrence Island, Alaska (Abstract). 18th Biennial Conference of the Biology of Marine Mammals, Quebec City, Quebec.
Shelden, K. E. W., & Clapham, P. J. (2006). Habitat require-ments and extinction risks of eastern North Pacific right whales (AFSC Processed Report No. 2006–06). Seattle, WA: U.S. Department of Commerce.
Shelden, K. E. W., Rugh, D. J., & Schulman-Janiger, A. (2004). Gray whale born north of Mexico: Indicator of recovery or consequence of regime shift. Ecological Applications, 14, 1789-1805. http://dx.doi.org/10.1890/03-5349
Shelden, K. E. W., Moore, S. E., Waite, J. M., Wade, P. R., & Rugh, D. J. (2005). Historic and current habitat use by North Pacific right whales Eubalaena japonica in the Bering Sea and Gulf of Alaska. Mammal Review, 35, 129-155. http://dx.doi.org/10.1111/j.1365-2907.2005.00065.x
Sherman, K., & Alexander, L. M. (Eds.). (1986). Variability and management of large marine ecosystems (AAAS Selected Symposium 99). Boulder, CO: Westview Press.
Smith, M. A. (2010). Arctic marine synthesis: Atlas of the Chukchi and Beaufort Seas. Anchorage: Audubon Alaska and Oceana.
Solangi, M. A., & Dukes, G. E. (1983). Atlantic bottle-nose dolphin, Tursiops truncatus herd studies in the Mississippi Sound, USA: Capture, freeze marking and biological sampling (Final Report, NMFS Contract No. NA82-GA-C-00023). Pascagoula, MA: National Marine Fisheries Service.
Speakman, T., Zolman, E., Adams, J., Defran, R. H., Laska, D., Schwacke, L., . . . Fair, P. (2006). Temporal and spa-tial aspects of bottlenose dolphin occurrence in coastal and estuarine waters near Charleston, South Carolina. Silver Spring, MD: Center for Coastal Environmental Health and Biomolecular Research, NOAA/NOS/NCCOS.
Springer, A. M., McRoy, C. P., & Flint, M. V. (1996). The Bering Sea Green Belt: Shelf edge processes and eco-system production. Fish Oceanography, 5, 205-223. http://dx.doi.org/10.1111/j.1365-2419.1996.tb00118.x
Stafford, K. M., Mellinger, D. K., Moore, S. E., & Fox, C. G. (2007). Seasonal variability and detection range model-ing of baleen whale calls in the Gulf of Alaska, 1999-2002. The Journal of the Acoustical Society of America, 122(6), 3378-3390. http://dx.doi.org/10.1121/1.2799905
Stafford, K. M., Moore, S. E., Stabeno, P. J., Holliday, D. V., Napp, J. M., & Mellinger, D. K. (2010). Biophysical ocean observation in the southeastern Bering Sea. Geophysical Research Letters, 37(2), L02606. http://dx.doi.org/10.1029/2009GL040724
Steeves, T. E., Darling, J. D., Rosel, P. E., Schaeff, C. M., & Fleischer, R. C. (2001). Preliminary analy-sis of mitochondrial DNA variation in a southern feeding group of Eastern North Pacific gray whales. Conservation Genetics, 2, 379-384. http://dx.doi.org/ 10.1023/A:1012590315579
Straley, J. M. (1990). Fall and winter occurrence of hump-back whales (Megaptera novaeangliae) in southeastern

Alaska. Individual recognition of Cetacea: Use of pho-toidentification and other techniques to estimate popu-lation parameters. In P. S. Hammond, S. A. Mizroch, & G. P. Donovan (Eds.), Reports of the International Whaling Commission, Special Issue 12, 319-323.
Straley, J. M. (1994). Seasonal characteristics of hump-back whales (Megaptera novaeangliae) in southeastern Alaska (Master of Science thesis). University of Alaska Fairbanks. 121 pp.
Straley, J. M., Gabriele, C. M., & Baker, C. S. (1994). Annual reproduction by individually identified hump-back whales (Megaptera novaeangliae) in Alaskan waters. Marine Mammal Science, 10, 87-92. http://dx.doi.org/10.1111/j.1748-7692.1994.tb00392.x
Straley, J. M., Gabriele, C. M., & Baker, C. S. (1995). Seasonal characteristics of humpback whales (Megaptera novaeangliae) in southeastern Alaska. In D. Engstrom (Ed.), Proceedings of the Third Glacier Bay Science Symposium 1993 (pp. 229-238). Anchorage, AK: National Park Service.
Sumich, J. L. (1986). Growth in young gray whales (Eschrichtius robustus). Marine Mammal Science, 2(2), 145-152. http://dx.doi.org/10.1111/j.1748-7692.1986.tb 00035.x
Suydam, R. S. (2009). Age, growth, reproduction, and movements of belugas whales (Delphinapterus leucas) from the eastern Chukchi Sea (Doctoral dissertation). University of Washington, Seattle. Retrieved 3 February 2015 from www.north-slope.org/assets/images/uploads/suydam_dissertation2009.pdf.
Suydam, R., Lowry, L. F., & Frost, K. J. (2005). Distribution and movements of beluga whales from the Eastern Chukchi Sea stock during summer and early autumn (OCS STUDY MMS 2005-035). Final Report prepared for U.S. Department of the Interior, Minerals Management Service, Alaska Outer Continental Shelf Region. 39 pp.
Suydam, R. S., Lowry, L. F., Frost, K. J., O’Corry-Crowe, G. M., & Pikok, Jr., D. (2001). Satellite tracking of eastern Chukchi Sea beluga whales in the Arctic Ocean. Arctic, 54(3), 237-243. http://dx.doi.org/10.14430/arctic784
Swartz, S. L., Taylor, B. L., & Rugh, D. J. (2006). Gray whale Eschrichtius robustus population and stock identity. Mammal Review, 36, 66-84. http://dx.doi.org/ 10.1111/j.1365-2907.2006.00082.x
Swingle, W. M., Barco, S. G., Pitchford, T. D., McLellan, W. A., & Pabst, D. (1993). Appearance of juvenile hump-back whales feeding in the nearshore waters of Virginia. Marine Mammal Science, 9(3), 309-315. http://dx.doi.org/10.1111/j.1748-7692.1993.tb00458.x
Teck, S. J., Halpern, B. S., Kappel, C. V., Micheli, F., Selkoe, K. A., Crain, C. M., . . . Cooke, R. (2010). Using expert judgment to estimate marine ecosystem vulnera-bility in the California Current. Ecological Applications, 20(5), 1402-1416. http://dx.doi.org/10.1890/09-1173.1
Torres, L. G., & Read, A. J. (2009). Where to catch a fish? The influence of foraging tactics on the ecology of bottlenose dolphins (Tursiops truncatus) in Florida
Bay, Florida. Marine Mammal Science, 25(4), 797-815. http://dx.doi.org/10.1111/j.1748-7692.2009.00297.x
Torres, L. G., Rosel, P. E., D’Agrosa, C., & Read, A. J. (2003). Improving management of overlapping bottle-nose dolphin ecotypes through spatial analysis and genetics. Marine Mammal Science, 19(3), 502-514. http://dx.doi.org/10.1111/j.1748-7692.2003.tb01317.x
Townsend, C. H. (1935). The distribution of certain whales as shown by logbook records of American whaleships. Zoologica, 19, 1-50.
Tynan, C. (2004). Cetacean populations on the SE Bering Sea shelf during the late 1990s: Implications for decadal changes in ecosystem structure and carbon flow. Marine Ecology Progress Series, 272, 281-300. http://dx.doi.org/10.3354/meps272281
Tynan, C. T., DeMaster, D. P., & Peterson, W. T. (2001). Endangered right whales on the southeastern Bering Sea shelf. Science, 294, 1894. http://dx.doi.org/10.1126/sci-ence.1065682
Tyson, R. B., Nowacek, S. M., & Nowacek, D. P. (2011). Community structure and abundance of bottlenose dol-phins Tursiops truncatus in coastal waters of the north-east Gulf of Mexico. Marine Ecology Progress Series, 438, 253-265. http://dx.doi.org/10.3354/meps09292
Urbán R., J., Weller, D., Tyurneva, O., Swartz, S., Bradford, A., Yakovlev, Y., . . . Gómez-Gallardo U. A. (2012). Report on the photographic comparison of the western and Mexican gray whale catalogues (Paper SC/64/BRG13). Presented to the International Whaling Commission Scientific Committee.
Urian, K. W., Hohn, A. A., & Hansen, L. J. (1999). Status of the photo-identification catalog of coastal bottlenose dolphins of the western North Atlantic: Report of a workshop of catalog contributors (NOAA Technical Memorandum NMFS-SEFSC-425). Washington, DC: National Oceanic and Atmospheric Administration.
Urian, K. W., Hofmann, S., Wells, R. S., & Read, A. J. (2009). Fine-scale population structure of bottlenose dolphins (Tursiops truncatus) in Tampa Bay, Florida. Marine Mammal Science, 25(3), 619-638. http://dx.doi.org/10.1111/j.1748-7692.2009.00284.x
Van Cise, A. M., Martien, K. K., Baird, R. W., Robertson, K. M., Chivers, S. J., & Morin, P. A. (2013). Mitochondrial diversity in short-finned pilot whales in the Pacific Ocean: Evidence of multiple genetically distinct populations. 20th Biennial Conference on the Biology of Marine Mammals, December 2013, Dunedin, New Zealand.
Vollmer, N. L. (2011). Population structure of common bottlenose dolphins in coastal and offshore waters of the Gulf of Mexico revealed by genetic and environmental analysis (Doctoral dissertation). University of Louisiana at Lafayette.
von Ziegesar, O., Goodwin, B., & DeVito, R. (2001). A catalog of humpback whales in Prince William Sound, Alaska 1977 to 2001. Homer, AK: Eye of the Whale Research.
Vu, E. T., Risch, D., Clark, C. W., Gaylord, S., Hatch, L. T., Thompson, M. A., . . . Van Parijs, S. M. (2012).
126 Literature Cited

Literature Cited 127
Humpback whale song occurs extensively on feeding grounds in the western North Atlantic Ocean. Aquatic Biology, 14, 175-183.
Wade, P. R., De Robertis, A., Hough, K. R., Booth, R., Kennedy, A., LeDuc, R. G., . . . Wilson, C. (2011a). Rare detections of North Pacific right whales in the Gulf of Alaska, with observations of their potential prey. Endangered Species Research, 13, 99-109. http://dx.doi.org/10.3354/esr00324
Wade, P. R., Heide-Jørgensen, M. P., Barlow, J., Carretta, J., Durban, J., LeDuc, R., . . . Sauter, A. (2006). Acoustic detection and satellite tracking leads to discovery of rare concentration of endangered North Pacific right whales. Biology Letters, 2, 417-419. http://dx.doi.org/10.1098/rsbl.2006.0460
Wade, P., Kennedy, A., LeDuc, R., Barlow, J., Carretta, J., Shelden, K., . . . Clapham, P. J. (2011b). The world’s smallest whale population? Biology Letters, 7, 83-85. http://dx.doi.org/10.1098/rsbl.2010.0477
Waite, J. M., Wynne, K., & Mellinger, D. K. (2003). Documented sightings of a North Pacific right whale in the Gulf of Alaska and post-sighting acoustic mod-eling. Northwest Nature, 84, 38-43. http://dx.doi.org/ 10.2307/3536721
Waite, J. M., Dahlheim, M. E., Hobbs, R. C., Mizroch, S. A., von Ziegesar-Matkin, O., Straley, J., . . . Jacobsen, J. (1999). Evidence of a feeding aggregation of humpback whales (Megaptera novaeangliae) around Kodiak Island, Alaska. Marine Mammal Science, 15, 210-220. http://dx. doi.org/10.1111/j.1748-7692.1999.tb00792.x
Waring, G. T., Josephson, E., Maze-Foley, K., & Rosel, P. E. (2013). U.S. Atlantic and Gulf of Mexico marine mammal stock assessments – 2012 (SAR No. TM 223). Woods Hole, MA: Northeast Fisheries Science Center.
Waring, G. T., Josephson, E., Maze-Foley, K., & Rosel, P. E. (2014). U.S. Atlantic and Gulf of Mexico marine mammal stock assessments – 2013 (SAR No. TM 228). Woods Hole, MA: Northeast Fisheries Science Center.
Weinrich, M. T. (1991). Long term stability in grouping patterns of humpback whales (Megaptera novaean-gliae) in the southern Gulf of Maine. Canadian Journal of Zoology, 69, 3012-3019. http://dx.doi.org/10.1139/z91-424; http://dx.doi.org/10.1139/z91-425
Weinrich, M. T., & Kuhlberg, A. E. (1991). Short-term association patterns of humpback whale (Megaptera novaeangliae) groups on their feeding grounds in the southern Gulf of Maine. Canadian Journal of Zoology, 69(12), 3005-3011. http://dx.doi.org/10.1139/z91-424
Weinrich, M. T., Kenney, R. D., & Hamilton, P. K. (2000). Right whales (Eubalaena glacialis) on Jeffreys Ledge: A habitat of unrecognized importance? Marine Mammal Science, 16(2), 326-337. http://dx.doi.org/10.1111/j.1748-7692.2000.tb00928.x
Weinrich, M., Martin, M., Griffiths, R., Bove, J., & Schilling, M. (1997). A shift in distribution of hump-back whales, Megaptera novaeangliae, in response to prey in the southern Gulf of Maine. Fishery Bulletin, 95(4), 826-836.
Weller, D. W. (1998). Global and regional variation in the biology and behavior of bottlenose dolphins (Doctoral dissertation). Texas A&M University, College Station. Retrieved 11 February 2015 from http://search.proquest.com/pqdtft/docview/304480392/a b s t r a c t / 1 3 A 3 C F 9 7 2 4 3 5 0 4 0 5 3 6 4 / 4 ? a c c o u n t id=10598.
Weller, D. W., & Brownell, R. L., Jr. (2012). A re-evalua-tion of gray whale records in the western North Pacific (Paper SC/64/BRG10). Presented to the International Whaling Commission Scientific Committee.
Weller, D. W., Würsig, B., Bradford, A. L., Burdin, A. M., Blokhin, S. A., Minakuchi, H., & Brownell, R. L., Jr. (1999). Gray whales (Eschrichtius robustus) off Sakhalin Island, Russia: Seasonal and annual patterns of occurrence. Marine Mammal Science, 15, 1208-1227. http://dx.doi.org/10.1111/j.1748-7692.1999.tb00886.x
Weller, D. W., Bradford, A. L., Lang, A. R., Kim, H. W., Sidorenko, M., Tsidulko, G. A., . . . Brownell, R. L., Jr. (2008). Status of western gray whales off northeastern Sakhalin Island, Russia, in 2007 (Paper SC/60/BRG3). Presented to the International Whaling Commission Scientific Committee. (Unpublished)
Weller, D. W., Klimek, A., Bradford, A. L., Calambokidis, J., Lang, A. R., Gisborne, B., . . . Brownell, R. L., Jr. (2011). Movements of western gray whales from the Okhotsk Sea to the eastern North Pacific (Paper SC/63/BRG6). Presented to the International Whaling Commission Scientific Committee.
Weller, D. W., Klimek, A., Bradford, A. L., Calambokidis, J., Lang, A. R., Gisborne, B., … Brownell, R. L., Jr. (2012). Movements of gray whales between the western and eastern North Pacific. Endangered Species Research, 18, 193-199. http://dx.doi.org/10.3354/esr00447
Wells, R. S. (1986a). Population structure of bottlenose dolphins: Behavioral studies along the central west coast of Florida (Contract Report to National Marine Fisheries Service, Southeast Fisheries Center. Contract No. 45-WCNF-5-003BB). 58 pp.
Wells, R. S. (1986b). Structural aspects of dolphin societ-ies. Santa Cruz: University of California, Santa Cruz.
Wells, R. S. (1991). The role of long-term study in under-standing the social structure of a bottlenose dolphin com-munity. In K. Pryor & K. S. Norris (Eds.), Dolphin soci-eties: Discoveries and puzzles (pp. 199-225). Berkeley: University of California Press.
Wells, R. S. (2003). Dolphin social complexity: Lessons from long-term study and life history. In F. B. M. de Waal & P. L. Tyack (Eds.), Animal social complex-ity: Intelligence, culture, and individualized societies (pp. 32-56). Cambridge, MA: Harvard University Press. http://dx.doi.org/10.4159/harvard.9780674419131.c4
Wells, R. S., Scott, M. D., & Irvine, A. B. (1987). The social structure of free-ranging bottlenose dolphins. In H. H. Genoways (Ed.), Current mammalogy (Vol. 1, pp. 247-305). New York: Plenum Press. http://dx.doi.org/10.1007/978-1-4757-9909-5_7

Wells, R. S., Bassos, M. K., Urian, K. W., Carr, W. J., & Scott, M. D. (1996a). Low-level monitoring of bottle-nose dolphins, Tursiops truncatus, in Charlotte Harbor, Florida: 1990-1994 (NOAA Technical Memorandum No. NMFS-SEFSC-384). 36 pp.
Wells, R. S., Urian, K. W., Read, A. J., Bassos, M. K., Carr, W. J., & Scott, M. D. (1996b). Low-level monitoring of bottlenose dolphins, Tursiops truncatus, in Tampa Bay, Florida: 1988-1993 (NOAA Technical Memorandum No. NMFS-SEFSC-385). 36 pp.
Wells, R. S., Bassos, M. K., Urian, K. W., Shane, S. H., Owne, E. C. G., Weiss, C. F., . . . Scott, M. D. (1997). Low-level monitoring of bottlenose dolphins, Tursiops truncatus, in Pine Island Sound, Florida: 1996 (Contract report of NMFS-SEFSC No. 40-WCNF601958).
Wessel, P., & Smith, W. H. F. (1996). A global self-con-sistent, hierarchical, high-resolution shoreline database. Journal of Geophysical Research, 101(B4), 8741-8743. http://dx.doi.org/10.1029/96JB00104
Westgate, A. J., Read, A. J., Cox, T. M., Schofield, T. D., Whitaker, B. R., & Anderson, K. E. (1998). Monitoring a rehabilitated harbor porpoise using satellite telemetry. Marine Mammal Science, 14(3), 599-604. http://dx.doi.org/10.1111/j.1748-7692.1998.tb00746.x
Whitt, A. D., Dudzinski, K. D., & Lalibert, J. R. (2013). North Atlantic right whale distribution and seasonal occurrence in nearshore waters off New Jersey, USA, and implications for management. Endangered Species Research, 20(1), 59-69. http://dx.doi.org/10.3354/esr00486
Wiley, D. N., Asmutis, R. A., Pitchford, T. D., & Gannon, D. P. (1995). Stranding and mortality of humpback whales, Megaptera novaeangliae, in the mid-Atlantic and southeast United States, 1985-1992. Fishery Bulletin, 93(1), 196-205.
Witteveen, B. H., Wynne, K. M., & Quinn II, T. J. (2007). A feeding aggregation of humpback whales (Megaptera novaeangliae) near Kodiak Island, Alaska: Current and historic abundance estimation. Alaska Fisheries Research Bulletin, 12(2), 187-196.
Witteveen, B. H., Worthy, G. A. J., Foy, R. J., & Wynne, K. M. (2011a). Modeling the diet of humpback whales: An approach using stable carbon and nitrogen isotopes in a Bayesian mixing model. Marine Mammal Science, 28(3), E233-250. http://dx.doi.org/10.1111/j.1748-7692. 2011.00508.x
Witteveen, B. H., Straley, J. M., von Ziegesar, O., Steel, D., & Scott Baker, C. (2004). Abundance and mtDNA differentiation of humpback whales (Megaptera novae-angliae) in the Shumagin Islands, Alaska. Canadian Journal of Zoology, 82, 1352-1359. http://dx.doi.org/ 10.1139/z04-120
Witteveen, B. H., Straley, J. M., Chenoweth, E., Baker, C. S., Barlow, J., Matkin, C., . . . Hirons, A. (2011b). Using movements, genetics and trophic ecology to differentiate inshore from offshore aggregations of humpback whales in the Gulf of Alaska. Endangered Species Research, 14, 217-225. http://dx.doi.org/10.3354/esr00351
Woodworth, P. A., Schorr, G. S., Baird, R. W., Webster, D. L., McSweeney, D. J., Hanson, M. B., . . . Polovina, J. J. (2011). Eddies as offshore foraging grounds for melon-headed whales (Peponocephala electra). Marine Mammal Science, 28, 638-647. http://dx.doi.org/10.1111/j.1748-7692.2011.00509.x
Wynne, K., & Witteveen, B. H. (2005). Opportunistic aerial sightings of large whales within Steller sea lion critical habitat in the Kodiak archipelago. In K Wynne, R. J. Foy, & C. L. Buck (Eds.), Gulf Apex Predator-Prey Study (GAP) final report FY 2001-2003 (NOAA Grant NA16FX1270, pp. 105-119). Fairbanks: University of Alaska Fairbanks.
Wynne, K., & Witteveen, B. H. (2013). GAP09: Whales as sentinels in a changing environment (Final Comprehensive Report, NOAA Federal Program Award Number NA09NMF4390339). Available from UAF School of Fisheries and Ocean Sciences, Kodiak Seafood and Marine Science Center, Kodiak, AK.
Zani, M. A., Taylor, J. K. D., & Kraus, S. D. (2008). Observation of a right whale (Eubalaena glacia-lis) birth in the coastal waters of the southeast United States. Aquatic Mammals, 34(1), 21-24. http://dx.doi.org/10.1578/AM.34.1.2008.21
Zeh, J. E., Clark, C. W., George, J. C., Withrow, D., Carroll, G. M., & Koski, W. R. (1993). Current population size and dynamics. In J. J. Burns, J. J. Montague, & C. J. Cowles (Eds.), The bowhead whale (Special Publication Number 2, pp. 409-489). Lawrence, KS: The Society for Marine Mammalogy.
Zerbini, A. N., Waite, J. M., Laake, J. L., & Wade, P. R. (2006). Abundance, trends and distribution of baleen whales off Western Alaska and the central Aleutian Islands. Deep-Sea Research Part I, 53, 1772-1790. http://dx.doi.org/10.1016/j.dsr.2006.08.009
128 Literature Cited