Les brèches associées aux gisements d'uranium de type ...
351
HAL Id: tel-01749830 https://hal.univ-lorraine.fr/tel-01749830 Submitted on 29 Mar 2018 HAL is a multi-disciplinary open access archive for the deposit and dissemination of sci- entific research documents, whether they are pub- lished or not. The documents may come from teaching and research institutions in France or abroad, or from public or private research centers. L’archive ouverte pluridisciplinaire HAL, est destinée au dépôt et à la diffusion de documents scientifiques de niveau recherche, publiés ou non, émanant des établissements d’enseignement et de recherche français ou étrangers, des laboratoires publics ou privés. Les brèches associées aux gisements d’uranium de type discordance du bassin Athabasca (Saskatchewan, Canada) Guillaume Lorilleux To cite this version: Guillaume Lorilleux. Les brèches associées aux gisements d’uranium de type discordance du bassin Athabasca (Saskatchewan, Canada). Sciences de la Terre. Institut National Polytechnique de Lor- raine, 2001. Français. NNT : 2001INPL007N. tel-01749830
-
Upload
khangminh22 -
Category
Documents
-
view
0 -
download
0
Transcript of Les brèches associées aux gisements d'uranium de type ...
HAL Id: tel-01749830https://hal.univ-lorraine.fr/tel-01749830
Submitted on 29 Mar 2018
HAL is a multi-disciplinary open accessarchive for the deposit and dissemination of sci-entific research documents, whether they are pub-lished or not. The documents may come fromteaching and research institutions in France orabroad, or from public or private research centers.
L’archive ouverte pluridisciplinaire HAL, estdestinée au dépôt et à la diffusion de documentsscientifiques de niveau recherche, publiés ou non,émanant des établissements d’enseignement et derecherche français ou étrangers, des laboratoirespublics ou privés.
Les brèches associées aux gisements d’uranium de typediscordance du bassin Athabasca (Saskatchewan,
Canada)Guillaume Lorilleux
To cite this version:Guillaume Lorilleux. Les brèches associées aux gisements d’uranium de type discordance du bassinAthabasca (Saskatchewan, Canada). Sciences de la Terre. Institut National Polytechnique de Lor-raine, 2001. Français. �NNT : 2001INPL007N�. �tel-01749830�
AVERTISSEMENT
Ce document est le fruit d'un long travail approuvé par le jury de soutenance et mis à disposition de l'ensemble de la communauté universitaire élargie. Il est soumis à la propriété intellectuelle de l'auteur. Ceci implique une obligation de citation et de référencement lors de l’utilisation de ce document. D'autre part, toute contrefaçon, plagiat, reproduction illicite encourt une poursuite pénale. Contact : [email protected]
LIENS Code de la Propriété Intellectuelle. articles L 122. 4 Code de la Propriété Intellectuelle. articles L 335.2- L 335.10 http://www.cfcopies.com/V2/leg/leg_droi.php http://www.culture.gouv.fr/culture/infos-pratiques/droits/protection.htm
o-ii'W pLoo·-t N
QD ~,{ Lo~ ·, LlEù'i) Gr -
in pl nancy
Ecole Doctorale RP2E (Sciences et Ingénierie des Ressources, Produits, Procédés, Environnement)
THE SE
Présentée pour l'obtention du titre de
Docteur de l'Institut National Polytechnique de Lorraine Spécialité : Géosciences
par
creg1u
1
S .rvice Commun de fa Documentation I ,. L
Guillaume LORILLEUX .Naucy-Brabms
LES BRECHES ASSOCIEES AUX GISEMENTS D'URANIUM DE TYPE DISCORDANCE DU BASSIN
ATHABASCA (SASKATCHEWAN, CANADA)
Soutenue publiquement, le 16 Février 2001 devant la Commission d'Examen
JURY
MM. l-J. ROYER, Ingénieur de Recherche au CNRS, CRPG, Nancy M. CUNEY, Directeur de Recherche au CNRS, UMR G2R, Nancy M. JEBRAK, Professeur, Université du Québec à Montréal, Canada K. KYSER, Professeur, Université de Queen, Kingston, Canada M. PAGEL, Professeur, Université Paris Sud XI J. MONDY, Responsable Régional Exploration, COGEMA, Vélizy V. MOULIN, Ingénieur, CEA
UMR G2R 7566- Géologie et Gestion des Ressources Minérales et Energétiques
Président Directeur de Thèse Co-Directeur de Thèse Rapporteur Rapporteur Examinateur Examinatrice
Université Henri Poincaré Nancy 1, Faculté des Sciences, BP 239, 54506 Vandoeuvre les Nancy Cedex

A~va~n~t~-p~r~o~p~o~s ___________________________________________________________ 3
Avant-propos
Le sujet de ce travail de doctorat est né en 1997 alors que je participais à la campagne
d'exploration de COGEMA Resources Inc (CRI) à Shea Creek dans le Bassin Athabasca
(Nord-Saskatchewan, Canada) en tant qu'élève-ingénieur à l'ENSG. Le développement
important des brèches associées aux minéralisations uranifères à Shea Creek conduisit
Monsieur J. MONDY, alors Vice-Président d'exploration de CRI, à me proposer de réaliser
une thèse sur les brèches associées aux gisements d'uranium de type discordance en me basant
essentiellement sur 1' étude des brèches de Shea Cree k.
La première année de thèse de Janvier 1998 à Janvier 1999 s'est déroulée au Canada dans
le cadre de la Coopération du Service National en Entreprise (CSNE) à la COGEMA au sein
du département d'exploration de CRI. Elle fut consacrée dans sa quasi-totalité au travail
d'observation, de mesure et d'échantillonnage à Shea Creek ainsi que dans la Mine à Ciel
Ouvert (MCO) de Sue C.
Les études de laboratoire sur les échantillons sélectionnés ont été réalisées en 1999 et 2000
au CREGU et à 1 'UMR G2R. Deux visites de terrain, au printemps de chaque année, ont
permis d'affiner la compréhension des brèches en levant les nouveaux forages d'exploration à
Shea Creek et les nouveaux bancs de la MCO de Sue C. La zone de Maw fut visitée en 1999.
Je remercie l'UMR G2R, dirigé par Monsieur P. LANDAIS, le CREGU, dirigé par
Monsieur P. SCHUMACHER, le département d'exploration de COGEMA Resources Inc,
dirigé par Monsieur J.-C. RIPPERT, le Groupe des Sciences de la Terre (GST) de COGEMA,
dirigé par Monsieur P. BRUNETON, ainsi que le Département des Sciences de la Terre de
l'UQAM, dirigé par Monsieur M. JEBRAK, pour m'avoir accueilli et donné les moyens
humains et techniques de mener à bien cette étude.
Je voudrais également remercier la COGEMA et le CEA qui ont financé les travaux de
cette thèse. Ce travail a aussi bénéficié du soutien financier du CNRS pour une partie de la
bourse de thèse BDI CNRS/Entreprise.
Je tiens à exprimer mes plus sincères remerciements à tous les membres qui composent le
jury et qui ont accepté de juger ce travail :
Monsieur M. CUNEY, Directeur de Recherches au CNRS, a dirigé ma thèse pendant ces 3
années. Il a su me faire partager ses connaissances étendues de la métallogénie de l'uranium et
me sensibiliser aux subtilités des bilans de masse géochimiques. J'ai apprécié son
4--------------------------------------------------------~A~va~n~t~-p~r~o~p~os
enthousiasme et sa grande disponibilité. Je lui expnme, 1c1, toute ma gratitude pour sa
constante attention aux travaux développés pendant cette thèse.
Monsieur M. JEBRAK, Professeur et Directeur du Département des Sciences de la Terre
et de l'Atmosphère de l'Université du Québec à Montréal (UQAM), a co-dirigé ma thèse
pendant ces 3 années. Je le remercie pour son accueil chaleureux à l'UQAM pendant 2
semaines en Décembre 1998. Malgré la distance séparant Montréal de Nancy, il m'a beaucoup
appris à la fois sur le plan de la connaissance et de la méthode, grâce à la grande richesse de
chacune de nos rencontres ainsi qu'aux fréquents échanges de courriers électroniques. Il m'a
convaincu de l'importance de comprendre les phénomènes géologiques sur le terrain et m'a
fait bénéficier de ses connaissances et de son expérience de la géologie structurale et de
l'étude des brèches. Je tiens à lui exprimer toute ma gratitude.
Monsieur K. KYSER, Professeur à l'Université de Queen à Kingston, m'a fait l'honneur
de m'inviter à présenter mes travaux de recherche à Geocanada2000, la réunion annuelle des
associations géologiques et minéralogiques du Canada (AGC-AMC) qui a eu lieu en Mai
2000. Je lui suis reconnaissant de bien vouloir juger ce travail.
Monsieur M. PAGEL, Professeur à l'Université de Paris Sud XI, a accepté de juger ce
mémoire, je 1' en remercie sincèrement.
Monsieur J.J. ROYER, Ingénieur de Recherche au CNRS, m'a fait bénéficier de son
expérience de la modélisation avec gücad ainsi que de ses connaissances sur la thermicité des
bassins. Il rn' a fait l'honneur d'accepter d'examiner ce mémoire et je lui en suis reconnaissant.
Monsieur J. MONDY, Responsable Régional d'Exploration pour l'Australie à la
COGEMA, est l'initiateur de ce travail. J'ai pu bénéficier de son expérience de la géologie des
gisements d'uranium ainsi que de son point de vue sur mes travaux au cours des réunions
d'état d'avancement de la thèse qui ont eu lieu régulièrement pendant ces 3 années. Je le
remercie d'avoir accepté la réalisation de cette thèse sous forme de recueil de publications
scientifiques et de bien vouloir examiner ce mémoire. Je lui exprime, ici, ma vive
reconnaissance.
Madame V. MOULIN, Ingénieur au CEA, a accepté d'examiner ce travail, Je l'en
remercie.
A~v~an~t~-p~r~o~~~o=s __________________________________________________________ 5
J'adresse mes sincères remerciements aux personnes qui, par leur contribution, à divers
titres, m'ont aidé à accomplir ce travail :
Monsieur P. BRUNETON, Chef du Groupe des Sciences de la Terre (GST) de COGEMA,
qui m'a accueilli dans les locaux du GST à Bessines/Gartempe, qui m'a fait bénéficier de ses
connaissances sur la géologie des gisements et en particulier sur les altérations associées aux
minéralisations et avec lequel j'ai eu plaisir à interagir régulièrement au cours de ces 3 années.
Monsieur J.-C. RIPPERT, Vice-Président d'Exploration de CRI, qui m'a accueilli pendant
15 mois au Département d'Exploration de CRI, qui m'a donné des moyens conséquents sur le
terrain pour mener à bien mes travaux et avec lequel j'ai eu plaisir à collaborer.
Monsieur P. PORTELLA, Responsable d'Exploration de l'Est-Athabasca pour CRI, qui
m'a appris à lever efficacement les carottes de forage et avec lequel j'ai eu des discussions
fructueuses.
Monsieur D. BAUDEMONT, Géologue Structuraliste à CRI, avec lequel j'ai eu plaisir à
travailler à l'interprétation de la zone de Anne à Shea Creek.
Monsieur J. REYX, Ingénieur COGEMA au GST, qui m'a apporté des informations
précieuses sur la métallographie des minéralisations uranifères.
Monsieur K. WHEATLEY, Géologue d'Exploration à CRI, avec lequel j'ai eu des
discussions intéressantes sur la genèse des gisements et qui a amélioré la qualité de l'anglais
de certaines parties du mémoire.
Monsieur R. AUMAITRE, Président d'Exploration de COGEMA en 1998 et 1999, et
Monsieur E. KONING, Responsable d'Exploration de l'Ouest-Athabasca pour CRI, avec
lesquels j'ai eu plaisir à collaborer.
Monsieur C. LE CARLIER DE VESLUD, Ingénieur de Recherches au CNRS, qui, grâce à
sa persévérance, a réalisé un travail remarquable et unique de modélisation de corps de
brèches avec gOcad, et Monsieur D. BECEL, qui a également largement contribué à la
construction du modèle.
Mademoiselle D. BERUBE, qui a réalisé le programme de calcul des cartes de distances
euclidiennes et m'a appris la méthode d'analyse fractale des formes de fragments à l'UQAM.
6--------------------------------------------------------~A~va~n~t~-p~r~o~p~os
Mademoiselle C. PEIFFERT, qui a réalisé des calculs avec le code EQ3NR/EQ6 avec une
grande rapidité.
Madame C. PADFIELD, bibliothécaire de CRI, qui m'a aidé efficacement dans mes
recherches bibliographiques pendant mon séjour au Canada.
Messieurs S. WILSON, Géologue d'Exploitation à la MCO de Sue C, et B.
KARLSTADT, qui m'ont accueilli et aidé lors de mes visites dans la MCO.
Monsieur D. MACDOUGALL, Géologue du Saskatchewan Energy and Mines, qui m'a
aimablement prêté des lames minces de la zone de Maw en 1998.
Madame T. LHOMME, qui a pris beaucoup de soin à la réalisation et l'interprétation des
spectres Raman de kaolinite/dickite.
Madame S. BARDA et Messieurs A. KOHLER et F. DIOT du Service Commun
d'Analyses par Sondes Electroniques de 1 'Université Henri Poincaré, qui ont réalisé les
analyses et images à la microsonde électronique et au MEB.
Monsieur J. GHANBAJA, du Service Commun de Microscopie Electronique par
Transmission, qui a réalisé les analyses et images au MET.
Messieurs A. BOUCHET, F. RASSINEUX et D. MARCHAND qui ont réalisé et
interprété une partie des spectres de diffraction aux rayons X.
Monsieur D. FERRAND, litholamelleur à COGEMA, qui a réalisé des lames minces de
qualité sur des brèches souvent très friables.
Monsieur P. LAGRANGE, qui a réalisé des photographies d'échantillons de très bonne
qualité et qui m'a donné des conseils précieux pour mes présentations.
Les géologues du département d'exploration de CRI avec lesquels j'ai vécu de nombreux
mois dans le Nord canadien et qui m'ont permis de travailler dans la bonne humeur, en
particulier Messieurs J. ROBBINS, S. ERIKS, G. CHAPMAN, G. LEE, D. MORRISON, C.
REVERING et P. MUNHOLLAND.
~A~v~an~t~-p~ro~p~o~s~---------------------------------------------------------7
Je remercie enfin tous les chercheurs et chercheuses de l'UMR G2R avec lesquels j'ai eu
beaucoup de plaisir à interagir. Je remercie en particulier les membres de l'équipe de M.
CUNEY qui travaillent sur d'autres aspects de la genèse des gisements d'uranium de type
discordance et avec lesquels j'ai eu des discussions particulièrement fructueuses: M.
BROUAND, D. DEROME, L. HECHT, P. KISTER etC. PEIFFERT.
Je dédie ce mémoire à mes parents.


~R~és~u~m~e~'-----------------------------------------------------------------9
Résumé : Les gisements d'uranium de type discordance du Bassin Athabasca (Canada) sont fréquemment associés à des corps de brèches qui forment l'encaissant et enveloppent la minéralisation dans des grès quartzeux. Afin de comprendre les mécanismes de formation de ces brèches et leur rôle dans la genèse de ces gisements d'uranium, les brèches associées aux minéralisations en U du prospect de Shea Creek et de la Mine à Ciel Ouvert de Sue C, et à la minéralisation en Y, terres rares etUde la zone de Maw ont été étudiées. La cartographie structurale et la modélisation 3D mettent en évidence le contrôle de la géométrie des brèches par des failles généralement inverses et graphiteuses dans le socle. L'étude des paragenèses minérales et les calculs d'âges chimiques U-Pb à Shea Creek mettent en évidence 3 phases de bréchification à sudoite-dravite, à Fe-chlorite et à hématite-sidérite. Elles sont respectivement contemporaines de 3 épisodes de réactivations tectoniques et/ou de surrection du bassin entre 1,52 et 1,25 Ga pendant la principale phase de dépôt des minéralisations à haute teneur et vers 900 et 350 Ma au cours de remobilisations des minéralisations uranifères. Les brèches contemporaines de la genèse de la minéralisation primaire se sont formées en 3 stades caractérisées par l'analyse fractale des formes de fragments exprimant leur degré de maturité. Le premier stade de formation des brèches a été initiée par une réactivation des failles inverses à graphite qui a provoqué une fracturation tectonique localisée dans le cœur des failles et une fracturation hydraulique, plus étendue, dans les zones de silicification massive précoce des grès. Le deuxième stade correspond à la dissolution du quartz due à la circulation verticale d'un fluide de socle sous-saturé par rapport au quartz dans les grès fracturés. Les rapports fluide/roche minimaux calculés sont très élevés de l'ordre de 3 000 dans la zone de Maw et de 3 8 000 dans les zones à boules de Sue. Cette variation reflète la diminution de l'intensité de la dissolution avec la distance à la discordance. Le volume minimal de fluide de socle ayant circulé dans les brèches est de 1' ordre du kilomètre cube. Les calculs de bilans de masse montrent que les fluides ont apporté les éléments U, V, Mg, B, Al, K, Bi, Ni, Co, Mo, As, S, W, Zn, Y et terres rares, conformément aux néoformations d'illite, de sudoite magnésienne et de dravite et au caractère polymétallique des minéralisations dans les grès. Le troisième stade s'exprime par des phénomènes d'effondrements gravitaires faisant suite à la formation de cavités de dissolution du quartz. Dans les zones à boules développées dans le cœur des failles, c'est la contraction tectonique qui a progressivement refermé les espaces vides créés par la dissolution. Les pertes de volumes peuvent atteindre 90 % dans les zones de dissolution les plus intenses, proches de la discordance. Dans les zones de faille à très fort pendage, les effondrements se sont propagés jusqu'à plus de 250 rn au-dessus de la discordance comme dans la zone de Maw, de la même manière que dans un karst. La précipitation d'uranium provoquée par le mélange du fluide réducteur de socle sous-saturé par rapport au quartz (> 250°C) avec des fluides diagénétiques oxydants de bassin ( < 240°C) a eu lieu pendant un temps de l'ordre de plusieurs millions d'années, en liaison avec la dissolution progressive du quartz libérant l'espace nécessaire au piégeage des minéralisations massives.
Mots-clefs : brèche, uranium, discordance, grès, zone de faille, dissolution, bilans de masse, analyse fractale.
10--------------------------------------------------------------~R~e~s~u~m~é
Abstract : Unconformity-type uranium deposits in the Athabasca Basin (Canada) are cornrnonly hosted and surrounded by breccia bodies in quartzose sandstones. In order to understand the rnechanisrns of breccia formation and their significance for the genesis of uranium deposits, the breccias associated with U rnineralizations of the Shea Creek prospect and Sue C open pit, and with the Y-REE-U rnineralization ofthe Maw Zone were studied. Structural rnapping and 3D rnodeling evidence the control ofbreccia geometries by reverse faults that are graphite-rich in the basernent. The study of mineral paragenesis and calculations ofU-Pb chernical ages at Shea Creek reveal 3 breccia phases with sudoite-dravite, Fe-chlorite and hematite-siderite cements. These breccias developed over more than 1 Ga respectively during 3 stages of tectonic reactivations and/or basin uplift rnainly between 1.52 and 1.25 Ga during the main event of prirnary uranium deposition and at about 900 and 350 Ma during phases of uranium rernobilization. The breccias coeval with the genesis of the prirnary rnineralization developed in 3 stages characterized by fractal analysis of fragment shapes expressing their degree ofrnaturity. The first stage of breccia formation has been triggered by a reactivation of graphite-rich reverse faults inducing localized tectonic fracturing in the core of faults and widespread hydraulic fracturing in early silicified zones. The second stage corresponds to quartz dissolution due to the vertical circulation of a basernent fluid undersaturated relative to quartz in fractured sandstones. Calculated minimum fluid/rock ratios are very high with values of 3,000 at the Maw Zone and 38,000 in the Sue «zones à boules » reflecting the decrease of dissolution intensity with the increase of distance to the unconformity. The minimum volume ofbasernent fluids that have circulated through the breccias is about 1 krn3
. Mass balance calculations show an input ofU, V, Mg, B, Al, K, Bi, Ni, Co, Mo, As, S, W, Zn, Y and REE, in accordance with the new formation of illite, Mg-rich sudoite and dravite and with the polyrnetallic sandstone-hosted rnineralization. The third stage is expressed by gravity-driven collapse phenornenons resulting from the cavities created by quartz dissolution. In « zones à boule_s » developed in the core of faults, it is the tectonic contraction that progressively closed the open spaces formed by quartz dissolution. Volume loss values reach 90 % in zones of intense dissolution close to the unconformity. In steeply dipping fault zones, collapse propagated up to more than 250 rn above the unconformity as observed at the Maw Zone, like in a karst. Uranium deposition induced by rnixing of the reducing basernent fluid undersaturated relative to quartz (> 250°C) with diagenetic oxidizing basin fluids ( < 240°C) occurred during about several million years, sirnultaneously with quartz dissolution providing the space needed to form the massive rnineralizations.
Keywords : breccia , uranium, unconformity, sandstone, fault zone, dissolution, mass balance, fractal analysis.
TABLE DES MATIERES

~Ta~b~l~e~d~e~s~m~a~tz~·èr~e~s ____________________________________________________ 11
TABLE DES MATIERES
Page
Avant-propos ................................................................................................................................. 3
RESUME ET ABSTRACT ........................................................................................................... 9
TABLE DES MATIERES .......................................................................................................... 11 LISTE DES TABLEAUX ........................................................................................................... 15 LISTE DES FIGURES ................................................................................................................ 17
I. Introduction Générale ....................................................................................................... 25
II. Etude Structurale et Texturale des Brèches de Shea Creek ................................... 37
Introduction ................................................................................................................................ 3 7
Article 1 : Polyphase hydrothermal breccias associated with unconformity-type uranium mineralization (Canada) : from fractal analysis to structural significance. Lori/leux, G., Jébrak, M, Cuney, M, Baudemont, D. (Accepté dans Journal of Structural Geology) .................................................................. 41
Résumé .............................................................................................................................. 42 Abstract. ............................................................................................................................. 42
1. Introduction ................................................................................................................. 44 2. Methodology ............................................................................................................... 4 7 3. Geological context ...................................................................................................... 49 4. Description and mechanisms of formation of the breccias ......................................... 52
4.1. Microcrystalline quartz breccias ...................................................................... 52 4. 2. Sudoite-dravite breccias ................................................................................... 54 4.3. Fe-chlorite breccias .......................................................................................... 57 4. 4. Polyphase carbonate breccias .......................................................................... 60
5. Discussion ................................................................................................................... 61 5.1. Chronological relationships ............................................................................. 61 5. 2. Breccia maturation ........................................................................................... 62 5. 3. Fluid circulation and ore gene sis ..................................................................... 66 5. 4. Tectonic his tory ................................................................................................. 67
6. Conclusion .................................................................................................................. 68 Acknowledgments ............................................................................................................. 69 References ......................................................................................................................... 70
III. Etude Structurale, Minéralogique et Géochimique des Brèches de la Mine à Ciel Ouvert de Sue C ......................................................................................................... 75
Introduction ................................................................................................................................ 75
12 __________________________________________________ =T,=a=bl=e~d=e~s~m~a~t~iè~r~es
Article 2 : Chemical brecciation processes in the Sue unconformity-type uranium deposits, Eastern Athabasca Basin (Canada) Lorilleux, G., Cuney, M, Jébrak, M, Rippert, JC., Portella, P. (Soumis à Journal of Geochemical Exploration) ............................................................... 78
Résumé .............................................................................................................................. 79 Abstract .............................................................................................................................. 80
1. Introduction ................................................................................................................. 82 2. Methodology ............................................................................................................... 84 3. Geological setting ....................................................................................................... 84
3.1. Regional geology ............................................................................................... 84 3. 2. Local geology ... ................................................................................................. 86
4. «Zones à boules» characteristics ............................................................................... 87 4.1. Structural contrais ............................................................................................ 87 4. 2. Macroscopic texturai and petrographie characteristics ................................... 88 4. 3. Mineral ogy ........................................................................................................ 91
5. Temperature-composition relationships of illite minerais .......................................... 94 6. Mass balance calculations ........................................................................................... 95 7. Discussion ................................................................................................................. 1 0 1
7.1. Tectonic contrais ............................................................................................. 101 7. 2. Hydrothermal fluids .. ...................................................................................... 102 7.3. "Zones à boules" evolution and permeability control of deformation ........... 104
8. Conclusion ................................................................................................................ 107 Acknowledgments ........................................................................................................... 108 References ....................................................................................................................... 1 09
IV. Etude Structurale, Texturale, Minéralogique et Géochimique comparée des Brèches de la Maw Zone, de Shea Creek et de Sue : Implications pour la
' d M. ' 1· . U ·e:, genese es mera 1satwns ran11eres ........................................................................... 117
Introduction .............................................................................................................................. 118
Article 3: Hydrothermal breccias associated with unconformity-type uranium mineralizations in the Athabasca Basin: implications for fluid flow and mineralization (Canada) Lorilleux, G., Cuney, M, Jébrak, M, Mandy, J, Bruneton, P. (Version longue destinée à Economie Geology) .............................................................. 120
Résumé ............................................................................................................................ 121 Abstract. ........................................................................................................................... 122
1. Introduction ............................................................................................................... 125 2. Methodology ............................................................................................................. 128 3. Geological setting ..................................................................................................... 130
3.1. Geology of the base ment ................................................................................. 130 3.2. The Athabasca Basin ....................................................................................... 130 3.3. The Maw Zone ................................................................................................. 131 3.4. The Shea Creek area ....................................................................................... 133 3.5. The Sue deposits .............................................................................................. 136
~T,~ab~l~e~d~e~s~m~a~t~iè~r~es~----------------------------------------------------13
4. Breccia geometry and structural controls .................................................................. 138 4.1. The Maw Zone ................................................................................................. 138 4. 2. The Shea Creek are a ....................................................................................... 13 8 4. 3. The Sue C open pit .......................................................................................... 140
5. Breccia textures and maturity evolution ................................................................... 141 5.1. The Maw Zone ................................................................................................. 141 5. 2. The Shea Creek area ....................................................................................... 142 5.3. The Sue C open pit .......................................................................................... 143
6. Mineral ogy and chemical ages .................................................................................. 145 6.1. The Maw Zone ................................................................................................. 146 6. 2. The Shea Creek are a ....................................................................................... 14 7 6.3. The Sue C open pit .......................................................................................... 161
7. Mass balance calculations ......................................................................................... 163 7.1. The Maw Zone ................................................................................................. 168 7. 2. The Shea Creek are a ....................................................................................... 172 7. 3. The Sue C open pit .......................................................................................... 180
8. Discussion ................................................................................................................. 181 8.1. Evidence of repeated seismic activity over 1 Ga ............................................ 181 8.2. Porosity, permeability, fluid pressure evolution and basement fluid circulation .............................................................................................................. 183 8. 3. Origin of jluid undersaturation in silica ......................................................... 187 8. 4. Fluid temperatures .......................................................................................... 188 8. 5. Hydrothermal fluid volume and ti me of breccia formation ............................ 190 8. 6. Uranium deposition and basin fluid volume ................................................... 190 8. 7. Uranium mineralization-related chemical variations ..................................... 195 8. 8. Sandstone alteration models ........................................................................... 195
9. Conclusions ............................................................................................................... 196 Acknowledgments ......................................................................................................... 198 References ..................................................................................................................... 199
Article 4: Uranium-bearing breccias in the Athabasca Basin, Saskatchewan (Canada) - Hydrothermal karsts in Proterozoic sandstones Lorilleux, G., Jébrak, M, Cuney, M, LeCarlier de Veslud, C., Royer, J.J. (Version longue; soumis à Geology) .............................................................................. 209
Résumé ............................................................................................................................ 210 Abstract ............................................................................................................................ 21 0
1. Introduction ............................................................................................................... 212 2. Methodology ............................................................................................................. 213 3. Geological setting ..................................................................................................... 214 4. Results ....................................................................................................................... 214
4.1. Sue C open pit ................................................................................................. 214 4. 2. Shea Creek ...................................................................................................... 215 4.3. Maw Zone ........................................................................................................ 218 4. 4. Genesis of breccias ......................................................................................... 219
5. Discussion ................................................................................................................. 220 5.1. Vertical fluid flow and uranium entrapment ........ ........................................... 220 5. 2. Hydrothermal karsts ....................................................................................... 220 5. 3. Permeability evolution .................................................................................... 222
14 ______________________________________________________ ~T,=a=b=le~d=e=s~m==a~ti~è~re=s
6. Conclusion ................................................................................................................ 222 Acknowledgments ........................................................................................................... 223 References cited ............................................................................................................... 224
V. Conclusions Générales .................................................................................................. 227
REFERENCES BIBLIOGRAPHIQUES .................................................................................. 241
ANNEXE I: PLANCHES PHOTOGRAPHIQUES ................................................................. 259 Photographies d'échantillons de Shea Creek, de Sue et de la zone de Maw ............................................. 259
ANNEXE II : MODELE GOCAD DE LA ZONE DE ANNE A SHEA CREEK .................... 269 Introduction ................................................................................................................................. 269 Principaux apports du modèle ......................................................................................................... 271
ANNEXE III : METHODES DE CALCULS ........................................................................... 277 1: Bilans de masse ......................................................................................................................... 277 Introduction ................................................................................................................................. 277
1: 1. Mesure d'une densité globale ............................................................................................ 277 1:1:1. Mesure de la masse à sec ........................................................................................... 277 1:1:2. Mesure de la masse immergée« à sec» ........................................................................ 277 1:1:3. Calcul de la densité globale ....................................................................................... 278
1:2. Calculs des variations de volume et des facteurs d'enrichissement et de perte .............................. 280 II: Rapports fluide/roche et temps de formation des brèches .............................................................. 282 Introduction ................................................................................................................................. 282
II: 1. Rapport fluide/roche d'une brèche .................................................................................... 282 11:2. Temps de formation des brèches ....................................................................................... 283
ANNEXE IV : LISTE DES ECHANTILLONS ET RESULTATS D'ANALYSES ................ 285 Introduction ................................................................................................................................. 285 1: Etudes réalisées sur les différents échantillons de Shea Creek, de Sue et de la Maw Zone ................... 285 II: Description et classification des brèches de Shea Creek réalisée sur le terrain ................................. 288 III: Analyses de diffraction aux rayons X ........................................................................................ 294 IV: Analyses chimiques globales ICP-AES et -MS, densités ............................................................... 295 V: Analyses chimiques ponctuelles à la microsonde électronique ........................................................ 300 VI: Spectres Raman de kaolinite/dickite .......................................................................................... 319
LISTE DES TABLEAUX

L~~~w~d~es~ta~b~l~ea~ux~--------------------------------------------------------15
LISTE DES TABLEAUX
Liste des tableaux des publications
Article 1 : Polyphase hydrothermal breccias associated with unconformity-type uranium mineralization (Canada) :from fractal analysis to structural significance.
Page
Table 1 - Summary of the main characteristics of the four types of faults. . ............................................................... 51
Table 2- Summary of the main characteristics of the four types ofbreccias ...... , ....................................................... 53
Article 2 : Chemical brecciation processes in the Sue unconformity-type uranium deposits, Eastern Athabasca Basin (Canada).
Table 1.- Results of the density measurements and of the geochemical analysis of major and trace elements for samples 7, 1, 2, 3, 4, 5. The calculated average chemical composition (av.) ofthe protolith and wall rock samples is also presented. When values were less than the detection limit, the 2/3 value of the detection limit was systematically attributed. Sst = sandstone, distance= distance from the "zone à boules" ................................... 96
Table 2.- Average structural formulae and parameters (IC interlayer charge; OC octahedral charge) of Sue illites and of illites from rhyolites (R) and andesites (A) of Los Azufres for comparison (Cathelineau and Izquierdo 1988). All the iron present in the Sue illites is assumed to be Fe3
+ ............................................................. 97
Article 3 : Hydrothermal breccias associated with unconjormity-type uranium mineralizations in the Athabasca Basin: implications for jluid flow and mineralization (Canada).
Table 1.- Average half structural formula and IC parameter (interlayer charge) of Sue illites, Shea Creek chlorites and kaolinites. All the Fe present in the Sue illites and Shea Creek kaolinites is assumed to be trivalent whereas Fe in chlorites is assumed to be di valent. ....................................................................................... 164
Table 2.- Major and trace elements geochemical and density data for the Shea Creek and Maw Zone samples used for mass balance calculations. When values were Jess than the detection limit, the 2/3 value of the detection limit was systematically attributed ............................................................................................................. 167
Table 3.- Results of the norm calculations for the Shea Creek and Maw Zone samples. The matrix and volume loss percentages as well as the fluid/rock ratios are also given. The fluid/rock ratios have been calculated assuming a silica saturation of 90 % and 99 % at Shea Creek and at the Maw Zone, respectively ............................ l73
Article 4 : Uranium-bearing breccias in the Athabasca Basin, Saskatchewan (Canada) - Hydrothermal karsts in Proterozoic sandstones.
Table 1.- Solution-collapse breccia characteristics in the Athabasca Basin .............................................................. 217
Liste des tableaux de l'annexe IV Page
Tableau A/V-1 à AIV-4- Liste des travaux réalisés sur différents échantillons de Shea Creek ............................... 286
16 ______________________________________________________ -=L~is~t~e~d~e~s~ta~b~l~ea~ux~
Tableau AIV-5 - Liste des travaux réalisés sur les différents échantillons de Sue. . ................................................ .287
Tableau AIV-6- Liste des travaux réalisés sur les différents échantillons de la zone de Maw ................................. 287
Tableau AIV-7 à AIV-11 - Classification des brèches de Shea Creek à partir de 1' analyse des textures et de la nature des ciments. Microcryst.=Microcrystalline ..................................................................................................... 289
Tableau AIV-12- Tableau de résultats d'analyses de diffraction aux rayons X de la fraction inférieure à 2Jlm d'échantillons de brèches de Shea Creek ................................................................................................................... 294
Tableau AIV-13- Tableau de résultats d'analyses de diffraction aux rayons X d'échantillons de grès et de zones à boules provenant de la Mine à Ciel Ouvert de Sue C. La distance des échantillons par rapport à une zone à boules est indiquée en mètres. Les pourcentages donnés pour Je quartz sont très approximatifs ................... 294
Tableau AIV-14- Compositions en éléments majeurs (%massique d'oxydes) et en traces (en ppm) des grès et des argiles des zones à boules de la Mine à Ciel Ouvert de Sue C. La distance est celle qui sépare l'échantillon d'une zone à boules ............................................................................................................................... 296
Tableau AIV-15- Compositions en éléments majeurs(% massique d'oxydes) et en traces (en ppm) des grès de référence de l'Ouest Athabasca et des brèches de Shea Creek .............................................................................. 297
Tableau AIV-16- Compositions en éléments majeurs (% massique d'oxydes) et en traces (en ppm) des brèches de Shea Creek. .............................................................................................................................................. 298
Tableau AIV-17- Compositions en éléments majeurs(% massique d'oxydes) et en traces (en ppm) de grès et de brèches de la zone de Maw .................................................................................................................................. .299
Tableau AIV-18 à AIV-20 - Compositions en % et formules structurales des chlorites et kaolinites des remplissages de ciment de brèches à Shea Creek. Formules structurales calculées sur la base de 14 oxygènes. Le Fe des chlorites est supposé bivalent. (n.d. = non détecté) ................................................................................... 30 1
Tableau AIV-21 - Compositions en% et formules structurales des interstratifiés illite-chlorite au contact de la minéralisation uranifère à Shea Creek. Formules structurales calculées sur la base de 11 oxygènes. Le Fe est supposé trivalent. (n.d. =non détecté) ....................................................................................................................... 304
Tableau AIV-22- Compositions en% et formules structurales des illites de l'encaissant des zones à boules dans la Mine à Ciel Ouvert de Sue C. Formules structurales calculées sur la base de 11 oxygènes. Le Fe des illites est supposé trivalent. (n.d. = non détecté) ........................................................................................................ 305
Tableau AIV-23- Compositions en% et formules structurales des illites de l'encaissant des zones à boules et d'une boule illitisée dans la Mine à Ciel Ouvert de Sue C. Formules structurales calculées sur la base de 11 oxygènes. Le Fe des illites est supposé trivalent. (n.d. = non détecté) ....................................................................... 306
Tableau AIV-24 à AIV-28- Compositions en % d'un cristal d'uraninite provenant de la minéralisation à la discordance de Shea Creek. Les âges chimiques sont calculés à l'aide de la formule de Suzuki et Adachi (1994). (n.d. =non détecté) ....................................................................................................................................... 307
Tableau AIV-29 à AIV-30- Compositions en % d'uraninites et de coffinites provenant de la minéralisation à la discordance de Shea Creek. Les âges chimiques sont calculés à l'aide de la formule de Suzuki et Adachi (1994). (n.d. =non détecté) ....................................................................................................................................... 312
Tableau AIV-31 à AIV-33- Compositions en% d'uraninites, de pechblendes et de coffmites provenant de la minéralisation à la discordance de Shea Creek. Les âges chimiques sont calculés à l'aide de la formule de Suzuki et Adachi (1994). (n.d. =non détecté) ........................................................................................................... 314
Tableau AIV-34- Compositions en % d'uraninites, de pechblendes et de coffinites provenant de la minéralisation à la discordance de Shea Creek et de celle associée aux brèches à chlorite ferrifere. Les âges chimiques sont calculés à l'aide de la formule de Suzuki et Adachi (1994). (n.d. =non détecté) ............................. 317
Tableau AIV-35- Compositions en % d'uraninites, de pechblendes et de coffinites provenant de la minéralisation associée aux brèches à chlorite ferrifere et à hématite à Shea Creek. Les âges chimiques sont calculés à l'aide de la formule de Suzuki et Adachi (1994). (n.d. =non détecté) ..................................................... .318
LISTE DES FIGURES

L~is~te~d~e~s~fi~~~u~r~es~-----------------------------------------------------------17
LISTE DES FIGURES
Liste des figures hors publications
Page
Figure 1-1- Domaines tectoniques du bouclier canadien et position des bassins d'âge Protérozoïque Moyen (modifié de Hoffinan, 1989) ........................................................................................................................................ 27
Figure 1-2 - Unités crustales et domaines lithostructuraux du socle et principaux gisements d'uranium du Bassin Athabasca (modifié de Ruzicka, 1986). Les 3 étoiles montrent la position des 3 zones d'étude: les gisements de Sue à l'est, le prospect de Shea Creek à l'ouest et la zone de Maw au sud-est. Gisements et minéralisations: 1 = Rabbit Lake, 2 =Collins Bay, 3 = Eagle Point, 4 = Horseshoe and Raven, 5 =West Bear, 6 = McC!ean and Sue, 7 = JEB, 8 =Dawn Lake, 9 = Midwest, 10 = Cigar Lake, 11 = McArthur River, 12 = Key Lake, 13 = CluffLake, 14 =Maurice Bay, 15 =Fond-du-Lac, 16 = Shea Creek, 17 = Maw Zone ..................... 28
Figure /1-1 - Vue du SE du modèle gücad de la zone de Anne avec la discordance et les formations lithologiques dans les grès. Le dégradé de couleurs sur la discordance correspond aux variations de profondeur ................................................................................................................................................................... .38
Figure /1-2- Vue du NE du modèle structural complet.. ............................................................................................ 39
Figure //I-1- Vue panoramique vers le nord de la MCO de Sue C en Juin 2000 ...................................................... 75
Figure //I-2- Brèche de pente à la discordance montrant des blocs de quartzite cimentés par de l'argile et du grès ............................................................................................................................................................................... 76
Figure /V-1- (a) Affleurement de brèche d'effondrement dans la zone de Maw. (b) Brèche de dissolutioneffondrement dans une carotte de forage à Shea Creek. (c) Affleurement de zone à boule dans la MCO de Sue C (le marteau donne 1' échelle) ................................................................................................................................... 117
Liste des figures des publications
Article 1 : Polyphase hydrothermal breccias associated with unconformity-type uranium mineralization (Canada) :from fractal analysis to structural signijicance.
Figure 1 - Geological map of the study area in the south part of the Shea Creek exploration zone at 350 meters below sea leve! (unconformity leve!). Felsic orthogneiss is the most widespread lithology and occurs on each side of a partly metasedimentary aluminous gneiss unit divided into metapelites and gametites. Four types of faults are observed. The main Type 1 fault separates the metapelites from the felsic gneisses and is the main control of the uranium mineralization. Inset: Location of the Shea Creek area and the Athabasca Basin
Page
relative to 2600-1800 Ma fold-thrust belts .................................................................................................................. .45
Figure 2 - Cross-section A-B displaying the relationships between the four types of faults, the breccia body, the unconformity and the mineralization. The breccia body includes ali the breccia types observed in sandstones. The faults crosscut the unconformity and control the location of ore as weil as the breccia body architecture. The lithology legend is the same as for Figure 1 .................................................................................... .46
Figure 3 - Cumulative thickness of the different breccia types within 100 meters of sandstones just above the unconformity projected on a structural map of the southem part of the Shea Creek area at 350 meters below sea leve! (unconformity leve!, see b). Black crosses represent drill holes intersecting the unconformity ................... .48
Figure 4 - The fractal dimension D of the particle morphology is computed using the Euclidean distance mapping method (Bérubé and Jébrak 1999). Stripes of increasing thickness are computed from the particle outline. The log of the area of each stripe is th en plotted against the log of the ir thickness. Measurement of two fragments from a polyphase carbonate breccia (black squares) and a sudoite-dravite breccia (gray squares) at Shea Creek .............................................................................................................................................................. .49
18 ________________________________________________________ ~L~is~œ~d~es~fibg~u~re=s
Figure 5- Fragment morphology (D*) distribution for the four types ofbreccias studied ......................................... 54
Figure 6- Photographs illustrating the different types of fragment morphologies and the different textures. (a) orientation of the fragments and anastomosing deformation bands and quartz-filled fractures in a microcrystalline quartz breccia. (b) Weil rounded fragments with reaction rims in a sudoite-dravite breccia. (c) Fragment (on the left) of a microcrystalline quartz breccia in a Fe-chlorite breccia (d) Complex fragment shapes in a polyphase carbonate breccia. The dark zone on the right is a sandstone ghost-fragment replaced by carbonate and hematite. Sequence (e) to (g) shows evolution from an immature to a mature Fe-chlorite breccia. Note the strong fracturing in the immature stage and the increase of matrix proportion, the corrosion of fragments and their reorganization into a graded bedding in the mature stage ........................................................ 55
Figure 7- Photographs illustrating different microscopie textures of the breccias. (a) Non-oriented quartz clasts in the matrix of a microcrystalline quartz breccia (transmitted light). (b) Corroded detrital quartz grains in a sudoite- and dravite-rich cement within the matrix of a sudoite-dravite breccia (transmitted light). (c) Secondary electron SEM image of a corroded detrital quartz grain at the surface of a Fe-chlorite breccia fragment. Note the numerous dissolution pits and embayments. The white needle-shaped minerais between quartz grains are dravite. (d) Secondary electron SEM image of dissolution textures on a quartz grain. Note the corrosion pits and the dravite needles which are also corroded. (e) Corrosion textures of detrital quartz grains in the matrix of a Fe-chlorite breccia (reflected light). Note the hematite rims showing the location of the grain borders prior to the dissolution. (f) Corroded detrital quartz grains in a cement of chlorite and siderite nodules of a polyphase carbonate breccia ........................................................... ., .......................................... 58
Figure 8 - Simplified paragenetic diagram showing chronological relationships between the four breccia varieties. Wavy !ines = tectonic reactivations initiating fluid circulation, shaded areas = subsequent solution breccias, black rectangles =precipitation, empty dashed rectangle = dissolution ....................................................... 59
Figure 9 - Diagram showing the relationship between rotation angle and size of tilted blacks in sudoite-dravite and Fe-chlorite breccias. Rotation angle tends to increase as the size decreases ............................................. 61
Figure JO- Synthetic diagram showing the temporal evolution of each breccia type according to their main descriptive features and fragment morphometry measurements. Note the reverse evolution for the last stage of Fe-chlorite collapse breccias ........................................................................................................................................ 65
Article 2 : Chemical brecciation processes in the Sue unconformity-type uranium deposits, Eastern Athabasca Basin (Canada).
Figure 1 -(a) Location of the Athabasca basin in Canada and of the Sue deposits at the eastern edge of the basin in the Wollaston Domain. (b) Basement lithologies and structural contrais of the Sue deposits located on the western flank of the Collins Bay granitic dome (modified from Baudemont et al., 1993). The dashed oval indicates the position of the Sue C open pit. ................................................................................................................ 83
Figure 2- Simplified structural map of the Sue C open pit with the location of samples 1 to 6 (black stars). Small stereograms represent "zones à boules" wall strikes at different locations. Note the alignment of breccias along the EGS. (a) Stereogram of "zones à boules" wall strikes. (b) Stereogram of fracture strikes in the Sue C open pit ........................................................................................................................................................ 85
Figure 3 - Photograph of a 1 meter-wide "zone à boules" outcrop located in the eastern part of the Sue pit on the EGS. The low matrix percentage indicates a low maturity degree. Flattened balls in the bottom left and corner of the picture show a local stratigraphie control. Note the curved striae in clay just below the hammer .......... 88
Figure 4 - Drawing showing the maturity evolution of a "zone à boules". Note the increase of matrix percentage and bali roundness with maturity ............................................................................................................... 89
Figure 5 - Photograph (a) and schematic drawing (b) of an illitized sandstone fragment. The high concentration of heavy minerais layers and their local deformation around a sandstone remnant indicate volume loss during alteration. (c) Illitized bali showing a concentric zonation from red in the center to light yellow along the borders (1 to V). This is due to a decreasing content of hematite away from the center. (d) Large bali with slickensides ......................................................................................................................................... 90
Figure 6- (a) Distribution of the width of 82 balls. The curve indicates a log-normal distribution. (b) Linear relation between the length and the width and height. (c) Bivariate histogram of the shape ratios RI = width 1 length and R2 = height 1 length .................................................................................................................................... 91
=L=is=œ~d=es~fi~g=u~re=s~--------------------------------------------------------19
Figure 7 - Microscopie photographs illustrating different microscopie textures. (a) Corrosion textures of detrital quartz grains. Cement between grains is illite (polarized reflected light). (b) Remplacement of dickite by illite (plane polarized transmitted light). (c) High concentration of zircons and Ti- and Fe-oxides in a totally illitized sandstone bali (polarized transmitted light). (d) TEM image of crandallite-goyazite-florencite minerais (black squares) ............................................................................................................................................................. 92
Figure 8 - Proportion of quartz, dickite and illite in samples 1, 2, 3, 4, 5 and 7 showing the progressive replacement of dickite by illite toward the breccia and the replacement of quartz by illite within the "zone à boules" ......................................................................................................................................................................... 93
Figure 9 - (Si - 6) versus IC (inter layer charge) plot of illites from samples 1, 3, 4, 5 and 6 and of 3 average illites from Los Azufres rhyolites (Cathelineau and Izquierdo 1988). Envelopes R517, R693 and Rl093 indicate their chemical variations. The line gives the theoretical trend corresponding to the 1 _1 (Si +1 Al _1) 1v substitution (muscovite-pyrophyllite) for R2
+ = 0 (no muscovite- celadonite substitution). The arrow indicates the temperature increase with the CI parameter ........................................................................................................... 94
Figure 10 - Elemental depletion-enrichment factor relative to the average proto li th for the "zone à boules" wall rock (a) and the clay bali (b) and matrix (c). Constant volume has been assumed for the "zone à boules" wall rock whereas Al immobility has been considered for the "zone à boules". Dashed white bars correspond to changes of concentration of stable elements due to different initial concentration in the sample and the average protolith. White bars indicate uncertain enrichments or depletions due to concentrations variations below 50 % that partially reflect the variability of the protolith. Grey bars correspond to reliable chemical variations ...................................................................................................................................................................... 98
Figure Il - Isocon diagram for sample 4 relative to the average protolith. The isocon is determined by considering Al as an immobile element. The angle between the isocon and the bissector corresponds to the amount of volume loss (84 %). The location of elements above or below the isocon indicates enrichment or depletion respectively, taking into account the effect of volume loss. Note the strong depletion in Si.. ...................... 99
Figure 12 - REE pattern for the clay bali sample 4 normalized to the clay matrix sample 5 illustrating the differentiai chemical behavior of LREE and HREE in the clay halls and matrix. Clay halls have been HREE enriched and LREE depleted relative to the clay matrix ............................................................................................ ! 00
Figure 13 - Synthetic drawing showing the "zone à boules" and permeability evolution in 4 stages. The relative scale between drawings is respected. The initial permeability is assumed to be about 1 0' 15 m2 and 2 x
1 0' 12 m2 for respectively the unfractured and fractured sandstone respectively, using 0.1 mm fracture openings. The first stage corresponds to the development of fractures and quartz-fi lied tension gashes in the sandstone during contraction. The second stage is characterized by tectonically induced fluid circulation in the fractures accompanied by quartz dissolution, hematite leaching and dickite replacement by illite. This is responsible for the formation of immature "zones à boules". The third stage is characterized by extreme quartz dissolution and major volume loss during a tectonic contraction phase. It leads to the formation of mature "zones à boules". The fourth stage corresponds to late tectonic reactivation accompanied by bali rotation. Each deformation phase is accompanied by sharp permeability increases but the overall trend is a decrease of the fault permeability due to self-sealing by clay ..................................................................................................................... 106
Article 3 : Hydrothermal breccias associated with unconjormity-type uranium mineralizations in the Athabasca Basin: implications for jluid flow and mineralization (Canada).
Figure 1 - Crustal units and lithostructural domains of the sub-Athabasca basement and main uranium deposits in the Athabasca Basin (modified from Ruzicka, 1986). The three stars indicate the location of the Maw Zone in the south east, of the Sue deposits in the east and of the Shea Creek exploration zone in the west. Deposits and mineralizations: 1 = Rabbit Lake, 2 =Collins Bay, 3 = Eagle Point, 4 = Horseshoe and Raven, 5 =West Bear, 6 = McClean and Sue, 7 = JEB, 8 =Dawn Lake, 9 = Midwest, 10 = Cigar Lake, Il= McArthur River, 12 =Key Lake, 13 = CluffLake, 14 =Maurice Bay, 15 =Fond-du-Lac, 16 = Shea Creek, 17 = Maw Zone ................ l26
Figure 2 - Composite cross-section of the Maw Zone. From the west to the east, the sections represented are 32S, 1215S (Maw Zone) and 0 (modified from a SMDC report on the Wheeler River Project, 1992) ..................... 132
Figure 3- (a) Geological map of the Anne area in the south part of the Shea Creek exploration zone at 360 meters below sea leve! (unconformity leve!). Orthoderived felsic gneiss is the most ubiquitous lithology and occurs each side of a partly metasedimentary aluminous gneiss unit divided into metapelites and gametites.
20 ________________________________________________________ ~L~~~t~e~d~e~s~fi~g~u~r~es
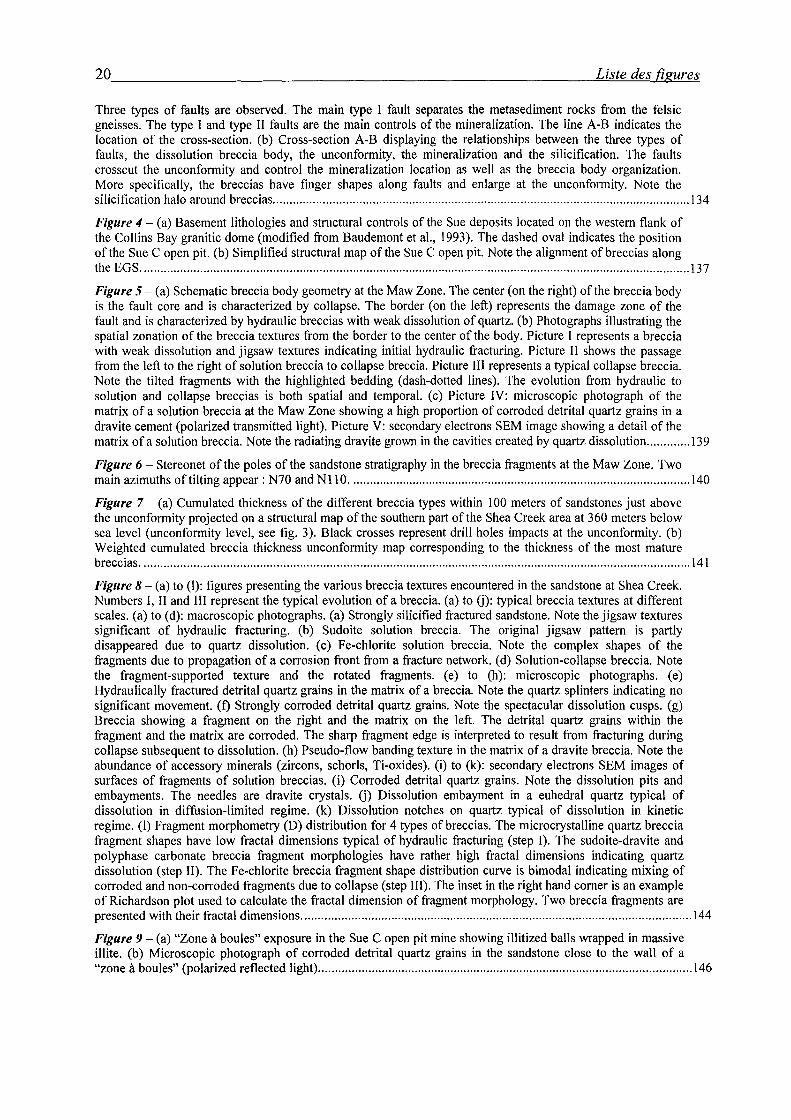
Three types of faults are observed. The main type 1 fault separates the metasediment rocks from the felsic gneisses. The type 1 and type II faults are the main controls of the mineralization. The tine A-B indicates the location of the cross-section. (b) Cross-section A-B displaying the relationships between the three types of faults, the dissolution breccia body, the unconformity, the mineralization and the silicification. The faults crosscut the unconformity and control the mineralization location as weil as the breccia body organization. More specifically, the breccias have finger shapes along faults and enlarge at the unconformity. Note the silicification halo around breccias .............................................................................................................................. l34
Figure 4- (a) Basement lithologies and structural controls of the Sue deposits located on the western flank of the Collins Bay granitic dome (modified from Baudemont et al., 1993). The dashed oval indicates the position ofthe Sue C open pit. (b) Simplified structural map of the Sue C open pit. Note the alignrnent ofbreccias along the EGS ...................................................................................................................................................................... 137
Figure 5- (a) Schematic breccia body geometry at the Maw Zone. The center (on the right) of the breccia body is the fault core and is characterized by collapse. The border (on the left) represents the damage zone of the fault and is characterized by hydraulic breccias with weak dissolution of quartz. (b) Photographs illustrating the spatial zonation of the breccia textures from the border to the center of the body. Picture 1 represents a breccia with weak dissolution and jigsaw textures indicating initial hydraulic fracturing. Picture II shows the passage from the left to the right of solution breccia to collapse breccia. Picture III represents a typical collapse breccia. Note the tilted fragments with the highlighted bedding (dash-dotted tines). The evolution from hydraulic to solution and collapse breccias is both spatial and temporal. (c) Picture IV: microscopie photograph of the matrix of a solution breccia at the Maw Zone showing a high proportion of corroded detrital quartz grains in a dravite cement (polarized transmitted light). Picture V: secondary electrons SEM image showing a detail of the matrix of a solution breccia. Note the radiating dravite grown in the cavities created by quartz dissolution ............. l39
Figure 6- Stereonet of the potes of the sandstone stratigraphy in the breccia fragments at the Maw Zone. Two main azimuths of ti !ting appear : N70 and N 11 O ....................................................................................................... 140
Figure 7- (a) Cumulated thickness of the different breccia types within 100 meters of sandstones just above the unconformity projected on a structural map of the southern part of the Shea Creek area at 360 meters below sea levet (unconformity levet, see fig. 3). Black crosses represent drill ho les impacts at the unconformity. (b) Weighted cumulated breccia thickness unconformity map corresponding to the thickness of the most mature breccias ...................................................................................................................................................................... 141
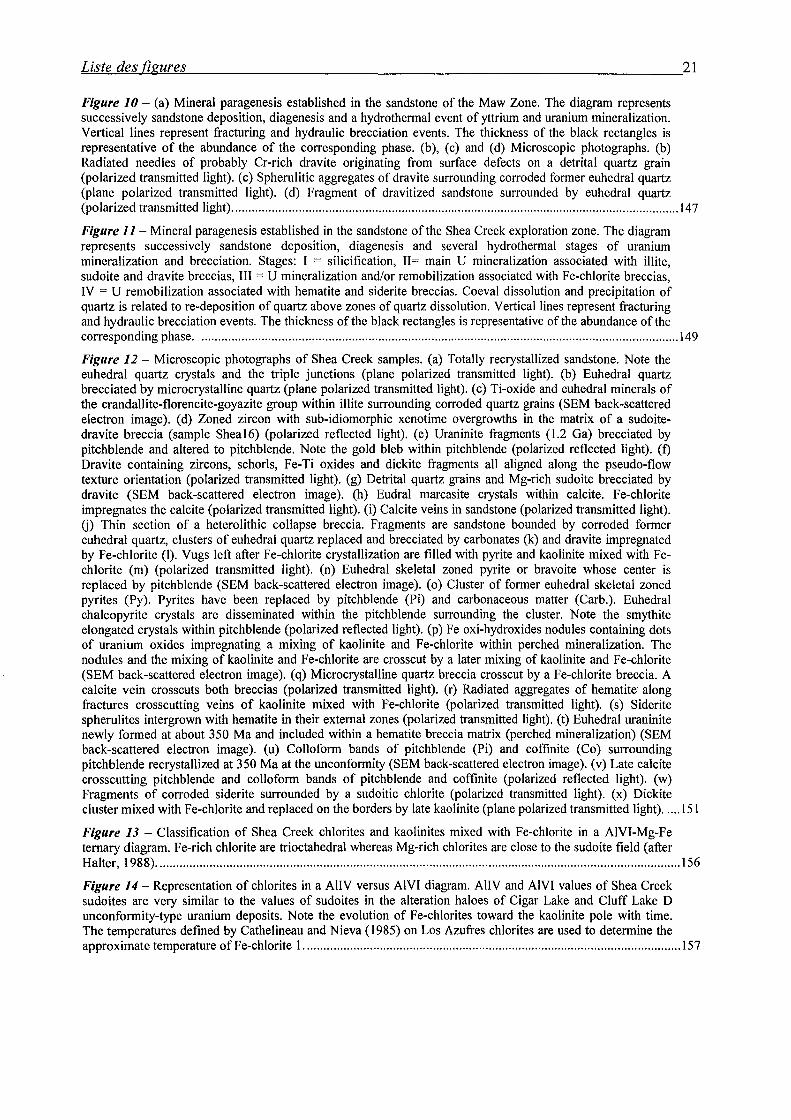
Figure 8- (a) to (1): figures presenting the various breccia textures encountered in the sandstone at Shea Creek. Numbers 1, II and III represent the typical evolution of a breccia. (a) to U): typical breccia textures at different scales. (a) to (d): macroscopic photographs. (a) Strongly silicified fractured sandstone. Note the jigsaw textures significant of hydraulic fracturing. (b) Sudoite solution breccia. The original jigsaw pattern is partly disappeared due to quartz dissolution. (c) Fe-chlorite solution breccia. Note the complex shapes of the fragments due to propagation of a corrosion front from a fracture network. (d) Solution-collapse breccia. Note the fragment-supported texture and the rotated fragments. (e) to (h): microscopie photographs. (e) Hydraulically fractured detrital quartz grains in the matrix of a breccia. Note the quartz splinters indicating no significant movement. (t) Strongly corroded detrital quartz grains. Note the spectacular dissolution cusps. (g) Breccia showing a fragment on the right and the matrix on the left. The detrital quartz grains within the fragment and the matrix are corroded. The sharp fragment edge is interpreted to result from fracturing during collapse subsequent to dissolution. (h) Pseudo-flow banding texture in the matrix of a dravite breccia. Note the abundance of accessory minerais (zircons, schorls, Ti-oxides). (i) to (k): secondary electrons SEM images of surfaces of fragments of solution breccias. (i) Corroded detrital quartz grains. Note the dissolution pits and embayments. The needles are dravite crystals. U) Dissolution embayment in a euhedral quartz typical of dissolution in diffusion-limited regime. (k) Dissolution notches on quartz typical of dissolution in kinetic regime. (1) Fragment morphometry (D) distribution for 4 types ofbreccias. The microcrystalline quartz breccia fragment shapes have low fractal dimensions typical of hydraulic fracturing (step 1). The sudoite-dravite and polyphase carbonate breccia fragment morphologies have rather high fractal dimensions indicating quartz dissolution (step II). The Fe-chlorite breccia fragment shape distribution curve is bimodal indicating mixing of corroded and non-corroded fragments due to collapse (step III). The inset in the right hand corner is an example of Richardson plot used to calculate the fractal dimension of fragment morphology. Two breccia fragments are presented with the ir fractal dimensions ...................................................................................................................... 144
Figure 9- (a) "Zone à boules" exposure in the Sue C open pit mine showing illitized halls wrapped in massive illite. (b) Microscopie photograph of corroded detrital quartz grains in the sandstone close to the wall of a "zone à boules" (polarized reflected light) ................................................................................................................. l46
~L~~~te~d~es~fi~g~u~re~s~--------------------------------------------------------21
Figure JO- (a) Mineral paragenesis established in the sandstone of the Maw Zone. The diagram represents successively sandstone deposition, diagenesis and a hydrothermal event of yttrium and uranium mineralization. Vertical !ines represent fracturing and hydraulic brecciation events. The thickness of the black rectangles is representative of the abundance of the corresponding phase. (b), (c) and (d) Microscopie photographs. (b) Radiated needles of probably Cr-rich dravite originating from surface defects on a detrital quartz grain (polarized transmitted light). (c) Spherulitic aggregates of dravite surrounding corroded former euhedral quartz (plane polarized transmitted light). (d) Fragment of dravitized sandstone surrounded by euhedral quartz (polarized transmitted light) ....................................................................................................................................... l47
Figure Il- Mineral paragenesis established in the sandstone of the Shea Creek exploration zone. The diagram represents successively sandstone deposition, diagenesis and severa! hydrothermal stages of uranium mineralization and brecciation. Stages: 1 = silicification, II= main U mineralization associated with illite, sudoite and dravite breccias, III = U mineralization and/or remobilization associated with Fe-chlorite breccias, IV = U remobilization associated with hematite and siderite breccias. Coeval dissolution and precipitation of quartz is related tore-deposition of quartz above zones of quartz dissolution. Verticallines represent fracturing and hydraulic brecciation events. The thickness of the black rectangles is representative of the abundance of the corresponding phase. . ............................................................................................................................................... 149
Figure 12- Microscopie photographs of Shea Creek samples. (a) Totally recrystallized sandstone. Note the euhedral quartz crystals and the triple junctions (plane polarized transmitted light). (b) Euhedral quartz brecciated by microcrystalline quartz (plane polarized transmitted light). (c) Ti-oxide and euhedral minerais of the crandallite-florencite-goyazite group within illite surrounding corroded quartz grains (SEM back-scattered electron image). (d) Zoned zircon with sub-idiomorphic xenotime overgrowths in the matrix of a sudoitedravite breccia (sample Shea16) (polarized reflected light). (e) Uraninite fragments (1.2 Ga) brecciated by pitchblende and altered to pitchblende. Note the gold bleb within pitchblende (polarized reflected light). (t) Dra vite containing zircons, schorls, Fe-Ti oxides and dickite fragments ali aligned along the pseudo-flow texture orientation (polarized transmitted light). (g) Detrital quartz grains and Mg-rich sudoite brecciated by dravite (SEM back-scattered electron image). (h) Eudral marcasite crystals within calcite. Fe-chlorite impregnates the calcite (polarized transmitted light). (i) Calcite veins in sandstone (polarized transmitted light). U) Thin section of a heterolithic collapse breccia. Fragments are sandstone bounded by corroded former euhedral quartz, clusters of euhedral quartz replaced and brecciated by carbonates (k) and dravite irnpregnated by Fe-chlorite (1). Vugs left after Fe-chlorite crystallization are filled with pyrite and kaolinite mixed with Fechlorite (rn) (polarized transmitted light). (n) Euhedral skeletal zoned pyrite or bravoite whose center is replaced by pitchblende (SEM back-scattered electron image). (o) Cluster of former euhedral skeletal zoned pyrites (Py). Pyrites have been replaced by pitchblende (Pi) and carbonaceous matter (Carb.). Euhedral chalcopyrite crystals are disseminated within the pitchblende surrounding the cluster. Note the smythite elongated crystals within pitchblende (polarized reflected light). (p) Fe oxi-hydroxides nodules containing dots of uranium oxides impregnating a mixing of kaolinite and Fe-chlorite within perched mineralization. The nodules and the mixing of kaolinite and Fe-chlorite are crosscut by a later mixing of kaolinite and Fe-chlorite (SEM back-scattered electron image). (q) Microcrystalline quartz breccia crosscut by a Fe-chlorite breccia. A calcite vein crosscuts both breccias (polarized transmitted light). (r) Radiated aggregates of hematite along fractures crosscutting veins of kaolinite mixed with Fe-chlorite (polarized transmitted light). (s) Siderite spherulites intergrown with hematite in their extemal zones (polarized transmitted light). (t) Euhedral uraninite newly formed at about 350 Ma and included within a hematite breccia matrix (perched mineralization) (SEM back-scattered electron image). (u) Colloform bands of pitchblende (Pi) and coffinite (Co) surrounding pitchblende recrystallized at 350 Ma at the unconformity (SEM back-scattered electron image). (v) Late calcite crosscutting pitchblende and colloform bands of pitchblende and coffinite (polarized reflected light). (w) Fragments of corroded siderite surrounded by a sudoitic chlorite (polarized transmitted light). (x) Dickite cluster mixed with Fe-chlorite and replaced on the borders by late kaolinite (plane polarized transmitted light) ..... 151
Figure 13 - Classification of Shea Creek chlorites and kaolinites mixed with Fe-chlorite in a AIVI-Mg-Fe ternary diagram. Fe-rich chlorite are trioctahedral whereas Mg-rich chlorites are close to the sudoite field (after Halter, 1988) .............................................................................................................................................................. 156
Figure 14 - Representation of chlorites in a AIIV versus A! VI diagram. AIIV and AIVI values of Shea Creek sudoites are very similar to the values of sudoites in the alteration haloes of Cigar Lake and Cluff Lake D unconformity-type uranium deposits. Note the evolution of Fe-chlorites toward the kaolinite pole with time. The temperatures defined by Cathelineau and Nieva (1985) on Los Azufres chlorites are used to determine the approximate temperature of Fe-chlorite l .................................................................................................................. 157
22--------------------------------------------------------~L~is~t~e~d~e~s~fi~g~u~r~es
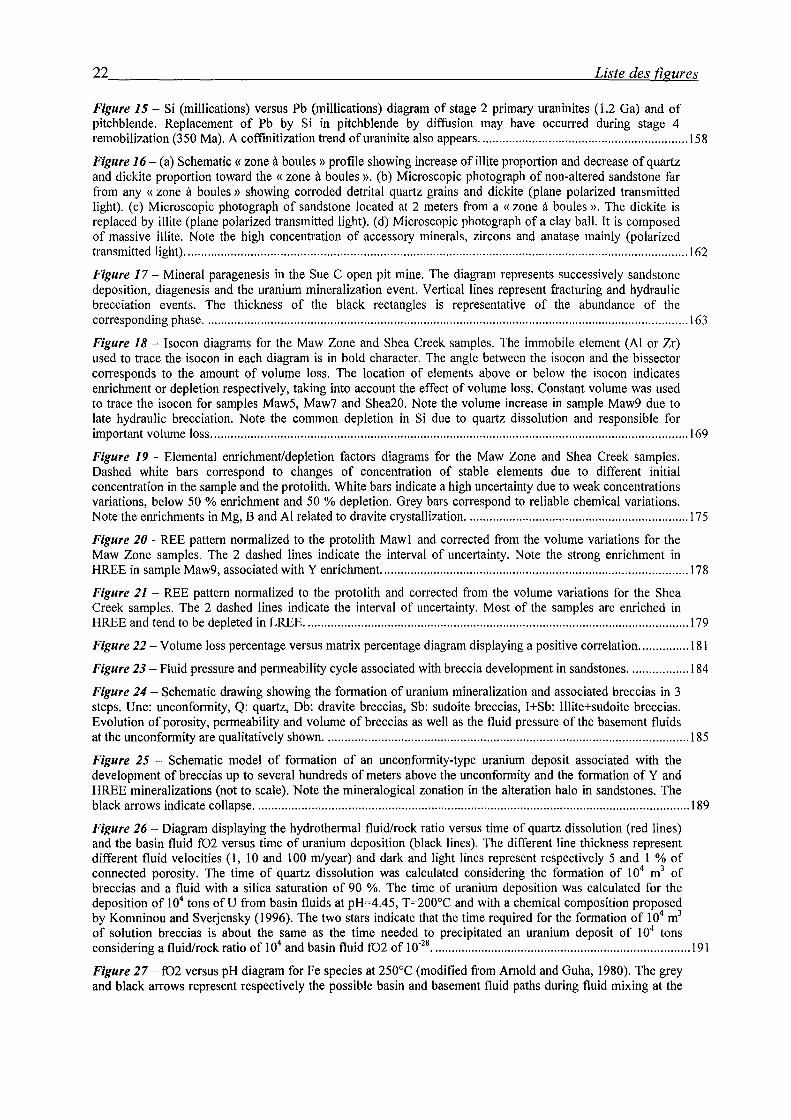
Figure 15- Si (millications) versus Pb (millications) diagram of stage 2 primary uraninites (1.2 Ga) and of pitchblende. Replacement of Pb by Si in pitchblende by diffusion may have occurred during stage 4 remobilization (350 Ma). A coffinitization trend ofuraninite also appears ............................................................... l58
Figure 16- (a) Schematic «zone à boules» profile showing increase ofillite proportion and decrease of quartz and dickite proportion toward the « zone à boules ». (b) Microscopie photograph of non-altered sandstone far from any « zone à boules » showing corroded detrital quartz grains and dickite (plane polarized transmitted light). (c) Microscopie photograph of sandstone located at 2 meters from a «zone à boules». The dickite is replaced by illite (plane polarized transmitted light). ( d) Microscopie photograph of a clay bali. It is composed of massive illite. Note the high concentration of accessory minerais, zircons and anatase mainly (polarized transmitted light) ........................................................................................................................................................ 162
Figure 17- Mineral paragenesis in the Sue C open pit mine. The diagram represents successively sandstone deposition, diagenesis and the uranium mineralization event. Vertical !ines represent fracturing and hydraulic brecciation events. The thickness of the black rectangles is representative of the abundance of the corresponding phase .................................................................................................................................................. 163
Figure 18- lsocon diagrams for the Maw Zone and Shea Creek samples. The immobile element (Al or Zr) used to trace the isocon in each diagram is in bold character. The angle between the isocon and the bissector corresponds to the amount of volume Joss. The location of elements above or below the isocon indicates enrichment or depletion respectively, taking into account the effect of volume Joss. Constant volume was used to trace the isocon for samples Maw5, Maw7 and Shea20. Note the volume increase in sample Maw9 due to late hydraulic brecciation. Note the common depletion in Si due to quartz dissolution and responsible for important volume Joss ................................................................................................................................................ 169
Figure 19 - Elemental enrichment/depletion factors diagrams for the Maw Zone and Shea Creek samples. Dashed white bars correspond to changes of concentration of stable elements due to different initial concentration in the sample and the protolith. White bars indicate a high uncertainty due to weak concentrations variations, below 50 % enrichment and 50 % depletion. Grey bars correspond to reliable chemical variations. Note the enrichments in Mg, Band Al related to dravite crystallization ................................................................... 175
Figure 20- REE pattern normalized to the protolith Mawl and corrected from the volume variations for the Maw Zone samples. The 2 dashed !ines indicate the interval of uncertainty. Note the strong enrichment in HREE in sample Maw9, associated with Y enrichment. ............................................................................................ 178
Figure 21 - REE pattern normalized to the protolith and corrected from the volume variations for the Shea Creek samples. The 2 dashed !ines indicate the interval of uncertainty. Most of the samples are enriched in HREE and tend to be depleted in LREE .................................................................................................................... 179
Figure 22- Volume loss percentage versus matrix percentage diagram displaying a positive correlation ............... 181
Figure 23- Fluid pressure and permeability cycle associated with breccia development in sandstones .................. 184
Figure 24 - Schematic drawing showing the formation of uranium mineralization and associated breccias in 3 steps. Une: unconformity, Q: quartz, Db: dravite breccias, Sb: sudoite breccias, I+Sb: Illite+sudoite breccias. Evolution of porosity, permeability and volume of breccias as weil as the fluid pressure of the basement fluids at the unconformity are qualitatively shown .............................................................................................................. 185
Figure 25 - Schematic mode! of formation of an unconformity-type uranium deposit associated with the development of breccias up to severa! hundreds of meters above the unconformity and the formation of Y and HREE mineralizations (not to scale). Note the mineralogical zonation in the alteration halo in sandstones. The black arrows indicate collapse ................................................................................................................................... 189
Figure 26- Diagram displaying the hydrothermal fluid/rock ratio versus time of quartz dissolution (red !ines) and the basin fluid f02 versus time of uranium deposition (black !ines). The different line thickness represent different fluid velocities (1, 10 and 100 m/year) and dark and light !ines represent respectively 5 and 1 % of connected porosity. The time of quartz dissolution was calculated considering the formation of 104 m3 of breccias and a fluid with a silica saturation of 90 %. The time of uranium deposition was calculated for the deposition of 104 tons of U from basin fluids at pH=4.45, T=200°C and with a chemical composition proposed by Komninou and Sverjensky (1996). The two stars indicate that the ti me required for the formation of 104 m3
of solution breccias is about the same as the time needed to precipitated an uranium deposit of 104 tons considering a fluid/rock ratio of 1 04 and basin fluid tD2 of 1 o·28
••••.••••••••••••••••••••••••••.••••••••••.•••••••••••••••••••••••••••••••.••• 191
Figure 27- tD2 versus pH diagram for Fe species at 250°C (modified from Arnold and Guha, 1980). The grey and black arrows represent respectively the possible basin and basement fluid paths during fluid mixing at the
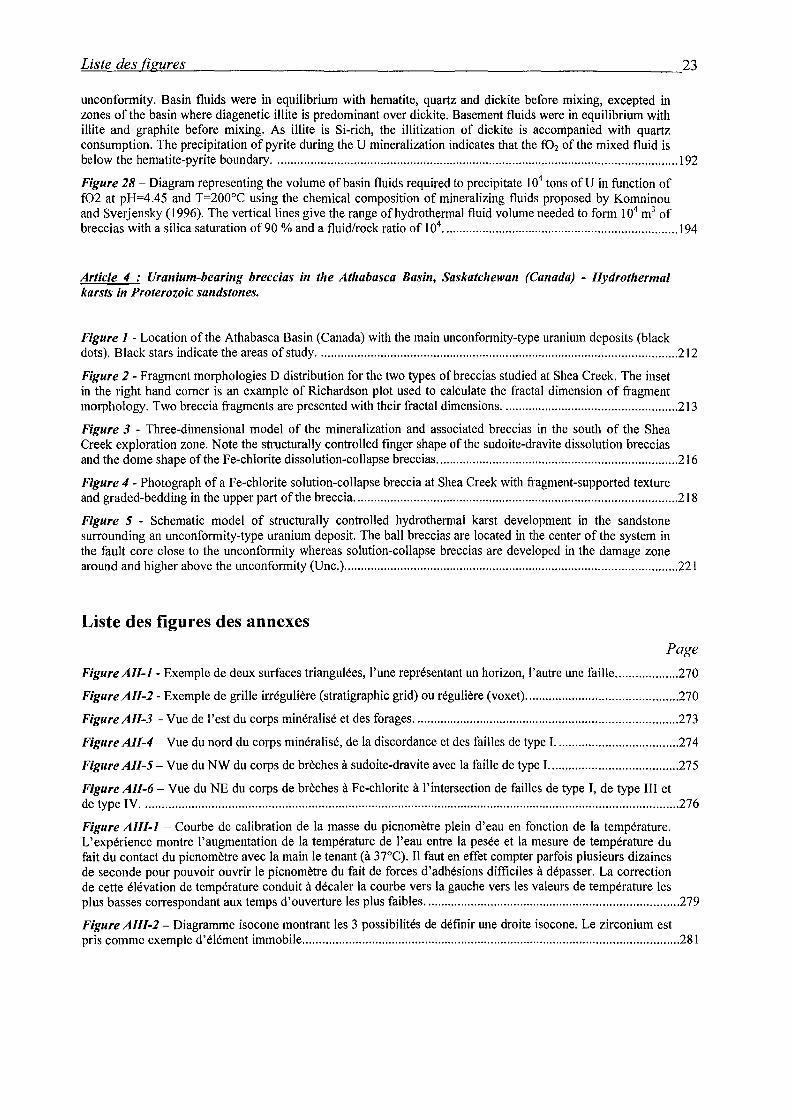
L~is~œ~d~es~fi~g~u~re~s~--------------------------------------------------------23
unconfonnity. Basin fluids were in equilibrium with hematite, quartz and dickite before mixing, excepted in zones of the basin where diagenetic illite is predominant over dickite. Basement fluids were in equilibrium with illite and graphite before mixing. As illite is Si-rich, the illitization of dickite is accompanied with quartz consumption. The precipitation of pyrite during the U mineralization indicates that the f02 of the mixed fluid is below the hematite-pyrite boundary .......................................................................................................................... 192
Figure 28- Diagram representing the volume of basin fluids required to precipitate 104 tons of U in function of f02 at pH=4.45 and T=200°C using the chemical composition of mineralizing fluids proposed by Komninou and Sverjensky (1996). The verticallines give the range ofhydrothermal fluid volume needed to form 104 m3 of breccias with a si li ca saturation of 90 % and a fluid/rock ratio of 104
••••••••••••••••••••••••••••••••••••••••••••••••••••••••••••••••••••••• 194
Article 4 : Uranium-bearing breccias in tite Athabasca Basin, Saskatchewan (Canada) - Hydrothermal karsts in Proterozoic sandstones.
Figure 1 -Location of the Athabasca Basin (Canada) with the main unconformity-type uranium deposits (black dots). Black stars indicate the areas ofstudy ............................................................................................................. 212
Figure 2- Fragment morphologies D distribution for the two types ofbreccias studied at Shea Creek. The inset in the right hand corner is an example of Richardson plot used to calculate the fractal dimension of fragment morpho1ogy. Two breccia fragments are presented with their fractal dimensions ..................................................... 213
Figure 3 - Three-dimensional mode! of the mineralization and associated breccias in the south of the Shea Creek exploration zone. Note the structurally controlled finger shape of the sudoite-dravite dissolution breccias and the dome shape of the Fe-chlorite dissolution-collapse breccias ......................................................................... 216
Figure 4- Photograph of a Fe-chlorite solution-collapse breccia at Shea Creek with fragment-supported texture and graded-bedding in the upper part of the breccia .................................................................................................. 218
Figure 5 - Schematic mode! of structurally controlled hydrothermal karst development in the sandstone surrounding an unconformity-type uranium deposit. The bali breccias are located in the center of the system in the fault core close to the unconformity whereas solution-collapse breccias are developed in the damage zone around and higher above the unconformity (Unc.) ..................................................................................................... 221
Liste des figures des annexes
Page
Figure All-I - Exemple de deux surfaces triangulées, l'une représentant un horizon, l'autre une faille ................... 270
Figure All-2- Exemple de grille irrégulière (stratigraphie grid) ou régulière (voxet) .............................................. 270
Figure A//-3- Vue de l'est du corps minéralisé et des forages ................................................................................ 273
Figure All-4- Vue du nord du corps minéralisé, de la discordance et des failles de type I. .................................... 274
Figure A//-5- Vue du NW du corps de brèches à sudoite-dravite avec la faille de type 1. ...................................... 275
Figure All-6- Vue du NE du corps de brèches à Fe-chlorite à l'intersection de failles de type I, de type III et de type IV .................................................................................................................................................................. 276
Figure A/Il-l -Courbe de calibration de la masse du picnomètre plein d'eau en fonction de la température. L'expérience montre l'augmentation de la température de l'eau entre la pesée et la mesure de température du fait du contact du picnomètre avec la main le tenant (à 37°C). Il faut en effet compter parfois plusieurs dizaines de seconde pour pouvoir ouvrir le picnomètre du fait de forces d'adhésions difficiles à dépasser. La correction de cette élévation de température conduit à décaler la courbe vers la gauche vers les valeurs de température les plus basses correspondant aux temps d'ouverture les plus faibles ............................................................................. 279
Figure A//1-2- Diagramme isocone montrant les 3 possibilités de définir une droite isocone. Le zirconium est pris comme exemple d'élément immobile .................................................................................................................. 281

24----------------------------------------------------------~L~~~t~e~d~e~s~fi~zg~u~r~e~s
Figure AIV-1- Spectres Raman de dickites des grès de la Mine à Ciel Ouvert de Sue C et d'un minéral probablement interstratifié kaolinite/dickite dans une brèche à Shea Creek (échantillon Shea28). Le pic vers 3710 cm·1 indique que le minéral n'est pas de la kaolinite mais de la dickite (Frost, 1995) ...................................... 319
1. INTRODUCTION GENERALE

l~n~t~ro~d~u~c~ll~·o~n~g~e~'n~é~ra~l~e~------------------------------------------------------25
1. INTRODUCTION GENERALE
Situation du sujet
La production d'électricité d'origine nucléaire dans le monde est en augmentation et a
atteint 2507,9 TWh en 1999. Cette tendance devrait continuer pour différentes raisons.
Premièrement, la consommation énergétique mondiale devrait augmenter de près de 50 %
d'ici 2015 (source CEA-DSE). Deuxièmement, suite à la réunion de 159 pays à Kyoto en
1997 afin d'adopter un protocole international de lutte contre 1' effet de serre, la production
d'énergie à partir de combustibles fossiles devrait diminuer dans un certain nombre de pays
industrialisés à partir de 2008. Cette diminution devrait s'accompagner d'une croissance de la
production d'électricité d'origine nucléaire qui ne génère pas de gaz à effet de serre.
Troisièmement, le nucléaire a l'avantage d'être une énergie peu sensible au coût du
combustible et qui permet d'assurer l'indépendance énergétique. Ces facteurs favorables au
développement de l'énergie nucléaire doivent être pondérés par les problèmes de gestion des
déchets radioactifs dont les solutions conditionneront fortement l'avenir de la filière nucléaire.
Les réserves d'uranium dans le monde hors CEl au 1 ier Janvier 1999 ont été estimées à
2 274 000 tonnes à un coût inférieur à 80 $/kg U. Au taux annuel de consommation mondiale
d'uranium de 59 400 tonnes en 1998 (source CEA/DES), ces réserves représentent 38 années
de consommation.
Le marché actuel de l'uranium est instable et incertain du fait de la proportion importante
d'uranium provenant de sources secondaires issues de déstockages ou d'excédents militaires.
En 1999, 50 %des besoins des réacteurs ont été alimentés par ces sources secondaires et ont
entraîné une baisse des prix spots jusqu'à moins de 19.8 $/kg. Dans un tel contexte, les seuls
gisements d'uranium économiques sont les gisements de type discordance qui ont les teneurs
les plus élevées et des tonnages considérables.
Les gisements d'uranium de type discordance sont situés à proximité de l'interface entre
un socle métamorphique et granitique d'âge Archéen à Protérozoïque Inférieur et une
couverture sédimentaire gréseuse d'âge Protérozoïque Moyen. Ces gisements ont été
découverts en Australie dans le bassin de McArthur et au Canada dans les bassins du Thélon
et Athabasca (Fig. I-1). Les gisements du Bassin Athabasca ont les plus fortes teneurs avec
186 000 tonnes à 14% d'U à McArthur River et 140 000 tonnes à 13,6% d'U à Cigar Lake.
Le premier gisement d'uranium de type discordance du Bassin Athabasca a été découvert en
1968 à Rabbit Lake (Heine, 1986). Les découvertes se sont ensuite multipliées avec les
gisements de Cluff Lake entre 1971 et 1974 (Tona et al., 1985), Collins Bay en 1971 et 1972
(Ruzicka, 1986), Key Lake en 1975 (Kirchner et Tan, 1994), Midwest en 1978 (Farstad et
Ayers, 1986), Dawn Lake entre 1978 et 1981 (Clarke et Fogwill, 1981 ), McLean Lake en

26 ______________________________________________________ ~1~nt~r~o~d~uc~t~io~n~g~én~e~'r~a~le
1979 et 1980 (Brurnmer et al., 1981), Eagle Point en 1980, Cigar Lake en 1981 (Fouques et
al., 1986), McArthur River en 1988 (McGill et al., 1993) et Sue en 1988 et 1989 (Baudemont
et al., 1993) (Fig. I-2). Depuis la fin des années 1980, malgré le maintien de l'effort
d'exploration, aucun autre gisement n'a été découvert dans le Bassin Athabasca à l'exception
de la zone minéralisée de Shea Creek (Rippert, 2000). Les découvertes de Rabbit Lake et de
Cluff Lake ont été réalisées grâce à des levés radiométriques aéroportés qui ont conduit à la
découverte d'alignements de blocs glaciaires minéralisés et ensuite des gisements par forages
carottés. La découverte de Key Lake a contribué de manière significative à l'établissement
d'un modèle d'exploration empirique associant les minéralisations uranifères avec des failles
enracinées dans des lithologies riches en graphite et recoupant la discordance et avec des halos
d'altération argileuse dans les grès. La plupart des gisements ont ensuite été découverts grâce
à ce modèle en testant par sondages les conducteurs graphiteux repérés en géophysique.
L'amélioration des techniques géophysiques a permis de détecter des conducteurs
électromagnétiques graphiteux à travers des épaisseurs de grès de plus en plus importantes,
conduisant ainsi à la découverte de minéralisations à des profondeurs atteignant 450 rn à Cigar
Lake, 600 rn à McArthur River et plus de 700 rn sous la surface à Shea Creek (Thomas et al.,
2000).
Les gisements d'uranium de type discordance sont généralement localisés à l'intersection
d'un ou plusieurs systèmes de failles avec la discordance. Ces failles sont systématiquement
graphiteuses dans le socle et ont rejoué, généralement en contraction, après l'induration des
grès du Bassin Athabasca (Dahlkamp, 1978 ; Hoeve et Sibbald, 1978 ; Jones, 1980 ; Stmad,
1980 ; Ey et al., 1985). Les gisements sont toujours associés à un halo d'altération argileuse
très étendu dans les grès jusqu'à 400 mètres en largeur, 500 mètres en hauteur et plusieurs
milliers de mètres en longueur (Thomas et al., 1998). Cependant, dans certains gisements
comme McArthur River, le halo d'altération est plus restreint autour de failles du fait d'une
forte silicification précoce des grès (McGill et al., 1993). Un halo d'altération à illite et
chlorite plus limité en extension est également présent dans le socle (Ruzicka, 1993). Deux
grands types de modèles d'altérations dans les grès sont distingués en exploration (Matthews
et al., 1997). Le premier type est rencontré dans la partie nord du Bassin Athabasca et est
caractérisé par une illitisation et une désilicification des grès. Le gisement correspondant le
mieux à ce modèle est Cigar Lake (Bruneton, 1993). Le deuxième type est plutôt rencontré
dans la partie sud du Bassin Athabasca et est caractérisé par une silicification, une
chloritisation, une dravitisation et une kaolinisation des grès. L'exemple le plus typique de ce
modèle est le gisement de McArthur River (McGill et al., 1993). Plusieurs auteurs ont noté la
présence de brèches entourant et/ou encaissant la minéralisation uranifère (Hoeve et Sibbald,
1978 ; Wallis et al., 1983 ; Bruneton et Caumartin, 1985 ; Ey et al., 1985 ; Lorilleux, 1999a et
b; 2000).
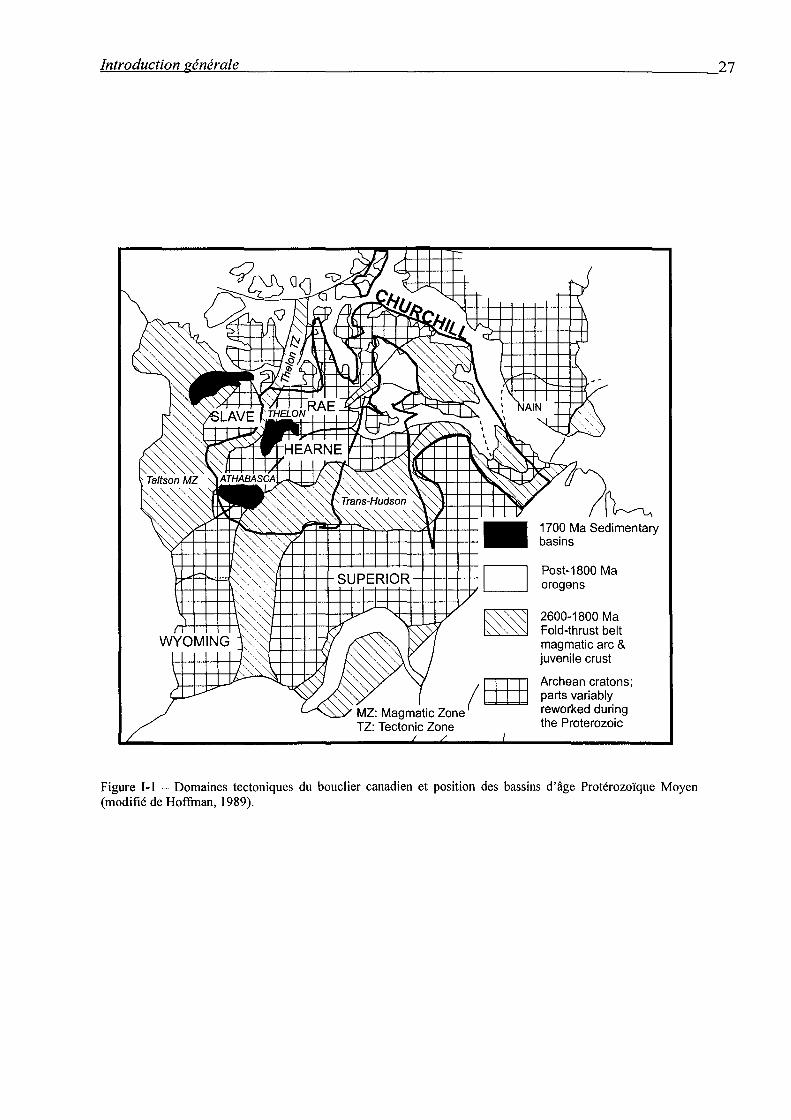
~In~t~ro~d~u~c~t~io~n~g~é~ne~'r~a~l~e __________________________________________________________ 27
MZ: Mag matie Zone TZ: Tectonic Zone
(EHE
Post-1800 Ma orogens
2600-1800 Ma Fold-thrust belt magmatic arc & juvenile crust
Archean cratons; parts variably reworked during the Proterozoic
Figure 1-1 -Domaines tectoniques du bouclier canadien et position des bassins d'âge Protérozoïque Moyen (modifié de Hoffman, 1989).
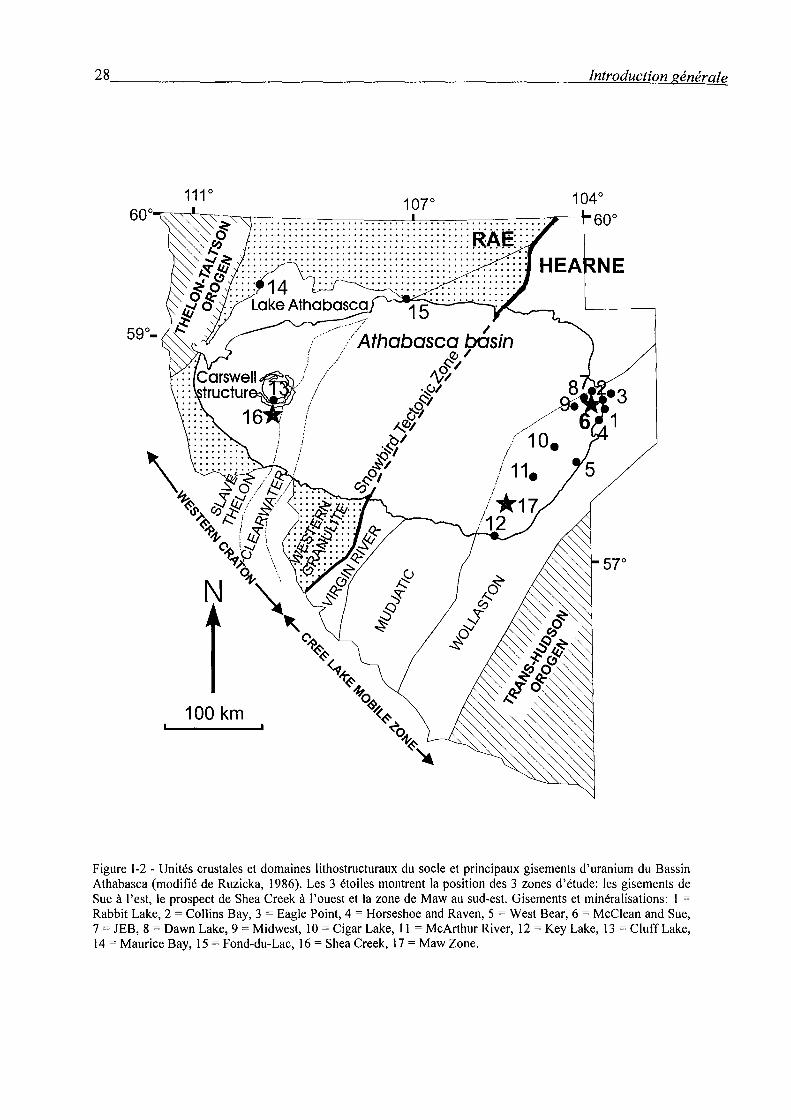
28 ______________________________________________________ ~1~n~~~o~d~u~ct~io~n~g~én~e~'r~a~le
N
100 km
Figure 1-2 -Unités crustales et domaines lithostructuraux du socle et principaux gisements d'uranium du Bassin Athabasca (modifié de Ruzicka, 1986). Les 3 étoiles montrent la position des 3 zones d'étude: les gisements de Sue à l'est, le prospect de Shea Creek à l'ouest et la zone de Maw au sud-est. Gisements et minéralisations: 1 = Rabbit Lake, 2 = Collins Bay, 3 = Eagle Point, 4 = Horseshoe and Raven, 5 = West Bear, 6 = McClean and Sue, 7 = JEB, 8 =Dawn Lake, 9 = Midwest, 10 = Cigar Lake, II = McArthur River, 12 =Key Lake, 13 = CluffLake, 14 =Maurice Bay, 15 =Fond-du-Lac, 16 = Shea Creek, 17 = Maw Zone.
J.~n~t~ro~d~u~c~t~io~n~g~e~'n~é~r~a~Ze~------------------------------------------------------29
Les brèches sont particulièrement développées dans les halos d'altération des gisements de
type sud-Athabasca comme à McArthur River (Matthews et al., 1997). Localement, des
affleurements de brèches à dravite ont été découverts plusieurs centaines de mètres au-dessus
du gisement de McArthur River (communication personnelle : P. Bruneton). Les
minéralisations uranifères peuvent être rencontrées soit dans le socle dans une tranche
verticale de 50 mètres sous la discordance et localement jusqu'à 450 mètres sous la
discordance (Eagle Point), soit dans les grès jusqu'à 50 mètres au-dessus de la discordance.
Localement, des minéralisations perchées peuvent être trouvées jusqu'à plus de 250 mètres
au-dessus de la discordance comme à Cigar Lake (Bruneton, 1993). Les minéralisations du
socle sont généralement monométalliques avec des oxydes d'uranium et de faibles quantités
de sulfures et d'arséniures. Elles correspondent à des gisements de type simple (Fayek et
Kyser, 1997). Les minéralisations à la discordance ou dans les grès correspondent au type
complexe ou polymétallique. Les oxydes d'uranium y sont associés à des sulfures et
arséniures de Ni-Co-As-Fe-Cu-Pb, du V, Au, Zn, Bi, Se et des éléments du groupe du Pt
(Hoeve and Sibbald, 1978; Fayek and Kyser, 1997).
Parallèlement à l'établissement d'un modèle d'exploration, 3 principaux modèles de
genèse des gisements d'uranium ont été proposés correspondant à des origines différentes
pour les fluides minéralisateurs : le modèle supergène, le modèle magmatique hydrothermal et
le modèle diagénétique hydrothermal.
Les partisans de l'hypothèse supergène (Knipping, 1974; Langford, 1974; 1977; Robertson
et Lattanzi, 1974; Ruzicka, 1975 ; Robertson et al., 1978; Tilsley, 1980) ont fait appel à un
lessivage de l'uranium et des autres constituants du minerai dans les roches du socle pendant
le développement d'un profil d'altération latéritique avant le dépôt des sédiments du Bassin
Athabasca, puis à un transport par des eaux de surface et enfin à une reprécipitation à la
rencontre d'un environnement réducteur adapté. Les roches du socle (Knipping, 1974;
Langford, 1974; 1977) et les shales riches en matière organique à la base de la formation
Athabasca (zone D à Cluff Lake; Robertson et Lattanzi, 1974; Ruzicka, 1975; Pagel et al.,
1980) ont été proposés pour former de tels pièges chimiques. Cependant, le développement
des halos d'altérations et des brèches dans les grès, les datations des minéralisations uranifères
et les études d'inclusions fluides ont montré que les gisements se sont formés postérieurement
au dépôt des sédiments Athabasca dans des conditions de diagenèse profonde (Pagel, 1975;
1977 ; Hoeve, 1977 ; Hoeve et Sibbald, 1978; Pagel et al., 1980). De plus, l'école supergène
ne fait pas intervenir la tectonique alors que les gisements sont clairement associés à des
mouvements tectoniques post-Athabasca (Stmad, 1980).
Une origine magmatique hydrothermale des gisements a été proposée par Little (1974),
Morton (1977), Munday (1979) et Binns et al. (1980). Ils ont envisagé des fluides
minéralisateurs ascendants chauds d'origine profonde qui se bloqueraient au niveau du piège
30 ______________________________________________________ ~L~n~~~o~d~u~c~ti~o~n~g~é~n~ér~a~l~e
de la discordance. Les arguments en faveur d'un tel concept dérivent de l'âge post-Athabasca
de la minéralisation et des données d'inclusions fluides indiquant des températures, pressions
et salinités élevées pour les solutions minéralisantes. De plus, les éléments Be, Y, Sn, Mo, Bi,
B présents dans la minéralisation sont caractéristiques de phénomènes pneumatolytiques
hydrothermaux. Cependant, les âges d'emplacement des granites et des dykes mafiques qui
pourraient être à 1' origine des fluides ne correspondent pas aux âges de la minéralisation (Le
Cheminant et Heaman, 1989 ; Crocker et al., 1993 ; Annesley et al., 1999). De plus, il n'y a
pas d'évidences pour dire que l'intrusion de dykes de diabases dans la formation Athabasca fut
accompagnée d'une activité hydrothermale significative. Egalement, le magmatisme mafique
seul est incompatible avec le large spectre géochimique des gisements. Si Ni, Co, As et Au
ont pu être extraits de magmas mafiques, des processus supplémentaires sont nécessaires pour
expliquer U et B. La notion que la précipitation de l'uranium a eu lieu en réponse à une
ébullition de C02 avec l'émergence des solutions ascendantes à la discordance n'a pas pu être
confirmée par les études d'inclusions fluides de Pagel (1975a; 1977).
L'hypothèse diagénétique hydrothermale a été proposé pour la première fois par Pagel
(1975a) à partir de l'étude d'inclusions fluides mettant en évidence des fluides diagénétiques
de bassin (Pagel, 1975b; 1977; Pagel et Jaffrezic, 1977). Le premier modèle complet a été
publié par Hoeve et Sibbald (1978). C'est actuellement le modèle qui explique le mieux les
caractéristiques des gisements. Hoeve et Sibbald ont proposé que les minéralisations
uranifères résultent de l'interaction à la discordance entre des fluides réducteurs riches en
méthane circulant le long de failles enracinées dans le socle avec des fluides oxydants de
bassin transportant l'uranium. Le méthane aurait été généré par réaction des fluides de bassin
avec les lithologies du socle riches en graphite. Les études isotopiques des minéraux
d'altérations associés aux gisements ont ensuite confirmé l'importance des fluides
diagénétiques ainsi que le mélange de fluides de socle et de bassin (Kotzer et Kyser, 1995). La
nature exacte et l'origine des fluides de socle sont encore méconnus. De récentes études
d'inclusions fluides, en partie sur les gisements australiens, mettent en évidence un mélange
probable entre deux saumures de bassin calciques et sodiques et un fluide de socle plus chaud
diluant (Derome et al., 2000a; 2000b). A partir du calcul des ùD de chlorites et d'illites dans
des gneiss minéralisés à Key Lake par Wilson et Kyser (1987), Kyser et al. (1989) ont suggéré
que les fluides de socle ont une origine profonde et ne sont pas dérivés d'incursions de fluides
de bassin. Fayek et Kyser (1997) ont distingué deux variantes du modèle diagénétique
hydrothermal, l'une dans laquelle les fluides de bassin interagissent avec les fluides de socle à
la discordance et dans les grès et l'autre dans laquelle les fluides de bassin interagissent
directement avec les roches du socle, expliquant ainsi la formation des gisements d'uranium
polymétalliques à la discordance et dans les grès, et monométalliques dans le socle,
respectivement. D'après Hoeve et Quirt (1984) et Raffensperger et Garven (1995a), les fluides
li=n=t~ro~d=u=c~t=io~n~g~e~'n=é~r=al=e ________________________________________________________ 31
de bassin ont circulé de manière convective pendant la formation des minéralisations. Le
mélange de fluides aurait eu lieu lors d'injections périodiques de fluides de socle dans les grès
provoquées par des réactivations tectoniques. Parcontre, Kotzer et Kyser (1995) proposent que
les fluides de bassin intervenant dans les processus de minéralisation circulaient latéralement
au fond du bassin.
Les brèches associées aux minéralisations n'ont fait l'objet que de très peu d'études
détaillées et ont été interprétées de différentes manières. Ey et al. (1985) ont décrit des brèches
appelées zones à boules qui encaissent la minéralisation du gisement D à Cluff Lake. Ils les
ont interprétées comme résultant de la combinaison d'une déformation et d'une altération
hydrothermale intense. Bruneton et Caumartin (1985) ont documenté l'existence de brèches
hydrauliques à Cigar Lake. A partir de 1' étude du gisement de McClean, Wallis et al. (1983)
ont proposé un modèle de formation des gisements associés à des brèches en deux étapes. La
première étape correspondrait à 1' événement principal de minéralisation associé à de la
fracturation en régime extensif et à des zones de précipitation de quartz et de brèches de
dissolution dans les grès. La deuxième étape serait une phase d'effondrement et de
rebréchification de la minéralisation. Par conséquent, plusieurs hypothèses ont été proposées
sur 1' origine de la formation des brèches. De plus, les liens génétiques entre les phénomènes
de bréchification et les processus de minéralisation sont très mal connus.
Objectifs de l'étude
La forte diminution des découvertes de gisements depuis la fin des années 80 amène les
géologues d'exploration à questionner les modèles utilisés. Le fort développement des brèches
dans les dernières zones minéralisées découvertes, McArthur River, Shea Creek et dans une
moindre mesure Sue, conduit à se demander quelle est leur rôle dans les processus de
piégeage des minéralisations uranifères. Comment peuvent-elles permettre d'affiner les
modèles génétiques proposés par Fayek et Kyser (1997)? Comment s'intègrent-elles dans les
modèles d'altération des grès proposés par Matthews et al. (1997)?
Afin de pouvoir répondre à ces questions, trois zones d'étude ont été choisies à différentes
distances de la discordance. La première zone sélectionnée est le prospect de Shea Creek situé
dans la partie ouest du Bassin Athabasca à quelques kilomètres au sud de Cluff Lake. Les
minéralisations à Shea Creek sont situées dans le socle et dans les grès à proximité de la
discordance à plus de 700 rn de profondeur et sont associées à d'importants corps de brèches
dans les grès. La deuxième zone choisie est la Mine à Ciel Ouvert (MCO) du gisement de Sue
C, située dans la partie est du Bassin Athabasca. Des brèches et des zones à boules sont
développées dans les grès jusqu'à 40 mètres au-dessus de la minéralisation à la discordance
(Baudemont et al., 1993). La troisième zone sélectionnée est la zone de Maw, située à 30 km
32 ______________________________________________________ ~l~n~&~o~d~u~ct~io~n~g~én~e~'r~a~le
au NE du gisement d'uranium de Key Lake. Elle a été choisie parce qu'elle montre de
spectaculaires affleurements de brèches à dravite à 250 mètres au-dessus de la discordance.
De tels affleurements sont très rares dans le Bassin Athabasca qui, dans sa majeure partie, est
recouvert d'une couverture glaciaire de plusieurs mètres à plusieurs dizaines de mètres
d'épaisseur. Les brèches encaissent une minéralisation à Y et terres rares lourdes et se
trouvent à 1' aplomb de minéralisations uranifères localisées à la discordance.
La première étape du travail a consisté à étudier les relations spatiales entre les brèches
localisées dans les grès et les structures, les altérations, la discordance et les lithologies du
socle. A Shea Creek et Douglas River South, les différents objets géologiques ont été levés sur
plus d'une centaine de forages, puis cartographiés de l'échelle 1/2000 jusqu'à 1/200 sur
certaines coupes. La reconnaissance des différents types de brèches a nécessité 1' établissement
d'un code de description lié à la forme des fragments et à la nature apparente du ciment. La
zone d'exploration la plus active en 1998, 1999 et 2000 a été la zone d'Anne à l'intérieur du
prospect de Shea Creek. C'est donc dans cette zone que les brèches ont été étudiées le plus en
détail. L'interprétation géologique de la zone d'Anne a beaucoup évolué pendant le
déroulement de la thèse du fait de la réalisation pour la première fois de mesures
d'orientations de carottes de forages en 1999 ainsi que d'un resserrement de la maille de
sondage à 20 m. Le modèle géologique de 1998 est présenté dans la partie II tandis que le
modèle de 2000 est présenté dans la partie IV. La cartographie des brèches a été remise à jour
chaque année lors de missions de terrain. Dans la MCO de Sue C, les brèches, les structures et
les altérations ont été cartographiées sur plusieurs bancs au fur et à mesure de
l'approfondissement de la mine de 1998 à l'an 2000. A la Maw Zone, l'orientation des
brèches a été mesurée et celles-ci ont été localement cartographiées. Les travaux sur
affleurements ont permis d'avoir directement une vision tridimensionnelle des corps de
brèches. La compréhension de 1' organisation spatiale des brèches à Shea Creek étant
beaucoup plus délicate, une modélisation tridimensionnelle avec le logiciel gücad a été
réalisée (voir annexe II).
Ensuite, les textures de brèches ont été décrites en détail dans les différentes zones.
Cependant, c'est à Shea Creek que 1' étude des textures a été réalisée préférentiellement du fait
de la grande variété des types de brèches et de la qualité des observations permise par les
carottes de forages. Plus de 200 intervalles de brèches ont été étudiés permettant ainsi d'avoir
un bon aperçu statistique des types prédominants et de sélectionner les meilleurs échantillons
pour les études de laboratoire (voir échantillons en annexe I et critères de description en
annexe IV). A Sue, une étude statistique des formes de fragments des zones à boules a été
réalisée.
A Shea Creek et dans la zone de Maw, des échantillons représentatifs des différents types
de brèches ont été prélevés. A Sue, des échantillons ont été pris le long d'un profil depuis
~In~t~ro~d~u~c~t~io~n~g~e~'n~é~ra=l~e ________________________________________________________ 33
l'encaissant jusqu'au cœur d'une zone à boules. Ces échantillons présentés en annexe 1 ont été
sélectionnés afin d'étudier précisément la minéralogie et les textures à l'échelle
microscopique et de réaliser des bilans de masse.
Les travaux de terrain ont permis de percevoir les phénomènes impliqués dans la
formation des brèches de manière essentiellement qualitative. La deuxième phase d'étude de
laboratoire a servi à préciser la nature des phases minérales et à quantifier les processus
impliqués dans la formation des brèches.
Les morphologies de fragments de brèches à Shea Creek ont été étudiées par une méthode
d'analyse fractale (voir partie 11). Dans un premier temps, les photographies de carottes de
brèches sciées ont été digitalisées. Ensuite, les images des fragments ont été traitées par un
programme développé par Bérubé et Jébrak (1999) dans NIH-Image afin de mesurer leur
dimension fractale. Celle-ci donne directement le degré de complexité de la forme des
fragments. La distribution statistique des dimensions fractales pour plusieurs types de brèches
a permis d'appréhender de manière quantitative les processus dominants dans leur formation.
Les textures des brèches ont été étudiées en lames minces ainsi qu'au MEB sur des
surfaces de fragments de brèches de Shea Creek.
Les différentes compositions minéralogiques des ciments des brèches ont été précisées par
analyses de diffraction aux rayons X (DRX), par observations de lames minces au microscope
pétrographique en lumière transmise et réfléchie, par microscopie électronique à balayage
(MEB), par microscopie électronique à transmission (MET), par analyses à la microsonde
électronique et par microspectroscopie Raman (voir annexe IV). Des calculs d'âges chimiques
avec la méthode de Suzuki et A dac hi ( 1994) ont été réalisés à partir de 1' analyses des oxydes
d'uranium et de coffinites à la microsonde électronique. Les différents échantillons étudiés
ainsi que les analyses sont présentés en annexe. Les paramètres d'analyses ainsi que les
standards utilisés pour les analyses à la microsonde électronique sont donnés dans les
paragraphes méthodologiques des parties Il, III et IV.
Afin de quantifier les processus d'interactions fluides-roche, des calculs de bilans de
masse ont été effectués. Dans ce but, les analyses géochimiques de 10 éléments majeurs et de
44 éléments traces des différents types de brèches de Shea Creek, de Sue et de la zone de Maw
ont été réalisées par ICP-AES et ICP-MS respectivement (annexe IV). La densité des
échantillons a été mesurée en utilisant un picnomètre à eau (voir annexe III). Les calculs de
bilans de masse ont été effectués en utilisant la méthode de Grant (1986) qui est une solution
graphique simple de la méthode de Gresens (1967) (voir annexe Ill). L'intérêt de travailler
dans les grès quartzeux relativement homogènes du Bassin Athabasca est qu'ils constituent un
blanc géochimique, déterminé par la diagenèse régionale, sur lequel se sont superposées des
altérations hydrothermales. Cependant, l'homogénéité de la partie quartzeuse majoritaire du
grès dissimule une forte hétérogénéité de distribution des minéraux accessoires concentrés en
34 ______________________________________________________ ~l~n=~~o~d~u~ct~i~on~g~é~n~ér~a~l~e
lits. Or, ce sont ces minéraux accessoires représentés par des oxydes de titane, des zircons et
des monazites qui contiennent les éléments les plus stables comme le Ti, Ta, Nb, Th, Zr et Hf.
Comme ces éléments stables servent de référence pour déterminer les variations de volume
lors des altérations, le choix du protolite a été délicat. Les résultats sont donc présentés avec
une marge d'incertitude directement liée à la variabilité de concentration des minéraux
accessoires. C'est le Zr qui a été choisi préférentiellement du fait de sa plus forte
concentration permettant d'avoir une meilleure précision de sa variation par rapport au
protolite. Certains échantillons montrant des évidences texturales d'absence de variations de
volume ont servi à déterminer une immobilité de l'aluminium pour certains types d'altération
comme l'illitisation dans les zones à boules de Sue. L'aluminium est en effet généralement
immobile dans les environnements diagénétiques (Hutcheon, 2000). De plus, la variabilité de
proportion des argiles est moindre que celle des minéraux accessoires. L'Al a donc été utilisé
pour les altérations à illite à Sue et à carbonates à Shea Creek. Ailleurs, c'est le Zr qui a été
utilisé vu que les néoformations de sudoite, de dravite et de Fe-chlorite sont associées à la
mobilité très probable de l'aluminium.
Les résultats des analyses géochimiques ont été utilisés pour réaliser des calculs normatifs
de composition minéralogique des différents échantillons. Combinés avec les pertes de
volume obtenues avec les bilans de masse, ces calculs normatifs ont permis d'estimer la
proportion de quartz dissous dans les grès et d'en déduire des rapports volumiques
fluides/roche cumulés pour différents types de brèches (voir annexe III).
Ce mémoire est constitué de 5 parties comprenant l'introduction générale et les
conclusions générales. Les 3 parties centrales sont présentées sous la forme de quatre
publications acceptées, soumises ou soumises prochainement. La deuxième partie (article 1)
présente les résultats de l'étude structurale et texturale des brèches de Shea Creek. L'analyse
fractale des morphologies de fragments ainsi que l'étude des textures de dissolution au MEB y
sont présentées. L'évolution des textures est utilisée pour proposer un modèle de formation
des brèches associé à des variations de perméabilité. La troisième partie (article 2) présente les
résultats de l'étude structurale, texturale, minéralogique et géochimique des zones à boules de
la MCO de Sue C. La combinaison de l'étude structurale et des bilans de masse permet de
proposer un modèle quantifié de formation des zones à boules. Des phénomènes d'altération
d'une intensité exceptionnelle sont mis en évidence. La quatrième partie (articles 3 et 4)
intègre les résultats de l'étude texturale, minéralogique et géochimique des brèches de la zone
de Maw, de l'étude minéralogique et géochimique des brèches de Shea Creek ainsi que la
synthèse des résultats des trois zones d'études. Les relations des brèches avec les structures,
l'évolution des textures et des paragenèses minérales dans l'espace et le temps, les âges
chimiques U-Th-Pb et les bilans de masse sont intégrés dans un modèle de formation des
brèches associées aux minéralisations uranifères. Les rapports fluide/roche et les temps de

J.~n~t~ro~d~u~c~tz~·o~n~g~e~'n~é~ra~l~e~------------------------------------------------------35
formation des brèches et du dépôt de la minéralisation uranifère sont estimés. L'accent est mis
en particulier sur 1' organisation géométrique et les relations génétiques possibles entre les
trois zones d'études (article 4). Les modèles d'altérations dans les grès sont affinés en tenant
compte du développement des brèches.

II. ETUDE STRUCTURALE ET
TEXTURALEDESBRECHESDU
PROSPECT DE SHEA CREEK


=E=tu=d~e~s=t~ru=c~t=u~ra=l=e~e~t~te=x=tu=r~a=l~e~d~e~s~b~re~'c~h~e~s~d~e~S~h~e~a~C~r~e~e~k _________________________ 37
II. ETUDE STRUCTURALE ET TEXTURALE DES
BRECHES DE SHEA CREEK
Introduction
Le prospect de Shea Creek est situé dans l'ouest du Bassin Athabasca et s'étend de 4 et 30
km au sud de la structure d'impact de Carswell de 3 9 km de diamètre. La zone de Anne est
située au nord du prospect où l'épaisseur des grès est environ de 700 rn. Les différentes
formations des grès Athabasca sont, du bas vers le haut, Manitou Falls C (MFC), Manitou
Falls D (MFD), Lazenby Lake (LZL), Wolverine Point A (WPA), Wolverine Point B (WPB)
et Locker Lake (LL). La figure II-I montre leur représentation dans le modèle gOcad de la
zone de Anne à partir des données des différents forages d'exploration. De la même manière,
le réseau structural interprété en 1998 a été modélisé sous gOcad (Fig. II-2). Les failles de type
II n'apparaissent pas puisqu'elles sont apparues dans 1 'interprétation en 1999.
Dans les grès de la formation Manitou Falls à Shea Creek, des brèches sont développées
de manière extensive généralement dans une tranche inférieure à 30 mètres au-dessus de la
discordance et localement au-dessus jusqu'à plus de 50 mètres. Ces brèches forment
généralement 1' encaissant de la minéralisation uranifère à la discordance. Des zones de
brèches sont également développées dans le socle, essentiellement le long de failles. Le but de
cette partie est de déterminer les mécanismes qui ont conduit à la formation et à l'évolution
des brèches dans les grès de la zone de Anne à Shea Creek. Les brèches ont été étudiées dans
les grès parce qu'elles sont plus développées que dans le socle et parce qu'il est plus simple de
comprendre leur formation dans les grès qui sont moins complexes minéralogiquement et
texturalernent que les faciès métamorphiques du socle. Cependant, les types de brèches dans
les grès à Shea Creek sont très nombreux et seuls quelques types prédominants ont été étudiés.
En particulier, malgré la faible influence de l'impact météorique de Carswell postérieur aux
minéralisations, certaines brèches à proximité de la discordance sont interprétées comme étant
liées à l'impact. La ressemblance entre les brèches d'impact et certaines brèches à chlorite
polyrnictes est parfois troublante et les choix d'interprétation ont parfois été difficiles.
La première phase du travail a consisté :
(1) à identifier les différents types de brèches sur une centaine de forages,
(2) à étudier leurs relations spatiales avec les failles et la minéralisation.
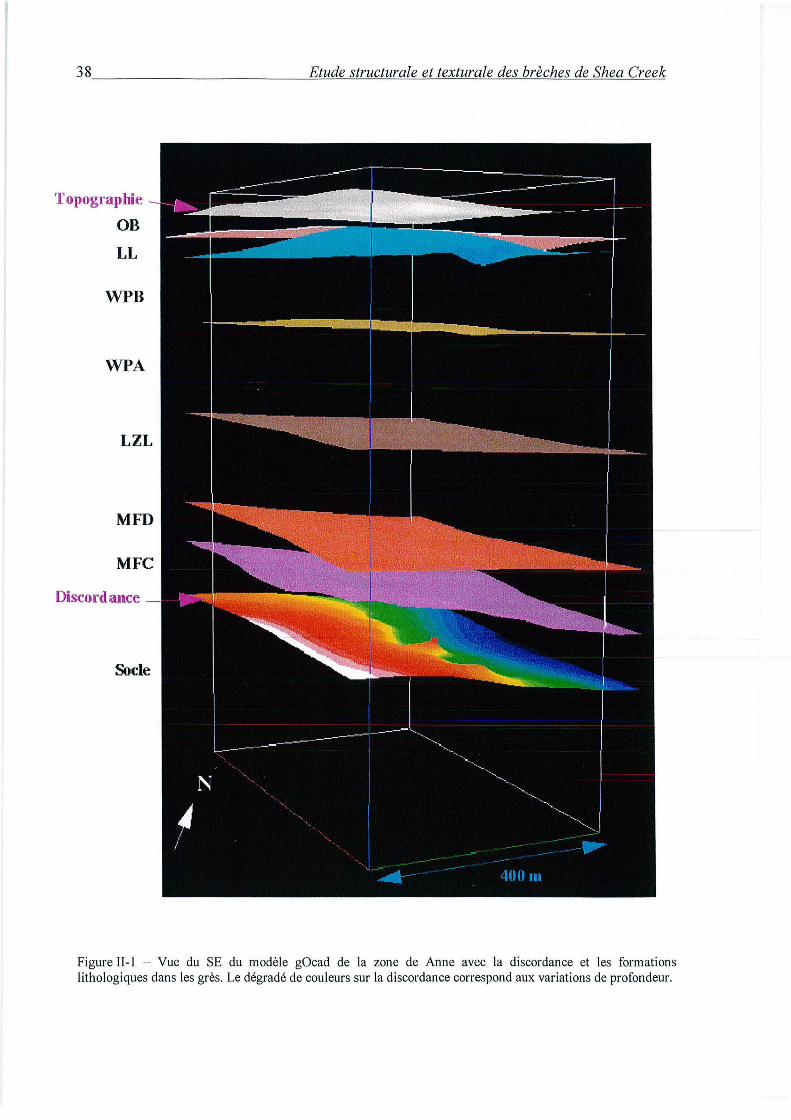
38 ________________________ ~E~tu~d~e~s~t~ru~c~t~ur~a~l~e~e~t~œ=x=tu=r~a~le~d=es~b~r~è~c~h=es~de~S~h=ea~C~r~ee~k
Topographie
OB
LL
WPB
WPA
Discordance
Figure II-I - Vue du SE du modèle gOcad de la zone de Anne avec la discordance et les formations lithologiques dans les grès. Le dégradé de couleurs sur la discordance correspond aux variations de profondeur.
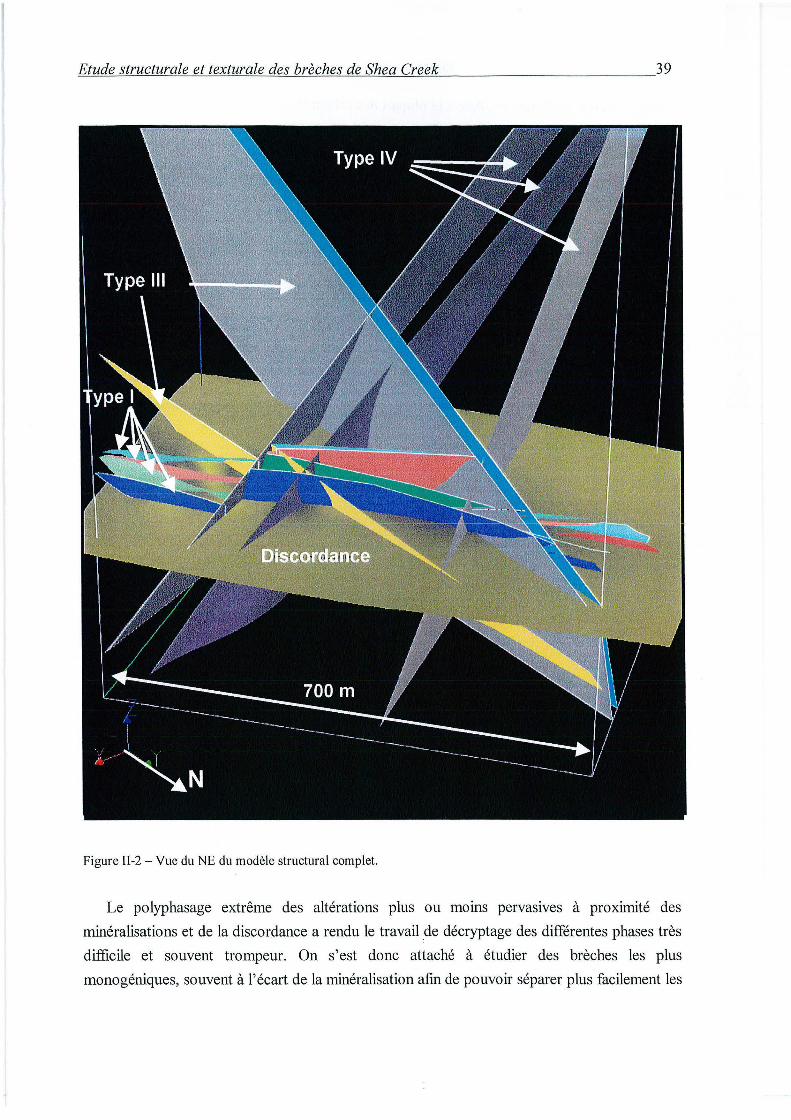
~E~tu~d~e~s~t~ru~c~t~u~ra~l~e~e~t~te~x~t~ur~a~l~e~d~es~b~re~'c~h~e~s~d~e~S~h~e~a~C~r~e~e~k _________________________ 39
Figure II-2- Vue du NE du modèle structural complet.
Le polyphasage extrême des altérations plus ou moms pervasives à proximité des
minéralisations et de la discordance a rendu le travail de décryptage des différentes phases très
difficile et souvent trompeur. On s'est donc attaché à étudier des brèches les plus
monogéniques, souvent à l'écart de la minéralisation afin de pouvoir séparer plus facilement les
40 ________________________ -=E~tu~d=e~s=t~r=uc=t=u~ra~l~e~e~t~te~x~tu~r~a~le~d~es~h~re~'c~h~e~s~d~e~S~h~e~a~C~r~e~ek
différentes phases d'altérations. Ainsi, la plupart des échantillons sélectionnés sont peu ou pas
minéralisés. Ensuite, les textures de brèches de l'échelle macroscopique à l'échelle du MEB
ont été étudiées. Les fragments ont des morphologies parfois complexes qui ont pu être
quantifiées par analyse fractale suite au développement d'un programme de calcul de cartes de
distances euclidiennes à l'UQAM. L'évolution des textures et des morphologies de fragments
dans 1' espace et le temps nous a amené à établir un modèle de formation des brèches.
L'organisation géométrique des corps de brèches et les relations chronologiques entre les
différents types ont permis de situer le développement des corps de brèches dans une histoire
tectonique du Bassin Athabasca. Les paragenèses minérales détaillées et les bilans des
transferts géochimiques associés au développement des brèches seront abordés dans la partie
IV.
~E~tu~d~e~s~û~u~c~tu~r~a~k~e~t~te~x~tu~r~a~k~d~e~s~b~r~èc~h~e~s~d~e~S~h~ea~C~re~e~k~ _____________________ 41
ARTICLE 1
Polyphase hydrothermal breccias associated with unconformity-type uranium mineralization (Canada): from fractal analysis to structural
significance
G. LorilleuxS, M. Jébrakb, M. Cuneya, D. Baudemontc
a CREGU-UMR G2R 7566, Université Henri Poincaré, BP 23, 54 501 Vandoeuvre-les-Nancy cedex, France
b UQAM, DST A, CP 8888, Centre Ville, Montréal (QUE) H3C 3P8 Canada
c COGEMA Resources Inc, Exploration Departrnent, 817-825 45th Street West, P.O. Box 9204,
Saskatoon (SK) S7K 3X5 Canada
Accepted in Journal of Structural Geology
42 ________________________ ~E~tu~d~e~s~t~ru~c~t~ur~a~l~e~e~t~te~x~tu~r~a~k~de~s~b~r~è~c~h~es~d~e~Sh~e~a~C~r~ee~k
Résumé
Les brèches entourant une minéralisation uranifère de type discordance dans les grès du
bassin Athabasca, dans le nord de la Saskatchewan, ont été cartographiées et décrites sur
carottes de forage. Quatre principaux types de brèches ont été distingués et classifiés
chronologiquement en fonction du type de matrice : quartz microcristallin, sudoite-dravite,
chlorite ferrifère et polyphasée à carbonate. La cartographie des brèches a montré qu'elles sont
contrôlées par différentes familles de failles de socle, incluant une structure graphitique
majeure. Les morphologies de fragments de brèches ont été quantifiées en utilisant une
méthode d'analyse de dimension fractale. Le pourcentage de matrice et la forme de la courbe
de distribution de la morphométrie des fragments permet de déterminer le degré de maturité et
la nature des interactions fluide-roche pour chaque type de brèche. Les brèches à quartz
microcristallin sont tectoniques et hydrauliques. Les brèches à sudoite-dravite, chlorite
ferrifère et polyphasées à carbonate sont formées par dissolution du quartz. Les brèches
matures à sudoite-dravite et à chlorite ferrifère présentent des textures d'effondrement liées
respectivement à des ouvertures par dissolution et à de la fracturation hydraulique. Les brèches
sont l'expression de réactivations de failles de socle postérieures au dépôt des grès (vers 1,7
Ga).
Chaque réactivation sismique créa des conduits structuraux entre des compartiments ayant
des pressions différentes, provoquant la circulation de fluides du socle vers les grès. Les
fluides furent ralentis dans les grès très fracturés et réagirent avec le quartz pour former des
brèches de dissolution. L'interaction de ces fluides dérivés du socle avec des fluides de bassin
pourrait être responsable de la formation des minéralisations uranifères de type discordance.
Cela expliquerait la corrélation positive entre les corps de brèches et la minéralisation
uranifère dans les grès, en particulier pour 1' événement à sudoite.
Abstract
Sandstone hosted breccias surrounding unconformity-type uranmm ore m the
Athabasca Basin, northem Saskatchewan, were mapped and described using drill core.
Four main breccia types were distinguished and were classified chronologically based on
the type of matrix: microcrystalline quartz, sudoite-dravite, Fe-chlorite and polyphase
carbonate. Mapping of the breccias has shown that they are controlled by various sets of
basement faults, including a major graphite-rich structure. Breccia fragment morphologies
were quantified using a fractal dimension analysis technique. The matrix percentage and
the shape of the fragment morphometry distribution curve allow determination of the
degree of maturity and the nature of fluid-rock interactions for each breccia.

~E~tu~d~e~s="~u=c=t=u~ra=l=e~e~t~te=x=t=ur~a=l=e~d~e~s~b~re~'c~h~e=s~d=e~S=h=e=a~C=r~e=e~k _________________________ 43
Microcrystalline quartz breccias are tectonic and fluid-assisted. Sudoite-dravite, Fe
chlorite and polyphase carbonate breccias were formed by dissolution of quartz. Mature
sudoite-dravite and Fe-chlorite breccias have collapse textures formed respectively by
dissolution opening and fluid-assisted brecciation. Breccias are the expression of basement
fault reactivation postdating sandstone deposition ( circa 1. 7 Ga).
Each seismic event created structural conduits between variably pressured
compartments, inducing fluid circulation from the basement to the sandstones. Fluids
flowed slower in the strongly fractured sandstones and dissolved quartz to form solution
breccias. Interaction of these basement derived fluids with basinal fluids may have led to
unconformity-type uranium mineralization deposition. This may explain the good
correlation between breccia bodies and sandstone-hosted uranium ore, especially for the
sudoite alteration event.

44 ________________________ ~E~tu~d~e~s~t~ru~c~tu~r~a=k~et~t=ex=t=u~ra~l~e~d~e~s~b~re~'c~h=es~de~S~he~a~C~re~e=k
1. Introduction
Breccias are commonly associated with hydrothermal ore deposits. Breccias occurring in
mesothermal Au, Cu-Au-U Olympie Dam-type, low temperature F-Ba-Pb-Zn, epithermal Ag
Au and Mississippi Valley-type Zn-Pb deposits are well documented in literature (Jébrak,
1984; Laznicka, 1988; Reeve et al., 1990; Carrier and Jébrak, 1994; Genna et al., 1996; Sass
Gustkiewicz, 1996). Breccia formation has been discussed in particular by Phillips (1986),
Sibson (1986), Laznicka (1988; 1989) and Jébrak (1992; 1997).
Numerous breccias have been described associated with the large unconformity-type
uranium deposits of the Mesoproterozoic Athabasca basin (Saskatchewan, Canada) containing
a resource of over 500 000 tonnes of uranium (Wheatley et al., 1996). These deposits are so
called because they are spatially related to the major unconformity underlying the Athabasca
Basin. These breccias surround and locally host the high-grade unconformity-type uranium
ores. They have been interpreted as being tectonic (Ey et al., 1985; Baudemont et al., 1993),
meteor impact-related (Von Einsiedel, 1981; Harper, 1983; Ey, 1984; Pagel et al., 1985) and
of dissolution-collapse origin (Wallis et al., 1983).
The significance of these breccias and their relation to faulting processes remain poorly
known. The purpose of this study is to determine the mechanisms that led to the brecciation
of the Athabasca sandstones, which host high-grade uranium deposits. A fractal analysis of
fragment contours was carried-out in order to quantify their shape complexity. The
relationships between fault zones, hydrothermal breccias and uranium ore emplacement was
deciphered. Breccia-body geometry and chronological relationships were used to get a better
understanding of the organization and functioning of faults in the sandstone basin. Simple
texturai and mineralogical characteristics of the Athabasca sandstone preclude the breccia
features from being controlled by any compositional and structural anisotropy in the parent
rocks.
Within the West Athabasca Basin, the Shea Creek exploration zone has been selected for a
case study because of the extensive development of breccias, their variety and the dense
exploration drilling pattern (20 to 40 rn intervals between wells) in the south part, that allows
a reconstruction of the 3D geometry of the breccia bodies, and extensive sampling
possibilities (Fig. 1 ). The study area represents a zone of 600 rn in length from north to south
and 200 rn in width.
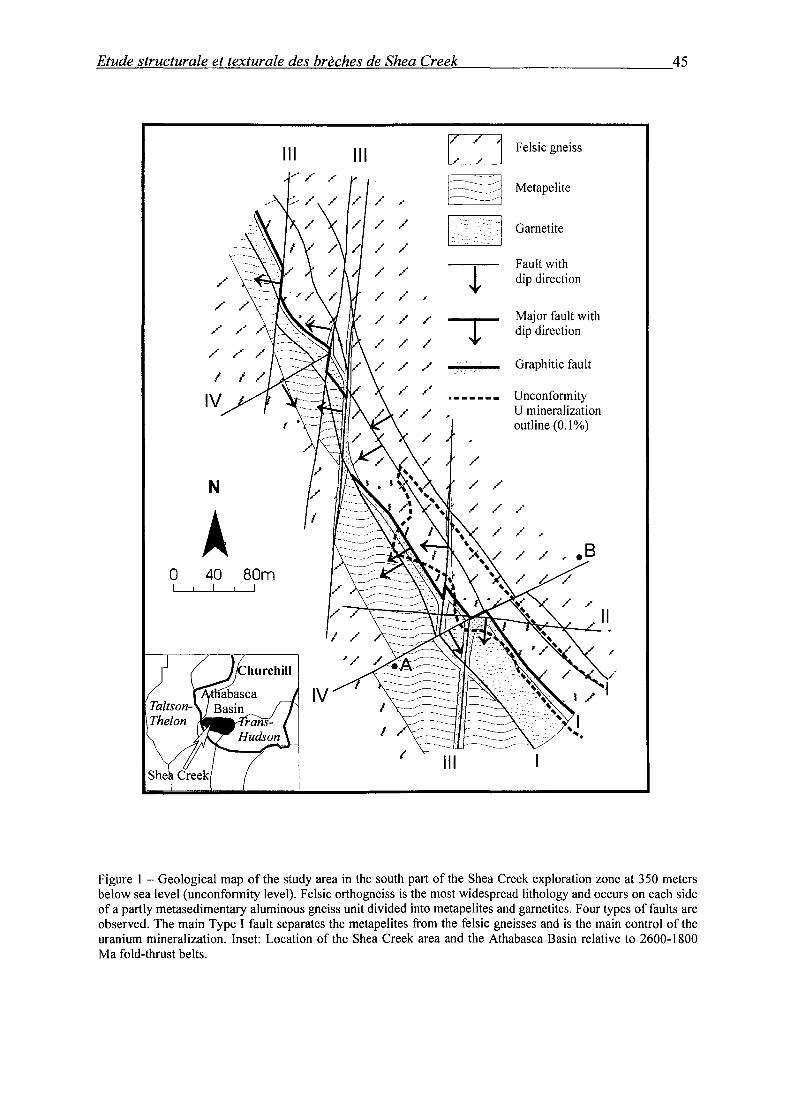
~E~tu~d~e~s~~~u~c~t~u~ra~l~e~e~t~œ~x~t~ur~a~l~e~d~e~s~b~re~'c~h~e~s~d~e~S~h~e~a~C~r~e~e~k _________________________ 45
Ill
Figure 1 - Geological map of the study area in the south part of the Shea Creek exploration zone at 350 meters below sea leve! (unconformity leve!). Felsic orthogneiss is the most widespread lithology and occurs on each side of a parti y metasedimentary aluminous gneiss unit divided into metapelites and gametites. Four types of faults are observed. The main Type I fault separates the metapelites from the felsic gneisses and is the main control of the uranium mineralization. Inset: Location of the Shea Creek area and the Athabasca Basin relative to 2600-1800 Ma fold-thrust belts.
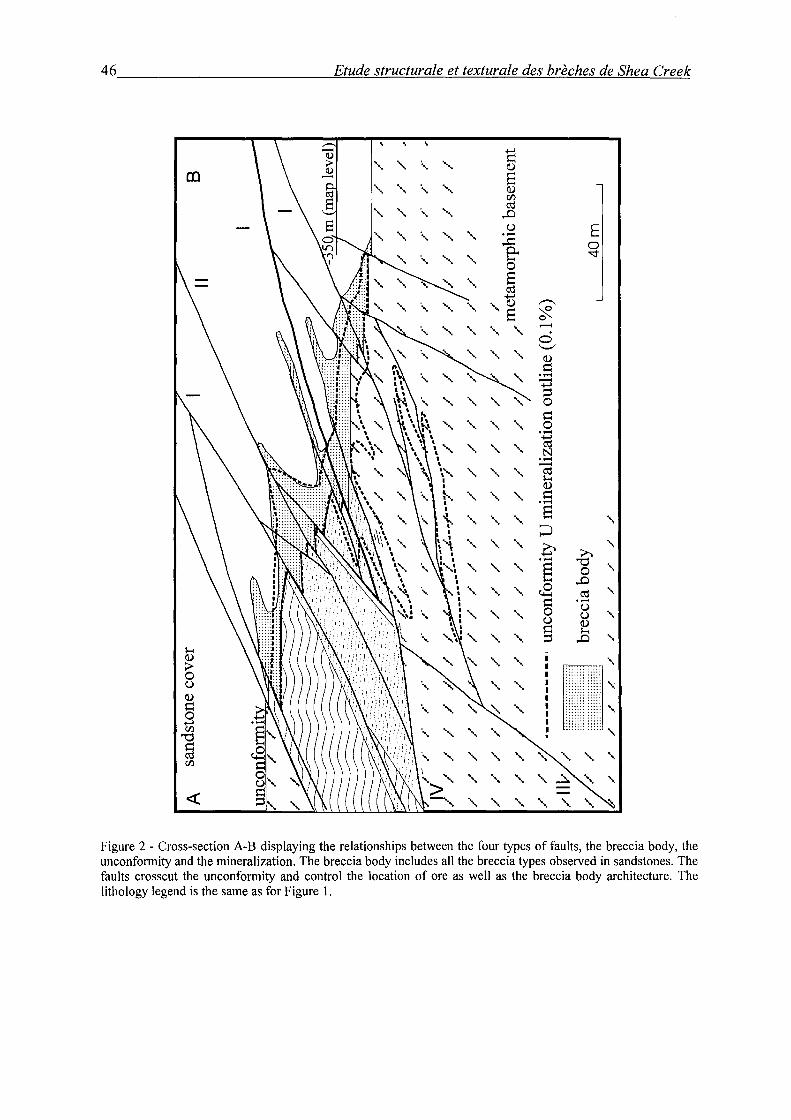
46 __________________________ ~E~tu~d~e~st~r~u~ct~u~r~a~le~e~t~t~e~xt~u~r~a~le~d~e~s~b~r~è~c~h~es~d~e~S~h~e~a~C~r~e~e~k
....... ....... ·, ...... 1::1 (l)
....... ....... ..... ...... s (l) r/)
....... ....... ·, ...... Cl:!
..0 C,) E ....... ..... ...... ...... ·-..J:::: 0
...... ....... e- '<:)"
0
§ ..;->
....... (l) ,-....
s 'J( ...... ......
....-<
0 '-"
....... ....... (l)
~ ·-........
...... ....... ~ 0 ~
...... ....... ....... ....... 0 ·-....... ....... .......
~ N ·-........
....... ....... ....... Cl:! ~ (l)
....... ....... ....... ~ ·-
....... ...... ....... s ..... ~
....... ...... ....... ô .....
·- .s ....... ....... ....... ê 0 .....
..0 ....... ....... ....... t.S Cl:! .....
~ ·-....... ....... 0 C,)
..... C,) C,) (l)
....... ~ ~
....... ;j ..0 ..... ~ (l)
....... .......
~: :> 0 C,) ....... (l)
~ ....... ..... 0
..;-> r/) ...... ....... .......
................. '"0 a ...... ....... ...... ....... " r/)
....... ....... ....... ......
<( ....... ....... ....... .......
Figure 2 - Cross-section A-B displaying the relationships between the four types of faults, the breccia body, the unconformity and the mineralization. The breccia body includes ali the breccia types observed in sandstones. The faults crosscut the unconformity and control the location of ore as weil as the breccia body architecture. The lithology legend is the same as for Figure l.
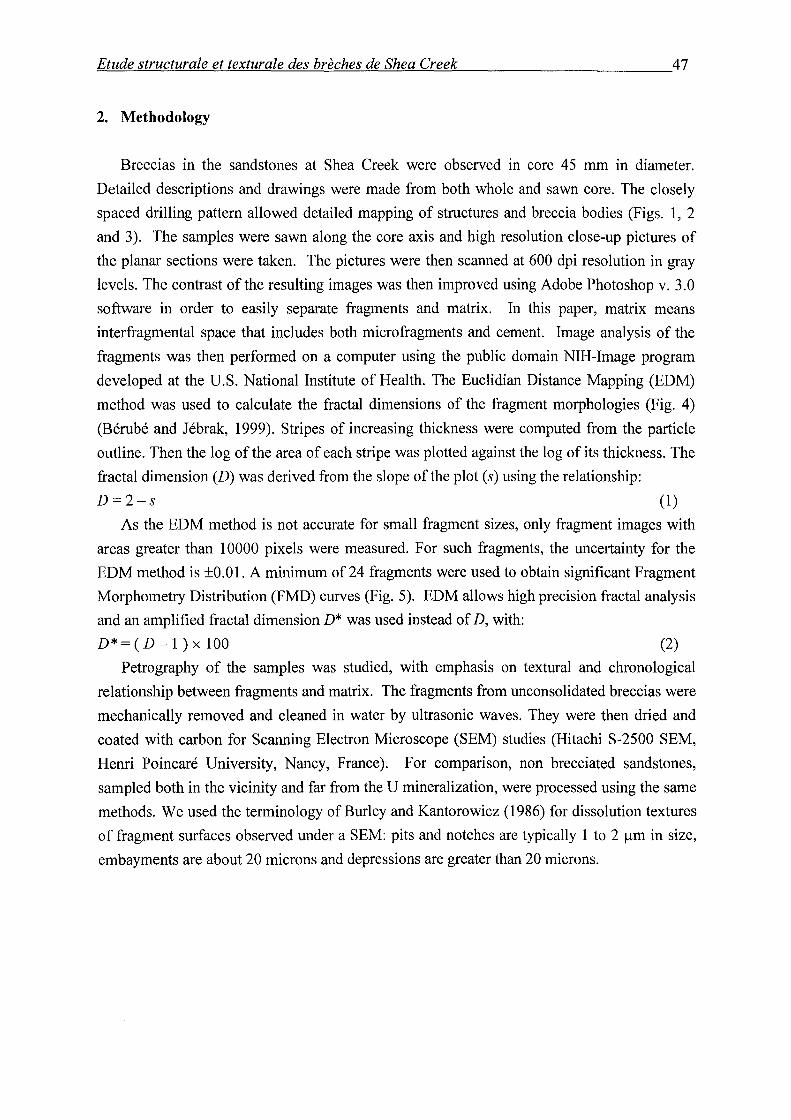
~E=tu=d=e~s=~~u=c=tu=r~a=le~et~t=ex=t=u~ra=l=e~d=e~s~b~re~'c=h=e~s=d=e~S~h=ea~C~r=ee=k~ _______________________ 47
2. Methodology
Breccias in the sandstones at Shea Creek were observed in core 45 mm in diameter.
Detailed descriptions and drawings were made from both whole and sawn core. The closely
spaced drilling pattern allowed detailed mapping of structures and breccia bodies (Figs. 1, 2
and 3). The samples were sawn along the core axis and high resolution close-up pictures of
the planar sections were taken. The pictures were then scanned at 600 dpi resolution in gray
levels. The contrast of the resulting images was then improved using Adobe Photoshop v. 3.0
software in order to easily separate fragments and matrix. In this paper, matrix means
interfragmental space that includes both microfragments and cement. Image analysis of the
fragments was then performed on a computer using the public domain NIH-Image program
developed at the U.S. National Institute of Health. The Euclidian Distance Mapping (EDM)
method was used to calculate the fractal dimensions of the fragment morphologies (Fig. 4)
(Bérubé and Jébrak, 1999). Stripes of increasing thickness were computed from the particle
outline. Then the log of the area of each stripe was plotted against the log of its thickness. The
fractal dimension (D) was derived from the slope of the plot (s) using the relationship:
D=2-s (1)
As the EDM method is not accurate for small fragment sizes, only fragment images with
areas greater than 10000 pixels were measured. For such fragments, the uncertainty for the
EDM method is ±0.01. A minimum of24 fragments were used to obtain significant Fragment
Morphometry Distribution (FMD) curves (Fig. 5). EDM allows high precision fractal analysis
and an amplified fractal dimension D* was used instead of D, with:
D * = ( D - 1 ) x 1 00 (2)
Petrography of the samples was studied, with emphasis on texturai and chronological
relationship between fragments and matrix. The fragments from unconsolidated breccias were
mechanically removed and cleaned in water by ultrasonic waves. They were then dried and
coated with carbon for Scanning Electron Microscope (SEM) studies (Hitachi S-2500 SEM,
Henri Poincaré University, Nancy, France). For comparison, non brecciated sandstones,
sampled both in the vicinity and far from the U mineralization, were processed using the same
methods. We used the terminology of Burley and Kantorowicz (1986) for dissolution textures
of fragment surfaces observed under a SEM: pits and notches are typically 1 to 2 11m in size,
embayments are about 20 microns and depressions are greater than 20 microns.
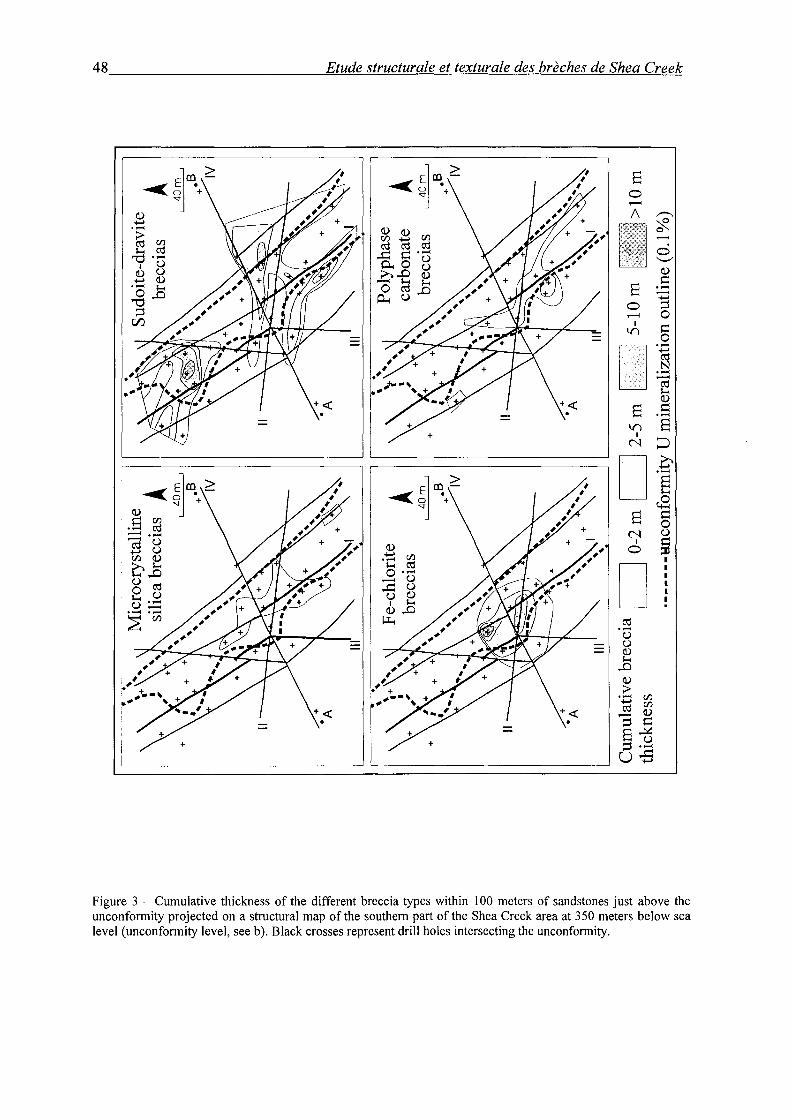
48 __________________________ =E=tu=d=e~st~r=u=ct=u~r=a~le~e~t~t=ex=t~u~r=a~le~d=e=s~b=r~è=c~h=es~d=e~S~h=e=a~C~r~e~e~k
8 0
8 0 .........
1 If)
D 8 If)
1 C"l
LJ 8
C"l 1
0
n
0 ..._., (!) $:1 ..... -'El 0 $:1 0 -~ N ..... ] ~ "§ ~ 0 "§ t8
$:1 0 ü
$ 1 1 1 1 1 1 .
Figure 3 - Cumulative thickness of the different breccia types within 100 meters of sandstones just above the unconformity projected on a structural map of the southem part of the Shea Creek area at 350 meters below sea lev el (unconformity Ievel, see b ). Black crosses represent drill ho les intersecting the unconformity.
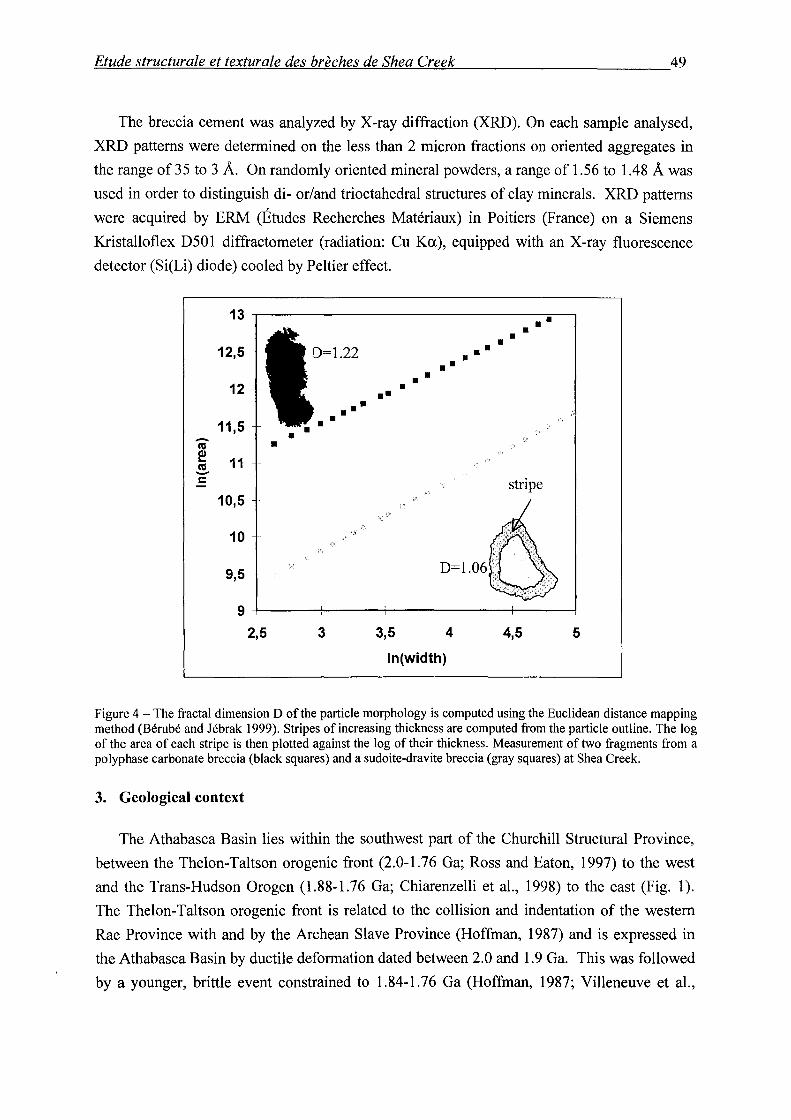
~E~tu~d~e~s=t~ru~c=t~u~ra=l=e~e~t~te~x~tu~r~a~l~e~d=es~b~re~'c~h~e~s~d=e~S~h~e~a~C~r~e~e~k _________________________ 49
The breccia cement was analyzed by X-ray diffraction (XRD). On each sample analysed,
XRD patterns were determined on the less than 2 micron fractions on oriented aggregates in
the range of 35 to 3 A. On randomly oriented mineral powders, a range of 1.56 to 1.48 A was
used in order to distinguish di- or/and trioctahedral structures of clay minerais. XRD patterns
were acquired by ERM (Études Recherches Matériaux) in Poitiers (France) on a Siemens
Kristalloflex D501 diffractometer (radiation: Cu Ka), equipped with an X-ray fluorescence
detector (Si(Li) diode) cooled by Peltier effect.
13 •• • • • 12,5 -
• •• ••
• • 12 - • •• • ••
11,5 • • - • co • e 11 -co -1: stripe 10,5 -
10 ,,;
9,5
9 2,5 3 3,5 4 4,5 5
ln(width)
Figure 4- The fractal dimension D of the particle morphology is computed using the Euclidean distance mapping method (Bérubé and Jébrak 1999). Stripes of increasing thickness are computed from the partie le outline. The log of the area of each stripe is then plotted against the log of the ir thickness. Measurement of two fragments from a polyphase carbonate breccia (black squares) and a sudoite-dravite breccia (gray squares) at Shea Creek.
3. Geological context
The Athabasca Basin lies within the southwest part of the Churchill Structural Province,
between the Thelon-Taltson orogenie front (2.0-1.76 Ga; Ross and Eaton, 1997) to the west
and the Trans-Hudson Orogen (1.88-1.76 Ga; Chiarenzelli et al., 1998) to the east (Fig. 1).
The Thel on-Taltson orogenie front is related to the collision and indentation of the western
Rae Province with and by the Archean Slave Province (Hoffman, 1987) and is expressed in
the Athabasca Basin by ductile deformation dated between 2.0 and 1.9 Ga. This was followed
by a younger, brittle event constrained to 1.84-1.76 Ga (Hoffman, 1987; Villeneuve et al.,
50 ____________ -=E,_,_,tu=d=e:...:s=tr'-..!u=c:..:..:tu=r=a=le'--'e=t--"t=ex=t=ur:....:a=l=-e =d=es"--"'-'br'-"è=c!;.he=s'-'d=e"-'S"""h'""'e::!;:a:._C=._!re~e:!!:k
1991 ). The Shea Creek area is located in the western part of the Basin in the Western Craton
which represents a Lower Proterozoic stable cratonic foreland (Hoeve et al., 1980).
The Athabasca Basin formed during the Mesoproterozoic at about 1. 7 Ga (Armstrong and
Ramaekers, 1985; Kotzer et al., 1992) and is separated from the underlying basement by a
major unconformity. lt is composed of series of sub-basins oriented NE-SW and controlled by
faults rooted in the crystalline basement. The Basin is filled by severallithostratigraphic units,
the basal Athabasca Group being the major division (Ramaekers and Dunn, 1977). The
Athabasca Group is composed of thick, unmetamorphosed and flat-lying sequences of
fluviatile to marine quartzose sandstones deposited in a land-proximal shelf environment
(Ramaekers, 1981 ). A maximum total thickness of 4 to 5 km of sediments in the Basin has
been proposed, based on fluid inclusions and diagenetic clay assemblages studies (Pagel,
1975; Hoeve et al., 1981; Halter, 1988).
At Shea Creek, the uneroded sandstone cover is about 700 rn thick. Six formations have
been distinguished, from bottom to top: Manitou Falls C, Manitou Falls D, Lazenby Lake,
Wolverine Point A, Wolverine Point Band Locker Lake. The sandstones hosting the studied
breccias mainly belong to the Manitou Falls C Formation. These sandstones directly overlie
the basement at Shea Creek and are typically medium to very coarse grained. Rare bedded
clay layers are generally one to two cm thick. In non-mineralized zones, clay typically forms
0.5 to 15 percent of the rock and averages around 5 percent (Ramaekers, 1990). Major
sandstone cements are quartz syntaxial overgrowths, clay minerais (kaolinite, illite, chlorite)
and iron oxides.
Two main Paleoproterozoic basement lithostratigraphic units are found at Shea Creek: a
metasedimentary unit in which graphite is mainly concentrated in faults, and a meta-igneous
felsic gneiss unit (Fig. 1 ).
Four types of faults have been recognized, based on their orientation and movement
(Table 1 ). They occur both in the Paleoproterozoic basement and in the Mesoproterozoic
cover. Type I reverse faults are regional and oriented Nl30°-150°. They are described in
greater detail below. Type II fault structures are local and oriented Nl00°-110°. They display
late stage normal-sinistral movements with throws up to 10 m. Type III reverse faults are
regional and oriented N5°-15°. Like Type I faults, they are graphite-rich and have a ductile
pre-Athabasca history. Their post-Athabasca throws may reach 20 m. Type IV fault
structures are local and oriented N50°-60°. They display sinistral-reverse to dextral-normal
movements with throws of up to 1 0 m.
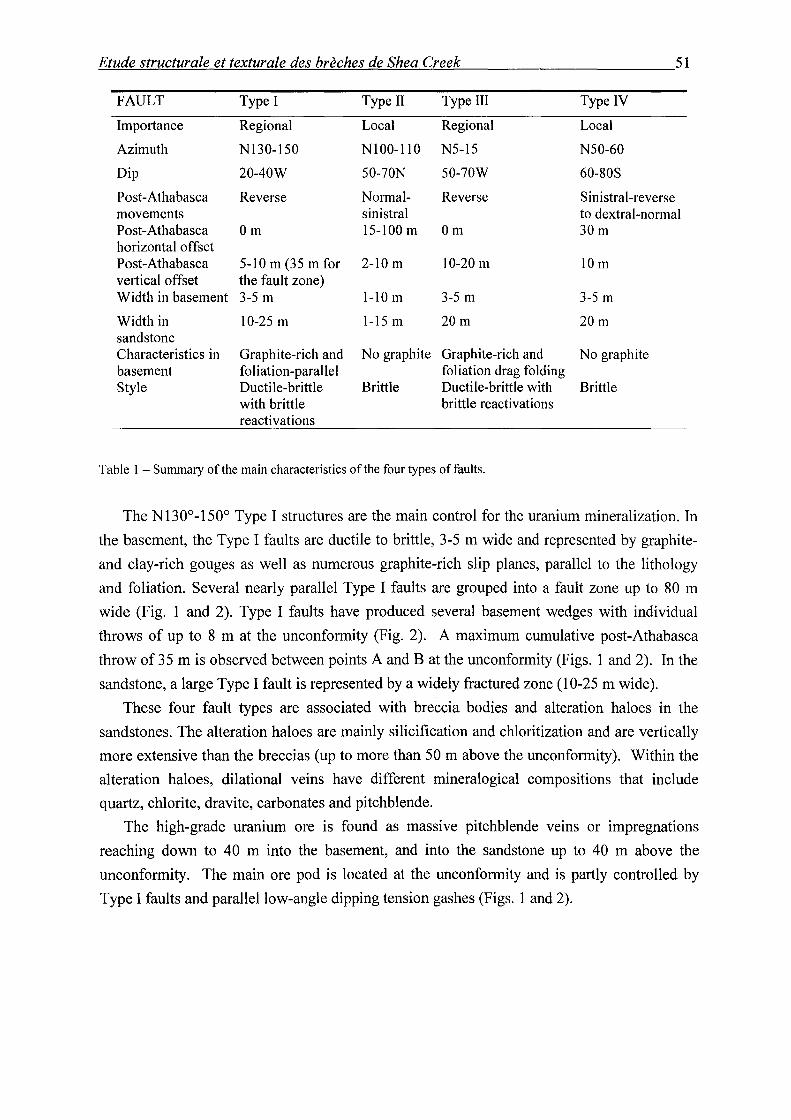
Etude structurale et texturale des brèches de Shea Creek 51
FAULT Type 1 Type II Type III Type IV
Importance Regional Local Regional Local
Azimuth N130-150 N100-110 N5-l5 N50-60
Dip 20-40W 50-70N 50-70W 60-SOS
Post-Athabasca Reverse Normal- Reverse Sinistral-reverse rnovernents sinistral to dextral-norrnal Post-Athabasca Om 15-lOOm Orn 30rn horizontal offset Post-Athabasca 5-10 rn (35 rn for 2-10 rn 10-20 rn 10 rn vertical offset the fault zone) Width in basernent 3-5 rn l-10 rn 3-5 rn 3-5 rn
Width in 10-25 rn 1-15 rn 20rn 20rn sandstone Characteristics in Graphite-rich and No graphite Graphite-rich and No graphite basement foliation-parallel foliation drag folding Style Ductile-brittle Brittle Ductile-brittle with Brittle
with brittle brittle reactivations reactivations
Table 1 - Summary of the main characteristics of the four types of faults.
The Nl30°-l50° Type I structures are the main control for the uranium mineralization. In
the basement, the Type I faults are ductile to brittle, 3-5 rn wide and represented by graphite
and clay-rich gouges as well as numerous graphite-rich slip planes, parallel to the lithology
and foliation. Several nearly parallel Type 1 faults are grouped into a fault zone up to 80 rn
wide (Fig. 1 and 2). Type 1 faults have produced several basement wedges with individual
throws of up to 8 rn at the unconformity (Fig. 2). A maximum cumulative post-Athabasca
throw of 35 rn is observed between points A and Bat the unconformity (Figs. 1 and 2). In the
sandstone, a large Type I fault is represented by a widely fractured zone (10-25 rn wide).
These four fault types are associated with breccia bodies and alteration haloes in the
sandstones. The alteration haloes are mainly silicification and chloritization and are vertically
more extensive than the breccias (up to more than 50 rn above the unconformity). Within the
alteration haloes, dilational veins have different mineralogical compositions that include
quartz, chlorite, dravite, carbonates and pitchblende.
The high-grade uranium ore is found as massive pitchblende veins or impregnations
reaching down to 40 rn into the basement, and into the sandstone up to 40 rn above the
unconformity. The main ore pod is located at the unconformity and is partly controlled by
Type I faults and parallellow-angle dipping tension gashes (Figs. 1 and 2).
52 ________________________ -=E=tu=d=e~s=t~ru=c=t=ur~a=l~e~e~t~œ=x=tu=r~a=k~de=s~b=r~è=c~h=es~de~S~h~ea~C~r~e~ek
4. Description and mechanisms of formation of the breccias
Breccia fragment morphology and visually determined composition of the cements were
used for breccia descriptions in the field. The nature of the cement made it possible to
distinguish the different breccia types, whereas the fragment morphology and matrix
proportion were used to describe the temporal and spatial breccia evolution within each
particular type. Each breccia was characterized in terms of evolutionar maturity (Laznicka,
1988). An immature breccia has a low matrix proportion and weakly corroded and/or abraded
and rarely rotated fragments. As the breccia evolved towards a more mature stage, the matrix
proportion increases and the fragments become more corroded and/or abraded and rotated.
Extreme maturity may be characterized by a decrease of the matrix proportion when collapse
occurs.
Four main types of breccias, based on the assemblage of hydrothermal minerais, were
recognized in the sandstone at Shea Creek: microcrystalline quartz, sudoite-dravite, Fe
chlorite and polyphase carbonate breccias (Table 2).
4.1. Microcrystalline quartz breccias
Description
Microcrystalline quartz breccias are characterized by white fine-grained quartz-rich
matrix. The breccia body is spatially correlated with the main Type I fault (Fig. 3).
On hand specimen, texturai variations are related to the maturity of the breccias (Table 2
and Fig. 6a). Immature breccias are represented by an oriented network of white
microcrystalline quartz granulation seams or bands. They locally present jigsaw textures. The
breccia contacts are typically fracture-controlled with variable clips. Offsets of one mm to
several cm are sometimes visible along granulation seams.
The matrix displays either microfragments of detrital quartz (Fig. 7a) or neogenic
microcrystalline quartz cement. Quartz microfragments are often angular, locally oriented and
sometimes elongated in splinters. They show clean cusps under SEM and are probably of
mechanical origin. Consequently, the white fine-grained matrix is either due to the presence of
microcrystalline quartz or to the fine granulation of the original detrital quartz grains and
overgrowths. Local jigsaw textures are locally recognized at the grain scale.
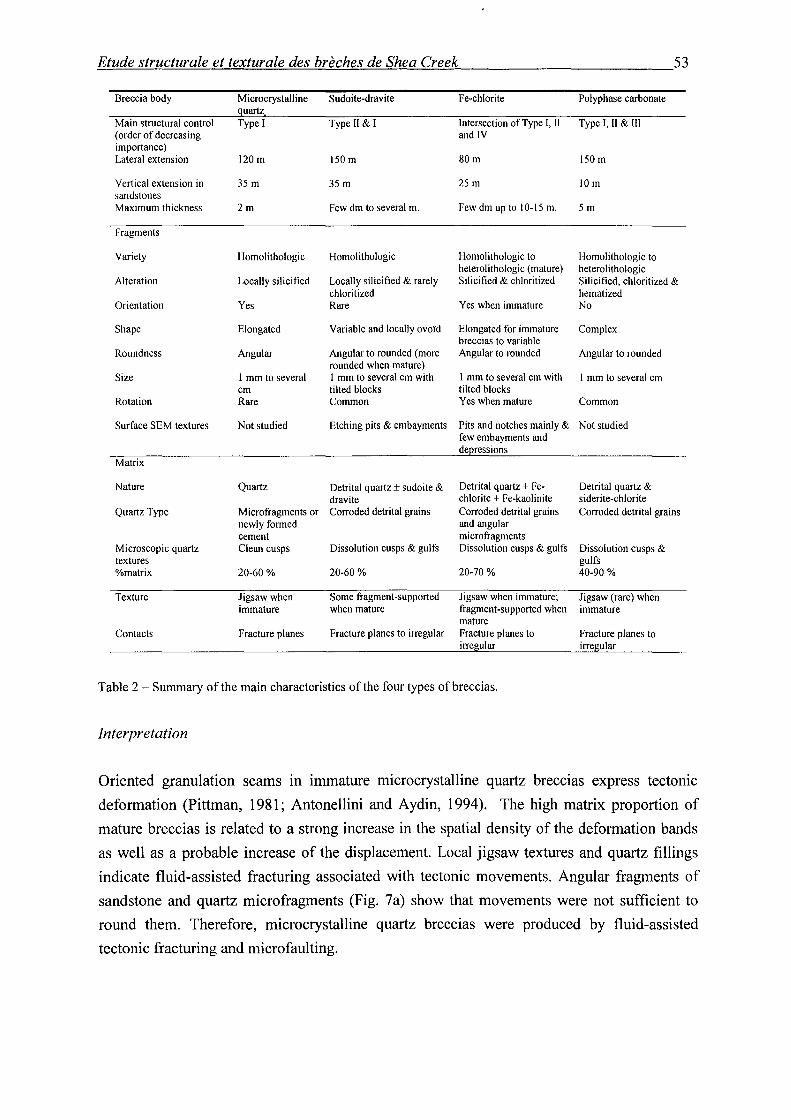
Etude structurale et texturale des brèches de Shea Creek 53
Breccia body Microcrystalline Sudoite-dravite Fe-chlorite Polyphase carbonate uartz
Main structural control Type 1 Type Il & 1 Intersection of Type 1, Il Type 1, Il & III ( order of decreasing and IV importance) Lateral extension 120m !SOm 80m !SOm
Vertical extension in 3S m 3S m 2S m IOm sandstones Maximum thickness 2m Few dm to severa! m. Few dm up to 10-IS m. Sm
Fragments
Variety Homolithologic Homolithologic Homolithologic to Homolithologic to heterolithologic (mature) heterolithologic
Alteration Locally silicified Locally silicified & rarely Silicified & chloritized Silicified, chloritized & chloritized hematized
Orientation Y es Rare Y es wh en immature No
Shape Elongated Variable and locally ovoïd Elongated for immature Complex breccias to variable
Roundness Angular Angular to rounded (more Angular to rounded Angular to rounded rounded when mature)
Size 1 mm to severa! 1 mm to severa! cm with 1 mm to severa! cm with 1 mm to severa! cm cm tilted blocks tilted blocks
Rotation Rare Common Y es wh en mature Common
Surface SEM textures Not studied Etching pits & embayments Pits and notches main! y & Not studied few embayments and de ressions
Ma tri x
Nature Quartz Detrital quartz± sudoite & Detrital quartz+ Fe- Detrital quartz & dravite chlorite + Fe-kaolinite siderite-chlorite
Quartz Type Microfragments or Corroded detrital grains Corroded detrital grains Corroded detrital grains newly forrned and angular cement microfragments
Microscopie quartz Clean cusps Dissolution cusps & gulfs Dissolution cusps & gulfs Dissolution cusps & textures gulfs %matrix 20-60% 20-60% 20-70% 40-90%
Texture Jigsaw when Sorne fragment-supported Jigsaw when immature; Jigsaw (rare) when immature when mature fragment-supported when immature
mature Contacts Fracture planes Fracture planes to irregular Fracture planes to Fracture planes to
irre ular irre ular
Table 2- Summary of the main characteristics of the four types ofbreccias.
Interpretation
Oriented granulation seams in immature microcrystalline quartz breccias express tectonic
deformation (Pittman, 1981; Antonellini and Aydin, 1994). The high matrix proportion of
mature breccias is related to a strong increase in the spatial density of the deformation bands
as well as a probable increase of the displacement. Local jigsaw textures and quartz fillings
indicate fluid-assisted fracturing associated with tectonic movements. Angular fragments of
sandstone and quartz microfragments (Fig. 7a) show that movements were not sufficient to
round them. Therefore, microcrystalline quartz breccias were produced by fluid-assisted
tectonic fracturing and microfaulting.
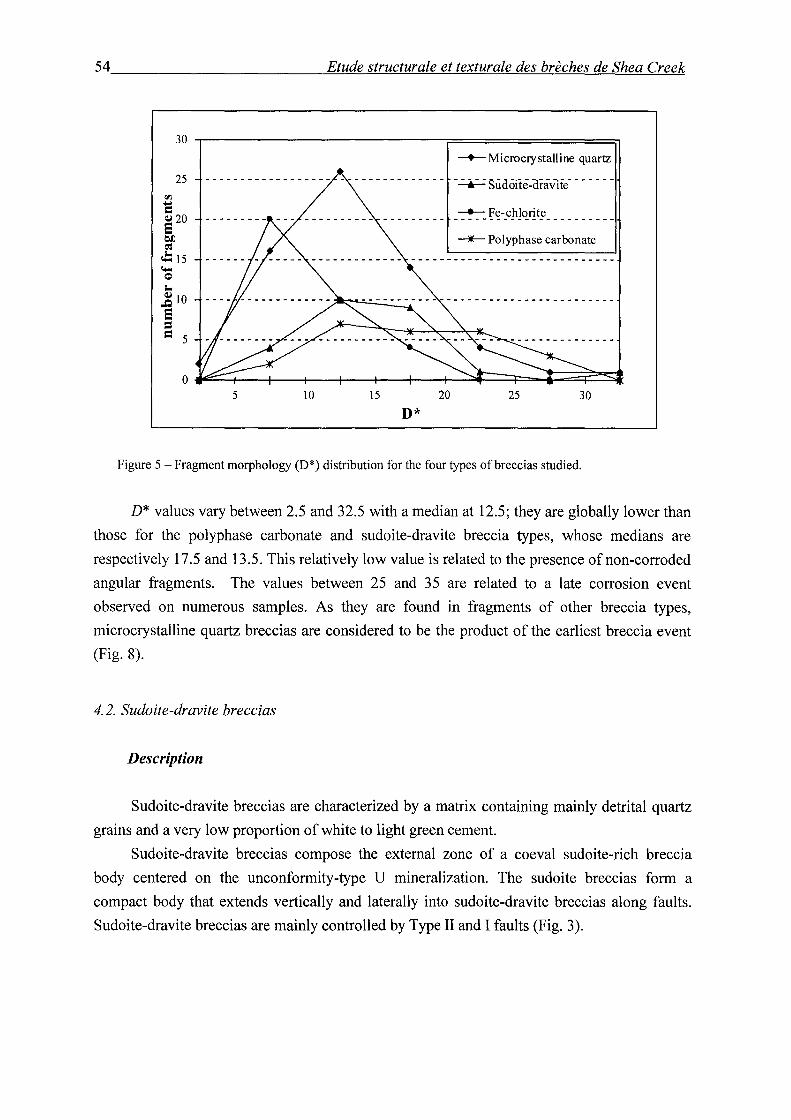
54 ________________________ -=E=tu=d=e~s=t~ru=c=t=u~ra=l~e~e~t~te=x~tu=r~a~le~d=es~br~è=c~h=es~d~e=S~h=ea~C~r~e~ek
30 .---------------------------r=================~
25
"' = Cl.l20 8 bJ) ~
~15 ~ c 1.
~10 8 = = 5
5 10
-+- Microcrystalline quartz
-..:..;r...: süaüïië-oraviie- --- -- -
__._Fe-ch lori te ------------------------7IE- Polyphase carbonate
15 20 25 30
D*
Figure 5- Fragment morphology (D*) distribution for the four types ofbreccias studied.
D* values vary between 2.5 and 32.5 with a median at 12.5; they are globally lower than
those for the polyphase carbonate and sudoite-dravite breccia types, whose medians are
respectively 17.5 and 13.5. This relatively low value is related to the presence ofnon-corroded
angular fragments. The values between 25 and 35 are related to a late corrosion event
observed on numerous samples. As they are found in fragments of other breccia types,
microcrystalline quartz breccias are considered to be the product of the earliest breccia event
(Fig. 8).
4. 2. Sudoite-dravite breccias
Description
Sudoite-dravite breccias are characterized by a matrix containing mainly detrital quartz
grains and a very low proportion of white to light green cement.
Sudoite-dravite breccias compose the extemal zone of a coeval sudoite-rich breccia
body centered on the unconformity-type U mineralization. The sudoite breccias form a
compact body that extends vertically and laterally into sudoite-dravite breccias along faults.
Sudoite-dravite breccias are mainly controlled by Type II and I faults (Fig. 3).
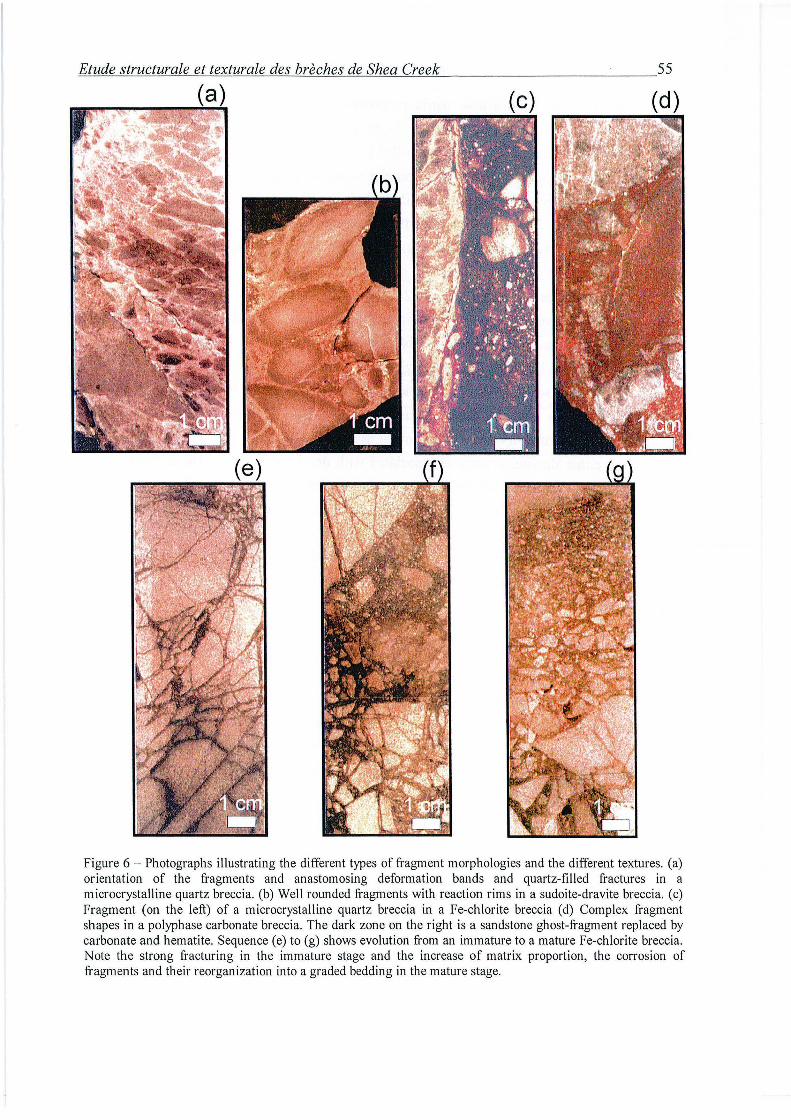
=E=tu=d=e~s=t~ru=c=t=u~ra=l~e~e~t~te=x=tu=r~a=l~e~d=es~b~re~'c~h=e~s~d=e~S~h=e=a~C=r~e=e=k _________________________ 55
Figure 6 - Photographs illustrating the different types of fragment morphologies and the different textures. (a) orientation of the fragments and anastomosing deformation bands and quartz-filled fractures in a microcrystalline quartz breccia. (b) Weil rounded fragments with reaction rims in a sudoite-dravite breccia. (c) Fragment (on the left) of a microcrystalline quartz breccia in a Fe-chlorite breccia ( d) Complex fragment shapes in a polyphase carbonate breccia. The dark zone on the right is a sandstone ghost-fragment replaced by carbonate and hematite. Sequence (e) to (g) shows evolution from an immature to a mature Fe-chlorite breccia. Note the strong fi'acturing in the immature stage and the increase of matrix proportion, the corrosion of fragments and their reorganization into a graded bedding in the mature stage.
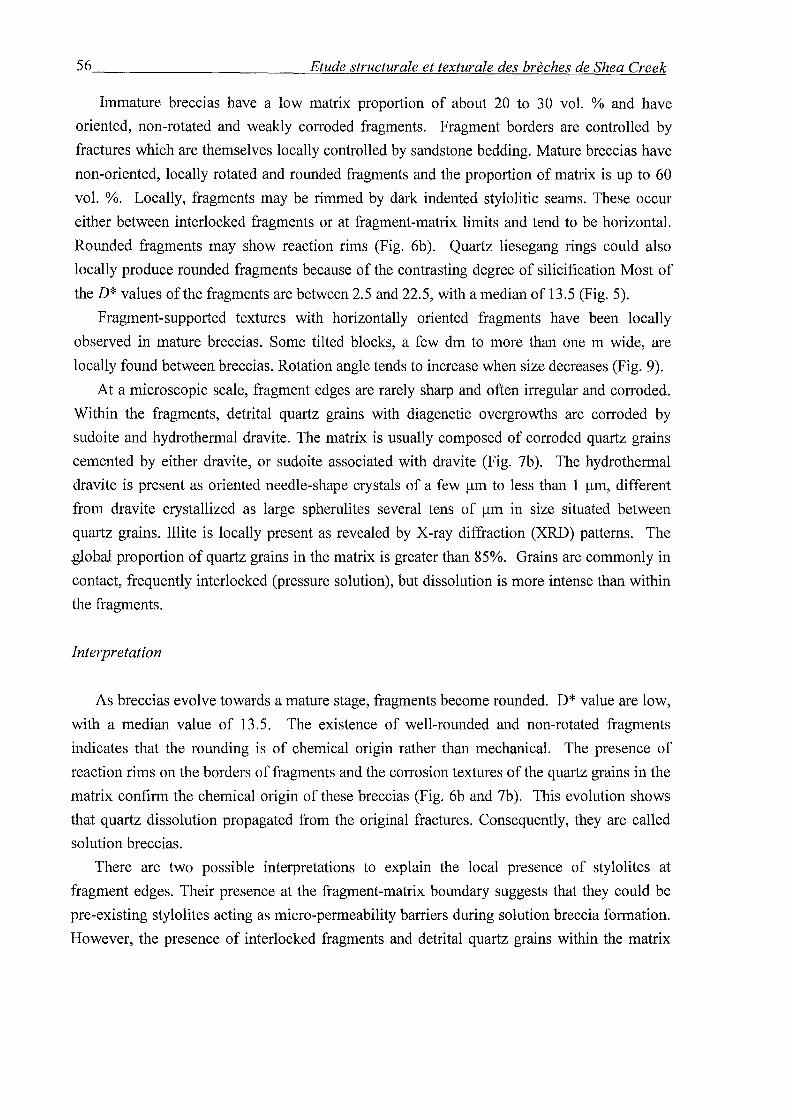
56 ________________________ _;E~tu~d~e~s~t~ru~c~t~u~ra~l~e~e~t~te~x~tu~r~a~le~d~es~br~è~c~h~es~d~e~S~h~ea~C~r~e~ek
Immature breccias have a low matrix proportion of about 20 to 30 vol. % and have
oriented, non-rotated and weakly corroded fragments. Fragment borders are controlled by
fractures which are themselves locally controlled by sandstone bedding. Mature breccias have
non-oriented, locally rotated and rounded fragments and the proportion of matrix is up to 60
vol. %. Locally, fragments may be rimmed by dark indented stylolitic seams. These occur
either between interlocked fragments or at fragment-matrix limits and tend to be horizontal.
Rounded fragments may show reaction rims (Fig. 6b ). Quartz lie se gang rings could also
locally produce rounded fragments because of the contrasting degree of silicification Most of
the D* values of the fragments are between 2.5 and 22.5, with a median of 13.5 (Fig. 5).
Fragment-supported textures with horizontally oriented fragments have been locally
observed in mature breccias. Sorne tilted blocks, a few dm to more than one rn wide, are
locally found between breccias. Rotation angle tends to increase when size decreases (Fig. 9).
At a microscopie scale, fragment edges are rarely sharp and often irregular and corroded.
Within the fragments, detrital quartz grains with diagenetic overgrowths are corroded by
sudoite and hydrothermal dravite. The matrix is usually composed of corroded quartz grains
cemented by either dravite, or sudoite associated with dravite (Fig. 7b ). The hydrothermal
dravite is present as oriented needle-shape crystals of a few !J.ID to less than 1 !J.ID, different
from dravite crystallized as large spherulites severa! tens of !J.ID in size situated between
quartz grains. Illite is locally present as revealed by X-ray diffraction (XRD) patterns. The
~obaJ proportion of quartz grains in the matrix is greater than 85%. Grains are commonly in
contact, frequently interlocked (pressure solution), but dissolution is more intense than within
the fragments.
Interpretation
As breccias evolve towards a mature stage, fragments become rounded. D* value are low,
with a median value of 13.5. The existence of well-rounded and non-rotated fragments
indicates that the rounding is of chemical origin rather than mechanical. The presence of
reaction rims on the borders of fragments and the corrosion textures of the quartz grains in the
matrix confirm the chemical origin of these breccias (Fig. 6b and 7b ). This evolution shows
that quartz dissolution propagated from the original fractures. Consequently, they are called
solution breccias.
There are two possible interpretations to explain the local presence of stylolites at
fragment edges. Their presence at the fragment-matrix boundary suggests that they could be
pre-existing stylolites acting as micro-permeability barriers during solution breccia formation.
However, the presence of interlocked fragments and detrital quartz grains within the matrix
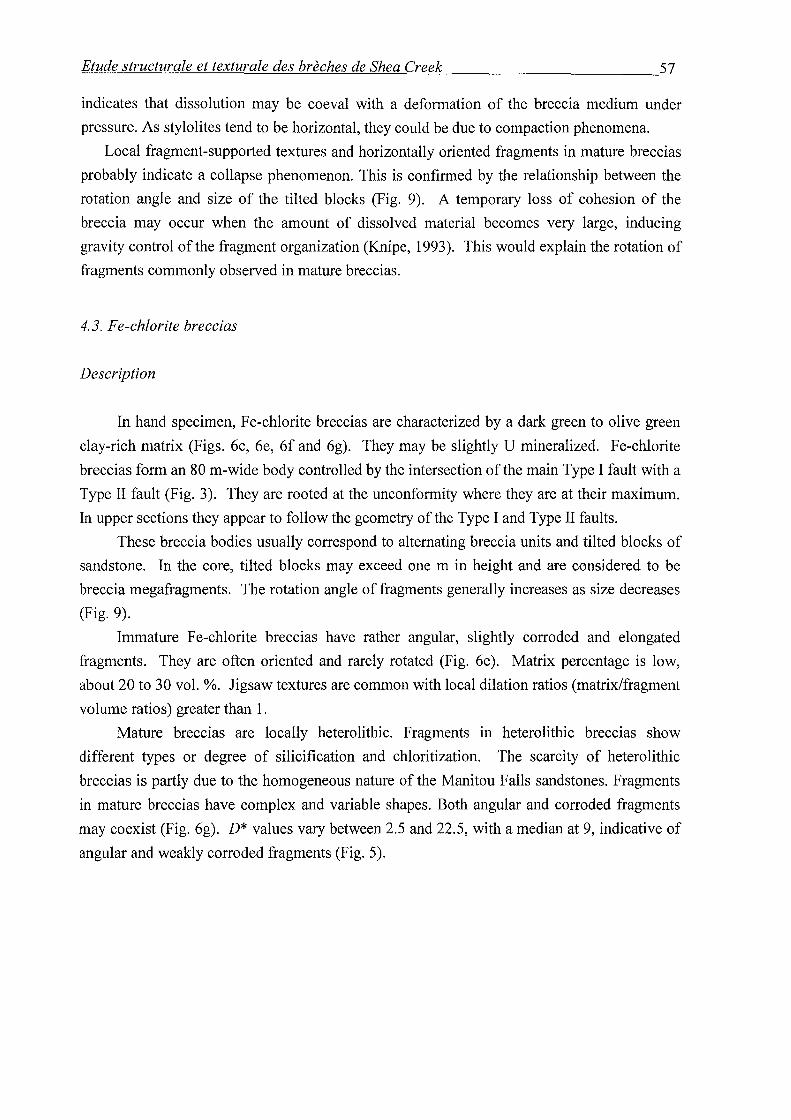
~E~tu~d~e~s~t~ru~c~t~u~ra~l~e~e~t~te~x~t~ur~a~l~e~d~e~s~b~re~'c~h~e~s~d~e~S~h~e~a~C~r~e~e~k _________________________ 57
indicates that dissolution may be coeval with a deformation of the breccia medium under
pressure. As stylolites tend to be horizontal, they could be due to compaction phenomena.
Local fragment-supported textures and horizontally oriented fragments in mature breccias
probably indicate a collapse phenomenon. This is confirmed by the relationship between the
rotation angle and size of the tilted blocks (Fig. 9). A temporary loss of cohesion of the
breccia may occur when the amount of dissolved material becomes very large, inducing
gravity control of the fragment organization (Knipe, 1993 ). This would ex plain the rotation of
fragments commonly observed in mature breccias.
4.3. Fe-chlorite breccias
Description
In hand specimen, Fe-chlorite breccias are characterized by a dark green to olive green
clay-rich matrix (Figs. 6c, 6e, 6f and 6g). They may be slightly U mineralized. Fe-chlorite
breccias forman 80 m-wide body controlled by the intersection of the main Type I fault with a
Type II fault (Fig. 3). They are rooted at the unconformity where they are at their maximum.
In upper sections they appear to follow the geometry of the Type I and Type II faults.
These breccia bodies usually correspond to altemating breccia units and tilted blocks of
sandstone. In the core, tilted blocks may exceed one rn in height and are considered to be
breccia megafragments. The rotation angle of fragments generally increases as size decreases
(Fig. 9).
Immature Fe-chlorite breccias have rather angular, slightly corroded and elongated
fragments. They are often oriented and rarely rotated (Fig. 6e ). Matrix percentage is low,
about 20 to 30 vol. %. Jigsaw textures are common with local dilation ratios (matrix/fragment
volume ratios) greater than 1.
Mature breccias are locally heterolithic. Fragments in heterolithic breccias show
different types or degree of silicification and chloritization. The scarcity of heterolithic
breccias is partly due to the homogeneous nature of the Manitou Falls sandstones. Fragments
in mature breccias have complex and variable shapes. Both angular and corroded fragments
may coexist (Fig. 6g). D* values vary between 2.5 and 22.5, with a median at 9, indicative of
angular and weakly corroded fragments (Fig. 5).
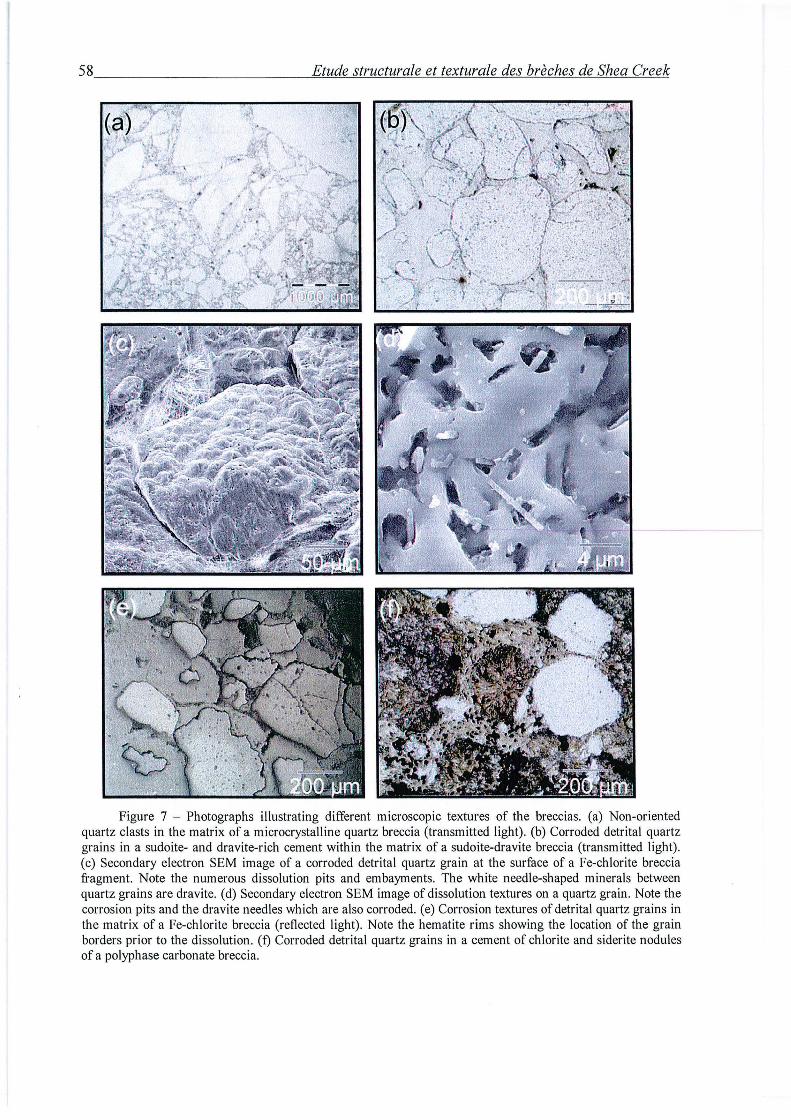
58 ________________________ ~E~t~ud~e~st~r~u=ct=u~ra=l=e~e=t~œ=x=t=ur~a=l=e~d=e~s~b~re='c~h=e=s~d=e~S~h=e=a~C=r~e~ek
Figure 7 - Photographs illustrating different microscopie textures of the breccias. (a) Non-oriented quartz clasts in the matrix of a microcrystalline quartz breccia (transmitted light). (b) Corroded detrital quartz grains in a sudoite- and dravite-rich cement within the matrix of a sudoite-dravite breccia (transmitted light) . (c) Secondary electron SEM image of a corroded detrital quartz grain at the surface of a Fe-chlorite breccia fragment. Note the numerous dissolution pits and embayments. The white needle-shaped minerais between quartz grains are dravite. (d) Secondary electron SEM image of dissolution textures on a quartz grain. Note the corrosion pits and the dra vite needles which are a Iso corroded. ( e) Corrosion textures of detrital quartz grains in the matrix of a Fe-chlorite breccia (reflected light). Note the hematite rims showing the location of the grain borders prior to the dissolution. (t) Corroded detrital quartz grains in a cement of chlorite and siderite nodules of a polyphase carbonate breccia.
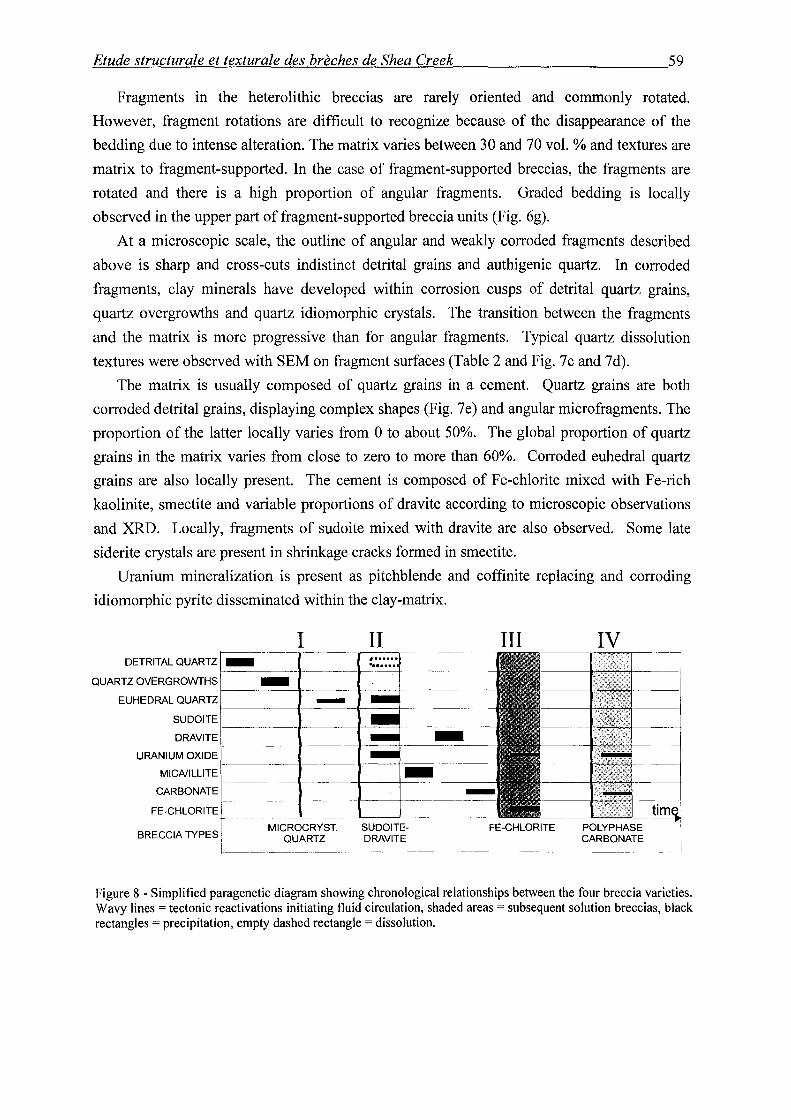
=E~tu~d~e~s~t~ru=c~t~u~ra~l~e~e~t~te=x=t=ur~a~l~e~d~e~s~b~re~'c~h~e~s~d~e~S~h~e=a~C~r~e~e~k _________________________ 59
Fragments in the heterolithic breccias are rarely oriented and commonly rotated.
However, fragment rotations are difficult to recognize because of the disappearance of the
bedding due to intense alteration. The matrix varies between 30 and 70 vol.% and textures are
matrix to fragment-supported. In the case of fragment-supported breccias, the fragments are
rotated and there is a high proportion of angular fragments. Graded bedding is locally
observed in the upper part of fragment-supported breccia units (Fig. 6g).
At a microscopie scale, the outline of angular and weakly corroded fragments described
above is sharp and cross-cuts indistinct detrital grains and authigenic quartz. In corroded
fragments, clay minerais have developed within corrosion cusps of detrital quartz grains,
quartz overgrowths and quartz idiomorphic crystals. The transition between the fragments
and the matrix is more progressive than for angular fragments. Typical quartz dissolution
textures were observed with SEM on fragment surfaces (Table 2 and Fig. 7c and 7d).
The matrix is usually composed of quartz grains in a cement. Quartz grains are both
corroded detrital grains, displaying complex shapes (Fig. 7e) and angular microfragments. The
proportion of the latter locally varies from 0 to about 50%. The global proportion of quartz
grains in the matrix varies from close to zero to more than 60%. Corroded euhedral quartz
grains are also locally present. The cement is composed of Fe-chlorite mixed with Fe-rich
kaolinite, smectite and variable proportions of dravite according to microscopie observations
and XRD. Locally, fragments of sudoite mixed with dravite are also observed. Sorne late
siderite crystals are present in shrinkage cracks formed in smectite.
Uranium mineralization is present as pitchblende and coffinite replacing and corroding
idiomorphic pyrite disseminated within the clay-matrix.
I II III IV DETRITAL QUARTZ -QUARTZ OVERGROWTHS
EUHEDRAL QUARTZ
SUDOITE
DRA VITE
URANIUM OXIDE
MICAIILLITE
CARBONATE
FE-CHLORITE - ----~-----
BRECCIA TYPES 1 MICROCRYST. SUDOITE-
QUARTZ DRA VITE 1 ------ --------------
Figure 8 - Simplified paragenetic diagram showing chronological relationships between the four breccia varieties. Wavy !ines= tectonic reactivations initiating fluid circulation, shaded areas =subsequent solution breccias, black rectangles =precipitation, empty dashed rectangle = dissolution.
60 ________________________ -=E=tu=d=e~s=t~ru=c=t=ur~a=l~e~e~t=te=x=tu=r~a=le~d=e=s~b=r~è=c~h=es~de~S~h=ea~C~r~ee~k
Interpretation
The existence oftypical jigsaw textures in weakly corroded fragments is representative of
hydraulic brecciation. However, the presence of corroded fragments and ubiquitous
microscopie quartz dissolution textures indicate a chernical control of the breccia formation.
The evolution of a Fe-chlorite breccia from an immature to a mature stage is characterized
by a displacernent and rnixing of angular and corroded fragments. Fragrnent-supported
textures and graded bedding, and the relationship between rotation angle and size of tilted
blocks in mature breccia zones indicate collapse phenornenon (Fig. 9). Such collapse events
could exp lain the rnixing of differently altered fragments.
4. 4. Polyphase carbonate breccias
Description
Polyphase carbonate breccias typically display a red clay- and carbonate-rich rnatrix
(Fig. 6d). They are locally associated with uranium mineralization. The body geornetry of
these breccias is controlled by the main Type I fault and Type II and III faults (Tab. 2 and Fig.
3). Their bodies are narrower than the other types of breccias and are located close to the
unconformity.
Rare immature breccias have sub-angular fragments with a low rnatrix proportion and
jigsaw textures. Mature breccias are cornrnonly heterolithic and contain fragments of variably
silicified, chloritized, hernatized and carbonate-rich sandstone and of hernatized and argillized
basernent fragments. They are rnatrix-supported and contain rnostly rounded and corroded
fragments. D* values vary largely from 2.5 to 32.5 with a median at 17.5 (Fig. 5). These
values are globally higher than for the other types of breccias and reflect more cornplex
fragment morphologies. Matrix proportion varies between 40 and 90 vol. %. In the rnatrix, a
greater percentage of quartz grains is sornetirnes found close to the edges of the fragments
over distance of a few mm, indicative of a corroded fragment rirn. Locally, quartz grain
distribution in the rnatrix is oriented within a fragment outline. Such distribution may then
represent the bedding of an original sandstone fragment, replaced by hematite and carbonates
(Fig. 6d).
At microscopie scale, sandstone fragments display corrosion of detrital quartz grains
and their overgrowths by carbonates. The rnatrix is usually cornposed of corroded quartz
grains in a cernent of chlorite, illite and siderite (Fig. 7f). Siderite crystallized as spherulites
and its proportion is highly variable. Very fine hematite disseminations give the rock a red
colour. The global proportion of quartz grains within the rnatrix varies from 5% to 40 vol. %.
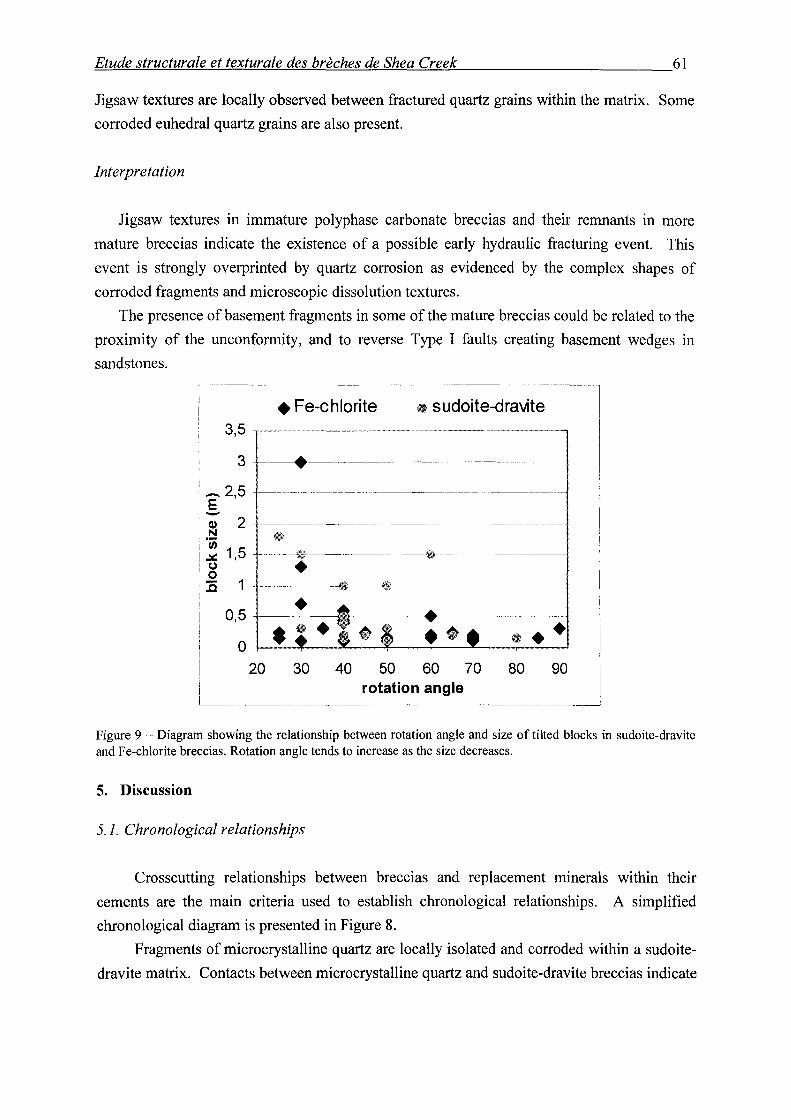
E~tu=d=e~s=t~ru=c=t=u~ra=l=e~e~t~œ=x=tu=r~a=l~e~d=e~s=b~re~'c~h~e~s~d~e~S=h~e~a~C~r~e~e~k _________________________ 6l
Jigsaw textures are locally observed between fractured quartz grains within the matrix. Sorne
corroded euhedral quartz grains are also present.
Interpretation
Jigsaw textures in immature polyphase carbonate breccias and their remnants in more
mature breccias indicate the existence of a possible early hydraulic fracturing event. This
event is strongly overprinted by quartz corrosion as evidenced by the complex shapes of
corroded fragments and microscopie dissolution textures.
The presence of basement fragments in sorne of the mature breccias could be related to the
proximity of the unconformity, and to reverse Type 1 faults creating basement wedges in
sand stones.
:-----~-~-~----~--~~----~~~~~~--~------~------·-1
! + Fe-chlorite s sudoite-dravite 1 ! 3,5 .-----------Y•·--~-------~------
3 ---+-~----
:-2,5 ,E -Cl)
.!:::! 1/)
~ CJ 0 ::s
2 ~~-----~------~----~--~----~-------
1,5 -·-------%$------------~--~------------------
• 0,5 • : •• ~ :. • ••
0 +-~~--~~--~--~--~~--~~~ 20 30 40 50 60 70 80 90
rotation angle
Figure 9 - Diagram showing the relationship between rotation angle and size of tilted blocks in sudoite-dravite and Fe-chlorite breccias. Rotation angle tends to increase as the size decreases.
5. Discussion
5.1. Chronological relationships
Crosscutting relationships between breccias and replacement minerais within their
cements are the main criteria used to establish chronological relationships. A simplified
chronological diagram is presented in Figure 8.
Fragments of microcrystalline quartz are locally isolated and corroded within a sudoite
dravite matrix. Contacts between microcrystalline quartz and sudoite-dravite breccias indicate
62 ________________________ ~E~tu~d~e~s~t~ru~c~t~u~ra~l~e~e~t~œ~x~tu~r~a~k~d~es~b~re~'c~h~e~s~d~e~S~h~ea~C~r~e~ek
the progression of a sudoite-dravite corrosion front that has altered the microcrystalline quartz
texture. In addition, microcrystalline quartz breccias never contain fragments of other types of
breccias. Therefore, they are considered to be the product of the earliest breccia event. In
most of the unconformity-type uranium deposits of the Athabasca Basin, the primary uraninite
mineralization event occurred between 1.55 and 1.0 Ga (Lainé, 1985; Fayek and Kyser, 1997).
At Cigar Lake, this event is dated at 1341 ± 12 Ma (U-Pb) and is contemporaneous with
sudoite breccias (Pacquet and Weber, 1993). Consequently, the microcrystalline quartz
breccias formed between approximately 1.7 and 1.3 Ga, after the induration of the basal
sediments of the Athabasca Basin.
Fragments of sudoite-dravite breccias are observed within Fe-chlorite breccias.
Consequently, sudoite-dravite breccias formed before Fe-chlorite breccias. The relationship
between sudoite and associated dravite is not clear. They might be contemporaneous as
documented by Pacquet and Weber (1993) at Cigar Lake, but dravite might also be related to a
later event. Ony of the several dravite events observed at Shea Creek is clearly later than the
sudoite phase. Pacquet and Weber (1993) indicate a K-Ar age of 925 ± 25 Ma for the
ferrikaolinite in perched bodies at Cigar Lake. The slightly mineralized Fe-chlorite breccias,
that contain Fe-rich kaolinite, might therefore be coeval with this phase.
Polyphase carbonate breccias contain chloritized fragments that are interpreted to be
coeval with the sudoite-dravite breccias. Siderite crystals were observed in cracks formed in
the matrix of Fe-chlorite breccias. These crystals are assumed to be contemporaneous with the
siderite present in the matrix of polyphase carbonate breccias that, consequently, would be
younger than the other types of breccias. These breccias could have formed between 300 and
200 Ma as indicated by dating of a pitchblende-carbonate association in the Dominique-Peter
unconformity-type U deposit located in the western part of the Athabasca Basin (Bell, 1985).
Fe-chlorite and polyphase carbonate breccias are commonly U mineralized and are therefore
probably related to secondary U mineralization and remobilization events.
Consequently, the four types of breccias described in Shea Creek might be
representative of a discontinuous geological evolution which began at about 1.7 Ga and
possibly lasted to about 200 Ma.
5. 2. Breccia maturation
The texturai characteristics and the morphometric measurements of the four types of
breccias allow interpretation of each of them in terms of maturity (Fig. 1 0).
Immature breccias
~E~tu~d~e~s~t~ru~c~t~u~ra~l~e~e~t~œ~x~t~ur~a~l~e~d~e~s~b~r~èc~h~e~s~d~e~S~h~e~a~C~r~e~e~k~ _______________________ 63
Immature microcrystalline quartz breccia fragments are controlled by granulation seams
and fluid-assisted quartz-filled fractures. The fracture intensity may vary in space according
to the distance to the faults.
Immature sudoite-dravite breccias have fracture-controlled, weakly corroded and oriented
fragments. They are coeval with the primary uraninite mineralization event that probably
coincided with a period of peak diagenesis under a 4 to 5 km thick sedimentary pile (Pagel,
1975; Fayek and Kyser, 1997). Fractures may therefore be fluid-assisted, as fluid pressures in
sedimentary basins below 3 km depths are commonly lithostatic (Hedenquist et al., 1992;
Egeberg, 1992). Fluid-assisted fracturing would also have been favored by the previous
silicification event that created impermeable zones above the unconformity. Such a fracturing
regime is indicated by the jigsaw textures observed in immature Fe-chlorite and polyphase
carbonate breccias.
Therefore, the first stage of breccia formation is controlled by tectonic and fluid-assisted
fractures as indicated by fragment shapes and low values of D* in immature breccias (Fig.
10).
Mature breccias
Fractal analysis of the fragment shapes allows recognition of both the intensity and type of
corrosion processes, and also its kinetic component.
D* median values for the four breccia types vary from 9 to 17.5 corresponding to different
complexity levels of the fragment shapes (Fig. 5). For each breccia type, increasing D* values
indicate the evolution from an immature to a mature stage. This evolution is also
characterized by an increase of the matrix proportion and by a loss of the fragments original
orientation. In the case of microcrystalline quartz breccias, the maturation corresponds to a
strong increase of fracturing intensity. Sudoite-dravite, Fe-chlorite and polyphase carbonate
breccia maturation is mainly associated with quartz dissolution.
Fragment morphologies of solution breccias are controlled by the quartz consumption
reaction. Two different regimes of the dissolution reaction may be distinguished (Hurst and
Bj0rkum, 1986; Jébrak, 1997). In the diffusion-limited regime, only the most exposed part of
the solid is reached and consumed as a reactant; corners will become smooth and fragments
may ultimately take a spherical morphology, decreasing the fractal dimension. Such a process
will occur if there is a strong chemical disequilibrium between the rock and the fluid. In the
kinetic regime, the alteration-dissolution rate is limited only by the chemical reaction rate.
The fluid has a relatively low chemical reactivity and the reaction will enhance the contrasting
compositions of the fragments and create more complex shape contours. Increasing D* values
64 ________________________ ~E~tu~d~e~s~t~ru=c~t~u~ra~l=e~e~t~œ=x~tu~r~a~le~d~es~br~è~c~h=es~d~e~S~h=ea~C~r~e~ek
are therefore significant of an evolution from diffusion-limited to kinetic processes in quartz
dissolution that indicates a decrease in hydrothermal solution undersaturation.
However, detailed analysis reveal a more complex history: in Fe-chlorite breccias, the
observation of sorne complex shapes and pervasively altered fragments as well as the
predominance of pits on fragment surfaces (Tab. 2 and Fig. 7d) would indicate local kinetic
regimes (Burley and Kantorowicz, 1986). In sudoite-dravite breccias, the presence of rounded
fragments is probably indicative of a diffusion-limited dissolution regime.
The FMD is indicative of the evolution of the corrosion process. Microcrystalline quartz
breccias, sudoite-dravite and polyphase carbonate breccias display normal FMD that
demonstrate homogeneous fragment shapes and a stationary process: the same D* value for
the different fragments within a type of breccia indicate that the same corrosion process reach
an equilibrium within the sandstone.
The Fe-chlorite breccias FMD curve is not unimodal. This reflects the superimposition of
the quartz dissolution process on another phenomenon. Low values represent non-corroded
fragments fallen from the breccia hanging wall during the collapse event. Higher values would
be representative of the fragments corroded by the dissolution event prior to the collapse.
The last stage of evolution of Fe-chlorite breccias is a collapse event. There are two
possible origins for this collapse. The first hypothesis is a chemical origin. If more quartz is
dissolved than new clay minerais are .formed, cavities will appear and may enhance fluid flow
and a positive feedback loop, resulting in further dissolution leading to cavity enlargement. If
large enough, collapse could occur and produce graded-bedded and fragment-supported
textures as well as a mixture of corroded and angular fragments. Similar textures were
observed by Dzulyll.ski and Sass-Gustkiewicz (1989) in solution-collapse breccias hosting
Mississippi Valley type deposits.
The second hypothesis is a fluid-assisted origin. The local presence of angular and very
weakly corroded fragments organized in jigsaw textures suggest fluid-assisted brecciation.
The matrix of such jigsaw breccias contains corroded detrital quartz grains within a clay
cement. This means that the fluid has probably dissolved and corroded quartz grains by
percolation along fractures before the hydraulic event causing detrital quartz grains to fall into
the matrix during the brecciation. This interpretation is the most probable as it explains all the
features of the Fe-chlorite breccias. As the dissolution phase occurred before the collapse
event, it caused an inverse evolution of the breccia maturity (Fig. 1 0) because of the
incorporation of non-corroded fragments co ming from the breccia fractured walls.
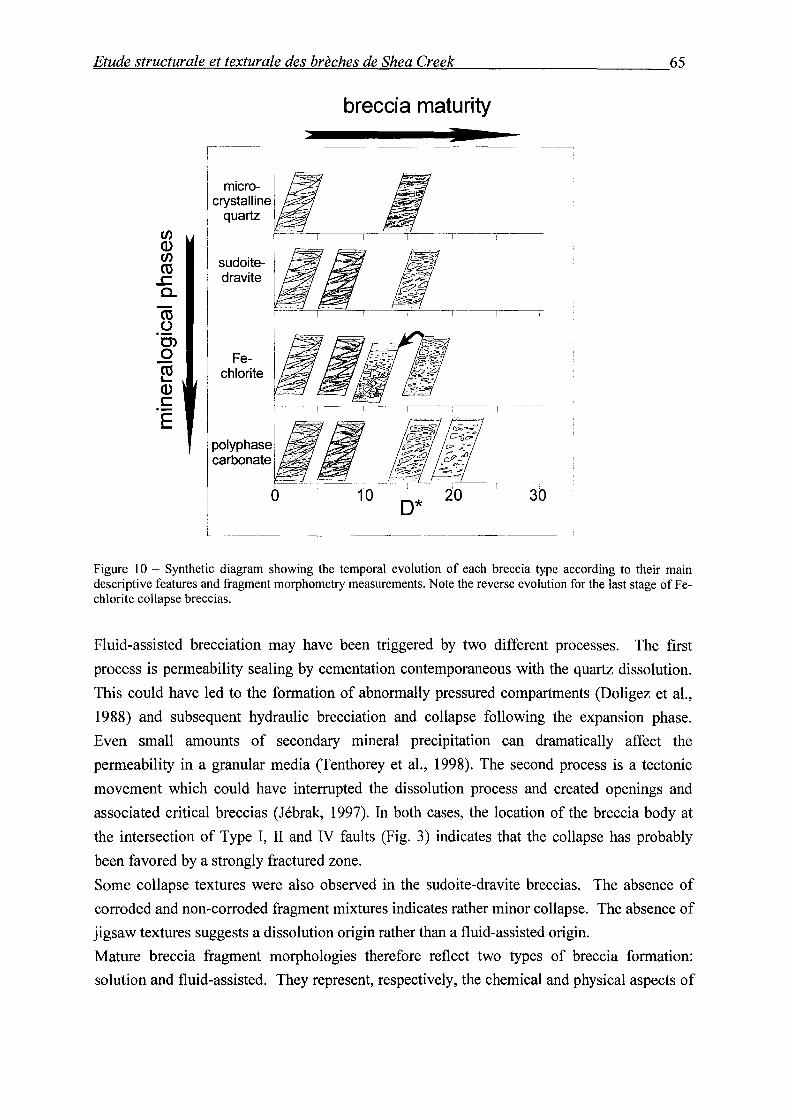
E~tu~d~e~s~t~ru~c~t~u~ra~l~e~e~t~te~x~tu~r~a~l~e~d~es~b~re~'c~h~e~s~d~e~S~h~e~a~C~r~e~e~k _________________________ 65
en Q) en cu
.J::. a.
~ 0> 0
~ Q) c E
i
sudoitedravite
Fechlorite
breccia maturity
D* L~---------------------·~~-
Figure 1 0 - Synthetic diagram showing the temporal evolution of each breccia type according to the ir main descriptive features and fragment morphometry measurements. Note the reverse evolution for the last stage of Fechlorite collapse breccias.
Fluid-assisted brecciation may have been triggered by two different processes. The first
process is permeability sealing by cementation contemporaneous with the quartz dissolution.
This could have led to the formation of abnormally pressured compartments (Doligez et al.,
1988) and subsequent hydraulic brecciation and collapse following the expansion phase.
Even small amounts of secondary mineral precipitation can dramatically affect the
permeability in a granular media (Tenthorey et al., 1998). The second process is a tectonic
movement which could have interrupted the dissolution process and created openings and
associated critical breccias (Jébrak, 1997). In both cases, the location of the breccia body at
the intersection of Type I, II and IV faults (Fig. 3) indicates that the collapse has probably
been favored by a strongly fractured zone.
Sorne collapse textures were also observed in the sudoite-dravite breccias. The absence of
corroded and non-corroded fragment mixtures indicates rather minor collapse. The absence of
jigsaw textures suggests a dissolution origin rather than a fluid-assisted origin.
Mature breccia fragment morphologies therefore reflect two types of breccia formation:
solution and fluid-assisted. They represent, respectively, the chemical and physical aspects of
66 ________________________ ~E~tu~d~e~s~t~ru~c~t=ur~a~l~e~e~t~te~x=tu~r~a~le~d~e~s~b~r~è~c~he~s~d~e~S~he~a~C~r~ee~k
fluid-rock interactions. Both solution and fluid-assisted types may occur as part of the
evolution of the same breccia system as demonstrated by the Fe-chlorite breccias.
Consequently, maturity corresponds to the temporal evolution of breccias. Furthermore,
spatial variations of fracture intensity at the immature stage also control the maturity as they
induce permeability variations. Breccia maturity varies therefore both in space and time.
5. 3. Fluid circulation and ore genesis
The spatial organization of breccia bodies suggests a strong control by faults. At the 400
rn scale of the study area, the major Type I fault seems to be the principal control, but
extended breccia bodies occur mostly at or close to fault intersections. In addition, the
formation of immature breccias is triggered by tectonic and fluid-assisted fractures. As the
fluids were undersaturated relative to quartz, it is improbable that they came from the
sandstones. They were probably derived from the basement along permeability channels such
as the main graphite-rich Type I shear zone, or the cross-cutting high angle faults such as the
Type II structures, or intersections of both (Kyser et al., 1989) that are commonly quartz-free.
Shear zones are proposed as conduits for focused flow of overpressured fluids (Kerrich and
Allison, 1978; Robert et al., 1983; Ridley, 1993). The graphite enrichment in the basement of
the major Type I fault could be responsible for reactivation during almost every seismic event
due to the lubricating properties of graphite. At each seismic event, transient fluids would
have moved rapidly along the basement channels (high pressure regime) and then would have
slowed down in the strongly fractured sandstones (low pressure regime) above the
unconformity.
Analysis of mature breccias indicates that breccia development is controlled by fluid-rock
interactions. Therefore, breccia-forming events in sandstone coïncide with basement fault
reactivation and subsequent onsets of fluid circulation. This circulation have been favored by
a high fracture permeability, especially at fault intersections, relative to early silicified
sandstones (Fig. 8).
Analysis of mature breccias indicates that breccia development is controlled by fluid-rock
interactions. Therefore, breccia-forming events in sandstone coïncide with basement fault
reactivation and subsequent onsets of fluid circulation. This circulation have been favored by
a high fracture permeability, especially at fault intersections, relative to early silicified
sandstones (Fig. 8). Fluids, widely dispersed in the fractured zone, reacted with the local
lithologies leading to breccia development. Consequently, the expression of the type I and II
faults in the sandstones would be an "island" in the sense of Newman (1993): a wide zone
where fluids may infiltrate the surrounding rocks. According to the genetic models of Hoeve
E~tu~d~e~s~t~ru~c~t~u~ra~l~e~e~t~œ~x~tu~r~a~k~d~es~b~re~'c~h~e~s~d~e~S~h~e~a~C~r~e~e~k _________________________ 67
et al. (1980) and Fayek and Kyser (1997), the fluids interacted with basinal fluids, leading to
uranium ore deposition.
The weak spatial correlation of sudoite-dravite breccias with uranium mineralization is
due to their zoning relationship with coeval and extremely mature sudoite breccias that are
closer to the unconformity and show good correlation with the U ore. Fe-chlorite and
polyphase carbonate breccias also display a good correlation with U mineralization but are
more local than the sudoite breccias.
5. 4. Tectonic history
The reverse Type I fault movements that are contemporaneous with the microcrystalline
quartz breccias could be the expression of a post-Thelon-Taltson orogenie readjustment event
between 1.7 and 1.5 Ga. The weak development of these breccias in sandstones as well as
their tectonic nature indicates rather limited fluid circulation.
The second event of sudoite-dravite and sudoite breccia formation is associated with the
reactivation of Type I and Type II faults. It is contemporaneous with the main primary U
mineralization event and the peak diagenesis period. The presence of shallow dipping
pitchblende-filled tension gashes indicates a reverse movement along the Type I faults. The
wide development of sudoite-rich breccias as well as the extent and high-grade of the U
mineralization suggest a major fluid circulation phase. The contemporaneous formation of
other unconformity-type uranium deposits in the western and eastern parts of the Athabasca
Basin indicates that this is a regional compressional phase. The presence of almost
undeformed Mackenzie diabase dikes dated 1.27 Ga (Le Cheminant and Heaman, 1989)
suggests that this phase occurred between 1.5 and 1.3 Ga. Sudoite and sudoite-dravite breccias
are partly superimposed on the earlier microcrystalline quartz breccias which could have
formed fluid conduits, especially in silicified sandstones (fig. 8).
Fe-chlorite breccia formation corresponds to a probable reactivation of Type II and/or IV
faults with a composite strike- and dip-slip movement. It indicates a strong rotation of the
regional stress field as the major Type I faults are not reactivated. Their possible 925 ± 25 Ma
age could correspond to a regional uranium mineralization event or a remobilization phase
dated at 918 and 860 Ma, at the Key Lake and Rabbit Lake unconformity-type deposits
respectively (Lainé, 1985). Fe-chlorite breccias are partly superimposed on the two previous
breccia types. The reactivation event triggered local fluid circulation at the intersection of
Type I, II and IV faults.
The polyphase carbonate breccia-forming event corresponds to the reactivation of the
reverse Type I and Type II and III faults, probably during a late tectonic phase between 300
and 200 Ma. The existence of remobilized uranium mineralization dated at 290, 215 and 200
68 ________________________ -=E~tu~d~e~s~t~ru~c~t~u~ra~l~e~e~t~œ=x=tu~r~a=le~d~es~b~re~'c~h~e~s~d~e~S~h~ea~C~r~e~ek
Ma respectively at Maurice Bay, Key Lake and Rabbit Lake deposits (Lainé, 1985), located in
the east part of the Athabasca Basin, suggests that the event is regional. The limited extension
of the breccia bodies suggests a small reactivation event with minor fluid flow compared to
the major sudoite-dravite breccia phase.
The four breccia bodies studied, therefore, may be related to regional tectonic events
between 1.7 Ga and 200 Ma. However, more systematic age determinations would be
necessary to ascertain the general validity of these ages. Different breccia body controls
indicate variations of the regional stress field between each sei smic event.
6. Conclusion
Four breccia types have been distinguished in the sandstones surrounding unconformity
type uranium mineralization in the southern part of the Shea Creek area: microcrystalline
quartz, sudoite-dravite, Fe-chlorite and polyphase carbonate breccias.
Their fragment morphologies have been quantified using fractal dimension analysis. The
matrix percentage and the shape of the fragment morphometry distribution (FMD) curves
have been used to determine the degree of maturity and the nature of fluid-rock interactions
for each breccia. The fractal dimension increases with the degree of maturity.
Microcrystalline quartz breccias are tectonic and fluid-assisted. Their maturation
corresponds to an increase of fracturing density. Sudoite-dravite, Fe-chlorite and polyphase
carbonate breccias are solution breccias. Solution breccia maturation may be described in
three phases. In the first phase, fault reactivation and fluid overpressure induced fracturing
and fluid circulation. The second phase is characterized by quartz dissolution resulting from
the chemical interaction of a basement-derived fluid with the overlying sandstones. Collapse
may occur in a third phase due to fluid-assisted brecciation or dissolution opening and is
exemplified by Fe-chlorite and sudoite-dravite breccias, respectively. Consequently, breccia
development is the result of alternating physical and chemical fluid-rock interactions, with
respectively high and low rates. In the former case, breccia maturity evolution would
represent spatial variations whereas in the latter it would correspond to temporal variations.
The four breccia bodies are mainly controlled by reverse Type I faults and intersections
with other types of faults. They are the expression of basement fault reactivations occurring
between 1. 7 Ga and 200 Ma. The first seismic reactivation could be the expression of minor
readjustment movements following the Thel on-Taltson orogeny. The second deformational
event between 1.5 and 1.3 Ga was a regional compressional phase leading to the main primary
uranium mineralization. The third and forth events could also have been regional as they are
possibly contemporaneous with mineralization phases dated circa 900 Ma and between 300
~E~tu~d~e~s~t~ru~c~t~u~ra~l~e~e~t~w~x~t~ur~a=l~e~d~e~s~b~re~'c~h~e~s~d~e~S~h~e~a~C~re~e~k~ _______________________ 69
and 200 Ma, respectively in several deposits. Different breccia body controls indicate major
changes of the regional stress field with time.
Each seismic event created structural connections between variably pressured
compartments, inducing fluid circulation from the basement to the sandstones. Fluids were
slowed down in the widely fractured sandstones, giving them time to react with the quartz to
form solution breccias. Interaction of these fluids with basin fluids may have led to
unconformity-type uranium mineralization deposition. This may explain the good correlation
of breccia bodies with the mineralization, especially for the sudoite event.
Acknowledgements
We are grateful to COGEMA and Cogema Resources Inc for their financial and technical
support. More specifically, we would like to thank Patrice Bruneton and Ken Wheatley for
helpful review, Philippe Portella for stimulating discussions, and Roland Aumaître, Claude
Caillat, Jean-Claude Carisey, Jean Mondy and Jean-Claude Rippert for permission to publish
the geological data collected in the field in June of 1999. The manuscript was improved by
Peter Laznicka and Charlie Sammis.

70 ________________________ ~E~tu~d~e~s~t~ru~c~tu~r~a~k~et~t~ex~t~u~ra~l~e~d~e~s~b~re~'c~h~e~s~d~e~S~h~ea~C~r~ee=k
References
Antonellini, M., Aydin, A., 1994. Effect of faulting on fluid flow in porous sandstones:
petrophysical properties. AAPG Bulletin 78, 355-377.
Armstrong, R.L., Ramaekers, P., 1985. Sr isotopie study of Helikian sediment and diabase
dikes in the Athabasca Basin, northern Saskatchewan. Canadian Journal of Earth
Sciences 22, 399-407.
Baudemont, D., Piquard, J.P., Ey, F., Zimmerman, J., 1993. The Sue Uranium Deposits,
Saskatchewan, Canada. Exploration Mining Geology 2, 179-202.
Bell, K., 1985. Geochronology of the Carswell area, Northern Saskatchewan. In: Lainé, R.,
Alonso, D., Svab, M. (Eds.), The Carswell structure uranium deposits, Saskatchewan.
Geological Association of Canada Special Paper 29, pp. 33-46.
Bérubé, D., Jébrak, M., 1999. High precision boundary fractal analysis for shape
characterization. Computers & Geosciences 25, 1059-1071.
Burley, S.D., Kantorowicz, J.D., 1986. Thin section and S.E.M. texturai criteria for the
recognition of cement-dissolution porosity in sandstones. Sedimentology 33, 587-604.
Carrier, A., Jébrak, M., 1994. Structural evolution and metallo geny of the Silidor mesothermal
gold-quartz deposit, southern Abitibi greenstone belt, Quebec. Geological Association
of Canada - Mineralogical Association of Canada, Annual meeting abstracts,
Waterloo. No. 19, A-18.
Chiarenzelli, J., Aspler, L., Villeneuve, M., Lewry, J., 1998. Early Proterozoic Evolution of
the Saskatchewan Craton and its Allochthonous Cover, Trans-Hudson Orogen. Journal
ofGeology 106,247-267.
Doligez, B., Burrus, J., Ungerer, P., 1988. Hydraulic fracturing during basin scale fluid
migration: an integrated approach. In: Hitchon, B., Bachu, S. (Eds.), Fluid flow, heat
transfer and mass transport in fractured rocks. 4th Canadian/American Conference on
Hydrogeology, pp. 251-259.
Dzuslynski, S., Sass-Gustkiewicz, M., 1989. Pb-Zn ores. In: Bosak, P., Ford, D.C., Glazek, J.,
Horacek, 1. (Eds.), Paleokarst. A Systematic and Regional Review. Elsevier and
Academia, Amsterdam and Praka, pp. 377-396.
von Einsiedel, C.A., 1981. Petrography and geochemistry of the Cluff Lake breccias, Carswell
structure, Northern Saskatchewan. Bachelor thesis, Carleton University, Ottawa,
Ontario.
~E~tu~d=e~s=u~u=c=tu=r~a=le~et~t=e=xt=u~r~al=e~d=e=s~b~r~èc~h=e=s~d=e~S~h=e~a~C~r~e~ek~-----------------------71
Egeberg, P .K., 1992. Brines in sedimentary environments. Academie Press, London.
Ey, F., 1984. Un exemple de gisement d'uranium sous discordance: les minéralisations
protérozoïques de Cluff Lake, Saskatchewan, Canada. Thèse d'Etat, Université Louis
Pasteur.
Ey, F., Gauthier-Lafaye, F., Lillié, F., Weber, F., 1985. A uranium unconformity deposit: the
geological setting of the D orebody (Saskatchewan-Canada). In: Lainé, R., Alonso, D.,
Svab, M. (Eds.), The Carswell structure uranium deposits, Saskatchewan. Geological
Association of Canada Special Paper 29, pp. 121-138.
Fayek, M., Kyser, T.K., 1997. Characterization of multiple fluid-flow events and Rare-Barth
Element mobility associated with formation of unconformity-type uranium deposits in
the Athabasca Basin, Saskatchewan. The Canadian Mineralogist 35, 627-658.
Genna, A., Jébrak, M., Marcoux, E., Milési, J.P., 1996. Genesis of cockade breccias in the
tectonic evolution of the Cirotan epithermal gold system, West Java. Canadian Journal
ofEarth Sciences 33, 93-102.
Gindy, A.R., Al-Shakiry, A.J., Sa'ad, N.A., 1985. Spheroidal weathering in maris and chalks
of Gebel Gumah near Luxor, Southern Egypt. Journal of Sedimentary Petrology. V.
55, p. 762-768.
Halter, G., 1988. Zonalités des altérations dans l'environnement des gisements d'uranium
associés à la discordance du Protérozoïque Moyen (Saskatchewan, Canada). Thèse de
doctorat, Université Louis Pasteur, Strasbourg.
Harper, C.T., 1983. The geology and uranium deposits of the central part of the Carswell
Structure, Northern Saskatchewan, Canada. Unpublished Ph.D. Thesis, Colorado
School of Mines, Golden, Colorado.
Hedenquist, J.W., Reyes, A.G., Simmons, S.F., Taguchi, S., 1992. The thermal and
geochemical structure of geothermal and epithermal systems: a framework for
interpreting fluid inclusion data. European Journal of Mineral ogy 4, 989-1015.
Hoeve, J., Sibbald, T.I.I., Ramaekers, P., Lewry, J.F., 1980. Athabasca Basin unconformity
type uranium deposits: a special class of sandstone-type deposits? In: Ferguson, S.,
Goleby, A. (Eds.), Uranium in the Pine Creek Geosyncline. IAEA, Vienna, pp. 575-
594.
Hoeve, J., Rawsthorn, K., Quirt, D., 1981. Uranium Metallogenetic Studies: Clay Mineral
Stratigraphy and Diagenesis in the Athabasca Group. Saskatchewan Research Council
Publication 22, pp. 76-89.
72 ________________________ ~E~tu~d~e~s~t~ru~c~tu~r~a~le~et~t~ex=t=u~ra~l~e~d~e~s~b~re~'c~h~es~de~S~he~a~C~re~e~k
Hoffman, P.F., 1987. Continental transform tectonics: Great Slave Lake shear zone (ca. 1.9
Ga), northwest Canada. Geology 15, 785-788.
Hurst, A.R., Bj0rkum, P.E., 1986. Discussion: Thin section and S.E.M. texturai criteria for
the recognition of cement-dissolution porosity in sandstones. Sedimentology 33, 605-
614.
Jébrak, M., 1984. Contribution à l'histoire naturelle des filons F-Ba des Hercynides françaises
et marocaines. Thèse ès Sciences, Document BRGM 99.
Jébrak, M., 1992. Les textures intra-filoniennes, marqueurs des conditions hydrauliques et
tectoniques. Chronique de la Recherche Minière 506, 25-35.
Jébrak, M., 1997. Hydrothermal breccias in vein-type ore deposits: A review ofmechanisms,
morphology and size distribution. Ore Geology Reviews 306, 1-24.
Kerrich, R., Allison, 1., 1978. Vein geometry and hydrostatics during Yellowknife
mineralization. Canadian Journal ofEarth Sciences 15, 1653-1660.
Knipe, R.J., 1993. The influence of Fault Zone Processes and Diagenesis on Fluid Flow. In:
Horbury, A.D., Robinson, A.G. (Eds.), Diagenesis and Basin Development. AAPG,
Studies in Geology 36, pp. 135-148.
Kotzer, T.G., Kyser, T.K., Irving, E., 1992. Paleomagnetism and the evolution of fluids in the
Proterozoic Athabasca Basin, northern Saskatchewan, Canada. Canadian Journal of
Earth Sciences 29, 1474-1491.
Kyser, T.K., Wilson, M.R., Ruhrmann, G., 1989. Stable isotope constraints on the role of
graphite in the genesis of unconformity-type uranium deposits. Canadian Journal of
Earth Sciences 26, 490-498.
Lainé, R., 1985. The Carswell uranium deposits- An example of not so unique unconformity
related uranium mineralization. In: Lainé, R., Alonso, D., Svab, M. (Eds.), The
Carswell structure uranium deposits, Saskatchewan. Geological Association of Canada
SpecialPaper 29, pp. 225-230.
Laznicka, P., 1988. Breccias and coarse fragmentites. Developments in Economie Geology,
25. Elsevier, Amsterdam.
Laznicka, P., 1989. Breccias and ores. Part 1: history, organization and petrography of
breccias. Ore Geology Reviews 4, 315-344.
Le Cheminant, A.N., Heaman, L.M., 1989. Mackenzie tgneous events, Canada: Middle
Proterozoic hotspot magmatism associated with ocean opening. Earth Planetary
Sciences Letters 96, 38-48.
~E~tu~d~e~s=u~u=c=tu=r~a=le~et~t=e=xt=u~r=al=e~d=e=s~b~re='c=h=e=s~d=e~S~h=ea~C~r=ee=k~ _______________________ 73
Newman, J., Mitra, G., 1993. Lateral variations in mylonite zone thickness as influenced by
fluid-rock interactions, Linville Falls fault, North Carolina. Journal of Structural
Geology 15, 849-863.
Pacquet, A., Weber, F., 1993. Pétrographie et minéralogie des halos d'altération autour du
gisement de Cigar Lake et leurs relations avec les minéralisations. Canadian Journal of
Earth Sciences 30, 674-688.
Pagel, M., 1975. Détermination des conditions physico-chimiques de la silicification
diagénétique des grès Athabasca (Canada) au moyen des inclusions fluides. Compte
rendu de l'Académie des Sciences 280, série D, 2301-2304.
Pagel, M., Weatley, K., Ey, F., 1985. The origin of the Carswell circular structure. In: Lainé,
R., Alonso, D., Svab, M. (Eds.), The Carswell structure uranium deposits,
Saskatchewan. Geological Association of Canada Special Paper 29, pp. 213-223.
Phillips, W.J., 1986. Hydraulic fracturing effects in the formation of mineral deposits.
Institution of Mining and Metallurgy Transactions, section B: Applied Earth Science
95, B17-B24.
Pittman, E.D., 1981. Effect of fault-related granulation on porosity and permeability of quartz
sandstones, Simpson Group (Ordovician), Oklahoma. AAPG Bulletin 65, 2381-2387.
Ramaekers, P., Dunn, C.D., 1977. Geology and geochemistry of the eastern margin of the
Athabasca Basin. Saskatchewan Geological Society Special Publication 3, pp. 297-
322.
Ramaeker, P., 1981. Hudsonian and Helikian basins of the Athabasca region, Northern
Saskatchewan. Geological Survey of Canada Paper 81, pp. 219-233.
Ramaekers, P., 1990. Geology of the Athabasca Group (Helikian) in Northern Saskatchewan.
Saskatchewan Energy and Mines, Saskatchewan Geological Survey, report 195.
Reeve, J.S., Cross, K.C., Smith, R.N., Oreskes, N., 1990. Olympie Dam. Copper-Uranium
Gold-Silver deposit. In: Hughes E.E. (Ed.), Geology of the mineral deposits of
Australia and Papua New Guinea. The Australasian Institute of Mining and
Metallurgy, Melbourne, pp. 1009-1035.
Ridley, J., 1993. The relations between mean rock stress and fluid flow in the crust: with
reference to vein- and lode-style gold deposits. Ore Geology Reviews 8, 23-37.
Robert, F., Brown, A.C., Audet, A.J., 1983. Structural control of gold mineralization at the
Sigma Mine, Val d'Or, Québec. Canadian Institute of Mining, Metallurgy and
Petroleum Bulletin 76, 72-80.
74 ________________________ ~E=tu=d=e~s=t~ru=c=m=r~a=le~et~t=ex=t=u~ra=l=e~d=e~s=b~re='c~h=es~de~S~he~a~C~re~e=k
Ross, G.M., Eaton, D.W., 1997. Winagami reflection sequence: Seismic evidence for
postcollisional magmatism in the Proterozoic of western Canada. Geology 25, 199-
202.
Sammis, C.G., Biegel, R.L., 1986. A self-similar model for the kinematics of gouge
deformation. AGU fall meeting. Eos Transactions 67, 1187.
Sass-Gustkiewicz, M., 1996. Internai sediments as a key to understanding the hydrothermal
karst origin of the upper silesian Zn-Pb ore deposits. Society of Economie Geologists,
Special Publication 4, pp. 171-181.
Sibson, R.H., 1986. Brecciation processes m fault zones: inferences from Earthquake
rupturing. Pure and Applied Geophysics 124, 161-17 5.
Spoljaric, N., 1971. Origin of colors and ironstone bands m the Columbia Formation,
Middletown-Odessa Area, Delaware. Southeastern Geology, Durham, North Carolina
12, 253-266.
Tenthorey, E., Scholz, C.H., Aharonov E., Léger, A., 1998. Precipitation sealing and
diagenesis. 1. Experimental results. Journal of Geophysical Research 103, 23951-
23967.
Villeneuve, M.E., Thériault, R.J., 1991. U-Pb ages and Sm-Nd signature oftwo granites from
the Fort Simpson magnetic high, northwest Canada. Canadian Journal of Earth
Sciences 28, 1003-1008.
Wallis, R.H., Saracoglu, N., Brummer, J.J., Golightly, J.P., 1983. Geology of the McLean
uranium deposits. In: Cameron, E.M. (Ed.), Uranium exploration in Athabasca Basin,
Saskatchewan, Canada. Saskatchewan Energy and Mines, Geological Survey of
Canada, pp. 71-110.
Wheatley, K., Murphy, J., Leppin, M., Cutts, C., Climie, J.A., 1996. Advances in the genetic
model and exploration techniques for unconformity type uranium deposits in the
Athabasca basin. Canadian Institute of Mining, Metallurgy and Petroleum (CIM)
conference, May 1996.
III. ETUDE STRUCTURALE,
MINERALOGIQUE ET GEOCHIMIQUE
DES BRECHES DE LA MINE A CIEL
OuvERT DE SuE C

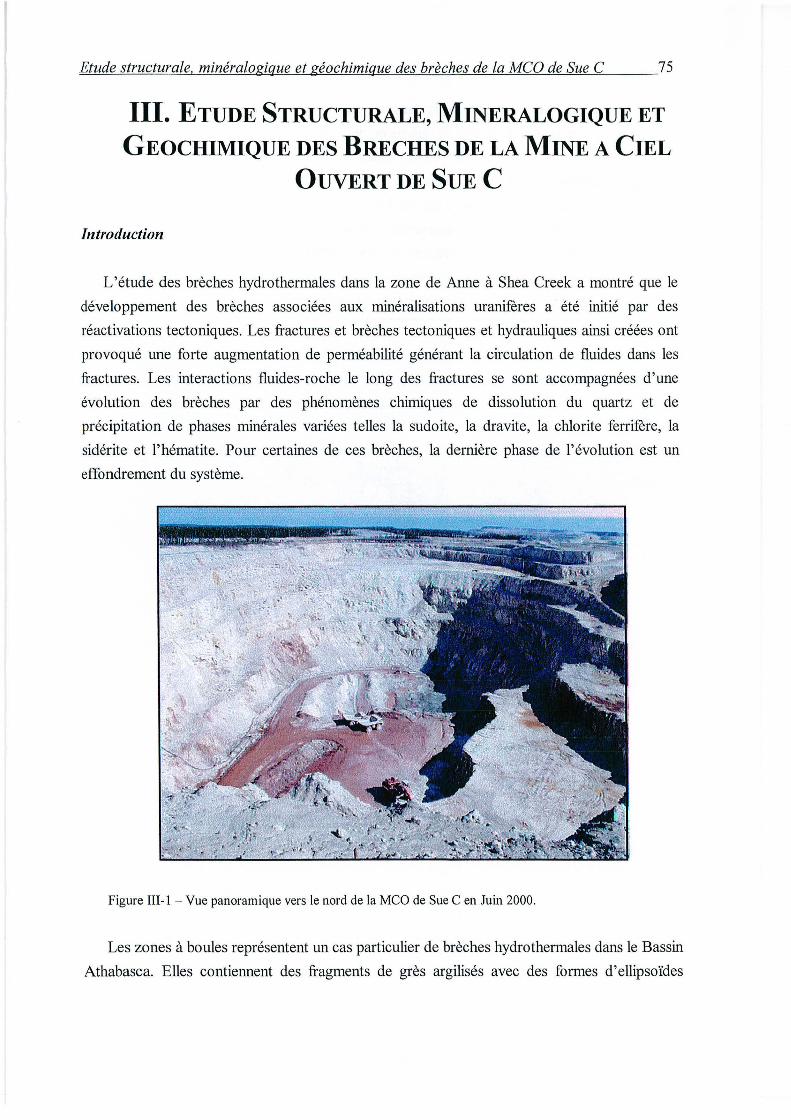
Etude structurale, minéralogique et géochimique des brèches de la MCO de Sue C 75
III. ETUDE STRUCTURALE, MINERALOGIQUE ET
GEOCIDMIQUE DES BRECHES DE LA MINE A CIEL
OUVERT DE SuE C
Introduction
L'étude des brèches hydrothermales dans la zone de Anne à Shea Creek a montré que le
développement des brèches associées aux minéralisations uranifères a été initié par des
réactivations tectoniques. Les fractures et brèches tectoniques et hydrauliques ainsi créées ont
provoqué une forte augmentation de perméabilité générant la circulation de fluides dans les
fractures. Les interactions fluides-roche le long des fractures se sont accompagnées d'une
évolution des brèches par des phénomènes chimiques de dissolution du quartz et de
précipitation de phases minérales variées telles la sudoite, la dravite, la chlorite ferrifere, la
sidérite et l'hématite. Pour certaines de ces brèches, la dernière phase de l'évolution est un
effondrement du système.
Figure III-1 - Vue panoramique vers le nord de la MCO de Sue C en Juin 2000 .
Les zones à boules représentent un cas particulier de brèches hydrothermales dans le Bassin
Athabasca. Elles contiennent des fragments de grès argilisés avec des formes d'ellipsoïdes
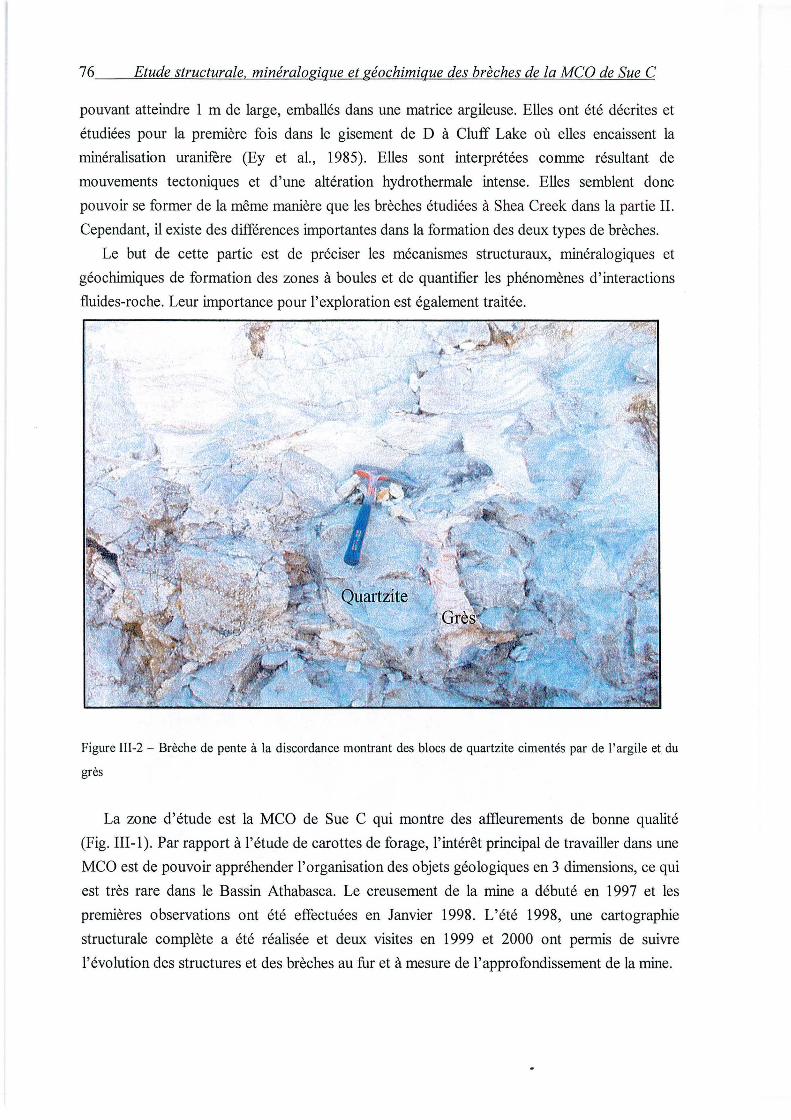
76 Etude structurale, minéralogique et géochimique des brèches de la MCO de Sue C
pouvant atteindre 1 rn de large, emballés dans une matrice argileuse. Elles ont été décrites et
étudiées pour la première fois dans le gisement de D à Clu:ff Lake où elles encaissent la
minéralisation uranifère (Ey et al., 1985). Elles sont interprétées comme résultant de
mouvements tectoniques et d'une altération hydrothermale intense. Elles semblent donc
pouvoir se former de la même manière que les brèches étudiées à Shea Creek dans la partie II.
Cependant, il existe des différences importantes dans la formation des deux types de brèches.
Le but de cette partie est de préciser les mécanismes structuraux, minéralogiques et
géochirniques de formation des zones à boules et de quantifier les phénomènes d'interactions
fluides-roche. Leur importance pour l'exploration est également traitée.
Figure Ill-2 - Brèche de pente à la discordance montrant des blocs de quartzite cimentés par de l'argile et du
grès
La zone d'étude est la MCO de Sue C qui montre des affleurements de bonne qualité
(Fig. III-1). Par rapport à l'étude de carottes de forage, l'intérêt principal de travailler dans une
MCO est de pouvoir appréhender l'organisation des objets géologiques en 3 dimensions, ce qui
est très rare dans le Bassin Athabasca. Le creusement de la mine a débuté en 1997 et les
premières observations ont été effectuées en Janvier 1998. L'été 1998, une cartographie
structurale complète a été réalisée et deux visites en 1999 et 2000 ont permis de suivre
l'évolution des structures et des brèches au fur et à mesure de l'approfondissement de la mine.

Etude structurale, minéralogique et géochimique des brèches de la MCO de Sue C 77
De superbes affleurements de brèches de pente ou« pseudo-fanglomérats » correspondant
à des glissements de terrain au niveau de la paléo-topographie formée par la discordance ont
été observés (Fig. 111-2). Ils sont les témoins d'une activité tectonique syn-sédimentaire
précoce. Les zones à boules étudiées dans cette partie illustrent une activité tectonique
postérieure au dépôt des sédiments Athabasca.
Les relations spatiales entre les zones à boules et les structures, leur orientation ainsi que
la forme des boules ont d'abord été étudiées afin de comprendre les contrôles structuraux des
zones à boules. L'étude minéralogique et les calculs de bilan de masse de l'encaissant des
zones à boules, des boules et de la matrice ont permis de comprendre la nature des processus
de précipitation, de dissolution et de transformation des phases minérales et de quantifier leur
intensité. Le rapport fluides/roche et le temps de formation des brèches sont estimés. Les
conditions thermiques de genèse des zones à boules ont été précisées en utilisant le
géothermomètre illite de Cathelineau et lzquierdo (1988). Les différents processus impliqués
dans la genèse des zones à boules sont intégrés dans un modèle synthétique étroitement lié à la
formation des minéralisations uranifères.
78 Etude structurale, minéralogique et géochimique des brèches de la MCO de Sue C
ARTICLE 2:
Chemical brecciation processes in the Sue unconformity-type uranium deposits, Eastern Athabasca Basin (Canada)
G. Lorilleux8 '*, M. Cuney\ M. Jébrakb, J.C. RippertC, P. Portellac
a CREGU-UMR G2R 7566, Université Henri Poincaré, BP 23, 54 501 Vandoeuvre-les-Nancy, France
b UQAM, DST A, CP 8888, Montréal (QUE) H3C 3P8 Canada
c COGEMA Resources Inc, Exploration Department, 817-825 45th Street West, P.O. Box 9204, Saskatoon (SK)
S7K 3X5 Canada
Submitted to Journal of Geochemical Exploration
* Corresponding author.
E-mail addresses and fax numbers: [email protected], (33) 3 83 91 38 01
(G. Lorilleux), [email protected], (33) 3 83 91 38 01 (M Cuney),
[email protected], 1 514 987 7749 (M Jébrak),[email protected], 1 306, 343 4632
(J. C. Ripper!}.
Etude structurale, minéralogique et géochimique des brèches de la MCO de Sue C 79
Résumé
La bréchification chimique dans les grès est associée à plusieurs gisements d'uranium de
type discordance dans le Bassin Athabasca, nord Saskatchewan (Canada). Elle s'exprime à
travers la formation de brèches appelées zones à boules. Les zones à boules correspondent à
des fragments de grès argilisés ayant des formes de boules avec des tailles variant de quelques
centimètres à 1 rn emballés par une matrice argileuse. Elles furent cartographiées et décrites
en détail dans la mine à ciel ouvert du gisement de type discordance de Sue C. Dans cette
mine, les zones à boules ont jusqu'à 5 rn de large et s'étendent verticalement sur 20 à 30 m.
Elles sont localisées le long d'une faille inverse riche en graphite contrôlant les gisements de
Sue A et B, et sont plus développées dans des zones d'intersection avec des structures dextres
orientées NE. Leur maturité, définie par le pourcentage de matrice, augmente près de la
discordance et aux intersections de failles. La distribution statistique des formes de boules est
typiquement log-normale.
Des échantillons de boules, de matrice et de grès ont été pris le long d'un profil traversant
une zone à boule pour des études pétrographiques et géochimiques. Le développement des
zones à boules est caractérisé par la dissolution massive du quartz, par le lessivage de
l'hématite primaire, la précipitation de minéraux du groupe des crandallite-florencite-goyazite
et par le remplacement de la dickite par de l'illite. La composition chimique des illites
déterminée par microsonde électronique indique une température de formation entre 240 et
280°C, légèrement supérieure à la température du maximum de diagenèse dans le bassin. Les
calculs de bilan de masse montrent que les fluides hydrothermaux ont apporté les éléments V,
K, Rb, B, W, Zn, terres rares légères, Mg, Cr, Sr, U et Y et ont lessivé Si et Fe. La dissolution
massive du quartz fut accompagnée d'une perte de volume de près de 85 %.
La formation des zones à boules fut déclenchée par fracturation tectonique dans les grès
pendant une phase de réactivation de faille. L'augmentation de perméabilité conséquente à la
fracturation induit la circulation de fluides de socle dans les grès. Ces fluides étaient sous
saturés en silice et provoquèrent la dissolution du quartz autour des fractures conduisant ainsi
à la formation de fragments arrondis. Les morphologies rondes sont probablement dues à une
dissolution en régime limité par la diffusion. L'argilisation massive associée fut responsable
de l'auto-colmatage du système hydrothermal. La forte perméabilité fut probablement
régénérée périodiquement par des réactivations sismiques, expliquant ainsi un rapport
fluide/roche minimum de 38 000 calculé avec une saturation en silice du fluide de 90 %. Les
espaces vides créés par la dissolution du quartz furent accommodés par un fluage sub-continu
de la matrice argileuse pendant les phases de contraction tectonique intersismique, créant ainsi
une perméabilité à 1' échelle du grain. Le fluage de la matrice fut accompagné par la rotation
des boules, augmentant le processus d'arrondissement. Ces phénomènes furent contemporains
80 Etude structurale. minéralogique et géochimique des brèches de la MCO de Sue C
de la formation des minéralisations uranifères haute-teneur de type discordance. Les
enrichissements en terres rares légères de la matrice par rapport aux boules et en terres rares
lourdes des boules par rapport à la matrice montrent qu'un fractionnement chimique s'est
couplé à la déformation différentielle entre les boules et la matrice. Le temps nécessaire pour
la formation des zones à boules fut probablement supérieur à 1 million d'années, indiquant un
processus relativement lent.
Mots-clefs: brèche, uranium, perméabilité, dissolution, zone de cisaillement, fractionnement.
Abstract
Chemical brecciation in sandstones is associated with several unconformity-type uranium
deposits in the Athabasca Basin, northem Saskatchewan (Canada), and is expressed through
"zones à boules" breccia formation. "Zones à boules" are represented by baU shape argillized
sandstone fragments, typically varying in size from several centimeters to 1 rn, wrapped in a
clay matrix. These were mapped and described in detail at the Sue C open pit unconformity
type uranium deposit. Here, the "zones à boules" are up to 5 rn wide and have a vertical
extension of 20 to 30 m. They are located along an eastern graphitic reverse fault controlling
the Sue A and B deposits, and are well developed at intersections with dextral NE-trending
structures. Their maturity, characterized by the matrix percentage, increases with proximity to
the unconformity and at fault intersections. Ball shape distribution is typically log-normal.
Ball, matrix and wall rock samples were taken along a profile crossing a "zone à boules"
for petrographie and geochemical studies. The "zones à boules" development is characterized
by massive quartz dissolution, leaching of hematite, crandallite-florencite-goyazite minerais
precipitation and replacement of dickite by illite. Illite chemical composition determined by
electron microprobe indicates formation temperatures between 240 and 280°C similar to
slightly higher than peak diagenesis temperature in the basin. Mass balance calculations show
that the hydrothermal fluids added V, K, Rb, B, W, Zn, LREE, Mg, Cr, Sr, U and Y and
leached out Si and Fe. Massive quartz dissolution was accompanied by about 85% volume
loss.
"Zones à boules" were initiated by tectonic fracturing in sandstones during fault
reactivation. The subsequent permeability increase induced the circulation of basement fluids
in the sandstone. These fluids were undersaturated relative to silica and provoked quartz
dissolution around fractures leading to rounded fragments formation. The rounded
morphologies are probably due to a diffusion-limited regime of dissolution. Associated
massive argillization was responsible for self sealing of the hydrothermal system. The high
permeability was probably periodically rejuvenated by seismic reactivations, causing a
Etude structurale, minéralogique et géochimique des brèches de la MCO de Sue C 81
minimum fluid/rock ratio of 38,000 calculated with a silica saturation of the fluid of 90%.
Sub-continuous ductile creep of the clay matrix by reaction weakening during interseismic
tectonic contraction accommodated the open spaces created by quartz dissolution resulting in
grain-scale permeability. The matrix creep was accompanied by ball rotation, enhancing the
shape rounding process. These processes were coeval with the formation of structurally
controlled high-grade unconformity-type uranium mineralization. Enrichments of LREE in the
matrix relative to the balls and of HREE in the balls relative to the matrix indicate that a
chemical partitioning was coupled with the strain partitioning between balls and matrix. The
length of time involved in the formation of the "zones à boules" was probably greater than 1
million years indicating a rather slow process.
Keywords: breccia, uranium, permeability, dissolution, shear zone, partitioning.
82 Etude structurale, minéralogique et géochimique des brèches de la MCO de Sue C
1. Introduction
Hydrothermal breccias containing spheroidal fragments are commonly found associated
with epigenetic hydrothermal deposits (Laznicka, 1988; Clark, 1990; Reeve et al., 1990). They
generally form by corrosive wear, wear-abrasion (Jébrak, 1997), hypogene exfoliation
(Sillitoe, 1985) and/or by the development of curviplanar fractures resulting from the
propagation of a shock wave (Clark, 1990). Fragments are typically a few centimeters in size.
Breccias containing decimeter- to meter-size rounded fragments may form in surficial
environment by spheroidal weathering (Augustithis and Ottemann, 1966; Augustithis et al.,
1980; Shahabpour, 1998) but are poorly documented in hydrothermal environments.
In the Athabasca Basin, "zones à boules" represent an unusual case of hydrothermal
breccias containing 10 cm to 1 rn diameter ball-shaped fragments developed in sandstones.
Fragments are partly to totally clay-altered, striated and wrapped in clay. They were for the
first time documented by Ey et al. (1985) in the Cluff D unconformity-type uranium deposit
located in the West Athabasca Basin. They represent one of the most important tectonic
feature associated with the Cluff D deposit and are strongly affected by the Carswell meteorite
impact event. "Zones à boules" were also observed by Baudemont et al. (1993) in the Sue C
deposit, the object of this paper, and are also present in the Rabbit Lake deposit, in the Cluff
Claude deposit and in the Shea Creek exploration zone, just south of Cluff Lake. Their close
association with unconformity-type uranium mineralization makes the understanding of their
development of major importance for exploration.
Breccia formation has been discussed particularly by Phillips (1986), Sibson (1986),
Laznicka (1988 ; 1989), Jébrak (1992; 1997) and Lorilleux et al. (2000) but« zones à boules»
formation was not considered. "Zones à boules" were interpreted by Ey et al. (1985) as
resulting from tectonic movements combined with hydrothermal alteration. However, no
quantitative data were provided conceming the alteration geochemistry and the formation of
the balls. The purpose of this study is to examine the geochemical and structural mechanisms
of formation of the "zones à boules" and to determine their significance for uranium
exploration. The area of study was confined to the Sue C open pit (Fig. 1 b and 2). The main
structural control in the area is a series of N10-15° faults, along which are located five
uranium deposits defining the Sue trend (Baudemont et al., 1993). The open pit provided good
quality exposures of "zones à boules". Detailed field and microscopie descriptions have been
combined with mass balance calculations in order to understand quantitatively the coupling
relationship between tectonic movements and hydrothermal alteration.
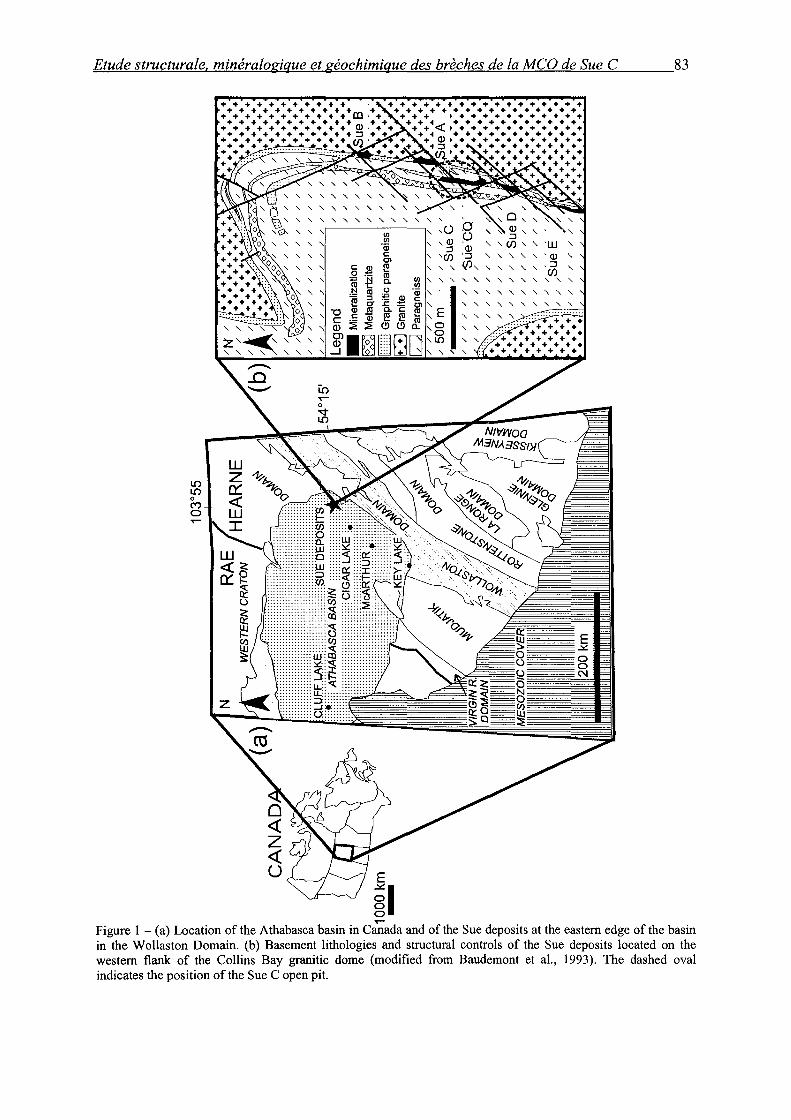
~E'-".!tu""d""e"-'sO<.:trn"-""'c=:.!te!:!u~ra~l~eL, '-'-m"""in'-"eo::.!' r~a~lo~g;...!i:!:l.q-""'u!<..e-"e"'-t og~éo~c::.!.h!:!.im=iq:l..!u~e::...:d!::!::e~s~b~r...!:è~c!..!.he:::!so!-d!::!::e~la:!:....M~C::..:O~d~e:...!:S~u~e:.....:C~---83
L{) L{) 0 (") 0 ......
E
§1 ......
Figure 1 - (a) Location of the Athabasca basin in Canada and of the Sue deposits at the eastern edge of the basin in the Wollaston Domain. (b) Basement lithologies and structuml controls of the Sue deposits located on the western flank of the Collins Bay granitic dome (modified from Baudemont et al., 1993). The dashed oval indicates the position of the Sue C open pit.

84 Etude structurale, minéralogique et géochimique des brèches de la MCO de Sue C
2 Methodology
"Zones à boules" were described on bench exposures of the Sue C open pit. Their
structural-controlled factors were determined by their orientations in the wall and/or ball
orientation rneasurernents. Ball shapes were systernatically rneasured. The ball size
distribution curve has been plotted using Statistica software.
Five sarnples, 1 to 5, were taken along a 6 rn profile crossing a "zone à boule". Two other
sarnples, 6 and 7, were taken in an other breccia outcrop and in a non-altered sandstone
respectively (see annexe 1). Petrographie characteristics of these non-rnineralized sarnples
have been studied by optical rnicroscopy. Their rnineralogy was determined by X-ray
diffraction (XRD) on whole-rock sarnples at the UQAM (Montréal, Canada) and by
transmission electron microscope (TEM), coupled with X-ray analysis at the Université Henri
Poincaré (Nancy, France) after agate rnortar crushing. Illite chernical composition was
analysed by electron rnicroprobe at 1 0 nA and at 15 k V with an average co un ting tirne of 9
seconds for the peak and 5 seconds for the background. The standards used for the analysis of
Na, Mg, Al, Si, Cl, K, Ca, Ti, V, Cr, Mn, Fe and Ni in illites were respectively albite, olivine,
albite, orthose, scapolite, orthose, wollastonite, MnTi03, pure vanadium, Cr20 3, MnTi03,
hematite and Niü. Relative proportions of quartz, dickite and kaolinite have been calculated
by norm analysis.
Mass balance calculations were determined using geochernical analysis of 10 major and 44
trace elements on whole rock sarnples 1, 2, 3, 4, 5 and 7 - by ICP-AES and ICP-MS at the
CRPG (Nancy) following a procedure described by Govindaraju and Mevelle (1987) (Table
1 ). Density of dry sarnples have been determined using a picnorneter with water (Vigneresse
and Cannat, 1987) (Table 1 ). The geochernical composition of sarnples 1 and 7 have been
used in the calculation of an average protolith composition. Mass balance calculations were
resolved using the Grant rnethod (Grant, 1986) which consists in a simple graphical solution
of Gresens' equation (Gresens, 1967) (see annexe III).
3. Geological setting
3.1. Regional geology
The unconformity-type Sue deposits (A, B, C, CQ, D, E) are located at the eastern edge of
the Athabasca Basin in northem Saskatchewan (Fig. 1 a). They lie within the Precarnbrian
Wollaston Domain, a lithostructural unit of the Heame Sub-province in the Churchill
Structural Province (Fig. la). The Wollaston Domain forms a fold belt along the northwestem
rnargin of the Trans-Hudson orogen (Ghandi, 1995) and is characterized by gneiss dornes,
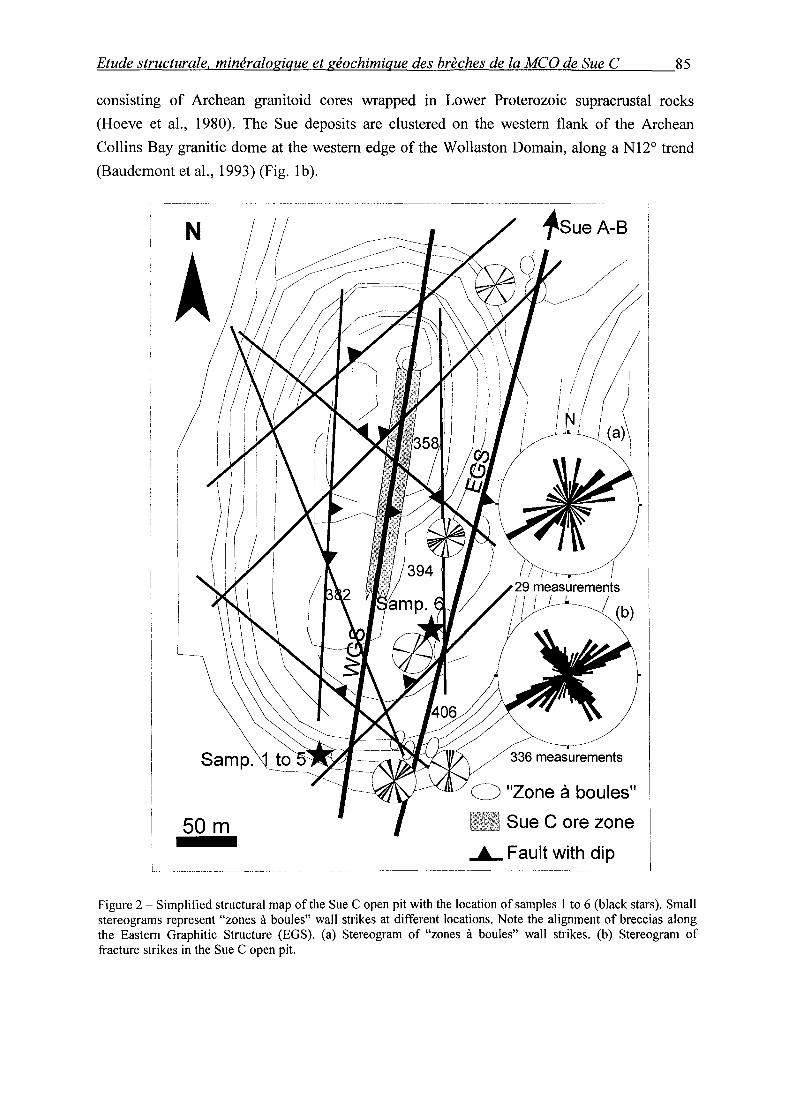
Etude structurale, minéralogique et géochimique des brèches de la MCO de Sue C 85
consisting of Archean granitoid cores wrapped in Lower Proterozoic supracrustal rocks
(Hoeve et al., 1980). The Sue deposits are clustered on the western flank of the Archean
Collins Bay granitic dome at the western edge of the Wollaston Domain, along a N12° trend
(Baudemont et al., 1993) (Fig. lb).
N
A
SOm
0 "Zone à boules"
Sue C ore zone
_._ Fault with dip
Figure 2- Simplified structural map of the Sue C open pit with the location of sam pies 1 to 6 (black stars). Small stereograms represent "zones à boules" wall strikes at different locations. Note the alignment of breccias along the Eastern Graphitic Structure (EGS). (a) Stereogram of "zones à boules" wall strikes. (b) Stereogram of fracture strikes in the Sue C open pit.
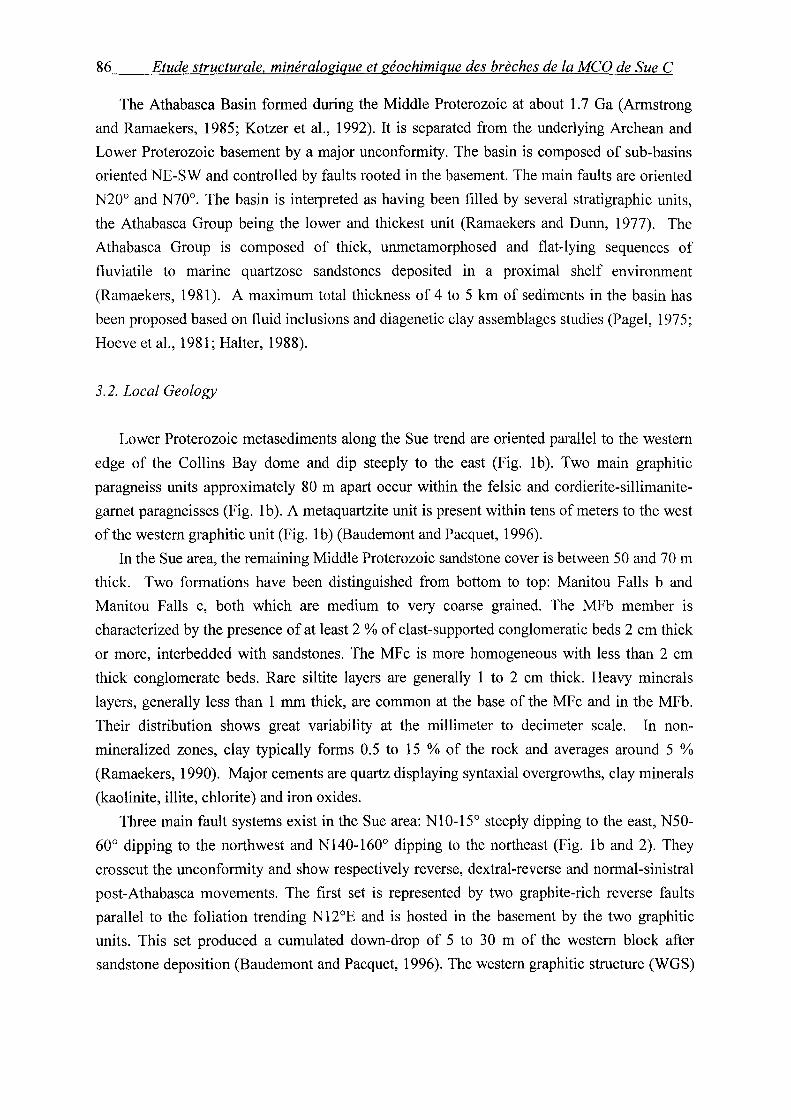
86 Etude structurale, minéralogique et géochimique des brèches de la MCO de Sue C
The Athabasca Basin formed during the Middle Proterozoic at about 1.7 Ga (Armstrong
and Ramaekers, 1985; Kotzer et al., 1992). It is separated from the underlying Archean and
Lower Proterozoic basement by a major unconformity. The basin is composed of sub-basins
oriented NE-SW and controlled by faults rooted in the basement. The main faults are oriented
N20° and N70°. The basin is interpreted as having been filled by several stratigraphie units,
the Athabasca Group being the lower and thickest unit (Ramaekers and Dunn, 1977). The
Athabasca Group is composed of thick, unmetamorphosed and flat-lying sequences of
fluviatile to marine quartzose sandstones deposited in a proximal shelf environment
(Ramaekers, 1981 ). A maximum total thickness of 4 to 5 km of sediments in the basin has
been proposed based on fluid inclusions and diagenetic clay assemblages studies (Pagel, 1975;
Hoeve et al., 1981; Halter, 1988).
3. 2. Local Geology
Lower Proterozoic metasediments along the Sue trend are oriented parallel to the western
edge of the Collins Bay dome and dip steeply to the east (Fig. 1 b ). Two main graphitic
paragneiss units approximately 80 rn apart occur within the felsic and cordierite-sillimanite
garnet paragneisses (Fig. 1 b ). A metaquartzite unit is present within tens of meters to the west
of the western graphitic unit (Fig. 1 b) (Baudemont and Pacquet, 1996).
In the Sue area, the remaining Middle Proterozoic sandstone cover is between 50 and 70 rn
thick. Two formations have been distinguished from bottom to top: Manitou Falls b and
Manitou Falls c, both which are medium to very coarse grained. The MFb member is
characterized by the presence of at least 2 % of clast-supported conglomeratic beds 2 cm thick
or more, interbedded with sandstones. The MFc is more homogeneous with less than 2 cm
thick conglomerate beds. Rare siltite layers are generally 1 to 2 cm thick. Heavy minerais
layers, generally less than 1 mm thick, are common at the base of the MFc and in the MFb.
Their distribution shows great variability at the millimeter to decimeter scale. In non
mineralized zones, clay typically forms 0.5 to 15 % of the rock and averages around 5 %
(Ramaekers, 1990). Major cements are quartz displaying syntaxial overgrowths, clay minerais
(kaolinite, illite, chlorite) and iron oxides.
Three main fault systems exist in the Sue area: N10-15° steeply dipping to the east, NS0-
600 dipping to the northwest and N140-160° dipping to the northeast (Fig. 1 b and 2). They
crosscut the unconformity and show respectively reverse, dextral-reverse and normal-sinistral
post-Athabasca movements. The first set is represented by two graphite-rich reverse faults
parallel to the foliation trending N12°E and is hosted in the basement by the two graphitic
units. This set produced a cumulated down-drop of 5 to 30 rn of the western block after
sandstone deposition (Baudemont and Pacquet, 1996). The western graphitic structure (WGS)
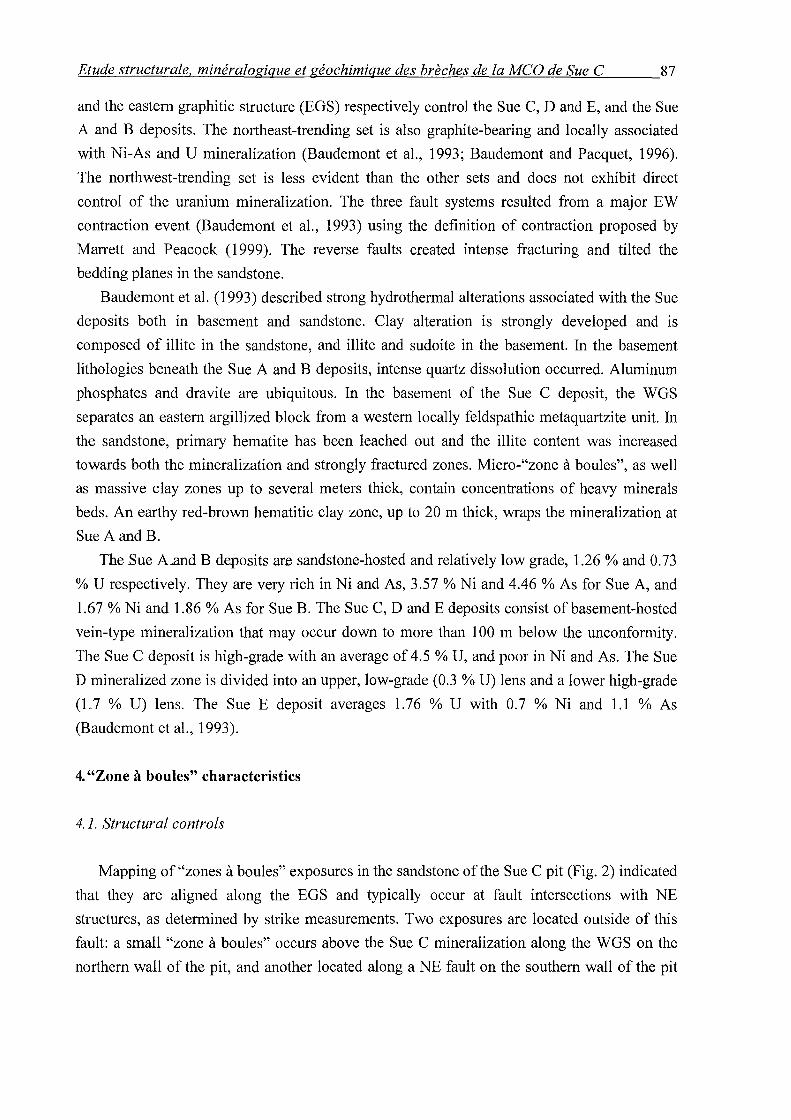
Etude structurale, minéralogique et géochimique des brèches de la MCO de Sue C 87
and the eastern graphitic structure (EGS) respectively control the Sue C, D and E, and the Sue
A and B deposits. The northeast-trending set is also graphite-bearing and locally associated
with Ni-As and U mineralization (Baudemont et al., 1993; Baudemont and Pacquet, 1996).
The northwest-trending set is less evident than the other sets and does not exhibit direct
control of the uranium mineralization. The three fault systems resulted from a major EW
contraction event (Baudemont et al., 1993) using the definition of contraction proposed by
Marrett and Peacock (1999). The reverse faults created intense fracturing and tilted the
bedding planes in the sandstone.
Baudemont et al. (1993) described strong hydrothermal alterations associated with the Sue
deposits both in basement and sandstone. Clay alteration is strongly developed and is
composed of illite in the sandstone, and illite and sudoite in the basement. In the basement
lithologies beneath the Sue A and B deposits, intense quartz dissolution occurred. Aluminum
phosphates and dravite are ubiquitous. In the basement of the Sue C deposit, the WGS
separates an eastern argillized block from a western locally feldspathic metaquartzite unit. In
the sandstone, primary hematite has been leached out and the illite content was increased
towards both the mineralization and strongly fractured zones. Micro-"zone à boules", as well
as massive clay zones up to severa! meters thick, contain concentrations of heavy minerais
beds. An earthy red-brown hematitic clay zone, up to 20 rn thick, wraps the mineralization at
Sue A and B.
The Sue A.and B deposits are sandstone-hosted and relatively low grade, 1.26% and 0.73
% U respectively. They are very rich in Ni and As, 3.57% Ni and 4.46% As for Sue A, and
1.67 %Ni and 1.86 % As for Sue B. The Sue C, D and E deposits consist of basement-hosted
vein-type mineralization that may occur down to more than 100 rn below the unconformity.
The Sue C deposit is high-grade with an average of 4.5 % U, and poor in Ni and As. The Sue
D mineralized zone is divided into an upper, low-grade (0.3 % U) lens and a lower high-grade
(1.7 % U) lens. The Sue E deposit averages 1.76 % U with 0.7 % Ni and 1.1 % As
(Baudemont et al., 1993).
4. "Zone à boules" characteristics
4.1. Structural contrais
Mapping of"zones à boules" exposures in the sandstone ofthe Sue C pit (Fig. 2) indicated
that they are aligned along the EGS and typically occur at fault intersections with NE
structures, as determined by strike measurements. Two exposures are located outside of this
fault: a small "zone à boules" occurs above the Sue C mineralization along the WGS on the
northern wall of the pit, and another located along a NE fault on the southern wall of the pit
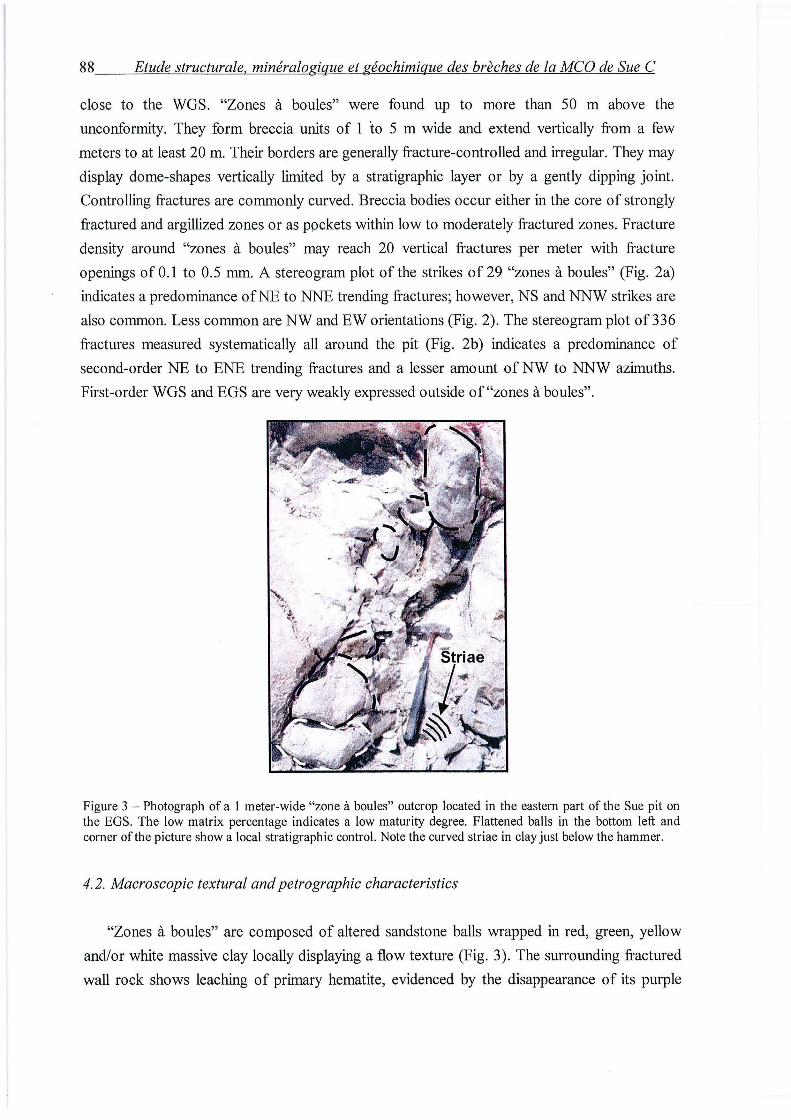
88 Etude structurale, minéralogique et géochimique des brèches de la MCO de Sue C
close to the WGS. "Zones à boules" were found up to more than 50 rn above the
unconformity. They form breccia units of 1 to 5 rn wide and extend vertically from a few
meters to at least 20 m. Their borders are generally fracture-controlled and irregular. They may
display dome-shapes vertically lirnited by a stratigraphie layer or by a gently dipping joint.
Controlling fractures are commonly curved. Breccia bodies occur either in the core of strongly
fractured and argillized zones or as ppckets within low to moderately fractured zones. Fracture
density around "zones à boules" may reach 20 vertical fractures per meter with fracture
openings of 0.1 to 0.5 mm. A stereogram plot of the strikes of 29 "zones à boules" (Fig. 2a)
indicates a predominance ofNE toNNE trending fractures; however, NS and NNW strikes are
also common. Less common are NW and EW orientations (Fig. 2). The stereo gram plot of 336
fractures measured systematically all around the pit (Fig. 2b) indicates a predominance of
second-order NE to ENE trending fractures and a lesser amount of NW to NNW azimuths.
First-order WGS and EGS are very weakly expressed outside of"zones à boules".
Figure 3 - Photograph of a 1 meter-wide "zone à boules" outcrop located in the eastern part of the Sue pit on the EGS. The low matrix percentage indicates a low maturity degree. Flattened balls in the bottom left and corner of the picture show a local stratigraphie control. Note the curved striae in clay just below the hammer.
4. 2. Macroscopic textura! and petrographie characteristics
"Zones à boules" are composed of altered sandstone balls wrapped in red, green, yellow
and/or white massive clay locally displaying a flow texture (Fig. 3). The surrounding fractured
wall rock shows leaching of primary hematite, evidenced by the disappearance of its purple
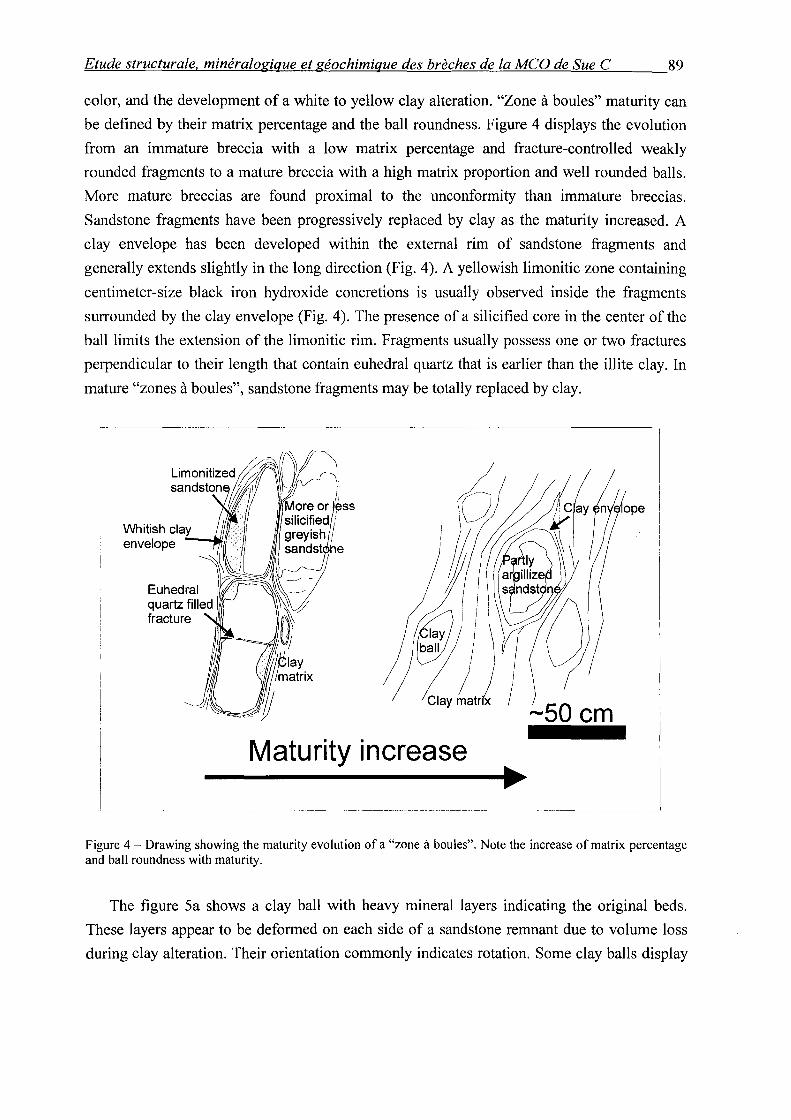
Etude structurale, minéralogique et géochimique des brèches de la MCO de Sue C 89
color, and the development of a white to yellow clay alteration. "Zone à boules" maturity can
be defined by their matrix percentage and the ball roundness. Figure 4 displays the evolution
from an immature breccia with a low matrix percentage and fracture-controlled weakly
rounded fragments to a mature breccia with a high matrix proportion and well rounded balls.
More mature breccias are found proximal to the unconformity than immature breccias.
Sandstone fragments have been progressively replaced by clay as the maturity increased. A
clay envelope has been developed within the external rim of sandstone fragments and
generally extends slightly in the long direction (Fig. 4). A yellowish limonitic zone containing
centimeter-size black iron hydroxide concretions is usually observed inside the fragments
surrounded by the clay envelope (Fig. 4 ). The presence of a silicified core in the center of the
ball limits the extension of the limonitic rim. Fragments usually possess one or two fractures
perpendicular to their length that contain euhedral quartz that is earlier than the illite clay. In
mature "zones à boules", sandstone fragments may be totally replaced by clay.
Maturity increase
Figure 4 - Drawing showing the maturity evolution of a "zone à boules". Note the increase of matrix percentage and bali roundness with maturity.
The figure 5a shows a clay ball with heavy mineral layers indicating the original beds.
These layers appear to be deformed on each side of a sandstone remnant due to volume loss
during clay alteration. Their orientation commonly indicates rotation. Sorne clay halls display
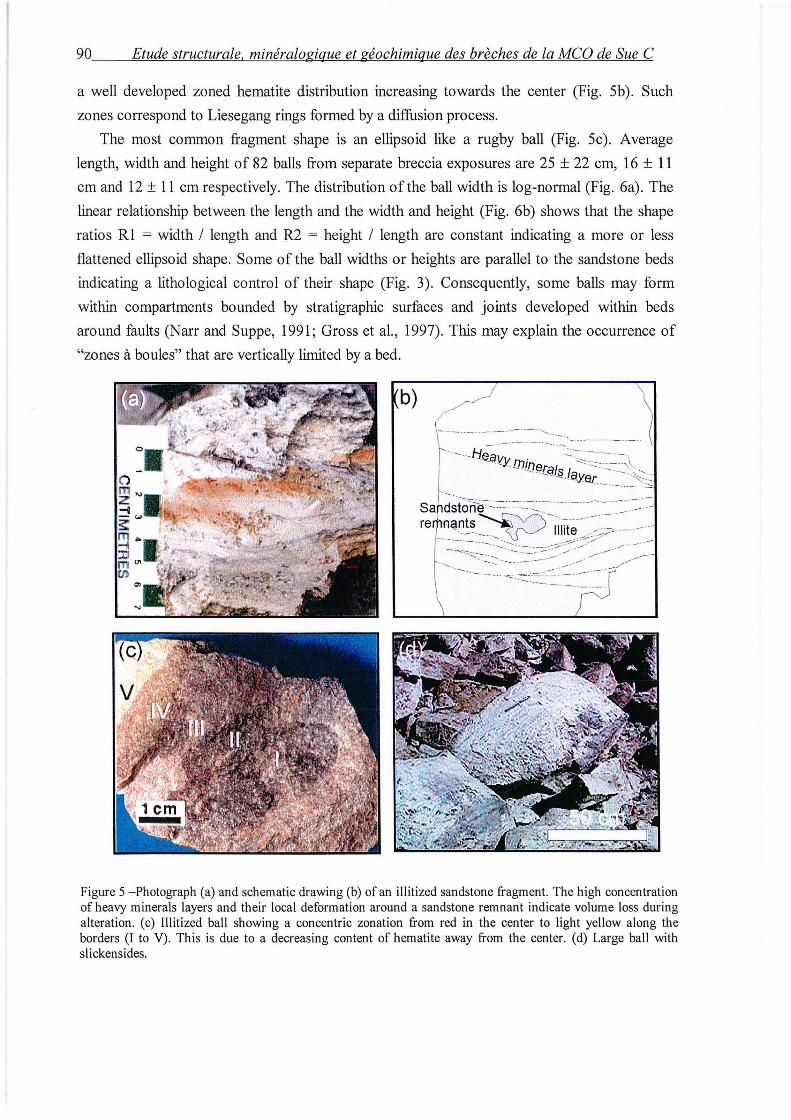
90 Etude structurale, minéralogique et géochimique des brèches de la MCO de Sue C
a weil developed zoned hematite distribution increasing towards the center (Fig. Sb). Such
zones correspond to Liesegang rings formed by a diffusion pro cess.
The most common fragment shape is an ellipsoid like a rugby bali (Fig. Sc). Average
length, width and height of 82 halls from separate breccia exposures are 25 ± 22 cm, 16 ± 11
cm and 12 ± 11 cm respectively. The distribution of the bali width is log-normal (Fig. 6a). The
linear relationship between the length and the width and height (Fig. 6b) shows that the shape
ratios R1 = width 1 length and R2 = height 1 length are constant indicating a more or less
flattened ellipsoid shape. Sorne of the bali widths or heights are parallel to the sandstone beds
indicating a lithological control of their shape (Fig. 3). Consequently, sorne baBs may form
within compartments bounded by stratigraphie surfaces and joints developed within beds
around faults (Narr and Suppe, 1991 ; Gross et al., 1997). This may explain the occurrence of
"zones à boules" that are vertically limited by a bed.
Figure 5 - Photograph (a) and schematic drawing (b) of an illitized sandstone fragment. The high concentration of heavy minerais layers and their local deformation around a sandstone remnant indicate volume loss during alteration. ( c) Illitized bali showing a concentric zonation from red in the center to light yellow along the borders (1 to V). This is due to a decreasing content of hematite away from the center. (d) Large bali with slickensides.
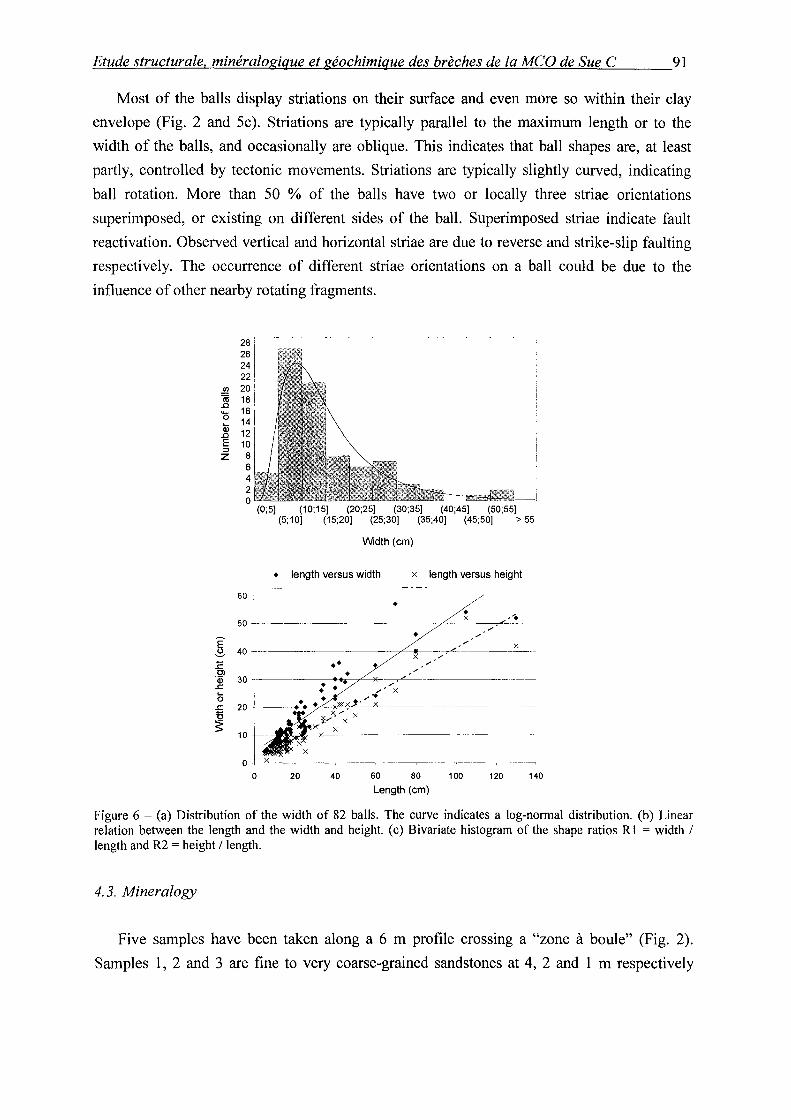
Etude structurale, minéralogique et géochimique des brèches de la MCO de Sue C 91
Most of the halls display striations on their surface and even more so within their clay
envel ope (Fig. 2 and Sc). Striations are typically parallel to the maximum length or to the
width of the halls, and occasionally are oblique. This indicates that ball shapes are, at least
partly, controlled by tectonic movements. Striations are typically slightly curved, indicating
ball rotation. More than 50 % of the halls have two or locally three striae orientations
superimposed, or existing on different sides of the ball. Superimposed striae indicate fault
reactivation. Observed vertical and horizontal striae are due to reverse and strike-slip faulting
respectively. The occurrence of different striae orientations on a ball could be due to the
influence of other nearby rotating fragments.
~-------~-- ·-------------~----·------~-------· ----
~~ 1 221
!!1 20. ~ 181 0 16 ..... 14 ~ 12 E 10 ::::J z 8
6 4 2 0
60 1
i
(0;5] (10;15] (20;25] (30;35] (40;45] (50;55] (5;10] (15;20] (25;30] (35;40] (45;50] >55
Width (cm)
• length versus width x length versus height
• 50-'-----------
'
Figure 6 - (a) Distribution of the width of 82 halls. The curve indicates a log-normal distribution. (b) Linear relation between the length and the width and height. (c) Bivariate histogram of the shape ratios RI = width 1 length and R2 = height 1 length.
4. 3. Minera/ogy
Five samples have been taken along a 6 rn profile crossing a "zone à boule" (Fig. 2).
Samples 1, 2 and 3 are fine to very coarse-grained sandstones at 4, 2 and 1 rn respectively
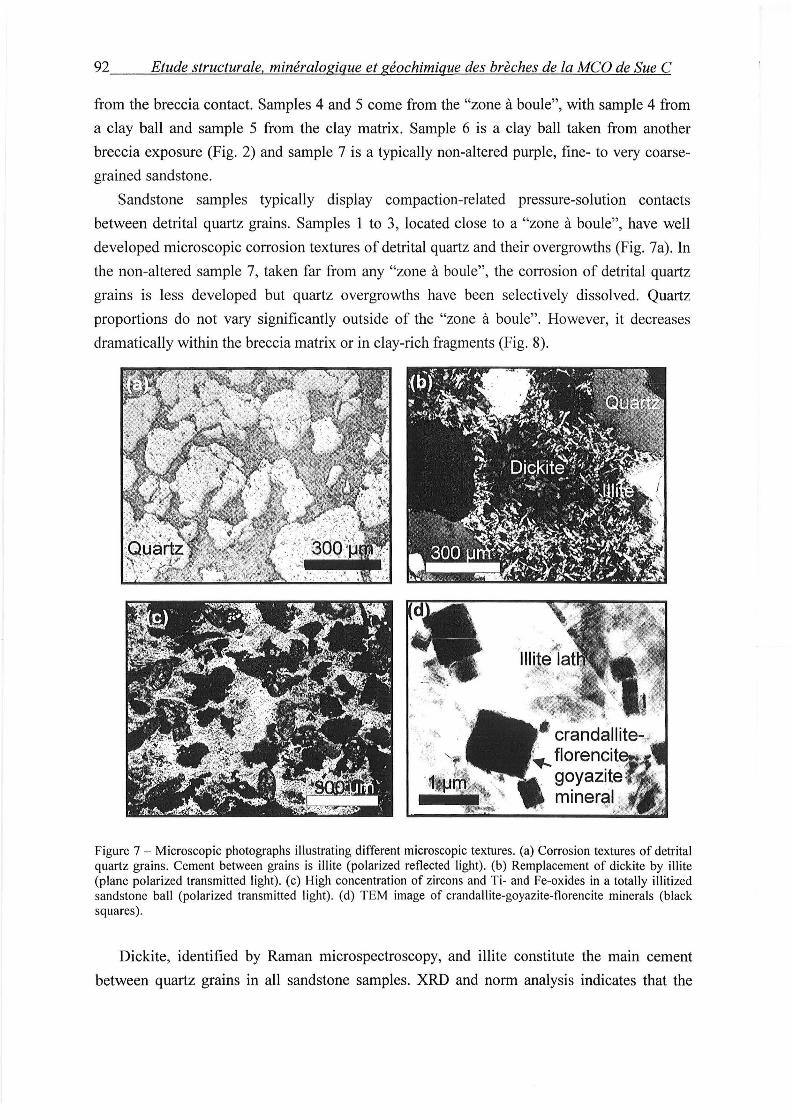
92 Etude structurale, minéralogique et géochimique des brèches de la MCO de Sue C
from the breccia contact. Samples 4 and 5 come from the "zone à boule", with sample 4 from
a clay hall and sample 5 from the clay matrix. Sample 6 is a clay hall taken from another
breccia exposure (Fig. 2) and sample 7 is a typically non-altered purple, fine- to very coarse
grained sandstone.
Sandstone samples typically display compaction-related pressure-solution contacts
between detrital quartz grains. Samples 1 to 3, located close to a "zone à boule", have well
developed microscopie corrosion textures of detrital quartz and their overgrowths (Fig. 7a). In
the non-altered sample 7, taken far from any "zone à boule", the corrosion of detrital quartz
grains is less developed but quartz overgrowths have been selectively dissolved. Quartz
proportions do not vary significantly outside of the "zone à boule". However, it decreases
dramatically within the breccia matrix or in clay-rich fragments (Fig. 8).
Figure 7- Microscopie photographs illustrating different microscopie textures. (a) Corrosion textures of detrital quartz grains. Cement between grains is illite (polarized reflected light). (b) Remplacement of dickite by illite (plane polarized transmitted light). (c) High concentration of zircons and Ti- and Fe-oxides in a totally illitized sandstone bali (polarized transmitted light). (d) TEM image of crandallite-goyazite-florencite minerais (black squares).
Dickite, identified by Raman microspectroscopy, and illite constitute the main cement
between quartz grains in all sandstone samples. XRD and norm analysis indicates that the
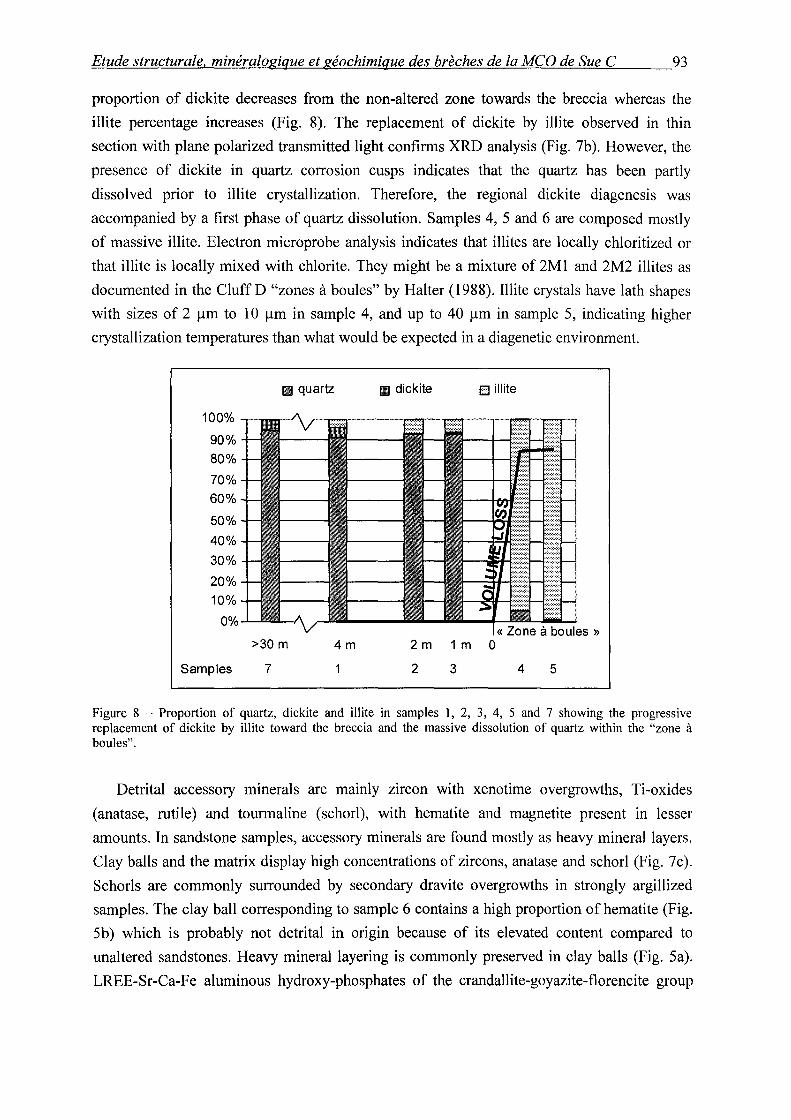
Etude structurale, minéralogique et géochimique des brèches de la MCO de Sue C 93
proportion of dickite decreases from the non-altered zone towards the breccia whereas the
illite percentage increases (Fig. 8). The replacement of dickite by illite observed in thin
section with plane polarized transmitted light confirms XRD analysis (Fig. 7b ). However, the
presence of dickite in quartz corrosion cusps indicates that the quartz has been partly
dissolved prior to illite crystallization. Therefore, the regional dickite diagenesis was
accompanied by a first phase of quartz dissolution. Samples 4, S and 6 are composed mostly
of massive illite. Electron microprobe analysis indicates that illites are locally chloritized or
that illite is locally mixed with chlorite. They might be a mixture of 2Ml and 2M2 illites as
documented in the Cluff D "zones à boules" by Halter (1988). Illite crystals have lath shapes
with sizes of 2 f..!m to 10 f..!m in sample 4, and up to 40 f..!m in sample S, indicating higher
crystallization temperatures than what would be expected in a diagenetic environment.
Ill quartz 11 dickite D illite
100%
90%
80%
70%
60%
50%
40%
30%
20%
10%
0%
>30 m 4m 2m 1 m
Sam pies 7 2 3 4 5
Figure 8 - Proportion of quartz, dickite and illite in samples 1, 2, 3, 4, 5 and 7 showing the progressive replacement of dickite by illite toward the breccia and the massive dissolution of quartz within the "zone à boules".
Detrital accessory minerais are mainly zircon with xenotime overgrowths, Ti-oxides
(anatase, rutile) and tourmaline (schorl), with hematite and magnetite present in lesser
amounts. In sandstone samples, accessory minerais are found mostly as heavy mineral layers.
Clay halls and the matrix display high concentrations of zircons, anatase and schorl (Fig. 7c).
Schorls are commonly surrounded by secondary dravite overgrowths in strongly argillized
samples. The clay hall corresponding to sample 6 contains a high proportion of hematite (Fig.
Sb) which is probably not detrital in origin because of its elevated content compared to
unaltered sandstones. Heavy mineral layering is commonly preserved in clay halls (Fig. Sa).
LREE-Sr-Ca-Fe aluminous hydroxy-phosphates of the crandallite-goyazite-florencite group
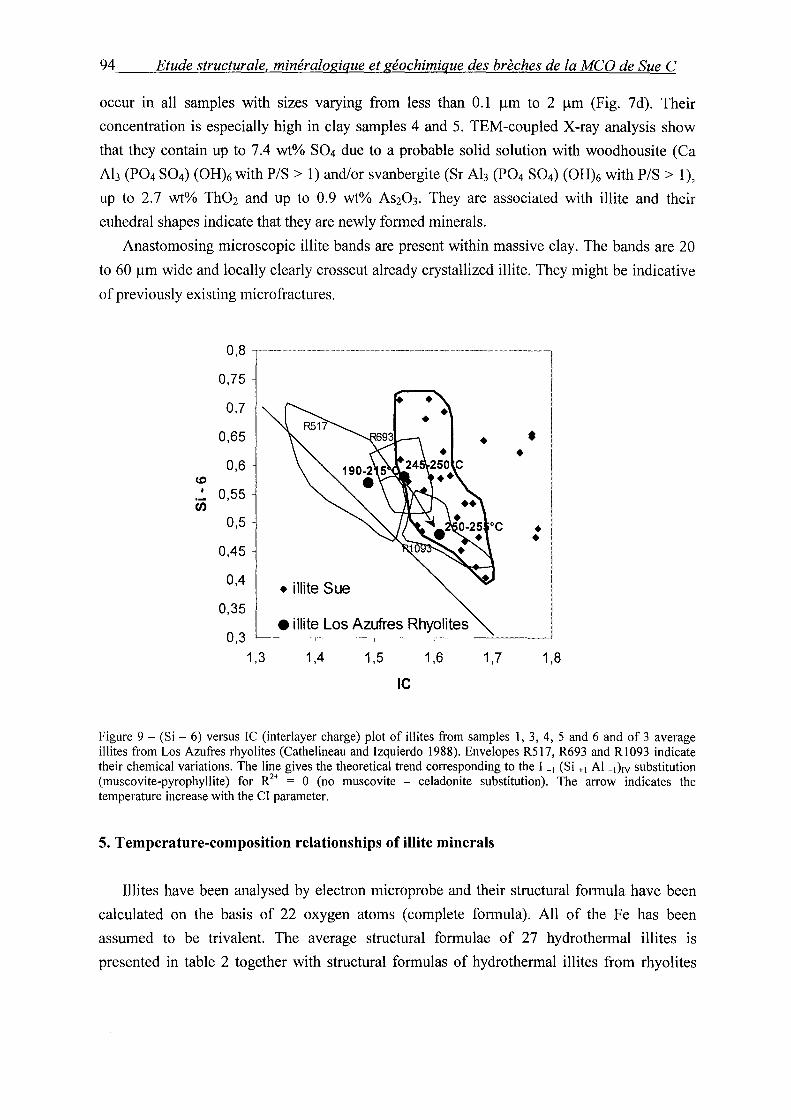
94 Etude structurale, minéralogique et géochimique des brèches de la MCO de Sue C
occur in all samples with sizes varying from less than 0.1 1-1m to 2 IJ.m (Fig. 7d). Their
concentration is especially high in clay samples 4 and 5. TEM-coupled X-ray analysis show
that they contain up to 7.4 wt% S04 due to a probable solid solution with woodhousite (Ca
Ah (P04 S04) (OH)6 with P/S > 1) and/or svanbergite (Sr Ah (P04 S04) (OH)6 with P/S > 1),
up to 2. 7 wt% Th02 and up to 0.9 wt% As203. They are associated with illite and their
euhedral shapes indicate that they are newly formed minerais.
Anastomosing microscopie illite bands are present within massive clay. The bands are 20
to 60 IJ.m wide and locally clearly crosscut already crystallized illite. They might be indicative
of previously existing micro fractures.
0,8
0,75
0,7
0,65
0,6 CD
1 0,55 ·-en 0,5 -
0,45
0,4 .
0,35.
0,3 .
1,3
•
• illite Sue
e illite Los Azufres Rhyolites
• •
• •
-----r-------~--·~--~---------.:.------1
1,4 1,5 1,6 1,7 1,8
IC
Figure 9- (Si- 6) versus IC (interlayer charge) plot of illites from samples 1, 3, 4, 5 and 6 and of 3 average illites from Los Azufres rhyolites (Cathelineau and Izquierdo 1988). Envelopes R517, R693 and R1093 indicate their chemical variations. The line gives the theoretical trend corresponding to the I _1 (Si +I Al _1) 1v substitution (muscovite-pyrophyllite) for R2
+ = 0 (no muscovite - celadonite substitution). The arrow indicates the temperature increase with the CI parameter.
5. Temperature-composition relationships of illite minerais
Illites have been analysed by electron microprobe and their structural formula have been
calculated on the basis of 22 oxygen atoms (complete formula). All of the Fe has been
assumed to be trivalent. The average structural formulae of 27 hydrothermal illites is
presented in table 2 together with structural formulas of hydrothermal illites from rhyolites
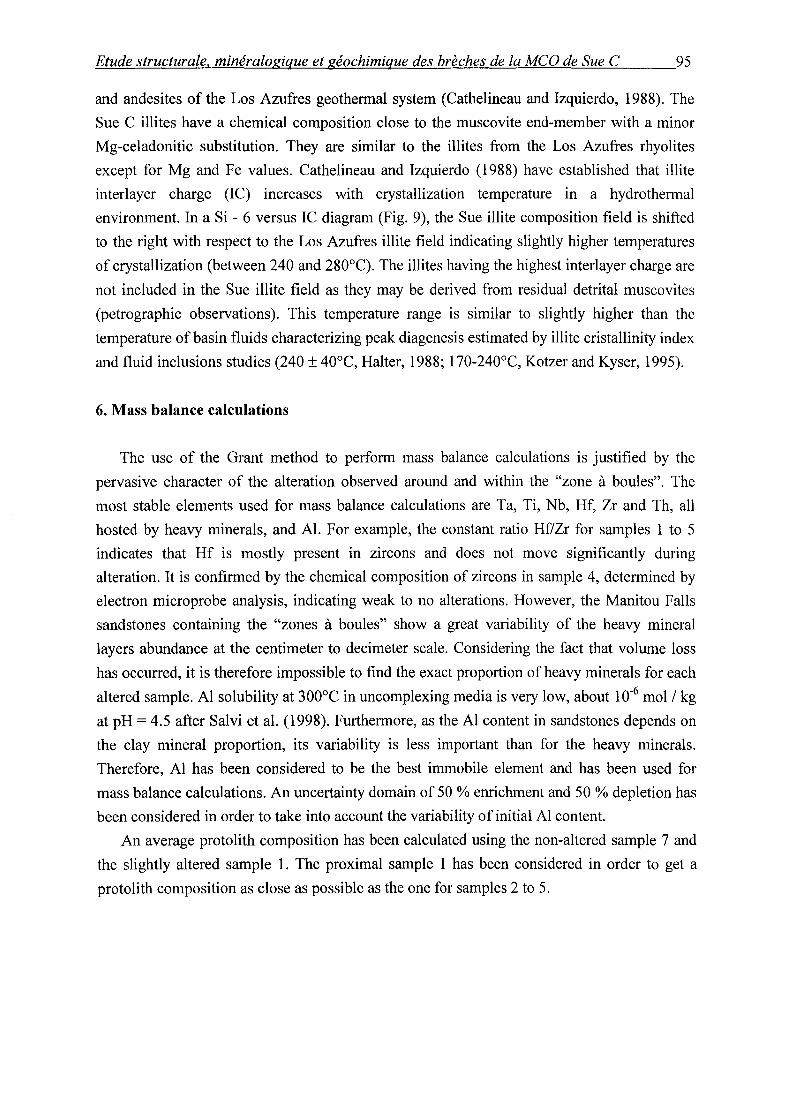
Etude structurale, minéralogique et géochimique des brèches de la MCO de Sue C 95
and andesites of the Los Azufres geothermal system (Cathelineau and lzquierdo, 1988). The
Sue C illites have a chemical composition close to the muscovite end-member with a minor
Mg-celadonitic substitution. They are similar to the illites from the Los Azufres rhyolites
except for Mg and Fe values. Cathelineau and Izquierdo (1988) have established that illite
interlayer charge (IC) increases with crystallization temperature in a hydrothermal
environment. In a Si - 6 versus IC diagram (Fig. 9), the Sue illite composition field is shifted
to the right with respect to the Los Azufres illite field indicating slightly higher temperatures
of crystallization (between 240 and 280°C). The illites having the highest interlayer charge are
not included in the Sue illite field as they may be derived from residual detrital muscovites
(petrographie observations). This temperature range is similar to slightly higher than the
temperature of basin fluids characterizing peak diagenesis estimated by illite cristallinity index
and fluid inclusions studies (240 ± 40°C, Halter, 1988; 170-240°C, Kotzer and Kyser, 1995).
6. Mass balance calculations
The use of the Grant method to perform mass balance calculations is justified by the
pervasive character of the alteration observed around and within the "zone à boules". The
most stable elements used for mass balance calculations are Ta, Ti, Nb, Hf, Zr and Th, all
hosted by heavy minerais, and Al. For example, the constant ratio Hf/Zr for samples 1 to 5
indicates that Hf is mostly present in zircons and does not move significantly during
alteration. It is confirmed by the chemical composition of zircons in sample 4, determined by
electron microprobe analysis, indicating weak to no alterations. However, the Manitou Falls
sandstones containing the "zones à boules" show a great variability of the heavy mineral
layers abundance at the centimeter to decimeter scale. Considering the fact that volume loss
has occurred, it is therefore impossible to find the exact proportion of heavy minerais for each
altered sample. Al solubility at 300°C in uncomplexing media is very low, about 1 o·6 mol 1 kg
at pH = 4.5 after Salvi et al. (1998). Furthermore, as the Al content in sandstones depends on
the clay mineral proportion, its variability is less important than for the heavy minerais.
Therefore, Al has been considered to be the best immobile element and has been used for
mass balance calculations. An uncertainty domain of 50 % enrichment and 50 % depletion has
been considered in order to take into account the variability of initial Al content.
An average protolith composition has been calculated using the non-altered sample 7 and
the slightly altered sample 1. The proximal sample 1 has been considered in order to get a
protolith composition as close as possible as the one for samples 2 to 5.
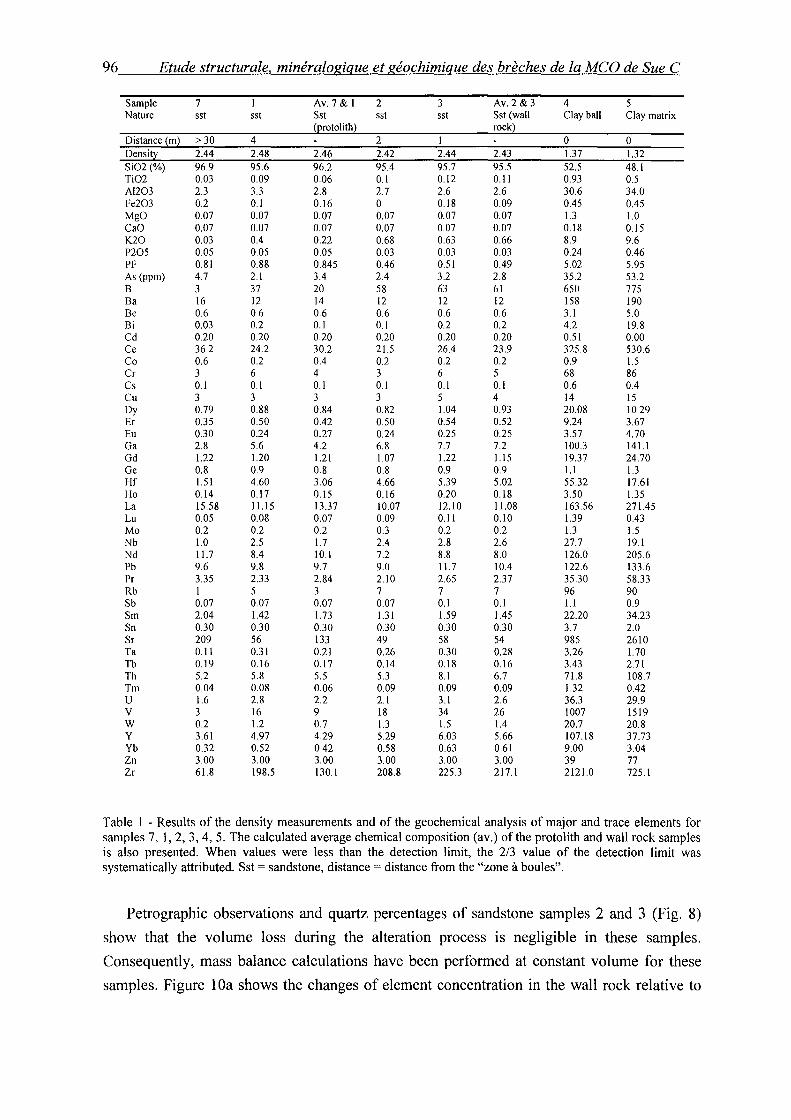
96 Etude structurale, minéralogique et géochimique des brèches de la MCO de Sue C
Sample 7 2 3 Av. 2 &3 4 5 Nature sst sst sst sst Sst (wall Clay bali Clay matrix
rock Distance ~m) >30 4 2 0 0 Densi!l: 2.44 2.48 2.46 2.42 2.44 2.43 1.37 1.32 Si02 (%) 96.9 95.6 96.2 95.4 95.7 95.5 52.5 48.1 Ti02 0.03 0.09 0.06 0.1 0.12 0.11 0.93 0.5 Al203 2.3 3.3 2.8 2.7 2.6 2.6 30.6 34.0 Fe203 0.2 0.1 0.16 0 0.18 0.09 0.45 0.45 MgO 0.07 0.07 0.07 0.07 0.07 0.07 1.3 1.0 CaO 0.07 0.07 0.07 0.07 0.07 0.07 0.18 0.15 K20 0.03 0.4 0.22 0.68 0.63 0.66 8.9 9.6 P205 0.05 0.05 0.05 0.03 0.03 0.03 0.24 0.46 PF 0.81 0.88 0.845 0.46 0.51 0.49 5.02 5.95 As (ppm) 4.7 2.1 3.4 2.4 3.2 2.8 35.2 53.2 B 3 37 20 58 63 61 650 775 Ba 16 12 14 12 12 12 158 190 Be 0.6 0.6 0.6 0.6 0.6 0.6 3.1 5.0 Bi 0.03 0.2 0.1 0.1 0.2 0.2 4.2 19.8 Cd 0.20 0.20 0.20 0.20 0.20 0.20 0.51 0.00 Ce 36.2 24.2 30.2 21.5 26.4 23.9 325.8 530.6 Co 0.6 0.2 0.4 0.2 0.2 0.2 0.9 1.5 Cr 3 6 4 3 6 5 68 86 Cs 0.1 0.1 0.1 0.1 0.1 0.1 0.6 0.4 Cu 3 3 3 3 5 4 14 15 Dy 0.79 0.88 0.84 0.82 1.04 0.93 20.08 10.29 Er 0.35 0.50 0.42 0.50 0.54 0.52 9.24 3.67 Eu 0.30 0.24 0.27 0.24 0.25 0.25 3.57 4.70 Ga 2.8 5.6 4.2 6.8 7.7 7.2 100.3 141.1 Gd 1.22 1.20 1.21 1.07 1.22 1.15 19.37 24.70 Ge 0.8 0.9 0.8 0.8 0.9 0.9 1.1 1.3 Hf 1.51 4.60 3.06 4.66 5.39 5.02 55.32 17.61 Ho 0.14 0.17 0.15 0.16 0.20 0.18 3.50 1.35 La 15.58 11.15 13.37 10.07 12.10 11.08 163.56 271.45 Lu 0.05 0.08 0.07 0.09 0.11 0.10 1.39 0.43 Mo 0.2 0.2 0.2 0.3 0.2 0.2 1.3 1.5 Nb 1.0 2.5 1.7 2.4 2.8 2.6 27.7 19.1 Nd 11.7 8.4 10.1 7.2 8.8 8.0 126.0 205.6 Pb 9.6 9.8 9.7 9.0 11.7 10.4 122.6 133.6 Pr 3.35 2.33 2.84 2.10 2.65 2.37 35.30 58.33 Rb 1 5 3 7 7 7 96 90 Sb 0.07 0.07 0.07 0.07 0.1 0.1 1.1 0.9 Sm 2.04 1.42 1.73 1.31 1.59 1.45 22.20 34.23 Sn 0.30 0.30 0.30 0.30 0.30 0.30 3.7 2.0 Sr 209 56 133 49 58 54 985 2610 Ta 0.11 0.31 0.21 0.26 0.30 0.28 3.26 1.70 Tb 0.19 0.16 0.17 0.14 0.18 0.16 3.43 2.71 Th 5.2 5.8 5.5 5.3 8.1 6.7 71.8 108.7 Tm 0.04 0.08 0.06 0.09 0.09 0.09 1.32 0.42 u 1.6 2.8 2.2 2.1 3.1 2.6 36.3 29.9 v 3 16 9 18 34 26 1007 1519 w 0.2 1.2 0.7 1.3 1.5 1.4 20.7 20.8 y 3.61 4.97 4.29 5.29 6.03 5.66 107.18 37.73 Yb 0.32 0.52 0.42 0.58 0.63 0.61 9.00 3.04 Zn 3.00 3.00 3.00 3.00 3.00 3.00 39 77 Zr 61.8 198.5 130.1 208.8 225.3 217.1 2121.0 725.1
Table 1 - Results of the density measurements and of the geochemical analysis of major and trace elements for samples 7, 1, 2, 3, 4, 5. The calculated average chemical composition (av.) ofthe protolith and wall rock samples is also presented. When values were Jess than the detection limit, the 2/3 value of the detection limit was systematically attributed. Sst = sandstone, distance= distance from the "zone à boules".
Petrographie observations and quartz percentages of sandstone samples 2 and 3 (Fig. 8)
show that the volume loss during the alteration process lS negligible in these samples.
Consequently, mass balance calculations have been performed at constant volume for these
samples. Figure 1 Oa shows the changes of element concentration in the wall rock relative to
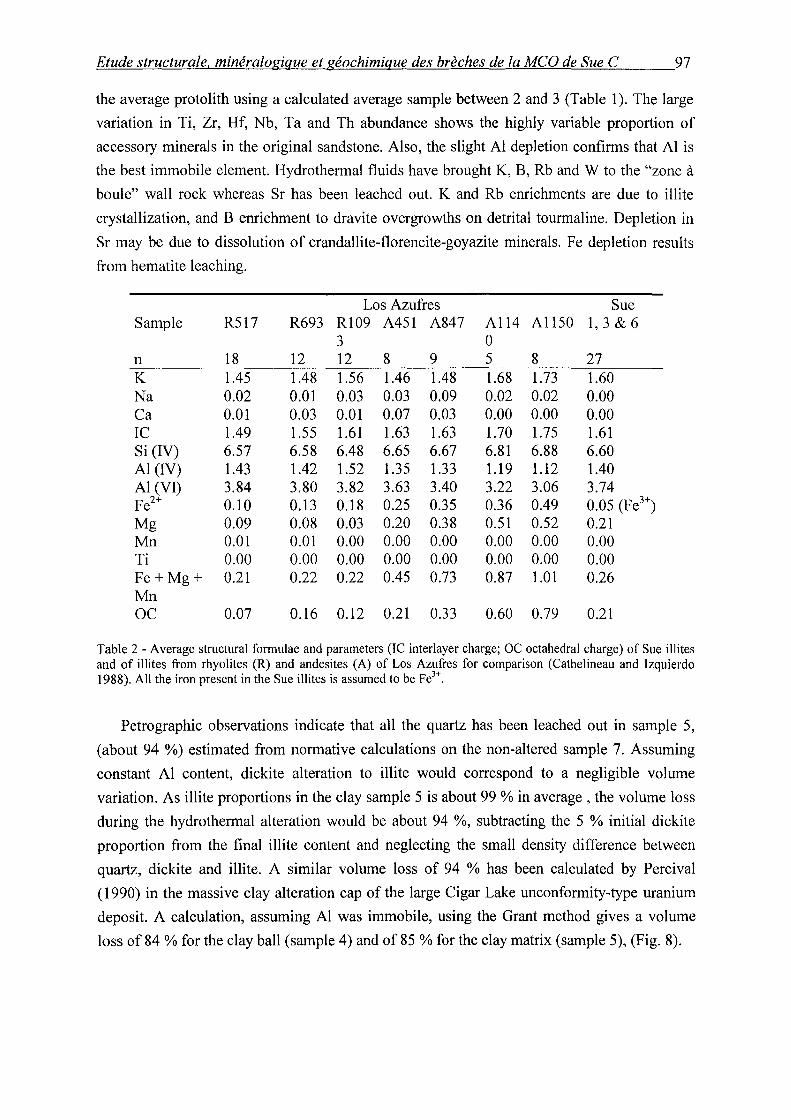
Etude structurale, minéralogique et géochimique des brèches de la MCO de Sue C 97
the average proto li th using a calculated average sample between 2 and 3 (Table 1 ). The large
variation in Ti, Zr, Hf, Nb, Ta and Th abundance shows the highly variable proportion of
accessory minerais in the original sandstone. Also, the slight Al depletion confirms that Al is
the best immobile element. Hydrothermal fluids have brought K, B, Rb and W to the "zone à
boule" wall rock whereas Sr has been leached out. K and Rb enrichments are due to illite
crystallization, and B enrichment to dravite overgrowths on detrital tourmaline. Depletion in
Sr may be due to dissolution of crandallite-florencite-goyazite minerais. Fe depletion results
from hematite leaching.
Los Azufres Sue Sample R517 R693 R109 A451 A847 A114 A1150 1, 3 & 6
3 0 n 18 12 12 8 9 5 8 27 K 1.45 1.48 1.56 1.46 1.48 1.68 1.73 1.60 Na 0.02 0.01 0.03 0.03 0.09 0.02 0.02 0.00 Ca 0.01 0.03 0.01 0.07 0.03 0.00 0.00 0.00 IC 1.49 1.55 1.61 1.63 1.63 1.70 1.75 1.61 Si (IV) 6.57 6.58 6.48 6.65 6.67 6.81 6.88 6.60 Al (IV) 1.43 1.42 1.52 1.35 1.33 1.19 1.12 1.40 Al (VI) 3.84 3.80 3.82 3.63 3.40 3.22 3.06 3.74 Fe2+ 0.10 0.13 0.18 0.25 0.35 0.36 0.49 0.05 (Fe3+) Mg 0.09 0.08 0.03 0.20 0.38 0.51 0.52 0.21 Mn 0.01 0.01 0.00 0.00 0.00 0.00 0.00 0.00 Ti 0.00 0.00 0.00 0.00 0.00 0.00 0.00 0.00 Fe+ Mg+ 0.21 0.22 0.22 0.45 0.73 0.87 1.01 0.26 Mn oc 0.07 0.16 0.12 0.21 0.33 0.60 0.79 0.21
Table 2 -Average structural fonnulae and parameters (IC interlayer charge; OC octahedral charge) of Sue illites and of illites from rhyolites (R) and andesites (A) of Los Azufres for comparison (Cathelineau and Izquierdo 1988). All the iron present in the Sue illites is assumed to be Fe3+.
Petrographie observations indicate that all the quartz has been leached out in sample 5,
(about 94 %) estimated from normative calculations on the non-altered sample 7. Assuming
constant Al content, dickite alteration to illite would correspond to a negligible volume
variation. As illite proportions in the clay sample 5 is about 99 % in average , the volume loss
during the hydrothermal alteration would be about 94 %, subtracting the 5 % initial dickite
proportion from the final illite content and neglecting the small density difference between
quartz, dickite and illite. A similar volume loss of 94 % has been calculated by Percival
(1990) in the massive clay alteration cap of the large Cigar Lake unconformity-type uranium
deposit. A calculation, assuming Al was immobile, using the Grant method gives a volume
loss of 84% for the clay ball (sample 4) and of 85 %for the clay matrix (sample 5), (Fig. 8).
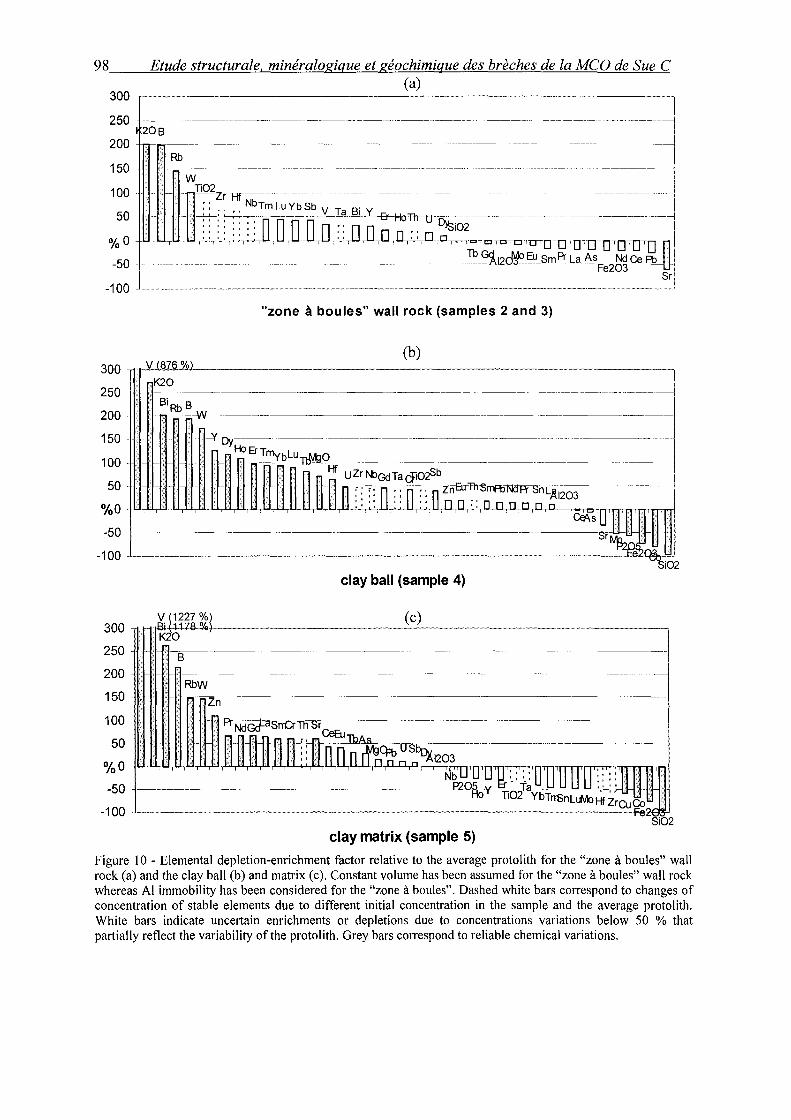
98
300
250
200
150
100
50
%0
-50 -
-100 -
300
250
200
Etude structurale, minéralogique et géochimique des brèches de la MCO de Sue C (a)
1 ----------- ------- -~- ···------- ---------- --------- ------··-· -------------1 os 1 --;----------------- -----------~-------------- -----~----------- --- -----------~
-------------1
"zone à boules" wall rock (samples 2 and 3)
(b) rV~~I:8~76~~%0 o~) _________________________________ _
1<20 ------------------------------------------------- ----------------
BiRbs -- -c-W------------- ----------~----------- -------------------
150 -'f--or;-:~----------~----------------~------~-----
100 - HoErTmybLU-nM;:jQ --~~-----------------
50 - - - - _rr_n-n-n~~Gd~~g"fi~~\nEu-Thsrm>NâPr---srn.j1203--------------o~;~ ------~~~----T_u ___ ll_J~J~U--,u--;-,_~~L_· ._,_ D_JJ,D,o,u.o.;,o 0 [lD,OA--côf,'~'[ .
-100 -'-·---------------····--·---------------------·------------··-·------------·---·-··---------r~ ~ "'Si02
300
250
200
150
100 -
50
clay bali (sample 4)
~~11~~-----------------( c_) ------------------------·--1<20
-------·-----------~----------~---------------
B -------------------------------------- -~----- -·----~----
RbW
...--------------------------~------
% 0 -fLLTU,-loi,J..y.J
Nb ·: ·: ·::: -. · -50
-100
-- --------------------------------P20~oY-To2f~YbTnBnLLM>~'--i~eu~.,,..
v~SiQ2
clay matrix (sample 5)
Figure 10 - Elemental depletion-enrichment factor relative to the average protolith for the "zone à boules" wall rock (a) and the clay bali (b) and matrix (c). Constant volume has been assumed for the "zone à boules" wall rock whereas Al immobility has been considered for the "zone à boules". Dashed white bars correspond to changes of concentration of stable elements due to different initial concentration in the sample and the average protolith. White bars indicate uncertain enrichments or depletions due to concentrations variations below 50 % that partially retlect the variability of the protolith. Grey bars correspond to reliable chemical variations.
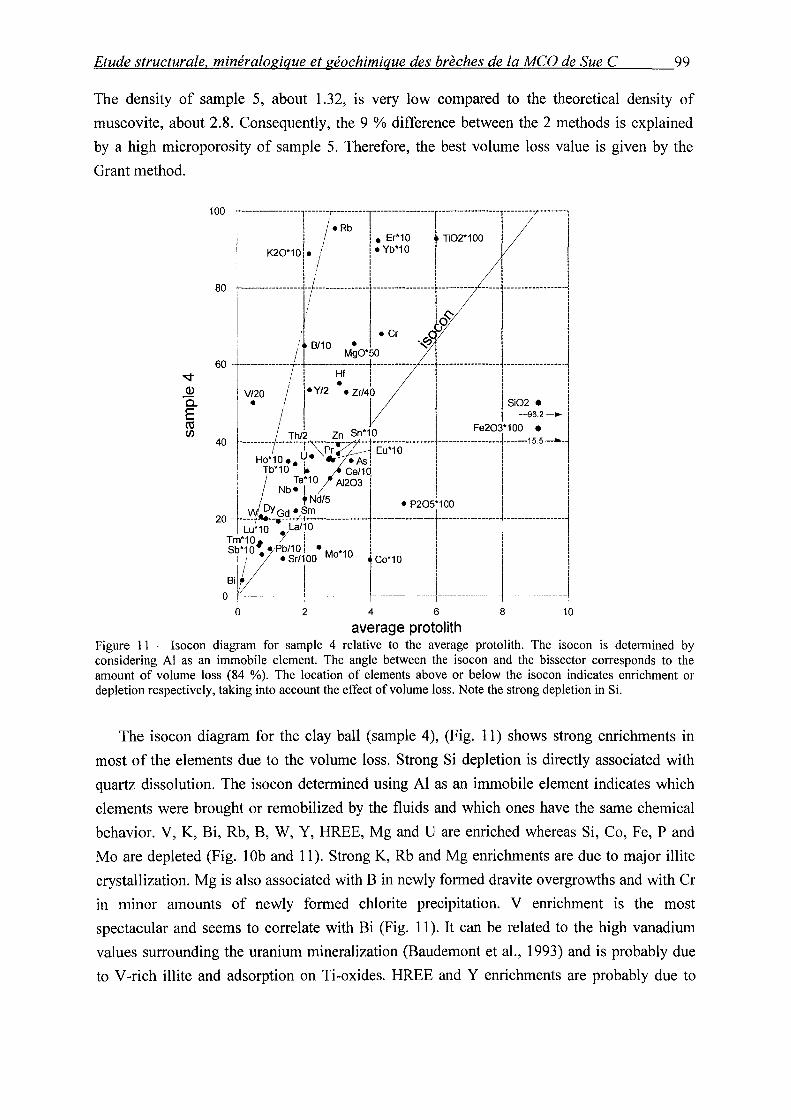
Etude structurale, minéralogique et géochimique des brèches de la MCO de Sue C 99
The density of sample 5, about 1.32, is very low compared to the theoretical density of
muscovite, about 2.8. Consequently, the 9 %difference between the 2 methods is explained
by a high microporosity of sample 5. Therefore, the best volume loss value is given by the
Grant method.
'V Q)
a. E ro Cf)
1 00 r---------------T---~--~~-~~----~-~--:·r~-~~------T~~:~~~-~~-----~--------- -------~ 1 K20*10ie I•Yb*10 ! ! !
1 1 / 1 1 1 1 80 t-----------------i·r-------------r----------------t-·------- -----t·----------------~
1
r 1 _Lo~ 1 1 fi 1 • cr O/ 1 i
i '~ B/10 • i ·~. 1 1 i / 1 Mg0*50 1 1 '
60 l' -------------·f·+----------------4----------- ----~-----------------4-----------------~ ; ! Hf ! i i ! 1 1 • 1 1 1 1
V/20 1 j•Y/2 • Zr/40 i i i
1
• / i i i i Si02 • i 1 ! ! ! 1
11 --96.2 -· 1
JI
1 1 1 1
40 --1--------- C.Il1là""--:--~;;~:~? _____________ J. ________ ~~~~I~~~15: =·.J 1
t" 1 .. "'Pre" J : Eu*1 0 i i i
Ho*1o •• Y• •As! ! ! ! ! Tb*10 • Ce/10 1 1 1 ! / Ta*10 AJ203 ! i i i i Nb• 1 ! / J /
20 -~-L~~~~~c~f~~-~---------4--------:_:~~~~~-~~-----------__j _________________ ~ Tm*10 r Î i 1 1 i Sb*10. • Pb/10 1 • 1 1 1 1
~v • srl1oo Mo*10 ~ Co*10 1 1 1
1
1 1 1 1 1
1 1 i 1 l Bi 1 1 1 1 1
0- 1
- l ---- t- i------ --- --1 ---- --! 0 2 4 6 8 10
average protolith Figure Il - Isocon diagram for sample 4 relative to the average protolith. The isocon is determined by considering Al as an immobile element. The angle between the isocon and the bissector corresponds to the amount of volume Joss (84 %). The location of elements above or below the isocon indicates enrichment or depletion respectively, taking into account the effect of volume Joss. Note the strong depletion in Si.
The isocon diagram for the clay hall (sample 4), (Fig. 11) shows strong enrichments in
most of the elements due to the volume loss. Strong Si depletion is directly associated with
quartz dissolution. The isocon determined using Al as an immobile element indicates which
elements were brought or remobilized by the fluids and which ones have the same chemical
behavior. V, K, Bi, Rb, B, W, Y, HREE, Mg and U are enriched whereas Si, Co, Fe, P and
Mo are depleted (Fig. 1 Ob and 11). Strong K, Rb and Mg enrichments are due to major illite
crystallization. Mg is also associated with B in newly formed dravite overgrowths and with Cr
in minor amounts of newly formed chlorite precipitation. V enrichment is the most
spectacular and seems to correlate with Bi (Fig. 11). 1t can be related to the high vanadium
values surrounding the uranium mineralization (Baudemont et al., 1993) and is probably due
to V -rich illite and adsorption on Ti-oxides. HREE and Y enrichments are probably due to
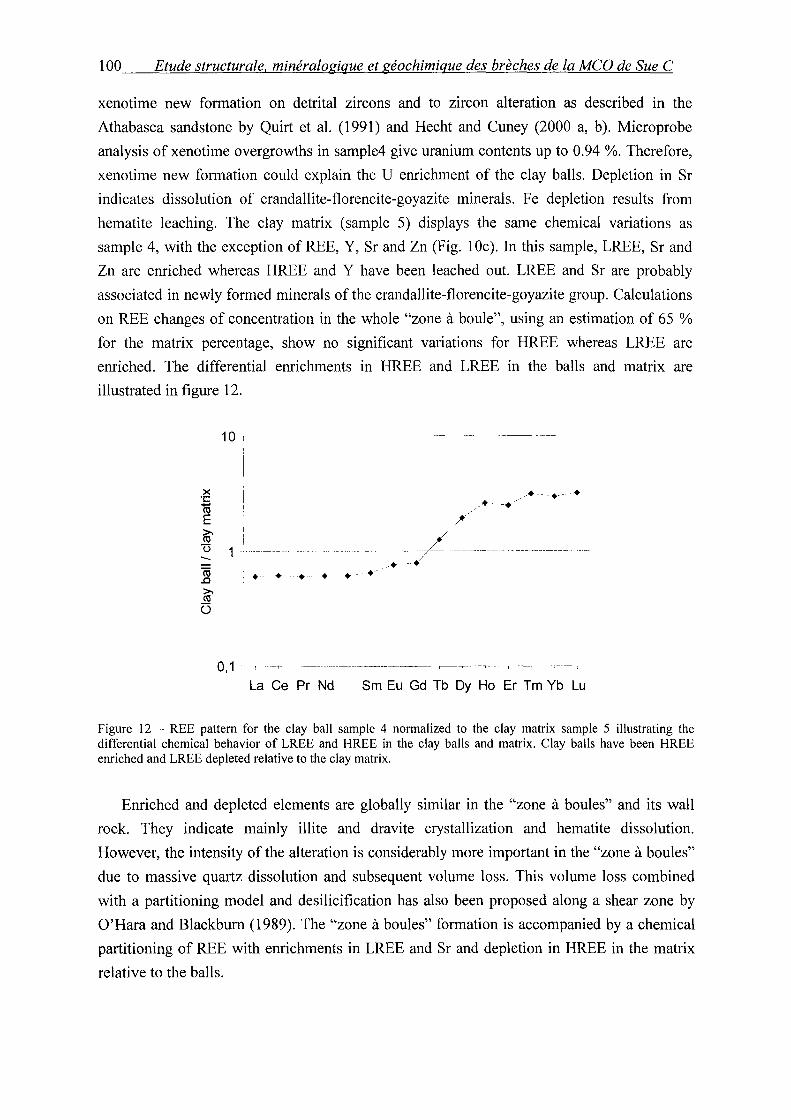
100 Etude structurale, minéralogique et géochimique des brèches de la MCO de Sue C
xenotime new formation on detrital zircons and to zircon alteration as described in the
Athabasca sandstone by Quirt et al. (1991) and Hecht and Cuney (2000 a, b). Microprobe
analysis of xenotime overgrowths in sample4 give uranium contents up to 0.94 %. Therefore,
xenotime new formation could explain the U enrichment of the clay halls. Depletion in Sr
indicates dissolution of crandallite-florencite-goyazite minerais. Fe depletion results from
hematite leaching. The clay matrix (sample 5) displays the same chemical variations as
sample 4, with the exception of REE, Y, Sr and Zn (Fig. lOc). In this sample, LREE, Sr and
Zn are enriched whereas HREE and Y have been leached out. LREE and Sr are probably
associated in newly formed minerais of the crandallite-florencite-goyazite group. Calculations
on REE changes of concentration in the who le "zone à boule", using an estimation of 65 %
for the matrix percentage, show no significant variations for HREE whereas LREE are
enriched. The differentiai enrichments in HREE and LREE in the halls and matrix are
illustrated in figure 12.
x ï:: -ro E 1ô' (3 ..._ 1 ;
1
• • • • . - . ~/
. - ·----· /·---·/ --;~-~------- -----
La Ce Pr Nd Sm Eu Gd Tb Dy Ho Er Tm Yb Lu
Figure 12 - REE pattern for the clay bali sample 4 normalized to the clay matrix sample 5 illustrating the differentiai chemical behavior of LREE and HREE in the clay balls and matrix. Clay balls have been HREE enriched and LREE depleted relative to the clay matrix.
Enriched and depleted elements are globally similar in the "zone à boules" and its wall
rock. They indicate mainly illite and dravite crystallization and hematite dissolution.
However, the intensity of the alteration is considerably more important in the "zone à boules"
due to massive quartz dissolution and subsequent volume loss. This volume loss combined
with a partitioning model and desilicification has also been proposed along a shear zone by
O'Hara and Blackburn (1989). The "zone à boules" formation is accompanied by a chemical
partitioning of REE with enrichments in LREE and Sr and depletion in HREE in the matrix
relative to the halls.
Etude structurale, minéralogique et géochimique des brèches de la MCO de Sue C 101
7. Discussion
7.1. Tectonic controls
"Zones à boules" are clearly controlled by the eastern graphitic structure (EGS) and seem
to be more developed at intersections with NE-trending structures. Their widths up to 5 rn,
suggest possible vertical movements of about the same amplitude along the EGS fault during
formation of the "zone à boules" (Scholz, 1990). This is consistent with the 5 to 30 rn down
drop of the western block. As most of the Sue primary uranium mineralization formed during
a contractional tectonic event (Baudemont et al., 1993), the syn-tectonic development of
"zones à boules" was probably contemporaneous with primary uranium mineralization.
The log-normal distribution statistics of the size of the ball indicates that they were
initiated by tectonic fracturing (Rouleau and Gale, 1985; Rives et al., 1992). The ball shape is
primarily controlled by the fracture network along the EGS, or locally by the sandstone beds.
This shows that prismatic fracturing, with at least 3 fracture orientations, or with 2
orientations combined with bedding planes, is needed to create the balls. Anastomosing
fracture zones may also be favorable to ball development and could explain the presence of
curved fractures at the breccia contact. The increase of matrix percentage toward the
unconformity could be caused by an increase of the fracture spatial density. The presence of
early euhedral quartz filling length-perpendicular fractures within sandstone balls may
represent tension gashes formed together with a fracture network during an initial tectonic
contraction phase (Fig. 13). This fracture network would have bounded sandstone blocks that
eventually evolved into balls.
The presence of striae on clay ball surfaces preferentially oriented parallel to the ball
length and/or width confirms that tectonic movements were coeval with the ball formation.
The presence of pervasive striae within clay envelopes around balls suggests a possible sub
continuous deformation process. The illite-rich matrix probably favored ductile creep by
reaction weakening (Cox et al., 2000) whereas the balls probably behaved in a brittle manner.
An analogous mechanical behavior has been described in mylonitic environment (Laznicka,
1988; Passchier and Trouw, 1996; Kisters et al., 2000). As for the separatrix surface of
mantled porphyroclasts at the microscopie scale (Passchier and Trouw, 1996), the striae were
probably formed by the differentiai movement between the creeping matrix and the rotating
fragments. Laznicka (1988) described ball breccias as a special case of porphyroclastic
mylonite, in which rolled hard, brittle fragments are enclosed in a ductile mylonitic matrix.
Sorne of the fractures perpendicular to the ball length observed within sandstone balls could
be the expression of their brittle behavior. They may also express a boudinage of the balls in a
102 Etude structurale, minéralogique et géochimique des brèches de la MCO de Sue C
pure shear deformation. However, simple shear has to occur to explain the 5 to 30 rn post
Athabasca offset along the EGS. Therefore, pure shear deformation possibly occurred but
were not coeval with reverse movements along the EGS.
7. 2. Hydrothermal fluids
Massive illite crystallization, quartz dissolution and considerable volume loss indicate
major fluid-rock interactions within "zones à boules". Illite replaced diagenetic dickite found
in non-altered zones of the Sue C pit. Estimated temperatures from illite chemistry are
comprised between 240 and 280 °C, probably slightly higher than those of diagenetic fluids.
Therefore, the fluids responsible for the formation of illite may correspond to a specifie
hydrothermal event localized along the EGS and locally along NE-trending structures.
Tectonic fracturing of sandstones by reactivation of the EGS created permeability paths
allowing fluids to circulate in the overlying sandstone. Fluid focusing has occurred in zones of
low fluid pressure at fault intersections. This, together with the prismatic fracturing needed to
form the balls, explains the preferential occurrence of "zones à boules" at structural
intersections. The maturity evolution of "zones à boules" indicates that quartz corrosion
occurred along fractures and propagated towards the fragment center. Preservation of silicified
sandstone cores within balls results from the low permeability of silicified sandstone.
Fragments totally replaced by clay were probably less silificied and therefore more permeable.
Using the average mineral chemical compositions determined from microprobe analysis,
the following chemical reaction ( 1) is proposed to ex plain the alteration of die ki te to illite:
1.13 Si02 + Al4Si4010(0H)s + 0.04 Fe3+ + 0.15 Mg2+ + 1.24 K+ ~
1.55 [Ko.sSÏJ.3Alo.7(Al,Fe)!.9Mgo.IOIO(OH)2] + 1.62 H20 + 1.65 H+ (1)
The reaction (1) shows that K+ and Mg2+ brought in by the fluids as K and Mg are present in
very small amount in the protolith. Fe was probably provided by hematite dissolution as mass
balance calculations indicate Fe leaching. The ratio [K+] 1 [H+] was close to 100 according to
the Log ([K+]/[H+]) versus Log[H4Si04] diagram in the Si-Al-K system at 200°C (Fritz,
1981 ). The reaction (1) demonstrates that quartz dissolution is needed to crystallize the illite
from dickite. However, the quantity of consumed quartz is limited by the initial amount of
dickite. Considering 5 wt. % of dickite and 94 wt. % of quartz in a non-altered sandstone, 88.4
wt. % of quartz would be dissolved after completion of reaction (1) to exp lain the massive
quartz depletion observed in "zone à boules". Fluids were therefore silica-undersaturated.
Quartz dissolution (reaction (2)) should have taken place in addition to reaction (1):
Etude structurale, minéralogique et géochimique des brèches de la MCO de Sue C 103
Silica undersaturated fluids probably came from the graphite-rich basement faults where
quartz may be absent (see part Il). This explains why dissolution is more developed proximal
to the unconformity, for fluid undersaturation in silica would decrease with the amount of
time the fluid circulated in the sandstone.
At the time of mineralization, the sediment pile was probably about 5 km thick (Pagel,
1975) giving a lithostatic pressure of about 130 MPa. The quartz solubility at 250°C and 100
MPa is about 1 o-2 mol 1 kg using the solubility of quartz in pure water given by Tester et al.
(1994). Assuming a silica saturation of 90% and 60% and considering samples 7 and 4 as
being representative of the rock composition before and after alteration, the fluid/rock ratio is
greater than 38,000 and 10,000 respectively. This shows that a considerable amount of fluids
has to have circulated within the shear zone-hosted "zone à boules". The fluid/rock ratio may
even be higher because quartz solubility at 250°C in NaCl bearing solutions tends to be lower
than in pure water (Fournier, 1983). Similar fluid/rock ratios, up to 10,000, have also been
documented by Fyfe and Kerrich (1985), Sinha et al. (1986) and Goddard and Evans (1995) in
shear zones. Such high fluid/rock ratios are probably necessary to exp lain the formation of the
high-grade Sue A and B unconformity-type uranium mineralization.
Mass balance calculations show that hydrothermal fluids brought into the "zone à boules"
the following elements, presented in order of decreasing abundance- V, K, Rb, B, U, W, Bi,
Zn, Mg, Sr, LREE, Cr, and Y. Si, together with small amounts of Co, Fe, P and Mo were
leached out of the zone. Such enrichments and depletions reflect newly formed illite, chlorite,
dravite and crandallite-florencite-goyazite group minerais crystallization and quartz and
hematite dissolution. Enrichments in elements such as Mg, Bi, Cr, W and Zn probably
indicate basement-derived fluids.
Illite alteration in sandstones has been commonly described as being associated with
unconformity-type uranium mineralization at Sue and in other deposits of the Athabasca Basin
(Halter et al., 1988; Baudemont et al., 1993; Iida, 1993; Percival et al., 1993). The age of this
hydrothermal event may correspond to the 1293 ± 36 Ma K-Ar age determined by Clauer et al.
(1985) on illites from the Cluff D deposit "zone à boules". Therefore, it is contemporaneous
with the main uranium unconformity-type mineralization event in the Athabasca Basin (Hoeve
et al., 1980; Lainé, 1985; Fayek and Kyser, 1997). As U has been slightly enriched in the
"zones à boules", hydrothermal fluids implicated in their formation were probably similar to
the mineralizing fluids. The absence of uranium mineralization within the "zones à boules"
might indicate that reducing basement fluids did not mix diagenetic oxidizing fluids at that
location. This confirms that illite alteration results from a pH front rather than from a redox
front (Hoeve and Quirt, 1984).
1 04 Etude structurale, minéralogique et géochimique des brèches de la MCO de Sue C
7.3. "Zones à boules" evolution and permeability control of deformation
During the first phase of "zone à boules" development, a tectonic reactivation of the EGS
induced the formation of fractures and tension gashes in sandstones (Fig. 13). The subsequent
permeability increase was accompanied by fluid circulation and euhedral quartz precipitation
in the tension gashes. A second tectonic reactivation is responsible for the development of
more fractures and for circulation of basement fluids in the sandstone. These fluids were
undersaturated relative to silica, leading to quartz dissolution, and they also leached the
primary hematite. The basement fluids were K, B, Mg, V, Cr, LREE and U rich and induced
alteration of dickite to illite. They also allowed minor formation of dravite, chlorite and
crandallite-florencite-goyazite minerais (Fig. 13). Such fluid flow could have been driven by
fluid buoyancy or fluid pressure (Cox et al., 2000). The fluid buoyancy is evidenced by
temperature gradients indicated by the anomalous temperature formation of illites within the
"zones à boules". Basement fluid flow in the sandstone has also been evidenced in the Shea
Creek exploration zone (see part Il). Clay mineral precipitation and quartz dissolution along
fractures were responsible for the formation of sandstone fragments in a clay matrix. In zones
of moderate fracturing and limited fluid circulation, the matrix percentage remained low,
leading to immature "zones à boules". In such immature breccias, rounded fragments may
indicate quartz dissolution in a diffusion-limited regime (Jébrak, 1997; see part Il) rather than
ball rotation. In strongly fractured sandstone, generally in the core of the EGS and close to the
unconformity, sandstone fragments have been totally dissolved leading to a high matrix
percentage typical of mature "zones à boules".
The intensity of alteration in mature "zones à boules" and the calculated high fluid/rock
ratio imply strong fluid focusing and sustainable permeability in order to allow fluid
circulation. The permeability evolution results from the competition between chemical and
deformation processes (Rice, 1992; Cox, 1995) (Fig. 13). Permeability increases with quartz
dissolution and decreases with illite precipitation. However, the 85 % calculated volume loss
in the most mature zones indicates that the porosity and permeability created by massive
quartz dissolution has been accommodated. The absence of collapse phenomenons and the
syn-tectonic evidence of "zones à boules" hydrothermal alteration suggest that volume loss
has been balanced by tectonic contraction during reverse movements of the EGS, resulting in
massive clay alteration (Fig. 13). This alteration event acted as a negative feedback for fluid
circulation by self-sealing of the system (Knipe, 1993; Cox, 1995; Tenthorey et al., 1998;
Etheridge, 2000). This probably occurred between seismic phases by sub-continuous ductile
creep of the matrix. Consequently, the main mechanism to renew permeability would be
periodic EGS seismic reactivations as documented elsewhere by Sibson et al. (1988), Knipe
Etude structurale, minéralogique et géochimique des brèches de la MCO de Sue C 105
(1993), Hickman et al. (1995) and Cox (1995). Reactivations are evidenced by severa!
superimposed striaes on halls and would be favored by the lubricant properties of the graphite
present in the extension of the fault in the basement. Tectonic reactivation may have reopened
or created new microfractures acting as discrete fluid channelways. Fracture openings would
have been favored by high fluid pressures, possibly close to lithostatic, due to the low
permeability of the sealed system. That would explain the illite cross-cutting anastomosing
bands observed in thin section.
The formation of halls in a clay matrix corresponds to strain partitioning, such as between
lithons and wrapping mylonites at the Renco mine in Zimbabwe (Kisters et al., 2000), due to
the competency contrast between clay and sandstone. The differentiai enrichment in LREE
and HREE between the halls and matrix indicates that this strain partitioning was coupled
with a chemical partitioning.
By estimating the fluid velocity of the fractured sandstone, it is possible to constrain the
minimum time of formation of the "zone à boules". The 5 rn wide, 20 rn long and 20 rn high
totally argillized "zone à boules" located along the EGS has been used for this determination.
The initial width of the zone was 33 rn before the 85 % volume loss. An initial fracture
frequency of 20 vertical fractures per meter with fracture openings of 0.1 mm has been
estimated, taking into account the strongly fractured rock immediately adjacent to the "zone à
boules". Using the cubic law, calculated fracture permeabilities are 2 x 10-12 m2 (Fig. 13).
This permeability is higher than the Darcy type sandstone permeability which was probably
below 10-15 m2, considering its low porosity, possibly below the percolation treshold, due to
compaction and cementation by quartz and dickite (Cox et al., 2000). Using the hydraulic
conductivity formulae for a family of fractures (Snow, 1969; Ababou, 1991), and neglecting
sandstone permeability, the calculated hydraulic conductivity is 260 m.year-1• This value
represents a maximal order of magnitude for the fluid velocity as rugosity and irregularity of
fractures were not taken into account. Considering a minimum fluid/rock ratio of 38,000, the
possible time of formation of the "zone à boules" is about 1,460,000 years, with fracture
openings of 0.1 mm and a fluid velocity of 260 m.year-1• As the quartz dissolution kinetics are
assumed to be very fast and as all the fluid flowing through the system did not react with the
rock, the calculated time is minimal. Furthermore, this calculation assumes a constant fracture
permeability. In reality, such permeability values correspond to seismic events. The low grain
scale permeability during interseismic ductile creep (Cox and Etheridge, 1989; Cox et al.,
2000) would control the overall time of formation of the "zones à boules" which is therefore
in the order of a few million years.
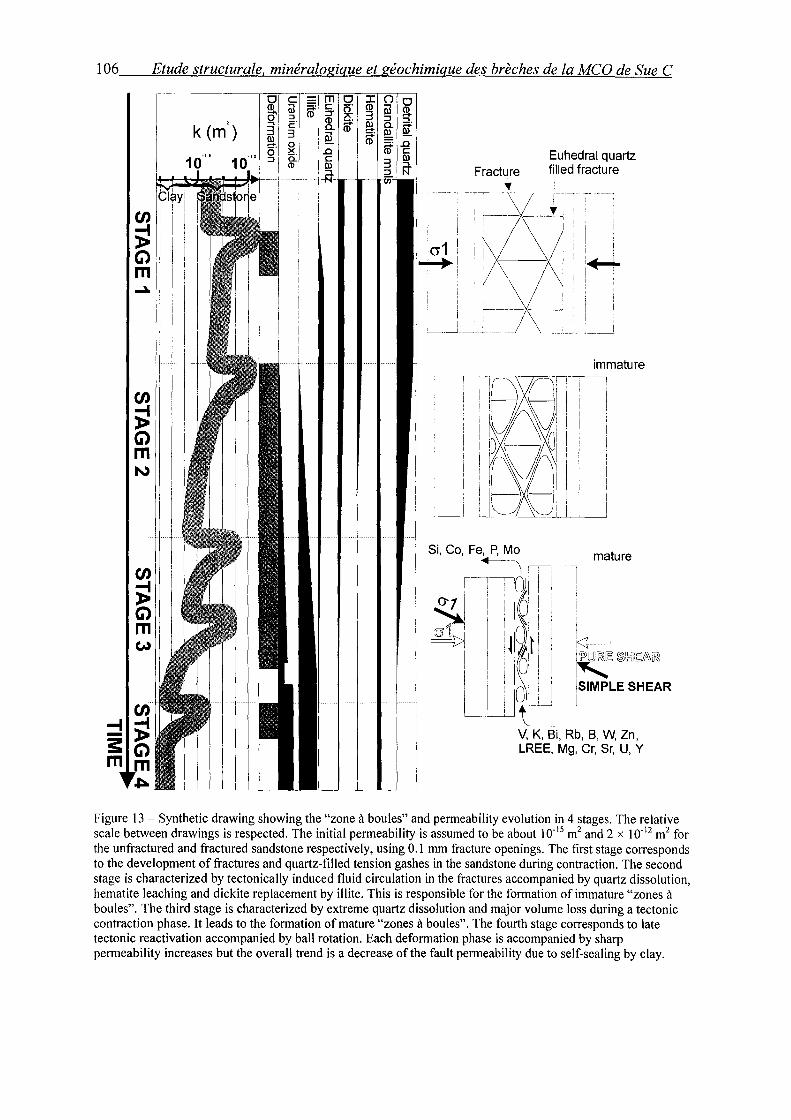
106 Etude structurale, minéralogique et géochimique des brèches de la MCO de Sue C
en >' G)l mil ~1 1
Il
en > G) rn N
en > G) rn w
' 1
Fracture 'If
Euhedral quartz filled fracture
1 ! 1
' 1 1 1
!+-J.. 1
i
'
immature
Si, Co, Fe, P, Mo -.--\ ,--c---,---
1----,-:~o' 1
; i : ! ;ri o-7 1 1 ' 1Q1
~1 1 i!l .-=<:11~ 1 1 '1 1
~ 1 i10t: ki= i 1 ~. ~ Ill 1 s: IJ'l[U)[R<,~ ~[}{]~ln, 1
1
JJ'I 0, 1
1 1 i ' LI 1 \~SIMPLE SHEAR
mature
V, K, Bi, Rb, B, W, Zn, LREE, Mg, Cr, Sr, U, Y
Figure 13 - Synthetic drawing showing the "zone à boules" and penneability evolution in 4 stages. The relative scale between drawings is respected. The initial penneability is assumed to be about 10-15 m2 and 2 x 10-12 m2 for the unfractured and fractured sandstone respectively, using 0.1 mm fracture openings. The first stage corresponds to the development of fractures and quartz-filled tension gashes in the sandstone during contraction. The second stage is characterized by tectonically induced fluid circulation in the fractures accompanied by quartz dissolution, hematite leaching and dickite replacement by il lite. This is responsible for the formation of immature "zones à boules". The third stage is characterized by extreme quartz dissolution and major volume Joss during a tectonic contraction phase. It leads to the fonnation of mature "zones à boules". The fourth stage corresponds to late tectonic reactivation accompanied by bali rotation. Each defonnation phase is accompanied by sharp penneability increases but the overall trend is a decrease of the fault penneability due to self-sealing by clay.
Etude structurale, minéralogique et géochimique des brèches de la MCO de Sue C 107
8. Conclusion
"Zones à boules" are hydrothermal shear zone-hosted breccias developed in sandstones
around unconformity-type uranium mineralization. They formed during peak diagenesis at
similar to slightly higher temperatures, between 240 and 280°C. Their evolution was
controlled by intense chemical processes combined with minor fault movements.
"Zones à boules" were initiated by fracturing having a log-normal distribution and
occurred mainly at fault intersections. Fracturing was followed by strongly focused basement
fluid circulation in sandstones. Reverse and dextral tectonic movements occurred after this
fracturing event along the EGS and the NE-trending faults respectively. Faults were
reactivated several times with cumulated offsets limited to a few meters. Pure shear may have
occurred in addition to simple shear. Reaction weakening due to clay alteration induced
matrix ductile creep and ball rotation during aseismic phases resulting in a strain partitioning.
The extreme hydrothermal alteration in "zones à boules" results from the chemical
interaction of basement fluids with the sandstone. It is a chemical brecciation process
characterized by major quartz dissolution and minor hematite dissolution, alteration of dickite
to illite and precipitation of dravite and crandallite-florencite-goyazite minerais. The meaning
of chemical brecciation used here is different from the one used by Sawkins (1969) to describe
a type of crackle breccias. Quartz dissolution is accompanied by about 85 % volume loss and
implies a minimum fluid/rock ratio of about 38,000 assuming 90% silica saturation of the
fluid. Mass balance calculations indicate Si and Fe leaching and enrichments in V, K, Rb, B,
W, Zn, LREE, Mg, Cr, Sr, U and Y. The alteration resulted in a chemical partitioning between
clay halls, enriched in HREE, and the clay matrix, enriched in LREE. It has to be noticed that
quartz dissolution preceding dickite precipitation indicates a regional diagenetic event and is
not related to hydrothermal alteration.
The permeability increase by quartz dissolution is balanced by tectonic contraction during
interseismic ductile creep of the matrix. The resulting self-sealing of the system induced a
progressive decrease of the permeability controlled by grain-scale dilatancy that was renewed
several times by seismic fault reactivations.
Ball exfoliations were created by rotation during tectonic movements and by quartz
dissolution in a diffusion-limited regime over a period of time, probably more than several
million years, indicating rather slow processes such as spheroidal alteration at the surface.
"Zones à boules" are probably coeval with high-grade primary uranium mineralization
which occurred at about 1.3 Ga. They are the expression of the hydrothermal alteration and
tectonic movements both genetically associated with the ore formation. From an exploration
standpoint, three criteria may be used to identify potential mineralized zones. The first one is
the presence of massive illitic argillization indicating the circulation of important quantities of
108 Etude structurale, minéralogique et géochimique des brèches de la MCO de Sue C
basement fluids in the sandstone. The second one is the illitic nature of the clay indicating
hydrothermal fluids with [K+] 1 [H+] ratios of about 100. The last one is the presence of halls
showing that the fluids circulated in an active reverse fault zone. When these three criteria are
satisfied and if the reverse structure is graphite-rich in the basement, uranium mineralized
zones may be found along the reverse fault, preferably at intersections with other structures.
Such fault intersections are favorable targets because they would have focused fluid
circulation with possible fluid mixing. Reducing fluids coming from the basement along the
reverse graphitic fault could have been mixed with uranium-bearing oxidizing basin fluids
focused along the crosscutting structures, inducing uranium precipitation.
Acknowledgements
COGEMA and COGEMA Resources Inc are greatly acknowledged for their financial and
technical support. M. Cathelineau provided valuable discussion about illite geothermometry.
T. Lhomme is thanked for her assistance with Raman spectroscopy. We also thank S. Barda,
F. Diot and J. Ghanbaja for technical assistance with electron microprobe determination and
TEM. The manuscript benefited from discussions with L. Hecht and J. Sausse, and from
reviews by P. Bruneton and J. Mondy. K. Weathley is gratefully thanked for improving the
quality of the English.
Etude structurale, minéralogique et géochimique des brèches de la MCO de Sue C 109
References
Ababou, R., 1991. Approaches to large scale unsaturated flow in heterogeneous stratified and
fractured geologie media. Section 4.2: Hydraulic properties of saturated fractured
media. - Report NUREG/CR-5743, U.S. Nuclear Regulatory Commission,
Washington D. C.
Armstrong, R.L., Ramaekers, P., 1985. Sr isotopie study of Helikian sediment and diabase
dikes in the Athabasca Basin, northern Saskatchewan. Canadian Journal of Earth
Sciences, 22, 399-407.
Augustithis, S.S., Ottemann, J., 1966. On diffusion nngs and sphaeroidal weathering.
Chemical Geology, 1, 201-209.
Augustithis, S.S., Mposkos, E., V genopoulos, A., 1980. Leaching of bauxites. "Traveaux"
ICSOBA. Zagreb, 11, 334-345.
Baudemont, D., Pacquet, A., 1996. The Sue D and E uranmm deposits, Northern
Saskatchewan: evidence for structurally controlled fluid circulation in the Athabasca
Basin. MinExpo '96 Symposium, Advances in Saskatchewan Geology and Mineral
Exploration, pp. 85-94.
Baudemont, D., Piquard, J.P., Ey, F., Zimmerman, J. 1993. The Sue Uranium Deposits,
Saskatchewan, Canada. Exploration and Mining Geology, 2, 179-202.
Cathelineau, M., Izquierdo, G., 1988. Temperature - composition relationships of authigenic
micaceous minerais in the Los Azufres geothermal system. Contributions to
Mineralogy and Petrology, 100, 418-428.
Clark, A.H., 1990. The slump breccias of the Toquepala porphyry Cu-(Mo) deposit, Peru:
Implications for fragment rounding in hydrothermal breccias. Economie Geology, 85,
1677-1685.
Clauer, N., Ey, F., Gauthier-Lafaye, F.,1985. K-Ar dating of different rock types from the
Cluff Lake uranium ore deposits (Saskatchewan-Canada). In: R. Lainé, D. Alonso and
M. Sv ab (Editors ), The Carswell structure uranium deposits, Saskatchewan. Geological
Association of Canada Special Paper 29, pp. 47-54.
Cox, S.F., 1995. Faulting processes at high fluid pressures: an example of fault valve behavior
from the Wattle Gull y Fault, Victoria, Australia. Journal of Geophysical Research, 100,
12841-12859.
110 Etude structurale, minéralogique et géochimique des brèches de la MCO de Sue C
Cox, S.F., Etheridge, M.A., 1989. Coupled grain-scale dilatancy and mass transfer during
deformation at high fluid pressures: examples from Mount Lyell, Tasmania. Journal of
Structural Geology, 11, 147-162.
Cox, S.F., Knackstedt, M.A., Braun, J., 2000. Principles of structural control on permeability
and fluid flow in hydrothermal systems. Reviews in Economie Geology. In press.
Etheridge, M.A., 2000. Regional to local structural controls on hydrothermal mineralisation -
Practical tools for finding, delineating and mining ore deposits. GeoCanada2000, The
Millennium Geoscience Summit, GAC-MAC joint annual meeting: Calgary, abstract
1260 (Conference CD).
Ey, F., Gauthier-Lafaye, F., Lillié, F., Weber, F., 1985. An uranium unconformity deposit: the
geological setting of the D orebody (Saskatchewan-Canada). In: R. Lainé, D. Alonso
and M. Svab (Editors), The Carswell structure uranium deposits, Saskatchewan.
Geological Association of Canada Special Paper 29, pp. 121-13 8.
Fayek, M., Kyser, T.K., 1997. Characterization of multiple fluid-flow events and Rare-Earth
Element mobility associated with formation of unconformity-type uranium deposits in
the Athabasca Basin, Saskatchewan. The Canadian Mineralogist, 35, 627-658.
Fournier, R.O., 1983. A method of calculating quartz solubilities in aqueous sodium chloride
solutions. Geochimica et Cosmochimica Acta., 47, 579-586.
Fritz, B., 1981. Etude thermodynamique et modélisation des réactions hydrothermales et
diagénétiques. Ph.D. Thesis, Université Louis Pasteur, Strasbourg.
Fyfe, W.S., Kerrich, R., 1985. Fluids and thrusting. Chemical Geology, 49, 353-362.
Gandhi, S.S., 1995. An overview ofthe exploration history and genesis ofProterozoic uranium
deposits in the Canadian Shield. Exploration and Research for Atomic Minerais,
Special issue: first-order uranium exploration target selection in the Proterozoic of
India, 8, 1-47.
Goddard, J.V., Evans, J.P., 1995. Chemical changes and fluid-rock interactions in faults of
crystalline thrust sheets, northwestern Wyoming, U.S.A. Journal of Structural Geology,
17, 533-547.
Govindaraju, K., Mevelle, G., 1987. Fully automated dissolution and separation methods for
inductively coupled plasma emission spectrometry rock analysis. Journal of Analytic
and Atomic Spectroscopy, 2, 615-621.
Grant, J .A., 1986. The isocon diagram, a simple solution to Gresens' equation for metasomatic
alteration. Economie Geology, 81, 197 6-1982.
Etude structurale, minéralogique et géochimique des brèches de la MCO de Sue C 111
Gresens, R.L., 1967. Composition-volume relationships of metasomatism. Chemical Geology,
2, 47-65.
Gross, M.R., Bahat, D., Becker, A., 1997. Relations between jointing and faulting based on
fracture-spacing ratios and fault-slip profiles: a new method to estimate strain in
layered rocks. Geology, 25, 887-890.
Halter, G., 1988. Zonalités des altérations dans l'environnement des gisements d'uranium
associés à la discordance du Protérozoïque Moyen (Saskatchewan, Canada). Ph.D.
Thesis, Université Louis Pasteur, Strasbourg.
Halter, G., Pagel, M., Sheppard, S.M.F., Weber, F., Clauer, N., 1988. Rétromorphose,
paléoaltération, diagenèse et hydrothermalisme de 1' encaissant des gisements
uranifères dans la structure de Carswell (Saskatchewan-Canada). In: Gisements
Métallifères dans leur Contexte Géologique, Document du BRGM, 158, 1, pp. 365-
388.
Hecht, L., Cuney, M., 2000a. Mechanism of uranium mobilization in the Athabasca basin and
basement by hydrothermal and/or diagenetic fluids. GeoCanada2000, The Millennium
Geoscience Summit, GAC-MAC joint annual meeting: Calgary, abstract 191
(Conference CD).
Hecht, L., Cuney, M., 2000b. Hydrothermal alteration of monazite in the Precambrian
crystalline basement of the Athabasca Basin (Saskatchewan, Canada): implications for
the formation of unconformity-related uranium deposits. Mineralium Deposita, 35,
791-795.
Hickman, S., Sibson, R., Bruhn, R., 1995. Introduction to special section: mechanical
involvement offluids in faulting. Journal ofGeophysical Research, 100, 12831-12840.
Hoeve, J., Quirt, D., 1984. Mineralization and host rock alteration in relation to clay mineral
diagenesis and evolution of the middle-Proterozoic Athabasca Basin, northem
Saskatchewan, Canada. Saskatchewan Research Council Technical Report no. 187.
Hoeve, J., Sibbald, T.I.I., Ramaekers, P., Lewry, J.F., 1980. Athabasca Basin unconformity
type uranium deposits: a special class of sandstone-type deposits? In: S. Ferguson and
A. Goleby (Editors), Uranium in the Pine Creek Geosyncline. IAEA, Vienna, pp. 575-
594.
Hoeve, J ., Rawsthom, K., Quirt, D., 1981. Uranium Metallogenetic Studies: Clay Mineral
Stratigraphy and Diagenesis in the Athabasca Group. Saskatchewan Research Council
Publication 22, pp. 76-89.
112 Etude structurale, minéralogique et géochimique des brèches de la MCO de Sue C
Iida, Y., 1993. Alteration and ore-forming processes of unconformity-related uranmm
deposits. Resource Geology Special Issue, 15, 299-308.
Jébrak, M., 1992. Les textures intra-filoniennes, marqueurs des conditions hydrauliques et
tectoniques. Chroniques de la Recherche Minière, 506, 25-35.
Jébrak, M., 1997. Hydrothermal breccias in vein-type ore deposits: A review of mechanisms,
morphology and size distribution. Ore Geology Reviews, 306, 1-24.
Kisters, A.F.M., Kolb, J., Meyer, F.M., Hoernes, S., 2000. Hydrologie segmentation of high
temperature shear zones: structural, geochemical and isotopie evidence from auriferous
mylonites of the Renco mine, Zimbabwe. Journal of Structural Geology, 22, 811-829.
Knipe, R.J., 1993. The influence of Fault Zone Processes and Diagenesis on Fluid Flow. In:
A.D. Horbury and A.G. Robinson (Editors), Diagenesis and Basin Development.
AAPG, Studies in Geology, 36, pp. 135-148.
Kotzer, T.G., Kyser, T.K., 1995. Petrogenesis of the Proterozoic Athabasca Basin, northern
Saskatchewan, Canada, and its relation to diagenesis, hydrothermal uramum
mineralization and paleohydrogeology. Chemical Geology, 120, 45-89.
Kotzer, T.G., Kyser, T.K., Irving, E., 1992. Paleomagnetism and the evolution of fluids in the
Proterozoic Athabasca Basin, northern Saskatchewan, Canada. Canadian Journal of
Earth Sciences, 29, 1474-1491.
Lainé, R., 1985. The Carswell uranium deposits - An example of not so unique unconformity
related uranium mineralization. In: R. Lainé, D. Alonso and M. Svab (Editors), The
Carswell structure uranium deposits, Saskatchewan, Geological Association of Canada
Special Paper 29. pp. 225-230.
Laznicka, P., 1988. Breccias and coarse fragmentites. Developments in Economie Geology,
25. Elsevier, Amsterdam.
Laznicka, P., 1989. Breccias and ores. Part 1: history, organization and petrography of
breccias. Ore Geology Reviews, 4, 315-344.
Lorilleux, G., Cuney, M., Jébrak, M., Mondy, J., 2000. A new approach ofunconformity-type
uranium metallogenesis from a structural breccia study (Northern Saskatchewan,
Canada). GeoCanada2000, The Millennium Geoscience Summit, GAC-MAC joint
annual meeting: Calgary, abstract 232 (Conference CD).
Marrett, R., Peacock, D.C.P., 1999. Strain and stress. Journal of Structural Geology, 21, 1057-
1063.
Etude structurale, minéralogique et géochimique des brèches de la MCO de Sue C 113
Narr, W., Suppe, J., 1991. Joint spacing in sedimentary rocks. Journal of Structural Geology,
13, 1037-1048.
O'Hara, K., Blackburn, W.H., 1989. Volume-loss model for trace-element enrichments in
mylonites. Geology, 17, 524-527.
Pagel, M., 1975. Détermination des conditions physico-chimiques de la silicification
diagénétique des grès Athabasca (Canada) au moyen des inclusions fluides. Compte
rendu de l'Académie des Sciences 280, série D, 2301-2304.
Passchier, C.W., Trouw, R.A.J., 1996. Microtectonics. Springer-Verlag, Berlin, Heidelberg.
Percival, J.B., 1990. Clay mineralogy, geochemistry and partitioning of uranium within the
alteration halo of the Cigar Lake uranium deposit, Saskatchewan, Canada. PhD Thesis,
Carleton University.
Percival, J.B., Bell, K., Torrance, J.K., 1993. Clay mineralogy and isotope geochemistry of the
alteration halo at the Cigar Lake uranium deposit. Canadian Journal of Earth Sciences,
30, 689-704.
Phillips, W.J., 1986. Hydraulic fracturing effects in the formation of mineral deposits.
Institution of Mining and Metallurgy Transactions, section B: Applied Earth Science
95, B17-B24.
Quirt, D., Kotzer, T., Kyser, T.K., 1991. Tourmaline, phosphate minerais, z1rcon, and
pitchblende in the Athabasca Group: Maw Zone and McArthur River areas,
Saskatchewan. In: Summary oflnvestigations 1991, Saskatchewan Geological Survey,
Saskatchewan Energy and Mines, Miscellaneous Report 91-4.
Ramaekers, P., 1981. Hudsonian and Helikian basins of the Athabasca region, Northern
Saskatchewan. Geological Survey of Canada Paper 81, pp. 219-233.
Ramaekers, P., 1990. Geology of the Athabasca Group (Helikian) in Northern Saskatchewan.
Saskatchewan Energy and Mines, Saskatchewan Geological Survey, report 195.
Ramaekers, P., Dunn, C.D., 1977. Geology and geochemistry of the eastern margin of the
Athabasca Basin. Saskatchewan Geological Society Special Publication 3, pp. 297-322.
Reeve, J.S., Cross, K.C., Smith, R.N., Oreskes, N., 1990. Olympie Dam. Copper-Uranium
Gold-Silver deposit. In: E.E. Hughes (Editor), Geology of the mineral deposits of
Australia and Papua New Guinea. The Australasian Institute of Mining and Metallurgy,
Melbourne, pp. 1009-1035.
114 Etude structurale, minéralogique et géochimique des brèches de la MCO de Sue C
Rice, J.R., 1992. Fault Stress States, Pore Pressure Distributions, and the Weakness ofthe San
Andreas Fault. In: B. Evans and T.-F. Wong (Editors), Fault Mechanics and Transport
Properties in rocks, Academie Press, pp. 475-503.
Rives, T., Razack, M., Petit, J.-P., Rawnsley, K.O., 1992. Joint spacmg: analogue and
numerical simulations. Journal of Structural Geology, 14,925-937.
Rouleau, A., Gale, J.E., 1985. Statistical characterization of the fracture system in the Stripa
Granite, Sweden. International Journal of Rock Mechanics and Mining Sciences, 22,
353-367.
Salvi, S., Pokrovski, G.S., Schott, J., 1998. Experimental investigation of aluminum-silica
aqueous complexing at 300°C. Chemical Geology, 151, 51-67.
Sawkins, F.J., 1969. Chemical brecciation, an unrecognized mechanism for breccia
formation? Economie Geology, 64, 613-617.
Scholz, C.H., 1990. The Mechanics ofEarthquakes and Faulting. Cambridge University Press,
New York.
Shahabpour, J., 1998. Liesegang blocks from sandstone beds of the Hodjedk Formation,
Kerman, Iran. Geomorphology, 22, 93-106.
Sibson, R.H., 1986. Brecciation processes in fault zones: inferences from Earthquake
rupturing. Pure and Applied Geophysics, 124, 161-175.
Sibson, R.H., Robert, F., Poulsen, K.H., 1988. High-angle reverse faults, fluid-pressure
cycling, and mesothermal gold-quartz deposits. Geology, 16, 551-555.
Sillitoe, R.H., 1985. Ore-related breccias in volcanoplutonic arcs. Economie Geology, 80,
1467-1514.
Sinha, A.K., Hewitt, D.A., Rimstidt, J.O., 1986. Fluid interaction and element mobility in the
development ofultramyonites. Geology, 14, 883-886.
Snow, D.T., 1969. Anisotropie permeability offractured media. Water Resources Research, 5,
1273-1289.
Tenthorey, E., Scholz, C.H., Aharonov, E., Léger, A., 1998. Precipitation sealing and
diagenesis. 1. Experimental results. Journal of Geophysical Research, 103, 23951-
23967.
Tester, J.W., Worley, W.G., Robinson, B.A., Grigsby, C.O., Feerer, J.L., 1994. Correlating
quartz dissolution kinetics in pure water from 25 to 625°C. Geochimica et
Cosmochimica Acta, 58, 2407-2420.

Etude structurale, minéralogique et géochimique des brèches de la MCO de Sue C 115
Vigneresse, J.L., Cannat, M., 1987. Mesures de paramètres physiques dans le sondage
d'Echassières (vitesse sismique, porosité, densité). Mémoire Géologie profonde de la
France, torne 1. Géologie de la France, no. 2-3, pp. 145-148.

IV. ETUDE STRUCTURALE,
TEXTURALE, MINERALOGIQUE ET
GEOCHIMIQUE CoMPAREE DES
BREcHES DE LA MA w ZoNE, DE SHEA
CREEK ET DE SuE: IMPLICATIONS
POUR LA GENESE DES
MINERALISATION U RANIFERE


Synthèse de l'étude structurale. texturale. minéralogique et géochimique des brèches 117
IV. ETUDE STRUCTURALE, TEXTURALE,
MINERALOGIQUE ET GEOCIDMIQUE COMPAREE
DES BRECHES DE LA MA w ZONE, DE SHEA
CREEK ET DE SuE: IMPLICATIONS PoUR LA
GENESE DES MINERALISATIONS URANIFERES
(a)
Figure IV-! - (a) Affleurement de brèche d'effondrement dans la zone de Maw. (b) Brèche de dissolution-effondrement dans une
carotte de forage à Shea Creek.(c)Affleurement de zone à boules dans la MCO de Sue C.
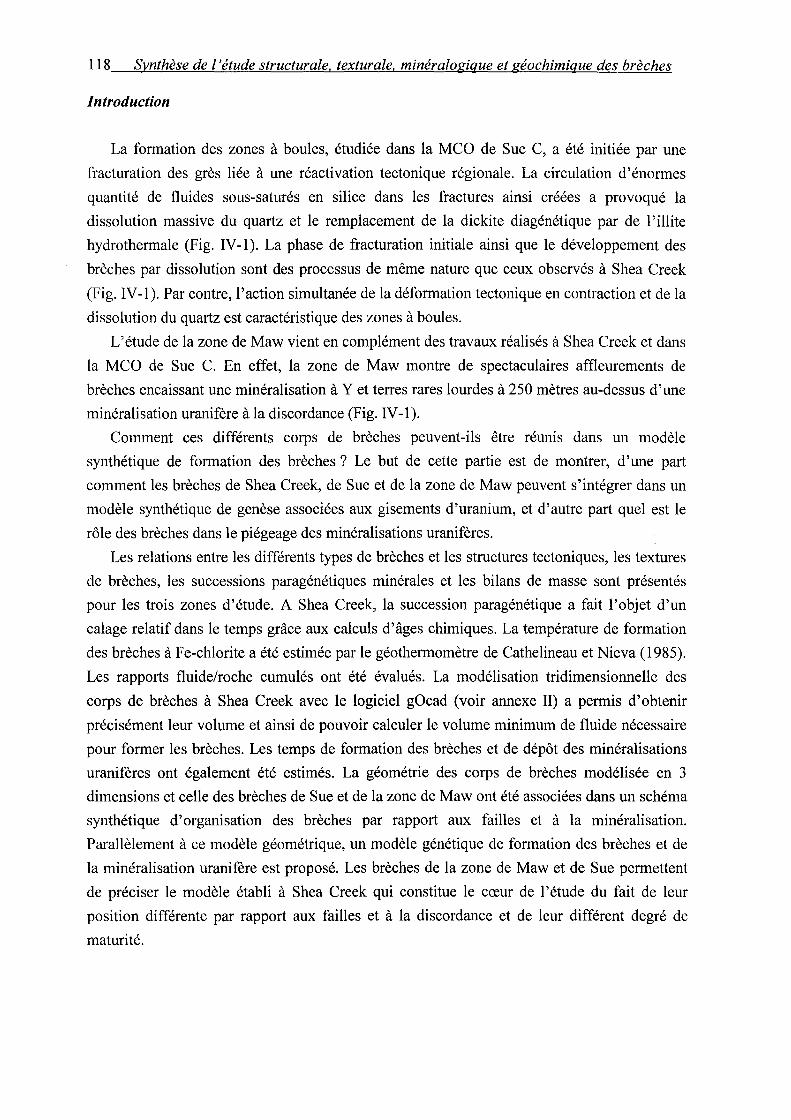
118 Synthèse de l'étude structurale, texturale, minéralogique et géochimique des brèches
Introduction
La formation des zones à boules, étudiée dans la MCO de Sue C, a été initiée par une
fracturation des grès liée à une réactivation tectonique régionale. La circulation d'énormes
quantité de fluides sous-saturés en silice dans les fractures ainsi créées a provoqué la
dissolution massive du quartz et le remplacement de la dickite diagénétique par de 1 'illite
hydrothermale (Fig. IV -1 ). La phase de fracturation initiale ainsi que le développement des
brèches par dissolution sont des processus de même nature que ceux observés à Shea Creek
(Fig. IV -1 ). Par contre, 1' action simultanée de la déformation tectonique en contraction et de la
dissolution du quartz est caractéristique des zones à boules.
L'étude de la zone de Maw vient en complément des travaux réalisés à Shea Creek et dans
la MCO de Sue C. En effet, la zone de Maw montre de spectaculaires affleurements de
brèches encaissant une minéralisation à Y et terres rares lourdes à 250 mètres au-dessus d'une
minéralisation uranifère à la discordance (Fig. IV -1 ).
Comment ces différents corps de brèches peuvent-ils être réunis dans un modèle
synthétique de formation des brèches? Le but de cette partie est de montrer, d'une part
comment les brèches de Shea Creek, de Sue et de la zone de Maw peuvent s'intégrer dans un
modèle synthétique de genèse associées aux gisements d'uranium, et d'autre part quel est le
rôle des brèches dans le piégeage des minéralisations uranifères.
Les relations entre les différents types de brèches et les structures tectoniques, les textures
de brèches, les successions paragénétiques minérales et les bilans de masse sont présentés
pour les trois zones d'étude. A Shea Creek, la succession paragénétique a fait l'objet d'un
calage relatif dans le temps grâce aux calculs d'âges chimiques. La température de formation
des brèches à Fe-chlorite a été estimée par le géothermomètre de Cathelineau et Nieva (1985).
Les rapports fluide/roche cumulés ont été évalués. La modélisation tridimensionnelle des
corps de brèches à Shea Creek avec le logiciel gOcad (voir annexe II) a permis d'obtenir
précisément leur volume et ainsi de pouvoir calculer le volume minimum de fluide nécessaire
pour former les brèches. Les temps de formation des brèches et de dépôt des minéralisations
uranifères ont également été estimés. La géométrie des corps de brèches modélisée en 3
dimensions et celle des brèches de Sue et de la zone de Maw ont été associées dans un schéma
synthétique d'organisation des brèches par rapport aux failles et à la minéralisation.
Parallèlement à ce modèle géométrique, un modèle génétique de formation des brèches et de
la minéralisation uranifère est proposé. Les brèches de la zone de Maw et de Sue permettent
de préciser le modèle établi à Shea Creek qui constitue le cœur de l'étude du fait de leur
position différente par rapport aux failles et à la discordance et de leur différent degré de
maturité.

Synthèse de 1 'étude structurale, texturale, minéralogique et géochimique des brèches 119
Les modèles existant dans la littérature sont essentiellement déduits d'études isotopiques,
d'inclusions fluides ou de modélisation numérique. L'originalité de cette approche réside dans
la quantification des processus physico-chimiques de dissolution du quartz, de piégeage de la
minéralisation uranifère et d'effondrement gravitaire.
Le premier article de synthèse est une version longue intégrant tous les éléments de
réflexion destinée à Economie Geology. Le deuxième article de synthèse soumis à Geology
est également dans une version longue.
120 Synthèse de l'étude structurale, texturale, minéralogique et géochimique des brèches
ARTICLE 3:
Hydrothermal breccias associated with unconformity-type uranium mineralizations in the Athabasca Basin: implications for fluid flow and
mineralization (Canada)
G. Lorilleuxa•*, M. Cuney\ M. Jébrakb, J. Mondyc, P. Brunetond
a CREGU-UMR G2R 7566, Université Henri Poincaré, BP 23, 54 501 Vandoeuvre-les-Nancy, France
b UQAM-DST A , CP 8888, Montréal (QUE) H3C 3P8 Canada
c COGEMA, 2-4 rue Paul Dautier, BP 4, 78 141 V élizy-Villacoublay cedex, France
d COGEMA GST, 1 avenue du Brugeaud, 87 250 Bessines-sur-Gartempe, France
Destiné à Economie Geology
(version longue)
* Corresponding author.
E-mail address: guillaume.lorilleux@g2r. uhp-nancy.fr
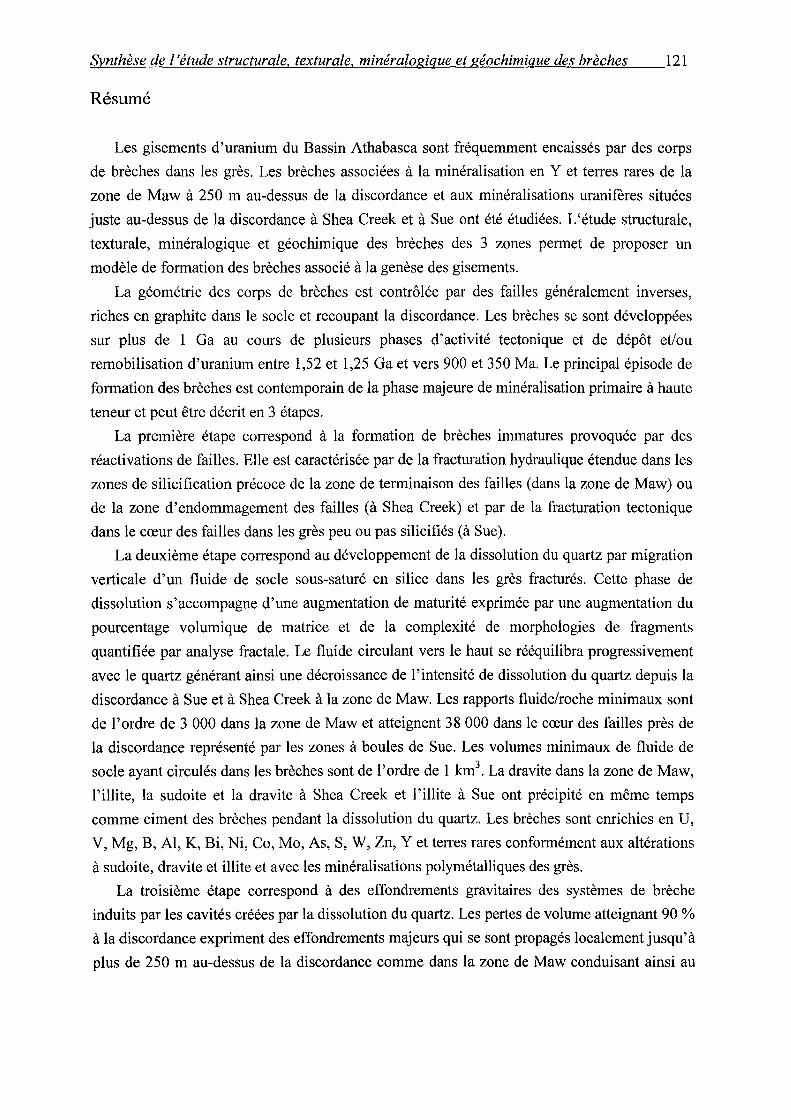
Synthèse de l'étude structurale, texturale, minéralogique et géochimique des brèches 121
Résumé
Les gisements d'uranium du Bassin Athabasca sont fréquemment encaissés par des corps
de brèches dans les grès. Les brèches associées à la minéralisation en Y et terres rares de la
zone de Maw à 250 rn au-dessus de la discordance et aux minéralisations uranifères situées
juste au-dessus de la discordance à Shea Creek et à Sue ont été étudiées. L'étude structurale,
texturale, minéralogique et géochimique des brèches des 3 zones permet de proposer un
modèle de formation des brèches associé à la genèse des gisements.
La géométrie des corps de brèches est contrôlée par des failles généralement inverses,
riches en graphite dans le socle et recoupant la discordance. Les brèches se sont développées
sur plus de 1 Ga au cours de plusieurs phases d'activité tectonique et de dépôt et/ou
remobilisation d'uranium entre 1,52 et 1,25 Ga et vers 900 et 350 Ma. Le principal épisode de
formation des brèches est contemporain de la phase majeure de minéralisation primaire à haute
teneur et peut être décrit en 3 étapes.
La première étape correspond à la formation de brèches immatures provoquée par des
réactivations de failles. Elle est caractérisée par de la fracturation hydraulique étendue dans les
zones de silicification précoce de la zone de terminaison des failles (dans la zone de Maw) ou
de la zone d'endommagement des failles (à Shea Creek) et par de la fracturation tectonique
dans le cœur des failles dans les grès peu ou pas silicifiés (à Sue).
La deuxième étape correspond au développement de la dissolution du quartz par migration
verticale d'un fluide de socle sous-saturé en silice dans les grès fracturés. Cette phase de
dissolution s'accompagne d'une augmentation de maturité exprimée par une augmentation du
pourcentage volumique de matrice et de la complexité de morphologies de fragments
quantifiée par analyse fractale. Le fluide circulant vers le haut se rééquilibra progressivement
avec le quartz générant ainsi une décroissance de l'intensité de dissolution du quartz depuis la
discordance à Sue et à Shea Creek à la zone de Maw. Les rapports fluide/roche minimaux sont
de l'ordre de 3 000 dans la zone de Maw et atteignent 38 000 dans le cœur des failles près de
la discordance représenté par les zones à boules de Sue. Les volumes minimaux de fluide de
socle ayant circulés dans les brèches sont de l'ordre de 1 km3. La dravite dans la zone de Maw,
l'illite, la sudoite et la dravite à Shea Creek et l'illite à Sue ont précipité en même temps
comme ciment des brèches pendant la dissolution du quartz. Les brèches sont enrichies en U,
V, Mg, B, Al, K, Bi, Ni, Co, Mo, As, S, W, Zn, Y et terres rares conformément aux altérations
à sudoite, dravite et illite et avec les minéralisations polymétalliques des grès.
La troisième étape correspond à des effondrements gravitaires des systèmes de brèche
induits par les cavités créées par la dissolution du quartz. Les pertes de volume atteignant 90 %
à la discordance expriment des effondrements majeurs qui se sont propagés localement jusqu'à
plus de 250 rn au-dessus de la discordance comme dans la zone de Maw conduisant ainsi au
122 Synthèse de l'étude structurale, texturale, minéralogique et géochimique des brèches
développement de karsts dans les grès. Dans les zones à boules au cœur des failles, les pertes
de volume résultent de la contraction tectonique contemporaine de la dissolution.
La dissolution du quartz dans les grès pourrait être une conséquence du développement
d'une réaction d'illitisation hydrothermale des feldspaths dans le socle accompagnée de
consommation de quartz avec log [K+]/[H+] ~ 4. Au début de l'illitisation, le fluide de socle, à
une température supérieure à 250°C, était encore en équilibre avec le quartz et précipitait le
quartz par refroidissement dans les grès à une température inférieure à 240°C, expliquant la
silicification pervasive précoce. La dissolution totale du quartz aurait ensuite provoqué la
sous-saturation du fluide de socle.
Le mélange du fluide réducteur de socle avec les fluides oxydants de bassin a provoqué la
précipitation d'uranium par diminution de la fugacité en oxygène. La porosité élevée et les
cavités créées par la dissolution intense du quartz à la discordance ont joué le rôle de piège
pour le dépôt de l'uranium. La dissolution du quartz et la précipitation de l'uranium se
développèrent en même temps sur plusieurs millions d'années. La perméabilité élevée et
constante nécessaire au maintien d'un front d'oxydo-réduction stationnaire afin de permettre le
dépôt de la minéralisation à haute teneur fut fournie par la dissolution du quartz dont le taux
était supérieur à celui de précipitation d'argiles. Cependant, la reprécipitation de quartz au
dessus des brèches et les effondrements ou la contraction tectonique eurent tendance à faire
décroître la perméabilité. Occasionnellement, des cycles de diminution de perméabilité,
d'accroissement de pression de fluides et de réouvertures de failles inverses en valve sismique
permirent de renouveler la perméabilité du système hydrothermal.
Les gisements d'uranium de type discordance dans les grès peuvent être classés en fonction
du développement des brèches. Les gisements associés des corps de brèches étendus dans les
grès sont associés à des silicifications précoces massives, a des altérations à chlorite sudoïtique
magnésienne et à dra vite et à de la dissolution de quartz limitée dans 1' espace autour de
fractures. Les gisements sans brèches dans les grès sont associés à une très faible silicification
précoce, à des zones d'illite massive dues à la dissolution pervasive du grès et à des halos
d'altérations à illite très étendus latéralement.
Abstract
Unconformity-type uranium deposits in the Athabasca Basin are commonly hosted and
surrounded by breccia bodies in sandstones. The breccias associated with the Maw Zone Y
REE mineralization located at 250 rn above the unconformity and with the Shea Creek and
Sue U mineralizations located just above the unconformity were studied. Structural, texturai,
mineralogical and geochemical studies of the breccias in the 3 zones allow to propose a model
of breccia formation associated with uranium deposition.
Synthèse de l'étude structurale, texturale, minéralogique et géochimique des brèches 123
The geometry of the breccia bodies is controlled by faults cross-cutting the unconformity
and generally reverse and graphite-rich in the basement. Breccia formation occurred over more
than 1 Ga during several phases of tectonic activity and uranium mineralization deposition
and/or remobilization between 1.52 and 1.25 Ga and at about 900 and 350 Ma. The main stage
of breccia formation is coeval with the main primary uranium mineralization event and can be
described in 3 steps of maturity evolution.
The fi.rst step of immature breccia formation was triggered by fault reactivation and is
characterized by widespread hydraulic fracturing in the early silicified damage zone of faults
(at Shea Creek) or in fault termination zones (at the Maw Zone) and by spatially limited
tectonic fracturing in the core offaults in non- to weakly silicified sandstones (at Sue).
The second step corresponds to the development of quartz dissolution by vertical migration
of silica undersaturated basement fluids in the fractured sandstones. It is accompanied with
maturity increase expressed by an increase of ma tri x volumic percentage and of the complexity
of fragment shapes quantified by fractal analysis. Quartz dissolution intensity decreased
upward from the unconformity at Sue and Shea Creek to the Maw Zone as fluids flowing
upward progressively re-equilibrated with quartz. Calculated fluid/rock ratios are about 3,000
at the Maw Zone and increase up to 38,000 in the core of faults at the unconformity
represented by the Sue "zones à boules". The minimum volume of fluids that have circulated
in the breccias is about 1 km3. Dra vite at the Maw Zone, illite, sudoitic chlorite and dra vite at
Shea Creek and illite at Sue precipitated simultaneously as breccia cement during the quartz
dissolution process. The fluids brought U, V, Mg, B, Al, K, Bi, Ni, Co, Mo, As, S, W, Zn, Y
and REE to the breccias, in accordance with the sudoite, dravite and illite alterations and with
the polymetallic sandstone-hosted mineralizations.
The third step corresponds to collapse of the breccia system due to creation of important
cavities by quartz removal. Volume losses up to 90 % at the unconformity indicate major
collapse phenomenons that propagated locally up to more than 250 rn above the unconformity
like at the Maw Zone leading to the development of karsts in sandstones. In the core of faults
like in the Sue "zones à boules", volume loss resulted from tectonic contraction rather than
collapse.
Quartz dissolution in sandstones might be due to the development of hydrothermal
illitization in the basement that was accompanied with quartz consumption with log
[K+]/[H+] ~ 4. At the onset of the illitization, the basement fluids, at a temperature above
250°C, were still in equilibrium with quartz and precipitated quartz by cooling in the
sandstone at a temperature less than 240°C, explaining the early pervasive silicification. When
the quartz in the basement was totally consumed by illitization, the basement fluids became
undersaturated and began to dissolve quartz in sandstones.
124 Synthèse de 1 'étude structurale, texturale, minéralogique et géochimique des brèches
Reducing basement fluids mixed with oxidizing and uranium-bearing basin fluids as they
penetrated into the sandstones inducing uranium precipitation. The high porosity created by
the intense quartz dissolution at the unconformity formed the trap for uranium deposition.
Quartz dissolution and uranium deposition occurred simultaneously over several millions
years. The sustainable permeability required to maintain a stationary redox front to allow the
deposition of high grade uranium mineralization was provided by quartz dissolution that acted
as a positive feedback loop. However, quartz reprecipitation above the breccias and collapse or
tectonic contraction tended to decrease the permeability. Periodically, cycles of permeability
decrease, fluid pressure increase and subsequent fault re-opening probably occurred by fault
valve behavior in order to renew the permeability of the system.
Sandstone-hosted unconformity-type deposits can be classified based on the occurrence of
breccias. Deposits associated with extended breccia bodies in sandstones are associated with
early massive silicification, sudoite and dravite alterations and spatially limited quartz
dissolution. Deposits without breccias in sandstones are associated with only minor
silicification, with massive illite alteration due to pervasive quartz dissolution and also with
extensive lateral illite alteration haloes.
Synthèse de l'étude structurale, texturale, minéralogique et géochimique des brèches 125
1. Introduction
Unconformity-type uranium deposits are located close to the unconformity between an
Archean to Lower Proterozoic metamorphic and granitic basement and a Middle Proterozoic
sandstone cover. They have been found in Canada in the Athabasca and Thelon Basins and in
Australia in the McArthur Basin. With large tonnages and very high grades - 219,000 tons at
14% U3Üs at McArthur River (Canada)- they are the most economie uranium deposits in the
world. The Athabasca Basin located in northem Saskatchewan (Fig. 1) is the premier host for
unconformity-type deposits and has an estimated resource in excess of 373,000 tons of U at a
cost less than 40 $ 1 kg U (Thomas et al., 1998).
The most accepted metallogenetic model of unconformity-type uranium mineralizations is
diagenetic-hydrothermal. The first complete diagenetic-hydrothermal model has been
presented by Hoeve and Sibbald (1976, 1978). They proposed that the unconformity-type
uranium mineralizations resulted from the interaction at the unconformity of methane-bearing
reducing solutions circulating upward along basement-rooted faults with 200°C uranium
bearing oxidizing basin fluids. The methane would have been generated by reaction of the
basin fluids with faulted graphite-rich basement rocks with which the deposits are commonly
associated (Hoeve and Sibbald, 1978; Thomas et al., 1998). The participation of diagenetic
basin fluids in the mineralization process is widely accepted as it is demonstrated by both
isotopie and fluid inclusions studies (Pagel, 1975b; 1977; Pagel and Jaffrezic, 1977; Kotzer
and Kyser, 1995). However, the origin of basement fluids is still controversed. Kyser et al.
(1989), using 8D values of chlorites and illites of mineralized gneisses at Key Lake (Wilson
and Kyser, 1987), proposed that the basement fluids were not derived from the basin fluids but
were rather deeply sourced in the basement. Fayek and Kyser (1997) have proposed two
variants of the diagenetic-hydrothermal model, one in which basin fluids interact with
basement fluids at the unconformity and another in which basin fluids interact directly with
basement rocks, explaining respective! y the formation of uranium deposits at the unconformity
or in the sandstone, and in the basement. The bulk of the uranium mineralization is hosted by
faults within breccias, veins and impregnations (Hoeve and Sibbald, 1978; Lorilleux et al.,
2000).
Basement-hosted mineralizations are generally monometallic with uranium oxides and
trace amounts of sulfides and arsenides. They are referred to as simple-type deposits (Fayek
and Kyser, 1997) and typically occur within 50 rn and locally up to 400 rn below the
unconformity (Thomas et al., 1998). Mineralizations located at the unconformity or in the
sandstone, referred as complex-type, are polymetallic because Ni-Co-As-Fe-Cu-Pb sulfides
and arsenides, V, Zn, Au, Pt-group elements, Bi and Se are associated with uranium oxides
(Hoeve and Sibbald, 1978; Fayek and Kyser, 1997). They are typically located within 25-50 rn
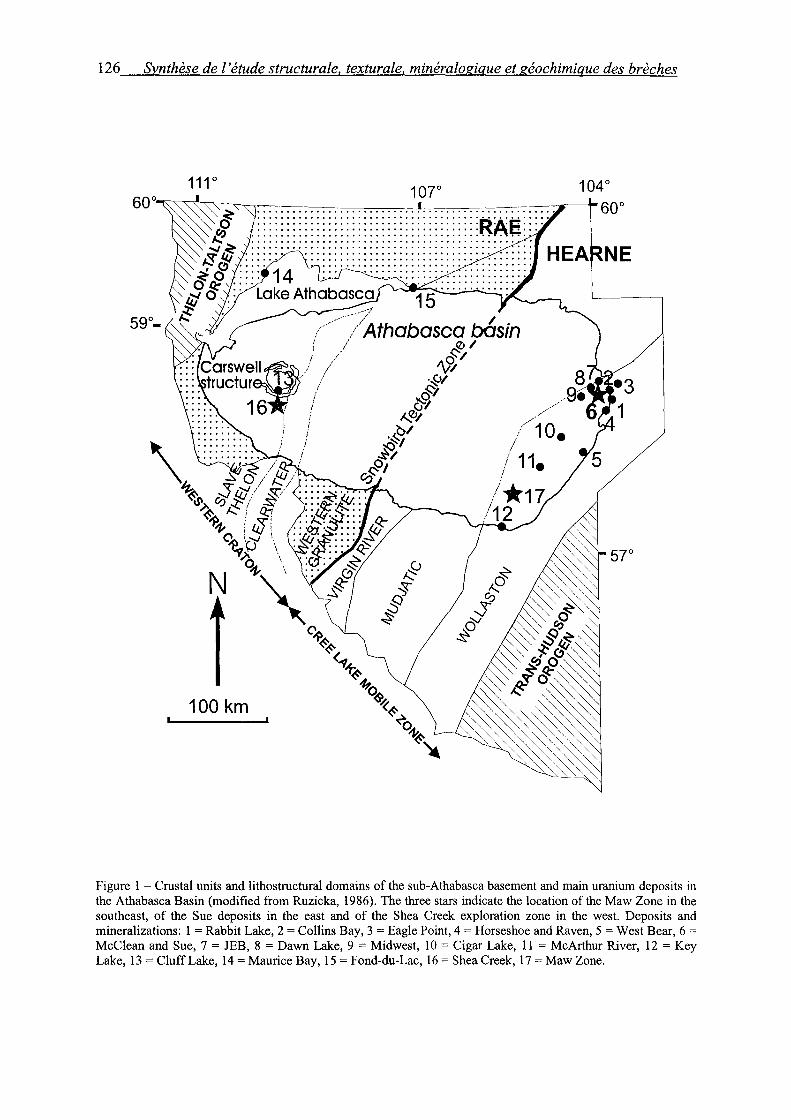
126 Synthèse de l'étude structurale, texturale, minéralogique et géochimique des brèches
1or 104° ~T.~ .. ~ .. ~.~ .. ~ .. ~ .. ~ .. ~.~ .. ~ .. ~ .. ~ .. ~ .. ~ .. ~.~ .. ~ .. ~ .. ~ .. ~ .. ~.~ .. ~ .. -.. ~ .. ~ .. -.~. --~60o
100 km
Figure l - Crustal units and lithostructural domains of the sub-Athabasca basement and main uranium deposits in the Athabasca Basin (modified from Ruzicka, 1986). The three stars indicate the location of the Maw Zone in the southeast, of the Sue deposits in the east and of the Shea Creek exploration zone in the west. Deposits and mineralizations: l = Rabbit Lake, 2 =Collins Bay, 3 = Eagle Point, 4 = Horseshoe and Raven, 5 =West Bear, 6 = McC!ean and Sue, 7 = JEB, 8 =Dawn Lake, 9 = Midwest, JO= Cigar Lake, Il = McArthur River, 12 =Key Lake, 13 = Cluff Lake, 14 = Maurice Bay, 15 = Fond-du-Lac, 16 = Shea Creek, 17 = Maw Zone.
Synthèse de l'étude structurale, texturale, minéralogique et géochimique des brèches 127
of the basement-sandstone unconformity. Perched mineralization may be found up to 250 rn
(Cigar Lake) above the unconformity in the sandstone (Pouques et al., 1986).
The main primary unconformity-type uranium mineralization event in the Athabasca Basin
is comprised between 1.52 and 1.25 Ga after KI Ar and U/Pb datations mainly (Hoeve et al.,
1980; Hoeve and Quirt, 1984; Lainé, 1985; McGill et al., 1993). A second uranium
mineralization stage has been documented around 1.1 Ga (Lainé, 1985). Two further
mineralization-remobilization events between 0.9 and 0.8 Ga and between 0.5 and 0.2 Ga are
given by Hoeve and Quirt (1984) and Lainé (1985).
Several authors have emphasized the major influence of the hydrodynamic controls on the
deposit formation. Hoeve and Quirt (1984) and Raffensperger and Garven (1995a) have
proposed a convective mechanism of fluid circulation in the sandstone. Fluid mixing would
have occurred during periodic basement fluid injections in sandstones due to reactivation of
graphite-rich basement rooted faults. Kotzer and Kyser (1995) proposed the existence of
extensive lateral movements of the basinal fluids involved in the mineralization.
Unconformity-type uranium mineralizations have been described as being associated with
extensive alteration haloes in the sandstone up to 400 rn wide at the base of the sandstone, up
to 500 rn thick and up to more than several thousand meters along strike (Thomas et al., 1998).
Such extended alteration haloes are consistent with convective cells. However, the alteration
haloe in the sandstone at McArthur River, which is the largest deposit of the Athabasca basin,
is more restricted around faults due to a strong silicification of the sandstone (McGill et al.,
1993 ). Two types of sandstone-hosted alteration haloes have been distinguished around
unconformity-type uranium deposits. The first type has been encountered in the northem part
of the Athabasca basin and is characterized by desilicification and illitization. The second type
is dominantly represented in the southem part of the basin and corresponds to dravitization,
chloritization and kaolinization (Matthews et al., 1997).
Unconformity-type uranium mineralizations are commonly hosted and surrounded by
breccias in the sandstone within a few tens of meters. Such breccias have been observed
around the recently discovered Shea Creek mineralization (Lorilleux et al., 2000; Rippert,
2000; see part II), at Cluff D and Claude deposits (Ey et al., 1985) (not taking into account
impact-related breccias), at Sue (see part III), at Rabbit Lake and at McArthur River. They
show a great variety of geometries, textures and mineralogy, depending of the type of
mineralization. They are present in the two types of alteration haloes but are more developed
in the southem type. Uranium-bearing breccias in the Athabasca Basin have been interpreted
as being tectonic (Ey et al., 1985), hydraulic (Bruneton and Caumartin, 1985) and dissolution
collapse (Wallis et al., 1983 ; Lorilleux et al., 2000; see part Ill). However, their genetic
relationship with the mineralization was not evaluated.
128 Synthèse de l'étude structurale. texturale, minéralogique et géochimique des brèches
Three zones of study have been chosen in the Athabasca Basin (Fig. 1 ). The Maw Zone,
located 30 km northeast of the Key Lake uranium deposits in the southeastern Athabasca
Basin, is a breccia-hosted Y -REE mineralization located in the sandstone 200 m above an
uranium enrichment zone located at the unconformity. It is one of the very rare natural breccia
outcrop of the Basin. The Shea Creek uranium mineralizations, recently discovered (Rippert et
al., 2000) and located in the west Athabasca Basin, south of the Cluff Lake mine site, show
spectacular breccia development surrounding and hosting high-grade mineralization. The Sue
C uranium deposit open pit is located in the eastern Athabasca Basin and displays good quality
ex po sures of breccias associated with structures controlling the Sue A and B deposits.
The purpose of this paper is to understand the processes of formation of the trap for the
uranium ore bodies and to constrain and quantify the evolution of the physical and chemical
parameters controlling fluid circulation and uranium mineralization. The texturai,
mineralogical and geochemical evolution of the breccias is studied in this goal.
2. Methodology
The study of exposures in the Sue C open pit, core rocks in the Shea Creek exploration
area and outcrops at the Maw Zone has allowed to describe and map the structures, the
alterations and the breccias associated with the mineralizations. Sandstone-hosted breccias
were studied because of their extensive development, and because of the simple texturai and
mineralogical characteristics of the Athabasca sandstone making the understanding of the
breccia genesis easier than in the metamorphosed basement rocks.
At Shea Creek, the closely spaced drilling pattern allowed detailed mapping of structures
and breccia bodies. The geometry of breccias of the south part of the Shea Creek exploration
prospect has been represented using the three-dimensional modeling software gücad (see
annexe II). The model was constructed using the location of breccia zones in drill holes and
the interpreted outline of breccia bodies in cross-sections. As the structural control of the
breccias is well established (see part Il), the surface of the breccia bodies between cross
sections was interpolated using fault direction as a guideline. The volume of the breccia bodies
was calculated by an implemented gücad function.
The breccia textures have been observed on macroscopic samples, in thin sections and with
Scanning Electron Microscope (SEM Hitachi S-2500) in the three zones of study. Texturai and
chronological relationships between fragments and matrix were particularly characterized.
Breccias have been classified using their degree of maturity that increases with matrix
percentage. Most of the samples were taken close to, but outside of mineralized zones in order
to get rid of complex, polyphase and strongly mature breccias. The study, when possible, of
Synthèse de l'étude structurale, texturale, minéralogique et géochimique des brèches 129
weakly to moderatly mature monophased breccias allowed to understand the processes of
fragmentation and the nature of the cement for each single breccia event.
At Shea Creek, detailed descriptions and drawings of sandstone breccias were realized
both on whole and saw-split core rocks 45 mm in diameter. The variety of breccia types and
their extensive development permitted to apply a statistical method of classification based on
fractal analysis of fragment morphologies. This method allowed to quantify the intensity and
type of corrosion processes (see part II).
SEM observations of fragments of unconsolidated breccias of the Shea Creek area were
realized ( see part II).
The ball-shaped breccia fragments found in the Sue C open pit were systematically
measured. The distribution curve of the baU sizes has been plotted using Statistica software
( see part III).
On Shea Creek samples, X-ray diffraction patterns were determined on the less than 2
micron fractions on oriented aggregates in the range of 35 to 3 angstroms (see annexe IV). On
randomly oriented powders, a range of 1.56 to 1.48 angstroms was used in order to distinguish
di- or/and trioctahedral structures of clay minerais. Acquisition of X-ray diffraction patterns
for Shea Creek samples was performed by ERM (Etudes Recherches Matériaux) in Poitiers
(France) on a Siemens Kristalloflex D501 diffractometer (radiation: Cu Ka) equipped with an
X-ray fluorescence detector (Si(Li) diode) cooled by Peltier effect. The mineralogy of breccia
samples at Sue was determined by X-ray diffraction (XRD) on whole-rock samples at the
UQAM (Montréal, Canada) and by transmission electron microscope (TEM), coupled with X
ray analysis at the Université Henri Poincaré (Nancy, France) after agate mortar crushing (see
annexe IV).
Raman microspectroscopy was used at the UMR G2R 7566 (Nancy, France) to determine
the polytype ofthe kaolinite minerais in breccias of Sue and Shea Creek (see annexe IV).
Illite, chlorite and kaolinite chemical compositions of Sue and Shea Creek breccias were
analyzed by electron microprobe (Cameca SX50, Université Henri Poincaré, Nancy, France) at
10 nA and at 15 k V with an average counting time of 9 seconds for the peak and 5 seconds for
the background (see annexe IV). The standards used for the analysis of Na, Mg, Al, Si, Cl, K,
Ca, Ti, V, Cr, Mn, Fe and Ni in clay minerais were respectively albite, olivine, albite, orthose,
scapolite, orthose, wollastonite, MnTi03, pure vanadium, Cr203, MnTi03, hematite and NiO.
Uranium oxides and silicates were analyzed by electron microprobe at 10 nA and at 15 kV
(see annexe IV). The standards used for the analysis of Si, S, Ca, Ti, Fe, As, Y, Ce, Gd, Yb,
Pb, Th, U in uranium minerais were respectively orthose, FeAsS, wollastonite, MnTi03,
hematite, AsGa, Y3Fe50I2(Grenat), CeP04, GdTiGe, YbCo2Sh, PbCr04, Th02 and U02 .
Chemical Th-U-total Pb isochron ages were determined using a formulae proposed by Suzuki
and Adachi (1994).
130 Synthèse de l'étude structurale. texturale. minéralogique et géochimique des brèches
Geochemical analysis of 10 major and 44 trace elements on 23 who le rock breccia samples
were performed in the three study areas - by ICP-AES and ICP-MS at the CRPG (Nancy)
following a procedure described by Govindaraju and Mevelle (1987). Density of dry samples
have been determined using a picnometer with water (Vigneresse and Cannat, 1987). Mass
balance calculations were resolved using the Grant method (Grant, 1986) which consists in a
simple graphical solution of Gresens' equation (Gresens, 1967) (see annexe III). Al and Nb
have been considered as immobile respectively in the Sue and Shea Creek zones whereas
constant volume has been considered at the Maw Zone. Relative proportions of the main
minerais constituting the breccias have been calculated by norm analysis in the three zones of
study.
3. Geological setting
3.1. Geology of the base ment
The Athabasca Basin lies within the southwest part of the Churchill Structural Province,
between the The lon-Taltson orogenie front to the west and the Trans-Hudson orogen to the
east (Fig. 1 ). The Thel on-Taltson orogenie front is related to the collision and indentation of
the western Rae Province by the Archean Slave province in an east-dipping subduction zone
from 2.0 to 1.76 Ga (Hoffman, 1987; Ross and Baton, 1997). It is expressed in the Athabasca
Basin by ductile deformation between 2.0 and 1.9 Ga, followed by a younger, brittle event
constrained to 1.84-1.76 Ga (Hoffman, 1987; Villeneuve et al., 1991). The Trans-Hudson
orogen evolved from a west-dipping subduction zone with collision of the Superior province
into the Heame Province from 1.88 to 1.76 Ga (Chiarenzelli et al., 1998). This two coeval
orogens were contemporaneous with a major crustal imbrication located southwest of the
Athabasca Basin in the Alberta basement and referred to as the east Alberta orogen (1.85-1.78
Ga; Ross et al., 1995).
On the basis of lithologie, structural and metamorphic criteria, the sub-Athabasca basement
has been divided in several crustal units, each of them being composed of several
lithostructural do mains (Lewry and Sibbald, 1980) (Fig. 1 ).
3.2. The Athabasca Basin
The Athabasca Basin formed during the Middle Proterozoic at about 1.7 Ga (Armstrong
and Ramaekers, 1985; Kotzer et al., 1992) and is separated from the underlying basement by a
major unconformity. It is composed of sub-basins oriented NE-SW and controlled by faults
rooted in the basement. The basin is interpreted as having been filled by several stratigraphie
Synthèse de l'étude structurale, texturale, minéralogique et géochimique des brèches 131
units, the Athabasca Group being the major unit located at the base (Ramaekers and Dunn,
1977). The Athabasca Group is composed of thick, unmetamorphosed and flat-lying sequences
of fluviatile to marine quartzose sandstones deposited in a proximal shelf environment
(Ramaekers, 1981 ). A maximum total thickness of 4 to S km of sediments in the basin has
been proposed based on fluid inclusions and diagenetic clay assemblages studies (Pagel,
197Sb; Hoeve et al., 1981; Halter, 1988).
The present thickness of the basin is about 70 rn at Sue, 700 rn at Shea Creek and 2SO rn at
the Maw Zone. The sandstones hosting these three zones of study are all part of the Manitou
Falls formation of the Athabasca Group. The Manitou Falls formation is subdivided into 4
members called MFa, MFb, MFc and MFd from bottom to top (Ramaekers, 1990). The MFb
member which hosts the Sue A and B mineralizations consists of sandstones containing at
least 2% of clast-supported conglomerates found in beds 2 cm thick. The MFc member hosts
the Shea Creek mineralization and breccias. It consists of sandstones containing conglomerates
beds less than 2 cm thick and less than 1 %clay intraclast-rich layers. The MFd member hosts
the Maw Zone Y and REE mineralization and breccias. It comprises relatively well-sorted
quartz arenites containing greater than 1 % clay intraclast-rich layers. The MFb and MFc
members are both medium- to very coarse-grained sandstone whereas the MFd member is
fine- to coarse-grained sandstone. Heavy minerais layers, generally less than 1 mm thick, are
common at the base of these two members. Their distribution shows great variability at the
millimeter to decimeter scale. In non-mineralized zones, clay typically forms O.S to 1S % of
the rock and averages around S % (Ramaekers, 1990).
Early syn-depositional tectonic movements have been evidenced by the presence of a
fanglomerate unit, better called debris flow by Quirt (2000), at the base of the Athabasca
sandstone. This debris flow unit has been observed at McArthur River and in the Sue C open
pit.
The Athabasca sandstones have undergone a deep to anchizonal diagenesis characterized
by quartz overgrowths, hematite, crandallite group minerais, anatase and dickite. Diagenetic
2M illite is developed in zones of peak diagenesis (Halter et al., 1988). Apatite and sudoite
crystallizations are locally present. Temperatures of early diagenetic fluids were estimated by
fluid inclusions studies in quartz overgrowths at about 180°C in the Rumple Lake area and
220°C in the Carswell area (Pagel, 197 Sa; 197 Sb), and at about 160°C in the Mc Arthur area
(Kotzer and Kyser, 199S). Peak diagenesis was characterized by temperatures estimated
between 200 and 240°C after illite crystallinity index, fluid inclusions and isotope
equilibration temperature studies (Hoeve et al., 1981; Halter, 1988 ; Kotzer and Kyser, 199S).
3.3. The Maw Zone
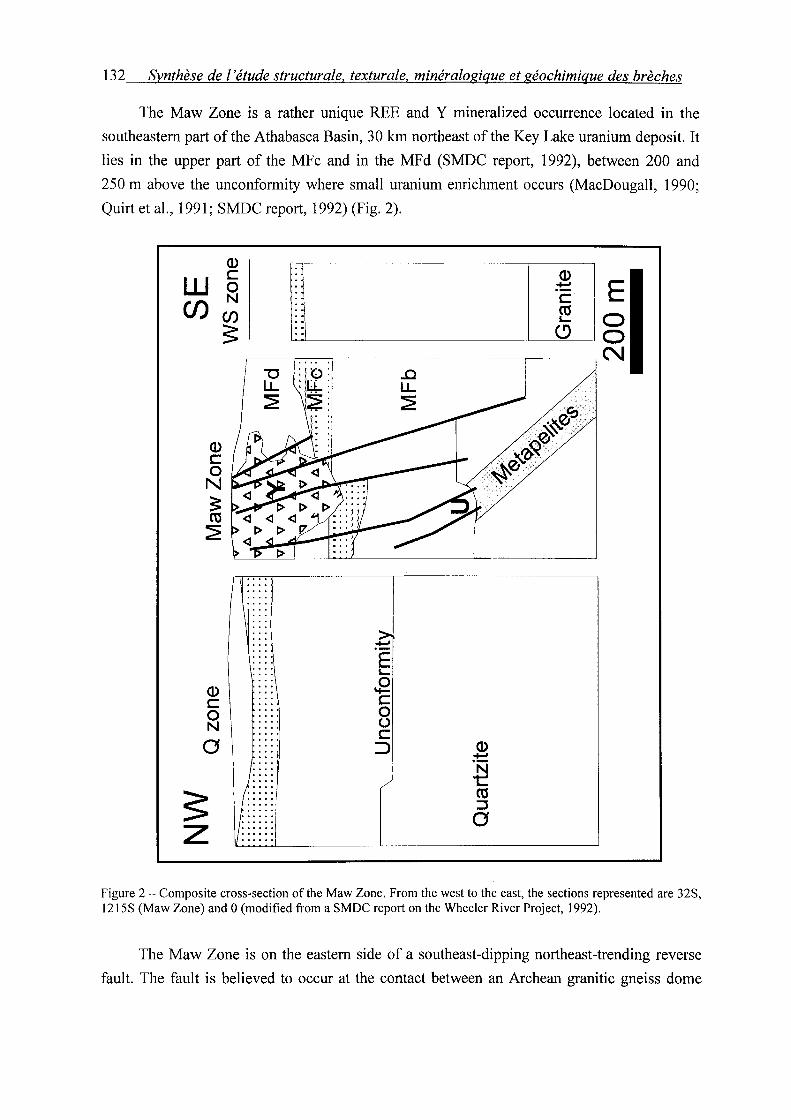
132 Synthèse de 1 'étude structurale, texturale, minéralogique et géochimique des brèches
The Maw Zone is a rather unique REE and Y mineralized occurrence located in the
southeastem part ofthe Athabasca Basin, 30 km northeast of the Key Lake uranium deposit. It
lies in the upper part of the MFc and in the MFd (SMDC report, 1992), between 200 and
250 rn above the unconformity where small uranium enrichment occurs (MacDougall, 1990;
Quirt et al., 1991; SMDC report, 1992) (Fig. 2).
(])
Ill 1~ w c (]) 0 .......
Cl) N c
Cl) ca s... s (9
N -c ..c LL LL ~ ~
(]) c 0 N 3: ca ~
r ...
~ E s...
(]) J2 c c 0 0 N (.)
c a => (]) ....... . N {::1 / t
~ ca ::::1 :::J
::::1 a .... z ••• •1 ... ·i
Figure 2 - Composite cross-section of the Maw Zone. From the west to the east, the sections represented are 32S, 1215S (Maw Zone) and 0 (modified from a SMDC report on the Wheeler River Project, 1992).
The Maw Zone is on the eastern side of a southeast-dipping northeast-trending reverse
fault. The fault is believed to occur at the contact between an Archean granitic gneiss dome
Synthèse de 1 'étude structurale, texturale. minéralogique et géochimique des brèches 133
and Wollaston Group pelitic graphitic gneiss. It is on the northwest side of a basement
topographie high, formed by metaquartzite and pelitic gneiss, that underlies the Maw Zone
(Quirt et al., 1991 ).
Alteration at the Maw Zone is characterized by pervasive silicification and extended
dravite-rich breccia development. Drusy quartz- and dravite-filled fractures are also common.
The REE mineralization is contained within the sandstone breccia and consists in
microcrystalline xenotime, surrounded by acicular dra vite ( Quirt et al., 1991 ). The zone is
described as containing 336,000 tonnes at 0.25 % of yttrium oxide (Agip Canada Ltd, 1985;
Energy Mines and Resources, 1989).
3. 4. The Shea Creek area
At Shea Creek, six formations have been distinguished in the sandstone, and from
bottom to top are named: MFc, MFd, Lazenby Lake (LzL), Wolverine Point A (WPa),
Wolverine Point B (WPb) and Locker Lake (LL) (see part II). The mineralization is hosted by
the MFc formation.
Two main Lower Proterozoic basement lithostratigraphic groups are found at Shea
Creek: a metasedimentary unit containing mostly shear-related graphite located between two
orthoderived felsic gneiss units (Fig. 3a and 3b). The metasedimentary unit is divided into
metapelites and gametites.
Three types of faults have been recognized, based on their orientation and kinematic
(Fig. 3a and 3b). They occur both in the Lower Proterozoic basement and in the sandstone
cover. Type I reverse faults are developed at the regional scale and oriented N130-150° with a
dip of 20 to 40° toward the west. They may display post-Athabasca vertical offsets of 5 to
10 m. In the basement, the type I faults are ductile and brittle, 3-5 rn wide and represented by
graphite- and clay-rich gouges as weil as numerous graphite-rich slip planes, parallel to the
lithology and foliation. Type II structures are local and oriented N100-110 with a dip of 50 to
70° toward the northeast. They display late normal-sinistral movements with vertical offsets up
to 10 m. Type III are regional reverse faults, oriented N5-15 with a dip of 50 to 70° toward the
west. Like type I faults, they have a ductile ante-Athabasca history and are locally graphite
rich. Their post-Athabasca vertical offsets may reach 20 m.
A maximal cumulated post-Athabasca vertical offset of 35 rn is observed between points
A and B at the unconformity due to the combinaison of offsets of the 3 fault types (Fig. 3a and
3b). The type I and type II faults are the main controls of the uranium mineralization in the
sandstone. In the basement, the mineralization seems more controlled by type III faults.
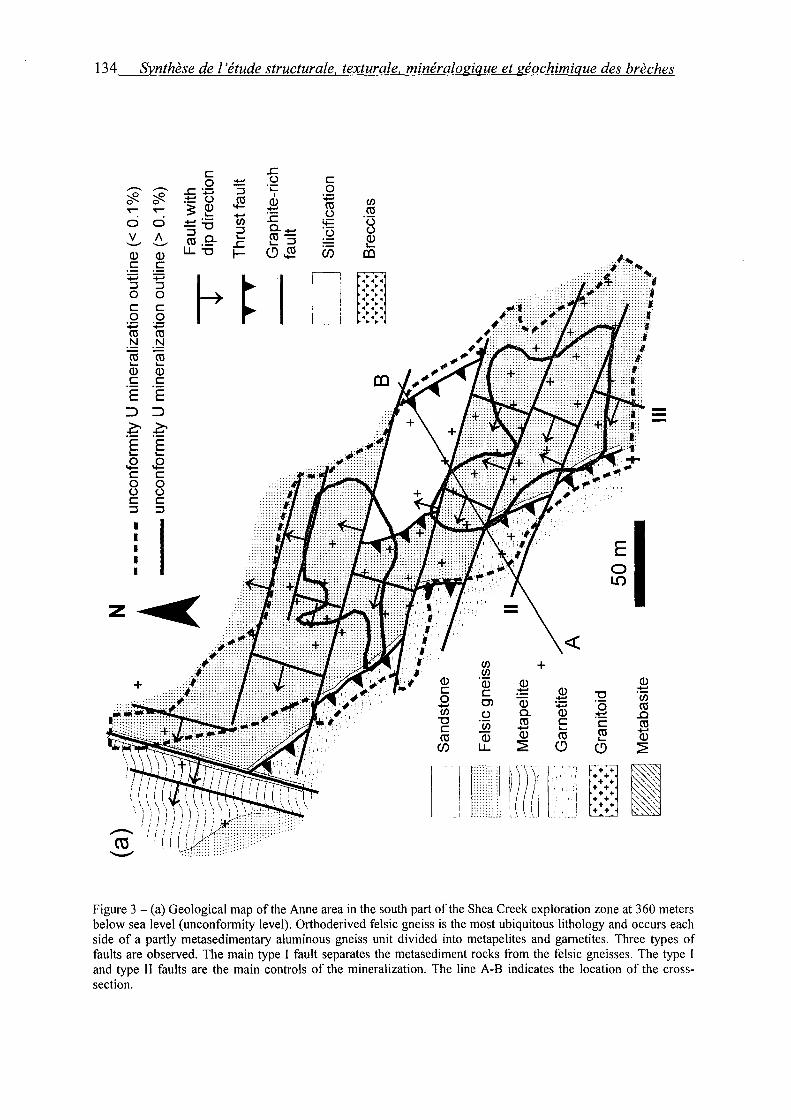
134 Synthèse de l'étude structurale, texturale, minéralogique et géochimique des brèches
c .c 0 :!:: (.)
....-.. ....-.. .c :o::; :::J ·;:::: ~ ~ 1 ."!::! (.) ~ Q) 0 0
3: ~ ..-- ..-- :t::: +-' .c 0 0 +-' ·- (/)
- ""0 :::J a._ v A :Jo. ..... co-'-"' '-"' co._ .c ..... :::J Q) Q) U..-a 1- ~~ c c
+=' +='
~ ~ 1
:::J :::J 0 0 c c 0 0
:o::; :o::; co co -~ -~ co co ..... ..... Q) Q) c c E E
:::> :::> >- ~ :t::: E E ..... ..... .E .E c c 0 0 (.) (.) c c :::J :::J
1
1 1 1 1 1
z ~
c 0
:o::; (/) co
(.) co "(3 tt=
:Q (.) Q) .....
Cf) co
[
(/) + (/) Q) (i) Q) c c ."!::! 0 Q) +-' 0> (/) (.) a.
""0 (i) co c +-'
co Q) Q)
Cf) u.. ~
1 c] P/~ tL\
Q) +-' :o::; Q) c ..... co ~
~-,--,,1
;;1 ·1 1
'1 !
""0 "ô :t::: c co ..... ~
E 0 l.()
Q) +-' ën co
..0 co
+-' Q)
~
Figure 3- (a) Geological map of the Anne area in the south part of the Shea Creek exploration zone at 360 meters below sea Ievel (unconformity level). Orthoderived felsic gneiss is the most ubiquitous lithology and occurs each side of a partly metasedimentary aluminous gneiss unit divided into metapelites and gametites. Three types of faults are observed. The main type 1 fault separates the metasediment rocks from the felsic gneisses. The type 1 and type Il faults are the main controls of the mineralization. The line A-B indicates the location of the crosssection.
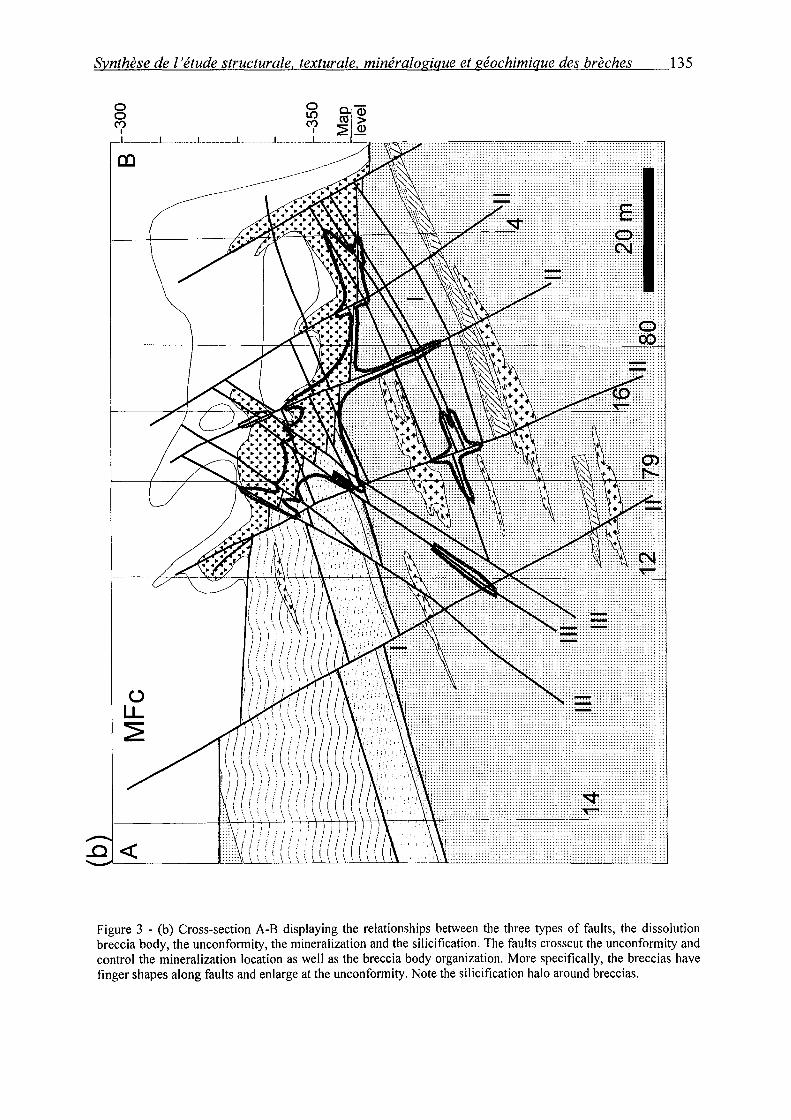
Synthèse de 1 'étude structurale, texturale, minéralogique et géochimique des brèches 135
0 0 C")
1
(,)
LL ~
<(
.......... ······ ............. . . . . . . . . . . . . . . . . . . . . . . . . . . . . . . . . ..... ························· .............. ························· ··•······················ ························· ................. . .................. . . . . . . . . . . . . . . . . . . . . . . . . ........................
························
·················· ................ ················· . . . . . . . . . . . . . . . . .
.......................
::::::::c::L: ... :UUÇNY
Figure 3 - (b) Cross-section A-B displaying the relationships between the three types of faults, the dissolution breccia body, the unconforrnity, the mineralization and the silicification. The faults crosscut the unconformity and control the mineralization location as weil as the breccia body organization. More specifically, the breccias have finger shapes along faults and enlarge at the unconforrnity. Note the silicification halo around breccias.
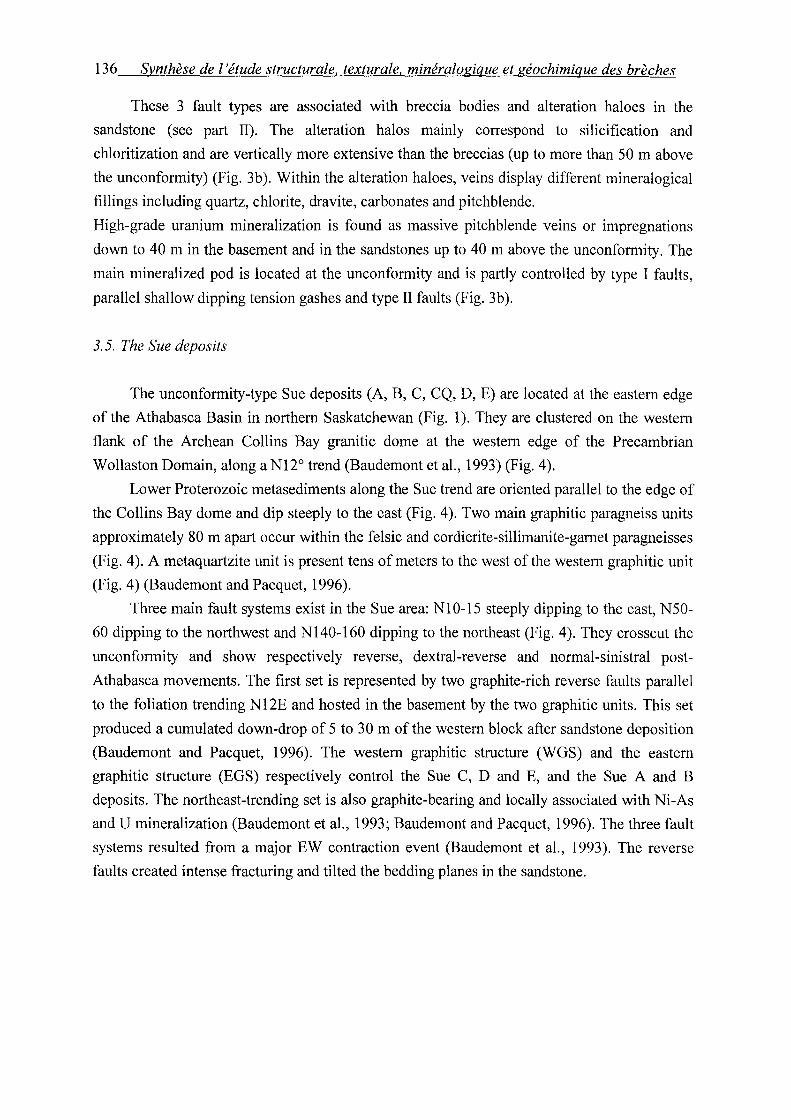
136 Synthèse de l'étude structurale, texturale, minéralogique et géochimique des brèches
These 3 fault types are associated with breccia bodies and alteration haloes in the
sandstone (see part II). The alteration halos mainly correspond to silicification and
chloritization and are vertically more extensive than the breccias (up to more than 50 rn above
the unconformity) (Fig. 3b ). Within the alteration haloes, veins display different mineralogical
fillings including quartz, chlorite, dravite, carbonates and pitchblende.
High-grade uranium mineralization is found as massive pitchblende veins or impregnations
down to 40 rn in the basement and in the sandstones up to 40 rn above the unconformity. The
main mineralized pod is located at the unconformity and is partly controlled by type I faults,
parallel shallow dipping tension gashes and type II faults (Fig. 3b).
3. 5. The Sue deposits
The unconformity-type Sue deposits (A, B, C, CQ, D, E) are located at the eastern edge
of the Athabasca Basin in northern Saskatchewan (Fig. 1 ). They are clustered on the western
flank of the Archean Collins Bay granitic dome at the western edge of the Precambrian
Wollaston Domain, along a N12° trend (Baudemont et al., 1993) (Fig. 4).
Lower Proterozoic metasediments along the Sue trend are oriented parallel to the edge of
the Collins Bay dome and dip steeply to the east (Fig. 4). Two main graphitic paragneiss units
approximately 80 rn apart occur within the felsic and cordierite-sillimanite-garnet paragneisses
(Fig. 4). A metaquartzite unit is present tens ofmeters to the west of the western graphitic unit
(Fig. 4) (Baudemont and Pacquet, 1996).
Three main fault systems exist in the Sue area: N10-15 steeply dipping to the east, N50-
60 dipping to the northwest and N140-160 dipping to the northeast (Fig. 4). They crosscut the
unconformity and show respectively reverse, dextral-reverse and normal-sinistral post
Athabasca movements. The first set is represented by two graphite-rich reverse faults parallel
to the foliation trending N12E and hosted in the basement by the two graphitic units. This set
produced a cumulated down-drop of 5 to 30 rn of the western block after sandstone deposition
(Baudemont and Pacquet, 1996). The western graphitic structure (WGS) and the eastern
graphitic structure (EGS) respectively control the Sue C, D and E, and the Sue A and B
deposits. The northeast-trending set is also graphite-bearing and locally associated with Ni-As
and U mineralization (Baudemont et al., 1993; Baudemont and Pacquet, 1996). The three fault
systems resulted from a major EW contraction event (Baudemont et al., 1993). The reverse
faults created intense fracturing and tilted the bedding planes in the sandstone.

Synthèse de l'étude structurale, texturale, minéralogique et géochimique des brèches 137
Ill -(/)
1 Q) Q. <( ::l "0 0 ~ - ..0 Q) ..c ~
.... -•ctl 0 '§; Q) u c ~
0 Q) ::l
~ ::l ctl
Cf) LL
0 D 1 '
'
-..c ~1
'-'~----------------------------------------------------------------------------~
Figure 4 - (a) Basement lithologies and structural controls of the Sue deposits located on the western flank of the Collins Bay granitic dome (modified from Baudemont et al., 1993). The dashed oval indicates the position of the Sue C open pit. (b) Simplified structural map of the Sue C open pit. Note the alignment of breccias along the EGS.

138 Synthèse del 'étude structurale, texturale, minéralogique et géochimique des brèches
Baudemont et al. (1993) described strong hydrothermal alterations associated with the
Sue deposits both in basement and sandstone. Clay alteration is composed of illite in the
sandstone, and illite and sudoite in the basement. In the sandstone, primary hematite has been
leached out and the illite content increased towards strongly fractured mineralized zones. An
earthy red-brown hematitic clay zone, up to 20 rn thick, wraps the mineralization at Sue A and
B. Newly formed aluminum phosphates and dravite are ubiquitous. Intense quartz dissolution
occurred both in the basement lithologies beneath the Sue A and B deposits and in sandstones.
In the sandstone of the Sue C open pit, quartz dissolution is mainly developed along the EGS.
It is expressed by "zones à boules" that consist in illitized and striated sandstone halls wrapped
in massive illite (see part III).
The Sue A and B deposits are relatively low grade, 1.26 % and 0.73 % U respectively.
They are very rich in Ni and As, 3.S7% Ni and 4.46% As for Sue A, and 1.67% Ni and 1.86
% As for Sue B. The Sue C, D and E deposits consist of basement-hosted vein-type
mineralization that may occur down to more than 100 rn below the unconformity.
4. Breccia geometry and structural controls
4.1. The Maw Zone
At the Maw Zone, breccia units of at least 20 rn long and 6 rn wide are well exposed on
outcrops (Fig. Sa). The overall breccia body, located between 200 and 2SO rn above the
unconformity, crosscuts the sandstone stratigraphy. The mapping of the tilting of breccia
fragments indicates N70 and NllO structural trends (Fig 6). The N70 direction corresponds
locally to regional structural orientations whereas N11 0 structures are not well known in the
area. A schematic cross-section realized by SMDC geologists shows that breccias have an
overall funnel shape controlled by a northeast-trending reverse fault zone rooted in graphite
rich lithologies (Figs. 2 and Sa). Their volume has been estimated at 40,000 m3 from outcrop
and drill hole data.
4. 2. The Shea Creek are a
At Shea Creek, sudoite-dravite and Fe-chlorite solution breccias were mapped in
sandstones. Cross-section mapping and three-dimensional modeling with the gücad software
show that sudoite-dravite breccias tend to have finger shapes, enlarged at the unconformity
(see annexe II) (Fig. 3b). Fe-chlorite breccia bodies display a dome shape at the intersection of
several faults (see annexe Il).
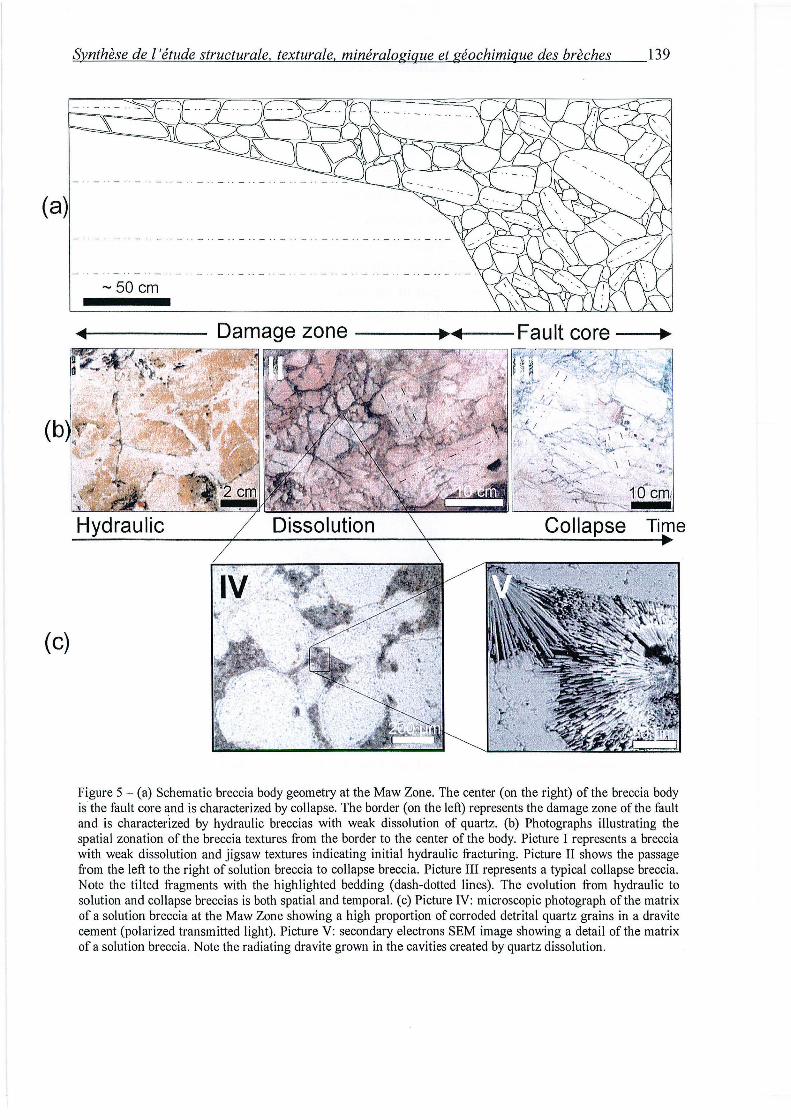
(a)
(c)
Synthèse de l'étude structurale. texturale. minéralogique et géochimique des brèches 139
-50 cm
Figure 5 - (a) Schematic breccia body geometry at the Maw Zone. The center (on the right) of the breccia body is the fault core and is characterized by collapse. The border (on the left) represents the damage zone of the fault and is characterized by hydraulic breccias with weak dissolution of quartz. (b) Photographs illustrating the spatial zonation of the breccia textures from the border to the center of the body. Picture I represents a breccia with weak dissolution and jigsaw textures indicating initial hydraulic fracturing. Picture II shows the passage from the left to the right of solution breccia to collapse breccia. Picture III represents a typical collapse breccia. Note the tilted fragments with the highlighted bedding (dash-dotted !ines). The evolution from hydraulic to solution and collapse breccias is both spatial and temporal. (c) Picture IV: microscopie photograph of the matrix of a solution breccia at the Maw Zone showing a high proportion of corroded detrital quartz grains in a dra vite cement (polarized transmitted light). Picture V: secondary electrons SEM image showing a detail of the matrix of a solution breccia. Note the radiating dra vite grown in the cavities created by quartz dissolution.
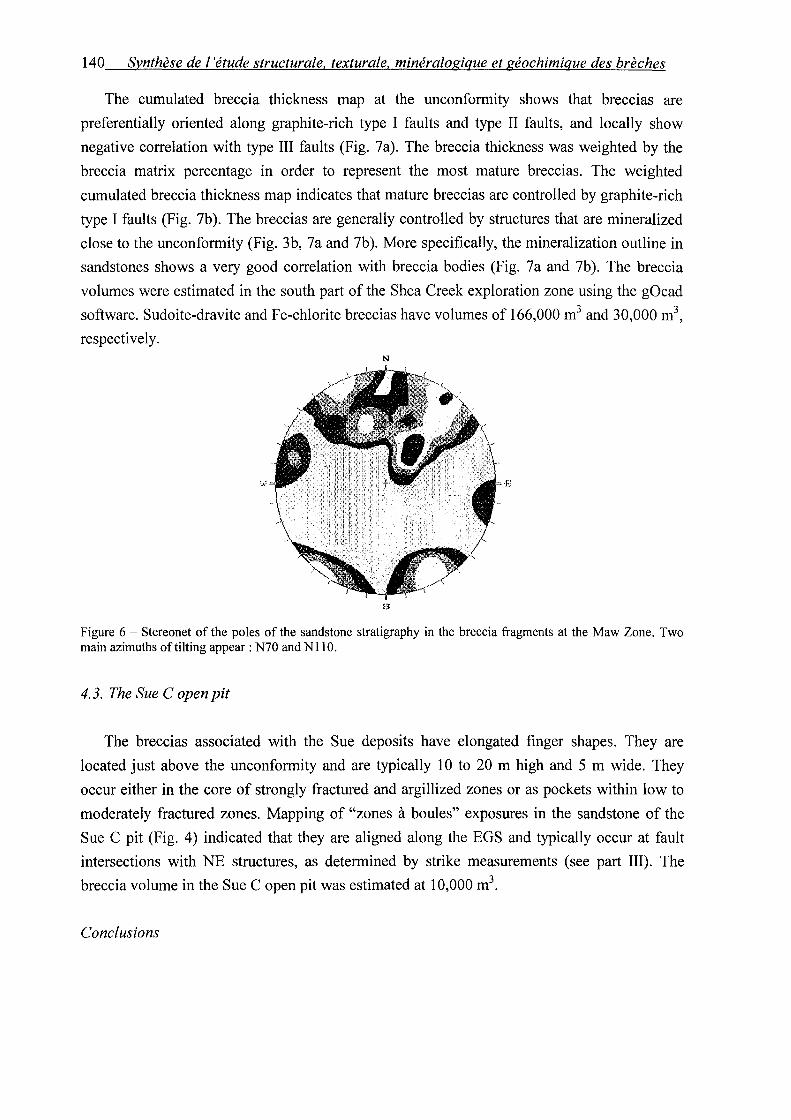
140 Synthèse de l'étude structurale, texturale, minéralogique et géochimique des brèches
The cumulated breccia thickness map at the unconformity shows that breccias are
preferentially oriented along graphite-rich type 1 faults and type II faults, and locally show
negative correlation with type III faults (Fig. 7a). The breccia thickness was weighted by the
breccia matrix percentage in order to represent the most mature breccias. The weighted
cumulated breccia thickness map indicates that mature breccias are controlled by graphite-rich
type 1 faults (Fig. 7b ). The breccias are generally controlled by structures that are mineralized
close to the unconformity (Fig. 3b, 7a and 7b). More specifically, the mineralization outline in
sandstones shows a very good correlation with breccia bodies (Fig. 7a and 7b ). The breccia
volumes were estimated in the south part of the Shea Creek exploration zone using the gücad
software. Sudoite-dravite and Fe-chlorite breccias have volumes of 166,000 m3 and 30,000 m3,
respectively. N
E
Figure 6 - Stereonet of the pol es of the sandstone stratigraphy in the breccia fragments at the Maw Zone. Two main azimuths oftilting appear: N70 and NilO.
4. 3. The Sue C open pit
The breccias associated with the Sue deposits have elongated finger shapes. They are
located just above the unconformity and are typically 10 to 20 rn high and 5 rn wide. They
occur either in the core of strongly fractured and argillized zones or as pockets within low to
moderately fractured zones. Mapping of "zones à boules" exposures in the sandstone of the
Sue C pit (Fig. 4) indicated that they are aligned along the EGS and typically occur at fault
intersections with NE structures, as determined by strike measurements (see part III). The
breccia volume in the Sue C open pit was estimated at 10,000 m3.
Conclusions
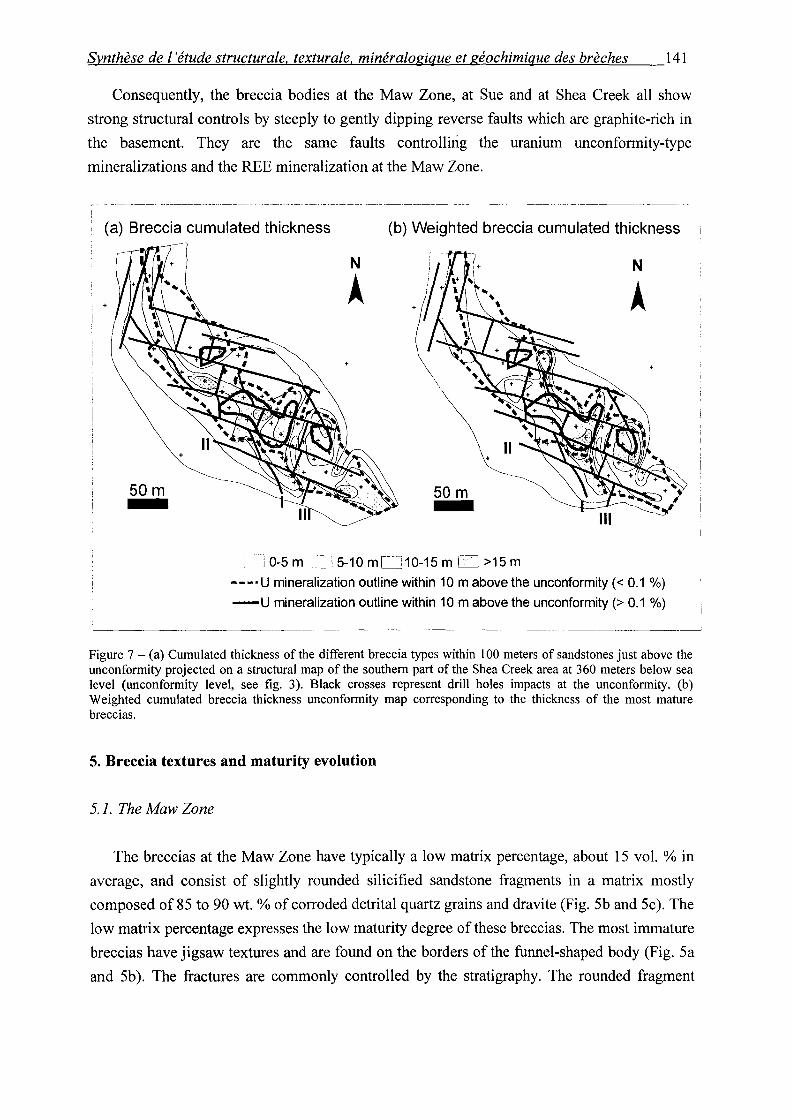
Synthèse de l'étude structurale. texturale. minéralogique et géochimique des brèches 141
Consequently, the breccia bodies at the Maw Zone, at Sue and at Shea Creek all show
strong structural controls by steeply to gently dipping reverse faults which are graphite-rich in
the basement. They are the same faults controllirig the uranium unconformity-type
mineralizations and the REE mineralization at the Maw Zone.
(a) Breccia cumulated thickness (b) Weighted breccia cumulated thickness
SOm -
N
A
50 m -D 0-5 m [~] 5-10 ml !10-15 mD >15 m
N
--- • U mineralization outline within 10 m above the unconformity ( < 0.1 %)
-U mineralization outline within 10 rn above the unconformity (> 0.1 %)
Figure 7 - (a) Cumulated thickness of the different breccia types within 100 meters of sandstones just above the unconfonnity projected on a structural map of the southem part of the Shea Creek area at 360 meters below sea leve! (unconformity leve!, see fig. 3). Black crosses represent drill holes impacts at the unconfonnity. (b) Weighted cumulated breccia thickness unconformity map corresponding to the thickness of the most mature breccias.
5. Breccia textures and maturity evolution
5.1. The Maw Zone
The breccias at the Maw Zone have typically a low matrix percentage, about 15 vol. % in
average, and consist of slightly rounded silicified sandstone fragments in a matrix mostly
composed of 85 to 90 wt. % of corroded detrital quartz grains and dravite (Fig. 5b and 5c ). The
low ma tri x percentage expresses the low maturity degree of these breccias. The most immature
breccias have jigsaw textures and are found on the borders of the funnel-shaped body (Fig. 5a
and 5b ). The fractures are commonly controlled by the stratigraphy. The rounded fragment
142 Synthèse de l'étude structurale, texturale, minéralogique et géochimique des brèches
shapes and the presence of corroded detrital quartz grains in the matrix indicate quartz
dissolution in the matrix and on the fragments borders (Fig. Sb and Sc). The dravite
crystallized as radiated bunches within interstitial spaces between corroded quartz and within
dissolution cusps (Fig. Sc). In the center of the funnel, breccias are heterolithic with tilted
fragments and fragment-supported textures (Fig. Sa and Sb).
The development of jigsaw textures and the local stratigraphie control of fractures are the
expression of hydraulic brecciation possibly related to a fault termination zone as it has been
documented by Cox et al. (2000). The formation of rounded fragment corners rather than cusps
producing complex shapes indicates a probable diffusion-limited regime of dissolution. The
heterolithic breccias with fragment-supported textures and the tilting of fragments indicate the
occurrence of collapse. The mapping of fragment tilting indicates that this collapse occurred
along structural trends. The low dissolution rate in these breccias suggests that the collapse is
not a consequence of the dissolution occurring within the breccias but is rather due to
dissolution occurring at the unconformity below and associated with unconformity-type
uranium enrichment.
5. 2. The Shea Creek are a
In the Shea Creek area, several breccia types have been distinguished in the sandstones
surrounding unconformity-type uranium mineralization: microcrystalline quartz, sudoite,
dravite, calcite, Fe-chlorite and polyphase carbonate breccias. Immature breccias show typical
jigsaw patterns indicating fluid-assisted fracturing (see part II) (Fig. 8a and 8e). In mature
breccias, except microcrystalline quartz ones, the presence of numerous corroded detrital
quartz grains in the matrix and the ubiquitous presence of quartz dissolution textures at the
macroscopic, thin section and SEM scales clearly demonstrate the major role of dissolution in
the breccia formation (see part Il) (Fig. 8b, 8c, 8f, 8g, 8h, 8i, 8j and 8k).
Sorne of these solution breccias may be called pseudo-breccias as quartz dissolution is
pervasive and not developed enough to destroy the sandstone cohesion (Fig. 8c ).
Dravite breccias commonly display shallow dipping contacts. Their matrix show pseudo
flow banding textures parallel to the contacts and formed by orientation of acicular dra vite and
alignment of numero us accessory minerais along layers parallel to the dra vite orientation (Fig.
8h). The high concentration of accessory minerais suggests volume loss after dissolution.
Therefore, the shallow dipping pseudo-flow bandings might result from vertical contraction
due to pure shear induced by gravity after quartz dissolution. Sudoite breccias are commonly
fragment-supported and contain horizontally oriented elongated fragments in mature zones.
They display a negative correlation between rotation angle and size of the tilted blocks
indicating collapse phenomenons (see part II). Fe-chlorite breccias are commonly heterolithic,
Synthèse de 1 'étude structurale, texturale, minéralogique et géochimique des brèches 143
fragment-supported and present the same relation between rotation angle and size of the tilted
blocks as in sudoite breccias. Graded-bedding textures are locally observed in the upper part of
fragment-supported breccia units. Consequently, Fe-chlorite breccias also present major
evidences of collapse. That would explain their dome shape typical of collapse breccia bodies
like in Mississippi Valley type deposits (Sass-Gustkiewicz, 1996; Dzuslynski and Sass
Gustkiewicz, 1989).
The variety of breccia types at Shea Creek is not only expressed by the nature of the
cement, but also by the fragment shapes. Fractal analysis of the fragment morphologies has
allowed recognition of the intensity and type of corrosion processes, and also its kinetic
processes (see part II) (Fig. 81). In microcrystalline quartz breccias, the low fractal dimensions
represent angular fragments formed during the first step of hydraulic brecciation. In sudoite
breccias, medium fractal dimensions characterize the predominance of rounded fragments.
They are the expression of the second step of sandstone dissolution in a slow diffusion-limited
regime (Jébrak, 1997). That is confirmed by the occurrence of dissolution embayments in
these breccias (Burley and Kantorowicz, 1986) (Fig. 8j). ln Fe-chlorite breccias, the bimodal
fragment shape distribution curve indicates a mixing of non-corroded angular fragments with
corroded fragments due to a third step of collapse (see part Il). The observation of sorne
complex shapes and pervasively altered fragments as well as the abundance of pits observed
with a SEM on fragment surfaces would indicate a fast kinetic regime of dissolution (Fig. 8c
and 8k) (Burley and Kantorowicz, 1986). ln polyphase carbonate breccias, the globally high
fractal dimension values reflect more complex fragment morphologies, suggesting a possible
kinetic regime of dissolution (Jébrak, 1997).
5. 3. The Sue C open pit
The breccias observed in the Sue C open pit are "zones à boules" (see part III) (Fig. 9a).
The statistical distribution of the ball shapes is log-normal. As the balls formed initially by
fracturing, this log-normal distribution indicates tectonic fracturing (see part III). That is
consistent with the narrow finger shapes of the breccia bodies restricted to the core of the EGS.
The development of ball shapes is due to quartz dissolution in diffusion-limited regime
combined with rotation during reverse fault movements. The presence of superimposed striaes
indicates the occurrence of several tectonic reactivation phases. The sandstone samples located
close to a "zone à boule" have well developed microscopie corrosion textures of detrital quartz
and of their overgrowths (Fig. 9b ).
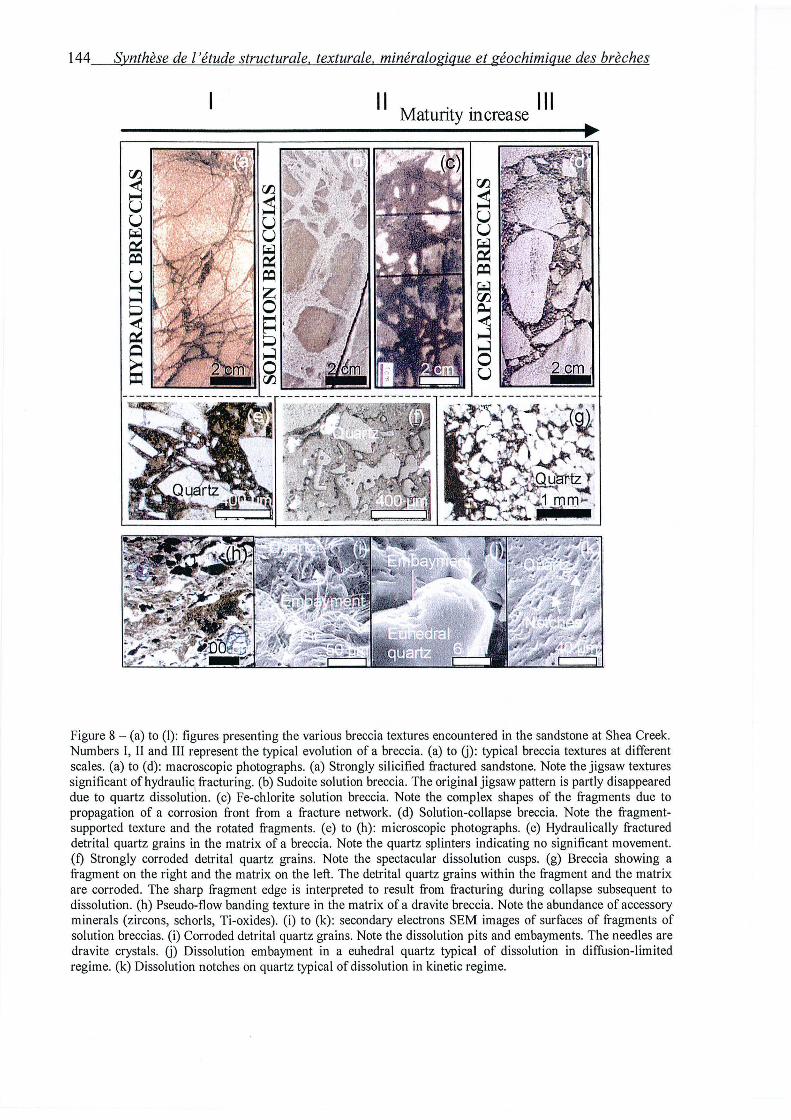
144 Synthèse de l'étude structurale, texturale, minéralogique et géochimique des brèches
Il M . . Ill atunty mcrease
Figure 8 -(a) to (1) : figures presenting the various breccia textures encountered in the sandstone at Shea Creek. Numbers I, II and III represent the typical evolution of a breccia. (a) to U): typical breccia textures at different scales. (a) to (d): macroscopic photographs. (a) Strongly silicified fractured sandstone. Note the jigsaw textures significant ofhydraulic
1 fracturing. (b) Sudoite solution breccia. The original jigsaw pattern is partly disappeared
due to quartz dissolution. (c) Fe-chlorite solution breccia. Note the complex shapes of the fragments due to propagation of a corrosion front from a fracture network. (d) Solution-collapse breccia. Note the fragmentsupported texture and the rotated fragments. (e) to (h): microscopie photographs. (e) Hydraulically fractured detrital quartz grains in the matrix of a breccia. Note the quartz splinters indicating no significant movement. (f) Strongly corroded detrital quartz grains. Note the spectacular dissolution cusps. (g) Breccia showing a fragment on the right and the matrix on the left. The detrital quartz grains within the fragment and the matrix are corroded. The sharp fragment edge is interpreted to result from fracturing during collapse subsequent to dissolution. (h) Pseudo-flow banding texture in the matrix of a dra vite breccia. Note the abundance of accessory minerais (zircons, schorls, Ti-oxides). (i) to (k): secondary electrons SEM images of surfaces of fragments of solution breccias. (i) Corroded detrital quartz grains. Note the dissolution pits and embayments. The needles are dravite crystals. U) Dissolution embayment in a euhedral quartz typical of dissolution in diffusion-limited regime. (k) Dissolution notches on quartz typical of dissolution in kinetic regime.
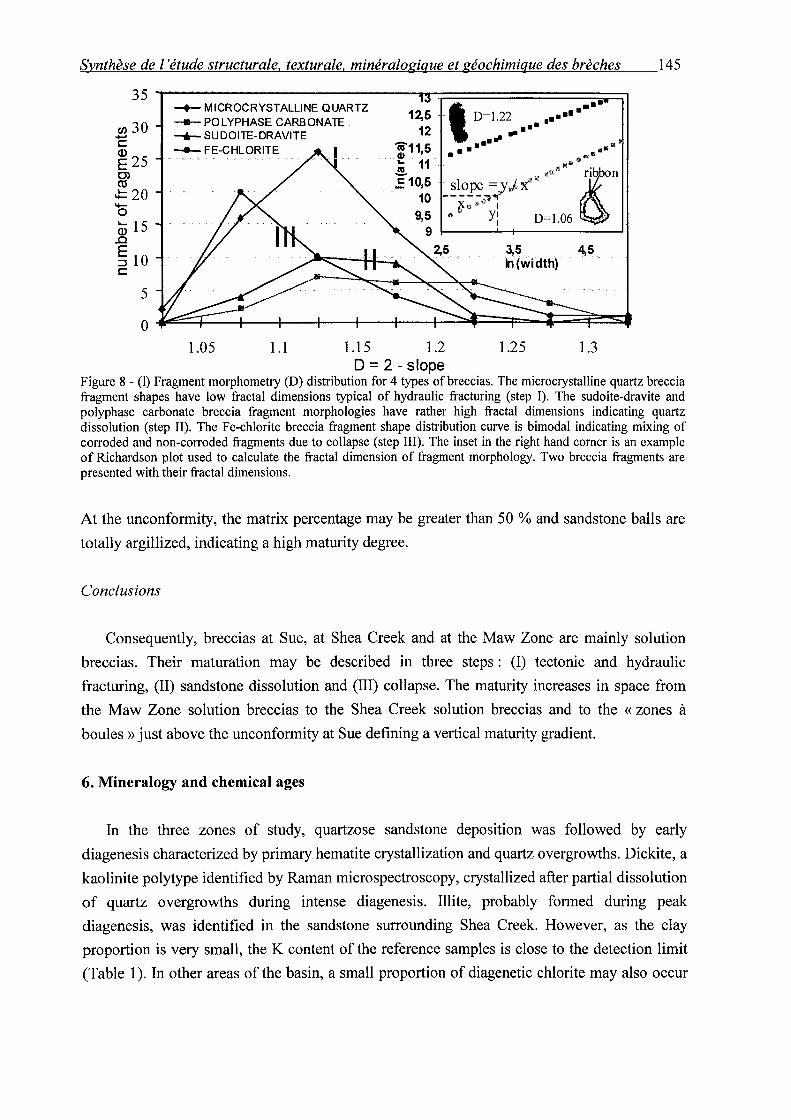
Synthèse de 1 'étude structurale, texturale, minéralogique et géochimique des brèches 145
35~--------------------~~============~~
12,5 ' D=1.22 •• ••1 .•••
(/) 30 ....... c
~ 25 0> ca ~20 ...... 0
03 15 .0
~ 10 c
5
~ MICROCRYSTALLINE QUARTZ ~POLYPHASE CARS ONA TE _ --6-- SUDOITE-DRAVITE
12 ••• ...... -:-11,5 • • •• .. .....
"... 11 - .... ..!,. m;mtt6:b .= 1 01~ . ~ ~l_?~ :?t=._.;r .~ '}(' w •" n n
g..r.J :-t rJ 1
9,5 --" Y: D=1.06 9 1
2,5 3,5 ln(width)
4,5
1.05 1.1 1.15 1.2 1.25 1.3 D = 2- slope
Figure 8- (1) Fragment morphometry (D) distribution for 4 types ofbreccias. The microcrystalline quartz breccia fragment shapes have low fractal dimensions typical of hydraulic fracturing (step 1). The sudoite-dravite and polyphase carbonate breccia fragment morphologies have rather high fractal dimensions indicating quartz dissolution (step II). The Fe-chlorite breccia fragment shape distribution curve is bimodal indicating mixing of corroded and non-corroded fragments due to collapse (step III). The inset in the right hand corner is an example of Richardson plot used to calculate the fractal dimension of fragment morphology. Two breccia fragments are presented with their fractal dimensions.
At the unconformity, the matrix percentage may be greater than 50% and sandstone halls are
totally argillized, indicating a high maturity degree.
Conclusions
Consequently, breccias at Sue, at Shea Creek and at the Maw Zone are mainly solution
breccias. Their maturation may be described in three steps : (1) tectonic and hydraulic
fracturing, (II) sandstone dissolution and (III) collapse. The maturity increases in space from
the Maw Zone solution breccias to the Shea Creek solution breccias and to the « zones à
boules »just above the unconformity at Sue defining a vertical maturity gradient.
6. Mineralogy and chemical ages
In the three zones of study, quartzose sandstone deposition was followed by early
diagenesis characterized by primary hematite crystallization and quartz overgrowths. Dickite, a
kaolinite polytype identified by Raman microspectroscopy, crystallized after partial dissolution
of quartz overgrowths during intense diagenesis. Illite, probably formed during peak
diagenesis, was identified in the sandstone surrounding Shea Creek. However, as the clay
proportion is very small, the K content of the reference samples is close to the detection limit
(Table 1 ). In other areas of the basin, a small proportion of diagenetic chlorite may also occur
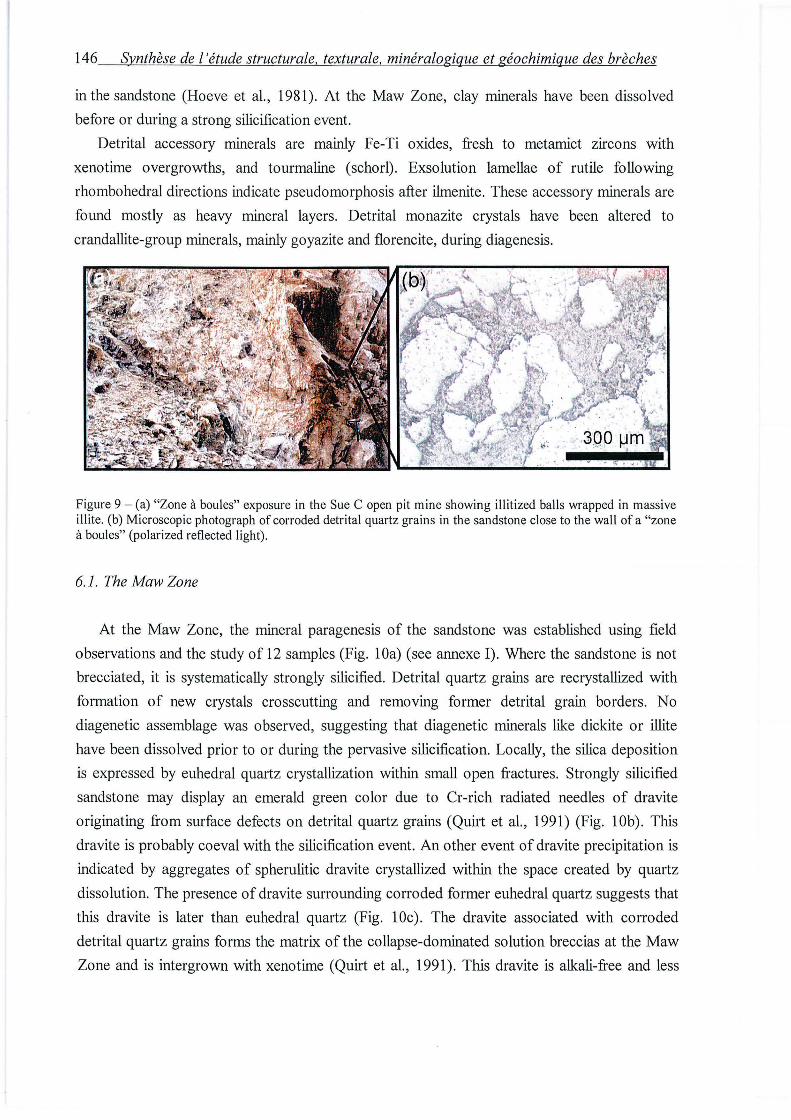
146 Synthèse de l'étude structurale, texturale, minéralogique et géochimique des brèches
in the sandstone (Hoeve et al., 1981). At the Maw Zone, clay minerais have been dissolved
before or during a strong silicification event.
Detrital accessory minerais are mainly Fe-Ti oxides, fresh to metarnict zircons with
xenotirne overgrowths, and tourmaline (schorl). Exsolution lamellae of rutile following
rhombohedral directions indicate pseudomorphosis a:fter ilmenite. These accessory minerais are
found mostly as heavy mineral layers. Detrital monazite crystals have been altered to
crandallite-group minerais, mainly goyazite and florencite, during diagenesis.
Figure 9 - (a) "Zone à boules" exposure in the Sue C open pit mine showing illitized balls wrapped in massive illite. (b) Microscopie photograph of corroded detrital quartz grains in the sandstone close to the wall of a "zone à boules" (polarized reflected light) .
6.1. The Maw Zone
At the Maw Zone, the mineral paragenesis of the sandstone was established using field
observations and the study of 12 samples (Fig. lOa) (see annexe 1). Where the sandstone is not
brecciated, it is systematically strongly silicified. Detrital quartz grains are recrystallized with
formation of new crystals crosscutting and removing former detrital grain borders. No
diagenetic assemblage was observed, suggesting that diagenetic minerais like dickite or illite
have been dissolved prior to or during the pervasive silicification. Locally, the silica deposition
is expressed by euhedral quartz crystallization within small open fractures. Strongly silicified
sandstone may display an emerald green color due to Cr-rich radiated needles of dravite
originating from surface defects on detrital quartz grains (Quirt et al., 1991) (Fig. lOb). This
dravite is probably coeval with the silicification event. An other event of dravite precipitation is
indicated by aggregates of spherulitic dravite crystallized within the space created by quartz
dissolution. The presence of dravite surrounding corroded former euhedral qumiz suggests that
this dravite is later than euhedral quartz (Fig. lOc). The dravite associated with corroded
detrital quartz grains forms the matrix of the collapse-dominated solution breccias at the Maw
Zone and is intergrown with xenotirne (Quirt et al., 1991). This dravite is alkali-free and less
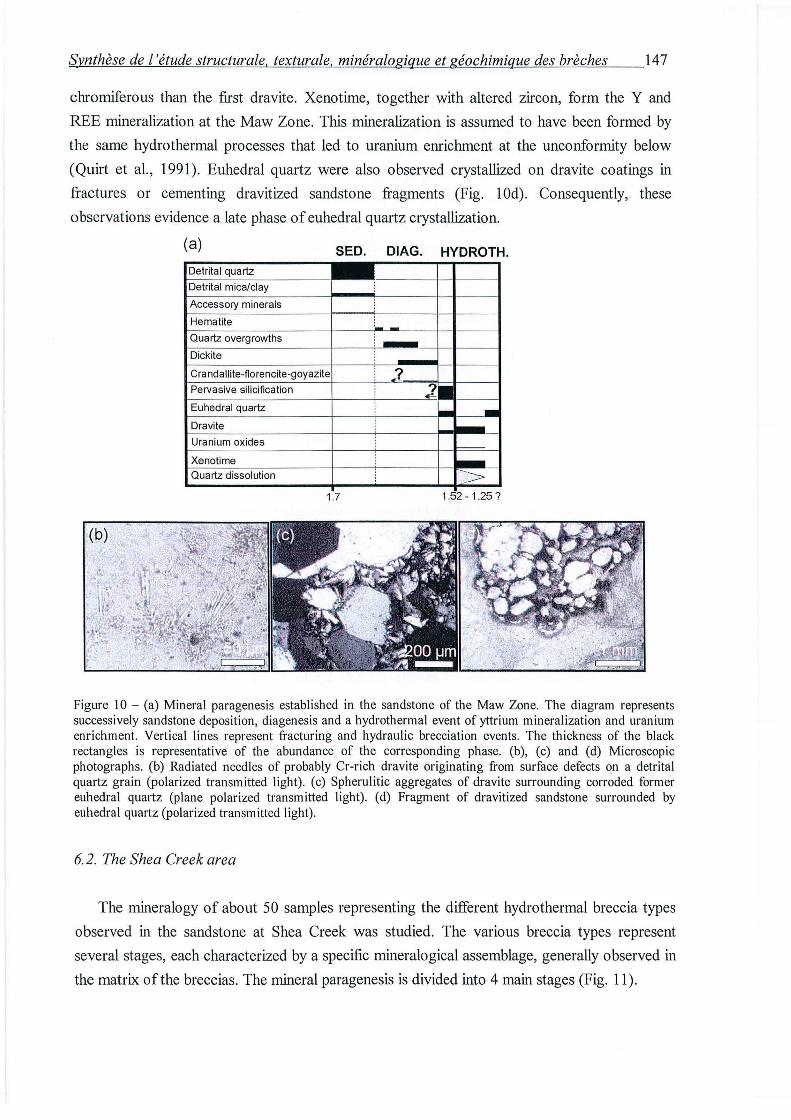
Synthèse de l'étude structurale, textura le, minéralogique et géochimique des brèches 14 7
chrorniferous than the fust dravite. Xenotime, together with altered zircon, form the Y and
REE mineralization at the Maw Zone. This mineralization is assumed to have been formed by
the same hydrothermal processes that led to uranium enrichment at the unconformity below
(Quirt et al., 1991). Euhedral quartz were also observed crystallized on dravite coatings in
fractures or cementing dravitized sandstone fragments (Fig. lOd). Consequently, these
observations evidence a late phase of euhedral quartz crystallization.
(a) SEO. DIAG. HYDROTH.
Figure 10 - (a) Mineral paragenesis established in the sandstone of the Maw Zone. The diagram represents successively sandstone deposition , diagenesis and a hydrothermal event of yttrium mineralization and uranium enrichment. Vertical !ines represent fracturing and hydraulic brecciation events. The thickness of the black rectangles is representative of the abundance of the corresponding phase. (b), (c) and (d) Microscopie photographs. (b) Radiated needles of probably Cr-rich dravite originating from surface defects on a detrital quartz grain (polarized transmitted light). ( c) Spherulitic aggregates of dra vite surrounding corroded former euhedral quartz (plane polarized transmitted light). (d) Fragment of dravitized sandstone surrounded by euhedral quartz (polarized transmitted light) .
6. 2. The Shea Creek a rea
The mineralogy of about 50 samples representing the different hydrothermal breccia types
observed in the sandstone at Shea Creek was studied. The various breccia types represent
several stages, each characterized by a specifie mineralogical assemblage, generally observed in
the matrix of the breccias. The mineral paragenesis is divided into 4 main stages (Fig. 11).
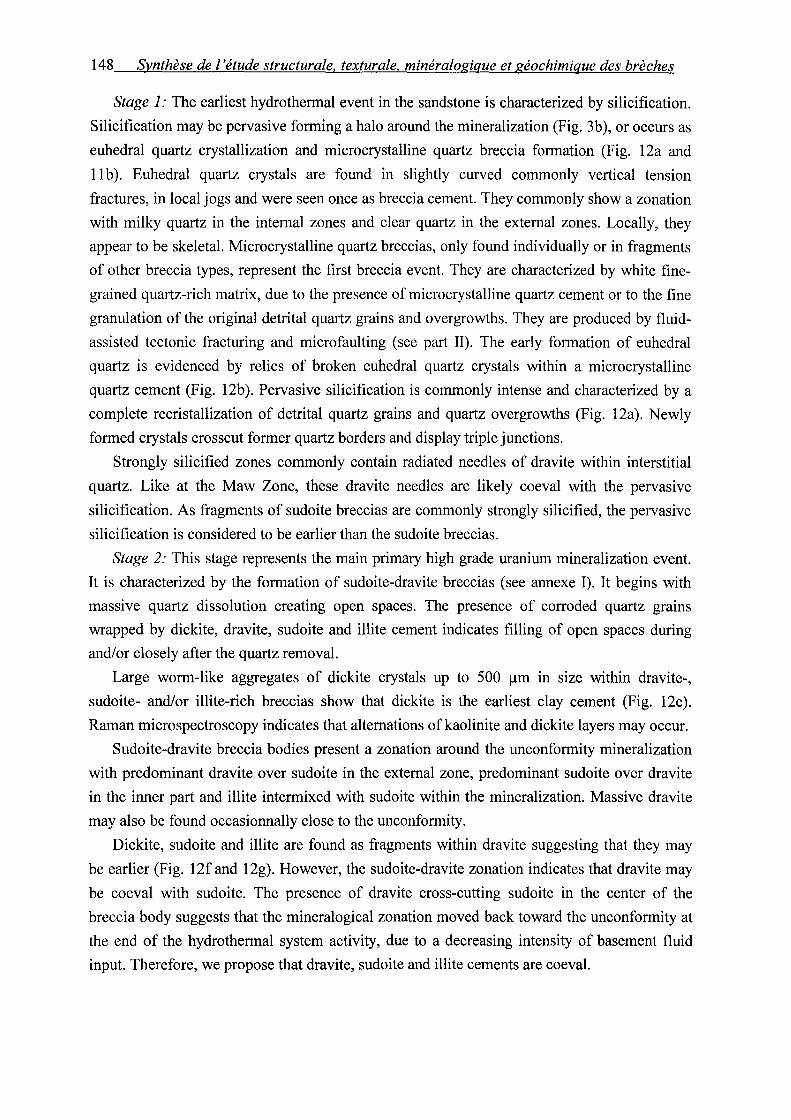
148 Synthèse de 1 'étude structurale, texturale, minéralogique et géochimique des brèches
Stage 1: The earliest hydrothermal event in the sandstone is characterized by silicification.
Silicification may be pervasive forming a halo around the mineralization (Fig. 3b ), or occurs as
euhedral quartz crystallization and microcrystalline quartz breccia formation (Fig. 12a and
11 b ). Euhedral quartz crystals are found in slightly curved commonly vertical tension
fractures, in local jogs and were seen once as breccia cement. They commonly show a zonation
with milky quartz in the internai zones and clear quartz in the extemal zones. Locally, they
appear to be skeletal. Microcrystalline quartz breccias, only found individually or in fragments
of other breccia types, represent the first breccia event. They are characterized by white fine
grained quartz-rich matrix, due to the presence of microcrystalline quartz cement or to the fine
granulation of the original detrital quartz grains and overgrowths. They are produced by fluid
assisted tectonic fracturing and microfaulting (see part II). The early formation of euhedral
quartz is evidenced by relies of broken euhedral quartz crystals within a microcrystalline
quartz cement (Fig. 12b). Pervasive silicification is commonly intense and characterized by a
complete recristallization of detrital quartz grains and quartz overgrowths (Fig. 12a). Newly
formed crystals crosscut former quartz borders and display triple junctions.
Strongly silicified zones commonly contain radiated needles of dravite within interstitial
quartz. Like at the Maw Zone, these dravite needles are likely coeval with the pervasive
silicification. As fragments of sudoite breccias are commonly strongly silicified, the pervasive
silicification is considered to be earlier than the sudoite breccias.
Stage 2: This stage represents the main primary high grade uranium mineralization event.
It is characterized by the formation of sudoite-dravite breccias (see annexe 1). It begins with
massive quartz dissolution creating open spaces. The presence of corroded quartz grains
wrapped by dickite, dravite, sudoite and illite cement indicates filling of open spaces during
and/or closely after the quartz removal.
Large worm-like aggregates of dickite crystals up to 500 1-1m in size within dravite-,
sudoite- and/or illite-rich breccias show that dickite is the earliest clay cement (Fig. 12c).
Raman microspectroscopy indicates that altemations ofkaolinite and dickite layers may occur.
Sudoite-dravite breccia bodies present a zonation around the unconformity mineralization
with predominant dravite over sudoite in the extemal zone, predominant sudoite over dravite
in the inner part and illite intermixed with sudoite within the mineralization. Massive dravite
may also be found occasionnally close to the unconformity.
Dickite, sudoite and illite are found as fragments within dravite suggesting that they may
be earlier (Fig. 12f and 12g). However, the sudoite-dravite zonation indicates that dravite may
be coeval with sudoite. The presence of dravite cross-cutting sudoite in the center of the
breccia body suggests that the mineralogical zonation moved back toward the unconformity at
the end of the hydrothermal system activity, due to a decreasing intensity of basement fluid
input. Therefore, we propose that dravite, sudoite and illite cements are coeval.
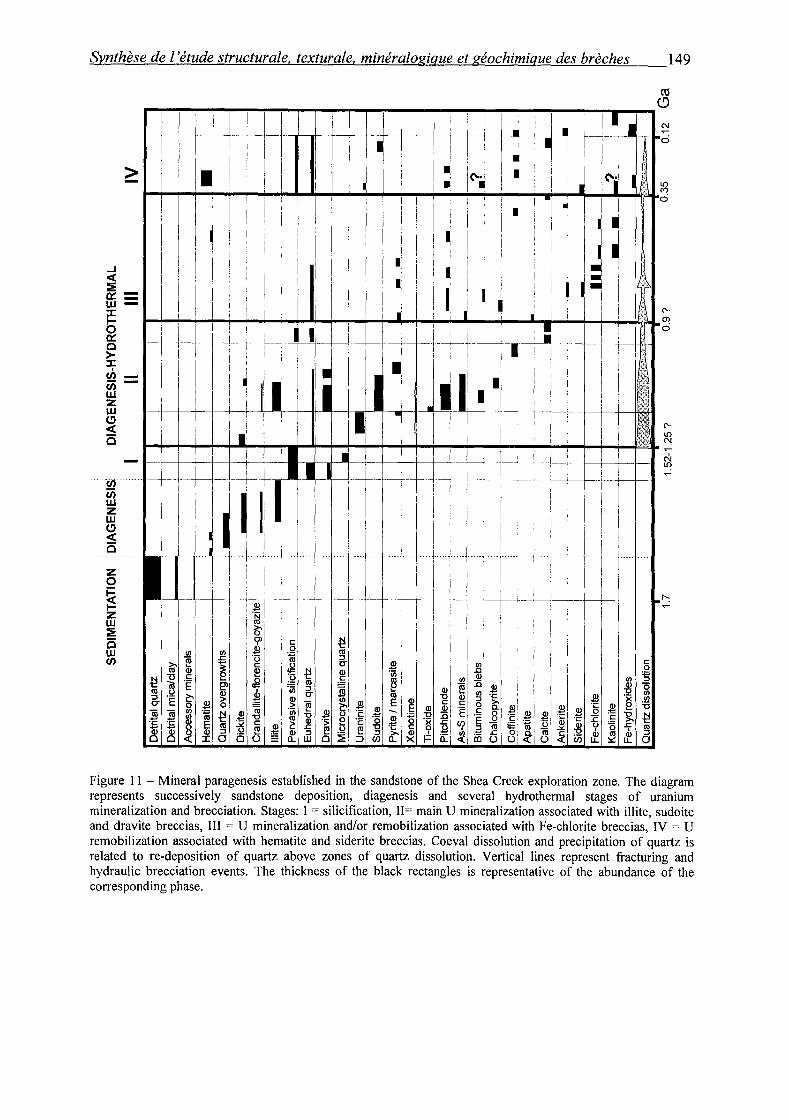
Synthèse de 1 'étude structurale, texturale, minéralogique et géochimique des brèches 149
...J < := o::= w x b 0:: c > x
1 Cl) c;; w z w (!)
< i3
·ur c;; w z w (!)
< i3
z 0
~ 1-' z w := i3 w Cl)
1-
l
i 1
1
t--
--- ,·---
~ ê
~ c
!
1 1
:
1
1
Il 1
1 1
1 ' 1
1 1
i 1
1
1
1
!
' 1 ' 1
1 1
1 i 1
: 1
i 1 1 1 1 ' ! 1
' 1
1 Il 1 1 ' 1
l
.r 1 _1 i 1 1
1
1 1 1 1
1 '
l ___ l
1
i 1
1
il t--
i ' !Q' i
1 1
1 : i ~ \6
1 f i t uJ ~ è 1 ~
1 1
i 1 _1 i 1
1
: •: 1
~ i i
1 1
1 1
~ 1
J J 1
1 1
1 1
_1 _1
i 1 1
1
1
1 1
i 1 1
1
1 __ 1 --- t- ---- t----- 1---
1 1
1
1
i
! ~ 1 ~
_l i 1 1 _! 1 i _-'
; 1 !
! i 1
1 1 . 1 N 1 -• 1
i i 1 ·6
; • !
• 1 !
1('• 1 1 ('i lit' • _1 -~ 1
1 1 i
'--' • 1 1 1
!. 1 1 1
• 1 1 1~ : 1 : • 1
1 1
1~ i 1 -1 1 1 ' 1 f!
1 1
i 1 { C'· 1 1 0>
1
: : 1 ci
l 1 . 1
1 1 1 ' 1 1
i 1 i
J _li~ 1 ' i
1 1
1 ,;i ! 1 i 1
' ('
1
1
1
1
1
1 1 1 1
1 j __;_ i j '
_j __ 1
1 1
+----' . ! i
1 i !
! ! ! 1
1 i
1
i
1 i 1 1 '
1 1
i 1
' 1
il--- ----:'- T. - j--·· ----r----1 -- 1 -----
1
1
' 1
! 1
1
i 1 ' r--:
!
! ! ......
:
1 1
1 i ' 1
! 1
' 1 i
1 1
i 1
1 -~
~ ~ ! j 1
J ~ 1
1 ~ IIi 13 H ~ i 11 ~ ~ <3 L/J
Figure 11 - Mineral paragenesis established in the sandstone of the Shea Creek exploration zone. The diagram represents successive1y sandstone deposition, diagenesis and severa! hydrothermal stages of uranium mineralization and brecciation. Stages: l = silicification, II= main U mineralization associated with illite, sudoite and dravite breccias, Ill = U mineralization and/or remobilization associated with Fe-chlorite breccias, IV = U remobilization associated with hematite and siderite breccias. Coeval dissolution and precipitation of quartz is related to re-deposition of quartz above zones of quartz dissolution. Vertical !ines represent fracturing and hydraulic brecciation events. The thickness of the black rectangles is representative of the abondance of the corresponding phase.
150 Synthèse de l'étude structurale. texturale. minéralogique et géochimique des brèches
Sudoite-dravite breccias have a matrix composed of a high proportion of corroded detrital
quartz grains, up to 85%, and of dravite and sudoite cement. Dravite is acicular and commonly
display spherulitic textures. In massive dravite zones, pseudo-flow banding textures are
common (Fig. 12f). The dravite breccias are polyphase as dravite aggregates are crosscut by
others. The dravite cement contains a very high proportion of accessory minerais like zircons,
anatase and schorls and very few corroded quartz remnants indicating intense dissolution (Fig.
12f). Accessory minerais are commonly organized parallel to the pseudo-flow banding
together with earl y aggregates of more or less illitized dickite (Fig. 12f).
In sudoite breccias, XRD analysis does not show systematically the predominance of peaks
at 4.73 A over peaks at 7.00 A, suggesting the presence of a mixture of sudoite (di
trioctahedral chlorite) with trioctahedral chlorite or the existence of mixed-layers. However,
the chemical composition of these chlorites suggests that they mostly correspond to sudoites
(Fig. 13). Their average formulae is (Ko.o7, Nao.oi, Cao.oi) (SÎJ.33 Alo.67) Ah.s4 (Feo.2, Mg1.77 ,
Nio.os) 010 (OH)s (Table 2). The presence of K is either due to mixing with, or pollution by,
illite. They have AliV, AlVI, Mg and Fe values similar to the sudoites of the Cigar Lake and
Cluff D uranium deposits alteration haloes (Halter, 1988) (Fig. 13 and 14). Therefore, the
spatially associated sudoite breccias and uraninite and pitchblende unconformity
mineralization suggests that they are contemporaneous.
The structural formula of clay minerais at the contact with uranium oxides suggest that
they are mixed layer illite-chlorite minerais (Table 2). Locally, mixed layer illite-chlorite
minerais are also found in the alteration halo. The presence of mixed layer illite-chlorite
minerais associated with dravite in the vicinity of perched mineralizations suggests that
unconformity and perched mineralizations are coeval.
Minerais of the crandallite-florencite-goyazite group are closely associated with illite
cement (Fig. 12c). ldiomorphic xenotime overgrowths were observed on zircons within the
sudoite-dravite matrix suggesting that xenotime new formation may be coeval with uranium
mineralization (Fig. 12d). The local presence of bituminous blebs trapped between 2 growth
zones of euhedral quartz shows that quartz deposition occurred after the stage 1. Therefore,
sorne of the euhedral quartz present within the silicification halo surrounding breccias and
mineralization may have formed by redeposition of the silica dissolved below after vertical
transport. The presence of multiple euhedral quartz growth zones in sorne fractures indicates
several fluid pulses.
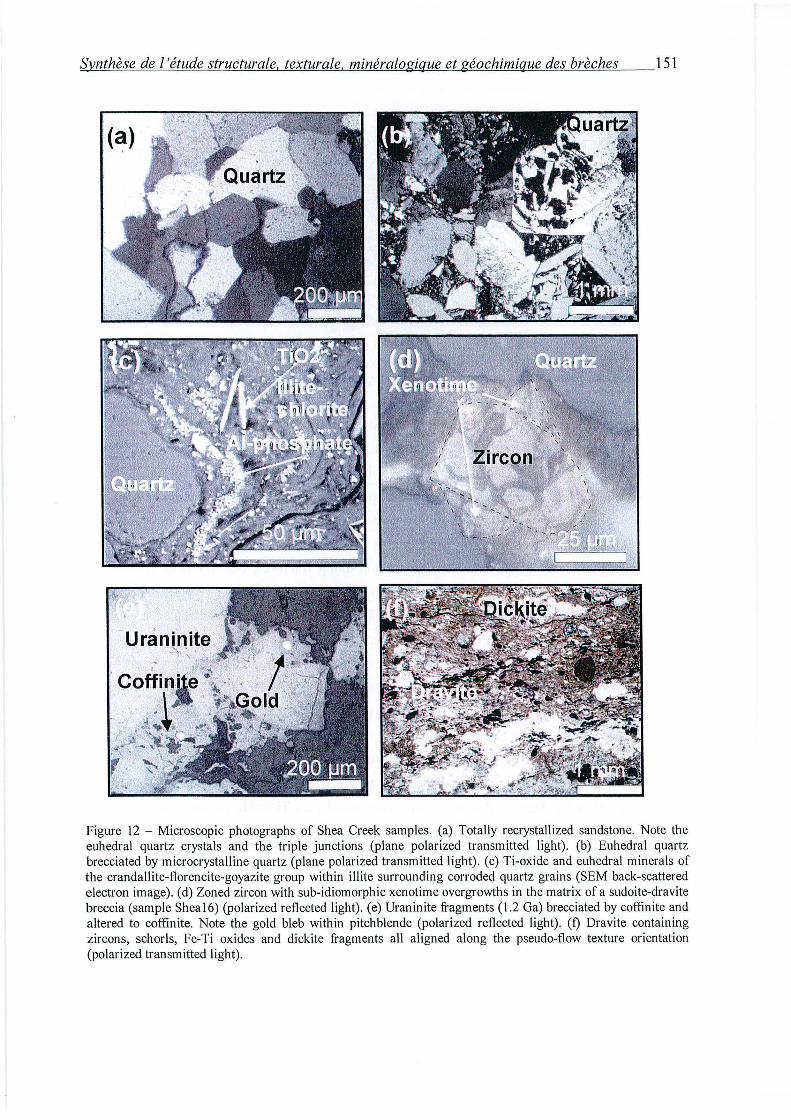
Svnthèse de l'étude structurale, texturale, minéralogique et géochimique des brèches 151
(a)
Figure 12 - Microscopie photographs of Shea Creek samples. (a) Totally recrystallized sandstone. Note the euhedral quartz crystals and the triple junctions (plane polarized transmitted light). (b) Euhedral quartz brecciated by microcrystalline quartz (plane polarized transmitted light). (c) Ti-oxide and euhedral minerais of the crandallite-florencite-goyazite group within illite surrounding corroded quartz grains (SEM back-scattered electron image). (d) Zoned zircon with sub-idiomorphic xenotime overgrowths in the matrix of a sudoite-dravite breccia (sample Shea16) (polarized reflected light). (e) Uraninite fragments (1.2 Ga) brecciated by coffinite and altered to coffinite. Note the gold bleb within pitchblende (polarized reflected light). (t) Dravite containing zircons, schorls, Fe-Ti oxides and dickite fragments ail aligned along the pseudo-flow texture orientation (polarized transmitted light).

152 Svnthèse de l 'étude structurale, texturale, minéralogique et géochimique des brèches
Figure 12- (g) Detrital quartz grains and sudoite brecciated by dravite (SEM back-scattered electron image). (h) Eudral marcasite crystals within calcite. Fe-chlorite impregnates the calcite (polarized transmitted light) .
Ore metallic minerais: High reflectance uraninite occurs as euhedral cubic crystals or as
radiated elements within chlorite- and illite-rich breccias within a few meters above the
unconformity (Fig. 12e ). Locally, uraninite is brecciated by pitchblende, that is altered to
coffmite (Fig. 12e). Pitchblende and pyrite impregnation of worm-like dickite indicate that
pitchblende is coeval with sudoite and/or illite crystallization. Pyrite was also observed as
cement of hydraulically microbreccif:lted quartz grains. High reflectance uraninite cubes are
commonly altered to coffmite on th~ borders and along fractures, occasionnally pyrite-filled,
showing that coffinite is later than uraninite and pyrite (Fig. 12e). A Si versus Pb diagram
expressed in millications shows two trends of uraninite alteration: a trend of replacement of Pb
by Si due to slow diffusion and coffinitization trend (Fig. 15).
Subidiomorphic U-Ti-Si and Ti-oxide crystals as well as native gold blebs are present within
the pitchblende indicating that they may be coeval with it (Fig. 12e). Native gold is commonly
associated with Bi seleno-tellurides. Arsenides, sulfoarsenides and sulfides frequently crosscut
or rim uraninite, or appear disseminated in low reflectance pitchblende or in the sudoite, illite
and dravite matrix. Ni, Co, Fe sulfoarsenides are common and locally rimmed by pitchblende.
Niccolite (NiAs), rammelsbergite (NiAs2) and gersdorffite (NiAsS) appear commonly in this
chronological order. Gersdorffi.te m(l.y form overgrowths on Ti-oxide minerais. Bravoite [(Ni,
Fe)S2] and skutterudite [(Ni, Co )As~] are locally developed and occur later than gersdorffite.
Lollingite (FeAsS) is also part of thy metallic mineral assemblage and is altered to native As.
Late molybdenite may also occur vyry locally. Bituminous blebs, locally found as fragments
within dravite, are locally rimmed by chalcopyrite and then by pyrite indicating that this pyrite
generation is later than chalcopyrite which is later than the carbonaceous material.
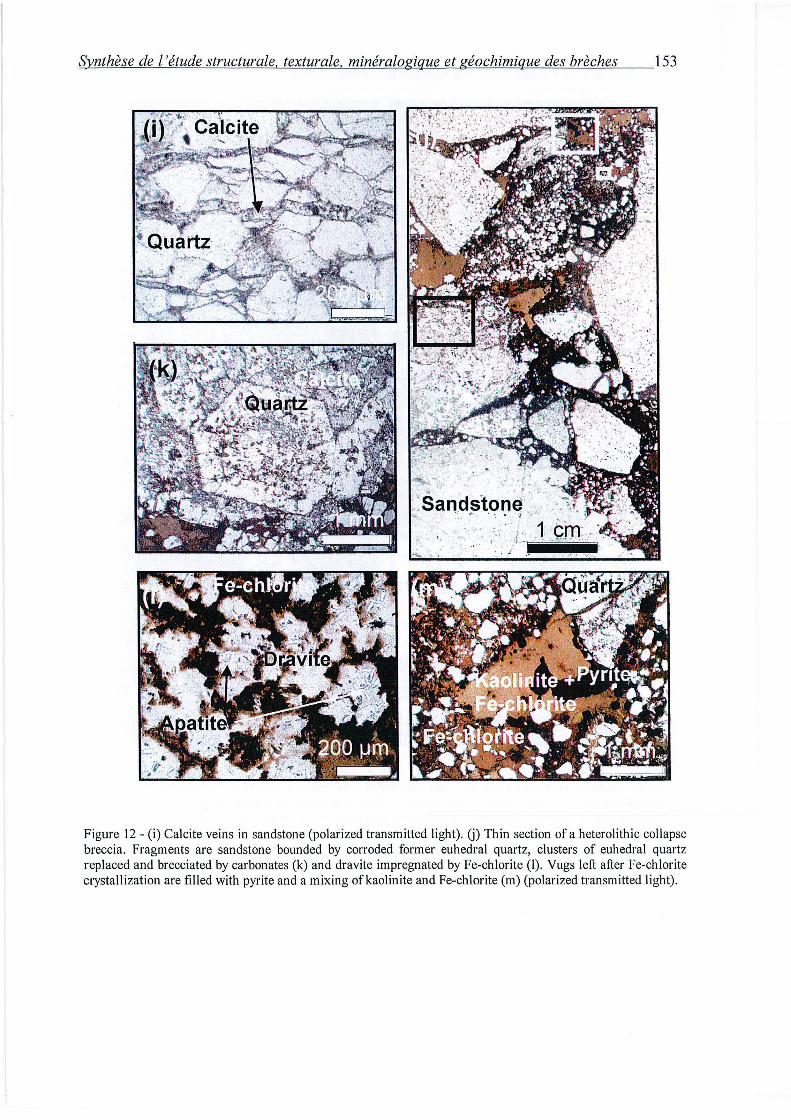
Svnthèse de l'étude structurale, texturale. minéralogique et géochimique des brèches 153
Figure 12- (i) Calcite veins in sandstone (polarized transmitted light). U) Thin section of a heterolithic collapse breccia. Fragments are sandstone bounded by corroded former euhedral quartz, clusters of euhedral quartz replaced and brecciated by carbonates (k) and dravite impregnated by Fe-chlorite (1). Vugs Ieft after Fe-chlorite crystallization are filled with pyrite and a mixing ofkaolinite and Fe-chlorite (rn) (polarized transmitted light).
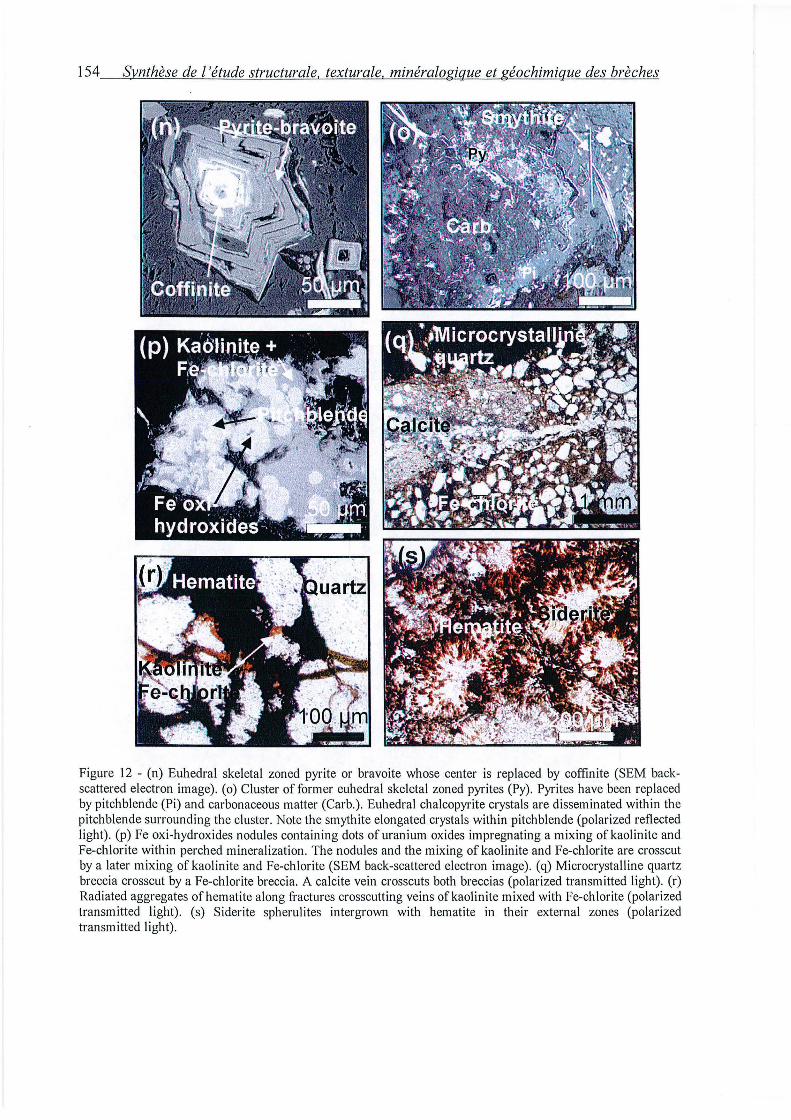
154 Synthèse de 1 'étude structurale, texturale, minéralogique et géochimique des brèches
Figure 12 - (n) Euhedral skeletal zoned pyrite or bravoite whose center is replaced by coffinite (SEM backscattered electron image). (o) Cluster offormer euhedral skeletal zoned pyrites (Py). Pyrites have been replaced by pitchblende (Pi) and carbonaceous matter (Carb.). Euhedral chalcopyrite crystals are disseminated within the pitchblende surrounding the cluster. Note the smythite elongated crystals within pitchblende (polarized reflected light). (p) Fe oxi-hydroxides nodules containing dots of uranium oxides impregnating a mixing of kaolinite and Fe-chlorite within perched mineralization. The nodules and the mixing ofkaolinite and Fe-chlorite are crosscut by a later mixing of kaolinite and Fe-chlorite (SEM back-scattered electron image). (q) Microcrystalline quartz breccia crosscut by a Fe-chlorite breccia. A calcite vein crosscuts both breccias (polarized transmitted light). (r) Radiated aggregates of hematite along fractures crosscutting veins ofkao\inite mixed with Fe-chlorite (polarized transmitted light). (s) Siderite spherulites intergrown with hematite in their external zones (polarized transmitted light) .
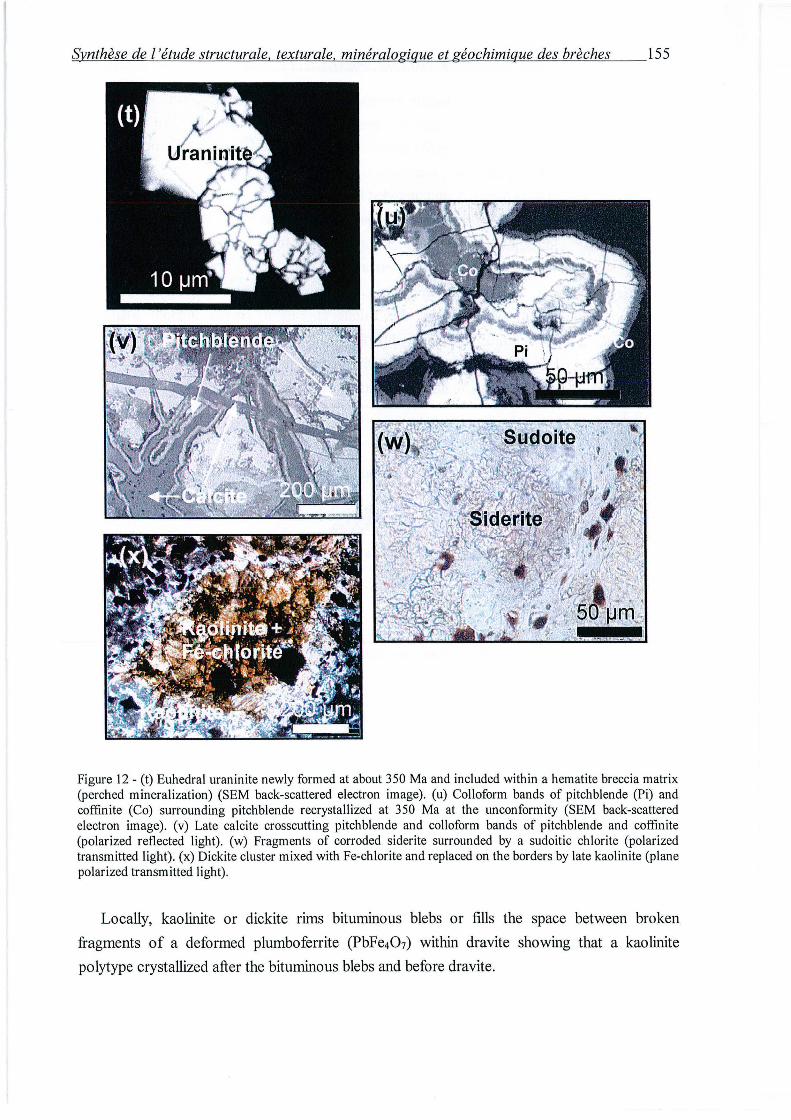
Synthèse de l'étude structurale. texturale. minéralogique et géochimique des brèches 155
Figure 12- (t) Euhedral uraninite newly formed at about 350 Ma and included within a hematite breccia matrix (perched mineralization) (SEM back-scattered electron image). (u) Colloform bands of pitchblende (Pi) and coffinite (Co) surrounding pitchblende recrystallized at 350 Ma at the unconformity (SEM back-scattered electron image). (v) Late calcite crosscutting pitchblende and colloform bands of pitchblende and coffinite (polarized retlected light). (w) Fragments of corroded siderite surrounded by a sudoitic chlorite (polarized transmitted light). (x) Dickite cluster mixed with Fe-chlorite and replaced on the borders by late kaolinite (plane polarized transmitted light).
Locally, kaolinite or dickite rims bituminous blebs or fills the space between broken
fragments of a deformed plumboferrite (PbFe4Ü7) within dravite showing that a kaolinite
polytype crystallized after the bituminous blebs and before dravite.
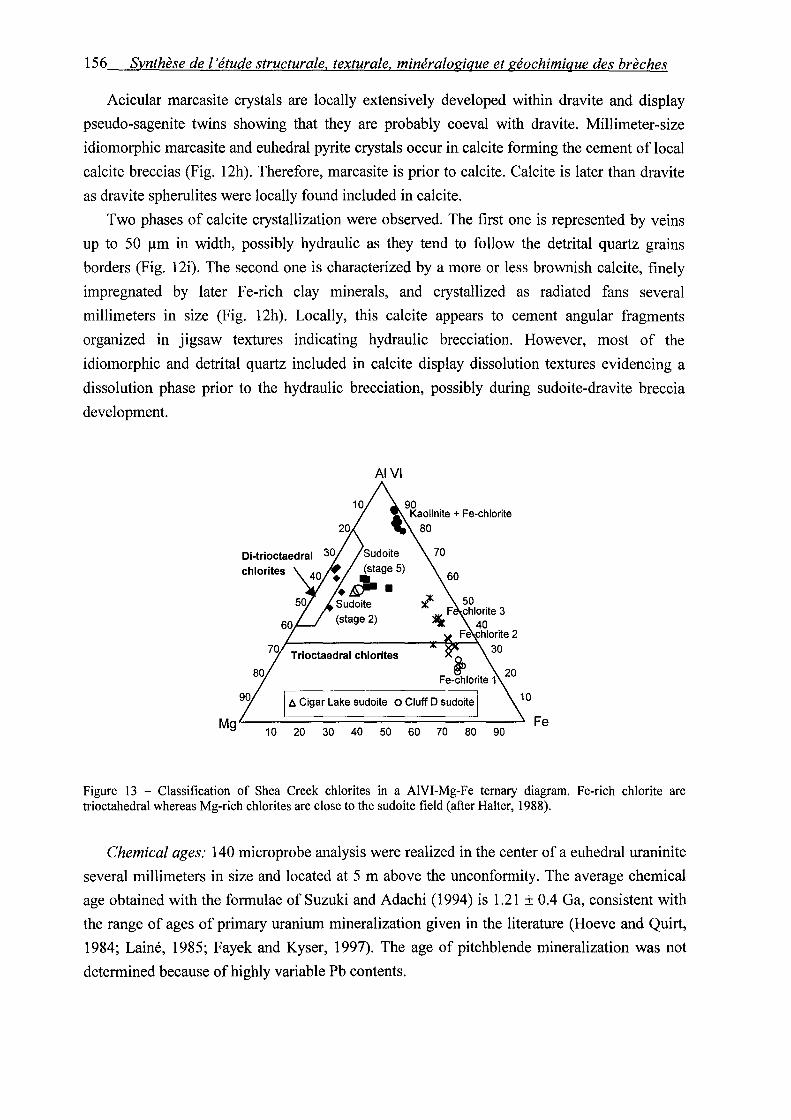
156 Synthèse de l'étude structurale, texturale, minéralogique et géochimique des brèches
Acicular marcasite crystals are locally extensively developed within dravite and display
pseudo-sagenite twins showing that they are probably coeval with dravite. Millimeter-size
idiomorphic marcasite and euhedral pyrite crystals occur in calcite forming the cement of local
calcite breccias (Fig. 12h). Therefore, marcasite is prior to calcite. Calcite is later than dravite
as dravite spherulites were locally found included in calcite.
Two phases of calcite crystallization were observed. The first one is represented by veins
up to 50 Jlm in width, possibly hydraulic as they tend to follow the detrital quartz grains
borders (Fig. 12i). The second one is characterized by a more or less brownish calcite, finely
impregnated by later Fe-rich clay minerais, and crystallized as radiated fans several
millimeters in size (Fig. 12h). Locally, this calcite appears to cement angular fragments
organized in jigsaw textures indicating hydraulic brecciation. However, most of the
idiomorphic and detrital quartz included in calcite display dissolution textures evidencing a
dissolution phase prior to the hydraulic brecciation, possibly during sudoite-dravite breccia
development.
chlorites
Al VI
Sudoite
(stage 5)
·.~.
Trioctaedral chlorites
t:. Cigar Lake sudoite o Cluff D sudoite
Fe
Figure 13 - Classification of Shea Creek chlorites in a AlVI-Mg-Fe temary diagram. Fe-rich chlorite are trioctahedral whereas Mg-rich chlorites are close to the sudoite field (after Halter, 1988).
Chemical ages: 140 microprobe analysis were realized in the center of a euhedral uraninite
several millimeters in size and located at 5 rn above the unconformity. The average chemical
age obtained with the formulae of Suzuki and A dac hi (1994) is 1.21 ± 0.4 Ga, consistent with
the range of ages of primary uranium mineralization given in the literature (Hoeve and Quirt,
1984; Lainé, 1985; Fayek and Kyser, 1997). The age of pitchblende mineralization was not
determined because of highly variable Pb contents.
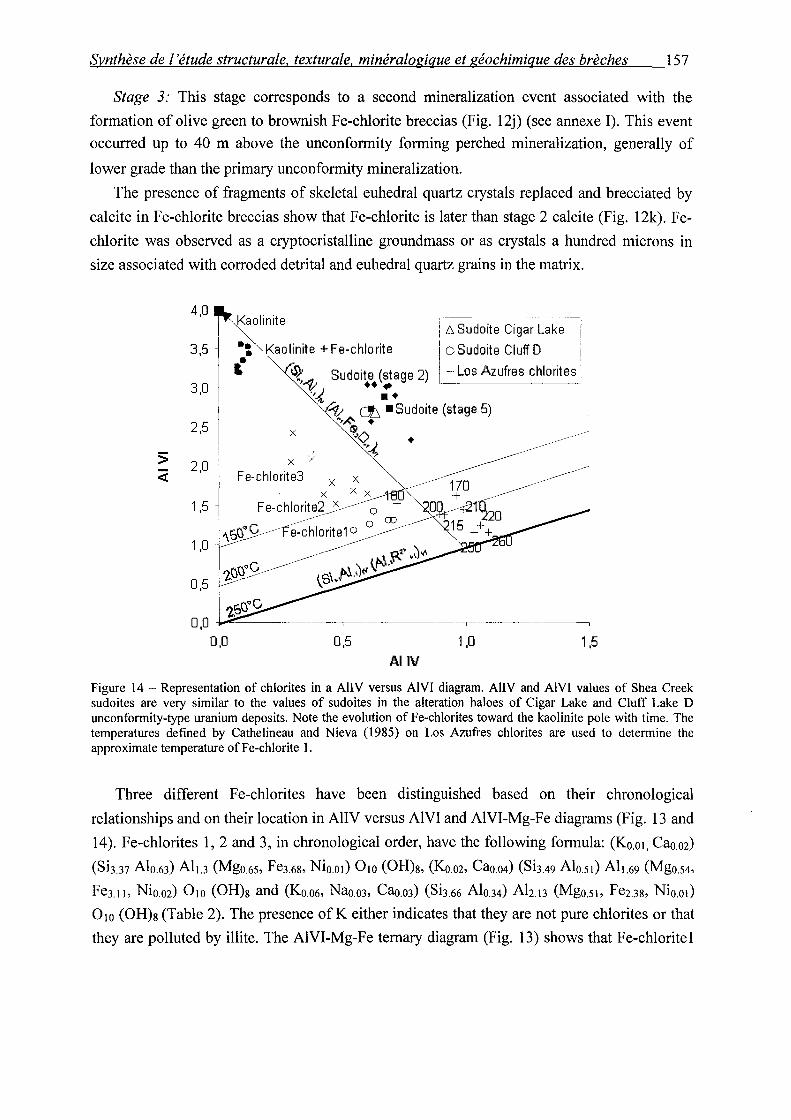
Synthèse de 1 'étude structurale, texturale, minéralogique et géochimique des brèches 157
Stage 3: This stage corresponds to a second mineralization event associated with the
formation of olive green to brownish Fe-chlorite breccias (Fig. 12j) (see annexe 1). This event
occurred up to 40 rn above the unconformity forming perched mineralization, generally of
lower grade than the primary unconformity mineralization.
The presence of fragments of skeletal euhedral quartz crystals replaced and brecciated by
calcite in Fe-chlorite breccias show that Fe-chlorite is later than stage 2 calcite (Fig. 12k). Fe
chlorite was observed as a cryptocristalline groundmass or as crystals a hundred microns in
size associated with corroded detrital and euhedral quartz grains in the matrix.
5 <(
4,0~1'' ao m1te
3,5 •: Kao linite + F e-chlo rite
' 3,0 ~·...-t. Sudoite (stage 2) '.v •• -
·~..{ .. ~ ·~ ·--------, [ !\ Sudoite Cigar Lake [
1 o Sudoite Cluff D 1
~Los Azufres chlorites J
At/ dh •Sudoite (stage 5) •,;(;- .
t%o • "'d
2,5 x
2,0 . x '/ F e-chlorite3 x x
1 ,5
1 ,0
0,5
0,5 1 ,0 1 ,5 Al IV
Figure 14 ~ Representation of chlorites in a AIIV versus AlVI diagram. AIIV and AlVI values of Shea Creek sudoites are very similar to the values of sudoites in the alteration haloes of Cigar Lake and Cluff Lake D unconformity-type uranium deposits. Note the evolution of Fe-chlorites toward the kaolinite pole with time. The temperatures defined by Cathelineau and Nieva (1985) on Los Azufres chlorites are used to determine the approximate temperature of Fe-chlorite 1.
Three different Fe-chlorites have been distinguished based on their chronological
relationships and on their location in AllY versus AlVI and AlVI-Mg-Fe diagrams (Fig. 13 and
14). Fe-chlorites 1, 2 and 3, in chronological order, have the following formula: (Ko.o1, Cao.o2)
(SÏJ.J7 Alo.6J) Alu (Mgo.6s, Fe3.6s, Nio.oi) 010 (OH)s, (Ko.o2, Cao.o4) (SÏ3.49 Alo.si) All.69 (Mgo.s4,
FeJ.JJ, Nio.o2) 010 (OH)s and (Ko.o6, Nao.oJ, Cao.oJ) (Sh66 Alo.J4) Ab.13 (Mgo.sJ, Fe2.3s, Nio.oi)
0 10 (OH)s (Table 2). The presence of K either indicates that they are not pure chlorites or that
they are polluted by illite. The AlVI-Mg-Fe temary diagram (Fig. 13) shows that Fe-chlorite1
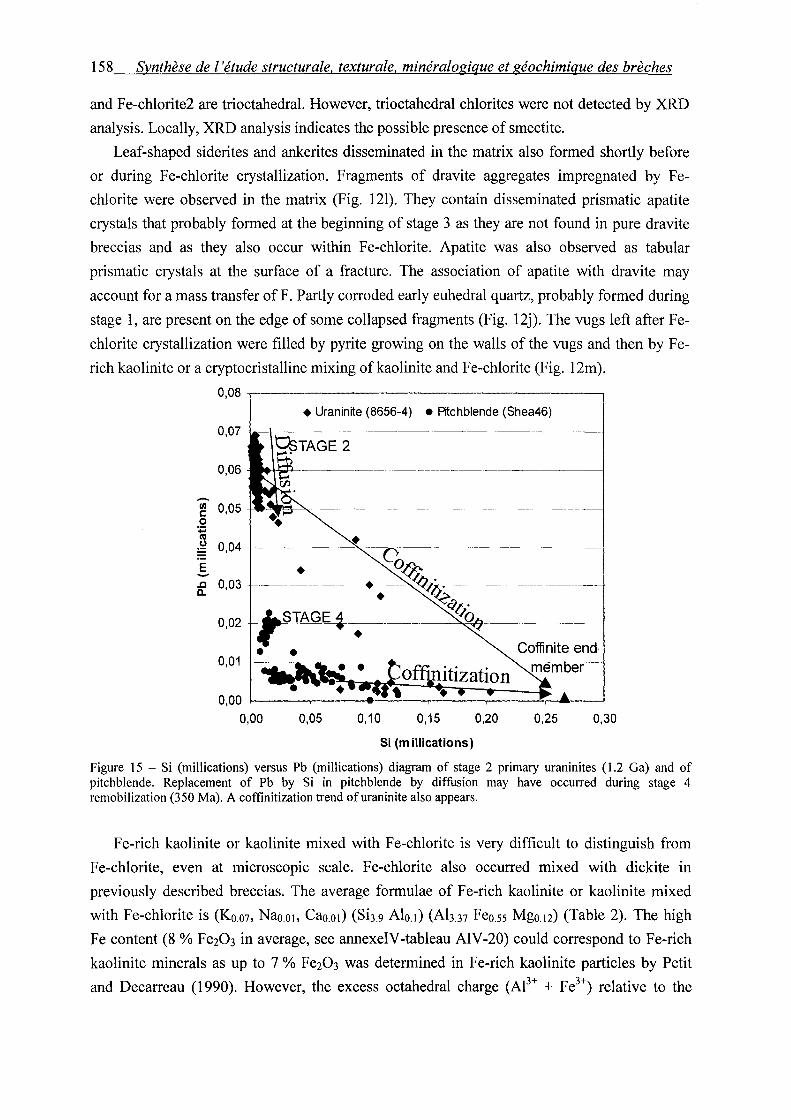
158 Synthèse de l'étude structurale, texturale, minéralogique et géochimique des brèches
and Fe-chlorite2 are trioctahedral. However, trioctahedral chlorites were not detected by XRD
analysis. Locally, XRD analysis indicates the possible presence of smectite.
Leaf-shaped siderites and ankerites disseminated in the matrix also formed shortly before
or during Fe-chlorite crystallization. Fragments of dravite aggregates impregnated by Fe
chlorite were observed in the matrix (Fig. 121). They contain disseminated prismatic apatite
crystals that probably formed at the beginning of stage 3 as they are not found in pure dravite
breccias and as they also occur within Fe-chlorite. Apatite was also observed as tabular
prismatic crystals at the surface of a fracture. The association of apatite with dravite may
account for a mass transfer ofF. Partly corroded early euhedral quartz, probably formed during
stage 1, are present on the edge of sorne collapsed fragments (Fig. 12j). The vugs left after Fe
chlorite crystallization were filled by pyrite growing on the walls of the vugs and then by Fe
rich kaolinite or a cryptocristalline mixing ofkaolinite and Fe-chlorite (Fig. 12m).
0,08 -..----------------------.
+Uraninite (8656-4) • Rtchblende (Shea46)
0,07
0,06
--Ill 0,05 c 0
:.;::; ca g 0,04 ·--------------!
E -.c 0,03 0..
0,02
0,01
0,00
0,00 0,05 0,10 0,15 0,20 0,25 0,30
Si (rn illications)
Figure 15 - Si (millications) versus Pb (millications) diagram of stage 2 primary uraninites (1.2 Ga) and of pitchblende. Replacement of Pb by Si in pitchblende by diffusion may have occurred during stage 4 remobilization (350 Ma). A coffinitization trend of uraninite also appears.
Fe-rich kaolinite or kaolinite mixed with Fe-chlorite is very difficult to distinguish from
Fe-chlorite, even at microscopie scale. Fe-chlorite also occurred mixed with dickite in
previously described breccias. The average formulae of Fe-rich kaolinite or kaolinite mixed
with Fe-chlorite is (Ko.o7, Nao.o1, Cao.oi) (SÏJ.9 Alo.I) (Ah_37 Feo.ss Mgo.12) (Table 2). The high
Fe content (8 % Fe203 in average, see annexeiV -tableau AIV -20) could correspond to Fe-rich
kaolinite minerais as up to 7% Fe203 was determined in Fe-rich kaolinite particles by Petit
and Decarreau (1990). However, the excess octahedral charge (Al3+ + Fe3+) relative to the
Synthèse de l'étude structurale, texturale, minéralogique et géochimique des brèches 159
tetrahedral charge (Si4+) indicate abundance of Fe oxides extemal to the kaolinite structure. In
addition, the Fe/(Fe+Mg) ratio ofthese kaolinite is about 0.82 and is similar to the Fe/(Fe+Mg)
ratio of Fe-chlorite minerais (between 0.82 and 0.85). Therefore, the formulae is more
probably representative of a mixing of kaolinite with Fe-chlorite than a Fe-rich kaolinite.
Idiomorphic zoned skeletal pyrite crystals are disseminated within the Fe-chlorite cement
or are grouped in clusters, showing that they are prior to Fe-chlorite (Fig. 12n). Locally, Ni
was detected in pyrite by X-ray analysis coupled with SEM indicating the probable existence
of bravoite. Pyrite crystals are commonly replaced by pitchblende in their center or along
zones. Locally, pyrites are partly replaced to totally pseudomorphosed by carbonaceous matter
(Fig. 12o ). Carbonaceous matter is occasionally surrounded by pitchblende associated with
disseminated euhedral chalcopyrite crystals.
Corroded pitchblende fragments and clusters of pyrite replaced by pitchblende and/or
carbonaceous matter are surrounded by a rim of radiated aggregates of more or less corroded
elongated prismatic crystals having a composition between pyrite and pyrrhotite, possibly
greigite (Fe3S4). Pyrrhotite may have formed around pyrite clusters by reduction due to action
of C as proposed by Hall (1986). Acicular smythite crystals several hundreds of microns in
length occur within the clay matrix generally close to mineralized fragments. A vug occurring
within pitchblende contains elongated crystals of pyrite and small pyrite cubes replacing
former tabular unidentified crystals. These tabular crystals are surrounded by a thin rim of
pitchblende and by coffinite. This shows that phases of pitchblende crystallization altemate
with phases of Fe-sulfide deposition.
One phase of pitchblende deposition corresponds to tiny U-oxide inclusions within
hematite and Fe-hydroxides nodules impregnating kaolinite mixed with Fe-chlorite (Fig. 12p).
A later kaolinite mixed with Fe-chlorite crosscut the uraniferous nodules. Uranium silicates,
possibly coffinite, rim corroded pyrites or pitchblende.
A late phase of ankerite and calcite crystallization occurred within vugs or as veins
crosscutting Fe-chlorites and sulfides (Fig. 12q). Ankerite crystals formed on the borders of
vugs whereas calcite crystallized in the middle. Therefore, calcite is later than ankerite.
Important lead loss in pitchblende precludes from giving any significant chemical age. An
approximate age of 900 Ma can be proposed for the Fe-chlorite breccias by comparison with a
possibly similar paragenetic sequence (Fe-rich kaolinite or kaolinite mixed with Fe-chlorite)
dated 900 ±50 Ma using a K-Ar method in the Cigar Lake deposit (Philippe et al., 1993).
Chlorite geothermometer: The location of Fe-chlorites 1, 2 and 3 and of later kaolinite
mixed with Fe-chlorite in a AllY versus AlVI diagram (Fig. 14) shows an evolution towards
the kaolinite pole possibly due to an increasing abundance of mixed layer kaolinite-chlorite
minerais. Cathelineau and Nieva (1985) have established that in a hydrothermal environment,
the temperature of crystallization of chlorite decreases linearly parallel to the substitution
160 Synthèse de 1 'étude structurale, texturale, minéralogique et géochimique des brèches
vector (Si+1AL1)1v (Al+,Fe_20+1)vi, where D is the vacancy (Fig. 14). The chlorites of the Los
Azufres geothermal field used by Cathelineau and Ni eva ( 1985) were plotted in the AliV
versus AlVI diagram with their estimated temperatures. The isotherms defined by the data at
Los Azufres were used to estimate a temperature of crystallization of Fe-chlorites 1 of about
180°C. As the other chlorite types are probably mixed layer minerais, they cannot be compared
with Los Azufres chlorites.
Stage 4: This stage is characterized by a weakly mineralized event, located between 30 and
40 rn above the unconformity. It is associated with hematite and siderite (see annexe I).
Hematite-filled fractures crosscut fractures filled with kaolinite mixed with Fe-chlorite,
indicating that hematite is later than these clay minerais (Fig. 12r). Hematite is also present
between corroded detrital quartz grains and occasionally as replacement of former euhedral
pyrites disseminated in kaolinite mixed with Fe-chlorite. It is frequently found crystallized in
radiated aggregates. Hematite-goethite nodules display intergrowths with siderite spherulites in
the matrix of polyphase carbonate breccias, showing that siderite, hematite and goethite are
coeval (Fig. 12s). Part of the hematite continued to be deposited later as it also surrounds
siderite.
The perched mineralization consists of pitchblende enclosing hematite crystals, followed
by botryoidal concretions of coffinite in vugs. Very locally, uraninites less than 10 !lm in size
are included in hematite, showing that it is earlier (Fig. 12t). At the unconformity, primary
pitchblende is corroded and contains banded pitchblende and coffinite with colloform textures
within vugs or syneresis cracks (Fig. 12u). Calcite veins, usually shallow dipping, crosscut the
various uranium mineral phases suggesting late crystallization (Fig. 12v).
A late chlorite generation locally occurs around corroded siderite crystals. (Fig. 12w).
XRD analysis indicates a mixture of trioctahedral with sorne di-trioctahedral chlorite. The
average chlorite formulae is (Ko.os, Cao.o2) (Sh_33 Alo.67) Ah_79 (Feo.s? Mg1.22) 010 (OH)8. Their
location close to the di-trioctahedral chlorite field in a AlVI-Mg-Fe temary diagram (Fig. 13)
shows that they can be assimilated to sudoites. They have similar AliV, AlVI, Mg and Fe
values to the sudoites of the Cigar Lake and Cluff D uranium deposits alteration haloes
(Halter, 1988) (Fig. 13 and 14).
Late urchin-like aggregates of goethite crystallized in vugs on hematite or replaced
hematite. Kaolinite appears to replace Fe-chlorite in sorne breccias, however its chronological
relationship with Fe-oxi-hydroxides is not clearly established (Fig. 12x). Kaolinite is the latest
phase which seems to be still crystallizing in relation with present meteoric fluids circulation
(Kotzer and Kyser, 1995).
The observation at macroscopic scale of silicification of solution breccia matrix suggests
the occurrence of pervasive silicification posterior to stage 2. Late euhedral quartz crystals,
possibly related to this silicification event, occur within vugs of these resilicified solution
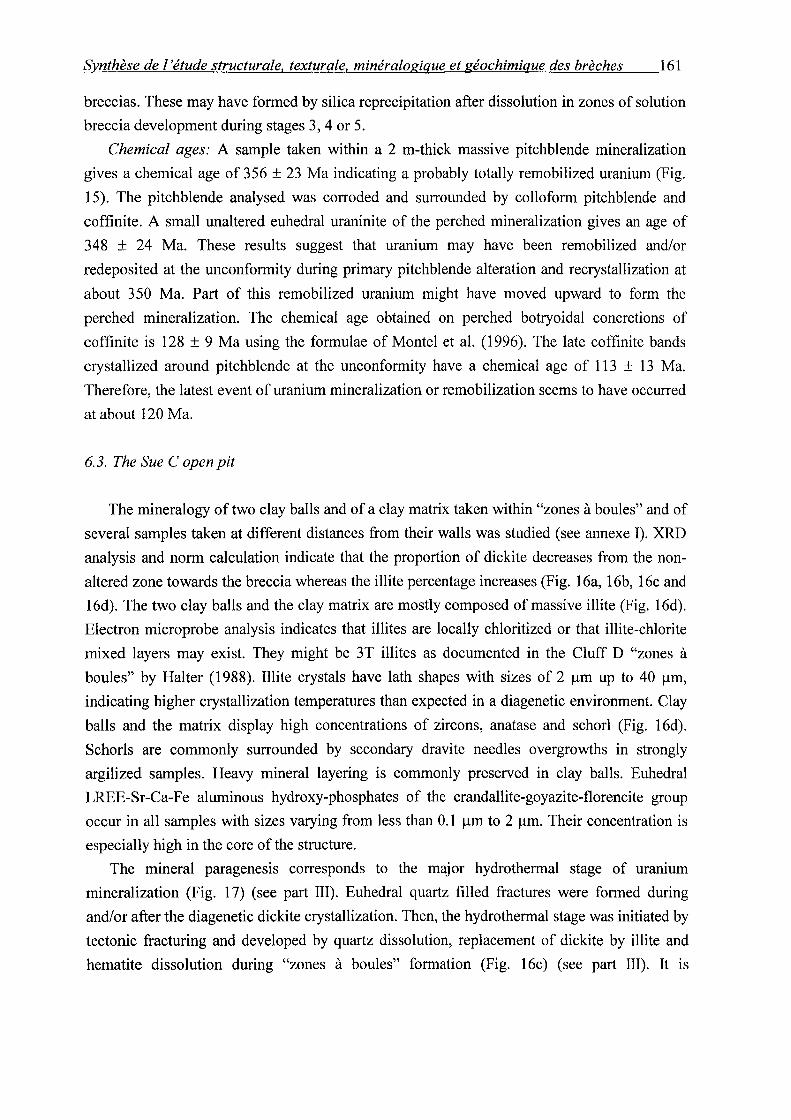
Synthèse de 1 'étude structurale, texturale, minéralogique et géochimique des brèches 161
breccias. These may have formed by silica reprecipitation after dissolution in zones of solution
breccia development during stages 3, 4 or 5.
Chemical ages: A sample taken within a 2 m-thick massive pitchblende mineralization
gives a chemical age of 356 ± 23 Ma indicating a probably totally remobilized uranium (Fig.
15). The pitchblende analysed was corroded and surrounded by colloform pitchblende and
coffinite. A small unaltered euhedral uraninite of the perched mineralization gives an age of
348 ± 24 Ma. These results suggest that uranium may have been remobilized and/or
redeposited at the unconformity during primary pitchblende alteration and recrystallization at
about 350 Ma. Part of this remobilized uranium might have moved upward to forrn the
perched mineralization. The chemical age obtained on perched botryoidal concretions of
coffinite is 128 ± 9 Ma using the formulae of Montel et al. (1996). The late coffinite bands
crystallized around pitchblende at the unconformity have a chemical age of 113 ± 13 Ma.
Therefore, the latest event of uranium mineralization or remobilization seems to have occurred
at about 120 Ma.
6.3. The Sue C open pit
The mineral ogy of two clay balls and of a clay matrix taken within "zones à boules" and of
severa! samples taken at different distances from their walls was studied (see annexe 1). XRD
analysis and norm calculation indicate that the proportion of dickite decreases from the non
altered zone towards the breccia whereas the illite percentage increases (Fig. 16a, 16b, 16c and
16d). The two clay balls and the clay matrix are mostly composed of massive illite (Fig. 16d).
Electron microprobe analysis indicates that illites are locally chloritized or that illite-chlorite
mixed layers may exist. They might be 3T illites as documented in the Cluff D "zones à
boules" by Halter (1988). Illite crystals have lath shapes with sizes of 2 J..Lm up to 40 J..Lm,
indicating higher crystallization temperatures than expected in a diagenetic environment. Clay
halls and the matrix display high concentrations of zircons, anatase and schorl (Fig. 16d).
Schorls are commonly surrounded by secondary dravite needles overgrowths in strongly
argilized samples. Heavy mineral layering is commonly preserved in clay balls. Euhedral
LREE-Sr-Ca-Fe aluminous hydroxy-phosphates of the crandallite-goyazite-florencite group
occur in all samples with sizes varying from less than 0.1 J..Lm to 2 J..Lm. Their concentration is
especially high in the core of the structure.
The mineral paragenesis corresponds to the major hydrothermal stage of uranium
mineralization (Fig. 17) (see part III). Euhedral quartz filled fractures were formed during
and/or after the diagenetic dickite crystallization. Then, the hydrothermal stage was initiated by
tectonic fracturing and developed by quartz dissolution, replacement of dickite by illite and
hematite dissolution during "zones à boules" formation (Fig. 16c) (see part III). lt is
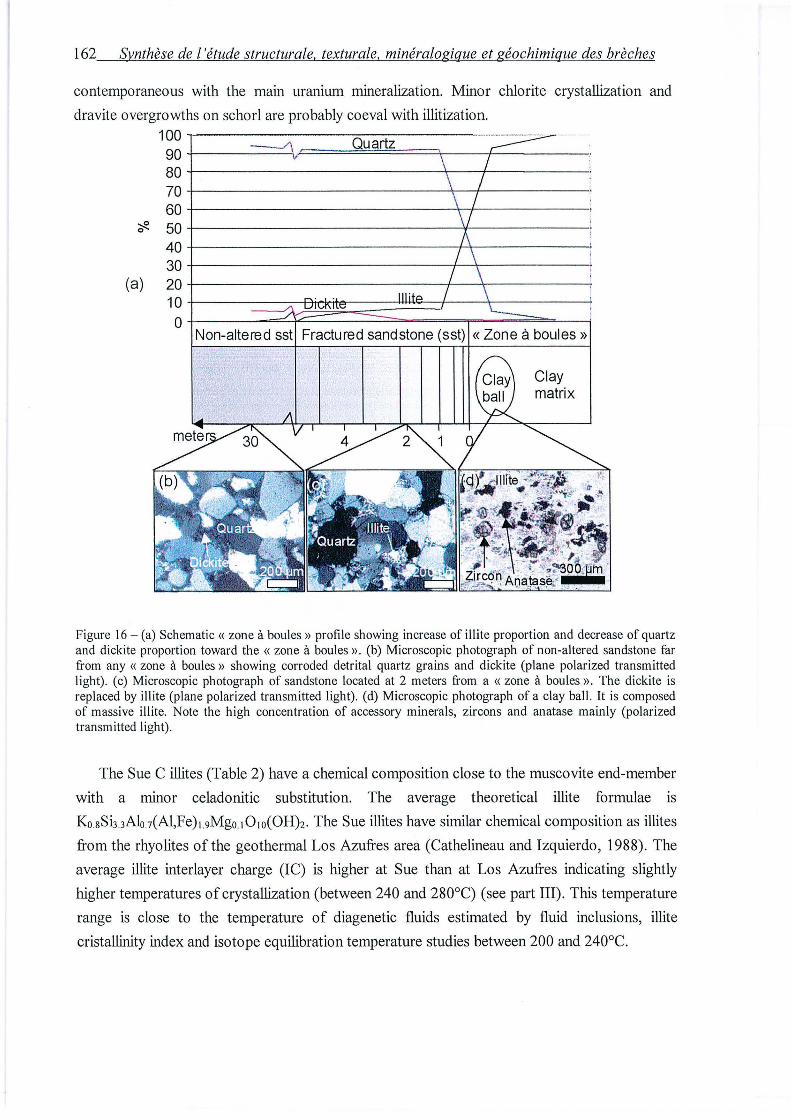
162 Synthèse de l'étude structurale. texturale. minéralogique et géochimique des brèches
contemporaneous with the main uranimn mineralization. Minor chlorite crystallization and
dravite overgrowths on schorl are probably coeval with illitization.
(a)
100,~--------------~--~------------ - ----=~ 90+-----~~r=====~====~--~c_ _______ , 80+--------------------------r---r----------70+-------------------------~--+-----------'
60+--------------------------+~-----------,
50+----------------------------~------------:
40+---------------------------~------------'
30+-------------------------~~~----------\
20+-------------------------+-~.---------~
1~t===~~~~~==~~~;::==J
Clay matrix
Figure 16- (a) Schematic « zone à boules» profile showing increase of illite proportion and decrease of quartz and dickite proportion toward the «zone à boules». (b) Microscopie photograph of non-altered sandstone far from any « zone à boules » showing corroded detrital quartz grains and dickite (plane polarized transmitted light). (c) Microscopie photograph of sandstone located at 2 meters from a « zone à boules ». The dickite is replaced by illite (plane polarized transmitted light). (d) Microscopie photograph of a clay bail. It is composed of massive illite. Note the high concentration of accessory minerais, zircons and anatase mainly (polarized transmitted light).
The Sue C illites (Table 2) have a chemical composition close to the muscovite end-member
with a minor celadonitic substitution. The average theoretical illite formulae is
Ko_sSb 3A1n(Al,Fe)t.9Mg0 ,ü 10(0H)2. The Sue illites have similar chemical composition as illites
from the rhyolites of the geothermal Los Azufres area (Cathelineau and Izquierdo, 1988). The
average illite interlayer charge (IC) is higher at Sue than at Los Azufres indicating slightly
higher temperatures of crystallization (between 240 and 280°C) (see part III). This temperature
range is close to the temperature of diagenetic fluids estirnated by fluid inclusions, illite
cristallinity index and isotope equilibration temperature studies between 200 and 240°C.
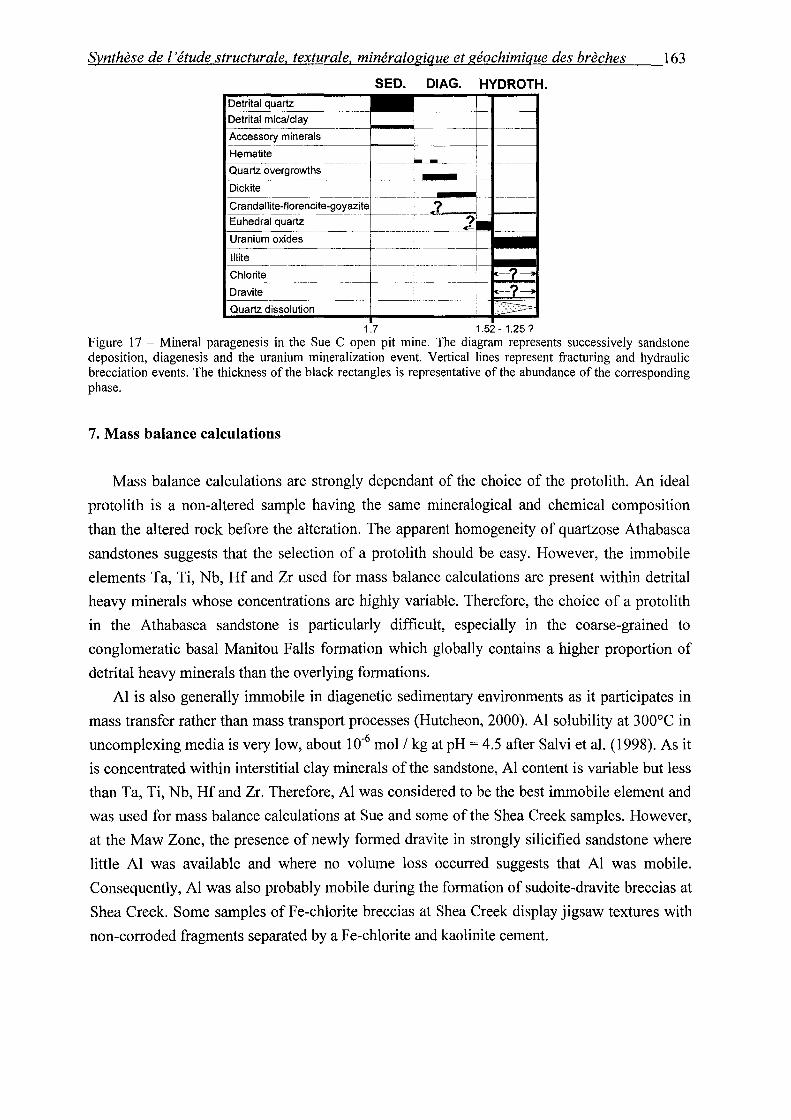
Synthèse de 1 'étude structurale, texturale, minéralogique et géochimique des brèches 163
SEO. DIAG. HYDROTH.
1.7 1 - 1.25? Figure 17 - Mineral paragenesis in the Sue C open pit mine. The diagram represents successively sandstone deposition, diagenesis and the uranium mineralization event. Vertical !ines represent fracturing and hydraulic brecciation events. The thickness of the black rectangles is representative of the abundance of the corresponding phase.
7. Mass balance calculations
Mass balance calculations are strongly dependant of the choice of the protolith. An ideal
protolith is a non-altered sample having the same mineralogical and chemical composition
than the altered rock before the alteration. The apparent homogeneity of quartzose Athabasca
sandstones suggests that the selection of a protolith should be easy. However, the immobile
elements Ta, Ti, Nb, Hf and Zr used for mass balance calculations are present within detrital
heavy minerais whose concentrations are highly variable. Therefore, the choice of a protolith
in the Athabasca sandstone is particularly difficult, especially in the coarse-grained to
conglomeratic basal Manitou Falls formation which globally contains a higher proportion of
detrital heavy minerais than the overlying formations.
Al is also generally immobile in diagenetic sedimentary environments as it participates in
mass transfer rather than mass transport processes (Hutcheon, 2000). Al solubility at 300°C in
uncomplexing media is very low, about 10-6 mol 1 kg at pH = 4.5 after Salvi et al. (1998). As it
is concentrated within interstitial clay minerais of the sandstone, Al content is variable but less
than Ta, Ti, Nb, Hf and Zr. Therefore, Al was considered to be the best immobile element and
was used for mass balance calculations at Sue and sorne of the Shea Creek samples. However,
at the Maw Zone, the presence of newly formed dravite in strongly silicified sandstone where
little Al was available and where no volume loss occurred suggests that Al was mobile.
Consequently, Al was also probably mobile during the formation of sudoite-dravite breccias at
Shea Creek. Sorne samples of Fe-chlorite breccias at Shea Creek display jigsaw textures with
non-corroded fragments separated by a Fe-chlorite and kaolinite cement.
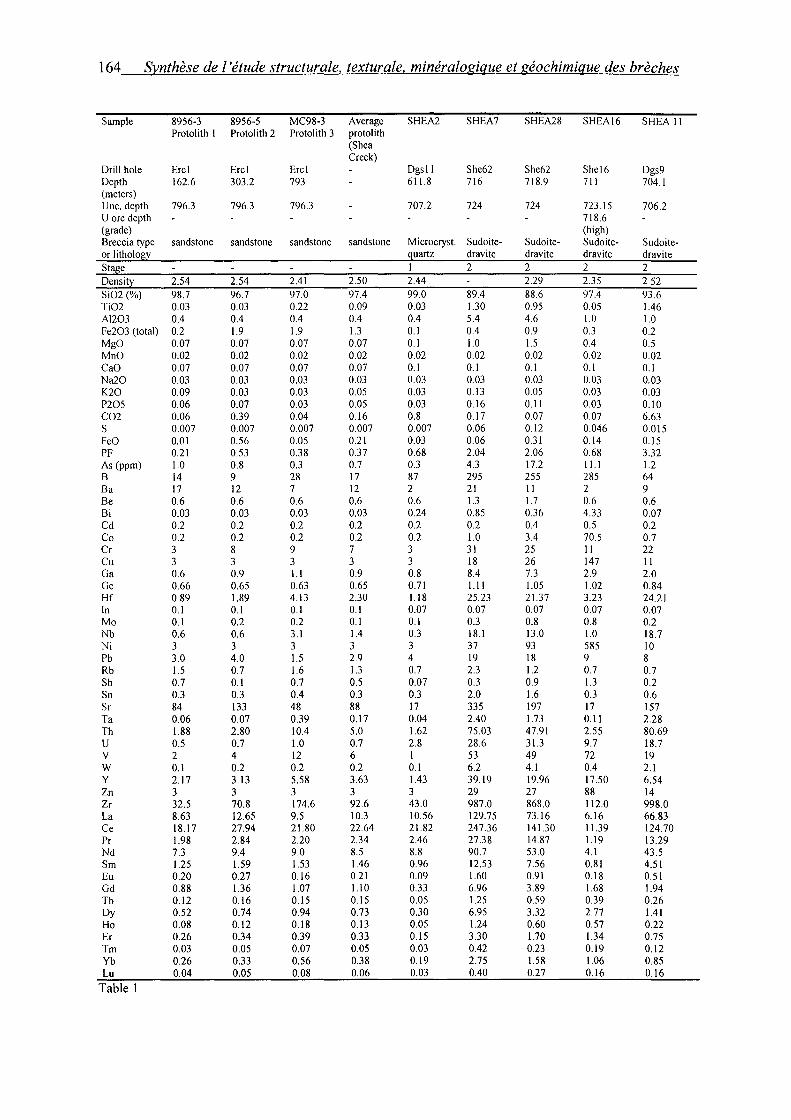
164 Synthèse de l'étude structurale, texturale, minéralogique et géochimique des brèches
Sample 8956-3 8956-5 MC98-3 Average SHEA2 SHEA7 SHEA28 SHEA16 SHEA Il Protolith 1 Protolith 2 Protolith 3 protolith
(Shea Creek)
Drill hole Ercl Ercl Ercl Dgsll She62 She62 Shel6 Dgs9 Depth 162.6 303.2 793 611.8 716 718.9 711 704.1 (meters) Une. depth 796.3 796.3 796.3 707.2 724 724 723.15 706.2 U ore depth 718.6 (grade) (high) Breccia type sandstone sandstone sandstone sandstone Microcryst. Sudoite- Sudoite- Sudoite- Sudoite-or lithology quartz dravite dravite dravite dravite Sta e 1 2 2 2 2 Density 2.54 2.54 2.41 2.50 2.44 2.29 2.35 2.52 Si02(%) 98.7 96.7 97.0 97.4 99.0 89.4 88.6 97.4 93.6 Ti02 0.03 0.03 0.22 0.09 0.03 1.30 0.95 0.05 1.46 Al203 0.4 0.4 0.4 0.4 0.4 5.4 4.6 1.0 1.0 Fe203 (total) 0.2 1.9 1.9 1.3 0.1 0.4 0.9 0.3 0.2 Mgü 0.07 0.07 0.07 0.07 0.1 1.0 1.5 0.4 0.5 Mnü 0.02 0.02 0.02 0.02 0.02 0.02 0.02 0.02 0.02 CaO 0.07 0.07 0.07 0.07 0.1 0.1 0.1 0.1 0.1 Na20 0.03 0.03 0.03 0.03 0.03 0.03 0.03 0.03 0.03 K20 0.09 0.03 0.03 0.05 0.03 0.13 0.05 0.03 0.03 P205 0.06 0.07 0.03 0.05 0.03 0.16 0.11 0.03 0.10 C02 0.06 0.39 0.04 0.16 0.8 0.17 0.07 0.07 6.63 s 0.007 0.007 0.007 0.007 0.007 0.06 0.12 0.046 0.015 Feü 0.01 0.56 0.05 0.21 0.03 0.06 0.31 0.14 0.15 PF 0.21 0.53 0.38 0.37 0.68 2.04 2.06 0.68 3.32 As (ppm) 1.0 0.8 0.3 0.7 0.3 4.3 17.2 11.1 1.2 B 14 9 28 17 87 295 255 285 64 Ba 17 12 7 12 2 21 Il 2 9 Be 0.6 0.6 0.6 0.6 0.6 1.3 1.7 0.6 0.6 Bi 0.03 0.03 0.03 0.03 0.24 0.85 0.36 4.33 0.07 Cd 0.2 0.2 0.2 0.2 0.2 0.2 0.4 0.5 0.2 Co 0.2 0.2 0.2 0.2 0.2 1.0 3.4 70.5 0.7 Cr 3 8 9 7 3 31 25 Il 22 Cu 3 3 3 3 3 18 26 147 Il Ga 0.6 0.9 1.1 0.9 0.8 8.4 7.3 2.9 2.0 Ge 0.66 0.65 0.63 0.65 0.71 1.11 1.05 1.02 0.84 Hf 0.89 1.89 4.13 2.30 1.18 25.23 21.37 3.23 24.21 In 0.1 0.1 0.1 0.1 0.07 0.07 0.07 0.07 0.07 Mo 0.1 0.2 0.2 0.1 0.1 0.3 0.8 0.8 0.2 Nb 0.6 0.6 3.1 1.4 0.3 18.1 13.0 1.0 18.7 Ni 3 3 3 3 3 37 93 585 10 Pb 3.0 4.0 1.5 2.9 4 19 18 9 8 Rb 1.5 0.7 1.6 1.3 0.7 2.3 1.2 0.7 0.7 Sb 0.7 0.1 0.7 0.5 0.07 0.3 0.9 1.3 0.2 Sn 0.3 0.3 0.4 0.3 0.3 2.0 1.6 0.3 0.6 Sr 84 133 48 88 17 335 197 17 157 Ta 0.06 0.07 0.39 0.17 0.04 2.40 1.73 0.11 2.28 Th 1.88 2.80 10.4 5.0 1.62 75.03 47.91 2.55 80.69 u 0.5 0.7 1.0 0.7 2.8 28.6 31.3 9.7 18.7 v 2 4 12 6 1 53 49 72 19 w 0.1 0.2 0.2 0.2 0.1 6.2 4.1 0.4 2.1 y 2.17 3.13 5.58 3.63 1.43 39.19 19.96 17.50 6.54 Zn 3 3 3 3 3 29 27 88 14 Zr 32.5 70.8 174.6 92.6 43.0 987.0 868.0 112.0 998.0 La 8.63 12.65 9.5 10.3 10.56 129.75 73.16 6.16 66.83 Ce 18.17 27.94 21.80 22.64 21.82 247.36 141.30 11.39 124.70 Pr 1.98 2.84 2.20 2.34 2.46 27.38 14.87 1.19 13.29 Nd 7.3 9.4 9.0 8.5 8.8 90.7 53.0 4.1 43.5 Sm 1.25 1.59 1.53 1.46 0.96 12.53 7.56 0.81 4.51 Eu 0.20 0.27 0.16 0.21 0.09 1.60 0.91 0.18 0.51 Gd 0.88 1.36 1.07 1.10 0.33 6.96 3.89 1.68 1.94 Tb 0.12 0.16 0.15 0.15 0.05 1.25 0.59 0.39 0.26 Dy 0.52 0.74 0.94 0.73 0.30 6.95 3.32 2.77 1.41 Ho 0.08 0.12 0.18 0.13 0.05 1.24 0.60 0.57 0.22 Er 0.26 0.34 0.39 0.33 0.15 3.30 1.70 1.34 0.75 Tm 0.03 0.05 0.07 0.05 0.03 0.42 0.23 0.19 0.12 Yb 0.26 0.33 0.56 0.38 0.19 2.75 1.58 1.06 0.85 Lu 0.04 0.05 0.08 0.06 0.03 0.40 0.27 0.16 0.16
Table 1
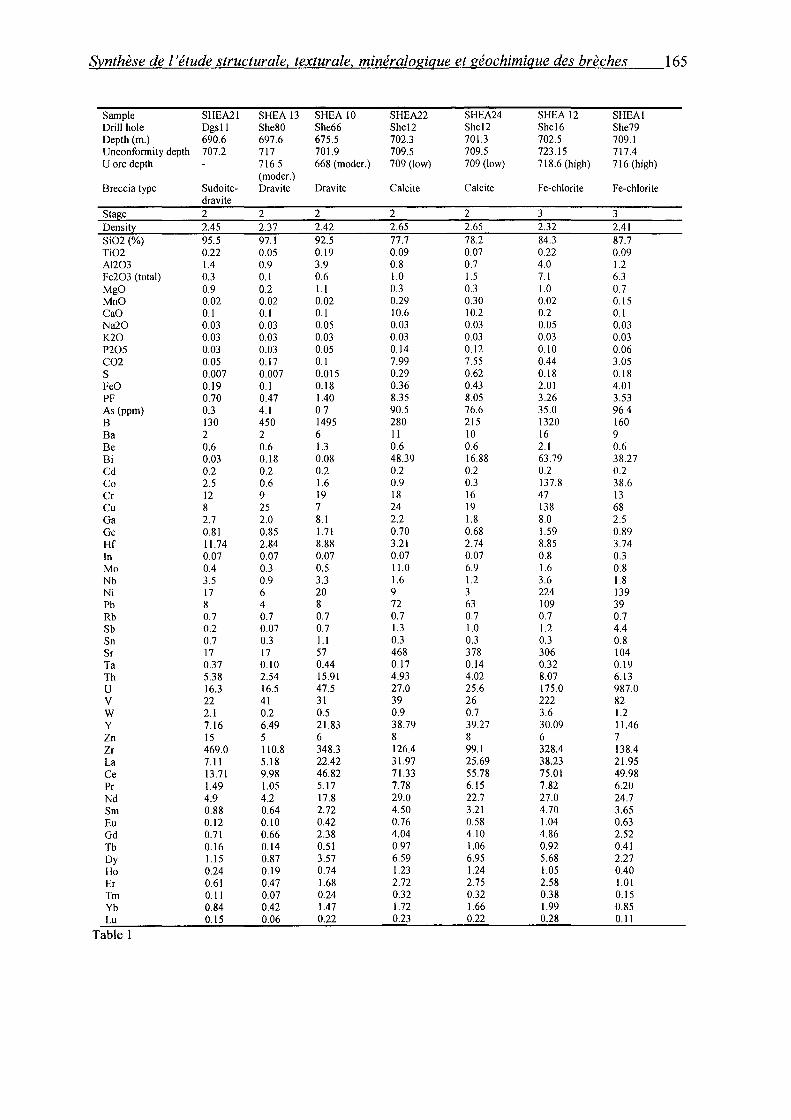
Synthèse de l'étude structurale, texturale, minéralogique et géochimique des brèches 165
Sample SHEA21 SHEA 13 SHEA 10 SHEA22 SHEA24 SHEA 12 SHEA1 Drill hole Dgs11 She80 She66 Shel2 Shel2 She16 She79 Depth (m.) 690.6 697.6 675.5 702.3 701.3 702.5 709.1 Unconfonnity depth 707.2 717 701.9 709.5 709.5 723.15 717.4 U ore depth 716.5 668 (moder.) 709 (low) 709 (low) 718.6 (high) 716 (high)
(moder.) Breccia type Sudoite- Dra vite Dra vite Calcite Calcite Fe-ch lori te Fe-ch lori te
dravite Sta e 2 2 2 2 2 3 3 Density 2.45 2.37 2.42 2.65 2.65 2.32 2.41 Si02 (%) 95.5 97.1 92.5 77.7 78.2 84.3 87.7 Ti02 0.22 0.05 0.19 0.09 0.07 0.22 0.09 Al203 1.4 0.9 3.9 0.8 0.7 4.0 1.2 Fe203 (total) 0.3 0.1 0.6 1.0 1.5 7.1 6.3 Mgü 0.9 0.2 1.1 0.3 0.3 1.0 0.7 Mnü 0.02 0.02 0.02 0.29 0.30 0.02 0.15 CaO 0.1 0.1 0.1 10.6 10.2 0.2 0.1 Na20 0.03 0.03 0.05 0.03 0.03 0.05 0.03 K20 0.03 0.03 0.03 0.03 0.03 0.03 0.03 P205 0.03 0.03 0.05 0.14 0.12 0.10 0.06 C02 0.05 0.17 0.1 7.99 7.55 0.44 3.05 s 0.007 0.007 0.015 0.29 0.62 0.18 0.18 FeO 0.19 0.1 0.18 0.36 0.43 2.01 4.01 PF 0.70 0.47 1.40 8.35 8.05 3.26 3.53 As (ppm) 0.3 4.1 0.7 90.5 76.6 35.0 96.4 B 130 450 1495 280 215 1320 160 Ba 2 2 6 Il 10 16 9 Be 0.6 0.6 1.3 0.6 0.6 2.1 0.6 Bi 0.03 0.18 0.08 48.39 16.88 63.79 38.27 Cd 0.2 0.2 0.2 0.2 0.2 0.2 0.2 Co 2.5 0.6 1.6 0.9 0.3 137.8 38.6 Cr 12 9 19 18 16 47 13 Cu 8 25 7 24 19 138 68 Ga 2.7 2.0 8.1 2.2 1.8 8.0 2.5 Ge 0.81 0.85 1.71 0.70 0.68 1.59 0.89 Hf 11.74 2.84 8.88 3.21 2.74 8.85 3.74 In 0.07 0.07 0.07 0.07 0.07 0.8 0.3 Mo 0.4 0.3 0.5 11.0 6.9 1.6 0.8 Nb 3.5 0.9 3.3 1.6 1.2 3.6 1.8 Ni 17 6 20 9 3 224 139 Pb 8 4 8 72 63 109 39 Rb 0.7 0.7 0.7 0.7 0.7 0.7 0.7 Sb 0.2 0.07 0.7 1.3 1.0 1.2 4.4 Sn 0.7 0.3 1.1 0.3 0.3 0.3 0.8 Sr 17 17 57 468 378 306 104 Ta 0.37 0.10 0.44 0.17 0.14 0.32 0.19 Th 5.38 2.54 15.91 4.93 4.02 8.07 6.13 u 16.3 16.5 47.5 27.0 25.6 175.0 987.0 v 22 41 31 39 26 222 82 w 2.1 0.2 0.5 0.9 0.7 3.6 1.2 y 7.16 6.49 21.83 38.79 39.27 30.09 11.46 Zn 15 5 6 8 8 6 7 Zr 469.0 110.8 348.3 126.4 99.1 328.4 138.4 La 7.11 5.18 22.42 31.97 25.69 38.23 21.95 Ce 13.71 9.98 46.82 71.33 55.78 75.01 49.98 Pr 1.49 1.05 5.17 7.78 6.15 7.82 6.20 Nd 4.9 4.2 17.8 29.0 22.7 27.0 24.7 Sm 0.88 0.64 2.72 4.50 3.21 4.70 3.65 Eu 0.12 0.10 0.42 0.76 0.58 1.04 0.63 Gd 0.71 0.66 2.38 4.04 4.10 4.86 2.52 Tb 0.16 0.14 0.51 0.97 1.06 0.92 0.41 Dy 1.15 0.87 3.57 6.59 6.95 5.68 2.27 Ho 0.24 0.19 0.74 1.23 1.24 1.05 0.40 Er 0.61 0.47 1.68 2.72 2.75 2.58 1.01 Tm 0.11 0.07 0.24 0.32 0.32 0.38 0.15 Yb 0.84 0.42 1.47 1.72 1.66 1.99 0.85 Lu 0.15 0.06 0.22 0.23 0.22 0.28 0.11
Table 1
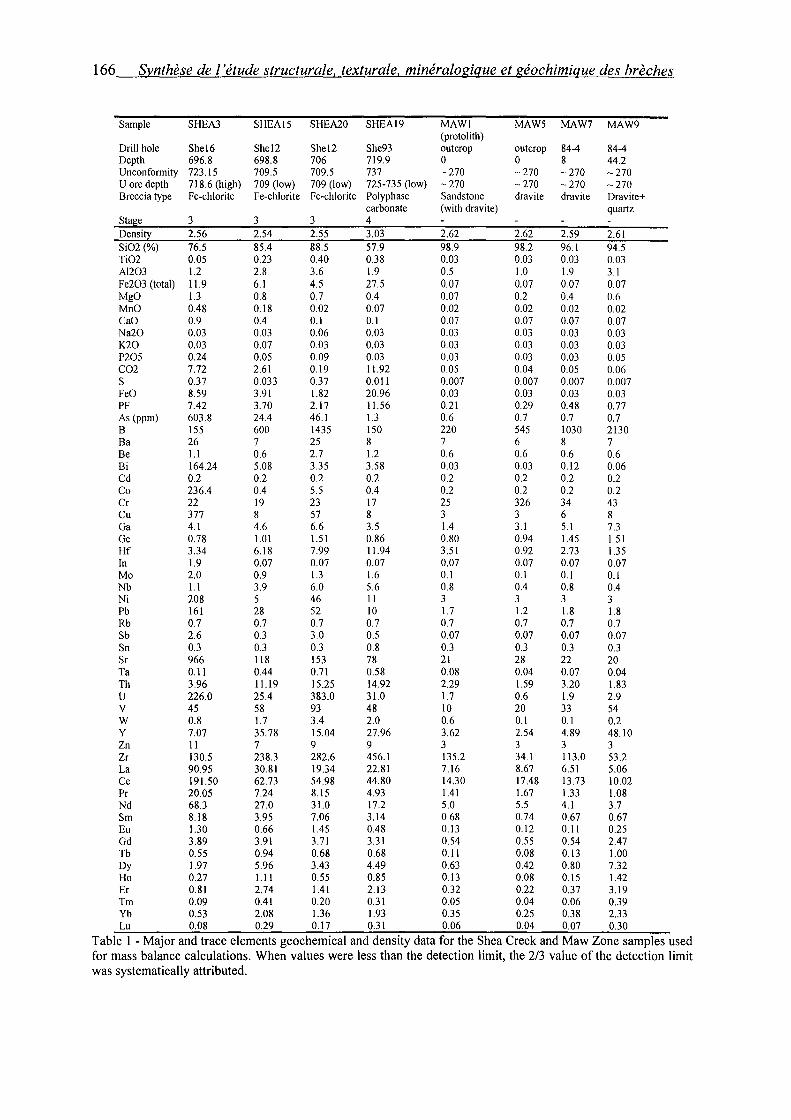
166 Synthèse de 1 'étude structurale, texturale, minéralogique et géochimique des brèches
Sample SHEA3 SHEA15 SHEA20 SHEA19 MAWl MAW5 MAW7 MAW9 (protolith)
Drill hole Shel6 Shel2 Shel2 She93 outcrop outcrop 84-4 84-4 Depth 696.8 698.8 706 719.9 0 0 8 44.2 Unconformity 723.15 709.5 709.5 737 -270 -270 -270 -270 U ore depth 718.6 (high) 709 (low) 709 (low) 725-735 (low) -270 -270 -270 -270 Breccia type Fe-chlorite Fe-chlorite Fe-ch lori te Polyphase Sandstone dra vite dravite Dravite+
carbonate (with dravite) quartz Sta e 3 3 3 4
Densi~ 2.56 2.54 2.55 3.03 2.62 2.62 2.59 2.61 Si02 (%) 76.5 85.4 88.5 57.9 98.9 98.2 96.1 94.5 Ti02 0.05 0.23 0.40 0.38 0.03 0.03 0.03 0.03 Al203 1.2 2.8 3.6 1.9 0.5 1.0 1.9 3.1 Fe203 (total) 11.9 6.1 4.5 27.5 0.07 0.07 0.07 0.07 MgO 1.3 0.8 0.7 0.4 0.07 0.2 0.4 0.6 MnO 0.48 0.18 0.02 0.07 0.02 0.02 0.02 0.02 CaO 0.9 0.4 0.1 0.1 0.07 0.07 0.07 0.07 Na20 0.03 0.03 0.06 0.03 0.03 0.03 0.03 0.03 K20 0.03 0.07 0.03 0.03 0.03 0.03 0.03 0.03 P205 0.24 0.05 0.09 0.03 0.03 0.03 0.03 0.05 C02 7.72 2.61 0.19 11.92 0.05 0.04 0.05 0.06 s 0.37 0.033 0.37 0.011 0.007 0.007 0.007 0.007 FeO 8.59 3.91 1.82 20.96 0.03 0.03 0.03 0.03 PF 7.42 3.70 2.17 11.56 0.21 0.29 0.48 0.77 As (ppm) 603.8 24.4 46.1 1.3 0.6 0.7 0.7 0.7 B !55 600 1435 !50 220 545 1030 2130 Ba 26 7 25 8 7 6 8 7 Be 1.1 0.6 2.7 1.2 0.6 0.6 0.6 0.6 Bi 164.24 5.08 3.35 3.58 0.03 0.03 0.12 0.06 Cd 0.2 0.2 0.2 0.2 0.2 0.2 0.2 0.2 Co 236.4 0.4 5.5 0.4 0.2 0.2 0.2 0.2 Cr 22 19 23 17 25 326 34 43 Cu 377 8 57 8 3 3 6 8 Ga 4.1 4.6 6.6 3.5 1.4 3.1 5.1 7.3 Ge 0.78 1.01 1.51 0.86 0.80 0.94 1.45 1.51 Hf 3.34 6.18 7.99 11.94 3.51 0.92 2.73 1.35 In 1.9 0.07 0.07 0.07 0.07 0.07 0.07 0.07 Mo 2.0 0.9 1.3 1.6 0.1 0.1 0.1 0.1 Nb 1.1 3.9 6.0 5.6 0.8 0.4 0.8 0.4 Ni 208 5 46 Il 3 3 3 3 Pb 161 28 52 10 1.7 1.2 1.8 1.8 Rb 0.7 0.7 0.7 0.7 0.7 0.7 0.7 0.7 Sb 2.6 0.3 3.0 0.5 0.07 0.07 0.07 0.07 Sn 0.3 0.3 0.3 0.8 0.3 0.3 0.3 0.3 Sr 966 118 153 78 21 28 22 20 Ta 0.11 0.44 0.71 0.58 0.08 0.04 0.07 0.04 Th 3.96 11.19 15.25 14.92 2.29 1.59 3.20 1.83 u 226.0 25.4 383.0 31.0 1.7 0.6 1.9 2.9 v 45 58 93 48 10 20 33 54 w 0.8 1.7 3.4 2.0 0.6 0.1 0.1 0.2 y 7.07 35.78 15.04 27.96 3.62 2.54 4.89 48.10 Zn Il 7 9 9 3 3 3 3 Zr 130.5 238.3 282.6 456.1 135.2 34.1 113.0 53.2 La 90.95 30.81 19.34 22.81 7.16 8.67 6.51 5.06 Ce 191.50 62.73 54.98 44.80 14.30 17.48 13.73 10.02 Pr 20.05 7.24 8.15 4.93 1.41 1.67 1.33 1.08 Nd 68.3 27.0 31.0 17.2 5.0 5.5 4.1 3.7 Sm 8.18 3.95 7.06 3.14 0.68 0.74 0.67 0.67 Eu 1.30 0.66 1.45 0.48 0.13 0.12 0.11 0.25 Gd 3.89 3.91 3.71 3.31 0.54 0.55 0.54 2.47 Tb 0.55 0.94 0.68 0.68 0.11 0.08 0.13 1.00 Dy 1.97 5.96 3.43 4.49 0.63 0.42 0.80 7.32 Ho 0.27 1.11 0.55 0.85 0.13 0.08 0.15 1.42 Er 0.81 2.74 1.41 2.13 0.32 0.22 0.37 3.19 Tm 0.09 0.41 0.20 0.31 0.05 0.04 0.06 0.39 Yb 0.53 2.08 1.36 1.93 0.35 0.25 0.38 2.33 Lu 0.08 0.29 0.17 0.31 0.06 0.04 0.07 0.30
Table 1 - Major and trace elements geochemical and density data for the Shea Creek and Maw Zone samples used for mass balance calculations. When values were Jess than the detection limit, the 2/3 value of the detection Iimit was systematically attributed.
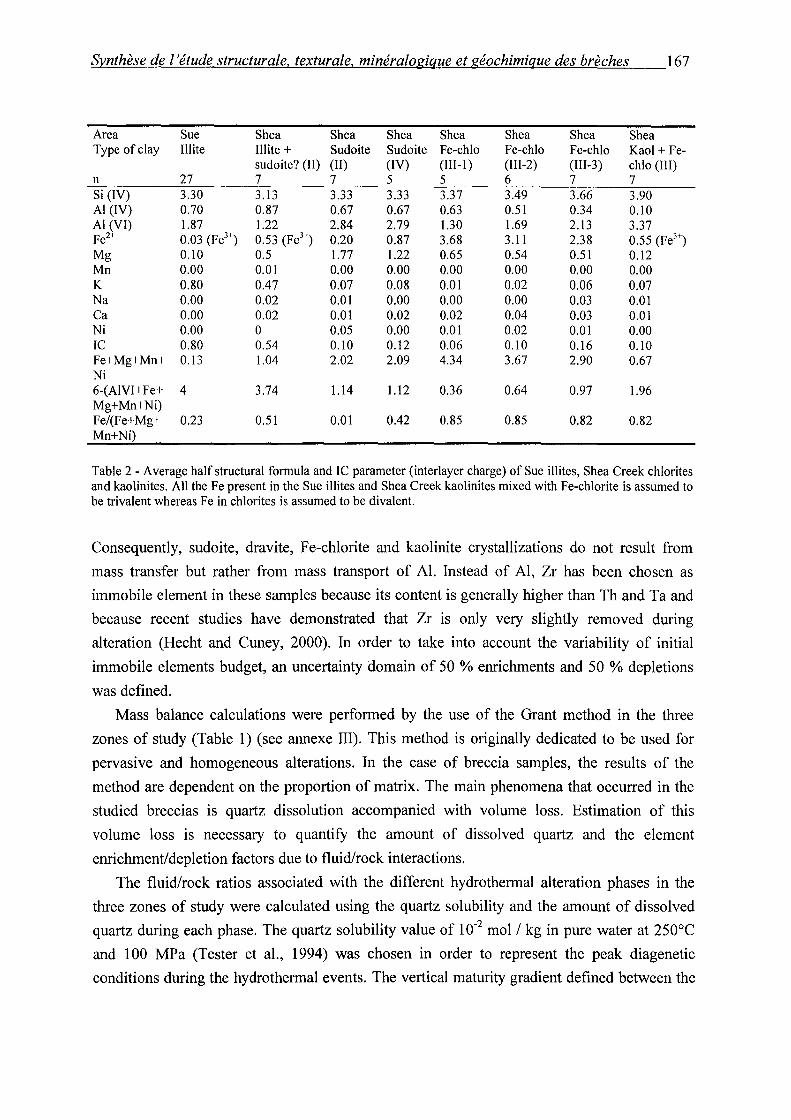
Synthèse de l'étude structurale, texturale, minéralogique et géochimique des brèches 167
A rea Sue Shea Shea Shea Shea Shea Shea Shea Type of clay Illite Illite + Sudoite Sudoite Fe-chio Fe-chio Fe-chio Kaol +Fe-
sudoite? (II) (Il) (IV) (111-1) (III-2) (III-3) chio (III) n 27 7 7 5 5 6 7 7 Si (IV) 3.30 3.13 3.33 3.33 3.37 3.49 3.66 3.90 Al (IV) 0.70 0.87 0.67 0.67 0.63 0.51 0.34 0.10 Al (VI) 1.87 1.22 2.84 2.79 1.30 1.69 2.13 3.37 Fe2+ 0.03 (Fe3+) 0.53 (Fe3+) 0.20 0.87 3.68 3.11 2.38 0.55 (Fe3+) Mg 0.10 0.5 1.77 1.22 0.65 0.54 0.51 0.12 Mn 0.00 0.01 0.00 0.00 0.00 0.00 0.00 0.00 K 0.80 0.47 0.07 0.08 0.01 0.02 0.06 0.07 Na 0.00 0.02 0.01 0.00 0.00 0.00 0.03 0.01 Ca 0.00 0.02 0.01 0.02 0.02 0.04 0.03 0.01 Ni 0.00 0 0.05 0.00 0.01 0.02 0.01 0.00 IC 0.80 0.54 0.10 0.12 0.06 0.10 0.16 0.10 Fe+Mg+Mn+ 0.13 1.04 2.02 2.09 4.34 3.67 2.90 0.67 Ni 6-(AIVI+Fe+ 4 3.74 1.14 1.12 0.36 0.64 0.97 1.96 Mg+Mn+Ni) Fe/(Fe+Mg+ 0.23 0.51 0.01 0.42 0.85 0.85 0.82 0.82 Mn+Ni)
Table 2 - Average half structural formula and IC parameter (inter layer charge) of Sue illites, Shea Creek chlorites and kaolinites. Ali the Fe present in the Sue illites and Shea Creek kaolinites mixed with Fe-chlorite is assumed to be trivalent whereas Fe in chlorites is assumed to be divalent.
Consequently, sudoite, dravite, Fe-chlorite and kaolinite crystallizations do not result from
mass transfer but rather from mass transport of Al. Instead of Al, Zr has been chosen as
immobile element in these samples because its content is generally higher than Th and Ta and
because recent studies have demonstrated that Zr is only very slightly removed during
alteration (Hecht and Cuney, 2000). ln order to take into account the variability of initial
immobile elements budget, an uncertainty domain of 50 % emichments and 50 % depletions
was defined.
Mass balance calculations were performed by the use of the Grant method in the three
zones of study (Table 1) (see annexe III). This method is originally dedicated to be used for
pervasive and homogeneous alterations. In the case of breccia samples, the results of the
method are dependent on the proportion of matrix. The main phenomena that occurred in the
studied breccias is quartz dissolution accompanied with volume loss. Estimation of this
volume loss is necessary to quantify the amount of dissolved quartz and the element
enrichment/depletion factors due to fluid/rock interactions.
The fluid/rock ratios associated with the different hydrothermal alteration phases in the
three zones of study were calculated using the quartz solubility and the amount of dissolved
quartz during each phase. The quartz solubility value of 1 o-2 mol 1 kg in pure water at 250°C
and 100 MPa (Tester et al., 1994) was chosen in order to represent the peak diagenetic
conditions during the hydrothermal events. The vertical maturity gradient defined between the
168 Synthèse de l'étude structurale. texturale, minéralogique et géochimique des brèches
low mature Maw Zone breccias and the mature Shea Creek and Sue breccias (§ 5.3) shows a
decrease of the dissolution intensity from the unconforrnity upward. Therefore, the fluid
undersaturation in silica was higher at the unconforrnity and lower above. As the fluid
undersaturation decreased with tirne due to re-equilibration with quartz, the fluid was
rnigrating upward along the reverse structure in the sandstone. A silica saturation of 90 %just
above the unconforrnity for Sue and Shea Creek and of 99 % 200 rn above the unconforrnity at
the Maw Zone were considered in fluidlrock ratio calculations to reflect the increase in silica
saturation of the basernent fluids rnigrating upward. However, these values are hypothetical
because they cannot be constrained precisely yet. For a silica saturation of 90% and 99 %, the
quartz solubility is 1 o-3 and 1 o-4 mol 1 kg, respectively.
7.1. The Maw Zone
At the Maw Zone, 3 strongly silicified breccia sarnples were studied, narnely Maw5, Maw7
and Maw9 (see annexe 1). The protolith Maw1 is a brecciated sandstone sarnple with a low
rnatrix percentage about 10 % and with a higher detrital quartz proportion than the other
sarnples (Table 3). It was selected in spite of its slight alteration because of its proxirnity to the
other sarnples. This proxirnity allows to compare sarnples with a sirnilar initial sandstone
composition. Maw5 has a slightly green color. Its rnatrix percentage is difficult to rneasure due
to the very progressive transition between the rnatrix and the sandstone but is estirnated at
about 15 %. Maw7 has 35% rnatrix. Euhedral quartz in a vug indicate late silicification after
quartz dissolution and dravite precipitation. Maw9 is a polyphase hydraulic breccia with a
rnatrix rnainly cornposed of newly forrned quartz. Newly forrned quartz crystals grew on
earlier dravite coatings on sandstone fragments.
The pervasive character of the dravitization and the low rnatrix percentage in sarnple
Maw5 suggest no to very little volume loss. Therefore, constant volume was considered in
rnass balance calculations for this sarnple (Fig. 18). The isocon diagrarn for sarnple Maw7
indicates a slight volume increase if Zr is taken as an immobile element (Fig. 18). However,
the slight Zr depletion in sarnple Maw7 relative to the protolith is more probably related to the
variability of Zr content in the sandstone. As Zr is located close to the constant volume isocon,
constant volume was also assurned in this sarnple. The strong depletion in Zr relative to the
protolith in sarnple Maw9 suggests volume increase (Fig. 18) consistent with the hydraulic
breccia texture of the sarnple. The calculated volume increase is about 61 % considering Zr
immobile. The volume increase due to hydraulic brecciation only is probably higher than 61 %
but this value also includes volume loss due to the quartz dissolution phase.
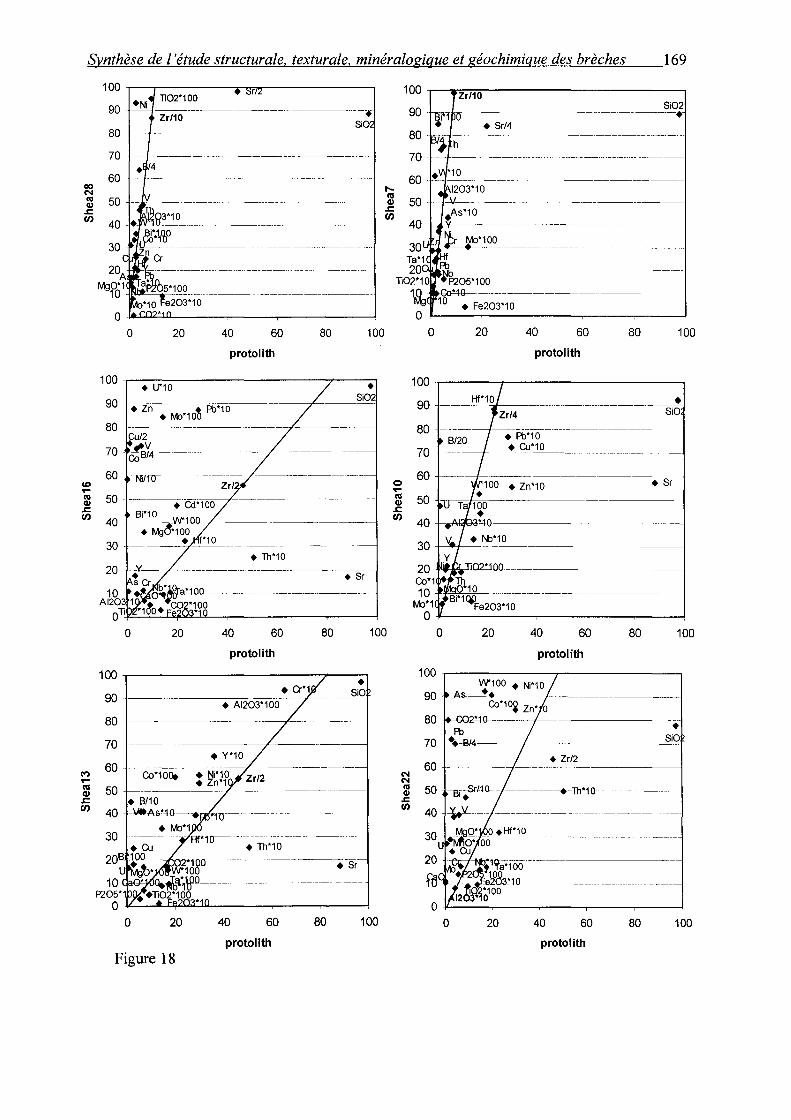
Synthèse de 1 'étude structurale. texturale. minéralogique et géochimique des brèches 169
CD ...... ni Cil
..c:: UJ
C'? ... ni Cil
..c:: UJ
100 -,---,.-------.,.......,r .,..----------, +Ni Ti02*1 00
90. ---------~--~·-· Zr/10 ---···---. SiO
80 - -·-·-·-·····-------··
70 ----·---····------···-----·-----• /4
60 - ·-------- ··-·---------·-··----·
50 y ___ ·-------··---··---·--·····
0 -~~~~--~---~---r--~ 0 20 40 60 80 100
protolith
100.-~~-----------------~r---~.~ • U"1 0
Si02 90 • Zn + Fb*10 • l'v\)*100
80 ----· Cu/2
10 $Y4 ------60 .. N't/10-----····-·-·----- ---------------·-
Zr/ 50 ----.-Cd*100
40 . ~10 WJ.OQ_/---------+~*100
• *10 30
20
40 60 80 100
protolith
100.-----------------------~--~
90 +--------~
80
70-J------
60 -1--------,~.
50
40
30
40 60
protolith
Figure 18
80 100
100 .--r-:;z::-;rt1.,o.---------------, Si02 ----·-·
60 . ~ _!()_ _________ _ 4 ~1203*10
50 . - "_jJ---·-··- ...
•As*10 40 ~ 1rY~------~-·--·-~-----···------·-·-·--
u l'v'o*100 30 - -·--··-····--····---- ·------~ ··-------- ..... . ... Ta*1_C ~
Ti0~91~ ·~~-~5*10-;-- - -------- ----------
0 ...... ni Cil
..c:: UJ
1~( ~~~:-F~~;;:1~----------··-----·--
0+-----~----------~----~----~
0
100
90
80
70
60.
50
40
30
20 Co*1 10
l'v'o*1 0
0
20 40 60 80 100
protolith
--···--·--·-··-·-----·- . SiO
• Fb*10 ·-+--•"--"C!J*_!Q ____ . _______ _
• Sr
J02'JOO------------------l Th 0*10
Bi*1~ ~-------- -------Fe203*10
20 40 60 80 100
protolith
100 ..--------.----------, W100 + Ni*10
90 c.As._ • .____ --~------~---Co*10~ zn• o
80 -00~0------
Fb 70 .. -B/4-
60
50 .-sr-.SrltD-- ------+-Th*1G---------
40 -t,.'"--~- -------------- -----····--
0 20 40 60 80 100
protolith
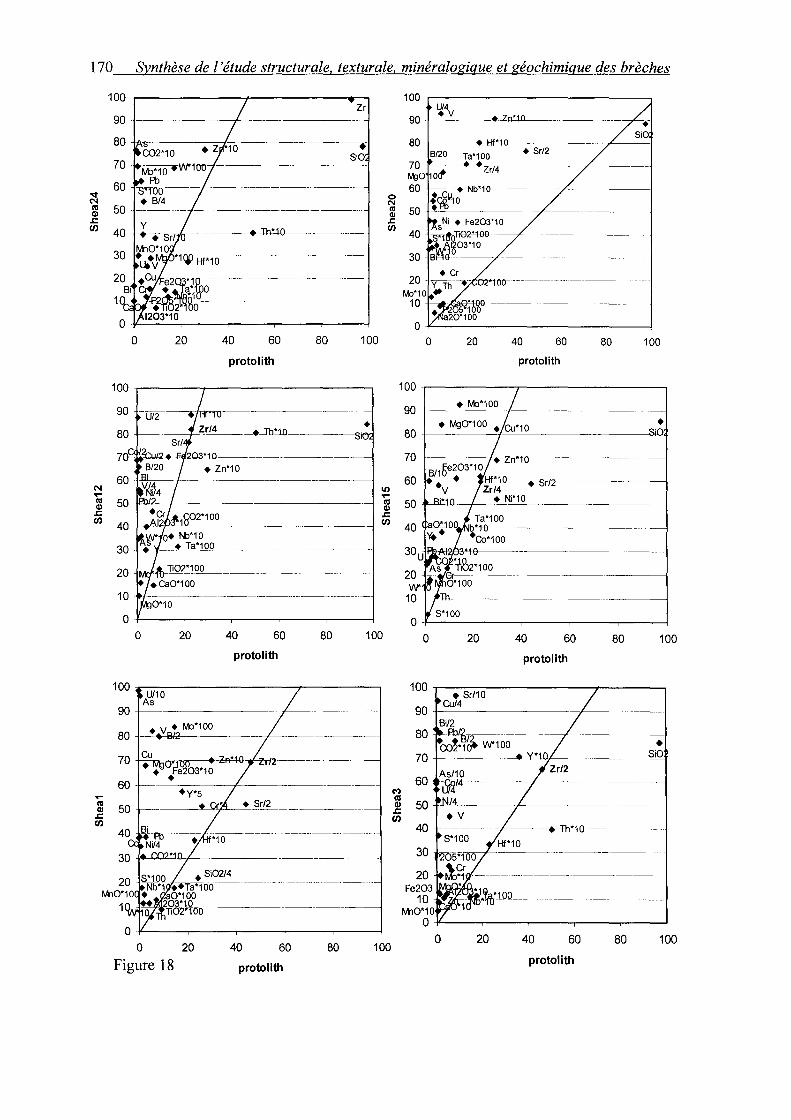
170 Synthèse de 1 'étude structurale, texturale, minéralogique et géochimique des brèches
..... ni Q)
..c: tl)
100 100 ,-------------------,
0 20 40 60 80
protolith
0 20 40 60 80
protolith
100 U/10
As 90
80 • v • M:J*100
-· B/2
70
60
50
0 20 40 60 80
Figure 18 proto li th
Zr
100
0 N ni Cl)
..c: tl)
1() ..... ni Q)
..c:
90. U/4 • v ___ ._.zftiD_____ _______ _
SiO 80. WH!-
B/20 Ta'100 + Sr/2
70 fv'gO 10~
• •zr74-
60 'W-
50
40
30
1oo- -------- ··· -----·- ·--·
0 0 20 40 60 80 100
protolith
100 .
90 ----
• 80
tl) 40~~~~~~------------~
100
100
----·---·-----1
0-~--r---r---r---r--~
0 20 40 60 80 100
protolith
100,---~~~----------~~----~ + Sr/10
Cu/4 90~----------------,L-------~
80
70
60
50
40
30
20 Fe203 10 ... "'\1<-\J>J~
·-- ----·-·+-Th'-10--··---------·
Hf'10
• SiO
M10*10 0~--~-----r----,-----~--~
0 20 40 60 80 100
proto li th

Ol ....
Synthèse de l'étude structurale, texturale, minéralogique et géochimique des brèches 171
100 ..-----.------------------,
70
60
• zn•fo ___________ _ -----j'--------'Cu-"--*1 ot
Il)
100~--------------------~~ • Al203*100
90 +---------------c;-:;:-:c::;-;~---l
80
70
60 • Cr/5
m 5o • Si02 ~ 50 - ------------- -------------
.s::. (/) 40 ---------------------
::1! 40 -----·----/-
30
0 20 40 60 80
protolith
100..-------------------------~
90-l----
80 • Nb*100
70 - ------ -------· ------.------- - ------· -----
60
40
30
• La*10
100
0 20 40 60 80 100
Maw1 (protolith)
30 ''lOO -------------- -• Y*10
20 --:+-V- --------------------o·1oo • Th*10 • Zr/2
10 • ~*10 • U*20
r-----.--Hf-"10
0~-------------~----~-~ 0 20 40 60 80 100
Maw1 (protolith)
100r-------------------------~
90
80 --------------------
70 --------~------------1
60 -··-l'v'g6'100 (7) 8~0. v ~ 50- .r
::1!
• U*20
•Cr 40 ----.-cu·5-----30 -•AI203.~-------------~~
0 20 40 60 80
Maw1 (protolith)
100
Figure 18 - Isocon diagrams for the Maw Zone and Shea Creek samples. The immobile element (Al or Zr) used to trace the isocon in each diagram is in bold character. The angle between the isocon and the bissector corresponds to the amount of volume Joss. The location of elements above or below the isocon indicates enrichment or depletion respectively, taking into account the effect of volume loss. Constant volume was used to trace the isocon for samples Maw5, Maw7 and Shea20. Note the volume increase in sample Maw9 due to late hydraulic brecciation. Note the common depletion in Si due to quartz dissolution and responsible for important volume Joss.
Elemental enrichment/depletion diagrams for samples Maw5 and Maw7 indicate
enrichments in Mg, B, Al and V, in order of decreasing importance (Fig. 19). Mg, B and Al
enrichments are related to dravite crystallization. Cr and Bi are strongly enriched in sample
Maw5 and Maw7, respectively. Cr enrichment is related to Cr-rich dravite as documented by
Quirt et al. (1991 ). In sample Maw5, the abundance of Cr, and therefore of Cr-rich dravite,
would exp lain the slightly green co lor of the sample (Table 1 ). The maximal
enrichment/depletion factors increase from sample Maw5 to sample Maw9 together with the
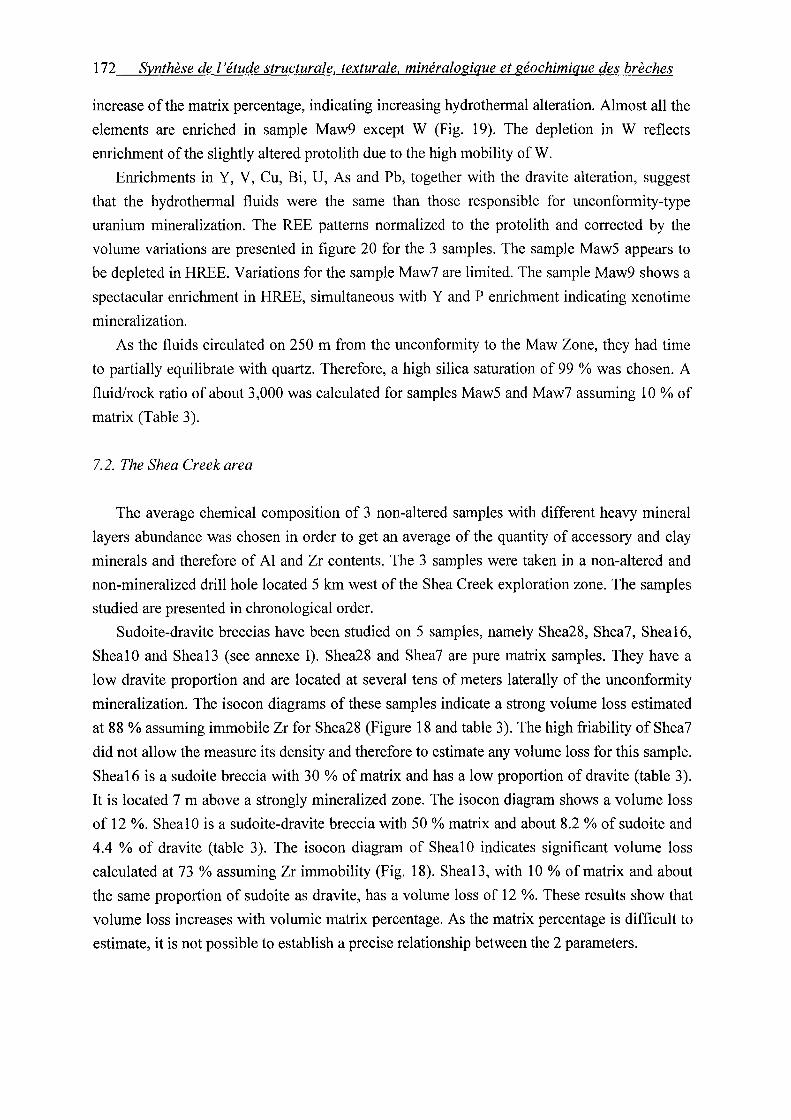
172 Synthèse de l'étude structurale, texturale. minéralogique et géochimique des brèches
increase of the matrix percentage, indicating increasing hydrothermal alteration. Almost all the
elements are enriched in sample Maw9 except W (Fig. 19). The depletion in W reflects
enrichment of the slightly altered protolith due to the high mobility of W.
Enrichments in Y, V, Cu, Bi, U, As and Pb, together with the dravite alteration, suggest
that the hydrothermal fluids were the same than those responsible for unconformity-type
uranium mineralization. The REE patterns normalized to the protolith and corrected by the
volume variations are presented in figure 20 for the 3 samples. The sample Maw5 appears to
be depleted in HREE. V aria ti ons for the sample Maw7 are limited. The sample Maw9 shows a
spectacular enrichment in HREE, simultaneous with Y and P enrichment indicating xenotime
mineralization.
As the fluids circulated on 250 rn from the unconformity to the Maw Zone, they had time
to partially equilibrate with quartz. Therefore, a high silica saturation of 99 % was chosen. A
fluid/rock ratio of about 3,000 was calculated for samples Maw5 and Maw7 assuming 10% of
matrix (Table 3).
7. 2. The Shea Creek are a
The average chemical composition of 3 non-altered samples with different heavy mineral
layers abundance was chosen in order to get an average of the quantity of accessory and clay
minerais and therefore of Al and Zr contents. The 3 samples were taken in a non-altered and
non-mineralized drill ho le located 5 km west of the Shea Creek exploration zone. The samples
studied are presented in chronological order.
Sudoite-dravite breccias have been studied on 5 samples, namely Shea28, Shea7, Shea16,
Shea10 and Shea13 (see annexe I). Shea28 and Shea7 are pure matrix samples. They have a
low dravite proportion and are located at several tens of meters laterally of the unconformity
mineralization. The isocon diagrams of these samples indicate a strong volume loss estimated
at 88 % assuming immobile Zr for Shea28 (Figure 18 and table 3). The high friability of Shea7
did not allow the measure its density and therefore to estimate any volume loss for this sample.
Shea16 is a sudoite breccia with 30 % of matrix and has a low proportion of dravite (table 3).
It is located 7 rn above a strongly mineralized zone. The isocon diagram shows a volume loss
of 12 %. Shea1 0 is a sudoite-dravite breccia with 50% matrix and about 8.2% of sudoite and
4.4 % of dravite (table 3). The isocon diagram of Shea10 indicates significant volume loss
calculated at 73 % assuming Zr immobility (Fig. 18). Shea13, with 10 % of matrix and about
the same proportion of sudoite as dravite, has a volume loss of 12 %. These results show that
volume loss increases with volumic matrix percentage. As the matrix percentage is difficult to
estimate, it is not possible to establish a precise relationship between the 2 parameters.
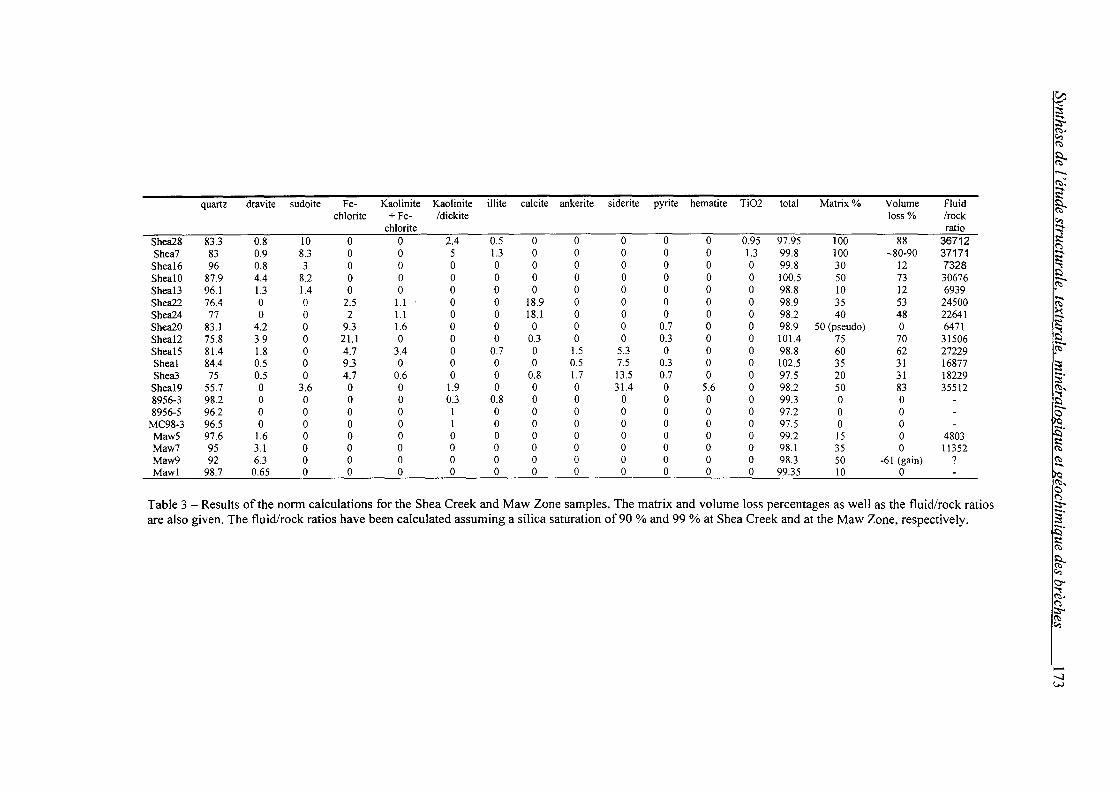
~ ;::;: ...... ;:s-. (1:),
"" (1:)
~ -(1:)~ ...... $.::!
quartz dravite sudoite Fe- Kaolinite Kaolinite illite calcite ankerite siderite pyrite hematite Ti02 total Matrix% Volume Fluid ~ chlorite +Fe- /dickite Joss% /rock
"" chlorite ratio ~ Shea28 83.3 0.8 10 0 0 2.4 0.5 0 0 0 0 0 0.95 97.95 100 88 36712 $.::!
("") Shea7 83 0.9 8.3 0 0 5 1.3 0 0 0 0 0 1.3 99.8 100 -80-90 37171 ......
$.::! Sheal6 96 0.8 3 0 0 0 0 0 0 0 0 0 0 99.8 30 12 7328 "'l
SheaiO 87.9 4.4 8.2 0 0 0 0 0 0 0 0 0 0 100.5 50 73 30676 !::) -Sheal3 96.1 1.3 1.4 0 0 0 0 0 0 0 0 0 0 98.8 10 12 6939 (1:)
Shea22 76.4 0 0 2.5 1.1 0 0 18.9 0 0 0 0 0 98.9 35 53 24500 ~ Shea24 77 0 0 2 1.1 0 0 18.1 0 0 0 0 0 98.2 40 48 22641 ...... Shea20 83.1 4.2 0 9.3 1.6 0 0 0 0 0 0.7 0 0 98.9 50 (pseudo) 0 6471 $.::!
"'l Sheal2 75.8 3.9 0 21.1 0 0 0 0.3 0 0 0.3 0 0 101.4 75 70 31506 !::) -Sheal5 81.4 1.8 0 4.7 3.4 0 0.7 0 1.5 5.3 0 0 0 98.8 60 62 27229 (1:)
Sheal 84.4 0.5 0 9.3 0 0 0 0 0.5 7.5 0.3 0 0 102.5 35 31 16877 ~ Shea3 75 0.5 0 4.7 0.6 0 0 0.8 1.7 13.5 0.7 0 0 97.5 20 31 18229 -· ;::;: Sheal9 55.7 0 3.6 0 0 1.9 0 0 0 31.4 0 5.6 0 98.2 50 83 35512 (1:),
8956-3 98.2 0 0 0 0 0.3 0.8 0 0 0 0 0 0 99.3 0 0 ~ 8956-5 96.2 0 0 0 0 1 0 0 0 0 0 0 0 97.2 0 0 -0
MC98-3 96.5 0 0 0 0 1 0 0 0 0 0 0 0 97.5 0 0 Maw5 97.6 1.6 0 0 0 0 0 0 0 0 0 0 0 99.2 15 0 4803 Maw7 95 3.1 0 0 0 0 0 0 0 0 0 0 0 98.1 35 0 11352 Maw9 92 6.3 0 0 0 0 0 0 0 0 0 0 0 98.3 50 -61 (gain) ?
Mawl 98.7 0.65 0 0 0 0 0 0 0 0 0 0 0 99.35 10 0
Table 3- Results of the norm calculations for the Shea Creek and Maw Zone samples. The matrix and volume Joss percentages as well as the fluid/rock ratios are also given. The fluid/rock ratios have been calculated assuming a silica saturation of90% and 99% at Shea Creek and at the Maw Zone, respectively.
!t:l $.::! (1:)
~ "" \:)-' "'l (1:), ("") ;:s-. (1:)
""
...... -...J w
174 Synthèse de 1 'étude structurale, texturale. minéralogique et géochimique des brèches
Enrichments in B, Mg and Al reflect sudoite and dravite new formation in the 5 samples
(Fig. 19). Enrichments in U, Ni, Co, As, S, Bi, Cu, Zn, V and Mo are typical of cornplex-type
deposits and are directly associated with the rnineralizing fluids. In Shea16, the maximal
elernental enrichment factors are one to two orders of magnitude greater than those of the other
sarnples, probably due to its close proxirnity to high grade U rnineralization. Fe, Si, Sr and P
have been leached out, in order of decreasing importance. The leaching of quartz, expressed by
Si depletion, is the main factor controlling volume loss. Fe depletion is due to the leaching of
prirnary hematite. Depletions in Sr and P correspond to leaching of diagenetic goyazite.
Taking into account volume loss, Shea28 appears to be depleted in HREE relative to the
proto li th (Fig. 21 ). REE content variations for Shea7 are within the uncertainty domain. The
sarnples Shea16, Shea10 and Sheal3, located close to rnineralization, show depletions in
LREE and enrichments in intermediate to heavy REE. LREE depletion, together with P, is
probably due to diagenetic florencite leaching. Enrichrnents in intermediate to heavy REE,
together with Y, are related to xenotirne replacement of zircon or new formation (Fig. 12d)
(Quirt et al., 1991 ). Part of the phosphorus of xenotirne may corne from crandallite-group
mineral leaching. Xenotirne may be U-rich explaining the enrichrnents in U of the samples.
Such enrichrnents in intermediate to HREE are also typical of uranium oxides (Pagel et al.,
1987; Quirt et al., 1991; Fayek and Kyser, 1997) and suggest that uranium rnineralization may
have been present in these sarnples and leached out.
Hydraulic calcite breccias occurring at the end of stage 2 are represented by sarnples
Shea22 and Shea24 (see annexe I). With rnatrix percentages of 40 and 35 %, they show
volume losses of 53 and 48 %, respectively (Fig. 18 and table 3). This volume loss represents
the quartz dissolution phase that occurred during sudoite-dravite breccia formation, partially
cornpensated by volume increase due to hydraulic brecciation.
Ca, C and Mn enrichments are due to calcite crystallization. The calcite cernent results
from rnass transport of Ca and C (Fig. 19). Enrichrnents in Mg and B correspond to local
dravite crystallization prior to the calcite. Mg is also incorporated in late Fe-chlorite
irnpregnating the calcite. Like in sudoite-dravite breccias, Fe and Si have been leached out due
to hematite and quartz dissolution, respectively. Significant enrichments in Bi, As, S, Mo, U
and Pb are due to the close vicinity of uranium rnineralization 8 rn below the 2 samples. As in
sudoite-dravite breccias, intermediate and heavy REE have been enriched together with Y
(Fig. 21 ). That suggests xenotirne new formation and/or the existence of a previous
rnineralization leached out and partly replaced by calcite. Sr enrichment indicates probable
goyazite new formation (Fig. 19).
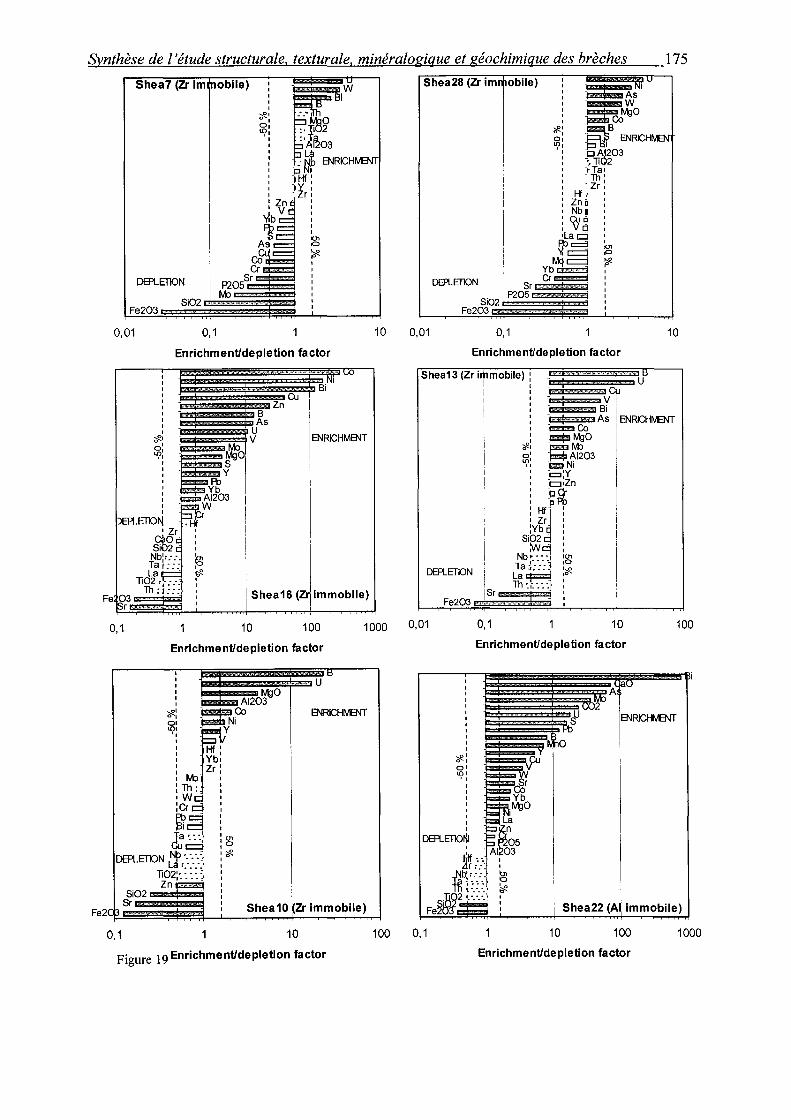
Synthèse de 1 'étude structurale, texturale, minéralogique et géochimique des brèches 175
Shea7 (Zr im tnobile)
DER..ETION
Si02 . ,
' ' ' ' >R• a,
~·
'w
Fe203
0,01
' ' ' ' ' ' ' ' ' ' cF.• o' on' ,, ' 1
0,1
Enrichment/depletion factor
~· B As
.. u ., v
""~01 y Pb
Yb A1203 1
w 1
' 1
~ ' r;F.
!
1 1
1
Cu Zn
Bi
ENRICHMENT
1 1 1 1 1
1 Shea16 (Zr immobile)
10
0,1 10 100 1000
Enrichment/depletion factor
cl=!: QI ono .,
1 1 1 1 1
:11/o :Th:. •W :er ~
~·.::
DER..ETION N~ •. ·• · •. La'···
T~o;:·. ~ ~ :_:
01 0
'#.
.u
ENRICHMENT
C~S~i~0;2;;;;;;;;t__L~~~~~~~~~~~ F 2 Sr · Shea10 Zr immobile) e
0,1 10 100
Figure 19 Enrichment/depletion factor
Shea28 (Zr im obile) 1 As w
1
~1 01
~eo~o
~B ENRICH
~A1~03 01 "?
-~ 1i02 -,Ta• 'Th' ~Zr:
Hlï Zn a Nbi Cuë V cl
La c:::J !}!<:::::::::! Tl=
Mj=:::J Yb~ Cr c:c::=:î
1 1 101 p ~ p 1 1
Si02 P20~r1 r '~j;:;:J DEPLETlON
Fe203
0,01 0,1
Enrichmentldepletion factor
Shea13(Zrirpmobile): r*:*"''f&'%i9"Y HJ
10
, ! =v't ! :==: :~ 1 ENRJCHMENT : a~o 'i cf: rvt> g: Al203
·: ~~i 1 : :zn 1
1 2 1
: ~ : 1 :Ybq :
1 · Si02d 1 ,
1 :VVCj : 1
1 ~b ;._:_::-~ :g: 1
DEFtEnON i 8
·'·-- ~ :* 1
La~-
0,01
0,1
Th ·.1:::: :
1~
Fe203,J~.r_,;_,._,?; !
~1 0 1 QI ll)l '1
1 1 1 1 1 1
0,1 10 100
Enrichmentldepletion factor
ENRICHvENT
Shea22 (A immobile)
10 100 1000
Enrichmentldepletion factor
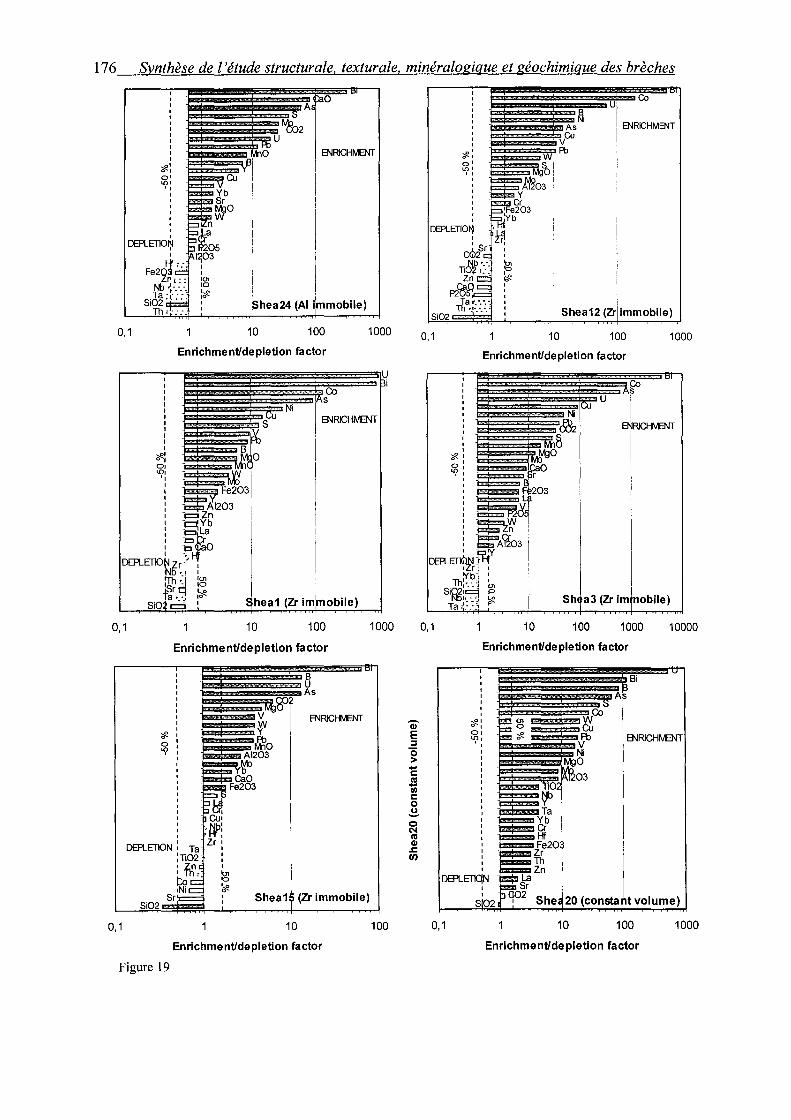
176 Synthèse de l'étude structurale, texturale, minéralogique et géochimique des brèches
EN RICH~ 1
~: o• !{)1 .,
1 1 1 1 1 1 1
DEPLETlO~ 1
Fe221::::. Nb) ... Ta .•.·.·.·.
Si02 .L •••
Th;·::.
0,1
1
hea24 (Al i~mobile)
10 100
Enrichment/depletion factor
1 .. 1 1 ... ,~, ·< - • ' ·-'v v,, Co 1 5 1 Ni 1
1000
u i ~
1 'sw ENRICHMINr 1 ... "" 1 .. IV 1 1 Bfb 1
""' __ Pli o, Dl
"'
=~:~203 1
:= Zn 1 _Yb 1
=ga 1 ~- 0
DEPLEllO~S~ ,I-f
1 1
~-: 1(}1 ID
far.S :~ ~ hea1 (Zr im~obile) SiO:f2 1
0,1 10 100 1000
Enrichment/depletion factor
B u As sa
v ENRICI-MNT f
"" 0
~0 0 "? Al203
~ cao
Fe203 1 1 1 1 1 1 1
DEPLETlON: Ta :Tto2,
:th'-Co '· •Ni
(Zr immobile) Sr Shea1 Si02
0,1 10 100
Enrichment/depletion factor
Figure 19
1 Co
101
1 1 u 1
~i 1 1 1 As ENRICHMENT 1
V Cu 1 1
#: w Pb a' t=c::::c:?. ,:..,gt "'' '1
1
Œ~03 1 1 1 1 p::gcr 1 J=,'Fe203 1 1 ~'yb
DEPLETIOI'j 1 l~
c~28~ 1 1
~-· g Tt i2 Zn ~
P2~~~ 1 1 1
Tar.·.·.· 1
Th·~·.·.·.· 1 Shea12 (Zr immobile) Si02 1
0,1 10 100 1000
Enrichment/depletion factor
u
0,1 10 100 1000 10000
Enrichment/depletion factor
1 1 Bi 1 1 1 A 1 1 1
G) ""' o, E Dl
"? ENRICHM::NT ::J
0 > -r::: 03 .l!l Ill r::: 0 ~ 0 N I'G Cil
20 (con,..l. volume)
.r::: (/)
0,1 10 100 1000
Enrichment/depletion factor
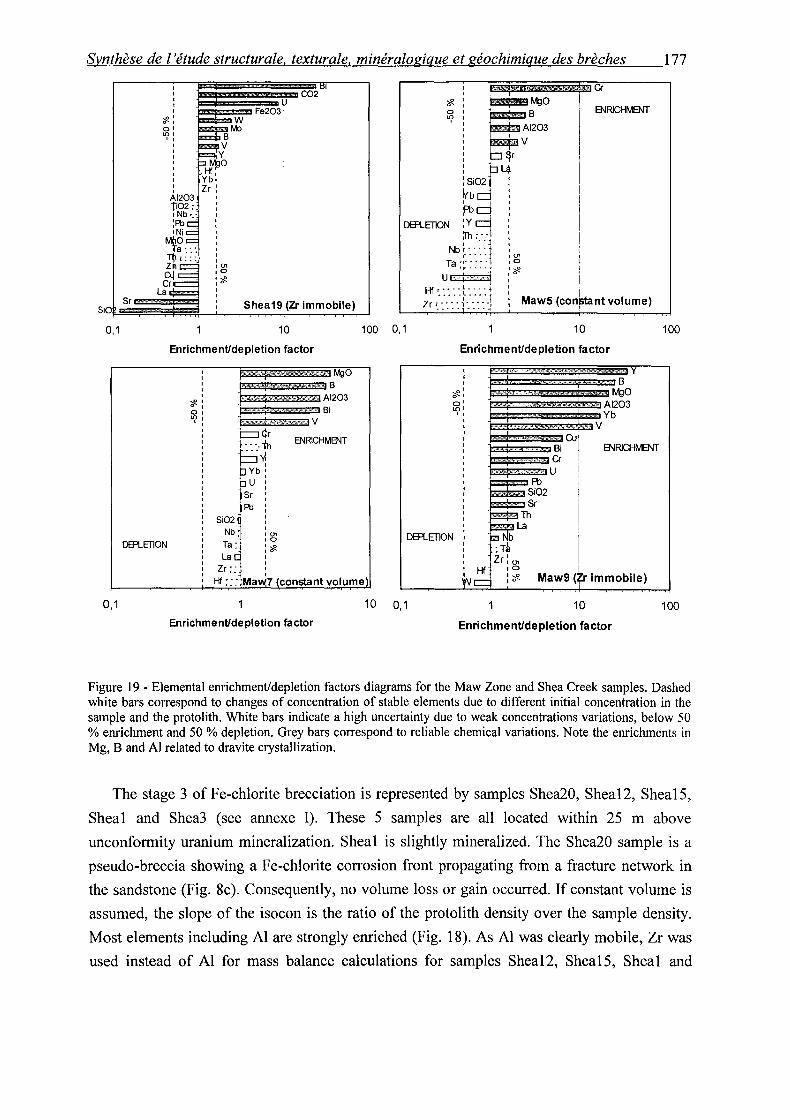
Synthèse de l'étude structurale. texturale, minéralogique et géochimique des brèches 177
0,1
DEPLETlON
0,1
C02
10
Enrichment/depletion factor
~· 0 1 0 II?
J"""'tz!ëf·:xxfJ&?fi§H~_,.,...,-tt;sJ rv'gO
{:;;:;:;;:::~03
B'JRICHMB'JT
Enrichment/depletion factor
100 0,1
DEA... ErlON
10 0,1
Cr
ENRICHrvHIT
10
Enrichment/depletion factor
ENRICHrveJT
10
Enrichment/depletion factor
100
100
Figure 19 - Elemental enrichment/depletion factors diagrams for the Maw Zone and Shea Creek samples. Dashed white bars correspond to changes of concentration of stable elements due to different initial concentration in the sample and the protolith. White bars indicate a high uncertainty due to weak concentrations variations, below 50 % enrichment and 50 % depletion. Grey bars correspond to reliable chemical variations. Note the enrichments in Mg, B and Al related to dravite crystallization.
The stage 3 of Fe-chlorite brecciation is represented by samples Shea20, Shea12, Shea15,
Sheal and Shea3 (see annexe 1). These 5 samples are all located within 25 rn above
unconformity uranium mineralization. Sheal is slightly mineralized. The Shea20 sample is a
pseudo-breccia showing a Fe-chlorite corrosion front propagating from a fracture network in
the sandstone (Fig. 8c). Consequently, no volume loss or gain occurred. If constant volume is
assumed, the slope of the isocon is the ratio of the protolith density over the sample density.
Most elements including Al are strongly enriched (Fig. 18). As Al was clearly mobile, Zr was
used instead of Al for mass balance calculations for samples Sheal2, Shea15, Sheal and
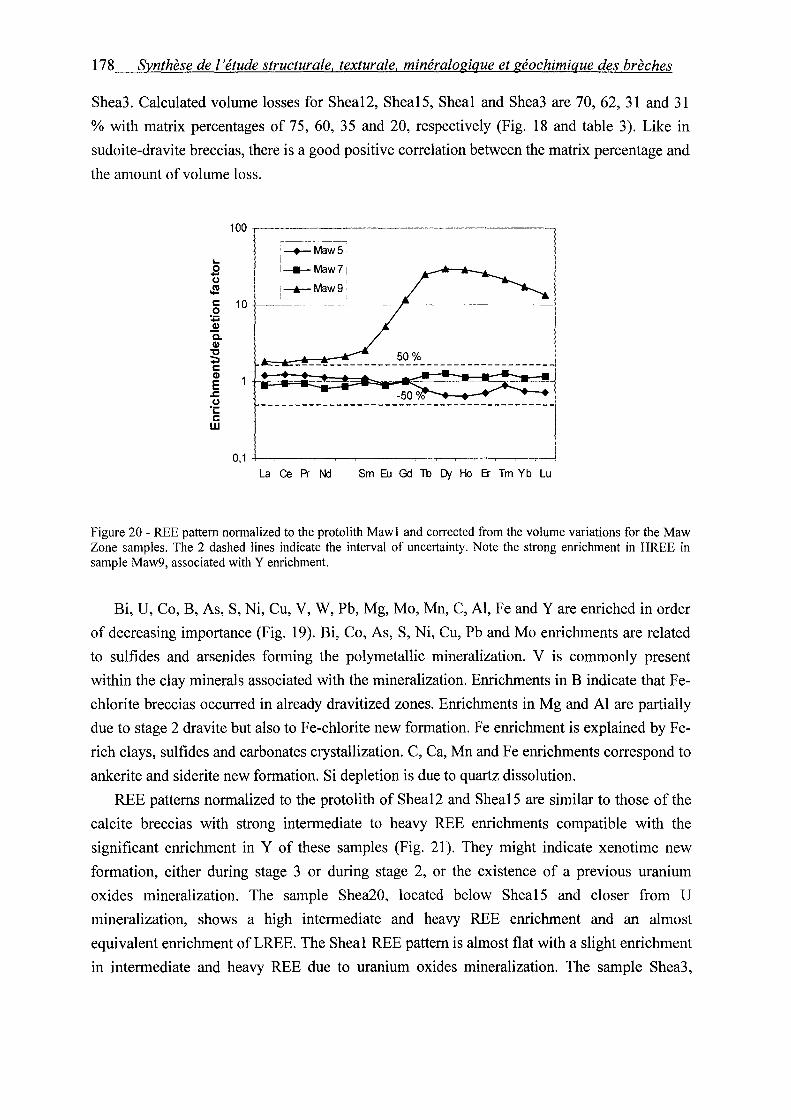
178 Synthèse del 'étude structurale, texturale, minéralogique et géochimique des brèches
Shea3. Calculated volume losses for Shea12, Shea15, Shea1 and Shea3 are 70, 62, 31 and 31
% with matrix percentages of 75, 60, 35 and 20, respectively (Fig. 18 and table 3). Like in
sudoite-dravite breccias, there is a good positive correlation between the matrix percentage and
the amount of volume loss.
... .s 0
~ s 10 +:i ~ a. Q)
:g c Q)
E .s::. 0 "i: c w
;--+-Maw5, i i
!---- Maw7 i i-.-Maw9· L __ -------- ____ __j
La Ce Pr Nd Sm Eu Gd Tb Dy Ho Er Tm Yb Lu
Figure 20- REE pattern normalized to the protolith Mawl and corrected from the volume variations for the Maw Zone samples. The 2 dashed !ines indicate the interval of uncertainty. Note the strong enrichment in HREE in sample Maw9, associated with Y enrichment.
Bi, U, Co, B, As, S, Ni, Cu, V, W, Pb, Mg, Mo, Mn, C, Al, Fe and Y are enriched in order
of decreasing importance (Fig. 19). Bi, Co, As, S, Ni, Cu, Pb and Mo enrichments are related
to sulfides and arsenides forming the polymetallic mineralization. V is commonly present
within the clay minerais associated with the mineralization. Enrichments in B indicate that Fe
chlorite breccias occurred in already dravitized zones. Enrichments in Mg and Al are partially
due to stage 2 dravite but also to Fe-chlorite new formation. Fe enrichment is explained by Fe
rich clays, sulfides and carbonates crystallization. C, Ca, Mn and Fe enrichments correspond to
ankerite and siderite new formation. Si depletion is due to quartz dissolution.
REE patterns normalized to the protolith of Shea12 and Shea15 are similar to those of the
calcite breccias with strong intermediate to heavy REE enrichments compatible with the
significant enrichment in Y of these samples (Fig. 21 ). They might indicate xenotime new
formation, either during stage 3 or during stage 2, or the existence of a previous uranium
oxides mineralization. The sample Shea20, located below Shea15 and doser from U
mineralization, shows a high intermediate and heavy REE enrichment and an almost
equivalent enrichment ofLREE. The Shea1 REE pattern is almost flat with a slight enrichment
in intermediate and heavy REE due to uranium oxides mineralization. The sample Shea3,
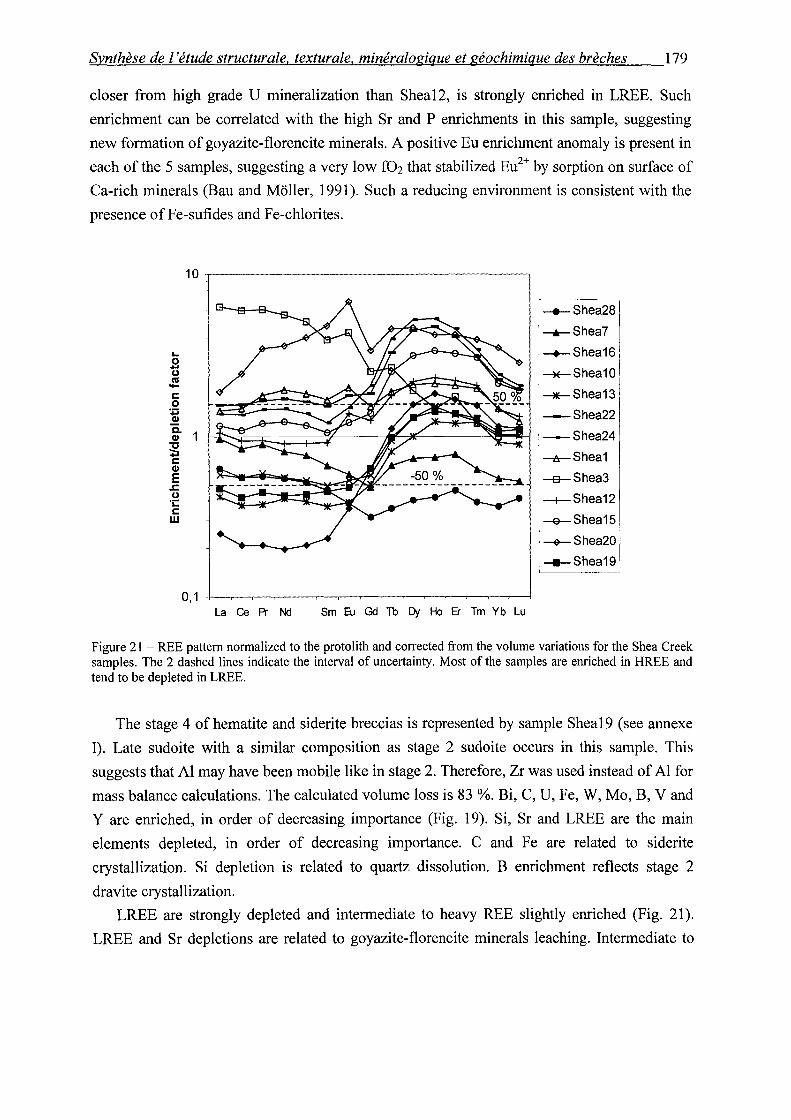
Synthèse de l'étude structurale, texturale, minéralogique et géochimique des brèches 179
closer from high grade U mineralization than Sheal2, is strongly enriched in LREE. Such
enrichment can be correlated with the high Sr and P enrichments in this sample, suggesting
new formation of goyazite-florencite minerais. A positive Eu enrichment anomaly is present in
each of the 5 samples, suggesting a very low f02 that stabilized Eu2+ by sorption on surface of
Ca-rich minerais (Bau and Müller, 1991 ). Such a reducing environment is consistent with the
presence of Fe-sufides and Fe-chlorites.
... .s (.)
J!! c: 0
~ c.. Cil '0 70:1 c: Cil E
.c: (.) ·;:: c: w
__._shea28
·---...-- Shea7
:-+-Shea16
:~Shea10
i~Shea13
i-Shea22
:Jl~E:~::t=:=::j==:r---~ ~~~~~l=lJ :-Shea24 l-ir-Shea1
--e-Shea3
La Ce Pr Nd Sm Eu Gd lb Dy Ho Er Tm Yb Lu
-+-Shea12
~Shea15
. --+--- Shea20
i-shea19
Figure 21 - REE pattern normalized to the protolith and corrected from the volume variations for the Shea Creek samples. The 2 dashed !ines indicate the interval of uncertainty. Most of the samples are enriched in HREE and tend to be depleted in LREE.
The stage 4 of hematite and siderite breccias is represented by sample Shea19 (see annexe
I). Late sudoite with a similar composition as stage 2 sudoite occurs in this sample. This
suggests that Al may have been mobile like in stage 2. Therefore, Zr was used instead of Al for
mass balance calculations. The calculated volume loss is 83 %. Bi, C, U, Fe, W, Mo, B, V and
Y are enriched, in order of decreasing importance (Fig. 19). Si, Sr and LREE are the main
elements depleted, in order of decreasing importance. C and Fe are related to siderite
crystallization. Si depletion is related to quartz dissolution. B enrichment reflects stage 2
dravite crystallization.
LREE are strongly depleted and intermediate to heavy REE slightly enriched (Fig. 21).
LREE and Sr depletions are related to goyazite-florencite minerais leaching. Intermediate to

180 Synthèse de l'étude structurale, texturale, minéralogique et géochimique des brèches
heavy REE and Y enrichments are probably due to xenotime new formation or to uranium
oxides that have been leached out.
Fluidlrock ratios
Fluid/rock ratios were calculated for each sample assuming a silica saturation of the fluid
of 90 % (table 3) (see annexe Ill). This silica saturation value is lower than the value used at
the Maw Zone in order to account for the fact that fluids were just emerging from the
basement and did not have time to equilibrate with quartz. The average fluid/rock ratios
integrated at the breccia bodies scale are approximately 5,000, 7,000, 6,000, 6,000 and 7,000
for sudoite, dravite, calcite, Fe-chlorite and polyphase carbonate breccias, respectively,
considering 10 % of matrix.
7. 3. The Sue C open pit
The Sue "zones à boules" are characterized by strong Si depletion and K and Rb
enrichments due to massive quartz dissolution and illite replacement of diagenetic dickite (see
part III). Quartz dissolution was accompanied by about 85 % volume loss, assuming immobile
Al. Like at the Maw Zone and at Shea Creek, hydrothermal fluids brought V, B, U, Bi, Mg and
Y, in order of decreasing importance, into the Sue "zone à boules" whereas Fe has been
leached out. W, Zn, Sr, LREE and Cr are also enriched like in sorne Shea Creek breccias like
Shea3. In addition to quartz dissolution and illite crystallization, enrichments and depletions
reflect newly formed sudoite, dravite and crandallite-florencite-goyazite group minerais
crystallization and hematite dissolution. The clay matrix displays the same chemical variations
as the clay halls, with the exception of REE, Y, Sr and Zn. In the matrix, LREE, Sr and Zn are
enriched whereas HREE and Y have been leached out. LREE and Sr are probably associated in
newly formed minerais of the crandallite-florencite-goyazite group. Calculations on REE
changes of concentration in the who le "zone à boule", using an estimation of 65 % for the
matrix percentage, show no significant variations for HREE whereas LREE are enriched.
Therefore, the alteration resulted in a chemical partitioning between clay halls, enriched in
HREE, and the clay matrix, enriched in LREE.
Assuming a silica saturation of 90 %, the calculated fluid/rock ratio is greater than 38,000
for a totally illitized zone (see part III).
Conclusions
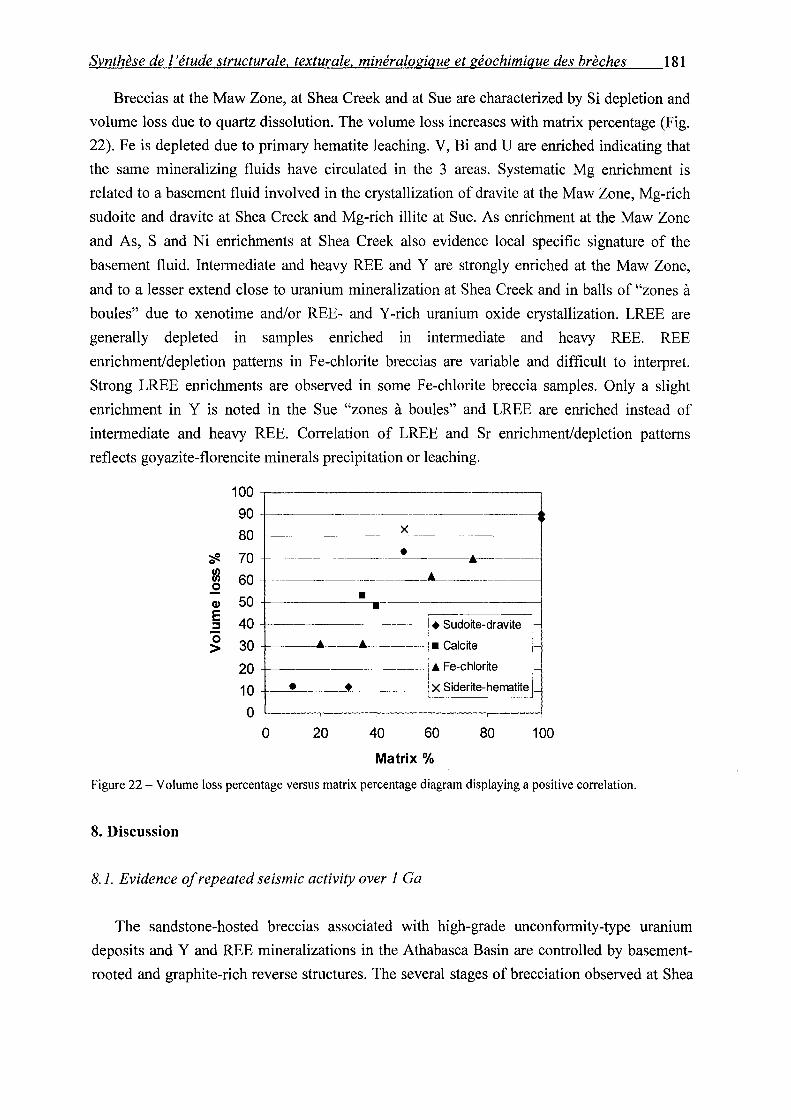
Synthèse de 1 'étude structurale, texturale, minéralogique et géochirnique des brèches 181
Breccias at the Maw Zone, at Shea Creek and at Sue are characterized by Si depletion and
volume loss due to quartz dissolution. The volume loss increases with matrix percentage (Fig.
22). Fe is depleted due to primary hematite leaching. V, Bi and U are enriched indicating that
the same mineralizing fluids have circulated in the 3 areas. Systematic Mg enrichment is
related to a basement fluid involved in the crystallization of dravite at the Maw Zone, Mg-rich
sudoite and dravite at Shea Creek and Mg-rich illite at Sue. As enrichment at the Maw Zone
and As, S and Ni enrichments at Shea Creek also evidence local specifie signature of the
basement fluid. Intermediate and heavy REE and Y are strongly enriched at the Maw Zone,
and to a lesser extend close to uranium mineralization at Shea Creek and in halls of "zones à
boules" due to xenotime and/or REE- and Y-rich uranium oxide crystallization. LREE are
generally depleted in samples enriched in intermediate and heavy REE. REE
enrichment/depletion patterns in Fe-chlorite breccias are variable and difficult to interpret.
Strong LREE enrichments are observed in sorne Fe-chlorite breccia samples. Only a slight
enrichment in Y is noted in the Sue "zones à boules" and LREE are enriched instead of
intermediate and heavy REE. Correlation of LREE and Sr enrichment/depletion patterns
reflects goyazite-florencite minerais precipitation or leaching.
~ .2 Q)
E :::::1
0 >
100 ..------------------. 90 +--------------------------------------j
80 +---------__ X __________ _
70 ----------------·----·------60 _________________ ..._______ _________ _
• 50 +----------------.------------------i
40 ----j • Sud~ite-dravite ~-30 f---------Â--Â--------1• Calcite ;-
20 f-------------------, • Fe-chlorite 1
1-
1 0 +-__...e:____ __ ___,~-------.! x Siderite-hematite 1_
0 +---~---,--~---,--~ 0 20 40 60 80 100
Matrix%
Figure 22 - Volume loss percentage versus matrix percentage diagram displaying a positive correlation.
8. Discussion
8.1. Evidence of repeated seismic activity over 1 Ga
The sandstone-hosted breccias associated with high-grade unconformity-type uranium
deposits and Y and REE mineralizations in the Athabasca Basin are controlled by basement
rooted and graphite-rich reverse structures. The several stages of brecciation observed at Shea
182 Synthèse de 1 'étude structurale. texturale. minéralogique et géochimique des brèches
Creek and at the Maw Zone and the superimposed striaes on fragments of « zones à boules » indicate that the basement-rooted faults were reactivated several times. These reactivations
were probably favored by the presence of graphite along faults in the basement that acted as a
lubricant. Most of the reactivations occurred in a contraction tectonic regime. However, type II
faults at Shea Creek also evidence post-Athabasca sinistral-normal movements. The
determination of the succession oftectonic events was based on the Shea Creek area because it
appears to have recorded more phases than the Sue or Maw zones.
Several ages of uranium mineralization have been obtained by U-Pb and K-Ar mainly
between 1.52 and 1.25 Ga, around 1.1 Ga, between 0.9 and 0.8 Ga and between 0.5 and 0.2 Ga
(Hoeve and Quirt, 1984 ; Lainé, 1985 ; McGill et al., 1993; Fayek and Kyser, 1997).
Sudoite, dravite and illite breccias at Shea Creek are coeval with the main mineralizing
stage between 1.52 and 1.25 Ga. The illite-rich « zones à boules » and the massive illite
associated with the Sue A and B deposits are also coeval with the primary uranium
mineralization. The dravite breccias at the Maw Zone are possibly related to the unconformity
uranium mineralization below and are therefore very likely contemporaneous with the dravite
breccias associated with the mineralization at Shea Creek.
Fe-chlorite breccias at Shea Creek, showing local mixing with kaolinite, might be coeval
with a second mineralization and/or remobilization event at about 900 Ma, by comparison with
a possibly similar Fe-rich kaolinite or kaolinite mixed with Fe-chlorite paragenetic sequence
dated 900 ± 50 Ma in the Cigar Lake deposit (Philippe et al., 1993). Consequently, the Fe
chlorite breccia episode might also be regional. The geometry of Fe-chlorite breccia bodies at
Shea Creek shows that the stress regime differed from the one prevailing during the first
mineralization event (see part Il)
The hematite- and siderite-rich breccias are contemporaneous with a third event of
mineralization and/or remobilization at about 350 Ma. It is also a regional event related to a
rapid uplift of the basin associated with incursion of meteoric fluids in the ore zones (Hoeve
and Quirt, 1984; Kotzer and Kyser, 1995).
The last phase of uranium remobilization at Shea Creek occurred at about 120 Ma. The
samples studied are located at about 5 km south from the 39 km in diameter Carswell meteoric
impact crater. The impact event was dated at 115 ± 10 Ma by Bottomley et al. ( 1990) using a 40 Ar-39 Ar method. That suggests that this last phase of uranium remobilization could have
been triggered by the very close Carswell meteoric impact. Therefore, the polyphase breccia
system associated with unconformity-type uranium mineralizations developed during at least 3
regional tectonic reactivations that occurred over 1 Ga. Each breccia event has been
accompanied by uranium mineralization and/or remobilization.
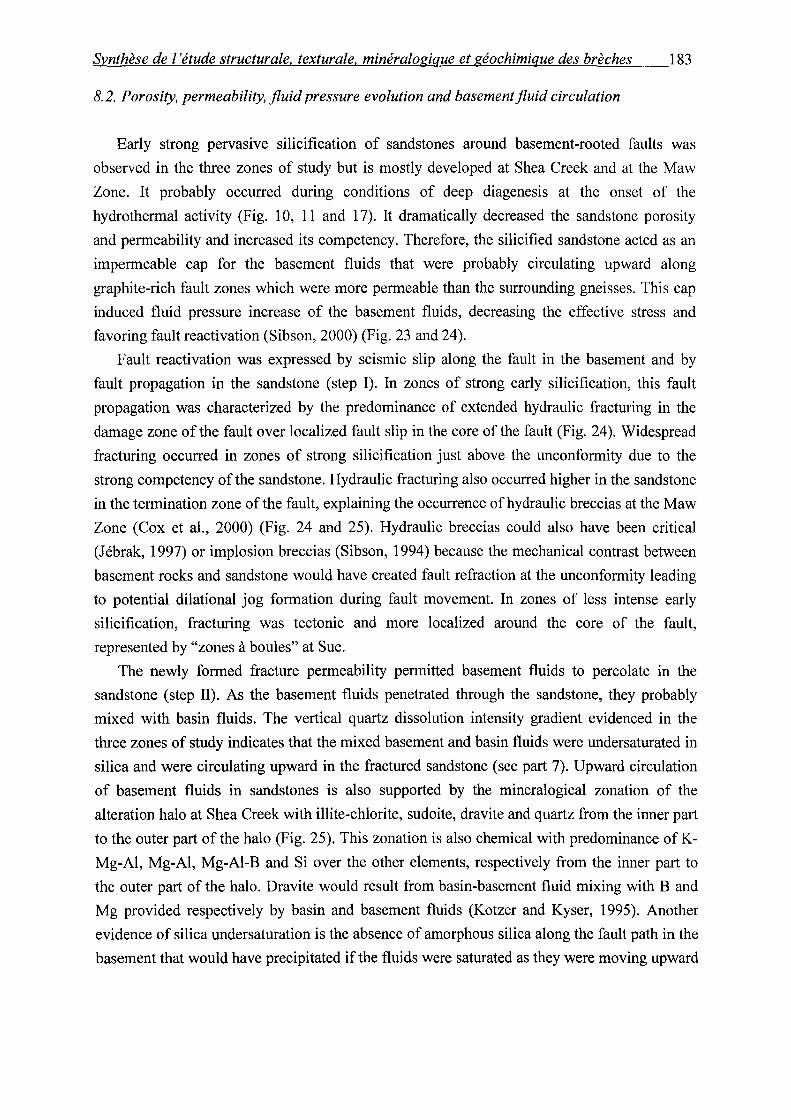
Synthèse de 1 'étude structurale, texturale, minéralogique et géochimique des brèches 183
8. 2. Porosity, permeability, fluid pressure evolution and basement fluid circulation
Early strong pervasive silicification of sandstones around basement-rooted faults was
observed in the three zones of study but is mostly developed at Shea Creek and at the Maw
Zone. It probably occurred during conditions of deep diagenesis at the onset of the
hydrothermal activity (Fig. 10, 11 and 17). It dramatically decreased the sandstone porosity
and permeability and increased its competency. Therefore, the silicified sandstone acted as an
impermeable cap for the basement fluids that were probably circulating upward along
graphite-rich fault zones which were more permeable than the surrounding gneisses. This cap
induced fluid pressure increase of the basement fluids, decreasing the effective stress and
favoring fault reactivation (Sibson, 2000) (Fig. 23 and 24).
Fault reactivation was expressed by seismic slip along the fault in the basement and by
fault propagation in the sandstone (step I). In zones of strong early silicification, this fault
propagation was characterized by the predominance of extended hydraulic fracturing in the
damage zone of the fault over localized fault slip in the core of the fault (Fig. 24). Widespread
fracturing occurred in zones of strong silicification just above the unconformity due to the
strong competency of the sandstone. Hydraulic fracturing also occurred higher in the sandstone
in the termination zone of the fault, explaining the occurrence of hydraulic breccias at the Maw
Zone (Cox et al., 2000) (Fig. 24 and 25). Hydraulic breccias could also have been critical
(Jébrak, 1997) or implosion breccias (Sibson, 1994) because the mechanical contrast between
basement rocks and sandstone would have created fault refraction at the unconformity leading
to potential dilational jog formation during fault movement. In zones of less intense early
silicification, fracturing was tectonic and more localized around the core of the fault,
represented by "zones à boules" at Sue.
The newly formed fracture permeability permitted basement fluids to percolate in the
sandstone (step II). As the basement fluids penetrated through the sandstone, they probably
mixed with basin fluids. The vertical quartz dissolution intensity gradient evidenced in the
three zones of study indicates that the mixed basement and basin fluids were undersaturated in
silica and were circulating upward in the fractured sandstone (see part 7). Upward circulation
of basement fluids in sandstones is also supported by the mineralogical zonation of the
alteration halo at Shea Creek with illite-chlorite, sudoite, dravite and quartz from the inner part
to the outer part of the halo (Fig. 25). This zonation is also chemical with predominance of K
Mg-Al, Mg-Al, Mg-Al-B and Si over the other elements, respectively from the inner part to
the outer part of the halo. Dravite would result from basin-basement fluid mixing with B and
Mg provided respectively by basin and basement fluids (Kotzer and Kyser, 1995). Another
evidence of silica undersaturation is the absence of amorphous silica along the fault path in the
basement that would have precipitated if the fluids were saturated as they were moving upward
184 Synthèse de 1 'étude structurale, texturale, minéralogique et géochimique des brèches
in a cooler environment. The very good spatial correlation between the graphite-type 1 fault
and breccias at Shea Creek (Fig. 7) clearly indicates that graphite-rich faults were the main
channels for upward migration ofbasement silica undersaturated fluids.
--------------------~--------
Tectonic/hyd rau 1 ic
BRECCIA TYPES
Solution r Dissolution
r ,_ Fracturing~Fiuid circulation / Pf increase
! Silicificationj /:, Cementation
No fluid supply
--~--1
1 1
Collapse i
Q) en ro ~ () c ~
1
1
1
Figure 23 - Fluid pressure and permeability cycle associated with breccia development in sandstones.
This basement fluid circulation could have been driven by two different processes :
buoyancy and/or pressure gradient. Buoyancy-driven flow is probable as basement fluids were
hotter (see part III) and likely less saline and less dense than the diagenetic brines as proposed
in Australian unconformity-type uranium deposits by Derome et al. (2000a). The low
interconnectivity of pores in the basement rocks at a depth greater than 5 km indicates that
fluid pressure was probably close to lithostatic. It is therefore possible that permeable faults
provided transient pathways for rapid upward migration of fluids under high driving pressure
gradients by tapping suprahydrostatically pressured deep level fluid reservoirs (Cox et al.,
2000). This hypothesis is consistent with the several thousand meters extension of sorne faults
cross-cutting the unconformity, evidenced by seismic signais (Hajnal et al., 1997).
The newly formed dilational jogs and Riedel shears at the unconformity and the
termination zones of the shear faults at the unconformity or above like at the Maw Zone were
zones of low mean stress. Low mean stress was also particularly developed at fault
intersections. In case of lithostatic fluid pressures, variations in mean stress at any depth were
reflected by variations in fluid pressure. Therefore, fluid flow would have been focused toward
these zones of low mean stress (Ridley, 1993). Not only the basement fluids should have been
focused toward these zones, but also basin fluids circulating laterally in the coarse-grained to
conglomeratic basal sandstone of the basin. That would exp lain the preferential development
of solution breccias at fault intersections, along shear faults at the unconformity or at fault

Synthèse de l'étude structurale, texturale, minéralogique et géochimique des brèches 185
+S
1
TECTONIC-HYDRAU LIC BRECCIAS
Il SOLUTION BRECCIAS
r tjasen1enr f/uid Si undersaturated
Ill COLLAPSE BRECCIAS
Ill
Figure 24 - Schematic drawing showing the formation of uranium mineralization and associated breccias in 3 steps. Une: unconformity, Q: quartz, Db: dravite breccias, Sb: sudoite breccias, I+Cb: Illite+chlorite breccias. Evolution ofporosity, permeability and volume ofbreccias as weil as the fluid pressure of the basement fluids at the unconformity are qualitatively shown.
186 Synthèse de 1 'étude structurale. texturale, minéralogique et géochimique des brèches
termination zones as exemplified by « zones à boules » at Sue, and solution breccias at Shea
Creek and at the Maw Zone, respectively. That would also explain that basin/basement fluid
mixing occurred preferentially in these zones.
The quartz dissolution strongly increased the porosity of the sandstone further increasing
the permeability and therefore acting as a feedback loop maintaining fluid circulation for a
long time (Fig. 23). However, the reprecipitation of quartz in an extemal zone above the
dissolution area could have decreased the porosity and permeability, leading to self-sealing.
This self-sealing would have induce fluid pressure increase and further hydraulic brecciation
(Fig. 23 and 24). The repetition of this same process could have lead to the propagation of a
breccia front upward with massive silica at the head of the front and quartz dissolution belo w.
Therefore, the maximal quartz dissolution at the unconformity can be explained not only by
the maximal silica undersaturation of the fluid circulating upward but also by the longuest time
of fluid-rock interactions. As a consequence, the massive silicification surrounding the
immature dravite breccias at the Maw Zone could result from the quartz dissolution that
probably occurred below at the unconformity.
Such a fluid cycle could be related to fault-valve or load-strengthening fault behavior
(Sibson, 1994 ; Cox, 1995). Each fluid pressure increase would have decreased the effective
stress triggering fault re-opening and basement fluid injection in sandstone. Such behavior
would have been favored by the impossibility for the basement fluids to escape laterally
because of the low permeability of the surrounding rocks and because of the impervious
graphite-rich slikensided planes parallel to the fault. That would explain the occurrence of
multiple euhedral quartz growth zones in fractures above the dissolution zone due to several
fluid pulses.
Clay minerais and dravite cementation occurred in zones of quartz dissolution and could
have also contributed to self-sealing below the silica front. That would have also induced fluid
pressure increase and subsequent re-opening of the system below the silica cap leading to
another phase of quartz dissolution and mineral cementation. That would explain the
occurrence of several phases of the same mineral precipitation within one main stage like in
Fe-chlorite breccias at Shea Creek. These fluid cycles would also explain the altemation
between oxidizing and reducing conditions observed at Shea Creek and in several deposits in
response to the predominance of one or the other type of fluid (Hoeve and Sibbald, 1978).
High-angle reverse faults, that are commonly associated with unconformity-type uranium
deposits (Thomas et al., 1998), are particularly favorable to fault-valve behavior (Sibson,
1994).
When a sufficient quantity of quartz was dissolved, collapse occurred (step III), creating
volume loss and closing porosity. This could have also led to fluid pressure increase and fault
reopening (Fig. 23). Most of the collapse probably occurred progressively during the
Synthèse de l'étude structurale, texturale, minéralogique et géochimique des brèches 187
dissolution (step Il) of sandstone, explaining the very high volume loss percentages. Collapse
would have propagated to higher levels like at the Maw Zone due to massive dissolution
below (Fig. 24). The breccia maturation would have been stopped by an interruption of the
fluid supply, possibly due to chemical sealing of the fault below or to a change in the stress
regime (Fig. 23 and 24). At the end of the hydrothermal activity, the alteration front would
move back toward the unconformity inducing locally oxidation of previously deposited
reduced paragenesis, silica precipitation in corroded zones and dravite precipitation in already
chloritized areas.
In the core of the faults, represented by "zones à boules", the porosity created by quartz
dissolution has been accomodated by tectonic contraction, possibly leading also to fluid
pressure increase and subsequent fault re-opening.
Consequently, the breccia system could have propagated upward along faults by a
succession of basement fluid injections. However, the period of time between each
permeability decrease and subsequent fault re-opening would have been rather long as
stationary hydrodynamic and redox conditions seem to be required for the deposition of high
grade uranium mineralization (Hoeve et al., 1980 ; Hoeve et Quirt, 1985). The different stages
of illite-sudoite-dravite, calcite and Fe-chlorite suggest that several basement fluid pulses may
have been repeated through the basin history between 1.52 and 0.9 Ga.
Hematite-siderite breccias of stage 4 at Shea Creek formed during a period of rapid uplift
and erosion of the basin clue to the incursion of meteoric <fhlid~ {Hoe-ve and <Qui·rt, ,19,84).
Therefore, the fluids in the sediment pore spaces probably contracted due to the cooling effect,
causing significant reduction in pore-fluid pressure (Magara, 1986). The resulting fluid
pressure gradient could have been responsible for further fracturing and fluid input in the
breccia zone. The fluids involved in the formation of these hematite breccias were probably
meteoric as indicated by 8180- and 8D-values of coeval kaolinites (Kotzer and Kyser, 1995).
8. 3. Origin of fluid undersaturation in si! ica
Quartz dissolution in the sandstone surrounding unconformity-type uranium deposits of the
Athabasca Basin was documented by Pagel (1975a), Pagel et al. (1980), Hoeve and Quirt
(1984; 1985), Iida (1993) and Ruzicka (1996). However, the origin of fluid undersaturation in
silica remains unknown. The fluid responsible for quartz dissolution seems to result from
mixing of a basement fluid with a basin fluid in equilibrium with quartz.
One hypothesis to explain quartz dissolution is that the basement fluids were equilibrated
with totally quartz-depleted zones, leading to their silica undersaturation. Petrographie studies
of sorne altered graphite-rich metamorphic rocks along the graphite-rich type 1 fault at Shea
Creek show the absence of quartz (Lorilleux, 1997). However, it is not reasonable to consider
188 Synthèse de l'étude structurale, texturale, minéralogique et géochimique des brèches
that the fluids were not locally in contact with quartz as quartz veins and fragments are
occasionnally present within graphite-rich faults. Furthermore, enrichments of elements like W
in breccias show that the basement fluids have probably circulated through granitic rocks
containing quartz.
A second hypothesis to explain quartz dissolution would be a chemical reaction occurring
in the basement that would undersaturate the fluid in silica. Hydrothermal illite and chlorite
alterations are intensively developed in the basement rocks below unconformity-type uranium
mineralizations, together with massive quartz dissolution (Hoeve et al., 1980 ; Halter, 1988 ;
Baudemont et al., 1993 ; Ii da, 1993 ; Mc Gill et al., 1993; Kotzer and Kyser, 1995). In
conditions of [K+]/[H+] ratio greater than 104, a fluid undersaturated in silica in contact with
illite may be stable (Fritz, 1981 ). Therefore, the hydrothermal alterations observed in the
basement are compatible with the circulation of a silica undersaturated fluid but it is not clear
how they may product such a fluid. In the sandstone, as the mixed fluid circulated upward
along faults, it progressively become equilibrated with quartz leading to only minor dissolution
like at the Maw Zone.
8. 4. Fluid temperatures
Illite geothermometry shows that the fluids responsible for quartz dissolution and illite
crystallization in the Sue « zones ·à boules ->> hacl·a temperatuœ -ab6ut 260 ± 20Cl.C, representing
the mineralizing fluid temperature during the first uranium deposition event, between 1.52 and
1.25 Ga.
The occurrence of uraninite crystals is also consistent with a temperature greater than 250
to 300°C (Albarède et al., 1985). The presence of dickite prior to the main mineralization
event indicates conditions of peak diagenesis during uranium deposition. The estimated
temperature of basin fluids during peak diagenesis is between 200 and 240°C (Hoeve et al.,
1981; Halter, 1988 ; Kotzer and Kyser, 1995). Therefore, the temperature of the mineralizing
fluids was higher than the one of the diagenetic fluids during peak diagenesis. That probably
reflects mixing of basin fluids with hotter basement fluids.
Chlorite geothermometry in Fe-chlorite breccias (stage 3) at Shea Creek gives fluid
temperatures of about 180°C at 900 Ma, indicating a significant cooling of basement and/or
basin fluids. Kaolinite mixed with Fe-chlorite, later than Fe-chlorite, would have formed in a
still cooler environment.
Siderite-hematite breccias (stage 4) probably formed at about 350 Ma and would
correspond to the incursion of meteoric waters less than 50°C (Kotzer and Kyser, 1995).
However, very local uraninite new formation suggests a possible injection of hot basement
fluids at that time.
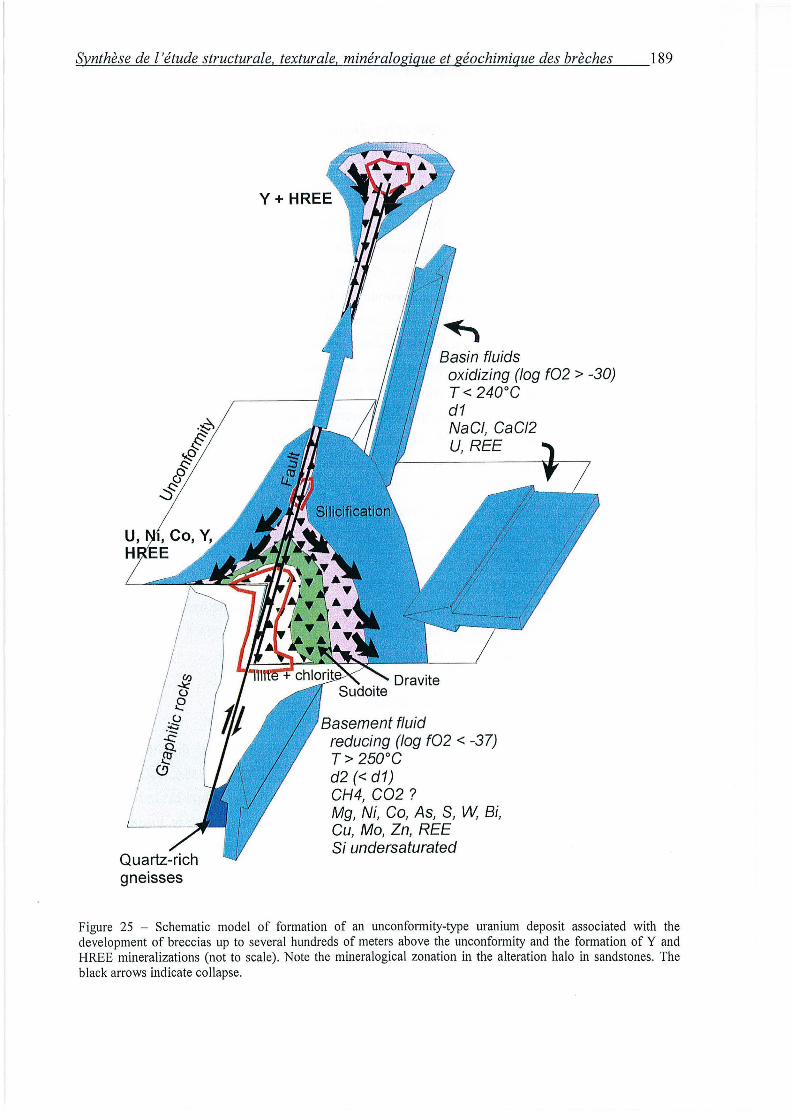
Synthèse de l'étude structurale, texturale, minéralogique et géochimique des brèches 189
gneisses
Basement fluid
Basin fluids oxidizing (log f02 > -30) T < 240°C d1 NaCI, CaCI2 U, REE
reducing (log f02 < -37) T > 250°C d2 (< d1) CH4, C02? Mg, Ni, Co, As, S, W, Bi, Cu, Mo, Zn, REE Si undersaturated
Figure 25 - Schematic model of formation of an unconformity-type uranium deposit associated with the development of breccias up to severa( hundreds of meters above the unconformity and the formation of Y and HREE mineralizations (not to scale). Note the mineralogical zonation in the alteration halo in sandstones. The black arrows indicate collapse.
190 Synthèse de 1 'étude structurale, texturale. minéralogique et géochimique des brèches
8. 5. Hydrothermal jluid volume and ti me of breccia formation
The very high calculated fluid/rock ratios indicate that huge volumes of hydrothermal
fluids have circulated within the breccias. In order to estimate the time of formation of the
breccias, a fluid circulating vertically through a breccia volume of 104 m3 with a horizontal
surface of 1 03 m2, corresponding to the development of breccias along the unconformity over
an average height of 10 rn, is considered. A dissolution efficiency of 100 % is assumed. The
fluid volume required to form this breccia volume is 108 m3, assuming a fluid/rock ratio of 104
with silica saturation close to 90 %. The connected porosity and subsequent permeability
varies with time due to the development of dissolution cavities that may have enhanced the
porosity but also to mineral precipitation that may have sealed the system. But average
connected porosities of 1 % were considered for calculation. The time of breccia formation for
a fluid/rock ratio of 104 would be comprised between 106 and 108 years for a porosity of 1 %
and for a fluid circulation velocity of 100 and 1 m/year respectively (Fig. 26). Fluid velocities
in the order of magnitude of 1 00 m/year were estimated for a strongly fractured zone ( see part
III).
Therefore, the minimum time of breccia formation is probably about 1 million years.
However, as the dissolution probably occurred in slow diffusion-limited regime (part 5.2), the
calculated times are minimal. The overall time of formation of one stage of breccia formation
also depends on the duration of interseismic periods of fluid pressure build-up to reopen the
connectivity of the breccia system after the ir sealing by mineral precipitation. The long time of
formation of the breccias is consistent with the probably long time required to form the large
high-grade uranium mineralizations (Raffensperger and Garven, 1995b ).
8. 6. Uranium deposition and basin jluid volume
Evidences of basement fluid flow in sandstones and occurrence of dravite as breccia
cement strongly indicate basin-basement fluid mixing. Therefore, our observations are in
accordance with the diagenetic hydrothermal model of sandstone-hosted uranium
mineralization proposed by Fayek and Kyser (1997). The absence or very limited quartz
dissolution in the sandstone above the basement-hosted Sue C deposit (Fig. 4) would be
consistent with the absence of basement fluids in the basement-hosted uranium mineralization
model proposed by Fayek and Kyser (1997).
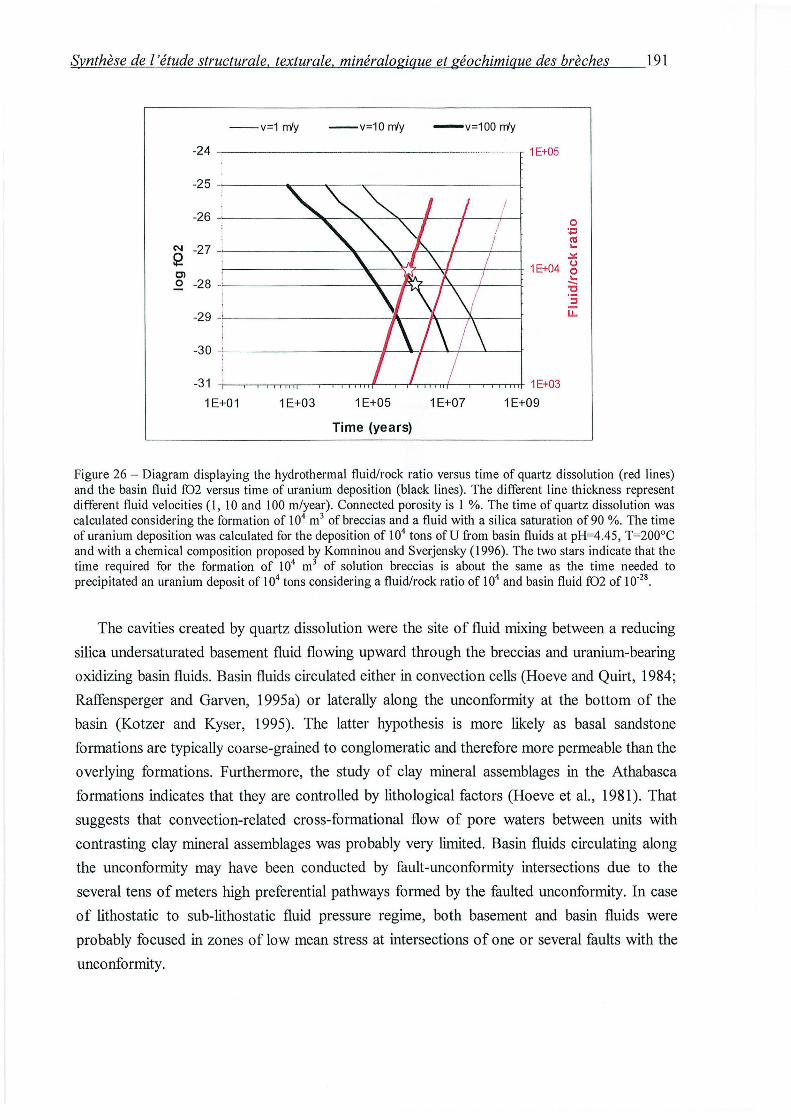
Synthèse de l'étude structurale. texturale. minéralogique et géochimique des brèches 191
--v=1 rr/y --v=10 rr/y -v=100 rr/y
-24 - -············-·-· 1E+05
-25 -
1 -26 - /
0 ~
"' N -27 - 1 ... 2 ~
1E+04 (,)
Cl 0 ... 0 -28 -: -"C
1
::::1
-29 _i u.
-30 -' i i 1
-31 1E+03
1 E+01 1E+03 1E+05 1E+07 1 E+09
Time (years)
Figure 26 - Diagram displaying the hydrothermal fluid/rock ratio versus time of quartz dissolution (red tines) and the basin fluid fD2 versus time of uranium deposition (black tines). The different tine thickness represent different fluid velocities (l, 10 and lOO m/year). Connected porosity is l %. The time of quartz dissolution was calculated considering the formation of l 04 m3 of breccias and a fluid with a si li ca saturation of 90 %. The time of uranium deposition was calculated for the deposition of 104 tons ofU from basin fluids at pH=4.45, T=200°C and with a chemical composition proposed by Komninou and Sverjensky (1996). The two stars indicate that the time required for the formation of 104 m3 of solution breccias is about the same as the time needed to precipitated an uranium deposit of l 04 tons considering a fluid/rock ratio of 104 and basin fluid f02 of 10"28
.
The cavities created by quartz dissolution were the site of fluid mixing between a reducing
silica undersaturated basement fluid flowing upward through the breccias and uranium-bearing
oxidizing basin fluids. Basin fluids circulated either in convection cells (Hoeve and Quirt, 1984;
Raffensperger and Garven, 1995a) or laterally along the unconforrnity at the bottom of the
basin (Kotzer and Kyser, 1995). The latter hypothesis is more likely as basal sandstone
formations are typically coarse-grained to conglomeratic and therefore more permeable than the
overlying formations. Furthermore, the study of clay mineral assemblages in the Athabasca
formations indicates that they are controlled by lithological factors (Hoeve et al., 1981). That
suggests that convection-related cross-formational flow of pore waters between units with
contrasting clay mineral assemblages was probably very lirnited. Basin fluids circulating along
the unconforrnity may have been conducted by fault-unconforrnity intersections due to the
several tens of meters high preferential pathways formed by the faulted unconforrnity. In case
of lithostatic to sub-lithostatic fluid pressure regime, both basement and basin fluids were
probably focused in zones of low mean stress at intersections of one or several faults with the
unconforrnity.

192 Synthèse de 1 'étude structurale. texturale, minéralogique et géochimique des brèches
The sudden drop of f02 of the basin fluids due to mixing with reducing fluids induced
uranium oxide precipitation within the dissolution cavities of the sandstone. The maximal
dissolution zones close to the unconformity were therefore the best trap for uranium
mineralization. The volume of basin fluids needed to precipitate the uranium mineralization of
an average 104 tons U deposit can be calculated using calculated uranium solubility. The
solubility of U02 is mainly dependant of the pH, the temperature, the nature and concentration
ofthe complexing agent and the f02 of the fluid. Uranium is assumed to have been transported
by oxidizing diagenetic fluids circulating in the basin (Kotzer and Kyser, 1995 ; Fayek and
Kyser, 1997).
-~ -N
0 ~
C) 0
...J
~ ~1 O"l
H2C03 (aq) + 1
1 1 1
Hematite
---------GT C .t:: -------r-----
(graphite) .=: 1 ~ 1 ~ ôl .t:: I'Ol o;j - l"; ~1;::::; "0
1 '< mH2CÜ3(aql mC!-4 (aq). _______
1 _ bri~ ---------~---------C-----
1 1
1 1 1
C (graphite) 1 1 ---------T---------r-----CH4 (aq) 1 1
1 1 1 1
42~----~--~--~------~----~~--~~ 3 4 5 6 7 pH
Figure 27 - fD2 versus pH diagram for Fe species at 250°C (modified from Arnold and Guha, 1980). The grey and black arrows represent respectively the possible basin and basement fluid paths during fluid mixing at the unconformity. Basin fluids were in equilibrium with hematite, quartz and dickite before mixing, excepted in zones of the basin where diagenetic il lite is predominant over dickite. Basement fluids were in equilibrium with il lite and graphite before mixing. As illite is Si-rich, the illitization of dickite is accompanied with quartz consumption. The precipitation of pyrite during the U mineralization indicates that the f02 of the mixed fluid is below the hematite-pyrite boundary.
The pH of the basin fluid was buffered by the coexistence of illite and kaolinite and was
therefore most probably comprised between 4 and 5 (Hoeve and Quirt, 1984) (Fig. 27). The
temperature of the uranium-bearing fluids was probably comprised between 200 and 240°C.
The basin fluids were in equilibrium with hematite. Therefore, the oxygen fugacity of the fluid

Synthèse de l'étude structurale, texturale, minéralogique et géochimique des brèches 193
may have been above the pyrite/hematite boundary (fig. 27). Fluid inclusion studies indicate
that the basin fluids contained up to 30 wt. % NaCl (Pagel et al. 1980; Derome et al., 2000b)
and up to 40 wt. % CaCh + MgCh (Derome et al., 2000b ). Several authors have suggested
that, at such pH, temperature and high content of cr, the uranyl-chloride complex U02Ct was
probably predominant over other complexes like carbonate, phosphate, sulfate, hydroxide and
fluoride (Nguyen-Trung, 1985; Wilde and Wall, 1987; Pagel et al., 1988; Raffensperger and
Garven, 1995b; Komninou and Sverjensky, 1996). Furthermore, gold, that is occasionnally
associated with primary mineralization (Shea Creek, Cluff D deposit), may also be transported
as chloride complexes (Jaireth, 1992). However, Fayek and Kyser (1997) propose that U was
mostly transported as fluoride complexes in the diagenetic basin fluids because detrital fluor
apatite was altered to F-poor crandallite group minerais releasing F, P, and HREEs into
solution. Calculations using the computer code EQ3NR/EQ6 (Wolery and Daveler, 1992)
indicate that at 250°C, pH= 5.5, 177 g/1 cr and 10 mg/1 F, uranyl-fluoride complexes (62.7
%) are largely predominant over uranyl-chloride complexes (1.9 %). The calculations also
show abundant uranyl-hydroxide complexes (35 %). So, in spite of the high concentration of
cr, the predominant complexes transporting uranium in the basin fluids might have been
fluorides and hydroxides and in lesser amounts chlorides. In order to constrain the validity of
this assertion, it would be necessary to estimate the initial quantity of fluor-apatite and to be
able to measure the quantity ofF in fluid inclusions of the basin.
At the magnetite/hematite boundary, 200°C, '}JH = '4 and f02 = -40 the solubility of U is
only about 24 ppb with transport as uranyl-hydroxyde complexes (Nguyen-Trung, 1985).
Komninou and Sverjensky ( 1996) proposed a significantly higher oxygen fugacity for the
Athabasca Basin fluids with log f02 = -25 at 200°C. They calculated an U solubility of 17 ppm
with transport as uranyl-chloride complexes at pH=4.45 and 200°C with a low concentration in
F of 10·6 mg/1 and a concentration in cr of 177.265 g/1. In the physico-chemical conditions
proposed by Komninou and Sverjensky, the basin fluid volume needed to precipitate 104 tons
of U with a deposition efficiency of 100% is given in figure 28 as a function of f02. The basin
fluid volume would be in the same order of magnitude as the fluid volume calculated to form
104 m3 of breccias as observed at Shea Creek with a silica undersaturation of 90 % for a f02
between 10"28 and 10"29.
The variations of f02, pH and mineralogy in the sandstones just above the unconformity
during basin-basement fluid mixing are illustrated in figure 27. Before fluid mixing, the
basement fluid was in equilibrium with illite, graphite and pyrite whereas basin fluids were in
equilibrium with hematite, quartz and dickite. However, in sorne parts of the basin where
diagenetic illite predominates over dickite, basin fluids would have been in equilibrium with
illite. Fluid mixing resulted in dickite alteration to illite and quartz dissolution at a pH buffered
around 4.5. Quartz dissolution is mainly due to silica undersaturation of the basement fluid but
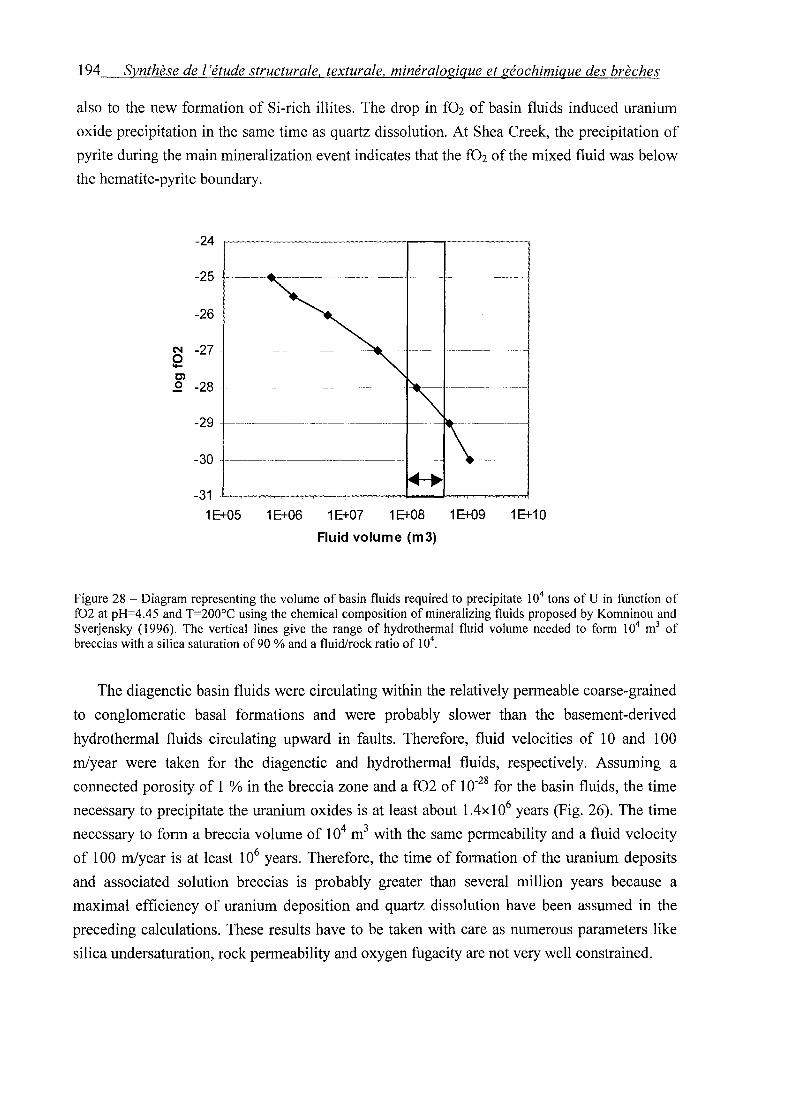
194 Synthèse de 1 'étude structurale, texturale, minéralogique et géochimique des brèches
also to the new formation of Si-rich illites. The drop in f02 of basin fluids induced uranium
oxide precipitation in the same time as quartz dissolution. At Shea Creek, the precipitation of
pyrite during the main mineralization event indicates that the f02 of the mixed fluid was below
the hematite-pyrite boundary.
-24
-25
-26
N -27 - ----------- -----· 2 C> 0 -28 . ---- --
-29 -
-30
-31
1E+05 1E+06 1E+07 1E+08
Fluid volume (m3)
1E+09 1E+10
Figure 28 - Diagram representing the volume of basin fluids required to precipitate 104 tons of U in function of f02 at pH=4.45 and T=200°C using the chemical composition of mineralizing fluids proposed by Komninou and Sverjensky (1996). The vertical Iines give the range of hydrothermal fluid volume needed to form 104 m3 of breccias with a silica saturation of90% and a fluid/rock ratio of 104
•
The diagenetic basin fluids were circulating within the relatively permeable coarse-grained
to conglomeratic basal formations and were probably slower than the basement-derived
hydrothermal fluids circulating upward in faults. Therefore, fluid velocities of 10 and 100
m/year were taken for the diagenetic and hydrothermal fluids, respectively. Assuming a
connected porosity of 1 % in the breccia zone and a f02 of 1 o-28 for the basin fluids, the time
necessary to precipitate the uranium oxides is at least about 1.4x 10⁶ years (Fig. 26). The time
necessary to form a breccia volume of 104 m3 with the same permeability and a fluid velocity
of 100 m/year is at least 106 years. Therefore, the time of formation of the uranium deposits
and associated solution breccias is probably greater than several million years because a
maximal efficiency of uranium deposition and quartz dissolution have been assumed in the
preceding calculations. These results have to be taken with care as numerous parameters like
silica undersaturation, rock permeability and oxygen fugacity are not very well constrained.
Synthèse del 'étude structurale, texturale, minéralogique et géochimique des brèches 195
8. 7. Uranium mineralization-related chemical variations
Enrichments in Bi, Ni, Co, Cu, Mo, As, and S at Shea Creek are typical of complex-type
uranium deposits. The polymetallic signature is less expressed in the Sue "zones à boules"
with Bi, W and Zn enrichments and at the Maw Zone with only Bi and As enrichments. The
similar REE enrichment/depletion signature in sudoite, dravite, calcite and polyphase
carbonate breccias at Shea Creek suggests that REE mobility mainly occurred during the
primary uranium mineralization event. Accordingly, Fayek and Kyser (1997) indicate that REE
are not substantially remobilized or fractionated during alteration of uraninite by late meteoric
waters. Y and intermediate and heavy REE enrichments related to xenotime crystallization are
typically associated with the mineralization. In addition, significant HREE and Y enrichments
in uraninites and pitchblendes from most unconformity-type uranium deposits were observed
(Quirt et al., 1991; Fayek and Kyser, 1997). Therefore, the mineralizing fluids were rich in Y
and intermediate and heavy REE. Chemical partitioning is commonly observed between LREE
and HREE due to their different chemical behavior. The REE mobility is not dependant of
f02, except for Eu and Ce, but rather of temperature, pH and type of complexing agent.
Therefore, REE deposition or leaching is not dependant of the unconformity-controlled redox
front as uranium and may occur higher above the unconformity or laterally away from uranium
mineralization. The cooling of hydrothermal fluids circulating upward might have been the
cause of Y anù 1iREE-depO'si:tion «at the -Maw Zone.
8. 8. Sandstone alteration models
Two types of alteration haloes in sandstones have been distinguished respectively in the
north and south part of the Athabasca Basin (Matthews et al., 1997). The north Athabasca type
is characterized by widespread illitization, the absence of early silicification and is typically
represented by the Cigar Lake deposit. The south Athabasca type corresponds to strong early
silicification, chloritization and dravitization and is probably best represented by the McArthur
River deposit.
The silicification and the sudoite and dravite alterations observed in the Shea Creek
sandstones are typical of the south type (Fig. 25). The early massive silicification has
permitted the development of extended breccia bodies. The strong competency of the silicified
sandstone favored widespread fracturing and its very low permeability limited quartz
dissolution to fracture borders only, making possible the preservation of fragments. Broad
zones of brecciation associated with the strong silicification, chloritization and dravitization
are also documented at McArthur River (Matthews et al., 1997).
196 Synthèse de l'étude structurale, texturale, minéralogique et géochimique des brèches
The illitic alteration at Sue corresponds to the north Athabasca type. Zones of massive
argilization were mostly formed by volume loss due to pervasive quartz dissolution. Such
pervasive dissolution was made possible by the significant Darcy-type permeability of the non
silicified sandstones that precluded from fragment preservation and breccia formation. At
Cigar Lake also, only little breccias of the type observed at Shea Creek were documented
(Bruneton and Caumartin, 1985). However, early pervasive silicification locally occurred at
Sue and favored the development of "zones à boules" breccias.
Therefore, a new classification of unconformity-type uranium deposits can be proposed
with 2 end-members: one characterized by intense early silicification and breccia development
due to quartz dissolution limited in space and the other characterized by massive clay
alteration and widespread quartz dissolution.
If the hypothesis that the quartz dissolution in the sandstone is due to illite alteration in the
basement (see § 8.3), the amount of silicification in the sandstone would be proportional to the
amount of quartz to be consumed in the development of illitization in the basement in order to
get silica undersaturated fluids. That seems to be confirmed by the mineralogical composition
of basement rocks below different deposits. The Cigar Lake basement rocks are typical
graphite-rich metasediments relatively poor in quartz that would explain the very limited
silicification in sandstones. The basement rocks below the Sue A and B deposits are graphite
rich metasediments and granites of the Collins Bay dome. The higher proportion of quartz in
granites than in metasediments would account for the local silicification that favored "zones à
boules" developement in sandstones. At Shea Creek, the predominance of felsic gneisses over
graphite-rich quartz depleted rocks would explain the massive silicification in sandstones. At
McArthur River, the basement contains significant zones of quartzites that would account for
the massive earl y silicification in sandstones. Matthews et al. ( 1997) documented that
silicification of sandstone is particularly prominent above or in the vicinity of basement
quartzite ridges. Therefore, there seems to be a correlation between the amount of quartz in the
basement rocks and the development of silicification and therefore of breccias in sandstones.
9. Conclusions
Unconformity-type uramum mineralization depositions and/or remobilizations in the
Athabasca Basin have been initiated by at least 3 main regional tectonic events between 1.52
and 1.25 Ga, at about 900 Ma and around 350 Ma.
The first uranium deposition stage occurred during peak diagenesis at a temperature greater
than 250°C. It is associated with the development of dra vite breccias and Y +HREE
mineralization at the Maw Zone, the formation of sudoite and dravite breccias at Shea Creek
and the development of illite-rich "zones à boules" at Sue. The breccias associated with
Synthèse de l'étude structurale, texturale, minéralogique et géochimique des brèches 197
uranium mineralizations developed in 3 steps: hydraulic, dissolution and collapse. This
evolution reflects increasing fluid-rock interactions expressed by increasing matrix proportion
mainly resulting from quartz dissolution and also from clay and dravite new formation.
During the regional tectonic events, graphite-rich basement rooted reverse faults have been
preferentially reactivated. Fault propagation in sandstones was expressed by localized tectonic
fracturing to widespread hydraulic fracturing in areas silicified at an early stage (step 1). The
newly formed fracture permeability caused probably both buoyancy- and fluid pressure
gradient-driven basement fluid circulation upward in sandstones.
Early silicification occurred by mixing between hot basement fluids flowing upward and
cooler basin fluids circulating laterally along the unconformity. During the development of
silicification in the sandstone, illitization accompanied with quartz consumption probably
occurred in the basement rocks below. When quartz was totally leached out in the alteration
zones below the unconformity, the basement fluids became silica undersaturated and began to
dissolve quartz when they reached the sandstone at the unconformity (step 2).
Intense quartz dissolution was associated with important volume losses up to 80-90 % at
Shea Creek and in "zones à boules" at Sue. At the Maw Zone, located 250 rn above the
unconformity, the fluids had time to partially re-equilibrate with quartz and induced therefore
only minor quartz dissolution. The collapse at the Maw Zone was induced by the volume loss
and collapse that probably occurred at the unconformity below, like at Shea Creek or at Sue
(step~3), leading to the development of karst systems in -sandstones. At SheaCreek where early
silicification was intense, quartz dissolution is widespread but limited around fractures
excepted at the unconformity. At Sue, quartz dissolution was expressed by massive illitization
in "zones à boules" due to a weaker early silicification.
The fluicl/rock ratios calculated using silica saturation of 90 % at the unconformity and of
99% at the Maw Zone are between 38,000 and 3,000, respectively in the Sue "zones à boules"
and at the Maw Zone. The time of formation of the breccias is estimated to be in the order of
magnitude of a few million years assuming a fluid velocity of 1 00 m/year and a connected
porosity of 1%. Such a long time of formation is consistent with the slow diffusion-limited
regime of dissolution evidenced in sudoite-dravite breccias and the time probably required to
form high grade uranium deposits.
The porosity created by quartz dissolution was the site of mixing between the reducing
silica undersaturated basement fluids and the uranium-bearing oxidizing basin fluids and
formed the trap for uranium mineralization. Quartz dissolution was very likely coeval with
uranium oxides deposition. Considering a f02 of 1 0"28 for basin fluids transporting uranium as
uranyl-chloride complexes, the time necessary to form a deposit of 104 tons of U would be
about a few million years for a fluid velocity of 10 m/year and a connected porosity of 1%, that
is a similar time than what is necessary to form 1 04 m3 of breccias.
198 Synthèse de l'étude structurale, texturale, minéralogique et géochimique des brèches
Sustainable fracture permeability and fluid circulation from the basement to the sandstone
was necessary in order to produce a stationary redox front at the unconformity. The
permeability would have been maintained by an equilibrium between quartz dissolution acting
as a positive feedback loop and collapse, tectonic contraction and alteration mineral
precipitation that tended to decrease permeability. Occasionnally or periodically, sealing ofthe
hydrothermal system induced fluid pressure increase and subsequent reopening possibly by a
fault-valve seismic mechanism.
A new approach of the classification of Matthews et al. (1997) of sandstone alteration
types is proposed based on the occurrence of breccias. Deposits that belong to the south
Athabasca models are associated with extended breccia bodies in silicified sandstones and
spatially limited quartz dissolution. Deposits of the north Athabasca model show very weak
breccia development, massive clay alteration due to pervasive quartz dissolution and extended
lateral clay alteration haloes.
The genetic model of uranium deposition and breccia formation proposed in this paper is
consistent with the model proposed by Fayek and Kyser (1997). Basement fluids are necessary
to explain the formation of quartz dissolution in sandstone-hosted mineralizations that would
result from basin-basement fluid mixing. The absence or very limited quartz dissolution above
the basement-hosted Sue C mineralization suggests that basement fluids might not be involved
in the formation of basement-hosted mineralizations as proposed by Fayek and Kyser (1997).
Therefore, the classification of deposit-s trased -cm -breccia occurrences would be·cvalid emly for
mineralizations occurring in the sandstone or just at the unconformity.
Acknowledgements
COGEMA and COGEMA Resources Inc are gratefully acknowledged for their financial,
logistical, technical and geological support. COGEMA and CAMECO are thanked for
permission to publish the geological data collected in the field from 1998 to 2000. We would
also like to thank C. Peiffert for realizing calculations with the computer code EQ3NR/EQ6.
The manuscript benefited from discussions with M. Cathelineau, D. Derome and M. Brouand.
Synthèse de l'étude structurale, texturale, minéralogique et géochimique des brèches 199
References
Agip Canada Ltd., 1985, Saskatchewan Energy and Mines, Assessment File 74H06-NW-0080.
Albarède, F., Michard, A., and Cuney, M., 1985, Les chronomètres uranium-thorium-plomb,
in Roth, E., and Poty, B., eds., Méthodes de datation par les phénomènes nucléaires
naturels. Applications: Paris, Masson, Série Scientifique, Collection CEA, p. 123-173.
Armstrong, R.L., and Ramaekers, P., 1985, Sr isotopie study ofHelikian sediment and diabase
dikes in the Athabasca Basin, northem Saskatchewan: Canadian Journal of Earth
Sciences, v. 22, p. 399-407.
Bau, M., and Müller, P., 1991, REE systematics as source of information on minerogenesis, in
Pagel, M., and Leroy, J., eds., Source, Transport and Deposition of Metals, Proceedings
ofthe 25 years SGA anniversary meeting, Nancy: Balkema, Rotterdam, p. 17-20.
Baudemont, D., Piquard, J.P., Ey, F., and Zimmerman, J., 1993, The Sue Uranium Deposits,
Saskatchewan, Canada: Exploration and Mining Geology, v. 2, p. 179-202.
Baudemont, D., and Pacquet, A., 1996, The Sue D and E uranium deposits, Northem
Saskatchewan: evidence for structurally controlled fluid circulation in the Athabasca
Basin, in MinExpo'96 Symposium, Advances in Saskatchewan Geology and Mineral
Exploration: p. 85-94.
Bottomley, R.J., York, D., and Grieve, R.A.F., 1990, 40 Argon-39 Argon dating of impact
craters, in Proceedings of the 20th Lunar and Planetary Science Conference: p. 421-431.
Bruneton, P., and Caumartin, P., 1985, Le gisement d'uranium de Cigar Lake (Saskatchewan,
Canada) - Contribution à la compréhension des mécanismes de formation des
gisements de 1' Athabasca, in Pro gram and extended abstracts, Concentration
mechanisms of uranium in geological environments: Nancy, France, p. 211-214.
Burley, S.D., and Kantorowicz, J.D., 1986, Thin section and S.E.M. texturai criteria for the
recognition of cement-dissolution porosity in sandstones: Sedimentology, v. 33, p. 587-
604.
Cathelineau, M., and Nieva, D., 1985, A chlorite solid solution geothermometer. The Los
Azufres (Mexico) geothermal system : Contributions to Mineral ogy and Petrology, v.
91' p. 235-244.
Cathelineau, M., and Izquierdo, G., 1988, Temperature - composition relationships of
authigenic micaceous minerais in the Los Azufres geothermal system: Contributions to
Mineralogy and Petrology, v. 100, p. 418-428.
200 Synthèse de l'étude structurale, texturale, minéralogique et géochimique des brèches
Chiarenzelli, J., Aspler, L., Villeneuve, M., and Lewry, J., 1998, Early Proterozoic Evolution
of the Saskatchewan Craton and its Allochthonous Caver, Trans-Hudson Orogen: The
Journal ofGeology, v. 106, p. 247-267.
Cox, S.F., 1995, Faulting processes at high fluid pressures: an example of fault valve behavior
from the Wattle Guily Fault, Victoria, Australia: Journal of Geophysical Research, v.
100, p. 12841-12859.
Cox, S.F., Knackstedt, M.A., and Braun, J., 2000, Principles of structural control on
permeability and fluid flow in hydrothermal systems: Reviews in Economie Geology,
(in press).
Derome, D., Cuney, M., Cathelineau, M., Fabre, C., Brisset, F., 2000a, Fluid regime in the
Kombolgie sandstones in the vicinity of unconformity-type uranium deposits (Northern
Territory, Australia), in Proceedings, GeoCanada2000, The Millennium Geoscience
Summit, Calgary: GAC-MAC joint annual meeting, abstract 178 (Conference CD).
Derome, D., Cathelineau, M., Cuney, M., Fabre, C., Dubessy, J., Lhomme, T., 2000b,
Reconstitution of the composition of individual fluid inclusion using
microthermometry, Raman microspectroscopy and Laser Induced Breakdown
Spectroscopy. Application to the genesis of Australian and Canadian world-class
unconformity-type uranium deposits, in Proceedings Symposium Metallogeny2000,
December 2000, Nancy, France
Dzuslynski, S., and Sass-Gustkiewicz, M., 1989, Pb-Zn ores, in Bosak, P., Ford, D.C., Glazek,
J., and Horacek, I., eds., Paleokarst. A Systematic and Regional Review: Amsterdam
and Praka, Elsevier and Academia, p. 377-396.
Energy Mines and Resources, 1989, Canadian mineral deposits not being mined in 1989:
National Mineral Inventory, Mineral Policy Sector, Mineral Bulletin MR 223, Sask. 47.
Ey, F., Gauthier-Lafaye, F., Lillié, F., and Weber, F., 1985, A uranium unconformity deposit:
The geological setting of the D orebody (Saskatchewan-Canada), in Lainé, R., Alonso,
D., and Svab, M., eds., The Carswell structure uranium deposits, Saskatchewan:
Geological Association of Canada Special Paper 29, p. 121-138.
Fayek, M., and Kyser, T.K., 1997, Characterization of multiple fluid-flow events and Rare
Barth-Element mobility associated with formation of unconformity-type uranium
deposits in the Athabasca Basin, Saskatchewan: The Canadian Mineralogist, v. 35, p.
627-658.
Fouques, J.P., Fowler, M., Knipping, H.D., and Schimann, K., 1986, The Cigar Lake uranium
deposit: discovery and general characteristics, in Evans, E.L., ed., Uranium Deposits of
Synthèse de l'étude structurale, texturale, minéralogique et géochimique des brèches 201
Canada: Canadian Institute of Mining Metallurgy and Petroleum (CIM), special
volume 33.
Fritz, B., 1981, Etude thermodynamique et modélisation des réactions hydrothermales et
diagénétiques [Ph.D. thesis]: Strasbourg, Louis Pasteur University, Sciences
Géologiques, mémoire 65, 197 p.
Govindaraju, K., and Mevelle, G., 1987, Fully automated dissolution and separation methods
for inductive1y coupled plasma emission spectrometry rock analysis: Journal of
Analytic and Atomic Spectroscopy, v. 2, p. 615-621.
Grant, J.A., 1986, The iso con diagram, a simple solution to Gresens' equation for metasomatic
alteration: Economie Geology, v. 81, p. 1976-1982.
Gres ens, R.L., 1967, Composition-volume relationships of metasomatism: Chemical Geology,
v. 2, p. 47-65.
Hajnal, Z., Annesley, I.R., White, D., Matthews, R.B., Sopuck, V., Koch, R., Leppin, M., and
Ahuja, S., 1997, Sedimentary-hosted mineral deposits: a high-resolution seismic survey
in the Athabasca Basin, in Gubins, A.G., ed., Proceedings of Exploration 97: Fourth
Decennial International Conference on Mineral Exploration, p. 421-432.
Hall, A.J., 1986, Pyrite-pyrrhotine redox reactions in nature: Mineralogical Magazine, v. 50, p.
223-229.
Halter, G., 1988, Zonalités des altérations dans l'environnement des gisements d'uranium
associés à la discordance du Protérozoïque Moyen (Saskatchewan, Canada) [Ph.D.
thesis]: Strasbourg, Louis Pasteur University, 252 p.
Halter, G., Pagel, M., Sheppard, S.M.F., Weber, F., and Clauer, N., 1988, Rétromorphose,
paléoaltération, diagenèse et hydrothermalisme de 1' encaissant des gisements uranifères
dans la structure de Carswell (Saskatchewan-Canada), in Gisements Métallifères dans
leur Contexte Géologique: Document du BRGM no. 158, v.1, p. 365-388.
Hecht, L., and Cuney, M., 2000, Mechanism of uranium mobilization in the Athabasca basin
and basement by hydrothermal and/or diagenetic fluids, in Proceedings,
GeoCanada2000, The Millennium Geoscience Summit, Calgary: GAC-MAC joint
annual meeting, abstract 191 (Conference CD).
Hoeve, J., and Sibbald, T.I.I., 1976, Rabbit Lake uranium deposit, in Dunn, C.E., ed., Uranium
in Saskatchewan: Geological Society of Saskatchewan Special Publication no. 3, p.
331-354.

202 Synthèse de l'étude structurale, texturale, minéralogique et géochimique des brèches
Hoeve, J., and Sibbald, T.I.I., 1978, On the genesis of Rabbit Lake and other unconforrnity
type uranium deposits in northem Saskatchewan, Canada: Economie Geology, v. 73, p.
1450-1473.
Hoeve, J., Sibbald, T.LI., Ramaekers, P., and Lewry, J.F., 1980, Athabasca Basin
unconforrnity-type uranium deposits: a special class of sandstone-type deposits?, in
Ferguson, S., and Goleby, A., eds., Uranium in the Pine Creek Geosyncline:
International Atomic Energy Agency, Vienna, p. 575-594.
Hoeve, J., Rawsthom, K., and Quirt, D., 1981, Uranium Metallogenetic Studies: Clay Mineral
Stratigraphy and Diagenesis in the Athabasca Group: Saskatchewan Research Council
Technical Report no. 22, p. 76-89.
Hoeve, J., and Quirt, D., 1984, Mineralization and host rock alteration in relation to clay
mineral diagenesis and evolution of the middle-Proterozoic Athabasca Basin, northem
Saskatchewan, Canada: Saskatchewan Research Council Technical Report 187, 187 p.
Hoeve, J., and Quirt, D., 1985, A stationary redox front as a critical factor in the formation of
high-grade, unconforrnity-type uranium ores in the Athabasca Basin, Saskatchewan, in
Program and extended abstracts, Concentration mechanisms of uranium in geological
environrnents: Nancy, France, p. 219-224.
Ho:ffman, P.F., 1987, Continental transforrn tectonics: Great Slave Lake shear zone (ca. 1.9
Ga), northwest Canada: Geology, v. 15, p. 785-788.
Hoffman, P.F., 1989, Precambrian geology and tectonic history of North America, in Bally,
A. W., and Palmer, A.R., eds., The Geology of North America- An Overview: Boulder,
Colorado, Geological Society of America, The Geology of North America, v. A, p.
447-512.
Hutcheon, 1., 2000, Principles of diagenesis and what drives mineral change, in Kyser, K., ed.,
Fluids and Basin Evolution: Mineralogical Association of Canada, Short Course Series,
v. 28, p. 93-114.
Iida, Y., 1993, Alteration and ore-forrning processes of unconforrnity-related uramum
deposits: Resource Geology Special Issue, no. 15, p. 299-308.
Jaireth, S., 1992, The calculated solubility of platinum and gold in oxygen-saturated fluids and
the genesis of platinum-palladium and gold mineralization in the unconforrnity-related
uranium deposits: Mineralium Deposita, v. 27, p. 42-54.
Jébrak, M., 1997, Hydrotherrnal breccias in vein-type ore deposits: A review of mechanisms,
morphology and size distribution: Ore Geology Reviews, v. 306, p. 1-24.
Synthèse de l'étude structurale, texturale, minéralogique et géochimique des brèches 203
Komninou, A., and Sverjensky, D.A., 1996, Geochemical modeling of the formation of an
unconformity-type uranium deposit: Economie Geology, v. 91, p. 590-606.
Kotzer, T. G., Kyser, T.K., and Irving, E., 1992, Paleomagnetism and the evolution of fluids in
the Proterozoic Athabasca Basin, northern Saskatchewan, Canada: Canadian Journal
ofEarth Sciences, v. 29, p. 1474-1491.
Kotzer, T.G., and Kyser, T.K., 1995, Petrogenesis of the Proterozoic Athabasca Basin,
northern Saskatchewan, Canada, and its relation to diagenesis, hydrothermal uranium
mineralization and paleohydrogeology: Chemical Geology, v. 120, p. 45-89.
Kyser, T.K., Wilson, M.R., and Ruhrmann, G., 1989, Stable isotope constraints on the role of
graphite in the genesis of unconformity-type uranium deposits : Canadian Journal of
Earth Sciences, v. 26, p. 490-498.
Lainé, R., 1985, The Carswell uranium deposits-An example of not so unique unconformity
related uranium mineralization, in Lainé, R., Alonso, D., and Svab, M., eds., The
Carswell structure uranium deposits, Saskatchewan: Geological Association of Canada
Special Paper 29, p. 225-230.
Lewry, J.F., and Sibbald, T.l.l., 1980, Thermotectonic evolution of the Churchill Province in
Northern Saskatchewan: Tectonophysics, v. 68, p. 45-82.
Lorilleux, G., 1997, Lithogéochimie des formations·métamorphiques et plutoniques encaissant
les gisements d'uranium de type discordance [M.Sc. thesis] : Nancy, Institut National
Polytechnique de Lorraine, 39 p.
Lorilleux, G., Cuney, M., Jébrak, M., and Mondy, J., 2000, A new approach of unconformity
type uranium metallogenesis from a structural breccia study (Northern Saskatchewan,
Canada), in Proceedings, GeoCanada2000, The Millennium Geoscience Summit,
Calgary: GAC-MAC joint annual meeting, abstract 232 (Conference CD).
MacDougall, D.G., 1990, Rare Earth Element mineralization in the Athabasca Group-Maw
Zone, in Summary of Investigations 1990: Saskatchewan Geological Survey,
Saskatchewan Energy and Mines, Miscellaneous Report 90-4, p. 103-105.
Magara, K., 1986, Geological models of petroleum entrapment : London, Elsevier Applied
Science Publishers, 328 p.
Matthews, R., Koch, R., and Leppin, M., 1997, Advances in integrated exploration for
unconformity uranium deposits in Western Canada, in Gubins, AG., ed., Proceedings
of Exploration 97: Fourth Decennial International Conference on Mineral Exploration,
p. 993-1024.

204 Synthèse del 'étude structurale, texturale, minéralogique et géochimique des brèches
McGill, B.D., Marlatt, J.L., Matthews, R.B., Sopuck, V.J., Homeniuk, L.A., and Hubregtse,
J.J., 1993, The P2 North uranium deposit, Saskatchewan, Canada : Exploration and
Mining Geology, v. 2, p. 321-331.
Montel, J.-M., Foret, S., Veschambre, M., Nicollet, C, and Provost, A., 1996, Electron
microprobe dating of monazite: Chemical Geology, v. 131, p. 37-53.
Nguyen Trung, C., 1985, Géochimie théorique et expérimentale des oxydes d'uranium dans
des solutions aqueuses de 25 à 700°C, sous une pression de 1 à 6000 bars. Synthèse
hydrothermale de certains minéraux d'uranium (VI) et (IV) [Ph.D. thesis]: Nancy,
Institut National Polytechnique de Lorraine, tome I, 479 p.
Pagel, M., 1975a, Cadre géologique des gisements d'uranium dans la structure Carswell
(Saskatchewan-Canada). Etude des phases fluides [Ph.D. thesis]: Nancy, Henri
Poincaré University (Nancy I), 157 p.
Pagel, M., 1975b, Détermination des conditions physico-chimiques de la silicification
diagénétique des grès Athabasca (Canada) au moyen des inclusions fluides: Comptes
Rendus de l'Académie des Sciences, v. 280, D, p. 2301-2304.
Pagel, M., 1977, Microthermometry and chemical analysis offluid inclusions from the Rabbit
Lake uranium deposit, Saskatchewan, Canada : Institution of Mining and Metallurgy
Transactions, section B, v. 86, p. B157-B158.
Pagel, M., and Jaffrezic, H., 1977, Analyses chimiques des saumures des inclusions du quartz
et de la dolomite du gisement d'uranium de Rabbit Lake (Canada). Aspect
méthodologique et importance génétique : Comptes Rendus de 1' Académie des
Sciences, v. 284, série D-113.
Pagel, M., Poty, B., and Sheppard, S.M.F., 1980, Contribution to sorne Saskatchewan uranium
deposits mainly from fluid inclusion and isotopie data, in Ferguson, S., and Goleby, A.,
eds., Uranium in the Pine Creek Geosyncline: International Atomic Energy Agency,
Vienna, p. 639-654.
Pagel, M., Pinte, G., and Rotach-Toulhoat, N., 1987, The rare earth elements in natural
uranium oxides, in Monograph Series on Mineral Deposits : Gebrüder Bomtraeger,
Berlin, v. 27, p. 81-85.
Pagel, M., Halter, G., Ruhlmann, F., and Tona, F., 1988, Evolution polycyclique de la
province uranifère Athabasca (Saskatchewan - Canada) et genèse des gisements liés
spatialement à la discordance du Protérozoïque Moyen dans la structure de Carswell, in
Gisements Métallifères dans leur Contexte Géologique : Document du BRGM no. 158,
v.l, p. 389-413.
Synthèse de l'étude structurale, texturale, minéralogique et géochimique des brèches 205
Petit, S., and Decarreau, A., 1990, Hydrothermal (200°C) synthesis and crystal chemistry of
iron-rich kaolinites: Clay Minerais, v. 25, p. 181-196.
Philippe, S., Lancelot, J.R., Clauer, N., and Pacquet, A., 1993, Formation and evolution of the
Cigar Lake uranium deposit based onU-Pb and K-Ar systematics: Canadian Journal of
Earth Sciences, v. 30, p. 720-730.
Quirt, D., Kotzer, T., and Kyser, T.K., 1991, Tourmaline, phosphate minerais, zircon, and
pitchblende in the Athabasca Group: Maw Zone and McArthur River areas,
Saskatchewan, in Summary of Investigations 1991: Saskatchewan Geological Survey,
Saskatchewan Energy and Mines, Miscellaneous Report 91-4, p. 181-191.
Quirt, D., 2000, Sub-Athabasca Group fanglomerate in the McArthur River-Read Lake area,
Saskatchewan, in Proceedings, GeoCanada2000, The Millennium Geoscience Summit,
Calgary: GAC-MAC joint annual meeting, abstract 251 (Conference CD).
Raffensperger, J.P., and Garven, G., 1995a, The formation ofunconformity-type uranium ore
deposits; 1. Coupled groundwater flow and heat transport modeling: American Journal
of Science, v. 295, p. 581-636.
Raffensperger, J.P., and Garven, G., 1995b, The formation ofunconformity-type uranium ore
deposits; 2. Coupled hydrochemical modeling: American Journal of Science, v. 295, p.
639-696.
Ramaekers, P., 1981, Hudsonian and Helikian basins of the Athabasca region, Northern
Saskatchewan: Geological Survey of Canada Paper 81-10, p. 219-233.
Ramaekers, P., 1990, Geology of the Athabasca Group (Helikian) in Northern Saskatchewan:
Saskatchewan Energy and Mines, Saskatchewan Geological Survey, report 195, 49 p.
Ramaekers, P., and Dunn, C.D., 1977, Geology and geochemistry ofthe eastern margin ofthe
Athabasca Basin: Saskatchewan Geological Society Special Publication no. 3, p. 297-
322.
Ridley, J., 1993, The relations between mean rock stress and fluid flow in the crust: with
reference to vein- and iode-style gold deposits: Ore Geology Reviews, v. 8, p. 23-37.
Rippert, J.C., Koning, E., Robbins, J., Koch, R., and Baudemont, D., 2000, The Shea Creek
Uranium Project, West Athabasca Basin, Saskatchewan, Canada, in Proceedings,
GeoCanada2000, The Millennium Geoscience Summit, Calgary: GAC-MAC joint
annual meeting, abstract 570 (Conference CD).
Ross, G.M., Milkereit, B., Eaton, D., White, D., Kanasewitch, E.R., and Burianyk, M.J.A.,
1995, Paleoproterozoic collisional orogen beneath the western Canada sedimentary
basin imaged by Lithoprobe crustal seismic-reflection data: Geology, v. 23, p. 195-199.
206 Synthèse de l'étude structurale, texturale, minéralogique et géochimique des brèches
Ross, G.M., and Eaton, D.W., 1997, Winagami reflection sequence: Seismic evidence for
postcollisional magmatism in the Proterozoic of western Canada: Geology, v. 25, p.
199-202.
Ruzicka, V., 1986, Uranium deposits in the Rabbit Lake-Collins Bay area, Saskatchewan, in
Evans, E.L., ed., Uranium Deposits of Canada: Canadian Institute of Mining
Metallurgy and Petroleum Special Volume 33, p. 144-154.
Ruzicka, V., 1996, Unconformity-associated uranium, in Eckstrand, O.R., Sinclair, W.D., and
Thorpe, R.l., eds., Geology of Canadian Mineral Deposit Types : Geological Survey of
Canada, Geology of Canada, no. 8, p. 197-210.
Salvi, S., Pokrovski, G.S., and Schott, J., 1998, Experimental investigation of aluminum-silica
aqueous complexing at 300°C: Chemical Geology, v. 151, p. 51-67.
Sass-Gustkiewicz, M., 1996, Internai sediments as a key to understanding the hydrothermal
karst origin of the upper silesian Zn-Pb ore deposits: Society of Economie Geologists,
Special Publication no. 4, p. 171-181.
Sibson, R.H., 1994, Crustal stress, faulting and fluid flow, in Parnell, J., ed., Geofluids:
Origin, Migration and Evolution of fluids in Sedimentary Basins : Geological Society
Special Publication no. 78, p. 69-84.
'Sihson, R.H., 2000, Tectonic controls on maximum sustainable -0verpressure: fluid
redistribution from stress transitions: Journal of Geochemical Exploration, v. 69, p.
471-475.
SMDC, 1992, Wheeler River Project. Inedited document.
Suzuki, K., and Adachi, M., 1994, Middle Precambrian detrital monazite and zircon from the
Hida gneiss on Oki-Dogo Island, Japan: their origin and implications for the correlation
ofbasement gneiss of Southwest Japan and Korea: Tectonophysics, v. 235, p. 277-292.
Tester, J.W., Worley, W.G., Robinson, B.A., Grigsby, C.O., and Feerer, J.L., 1994,
Correlating quartz dissolution kinetics in pure water from 25 to 625°C: Geochimica et
Cosmochimica Acta, v. 58, p. 2407-2420.
Thomas, D.J., Matthews, R.B., and Sopuck, V., 1998, Athabasca Basin Unconformity-Type
Uranium Deposits: A Synopsis of the Empirical Model and Review of Exploration and
Production Trends, in Proceedings, Canadian Institute of Mining, Metallurgy and
Petroleum meeting, Montréal.
Vigneresse, J.L., and Cannat, M., 1987, Mesures de paramètres physiques dans le sondage
d'Echassières (vitesse sismique, porosité, densité), in Mémoire Géologie profonde de
la France, tome 1: Géologie de la France, no. 2-3, p. 145-148.
Synthèse del 'étude structurale, texturale. minéralogique et géochimique des brèches 207
Villeneuve, M.E., and Thériault, R.J., 1991, U-Pb ages and Sm-Nd signature of two granites
from the Fort Simpson magnetic high, northwest Canada: Canadian Journal of Earth
Sciences, v. 28, p. 1003-1008.
Wallis, R.H., Saracoglu, N., Brummer, J.J., and Golightly, J.P., 1983, Geology ofthe McLean
uranium deposits, in Cameron, E.M., ed., Uranium exploration in Athabasca Basin,
Saskatchewan, Canada: Saskatchewan Energy and Mines, Geological Survey of
Canada, p. 71-110.
Wilde, A.R., and Wall, V.J., 1987, Geology of the Nabarlek uranium deposit, Northem
Territory, Australia: Economie Geology, v. 82, p. 1152-1168.
Wilson, M.R., and Kyser, T.K., 1987, Stable isotope geochemistry of alteration associated
with the Key Lake uranium deposit: Economie Geology, v. 82, p. 1450-1557.
Wolery, T.J., and Daveler, S.A., 1992, EQ3/6, a software package for geochemical modeling
of aqueous systems. UCRL-MA-110772 PT I-IV: Berkeley, University of Califomia,
Lawrence Livermore National Laboratory.

Synthèse de l'étude structurale, texturale, minéralogique et géochimique des brèches 209
ARTICLE4:
Uranium-bearing breccias in the Athabasca Basin, Saskatchewan (Canada)
Hydrothermal karsts in Proterozoic sandstones
Guillaume Lorilleux CREGU-UMR G2R 7566, U. H. P., BP 23, F-54501 Vandoeuvre, France Michel Jébrak UQAM-DST A, CP 8888, Montréal (QUE) H3C 3P8 Canada
Michel Cuney CREGU-UMR G2R 7566, U. H. P., BP 23, F-54501 Vandoeuvre, France Christian Le Carlier de Veslud CRPG, BP 20, F-54501 Vandoeuvre, France
Jean-Jacques Royer CRPG, BP 20, F-54501 Vandoeuvre, France
Destiné à GEOLOGY (version longue)
210 Synthèse de l'étude structurale, texturale, minéralogique et géochimique des brèches
Résumé
La modélisation tridimensionnelle de la géométrie des brèches, 1' analyse fractale des
morphologies de fragments et les calculs de bilans de masse montrent que les brèches
associées aux minéralisations uranifères encaissées par les grès Protérozoïque Moyen du
Bassin Athabasca sont l'expression d'une karstification hydrothermale. La formation des
karsts a été déclenchée par un événement tectonique entre 1,52 et 1,25 Ga provoquant une
fracturation tectonique et hydraulique et initiant la circulation verticale ascendante de fluides
de socle sous-saturés en silice dans les grès fracturés. Les systèmes de karsts se sont ensuite
développés par dissolution du quartz et effondrements gravitaires mis en évidence par des
pertes de volume spectaculaires pouvant atteindre 90 %. Les zonations de perméabilité
latérales et verticales des principales failles inverses contrôlant la minéralisation uranifère dans
les grès ont constitué un paramètre majeur de l'évolution des karsts. L'intensité de dissolution
était maximale à la discordance jouant le rôle de piège pour la minéralisation uranifère. Les
très forts rapports fluide/roche jusqu'à 38 000 dans le cœur de la faille contrôlant les gisements
de Sue A et B mettent en évidence la percolation d'énormes quantités de fluides et une longue
période d'activité du système karstique hydrothermal. Ces facteurs apparaissent indispensables
pour expliquer les forts tonnages et les très hautes teneurs des gisements d'uranium de type
.discordance.
Mots-clefs : karst, dissolution, grès, brèche, uranium.
Abstract
3D modeling of the geometry ofbreccias, fractal analysis of the morphology of the breccia
fragments and mass balance calculations indicate that breccias associated with uranium
mineralizations hosted by the Proterozoic Athabasca sandstone are the expression of
hydrothermal karstification. Karst formation has been triggered by a tectonic event between
1.52 and 1.25 Ga inducing tectonic and hydraulic fracturing and initiating circulation of silica
undersaturated basement fluids upward in the fractured sandstone. The karst systems
developed by quartz dissolution and subsequent collapse, evidenced by spectacular volume
lasses up to 90 %. The lateral and vertical permeability zonation in the sandstone of the main
reverse structures controlling the uranium mineralization was a major parameter of the karst
evolution. The intensity of dissolution was maximal at the unconformity acting as a trap for
the uranium mineralization. The very high fluid/rock ratios up to 38,000 in the core of the fault
controlling the Sue A and B uranium deposits indicate percolation of huge amounts of fluids

Synthèse del 'étude structurale, texturale, minéralogique et géochimique des brèches 211
and a long time of activity of the hydrothermal karst systems. That appear to be one of the
major parameters explaining the large tonnages and very high grades of the unconformity-type
uranium deposits.
Keywords : karst, dissolution, sandstone, breccia, uranium.
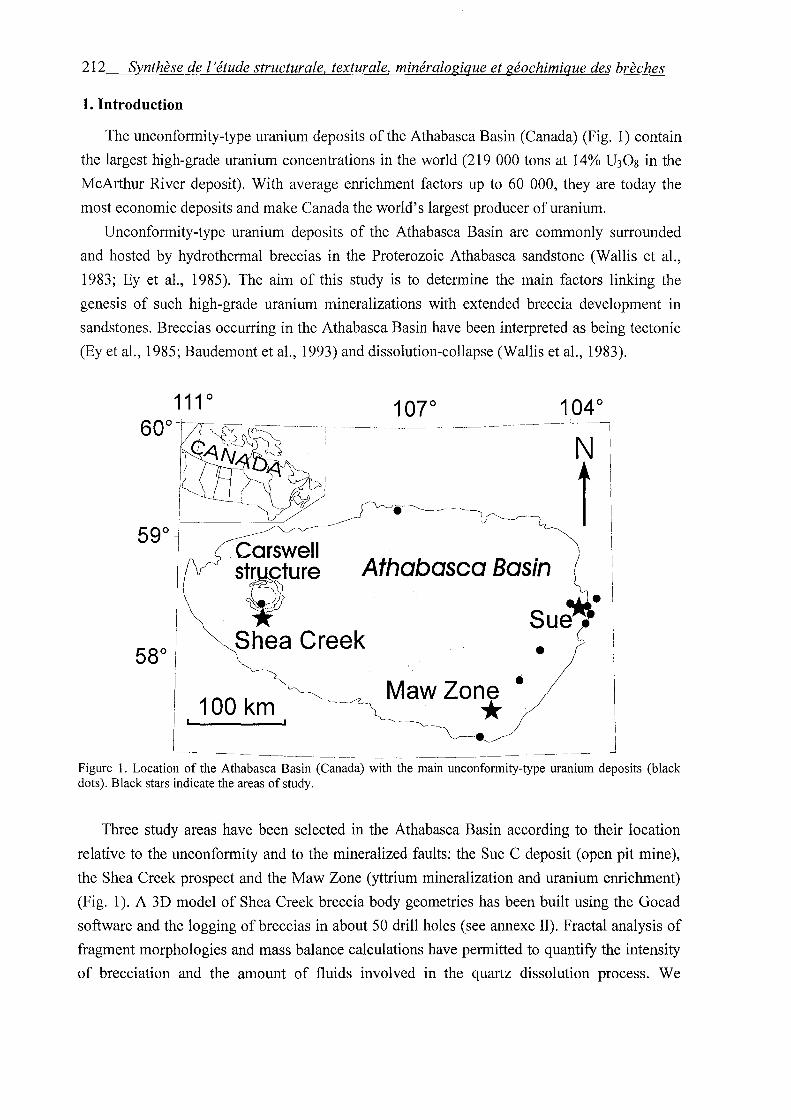
212 Synthèse de l'étude structurale, texturale, minéralogique et géochimique des brèches
1. Introduction
The unconformity-type uranium deposits of the Athabasca Basin (Canada) (Fig. 1) contain
the largest high-grade uranium concentrations in the world (219 000 tons at 14% U30 8 in the
McArthur River deposit). With average emichment factors up to 60 000, they are today the
most economie deposits and make Canada the world's largest producer of uranium.
Unconformity-type uranium deposits of the Athabasca Basin are commonly surrounded
and hosted by hydrothermal breccias in the Proterozoic Athabasca sandstone (Wallis et al.,
1983; Ey et al., 1985). The aim of this study is to determine the main factors linking the
genesis of such high-grade uranium mineralizations with extended breccia development in
sandstones. Breccias occurring in the Athabasca Basin have been interpreted as being tectonic
(Ey et al., 1985; Baudemont et al., 1993) and dissolution-collapse (Wallis et al., 1983).
111° 107° 104°
( 0 b: 1 ~-~lt~~~--
sgoi ~ ~ l ) ~ars~ell . "\ 1 (V st~cture Athabasca Bas1n (
r· ·i) Sue~· 580 i Shea Creek •
1
100 km ~ Maw Zone •
~~-* 1 1
__ __j 1 ~------~-
Figure 1. Location of the Athabasca Basin (Canada) with the main unconformity-type uranium deposits (black dots). Black stars indicate the areas ofstudy.
Three study areas have been selected in the Athabasca Basin according to their location
relative to the unconformity and to the mineralized faults: the Sue C deposit (open pit mine),
the Shea Creek prospect and the Maw Zone (yttrium mineralization and uranium emichment)
(Fig. 1 ). A 3D model of Shea Creek breccia body geometries has been built using the Gocad
software and the logging of breccias in about 50 drill holes (see annexe II). Fractal analysis of
fragment morphologies and mass balance calculations have permitted to quantify the intensity
of brecciation and the amount of fluids involved in the quartz dissolution process. We
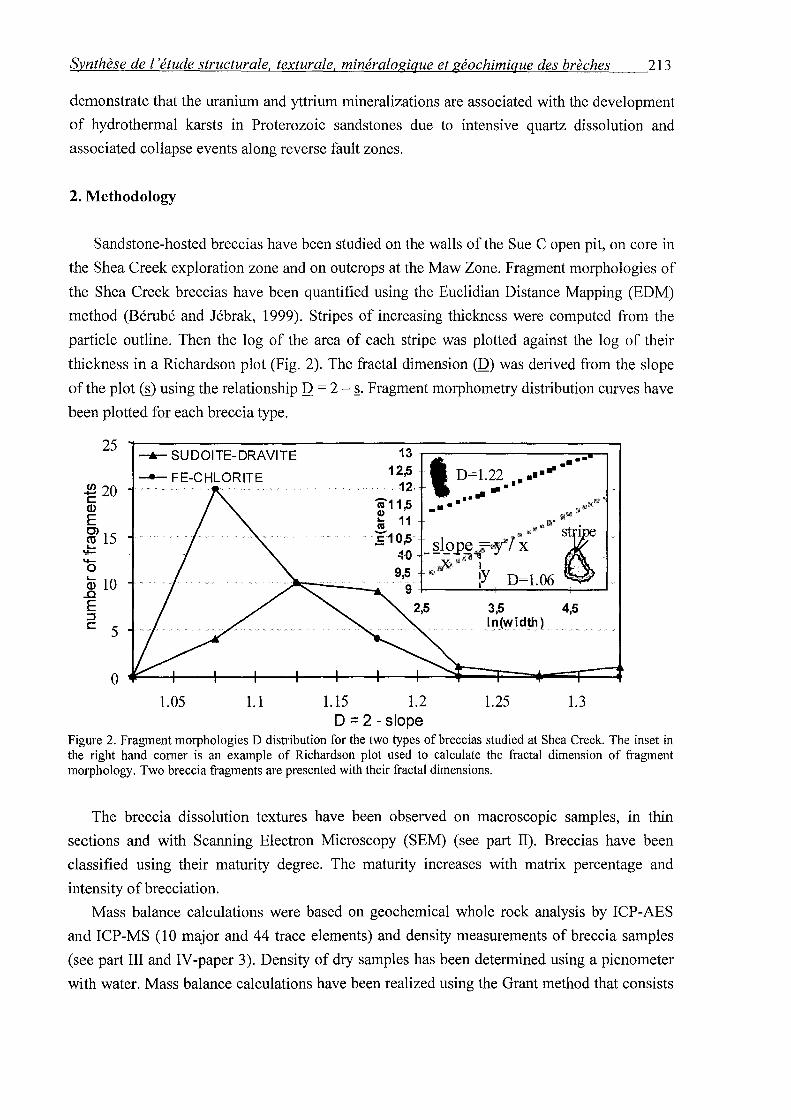
Synthèse de l'étude structurale, texturale, minéralogique et géochimique des brèches 213
demonstrate that the uranium and yttrium mineralizations are associated with the development
of hydrothermal karsts in Proterozoic sandstones due to intensive quartz dissolution and
associated collapse events along reverse fault zones.
2. Methodology
Sandstone-hosted breccias have been studied on the walls of the Sue C open pit, on core in
the Shea Creek exploration zone and on outcrops at the Maw Zone. Fragment morphologies of
the Shea Creek breccias have been quantified using the Euclidian Distance Mapping (EDM)
method (Bérubé and Jébrak, 1999). Stripes of increasing thickness were computed from the
particle outline. Then the log of the area of each stripe was plotted against the log of their
thickness in a Richardson plot (Fig. 2). The fractal dimension (Q) was derived from the slope
of the plot (~) using the relationship D = 2 - ~· Fragment morphometry distribution curves have
been plotted for each breccia type.
25
$20 c ())
E ~15
.J:: 0 <vw .c E ::::::1 c 5
0
__.__ SUDOITE-DRAVITE
- FE-CHLORITE
1.05 1.1 1.15
13 .----::------------=--,.---, 12.5 - ' D=l.22 ...... ·• •• '-12~- • 1
'ii11 ,5 ~ 11 ni
-· •• .... 11111 '
a'" Il!! rut> •
Eto,s 40
m"'"'~ Sl . _§.19_~~'~~ .. ~lx _._ _ .,p;œ 1 .
9•5 "' lY D=l.06 --·· 9+---~-+------+----'
3,5 4,5 ln(width)
1.2 1.25 1.3 D = 2- slope
Figure 2. Fragment morphologies D distribution for the two types of breccias studied at Shea Creek. The inset in the right hand corner is an example of Richardson plot used to calculate the fractal dimension of fragment morphology. Two breccia fragments are presented with their fractal dimensions.
The breccia dissolution textures have been observed on macroscopic samples, in thin
sections and with Scanning Electron Microscopy (SEM) (see part II). Breccias have been
classified using their maturity degree. The maturity increases with matrix percentage and
intensity ofbrecciation.
Mass balance calculations were based on geochemical whole rock analysis by ICP-AES
and ICP-MS (10 major and 44 trace elements) and density measurements of breccia samples
(see part III and IV -paper 3). Density of dry samples has been determined using a picnometer
with water. Mass balance calculations have been realized using the Grant method that consists
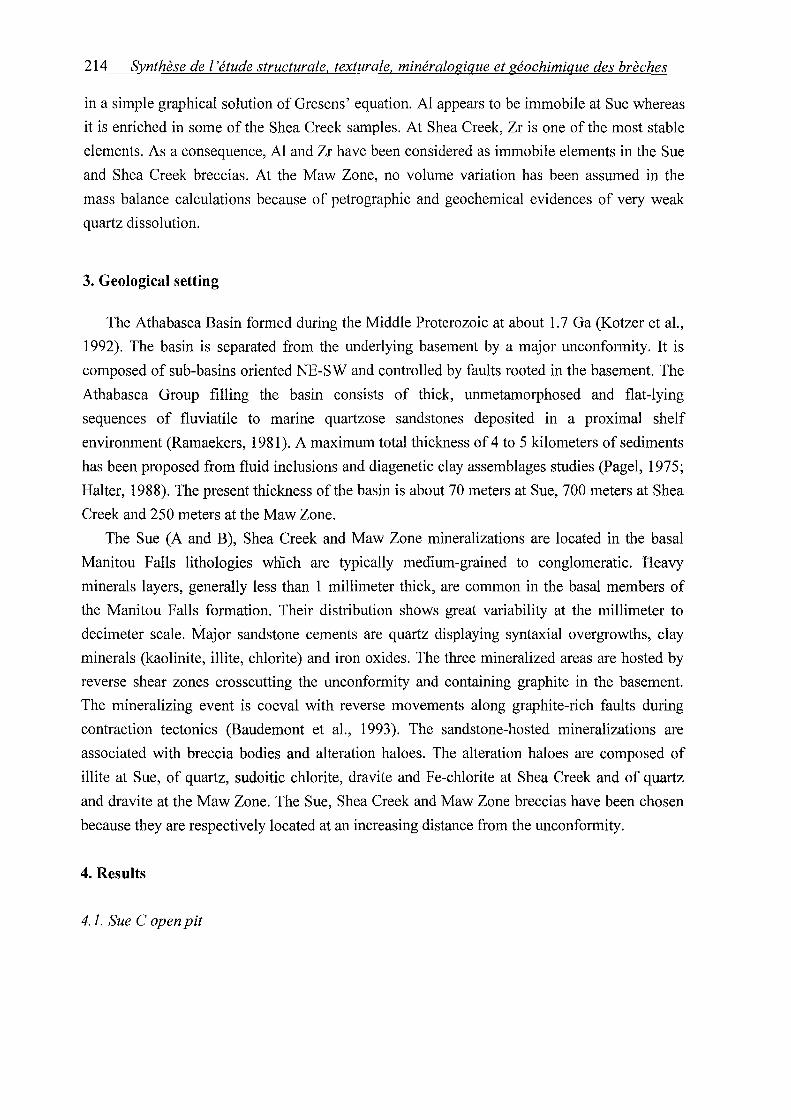
214 Synthèse de l'étude structurale, texturale, minéralogique et géochimique des brèches
in a simple graphical solution of Gresens' equation. Al appears to be immobile at Sue whereas
it is enriched in sorne of the Shea Creek samples. At Shea Creek, Zr is one of the most stable
elements. As a consequence, Al and Zr have been considered as immobile elements in the Sue
and Shea Creek breccias. At the Maw Zone, no volume variation has been assumed in the
mass balance calculations because of petrographie and geochemical evidences of very weak
quartz dissolution.
3. Geological setting
The Athabasca Basin formed during the Middle Proterozoic at about 1. 7 Ga (Kotzer et al.,
1992). The basin is separated from the underlying basement by a major unconformity. It is
composed of sub-basins oriented NE-SW and controlled by faults rooted in the basement. The
Athabasca Group filling the basin consists of thick, unmetamorphosed and flat-lying
sequences of fluviatile to marine quartzose sandstones deposited in a proximal shelf
environment (Ramaekers, 1981 ). A maximum total thickness of 4 to 5 kilometers of sediments
has been proposed from fluid inclusions and diagenetic clay assemblages studies (Pagel, 1975;
Halter, 1988). The present thickness of the basin is about 70 meters at Sue, 700 meters at Shea
Creek and 250 meters at the Maw Zone.
The Sue (A and B), Shea Creek and Maw Zone mineralizations are located in the basal
Manitou Falls lithologies whl.ch are typically medium-grained to conglomeratic. Heavy
minerais layers, generally less than 1 millimeter thick, are common in the basal members of
the Manitou Falls formation. Their distribution shows great variability at the millimeter to
decimeter scale. Major sandstone cements are quartz displaying syntaxial overgrowths, clay
minerais (kaolinite, illite, chlorite) and iron oxides. The three mineralized areas are hosted by
reverse shear zones crosscutting the unconformity and containing graphite in the basement.
The mineralizing event is coeval with reverse movements along graphite-rich faults during
contraction tectonics (Baudemont et al., 1993). The sandstone-hosted mineralizations are
associated with breccia bodies and alteration haloes. The alteration haloes are composed of
illite at Sue, of quartz, sudoitic chlorite, dravite and Fe-chlorite at Shea Creek and of quartz
and dravite at the Maw Zone. The Sue, Shea Creek and Maw Zone breccias have been chosen
because they are respectively located at an increasing distance from the unconformity.
4. Results
4.1. Sue C open pit

Synthèse de l'étude structurale, texturale, minéralogique et géochimique des brèches 215
The Sue C open pit presents local but intense brecciation phenomenons within 50 meters
above the unconformity. The main structural control of the Sue deposits is a serie of N12
graphite-rich reverse faults. The Sue A and B uranium mineralization is sandstone-hosted up
to 50 meters above the unconformity whereas the Sue C, D and E uranium deposits consist of
basement-hosted vein-type mineralizations occurring down to more than 100 meters below the
unconformity (Baudemont et al., 1993).
The breccias have elongated finger shapes narrowly controlled by the graphite-rich reverse
basement-rooted structure controlling also the Sue A and B deposits. They are more
developed at fault intersections, are located just above the unconformity and are typically 10
to 20 meters high, 5 meters wide and 10 meters long.
They are composed of illitized striated sandstone balls wrapped in massive illite and are
caUed "zones à boules", that were described for the first time in the Cluff D uranium deposit
(Ey et al., 1985). The baU shapes are due to quartz dissolution in a diffusion-limited regime
(Jébrak, 1997) combined with ball rotation during reverse fault movements. At the
unconformity, the illitic matrix percentage may be greater than 50 vol. %and sandstone balls
are totally illitized, indicating an extreme degree of maturity. Microscopie observations
indicate that illite replaces diagenetic dickite showing Al transfer rather than transport.
Therefore, Al was considered as immobile in mass balance calculations. Extreme volume loss
has been calculated due to intense quartz dissolution (Table 1). As only limited collapse has
been observed, the volume loss was probably accommodated by tectonic contraction because
of the reverse movements and baU rotations observed along the fault.
4. 2. Shea Creek
The Shea Creek area was selected because of the widespread breccia development in the
sandstone surrounding the high-grade uranium mineralization. The Shea Creek ore is found
down to 40 meters in the basement and, in the sandstone up to 40 meters above the
unconformity (Rippert et al., 2000).
Sudoite-dravite and Fe-chlorite breccias, defined by the nature of their cement, are the
main breccia types in sandstones. Three-dimensional modeling using systematic breccia
logging along about 50 drill holes shows that sudoite-dravite breccias have finger shapes. The
breccia fingers enlarge at the unconformity, and are controlled by mineralized reverse
structures which are graphite-rich in the basement (Fig. 3). The development of Fe-chlorite
breccias is later than the sudoite-dravite breccias. The Fe-chlorite breccia bodies display a
dome shape developed at the intersection of severa! faults (Fig. 3).
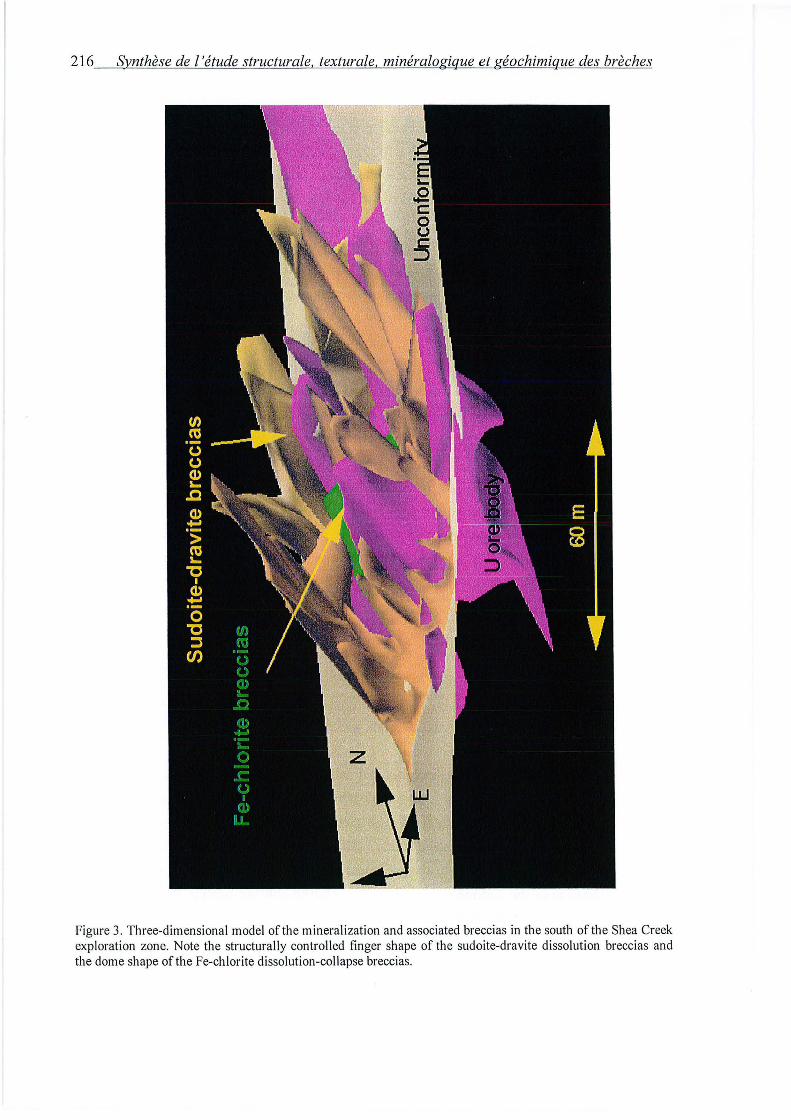
216 Svnthèse de l'étude structurale. texturale. minéralogique et géochimique des brèches
Figure 3. Three-dimensional mode! ofthe mineralization and associated breccias in the south of the Shea Creek exploration zone. Note the structurally controlled finger shape of the sudoite-dravite dissolution breccias and the dome shape of the Fe-chlorite dissolution-collapse breccias.
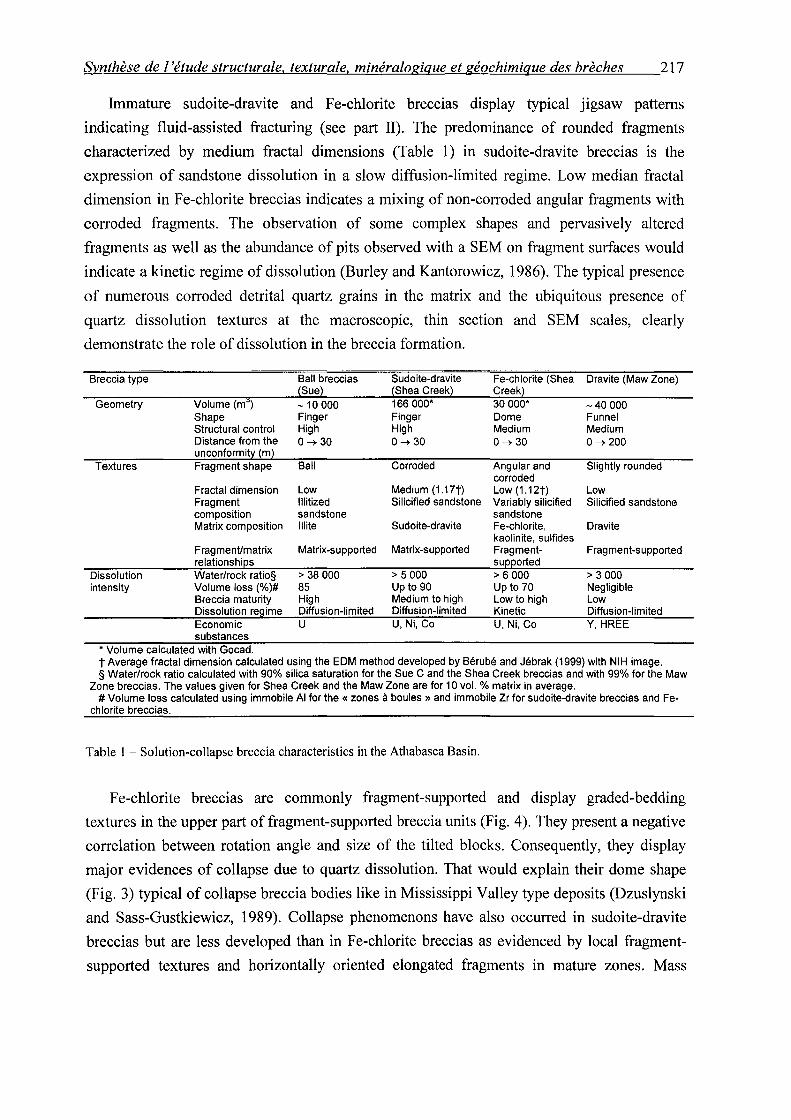
Synthèse de l'étude structurale, texturale, minéralogique et géochimique des brèches 217
Immature sudoite-dravite and Fe-chlorite breccias display typical jigsaw patterns
indicating fluid-assisted fracturing (see part Il). The predominance of rounded fragments
characterized by medium fractal dimensions (Table 1) in sudoite-dravite breccias is the
expression of sandstone dissolution in a slow diffusion-limited regime. Low median fractal
dimension in Fe-chlorite breccias indicates a mixing of non-corroded angular fragments with
corroded fragments. The observation of sorne complex shapes and pervasively altered
fragments as well as the abundance of pits observed with a SEM on fragment surfaces would
indicate a kinetic regime of dissolution (Burley and Kantorowicz, 1986). The typical presence
of numerous corroded detrital quartz grains in the matrix and the ubiquitous presence of
quartz dissolution textures at the macroscopic, thin section and SEM scales, clearly
demonstrate the role of dissolution in the breccia formation.
Breccia type
Geometry
Textures
Dissolution intensity
Volume (m3)
Shape Structural control Distance from the unconformity (m) Fragment shape
Fractal dimension Fragment composition Matrix composition
Fragment/matrix relationships Water/rock ratio§ Volume loss (%)# Breccia maturity Dissolution regime Economie substances
* Volume calculated with Gocad.
Bali breccias (Sue)
-10 000 Finger High 0~30
Bali
Low lllitized sandstone lllite
Matrix-supported
> 38 000 85 High Diffusion-limited u
Sudoite-dravite (Shea Creek) 166 000* Finger High 0~30
Corroded
Medium (1.17t) Silicified sandstone
Sudoite-dravite
Matrix-supported
> 5 000 Up to 90 Medium to high Diffusion-limited U, Ni, Co
Fe-chlorite (Shea Creek) 30 000* Do me Medium 0~30
Angular and corroded Low(1.12t) Variably silicified sandstone Fe-chlorite, kaolinite, sulfides Fragmentsupported > 6 000 Up to 70 Low to high Kinetic U, Ni, Co
Dravite (Maw Zone)
-40 000 Funnel Medium 0~200
Slightly rounded
Low Silicified sandstone
Dra vite
Fragment-supported
> 3 000 Negligible Low Diffusion-limited Y,HREE
t Average fractal dimension calculated using the EDM method developed by Bérubé and Jébrak (1999) with NIH image. § Water/rock ratio calculated with 90% silica saturation for the Sue C and the Shea Creek breccias and with 99% for the Maw
Zone breccias. The values given for Shea Creek and the Maw Zone are for 10 vol. % matrix in average. # Volume loss calculated using immobile Al for the « zones à boules » and immobile Zr for sudoite-dravite breccias and Fe
chlorite breccias.
Table 1 - Solution-collapse breccia characteristics in the Athabasca Basin.
Fe-chlorite breccias are commonly fragment-supported and display graded-bedding
textures in the upper part offragment-supported breccia units (Fig. 4). They present a negative
correlation between rotation angle and size of the tilted blocks. Consequently, they display
major evidences of collapse due to quartz dissolution. That would explain their dome shape
(Fig. 3) typical of collapse breccia bodies like in Mississippi Valley type deposits (Dzuslynski
and Sass-Gustkiewicz, 1989). Collapse phenomenons have also occurred in sudoite-dravite
breccias but are less developed than in Fe-chlorite breccias as evidenced by local fragment
supported textures and horizontally oriented elongated fragments in mature zones. Mass
218 Synthèse de l 'étude structurale, textura le, minéralogique et géochimique des brèches
balance calculations using immobile Zr indicate volume loss up to 90 % in sudoite-dravite
mature zones with an average of 8 % in the overall breccia body (Table 1 ). The calculated
volume loss in Fe-chlorite breccias is highly variable. It is negligible in low matrix collapse
zones in the upper part of the body and about 65% in average in zones with 60 to 70 vol.% of
matrix. Weak volume loss zones may therefore occur in the upper part of the body where
collapsed sandstone fragments dominate over residual minerais after dissolution.
Figure 4. Photograph of a Fe-chlorite solution-collapse breccia at Shea Creek with fragment-supported texture and graded-bedding in the upper part of the breccia.
4.3. MawZone
The Maw Zone was chosen because ofthe large development ofbreccias between 200 and
250 meters above the unconformity. The breccias, located below and within intraclast-rich
sandstone lithologies, host yttrium and REE mineralization. Small uranium enrichment occurs
at the unconformity below the breccia body (MacDougall, 1990; Quirt et al. , 1991).
The breccias display an overall funnel shape controlled by a reverse structure rooted in
graphite-rich lithologies. Their volume has been estirnated at 40,000 m3 from outcrop and drill
hole data (Table 1). They have typically a low matrix percentage, about 15 vol. %in average
Synthèse de l'étude structurale, texturale, minéralogique et géochimique des brèches 219
and rarely up to 30 vol. %. They consist of slightly rounded silicified sandstone fragments in a
matrix mostly composed of 85 to 90 wt. % of corroded detrital quartz grains and dravite. The
low matrix percentage and the high proportion of detrital quartz grains in the matrix express
the low maturity degree of these breccias. The most immature breccias have jigsaw textures
and are found on the margins of the funnel. Jigsaw textures are the expression of hydraulic
brecciation that could be related to the termination zone of the basement-rooted reverse fault
(Cox et al., 2000). The rounded fragment shapes and the presence of corroded detrital quartz
grains in the matrix indicate quartz dissolution in the matrix and on the fragments borders.
The formation of rounded shapes rather than cusps producing complex shapes suggests a
probable diffusion-limited regime of dissolution (Jébrak, 1997) (Table 1 ). In the center of the
funnel, breccias are heterolithic with tilted fragments and fragment-supported textures,
indicating the occurrence of collapse. The systematic measurements of the azimuth of tilted
blocks demonstrate that this collapse occurred along structural trends. Mass balance
calculations show negligible volume loss due to poorly developed dissolution (Table 1 ).
Therefore, the collapse could not be attributed to the dissolution at the Maw Zone.
4. 4. Gene sis of breccias
The spatial correlation between breccias and uranium mineralizations at Shea Creek and
Sue and the presence of typical unconformity-type hydrothermal alteration minerais sueh as
sudoitic chlorite, illite and dravite in the breccia cement of the three zones of study suggests
that breccias and unconformity-type uranium mineralizations are coeval.
Sandstone-hosted immature breccias show that they were initiated by hydraulic or tectonic
fracturing along reverse faults which are graphite-rich in the basement. The similar ages of
uranium mineralizations in various deposits (Cumming and Krstic, 1992) indicate that breccia
formation was triggered by a regional tectonic reactivation of reverse faults between 1.52 and
1.25 Ga. The maturity evolution of the breccias mainly results from progressive quartz
dissolution in response to circulation of a fluid undersaturated in silica. Such fluid flow
occurred in the fractures and permeable matrix of the tectonic and hydraulic breccias. The
maturity of the breccias decreases with the distance to the unconformity as indicated by
extremely mature "zones à boules" just above the unconformity at Sue, mature breccias at
Shea Creek and immature breccias at the Maw Zone, creating a vertical maturity gradient.
Where dissolution created enough space, collapse occurred except in "zones à boules" where
volume loss has been accommodated by tectonic contraction.
220 Synthèse de l'étude structurale, texturale, minéralogique et géochimique des brèches
S. Discussion
5.1. Verticaljluidflow and uranium entrapment
Fayek and Kyser (1997) have proposed that uranium mineralization at the unconformity
results from the mixing of reducing basement fluids flowing upward in the basement with
oxidizing basin fluids circulating laterally in the sandstone. The evidence of a vertical
maturity gradient in sandstones shows that the dissolution intensity decreased upward.
Therefore, as the fluid undersaturation in silica would have decreased with time, our results
indicate that fluids were migrating upward along the reverse structure in the sandstone.
Consequently, the fluid probably derives from the quartz-depleted basement below, along
graphite-rich reverse structures.
A silica saturation of 90 % just above the unconformity for Sue and Shea Creek and of 99
% 200 meters above the unconformity at the Maw Zone were considered in fluid/rock ratio
calculations to reflect the increase in silica saturation of the basement fluids migrating
upward. However, these values are hypothetical because they cannot be constrained precisely
yet. The very high calculated fluid/rock ratios (Table 1) indicate a long time of formation
consistent with the slow diffusion-limited regime of dissolution. Assuming an hydraulic
conductivity of 100 m/year and a connected porosity of 1 %, the time of formation of breccias
of the Sue C open pit mine is about <800 000 years. The minimal fluid volumes which have
circulated in the faulted sandstones have been estimated between 0.16 and 2.5 km3 using the
breccia volumes, the volume loss values and the fluid/rock ratios.
The massive quartz dissolution in sandstones near the unconformity has created the empty
space needed for the deposition of uranium mineralization. The basement fluids dissolving
quartz also interacted with basin fluids leading to uranium oxide precipitation. Therefore, the
mineralization was coeval with the development of hydrothermal breccias in sandstones.
5. 2. Hydrothermal karsts
"Zones à boules" were initiated by tectonic fracturing in the core of the faults whereas
solution-collapse breccias at Shea Creek and at the Maw Zone were initiated by hydraulic
fracturing in the damage zone of the faults (Caine et al., 1996). Then, circulation of silica
undersaturated fluids induced massive quartz dissolution and subsequent collapse. The
collapse-dominated solution breccias at the Maw Zone and in the upper part of Fe-chlorite
breccia bodies at Shea Creek are due to collapse propagation after intense quartz dissolution
belo w.
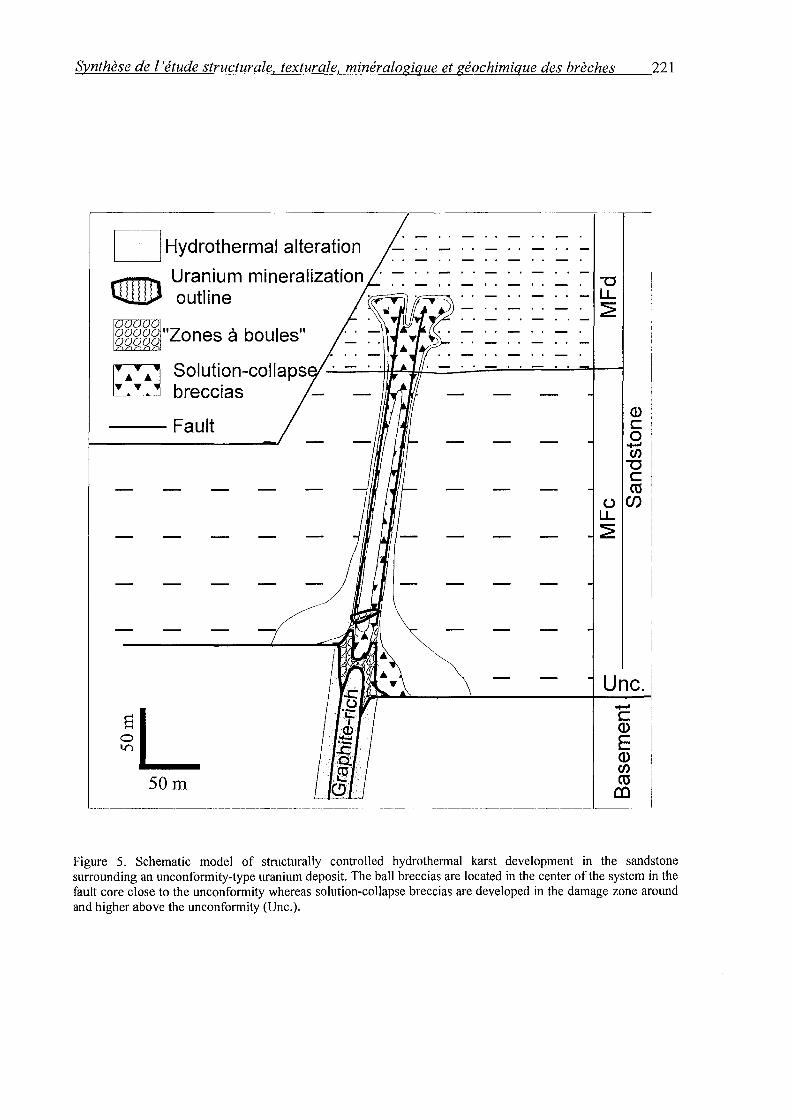
Synthèse de l'étude structurale, texturale, minéralogique et géochimique des brèches 221
[~ 1 Hydrothermal alteration
rrr111'Tl Uranium mineralization ~ outline ·~~,
Solution-collaps breccias
--- Fault
~L 50m
Q) c 0 ........ en
"'C c ro
(.)(/) LL ~
Unc.i ........ c Q)
E Q) en ro
(X) --------------- -~----- --- - --------- -----~ ----~~---------------- ________ , ____ ,
Figure 5. Schematic mode] of structurally controlled hydrothermal karst development in the sandstone surrounding an unconformity-type uranium deposit. The ball breccias are Iocated in the center of the system in the fault core close to the unconformity whereas solution-collapse breccias are developed in the damage zone around and higher above the unconformity (Une.).
222 Synthèse de l'étude structurale, texturale, minéralogique et géochimique des brèches
Consequently, the importance of dissolution observed at the base of the Athabasca
sandstones and the collapse structures associated with U and REE-Y mineralization can be
compared to hydrothermal karsts developed in limestones (Fig. 5). Such hydrothermal
karstification is found in Pb-Zn Mississippi Valley type deposits (Dzuslynski and Sass
Gustkiewicz, 1989; Clendenin and Duane, 1990), in basement-hosted unconformity-type
uranium mineralizations (Ferguson et al., 1980) and in breccia pipe uranium deposits in
Colorado (U.S.A.) (Finch, 1992).
5. 3. Permeability evolution
The higher fluid/rock ratio in "zones à boules" than in the surrounding solution-collapse
breccias indicate that the permeability was higher in the fault core than in the damage zone.
Therefore, basement fluids circulated rapidly upwards along the fault core and slowed clown
laterally and above in the hydraulically formed damage zone. As a consequence, the
permeability of the hydrothermal system was dependant on the fault zonation. Quartz
dissolution would have operated as a fluid feedback mechanism allowing the sustainable
permeability required for the circulation of the huge quantity of fluids needed for quartz
dissolution and massive uranium precipitation. Dissolution and collapse due to fluid focusing
in fault zones were also described by Knipe (1993). Breccias evolved from tectonic fracture
'Zones iD ''zones à boules" in the core of the fault-s close to the unconformity and from
hydraulic breccias to solution-collapse breccias in an extended damage zone (Fig. 5).
6. Conclusion
The genesis of unconformity-type uramum deposits has been triggered by a regional
tectonic reactivation between 1.52 and 1.25 Ga initiating circulation of a silica undersaturated
basement fluid upward in the sandstone. This fluid flow induced the formation of a
hydrothermal karst system by intense quartz dissolution and subsequent collapse propagation.
The fluid mixing between basement and uranium-bearing basin fluids occurred within the
spaces created by quartz dissolution inducing uranium oxides precipitation. The intensity of
dissolution was maximal at the unconformity creating the best trap for the world class
unconformity-type uranium mineralizations. The very high calculated fluid/rock ratios indicate
that huge volumes of fluids have circulated within the reverse faults. That would be one of the
parameters explaining the large tonnages and very high grades of the unconformity-type
uranium deposits. The long time of formation of the uranium mineralization, requiring a
stationary redox front, is evidenced by the very high fluid/rock ratios and by a diffusion
limited regime of quartz dissolution.
Synthèse de 1 'étude structurale, texturale, minéralogique et géochimique des brèches 223
Acknowledgments
We would like to acknowledge COGEMA and COGEMA Resources Inc for their financial
and technical support. COGEMA and CAMECO are thanked for permission to publish the
geological data collected in the field and in laboratory. D. Becel is thanked for his help in the
construction of the Gocad model. The manuscript benefited from reviews by Patrice Bruneton,
Jean Mondy and Jean-Claude Rippert.
224 Synthèse de l'étude structurale, texturale, minéralogique et géochimique des brèches
References cited
Baudemont, D., Piquard, J.P., Ey, F., and Zimmerman, J., 1993, The Sue Uranium Deposits,
Saskatchewan, Canada: Exploration and Mining Geology, v. 2, p. 179-202.
Bérubé, D., and Jébrak, M., 1999, High precision boundary fractal analysis for shape
characterization: Computers & Geosciences, v. 25, p. 1059-1071.
Burley, S.D., and Kantorowicz, J.D., 1986, Thin section and S.E.M. texturai criteria for the
recognition of cement-dissolution porosity in sandstones: Sedimentology, v. 33, p. 587-
604.
Caine, J.S., Evans, J.P., and Forster, C.B., 1996, Fault zone architecture and permeability
structure: Geology, v. 24, p. 1025-1028.
Clendenin, C.W., and Duane, M.J., 1990, Focused fluid flow and Ozark Mississippi Valley
type deposits: Geology, v. 18, p. 116-119.
Cox, S.F., Knackstedt, M.A., and Braun, J., 2000, Principles of structural control on
permeability and fluid flow in hydrothermal systems: Reviews in Economie Geology,
(in press).
Cumming, G.L., and Krstic, D., 1992, The age ofunconformity-related uranium mineralization
in the Athabasca Basin, northem Saskatchewan: Canadian Journal ofEarth Sciences, v.
29, p. 1623-1639.
Dzuslynski, S., and Sass-Gustkiewicz, M., 1989, Pb-Zn ores, in Bosak, P., Ford, D.C., Glazek,
1., and Horacek, I., eds., Paleokarst. A Systematic and Regional Review: Amsterdam
and Praka, Elsevier and Academia, p. 377-396.
Ey, F., Gauthier-Lafaye, F., Lillié, F., and Weber, F., 1985, A uranium unconformity deposit:
The geological setting of the D ore body (Saskatchewan-Canada), in Lainé, R., Alonso,
D., and Svab, M., eds., The Carswell structure uranium deposits, Saskatchewan:
Geological Association of Canada Special Paper 29, p. 121-138.
Fayek, M., and Kyser, T.K., 1997, Characterization of multiple fluid-flow events and Rare
Earth-Element mobility associated with formation of unconformity-type uranium
deposits in the Athabasca Basin, Saskatchewan: The Canadian Mineralogist, v. 35, p.
627-658.
Ferguson, J., Ewers, G.R., and Donnelly, T.H., 1980, Model for the development of economie
uranium mineralization in the Alligators Rivers uranium field: N.T., in Ferguson, S.
Synthèse de 1 'étude structurale, texturale, minéralogique et géochimique des brèches 225
and Goleby, A., eds., Uranium in the Pine Creek Geosyncline: Vienna, International
Atomic Energy Agency, p. 563-574.
Finch, W.I., 1992, Descriptive model of solution-collapse breccia pipe uranium deposits, in
Bliss, J.D., ed., Developments in mineral deposit modeling: U.S. Geological Survey
Bulletin 2004, p. 33-35.
Halter, G., 1988, Zonalités des altérations dans l'environnement des gisements d'uranium
associés à la discordance du Protérozoïque Moyen (Saskatchewan, Canada) [Ph.D.
thesis]: Strasbourg, Louis Pasteur University, 252 p.
Jébrak, M., 1997, Hydrothermal breccias in vein-type ore deposits: A review of mechanisms,
morphology and size distribution: Ore Geology Reviews, v. 306, p. 1-24.
Knipe, R.J., 1993, The influence of Fault Zone Processes and Diagenesis on Fluid Flow, in
Horbury, AD., and Robinson, A.G., eds., Diagenesis and Basin Development: The
American Association ofPetroleum Geologists, Studies in Geology, v. 36, p. 135-148.
Kotzer, T.G., Kyser, T.K., and Irving, E., 1992, Paleomagnetism and the evolution of fluids in
the Proterozoic Athabasca Basin, northern Saskatchewan, Canada: Canadian Journal of
Earth Sciences, v. 29, p. 1474-1491.
MacDougall, D.G., 1990, Rare Earth Element mineralization in the Athabasca Group-Maw
Zone, in 'Summary of Investigations 1-990: Saskatchewan Geological Survey,
Saskatchewan Energy and Mines, Miscellaneous Report 90-4, p. 103-105.
Pagel, M., 1975, Détermination des conditions physico-chimiques de la silicification
diagénétique des grès Athabasca (Canada) au moyen des inclusions fluides: Comptes
Rendus de l'Académie des Sciences, v. 280, D, p. 2301-2304.
Quirt, D., Kotzer, T., and Kyser, T.K., 1991, Tourmaline, phosphate minerais, zircon, and
pitchblende in the Athabasca Group: Maw Zone and McArthur River areas,
Saskatchewan, in Summary of Investigations 1991: Saskatchewan Geological Survey,
Saskatchewan Energy and Mines, Miscellaneous Report 91-4, p. 181-191.
Ramaekers, P., 1981, Hudsonian and Helikian basins of the Athabasca region, Northern
Saskatchewan: Geological Survey of Canada Paper 81-10, p. 219-233.
Rippert, J.C., Koning, E., Robbins, J., Koch, R., and Baudemont, D., 2000, The Shea Creek
Uranium Project, West Athabasca Basin, Saskatchewan, Canada, in Proceedings,
GeoCanada2000, The Millennium Geoscience Summit, Calgary: GAC-MAC joint
annual meeting, abstract 570 (Conference CD).
Thomas, D.J., Matthews, R.B., and Sopuck, V., 1998, Athabasca Basin Unconformity-Type
Uranium Deposits: A Synopsis of the Empirical Model and Review of Exploration and

226 Synthèse de l'étude structurale, texturale, minéralogique et géochimique des brèches
Production Trends, in Proceedings, Canadian Institute of Mining, Metallurgy and
Petroleum meeting, Montréal.
Wallis, R.H., Saracoglu, N., Brummer, J.J., and Golightly, J.P., 1983, Geology ofthe McLean
uranium deposits, in Cameron, E.M., ed., Uranium exploration in Athabasca Basin,
Saskatchewan, Canada: Saskatchewan Energy and Mines, Geological Survey of
Canada, p. 71-110.
-V. CoNCLUSIONS GENERALES
~C~o~n=c~lu=s~io~n=s~g~e~'n=é~r=al=e=s ___________________________________________________ 227
CONCLUSIONS GENERALES
L'étude structurale, texturale, minéralogique et géochimique des brèches associées aux
minéralisations de Shea Creek, de Sue et de la zone de Maw permet de proposer une histoire
de développement des systèmes brèchiques dans le Bassin Athabasca. Les 3 zones d'étude ont
permis d'approcher les brèches à différentes positions par rapport à la discordance, aux failles
et à la minéralisation uranifère ainsi qu'à différents niveaux d'intensité de développement,
permettant ainsi de comprendre leur évolution dans l'espace et dans le temps et leur rôle dans
la formation des gisements d'uranium.
Les brèches associées aux gisements d'uranium de type discordance du Bassin Athabasca:
reflets d'une histoire tectonique polyphasée
Les brèches intra-grès associées aux gisements d'uranium de type discordance du Bassin
Athabasca se sont développées au cours de plusieurs événements régionaux de réactivations
tectoniques de failles de socle sur une période supérieure à 1 Ga. La plupart de ces
événements de bréchification des grès sont contemporains de phases de minéralisation et/ou
de remobilisation d'uranium. Dans les exemples étudiés, le polyphasage des brèches est
essentiellement exprimé à Shea Creek.
La toute première phase de brécliificafion apparaît au début du dépôt des sédiments
Athabasca avec la formation de glissements de terrain interprétés comme étant liés à des
mouvements tectoniques et souvent appelés fanglomérats. Ces glissements de terrain
apparaissent souvent à proximité du contact entre des quartzites et des schistes graphiteux
préférentiellement réactivés à cause du contraste de compétence (MCO de Sue C, McArthur
River).
Le premier événement de bréchification post-Athabasca eu lieu avant le dépôt de la
minéralisation primaire entre 1. 7 Ga, âge du dépôt des sédiments Athabasca, et 1. 52-1.25 Ga.
Il s'agit de brèches tectoniques et/ou hydrauliques à quartz microcristallin dont le
développement dans les grès est limité. Elles se sont développées au cours ou légèrement
après un événement de silicification pervasive précoce.
Le deuxième événement de bréchification post-Athabasca est le plus important en
extension et a eu lieu entre 1.52 et 1.25 Ga. Il est représenté par des brèches à chlorite
sudoïtique ± illite à Shea Creek et est responsable de la formation des brèches à illite de type
zones à boules dans la MCO de Sue C et des brèches à dravite dans la zone de Maw. Il est
contemporain de la principale phase de dépôt d'uraninite et de pechblende. Il est l'expression
d'une phase de réactivation tectonique faisant rejouer des failles riches en graphite en régime
228 ________________________________________________ ~C~o~n~c~lu~s~io~n~s~g~e~'n~é~ra~l~es
de compression. La contrainte maximale cr1 serait globalement EW mais avec des variations
importantes jusqu'à 60° d'écart entre les trois zones d'étude.
Le troisième événement de bréchification post-Athabasca a probablement eu lieu vers 900
Ma et est représenté par des brèches à Fe-chlorite. Il correspond à une minéralisation et/ou
remobilisation d'uranium avec dépôt de pechblende et de coffinite parfois perché plusieurs
dizaines de mètres au-dessus de la discordance. C'est l'événement le moins bien contraint du
point du vue de l'âge puisque seuls une comparaison avec des argiles de mêmes
caractéristiques datées parK-Ar à Cigar Lake et sa chronologie relative avec les autres phases
permet de proposer cette âge.
Le quatrième événement de bréchification post-Athabasca a eu lieu vers 350 Ma et est
exprimé par des brèches à sidérite-hématite. Il correspond à une minéralisation et/ou
remobilisation d'uranium avec précipitation de pechblende, de coffinite et très accessoirement
d'uraninite souvent en minéralisations perchées jusqu'à plus de 40 rn au-dessus de la
discordance à Shea Creek. Cet événement est très développé à Shea Creek comme le montre
la présence de minéralisations métriques à pechblende massive complètement remobilisées.
A Shea Creek, il existe aussi un événement de coffinitisation vers 120 Ma probablement
provoqué par de la fracturation et des changements physico-chimiques importants liés à
l'impact météorique de Carswell dont le bord de l'anneau est à quelques kilomètres seulement
des échantillons étudiés. L'événement de Carswell a en effet été daté à 115 ± 10 Ma par la
méthode 40 Ar-39 Ar.
La complexité et le polyphasage des altérations à Shea Creek est probablement à corréler
avec la complexité structurale du site puisque au moins trois familles de failles majeures ont
été mises en évidence. Les différents types de failles ont pu jouer le rôle de conduits pour des
fluides de nature différente au cours des phases de réactivations. Les différentes orientations
des structures ont créé un potentiel de réactivation important pour une large gamme de
régimes de contraintes permettant ainsi de faire rejouer la zone à chaque période d'activité
sismique régionale. La précipitation de chlorite et de sulfures au cours des phases à 1 ,52-1 ,25
et 0,9 Ga suggère la prédominance de fluides réducteurs même si des alternances de
conditions oxydantes et réduites apparaissent localement pendant chaque phase indiquant un
envahissement total du système par les saumures de bassin oxydantes. La néoformation
d'hématite vers 350 Ma indique plutôt des conditions oxydantes dues à l'incursion de fluides
météoriques.
Relations spatiales entre les brèches, les failles et la discordance
La géométrie des brèches associées aux gisements d'uranium de type discordance du
Bassin Athabasca est contrôlée par 1' orientation des failles enracinées dans le socle qui ont été
~C~o~n~c~lu~s~io~n~s~g~e~'n~é~ra~l~e~s ___________________________________________________ 229
réactivées pendant et après le dépôt et l'induration des ·sédiments Athabasca. Les brèches se
développent dans les grès préférentiellement le long de failles inverses graphiteuses dans le
socle du fait du caractère lubrifiant du graphite qui a favorisé les réactivations en régime
compressif. Ces failles ont des pendages variables allant de 30 à 40° pour des failles de type I
à Shea Creek à près de 90° pour les failles contrôlant les minéralisations à Sue. Si on
considère une faille inverse avec un jeu post-Athabasca, les différents types de brèches
rencontrés s'organisent spatialement en fonction de la zonation à la fois horizontale et
verticale de la faille. Les zones à boules se forment dans le cœur de la faille au niveau de la
discordance où les mouvements et la contraction sont les plus importants. Elles ont des formes
en doigts étroits allongés parallèlement à la faille qui peuvent atteindre plus de 20 rn de haut,
plusieurs dizaines de mètres de long et 5 rn de large. Les brèches hydrauliques et de
dissolution se développent latéralement dans la zone d'endommagement autour du cœur de la
faille au niveau de la discordance et verticalement dans la zone de terminaison de faille. Le
caractère hydraulique des brèches est le plus marqué dans la zone de terminaison de faille et
est progressivement effacé par la dissolution en approchant de la discordance. Les brèches de
terminaison de faille, représentées par la zone de Maw à 250 rn au-dessus de la discordance,
se développent sur au moins 20 rn de long et 6 rn de large. Verticalement, elles peuvent
s'étendre sur plus de 200 rn et rejoindre très probablement les corps de brèches développés à
la discordance. Ce dernier type de brèche ne se développe que pour des failles à fort pendage.
Quand le pendage est plus faible comme pour les fai11es de type I à Shea 'Creek, les failles
deviennent rapidement horizontales et la zone de terminaison de faille peut se trouver à moins
de 50 rn de la discordance. Les brèches de dissolution à sudoite-dravite ont des formes de
doigts allongés parallèles aux failles mais plus larges et étalées à la discordance que les zones
à boules (voir annexe II). Elles ont un volume de 166 000 m3 dans la zone de Anne à Shea
Creek et atteignent 30 rn de haut, près de 100 rn de large le long de la discordance et plusieurs
centaines de mètres de long. Les brèches de dissolution à Fe-chlorite se développent dans des
zones de percolation maximale à l'intersection de plusieurs failles d'orientations différentes et
ont une forme de dôme avec un contrôle plus faible par l'orientation des failles que les
brèches à sudoite-dravite (voir annexe II). Le corps à Fe-chlorite a un volume de l'ordre de
30 000 m3 et une hauteur de plus de 30 rn, ainsi qu'une largeur et une longueur de près de 70
rn.
Evolution de la maturité des brèches: développement d'un système karstique
La maturité d'une brèche augmente avec le pourcentage de matrice et la dimension
fractale des fragments qui exprime leur complexité morphologique. L'évolution de la maturité
230 ________________________________________________ ~C~o~n~c~lu~s~io~n~s~g~e~'n~é~ra~l~es
des brèches reflète directement les processus impliqués dans leur genèse. Trois étapes de
développement ont pu être distinguées dans les gisements d'uranium de type discordance.
La première étape est représentée par des brèches immatures qui sont des brèches
tectoniques caractérisées par la prédominance de la fracturation sur l'attrition ou des brèches
hydrauliques avec un faible rapport de dilatation (volume de matrice) 1 (volume de fragments).
Ces brèches se sont formées lors des réactivations tectoniques des failles de socle. Les zones à
boules, situées dans le cœur des failles comme à Sue, ont été initiées par une fracturation
tectonique tandis que les brèches de dissolution dans la zone de Maw et à Shea Creek ont été
initiées par une fracturation hydraulique dans la zone d'endommagement ou dans la zone de
terminaison de faille. Cette fracturation hydraulique a été provoquée par une surpression de
fluides ascendants sous des zones imperméables de silicification précoce dans les grès.
La deuxième étape de maturation des brèches correspond au développement de la
dissolution du quartz. La dissolution du quartz s'accompagne d'une augmentation du
pourcentage de matrice ainsi que d'un accroissement de la complexité des fragments lié à la
formation de figures de corrosion. Les brèches matures sont développées essentiellement près
de la discordance à Shea Creek et à Sue, tandis que dans la zone de Maw les brèches sont
restées immatures du fait de la saturation progressive en silice du fluide ascendant. La
dissolution maximale se développe au cœur des failles dans les zones à boules. La maturité et
donc l'intensité de la dissolution décroît ainsi avec la distance à la discordance et aux failles.
La troisiême étape de maturation correspond à des phénomènes d'effondrements
gravitaires provoqués par la formation de cavités de dissolution. Ces effondrements
s'accompagnent d'une inversion de maturité due à l'augmentation de la quantité de fragments
et au mélange de fragments anguleux et corrodés. Dans les zones à boules, la dissolution du
quartz est compensée non pas par des effondrements mais par la contraction tectonique qui est
maximum dans le cœur des failles.
Le pourcentage de matrice est un meilleur paramètre que la forme des fragments pour
connaître le degré de maturité d'une brèche. En effet, la forme des fragments dépend non
seulement du degré de corrosion mais également du régime de dissolution. En régime de
dissolution limité par la diffusion, les fragments vont avoir tendance à s'arrondir tandis qu'en
régime cinétique, les formes de fragments sont plus complexes et mettent en évidence les
hétérogénéités de texture et de composition initiales. Les brèches de dissolution
contemporaines de l'événement de minéralisation principal (stade 2) se sont formées en
régime lent, limité par la diffusion. Les brèches de dissolution à Fe-chlorite plus tardives
(stade 3) se sont plutôt formées en régime de dissolution rapide, limité par la cinétique.
Une corrélation entre le type d'effondrement et le type de dissolution peut être ici
proposée. Les effondrements dans les brèches à sudoite-dravite conduisent moins souvent à
des mélanges polymictes et à des brèches supportées par les fragments que les brèches de
~C~o~n~c~lu=s~io~n=s~g~e='n=é~r=a=k=s ___________________________________________________ 231
dissolution à Fe-chlorite. Cela suggère que la dissolution lente dans les brèches du stade 2
s'accompagnerait d'effondrements progressifs avec maintien d'une grande quantité de grains
de quartz corrodés entre les fragments limitant ainsi les contacts fragments-fragments. Au
contraire, la dissolution plus rapide des brèches du stade 3 permettrait de maintenir l'existence
de cavités plus longtemps et de provoquer ainsi des effondrements plus rapides et plus
spectaculaires.
La maturité des brèches étant liée à la quantité de quartz dissous, le pourcentage de
matrice peut être utilisé pour estimer la perte de volume liée à la dissolution du quartz, aux
néoformations près. Ceci n'est cependant pas valable dans les zones à boules où le quartz est
dissous à la fois dans la matrice et dans les boules, ni dans certaines zones d'effondrements où
les fragments sont concentrés à la base du système. Les pertes de volume calculées dans les
zones à boules et localement dans les brèches de dissolution à sudoite-dravite les plus matures
à Shea Creek peuvent atteindre 80 à 90 % indiquant des phénomènes de dissolution extrêmes.
En revanche, dans la zone de Maw où la dissolution du quartz est très faible, les pertes de
volume sont négligeables. Les effondrements observés dans la zone de Maw sont
probablement liés à des pertes de volume en-dessous à la discordance. Les brèches associées
aux gisements d'uranium de type discordance peuvent donc conduire au développement de
systèmes karstiques verticaux de plus de 250 rn de haut dans les grès avec une dissolution
importante à la discordance et des effondrements dans les parties supérieures.
Zonation minéralogique
Les brèches contemporaines de l'événement de minéralisation principal entre 1.52 et 1.25
Ga à Shea Creek montrent une zonation minéralogique verticale et en partie latérale du fait du
faible pendage des failles de type I. Au niveau de la discordance et au contact de la
minéralisation uranifère, le ciment des brèches est constitué de minéraux interstratifiés
chlorite-illite. Au-dessus, c'est la chlorite sudoïtique qui prédomine mélangée avec un peu de
dravite. Encore au-dessus, c'est la dravite qui prédomine sur la sudoite. Localement, un peu
d'illite est mélangé à la sudoite et à la dravite. La dickite apparaît également dans le halo
d'altération et est parfois massive associée à de la dravite à la discordance. Une partie de cette
dickite est probablement héritée de la dickite diagénétique mais la taille très importante de
certains cristaux et certaines zones de cristallisation massive indiquent qu'elle pourrait être
également en partie hydrothermale. Ces brèches sont entourées d'une silicification pervasive
formée par reprécipitation du quartz dissous dans les brèches.
Une telle zonation illustre un front géochimique probablement lié à l'interaction d'un
fluide de socle circulant dans les failles recoupant la discordance avec un fluide de bassin
circulant latéralement au fond du bassin. Elle pourrait résulter d'un gradient de proportion de
232 ________________________________________________ ~C=o~n=c=lu=s~io~n=s~g~e~'n~é~ra~l~es
fluides de socle par rapport aux fluides de bassin contrôlant la précipitation des phases
minérales en fonction de leur produit de solubilité. La dravite résulte selon Kotzer et Kyser
(1995) d'un mélange de fluides de socle et de bassin et serait à l'extérieur du halo parce
qu'elle nécessite du B fourni par le fluide de bassin tandis que la sudoïte magnésienne
contient du Mg et de l'Al fournis par le fluide de socle et précipite donc plus près de la
discordance.
Si la dissolution du quartz dans le socle est bien à 1' origine de la silicification précoce
dans les grès, le développement du halo d'altération et des brèches correspond à une migration
vers le haut d'un front de dissolution précédé d'un front de silicification. Cette migration
exprime un envahissement progressif des grès du bassin par le fluide de socle.
Circulation des fluides au cours du développement des brèches
Au minimum deux fluides peuvent être distingués : une saumure diagénétique de bassin
oxydante et un fluide de socle réducteur ascendant le long de failles. Le fluide minéralisateur
serait un mélange des fluides de bassin et de socle d'après le modèle diagénétique
hydrothermal. Le fluide de bassin circulait soit par des mouvements convectifs, soit
latéralement le long de la discordance. L'hypothèse de circulation le long de la discordance
semble plus probable puisque les forts contrastes entre les assemblages argileux dans les
différentes formations indiquent que la cl.rculation verticale des fluides était probablement
réduite. De plus, les niveaux grossiers à conglomératiques de la base des grès de la formation
Manitou Falls sont plus perméables que les grès sus-jacents. Les travaux de Derome (2000b)
ont montré qu'il existe en fait davantage de types de fluides et en particulier plusieurs types de
saumures. Le fluide de socle est soit dérivé d'un fluide de bassin percolant dans le socle, soit
un fluide profond sans lien avec les fluides de bassin.
La silicification pervasive précoce des grès en halos centrés autour de failles inverses à
graphite est très développée dans certaines zones minéralisées comme Shea Creek ou
McArthur River. Elle est probablement postérieure à une réactivation de faille qui a induit la
circulation d'un fluide de socle chaud ascendant qui, en se refroidissant dans les grès, a
provoqué la précipitation de quartz. Cette phase pourrait être contemporaine du début de
l'illitisation dans le socle. La fermeture de porosité liée à cette silicification a provoqué une
diminution de perméabilité induisant une surpression de fluide de socle sous-jacent.
L'augmentation de pression de fluides s'est accompagnée d'une diminution de la contrainte
effective provoquant un rejeu inverse de la faille et sa propagation dans les grès.
La propagation de la faille dans la couverture gréseuse est caractérisée par de la
fracturation hydraulique dans la zone d'endommagement silicifiée et par des mouvements
tectoniques inverses le long de plans de glissement dans le cœur de la faille. La forte
~C=o~n=c=lu=s~i=o~ns~g~é~n~ér~a~l~es~---------------------------------------------------233
compétence des grès silicifiés aurait été responsable de la formation de larges zones de
fractures permettant la percolation des fluides jusqu'à plusieurs dizaines de mètres autour des
failles dans les grès. La fracturation hydraulique s'est également développée dans la zone de
terminaison de faille représentée par la zone de Maw. Une partie des brèches hydrauliques est
probablement de type critique développée dans des ouvertures créées à la discordance par la
réfraction de la faille dans les grès.
La perméabilité des grès ainsi renouvelée a permis la circulation ascendante des fluides de
socle induisant une nouvelle silicification et une autre phase de rejeu de la faille. Un tel cycle
pourrait correspondre à un fonctionnement en valve sismique de la faille. Les brèches
précoces à quartz microcristallin pourraient être l'expression de ces réactivations au cours de
l'événement de silicification. Au bout de plusieurs cycles, les fluides sont devenus sous
saturés probablement du fait de la dissolution totale du quartz dans les zones illitisées de socle
sous-jacent.
Le gradient vertical de maturité de la zone de Maw perchée dans les grès aux brèches de
Shea Creek, puis celles de Sue au niveau de la discordance montre que le fluide sous-saturé en
silice a dû circuler verticalement dans les grès le long de failles. La décroissance de l'intensité
de la dissolution en s'éloignant de la discordance est due au rééquilibrage progressif du fluide
avec le quartz du grès. Les pertes de volume considérables à la discordance montrent que le
taux de dissolution était supérieur au taux de néoformations minérales. Ceci indique un fort
accroissement de la perméabilité qui a permis la circulation d'une grande quantité de fluides
nécessaires à la dissolution du quartz et à la précipitation d'oxydes d'uranium.
Il est probable que la précipitation de minéraux argileux et de dravite combinée avec les
effondrements ou la contraction tectonique aient fait diminuer la perméabilité provoquant
occasionnellement ou périodiquement des surpressions de fluides à l'origine d'un
fonctionnement des failles inverses en valve sismique avec réouverture du système et nouvelle
injection de fluide de socle dans le bassin. Il est également possible que la cimentation des
grès au-dessus des brèches par du quartz provenant de la dissolution sous-jacente ait provoqué
des surpressions de fluide et des réouvertures des failles inverses accompagnées de
fracturation de la zone silicifiée. Les fluides injectés lors de ces phases sismiques auraient
alors pu circuler plus haut dans les grès dans les fractures nouvellement créées et ainsi
propager le front de dissolution vers le haut.
Les rapports fluides/roche cumulés ont été calculés avec un pourcentage de sous-saturation
en silice de 10 %juste au-dessus de la discordance et de 1 % seulement au niveau des brèches
de la zone de Maw afin de rendre compte du gradient de sous-saturation des fluides. Les
rapports fluides/roche ont des valeurs très élevées de quelques milliers dans les corps de
brèches de dissolution à Shea Creek et dans la zone de Maw et atteignent près de 40 000 dans
les zones à boules. De plus, ce sont des valeurs minimum puisqu'on a considéré que tout le
234 ________________________________________________ ~C=o~n=c=lu~s~io~n~s~g~e~'n~é~ra~l~e~s
fluide a réagi avec la roche avec une cinétique maximale. Les volumes de fluides nécessaires
pour dissoudre le quartz sont de 1' ordre du kilomètre cube pour 200 000 m3 de brèches à 10 %
de matrice ou pour 5 000 m3 de brèches complètement argilisées avec 80 % de perte de
volume.
Caractéristiques des fluides
Les fluides de la diagenèse précoce dans le Bassin Athabasca ont des températures
croissantes de 1' est vers 1' ouest du bassin avec 160°C dans la zone de Mc Arthur River, 180°C
dans la zone de Rumple Lake au centre du bassin et 220°C dans les grès autour de la structure
de Carswell. Les fluides de la diagenèse profonde ont des températures estimées entre 200 et
240°C. Le géothermomètre à illite appliqué dans les zones à boules de Sue contemporaines de
la phase principale de minéralisation donne une température de 260 ± 20°C supérieure à la
celle des fluides de la diagenèse profonde. Les cristallisations d'uraninites automorphes
contemporaines de l'illite hydrothermale indiquent des températures supérieures à 250°C. En
accord avec le modèle diagénétique hydrothermal, ces températures résultent probablement du
mélange de fluides diagénétiques de bassin et d'un fluide de socle plus chaud de température
supérieure à 250°C. Le géothermomètre à chlorite appliqué sur des Fe-chlorites de Shea Creek
donne une température approximative de 180°C indiquant des fluides plus froids vers 900 Ma.
Des enrichissements en U, V, Mg, B, Al, K, Bi, Ni, Co, Mo, As, S, W, Zn, Y èt terres
rares ont été mis en évidence dans les brèches. La majeure partie des éléments sauf U, B et V
ont probablement leur source dans le socle et furent transportés par le fluide issu du socle. La
mobilité de l'aluminium et des terres rares est en accord avec des volumes de fluide
importants et suggère des complexants spécifiques comme les fluorures, les chlorures, les
phosphates ou les carbonates. Les fortes concentrations en NaCl des fluides de bassin jusqu'à
plus de 30 pds % éq. de NaCl suggèrent que l'uranium était complexé par les chlorures.
Cependant, les fluorures ont pu avoir un rôle important puisqu'ils complexent davantage
l'uranium que les fluorures à des concentrations de 10 mg/1.
Le pH du fluide minéralisateur, mélange de fluides de bassin et de socle, était
probablement compris entre 4 et 5 grâce au rôle de tampon de la réaction dickite-illite. A un
tel pH et à 250°C, les fluides de bassin avaient une fugacité en oxygène supérieure à 1 o-33 du
fait de leur équilibre avec l'hématite.
Une étude plus approfondie des fluides, en particulier du fluide de socle, est nécessaire
pour mieux contraindre le modèle de formation des gisements. Les études d'inclusions fluides
en cours devraient permettre de mieux connaître la nature des différents types de fluides
impliqués dans la genèse des minéralisations uranifères.
~C~o~n~c~lu~s~io~n~s~g~e~'n~é~ra~l~e~s ___________________________________________________ 235
Rôle de la bréchiflcation pour la formation des gisements d'uranium de type discordance
La formation des fractures dans les grès et des brèches immatures a permis la circulation
de fluides de socle dans les grès et leur mélange avec les fluides de bassin. La dissolution
massive du quartz a créé une porosité importante au sein de laquelle le fluide réducteur de
socle s'est mélangé avec le fluide oxydant de bassin porteur d'uranium. La brusque
diminution de la fugacité en oxygène du fluide transportant l'U provoquée par la rencontre
avec les fluides réducteurs entraîna la précipitation des oxydes d'uranium dans les cavités
créées par la dissolution. La dissolution massive du quartz à la discordance a donc créé
l'espace nécessaire aux minéralisations uranifères massives. Le dépôt de l'uranium s'est
effectué à la discordance pour plusieurs raisons. (1) L'intensité de la dissolution était la plus
forte à la discordance et a donc constitué le meilleur piège. (2) Le front rédox était localisé à la
discordance dans la zone de mélange de fluides réducteurs de socle ascendants et de fluides
oxydants de bassin circulant latéralement le long de la discordance. (3) Les mouvements
tectoniques inverses responsables de la circulation du fluide de socle provoquèrent la
formation de fentes de tension et de zones d'ouvertures à la discordance favorisant ainsi le
mélange de fluides attirés à la discordance par gradient de pression.
En prenant une très faible teneur en fluorures de 1 o-6 mg/1 et une teneur en chlorures de
177 g/1, et à un pH de 4,45, une température de 200°C et une fugacité en oxygène de 10-28, les
ca1cu1s de modelisation geoèhimique avec EQ3NR/EQ6 suggèrent que l'uranium était
transporté par des complexes hydroxydes. Dans ces conditions, le temps de dépôt de
104 tonnes d'U est de l'ordre du million d'années en considérant une vitesse de circulation des
fluides de bassin de 1 0 rn/an, une efficacité maximale de dépôt et une porosité connectée de
1 %. Or le temps de formation des corps de brèches est du même ordre de grandeur en
considérant une vitesse de circulation supérieure de 1 00 rn/an dans la faille et une sous
saturation en silice de 1 0 %juste au-dessus de la discordance. Il est donc vraisemblable que la
précipitation d'uranium ait eu lieu au fur et à mesure de la dissolution du quartz sur une
période de l'ordre de quelques millions d'années en considérant une efficacité de dissolution
et de précipitation plus faible. Les minéralisations à Y et terres rares lourdes apparaissent
moins bien contrôlées par la discordance car elles ne dépendent pas de la f02• La précipitation
de xénotime dans la zone de Maw a probablement été provoquée par la diminution de
température du mélange de fluides ascendant dans la zone plus fracturée de terminaison de
failles jouant le rôle de piège secondaire par rapport à la discordance.
Par conséquent, la genèse des brèches et leur rôle dans la formation des gisements
d'uranium de type discordance s'inscrit bien dans le modèle de mélange de fluides de bassin
et de socle proposé par Fayek et Kyser (1997) pour les minéralisations dans les grès.
L'absence ou le très faible développement de la dissolution du quartz dans les grès sus-jacents
236 ________________________________________________ =C=o~n=cl=u=s=io~n=s~g~é~n=é~ra~l~es
à la minéralisation de socle de Sue C pourrait indiquer l'absence de fluide de socle et donc de
mélange de fluides dans la genèse des minéralisations encaissées par les lithologies du socle.
Ce serait en accord avec Fayek et Kyser (1997) qui proposent que les minéralisations de socle
résulteraient d'incursions de fluides de bassin dans le socle qui, au contact de lithologies
riches en graphite, précipiteraient l'uranium par diminution brusque de la fugacité en oxygène.
Par conséquent, en plus des circulations latérales de fluides diagénétiques de bassin, les
échanges verticaux de fluides de part et d'autre de la discordance par le biais de failles ont une
importance fondamentale dans la genèse des gisements. Cette étude montre que les
circulations de fluides de socle dans les grès peuvent monter à plus de 250 mètres au-dessus
de la discordance.
Différence entre Shea Creek et Sue: implications pour l'exploration
La forte silicification précoce, la chloritisation et la dravitisation observées à Shea Creek
correspondent au modèle d'altération proposé par Matthews et al. (1997) pour les grès •
encaissant les gisements de la partie sud-Athabasca comme McArthur River. Le
développement des brèches est particulièrement étendu dans les grès de Shea Creek du fait de
la silicification précoce intense. La forte compétence des grès silicifiés a permis le
développement d'une zone de fracturation large. La fermeture de la porosité intergranulaire
par le quartz a limité la circulation des fluides dans les fractures. Ainsi, dans les zones
silicifiées, les fragments ont été très lentement corrodés à partir des fractures et ont pu être en
partie préservés.
A Sue et plus particulièrement le long de la structure contrôlant Sue A et B, la faible
silicification et la prédominance de l'illitisation dans les grès sont plutôt en accord avec le
modèle nord-Athabasca de Matthews et al. (1997). Le faible développement des brèches à Sue
est dû à la faible silicification qui a permis aux fluides de corroder les grès de manière
pervasive sans possibilité de préservation des fragments. Un tel processus a conduit à la
formation de zones d'illite massive dans les zones à boules et autour des minéralisation dans
les grès de Sue A et B. La formation des zones à boules est cependant en partie liée à des
silicifications locales.
Quelle que soit la nature des minéraux d'altérations, la silicification précoce est le
principal contrôle du développement des brèches. Le modèle de Matthews et al. (1997) peut
donc être reconsidéré dans le cadre de cette nouvelle approche. Le type d'altération sud
Athabasca se caractérise par une forte silicification pervasive précoce et des corps de brèches
très étendus dans les grès. Le type nord-Athabasca se traduit par une très faible silicification
précoce et un développement de brèches très limité et davantage par une dissolution pervasive
~C~o~n~c~lu~s~io=n~s~g~én~e~'r~a~l~es~---------------------------------------------------237
des grès sur de grands volumes provoquant la formation d'une épaisse cape argileuse au
dessus de la minéralisation qui la préserve des remobilisations ultérieures.
Il existe une corrélation entre la teneur en quartz des lithologies du socle sous-jacentes ou
à proximité des gisements et le développement de la silicification précoce dans les grès. A
Shea Creek et à McArthur River, la proportion importante de faciès riches en quartz comme
les gneiss felsiques et les quartzites permettraient d'expliquer les silicifications massives
précoces dans les grès par reprécipitation de quartz dissous pendant l'illitisation des faciès
quartzeux du socle. A Sue et à Cigar Lake, la prédominance de faciès métasédimentaires
riches en graphite et pauvres en quartz permettraient de rendre compte de la faible
silicification précoce dans les grès. Les brèches hydrothermales dans les grès se
développeraient donc favorablement à proximité de roches de socle riches en quartz comme
les quartzites, les granites ou les gneiss felsiques.
Analogues naturels
Cette étude montre que suite à la phase majeure de dépôt des minéralisations uranifères
entre 1.52 et 1.25 Ga, plusieurs phases de bréchification liées à des réactivations tectoniques
et/ou à la surrection du bassin ont provoqué des remobilisations de l'uranium en partie liées à
l'incursion de fluides météoriques. A Shea Creek, il existe un unique forage qui contient une
minéralisation massive à la aiscordance sans brèChes sus·-jacentes. C'est une minéralisation
donnant un âge chimique approximatif de 350 Ma suggérant une migration latérale le long de
la discordance de minéralisation primaire originellement associée à des brèches. Cependant,
l'amplitude des déplacements reste de l'ordre de quelques mètres. De plus, les spectres de
terres rares dans les différentes phases de brèches même les plus tardives montrent le plus
souvent les mêmes enrichissements en terres rares lourdes et intermédiaires liés au
phénomène minéralisateur initial. Cela montre que les terres rares n'ont presque pas été
remobilisées depuis le dépôt initial des minéralisations. Par conséquent, les gisements
d'uranium de type discordance ont été préservés depuis près de 1.5 Ga dans des conditions de
confinement naturel. La très faible mobilité des terres rares, qui ont des comportements
similaires aux radionucléides, et de l'uranium sur un tel laps de temps montre que les
gisements d'uranium de type discordance constituent de très bons analogues naturels de
stockage de déchets radioactifs indiquant les conditions intéressantes pour la préservation du
confinement des déchets. De plus, les fluides qui ont pu circuler au niveau de la zone
minéralisée lors des phases de bréchification avaient des températures inférieures à 200°C,
voisines des températures maximales qui seraient atteintes dans les conditions de stockage
actuelles (entre 150 et 200°C ; Cramer, 1986). Leur composition était également relativement
similaire à celle attendue dans un site de stockage (Cramer, 1986).
238 __________________________________________________ ~C~o~n~c~lu~s~io~n~s~g~e~'n~e~'r~a~le=s
Cette excellente préservation de la minéralisation uranifère et des terres rares est en partie
due à la formation de barrières naturelles que sont les altérations entourant les gisements qui
ont limité la circulation des fluides. Dans les gisements associés à des développements
importants de brèches comme McArthur River ou Shea Creek, la silicification massive qui
entoure les brèches et la minéralisation constitue une barrière très peu perméable. En
particulier, elle limite beaucoup l'extension des altérations argileuses pervasives et rend très
difficile le travail des explorateurs par la faiblesse des halos de dispersion des éléments autour
du corps minéralisé. Dans les gisements où les brèches sont peu développées comme à Cigar
Lake, c'est l'illitisation massive, directement liée aux pertes de volume faisant suite à la
dissolution du quartz, qui constitue la barrière de perméabilité représentant un excellent
analogue des barrières ouvragées argileuses.
Les faibles remobilisations spatiales de l'uranium lors des réactivations tectoniques sont
probablement dues aux phénomènes d'autocicatrisation constitués par les cimentations
argileuses et les effondrements gravitaires des brèches. De plus, l'amortissement souvent
rapide des failles dans les grès a fortement limité les possibilités de dispersion d'éléments.
Par conséquent, malgré l'activité tectonique du bassin à certains moments de son histoire,
de très bonnes conditions de confinement ont pu être maintenues grâce aux barrières
naturelles constituées par les silicifications pervasives et les argilisations massives et grâce
aux phénomènes d'autocicatrisation pendant les phases de réactivations tectoniques.
Perspectives
Il reste encore de nombreux problèmes à résoudre avant d'obtenir un modèle statisfaisant
de genèse des gisements d'uranium de type discordance du Bassin Athabasca.
Afin de pouvoir préciser le contrôle structural des minéralisations, il serait nécessaire de
connaître le régime de contraintes au cours de la phase principale de dépôt de l'uranium en
relation avec un événement tectonique régional. Pour cela, il faudrait réduire l'incertitude sur
l'âge de la minéralisation uranifère (entre 1.52 et 1.25 Ga) pour pouvoir la relier à une phase
tectonique régionale.
On ne connaît pas encore précisément les paramètres nécessaires au développement de
minéralisations à très haute teneur. Une seule phase de dépôt est-elle suffisante? Ou est-ce
que la gamme très large d'âges entre 1.52 et 1.25 Ga pour la minéralisation principale reflète
un phénomène polyphasé ?
L'importance du graphite reste encore à préciser. On sait que le graphite joue
probablement un rôle mécanique de concentration de la déformation du fait de ses propriétés
lubrifiantes mais son rôle chimique reste très discuté. L'altération du graphite observée est-
~C~o~n~c~lu~s~io~n~s~g~e~'n~é~ra~l~e~s ___________________________________________________ 239
elle une conséquence du phénomène minéralisateur ou au contraire une cause à 1 'origine des
fluides réducteurs ?
Quelle est la nature et l'origine des fluides réducteurs? Ont-ils une source profonde dans
le socle ou dérivent-ils de fluides de bassin? Les études d'inclusions fluides devraient
permettre de préciser leur composition, leur température et leur pression afin de contraindre le
modèle de circulation des fluides.
L'analyse de la composition des inclusions fluides devrait également permettre de préciser
la nature des complexants qui ont transporté 1 'uranium et ainsi de contraindre sa solubilité, les
volumes de fluide et le temps de formation des gisements. De même, la connaissance des
complexants de l'aluminium permettrait de contraindre les volumes de fluide et le temps de
formation des brèches à sudoite-dravite.
L'origine de la sous-saturation en silice du fluide minéralisateur reste incertaine et il serait
nécessaire d'étudier en détailles différentes réactions possibles pouvant provoquer une sous
saturation du fluide de socle. En particulier, il serait très important d'étudier les cinétiques de
réaction par rapport à la vitesse de circulation des fluides.
Les études d'inclusions fluides de Pagel ( 197 Sb) et de Pagel et J affrezic ( 1977) montrent
que la température et la pression des fluides diagénétiques augmentent d'est en ouest du
bassin de 160°C et 700 bars à Rabbit Lake, à 180°C et 1250 bars à Rumple Lake et jusqu'à
220°C et 1500 bars à CluffLake, donnant ainsi des gradients géothermiques moyens de 50, 38
et 39 °C/km, respectivement. Ces gradients sont anormalement élevés et il serait
probablement utile de connaître l'origine de ces anomalies et de ces variations. S'agit-il d'une
anomalie thermique régionale à l'est du bassin? Quelle est l'influence de cette anomalie et de
ces variations sur la minéralisation ?
Les phénomènes de bréchification dans les grès associés aux gisements d'uranium de type
discordance sont-ils uniques au Bassin Athabasca? Les minéralisations de type discordance
du Bassin de McArthur en Australie sont entièrement situées dans le socle. Elles sont parfois
associées à d'importants phénomènes de bréchification des carbonates dans le socle.
Cependant, dans la zone minéralisée de Jabiluka II, Gustafson et Curtis (1983) montrent
également de très belles évidences de brèches à chlorite magnésienne du même type que celle
associée à la minéralisation dans les grès de la formation Kombolgie au-dessus de la
discordance. La chlorite se forme à la fois dans des veines recoupant le grès ou de manière
pervasive en remplacement du quartz jusqu'à une hauteur de 312 rn au-dessus de la
discordance. Les analyses chimiques des grès chloritisés montrent des enrichissements en Mg,
U, Zr, P, Y, Ni, Co et V, c'est-à-dire les mêmes enrichissements que ceux observés dans les
brèches à sudoite du Bassin Athabasca. L'enrichissement en Zr reporté par ces auteurs indique
de toute évidence des pertes de volume très probablement liées à la dissolution du quartz.
240 ________________________________________________ ~C~o~n~c~lu~s~io~n~s~g~e~'n~é~r~al~e~s
Durak (1983) décrit des phénomènes d'altérations polyphasées dans les grès Kombolgie du
gisement de Jabiluka avec un épisode à illite, chlorite et dravite contemporain de la
minéralisation primaire vers 1,38 Ga et 2 phases de bréchification vers 900 et 400 Ma
associées à des remobilisations d'uranium, suggérant une histoire géologique comparable à
celle décrite dans les grès de Shea Creek.
Par conséquent, des phénomènes d'altération et de bréchification tout-à-fait similaires
semblent se développer dans les grès des deux bassins. Ceci montre qu'il serait utile d'étudier
systématiquement 1' origine des brèches intra-grès et leur relation avec les gisements
d'uranium de type discordance afin de tenter d'établir un modèle génétique et d'exploration
applicable au Canada et en Australie.
REFERENCES BIBLIOGRAPHIQUES

=R~éfl~é~re=n=c=e=s~b~ib~l=io~g~r~ap~h=z~·q=u=es~ ___________________________________________ 241
REFERENCES BIBLIOGRAPHIQUES
Ababou, R., 1991, Approaches to large scale unsaturated flow in heterogeneous stratified and
fractured geologie media. Section 4.2: Hydraulic properties of saturated fractured
media: Report NUREG/CR-5743, U.S. Nuclear Regulatory Commission, Washington
D.C.
Agip Canada Ltd., 1985, Saskatchewan Energy and Mines, Assessment File 74H06-NW-0080.
Albarède, F., Michard, A., et Cuney, M., 1985, Les chronomètres uranium-thorium-plomb, in
Roth, E., and Poty, B., eds., Méthodes de datation par les phénomènes nucléaires
naturels. Applications: Paris, Masson, Série Scientifique, Collection CEA, p. 123-173.
Annesley, I.R., Madore, C., Krogh, T.E., Kwok, Y.Y., et Kamo, S.L., 1999, New U-Pb zircon
and monazite geochronological results for Archean and Paleoproterozoic basement to
the southeastem part of the Athabasca Basin, Saskatchewan, in Summary of
Investigations 1999: Saskatchewan Geological Survey, Saskatchewan Energy and
Mines, Miscellaneous Report 99-4.2, p. 90-99.
Antonellini, M., et Aydin, A., 1994, Effect of faulting on fluid flow in porous sandstones:
petrophysical properties: American Association of Petroleum Geologists Bulletin, v.
78, p. 355-377.
Armstrong, R.L., et Ramaekers, P., 1985, Sr isotopie study of Helikian sediment and diabase
dikes in the Athabasca Basin, northem Saskatchewan: Canadian Journal of Earth
Sciences, v. 22, p. 399-407.
Augustithis, S.S., et Ottemann, J., 1966, On diffusion rings and sphaeroidal weathering:
Chemical Geology, v. 1, p. 201-209.
Augustithis, S.S., Mposkos, E., et V genopoulos, A., 1980, Leaching of bauxites: "Traveaux"
ICSOBA, Zagreb, v. 11, p. 334-345.
Bau, M., et Müller, P., 1991, REE systematics as source of information on minerogenesis, in
Pagel, M., and Leroy, J., eds., Source, Transport and Deposition ofMetals, Proceedings
of the 25 years SGA anniversary meeting, Nancy: Balkema, Rotterdam, p. 17-20.
Baudemont, D., et Pacquet, A., 1996, The Sue D and E uranium deposits, Northem
Saskatchewan: evidence for structurally controlled fluid circulation in the Athabasca
Basin, in MinExpo'96 Symposium, Advances in Saskatchewan Geology and Mineral
Exploration: p. 85-94.

242 ____________________________________________ ~R~e~'fl=ér~e~n~c=es~b~ib~ll~·o~g~ra~p~h~i~q~u~es
Baudemont, D., Piquard, J.P., Ey, F., et Zimmerman, J., 1993, The Sue Uranium Deposits,
Saskatchewan, Canada: Exploration and Mining Geology, v. 2, p. 179-202.
Bell, K., 1985, Geochronology of the Carswell area, Northern Saskatchewan, in Lainé, R.,
Alonso, D., Svab, M., eds., The Carswell structure uranium deposits, Saskatchewan:
Geological Association of Canada Special Paper 29, p. 33-46.
Bérubé, D., et Jébrak, M., 1999, High precision boundary fractal analysis for shape
characterization: Computers & Geosciences, v. 25, p. 1059-1071.
Binns, R.A., Mc Andrew, J. et Sun, S.S., 1980, Origin of uranium mineralization at Jabiluka,
in Ferguson, S., and Goleby, A., eds., Uranium in the Pine Creek Geosyncline:
International Atomic Energy Agency, Vienna, p. 543-562.
Bottomley, R.J., York, D., et Grieve, R.A.F., 1990, 40Argon-39Argon dating of impact craters,
in Proceedings of the 201h Lunar and Planetary Science Conference: p. 421-4 31.
Brummer, J.J., Saracoglu, N., Wallis, R.H., et Golightly, J.P., 1981, McClean Lake Uranium
Deposits, Saskatchewan: Canadian Institute of Mining, Metallurgy and Petroleum,
Geology Division, Uranium Field Excursion Guidebook, p. 43-64.
Bruneton, P., 1993, Geological environment of the Cigar Lake uranium deposit: Canadian
Journal ofEarth Sciences, v. 30, p. 653-673.
Bruneton, P., et Caumartin, P., 1985, Le gisement d'uranium de Cigar Lake (Saskatchewan,
Canada) - Contribution à la compréhension des mécanismes de formation des
gisements de l'Athabasca, in Program and extended abstracts, Concentration
mechanisms of uranium in geological environments: Nancy, France, p. 211-214.
Burley, S.D., et Kantorowicz, J.D., 1986, Thin section and S.E.M. texturai criteria for the
recognition of cement-dissolution porosity in sandstones: Sedimentology, v. 33, p. 587-
604.
Caine, J.S., Evans, J.P., et Forster, C.B., 1996, Fault zone architecture and permeability
structure: Geology, v. 24, p. 1025-1028.
Carrier, A., et Jébrak, M., 1994, Structural evolution and metallogeny of the Silidor
mesothermal gold-quartz deposit, southern Abitibi greenstone belt, Quebec, in Annual
Meeting Abstracts Geological Association of Canada - Mineralogical Association of
Canada: Waterloo, no. 19, p. A-18.
Cathelineau, M., et lzquierdo, G., 1988, Temperature - composition relationships of
authigenic micaceous minerais in the Los Azufres geothermal system: Contributions to
Mineralogy and Petrology, v. 100, p. 418-428.
~R~éb~é~re~n~c~e~s~b~ib~l~io~gr~a~ph~z~·q~u=es~-------------------------------------------243
Cathelineau, M., et Nieva, D., 1985, A chlorite solid solution geothermometer. The Los
Azufres (Mexico) geothermal system: Contributions to Mineralogy and Petrology, v.
91, p. 235-244.
Chiarenzelli, J., Aspler, L., Villeneuve, M., et Lewry, J., 1998, Early Proterozoic Evolution of
the Saskatchewan Craton and its Allochthonous Cover, Trans-Hudson Orogen: The
Journal ofGeology, v. 106, p. 247-267.
Clark, A.H., 1990, The slump breccias of the Toquepala porphyry Cu-(Mo) deposit, Peru:
Implications for fragment rounding in hydrothermal breccias: Economie Geology, v.
85, p. 1677-1685.
Clarke, P.J., et Fogwill, W.D., 1981, Geology of the Asamera Dawn Lake, Uranium Deposits,
Northern Saskatchewan, in Proceedings of Canadian Institute of Mining, Metallurgy
and Petroleum, Uranium Symposium.
Clauer, N., Ey, F., et Gauthier-Lafaye, F., 1985, K-Ar dating of different rock types from the
Cluff Lake uranium ore deposits (Saskatchewan-Canada), in Lainé, R., Alonso, D., and
Svab, M., eds., The Carswell structure uranium deposits, Saskatchewan: Geological
Association of Canada Special Paper 29, p. 47-54.
Clendenin, C.W., et Duane, M.J., 1990, Focused fluid flow and Ozark Mississippi Valley-type
deposits: Geolo.gy, v. 18, p. 116-119.
Cox, S.F., 1995, Faulting processes at high fluid pressures: an example of fault valve behavior
from the Wattle Gully Fault, Victoria, Australia: Journal of Geophysical Research, v.
100,p. 12841-12859.
Cox, S.F., et Etheridge, M.A., 1989, Coupled grain-scale dilatancy and mass transfer during
deformation at high fluid pressures: examples from Mount Lyell, Tasmania: Journal of
Structural Geology, v. 11, p. 147-162.
Cox, S.F., Knackstedt, M.A., et Braun, J., 2000, Principles of structural control on
permeability and fluid flow in hydrothermal systems: Reviews in Economie Geology,
(in press).
Cramer, J.J., 1986, Sandstone-hosted uranium deposits in northern Saskatchewan as natural
analogs to nuclear fuel waste disposai vaults: Chemical Geology, v. 55, p. 269-279.
Crocker, C.H., Collerson, K.D., Lewry, J.F., et Bickford, M.E., 1993, Sm-Nd, U-Pb, and Rb
Sr geochronology and lithostructural relationships in the southwestern Rae province:
constraints on crustal assembly in the western Canadian shield: Precambrian Research,
V. 61, p. 27-50.
244 ____________________________________________ R~é6~é~re~n~c~es~b~ib~lz~·o~gr~a~p~h~i~q~ue~s
Cumming, G.L., et Krstic, D., 1992, The age of unconformity-related uranium mineralization
in the Athabasca Basin, northem Saskatchewan: Canadian Journal ofEarth Sciences, v.
29, p. 1623-1639.
Dahlkamp, F.J., 1978, Geological appraisal of the Key Lake U-Ni deposits, northem
Saskatchewan: Economie Geology, v. 73, p. 1430-1449.
Derome, D., Cuney, M., Cathelineau, M., Fabre, C., et Brisset, F., 2000a, Fluid regime in the
Kombolgie sandstones in the vicinity ofunconformity-type uranium deposits (Northem
Territory, Australia), in Proceedings, GeoCanada2000, The Millennium Geoscience
Summit, Calgary: GAC-MAC joint annual meeting, abstract 178 (Conference CD).
Derome, D., Cathelineau, M., Cuney, M., Fabre, C., Dubessy, J., et Lhomme, T., 2000b,
Reconstitution of the composition of individual fluid inclusion using
microthermometry, Raman microspectroscopy and Laser Induced Breakdown
Spectroscopy. Application to the genesis of Australian and Canadian world-class
unconformity-type uranium deposits, in Proceedings Symposium Metallogeny2000,
December 2000, Nancy, France.
Do li gez, B., Burrus, J., et Ungerer, P., 1988, Hydraulic fracturing during basin scale fluid
migration: an integrated approach, in Hitchon, B., and Bachu, S., eds., Fluid flow, heat
transfer and mass transport in fractured rocks: 4th Canadian/American Conference on
Hydrogeology, p. 251-259.
Durak, B., 1983, Le gisement de Jabiluka, in Pagel, M., ed., Les gisements d'uranium liés
spatialement aux discordances: Géologie et Géochimie de l'Uranium, CREGU,
Mémoire 1, p. 57-93.
Dzuslynski, S., et Sass-Gustkiewicz, M., 1989, Pb-Zn ores, in Bosak, P., Ford, D.C., Glazek,
J., and Horacek, I., eds., Paleokarst. A Systematic and Regional Review: Amsterdam
and Praka, Elsevier and Academia, p. 377-396.
Egeberg, P.K., 1992, Brines in sedimentary environments: London, Academie Press.
von Einsiedel, C.A., 1981, Petrography and geochemistry of the Cluff Lake breccias, Carswell
structure, Northem Saskatchewan [Bachelor thesis]: Ottawa, Carleton University.
Energy Mines and Resources, 1989, Canadian mineral deposits not being mined in 1989:
National Mineral Inventory, Mineral Policy Sector, Mineral Bulletin MR 223, Sask. 47.
Etheridge, M.A., 2000, Regional to local structural controls on hydrothermal mineralisation -
Practical tools for finding, delineating and mining ore deposits, in Proceedings,
GeoCanada2000, The Millennium Geoscience Summit, Calgary: GAC-MAC joint
annual meeting, abstract 1260 (Conference CD).
=R~é6~é~re=n~c~e=s~b~ib~l~io~g~r~a~ph~z=·q~u=es~ ___________________________________________ 245
Ey, F., 1984, Un exemple de gisement d'uranium sous discordance: les minéralisations
protérozoïques de Cluff Lake, Saskatchewan, Canada [Thèse d'Etat]: Strasbourg,
Université Louis Pasteur.
Ey, F., Gauthier-Lafaye, F., Lillié, F., et Weber, F., 1985, A uranium unconformity deposit:
The geological setting of the D ore body (Saskatchewan-Canada), in Lainé, R., Alonso,
D., and Svab, M., eds., The Carswell structure uranium deposits, Saskatchewan:
Geological Association of Canada Special Paper 29, p. 121-138.
Farstad, J., et Ayers, D.E., 1986, Geology of the Midwest uranium deposit, in Evans, E.L., ed.,
Uranium Deposits of Canada: Canadian Institute of Mining, Metallurgy and Petroleum
Special Volume 33, p. 178-183.
Fayek, M., et Kyser, T.K., 1997, Characterization of multiple fluid-flow events and Rare
Barth-Element mobility associated with formation of unconformity-type uranium
deposits in the Athabasca Basin, Saskatchewan: The Canadian Mineralogist, v. 35, p.
627-658.
Ferguson, J., Ewers, G.R., et Donnelly, T.H., 1980, Model for the development of economie
uranium mineralization in the Alligators Rivers uranium field: N.T., in Ferguson, S.
and Goleby, A., eds., Uranium in the Pine Creek Geosyncline: Vienna, International
Atomic Energy Agency, p. 563-574.
Finch, W.I., 1992, Descriptive model of solution-collapse breccia pipe uranium deposits, in
Bliss, J.D., ed., Developments in mineral deposit modeling: U.S. Geological Survey
Bulletin 2004, p. 33-35.
Pouques, J.P., Fowler, M., Knipping, H.D., et Schimann, K., 1986, The Cigar Lake uranium
deposit: discovery and general characteristics, in Evans, E.L., ed., Uranium Deposits of
Canada: Canadian Institute of Mining Metallurgy and Petroleum, special volume 33,
p.218-229.
Fournier, R. 0., 1983, A method of calculating quartz solubilities in aqueous sodium chloride
solutions: Geochimica et Cosmochimica Acta., v. 47, p. 579-586.
Fritz, B., 1981, Etude thermodynamique et modélisation des réactions hydrothermales et
diagénétiques [Thèse de Doctorat]: Strasbourg, Université Louis Pasteur, Sciences
Géologiques, mémoire 65, 197 p.
Frost, R.L., 1995, Fourier transform Raman spectroscopy of kaolinite, dickite and halloysite:
Clays and Clay Minerais, v. 43, p. 191-195.
Fyfe, W.S., et Kerrich, R., 1985, Fluids and thrusting: Chemical Geology, v. 49, p. 353-362.
246 __________________________________________ ~R~e~u~ér~e~n~c~es~bz~·b~Zz~·o~g~ra~p~h~iq~u~e~s
Gandhi, S.S., 1995, An overview of the exploration history and genesis ofProterozoic uranium
deposits in the Canadian Shield, in First Order Uranium Exploration Target Selection
in the Proterozoic of India: Exploration and Research for Atomic Minerais special
issue, vol. 8, p. 1-47.
Genna, A., Jébrak, M., Marcoux, E., et Milési, J.P., 1996, Genesis of cockade breccias in the
tectonic evolution of the Cirotan epitherrnal gold system, West Java: Canadian Journal
ofEarth Sciences, v. 33, p. 93-102.
Gindy, A.R., Al-Shakiry, A.J., et Sa'ad, N.A., 1985, Spheroidal weathering in maris and
chalks of Gebel Gurnah near Luxor, Southern Egypt: Journal of Sedimentary Petrology,
v. 55, p. 762-768.
Goddard, J.V., et Evans, J.P., 1995, Chemical changes and fluid-rock interactions in faults of
crystalline thrust sheets, northwestern Wyoming, U.S.A.: Journal of Structural
Geology, v. 17, p. 533-547.
Govindaraju, K., et Mevelle, G., 1987, Fully automated dissolution and separation methods for
inductively coupled plasma emission spectrometry rock analysis: Journal of Analytic
and Atomic Spectroscopy, v. 2, p. 615-621.
Grant, J.A., 1986, The isocon diagram, a simple solution to Gresens' equation for metasomatic
alteration: Economie Geolo$J, v. 81,p. 1976-1982.
Gresens, R.L., 1967, Composition-volume relationships of metasomatism: Chemical Geology,
V. 2, p. 47-65.
Gross, M.R., Bahat, D., et Becker, A., 1997, Relations between jointing and faulting based on
fracture-spacing ratios and fault-slip profiles: a new method to estimate strain in
layered rocks: Geology, v. 25, p. 887-890.
Gustafson, L.B., et Curtis, L.W., 1983, Post-Kombolgie metasomatism at Jabiluka, Northern
Territory, Australia, and its significance in the formation of high-grade uranium
mineralization in lower Proterozoic rocks: Economie Geology, v. 78, p. 26-56.
Hajnal, Z., Annesley, I.R., White, D., Matthews, R.B., Sopuck, V., Koch, R., Leppin, M., et
Ahuja, S., 1997, Sedimentary-hosted mineral deposits: a high-resolution seismic survey
in the Athabasca Basin, in Gubins, A.G., ed., Proceedings of Exploration 97: Fourth
Decennial International Conference on Mineral Exploration, p. 421-432.
Hall, A.J., 1986, Pyrite-pyrrhotine redox reactions in nature: Mineralogical Magazine, v. 50, p.
223-229.
=R~éfi~é~re=n=c=e=s~b~ib~l~io~g~r~a~ph~z~·q~u=es~-------------------------------------------247
Halter, G., 1988, Zonalités des altérations dans l'environnement des gisements d'uranium
associés à la discordance du Protérozoïque Moyen (Saskatchewan, Canada) [Thèse de
doctorat]: Strasbourg, Université Louis Pasteur, 252 p.
Halter, G., Pagel, M., Sheppard, S.M.F., Weber, F., et Clauer, N., 1988, Rétromorphose,
paléoaltération, diagenèse et hydrothermalisme de 1' encaissant des gisements uranifères
dans la structure de Carswell (Saskatchewan-Canada), in Gisements Métallifères dans
leur Contexte Géologique: Document du BRGM no. 158, v.l, p. 365-388.
Hanmer, S., Williams, M., et Kopf, C., 1995, Striding-Athabasca mylonite zone: implications
for the Archean and Early Proterozoic tectonics of the western Canadian Shield:
Canadian Journal of Earth Sciences, v. 32, p. 178-196.
Harper, C.T., 1983, The geology and uranium deposits of the central part of the Carswell
Structure, Northern Saskatchewan, Canada [Thèse de doctorat]: Golden, Colorado,
Colorado School of Mines.
Recht, L., et Cuney, M., 2000a, Mechanism of uranium mobilization in the Athabasca basin
and basement by hydrothermal and/or diagenetic fluids, in Proceedings,
GeoCanada2000, The Millennium Geoscience Summit, Calgary: GAC-MAC joint
annual meeting, abstract 191 (Conference CD).
Recht, L., et Cuney, M., 2000b, Bydrothermal alteration of monazite in the Precambrian
crystalline basement of the Athabasca Basin (Saskatchewan, Canada): implications for
the formation of unconformity-related uranium deposits: Mineralium Deposita, v. 35,
p. 791-795.
Hedenquist, J.W., Reyes, A.G., Simmons, S.F., et Taguchi, S., 1992, The thermal and
geochemical structure of geothermal and epithermal systems: a framework for
interpreting fluid inclusion data: European Journal of Mineral ogy, v. 4, p. 989-1 015.
Heine, T.H., 1986, The geology of the Rabbit Lake uranium deposit, Saskatchewan, in Evans,
E.L., ed., Uranium Deposits of Canada: Canadian Institute of Mining, Metallurgy and
Petroleum Special Volume 33, p. 134-143.
Hickman, S., Sibson, R., et Bruhn, R., 1995, Introduction to special section: mechanical
involvement of fluids in faulting: Journal of Geophysical Research, v. 100, p. 12831-
12840.
Hoeve, J ., 1977, Uranium Metallogenetic Studies no.11: Rab bit Lake: mineral ogy and
geochemistry, in Christopher, J.E., and MacDonald, R., eds., Surnmary of
Investigations 1977: Saskatchewan Geological Survey, Saskatchewan Energy and
Mines, Miscellaneous Report, p. 103-105.

248 __________________________________________ ~R~éfi~é~re~n=c=es~b=ib~ll=·o~g~ra~p~h~i~qu~e=s
Hoeve, J., et Quirt, D., 1984, Mineralization and host rock alteration in relation to clay mineral
diagenesis and evolution of the middle-Proterozoic Athabasca Basin, northem
Saskatchewan, Canada: Saskatchewan Research Council Technical Report 187, 187 p.
Hoeve, J., et Quirt, D., 1985, A stationary redox front as a critical factor in the formation of
high-grade, unconformity-type uranium ores in the Athabasca Basin, Saskatchewan, in
Program and extended abstracts, Concentration mechanisms of uranium in geological
environments: Nancy, France, p. 219-224.
Hoeve, J., et Sibbald, T.I.I., 1976, Rabbit Lake uranium deposit, in Dunn, C.E., ed., Uranium
in Saskatchewan: Geological Society of Saskatchewan Special Publication no. 3, p.
331-354.
Hoeve, J., et Sibbald, T.I.I., 1978, On the genesis of Rabbit Lake and other unconformity-type
uranium deposits in northem Saskatchewan, Canada: Economie Geology, v. 73, p.
1450-1473.
Hoeve, J., Sibbald, T.I.I., Ramaekers, P., et Lewry, J.F., 1980, Athabasca Basin unconformity
type uranium deposits: a special class of sandstone-type deposits?, in Ferguson, S., and
Goleby, A., eds., Uranium in the Pine Creek Geosyncline: International Atomic Energy
Agency, Vienna, p. 575-594.
Hoeve, J., Rawsthom, K., et Quirt, D., 1981, Uranium Metallogenetic Studies: Clay Mineral
Stratigraphy and Diagenesis in the Athabasca Group: Saskatchewan Research Council
Technical Report no. 22, p. 76-89.
Hoffman, P.F., 1987, Continental transform tectonics: Great Slave Lake shear zone (ca. 1.9
Ga), northwest Canada: Geology, v. 15, p. 785-788.
Hoffman, P.F., 1989, Precambrian geology and tectonic history of North America, in Bally,
A. W., and Palmer, A.R., eds., The Geology ofNorth America- An Overview: Boulder,
Colorado, Geological Society of America, The Geology of North America, v. A, p.
447-512.
Hurst, A.R., et Bj0rkum, P.E., 1986, Discussion: Thin section and S.E.M. texturai criteria for
the recognition of cement-dissolution porosity in sandstones: Sedimentology, v. 33, p.
605-614.
Hutcheon, I., 2000, Principles of diagenesis and what drives mineral change, in Kyser, K., ed.,
Fluids and Basin Evolution: Mineralogical Association of Canada, Short Course Series,
v. 28, p. 93-114.
Iida, Y., 1993, Alteration and ore-forming processes of unconformity-related uranium
deposits: Resource Geology Special Issue, no. 15, p. 299-308.
=R=éb~é~re=n=c=e~s~b~ib~l~io~gr~a~ph~z~·q=u=es~-------------------------------------------249
Jaireth, S., 1992, The calculated solubility of platinum and gold in oxygen-saturated fluids and
the genesis of platinum-palladium and gold mineralization in the unconformity-related
uranium deposits: Mineralium Deposita, v. 27, p. 42-54.
Jébrak, M., 1984, Contribution à l'histoire naturelle des filons F-Ba des Hercynides françaises
et marocaines [Thèse de doctorat]: Document BRGM 99.
Jébrak, M., 1992, Les textures intra-filoniennes, marqueurs des conditions hydrauliques et
tectoniques: Chroniques de la Recherche Minière, v. 506, p. 25-35.
Jébrak, M., 1997, Hydrothermal breccias in vein-type ore deposits: A review of mechanisms,
morphology and size distribution: Ore Geology Reviews, v. 306, p. 1-24.
Jones, B.E., 1980, The geology of the Collins Bay uranium deposits, Saskatchewan: Canadian
Institute ofMining, Metallurgy and Petroleum Bulletin, v. 73, p. 84-90.
Kerrich, R., et Allison, I., 1978, Vein geometry and hydrostatics during Yellowknife
mineralization: Canadian Journal ofEarth Sciences, v. 15, p. 1653-1660.
Kirchner, G., et Tan, B., 1994, Key Lake: the trail of its discovery: Canadian Institute of
Mining, Metallurgy and Petroleum, v. 87, p. 57-61.
Kisters, A.F.M., Kolb, J., Meyer, F.M., et Hoernes, S., 2000, Hydrologie segmentation ofhigh
temperature shear zones: structural, geochemical and isotopie evidence from auriferous
mylonites of the Renco mine, Zimbabwe: Journal of Structural Geology, v. 22, p. 811-
829.
Knipe, R.J., 1993, The influence of Fault Zone Processes and Diagenesis on Fluid Flow, in
Horbury, A.D., and Robinson, A.G., eds., Diagenesis and Basin Development: The
American Association ofPetroleum Geologists, Studies in Geology, v. 36, p. 135-148.
Knipping, H.D., 1974, The concepts of supergene versus hypogene emplacement of uranium at
Rabbit Lake, Saskatchewan, Canada, in Proceedings of a symposium, Formation of
Uranium Deposits, Athens, 6-10 May 1974: International Atomic Energy Agency,
Vienna, p. 531-548.
Komninou, A., et Sverjensky, D.A., 1996, Geochemical modeling of the formation of an
unconformity-type uranium deposit: Economie Geology, v. 91, p. 590-606.
Kotzer, T.G., et Kyser, T.K., 1995, Petrogenesis of the Proterozoic Athabasca Basin, northern
Saskatchewan, Canada, and its relation to diagenesis, hydrothermal uramum
mineralization and paleohydrogeology: Chemical Geology, v. 120, p. 45-89.
250 ____________________________________________ R~é6~é~re~n~c~e~s~b~ib~l~io~g~ra~p~h~i~q~ue~s
Kotzer, T.G., Kyser, T.K., et Irving, E., 1992, Paleomagnetism and the evolution of fluids in
the Proterozoic Athabasca Basin, northern Saskatchewan, Canada: Canadian Journal of
Earth Sciences, v. 29, p. 1474-1491.
Kyser, T.K., Wilson, M.R., et Ruhrmann, G., 1989, Stable isotope constraints on the role of
graphite in the genesis of unconformity-type uranium deposits : Canadian Journal of
Earth Sciences, v. 26, p. 490-498.
Lainé, R., 1985, The Carswell uranium deposits-An example of not so unique unconformity
related uranium mineralization, in Lainé, R., Alonso, D., and Svab, M., eds., The
Carswell structure uranium deposits, Saskatchewan: Geological Association of Canada
Special Paper 29, p. 225-230.
Langford, F.F., 1974, Origin of Australian uranium deposits: A universal process that can be
applied to deposits in Saskatchewan, in Parslow, G.R., ed., Fuels, a geological
appraisal: Geolological Society of Saskatchewan Special Publication no. 2, p. 229-244.
Langford, F.F., 1977, Superficial origin of North American pitchblende and related uranium
deposits: American Association ofPetroleum Geologists Bulletin, v. 61, p. 28-42.
Laznicka, P., 1988, Breccias and coarse fragmentites: Elsevier, Amsterdam, Developments in
Economie Geology, 25.
Laznicka, P., 1989, BTeccias and -ores. Part 1: history, organization and petr.ography of
breccias: Ore Geology Reviews, v. 4, p. 315-344.
Le Cheminant, A.N., et Heaman, L.M., 1989, Mackenzie igneous events, Canada: Middle
Proterozoic hotspot magmatism associated with ocean opening: Earth Planetary
Sciences Letters, v. 96, p. 38-48.
Lewry, J.F., et Sibbald, T.I.I., 1980, Thermotectonic evolution of the Churchill Province in
Northern Saskatchewan: Tectonophysics, v. 68, p. 45-82.
Little, H.W., 1974, Uranium in Canada. Report of Activities, Part A: Geological Survey of
Canada Paper no. 74-1, p. 137-139.
Lorilleux, G., 1997, Lithogéochimie des formations métamorphiques et plutoniques encaissant
les gisements d'uranium de type discordance [Mémoire de DEA]: Nancy, Institut
National Polytechnique de Lorraine, 39 p.
Lorilleux, G., Jébrak, M., Cuney, M., Baudemont, D., Bérubé, D., et Bruneton, P., 1999a,
Breccias and dissolution processes in unconformity-type uranium deposits of the
Athabasca Basin (Saskatchewan, Canada), in Proceedings, International Workshop on
« Fluids and Fractures in the Lithosphere »,Nancy, 26-27 March 1999, p. 90.
~R~é~@~r~en~c~e=s~b=ib~l~io~g~r~a~p=ht~·q~u=es~-------------------------------------------251
Lorilleux, G., Jébrak, M., Cuney, M., Baudemont, D., Bérubé, D., et Bruneton, P., 1999b
Breccias associated with unconformity-type uranium deposits in the Athabasca Basin
(Saskatchewan, Canada), in Proceedings of a conference, Sudbury, Ontario, 26-28 May
1999: GAC-MAC joint annual meeting, p. 74.
Lorilleux, G., Cuney, M., Jébrak, M., et Mondy, J., 2000, A new approach of unconformity
type uranium metallogenesis from a structural breccia study (Northern Saskatchewan,
Canada), in Proceedings, GeoCanada2000, The Millennium Geoscience Summit,
Calgary: GAC-MAC joint annual meeting, abstract 232 (Conference CD).
MacDougall, D.G., 1990, Rare Earth Element mineralization in the Athabasca Group-Maw
Zone, in Summary of Investigations 1990: Saskatchewan Geological Survey,
Saskatchewan Energy and Mines, Miscellaneous Report 90-4, p. 103-105.
Magara, K., 1986, Geological models of petroleum entrapment : London, Elsevier Applied
Science Publishers, 328 p.
Mallet, J.-L., 1992, Discrete smooth interpolation: Computer - aided design, v. 24, p. 178-
191.
Marrett, R., et Peacock, D.C.P., 1999, Strain and stress: Journal of Structural Geology, v. 21,
p. 1057-1063.
Matthews, R., Koch, R., et Leppin, M., 1997, A<ivances iR integrated exploration for
unconformity uranium deposits in Western Canada, in Gubins, A.G., ed., Proceedings
of Exploration 97: Fourth Decennial International Conference on Mineral Exploration,
p. 993-1024.
McGill, B.D., Marlatt, J.L., Matthews, R.B., Sopuck, V.J., Homeniuk, L.A., et Hubregtse, J.J.,
1993, The P2 North uranium deposit, Saskatchewan, Canada: Exploration and Mining
Geology, v. 2, p. 321-331.
Montel, J.-M., Foret, S., Veschambre, M., Nicollet, C, et Provost, A., 1996, Electron
microprobe dating of monazite: Chemical Geology, v. 131, p. 37-53.
Morton, R.D., 1977, The western and northern australian uranium deposits-exploration guides
of exploration deterrents for Saskatchewan?, in Dunn, C.E., ed., Proceedings of a
Symposium on Uranium in Saskatchewan: Geological Society of Saskatchewan Special
Publication no. 3, p. 211-255.
Munday, R.J., 1979, Uranium mineralization in northern Saskatchewan: Canadian Mining and
Metallurgical Bulletin, v. 72, p. 102-111.
Narr, W., et Suppe, J., 1991, Joint spacmg m sedimentary rocks: Journal of Structural
Geology, v. 13, p. 1037-1048.
252 __________________________________________ ~R=e~'fl~ér~e~n=c=es~bl=·b~b="oogr~a~p~h=iq~u=e=s
Newman, J ., et Mitra, G ., 1993, Lateral variations in mylonite zone thickness as influenced by
fluid-rock interactions, Linville Falls fault, North Carolina: Journal of Structural
Geology, v.15, p. 849-863.
Nguyen Trung, C., 1985, Géochimie théorique et expérimentale des oxydes d'uranium dans
des solutions aqueuses de 25 à 700°C, sous une pression de 1 à 6000 bars. Synthèse
hydrothermale de certains minéraux d'uranium (VI) et (IV) [Thèse de doctorat]: Nancy,
Institut National Polytechnique de Lorraine, tome I, 479 p.
O'Hara, K., et Blackburn, W.H., 1989, Volume-loss model for trace-element enrichments in
mylonites: Geology, v. 17, p. 524-527.
Pacquet, A., et Weber, F., 1993, Pétrographie et minéralogie des halos d'altération autour du
gisement de Cigar Lake et leurs relations avec les minéralisations: Canadian Journal of
Earth Sciences, v. 30, p. 674-688.
Pagel, M., 1975a, Cadre géologique des gisements d'uranium dans la structure Carswell
(Saskatchewan-Canada). Etude des phases fluides. [Thèse de doctorat]: Nancy,
Université Nancy I, 156 p.
Pagel, M., 1975b, Détermination des conditions physico-chimiques de la silicification
diagénétique des grès Athabasca (Canada) au moyen des inclusions fluides: Comptes
Rendus d.e l'Académie des Sciences, v. 280, D, p. 2301-2304.
Pagel, M., 1977, Microthermometry and chemical analysis of fluid inclusions from the Rab bit
Lake uranium deposit, Saskatchewan, Canada: Institution of Mining and Metallurgy
Transactions, section B, v. 86, p. B157-B158.
Pagel, M., et Jaffrezic, H., 1977, Analyses chimiques des saumures des inclusions du quartz et
de la dolomite du gisement d'uranium de Rabbit Lake (Canada). Aspect
méthodologique et importance génétique: Comptes Rendus de 1' Académie des
Sciences, v. 284, série D-113.
Pagel, M., Poty, B., et Sheppard, S.M.F., 1980, Contribution to sorne Saskatchewan uranium
deposits mainly from fluid inclusion and isotopie data, in Ferguson, S., and Goleby, A.,
eds., Uranium in the Pine Creek Geosyncline: International Atomic Energy Agency,
Vienna, p. 639-654.
Pagel, M., Weatley, K., et Ey, F., 1985, The origin of the Carswell circular structure, in Lainé,
R., Alonso, D., and Svab, M., eds., The Carswell structure uranium deposits,
Saskatchewan: Geological Association of Canada Special Paper 29, p. 213-223.
=R~é~@~r=en=c=e=s~b~ib=l=io~g~r~a~p~h~iq~u=es~-------------------------------------------253
Pagel, M., Pinte, G., et Rotach-Toulhoat, N., 1987, The rare earth elements in natural uranium
oxides, in Monograph Series on Mineral Deposits: Gebrüder Borntraeger, Berlin, v. 27,
p. 81-85.
Pagel, M., Halter, G., Ruhlmann, F., et Torra, F., 1988, Evolution polycyclique de la province
uranifère Athabasca (Saskatchewan- Canada) et genèse des gisements liés spatialement
à la discordance du Protérozoïque Moyen dans la structure de Carswell, in Gisements
Métallifères dans leur Contexte Géologique: Document du BRGM no. 158, v.l, p. 389-
413.
Passchier, C.W., et Trouw, R.A.J., 1996, Microtectonics: Springer-Verlag, Berlin, Heidelberg,
289p.
Percival, J.B., 1990, Clay mineralogy, geochemistry and partitioning of uranium within the
alteration halo of the Cigar Lake uranium deposit, Saskatchewan, Canada [Thèse de
doctorat]: Ottawa, Carleton University, 343 p.
Percival, J.B., Bell, K., et Torrance, J.K., 1993, Clay mineralogy and isotope geochemistry of
the alteration halo at the Cigar Lake uranium deposit: Canadian Journal of Earth
Sciences, v. 30, p. 689-704.
Petit, S., and Decarreau, A., 1990, Hydrothermal (200°C) synthesis and crystal chemistry of
iron-rich kaolinites: ClCJ.y Minerais, v. 25, p. 181-196.
Philippe, S., Lancelot, J.R., Clauer, N., et Pacquet, A., 1993, Formation and evolution of the
Cigar Lake uranium deposit based onU-Pb and K-Ar systematics: Canadian Journal of
Earth Sciences, v. 30, p. 720-730.
Phillips, W .J., 1986, Hydraulic fracturing effects in the formation of mineral deposits:
Institution of Mining and Metallurgy Transactions, section B: Applied Earth Science
95, p. B17-B24.
Pittman, E.D., 1981, Effect of fault-related granulation on porosity and permeability of quartz
sandstones, Simpson Group (Ordovician), Oklahoma: American Association of
Petroleum Geologists Bulletin, v. 65, p. 2381-2387.
Quirt, D., 2000, Sub-Athabasca Group fanglomerate in the McArthur River-Read Lake area,
Saskatchewan, in Proceedings, GeoCanada2000, The Millennium Geoscience Summit,
Calgary: GAC-MAC joint annual meeting, abstract 251 (Conference CD).
Quirt, D., Kotzer, T., et Kyser, T.K., 1991, Tourmaline, phosphate minerais, zucon, and
pitchblende in the Athabasca Group: Maw Zone and McArthur River areas,
Saskatchewan, in Summary of Investigations 1991: Saskatchewan Geological Survey,
Saskatchewan Energy and Mines, Miscellaneous Report 91-4, p. 181-191.
254 __________________________________________ ~R~e~'fi~ér~e~n~c~es~bt~·b~lt~·o~g~ra~~~h~iq~u~e~s
Raffensperger, J.P., et Garven, G., 1995a, The formation of unconformity-type uranium ore
deposits; 1. Coupled groundwater flow and heat transport modeling: American Journal
of Science, v. 295, p. 581-636.
Raffensperger, J.P., et Garven, G., 1995b, The formation of unconformity-type uranium ore
deposits; 2. Coupled hydrochemical modeling: American Journal of Science, v. 295, p.
639-696.
Ramaekers, P., 1981, Hudsonian and Helikian basins of the Athabasca region, Northern
Saskatchewan: Geological Survey of Canada Paper 81-10, p. 219-233.
Ramaekers, P., 1990, Geology of the Athabasca Group (Helikian) in Northern Saskatchewan:
Saskatchewan Energy and Mines, Saskatchewan Geological Survey, report 195, 49 p.
Ramaekers, P., et Dunn, C.D., 1977, Geology and geochemistry of the eastern margin of the
Athabasca Basin: Saskatchewan Geological Society Special Publication no. 3, p. 297-
322.
Reeve, J.S., Cross, K.C., Smith, R.N., et Oreskes, N., 1990, Olympie Dam. Copper-Uranium
Gold-Silver deposit, in Hughes, E.E., ed., Geology of the mineral deposits of Australia
and Papua New Guinea: The Australasian Institute of Mining and Metallurgy,
Melbourne, p. 1009-1035.
Rice, J.R., 1992, Fault Stress States, Pore Pressure Distributions, and the Weakness ofthe San
Andreas Fault, in Evans, B., et Wong, T.-F., eds., Fault Mechanics and Transport
Properties in rocks: Academie Press, p. 475-503.
Ridley, J., 1993, The relations between mean rock stress and fluid flow in the crust: with
reference to vein- and Iode-style gold deposits: Ore Geology Reviews, v. 8, p. 23-37.
Rippert, J.C., Koning, E., Robbins, J., Koch, R., et Baudemont, D., 2000, The Shea Creek
Uranium Project, West Athabasca Basin, Saskatchewan, Canada, in Proceedings,
GeoCanada2000, The Millennium Geoscience Summit, Calgary: GAC-MAC joint
annual meeting, abstract 570 (Conference CD).
Rives, T., Razack, M., Petit, J.-P., et Rawnsley, K.D., 1992, Joint spacing: analogue and
numerical simulations: Journal of Structural Geology, v. 14, p. 925-937.
Robert, F., Brown, A.C., et Audet, A.J., 1983, Structural control of gold mineralization at the
Sigma Mine, Val d'Or, Québec: Canadian Institute of Mining, Metallurgy and
Petroleum Bulletin 76, p. 72-80.
Robertson, D.A., et Lattanzi, C.R., 1974, Uranium deposits of Canada: Geoscience Canada, v.
1, p. 8-19.
~R~éfi~é~re~n~c~e~s~b~ib~l~io~g~r~a~ph~l~·q~u~es~-------------------------------------------255
Robertson, D.S., Tilsley, J.E., et Hogg, G.M., 1978, The time-bound character of uranium
deposits: Economie Geology, v. 73, p. 1409-1419.
Ross, G.M., et Eaton, D.W., 1997, Winagami reflection sequence: Seismic evidence for
postcollisional magmatism in the Proterozoic of western Canada: Geology, v. 25, p.
199-202.
Ross, G.M., Milkereit, B., Eaton, D., White, D., Kanasewitch, E.R., et Burianyk, M.J.A., 1995,
Paleoproterozoic collisional orogen beneath the western Canada sedimentary basin
imaged by Lithoprobe crustal seismic-reflection data: Geology, v. 23, p. 195-199.
Rouleau, A., et Gale, J.E., 1985, Statistical characterization of the fracture system in the Stripa
Granite, Sweden: International Journal of Rock Mechanics and Mining Sciences, v. 22,
p. 353-367.
Ruzicka, V., 1975, Sorne metallogenic features of the "D" uranium deposit at Cluff Lake,
Saskatchewan, in Report of activities, part C: Geological Survey of Canada Paper 75-
1C, p. 279-283.
Ruzicka, V., 1986, Uranium deposits in the Rabbit Lake-Collins Bay area, Saskatchewan, in
Evans, E.L., ed., Uranium Deposits of Canada: Canadian Institute of Mining
Metallurgy and Petroleum Special Volume 33, p. 144-149.
Ruzicka, V.,1993, Unconformity-type uranium deposits, in Kirkham, R.V., Sinclair, W.D.,
Thorpe, R.I., et Duke, J.M., eds., Mineral Deposit Modeling: Geological Association of
Canada Special paper 40, p. 125-149.
Ruzicka, V., 1996, Unconformity-associated uranium, in Eckstrand, O.R., Sinclair, W.D., et
Thorpe, R.I., eds., Geology of Canadian Mineral Deposit Types: Geological Survey of
Canada, Geology of Canada, no. 8, p. 197-210.
Salvi, S., Pokrovski, G.S., et Schott, J., 1998, Experimental investigation of aluminum-silica
aqueous complexing at 300°C: Chemical Geology, v. 151, p. 51-67.
Sammis, C.G., et Biegel, R.L., 1986, A self-similar model for the kinematics of gouge
deformation: Eos Transactions, v. 67, p. 1187.
Sass-Gustkiewicz, M., 1996, Internai sediments as a key to understanding the hydrothermal
karst origin of the upper silesian Zn-Pb ore deposits: Society of Economie Geologists,
Special Publication no. 4, p. 171-181.
Sawkins, F.J., 1969, Chemical brecciation, an umecognized mechanism for breccia
formation?: Economie Geology, v. 64, p. 613-617.
256 __________________________________________ ~R~e~'6~é~re~n=c=es~bz=·b~ll=·oôg~ra~~~h=~~u~e=s
Sc holz, C.H., 1990, The Mechanics of Earthquakes and Faulting: New York, Cambridge
University Press.
Shahabpour, J., 1998, Liesegang blocks from sandstone beds of the Hodjedk Formation,
Kerman, Iran: Geomorphology, v. 22, p. 93-106.
Sibson, R.H., 1986, Brecciation processes in fault zones: inferences from Earthquake
rupturing: Pure and Applied Geophysics, v. 124, p. 161-175.
Sibson, R.H., 1994, Crustal stress, faulting and fluid flow, in Parnell, J., ed., Geofluids: Origin,
Migration and Evolution of fluids in Sedimentary Basins : Geological Society Special
Publication no. 78, p. 69-84.
Sibson, R.H., 2000, Tectonic controls on maximum sustainable overpressure: fluid
redistribution from stress transitions: Journal of Geochemical Exploration, v. 69, p.
471-475.
Sibson, R.H., Robert, F., et Poulsen, K.H., 1988, High-angle reverse faults, fluid-pressure
cycling, and mesothermal gold-quartz deposits: Geology, v. 16, p. 551-555.
Sillitoe, R.H., 1985, Ore-related breccias in volcanoplutonic arcs: Economie Geology, v. 80, p.
1467-1514.
Sinha, A.K., Hewitt, D.A., et Rimstidt, J.D., 1986, Fluid interaction and element mobility in
the development ofultramyonites: Geology, v. 14, p. 883-886.
SMDC, 1992, Wheeler River Project. Inedited document.
Snow, D.T., 1969, Anisotropie permeability offractured media: Water Resources Research, v.
5, p. 1273-1289.
Spoljaric, N., 1971, Origin of colors and ironstone bands in the Columbia Formation,
Middletown-Odessa Area, Delaware: Southeastern Geology, Durham, North Carolina,
v. 12, p. 253-266.
Strnad, J.G., 1980, Genetic models and their impact on uranium exploration in the Athabasca
sandstone basin, Saskatchewan, Canada, in Ferguson, S., et Goleby, A., eds., Uranium
in the Pine Creek Geosyncline: International Atomic Energy Agency, Vienna, p. 631-
638.
Suzuki, K., et Adachi, M., 1994, Middle Precambrian detrital monazite and zircon from the
Hida gneiss on Oki-Dogo Island, Japan: their origin and implications for the correlation
ofbasement gneiss of Southwest Japan and Korea: Tectonophysics, v. 235, p. 277-292.
=R~é6~é~re=n=c=e=s~b~ib~l=io~g~r~a~ph~z~·q~u=es~ ___________________________________________ 257
Tenthorey, E., Scholz, C.H., Aharonov E., et Léger, A., 1998, Precipitation sealing and
diagenesis. 1. Experimental results: Journal of Geophysical Research, v. 103, p. 23951-
23967.
Tester, J.W., Worley, W.G., Robinson, B.A., Grigsby, C.O., et Feerer, J.L., 1994, Correlating
quartz dissolution kinetics in pure water from 25 to 625°C: Geochimica et
Cosmochimica Acta, v. 58, p. 2407-2420.
Thomas, D.J., Matthews, R.B., et Sopuck, V., 1998, Athabasca Basin Unconformity-Type
Uranium Deposits: A Synopsis of the Empirical Model and Review of Exploration and
Production Trends, in Proceedings, Canadian Institute of Mining, Metallurgy and
Petroleum meeting, Montréal.
Thomas, D.J., Matthews, R.B., et Sopuck, V., 2000, Athabasca Basin (Canada) unconformity
type uranium deposits : exploration model, current mine developments and exploration
directions, in the Great Basin and Beyond Proceedings , Geology and Ore Deposits
2000, volume 1.
Tilsley, J .E., 1980, Continental weathering and development of paleosurface related uranium
deposits: sorne genetic considerations, in Ferguson, S., and Goleby, A., eds., Uranium
in the Pine Creek Geosyncline: International Atomic Energy Agency, Vienna, p. 721-
732.
Tona, F., Alonso, D., et Svab, M., 1985, Geology and mineralization in the Carswell Structure
- A general approach, in Lainé, R., Alonso, D., and Svab, M., eds., The Carswell
structure uranium deposits, Saskatchewan: Geological Association of Canada Special
Paper 29, p. 1-18.
Vigneresse, J.L., et Cannat, M., 1987, Mesures de paramètres physiques dans le sondage
d'Echassières (vitesse sismique, porosité, densité), in Mémoire Géologie profonde de
la France, tome 1: Géologie de la France, no. 2-3, p. 145-148.
Villeneuve, M.E., et Thériault, R.J., 1991, U-Pb ages and Sm-Nd signature of two granites
from the Fort Simpson magnetic high, northwest Canada: Canadian Journal of Earth
Sciences, v. 28, p. 1003-1008.
Wallis, R.H., Saracoglu, N., Brummer, J.J., et Golightly, J.P., 1983, Geology of the McLean
uranium deposits, in Cameron, E.M., ed., Uranium exploration in Athabasca Basin,
Saskatchewan, Canada: Saskatchewan Energy and Mines, Geological Survey of
Canada, p. 71-110.
Wheatley, K., Murphy, J., Leppin, M., Cutts, C., et Climie, J.A., 1996, Advances in the genetic
model and exploration techniques for unconformity type uranium deposits in the
258 __________________________________________ ~R~e~'6=é~re~n~c=es~bz~·b~h="oog~ra~p~h~iq~u~e=s
Athabasca basin, in Proceedings, Canadian Institute of Mining, Metallurgy and
Petroleum conference, May 1996.
Wilde, A.R., et Wall, V.J., 1987, Geology of the Nabarlek uranium deposit, Northem
Territory, Australia: Economie Geology, v. 82, p. 1152-1168.
Wilson, M.R., et Kyser, T.K., 1987, Stable isotope geochemistry of alteration associated with
the Key Lake uranium deposit: Economie Geology, v. 82, p. 1450-1557.
Wolery, T.J., et Daveler, S.A., 1992, EQ3/6, a software package for geochemical modeling of
aqueous systems. UCRL-MA-110772 PT 1-IV: Berkeley, University of Califomia,
Lawrence Liverrnore National Laboratory.

ANNEXEI:
PLANCHES PHOTOGRAPHIQUES

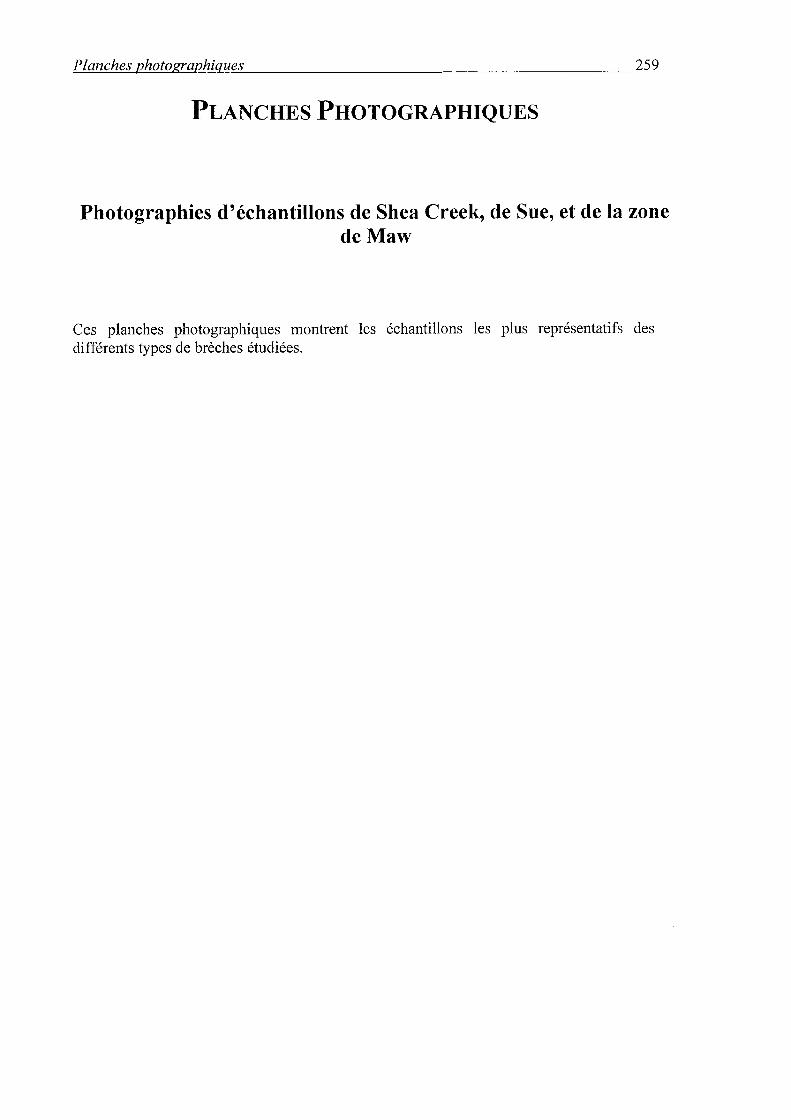
~P=la~n=ch~e=s~p~ho~t~og~r~a~ph~i~qu~e=s ______________________________________ 259
PLANCHES PHOTOGRAPHIQUES
Photographies d'échantillons de Shea Creek, de Sue, et de la zone deMaw
Ces planches photographiques montrent les échantillons les plus représentatifs des différents types de brèches étudiées.

260 ____________________________________________ ~P~l=a=n=c~h=es~oh~o=t=o~g~ra~o~h=i~q~ue~s
Planche photographique 1 (Shea Creek)
Photographie 1 : Echantillon Shea2 représentant une brèche à quartz microcristallin du
stade 1 de la paragenèse à Shea Creek. Les fragments allongés et orientés indiquent une
fracturation tectonique.
Photographie 2 : Echantillon Sheal 0 représentant une brèche de dissolution à sudoite et
dravite contemporaine de la minéralisation uranifère principale (stade 2). Les textures en
puzzle (ou «jigsaw ») illustrent l'origine hydraulique de la fracturation. Les grains de
quartz dans la matrice sont des résidus de dissolution.
Photographie 3 : Echantillon Shea16 représentant une brèche de dissolution à sudoite
(stade 2). Les rotations des fragments mises en évidence par l'orientation du litage
sédimentaire sont dues à des effondrements gravitaires faisant suite aux dissolutions.
Photographie 4 : Echantillon Shea22 représentant une brèche hydraulique à calcite
(stade2). Les textures en puzzle sont typiques de la brèche hydraulique. La corrosion des
fragments et la quantité importante de grains de quartz détritiques dans la matrice
proviennent d'une phase de dissolution antérieure (au début du stade 2).
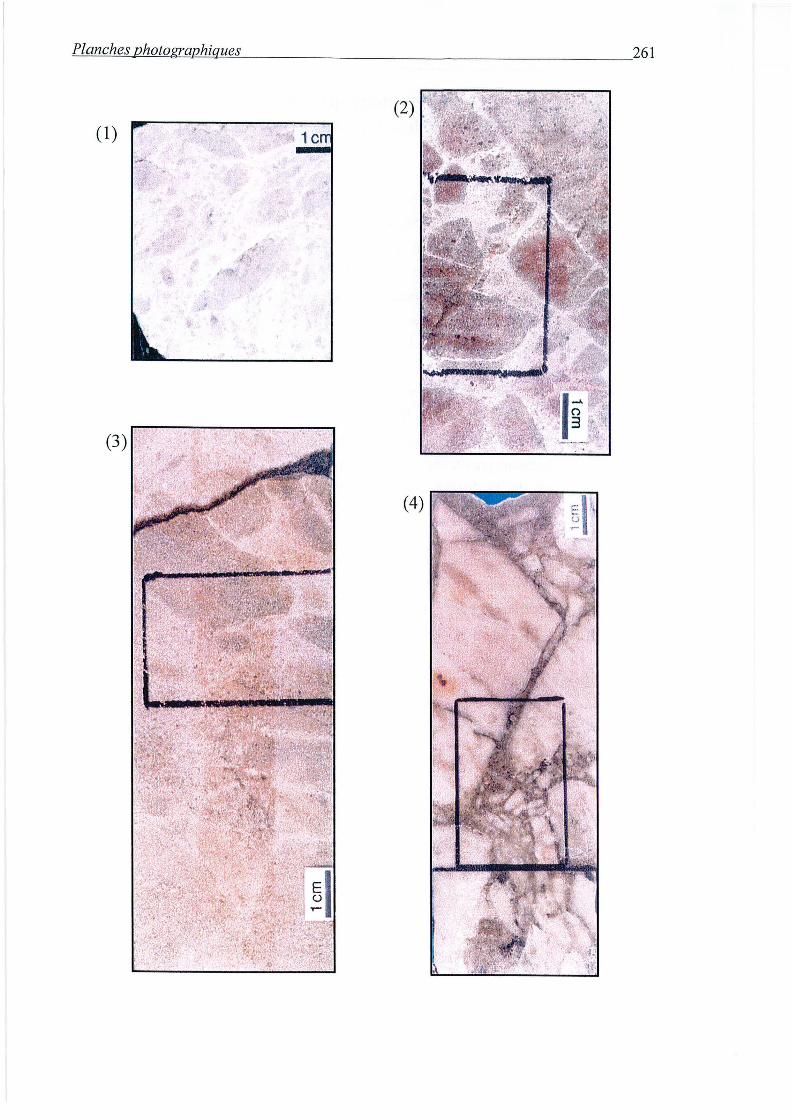
~P=la=n=ch=e=s~v~h~ot~o~w~a~v~hz~·q~ue~s ________________________________________ 26l
(2)
(1)
(3)
(4)
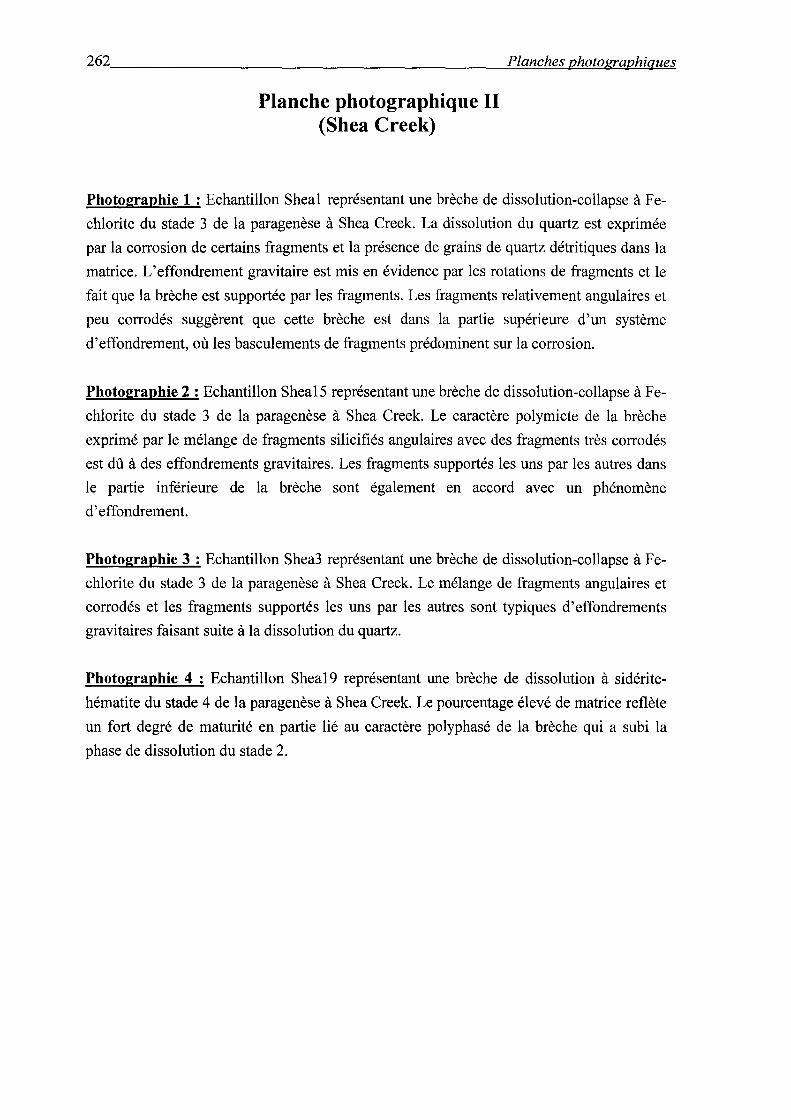
262 ______________________________________________ ~P~la~n~c~h~e~s~p~h~o~to~gr~ap~h~l~·q~u~es
Planche photographique II (Shea Creek)
Photographie 1 : Echantillon Sheal représentant une brèche de dissolution-collapse à Fe
chlorite du stade 3 de la paragenèse à Shea Creek. La dissolution du quartz est exprimée
par la corrosion de certains fragments et la présence de grains de quartz détritiques dans la
matrice. L'effondrement gravitaire est mis en évidence par les rotations de fragments et le
fait que la brèche est supportée par les fragments. Les fragments relativement angulaires et
peu corrodés suggèrent que cette brèche est dans la partie supérieure d'un système
d'effondrement, où les basculements de fragments prédominent sur la corrosion.
Photographie 2 : Echantillon Shea15 représentant une brèche de dissolution-collapse à Fe
chlorite du stade 3 de la paragenèse à Shea Creek. Le caractère polymicte de la brèche
exprimé par le mélange de fragments silicifiés angulaires avec des fragments très corrodés
est dû à des effondrements gravitaires. Les fragments supportés les uns par les autres dans
le partie inférieure de la brèche sont également en accord avec un phénomène
d'effondrement.
Photographie 3 : Echantillon Shea3 représentant une brèche de dissolution-collapse à Fe
chlorite du stade 3 de la paragenèse à Shea Creek. Le mélange de fragments angulaires et
corrodés et les fragments supportés les uns par les autres sont typiques d'effondrements
gravitaires faisant suite à la dissolution du quartz.
Photographie 4 : Echantillon Shea19 représentant une brèche de dissolution à sidérite
hématite du stade 4 de la paragenèse à Shea Creek. Le pourcentage élevé de matrice reflète
un fort degré de maturité en partie lié au caractère polyphasé de la brèche qui a subi la
phase de dissolution du stade 2.
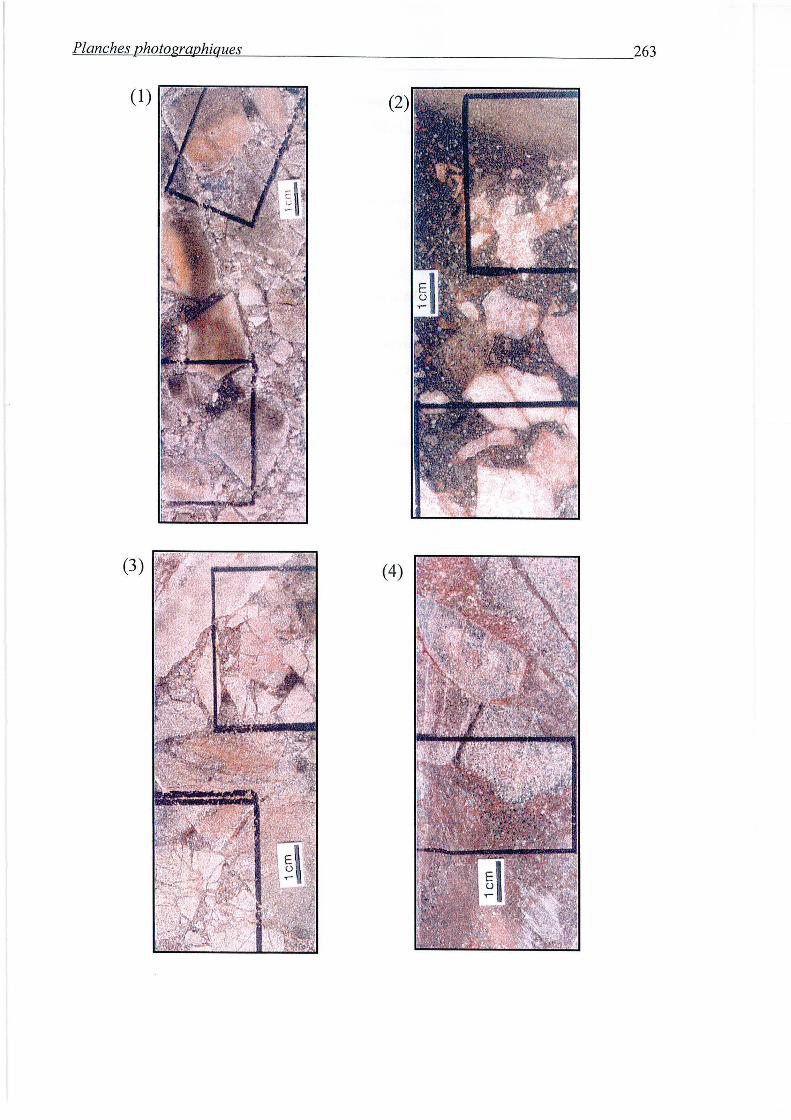
~Pl=a=nc=h=es~p~h=ot=ow~ap~h~iq~u=es~---------------------------------263
(3) (4)
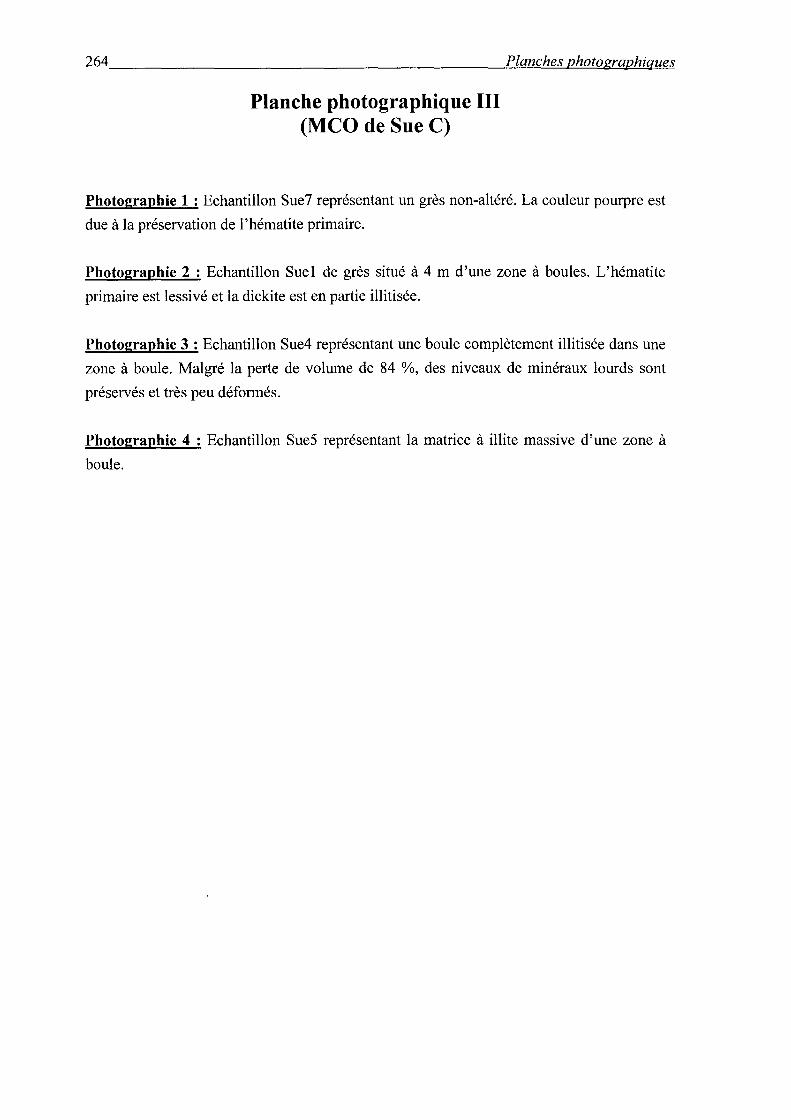
264 ____________________________________________ ~P~l=an~c=h=e=s~p~h=o=to~g~r~ap~h~i~q~ue=s
Planche photographique III (MCO de Sue C)
Photographie 1 : Echantillon Sue7 représentant un grès non-altéré. La couleur pourpre est
due à la préservation de 1 'hématite primaire.
Photographie 2 : Echantillon Suel de grès situé à 4 rn d'une zone à boules. L'hématite
primaire est lessivé et la dickite est en partie illitisée.
Photographie 3 : Echantillon Sue4 représentant une boule complètement illitisée dans une
zone à boule. Malgré la perte de volume de 84 %, des niveaux de minéraux lourds sont
préservés et très peu déformés.
Photographie 4 : Echantillon SueS représentant la matrice à illite massive d'une zone à
boule.
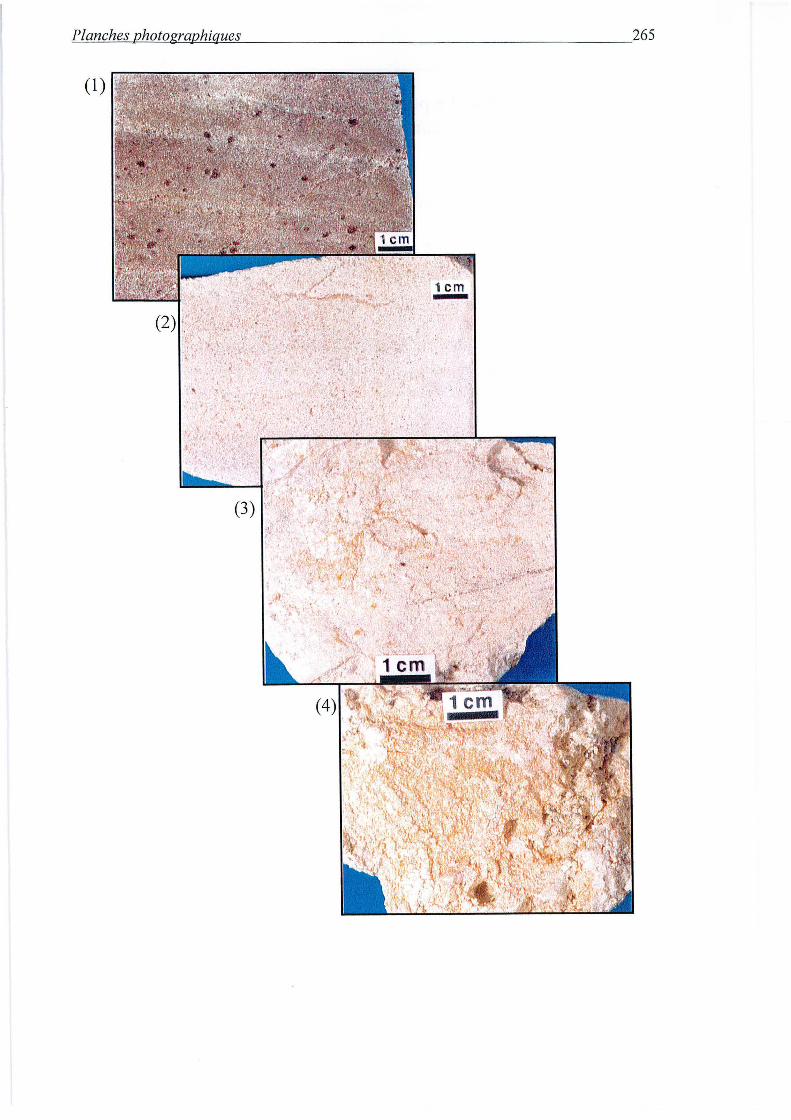
~P=la~n=c~h=es~v~h~o~t=o~gr~a~v~h=iq~u=e=s ____________________________________________ 265
(1)
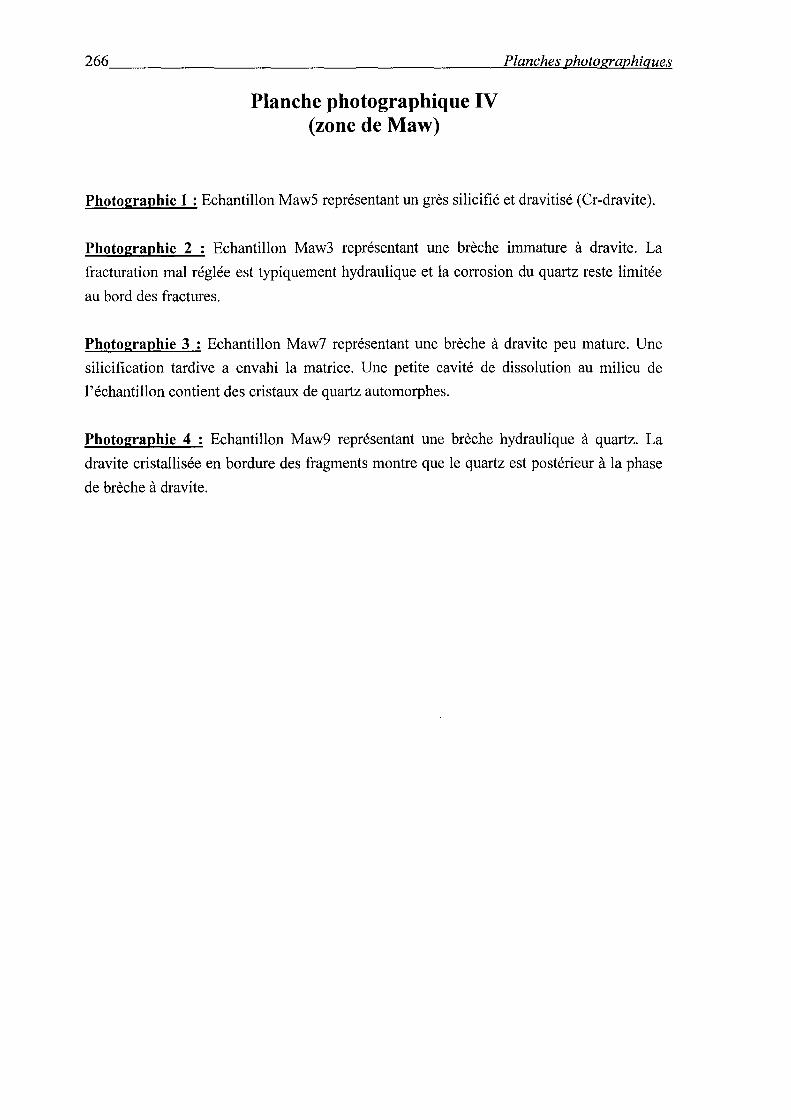
266 ____________________________________________ ~P~la=n=c~h=es~ph=o=t=o~gr~a~p=h=iq~u=e=s
Planche photographique IV (zone de Maw)
Photographie 1 : Echantillon Maw5 représentant un grès silicifié et dravitisé (Cr-dravite).
Photographie 2 : Echantillon Maw3 représentant une brèche immature à dravite. La
fracturation mal réglée est typiquement hydraulique et la corrosion du quartz reste limitée
au bord des fractures.
Photographie 3 : Echantillon Maw7 représentant une brèche à dravite peu mature. Une
silicification tardive a envahi la matrice. Une petite cavité de dissolution au milieu de
1' échantillon contient des cristaux de quartz automorphes.
Photographie 4 : Echantillon Maw9 représentant une brèche hydraulique à quartz. La
dravite cristallisée en bordure des fragments montre que le quartz est postérieur à la phase
de brèche à dravite.
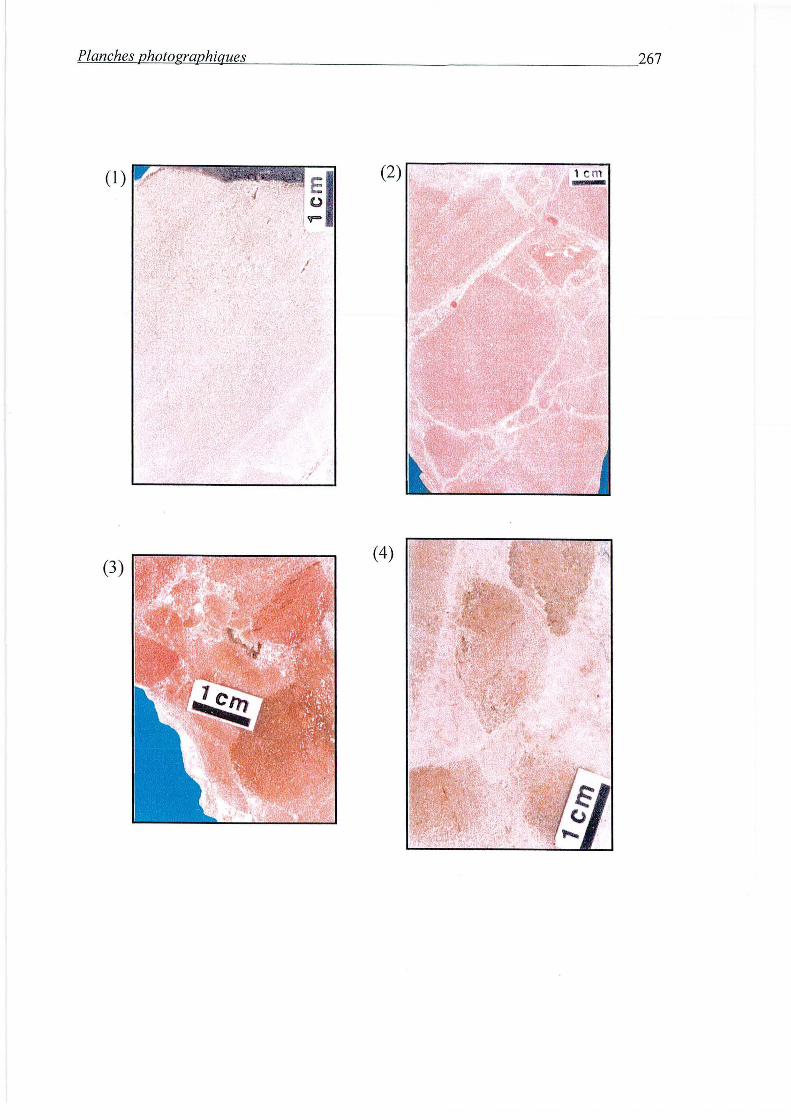
~P=la=n=c~h=es~p~h=o=t=o~gr~a~p~h=iq~u=e~s ____________________________________________ 267
(1)
(3) (4)

ANNEXE II: MoDELE GÜCAD DE LA ZoNE DE
ANNE A SHEA CREEK

A~n~n~ex~e~II~·~·~~o~d~è~le~G~o~ca~d~d~e~la~z~on~e~d~e~A~n~n~e~à~S~h~e~a~C~re~e~k~ ___________________ 269
MODELE GÜCAD DE LA ZONE DE ANNE A SHEA
CREEK
Introduction
Le modèle gOcad de la zone de Anne présenté dans cette annexe a été réalisé à Nancy au
LIAD par Christian Le Carlier de Veslud, David Becel, Jean-Jacques Royer et Guillaume
Lorilleux. Le modèle a été construit en plusieurs étapes. Les parties lithologiques et
structurales ainsi que la minéralisation uranifère ont été réalisées pendant 1' été 1999 et les
corps de brèches dans le courant de l'année 2000. Les données de forages (localisations,
géologie, levés radiométriques) servant de base à la construction du modèle ont été transmises
par le département d'exploration de CRI. Les derniers forages réalisés en 2000 ont été intégrés
au modèle afin de réactualiser le contour de la minéralisation et certains contacts géologiques.
L'interprétation utilisée a été réalisée en 1998 à partir des levés de carottes de forages par
David Baudemont, géologue structuraliste à CRI, et Guillaume Lorilleux. La première étape a
été de convertir au format gOcad les fichiers envoyés par le département d'exploration.
Ensuite, les différentes coupes et cartes interprétatives réalisées dans la zone de Anne ont été
digitalisées afin de les utiliser avec les données de forages comme guides pour la réalisation
des surfaces d'interpolation du modèle.
La construction du modèle 3D repose sur trois types d'objets géométriques: (i) des lignes
polygonales, représentant généralement les données; (ii) un modèle surfacique, basé sur des
surfaces triangulées et représentant les interfaces entre les corps géologiques (failles, contacts)
(Fig. AII-1), (iii) un modèle volumique, déduit automatiquement du modèle surfacique
(Fig. AII-2).
La construction du modèle surfacique constitue l'un des points clé du travail. La
représentation des surfaces utilise un maillage triangulaire pour lequel les points de données
constituent des contraintes. L'interpolation des surfaces entre les points de données se fait par
l'algorithme DSI (Mallet, 1992), complété par un large choix de contraintes permettant
d'assurer la consistance géologique et géométrique des relations entre objets. On peut citer par
exemple:
• les points ou courbes de contrôle, permettant de contraindre les surfaces par des
données exactes (forage par exemple) ou floues (interprétation par exemple);
• les contraintes sur une surface, permettant de contraindre automatiquement une
surface (un horizon par exemple) à rester en contact avec d'autres objets surfaciques (des
failles par exemple).

270 ___________________ A~n~n~ex~e~l=J~:~Af<~o=d~èl~e~G~o~c~a=d~d=e~la~z=o~n~e~d~e~A~nn~e~à~S~h~e=a~C~r~e~ek
La topologie des surfaces peut être adaptée automatiquement à la variabilité des données
par des critères automatiques (calcul de courbure ou d'estimation d'erreur), permettant de ne
densifier le maillage que là où nécessaire et économisant ainsi de la place. Des opérateurs
arithmétiques entre surfaces (coupure, soustraction, ... ) facilitent la construction d'objets
complexes. Ceci permet finalement de fournir un modèle 3D final lissé, conforme du point de
vue géologique, notamment au niveau des failles.
Faille
x
Figure All-I -Exemple de deux surfaces triangulées, l'une représentant un horizon, l'autre une faille.
Figure AII-2- Exemple de grille irrégulière (stratigraphie grid) ou régulière (voxet).
Pour finir, un modèle volumique 3D est utilisé pour déduire automatiquement les régions
à partir du modèle surfacique. Ce modèle volumique peut se présenter sous deux formes:
• un modèle volumique de Weiler, décrivant chaque région par les morceaux de surface
qui la ferment,
~A~n~n~ex~e~II~·~·~~o~d~è~le~G~o~ca~d~d~e~la~z~on~e~d~e~A~n~n~e~a~'S~h~e~a~C~r~ee~k~ ___________________ 27I
• un modèle volumique de grille (régulière ou non) (Fig. AII-2). Ce modèle utilise
préalablement un maillage de 1' espace par une grille. A partir de là, chaque région est
décrite par l'union de toutes les cellules élémentaires qui la composent.
C'est le modèle de Weiler qui a été réalisé pour le modèle de la zone de Anne. Ce modèle
volumique peut être utilisé pour calculer les volumes d'un corps, ou par exemple, une
abondance relative. Cette partition de l'espace peut aussi être utilisée pour affecter des
propriétés physiques à des roches (densité, perméabilité, ... ) en fonction de la lithologie, dans
le but de procéder à des calculs de modélisation directe: réponse gravimétrique ou transferts
de chaleur et de masse par exemple. Enfin, le modèle volumique rend également possible la
réalisation de coupes dans toutes les directions et non-nécessairement rectilignes. Il suffit pour
cela de tracer la ligne de coupe souhaitée sur le modèle.
Les différentes formations sédimentaires, la discordance, le graphite, les failles de type I,
III et IV (voir partie II), le corps minéralisé et les corps de brèches à sudoite-dravite et Fe
chlorite ont été représentés (Fig. AII-3, AII-4, AII-5 et AII-6). Les enveloppes des corps
minéralisés et de brèches ont été créées en rejoignant les contours fermés interprétés sur les
coupes d'exploration par des surfaces. L'enveloppe du corps minéralisé a été dessinée en
combinant le contour interprété sur les coupes d'exploration avec les intervalles des logs
radiométriques correspondant à des teneurs supérieures à 3000 ppm d'uranium. Le contrôle de
l'orientation des corps de brèches par les failles a servi de guide pour les surfaces
ù'interpolatiun entre les-coupes.
Principaux apports du modèle
La modélisation tridimensionnelle de la zone de Anne a permis de montrer la très bonne
corrélation spatiale entre le maximum de dénivellation de la discordance, lié aux failles de
type I et le corps minéralisé (Fig. AII-4). Le modèle a également mis en évidence une
propagation de la dénivellation à la discordance dans les couches sédimentaires sus-jacentes
qui s'atténue vers le haut (Fig. II-1). Localement, des zones de dépression apparaissent. Deux
interprétations sont possibles : soit cette propagation correspond aux failles inverses
«aveugles» de type I qui s'atténuent dans les grès, soit il s'agit de zones d'effondrement liées
à des dissolutions de grès au niveau des minéralisations sous-jacentes. Le modèle a confirmé
la très bonne corrélation spatiale entre les corps de brèches et la minéralisation uranifère. Il
apparaît qu'une partie importante de la minéralisation enveloppe les brèches. Dans la réalité,
c'est le contraire mais l'utilisation des contours assez larges de zones minéralisées (teneur de
coupure inférieures à 3000 ppm d'U) dans les coupes pour appuyer les surfaces
d'interpolation ont conduit à maximiser le volume de la minéralisation. Le modèle a
également permis de montrer la forme en doigts des brèches à sudoite-dravite étroitement
272 __________________ ~A~n~n~e~x~e~I~I~:~~~od~e~'l~e~G~o~c~a~d~d~e~l~a~z~o~n~e~d~e~A~n~n~e~a~'~S~h~ea~C~r~e~ek
contrôlées par les failles de type I essentiellement (Fig. AII-5). Les brèches à Fe-chlorite ont
une forme plus étalée en dôme à l'intersection de 3 types de failles, probablement due à un
effondrement de type « Mississippi Valley Type deposits »faisant suite à la dissolution
massive du quartz (Fig. AII-6). La fonction Getvolume de gücad a permis de calculer
facilement le volume des corps de brèches. Les brèches à sudoite-dravite dans la zone de
Anne ont un volume de 166 000 m3 tandis que les brèches à Fe-chlorite ont un volume de
30 000 m3. Ces volumes ont été utilisés afin d'estimer le volume de fluides sous-saturés en
silice qui ont circulé dans les brèches.
La modélisation tridimensionnelle a également mis en évidence un certain nombre de
problèmes de correspondance entre cartes et coupes. En particulier, des choix interprétatifs ont
dû être effectués concernant 1' orientation et la forme des failles entre les coupes. Le dessin des
corps de brèches a posé de nombreux problèmes puisque des zones importantes de brèches
levées dans des forages réalisés en 1999 se sont retrouvées éloignées de toute faille pouvant
les justifier. Ces difficultés ont mis en évidence les limites du modèle de 1998. Depuis, les
nouveaux forages réalisés en 1999 et 2000 et surtout les premières orientations de carottes ont
permis aux géologues d'exploration d'établir un nouveau modèle présenté dans la partie IV
(figure 3). Ce modèle comprend une nouvelle famille de failles orientée N100-110 (type II)
(voir partie IV) et qui avait été suggérée par 1' orientation N 1 00-110 de certains corps de
brèches cartographiés lors de la mission de terrain de juin 1999 (Rapport interne COGEMA,
Lorilleux). Ces failles corréleraient donc très bien avec les brèches isolées du moclèk.
La principale difficulté rencontrée lors de la construction de ce modèle a donc été
d'intégrer des données de forages récentes qui ne correspondaient pas nécessairement à
1 'interprétation de 1998. La reconstruction du nouveau modèle en cours, si elle a lieu,
nécessitera de reprendre le travail de modélisation au point de départ puisque les changements
de localisation et d'orientation des failles impliquent de reconstruire toutes les failles avec un
nouveau redécoupage des failles entre elles.
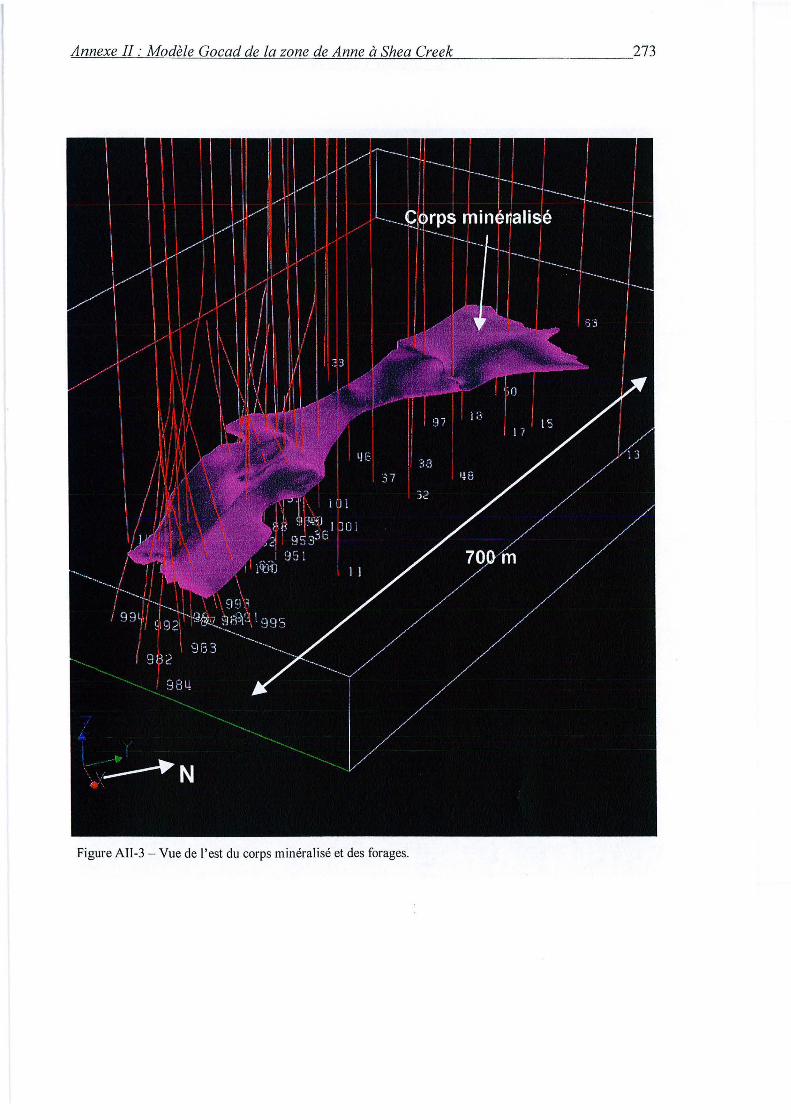
=A~n~n=ex=e~l=l~:~A1<==o=de='l=e~G~o~c=a=d~d~e~l=a~z=o~n~e=d=e~A~n~n=e~à~S~h~e=a~C~r~e=e~k ____________________ 273
Figure All-3- Vue de l'est du corps minéralisé et des forages.
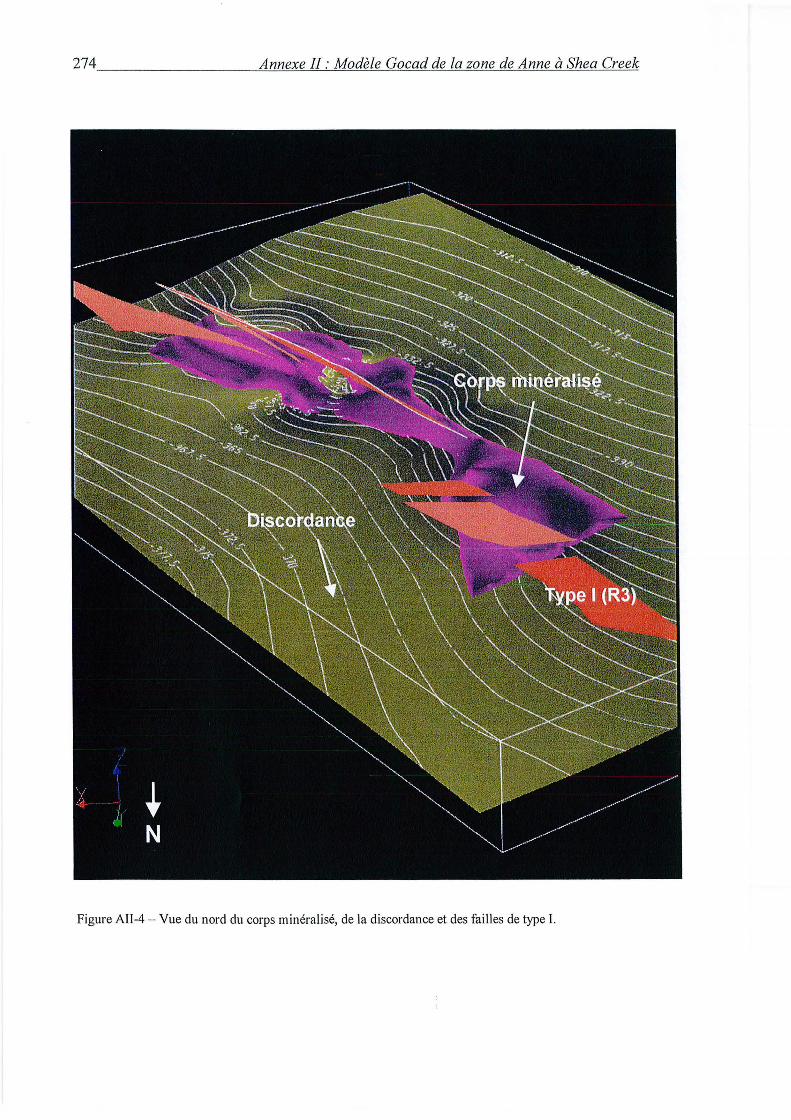
274 __________________ ~A~n~n~ex~e~I~I~:~Af.~o~de~'Z~e~G~o~c~a~d~d~e~l~a~z~o~ne~d~e~A~n~n~e~à~S~h~e~a~C=r~e~ek
Figure AII-4 - Vue du nord du corps minéralisé, de la discordance et des failles de type l.
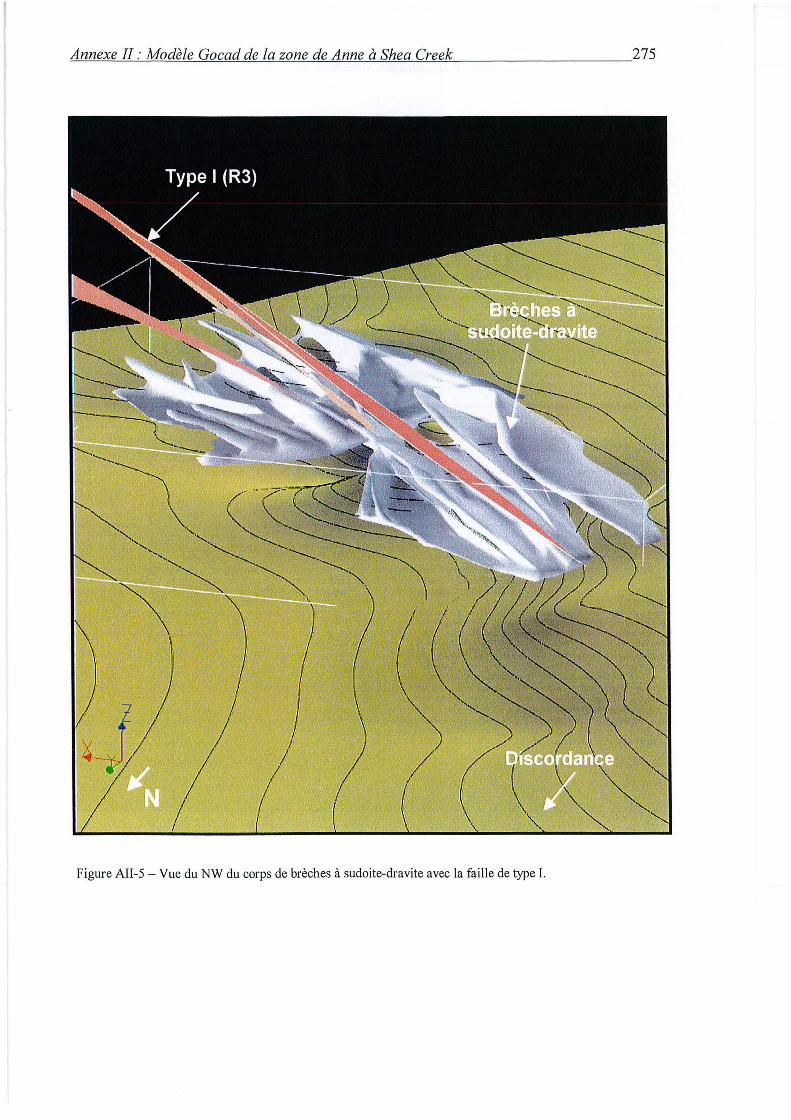
A~n~ne=x=e~J=J~:~Aft==od=e='l=e~G~o~c~a=d~d~e~l=a~z=on~e~d=e~A~n=n=e~à~S~h~e~a~C~r~e=ek~ ___________________ 275
Figure AII-5- Vue du NW du corps de brèches à sudoite-dravite avec la faille de type I.
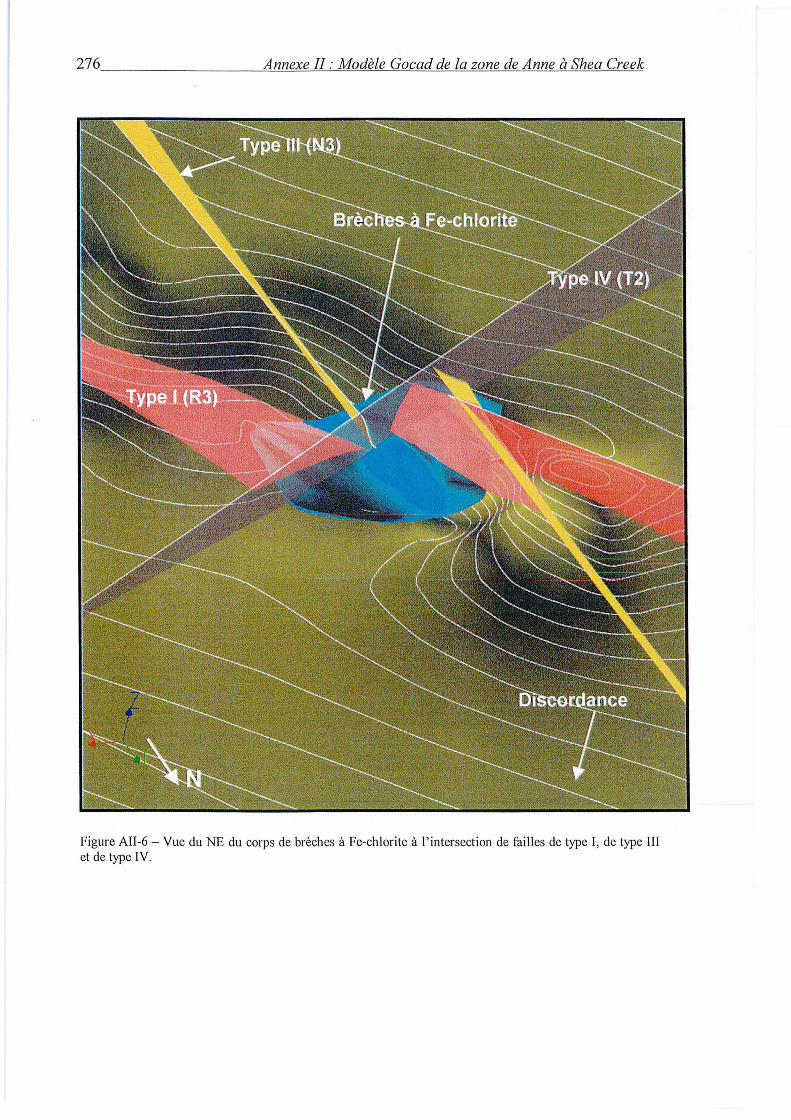
276 __________________ ~A~n~n~ex~e~I~l~:~~==od=e='l=e~G~o~c~a~d~d~e2l~a~z~o~ne~d~e~A~n~n=e~à~S~h~e~a~C=r~e~ek
Figure AII-6 - Vue du NE du corps de brèches à Fe-chlorite à l'intersection de failles de type I, de type III et de type IV.
ANNEXE III: METHODES DE CALCUL

A~n~n~ex~e~I=I~l~:~~~e~'t~h~o~d~es~de~c~a~lc~u~~~-----------------------------------------277
METHODES DE CALCULS
1: Bilans de masse
Introduction
Les bilans de masse permettent de quantifier les gains et pertes en éléments chimiques
d'une roche altérée par rapport à son équivalent non-altéré (protolite). Dans le cas d'un
phénomène de bréchification hydrothermale, les variations de volume sont souvent
considérables et il est nécessaire de prendre en compte la densité dans les calculs. C'est la
méthode de Grant (1986), particulièrement simple d'utilisation, qui a servi pour réaliser les
calculs de bilans de masse.
1:1. Mesure d'une densité globale
La méthode utilisée est celle de la pesée de 1' échantillon sec pms immergé dans un
picnomètre.
1:1: 1. Mesure de la masse à sec
L'échantillon doit dans un premier temps être mis à l'étuve pendant 24 heures. L'élévation
de température doit être progressive afin d'atténuer l'apparition de porosité par dilatation
thermique (Vigneresse et Cannat, 1987). Il est préférable de ne pas dépasser la température de
100°C afin d'éviter la production de nouvelles microfractures par dilatation thermique
différentielle des minéraux (Heard et Page, 1982). Une réhumidification de 1' échantillon se
produit dès la sortie de l'étuve. La mesure de la masse doit donc être effectuée rapidement.
1:1:2. Mesure de la masse immergée« à sec»
La masse immergée « à sec » est mesurée immédiatement après la mesure de la masse à
sec. La mise de 1' échantillon dans le picnomètre doit être très rapide pour éviter les pertes de
bulles d'air faisant suite à la pénétration de 1 'eau dans 1 'échantillon. L'eau présente sur les
parois extérieures du récipient est consciencieusement essuyée avant de mesurer la masse. La
température de l'eau doit être mesurée avant et après cette mesure de masse afin d'effectuer la
correction de température. En effet, si l'échantillon n'est pas poreux, sa température élevée à la
278 __________________________________________ ~A=n=n=e=x~e~Il=l~:~~==ét~h=o=d=e~s~d~e~c~a~lc~u~~
sortie de l'étuve va provoquer une dilatation de l'eau et une perte par le haut du picnomètre.
Dans ce cas, le calcul de la densité devra tenir compte de la température après la mesure de la
masse immergée «à sec». Cette mesure de température doit être très rapide puisqu'elle
continue à augmenter après la pesée. Si l'échantillon est poreux, l'eau va petit à petit pénétrer
l'échantillon après la fermeture du picnomètre. Le niveau d'eau va donc diminuer. Dans ce
cas, la température à considérer est celle de l'eau avant contact avec l'échantillon puisque c'est
la masse du picnomètre plein qui importe dans le calcul de la densité.
Certains échantillons poreux ont été couverts d'une légère couche de vernis à l'aide d'un
aérosol afin de vérifier que la durée de fermeture du picnomètre n'affecte pas sensiblement les
résultats. Une différence moyenne de 0,01 a été obtenue sur les échantillons poreux dont la
valeur de la densité globale a donc été corrigée en conséquence en l'abaissant de 0,01. Il a été
vérifié sur des échantillons non poreux que la couche de vernis est suffisamment fine pour ne
pas affecter la densité. Les échantillons argileux et friables ont sytématiquement été revêtus
d'une couche de vernis afin d'éviter leur désaggrégation avant la fermeture du picnomètre. Il
est préférable d'utiliser les plus gros échantillons possibles afin de minimiser une éventuelle
légère modification de la densité du fait de l'application du vernis.
1:1:3. Calcul de la densité globale
Dn caîcuïe la dens-ité en utilisant la formule suivante :
D =(Ms 1 (Pe- Ps +Ms)) x De
,où : Ms = masse de 1' échantillon sec,
Pe =masse du picnomètre plein d'eau,
Ps =masse du picnomètre plein d'eau contenant l'échantillon,
De = densité de 1' eau,
D = densité globale de 1' échantillon.
Pe et De sont fonction de la température. Il faut donc calibrer Pe en fonction de la
température expérimentalement. Cette calibration doit être précise puisque une erreur de 2
degrés sur la température induit une erreur de l'ordre de 1 centième sur la densité globale. La
courbe de calibration obtenue n'est pas une droite mais une courbe dont la concavité est
tournée vers le bas (Fig. AIII-1). A pression atmosphérique, la courbe atteint un maximum à
4°C. Les valeurs de De en fonction de la température ont été prises dans le Handbook of
Physical Constants.
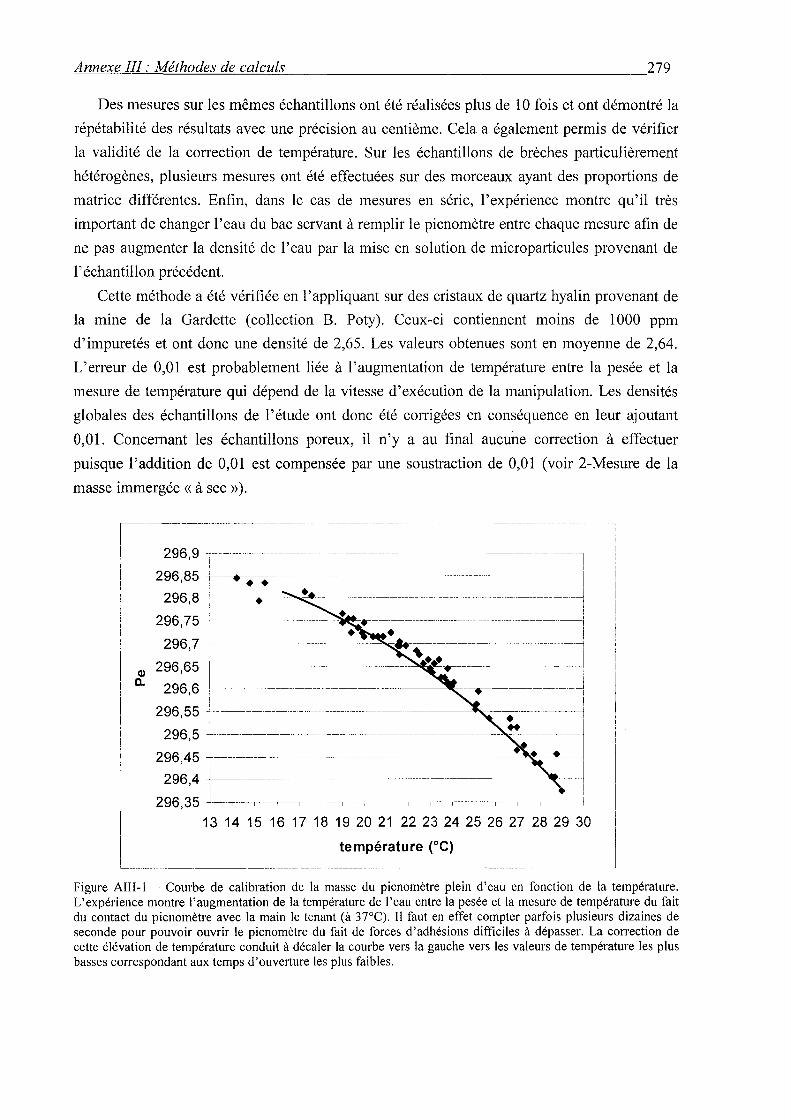
A~n=ne=x=e~l=Il~:~==é=th~o=d=e=s~d=e~c=a=lc=u~~~---------------------------------------279
Des mesures sur les mêmes échantillons ont été réalisées plus de 1 0 fois et ont démontré la
répétabilité des résultats avec une précision au centième. Cela a également permis de vérifier
la validité de la correction de température. Sur les échantillons de brèches particulièrement
hétérogènes, plusieurs mesures ont été effectuées sur des morceaux ayant des proportions de
matrice différentes. Enfin, dans le cas de mesures en série, l'expérience montre qu'il très
important de changer l'eau du bac servant à remplir le picnomètre entre chaque mesure afin de
ne pas augmenter la densité de l'eau par la mise en solution de microparticules provenant de
l'échantillon précédent.
Cette méthode a été vérifiée en l'appliquant sur des cristaux de quartz hyalin provenant de
la mine de la Gardette (collection B. Poty). Ceux-ci contiennent moins de 1000 ppm
d'impuretés et ont donc une densité de 2,65. Les valeurs obtenues sont en moyenne de 2,64.
L'erreur de 0,01 est probablement liée à l'augmentation de température entre la pesée et la
mesure de température qui dépend de la vitesse d'exécution de la manipulation. Les densités
globales des échantillons de l'étude ont donc été corrigées en conséquence en leur ajoutant
0,01. Concernant les échantillons poreux, il n'y a au final aucune correction à effectuer
puisque l'addition de 0,01 est compensée par une soustraction de 0,01 (voir 2-Mesure de la
masse immergée « à sec » ).
~---~-----------·-···--~-------- . -----------
296,9 r -- -- --- --296 85 +----.--:;---- ..
' i ••
296,8 ~-----.--- -
296,75~-------------- ..
296,7 ----~--------
Q) 296 65 -r-- _______ _ o.. 29~,6 - ---- -- -------
296,55 ----- ----- --------
296 5 -t- ------296 ~5 J_ _______ --- -·- -------
-----------~ --- ·-·------1
' 1 296,4 -j~--------·· --------- ---------------------·····-·-------~---~---- - - --1 • 1
296 35 ~----·-,---- -r--,--- ·1· - ---,-----,---· ,----,----,~-,----,-~-,.-----,-----,-----,----,--~ '
13 14 15 16 17 18 19 20 21 22 23 24 25 26 27 28 29 30
température (0 C)
Figure AIII-1 - Courbe de calibration de la masse du picnomètre plein d'eau en fonction de la température. L'expérience montre l'augmentation de la température de l'eau entre la pesée et la mesure de température du fait du contact du picnomètre avec la main le tenant (à 37°C). Il faut en effet compter parfois plusieurs dizaines de seconde pour pouvoir ouvrir le picnomètre du fait de forces d'adhésions difficiles à dépasser. La correction de cette élévation de température conduit à décaler la courbe vers la gauche vers les valeurs de température les plus basses correspondant aux temps d'ouverture les plus faibles.

280 __________________________________________ ~A~n~n~e~x~e~II~I~:~A!I~ét~h~o~d~e~s~d~e~c~a~lc~u~ù
1:2. Calculs des variations de volume et des facteurs d'enrichissement et de
perte : la méthode isocone
Grant (1986) a réécrit l'équation de Gresens (1967) sous la forme suivante:
,où : C = concentration,
M = masse de 1' échantillon,
A= indice pour altéré,
0 = indice pour originel (non-altéré),
i = indice pour élément,
~Ci = variation de concentration de 1' élément i.
Pour chaque élément, il existe une équation de cette forme pour laquelle (M0 1 MA) est
une constante. En identifiant les éléments pour lesquels ~Ci = 0, on peut connaître la valeur
de ce rapport en résolvant de manière simultanée un ensemble d'équations de la forme:
La solution peut être facilement obtenue graphiquement en traçant les valeurs de cAi en
fonction de C0 i (Fig. AIII-2). Les éléments immobiles génèrent alors une droite passant par
1' origine de pente (M0 1 MA), qui est le rapport fondamental de masses équivalentes avant
et après l'altération. Cette droite, pour laquelle ~Ci = 0, est appelée isocone, c'est-à-dire
une ligne reliant des points de même concentration géochimique.
Si on considère que le Zr est immobile,
Si on considère une altération sans variation de masse,
Si on considère une altération à volume constant,
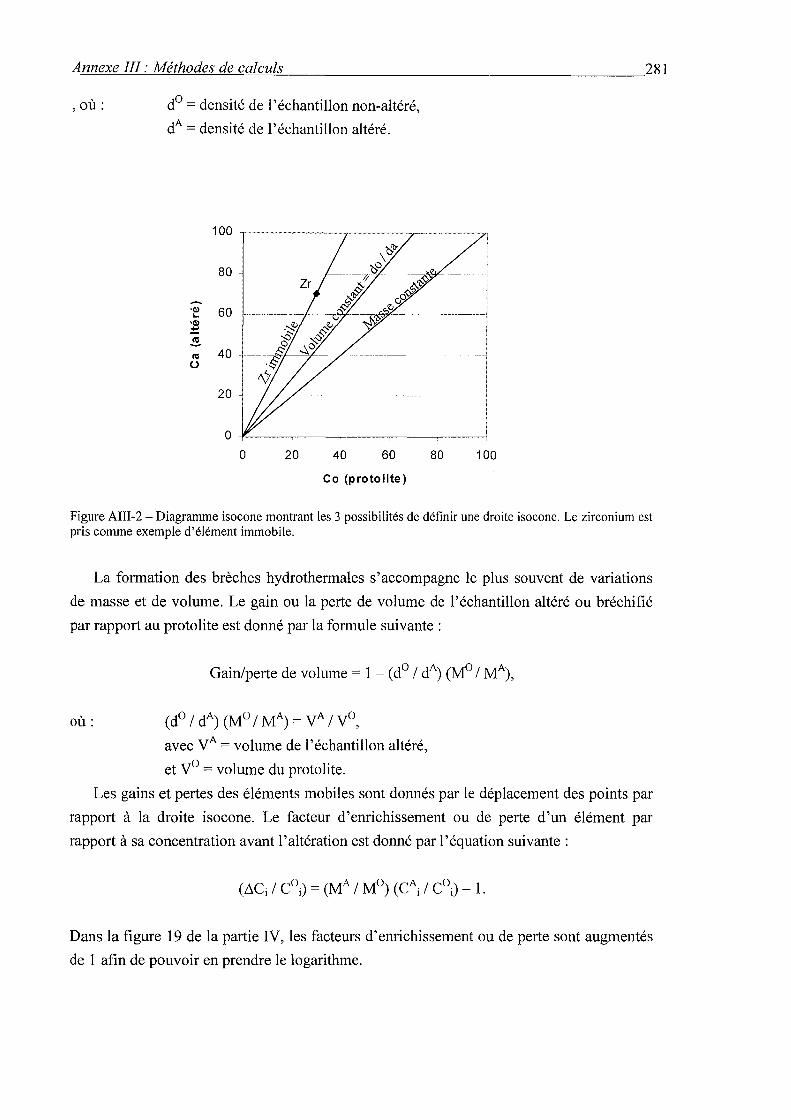
=A~n~n=ex=e~I=I~J~:=Afl=e='ffi~o~d=e=s~d=e~c=a=lc~u=~~---------------------------------------281
, où : d0 = densité de 1' échantillon non-altéré,
dA = densité de 1' échantillon altéré.
80
•Q) 60 ... •Q) .:!::: ~ Ill 40 (.)
20
0
0 20 40 60
Co (protolite)
80 100
Figure AIII-2- Diagramme isocone montrant les 3 possibilités de définir une droite isocone. Le zirconium est pris comme exemple d'élément immobile.
La formation des brèches hydrothermales s'accompagne le plus souvent de variations
de masse et de volume. Le gain ou la perte de volume de 1' échantillon altéré ou bréchifié
par rapport au protolite est donné par la formule suivante :
où: (d0 1 dA) (M0 1 MA)= yA 1 V0 ,
avec yA =volume de l'échantillon altéré,
et V0 = volume du protolite.
Les gains et pertes des éléments mobiles sont donnés par le déplacement des points par
rapport à la droite isocone. Le facteur d'enrichissement ou de perte d'un élément par
rapport à sa concentration avant 1' altération est donné par 1' équation suivante :
Dans la figure 19 de la partie IV, les facteurs d'enrichissement ou de perte sont augmentés
de 1 afin de pouvoir en prendre le logarithme.
282 __________________________________________ ~A~n~n~e~xe~Il~l~:~A!I~ét~h~o~d~es~d~e~c~a~lc~u~~
II: Rapports fluide/roche et temps de formation des brèches
Introduction
Les brèches étudiées sont caractérisées par la dissolution massive du quartz. En calculant la
quantité de quartz dissous et en supposant un degré de sous-saturation en silice du fluide, on
peut calculer le volume de fluide minimum nécessaire pour former un certain volume de
brèche. En tenant compte de la conductivité hydraulique et de la porosité du milieu, on peut
estimer un temps minimum de formation des brèches.
11:1. Rapport fluide/roche d'un échantillon de brèche
Les pourcentages de quartz d'un échantillon de brèche et de son protolite sont obtenus par
calcul normatif à partir de la composition chimique de 1' échantillon et des minéraux le
composant. Si la bréchification ne s'est pas accompagnée de perte de volume, le pourcentage
massique de quartz dissous (Mqtz)est donné par :
où: M0 qtz = pourcentage massique de quartz dans le proto lite,
MA qtz = pourcentage massique de quartz dans 1' échantillon bréchifié.
Si une perte de volume a eu lieu, ce qui est presque systématiquement le cas,
0 A ( A/ 0) Mqtz = M qtz - M qtz M M .
Pour 1 kg de roche initiale, le nombre de moles de quartz dissous (n) est donné par :
n = (1000 (Mqtz 1 100)) 1 60.
Si on considère une solubilité (s) du quartz en mol/kg et une sous-saturation (t) du
fluide en%, le rapport volumique fluide/roche cumulé (w/r) est donné par :
w/r = d0 (n 1 (s (t 1 1 00))).
Il s'agit d'un rapport fluide/roche relatif au volume initial de roche. C'est une valeur
minimale puisqu'on fait l'hypothèse que tout le fluide qui a circulé a réagi avec le quartz
A~n~n=ex=e~!=I=I~:~~=e='t=h=o=d=es~de~c=a~lc~u=~~-----------------------------------------283
de manière instantanée. Il faudrait également prendre en compte la cinétique de réaction ou
le temps de diffusion des éléments dans le fluide.
11:2. Temps de formation des brèches
Afin d'estimer un temps de formation des brèches, il est nécessaire d'avoir une idée de
la vitesse de circulation du fluide sous-saturé en silice, ou conductivité hydraulique.
Considérant une famille de fractures parallèles avec un espacement fracturai moyen (Sm) et
une ouverture moyenne des fractures (Am), la conductivité hydraulique « directionnelle » (Km) (Snow, 1969; Ababou, 1991 ; Vuillod, 1995) est donnée par :
où: g = accélération gravitationnelle,
11 =viscosité cinématique du fluide ( ~ 1 0"6).
En tenant compte de la perte de volume, le volume de fluide (Vf) nécessaire pour
former un corps de brèche de volume (V) est donné par :
Vf= w/r (V (V0 1 VA)).
Considérant que le fluide traverse le corps de brèche à travers une section (S) sur une
longueur (L), et en supposant une porosité (p) en%, la hauteur (H) de la colonne d'eau qui
doit passer perpendiculairement à la section est donnée par :
H = Vf 1 (S (p 1 1 00)).
Le temps minimum (T) de formation d'un corps de brèches de volume V est donc:
T =Hl (Km)-
Il s'agit bien d'un temps minimum puisque w/r est également minimum.

ANNEXE IV: LISTE DES EcHANTILLONS ET
REsuLTATS D'ANALYSES

A==nn=e=x=e~l~V~:=L=~=te~d=e=s~e='c~ha=n=t=ill=o~n~s=et~r~é=su=l=w=Œ~d~'a~n=al~ys=e=s _____________________ 285
LISTE DES ECHANTILLONS ET RESULTATS
D'ANALYSES
Introduction
Cette annexe présente :
( 1) les différents échantillons étudiés à Shea Creek, à Sue et dans la zone de Maw,
(2) les descriptions systématiques de différents types de brèches de Shea Creek,
(3) les résultats d'analyses chimiques ponctuelles à la microsonde électronique,
d'analyses chimiques globales ICP-AES et -MS, de mesures de densités et
d'analyses de diffraction aux rayons X, ainsi que les spectres Raman de
kaolinite/dickite.
I: Etudes réalisées sur les différents échantillons de Shea Creek, de Sue et de la Maw Zone
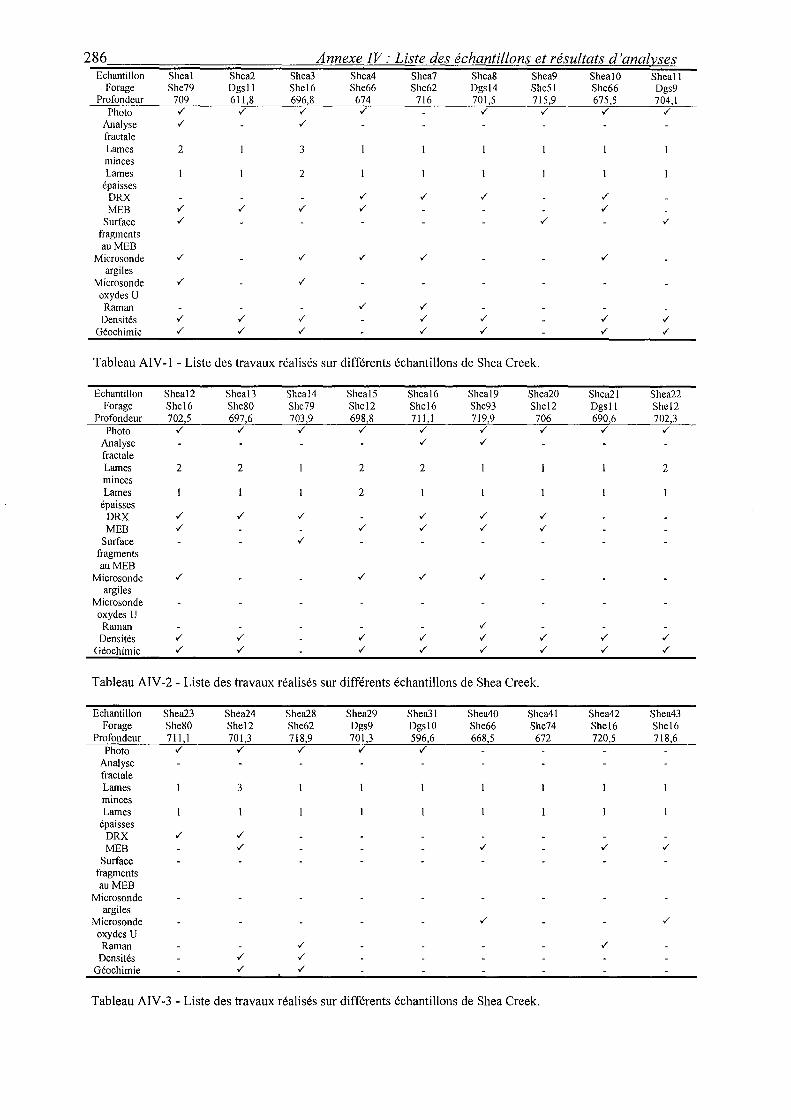
286 Annexe IV: Liste des échantillons et résultats d'analyses Echantillon Sheal Shea2 Shea3 Shea4 Shea7 Shea8 Shea9 SheaiO Sheall
Forage She79 Dgsll She16 She66 She62 Dgsl4 She51 She66 Dgs9 Profondeur 709 611,8 696,8 674 716 701,5 715,9 675,5 704,1
Photo .,/ .,/ .,/ .,/ .,/ .,/ .,/ .,/
Analyse .,/ .,/
fractale Lames 2 3 minces Lames 2
épaisses ORX .,/ .,/ .,/ .,/
MEB .,/ .,/ .,/ .,/ .,/
Surface .,/ .,/ .,/
fragments auMEB
Microsonde .,/ .,/ .,/ .,/ .,/
argiles Microsonde .,/ .,/
oxydes U Raman .,/ .,/
Densités .,/ .,/ .,/ .,/ .,/ .,/ .,/
Géochimie .,/ .,/ .,/ .,/ .,/ .,/ .,/
Tableau AIV -1 - Liste des travaux réalisés sur différents échantillons de Shea Cree k.
Echantillon Sheal2 Sheal3 Sheal4 Sheal5 Sheal6 Sheal9 Shea20 Shea21 Shea22 Forage Shel6 She80 She79 Shel2 Shel6 She93 Shel2 Dgsll Shel2
Profondeur 702,5 697,6 703,9 698,8 711,1 719,9 706 690,6 702,3 Photo .,/ .,/ .,/ .,/ .,/ .,/ .,/ .,/ .,/
Analyse .,/ .,/
fractale Lames 2 2 2 2 2 minces Lames 2
épaisses ORX .,/ .,/ .,/ .,/ .,/ .,/
MEB .,/ .,/ .,/ .,/ .,/
Surface .,/
fragments auMEB
Microsonde .,/ .,/ .,/ .,/
argiles Microsonde oxydes U
Raman .,/
Densités .,/ .,/ .,/ .,/ ./ .,/ .,/ .,/
Géochimie .,/ .,/ .,/ .,/ ./ .,/ .,/ .,/
Tableau AIV -2 - Liste des travaux réalisés sur différents échantillons de Shea Cree k.
Echantillon Shea23 Shea24 Shea28 Shea29 Shea31 Shea40 Shea41 Shea42 Shea43 Forage She80 Shel2 She62 Dgs9 DgsiO She66 She74 Shel6 Shel6
Profondeur 711,1 701,3 718,9 701,3 596,6 668,5 672 720,5 718,6 Photo .,/ .,/ .,/ .,/ .,/
Analyse fractale Lames 3 minces Lames
épaisses ORX .,/ .,/
MEB .,/ ./ .,/ .,/
Surface fragments auMEB
Microsonde argiles
Microsonde ./ .,/
oxydes U Raman ./ .,/
Densités ./ .,/
Géochimie .,/ ./
Tableau AIV -3 - Liste des travaux réalisés sur différents échantillons de Shea Cree k.
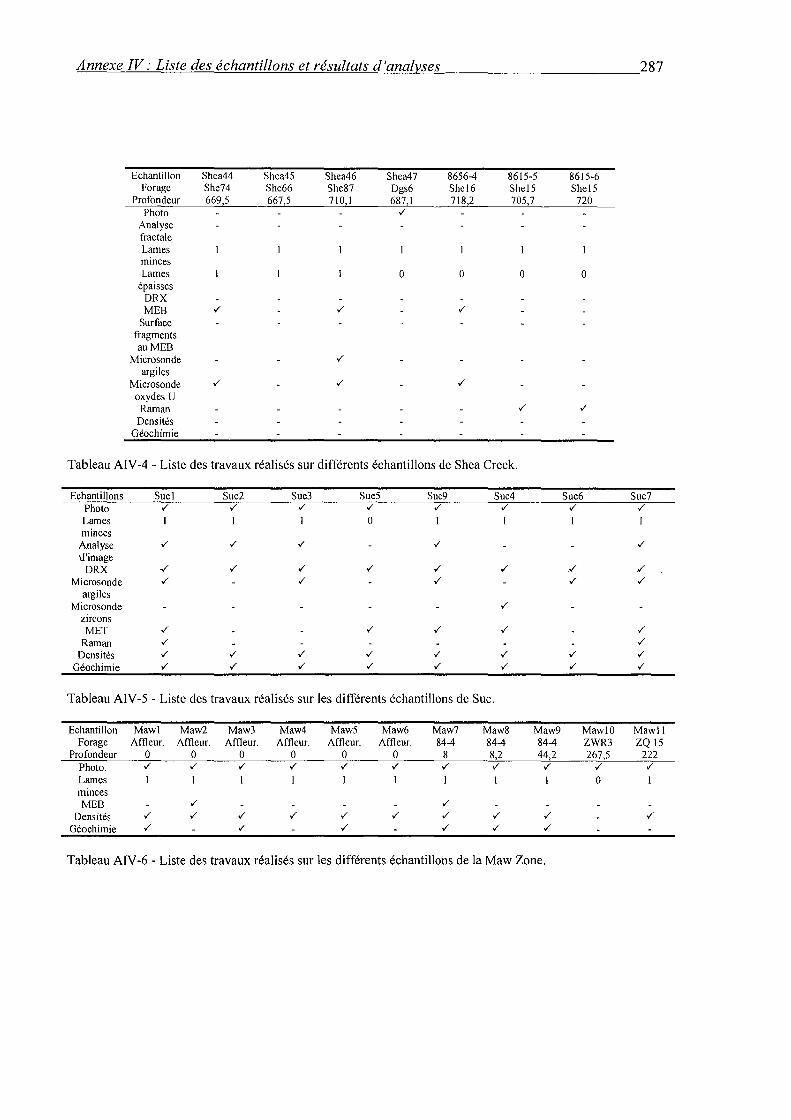
A~n~n=ex=e~IV~:~L~i~st~e~d=e=s~e~'c~h~a~n~t~il~lo~n~s~e~t~r~é~s~ul~t~a~Œ~d~'a~n~a~lv~s~e~s ________________________ 287
Echantillon Shea44 Shea45 Shea46 Shea47 8656-4 8615-5 8615-6 Forage She74 She66 She87 Dgs6 Shel6 She!S She!S
Profondeur 669,5 667,5 710,1 687,1 718,2 705,7 720 Photo ./
Analyse fractale Lames minces Lames 0 0 0 0
épaisses ORX MEB ./ ./ ./
Surface fragments auMEB
Microsonde ./
argiles Microsonde ./ ./ ./
oxydes U Raman ./ ./
Densités Géochimie
Tableau AIV-4- Liste des travaux réalisés sur différents échantillons de Shea Creek.
Echantillons Sue! Sue2 Sue3 SueS Sue9 Sue4 Sue6 Sue7 Photo ./ ./ ./ ./ ./ ./ ./ ./
Lames 1 1 1 0 1 1 1 1 minces
Analyse ./ ./ ./ ./ ./
'd'image ORX .,./ ./ ./ ./ ./ ./ ./ . ./
Microsonde ./ ./ ./ ./ ./
argiles Microsonde ./
zircons MET ./ ./ ./ ./ ./
Raman ./ ./
Densités ./ ./ ./ ./ ./ ./ ./ ./
Géochimie ./ ./ ./ ./ ./ ./ ./ ./
Tableau AIV -5 - Liste des travaux réalisés sur les différents échantillons de Sue.
Echantillon Mawl Maw2 Maw3 Maw4 Maw5 Maw6 Maw7 Maw8 Maw9 Maw!O Mawll Forage Affleur. Affleur. Affleur. Affleur. Affleur. Affleur. 84-4 84-4 84-4 ZWR3 ZQ 15
Profondeur 0 0 0 0 0 0 8 8,2 44,2 267,5 222 Photo. ./ ./ ./ ./ ./ ./ ./ ./ ./ ./ ./
Lames 1 1 1 1 1 1 1 1 1 0 1 minces MEB ./ ./
Densités ./ ./ ./ ./ ./ ./ ./ ./ ./ ./
Géochimie ./ ./ ./ ./ ./ ./
Tableau AIV -6 - Liste des travaux réalisés sur les différents échantillons de la Maw Zone.
288 ____________________ -=A=nn=e=x=e~IV~:=L=is=œ~d=e~s=éc=h=a=nt=il=lo~n~s=et~r~é=su=lt=a=~~d~'=an=a=lv~s~es
II: Description et class1licafion des 'brèches de Sbea Cree'k réalisée sur le terrain
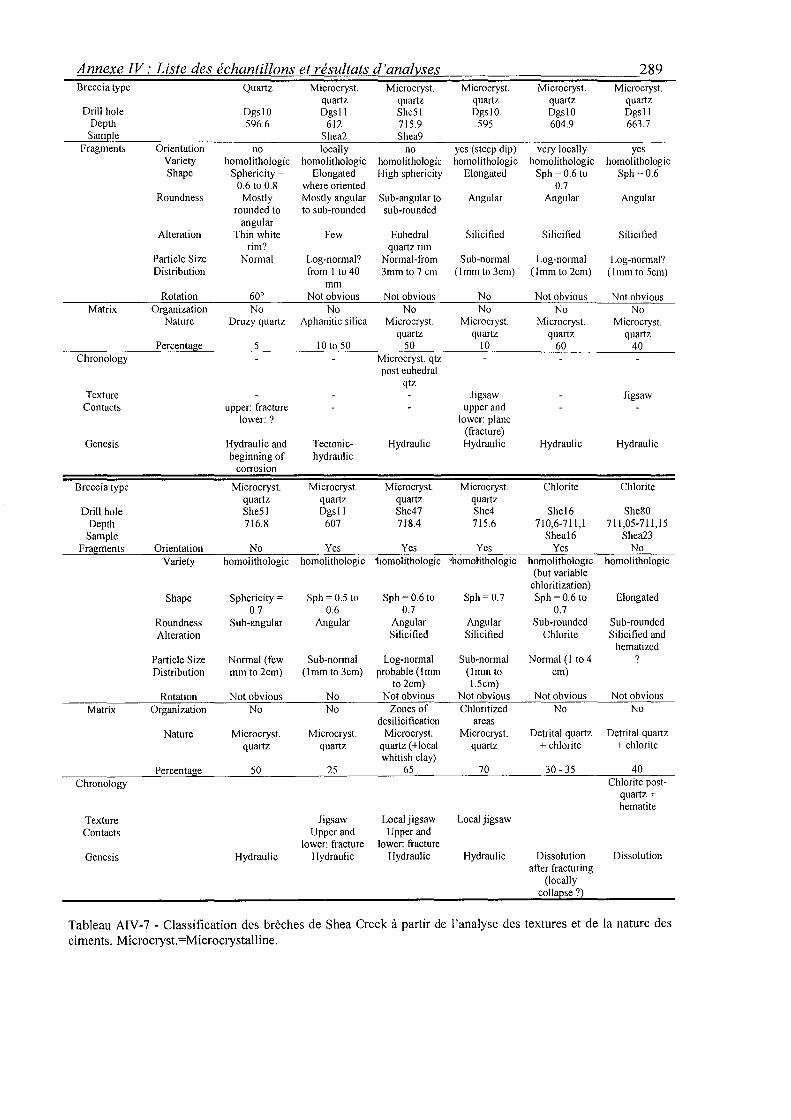
Annexe IV: Liste des échantillons et résultats d'analy_ses 289 Breccia type Quartz Microcryst. Microcryst. Microcryst. Microcryst. Microcryst.
quartz quartz quartz quartz quartz Drill hole Dgs!O Dgsll She51 Dgs!O Dgs!O Dgsll
Depth 596.6 612 715.9 595 604.9 663.7 Sam le Shea2 Shea9
Fragments Orientation no locally no yes (steep dip) very locally y es Variety homolithologic homolithologic homolithologic homolithologic homolithologic homolithologic Shape Sphericity = Elongated High sphericity Elongated Sph = 0.6 to Sph = 0.6
0.6 to 0.8 where oriented 0.7 Roundness Most! y Mostly angular Sub-angular to Angular Angular Angular
rounded to to sub-rounded sub-rounded angular
Alteration Thin white Few Euhedral Silicified Silicified Silicified rim~ quartz rim
Particle Size Normal Log-nom1al? Normal-from Sub-normal Log-normal Log-normal? Distribution from 1 to 40 3mm to 7 cm (!mm to 3cm) (!mm to 2cm) (!mm to Sem)
mm Rotation 60° Not obvious Not obvious No Not obvious Not obvious
Matrix Organization No No No No No No Nature Druzy quartz Aphanitic si! ica Microcryst. Microcryst. Microcryst. Microcryst.
quartz quartz quartz quartz Percentage 5 10 to 50 50 10 60 40
Chronology Microcryst. qtz post euhedral
qtz Texture Jigsaw Jigsaw
Contacts upper: fracture upper and lower:? lower: plane
(fracture) Genesis Hydraulic and Tectonic- Hydraulic Hydraulic Hydraulic Hydraulic
beginning of hydraulic corrosion
B re cci a type Microcryst. Microcryst. Microcryst. Microcryst. Chlorite Chlorite quartz quartz quartz quartz
Drill hole She51 Dgsll She47 She4 Shel6 She80 Depth 716.8 607 718.4 715.6 710,6-711,1 711,05-711,15
Sample Sheal6 Shea23 Fragments Orientation No Y es Y es Y es Y es No
Variety homolithologic homolithologic 110molithologic ·homolithologic homo l-ithologie homolithologic (but variable
chloritization) Shape Sphericity = Sph =0.5 to Sph= 0.6to Sph = 0.7 Sph = 0.6 to Elongated
0.7 0.6 0.7 0.7 Roundness Sub-angular Angular Angular Angular Sub-rounded Sub-rounded Alteration Silicified Silicified Chlorite Silicified and
hematized Particle Size Normal (few Sub-normal Log-normal Sub-normal Normal (1 to 4 Distribution mm to2cm) (!mm to 3cm) probable (!mm (!mm to cm)
to 2cm) !.Sem) Rotation Not obvions No Not obvious Not obvions Not obvious Not obvious
Matrix Organization No No Zones of Chloritized No No desilicification a reas
Nature Microcryst. Microcryst. Microcryst. Microcryst. Detrital quartz Detrital quartz quartz quartz quartz (+local quartz + chlorite + chlorite
whitish clay) Percentage 50 25 65 70 30-35 40
Chrono! ogy Chlorite post-quartz+ hematite
Texture Jigsaw Local j igsaw Local j igsaw Contacts Upper and Upper and
lower: fracture lower: fracture Genesis Hydraulic Hydraulic Hydraulic Hydraulic Dissolution Dissolution
after fracturing (loc ally
colla se?
Tableau AIV-7 -Classification des brèches de Shea Creek à partir de l'analyse des textures et de la nature des ciments. Microcryst.=Microcrystalline.
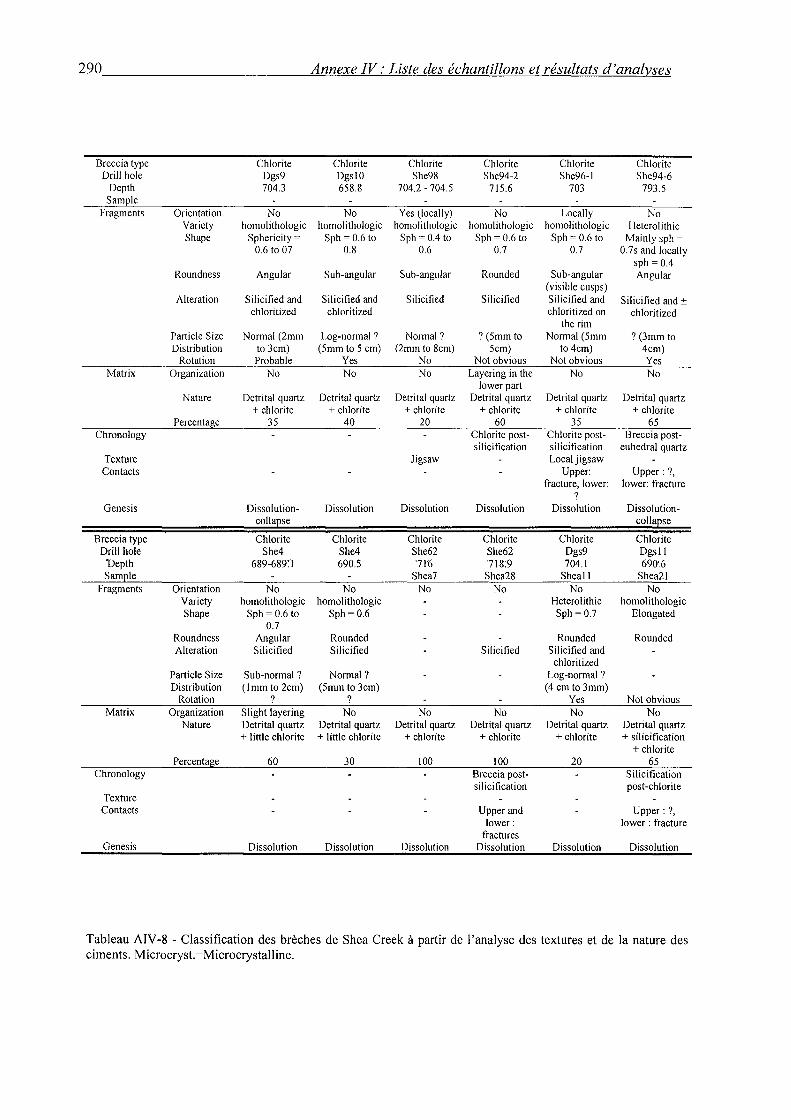
290 ________________________ ~A~n~n~e~xe~I~V~:~L~i~st~e~d~e~s~e~'c~h~a~n~ti~ll~o~n~s~e~t~r~és~u~l~ta~t~s~d~'a~n~a~l~v~s~es
Breccia type Chlorite Chlorite Chlorite Chlorite Ch lori te Chlorite Drill hole Dgs9 DgsiO She98 She94-2 She96-l She94-6
Depth 704.3 658.8 704.2 - 704.5 715.6 703 793.5 Sam le
Fragments Orientation No No Y es (locally) No Locally No Variety homolithologic homolithologic homolithologic homolithologic homolithologic Heterolithic Shape Sphericity = Sph = 0.6 to Sph = 0.4 to Sph = 0.6 to Sph = 0.6 to Maint y sph =
0.6 to 07 0.8 0.6 0.7 0.7 0.7s and locally sph = 0.4
Roundness Angular Sub-angular Sub-angular Rounded Sub-angular Angular (visible cusps)
Alteration Silicified and Silicified and Silicified Silicified Silicified and Silicified and± chloritized chloritized chloritized on chloritized
therim Particle S ize Normal (2mm Log-normal ? Normal? ? (Smm to Normal (Smm ? (3mm to Distribution to 3cm) (Smm to 5 cm) (2mm to Sem) Sem) to 4cm) 4cm)
Rotation Probable Y es No Not obvious Not obvious Y es Matrix Organization No No No Layering in the No No
lower part Nature Detrital quartz Detrital quartz Detrital quartz Detrital quartz Detrital quartz Detrital quartz
+ chlorite + chlorite +ch lori te + chlorite + chlorite + chlorite Percentage 35 40 20 60 35 65
Chronology Chlorite post- Chlorite post- Breccia post-silicification silicification euhedral quartz
Texture Jigsaw Local jigsaw Contacts Upper: Upper:?,
fracture, lower: lower: fracture ?
Genesis Dissolution- Dissolution Dissolution Dissolution Dissolution Dissolution-colla se colla se
Breccia type Chlorite Chlorite Chlorite Chlorite Chlorite Chlorite Drill hole She4 She4 She62 She62 Dgs9 Dgsll
Depth 689-689] 690.5 "71'6 "718:9 704.1 690:6 Sample Shea7 Shea28 Sheall Shea21
Fragments Orientation No No No No No No Variety homolithologic homolithologic Heterolithic homolithologic Shape Sph = 0.6 to Sph = 0.6 Sph = 0.7 Elongated
0.7 Roundness Angular Rounded Rounded Rounded Alteration Silicified Silicified Silicified Silicified and
chloritized Particle Size Sub-normal ? Normal? Log-normal? Distribution (!mm to 2cm) (Smm to 3cm) (4 cm to 3mm)
Rotation ? ? Y es Not obvious Matrix Organization Slight layering No No No No No
Nature Detrital quartz Detrital quartz Detrital quartz Detrital quartz Detrital quartz Detrital quartz + little chlorite + little ch lori te + chlorite + chlorite + chlorite + silicification
+ chlorite Percentage 60 30 100 100 20 65
Chrono! ogy Breccia post- Silicification silicification post-chlorite
Texture Contacts Upper and Upper:?,
lower: lower : fracture fractures
Genesis Dissolution Dissolution Dissolution Dissolution Dissolution Dissolution
Tableau AIV-8- Classification des brèches de Shea Creek à partir de l'analyse des textures et de la nature des ciments. Microcryst.=Microcrystalline.
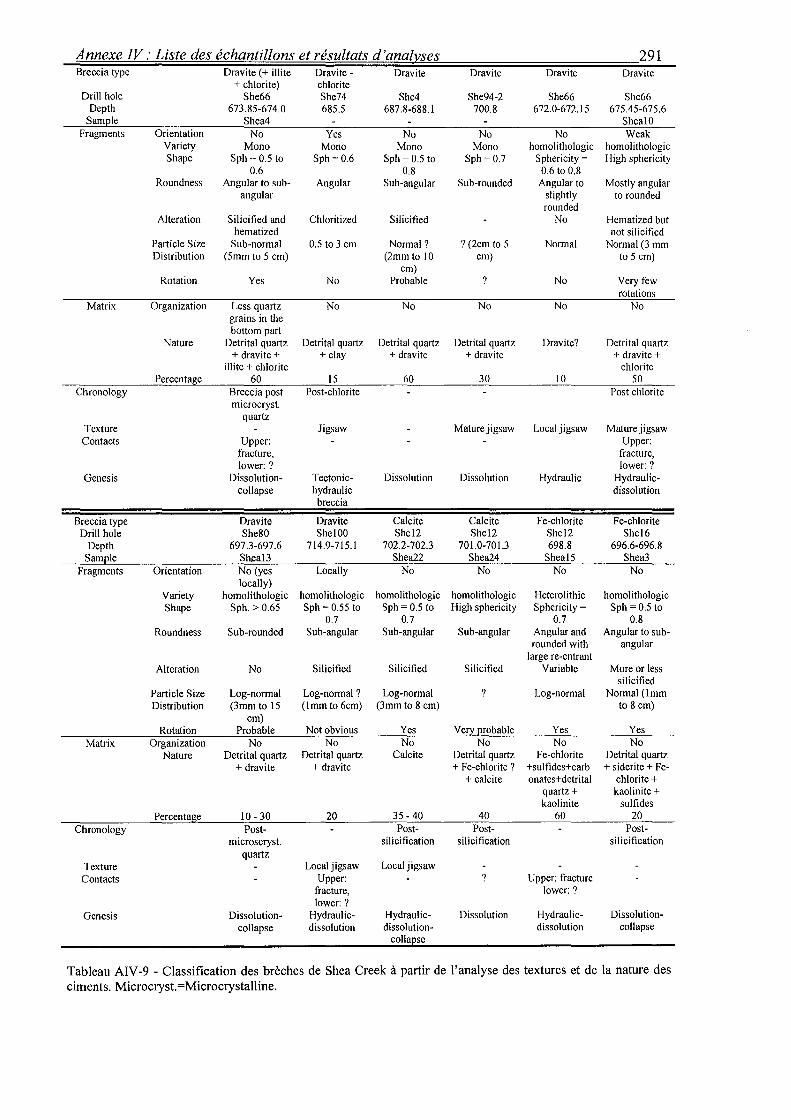
Annexe IV: Liste des échantillons et résultats d'ana/}!_ses 291 Breccia type Dravite ( + illite Dravite- Dravite Dravite Dra vite Dra vite
+ chlorite) chlorite Drill hole She66 She74 She4 She94-2 She66 She66
Depth 673.85-674.0 685.5 687.8-688.1 700.8 672.0-672.15 675.45-675.6 Sam~le Shea4 Shea!O
Fragments Orientation No Y es No No No Weak Variety Mono Mono Mono Mono homolithologic homolithologic Shape Sph =0.5 to Sph=0.6 Sph = 0.5 to Sph = 0.7 Sphericity = High sphericity
0.6 0.8 0.6 to 0.8 Roundness Angular to sub- Angular Sub-angular Sub-rounded Angularto Most! y angular
angular slightly to rounded rounded
Alteration Silicified and Chloritized Silicified No Hematized but hematized not silicified
Parti cie Size Sub-normal 0.5 to 3 cm Normal? ? (2cm to 5 Normal Normal(3 mm Distribution (Smm to 5 cm) (2mm to 10 cm) to 5 cm)
cm) Rotation Y es No Probable ? No Very few
rotations Matrix Organization Less quartz No No No No No
grains in the bottom part
Nature Detrital quartz Detrital quartz Detrital quartz Detrital quartz Dravite? Detrital quartz + dravite + +clay + dravite + dravite + dravite +
illite + chlorite chlorite Percentage 60 15 60 30 10 50
Chronology Breccia post Post-chlorite Post chlorite microcryst.
quartz Texture Jigsaw Mature jigsaw Local jigsaw Mature jigsaw Contacts Upper: Upper:
fracture, fracture, lower:? lower:?
Genesis Dissolution- Tectonic- Dissolution Dissolution Hydraulic Hydraulic-collapse hydraulic dissolution
breccia
Breccia type Dravite Dravite Calcite Calcite Fe-chlorite Fe-chlorite Drill hole She80 She!OO Shel2 Shel2 Shel2 Shel6
Depth 697.3-697.6 714.9-715.1 702.2-702.3 701.0-701.3 698.8 696.6-696.8 Sample Sheal3 Shea22 Shea24 Shea!S Shea3
Fragments Orientation No (yes Locally No No No No locally)
Variety homolithologic homolithologic homolithologic homolithologic Heterolithic homolithologic Shape Sph. > 0.65 Sph = 0.55 to Sph = 0.5 to High sphericity Sphericity = Sph = 0.5 to
0.7 0.7 0.7 0.8 Roundness Sub-rounded Sub-angular Sub-angular Sub-angular Angular and Angular to sub-
rounded with angular large re-entrant
Alteration No Silicified Silicified Silicified Variable More or less silicified
Parti cie Size Log-normal Log-normal ? Log-normal ? Log-normal Normal (!mm Distribution (3mm to 15 (!mm to 6cm) (3mm to 8 cm) to 8 cm)
cm) Rotation Probable Not obvious Y es Ve!:Y ~robable Y es Y es
Matrix Organization No No No No No No Nature Detrital quartz Detrital quartz Calcite Detrital quartz Fe-chlorite Detrital quartz
+ dravite + dravite + Fe-chlorite ? +sulfides+carb + siderite + Fe-+calcite onates+detrital chlorite +
quartz+ kaolinite + kaolinite sulfides
Percentage 10-30 20 35-40 40 60 20 Chronology Post- Post- Post- Post-
microscryst. silicification silicification silicification quartz
Texture Local j igsaw Local j igsaw Contacts Upper: ? Upper: fracture
fracture, lower:? lower:?
Genesis Dissolution- Hydraulic- Hydraulic- Dissolution Hydraulic- Dissolution-collapse dissolution dissolution- dissolution collapse
colla se
Tableau AIV-9 -Classification des brèches de Shea Creek à partir de l'analyse des textures et de la nature des ciments. Microcryst.=Microcrystalline.
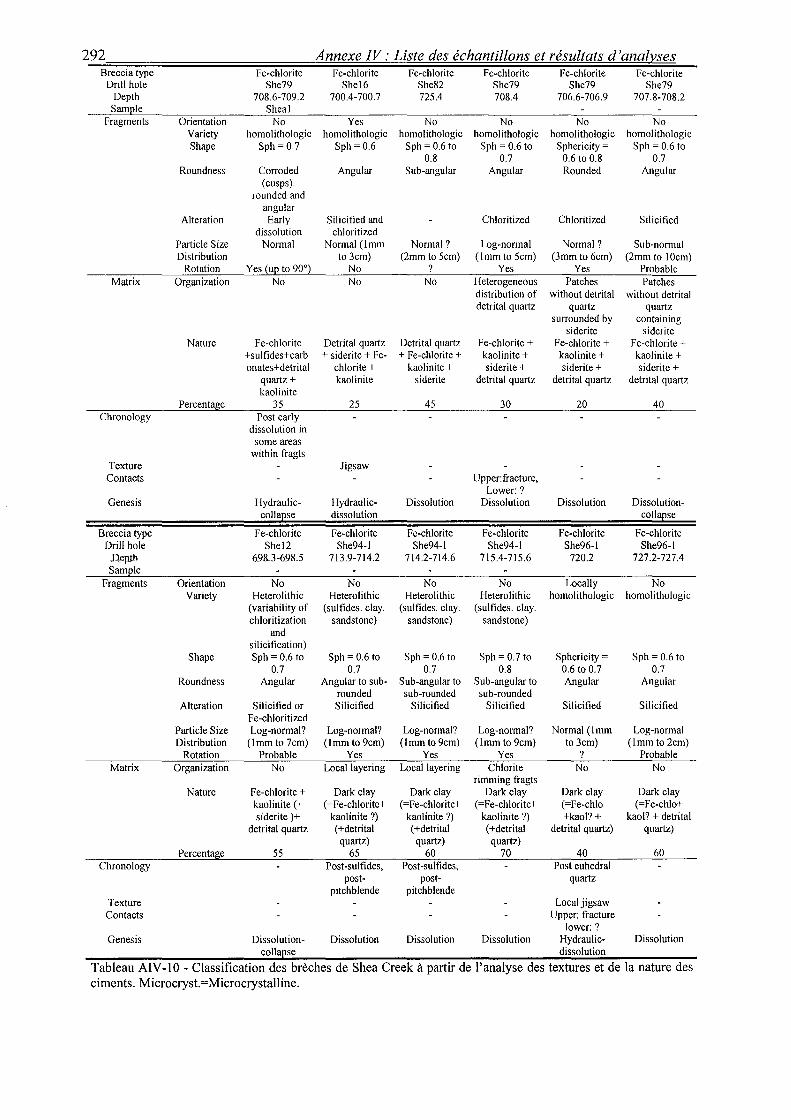
292 Annexe IV: Liste des échantillons et résultats d'analy_ses Breccia type Fe-ch lori te Fe-chlorite Fe-ch lori te Fe-chlorite Fe-chlorite Fe-chlorite
Drill hole She79 Shel6 She82 She79 She79 She79 Depth 708.6-709.2 700.4-700.7 725.4 708.4 706.6-706.9 707.8-708.2
Sam le Sheal Fragments Orientation No Y es No No No No
Variety homolithologic homolithologic homolithologic homolithologic homolithologic homolithologic Shape Sph= 0.7 Sph=0.6 Sph = 0.6 to Sph = 0.6 to Sphericity = Sph = 0.6 to
0.8 0.7 0.6 to 0.8 0.7 Roundness Corroded Angular Sub-angular Angular Rounded Angular
(cusps). rounded and
angular Alteration Earl y Silicified and Chloritized Chloritized Silicified
dissolution chloritized Particle Size Normal Normal (!mm Normal? Log-normal Normal ? Sub-normal Distribution to3cm) (2mm to Sem) (!mm to Sem) (3mm to 6cm) (2mm to !Ocm)
Rotation Y es (UQ to 90°) No ? Y es Y es Probable Matrix Organization No No No Heterogeneous Patch es Patch es
distribution of without detrital without detrital detrital quartz quartz quartz
surrounded by containing siderite siderite
Nature F e-chlorite Detrital quartz Detrital quartz Fe-chlorite + F e-chlorite + F e-chlorite + +sulfides+carb + siderite+ Fe- + Fe-chlorite + kaolinite + kaolinite + kaolinite + onates+detrital chlorite + kaolinite + siderite+ siderite+ siderite+
quartz+ kaolinite siderite detrital quartz detrital quartz detrital quartz kaolinite
Percentage 35 25 45 30 20 40 Chronology Post earl y
dissolution in sorne areas
within fragts Texture Jigsaw Contacts Upper: fracture,
Lower:? Genesis Hydraulic- Hydraulic- Dissolution Dissolution Dissolution Dissolution-
collaEse dissolution collaEse
Breccia type Fe-chlorite F e-chlorite Fe-chlorite Fe-chlorite Fe-chlorite F e-chlorite Drill hole Shel2 She94-l She94-l She94-l She96-l She96-l Jl.ep.th 698.3-698.5 713.9-714.2 714.2-714.6 715.4-715.6 720.2 727.2-727.4 Sam le
Fragments Orientation No No No No Locally No Variety Heterolithic Heterolithic Heterolithic Heterolithic homolithologic homolithologic
(variability of (sulfides. clay. (sulfides. clay. (sulfides. clay. chloritization sandstone) sandstone) sandstone)
and silicification)
Shape Sph =0.6 to Sph =0.6 to Sph = 0.6 to Sph = 0.7 to Sphericity = Sph = 0.6 to 0.7 0.7 0.7 0.8 0.6 to 0.7 0.7
Roundness Angular Angular to sub- Sub-angular to S ub-angular to Angular Angular rounded sub-rounded sub-rounded
Alteration Silicified or Silicified Silicified Silicified Silicified Silicified Fe-chloritized
Particle Size Log-normal? Log-normal? Log-normal? Log-normal? Normal (!mm Log-normal Distribution (!mm to 7cm) (!mm to 9cm) (!mm to 9cm) (!mm to 9cm) to3cm) (!mm to 2cm)
Rotation Probable Y es Y es Y es ? Probable Matrix Organization No Locallayering Locallayering Chlorite No No
rimming fragts Nature Fe-chlorite + Dark clay Dark clay Dark clay Dark clay Dark clay
kaolinite (+ (=Fe-chlorite+ (=Fe-chlorite+ (=Fe-chlorite+ (=Fe-chio (=Fe-chio+ siderite)+ kaolinite ?) kaolinite ?) kaolinite ?) +kaol? + kaol? + detrital
detrital quartz (+detrital (+detrital (+detrital detrital quartz) quartz) quartz) quartz) quartz)
Percentage 55 65 60 70 40 60 Chronology Post-sulfides, Post-sulfides, Post euhedral
post- post- quartz pitchblende pitchblende
Texture Local j igsaw Contacts Upper: fracture
lower:? Genesis Dissolution- Dissolution Dissolution Dissolution Hydraulic- Dissolution
colla se dissolution
Tableau AIV-10- Classification des brèches de Shea Creek à partir de l'analyse des textures et de la nature des ciments. Microcryst.=Microcrystalline.
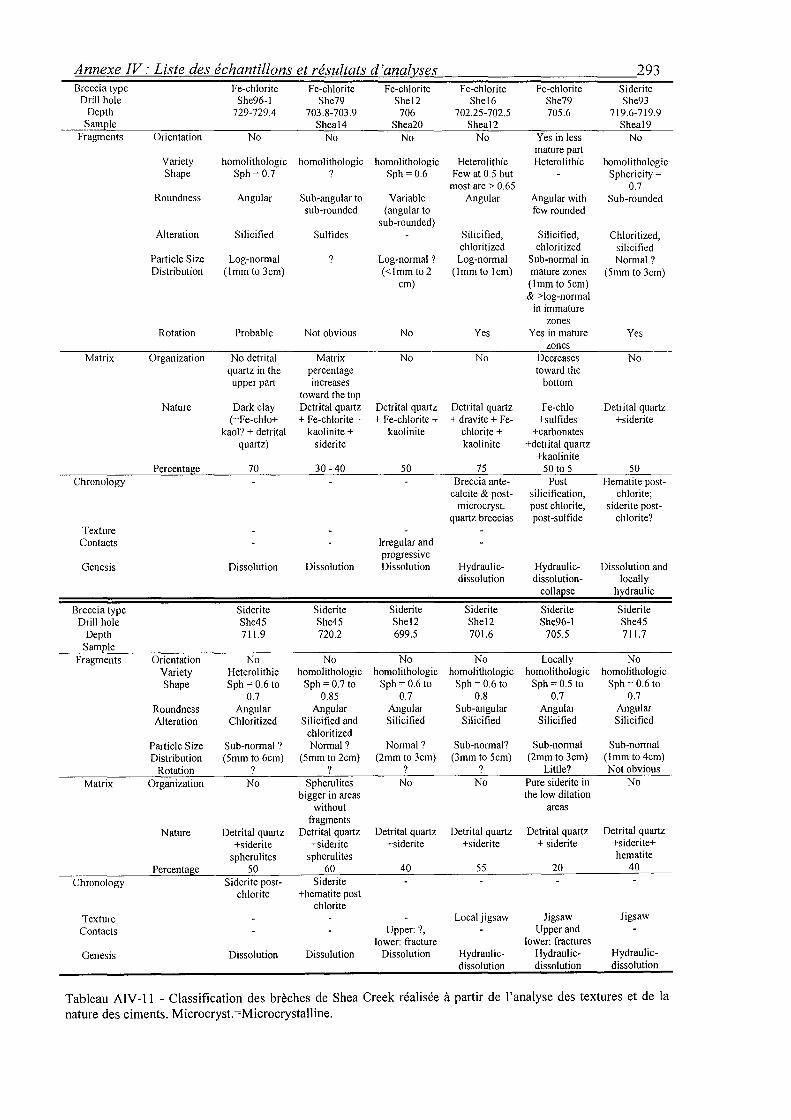
Annexe IV: Liste des échantillons et résultats d'analyses 293 Breccia type Fe-ch lori te Fe-chlorite Fe-chlorite Fe-ch lori te Fe-ch lori te Siderite
Drill hole She96-l She79 Shel2 Shel6 She79 She93 Depth 729-729.4 703.8-703.9 706 702.25-702.5 705.6 719.6-719.9
SamEle Sheal4 Shea20 Sheal2 Sheal9 Fragments Orientation No No No No Y es in Jess No
mature part Variety homolithologic homolithologic homolithologic Heterolithic Heterolithic homolithologic Shape Sph = 0.7 ? Sph= 0.6 Few at 0.5 but Sphericity =
most are> 0.65 0.7 Roundness Angular Sub-angular to Variable Angular Angular with Sub-rounded
sub-rounded (angular to few rounded sub-rounded)
Alteration Silicified Sul fides Silicified, Silicified, Chloritized, chloritized chloritized silicified
Parti cie Size Log-normal Log-normal ? Log-normal Sub-normal in Normal? Distribution (!mm to 3cm) (<!mm to2 (!mm to lem) mature zones (5mm to 3cm)
cm) (!mm to Sem) & >log-normal
in immature zones
Rotation Probable Not obvious No Y es Y es in mature Y es zones
Matrix Organization No detrital Matrix No No Decreases No quartz in the percentage toward the upper part increases bottom
toward the top Nature Dark clay Detrital quartz Detrital quartz Detrital quartz Fe-chio Detrital quartz
(=Fe-chio+ + Fe-chlorite + + Fe-chlorite + + dravite + Fe- +sul fides +siderite kaol? + detrital kaolinite + kaolinite chlorite + +carbonates
quartz) siderite kaolinite +detrital quartz +kaolinite
Percentage 70 30-40 50 75 50 to 5 50 Chronology Breccia ante- Post Hematite post-
calcite & post- silicification, chlorite; microcryst. post chlorite, siderite post-
quartz breccias post -sulfide chlorite? Texture
Contacts Irregular and progressive
Genesis Dissolution Dissolution Dissolution Hydraulic- Hydraulic- Dissolution and dissolution dissolution- locally
colla se h draulic
Breccia type Siderite Siderite Siderite Siderite Siderite Siderite Drill hole She45 She45 She\2 She\2 She96-l She45
Depth 711.9 720.2 699.5 701.6 705.5 711.7 Sam le
Fragments Orientation No No No No Loc ally No Variety Heterolithic homolithologic homolithologic homolithologic homolithologic homolithologic Shape Sph = 0.6 to Sph = 0.7 to Sph= 0.6 to Sph = 0.6 to Sph = 0.5 to Sph = 0.6 to
0.7 0.85 0.7 0.8 0.7 0.7 Roundness Angular Angular Angular Sub-angular Angular Angular Alteration Chloritized Silicified and Silicified Silicified Silicified Silicified
chloritized Particle Size Sub-normal? Normal? Normal? Sub-normal? Sub-normal Sub-normal Distribution (5mm to 6cm) (5mm to 2cm) (2mm to 3cm) (3mm to Sem) (2mm to 3cm) (!mm to4cm)
Rotation ? ? ? ? Little? Not obvious
Matrix Organization No Spherulites No No Pure siderite in No bigger in areas the low dilation
without are as fragments
Nature Detrital quartz Detrital quartz Detrital quartz Detrital quartz Detrital quartz Detrital quartz +siderite +siderite +siderite +siderite +siderite +siderite+
spherul ites spherulites hematite
Percentage 50 60 40 55 20 40
Chronology Siderite post- Siderite chlorite +hematite post
chlorite Texture Local jigsaw Jigsaw Jigsaw
Contacts Upper:?, Upper and lower: fracture lower: fractures
Genesis Dissolution Dissolution Dissolution Hydraulic- Hydraulic- Hydraulic-dissolution dissolution dissolution
Tableau AIV-11 -Classification des brèches de Shea Creek réalisée à partir de l'analyse des textures et de la nature des ciments. Microcryst.=Microcrystalline.
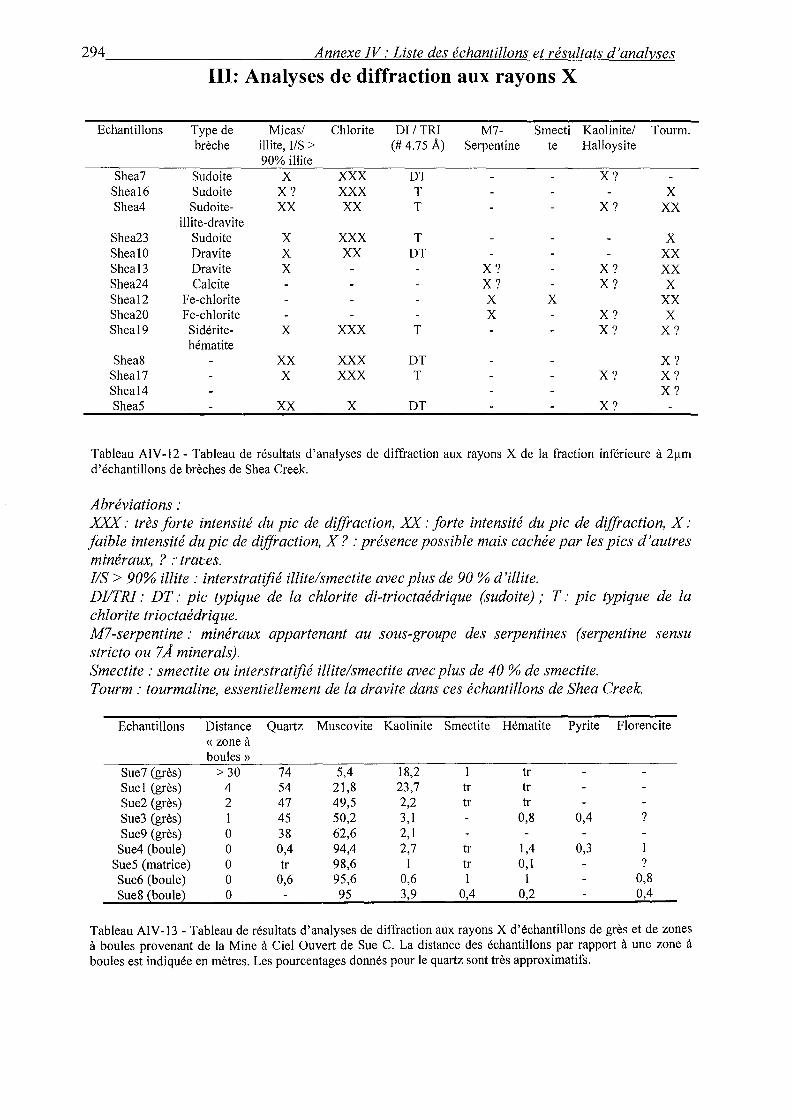
294 Annexe IV: Liste des échantillons et résultats d'analy_ses
III: Analyses de diffraction aux rayons X
Echantillons Type de Micas/ Chlorite DI 1 TRI M7- Smecti Kaolinite/ Tourm. brèche illite, liS > (# 4.75 A) Serpentine te Halloysite
90% illite Shea7 Sudoite x xxx DT X?
Sheal6 Sudoite X? xxx T x Shea4 Sudoite- xx xx T X? xx
illite-dravite Shea23 Sudoite x xxx T x Shea10 Dra vite x xx DT xx Shea13 Dra vite x X? X? xx Shea24 Calcite X? X? x Shea12 Fe-chlorite x x xx Shea20 Fe-chlorite x X? x Shea19 Sidérite- x xxx T X? X?
hématite Shea8 xx xxx DT X?
Shea17 x xxx T X? X? Shea14 X? Shea5 xx x DT X?
Tableau AIV-12- Tableau de résultats d'analyses de diffraction aux rayons X de la fraction inférieure à 2!lm d'échantillons de brèches de Shea Creek.
Abréviations : XXX: très forte intensité du pic de diffraction, XX: forte intensité du pic de diffraction, X: faible intensité du pic de diffraction, X? :présence possible mais cachée par les pics d'autres minéraux, ? :·traces. IlS> 90% illite: interstratifié illite/smectite avec plus de 90% d'illite. Dl/TRI: DT: pic typique de la chlorite di-trioctaédrique (sudoite) ; T: pic typique de la chlorite trioctaédrique. M7 -serpentine : minéraux appartenant au sous-groupe des serpentines (serpentine sensu stricto ou 7 A minerais). Smectite : smectite ou interstratifié illite/smectite avec plus de 40 % de smectite. Tourm : tourmaline, essentiellement de la dravite dans ces échantillons de Shea Creek.
Echantillons Distance Quartz Muscovite Kaolinite Smectite Hématite Pyrite Florencite «zone à boules»
Sue7 (grès) > 30 74 5,4 18,2 tr Sue! (grès) 4 54 21,8 23,7 tr tr Sue2 (grès) 2 47 49,5 2,2 tr tr Sue3 (grès) 1 45 50,2 3,1 0,8 0,4 ? Sue9 (grès) 0 38 62,6 2,1
Sue4 (boule) 0 0,4 94,4 2,7 tr 1,4 0,3 Sue5 (matrice) 0 tr 98,6 1 tr 0,1 ? Sue6 (boule) 0 0,6 95,6 0,6 1 1 0,8 SueS (boule) 0 95 3,9 0,4 0,2 0,4
Tableau AIV-13- Tableau de résultats d'analyses de diffraction aux rayons X d'échantillons de grès et de zones à boules provenant de la Mine à Ciel Ouvert de Sue C. La distance des échantillons par rapport à une zone à boules est indiquée en mètres. Les pourcentages donnés pour le quartz sont très approximatifs.
~A=nn=e=x=e~IV~:=LT=st=e~d=es~e='c=h=an=t=il=lo=ns~et~r=~=u=lt=at~s~d~a~n=al~~~e~s ___________________ 295
IV: Analyses chimiques globales ICP-AES et -MS, densités
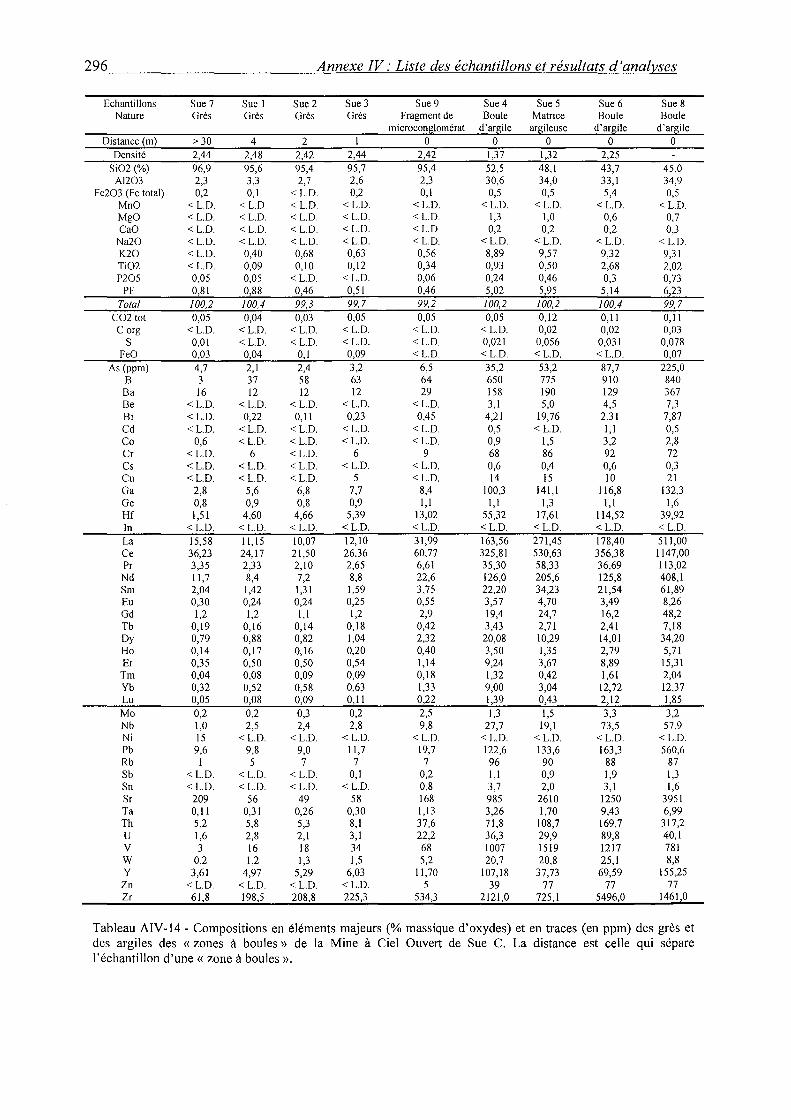
296 Annexe IV: Liste des échantillons et résultats d'analyses
Echantillons Sue 7 Sue 1 Sue 2 Sue 3 Sue 9 Sue 4 Sue 5 Sue 6 Sue 8 Nature Grès Grès Grès Grès Fragment de Boule Matrice Boule Boule
microconglomérat d'argile argileuse d'argile d'argile Distance (rn) > 30 4 2 0 0 0 0 0
Densité 2,44 2,48 2,42 2,44 2,42 1,37 1,32 2,25 Si02(%) 96,9 95,6 95,4 95,7 95,4 52,5 48,1 43,7 45,0
Al203 2,3 3,3 2,7 2,6 2,3 30,6 34,0 33,1 34,9 Fe203 (Fe total) 0,2 0,1 < L.D. 0,2 0,1 0,5 0,5 5,4 0,5
MnO < L.D. < L.D. < L.D. < L.D. < L.D. < L.D. < L.D. < L.D. < L.D. MgO < L.D. < L.D. < L.D. < L.D. < L.D. 1,3 1,0 0,6 0,7 CaO < L.D. < L.D. < L.D. < L.D. < L.D. 0,2 0,2 0,2 0,3
Na20 < L.D. < L.D. < L.D. < L.D. < L.D. <L.D. < L.D. < L.D. < L.D. K20 <L.D. 0,40 0,68 0,63 0,56 8,89 9,57 9,32 9,31 Ti02 < L.D. 0,09 0,10 0,12 0,34 0,93 0,50 2,68 2,02 P205 0,05 0,05 < L.D. < L.D. 0,06 0,24 0,46 0,3 0,73
PF 0,81 0,88 0,46 0,51 0,46 5,02 5,95 5,14 6,23 Total 100,2 100,4 99,3 99,7 99,2 100,2 100,2 100,4 99,7
C02tot 0,05 0,04 0,03 0,05 0,05 0,05 0,12 0,11 0,11 C org <L.D. < L.D. < L.D. < L.D. <L.D. < L.D. 0,02 0,02 0,03
s 0,01 < L.D. < L.D. < L.D. < L.D. 0,021 0,056 0,031 O,ü78 FeO 0,03 0,04 0,1 0,09 < L.D. < L.D. < L.D. < L.D. 0,07
As (ppm) 4,7 2,1 2,4 3,2 6,5 35,2 53,2 87,7 225,0 B 3 37 58 63 64 650 775 910 840
Ba 16 12 12 12 29 158 190 129 367 Be < L.D. < L.D. < L.D. < L.D. < L.D. 3,1 5,0 4,5 7,3 Bi <L.D. 0,22 0,11 0,23 0,45 4,21 19,76 2,31 7,87 Cd < L.D. < L.D. < L.D. < L.D. <L.D. 0,5 < L.D. 1,1 0,5 Co 0,6 <L.D. < L.D. < L.D. <L.D. 0,9 1,5 3,2 2,8 Cr <L.D. 6 < L.D. 6 9 68 86 92 72 Cs <L.D. <L.D. < L.D. < L.D. < L.D. 0,6 0,4 0,6 0,3 Cu <L.D. < L.D. < L.D. 5 < L.D. 14 15 10 21 Ga 2,8 5,6 6,8 7,7 8,4 100,3 141,1 116,8 132,3 Ge 0,8 0,9 0,8 0,9 1,1 1,1 1,3 1,1 1,6 Hf 1,51 4,60 4,66 5,39 13,02 55,32 17,61 114,52 39,92 ln <L.D. <L.D. < L.D. < L.D. <L.D. <L.D. <L.D. <L.D. < L.D. La 15,58 Il, 15 10,07 12,10 31,99 163,56 271,45 178,40 511,00 Ce 36,23 24,17 21,50 26.36 60,77 325,81 530,63 356,38 1147,00 Pr 3,35 2,33 2,10 2,65 6,61 35,30 58,33 36,69 113,02 Nd 11,7 8,4 7,2 8,8 22,6 126,0 205,6 125,8 408,1 Sm 2,04 1,42 1,31 1,59 3,75 22,20 34,23 21,54 61,89 Eu 0,30 0,24 0,24 0,25 0,55 3,57 4,70 3,49 8,26 Gd 1,2 1,2 1,1 1,2 2,9 19,4 24,7 16,2 48,2 Tb 0,19 0,16 0,14 0,18 0,42 3,43 2,71 2,41 7,18 Dy 0,79 0,88 0,82 1,04 2,32 20,08 10,29 14,01 34,20 Ho 0,14 0,17 0,16 0,20 0,40 3,50 1,35 2,79 5,71 Er 0,35 0,50 0,50 0,54 1,14 9,24 3,67 8,89 15,31
Tm 0,04 0,08 0,09 0,09 0,18 1,32 0,42 1,61 2,04 Yb 0,32 0,52 0,58 0,63 1,33 9,00 3,04 12,72 12,37 Lu 0,05 0,08 0,09 0,11 0,22 1,39 0,43 2,12 1,85 Mo 0,2 0,2 0,3 0,2 2,5 1,3 1,5 3,3 3,2 Nb 1,0 2,5 2,4 2,8 9,8 27,7 19,1 73,5 57,9 Ni 15 <L.D. < L.D. < L.D. < L.D. < L.D. < L.D. < L.D. < L.D. Pb 9,6 9,8 9,0 11,7 19,7 122,6 133,6 163,3 560,6 Rb 1 5 7 7 7 96 90 88 87 Sb <L.D. < L.D. < L.D. 0,1 0,2 1,1 0,9 1,9 1,3 Sn < L.D. < L.D. < L.D. < L.D. 0,8 3,7 2,0 3,1 1,6 Sr 209 56 49 58 168 985 2610 1250 3951 Ta 0,11 0,31 0,26 0,30 1,13 3,26 1,70 9,43 6,99 Th 5,2 5,8 5,3 8,1 37,6 71,8 108,7 169,7 317,2 u 1,6 2,8 2,1 3,1 22,2 36,3 29,9 89,8 40,1 v 3 16 18 34 68 1007 1519 1217 781 w 0,2 1,2 1,3 1,5 5,2 20,7 20,8 25,1 8,8 y 3,61 4,97 5,29 6,03 11,70 107,18 37,73 69,59 155,25
Zn < L.D. < L.D. < L.D. < L.D. 5 39 77 77 77 Zr 61,8 198,5 208,8 225,3 534,3 2121,0 725,1 5496,0 1461,0
Tableau AIV-14- Compositions en éléments majeurs(% massique d'oxydes) et en traces (en ppm) des grès et des argiles des « zones à boules » de la Mine à Ciel Ouvert de Sue C. La distance est celle qui sépare l'échantillon d'une« zone à boules».
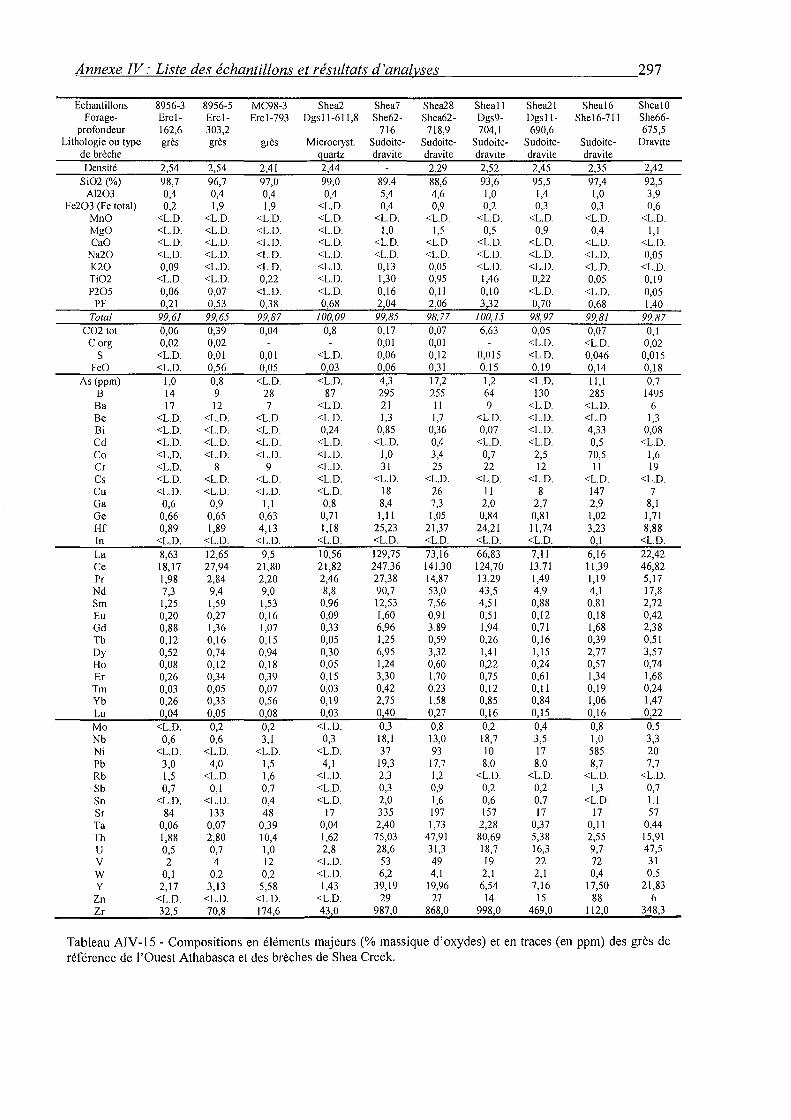
Annexe IV: Liste des échantillons et résultats d'analyses 297
Echantillons 8956-3 8956-5 MC98-3 Shea2 Shea7 Shea28 Sheall Shea21 Sheal6 Shea!O Forage- Ercl- Ercl- Ercl-793 Dgsll-611,8 She62- Shea62- Dgs9- Dgsll- Shel6-711 She66-
profondeur 162,6 303,2 716 718,9 704,1 690,6 675,5 Lithologie ou type grès grès grès Microcryst. Sudoite- Sudoite- Sudoite- Sudoite- Sudoite- Dravite
de brèche quartz dravite dravite dra vite dra vite dra vite Densité 2,54 2,54 2,41 2,44 2,29 2,52 2,45 2,35 2,42
Si02 (%) 98,7 96,7 97,0 99,0 89,4 88,6 93,6 95,5 97,4 92,5 Al203 0,4 0,4 0,4 0,4 5,4 4,6 1,0 1,4 1,0 3,9
Fe203 (Fe total) 0,2 1,9 1,9 <L.D. 0,4 0,9 0,2 0,3 0,3 0,6 MnO <L.D. <L.D. <L.D. <L.D. <L.D. <L.D. <L.D. <L.D. <L.D. <L.D. MgO <L.D. <L.D. <L.D. <L.D. 1,0 1,5 0,5 0,9 0,4 1,1 CaO <L.D. <L.D. <L.D. <L.D. <L.D. <L.D. <L.D. <L.D. <L.D. <L.D.
Na20 <L.D. <L.D. <L.D. <L.D. <L.D. <L.D. <L.D. <L.D. <L.D. 0,05 K20 0,09 <L.D. <L.D. <L.D. 0,13 0,05 <L.D. <L.D. <L.D. <L.D. Ti02 <L.D. <L.D. 0,22 <L.D. 1,30 0,95 1,46 0,22 0,05 0,19 P205 0,06 0,07 <L.D. <L.D. 0,16 0,11 0,10 <L.D. <L.D. 0,05
PF 0,21 0,53 0,38 0,68 2,04 2,06 3,32 0,70 0,68 1,40 Total 99,61 99,65 99,87 100,09 99,85 98,77 100,15 98,97 99,81 99,87
C02 tot 0,06 0,39 0,04 0,8 0,17 0,07 6,63 0,05 0,07 0,1 C org 0,02 0,02 0,01 0,01 <L.D. <L.D. 0,02
s <L.D. 0,01 0,01 <L.D. 0,06 0,12 O,ül5 <L.D. 0,046 O,ül5 FeO <L.D. 0,56 0,05 0,03 0,06 0,31 0,15 0,19 0,14 0,18
As (ppm) 1,0 0,8 <L.D. <L.D. 4,3 17,2 1,2 <L.D. 11,1 0,7 B 14 9 28 87 295 255 64 130 285 1495 Ba 17 12 7 <L.D. 21 Il 9 <L.D. <L.D. 6 Be <L.D. <L.D. <L.D. <L.D. 1,3 1,7 <L.D. <L.D. <L.D. 1,3 Bi <L.D. <L.D. <L.D. 0,24 0,85 0,36 0,07 <L.D. 4,33 0,08 Cd <L.D. <L.D. <L.D. <L.D. <L.D. 0,4 <L.D. <L.D. 0,5 <L.D. Co <L.D. <L.D. <L.D. <L.D. 1,0 3,4 0,7 2,5 70,5 1,6 Cr <L.D. 8 9 <L.D. 31 25 22 12 Il 19 Cs <L.D. <L.D. <L.D. <L.D. <L.D. <L.D. <L.D. <L.D. <L.D. <L.D. Cu <L.D. <L.D. <L.D. <L.D. 18 26 Il 8 147 7 Ga 0,6 0,9 1,1 0,8 8,4 7,3 2,0 2,7 2,9 8,1 Ge 0,66 0,65 0,63 0,71 1,11 1,05 0,84 0,81 1,02 1,71 Hf 0,89 1,89 4,13 1,18 25,23 21,37 24,21 11,74 3,23 8,88 In <L.D. <L.D. <L.D. <L.D. <L.D. <L.D. <L.D. <L.D. 0,1 <L.D. La 8,63 12,65 9,5 10,56 129,75 73,16 66,83 7,11 6,16 22,42 Ce 18,17 27,94 21,80 21,82 247,36 141,30 124,70 13,71 11,39 46,82 Pr 1,98 2,84 2,20 2,46 27,38 14,87 13,29 1,49 1,19 5,17 Nd 7,3 9,4 9,0 8,8 90,7 53,0 43,5 4,9 4,1 17,8 Sm 1,25 1,59 1,53 0,96 12,53 7,56 4,51 0,88 0,81 2,72 Eu 0,20 0,27 0,16 0,09 1,60 0,91 0,51 0,12 0,18 0,42 Gd 0,88 1,36 1,07 0,33 6,96 3,89 1,94 0,71 1,68 2,38 Tb 0,12 0,16 0,15 0,05 1,25 0,59 0,26 0,16 0,39 0,51 Dy 0,52 0,74 0,94 0,30 6,95 3,32 1,41 1,15 2,77 3,57 Ho 0,08 0,12 0,18 0,05 1,24 0,60 0,22 0,24 0,57 0,74 Er 0,26 0.,34 0,39 0,15 3,30 1,70 0,75 0,61 1,34 1,68
Tm 0,03 0,05 0,07 0,03 0,42 0,23 0,12 0,11 0,19 0,24 Yb 0,26 0,33 0,56 0,19 2,75 1,58 0,85 0,84 1,06 1,47 Lu 0,04 0,05 0,08 0,03 0,40 0,27 0,16 0,15 0,16 0,22
Mo <L.D. 0,2 0,2 <L.D. 0,3 0,8 0,2 0,4 0,8 0,5 Nb 0,6 0,6 3,1 0,3 18,1 13,0 18,7 3,5 1,0 3,3 Ni <L.D. <L.D. <L.D. <L.D. 37 93 10 17 585 20 Pb 3,0 4,0 1,5 4,1 19,3 17,7 8,0 8,0 8,7 7,7 Rb 1,5 <L.D. 1,6 <L.D. 2,3 1,2 <L.D. <L.D. <L.D. <L.D. Sb 0,7 0,1 0,7 <L.D. 0,3 0,9 0,2 0,2 1,3 0,7 Sn <L.D. <L.D. 0,4 <L.D. 2,0 1,6 0,6 0,7 <L.D. 1,1 Sr 84 133 48 17 335 197 157 17 17 57 Ta 0,06 0,07 0,39 0,04 2,40 1,73 2,28 0,37 0,11 0,44 Th 1,88 2,80 10,4 1,62 75,03 47,91 80,69 5,38 2,55 15,91 u 0,5 0,7 1,0 2,8 28,6 31,3 18,7 16,3 9,7 47,5 v 2 4 12 <L.D. 53 49 19 22 72 31 w 0,1 0,2 0,2 <L.D. 6,2 4,1 2,1 2,1 0,4 0,5 y 2,17 3,13 5,58 1,43 39,19 19,96 6,54 7,16 17,50 21,83
Zn <L.D. <L.D. <L.D. <L.D. 29 27 14 15 88 6 Zr 32,5 70,8 174,6 43,0 987,0 868,0 998,0 469,0 112,0 348,3
Tableau AIV-15- Compositions en éléments majeurs(% massique d'oxydes) et en traces (en ppm) des grès de référence de l'Ouest Athabasca et des brèches de Shea Creek.
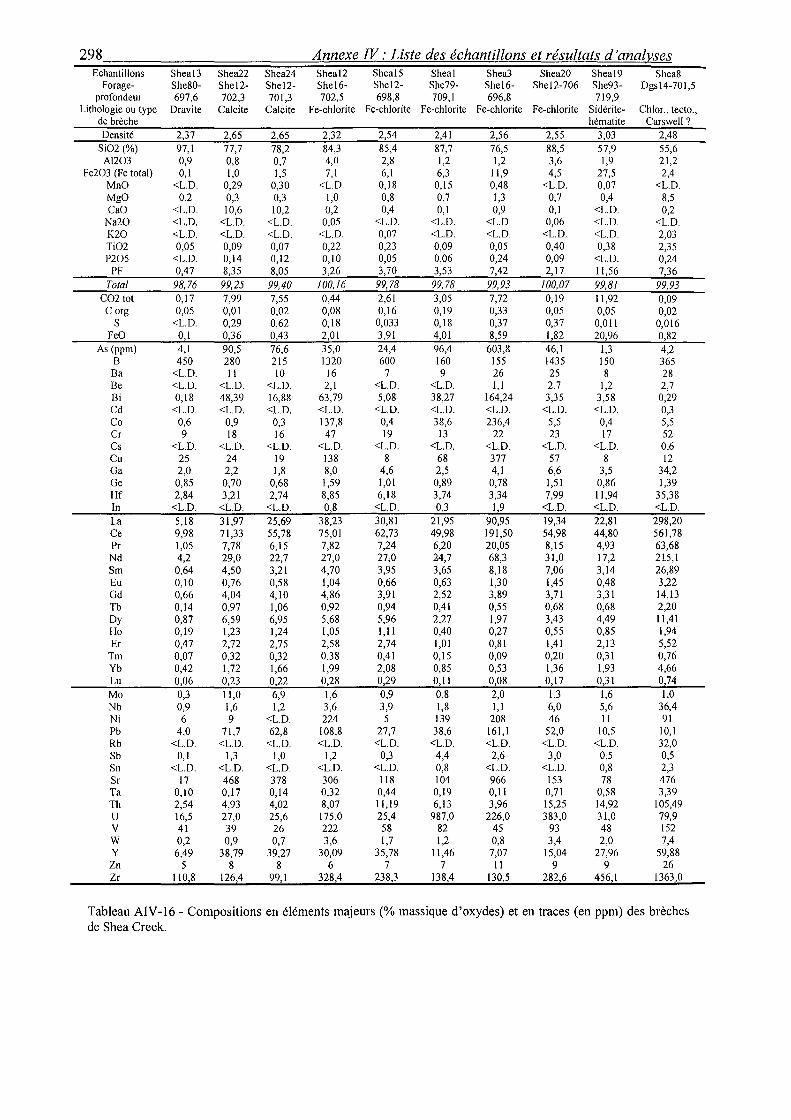
298 Annexe IV: Liste des échantillons et résultats d 'analy_ses Echantillons Shea13 Shea22 Shea24 Shea12 Shea!S Sheal Shea3 Shea20 Shea19 Shea8
Forage- She80- She12- She12- She16- She12- She79- She16- She12-706 She93- Dgs14-701,5 profondeur 697,6 702,3 701,3 702,5 698,8 709,1 696,8 719,9
Lithologie ou type Dravite Calcite Calcite Fe-chlorite Fe-chlorite Fe-chlorite Fe-chlorite Fe-chlorite Sidérite- Chlor., tecto., de brèche hématite Carswell? Densité 2,37 2,65 2,65 2,32 2,54 2,41 2,56 2,55 3,03 2,48
Si02 (%) 97,1 77,7 78,2 84,3 85,4 87,7 76,5 88,5 57,9 55,6 A1203 0,9 0,8 0,7 4,0 2,8 1,2 1,2 3,6 1,9 21,2
Fe203 (Fe total) 0,1 1,0 1,5 7,1 6,1 6,3 11,9 4,5 27,5 2,4 MnO <L.D. 0,29 0,30 <L.D. 0,18 0,15 0,48 <L.D. 0,07 <L.D. MgO 0,2 0,3 0,3 1,0 0,8 0,7 1,3 0,7 0,4 8,5 CaO <L.D. 10,6 10,2 0,2 0,4 0,1 0,9 0,1 <L.D. 0,2
Na20 <L.D. <L.D. <L.D. 0,05 <L.D. <L.D. <L.D. 0,06 <L.D. <L.D. K20 <L.D. <L.D. <L.D. <L.D. 0,07 <L.D. <L.D. <L.D. <L.D. 2,03 Ti02 0,05 0,09 0,07 0,22 0,23 0,09 0,05 0,40 0,38 2,35 P205 <L.D. 0,14 0,12 0,10 0,05 0,06 0,24 0,09 <L.D. 0,24
PF 0,47 8,35 8,05 3,26 3,70 3,53 7,42 2,17 11,56 7,36 Total 98,76 99,25 99,40 100,16 99,78 99,78 99,93 100,07 99,81 99,93
C02tot 0,17 7,99 7,55 0,44 2,61 3,05 7,72 0,19 11,92 0,09 C org 0,05 0,01 0,02 0,08 0,16 0,19 0,33 0,05 0,05 0,02
s <L.D. 0,29 0,62 0,18 0,033 0,18 0,37 0,37 0,011 0,016 FeO 0,1 0,36 0,43 2,01 3,91 4,01 8,59 1,82 20,96 0,82
As {ppm) 4,1 90,5 76,6 35,0 24,4 96,4 603,8 46,1 1,3 4,2 B 450 280 215 1320 600 160 !55 1435 ISO 365 Ba <L.D. Il 10 16 7 9 26 25 8 28 Be <L.D. <L.D. <L.D. 2,1 <L.D. <L.D. 1,1 2,7 1,2 2,7 Bi 0,18 48,39 16,88 63,79 5,08 38,27 164,24 3,35 3,58 0,29 Cd <L.D. <L.D. <L.D. <L.D. <L.D. <L.D. <L.D. <L.D. <L.D. 0,3 Co 0,6 0,9 0,3 137,8 0,4 38,6 236,4 5,5 0,4 5,5 Cr 9 18 16 47 19 13 22 23 17 52 Cs <L.D. <L.D. <L.D. <L.D. <L.D. <L.D. <L.D. <L.D. <L.D. 0,6 Cu 25 24 19 138 8 68 377 57 8 12 Ga 2,0 2,2 1,8 8,0 4,6 2,5 4,1 6,6 3,5 34,2 Ge 0,85 0,70 0,68 !,59 1,01 0,89 0,78 1,51 0,86 1,39 Hf 2,84 3,21 2,74 8,85 6,18 3,74 3,34 7,99 11,94 35,38 In <L.D. <L.D. <L.D. 0,8 <L.D. 0,3 1,9 <L.D. <L.D. <L.D. La 5,18 31,97 25,69 38,23 30,81 21,95 90,95 19,34 22,81 298,20 Ce 9,98 71,33 55,78 75,01 62,73 49,98 191,50 54,98 44,80 561,78 Pr 1,05 7,78 6,15 7,82 7,24 6,20 20,05 8,15 4,93 63,68 Nd 4,2 29,0 22,7 27,0 27;0 24,7 68,3 31,0 17,2 215,1 Sm 0,64 4,50 3,21 4,70 3,95 3,65 8,18 7,06 3,14 26,89 Eu 0,10 0,76 0,58 1,04 0,66 0,63 1,30 1,45 0,48 3,22 Gd 0,66 4,04 4,10 4,86 3,91 2,52 3,89 3,71 3,31 14,13 Tb 0,14 0,97 1,06 0,92 0,94 0,41 0,55 0,68 0,68 2,20 Dy 0,87 6,59 6,95 5,68 5,96 2,27 1,97 3,43 4,49 11,41 Ho 0,19 1,23 1,24 1,05 1,11 0,40 0,27 0,55 0,85 1,94 Er 0,47 2,72 2,75 2,58 2,74 1,01 0,81 1,41 2,13 5,52
Tm 0,07 0,32 0,32 0,38 0,41 0,15 0,09 0,20 0,31 0,76 Yb 0,42 1,72 1,66 1,99 2,08 0,85 0,53 1,36 1,93 4,66 Lu 0,06 0,23 0,22 0,28 0,29 0,11 0,08 0,17 0,31 0,74 Mo 0,3 11,0 6,9 1,6 0,9 0,8 2,0 1,3 1,6 1,0 Nb 0,9 1,6 1,2 3,6 3,9 1,8 1,1 6,0 5,6 36,4 Ni 6 9 <L.D. 224 5 139 208 46 Il 91 Pb 4,0 71,7 62,8 108,8 27,7 38,6 161,1 52,0 10,5 10,1 Rb <L.D. <L.D. <L.D. <L.D. <L.D. <L.D. <L.D. <L.D. <L.D. 32,0 Sb 0,1 1,3 1,0 1,2 0,3 4,4 2,6 3,0 0,5 0,5 Sn <L.D. <L.D. <L.D. <L.D. <L.D. 0,8 <L.D. <L.D. 0,8 2,3 Sr 17 468 378 306 118 104 966 !53 78 476 Ta 0,10 0,17 0,14 0,32 0,44 0,19 0,11 0,71 0,58 3,39 Th 2,54 4,93 4,02 8,07 11,19 6,13 3,96 15,25 14,92 105,49 u 16,5 27,0 25,6 175,0 25,4 987,0 226,0 383,0 31,0 79,9 v 41 39 26 222 58 82 45 93 48 !52 w 0,2 0,9 0,7 3,6 1,7 1,2 0,8 3,4 2,0 7,4 y 6,49 38,79 39,27 30,09 35,78 11,46 7,07 15,04 27,96 59,88
Zn 5 8 8 6 7 7 Il 9 9 26 Zr 110,8 126,4 99,1 328,4 238,3 138,4 130,5 282,6 456,1 1363,0
Tableau AIV-16- Compositions en éléments majeurs(% massique d'oxydes) et en traces (en ppm) des brèches de Shea Creek.
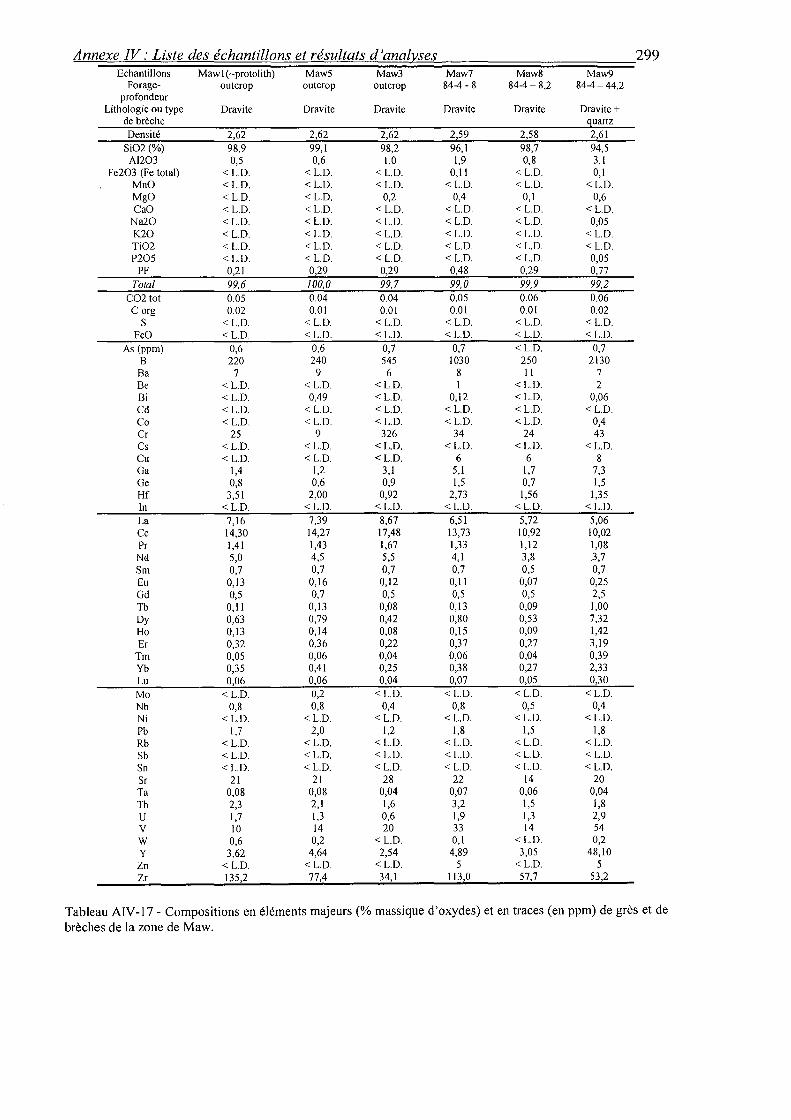
Annexe IV: Liste des échantillons et résultats d 'analy_ses 299 Echantillons Maw 1 ( -protolith) Maw5 Maw3 Maw7 Maw8 Maw9
Forage- outcrop outcrop outcrop 84-4-8 84-4-8,2 84-4-44,2 profondeur
Lithologie ou type Dra vite Dravite Dravite Dravite Dravite Dravite + de brèche uartz Densité 2,62 2,62 2,62 2,59 2,58 2,61
Si02 (%) 98,9 99,1 98,2 96,1 98,7 94,5 Al203 0,5 0,6 1,0 1,9 0,8 3,1
Fe203 (Fe total) < L.D. < L.D. <L.D. 0,11 <L.D. 0,1 MnO < L.D. < L.D. < L.D. < L.D. < L.D. < L.D. MgO < L.D. < L.D. 0,2 0,4 0,1 0,6 CaO < L.D. < L.D. < L.D. <L.D. < L.D. < L.D.
Na20 < L.D. < L.D. < L.D. <L.D. <L.D. 0,05 K20 < L.D. < L.D. <L.D. < L.D. < L.D. < L.D. Ti02 < L.D. < L.D. < L.D. <L.D. <L.D. < L.D. P205 < L.D. < L.D. < L.D. < L.D. < L.D. 0,05
PF 0,21 0,29 0,29 0,48 0,29 0,77
Total 99,6 /00,0 99,7 99,0 99,9 99,2 C02 tot 0.05 0.04 0.04 0.05 0.06 0.06 C org 0.02 0.01 0.01 0.01 0.01 0.02
s < L.D. < L.D. < L.D. < L.D. < L.D. < L.D. FeO < L.D. < L.D. <L.D. < L.D. < L.D. < L.D.
As (ppm) 0,6 0,6 0,7 0,7 <L.D. 0,7 B 220 240 545 1030 250 2130
Ba 7 9 6 8 Il 7 Be < L.D. < L.D. <L.D. 1 < L.D. 2 Bi < L.D. 0,49 < L.D. 0,12 < L.D. 0,06 Cd < L.D. < L.D. < L.D. < L.D. <L.D. < L.D. Co < L.D. < L.D. <L.D. < L.D. <L.D. 0,4 Cr 25 9 326 34 24 43 Cs < L.D. < L.D. < L.D. <L.D. < L.D. < L.D. Cu < L.D. < L.D. <L.D. 6 6 8 Ga 1,4 1,2 3,1 5,1 1,7 7,3 Ge 0,8 0,6 0,9 1,5 0,7 1,5 Hf 3,51 2,00 0,92 2,73 1,56 1,35 ln <L.D. < L.D. <L.D. <L.D. <L.D. <L.D. La 7,16 7,39 8,67 6,51 5,72 5,06 Ce 14,30 14,27 17,48 13,73 10,92 10,02 Pr 1,41 1,43 1,67 1,33 1,12 1,08 Nd 5,0 4,5 5,5 4,1 3,8 3,7 Sm 0,7 0,7 0,7 0,7 0,5 0,7 Eu 0,13 0,16 0,12 0,11 0,07 0,25 Gd 0,5 0,7 0,5 0,5 0,5 2,5 Tb 0,11 0,13 0,08 0,13 0,09 1,00 Dy 0,63 0,79 0,42 0,80 0,53 7,32 Ho 0,13 0,14 0,08 0,15 0,09 1,42 Er 0,32 0,36 0,22 0,37 0,27 3,19
Tm 0,05 0,06 0,04 0,06 0,04 0,39 Yb 0,35 0,41 0,25 0,38 0,27 2,33 Lu 0,06 0,06 0,04 0,07 0,05 0,30
Mo < L.D. 0,2 < L.D. <L.D. < L.D. < L.D. Nb 0,8 0,8 0,4 0,8 0,5 0,4 Ni < L.D. < L.D. < L.D. <L.D. < L.D. < L.D. Pb 1,7 2,0 1,2 1,8 1,5 1,8 Rb <L.D. < L.D. < L.D. <L.D. <L.D. < L.D. Sb < L.D. < L.D. < L.D. <L.D. < L.D. <L.D. Sn < L.D. < L.D. < L.D. < L.D. < L.D. < L.D. Sr 21 21 28 22 14 20 Ta 0,08 0,08 0,04 0,07 0,06 0,04 Th 2,3 2,1 1,6 3,2 1,5 1,8 u 1,7 1,3 0,6 1,9 1,3 2,9 v 10 14 20 33 14 54 w 0,6 0,2 < L.D. 0,1 < L.D. 0,2 y 3,62 4,64 2,54 4,89 3,05 48,10
Zn < L.D. < L.D. < L.D. 5 < L.D. 5 Zr 135,2 77,4 34,1 113,0 57,7 53,2
Tableau AIV-17- Compositions en éléments majeurs(% massique d'oxydes) et en traces (en ppm) de grès et de brèches de la zone de Maw.
300 ______________________ ~A~n~n~e~xe~IV~:~L~~~te~de~s~e~'c~h~a~n~ti~ll~on~s~e~t~r~é~su~l~w~t~s~d~'a~n~a~lv~s~es
V: Analyses chimiques ponctuelles à la microsonde électronique
Les compositions des minéraux suivants sont détaillées :
l.es chlorites,
la kaolinite riche en Fe,
les illites
les uraninites et pechblendes,
la coffinite.
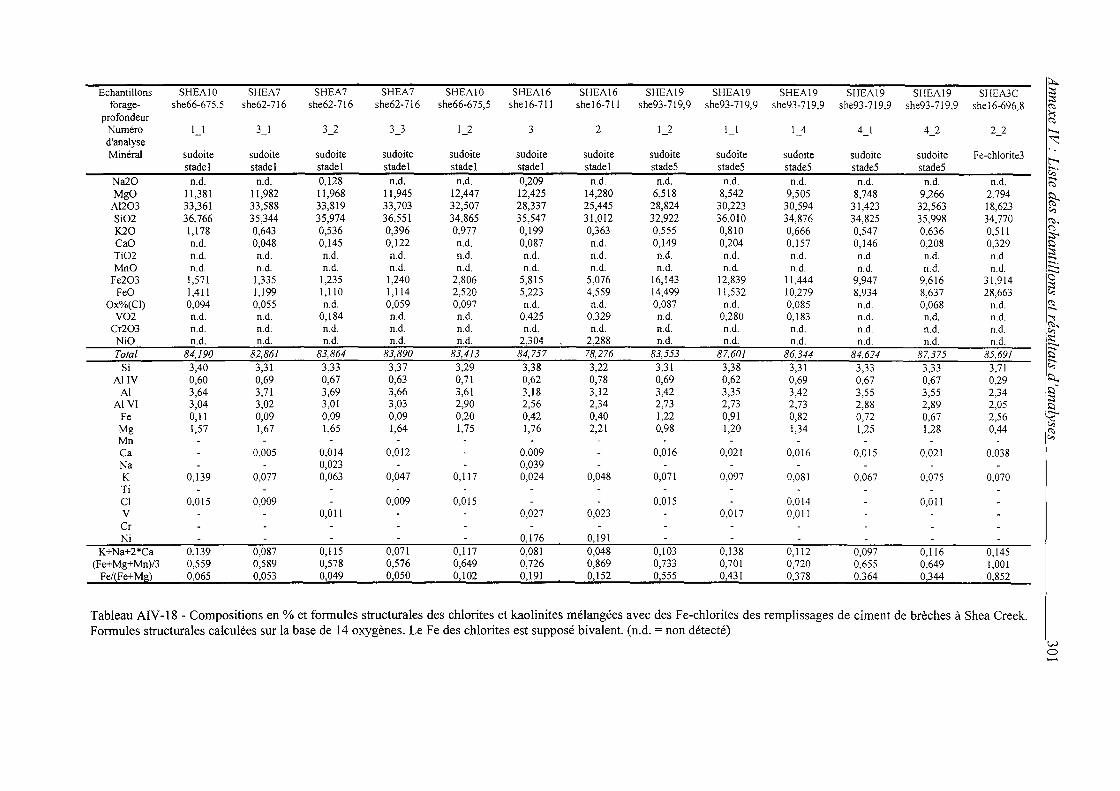
~ Echantillons SHEA10 SHEA7 SHEA7 SHEA7 SHEA10 SHEA16 SHEA16 SHEA19 SHEA19 SHEA19 SHEA19 SHEA19 SHEA3C :::i
forage- she66-675,5 she62-716 she62-716 she62-716 she66-675,5 shel6-711 shel6-711 she93-719,9 she93-719, 9 she93-719,9 she93-719,9 she93-719,9 she 16-696,8 :::i ~
profondeur :-: ~
Numéro 1_1 3_1 3_2 3_3 1_2 3 2 1_2 1 1 1 4 4 1 4 2 2 2 .._. d'analyse ~ Minéral sudoite sudoite sudoite sudoite sudoite sudoite sudoite sudoite sudoite sudoite sudoite sudoite F e-chlorite3 t"-< stade! stade! stade! stade! stade! stade! stade! stadeS stadeS stadeS stadeS stadeS .....
c_, Na20 n.d. n.d. 0,128 n.d. n.d. 0,209 n.d. n.d. n.d. n.d. n.d. n.d. n.d.
....,. ~
MgO 11,381 11,982 11,968 11,945 12,447 12,42S 14,280 6,518 8,S42 9,505 8,748 9,266 2,794 ~ Al203 33,361 33,588 33,819 33,703 32,S07 28,337 25,445 28,824 30,223 30,594 31,423 32,563 18,623 c_, Si02 36,766 35,344 35,974 36,SSI 34,86S 3S,S47 31,012 32,922 36,010 34,876 34,82S 35,998 34,770 ~' K20 1,178 0,643 0,536 0,396 0,977 0,199 0,363 0,55S 0,810 0,666 0,547 0,636 0,511 (':)
;::;-. CaO n.d. 0,048 0,14S 0,122 n.d. 0,087 n.d. 0,149 0,204 0,157 0,146 0,208 0,329 ~
Ti02 n.d. n.d. n.d. n.d. n.d. n.d. n.d. n.d. n.d. n.d. n.d. n.d. n.d. :::i ~-
MnO n.d. n.d. n.d. n.d. n.d. n.d. n.d. n.d. n.d. n.d. n.d. n.d. n.d. ..._ ..._ Fe203 1,571 1,335 1,235 1,240 2,806 S,815 5,076 16,143 12,839 11,444 9,947 9,616 31,914 0
:::i FeO 1,411 1,199 1,110 1,114 2,520 5,223 4,559 14,499 11,532 10,279 8,934 8,637 28,663 c_,
Ox%(Cl) 0,094 0,055 n.d. O,OS9 0,097 n.d. n.d. 0,087 n.d. 0,085 n.d. 0,068 n.d. ~ ....,. V02 n.d. n.d. 0,184 n.d. n.d. 0,42S 0,329 n.d. 0,280 0,183 n.d. n.d. n.d. "':
Cr203 n.d. n.d. n.d. n.d. n.d. n.d. n.d. n.d. n.d. n.d. n.d. n.d. n.d. ~' c_,
NiO n.d. n.d. n.d. n.d. n.d. 2,304 2,288 n.d. n.d. n.d. n.d. n.d. n.d. :.:: ..._ Total 84,190 82,861 83,864 83,890 83,413 84,757 78,276 83,553 87,601 86,344 84,624 87,375 85,691 B'
Si 3,40 3,31 3,33 3,37 3,29 3,38 3,22 3,31 3,38 3,31 3,33 3,33 3,71 {;;"
AllY 0,60 0,69 0,67 0,63 0,71 0,62 0,78 0,69 0,62 0,69 0,67 0,67 0,29 $:l...,
Al 3,64 3,71 3,69 3,66 3,61 3,18 3,12 3,42 3,35 3,42 3,55 3,S5 2,34 ~-:::i
A! VI 3,04 3,02 3,01 3,03 2,90 2,56 2,34 2,73 2,73 2,73 2,88 2,89 2,05 ~ Fe 0,11 0,09 0,09 0,09 0,20 0,42 0,40 1,22 0,91 0,82 0,72 0,67 2,56
..._
Mg l,S7 1,67 1,65 1,64 1,75 1,76 2,21 0,98 1,20 1,34 1,2S 1,28 0,44 c_, ~
Mn c_,
Ca 0,005 0,014 0,012 0,009 0,016 0,021 0,016 0.015 0,021 O,ü38 Na 0,023 0,039 K 0,139 0,077 0,063 0,047 0,117 0,024 0,048 0,071 0,097 0,081 0,067 0,075 0,070 Ti Cl 0,015 0,009 0,009 O,ül5 0,015 0,014 0,011 v 0,011 0,027 0,023 0,017 0,011 Cr Ni - - - 0,176 0,191
K+Na+2*Ca 0,139 0,087 0,115 0,071 0,117 0,081 0,048 0,103 0,138 0,112 0,097 0,116 0,145 (Fe+Mg+Mn)/3 0,559 0,589 0,578 0,576 0,649 0,726 0,869 0,733 0,701 0,720 0,655 0,649 1,001
Fe/(Fe+Mg) 0,065 O,OS3 0,049 0,050 0,102 0,191 0,152 O,S55 0,431 0,378 0,364 0,344 0,852
Tableau AIV-18- Compositions en% et formules structurales des chlorites et kaolinites mélangées avec des Fe-chlorites des remplissages de ciment de brèches à Shea Creek. Formules structurales calculées sur la base de 14 oxygènes. Le Fe des chlorites est supposé bivalent. (n.d. =non détecté)
w 0
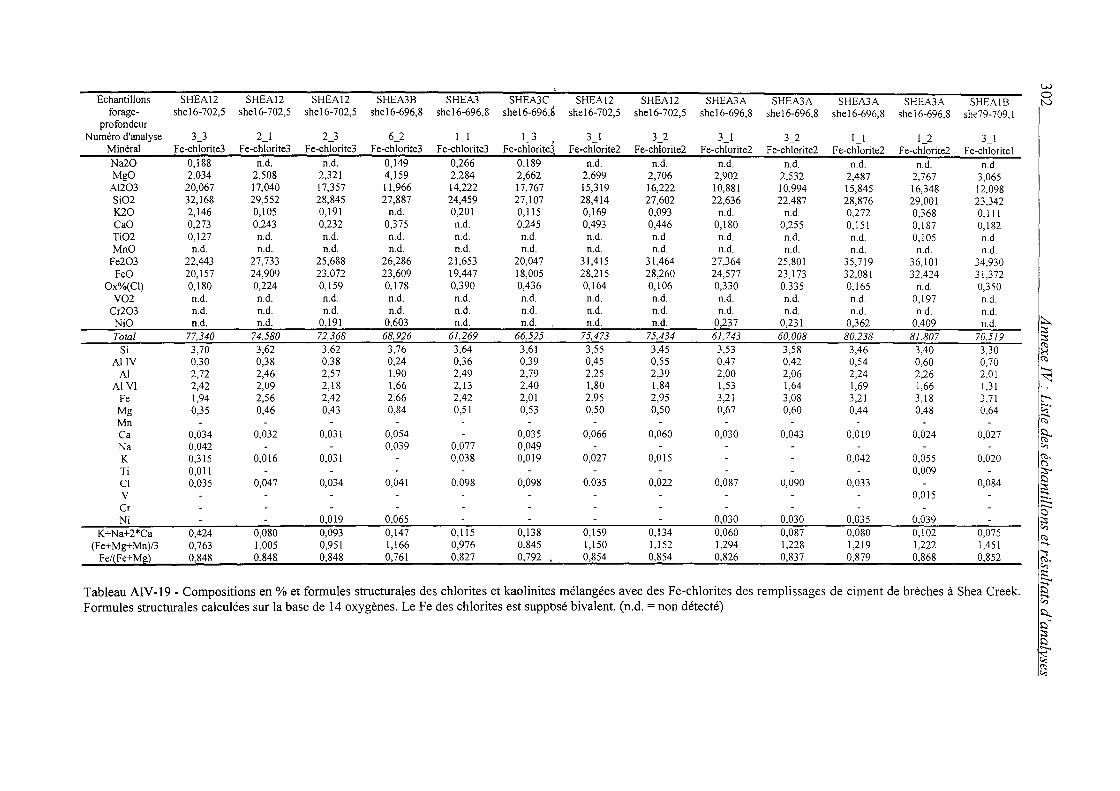
VJ
Echantillons SHEA12 SHEA12 SHEA12 SHEA3B SHEA3 SHEA3C SHEA12 SHEA12 SHEA3A SHEA3A SHEA3A SHEA3A 0
SHEAlB N forage- she 16-702,5 shel6-702,5 she 16-702,5 she 16-696,8 she 16-696,8 she 16-696,S she 16-702,5 she 16-702,5 she 16-696,8 she 16-696,8 she 16-696,8 she 16-696,8 she79-709, 1
profondeur Numéro d'analyse 3_3 2_1 2_3 6_2 1 1 1_3 ' 3_1 3_2 3_1 3_2 1_1 1_2 3_1
Minéral Fe-chlorite3 F e-chlorite3 F e-chlorite3 Fe-chlorite3 Fe-chlorite3 F e-chlorite3 F e-chlorite2 F e-chlorite2 Fe-chlorite2 F e-chlorite2 F e-chlorite2 F e-chlorite2 F e-chlorite 1 Na20 0,188 n.d. n.d. 0,149 0,266 0,189 n.d. n.d. n.d. n.d. n.d. n.d. n.d. MgO 2,034 2,508 2,321 4,159 2,284 2,662 2,699 2,706 2,902 2,532 2,487 2,767 3,065
Al203 20,067 17,040 17,357 11,966 14,222 17,767 15,319 16,222 10,881 10,994 15,845 16,348 12,098 Si02 32,168 29,552 28,845 27,887 24,459 27,107 28,414 27,602 22,636 22,487 28,876 29,001 23,342 K20 2,146 0,105 0,191 n.d. 0,201 0,115 0,169 0,093 n.d. n.d. 0,272 0,368 0,111 CaO 0,273 0,243 0,232 0,375 n.d. 0,245 0,493 0,446 0,180 0,255 0,151 0,187 0,182 Ti02 0,127 n.d. n.d. n.d. n.d. n.d. n.d. n.d. n.d. n.d. n.d. 0,105 n.d. MnO n.d. n.d. n.d. n.d. n.d. n.d. n.d. n.d. n.d. n.d. n.d. n.d. n.d.
Fe203 22,443 27,733 25,688 26,286 21,653 20,047 31,415 31,464 27,364 25,801 35,719 36,101 34,930 FeO 20,157 24,909 23,072 23,609 19,447 18,005 28,215 28,260 24,577 23,173 32,081 32,424 31,372
Ox%(Cl) 0,180 0,224 0,159 0,178 0,390 0,436 0,164 0,106 0,330 0335 0,165 n.d. 0,350 V02 n.d. n.d. n.d. n.d. n.d. n.d. n.d. n.d. n.d. n.d. n.d. 0,197 n.d.
Cr203 n.d. n.d. n.d. n.d. n.d. n.d. n.d. n.d. n.d. n.d. n.d. n.d. n.d. NiO n.d. n.d. 0,191 0,603 n.d. n.d. n.d. n.d. 0,237 0,231 0,362 0,409 n.d. ~
Total 77,340 74,580 72,368 68,926 61,269 66,525 75,473 75,434 61,743 60,008 80,238 81,807 70,519 ;::; ;::;
Si 3,70 3,62 3,62 3,76 3,64 3,61 3,55 3,45 3,53 3,58 3,46 3,40 3,30 (Il ~
AllY 0,30 0,38 0,38 0,24 0,36 0,39 0,45 0,55 0,47 0,42 0,54 0,60 0,70 (Il
Al 2,72 2,46 2,57 1,90 2,49 2,79 2,25 2,39 2,00 2,06 2,24 2,26 2,01 ....... ~
AIVl 2,42 2,09 2,18 1,66 2,13 2,40 1,80 1,84 1,53 1,64 1,69 1,66 1,31 Fe 1,94 2,56 2,42 2,66 2,42 2,01 2,95 2,95 3,21 3,08 3,21 3,18 3,71 t'-< Mg 0,35 0,46 0,43 0,84 0,51 0,53 0,50 0,50 0,67 0,60 0,44 0,48 0,64 c;;· .... Mn (Il
Ca 0,034 0,032 0,031 0,054 0,035 0,066 0,060 0,030 0,043 0,019 0,024 0,027 ~ Na 0,042 0,039 0,077 0,049 "' K 0,315 0,016 0,031 0,038 0,019 0,027 O,û15 0,042 0,055 0,020 (Il,
(J
Ti 0,011 0,009 ;::;--Cl 0,035 0,047 0,034 0,041 0,098 0,098 0,035 0,022 0,087 0,090 0,033 0,084 1::)
;::; v 0,015 ~-Cr
.._ .._ 0
Ni 0,019 0,065 0,030 0,030 0,035 0,039 ;::; K+Na+2*Ca 0,424 0,080 0,093 0,147 0,115 0,138 0,159 0,134 0,060 0,087 0,080 0,102 0,075 "' (Il
(Fe+Mg+Mn)/3 0,763 1,005 0,951 1,166 0,976 0,845 1,150 1,152 1,294 1,228 1,219 1,222 1.451 .... Fe/(Fe+Mg) 0,8_48 0,848 0,848 0,761 0,827 0,792 0,854 0,854 0,826 0,837 0,879 0,868 0,852 ""':
(Il,
"' ::: .._ Tableau AIV-19- Compositions en% et formules structurales des chlorites et kaolinites mélangées avec des Fe-chlorites des remplissages de ciment de brèches à Shea Creek. 1~ Formules structurales calculées sur la base de 14 oxygènes. Le Fe des chlorites est supposé bivalent. (n.d. =non détecté) ~
~::)" ;::; 1::) .._ ~ (Il
"'
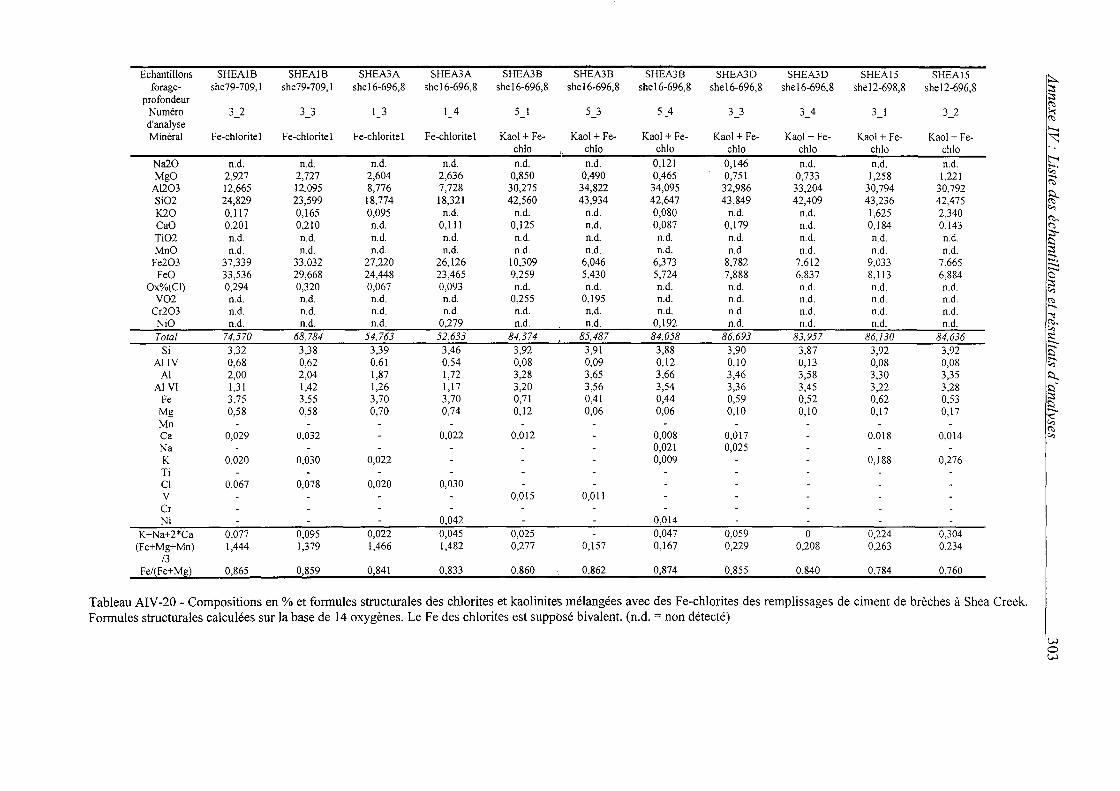
Echantillons SHEAIB SHEAlB SHEA3A SHEA3A SHEA3B SHEA3B SHEA3B SHEA3D SHEA3D SHEA15 SHEA15 À forage- she79-709, 1 she79-709,1 shel6-696,8 shel6-696,8 she 16-696,8 she16-696,8 she 16-696,8 she 16-696,8 she 16-696,8 she 12-698,8 she 12-696,8 ~
profondeur ;::; (1:>
Numéro 3_2 3_3 1_3 1 4 5_1 5_3 5_4 3_3 3_4 3 1 3 2 :-: d'analyse
(1:>
........ Minéral Fe-chloritel F e-chlorite 1 F e-chlorite 1 F e-chlorite 1 Kaol +Fe- Kaol +Fe- Kaol +Fe- Kaol +Fe- Kaol +Fe- Kaol +Fe- Kaol +Fe- ~
chio chio chio chio chio chio chio
Na20 n.d. n.d. n.d. n.d. n.d. n.d. 0,121 0,146 n.d. n.d. n.d. t'-< ;;:;·
Mgü 2,927 2,727 2,604 2,636 0,850 0,490 0,465 0,751 0,733 1,258 1,221 ....... Al203 12,665 12,095 8,776 7,728 30,275 34,822 34,095 32,986 33,204 30,794 30,792
(1:>
Si02 24,829 23,599 18,774 18,321 42,560 43,934 42,647 43,849 42,409 43,236 42,475 ~ K20 0,117 0,165 0,095 n.d. n.d. n.d. 0,080 n.d. n.d. 1,625 2,340
c, (1:>,
CaO 0,201 0,210 n.d. 0,111 0,125 n.d. 0,087 0,179 n.d. 0,184 0,143 ("")
Ti02 n.d. n.d. n.d. n.d. n.d. n.d. n.d. n.d. n.d. n.d. n.d. ;::;-.. 1:::)
Mnü n.d. n.d. n.d. n.d. n.d. n.d. n.d. n.d. n.d. n.d. n.d. ;::; .......
Fe203 37,339 33,032 27,220 26,126 10,309 6,046 6,373 8,782 7,612 9,033 7,665 ...... ...... Feü 33,536 29,668 24,448 23,465 9,259 5,430 5,724 7,888 6,837 8,113 6,884
...... 0
Ox%(Cl) 0,294 0,320 0,067 0,093 n.d. n.d. n.d. n.d. n.d. n.d. n.d. ;::; c,
Y02 n.d. n.d. n.d. n.d. 0,255 0,195 n.d. n.d. n.d. n.d. n.d. (1:>
Cr203 n.d. n.d. n.d. n.d. n.d. n.d. n.d. n.d. n.d. n.d. n.d. ....... "'!
NiO n.d. n.d. n.d. 0,279 n.d. n.d. 0,192 n.d. n.d. n.d. n.d. (1:>, c,
Total 74,570 68,784 54,763 52,633 84,374 85,487 84,058 86,693 83,957 86,130 84,636 :;::: ...... Si 3,32 3,38 3,39 3,46 3,92 3,91 3,88 3,90 3,87 3,92 3,92 s
AllY 0,68 0,62 0,61 0,54 0,08 0,09 0,12 0,10 0,13 0,08 0,08 1:;" Al 2,00 2,04 1,87 1,72 3,28 3,65 3,66 3,46 3,58 3,30 3,35 ~
AIYl 1,31 1,42 1,26 1,17 3,20 3,56 3,54 3,36 3,45 3,22 3,28 1:::)~
Fe 3,75 3,55 3,70 3,70 0,71 0,41 0,44 0,59 0,52 0,62 0,53 ;::; 1:::)
Mg 0,58 0,58 0,70 0,74 0,12 0,06 0,06 0,10 0,10 0,17 0,17 ...... Mn - c,
(1:> Ca 0,029 0,032 0,022 0,012 0,008 0,017 0,018 0,014 c,
Na - - 0,021 0,025 K 0,020 0,030 0,022 - - 0,009 0,188 0,276 Ti Cl 0,067 0,078 0,020 0,030 y 0,015 0,011 Cr Ni - 0,042 0,014
K+Na+2*Ca 0,077 0,095 0,022 0,045 0,025 0,047 0,059 0 0,224 0,304 (Fe+Mg+Mn) 1,444 1,379 1,466 1,482 0,277 0,157 0,167 0,229 0,208 0,263 0,234
13 Fe/(Fe+Mg) 0,865 0,859 0,841 0,833 0,860 0,862 0,874 0,855 0,840 0,784 0,760
Tableau AIV-20- Compositions en% et formules structurales des chlorites et kaolinites mélangées avec des Fe-chlorites des remplissages de ciment de brèches à Shea Creek. Formules structurales calculées sur la base de 14 oxygènes. Le Fe des chlorites est suppbsé bivalent. (n.d. =non détecté)
1 w 0 w
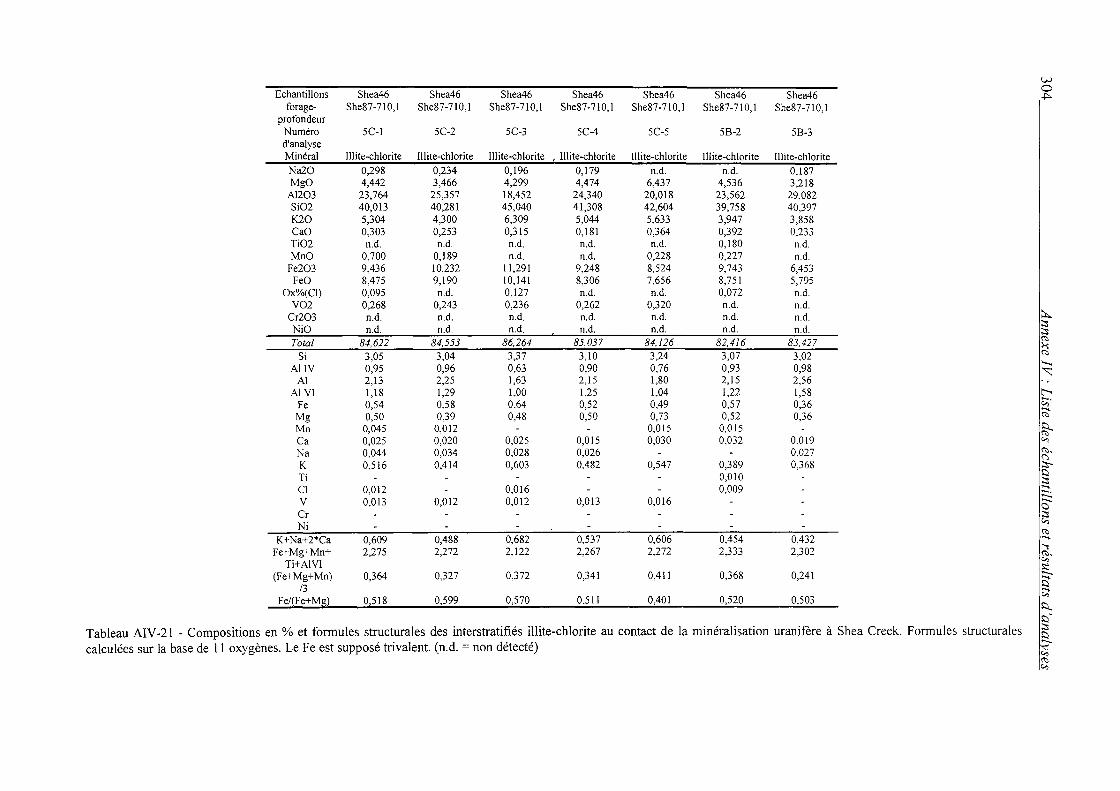
VJ
Echantillons Shea46 Shea46 Shea46 Shea46 Shea46 Shea46 Shea46 0 +:-
forage- She87-710,1 She87-710,1 She87 -710,1 She87-710,1 She87-710,1 She87-710,1 She87-710,1 profondeur
Numéro 5C-l 5C-2 5C-3 5C-4 5C-5 58-2 58-3 d'analyse Minéral lllite-chlorite lllite-chlorite lllite-chlorite , lllite-chlorite lllite-chlorite Illite-chlorite lll i te-ch 1 orite Na20 0,298 0,234 0,196 0,179 n.d. n.d. 0,187 MgO 4,442 3,466 4,299 4,474 6,437 4,536 3,218
Al203 23,764 25,357 18,452 24,340 20,018 23,562 29,082 Si02 40,013 40,281 45,040 41,308 42,604 39,758 40,397 K20 5,304 4,300 6,309 5,044 5,633 3,947 3,858 CaO 0,303 0,253 0,315 0,181 0,364 0,392 0,233 Ti02 n.d. n.d. n.d. n.d. n.d. 0,180 n.d. MnO 0,700 0,189 n.d. n.d. 0,228 0,227 n.d.
Fe203 9,436 10,232 11,291 9,248 8,524 9,743 6,453 FeO 8,475 9,190 10,141 8,306 7,656 8,751 5,795
Ox%(Cl) 0,095 n.d. 0,127 n.d. n.d. 0,072 n.d. V02 0,268 0,243 0,236 0,262 0,320 n.d. n.d.
Cr203 n.d. n.d. n.d. n.d. n.d. n.d. n.d. :::t.. NiO n.d. n.d. n.d. n.d. n.d. n.d. n.d.
;::::: ;:::::
Total 84,622 84,553 86,264 85,037 84,126 82,416 83,427 (\:)
~ Si 3,05 3,04 3,37 3,10 3,24 3,07 3,02 (\:)
AllY 0,95 0,96 0,63 0,90 0,76 0,93 0,98 ........
Al 2,13 2,25 1,63 2,15 1,80 2,15 2,56 ~
AIVl 1,18 1,29 1,00 1,25 1,04 1,22 1,58 t-< Fe 0,54 0,58 0,64 0,52 0,49 0,57 0,36 c;;;· ..... Mg 0,50 0,39 0,48 0,50 0,73 0,52 0,36 (\:)
Mn 0,045 0,012 0,015 0,015 ~ Ca 0,025 0,020 0,025 0,015 O,û30 0,032 0,019 "' Na 0,044 0,034 0,028 0,026 0,027 (1:>,
(':)
K 0,516 0,414 0,603 0,482 0,547 0,389 0,368 ;:::::-..
Ti - 0,010 >:) ;:::::
Cl 0,012 0,016 0,009 ..... -· v 0,013 0,012 0,012 0,013 0,016 ..._ ..._ a
Cr ;::::: Ni - "' (\:)
K+Na+2*Ca 0,488 0,682 0,606 0,609 0,537 0,454 0,432 ..... Fe+Mg+Mn+ 2,275 2,272 2,122 2,267 2,272 2,333 2,302 "'1
i3;-Ti+AlVl :;::
(Fe+Mg+Mn) 0,364 0,327 0,372 0,341 0,411 0,368 0,241 ..._ .....
/3 >:)
Fe/(Fe+Mg) 0,518 0,599 0,570 0,511 0,401 0,520 0,503 [;j s:::,... s;::,'
Tableau AIV -21 - Compositions en % et formules structurales des interstratifiés illite-chlorite au contact de la minéralisation uranifère à Shea Creek. Formules structurales
~ calculées sur la base de 11 oxygènes. Le Fe est supposé trivalent. (n.d. =non détecté) (\:)
"'
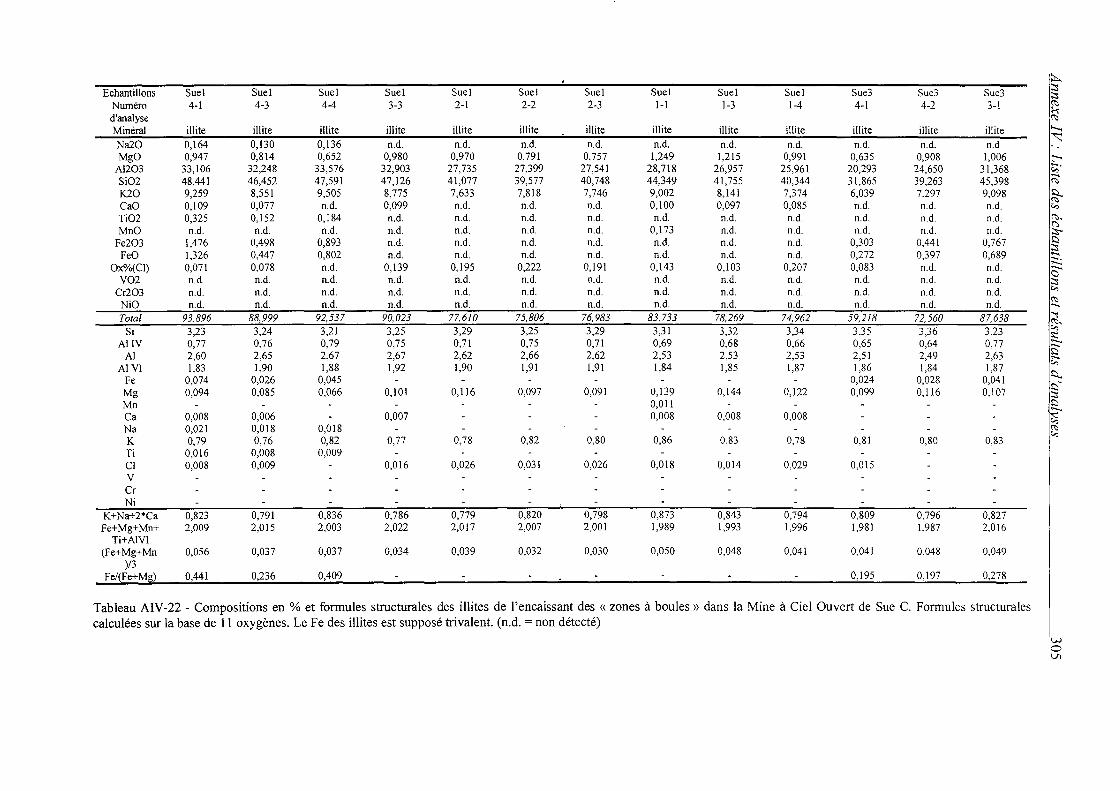
~
Echantillons Sue! Sue! Sue! Sue! Sue! Sue! Sue! Sue! Sue! Sue! Sue3 Sue3 Sue3 ;:::: ;:s
Numéro 4-1 4-3 4-4 3-3 2-1 2-2 2-3 1-1 1-3 1-4 4-1 4-2 3-1 ~ d'analyse (';)
Minéral illite illite illite illite illite illite illite illite illite illite illite illite illite ......,
Na20 0,164 0,130 0,136 n.d. n.d. n.d. n.d. n.d. n.d. n.d. n.d. n.d. n.d. -.::::;
MgO 0,947 0,814 0,652 0,980 0,970 0,791 0,757 1,249 1,215 0,991 0,635 0,908 1,006 t:--< Al203 33,106 32,248 33,576 32,903 27,735 27,399 27,541 28,718 26,957 25,961 20,293 24,650 31,368 t:;;· Si02 48,441 46,452 47,591 47,126 41,077 39,577 40,748 44,349 41,755 40,344 31,865 39,263 45,398 ~ K20 9,259 8,551 9,505 8,775 7,633 7,818 7,746 9,002 8,141 7,374 6,039 7,297 9,098 ~ CaO 0,109 0,077 n.d. 0,099 n.d. n.d. n.d. 0,100 0,097 0,085 n.d. n.d. n.d. c..,
Ti02 0,325 0,152 0,184 n.d. n.d. n.d. n.d. n.d. n.d. n.d. n.d. n.d. n.d. (';), ("")
MnO n.d. n.d. n.d. n.d. n.d. n.d. n.d. 0,173 n.d. n.d. n.d. n.d. n.d. ;:s-Fe203 1,476 0,498 0,893 n.d. n.d. n.d. n.d. n.d. n.d. n.d. 0,303 0,441 0,767 ~
;:s FeO 1,326 0,447 0,802 n.d. n.d. n.d. n.d. n.d. n.d. n.d. 0,272 0,397 0,689 ..... -· Oxo/o(CI) 0,071 0,078 n.d. 0,139 0,195 0,222 0,191 0,143 0,103 0,207 0,083 n.d. n.d. --a V02 n.d. n.d. n.d. n.d. n.d. n.d. n.d. n.d. n.d. n.d. n.d. n.d. n.d. ;:s
Cr203 n.d. n.d. n.d. n.d. n.d. n.d. n.d. n.d. n.d. n.d. n.d. n.d. n.d. c..,
NiO n.d. n.d. n.d. n.d. n.d. n.d. n.d. n.d. n.d. n.d. n.d. n.d. n.d. (';) .....
Total 93,896 88,999 92,537 90,023 77,610 75,806 76,983 83,733 78,269 74,962 59,218 72,560 87,638 "'l (';),
Si 3,23 3,24 3,21 3,25 3,29 3,25 3,29 3,31 3,32 3,34 3,35 3,36 3,23 c.., ~
AllY 0,77 0,76 0,79 0,75 0,71 0,75 0,71 0,69 0,68 0,66 0,65 0,64 0,77 -El' Al 2,60 2,65 2,67 2,67 2,62 2,66 2,62 2,53 2,53 2,53 2,51 2,49 2,63 c;:;-Al VI 1,83 1,90 1,88 1,92 1,90 1,91 1,91 1,84 1,85 1,87 1,86 1,84 1,87
$::)... Fe 0,074 0,026 0,045 - - 0,024 0,028 0,041
~-Mg 0,094 0,085 0,066 0,101 0,116 0,097 0,091 0,139 0,144 0,122 0,099 0,116 0,107 ;:s Mn 0,011 ~ -Ca 0,008 0,006 0,007 0,008 0,008 0,008 c.., Na 0,021 0,018 0,018 (';)
c.., K 0,79 0,76 0,82 0,77 0,78 0,82 0,80 0,86 0,83 0,78 0,81 0,80 0,83 Ti 0,016 0,008 0,009 Cl 0,008 0,009 0,016 0,026 0,031 0,026 O,û18 0,014 0,029 0,015 v Cr Ni
K+Na+2*Ca 0,823 0,791 0,836 0,786 0,779 0,820 0,798 0,873 0,843 0,794 0,809 0,796 0,827 Fe+Mg+Mn+ 2,009 2,015 2,003 2,022 2,017 2,007 2,001 1,989 1,993 1,996 1,981 1,987 2,016
Ti+ AI VI (Fe+Mg+Mn 0,056 0,037 0,037 0,034 0,039 0,032 0,030 0,050 0,048 0,041 0,041 0,048 0,049
)/3 Fe/(Fe+Mg) 0,441 0,236 0,409 0,195 0,197 0,278
Tableau AIV-22 - Compositions en % et formules structurales des illites de l'encaissant des «zones à boules» dans la Mine à Ciel Ouvert de Sue C. Formules structurales calculées sur la base de Il oxygènes. Le Fe des illites est supposé trivalent. (n.d. = non détecté)
1
w 0 VI
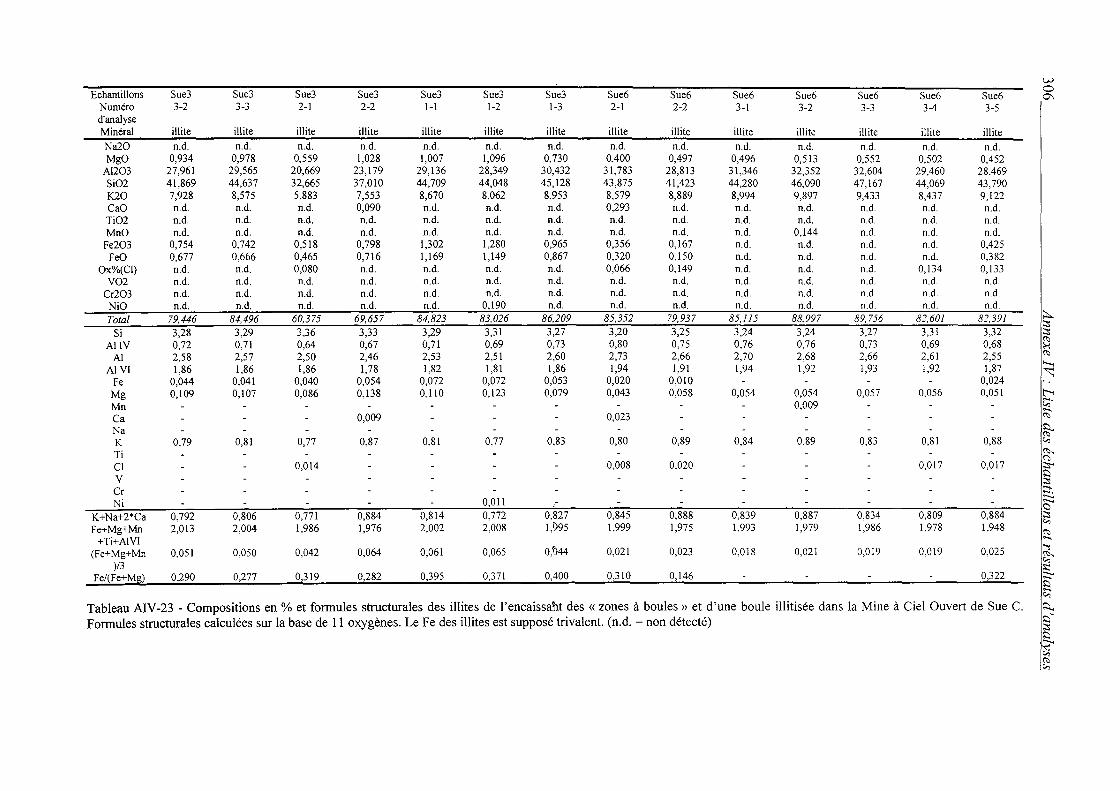
w
Echantillons Sue3 Sue3 Sue3 Sue3 Sue3 Sue3 Sue3 Sue6 Sue6 Sue6 Sue6 Sue6 Sue6 Sue6 0 0\
Numéro 3-2 3-3 2-1 2-2 1-1 1-2 1-3 2-1 2-2 3-1 3-2 3-3 3-4 3-5 d'analyse Minéral illite illite illite illite illite illite illite illite illite illite illite illite illite illite
Na20 n.d. n.d. n.d. n.d. n.d. n.d. n.d. n.d. n.d. n.d. n.d. n.d. n.d. n.d. Mgü 0,934 0,978 0,559 1,028 1,007 1,096 0,730 0,400 0,497 0,496 0,513 0,552 0,502 0,452
Al203 27,961 29,565 20,669 23,179 29,136 28,349 30,432 31,783 28,813 31,346 32,352 32,604 29,460 28,469 Si02 41,869 44,637 32,665 37,010 44,709 44,048 45,128 43,875 41,423 44,280 46,090 47,167 44,069 43,790 K20 7,928 8,575 5,883 7,553 8,670 8,062 8,953 8,579 8,889 8,994 9,897 9,433 8,437 9,122 CaO n.d. n.d. n.d. 0,090 n.d. n.d. n.d. 0,293 n.d. n.d. n.d. n.d. n.d. n.d. Ti02 n.d. n.d. n.d. n.d. n.d. n.d. n.d. n.d. n.d. n.d. n.d. n.d. n.d. n.d. Mnü n.d. n.d. n.d. n.d. n.d. n.d. n.d. n.d. n.d. n.d. 0,144 n.d. n.d. n.d.
Fe203 0,754 0,742 0,518 0,798 1,302 1,280 0,965 0,356 0,167 n.d. n.d. n.d. n.d. 0,425 FeO 0,677 0,666 0,465 0,716 1,169 1,149 0,867 0,320 0,150 n.d. n.d. n.d. n.d. 0,382
Oxo/o(Cl) n.d. n.d. 0,080 n.d. n.d. n.d. n.d. 0,066 0,149 n.d. n.d. n.d. 0,134 0,133 V02 n.d. n.d. n.d. n.d. n.d. n.d. n.d. n.d. n.d. n.d. n.d. n.d. n.d. n.d.
Cr203 n.d. n.d. n.d. n.d. n.d. n.d. n.d. n.d. n.d. n.d. n.d. n.d. n.d. n.d. NiO n.d. n.d. n.d. n.d. n.d. 0,190 n.d. n.d. n.d. n.d. n.d. n.d. n.d. n.d.
Total 79,446 84,496 60,375 69,657 84,823 83,026 86,209 85,352 79,937 85,J15 88,997 89,756 82,601 82,391 ::t:.. ;:::;
Si 3,28 3,29 3,36 3,33 3,29 3,31 3,27 3,20 3,25 3,24 3,24 3,27 3,31 3,32 ;:::;
AllY 0,72 0,71 0,64 0,67 0,71 0,69 0,73 0,80 0,75 0,76 0,76 0,73 0,69 0,68 ~ Al 2,58 2,57 2,50 2,46 2,53 2,51 2,60 2,73 2,66 2,70 2,68 2,66 2,61 2,55 (';)
Al VI 1,86 1,86 1,86 1,78 1,82 1,81 1,86 1,94 1,91 1,94 1,92 1,93 1,92 1,87 .......
Fe 0,044 0,041 0,040 0,054 0,072 0,072 0,053 0,020 O,û!O 0,024 ~
Mg 0,109 0,107 0,086 0,138 0,110 0,123 0,079 0,043 0,058 0,054 0,054 0,057 0,056 0,051 t--< Mn - 0,009 c;:;·
....... Ca - 0,009 0,023 - (';)
Na - ~ K 0,79 0,81 0,77 0,87 0,81 0,77 0,83 0,80 0,89 0,84 0,89 0,83 0,81 0,88 "' Ti - - - (';),
~ Cl 0,014 0,008 O,ü20 0,017 0,017 ;::;-.
v ~ ;:::;
Cr :::::-. Ni 0,011
..._ - - - ..._
0 0,827 K+Na+2*Ca 0,792 0,806 0,771 0,884 0,814 0,772 0,845 0,888 0,839 0,887 0,834 0,809 0,884 ;:::;
Fe+Mg+Mn 2,013 2,004 1,986 1,976 2,002 2,008 1,995 1,999 1,975 1,993 1,979 1,986 1,978 1,948 "' (';)
+Ti+AlVl .......
(Fe+Mg+Mn 0,051 0,050 0,042 0,064 0,061 0,065 o,t44 0,021 0,023 0,018 0,021 0,019 0,019 0,025 """!: (';),
)/3 "' s:: Fe/(Fe+_Mg) 0,290 0,277 0,319 0,282 0,395 0,371 0,400 0,310 0,146 0,322
..._
....... ~ c;:;-
Tableau AIV-23 -Compositions en% et formules structurales des illites de l'encaissant des «zones à boules» et d'une boule illitisée dans la Mine à Ciel Ouvert de Sue C. 1~ Formules structurales calculées sur la base de Il oxygènes. Le Fe des illites est supposé trivalent. (n.d. =non détecté) ~ ..._ ~ (';)
"'

Echantillons forage-
profondeur Numéro d'analyse Minéral
Si02 S03 CaO Ti02 FeO
As203 Y203 Ce203 Gd203 Yb203
PbO Th02 U02 Total
Age (Ga)
Echantillons forage-
profondeur Numéro d'analyse Minéral
Si02 S03 CaO Ti02 FeO
As203 Y203 Ce203 Gd203 Yb203
PbO Th02 U02 Total
Age (Ga)
8656-4 8656-4 She 16-718,2 She 16-718,2
0-Gl 1 1
uraninite
0,453 n.d.
1,673 n.d.
0,490 n.d.
0,183 n.d. n.d. n.d.
12,156 n.d.
79,562 94,516 1,028
O-G1 1 2
uraninite
0,268 n.d.
1,113 n.d. n.d.
0,409 n.d. n.d. n.d. n.d.
14,169 n.d.
78,742 94,701 1,188
8656-4 She16-718,2
0-Gl 1 3
uraninite
0,207 n.d.
1,175 n.d. n.d. n.d. n.d. n.d. n.d. n.d.
13,921 n.d.
80,112 95,414 1,152
8656-4 She 16-718,2
0-Gl 1 4
uraninite
0,224 n.d.
1,032 n.d. n.d. n.d. n.d. n.d. n.d. n.d.
14,811 n.d.
78,015 94,082 1,245
8656-4 8656-4 8656-4 8656-4 She16-718,2 She16-718,2 She16-718,2 She16-718,2
O-G1 1 14
uraninite
0,153 n.d.
0,961 n.d. n.d. n.d. n.d. n.d. n.d. n.d.
14,494 n.d.
79,317 94,926 1,204
O-G1_2_1
uraninite
0,262 n.d.
0,868 n.d. n.d. n.d. n.d. n.d. n.d. n.d.
14,921 n.d.
79,354 95,404 1,235
O-Gl_2_2
uraninite 0,418 n.d.
1,630 n.d.
0,377 n.d.
0,150 n.d. n.d. n.d.
13,137 n.d.
82,620 98,332 1,065
O-G1_2_3
uraninite
0,217 n.d.
0,967 n.d. n.d. n.d. n.d. n.d. n.d. n.d.
14,212 n.d.
79,865 95,261 1,176
8656-4 8656-4 8656-4 Shel6-718,2 Shel6-718,2 She16-718,2
O-G1_1_5
uraninite
0,366 n.d.
1,509 n.d. n.d. n.d. n.d. n.d. n.d. n.d.
12,215 n.d.
80,716 94,806 1,019
O-G1_1_6
uraninite
0,421 n.d.
0,952 n.d. n.d. n.d. n.d. n.d. n.d. n.d.
13,603 n.d.
77,904 92,880 1,157
O-G1 1 7
~ uraninite
0,313 n.d.
0,971 n.d. n.d. n.d. n.d. n.d. n.d. n.d.
13,428 n.d.
78,493 93,204 1,136
8656-4 8656-4 8656-4 She 16-718,2 She 16-718,2 She 16-718,2
O-Gl_2_4
uraninite 0,242 n.d.
1,205 n.d. n.d. n.d. n.d. n.d. n.d. n.d.
14,268 n.d.
80,592 96,308 1,171
O-Gl_2_5
uraninite 0,180 n.d.
0,955 n.d. n.d. n.d. n.d. n.d. n.d. n.d.
14,276 n.d.
80,042 95,453 1,179
O-G1_2_6
uraninite 0,414 n.d.
1,275 n.d. n.d. n.d. n.d. n.d. n.d. n.d.
12,491 n.d.
75,341 89,521 1,105
8656-4 She16-718,2
O-G1 1 8
uraninite
0,271 n.d.
1,012 n.d. n.d. n.d. n.d. n.d. n.d. n.d.
14,920 n.d.
79,108 95,312 1,238
8656-4 She16-718,2
O-Gl_l_9
uraninite
0,357 n.d.
1,255 n.d. n.d. n.d. n.d. n.d. n.d. n.d.
12,805 n.d.
79,569 93,987 1,076
8656-4 8656-4 She 16-718,2 She 16-718,2
O-G1_2_7
uraninite 0,306 n.d.
1,326 n.d. n.d.
0,559 n.d. n.d. n.d. n.d.
13,229 n.d.
79,390 94,810 1,110
O-Gl_2_8
uraninite 0,286 n.d.
1,129 n.d.
0,300 0,485 n.d. n.d. n.d. n.d.
14,797 n.d.
80,828 97,824 1,206
8656-4 Shel6-718,2
0-Gl 1 10
uraninite
0,287 n.d.
1,127 n.d. n.d. n.d. n.d. n.d. n.d. n.d.
14,285 n.d.
79,138 94,837 1,191
8656-4 Shel6-718,2
0-Gl 2 9
uraninite 0,463 n.d.
1,777 n.d.
0,617 n.d.
0,265 n.d. n.d. n.d.
11,822 n.d.
81,155 96,099 0,984
8656-4 8656-4 She16-718,2 She16-718,2
0-Gl 1 Il
uraninite
0,265 n.d.
1,113 n.d. n.d. n.d. n.d. n.d. n.d. n.d.
14,514 n.d.
80,710 96,601 1,187
8656-4 She 16-718,2
O-Gl_2_10
uraninite 0,206 n.d.
0,967 n.d. n.d. n.d. n.d. n.d. n.d. n.d.
14,575 n.d.
79,754 95,502 1,204
0-Gl 1 12
uraninite
0,212 n.d.
1,206 n.d. n.d. n.d. n.d. n.d. n.d. n.d.
14,010 n.d.
80,426 95,854 1,155
8656-4 Shel6-718,2
O-Gl_2_11
uraninite 0,180 n.d.
1,042 n.d. n.d.
0,443 n.d. n.d. n.d. n.d.
14,670 n.d.
79,552 95,886 1,214
8656-4 She16-718,2
0-Gl 1 13
uraninite
0,253 n.d.
0,975 n.d. n.d. n.d. n.d. n.d. n.d. n.d.
14,689 n.d.
79,180 95,096 1,220
8656-4 Shel6-718,2
O-Gl_2_12
uraninite 0,288 n.d.
1,293 n.d. n.d. n.d. n.d. n.d. n.d. n.d.
13,512 n.d.
79,877 94,971 1,125
Tableau AIV-24- Compositions en% d'un cristal d'uraninite provenant de la minéralisation à la discordance de Shea Creek. Les âges chimiques sont calculés à l'aide de la formule de Suzuki et Adachi (1994). (n.d. =non détecté)
~ ~ ;:s
~ ~
....... ~
t--< c;:;· ~
~ "' ~' ~ ~ ;:s -..
~ !:; ~ ...... "':
~' ~ --s ;:;;-~ ~;:s ~ --"" ~ "'
w 0 -.....)

V-l
Echantillons 8656-4 8656-4 8656-4 8656-4 8656-4 8656-4 8656-4 8656-4 8656-4 8656-4 8656-4 8656-4 8656-4 0 00
forage- She16-7!8,2 She 16-718,2 She16-718,2 She16-718,2 She16-718,2 She 16-718,2 She16-718,2 She 16-718,2 She16-718,2 She 16-718,2 She16-718,2 She16-718,2 She 16-718,2 profondeur
Numéro O-Gl_2_13 O-G1_2_14 0-G1_3_1 O-Gl_3_2 O-G1_3_3 O-G1_3_4 O-G1_3_5 O-G1_3_6 O-Gi_3_7 O-G1_3_8 O-GI_3_9 O-GI_3_10 O-G1_3_11 d'analyse Minéral uraninite uraninite uraninite uraninite uraninite uraninite uraninite uraninite uraninite uraninite uraninite uraninite uraninite
Si02 0,179 0,214 0,326 0,244 0,223 0,211 0,213 0,236 0,222 0,239 0,175 0,267 0,447 S03 n.d. n.d. n.d. n.d. n.d. n.d. n.d. n.d. n.d. n.d. n.d. n.d. n.d. CaO 0,854 0,973 1,087 0,902 0,917 1,064 1,051 1,439 1,035 0,875 0,980 0,884 1,513 Ti02 n.d. n.d. n.d. n.d. n.d. n.d. n.d. n.d. n.d. n.d. n.d. n.d. n.d. FeO n.d. n.d. n.d. n.d. n.d. n.d. n.d. n.d. n.d. n.d. n.d. n.d. n.d.
As203 n.d. n.d. n.d. 0,441 n.d. n.d. n.d. n.d. n.d. n.d. 0,493 n.d. n.d. Y203 n.d. n.d. n.d. n.d. n.d. n.d. n.d. n.d. n.d. n.d. n.d. n.d. n.d. Ce203 n.d. n.d. n.d. n.d. n.d. n.d. n.d. n.d. n.d. n.d. n.d. n.d. n.d. Gd203 n.d. n.d. n.d. n.d. n.d. n.d. n.d. n.d. n.d. n.d. n.d. n.d. n.d. Yb203 n.d. n.d. n.d. n.d. n.d. n.d. n.d. n.d. n.d. n.d. n.d. n.d. n.d.
PbO 15,040 13,763 14,523 15,045 15,067 14,456 13,392 13,151 15,090 14,012 14,414 14,771 11,284 Th02 n.d. n.d. n.d. n.d. n.d. n.d. n.d. n.d. n.d. n.d. n.d. n.d. n.d. U02 80,377 79,612 80,244 79,690 78,570 79,797 79,583 81,210 80,169 79,006 78,638 79,833 80,630 ~
Total 96,451 94,562 96,179 96,322 94,777 95,528 94,239 96,037 96,516 94,132 94,700 95,755 93,873 ;::; ;::;
Age (Ga) 1,229 1,147 1,194 1,239 1,256 1,195 1,120 1,082 1,236 1,173 1,207 1,217 0,949 ('::>
:-.: ('::>
Echantillons 8656-4 8656-4 8656-4 8656-4 8656-4 8656-4 8656-4 8656-4 8656-4 8656-4 8656-4 8656-4 8656-4 ........ forage- She 16-718,2 She 16-718,2 She 16-718,2 She 16-718,2 She 16-718,2 She 16-718,2 She16-718,2 She16-718,2 She16-718,2 She16-718,2 She16-718,2 Shel6-718,2 She16-718,2 ~
profondeur t-< Numéro O-G1_3_12 O-G1_3_13 0-G1_3_14 O-G1_4_1 O-G1_ 4_2 O-G1_4_3 O-G1_ 4_ 4 O-G1_ 4_5 O-G1_ 4_6 O-G1_ 4_7 O-G1_ 4_8 O-G1_ 4_9 O-G1_ 4_10 c;;· d'analyse .......
('::>
Minéral uraninite uraninite uraninite uraninite uraninite uraninite uraninite uraninite uraninite uraninite uraninite uraninite uraninite f} Si02 0,287 0,235 0,380 0,295 0,245 0,186 0,252 0,255 0,352 0,210 0,265 0,359 0,278 "" S03 n.d. n.d. n.d. n.d. n.d. n.d. n.d. n.d. n.d. 0,157 n.d. n.d. n.d. ('::>,
CaO 1,268 1,096 2,208 1,043 1,095 1,002 0,144 0,976 1,319 0,935 1,448 1,192 0,913 <:0 ;:s-.
Ti02 n.d. n.d. n.d. n.d. n.d. n.d. n.d. n.d. n.d. n.d. n.d. n.d. n.d. l:::i FeO n.d. 0,295 0,298 n.d. n.d. n.d. n.d. n.d. n.d. n.d. n.d. n.d. n.d.
;::; :::::-.
As203 n.d. 0,507 n.d. n.d. n.d. n.d. n.d. n.d. 0,413 0,448 n.d. 0,439 n.d. ....._ ....._ Y203 n.d. n.d. 0,293 n.d. n.d. n.d. n.d. n.d. n.d. n.d. 0,144 n.d. n.d. 0
;::; Ce203 n.d. n.d. n.d. n.d. n.d. n.d. 0,199 n.d. n.d. n.d. n.d. n.d. n.d. "" Gd203 n.d. n.d. n.d. n.d. n.d. n.d. n.d. n.d. n.d. n.d. n.d. n.d. n.d. ('::>
....... Yb203 n.d. n.d. n.d. n.d. n.d. n.d. n.d. n.d. n.d. n.d. n.d. n.d. n.d. ~
PbO 13,750 13,897 11,223 14,773 14,194 15,275 25,691 15,010 13,495 14,433 13,243 13,886 14,152 ('::>,
"" Th02 n.d. n.d. n.d. n.d. n.d. n.d. n.d. n.d. n.d. n.d. n.d. n.d. n.d. s::: ....._ U02 77,755 80,772 81,978 80,148 80,774 79,340 7,136 80,329 79,958 79,283 82,125 79,669 79,798 !S' Total 93,059 96,802 96,380 96,259 96,307 95,802 33,422 96,569 95,537 95,467 97,225 95,545 95,141 r::;-
Age (Ga) 1_,170 1,142 0,931 1,213 1,163 1,260 6,055 1,228 1,123 1,200 1,078 1,155 1,173 l:::i... l:::i-;::;
Tableau AIV-25- Compositions en% d'un cristal d'uraninite provenant de la minéralisation à la discordance de Shea Creek. Les âges chimiques sont calculés à l'aide de la [ formule de Suzuki et Adachi (1994). (n.d. =non détecté)
""
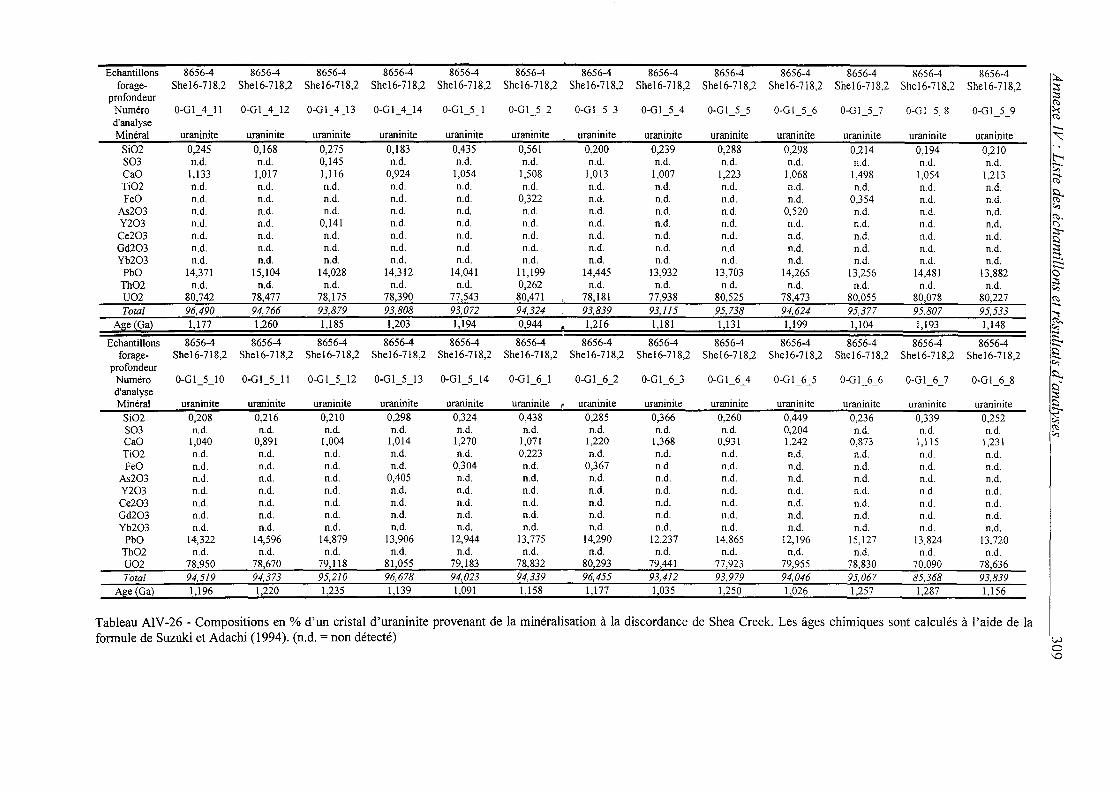
Echantillons 8656-4 8656-4 8656-4 8656-4 8656-4 8656-4 8656-4 8656-4 8656-4 8656-4 8656-4 8656-4 8656-4 ~ forage- She16-718,2 She 16-718,2 She16-718,2 She16-718,2 She16-718,2 She16-718,2 She 16-718,2 She16-718,2 She16-718,2 She16-718,2 She16-718,2 She16-718,2 She16-718,2 ~
profondeur ;:s ~
Numéro 0-Gl 4 Il 0-Gl 4 12 0-Gl 4 13 0-Gl 4 14 0-Gl 5 1 0-Gl 5 2 0-Gl 5 3 0-Gl 5 4 O-Gl_5_5 O-Gl_5_6 0-Gl_5_7 O-Gl_5_8 O-Gl_5_9 ~ -- -- -- -- -- -- -- -- ~ d'analyse ......, Minéral uraninite uraninite uraninite uraninite uraninite uraninite uraninite uraninite uraninite uraninite uraninite uraninite uraninite ~
Si02 0,245 0,168 0,275 0,183 0,435 0,561 0,200 0,239 0,288 0,298 0,214 0,194 0,210 t:"-< S03 n.d. n.d. 0,145 n.d. n.d. n.d. n.d. n.d. n.d. n.d. n.d. n.d. n.d. c;;·
CaO 1,133 1,017 1,116 0,924 1,054 1,508 1,013 1,007 1,223 1,068 1,498 1,054 1,213 ~ Ti02 n.d. n.d. n.d. n.d. n.d. n.d. n.d. n.d. n.d. n.d. n.d. n.d. n.d.
f} FeO n.d. n.d. n.d. n.d. n.d. 0,322 n.d. n.d. n.d. n.d. 0,354 n.d. n.d. As203 n.d. n.d. n.d. n.d. n.d. n.d. n.d. n.d. n.d. 0,520 n.d. n.d. n.d.
c,
~' Y203 n.d. n.d. 0,141 n.d. n.d. n.d. n.d. n.d. n.d. n.d. n.d. n.d. n.d. (")
Ce203 n.d. n.d. n.d. n.d. n.d. n.d. n.d. n.d. n.d. n.d. n.d. n.d. n.d. ;:s-. !::)
Gd203 n.d. n.d. n.d. n.d. n.d. n.d. n.d. n.d. n.d. n.d. n.d. n.d. n.d. ;:s ......
Yb203 n.d. n.d. n.d. n.d. n.d. n.d. n.d. n.d. n.d. n.d. n.d. n.d. n.d. -· ,._ PbO 14,371 15,104 14,028 14,312 14,041 11,199 14,445 13,932 13,703 14,265 13,256 14,481 13,882
,._ 0
Th02 n.d. n.d. n.d. n.d. n.d. 0,262 n.d. n.d. n.d. n.d. n.d. n.d. n.d. ;:s c,
U02 80,742 78,477 78,175 78,390 77,543 80,471 78,181 77,938 80,525 78,473 80,055 80,078 80,227 ~
Total 96,490 94,766 93,879 93,808 93,072 94,324 93,839 93,JJ5 95,738 94,624 95,377 95,807 ......
95,533 ...., A~e ~Gal 1,177 1,260 1,185 1,203 1,194 0,944 1,216 1,181 1,131 1,199 1,104 1,193 1,148 ~'
A c, :::
Echantillons 8656-4 8656-4 8656-4 8656-4 8656-4 8656-4 8656-4 8656-4 8656-4 8656-4 8656-4 8656-4 8656-4 ,._ ......
forage- Shel6-718,2 She 16-718,2 She16-718,2 Shel6-718,2 Shel6-718,2 She 16-718,2 Shel6-718,2 Shel6-718,2 She 16-718,2 Shel6-718,2 She16-718,2 Shel6-718,2 She16-718,2 !::) r::;-
profondeur !::)...
Numéro O-Gl_5_10 O-Gl_5_11 O-G1_5_12 O-Gl_5_13 O-Gl_5_14 O-Gl_6_1 O-Gl_6_2 O-Gl_6_3 O-Gl_6_4 O-Gl_6_5 O-G1_6_6 O-Gl_6_7 O-Gl_6_8 !::)"
d'analyse ;:s Minéral uraninite uraninite uraninite uraninite uraninite uraninite ~ uraninite uraninite uraninite uraninite uraninite uraninite uraninite !::) ,._
Si02 0,208 0,216 0,210 0,298 0,324 0,438 0,285 0,366 0,260 0,449 0,236 0,339 0,252 c, S03 n.d. n.d. n.d. n.d. n.d. n.d. n.d. n.d. n.d. 0,204 n.d. n.d. n.d. ~
c, CaO 1,040 0,891 1,004 1,014 1,270 1,071 1,220 1,368 0,931 1,242 0,873 1,115 1,231 Ti02 n.d. n.d. n.d. n.d. n.d. 0,223 n.d. n.d. n.d. n.d. n.d. n.d. n.d. Feü n.d. n.d. n.d. n.d. 0,304 n.d. 0,367 n.d. n.d. n.d. n.d. n.d. n.d.
As203 n.d. n.d. n.d. 0,405 n.d. n.d. n.d. n.d. n.d. n.d. n.d. n.d. n.d. Y203 n.d. n.d. n.d. n.d. n.d. n.d. n.d. n.d. n.d. n.d. n.d. n.d. n.d. Ce203 n.d. n.d. n.d. n.d. n.d. n.d. n.d. n.d. n.d. n.d. n.d. n.d. n.d. Gd203 n.d. n.d. n.d. n.d. n.d. n.d. n.d. n.d. n.d. n.d. n.d. n.d. n.d. Yb203 n.d. n.d. n.d. n.d. n.d. n.d. n.d. n.d. n.d. n.d. n.d. n.d. n.d.
Pbü 14,322 14,596 14,879 13,906 12,944 13,775 14,290 12,237 14,865 12,196 15,127 13,824 13,720 Th02 n.d. n.d. n.d. n.d. n.d. n.d. n.d. n.d. n.d. n.d. n.d. n.d. n.d. U02 78,950 78,670 79,118 81,055 79,183 78,832 80,293 79,441 77,923 79,955 78,830 70,090 78,636 Total 94,519 94,373 95,210 96,678 94,023 94,339 96,455 93,412 93,979 94,046 95,067 85,368 93,839
Age(Ga) 1,196 1,220 1,235 1,139 1,091 1,158 1,177 .. _1_,035_ 1,250 1,026 1,257 1,287 1,156
Tableau AIV-26- Compositions en% d'un cristal d'uraninite provenant de la minéralisation à la discordance de Shea Creek. Les âges chimiques sont calculés à l'aide de la formule de Suzuki et Adachi (1994). (n.d. =non détecté) w
0 '-D
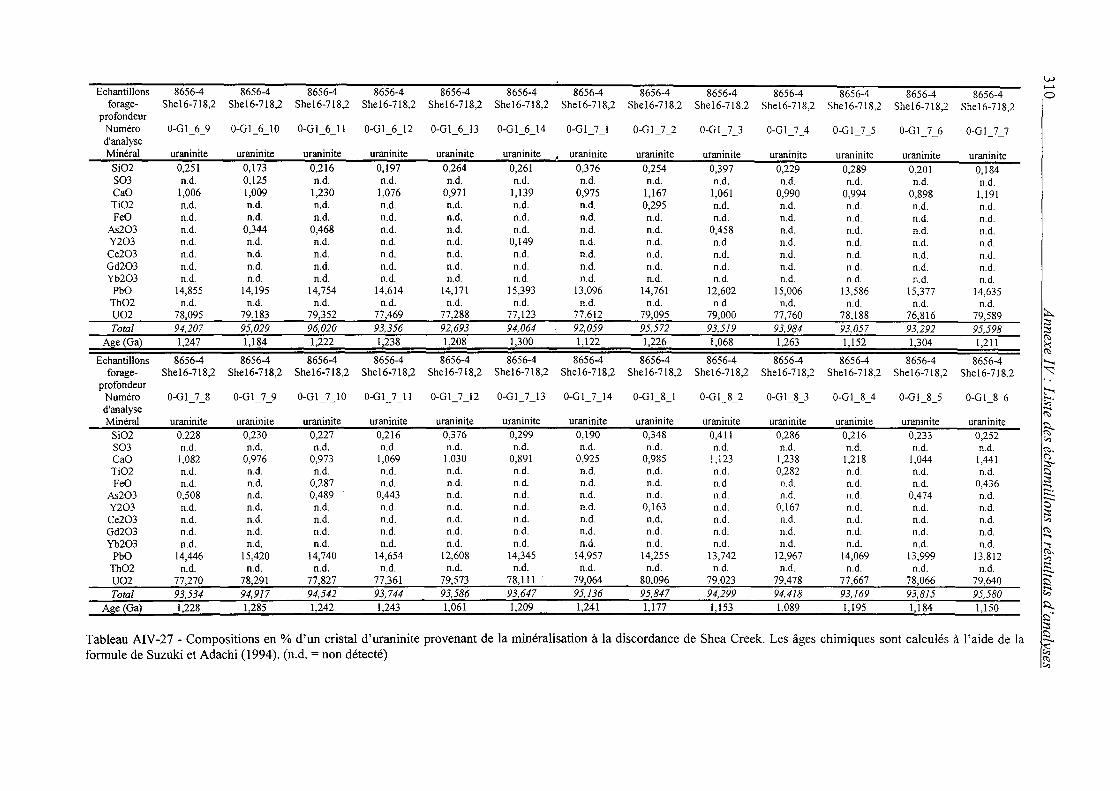
w Echantillons 8656-4 8656-4 8656-4 8656-4 8656-4 8656-4 8656-4 8656-4 8656-4 8656-4 8656-4
....... 8656-4 8656-4 0
forage- She 16-718,2 Shel6-7!8,2 Shel6-718,2 Shel6-7!8,2 Shel6-718,2 She 16-718,2 Shel6-718,2 She 16-718,2 Shel6-718,2 Shel6-7!8,2 She!6-718,2 Shel6-7!8,2 Shel6-718,2 profondeur
Numéro O-Gl_6_9 O-Gl_6_!0 0-Gl_6_11 O-Gl_6_12 O-Gl_6_13 O-Gl_6_14 d'analyse
O-Gl_7_1 O-Gl_7_2 O-G!_7_3 O-Gl_7_ 4 O-Gl_7_5 O-Gl_7_6 O-Gl_7_7
Minéral uraninite uraninite uraninite uraninite uraninite uraninite ~
uraninite uraninite uraninite uraninite uraninite uraninite uraninite Si02 0,251 0,173 0,216 0,197 0,264 0,261 0,376 0,254 0,397 0,229 0,289 0,201 0,184 S03 n.d. 0,125 n.d. n.d. n.d. n.d. n.d. n.d. n.d. n.d. n.d. n.d. n.d. CaO 1,006 1,009 1,230 1,076 0,971 1,139 0,975 1,167 1,061 0,990 0,994 0,898 1,191 Ti02 n.d. n.d. n.d. n.d. n.d. n.d. n.d. 0,295 n.d. n.d. n.d. n.d. n.d. FeO n.d. n.d. n.d. n.d. n.d. n.d. n.d. n.d. n.d. n.d. n.d. n.d. n.d.
As203 n.d. 0,344 0,468 n.d. n.d. n.d. n.d. n.d. 0,458 n.d. n.d. n.d. n.d. Y203 n.d. n.d. n.d. n.d. n.d. 0,149 n.d. n.d. n.d. n.d. n.d. n.d. n.d. Ce203 n.d. n.d. n.d. n.d. n.d. n.d. n.d. n.d. n.d. n.d. n.d. n.d. n.d. Gd203 n.d. n.d. n.d. n.d. n.d. n.d. n.d. n.d. n.d. n.d. n.d. n.d. n.d. Yb203 n.d. n.d. n.d. n.d. n.d. n.d. n.d. n.d. n.d. n.d. n.d. n.d. n.d.
PbO 14,855 14,195 14,754 14,614 14,171 15,393 13,096 14,761 12,602 15,006 13,586 15,377 14,635 Th02 n.d. n.d. n.d. n.d. n.d. n.d. n.d. n.d. n.d. n.d. n.d. n.d. n.d. U02 78,095 79,183 79,352 77,469 77,288 77,123 77,612 79,095 79,000 77,760 78,188 76,816 79,589 ~
Total 94,207 95,029 96,020 93,356 92,693 94,064 92,059 95,572 93,519 93,984 93,057 93,292 95,598 :::s :::s
A~e !Gal 1,247 1,184 1,222 1,238 1,208 1,300 1,122 1,226 1,068 1,263 1,152 1,304 1,211 (':>
~ (':>
Echantillons 8656-4 8656-4 8656-4 8656-4 8656-4 8656-4 8656-4 8656-4 8656-4 8656-4 8656-4 8656-4 8656-4 ....... forage- Shel6-718,2 Shel6-718,2 Shel6-718,2 She 16-718,2 Shel6-718,2 Shel6-718,2 Shel6-718,2 Shel6-718,2 She 16-718,2 She 16-718,2 She 16-718,2 Shel6-718,2 Shel6-7!8,2 ~
profondeur t:--< Numéro O-Gl_7_8 O-Gl_7_9 O-G1_7_10 0-Gl 7 Il O-Gl_7_12 O-Gl_7_13 O-G1_7_14 O-Gl_8_! O-Gl_8_2 O-Gl_8_3 O-Gl_8_4 O-Gl_8_5 O-G1_8_6 ...... "' d'analyse -.. (':>
Minéral uraninite uraninite uraninite uraninite uraninite uraninite uraninite uraninite uraninite uraninite uraninite uraninite uraninite ~ Si02 0,228 0,230 0,227 0,216 0,376 0,299 0,190 0,348 0,411 0,286 0,216 0,233 0,252 "' S03 n.d. n.d. n.d. n.d. n.d. n.d. n.d. n.d. n.d. n.d. n.d. n.d. n.d. (':>,
CaO 1,082 0,976 0,973 1,069 1,030 0,891 0,925 0,985 1,123 1,238 1,218 1,044 1,441 ~ ;:s-.
Ti02 n.d. n.d. n.d. n.d. n.d. n.d. n.d. n.d. n.d. 0,282 n.d. n.d. n.d. >::)
FeO n.d. n.d. 0,287 n.d. n.d. n.d. n.d. n.d. n.d. n.d. n.d. n.d. 0,436 :::s ::::-.
As203 0,508 n.d. 0,489 0,443 n.d. n.d. n.d. n.d. n.d. n.d. n.d. 0,474 n.d. --Y203 n.d. n.d. n.d. n.d. n.d. n.d. n.d. 0,163 n.d. 0,167 n.d. n.d. n.d. 0 :::s
Ce203 n.d. n.d. n.d. n.d. n.d. n.d. n.d. n.d. n.d. n.d. n.d. n.d. n.d. "' Gd203 n.d. n.d. n.d. n.d. n.d. n.d. n.d. n.d. n.d. n.d. n.d. n.d. n.d. (':> -.. Yb203 n.d. n.d. n.d. n.d. n.d. n.d. n.d. n.d. n.d. n.d. n.d. n.d. n.d. "!:
PbO 14,446 15,420 14,740 14,654 12,608 14,345 14,957 14,255 13,742 12,967 14,069 13,999 13,812 (':>,
"' Th02 n.d. n.d. n.d. n.d. n.d. n.d. n.d. n.d. n.d. n.d. n.d. n.d. n.d. ::.::! -U02 77,270 78,291 77,827 77,361 79,573 78,111 79,064 80,096 79,023 79,478 77,667 78,066 79,640 s Total 93,534 94,917 94,542 93,744 93,586 93,647 95,136 95,847 94,299 94,418 93,169 93,815 95,580 r;;-
Age (Ga) _1,228 1,285 1,242 1,243 1,061 1,209 1,241 1,177 1,153 1,089 1,195 1,184 1,150 $::)... >::)-
:::s Tableau AIV-27 -Compositions en% d'un cristal d'uraninite provenant de la minéralisation à la discordance de Shea Creek. Les âges chimiques sont calculés à l'aide de la [ formule de Suzuki et Adachi (1994). (n.d. =non détecté)
"'
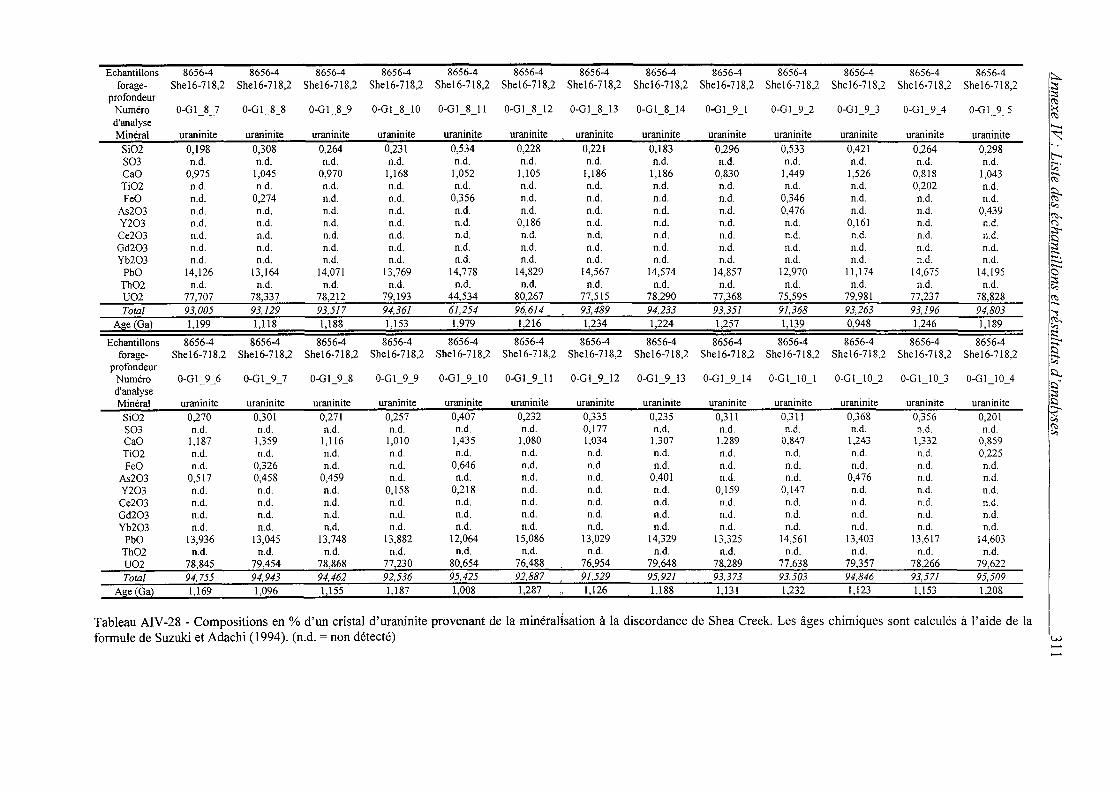
Echantillons 8656-4 8656-4 8656-4 8656-4 8656-4 8656-4 8656-4 8656-4 8656-4 8656-4 8656-4 8656-4 8656-4 ::t... forage- She 16-718,2 She16-718,2 She16-718,2 She16-718,2 She 16-718,2 She16-718,2 She16-718,2 She16-718,2 She16-718,2 She 16-718,2 She16-718,2 She16-718,2 She16-718,2 ~
profondeur ;:s ('!;)
Numéro O-G1_8_7 O-G1_8_8 O-G1_8_9 O-G1 8 10 O-G1_8_11 O-G1_8_12 O-G1_8_13 O-G1_8_14 O-Gl_9_1 O-Gl_9_2 0-Gl 9 3 O-Gl_9_4 O-Gl_9_5 ~ ('!;)
d'analyse "-< Minéral uraninite uraninite uraninite uraninite uraninite uraninite uraninite uraninite uraninite uraninite uraninite uraninite uraninite ~
Si02 0,198 0,308 0,264 0,231 0,534 0,228 0,221 0,183 0,296 0,533 0,421 0,264 0,298 t:--< S03 n.d. n.d. n.d. n.d. n.d. n.d. n.d. n.d. n.d. n.d. n.d. n.d. n.d. ....
CaO 0,975 1,045 0,970 1,168 1,052 1,105 1,186 1,186 0,830 1,449 1,526 0,818 1,043 c, -..
Ti02 n.d. n.d. n.d. n.d. n.d. n.d. n.d. n.d. n.d. n.d. n.d. 0,202 n.d. ('!;)
FeO n.d. 0,274 n.d. n.d. 0,356 n.d. n.d. n.d. n.d. 0,346 n.d. n.d. n.d. f} As203 n.d. n.d. n.d. n.d. n.d. n.d. n.d. n.d. n.d. 0,476 n.d. n.d. 0,439
c, ('!;),
Y203 n.d. n.d. n.d. n.d. n.d. 0,186 n.d. n.d. n.d. n.d. 0,161 n.d. n.d. ("')
Ce203 n.d. n.d. n.d. n.d. n.d. n.d. n.d. n.d. n.d. n.d. n.d. n.d. n.d. ;:::;.. $::)
Gd203 n.d. n.d. n.d. n.d. n.d. n.d. n.d. n.d. n.d. n.d. n.d. n.d. n.d. ~ -.. Yb203 n.d. n.d. n.d. n.d. n.d. n.d. n.d. n.d. n.d. n.d. n.d. n.d. n.d. .... ......
14,126 13,164 14,071 13,769 14,778 14,829 14,567 14,574 14,857 12,970 11,174 14,675 14,195 ......
PbO 0 Th02 n.d. n.d. n.d. n.d. n.d. n.d. n.d. n.d. n.d. n.d. n.d. n.d. n.d.
;:s c,
U02 77,707 78,337 78,212 79,193 44,534 80,267 77,515 78,290 77,368 75,595 79,981 77,237 78,828 ('!;)
94,361 61,254 96,614 93,489 94,233 91,368 93,263 93,196 ......
Total 93,005 93,129 93,517 93,351 94,803 ~
Age (Ga) 1,199 1,118 1,188 1,153 1,979 1,216 1,234 1,224 1,257 1,139 0,948 1,246 1,189 i;;-~
EchantilJons 8656-4 8656-4 8656-4 8656-4 8656-4 8656-4 8656-4 8656-4 8656-4 8656-4 8656-4 8656-4 8656-4 ...... forage- She 16-718,2 She16-718,2 She 16-718,2 She 16-718,2 She 16-718,2 She 16-718,2 She 16-718,2 She 16-718,2 Shel6-718,2 Shel6-718,2 She 16-718,2 She 16-718,2 Shel6-718,2 s
1;j profondeur
$::l... Numéro O-Gl_9_6 O-G1_9_7 O-Gl_9_8 O-Gl_9_9 O-Gl_9_10 O-Gl_9_11 O-Gl_9_12 O-G1_9_13 0-Gl_9_14 0-Gl_IO_I O-GI_l0_2 O-GI_I0_3 O-GI_I0_4 $::). d'analyse ;:s Minéral uraninite uraninite uraninite uraninite uraninite uraninite uraninite uraninite uraninite uraninite uraninite uraninite uraninite $::) ......
Si02 0,270 0,301 0,271 0,257 0,407 0,232 0,335 0,235 0,311 0,311 0,368 0,356 0,201 c, S03 n.d. n.d. n.d. n.d. n.d. n.d. 0,177 n.d. n.d. n.d. n.d. n.d. n.d. ('!;)
c, CaO 1,187 1,359 1,116 1,010 1,435 1,080 1,034 1,307 1,289 0,847 1,243 1,332 0,859 Ti02 n.d. n.d. n.d. n.d. n.d. n.d. n.d. n.d. n.d. n.d. n.d. n.d. 0,225 FeO n.d. 0,326 n.d. n.d. 0,646 n.d. n.d. n.d. n.d. n.d. n.d. n.d. n.d.
As203 0,517 0,458 0,459 n.d. n.d. n.d. n.d. 0,401 n.d. n.d. 0,476 n.d. n.d. Y203 n.d. n.d. n.d. 0,158 0,218 n.d. n.d. n.d. 0,159 0,147 n.d. n.d. n.d.
Ce203 n.d. n.d. n.d. n.d. n.d. n.d. n.d. n.d. n.d. n.d. n.d. n.d. n.d. Gd203 n.d. n.d. n.d. n.d. n.d. n.d. n.d. n.d. n.d. n.d. n.d. n.d. n.d. Yb203 n.d. n.d. n.d. n.d. n.d. n.d. n.d. n.d. n.d. n.d. n.d. n.d. n.d.
PbO 13,936 13,045 13,748 13,882 12,064 15,086 13,029 14,329 13,325 14,561 13,403 13,617 14,603 Th02 n.d. n.d. n.d. n.d. n.d. n.d. n.d. n.d. n.d. n.d. n.d. n.d. n.d. U02 78,845 79,454 78,868 77,230 80,654 76,488 76,954 79,648 78,289 77,638 79,357 78,266 79,622
Total 94,755 94,943 94,462 92,536 95,425 92,887 91,529 95,921 93,373 93,503 94,846 93,571 95,509
Alle ~Ga2 1,169 1,096 1,155 1,187 1,008 1,287 1,126 1,188 1,131 1,232 1,123 1,153 1,208
Tableau AIV-28- Compositions en% d'un cristal d'uraninite provenant de la minéralisation à la discordance de Shea Creek. Les âges chimiques sont calculés à l'aide de la formule de Suzuki et Adachi (1994 ). (n.d. = non détecté) w
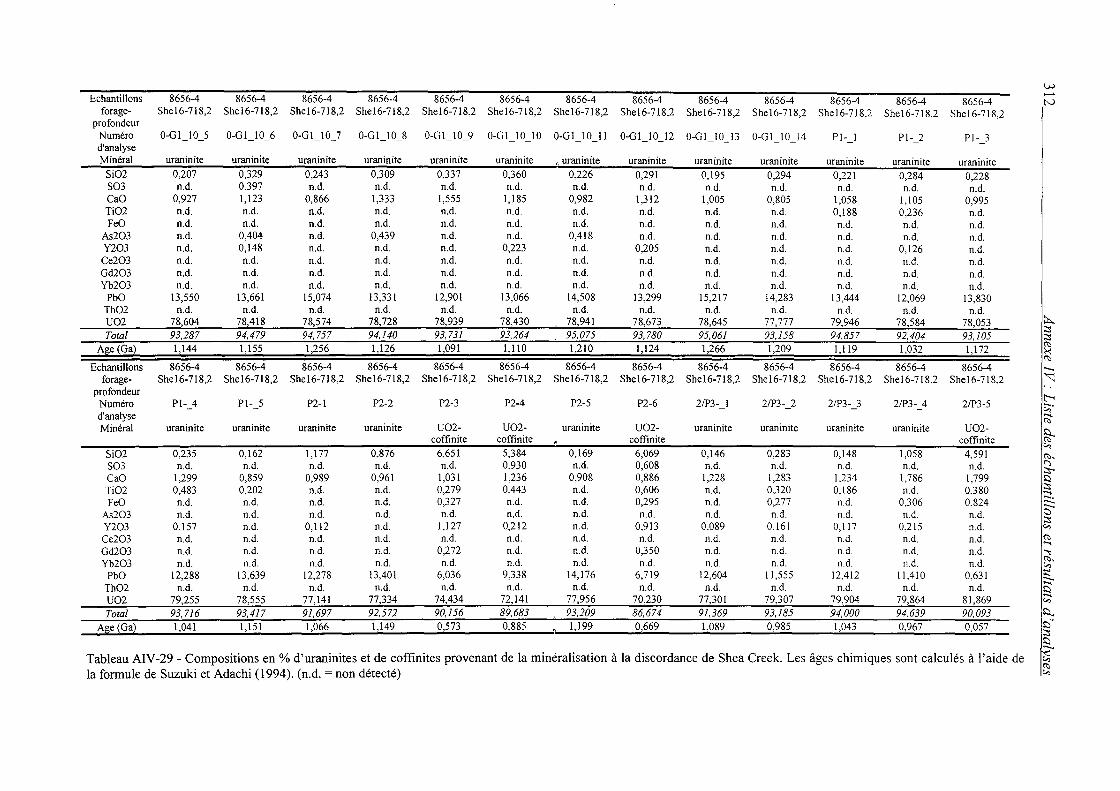
Echantillons forage-
profondeur Numéro d'analyse Minéral
Si02 S03 CaO Ti02 FeO
As203 Y203
Ce203 Gd203 Yb203
PbO Th02 U02 Total
Age (Ga)
Echantillons forage-
profondeur Numéro d'analyse Minéral
Si02 S03 CaO Ti02 FeO
As203 Y203 Ce203 Gd203 Yb203
PbO Th02 U02 Total
Age (Ga)
8656-4 8656-4 8656-4 8656-4 8656-4 8656-4 8656-4 8656-4 8656-4 8656-4 8656-4 8656-4 8656-4 Shel6-718,2 Shel6-718,2 Shel6-718,2 She16-718,2 Shel6-718,2 Shel6-718,2 Shel6-718,2 Shel6-718,2 Shel6-718,2 Shel6-718,2 Shel6-718,2 Shel6-718,2 Shel6-718,2
O-Gl_l0_5 O-Gl_l0_6 O-Gl_l0_7 O-Gl_l0_8 O-Gl_l0_9 0-Gl_lO_lO 0-Gl_lO_ll O-Gl_l0_12 O-Gl_l0_13 O-Gl_l0_14 Pl- 1 Pl-_2 Pl-_3
uraninite
0,207 n.d.
0,927 n.d. n.d. n.d. n.d. n.d. n.d. n.d.
13,550 n.d.
78,604 93,287 1,144
8656-4 Shel6-718,2
Pl- 4
uraninite
0,235 n.d.
1,299 0,483 n.d. n.d.
0,157 n.d. n.d. n.d.
12,288 n.d.
79,255 93,716 1,041
uraninite 0,329 0,397 1,123 n.d. n.d.
0,404 0,148 n.d. n.d. n.d.
13,661 n.d.
78,418 94,479 1,155
uraninite 0,243 n.d.
0,866 n.d. n.d. n.d. n.d. n.d. n.d. n.d.
15,074 n.d.
78,574 94,757 1,256
uraninite 0,309 n.d.
1,333 n.d. n.d.
0,439 n.d. n.d. n.d. n.d.
13,331 n.d.
78,728 94,140 1,126
uraninite 0,337 n.d.
1,555 n.d. n.d. n.d. n.d. n.d. n.d. n.d.
12,901 n.d.
78,939 93,731 1,091
uraninite 0,360 n.d.
1,185 n.d. n.d. n.d.
0,223 n.d. n.d. n.d.
13,066 n.d.
78,430 93,264 1,110
, uraninite 0,226 n.d.
0,982 n.d. n.d.
0,418 n.d. n.d. n.d. n.d.
14,508 n.d.
78,941 95,075 1,210
uraninite 0,291 n.d.
1,312 n.d. n.d. n.d.
0,205 n.d. n.d. n.d.
13,299 n.d.
78,673 93,780 1,124
uraninite 0,195 n.d.
1,005 n.d. n.d. n.d. n.d. n.d. n.d. n.d.
15,217 n.d.
78,645 95,061 1,266
uraninite 0,294 n.d.
0,805 n.d. n.d. n.d. n.d. n.d. n.d. n.d.
14,283 n.d.
77,777 93,158 1,209
uraninite 0,221 n.d.
1,058 0,188 n.d. n.d. n.d. n.d. n.d. n.d.
13,444 n.d.
79,946 94,857 1,119
uraninite 0,284 n.d.
1,105 0,236 n.d. n.d.
0,126 n.d. n.d. n.d.
12,069 n.d.
78,584 92,404 1,032
uraninite 0,228 n.d.
0,995 n.d. n.d. n.d. n.d. n.d. n.d. n.d.
13,830 n.d.
78,053 93,105 1,172
8656-4 8656-4 8656-4 8656-4 8656-4 8656-4 8656-4 8656-4 8656-4 8656-4 8656-4 8656-4 Shel6-718,2 Shel6-718,2 Shel6-718,2 Shel6-718,2 Shel6-718,2 Shel6-718,2 Shel6-718,2 Shel6-718,2 Shel6-718,2 Shel6-718,2 Shel6-718,2 Shel6-718,2
Pl-_5
uraninite
0,162 n.d.
0,859 0,202 n.d. n.d. n.d. n.d. n.d. n.d.
13,639 n.d.
78,555 93,417 1,151
P2-l
uraninite
1,177 n.d.
0,989 n.d. n.d. n.d.
0,112 n.d. n.d. n.d.
12,278 n.d.
77,141 91,697 1,066
P2-2
uraninite
0,876 n.d.
0,961 n.d. n.d. n.d. n.d. n.d. n.d. n.d.
13,401 n.d.
77,334 92,572 1,149
P2-3
U02-coffinite
6,651 n.d.
1,031 0,279 0,327 n.d.
1,127 n.d.
0,272 n.d.
6,036 n.d.
74,434 90,156 0,573
P2-4
U02-coffinite
5,384 0,930 1,236 0,443 n.d. n.d.
0,212 n.d. n.d. n.d.
9,338 n.d.
72,141 89,683 0,885
P2-5
uraninite
0,169 n.d.
0,908 n.d. n.d. n.d. n.d. n.d. n.d. n.d.
14,176 n.d.
77,956 93,209 1,199
P2-6
U02-coffinite
6,069 0,608 0,886 0,606 0,295 n.d.
0,913 n.d.
0,350 n.d.
6,719 n.d.
70,230 86,674 0,669
2/P3-_1
uraninite
0,146 n.d.
1,228 n.d. n.d. n.d.
0,089 n.d. n.d. n.d.
12,604 n.d.
77,301 91,369 1,089
2/P3-_2
uraninite
0,283 n.d.
1,283 0,320 0,277 n.d.
0,161 n.d. n.d. n.d.
11,555 n.d.
79,307 93,185 0,985
2/P3-_3
uraninite
0,148 n.d.
L234 0,186 n.d. n.d.
0,117 n.d. n.d. n.d.
12,412 n.d.
79,904 94,000 1,043
2/P3- 4
uraninite
1,058 n.d.
1,786 n.d.
0,306 n.d.
0,215 n.d. n.d. n.d.
11,410 n.d.
79,864 94,639 0,967
2/P3-5
U02-coffinite
4,591 n.d.
1,799 0,380 0,824 n.d. n.d. n.d. n.d. n.d.
0,631 n.d.
81,869 90,093 0,057
Tableau AIV-29- Compositions en% d'uraninites et de coffinites provenant de la minéralisation à la discordance de Shea Creek. Les âges chimiques sont calculés à l'aide de la formule de Suzuki et Adachi (1994). (n.d. =non détecté)
w _. N
~ ;:s ;:s
~ ........ ~
t--< c;;· ~
~ "' (1:), (0 ~ ~ ;:s :::::-. :::::::: a ~ (1:) ..... ""'!: (1:),
"' :;:: .._
~ ~ ~;:s ~ .._ v; (1:)
"'

Echantillons 8656-4 8656-4 8656-4 8656-4 8656-4 8656-4 8656-4 8656-4 8656-4 8656-4 8656-4 8656-4 8656-4 À forage- She16-718,2 She16-718,2 She16-718,2 She16-718,2 She 16-718,2 She16-718,2 She 16-718,2 She16-718,2 She16-718,2 She 16-718,2 She16-718,2 Shel6-718,2 She 16-718,2 ;:s
profondeur ;:s
Numéro 2/P3-6 2/P3-7 2/P3-8 2/P3-9 3/P4-_1 3/P4-_2 3/P4- 3 3/P4- 4 3/P4- 5 3/P4- 6 3/P4- 7 3/P4-_8 3/P4-_9 ~ (1)
d'analyse ......... Minéral U02-coffinite coffinite uraninite uraninite uraninite uraninite uraninite uraninite uraninite uraninite uraninite uraninite uraninite ~
Si02 7,126 10,748 0,362 0,439 0,138 0,078 0,188 0,088 0,549 0,124 0,163 0,156 0,166 t-< S03 n.d. n.d. n.d. n.d. n.d. n.d. n.d. n.d. n.d. n.d. n.d. n.d. 0,292 t;;· CaO 1,661 0,808 1,708 0,949 1,199 0,962 1,213 1,027 1,166 1,479 1,106 0,925 1,126 .....
(1) Ti02 0,707 0,706 0,459 n.d. n.d. n.d. n.d. n.d. n.d. n.d. n.d. n.d. n.d.
~ FeO 0,844 0,417 n.d. n.d. n.d. n.d. n.d. n.d. 0,296 n.d. n.d. n.d. n.d. As203 n.d. 0,649 n.d. n.d. n.d. n.d. n.d. n.d. 0,494 n.d. n.d. n.d. n.d.
v, (1),
Y203 n.d. 0,308 0,210 n.d. 0,093 n.d. 0,137 n.d. n.d. 0,150 n.d. n.d. n.d. (')
Ce203 n.d. n.d. n.d. n.d. n.d. n.d. n.d. n.d. n.d. n.d. n.d. n.d. n.d. ;::;-. >::l
Gd203 n.d. n.d. n.d. n.d. n.d. n.d. n.d. n.d. n.d. n.d. n.d. n.d. n.d. ;:s ..... Yb203 n.d. n.d. n.d. n.d. n.d. n.d. n.d. n.d. n.d. n.d. n.d. n.d. n.d. -· -...
PbO 1,074 0,554 12,535 12,358 12,921 14,470 12,901 14,291 13,464 12,483 14,180 13,969 13,946 -... 0
Th02 n.d. n.d. n.d. n.d. n.d. n.d. n.d. n.d. n.d. n.d. n.d. n.d. n.d. ;:s v,
U02 79,308 74,156 78,581 80,250 80,099 76,912 79,271 77,067 77,276 77,677 78,133 77,183 77,610 (1)
93,995 94,450 92,422 93,710 92,474 93,244 91,913 93,583 92,233 ....,.
Total 90,720 88,346 93,855 ' 93,140 "l
Age (Ga) 0,100 0,056 1,068 1,035 1,079 1,235 1,087 1,220 1,155 1,075 1,197 1,194 1,187 (1), v, ~
Echantillons 8656-4 8656-4 8656-4 8656-4 8656-4 8656-4 8656-4 8656-4 8656-4 8656-4 8656-4 8656-4 8656-4 -... forage- She 16-718,2 She 16-718,2 Shel6-718,2 Shel6-718,2 She 16-718,2 Shel6-718,2 Shel6-718,2 She 16-718,2 Shel6-718,2 She 16-718,2 Shel6-718,2 She 16-718,2 Shel6-718,2 B
~ profondeur
s::<... Numéro 3/P4-_IO 4/P5-_l 4/P5-_2 4/P5-_3 4/P5- 4 4/P5-_5 4/P5-_6 4/P5-_7 4/P5-_8 4/P5-_9 4/P5-_IO 5/P6-_l 51?6-_2 >::l-d'analyse ;:s Minéral uraninite uraninite uraninite uraninite U02- U02- U02- U02- uraninite uraninite U02- uraninite uraninite >::l -...
coffinite coffinite coffinite coffinite coffinite v, Si02 0,451 0,160 0,194 0,075 6,465 7,422 7,224 12,230 1,433 0,167 4,031 0,127 1,126 (1)
v, S03 n.d. n.d. n.d. n.d. n.d. n.d. n.d. n.d. n.d. n.d. 0,332 n.d. n.d. CaO 1,197 0,905 1,146 0,818 1,724 1,360 1,147 0,831 1,503 0,893 2,228 1,084 1,339 Ti02 0,289 n.d. n.d. n.d. 0,211 0,605 0,204 n.d. 0,601 0,261 0,214 n.d. 0,286 FeO 0,409 n.d. 0,294 n.d. 0,510 0,674 0,576 0,492 0,445 n.d. 0,819 n.d. 0,471
As203 0,504 n.d. n.d. n.d. n.d. n.d. n.d. 0,514 n.d. n.d. 0,455 n.d. n.d. Y203 n.d. n.d. n.d. n.d. n.d. 0,241 0,097 0,462 n.d. n.d. n.d. n.d. n.d. Ce203 n.d. n.d. n.d. n.d. n.d. n.d. n.d. n.d. n.d. n.d. n.d. n.d. n.d. Gd203 n.d. n.d. n.d. n.d. n.d. n.d. n.d. n.d. n.d. n.d. n.d. n.d. n.d. Yb203 n.d. n.d. n.d. n.d. n.d. n.d. n.d. n.d. n.d. n.d. n.d. n.d. n.d.
PbO 11,628 14,216 14,000 14,738 0,558 0,608 2,185 0,513 10,354 14,148 1,613 14,259 10,655 Th02 n.d. n.d. n.d. n.d. n.d. n.d. n.d. n.d. n.d. n.d. n.d. n.d. n.d. U02 78,551 78,139 79,705 78,071 79,536 79,235 77,994 72,278 80,873 78,207 74,705 77,279 80,029 Total 93,029 93,420 95,338 93,702 89,004 90,144 89,427 87,320 95,207 93,677 84,397 92,749 93,906
Age (Ga) 0,999 1,199 1,163 1,239 0,052 0,057 0,205 0,053 0,876 1,194 0,159 1,214 0,908
Tableau AIV-30- Compositions en% d'uraninites et de coffinites provenant de la minéralisation à la discordance de Shea Creek. Les âges chimiques sont calculés à l'aide de w la formule de Suzuki et Adachi (1994). (n.d. =non détecté) ,.......
w
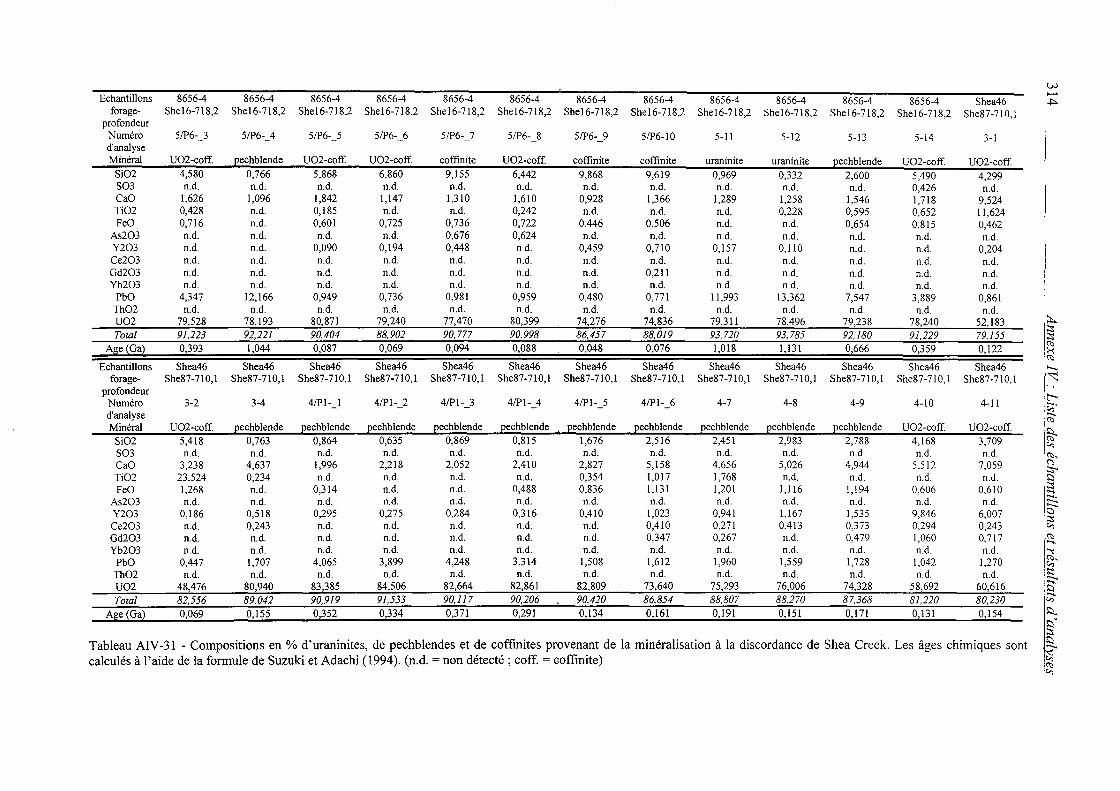
w Echantillons 8656-4 8656-4 8656-4 8656-4 8656-4 8656-4
------------- ....... 8656-4 8656-4 8656-4 8656-4 8656-4 8656-4 Shea46 ~
forage- She16-718,2 She16-718,2 She16-718,2 She16-718,2 She16-718,2 She16-718,2 profondeur
She16-718,2 She16-718,2 She 16-718,2 She16-718,2 She 16-718,2 She16-718,2 She87-710,1
Numéro 5/P6-_3 5/P6-_ 4 5/P6-_5 5/P6-_6 5/P6-_7 5/P6-_8 5/P6-_9 5/P6-10 5-11 5-12 5-13 5-14 3-1 d'analyse Minéral U02-coff. eechb1ende U02-coff. U02-coff. coffinite U02-coff. coffinite coffinite uraninite uraninite 12echb1ende U02-coff. U02-coff.
Si02 4,580 0,766 5,868 6,860 9,155 6,442 9,868 9,619 0,969 0,332 2,600 5,490 4,299 S03 n.d. n.d. n.d. n.d. n.d. n.d. n.d. n.d. n.d. n.d. n.d. 0,426 n.d. CaO 1,626 1,096 1,842 1,147 1,310 1,610 0,928 1,366 1,289 1,258 1,546 1,718 9,524 Ti02 0,428 n.d. 0,185 n.d. n.d. 0,242 n.d. n.d. n.d. 0,228 0,595 0,652 11,624 FeO 0,716 n.d. 0,601 0,725 0,736 0,722 0,446 0,506 n.d. n.d. 0,654 0,815 0,462
As203 n.d. n.d. n.d. n.d. 0,676 0,624 n.d. n.d. n.d. n.d. n.d. n.d. n.d. Y203 n.d. n.d. 0,090 0,194 0,448 n.d. 0,459 0,710 0,157 0,110 n.d. n.d. 0,204 Ce203 n.d. n.d. n.d. n.d. n.d. n.d. n.d. n.d. n.d. n.d. n.d. n.d. n.d. Gd203 n.d. n.d. n.d. n.d. n.d. n.d. n.d. 0,211 n.d. n.d. n.d. n.d. n.d. Yb203 n.d. n.d. n.d. n.d. n.d. n.d. n.d. n.d. n.d. n.d. n.d. n.d. n.d.
PbO 4,347 12,166 0,949 0,736 0,981 0,959 0,480 0,771 11,993 13,362 7,547 3,889 0,861 Th02 n.d. n.d. n.d. n.d. n.d. n.d. n.d. n.d. n.d. n.d. n.d. n.d. n.d. U02 79,528 78,193 80,871 79,240 77,470 80,399 74,276 74,836 79,311 78,496 79,238 78,240 52,183 ~
Total 91,223 92,221 90,404 88,902 90,777 90,998 86,457 88,019 93,720 93,785 92,180 91,229 79,155 ;:::: ;::::
Age (Ga) 0,393 1,044 0,087 0,069 0,094 0,088 0,048 0,076 1,018 1,131 0,666 0,359 0,122 ~ l-i ~
Echantillons Shea46 Shea46 Shea46 Shea46 Shea46 Shea46 Shea46 Shea46 Shea46 Shea46 Shea46 Shea46 Shea46 ....... forage- She87-710,1 She87-710,1 She87-710,1 She87-710,1 She87-710,1 She87-710,1 She87-710,1 She87-710,1 She87-710,1 She87-710,1 She87-710,1 She87-710,1 She87-710,1 ~
profondeur t--< Numéro 3-2 3-4 4/Pl-_1 4/Pl-_2 4/Pl-_3 4/P1-_4 4/Pl-_5 4/Pl-_6 4-7 4-8 4-9 4-10 4-11 t;;· d'analyse .......
~ Minéral U02-coff. eechblende eechb1ende eechblende eechb1ende 12echblende eechblende 12echblende eechblende eechblende 12echblende U02-coff. U02-coff.
~ Si02 5,418 0,763 0,864 0,635 0,869 0,815 1,676 2,516 2,451 2,983 2,788 4,168 3,709 "' S03 n.d. n.d. n.d. n.d. n.d. n.d. n.d. n.d. n.d. n.d. n.d. n.d. n.d. ~-
CaO 3,238 4,637 1,996 2,218 2,052 2,410 2,827 5,158 4,656 5,026 4,944 5,512 7,059 ~ ;::::;...
Ti02 23,524 0,234 n.d. n.d. n.d. n.d. 0,354 1,017 1,768 n.d. n.d. n.d. n.d. >::)
FeO 1,268 n.d. 0,314 n.d. n.d. 0,488 0,836 1,131 1,201 1,116 1,194 0,606 0,610 ;:::: .......
As203 n.d. n.d. n.d. n.d. n.d. n.d. n.d. n.d. n.d. n.d. n.d. n.d. n.d. ..... ........ ........
Y203 0,186 0,518 0,295 0,275 0,284 0,316 0,410 1,023 0,941 1,167 1,535 9,846 6,007 a ;::::
Ce203 n.d. 0,243 n.d. n.d. n.d. n.d. n.d. 0,410 0,271 0,413 0,373 0,294 0,243 "' Gd203 n.d. n.d. n.d. n.d. n.d. n.d. n.d. 0,347 0,267 n.d. 0,479 1,060 0,717 ~ ....... Yb203 n.d. n.d. n.d. n.d. n.d. n.d. n.d. n.d. n.d. n.d. n.d. n.d. n.d. .....
PbO 0,447 1,707 4,065 3,899 4,248 3,314 1,508 1,612 1,960 1,559 1,728 1,042 1,270 ~-"' Th02 n.d. n.d. n.d. n.d. n.d. n.d. n.d. n.d. n.d. n.d. n.d. n.d. n.d. :::: ........
U02 48,476 80,940 83,385 84,506 82,664 82,861 82,809 73,640 75,293 76,006 74,328 58,692 60,616 s Total 82,556 89,042 90,919 91,533 90,117 90,206 90,420 86,854 88,807 88,270 87,368 81,220 80,230 ;;;;-
Age (Ga) 0,069 _0,155 0,352 0,334 0,371 0,291 0,134 0,161 0,191 0,151 0,171 0,131 -0,154 >:l... >::)-;::::
Tableau AIV -31 - Compositions en % d'uraninites, de pechblendes et de coffinites provenant de la minéralisation à la discordance de Shea Cree k. Les âges chimiques sont t calculés à l'aide de la formule de Suzuki et Adachi (1994). (n.d. =non détecté; coff. = coffinite)
"'

Echantillons Shea46 Shea46 Shea46 Shea46 Shea46 Shea46 Shea46 Shea46 Shea46 Shea46 Shea46 Shea46 Shea46 ~ forage- She87-710,1 She87-710,1 She87-710,1 She87 -710,1 She87-710,1 She87 -710,1 She87-710,1 She87-710,1 She87-710,1 She87-710,1 She87-710,1 She87-710,1 She87-710,1 :::s
profondeur :::s Numéro 4-12 4-13 5-1 5-2 5-3 5-4 7-1 7-2 7-3 7-4 7-5 7-6 7-7 ~ d'analyse
('Il
"""" Minéral U02- U02- pechblende pechblende U02- U02- U02- U02- U02- U02- pechblende pechblende pechblende ~ coffinite coffinite coffinite coffinite coffinite coffinite coffinite coffinite
Si02 5,720 6,421 3,200 2,205 6,879 5,227 5,138 4,701 5,651 4,718 0,988 1,229 1,173 t-< r::;·
S03 n.d. n.d. n.d. n.d. n.d. n.d. n.d. n.d. n.d. n.d. n.d. n.d. n.d. -.. CaO 5,460 5,281 6,085 8,922 4,953 5,789 5,166 5,526 6,529 5,339 3,494 2,067 3,146
('Il
Ti02 n.d. n.d. 0,700 n.d. 0,460 0,442 n.d. 0,519 6,128 4,469 0,629 1,450 2,048 ~ FeO n.d. n.d. 0,443 0,334 n.d. 0,406 0,464 0,550 n.d. 0,531 n.d. 0,638 0,689
<:.., \'Il,
As203 n.d. n.d. n.d. n.d. n.d. n.d. n.d. n.d. n.d. n.d. n.d. n.d. n.d. (")
Y203 13,603 14,092 4,309 0,319 17,455 14,324 0,875 0,701 0,575 0,615 0,508 0,453 0,505 ;::;... 1::)
Ce203 0,172 0,181 0,407 0,269 0,193 0,351 0,297 0,348 0,427 0,380 0,188 0,206 0,277 :::s -.. Gd203 1,298 1,406 0,551 0,232 1,707 1,407 0,345 0,355 0,290 0,249 n.d. n.d. n.d. -· ..._ Yb203 0,416 0,384 n.d. n.d. n.d. n.d. n.d. n.d. n.d. n.d. n.d. n.d. n.d.
..._ 0
PbO 0,756 0,617 1,384 2,769 0,299 0,783 0,976 1,243 1,925 1,885 1,670 1,094 1,089 :::s <:..,
Th02 n.d. n.d. n.d. n.d. n.d. n.d. n.d. n.d. 0,523 0,308 n.d. n.d. n.d. ('Il
U02 47,871 45,699 64,575 66,908 34,340 48,160 69,802 69,760 63,880 70,707 81,643 81,684 78,427 -.. ""'!
Total 75,296 74,081 81,655 81,958 66,286 76,889 83,062 83,704 85,928 89,201 89,121 88,820 87,352 ~' Ajle ~Gal 0,117 0,100 0,158 0,301 0,065 0,120 0,104 0,132 0,220 0,195 0,151 0,099 0,103 :::: ..._
Echantillons Shea46 Shea46 Shea46 Shea46 Shea46 Shea46 Shea46 Shea46 Shea46 Shea46 Shea46 Shea46 Shea46 B' forage- She87-710,1 She87-710,1 She87-710,1 She87-710,1 She87-710,1 She87 -710,1 She87-710,1 She87-710,1 She87-710,1 She87-710,1 She87-710,1 She87-710,1 She87-710,1
;;;-t:l... profondeur 1::)-
Numéro 7-8 7-9 7-10 7-11 7-12 7-13 7-14 7-15 10-1 10-2 10-3 10-4 10-5 :::s d'analyse 1::) ..._ Minéral eechblende eechblende eechblende eechblende eechblende eechblende • eechblende U02-coff. eechblende eechblende eechblende eechblende U02-coff <:..,
Si02 1,085 0,494 0,683 0,664 1,542 2,805 2,860 3,771 0,695 1,712 2,712 2,031 3,515 ('Il <:..,
S03 n.d. n.d. n.d. n.d. n.d. n.d. n.d. n.d. n.d. n.d. n.d. n.d. n.d. CaO 3,268 1,802 1,819 1,738 3,570 3,624 4,447 5,355 2,058 4,669 6,038 6,828 6,002 Ti02 1,938 1,444 0,466 0,429 n.d. n.d. n.d. 3,955 n.d. 2,447 3,793 0,289 4,323 FeO 0,666 0,465 n.d. n.d. 1,000 0,820 0,453 0,493 n.d. 0,640 0,712 0,471 0,636
As203 n.d. n.d. n.d. n.d. n.d. n.d. n.d. n.d. n.d. n.d. n.d. n.d. n.d. Y203 0,474 0,117 0,240 0,266 0,515 0,914 1,034 0,600 0,243 0,627 0,625 1,512 0,604
Ce203 0,205 n.d. n.d. n.d. 0,172 0,411 0,347 0,293 n.d. 0,303 n.d. 0,212 0,377 Gd203 0,214 n.d. n.d. n.d. n.d. 0,330 0,395 n.d. n.d. n.d. n.d. 0,394 n.d. Yb203 n.d. n.d. n.d. n.d. n.d. n.d. n.d. n.d. n.d. n.d. n.d. n.d. n.d.
PbO 1,205 2,854 3,749 3,575 1,120 1,337 1,150 1,867 3,891 1,330 1,869 1,196 1,978 Th02 n.d. n.d. n.d. n.d. n.d. n.d. n.d. 0,342 n.d. n.d. n.d. n.d. n.d. U02 79,494 86,054 84,626 85,152 80,040 78,972 77,287 69,767 83,814 76,144 72,051 72,653 70,893 Total 88,549 93,230 91,584 91,825 87,960 89,211 87,973 86,443 90,700 87,870 87,799 85,587 88,328
Age (Ga) 0,112 0,242 0,321 0,305 0,104 0,125 0,110 0,196 0,336 0,129 0,191 0,122 0,205
Tableau AIV-32- Compositions en% d'uraninites, de pechblendes et de coffinites provenant de la minéralisation à la discordance de Shea Creek. Les âges chimiques sont w calculés à l'aide de la formule de Suzuki et Adachi (1994). (n.d. =non détecté; coff = coffinite) ........
Vl
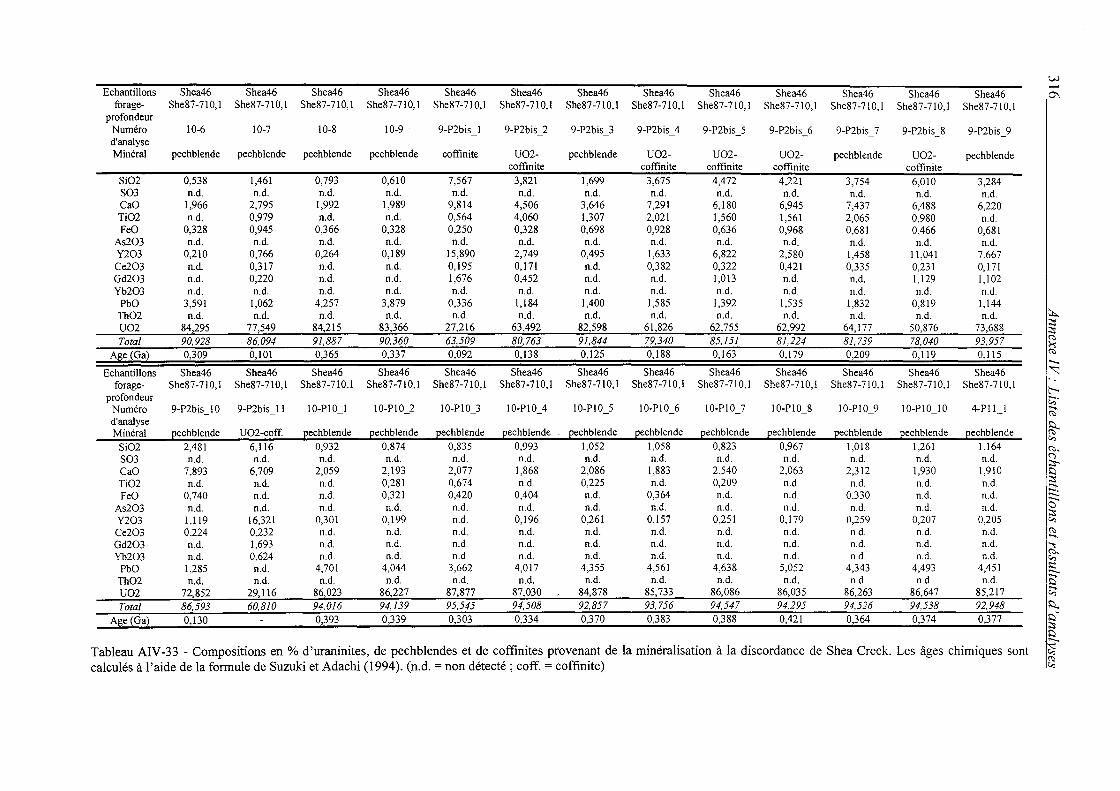
V-l
Echantillons Shea46 Shea46 Shea46 Shea46 Shea46 Shea46 Shea46 _.
Shea46 Shea46 Shea46 Shea46 Shea46 Shea46 0\ forage- She87-710,1 She87-710,1 She87-71 0,1 She87-710,1 She87-710,1 She87-710,1 She87-710,1 She87-710,1 She87-710,1 She87-710,1 She87-710,1 She87-710,1 She87-71 0,1
profondeur Numéro 10-6 10-7 10-8 10-9 9-P2bis 1 9-P2bis_2 9-P2bis_3 9-P2bis_4 9-P2bis_5 9-P2bis_6 9-P2bis_7 9-P2bis_8 9-P2bis_9 d'analyse Minéral pechblende pechblende pechblende pechblende coffinite U02- pechblende U02- U02- U02- pechblende U02- pechblende
coffinite coffinite coffinite coffinite coffinite Si02 0,538 1,461 0,793 0,610 7,567 3,821 1,699 3,675 4,472 4,221 3,754 6,010 3,284 S03 n.d. n.d. n.d. n.d. n.d. n.d. n.d. n.d. n.d. n.d. n.d. n.d. n.d. CaO 1,966 2,795 1,992 1,989 9,814 4,506 3,646 7,291 6,180 6,945 7,437 6,488 6,220 Ti02 n.d. 0,979 n.d. n.d. 0,564 4,060 1,307 2,021 1,560 1,561 2,065 0,980 n.d. FeO 0,328 0,945 0,366 0,328 0,250 0,328 0,698 0,928 0,636 0,968 0,681 0,466 0,681
As203 n.d. n.d. n.d. n.d. n.d. n.d. n.d. n.d. n.d. n.d. n.d. n.d. n.d. Y203 0,210 0,766 0,264 0,189 15,890 2,749 0,495 1,633 6,822 2,580 1,458 11,041 7,667 Ce203 n.d. 0,317 n.d. n.d. 0,195 0,171 n.d. 0,382 0,322 0,421 0,335 0,231 0,171 Gd203 n.d. 0,220 n.d. n.d. 1,676 0,452 n.d. n.d. 1,013 n.d. n.d. 1,129 1,102 Yb203 n.d. n.d. n.d. n.d. n.d. n.d. n.d. n.d. n.d. n.d. n.d. n.d. n.d.
PbO 3,591 1,062 4,257 3,879 0,336 1,184 1,400 1,585 1,392 1,535 1,832 0,819 1,144 Th02 n.d. n.d. n.d. n.d. n.d. n.d. n.d. n.d. n.d. n.d. n.d. n.d. n.d. ~
U02 84,295 77,549 84,215 83,366 27,216 63,492 82,598 61,826 62,755 62,992 64,177 50,876 73,688 ;:s ;:s
Total 90,928 86,094 91,887 90,360 63,509 80,763 91,844 79,340 85,151 81,224 81,739 78,040 93,957 (1:>
?--: Alle ~Gal 0,309 0,101 0,365 0,337 0,092 0,138 0,125 0,188 0,163 0,179 0,209 0,119 0,115 (1:>
........ Echantillons Shea46 Shea46 Shea46 Shea46 Shea46 Shea46 Shea46 Shea46 Shea46 Shea46 Shea46 Shea46 Shea46 ~
forage- She87 -710,1 She87-710,1 She87-710,1 She87-710,J She87-710,1 She87-710,1 She87-710,1 She87-710,1 She87-710,l She87-710,1 She87-710,1 She87-710,1 She87-710,1 t'-<
profondeur c;;· Numéro 9-P2bis_l0 9-P2bis_ll !O-PIO_! 10-Pl0_2 10-Pl0_3 10-PJ0_4 10-Pl0_5 10-Pl0_6 JO-Pl0_7 10-Pl0_8 10-Pl0_9 10-PIO_IO 4-Pll_l ......
(1:>
d'analyse ~ Minéral pechblende U02-coff. pechblende pechblende pechblende pechblende pechblende pechblende pechblende pechblende pechblende pechblende pechblende
"' Si02 2,481 6,116 0,932 0,874 0,835 0,993 1,052 1,058 0,823 0,967 1,018 1,261 1,164 (1:>,
S03 n.d. n.d. n.d. n.d. n.d. n.d. n.d. n.d. n.d. n.d. n.d. n.d. n.d. (") ;:s..
CaO 7,893 6,709 2,059 2,193 2,077 1,868 2,086 1,883 2,540 2,063 2,312 1,930 1,910 l:l Ti02 n.d. n.d. n.d. 0,281 0,674 n.d. 0,225 n.d. 0,209 n.d. n.d. n.d. n.d.
;:s ......
FeO 0,740 n.d. n.d. 0,321 0,420 0,404 n.d. 0,364 n.d. n.d. 0,330 n.d. n.d. ..... --As203 n.d. n.d. n.d. n.d. n.d. n.d. n.d. n.d. n.d. n.d. n.d. n.d. n.d. a ;:s
Y203 1,119 16,321 0,301 0,199 n.d. 0,196 0,261 0,157 0,251 0,179 0,259 0,207 0,205 "' Ce203 0,224 0,232 n.d. n.d. n.d. n.d. n.d. n.d. n.d. n.d. n.d. n.d. n.d. (1:> ......
Gd203 n.d. 1,693 n.d. n.d. n.d. n.d. n.d. n.d. n.d. n.d. n.d. n.d. n.d. "'l
Yb203 n.d. 0,624 n.d. n.d. n.d. n.d. n.d. n.d. n.d. n.d. n.d. n.d. n.d. ~-PbO 1,285 n.d. 4,701 4,044 3,662 4,017 4,355 4,561 4,638 5,052 4,343 4,493 4,451 ~ -Th02 n.d. n.d. n.d. n.d. n.d. n.d. n.d. n.d. n.d. n.d. n.d. n.d. n.d. s U02 72,852 29,116 86,023 86,227 87,877 87,030 84,878 85,733 86,086 86,035 86,263 86,647 85,217 ;;;-Total 86,593 60,810 94,016 94,139 95,545 94,508 92,857 93,756 94,547 94,295 94,526 94,538 92,948 l:l..
Age (Ga) __ Q,130 0,393 0,339 0,303 0,334 0,370 0,383 0,388 0,421 0,364 0,374 0,377 l:l-;:s l:l -Tableau AIV-33 -Compositions en% d'uraninites, de pechblendes et de coffinites provenant de la minéralisation à la discordance de Shea Creek. Les âges chimiques sont ~ calculés à l'aide de la formule de Suzuki et A dac hi (1994 ). (n.d. = non détecté ; coff. = coffinite)
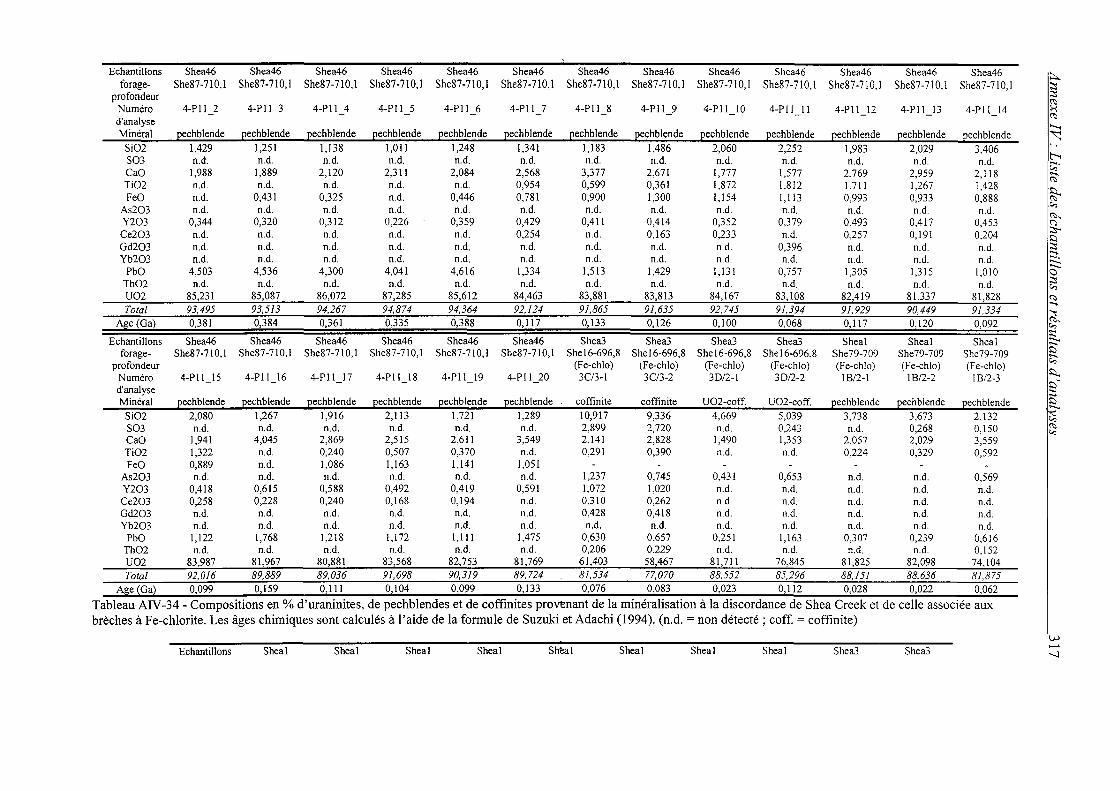
Echantillons Shea46 Shea46 Shea46 Shea46 Shea46 Shea46 Shea46 Shea46 Shea46 Shea46 Shea46 Shea46 Shea46 À forage- She87-710,1 She87-710,1 She87-710,1 She87-710,1 She87 -710,1 She87 -710,1 She87-710,1 She87-710,1 She87 -710,1 She87-710,1 She87-710,1 She87-710,1 She87 -710,1 ;:::::
profondeur ;:s (';)
Numéro 4-Pll 2 4-Pll 3 4-Pll 4 4-Pll 5 4-Pll 6 4-Pll 7 4-Pll 8 4-Pll_9 4-Pll_lO 4-Pll Il 4-Pll 12 4-Pll_13 4-Pll 14 ~ - - - - - - - (';) d'analyse ....., Minéral Eechblende Eechblende Eechblende Eechblende Eechblende Eechblende Eechblende Eechblende Eechblende Eechblende Eechblende Eechblende Eechblende ~
Si02 1,429 1,251 1,138 1,011 1,248 1,341 1,183 1,486 2,060 2,252 1,983 2,029 3,406 S03 n.d. n.d. n.d. n.d. n.d. n.d. n.d. n.d. n.d. n.d. n.d. n.d. n.d. t-< ..... CaO 1,988 1,889 2,120 2,311 2,084 2,568 3,377 2,671 1,777 1,577 2,769 2,959 2,118 "" ..... Ti02 n.d. n.d. n.d. n.d. n.d. 0,954 0,599 0,361 1,872 1,812 1,711 1,267 1,428
(';)
FeO n.d. 0,431 0,325 n.d. 0,446 0,781 0,900 1,300 1,154 1,113 0,993 0,933 0,888 ~ As203 n.d. n.d. n.d. n.d. n.d. n.d. n.d. n.d. n.d. n.d. n.d. n.d. n.d. "" (';), Y203 0,344 0,320 0,312 0,226 0,359 0,429 0,411 0,414 0,352 0,379 0,493 0,417 0,453 ~
Ce203 n.d. n.d. n.d. n.d. n.d. 0,254 n.d. 0,163 0,233 n.d. 0,257 0,191 0,204 ::::;... ~
Gd203 n.d. n.d. n.d. n.d. n.d. n.d. n.d. n.d. n.d. 0,396 n.d. n.d. n.d. ;::::: ..... Yb203 n.d. n.d. n.d. n.d. n.d. n.d. n.d. n.d. n.d. n.d. n.d. n.d. n.d. ..... .......
PbO 4,503 4,536 4,300 4,041 4,616 1,334 1,513 1,429 1,131 0,757 1,305 1,315 1,010 ....... 0
Th02 n.d. n.d. n.d. n.d. n.d. n.d. n.d. n.d. n.d. n.d. n.d. n.d. n.d. ;:s
"" U02 85,231 85,087 86,072 87,285 85,612 84,463 83,881 83,813 84,167 83,108 82,419 81,337 81,828 (';)
Total 93,495 93,513 94,267 94,874 94,364 92,124 91,865 91,635 92,745 91,394 91,929 90,449 91,334 ..... ~
~e!Ga) 0,381 0,384 0,361 0,335 0,388 0,117 0,133 0,126 0,100 0,068 0,117 0,120 0,092 (';),
"" ::: Echantillons Shea46 Shea46 Shea46 Shea46 Shea46 Shea46 Shea3 Shea3 Shea3 Shea3 Sheal Sheal Sheal .......
forage- She87-710,1 She87-710,1 She87-710,1 She87-710,1 She87-71 0,1 She87-71 0,1 She 16-696,8 She 16-696,8 She 16-696,8 She 16-696,8 She79-709 She79-709 She79-709 l3" profondeur (Fe-chio) (Fe-chio) (Fe-chio) (Fe-chio) (Fe-chio) (Fe-chio) (Fe-chio)
1:j
Numéro 4-Pl1_15 4-Pll_l6 4-Pll_l7 4-Pll_l8 4-Pll_l9 4-Pll_20 3C/3-l 3C/3-2 30/2-1 30/2-2 18/2-1 18/2-2 1 B/2-3 ~ ~-
d'analyse ;:s Minéral Eechblende pechblende Eechblende Eechblende Eechblende Eechblende coffinite coffinite U02-coff. U02-coff. Eechblende Eechblende Eechblende ~ .......
Si02 2,080 1,267 1,916 2,113 1,721 1,289 10,917 9,336 4,669 5,039 3,738 3,673 2.132 "" S03 n.d. n.d. n.d. n.d. n.d. n.d. 2,899 2,720 n.d. 0,243 n.d. 0,268 0,150 (';)
"" CaO 1,941 4,045 2,869 2,515 2,611 3,549 2,141 2,828 1,490 1,353 2,057 2,029 3,559 Ti02 1,322 n.d. 0,240 0,507 0,370 n.d. 0,291 0,390 n.d. n.d. 0,224 0,329 0,592 FeO 0,889 n.d. 1,086 1,163 1,141 1,051
As203 n.d. n.d. n.d. n.d. n.d. n.d. 1,237 0,745 0,431 0,653 n.d. n.d. 0,569 Y203 0,418 0,615 0,588 0,492 0,419 0,591 1,072 1,020 n.d. n.d. n.d. n.d. n.d. Ce203 0,258 0,228 0,240 0,168 0,194 n.d. 0,310 0,262 n.d. n.d. n.d. n.d. n.d. Gd203 n.d. n.d. n.d. n.d. n.d. n.d. 0,428 0,418 n.d. n.d. n.d. n.d. n.d. Yb203 n.d. n.d. n.d. n.d. n.d. n.d. n.d. n.d. n.d. n.d. n.d. n.d. n.d.
PbO 1,122 1,768 1,218 1,172 1,111 1,475 0,630 0,657 0,251 1,163 0,307 0,239 0,616 Th02 n.d. n.d. n.d. n.d. n.d. n.d. 0,206 0,229 n.d. n.d. n.d. n.d. 0,152 U02 83,987 81,967 80,881 83,568 82,753 81,769 61,403 58,467 81,711 76,845 81,825 82,098 74,104 Total 92,016 89,889 89,036 91,698 90,319 89,724 81,534 77,070 88,552 85,296 88,151 88,636 81,875
As:e ~Gal 0,099 0,159 0,111 0,104 0,099 0,133 0,076 0,083 0,023 0,112 0,028 0,022 0,062
Tableau AIV-34- Compositions en% d'uraninites, de pechblendes et de coffinites provenant de la minéralisation à la discordance de Shea Creek et de celle associée aux brèches à Fe-chlorite. Les âges chimiques sont calculés à l'aide de la formule de Suzuki et Adachi (1994). (n.d. =non détecté; coff. = coffinite)
1 w
Echantillons Sheal Sheal Sheal Sheal Shtal Sheal Sheal Sheal Shea3 Shea3 --....]
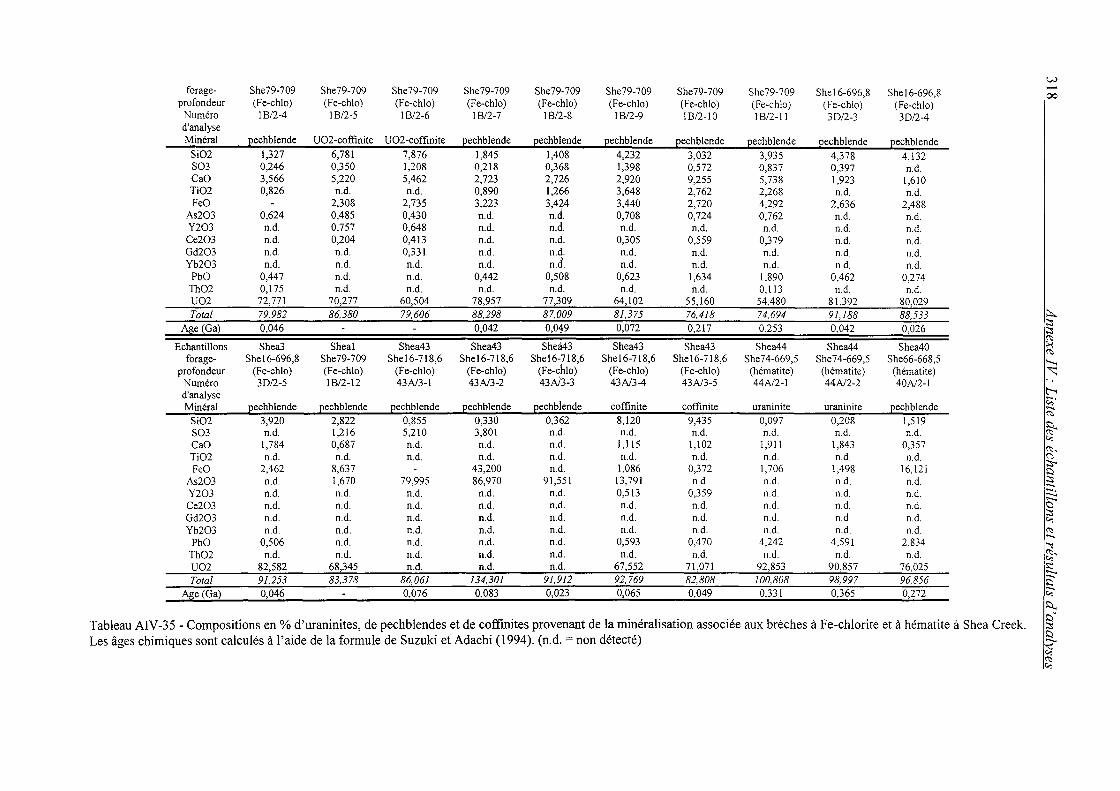
forage- She79-709 She79-709 She79-709 She79-709 She79-709 She79-709 She79-709 She79-709 She 16-696,8 She 16-696,8 profondeur (Fe-chio) (Fe-chio) (Fe-chio) (Fe-chio) (Fe-chio) (Fe-chio) (Fe-chio) (Fe-chio) (Fe-chio) (Fe-chio)
Numéro 18/2-4 18/2-5 18/2-6 18/2-7 18/2-8 18/2-9 18/2-10 18/2-11 30/2-3 30/2-4 d'analyse Minéral Eechblende U02-coffinite U02-coffinite Eechblende Eechblende Eechblende Eechblende Eechblende Eechblende Eechblende
Si02 1,327 6,781 7,876 1,845 1,408 4,232 3,032 3,935 4,378 4,132 S03 0,246 0,350 1,208 0,218 0,368 1,398 0,572 0,837 0,397 n.d. CaO 3,566 5,220 5,462 2,723 2,726 2,920 9,255 5,738 1,923 1,610 Ti02 0,826 n.d. n.d. 0,890 1,266 3,648 2,762 2,268 n.d. n.d. FeO 2,308 2,735 3,223 3,4?4 3,440 2,720 4,292 2,636 2,488
As203 0,624 0,485 0,430 n.d. n.d. 0,708 0,724 0,762 n.d. n.d. Y203 n.d. 0,757 0,648 n.d. n.d. n.d. n.d. n.d. n.d. n.d. Ce203 n.d. 0,204 0,413 n.d. n.d. 0,305 0,559 0,379 n.d. n.d. Gd203 n.d. n.d. 0,331 n.d. n.d. n.d. n.d. n.d. n.d. n.d. Yb203 n.d. n.d. n.d. n.d. n.d. n.d. n.d. n.d. n.d. n.d.
PbO 0,447 n.d. n.d. 0,442 0,508 0,623 1,634 1,890 0,462 0,274 Th02 0,175 n.d. n.d. n.d. n.d. n.d. n.d. 0,113 n.d. n.d. U02 72,771 70,277 60,504 78,957 77,309 64,102 55,160 54,480 81,392 80,029 Total 79,982 86,380 79,606 88,298 87,0.09 81,375 76,418 74,694 91,188 88,533
A!;le ~Ga) 0,046 0,042 0,049 0,072 0,217 0,253 0,042 0,026
Echantillons Shea3 Shea1 Shea43 Shea43 Shea43 Shea43 Shea43 Shea44 Shea44 Shea40 forage- She 16-696,8 She79-709 She 16-718,6 She16-718,6 She16-718,6 Shel6-718,6 She 16-718,6 She 7 4-669,5 She74-669,5 She66-668,5
profondeur (Fe-chio) (Fe-chio) (Fe-chio) (Fe-chio) (Fe-chio) (Fe-chio) (Fe-chio) (hématite) (hématite) (hématite) Numéro 30/2-5 18/2-12 43A/3-1 43A/3-2 43Ai3-3 43A/3-4 43A/3-5 44A/2-l 44A/2-2 40A/2-l d'analyse Minéral Eechblende Eechblende Eechblende Eechblende EechbÎende coffinite coffinite uraninite uraninite Eechblende
Si02 3,920 2,822 0,855 0,330 0,362 8,120 9,435 0,097 0,208 1,519 S03 n.d. 1,216 5,210 3,801 n.d. n.d. n.d. n.d. n.d. n.d. CaO 1,784 0,687 n.d. n.d. n.d. 1,115 1,102 1,911 1,843 0,357 Ti02 n.d. n.d. n.d. n.d. n.d. n.d. n.d. n.d. n.d. n.d. FeO 2,462 8,637 43,200 n.d. 1,086 0,372 1,706 1,498 16,121
As203 n.d. 1,670 79,995 86,970 91,551 13,791 n.d. n.d. n.d. n.d. Y203 n.d. n.d. n.d. n.d. n.d. 0,513 0,359 n.d. n.d. n.d. Ce203 n.d. n.d. n.d. n.d. n.d. n.d. n.d. n.d. n.d. n.d. Gd203 n.d. n.d. n.d. n.d. n.d. n.d. n.d. n.d. n.d. n.d. Yb203 n.d. n.d. n.d. n.d. n.d. n.d. n.d. n.d. n.d. n.d.
PbO 0,506 n.d. n.d. n.d. n.d. 0,593 0,470 4,242 4,591 2,834 Th02 n.d. n.d. n.d. n.d. n.d. n.d. n.d. n.d. n.d. n.d. U02 82,582 68,345 n.d. n.d. n.d. 67,552 71,071 92,853 90,857 76,025 Total 91,253 83,378 86,061 134,301 91,912 92,769 82,808 100,808 98,997 96,856
Age (Ga) 0,046 - 0,076 0,083 o,on__ - 0,065 0,049 0,331 0,365 0,272
Tableau AIV-35- Compositions en% d'uraninites, de pechblendes et de coffinites provenant de la minéralisation associée aux brèches à Fe-chlorite et à hématite à Shea Creek. Les âges chimiques sont calculés à l'aide de la formule de Suzuki et Adachi (1994). (n.d. =non détecté)
v.> ,....... 00
~ ;:s ;:s
~ ~
........ ~
t--< r;;· -.. ~
~ c..,
~' <:;, ;:s-. l:::i ;:s :::::-. ..._ ..._ 0
~ ~ -.. ~
~' :;:: ..._ B' c;;-l:::i... ~::i" ;:s l:::i ..._
"' ~ c..,
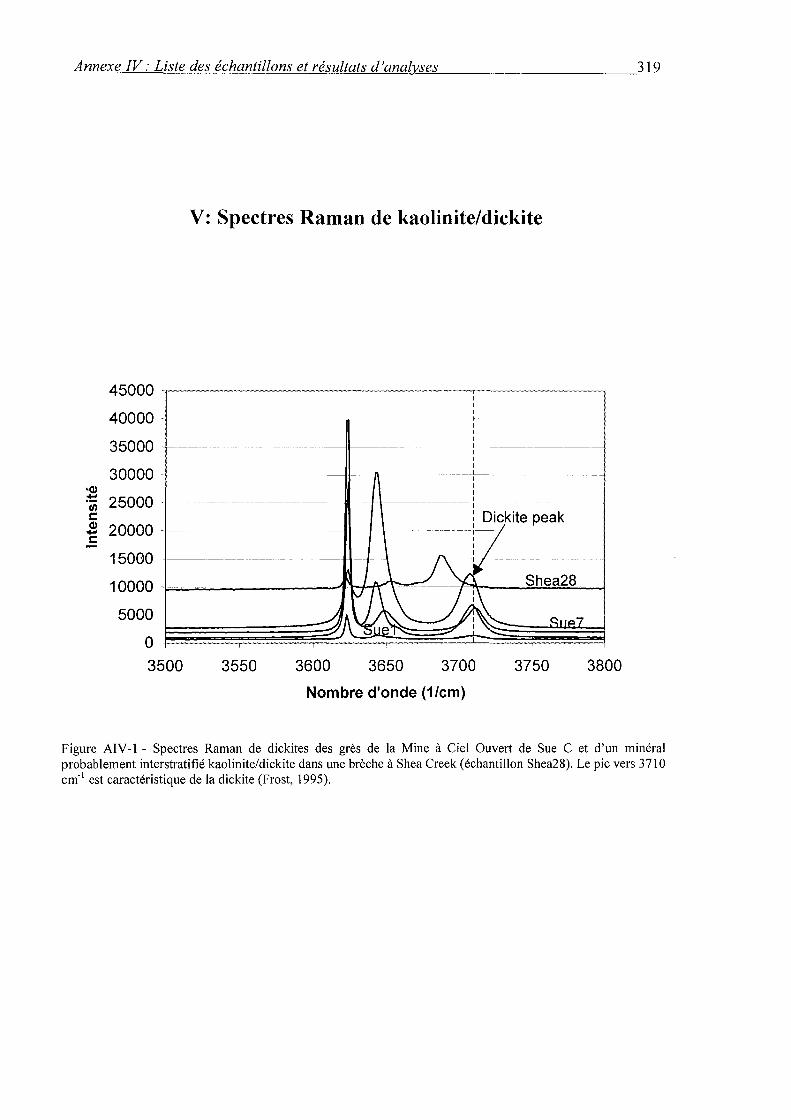
A~n~n~ex~e~I~V~:~L~is~t~e~d~e~s~é~ch~a~n~t~il~lo~n~s~e~t~r~é~su~l~ta~t~s~d~'a~n~a~l~v~se~s~---------------------319
•Q) :!: en r:: Q) ..... r::
45000
40000
35000
30000
25000
20000
15000
V: Spectres Raman de kaolinite/dickite
~~-~~----------~------------~---------,
1 1 1
-1-------------- -----------------------1----- ---- -----------
--------·-- ---- ----- ----·---------11
1 1 1
-- ----------L------------
1 1 1
______ L _____________ --1 1 1 1
1 1
- ---:-- ---------1 1 1 1
1 0000 -l===------~~ ........... -----1,l-f*-t="'~- Shea28__
5000 +----------------·--/1-.c-\-1
0~~~~~~~~~~~~ 3500 3550 3600 3650 3700 3750 3800
Nombre d'onde (1/cm)
Figure AIV -1 - Spectres Raman de dickites des grès de la Mine à Ciel Ouvert de Sue C et d'un minéral probablement interstratifié kaolinite/dickite dans une brèche à Shea Creek (échantillon Shea28). Le pic vers 3710 cm·1 est caractéristique de la dickite (Frost, 1995).

AUTORISATION DE SOUTENANCE DE THESE
DU DOCTORAT D~JJ:îïiJ~$lJI~T,UT NATIONAL
POLYTECHNIQUE DE LORRAINE . . .
" VU LES RAPPORTS ETABLIS PAR: Mo~sieur PAGEL Maurice, Professeur, UniversitéParis Sud XI, Orsay
Monsieur KYSER Kurt, Professeur, Qùe~!l's Univers~ty, Ontario· Canada
,.
Le Président del'Institùt :National Polytechnique de Làfl'aine, autorise
Monsiepr LORILLEUX Guillaume
à soutenir devant un jury de l'INSTITUT NATIONAL POLYTECHNIQUE DE LORRAINE, une thèse intitulée :
INSTITUT NATIONAL POLYTECHNIQUE DE LORRAINE
, NANCY BRABOIS
2, AVENUE DE LA FORET -DE -HAYE
"Les brèches associées aux gisements .d'uranium de type discordance du bassin BOITE POSTALE 3
A,.thab~$ca (Saskatchewan, Canada)''. F · · · 5 4 5 0 1 . :x.o·i·l~·,·· VANDŒUVRE CEDEX
en vue de l'obtention du. titre de :
DOCTEUR DEL 'INSTITUT NATIONAL POL YTECHNIQPE DE LORRAINE
.• Spécialité : « Géosciences »
Fait~ Vandoeuvre,J5:S
Le Président de l'I
TEL. 33/03.83.59.59.59 FAX. 33/03.83.59.59.55

Guillaume Lorilleux- 2001
Résumé : Les gisements d'uranium de type discordance du Bassin Athabasca (Canada) sont fréquemment associés à des corps de brèches qui forment l'encaissant et enveloppent la minéralisation dans des grès quartzeux. Afin de comprendre les mécanismes de formation de ces brèches et leur rôle dans la genèse de ces gisements d'uranium, les brèches associées aux minéralisations en U du prospect de Shea Creek et de la Mine à Ciel Ouvert de Sue C, et à la minéralisation en Y, terres rares etUde la zone de Maw ont été étudiées. La cartographie structurale et la modélisation 3D mettent en évidence le contrôle de la géométrie des brèches par des failles généralement inverses et graphiteuses dans le socle. L'étude des paragenèses minérales et les calculs d'âges chimiques U-Pb à Shea Creek mettent en évidence 3 phases de bréchification à sudoite-dravite, à Fe-chlorite et à hématite-sidérite. Elles sont respectivement contemporaines de 3 épisodes de réactivations tectoniques et/ou de surrection du bassin entre 1,52 et 1,25 Ga pendant la principale phase de dépôt des minéralisations à haute teneur et vers 900 et 350 Ma au cours de remobilisations des minéralisations uranifères. Les brèches contemporaines de la genèse de la minéralisation primaire se sont formées en 3 stades caractérisées par l'analyse fractale des formes de fragments exprimant leur degré de maturité. Le premier stade de formation des brèches a été initiée par une réactivation des failles inverses à graphite qui a provoqué une fracturation tectonique localisée dans le cœur des failles et une fracturation hydraulique, plus étendue, dans les zones de silicification massive précoce des grès. Le deuxième stade correspond à la dissolution du quartz due à la circulation verticale d'un fluide de socle sous-saturé par rapport au quartz dans les grès fracturés. Les rapports fluide/roche minimaux calculés sont très élevés de l'ordre de 3 000 dans la zone de Maw et de 38 000 dans les zones à boules de Sue. Cette variation reflète la diminution de l'intensité de la dissolution avec la distance à la discordance. Le volume minimal de fluide de socle ayant circulé dans les brèches est de l'ordre du kilomètre cube. Les calculs de bilans de masse montrent que les fluides ont apporté les éléments U, V, Mg, B, Al, K, Bi, Ni, Co, Mo, As, S, W, Zn, Y et terres rares, conformément aux néoformations d'illite, de sudoite magnésienne et de dravite et au caractère polymétallique des minéralisations dans les grès. Le troisième stade s'exprime par des phénomènes d'effondrements gravitaires faisant suite à la formation de cavités de dissolution du quartz. Dans les zones à boules développées dans le cœur des failles, c'est la contraction tectonique qui a progressivement refermé les espaces vides créés par la dissolution. Les pertes de volumes peuvent atteindre 90 % dans les zones de dissolution les plus intenses, proches de la discordance. Dans les zones de faille à très fort pendage, les effondrements se sont propagés jusqu'à plus de 2,50 rn audessus de la discordance comme dans la zone de Maw, de la même manière que dans un karst.
La précipitation d'uranium provoquée par le mélange du fluide réducteur de socle sous-saturé par rapport au quartz (> 250°C) avec des fluides diagénétiques oxydants de bassin(< 240°C) a eu lieu pendant un temps de l'ordre de plusieurs millions d'années, en liaison avec la dissolution progressive du quartz libérant l'espace nécessaire au piégeage des minéralisations massives.
BRECCIAS ASSOCIATED WITH UNCONFORMITY-TYPE URANIUM DEPOSITS IN THE ATHABASCA BASIN (SASKATCHEWAN, CANADA)
Abstract : Unconformity-type uranium deposits in the Athabasca Basin (Canada) are commonly hosted and surrounded by breccia bodies in quartzose sandstones. In order to understand the mechanisms of breccia formation and the ir significance for the genesis of uranium deposits, the breccias associated with U mineralizations of the Shea Creek prospect and Sue C open pit, and with the Y-REEU mineralization of the Maw Zone were studied. Structural mapping and 3D modeling evidence the control of breccia geometries by reverse faults that are graphite-rich in the basement. The study of mineral paragenesis and calculations of U-Pb chemical ages at Shea Creek reveal 3 breccia phases with sudoite-dravite, Fe-chlorite and hematite-siderite cements. These breccias developed over more than 1 Ga respectively during 3 stages of tectonic reactivations and/or basin uplift main! y between 1.52 and 1.25 Ga during the main event of primary uranium deposition and at about 900 and 350 Ma during phases of uranium remobilization. The breccias coeval with the genesis of the primary mineralization developed in 3 stages characterized by fractal analysis of fragment shapes expressing their degree ofmaturity. The first stage of breccia formation has been triggered by a reactivation of graphite-rich reverse faults inducing localized tectonic fracturing in the core offaults and widespread hydraulic fracturing in early silicified zones. The second stage corresponds to quartz dissolution due to the vertical circulation of a basement t1uid undersaturated relative to silica in fractured sandstones. Calculated minimum t1uid/rock ratios are very high with values of3,000 at the Maw Zone and 38,000 in the Sue « zones à boules» ret1ecting the decrease of dissolution intensity with the increase of distance to the unconformity. The minimum volume ofbasement t1uids that have circulated through the breccias is about 1 km3
• Mass balance calculations show an input ofU, V, Mg, B, Al, K, Bi, Ni, Co, Mo, As, S, W, Zn, Y and REE, in accordance with the new formation of illite, Mg-rich sudoite and dravite and with the polymetallic sandstone-hosted mineralization. The third stage is expressed by gravity-driven collapse phenomenons resulting from the cavities created by quartz dissolution. In « zones à boules » developed in the core of faults, it is the tectonic contraction that progressively closed the open spaces formed by quartz dissolution. Volume Joss values reach 90 % in zones of intense dissolution close to the unconformity. In steeply dipping fault zones, collapse propagated up to more than 250 rn above the unconformity as observed at the Maw Zone, like in a karst.
Uranium deposition induced by mixing of the reducing basement fluid undersaturated relative to quartz (> 250°C) with diagenetic oxidizing basin t1uids (< 240°C) occurred during about severa! million years, simultaneously with quartz dissolution providing the space needed to form the massive mineralizations.
Mots-clefs : brèche, uranium, discordance, grès, zone de faille, dissolution, bilans de masse, analyse fractale.
Keywords : breccia, uranium, unconformity, sandstone, fault zone, dissolution, mass balance, fractal analysis.
UMR G2R 7566- Géologie et Gestion des Ressources Minérales et Energétiques Université Henri Poincaré Nancy 1, Faculté des Sciences, BP 239, 54506 Vandoeuvre-lès-Nancy Cedex