Contribution aux études de coordination d'isolement dans les ...
234
THÈSE Pour obtenir le grade de DOCTEUR DE L’UNIVERSITE GRENOBLE ALPES Spécialité : Génie électrique Arrêté ministériel : 25 mai 2016 Présentée par Nicolas Alejandro MANDULEY RIVAS Thèse dirigée par Bertrand RAISON, PR et codirigée par Alain XEMARD, PhD HDR Préparée au sein du Laboratoire de Génie Electrique de Grenoble (G2ELab) dans l'École Doctorale d’Electronique, Electrotechnique, Automatique et Traitement du Signal (EEATS) Contribution aux études de coordination d’isolement dans les réseaux VSC-HVDC Thèse soutenue publiquement le 3 décembre, 2020 devant le jury composé de : M. Jean-Pascal CAMBRONNE Président Professeur, Université Paul Sabatier Mme. Françoise PALADIAN Rapportrice Professeur, Université Clermont Auvergne M. Ivo UGLEŠIĆ Rapporteur Professeur, University of Zagreb (Sveučilište u Zagrebu) M. Bertrand RAISON Directeur Professeur, Université Grenoble Alpes M. Alain XEMARD Co-directeur Ingénieur HDR, EDF Lab Paris-Saclay M. Sellé TOURE Co-encadrant Ingénieur Docteur, SuperGrid Institute M. Stephan PACK Invité Professeur, Technische Universität Graz (TU Graz)
-
Upload
khangminh22 -
Category
Documents
-
view
2 -
download
0
Transcript of Contribution aux études de coordination d'isolement dans les ...
THÈSE
Pour obtenir le grade de
DOCTEUR DE L’UNIVERSITE GRENOBLE ALPES
Spécialité : Génie électrique
Arrêté ministériel : 25 mai 2016
Présentée par
Nicolas Alejandro MANDULEY RIVAS Thèse dirigée par Bertrand RAISON, PR et codirigée par Alain XEMARD, PhD HDR Préparée au sein du Laboratoire de Génie Electrique de Grenoble (G2ELab) dans l'École Doctorale d’Electronique, Electrotechnique, Automatique et Traitement du Signal (EEATS) Contribution aux études de coordination d’isolement dans les réseaux VSC-HVDC Thèse soutenue publiquement le 3 décembre, 2020 devant le jury composé de :
M. Jean-Pascal CAMBRONNE
Président Professeur, Université Paul Sabatier
Mme. Françoise PALADIAN
Rapportrice Professeur, Université Clermont Auvergne
M. Ivo UGLEŠIĆ
Rapporteur Professeur, University of Zagreb (Sveučilište u Zagrebu)
M. Bertrand RAISON
Directeur Professeur, Université Grenoble Alpes
M. Alain XEMARD
Co-directeur Ingénieur HDR, EDF Lab Paris-Saclay
M. Sellé TOURE
Co-encadrant Ingénieur Docteur, SuperGrid Institute
M. Stephan PACK
Invité Professeur, Technische Universität Graz (TU Graz)

Contribution to Insulation Coordination Studies for VSC-HVDC Systems Declaration
Nicolas Manduley 2020 Page i
Declaration
I hereby declare that the work presented in this thesis has not been submitted for any other
degree or professional qualification, and that it is the result of my own independent work.
Nicolas Manduley
Date

Contribution to Insulation Coordination Studies for VSC-HVDC Systems Abstract
Nicolas Manduley 2020 Page ii
Contribution to Insulation Coordination Studies for VSC-HVDC Systems Abstract
Nicolas Manduley 2020 Page iii
Abstract
HVDC power transmission systems are developing and expanding rapidly all over the world.
Some of the main reasons behind this growth are the restrictions and limitations regarding
the use of the Right-of-Way (ROW) and the increasing commissioning of offshore wind parks.
Both cases converge into solutions involving the installation of long underground or
submarine cables, for which AC technologies are not suitable over long distances. Moreover,
HVDC transmission offer a series of advantages over HVAC in terms of power transmission
capacity and reduction of losses, which may lead to an increase in the commissioning of HVDC
lines and the conversion of existing AC overhead lines into DC.
It is within this context that this thesis is presented as a contribution to the development of
high-scale HVDC systems, particularly regarding insulation coordination for Voltage Source
Converter (VSC) based technologies. In particular, the Modular Multilevel Converter (MMC)
represents one of the most promising VSC implementations in HVDC transmission.
Insulation coordination consists of the selection of the required dielectric strength of the
insulating materials in a utility. It ensures the safe operation of the system in both steady state
and transient conditions such as faults, lightning strikes and other phenomena generating
overvoltages. Therefore, insulation coordination is a crucial stage of any engineering project
in order to guarantee not only the integrity of the components, but also the safety of the staff
at the installations.
Existing standards provide procedures and guidelines on how to conduct insulation
coordination studies for HVAC and LCC systems. As of today, no existing standard covers VSC
insulation coordination. This thesis aims to constitute a contribution towards the
development of detailed insulation coordination procedures for VSCs, and particularly for the
MMC, taking into account the specific characteristics and transient behaviour of VSCs, and
their differences with AC and LCC systems.
In line with such purposes, an exhaustive study of the literature is performed in order to
identify the fundamental aspects that need to be considered to adapt the insulation
coordination principles to VSC-HVDC systems. Studies are conducted using electromagnetic
transient modelling in EMTP to study in detail the behaviour of VSC-HVDC systems under
transient events leading to the highest overvoltage levels which, in combination with the
installation of surge arresters, will determine the insulation requirements of the system.
A procedure is proposed to conduct insulation coordination studies on MMC-HVDC systems.
The proposed procedure takes into account all the factors determined to have an influence
on the way in which the insulation coordination principles should be applied to MMC-HVDC
systems.
Contribution to Insulation Coordination Studies for VSC-HVDC Systems Abstract
Nicolas Manduley 2020 Page iv
In the domain of HVDC overhead lines, there are some challenges regarding the evaluation of
the lightning performance of such systems. The existing procedures have been developed for
HVAC systems, and some cases require more detailed studies and methodologies to
adequately evaluate the lightning performance. Some examples are asymmetric
configurations, schemes with surge arresters and double-circuit HVDC overhead lines
(especially for studies regarding multiple simultaneous flashovers). In this research, existing
procedures have been adapted to VSC-HVDC applications in order to analyse asymmetric
configurations, non-linear devices and double flashovers, which conventional methods cannot
take into account. Moreover, two solutions for the improvement of the lightning performance
using arresters and unbalanced insulation string lengths have been studied and analysed in
detail.
Contribution to Insulation Coordination Studies for VSC-HVDC Systems Résumé
Nicolas Manduley 2020 Page v
Résumé
Les systèmes de transport d'énergie en courant continu (HVDC) se développent très
rapidement dans le monde entier. Certaines des principales raisons de cette croissance sont
les restrictions et les limites concernant l'utilisation des droits de passage et la mise en service
des parcs éoliens offshore. Les deux cas décrits ci-dessus convergent vers des solutions
impliquant l'installation de longs câbles souterrains ou sous-marins, pour lesquels les
technologies AC ne conviennent pas sur de longues distances. De plus, le transport d’énergie
en HVDC offre une série d'avantages par rapport au HVAC en termes de capacité de
transmission de puissance et de réduction des pertes.
C'est dans ce contexte que cette thèse est présentée comme une contribution au
développement des systèmes HVDC à grande échelle, en particulier en ce qui concerne la
coordination d'isolement pour les technologies fondées sur les convertisseurs de source de
tension (VSC). En particulier, le convertisseur modulaire multiniveaux (MMC) représente l'une
des implémentations VSC les plus prometteuses dans le domaine du HVDC.
La coordination d’isolement est la procédure de sélection de la tenue diélectrique du matériel
isolant des équipements d’un système électrique. Il garantit sécurité opérationnelle du
système en régime permanent, ainsi qu’en régime transitoire en cas de défauts, chocs de
foudre et autres phénomènes générant des surtensions importantes. Par conséquent, la
coordination d’isolement est une étape cruciale de tout projet d'ingénierie pour garantir non
seulement l'intégrité des composants qui y sont connectés, mais également la sécurité du
personnel dans les installations.
Les normes existantes proportionnent des procédures et recommandations pour la réalisation
des études de coordination d'isolement pour les systèmes AC et LCC. À ce jour, aucune norme
existante n’adresse la coordination d’isolement pour des systèmes VSC. Cette thèse a pour
objectif de contribuer au développement de procédures détaillées de coordination
d’isolement pour les systèmes VSC, et en particulier pour le MMC, prenant compte de ses
caractéristiques et comportement en régime transitoire, ainsi que ses différences avec les
systèmes AC et LCC.
Dans cette optique, nous avons réalisé une étude exhaustive de la littérature afin d'identifier
les aspects fondamentaux à prendre en compte pour adapter les principes de coordination
d’isolement aux systèmes VSC. Ces études ont été menées en utilisant des simulations de
transitoires électromagnétiques dans EMTP pour étudier en détail le comportement des
systèmes VSC sous des événements transitoires conduisant aux niveaux de surtension les plus
élevés qui, en combinaison avec les équipements de limitation de surtension, détermineront
les exigences de tenue diélectrique du système.
Contribution to Insulation Coordination Studies for VSC-HVDC Systems Résumé
Nicolas Manduley 2020 Page vi
Dans ce travail, nous proposons une méthodologie permettant de conduire des études de
coordination d'isolement sur les systèmes VSC-MMC. La procédure proposée prend en
compte tous les facteurs déterminés comme ayant une influence sur la manière dont les
principes de coordination d'isolement doivent être appliqués aux systèmes MMC.
Dans le domaine des lignes aériennes HVDC, il y a des défis concernant l'évaluation de la
performance en cas de choc de foudre. Les procédures existantes ont été développées pour
les systèmes AC, et certains cas nécessitent des études et des méthodologies plus détaillées
pour évaluer les performances en choc de foudre. Dans cette thèse, nous avons adapté les
procédures existantes aux applications VSC afin d’analyser des configurations asymétriques,
des composants non linéaires et des amorçages multiples, que les méthodes conventionnelles
ne peuvent pas prendre en compte. De plus, deux solutions pour l'amélioration des
performances en choc de foudre à l'aide de parafoudres et de l’utilisation des longueurs des
chaînes d’isolateurs asymétriques ont été étudiées et analysées en détail.
Contribution to Insulation Coordination Studies for VSC-HVDC Systems Publications associated with this research
Nicolas Manduley 2020 Page vii
Publications Associated with this Research
Journal Articles
Manduley, N., Pack, S., Xémard, Touré, S., A., Raison, B., & Poullain, S. (2020).
Techniques for the Improvement of the Lightning Back-Flashover Performance of
Double Circuit HVDC Lines. Submitted to Electric Power Systems Research (EPSR) in
October 2020.
Conference Articles
Manduley, N., Pack, S., Touré, S., Xémard, A., Raison, B., & Poullain, S. (2019). Use of
Unbalanced Insulation for the Limitation of Double-Pole Lightning Flashovers in Double
Circuit HVDC Overhead Lines. International Colloquium on Lightning and Power
Systems (ICLPS 2019).
Manduley, N., Touré, S., Xémard, A., Raison, B., & Poullain, S. (2019). Effect of the
Surge Arrester Configuration in MMC-HVDC Systems under DC and Converter Fault
Conditions. International Conference on Power System Transients (IPST 2019).

Nicolas Manduley 2020 Page viii

Nicolas Manduley 2020 Page ix
To my beloved mother.
Contribution to Insulation Coordination Studies for VSC-HVDC Systems Acknowledgements
Nicolas Manduley 2020 Page x
Contribution to Insulation Coordination Studies for VSC-HVDC Systems Acknowledgements
Nicolas Manduley 2020 Page xi
Acknowledgements
A Ph.D. thesis is a long journey full of daily challenges and enriching experiences. It involves a
lot of learning and success, but also many failures, which require adapting, rethinking,
sometimes even starting all over again from scratch. And it is precisely in those failures where
the core and the true essence of the final result—this manuscript—are shaped.
For that reason, I want to dedicate this section to thank all the people who contributed in one
way or another to the development of this work through their expertise, advice and daily
support, for without them this would not have been possible.
I wish to express my sincere gratitude to all my thesis supervisors: to my thesis directors,
Bertrand Raison and Alain Xémard, for accepting to supervise this thesis in the first place, but
most importantly for their constant support, availability, kindness and invaluable advice. To
my SuperGrid Institute supervisor, Sellé Touré, for his expertise and his daily encouragement
since my first day at the institute. Finally yet importantly, a very special mention to Stephan
Pack, for his precious guidance and support through the collaboration between the SuperGrid
Institute and the TU Graz.
Bertrand, you accepted me as a student and agreed to supervise my thesis without knowing
me. I understand what a leap of faith that is, and it has motivated me to do my best since day
one. And from that day on, I have always valued and admired your dedication, your patience
and your pedagogy to transmit your ideas. Thank you for being my supervisor, for your trust,
your engagement, your wisdom and your always-present sense of humour.
Alain, thank you for sharing your expertise and introducing me to the complex domain of
insulation coordination. It was a difficult subject to grab at first, but you contributed greatly
for me to constantly gain a better understanding of it, not only at the beginning, but also
throughout the whole development of the thesis. Every meeting and every discussion with
you I would learn something new or gain a deeper understanding of the domain. But even
more importantly, I always felt that I could count on you whenever I had doubts, questions or
just felt stuck. I never underestimated the time and the efforts that you have invested to make
this work possible, and I could not thank you enough for that.
Sellé, it is very difficult to put into words how much I have learned and grown, personally and
professionally, working by your side during all of these years. Your kindness, your honesty and
your unconditional support during both the good and the bad times are only a few of the many
virtues I admire in you and that I will always remember. More than once you gave me the push
and the motivation I needed to go on, especially during this last year. You were there when I
needed it the most, as a mentor, as a colleague, as a friend. And for that, I am eternally
grateful.

Contribution to Insulation Coordination Studies for VSC-HVDC Systems Acknowledgements
Nicolas Manduley 2020 Page xii
Professor Pack, it has been a real pleasure and honour to work with you during the last years.
Not only did I have the opportunity to discover a whole field that was a complete mystery to
me, but also to grow a lot as a researcher through your supervision. Your advice was always
good advice, and contributed significantly to improve my critical and scientific thinking. Thank
you for teaching me so much and for making my stays in Graz a complete and unforgettable
experience through your guidance, support and your daily dose of sense of humour.
To all of you: thank you. I could not even imagine a better team of supervisors, as each one of
you has greatly contributed to this work, not only individually, but also as a group. It is rare to
find a group with such a good synergy, where every single meeting and discussion was always
a step forward. You can be sure that it was a true honour working with you, and that I consider
myself immensely lucky for having you as my supervisors.
I wish to thank as well all my colleagues at the SuperGrid Institute. It was a true pleasure to
spend the last four years among such kind, friendly and brilliant people who made the work
environment a nice and enjoyable place to be. Thank you for all the laughs, the discussions
beside the coffee machine, and in short, for all the good times spent together.
On a final and more personal note, I want to thank my family and friends who supported me,
no matter the distance or the circumstances. You were always there for me and motivated me
to keep moving forward. I could not have done this without all the love and support you
showed me during these years.
Contribution to Insulation Coordination Studies for VSC-HVDC Systems Table of Contents
Nicolas Manduley 2020 Page xiii
Table of Contents
Declaration .......................................................................................................................... i
Abstract ............................................................................................................................. iii
Résumé ............................................................................................................................... v
Publications Associated with this Research ........................................................................ vii
Acknowledgements ............................................................................................................ xi
Table of Contents .............................................................................................................. xiii
List of Figures ................................................................................................................... xvii
List of Tables ................................................................................................................... xxiii
Glossary ......................................................................................................................... xxvii
Introduction ........................................................................................................................ 1
1. Motivation .......................................................................................................................... 1
2. Thesis Objectives ................................................................................................................ 4
3. Thesis Outline ..................................................................................................................... 5
4. Thesis Contributions ........................................................................................................... 6
Chapter 1 State of the Art and Literature Review ................................................................ 9
1. Introduction ........................................................................................................................ 9
2. Generalities Regarding Insulation Coordination .................................................................. 9
3. Specificities of HVAC Regarding Insulation Coordination ................................................... 12
3.1 Insulation Configurations and Types .................................................................................................. 12
3.2 Voltage and Overvoltage Classes ....................................................................................................... 13
3.3 Characteristics of Overvoltage Protection Devices ............................................................................ 14
3.4 Insulation Coordination Procedure for AC Systems ........................................................................... 16
4. Specificities of HVDC ......................................................................................................... 18
4.1 Main Differences with AC .................................................................................................................. 19
4.2 DC Insulation Coordination (IEC 60071-5) ......................................................................................... 29
4.3 VSC-HVDC: Modular Multi-level Converter (MMC) ........................................................................... 31
5. Lightning Overview ........................................................................................................... 34
5.1 Generalities ........................................................................................................................................ 34
5.2 Electrisation of the Clouds and Lightning Classification .................................................................... 35
5.3 Characterization of the Lightning Currents ........................................................................................ 36
5.4 Characterization of Regional Lightning Activity ................................................................................. 37
5.5 Lightning Waveshapes of Negative Downward Strokes .................................................................... 39
Contribution to Insulation Coordination Studies for VSC-HVDC Systems Table of Contents
Nicolas Manduley 2020 Page xiv
5.6 Foundations of the Determination of the Impact Point .................................................................... 43
6. Stakes of the Estimation of the Overhead Line Lightning Performance .............................. 49
6.1 Origin of Flashovers due to Lightning Strokes ................................................................................... 49
6.2 Significance of Lightning as a Source of Faults ................................................................................... 54
6.3 Consequences of Lightning Flashovers on the Transmission System Performance .......................... 55
6.4 Estimation of the Overhead Line Lightning Performance .................................................................. 55
Chapter 2 Tools and Electromagnetic Modelling ............................................................... 61
1. Introduction ...................................................................................................................... 61
2. Numerical Considerations ................................................................................................. 61
3. Modelling Aspects ............................................................................................................. 63
3.1 Overhead Lines and Cables ................................................................................................................ 63
3.2 Transmission Towers .......................................................................................................................... 64
3.3 Air Gaps, Line Insulators .................................................................................................................... 65
3.4 Surge Arresters .................................................................................................................................. 66
3.5 Modular Multi-level Converter (MMC) .............................................................................................. 67
3.6 Faults .................................................................................................................................................. 69
3.7 Lightning Strokes ................................................................................................................................ 69
3.8 General Representation of Overhead Lines for Fast-Front Overvoltage Studies ............................... 71
4. Conclusion ........................................................................................................................ 72
Chapter 3 Protection of the MMC against Slow-Front and Temporary Overvoltages ......... 73
1. Introduction ...................................................................................................................... 73
2. Fundamental Schemes ...................................................................................................... 74
3. Voltages and Overvoltages in MMC-HVDC Stations ........................................................... 76
3.1 Voltages in Service ............................................................................................................................. 76
3.2 Sources of Temporary Overvoltages (TOV) ........................................................................................ 81
3.3 Sources of Slow-Front Overvoltages (SFO) ........................................................................................ 83
3.4 Overvoltage Limitation with Arresters ............................................................................................... 83
4. Overvoltage Analysis of MMC-HVDC Stations .................................................................... 84
4.1 Modelling Aspects .............................................................................................................................. 85
4.2 MMC-HVDC Station with the Arm Reactor on the DC Side ................................................................ 86
4.3 MMC-HVDC Station with the Arm Reactor on the AC Side ................................................................ 91
4.4 Surge Arrester Interactions ................................................................................................................ 94
5. Proposed Procedures for the Insulation Coordination of MMC-HVDC Systems Regarding
Temporary and Slow-Front Overvoltages ................................................................................ 103
5.1 Procedure ......................................................................................................................................... 104
5.2 Overvoltage Protection .................................................................................................................... 107
5.3 Algorithm for the Specification of the Surge Arresters .................................................................... 111
6. Conclusion ...................................................................................................................... 111
Contribution to Insulation Coordination Studies for VSC-HVDC Systems Table of Contents
Nicolas Manduley 2020 Page xv
Chapter 4 Fast-Front Overvoltage Analysis and Improvement of the Overhead Line
Lightning Performance ..................................................................................................... 115
1. Introduction .................................................................................................................... 115
2. Specificities of HVDC Overhead Lines Regarding Lightning Performance .......................... 115
2.1 Consequences of Faults due to Lightning Strokes on a DC System .................................................. 116
2.2 Particularities of Double Circuit HVDC Overhead Lines ................................................................... 117
3. Hypotheses and Procedures ............................................................................................ 118
4. Effect of the Configuration of the DC Poles ...................................................................... 119
4.1 Case Study Setup .............................................................................................................................. 120
4.2 Results .............................................................................................................................................. 121
4.3 Discussion ........................................................................................................................................ 126
4.4 Conclusions and Final Considerations .............................................................................................. 128
5. Techniques for the Improvement of the Lightning Performance of HVDC Overhead Lines 128
5.1 Installation of Line Surge Arresters (LSA) ......................................................................................... 129
5.2 Use of Unbalanced Insulation .......................................................................................................... 137
6. Surge Arrester Specifications .......................................................................................... 141
6.1 Surge Arrester Energy Handling Capability ...................................................................................... 142
6.2 Direct Strikes to the Tower .............................................................................................................. 142
6.3 Shielding Failure Case ...................................................................................................................... 144
6.4 Discussion ........................................................................................................................................ 153
6.5 Summary and Conclusions ............................................................................................................... 155
7. Conclusion ...................................................................................................................... 156
Conclusion ....................................................................................................................... 159
Perspectives and Future Research .................................................................................... 163
References ....................................................................................................................... 165

Contribution to Insulation Coordination Studies for VSC-HVDC Systems List of Figures
Nicolas Manduley 2020 Page xvi
Contribution to Insulation Coordination Studies for VSC-HVDC Systems List of Figures
Nicolas Manduley 2020 Page xvii
List of Figures
Figure 1.1 Graphical representation of the evaluation of the risk of failure as a function of the probability
density of the overvoltage f(U) and the discharge probability of the insulation P(U). Extracted from IEC
60071-2. ............................................................................................................................................. 11
Figure 1.2 Insulation configurations considered in the IEC insulation coordination standards ....................... 12
Figure 1.3 Classes and shapes of overvoltages, standard voltage shapes and standard withstand voltage tests.
Extracted from IEC 60071-1. ................................................................................................................ 13
Figure 1.4 V-I characteristic for a SIEMENS surge arrester rated Ur = 336 kV (rms), typically used for an AC
system rated Us = 420 kV; extracted from Hinrichsen (2012). ............................................................... 15
Figure 1.5 Flow chart for the determination of the rated or standard insulation levels; extracted from IEC
60071-1. ............................................................................................................................................. 17
Figure 1.6 AC vs DC comparison of the indicative insulation distance requirements for switching (blue),
lightning (red) and pollution (green). Extracted from CIGRE TB 518 ..................................................... 20
Figure 1.7 Left: AC versus DC arcing differences across the insulator (extracted from CIGRE TB 518). Right:
Flashover process in polluted insulators in presence of dry bands along the surface (from CIGRE TB
158). ................................................................................................................................................... 21
Figure 1.8 AC breakdown voltage (in RMS) for different gap configurations. Extracted from CIGRE TB 72. .... 23
Figure 1.9 DC breakdown voltage as a function of the gap clearance for a rod-plane configuration. Extracted
from CIGRE TB 72................................................................................................................................ 24
Figure 1.10 Examples of the main converter topologies in HVDC systems ..................................................... 30
Figure 1.11 Fundamental scheme of a base 12-pulse LCC-HVDC station including the AC side, DC side,
converter station and components, switches and possible surge arresters which could be decided to
install for a given configuration. Extracted from IEC 60071-5. .............................................................. 30
Figure 1.12 Modular Multi-level Converter basic scheme. Extracted from Kouro et al., 2010. ....................... 33
Figure 1.13 Classification of lightning strokes according to their polarity (positive or negative) and the
direction of the propagation of the initial leader (upward or downward) indicated by the arrow. Figures
extracted from CIGRE TB 549. ............................................................................................................. 36
Figure 1.14 Illustration of the first and subsequent strokes that can occur during a cloud-to-ground flash. ... 37
Figure 1.15 Mean annual ground flash density maps for North America in the 2001 – 2004 period. Extracted
from Orville et al. 2011. ...................................................................................................................... 38
Figure 1.16 Shape and front parameters of the CIGRE concave shape used to represent lightning strokes,
where I is the peak amplitude, Sm the maximum steepness (or rate of rise) and tf the equivalent front
duration. ............................................................................................................................................ 39
Figure 1.17 Reference distributions for negative lightning current amplitudes (extracted from CIGRE TB 063).
The horizontal axis features the current amplitudes for the first stroke, while the vertical axis provides
the probability for the lightning current amplitude to be equal or lower than the considered value. ... 41
Figure 1.18 Illustration of the fundamental principles of the electrogeometric model (EGM) based on the
striking distance to each conductor (rc) and to the ground (rg) to determine the impact point of the
lightning stroke. ................................................................................................................................. 45
Figure 1.19 Evolution of the striking distances as the lightning amplitude increases until reaching a critical
value where the total exposure Dc = 0, for which the corresponding current is Imsf. Since the total
exposure is zero, it is considered that no shielding failures can occur for current amplitudes higher to
Imsf. ..................................................................................................................................................... 46
Contribution to Insulation Coordination Studies for VSC-HVDC Systems List of Figures
Nicolas Manduley 2020 Page xviii
Figure 1.20 Illustration of the different angles and parameters required for the calculation of the total
exposure width (Dc) and maximum shielding failure current (Imsf) required for the estimation of the
shielding failure flashover rate (SFFOR) using the electrogeometric model (EGM) ............................... 47
Figure 1.21 Scheme illustrating the repartition of the current for a direct strike on the tower and the main
back-flashover mechanism. For simplicity and for easier visualization, the curves in the figure
correspond to a positive lightning stroke, and according to the voltage convention, the voltage Vins
corresponds to the insulator of a positive DC conductor. ..................................................................... 50
Figure 1.22 a) Upper section: CIGRE concave shape model for a lightning stroke of +120 kA. Lower section:
potential rise of the tower at the upper and lower cross arms (red and green curves) and effect of the
inductive coupling between the lines (blue and pink curves); b) Voltage measurements and tower
geometry used for this example. ......................................................................................................... 52
Figure 1.23 Scheme illustrating the repartition of the current for a shielding failure. For simplicity and for
easier visualization, the curves in the figure correspond to a positive lightning stroke, and according to
the voltage convention, the voltage Vins corresponds to the insulator of a positive DC conductor. ....... 53
Figure 1.24 Average lightning flash density [flashes/km²/year] and frequency of short outages [tripouts/site]
in France over the period between 2010 – 2019. ................................................................................. 54
Figure 1.25 Comparison of the average ground flash density and short outages per region in France for 2019,
extracted from RTE, Bilan Electrique, 2019. Short outage rates tend to be directly proportional to the
lightning activity of each particular region. ......................................................................................... 55
Figure 2.1 Example of a typical non-linear V-I characteristic represented by three, four and six linear
segments ............................................................................................................................................ 62
Figure 2.2 a) IEEE model and b) Pinceti model of the surge arrester for high frequency studies ..................... 67
Figure 2.3 MMC architectures with the arm reactor a) on the AC side, and b) on the DC side (for a
symmetrical monopole) ...................................................................................................................... 68
Figure 2.4 Modelling of the lightning stroke for EMTP simulations ............................................................... 69
Figure 2.5 Schematic representation of the overhead line section to be modelled for fast-front overvoltage
(FFO) studies. ..................................................................................................................................... 72
Figure 3.1 Fundamental scheme of an MMC-HVDC station including all the basic components and possible
locations for the surge arresters for a station architecture with the arm reactor on the AC side. The
green arrows indicate the voltage convention of the longitudinal elements. ....................................... 75
Figure 3.2 Fundamental scheme of an MMC-HVDC station including all the basic components and possible
locations for the surge arresters for a station architecture with the arm reactor on the DC side. The
green arrows indicate the voltage convention of the longitudinal elements. ....................................... 75
Figure 3.3 Voltages in service of the main components and locations of an MMC-HVDC architecture with the
arm reactor on the AC side. ................................................................................................................ 77
Figure 3.4 Voltages in service of the main components and locations of an MMC-HVDC architecture with the
arm reactor on the DC side ................................................................................................................. 78
Figure 3.5 Reduced fundamental scheme for an MMC-HVDC substation with the arm rector on the AC side.
The surge arresters, as well as the sections corresponding to the metallic return and overhead lines
have been removed. The smoothing reactor has been also omitted. ................................................... 84
Figure 3.6 Reduced fundamental scheme for an MMC-HVDC substation with the arm rector on the DC side.
The surge arresters, as well as the sections corresponding to the metallic return and overhead lines
have been removed. ........................................................................................................................... 85
Figure 3.7 Cable geometry and parameters used to build the EMTP model for the overvoltage studies ........ 86
Figure 3.8 Fault scenarios considered for the temporary and slow-front overvoltage studies for an MMC-
HVDC station with the arm reactor on the DC side .............................................................................. 86
Contribution to Insulation Coordination Studies for VSC-HVDC Systems List of Figures
Nicolas Manduley 2020 Page xix
Figure 3.9 Magnitude and path of the fault current through the MMC submodule during a short-circuit of the
MMC submodule (fault I) .................................................................................................................... 88
Figure 3.10 Fault scenarios considered for the temporary and slow-front overvoltage studies for an MMC-
HVDC station with the arm reactor on the AC side .............................................................................. 92
Figure 3.11 Symmetric monopolar configuration scheme including the faults and surge arresters considered
in the study ........................................................................................................................................ 95
Figure 3.12 Surge arrester configurations considered ................................................................................... 95
Figure 3.13 Maximum slow-front overvoltages (SFO) obtained for each considered component and for each
considered arrangement of arresters. The maximum value is indicated above the corresponding
configuration. ..................................................................................................................................... 99
Figure 3.14 Maximum temporary overvoltages (TOV) obtained for each considered component and for each
considered arrangement of arresters. The maximum value is indicated above the corresponding
configuration. ..................................................................................................................................... 99
Figure 3.15 Current path through arrester A3 on phase b of the upper arm where the maximum current is
measured for DC pole to ground fault at the middle of the cable (fault L). ......................................... 100
Figure 3.16 Comparison between the case without surge arresters (NS, red) and the A1-A2-A3 configuration
(blue) for DC pole to ground fault. On the left, the currents flowing through the MMC submodules
(phase B), including the current of the corresponding upper surge arrester A3 (green). On the right, the
voltage levels at the point protected by arrester A3 (upper valve). It is seen how the overvoltage levels
are effectively limited by the surge arrester. ..................................................................................... 100
Figure 3.17 Energy absorption levels of each surge arrester in every configuration ..................................... 101
Figure 3.18 Flowchart illustrating the different steps of the procedure for insulation coordination of MMC-
HVDC systems using electromagnetic transient simulations. ............................................................. 106
Figure 4.1 Four possible pole configurations in a two-cross arm double-circuit HVDC configuration: a) both
positives on top (Top), b) both positives at the bottom (Bot), c) both positives on one side (Side) and d)
crossed polarities (Xed) .................................................................................................................... 117
Figure 4.2 Illustration of the dichotomy method used to determine the critical flashover current If through
successive EMTP simulations ............................................................................................................ 118
Figure 4.3 Detailed view of the a) voltage source, b) central and c) current source side of the EMTP model for
the double monopolar configuration ................................................................................................ 121
Figure 4.4 Tower geometry and dimensions considered for the case studies .............................................. 121
Figure 4.5 a) Overall and b) double back-flashover rates for all configurations in the 320 kV system ........... 122
Figure 4.6 a) Overall and b) double back-flashover rates for all configurations in the 500 kV system ........... 122
Figure 4.7 a) Upper section: CIGRE concave shape model for a lightning stroke of +120 kA. Lower section:
potential rise of the tower at the upper and lower cross arms (red and green curves) and effect of the
inductive coupling between the lines (blue and pink curves); b) Voltage measurements in the crossed
(Xed) configuration used for this example. ........................................................................................ 124
Figure 4.8 Scheme of the tower model including the grounding, tower structure, cross arms, air gaps of the
insulators and DC poles of one side of the tower ............................................................................... 124
Figure 4.9 The different surge arrester arrangements considered for a Xed configuration. Each configuration
is named based on its respective cross arm (upper or lower) and the polarity of the pole (positive or
negative). ......................................................................................................................................... 130
Figure 4.10 Base V-I characteristic used corresponding to a surge arrester with a rated voltage of 336 kV
(rms). Extracted from Hinrichsen (2012). ........................................................................................... 131
Figure 4.11 Overall back-flashover rates for the cases with line surge arresters as a function of the footing
resistance ......................................................................................................................................... 132
Contribution to Insulation Coordination Studies for VSC-HVDC Systems List of Figures
Nicolas Manduley 2020 Page xx
Figure 4.12 Double back-flashover rates for the cases with line surge arresters as a function of the footing
resistance ......................................................................................................................................... 132
Figure 4.13 Overall (left) and double (right) back-flashover performances for the strikes on adjacent towers
........................................................................................................................................................ 134
Figure 4.14 Illustration of the path of the current when lightning strikes a tower adjacent to another which is
protected by line surge arresters. ..................................................................................................... 135
Figure 4.15 Shielding failure flashover rates (SFFOR) for each surge arrester configuration considered for the
double circuit 500 kV HVDC system studied using the electrogeometric model (EGM). ...................... 136
Figure 4.16 Case study for the unbalanced insulation solution including a reduced air gap on a complete
circuit. All cases are performed on a configuration with both positive poles in the upper cross arm .. 137
Figure 4.17 Overall back-flashover rate comparison using various values for the difference in distance
between the arcing horns of the insulators of both circuits ............................................................... 138
Figure 4.18 Double back-flashover rate comparison using various values for the difference in distance
between the arcing horns of the insulators of both circuits ............................................................... 138
Figure 4.19 Overall (left) and double (right) back-flashover rate (BFOR) for an unbalanced insulation solution
on a single positive pole insulator and on both insulators on one side ............................................... 140
Figure 4.20 Comparison of the overall (left) and double (right) back-flashover rates of the surge arrester and
unbalanced insulation solutions ....................................................................................................... 140
Figure 4.21 Total energy absorbed by the surge arrester for a) direct positive and b) direct negative strokes to
the top of the tower ......................................................................................................................... 143
Figure 4.22 a) Direct stroke to the conductor protected by the surge arrester, and b) direct stroke to the
conductor in the opposite side of the cross arm (not protected by a surge arrester) .......................... 144
Figure 4.23 Insulator longitudinal voltages with and without surge arrester (blue and red curves,
respectively) for a) positive stroke and b) negative stroke (parameters used: Ipeak = ±20 kA and Rgnd = 10
Ω) ..................................................................................................................................................... 145
Figure 4.24 Insulator longitudinal voltages when a surge arrester is present for Ipeak of ±10 and ±50 kA and
grounding resistances of 10 Ω and 100 Ω for a) positive strokes and b) negative strokes ................... 146
Figure 4.25 Comparison of the current distribution for a positive 50 kA lightning stroke on the conductor
directly protected by the surge arrester (i.e. lower positive DC pole) for grounding resistances of 10 Ω
and 100 Ω (left and right, respectively). ............................................................................................ 146
Figure 4.26 Surge arrester total energy absorption levels for different peak current intensities (10-50 kA) and
grounding resistances (10-100 Ω) for a) positive strokes and b) negative strokes on the protected DC
pole .................................................................................................................................................. 147
Figure 4.27 Insulator longitudinal voltages of the struck pole with and without surge arrester (blue and red
curves, respectively) for a) positive stroke and b) negative stroke on the unprotected pole (parameters
used: Ipeak = ±20 kA and Rgnd = 10 Ω) .................................................................................................. 148
Figure 4.28 Comparison of the current distribution for a positive 50 kA lightning stroke on the unprotected
conductor (i.e. lower negative DC pole) for grounding resistances of 10 Ω and 100 Ω (left and right,
respectively) ..................................................................................................................................... 148
Figure 4.29 Insulator longitudinal voltages on the unprotected pole (i.e. lower negative DC pole) when a
surge arrester is installed on the opposite pole of the cross arm (i.e. lower positive DC pole) for Ipeak of
±20 and ±50 kA and grounding resistances of 10 Ω and 100 Ω for a) a positive stroke and b) a negative
stroke. Note: in this figure, 20 kA was chosen as the minimum value because for 10 kA no flashovers
are produced for either polarity. ....................................................................................................... 149
Figure 4.30 Insulator longitudinal voltages on the pole protected by a surge arrester (i.e. lower positive DC
pole) when lightning strikes the unprotected pole (i.e. the lower negative DC pole) for Ipeak of ±10 and
Contribution to Insulation Coordination Studies for VSC-HVDC Systems List of Figures
Nicolas Manduley 2020 Page xxi
±50 kA and grounding resistances of 10 Ω and 100 Ω for a) a positive stroke and b) a negative stroke.
........................................................................................................................................................ 149
Figure 4.31 Surge arrester currents for the case when the unprotected conductor (i.e. lower negative DC
pole) is struck by a) positive lightning, and b) negative lightning, for Ipeak of ±10 and ±50 kA and
grounding resistances of 10 Ω and 100 Ω .......................................................................................... 150
Figure 4.32 Induced currents on the shield wires by the lightning current being diverted in both directions of
the struck conductor due to the coupling between the conductor and the shield wires, for a stroke
produced on the unprotected DC conductor (i.e. lower negative DC pole) when a surge arrester is
present on the opposite side of the cross arm (i.e. on the lower positive DC pole) for a) a positive
stroke, and b) a negative stroke. ....................................................................................................... 151
Figure 4.33 Currents flowing through the grounding resistance for a stroke produced on the unprotected DC
conductor (i.e. lower negative DC pole) when a surge arrester is present on the opposite side of the
cross arm (i.e. on the lower positive DC pole) for a) a positive stroke, and b) a negative stroke. ........ 151
Figure 4.34 Surge arrester total energy absorption levels for different peak current intensities (10-50 kA) and
grounding resistances (10-100 Ω) for a) positive strokes and b) negative strokes on the unprotected
conductor. ........................................................................................................................................ 152
Fig. A-1 Typical V-t characteristic of a rod-rod gap (left) and a string insulator (right). The vertical axis
represents the ratio between the breakdown voltage (UB) and the critical flashover voltage (U50), while
the horizontal axis features the total time to breakdown in µs. Extracted from CIGRE TB 72. ............. 178
Fig. A-2 Impact of the conductor height (hp) and applied voltage (V) on the corona radius (Rc). The blue lines
represent the hp vs. Rc curves for different fixed values of V, while the red lines represent the V vs. Rc
curves for different fixed values of hp. .............................................................................................. 180
Fig. A-3 Impact of the conductor height (hp) and applied voltage (V) on the surge impedance under corona
(Zs). The blue lines represent the hp vs. Zs curves for different fixed values of V, while the red lines
represent the V vs. Zs curves for different fixed values of hp. ............................................................. 180
Fig. D-1 Voltages V2 and V3low after the occurrence of fault K (before the blocking of the MMC).................. 195
Fig. D-2 Voltages V2 and V3low after the occurrence of fault K before and after the blocking of the converter
(from phase 1 to the beginning of phase 4) ....................................................................................... 196
Fig. D-3 Voltages V3 and V4 (positive and negative DC poles) after the occurrence of fault K before and after
the blocking of the converter (phases 1 through 4) ........................................................................... 196
Fig. E-1 Algorithm proposed for the specification of the surge arresters for the overvoltage protection
strategy of an MMC-HVDC station under slow-front and temporary overvoltages. ............................ 200

Contribution to Insulation Coordination Studies for VSC-HVDC Systems List of Tables
Nicolas Manduley 2020 Page xxii
Contribution to Insulation Coordination Studies for VSC-HVDC Systems List of Tables
Nicolas Manduley 2020 Page xxiii
List of Tables
Table 1.1 Comparative matrix on the fundamental differences between AC and DC regarding insulation
coordination ....................................................................................................................................... 26
Table 1.2 Median (M) and logarithmic standard deviation (β) for the overall distribution of the peak current
of downward negative strokes, the shielding failure domain (below or equal to 20 kA), the back-flash
domain (above 20 kA) and for subsequent strokes. ............................................................................. 40
Table 1.3 Median (M) and logarithmic standard deviation (β) for the log-normal representation of the front
time tf of downward negative strokes. The same parameters are recommended for both ranges of first
strokes (i.e. shielding failure and back-flash domains) and subsequent strokes. .................................. 42
Table 1.4 Median (M) and logarithmic standard deviation (β) for the log-normal representation of the
maximum steepness Sm of downward negative strokes. ...................................................................... 42
Table 1.5 Derived statistics for the estimation of the maximum steepness Sm and the front time tf as a
function of the peak current IF (first strokes) ....................................................................................... 43
Table 1.6 Derived statistics for the estimation of the maximum steepness Sm and the front time tf as a
function of the peak current IF (subsequent strokes) ........................................................................... 43
Table 1.7 Parameters for the electrogeometric model implementation from different authors .................... 47
Table 1.8 Parameters for the simplified leader progression model implementation resulting from applying
regressions over a certain range of values of current and conductor height from different authors. .... 49
Table 2.1 Summary of the different transmission line models, their main characteristics and respective
applications considered in this research. ............................................................................................. 64
Table 2.2 MMC model setup and parameters for EMTP simulations ............................................................. 68
Table 3.1 Kirchhoff’s voltage equations from the fundamental MMC-HVDC scheme with the arm reactor on
the AC side ......................................................................................................................................... 80
Table 3.2 Kirchhoff’s voltage equations from the fundamental MMC-HVDC scheme with the arm reactor on
the DC side ......................................................................................................................................... 80
Table 3.3 Analytical expressions of the service voltages of the different components of the MMC-HVDC
station in monopolar and bipolar configurations, and with the arm reactor on the AC and DC sides of
the converter. The comparison assumes identical DC outputs. ............................................................ 81
Table 3.4 Description of the faults considered in the overvoltage studies for an MMC-HVDC station with the
arm reactor on the DC side ................................................................................................................. 87
Table 3.5 Absolute value (in p.u.) of the peak voltage levels at the different locations of the MMC-HVDC
station obtained through simulation for the monopolar and bipolar configurations with the arm reactor
on the DC side. The value in p.u. is calculated by considering 1 p.u. = 320 kV (the nominal DC voltage).
.......................................................................................................................................................... 87
Table 3.6 Maximum slow-front overvoltage (SFO) and temporary overvoltage (TOV) levels at each location of
the monopolar and bipolar MMC-HVDC stations with the arm reactor on the DC side. The values are
expressed in p.u. with 1 p.u. equal to 320 kV (i.e. the nominal DC voltage).......................................... 88
Table 3.7 Conclusions and particular recommendations to take into account for the overvoltage protection
strategy for monopolar and bipolar MMC-HVDC configurations with the arm reactor on the DC side. . 91
Table 3.8 Absolute value (in p.u.) of the peak voltage levels under normal operating conditions at the
different locations of the MMC-HVDC station obtained through simulation for the symmetric
monopolar configuration with the arm reactor on the AC side. The value in p.u. is calculated by
considering 1 p.u. = 320 kV (the nominal DC voltage). ......................................................................... 92
Contribution to Insulation Coordination Studies for VSC-HVDC Systems List of Tables
Nicolas Manduley 2020 Page xxiv
Table 3.9 Maximum slow-front overvoltage (SFO) and temporary overvoltage (TOV) levels at each location of
the symmetric monopolar MMC-HVDC station with the arm reactor on the AC side. The values are
expressed in p.u. with 1 p.u. equal to 320 kV (i.e. the nominal DC voltage).......................................... 93
Table 3.10 Conclusions and particular recommendations to take into account for the overvoltage protection
strategy of the symmetric monopolar MMC-HVDC configuration with the arm reactor on the AC side . 94
Table 3.11 Ratings of the surge arresters used in the study .......................................................................... 97
Table 3.12 Maximum SFO and TOV levels in configuration A1-A2-A3-C ....................................................... 102
Table 4.1 Different pole configurations labelled with respect to the position of the positive poles in the
arrangement as: Top (positives on top), Bot (positives at the bottom), Side (positives on one side) and
Xed (positives crossed) ..................................................................................................................... 119
Table 4.2 Summary of the surge arrester parameters used in this chapter .................................................. 131
Tbl. A-1 Base inputs for the parametric study conducted ........................................................................... 179
Tbl. B-1 Summary of the values of K1 and K2 for AC, positive DC and negative DC polarities for the estimation
of the onset corona gradient Ec ......................................................................................................... 184
Tbl. C-1 For the configuration without surge arresters: slow-front and temporary overvoltage levels (SFO and
TOV, respectively) for each location during the different fault scenarios considered. The values are
given in p.u. (with 1 p.u. = 320 kV). A value of zero indicates that no disturbances were measured to be
above the normal operating voltage. ................................................................................................ 187
Tbl. C-2 For the configuration with arresters A1 and A2: slow-front and temporary overvoltage levels (SFO
and TOV, respectively) for each location during the different fault scenarios considered. The values are
given in p.u. (with 1 p.u. = 320 kV). A value of zero indicates that no disturbances were measured to be
above the normal operating voltage. ................................................................................................ 187
Tbl. C-3 Maximum current and energy absorption levels for each fault and for each arrester in the
configuration. Current values under 1 mA are considered zero. ......................................................... 187
Tbl. C-4 For the configuration with arresters A1, A2 and A3: slow-front and temporary overvoltage levels
(SFO and TOV, respectively) for each location during the different fault scenarios considered. The
values are given in p.u. (with 1 p.u. = 320 kV). A value of zero indicates that no disturbances were
measured to be above the normal operating voltage level. ............................................................... 188
Tbl. C-5 Maximum current and energy absorption levels for each fault and for each arrester in the
configuration. Current values under 1 mA are considered zero. ......................................................... 188
Tbl. C-6 For the configuration with arresters A1, A2 and C: slow-front and temporary overvoltage levels (SFO
and TOV, respectively) for each location during the different fault scenarios considered. The values are
given in p.u. (with 1 p.u. = 320 kV). A value of zero indicates that no disturbances were measured to be
above the normal operating voltage level. ........................................................................................ 189
Tbl. C-7 Maximum current and energy absorption levels for each fault and for each arrester in the
configuration. Current values under 1 mA are considered zero. ......................................................... 189
Tbl. C-8 For the configuration with arresters A1, A2, A3 and C: slow-front and temporary overvoltage levels
(SFO and TOV, respectively) for each location during the different fault scenarios considered. The
values are given in p.u. (with 1 p.u. = 320 kV). A value of zero indicates that no disturbances were
measured to be above the normal operating voltage level. ............................................................... 190
Tbl. C-9 Maximum current and energy absorption levels for each fault and for each arrester in the
configuration. Current values under 1 mA are considered zero. ......................................................... 190
Tbl. D-1 General variation equations for configurations based on the fundamental scheme of MMC-HVDC
stations with the arm reactor on the DC side .................................................................................... 192
Contribution to Insulation Coordination Studies for VSC-HVDC Systems List of Tables
Nicolas Manduley 2020 Page xxv
Tbl. D-2 Variation equations for the first instants after a positive DC bus-to-ground fault (fault K) on a
symmetric monopolar configuration with the arm reactor on the DC side ......................................... 194
Tbl. E-1 Input required for the initialisation of the iterative procedure through the proposed algorithm ..... 201

Contribution to Insulation Coordination Studies for VSC-HVDC Systems Glossary
Nicolas Manduley 2020 Page xxvi
Contribution to Insulation Coordination Studies for VSC-HVDC Systems Glossary
Nicolas Manduley 2020 Page xxvii
Glossary
BFOR Back-Flashover Rate
CFO Critical Flashover Voltage (also U50)
CP Constant Parameters line model
CSC Current Source Converter
Dc Total exposure width for which a conductor is exposed to shielding failures
DMR Dedicated Metallic Return (also MR)
E0 Limiting corona gradient
Ec Corona onset gradient
EGM Electrogeometric Model
EHV Extra-High Voltage
EMT Electromagnetic Transient
FD Frequency Dependent line model
FFO Fast-Front Overvoltage
HT Height of the tower
Ic Minimum lightning current amplitude producing a flashover across an insulator in
case of shielding failure
If Minimum lightning current amplitude producing a back-flashover across an
insulator in case of direct strike to the tower or shield wires
IGBT Insulated Gate Bipolar Transistor
Imsf Maximum shielding failure current that can bypass the protection of the shield
wires
LCC Line Commutated Converter
LIPL Lightning Impulse Protective Level
LIWV Lightning Impulse Withstand Voltage
LPM Leader Progression Model
MMC Modular Multi-level Converter
MR Metallic Return (also DMR)
Ng Ground flash density [flashes/km²/year]
NL Lightning incidence [flashes/100 km/year]
OHL Overhead Lines
Rc Corona radius
rc Striking distance to the conductors in electrogeometric models
rg Striking distance to the ground in electrogeometric models
SFFOR Shielding Failure Flashover Rate [flashes/100 km/year]
SFO Slow-Front Overvoltage
Contribution to Insulation Coordination Studies for VSC-HVDC Systems Glossary
Nicolas Manduley 2020 Page xxviii
SFR Shielding Failure Rate [flashes/100 km/year]
SIPL Switching Impulse Protective Level
SIWV Switching Impulse Withstand Voltage
Sm Maximum front steepness (CIGRE concave shape)
STIPL Steep Impulse Protective Level
STIWV Steep Impulse Withstand Voltage
tb Time to breakdown across an air gap or insulator under a transient stress
producing a flashover
td30 Equivalent front duration of an impulse (also tf)
tf Equivalent front duration of an impulse (also td30)
th Time to half value of an impulse shape
TOV Temporary Overvoltages. Long duration transients caused by system faults, load
shedding, disconnections, resonance, etc.
U50 Overvoltage with 50% probability of producing a disruptive discharge in an air gap
U50RP Overvoltage with 50% probability of producing a disruptive discharge in a rod-
plane gap
Ub Breakdown voltage
Uc Maximum continuous voltage that can be applied across a surge arrester. in IEEE
standards, it is named Maximum Continuous Operating Voltage (MCOV).
Ucw Coordination withstand voltage
UHV Ultra-High Voltage
Um Highest voltage for equipment
Un Nominal system voltage
Ur Rated voltage of the surge arrester
Urp Representative voltage or overvoltage
Urw Required withstand voltage
Us Highest system voltage (in AC, the maximum RMS phase to phase voltage under
normal conditions; in DC, the maximum DC voltage under normal conditions)
Uw Standard rated withstand voltage
VFFO Very Fast-Front Overvoltage
VSC Voltage Source Converters
WB Wideband line model
ZnO Zinc-Oxide surge arrester
Zs Surge impedance under corona
Contribution to Insulation Coordination Studies for VSC-HVDC Systems Introduction
Nicolas Manduley 2020 Page 1
Introduction
1. Motivation
HVDC power transmission technologies are in constant growth and development worldwide.
There are several reasons for this phenomenon, which include both technical and economic
constraints that may lead to prefer HVDC transmission over HVAC for several applications.
On one hand, the difficulty associated to the construction of new overhead lines because of
restrictions on the use of the Right-of-Way (ROW) makes that solutions involving the use of
underground cables become more and more common. On the other hand, the increasing
development of offshore wind parks several kilometres away from the coast also requires the
use of submarine cables. In both cases above, AC transmission is limited by the capacitive
currents generated by the cable insulation and geometry, and after a certain distance, it
becomes impossible to transmit any active power through an AC cable without including shunt
compensation equipment. In such cases, the use of DC transmission is a technical and
economic decision since DC cables allow transmitting large amounts of power efficiently along
great distances without the need of shunt compensation.
Besides the technical reasons regarding the use of cables, HVDC transmission has a number of
general advantages over HVAC. For instance, the absence of skin effect under normal
operating conditions allows a better utilisation of the cable section, and thus higher power
transmission without increasing the temperature and losses due to the heating of the
conductor. This reduction in the losses along the line could compensate the higher costs of
the substations (due to the high cost of the converters and associated equipment) and make
it an economically better option than AC, especially over long distances (see CIGRE TB 186).
Furthermore, since there are no varying electromagnetic fields along the line in normal
operation, the regular transposition of the conductors is not required in DC to avoid
introducing unbalances in the line. In addition, a DC link only requires two cables to operate,
while AC lines require a minimum of three (in both cases, not considering the shield wires or
metallic returns).
Moreover, it has been shown that by converting existing AC overhead lines to DC, it is possible
to significantly increase the transmitted power with minor modifications to the line itself. This
allows optimizing the use of the existing corridors, especially when restrictions regarding the
use of the Right-of-Way make it impossible to build a new corridor.
It is clear that there is great interest in continuing to develop HVDC technologies, especially
for the transmission or large amounts of power over very long distances. Besides providing an
efficient link between the greatest generation and consumption nodes of the grid, it would
Contribution to Insulation Coordination Studies for VSC-HVDC Systems Introduction
Nicolas Manduley 2020 Page 2
allow the massive integration of renewable energies in an efficient and reliable way. Projects
such as the European supergrid would increase the scale of the integration of renewable
energies in the region, as well as increasing the reliability and stability of the European grid,
through the HVDC interconnection of all the regional transmission system operators.
It is within this context that this thesis is presented as a contribution to the development of
high-scale HVDC systems, particularly regarding insulation coordination.
Insulation coordination is the procedure for the selection of the required dielectric strength
of the insulating materials in a utility. It ensures that not only the equipment connected to the
system will be able to operate safely in steady state, but also that it will withstand long and
short duration overvoltage levels due to faults, switching operations, lightning strikes on the
overhead lines and other sources of transients.
Therefore, insulation coordination is a crucial stage of any engineering project, and should
absolutely be covered in order to guarantee the safe operation of the system, the integrity of
the components connected to it and the safety of the staff around it. Furthermore, even if the
manufacturer is in charge of specifying the insulation coordination—which is also often
specified by the system operators—the utility should be also able to evaluate the
appropriateness of the choices made by the manufacturer and verify that the final design
meets the requirements and ensures a safe operation.
Current standards provide procedures and guidelines on how to conduct insulation
coordination studies for HVAC systems (IEC 60071 Part 1 and Part 2) and for Line Commutated
Converters (LCC-HVDC) systems (IEC 60071 Part 5). Such standards are the result of physical
analyses combined with several decades of experience in such kind of systems, which have
allowed to improve the methods throughout the years. However, the application of Voltage
Source Converters (VSC) to high voltage direct current (HVDC) transmission systems is
relatively recent, especially regarding the Modular Multi-level Converter (MMC). The first
commercial application was completed in 2010 (Trans Bay Cable, San Francisco, USA).
Therefore, there is still little experience regarding the achievement of such type of projects
and how they should be designed in terms of insulation and overvoltage protection. As of
today, no existing standard covers for VSC-HVDC or MMC-HVDC insulation coordination.
In addition, although there is significant experience in HVDC systems using LCC technologies,
there are no universally recognized procedures for insulation coordination in HVDC. This
includes the absence of standard rated withstand voltages for the equipment, which is one of
the fundamental aspects allowing to provide detailed procedures in the insulation
coordination standards for HVAC (IEC 60071-1 and 2) based on the highest voltage of the
equipment. This is due to the fact that a simple transposition of the AC insulation coordination
rules to DC is not possible due to the fundamental differences in the architecture, behaviour
Contribution to Insulation Coordination Studies for VSC-HVDC Systems Introduction
Nicolas Manduley 2020 Page 3
under transient conditions and other reasons that will be discussed later. For instance, surge
arresters in DC might be used to limit temporary overvoltages, in spite of the arrester energy
duty concerns, which is never the case in HVAC.
Similarly, it is expectable that the fundamental differences between LCC and VSC exclude the
possibility of performing a direct transposition of the LCC-HVDC standard to VSC-HVDC
systems.
The presence of power electronic components (e.g. thyristors or IGBTs) also makes it difficult
to define a clear frontier between the role of the utility and the role of the manufacturer
regarding the withstand voltage of the equipment. In AC systems, this is clearly defined in the
standards as there are preferential associations between the standard withstand levels and
the highest voltages for equipment. As explained above, there are no equivalent associations
for HVDC.
Even more, since insulation coordination is a subject that concerns mainly the industrial actors
of an engineering project, there is very scarce scientific literature available because each utility
may prefer to keep confidential the procedures and the methodology leading to the final
design.
Summarizing, the main challenges towards the development of insulation coordination
procedures for VSC-HVDC systems can be listed as follows:
Limited experience in HVDC utilities, despite of decades of existence of LCC-HVDC
systems.
Absence of recognized procedures for HVDC insulation coordination studies.
Limited standardization, especially regarding the rated withstand voltages for DC
applications and their respective associations with the highest voltage of the
equipment, as there is for HVAC systems.
Impossibility of performing a direct transposition of the AC principles to DC, as well as
from LCC to VSC.
Unclear frontier between the role of the utility and the role of the manufacturer
regarding insulation coordination.
Scarce scientific literature on the subject.
The main goal of this thesis is to contribute to remedy these major deficiencies in the context
of HVDC insulation coordination, and specifically for VSC-MMC systems.
In the particular case of DC overhead lines, an additional aspect besides DC insulation
coordination is assessed, and concerns the continuity of service. Lightning is generally the
main source of faults in overhead lines, and consequently, it is of particular interest to
Contribution to Insulation Coordination Studies for VSC-HVDC Systems Introduction
Nicolas Manduley 2020 Page 4
investigate how the lightning performance of a DC overhead line should be evaluated, as well
as the measures to be taken in order to get an acceptable number of faults from an industrial
point of view. It is a timely subject considering the benefits of HVDC transmission discussed
above, as well as the restrictions that may lead to the conversion of AC overhead lines to DC.
2. Thesis Objectives
In order to contribute to overcome the above challenges and deficiencies regarding insulation
coordination, this dissertation is split into two main axes: insulation coordination of VSC-HVDC
systems, and the evaluation and improvement of the lightning performance of HVDC
overhead lines. It is important to note that, although both subjects will be addressed and
developed separately, they are not independent from each other, from both a scientific and
an industrial point of view. From the scientific point of view, in both cases the electromagnetic
behaviour of the system is considered. From an industrial point of view, the lightning
overvoltages produced along the line are related to the withstand voltage of the insulator
strings, which at the same time are related to the general specifications of the system.
Regarding the insulation coordination of HVDC systems, the main objectives are:
To provide a base on which the insulation coordination of MMC-HVDC stations can be
performed, inspired on the approach of AC and DC insulation coordination standards
and how it should be adapted to VSC-MMC systems taking into account their
respective features and characteristics.
To propose a methodology to perform transient studies in order to estimate the
required withstand voltages of the different apparatuses of MMC-HVDC stations.
To provide guidelines and recommendations on how the overvoltage protection
strategy should be designed, particularly regarding the characteristics of the arresters
and their energy duty.
Concerning the lightning performance of HVDC overhead lines, the main objectives are:
To adapt an existing procedure for the evaluation of the lightning performance of
overhead lines to HVDC transmission allowing to consider asymmetrical configurations
of the towers or overhead lines, non-linear devices and double flashovers.
Propose and assess solutions for the improvement of the lightning performance of
HVDC overhead lines considering both single and multiple insulator flashovers due to
lightning strikes.
Provide a better understanding of how HVDC systems behave in case of lightning
strikes (applicable to both VSC-HVDC and LCC-HVDC).
Contribution to Insulation Coordination Studies for VSC-HVDC Systems Introduction
Nicolas Manduley 2020 Page 5
3. Thesis Outline
This thesis is structured in four chapters, each developing one of the fundamental aspects
towards the achievements of the objectives above listed.
Chapter 1 constitutes an overview of the state of the art and literature review concerning
insulation coordination of HVDC systems. It presents the general philosophy of insulation
coordination, the procedures for HVAC systems and the specificities of HVDC that need to be
taken into consideration to adapt the fundamental insulation coordination principles given in
the standards to DC, and in particular for VSC-HVDC. Moreover, a general overview on
lightning is provided from the electrisation of the clouds to the statistical distribution of
lightning strike parameters and the methods to determine their impact points. Over this base,
the stakes of the estimation of the overhead line lightning performance are introduced.
Chapter 2 presents all the aspects relative to electromagnetic modelling of the different
components considered throughout the achievement of this research. It covers from
numerical considerations and individual component modelling (e.g. overhead lines,
transmission towers, insulators, surge arresters, faults and lightning strikes) to the modelling
of systems including several components (such as MMC stations and the general model used
for lightning studies).
In Chapter 3, studies are conducted aiming to analyse the overvoltage profiles and overvoltage
protection strategies of MMC-HVDC systems considering different architectures and
topologies of the MMC, as well as the influence of the surge arrester characteristics and
arrangement on the overvoltage profiles. A procedure is proposed to perform insulation
coordination studies on MMC-HVDC stations, particularly considering slow-front overvoltages
(SFO) due to faults, which typically lead to the highest overvoltage levels in transmission
systems (excluding external source faults as lightning). Guidelines are provided regarding the
design of the different surge arresters that may be present in the station for the overvoltage
protection strategy.
Chapter 4 deals with the evaluation and improvement of the lightning performance in HVDC
overhead lines. It introduces the hypotheses considered for the adaptation of the procedures
described in Chapter 1 to be able to consider asymmetric configurations—regarding the
transmission tower or the overhead lines—, surge arresters and double flashovers. Then, a
study is presented aiming to determine the influence of the position of the DC poles of each
polarity within a double-circuit HVDC overhead line, followed by the research on the proposed
techniques for the improvement of the lightning performance of HVDC lines.
Recommendations for the specification of the line surge arrester characteristics are provided.
Contribution to Insulation Coordination Studies for VSC-HVDC Systems Introduction
Nicolas Manduley 2020 Page 6
4. Thesis Contributions
The main goal of this thesis is to contribute to the development of insulation coordination
procedures for VSC-HVDC systems, particularly regarding the MMC which is the main type of
VSC used for high voltage applications. In order to take into account the behaviour of the
system under transient conditions, as well as the effect of surge arresters, breakdown of
insulators and other complex phenomena that influence the transient behaviour, the studies
presented in this work are mostly based on electromagnetic transient simulations. In the
interest of scientific rigor, qualitative and quantitative interpretations of the obtained results
are given as much as possible so that the proposed methods, procedures and
recommendations remain within the scientific domain and can be used for technical and
engineering applications.
In this context, the main contributions of this thesis are:
Through a comprehensive study of the existing literature and standards, the challenges
and main influencing factors in the development of a procedure for insulation
coordination of VSC-HVDC systems have been identified.
Fundamental schemes for MMC-HVDC systems have been proposed in which
insulation coordination can be based on, inspired on the approach adopted in IEC
60071-5 for LCC-HVDC systems. Such schemes are designed to be as detailed as
possible, while also being able to represent each possible topology (monopolar,
bipolar with or without metallic return and their respective operating modes in steady
state), configuration (point-to-point or MTDC), link technology (underground or
submarine cables, overhead lines, hybrid lines) and architecture (e.g. arm reactors on
the AC or the DC line).
Protection rules and guidelines for the overvoltage protection of MMC-HVDC systems
have been proposed based on qualitative and quantitative analysis for monopolar and
bipolar configurations. This includes design rules based on the maximum overvoltage
levels at each point of the system, design and location of surge arresters.
The effect of the surge arrester configuration within a station, their interactions and
consequences on the system and overall design have been studied under fault
conditions. Recommendations for the arrangement and design of the surge arresters
are provided based on the results.
The upgrade of an existing procedure for the estimation of the lightning performance
is provided so that it is able to consider asymmetric configurations regarding the
transmission towers or overhead lines, line surge arresters and double-pole flashovers
while also keeping and up-to-date modelling of the lightning strokes.
Contribution to Insulation Coordination Studies for VSC-HVDC Systems Introduction
Nicolas Manduley 2020 Page 7
The lightning back-flashover performance of different pole arrangements has been
studied and explained for HVDC double-circuit configurations, which are likely to
become more popular in the future due to the restrictions concerning the Right-of-
Way.
The use of unbalanced insulation have been studied to improve the lightning back-
flashover and double back-flashover performance of HVDC double-circuit
configurations with the same DC polarity on each cross arm. It has been shown that
similar or even better performances can be obtained using this solution compared to
the most commonly studied configuration with mixed polarities on each cross arm.
The use of line surge arresters have been also studied to improve the overall lightning
performance of HVDC overhead lines. Recommendations are provided regarding the
number and location of surge arresters per tower, as well as on how the surge arresters
should be designed and specified.
Contribution to Insulation Coordination Studies for VSC-HVDC Systems Chapter 1: State of the Art and Literature Review
Nicolas Manduley 2020 Page 8
Contribution to Insulation Coordination Studies for VSC-HVDC Systems Chapter 1: State of the Art and Literature Review
Nicolas Manduley 2020 Page 9
Chapter 1 State of the Art and Literature Review
1. Introduction
The main goals of this chapter are to provide a general overview of the state of the art
regarding insulation coordination through the available literature, and to present the scientific
and technical foundations of the topics presented in this dissertation. This will allow to
introduce the current challenges concerning the insulation coordination of HVDC systems, and
in particular for the high voltage applications of Voltage Source Converters (VSC-HVDC).
Firstly, the generalities of insulation coordination are presented to set the bases and provide
some context for the different aspects discussed in this chapter. Then, the specificities of
HVAC insulation coordination are explained based on the definitions and procedures given in
the IEC insulation coordination standards for HVAC. Next, the specificities of HVDC are
discussed by identifying the fundamental differences between AC and DC, and how these
differences have been taken into account to adapt the AC insulation coordination to DC in the
case of Line Commutated Converters (LCC). Similarly, the fundamental characteristics of VSC,
as well as their differences with LCC, are assessed to identify the specific challenges about how
the insulation coordination should be performed for such systems in a future standard.
Afterwards, a general overview on lightning is included so that the physical principles, as well
as the adequate vocabulary, are provided to support the discussions regarding lightning
studies in further chapters. Finally, after all of the above described aspects, the particular
contributions of this thesis are presented so that they can be easily put within the context of
insulation coordination, especially regarding VSC-HVDC systems.
2. Generalities Regarding Insulation Coordination
When designing an electrical network, it is essential that the insulation strength of all
equipment connected to it is designed to be higher than the maximum stresses expected to
appear in the network. This includes not only the nominal stresses, but also stresses due to
faults, malfunctioning, switching operations, or any kind of action that could introduce a
disturbance to the system. These disturbances may compromise the integrity of the
equipment as well as the safety of the operators.
From the previous paragraph it is possible to extract the fundamental mechanism behind
insulation coordination: the relations and interactions between stresses and insulation
strengths, and the need for the latter to be higher than the former. In order to achieve this
objective, there are two possibilities: either increase the strength, or reduce the stress
through voltage limitation devices, such as surge arresters or spark gaps.
According to IEC 60071 standards, insulation coordination is defined as:

Contribution to Insulation Coordination Studies for VSC-HVDC Systems Chapter 1: State of the Art and Literature Review
Nicolas Manduley 2020 Page 10
“Selection of dielectric strength of equipment in relation to the operating voltages and
overvoltages which can appear on the system for which the equipment is intended and
taking into account the service environment and the characteristics of the available
preventing and protective devices”
Insulation coordination can be thus described as a relative process consisting of the
harmonization between the insulation strengths of the equipment connected to the network
and the stresses that may appear during a wide spectrum of possible events. The final choice
is usually made on the basis of technical and economic considerations, by finding a balance
between the tolerated risk of failure and the total overall costs of the project.
The main difficulties associated to insulation coordination can be grouped in three categories:
a) the statistical nature of the procedure, b) the compatibility of stress and strength, and c)
the standardization requirements (Hutzler, 1994).
The fact that the physical phenomena behind the possible failure modes of the equipment are
of statistical nature represents one of the fundamental complexities of insulation
coordination. For each overvoltage value U, there is a probability f(U) for such overvoltage to
appear in the system, and a probability P(U) for the insulation to break down under the stress
of U. The risk of failure R is thus expressed as the convolution of f(U) and P(U) as shown in
equation (1-1) and illustrated in Figure 1.1.
𝑅 = ∫ 𝑓(𝑈) × 𝑃(𝑈) 𝑑𝑈𝑈𝑡
𝑈50−4𝑍
(1-1)
where, as defined in IEC 60071-2 standard:
f(U) is the probability density of overvoltage occurrence described by a
truncated Gaussian or a Weibull function;
P(U) is the discharge probability of insulation described by a modified Weibull
function;
Ut is the truncation value of the overvoltage probability distribution;
U50 – 4Z is the truncation value of the discharge probability distribution
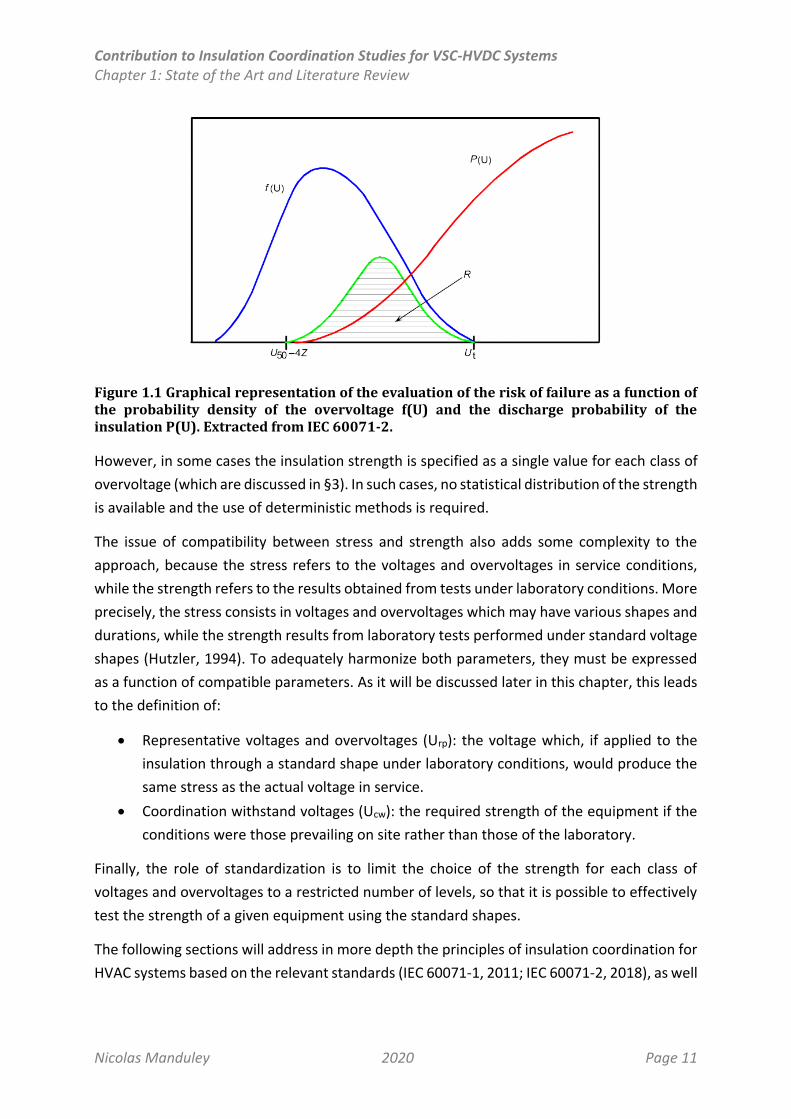
Contribution to Insulation Coordination Studies for VSC-HVDC Systems Chapter 1: State of the Art and Literature Review
Nicolas Manduley 2020 Page 11
Figure 1.1 Graphical representation of the evaluation of the risk of failure as a function of the probability density of the overvoltage f(U) and the discharge probability of the insulation P(U). Extracted from IEC 60071-2.
However, in some cases the insulation strength is specified as a single value for each class of
overvoltage (which are discussed in §3). In such cases, no statistical distribution of the strength
is available and the use of deterministic methods is required.
The issue of compatibility between stress and strength also adds some complexity to the
approach, because the stress refers to the voltages and overvoltages in service conditions,
while the strength refers to the results obtained from tests under laboratory conditions. More
precisely, the stress consists in voltages and overvoltages which may have various shapes and
durations, while the strength results from laboratory tests performed under standard voltage
shapes (Hutzler, 1994). To adequately harmonize both parameters, they must be expressed
as a function of compatible parameters. As it will be discussed later in this chapter, this leads
to the definition of:
Representative voltages and overvoltages (Urp): the voltage which, if applied to the
insulation through a standard shape under laboratory conditions, would produce the
same stress as the actual voltage in service.
Coordination withstand voltages (Ucw): the required strength of the equipment if the
conditions were those prevailing on site rather than those of the laboratory.
Finally, the role of standardization is to limit the choice of the strength for each class of
voltages and overvoltages to a restricted number of levels, so that it is possible to effectively
test the strength of a given equipment using the standard shapes.
The following sections will address in more depth the principles of insulation coordination for
HVAC systems based on the relevant standards (IEC 60071-1, 2011; IEC 60071-2, 2018), as well
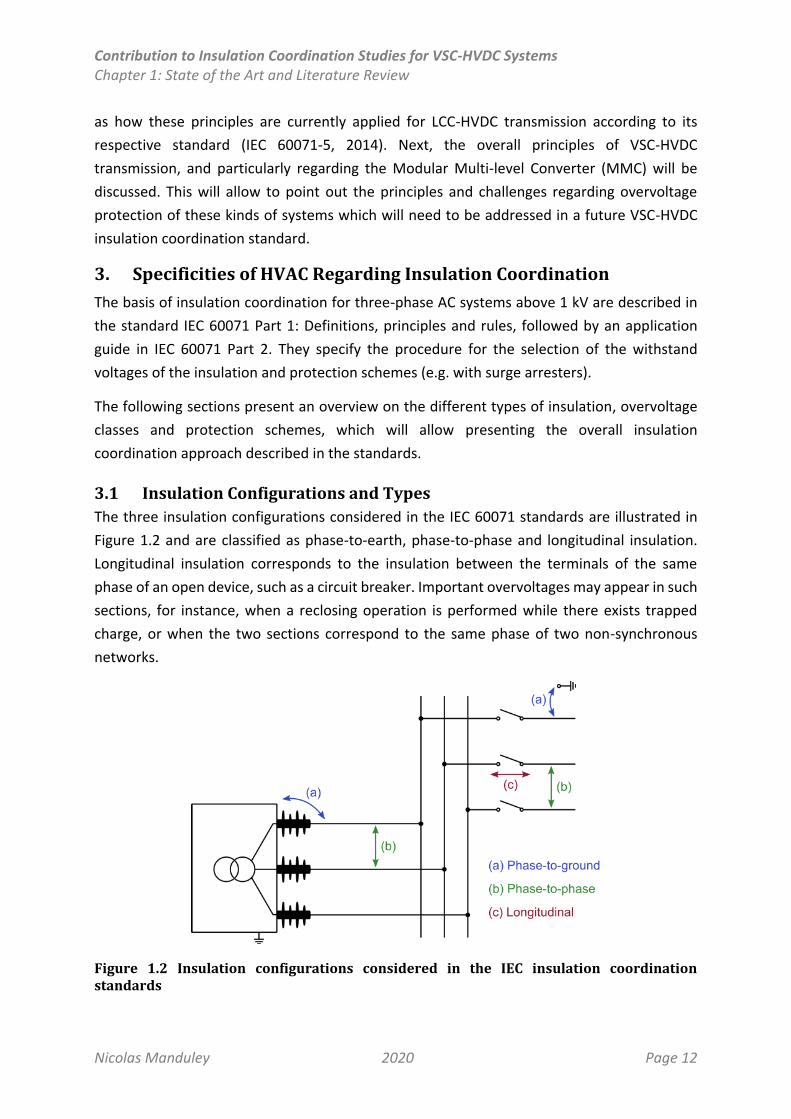
Contribution to Insulation Coordination Studies for VSC-HVDC Systems Chapter 1: State of the Art and Literature Review
Nicolas Manduley 2020 Page 12
as how these principles are currently applied for LCC-HVDC transmission according to its
respective standard (IEC 60071-5, 2014). Next, the overall principles of VSC-HVDC
transmission, and particularly regarding the Modular Multi-level Converter (MMC) will be
discussed. This will allow to point out the principles and challenges regarding overvoltage
protection of these kinds of systems which will need to be addressed in a future VSC-HVDC
insulation coordination standard.
3. Specificities of HVAC Regarding Insulation Coordination
The basis of insulation coordination for three-phase AC systems above 1 kV are described in
the standard IEC 60071 Part 1: Definitions, principles and rules, followed by an application
guide in IEC 60071 Part 2. They specify the procedure for the selection of the withstand
voltages of the insulation and protection schemes (e.g. with surge arresters).
The following sections present an overview on the different types of insulation, overvoltage
classes and protection schemes, which will allow presenting the overall insulation
coordination approach described in the standards.
3.1 Insulation Configurations and Types
The three insulation configurations considered in the IEC 60071 standards are illustrated in
Figure 1.2 and are classified as phase-to-earth, phase-to-phase and longitudinal insulation.
Longitudinal insulation corresponds to the insulation between the terminals of the same
phase of an open device, such as a circuit breaker. Important overvoltages may appear in such
sections, for instance, when a reclosing operation is performed while there exists trapped
charge, or when the two sections correspond to the same phase of two non-synchronous
networks.
Figure 1.2 Insulation configurations considered in the IEC insulation coordination standards
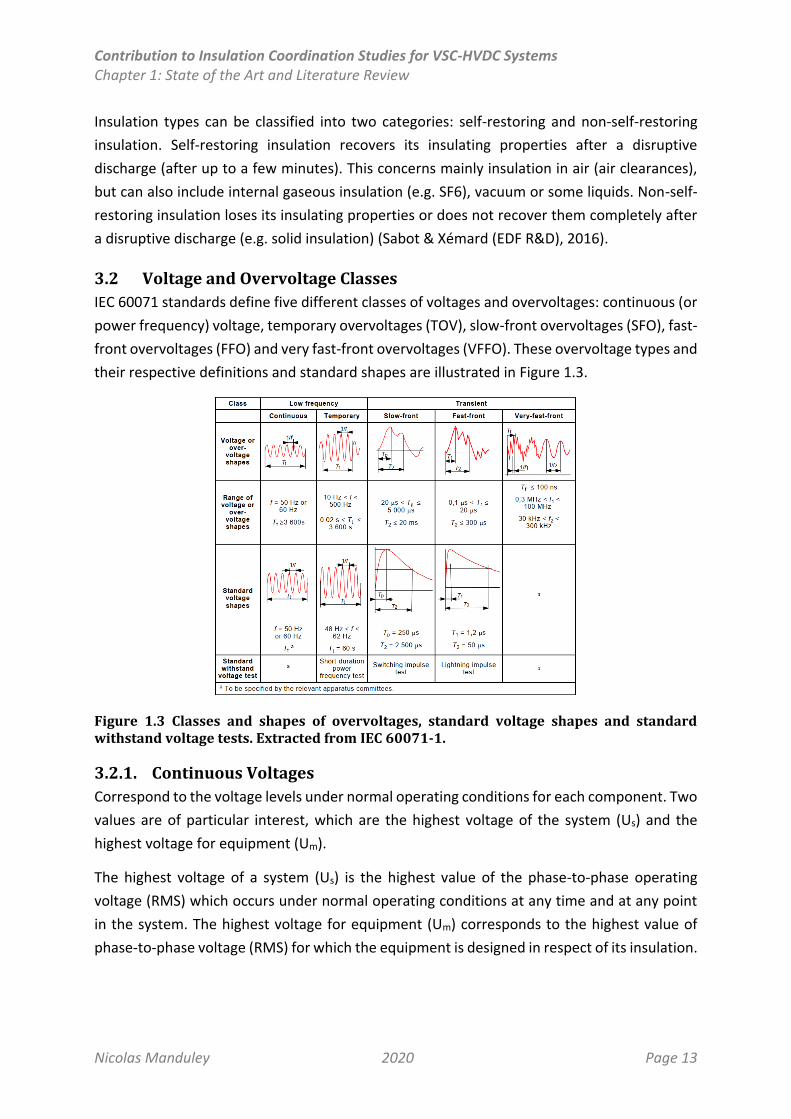
Contribution to Insulation Coordination Studies for VSC-HVDC Systems Chapter 1: State of the Art and Literature Review
Nicolas Manduley 2020 Page 13
Insulation types can be classified into two categories: self-restoring and non-self-restoring
insulation. Self-restoring insulation recovers its insulating properties after a disruptive
discharge (after up to a few minutes). This concerns mainly insulation in air (air clearances),
but can also include internal gaseous insulation (e.g. SF6), vacuum or some liquids. Non-self-
restoring insulation loses its insulating properties or does not recover them completely after
a disruptive discharge (e.g. solid insulation) (Sabot & Xémard (EDF R&D), 2016).
3.2 Voltage and Overvoltage Classes
IEC 60071 standards define five different classes of voltages and overvoltages: continuous (or
power frequency) voltage, temporary overvoltages (TOV), slow-front overvoltages (SFO), fast-
front overvoltages (FFO) and very fast-front overvoltages (VFFO). These overvoltage types and
their respective definitions and standard shapes are illustrated in Figure 1.3.
Figure 1.3 Classes and shapes of overvoltages, standard voltage shapes and standard withstand voltage tests. Extracted from IEC 60071-1.
3.2.1. Continuous Voltages
Correspond to the voltage levels under normal operating conditions for each component. Two
values are of particular interest, which are the highest voltage of the system (Us) and the
highest voltage for equipment (Um).
The highest voltage of a system (Us) is the highest value of the phase-to-phase operating
voltage (RMS) which occurs under normal operating conditions at any time and at any point
in the system. The highest voltage for equipment (Um) corresponds to the highest value of
phase-to-phase voltage (RMS) for which the equipment is designed in respect of its insulation.
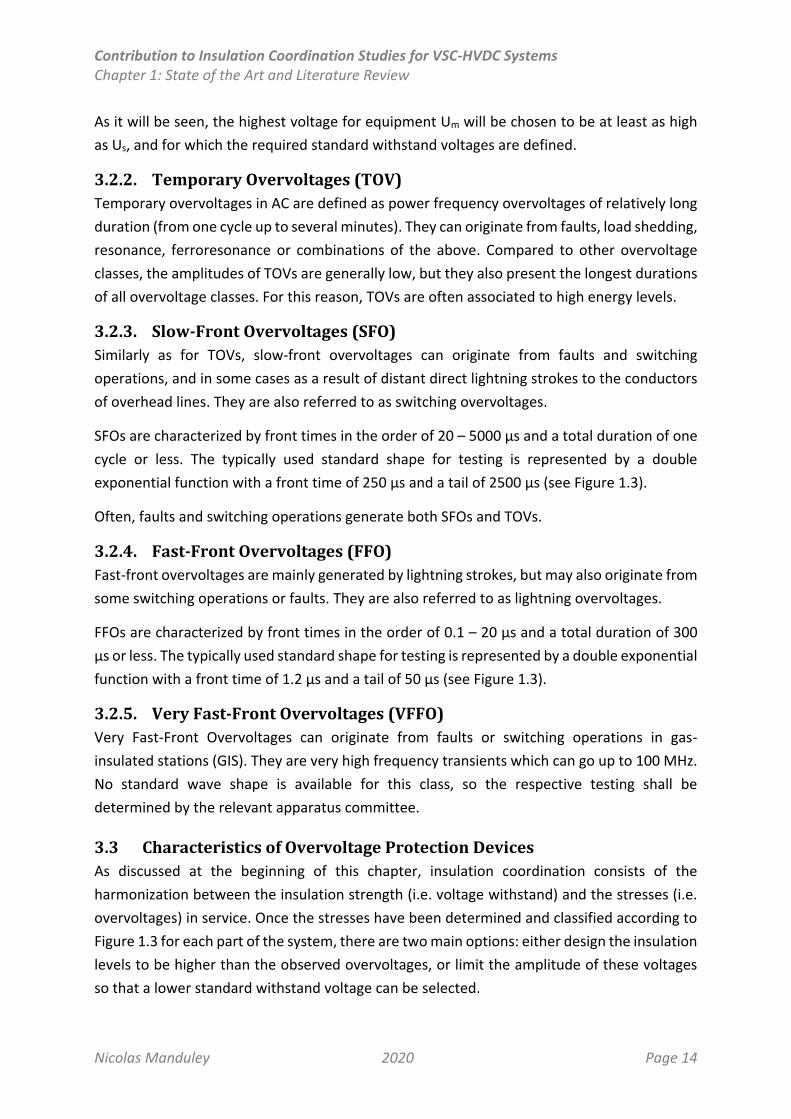
Contribution to Insulation Coordination Studies for VSC-HVDC Systems Chapter 1: State of the Art and Literature Review
Nicolas Manduley 2020 Page 14
As it will be seen, the highest voltage for equipment Um will be chosen to be at least as high
as Us, and for which the required standard withstand voltages are defined.
3.2.2. Temporary Overvoltages (TOV)
Temporary overvoltages in AC are defined as power frequency overvoltages of relatively long
duration (from one cycle up to several minutes). They can originate from faults, load shedding,
resonance, ferroresonance or combinations of the above. Compared to other overvoltage
classes, the amplitudes of TOVs are generally low, but they also present the longest durations
of all overvoltage classes. For this reason, TOVs are often associated to high energy levels.
3.2.3. Slow-Front Overvoltages (SFO)
Similarly as for TOVs, slow-front overvoltages can originate from faults and switching
operations, and in some cases as a result of distant direct lightning strokes to the conductors
of overhead lines. They are also referred to as switching overvoltages.
SFOs are characterized by front times in the order of 20 – 5000 µs and a total duration of one
cycle or less. The typically used standard shape for testing is represented by a double
exponential function with a front time of 250 µs and a tail of 2500 µs (see Figure 1.3).
Often, faults and switching operations generate both SFOs and TOVs.
3.2.4. Fast-Front Overvoltages (FFO)
Fast-front overvoltages are mainly generated by lightning strokes, but may also originate from
some switching operations or faults. They are also referred to as lightning overvoltages.
FFOs are characterized by front times in the order of 0.1 – 20 µs and a total duration of 300
µs or less. The typically used standard shape for testing is represented by a double exponential
function with a front time of 1.2 µs and a tail of 50 µs (see Figure 1.3).
3.2.5. Very Fast-Front Overvoltages (VFFO)
Very Fast-Front Overvoltages can originate from faults or switching operations in gas-
insulated stations (GIS). They are very high frequency transients which can go up to 100 MHz.
No standard wave shape is available for this class, so the respective testing shall be
determined by the relevant apparatus committee.
3.3 Characteristics of Overvoltage Protection Devices
As discussed at the beginning of this chapter, insulation coordination consists of the
harmonization between the insulation strength (i.e. voltage withstand) and the stresses (i.e.
overvoltages) in service. Once the stresses have been determined and classified according to
Figure 1.3 for each part of the system, there are two main options: either design the insulation
levels to be higher than the observed overvoltages, or limit the amplitude of these voltages
so that a lower standard withstand voltage can be selected.

Contribution to Insulation Coordination Studies for VSC-HVDC Systems Chapter 1: State of the Art and Literature Review
Nicolas Manduley 2020 Page 15
Metal-oxide surge arresters (MOSA) without gaps are the most widely used arresters to
directly protect the equipment and lines from overvoltages. The fundamental characteristics
and selection rules of metal-oxide arresters without gaps for AC systems are covered in their
respective standards (IEC 60099-4, 2014; IEC 60099-5, 2000).
Surge arresters consist of a non-linear resistance which presents a very high impedance under
normal operating conditions which is dramatically reduced when high overvoltages appear
across its terminals. This property is represented by their respective voltage-current (V-I)
characteristic, such as the one shown in Figure 1.4, which illustrates their performance under
normal and transient conditions. In particular, some of the most relevant concepts concerning
surge arresters are defined below:
Uc (continuous operating voltage): maximum voltage that can be continuously applied
to a surge arrester without any type of restriction.
Ur (rated voltage): typically defined as the voltage that can be applied to the arrester
during 10 seconds; it characterizes the capability of the arrester to deal with temporary
overvoltages (TOV) in AC.
SIPL (Switching Impulse Protective Level): residual voltage that appears across the
arrester when a switching impulse current flows through it (typically with the 30/60 µs
impulse shape (IEC 60099-4, 2014) at 1 kA or 2 kA nominal discharge current).
LIPL (Lightning Impulse Protective Level): residual voltage that appears across the
arrester when a lightning impulse current flows through it (typically with the 8/20 µs
impulse shape (IEC 60099-4, 2014) at 10 kA or 20 kA nominal discharge current).
Figure 1.4 V-I characteristic for a SIEMENS surge arrester rated Ur = 336 kV (rms), typically used for an AC system rated Us = 420 kV; extracted from Hinrichsen (2012).
The general procedure for the selection of surge arresters is recommended in IEC 60099-5,
and consists of the specification of each of the above parameters (i.e. Uc, Ur, SIPL and LIPL) by
Contribution to Insulation Coordination Studies for VSC-HVDC Systems Chapter 1: State of the Art and Literature Review
Nicolas Manduley 2020 Page 16
taking into account the energy absorption level of the surge arresters, in order to avoid
thermal failure.
These surge arrester parameters are specified by the constructor by applying standard current
waveshape and measuring the voltage that appears across the surge arrester (which is
referred to as the residual voltage of the arrester). For instance, the LIPL is measured as the
residual voltage that appears when a 20 kA, 8/20 µs current waveshape is applied to the
arrester. The constructor may specify the residual voltages for several peak currents with the
8/20 µs curve (e.g. 10, 20, 40 kA) which provides more points to model the V-I characteristic
more precisely. Therefore, the reference value of the LIPL is obtained by choosing one of these
points on the V-I characteristic. For high voltage applications, typically the 20 kA value is used
as reference. A similar reasoning can be applied to the determination of the SIPL.
Since the TOVs are generally the most critical overvoltages for the surge arresters in terms of
energy absorption (due to their long duration), AC arresters are often designed so that the
rated voltage of the arrester (Ur) matches the maximum TOV of the system. Since the rated
voltage Ur can be described as the voltage level that the arrester can withstand during 10 s,
this approach generally ensures that the arrester will not absorb great amounts of energy, and
will only conduct significant currents during switching or lightning overvoltages. Then, it must
be verified that the continuous operating voltage (Uc) of the arrester is higher than the
maximum voltage under normal operating conditions, and finally, the values of SIPL and LIPL
are determined.
As it will be seen in the next section, this is an iterative procedure. For a given initial design,
several iterations may be required until an optimal design is obtained which fits the
performance criterion and does not result in thermal overload of the surge arresters.
3.4 Insulation Coordination Procedure for AC Systems
The general procedure for insulation coordination can be now described as the selection of
the highest voltage of the equipment together with a corresponding set of standard rated
withstand voltages which characterize the insulation of the equipment needed for the
application (IEC 60071-1, 2011). This procedure is illustrated in Figure 1.5 and can be explained
through the calculation of four parameters: the representative voltages (Urp), the coordination
withstand voltages (Ucw), the required withstand voltage (Urw) and the standard insulation
level (Uw).
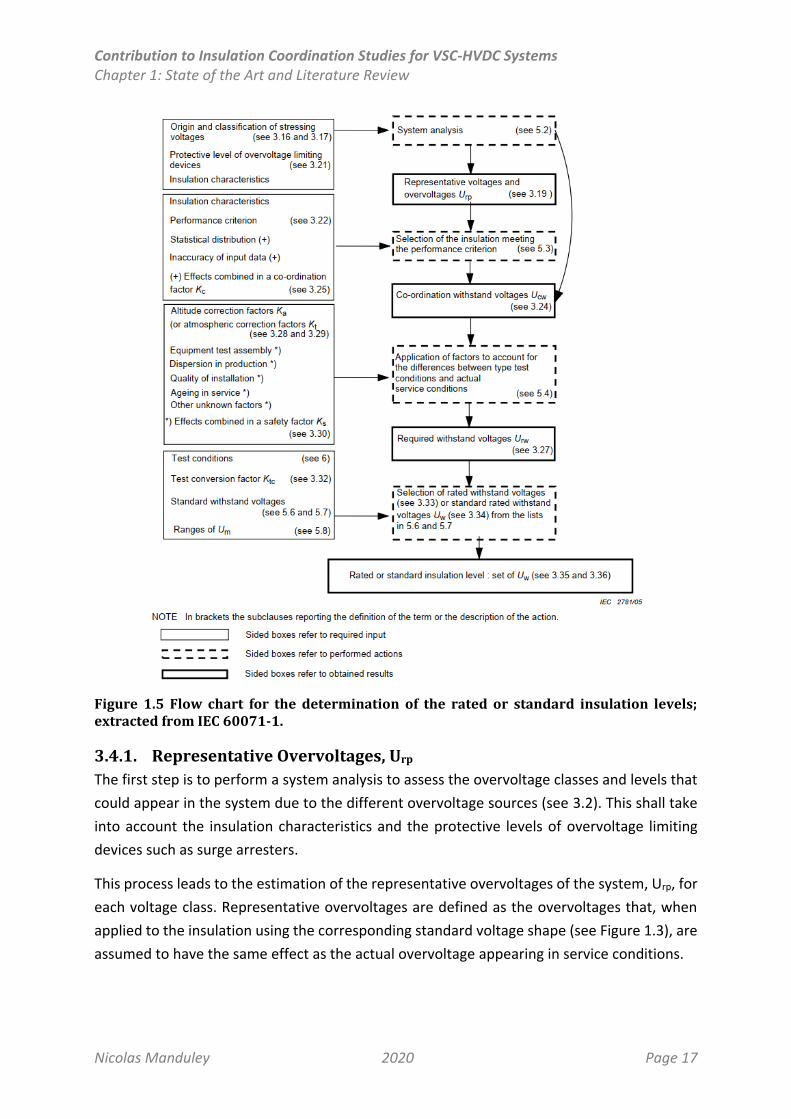
Contribution to Insulation Coordination Studies for VSC-HVDC Systems Chapter 1: State of the Art and Literature Review
Nicolas Manduley 2020 Page 17
Figure 1.5 Flow chart for the determination of the rated or standard insulation levels; extracted from IEC 60071-1.
3.4.1. Representative Overvoltages, Urp
The first step is to perform a system analysis to assess the overvoltage classes and levels that
could appear in the system due to the different overvoltage sources (see 3.2). This shall take
into account the insulation characteristics and the protective levels of overvoltage limiting
devices such as surge arresters.
This process leads to the estimation of the representative overvoltages of the system, Urp, for
each voltage class. Representative overvoltages are defined as the overvoltages that, when
applied to the insulation using the corresponding standard voltage shape (see Figure 1.3), are
assumed to have the same effect as the actual overvoltage appearing in service conditions.
Contribution to Insulation Coordination Studies for VSC-HVDC Systems Chapter 1: State of the Art and Literature Review
Nicolas Manduley 2020 Page 18
3.4.2. Coordination Withstand Overvoltages, Ucw
Coordination withstand voltages have the same shape as representative voltages (i.e. the
standard voltage shapes shown in Figure 1.3). While representative overvoltages are the
values producing the same stress on the insulation, the coordination withstand voltages refer
to the minimum strength of the insulation which would satisfy the performance criterion (i.e.
the risk of failure defined as tolerable) under in-site conditions. Hence, the coordination
withstand Ucw can be calculated by multiplying the representative overvoltage Urp by a
coordination factor, which will depend on how the representative voltages were obtained.
Alternatively, by performing simulations of overvoltage events with the simultaneous
evaluation of the risk of failure permits the direct determination of the Ucw without calculating
the Urp.
3.4.3. Required Withstand Voltage, Urw
When the minimum strength of the insulation satisfying the performance criterion is
determined (represented by the coordination withstand Ucw), the next step is to adjust this
strength to appropriate standard test conditions considering the actual in-service conditions.
This is done by multiplying the Ucw by a factor accounting for possible variabilities associated
to the atmospheric conditions, the dispersion in the product quality, the installation, the
ageing of the insulation and other factors that may be considered appropriate.
3.4.4. Rated Insulation Level, Uw
Finally, after the minimum required insulation strength is calculated, the last step is to specify
the standard withstand strength by selecting among the available existing values listed in the
IEC 60071 standards for each voltage level. To do so, the chosen rated voltage shall be higher
or at least equal to the required withstand voltage Urw calculated in the previous step for each
voltage class.
All of the above process described in the previous paragraphs may lead to different insulation
requirements depending on the initial conditions (e.g. surge arrester locations and
specifications, insulation characteristics…) or the initial requirements (e.g. performance
criterion) provided in the initial step. Throughout the process, one or more of these aspects
may be modified to adjust the final design and find an optimal solution from a technical and
economical point of view. Therefore, it can be concluded that insulation coordination is in
itself a process of iterative nature, and several iterations may be required before reaching the
final design.
4. Specificities of HVDC
Currently, the only available insulation coordination standard for HVDC applications concerns
LCC-HVDC converters (IEC 60071-5, 2014). In this section, the fundamental differences
Contribution to Insulation Coordination Studies for VSC-HVDC Systems Chapter 1: State of the Art and Literature Review
Nicolas Manduley 2020 Page 19
between AC and DC regarding insulation coordination will be analysed, as well as how the
insulation coordination philosophy has been adapted from the AC standards to DC in IEC
60071-5 taking into account the specificities of DC insulation coordination. Then, the
particular differences between VSC-HVDC and LCC-HVDC transmission will be discussed, in
order to explain how the general insulation coordination philosophy should be adapted for
VSC-HVDC applications.
4.1 Main Differences with AC
According to the bibliographical study performed in this work, the fundamental differences
between AC and DC regarding insulation coordination can be grouped into three main
categories: pollution, voltage levels and pre-stresses and environmental factors. In this
section, the most important aspects of each one are discussed, and an overall comparison is
presented in Table 1.1 for AC and DC.
The knowledge of these differences will be of great use to understand how the insulation
coordination principles from the AC standards should be transposed to DC. This will help to
understand how these fundamental principles were transposed to LCC-HVDC, as well as to
provide some hints on how they should be applied to VSC-HVDC systems in a future standard.
Some relevant references consulted to make this classification: (CENELEC 50341, 2012; CIGRE
TB 158, 2000; CIGRE TB 518, 2012; CIGRE TB 72, 1992; Cortina et al., 1984; IEC 60052, 2002;
Udo & Watanabe, 1968; Watanabe, 1968).
4.1.1. Pollution
One of the most influencing factors that differentiate AC from DC insulation coordination is
the effect of pollution in the design of the overhead line insulators. Figure 1.6 illustrates the
strong impact that pollution has on the calculation of the minimum insulation distances in
HVDC whenever line insulator strings are present, while in HVAC switching overvoltages are
typically the determining parameter.
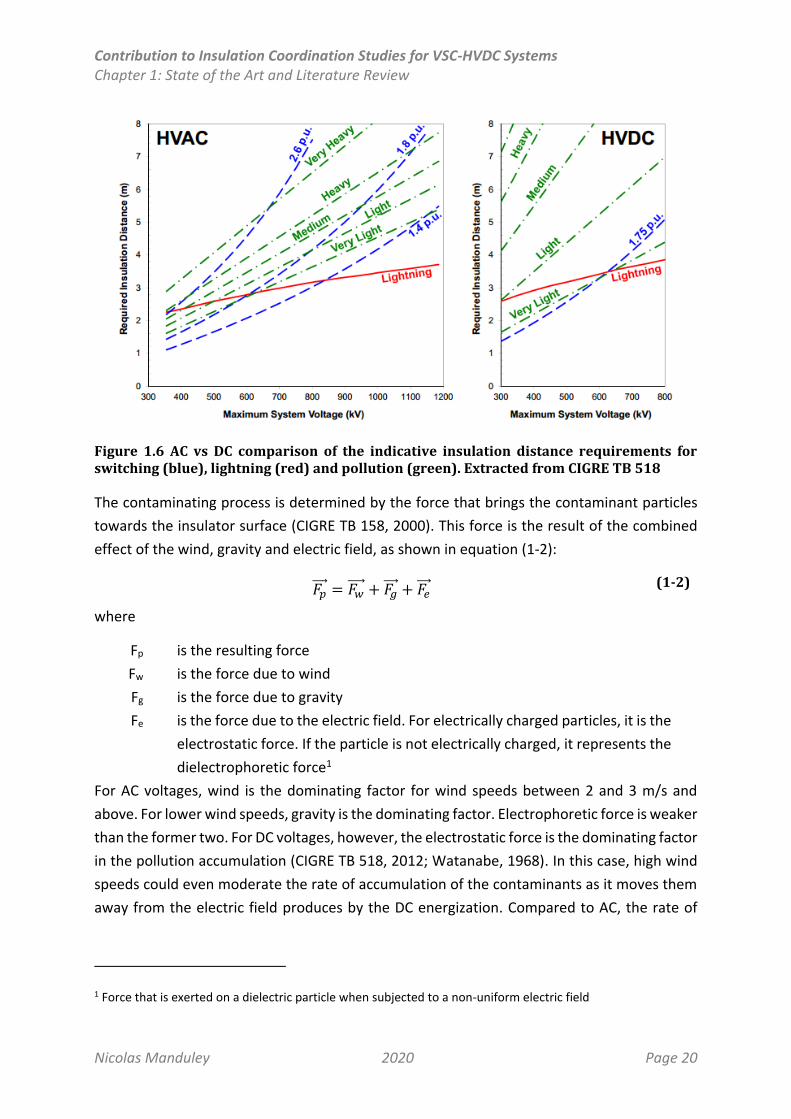
Contribution to Insulation Coordination Studies for VSC-HVDC Systems Chapter 1: State of the Art and Literature Review
Nicolas Manduley 2020 Page 20
Figure 1.6 AC vs DC comparison of the indicative insulation distance requirements for switching (blue), lightning (red) and pollution (green). Extracted from CIGRE TB 518
The contaminating process is determined by the force that brings the contaminant particles
towards the insulator surface (CIGRE TB 158, 2000). This force is the result of the combined
effect of the wind, gravity and electric field, as shown in equation (1-2):
𝐹𝑝⃗⃗ ⃗ = 𝐹𝑤⃗⃗⃗⃗ + 𝐹𝑔⃗⃗ ⃗ + 𝐹𝑒⃗⃗ ⃗ (1-2)
where
Fp is the resulting force
Fw is the force due to wind
Fg is the force due to gravity
Fe is the force due to the electric field. For electrically charged particles, it is the
electrostatic force. If the particle is not electrically charged, it represents the
dielectrophoretic force1
For AC voltages, wind is the dominating factor for wind speeds between 2 and 3 m/s and
above. For lower wind speeds, gravity is the dominating factor. Electrophoretic force is weaker
than the former two. For DC voltages, however, the electrostatic force is the dominating factor
in the pollution accumulation (CIGRE TB 518, 2012; Watanabe, 1968). In this case, high wind
speeds could even moderate the rate of accumulation of the contaminants as it moves them
away from the electric field produces by the DC energization. Compared to AC, the rate of
1 Force that is exerted on a dielectric particle when subjected to a non-uniform electric field

Contribution to Insulation Coordination Studies for VSC-HVDC Systems Chapter 1: State of the Art and Literature Review
Nicolas Manduley 2020 Page 21
pollution deposit in DC can be up to 10 times higher (CIGRE TB 518, 2012) and generally
represents a more serious situation for DC systems than for AC (X. Li, Zhou, He, & Wang, 2017).
In addition to the higher rates of accumulation of pollution, the fact that the insulator strings
are subjected to a constant DC voltage also affects the flashover mechanism of the insulator.
Experimental studies have shown that under DC voltage the arc propagation across the
surface of the insulator differs from that under AC energisation (CIGRE TB 518, 2012). In
general, the arc tends to propagate along the surface of the insulator, and after the first
ignition is produced, the arc may “jump” between the sheds across the air. This is less likely
to happen in AC because the arc needs to reignite after each zero-crossing of the voltage, and
thus there is less time for these jumps to occur. Conversely, since in DC there is no zero-
crossing of the voltage, arcs are more likely to propagate through the air jumping across the
sheds, as shown in Figure 1.7 (left).
Figure 1.7 Left: AC versus DC arcing differences across the insulator (extracted from CIGRE TB 518). Right: Flashover process in polluted insulators in presence of dry bands along the surface (from CIGRE TB 158).
This effect is magnified when combined with the formation of dry bands due to the non-
uniform accumulation of pollution and/or wetting of the surface of the insulator. The lower
conductivity of such dry bands may produce small jumps along some sections of the surface
of the insulation, thus reducing the effective creepage distance before the first ignition. The
flashover process due to pollution including the presence of dry bands is illustrated in Figure
1.7 (right).
As a result of the increased attraction to contaminants, the variation in the flashover
mechanism, and the formation of dry bands along the surface of the insulator, the overall
design of DC insulators differs significantly from that of AC insulators. Some of the most
remarkable differences are:
Considerably longer strings are required to compensate the reduction of the effective
creepage distance;
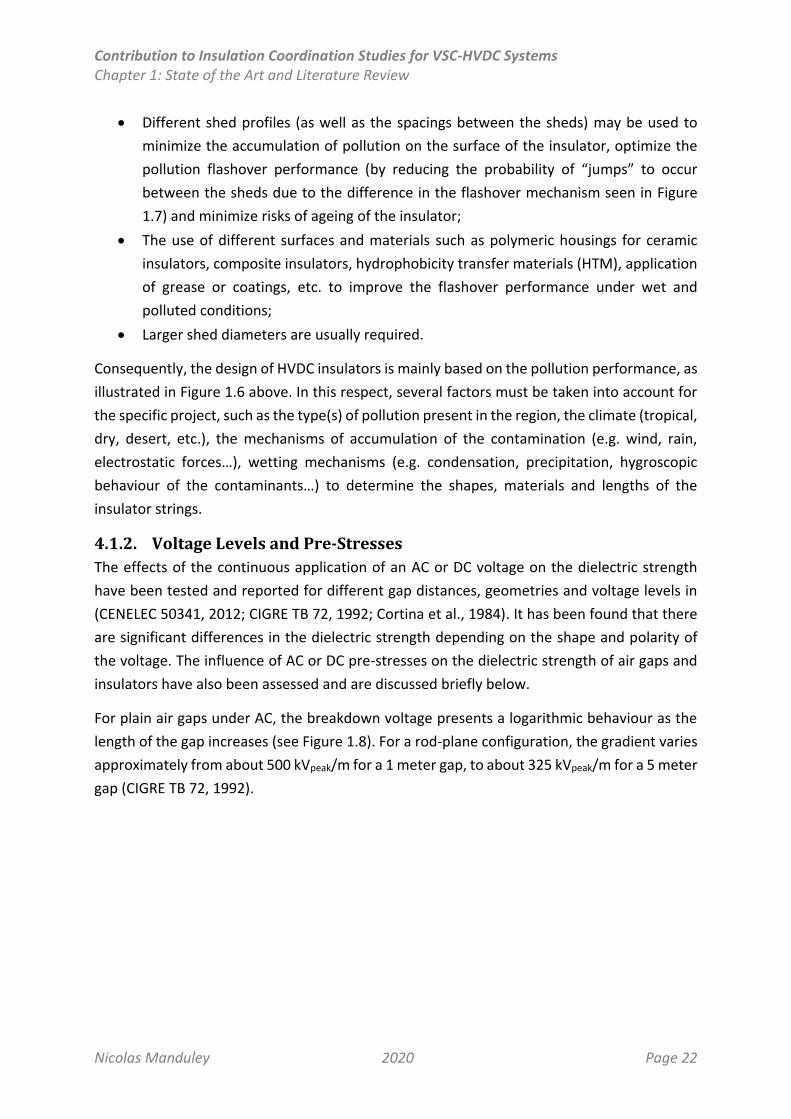
Contribution to Insulation Coordination Studies for VSC-HVDC Systems Chapter 1: State of the Art and Literature Review
Nicolas Manduley 2020 Page 22
Different shed profiles (as well as the spacings between the sheds) may be used to
minimize the accumulation of pollution on the surface of the insulator, optimize the
pollution flashover performance (by reducing the probability of “jumps” to occur
between the sheds due to the difference in the flashover mechanism seen in Figure
1.7) and minimize risks of ageing of the insulator;
The use of different surfaces and materials such as polymeric housings for ceramic
insulators, composite insulators, hydrophobicity transfer materials (HTM), application
of grease or coatings, etc. to improve the flashover performance under wet and
polluted conditions;
Larger shed diameters are usually required.
Consequently, the design of HVDC insulators is mainly based on the pollution performance, as
illustrated in Figure 1.6 above. In this respect, several factors must be taken into account for
the specific project, such as the type(s) of pollution present in the region, the climate (tropical,
dry, desert, etc.), the mechanisms of accumulation of the contamination (e.g. wind, rain,
electrostatic forces…), wetting mechanisms (e.g. condensation, precipitation, hygroscopic
behaviour of the contaminants…) to determine the shapes, materials and lengths of the
insulator strings.
4.1.2. Voltage Levels and Pre-Stresses
The effects of the continuous application of an AC or DC voltage on the dielectric strength
have been tested and reported for different gap distances, geometries and voltage levels in
(CENELEC 50341, 2012; CIGRE TB 72, 1992; Cortina et al., 1984). It has been found that there
are significant differences in the dielectric strength depending on the shape and polarity of
the voltage. The influence of AC or DC pre-stresses on the dielectric strength of air gaps and
insulators have also been assessed and are discussed briefly below.
For plain air gaps under AC, the breakdown voltage presents a logarithmic behaviour as the
length of the gap increases (see Figure 1.8). For a rod-plane configuration, the gradient varies
approximately from about 500 kVpeak/m for a 1 meter gap, to about 325 kVpeak/m for a 5 meter
gap (CIGRE TB 72, 1992).
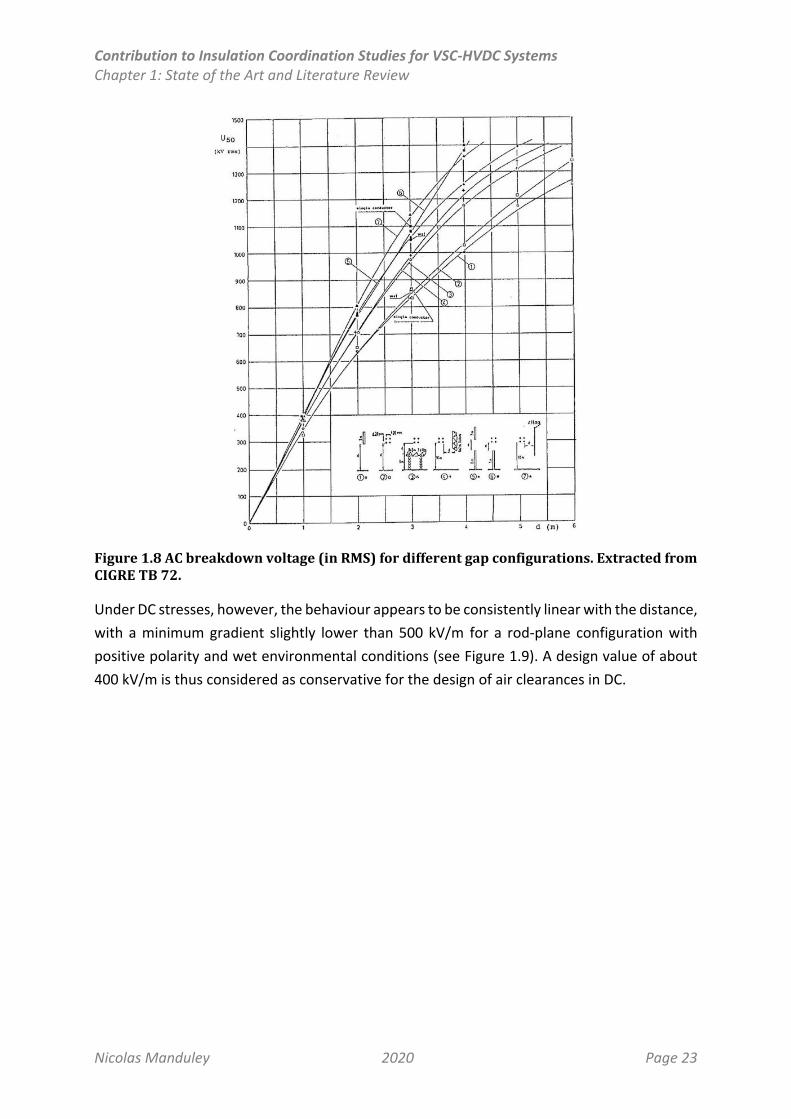
Contribution to Insulation Coordination Studies for VSC-HVDC Systems Chapter 1: State of the Art and Literature Review
Nicolas Manduley 2020 Page 23
Figure 1.8 AC breakdown voltage (in RMS) for different gap configurations. Extracted from CIGRE TB 72.
Under DC stresses, however, the behaviour appears to be consistently linear with the distance,
with a minimum gradient slightly lower than 500 kV/m for a rod-plane configuration with
positive polarity and wet environmental conditions (see Figure 1.9). A design value of about
400 kV/m is thus considered as conservative for the design of air clearances in DC.
Contribution to Insulation Coordination Studies for VSC-HVDC Systems Chapter 1: State of the Art and Literature Review
Nicolas Manduley 2020 Page 24
Figure 1.9 DC breakdown voltage as a function of the gap clearance for a rod-plane configuration. Extracted from CIGRE TB 72.
When insulators are considered, a strong reduction in the strength is observed for both AC
and DC energised insulators under rain, while under dry conditions, only a slight variation is
produced on DC insulators compared to the strength of an air gap.
In case of voltage impulses (i.e. switching and lightning surges) applied with pre-existing
stresses, little to no variation of the strength seems to exist for AC pre-stresses in general
(except for insulators under polluted conditions). Moreover, the effect of pre-existing DC
stresses only seem to be significant for wet insulators (clean or polluted) under switching and
lighting impulses (see Table 1.1).
However, it is very common to install arcing horns in parallel with the insulators (e.g. for line
insulators) to protect them from discharges along the surface or through the interior of the
insulating material. In such cases, insulators may be considered to behave as the
corresponding air gap represented by the arcing horns, where no significant variations are
observed. For more details, consult Table 1.1 below.
4.1.3. Environmental Factors
Finally, some environmental factors may also have slightly different effects in DC compared
to AC. For instance, the deposit of snow in the surface of the insulator may result in withstand
voltages much lower than under dry and clean conditions, and seems to be especially
constraining in DC (Udo & Watanabe, 1968).
Contribution to Insulation Coordination Studies for VSC-HVDC Systems Chapter 1: State of the Art and Literature Review
Nicolas Manduley 2020 Page 25
The wind, as explained in §4.1.1, is the main mechanism behind the accumulation of pollution
in AC insulators. In the case of DC insulators, it might attenuate the accumulation of pollution
by countering the effect of the electrostatic field.
Additionally, some particular considerations are made regarding the temperature, air density
and humidity correction for AC (CENELEC 50341, 2012; IEC 60052, 2002) and DC (Watanabe,
1968). However, it is not clear whether these approaches would produce a significantly
different effect in DC compared to AC.
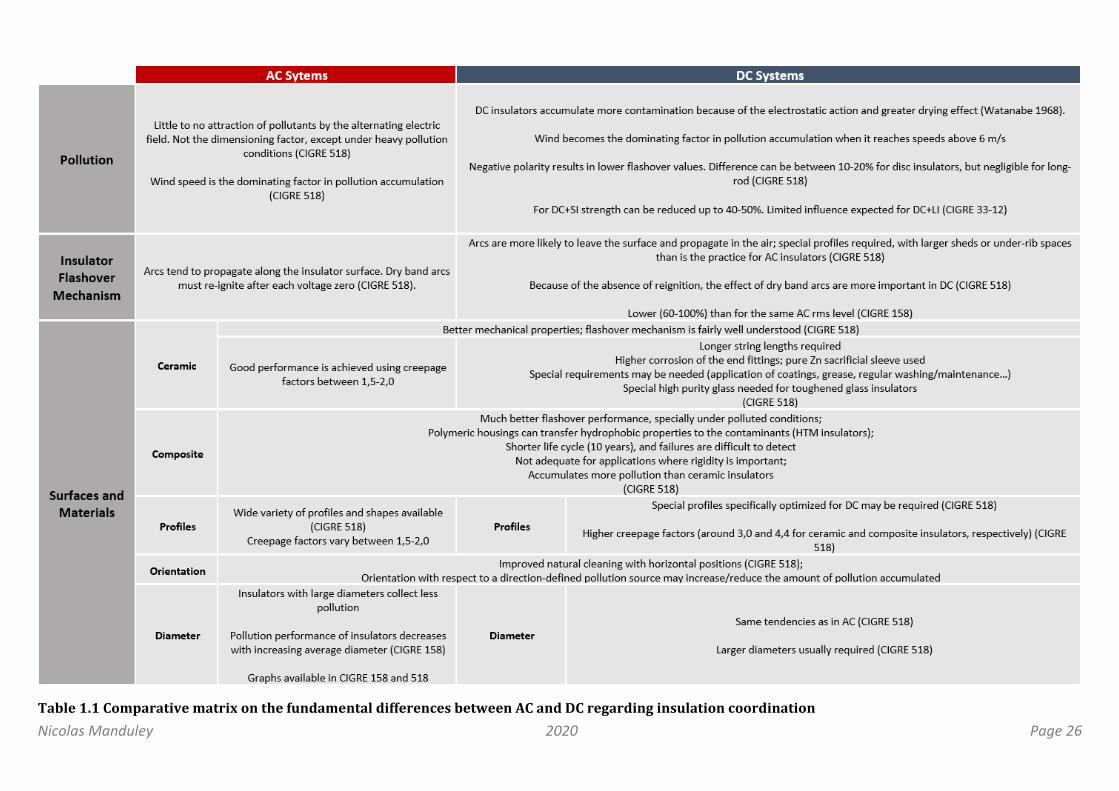
Nicolas Manduley 2020 Page 26
Table 1.1 Comparative matrix on the fundamental differences between AC and DC regarding insulation coordination
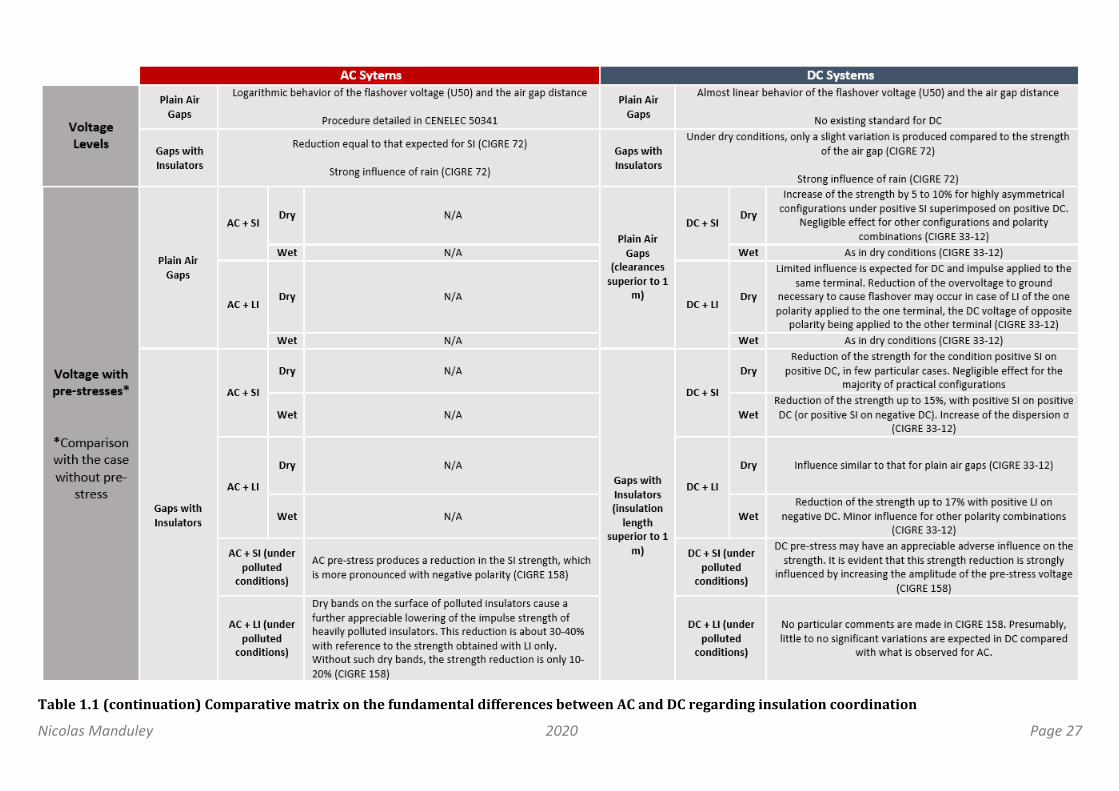
Nicolas Manduley 2020 Page 27
Table 1.1 (continuation) Comparative matrix on the fundamental differences between AC and DC regarding insulation coordination
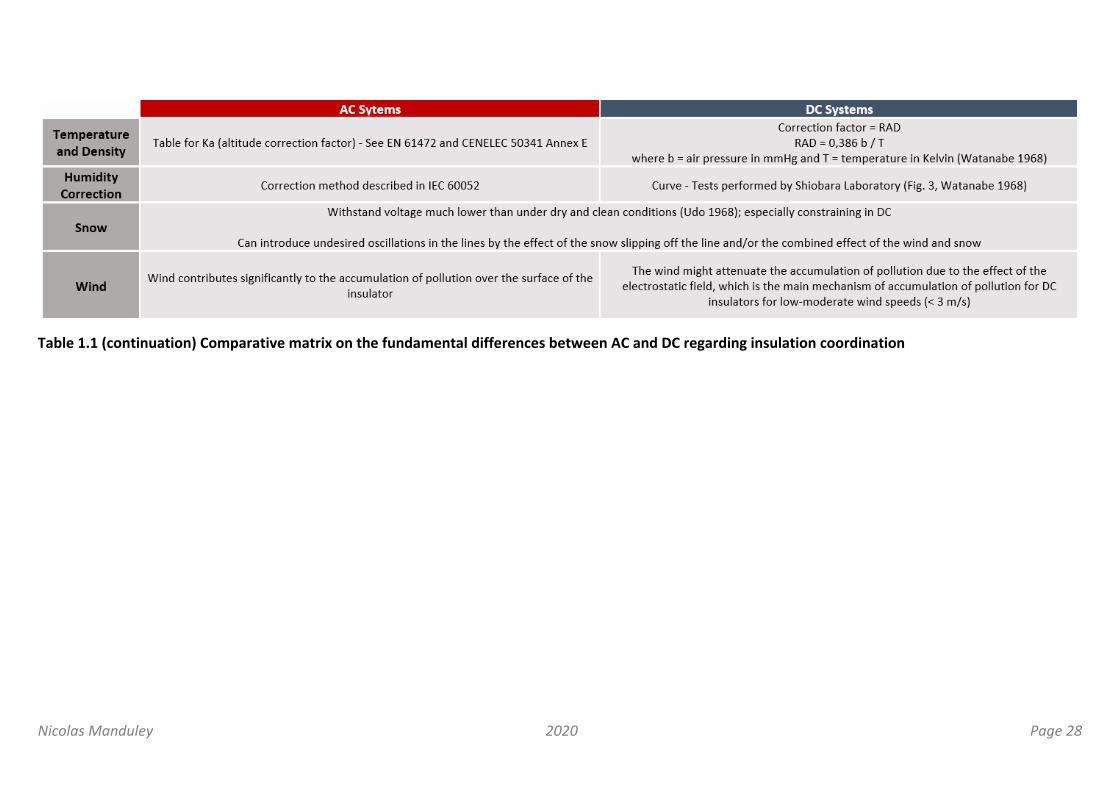
Nicolas Manduley 2020 Page 28
Table 1.1 (continuation) Comparative matrix on the fundamental differences between AC and DC regarding insulation coordination
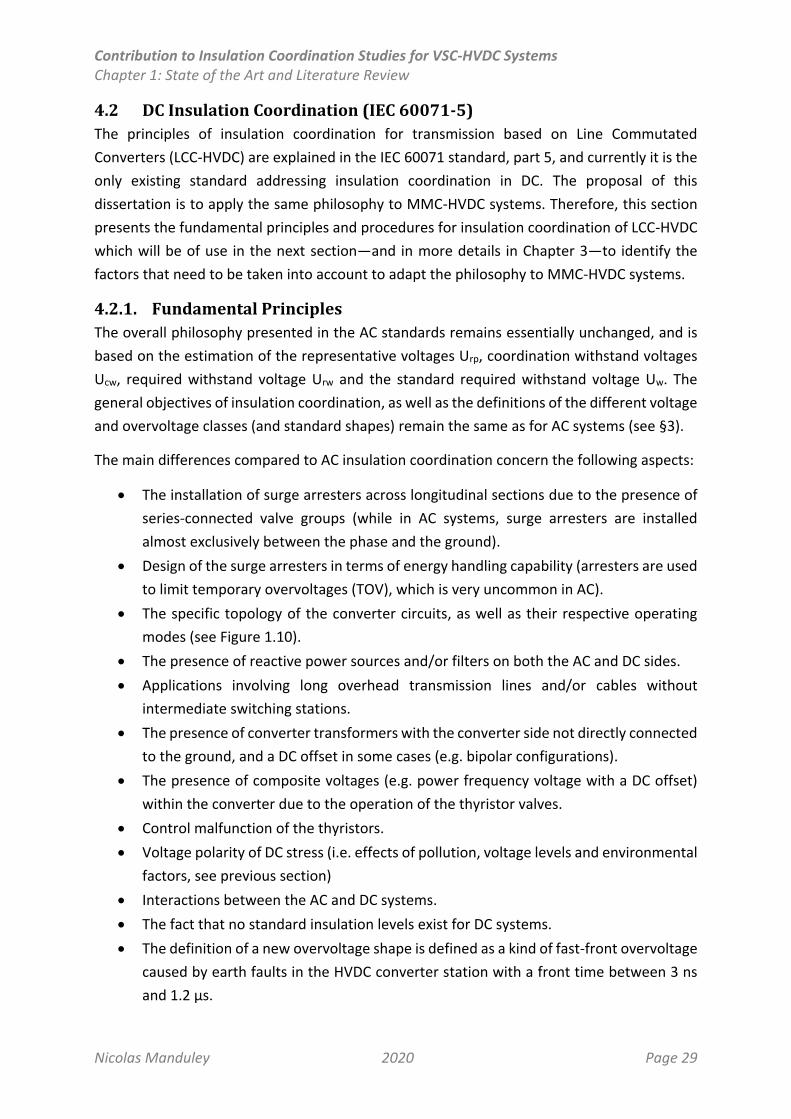
Contribution to Insulation Coordination Studies for VSC-HVDC Systems Chapter 1: State of the Art and Literature Review
Nicolas Manduley 2020 Page 29
4.2 DC Insulation Coordination (IEC 60071-5)
The principles of insulation coordination for transmission based on Line Commutated
Converters (LCC-HVDC) are explained in the IEC 60071 standard, part 5, and currently it is the
only existing standard addressing insulation coordination in DC. The proposal of this
dissertation is to apply the same philosophy to MMC-HVDC systems. Therefore, this section
presents the fundamental principles and procedures for insulation coordination of LCC-HVDC
which will be of use in the next section—and in more details in Chapter 3—to identify the
factors that need to be taken into account to adapt the philosophy to MMC-HVDC systems.
4.2.1. Fundamental Principles
The overall philosophy presented in the AC standards remains essentially unchanged, and is
based on the estimation of the representative voltages Urp, coordination withstand voltages
Ucw, required withstand voltage Urw and the standard required withstand voltage Uw. The
general objectives of insulation coordination, as well as the definitions of the different voltage
and overvoltage classes (and standard shapes) remain the same as for AC systems (see §3).
The main differences compared to AC insulation coordination concern the following aspects:
The installation of surge arresters across longitudinal sections due to the presence of
series-connected valve groups (while in AC systems, surge arresters are installed
almost exclusively between the phase and the ground).
Design of the surge arresters in terms of energy handling capability (arresters are used
to limit temporary overvoltages (TOV), which is very uncommon in AC).
The specific topology of the converter circuits, as well as their respective operating
modes (see Figure 1.10).
The presence of reactive power sources and/or filters on both the AC and DC sides.
Applications involving long overhead transmission lines and/or cables without
intermediate switching stations.
The presence of converter transformers with the converter side not directly connected
to the ground, and a DC offset in some cases (e.g. bipolar configurations).
The presence of composite voltages (e.g. power frequency voltage with a DC offset)
within the converter due to the operation of the thyristor valves.
Control malfunction of the thyristors.
Voltage polarity of DC stress (i.e. effects of pollution, voltage levels and environmental
factors, see previous section)
Interactions between the AC and DC systems.
The fact that no standard insulation levels exist for DC systems.
The definition of a new overvoltage shape is defined as a kind of fast-front overvoltage
caused by earth faults in the HVDC converter station with a front time between 3 ns
and 1.2 µs.
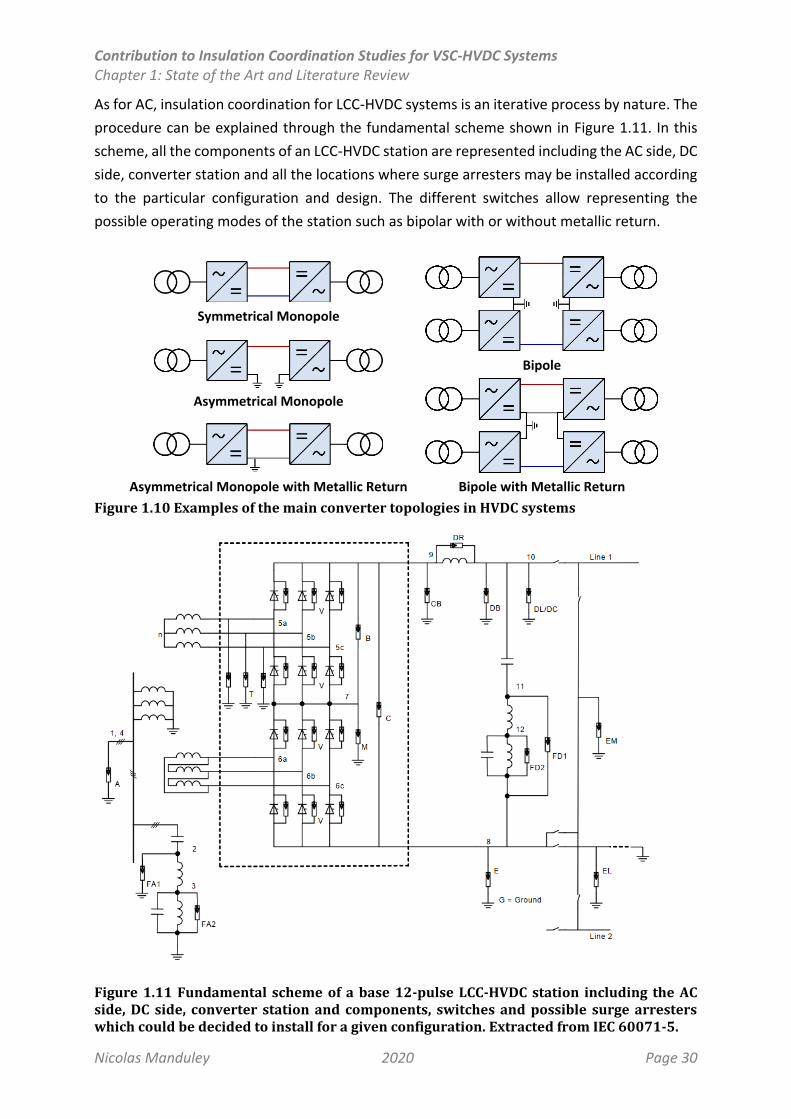
Contribution to Insulation Coordination Studies for VSC-HVDC Systems Chapter 1: State of the Art and Literature Review
Nicolas Manduley 2020 Page 30
As for AC, insulation coordination for LCC-HVDC systems is an iterative process by nature. The
procedure can be explained through the fundamental scheme shown in Figure 1.11. In this
scheme, all the components of an LCC-HVDC station are represented including the AC side, DC
side, converter station and all the locations where surge arresters may be installed according
to the particular configuration and design. The different switches allow representing the
possible operating modes of the station such as bipolar with or without metallic return.
Symmetrical Monopole
Bipole
Asymmetrical Monopole
Bipole with Metallic Return
Asymmetrical Monopole with Metallic Return
Figure 1.10 Examples of the main converter topologies in HVDC systems
Figure 1.11 Fundamental scheme of a base 12-pulse LCC-HVDC station including the AC side, DC side, converter station and components, switches and possible surge arresters which could be decided to install for a given configuration. Extracted from IEC 60071-5.
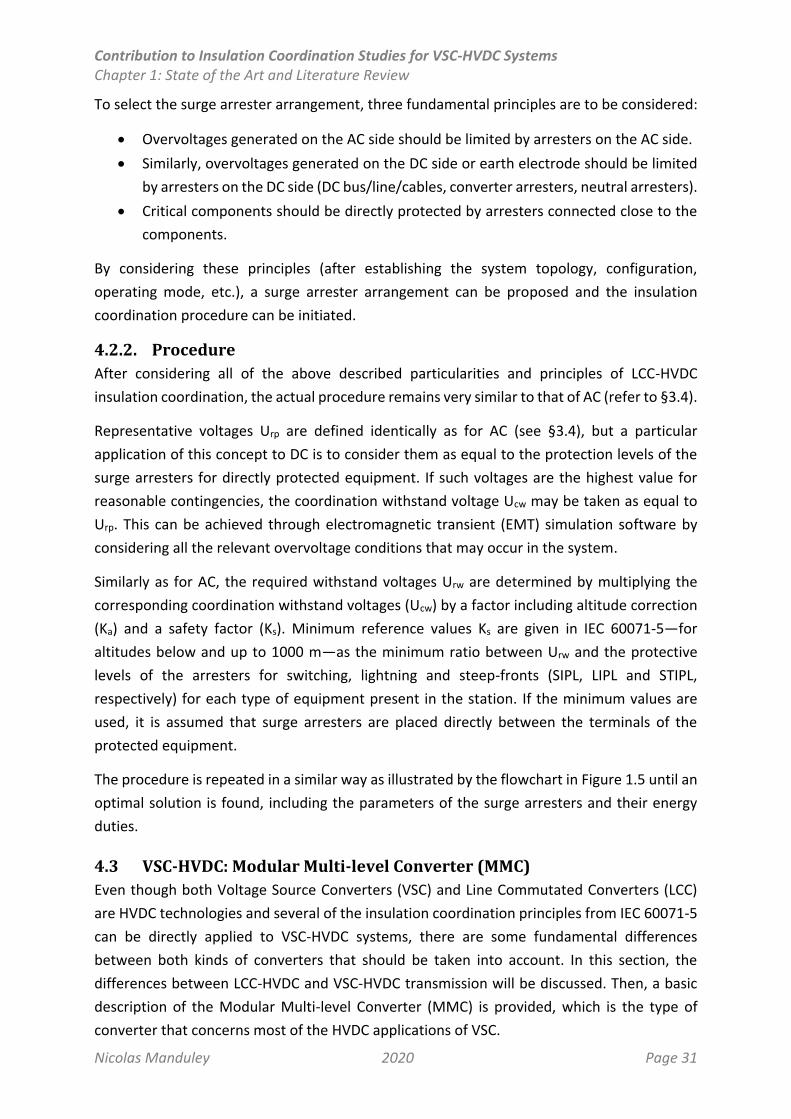
Contribution to Insulation Coordination Studies for VSC-HVDC Systems Chapter 1: State of the Art and Literature Review
Nicolas Manduley 2020 Page 31
To select the surge arrester arrangement, three fundamental principles are to be considered:
Overvoltages generated on the AC side should be limited by arresters on the AC side.
Similarly, overvoltages generated on the DC side or earth electrode should be limited
by arresters on the DC side (DC bus/line/cables, converter arresters, neutral arresters).
Critical components should be directly protected by arresters connected close to the
components.
By considering these principles (after establishing the system topology, configuration,
operating mode, etc.), a surge arrester arrangement can be proposed and the insulation
coordination procedure can be initiated.
4.2.2. Procedure
After considering all of the above described particularities and principles of LCC-HVDC
insulation coordination, the actual procedure remains very similar to that of AC (refer to §3.4).
Representative voltages Urp are defined identically as for AC (see §3.4), but a particular
application of this concept to DC is to consider them as equal to the protection levels of the
surge arresters for directly protected equipment. If such voltages are the highest value for
reasonable contingencies, the coordination withstand voltage Ucw may be taken as equal to
Urp. This can be achieved through electromagnetic transient (EMT) simulation software by
considering all the relevant overvoltage conditions that may occur in the system.
Similarly as for AC, the required withstand voltages Urw are determined by multiplying the
corresponding coordination withstand voltages (Ucw) by a factor including altitude correction
(Ka) and a safety factor (Ks). Minimum reference values Ks are given in IEC 60071-5—for
altitudes below and up to 1000 m—as the minimum ratio between Urw and the protective
levels of the arresters for switching, lightning and steep-fronts (SIPL, LIPL and STIPL,
respectively) for each type of equipment present in the station. If the minimum values are
used, it is assumed that surge arresters are placed directly between the terminals of the
protected equipment.
The procedure is repeated in a similar way as illustrated by the flowchart in Figure 1.5 until an
optimal solution is found, including the parameters of the surge arresters and their energy
duties.
4.3 VSC-HVDC: Modular Multi-level Converter (MMC)
Even though both Voltage Source Converters (VSC) and Line Commutated Converters (LCC)
are HVDC technologies and several of the insulation coordination principles from IEC 60071-5
can be directly applied to VSC-HVDC systems, there are some fundamental differences
between both kinds of converters that should be taken into account. In this section, the
differences between LCC-HVDC and VSC-HVDC transmission will be discussed. Then, a basic
description of the Modular Multi-level Converter (MMC) is provided, which is the type of
converter that concerns most of the HVDC applications of VSC.

Contribution to Insulation Coordination Studies for VSC-HVDC Systems Chapter 1: State of the Art and Literature Review
Nicolas Manduley 2020 Page 32
4.3.1. Main Differences between VSC-HVDC and LCC-HVDC
The fundamental differences between VSC and LCC transmission in HVDC result from two
main factors: the commutation principle and the source type (CIGRE TB 269, 2005). On the
commutation principle, LCC technologies use thyristors, which are closed by a gate signal, but
require a zero-crossing to open. VSC technologies use transistors (typically IGBTs), which are
switches with a controlled turn-on and turn-off capability that enables self-commutation. On
the source type, LCC are a specific type of Current Source Converters (CSC) which stores the
DC side energy in inductors, while Voltage Source Converters store the energy in capacitors.
The main differences derived from the commutation principle are:
VSC does not require a voltage source in the AC system, while LCC depends on the AC
grid for the commutation process.
VSC can be controlled to generate or absorb reactive power as required and
independently from the active power control, while LCC always consume reactive
power for the commutation process.
VSC does not have major requirements on the ratio between the short circuit power
at the connection point and the DC power of the transmission (i.e. short circuit ratio,
SCR), while LCC may incur in voltage stability below a certain value.
LCC generates harmonics of the order of 6n ± 1, where n is the number of 6-pulse
bridges in the configuration (for example, Figure 1.11 features a 12-pulse bridge), and
thus harmonic filters are required. VSC can operate at frequencies in the order of kHz,
which allows the harmonic generation to be compensated. Hence, VSC may not
present significant (if any) filtering requirements.
During an AC system fault, VSC can continue to transfer active power, depending on
the severity of the fault, while LCC might suffer a commutation failure and interrupt
the power transmission.
Regarding the source type, the following differences are derived:
Power flow reversal in LCC is only possible by reversing the voltage polarity of the
system (because the current direction cannot be changed). Therefore:
o Low cost extruded polymeric cables cannot be used in LCC (because polarity
reversal is not allowed in such cables).
o In a multi-terminal DC (MTDC) configuration, a polarity change of the DC
voltage would mean a power flow reversal of the whole grid; hence, multi-
terminal HVDC configurations become complex with LCC technologies.
Conversely, the power flow reversal in VSC technologies is achieved by reversing the
current and maintaining the voltage constant, which makes this technology more
suitable to build MTDC grids.
In case of DC system faults, LCC can easily limit the fault current, and effectively
disconnect the converter by blocking the thyristors. In VSC, this is only possible if full-
Contribution to Insulation Coordination Studies for VSC-HVDC Systems Chapter 1: State of the Art and Literature Review
Nicolas Manduley 2020 Page 33
bridge submodules are used. VSC with half-bridge submodules—which is the most
common configuration—will allow the DC current to flow to the fault through the
free-wheeling diodes even if the IGBTs are blocked.
Therefore, the main differences between AC and DC regarding insulation coordination—in the
context of VSC-HVDC converters—remain the same as those listed in §4.1, except for: filtering
requirements (little to none), control malfunction of the thyristors (redundant IGBT modules
and higher frequency operation allow to limit overshoots and possible distortions due to
errors in the commutation) and interactions between AC and DC systems (as VSC transmission
is less dependent on the AC side of the system).
4.3.2. Basic Description of the Modular Multi-level Converter (MMC)
The MMC is a type of VSC that has been gaining increasing attention since its development
(Marquardt, 2001), especially for HVDC applications. It consists of a series of cascaded
submodules, each containing a power cell with a capacitor and a switch arrangement (see
Figure 1.12). The switch arrangement consists—in the case of a half-bridge scheme, as shown
in the figure—of two IGBTs with an anti-parallel diode controlled with complementary signals,
whose state determines if the capacitor is connected or bypassed with respect to the total
array of capacitors of the converter arm2 (Kouro et al., 2010). In case of failure, the converter
is blocked by turning off both IGBTs on all the modules, which allows the current to circulate
freely through the diodes3.
Figure 1.12 Modular Multi-level Converter basic scheme. Extracted from Kouro et al., 2010.
2 Arm: converter section consisting of the cascaded power cells (or submodules) and reactors between the DC pole and the AC side of the converter. Two arms constitute one leg. Conventionally, there is one leg (two arms) for each AC phase. 3 In reality, when the converter is blocked, the diodes are bypassed by thyristors for current withstand.
Contribution to Insulation Coordination Studies for VSC-HVDC Systems Chapter 1: State of the Art and Literature Review
Nicolas Manduley 2020 Page 34
Under normal conditions, the capacitors can be considered as ideal voltage sources, and the
MMC control determines how many capacitors are connected in series for each arm.
Therefore, the total DC side voltage is the sum of all the capacitor voltages in one leg.
Since the output voltage waveform can be produced with a very large number of individual
capacitors (up to a few hundreds), it is possible to operate the submodules with a very low
switching frequency and with a minimal harmonic distortion due to the small variation rate of
the voltage at each step and low ripple (Du, Dekka, Wu, & Zargari, 2017). This not only makes
the MMC suitable for a very wide range of voltage levels, but also reduces drastically the need
for harmonic filtering, which is an important drawback of LCC-HVDC systems.
4.3.3. Principles and Challenges of Overvoltage Protection
Even though the MMC overcomes many of the drawbacks of LCC-HVDC systems (i.e. harmonic
generation and filter requirements, reactive power control, dependence on the AC system and
flexibility of power flow reversal in MTDC schemes), there are several aspects that need to be
assessed in terms of insulation coordination that are bound to differ significantly from the LCC
approach from IEC 60071-5. Based on the different issues addressed in this section, some of
the main differences between LCC and VSC regarding insulation coordination are listed below:
Architecture of the converter (and associated equipment)
Location and design of the surge arresters
Internal converter faults
Overvoltage levels
In addition, to this date LCC-HVDC systems concern almost exclusively bipolar configurations
(or asymmetric monopolar with a future extension to bipolar planned). For VSC-HVDC
systems, the use of symmetric monopoles is becoming more common, and in some cases, two
parallel symmetric monopoles might be preferred over a single bipolar configuration (see
Figure 1.10).
These aspects, along with the overall differences between AC and LCC listed in §4.2 (except
for those previously discussed that do not concern VSC) are thus expected to constitute the
main challenges of overvoltage protection of VSC-HVDC systems.
5. Lightning Overview
5.1 Generalities
Lightning consists of a high-current electric discharge in air which can be produced inside a
cloud, between clouds or between a cloud and the ground or other objects in the atmosphere
(CIGRE TB 549, 2013). They are the result of the accumulation of charge in the clouds when
the electric field between the two (or more) regions involved reaches a critical value in which
the air becomes ionized and a lightning channel is formed. As a result, electric charges flow
from one region to another, and the charge distribution is rebalanced.
Contribution to Insulation Coordination Studies for VSC-HVDC Systems Chapter 1: State of the Art and Literature Review
Nicolas Manduley 2020 Page 35
Because of the potentially high effects that such events can have in the electric grid, it is of
particular interest to accurately describe the nature of lightning so that it can be adequately
represented for the purposes of lightning studies. Since this mainly concerns discharges to the
ground, the following sections will focus on this kind of lightning discharge.
As defined in CIGRE TB 549, the term “lightning strike” refers to lightning discharges involving
an object on ground or in the atmosphere, while “stroke” refers uniquely to components of
cloud-to-ground discharges. This section discusses the essential mechanisms behind the
formation of lightning strokes and their classification which will be of use in further sections
and chapters.
5.2 Electrisation of the Clouds and Lightning Classification
Stormy clouds are characterized by the presence of huge water masses (in the form of steam,
droplets, ice crystals, hail, etc.) along with strong warm and cold air currents producing winds
which can reach velocities of more than 100 km/h. The intense activity in the cloud produces,
through complex meteorological processes not yet fully understood (Cooray, 2014), the
separation of electric charges in such a way that water droplets get negatively charged and
ice crystals (or flakes) get positively charged. Because of the difference in density of liquid and
solid water, the water droplets with the negative charge tend to accumulate in the lower part
of the cloud due to the action of gravity, while the positive charges tend to accumulate in the
upper part of the cloud.
As a result, most (about 90% as per CIGRE TB 549) of the discharges between the clouds and
the ground consist of negative charges flowing from the cloud to the ground (also referred to
as a negative strokes). However, lightning strokes between the ground and the positive region
of a cloud are also possible (i.e. positive strokes), as well as for lightning channels to form from
the cloud to the ground and vice versa (i.e. downward and upward strokes, respectively). This
classification is illustrated in Figure 1.13.
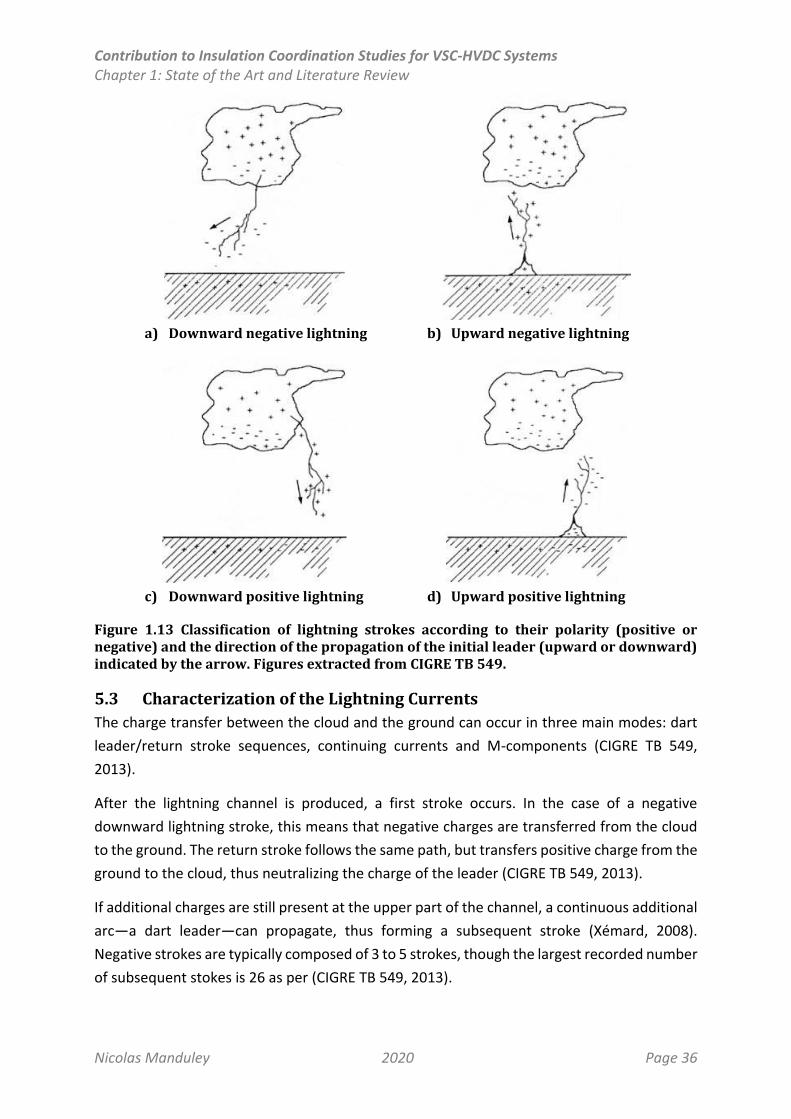
Contribution to Insulation Coordination Studies for VSC-HVDC Systems Chapter 1: State of the Art and Literature Review
Nicolas Manduley 2020 Page 36
a) Downward negative lightning
b) Upward negative lightning
c) Downward positive lightning
d) Upward positive lightning
Figure 1.13 Classification of lightning strokes according to their polarity (positive or negative) and the direction of the propagation of the initial leader (upward or downward) indicated by the arrow. Figures extracted from CIGRE TB 549.
5.3 Characterization of the Lightning Currents
The charge transfer between the cloud and the ground can occur in three main modes: dart
leader/return stroke sequences, continuing currents and M-components (CIGRE TB 549,
2013).
After the lightning channel is produced, a first stroke occurs. In the case of a negative
downward lightning stroke, this means that negative charges are transferred from the cloud
to the ground. The return stroke follows the same path, but transfers positive charge from the
ground to the cloud, thus neutralizing the charge of the leader (CIGRE TB 549, 2013).
If additional charges are still present at the upper part of the channel, a continuous additional
arc—a dart leader—can propagate, thus forming a subsequent stroke (Xémard, 2008).
Negative strokes are typically composed of 3 to 5 strokes, though the largest recorded number
of subsequent stokes is 26 as per (CIGRE TB 549, 2013).
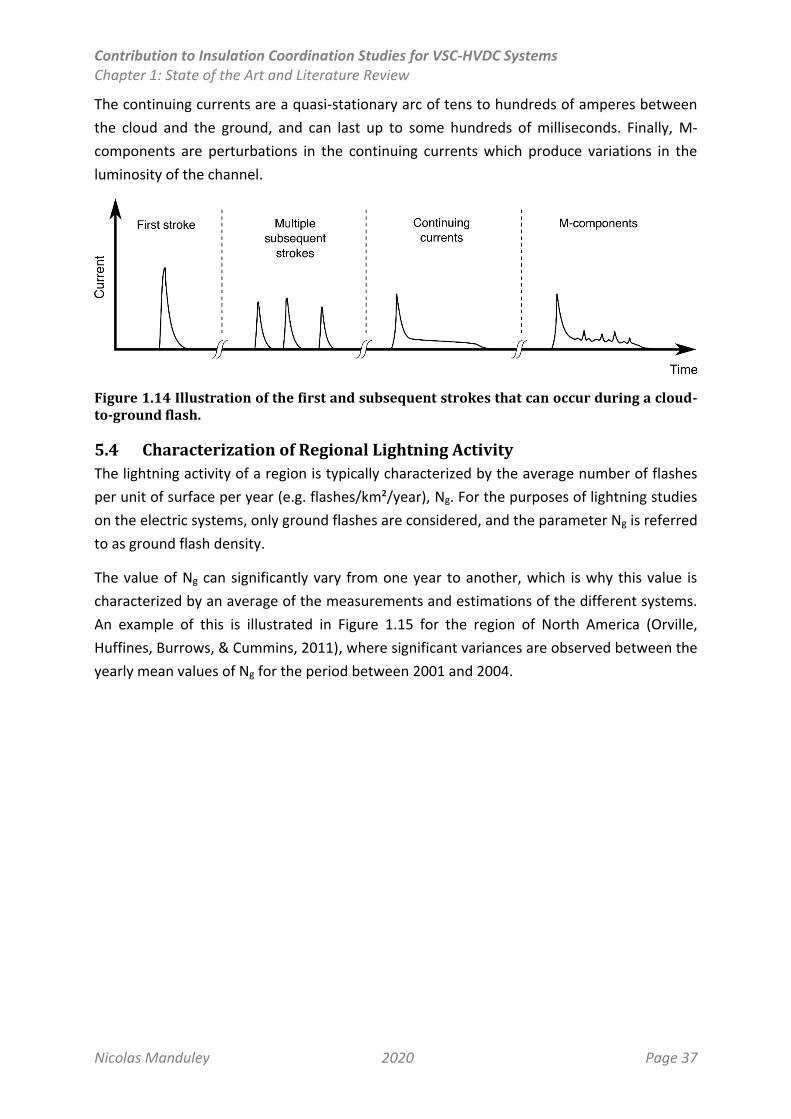
Contribution to Insulation Coordination Studies for VSC-HVDC Systems Chapter 1: State of the Art and Literature Review
Nicolas Manduley 2020 Page 37
The continuing currents are a quasi-stationary arc of tens to hundreds of amperes between
the cloud and the ground, and can last up to some hundreds of milliseconds. Finally, M-
components are perturbations in the continuing currents which produce variations in the
luminosity of the channel.
Figure 1.14 Illustration of the first and subsequent strokes that can occur during a cloud-to-ground flash.
5.4 Characterization of Regional Lightning Activity
The lightning activity of a region is typically characterized by the average number of flashes
per unit of surface per year (e.g. flashes/km²/year), Ng. For the purposes of lightning studies
on the electric systems, only ground flashes are considered, and the parameter Ng is referred
to as ground flash density.
The value of Ng can significantly vary from one year to another, which is why this value is
characterized by an average of the measurements and estimations of the different systems.
An example of this is illustrated in Figure 1.15 for the region of North America (Orville,
Huffines, Burrows, & Cummins, 2011), where significant variances are observed between the
yearly mean values of Ng for the period between 2001 and 2004.
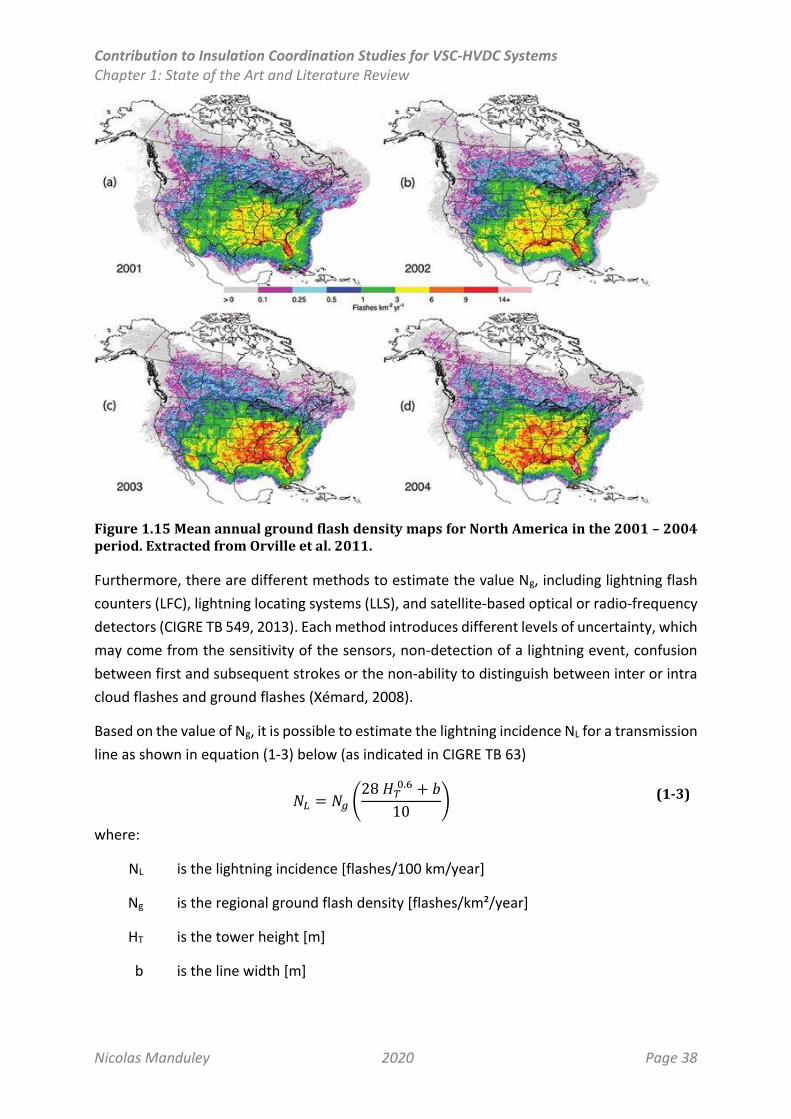
Contribution to Insulation Coordination Studies for VSC-HVDC Systems Chapter 1: State of the Art and Literature Review
Nicolas Manduley 2020 Page 38
Figure 1.15 Mean annual ground flash density maps for North America in the 2001 – 2004 period. Extracted from Orville et al. 2011.
Furthermore, there are different methods to estimate the value Ng, including lightning flash
counters (LFC), lightning locating systems (LLS), and satellite-based optical or radio-frequency
detectors (CIGRE TB 549, 2013). Each method introduces different levels of uncertainty, which
may come from the sensitivity of the sensors, non-detection of a lightning event, confusion
between first and subsequent strokes or the non-ability to distinguish between inter or intra
cloud flashes and ground flashes (Xémard, 2008).
Based on the value of Ng, it is possible to estimate the lightning incidence NL for a transmission
line as shown in equation (1-3) below (as indicated in CIGRE TB 63)
𝑁𝐿 = 𝑁𝑔 (28 𝐻𝑇
0.6 + 𝑏
10) (1-3)
where:
NL is the lightning incidence [flashes/100 km/year]
Ng is the regional ground flash density [flashes/km²/year]
HT is the tower height [m]
b is the line width [m]
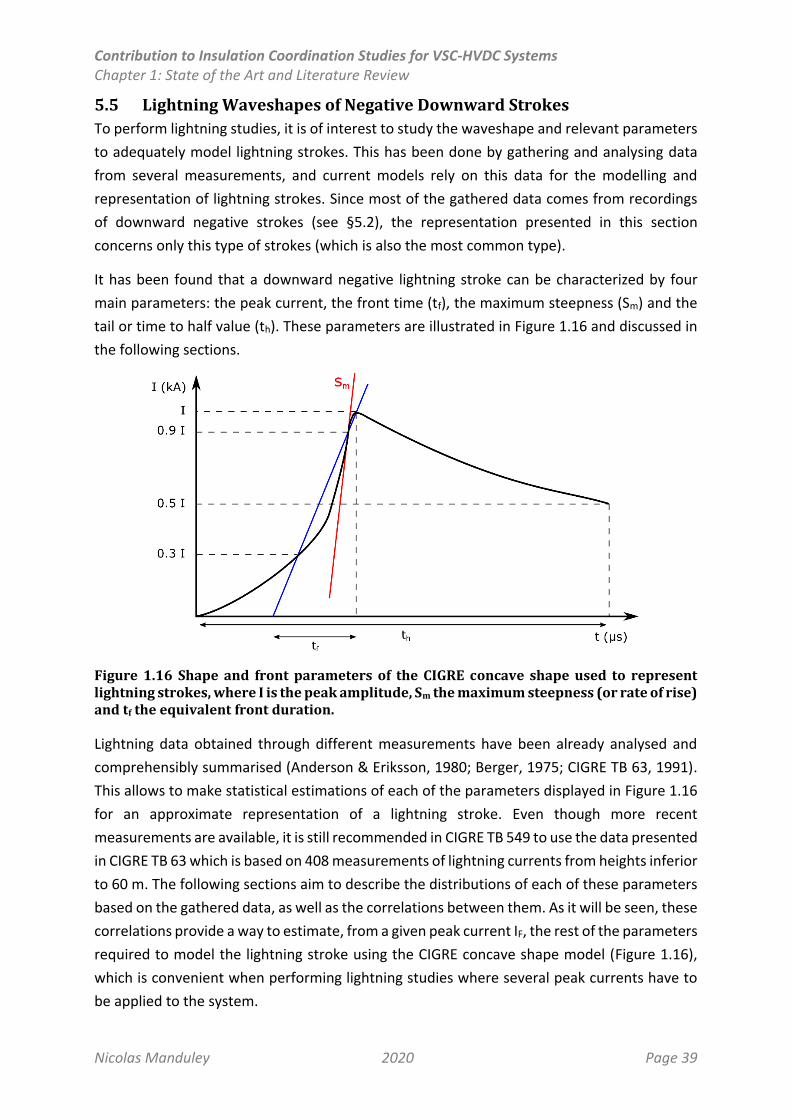
Contribution to Insulation Coordination Studies for VSC-HVDC Systems Chapter 1: State of the Art and Literature Review
Nicolas Manduley 2020 Page 39
5.5 Lightning Waveshapes of Negative Downward Strokes
To perform lightning studies, it is of interest to study the waveshape and relevant parameters
to adequately model lightning strokes. This has been done by gathering and analysing data
from several measurements, and current models rely on this data for the modelling and
representation of lightning strokes. Since most of the gathered data comes from recordings
of downward negative strokes (see §5.2), the representation presented in this section
concerns only this type of strokes (which is also the most common type).
It has been found that a downward negative lightning stroke can be characterized by four
main parameters: the peak current, the front time (tf), the maximum steepness (Sm) and the
tail or time to half value (th). These parameters are illustrated in Figure 1.16 and discussed in
the following sections.
Figure 1.16 Shape and front parameters of the CIGRE concave shape used to represent lightning strokes, where I is the peak amplitude, Sm the maximum steepness (or rate of rise) and tf the equivalent front duration.
Lightning data obtained through different measurements have been already analysed and
comprehensibly summarised (Anderson & Eriksson, 1980; Berger, 1975; CIGRE TB 63, 1991).
This allows to make statistical estimations of each of the parameters displayed in Figure 1.16
for an approximate representation of a lightning stroke. Even though more recent
measurements are available, it is still recommended in CIGRE TB 549 to use the data presented
in CIGRE TB 63 which is based on 408 measurements of lightning currents from heights inferior
to 60 m. The following sections aim to describe the distributions of each of these parameters
based on the gathered data, as well as the correlations between them. As it will be seen, these
correlations provide a way to estimate, from a given peak current IF, the rest of the parameters
required to model the lightning stroke using the CIGRE concave shape model (Figure 1.16),
which is convenient when performing lightning studies where several peak currents have to
be applied to the system.
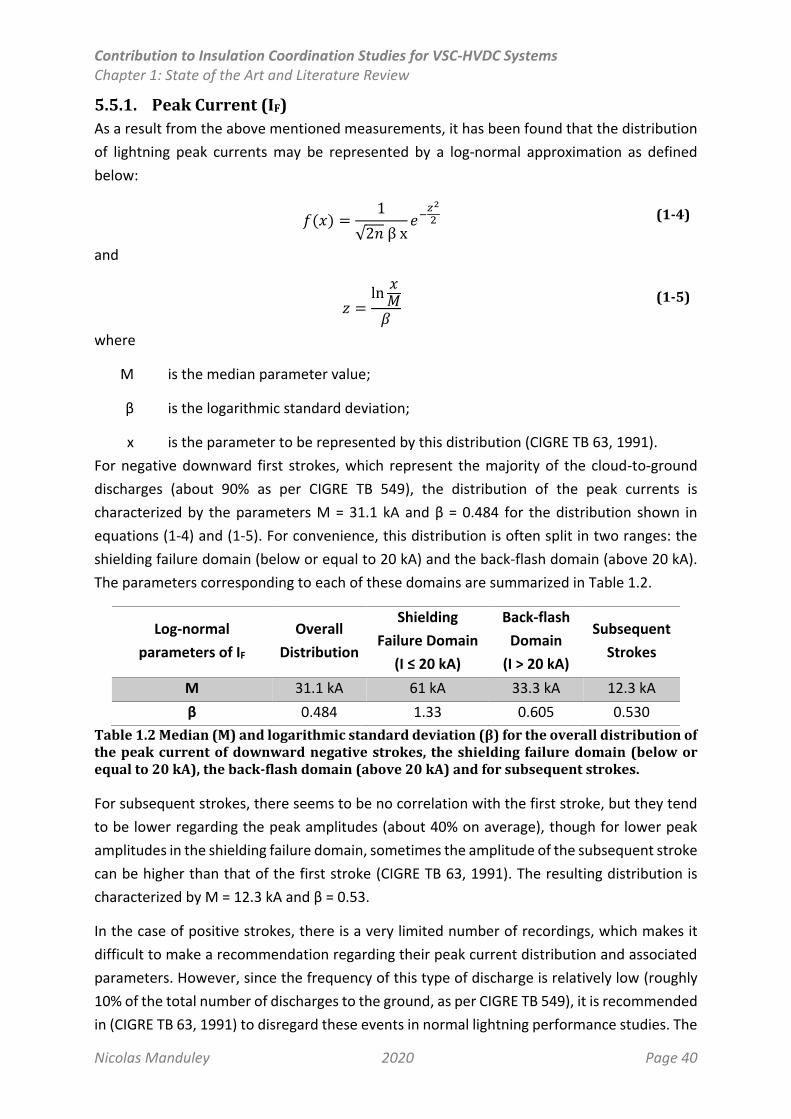
Contribution to Insulation Coordination Studies for VSC-HVDC Systems Chapter 1: State of the Art and Literature Review
Nicolas Manduley 2020 Page 40
5.5.1. Peak Current (IF)
As a result from the above mentioned measurements, it has been found that the distribution
of lightning peak currents may be represented by a log-normal approximation as defined
below:
𝑓(𝑥) =1
√2𝑛 β x𝑒−
𝑧2
2 (1-4)
and
𝑧 =ln𝑥𝑀𝛽
(1-5)
where
M is the median parameter value;
β is the logarithmic standard deviation;
x is the parameter to be represented by this distribution (CIGRE TB 63, 1991).
For negative downward first strokes, which represent the majority of the cloud-to-ground
discharges (about 90% as per CIGRE TB 549), the distribution of the peak currents is
characterized by the parameters M = 31.1 kA and β = 0.484 for the distribution shown in
equations (1-4) and (1-5). For convenience, this distribution is often split in two ranges: the
shielding failure domain (below or equal to 20 kA) and the back-flash domain (above 20 kA).
The parameters corresponding to each of these domains are summarized in Table 1.2.
Log-normal
parameters of IF
Overall
Distribution
Shielding
Failure Domain
(I ≤ 20 kA)
Back-flash
Domain
(I > 20 kA)
Subsequent
Strokes
M 31.1 kA 61 kA 33.3 kA 12.3 kA
β 0.484 1.33 0.605 0.530
Table 1.2 Median (M) and logarithmic standard deviation (β) for the overall distribution of the peak current of downward negative strokes, the shielding failure domain (below or equal to 20 kA), the back-flash domain (above 20 kA) and for subsequent strokes.
For subsequent strokes, there seems to be no correlation with the first stroke, but they tend
to be lower regarding the peak amplitudes (about 40% on average), though for lower peak
amplitudes in the shielding failure domain, sometimes the amplitude of the subsequent stroke
can be higher than that of the first stroke (CIGRE TB 63, 1991). The resulting distribution is
characterized by M = 12.3 kA and β = 0.53.
In the case of positive strokes, there is a very limited number of recordings, which makes it
difficult to make a recommendation regarding their peak current distribution and associated
parameters. However, since the frequency of this type of discharge is relatively low (roughly
10% of the total number of discharges to the ground, as per CIGRE TB 549), it is recommended
in (CIGRE TB 63, 1991) to disregard these events in normal lightning performance studies. The

Contribution to Insulation Coordination Studies for VSC-HVDC Systems Chapter 1: State of the Art and Literature Review
Nicolas Manduley 2020 Page 41
impact of positive strokes may be greater when dealing with very tall structures (about 200
m) or regions with frequent winter thunderstorms, where the incidence of positive strokes
may be higher.
The distribution of the peak currents based on the gathered data for CIGRE and IEEE
approaches is illustrated in Figure 1.17 below.
Figure 1.17 Reference distributions for negative lightning current amplitudes (extracted from CIGRE TB 063). The horizontal axis features the current amplitudes for the first stroke, while the vertical axis provides the probability for the lightning current amplitude to be equal or lower than the considered value.
A simple alternative method has been provided by Anderson, which is shown in equation (1-6)
below. This equation provides very similar values to those obtained by integrating the
expression from equation (1-4) for the current peak amplitude.
𝑃(𝐼 ≥ 𝐼𝑓) =1
1 + (𝐼31)2.6 (1-6)
5.5.2. Front Time (tf)
First stroke currents typically start with a concave front followed by an abrupt rise around the
half peak, after which the maximum steepness (Sm) is reached, followed by the peak current
value. Different definitions of the front time are found in (CIGRE TB 63, 1991), but the one that
is recommended for lightning studies is given by the time interval between the instant of the
Contribution to Insulation Coordination Studies for VSC-HVDC Systems Chapter 1: State of the Art and Literature Review
Nicolas Manduley 2020 Page 42
maximum peak and the intersection with the horizontal axis of the line crossing the 30% and
90% of the peak current (blue line in Figure 1.16), which is noted as tf.
The front time is also approximated by a log-normal distribution with the parameters
indicated in Table 1.3. As it can be observed, the same parameters are recommended for all
cases including both current ranges of first strokes, as well as subsequent strokes.
Log-normal
parameters of tf
Shielding Failure Domain
(IF ≤ 20 kA)
Back-flash Domain
(IF > 20 kA)
Subsequent
Strokes
M 3.83 µs 3.83 µs 3.83 µs
β 0.553 0.553 0.553
Table 1.3 Median (M) and logarithmic standard deviation (β) for the log-normal representation of the front time tf of downward negative strokes. The same parameters are recommended for both ranges of first strokes (i.e. shielding failure and back-flash domains) and subsequent strokes.
5.5.3. Maximum Steepness (Sm)
After the initial concave front and the abrupt rise above mentioned, a point of maximum
steepness (i.e. maximum rate of rise of the current) is reached and is specified in kA/µs. It is
graphically represented in Figure 1.16 (red line) and its log-normal representation is given by
the parameters shown in Table 1.4 for first and subsequent strokes.
Log-normal
parameters of tf
Shielding Failure Domain
(IF≤ 20 kA)
Back-flash Domain
(IF> 20 kA)
Subsequent
Strokes
M 24.3 kA/µs 24.3 kA/µs 39.9 kA/µs
β 0.599 0.599 0.852
Table 1.4 Median (M) and logarithmic standard deviation (β) for the log-normal representation of the maximum steepness Sm of downward negative strokes.
5.5.4. Time to Half Value (th)
After the peak current value is reached, the lightning current starts to decrease slowly. This
decrease is parametrized by the time to half value th, or tail time, which specifies the total
duration of the stroke until it falls down to 50% of the peak current. For about 90% of the
strokes, the tail time can range between 30-200 µs for first strokes and between 6.5-140 µs
for subsequent strokes (according to the 408 measurements from CIGRE TB 63).
However, it has been stated that the exact value of the tail time does not have a significant
impact on the lightning performance, and the use of the median values is recommended. The
median values of the tail time for first and subsequent strokes are 77.5 µs and 30.2 µs,
respectively.
5.5.5. Correlations and Derived Statistics
The correlations between the parameters discussed above and the peak currents have been
also studied. Through these correlations it has been possible to derive expressions to estimate
the values of tf and Sm using the value of the peak current IF (CIGRE TB 63, 1991), which is
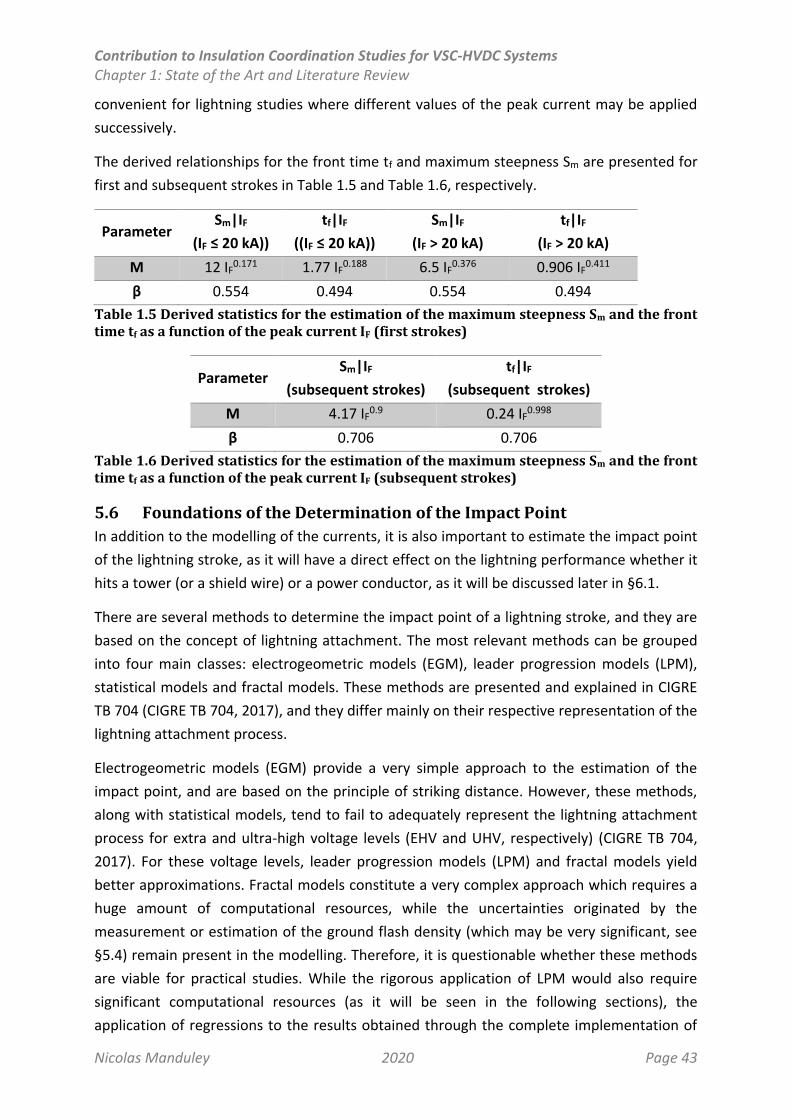
Contribution to Insulation Coordination Studies for VSC-HVDC Systems Chapter 1: State of the Art and Literature Review
Nicolas Manduley 2020 Page 43
convenient for lightning studies where different values of the peak current may be applied
successively.
The derived relationships for the front time tf and maximum steepness Sm are presented for
first and subsequent strokes in Table 1.5 and Table 1.6, respectively.
Parameter Sm|IF
(IF ≤ 20 kA))
tf|IF
((IF ≤ 20 kA))
Sm|IF
(IF > 20 kA)
tf|IF
(IF > 20 kA)
M 12 IF0.171 1.77 IF
0.188 6.5 IF0.376 0.906 IF
0.411
β 0.554 0.494 0.554 0.494
Table 1.5 Derived statistics for the estimation of the maximum steepness Sm and the front time tf as a function of the peak current IF (first strokes)
Parameter Sm|IF
(subsequent strokes)
tf|IF
(subsequent strokes)
M 4.17 IF0.9 0.24 IF
0.998
β 0.706 0.706
Table 1.6 Derived statistics for the estimation of the maximum steepness Sm and the front time tf as a function of the peak current IF (subsequent strokes)
5.6 Foundations of the Determination of the Impact Point
In addition to the modelling of the currents, it is also important to estimate the impact point
of the lightning stroke, as it will have a direct effect on the lightning performance whether it
hits a tower (or a shield wire) or a power conductor, as it will be discussed later in §6.1.
There are several methods to determine the impact point of a lightning stroke, and they are
based on the concept of lightning attachment. The most relevant methods can be grouped
into four main classes: electrogeometric models (EGM), leader progression models (LPM),
statistical models and fractal models. These methods are presented and explained in CIGRE
TB 704 (CIGRE TB 704, 2017), and they differ mainly on their respective representation of the
lightning attachment process.
Electrogeometric models (EGM) provide a very simple approach to the estimation of the
impact point, and are based on the principle of striking distance. However, these methods,
along with statistical models, tend to fail to adequately represent the lightning attachment
process for extra and ultra-high voltage levels (EHV and UHV, respectively) (CIGRE TB 704,
2017). For these voltage levels, leader progression models (LPM) and fractal models yield
better approximations. Fractal models constitute a very complex approach which requires a
huge amount of computational resources, while the uncertainties originated by the
measurement or estimation of the ground flash density (which may be very significant, see
§5.4) remain present in the modelling. Therefore, it is questionable whether these methods
are viable for practical studies. While the rigorous application of LPM would also require
significant computational resources (as it will be seen in the following sections), the
application of regressions to the results obtained through the complete implementation of
Contribution to Insulation Coordination Studies for VSC-HVDC Systems Chapter 1: State of the Art and Literature Review
Nicolas Manduley 2020 Page 44
the LPMs over a range of values allows to obtain equivalent expressions (CIGRE TB 704, 2017;
Cooray, 2014), similar to those obtained through EGMs and improved EGMs.
For the reasons listed above, in this work only EGM and the simplified equivalent LPM models
are addressed, so that an adequate representation of the lightning attachment process can
be done while also keeping the approach as simple as possible. The following sections describe
the fundamentals of lightning attachment, followed by the basic principles of EGM and LPM
methods that will be of use later in this work to estimate the lightning performance of a
system.
5.6.1. Lightning Attachment Principle
The following explanation has been partially extracted from (Cooray, 2014), where more
details can be found regarding lightning attachment.
Consider a downward stroke. As the descending leader approaches the structure, the electric
field at the grounded structure increases steadily. When this value reaches a critical value of
about 3000 kV/m (i.e. the corona inception value), electron avalanches start being generated
from the tip of the grounded structure. The electric field continues to increase, until a critical
value of about 108–109 V/m and the local electron avalanches are transformed into a streamer
discharge (i.e. avalanche to streamer transition). When the charge at the streamer burst is
high enough, the streamer to leader transition occurs, leading to the inception of the
connecting leader. The connecting leader then starts growing towards the descending leader,
and when the potential gradient between the tips of both leaders reaches a critical value of
about 500 kV/m, the final jump occurs and both leaders connect, leading to the rapid
neutralization of the stepped leader charge (i.e. a return stroke, see §5.3).
In the case of upward strokes, the process is very similar to the above described, except that
they tend to occur when tall grounded structures are involved. In addition, typically several
subsequent strokes take place when the leader initiated from the tall structure reaches the
charge centre of the cloud.
It is clear from the above paragraphs that a correct representation of the lightning attachment
involves the study and modelling of very complex processes and the computational cost can
increase rapidly. The upcoming sections discuss the fundamental aspects of EGM and LPM
which, as previously mentioned, provide a simple approach to represent the lightning
attachment.
5.6.2. Electrogeometric Models (EGM)
Electrogeometric models are based on the concept of striking distance to represent, in a
simplified way, the lightning attachment. The basic principles and assumptions of the
electrogeometric models are:
When a downward leader reaches a certain critical distance to the conductor, the
inception of the upward leader occurs. It is assumed that the final jump between the
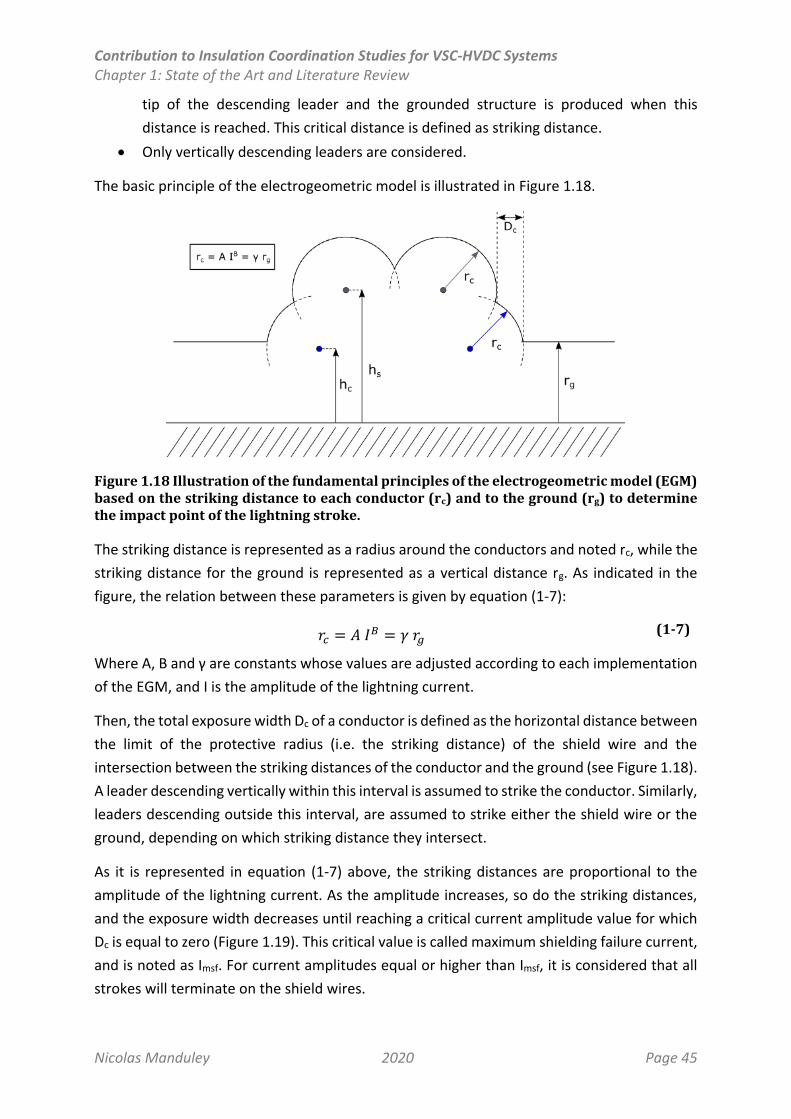
Contribution to Insulation Coordination Studies for VSC-HVDC Systems Chapter 1: State of the Art and Literature Review
Nicolas Manduley 2020 Page 45
tip of the descending leader and the grounded structure is produced when this
distance is reached. This critical distance is defined as striking distance.
Only vertically descending leaders are considered.
The basic principle of the electrogeometric model is illustrated in Figure 1.18.
Figure 1.18 Illustration of the fundamental principles of the electrogeometric model (EGM) based on the striking distance to each conductor (rc) and to the ground (rg) to determine the impact point of the lightning stroke.
The striking distance is represented as a radius around the conductors and noted rc, while the
striking distance for the ground is represented as a vertical distance rg. As indicated in the
figure, the relation between these parameters is given by equation (1-7):
𝑟𝑐 = 𝐴 𝐼𝐵 = 𝛾 𝑟𝑔 (1-7)
Where A, B and γ are constants whose values are adjusted according to each implementation
of the EGM, and I is the amplitude of the lightning current.
Then, the total exposure width Dc of a conductor is defined as the horizontal distance between
the limit of the protective radius (i.e. the striking distance) of the shield wire and the
intersection between the striking distances of the conductor and the ground (see Figure 1.18).
A leader descending vertically within this interval is assumed to strike the conductor. Similarly,
leaders descending outside this interval, are assumed to strike either the shield wire or the
ground, depending on which striking distance they intersect.
As it is represented in equation (1-7) above, the striking distances are proportional to the
amplitude of the lightning current. As the amplitude increases, so do the striking distances,
and the exposure width decreases until reaching a critical current amplitude value for which
Dc is equal to zero (Figure 1.19). This critical value is called maximum shielding failure current,
and is noted as Imsf. For current amplitudes equal or higher than Imsf, it is considered that all
strokes will terminate on the shield wires.
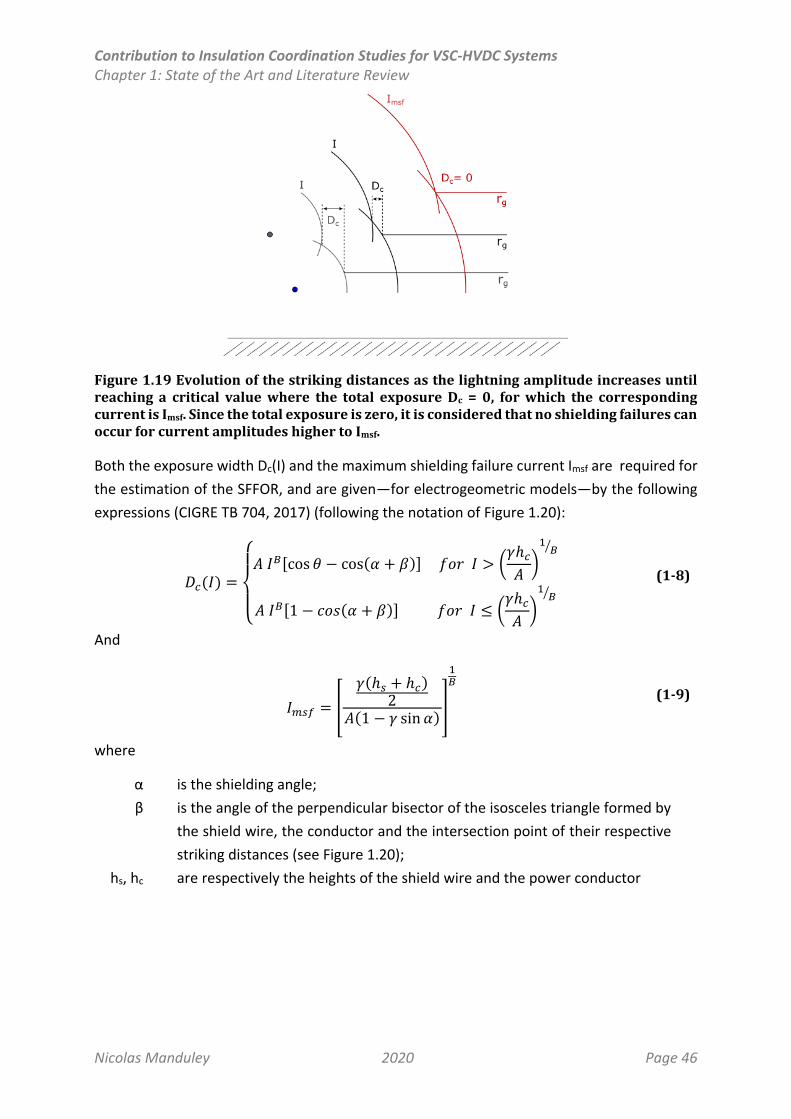
Contribution to Insulation Coordination Studies for VSC-HVDC Systems Chapter 1: State of the Art and Literature Review
Nicolas Manduley 2020 Page 46
Figure 1.19 Evolution of the striking distances as the lightning amplitude increases until reaching a critical value where the total exposure Dc = 0, for which the corresponding current is Imsf. Since the total exposure is zero, it is considered that no shielding failures can occur for current amplitudes higher to Imsf.
Both the exposure width Dc(I) and the maximum shielding failure current Imsf are required for
the estimation of the SFFOR, and are given—for electrogeometric models—by the following
expressions (CIGRE TB 704, 2017) (following the notation of Figure 1.20):
𝐷𝑐(𝐼) =
{
𝐴 𝐼𝐵[cos 𝜃 − cos(𝛼 + 𝛽)] 𝑓𝑜𝑟 𝐼 > (
𝛾ℎ𝑐𝐴)
1𝐵⁄
𝐴 𝐼𝐵[1 − 𝑐𝑜𝑠(𝛼 + 𝛽)] 𝑓𝑜𝑟 𝐼 ≤ (𝛾ℎ𝑐𝐴)
1𝐵⁄
(1-8)
And
𝐼𝑚𝑠𝑓 = [
𝛾(ℎ𝑠 + ℎ𝑐)2
𝐴(1 − 𝛾 sin 𝛼)]
1𝐵
(1-9)
where
α is the shielding angle;
β is the angle of the perpendicular bisector of the isosceles triangle formed by
the shield wire, the conductor and the intersection point of their respective
striking distances (see Figure 1.20);
hs, hc are respectively the heights of the shield wire and the power conductor
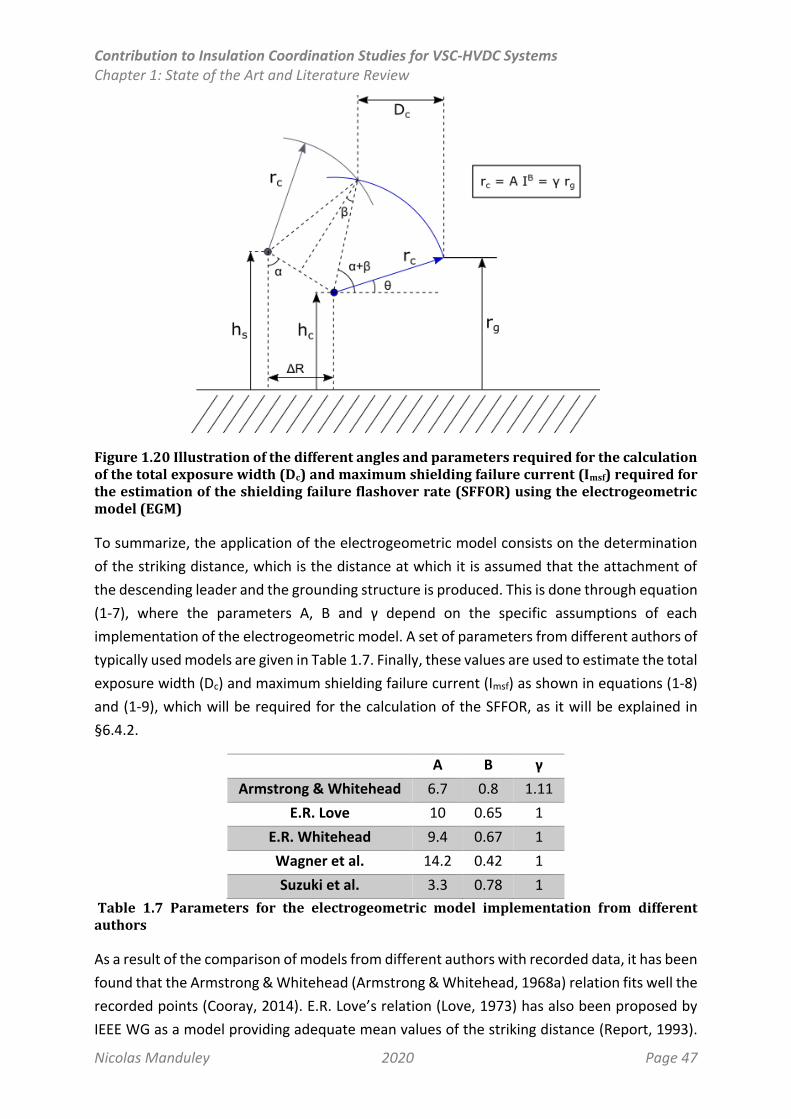
Contribution to Insulation Coordination Studies for VSC-HVDC Systems Chapter 1: State of the Art and Literature Review
Nicolas Manduley 2020 Page 47
Figure 1.20 Illustration of the different angles and parameters required for the calculation of the total exposure width (Dc) and maximum shielding failure current (Imsf) required for the estimation of the shielding failure flashover rate (SFFOR) using the electrogeometric model (EGM)
To summarize, the application of the electrogeometric model consists on the determination
of the striking distance, which is the distance at which it is assumed that the attachment of
the descending leader and the grounding structure is produced. This is done through equation
(1-7), where the parameters A, B and γ depend on the specific assumptions of each
implementation of the electrogeometric model. A set of parameters from different authors of
typically used models are given in Table 1.7. Finally, these values are used to estimate the total
exposure width (Dc) and maximum shielding failure current (Imsf) as shown in equations (1-8)
and (1-9), which will be required for the calculation of the SFFOR, as it will be explained in
§6.4.2.
A B γ
Armstrong & Whitehead 6.7 0.8 1.11
E.R. Love 10 0.65 1
E.R. Whitehead 9.4 0.67 1
Wagner et al. 14.2 0.42 1
Suzuki et al. 3.3 0.78 1
Table 1.7 Parameters for the electrogeometric model implementation from different authors
As a result of the comparison of models from different authors with recorded data, it has been
found that the Armstrong & Whitehead (Armstrong & Whitehead, 1968a) relation fits well the
recorded points (Cooray, 2014). E.R. Love’s relation (Love, 1973) has also been proposed by
IEEE WG as a model providing adequate mean values of the striking distance (Report, 1993).
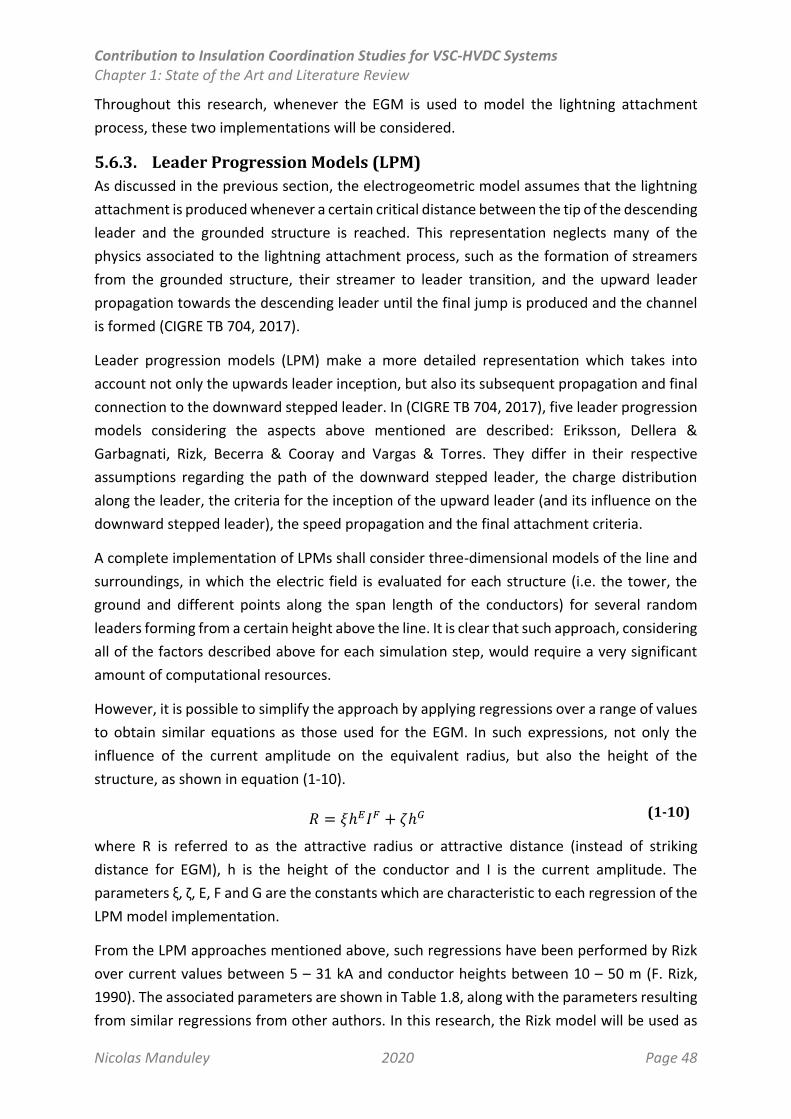
Contribution to Insulation Coordination Studies for VSC-HVDC Systems Chapter 1: State of the Art and Literature Review
Nicolas Manduley 2020 Page 48
Throughout this research, whenever the EGM is used to model the lightning attachment
process, these two implementations will be considered.
5.6.3. Leader Progression Models (LPM)
As discussed in the previous section, the electrogeometric model assumes that the lightning
attachment is produced whenever a certain critical distance between the tip of the descending
leader and the grounded structure is reached. This representation neglects many of the
physics associated to the lightning attachment process, such as the formation of streamers
from the grounded structure, their streamer to leader transition, and the upward leader
propagation towards the descending leader until the final jump is produced and the channel
is formed (CIGRE TB 704, 2017).
Leader progression models (LPM) make a more detailed representation which takes into
account not only the upwards leader inception, but also its subsequent propagation and final
connection to the downward stepped leader. In (CIGRE TB 704, 2017), five leader progression
models considering the aspects above mentioned are described: Eriksson, Dellera &
Garbagnati, Rizk, Becerra & Cooray and Vargas & Torres. They differ in their respective
assumptions regarding the path of the downward stepped leader, the charge distribution
along the leader, the criteria for the inception of the upward leader (and its influence on the
downward stepped leader), the speed propagation and the final attachment criteria.
A complete implementation of LPMs shall consider three-dimensional models of the line and
surroundings, in which the electric field is evaluated for each structure (i.e. the tower, the
ground and different points along the span length of the conductors) for several random
leaders forming from a certain height above the line. It is clear that such approach, considering
all of the factors described above for each simulation step, would require a very significant
amount of computational resources.
However, it is possible to simplify the approach by applying regressions over a range of values
to obtain similar equations as those used for the EGM. In such expressions, not only the
influence of the current amplitude on the equivalent radius, but also the height of the
structure, as shown in equation (1-10).
𝑅 = 𝜉ℎ𝐸𝐼𝐹 + 𝜁ℎ𝐺 (1-10)
where R is referred to as the attractive radius or attractive distance (instead of striking
distance for EGM), h is the height of the conductor and I is the current amplitude. The
parameters ξ, ζ, E, F and G are the constants which are characteristic to each regression of the
LPM model implementation.
From the LPM approaches mentioned above, such regressions have been performed by Rizk
over current values between 5 – 31 kA and conductor heights between 10 – 50 m (F. Rizk,
1990). The associated parameters are shown in Table 1.8, along with the parameters resulting
from similar regressions from other authors. In this research, the Rizk model will be used as
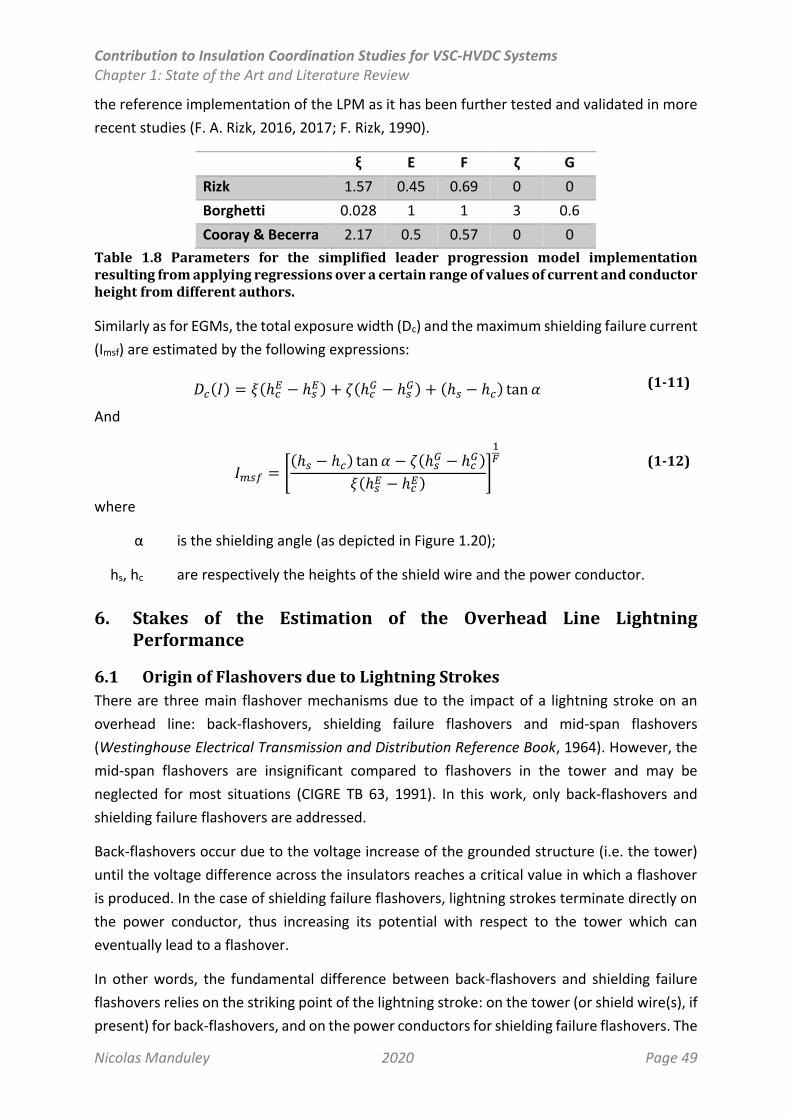
Contribution to Insulation Coordination Studies for VSC-HVDC Systems Chapter 1: State of the Art and Literature Review
Nicolas Manduley 2020 Page 49
the reference implementation of the LPM as it has been further tested and validated in more
recent studies (F. A. Rizk, 2016, 2017; F. Rizk, 1990).
ξ E F ζ G
Rizk 1.57 0.45 0.69 0 0
Borghetti 0.028 1 1 3 0.6
Cooray & Becerra 2.17 0.5 0.57 0 0
Table 1.8 Parameters for the simplified leader progression model implementation resulting from applying regressions over a certain range of values of current and conductor height from different authors.
Similarly as for EGMs, the total exposure width (Dc) and the maximum shielding failure current
(Imsf) are estimated by the following expressions:
𝐷𝑐(𝐼) = 𝜉(ℎ𝑐𝐸 − ℎ𝑠
𝐸) + 𝜁(ℎ𝑐𝐺 − ℎ𝑠
𝐺) + (ℎ𝑠 − ℎ𝑐) tan 𝛼 (1-11)
And
𝐼𝑚𝑠𝑓 = [(ℎ𝑠 − ℎ𝑐) tan 𝛼 − 𝜁(ℎ𝑠
𝐺 − ℎ𝑐𝐺)
𝜉(ℎ𝑠𝐸 − ℎ𝑐
𝐸)]
1𝐹
(1-12)
where
α is the shielding angle (as depicted in Figure 1.20);
hs, hc are respectively the heights of the shield wire and the power conductor.
6. Stakes of the Estimation of the Overhead Line Lightning Performance
6.1 Origin of Flashovers due to Lightning Strokes
There are three main flashover mechanisms due to the impact of a lightning stroke on an
overhead line: back-flashovers, shielding failure flashovers and mid-span flashovers
(Westinghouse Electrical Transmission and Distribution Reference Book, 1964). However, the
mid-span flashovers are insignificant compared to flashovers in the tower and may be
neglected for most situations (CIGRE TB 63, 1991). In this work, only back-flashovers and
shielding failure flashovers are addressed.
Back-flashovers occur due to the voltage increase of the grounded structure (i.e. the tower)
until the voltage difference across the insulators reaches a critical value in which a flashover
is produced. In the case of shielding failure flashovers, lightning strokes terminate directly on
the power conductor, thus increasing its potential with respect to the tower which can
eventually lead to a flashover.
In other words, the fundamental difference between back-flashovers and shielding failure
flashovers relies on the striking point of the lightning stroke: on the tower (or shield wire(s), if
present) for back-flashovers, and on the power conductors for shielding failure flashovers. The
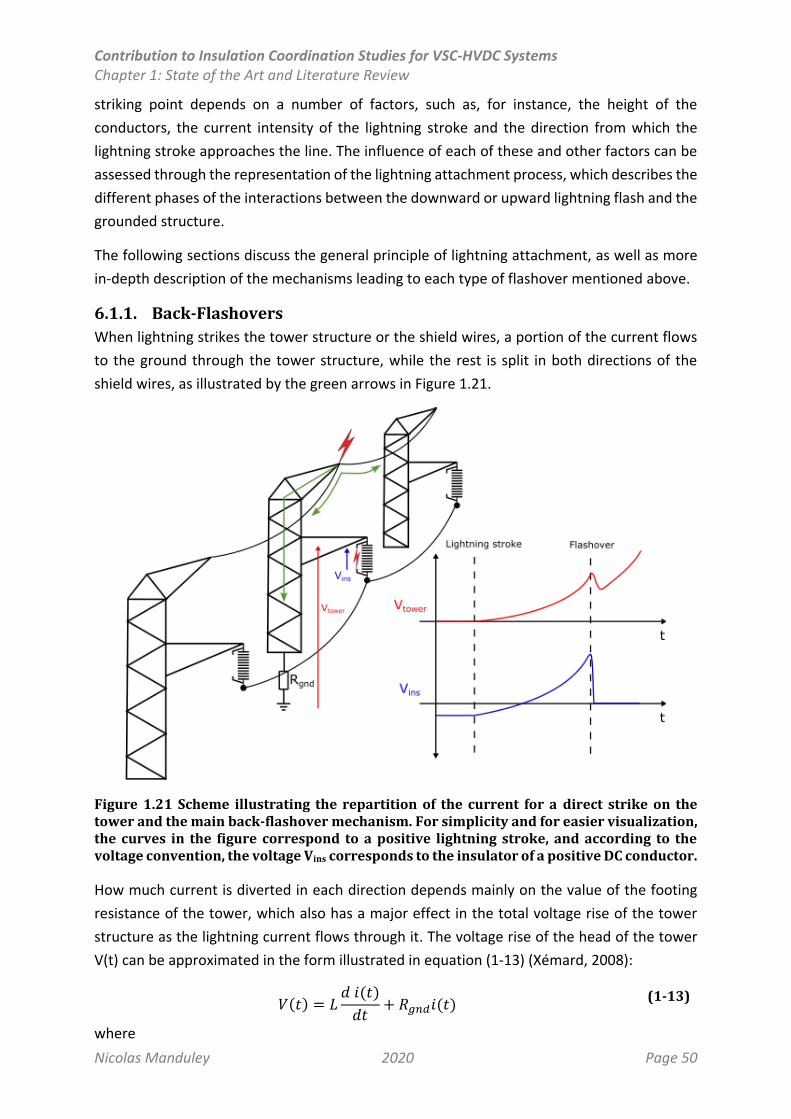
Contribution to Insulation Coordination Studies for VSC-HVDC Systems Chapter 1: State of the Art and Literature Review
Nicolas Manduley 2020 Page 50
striking point depends on a number of factors, such as, for instance, the height of the
conductors, the current intensity of the lightning stroke and the direction from which the
lightning stroke approaches the line. The influence of each of these and other factors can be
assessed through the representation of the lightning attachment process, which describes the
different phases of the interactions between the downward or upward lightning flash and the
grounded structure.
The following sections discuss the general principle of lightning attachment, as well as more
in-depth description of the mechanisms leading to each type of flashover mentioned above.
6.1.1. Back-Flashovers
When lightning strikes the tower structure or the shield wires, a portion of the current flows
to the ground through the tower structure, while the rest is split in both directions of the
shield wires, as illustrated by the green arrows in Figure 1.21.
Figure 1.21 Scheme illustrating the repartition of the current for a direct strike on the tower and the main back-flashover mechanism. For simplicity and for easier visualization, the curves in the figure correspond to a positive lightning stroke, and according to the voltage convention, the voltage Vins corresponds to the insulator of a positive DC conductor.
How much current is diverted in each direction depends mainly on the value of the footing
resistance of the tower, which also has a major effect in the total voltage rise of the tower
structure as the lightning current flows through it. The voltage rise of the head of the tower
V(t) can be approximated in the form illustrated in equation (1-13) (Xémard, 2008):
𝑉(𝑡) = 𝐿𝑑 𝑖(𝑡)
𝑑𝑡+ 𝑅𝑔𝑛𝑑𝑖(𝑡)
(1-13)
where
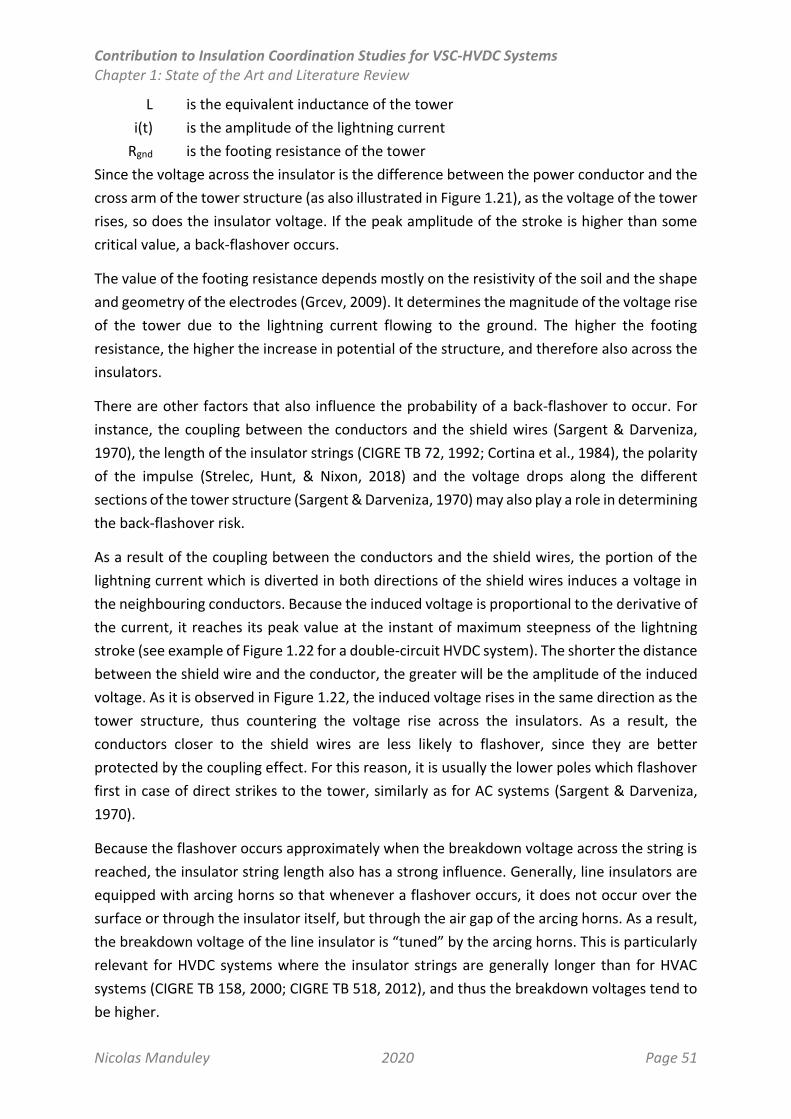
Contribution to Insulation Coordination Studies for VSC-HVDC Systems Chapter 1: State of the Art and Literature Review
Nicolas Manduley 2020 Page 51
L is the equivalent inductance of the tower
i(t) is the amplitude of the lightning current
Rgnd is the footing resistance of the tower
Since the voltage across the insulator is the difference between the power conductor and the
cross arm of the tower structure (as also illustrated in Figure 1.21), as the voltage of the tower
rises, so does the insulator voltage. If the peak amplitude of the stroke is higher than some
critical value, a back-flashover occurs.
The value of the footing resistance depends mostly on the resistivity of the soil and the shape
and geometry of the electrodes (Grcev, 2009). It determines the magnitude of the voltage rise
of the tower due to the lightning current flowing to the ground. The higher the footing
resistance, the higher the increase in potential of the structure, and therefore also across the
insulators.
There are other factors that also influence the probability of a back-flashover to occur. For
instance, the coupling between the conductors and the shield wires (Sargent & Darveniza,
1970), the length of the insulator strings (CIGRE TB 72, 1992; Cortina et al., 1984), the polarity
of the impulse (Strelec, Hunt, & Nixon, 2018) and the voltage drops along the different
sections of the tower structure (Sargent & Darveniza, 1970) may also play a role in determining
the back-flashover risk.
As a result of the coupling between the conductors and the shield wires, the portion of the
lightning current which is diverted in both directions of the shield wires induces a voltage in
the neighbouring conductors. Because the induced voltage is proportional to the derivative of
the current, it reaches its peak value at the instant of maximum steepness of the lightning
stroke (see example of Figure 1.22 for a double-circuit HVDC system). The shorter the distance
between the shield wire and the conductor, the greater will be the amplitude of the induced
voltage. As it is observed in Figure 1.22, the induced voltage rises in the same direction as the
tower structure, thus countering the voltage rise across the insulators. As a result, the
conductors closer to the shield wires are less likely to flashover, since they are better
protected by the coupling effect. For this reason, it is usually the lower poles which flashover
first in case of direct strikes to the tower, similarly as for AC systems (Sargent & Darveniza,
1970).
Because the flashover occurs approximately when the breakdown voltage across the string is
reached, the insulator string length also has a strong influence. Generally, line insulators are
equipped with arcing horns so that whenever a flashover occurs, it does not occur over the
surface or through the insulator itself, but through the air gap of the arcing horns. As a result,
the breakdown voltage of the line insulator is “tuned” by the arcing horns. This is particularly
relevant for HVDC systems where the insulator strings are generally longer than for HVAC
systems (CIGRE TB 158, 2000; CIGRE TB 518, 2012), and thus the breakdown voltages tend to
be higher.
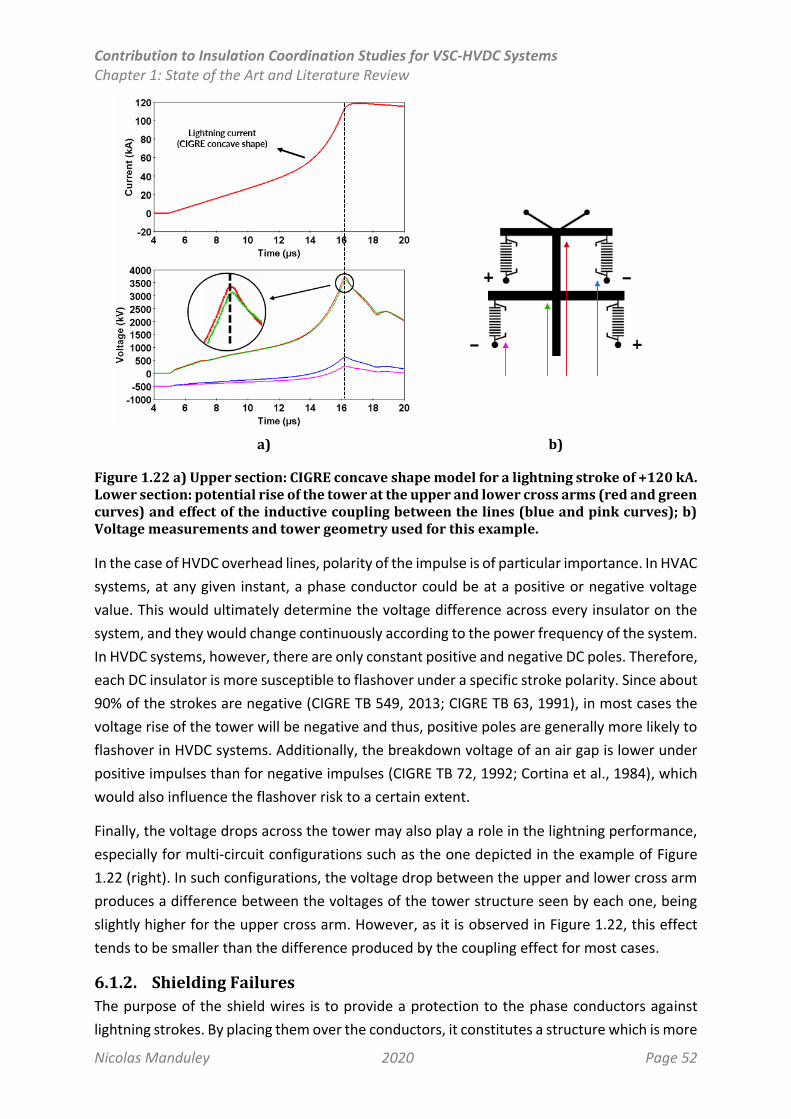
Contribution to Insulation Coordination Studies for VSC-HVDC Systems Chapter 1: State of the Art and Literature Review
Nicolas Manduley 2020 Page 52
a)
b)
Figure 1.22 a) Upper section: CIGRE concave shape model for a lightning stroke of +120 kA. Lower section: potential rise of the tower at the upper and lower cross arms (red and green curves) and effect of the inductive coupling between the lines (blue and pink curves); b) Voltage measurements and tower geometry used for this example.
In the case of HVDC overhead lines, polarity of the impulse is of particular importance. In HVAC
systems, at any given instant, a phase conductor could be at a positive or negative voltage
value. This would ultimately determine the voltage difference across every insulator on the
system, and they would change continuously according to the power frequency of the system.
In HVDC systems, however, there are only constant positive and negative DC poles. Therefore,
each DC insulator is more susceptible to flashover under a specific stroke polarity. Since about
90% of the strokes are negative (CIGRE TB 549, 2013; CIGRE TB 63, 1991), in most cases the
voltage rise of the tower will be negative and thus, positive poles are generally more likely to
flashover in HVDC systems. Additionally, the breakdown voltage of an air gap is lower under
positive impulses than for negative impulses (CIGRE TB 72, 1992; Cortina et al., 1984), which
would also influence the flashover risk to a certain extent.
Finally, the voltage drops across the tower may also play a role in the lightning performance,
especially for multi-circuit configurations such as the one depicted in the example of Figure
1.22 (right). In such configurations, the voltage drop between the upper and lower cross arm
produces a difference between the voltages of the tower structure seen by each one, being
slightly higher for the upper cross arm. However, as it is observed in Figure 1.22, this effect
tends to be smaller than the difference produced by the coupling effect for most cases.
6.1.2. Shielding Failures
The purpose of the shield wires is to provide a protection to the phase conductors against
lightning strokes. By placing them over the conductors, it constitutes a structure which is more
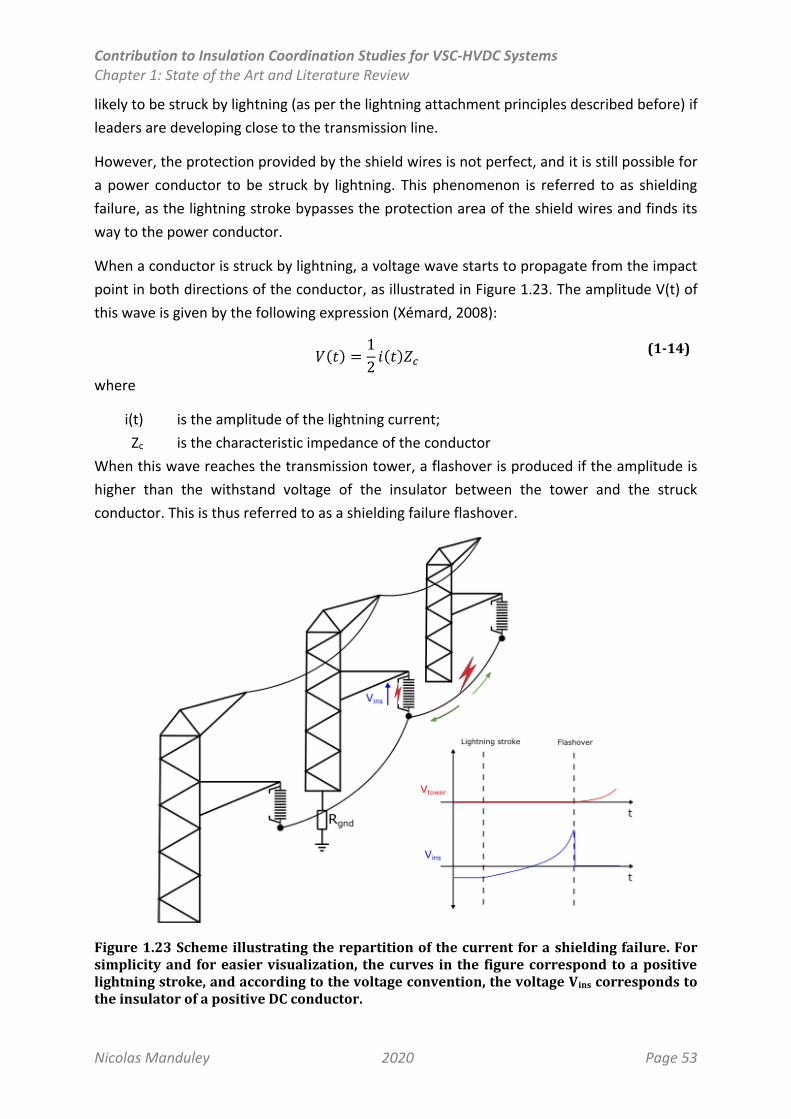
Contribution to Insulation Coordination Studies for VSC-HVDC Systems Chapter 1: State of the Art and Literature Review
Nicolas Manduley 2020 Page 53
likely to be struck by lightning (as per the lightning attachment principles described before) if
leaders are developing close to the transmission line.
However, the protection provided by the shield wires is not perfect, and it is still possible for
a power conductor to be struck by lightning. This phenomenon is referred to as shielding
failure, as the lightning stroke bypasses the protection area of the shield wires and finds its
way to the power conductor.
When a conductor is struck by lightning, a voltage wave starts to propagate from the impact
point in both directions of the conductor, as illustrated in Figure 1.23. The amplitude V(t) of
this wave is given by the following expression (Xémard, 2008):
𝑉(𝑡) =1
2𝑖(𝑡)𝑍𝑐
(1-14)
where
i(t) is the amplitude of the lightning current;
Zc is the characteristic impedance of the conductor
When this wave reaches the transmission tower, a flashover is produced if the amplitude is
higher than the withstand voltage of the insulator between the tower and the struck
conductor. This is thus referred to as a shielding failure flashover.
Figure 1.23 Scheme illustrating the repartition of the current for a shielding failure. For simplicity and for easier visualization, the curves in the figure correspond to a positive lightning stroke, and according to the voltage convention, the voltage Vins corresponds to the insulator of a positive DC conductor.

Contribution to Insulation Coordination Studies for VSC-HVDC Systems Chapter 1: State of the Art and Literature Review
Nicolas Manduley 2020 Page 54
When the flashover occurs, a significant portion of the current enters the tower, part of which
flows to the ground and produces a voltage rise of the tower structure which depends strongly
on the footing resistance. This, as well as other mechanisms associated to the shielding failure,
will be addressed in more details in Chapter 4.
6.2 Significance of Lightning as a Source of Faults
Lightning is one of the most common causes of outages in transmission systems (CIGRE TB
704). Between 2002 and 2013, they represented from 36% to over 50% of the total
transmission line outages in Malaysia (Rawi & Kadir, 2016), and between 53% and up to 83%
of the outages in Japan between 1997 and 2012 (Shindo et al., 2016).
Moreover, there is generally a significant correlation between outages of short duration
(between 1 second and 3 minutes) and the total incidence of lightning in a region. For instance,
a summary of the average ground flash density (Ng) and short outages frequency of France is
presented in Figure 1.24 for the period between 2010 and 2019. The data has been obtained
from RTE’s Electrical Report for 2019 (RTE, Bilan Electrique, 2019).
Figure 1.24 Average lightning flash density [flashes/km²/year] and frequency of short outages [tripouts/site] in France over the period between 2010 – 2019.
As it can be observed, there is a non-negligible correlation between the lightning activity and
the outage frequency, especially between the years 2010 and 2014 (Pearson correlation factor
of about 0.85). Even though the correlation is less evident for the period between 2014 and
2019, this could be at least partially explained through the high variability of Ng (as discussed
in §5.4) and by the fact that the lightning density illustrated includes all ground flashes, which
do not necessarily occur on or near a transmission line. Improvements on the lightning
performance of the transmission line implemented through the years may also play a role.
Nevertheless, it is clear that moderate to high correlations can be found between the lightning
activity and the total number of short outages of a region. This is also shown in Figure 1.25,
which illustrates the average ground flash density and the average short outages per region
Contribution to Insulation Coordination Studies for VSC-HVDC Systems Chapter 1: State of the Art and Literature Review
Nicolas Manduley 2020 Page 55
in France for the year 2019 (also extracted from RTE, Bilan Electrique, 2019). It is observed
that the short outage rates tend to be directly proportional to the lightning activity of each
particular region.
Figure 1.25 Comparison of the average ground flash density and short outages per region in France for 2019, extracted from RTE, Bilan Electrique, 2019. Short outage rates tend to be directly proportional to the lightning activity of each particular region.
6.3 Consequences of Lightning Flashovers on the Transmission System Performance
A flashover due to lightning can introduce disturbances at the delivery points of the
transmission grid (i.e. distribution grid or industrial clients). These disturbances can be
classified into three categories (RTE, Bilan Electrique, 2019; Xémard, 2008):
Short outages, of which the duration of the voltage interruption is between one second
and three minutes.
Very short outages, of which the duration of the voltage interruption is inferior to one
second.
Voltage dips, which are short (usually less than one second) and temporary drops of
the system voltage, which may cause malfunctions on some equipment connected to
the grid, depending on their amplitude and duration.
Long outages (of a duration of more than three minutes) are never produced by faults
originated by lightning. However, if the flashover occurs on an important or strategic line of
the system, it could in some rare cases compromise the stability of the system (Xémard, 2008).
6.4 Estimation of the Overhead Line Lightning Performance
The lightning performance is expressed as the average number of flashovers due to lightning
expected to occur for a 100 km line segment over a year (flashovers/100 km/year). As
discussed in §6.1, there are two types of flashovers that can arise due to lightning: back-
flashovers and shielding failure flashovers. The overall lightning performance of a system is
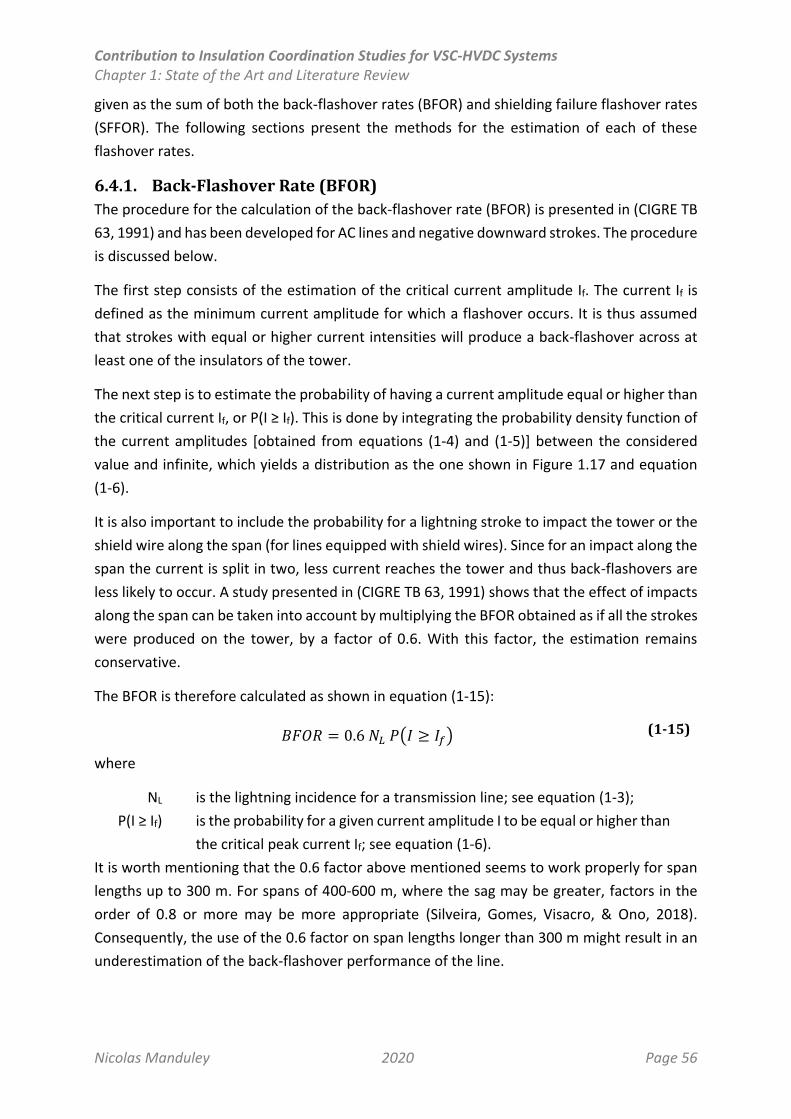
Contribution to Insulation Coordination Studies for VSC-HVDC Systems Chapter 1: State of the Art and Literature Review
Nicolas Manduley 2020 Page 56
given as the sum of both the back-flashover rates (BFOR) and shielding failure flashover rates
(SFFOR). The following sections present the methods for the estimation of each of these
flashover rates.
6.4.1. Back-Flashover Rate (BFOR)
The procedure for the calculation of the back-flashover rate (BFOR) is presented in (CIGRE TB
63, 1991) and has been developed for AC lines and negative downward strokes. The procedure
is discussed below.
The first step consists of the estimation of the critical current amplitude If. The current If is
defined as the minimum current amplitude for which a flashover occurs. It is thus assumed
that strokes with equal or higher current intensities will produce a back-flashover across at
least one of the insulators of the tower.
The next step is to estimate the probability of having a current amplitude equal or higher than
the critical current If, or P(I ≥ If). This is done by integrating the probability density function of
the current amplitudes [obtained from equations (1-4) and (1-5)] between the considered
value and infinite, which yields a distribution as the one shown in Figure 1.17 and equation
(1-6).
It is also important to include the probability for a lightning stroke to impact the tower or the
shield wire along the span (for lines equipped with shield wires). Since for an impact along the
span the current is split in two, less current reaches the tower and thus back-flashovers are
less likely to occur. A study presented in (CIGRE TB 63, 1991) shows that the effect of impacts
along the span can be taken into account by multiplying the BFOR obtained as if all the strokes
were produced on the tower, by a factor of 0.6. With this factor, the estimation remains
conservative.
The BFOR is therefore calculated as shown in equation (1-15):
𝐵𝐹𝑂𝑅 = 0.6 𝑁𝐿 𝑃(𝐼 ≥ 𝐼𝑓) (1-15)
where
NL is the lightning incidence for a transmission line; see equation (1-3);
P(I ≥ If) is the probability for a given current amplitude I to be equal or higher than
the critical peak current If; see equation (1-6).
It is worth mentioning that the 0.6 factor above mentioned seems to work properly for span
lengths up to 300 m. For spans of 400-600 m, where the sag may be greater, factors in the
order of 0.8 or more may be more appropriate (Silveira, Gomes, Visacro, & Ono, 2018).
Consequently, the use of the 0.6 factor on span lengths longer than 300 m might result in an
underestimation of the back-flashover performance of the line.
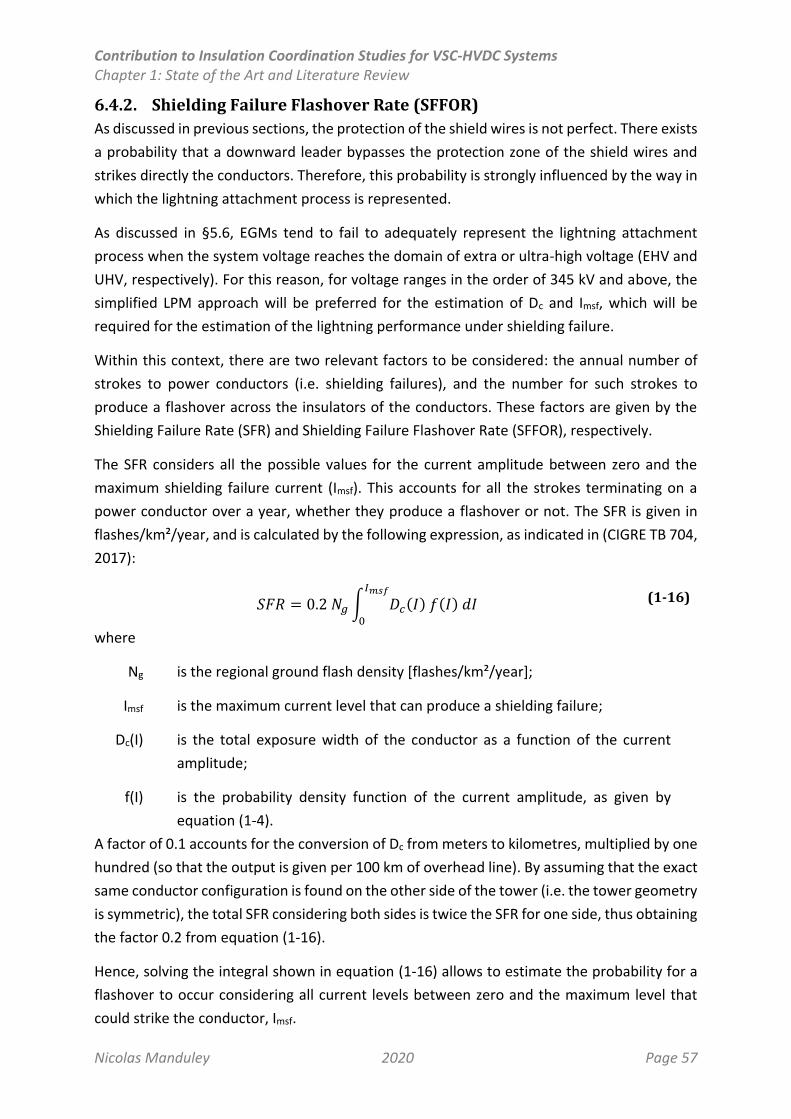
Contribution to Insulation Coordination Studies for VSC-HVDC Systems Chapter 1: State of the Art and Literature Review
Nicolas Manduley 2020 Page 57
6.4.2. Shielding Failure Flashover Rate (SFFOR)
As discussed in previous sections, the protection of the shield wires is not perfect. There exists
a probability that a downward leader bypasses the protection zone of the shield wires and
strikes directly the conductors. Therefore, this probability is strongly influenced by the way in
which the lightning attachment process is represented.
As discussed in §5.6, EGMs tend to fail to adequately represent the lightning attachment
process when the system voltage reaches the domain of extra or ultra-high voltage (EHV and
UHV, respectively). For this reason, for voltage ranges in the order of 345 kV and above, the
simplified LPM approach will be preferred for the estimation of Dc and Imsf, which will be
required for the estimation of the lightning performance under shielding failure.
Within this context, there are two relevant factors to be considered: the annual number of
strokes to power conductors (i.e. shielding failures), and the number for such strokes to
produce a flashover across the insulators of the conductors. These factors are given by the
Shielding Failure Rate (SFR) and Shielding Failure Flashover Rate (SFFOR), respectively.
The SFR considers all the possible values for the current amplitude between zero and the
maximum shielding failure current (Imsf). This accounts for all the strokes terminating on a
power conductor over a year, whether they produce a flashover or not. The SFR is given in
flashes/km²/year, and is calculated by the following expression, as indicated in (CIGRE TB 704,
2017):
𝑆𝐹𝑅 = 0.2 𝑁𝑔∫ 𝐷𝑐(𝐼) 𝑓(𝐼) 𝑑𝐼𝐼𝑚𝑠𝑓
0
(1-16)
where
Ng is the regional ground flash density [flashes/km²/year];
Imsf is the maximum current level that can produce a shielding failure;
Dc(I) is the total exposure width of the conductor as a function of the current
amplitude;
f(I) is the probability density function of the current amplitude, as given by
equation (1-4).
A factor of 0.1 accounts for the conversion of Dc from meters to kilometres, multiplied by one
hundred (so that the output is given per 100 km of overhead line). By assuming that the exact
same conductor configuration is found on the other side of the tower (i.e. the tower geometry
is symmetric), the total SFR considering both sides is twice the SFR for one side, thus obtaining
the factor 0.2 from equation (1-16).
Hence, solving the integral shown in equation (1-16) allows to estimate the probability for a
flashover to occur considering all current levels between zero and the maximum level that
could strike the conductor, Imsf.
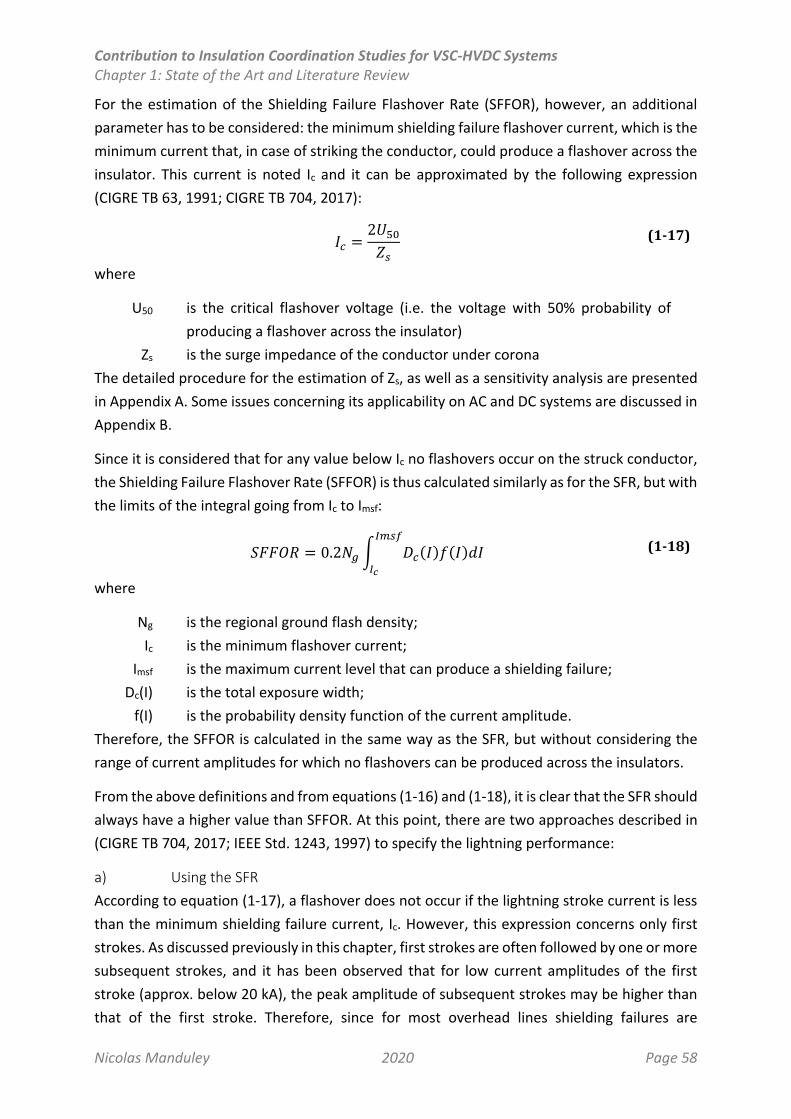
Contribution to Insulation Coordination Studies for VSC-HVDC Systems Chapter 1: State of the Art and Literature Review
Nicolas Manduley 2020 Page 58
For the estimation of the Shielding Failure Flashover Rate (SFFOR), however, an additional
parameter has to be considered: the minimum shielding failure flashover current, which is the
minimum current that, in case of striking the conductor, could produce a flashover across the
insulator. This current is noted Ic and it can be approximated by the following expression
(CIGRE TB 63, 1991; CIGRE TB 704, 2017):
𝐼𝑐 =2𝑈50𝑍𝑠
(1-17)
where
U50 is the critical flashover voltage (i.e. the voltage with 50% probability of
producing a flashover across the insulator)
Zs is the surge impedance of the conductor under corona
The detailed procedure for the estimation of Zs, as well as a sensitivity analysis are presented
in Appendix A. Some issues concerning its applicability on AC and DC systems are discussed in
Appendix B.
Since it is considered that for any value below Ic no flashovers occur on the struck conductor,
the Shielding Failure Flashover Rate (SFFOR) is thus calculated similarly as for the SFR, but with
the limits of the integral going from Ic to Imsf:
𝑆𝐹𝐹𝑂𝑅 = 0.2𝑁𝑔∫ 𝐷𝑐(𝐼)𝑓(𝐼)𝑑𝐼𝐼𝑚𝑠𝑓
𝐼𝑐
(1-18)
where
Ng is the regional ground flash density;
Ic is the minimum flashover current;
Imsf is the maximum current level that can produce a shielding failure;
Dc(I) is the total exposure width;
f(I) is the probability density function of the current amplitude.
Therefore, the SFFOR is calculated in the same way as the SFR, but without considering the
range of current amplitudes for which no flashovers can be produced across the insulators.
From the above definitions and from equations (1-16) and (1-18), it is clear that the SFR should
always have a higher value than SFFOR. At this point, there are two approaches described in
(CIGRE TB 704, 2017; IEEE Std. 1243, 1997) to specify the lightning performance:
a) Using the SFR
According to equation (1-17), a flashover does not occur if the lightning stroke current is less
than the minimum shielding failure current, Ic. However, this expression concerns only first
strokes. As discussed previously in this chapter, first strokes are often followed by one or more
subsequent strokes, and it has been observed that for low current amplitudes of the first
stroke (approx. below 20 kA), the peak amplitude of subsequent strokes may be higher than
that of the first stroke. Therefore, since for most overhead lines shielding failures are
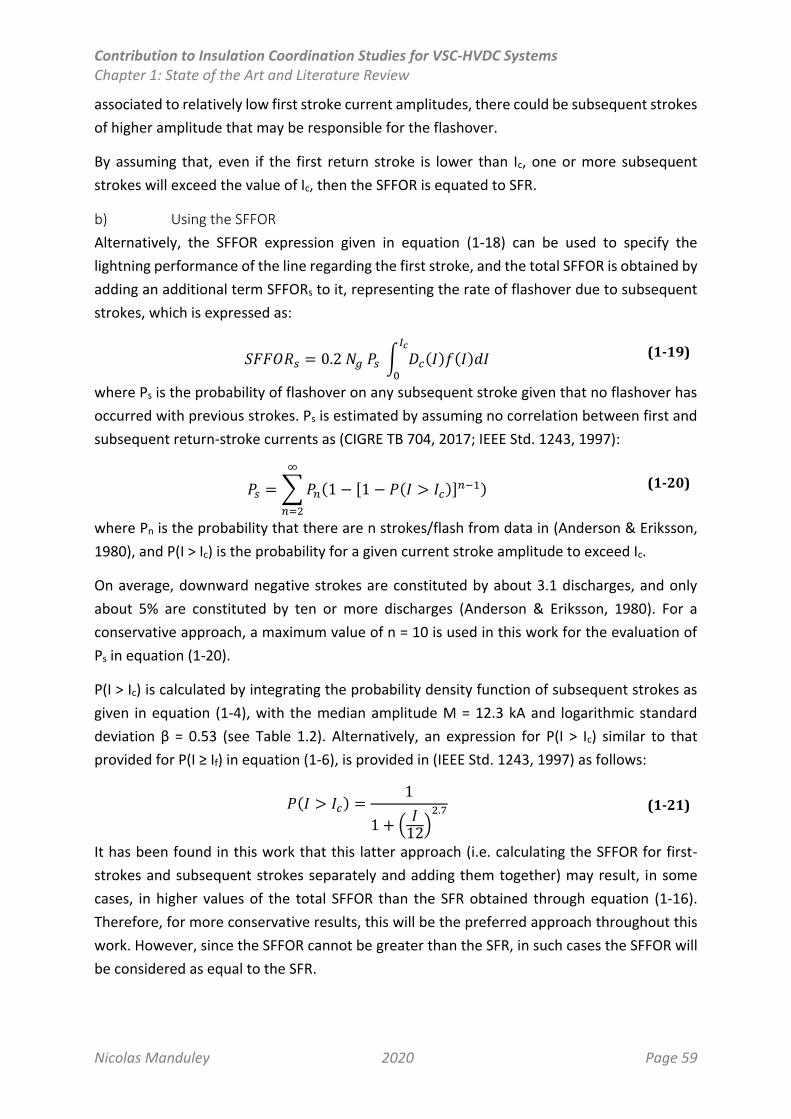
Contribution to Insulation Coordination Studies for VSC-HVDC Systems Chapter 1: State of the Art and Literature Review
Nicolas Manduley 2020 Page 59
associated to relatively low first stroke current amplitudes, there could be subsequent strokes
of higher amplitude that may be responsible for the flashover.
By assuming that, even if the first return stroke is lower than Ic, one or more subsequent
strokes will exceed the value of Ic, then the SFFOR is equated to SFR.
b) Using the SFFOR
Alternatively, the SFFOR expression given in equation (1-18) can be used to specify the
lightning performance of the line regarding the first stroke, and the total SFFOR is obtained by
adding an additional term SFFORs to it, representing the rate of flashover due to subsequent
strokes, which is expressed as:
𝑆𝐹𝐹𝑂𝑅𝑠 = 0.2 𝑁𝑔 𝑃𝑠 ∫ 𝐷𝑐(𝐼)𝑓(𝐼)𝑑𝐼𝐼𝑐
0
(1-19)
where Ps is the probability of flashover on any subsequent stroke given that no flashover has
occurred with previous strokes. Ps is estimated by assuming no correlation between first and
subsequent return-stroke currents as (CIGRE TB 704, 2017; IEEE Std. 1243, 1997):
𝑃𝑠 = ∑𝑃𝑛(1 − [1 − 𝑃(𝐼 > 𝐼𝑐)]𝑛−1)
∞
𝑛=2
(1-20)
where Pn is the probability that there are n strokes/flash from data in (Anderson & Eriksson,
1980), and P(I > Ic) is the probability for a given current stroke amplitude to exceed Ic.
On average, downward negative strokes are constituted by about 3.1 discharges, and only
about 5% are constituted by ten or more discharges (Anderson & Eriksson, 1980). For a
conservative approach, a maximum value of n = 10 is used in this work for the evaluation of
Ps in equation (1-20).
P(I > Ic) is calculated by integrating the probability density function of subsequent strokes as
given in equation (1-4), with the median amplitude M = 12.3 kA and logarithmic standard
deviation β = 0.53 (see Table 1.2). Alternatively, an expression for P(I > Ic) similar to that
provided for P(I ≥ If) in equation (1-6), is provided in (IEEE Std. 1243, 1997) as follows:
𝑃(𝐼 > 𝐼𝑐) =1
1 + (𝐼12)2.7 (1-21)
It has been found in this work that this latter approach (i.e. calculating the SFFOR for first-
strokes and subsequent strokes separately and adding them together) may result, in some
cases, in higher values of the total SFFOR than the SFR obtained through equation (1-16).
Therefore, for more conservative results, this will be the preferred approach throughout this
work. However, since the SFFOR cannot be greater than the SFR, in such cases the SFFOR will
be considered as equal to the SFR.
Contribution to Insulation Coordination Studies for VSC-HVDC Systems Chapter 1: State of the Art and Literature Review
Nicolas Manduley 2020 Page 60
6.4.3. Limitations of the Presented Approach
Even though the approach above presented constitute a simple method to estimate the
lightning performance of transmission line, and that it generally yields results which are
coherent with the available experience (CIGRE TB 63, 1991; CIGRE TB 704, 2017), these results
are often difficult to interpret (Xémard, 2008). The presented approach considers
homogeneous lines, plain terrains or downward leaders descending vertically (thus in theory
a negative shielding angle α would provide perfect protection to the conductor, which is not
true in practice due to stepped leaders approaching horizontally or in an angle). Some
approaches are proposed to modify these methods to take into account the inclination of the
terrain (e.g. for mountainous areas) or for stepped leaders approaching in an angle, it is not
yet clear whether a thorough application of electrogeometric models can actually yield
accurate and realistic results. In addition, this approach is not suitable on its own for studies
considering asymmetric configurations, non-linear devices (such as surge arresters) and multi-
circuit lines.
Even more, the lightning activity may vary according to the region, season and even from one
year to another (represented by the value of the ground flash density, Ng), which is difficult to
take into account properly. An additional uncertainty is also introduced by the fact that the
parameters used to model the lightning currents are obtained using the median values of the
data presented in CIGRE TB 63, gathered from different regions of the world. Therefore, a
relatively high dispersion around the median value of each of these parameters may be
expected in real strokes.
Despite these limitations, it is also important to highlight the key strengths of the presented
approach, for it allows to compare quantitatively different solutions aiming to reduce the
flashover rates of a given configuration by taking into account the current scientific knowledge
on the nature of lightning. Moreover, some of the limitations evoked above—such as the line
homogeneity, the presence of non-linear devices, asymmetric configurations and multi-circuit
lines—can be compensated by combining it with electromagnetic transient (EMT) simulations,
as it will be discussed in Chapter 2.
Contribution to Insulation Coordination Studies for VSC-HVDC Systems Chapter 2: Tools and Electromagnetic Modelling
Nicolas Manduley 2020 Page 61
Chapter 2 Tools and Electromagnetic Modelling
1. Introduction
As discussed in the previous chapter, one of the fundamental steps in the insulation
coordination is the estimation of the overvoltage levels that can appear in the system due to
faults, switching operations, lightning strokes, resonance, etc.
Electricity utilities make use of simulation programs which take into account the
electromagnetic behaviour of the components and their interactions. The accuracy of the
results depends directly on the accuracy of the models. In this research, EMTP has been used.
EMTP is a software program for the calculation of electromagnetic transients occurring in an
electrical system, and is a broadly used tool for electrical system simulations. It includes a
graphical user interface with a component library, based on which the user builds the system,
and a calculation engine for computing load-flow, steady state and time-domain solutions
(Mahseredjian, Dennetière, Dubé, Khodabakhchian, & Gérin-Lajoie, 2007).
EMTP allows solving both voltage and current distributions from the steady state to the high
frequency transients region considering not only the main equipment, but also the control
functions and non-linear effects and devices (e.g. surge arresters, transformer saturation).
Clearly, an appropriate modelling of the components, as well as a correct choice of their
respective parameters, is required to obtain accurate results. This chapter addresses the
modelling aspects regarding the system and components used in this work. The main goal is
to provide a clear and comprehensive description of the choices that have been made to
model each component of the system where EMT simulations have been performed to
support the studies. This has been done after a detailed analysis of the literature, and the
guidelines used here may be used as a guide for further similar studies.
2. Numerical Considerations
This section discusses the numerical considerations to be taken into account in order to obtain
an accurate representation of the overvoltages present in the system using electromagnetic
transient simulations. This includes issues related to the initialization of the system, time step
choice, duration of the simulation, oscillations (of physical or numerical nature) and non-linear
elements. These issues are explained in IEC 60071-4 and are briefly summarized below.
The solution of a transient phenomenon is dependent on the initial conditions with which the
transient is started (IEC 60071-4, 2004). Therefore, it is important to ensure that the correct
conditions are met when the transient event is simulated for analysis. The simplest approach
to initialize the system in EMT-like simulations is to start the calculation and let the transients
settle down to steady-state conditions. For cases where this approach may result in very long
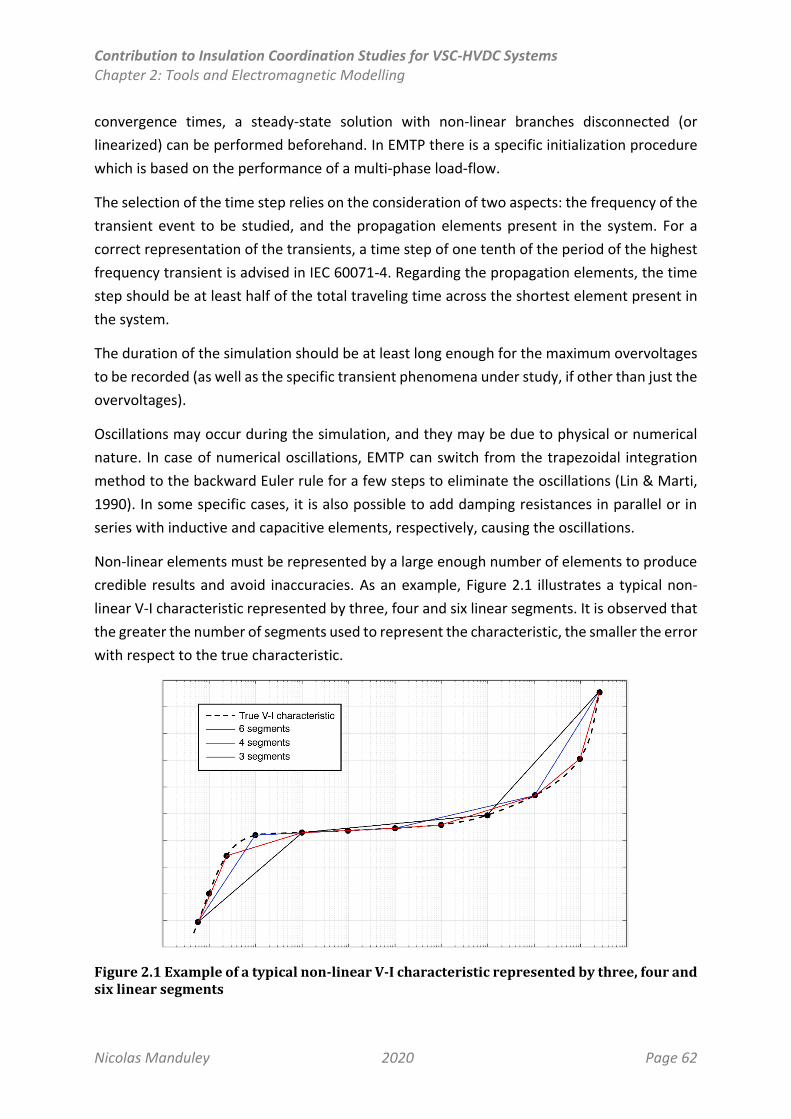
Contribution to Insulation Coordination Studies for VSC-HVDC Systems Chapter 2: Tools and Electromagnetic Modelling
Nicolas Manduley 2020 Page 62
convergence times, a steady-state solution with non-linear branches disconnected (or
linearized) can be performed beforehand. In EMTP there is a specific initialization procedure
which is based on the performance of a multi-phase load-flow.
The selection of the time step relies on the consideration of two aspects: the frequency of the
transient event to be studied, and the propagation elements present in the system. For a
correct representation of the transients, a time step of one tenth of the period of the highest
frequency transient is advised in IEC 60071-4. Regarding the propagation elements, the time
step should be at least half of the total traveling time across the shortest element present in
the system.
The duration of the simulation should be at least long enough for the maximum overvoltages
to be recorded (as well as the specific transient phenomena under study, if other than just the
overvoltages).
Oscillations may occur during the simulation, and they may be due to physical or numerical
nature. In case of numerical oscillations, EMTP can switch from the trapezoidal integration
method to the backward Euler rule for a few steps to eliminate the oscillations (Lin & Marti,
1990). In some specific cases, it is also possible to add damping resistances in parallel or in
series with inductive and capacitive elements, respectively, causing the oscillations.
Non-linear elements must be represented by a large enough number of elements to produce
credible results and avoid inaccuracies. As an example, Figure 2.1 illustrates a typical non-
linear V-I characteristic represented by three, four and six linear segments. It is observed that
the greater the number of segments used to represent the characteristic, the smaller the error
with respect to the true characteristic.
Figure 2.1 Example of a typical non-linear V-I characteristic represented by three, four and six linear segments

Contribution to Insulation Coordination Studies for VSC-HVDC Systems Chapter 2: Tools and Electromagnetic Modelling
Nicolas Manduley 2020 Page 63
Nevertheless, the points where the characteristic is not differentiable can still be a source of
inaccuracies. This is due to the fact that when the transient forces the model to switch the
specific segment, non-physical oscillations or numerical errors which are difficult to treat may
appear.
3. Modelling Aspects
This section discusses the modelling aspects for each of the components considered in this
research to guarantee that the conditions presented in this section are met for each case
study.
3.1 Overhead Lines and Cables
Several models based on the line-theory exist for the representation of overhead lines and
cables for transient simulations. Among them, the traveling-wave types can be considered the
most important models implemented in EMTP, which allow representing the propagation of
the waves produced by transient events such as faults, lightning strokes, switching operations,
etc. Considering their respective characteristics and limitations (IEC 60071-4, 2004; Ramos L,
2013) which are explained below, the following line models are considered in this research:
constant parameters (CP), frequency dependent (FD) and wideband (WB) models. Their main
characteristics are explained below, and summarized in Table 2.1 along with their respective
applications.
The CP model is obtained by assuming the transmission line model parameters R, L, G and C
as constant (i.e. independent from the frequency). With this simplification, the time domain
representation of the line model does not contain convolutions. As a result, the model is
computationally efficient, but loses accuracy and tends to exaggerate transient phenomena
(Ramos L, 2013). For multi-phase lines, the system is solved in the modal domain through a
transformation matrix which is assumed to be real and constant. As it will be discussed in the
following subsection, this model is well suited to represent the tower structure because it can
be represented as a single line.
The FD model takes into account the frequency dependency of the line parameters, which
results in a model that contains convolutions, and the transformation matrix is also assumed
to be real and constant within the frequency range of study (Ramos L, 2013). As a result, this
model provides a more accurate representation of transient events for many multiphase lines,
such as typical overhead lines, but is not well suited for cases with frequency dependence of
the transformation matrix (e.g. underground/submarine cables).
The WB model solves the issues of configurations with strong frequency dependence of their
parameters, such as underground or submarine cables, by formulating the line directly in the
phase domain. The modes are calculated in order to accurately establish the parameters of
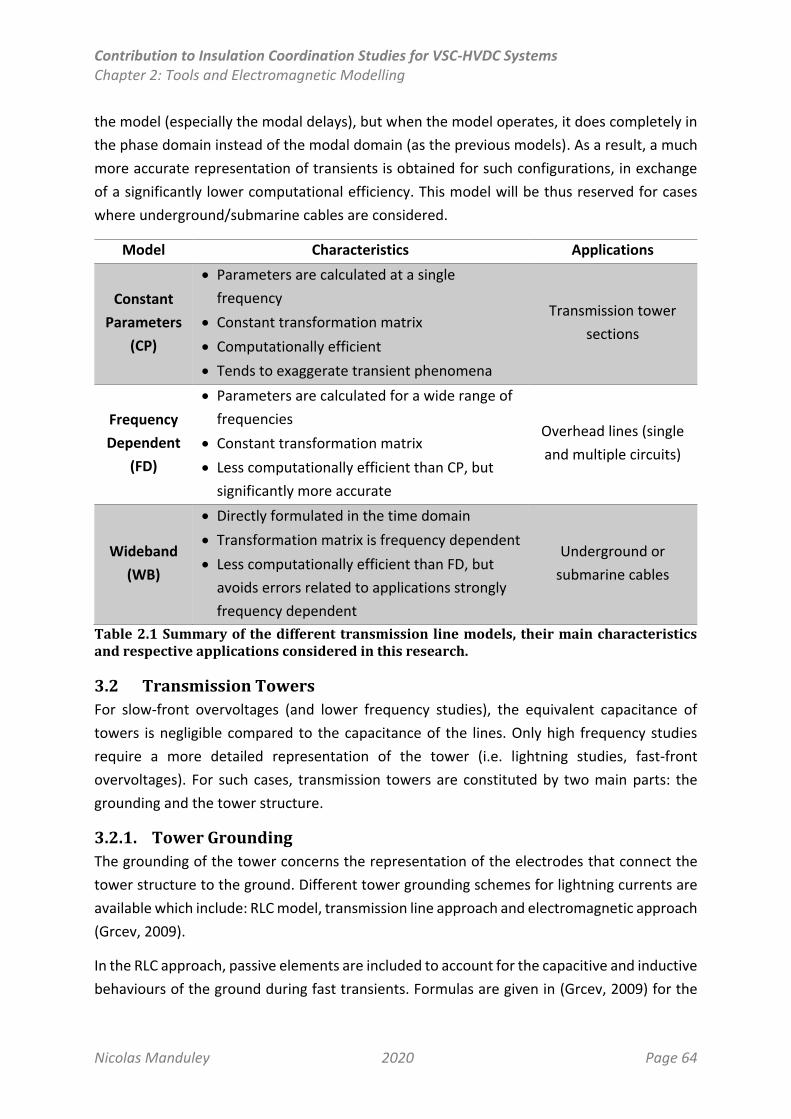
Contribution to Insulation Coordination Studies for VSC-HVDC Systems Chapter 2: Tools and Electromagnetic Modelling
Nicolas Manduley 2020 Page 64
the model (especially the modal delays), but when the model operates, it does completely in
the phase domain instead of the modal domain (as the previous models). As a result, a much
more accurate representation of transients is obtained for such configurations, in exchange
of a significantly lower computational efficiency. This model will be thus reserved for cases
where underground/submarine cables are considered.
Model Characteristics Applications
Constant
Parameters
(CP)
Parameters are calculated at a single
frequency
Constant transformation matrix
Computationally efficient
Tends to exaggerate transient phenomena
Transmission tower
sections
Frequency
Dependent
(FD)
Parameters are calculated for a wide range of
frequencies
Constant transformation matrix
Less computationally efficient than CP, but
significantly more accurate
Overhead lines (single
and multiple circuits)
Wideband
(WB)
Directly formulated in the time domain
Transformation matrix is frequency dependent
Less computationally efficient than FD, but
avoids errors related to applications strongly
frequency dependent
Underground or
submarine cables
Table 2.1 Summary of the different transmission line models, their main characteristics and respective applications considered in this research.
3.2 Transmission Towers
For slow-front overvoltages (and lower frequency studies), the equivalent capacitance of
towers is negligible compared to the capacitance of the lines. Only high frequency studies
require a more detailed representation of the tower (i.e. lightning studies, fast-front
overvoltages). For such cases, transmission towers are constituted by two main parts: the
grounding and the tower structure.
3.2.1. Tower Grounding
The grounding of the tower concerns the representation of the electrodes that connect the
tower structure to the ground. Different tower grounding schemes for lightning currents are
available which include: RLC model, transmission line approach and electromagnetic approach
(Grcev, 2009).
In the RLC approach, passive elements are included to account for the capacitive and inductive
behaviours of the ground during fast transients. Formulas are given in (Grcev, 2009) for the
Contribution to Insulation Coordination Studies for VSC-HVDC Systems Chapter 2: Tools and Electromagnetic Modelling
Nicolas Manduley 2020 Page 65
calculation of the equivalent footing impedance of the tower. On the other hand, the
implementation of the transmission line and electromagnetic approaches is complex, and may
present some limitations when non-linear phenomena are present (Grcev, 2009; IEC 60071-4,
2004). Therefore, the RLC model is the recommended approach for lightning studies. In most
cases, a single resistance is sufficient to represent the grounding impedance (IEC 60071-4,
2004).
Besides the representation of the electrodes, there are two effects that may be taken into
account: the non-linear effect of the ionization of the soil, and the frequency dependence of
the parameters of the soil. The ionization of the soil is a very local phenomenon which is
typically not relevant for long electrodes buried in soils with moderate to high resistivity
(Visacro & Silveira, 2015) and usually requires very large current amplitudes to occur. It may
become relevant for small electrodes in high resistivity soils and high currents. The frequency
dependence of the parameters of the soil is independent from the current amplitude and may
affect the values of the elements of the RLC model (CIGRE TB 781).
However, for both effects above described, the overall effect is to reduce the value of the
footing impedance, which represents a favourable effect in terms of lightning performance of
the tower. Therefore, and in order to obtain more conservative results, they will be not
considered in this research and the grounding of the tower will be represented by a single
resistance.
3.2.2. Tower Structure
The tower structure can be subdivided into the sections corresponding to the tower body,
cross arms and support for the shield wires. The tower body can be modelled as an equivalent
inductance, as a lossless propagation line with constant parameters (with or without a
damping inductance) or as a radiating structure (IEC 60071-4, 2004).
In order to consider the wave reflections and their respective traveling time between the
conductors and the ground, the body of the tower in our research has been modelled as a
propagation line with constant parameters (CP model). However, using this model for the
cross arms and shield wire support structures would have required, because of their short
lengths, very small simulation time steps. This would have significantly increased the
computational requirements, without a major gain in accuracy of the results. For these
sections, a simple inductance is used with a value of 1 µH/m, as advised in IEC 60071-4.
3.3 Air Gaps, Line Insulators
In this research, the modelling of insulators and/or their respective air gaps concerns only the
analysis of fast-front overvoltages (FFO, see Chapter 1, §3.2.4). For such cases, it is
recommended in IEC 60071-4 to model both the flashover trigger and the flashover process.
Contribution to Insulation Coordination Studies for VSC-HVDC Systems Chapter 2: Tools and Electromagnetic Modelling
Nicolas Manduley 2020 Page 66
For the flashover trigger, three approaches are recommended in IEC 60071-4 standard to
determine the instant of the flashover: the use of a volt-time (V-t) characteristic, an air gap
model using the area criterion and an air gap model based on the leader propagation
representation (CIGRE TB 63 and 72). The V-t characteristic is constructed based on standard
impulses in the laboratory, and hence it may not be accurate for non-standard impulses. The
air gap model using the area criterion can be adjusted for different polarities and gap
configurations. Based on comparisons with experimental data, this model is only
recommended for small air gaps (lower than 1.2 m). For longer air gaps, a leader propagation
representation is recommended (CIGRE TB 63, 1991; IEC 60071-4, 2004).
The leader propagation representation considers the three phases of a breakdown: corona
inception, streamer propagation and leader propagation (though the corona inception phase
can be often neglected for practical purposes, as stated in CIGRE TB 63). A model of this type
has been proposed by Shindo & Suzuki (1985), and has been validated through experimental
tests for rod-rod and rod-plane configurations with different polarity configurations for gap
lengths up to 7 m.
The model proposed by Shindo & Suzuki is available in the EMTP library. For the gap lengths
considered in this research (about 2.75 m – 5.2 m), it has been observed that using the EMTP
default values, significant pre-discharge currents flow through the gap before the actual
flashover occurs. As a result, the knee of the voltage curve corresponding to the flashover
instant is rounded, and the flashover time becomes significantly larger than what it is observed
in real flashover tests (e.g. Hagenguth, Rohlfs, & Degnan, 1952). In this research, EMTP tests
have been performed in order to configure the parameters of the model and adjust the pre-
discharge currents to a more realistic level. It has been found that, for the insulator string
lengths considered in this work, changing the default value of the capacitance between the
leader and the ground of the Shindo & Suzuki model from 500 pF/m (default) to 50 pF/m, the
pre-discharge current levels (and thus the breakdown curves) correspond to what it is
observed in the laboratory for similar gap lengths.
3.4 Surge Arresters
Whenever surge arresters are considered, the model used is determined by the frequency of
the studied transients. For slow-front overvoltages (SFO) and lower frequency studies, the
native EMTP surge arrester model (type 92 device) is used, which corresponds to a non-linear
resistance with a V-I characteristic represented by several exponential segments.
For fast-front overvoltages (e.g. lightning), however, surge arresters present an inductive
behaviour. As a result, the maximum current peak instant does not correspond with the
maximum voltage peak instant across the surge arrester. For such cases, a high frequency
surge arrester model must be used. There are different high frequency models proposed in

Contribution to Insulation Coordination Studies for VSC-HVDC Systems Chapter 2: Tools and Electromagnetic Modelling
Nicolas Manduley 2020 Page 67
the literature, like the IEEE model (IEEE Working Group 3.4.11, 1992), Pinceti model (Pinceti
& Giannettoni, 1999), Fernandez model (Fernandez & Diaz, 2001), CIGRE model, among others
(Martinez-Velasco, 2010, 2015).
The IEEE model (Figure 2.2a) has shown to be accurate for crest times between 0.5 µs and 45
µs (Pinceti & Giannettoni, 1999). It is the most complete model to date as it takes into account
physical and electrical data for its implementation. However, it usually requires several
iterations to achieve a satisfactory set of values (Bayadi, 2008; Pinceti & Giannettoni, 1999),
and it is particularly difficult to implement when no physical data is available. The Pinceti
model is a variation of the IEEE model and it is depicted in (Figure 2.2b). It has proved to be
accurate within a wide range of crest times (from 1 µs to 30 µs) with a maximum error of
about 4.5% (Pinceti & Giannettoni, 1999). The main advantages of this model are that it only
requires electrical data to determine its parameters, and that it does not require additional
iterations to achieve the level of accuracy mentioned above.
For the above reasons, the Pinceti model will be the preferred surge arrester model for high
frequency studies in this research.
a) IEEE model
b) Pinceti model
Figure 2.2 a) IEEE model and b) Pinceti model of the surge arrester for high frequency studies
3.5 Modular Multi-level Converter (MMC)
Two architectures of the MMC are considered depending on the position of the arm reactor4,
which can be on the AC or the DC side. This is illustrated in Figure 2.3 for a symmetrical
monopole, including the star-point reactor which is the typical grounding scheme for this
architecture. In the case of a bipolar configuration, the star point reactor is removed and one
of the DC sides represented in the figure is solidly grounded, thus representing one half of the
bipole.
4 Also called bridge arm reactor, from which the notation VBR was chosen

Contribution to Insulation Coordination Studies for VSC-HVDC Systems Chapter 2: Tools and Electromagnetic Modelling
Nicolas Manduley 2020 Page 68
a)
b)
Figure 2.3 MMC architectures with the arm reactor a) on the AC side, and b) on the DC side (for a symmetrical monopole)
In all cases, the parameters used correspond to the native values of EMTP, which are
presented in Table 2.2. Only the blocking function has been modified to consider the current
measurements at each individual arm of the MMC and set the overcurrent protection to 2 p.u.
(instead of 6 p.u. at the DC bus, as in the native EMTP model).
Parameter Value
Rated power 1000 MVA
Primary AC voltage 400 kV (p-p rms)
Secondary AC voltage 320 kV (p-p rms)
DC pole to pole voltage 640 kV
Transformer reactance 0.18 p.u.
Arm reactor 0.15 p.u.
Capacitor energy 40 kJ/MVA (per submodule)
# of submodules per arm 400
Cable length 100 km (WB model)
Overcurrent protection 2 p.u.
MMC blocking delay 40 µs (EMTP native value)
AC breaker opening time 40 ms
Table 2.2 MMC model setup and parameters for EMTP simulations
For the EMTP model and the control functions, the model 3 has been used, which corresponds
to an average model of the MMC arm with an equivalent capacitor, assuming that the
capacitor voltages of each arm are balanced (Hani Saad et al., 2014), i.e. that the MMC is able
to control the charge-discharge cycles of the capacitors in such a way that they can be
considered to be constant. The equivalent capacitor is then calculated based on an equivalent
switching arm function depending on the number n of identical capacitors connected in series
at a given instant. When the IGBTs of the submodule are in the blocked state, the submodule
is represented by a half-bridge diode connected to the equivalent capacitor.
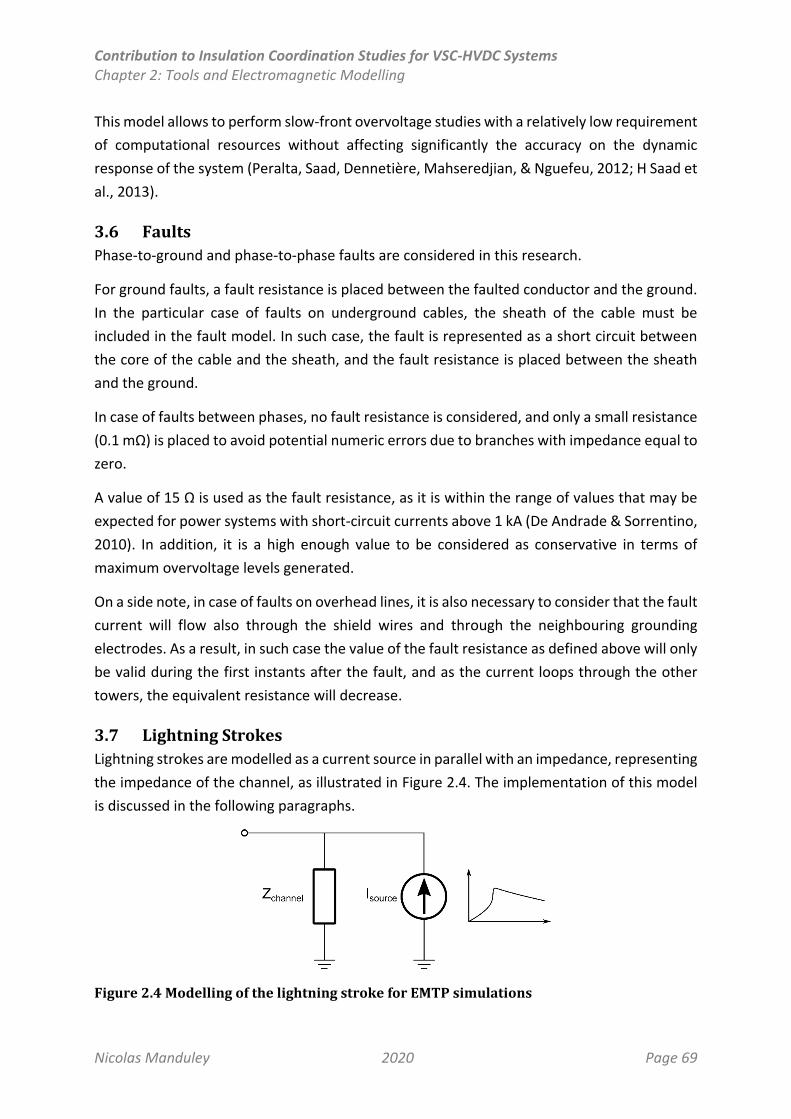
Contribution to Insulation Coordination Studies for VSC-HVDC Systems Chapter 2: Tools and Electromagnetic Modelling
Nicolas Manduley 2020 Page 69
This model allows to perform slow-front overvoltage studies with a relatively low requirement
of computational resources without affecting significantly the accuracy on the dynamic
response of the system (Peralta, Saad, Dennetière, Mahseredjian, & Nguefeu, 2012; H Saad et
al., 2013).
3.6 Faults
Phase-to-ground and phase-to-phase faults are considered in this research.
For ground faults, a fault resistance is placed between the faulted conductor and the ground.
In the particular case of faults on underground cables, the sheath of the cable must be
included in the fault model. In such case, the fault is represented as a short circuit between
the core of the cable and the sheath, and the fault resistance is placed between the sheath
and the ground.
In case of faults between phases, no fault resistance is considered, and only a small resistance
(0.1 mΩ) is placed to avoid potential numeric errors due to branches with impedance equal to
zero.
A value of 15 Ω is used as the fault resistance, as it is within the range of values that may be
expected for power systems with short-circuit currents above 1 kA (De Andrade & Sorrentino,
2010). In addition, it is a high enough value to be considered as conservative in terms of
maximum overvoltage levels generated.
On a side note, in case of faults on overhead lines, it is also necessary to consider that the fault
current will flow also through the shield wires and through the neighbouring grounding
electrodes. As a result, in such case the value of the fault resistance as defined above will only
be valid during the first instants after the fault, and as the current loops through the other
towers, the equivalent resistance will decrease.
3.7 Lightning Strokes
Lightning strokes are modelled as a current source in parallel with an impedance, representing
the impedance of the channel, as illustrated in Figure 2.4. The implementation of this model
is discussed in the following paragraphs.
Figure 2.4 Modelling of the lightning stroke for EMTP simulations
Contribution to Insulation Coordination Studies for VSC-HVDC Systems Chapter 2: Tools and Electromagnetic Modelling
Nicolas Manduley 2020 Page 70
3.7.1. Number of Strokes
Only first strokes are considered in EMTP simulations. This is justified by the following reasons:
In back-flashover studies, typically high current amplitudes are involved. For such
current levels, subsequent strokes tend to have a lower amplitude compared to the
first stroke, and thus may not contribute significantly to the flashover risk (CIGRE TB
63).
In the shielding failure domain (I ≤ 20 kA), sometimes the amplitude of a subsequent
stroke might be greater than that of the first stroke (CIGRE TB 63). The influence of
subsequent strokes in the flashover risk due to shielding failure is taken into account
in the analytical estimation of the SFFOR (see Chapter 1, §6.4.2 or CIGRE TB 704),
where no EMTP simulations are involved. EMTP simulations are reserved to the study
of the behaviour of the system when a shielding failure occurs, in which the influence
of subsequent strikes is neglected for simplicity.
In terms of energy absorption of the surge arresters, subsequent strokes are not
expected to contribute significantly, except maybe for shielding failures. However, as
it will be seen in Chapter 4, the energy absorption levels associated to shielding failures
are significantly lower than for the back-flashovers, in which case the current
amplitude of subsequent strokes tend to be much lower than for first strokes.
3.7.2. Lightning Waveshape and Parameters
Negative strokes are modelled using the CIGRE concave shape (Figure 1.16) with the
parameters obtained from the statistical analysis of the data gathered for negative strokes, as
discussed in Chapter 1. Concretely, the median values (M) of the maximum steepness (Sm) and
front time (tf) are used, and are calculated as a function of the peak current (IF) using the
derived statistics from Table 1.5.
In absence of comparable data for positive strokes, whenever positive lightning is considered,
it is assumed to have the same waveshape parameters from the data corresponding to
negative strokes. Although there are some known differences between positive and negative
strokes, this assumption allows to—qualitatively and quantitatively—investigate the effect of
the polarity of the lightning strike on the system and its lightning performance.
3.7.3. Characterization of the Lightning Channel Impedance
When the lightning channel is formed, a conductive path is formed between the cloud and the
ground. This means that an equivalent impedance is introduced to the system. Different
estimations and measurements (e.g. Wagner & Hileman, 1961; Gorin & Shkilev, 1984; Rakov,
Contribution to Insulation Coordination Studies for VSC-HVDC Systems Chapter 2: Tools and Electromagnetic Modelling
Nicolas Manduley 2020 Page 71
1998) have finally determined that the average resistance of the channel can range from
several hundred to a few kilo ohms5, as stated in CIGRE TB 549.
When the impedance of the structure on which lightning strikes is much smaller than the
resistance of the channel, the current source can be modelled as an ideal source (i.e. with an
infinite impedance) without introducing any significant error to the results. However, this is
not usually the case with overhead lines and towers, where the typical surge impedance values
vary from some to several hundred ohms, in which case the resistance of the channel must be
taken into account.
Simulation studies suggest that below 1 kΩ, both the BFOR and the SFFOR of overhead
transmission lines vary significantly with the value of the lightning channel impedance, while
for values above 1 kΩ both remain relatively constant (Datsios, Mikropoulos, & Tsovilis, 2019;
Grebovic & Oprasic, 2018). Since the main consequence of reducing the lightning channel
impedance is to reduce the equivalent current that is injected to the transmission line, this
reduction would result in less conservative results. Therefore, a value of 1 kΩ has been chosen
to conduct the studies in this research.
3.8 General Representation of Overhead Lines for Fast-Front Overvoltage Studies
The following considerations must be taken into account when performing fast-front
overvoltage studies in overhead lines.
For the region close to the stroke inception point, a line section of about 2000 m must be
accurately modelled (IEC 60071-4, 2004), including a detailed model of the towers, the spans
and equipment considered in the studies (e.g. insulators, air gaps, surge arresters…). This
means that if the impact point is considered to be in the middle of the line, a 4000 m line
section must be modelled. Far from the stroke inception point, the line can be terminated in
its equivalent surge impedance to avoid undesired reflections (see Figure 2.5).
To avoid such reflections, the line section under study is isolated from the termination points
by adding a long line section at each extremity (e.g. 50 km) with the same characteristics as
the spans between the towers. To initialize the system to the normal operating conditions
before the transient event, ideal voltage and current sources are installed at each extremity
after the long line section.
5 In fact, the resistance of the channel is a function of the current flowing through the channel. However, for most practical applications it is possible to represent it as a constant resistance, as explained and recommended in CIGRE Technical Brochure 549.
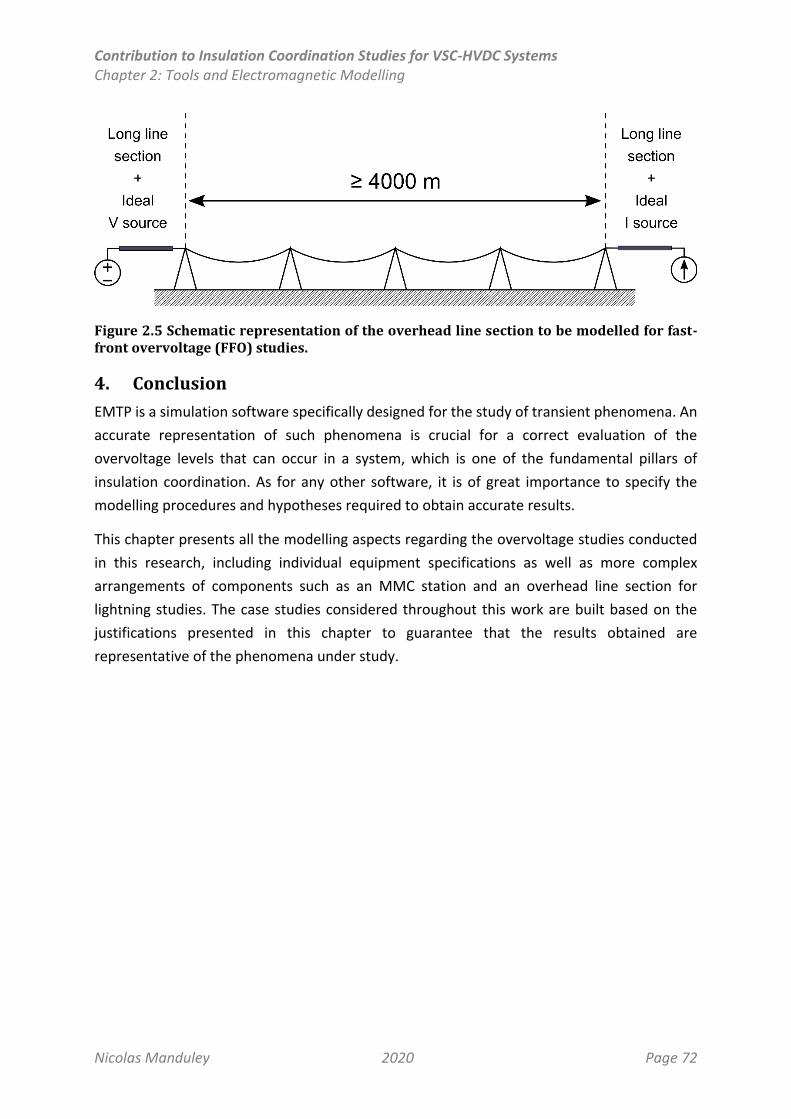
Contribution to Insulation Coordination Studies for VSC-HVDC Systems Chapter 2: Tools and Electromagnetic Modelling
Nicolas Manduley 2020 Page 72
Figure 2.5 Schematic representation of the overhead line section to be modelled for fast-front overvoltage (FFO) studies.
4. Conclusion
EMTP is a simulation software specifically designed for the study of transient phenomena. An
accurate representation of such phenomena is crucial for a correct evaluation of the
overvoltage levels that can occur in a system, which is one of the fundamental pillars of
insulation coordination. As for any other software, it is of great importance to specify the
modelling procedures and hypotheses required to obtain accurate results.
This chapter presents all the modelling aspects regarding the overvoltage studies conducted
in this research, including individual equipment specifications as well as more complex
arrangements of components such as an MMC station and an overhead line section for
lightning studies. The case studies considered throughout this work are built based on the
justifications presented in this chapter to guarantee that the results obtained are
representative of the phenomena under study.
Contribution to Insulation Coordination Studies for VSC-HVDC Systems Chapter 3: Slow-Front Overvoltages and Fault Analysis
Nicolas Manduley 2020 Page 73
Chapter 3 Protection of the MMC against Slow-Front and Temporary Overvoltages
1. Introduction
As discussed in previous chapters, there are some inherent differences between HVDC
technologies based on line commutated converters (LCC) and voltage source converters (VSC).
These differences concern mainly the commutation principle and the source type (see Chapter
1, §4.3.1), from which it is reasonable to expect that, even though the fundamental principles
of insulation coordination are the same, some of them may need to be adapted to VSC
technologies, especially regarding modular multilevel converters (MMC).
The main difficulties associated to the insulation coordination of MMC-HVDC stations is that
no current standard defines the procedures for insulation coordination of VSC-HVDC systems
and the scientific literature on the subject is very scarce—even at the CIGRE and IEEE. A
thorough study of the insulation coordination standards for AC and LCC-HVDC has been
necessary in order to determine how the fundamental principles should be adapted to VSC-
HVDC systems.
The main goals of this chapter are:
To provide a base on which the insulation coordination of MMC-HVDC stations can be
performed, inspired on the approach of AC and DC insulation coordination standards
and taking into account the differences and features of MMC converters.
To propose a methodology to perform temporary and slow-front overvoltage studies
in order to estimate the required withstand voltage of the different apparatuses.
To determine the location and the characteristics of the arresters, especially regarding
the energy duty.
As discussed in Chapter 1, some of the main aspects that differentiate VSC systems from LCC
regarding insulation coordination include: the architecture of the converter, the use of a wider
variety of station configurations (e.g. symmetric monopolar or bipolar configuration), the
location and design of the surge arresters, the transient behaviour and the overvoltage levels.
In this chapter, all of the aspects above mentioned are addressed in order to propose an
insulation coordination procedure adapted to the features and characteristics of MMC-HVDC
stations.
Such procedure is fundamentally based on performing EMT simulations for determining the
maximum overvoltage levels and analysing the behaviour of the system. The feasibility,
limitations and practical advantages and disadvantages of a qualitative approach independent
from the numerical analysis have been also considered and analysed, and are presented in
Contribution to Insulation Coordination Studies for VSC-HVDC Systems Chapter 3: Slow-Front Overvoltages and Fault Analysis
Nicolas Manduley 2020 Page 74
detail in Appendix D. As a result of such analysis, it was determined that there are major
fundamental limitations on such kind of approach which make it difficult to perform the
insulation coordination without performing numerical simulations. This provides solid
justification to the fact that the insulation coordination procedures proposed in this chapter
are based on the assumption that electromagnetic transient simulations are performed.
As a result of the research presented on this chapter, and inspired on the approach of LCC-
HVDC insulation coordination standard (IEC 60071-5), two fundamental schemes are
proposed in order to be able to take into account any possible architecture, station
configuration and surge arrester locations. Hence, such schemes constitute the base for the
case studies presented in this chapter, as well as for the proposed procedures for the
insulation coordination of MMC-HVDC systems.
This chapter is structured as follows. First, the fundamental schemes proposed are presented
and explained. Next, the voltage shapes and sources of MMC-HVDC systems under normal
and transient conditions are discussed. Then, the overvoltage analysis of MMC-HVDC stations
performed in EMTP is presented for different configurations and architectures. The influence
of the surge arrester arrangement—as well as their respective interactions—on the behaviour
and overvoltage profile of the system under transient conditions is also investigated. After
presenting and discussing the results of the studies, recommendations are provided with
respect to the particular procedures that shall be followed for the insulation coordination of
MMC-HVDC systems, as well as for the characteristics of the different arresters that may be
considered for the overvoltage protection strategy of any such system.
2. Fundamental Schemes
As already mentioned in Chapter 1, MMC-HVDC stations can have two main architectures
based on the location of the arm reactor. For a clearer definition of the principles developed
in this chapter, and inspired on the approach of the IEC 60071-5 standard, a fundamental
scheme has been proposed for each architecture. Such architectures correspond to a
configuration with the arm reactor on the AC or DC side of the converter, and are illustrated
in Figure 3.1 and Figure 3.2, respectively.
Each figure features the different equipment present in the station: the converter
transformer, the arm reactors (BR), the MMC submodules (SM), the transmission line (cable,
overhead line or hybrid), possible grounding schemes (star-point reactor on the AC side of the
converter or through an impedance on the DC side) and the different surge arresters that may
be present at each location. The meaning, as well as the design recommendations for each of
such arresters, will be discussed in detail in §5.2.

Contribution to Insulation Coordination Studies for VSC-HVDC Systems Chapter 3: Slow-Front Overvoltages and Fault Analysis
Nicolas Manduley 2020 Page 75
Figure 3.1 Fundamental scheme of an MMC-HVDC station including all the basic components and possible locations for the surge arresters for a station architecture with the arm reactor on the AC side. The green arrows indicate the voltage convention of the longitudinal elements.
Figure 3.2 Fundamental scheme of an MMC-HVDC station including all the basic components and possible locations for the surge arresters for a station architecture with the arm reactor on the DC side. The green arrows indicate the voltage convention of the longitudinal elements.
Each fundamental scheme is conceived so that the general procedures of insulation
coordination can be described based on them and be applicable to any possible topology
derived from such schemes. For instance, the switchgear displayed in the figures allow the
configuration of the station as a symmetrical monopole by connecting the lower bus of the
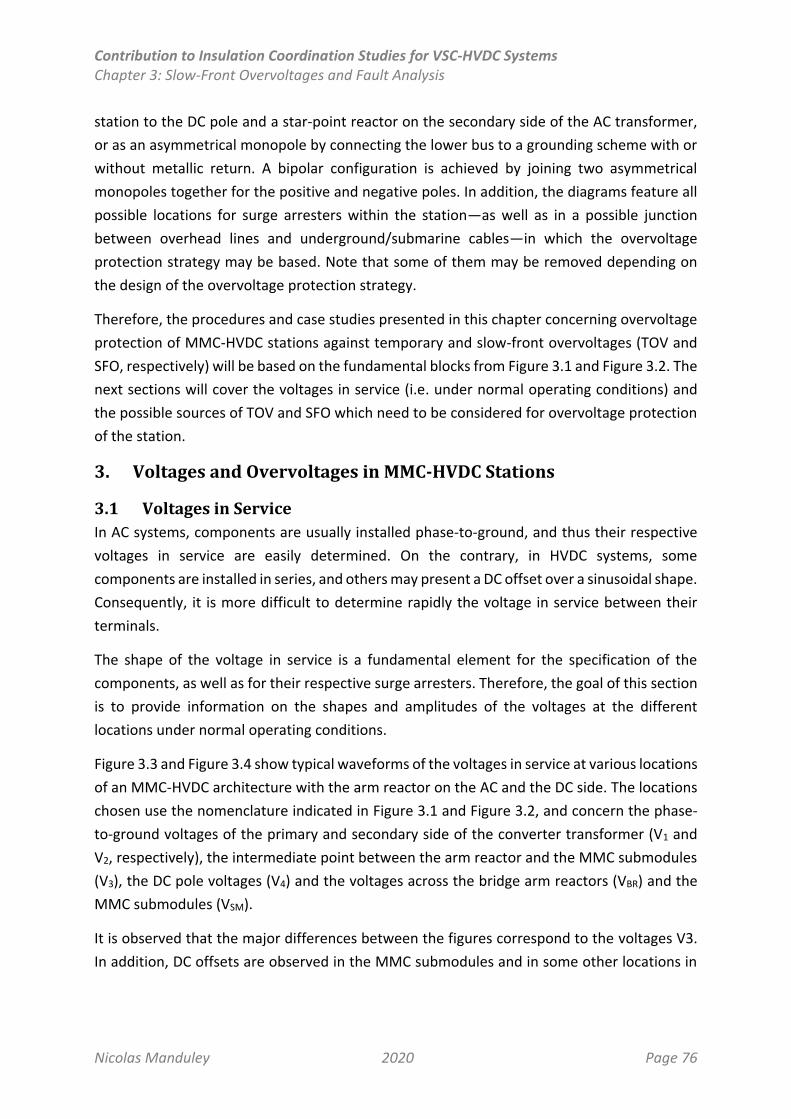
Contribution to Insulation Coordination Studies for VSC-HVDC Systems Chapter 3: Slow-Front Overvoltages and Fault Analysis
Nicolas Manduley 2020 Page 76
station to the DC pole and a star-point reactor on the secondary side of the AC transformer,
or as an asymmetrical monopole by connecting the lower bus to a grounding scheme with or
without metallic return. A bipolar configuration is achieved by joining two asymmetrical
monopoles together for the positive and negative poles. In addition, the diagrams feature all
possible locations for surge arresters within the station—as well as in a possible junction
between overhead lines and underground/submarine cables—in which the overvoltage
protection strategy may be based. Note that some of them may be removed depending on
the design of the overvoltage protection strategy.
Therefore, the procedures and case studies presented in this chapter concerning overvoltage
protection of MMC-HVDC stations against temporary and slow-front overvoltages (TOV and
SFO, respectively) will be based on the fundamental blocks from Figure 3.1 and Figure 3.2. The
next sections will cover the voltages in service (i.e. under normal operating conditions) and
the possible sources of TOV and SFO which need to be considered for overvoltage protection
of the station.
3. Voltages and Overvoltages in MMC-HVDC Stations
3.1 Voltages in Service
In AC systems, components are usually installed phase-to-ground, and thus their respective
voltages in service are easily determined. On the contrary, in HVDC systems, some
components are installed in series, and others may present a DC offset over a sinusoidal shape.
Consequently, it is more difficult to determine rapidly the voltage in service between their
terminals.
The shape of the voltage in service is a fundamental element for the specification of the
components, as well as for their respective surge arresters. Therefore, the goal of this section
is to provide information on the shapes and amplitudes of the voltages at the different
locations under normal operating conditions.
Figure 3.3 and Figure 3.4 show typical waveforms of the voltages in service at various locations
of an MMC-HVDC architecture with the arm reactor on the AC and the DC side. The locations
chosen use the nomenclature indicated in Figure 3.1 and Figure 3.2, and concern the phase-
to-ground voltages of the primary and secondary side of the converter transformer (V1 and
V2, respectively), the intermediate point between the arm reactor and the MMC submodules
(V3), the DC pole voltages (V4) and the voltages across the bridge arm reactors (VBR) and the
MMC submodules (VSM).
It is observed that the major differences between the figures correspond to the voltages V3.
In addition, DC offsets are observed in the MMC submodules and in some other locations in
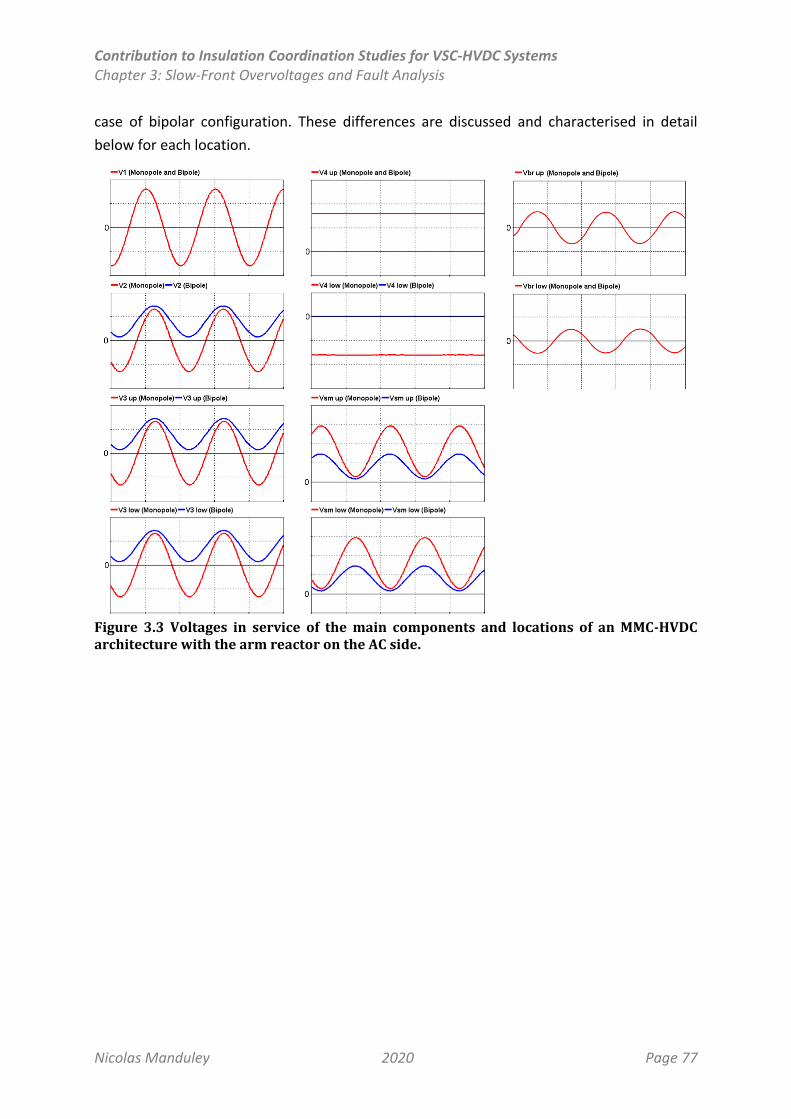
Contribution to Insulation Coordination Studies for VSC-HVDC Systems Chapter 3: Slow-Front Overvoltages and Fault Analysis
Nicolas Manduley 2020 Page 77
case of bipolar configuration. These differences are discussed and characterised in detail
below for each location.
Figure 3.3 Voltages in service of the main components and locations of an MMC-HVDC architecture with the arm reactor on the AC side.
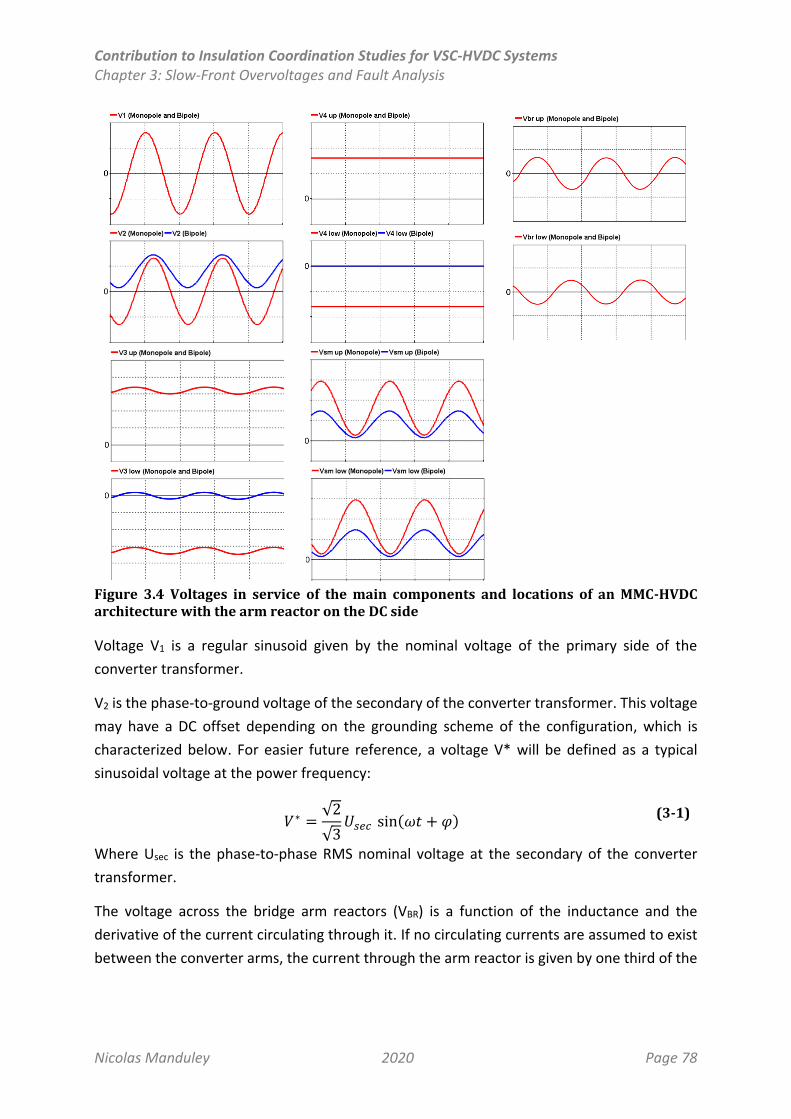
Contribution to Insulation Coordination Studies for VSC-HVDC Systems Chapter 3: Slow-Front Overvoltages and Fault Analysis
Nicolas Manduley 2020 Page 78
Figure 3.4 Voltages in service of the main components and locations of an MMC-HVDC architecture with the arm reactor on the DC side
Voltage V1 is a regular sinusoid given by the nominal voltage of the primary side of the
converter transformer.
V2 is the phase-to-ground voltage of the secondary of the converter transformer. This voltage
may have a DC offset depending on the grounding scheme of the configuration, which is
characterized below. For easier future reference, a voltage V* will be defined as a typical
sinusoidal voltage at the power frequency:
𝑉∗ =√2
√3𝑈𝑠𝑒𝑐 sin(𝜔𝑡 + 𝜑)
(3-1)
Where Usec is the phase-to-phase RMS nominal voltage at the secondary of the converter
transformer.
The voltage across the bridge arm reactors (VBR) is a function of the inductance and the
derivative of the current circulating through it. If no circulating currents are assumed to exist
between the converter arms, the current through the arm reactor is given by one third of the
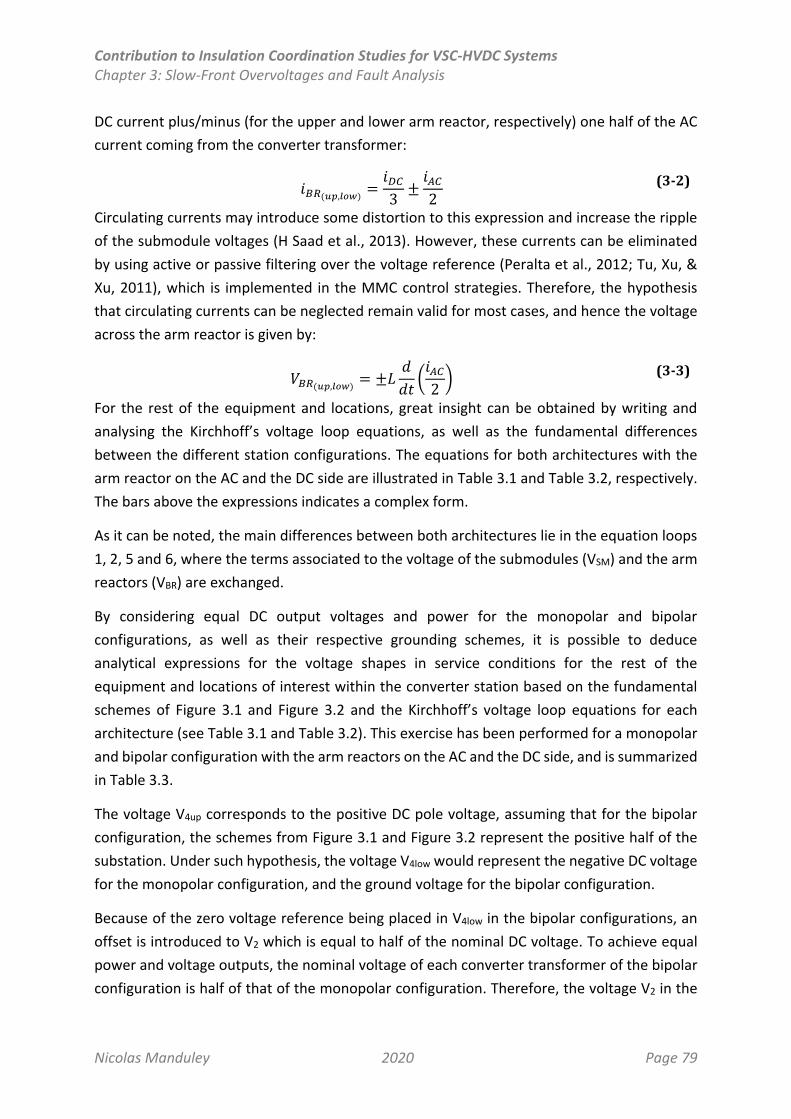
Contribution to Insulation Coordination Studies for VSC-HVDC Systems Chapter 3: Slow-Front Overvoltages and Fault Analysis
Nicolas Manduley 2020 Page 79
DC current plus/minus (for the upper and lower arm reactor, respectively) one half of the AC
current coming from the converter transformer:
𝑖𝐵𝑅(𝑢𝑝,𝑙𝑜𝑤) =𝑖𝐷𝐶3±𝑖𝐴𝐶2
(3-2)
Circulating currents may introduce some distortion to this expression and increase the ripple
of the submodule voltages (H Saad et al., 2013). However, these currents can be eliminated
by using active or passive filtering over the voltage reference (Peralta et al., 2012; Tu, Xu, &
Xu, 2011), which is implemented in the MMC control strategies. Therefore, the hypothesis
that circulating currents can be neglected remain valid for most cases, and hence the voltage
across the arm reactor is given by:
𝑉𝐵𝑅(𝑢𝑝,𝑙𝑜𝑤) = ±𝐿𝑑
𝑑𝑡(𝑖𝐴𝐶2)
(3-3)
For the rest of the equipment and locations, great insight can be obtained by writing and
analysing the Kirchhoff’s voltage loop equations, as well as the fundamental differences
between the different station configurations. The equations for both architectures with the
arm reactor on the AC and the DC side are illustrated in Table 3.1 and Table 3.2, respectively.
The bars above the expressions indicates a complex form.
As it can be noted, the main differences between both architectures lie in the equation loops
1, 2, 5 and 6, where the terms associated to the voltage of the submodules (VSM) and the arm
reactors (VBR) are exchanged.
By considering equal DC output voltages and power for the monopolar and bipolar
configurations, as well as their respective grounding schemes, it is possible to deduce
analytical expressions for the voltage shapes in service conditions for the rest of the
equipment and locations of interest within the converter station based on the fundamental
schemes of Figure 3.1 and Figure 3.2 and the Kirchhoff’s voltage loop equations for each
architecture (see Table 3.1 and Table 3.2). This exercise has been performed for a monopolar
and bipolar configuration with the arm reactors on the AC and the DC side, and is summarized
in Table 3.3.
The voltage V4up corresponds to the positive DC pole voltage, assuming that for the bipolar
configuration, the schemes from Figure 3.1 and Figure 3.2 represent the positive half of the
substation. Under such hypothesis, the voltage V4low would represent the negative DC voltage
for the monopolar configuration, and the ground voltage for the bipolar configuration.
Because of the zero voltage reference being placed in V4low in the bipolar configurations, an
offset is introduced to V2 which is equal to half of the nominal DC voltage. To achieve equal
power and voltage outputs, the nominal voltage of each converter transformer of the bipolar
configuration is half of that of the monopolar configuration. Therefore, the voltage V2 in the

Contribution to Insulation Coordination Studies for VSC-HVDC Systems Chapter 3: Slow-Front Overvoltages and Fault Analysis
Nicolas Manduley 2020 Page 80
bipolar configuration is expressed as half of the sum of the DC voltage (V4up) and the regular
sinusoid used for the monopolar configuration (V*), as also illustrated in Figure 3.3 and Figure
3.4.
Voltages V3 differ significantly depending on the position of the arm reactor and the
configuration of the station. When the arm reactor is on the AC side, V3 has the same shape
as V2 with only a small variation introduced by the voltage of the corresponding arm reactor
(loop equations 1 and 2 in Table 3.1). When the arm reactor is on the DC side, V3 resembles
V4, which is a DC voltage, with a superposed AC wave equal to the voltage of the corresponding
arm reactor (loop equations 5 and 6 in Table 3.2). Furthermore, in the bipolar configuration,
V3low presents a particularly low voltage level because the voltage V4low corresponds to the
zero voltage reference. All the above conclusions are also illustrated in Figure 3.3 and Figure
3.4.
Loop Equation
1 𝑉2 − 𝑉𝐵𝑅𝑢𝑝 − 𝑉3𝑢𝑝 = 0
2 𝑉2 + 𝑉𝐵𝑅𝑙𝑜𝑤 − 𝑉3𝑙𝑜𝑤 = 0
3 𝑉2 + 𝑉𝑆𝑀𝑢𝑝 − 𝑉𝐵𝑅𝑢𝑝 − 𝑉4𝑢𝑝 = 0
4 𝑉2 − 𝑉𝑆𝑀𝑙𝑜𝑤 + 𝑉𝐵𝑅𝑙𝑜𝑤 − 𝑉4𝑙𝑜𝑤 = 0
5 𝑉3𝑢𝑝 + 𝑉𝑆𝑀𝑢𝑝 − 𝑉4𝑢𝑝 = 0
6 𝑉3𝑙𝑜𝑤 − 𝑉𝑆𝑀𝑙𝑜𝑤 − 𝑉4𝑙𝑜𝑤 = 0
7 𝑉4𝑢𝑝 − 𝑉4𝑙𝑜𝑤 + 𝑉𝐵𝑅𝑢𝑝 + 𝑉𝐵𝑅𝑙𝑜𝑤 − 𝑉𝑆𝑀𝑢𝑝 − 𝑉𝑆𝑀𝑙𝑜𝑤 = 0
Table 3.1 Kirchhoff’s voltage equations from the fundamental MMC-HVDC scheme with the arm reactor on the AC side
Loop Equation
1 𝑉2 + 𝑉𝑆𝑀𝑢𝑝 − 𝑉3𝑢𝑝 = 0
2 𝑉2 − 𝑉𝑆𝑀𝑙𝑜𝑤 − 𝑉3𝑙𝑜𝑤 = 0
3 𝑉2 + 𝑉𝑆𝑀𝑢𝑝 − 𝑉𝐵𝑅𝑢𝑝 − 𝑉4𝑢𝑝 = 0
4 𝑉2 − 𝑉𝑆𝑀𝑙𝑜𝑤 + 𝑉𝐵𝑅𝑙𝑜𝑤 − 𝑉4𝑙𝑜𝑤 = 0
5 𝑉3𝑢𝑝 − 𝑉𝐵𝑅𝑢𝑝 − 𝑉4𝑢𝑝 = 0
6 𝑉3𝑙𝑜𝑤 + 𝑉𝐵𝑅𝑙𝑜𝑤 − 𝑉4𝑙𝑜𝑤 = 0
7 𝑉4𝑢𝑝 − 𝑉4𝑙𝑜𝑤 + 𝑉𝐵𝑅𝑢𝑝 + 𝑉𝐵𝑅𝑙𝑜𝑤 − 𝑉𝑆𝑀𝑢𝑝 − 𝑉𝑆𝑀𝑙𝑜𝑤 = 0
Table 3.2 Kirchhoff’s voltage equations from the fundamental MMC-HVDC scheme with the arm reactor on the DC side
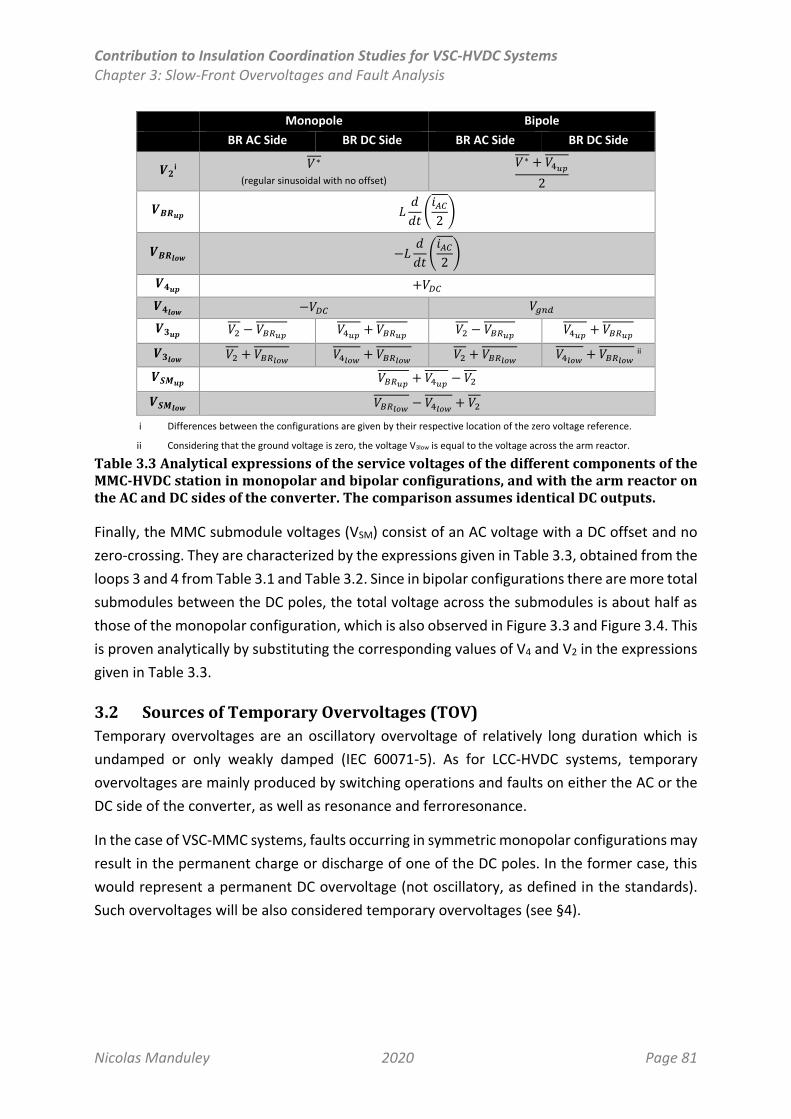
Contribution to Insulation Coordination Studies for VSC-HVDC Systems Chapter 3: Slow-Front Overvoltages and Fault Analysis
Nicolas Manduley 2020 Page 81
Monopole Bipole
BR AC Side BR DC Side BR AC Side BR DC Side
𝑽𝟐i 𝑉∗
(regular sinusoidal with no offset)
𝑉∗ + 𝑉4𝑢𝑝2
𝑽𝑩𝑹𝒖𝒑 𝐿𝑑
𝑑𝑡(𝑖𝐴𝐶2)
𝑽𝑩𝑹𝒍𝒐𝒘 −𝐿𝑑
𝑑𝑡(𝑖𝐴𝐶2)
𝑽𝟒𝒖𝒑 +𝑉𝐷𝐶
𝑽𝟒𝒍𝒐𝒘 −𝑉𝐷𝐶 𝑉𝑔𝑛𝑑
𝑽𝟑𝒖𝒑 𝑉2 − 𝑉𝐵𝑅𝑢𝑝 𝑉4𝑢𝑝 + 𝑉𝐵𝑅𝑢𝑝 𝑉2 − 𝑉𝐵𝑅𝑢𝑝 𝑉4𝑢𝑝 + 𝑉𝐵𝑅𝑢𝑝
𝑽𝟑𝒍𝒐𝒘 𝑉2 + 𝑉𝐵𝑅𝑙𝑜𝑤 𝑉4𝑙𝑜𝑤 + 𝑉𝐵𝑅𝑙𝑜𝑤 𝑉2 + 𝑉𝐵𝑅𝑙𝑜𝑤 𝑉4𝑙𝑜𝑤 + 𝑉𝐵𝑅𝑙𝑜𝑤 ii
𝑽𝑺𝑴𝒖𝒑 𝑉𝐵𝑅𝑢𝑝 + 𝑉4𝑢𝑝 − 𝑉2
𝑽𝑺𝑴𝒍𝒐𝒘 𝑉𝐵𝑅𝑙𝑜𝑤 − 𝑉4𝑙𝑜𝑤 + 𝑉2
i Differences between the configurations are given by their respective location of the zero voltage reference.
ii Considering that the ground voltage is zero, the voltage V3low is equal to the voltage across the arm reactor.
Table 3.3 Analytical expressions of the service voltages of the different components of the MMC-HVDC station in monopolar and bipolar configurations, and with the arm reactor on the AC and DC sides of the converter. The comparison assumes identical DC outputs.
Finally, the MMC submodule voltages (VSM) consist of an AC voltage with a DC offset and no
zero-crossing. They are characterized by the expressions given in Table 3.3, obtained from the
loops 3 and 4 from Table 3.1 and Table 3.2. Since in bipolar configurations there are more total
submodules between the DC poles, the total voltage across the submodules is about half as
those of the monopolar configuration, which is also observed in Figure 3.3 and Figure 3.4. This
is proven analytically by substituting the corresponding values of V4 and V2 in the expressions
given in Table 3.3.
3.2 Sources of Temporary Overvoltages (TOV)
Temporary overvoltages are an oscillatory overvoltage of relatively long duration which is
undamped or only weakly damped (IEC 60071-5). As for LCC-HVDC systems, temporary
overvoltages are mainly produced by switching operations and faults on either the AC or the
DC side of the converter, as well as resonance and ferroresonance.
In the case of VSC-MMC systems, faults occurring in symmetric monopolar configurations may
result in the permanent charge or discharge of one of the DC poles. In the former case, this
would represent a permanent DC overvoltage (not oscillatory, as defined in the standards).
Such overvoltages will be also considered temporary overvoltages (see §4).
Contribution to Insulation Coordination Studies for VSC-HVDC Systems Chapter 3: Slow-Front Overvoltages and Fault Analysis
Nicolas Manduley 2020 Page 82
Because of their long duration6, temporary overvoltages may be decisive in setting the rated
voltage of surge arresters installed for the overvoltage protection strategy, especially in the
case of permanent DC overvoltages.
3.2.1. On the AC side
Usually switching operations or faults are at the origin of the highest TOVs on the AC side.
Some faults on the DC side may introduce an offset on the AC side of the converter, thus
producing oscillations at—or close to—the power frequency of the system that can last until
the blocking of the MMC or the opening of the AC or DC breakers.
Asymmetric faults on the AC side (e.g. single phase-to-ground fault) may also result in
significant TOV levels on the AC side of the converter.
As in LCC-HVDC systems, the presence of filters may also contribute to the appearance of long
duration oscillations. However, as explained in Chapter 1, the harmonic distortion of MMC
converters is negligible, for which it is less common to install harmonic filters in MMC-HVDC
stations.
3.2.2. On the DC side
Ground faults on the DC side may cause an excessive charge of the healthy pole, particularly
in systems with underground or submarine cables due to the fault current being able to loop
through the sheaths of the cables, to the ground and to the opposite pole (when a high-
impedance grounding scheme is used at the station, as in symmetric monopolar
configurations).
Asymmetric faults on the AC side, as well as internal converter faults to the ground, may also
result in long duration overvoltages on the DC side or inside the converter station. This is
mainly due to the fault current flowing to the ground and reaching one of the DC poles through
its respective sheath, as in the case described above.
As a consequence of the blocking of the MMC submodules, the converter station behaves as
an uncontrolled diode rectifier. In such case, a power-frequency oscillation may be applied
inside the converter and transmitted to the DC poles, lasting until the opening of the AC
breaker.
6 Typically longer than one power frequency period, and up to one hour (3600 s)
Contribution to Insulation Coordination Studies for VSC-HVDC Systems Chapter 3: Slow-Front Overvoltages and Fault Analysis
Nicolas Manduley 2020 Page 83
3.3 Sources of Slow-Front Overvoltages (SFO)
Slow-front overvoltages are voltage impulses with a time to front in the order of 20 – 5000 µs
(IEC 60071). These overvoltages typically represent the highest overvoltage levels obtained in
a system due to switching operations and the initiation or clearing of faults.
3.3.1. On the AC side
Asymmetric faults on the AC network may produce SFOs and TOVs on the healthy phases of
the AC side.
Due to the architecture of MMC stations, internal converter faults or DC faults may also
transmit significant voltage impulses to the AC side (in addition to the TOVs discussed in
§3.2.1).
Both symmetric and asymmetric faults could result in transformer saturation, which may have
an influence on the overvoltage levels depending on the fault instant and clearance.
3.3.2. On the DC side
Most slow-front overvoltages on the DC side are produced by faults on the DC side or inside
the converter station (CIGRE TB 388, 2009; Neumann et al., 2016). However, significant SFOs
can also appear due to asymmetric faults on the AC side of the converter station.
3.4 Overvoltage Limitation with Arresters
The overvoltage protection strategy consists of an arrangement of surge arresters placed at
different locations to ensure that the maximum overvoltage levels are below the insulation
withstand voltage of the equipment, as illustrated in Figure 3.1 and Figure 3.2.
The arresters featured in Figure 3.1 and Figure 3.2 represent all the locations and equipment
that may require to be directly protected by a surge arrester. They have been placed such that
it is always possible to design a surge arrester arrangement that respect the three
fundamental principles for the overvoltage protection of HVDC systems (see Chapter 1,
§4.2.1):
Overvoltages generated on the AC side should be limited by arresters on the AC side.
Overvoltages generated on the DC side or earth electrode should be limited by
arresters on the DC side.
Critical equipment should be directly protected by arresters connected close to the
components.
The effect of the particular arrangement of surge arresters—as well as their interactions
during a transient event—on the overvoltage profile of a system is analysed in detail in §4.4,
and guidelines for the design of each of the arresters in Figure 3.1 and Figure 3.2 are given in
§5.2.
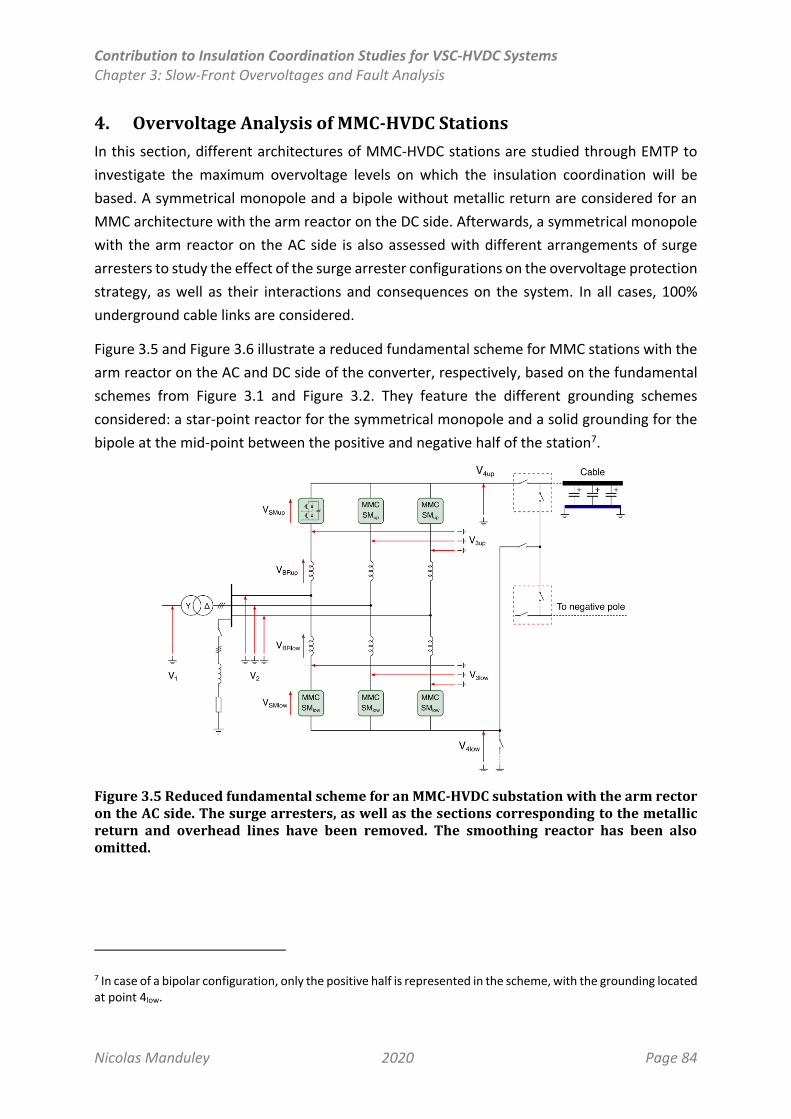
Contribution to Insulation Coordination Studies for VSC-HVDC Systems Chapter 3: Slow-Front Overvoltages and Fault Analysis
Nicolas Manduley 2020 Page 84
4. Overvoltage Analysis of MMC-HVDC Stations
In this section, different architectures of MMC-HVDC stations are studied through EMTP to
investigate the maximum overvoltage levels on which the insulation coordination will be
based. A symmetrical monopole and a bipole without metallic return are considered for an
MMC architecture with the arm reactor on the DC side. Afterwards, a symmetrical monopole
with the arm reactor on the AC side is also assessed with different arrangements of surge
arresters to study the effect of the surge arrester configurations on the overvoltage protection
strategy, as well as their interactions and consequences on the system. In all cases, 100%
underground cable links are considered.
Figure 3.5 and Figure 3.6 illustrate a reduced fundamental scheme for MMC stations with the
arm reactor on the AC and DC side of the converter, respectively, based on the fundamental
schemes from Figure 3.1 and Figure 3.2. They feature the different grounding schemes
considered: a star-point reactor for the symmetrical monopole and a solid grounding for the
bipole at the mid-point between the positive and negative half of the station7.
Figure 3.5 Reduced fundamental scheme for an MMC-HVDC substation with the arm rector on the AC side. The surge arresters, as well as the sections corresponding to the metallic return and overhead lines have been removed. The smoothing reactor has been also omitted.
7 In case of a bipolar configuration, only the positive half is represented in the scheme, with the grounding located at point 4low.
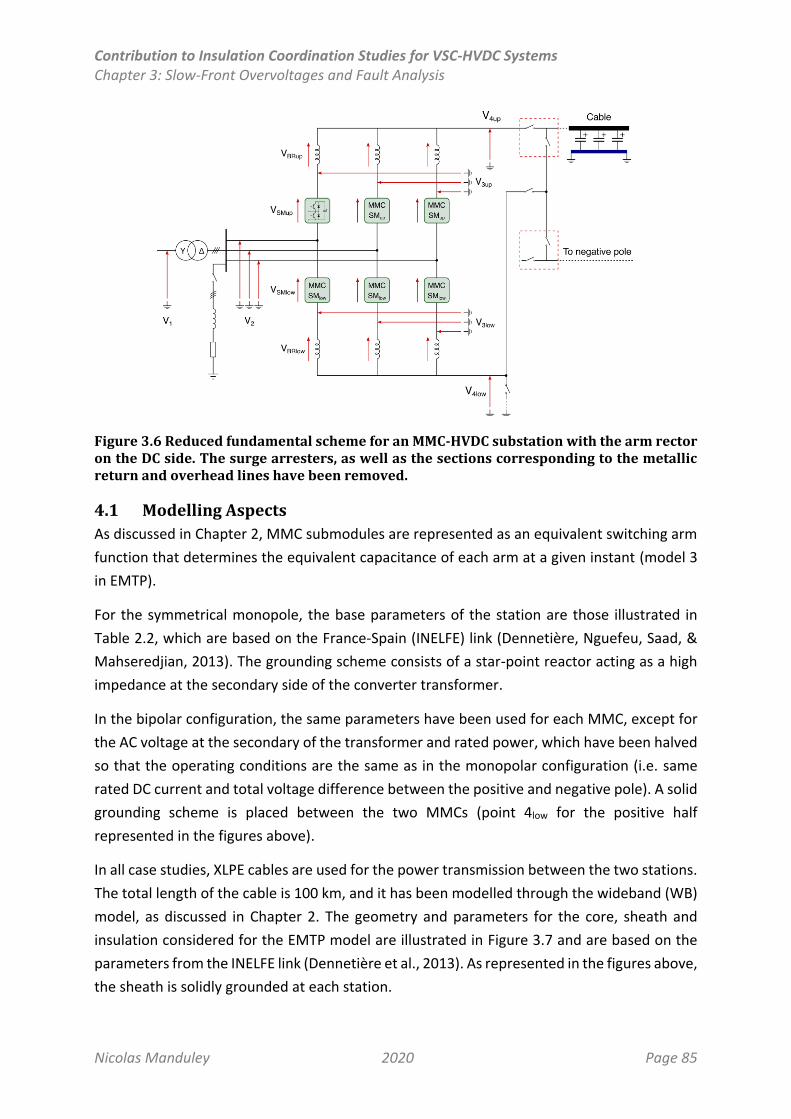
Contribution to Insulation Coordination Studies for VSC-HVDC Systems Chapter 3: Slow-Front Overvoltages and Fault Analysis
Nicolas Manduley 2020 Page 85
Figure 3.6 Reduced fundamental scheme for an MMC-HVDC substation with the arm rector on the DC side. The surge arresters, as well as the sections corresponding to the metallic return and overhead lines have been removed.
4.1 Modelling Aspects
As discussed in Chapter 2, MMC submodules are represented as an equivalent switching arm
function that determines the equivalent capacitance of each arm at a given instant (model 3
in EMTP).
For the symmetrical monopole, the base parameters of the station are those illustrated in
Table 2.2, which are based on the France-Spain (INELFE) link (Dennetière, Nguefeu, Saad, &
Mahseredjian, 2013). The grounding scheme consists of a star-point reactor acting as a high
impedance at the secondary side of the converter transformer.
In the bipolar configuration, the same parameters have been used for each MMC, except for
the AC voltage at the secondary of the transformer and rated power, which have been halved
so that the operating conditions are the same as in the monopolar configuration (i.e. same
rated DC current and total voltage difference between the positive and negative pole). A solid
grounding scheme is placed between the two MMCs (point 4low for the positive half
represented in the figures above).
In all case studies, XLPE cables are used for the power transmission between the two stations.
The total length of the cable is 100 km, and it has been modelled through the wideband (WB)
model, as discussed in Chapter 2. The geometry and parameters for the core, sheath and
insulation considered for the EMTP model are illustrated in Figure 3.7 and are based on the
parameters from the INELFE link (Dennetière et al., 2013). As represented in the figures above,
the sheath is solidly grounded at each station.
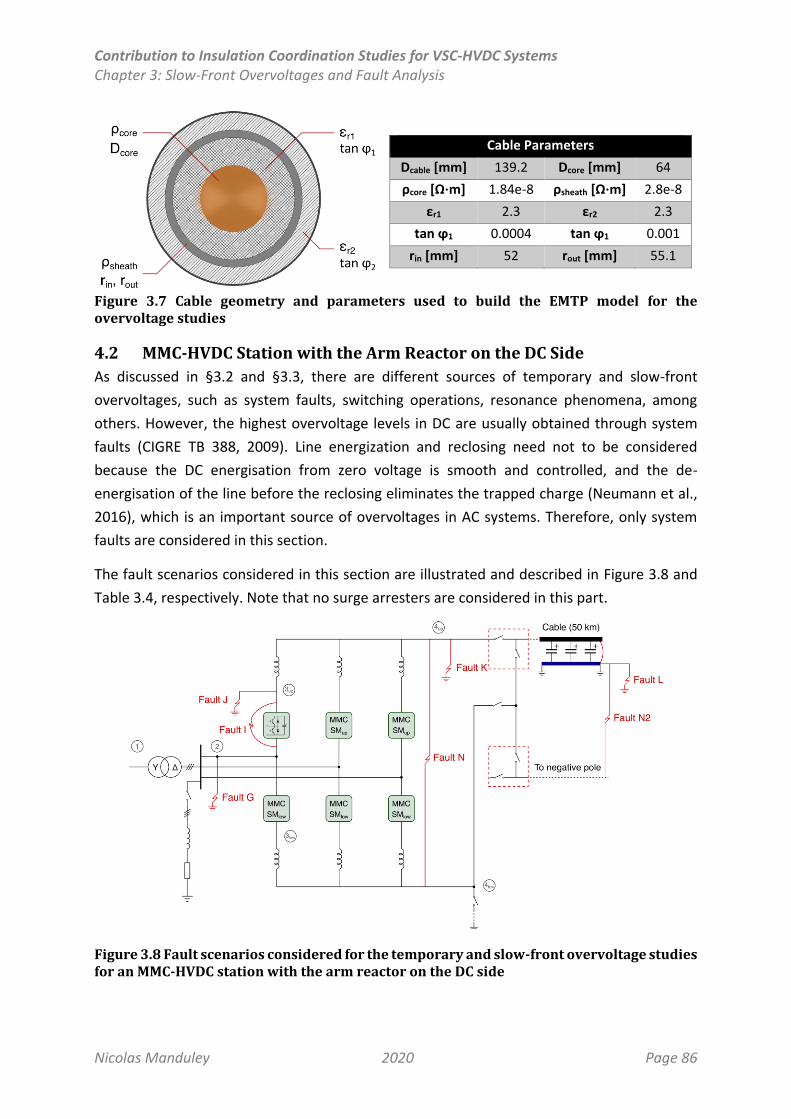
Contribution to Insulation Coordination Studies for VSC-HVDC Systems Chapter 3: Slow-Front Overvoltages and Fault Analysis
Nicolas Manduley 2020 Page 86
Cable Parameters
Dcable [mm] 139.2 Dcore [mm] 64
ρcore [Ω⋅m] 1.84e-8 ρsheath [Ω⋅m] 2.8e-8
εr1 2.3 εr2 2.3
tan ϕ1 0.0004 tan ϕ1 0.001
rin [mm] 52 rout [mm] 55.1
Figure 3.7 Cable geometry and parameters used to build the EMTP model for the overvoltage studies
4.2 MMC-HVDC Station with the Arm Reactor on the DC Side
As discussed in §3.2 and §3.3, there are different sources of temporary and slow-front
overvoltages, such as system faults, switching operations, resonance phenomena, among
others. However, the highest overvoltage levels in DC are usually obtained through system
faults (CIGRE TB 388, 2009). Line energization and reclosing need not to be considered
because the DC energisation from zero voltage is smooth and controlled, and the de-
energisation of the line before the reclosing eliminates the trapped charge (Neumann et al.,
2016), which is an important source of overvoltages in AC systems. Therefore, only system
faults are considered in this section.
The fault scenarios considered in this section are illustrated and described in Figure 3.8 and
Table 3.4, respectively. Note that no surge arresters are considered in this part.
Figure 3.8 Fault scenarios considered for the temporary and slow-front overvoltage studies for an MMC-HVDC station with the arm reactor on the DC side
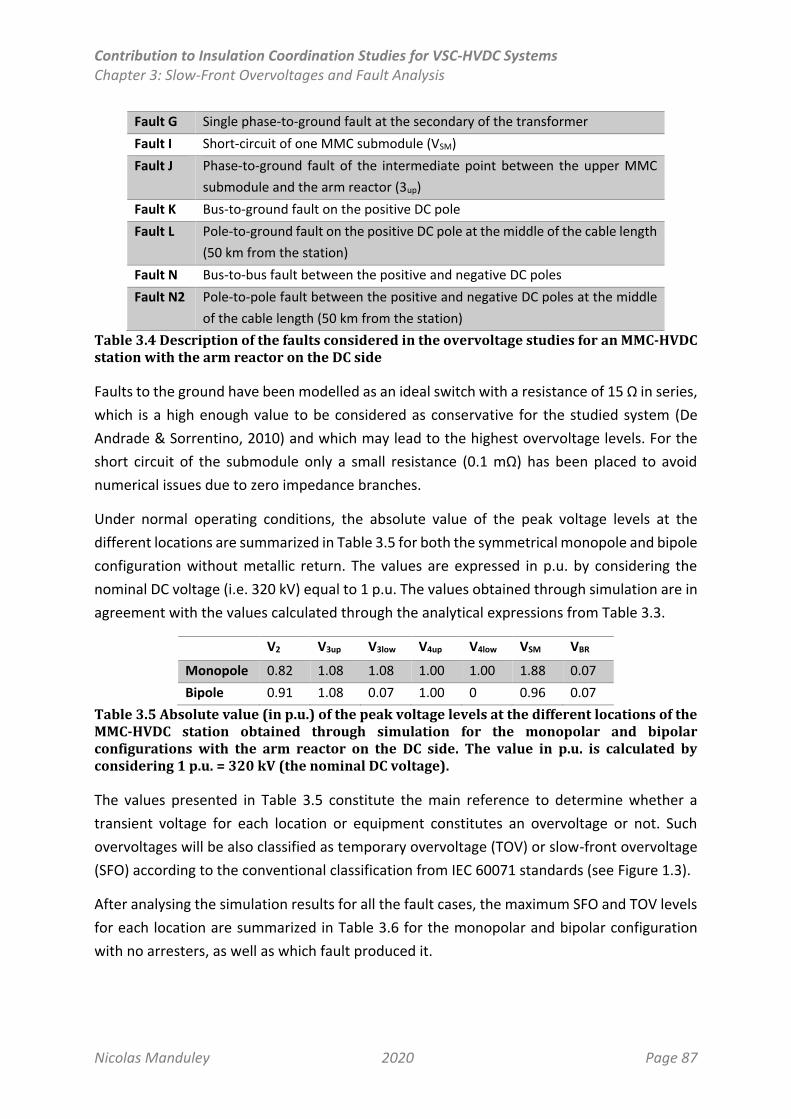
Contribution to Insulation Coordination Studies for VSC-HVDC Systems Chapter 3: Slow-Front Overvoltages and Fault Analysis
Nicolas Manduley 2020 Page 87
Fault G Single phase-to-ground fault at the secondary of the transformer
Fault I Short-circuit of one MMC submodule (VSM)
Fault J Phase-to-ground fault of the intermediate point between the upper MMC
submodule and the arm reactor (3up)
Fault K Bus-to-ground fault on the positive DC pole
Fault L Pole-to-ground fault on the positive DC pole at the middle of the cable length
(50 km from the station)
Fault N Bus-to-bus fault between the positive and negative DC poles
Fault N2 Pole-to-pole fault between the positive and negative DC poles at the middle
of the cable length (50 km from the station)
Table 3.4 Description of the faults considered in the overvoltage studies for an MMC-HVDC station with the arm reactor on the DC side
Faults to the ground have been modelled as an ideal switch with a resistance of 15 Ω in series,
which is a high enough value to be considered as conservative for the studied system (De
Andrade & Sorrentino, 2010) and which may lead to the highest overvoltage levels. For the
short circuit of the submodule only a small resistance (0.1 mΩ) has been placed to avoid
numerical issues due to zero impedance branches.
Under normal operating conditions, the absolute value of the peak voltage levels at the
different locations are summarized in Table 3.5 for both the symmetrical monopole and bipole
configuration without metallic return. The values are expressed in p.u. by considering the
nominal DC voltage (i.e. 320 kV) equal to 1 p.u. The values obtained through simulation are in
agreement with the values calculated through the analytical expressions from Table 3.3.
V2 V3up V3low V4up V4low VSM VBR
Monopole 0.82 1.08 1.08 1.00 1.00 1.88 0.07
Bipole 0.91 1.08 0.07 1.00 0 0.96 0.07
Table 3.5 Absolute value (in p.u.) of the peak voltage levels at the different locations of the MMC-HVDC station obtained through simulation for the monopolar and bipolar configurations with the arm reactor on the DC side. The value in p.u. is calculated by considering 1 p.u. = 320 kV (the nominal DC voltage).
The values presented in Table 3.5 constitute the main reference to determine whether a
transient voltage for each location or equipment constitutes an overvoltage or not. Such
overvoltages will be also classified as temporary overvoltage (TOV) or slow-front overvoltage
(SFO) according to the conventional classification from IEC 60071 standards (see Figure 1.3).
After analysing the simulation results for all the fault cases, the maximum SFO and TOV levels
for each location are summarized in Table 3.6 for the monopolar and bipolar configuration
with no arresters, as well as which fault produced it.
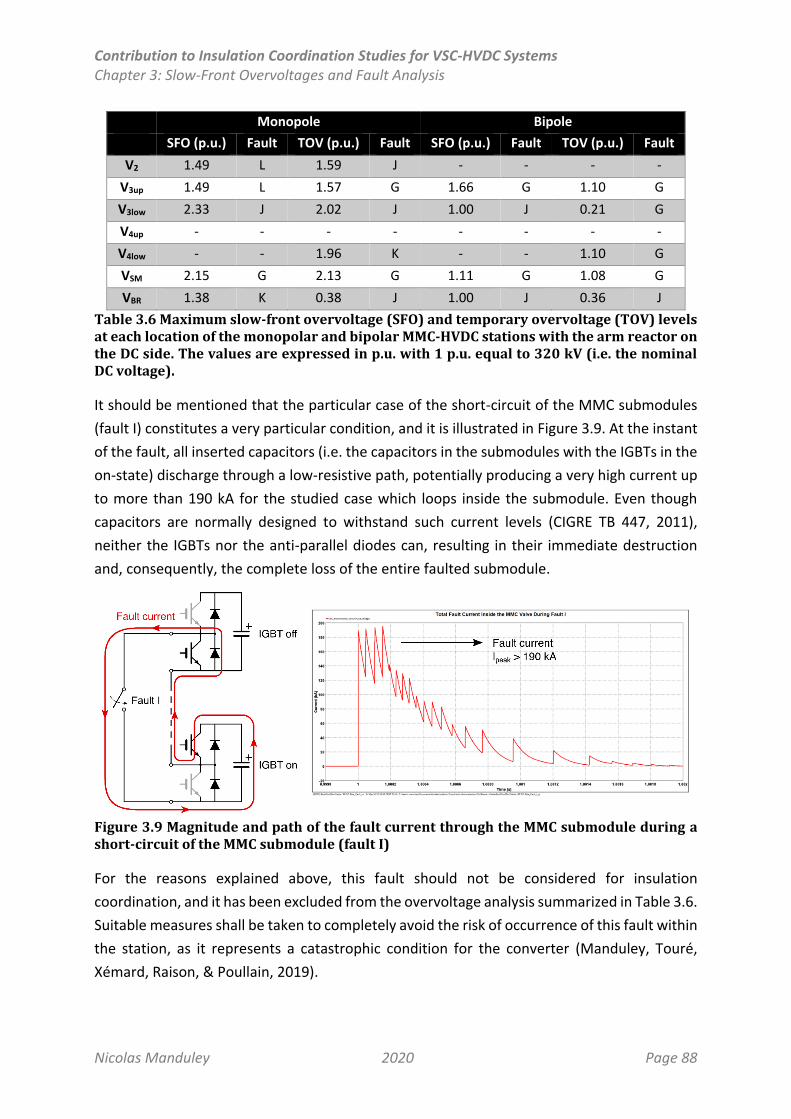
Contribution to Insulation Coordination Studies for VSC-HVDC Systems Chapter 3: Slow-Front Overvoltages and Fault Analysis
Nicolas Manduley 2020 Page 88
Monopole Bipole
SFO (p.u.) Fault TOV (p.u.) Fault SFO (p.u.) Fault TOV (p.u.) Fault
V2 1.49 L 1.59 J - - - -
V3up 1.49 L 1.57 G 1.66 G 1.10 G
V3low 2.33 J 2.02 J 1.00 J 0.21 G
V4up - - - - - - - -
V4low - - 1.96 K - - 1.10 G
VSM 2.15 G 2.13 G 1.11 G 1.08 G
VBR 1.38 K 0.38 J 1.00 J 0.36 J
Table 3.6 Maximum slow-front overvoltage (SFO) and temporary overvoltage (TOV) levels at each location of the monopolar and bipolar MMC-HVDC stations with the arm reactor on the DC side. The values are expressed in p.u. with 1 p.u. equal to 320 kV (i.e. the nominal DC voltage).
It should be mentioned that the particular case of the short-circuit of the MMC submodules
(fault I) constitutes a very particular condition, and it is illustrated in Figure 3.9. At the instant
of the fault, all inserted capacitors (i.e. the capacitors in the submodules with the IGBTs in the
on-state) discharge through a low-resistive path, potentially producing a very high current up
to more than 190 kA for the studied case which loops inside the submodule. Even though
capacitors are normally designed to withstand such current levels (CIGRE TB 447, 2011),
neither the IGBTs nor the anti-parallel diodes can, resulting in their immediate destruction
and, consequently, the complete loss of the entire faulted submodule.
Figure 3.9 Magnitude and path of the fault current through the MMC submodule during a short-circuit of the MMC submodule (fault I)
For the reasons explained above, this fault should not be considered for insulation
coordination, and it has been excluded from the overvoltage analysis summarized in Table 3.6.
Suitable measures shall be taken to completely avoid the risk of occurrence of this fault within
the station, as it represents a catastrophic condition for the converter (Manduley, Touré,
Xémard, Raison, & Poullain, 2019).
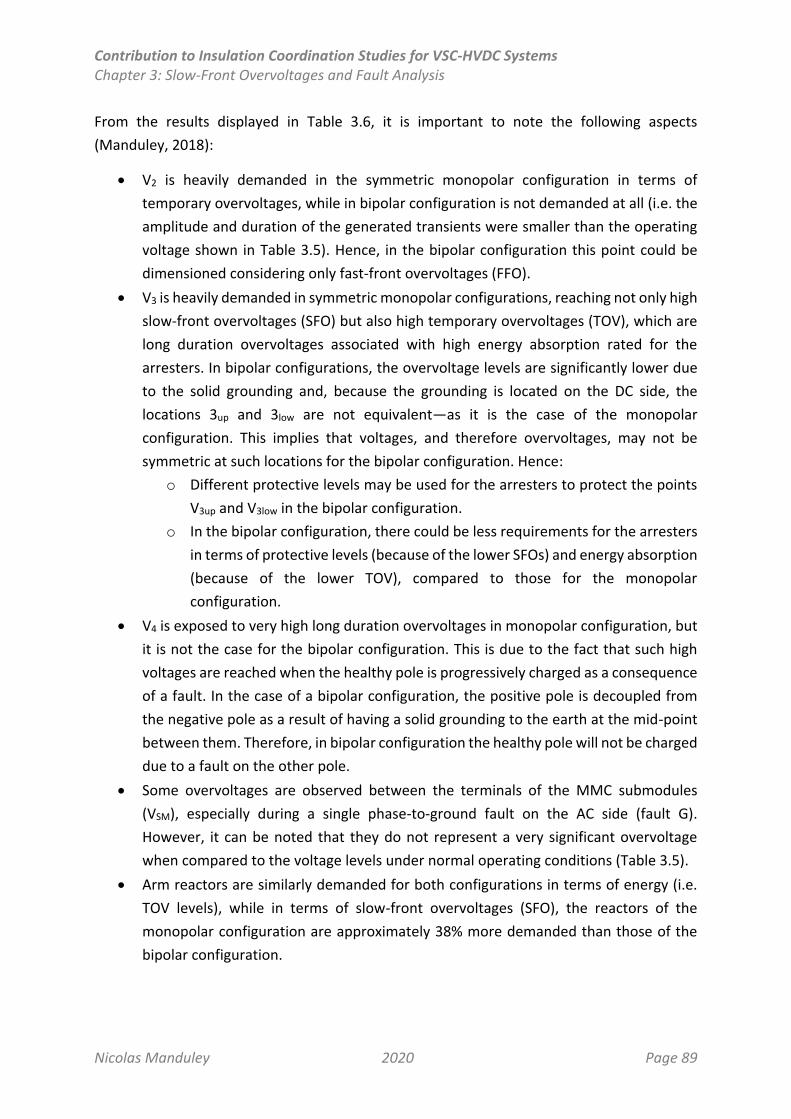
Contribution to Insulation Coordination Studies for VSC-HVDC Systems Chapter 3: Slow-Front Overvoltages and Fault Analysis
Nicolas Manduley 2020 Page 89
From the results displayed in Table 3.6, it is important to note the following aspects
(Manduley, 2018):
V2 is heavily demanded in the symmetric monopolar configuration in terms of
temporary overvoltages, while in bipolar configuration is not demanded at all (i.e. the
amplitude and duration of the generated transients were smaller than the operating
voltage shown in Table 3.5). Hence, in the bipolar configuration this point could be
dimensioned considering only fast-front overvoltages (FFO).
V3 is heavily demanded in symmetric monopolar configurations, reaching not only high
slow-front overvoltages (SFO) but also high temporary overvoltages (TOV), which are
long duration overvoltages associated with high energy absorption rated for the
arresters. In bipolar configurations, the overvoltage levels are significantly lower due
to the solid grounding and, because the grounding is located on the DC side, the
locations 3up and 3low are not equivalent—as it is the case of the monopolar
configuration. This implies that voltages, and therefore overvoltages, may not be
symmetric at such locations for the bipolar configuration. Hence:
o Different protective levels may be used for the arresters to protect the points
V3up and V3low in the bipolar configuration.
o In the bipolar configuration, there could be less requirements for the arresters
in terms of protective levels (because of the lower SFOs) and energy absorption
(because of the lower TOV), compared to those for the monopolar
configuration.
V4 is exposed to very high long duration overvoltages in monopolar configuration, but
it is not the case for the bipolar configuration. This is due to the fact that such high
voltages are reached when the healthy pole is progressively charged as a consequence
of a fault. In the case of a bipolar configuration, the positive pole is decoupled from
the negative pole as a result of having a solid grounding to the earth at the mid-point
between them. Therefore, in bipolar configuration the healthy pole will not be charged
due to a fault on the other pole.
Some overvoltages are observed between the terminals of the MMC submodules
(VSM), especially during a single phase-to-ground fault on the AC side (fault G).
However, it can be noted that they do not represent a very significant overvoltage
when compared to the voltage levels under normal operating conditions (Table 3.5).
Arm reactors are similarly demanded for both configurations in terms of energy (i.e.
TOV levels), while in terms of slow-front overvoltages (SFO), the reactors of the
monopolar configuration are approximately 38% more demanded than those of the
bipolar configuration.
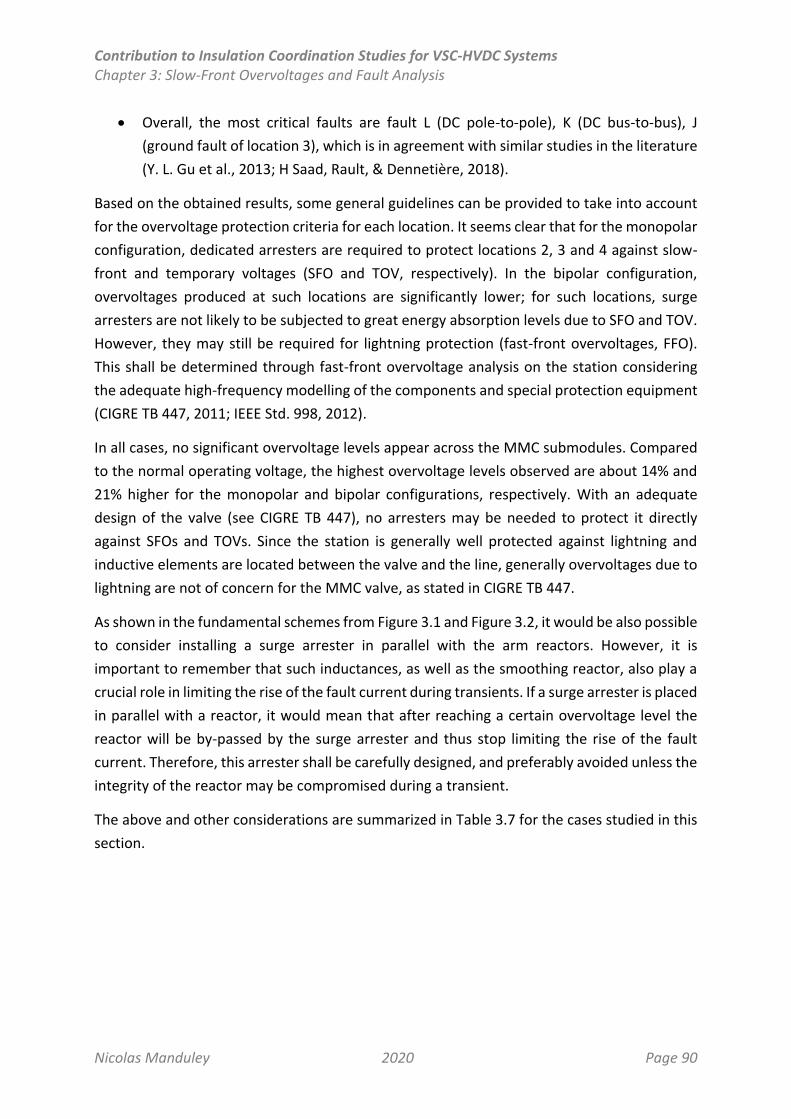
Contribution to Insulation Coordination Studies for VSC-HVDC Systems Chapter 3: Slow-Front Overvoltages and Fault Analysis
Nicolas Manduley 2020 Page 90
Overall, the most critical faults are fault L (DC pole-to-pole), K (DC bus-to-bus), J
(ground fault of location 3), which is in agreement with similar studies in the literature
(Y. L. Gu et al., 2013; H Saad, Rault, & Dennetière, 2018).
Based on the obtained results, some general guidelines can be provided to take into account
for the overvoltage protection criteria for each location. It seems clear that for the monopolar
configuration, dedicated arresters are required to protect locations 2, 3 and 4 against slow-
front and temporary voltages (SFO and TOV, respectively). In the bipolar configuration,
overvoltages produced at such locations are significantly lower; for such locations, surge
arresters are not likely to be subjected to great energy absorption levels due to SFO and TOV.
However, they may still be required for lightning protection (fast-front overvoltages, FFO).
This shall be determined through fast-front overvoltage analysis on the station considering
the adequate high-frequency modelling of the components and special protection equipment
(CIGRE TB 447, 2011; IEEE Std. 998, 2012).
In all cases, no significant overvoltage levels appear across the MMC submodules. Compared
to the normal operating voltage, the highest overvoltage levels observed are about 14% and
21% higher for the monopolar and bipolar configurations, respectively. With an adequate
design of the valve (see CIGRE TB 447), no arresters may be needed to protect it directly
against SFOs and TOVs. Since the station is generally well protected against lightning and
inductive elements are located between the valve and the line, generally overvoltages due to
lightning are not of concern for the MMC valve, as stated in CIGRE TB 447.
As shown in the fundamental schemes from Figure 3.1 and Figure 3.2, it would be also possible
to consider installing a surge arrester in parallel with the arm reactors. However, it is
important to remember that such inductances, as well as the smoothing reactor, also play a
crucial role in limiting the rise of the fault current during transients. If a surge arrester is placed
in parallel with a reactor, it would mean that after reaching a certain overvoltage level the
reactor will be by-passed by the surge arrester and thus stop limiting the rise of the fault
current. Therefore, this arrester shall be carefully designed, and preferably avoided unless the
integrity of the reactor may be compromised during a transient.
The above and other considerations are summarized in Table 3.7 for the cases studied in this
section.
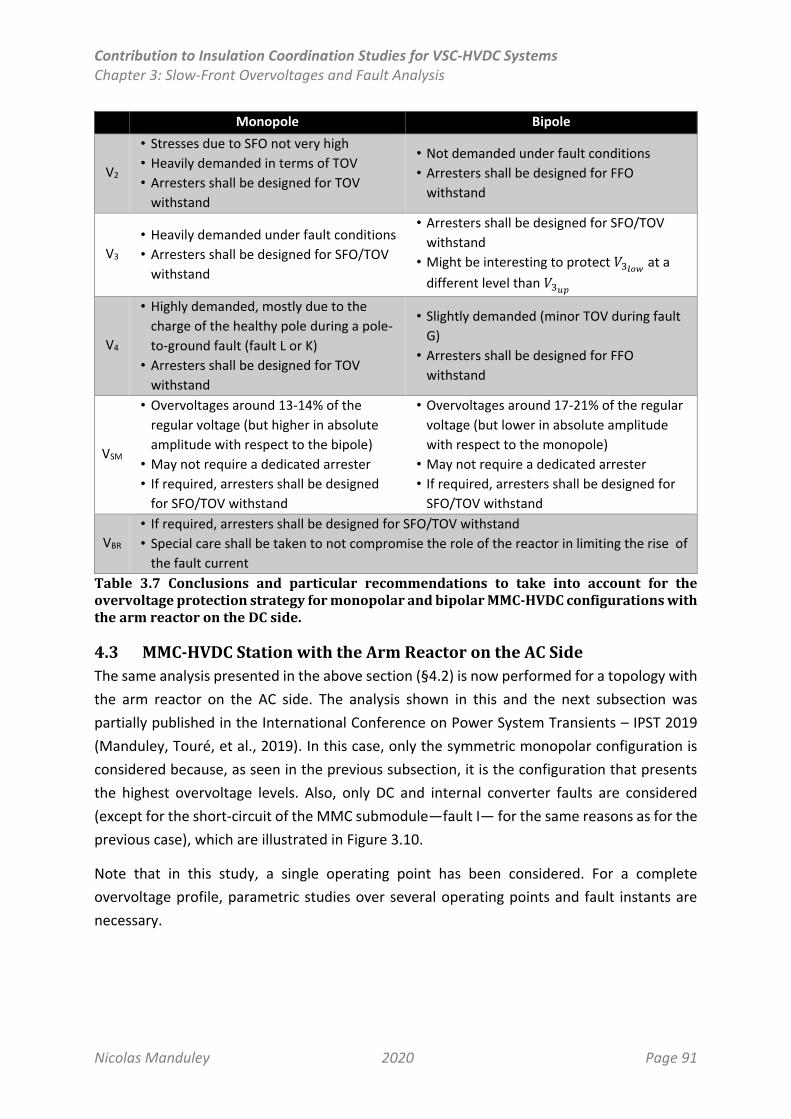
Contribution to Insulation Coordination Studies for VSC-HVDC Systems Chapter 3: Slow-Front Overvoltages and Fault Analysis
Nicolas Manduley 2020 Page 91
Monopole Bipole
V2
• Stresses due to SFO not very high
• Heavily demanded in terms of TOV
• Arresters shall be designed for TOV
withstand
• Not demanded under fault conditions
• Arresters shall be designed for FFO
withstand
V3
• Heavily demanded under fault conditions
• Arresters shall be designed for SFO/TOV
withstand
• Arresters shall be designed for SFO/TOV
withstand
• Might be interesting to protect 𝑉3𝑙𝑜𝑤 at a
different level than 𝑉3𝑢𝑝
V4
• Highly demanded, mostly due to the
charge of the healthy pole during a pole-
to-ground fault (fault L or K)
• Arresters shall be designed for TOV
withstand
• Slightly demanded (minor TOV during fault
G)
• Arresters shall be designed for FFO
withstand
VSM
• Overvoltages around 13-14% of the
regular voltage (but higher in absolute
amplitude with respect to the bipole)
• May not require a dedicated arrester
• If required, arresters shall be designed
for SFO/TOV withstand
• Overvoltages around 17-21% of the regular
voltage (but lower in absolute amplitude
with respect to the monopole)
• May not require a dedicated arrester
• If required, arresters shall be designed for
SFO/TOV withstand
VBR
• If required, arresters shall be designed for SFO/TOV withstand
• Special care shall be taken to not compromise the role of the reactor in limiting the rise of
the fault current
Table 3.7 Conclusions and particular recommendations to take into account for the overvoltage protection strategy for monopolar and bipolar MMC-HVDC configurations with the arm reactor on the DC side.
4.3 MMC-HVDC Station with the Arm Reactor on the AC Side
The same analysis presented in the above section (§4.2) is now performed for a topology with
the arm reactor on the AC side. The analysis shown in this and the next subsection was
partially published in the International Conference on Power System Transients – IPST 2019
(Manduley, Touré, et al., 2019). In this case, only the symmetric monopolar configuration is
considered because, as seen in the previous subsection, it is the configuration that presents
the highest overvoltage levels. Also, only DC and internal converter faults are considered
(except for the short-circuit of the MMC submodule—fault I— for the same reasons as for the
previous case), which are illustrated in Figure 3.10.
Note that in this study, a single operating point has been considered. For a complete
overvoltage profile, parametric studies over several operating points and fault instants are
necessary.
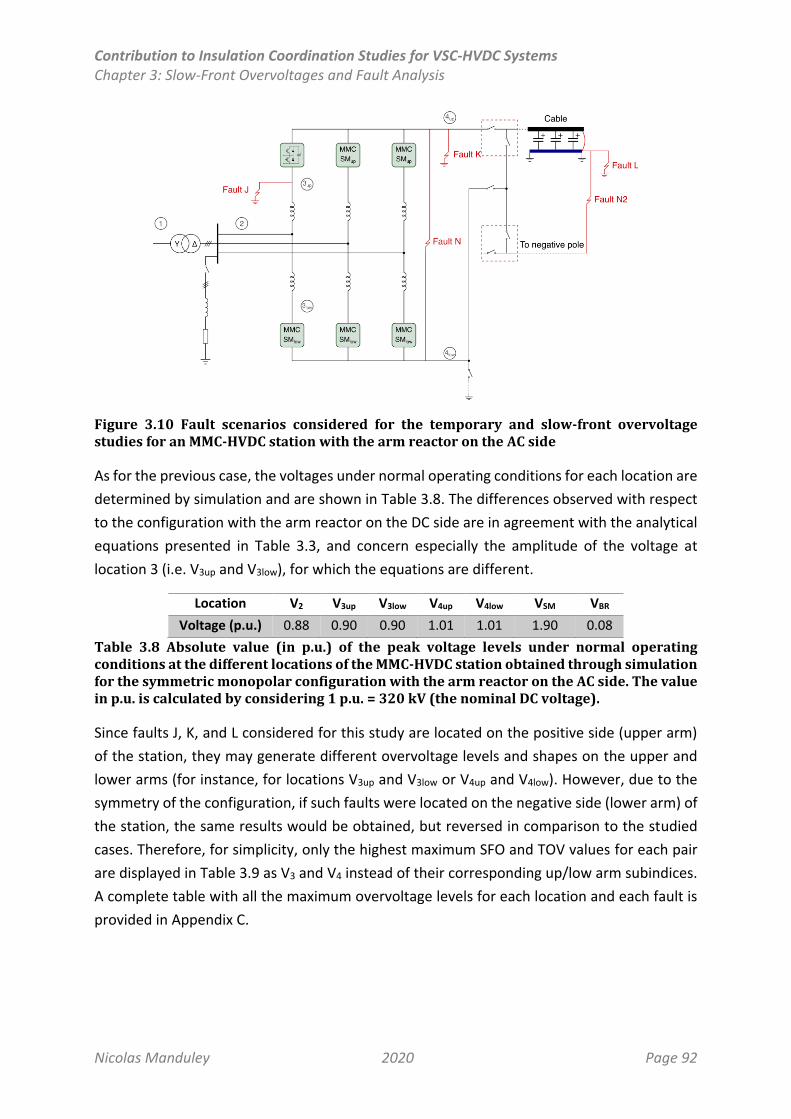
Contribution to Insulation Coordination Studies for VSC-HVDC Systems Chapter 3: Slow-Front Overvoltages and Fault Analysis
Nicolas Manduley 2020 Page 92
Figure 3.10 Fault scenarios considered for the temporary and slow-front overvoltage studies for an MMC-HVDC station with the arm reactor on the AC side
As for the previous case, the voltages under normal operating conditions for each location are
determined by simulation and are shown in Table 3.8. The differences observed with respect
to the configuration with the arm reactor on the DC side are in agreement with the analytical
equations presented in Table 3.3, and concern especially the amplitude of the voltage at
location 3 (i.e. V3up and V3low), for which the equations are different.
Location V2 V3up V3low V4up V4low VSM VBR
Voltage (p.u.) 0.88 0.90 0.90 1.01 1.01 1.90 0.08
Table 3.8 Absolute value (in p.u.) of the peak voltage levels under normal operating conditions at the different locations of the MMC-HVDC station obtained through simulation for the symmetric monopolar configuration with the arm reactor on the AC side. The value in p.u. is calculated by considering 1 p.u. = 320 kV (the nominal DC voltage).
Since faults J, K, and L considered for this study are located on the positive side (upper arm)
of the station, they may generate different overvoltage levels and shapes on the upper and
lower arms (for instance, for locations V3up and V3low or V4up and V4low). However, due to the
symmetry of the configuration, if such faults were located on the negative side (lower arm) of
the station, the same results would be obtained, but reversed in comparison to the studied
cases. Therefore, for simplicity, only the highest maximum SFO and TOV values for each pair
are displayed in Table 3.9 as V3 and V4 instead of their corresponding up/low arm subindices.
A complete table with all the maximum overvoltage levels for each location and each fault is
provided in Appendix C.

Contribution to Insulation Coordination Studies for VSC-HVDC Systems Chapter 3: Slow-Front Overvoltages and Fault Analysis
Nicolas Manduley 2020 Page 93
Overvoltages
SFO (p.u.) Fault TOV (p.u.) Fault
V2 2.16 L 1.74 J
V3 2.65 L 1.68 J
V4 2.25 K, L 2.16 K, L
VSM 2.21 J 2.17 J
VBR 1.10 L 0.27 J
Table 3.9 Maximum slow-front overvoltage (SFO) and temporary overvoltage (TOV) levels at each location of the symmetric monopolar MMC-HVDC station with the arm reactor on the AC side. The values are expressed in p.u. with 1 p.u. equal to 320 kV (i.e. the nominal DC voltage).
It is observed that the location of the arm reactor influences the overvoltage profile of the
MMC station. For instance, the maximum overvoltage levels at locations 2, 3 and 4 are
significantly higher than for the configuration with the arm reactor on the DC side (see Table
3.6), as well as slightly higher for the MMC valve (VSM) and lower across the arm reactor (VBR).
This is one of the reasons why two separate fundamental schemes are considered for the
architecture and insulation coordination of the MMC station. As it will be seen later in the next
subsection, this essential difference also influences the interactions between the surge
arresters and thus their respective modelling.
An important aspect to consider is that no smoothing reactor is present in this configuration.
As a result, some low inductance paths may appear, for instance, during the DC bus-to-ground
or pole-to-ground faults along which the fault current will not be sufficiently limited by
inductive elements, and therefore may allow some transient spikes to appear on the DC bus.
This explains the 2.25 p.u. SFO at location 4 (DC bus) which did not occur in the configuration
with the arm reactor on the DC side. For this reason, typically a smoothing reactor is required
in MMC configurations with the arm reactor on the AC side, to limit the short-circuit current
and attenuate the slow-front spikes that may be generated by DC faults.
In the case of the submodule and arm reactor voltages, the overvoltage levels do not change
significantly compared to those obtained for the configuration with the arm reactor on the DC
side. Therefore, the guidelines and recommendations for the overvoltage protection strategy
are the same as those given in Table 3.7.
Table 3.10 summarizes the general observations and recommendations to consider when
designing the overvoltage protection strategy for the critical locations of an MMC station with
the arm reactor on the DC side in a monopolar configuration, based on the obtained results
and the above discussion.
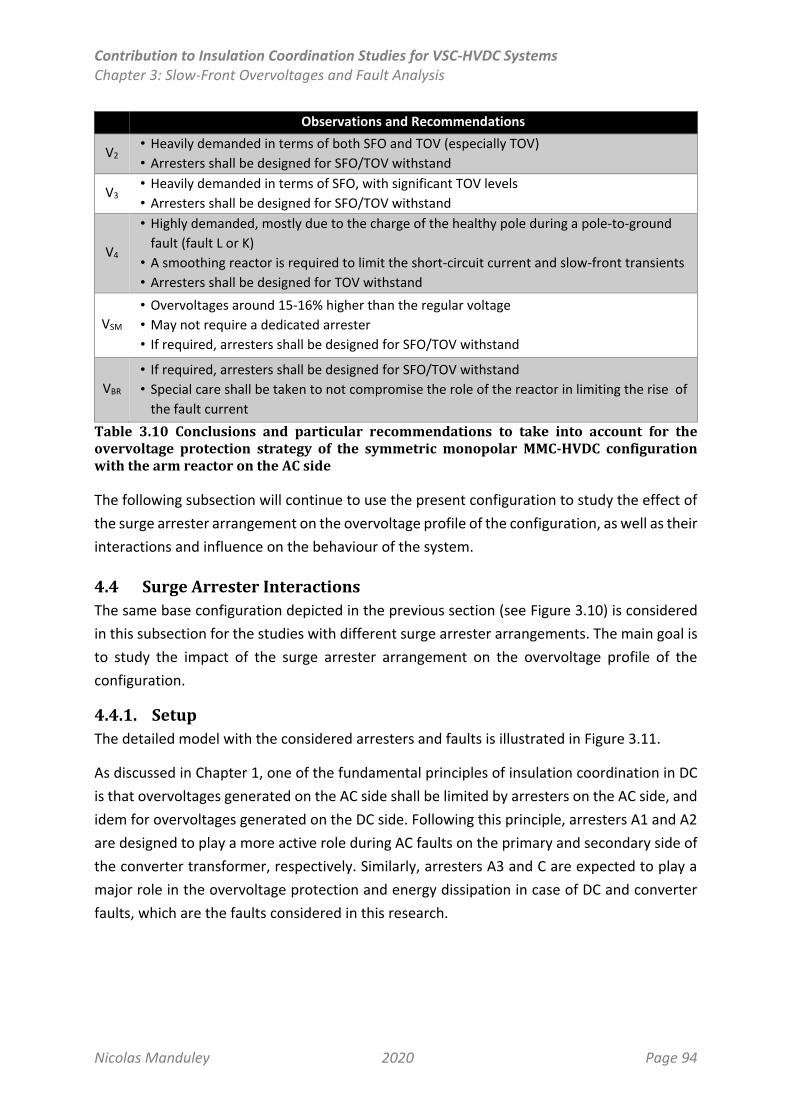
Contribution to Insulation Coordination Studies for VSC-HVDC Systems Chapter 3: Slow-Front Overvoltages and Fault Analysis
Nicolas Manduley 2020 Page 94
Observations and Recommendations
V2 • Heavily demanded in terms of both SFO and TOV (especially TOV)
• Arresters shall be designed for SFO/TOV withstand
V3 • Heavily demanded in terms of SFO, with significant TOV levels
• Arresters shall be designed for SFO/TOV withstand
V4
• Highly demanded, mostly due to the charge of the healthy pole during a pole-to-ground
fault (fault L or K)
• A smoothing reactor is required to limit the short-circuit current and slow-front transients
• Arresters shall be designed for TOV withstand
VSM
• Overvoltages around 15-16% higher than the regular voltage
• May not require a dedicated arrester
• If required, arresters shall be designed for SFO/TOV withstand
VBR
• If required, arresters shall be designed for SFO/TOV withstand
• Special care shall be taken to not compromise the role of the reactor in limiting the rise of
the fault current
Table 3.10 Conclusions and particular recommendations to take into account for the overvoltage protection strategy of the symmetric monopolar MMC-HVDC configuration with the arm reactor on the AC side
The following subsection will continue to use the present configuration to study the effect of
the surge arrester arrangement on the overvoltage profile of the configuration, as well as their
interactions and influence on the behaviour of the system.
4.4 Surge Arrester Interactions
The same base configuration depicted in the previous section (see Figure 3.10) is considered
in this subsection for the studies with different surge arrester arrangements. The main goal is
to study the impact of the surge arrester arrangement on the overvoltage profile of the
configuration.
4.4.1. Setup
The detailed model with the considered arresters and faults is illustrated in Figure 3.11.
As discussed in Chapter 1, one of the fundamental principles of insulation coordination in DC
is that overvoltages generated on the AC side shall be limited by arresters on the AC side, and
idem for overvoltages generated on the DC side. Following this principle, arresters A1 and A2
are designed to play a more active role during AC faults on the primary and secondary side of
the converter transformer, respectively. Similarly, arresters A3 and C are expected to play a
major role in the overvoltage protection and energy dissipation in case of DC and converter
faults, which are the faults considered in this research.

Contribution to Insulation Coordination Studies for VSC-HVDC Systems Chapter 3: Slow-Front Overvoltages and Fault Analysis
Nicolas Manduley 2020 Page 95
Figure 3.11 Symmetric monopolar configuration scheme including the faults and surge arresters considered in the study
Therefore, the surge arrester configurations considered are thus combinations of arresters A3
and C while arresters A1-A2 will be present in all configurations, as shown in Figure 3.12
Name Description
NS No surge arresters
A1-A2 Transformer arresters
A1-A2-A3 Transformer and arm-to-ground arresters
A1-A2-C Transformer and DC pole arresters
A1-A2-A3-C All arresters considered
Figure 3.12 Surge arrester configurations considered
All scenarios have been simulated in EMTP for each surge arrester configuration, giving a total
of 30 study cases.
4.4.2. Surge Arrester Design and Parameters
The initial parameters of the surge arresters have been determined differently for AC and DC
side arresters, and are presented in Table 3.11 for both the maximum continuous operating
voltage (Uc) and rated voltage (Ur) of the arresters in their equivalent RMS value. The V-I matrix
used is shown in Figure 1.4 (obtained from Hinrichsen 2012), and has been scaled to match
the required rated voltage of the arresters.
Since the surge arrester specification is a fundamental part of insulation coordination, which
is a naturally iterative process, it is clear that a precise specification of the surge arrester
parameters is also an iterative process. Because the goal of this section is to study the
interactions of the surge arresters and the effects of having different arrester arrangements
within the configuration, the procedures described below aim to obtain a reasonable and
realistic value that may be found in real applications. The hypotheses considered to reach this
goal are also described in the upcoming paragraphs.
Contribution to Insulation Coordination Studies for VSC-HVDC Systems Chapter 3: Slow-Front Overvoltages and Fault Analysis
Nicolas Manduley 2020 Page 96
Arresters A1 and A2 have been specified by using typical values of arresters used for such
nominal AC voltage levels (i.e. 400 kV and 320 kV, respectively). Since the nominal voltages
refer to phase-to-phase voltages, the respective phase-to-ground voltages in RMS are 231 kV
and 185 kV. As explained in Chapter 1, AC arresters are typically designed based on the rated
voltage of the arrester (Ur) and TOV withstand. The maximum TOV values depend on the earth
fault factor, which can range from 1.25 to 1.73. Considering earth faults and load shedding, a
value around 1.5 may be considered conservative as values around 1.3 and 1.4 are expected
for such events (IEC 60071-2). Therefore, by considering the earth fault factor and the
corresponding nominal voltage levels, the Ur values for A1 and A2 are given as follows:
Ur_A1 = 231 𝑘𝑉𝑅𝑀𝑆 (1.5) = 347 𝑘𝑉𝑅𝑀𝑆 (3-4)
𝑈𝑟_𝐴2 = 185 𝑘𝑉𝑅𝑀𝑆 (1.5) = 278 𝑘𝑉𝑅𝑀𝑆 (3-5)
Which, adjusting for the next higher standard arrester rated voltage for AC, yields the values
shown in Table 3.11.
As the relationship between Ur and Uc of surge arresters in general is constant (Hinrichsen,
2012), the specification of arresters A1 and A2 can be also expressed as a function of Uc and a
coefficient, such that:
𝑐𝑜𝑒𝑓𝑓𝐴1 =𝑈𝑐_𝐴1𝑉1
=288 𝑘𝑉𝑅𝑀𝑆
400 𝑘𝑉𝑅𝑀𝑆 √3⁄= 1.247 (3-6)
and
𝑐𝑜𝑒𝑓𝑓𝐴2 =𝑈𝑐_𝐴2𝑉2
=231 𝑘𝑉𝑅𝑀𝑆
320 𝑘𝑉𝑅𝑀𝑆 √3⁄= 1.250 (3-7)
For converter and DC arresters (i.e. A3 and C), the design is done by considering the maximum
continuous voltage (Uc) and the nominal voltage under normal operating conditions. In order
to maintain a certain uniformity in the overall design of the arresters, a similar coefficient is
applied to the peak voltage of the location under normal operating conditions where the surge
arrester is located. However, since AC arresters are typically designed to not conduct
significant currents during SFO events, a slightly lower coefficient is used for arresters A3 and
C to ensure that the protective level will be lower so that the arresters will conduct during
fault events and their interactions can be studied. For the purposes of this study, a coefficient
of 1.20 is used for such arresters as a hypothesis to establish a reasonable initial specification
of the arresters.
Arrester A3 is placed in location 3 (see Figure 3.10), which presents a regular sinusoidal
waveshape with no offset (see Figure 3.3) with a peak amplitude of 0.9 p.u. or 288 kVpeak. To
lookup the corresponding value in a surge arrester catalog, it is convenient to convert this
value in an equivalent RMS value, as it is usually specified in the datasheets. Therefore:
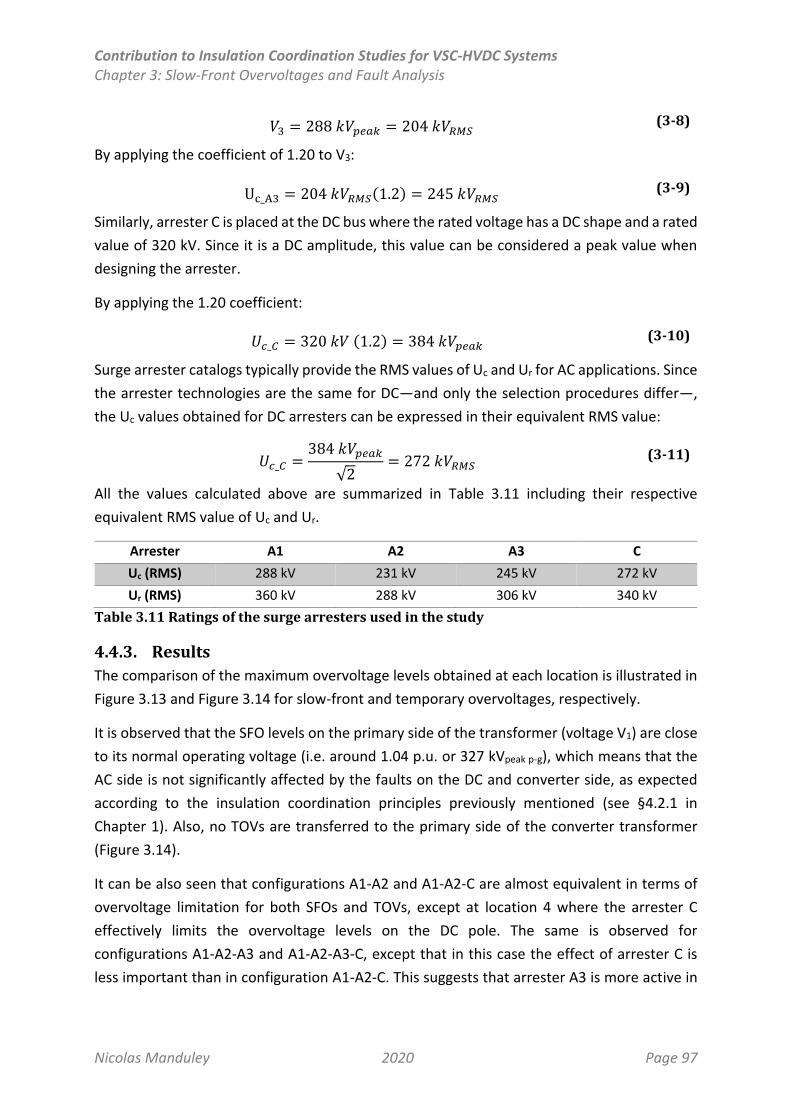
Contribution to Insulation Coordination Studies for VSC-HVDC Systems Chapter 3: Slow-Front Overvoltages and Fault Analysis
Nicolas Manduley 2020 Page 97
𝑉3 = 288 𝑘𝑉𝑝𝑒𝑎𝑘 = 204 𝑘𝑉𝑅𝑀𝑆 (3-8)
By applying the coefficient of 1.20 to V3:
Uc_A3 = 204 𝑘𝑉𝑅𝑀𝑆(1.2) = 245 𝑘𝑉𝑅𝑀𝑆 (3-9)
Similarly, arrester C is placed at the DC bus where the rated voltage has a DC shape and a rated
value of 320 kV. Since it is a DC amplitude, this value can be considered a peak value when
designing the arrester.
By applying the 1.20 coefficient:
𝑈𝑐_𝐶 = 320 𝑘𝑉 (1.2) = 384 𝑘𝑉𝑝𝑒𝑎𝑘 (3-10)
Surge arrester catalogs typically provide the RMS values of Uc and Ur for AC applications. Since
the arrester technologies are the same for DC—and only the selection procedures differ—,
the Uc values obtained for DC arresters can be expressed in their equivalent RMS value:
𝑈𝑐_𝐶 =384 𝑘𝑉𝑝𝑒𝑎𝑘
√2= 272 𝑘𝑉𝑅𝑀𝑆 (3-11)
All the values calculated above are summarized in Table 3.11 including their respective
equivalent RMS value of Uc and Ur.
Arrester A1 A2 A3 C
Uc (RMS) 288 kV 231 kV 245 kV 272 kV
Ur (RMS) 360 kV 288 kV 306 kV 340 kV
Table 3.11 Ratings of the surge arresters used in the study
4.4.3. Results
The comparison of the maximum overvoltage levels obtained at each location is illustrated in
Figure 3.13 and Figure 3.14 for slow-front and temporary overvoltages, respectively.
It is observed that the SFO levels on the primary side of the transformer (voltage V1) are close
to its normal operating voltage (i.e. around 1.04 p.u. or 327 kVpeak p-g), which means that the
AC side is not significantly affected by the faults on the DC and converter side, as expected
according to the insulation coordination principles previously mentioned (see §4.2.1 in
Chapter 1). Also, no TOVs are transferred to the primary side of the converter transformer
(Figure 3.14).
It can be also seen that configurations A1-A2 and A1-A2-C are almost equivalent in terms of
overvoltage limitation for both SFOs and TOVs, except at location 4 where the arrester C
effectively limits the overvoltage levels on the DC pole. The same is observed for
configurations A1-A2-A3 and A1-A2-A3-C, except that in this case the effect of arrester C is
less important than in configuration A1-A2-C. This suggests that arrester A3 is more active in
Contribution to Insulation Coordination Studies for VSC-HVDC Systems Chapter 3: Slow-Front Overvoltages and Fault Analysis
Nicolas Manduley 2020 Page 98
the overvoltage limitation, and/or that the protective level of arrester C is too high and could
be lowered, if the minimum withstand voltage of the protected equipment allows it. The
energy absorption levels will determine the feasibility of this possibility, along with the
withstand levels of the DC cable.
Furthermore, it is observed that the SFO levels are higher for all points and equipment in the
configuration without surge arresters (NS configuration), except for the arm reactors (VBR in
Figure 3.13). In this case, the SFO levels are higher in all surge arrester configurations than in
the base case without surge arresters. This is explained through the fact that when a surge
arrester starts conducting, a new current path is created within the system. Consequently, the
voltage and current distribution changes within the converter, as well as the voltage levels
attained which could be different at each point compared to the case without surge arresters.
This concerns particularly the arm inductances, since they are the only components that are
able to react instantaneously to the rapid voltage variation during the first instants after the
fault.
Special care shall be then taken to the possible loops created by the conduction of the surge
arresters, as it could even create paths without limiting inductors, potentially resulting in very
high currents through the MMC submodules and other equipment. This is because when an
overvoltage is applied to a point directly protected by an arrester, current will start flowing
through it according to the V-I characteristic of the arrester, and a new current path is created.
One of the most critical scenarios found is depicted in Figure 3.15 and corresponds to the
current path created during fault L through arrester A3. When the propagating wave reaches
the station, current starts flowing through the arrester according to its V-I characteristic due
to the overvoltage that appears between its terminals. Since no inductance is present in the
loop created (red path in Figure 3.15), this current will continue to increase for at least 40 µs
(Figure 3.16 left, green curve) and most of it will flow directly into the valve (see Figure 3.16
left, blue curve). Longer MMC blocking delays imply even higher current levels. This represents
a potentially dangerous condition for the IGBTs inside the submodules. This supports the fact
that the installation of a smoothing reactor in installations with the arm reactor on the AC side
is considered mandatory. This way, no loops without inductive elements can be created
through the MMC submodules.
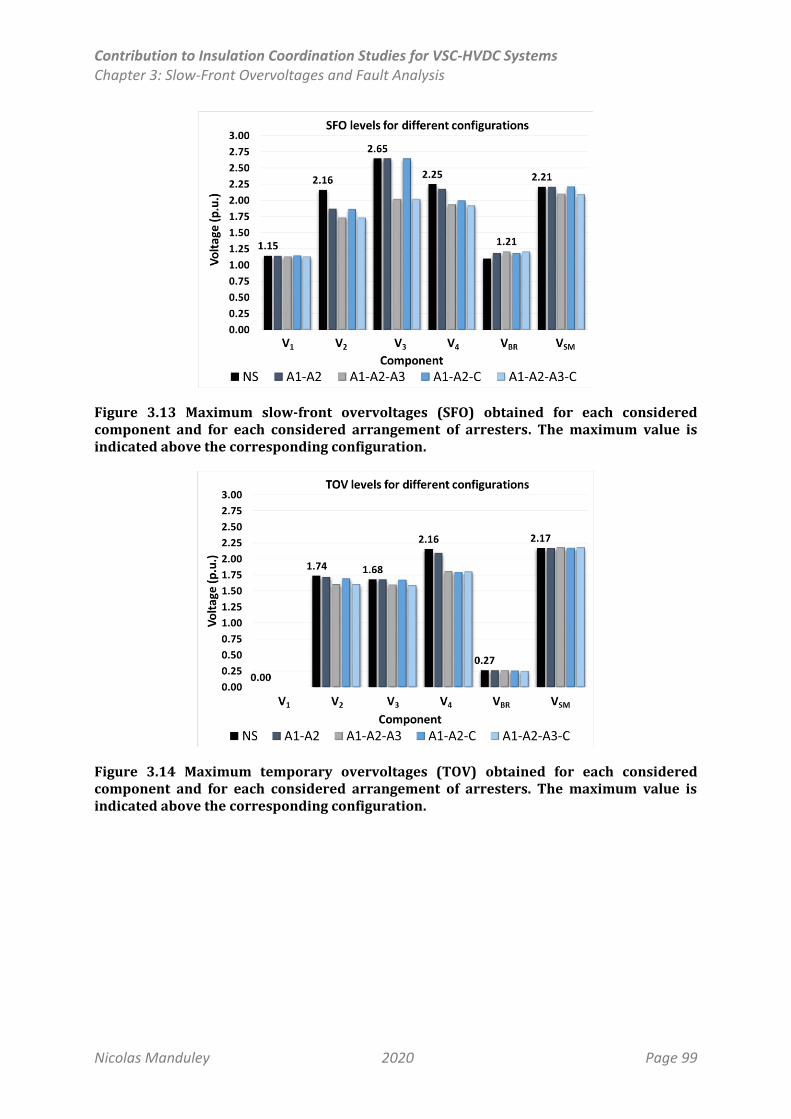
Contribution to Insulation Coordination Studies for VSC-HVDC Systems Chapter 3: Slow-Front Overvoltages and Fault Analysis
Nicolas Manduley 2020 Page 99
Figure 3.13 Maximum slow-front overvoltages (SFO) obtained for each considered component and for each considered arrangement of arresters. The maximum value is indicated above the corresponding configuration.
Figure 3.14 Maximum temporary overvoltages (TOV) obtained for each considered component and for each considered arrangement of arresters. The maximum value is indicated above the corresponding configuration.

Contribution to Insulation Coordination Studies for VSC-HVDC Systems Chapter 3: Slow-Front Overvoltages and Fault Analysis
Nicolas Manduley 2020 Page 100
Figure 3.15 Current path through arrester A3 on phase b of the upper arm where the maximum current is measured for DC pole to ground fault at the middle of the cable (fault L).
Figure 3.16 Comparison between the case without surge arresters (NS, red) and the A1-A2-A3 configuration (blue) for DC pole to ground fault. On the left, the currents flowing through the MMC submodules (phase B), including the current of the corresponding upper surge arrester A3 (green). On the right, the voltage levels at the point protected by arrester A3 (upper valve). It is seen how the overvoltage levels are effectively limited by the surge arrester.
The energy absorption levels of the surge arresters for each configuration is shown in Figure
3.17. Energy absorption levels for arrester A1 were negligible in all cases, hence it is not
represented in the graphs.
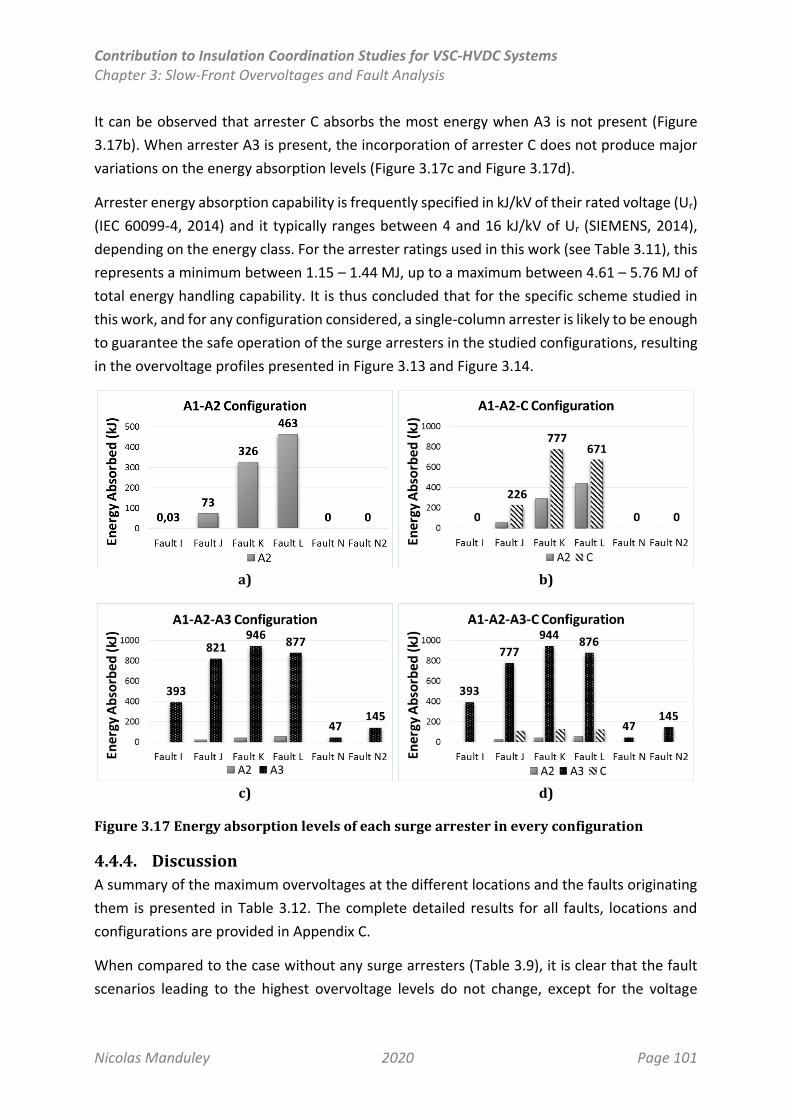
Contribution to Insulation Coordination Studies for VSC-HVDC Systems Chapter 3: Slow-Front Overvoltages and Fault Analysis
Nicolas Manduley 2020 Page 101
It can be observed that arrester C absorbs the most energy when A3 is not present (Figure
3.17b). When arrester A3 is present, the incorporation of arrester C does not produce major
variations on the energy absorption levels (Figure 3.17c and Figure 3.17d).
Arrester energy absorption capability is frequently specified in kJ/kV of their rated voltage (Ur)
(IEC 60099-4, 2014) and it typically ranges between 4 and 16 kJ/kV of Ur (SIEMENS, 2014),
depending on the energy class. For the arrester ratings used in this work (see Table 3.11), this
represents a minimum between 1.15 – 1.44 MJ, up to a maximum between 4.61 – 5.76 MJ of
total energy handling capability. It is thus concluded that for the specific scheme studied in
this work, and for any configuration considered, a single-column arrester is likely to be enough
to guarantee the safe operation of the surge arresters in the studied configurations, resulting
in the overvoltage profiles presented in Figure 3.13 and Figure 3.14.
a)
b)
c)
d)
Figure 3.17 Energy absorption levels of each surge arrester in every configuration
4.4.4. Discussion
A summary of the maximum overvoltages at the different locations and the faults originating
them is presented in Table 3.12. The complete detailed results for all faults, locations and
configurations are provided in Appendix C.
When compared to the case without any surge arresters (Table 3.9), it is clear that the fault
scenarios leading to the highest overvoltage levels do not change, except for the voltage
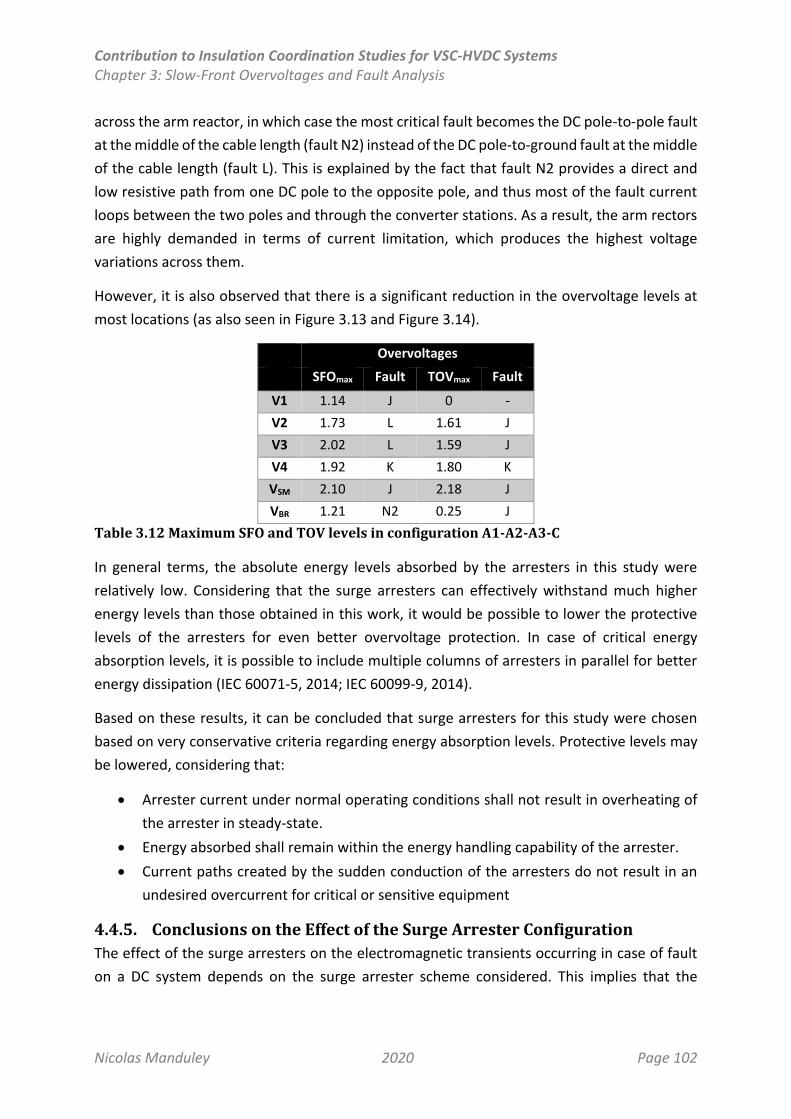
Contribution to Insulation Coordination Studies for VSC-HVDC Systems Chapter 3: Slow-Front Overvoltages and Fault Analysis
Nicolas Manduley 2020 Page 102
across the arm reactor, in which case the most critical fault becomes the DC pole-to-pole fault
at the middle of the cable length (fault N2) instead of the DC pole-to-ground fault at the middle
of the cable length (fault L). This is explained by the fact that fault N2 provides a direct and
low resistive path from one DC pole to the opposite pole, and thus most of the fault current
loops between the two poles and through the converter stations. As a result, the arm rectors
are highly demanded in terms of current limitation, which produces the highest voltage
variations across them.
However, it is also observed that there is a significant reduction in the overvoltage levels at
most locations (as also seen in Figure 3.13 and Figure 3.14).
Overvoltages
SFOmax Fault TOVmax Fault
V1 1.14 J 0 -
V2 1.73 L 1.61 J
V3 2.02 L 1.59 J
V4 1.92 K 1.80 K
VSM 2.10 J 2.18 J
VBR 1.21 N2 0.25 J
Table 3.12 Maximum SFO and TOV levels in configuration A1-A2-A3-C
In general terms, the absolute energy levels absorbed by the arresters in this study were
relatively low. Considering that the surge arresters can effectively withstand much higher
energy levels than those obtained in this work, it would be possible to lower the protective
levels of the arresters for even better overvoltage protection. In case of critical energy
absorption levels, it is possible to include multiple columns of arresters in parallel for better
energy dissipation (IEC 60071-5, 2014; IEC 60099-9, 2014).
Based on these results, it can be concluded that surge arresters for this study were chosen
based on very conservative criteria regarding energy absorption levels. Protective levels may
be lowered, considering that:
Arrester current under normal operating conditions shall not result in overheating of
the arrester in steady-state.
Energy absorbed shall remain within the energy handling capability of the arrester.
Current paths created by the sudden conduction of the arresters do not result in an
undesired overcurrent for critical or sensitive equipment
4.4.5. Conclusions on the Effect of the Surge Arrester Configuration
The effect of the surge arresters on the electromagnetic transients occurring in case of fault
on a DC system depends on the surge arrester scheme considered. This implies that the
Contribution to Insulation Coordination Studies for VSC-HVDC Systems Chapter 3: Slow-Front Overvoltages and Fault Analysis
Nicolas Manduley 2020 Page 103
selection of the surge arrester configuration and their individual parameters does not only
depend on the overvoltage levels of the component to be protected, but also on the other
arresters and their effect on the system dynamics.
The operating principle of the surge arresters involves the formation of temporary current
paths during the transient state. Whenever a new surge arrester configuration is studied,
special care shall be taken to the possible loops created by the action of the surge arresters in
case of overvoltage.
For MMC-HVDC systems presenting the arm reactor on the AC side, the smoothing reactor
will also play a role in limiting the fault current through the MMC valve when the arm-to-
ground arrester starts conducting by avoiding the creation of a low-inductance path. Its
installation is thus considered mandatory on MMC-HVDC systems with the arm reactor on the
AC side. In configurations with the surge arrester on the DC side, such paths would not be
created, and thus the installation of a dedicated smoothing reactor on the DC bus would not
be necessary for such purpose.
The installation of surge arresters could effectively increase the longitudinal withstand voltage
requirements of the inductances present in the system, as seen in the case of the arm reactors.
This effect, though relatively small, shall be taken into account for the design of the clearances
and insulation of the reactors, and can be considered as a key factor to decide whether the
inductances will require a dedicated overvoltage protection (i.e. a surge arrester in parallel).
The most critical faults found in terms of both overvoltages and energy dissipation levels
associated are the pole-to-ground, bus-to-ground and arm-to-ground fault (faults L, K and J,
respectively), which is consistent with what has been found in the existing literature (Y. L. Gu
et al., 2013; H Saad et al., 2018).
5. Proposed Procedures for the Insulation Coordination of MMC-HVDC Systems Regarding Temporary and Slow-Front Overvoltages
As for LCC-HVDC systems, the fundamental principle of insulation coordination of MMC-HVDC
systems—regarding slow-front and temporary overvoltages—involves the determination of
the representative, coordination and required voltages and overvoltages (Urp, Ucw and Urw,
respectively). The essential differences with LCC-HVDC insulation coordination concern
mainly, as hypothesized in Chapter 1, §4.3.3:
Architecture of the converter (and associated equipment)
Configuration of the station (such as symmetrical monopole or bipole with/without
metallic return)
Location and specification of the surge arresters
Internal converter faults and general fault behaviour
Contribution to Insulation Coordination Studies for VSC-HVDC Systems Chapter 3: Slow-Front Overvoltages and Fault Analysis
Nicolas Manduley 2020 Page 104
Overvoltage levels
The first three points are covered by the fundamental schemes from Figure 3.1 and Figure 3.2.
These are basic blocks from which any setup can be obtained taking into account the
configuration (e.g. symmetrical or asymmetrical monopole, bipole with or without metallic
return), the topology (point-to-point or MTDC), the architecture (arm reactor on the AC or DC
side—and its implications), type of link (underground/submarine cable, overhead line or
hybrid) and possible locations of the arresters. The insulation coordination procedure can be
thus adapted to MMC-HVDC by applying the essential insulation coordination philosophy from
IEC standards to the fundamental schemes proposed in this chapter.
The last two points are given by the detailed electromagnetic transient simulations, through
which the behavioural differences between configurations and overvoltage levels during
transients have been identified, as well as the differences with LCC-HVDC systems.
Therefore, the proposed procedure for insulation coordination for MMC-HVDC systems is
based directly on the fundamental schemes from Figure 3.1 and Figure 3.2 and is described in
§5.1 below. Next, recommendations for the overvoltage protection, and in particular for the
specification of the arresters shown in the proposed fundamental schemes, are given in §5.2
based on the results obtained through this research.
5.1 Procedure
Because of the critical need to consider the effect of non-linear devices as the surge arresters
in the insulation coordination, this procedure assumes that detailed studies are performed
through electromagnetic transient simulations.
Four main stages can be identified in the insulation coordination of MMC-HVDC systems, and
are illustrated in Figure 3.18.
In the first stage, a system analysis is performed taking into consideration the configuration
and architecture of the system, which can be done by adjusting the fundamental schemes
from Figure 3.1 and Figure 3.2 to the particular case (as it was done in §4.2 and §4.3, see Figure
3.8 and Figure 3.10). The insulation configuration and types, as well as a surge arrester
arrangement, must be also established in this section to determine the desired final outputs
of the design. Then, the voltages in service can be estimated analytically for each location (for
instance, using the equations from Table 3.3), which provides a first estimation of the
representative voltages Urp (and/or the coordination withstand voltages, depending on the
coordination factor considered) under normal operating conditions for the different locations.
An initial value of the parameters of the surge arresters can be calculated based on Urp or Ucw.
Contribution to Insulation Coordination Studies for VSC-HVDC Systems Chapter 3: Slow-Front Overvoltages and Fault Analysis
Nicolas Manduley 2020 Page 105
Next, the system is modelled in the electromagnetic transient (EMT) tool used to conduct the
studies, and the transient events are defined (faults, disconnections, resonance,
ferroresonance, etc.). Multiple iterations may be required in order to optimize the surge
arrester parameters while meeting the performance criterion and respecting the surge
arrester energy absorption capability. The maximum slow-front and temporary overvoltages
resulting from all the considered events constitute the minimum coordination withstand
voltage (Ucw), as suggested in IEC 60071-5, for each location under transient conditions.
After obtaining all the values for Ucw, the required withstand voltage Urw for each location is
obtained by taking into account a safety factor and an altitude correction factor, as defined in
IEC 60071-5 for LCC-HVDC systems. The same reference factors indicated in IEC 60071-5 may
be used for MMC-HVDC since they are given according to the general station location (AC or
DC switchyard, valve hall equipment, transformers, etc.). These required withstand voltage
values will constitute one of the main input parameters for the calculation of the required air
clearances (following the procedures from IEC 60071-2 or CENELEC 50341) and general
insulation design (as specified, for instance, in IEC 60815 standards for AC and DC insulators).
Finally, the design is completed by specifying the dielectric strength for every equipment of
the system along with the location and parameters of the surge arresters used for the
overvoltage protection strategy. In the case of AC systems, a standard dielectric strength may
be selected. In absence of standard values for DC, the final specification consists of the
minimum required withstand calculated in the previous step. Alternatively, the standard
values for AC may be used. The preferred procedure should be specified by the technical
committee.
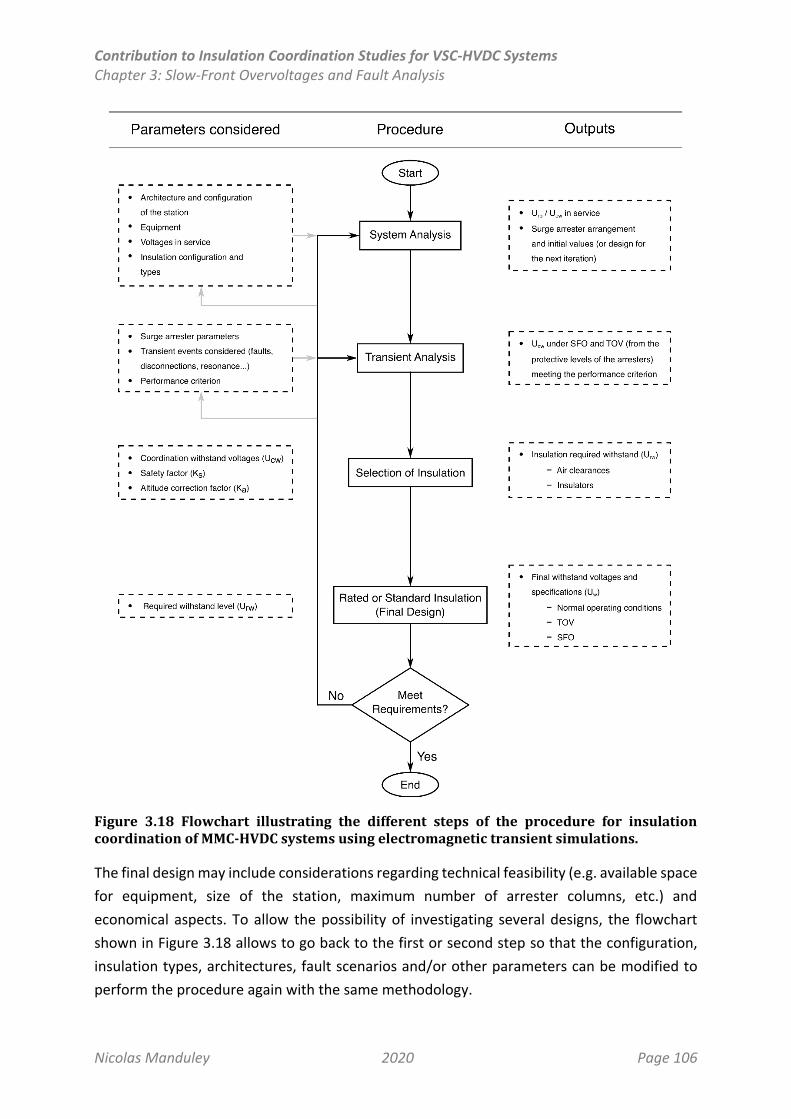
Contribution to Insulation Coordination Studies for VSC-HVDC Systems Chapter 3: Slow-Front Overvoltages and Fault Analysis
Nicolas Manduley 2020 Page 106
Figure 3.18 Flowchart illustrating the different steps of the procedure for insulation coordination of MMC-HVDC systems using electromagnetic transient simulations.
The final design may include considerations regarding technical feasibility (e.g. available space
for equipment, size of the station, maximum number of arrester columns, etc.) and
economical aspects. To allow the possibility of investigating several designs, the flowchart
shown in Figure 3.18 allows to go back to the first or second step so that the configuration,
insulation types, architectures, fault scenarios and/or other parameters can be modified to
perform the procedure again with the same methodology.
Contribution to Insulation Coordination Studies for VSC-HVDC Systems Chapter 3: Slow-Front Overvoltages and Fault Analysis
Nicolas Manduley 2020 Page 107
5.2 Overvoltage Protection
This section provides a series of indications and recommendations for the design of the
different surge arresters illustrated in Figure 3.1 and Figure 3.2, and are given based on the
results obtained in this research and explained in previous sections of this chapter.
5.2.1. Arrester A1 (Primary Side of the Converter Transformer)
Arrester A1 is installed to protect the windings of the primary side of the converter
transformer. Since no significant overvoltages are transmitted to the primary side due to AC,
DC or converter faults, no significant energy is absorbed by this arrester during slow-front and
temporary overvoltages coming from the secondary side. Therefore, and considering that
generally the station is well designed to avoid such events to originate within the station,
arrester A1 shall be dimensioned for fast-front overvoltage (FFO) withstand in case of lightning
strokes hitting the station.
The conventional method used for the design of AC arresters based on the estimation of the
maximum TOV (see IEC 60071-1 and 2) shall be enough to guarantee an adequate overvoltage
limitation on the windings of the transformer in case of FFO, as well as the safe operation of
the arrester in terms of energy absorption and service conditions.
5.2.2. Arrester A2 (Secondary Side of the Converter Transformer)
As for arrester A1, with three main differences:
Significant overvoltages may appear at location 2 due to faults coming from the
converter or the DC line.
In case of a bipolar configuration, the phase-to-ground voltage of location 2 is not a
regular sinusoidal, but a sinusoidal with a DC offset (see Figure 3.3 and Figure 3.4).
The overvoltage levels are significantly lower for bipolar configurations than for
monopolar configurations.
Therefore, even though the conventional method for the design of AC arresters from IEC
60071 standards may yield an adequate design, simulation studies shall determine if the
overvoltage levels in case of events generating slow-front and temporary overvoltages do not
represent a dangerous scenario in terms of energy absorption of the arrester, especially for
monopolar configurations.
5.2.3. Arrester A3 (Intermediate Point between the MMC Submodules and the Arm Reactor)
Arrester A3 is subjected to different overvoltage conditions depending on the location of the
arm reactor (AC or DC side) and, in case of a bipolar configuration, its location within the
converter leg (upper or lower arm).
Contribution to Insulation Coordination Studies for VSC-HVDC Systems Chapter 3: Slow-Front Overvoltages and Fault Analysis
Nicolas Manduley 2020 Page 108
The most critical overvoltage levels are reached by the symmetric monopolar configuration
with the arm reactor on the AC side, where location 3 can reach overvoltage values up to
approximately 2.65 p.u. for a DC pole-to-ground fault at the middle of the cable section (fault
L, see §4.3). Slightly lower overvoltages are reached for a configuration with the arm reactor
on the DC side, in the order of 2.33 p.u. Therefore, for all symmetric monopolar configurations,
special attention shall be paid to the energy absorption level of arrester A3 and its energy
handling capability to ensure a safe operation. Multiple parallel columns may be used if
needed with this respect.
In bipolar configurations, overvoltage levels are generally not very significant due to the low
grounding resistance of the system, which naturally reduces the overvoltage levels during
faults. However, in certain cases, some discontinuities may be found on the soil resistivity,
which would affect the maximum overvoltage levels during transients. In such cases, the
grounding scheme should adequately represent this case.
For configurations with the arm reactor on the AC side, arrester A3low can be considered
equivalent to arrester V (in case of solid grounding of the neutral point). In such case, arrester
A3low may be omitted. If another grounding scheme is used for the neutral point, the Uc of
arrester A3low shall be at least as high as the operating voltage of the MMC valve, and the
overvoltage levels to which it would be subjected would depend on the grounding scheme,
being directly proportional to the impedance of the grounding scheme used. Simulation
studies shall then determine the utility of this arrester.
Similarly, for bipolar configurations with the arm reactor on the DC side, arrester A3low can be
considered equivalent to arrester BR (in case of solid grounding of the neutral point), and thus
be omitted. In case of a different grounding scheme for the neutral point, it might still conduct
significant currents that would not be limited by the arm reactor, which represents a potential
danger to the system. In such case, which have not been considered in this research,
simulation studies shall determine the need for this arrester. If needed, there is interest on
keeping the protective levels as high as possible to prevent the fault currents from bypassing
the arm reactor.
5.2.4. Arrester BR (Bridge Arm Reactor)
The arm reactor plays a significant role in limiting the rise of the fault current that enters the
converter station and flows through the MMC valves. The conduction of arrester BR would
bypass the arm reactor and thus prevent it from limiting the di/dt of the fault current, which
represents a potentially dangerous condition for the MMC valve.
Therefore, arrester BR should only be installed if the overvoltage levels that may appear across
the arm reactor may reach or surpass the withstand voltage of the reactor. In such case, there
Contribution to Insulation Coordination Studies for VSC-HVDC Systems Chapter 3: Slow-Front Overvoltages and Fault Analysis
Nicolas Manduley 2020 Page 109
is special interest in keeping the protective level of arrester BR as high as possible to not
sacrifice the ability of the arm reactor to limit the rise of the currents entering the station.
5.2.5. Arresters C/D (DC Bus) and DL/DC (Line/Cable Departure)
These arresters are installed to protect the DC switchyard equipment connected to the DC
pole and may be subjected to different kinds of stresses depending on the configuration. In a
bipolar configuration, such arresters are mainly subjected to lightning stresses, while in
symmetric monopolar configurations they can be also subjected to slow-front and temporary
overvoltages, as seen in the studies presented in this chapter.
Within the context of lightning protection, due to the high rise rate of lightning currents,
several arresters may be required at various locations to provide protection to different areas
of the station. For instance, arresters C and D provide direct protection to the DC bus, and
some indirect protection to the smoothing reactor (for configurations where a smoothing
reactor is present). Arresters DL and DC provide protection to the departure of the line or
cable, respectively.
For a symmetric monopolar configuration, DC bus/cable/line arresters may be heavily
demanded, mainly due to the charge of the healthy pole in case of a ground fault on the DC
bus or cable/line. In such cases, special care shall be taken when specifying such arresters to
guarantee the safe operation of the arresters, particularly in terms of energy absorption
capability.
For all arresters above, the minimum continuous operating voltage Uc is the maximum
nominal DC voltage at which the system is designed to operate.
For a 100% cable link where no significant SFOs or TOVs occur, arrester DC may be omitted
since the cable may not be exposed to lightning overvoltages (IEC 60071-5).
5.2.6. Arrester E, EL and EM (Neutral Bus)
Since arresters E, EL and EM only concern bipolar configurations (and their respective
operating modes), the specification of such arresters follows the same methodology described
in IEC 60071-5 for LCC-HVDC systems.
Briefly, during balanced bipolar operation, the neutral point is subjected to very low voltages
under normal operating conditions (in case of a solid grounding scheme). However, during
asymmetric monopolar or unbalanced bipolar operation, usually a metallic return is present,
and more significant voltage levels may appear in normal operating conditions due to the
voltage drop produced by the return current across the metallic return. Arresters shall be
capable of operating at such levels, if the station is designed to operate in such modes in
normal operating conditions.
Contribution to Insulation Coordination Studies for VSC-HVDC Systems Chapter 3: Slow-Front Overvoltages and Fault Analysis
Nicolas Manduley 2020 Page 110
In addition, neutral bus arresters shall be capable of discharging large amounts of energy. This
may become difficult, as the energy handling capability is proportional to the rated voltage of
the arrester. Since the voltage drop in the metallic return is small (compared, for instance, to
the nominal DC voltage), it is likely that the energy handling capability of the neutral arresters
is not high enough to guarantee the safe functioning of the arrester during such discharge of
energy. When this is the case, several arrester columns may be installed in parallel for higher
energy absorption capability. In case of excessive energy ratings, a sacrificial arrester may be
installed.
5.2.7. Arresters J and JM (Junction between Cables and Overhead Lines)
Whenever a hybrid line is present, a surge arrester may be placed in the cable – overhead line
junction to prevent excessive overvoltages on the cable (IEC 60071-5). The procedures and
considerations for the specifications of the parameters of arresters J and JM are the same as
for arresters of the DC bus or line (arresters C, D, DL/DC in §5.2.5) and for the neutral bus
(arrester EM in §5.2.6).
5.2.8. Arrester SPR (Star-Point Reactor Resistance)
The star-point reactor represents a high-impedance grounding scheme for the secondary side
of the converter transformer. The goal of the resistance is to limit as much as possible the
current flowing through the ground and avoid the saturation of the reactors connected to the
phases of the secondary side of the transformer. This way, the star-point reactor can
effectively provide a zero-voltage reference to the system.
Therefore, arrester SPR should only be installed if the overvoltage levels that may appear
across the resistance of the star-point reactor may reach or surpass the withstand voltage of
the resistance. If needed, there is particular interest in keeping the protective levels of the
arrester as high as possible to avoid the saturation of the inductances of the star-point reactor.
5.2.9. Arrester SR (Smoothing Reactor)
Similarly as for arrester BR, the smoothing reactor plays a significant role in limiting the fault
currents entering the station, and particularly in case of fast-front overvoltages due to
lightning strikes coming from the line.
Therefore, arrester SR should only be installed if the overvoltage levels that may appear across
the smoothing reactor may reach or surpass the withstand voltage of the reactor. In such case,
there is special interest in keeping the protective level of arrester SR as high as possible to not
sacrifice the ability of the smoothing reactor to limit the rise of the currents entering the
station.

Contribution to Insulation Coordination Studies for VSC-HVDC Systems Chapter 3: Slow-Front Overvoltages and Fault Analysis
Nicolas Manduley 2020 Page 111
5.2.10. Arrester V (MMC Valve)
The minimum operating voltage Uc of the arrester shall be at least as high as the normal
operating voltage of the MMC submodule (VSM). However, as seen in previous sections,
overvoltage levels across the MMC submodule are barely above the voltage under normal
operating conditions (about 10 – 20% higher). As a result, no significant currents would flow
through arrester V during SFOs and TOVs, and therefore it may be omitted for most
applications.
Furthermore, the design rules of semiconductor components typically result in relatively high
overvoltage withstand. For instance, an IGBT may be designed for 3 kV and selected to operate
at 1.5 kV. In such a case, a dedicated overvoltage protection through surge arresters would
not be justified since the maximum overvoltage is significantly inferior to the maximum
withstand voltage of the component.
5.3 Algorithm for the Specification of the Surge Arresters
An algorithm is proposed for the specification of the parameters of the surge arresters taking
into consideration the main conclusions from this research. It consists of an iterative process
involving electromagnetic transient simulations of faults, switching operations and other
phenomena leading to slow-front and temporary overvoltages. Throughout the process, the
specifications of the surge arresters are adjusted after each iteration by considering the
energy absorption levels of each arrester, as well as the maximum overvoltage levels for each
location.
However, this algorithm has not yet been tested, for which is it presented and explained in
Appendix E. Further studies shall investigate the performance of this algorithm and its capacity
to obtain an optimal specification of the surge arresters for the overvoltage protection
strategy of the MMC-HVDC station, based on the fundamental principles described in this
chapter.
6. Conclusion
Insulation coordination consists of the selection of the dielectric strength of the insulating
materials taking into account the action of overvoltage limitation devices, such as surge
arresters. To complete this task, it is fundamental to understand the behaviour of the system
under both normal and transient conditions to be able to design an adequate overvoltage
protection strategy leading to an optimal design of the insulation of the system.
One of the current challenges regarding VSC-HVDC systems, and particularly the MMC, is that
there are currently no standards providing the guidelines on how the insulation coordination
should be performed for such systems.
Contribution to Insulation Coordination Studies for VSC-HVDC Systems Chapter 3: Slow-Front Overvoltages and Fault Analysis
Nicolas Manduley 2020 Page 112
In this chapter, the fundamental principles of insulation coordination, extracted from the
HVAC and LCC-HVDC standards, have been adapted to MMC-HVDC configurations within the
context of slow-front and temporary overvoltages. The procedures have been adapted by
considering the essential differences between AC and DC, and also the specific differences
between LCC-HVDC and VSC-HVDC systems. The latter includes mainly: the architecture of the
converter, the use of a wider variety of station configurations (e.g. symmetric monopolar or
bipolar configuration), the location and design of the surge arresters, the transient behaviour
and the overvoltage levels.
Inspired on the approach of IEC 60071-5 for LCC-HVDC systems, two fundamental schemes
are proposed in this work to constitute the base for the insulation coordination studies for
MMC-HVDC stations. Such fundamental schemes allow extending the insulation coordination
principles to any architecture (with the arm reactor on the AC or DC side), configuration
(monopolar, bipolar, MTDC) and possible locations for the surge arresters for the overvoltage
protection strategy. They also include the possibility to have different link technologies (cable,
overhead lines or hybrid links) and analyse different operating modes with or without metallic
returns.
A voltage and overvoltage analyses have been performed using both analytical expressions
and simulation studies to characterise the types of overvoltages that may occur at the critical
locations and components, as well as their causes. The results have been analysed in order to
provide general insights on the potential stresses that may appear for each location and the
aspects to be considered for the design of their respective surge arresters. In addition, the
influence of the surge arrester arrangement within the station have been investigated by
analysing various surge arrester configurations, all designed with the same criteria for each
case, under the most critical fault scenarios as defined by the studies presented in this chapter
as well as studies available in the literature. It has been concluded that the particular
arrangement of surge arresters chosen for the overvoltage protection strategy has a very
significant impact on the role that each arrester plays during transients, as well as on the
selection of their individual parameters.
Based on the analysis of the results and individual conclusions for each section, a general
insulation coordination procedure for MMC-HVDC systems has been proposed. The proposed
approach addresses all the aspects discussed in Chapter 1 and at the beginning of this chapter
that have been determined to be essential in adapting the fundamental principles of insulation
coordination to such systems. It also provides specific guidelines for the design of each of the
surge arresters that may be considered in the overvoltage protection strategy. On the same
line, an algorithm for the specification of the surge arresters has been proposed, which is
presented in Appendix E. The proposed algorithm allows selecting the protective levels of the
Contribution to Insulation Coordination Studies for VSC-HVDC Systems Chapter 3: Slow-Front Overvoltages and Fault Analysis
Nicolas Manduley 2020 Page 113
surge arresters and number of parallel columns based on the energy absorption levels
obtained through the electromagnetic transient simulations.
It is worth mentioning that a fully qualitative method for the study and analysis of the transient
behaviour of a system has been proposed, which is presented in Appendix D. The method
proves to be useful for obtaining valuable information about potentially critical events leading
to overvoltages, as well as the most vulnerable points and the most critical instants for each
fault type to occur, without the need for performing electromagnetic transient simulations.
However, there are often several phenomena that may have a significant influence on the
overvoltage levels that cannot be considered through the simplified approach. The method is
therefore considered a useful additional tool in addition to the EMT simulations, which can
help achieve a better understanding of the fundamental behaviour of the system, but cannot
constitute an accurate analysis method on its own.
The conclusions obtained in this last part justify the choice of laying the foundations of the
insulation coordination approach proposed in this chapter on simulation studies.
In the next chapter, the specificities of HVDC are analysed in the context of overvoltage
protection of HVDC lines against fast-front overvoltages due to lightning strokes on the lines,
as well as other aspects regarding lightning protection that concerns MMC-HVDC systems with
overhead lines.
Contribution to Insulation Coordination Studies for VSC-HVDC Systems Chapter 4: Fast-Front Overvoltage Analysis and Improvement of the Overhead Line Lightning Performance
Nicolas Manduley 2020 Page 114
Contribution to Insulation Coordination Studies for VSC-HVDC Systems Chapter 4: Fast-Front Overvoltage Analysis and Improvement of the Overhead Line Lightning Performance
Nicolas Manduley 2020 Page 115
Chapter 4 Fast-Front Overvoltage Analysis and Improvement of the Overhead Line Lightning Performance
1. Introduction
Lightning strokes are the most common source of fast-front overvoltages in overhead lines.
The impacts can be produced at either the tower and/or shield wires (back-flashover) or
directly to the power conductors (shielding failure). The estimation of lightning performance
consists of the calculation of the flashover risk in both above mentioned cases, namely the
back-flashover rate (BFOR) and shielding failure flashover rate (SFFOR).
The main goal of this chapter is to provide information on how to perform lightning studies
for HVDC systems according to the existing standards and guidelines (CIGRE TB 549, 2013;
CIGRE TB 63, 1991; CIGRE TB 704, 2017; IEC 60071-1, 2011; IEC 60071-2, 2018; IEC 60071-5,
2014; IEEE Std. 1243, 1997), and use this knowledge to achieve a better understanding of how
HVDC (and specially VSC-HVDC) systems behave and to propose solutions for the
improvement of the lightning performance in such systems. The calculation methods and
procedures followed for the estimation of both the BFOR and SFFOR are explained in detail in
Chapter 1, §6.4.
To do so, the specific particularities of HVDC systems are addressed. Special emphasis will be
placed on the case of double-circuit HVDC configurations since they present the potentially
most critical conditions in terms of lightning performance and loss of transmitted power, while
also including all the issues associated to single circuit lines.
Next, case studies will be presented to analyse the impact of the configuration of the DC poles
on the lightning performance of double circuit configurations. Factors such as the footing
resistance of the tower, the coupling of the conductors, the polarity of the stroke and the
voltage drops across the tower are considered to perform the analysis.
Finally, and over the base constructed in the above mentioned sections, two solutions aiming
to improve the lightning performance are investigated, namely the installation of line surge
arresters and the use of unbalanced insulation for double-circuit HVDC lines.
2. Specificities of HVDC Overhead Lines Regarding Lightning Performance
This section addresses different aspects regarding the lightning performance of HVDC
systems. Generally speaking, the fundamental factors playing a role in the lightning
performance of HVDC lines are the same as those for HVAC lines (see Chapter 1). The main
differences are associated to the insulator string lengths, which are typically longer for HVDC
insulators, and the power frequency voltages of the phases.
Contribution to Insulation Coordination Studies for VSC-HVDC Systems Chapter 4: Fast-Front Overvoltage Analysis and Improvement of the Overhead Line Lightning Performance
Nicolas Manduley 2020 Page 116
As in HVAC lines the voltage across the insulators is constantly changing, the flashover risk of
each phase will depend on the instantaneous voltage when the stroke is produced. Because
each phase goes through positive and negative semi-cycles, the overall risk associated to the
polarity of the conductors is averaged over the whole cycles of each phase. Conversely, in
HVDC systems the voltages are constant, and the flashover risk of each DC conductor is
different depending on their respective polarity and does not depend on the instant when
lightning strikes.
This fact introduces a particular problem when double (or multi) circuit HVDC configurations
are considered. Since the polarities and amplitudes of the conductors are constant, the
geometric configuration of the DC poles within the tower may have a significant effect on the
overall lightning performance against strikes of either polarity. Additionally, when the
operating voltages of two separate circuits are the same, it means that there are always two
conductors guaranteed to have the same voltage level at the moment of the strike. In other
words, two conductors from different circuits may be equally or similarly likely to flashover,
which could lead to the simultaneous loss of two circuits due to the same stroke.
In this section, the consequences of faults due to lightning strokes on a DC system are
discussed, as well as the mechanisms involved in the lightning performance of HVDC systems,
and in particular for double-circuit HVDC configurations.
2.1 Consequences of Faults due to Lightning Strokes on a DC System
Whenever a flashover due to lightning occurs, a temporary pole-to-ground fault appears.
Depending on the protection strategy of the DC system, an AC or DC circuit breaker may be
required to open to interrupt the fault current (CIGRE TB 269, 2005). Except in the cases where
the extinction of the arc is produced before the protection reacts (Woodford, 2014), this may
result in a significant temporary loss of transmitted power. As discussed in Chapter 1, this may
result in disturbances which may last less than a second to up to one minute, and in some
cases, it could compromise the stability of the system.
In the case of double circuit DC transmission towers, and particularly for direct strikes to the
tower or shield wires, this risk may be especially high since two DC poles of the same polarity
could back-flashover at the same time due to the same stroke, potentially resulting in an even
higher loss of transmitted power. In single circuit configurations, this risk is significantly lower
because the only two poles present are of opposite polarities, and therefore the voltage
variation across their respective insulators due to the voltage rise of the tower will tend to
add to the previous voltage level of one, and subtract from the other.
For instance, consider the insulator of a positive DC pole. In the event of a negative stroke, the
voltage of the tower increases negatively, and thus the total difference between the positive
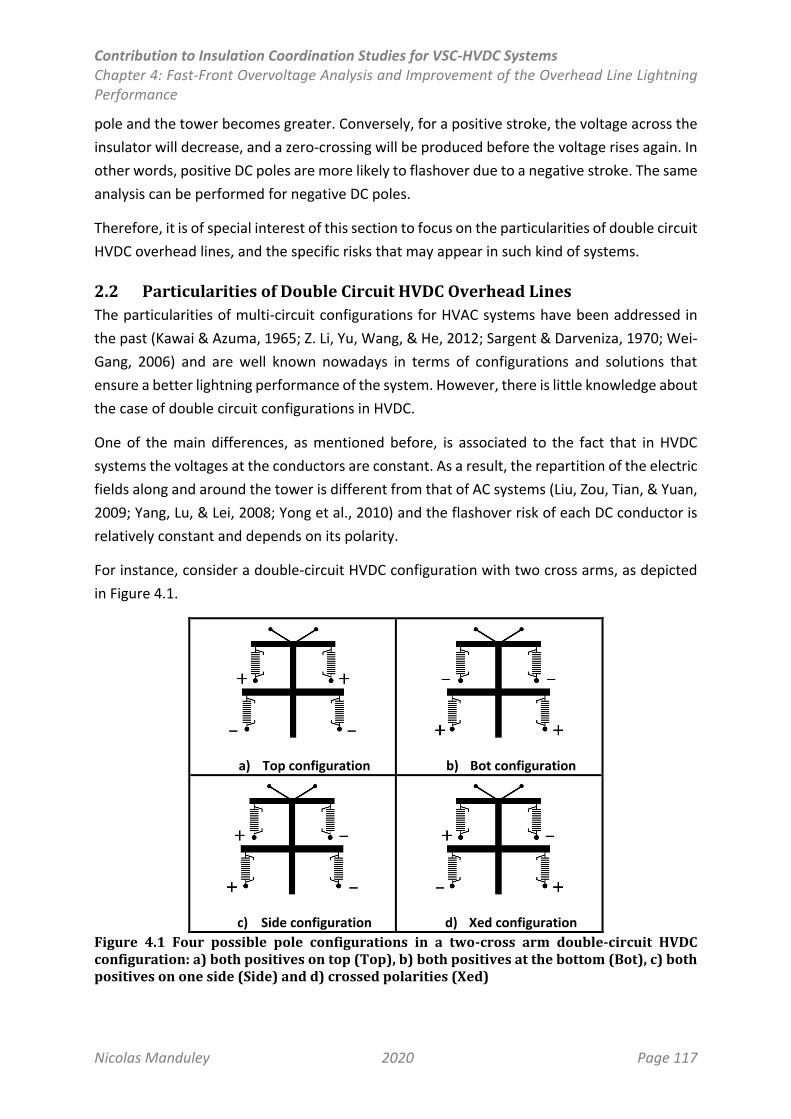
Contribution to Insulation Coordination Studies for VSC-HVDC Systems Chapter 4: Fast-Front Overvoltage Analysis and Improvement of the Overhead Line Lightning Performance
Nicolas Manduley 2020 Page 117
pole and the tower becomes greater. Conversely, for a positive stroke, the voltage across the
insulator will decrease, and a zero-crossing will be produced before the voltage rises again. In
other words, positive DC poles are more likely to flashover due to a negative stroke. The same
analysis can be performed for negative DC poles.
Therefore, it is of special interest of this section to focus on the particularities of double circuit
HVDC overhead lines, and the specific risks that may appear in such kind of systems.
2.2 Particularities of Double Circuit HVDC Overhead Lines
The particularities of multi-circuit configurations for HVAC systems have been addressed in
the past (Kawai & Azuma, 1965; Z. Li, Yu, Wang, & He, 2012; Sargent & Darveniza, 1970; Wei-
Gang, 2006) and are well known nowadays in terms of configurations and solutions that
ensure a better lightning performance of the system. However, there is little knowledge about
the case of double circuit configurations in HVDC.
One of the main differences, as mentioned before, is associated to the fact that in HVDC
systems the voltages at the conductors are constant. As a result, the repartition of the electric
fields along and around the tower is different from that of AC systems (Liu, Zou, Tian, & Yuan,
2009; Yang, Lu, & Lei, 2008; Yong et al., 2010) and the flashover risk of each DC conductor is
relatively constant and depends on its polarity.
For instance, consider a double-circuit HVDC configuration with two cross arms, as depicted
in Figure 4.1.
a) Top configuration
b) Bot configuration
c) Side configuration
d) Xed configuration
Figure 4.1 Four possible pole configurations in a two-cross arm double-circuit HVDC configuration: a) both positives on top (Top), b) both positives at the bottom (Bot), c) both positives on one side (Side) and d) crossed polarities (Xed)
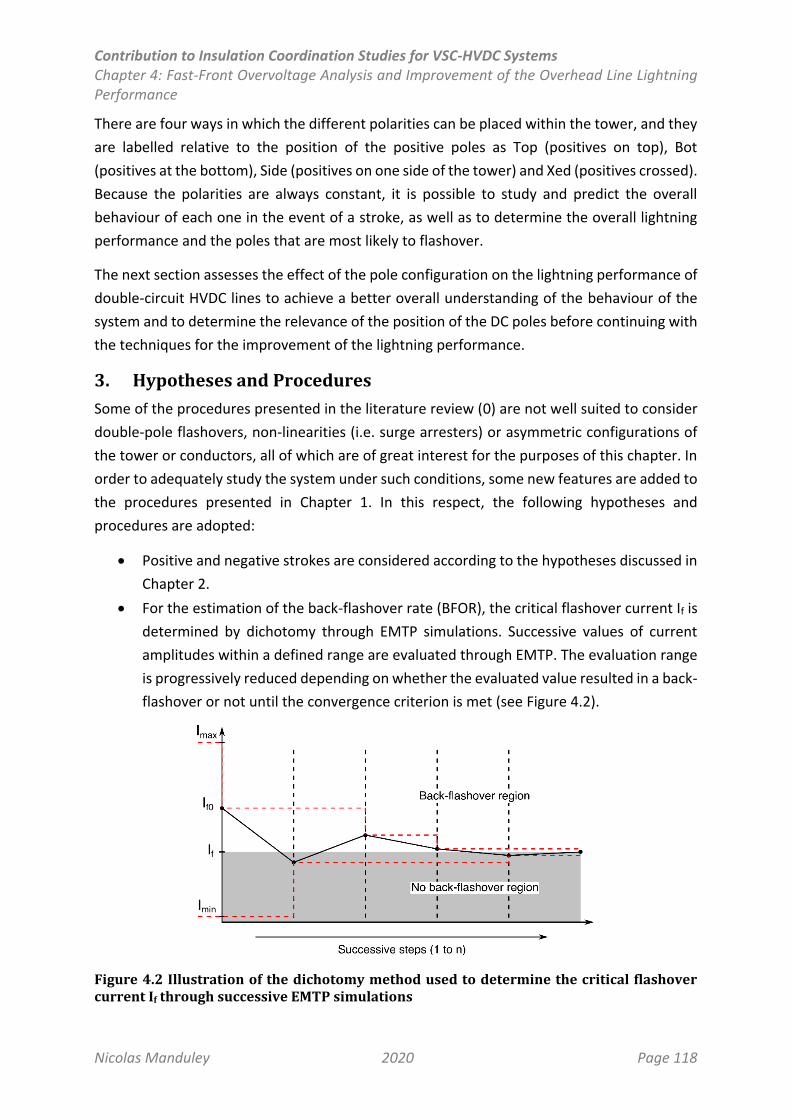
Contribution to Insulation Coordination Studies for VSC-HVDC Systems Chapter 4: Fast-Front Overvoltage Analysis and Improvement of the Overhead Line Lightning Performance
Nicolas Manduley 2020 Page 118
There are four ways in which the different polarities can be placed within the tower, and they
are labelled relative to the position of the positive poles as Top (positives on top), Bot
(positives at the bottom), Side (positives on one side of the tower) and Xed (positives crossed).
Because the polarities are always constant, it is possible to study and predict the overall
behaviour of each one in the event of a stroke, as well as to determine the overall lightning
performance and the poles that are most likely to flashover.
The next section assesses the effect of the pole configuration on the lightning performance of
double-circuit HVDC lines to achieve a better overall understanding of the behaviour of the
system and to determine the relevance of the position of the DC poles before continuing with
the techniques for the improvement of the lightning performance.
3. Hypotheses and Procedures
Some of the procedures presented in the literature review (0) are not well suited to consider
double-pole flashovers, non-linearities (i.e. surge arresters) or asymmetric configurations of
the tower or conductors, all of which are of great interest for the purposes of this chapter. In
order to adequately study the system under such conditions, some new features are added to
the procedures presented in Chapter 1. In this respect, the following hypotheses and
procedures are adopted:
Positive and negative strokes are considered according to the hypotheses discussed in
Chapter 2.
For the estimation of the back-flashover rate (BFOR), the critical flashover current If is
determined by dichotomy through EMTP simulations. Successive values of current
amplitudes within a defined range are evaluated through EMTP. The evaluation range
is progressively reduced depending on whether the evaluated value resulted in a back-
flashover or not until the convergence criterion is met (see Figure 4.2).
Figure 4.2 Illustration of the dichotomy method used to determine the critical flashover current If through successive EMTP simulations
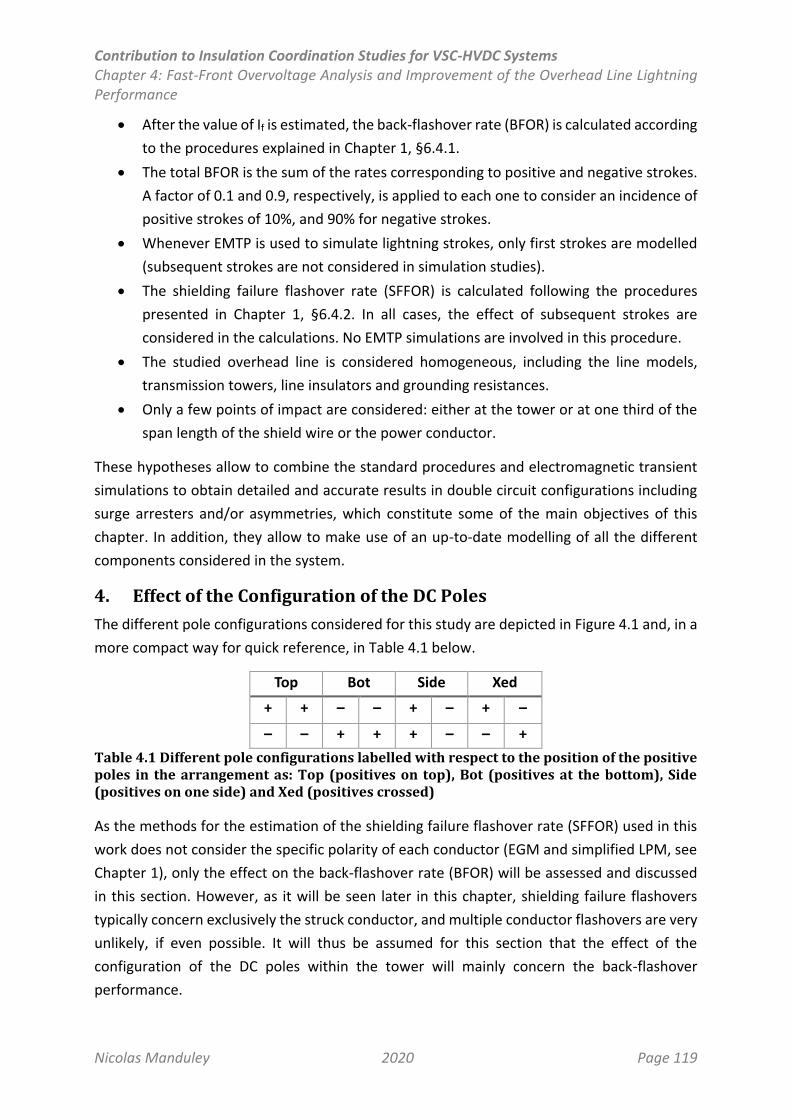
Contribution to Insulation Coordination Studies for VSC-HVDC Systems Chapter 4: Fast-Front Overvoltage Analysis and Improvement of the Overhead Line Lightning Performance
Nicolas Manduley 2020 Page 119
After the value of If is estimated, the back-flashover rate (BFOR) is calculated according
to the procedures explained in Chapter 1, §6.4.1.
The total BFOR is the sum of the rates corresponding to positive and negative strokes.
A factor of 0.1 and 0.9, respectively, is applied to each one to consider an incidence of
positive strokes of 10%, and 90% for negative strokes.
Whenever EMTP is used to simulate lightning strokes, only first strokes are modelled
(subsequent strokes are not considered in simulation studies).
The shielding failure flashover rate (SFFOR) is calculated following the procedures
presented in Chapter 1, §6.4.2. In all cases, the effect of subsequent strokes are
considered in the calculations. No EMTP simulations are involved in this procedure.
The studied overhead line is considered homogeneous, including the line models,
transmission towers, line insulators and grounding resistances.
Only a few points of impact are considered: either at the tower or at one third of the
span length of the shield wire or the power conductor.
These hypotheses allow to combine the standard procedures and electromagnetic transient
simulations to obtain detailed and accurate results in double circuit configurations including
surge arresters and/or asymmetries, which constitute some of the main objectives of this
chapter. In addition, they allow to make use of an up-to-date modelling of all the different
components considered in the system.
4. Effect of the Configuration of the DC Poles
The different pole configurations considered for this study are depicted in Figure 4.1 and, in a
more compact way for quick reference, in Table 4.1 below.
Top Bot Side Xed
+ + – – + – + –
– – + + + – – +
Table 4.1 Different pole configurations labelled with respect to the position of the positive poles in the arrangement as: Top (positives on top), Bot (positives at the bottom), Side (positives on one side) and Xed (positives crossed)
As the methods for the estimation of the shielding failure flashover rate (SFFOR) used in this
work does not consider the specific polarity of each conductor (EGM and simplified LPM, see
Chapter 1), only the effect on the back-flashover rate (BFOR) will be assessed and discussed
in this section. However, as it will be seen later in this chapter, shielding failure flashovers
typically concern exclusively the struck conductor, and multiple conductor flashovers are very
unlikely, if even possible. It will thus be assumed for this section that the effect of the
configuration of the DC poles within the tower will mainly concern the back-flashover
performance.
Contribution to Insulation Coordination Studies for VSC-HVDC Systems Chapter 4: Fast-Front Overvoltage Analysis and Improvement of the Overhead Line Lightning Performance
Nicolas Manduley 2020 Page 120
Therefore, the effect of the pole configuration on the overall and double back-flashover
lightning performance is investigated for two voltage levels (320 kV and 500 kV)—in line with
the current tendencies for the construction of HVDC lines in Europe—and different values of
the tower resistance ranging from 10 to 100 Ω. The contents and the results presented in this
section have been submitted by the author to EPSR journal in October 2020.
4.1 Case Study Setup
The studies have been carried out using EMTP, and each component has been modelled
following the guidelines and methods discussed in Chapter 2.
The general simulation setup used in this work for lightning studies, based on the guidelines
presented in Chapter 2, is illustrated in Figure 4.3 and Figure 4.4. A section of eleven towers
has been modelled to take into consideration the effect of successive reflections on
neighbouring towers. Line sections of 300 m are used to represent the spans between the
towers. A long line section (50 km) is placed at both ends to avoid reflections with the stations.
The initial conditions are set with ideal voltage and current sources at the ends of the line
section (see Figure 4.3a and Figure 4.3b). This EMTP model allows to apply strokes on either
the shield wires or the power conductors, either at the tower level or along the span (see
Figure 4.3b).
Overhead lines, including the spans and the 50 km sections, are represented by a frequency
dependent (FD) model. Two and three-bundle conductors configurations are used for the 320
kV and 500 kV systems, respectively, as it is typical for such voltage levels (CIGRE TB 388,
2009). To consider the skin effect, each individual conductor is modelled as a solid conductor
in EMTP.
Insulator strings are represented through their arcing horns using the leader model proposed
by Shindo (with the adaptations specified in Chapter 2), which is recommended for long gaps
and considers the streamer and leader formation phases of a flashover (Shindo & Suzuki,
1985), as well as the polarity of the impulse. The base string length of the insulators were
chosen as typical approximate values presented in (CIGRE TB 388, 2009) for HVDC links for
both voltage levels, and are 3.42 m and 5.2 m for the 320 kV and 500 kV systems, respectively.
Their respective air distances between the arcing horns are 2.74 m and 4.16 m, which are the
values used to model the air gap between the arcing horns.
Lightning strokes are applied at the middle of the considered line section (i.e. tower 6).
Lightning currents up to 350 kA were considered. If no flashovers were produced at 350 kA,
the corresponding value of back-flashover rate (BFOR) is considered to be zero. This is justified
by the extremely low probability for a stroke of such intensity to occur, for which it can be
neglected in the calculations.
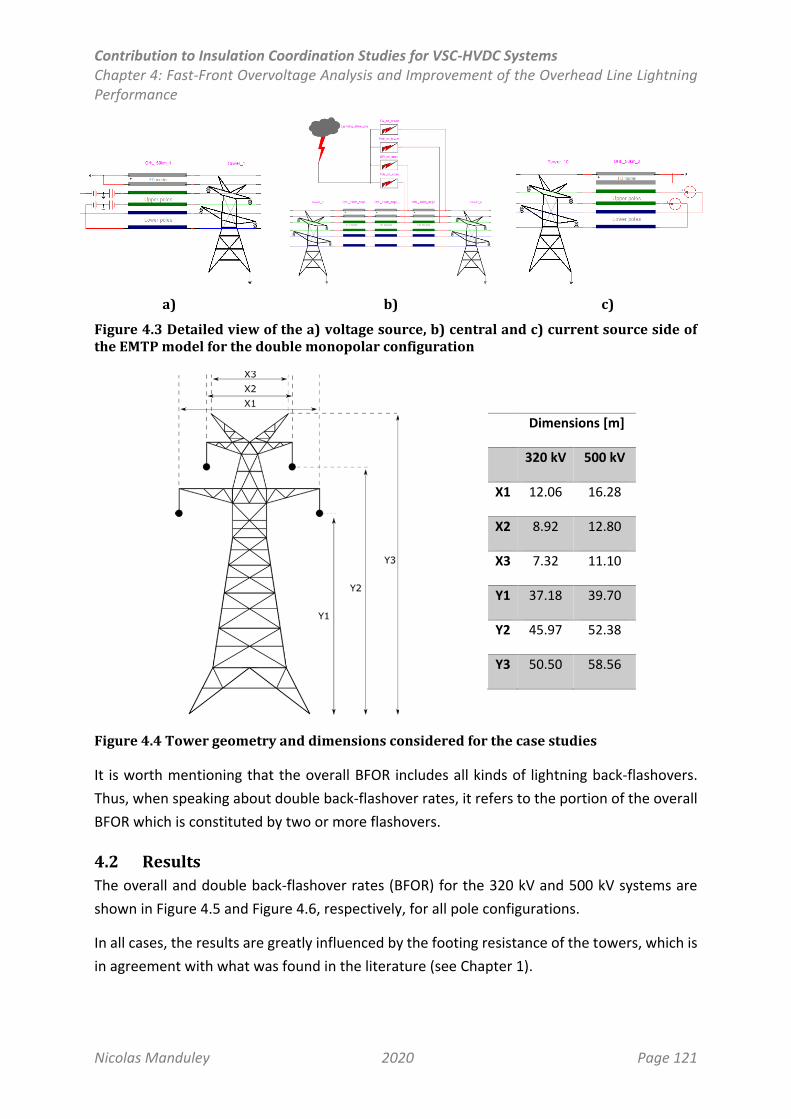
Contribution to Insulation Coordination Studies for VSC-HVDC Systems Chapter 4: Fast-Front Overvoltage Analysis and Improvement of the Overhead Line Lightning Performance
Nicolas Manduley 2020 Page 121
a)
b)
c)
Figure 4.3 Detailed view of the a) voltage source, b) central and c) current source side of the EMTP model for the double monopolar configuration
Dimensions [m]
320 kV 500 kV
X1 12.06 16.28
X2 8.92 12.80
X3 7.32 11.10
Y1 37.18 39.70
Y2 45.97 52.38
Y3 50.50 58.56
Figure 4.4 Tower geometry and dimensions considered for the case studies
It is worth mentioning that the overall BFOR includes all kinds of lightning back-flashovers.
Thus, when speaking about double back-flashover rates, it refers to the portion of the overall
BFOR which is constituted by two or more flashovers.
4.2 Results
The overall and double back-flashover rates (BFOR) for the 320 kV and 500 kV systems are
shown in Figure 4.5 and Figure 4.6, respectively, for all pole configurations.
In all cases, the results are greatly influenced by the footing resistance of the towers, which is
in agreement with what was found in the literature (see Chapter 1).
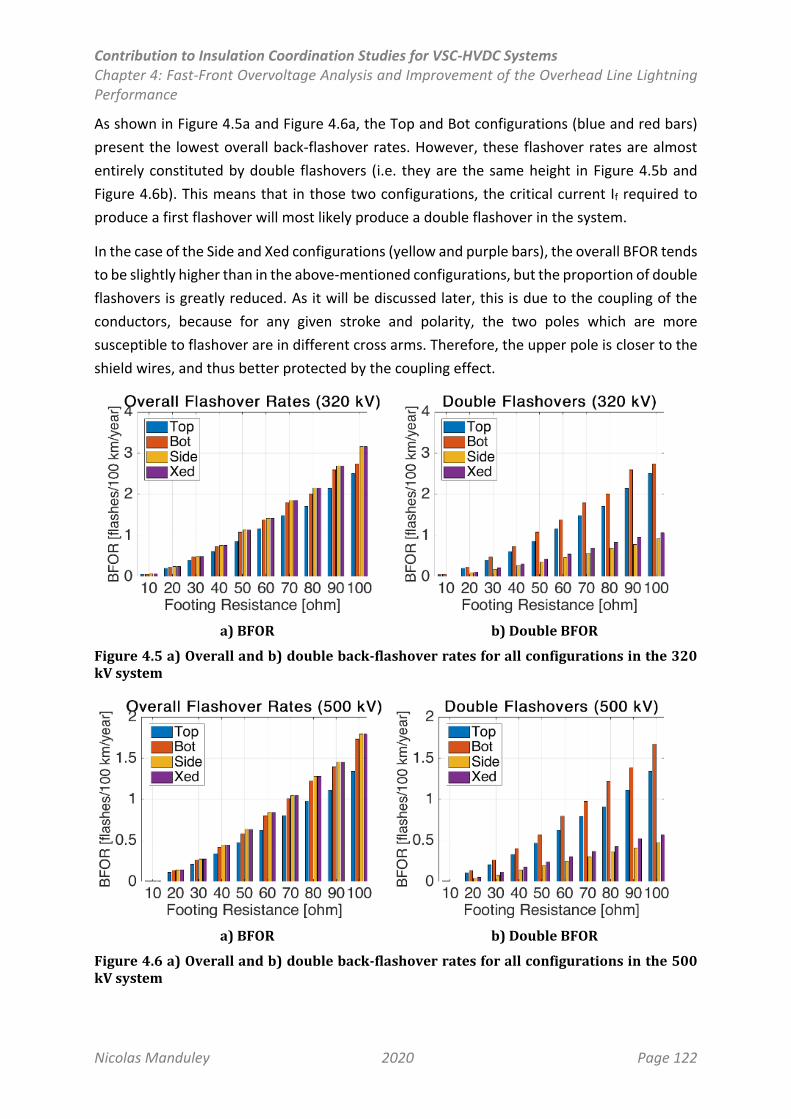
Contribution to Insulation Coordination Studies for VSC-HVDC Systems Chapter 4: Fast-Front Overvoltage Analysis and Improvement of the Overhead Line Lightning Performance
Nicolas Manduley 2020 Page 122
As shown in Figure 4.5a and Figure 4.6a, the Top and Bot configurations (blue and red bars)
present the lowest overall back-flashover rates. However, these flashover rates are almost
entirely constituted by double flashovers (i.e. they are the same height in Figure 4.5b and
Figure 4.6b). This means that in those two configurations, the critical current If required to
produce a first flashover will most likely produce a double flashover in the system.
In the case of the Side and Xed configurations (yellow and purple bars), the overall BFOR tends
to be slightly higher than in the above-mentioned configurations, but the proportion of double
flashovers is greatly reduced. As it will be discussed later, this is due to the coupling of the
conductors, because for any given stroke and polarity, the two poles which are more
susceptible to flashover are in different cross arms. Therefore, the upper pole is closer to the
shield wires, and thus better protected by the coupling effect.
a) BFOR
b) Double BFOR
Figure 4.5 a) Overall and b) double back-flashover rates for all configurations in the 320 kV system
a) BFOR
b) Double BFOR
Figure 4.6 a) Overall and b) double back-flashover rates for all configurations in the 500 kV system
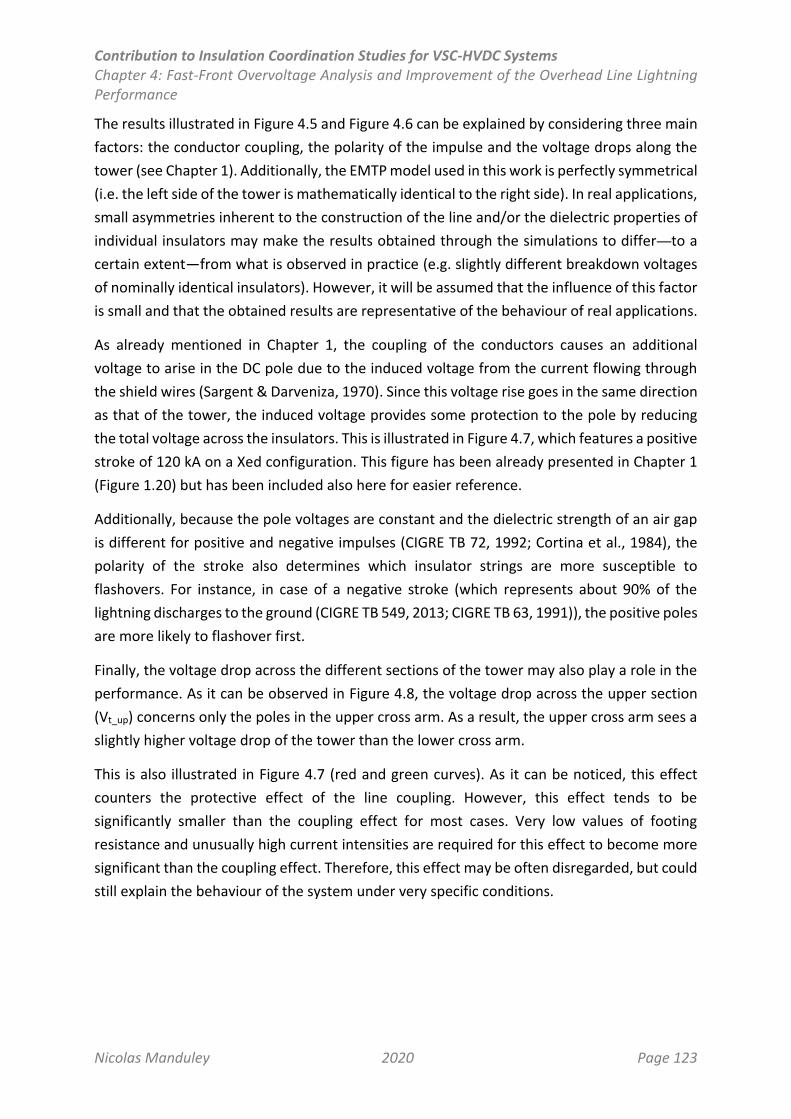
Contribution to Insulation Coordination Studies for VSC-HVDC Systems Chapter 4: Fast-Front Overvoltage Analysis and Improvement of the Overhead Line Lightning Performance
Nicolas Manduley 2020 Page 123
The results illustrated in Figure 4.5 and Figure 4.6 can be explained by considering three main
factors: the conductor coupling, the polarity of the impulse and the voltage drops along the
tower (see Chapter 1). Additionally, the EMTP model used in this work is perfectly symmetrical
(i.e. the left side of the tower is mathematically identical to the right side). In real applications,
small asymmetries inherent to the construction of the line and/or the dielectric properties of
individual insulators may make the results obtained through the simulations to differ—to a
certain extent—from what is observed in practice (e.g. slightly different breakdown voltages
of nominally identical insulators). However, it will be assumed that the influence of this factor
is small and that the obtained results are representative of the behaviour of real applications.
As already mentioned in Chapter 1, the coupling of the conductors causes an additional
voltage to arise in the DC pole due to the induced voltage from the current flowing through
the shield wires (Sargent & Darveniza, 1970). Since this voltage rise goes in the same direction
as that of the tower, the induced voltage provides some protection to the pole by reducing
the total voltage across the insulators. This is illustrated in Figure 4.7, which features a positive
stroke of 120 kA on a Xed configuration. This figure has been already presented in Chapter 1
(Figure 1.20) but has been included also here for easier reference.
Additionally, because the pole voltages are constant and the dielectric strength of an air gap
is different for positive and negative impulses (CIGRE TB 72, 1992; Cortina et al., 1984), the
polarity of the stroke also determines which insulator strings are more susceptible to
flashovers. For instance, in case of a negative stroke (which represents about 90% of the
lightning discharges to the ground (CIGRE TB 549, 2013; CIGRE TB 63, 1991)), the positive poles
are more likely to flashover first.
Finally, the voltage drop across the different sections of the tower may also play a role in the
performance. As it can be observed in Figure 4.8, the voltage drop across the upper section
(Vt_up) concerns only the poles in the upper cross arm. As a result, the upper cross arm sees a
slightly higher voltage drop of the tower than the lower cross arm.
This is also illustrated in Figure 4.7 (red and green curves). As it can be noticed, this effect
counters the protective effect of the line coupling. However, this effect tends to be
significantly smaller than the coupling effect for most cases. Very low values of footing
resistance and unusually high current intensities are required for this effect to become more
significant than the coupling effect. Therefore, this effect may be often disregarded, but could
still explain the behaviour of the system under very specific conditions.
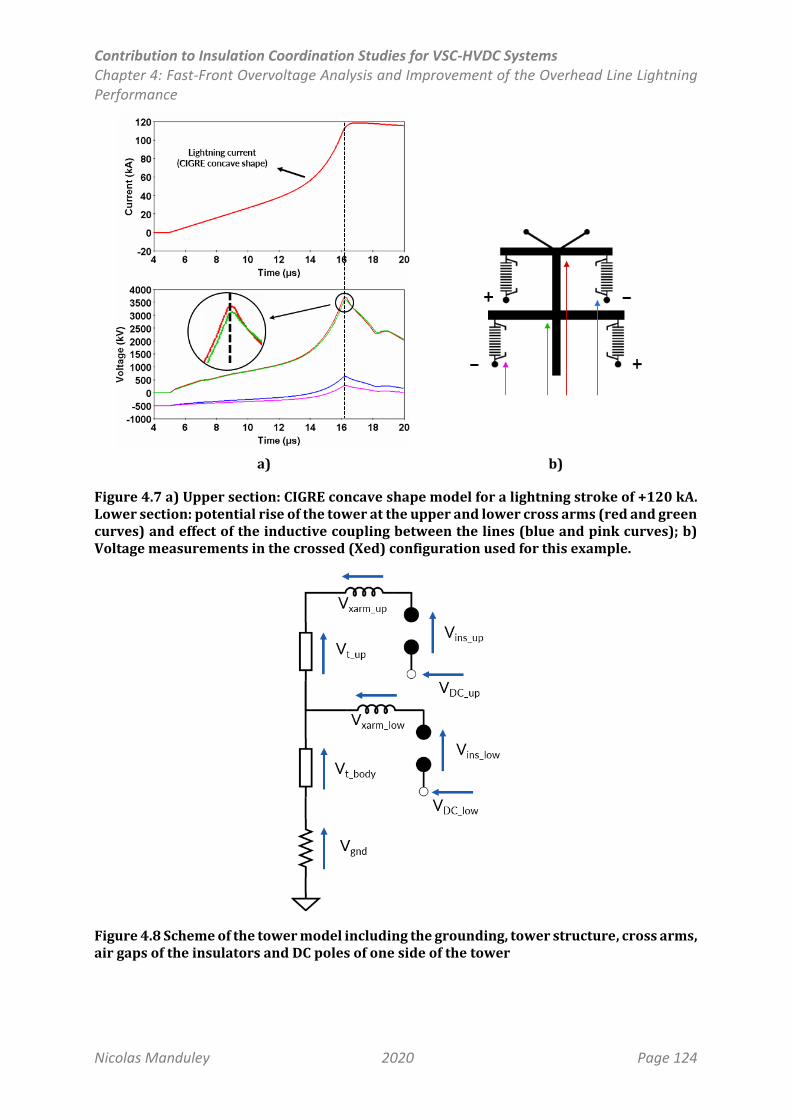
Contribution to Insulation Coordination Studies for VSC-HVDC Systems Chapter 4: Fast-Front Overvoltage Analysis and Improvement of the Overhead Line Lightning Performance
Nicolas Manduley 2020 Page 124
a)
b)
Figure 4.7 a) Upper section: CIGRE concave shape model for a lightning stroke of +120 kA. Lower section: potential rise of the tower at the upper and lower cross arms (red and green curves) and effect of the inductive coupling between the lines (blue and pink curves); b) Voltage measurements in the crossed (Xed) configuration used for this example.
Figure 4.8 Scheme of the tower model including the grounding, tower structure, cross arms, air gaps of the insulators and DC poles of one side of the tower
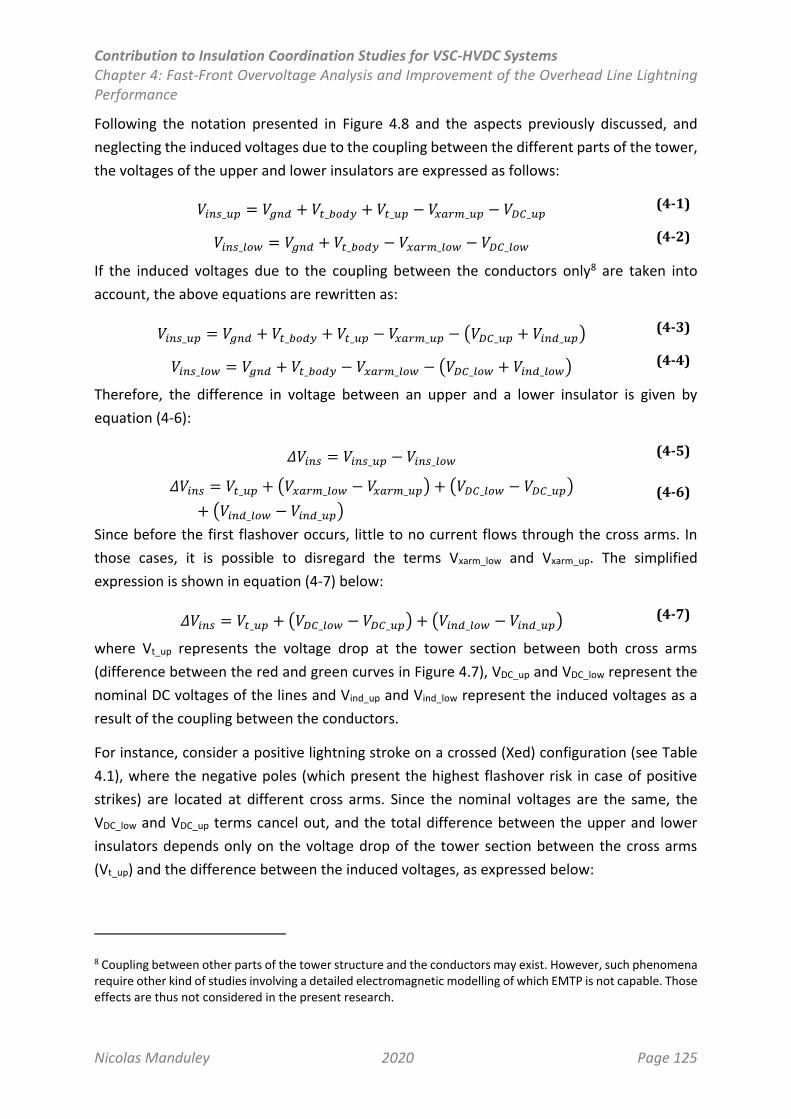
Contribution to Insulation Coordination Studies for VSC-HVDC Systems Chapter 4: Fast-Front Overvoltage Analysis and Improvement of the Overhead Line Lightning Performance
Nicolas Manduley 2020 Page 125
Following the notation presented in Figure 4.8 and the aspects previously discussed, and
neglecting the induced voltages due to the coupling between the different parts of the tower,
the voltages of the upper and lower insulators are expressed as follows:
𝑉𝑖𝑛𝑠_𝑢𝑝 = 𝑉𝑔𝑛𝑑 + 𝑉𝑡_𝑏𝑜𝑑𝑦 + 𝑉𝑡_𝑢𝑝 − 𝑉𝑥𝑎𝑟𝑚_𝑢𝑝 − 𝑉𝐷𝐶_𝑢𝑝 (4-1)
𝑉𝑖𝑛𝑠_𝑙𝑜𝑤 = 𝑉𝑔𝑛𝑑 + 𝑉𝑡_𝑏𝑜𝑑𝑦 − 𝑉𝑥𝑎𝑟𝑚_𝑙𝑜𝑤 − 𝑉𝐷𝐶_𝑙𝑜𝑤 (4-2)
If the induced voltages due to the coupling between the conductors only8 are taken into
account, the above equations are rewritten as:
𝑉𝑖𝑛𝑠_𝑢𝑝 = 𝑉𝑔𝑛𝑑 + 𝑉𝑡_𝑏𝑜𝑑𝑦 + 𝑉𝑡_𝑢𝑝 − 𝑉𝑥𝑎𝑟𝑚_𝑢𝑝 − (𝑉𝐷𝐶_𝑢𝑝 + 𝑉𝑖𝑛𝑑_𝑢𝑝) (4-3)
𝑉𝑖𝑛𝑠_𝑙𝑜𝑤 = 𝑉𝑔𝑛𝑑 + 𝑉𝑡_𝑏𝑜𝑑𝑦 − 𝑉𝑥𝑎𝑟𝑚_𝑙𝑜𝑤 − (𝑉𝐷𝐶_𝑙𝑜𝑤 + 𝑉𝑖𝑛𝑑_𝑙𝑜𝑤) (4-4)
Therefore, the difference in voltage between an upper and a lower insulator is given by
equation (4-6):
𝛥𝑉𝑖𝑛𝑠 = 𝑉𝑖𝑛𝑠_𝑢𝑝 − 𝑉𝑖𝑛𝑠_𝑙𝑜𝑤 (4-5)
𝛥𝑉𝑖𝑛𝑠 = 𝑉𝑡_𝑢𝑝 + (𝑉𝑥𝑎𝑟𝑚_𝑙𝑜𝑤 − 𝑉𝑥𝑎𝑟𝑚_𝑢𝑝) + (𝑉𝐷𝐶_𝑙𝑜𝑤 − 𝑉𝐷𝐶_𝑢𝑝)
+ (𝑉𝑖𝑛𝑑_𝑙𝑜𝑤 − 𝑉𝑖𝑛𝑑_𝑢𝑝) (4-6)
Since before the first flashover occurs, little to no current flows through the cross arms. In
those cases, it is possible to disregard the terms Vxarm_low and Vxarm_up. The simplified
expression is shown in equation (4-7) below:
𝛥𝑉𝑖𝑛𝑠 = 𝑉𝑡_𝑢𝑝 + (𝑉𝐷𝐶_𝑙𝑜𝑤 − 𝑉𝐷𝐶_𝑢𝑝) + (𝑉𝑖𝑛𝑑_𝑙𝑜𝑤 − 𝑉𝑖𝑛𝑑_𝑢𝑝) (4-7)
where Vt_up represents the voltage drop at the tower section between both cross arms
(difference between the red and green curves in Figure 4.7), VDC_up and VDC_low represent the
nominal DC voltages of the lines and Vind_up and Vind_low represent the induced voltages as a
result of the coupling between the conductors.
For instance, consider a positive lightning stroke on a crossed (Xed) configuration (see Table
4.1), where the negative poles (which present the highest flashover risk in case of positive
strikes) are located at different cross arms. Since the nominal voltages are the same, the
VDC_low and VDC_up terms cancel out, and the total difference between the upper and lower
insulators depends only on the voltage drop of the tower section between the cross arms
(Vt_up) and the difference between the induced voltages, as expressed below:
8 Coupling between other parts of the tower structure and the conductors may exist. However, such phenomena require other kind of studies involving a detailed electromagnetic modelling of which EMTP is not capable. Those effects are thus not considered in the present research.
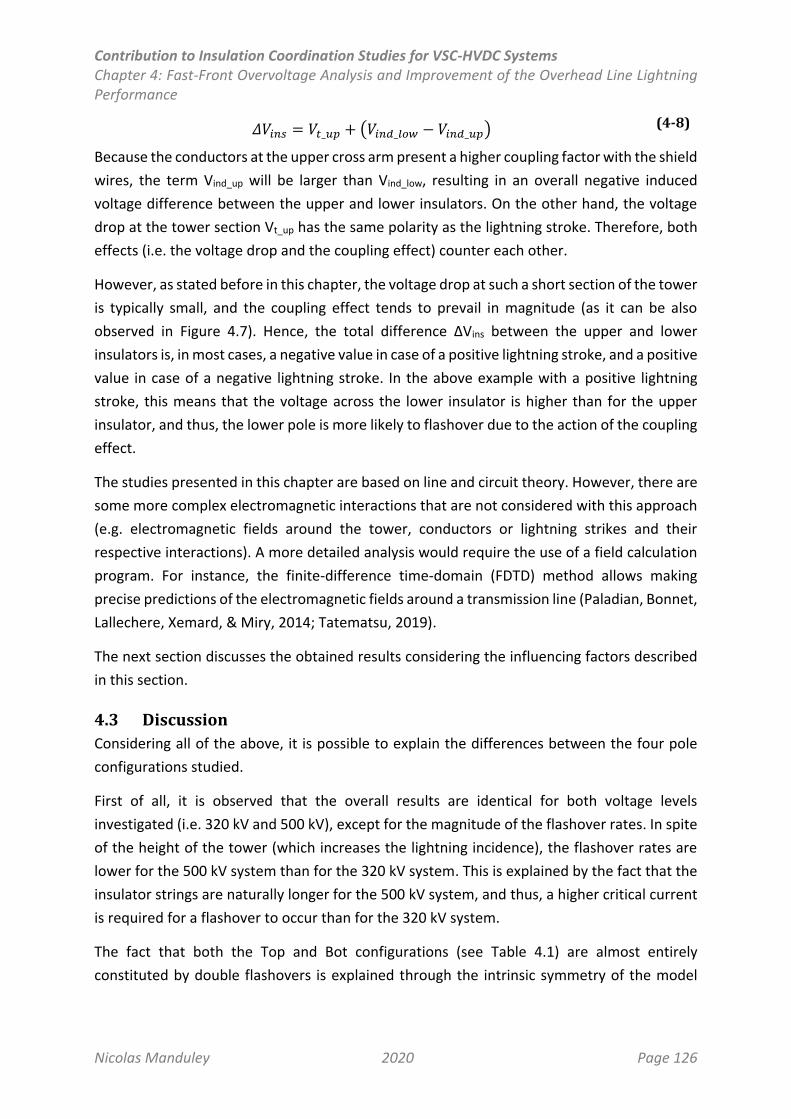
Contribution to Insulation Coordination Studies for VSC-HVDC Systems Chapter 4: Fast-Front Overvoltage Analysis and Improvement of the Overhead Line Lightning Performance
Nicolas Manduley 2020 Page 126
𝛥𝑉𝑖𝑛𝑠 = 𝑉𝑡_𝑢𝑝 + (𝑉𝑖𝑛𝑑_𝑙𝑜𝑤 − 𝑉𝑖𝑛𝑑_𝑢𝑝) (4-8)
Because the conductors at the upper cross arm present a higher coupling factor with the shield
wires, the term Vind_up will be larger than Vind_low, resulting in an overall negative induced
voltage difference between the upper and lower insulators. On the other hand, the voltage
drop at the tower section Vt_up has the same polarity as the lightning stroke. Therefore, both
effects (i.e. the voltage drop and the coupling effect) counter each other.
However, as stated before in this chapter, the voltage drop at such a short section of the tower
is typically small, and the coupling effect tends to prevail in magnitude (as it can be also
observed in Figure 4.7). Hence, the total difference ΔVins between the upper and lower
insulators is, in most cases, a negative value in case of a positive lightning stroke, and a positive
value in case of a negative lightning stroke. In the above example with a positive lightning
stroke, this means that the voltage across the lower insulator is higher than for the upper
insulator, and thus, the lower pole is more likely to flashover due to the action of the coupling
effect.
The studies presented in this chapter are based on line and circuit theory. However, there are
some more complex electromagnetic interactions that are not considered with this approach
(e.g. electromagnetic fields around the tower, conductors or lightning strikes and their
respective interactions). A more detailed analysis would require the use of a field calculation
program. For instance, the finite-difference time-domain (FDTD) method allows making
precise predictions of the electromagnetic fields around a transmission line (Paladian, Bonnet,
Lallechere, Xemard, & Miry, 2014; Tatematsu, 2019).
The next section discusses the obtained results considering the influencing factors described
in this section.
4.3 Discussion
Considering all of the above, it is possible to explain the differences between the four pole
configurations studied.
First of all, it is observed that the overall results are identical for both voltage levels
investigated (i.e. 320 kV and 500 kV), except for the magnitude of the flashover rates. In spite
of the height of the tower (which increases the lightning incidence), the flashover rates are
lower for the 500 kV system than for the 320 kV system. This is explained by the fact that the
insulator strings are naturally longer for the 500 kV system, and thus, a higher critical current
is required for a flashover to occur than for the 320 kV system.
The fact that both the Top and Bot configurations (see Table 4.1) are almost entirely
constituted by double flashovers is explained through the intrinsic symmetry of the model

Contribution to Insulation Coordination Studies for VSC-HVDC Systems Chapter 4: Fast-Front Overvoltage Analysis and Improvement of the Overhead Line Lightning Performance
Nicolas Manduley 2020 Page 127
used and the coupling of the conductors. Both poles on any given cross arm will see the same
voltage rise of the tower and, regardless of the polarity of the stroke, the protective effect of
the coupling will be almost identical on both sides (because the currents flowing on both shield
wires are roughly the same).
However, to explain why the Top configuration presents a better overall performance than
the Bot configuration, it is required to consider the fact that most strokes are negative. In case
of direct negative strokes, the positive poles are more likely to flashover, and in the Top
configuration both positive poles are located closer to the shield wires, and thus are better
protected by the coupling effect than in the Bot configuration. For this same reason, the Bot
configuration presents a slightly better performance than the Top configuration under
positive strikes, but since this only represents about 10% of the cases, the overall performance
of the Top configuration remains superior.
Similarly, the fact that both the Side and Xed configurations present the same overall BFOR,
but different distributions of double flashovers, is also explained through the coupling effect.
Both configurations have a positive and a negative pole in the lower cross arm. Hence,
regardless of the polarity of the stroke, one of the lower poles will flashover first (as the upper
poles are better protected by coupling effect). These effects are almost identical for both
configurations during the first flashover.
However, as the first insulator flashes, a significant current is injected into the DC pole. This
has two main consequences: firstly, the current flowing through the tower to the ground will
decrease, and thus, the voltage of the tower structure will also drop (remind 0, Figure 1.21),
making it more difficult for a second flashover to occur. Secondly, the variation of the current
being injected to the DC pole will also induce a voltage on neighbouring conductors with the
same polarity as the one originated by the shield wires, hence also contributing to the
protection of the other insulators and associated poles.
In the Side configuration, the second insulator that could flashover is right above the faulted
pole, and thus closer than in the Xed configuration and better protected by the induction from
the faulted DC pole. Consequently, for a second flashover to occur, a higher critical current If
is required in the Side configuration than in the Xed configuration, thus producing the
difference on double BFOR observed in Figure 4.5 and Figure 4.6.
Nevertheless, the Side configuration may present a series of practical drawbacks. In particular,
the unbalanced distribution of the electric field which could result in a wider corridor (Liu et
al., 2009; Yang et al., 2008), and the maintenance of a single circuit may be complicated
because both poles would necessarily be on opposite sides of the tower. These potential
drawbacks are naturally avoided with the Xed configuration.
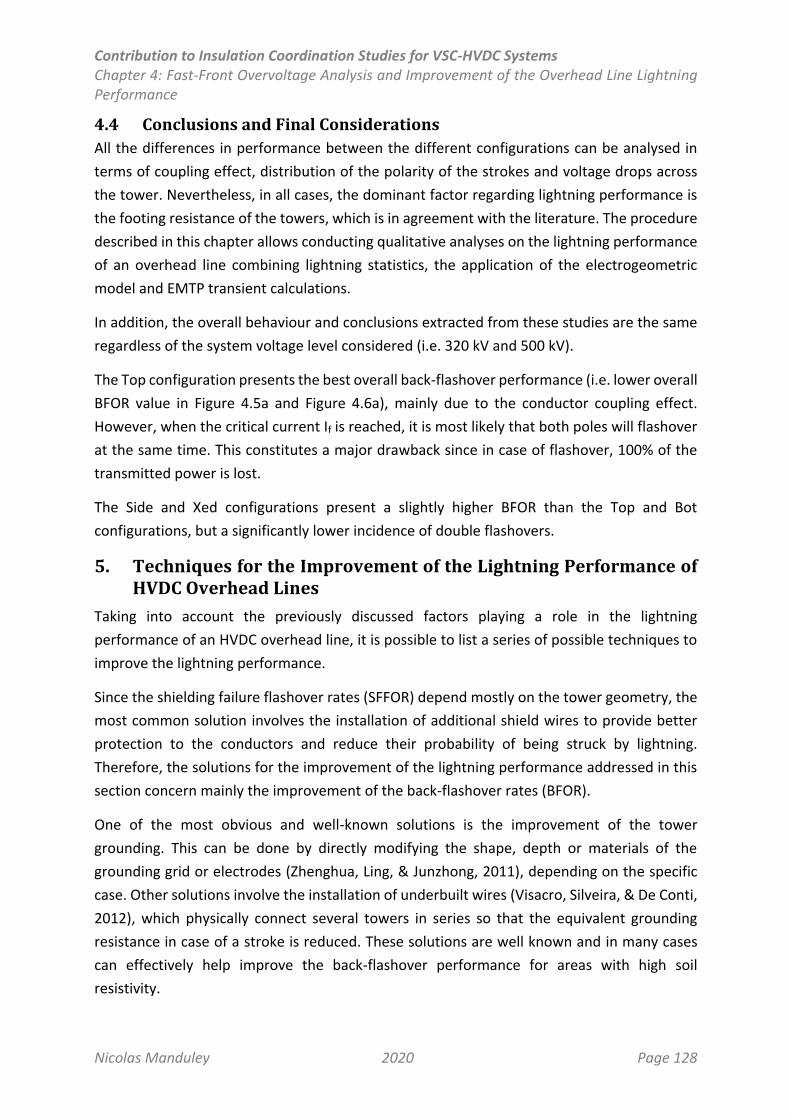
Contribution to Insulation Coordination Studies for VSC-HVDC Systems Chapter 4: Fast-Front Overvoltage Analysis and Improvement of the Overhead Line Lightning Performance
Nicolas Manduley 2020 Page 128
4.4 Conclusions and Final Considerations
All the differences in performance between the different configurations can be analysed in
terms of coupling effect, distribution of the polarity of the strokes and voltage drops across
the tower. Nevertheless, in all cases, the dominant factor regarding lightning performance is
the footing resistance of the towers, which is in agreement with the literature. The procedure
described in this chapter allows conducting qualitative analyses on the lightning performance
of an overhead line combining lightning statistics, the application of the electrogeometric
model and EMTP transient calculations.
In addition, the overall behaviour and conclusions extracted from these studies are the same
regardless of the system voltage level considered (i.e. 320 kV and 500 kV).
The Top configuration presents the best overall back-flashover performance (i.e. lower overall
BFOR value in Figure 4.5a and Figure 4.6a), mainly due to the conductor coupling effect.
However, when the critical current If is reached, it is most likely that both poles will flashover
at the same time. This constitutes a major drawback since in case of flashover, 100% of the
transmitted power is lost.
The Side and Xed configurations present a slightly higher BFOR than the Top and Bot
configurations, but a significantly lower incidence of double flashovers.
5. Techniques for the Improvement of the Lightning Performance of HVDC Overhead Lines
Taking into account the previously discussed factors playing a role in the lightning
performance of an HVDC overhead line, it is possible to list a series of possible techniques to
improve the lightning performance.
Since the shielding failure flashover rates (SFFOR) depend mostly on the tower geometry, the
most common solution involves the installation of additional shield wires to provide better
protection to the conductors and reduce their probability of being struck by lightning.
Therefore, the solutions for the improvement of the lightning performance addressed in this
section concern mainly the improvement of the back-flashover rates (BFOR).
One of the most obvious and well-known solutions is the improvement of the tower
grounding. This can be done by directly modifying the shape, depth or materials of the
grounding grid or electrodes (Zhenghua, Ling, & Junzhong, 2011), depending on the specific
case. Other solutions involve the installation of underbuilt wires (Visacro, Silveira, & De Conti,
2012), which physically connect several towers in series so that the equivalent grounding
resistance in case of a stroke is reduced. These solutions are well known and in many cases
can effectively help improve the back-flashover performance for areas with high soil
resistivity.
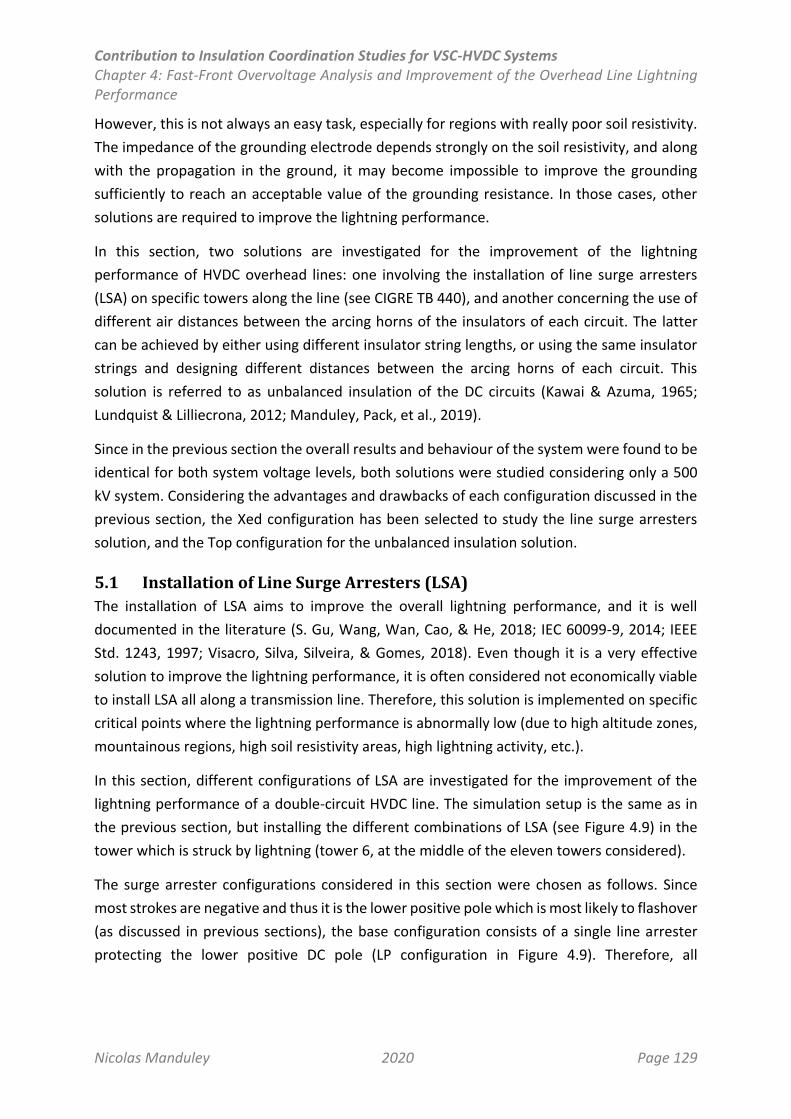
Contribution to Insulation Coordination Studies for VSC-HVDC Systems Chapter 4: Fast-Front Overvoltage Analysis and Improvement of the Overhead Line Lightning Performance
Nicolas Manduley 2020 Page 129
However, this is not always an easy task, especially for regions with really poor soil resistivity.
The impedance of the grounding electrode depends strongly on the soil resistivity, and along
with the propagation in the ground, it may become impossible to improve the grounding
sufficiently to reach an acceptable value of the grounding resistance. In those cases, other
solutions are required to improve the lightning performance.
In this section, two solutions are investigated for the improvement of the lightning
performance of HVDC overhead lines: one involving the installation of line surge arresters
(LSA) on specific towers along the line (see CIGRE TB 440), and another concerning the use of
different air distances between the arcing horns of the insulators of each circuit. The latter
can be achieved by either using different insulator string lengths, or using the same insulator
strings and designing different distances between the arcing horns of each circuit. This
solution is referred to as unbalanced insulation of the DC circuits (Kawai & Azuma, 1965;
Lundquist & Lilliecrona, 2012; Manduley, Pack, et al., 2019).
Since in the previous section the overall results and behaviour of the system were found to be
identical for both system voltage levels, both solutions were studied considering only a 500
kV system. Considering the advantages and drawbacks of each configuration discussed in the
previous section, the Xed configuration has been selected to study the line surge arresters
solution, and the Top configuration for the unbalanced insulation solution.
5.1 Installation of Line Surge Arresters (LSA)
The installation of LSA aims to improve the overall lightning performance, and it is well
documented in the literature (S. Gu, Wang, Wan, Cao, & He, 2018; IEC 60099-9, 2014; IEEE
Std. 1243, 1997; Visacro, Silva, Silveira, & Gomes, 2018). Even though it is a very effective
solution to improve the lightning performance, it is often considered not economically viable
to install LSA all along a transmission line. Therefore, this solution is implemented on specific
critical points where the lightning performance is abnormally low (due to high altitude zones,
mountainous regions, high soil resistivity areas, high lightning activity, etc.).
In this section, different configurations of LSA are investigated for the improvement of the
lightning performance of a double-circuit HVDC line. The simulation setup is the same as in
the previous section, but installing the different combinations of LSA (see Figure 4.9) in the
tower which is struck by lightning (tower 6, at the middle of the eleven towers considered).
The surge arrester configurations considered in this section were chosen as follows. Since
most strokes are negative and thus it is the lower positive pole which is most likely to flashover
(as discussed in previous sections), the base configuration consists of a single line arrester
protecting the lower positive DC pole (LP configuration in Figure 4.9). Therefore, all
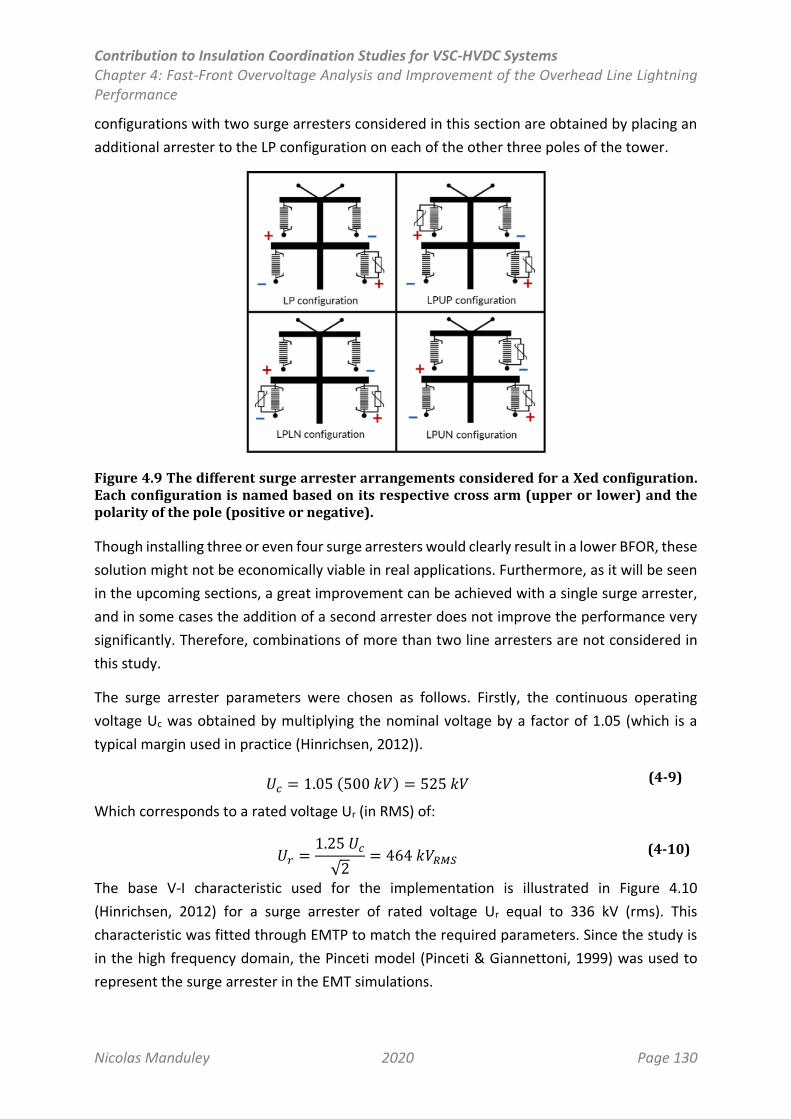
Contribution to Insulation Coordination Studies for VSC-HVDC Systems Chapter 4: Fast-Front Overvoltage Analysis and Improvement of the Overhead Line Lightning Performance
Nicolas Manduley 2020 Page 130
configurations with two surge arresters considered in this section are obtained by placing an
additional arrester to the LP configuration on each of the other three poles of the tower.
Figure 4.9 The different surge arrester arrangements considered for a Xed configuration. Each configuration is named based on its respective cross arm (upper or lower) and the polarity of the pole (positive or negative).
Though installing three or even four surge arresters would clearly result in a lower BFOR, these
solution might not be economically viable in real applications. Furthermore, as it will be seen
in the upcoming sections, a great improvement can be achieved with a single surge arrester,
and in some cases the addition of a second arrester does not improve the performance very
significantly. Therefore, combinations of more than two line arresters are not considered in
this study.
The surge arrester parameters were chosen as follows. Firstly, the continuous operating
voltage Uc was obtained by multiplying the nominal voltage by a factor of 1.05 (which is a
typical margin used in practice (Hinrichsen, 2012)).
𝑈𝑐 = 1.05 (500 𝑘𝑉) = 525 𝑘𝑉 (4-9)
Which corresponds to a rated voltage Ur (in RMS) of:
𝑈𝑟 =1.25 𝑈𝑐
√2= 464 𝑘𝑉𝑅𝑀𝑆 (4-10)
The base V-I characteristic used for the implementation is illustrated in Figure 4.10
(Hinrichsen, 2012) for a surge arrester of rated voltage Ur equal to 336 kV (rms). This
characteristic was fitted through EMTP to match the required parameters. Since the study is
in the high frequency domain, the Pinceti model (Pinceti & Giannettoni, 1999) was used to
represent the surge arrester in the EMT simulations.
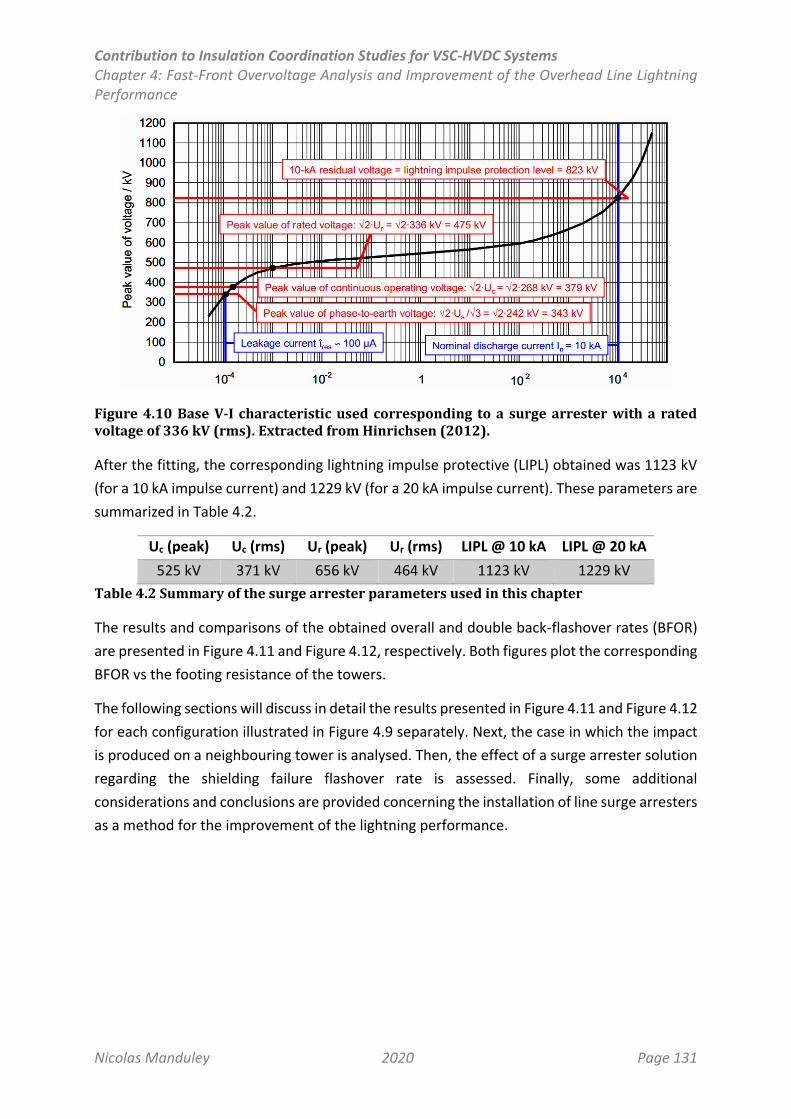
Contribution to Insulation Coordination Studies for VSC-HVDC Systems Chapter 4: Fast-Front Overvoltage Analysis and Improvement of the Overhead Line Lightning Performance
Nicolas Manduley 2020 Page 131
Figure 4.10 Base V-I characteristic used corresponding to a surge arrester with a rated voltage of 336 kV (rms). Extracted from Hinrichsen (2012).
After the fitting, the corresponding lightning impulse protective (LIPL) obtained was 1123 kV
(for a 10 kA impulse current) and 1229 kV (for a 20 kA impulse current). These parameters are
summarized in Table 4.2.
Uc (peak) Uc (rms) Ur (peak) Ur (rms) LIPL @ 10 kA LIPL @ 20 kA
525 kV 371 kV 656 kV 464 kV 1123 kV 1229 kV
Table 4.2 Summary of the surge arrester parameters used in this chapter
The results and comparisons of the obtained overall and double back-flashover rates (BFOR)
are presented in Figure 4.11 and Figure 4.12, respectively. Both figures plot the corresponding
BFOR vs the footing resistance of the towers.
The following sections will discuss in detail the results presented in Figure 4.11 and Figure 4.12
for each configuration illustrated in Figure 4.9 separately. Next, the case in which the impact
is produced on a neighbouring tower is analysed. Then, the effect of a surge arrester solution
regarding the shielding failure flashover rate is assessed. Finally, some additional
considerations and conclusions are provided concerning the installation of line surge arresters
as a method for the improvement of the lightning performance.
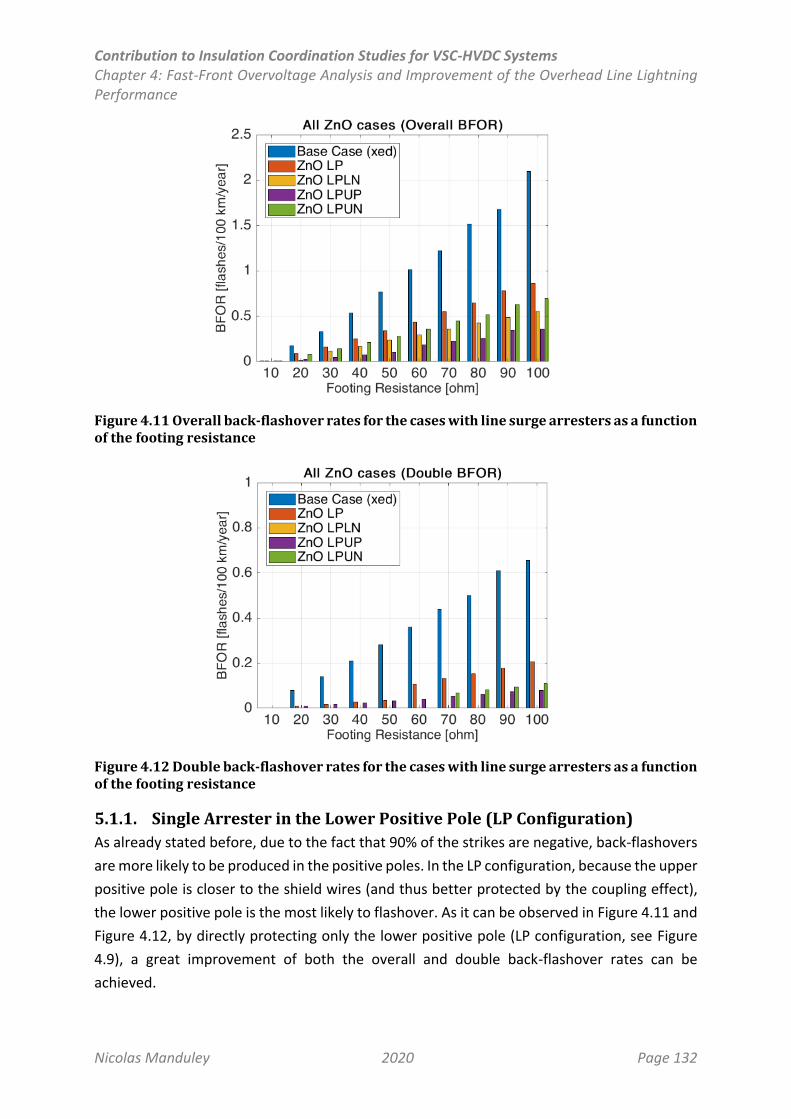
Contribution to Insulation Coordination Studies for VSC-HVDC Systems Chapter 4: Fast-Front Overvoltage Analysis and Improvement of the Overhead Line Lightning Performance
Nicolas Manduley 2020 Page 132
Figure 4.11 Overall back-flashover rates for the cases with line surge arresters as a function of the footing resistance
Figure 4.12 Double back-flashover rates for the cases with line surge arresters as a function of the footing resistance
5.1.1. Single Arrester in the Lower Positive Pole (LP Configuration)
As already stated before, due to the fact that 90% of the strikes are negative, back-flashovers
are more likely to be produced in the positive poles. In the LP configuration, because the upper
positive pole is closer to the shield wires (and thus better protected by the coupling effect),
the lower positive pole is the most likely to flashover. As it can be observed in Figure 4.11 and
Figure 4.12, by directly protecting only the lower positive pole (LP configuration, see Figure
4.9), a great improvement of both the overall and double back-flashover rates can be
achieved.
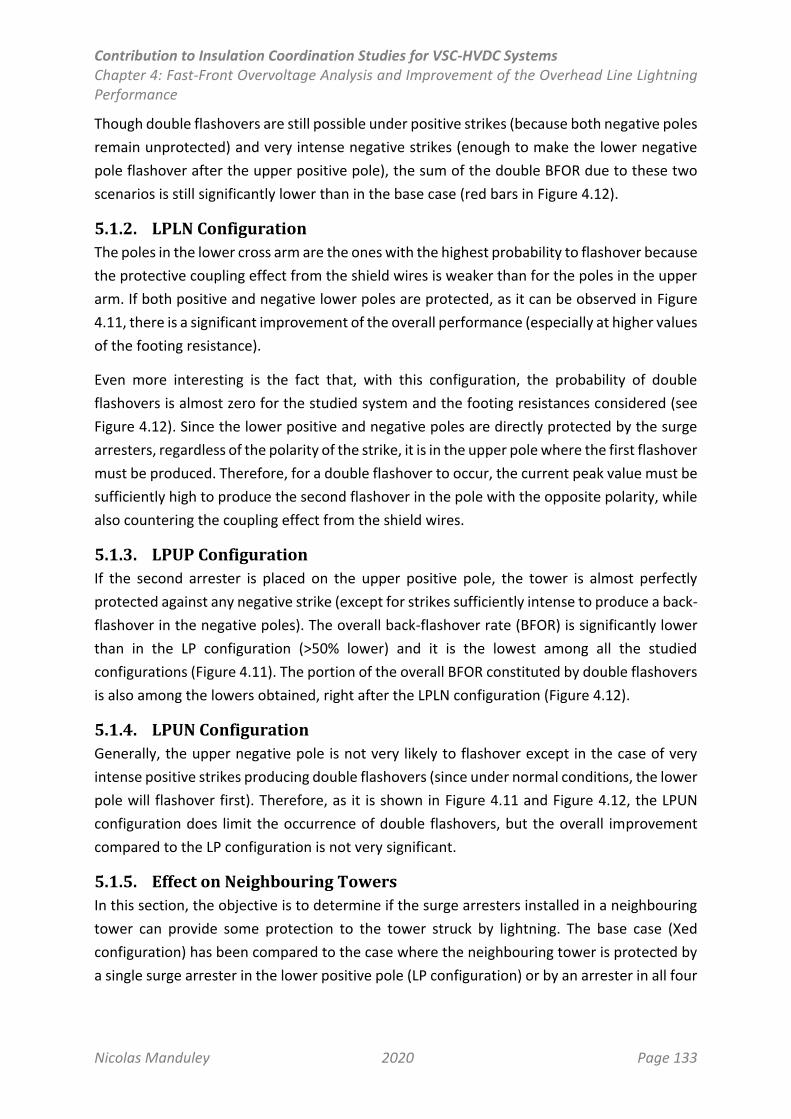
Contribution to Insulation Coordination Studies for VSC-HVDC Systems Chapter 4: Fast-Front Overvoltage Analysis and Improvement of the Overhead Line Lightning Performance
Nicolas Manduley 2020 Page 133
Though double flashovers are still possible under positive strikes (because both negative poles
remain unprotected) and very intense negative strikes (enough to make the lower negative
pole flashover after the upper positive pole), the sum of the double BFOR due to these two
scenarios is still significantly lower than in the base case (red bars in Figure 4.12).
5.1.2. LPLN Configuration
The poles in the lower cross arm are the ones with the highest probability to flashover because
the protective coupling effect from the shield wires is weaker than for the poles in the upper
arm. If both positive and negative lower poles are protected, as it can be observed in Figure
4.11, there is a significant improvement of the overall performance (especially at higher values
of the footing resistance).
Even more interesting is the fact that, with this configuration, the probability of double
flashovers is almost zero for the studied system and the footing resistances considered (see
Figure 4.12). Since the lower positive and negative poles are directly protected by the surge
arresters, regardless of the polarity of the strike, it is in the upper pole where the first flashover
must be produced. Therefore, for a double flashover to occur, the current peak value must be
sufficiently high to produce the second flashover in the pole with the opposite polarity, while
also countering the coupling effect from the shield wires.
5.1.3. LPUP Configuration
If the second arrester is placed on the upper positive pole, the tower is almost perfectly
protected against any negative strike (except for strikes sufficiently intense to produce a back-
flashover in the negative poles). The overall back-flashover rate (BFOR) is significantly lower
than in the LP configuration (>50% lower) and it is the lowest among all the studied
configurations (Figure 4.11). The portion of the overall BFOR constituted by double flashovers
is also among the lowers obtained, right after the LPLN configuration (Figure 4.12).
5.1.4. LPUN Configuration
Generally, the upper negative pole is not very likely to flashover except in the case of very
intense positive strikes producing double flashovers (since under normal conditions, the lower
pole will flashover first). Therefore, as it is shown in Figure 4.11 and Figure 4.12, the LPUN
configuration does limit the occurrence of double flashovers, but the overall improvement
compared to the LP configuration is not very significant.
5.1.5. Effect on Neighbouring Towers
In this section, the objective is to determine if the surge arresters installed in a neighbouring
tower can provide some protection to the tower struck by lightning. The base case (Xed
configuration) has been compared to the case where the neighbouring tower is protected by
a single surge arrester in the lower positive pole (LP configuration) or by an arrester in all four
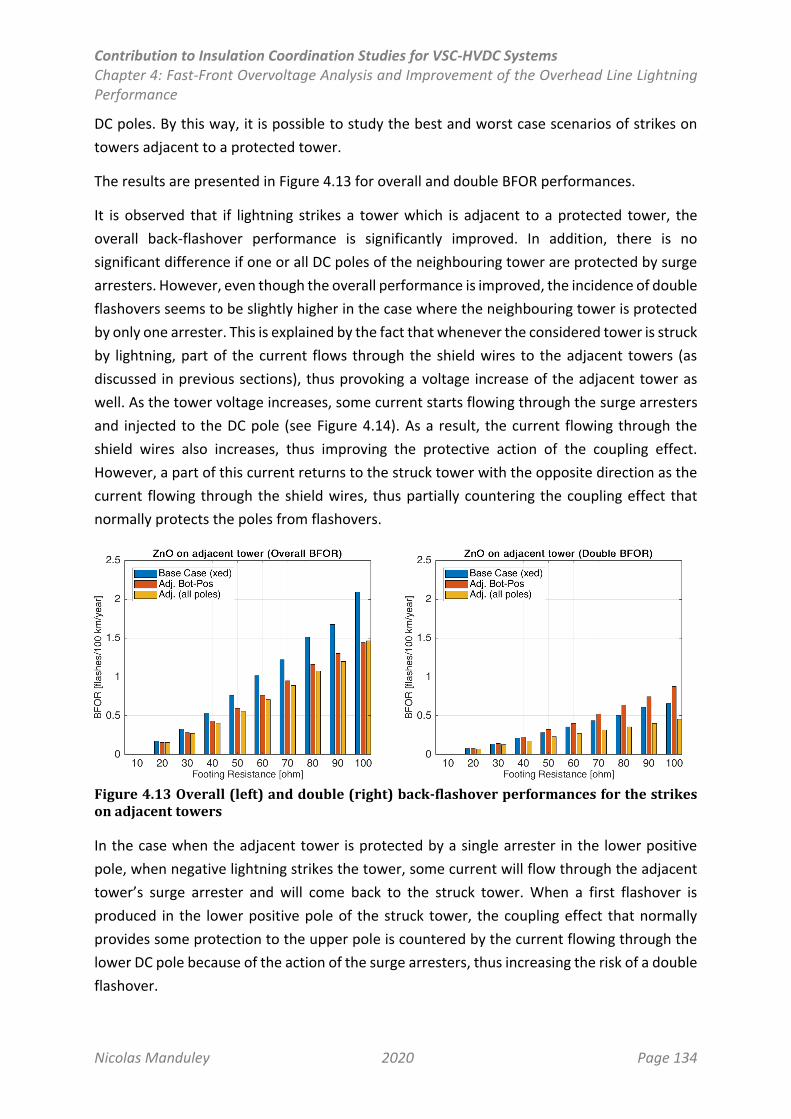
Contribution to Insulation Coordination Studies for VSC-HVDC Systems Chapter 4: Fast-Front Overvoltage Analysis and Improvement of the Overhead Line Lightning Performance
Nicolas Manduley 2020 Page 134
DC poles. By this way, it is possible to study the best and worst case scenarios of strikes on
towers adjacent to a protected tower.
The results are presented in Figure 4.13 for overall and double BFOR performances.
It is observed that if lightning strikes a tower which is adjacent to a protected tower, the
overall back-flashover performance is significantly improved. In addition, there is no
significant difference if one or all DC poles of the neighbouring tower are protected by surge
arresters. However, even though the overall performance is improved, the incidence of double
flashovers seems to be slightly higher in the case where the neighbouring tower is protected
by only one arrester. This is explained by the fact that whenever the considered tower is struck
by lightning, part of the current flows through the shield wires to the adjacent towers (as
discussed in previous sections), thus provoking a voltage increase of the adjacent tower as
well. As the tower voltage increases, some current starts flowing through the surge arresters
and injected to the DC pole (see Figure 4.14). As a result, the current flowing through the
shield wires also increases, thus improving the protective action of the coupling effect.
However, a part of this current returns to the struck tower with the opposite direction as the
current flowing through the shield wires, thus partially countering the coupling effect that
normally protects the poles from flashovers.
Figure 4.13 Overall (left) and double (right) back-flashover performances for the strikes on adjacent towers
In the case when the adjacent tower is protected by a single arrester in the lower positive
pole, when negative lightning strikes the tower, some current will flow through the adjacent
tower’s surge arrester and will come back to the struck tower. When a first flashover is
produced in the lower positive pole of the struck tower, the coupling effect that normally
provides some protection to the upper pole is countered by the current flowing through the
lower DC pole because of the action of the surge arresters, thus increasing the risk of a double
flashover.

Contribution to Insulation Coordination Studies for VSC-HVDC Systems Chapter 4: Fast-Front Overvoltage Analysis and Improvement of the Overhead Line Lightning Performance
Nicolas Manduley 2020 Page 135
Figure 4.14 Illustration of the path of the current when lightning strikes a tower adjacent to another which is protected by line surge arresters.
If the neighbouring tower is protected by surge arresters on all the DC poles, when negative
lightning strikes the tower, two things occur in comparison to the previous case: firstly, more
current is drawn by the surge arresters (since both positive poles of the neighbouring tower
are protected), thus increasing the protective action of the coupling effect. Secondly, the total
current that returns to the struck tower due to the action of the neighbouring surge arresters
is distributed in both positive DC poles. Therefore, the countering of the coupling effect with
the shield wires is reduced by the action of the surge arresters, thus further reducing the
double back-flashover rates.
5.1.6. Considerations Regarding the Effect on the SFFOR
The evaluation of the shielding failure flashover rate (SFFOR) using the simplified LPM
approach (see Chapter 1) yields a value of 0 flashovers/100 km/year (using Rizk’s
implementation, see Table 1.8) for the base model illustrated in Figure 4.4. This suggests that
for the 500 kV HVDC system considered in this section, the overall lightning performance
would be dominated by the back-flashover rate (BFOR), and that the effect of the SFFOR would
be negligible.
As discussed in Chapter 1, the EGM tends to overestimate the value of the SFFOR for extra-
high voltage (EHV) levels and above. Therefore, the application of the EGM to the studied
system is expected to result in a very conservative estimation of the SFFOR. Under this
hypothesis, and using the Armstrong & Whitehead model (see Table 1.7), a value of 0.08622
flashovers/100 km/year is obtained for the base case without arresters, which is more
comparable to (or even higher than) the BFOR for low footing resistances (see Figure 4.11).
By considering a second hypothesis that protecting a DC pole directly with a line surge arrester
no flashovers can occur on that pole, it is possible to see that each surge arrester configuration
depicted in Figure 4.9 results in a different value of SFFOR. As it is observed in Figure 4.15, the
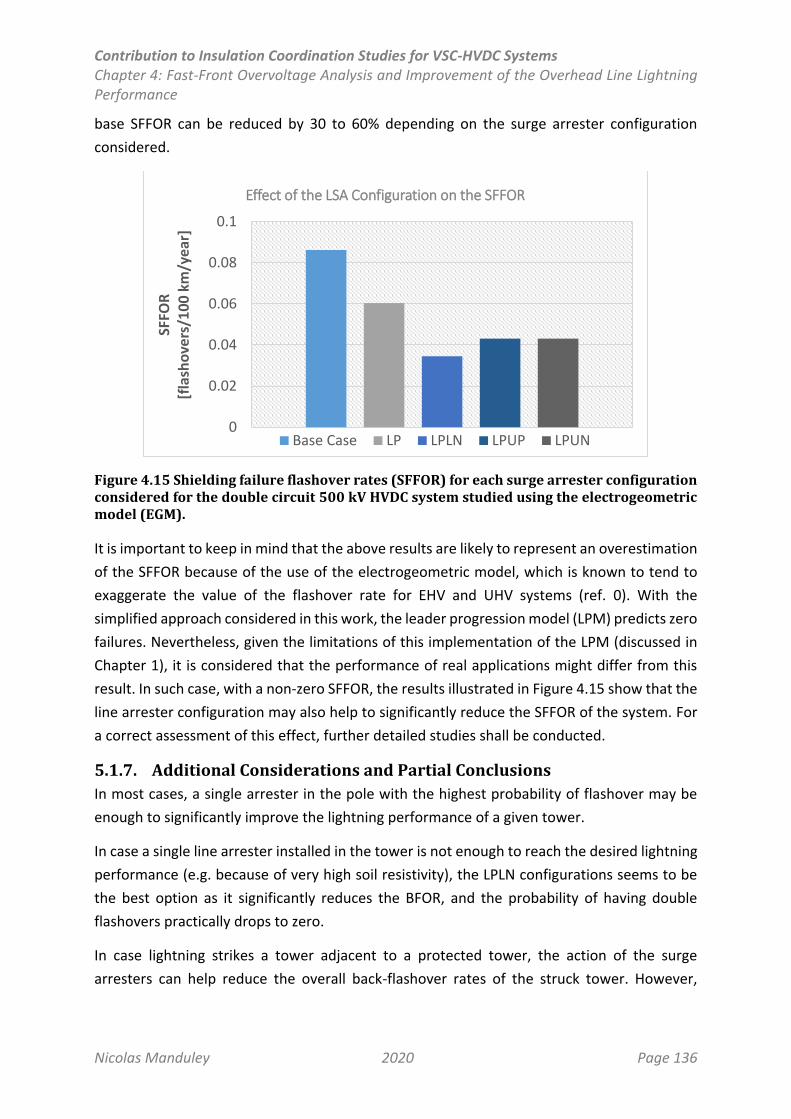
Contribution to Insulation Coordination Studies for VSC-HVDC Systems Chapter 4: Fast-Front Overvoltage Analysis and Improvement of the Overhead Line Lightning Performance
Nicolas Manduley 2020 Page 136
base SFFOR can be reduced by 30 to 60% depending on the surge arrester configuration
considered.
Figure 4.15 Shielding failure flashover rates (SFFOR) for each surge arrester configuration considered for the double circuit 500 kV HVDC system studied using the electrogeometric model (EGM).
It is important to keep in mind that the above results are likely to represent an overestimation
of the SFFOR because of the use of the electrogeometric model, which is known to tend to
exaggerate the value of the flashover rate for EHV and UHV systems (ref. 0). With the
simplified approach considered in this work, the leader progression model (LPM) predicts zero
failures. Nevertheless, given the limitations of this implementation of the LPM (discussed in
Chapter 1), it is considered that the performance of real applications might differ from this
result. In such case, with a non-zero SFFOR, the results illustrated in Figure 4.15 show that the
line arrester configuration may also help to significantly reduce the SFFOR of the system. For
a correct assessment of this effect, further detailed studies shall be conducted.
5.1.7. Additional Considerations and Partial Conclusions
In most cases, a single arrester in the pole with the highest probability of flashover may be
enough to significantly improve the lightning performance of a given tower.
In case a single line arrester installed in the tower is not enough to reach the desired lightning
performance (e.g. because of very high soil resistivity), the LPLN configurations seems to be
the best option as it significantly reduces the BFOR, and the probability of having double
flashovers practically drops to zero.
In case lightning strikes a tower adjacent to a protected tower, the action of the surge
arresters can help reduce the overall back-flashover rates of the struck tower. However,
0
0.02
0.04
0.06
0.08
0.1
SFFO
R[f
lash
ove
rs/1
00
km
/ye
ar]
Effect of the LSA Configuration on the SFFOR
Base Case LP LPLN LPUP LPUN

Contribution to Insulation Coordination Studies for VSC-HVDC Systems Chapter 4: Fast-Front Overvoltage Analysis and Improvement of the Overhead Line Lightning Performance
Nicolas Manduley 2020 Page 137
depending on the configuration, the incidence of double flashovers might be slightly
increased. This may also depend on the configuration of the poles within the tower, the length
of the span and the point of impact (for instance, if the stroke terminates along the span
between a protected and an unprotected tower). Further studies are required for a better
understanding of this effect, as well as to consider more possible scenarios and influencing
factors (e.g. different grounding conditions between the towers).
5.2 Use of Unbalanced Insulation
The unbalanced insulation solution consists in using different air gap lengths (i.e. distances in
air between the arcing horns of the insulators) in one or more of the DC circuits. This way, it
is possible to determine in advance which circuit will flashover first in case of lightning stroke,
and thus prevent the incidence of flashovers on the other circuit.
This technique has been studied in the past for AC systems also aiming to reduce multi-circuit
flashovers (Kawai & Azuma, 1965; Z. Li et al., 2012), but their efficiency is quite limited due to
the fact that in AC the phase voltages change constantly. Because in DC systems all voltages
are constant, double circuit DC applications might take greater benefit from this technique.
For DC, this technique has only been addressed for the SouthWest Link project, which features
a horizontal disposition of the poles (Lundquist & Lilliecrona, 2012), and in (Manduley, Pack,
et al., 2019) for a generic two cross arm configuration. This section aims to dig deeper further
into the applicability of the unbalanced insulation of DC systems.
As a reminder from previous sections, the base distance between the arcing horns used is 4.16
m, and the unbalance has been introduced by reducing the length on one of the sides by 10,
30 and/or 50 cm. The case studies considered are illustrated in Figure 4.16. As stated at the
beginning of this section, the Top configuration has been chosen to perform these studies,
based on the conclusions from §3.
Figure 4.16 Case study for the unbalanced insulation solution including a reduced air gap on a complete circuit. All cases are performed on a configuration with both positive poles in the upper cross arm
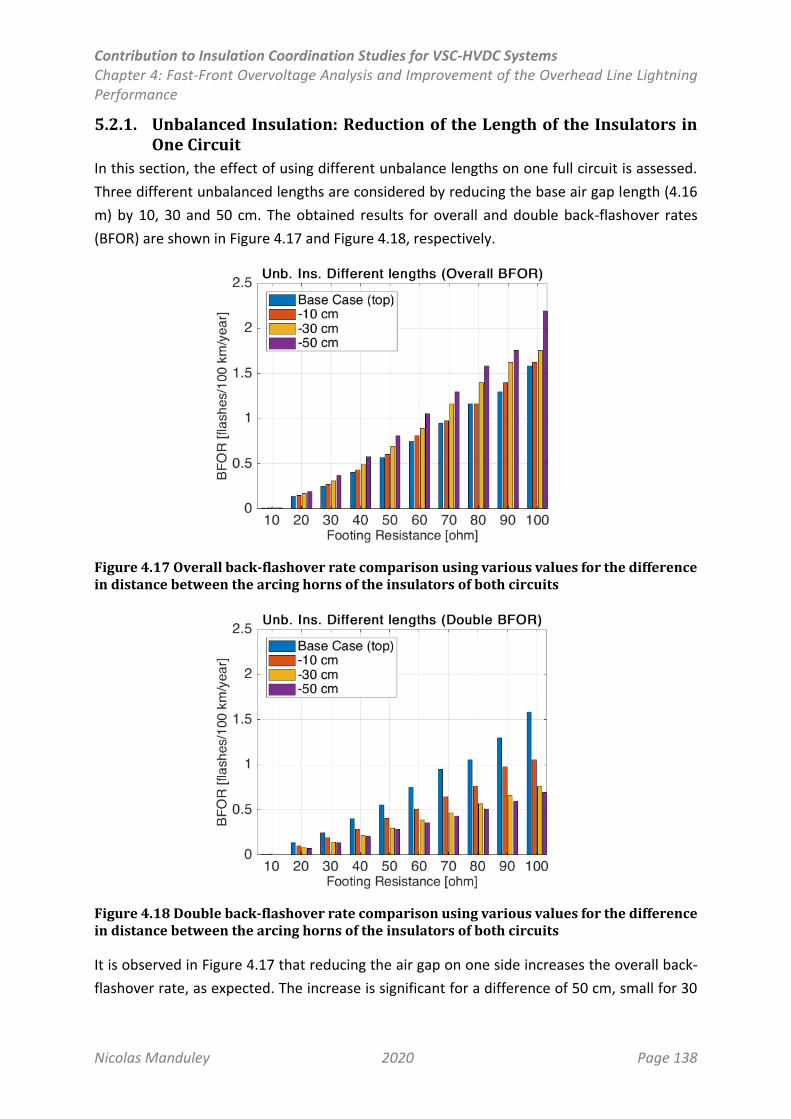
Contribution to Insulation Coordination Studies for VSC-HVDC Systems Chapter 4: Fast-Front Overvoltage Analysis and Improvement of the Overhead Line Lightning Performance
Nicolas Manduley 2020 Page 138
5.2.1. Unbalanced Insulation: Reduction of the Length of the Insulators in One Circuit
In this section, the effect of using different unbalance lengths on one full circuit is assessed.
Three different unbalanced lengths are considered by reducing the base air gap length (4.16
m) by 10, 30 and 50 cm. The obtained results for overall and double back-flashover rates
(BFOR) are shown in Figure 4.17 and Figure 4.18, respectively.
Figure 4.17 Overall back-flashover rate comparison using various values for the difference in distance between the arcing horns of the insulators of both circuits
Figure 4.18 Double back-flashover rate comparison using various values for the difference in distance between the arcing horns of the insulators of both circuits
It is observed in Figure 4.17 that reducing the air gap on one side increases the overall back-
flashover rate, as expected. The increase is significant for a difference of 50 cm, small for 30

Contribution to Insulation Coordination Studies for VSC-HVDC Systems Chapter 4: Fast-Front Overvoltage Analysis and Improvement of the Overhead Line Lightning Performance
Nicolas Manduley 2020 Page 139
cm and not very significant for 10 cm. However, for all cases, a significant reduction of the
occurrence of double flashovers is obtained, which is the main benefit of this solution.
It is also noticed that when increasing the difference from 30 to 50 cm, the increase in the
overall back-flashover rate (BFOR) begins to be more significant than the reduction of the
double BFOR. From 10 to 30 cm, both the increase of the overall BFOR and the reduction of
the double BFOR are smaller, but significant.
Based on these results and considerations, it is concluded that an optimal value may range
between 30 and 50 cm.
In addition, it was concluded in (Manduley, Pack, et al., 2019) that huge differences between
the air gap lengths of both DC circuits (above 80 cm) may not necessarily contribute
significantly to the improvement of the lightning performance, and that an optimal value may
be close to 40 cm. In (Lundquist & Lilliecrona, 2012), a difference of 50 cm was found to be
optimal for the design used in SouthWest Link. Therefore, it can be concluded that the results
obtained in this work are in agreement with the existing studies available in the literature, and
provides further evidence supporting that the optimal value for an unbalanced insulation
solution should range between 30 cm and 50 cm.
5.2.2. Unbalanced Insulation: Reduction of the Length of a Single Insulator
As an alternative solution, this section aims to study the effect of the reduction of the length
of a single insulator. Similarly as in the single surge arrester case previously discussed, the
unbalance is introduced in one of the upper positive pole (see Figure 4.16) because their
higher likelihood to flashover due to a negative stroke. For this case, a single unbalance of 50
cm has been introduced, since it is the highest unbalance considered to be reasonable for the
limitation of double flashovers (Lundquist & Lilliecrona, 2012; Manduley, Pack, et al., 2019).
The results are compared with the case where the same unbalance is used for the full single
circuit (see previous section) and the base case, and are presented in Figure 4.19.
It can be observed that when the unbalanced insulation is applied to a single positive DC pole,
the overall BFOR with respect to the base case is slightly lower than when the solution is
applied on both poles of the circuit. However, the double BFOR is slightly higher.
These results are explained by the fact that by reducing only the length of the gap of the
positive pole, the system is protected identically against negative strikes, which represent the
majority of the cases. However, against positive strikes, the system behaves as the base case
with identical air gap lengths on all of the DC poles. With the base length in the negative poles,
there are less total flashovers in case of positive strikes, but roughly all of them produce
double flashovers (as discussed in the previous sections).
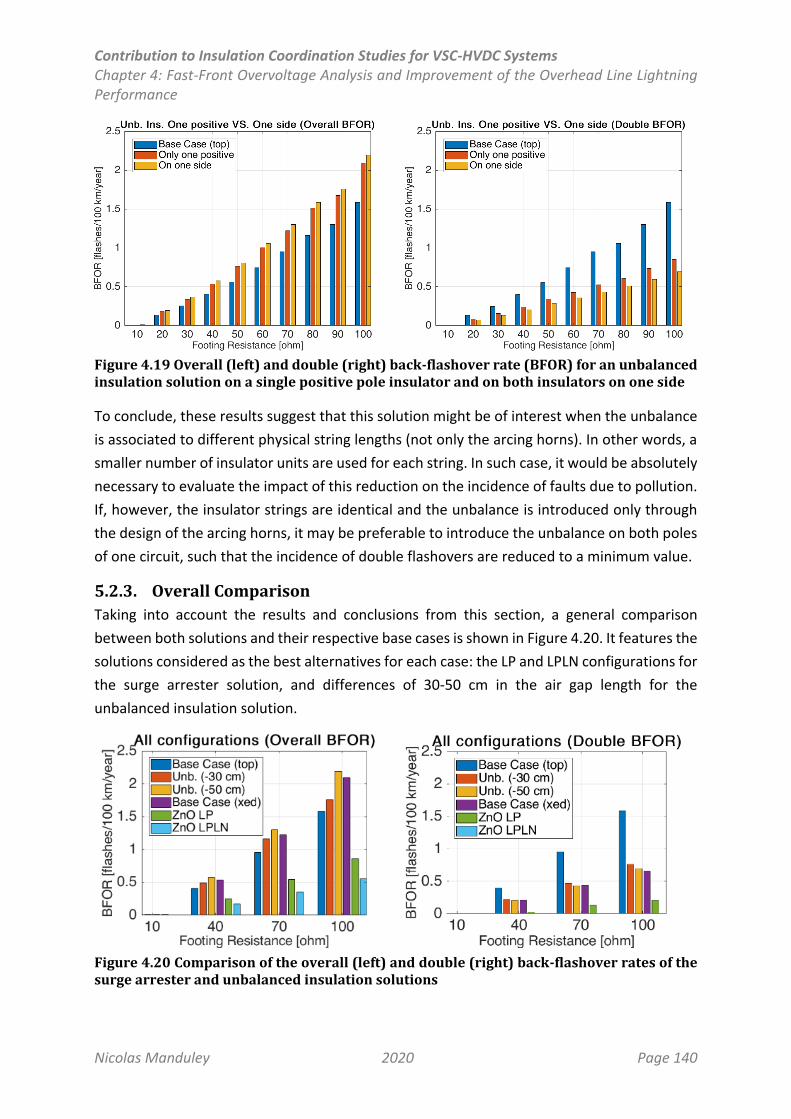
Contribution to Insulation Coordination Studies for VSC-HVDC Systems Chapter 4: Fast-Front Overvoltage Analysis and Improvement of the Overhead Line Lightning Performance
Nicolas Manduley 2020 Page 140
Figure 4.19 Overall (left) and double (right) back-flashover rate (BFOR) for an unbalanced insulation solution on a single positive pole insulator and on both insulators on one side
To conclude, these results suggest that this solution might be of interest when the unbalance
is associated to different physical string lengths (not only the arcing horns). In other words, a
smaller number of insulator units are used for each string. In such case, it would be absolutely
necessary to evaluate the impact of this reduction on the incidence of faults due to pollution.
If, however, the insulator strings are identical and the unbalance is introduced only through
the design of the arcing horns, it may be preferable to introduce the unbalance on both poles
of one circuit, such that the incidence of double flashovers are reduced to a minimum value.
5.2.3. Overall Comparison
Taking into account the results and conclusions from this section, a general comparison
between both solutions and their respective base cases is shown in Figure 4.20. It features the
solutions considered as the best alternatives for each case: the LP and LPLN configurations for
the surge arrester solution, and differences of 30-50 cm in the air gap length for the
unbalanced insulation solution.
Figure 4.20 Comparison of the overall (left) and double (right) back-flashover rates of the surge arrester and unbalanced insulation solutions
Contribution to Insulation Coordination Studies for VSC-HVDC Systems Chapter 4: Fast-Front Overvoltage Analysis and Improvement of the Overhead Line Lightning Performance
Nicolas Manduley 2020 Page 141
As expected, the surge arrester solution is much more effective in improving the lightning
performance. However, this solution is only economically viable to improve the performance
of some critical towers along the line. The unbalanced solution, on the other hand, can be
implemented and studied along the whole line from the initial design, and due to the short
distances involved in the unbalance, mechanical constraints are not likely to represent a
serious problem.
From the results presented in Figure 4.20, it is noticed that a pole configuration with both
positive poles on the upper arm (Top), combined with the unbalanced insulation solution, can
present a slightly better overall lightning performance for length unbalances between 30 and
50 cm. The resulting incidence of double flashovers reaches similar values as in the crossed
(Xed) configuration, where the unbalance is naturally introduced by placing both poles of the
same polarity at different heights.
It should be also noted that the increase in the BFOR observed in the unbalanced insulation
solution is due to the fact that the air gap length is reduced (with respect to the base value)
on one side. If the solution is considered from the conception of the line (as it is intended to
be), the alternative of increasing the air gap length on one side should be prioritized whenever
possible. In that case, the overall BFOR would remain at least the same as in the base case
(because it is dictated by the circuit with the shortest air gap lengths), as also seen in
(Manduley, Pack, et al., 2019), and even better performances can be achieved. In the worst
case scenario, only slight modifications to the design of the tower shall be made to guarantee
that all the minimum clearances are respected. However, the applicability of this alternative
is likely to be limited if it is to be applied to an existing double circuit overhead line where the
transmission towers are already built and no much room may be available to increase the
length of the insulator strings.
With a proper design of the insulation, the Top configuration may present better lightning
performances than the most typically used crossed (Xed) configuration, as found for example
in (Dong et al., 2013; Hu, Xie, & Tai, 2017; J. Li et al., 2018; Ma, Li, Wang, & Wu, 2018). In any
case, the technical study must be amended by an economic study.
6. Surge Arrester Specifications
As seen in previous sections, the installation of line surge arresters is an effective way to limit
lightning overvoltages and avoid the occurrence of flashovers (and double flashovers) across
the tower insulators. To effectively reach this goal, it is essential to adequately specify the
protective level of the arrester as well as its energy handling capability, such that it provides a
maximum protection while keeping a low risk of failure.
Contribution to Insulation Coordination Studies for VSC-HVDC Systems Chapter 4: Fast-Front Overvoltage Analysis and Improvement of the Overhead Line Lightning Performance
Nicolas Manduley 2020 Page 142
6.1 Surge Arrester Energy Handling Capability
To this date, the current surge arrester standards address the issue of the energy handling
capability in terms of thermal stability tests (such as the switching surge operating duty test)
to verify that, under certain conditions, the surge arrester will not absorb more energy than it
can dissipate until reaching a critical point where failure occurs due to thermal runaway (IEC
60099-4, 2014). Other tests performed by the manufacturers may provide some direct or
indirect information about the energy stresses that a surge arrester can handle. However, with
the current state of the art of metal-oxide arresters, new applications have become possible
(including HVDC and line arresters) (Hinrichsen, Reinhard, & Richter, 2007) and the procedures
featured in the standards in terms of the specification of the line discharge class normally
apply to classical arrester applications. There is still no clear definition of the energy handling
capability which is valid or directly applicable to all cases (Hinrichsen et al., 2007).
Hence, manufacturers typically specify the line discharge class in terms of the specific energy
withstand as a result of the standard tests and as a function of the rated voltage Ur (in RMS)
or continuous operating voltage Uc (or MCOV in American standards), and is given in kJ/kV.
While more adequate definitions of energy handling capability and specific procedures are
developed, the measurement of the total energy absorbed by the surge arrester seems to be
the method which is closest to be in agreement with the current developments and
recommendations from the standards.
In order to provide some insights on how to specify the surge arresters for an HVDC overhead
line applications, this section will analyse the behaviour and energy absorption levels of the
surge arrester under different scenarios. Concretely, direct strikes to the tower or shield wires
(potentially leading to back-flashovers) and shielding failures are considered. The main goal of
this study is to assess the behaviour of the surge arrester and compare the different energy
absorption levels, and thus provide recommendations on how should the arrester
characteristics be specified for HVDC overhead line applications.
A double-circuit HVDC 500 kV base system model has been used to conduct the studies with
the same tower and insulation parameters as in the previous section. In this case, only a single
surge arrester has been placed in the lower positive pole (configuration LP, Figure 4.9) and
different lightning current peak amplitudes have been tested to study the behaviour and
energy absorption of the arresters under different conditions.
6.2 Direct Strikes to the Tower
Different lightning peak current amplitudes were applied between 50 kA and 250 kA in steps
of 50 kA. Ten values for the tower grounding resistance were considered between 10 Ω and
100 Ω (as in the previous sections).
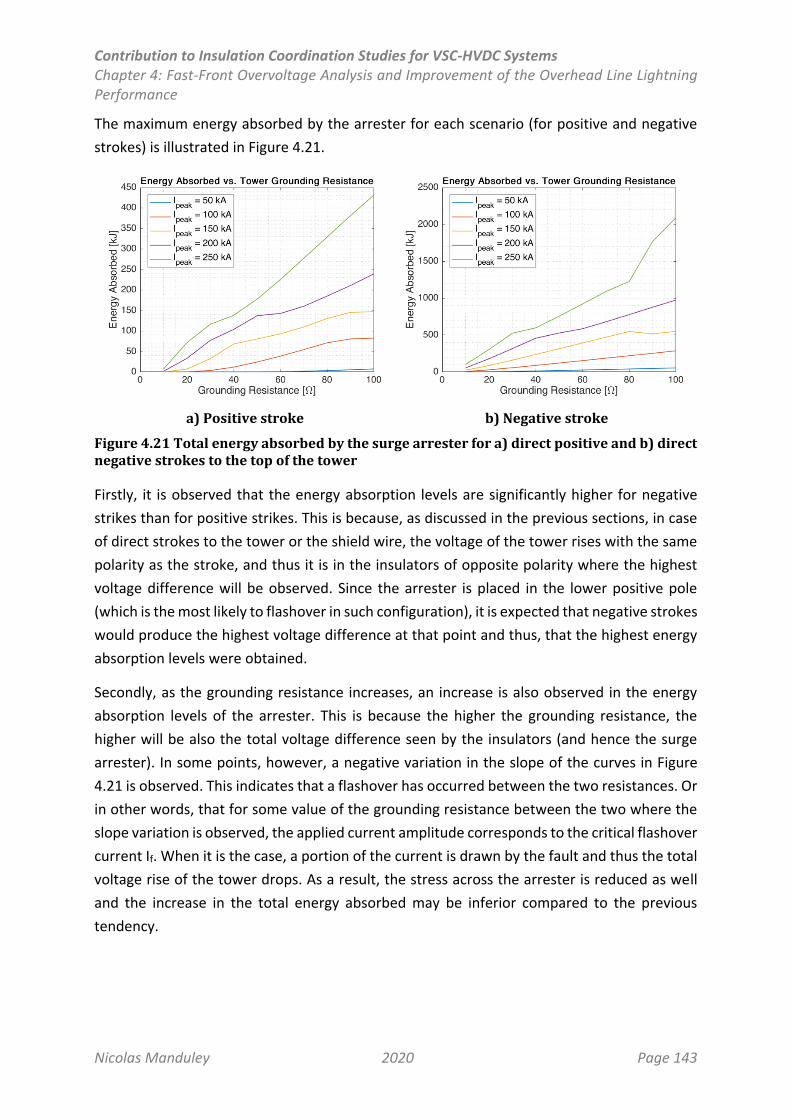
Contribution to Insulation Coordination Studies for VSC-HVDC Systems Chapter 4: Fast-Front Overvoltage Analysis and Improvement of the Overhead Line Lightning Performance
Nicolas Manduley 2020 Page 143
The maximum energy absorbed by the arrester for each scenario (for positive and negative
strokes) is illustrated in Figure 4.21.
a) Positive stroke
b) Negative stroke
Figure 4.21 Total energy absorbed by the surge arrester for a) direct positive and b) direct negative strokes to the top of the tower
Firstly, it is observed that the energy absorption levels are significantly higher for negative
strikes than for positive strikes. This is because, as discussed in the previous sections, in case
of direct strokes to the tower or the shield wire, the voltage of the tower rises with the same
polarity as the stroke, and thus it is in the insulators of opposite polarity where the highest
voltage difference will be observed. Since the arrester is placed in the lower positive pole
(which is the most likely to flashover in such configuration), it is expected that negative strokes
would produce the highest voltage difference at that point and thus, that the highest energy
absorption levels were obtained.
Secondly, as the grounding resistance increases, an increase is also observed in the energy
absorption levels of the arrester. This is because the higher the grounding resistance, the
higher will be also the total voltage difference seen by the insulators (and hence the surge
arrester). In some points, however, a negative variation in the slope of the curves in Figure
4.21 is observed. This indicates that a flashover has occurred between the two resistances. Or
in other words, that for some value of the grounding resistance between the two where the
slope variation is observed, the applied current amplitude corresponds to the critical flashover
current If. When it is the case, a portion of the current is drawn by the fault and thus the total
voltage rise of the tower drops. As a result, the stress across the arrester is reduced as well
and the increase in the total energy absorbed may be inferior compared to the previous
tendency.
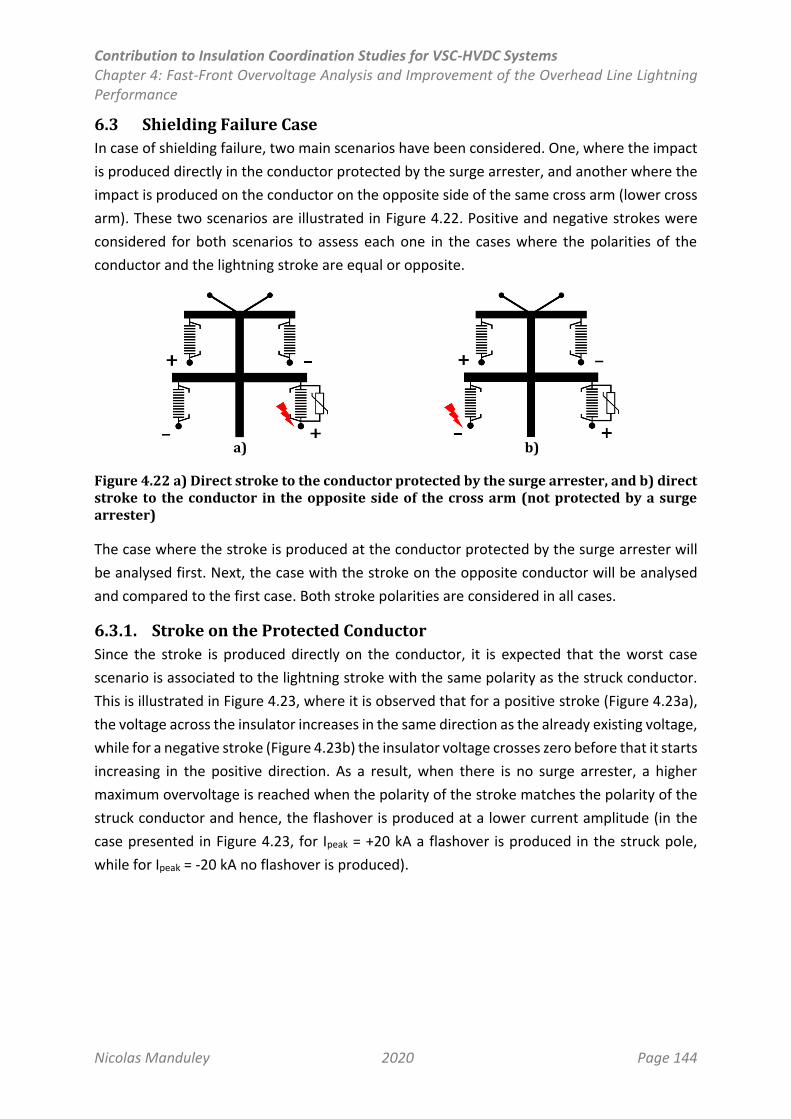
Contribution to Insulation Coordination Studies for VSC-HVDC Systems Chapter 4: Fast-Front Overvoltage Analysis and Improvement of the Overhead Line Lightning Performance
Nicolas Manduley 2020 Page 144
6.3 Shielding Failure Case
In case of shielding failure, two main scenarios have been considered. One, where the impact
is produced directly in the conductor protected by the surge arrester, and another where the
impact is produced on the conductor on the opposite side of the same cross arm (lower cross
arm). These two scenarios are illustrated in Figure 4.22. Positive and negative strokes were
considered for both scenarios to assess each one in the cases where the polarities of the
conductor and the lightning stroke are equal or opposite.
a) b)
Figure 4.22 a) Direct stroke to the conductor protected by the surge arrester, and b) direct stroke to the conductor in the opposite side of the cross arm (not protected by a surge arrester)
The case where the stroke is produced at the conductor protected by the surge arrester will
be analysed first. Next, the case with the stroke on the opposite conductor will be analysed
and compared to the first case. Both stroke polarities are considered in all cases.
6.3.1. Stroke on the Protected Conductor
Since the stroke is produced directly on the conductor, it is expected that the worst case
scenario is associated to the lightning stroke with the same polarity as the struck conductor.
This is illustrated in Figure 4.23, where it is observed that for a positive stroke (Figure 4.23a),
the voltage across the insulator increases in the same direction as the already existing voltage,
while for a negative stroke (Figure 4.23b) the insulator voltage crosses zero before that it starts
increasing in the positive direction. As a result, when there is no surge arrester, a higher
maximum overvoltage is reached when the polarity of the stroke matches the polarity of the
struck conductor and hence, the flashover is produced at a lower current amplitude (in the
case presented in Figure 4.23, for Ipeak = +20 kA a flashover is produced in the struck pole,
while for Ipeak = -20 kA no flashover is produced).
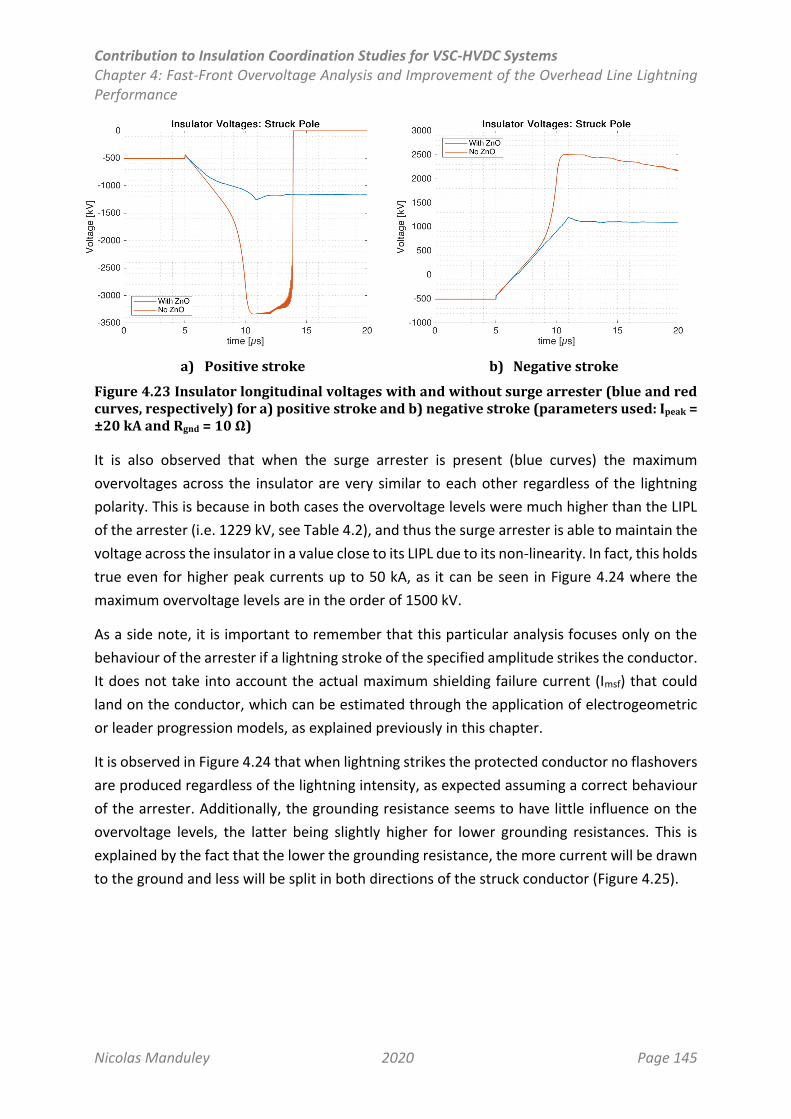
Contribution to Insulation Coordination Studies for VSC-HVDC Systems Chapter 4: Fast-Front Overvoltage Analysis and Improvement of the Overhead Line Lightning Performance
Nicolas Manduley 2020 Page 145
a) Positive stroke
b) Negative stroke
Figure 4.23 Insulator longitudinal voltages with and without surge arrester (blue and red curves, respectively) for a) positive stroke and b) negative stroke (parameters used: Ipeak = ±20 kA and Rgnd = 10 Ω)
It is also observed that when the surge arrester is present (blue curves) the maximum
overvoltages across the insulator are very similar to each other regardless of the lightning
polarity. This is because in both cases the overvoltage levels were much higher than the LIPL
of the arrester (i.e. 1229 kV, see Table 4.2), and thus the surge arrester is able to maintain the
voltage across the insulator in a value close to its LIPL due to its non-linearity. In fact, this holds
true even for higher peak currents up to 50 kA, as it can be seen in Figure 4.24 where the
maximum overvoltage levels are in the order of 1500 kV.
As a side note, it is important to remember that this particular analysis focuses only on the
behaviour of the arrester if a lightning stroke of the specified amplitude strikes the conductor.
It does not take into account the actual maximum shielding failure current (Imsf) that could
land on the conductor, which can be estimated through the application of electrogeometric
or leader progression models, as explained previously in this chapter.
It is observed in Figure 4.24 that when lightning strikes the protected conductor no flashovers
are produced regardless of the lightning intensity, as expected assuming a correct behaviour
of the arrester. Additionally, the grounding resistance seems to have little influence on the
overvoltage levels, the latter being slightly higher for lower grounding resistances. This is
explained by the fact that the lower the grounding resistance, the more current will be drawn
to the ground and less will be split in both directions of the struck conductor (Figure 4.25).
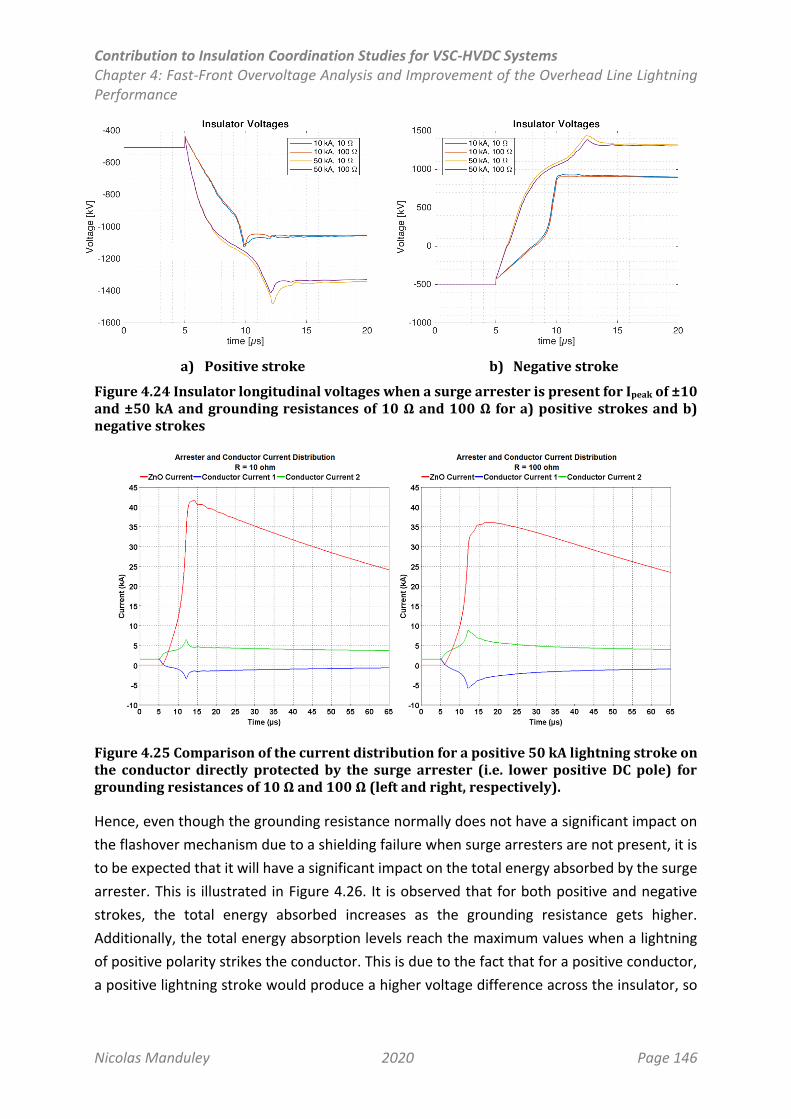
Contribution to Insulation Coordination Studies for VSC-HVDC Systems Chapter 4: Fast-Front Overvoltage Analysis and Improvement of the Overhead Line Lightning Performance
Nicolas Manduley 2020 Page 146
a) Positive stroke
b) Negative stroke
Figure 4.24 Insulator longitudinal voltages when a surge arrester is present for Ipeak of ±10 and ±50 kA and grounding resistances of 10 Ω and 100 Ω for a) positive strokes and b) negative strokes
Figure 4.25 Comparison of the current distribution for a positive 50 kA lightning stroke on the conductor directly protected by the surge arrester (i.e. lower positive DC pole) for grounding resistances of 10 Ω and 100 Ω (left and right, respectively).
Hence, even though the grounding resistance normally does not have a significant impact on
the flashover mechanism due to a shielding failure when surge arresters are not present, it is
to be expected that it will have a significant impact on the total energy absorbed by the surge
arrester. This is illustrated in Figure 4.26. It is observed that for both positive and negative
strokes, the total energy absorbed increases as the grounding resistance gets higher.
Additionally, the total energy absorption levels reach the maximum values when a lightning
of positive polarity strikes the conductor. This is due to the fact that for a positive conductor,
a positive lightning stroke would produce a higher voltage difference across the insulator, so
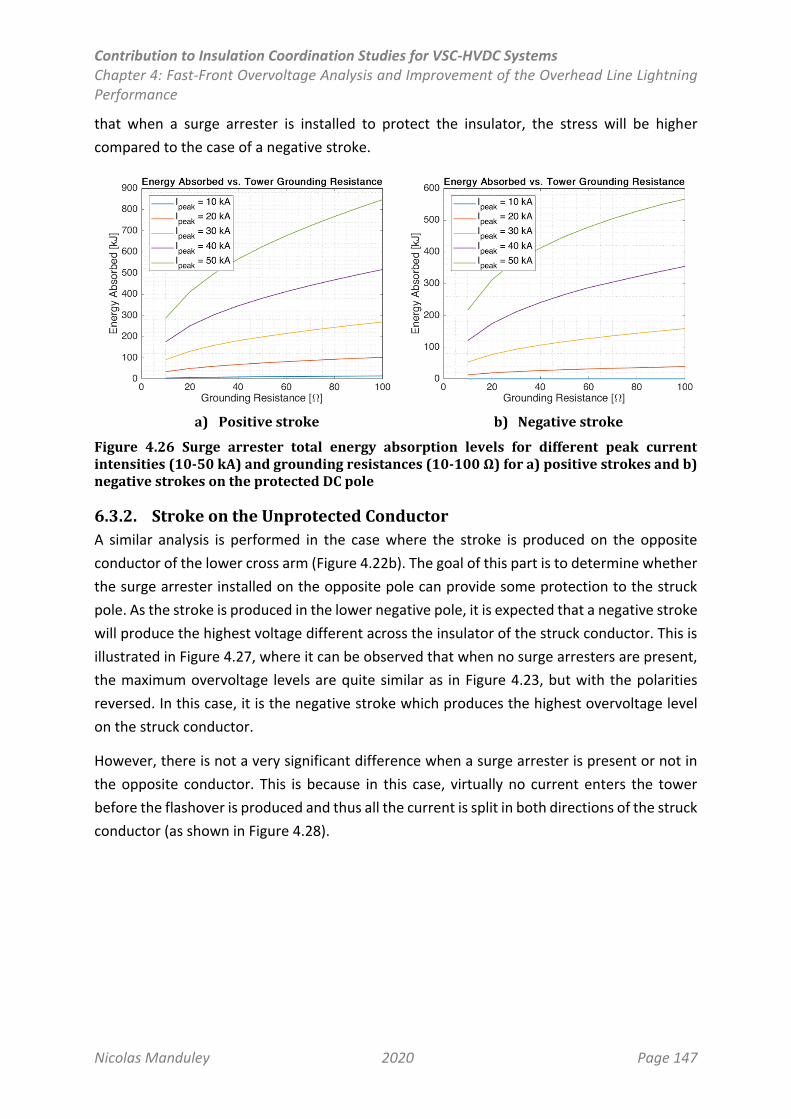
Contribution to Insulation Coordination Studies for VSC-HVDC Systems Chapter 4: Fast-Front Overvoltage Analysis and Improvement of the Overhead Line Lightning Performance
Nicolas Manduley 2020 Page 147
that when a surge arrester is installed to protect the insulator, the stress will be higher
compared to the case of a negative stroke.
a) Positive stroke
b) Negative stroke
Figure 4.26 Surge arrester total energy absorption levels for different peak current intensities (10-50 kA) and grounding resistances (10-100 Ω) for a) positive strokes and b) negative strokes on the protected DC pole
6.3.2. Stroke on the Unprotected Conductor
A similar analysis is performed in the case where the stroke is produced on the opposite
conductor of the lower cross arm (Figure 4.22b). The goal of this part is to determine whether
the surge arrester installed on the opposite pole can provide some protection to the struck
pole. As the stroke is produced in the lower negative pole, it is expected that a negative stroke
will produce the highest voltage different across the insulator of the struck conductor. This is
illustrated in Figure 4.27, where it can be observed that when no surge arresters are present,
the maximum overvoltage levels are quite similar as in Figure 4.23, but with the polarities
reversed. In this case, it is the negative stroke which produces the highest overvoltage level
on the struck conductor.
However, there is not a very significant difference when a surge arrester is present or not in
the opposite conductor. This is because in this case, virtually no current enters the tower
before the flashover is produced and thus all the current is split in both directions of the struck
conductor (as shown in Figure 4.28).
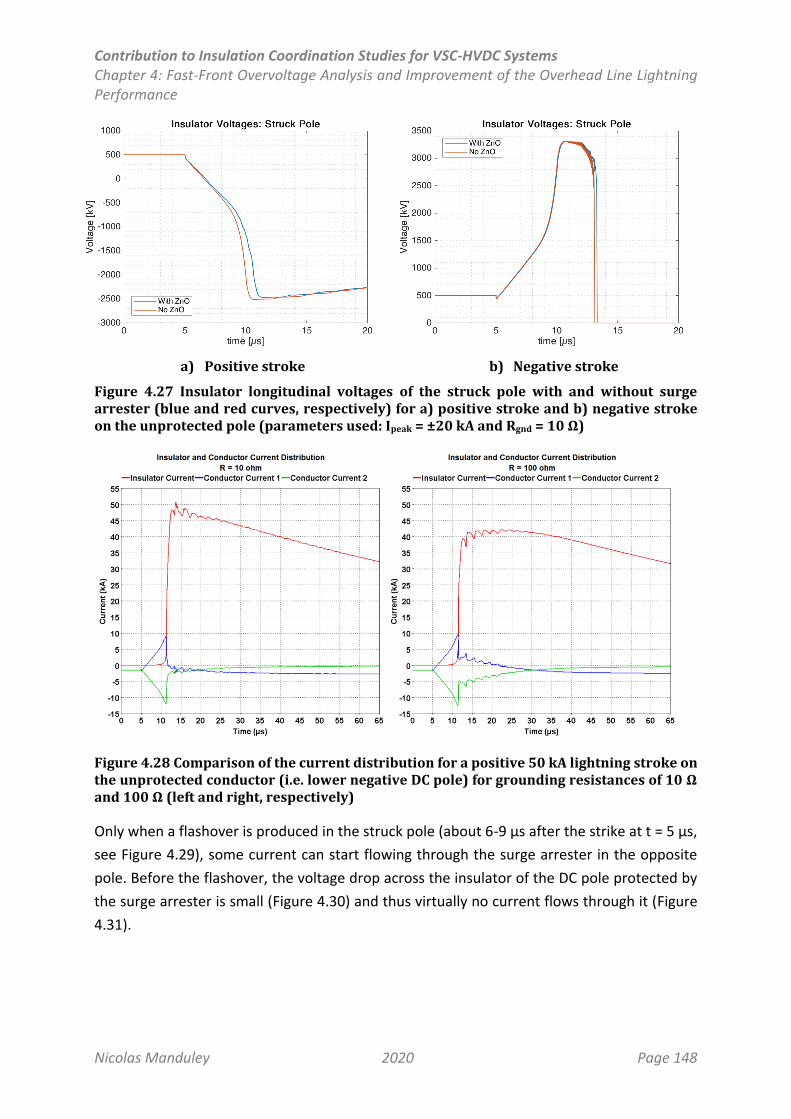
Contribution to Insulation Coordination Studies for VSC-HVDC Systems Chapter 4: Fast-Front Overvoltage Analysis and Improvement of the Overhead Line Lightning Performance
Nicolas Manduley 2020 Page 148
a) Positive stroke
b) Negative stroke
Figure 4.27 Insulator longitudinal voltages of the struck pole with and without surge arrester (blue and red curves, respectively) for a) positive stroke and b) negative stroke on the unprotected pole (parameters used: Ipeak = ±20 kA and Rgnd = 10 Ω)
Figure 4.28 Comparison of the current distribution for a positive 50 kA lightning stroke on the unprotected conductor (i.e. lower negative DC pole) for grounding resistances of 10 Ω and 100 Ω (left and right, respectively)
Only when a flashover is produced in the struck pole (about 6-9 µs after the strike at t = 5 µs,
see Figure 4.29), some current can start flowing through the surge arrester in the opposite
pole. Before the flashover, the voltage drop across the insulator of the DC pole protected by
the surge arrester is small (Figure 4.30) and thus virtually no current flows through it (Figure
4.31).
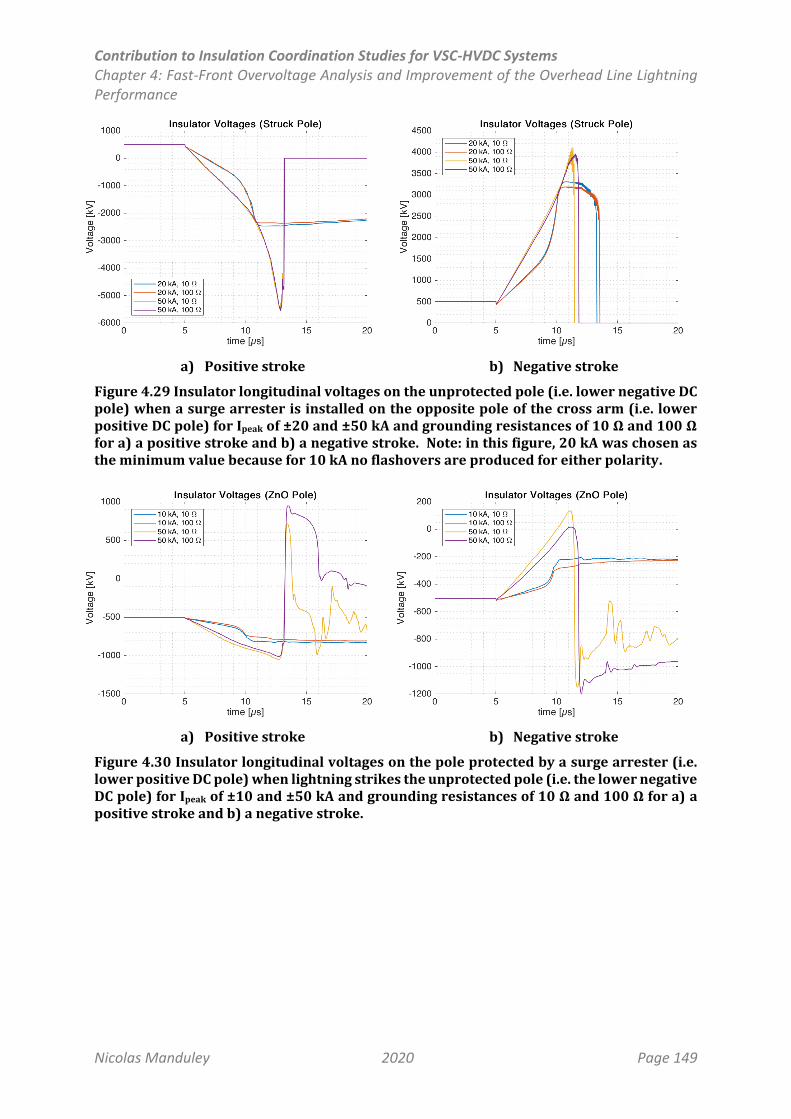
Contribution to Insulation Coordination Studies for VSC-HVDC Systems Chapter 4: Fast-Front Overvoltage Analysis and Improvement of the Overhead Line Lightning Performance
Nicolas Manduley 2020 Page 149
a) Positive stroke
b) Negative stroke
Figure 4.29 Insulator longitudinal voltages on the unprotected pole (i.e. lower negative DC pole) when a surge arrester is installed on the opposite pole of the cross arm (i.e. lower positive DC pole) for Ipeak of ±20 and ±50 kA and grounding resistances of 10 Ω and 100 Ω for a) a positive stroke and b) a negative stroke. Note: in this figure, 20 kA was chosen as the minimum value because for 10 kA no flashovers are produced for either polarity.
a) Positive stroke
b) Negative stroke
Figure 4.30 Insulator longitudinal voltages on the pole protected by a surge arrester (i.e. lower positive DC pole) when lightning strikes the unprotected pole (i.e. the lower negative DC pole) for Ipeak of ±10 and ±50 kA and grounding resistances of 10 Ω and 100 Ω for a) a positive stroke and b) a negative stroke.
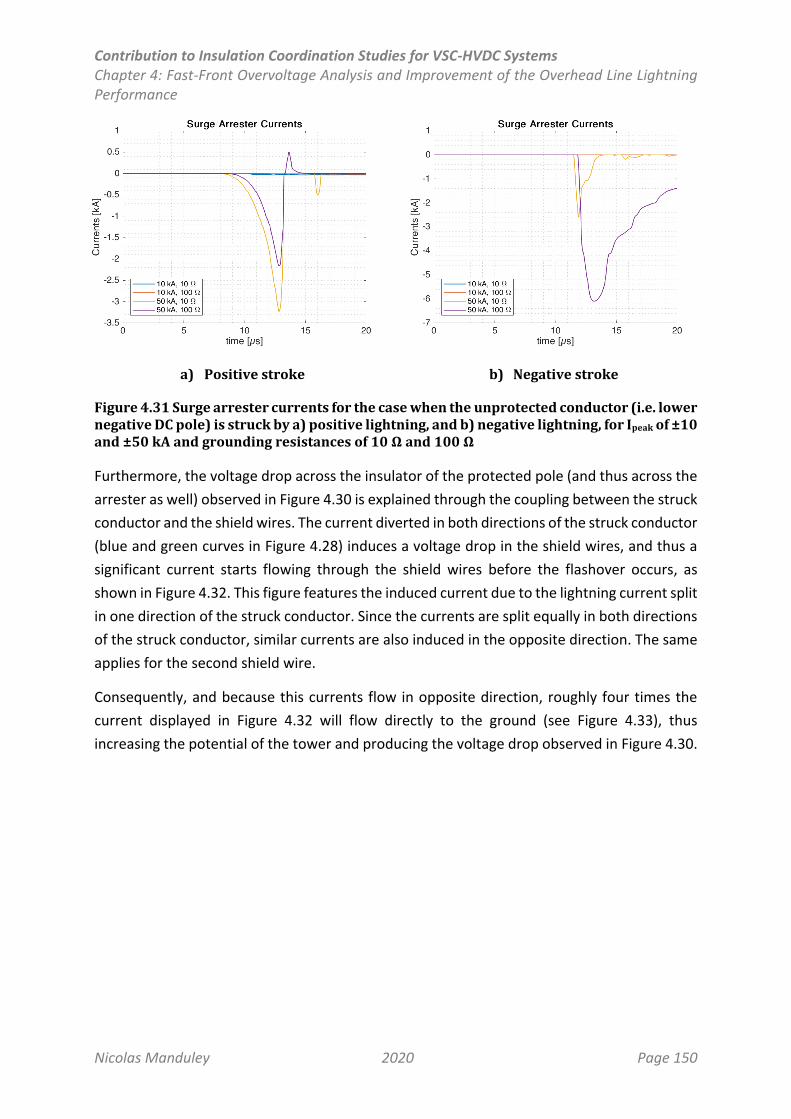
Contribution to Insulation Coordination Studies for VSC-HVDC Systems Chapter 4: Fast-Front Overvoltage Analysis and Improvement of the Overhead Line Lightning Performance
Nicolas Manduley 2020 Page 150
a) Positive stroke
b) Negative stroke
Figure 4.31 Surge arrester currents for the case when the unprotected conductor (i.e. lower negative DC pole) is struck by a) positive lightning, and b) negative lightning, for Ipeak of ±10 and ±50 kA and grounding resistances of 10 Ω and 100 Ω
Furthermore, the voltage drop across the insulator of the protected pole (and thus across the
arrester as well) observed in Figure 4.30 is explained through the coupling between the struck
conductor and the shield wires. The current diverted in both directions of the struck conductor
(blue and green curves in Figure 4.28) induces a voltage drop in the shield wires, and thus a
significant current starts flowing through the shield wires before the flashover occurs, as
shown in Figure 4.32. This figure features the induced current due to the lightning current split
in one direction of the struck conductor. Since the currents are split equally in both directions
of the struck conductor, similar currents are also induced in the opposite direction. The same
applies for the second shield wire.
Consequently, and because this currents flow in opposite direction, roughly four times the
current displayed in Figure 4.32 will flow directly to the ground (see Figure 4.33), thus
increasing the potential of the tower and producing the voltage drop observed in Figure 4.30.
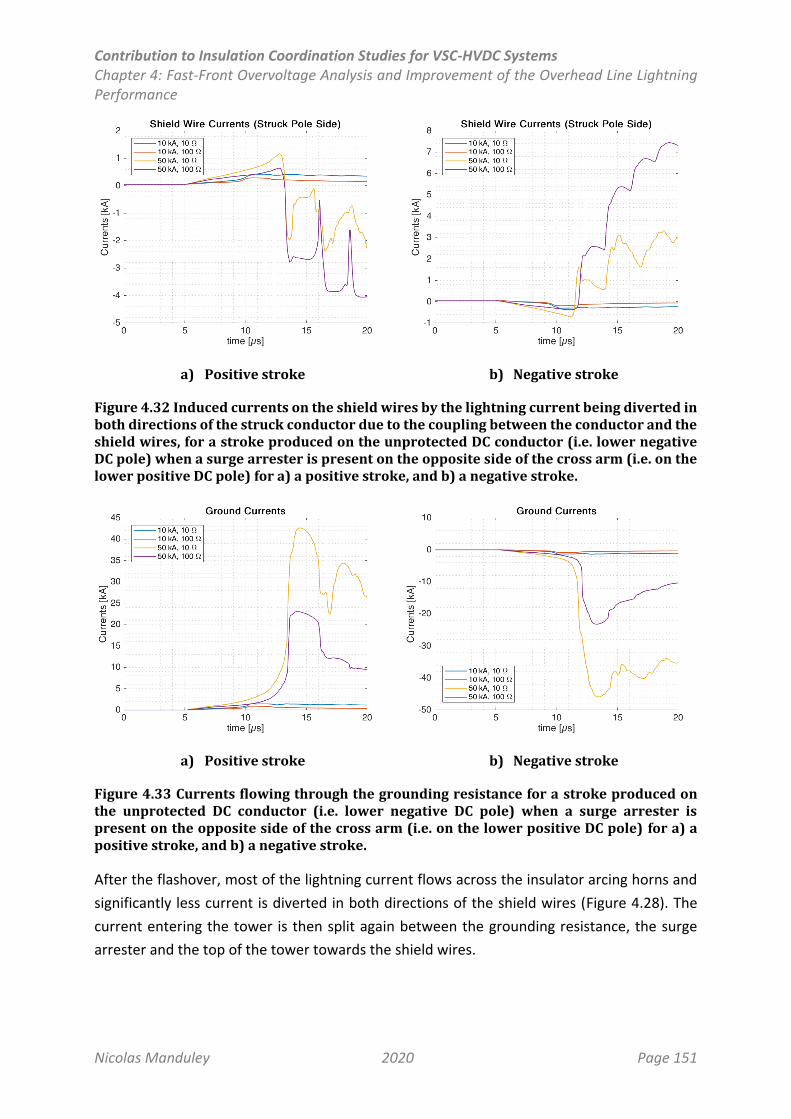
Contribution to Insulation Coordination Studies for VSC-HVDC Systems Chapter 4: Fast-Front Overvoltage Analysis and Improvement of the Overhead Line Lightning Performance
Nicolas Manduley 2020 Page 151
a) Positive stroke
b) Negative stroke
Figure 4.32 Induced currents on the shield wires by the lightning current being diverted in both directions of the struck conductor due to the coupling between the conductor and the shield wires, for a stroke produced on the unprotected DC conductor (i.e. lower negative DC pole) when a surge arrester is present on the opposite side of the cross arm (i.e. on the lower positive DC pole) for a) a positive stroke, and b) a negative stroke.
a) Positive stroke
b) Negative stroke
Figure 4.33 Currents flowing through the grounding resistance for a stroke produced on the unprotected DC conductor (i.e. lower negative DC pole) when a surge arrester is present on the opposite side of the cross arm (i.e. on the lower positive DC pole) for a) a positive stroke, and b) a negative stroke.
After the flashover, most of the lightning current flows across the insulator arcing horns and
significantly less current is diverted in both directions of the shield wires (Figure 4.28). The
current entering the tower is then split again between the grounding resistance, the surge
arrester and the top of the tower towards the shield wires.

Contribution to Insulation Coordination Studies for VSC-HVDC Systems Chapter 4: Fast-Front Overvoltage Analysis and Improvement of the Overhead Line Lightning Performance
Nicolas Manduley 2020 Page 152
The current flowing to the ground is determined the grounding resistance, being significantly
lower for higher values (Figure 4.33). However, for high grounding resistances, even though
the current is lower, the total voltage drop is higher, which is reflected on the voltage drop of
the insulators. Because of this fact, the voltage stress for the surge arrester is more significant
for higher grounding resistances and thus more current flows through the surge arrester,
according to its respective V-I characteristic (Figure 4.30 and Figure 4.31). The rest of the
current is diverted to the shield wires (Figure 4.32 for one of the directions of one of the shield
wires).
It is thus seen that the arrester has little to no effect regarding the flashover probability of the
unprotected pole, but after the flashover occurs, significant currents can still flow through it
due to the flashover current flowing to the ground and increasing the voltage of the tower
structure.
Finally, the absolute energy absorbed by the surge arresters is presented in Figure 4.34.
Figure 4.34 Surge arrester total energy absorption levels for different peak current intensities (10-50 kA) and grounding resistances (10-100 Ω) for a) positive strokes and b) negative strokes on the unprotected conductor.
Firstly, it is observed that, as expected, the overall energy absorption levels are significantly
lower than when the stroke is produced on the protected conductor (about 5% of the total
energy absorbed in such case). This is because when lightning strikes the protected conductor,
the propagating voltage wave reaches the surge arrester directly, while when the unprotected
pole is struck, this voltage wave practically only affects the insulators of that conductor, where
no surge arrester is present and no current flows until a flashover is produced. The energy
absorption levels in this case are thus associated to the flashover current entering the tower
and flowing to the ground, and to some extent to the induced voltages on the shield wires,
which also produce a small voltage drop of the tower due to the current that flows through
the ground.
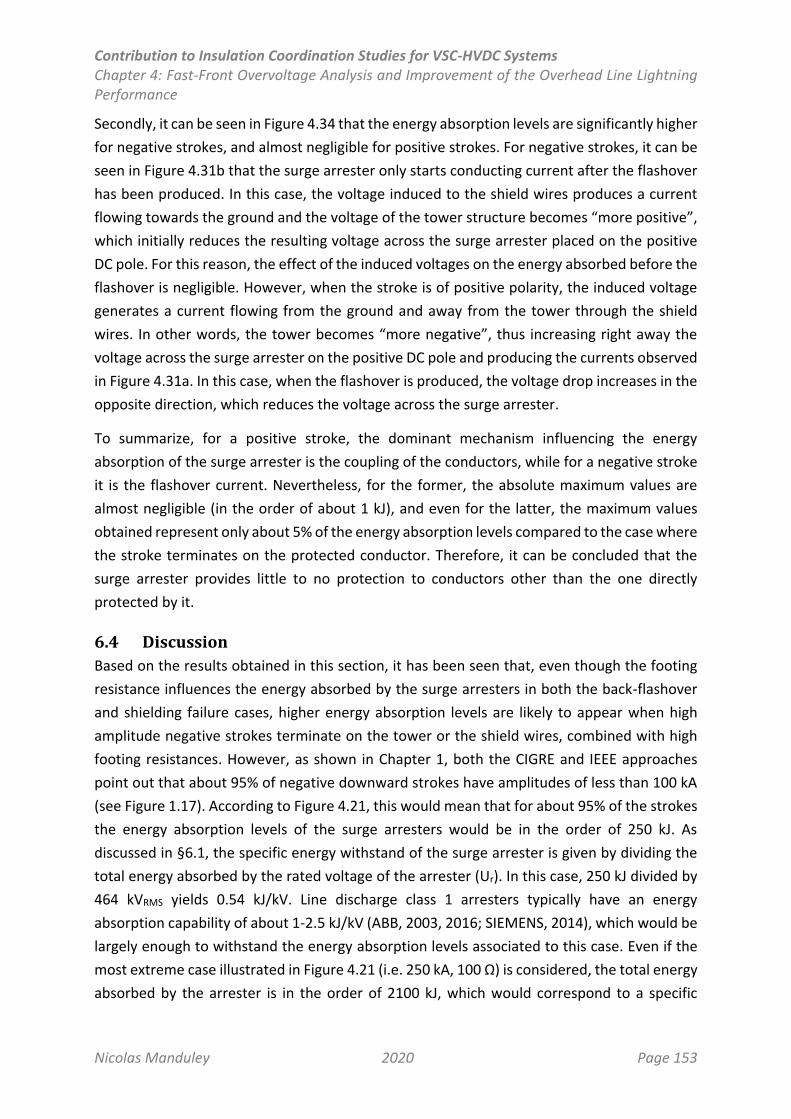
Contribution to Insulation Coordination Studies for VSC-HVDC Systems Chapter 4: Fast-Front Overvoltage Analysis and Improvement of the Overhead Line Lightning Performance
Nicolas Manduley 2020 Page 153
Secondly, it can be seen in Figure 4.34 that the energy absorption levels are significantly higher
for negative strokes, and almost negligible for positive strokes. For negative strokes, it can be
seen in Figure 4.31b that the surge arrester only starts conducting current after the flashover
has been produced. In this case, the voltage induced to the shield wires produces a current
flowing towards the ground and the voltage of the tower structure becomes “more positive”,
which initially reduces the resulting voltage across the surge arrester placed on the positive
DC pole. For this reason, the effect of the induced voltages on the energy absorbed before the
flashover is negligible. However, when the stroke is of positive polarity, the induced voltage
generates a current flowing from the ground and away from the tower through the shield
wires. In other words, the tower becomes “more negative”, thus increasing right away the
voltage across the surge arrester on the positive DC pole and producing the currents observed
in Figure 4.31a. In this case, when the flashover is produced, the voltage drop increases in the
opposite direction, which reduces the voltage across the surge arrester.
To summarize, for a positive stroke, the dominant mechanism influencing the energy
absorption of the surge arrester is the coupling of the conductors, while for a negative stroke
it is the flashover current. Nevertheless, for the former, the absolute maximum values are
almost negligible (in the order of about 1 kJ), and even for the latter, the maximum values
obtained represent only about 5% of the energy absorption levels compared to the case where
the stroke terminates on the protected conductor. Therefore, it can be concluded that the
surge arrester provides little to no protection to conductors other than the one directly
protected by it.
6.4 Discussion
Based on the results obtained in this section, it has been seen that, even though the footing
resistance influences the energy absorbed by the surge arresters in both the back-flashover
and shielding failure cases, higher energy absorption levels are likely to appear when high
amplitude negative strokes terminate on the tower or the shield wires, combined with high
footing resistances. However, as shown in Chapter 1, both the CIGRE and IEEE approaches
point out that about 95% of negative downward strokes have amplitudes of less than 100 kA
(see Figure 1.17). According to Figure 4.21, this would mean that for about 95% of the strokes
the energy absorption levels of the surge arresters would be in the order of 250 kJ. As
discussed in §6.1, the specific energy withstand of the surge arrester is given by dividing the
total energy absorbed by the rated voltage of the arrester (Ur). In this case, 250 kJ divided by
464 kVRMS yields 0.54 kJ/kV. Line discharge class 1 arresters typically have an energy
absorption capability of about 1-2.5 kJ/kV (ABB, 2003, 2016; SIEMENS, 2014), which would be
largely enough to withstand the energy absorption levels associated to this case. Even if the
most extreme case illustrated in Figure 4.21 (i.e. 250 kA, 100 Ω) is considered, the total energy
absorbed by the arrester is in the order of 2100 kJ, which would correspond to a specific
Contribution to Insulation Coordination Studies for VSC-HVDC Systems Chapter 4: Fast-Front Overvoltage Analysis and Improvement of the Overhead Line Lightning Performance
Nicolas Manduley 2020 Page 154
energy withstand of about 4.48 kJ/kV. Line discharge class 2 arresters typically have an energy
absorption capability of roughly 5 kJ/kV (ABB, 2003, 2016; SIEMENS, 2014), which would be
capable of withstanding such elevated energy absorption levels. If the same exercise is
performed for a 200 kA stroke (which is the typically used maximum value for negative
lightning strokes (CIGRE TB 704, 2017)), the energy absorption levels would be in the order of
1000 kJ, or 2.14 kJ/kV for the current application. In this case, it is clear that a line discharge
class 2 arrester would be largely enough for such applications.
In the case of shielding failure, significantly lower energy absorption levels were obtained even
for the most extreme cases, going up to about 850 kJ for 50 kA strokes with a footing
resistance of 100 Ω. However, the value of 50 kA was chosen to be the absolute maximum
value used for the studies, but it is actually very unlikely for a lightning current of such
amplitude to strike the power conductor. By applying the electrogeometric model analysis on
the considered case study, the maximum shielding failure current (Imsf) is estimated to be
between 17-20 kA using the models of Armstrong & Whitehead (1968b) and Love (1973) (see
Chapter 1). From Figure 4.26, it is observed that for currents of such orders of magnitude, the
maximum energy absorbed by the surge arresters may be in the range of about 90-250 kJ,
which is similar but lower than the values expected when strokes terminate on the shield wires
or the tower. Moreover, as discussed in Chapter 1, EGM tends to overestimate the SFFOR for
EHV and UHV systems (CIGRE TB 704, 2017). By applying the simplified LPM approach of Rizk
(1990), the Imsf obtained is in the range of 2-3 kA for the considered system, for which the
energy absorption levels of the arrester would be virtually negligible as per Figure 4.26.
It is worth mentioning the fact that there is a family of lightning strokes that are not
considered. In the presented studies, positive strokes are modelled using the statistics
gathered for downward negative strokes. Although positive strokes represent roughly 10% of
all strikes to the ground (CIGRE TB 549), the available data indicates that such strokes are
significantly more likely to feature long duration continuing currents in the order of
milliseconds which would be much more stressing for the arresters.
One direct and potentially serious consequence of the facts mentioned in the previous
paragraph is that after failure, arresters behave like short-circuits, thus introducing a
permanent fault to the overhead line. For such scenario, a possibility may be to use arresters
with air gaps which are able to withstand the permanent voltage and the switching
overvoltages that may appear (excluding those due to faults along the same pole). This
solution is discussed in CIGRE TB 440 and IEC 60099-8 for AC systems. However, it remains a
very complex issue to coordinate the gap of the arrester with the gap of the insulator string
of the tower, which requires empiric approaches. Moreover, the application of surge arresters
in HVDC systems is only covered by IEC 60099-9 standard, which concerns gapless arresters
Contribution to Insulation Coordination Studies for VSC-HVDC Systems Chapter 4: Fast-Front Overvoltage Analysis and Improvement of the Overhead Line Lightning Performance
Nicolas Manduley 2020 Page 155
only. Although this standard concerns the HVDC converter stations, it may be used as a
reference for HVDC overhead lines in absence of a dedicated standard for such case.
Another important aspect concerns the energy withstand capability of surge arresters. In IEC
60099-9 standard, the notion of charge transfer rating is used to specify the energy withstand
of an arrester instead of the concept of line discharge class. Such approach involve a
classification in thermal energy ratings based on the capacity of the arrester to withstand
successive impulse currents with a duration going up to 200 µs for lightning impulses. Such
approach may be more appropriate for specifying the energy withstand of HVDC arresters.
Although the notion of line discharge classes used in this dissertation is not standardized
anymore in IEC standards, it is still in favour in the industry. Furthermore, a comparison
between both approaches is presented in annex L of IEC 60099-4. In all cases, it is clear that
the choice of the energy duty of arresters remain a very complex subject, and special care
must be taken when dealing with this issue, especially regarding HVDC arresters.
6.5 Summary and Conclusions
To recapitulate: in this section, the energy absorption levels of the line surge arresters—and
the mechanisms associated to them—were investigated for both the back-flashover and
shielding failure cases. The main motivation behind this study was to determine the aspects
that must be taken into account to design and specify the line surge arresters for a given
application.
It has been seen that strokes terminating on the tower or the shield wires are likely to lead to
the highest energy absorption levels of the surge arrester. For many cases (about 95%), a line
discharge class 1 arrester may be capable of withstanding the associated energy absorption
levels, while a class 2 is very likely to be largely enough for current amplitudes up to 200 kA,
which is the typical maximum value considered for lightning studies.
In both the cases of direct strike on the tower or shield wires and shielding failure, the footing
resistance proved to be an influencing factor in the overall energy absorbed by the surge
arrester. This is due to the fact that whenever a surge arrester is present, currents can flow
between the conductors and the tower structure which only depend on the V-I characteristic
of the arrester. If no surge arresters are present, a flashover is required to occur so that a
current can flow between the tower and the conductors.
Furthermore, it was confirmed that the protective effect of the surge arrester concerns only
the insulator directly protected by it. For strokes produced on other conductors not protected
by surge arresters, little to no protective action is performed by the surge arrester.
Contribution to Insulation Coordination Studies for VSC-HVDC Systems Chapter 4: Fast-Front Overvoltage Analysis and Improvement of the Overhead Line Lightning Performance
Nicolas Manduley 2020 Page 156
It has been also discussed that the aspects regarding the energy withstand capability of the
surge arresters still constitute a very complex subject that shall be treated with care. Besides
the issue of the specification of the arrester in terms of energy handling capability, it also
makes difficult to estimate the risk of failure of a surge arrester and the solutions that may be
used, especially regarding HVDC applications, for which no standard covers the application of
gapped surge arresters.
7. Conclusion
The estimation of the lightning performance of an overhead line consists of the analysis of two
main scenarios that may occur: direct strikes to the tower or shield wires (leading to a back-
flashover) and strikes to the power conductors (due to a shielding failure). The back-flashover
rate (BFOR) depends strongly on the grounding resistance of the considered tower, and also
on the coupling between the conductors, the polarity of the stroke and considered
conductors, and the different voltage drops across the tower structure. The shielding failure
flashover rate (SFFOR) depends mainly on the tower and conductor geometry, insulator
characteristics and regional lightning data. The sum of both the BFOR and SFFOR constitutes
the overall lightning performance of a given system.
Even though there are certain similarities in the behaviour of HVAC and HVDC lines regarding
lightning strokes, the characteristics of HVDC systems make the lightning performance
analysis of HVDC overhead lines differ from the HVAC case. In particular, the fact that the
voltage levels are constant at all times in HVDC systems removes the dependency of the
lightning performance on the instant when lightning strikes the system.
In double circuit HVDC configurations, the position of the DC poles plays a major role in the
overall and double back-flashover rates because of the high effect of the conductor coupling
and the polarity of the lightning stroke. In this work, the effect of the configuration of the DC
poles has been analysed in details to provide a better understanding on its impact on the
lightning performance of double-circuit HVDC overhead lines.
Additionally, two solutions for the improvement of the lightning performance have been
studied to contribute to the insulation coordination of HVDC overhead lines: the installation
of line surge arresters and the use of unbalanced insulation in double-circuit HVDC overhead
lines.
It has been found that the installation of line surge arresters can significantly improve the
performance of a given tower. A very significant improvement may still be achieved with one
surge arrester on a single positive pole (in the case of double-circuit configurations, in the
lower positive pole which has the highest flashover risk). For practical and economic reasons,
Contribution to Insulation Coordination Studies for VSC-HVDC Systems Chapter 4: Fast-Front Overvoltage Analysis and Improvement of the Overhead Line Lightning Performance
Nicolas Manduley 2020 Page 157
this solution is to be used only on specific towers presenting high flashover rates, most
commonly due to poor grounding conditions.
In addition, the results suggest that surge arrester may also help to significantly reduce the
shielding failure rate, and that the degree of improvement depends greatly on the surge
arrester configuration considered. Further studies are required to correctly assess the
relevance of this effect.
In terms of line surge arrester specifications, one of the most important parameters to
consider is the energy absorption level of the arresters, to avoid potential failures due to
excess of energy absorbed due to a lightning stroke. The striking point proved to be of
importance, as strokes terminating on the tower or shield wires may lead to higher energy
absorption levels than the case of shielding failure. In both cases, however, a line discharge
class 1 or 2 arrester is likely to be enough to withstand the absolute energy absorption levels
associated to lightning strokes on the transmission line.
The unbalanced insulation solution consists of the use of different insulator (or arcing horns)
lengths for each circuit in a double circuit configuration. It represents a solution that can be
implemented along the whole line from its very conception phase and that can significantly
improve the lightning performance of double-circuit HVDC lines, especially regarding the risk
of double flashovers. Concretely, it has been found that the use of an unbalanced insulation
can effectively improve the double back-flashover performance of a system in which both
poles of the same polarity are placed at the same height (Top configuration, Figure 4.1). With
a proper design, such configuration, combined with an unbalanced insulation solution, can
achieve similar or even better lightning performances than the most commonly used
configuration with the polarities crossed (Xed configuration).
For the effects of the application of the unbalanced insulation solution, an unbalance of about
30 to 50 cm seems to be optimal.

Contribution to Insulation Coordination Studies for VSC-HVDC Systems Conclusion
Nicolas Manduley 2020 Page 158
Contribution to Insulation Coordination Studies for VSC-HVDC Systems Conclusion
Nicolas Manduley 2020 Page 159
Conclusion
HVDC power transmission technologies are in constant development and growth worldwide.
As it has been discussed, HVDC offers a series of advantages over HVAC in terms of power
transmission capacity and reduction of losses over long distances. HVDC technologies based
on Voltage Source Converters (VSC) have proven to be very promising regarding the massive
integration of renewable energies to the grid, as well as in providing a feasible way to
interconnect several transmission systems through HVDC, thus increasing the reliability and
stability of the grid. Advances in such developments are likely to translate into several actions,
such as the increase of the commissioning of VSC-HVDC projects—especially regarding
Modular Multilevel Converters (MMC)—the construction of new HVDC links, or the conversion
of existing AC overhead lines into DC.
For any engineering project of the kind, insulation coordination is a crucial stage in the design
phase of the project as it deals with the insulation requirements and overvoltage protection
strategy of the system and the equipment connected to it. However, there are no universally
recognized procedures for insulation coordination in HVDC. Current insulation coordination
standards for high voltage engineering only cover HVAC, and HVDC technologies based on Line
Commutated Converters (LCC) only. Even in the case of LCC-HVDC, there is an absence of
standard rated withstand voltages for DC equipment in general, which also represents a
significant obstacle to the development of detailed insulation coordination procedures.
Moreover, a direct transposition of the AC or LCC principles to VSC is not possible, as already
discussed in this dissertation, and the scientific literature on the subject is scarce. All of the
above makes it difficult to develop adequate insulation coordination guidelines for HVDC
systems, including VSC.
This thesis is intended to contribute to remedy such major deficiencies surrounding the
development of insulation coordination procedures for HVDC systems, particularly regarding
VSC-MMC architectures.
To do so, a thorough state of the art and literature review was presented regarding insulation
coordination in Chapter 1. The current methods and procedures described in the standards,
as well as in technical brochures, scientific papers, PhD dissertations and books, were
discussed in order to establish the current state of development on the different subjects
addressed in this dissertation. This literature review has allowed to identify the fundamental
aspects that differentiates VSC technologies from AC and LCC within the context of insulation
coordination, and that need to be taken into account for the development of detailed
insulation coordination procedures for such systems.
Contribution to Insulation Coordination Studies for VSC-HVDC Systems Conclusion
Nicolas Manduley 2020 Page 160
Then, the methodology used to conduct the studies performed in this research was described
in Chapter 2. It includes all the details regarding the electromagnetic transient modelling of
individual components, as well as the guidelines to build the case studies presented in this
dissertation.
Over the above foundations, the different objectives of the thesis have been addressed. As
discussed in the introduction, they concern two main axes: insulation coordination of VSC-
HVDC systems, and the evaluation and improvement of the lightning performance of HVDC
overhead lines. The main conclusions of both are described below.
Regarding the first axis, three main objectives were established. The first, to provide a base
on how the insulation coordination procedures should be adapted to VSC-HVDC systems. The
second, the proposal of a methodology to perform insulation coordination studies for such
systems. The third, to provide guidelines and recommendations on how the overvoltage
protection strategy should be designed.
The fundamental principles of insulation coordination have been adapted to VSC-MMC
technologies taking into account the essential differences between AC and DC, as well as
between LCC and VSC technologies identified previously. Inspired on the approach from LCC-
HVDC insulation coordination standard, two fundamental schemes of MMC stations are
proposed which allow to generalize the insulation coordination principles based on such
schemes, and remain valid for any possible architecture, topology, operating mode of the
station or surge arrester arrangement for the overvoltage protection strategy. This establishes
a solid base over which the insulation coordination principles can be adapted to VSC-MMC
technologies, which covers the first objective.
The overvoltage profiles have been characterised for different architectures and topologies
with and without surge arresters, in order to study the behaviour of MMC stations and provide
general guidelines for the design of the overvoltage protection strategy. It has been found
that all the above factors influence the transient behaviour and the overvoltage profiles of the
system significantly. Moreover, it has been shown that the particular arrangement of surge
arresters has a very significant influence on the response of the system under transient
stresses due to the complex interactions between the different surge arresters and the
system. Consequently, individual arresters should be characterised by taking into account not
only the voltage and overvoltage levels of the system, but also the particular arrangement or
combination of arresters chosen for the overvoltage protection strategy.
Based on the conclusions of the above studies, a general insulation coordination procedure
for MMC-HVDC systems has been proposed, which covers all the aspects identified to be
essential on adapting the fundamental principles of insulation coordination to such systems
and the results obtained from the studies described above. The procedure consists of different
Contribution to Insulation Coordination Studies for VSC-HVDC Systems Conclusion
Nicolas Manduley 2020 Page 161
design phases—as well as the inputs and outputs of each one—and recommendations on the
possible location, as well as guidelines for the characterisation, of each one of the surge
arresters that may be considered for the overvoltage protection strategy of the system.
Following such procedure allows to effectively perform insulation coordination studies on
VSC-MMC based systems. In combination with the previous paragraph, this covers for the
second and third objectives regarding the insulation coordination of HVDC systems.
Furthermore, the feasibility of developing a fully qualitative approach to estimate the
maximum overvoltage levels of a system without performing numerical simulations has been
studied and discussed. It has been proven that such an approach may be considered to
constitute a useful tool in addition to the numerical analysis, but that is not able to accurately
predict the behaviour of the system on its own. This provides an important justification
regarding the choice of basing the general insulation coordination procedures on EMT
simulations.
Regarding the second axis, three main objectives were established. The first consists of the
adaptation the existing procedures for the evaluation of the lightning performance of
overhead lines to VSC-HVDC applications, including the possibility to analyse asymmetric
configurations, non-linear devices and double flashovers. The second objective involves the
proposal and study of solutions for the improvement of the lightning performance considering
both single and multiple insulator flashovers. The third concerns an overall improvement in
the understanding of the behaviour of HVDC overhead lines in case of lightning strikes.
The procedure used to estimate the lightning performance with the specified requirements
consists of a combination of the existing methods documented in the literature and numerical
simulations using electromagnetic transient modelling of the system and components. This
allows a precise estimation of the critical flashover currents for each system taking into
consideration an adequate modelling of the overhead lines, surge arresters, asymmetric
configurations (such as the unbalanced insulation solution), grounding conditions and other
parameters. Then, the calculation of the flashover rate is performed using the traditional
methods recommended in the literature. This covers the first objective listed above.
Through the application of the method described above, it has been found that there are
significant differences between the behaviours of AC and DC overhead lines in case of lightning
strikes. For instance, the fact that the voltage levels are constant in DC removes the
dependency on the instant during which lightning strikes the line, while in AC it can play a
major role in determining which phase is more likely to flashover. Moreover, it has been found
that the position of the DC poles within the transmission tower is a very significant influencing
factor on the lightning performance of double-circuit HVDC overhead lines, mainly due to the
coupling between the conductors. Also, the fact that in such configurations two conductors
Contribution to Insulation Coordination Studies for VSC-HVDC Systems Conclusion
Nicolas Manduley 2020 Page 162
may be permanently subjected to the same voltage level increases the probability of double
flashovers to occur.
Based on the obtained results and analysis, two solutions for the improvement of the lightning
performance of double-circuit HVDC overhead lines have been studied, which covers for the
second objective: the installation of line surge arresters and the use of unbalanced insulation.
Different scenarios using one or two arresters have been investigated, as well as their
respective advantages and disadvantages. It has been found in this work that very significant
improvements in the lightning performance can be achieved by installing even a single surge
arrester on the lower positive pole. Recommendations for the specification of line arresters
are also provided, particularly in terms of the energy absorption levels of the surge arresters
in case of direct strikes and shielding failures. In the case of the unbalanced insulation solution,
it has been shown in this research that this solution can effectively improve the double back-
flashover performance of a system, and that similar or better lightning performances can be
obtained by combining this solution with DC pole configurations not typically used in practice.
It has been also determined that for an unbalance beyond 50 cm the improvement on the
lightning performance increases very slowly. An unbalance of 30 to 50 cm seems to be optimal
for practical applications.
The results and the analysis of all the above studies constitute altogether a contribution to the
better overall understanding of the behaviour of HVDC overhead lines under lightning strikes,
which accounts for the third objective of this axis.
In summary, this thesis presents a series of developments aiming to contribute to compensate
the scarcity of scientific knowledge on insulation coordination for VSC-HVDC, and particularly
for the MMC. Concretely, contributions in the areas related to the development of detailed
insulation coordination procedures for such systems are presented, as well as in the areas of
lightning performance of HVDC overhead lines. Particular effort has been put into the
transposition of the insulation coordination principles for HVAC and LCC-HVDC by taking into
consideration all the influencing factors and essential differences between each kind of
system.
Contribution to Insulation Coordination Studies for VSC-HVDC Systems Perspectives and Future Research
Nicolas Manduley 2020 Page 163
Perspectives and Future Research
Insulation coordination involves an extremely wide range of subjects, and each one of them
is important to ensure a correct design of the insulation and the overvoltage protection
strategy of a system. As such, there are still several aspects that need to be studied thoroughly
before being able to standardize the insulation coordination procedures for VSC-HVDC
systems that were not included in this research.
Among the natural next steps of this research, the following subjects have been identified:
Application of the developed procedure on other case studies and thus provide further
validation of the obtained conclusions.
Perform the overvoltage analysis on MMC-HVDC systems involving both cable and
overhead lines. This and the task above may be performed jointly by considering a
hybrid line case, such as the SouthWest Link, for both tasks.
Validation and further development of an algorithm allowing to conduct the iterative
design of the surge arresters for the overvoltage protection of the system.
Development of a tool allowing to automate the procedures, from the modelling of
the system to the specification of the required air clearances, dielectric strengths
insulating materials and overvoltage protection strategies.
Among the subjects considered for future research, the following areas might be of interest:
Lightning protection of the MMC-HVDC station. Such studies require a detailed high-
frequency modelling of the components as well as of the grounding grid of the station.
Moreover, different applications of the electrogeometric or leader progression models
(EGM and LPM, respectively) are found in the station, such as the case of tall lightning
rods placed in different locations of the installations, which constitutes a more
complex scenario regarding lightning protection that may require particular and
dedicated studies.
Analysis of case studies featuring multi-terminal topologies (MTDC). One of the long-
term goals of VSC-HVDC transmission is the interconnection of large transmission
systems and the formation of true HVDC grids where each node may be connected to
several other nodes. Therefore, it is of great interest to conduct studies considering
multi-terminal topologies and the potential impact of such schemes on insulation
coordination.
Transient analysis of other phenomena potentially leading to overvoltages, such as
resonance, ferroresonance, load shedding or unexpected opening of AC or DC
breakers. Although such phenomena may not lead to the maximum overvoltage levels,
they are required to constitute a detailed overvoltage profile of the system and to
Contribution to Insulation Coordination Studies for VSC-HVDC Systems Perspectives and Future Research
Nicolas Manduley 2020 Page 164
ensure that they do not represent a danger for the operation of the surge arresters—
and therefore to the system as well.

Contribution to Insulation Coordination Studies for VSC-HVDC Systems References
Nicolas Manduley 2020 Page 165
References
ABB. (2003). Simplified Selection Procedure (Buyer’s Guide). ABB.
ABB. (2016). High Voltage Surge Arresters. Buyer’s Guide (12th ed.). ABB.
Anderson, R. B., & Eriksson, A. J. (1980). Lightning parameters for engineering application.
Electra, 69, 65–102.
Armstrong, H. R., & Whitehead, E. R. (1968a). Field and Analytical Studies of Transmission Line
Shielding. IEEE Transactions on Power Apparatus and Systems, PAS-87(1), 270–281.
Armstrong, H. R., & Whitehead, E. R. (1968b). Field and Analytical Studies of Transmission Line
Shielding. IEEE Transactions on Power Apparatus and Systems, PAS-87(1), 270–281.
Bayadi, A. (2008). Parameter identification of ZnO surge arrester models based on genetic
algorithms. Electric Power Systems Research, 78(7), 1204–1209.
Berger, K. (1975). Parameters of lightning flashes. Electra, 41, 23–37.
CENELEC 50341 Overhead electrical lines exceeding AC 1 kV - Part 1: General requirements -
Common specifications (2012). CENELEC.
China Electric Power Research Institute. (2017). UHV Transmission Technology. China EPRI.
CIGRE TB 158, W. G. 33. 04. 0. (2000). CIGRE Technical Brochure 158: Polluted Insulators: A
Review of Current Knowledge. CIGRE.
CIGRE TB 186, W. G. 14. 2. (2001). CIGRE Technical Brochure 186: Economic assessmment of
HVDC links. CIGRE.
CIGRE TB 269, W. G. B. 3. (2005). CIGRE Technical Brochure 269: VSC Transmission. CIGRE.
CIGRE TB 388, J. W. G. B. 1. (2009). CIGRE Technical Brochure 388: Impacts of HVDC lines on
the economics of HVDC projects. CIGRE.
Contribution to Insulation Coordination Studies for VSC-HVDC Systems References
Nicolas Manduley 2020 Page 166
CIGRE TB 440, W. G. C. 30. (2010). CIGRE Technical Brochure 440: Use of Surge Arresters for
Lightning Protection of Transmission Lines. CIGRE.
CIGRE TB 447, W. G. B. 4. (2011). CIGRE Technical Brochure 447: Component Testing of VSC
System for HVDC Applications. CIGRE.
CIGRE TB 518, W. G. C. 30. (2012). CIGRE Technical Brochure 518: Outdoor Insulation in
Polluted Conditions: Guidelines for Selection and Dimensioning - Part 2: The DC Case.
CIGRE.
CIGRE TB 549, W. G. C. 40. (2013). CIGRE Technical Brochure 549: Lightning Parameters for
Engineering Applications. CIGRE.
CIGRE TB 583, W. G. B. 4. (2014). CIGRE Technical Brochure 583: Guide to the Conversion of
Existing AC Lines to DC Operation. CIGRE.
CIGRE TB 63, W. G. 33. 0. (1991). CIGRE Technical Brochure 063: Guide to Procedures for
Estimating the Lightning Performance of Transmission Lines. CIGRE.
CIGRE TB 704, W. G. C. 2. (2017). CIGRE Technical Brochure 704: Evaluation of Lightning
Shielding Analysis Methods for EHV and UHV DC and AC Transmission Lines. CIGRE.
CIGRE TB 72, W. G. 33. 0. (1992). CIGRE Technical Brochure 072: Guidelines for the Evaluation
of the Dielectric Strength of External Insulation. CIGRE.
CIGRE TB 781, W. G. C. 3. (2019). CIGRE Technical Brochure 781: Impact of soil-parameter
frequency dependence on the response of grounding electrodes and on the lightning
performance of electrical systems. CIGRE.
Cooray, G. V. (2014). The lightning flash. Iet.
Contribution to Insulation Coordination Studies for VSC-HVDC Systems References
Nicolas Manduley 2020 Page 167
Cortina, R., Marrone, G., Pigini, A., Thione, L., Petrusch, W., & Verma, M. P. (1984). Study of
the Dielectric Strength of External Insulation of HVDC Systems and Application to
Design and Testing. International Conference on Large High Voltage Electric Systems.
Datsios, Z. G., Mikropoulos, P. N., & Tsovilis, T. E. (2019). Effects of Lightning Channel
Equivalent Impedance on Lightning Performance of Overhead Transmission Lines. IEEE
Transactions on Electromagnetic Compatibility, 61(3), 623–630.
De Andrade, V., & Sorrentino, E. (2010). Typical expected values of the fault resistance in
power systems. 2010 IEEE/PES Transmission and Distribution Conference and
Exposition: Latin America (T&D-LA) (pp. 602–609). IEEE.
Dennetière, S., Nguefeu, S., Saad, H., & Mahseredjian, J. (2013). Modeling of modular
multilevel converters for the France-Spain link. Star, 2(3), 4.
Dong, M., Yuan, Z., Li, T., Zhao, X., Zhang, J., & He, J. (2013). Protection of±500 kV HVDC
Double-circuit Converter Station from Lightning Induced Overvoltage. 高电压技术,
39(8).
Du, S., Dekka, A., Wu, B., & Zargari, N. (2017). Modular multilevel converters: analysis, control,
and applications. John Wiley & Sons.
EPRI Transmission Line Reference Book, 345 kV and Above. (1982). (2nd ed.). EPRI.
Fernandez, F., & Diaz, R. (2001). Metal oxide surge arrester model for fast transient
simulations. The Int. Conf. on Power System Transients IPAT (Vol. 1). Citeseer.
Grcev, L. (2009). Modeling of grounding electrodes under lightning currents. IEEE Transactions
on Electromagnetic Compatibility, 51(3), 559–571.
Contribution to Insulation Coordination Studies for VSC-HVDC Systems References
Nicolas Manduley 2020 Page 168
Grebovic, S., & Oprasic, N. (2018). Influence of Lightning Channel Impedance and Nonuniform
Tower Footing Resistance Distribution on Line Surge Arrester Energy Duty. 2018 IEEE
PES Innovative Smart Grid Technologies Conference Europe (ISGT-Europe) (pp. 1–5).
Gu, S., Wang, J., Wan, S., Cao, W., & He, J. (2018). Comparison and Analysis on Key
Performance of EHV/UHV DC Transmission Line Surge Arresters. 2018 34th
International Conference on Lightning Protection (ICLP) (pp. 1–6). IEEE.
Gu, Y. L., Huang, X. M., Qiu, P., Hua, W., Zhang, Z. R., & Xu, Z. (2013). Study of Overvoltage
Protection and Insulation Coordination for MMC based HVDC. Applied Mechanics and
Materials (Vol. 347, pp. 1812–1817). Trans Tech Publ.
Hagenguth, J., Rohlfs, A., & Degnan, W. (1952). Sixty-Cycle and Impulse Sparkover of Large
Gap Spacings [includes discussion]. Transactions of the American Institute of Electrical
Engineers. Part III: Power Apparatus and Systems, 71(1), 455–460.
Hinrichsen, V. (2012). Metal-Oxide Surge Arresters in High-Voltage Power Systems
Fundamentals (3rd ed.). SIEMENS.
Hinrichsen, V., Reinhard, M., & Richter, B. (2007). Energy handling capability of high-voltage
metal-oxide surge arresters part 1: a critical review of the standards. Cigré
International Colloquium–September 12th and 13th.
Hu, B., Xie, K., & Tai, H.-M. (2017). Reliability Evaluation and Weak Component Identification
of±500kV HVDC Transmission Systems with Double-Circuit Lines on the Same Tower.
IEEE Transactions on Power Delivery.
Hutzler, B. (1994). Evolution of Insulation Coordination Standards. Conference presented at
the homage to Gianguido Carrara at the Centro Elettrotecnico Sperimentale Italiano
(CESI).
Contribution to Insulation Coordination Studies for VSC-HVDC Systems References
Nicolas Manduley 2020 Page 169
IEC 60052 Voltage measurement by means of standard air gaps (2002). International
Electrotechnical Commission (IEC).
IEC 60071-1 Insulation Coordination Part 1: Definitions, principles and rules (2011).
International Electrotechnical Commission (IEC).
IEC 60071-2 Insulation Coordination Part 2: Application Guide (2018). International
Electrotechnical Commission (IEC).
IEC 60071-4 Insulation Coordination Part 4: Computational guide to insulation co-ordination
and modelling of electrical network (2004). International Electrotechnical Commission
(IEC).
IEC 60071-5 Insulation Coordination Part 5: Procedures for HVDC converter stations (2014).
International Electrotechnical Commission (IEC).
IEC 60099-4 Surge arresters - Part 4: Metal-oxide surge arresters without gaps for a.c. systems
(2014). International Electrotechnical Commission (IEC).
IEC 60099-5 Surge arresters - Part 5: Selection and application recommendations (2000).
International Electrotechnical Commission (IEC).
IEC 60099-8 Surge arresters - Part 8: Metal-oxide surge arresters with external series gap
(EGLA) for overhead transmission and distribution lines of a.c. systems above 1 kV
(2017). International Electrotechnical Commission (IEC).
IEC 60099-9 Surge arresters - Part 9: Metal-oxide surge arresters without gaps for HVDC
converter stations (2014). International Electrotechnical Commission (IEC).
IEEE Std. 1243 Guide for improving the lightning performance of transmission lines (1997).
New York: IEEE Press.
Contribution to Insulation Coordination Studies for VSC-HVDC Systems References
Nicolas Manduley 2020 Page 170
IEEE Std. 998 Guide for Direct Lightning Stroke Shielding of Substations (2012). New York: IEEE
Press.
IEEE Working Group 3.4.11. (1992). Modeling of metal oxide surge arresters. IEEE Transactions
on Power Delivery, 7(1), 302–309.
Kawai, M., & Azuma, H. (1965). Design and performance of unbalanced insulation in double-
circuit transmission lines. IEEE Transactions on Power Apparatus and Systems, 84(9),
839–846.
Kouro, S., Malinowski, M., Gopakumar, K., Pou, J., Franquelo, L. G., Wu, B., Rodriguez, J., et al.
(2010). Recent advances and industrial applications of multilevel converters. IEEE
Transactions on industrial electronics, 57(8), 2553–2580.
Li, J., Ren, H., Xu, L., Long, C., Yang, Q., & Xiang, Y. (2018). Research on Lightning Performance
of Back-flashover of UHV Direct Current Double-circuit Mixed-voltage Transmission
Lines on the Same Tower. 2018 10th International Conference on Communications,
Circuits and Systems (ICCCAS) (pp. 50–54). IEEE.
Li, X., Zhou, P., He, H., & Wang, L. (2017). Study of overvoltage and insulation coordination of
UHV DC transmission line. Electrical Materials and Power Equipment (ICEMPE), 2017
1st International Conference on (pp. 354–358). IEEE.
doi:10.1109/icempe.2017.7982102
Li, Z., Yu, Z., Wang, X., & He, J. (2012). A design of unbalanced insulation to improve the
lightning performance of multi-circuit transmission lines. 2012 International
Conference on Lightning Protection (ICLP) (pp. 1–4). IEEE.
Lin, J., & Marti, J. R. (1990). Implementation of the CDA procedure in the EMTP. IEEE
Transactions on Power Systems, 5(2), 394–402.
Contribution to Insulation Coordination Studies for VSC-HVDC Systems References
Nicolas Manduley 2020 Page 171
Liu, J., Zou, J., Tian, J., & Yuan, J. (2009). Analysis of electric field, ion flow density, and corona
loss of same-tower double-circuit HVDC lines using improved FEM. IEEE Transactions
on Power Delivery, 24(1), 482–483.
Love, E. R. (1973). Improvements in lightning stroke modeling and applications to design of
EHV and UHV transmission lines. University of Colorado.
Lundquist, J., & Lilliecrona, J. (2012). Novel design for parallel VSC HVDC links on common
overhead line towers. CIGRE Colloquium, San Francisco, USA.
Ma, Y., Li, H., Wang, G., & Wu, J. (2018). Fault Analysis and Traveling-Wave-Based Protection
Scheme for Double-Circuit LCC-HVDC Transmission Lines With Shared Towers. IEEE
Transactions on Power Delivery, 33(3), 1479–1488.
Mahseredjian, J., Dennetière, S., Dubé, L., Khodabakhchian, B., & Gérin-Lajoie, L. (2007). On a
new approach for the simulation of transients in power systems. Electric power
systems research, 77(11), 1514–1520.
Manduley, N. (2018). Monopole vs Bipole without Metallic Return Comparison for Insulation
Coordination Studies (SGI Internal Technical Report). SuperGrid Institute.
Manduley, N., Pack, S., Touré, S., Xémard, A., Raison, B., & Poullain, S. (2019). Use of
Unbalanced Insulation for the Limitation of Double-Pole Lightning Flashovers in Double
Circuit HVDC Overhead Lines. International Colloquium on Lightning and Power
Systems (ICLPS 2019).
Manduley, N., Touré, S., Xémard, A., Raison, B., & Poullain, S. (2019). Effect of the Surge
Arrester Configuration in MMC-HVDC Systems under DC and Converter Fault
Conditions. International Conference on Power System Transients (IPST 2019).
Contribution to Insulation Coordination Studies for VSC-HVDC Systems References
Nicolas Manduley 2020 Page 172
Marquardt, R. (2001). Stromrichterschaltungen mit verteilten energiespeichern. German
Patent DE10103031A1, 24.
Martinez-Velasco, J. A. (2010). Power system transients: parameter determination. CRC press.
Martinez-Velasco, J. A. (2015). Transient analysis of power systems: solution techniques, tools
and applications. John Wiley & Sons.
Neumann, C., Wasserrab, A., Balzer, G., Rusek, B., Steevens, S., & Kleinekorte, K. (2016).
Aspects of insulation coordination for DC links using hybrid lines. CIGRE-IEC
Colloquium.
Orville, R. E., Huffines, G. R., Burrows, W. R., & Cummins, K. L. (2011). The North American
lightning detection network (NALDN)—Analysis of flash data: 2001–09. Monthly
Weather Review, 139(5), 1305–1322.
Paladian, F., Bonnet, P., Lallechere, S., Xemard, A., & Miry, C. (2014). On the numerical analysis
of lightning effect on power installations. International Colloquium on Lightning and
Power Systems, Lyon, France.
Peek, F. W. (1920). Dielectric phenomena in high voltage engineering (First.). McGraw-Hill
Book Company, Incorporated.
Peek, F. W. (1929). Dielectric phenomena in high voltage engineering (Third.). McGraw-Hill
Book Company, Incorporated.
Peralta, J., Saad, H., Dennetière, S., Mahseredjian, J., & Nguefeu, S. (2012). Detailed and
averaged models for a 401-level MMC-HVDC system. IEEE Transactions on Power
Delivery, 27(3), 1501.
Pinceti, P., & Giannettoni, M. (1999). A simplified model for zinc oxide surge arresters. IEEE
transactions on power delivery, 14(2), 393–398.
Contribution to Insulation Coordination Studies for VSC-HVDC Systems References
Nicolas Manduley 2020 Page 173
Rakov, V. A. (1998). Some inferences on the propagation mechanisms of dart leaders and
return strokes. Journal of Geophysical Research: Atmospheres, 103(D2), 1879–1887.
Ramos L, O. (2013). Wideband Line/Cable Models for Real-Time and Off-Line Simulations of
Electromagnetic Transients. Ecole Polytechnique de Montréal.
Rawi, I. M., & Kadir, M. (2016). A case study and observation on cause of transmission line
outages in Malaysia. Proc. CIGRE Session (Vol. 46, pp. 1–7).
Report, I. W. (1993). Estimating lightning performance of transmission lines. II. Updates to
analytical models. IEEE Transactions on Power Delivery, 8(3), 1254–1267.
Rizk, F. (1990). Modeling of transmission line exposure to direct lightning strokes. IEEE
Transactions on Power Delivery, 5(4), 1983.
Rizk, F. A. (2016). Modeling of UHV and double-circuit EHV transmission-line exposure to
direct lightning strikes. IEEE Transactions on Power Delivery, 32(4), 1739–1747.
Rizk, F. A. (2017). A simplified approach for assessment of exposure of EHV and UHV lines to
direct lightning strikes. IEEE Transactions on Power Delivery, 33(5), 2420–2427.
Rosen, M. I. (1995). Niels Hendrik Abel and equations of the fifth degree. The American
mathematical monthly, 102(6), 495–505.
RTE, Bilan Electrique. (2019).
Saad, H., Dennetière, S., Mahseredjian, J., Delarue, P., Guillaud, X., Peralta, J., & Nguefeu, S.
(2014). Modular multilevel converter models for electromagnetic transients. IEEE
Transactions on Power Delivery, 29(3), 1481–1489.
Saad, H., Peralta, J., Dennetiere, S., Mahseredjian, J., Jatskevich, J., Martinez, J., Davoudi, A.,
et al. (2013). Dynamic averaged and simplified models for MMC-based HVDC
transmission systems. IEEE transactions on Power delivery, 28(3), 1723–1730.
Contribution to Insulation Coordination Studies for VSC-HVDC Systems References
Nicolas Manduley 2020 Page 174
Saad, H., Rault, P., & Dennetière, S. (2018). Study on transient overvoltages in converter
station of MMC-HVDC links. Electric Power Systems Research, 160, 397–403.
Sabot, A., & Xémard (EDF R&D), A. (2016). Insulation Coordination according to IEC 60071.
[Powerpoint slides].
Sargent, M. A., & Darveniza, M. (1970). Lightning performance of double-circuit transmission
lines. IEEE Transactions on Power Apparatus and Systems, (5), 913–925.
Shindo, T., Motoyama, H., Miki, T., Saito, M., Matsueda, A., Honma, N., Hida, T., et al. (2016).
Lightning occurrence data observed with lightning location systems of electric power
companies in Japan: 2009–2013. IEEJ Transactions on Electrical and Electronic
Engineering, 11, S28–S33.
Shindo, T., & Suzuki, T. (1985). A new calculation method of breakdown voltage-time
characteristics of long air gaps. IEEE transactions on power apparatus and systems, (6),
1556–1563.
SIEMENS. (2014). High-voltage surge arresters (product guide). SIEMENS.
Silveira, F. H., Gomes, R. M., Visacro, S., & Ono, R. S. (2018). The Impact of the Distribution of
Lightning Strikes along the Span on Backflashover Rate of Transmission Lines. 2018
34th International Conference on Lightning Protection (ICLP) (pp. 1–5). IEEE.
Strelec, G. J., Hunt, H. G. P., & Nixon, K. J. (2018). Disparity in the lightning performance
between the poles of the Cahora-Bassa HVDC lines. 2018 34th International
Conference on Lightning Protection (ICLP).
Tatematsu, A. (2019). Lightning Surge Analysis of a Transmission Line Tower With an XLPE
Power Cable and Metallic Cleats Using the FDTD Method. IEEE Transactions on
Electromagnetic Compatibility.
Contribution to Insulation Coordination Studies for VSC-HVDC Systems References
Nicolas Manduley 2020 Page 175
Tu, Q., Xu, Z., & Xu, L. (2011). Reduced switching-frequency modulation and circulating current
suppression for modular multilevel converters. IEEE transactions on power delivery,
26(3), 2009–2017.
Udo, T., & Watanabe, Y. (1968). Dc high-voltage sparkover characteristics of gaps and insulator
strings. IEEE Transactions on Power Apparatus and Systems, (1), 266–270.
Visacro, S., Silva, B. P., Silveira, F. H., & Gomes, R. M. (2018). Concerns on surge-arrester
application for improving the backflashover rate of transmission lines. 2018 34th
International Conference on Lightning Protection (ICLP) (pp. 1–4). IEEE.
Visacro, S., & Silveira, F. H. (2015). Lightning performance of transmission lines: requirements
of tower-footing electrodes consisting of long counterpoise wires. IEEE Transactions
on Power Delivery, 31(4), 1524–1532.
Visacro, S., Silveira, F. H., & De Conti, A. (2012). The use of underbuilt wires to improve the
lightning performance of transmission lines. IEEE Transactions on Power Delivery,
27(1), 205–213.
Wagner, C., & Hileman, A. (1961). Surge impedance and its application to the lightning stroke.
Transactions of the American Institute of Electrical Engineers. Part III: Power Apparatus
and Systems, 80(3), 1011–1020.
Watanabe, Y. (1968). Influence of preexisting DC voltage on switching surge flashover
characteristics. IEEE Transactions on Power Apparatus and Systems, (4), 964–969.
Wei-Gang, H. (2006). Lightning performance of 500-kV double-circuit line schemes for the
three-gorge project. IEEE transactions on power delivery, 21(2), 736–743.
Westinghouse Electrical Transmission and Distribution Reference Book. (1964). (Fourth.). East
Pittsburgh Pennsylvania, USA: Westinghouse.
Contribution to Insulation Coordination Studies for VSC-HVDC Systems References
Nicolas Manduley 2020 Page 176
Woodford, D. (2014). Symmetrical monopole VSC transmission. Electranix technical paper.
Xémard, A. (2008). Modélisation électromagnétique des effets de la foudre sur les réseaux
d’énergie électrique. Ecole Centrale de Lyon.
Yang, Y., Lu, J., & Lei, Y. (2008). A calculation method for the electric field under double-circuit
HVDC transmission lines. IEEE transactions on power delivery, 23(4), 1736–1742.
Yong, J., Jiayu, L., Wenliang, Z., Hui, H., Jun, J., Chendong, X., Peng, Z., et al. (2010). Study on
simulating test of total electric field of double-circuit DC transmission line. 2010 Asia-
Pacific International Symposium on Electromagnetic Compatibility (pp. 263–271). IEEE.
Zhenghua, F., Ling, L., & Junzhong, F. (2011). Research on reducing grounding resistance of
transmission line tower grounding grid. 2011 International Conference on Electrical
and Control Engineering (pp. 1216–1219). IEEE.
Contribution to Insulation Coordination Studies for VSC-HVDC Systems Appendices
Nicolas Manduley 2020 Page 177
Appendix A. Estimation of the Surge Impedance under Corona
A.1 Surge Impedance under Corona
When a high voltage impulse is applied on a conductor, electron avalanches can form in the
vicinities of the conductor which may result in corona. As a result, the equivalent radius of the
conductor may be increased, therefore modifying the equivalent impedance of the conductor
(EPRI Transmission Line Reference Book, 345 kV and Above, 1982).
The surge impedance under corona Zs is thus given by:
𝑍𝑠 = 60 √𝑙𝑛 (2ℎ𝑝
𝑟𝑐𝑜𝑛𝑑) 𝑙𝑛 (
2ℎ𝑝
𝑅𝑐) [A-1]
Where hp is the height of the conductor, rcond is the radius of the conductor and Rc is the corona
radius.
The corona radius can be neglected when bundled conductors are used, because the increase
in the equivalent radius due to corona may be insignificant compared to the bundle equivalent
radius (EPRI Transmission Line Reference Book, 345 kV and Above, 1982). If no bundled
conductors are used, or if the effects of corona are to be taken into account, the estimation
of the corona radius Rc is discussed in the next section.
A.2 Corona Radius
The expression for the corona radius can be derived from Gauss’ Law for a coaxial cable (EPRI
Transmission Line Reference Book, 345 kV and Above, 1982), and is given by the following
expression:
𝑅𝑐 𝑙𝑛 (2ℎ𝑎𝑣𝑔𝑅𝑐
) =𝑉
𝐸0 [A-2]
Where havg is the average height of the conductor, V the applied voltage on the conductor and
E0 the limiting corona gradient.
However, it can be noted that the expression shown in equation [A-2] has no straightforward
analytical solution for Rc. A sensitivity analysis has been conducted to determine the impact
of the height of the conductor (h) and the applied voltage (V) on the value of Rc and on the
value of Zs. For these purposes, equation [A-2] has been solved for Rc using the Newton-
Raphson algorithm for different values of h (with havg calculated for plain areas when needed
(China Electric Power Research Institute, 2017)) and V.
Before presenting the results of this study, the parameters V and E0 will be discussed in the
following sections.
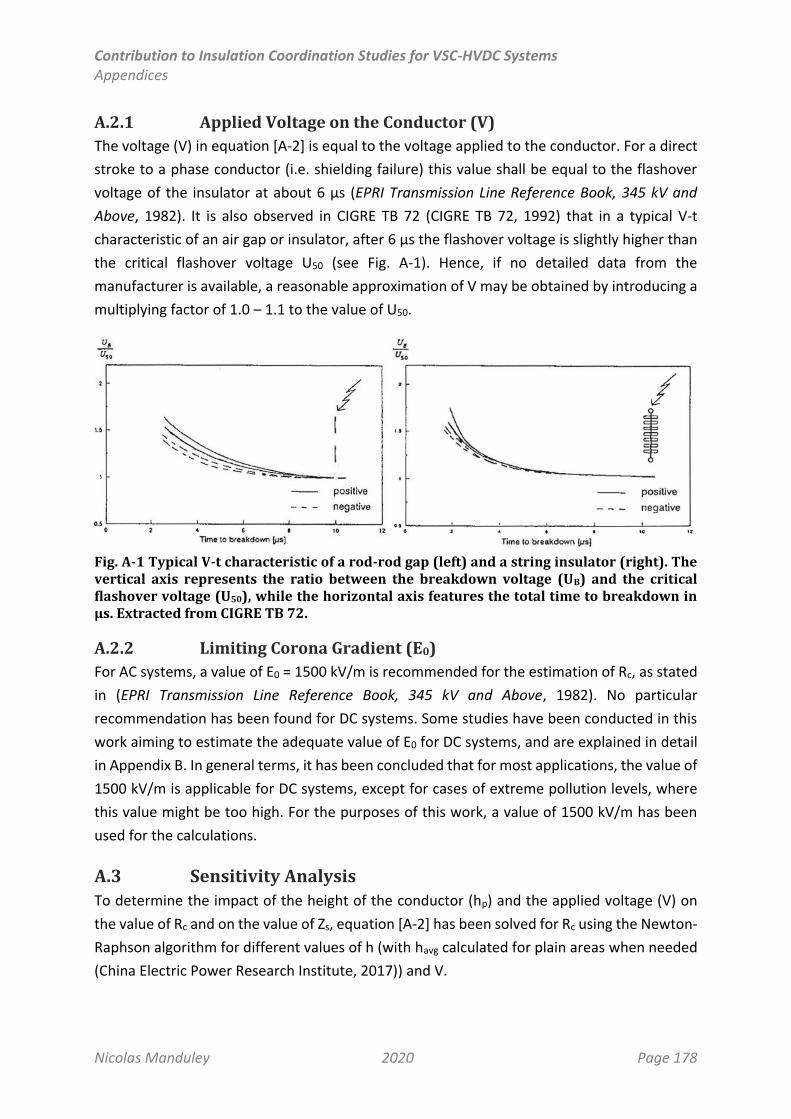
Contribution to Insulation Coordination Studies for VSC-HVDC Systems Appendices
Nicolas Manduley 2020 Page 178
A.2.1 Applied Voltage on the Conductor (V)
The voltage (V) in equation [A-2] is equal to the voltage applied to the conductor. For a direct
stroke to a phase conductor (i.e. shielding failure) this value shall be equal to the flashover
voltage of the insulator at about 6 µs (EPRI Transmission Line Reference Book, 345 kV and
Above, 1982). It is also observed in CIGRE TB 72 (CIGRE TB 72, 1992) that in a typical V-t
characteristic of an air gap or insulator, after 6 µs the flashover voltage is slightly higher than
the critical flashover voltage U50 (see Fig. A-1). Hence, if no detailed data from the
manufacturer is available, a reasonable approximation of V may be obtained by introducing a
multiplying factor of 1.0 – 1.1 to the value of U50.
Fig. A-1 Typical V-t characteristic of a rod-rod gap (left) and a string insulator (right). The vertical axis represents the ratio between the breakdown voltage (UB) and the critical flashover voltage (U50), while the horizontal axis features the total time to breakdown in µs. Extracted from CIGRE TB 72.
A.2.2 Limiting Corona Gradient (E0)
For AC systems, a value of E0 = 1500 kV/m is recommended for the estimation of Rc, as stated
in (EPRI Transmission Line Reference Book, 345 kV and Above, 1982). No particular
recommendation has been found for DC systems. Some studies have been conducted in this
work aiming to estimate the adequate value of E0 for DC systems, and are explained in detail
in Appendix B. In general terms, it has been concluded that for most applications, the value of
1500 kV/m is applicable for DC systems, except for cases of extreme pollution levels, where
this value might be too high. For the purposes of this work, a value of 1500 kV/m has been
used for the calculations.
A.3 Sensitivity Analysis
To determine the impact of the height of the conductor (hp) and the applied voltage (V) on
the value of Rc and on the value of Zs, equation [A-2] has been solved for Rc using the Newton-
Raphson algorithm for different values of h (with havg calculated for plain areas when needed
(China Electric Power Research Institute, 2017)) and V.
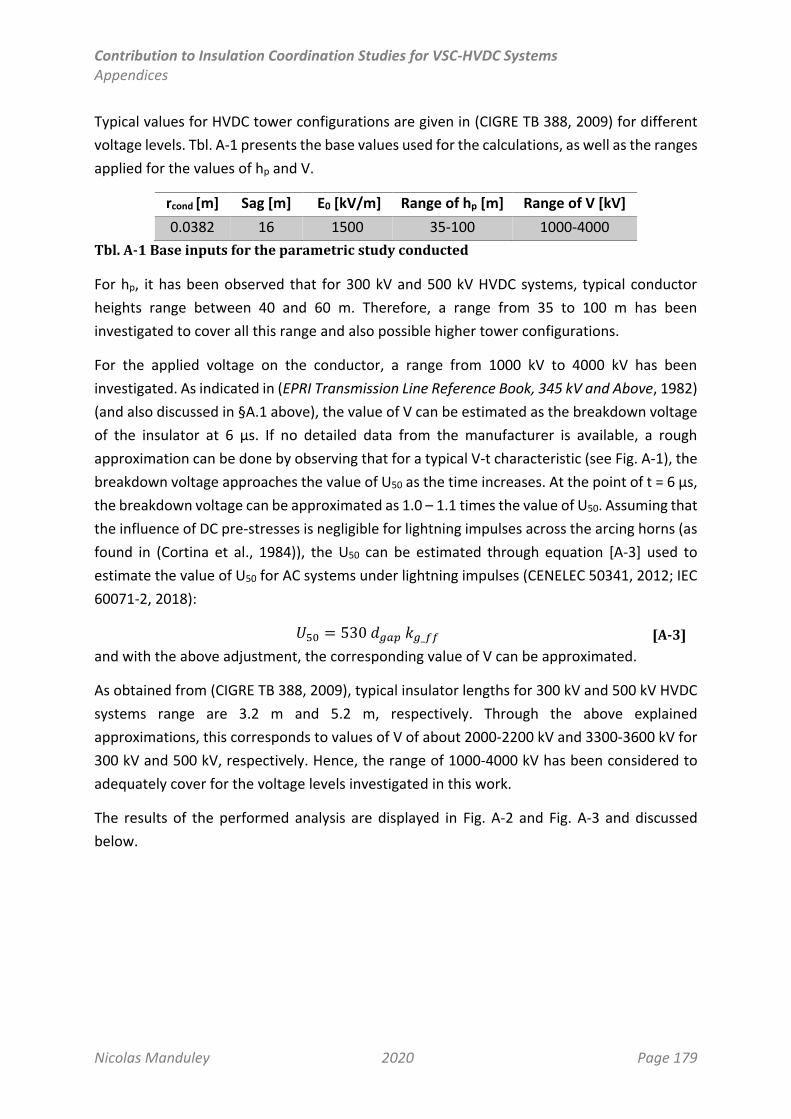
Contribution to Insulation Coordination Studies for VSC-HVDC Systems Appendices
Nicolas Manduley 2020 Page 179
Typical values for HVDC tower configurations are given in (CIGRE TB 388, 2009) for different
voltage levels. Tbl. A-1 presents the base values used for the calculations, as well as the ranges
applied for the values of hp and V.
rcond [m] Sag [m] E0 [kV/m] Range of hp [m] Range of V [kV]
0.0382 16 1500 35-100 1000-4000
Tbl. A-1 Base inputs for the parametric study conducted
For hp, it has been observed that for 300 kV and 500 kV HVDC systems, typical conductor
heights range between 40 and 60 m. Therefore, a range from 35 to 100 m has been
investigated to cover all this range and also possible higher tower configurations.
For the applied voltage on the conductor, a range from 1000 kV to 4000 kV has been
investigated. As indicated in (EPRI Transmission Line Reference Book, 345 kV and Above, 1982)
(and also discussed in §A.1 above), the value of V can be estimated as the breakdown voltage
of the insulator at 6 µs. If no detailed data from the manufacturer is available, a rough
approximation can be done by observing that for a typical V-t characteristic (see Fig. A-1), the
breakdown voltage approaches the value of U50 as the time increases. At the point of t = 6 µs,
the breakdown voltage can be approximated as 1.0 – 1.1 times the value of U50. Assuming that
the influence of DC pre-stresses is negligible for lightning impulses across the arcing horns (as
found in (Cortina et al., 1984)), the U50 can be estimated through equation [A-3] used to
estimate the value of U50 for AC systems under lightning impulses (CENELEC 50341, 2012; IEC
60071-2, 2018):
𝑈50 = 530 𝑑𝑔𝑎𝑝 𝑘𝑔_𝑓𝑓 [A-3]
and with the above adjustment, the corresponding value of V can be approximated.
As obtained from (CIGRE TB 388, 2009), typical insulator lengths for 300 kV and 500 kV HVDC
systems range are 3.2 m and 5.2 m, respectively. Through the above explained
approximations, this corresponds to values of V of about 2000-2200 kV and 3300-3600 kV for
300 kV and 500 kV, respectively. Hence, the range of 1000-4000 kV has been considered to
adequately cover for the voltage levels investigated in this work.
The results of the performed analysis are displayed in Fig. A-2 and Fig. A-3 and discussed
below.
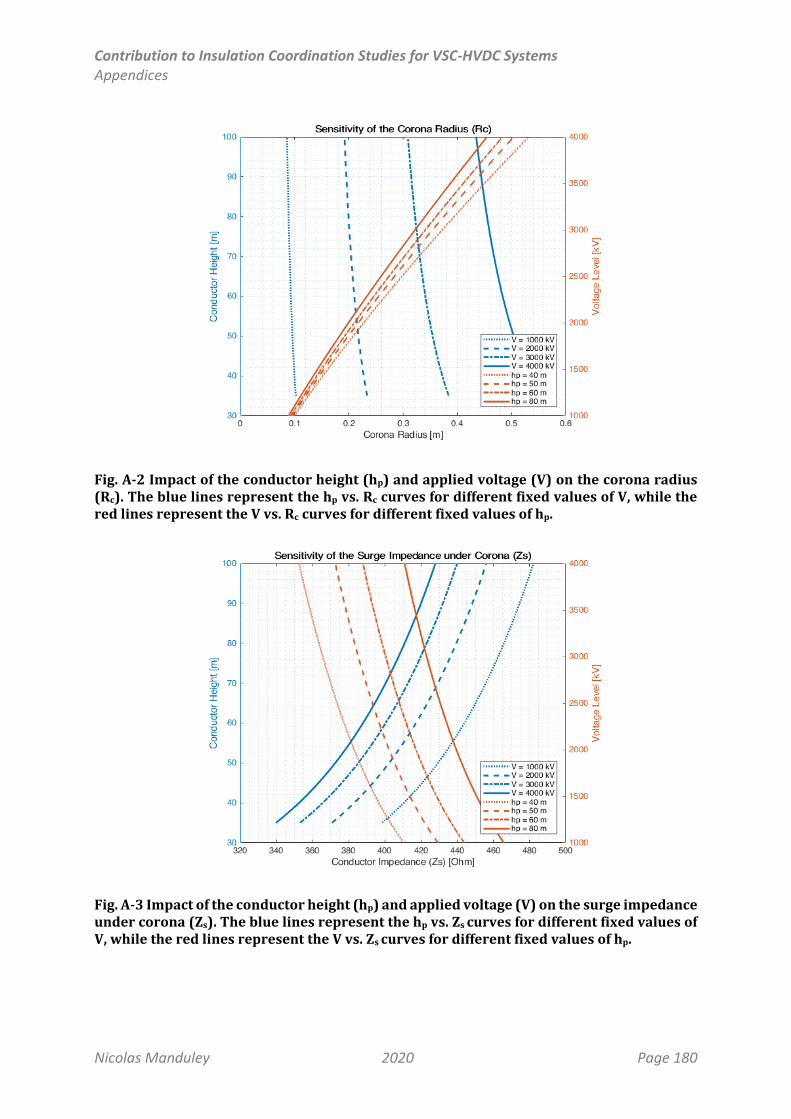
Contribution to Insulation Coordination Studies for VSC-HVDC Systems Appendices
Nicolas Manduley 2020 Page 180
Fig. A-2 Impact of the conductor height (hp) and applied voltage (V) on the corona radius (Rc). The blue lines represent the hp vs. Rc curves for different fixed values of V, while the red lines represent the V vs. Rc curves for different fixed values of hp.
Fig. A-3 Impact of the conductor height (hp) and applied voltage (V) on the surge impedance under corona (Zs). The blue lines represent the hp vs. Zs curves for different fixed values of V, while the red lines represent the V vs. Zs curves for different fixed values of hp.
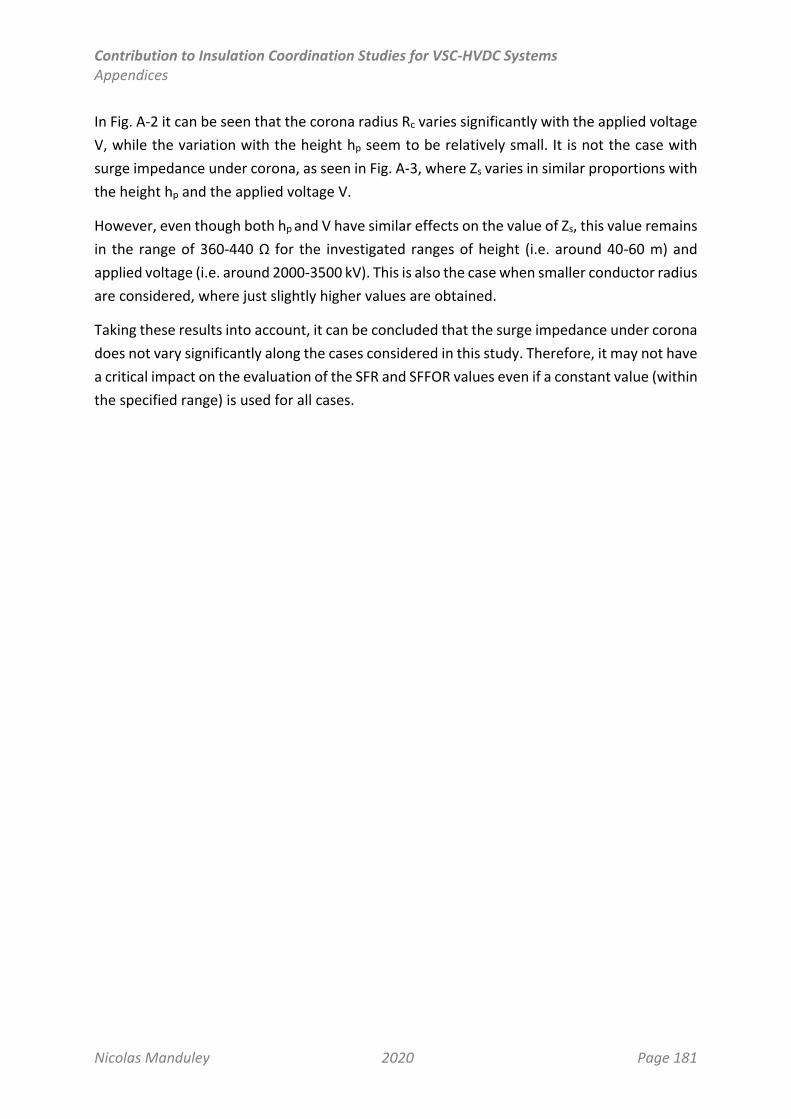
Contribution to Insulation Coordination Studies for VSC-HVDC Systems Appendices
Nicolas Manduley 2020 Page 181
In Fig. A-2 it can be seen that the corona radius Rc varies significantly with the applied voltage
V, while the variation with the height hp seem to be relatively small. It is not the case with
surge impedance under corona, as seen in Fig. A-3, where Zs varies in similar proportions with
the height hp and the applied voltage V.
However, even though both hp and V have similar effects on the value of Zs, this value remains
in the range of 360-440 Ω for the investigated ranges of height (i.e. around 40-60 m) and
applied voltage (i.e. around 2000-3500 kV). This is also the case when smaller conductor radius
are considered, where just slightly higher values are obtained.
Taking these results into account, it can be concluded that the surge impedance under corona
does not vary significantly along the cases considered in this study. Therefore, it may not have
a critical impact on the evaluation of the SFR and SFFOR values even if a constant value (within
the specified range) is used for all cases.
Contribution to Insulation Coordination Studies for VSC-HVDC Systems Appendices
Nicolas Manduley 2020 Page 182
Contribution to Insulation Coordination Studies for VSC-HVDC Systems Appendices
Nicolas Manduley 2020 Page 183
Appendix B. Limiting Corona Gradient and Surface Conductor Gradient in DC
B.1 Problem
As the voltage on a conductor increases, so does the electric field on its surface. The capacitive
coupling with other neighbouring conductors may also contribute to the increase of the
electric field on the surface of the considered conductor. When this electric field reaches a
critical value, corona discharges start to appear in the vicinities of the conductor. This critical
value is known as corona onset gradient Ec.
The limiting corona gradient E0 is thus defined as the maximum electrical field that
manufacturers will allow to appear in the surface of the conductor under normal operating
conditions to avoid the formation of corona discharges. As a general rule, it is recommended
that the maximum surface gradient of the conductor does not exceed 95% of the onset
gradient (CIGRE TB 388, 2009).
For AC systems, a value of E0 = 1500 kV/m is recommended for the estimation of Rc, as stated
in (EPRI Transmission Line Reference Book, 345 kV and Above, 1982). However, no particular
recommendation has been found for DC systems. Therefore, the goal of this section is to study
the correct way to determine the limiting corona gradient applied to DC systems.
B.2 Estimation of E0 and Ec
As previously mentioned, the limiting corona gradient (E0) is the maximum value of the electric
field allowed to appear on the surface of the conductor to avoid reaching the corona onset
gradient (Ec), which is the value at which visible corona appears on the conductor (CIGRE TB
583, 2014). The general recommendation is that E0 does not exceed 95% of Ec (CIGRE TB 388,
2009).
In the 1920’s, Peek (Peek, 1920, 1929) derived an empirical formula for the calculation of the
corona onset gradient, Ec, which is shown in equation [B-1] below:
𝐸𝑐 = 𝐾1 𝛿 𝑚 (1 +𝐾2
√𝛿 𝑟) [B-1]
Where δ is the relative air density, m is the irregularity factor, r is the radius of the conductor
and K1 and K2 are fixed constants. These constants have been found to be different for AC,
positive DC and negative DC polarities, and their respective values are given in CIGRE TB 583
(CIGRE TB 583, 2014).
However, one of the most determining factors seems to be the irregularity factor m, which is
influenced by the geometry of the conductor and the accumulation of pollution on its surface.
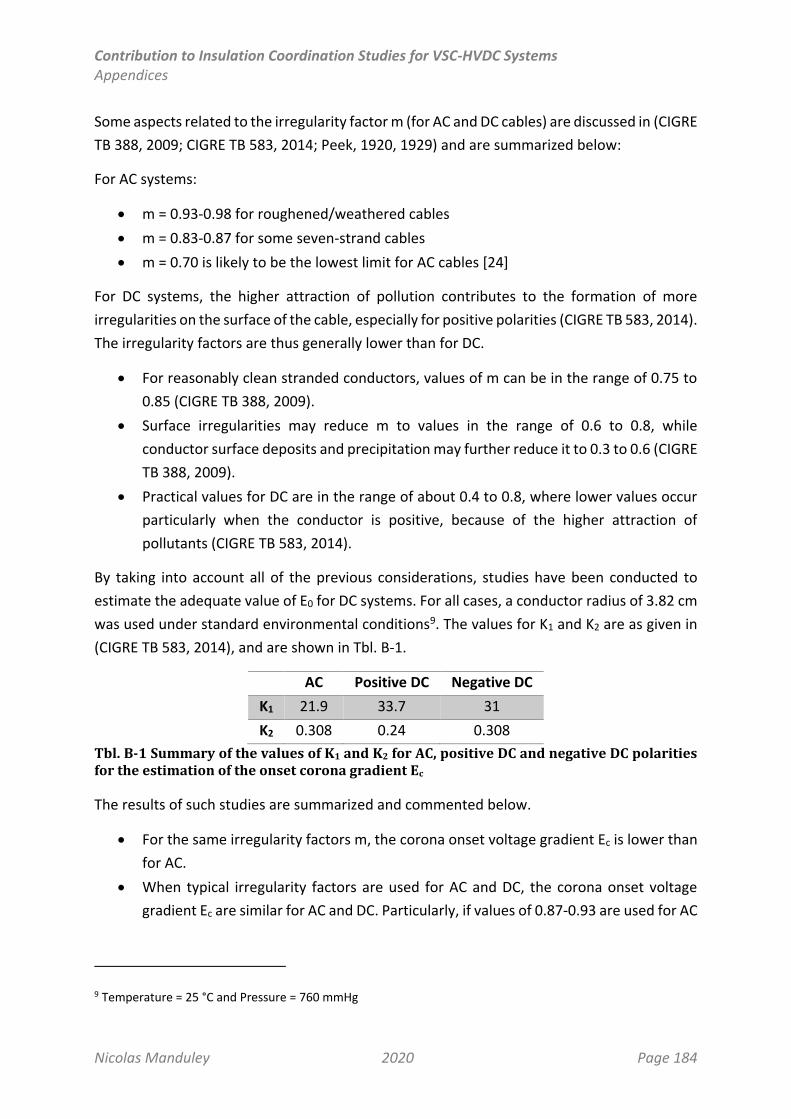
Contribution to Insulation Coordination Studies for VSC-HVDC Systems Appendices
Nicolas Manduley 2020 Page 184
Some aspects related to the irregularity factor m (for AC and DC cables) are discussed in (CIGRE
TB 388, 2009; CIGRE TB 583, 2014; Peek, 1920, 1929) and are summarized below:
For AC systems:
m = 0.93-0.98 for roughened/weathered cables
m = 0.83-0.87 for some seven-strand cables
m = 0.70 is likely to be the lowest limit for AC cables [24]
For DC systems, the higher attraction of pollution contributes to the formation of more
irregularities on the surface of the cable, especially for positive polarities (CIGRE TB 583, 2014).
The irregularity factors are thus generally lower than for DC.
For reasonably clean stranded conductors, values of m can be in the range of 0.75 to
0.85 (CIGRE TB 388, 2009).
Surface irregularities may reduce m to values in the range of 0.6 to 0.8, while
conductor surface deposits and precipitation may further reduce it to 0.3 to 0.6 (CIGRE
TB 388, 2009).
Practical values for DC are in the range of about 0.4 to 0.8, where lower values occur
particularly when the conductor is positive, because of the higher attraction of
pollutants (CIGRE TB 583, 2014).
By taking into account all of the previous considerations, studies have been conducted to
estimate the adequate value of E0 for DC systems. For all cases, a conductor radius of 3.82 cm
was used under standard environmental conditions9. The values for K1 and K2 are as given in
(CIGRE TB 583, 2014), and are shown in Tbl. B-1.
AC Positive DC Negative DC
K1 21.9 33.7 31
K2 0.308 0.24 0.308
Tbl. B-1 Summary of the values of K1 and K2 for AC, positive DC and negative DC polarities for the estimation of the onset corona gradient Ec
The results of such studies are summarized and commented below.
For the same irregularity factors m, the corona onset voltage gradient Ec is lower than
for AC.
When typical irregularity factors are used for AC and DC, the corona onset voltage
gradient Ec are similar for AC and DC. Particularly, if values of 0.87-0.93 are used for AC
9 Temperature = 25 °C and Pressure = 760 mmHg
Contribution to Insulation Coordination Studies for VSC-HVDC Systems Appendices
Nicolas Manduley 2020 Page 185
and 0.6 for DC, the values of Ec range between 2100-2300 kV/m for all AC, positive DC
and negative DC polarities.
For values of m under 0.45, the value of 1500 kV/m starts being higher than the
recommended 0.95 Ec. This is more likely to happen for the positive pole under certain
pollution conditions. For these cases, it may be necessary to consider a lower value of
E0.
For all cases, the obtained values for Ec are strongly influenced by the relative air
density (δ) and the irregularity factor (m).
Consequently, it is concluded that the value E0 = 1500 kV/m is adequate for DC applications
with irregularity factors (m) as low as 0.5-0.6, as long as standard environmental conditions
(25 °C and 760 mmHg) are assumed. These values correspond to DC conductors in a region
with moderate to severe pollution conditions. For high temperatures and/or high altitudes,
lower values might be necessary.
Therefore, for the purposes of this work, the value E0 = 1500 kV/m is considered as a good
approximation for the studies regarding the calculation of the corona radius and surge
impedance under corona, assuming normal environmental conditions and moderate pollution
conditions.

Contribution to Insulation Coordination Studies for VSC-HVDC Systems Appendices
Nicolas Manduley 2020 Page 186
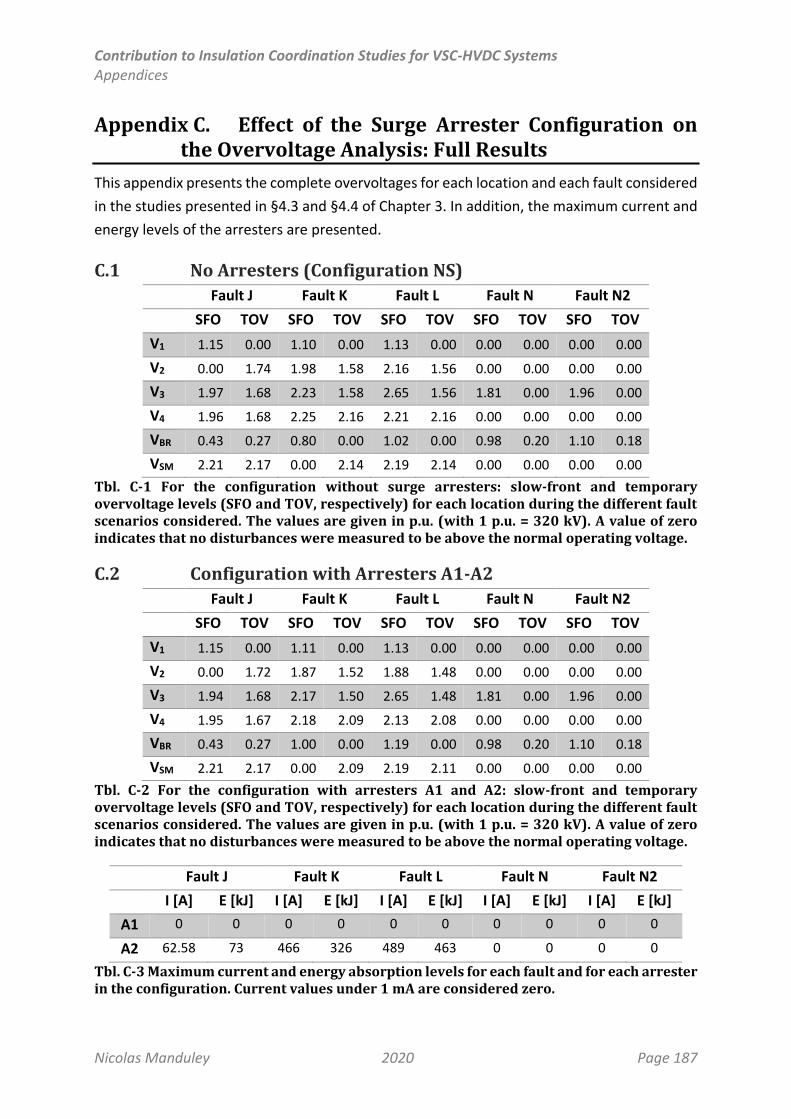
Contribution to Insulation Coordination Studies for VSC-HVDC Systems Appendices
Nicolas Manduley 2020 Page 187
Appendix C. Effect of the Surge Arrester Configuration on the Overvoltage Analysis: Full Results
This appendix presents the complete overvoltages for each location and each fault considered
in the studies presented in §4.3 and §4.4 of Chapter 3. In addition, the maximum current and
energy levels of the arresters are presented.
C.1 No Arresters (Configuration NS)
Fault J Fault K Fault L Fault N Fault N2
SFO TOV SFO TOV SFO TOV SFO TOV SFO TOV
V1 1.15 0.00 1.10 0.00 1.13 0.00 0.00 0.00 0.00 0.00
V2 0.00 1.74 1.98 1.58 2.16 1.56 0.00 0.00 0.00 0.00
V3 1.97 1.68 2.23 1.58 2.65 1.56 1.81 0.00 1.96 0.00
V4 1.96 1.68 2.25 2.16 2.21 2.16 0.00 0.00 0.00 0.00
VBR 0.43 0.27 0.80 0.00 1.02 0.00 0.98 0.20 1.10 0.18
VSM 2.21 2.17 0.00 2.14 2.19 2.14 0.00 0.00 0.00 0.00
Tbl. C-1 For the configuration without surge arresters: slow-front and temporary overvoltage levels (SFO and TOV, respectively) for each location during the different fault scenarios considered. The values are given in p.u. (with 1 p.u. = 320 kV). A value of zero indicates that no disturbances were measured to be above the normal operating voltage.
C.2 Configuration with Arresters A1-A2
Fault J Fault K Fault L Fault N Fault N2
SFO TOV SFO TOV SFO TOV SFO TOV SFO TOV
V1 1.15 0.00 1.11 0.00 1.13 0.00 0.00 0.00 0.00 0.00
V2 0.00 1.72 1.87 1.52 1.88 1.48 0.00 0.00 0.00 0.00
V3 1.94 1.68 2.17 1.50 2.65 1.48 1.81 0.00 1.96 0.00
V4 1.95 1.67 2.18 2.09 2.13 2.08 0.00 0.00 0.00 0.00
VBR 0.43 0.27 1.00 0.00 1.19 0.00 0.98 0.20 1.10 0.18
VSM 2.21 2.17 0.00 2.09 2.19 2.11 0.00 0.00 0.00 0.00
Tbl. C-2 For the configuration with arresters A1 and A2: slow-front and temporary overvoltage levels (SFO and TOV, respectively) for each location during the different fault scenarios considered. The values are given in p.u. (with 1 p.u. = 320 kV). A value of zero indicates that no disturbances were measured to be above the normal operating voltage.
Fault J Fault K Fault L Fault N Fault N2
I [A] E [kJ] I [A] E [kJ] I [A] E [kJ] I [A] E [kJ] I [A] E [kJ]
A1 0 0 0 0 0 0 0 0 0 0
A2 62.58 73 466 326 489 463 0 0 0 0
Tbl. C-3 Maximum current and energy absorption levels for each fault and for each arrester in the configuration. Current values under 1 mA are considered zero.
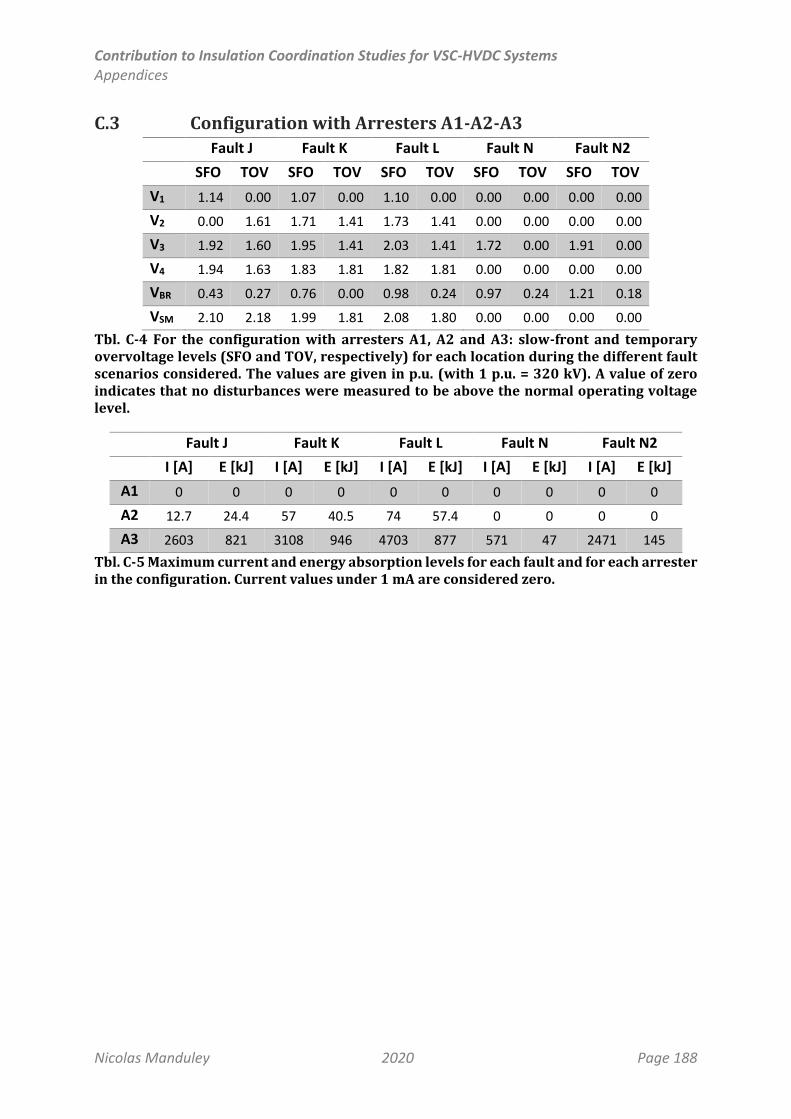
Contribution to Insulation Coordination Studies for VSC-HVDC Systems Appendices
Nicolas Manduley 2020 Page 188
C.3 Configuration with Arresters A1-A2-A3
Fault J Fault K Fault L Fault N Fault N2
SFO TOV SFO TOV SFO TOV SFO TOV SFO TOV
V1 1.14 0.00 1.07 0.00 1.10 0.00 0.00 0.00 0.00 0.00
V2 0.00 1.61 1.71 1.41 1.73 1.41 0.00 0.00 0.00 0.00
V3 1.92 1.60 1.95 1.41 2.03 1.41 1.72 0.00 1.91 0.00
V4 1.94 1.63 1.83 1.81 1.82 1.81 0.00 0.00 0.00 0.00
VBR 0.43 0.27 0.76 0.00 0.98 0.24 0.97 0.24 1.21 0.18
VSM 2.10 2.18 1.99 1.81 2.08 1.80 0.00 0.00 0.00 0.00
Tbl. C-4 For the configuration with arresters A1, A2 and A3: slow-front and temporary overvoltage levels (SFO and TOV, respectively) for each location during the different fault scenarios considered. The values are given in p.u. (with 1 p.u. = 320 kV). A value of zero indicates that no disturbances were measured to be above the normal operating voltage level.
Fault J Fault K Fault L Fault N Fault N2
I [A] E [kJ] I [A] E [kJ] I [A] E [kJ] I [A] E [kJ] I [A] E [kJ]
A1 0 0 0 0 0 0 0 0 0 0
A2 12.7 24.4 57 40.5 74 57.4 0 0 0 0
A3 2603 821 3108 946 4703 877 571 47 2471 145
Tbl. C-5 Maximum current and energy absorption levels for each fault and for each arrester in the configuration. Current values under 1 mA are considered zero.

Contribution to Insulation Coordination Studies for VSC-HVDC Systems Appendices
Nicolas Manduley 2020 Page 189
C.4 Configuration with Arresters A1-A2-C
Fault J Fault K Fault L Fault N Fault N2
SFO TOV SFO TOV SFO TOV SFO TOV SFO TOV
V1 1.15 0.00 1.12 0.00 1.09 0.00 0.00 0.00 0.00 0.00
V2 0.00 1.70 1.86 1.41 1.87 1.41 0.00 0.00 0.00 0.00
V3 1.93 1.68 2.00 1.41 2.65 1.41 1.81 0.00 1.96 0.00
V4 1.93 1.66 2.00 1.80 1.99 1.80 0.00 0.00 0.00 0.00
VBR 0.43 0.26 1.00 0.00 1.19 0.00 0.98 0.22 1.10 0.18
VSM 2.21 2.18 0.00 1.90 2.19 1.81 0.00 0.00 0.00 0.00
Tbl. C-6 For the configuration with arresters A1, A2 and C: slow-front and temporary overvoltage levels (SFO and TOV, respectively) for each location during the different fault scenarios considered. The values are given in p.u. (with 1 p.u. = 320 kV). A value of zero indicates that no disturbances were measured to be above the normal operating voltage level.
Fault J Fault K Fault L Fault N Fault N2
I [A] E [kJ] I [A] E [kJ] I [A] E [kJ] I [A] E [kJ] I [A] E [kJ]
A1 0 0 0 0 0 0 0 0 0 0
A2 47.3 60.8 267 295 452 444 0 0 0 0
C 210 226 617 777 517 671 0 0 0 0
Tbl. C-7 Maximum current and energy absorption levels for each fault and for each arrester in the configuration. Current values under 1 mA are considered zero.
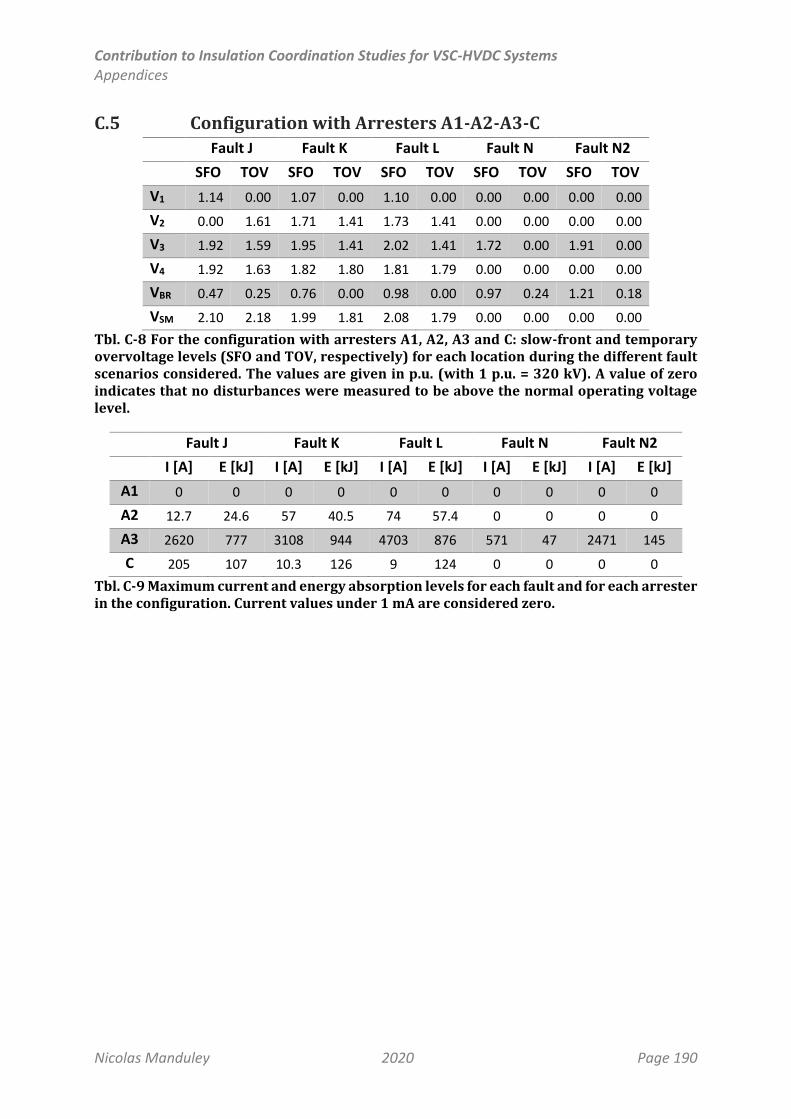
Contribution to Insulation Coordination Studies for VSC-HVDC Systems Appendices
Nicolas Manduley 2020 Page 190
C.5 Configuration with Arresters A1-A2-A3-C
Fault J Fault K Fault L Fault N Fault N2
SFO TOV SFO TOV SFO TOV SFO TOV SFO TOV
V1 1.14 0.00 1.07 0.00 1.10 0.00 0.00 0.00 0.00 0.00
V2 0.00 1.61 1.71 1.41 1.73 1.41 0.00 0.00 0.00 0.00
V3 1.92 1.59 1.95 1.41 2.02 1.41 1.72 0.00 1.91 0.00
V4 1.92 1.63 1.82 1.80 1.81 1.79 0.00 0.00 0.00 0.00
VBR 0.47 0.25 0.76 0.00 0.98 0.00 0.97 0.24 1.21 0.18
VSM 2.10 2.18 1.99 1.81 2.08 1.79 0.00 0.00 0.00 0.00
Tbl. C-8 For the configuration with arresters A1, A2, A3 and C: slow-front and temporary overvoltage levels (SFO and TOV, respectively) for each location during the different fault scenarios considered. The values are given in p.u. (with 1 p.u. = 320 kV). A value of zero indicates that no disturbances were measured to be above the normal operating voltage level.
Fault J Fault K Fault L Fault N Fault N2
I [A] E [kJ] I [A] E [kJ] I [A] E [kJ] I [A] E [kJ] I [A] E [kJ]
A1 0 0 0 0 0 0 0 0 0 0
A2 12.7 24.6 57 40.5 74 57.4 0 0 0 0
A3 2620 777 3108 944 4703 876 571 47 2471 145
C 205 107 10.3 126 9 124 0 0 0 0
Tbl. C-9 Maximum current and energy absorption levels for each fault and for each arrester in the configuration. Current values under 1 mA are considered zero.
Contribution to Insulation Coordination Studies for VSC-HVDC Systems Appendices
Nicolas Manduley 2020 Page 191
Appendix D. Overvoltage Analysis: Qualitative Approach
The studies presented in chapter Chapter 3 address an approach to insulation coordination of
MMC-HVDC stations based mainly on quantitative analysis through simulations. It would be
of great interest to have also a qualitative approach that allows extracting essential
information of the system without the need of performing several detailed simulations.
It is important to note that any analysis involving the solution of a system of differential
equations of five or more unknowns is most likely to involve numerical methods for its solution
rather than a fully analytical solution. This is due to the Abel–Ruffini theorem, which states
that there is no solution in radicals to general polynomials of order five or higher (Rosen,
1995). Since many methods for the solution of high-order differential equations involve their
conversion to algebraic polynomials through the Laplace transform, the Abel–Ruffini theorem
represents an important limitation regarding the possibility of obtaining general analytical
solutions of a system with five or more unknowns.
In this context, a simplified qualitative approach has been investigated to explore the depth
of the knowledge that is possible to obtain from a given architecture about its behaviour, and
is explained below.
D.1 Hypotheses and Assumptions
The presented analysis involves the use of Kirchhoff’s loop equations (see Table 3.1 and Table
3.2) and a series of hypotheses and simplifications allowing to make a rough estimation of the
behaviour of a system during the first instants of transient events.
The main hypotheses considered for this analysis are listed below:
MMC submodules can be approximated as a capacitor (see Chapter 2, §3.3). Therefore,
since its voltage cannot change instantly, it can be considered constant during the first
instants after a fault or another event.
In case of underground or submarine cables, due to their high stray capacitance, it is
also assumed that the voltage does not vary instantly, and can be considered constant
after a fault (except at the location of the fault, if it occurs directly on the cable).
Current variations are limited by the inductances present in the considered loop.
When the MMC is blocked (i.e. the series capacitors are simultaneously disconnected
from the circuit), its voltage drops to zero instantly10.
When a specific point is connected to the ground, its voltage drops to zero instantly.
10 For the purposes of this analysis, the voltage drop across the diodes and thyristors of the MMC in blocked state is neglected.
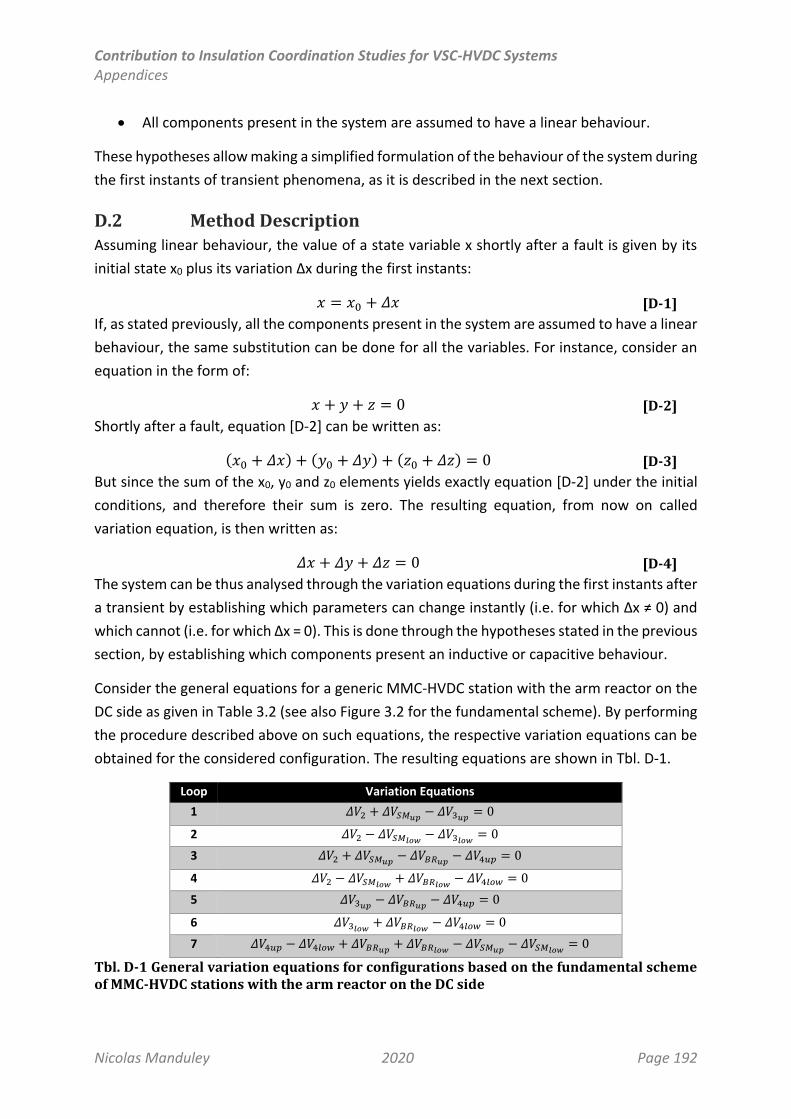
Contribution to Insulation Coordination Studies for VSC-HVDC Systems Appendices
Nicolas Manduley 2020 Page 192
All components present in the system are assumed to have a linear behaviour.
These hypotheses allow making a simplified formulation of the behaviour of the system during
the first instants of transient phenomena, as it is described in the next section.
D.2 Method Description
Assuming linear behaviour, the value of a state variable x shortly after a fault is given by its
initial state x0 plus its variation Δx during the first instants:
𝑥 = 𝑥0 + 𝛥𝑥 [D-1]
If, as stated previously, all the components present in the system are assumed to have a linear
behaviour, the same substitution can be done for all the variables. For instance, consider an
equation in the form of:
𝑥 + 𝑦 + 𝑧 = 0 [D-2]
Shortly after a fault, equation [D-2] can be written as:
(𝑥0 + 𝛥𝑥) + (𝑦0 + 𝛥𝑦) + (𝑧0 + 𝛥𝑧) = 0 [D-3]
But since the sum of the x0, y0 and z0 elements yields exactly equation [D-2] under the initial
conditions, and therefore their sum is zero. The resulting equation, from now on called
variation equation, is then written as:
𝛥𝑥 + 𝛥𝑦 + 𝛥𝑧 = 0 [D-4]
The system can be thus analysed through the variation equations during the first instants after
a transient by establishing which parameters can change instantly (i.e. for which Δx ≠ 0) and
which cannot (i.e. for which Δx = 0). This is done through the hypotheses stated in the previous
section, by establishing which components present an inductive or capacitive behaviour.
Consider the general equations for a generic MMC-HVDC station with the arm reactor on the
DC side as given in Table 3.2 (see also Figure 3.2 for the fundamental scheme). By performing
the procedure described above on such equations, the respective variation equations can be
obtained for the considered configuration. The resulting equations are shown in Tbl. D-1.
Loop Variation Equations
1 𝛥𝑉2 + 𝛥𝑉𝑆𝑀𝑢𝑝 − 𝛥𝑉3𝑢𝑝 = 0
2 𝛥𝑉2 − 𝛥𝑉𝑆𝑀𝑙𝑜𝑤 − 𝛥𝑉3𝑙𝑜𝑤 = 0
3 𝛥𝑉2 + 𝛥𝑉𝑆𝑀𝑢𝑝 − 𝛥𝑉𝐵𝑅𝑢𝑝 − 𝛥𝑉4𝑢𝑝 = 0
4 𝛥𝑉2 − 𝛥𝑉𝑆𝑀𝑙𝑜𝑤 + 𝛥𝑉𝐵𝑅𝑙𝑜𝑤 − 𝛥𝑉4𝑙𝑜𝑤 = 0
5 𝛥𝑉3𝑢𝑝 − 𝛥𝑉𝐵𝑅𝑢𝑝 − 𝛥𝑉4𝑢𝑝 = 0
6 𝛥𝑉3𝑙𝑜𝑤 + 𝛥𝑉𝐵𝑅𝑙𝑜𝑤 − 𝛥𝑉4𝑙𝑜𝑤 = 0
7 𝛥𝑉4𝑢𝑝 − 𝛥𝑉4𝑙𝑜𝑤 + 𝛥𝑉𝐵𝑅𝑢𝑝 + 𝛥𝑉𝐵𝑅𝑙𝑜𝑤 − 𝛥𝑉𝑆𝑀𝑢𝑝 − 𝛥𝑉𝑆𝑀𝑙𝑜𝑤 = 0
Tbl. D-1 General variation equations for configurations based on the fundamental scheme of MMC-HVDC stations with the arm reactor on the DC side
Contribution to Insulation Coordination Studies for VSC-HVDC Systems Appendices
Nicolas Manduley 2020 Page 193
With such approach, transient events such as system faults can be represented as known
values of the voltage variations of one or more of the variables from Tbl. D-1.
In general, faults associated to MMC-HVDC stations can be divided in four main phases
(Manduley, 2018):
Phase 1: fault inception. The fault occurs and travelling waves propagate within the
system, thus causing a sudden variation of the voltage levels across inductive
elements. During a short period after the fault, voltages across capacitive elements
and currents flowing through inductive elements can be considered constant, which
will determine the initial repartition of the voltages resulting from the occurrence of
the fault.
Phase 2: before MMC blocking. After the first instants, capacitive elements (such as
the DC poles or the MMC submodules) can get charged or discharged slowly, while
current across inductive elements (such as arm reactors or smoothing reactors)
increase or decrease slowly.
Phase 3: MMC blocking. Similarly as in phase 1, the blocking of the MMC constitutes
a sudden voltage variation across the MMC submodules, thus generating new
travelling waves and transients. Therefore, during a short period after the blocking of
the MMC, voltages across capacitive elements and currents flowing through inductive
elements can be considered constant.
Phase 4: after MMC blocking. As in phase 2, currents and voltages at the different
locations evolve according to the nature of their respective passive elements towards
an equilibrium state.
Since the method described in this section concerns only the first instants after a fault, it is
only applicable to phases 1 and 3. For phases 2 and 4, more elaborate methods are required
to estimate the behaviour of the system. However, for phases 1 and 3 it is possible to obtain
an accurate distribution of the voltages right after the fault—given that the initial conditions
are known—allowing to identify critical conditions and particular vulnerabilities of the system
during a given event.
D.3 Case Study: Positive DC Bus-to-Ground Fault (Fault K)
Consider a positive DC bus-to-ground fault (fault K) on a symmetric monopolar configuration
with the arm reactor on the DC side. In this case, the fault implies that the voltage of the
positive DC pole goes from V4up = 1 p.u. to V4up = 0, and thus ΔV4up = -1 p.u.
In addition, since the voltage across the MMC submodules (VSM) and the healthy pole (V4low)
are considered to remain constant during the first instants, the voltage variations at such
locations (ΔVSM and ΔV4low respectively) are considered equal to zero.
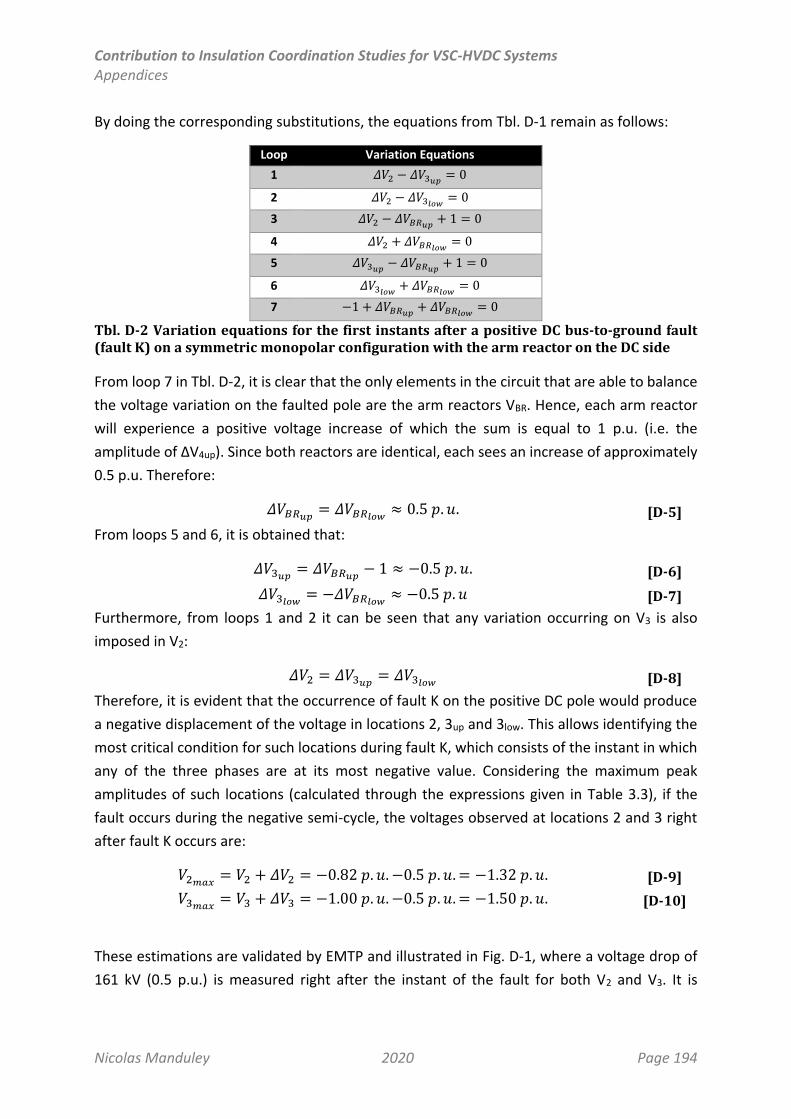
Contribution to Insulation Coordination Studies for VSC-HVDC Systems Appendices
Nicolas Manduley 2020 Page 194
By doing the corresponding substitutions, the equations from Tbl. D-1 remain as follows:
Loop Variation Equations
1 𝛥𝑉2 − 𝛥𝑉3𝑢𝑝 = 0
2 𝛥𝑉2 − 𝛥𝑉3𝑙𝑜𝑤 = 0
3 𝛥𝑉2 − 𝛥𝑉𝐵𝑅𝑢𝑝 + 1 = 0
4 𝛥𝑉2 + 𝛥𝑉𝐵𝑅𝑙𝑜𝑤 = 0
5 𝛥𝑉3𝑢𝑝 − 𝛥𝑉𝐵𝑅𝑢𝑝 + 1 = 0
6 𝛥𝑉3𝑙𝑜𝑤 + 𝛥𝑉𝐵𝑅𝑙𝑜𝑤 = 0
7 −1 + 𝛥𝑉𝐵𝑅𝑢𝑝 + 𝛥𝑉𝐵𝑅𝑙𝑜𝑤 = 0
Tbl. D-2 Variation equations for the first instants after a positive DC bus-to-ground fault (fault K) on a symmetric monopolar configuration with the arm reactor on the DC side
From loop 7 in Tbl. D-2, it is clear that the only elements in the circuit that are able to balance
the voltage variation on the faulted pole are the arm reactors VBR. Hence, each arm reactor
will experience a positive voltage increase of which the sum is equal to 1 p.u. (i.e. the
amplitude of ΔV4up). Since both reactors are identical, each sees an increase of approximately
0.5 p.u. Therefore:
𝛥𝑉𝐵𝑅𝑢𝑝 = 𝛥𝑉𝐵𝑅𝑙𝑜𝑤 ≈ 0.5 𝑝. 𝑢. [D-5]
From loops 5 and 6, it is obtained that:
𝛥𝑉3𝑢𝑝 = 𝛥𝑉𝐵𝑅𝑢𝑝 − 1 ≈ −0.5 𝑝. 𝑢. [D-6]
𝛥𝑉3𝑙𝑜𝑤 = −𝛥𝑉𝐵𝑅𝑙𝑜𝑤 ≈ −0.5 𝑝. 𝑢 [D-7]
Furthermore, from loops 1 and 2 it can be seen that any variation occurring on V3 is also
imposed in V2:
𝛥𝑉2 = 𝛥𝑉3𝑢𝑝 = 𝛥𝑉3𝑙𝑜𝑤 [D-8]
Therefore, it is evident that the occurrence of fault K on the positive DC pole would produce
a negative displacement of the voltage in locations 2, 3up and 3low. This allows identifying the
most critical condition for such locations during fault K, which consists of the instant in which
any of the three phases are at its most negative value. Considering the maximum peak
amplitudes of such locations (calculated through the expressions given in Table 3.3), if the
fault occurs during the negative semi-cycle, the voltages observed at locations 2 and 3 right
after fault K occurs are:
𝑉2𝑚𝑎𝑥 = 𝑉2 + 𝛥𝑉2 = −0.82 𝑝. 𝑢. −0.5 𝑝. 𝑢. = −1.32 𝑝. 𝑢. [D-9]
𝑉3𝑚𝑎𝑥 = 𝑉3 + 𝛥𝑉3 = −1.00 𝑝. 𝑢. −0.5 𝑝. 𝑢. = −1.50 𝑝. 𝑢. [D-10]
These estimations are validated by EMTP and illustrated in Fig. D-1, where a voltage drop of
161 kV (0.5 p.u.) is measured right after the instant of the fault for both V2 and V3. It is
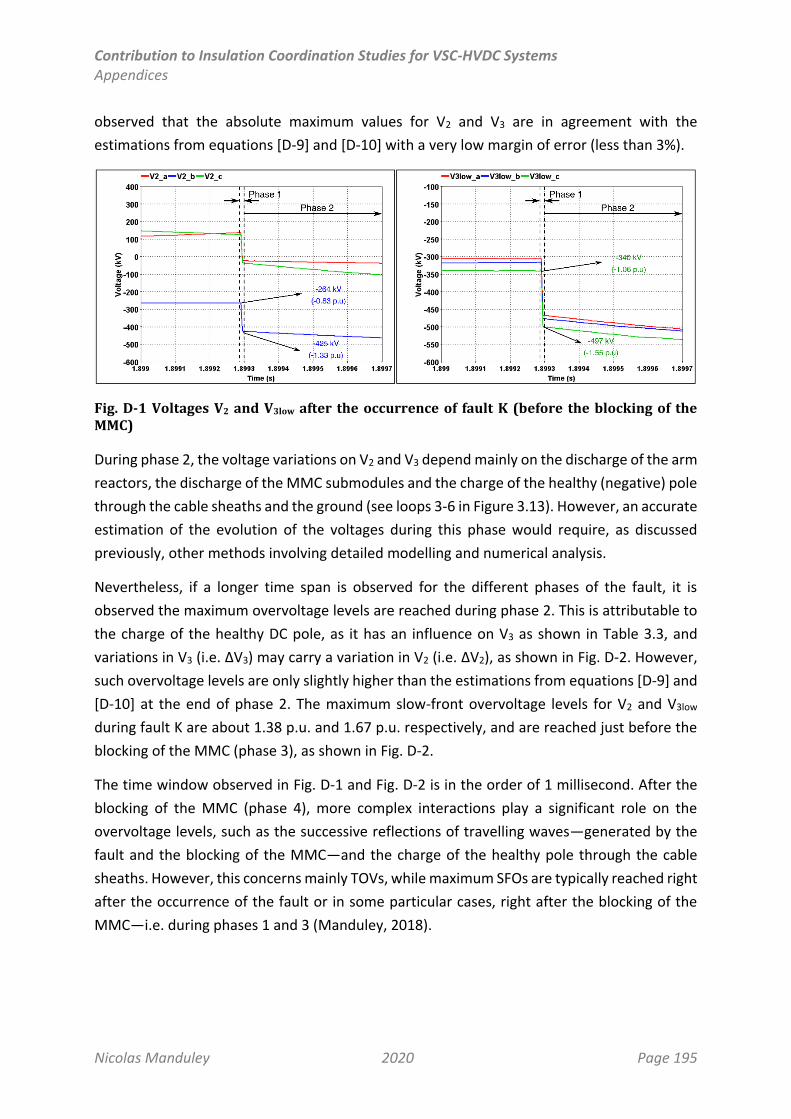
Contribution to Insulation Coordination Studies for VSC-HVDC Systems Appendices
Nicolas Manduley 2020 Page 195
observed that the absolute maximum values for V2 and V3 are in agreement with the
estimations from equations [D-9] and [D-10] with a very low margin of error (less than 3%).
Fig. D-1 Voltages V2 and V3low after the occurrence of fault K (before the blocking of the MMC)
During phase 2, the voltage variations on V2 and V3 depend mainly on the discharge of the arm
reactors, the discharge of the MMC submodules and the charge of the healthy (negative) pole
through the cable sheaths and the ground (see loops 3-6 in Figure 3.13). However, an accurate
estimation of the evolution of the voltages during this phase would require, as discussed
previously, other methods involving detailed modelling and numerical analysis.
Nevertheless, if a longer time span is observed for the different phases of the fault, it is
observed the maximum overvoltage levels are reached during phase 2. This is attributable to
the charge of the healthy DC pole, as it has an influence on V3 as shown in Table 3.3, and
variations in V3 (i.e. ΔV3) may carry a variation in V2 (i.e. ΔV2), as shown in Fig. D-2. However,
such overvoltage levels are only slightly higher than the estimations from equations [D-9] and
[D-10] at the end of phase 2. The maximum slow-front overvoltage levels for V2 and V3low
during fault K are about 1.38 p.u. and 1.67 p.u. respectively, and are reached just before the
blocking of the MMC (phase 3), as shown in Fig. D-2.
The time window observed in Fig. D-1 and Fig. D-2 is in the order of 1 millisecond. After the
blocking of the MMC (phase 4), more complex interactions play a significant role on the
overvoltage levels, such as the successive reflections of travelling waves—generated by the
fault and the blocking of the MMC—and the charge of the healthy pole through the cable
sheaths. However, this concerns mainly TOVs, while maximum SFOs are typically reached right
after the occurrence of the fault or in some particular cases, right after the blocking of the
MMC—i.e. during phases 1 and 3 (Manduley, 2018).
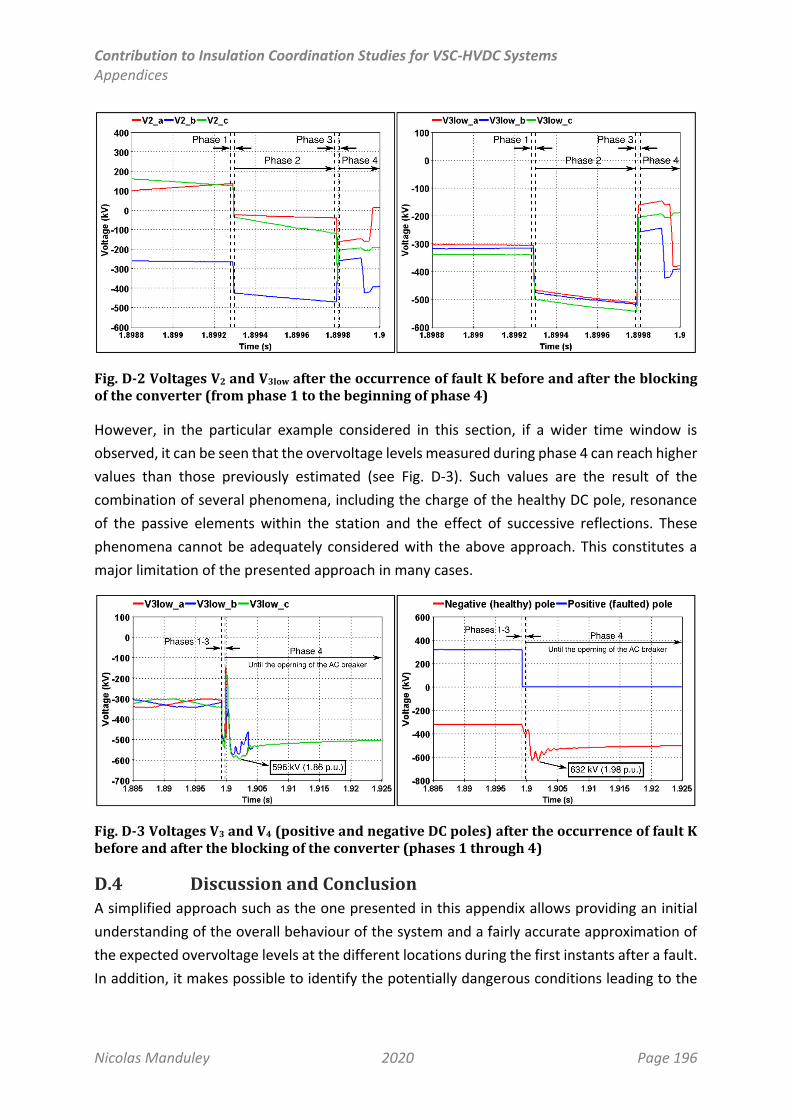
Contribution to Insulation Coordination Studies for VSC-HVDC Systems Appendices
Nicolas Manduley 2020 Page 196
Fig. D-2 Voltages V2 and V3low after the occurrence of fault K before and after the blocking of the converter (from phase 1 to the beginning of phase 4)
However, in the particular example considered in this section, if a wider time window is
observed, it can be seen that the overvoltage levels measured during phase 4 can reach higher
values than those previously estimated (see Fig. D-3). Such values are the result of the
combination of several phenomena, including the charge of the healthy DC pole, resonance
of the passive elements within the station and the effect of successive reflections. These
phenomena cannot be adequately considered with the above approach. This constitutes a
major limitation of the presented approach in many cases.
Fig. D-3 Voltages V3 and V4 (positive and negative DC poles) after the occurrence of fault K before and after the blocking of the converter (phases 1 through 4)
D.4 Discussion and Conclusion A simplified approach such as the one presented in this appendix allows providing an initial
understanding of the overall behaviour of the system and a fairly accurate approximation of
the expected overvoltage levels at the different locations during the first instants after a fault.
In addition, it makes possible to identify the potentially dangerous conditions leading to the
Contribution to Insulation Coordination Studies for VSC-HVDC Systems Appendices
Nicolas Manduley 2020 Page 197
maximum overvoltage levels (e.g. the most critical fault instant or phase or location more
vulnerable during a specific type of fault) without the need of performing simulations.
However, these estimations are only pertinent if the maximum overvoltage effectively occurs
right after the fault or the blocking of the MMC and the initial conditions are known. As it has
been shown, there are other phenomena that may lead to higher overvoltages during phase
4 (after the blocking of the MMC), including the charge of the healthy DC pole, resonance of
the passive elements within the station and the effect of successive reflections between the
station and the fault location and/or the other station.
The study of such phenomena would require more appropriate and detailed models. On the
other hand, increasing the complexity of the model increases the difficulty to maintain a fully
qualitative approach, for the reasons explained in Chapter 3. Although there may be ways of
implementing a simplified method that would not require the use of numerical methods for
its resolution, it would only be valid if no surge arresters are present, because of their non-
linearity.
Therefore, it seems difficult to make conclusions based only on a simplified approach such as
the one presented in this appendix. There are interactions between non-linear elements
which cannot be taken into account by such kind of methods, as well as other complex
phenomena which play an important role in the transient behaviour of the system and that
has a direct impact on the overvoltage levels.
Nevertheless, this approach makes possible to identify the most critical events leading to a
sequence of slow-front and/or temporary overvoltages (SFO and TOV, respectively), as well as
the most vulnerable points and the most critical instants for each fault type to occur. This
allows having a rough approximation of the overvoltage profile of the system before
performing detailed EMT simulations, the critical scenarios and an initial point for the
overvoltage protection strategy. In addition, it can help achieve a better understanding of the
fundamental behaviour of the system.
The qualitative approach can therefore constitute a useful additional tool during the system
analysis phase of insulation coordination for any system (see Figure 3.18). In all cases, detailed
EMT simulation studies are necessary to make accurate estimations of the overvoltage profile
of the system, a correct design of the overvoltage protection strategy and general insulation
coordination of MMC-HVDC systems.

Contribution to Insulation Coordination Studies for VSC-HVDC Systems Appendices
Nicolas Manduley 2020 Page 198
Contribution to Insulation Coordination Studies for VSC-HVDC Systems Appendices
Nicolas Manduley 2020 Page 199
Appendix E. Algorithm for the Iterative Specification of Surge Arresters
As discussed in previous chapters, insulation coordination is an iterative process. The
parameters of the surge arresters depend not only on the specific voltages and overvoltages
of the location or component protected directly by the arrester, but also on the specifications
of other arresters present, the complex interactions between them and with the system
(Manduley, Touré, et al., 2019), as also discussed in Chapter 3 of this dissertation.
In this appendix, an algorithm is proposed for the specification of the parameters of the surge
arresters. It consists of an iterative process involving electromagnetic transient simulations of
faults, switching operations and other phenomena leading to slow-front and temporary
overvoltages. Throughout the process, the specifications of the surge arresters are adjusted
after each iteration by considering:
The energy absorption level of each arrester
The maximum overvoltage levels for each location
Depending on the results and the requirements established for the design, the surge arrester
specifications are adapted in terms of their protective level and the number of parallel
columns until the stopping criteria are met.
E.1 Fundamental Description
The flowchart of the proposed algorithm is illustrated in Fig. E-1.
First, the input values are entered by the user, which include the maximum voltage and
overvoltage levels at each location without surge arresters, the arrangement of surge
arresters desired (based on the fundamental schemes from Figure 3.1 and Figure 3.2) and the
energy absorption capability and maximum number of parallel columns allowed for each one.
The user may also provide a particular V-I characteristic to be used for each location. For
detailed information about the inputs, consult Tbl. E-1.
Next, the provided information is used to configure the base case that will be used for the
EMT simulations. Then, successive iterations are conducted and evaluated in terms of the
energy absorbed by the surge arresters and the overvoltage levels obtained with each
configuration. The arrester specifications are modified according to the obtained results and
the next iteration is prepared.
Finally, the process is repeated until the stopping criteria are met.
The details of the processes that take place at each step of the algorithm are discussed in the
following sections.
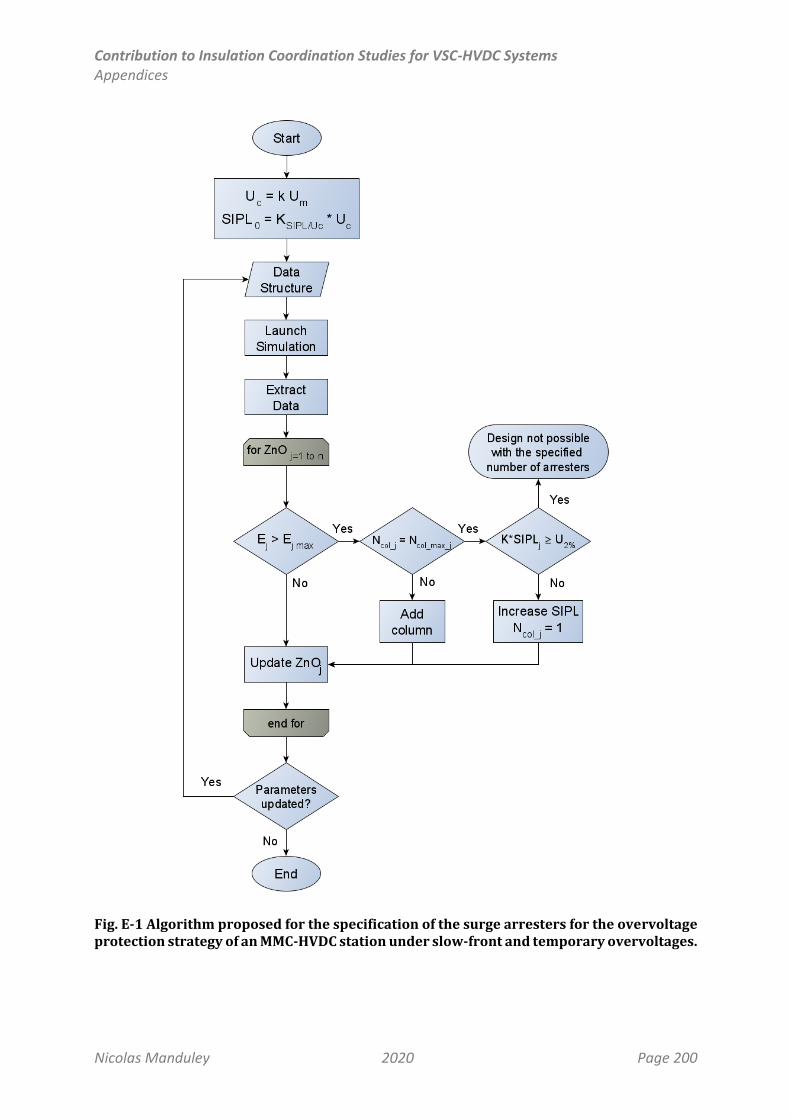
Contribution to Insulation Coordination Studies for VSC-HVDC Systems Appendices
Nicolas Manduley 2020 Page 200
Fig. E-1 Algorithm proposed for the specification of the surge arresters for the overvoltage protection strategy of an MMC-HVDC station under slow-front and temporary overvoltages.

Contribution to Insulation Coordination Studies for VSC-HVDC Systems Appendices
Nicolas Manduley 2020 Page 201
E.2 Inputs Description Symbol Method of Definition
Surge arrester arrangement - Selected by user based on the fundamental schemes
(e.g. Figure 3.1 and Figure 3.2)
V-I characteristic of the
arrester - Entered by user (default characteristic available)
Specific energy absorption
capability for each arrester in
[kJ/kV] of Uc or Ur
emax
a) Specified by user
b) Specification of the energy class, for which
approximate values of kJ/kV are available
Ratio between the SIWV and
SIPL k
Defined by user (reference IEC 60071-5 for minimum
values under 1000 m)
Ratio between SIPL and Uc of
each arrester KSIPL/Uc
Entered by the user (default value available if default
V-I characteristic is used)
Maximum number of parallel
columns of arresters Ncol_max Defined by user (default value = 1)
Minimum withstand voltage
for each location without
considering arresters
U2% Obtained by simulation without arresters
Maximum voltage under
normal conditions (for each
location)
Umax
a) Specified by user
b) Calculated analytically from the nominal values
(see Table 3.3)
Tbl. E-1 Input required for the initialisation of the iterative procedure through the proposed algorithm
E.3 Initial Design and Parameters
The initial specifications of the surge arresters are defined according to the minimum
protective levels possible. This is done by setting the continuous operating voltage of the
arrester (Uc) slightly above the maximum voltage level under normal conditions (Umax). By
convention, a marge of 5% may be used:
𝑈𝑐0 = 1.05 𝑈𝑚𝑎𝑥 [E-1]
Once the initial specification for each surge arrester is defined as shown in equation [E-3], the
SIPL will be used as the main reference for the characterisation of the surge arresters.
Therefore, through the known ratio between the SIPL and the Uc of each arrester, the value
of SIPL can be estimated as shown in equation [E-2]
𝑆𝐼𝑃𝐿 = 𝑈𝑐 · 𝐾𝑆𝐼𝑃𝐿/𝑈𝑐 [E-2]
And the maximum energy absorption capability Emax of each arrester is given by multiplying
the specific energy absorption capability by the continuous operating voltage of the arrester
Uc:
𝐸𝑚𝑎𝑥 = 𝑈𝑐 · 𝑒𝑚𝑎𝑥 [E-3]
Contribution to Insulation Coordination Studies for VSC-HVDC Systems Appendices
Nicolas Manduley 2020 Page 202
By default, the initial number of columns for each arrester is one regardless of the maximum
allowed by the user.
The factor k represents the ratio between the withstand voltage of the equipment (SIWV) and
the protective level of the arrester (SIPL). By knowing the absolute maximum overvoltage
levels without arresters (U2%), a maximum value of SIWV may be established by considering
that the maximum withstand voltage of the equipment corresponds to the dielectric strength
which is equal or higher to the maximum overvoltage. One way of doing this is by making SIWV
equal (or proportional by a given factor) to U2%, as typically done in IEC 60071 standards for
switching overvoltages. Then, the maximum SIPL can be specified as follows:
𝑆𝐼𝑃𝐿𝑚𝑎𝑥 =𝑈2%𝑘
[E-4]
As discussed in §4.2 in Chapter 1, the minimum values for this factor are given in IEC 60071-5
standard. This value is used to provide a stopping criterion in case one or more arresters reach
the maximum overvoltage protection level, in which case the initial conditions provided do
not converge into an optimal solution.
E.4 EMT Simulations
After the initial values are set, they are transferred to a data structure from which they can be
read by the function in charge of modifying the netlist of the base EMTP case to set the
simulation case. The base EMTP case used should include all the arresters that may be present
in the configuration. The surge arresters which are not present in the current configuration
may be set to a sufficiently high protective level so that it is guaranteed that they will always
behave as an infinite resistance. This method allows to easily modify the surge arrester
arrangement using the same EMTP base case.
Once the netlist of the EMTP base case has been modified to include all the considered
arresters, the simulations are launched. They may include different scenarios producing
transients such as faults, switching operations, disconnections, resonance and other sources
of slow-front and temporary overvoltage (see §3.2 and §3.3 in Chapter 3).
E.5 Modification of the Surge Arrester Specifications
The results of the EMTP simulations are extracted and treated to constitute the maximum
overvoltage profile of the system, as well as the maximum total energy absorbed by the
arresters. For each arrester:
If the total energy absorbed is lower Emax, no modifications are required for such
arrester.
If the total energy absorbed is higher than Emax and the current number of columns is
lower than the maximum admitted (Ncol_max), a column is added.
Contribution to Insulation Coordination Studies for VSC-HVDC Systems Appendices
Nicolas Manduley 2020 Page 203
If the total energy absorbed is higher than Emax and the current number of columns is
the maximum admitted, the protective level of the surge arrester (SIPL) is increased by
a defined step. In such case, the number of columns is reset to one for the next
iteration.
If with the maximum number of columns the SIPL reaches the maximum value (SIPLmax, see
equation [E-4]), a warning shall be prompted indicating that the design is not possible using
the specified number of parallel columns of arresters for the concerned location. In such case,
either a higher number of columns shall be specified, or an alternative solution may be
considered (e.g. different arrester arrangement, the removal of such arrester, or the use of
sacrificial arresters).
E.6 Stopping Criteria
The algorithm stops when the considered design does not result in an excess of energy
absorbed by any of the arresters present in the configuration. Also, if one or more arresters
reach their maximum SIPL level, no further modifications will be performed on such arresters,
and a warning shall be prompted indicating that the design is not possible with the provided
specifications
E.7 Discussion
Since the installation of multiple columns of arresters may carry some problems regarding the
distribution of the currents between the different columns (IEC 60099-9), solutions with a
single column will typically be preferred unless absolutely necessary. In this respect, an initial
approach could be to set the maximum number or parallel columns to one to all arresters. If
the final design features unacceptably high energy absorption levels for one or more arresters,
the procedure may be repeated by modifying the maximum number of columns for the
concerned arresters until a satisfactory design is obtain.
The same principle applies if the energy absorption levels are acceptable but not the final
maximum overvoltage levels at one or more specific locations.
Furthermore, in this proposal, a progressive increase of the SIPL is performed whenever the
energy absorption levels are too high. Whenever the SIPL has to be increased, it is done in
defined small steps in order to progressively reduce the energy absorption levels of the
considered arrester. Therefore, no reductions of the SIPL are considered at any point of the
algorithm to avoid initiating infinite loops in which several arresters are modified in each step
and no optimal solution is reached. However, other approaches to adjust the SIPL may be
considered after further studies. It might be possible to determine the final value of SIPL by
dichotomy considering one or more arresters at a time, or even the number of columns
Contribution to Insulation Coordination Studies for VSC-HVDC Systems Appendices
Nicolas Manduley 2020 Page 204
present at each location in the current/previous iteration. This shall be addressed in future
studies.
Therefore, this algorithm shall be tested in future studies to determine the best methods for
obtaining an optimal specification of the surge arresters of a given configuration considering:
The procedures for the modification of the SIPL on each iteration
How to deal with the addition or removal of parallel columns
The resulting overvoltage profile and insulation design