Leitner, K-H. (2015): Intellectual Capital, Innovation and Performance: Empirical Evidence from...
38
Intellectual Capital, Innovation and Performance: Empirical Evidence from SMEs Accepted for publication by the International Journal of Innovation Management November 2014 Karl-Heinz Leitner Austrian Institute of Technology Donau-City-Strasse 1 1220 Vienna Austria Email: [email protected] Abstract This research paper examines the relationship between intellectual capital, product innovation and performance based on a study of Austrian firms covering a ten-year period. It is argued that intellectual capital enhances a firm’s ability to successfully realize innovations and thus contributes positively to its performance. Our study found that human capital and structural capital were both significantly associated with performance in product innovating firms, but that each had a different impact on this performance. While human capital had a positive impact on profitability and growth in the long run, contrary to expectations, structural capital had a negative effect on profitability and growth indicating that apparent strength can turn into a weakness over time. In addition, the study found that human capital and structural capital had no joint effect on the performance of product innovating firms. Key Words Intellectual capital, human capital, structural capital, product innovation, longitudinal study, small and medium enterprises
-
Upload
austrianinstituteoftechnology -
Category
Documents
-
view
2 -
download
0
Transcript of Leitner, K-H. (2015): Intellectual Capital, Innovation and Performance: Empirical Evidence from...
Intellectual Capital, Innovation and Performance: Empirical Evidence
from SMEs
Accepted for publication by the International Journal of Innovation Management
November 2014
Karl-Heinz Leitner
Austrian Institute of Technology
Donau-City-Strasse 1
1220 Vienna
Austria
Email: [email protected]
Abstract
This research paper examines the relationship between intellectual capital, product innovation
and performance based on a study of Austrian firms covering a ten-year period. It is argued
that intellectual capital enhances a firm’s ability to successfully realize innovations and thus
contributes positively to its performance. Our study found that human capital and structural
capital were both significantly associated with performance in product innovating firms, but
that each had a different impact on this performance. While human capital had a positive
impact on profitability and growth in the long run, contrary to expectations, structural capital
had a negative effect on profitability and growth indicating that apparent strength can turn
into a weakness over time. In addition, the study found that human capital and structural
capital had no joint effect on the performance of product innovating firms.
Key Words
Intellectual capital, human capital, structural capital, product innovation, longitudinal study,
small and medium enterprises
1
Intellectual Capital, Innovation and Performance: Empirical Evidence
from SMEs
1. Introduction
The product innovation process is frequently interpreted and analysed from the resource-
based view (e.g. Nelson, 1991; Nonaka, 1994; Verona, 1999; Teece, 2000; Terziovski 2010)
examing different forms of resources and competences in relation to corporate product
innovation activities. In doing so, this strand of literature focuses on factors which go beyond
those traditionally regarded as crucial for successful innovation activities, such as investments
in R&D, market orientation or product strategy (e.g. Cooper and Kleinschmidt, 1987; Han et
al., 1998). Innovation is hence a knowledge creating process, and the ability to innovate is
closely related to a firm’s intangible resources.
Some authors (e.g. Barney, 1991; Teece, 2000; Subramaniam and Youndt, 2005)
differentiate between various forms of intangible resources, often referred to as knowledge
assets or intellectual capital, to study their impact on innovation, competitiveness and
performance. Accordingly, they contend that firms should invest in human resources,
relationships and organisational procedures to raise their innovation capabilities and build up
the important complementary assets that assure the success of improved or new products. In
this study, we refer to the strand of literature which distinguishes different forms of
intellectual capital and investigate its role on the innovativeness and performance of firms.
We argue that intellectual capital facilitates the successful deployment of product innovations
in several ways, including design and manufacturing quality, congruence with customer needs
and timely product launches, a view which is, for instance, also adopted by Thornhill (2006).
We divide intellectual capital into two components: human capital and structural capital and
therefore adopt a taxonomy suggested by early proponents of intellectual capital literature
2
(e.g. Roos et al., 1997). Human capital is defined in this paper as the capabilities and attitude
of a firm’s employees, while structural capital is its processes, structures, brands and
relationships with customers. This basic distinction is also similar to that proposed by scholars
of the resource-based view (RBV); Barney (1991), for instance, distinguishes between human
resources and organisational resources.
The empirical evidence about the relationship between intellectual capital and innovation
is still fragmented, which is particularly true for SMEs. Most studies to date investigate the
role of different forms of intellectual capital in isolation and, for instance, examine the impact
of human capital, social capital or close customer relationships on product innovation (e.g.
Hsieh and Tsai, 2007; Olavarrieta and Friedmann, 2008). In extension to many other studies
we see intellectual capital not only as having a direct effect on product innovation activities
but consider intellectual capital as factor which moderates the relationship between
innovation and firm performance. This question is also of interest for practice as one can ask
whether companies should invest rather in human capital (e.g. training of employees) or in
structural capital (e.g. organisational processes), or in both, to improve the innovation
performance of a company. Moreover, intellectual capital is a phenomenon based on
interactions, combinations and complementarities (Galunic and Rodan, 1998) and only a very
few studies to date have examined the joint effect of different forms of intellectual capital
(e.g. Subramaniam and Youndt, 2005; Huang and Liu, 2005). Our study therefore contributes
to the debate by investigating the combined effect of human and structural capital on
performance in product innovating firms.
In this paper we firstly analyse the role of human and structural capital for product
innovating firms, these are firms which at least once introduced a significantly improved
product on the market covering a ten-year period. Secondly, we examine the group of firms
which continuously develop new products and are considered to be ‘highly innovative’ for the
purposes of this paper. We assume that the more innovative a firm is, the more crucial

3
intellectual capital will be in the successful development of new products, and that regular
product development also contributes to the development of intellectual capital. Thus, both
activities are path dependent and reinforce each other (Danneels, 2002). Thirdly, we
investigate whether human capital and structural capital jointly interact to contribute to the
performance of product innovating firms.
There is less literature available that considers the impact of intellectual capital on
performance over a longer period of time (e.g. Keller, 2004). In this respect, Wiggins and
Ruefli (2002), for instance, emphasize the importance of a longitudinal dataset covering at
least ten years to reliably assess the impact of resources and capabilities on performance. This
is particularly relevant, as proponents of the RBV have argued that intangible investments
should have a sustaining effect on performance (e.g. Barney, 1991). This issue is taken into
account in this paper, as we carry out a study among manufacturing SMEs covering the period
1992-2002. The paper uses data from a sample of 91 Austrian SMEs which provided data on
their performance and innovation behavior in this period in two surveys carried out in 1995
and 2003, this long term perspective is a further contribution of the paper.
In the next section, we develop hypotheses based on literature on the resource-based view
of the firm, intellectual capital management and innovation economics. We then explain how
the innovation, intellectual capital and firm performance variables are measured, present the
results of our statistical analysis and conclude with a discussion of the main findings.
2. Background and Hypotheses
Different theories and perspectives from industrial economics, the resource-based view
(RBV) of the firm, evolutionary economics and organisational theory have all been used to
explain the role of innovation in corporate development and performance. In the RBV, firms
are understood in terms of resources and routines and, accordingly, gain competitive
advantage through their heterogeneous combination of resources, rather than through the
product market conditions and positioning activities (e.g. Barney, 1991; Grant, 1996). In the
4
RBV context, innovation and product development are the result of unique resources and the
accumulation of knowledge (e.g. Iansiti and Clark, 1994; Verona, 1999; Danneels, 2002;
Branzei and Vertinsky, 2006).
Intellectual capital concepts and taxonomies help to explain the different roles played by
intangible resources in the entrepreneurial innovation process. Many authors in this field
argue that different forms of intellectual capital, such as human, structural or customer capital,
contribute to a firm’s competitiveness and innovativeness (e.g. Stewart, 1997; Sveiby, 1997;
Nahapiet and Ghoshal, 1998; Subramaniam and Youndt, 2005).
Human capital is suggested as one important element of intellectual capital and is part of
all taxonomies proposed in the literature (e.g. Stewart, 1997; Roos et al., 1997; Nahapiet and
Ghoshal, 1998; Subramaniam and Youndt, 2005). Since innovation is viewed as the ongoing
pursuit and harnessing of new and unique knowledge, the individual knowledge, skills and
abilities of a firm’s employees, that is its human capital, are an important element in
innovation. Agile and well trained individuals are seen as fundamental to innovation and form
the basis for the creation, integration and transfer of knowledge within a firm (e.g. Michie and
Sheehan, 1999; Shrader and Siegel, 2007).
Organisational capital or structural capital (e.g. Edvinsson and Malone, 1997, Roos et al.,
1997), both terms are often used interchangeably, is another frequently discussed and
important form of intellectual capital which may be positively associated with the
innovativeness and performance of firms. Organisational structures, processes and routines
are important elements of organisational or structural capital (Bontis, 1998) which, for
instance, enable an efficient product planning process, facilitate communication within new
product development teams and provide the necessary information for product development.
In general, quality management has become one of the key types of management system
implemented within SMEs across Europe (van der Wiele and Brown, 1998), and it can be
assumed that particular quality management systems are positively associated with
5
innovativeness and performance (Chu and Pucik, 2005). Systems like ISO 9000 or TQM
allow systematic process management and build up routines which facilitate product
development processes.
The communication and sharing of knowledge both within the organisation and with
external parties (in particular customers) is a further form of intellectual capital.
Consequently, Edvinsson and Malone (1997) or Roos et al. (1997) divide structural capital
into two subcategories, namely organisational capital and customer capital. In contrast, other
authors define relational or social capital as separate forms of intellectual capital on a par with
the other intellectual capital categories (e.g. Stewart, 1997; Nahapiet and Ghoshal, 1998), a
view which is no adopted in this paper. Relationships and networks with partners (e.g.
customers, suppliers and research institutions) are highly important for innovation activities as
they allow firms to combine new forms of knowledge in a unique way and enhance
information exchange not only within an innovation project team, but also with external
actors. Good customer relationships are particularly important for product innovation
activities, as they serve to raise customer trust, increase customer retention and produce
superior performance (Baker and Sinkula, 2005).
For the purposes of the research presented in this paper, we classify intellectual capital into
two forms, namely human capital and structural capital, and include both organisational and
customer capital in the latter (Roos et al., 1997). Human capital captures the capabilities and
attitudes of employees. Structural capital is defined in this paper as covering processes,
routines, structures, brands and relationships with customers.
In literature, there is no consensus as to the relationship between different forms of
intellectual capital and innovation. Some authors (e.g. Evenson and Westphal, 1995; Roos et
al., 1997; McElroy, 2003) regard innovation as a specific aspect or sub-category of structural
or organisational capital and occasionally use the term innovation capital. A few authors (e.g.
Subramaniam and Youndt, 2005) consider innovation capabilities as the result of good
6
intellectual capital while others maintain that innovation capabilities strengthen intellectual
capital (e.g. Marqués et al., 2006). Marqués et al. (2006) propose that innovation capabilities
have an impact on the different forms of intellectual capital. In line with some authors (e.g.
Youndt et al., 2004), we conceptualise innovation as a separate construct, thus permitting us
to study its interaction effects with intellectual capital.
Despite the appealing logic and convincing arguments put forward in the resource-based
view, empirical evidence regarding the role of the different forms of intangibles, their
interrelatedness and links to innovation is still limited, particularly for SMEs. In general,
research in this field has so far examined the contribution of different intangible resources or
intellectual capital mainly in isolation. A large number of publications examine how human
resources or human capital is directly associated with the innovation activities of firms. In a
study of Canadian SMEs, Baldwin and Johnson (1996), for instance, find evidence that more
innovative firms are more likely to offer their employees access to formal and informal
training or make use of innovative compensation packages than their less innovative
counterparts. However, some studies also argue that human assets enable a firm to leverage
innovation into performance thus emphasising the moderating effect of human capital
(Thornhill, 2006). Thornhill (2006) reports that the education level of the workforce and
training investments (defined as knowledge assets) and innovation jointly interact to have an
positive effect on firm performance based on a Canadian survey.
Huang and Liu (2005) employ multiple regression models to examine relationships
between innovation and/or structural capital and firm performance. They find that investment
in structural capital has a positive effect on performance, but that this influence can become
negative when the investment exceeds an optimal level. Further evidence on the role of
different knowledge assets is provided by Smith et al. (2005), who study the rate of new
product launches in high-tech firms. Their results indicate that existing employee knowledge
7
and an organisational environment which supports knowledge exchange both contribute
positively to the number of new products launched by a firm.
Drawing on the arguments provided, we assume that intellectual capital and innovation
jointly interact to be positively associated with firm performance in the long run and propose
the following hypotheses:
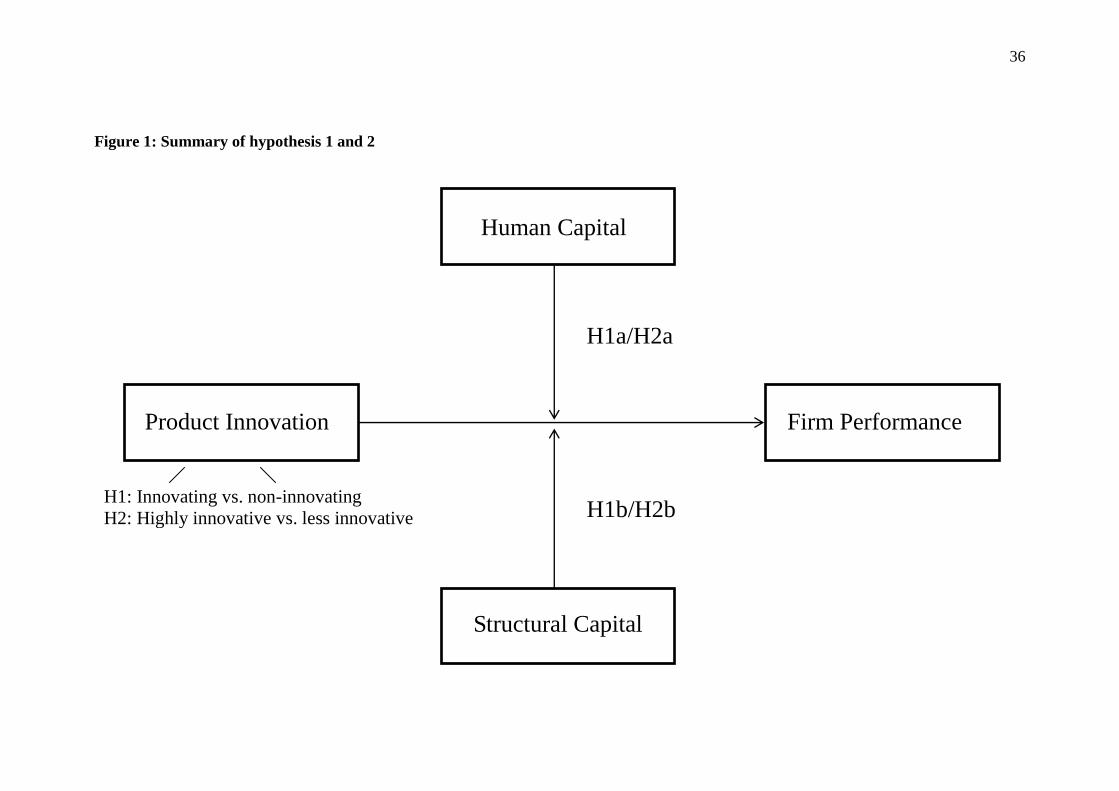
Hypothesis 1a: The stronger the human capital of the firm, the higher the positive effect of
product innovation on firm performance in the long run.
Hypothesis 1b: The stronger the structural capital of the firm, the higher the positive effect
of product innovation on firm performance in the long run.
There is no common understanding in the literature whether firms which continuously
develop new products deploy specific forms of intellectual capital to be successful. We
therefore distinguish in our study between less innovative and highly innovative firms,
defining the latter as firms which regularly develop and launch new products.
Some scholars argue that human capital is more strongly linked to the ability to develop
more (radical) innovative products and include in particular those capabilities which allow
organisational barriers to innovation to be overcome (e.g. Rothaermel and Hess, 2007;
Branzei and Vertinsky 2006). Individuals and their associated human capital may encourage
the questioning of existing norms and develop new ways of thinking (Subramaniam and
Youndt 2005).
In addition, some empirical data delivers evidence that strong structural capital contributes
positively to the deployment of investments in the development of new products. Cho and
Pucik (2005), for instance, report that effective quality management systems are positively
associated with the performance in firms which continuously develop new products. Appiah-
Adu and Singh (1998) emphasise the importance of good customer relationships for the
commercial success and firm performance of new product innovating firms. Thus, structural
capital is more important for more innovative firms than for incremental product innovators.
8
The development of intellectual capital can be regarded as an accumulative process which
not only creates incentives to be exploited by product innovations, but also delivers the
required complementary assets. The development of new products expands a firm’s
competence base, which in turn enables further product innovations (Danneels, 2002). Thus,
in contrast to incremental innovations or product enhancements, continuous new product
developments permit the renewal of organisational resources and can contribute to the
building up of dynamic capabilities (Teece 2007; Eisenhardt and Martin, 2000). In line with
these arguments, we argue that continuous product development enhances a firm’s ability to
alter its resource configurations and explore new knowledge. We hence propose that both
human capital and structural capital are particularly significant for the success of highly
innovative firms, defined as firms which continuously develop new products, and formulate:
Hypothesis 2a: The stronger the human capital, the higher the performance of highly
innovative firms compared to less innovative firms.
Hypothesis 2b: The stronger the structural capital, the higher the performance of highly
innovative firms compared to less innovative firms.
Figure 1 summarises hypotheses 1 and 2.
Figure 1 about here
The concept of resource bundles conveys the notion that competitive advantage frequently
depends on the interaction of resources (Barney, 1991; Galunic and Rodan, 1998). Scholars
argue that the different forms of intellectual capital are not found in neat, separate packages
but instead both make use of individual and organisational knowledge (e.g. Subramaniam and
Youndt, 2005; Nonaka et al., 2006; Namasivayam and Denizci, 2006). There is the belief that
focusing solely on one element would lead to inferior performance, since the best human
capital, would not, for instance, be able to unfold its creative and productive potential if
organisational structures and processes were too bureaucratic and inefficient (Edvinsson and
Malone, 1997; Hitt et al., 2000). Indeed, literature on this subject stresses that intellectual
9
capital is a phenomenon based on interactions, combinations and complementarities. Hence,
individual knowledge can only be transformed into value if it is supported by appropriate
organisational processes, such as codification, and if internal and external networks facilitate
knowledge transfer. Stieglitz and Heine (2007) claim that firms which invest in human capital
also tend to invest in complementary assets to bind employees to the firm. Thus, strong
structural capital not only attracts talented employees, it may also facilitate knowledge
creation and sharing.
The role of complementarity and interaction between different resources has been largely
ignored in empirical studies. Most studies investigate the role and bundling of various human
resource practices (e.g. Michie and Sheehan, 1999; Laursen and Foss, 2003), which does not
account for structural or organisational capital as understood in our study. Branzei and
Vertinsky (2006) assert that human capital has no direct effect on new product development
success, but does catalyse the absorption of external ideas and enable the transformation of
ideas into operations, thus indirectly contributing to innovation success. Hardly any empirical
research has so far been carried out studying the relative impact and possible combined
effects on innovation performance. In this context, we assume that human and structural
capital to be complementary for product innovating firms and propose:
Hypothesis 3: Human and structural capital jointly interact to have a positive effect on the
relationship between product innovation and firm performance in the long run.
Figure 2 summarises hypothesis 3.
Figure 2 about here
10
3. Sample
The data used to test the above hypotheses is taken from a longitudinal study of Austrian
SMEs with 20 to 500 employees. The first survey was carried out in 1995 and was followed
by a second survey of the same firm sample in 2003.
The firms were selected at random from the Dun&Bradstreet database, which covers all
Austrian firms with more than 10 employees. The seven industries chosen represent about
30% of all SMEs in the country’s manufacturing sector and cover the typical low- and
medium-tech manufacturing industries which contribute to economic growth, technological
change and productivity in Austria (ÖSTAT 1998). The total number of firms in these seven
sectors was 2,051 in 1995. The selected firms are distributed across the Austrian industry
classification standards and cover ‘manufacture of wood and of products of wood’ (NACE
20): 16%; ‘manufacture of furniture’ (NACE 36): 10%; ‘manufacture of basic metals’ (NACE
27): 11%; ‘manufacture of fabricated metal products’ (NACE 28): 24%; ‘manufacture of
machinery and equipment’ (NACE 29): 19%; ‘manufacture of chemicals and chemical
products’ (NACE 24): 8%; ‘manufacture of rubber and plastic products’ (NACE 25): 12%.
This distribution accounts for the relative importance of these sectors across the Austrian
manufacturing industry.
The interviews were carried out by phone as this method usually assures a higher response
rate. It was also anticipated that the personal contact established by using this method would
help to assure a high response rate in a subsequent interview. The interviews lasted about 90
minutes and were carried with the managing directors of the participating firms using a
standard questionnaire. With the exception of those firms that had gone out of business in the
meantime, we were able to convince all the firms to participate in our second survey in 2003,
where interviews were again carried out by phone with the managing directors based on the
same questionnaire. Nine of the firms initially interviewed had since gone out of business,
leaving us with 91 firms for the second survey.
11
4. Measures and Methods
Innovation
We measured the innovation behaviour of the selected firms at both points in time by the
type of innovation activities they had realised in the three years prior to the investigation,
based on the information provided by the firms themselves. To obtain this information, we
asked them if they had introduced incremental product innovations (‘we have introduced a
strongly improved product in the last three years’) or developed new products (‘we have
introduced a new product which is new for the firm in the last three years’). Capturing two
levels of innovativeness in this way is a common method of measuring a firm’s innovation
output (e.g. Baldwin and Johnson, 1996; Vaona and Pianta, 2007). Following suggestions
found in the literature on innovation (Noteboom, 1994), changes involving only minor design
alterations were not considered innovative. Thus, we considered firms which had developed
and launched new products between 1992 and 2002 to be more innovative than firms which
had only incrementally improved their existing products.
Based on these measurements, we were then able to classify the firms into two large
groups: firms which had introduced a product innovation at least in one period were classified
as ‘product innovating firms’, firms which had not introduced any product innovation at all as
“non-innovating firms”. The group of the ‘product innovating firms’ was further divided into
two subgroups, firms which had developed a new product in both periods were categorised as
‘highly innovative firms’, and firms which had developed new products irregularly or
introduced incremental product innovations were classified as ‘less innovative firms’. Thus,
the group of innovative firms comprised those firms classified as ‘highly innovative firms’
and ‘less innovative firms’. All variables were dummy coded.
In addition, R&D expenditure as a percentage of the total turnover were measured. We
calculated relative R&D expenditure (industry adjusted R&D) by subtracting the average
12
industry R&D expenditure obtained from the Austrian Statistical Office) from the firm’s
R&D expenditure to account for industry effects. The number of all patents granted to a firm
in 1995 served as further variable indicative of product innovation activities.
Controls
Previous research suggests that firm size and firm age are important factors which
influence performance (Birley and Westhead, 1990; Almus and Nerlinger, 1999). For
instance, firm growth tends to decline with increasing firm size and age. Consequently, we
used firm size (measured as the total number of employees) and firm age in 1995 (log
transformed) as control variables.
In addition to firm-specific factors, we also accounted for industry environment, since this
can also have an impact on firm performance. Since we had adjusted the growth rates by
industry growth figures and asked the firms to compare their own financial performance
(profitability) with that of their main competitors, we had already checked for a possible
confounding effect of industry on performance and did not include industry as further control
variable.
Intellectual Capital
Empirical research on intangible resources and capabilities had not provided original scales
for a comprehensive measurement of capabilities and intellectual capital when the first survey
was designed in 1995. Although researchers have addressed the extent to which corporate
resources and competences can indeed be measured at all, we followed an approach
frequently encountered in the literature and measured the strength of the participating firms
based on their self-assessment of their own strengths relative to those of their competitors
(Miller and Roth, 1994). This approach is similar to the method used by Spanos and Lioukas
(2001) to measure corporate assets, which captures a firm’s intellectual capital using the
respondents’ own assessment of their human and structural capital in different areas (see
Appendix 1 for a definition of variables).
13
Human capital was a four-item measure assessed by a firm’s strength relative to its
competitors in the areas ‘qualification of personnel’, ‘flexibility of personnel’, ‘well-informed
personnel’ and ‘ability to communicate’ in line with typical features of human capital
described in literature (e.g. Stewart, 1997; Roos et al., 1997). This measure accounts in
particular for those features of human capital that are said to affect knowledge creation and
knowledge transfer and are crucial for innovation (e.g. Nonaka, 1991). To test validity and
reliability, we checked factor loadings, item-total correlation and Cronbach’s alpha. The
factor loadings were all greater than 0.65 and significant, item-total correlations were very
high, and Cronbach’s alpha of the human capital factor was 0.71.
Structural capital was a five-item factor constructed of a firm’s strength in the areas
‘quality management system’, ‘operational efficiency’, ‘reputation, ‘customer relationships’
and ‘distribution and marketing’ which was derived from the discussion of components which
may influence innovation performance in SMEs in section 2 above. This is in line with
suggestions regarding the basic characteristics of structural capital and its organisational and
customer capital components (e.g. Edvinsson and Malone, 1997, Roos et al., 1997). Quality
management systems and operational efficiency were regarded particularly relevant for
manufacturing firms. However, we did not account for databases or information systems as
we assumed that databases still played a minor role in the mid-1990s in small manufacturing
firms. The importance of patents is straightforward to measure and was captured as one aspect
of innovation activities together with R&D investments. In the final structural capital
construct the factor loadings were all higher than 0.59, while Cronbach’s alpha was 0.69. In
addition, item-total scale correlation analysis revealed significant high relationships in the
anticipated direction, indicating that all items contributed meaningfully to the respective
dimensions of structural capital in the study.
The alphas for both constructs exceeded the lowest alpha suggested by Naman and Slevin
(1993) and were in the upper level proposed for broad constructs by Van de Ven and Ferry
14
(1997). Both variables served as composite measures for hypothesis testing. Discriminant
validity was assessed by checking the magnitude of the correlation coefficients between the
two variables which at 0.51 were below the conventional cut-off point of 0.70 (Cohen and
Cohen, 1983).
A potential weakness of a self-assessment of a firm’s strength compared to its competitors
is that it may lead to a biased measurement since the assessment depends on the competitive
environment and the firm’s benchmarking experience. We hence checked whether firm size,
firm age or industry had an effect on the distribution of all nine human and structural capital
items. This analysis showed that all correlation coefficients were lower than 0.20, indicating
that there was no structural factor bias.
Performance
Various studies have addressed the relationship between different performance variables,
suggesting that performance is a multi-dimensional construct. In general, product innovation
strategies are said to be associated with both financial performance and growth. Moreover,
some scholars (e.g. Baum et al., 2001) maintain that growth is often necessary to survive in
highly competitive environments, particularly for young and small firms, and is thus also a
condition for financial performance.
Three performance indicators were used in our study in both time periods: average
profitability, turnover growth and employment growth. It is often difficult to obtain data on
the profit levels of small firms as they are, in many cases, not obliged to publish their results
and are also often reluctant to provide financial information (Sapienza et al., 1988).
Profitability was measured in our study on the basis of a self-assessment by respondents, who
were asked to compare themselves with their competitors using a 5-point scale (where
1=much worse and 5=much better). Respondents were asked to assess their annual
performance for each year between 1992 and 2002. We then calculated the mean, obtaining
15
an average value for profitability ranging from 1.00 (1 in each year) to 5.00 (5 in each year)
for the period 1992-2002.
The figures for turnover and employment for the years 1992 and 2002 were reported by the
interviewed firms themselves in both surveys. Firm growth rate can be operationalized in
different ways (Delmar, 1997): we took the figures for 1992 and 2002 and calculated the
average annual percentage growth. Given the differing growth rates in the industries used in
the sample, the average annual percentage growth rate (turnover and employment) of a firm’s
principal industry was subtracted from its real growth rate obtained by the Austrian Statistical
Office.
Methods
Regression analyses were used to test the research question. The three performance
variables – profitability, turnover growth and employment growth – served as dependent
variables. The different variables for innovation, intellectual capital along with the control
factor served as independent variables. For the regression models, we calculated a base model
with the control variable, innovation factors and intellectual capital, added the interaction
term between innovation and intellectual capital in a second step and the interaction between
human capital, structural capital and innovation in a third. We also calculated the variance
inflation factors for the regression models to check for multicollinearity. See Appendix for a
definition of all variables and Table 1 for a summary of the statistics.
Insert Table 1 about here
4. Results
We give first an overview of the general characteristics and innovation behaviour of the
participating firms for the period in question. The size of the firms studied, which cover low-
tech and medium-tech firms, ranged from 21 to 470 employees, with a mean of 128 (see also
Table 1). The average age of the firms was 48 years, with actual values ranging from 2 to 183
years, indicating that the firms were fairly mature. The results of the study indicate that 58%
16
of the participating SMEs were innovative and had introduced an incrementally improved or
new product on the market in the three years prior to each of the two surveys. This ratio of
innovative firms is comparable with other studies both in Austria and at a European level
(Vaona and Pianta, 2007; Leo, 1999) and also indicates the external validity of our research.
In addition, the correlation table (see Table 1) showed virtually no direct relationships
between the indicators of innovation behaviour and human and structural capital.
Insert Table 2 about here
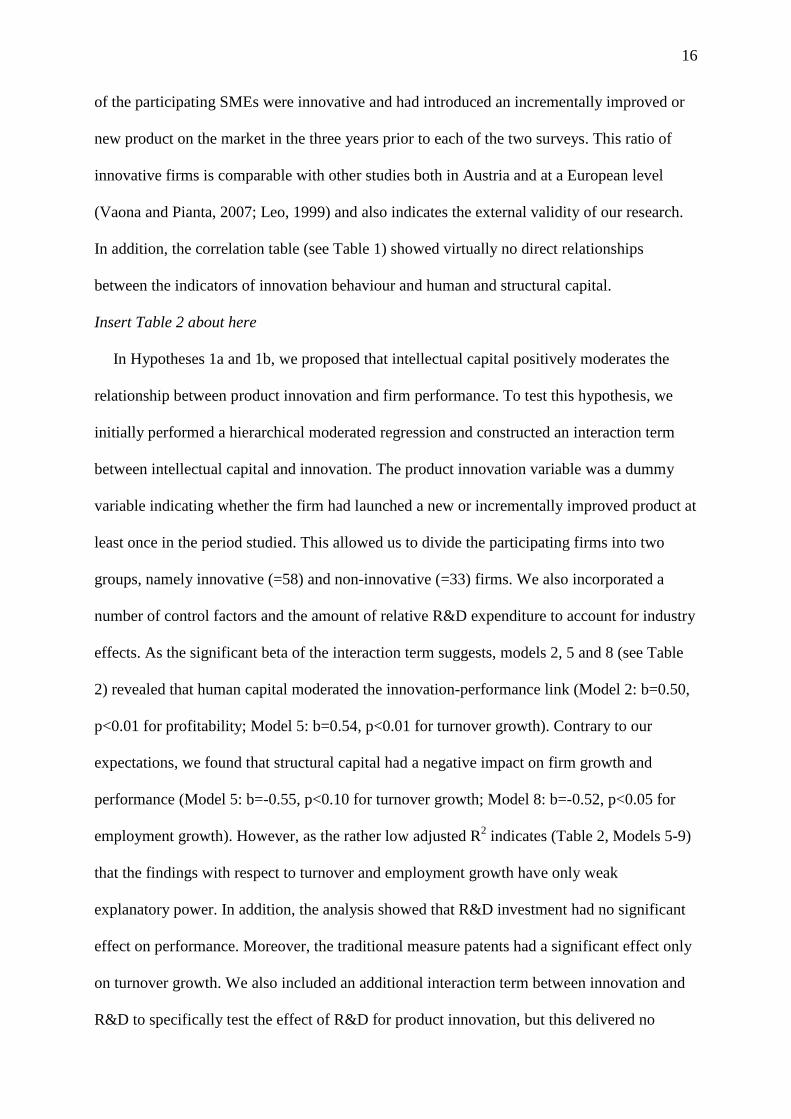
In Hypotheses 1a and 1b, we proposed that intellectual capital positively moderates the
relationship between product innovation and firm performance. To test this hypothesis, we
initially performed a hierarchical moderated regression and constructed an interaction term
between intellectual capital and innovation. The product innovation variable was a dummy
variable indicating whether the firm had launched a new or incrementally improved product at
least once in the period studied. This allowed us to divide the participating firms into two
groups, namely innovative (=58) and non-innovative (=33) firms. We also incorporated a
number of control factors and the amount of relative R&D expenditure to account for industry
effects. As the significant beta of the interaction term suggests, models 2, 5 and 8 (see Table
2) revealed that human capital moderated the innovation-performance link (Model 2: b=0.50,
p<0.01 for profitability; Model 5: b=0.54, p<0.01 for turnover growth). Contrary to our
expectations, we found that structural capital had a negative impact on firm growth and
performance (Model 5: b=-0.55, p<0.10 for turnover growth; Model 8: b=-0.52, p<0.05 for
employment growth). However, as the rather low adjusted R2 indicates (Table 2, Models 5-9)
that the findings with respect to turnover and employment growth have only weak
explanatory power. In addition, the analysis showed that R&D investment had no significant
effect on performance. Moreover, the traditional measure patents had a significant effect only
on turnover growth. We also included an additional interaction term between innovation and
R&D to specifically test the effect of R&D for product innovation, but this delivered no
17
substantive results (not shown). Thus, we found support for Hypothesis 1a, but had to reject
Hypothesis 1b.
Hence, although there was a positive link between human and structural capital (i.e. firms
with strong human capital are also more likely to have strong structural capital), each factor
had a different effect on performance. As mentioned above, this relationship indicated a
possible multicollinearity problem, although this proved to be more analytical than theoretical
in nature. This type of multicollinearity is common in innovation research when studying the
different determinants of performance and innovation (Crepon et al., 1998). However, the
correlation coefficients between all other independent variables used in the regression models
were all below 0.40 (Kennedy, 1992) and none of the variance inflation factors for the models
were greater than 4.6, which is the guideline figure (10) suggested by Chatterjee and Price
(1991). Thus, it was unlikely that multicollinearity between the independent variables affected
the findings.
We also carried out some additional post-hoc analysis to explore the reasons for the
negative impact of structural capital on growth in the long term. This involved additional
analysis using performance variables covering only the period from 1992-1994 (prior to the
firms’ assessment of their intellectual capital) to test whether the impact of structural capital
might be positive if considered only for a short period of time. However, the findings of this
analysis were no different to those obtained in the initial analysis and confirmed the results.
As we also measured the importance of different innovation barriers (by asking respondents
to assess this importance on a 5-point scale in the first survey), we tested for specific patterns
in firms with strong structural capital. Interestingly, our research revealed that innovating
firms which assessed their structural capital to be strong were more likely to complain about
higher innovation barriers, such as perceived commercial risks (r=-0.26, p<0.5).
Insert Table 3 about here
18
Hypotheses 2a and 2b propose that a strength in structural and human capital positively
contributes to the firm performance of firms which continuously develop new products. To
test this proposition, we used a second innovation variable (dummy coded) to measure
whether a firm was a continuous new product developer (‘highly innovative’) or an irregular
or incremental innovator (‘less innovative’). 23 of the participating SMEs had launched a new
product in both periods, and an analysis of these firms showed that the majority had launched
incremental innovations, too. We employed a hierarchical moderated regression analysis
within the innovative firms subgroup (=58 firms), constructing an interaction term between
structural capital and the continuous new product development variable.
The base models (1, 3, 5) (see Table 3) confirmed the results from above, they showed the
positive impact of human capital and negative impact of structural capital for the entire
innovative firm group (irrespective of product innovativeness). The regression equation
integrating the interaction term showed that the interaction coefficients between product
innovativeness and intellectual capital were generally negative with respect to human capital
and positive with respect to structural capital (see Table 3: Models 2 and 4). The coefficients
were significant for structural capital regarding the effect on turnover growth (Model 4:
b=0.18; p<0.05). Given that the innovation variable is dummy coded, it is apparent that
structural capital is negatively associated with firm growth, particularly for the less innovative
firm group. With respect to human capital, the interaction coefficient between human capital
and continuous product development (=highly innovative) was negative, albeit not significant.
We also performed split sample analysis to check the results and hence we compared the
impact of human capital and structural capital separately within the less and highly innovative
firm group. These models revealed that the negative relationship of structural capital is
significantly associated with growth for less innovative firms. In general, the positive
influence of human capital and the negative influence of structural capital are stronger in the
19
less innovative firm group than in the highly innovative firm group. Thus, we found no
support for Hypothesis 2a and only weak support for Hypothesis 2b.
Overall, continuous product developers were neither more profitable nor had they grown
more strongly than irregular product developers or incremental innovators. Again, traditional
R&D expenditure had no impact in this model, while the number of patents had a positive
impact only on turnover growth (Model 3 and 4: b=0.37; p<0.01).
Hypothesis 3 deals with the question of whether innovative firms with strengths in both
human and structural capital can be associated with higher performance. To test this
hypothesis, we constructed a three-way interaction to identify trade-offs or synergies between
both elements and their effect among product innovating firms (see Table 2, Models 3, 6 and
9). We found no clear evidence of either a positive or a negative association between human
and structural capital and the three performance variables. The regression analysis revealed
that integrating this interaction term did not increase the predictive power of the model.
Hence, no evidence was found to support Hypothesis 3.
20
6. Discussion
The resource-based view of the firm sees innovation and new product development as a
knowledge generating and competence building process. Our study dealt with the long-term
links between human capital, structural capital, innovation and performance. We did not
explicitly address innovation capabilities or innovation capital, but were instead interested in
the impact of intellectual capital on performance in product innovating firms, assuming that
intellectual capital does actually moderate the innovation-performance link. Accordingly, we
argue that innovation cannot be fully understood by focusing on input measures such as R&D
expenditure, but must also take account of complementary resources. Furthermore, our study
contributes to research by examining the role of both human and structural capital and seeking
to explain the interconnectedness between these different resources.
Our study delivered evidence that the innovation persistence of firms is very high; we had
a considerable number of firms which continuously introduced product innovations. We
found that the classic innovation indicator R&D expenditure had no influence, while
intellectual capital had both a direct and an indirect effect on performance. This suggests that
intellectual capital may have a stronger effect on performance in innovative firms than the
level of relative R&D expenditure. The number of patents had a positive impact only on
turnover growth. Both R&D investments and the number of patents are sometimes also
interpreted as measures of a firm’s innovation capital, but were treated separately in our study
as our interest lay in the complementary relationship between intellectual capital and
innovation (e.g. Thornhill, 2006).
At the same time, neither human capital nor structural capital had an effect on performance
for the whole group of firms studied, while intellectual capital moderated the innovation-
performance link. Human capital was generally associated positively with both profitability
and turnover growth. While human capital had a positive impact on performance – in line
with the findings in the extensive literature on this topic (e.g. Hayton, 2003) – structural

21
capital had a negative impact on employee and turnover growth over a ten-year period, which
was contrary to our expectations. However, these results do not take into account the product
innovativeness of a firm, i.e. whether a firm is less or highly innovative.
Structural capital was represented in our study by strengths in operational efficiency,
quality management systems, customer relationships, marketing, brands and reputation.
Hence, it incorporates important aspects of organisational and customer capital used by other
scholars to define intellectual capital (e.g. Roos and Roos, 1997). Thus, product innovating
firms with what might normally be described by accountants as a high level of ‘goodwill’
found it difficult to grow. Although we did not investigate the reasons or environmental
context for this growth barrier, we speculate that firms are constrained by their own strengths
and in some way lose their ability to think creatively and develop new strategies beyond their
traditional industry or market paradigms. This holds particularly true for firms which did not
continuously develop new products, as this effect was particular strong for less innovative
firms. Thus, highly innovative firms seem to be able to develop their structural capital more
dynamically (Eisenhardt and Martin, 2000). Moreover, these results show that the product
innovativeness has to be considered when assessing the role and contribution of structural
capital for the successful creation and implementation of product innovations.
The negative association between structural capital and performance in the long term can
also be explained by a phenomenon referred to by Leonhard-Barton (1992) as ‘core
rigidities’. Even though literature stresses the importance of developing resources
dynamically, structural capital may be interpreted as a rather static resource for firms and one
that is hard to transform and associated with lock-in and inertia, particularly for less
innovative firms. Thus, the existence of well-organised management systems, established
routines, efficient processes or strong brands also make firms more reluctant to enter new
product markets and leave their established trajectories for fear of placing their strengths, for
example a good reputation, at risk. Accordingly, firms may opt to develop their strengths

22
along their established trajectory, for instance, by optimising established systems or fostering
existing customer relationships instead of re-engineering processes or developing new market
segments. These routines limit their capacities to selectively search and acquire new
knowledge (March, 1991; Brenner and Tushman, 2002). Thus, SMEs tend to focus their
routines around those functions or competencies that have brought them success in the past
(‘competency trap’), but neglect new important technological areas or markets.
With particular regard to customer capital (treated as a component of structural capital in
our study), authors like Christensen and Bower (1996) also claim that a strong focus on
customer needs (measured in our study, for instance, by customer relationships) may
negatively affect innovativeness and performance. By focusing on current customers, firms
develop a tendency to self-confirm their mental models and limit their ability to absorb the
knowledge from outside their customer base that would be important for more radical
innovation. In addition, we found that firms with good structural capital also complained
more frequently about barriers to innovation, thus making our results more plausible.
However, as mentioned above, this is particularly valid for less innovative firms, these are
incremental and irregular product developers.
We found no evidence that human capital and structural capital reinforce each other.
Indeed, the converse would seem to be true, with human and structural capital showing
mainly a negative interaction effect on the various performance variables, albeit not
significant and not taking into account the product innovativeness. Hence, firms which were
only strong in terms of human capital were more successful than firms with strengths in both
dimensions. In this respect, Subramaniam and Youndt (2005) find no combined effect of
organisational capital and human capital on incremental innovation capabilities. In their study
of large firms, Youndt et al. (2004), for instance, show that a relatively small group of
superior performing firms exhibited high levels of human and organisational capital, but that
most firms tended to specialise and focus primarily on only one form of intellectual capital.
23
In interpreting the findings of this field study, also have to consider its limitations. The
longitudinal survey was exploratory in nature with a relatively small sample size of low-tech
and medium-tech firms. However, using this sample of firms allowed us to study the
sustaining impact of intellectual capital and innovation SMEs over a ten-year period. Since
nine of the participating firms went out of business between the two surveys, there was also a
survival bias in the sample. We used a fairly simple measure for product innovativeness and
did not deal with process and organisational innovations. Examining the links with other
forms of innovation would be an interesting question for further research and might also
deliver a better indication of the effects of intellectual capital on a firm’s product and
organisational innovativeness. Furthermore, we did not deal with the reverse causality issue
and assumed that innovation strategy and intellectual capital had an impact on performance.
Similarly, intellectual capital may have a direct effect on the product innovation activities and
innovativeness as studied in other papers (e.g. Subramaniam and Youndt, 2005), which is not
specifically addressed in this paper, though. Moreover, we did not study the role of the
industry setting, opting instead to focus on the manufacturing sector under the assumption that
similar human and structural capital aspects would be relevant in this homogenous group.
Structural and human capital may also have different effects in large firms, which would be
another interesting topic for further research.
Our human and structural capital measure included some basic features of human and
structural capital which addressed the specifics of manufacturing SMEs. As mentioned, we do
not explicitly cover social capital (which is considered an integral element in human and
structural capital), and focus instead on customer relationships. We also did not address the
investment in and development of intellectual capital over the entire period, since we only
examined intellectual capital strength in the first survey. The data for assessing the intellectual
capital was collected in 1995. Since then, a number of publications has been reported which
conceptualise different and more sophisticated forms of structural capital, for example dealing
24
with organisational connectedness (e.g. Jansen et al., 2006). This new development in the
literature has not been accounted for in this article, though.
The fact that we investigated the effects of intellectual capital and innovation in the long
term may also explain the relatively low predictive power of the models (particularly for
growth), although it should be noted that a myriad of factors beyond the scope of any single
study influence the development of a firm (Thornhill, 2006).
The management conclusion for SMEs seeking to foster their innovation capabilities, yet
which currently only have low or medium levels of innovation, is that they should invest
primarily in human capital. When it comes to innovation, these investments are at least as
important as any investments in R&D. Moreover, entrepreneurs and small business managers
aiming to grow their firms should continuously and critically analyse whether their purported
internal process and customer base strengths might inhibit their development and growth in
the long run. It might also be of interest for further studies to examine what constitutes the
optimal level of structural capital and how managers can determine the point in time at which
they have to transform and reconfigure their structural assets for the long term.
25
References
Almus, M. and Nerlinger, E.A. (1999). Growth of New Technology-Based Firms: Which
Factors Matter, Small Business Economics, 13(2), 141-154.
Appiah-Adu, K. and Singh, S. (1998). Customer Orientation and Performance: A Study of
SMEs, Management Decision, 36(6), 385–402.
Baker, W.E. and Sinkula, J.M. (2004). Market orientation and the New Product Paradox,
Journal of Product Innovation Management, 22, 483-502.
Baldwin, J.R. and Johnson, J. (1996). Business strategies in more- and less-innovative firms
in Canada, Research Policy, 25, 785-804.
Barney, J. (1991). Firm Resources and Sustained Competitive Advantage, Journal of
Management, 17(1), 99-120.
Baum, J.R., Locke, E.A. and Smith, K.G. (2001). A Multidimensional Model of Venture
Growth, Academy of Management Journal, 44(2), 292-303.
Benner, M.J. and Tushman, M. (2002). Process Management and Technological Innovation:
A Study of the Photography and Paint Industries, Administrative Science Quarterly, 47, 676-
706.
Birley, S. and Westhead, P. (1990). Growth and performance contrasts between “types” of
small firms, Strategic Management Journal, 11, 535-557.
Bontis, N. (1998). Intellectual Capital: An Exploratory Study that Develops Measures and
Models, Management Decision, 36, 63-76.
Branzei, O. and Vertinsky, I. (2006). Strategic pathways to product innovation capabilities in
SMEs, Journal of Business Venturing, 21, 75-105.
Cabrita, M.R. and Vaz, J.L. (2005). Intellectual Capital and Value Creation: Evidence from
the Portuguese Banking Industry, The Electronic Journal of Knowledge Management, 4(1),
11-20.
Chatterjee, S. and Price, B. (1991). Regression Analysis by Example. New York: John Wiley.
26
Cohen, J. and Cohen, P. (1981). Applied Multiple Regression/Correlation Analysis for the
Behavioral Scientist, Erlbaum, Hillsdale, New York.
Cooper, R.G., Kleinschmidt, E.J. (1987). New Products: What Separates Winners from
Losers? Journal of Product Innovation Management, 4, 169-184.
Christensen, C.M. and Bower, J. L. (1996). Customer Power, Strategic Investment, and the
Failure of Leading Firms, Strategic Management Journal, 17, 197-219.
Cho, H.-J. and Pucik, V. (2005). Relationship between innovativeness, quality, growth,
profitability, and market value, Strategic Management Journal, 26, 555-575.
Crepon, B., Duguet, E. and Mairesse, J. (1998). Research, Innovation and Productivity: an
Econometric Analysis at the Firm Level, Economics of Innovation and New Technology, 7, 2,
115-158.
Danneels, E. (2002). The dynamics of product innovation and firm competences, Strategic
Management Journal, 23, 1095-1121.
Delmar, F. (1997). Measuring growth: Methodological considerations and empirical results.
In R. Donckels and A. Miettinen (Eds.), Entrepreneurship and SME research: On its way to
the next millennium, Bookfield, VA, Aldershot, 190–216.
Edvinsson, L. (1997). Developing intellectual capital at Skandia, Long Range Planning, 30,
366-373.
Edvinsson, L. and Malone, M.S. (1997). Intellectual Capital: Realizing Your Company’s True
Value by Finding its Hidden Brainpower. New York: HarperBusiness.
Eisenhardt, K.M. and Martin, J.A. (2000). Dynamic capabilities: what are they? Strategic
Management Journal, 21(10/11), 1105-1121.
Evenson, R.E. and Westphal, L.E. (1995). Technological Change and Technological Strategy,
in: J. Behrman and T.N. Srinivasan (Eds.). Handbook of Development Economics.
Amsterdam: North-Holland.
27
Galunic, D.C. and Rodan, S. (1998): Resource combinations in the firm: Knowledge
structures and the potential for Schumpeterian innovation, Strategic Management Journal, 19,
1193-1201.
Hayton, J.C. (2003). Strategic human capital management in SMEs: an empirical study of
entrepreneurial performance, Human Resource Management, 42, 4, 375-91.
Han, J.K., Kim, N. and Srivastava, R.K. (1998). Market orientation and organizational
performance: Is innovation a missing link? Journal of Marketing, 62, 30-45.
Heirman, A. and Clarysee, B. (2007). Which Tangible and Intangible Assets Matter for
Innovation Speed in Start-Ups? Journal of Product Innovation Management, 24, 303-15.
Helfat, C.E. and Raubitschek, R.S. (2000). Product sequencing: co-evolution of knowledge,
capabilities and products, Strategic Management Journal, 21, 10/11, 961-79.
Hitt, M., Bierman, L., Shimizu, K. and Kochhar, R. (2001). Direct and moderating effects of
human capital on strategy and performance in professional service firms: A resource-based
perspective, Academy of Management Journal, 44, 13-28.
Huang, C. J., and Liu, C. J. (2005). Exploration for the relationship between innovation, IT
and performance. Journal of Intellectual Capital, 6(2), 237-252.
Iansiti, M. and Clark, K.B. (1994). Integration and Dynamic Capability: Evidence from
Product Development in Automobiles and Mainframe Computers, Industrial and Corporate
Change, 3, 557-605.
Jansen, J.J.P., Bosch, F. and Volberda, H.W. (2006). Exploratory innovation, exploitative
innovation, and performance: effects of organizational antecedents and environmental
moderators. Management Science, 52(11), 1661-1674.
Keller, R.T. (2004). A resource-based study of new product development: Predicting five-
year later commercial success and speed to market, International Journal of Innovation
Management, 8(3), 243-260.
Kennedy, P. (1992). A Guide to Econometric Methods. Cambridge: MIT Press.
28
Laursen, K. and Foss, N.J., (2003). New human resource management practices,
complementarities, and the impact on innovation performance, Cambridge Journal of
Economics, 27, 253-63.
Leo, H. (1999). Die Innovationstätigkeit des produzierenden Sektors in Österreich.
Community Innovation Survey 1996, Working Paper, WIFO, Vienna.
Leonhard-Barton, D. (1992). Core Capabilities and Core Rigidities: A Paradox in Managing
New Product Development, Strategic Management Journal, 13, 111-125.
Marqués, D.P., Simón, F.J.G. and Caranana, C.D. (2006). The effect of innovation on
intellectual capital: An empirical evaluation in the biotechnology and telecommunications
industries, International Journal of Innovation Management, 10, 1, 89-112.
McElroy, M. W. (2003). The new knowledge management: complexity, learning, and
sustainable innovation. Burlington: Butterworth-Heinemann.
Michie, J. and Sheehan, M. (199). HRM practices, R&D expenditures and innovative
investment: evidence from the UK’s 1990 workplace industrial relations survey (WIRS),
Industrial and Corporate Change, 8(2), 211-234.
Miller, J.G. and Roth, A. (1994). A taxonomy of manufacturing strategies, Management
Science, 40(3), 285–304.
Murphy, G.B., Trailer, J.W., and Hill, R.C (1996). Measuring Performance in
Entrepreneurship Research, Journal of Business Research, 36, 15-23.
Nahapiet, J. and Ghoshal, S. (1998). Social capital, intellectual capital, and the organizational
advantage, Academy of Management Review, 23, 242-256.
Nelson, R.R. (1991). Why do firms differ, and how does it matter, Strategic Management
Journal, 12, 61-74.
Naman, J.L. and Slevin, D.P. (1993). Entrepreneurship and the Concept of Fit: A Model and
Empirical Test, Strategic Management Journal, 14, 2, 137-54.
29
Namasivayam, K., and Denizci, B. (2006). Human capital in service organizations:
identifying value drivers, Journal of Intellectual Capital, 7(3), 381-393.
Nonaka, I. (1994). A dynamic theory of organizational knowledge creation, Organization
Science, 5(1),4-37.
Nonaka, I., von Krogh, G. and Voelpel, S. (2006). Organizational Knowledge Creation
Theory: Evolutionary paths and future advances, Organization Studies, 27(8), 1179-208.
Olavarrieta, S. and Friedmann, R. (2008). Market orientation, knowledge-related resources
and firm performance, Journal of Business Research, 61(6), 623-630
Roos, G. and Roos, J. (1997). Measuring your company’s intellectual performance, Long
Range Planning, 30(3), 413-426.
Roos, J., Roos, G., Dragonetti, N.C. and Edvinsson, L. (1997). Intellectual Capital:
Navigating the New Business Landscape. Basingstoke: MacMillan Press.
Roper, S. (1997). Product Innovation and Small Business Growth: A Comparison of the
Strategies of German, UK and Irish Companies, Small Business Economics, 9(6), 523-537.
Rothaermel, F.T. and Hess, A.M. (2007). Building dynamic capabilities: Innovation driven by
individual, firm, and network level effects, Organization Science, 18(6), 898-921.
Shrader, R. and Siegel, D.S. (2007). Assessing the Relationship between Human Capital and
Firm Performance: Evidence from Technology-Based New Ventures, Entrepreneurship
Theory and Practice, November, 893-908.
Smith, K.G., Collins, C.J. and Clark, K.D. (2005). Existing knowledge, knowledge creation
capabilities and the rate of new product introduction in high technology firms, Academy of
Management Journal, 48(2), 346-357.
Spanos, Y.E. and Lioukas, S. (2001). An examination into the causal logic of rent generation:
Contrasting Porter’s Competitive Strategy Framework and the Resource-based Perspective,
Strategic Management Journal, 22(10), 907-934.
30
Stewart, T.A. (1996). Intellectual Capital: The New Wealth of Organizations. New York:
Currency Doubleday.
Sveiby, K.E. (1997). The New Organizational Wealth: Managing and Measuring Knowledge-
Based Assets. San Francisco: Berrett-Koehler.
Stieglitz, N. and Heine, K. (2007). Innovations and the role of complementarities in a
strategic theory of the firm, Strategic Management Journal, 28, 1-15.
Subramaniam, M. and Youndt, M.A. (2005). The influence of intellectual capital on the types
of innovative capabilities, Academy of Management Journal, 48(3), 450-63.
Teece, D.J. (2000). Managing Intellectual Capital. Oxford: Oxford University Press.
Teece, D.J. (2007). Explicating Dynamic Capabilities: The Nature and Microfoundations of
(Sustainable) Enterprise Performance, Strategic Management Journal, 28, 1319-1350.
Terziovksi, M. (2010): Innovation Practice and its Performance Implications in Small and
Medium-Sized Enterprises (SMEs) in the Manufacturing Sector: A Resource-Based View,
Strategic Management Journal, 31, 892-902.
Thornhill, S. (2006). Knowledge, innovation and firm performance in high- and low-
technology regimes, Journal of Business Venturing, 21, 687-703.
van der Wiele, T. and Brown, A. (1998). Venturing down the TQM path for SME's,
International Small Business Journal, 16(2), 50-58.
Van de Ven, A. and Ferry, D. (1997). Measuring and Assessing Organizations. New York:
The Free Press.
Vaona, A. and Pianta, M. (2007). Firm Size and Innovation in European Manufacturing,
Small Business Economics, 30(3), 283-299.
Verona, G. (1999). A resource-based view of product development, Academy of Management
Review, 24(1), 132-142.

31
Wiggins, R.R. and Ruefli, T.M. (2002). Sustained competitive advantage: Temporal dynamics
and the incidence and persistence of superior economic performance, Organization Science,
13, 82-105.
Youndt, M.A., Subramaniam, M. and Snell, S.A. (2004). Intellectual Capital Profiles: An
Examination of Investments and Returns, Journal of Management Studies, 41(2), 335–361.
32
Appendix 1: List of variables
Variable Scale Definition, construction, coding and date of survey
Control variables
Firm size ordinal Number of employees in 1995
Firm age metric Log of the number of years since inception in 1995
Innovation
Relative R&D expenditure metric R&D intensity of the firm as % of turnover in 1995 relative to the
industry level R&D on the 3-digit level
Patents ordinal Number of patents in 1995
Product Innovation
(= Product Innovating Firm)
dichotomous 1: Firm has introduced a new product or a strongly improved product
in the three years prior to 1995 or 2002;
0: other (= not innovative)
Highly Innovative
(=Continuous Product
Development)
dichotomous 1: Firm has introduced a new product in the three years prior to both
1995 and 2002;
0: other
Intellectual Capital
Human capital
metric
(alpha=0.71)
Firm’s strength (1995) relative to competition in:
- qualification of personnel (factor loading=0.77)
- flexibility of personnel (factor loading=0.65)
- well-informed personnel (factor loading=0.76)
- individual ability to communicate (factor loading=0.73)
Structural capital
metric
(alpha=0.69)
Firm’s strength (1995) relative to competition in:
- operational efficiency (factor loading=0.60)
- quality management system (factor loading=0.77)
- distribution and marketing (factor loading=0.76)
- customer relationships (factor loading=0.59)
- reputation (factor loading=0.76)
Performance
Profitability metric Average score of the sequence of values in every year from 1992 to
2002: self-assessment in comparison to main competitors (1: much
worse, 5: much better)
Turnover growth metric Average annual growth in % between 1992 and 2002 (industry
adjusted)
Employment growth metric Average annual growth in % between 1992 and 2002 (industry
adjusted)
33
Table 1: Summary Statistics and Correlation Matrix
Variable Mean S.D. 1 2 3 4 5 6 7 8 9 10 11
1 Firm Size 133.9 97.50 1
2 Firm Age 3.46 1.10 0.178 1
3 Patents 1.27 2.74 0.141 0.161 1
4 Relative R&D Intensity -0.82 1.40 0.286** -0.075 0.100 1
5 Product Innovation 0.65 0.48 0.119 0.111 0.138 0.342** 1
6 Highly Innovative 0.25 0.44 0.126 -0.029 0.133 0.036 0.470** 1
7 Human Capital 3.93 0.62 0.036 -0.080 0.106 0.164 0.124 0.211* 1
8 Structural Capital 3.72 0.67 0.107 -0.173 0.044 0.257* 0.013 0.036 0.512** 1
9 Profitability 3.64 0.67 0.075 0.093 0.058 -0.076 -0.080 -0.027 0.232* 0.162 1
10 Turnover Growth 2.66 8.46 0.076 0.053 0.159 0.005 -0.008 -0.048 0.082 -0.018 0.444** 1
11 Employment Growth 0.56 6.81 0.102 0.084 0.092 0.073 -0.057 0.003 0.178 0.096 0.422** 0.778** 1
* p < 0.05; ** p < 0.01
N=91, except for the variable ‘Highly Innovative’ (N=58)
34
Table 2: Regression Analysis: Intellectual Capital, Product Innovation and Performance
All Firms (N=91)
Dependent Variable Profitability Turnover Growth Employment Growth
Model 1 Model 2 Model 3 Model 4 Model 5 Model 6 Model 7 Model 8 Model 9
Control
Firm Size 0.00 -0.07 -0.08 0.04 -0.03 -0.04 0.04 0.01 0.01
Firm Age 0.13 0.11 0.11 0.06 0.03 0.03 0.11 0.09 0.09
Innovation
Relative R&D Intensity -0.07 -0.02 -0.02 0.09 0.14 0.14 -0.07 -0.07 -0.07
Patents 0.13 0.13 0.12 0.25* 0.26* 0.25* 0.16 0.17 0.17
Product Innovation (=Innovating
Firm)
0.08 0.10 0.04 0.12 0.12 0.07 0.04 0.05 0.07
Intellectual Capital
Human Capital 0.18 -0.22 -0.22 0.10 -0.26+ -0.27
+ 0.22
+ 0.07 0.07
Structural Capital 0.13 0.29 0.30 -0.04 0.31 0.31 -0.03 0.35 0.35
Interaction1
Innovation x Human Capital 0.50** 0.50** 0.54** 0.60** 0.25 0.25
Innovation x Structural Capital -0.41+ -0.41
+ -0.55* -0.56* -0.52* -0.52*
Innovation x Human Capital x
Structural Capital
0.11 -0.11 -0.01
Adj. R2 0.04 0.10 0.10 0.04 0.07 0.07 0.06 0.09 0.08
Model F 1.53 2.22* 2.18* 1.05 1.95+ 1.83
+ 1.90
+ 2.08* 1.82
+
Note: Standardised coefficients are reported; + p < 0.10; * p < 0.05; ** p < 0.01;
1) In cases of interaction, the information conveyed by the coefficients for the independent terms that make up these interactions is not meaningful, and possibly misleading
(Cohen and Cohen, 1983).

35
Table 3: Regression Analysis: Intellectual Capital, Continuous New Product Development and Performance
Product Innovating Firms (N=58)
Dependent Variable Profitability Turnover Growth Employment Growth
Model 1 Model 2 Model 3 Model 4 Model 5 Model 6
Control
Firm Size -0.07 0.06 -0.11 -0.04 -0.09 -0.04
Firm Age -0.08 -0.07 0.08 0.09 0.08 0.05
Innovation
Relative R&D Intensity 0.02 0.04 0.06 0.08 0.10 -0.11
Patents 0.08 0.08 0.37** 0.32* 0.26* 0.26+
Highly Innovative (= Continuous
New Product Development)
-0.05 -0.04 -0.09 -0.08+ 0.10 0.11
Intellectual Capital
Human Capital 0.57** 0.73** 0.36** 0.43* 0.39** 0.39*
Structural Capital -0.15 -0.49+ -0.21* -0.32 -0.31* -0.31*
Interaction 1
Highly Innovative x
Human Capital
-0.17 -0.09 -0.32
Highly Innovative x
Structural Capital
0.42 0.18* 0.55
Adj. R2 0.18 0.19 0.12 0.09 0.15 0.16
Model F 2.63* 2.56* 2.50* 1.56 2.21* 2.21*
Note: Standardized coefficients are reported; + p < 0.10; * p < 0.05; ** p < 0.01;
1) In cases of interaction, the information conveyed by the coefficients for the independent terms that make up these interactions is not meaningful, and possibly misleading
information (Cohen and Cohen, 1983).
36
Figure 1: Summary of hypothesis 1 and 2
Product Innovation
Firm Performance
Human Capital
Structural Capital
H1a/H2a
H1b/H2b H1: Innovating vs. non-innovating
H2: Highly innovative vs. less innovative

37
Figure 2: Summary of hypothesis 3
Product Innovation
Firm Performance
Human Capital
Structural Capital H3