International Musician 1935-05: Vol 32 Iss 11 - World Radio History

Arthropods
Vol. 4, No. 2, 1 June 2015
International Academy of Ecology and Environmental Sciences
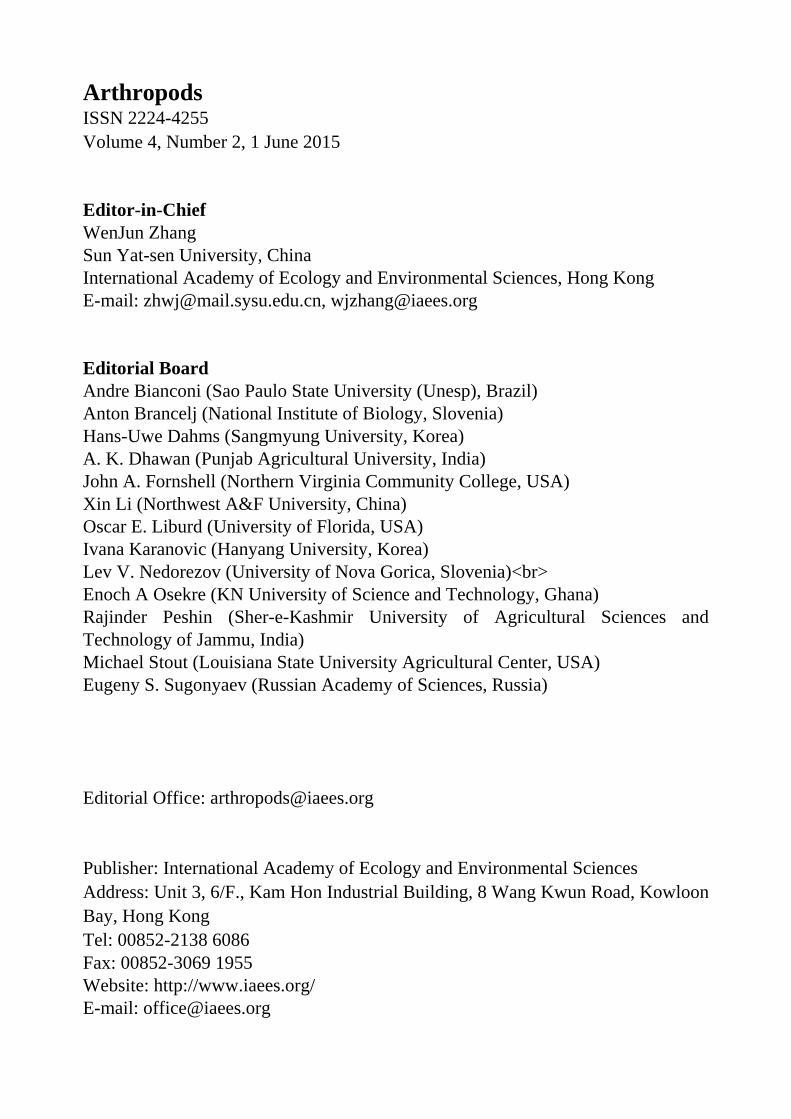
Arthropods ISSN 2224-4255 Volume 4, Number 2, 1 June 2015 Editor-in-Chief WenJun Zhang Sun Yat-sen University, China International Academy of Ecology and Environmental Sciences, Hong Kong E-mail: [email protected], [email protected] Editorial Board Andre Bianconi (Sao Paulo State University (Unesp), Brazil) Anton Brancelj (National Institute of Biology, Slovenia) Hans-Uwe Dahms (Sangmyung University, Korea) A. K. Dhawan (Punjab Agricultural University, India) John A. Fornshell (Northern Virginia Community College, USA) Xin Li (Northwest A&F University, China) Oscar E. Liburd (University of Florida, USA) Ivana Karanovic (Hanyang University, Korea) Lev V. Nedorezov (University of Nova Gorica, Slovenia)<br> Enoch A Osekre (KN University of Science and Technology, Ghana) Rajinder Peshin (Sher-e-Kashmir University of Agricultural Sciences and Technology of Jammu, India) Michael Stout (Louisiana State University Agricultural Center, USA) Eugeny S. Sugonyaev (Russian Academy of Sciences, Russia)
Editorial Office: [email protected] Publisher: International Academy of Ecology and Environmental Sciences Address: Unit 3, 6/F., Kam Hon Industrial Building, 8 Wang Kwun Road, Kowloon Bay, Hong Kong Tel: 00852-2138 6086 Fax: 00852-3069 1955 Website: http://www.iaees.org/ E-mail: [email protected]

Arthropods, 2015, 4(2): 32-37
IAEES www.iaees.org
Article
Redescription of Harpactea korgei Brignoli, 1979 (Araneae:
Dysderidae) with the first description of the female
Recep Sulhi Özkütük1, Kadir Boğaç Kunt1, Gizem Karakaş1, Tarık Danışman2 1Department of Biology, Faculty of Science, Anadolu University, TR- 26470 Eskişehir, Turkey 2Department of Biology, Faculty of Science and Arts, University of Kırıkkale, TR-71450 Yahşihan, Kırıkkale, Turkey
E-mail: [email protected]
Received 15 January 2015; Accepted 20 February 2015; Published online 1 June 2015
Abstract
The redescription of dysderid spider Harpactea korgei Brignoli, 1979, on the basis of newly collected material
is provided. The female of this species, previously unknown, is described here for the first time.
Keywords Anatolia; Haplogynae; Harpacteinae; spider; Turkey.
1 Introduction
Harpactea Bristowe, 1939, which is a common genus in the Mediterranean basin's pine and deciduous forests,
has 23 species recorded from Turkey (Bayram et al., 2014). Although the vast majority of them are known
only from the type locality, some species such as H. babori (Nosek, 1905) and H. sturanyi (Nosek, 1905) are
known to have a wider distribution (Kunt et al., 2011).
The purpose of this short article is to describe the female of H. korgei which hitherto was described based
only on a male specimen from the Western Black Sea region of Turkey by Brignoli (1979) and so far only
known from the type locality, and to provide additional morphological information for males.
2 Materials and Methods
All specimens were collected from the Western Black Sea region of Turkey (Fig. 1). The specimens were
collected using pitfall traps, sifter and collection by active searching. Digital images of the pedipalps and
vulvae were taken with a Leica DFC295 digital camera attached to a Leica S8AP0 stereomicroscope, with 5–
15 photographs taken at different focal planes and combined using image stacking software. Photographic
images were edited using Photoshop CS2 and Corel-DRAW X3 was used to create the plates. All
measurements are in mm, with methods as per Chatzaki and Arnedo (2006). Terminology for the copulatory
organs is adapted from Alicata (1966) and Deeleman-Reinhold (1993). The following abbreviations are used in
Arthropods ISSN 22244255 URL: http://www.iaees.org/publications/journals/arthropods/onlineversion.asp RSS: http://www.iaees.org/publications/journals/arthropods/rss.xml Email: [email protected] EditorinChief: WenJun Zhang Publisher: International Academy of Ecology and Environmental Sciences

Arthropods, 2015, 4(2): 32-37
IAEES www.iaees.org
the text: AL, abdominal length; CL, carapace length; CWmax, maximum carapace width; CWmin, minimum
carapace width; AME, anterior median eyes; PLE, posterior lateral eyes; PME, posterior median eyes; AMEd,
diameter of anterior median eyes; PLEd, diameter of posterior lateral eyes; PMEd, diameter of posterior
median eyes; ChF, length of cheliceral fang; ChG, length of cheliceral groove; ChL, total length of chelicera
(lateral external view); Ta, tarsus; Me, metatarsus, Ti, tibia; Pa, patella; Fe, femur; Tr, trochanter; C, coxa; D,
dorsal; Pl, prolateral; Rl, retrolateral; V, ventral; Depository: AUZM, Anadolu University Zoology Museum,
Eskişehir, Turkey; NHMG, The Natural History Museum of Geneva, Switzerland; SMF, Senckenberg
Museum, Frankfurt am Main, Germany. 3 Results
Harpactea korgei Brignoli, 1979
H. korgei: Brignoli, 1979: 311, f. 3-5 (D♂).
H. korgei: Le Peru, 2011: 272, f. 417 (♂).
Examined material: TURKEY 4 ♂♂, 1 ♀ (AUZM), Azdavay District, Kastamonu Province, 41°36'13.35"N
33°14'14.27"E, 30 May 2009, Leg. Y. M. Marusik — 1 ♂ (AUZM), Valla Valley, Pınarbaşı District,
Kastamonu Province, 41°42'16.79"N 33° 5'1.05"E, 05 May 2011, Leg. K. B. Kunt — 1 ♀ (AUZM), Daday-
Ballıdağ Hwy., Kastamonu Province, 41°30'9.00"N 33°23'38.00"E, 22 May 2012, Leg. T. Danışman — 2 ♂♂,
3 ♀♀ 1 ♀ (AUZM), Ecevit Mountain Pass, Between Küre & İnebolu Districts, Kastamonu Province,
41°46'39.00"N 33°43'5.00"E, 26 May 2012, Leg. T. Danışman — 1 ♀ 1 ♀ (AUZM), Out of Düzce, Düzce
Province, 40°58'36.00"N 30°10'44.00"E, 27 June 2012, Leg. T. Danışman — 2 ♂♂, 2 ♀♀, 6 J 1 ♀ (AUZM),
Abant Vicinity, Dereceören Village, Bolu Province, 40°38'21.00"N 31°21'51.00"E, 13 September 2012 Leg. T.
Danışman — 2 ♂♂, 1 ♀ 1 ♀ (NHMG), Ballıdağ-Azdavay Hwy., Azdavay District, Kastamonu Province,
41°34'19.20"N 33°19'21.00"E, 28 April 2013, Leg. K. B. Kunt — 1 ♂ (AUZM), Pınarbaşı Entrance,
Kastamonu Province, 41°35'40.70"N 33°8'16.80"E, Pine Forest, pitfall trap, 28 April↔9 July 2013, Leg. K. B.
Kunt & R. S. Özkütük — 6 ♂♂, 3 ♀♀ (AUZM), Abant-Bolu Hwy., Bolu Province, 40°41'48.90"N
31°27'2.90"E, Pine Forest, pitfall trap, 15 April↔10 July 2013, Leg. K. B. Kunt & T. Danışman — 1 ♂, 2 ♀♀
(SMF), Dranaz Pass, Kastamonu-Sinop Old Hwy., Boyabat District, Sinop Province, 41°41'16.61"N
34°52'50.46"D, 7 June 2013, Leg. M. Elverici — 1 ♀, 5 J (AUZM), Ballıdağ-Azdavay Hwy., Azdavay District,
Kastamonu Province, 41°34'19.20"N 33°19'21.00"E, Pine Forest, in litters, 8.07.2013, Leg. K. B. Kunt.
Diagnosis: Harpactea korgei Brignoli, 1979 can be separated from all other known species of Harpactea
males by its flat and heavily sclerotized embolus on almost entire surfaces and the accompanying massive and
long Apa which has a hammer-head-shaped tip. Brignoli (1979) associated the H. korgei male with H. osellai
Brignoli, 1978 and H. sturanyi Nosek, 1905. However, in both these species the morphology of the distal
extensions is different from that in H. korgei. The female of H. korgei is unique due to the diverticulum
posterior vulva, significantly being extremely heavily sclerotized and the horseshoe-shaped anterior basal arc.
Measurements [♂♂ / ♀♀]: AL 3.80-4.20 / 3.80-5.80; CL 2.90-3.40 / 2.80-3.40; CWmax 2.30-2.70 / 2.20-
2.90; CWmin 1.10-1.60 / 1.10-1.80; AMEd 0.10-0.20 / 0.10-0.20; PLEd 0.10-0.20 / 0.10-0.20; PMEd 0.10-
0.10 / 0.10-0.10; ChF 0.30-0.50 / 0.30-0.50; ChG 0.20-0.30 / 0.20-0.50; ChL 1.10-1.20 / 0.80-1.30 mm. Leg
measurements are given in Table 1.
33

Arthropods, 2015, 4(2): 32-37
IAEES www.iaees.org
Fig. 1 Study area.
Description: Carapace greenish-brown in males, brown in females. Surface is smooth in both sexes. Cephalic
region darker than thoracic region. Fovea longitudinal, distinct. AME, PLE and PME as is characteristic of the
genus, i.e. closely grouped and arranged in a circular pattern; AME separated, the distance between them
significant. There is a distinct gap between PME and PLE. Sternum, labium, gnathocoxae and chelicerae
brown. In males these areas are relatively darker and greenish. Sternum bright, smooth, barely skin-like; edges
dark brown. Entire surface of sternum covered with sparsely distributed fine blackish hairs. In females these
hairs are more dense and longer. Cheliceral groove with four teeth: teeth of retromargin smaller than
promargin and cone-shaped. Promarginal teeth bigger and triangular. Blackish brown hairs on labium and tips
of gnathocoxae. These hairs more dense on gnathocoxae. Chelicerae brown. Blackish hairs on the front surface
of the chelicerae and dark brown ridges at the base of these hairs. Abdomen yellowish-light brown, sub-
cylindrical. Surface covered with fine brown hairs. Legs yellowish; segments with infrequent blackish hairs.
Leg IV > I > II > III.
Tarsi 3 and 4 very weak; metatarsi 3 and 4 scopulae covering slightly less than the distal half of the segment.
Scopulae of metatarsi 3 stronger than metatarsi 4. In males, 0-1 spines on the dorsal part of coxa III, 0-2 spines
on the dorsal part of coxa IV. In females, coxa III without spine, 0-3 spines on the dorsal part of coxa IV.
Details of leg spination for H. korgei are given in Table 2.
Palp: Tegulum light brown, pear-shaped. Embolus and Apa strongly sclerotized, solid, black. Nearly 1/3 of
34

Arthropods, 2015, 4(2): 32-37
IAEES www.iaees.org
tegulum length. Apa is longer than embolus, connected with a wide base to the tegulum, top is hammer-head-
shaped (Fig. 2a-c).
Table 1 Harpacea korgei, leg measurements.
♂ Co Fe Pa Ti Me Ta To Leg I 1.20-1.60 2.50-3.00 1.70-1.90 2.40-2.90 2.10-2.70 0.50-0.80 10.90-12.60 Leg II 1.00-1.40 2.40-2.90 1.40-1.80 2.10-2.60 1.80-2.40 0.60-0.80 8.70-11.20 Leg III 0.60-0.90 1.90-2.40 0.80-1.10 1.40-1.70 1.90-2.30 0.50-0.70 7.30-8.90
Leg IV 0.80-1.10 3.60-3.00 1.30-1.50 2.40-2.80 2.90-3.30 0.70-0.90 11.30-12.40
♀ Co Fe Pa Ti Me Ta To Leg I 1.10-1.50 2.10-3.00 1.20-2.00 1.80-2.30 1.80-1.90 0.50-0.80 8.80-11.30 Leg II 0.90-1.20 2.00-3.00 1.20-1.90 1.70-2.60 1.60-2.40 0.50-0.70 8.00-11.80 Leg III 0.60-1.10 1.60-2.40 0.80-1.10 1.20-1.70 1.60-2.20 0.50-0.70 6.50-8.70
Leg IV 0.80-1.30 2.40-3.40 1.10-1.50 1.90-2.60 2.40-3.10 0.70-0.80 9.60-12.40
Table 2 Harpacea korgei, leg spination.
♂ Leg I Leg II Leg III Leg IV C 0 0 0-1 D 0-2 D Fe 1, 1-2 Pl 1, 1 Pl 1, 1-3 Pl 1-6 D 1, 1-2 Rl 1-4 Pl Pa 0 0 1 Rl 0-1 Rl Ti 0 0 2 Pl 3 Rl 4-5 V 3 Pl 3 Rl 5-8 V Me 0 0 2 Pl 3 Rl 3-5 V 3 Pl 4 Rl 3-6 V ♀ C 0 0 0 0-3 D Fe 1-2 Pl 0-2 Pl 0-3 Pl 0-4 Rl 0-5 D 0-1 V 0-3 Pl 0-4 D 0-2 V Pa 0 0-1 Pl 1 Rl 0-1 Pl 0-1 Rl Ti 0 0 2-3 Pl 3 Rl 2, 1, 2 V 3 Pl 3 Rl 5-7 V Me 0 0 2-3 Pl 3 Rl 3-5 V 2-5 Pl 3-5 Rl 3-5 V Vulva: All surfaces extremely strongly sclerotized, such that nearly all of the vulva can be distinguished from the ventral side of the abdomen, even before being subjected any chemical clearing process.
35

Arthropods, 2015, 4(2): 32-37
IAEES www.iaees.org
Fig. 2 Harpactea korgei (a) Male palp, prolateral view (b) Ditto, retrolateral view (c) Ditto, nearly retrolateral view (d, e) Vulva, dorsal view (f, g) Ditto, ventral view Scale lines: 0.1 mm Abbreviations: aba, anterior basal arc; apa, apophysisa; btas, basal transverse part of the anterior spermatheca; dc, distal crest; des, distal expansion of the spermatheca; em, embolus; Pd, posterior diverticulum; tb, transverse bar.
Distal crest short, triangular tip, blunt. Rod-shaped part of the anterior spermatheca composes distal crest
with torsion after achieved distal expansion of the spermatheca. The central part of the anterior basal arc, a
thick crescent-shape directed towards the anterior; this section is strongly sclerotized compared to peripheral
parts. Transverse bar, surrounding tubular structure to the central part of the strongly sclerotized crescent-
shaped anterior basal arc, but longer than the anterior basal arc. Symmetrical furcates on both sides. One of the
branches is blunt, the other one has a tubular structure and reaches through the posterior diverticulum.
Posterior diverticulum wide, strongly sclerotized. Membranous sac absent (Fig. 2d-g).
36

Arthropods, 2015, 4(2): 32-37
IAEES www.iaees.org
Distribution: H. korgei, which was hitherto known only from the type locality (Akçakoca District, Düzce
Province), Western Black Sea coastline of Turkey (up to about 1300 metres above sea level), shows a wide
distribution.
4 Remarks
Deeleman-Reinhold (1993) divided the genus Harpactea into 4 groups according to characteristics of the
copulatory organs of both sexes. Based on her classification, H. korgei should be included in the rubicunda (D)
group based on the structure of the male copulatory organ and the 3rd patellae and 4th coxae carry "thorns".
However, the female of H. korgei fits better in the lepida (C) group because the posterior diverticulum of the
vulva is wide and strongly sclerotized; membranous sac is reduced. Then vulva of the female does not conform
to the existing definition of Deeleman-Reinhold’s (1993) rubicunda (D) group. We believe, in the near future,
that an in-depth study of the genus Harpactea will demonstrate that this species is an exception or is a sign that
the groups need to be revised.
Acknowledgements
This study was supported by Anadolu University Scientific Research Projects Commission under the grant no:
1301F007. We would like to thank Dr. Fulvio Gasparo (Italy) for providing invaluable suggestions for the
taxonomic position of the H. korgei. All drawings presented inwith this paper belong to Dr. Mykola Kovblyuk
(Ukraine). The English of the final draft was kindly checked by Dr. David Penney (United Kingdom).
References
Alicata P. 1966. Le Harpactea (Araneae, Dysderidae) della fauna italiana e considerazioni sulla loro origine.
Atti dell' Accademia Gioenia di Scienze Naturali in Catania, 6(18): 190-221
Bayram A, Kunt KB, Danışman T. 2014. The Checklist of the Spiders of Turkey. Version 2014. Available at
http://www.spidersofturkey.info
Brignoli PM. 1979. Spiders from Turkey, VI. Four new species from the coast of the Black Sea (Araneae).
Bulletin of the British Arachnological Society, 4: 310-313
Chatzaki M, Arnedo MA. 2006. Taxonomic revision of the epigean representatives of the spider subfamily
Harpacteinae (Araneae: Dysderidae) on the island of Crete. Zootaxa, 1169: 1-32
Deeleman-Reinhold CL. 1993. The genus Rhode and the harpacteine genera Stalagtia, Folkia, Minotauria, and
Kaemis (Araneae, Dysderidae) of Yugoslavia and Crete, with remarks on the genus Harpactea. Revue
Arachnologique, 10: 105-135
Kunt KB, Elverici M, Özkütük RS, et al. 2011. Two new species of Harpactea (Araneae; Dysderidae) from
Turkey. Zookeys, 145: 129-141
37

Arthropods, 2015, 4(2): 38-45
Article
Chemical composition and insecticidal efficacy of essential oil of
Echinophora platiloba DC (Apiaceae) from Zagros foothills, Iran
Iman Sharifian1, Ali Darvishzadeh2 1Young Researchers and Elite Club, Islamic Azad University, Izeh Branch, Izeh, Iran 2Young Researchers and Elite Club, Islamic Azad University, Karaj Branch, Karaj, Iran
E-mail: [email protected]
Received 30 October 2014; Accepted 5 December 2014; Published online 1 June 2015
Abstract
Essential oil of Echinophora platyloba was screened for its chemical composition and possible fumigant and
contact toxicity effects against Tribolium castaneum (Herbst), Callosobruchus maculatus (F.) and Rhyzopertha
dominica (F.). Aerial parts were subjected to hydrodistillation and obtained oil chemical composition was
analyzed by GC-MS. (Z)-β-ocimene (33.06%), p-cymene (10.98%) and Limonene (5.77 %) were major
constituents. Fumigation tests were performed for 24, 48 and 72 h, while contact toxicity of essential oil was
evaluated in 24h. Experimental units were located in 25±2 °C and darkness condition. In contact toxicity
evaluation tests T. castaneum (LC50= 14.712 µl/39cm2) was more tolerant and R. dominica (LC50= 9.712
µl/39cm2) was more susceptible species. After 24 h, T. castaneum (LC50= 39.658 µl/250 ml air) and C.
maculatus (LC50= 3.835 µl/250 ml air) were more tolerant and susceptible species in fumigation bioassays,
respectively. In general, mortality increased as the doses of essential oil and exposure time increased.
Keywords Echinophora platyloba; chemical composition; insecticidal efficacy; contact toxicity; fumigant
toxicity; stored products beetles.
1 Introduction
Stored products of agricultural and animal origin were attacked by more than 600 species of beetle pests
causing quantitative and qualitative losses (Rajendran, 2002). Fumigation plays a major role in insect pest
elimination in stored products. Chemical control of stored products’ pests with current chemical pesticides
may cause special problems on stored products (Collins et al., 2002). These problems have highlighted the
need for the development of new types of selective insect-control alternatives with fumigant action (Negahban
et al., 2006). Plant essential oils do not leave toxic residues in the environment and have medicinal properties
for humans (Isman, 2006). It is believed that they have the advantage over conventional fumigants in terms of
Arthropods ISSN 22244255 URL: http://www.iaees.org/publications/journals/arthropods/onlineversion.asp RSS: http://www.iaees.org/publications/journals/arthropods/rss.xml Email: [email protected] EditorinChief: WenJun Zhang Publisher: International Academy of Ecology and Environmental Sciences

Arthropods, 2015, 4(2): 38-45
low mammalian toxicity, rapid degradation and local availability (Rajendran and Sriranjini, 2008).
In some cases it is alleged that the Apiaceae family oils are alternatives to conventional chemical
insecticides (Ebadollahi, 2013). Coumarins, polyacetylenes, flavonoids, sesquiterpenes, and phthalides are
among the important chemical constituents of Apiaceae family (Christensen and Brandt, 2006; Iranshahy and
Iranshahi, 2011; Nazari and Iranshahi, 2011; Sajjadi et al., 2009; Shokoohinia et al., 2010). Iran’s climate is
suitable for the growth of apiaceous plants and 114 wild genera with 12 endemic genera are growing in it
(Mozaffarian, 1996).
Some Apiaceae species (for example Azilia eryngioides (Cham. & Schltdl.), Carum copticum (L.), Carum
carvi (L.), Cuminum cyminum (L.), Coriandrum sativum (L.) Ferula gummosa (L.), Foeniculum vulgare
(Mill.), Heracleum persicum (Desf. ex Fisch.) and Prangos acaulis (DC.), Cominum cyminum (L.) etc.)
showed repellent, antifeedant and insecticidal activities against many species of stored products pests
(Sitophilus granaries; T. castaneum; Plodia interpunctella; Oryzaphilus surinamensis; Rhyzopertha dominica;
Tribolium confusum; Callosobruchus maculatus; etc.) in Iran (Ebadollahi and Mahboubi, 2011; Sahaf et al.,
2007; Shojaaddini et al., 2008; Rafiei-Karahroodi et al,. 2009; Shokri-Habashi et al., 2011). Echinophora
genus is endemic for Iran and there are no published documents about insecticidal activity of E. platyloba.
Echinophora platyloba (Apiaceae, subfamily Apioideae, tribe Echinophoreae) is an aromatic, mid-
summer plant that wildly grows and mainly used for imparting flavor and taste to the food in Iran (Avijgan et
al., 2010). Hydroalcholic and aqueous extracts of E. platyloba have antioxidant and antibacterial effects and
could inhibit oxidation by scavenging free radicals as a natural food preservative (Sharafati-chaleshtori et al.,
2012).
In this study, we investigated the chemical composition of the essential oil of E. platiloba. In addition, we
evaluated its efficacy as a contact and fumigant toxic agent in the management of the red flour beetle
Tribolium castaneum (Herbst), cowpea weevil Callosobruchus maculatus (F.), and lesser grain borer
Rhyzopertha dominica (F.) that are of most important beetle pests of stored products all over the world.
2 Materials and Methods
2.1 Plant material and extract preparation
The aerial parts of the plant were collected from Zagros foothills (Charmahal o Bakhtiary province [latitude:
32° 16', longitude: 50° 59'; altitude: 2101 m]), Iran. Plant parts were picked up in May-June 2013 and dried
away from direct sunlight. Shade-dried parts were crushed using a pestle and their extract obtained by
hydrodistillation using Clevenger apparatus (Sharifian et al., 2013).
2.2 GC-MS analysis
The constituents of E. platyloba essential oil were analyzed by gas chromatography mass spectrometry (GC-
MS) (Thermo-UFM). The GS conditions were as follows: capillary column 1-ph (30 m x 0.25 mm, film
thickness 0.25 pm); helium as a carrier gas (0.5 ml/min); oven temperature program, initially 40°C rising to
250°C (80°C/ min, 3 min); injector and detector temperature of 250°C. The identification of individual
compounds was based on comparison of their relative retention times with those of authentic samples on a
capillary column, and by matching their mass spectra of peaks with those obtained from authentic samples and
published data.
2.3 Bioassay
In contact toxicity evaluation, 7 cm-diameter Petri dishes were applied as experimental vials. A 2cm hole was
embedded on top of each Petri dish for ventilation and removing the fumigant effects of essential oil. Essential
oil was poured on filter papers that covered the vials floor after dilution in 0.5 ml acetone. Twenty adult insects
were located on filter papers in each treatment after 2-3 minutes (time of acetone evaporation). 0.5 ml acetone
39
Arthropods, 2015, 4(2): 38-45
was poured on filter paper in control with similar conditions. Experimental units were located in 25±2 °C,
65±15% relative humidity and darkness condition for 24 h.
For investigation of fumigant toxicity, each concentration was applied to filter paper strips (Whatman No.
1, cut into 4 × 5 cm paper strip). Treated filter papers were placed at the bottom of 250 ml glass jars. Twenty
adult of insects (1-7 days old) were placed in small plastic tubes (3.5 cm diameter and 5 cm height) with open
ends covered with cloth mesh. Tubes were hung at the geometrical centre of the glass jars and then sealed with
air-tight lids. Thus, there was no direct contact between the oil and insects (Sharifian et al., 2012). In the
control jars, oil was not applied on the filter papers. Experimental units were located in 25±2 °C and darkness
condition. Mortality was determined after 24, 48, and 72 h of exposure’s beginning.
To determine the mortalities at each contact and fumigant toxicity tests, insects were removed from the
jar and checked with a fine brush. Insects were considered as dead when no leg or antennal movements were
observed. Each experiment was replicated five times for each concentration and time (in case of fumigant
toxicity).
2.4 Data analysis
In order to calculate significant differences in toxicity between concentrations and times of exposure, a one-
way analysis of variance (ANOVA) was used at the P<0.05 (SPSS 18.0) (Darvishzadeh et al., 2014). Probit
analysis was used to evaluate the LC50 values (Abbott 1925). Poloplus 2.0 software was used to calculate LC50
values.
3 Results
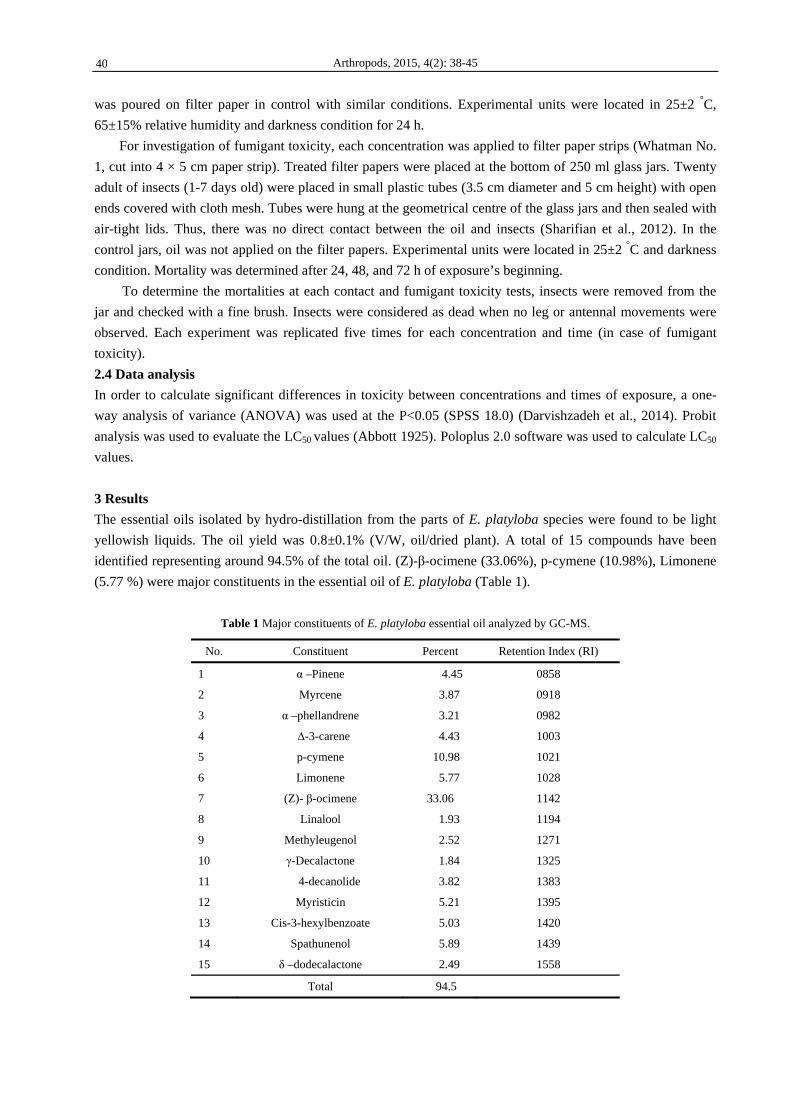
The essential oils isolated by hydro-distillation from the parts of E. platyloba species were found to be light
yellowish liquids. The oil yield was 0.8±0.1% (V/W, oil/dried plant). A total of 15 compounds have been
identified representing around 94.5% of the total oil. (Z)-β-ocimene (33.06%), p-cymene (10.98%), Limonene
(5.77 %) were major constituents in the essential oil of E. platyloba (Table 1).
Table 1 Major constituents of E. platyloba essential oil analyzed by GC-MS.
No. Constituent Percent Retention Index (RI)
1 α –Pinene 4.45 0858
2 Myrcene 3.87 0918
3 α –phellandrene 3.21 0982
4 ∆-3-carene 4.43 1003
5 p-cymene 10.98 1021
6 Limonene 5.77 1028
7 (Z)- β-ocimene 33.06 1142
8 Linalool 1.93 1194
9 Methyleugenol 2.52 1271
10 γ-Decalactone 1.84 1325
11 4-decanolide 3.82 1383
12 Myristicin 5.21 1395
13 Cis-3-hexylbenzoate 5.03 1420
14 Spathunenol 5.89 1439
15 δ –dodecalactone 2.49 1558
Total 94.5
40
Arthropods, 2015, 4(2): 38-45
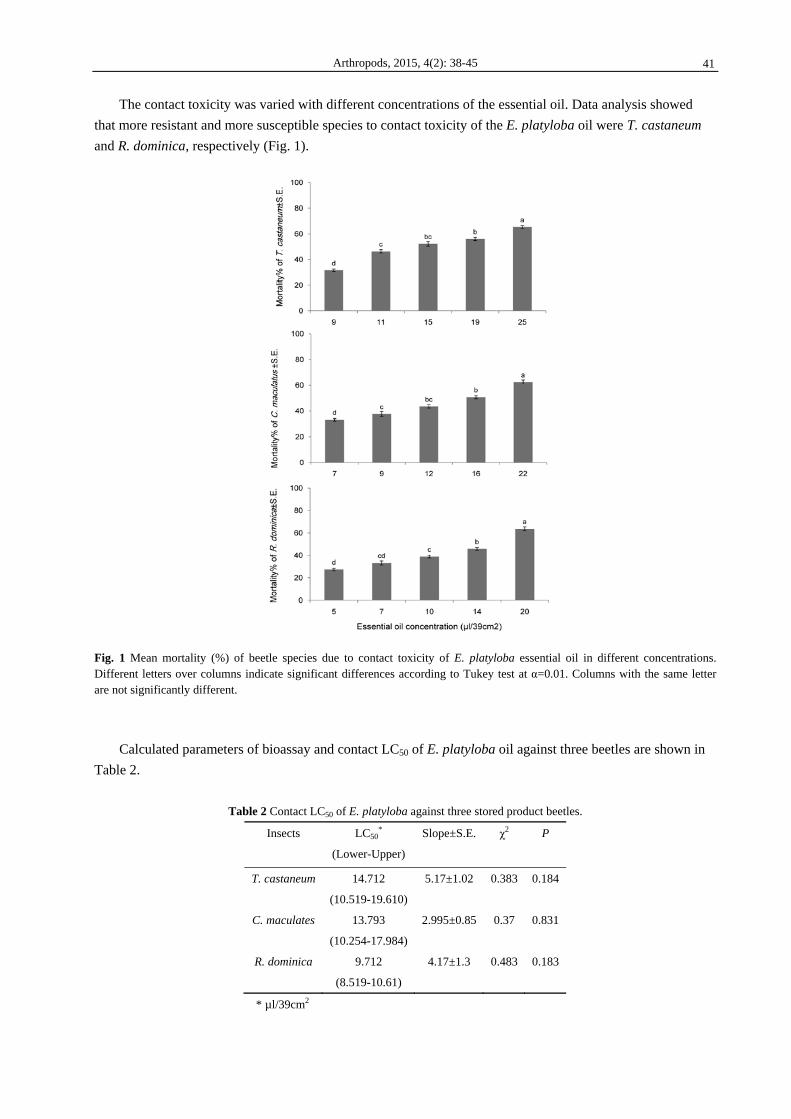
The contact toxicity was varied with different concentrations of the essential oil. Data analysis showed
that more resistant and more susceptible species to contact toxicity of the E. platyloba oil were T. castaneum
and R. dominica, respectively (Fig. 1).
Fig. 1 Mean mortality (%) of beetle species due to contact toxicity of E. platyloba essential oil in different concentrations. Different letters over columns indicate significant differences according to Tukey test at α=0.01. Columns with the same letter are not significantly different.
Calculated parameters of bioassay and contact LC50 of E. platyloba oil against three beetles are shown in
Table 2.
Table 2 Contact LC50 of E. platyloba against three stored product beetles.
Insects LC50*
(Lower-Upper)
Slope±S.E. χ2 P
T. castaneum 14.712
(10.519-19.610)
5.17±1.02 0.383 0.184
C. maculates 13.793
(10.254-17.984)
2.995±0.85 0.37 0.831
R. dominica 9.712
(8.519-10.61)
4.17±1.3 0.483 0.183
* µl/39cm2
41

Arthropods, 2015, 4(2): 38-45
E. platyloba essential oil showed strong fumigant toxicity against the beetle species at several
concentrations and exposure times. The lethal concentration of 50% (LC50) for T. castaneum, C. maculatus and
R. dominica at 24 h exposure time were 39.658, 3.835 and 5.66 µl/250 ml air, respectively. Probit analysis
showed that at exposure time of 24 h, C. maculatus was more susceptible than the other species to fumigant
toxicity of the oil, while T. castaneum was more resistant one. Furthermore, with the increase of exposure time
to 72 h, mortality increased and LC50 values decreased in all three species (Table 3).
Table 3 LC50 and parameters of probit analysis of E. platyloba essential oil fumigant toxicity against three stored product beetles.
Insect species Exposure time LC50* χ2 (df=3) Slope±S.E. P
T. castaneum
24
48
72
39.658
29.418
26.772
4.294
3.017
3.502
2.23±0.78
2.817±0.96
2.984±0.79
0.231
0.39
0.32
C. maculates
24
48
72
3.835
1.511
1.345
1.616
4.335
6.480
1.444±0.12
1.773±0.67
1.892±0.85
0.656
0.227
0.090
R. dominica
24
48
72
5.66
4.275
2.36
0.372
4.025
8.032
1.426±0.35
1.983±0.42
1.719±0.51
0.496
0.259
0.08
* (µl/250 ml air)
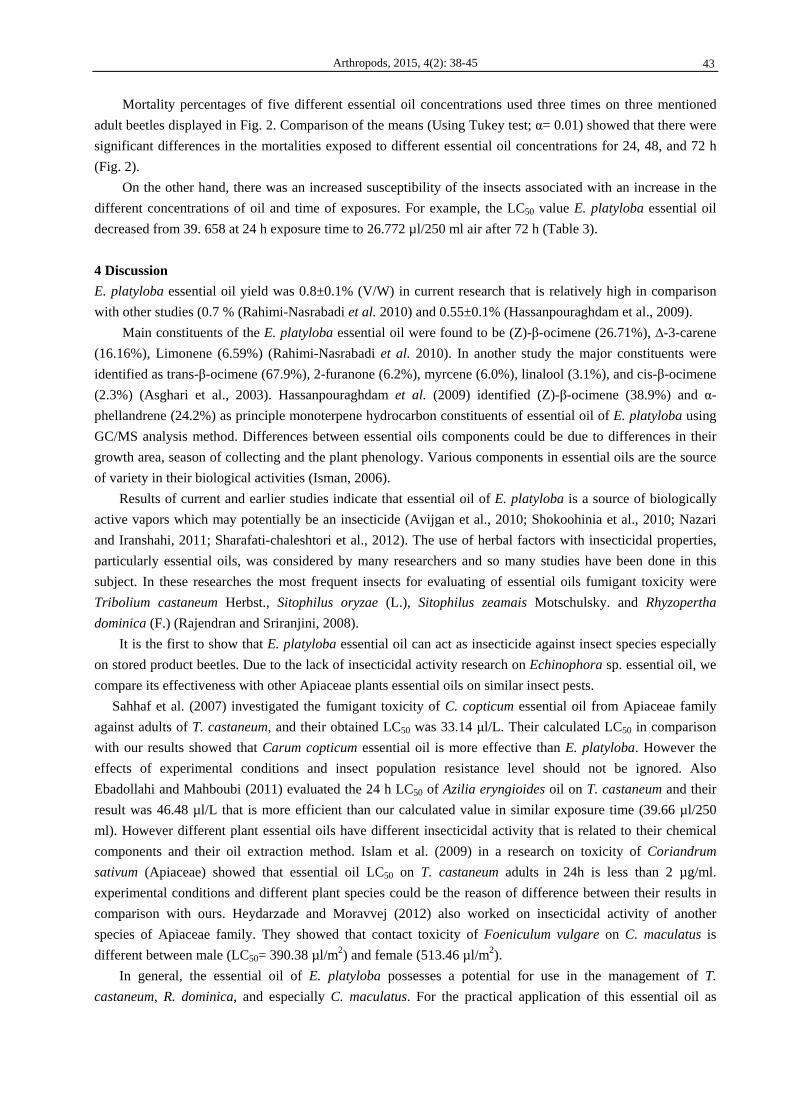
Fig. 2 Mean mortality (%) of T. castaneum, R. dominica and C. maculatus adults exposed to different concentrations of E. platyloba essential oil fumigation. Different letters over columns indicate significant differences according to Tukey test at α= 0.01. Columns with the same letter are not significantly different.
42
Arthropods, 2015, 4(2): 38-45
Mortality percentages of five different essential oil concentrations used three times on three mentioned
adult beetles displayed in Fig. 2. Comparison of the means (Using Tukey test; α= 0.01) showed that there were
significant differences in the mortalities exposed to different essential oil concentrations for 24, 48, and 72 h
(Fig. 2).
On the other hand, there was an increased susceptibility of the insects associated with an increase in the
different concentrations of oil and time of exposures. For example, the LC50 value E. platyloba essential oil
decreased from 39. 658 at 24 h exposure time to 26.772 µl/250 ml air after 72 h (Table 3).
4 Discussion
E. platyloba essential oil yield was 0.8±0.1% (V/W) in current research that is relatively high in comparison
with other studies (0.7 % (Rahimi-Nasrabadi et al. 2010) and 0.55±0.1% (Hassanpouraghdam et al., 2009).
Main constituents of the E. platyloba essential oil were found to be (Z)-β-ocimene (26.71%), ∆-3-carene
(16.16%), Limonene (6.59%) (Rahimi-Nasrabadi et al. 2010). In another study the major constituents were
identified as trans-β-ocimene (67.9%), 2-furanone (6.2%), myrcene (6.0%), linalool (3.1%), and cis-β-ocimene
(2.3%) (Asghari et al., 2003). Hassanpouraghdam et al. (2009) identified (Z)-β-ocimene (38.9%) and α-
phellandrene (24.2%) as principle monoterpene hydrocarbon constituents of essential oil of E. platyloba using
GC/MS analysis method. Differences between essential oils components could be due to differences in their
growth area, season of collecting and the plant phenology. Various components in essential oils are the source
of variety in their biological activities (Isman, 2006).
Results of current and earlier studies indicate that essential oil of E. platyloba is a source of biologically
active vapors which may potentially be an insecticide (Avijgan et al., 2010; Shokoohinia et al., 2010; Nazari
and Iranshahi, 2011; Sharafati-chaleshtori et al., 2012). The use of herbal factors with insecticidal properties,
particularly essential oils, was considered by many researchers and so many studies have been done in this
subject. In these researches the most frequent insects for evaluating of essential oils fumigant toxicity were
Tribolium castaneum Herbst., Sitophilus oryzae (L.), Sitophilus zeamais Motschulsky. and Rhyzopertha
dominica (F.) (Rajendran and Sriranjini, 2008).
It is the first to show that E. platyloba essential oil can act as insecticide against insect species especially
on stored product beetles. Due to the lack of insecticidal activity research on Echinophora sp. essential oil, we
compare its effectiveness with other Apiaceae plants essential oils on similar insect pests.
Sahhaf et al. (2007) investigated the fumigant toxicity of C. copticum essential oil from Apiaceae family
against adults of T. castaneum, and their obtained LC50 was 33.14 μl/L. Their calculated LC50 in comparison
with our results showed that Carum copticum essential oil is more effective than E. platyloba. However the
effects of experimental conditions and insect population resistance level should not be ignored. Also
Ebadollahi and Mahboubi (2011) evaluated the 24 h LC50 of Azilia eryngioides oil on T. castaneum and their
result was 46.48 µl/L that is more efficient than our calculated value in similar exposure time (39.66 µl/250
ml). However different plant essential oils have different insecticidal activity that is related to their chemical
components and their oil extraction method. Islam et al. (2009) in a research on toxicity of Coriandrum
sativum (Apiaceae) showed that essential oil LC50 on T. castaneum adults in 24h is less than 2 µg/ml.
experimental conditions and different plant species could be the reason of difference between their results in
comparison with ours. Heydarzade and Moravvej (2012) also worked on insecticidal activity of another
species of Apiaceae family. They showed that contact toxicity of Foeniculum vulgare on C. maculatus is
different between male (LC50= 390.38 µl/m2) and female (513.46 µl/m2).
In general, the essential oil of E. platyloba possesses a potential for use in the management of T.
castaneum, R. dominica, and especially C. maculatus. For the practical application of this essential oil as
43

Arthropods, 2015, 4(2): 38-45
insecticides, further studies on the development of formulations are necessary to improve efficacy and stability,
and to reduce cost.
Acknowledgements
This study was supported by Young Researchers and Elite Club, Islamic Azad University, Izeh Branch
numbered 92362.
References
Asghari GR, Sajjadi SE, Sadraei H, Yaghobi K. 2003. Essential oil constituents of Echinophora platyloba DC.
Iranian Journal of Pharmaceutical Science, 2: 185-186
Avijgan M, Mahboubi M, Darabi M, Saadat M, Sarikhani S, Nazilla K. 2010. Overview on Echinophora
platyloba, a synergistic antifungal agent candidate. Journal of Yeast Fungal Research, 1: 88-94
Christensen L, Brandt K. 2006. Bioactive polyacetylenes in food plants of the Apiaceae family: occurrence,
bioactivity and analysis. Journal of Pharmacy and Biomedical Analaysis, 41(3): 683-693
Collins PJ, Daglish GJ, Bengston M, Lambkin TM, Hervoika P. 2002. Genetics of resistance to Phosphine in
Rhyzopertha dominica (Coleoptera: Bostrichidae). Journal of Economic Entomology, 95: 862-869
Darvishzadeh A, Salimian-Rizi S, Katoulinezhad AA. 2014. Effect of Biolep®, Permethrin and Hexaflumuron
on mortality of cotton bollworm, Helicoverpa armigera (Noctuidae: Lepidoptera). Arthropods, 3(4): 161-
165
Ebadollahi A. 2013. Plant Essential Oils from Apiaceae Family as Alternatives to Conventional Insecticides.
Ecologia Balkanica, 5(1): 149-172
Ebadollahi A, Mahboubi M. 2011. Insecticidal activity of the essential oil isolated from Azilia eryngioides
(Pau) Hedge Et Lamond against two beetle pests. Chilean Journal of Agricultural Research, 71: 406-411
Hassanpouraghdam MB, Shalamzari MS, Sepehri N. 2009. GC/MS analysis of Echinophora platyloba DC.
essential oil from Northwest Iran: a potential source of (Z)-β-ocimene and α-phellandrene. Chemija. 20(2):
120-123
Heydarzade A, Moravvej GH. 2012. Contact toxicity and persistence of essential oils from Foeniculum
vulgare, Teucrium polium and Satureja hortensis against Callosobruchus maculatus (Fabricius) adults
(Coleoptera: Bruchidae). Turkiye Entomoloji Dergisi, 36(4): 507-519
Iranshahy M, Iranshahi M. 2011. Traditional uses; phytochemistry and pharmacology of asafoetida (Ferula
assa-foetida oleo-gum-resin)-A review. Journal of Ethnopharmacology, 134(1): 1-10
Islam MS, Mahbub H, Xiong WS, Zhang C, Lei CL. 2009. Fumigant and repellent activities of essential oil
from Coriandrum sativum (L.) (Apiaceae) against red flour beetle Tribolium castaneum (Herbst)
(Coleoptera: Tenebrionidae). Journal of Pest Science 82: 171-177
Isman B. 2006. Botanical insecticides, deterrents, and repellents in modern agriculture and an increasingly
regulated world. Annual Review of Entomology, 51: 45-66
Mozaffarian V. 1996. A Dictionary of Iranian Plant Names. Farhang Moaser, Tehran, Iran
Nazari ZE, Iranshahi M. 2011. Biologically active sesquiterpene coumarins from Ferula species. Phytotherapy
Research, 25(3): 315-323
Negahban M, Moharramipour S, Sefidkon F. 2006. Chemical composition and insecticidal activity of
Artemisia scoparia essential oil against three coleopteran stored-product insects. Journal of Asia-Pacific
Entomology, 9: 1-8
44

Arthropods, 2015, 4(2): 38-45
Rafiei-Karahroodi Z, Moharramipour S, Rahbarpour A. 2009. Investigated repellency effect of some essential
oils of 17 native medicinal plants on adults Plodia interpunctella. American-Eurasian Journal of
Sustainable Agriculture, 3: 181-184
Rahimi-Nasrabadi M, Gholivand MB, Niasari M, Vatanara A. 2010. Chemical composition of the essential oil
from aerial parts of Echinophora platyloba DC. from Iran. Journal of Medicinal Plants, 9(6): 53-56
Rajendran S. 2002. Postharvest pest losses. In: Encyclopedia of Pest Management (Pimentel D, ed). 654-
656Marcel Dekker Inc, New York, USA
Rajendran S, Sriranjini V. 2008. Plant products as fumigants for stored-product insect control. Journal of
Stored Products Research, 44: 126-135
Sahaf BZ, Moharramipour S, Meshkatalsadat MH. 2007. Chemical constituents and fumigant toxicity of
essential oil from carum copticum against two stored product beetles. Insect Science, 14(3): 213-218
Sajjadi SE, Zeinvand H, Shokoohinia Y. 2009. Isolation and identification of osthol from the fruits and
essential oil composition of the leaves of Prangos asperula. Boiss. Research in Pharmaceutical Sciences,
4(1): 19-23
Sharafati-chaleshtori R, Rafieian-kopaei M, Mortezaei S, Sharafati-chaleshtori A, Amini E. 2012. Antioxidant
and antibacterial activity of the extracts of Echinophora platyloba DC. African Journal of Pharmacy and
Pharmacology, 6(37): 2692-2695
Sharifian I, Hashemi SM, Aghaei M, Alizadeh M. 2012. Insecticidal activity of essential oil of Artemisia
herba-alba Asso against three stored product beetles. Biharean Biologist, 6(2): 90-93
Sharifian I, Hashemi SM, Darvishzadeh A. 2013. Fumigant toxicity of essential oil of Mugwort (Artemisia
vulgaris L.) against three major stored product beetles. Archives of Phytopathology and Plant Protection,
46(4): 445-450
Shojaaddini M, Moharramipour S, Sahaf BZ. 2008. Fumigant toxicity of essential oil from Carum copticum
against Indian meal moth, Plodia interpunctella. Journal of Plant Protection Research, 48: 411-419
Shokri-Habashi A, Safaralizadeh MH, Safavi SA. 2011. Fumigant toxicity of Carum copticum L. oil against
Tribolium confusum du Val, Rhyzopertha dominica F. and Oryzaphilus surinamensis L. Munis Entomology
and Zoology, 6: 282-289
Shokoohinia Y, Sajjadi SE, Mehr-amiri P. 2010. Isolation of 3-butyliden-4,5-dihydrophthalide and steroids
from Kelussia odoratissima, a Persian food seasoning. Planta Medica, 76: 328-331
45

Arthropods, 2015, 4(2): 46-68
IAEES www.iaees.org
Article
Diversity and population dynamics of phytophagous scarabaeid
beetles (Coleoptera: Scarabaeidae) in different landscapes of
Himachal Pradesh, India
Mandeep Pathania1,2, RS Chandel1, KS Verma1, PK Mehta1
1Department of Entomology, College of Agriculture, Chaudhary Sarwan Kumar Himachal Pradesh Krishi Vishvavidyalaya,
Palampur, Himachal Pradesh, India 176062 2Punjab Agricultural University, Regional Research Station, Abohar, Punjab, India 152116
E-mail: [email protected]
Received 9 December 2014; Accepted 15 January 2015; Published online 1 June 2015
Abstract
Scarabaeid beetles constitute a major group of defoliators of cultivated and wild plants. Therefore, it is
important to understand their diversity, abundance and distribution for planning effective pest management
programmes. We surveyed scarabaeid beetles from 8 landscapes from different zones in Himachal Pradesh (N
32o 29' and E 75o 10'), India. In 2011 and 2012, surveys were conducted during 4 months period (May-August)
by using UV light traps. A total of 13,569 scarabaeid adults of 20 genera and 56 species belonging to
subfamilies Melolonthinae, Rutelinae, Cetoniinae and Dynastinae were recorded. The five most common
species were Brahmina coriacea, Adoretus lasiopygus, Anomala lineatopennis, Maladera insanabilis and
Holotrichia longipennis. They comprised 9.88-10.05, 7.18-7.76, 7.13-7.27, 6.80-7.62 and 5.22-5.30% during
2011-12, respectively. Anomala (10 species) was the most dominant genus in the present study, whereas
Melolonthinae was the most dominant subfamily accounting 53.23% of total scarabs collected from the study
sites. Among different landscapes, Palampur had maximum diversity and abundance, while Shillaroo had least
diversity but more abundance of single species B. coriacea. The value of alpha diversity indices viz. Shannon
index was maximum (H'=3.01-3.03) at Palampur. This indicates maximum evenness and abundance of species
at Palampur. Shillaroo had lowest Shannon index (H'=1.12-1.17) and Pielou’s evenness index (J'=0.46-0.49).
This showed least species diversity and higher unevenness of scarabaeid beetles at Shillaroo. The results of
beta diversity analysis revealed poor similarity of scarabaeid species between different sites confirming that
the scarabaeid community in the north western Himalayan regions is much diverse.
Keywords abundance; biodiversity; Coleoptera; Himachal Pradesh; India; richness; Scarabaeid beetles.
Arthropods ISSN 22244255 URL: http://www.iaees.org/publications/journals/arthropods/onlineversion.asp RSS: http://www.iaees.org/publications/journals/arthropods/rss.xml Email: [email protected] EditorinChief: WenJun Zhang Publisher: International Academy of Ecology and Environmental Sciences

Arthropods, 2015, 4(2): 46-68
IAEES www.iaees.org
1 Introduction
Scarabaeidae is the second largest family within the order Coleoptera, and is cosmopolitan in distribution
(Ritcher, 1958). Scarabaeidae falls into two main groups, one group including Coprinae, Aphodiinae,
Geotrupinae and Troginae which are either saprophagous or fungus feeders and form a separate group
‘Laprosticti’. The second group includes the subfamilies Melolonthinae, Rutelinae, Dynastinae and Cetoniinae
which are strictly phytophagous forming 'Pleurosticti' (Ritcher, 1958). The world fauna of scarabaeids exceeds
30,000 species (Mittal, 2000; Jameson and Ratcliffe, 2001). Maximum numbers occur in the tropical areas of
the world, particularly in the African and Oriental regions. The family Scarabaeidae represents about 2,500
species from the Indian sub-continent to which the majority of the phytophagous scarabs belong to and the
economically most important sub families include Melolonthinae, Rutelinae, Dynastinae and Cetoniinae (Ali,
2001). The scarabaeid beetles and their larvae cause extensive damage to both cultivated and forest plants. The
adult beetles become active during May-June and feed on the foliage of different fruit and forest trees (Mehta
et al., 2008). Adults of the sub-family Melolonthinae and Rutelinae are pre-eminently leaf feeders (Arrow,
1917), whereas the adults of Cetoniinae feed on flowers and fruits, and are popularly referred to as flower
beetles. However, the larvae of scarabaeids commonly known as whitegrubs, cause extensive damage to the
roots of cereals, legumes, small fruit plants, shrubs and trees in many parts of the world. In India, whitegrubs
are pests of national importance and cause extensive damage to field crops and fruit trees (Mehta et al., 2010).
Among the soil macro fauna, whitegrubs form a major component both in number of species and diversity of
habits (Veeresh, 1988).The scarab fauna is quite diverse, but in Indian sub-continent it is yet to be fully
explored (Mishra and Singh, 1999). Scarabaeid beetles are serious pests of many field crops and fruit and
forest trees (Lawrence et al., 2000). Loss in biodiversity and degradation of natural habitats due to climate
change and human interference in natural ecosystem has necessitated the need to have an inventory of species
richness in an ecosystem.
Sampling is the basis of documenting the spatial distribution of species or assessing changes in ecosystem
structure, composition and function (Kremen et al., 1993; Heywood, 1995; Humphries et al., 1995; Stork and
Samways, 1995; Yoccoz et al., 2001; Coscaron et al., 2009; Zhang, 2011). It is important to use simple and
most effective methods to obtain an estimate of diversity and relative abundance of species (Southwood and
Henderson, 2000). Different methods have been used for collecting beetles for research purposes, and for
preparing inventories depending on their biology and host range (Lobo et al., 1988; White et al., 1990; Hayes,
2000; Falach and Shani, 2000; McIntosh et al., 2001; Missa et al., 2009).
Insects as a class respond to electromagnetic radiations from approximately 2537 A0-7000 A0, i.e., from
ultraviolet to the infrared. At the long range end of the spectrum, the most effective wavelength for insects is
of the order of 6500 A0 (Detheir, 1953). Based on light as an attractant, a variety of insect traps have been
developed and used to monitor long term changes in population of nocturnal insects. Light trap also provide
information on time of arrival of a particular species insect in a particular locality (Saini and Verma, 1991).
Many studies have been focused focus on sampling methods for analyzing and assessing the diversity of
scarabaeid beetles in different ecosystems (cultivated or forest ecosystem) by using different types of light
traps (Sanders and Fracker, 1916; Morofsky, 1933; Stearns, 1937; Gruner, 1975; Forschler and Gardner, 1991;
Kard and Hain, 1990; Rodriguez Jimenez et al., 2002; Zahoor et al., 2003; Pardo et al., 2005; Dhoj et al., 2009;
Khanal et al., 2012; Kishimota et al., 2011; Gracia et al., 2008; Petty, 1977; Stewart and Lam, 1968; Cho et al.,
1989; Freitas et al., 2002). In India, several studies have been conducted in different regions to explore the
scarab fauna, their diversity and bioecology by using different light sources for reporting and conservation of
species (Pal, 1977; Nath et al., 1978; Bakhetia and Sohi, 1982; Tripathi and Gupta, 1985; Vora and Rama
Krishnan, 1991; Chandramohan and Nanjan, 1991; Mishra and Singh, 1996; Mishra and Singh, 1997; Mishra
47

Arthropods, 2015, 4(2): 46-68
IAEES www.iaees.org
and Singh, 1999; Patel and Patel, 1999; Bhat et al., 2005; Thakare and Zade, 2012; Chandra and Gupta, 2012;
Dhasad et al., 2008; Bhawne et al., 2012; Viraktamath and Kumar, 2005; Chenchaiah, 2006; Devi et al., 1994;
Bhagat and Kashyap,1997).
The scarabaeid beetles and whitegrubs are widely distributed throughout the cultivated and forest areas of
Himachal Pradesh (Arrow, 1917; Bhalla and Pawar, 1977; Chandra, 2005; Sharma and Bhalla, 1964; Sharma
et al., 1969, 1971, 2004; Chandel et al., 1994; Kumar et al., 1996). However, little information is available on
species diversity, emergence pattern, richness and relative abundance in different agroecological regions of
Himalayan regions. This poses a basic problem in developing effective integrated pest management schedules
against these pests. To combat the burgeoning problem of whitegrubs, it is imperative to understand the
species distribution in different regions, so to develop a strategy for their management, and conservation in
wild habitats to maintain the ecological balance. Keeping these points in view, we studied the diversity and
relative abundance of scarabaeid beetles at 8 locations of Himachal Pradesh, India by using UV light traps
between May-August during 2011 and 2012.
2 Methods
2.1 Field sites
Populations of scarabaeid beetles were monitored through UV light traps installed in six districts in zone I
(sub-tropical, sub-mountane and low hills), zone II (sub-temperate, sub humid mid hills), zone III (wet-
temperate high hills) and zone IV (dry-temperate high hills and cold deserts) of Himachal Pradesh, in the
northwestern Himalayan region, India in 2011 and 2012 lying between N 320, 05 to N 310, 12 Latitude and E
760, 32 to E 770, 25 Longitude with Altitude ranging from 1222-2479 m amsl (Fig. 1). The entire light traps
installed were either in fruit orchards or farmlands with different cropping patterns, which were grouped on the
basis of terrain and vegetation characteristics. The details of study sites are given in Table 1.
Fig.1 Map showing sites for sampling of scarab beetle populations in Himachal Pradesh, India.
48
Arthropods, 2015, 4(2): 46-68
IAEES www.iaees.org
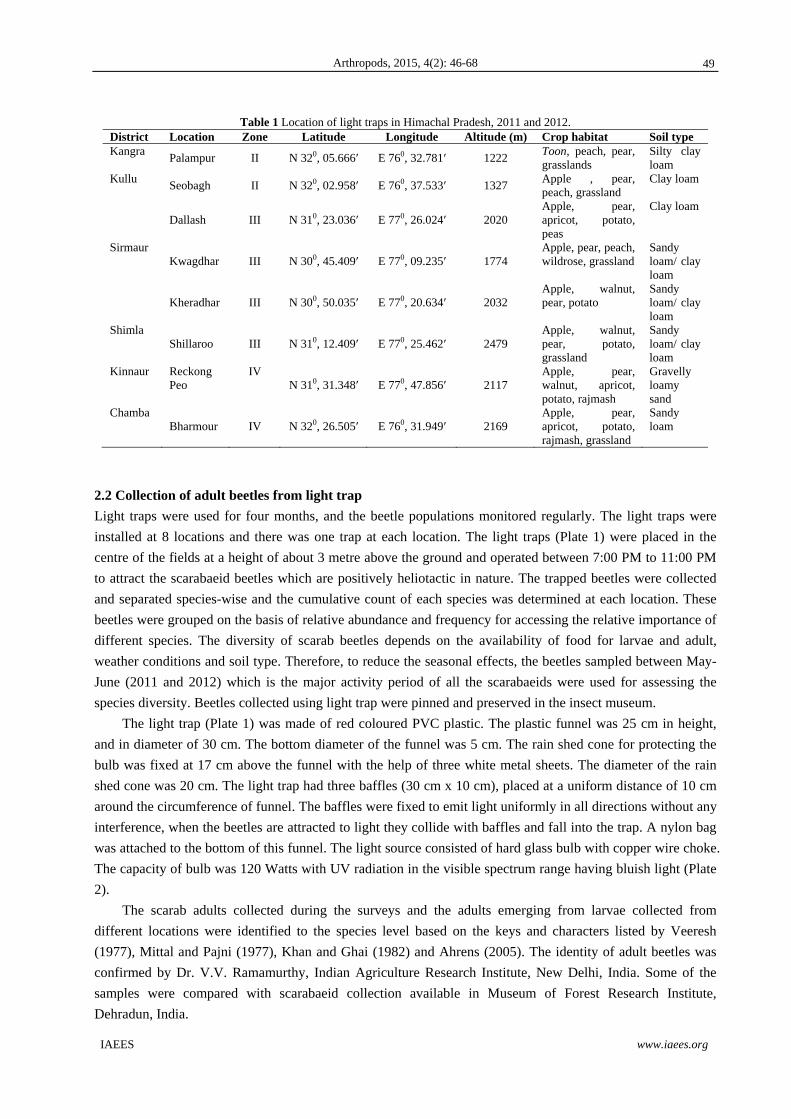
Table 1 Location of light traps in Himachal Pradesh, 2011 and 2012. District Location Zone Latitude Longitude Altitude (m) Crop habitat Soil type Kangra
Palampur II N 320, 05.666′ E 760, 32.781′ 1222 Toon, peach, pear, grasslands
Silty clay loam
Kullu Seobagh II N 320, 02.958′ E 760, 37.533′ 1327
Apple , pear, peach, grassland
Clay loam
Dallash III N 310, 23.036′ E 770, 26.024′ 2020 Apple, pear, apricot, potato, peas
Clay loam
Sirmaur Kwagdhar III N 300, 45.409′ E 770, 09.235′ 1774
Apple, pear, peach, wildrose, grassland
Sandy loam/ clay loam
Kheradhar III N 300, 50.035′ E 770, 20.634′ 2032 Apple, walnut, pear, potato
Sandy loam/ clay loam
Shimla Shillaroo III N 310, 12.409′ E 770, 25.462′ 2479
Apple, walnut, pear, potato, grassland
Sandy loam/ clay loam
Kinnaur Reckong Peo
IV N 310, 31.348′ E 770, 47.856′ 2117
Apple, pear, walnut, apricot, potato, rajmash
Gravelly loamy sand
Chamba Bharmour IV N 320, 26.505′ E 760, 31.949′ 2169
Apple, pear, apricot, potato, rajmash, grassland
Sandy loam
2.2 Collection of adult beetles from light trap
Light traps were used for four months, and the beetle populations monitored regularly. The light traps were
installed at 8 locations and there was one trap at each location. The light traps (Plate 1) were placed in the
centre of the fields at a height of about 3 metre above the ground and operated between 7:00 PM to 11:00 PM
to attract the scarabaeid beetles which are positively heliotactic in nature. The trapped beetles were collected
and separated species-wise and the cumulative count of each species was determined at each location. These
beetles were grouped on the basis of relative abundance and frequency for accessing the relative importance of
different species. The diversity of scarab beetles depends on the availability of food for larvae and adult,
weather conditions and soil type. Therefore, to reduce the seasonal effects, the beetles sampled between May-
June (2011 and 2012) which is the major activity period of all the scarabaeids were used for assessing the
species diversity. Beetles collected using light trap were pinned and preserved in the insect museum.
The light trap (Plate 1) was made of red coloured PVC plastic. The plastic funnel was 25 cm in height,
and in diameter of 30 cm. The bottom diameter of the funnel was 5 cm. The rain shed cone for protecting the
bulb was fixed at 17 cm above the funnel with the help of three white metal sheets. The diameter of the rain
shed cone was 20 cm. The light trap had three baffles (30 cm x 10 cm), placed at a uniform distance of 10 cm
around the circumference of funnel. The baffles were fixed to emit light uniformly in all directions without any
interference, when the beetles are attracted to light they collide with baffles and fall into the trap. A nylon bag
was attached to the bottom of this funnel. The light source consisted of hard glass bulb with copper wire choke.
The capacity of bulb was 120 Watts with UV radiation in the visible spectrum range having bluish light (Plate
2).
The scarab adults collected during the surveys and the adults emerging from larvae collected from
different locations were identified to the species level based on the keys and characters listed by Veeresh
(1977), Mittal and Pajni (1977), Khan and Ghai (1982) and Ahrens (2005). The identity of adult beetles was
confirmed by Dr. V.V. Ramamurthy, Indian Agriculture Research Institute, New Delhi, India. Some of the
samples were compared with scarabaeid collection available in Museum of Forest Research Institute,
Dehradun, India.
49

Arthropods, 2015, 4(2): 46-68
IAEES www.iaees.org
a b
Plate 1 UV light trap at Palampur (a), and at Kwagdhar (b).
2.3 Data analysis
2.3.1 Alpha diversity
The numbers of species recorded per site were considered as alpha diversity. Richness (number of species),
abundance (number of individuals) and four indices were used to access species diversity. The diversity
indices assume that individuals are randomly sampled from an infinitely large population. The Shannon index
(H') explains the evenness of the abundance of species, while the Simpson’s index of diversity (D) is less
sensitive to species richness, but more sensitive to the most abundant species (Price, 2004; Hill, 1973; Oksanen,
2013; Wilson and Peter, 1988; Whittaker, 1960, 1965; Chao, 2004). Pielou’s evenness index (J') explains the
evenness of allotment of individuals among the species (McDonald et al., 2010). The diversity indices were
based on all the information recorded during study period at each site by using the following indices (Krebs,
2001).
i) Shannon index
ii) Simpson’s index of diversity
s
D = 1- ∑ (pi)2
i=1 iii) Simpson’s reciprocal index= 1/D
iv) Pielou’s evenness index (J')
J' = H'/ Hmax
where
H'= Shannon diversity index
pi= Proportion of total sample belonging to the ith species.
S= Number of species.
∑= Sum from species 1 to species S
D= Simpson’s index of diversity.
N= Total percentage cover or total number of organisms.
n= Percentage cover of a species or number of organisms of a species
J'= Evenness of allotment of individuals among the species.
Hmax= Maximum species diversity (H') = Log2S
S H' = - ∑ (pi) (log2pi) i=1
50

Arthropods, 2015, 4(2): 46-68
IAEES www.iaees.org
Diversity dominance plots were drawn to assess the changes in abundance in each species at each locality.
The properties and merit of each index, and the appropriateness of each index has been discussed extensively
by Kempton (1979); Routledge (1979); Koeleff et al. (2003); Magurran (1988, 2004). A combination of
indices, which measure species richness, diversity and evenness are more appropriate for the purpose
(McDonald et al., 2010).
2.3.2 Beta diversity
Bray-Curtis index to estimate species similarity between two habitats was calculated as follows (Chandra and
Gupta, 2012; Koleff et al., 2003).
CN = 2jN/(Na+Nb)
where
Na = the total number individuals in site Aj
Nb = the total number of individuals in site Bj
2jN = the sum of the lower of the two abundance for species found in both sites. The index value ranges from
one (or 100) when two samples are identical, 0 when there are no shared species between them. The index is
selected because it reflects differences in total abundance rather than relative abundance (Magurran, 2004).
Sorensens similarity index is a simple measure of beta diversity
ß=2C/(C+S1+S2)
where C= no. of shared species between different landscapes
S1= no. of species in site 1
S2= no. of species present in site 2.
Jaccard similarity index was calculated according to Jaccard (1912) by using the following formula.
S=a/(a+b+c)
where
a= No. of shared species between different landscapes
b= No. of species in site 1
c= No. of species present in site 2.
3 Results
3.1 Species composition
Information in relation to the topography, climate, soil, and vegetation are given in Table 1. A total of 13,569
scarabaeid beetles were collected in the light traps from 8 landscapes in Himachal Pradesh with an average of
316.75 individuals per trap per month. The total scarabaeid fauna represented 20 genera and 56 species during
the period. The collected beetles belonged to four sub-families, Melolonthinae (51.79%), Rutelinae (33.93%),
Cetoniinae (10.71%) and Dynastinae (3.57%). The light trap catches from 8 locations completed at 29 (Fig. 2)
Melolonthinae species in 10 genera (Fig. 3), 19 Rutelinae species in 5 genera, 6 Cetoniinae species in 4 genera,
and 2 Dynastinae species. Maximum species belonged to Melolonthinae (52.95 and 53.5% during 2011 and
2012, respectively (Fig. 4) followed by Rutelinae (42.66% in 2011 and 42.37% in 2012).The species belonged
to Cetoniinae and Dynastinae were least abundant in terms of total number of individuals trapped during the
study period (Fig. 4). The maximum number of scarabs across years and locations (Fig. 5) were caught in June
(50.79%). The average trap catch during July, May and August was 29.81, 12.92 and 6.46%, respectively (Fig.
5). Species belonged to Melolonthinae and Rutelinae were the most abundant species of whitegrubs in
Himachal Pradesh. However, the species belonged to these subfamilies are quite different in behavior and
51

Arthropods, 2015, 4(2): 46-68
IAEES www.iaees.org
period of activity. Activity of Melolonthids was low in May (38.59%), but a sharp increase was observed in
the activity of beetles of the subfamily with the onset of monsoon rains and it became most dominant group in
June (87.84% of total catch) (Fig. 5). The activity of rutelinids was maximum during the hot summer in May
(68.41%) and their number declined afterwards (Fig. 5).
51.79
33.93
10.71
3.57
29
19
62
0
20
40
60
Sp
ecie
s D
iver
sity
Relative percentagespecies
No. of Species
Fig. 2 Subfamily-wise distribution of scarabaeid species on light traps in Himachal Pradesh.
Fig. 3 Genus wise dominance of scarabaeids in light traps in Himachal Pradesh.
Fig. 4 Subfamily-wise distribution of number of individuals of scarabaeids caught in light traps in Himachal Pradesh.
Fig. 5 Month-wise catch of beetles belonging to different subfamilies from Himachal Pradesh (in 2011 and 2012).
3.2 Distribution and abundance
Maximum diversity was recorded in genus Anomala with 11 species (Tables 2 and 3) followed by 9 in
Brahmina and 4 in Holotrichia. The genera Maladera, Melolontha, Adoretus, Mimela, Popillia and Protaetia
were represented by 3 species each (Tables 2 and 3).
Dominance diversity plots for 2011 and 2012 showed differences in populations of different species
between the habitats (Fig. 6). The relative abundance of the scarabaeid adults was quite variable across habitats
but number of some species showing high abundance when correlated with other less abundant species. B.
coriacea was the most abundant species followed by A. lasiopygus, A. lineatopennis, M. insanabilis and H.
longipennis. They accounted for 37.11% of total individuals collected (Fig. 7). B. coriacea (676 beetles/trap)
accounted for 9.96% of the total number of scarabaeid beetles collected, followed by A. lasiopygus (506.5
beetles/trap) accounting for 7.47% of the total catch. The relative abundance of M. insanabilis and A.
lineatopennis was 7.21 and 7.20%, with an average catch of 489.5 and 488.5 beetles/trap, respectively.
52

Arthropods, 2015, 4(2): 46-68
IAEES www.iaees.org
Table 2 Scarabaeid beetle species collected in UV light traps at different locations in Himachal Pradesh (May - August, 2011).
Species Palampur Kullu Dallash Shillaroo Kheradhar Kwagdhar Bharmour Reckong
PTotal no. of beetles
% Dominance No. % No. % No. % No. % No. % No. % No. % No. %
Apogonia carinata Barlow 8 0.67 8 0.12
Apogonia ferruginea Fab. 3 0.38 3 0.04
Apogonia villosella Bl. 40 3.33 30 3.75 70 1.04
Autoserica phthisica Br. 43 3.57 97 12.13 140 2.09
Brahmina bilobus Fab. 16 2.00 22 2.89 27 3.34 65 0.97
Brahmina coriacea (Hope) 4 0.33 103 12.88 72 6.77 256
70.52
148
21.23
78 7.75 77 10.12
100
12.38
838 12.50
Brahmina crinicollis Burm. 2 0.25 4 0.40 58 7.62 43 5.32 107 1.60
Brahmina flavosericea Br. 6 0.50 29 2.73 27 7.44 49 4.87 41 5.39 77 9.53 229 3.42
Brahmina kuluensis Moser 25 3.29 25 0.37
Brahmina sp. 1 17 2.13 17 0.25
Brahmina sp. 2 5 1.38 5 0.07
Brahmina sp. 3 3 0.39 3 0.04
Brahmina sp. 4 8 0.99 8 0.12
Holotrichia longipennis Bl. 89 7.40 87 10.88 85 7.99 28 7.71 61 8.75 63 6.26 41 5.39 60 7.43 514 7.67
Holotrichia nigricollis Br. 51 4.24 51 0.76
Holotrichia problematica Br. 8 2.20 8 0.12
Holotrichia sikkimensis Br. 54 4.49 42 5.25 57 5.36 22 3.16 175 2.61
Lepidiota stigma (Fab.) 5 0.63 5 0.07
Maladera insanabilis (Br.) 148 12.30 62 7.75 87 8.18 89 8.84 132
16.34
518 7.73
Maladera irridescens Bl. 27 2.24 4 0.50 31 0.46
Maladera piluda 15 1.25 8 0.79 23 0.34
Melolontha cuprescens Bl. 21 2.63 34 3.20 23 3.30 63 8.28 47 5.82 188 2.80
Melolontha furcicauda Ancy 33 2.74 27 3.38 43 4.04 32 4.59 73 9.59 208 3.10
Melolontha indica Hope 38 3.16 41 3.85 79 1.18
Melolontha virescens Br. 5 0.42 5 0.07
Microtrichia cotesi Br. 16 1.33 16 0.24
Schizonycha sp. 1 4 0.50 26 2.44 6 0.60 57 7.49 97 12.00
190 2.83
Schizonycha sp. 2 6 1.65 6 0.09
Trichoserica umbrinella (Br.) 8 0.67 9 1.18 17 0.25
Adoretus bimarginatus Ohaus 121 11.37
95 13.63
216 3.22
Adoretus lasiopygus Burm. 94 7.81 119 11.18
99 14.20
97 12.75
111
13.74
520 7.76
Adoretus pallens Bl. 81 6.73 168 16.68
249 3.71
Anomala comma Arrow 9 0.75 9 0.13
Anomala dimidiata Hope 39 3.24 59 7.38 72 6.77 170 2.54
Aomala lineatopennis Bl. 94 7.81 88 8.27 296 29.39
478 7.13
Anomala pellucida Arrow 15 1.25 15 0.22
Anomala polita Bl. 18 2.25 18 0.27
Anomala rufiventris Redt. 44 3.66 83 10.38 52 4.89 63 9.04 106
13.93
348 5.19
Anomala rugosa Arrow 19 1.58 46 6.60 65 0.97
Anomala singularis Arrow 22 1.83 20 2.50 42 0.63
Anomala stoliezkoe Hope 50 6.19 50 0.75
Anomala varicolor (Gyll.) 85 7.07 78 7.33 243 24.13
406 6.06
Mimela fulgidivittata Bl. 54 4.49 60 5.64 114 1.70
Mimela passerinii Hope 20 5.51 42 6.03 40 5.26 15 1.86 117 1.75
Mimela pectoralis Bl. 42 6.03 42 0.63
Popillia cyanea Hope 4 1.10 4 0.06
Popillia nasuate Newman 5 1.38 5 0.07
Popillia virescens 2 0.29 2 0.03
Clinteria spilota (Hope) 1 0.10 1 0.01
Heterorrhina nigritarsis Hope 4 1.10 4 0.06
Protaetia coensa (West.) 6 0.50 4 0.57 10 0.15
Protaetia impavida Jan. 4 0.50 4 0.06
Protaetia neglecta Hope 18 2.58 49 6.44 37 4.58 104 1.55
Oxycetonia albopunctata (Fab.) 2 0.20 2 0.03
Heteronychus lioderes (Fabricius)
56 4.66 78 9.75 134 2.00
Phyllognathus dionysius Redt. 22 2.75 22 0.33
Total 1203 800 1064 363
697
1007 761
808
6703
53

Arthropods, 2015, 4(2): 46-68
IAEES www.iaees.org
Table 3 Scarabaeid beetle species collected in UV light traps at different locations in Himachal Pradesh (May - August, 2012).
Species Palampur Kullu Dallash Shillaroo Kheradhar Kwagdhar Bharmour Reckong
PTotal no. of beetles
% DominanceNo. % No. % No. % No. % No. % No. % No. % No. %
Apogonia carinata Barlow 8 0.60 8 0.12
Apogonia ferruginea Fab. 4 0.51 4 0.06
Apogonia villosella Bl. 35 2.63 31 3.98 66 0.96
Autoserica phthisica Br. 58 4.35 111 14.25 169 2.46
Brahmina bilobus Fab. 13 1.67 26 3.12 19 2.49 58 0.84
Brahmina coriacea (Hope) 5 0.38 98 12.58 60 5.56 291 72.39 130 19.23 64 6.39 92 11.03 88 11.55 828 12.06
Brahmina crinicollis Burm. 1 0.13 7 0.70 70 8.39 57 7.48 135 1.97
Brahmina flavosericea Br. 9 0.68 29 2.69 20 4.98 42 4.20 50 6.00 87 11.42 237 3.45
Brahmina kuluensis Moser 18 2.16 18 0.26
Brahmina sp. 1 22 2.82 22 0.32
Brahmina sp. 2 3 0.75 3 0.04
Brahmina sp. 3 5 0.60 5 0.07
Brahmina sp. 4 5 0.66 5 0.07
Holotrichia longipennis Bl. 99 7.43 51 6.55 107 9.91 30 7.46 60 8.88 66 6.59 43 5.16 63 8.27 519 7.56
Holotrichia nigricollis Br. 62 4.65 62 0.90
Holotrichia problematica Br. 11 2.74 11 0.16
Holotrichia sikkimensis Br. 53 3.98 58 7.45 59 5.46 29 4.29 199 2.90
Lepidiota stigma (Fab.) 3 0.39 3 0.04
Maladera insanabilis (Br.) 182 13.66 53 6.80 89 8.24 98 9.79 148 19.42 570 8.30
Maladera irridescens Bl. 35 2.63 7 0.90 42 0.61
Maladera piluda 10 0.75 4 0.40 14 0.20
Melolontha cuprescens Bl. 24 3.08 40 3.70 20 2.96 66 7.91 36 4.72 186 2.71
Melolontha furcicauda Ancy 28 2.10 22 2.82 45 4.17 32 4.73 81 9.71 208 3.03
Melolontha indica Hope 33 2.48 45 4.17 78 1.14
Melolontha virescens Br. 7 0.53 7 0.10
Microtrichia cotesi Br. 17 1.28 17 0.25
Schizonycha sp. 1 2 0.26 28 2.59 10 1.00 66 7.91 75 9.84 181 2.64
Schizonycha sp. 2 8 1.99 8 0.12
Trichoserica umbrinella (Br.) 3 0.23 9 1.08 12 0.17
Adoretus bimarginatus Ohaus 103 9.54 90 13.31 193 2.81
Adoretus lasiopygus Burm. 112 8.41 109 10.09 88 13.02 99 11.87 98 12.86 506 7.37
Adoretus pallens Bl. 77 5.78 184 18.38 261 3.80
Anomala comma Arrow 12 0.90 12 0.17
Anomala dimidiata Hope 39 2.93 54 6.93 77 7.13 170 2.48
Aomala lineatopennis Bl. 99 7.43 77 7.13 284 28.37 460 6.70
Anomala pellucida Arrow 24 1.80 24 0.35
Anomala polita Bl. 21 2.70 21 0.31
Anomala rufiventris Redt. 40 3.00 86 11.04 54 5.00 73 10.80 117 14.03 370 5.39
Anomala rugosa Arrow 38 2.85 41 6.07 79 1.15
Anomala singularis Arrow 23 1.73 26 3.34 49 0.71
Anomala stoliezkoe Hope 46 6.04 46 0.67
Anomala varicolor (Gyll.) 84 6.31 95 8.80 239 23.88 418 6.09
Mimela fulgidivittata Bl. 73 5.48 63 5.83 136 1.98
Mimela passerinii Hope 24 5.97 42 6.21 49 5.88 8 1.05 123 1.79
Mimela pectoralis Bl. 41 6.07 41 0.60
Popillia cyanea Hope 3 0.75 3 0.04
Popillia nasuate Newman 5 1.24 5 0.07
Popillia virescens 3 0.44 3 0.04
Clinteria spilota (Hope) 2 0.20 2 0.03
Heterorrhina nigritarsis Hope 0 0.00
Protaetia coensa (West.) 5 0.38 3 0.44 8 0.12
Protaetia impavida Jan. 2 0.26 2 0.03
Protaetia neglecta Hope 24 3.55 43 5.16 30 3.94 97 1.41
Oxycetonia albopunctata (Fab.)
1 0.10 1 0.01
Heteronychus lioderes (Fab.) 62 4.65 67 8.60 7 1.74 136 1.98
Phyllognathus dionysius Redt. 25 3.21 25 0.36
Total 1332 779 1080 402 676 1001 834 762 6866
54

Arthropods, 2015, 4(2): 46-68
IAEES www.iaees.org
Fig. 6 Dominance diversity plot, numeric code for each species corresponds to those in Tables 2 and 3.
0
2
4
6
8
10
12
(%)
Pro
port
ion
2011 2012
Fig. 7 Dominant species of scarabaeid beetles caught in light trap in Himachal Pradesh.
Chandel et al. (1994) reported that B. coriacea constituted 13.4-18.9% of total beetle catch on light trap at
Nauni in Solan, Himachal Pradesh. In Kullu valley, B. coriacea comprised up to 26.87% of total catch in light
trap (Kumar et al., 2007). This is the most abundant species in Shimla hills constituting 96.38% of total beetle
catch at Shillaroo. At Kheradhar, B. coriacea accounted to 84.95% of total catch (Gupta, 2012). Kumar et al.
(1996) reported that M. insanabilis was the most predominant species in Kullu valley and comprised of 16.04 -
29.58% of the total beetle catch in the light trap. Anomala lineatopennis was the predominant species at
Palampur (Chandel et al., 2010) and Kwagdhar (Anon, 2010). Holotrichia longipennis (357 beetles/trap)
constituted 5.26% of the total scarabaeid beetles collected in light trap during 2011-12. It accounted for 11.2-
13.7% of the total beetle catch at Nauni (Chandel et al., 1994), 10.66-18.43% in Kullu valley (Kumar et al.,
2007) and 5.05% at Palampur (Mehta et al., 2010). According to Sushil et al. (2006), H. longipennis is the
55

Arthropods, 2015, 4(2): 46-68
IAEES www.iaees.org
most abundant species in Uttrakhand (8.15-10.41% of total beetle catch). Five species viz., O. albopunctata, C.
spilota, P. impavida, P. cynea and A. ferruginea were least abundant species in Himachal Pradesh and were
region specific (Tables 2 and 3). The species H. nigritarsis was observed only during 2011. The scarabaeid
beetles were quite abundant in the Himalayan region, India. The average light trap catch per month was 257.13
beetles/trap and maximum numbers were recorded in Zone II. In zone III and IV, the average trap per month
was 196.56 and 197.81 beetles/trap, respectively. Maximum species diversity was recorded in the mid hills
(zone I and II), where 38 species were recorded.
Table 4 Data matrix with beta diversity values obtained through Sorensen similarity index, Jaccard similarity index and Bray Curtis index with number of species per site and number of shared species for 2011-12.
Site I*
Site II*
No. of species at
site 1
No. of species at
site II
Shared species
Sorensen index
Jaccard index
Bray Curtis index
1 2 29 21 11 0.3607 0.1803 0.4573 1 3 29 16 10 0.3636 0.1818 0.5867 1 4 29 10 3 0.1429 0.0714 0.0485 1 5 29 12 7 0.2917 0.1458 0.2947 1 6 29 14 8 0.3137 0.1569 0.3891 1 7 29 15 8 0.3077 0.1538 0.2342 1 8 29 14 5 0.2083 0.1042 0.2944 2 3 21 16 10 0.4255 0.2128 0.4549 2 4 21 10 2 0.1212 0.0606 0.2253 2 5 21 12 6 0.3077 0.1538 0.3968 2 6 21 14 4 0.2051 0.1026 0.2313 2 7 21 15 9 0.4000 0.2000 0.3472 2 8 21 14 7 0.3333 0.1667 0.3296 3 4 16 10 3 0.2069 0.1034 0.1780 3 5 16 12 8 0.4444 0.2222 0.5179 3 6 16 14 7 0.3784 0.1892 0.4085 3 7 16 15 8 0.4103 0.2051 0.4449 3 8 16 14 7 0.3784 0.1892 0.4476 4 5 10 12 3 0.2400 0.1200 0.4113 4 6 10 14 3 0.2222 0.1111 0.1942 4 7 10 15 4 0.2759 0.1379 0.3185 4 8 10 14 4 0.2857 0.1429 0.2647 5 6 12 14 2 0.1429 0.0714 0.1631 5 7 12 15 7 0.4118 0.2059 0.5364 5 8 12 14 6 0.3750 0.1875 0.4186 6 7 14 15 5 0.2941 0.1471 0.1912 6 8 14 14 6 0.3529 0.1765 0.3152 7 8 15 14 10 0.5128 0.2564 0.6080 *1 = Palampur, 2 = Kullu, 3 = Dallash, 4 = Shillaroo, 5 = Kwagdhar, 6 = Kheradhar, 7 = Bharmour, 8 = Reckong Peo
3.3 Species diversity across locations
A large variation was observed in diversity and abundance of species across locations. Abundance of
scarabaeid beetles was three times greater at Palampur (1203 adults during 2011 and 1332 in 2012) with 29
species from 13 genera, comprising 18.68% of the total scarabaeid species during 2011-2012 as compared to
Shillaroo (363 adults during 2011 and 402 in 2012), constituting 5.63% of total catch during 2011-12 with 10
species belonging to 7 genera (Tables 2 and 3). Abundance and diversity of scarabaeid beetles was
significantly and negatively correlated with altitude (p<0.01 or p<0.05= -0.697). At Dallash, 1,064 and 1,080
beetles from 16 species belonging to 10 genera were collected during 2011 and 2012, respectively, which
constituted 15.80% of the total catch. The highest numbers of beetles were collected in Kwagdhar and Dallash,
which belonged to subfamily Rutelinae. At other sites most of the beetles belonged to Melolonthinae in terms
of numbers of adults collected (Tables 2 and 3). At Kwagdhar, Kheradhar, Reckong Peo, Bharmour and Kullu,
56
Arthropods, 2015, 4(2): 46-68
IAEES www.iaees.org
the number of species ranged from 12-21 (Fig. 8a) constituting 14.80, 10.12, 11.57, 11.75 and 11.64% of the
total catch during 2011-12, respectively. No beetles of the subfamily Dynastinae were collected during the
study period from Dallash, Kheradhar, Kwagdhar, Bharmour and Reckong Peo. Similarly, from Dallash, no
species belonged to subfamily Cetoniinae were recorded. The general diversity of scarab beetles at each site is
shown in Tables 2 and 3.
3.4 Emergence pattern and activity period
To study the beetle’s emergence pattern and peak activity period at different locations, data were recorded for
four months, i.e., May-August. Adult emergence starts in May at all the locations comprising 3.86-12.97% of
the total catch in Shillaroo, Kheradhar, Kullu, Bharmour, Palampur and Dallash, respectively, during 2011 (Fig.
9). A similar trend was observed during 2012 at all the locations (Fig. 10). However, the scarab catch was
maximum in Kwagdhar during the month of May (36.54%) because of the high abundance of rutelinids,
especially A. lineatopennis and A. varicolor suggesting that May is the peak activity period for rutelinids (Figs.
9 and 10). At Reckong Peo, no scarab activity was recorded during May (Figs. 9 and 10). Total beetle catch
was maximum in June at all the locations which coincided with onset of monsoon rains except at Reckong Peo,
where the beetle catch was highest in July 2011 (55.32% of total beetle catch at Reckong Peo). Reckong Peo is
located in the dry temperate zone of Himalayas and monsoon rains starts in late July. There was a direct
relationship with occurrence of pre-monsoon rains and peak activity of scarabaeids. By the end of the August
the scarab activity began to decline, with minimum catch at all the locations (Figs. 9 and 10).
57

Arthropods, 2015, 4(2): 46-68
IAEES www.iaees.org
Fig. 9 Monthwise catch of scarabaeid beetles in light traps during 2011.
a) Richness
b) Abundance
c) d)
e)
f)
Fig. 8 Scarabaeid beetle diversity at eight study sites in Himachal Pradesh. a) Number of Species, b) Total number of beetle specimen, c) Shannon index (H'), d) Simpson’s index of diversity (D), e) Simpson’s reciprocal index ( 1/D), and f) Pielou’s evenness index (J').
58
Arthropods, 2015, 4(2): 46-68
IAEES www.iaees.org
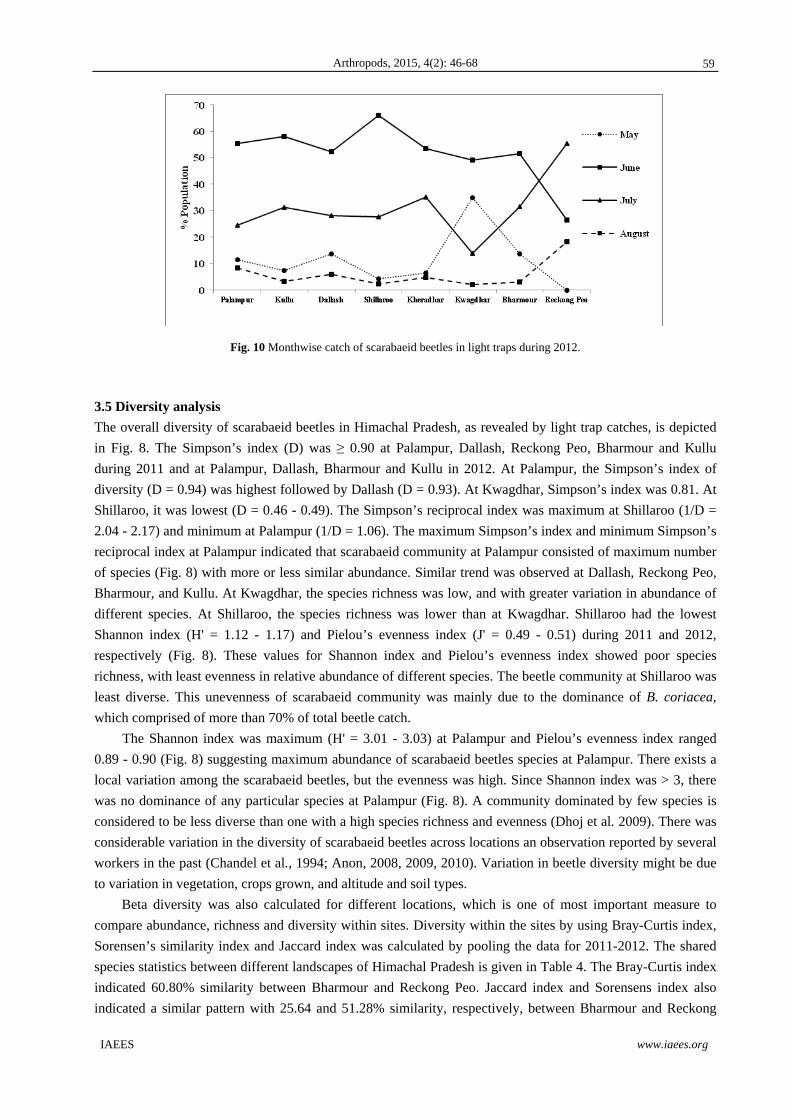
Fig. 10 Monthwise catch of scarabaeid beetles in light traps during 2012.
3.5 Diversity analysis
The overall diversity of scarabaeid beetles in Himachal Pradesh, as revealed by light trap catches, is depicted
in Fig. 8. The Simpson’s index (D) was ≥ 0.90 at Palampur, Dallash, Reckong Peo, Bharmour and Kullu
during 2011 and at Palampur, Dallash, Bharmour and Kullu in 2012. At Palampur, the Simpson’s index of
diversity (D = 0.94) was highest followed by Dallash (D = 0.93). At Kwagdhar, Simpson’s index was 0.81. At
Shillaroo, it was lowest (D = 0.46 - 0.49). The Simpson’s reciprocal index was maximum at Shillaroo (1/D =
2.04 - 2.17) and minimum at Palampur (1/D = 1.06). The maximum Simpson’s index and minimum Simpson’s
reciprocal index at Palampur indicated that scarabaeid community at Palampur consisted of maximum number
of species (Fig. 8) with more or less similar abundance. Similar trend was observed at Dallash, Reckong Peo,
Bharmour, and Kullu. At Kwagdhar, the species richness was low, and with greater variation in abundance of
different species. At Shillaroo, the species richness was lower than at Kwagdhar. Shillaroo had the lowest
Shannon index (H' = 1.12 - 1.17) and Pielou’s evenness index (J' = 0.49 - 0.51) during 2011 and 2012,
respectively (Fig. 8). These values for Shannon index and Pielou’s evenness index showed poor species
richness, with least evenness in relative abundance of different species. The beetle community at Shillaroo was
least diverse. This unevenness of scarabaeid community was mainly due to the dominance of B. coriacea,
which comprised of more than 70% of total beetle catch.
The Shannon index was maximum (H' = 3.01 - 3.03) at Palampur and Pielou’s evenness index ranged
0.89 - 0.90 (Fig. 8) suggesting maximum abundance of scarabaeid beetles species at Palampur. There exists a
local variation among the scarabaeid beetles, but the evenness was high. Since Shannon index was > 3, there
was no dominance of any particular species at Palampur (Fig. 8). A community dominated by few species is
considered to be less diverse than one with a high species richness and evenness (Dhoj et al. 2009). There was
considerable variation in the diversity of scarabaeid beetles across locations an observation reported by several
workers in the past (Chandel et al., 1994; Anon, 2008, 2009, 2010). Variation in beetle diversity might be due
to variation in vegetation, crops grown, and altitude and soil types.
Beta diversity was also calculated for different locations, which is one of most important measure to
compare abundance, richness and diversity within sites. Diversity within the sites by using Bray-Curtis index,
Sorensen’s similarity index and Jaccard index was calculated by pooling the data for 2011-2012. The shared
species statistics between different landscapes of Himachal Pradesh is given in Table 4. The Bray-Curtis index
indicated 60.80% similarity between Bharmour and Reckong Peo. Jaccard index and Sorensens index also
indicated a similar pattern with 25.64 and 51.28% similarity, respectively, between Bharmour and Reckong
59

Arthropods, 2015, 4(2): 46-68
IAEES www.iaees.org
Peo which had the highest similarity across locations. The Bray-Curtis index was minimum (0.0485) between
Palampur and Shillaroo which indicating that these two sites have poor similarity in terms of diversity,
richness and abundance.
3.6 Species turnover comparison across the locations
Jaccard similarity coefficient matrix was used to find out the differences in species composition between the
locations. Dendrogram prepared by using Jaccard similarity matrix for clustering of habitats with similar
diversity is given in Fig. 11. Clustering was measured on the basis of similarity, richness and abundance of the
scarab taxa. Palampur, Kullu, Dallash and Shillaroo were in a single cluster while Kheradhar and Reckong Peo
in another cluster. Kwagdhar and Bharmour were placed in separate clusters. The composition and population
structure of scarabs species were similar between Palampur, Kullu and Dallash whereas, Bharmour area was
completely different from these clusters.
4 Discussion and Conclusions
In the present study, 56 species belonging to subfamilies Melolonthinae, Rutelinae, Cetoniinae and Dynastinae
were recorded from the eight locations in the northwestern Himalayan region of Himachal Pradesh. More than
50% of the species found in Palampur and Kullu which have one of most important and diverse scarab fauna in
India (Chandra, 2005; Kumar et al., 2007; Chandel et al., 1994). These habitats had a diverse scarabs beetle
fauna, because they are rich in vegetation for feeding, mating and nesting (Cherty et al., 2008; Dhoj et al.,
2009; Bhalla and Pawar, 1964; Kumar et al., 1996, 2005). These agroecological regions have a high scarab
diversity for historical, geographical and landscape reasons. There is a long history of fruit and vegetable
cultivation in these regions which serve as important adult and larval food, for conserving the scarab fauna.
The surveyed landscapes are located in sub-tropical and dry temperate latitudinal region (N 300, 45.409'-320,
05.666' (Table 1)), with a broad altitude range (1222 - 2479 m amsl; Table 1, Fig. 1), which facilitated the
diversity of scarab fauna in different habitats. Most of the landscapes are surrounded by natural vegetation,
which might contribute to greater diversity of scarab fauna in the region (Dhoj et al., 2009; Khanal et al., 2012;
Chandra and Gupta, 2012). B. coriacea was the dominant species in high hills and dry temperate zones,
whereas H. longipennis was dominant in the mid hills.
There was a large variation in beetle abundance in different landscapes across years 2011 and 2012
(Tables 2 and 3). The abundance and diversity decreased with an increase in altitude. Species richness was
significantly and negatively correlated with altitude. The possible reason may be low temperatures of high
altitudes which limits the growth and development of scarabs. A similar relationship has been observed in the
Iberian mountains of Spain (Martin-Piera et al., 1992; Romero-Alcaraz and Avila, 2000) and, the central
region of mainland Japan (Imura et al., 2010). The species richness at Palampur and Kullu was exceptionally
high as compared to the other landscapes. This might be due surrounding uncultivated wild habitats, which
served as a source of scarab beetles. The broad leaved deciduous forests and pastures increase species richness,
whereas artificial coniferous forests decrease species richness (Imura et al., 2011). A positive relationship
between local abundance and the distribution range of species is a ubiquitously observed phenomenon in
taxonomic assemblages (Hanski, 1982; Brown, 1984; Lawton, 1993, and Gaston, 1996). In the present study,
all the species exhibited such a relationship. These findings are in conformity with the earlier studies by
Chandra (2005), Chandra and Gupta (2012), Dhoj et al. (2009), Hanski and Koskela (1978) and Romero-
Alcaraz and Avila (2000). A positive distribution-abundance relationship is significant in conservation and the
species with restricted host range and small populations are more vulnerable to human activities, risk of
extinction and likely emergence of new pests or secondary pest problems in managed ecosystems (Lawton,
1996). The results of the present study also stressed the need for continuous large scale monitoring to assess
60

Arthropods, 2015, 4(2): 46-68
IAEES www.iaees.org
the distribution and abundance of scarab beetles for effective conservation of species, as well as to study their
movements/shifts from forests to cultivated crops of agricultural and horticultural importance.
(Jaccard similarity matrix-abundance) Fig. 11 Dendrogram comparing different sites for scarabaeid beetle species assemblage (b = Palampur, c = Kullu, d = Dallash, e = Shillaroo, f = Kwagdhar, g = Kheradhar, h = Bharmour, I = Reckong Peo).
Fig. 12 Overall emergence pattern of scarabaeid adults in Himachal Pradesh, India (2011-2012).
In the present study 13,569 adults of scarabaeid beetles belonging to 56 species of 4 subfamilies were
recorded from different landscapes. The five most dominating species were B. coriacea, A. lasiopygus, A.
lineatopennis, M. insanabilis and H. longipennis. Melolonthinae was most dominant with 29 species,
comprising 51.79% (Fig. 4) of the total species followed by Rutelinae with 19 species (33.93%). Anomala was
the most dominant genus with 17.86% of total species followed by Brahmina (16.07% of total species).
Chandra (2005) collected 89 species of phytophagous scarabs in Himachal Pradesh, belonging to 33 genera.
He reported 34 species in subfamily Melolonthinae, and recorded maximum diversity (13 species) under the
genus Anomala. Mehta et al. (2010) reviewed the status of whitegrubs in north western Himalaya and listed
116 species belonging to 43 genera, with maximum diversity in the genus Anomala (19 species). Maximum
species diversity in the present study was in genus Anomala. June was the most critical month for planning
management and conservation strategies for the scarab beetles, as 50.80% (Fig. 12) of the total scarab beetles
were trapped in June followed by July. Among the collected species, B. coriacea, B. flavosericea, B. crinicollis,
61

Arthropods, 2015, 4(2): 46-68
IAEES www.iaees.org
H. longipennis, H. sikkimensis, A. lineatopennis, A. dimidiata, A. varicolor, M. indica, M. furcicauda, M.
cuprescens, Schizonycha spp., M. insanabilis, M. cotesi, H. lioderes, P. dionysius, Popillia spp.and C. spilota
has been reported to be of agricultural and horticultural pests.
The structure of the organism’s diversity at the landscape scale can be analyzed by using within
community (α diversity) and between community (β diversity) (Whittaker, 1972; Magurran, 1988; Southwood
and Herderson, 2000). To understand the structure and functioning of the ecosystem, it is important to specify
how species composition and distribution are determined. Beta diversity indicates that species composition
over large areas, which fluctuates in a random (Legendre et al. 2005). The present study supported second and
third hypotheses as Beta diversity was observed to be <50% between the locations except Bharmour and
Reckong Peo (60.80% similarity) and Kwagdhar and Bharmour (53.64% similarity) and Dallash and
Kwagdhar (51.79% similarity). The overall results of beta diversity analysis indicated that Himachal Pradesh
has a rich diversity of scarabaeid beetles and shared species between the landscapes were very low. This may
be because of differences in cropping patterns and the surrounding wild habitats. Differences in climatic,
edaphic and landscape management may be responsible for the observed differences in beta diversity of beetle
communities in the Himalayan regions.
Biodiversity surveys play a crucial role in providing information for conservation, justification for the
protected areas as well as designing and development of pest management plans (Spector and Forsyth, 1998).
Mid hill regions in Himachal Pradesh were rich in diversity of scarab beetles. The information on species
diversity, abundance, richness and dominance will be helpful for planning strategies for conservation of
ecosystems and biological health of natural habitats. This information can be utilized to solve the increasing
menace of scarab beetles in field crops and fruit trees in the Himalayan regions in Himachal Pradesh.
Acknowledgements
We are grateful to Dr. V. V. Ramamurthy (Principal Scientist), Division of Entomology, IARI, New Delhi and
Dr. Sunil Singh (Principal Scientist), Division of Entomology, FRI, Dehradun for their help in identification of
scarabaeid species. We are also thankful to Dr. K. D. Sharma and Dr. Rajesh Thakur, Department of
Agriculture Economics, CSKHPKV, Palampur, Himachal Pradesh for their help in data analysis. The study
was supported by the funding of Department of Science and Technology (DST), Government of India, New
Delhi, in the form of INSPIRE Fellowship. We are thankful to Network Coordinator, All India Network
Project on Whitegrubs and Other Soil Arthropods, Jaipur for providing necessary facilities and encouragement.
References
Ahrens D. 2005. Illustrated key of phytophagous scarabs of the Chitwan region (Nepal): Including figures of
adults of white grubs recorded in the IPM project entitled “Identification of whitegrub species of Nepal”.
Project report NE36 (43636) Version 1.2
Ali ATM. 2001. Biosystematics of phytophagous scarabaeidae-An Indian Overview. In: Indian Phytophagous
Scarabs and their Management. Present Status and Future Strategies (Sharma G, Mathur YS, Gupta RBL
eds). 5-37, Agrobios, India
Anonymous. 2008. Annual Report, 2007-08. All India Network project on White Grubs and Other Soil
Arthropods, Palampur, India
Anonymous. 2009. Annual Report, 2008-09. All India Network project on White Grubs and Other Soil
Arthropods, Palampur, India
62

Arthropods, 2015, 4(2): 46-68
IAEES www.iaees.org
Anonymous. 2010. Annual Report, 2009-10. All India Network project on White Grubs and Other Soil
Arthropods, Palampur, India
Arrow GJ. 1917. The fauna of British India. Including Ceylon and Burma. Coleoptera, Lamellicornia Part 2
(Rutelinae: Desmonycinae and Euchirinae). Taylor and Francis, London, UK
Bakhetia DRC, Sohi AS. 1982. Scarabaeid beetles collected in the light traps. Journal of Soil Biology and
Ecology, 2: 99-100
Bhagat RM, Kashyap NP. 1997. A preliminary study on white grubs of Dhauladhar foot hills (Himachal
Pradesh) and adjoining areas. Indian Journal of Entomology, 59: 337-340
Bhalla OP, Pawar AD. 1977. A survey study of insect and non insect pests of economic importance in
Himachal Pradesh. Tikku and Tikku, Kitab Mehal, Bombay India
Bhat OK, Bhat AA, Kaul VK. 2005. Faunistic studies of white grubs in Kashmir. Insect Environment, 11: 14-
15
Bhawane GP, Mamlayya AB, Wagh SR, Chougule AK. 20120 Diversity of white grub beetles and their host
range from northern western ghats, Kolhapur District (MS) India. The Bioscan, 7: 589-596
Brown JH. 1984. On the relationship between abundance and distribution of species. American Naturalist, 14:
255-279
Chandel RS, Gupta PR, Chander R. 1994. Diversity of scarabaeid beetles in mid hills of Himachal Pradesh.
Himachal Journal of Agriculture Research, 20: 98-101
Chandel RS, Mehta PK, Verma KS, Sharma PC. 2010. A survey study of white grubs of economic importance
in Himachal Pradesh. In: Proceedings of National Conference on Plant Protection in Agriculture through
Ecofriendly Techniques and Traditional Farming Practice. 441-442, Durgapur Rajasthan, India
Chandra K, Gupta D. 2012. An inventory of scarab beetles (Coleoptera: Scarabaeidae) of Achanakmar-
Amarkantak Biosphere Reserve, Chhattisgarh, India. International Journal of Science and Nature, 3: 886-
891
Chandra K. 2005. Insecta: Coleoptera: Scarabaeidae. Zoological Survey of India, Fauna of West Himachal
(Part 2). 141-155, India
Chandramohan N, Nanjan K. 1991. Pattern of emergence of white grubs in Nilgiris. South Indian Horticulture,
39: 382-383
Chao A. 2004. Species richness estimation. In: Encyclopedia of Statistical sciences (Balakrishnan N, Read CB,
Vidakovic B, eds). Wiley, New York, USA
Chenchaiah KC. 2006. Biology and control of white grubs of arecanut in Sub-Himalayan Tarai region of West
Bengal. Indian Journal of Plant Protection, 34: 33-35
Cho SS, Kim SH, Yang JS. 1989. Studies on the seasonal occurrence of the white grubs and the chafers, and
on the species of chafers in the Peanut fields in Yeo-Ju area. Res Rep of Rural Development Admin: Crop
Protection, 31: 19-26
Coscaron MC, Melo MC, Coddington JA, Corronca J. 2009. Estimating biodiversity: a case study on true bugs
in Argentinian wetlands. Biodiversity and Conservation, 18: 1491-1507
Cronin JT, Hayes JL, Turchin P. 2000. Evaluation of traps used to monitor southern pine beetle aerial
populations and sex ratios. Agriculture and Forest Entomology, 2: 69-76
Dashad SS, Chauhan R, Choudhary OP. 2008. Emergence of different species of white grub beetles in relation
to abiotic factors based on light trap catches. Research on Crops. 9: 688-691
Dethier VG. 1953. Vision. In: Insect Physiology (Roeder KD, ed). 488-522, Wiley New York, USA
Devi N, Raj D, Kashyap NP. 1994. Relative abundance of some white grub beetles in mid hill zone of
Himachal Pradesh (India). Journal of Entomological Research, 18: 139-142
63

Arthropods, 2015, 4(2): 46-68
IAEES www.iaees.org
Dhoj Yubak GC, Keller S, Nagel P, Kafle L. 2009. Abundance and diversity of scarabaeid beetles (Coleoptera:
Scarabaeidae) in different farming areas of Nepal. Formosan Entomon, 29: 103-112
Falach L, Shani A. 2000. Trapping efficiency and sex ratio of Maladera matrida beetles in yellow and black
traps. Journal of Chemical Ecology, 26: 2619-2624
Forschler BT, Gardener WA. 1991. Flight activity and relative abundance of phytophagous scarabaeidae
attracted to blacklight traps in Georgia. Journal of Agriculture, 8: 179-187
Freitas FA de, Zanuncio TV, Lacerda MC, Zanuncio JC. 2002. Fauna of coleoptera collected with light traps in
a Eucalyptus grandis plantation in Santa Barbara, Minas Gerais, Brazil. Revist Arvo, 26: 505-511
Garg DK,Shah NK. 1983. White grub outbreak on rainfed dryland rice in Uttar Pradesh. International Rice
Research Newsletter. 8: 16-17
Gaston KJ. 1996. The multiple forms of interspecific abundance-distribution relationship. Oikos, 76: 211-220
GhartyChetry YD. 2006. Whitegrubs (Coleoptera: Scarabaeideae) associated with Neplaese agriculture and
their control with the indigenous entomopathogenic fungus Metarrhizium anisopliae (metsch.). Ph. D
Thesis. University of Basel, Switzerland
Gracia A, Trujillo NA, Moron CD, Lopez MA, Olguin JF. 2008. Use of fluorescent light traps for the
management of white grubs (Coleoptera: Melolonthinae) in maize (Zea mays L.). Agrociencia-Montecillo,
42: 217-223
Gruner L. 1975. An investigation on the activity of various West Indian scarabaeids with the aid of light traps
and chemical traps. Ann-de-Zool-Animale, 7: 399-423
Gupta BD, Joshi NK, Joshi ID. 1977. Some important defoliating and fruit eating beetles of temperate fruit
trees: A Survey Study and Control. Progressive Horticulture, 8: 53-60
Gupta S. 2012. Distribution and abundance of Brahmina coriacea (Hope) in Himachal Pradesh. MSc Thesis.
CSK HPKV, Palampur, Himachal Pradesh, India
Hanski I. 1982. Dynamics of regional distribution: the core and satellite species hypotheses. Oikos, 38: 210-
221
HanskiI, Koskela H. 1978. Stability, abundance and niche width in the beetle community inhabiting cow dung.
Okios, 31: 290-298
Heywood VH, Watson RT. 1995. Globalbiodiversity Assessment. Cambridge University Press, USA
Hill MO. 1973. Diversity and evenness: a unifying notation and its consequences. Ecology, 54: 427-473
Humphries CJ, Williams PH, Vane-Wright RI. 1995. Measuring biodiversity value for conservation. Annual
Review of Ecology and Systematics, 26: 93-111
Imura O. 2010. Diversity and function of dung beetles in pastures. In: Conservation and Ecology of Grasslands
(Japanese Society of Grassland Science, ed). 204-214, Scientific Societies Press, Tokyo, Japan
Imura O, Morimoto N, Shi K and Sasaki H. 2014. Landscape diversity of pasture dung beetle communities in
the central region of mainland Japan and implications for conservation management. Biodiversity and
Conservation, 23: 597-616
Imura O, sasaki H, Shi K, Morimoto N. 2011. Landscape for conserving diversity of pasture dung beetles.
Journal of Japan Agricultural Society, 27: 9-20
Jaccard. 1912. The distribution of the flora of the alpine zone. New Phytologist, 11: 37-50
Jameson ML, Ratcliffe BC. 2001. Scarabaeoidea:Scarabaeoid beetles (= Lamellicornia) (URL:
http://wwwmuseum.unl.edu/research/entomology/Guide/ Scarabaeoidea /Scarabaeoidea-ages/
Scarabaeoidea-Overview/ScarabaeoideaO.html). In: Generic Guide to New World Scarab Beetles (URL:
http://www-museum.unl.edu/research/entomology/Guide/ index4.htm) (Ratcliffe BC, Jameson ML, eds).
Kard BMR, Hain FP. 1990. Flight pattern and white grub population densities of three beetles species
64

Arthropods, 2015, 4(2): 46-68
IAEES www.iaees.org
(Coleoptera: Scarabaeidae) in the mountains of northwestern North Carolina. Journal of Entomological
Science, 25: 34-43
Kempton RA. 1979. Structure of species abundance and measurement of diversity. Biometircs, 35: 307-322
Khan KM, Ghai S. 1982. Taxonomic status of the genus Holotrichia Hope.(Melolonthini: Melolonthinae:
Sacarbaeidae) with description of five new species from India along with redescription of two poorly
described species and a key to species. Indian Journal of Entomology, 23: 28-45
Khanal D, Dhoj YGC, Sporleder M, Thapa RB. 2012. Distribution of whitegrubs in here ecological domains of
Nepal. The Journal of Agriculture and Environment, 13: 40-46
Kishimoto YK, Itioka T, Nakagawa M, Momose K, Nakashizuka T. 2011. Phytophagous sacrabaeid diversity
in Swidden cultivation landscapes in Sarawak, Malaysia. Raffales Bulletin of Zoology, 59: 285-293
Koleff P, Gaston KJ, Lennon JJ. 2003. Measuring beta diversity for presence-absence data. Journal of Animal
Ecology, 72: 367-382
Korschefsky VR. 1940. Bestimmugstabelle der haufigsten deutschen scarabaeidanlarven. Arbaei Ten Uber
Physiol Ung Ange Wante Ento, Berlin-Dalhem, 7: 41-51
Krebs CJ. 2001. Species diversity measures of heterogeneity. In: FogartyE, Dutton H, EarlW (eds) Ecology:
The Experimental Analysis of Distribution and Abundances. 617-618, Wesley Longman Inc, San Fransisco,
USA
Kremen C, Colwell RK, Erwin TL, MurphyDD, Noss RF, Sanjayan MA. 1993. Terrestrial arthropod
assemblages: their use in conservation planning. Conservation Biology, 7: 796-808
Kumar J, Kashyap NP, Chandel RS. 1996. Diversity and density of defoliating beetles in Kullu valley of
Himachal Pradesh. Pest Management and Economic Zoology, 4: 25-29
Kumar J, Sharma SD, Lal R. 2007. Scarabaied beetles of Kullu valley, Himachal Pradesh. Entomon, 32: 103-
110
Kumar J, Sharma SD, Lal R, Deor BS. 2005. White grubs damaging maize and paddy crops in Kullu and
Mandi districts of Himachal Pradesh. Pest Management and Economic Zoology, 13: 15-20
Lawrence JF, Hastings AM, Dallwitz MJ, Paine TA, Zurcher EJ. 2000. Beetles of the World. CSIRO
Publishing, Australia
Lawrence JF, BrittonEB. 1994. Australian Beetles. CSIRO Publishing, Australia
Lawton JH. 1993. Range, population abundance and conservation. Trends in Ecology and Evolution, 8: 409-
413
Legendre P, Borcard D, Peres-Neto PR. 2005. Analysing beta diversity: Partitioning the Spatial Variation of
Community Composition Data. Ecology Monograph, 75: 435-450
Lobo JM, Martín-Piera F, Veiga CM. 1988. Las trampas pitfall con cebo, sus sibilidadesen el estudio de las
comunidades coprófagas de Scarabaeoidea (Col.) I. Revue 'Écologie et de Biologie du Sol, 25: 77-100
Magurran AE. 1988. Ecological Diversity and Its Measurement. Princeton University Press, Princeton, USA
Magurran AE. 2004. Measuring Biological Diversity. Blackwell Science LTD, USA
Martin-Piera F, Veiga CM, Lobo Jm. 1992. Ecology and biogeography of dung-beetle communities
(Coleoptera: Scarabaeoidea) in an Iberian mountain range. Journal of Biogeogrgraphy, 19: 677-691
Mc Donald C, Smith R, Scott M and Dick J. 2010. Using indices to measure biodiversity change through time.
In: International Workshop On Spatio-Temporal Modeling. Santiago de Compostela, Spain
McIntosh RL, Katinic PJ, Allison J, Borden JH, Downey DL. 2001. Comparative efficacy of five types of trap
for woodborers in the Cerambycidae, Buprestidae and Siricidae. Agricultural and Forest Entomology, 3:
113-120
Mehta PK, Chandel RS, Mathur YS. 2008. Phytophagous whitegrubs of Himachal Pradesh. Technical Bulletin:
65

Arthropods, 2015, 4(2): 46-68
IAEES www.iaees.org
Department of Entomology, CSK HPKV, Palampur, India
Mehta PK, Chandel RS, Mathur YS. 2010. Status of whitegrubs in north western Himalaya. Journal of Insect
Science, 23: 1-14
Mishra PN, Singh MP. 1996. Studies on the white grubs (Coleoptera: Scarabaeidae) prevalent in Uttar Pradesh
hills. Annals of Agriculture Research, 17: 411-413
Mishra PN, Singh MP. 1997. Determination of predominant species of white grub in Kumaon region of Uttar
Pradesh hills and their control. Annals of Plant Protection Science, 5: 154-156
Mishra PN, Singh MP. 1999. Determination of predominant species of whitegrubs in Garhwal regions of Uttar
Pradesh hills (India). Journal of Entomological Research, 23: 65-69
Mishra PN. 2001. Scarab fauna of Himalayan region and their management. In: Indian Phytophagous Scarabs
and their Management: Present Status and Future Strategies (Sharma, Mathur YS, Gupta RBL, eds). 74-85,
Agrobios, India
Missa O, Basset Y, Alonso A, Miller SE, Curletti G, Meyer MD, Eardley C, Mansell MW, Wagner T. 2009.
Monitoring arthropods in a tropical landscape: relative effects of sampling methods and habitat types on
trap catches. Journal of Insect Conservation, 13: 103-118
Mittal IC, Pajni HR. 1977. New species belonging to Melolonthini (Coleoptera: Scarabaeidae: Melolonthinae)
from India. Entomologist, 2: 85-88
Mittal IC. 2000. Survey of Scarabaeid (Coleoptera) fauna of Himanchal Pradesh (India). Journal of
Entomology Research, 24: 133-141
Morofsky WF. 1933. Distribution of May beetles (Phyllophaga) in Michigan. Journal of Economic
Entomology, 26: 831-834
Nath P, Singh J. 1981. Monitoring of rootgrubs in Varanasi and Mirzapur districts of eastern Uttar Pradesh.
Pesticides, 15: 7-9
Nath V, Srivastva AS, Dhari R, Singh R, Verma RS. 1978. Effect of light trap on the beetles of white grub,
Holotrichia consanguinea Blanchard. Indian Journal of Entomology, 40: 465-466
Oksanen J. 2013. Vegan: Ecological diversity. Id: diversity-vegan. Rnw 2807 2013-12-05 11:50:52Z Jarioksa
processed with vegan 2.0-10 in r under development (unstable). 2013-12-11 r64449) on December 12,
2013
Pal SK. 1977. Relative abundance of scarabaeid beetles on light trap. Indian Journal of Applied Entomology,
39: 197-200
Pardo LLC, Motoya LJ, Bellotti AC, Schoonhoven A Van. 2005. Structure and composition of the white grub
complex (Coleoptera: Scarabaeidae) in agroecological systems of North Cauca, Columbia. Florida
Entomologist, 88: 355-363
Patel BD, Patel GM. 1999. First record of new species of white grubs in Gujarat. Gujarat Agricultural
University Research Journal, 25: 110-111
Petty GJ. 1977. Beetle pests of pineapples: Some Biological Aspects. Citrus and Subtropical-Fruit Journal, 529:
4-7
Pinto RZJ, Zanuncio HS, Zanuncio TV and Lacerda MC. 2004. Coleoptera collected with light traps in
plantation of Eucalyptus urophylla in the Brazillian Amazonian Region. Ciencia Florestal, 14: 111-119
Price DL. 2004. Species diversity and seasonal abundance of scarabaeid dung beetles (Coleoptera:
Scarabaeidae, Geotrupidae and Trogidae) attracted to cow dung in central New Jersey. Journal of New
York Entomological Society, 112: 334-347
Ritcher PO. 1958. Biology of Scarabaeidae. Annual Review of Entomology, 3: 311-334
Rodriguez J, Sinse Luis ML, Grillo Ravelo VH. 2002. Timing of employment of light traps for the capture of
66

Arthropods, 2015, 4(2): 46-68
IAEES www.iaees.org
scarabaieds (Coleoptera: Scarabaeidae) in pineapple plantations in Ciego de Avila. Centro-Agricola, 29:
71-74
Romero-AlcarazE, Avila JM. 2000. Landscape heterogeneity in relation to variations in epigaeic beetle
diversity of Mediterranian ecosystem.Implications for conservation. Biodiversity Conservation, 9: 985-
1005
Routledge RD. 1979. Diversity indices: which ones are admissible. Journal of Theoretical Biology, 76: 503-
515
Saini RK, Verma AN. 1991. Effectiveness of light traps in suppressing populations of red hairy caterpillar,
Amsacta moorei Butler. Haryana Agriculture University Journal of Research, 21: 250-251
Sanders JS, Fracker SB. 1916. Lachnosterna Records in Wisconsin. Journal of Economic Entomology, 9: 253-
261
Shah NK, Garg DK. 1985. White grubs and their beetles (Coleoptera: Scarabaeidae) in Uttar Pradesh hills.
Indian Journal of Entomology, 47: 240-244
Shah NK, Garg DK. 1988. Seasonal abundance of whitegrub beetles on a light trap. Indian Journal of Ecology,
15: 105-108
Sharma PL, Bhalla OP. 1964. A survey study of insect pests of economic importance in Himachal Pradesh.
Indian Journal of Entomology, 26:318-331
Sharma PL, Aggarwal SC, Attri BS. 1971. Beetles eating pome and stone fruits in Himachal Pradesh and their
control. Himachal Journal of Agriculture Research, 1: 57-60
Sharma PL, Attari BS, Aggarwal SC. 1969. Beetles causing damage to pome and stone fruits in Himachal
Pradesh. Indian Journal of Entomology,, 31: 377-379
Sharma RM, Mitra B, Chakraborty P. 2004. Beetles of Kalatop-Khajjiar wild life Sanctuary, Himachal Pradesh.
Zoo’s Print Journal, 19: 1626
Southwood TRE, Henderson PA. 2000. Ecological Methods (3rd Edition). Blackwell Science LTD, USA
Spector S, Forysth AB. 198. Indicator taxa in the vanishing tropics. In: Conservation in a Changing World
(Blamford A, Mace G, eds). 181-210, Zoological Society of London, London, UK
Stearns LA. 1937. Important insects of the year. Bulletin of Delaware Agricultural Experiment Station, 207:
29-30
Stewart PA, Lam Jr JJ. 1968. Catch of insects at different traps equipped with blacklight lamps. Journal of
Economic Entomology, 61: 1227-1230
Stork NE, Samways MJ. 1995. Inventorying and monitoring. In: Global Biodiversity Assessment (Heywood
VH, ed). 453-543, Cambridge University Press, USA
Sushil SN, Mohan M, Selvakumar G, Bhatt JC. 2006. Relative abundance and host preference of white grubs
(Coleoptera: Scarabaeidae) in Kumaon hills of Indian Himalayas. Indian Journal of Agriculture Science, 76:
338-339
Sushil SN, Pant SK, Bhatt JC. 2004. Light trap catches of white grub and its relation with climatic factors in
Kumaon region of North Western Himalaya. Annals of Plant Protection Science. 12: 254-256
Thakare VG, Zade VS. 2012. Diversity of beetles (Insecta: Coleoptera) from the vicinity of Semadoh-Makhala
road, Sipnarange, Melghat Tiger Reserve, (MS) India. Bioscience Discovery, 3: 112-115
Tripathi GM, Gupta BP. 1985. Studies on collection of beetles at light trap at Chaubattia in Uttar Pradesh hills.
Progressive Horticulture, 17: 347-353
Veeresh GK. 1988. Whitegrubs. In: Applied Soil Biology and Ecology (2nd Edition) (Veeresh GK, Rajgopal D,
eds). 243-282, IBH, New Delhi, India
Veeresh GK. 1977. Studies on root grubs in Karnataka with special reference to bionomics and control of
67

Arthropods, 2015, 4(2): 46-68
IAEES www.iaees.org
Holotrichia serrata F. (Coleoptera: Melolonthinae). UAS Monograph Series No. 2, Bangalore. India
Viraktamath S, Kumar KHD. 2005. Efficacy of two types of light traps in attracting insect pests of economic
importance. Insect Environment, 10: 162-164
Vora VJ, Ramakrishnan N. 1991. Attraction of beetles, Holotrichia consanguinea Blanchard (Scarabaeidae:
Coleoptera) to light and host plant. Indian Journal of Entomology, 53: 45-49
White NDG, Arbogast RT, Fields PG, Hillmann RC, Loschiavo SR, Subramanyam B, Throne JE, Wright VF.
1990. The development and use of pitfall and probe traps for capturing insects in stored grain. Journal of
the Kansas Entomology Society, 63: 506-525
Whittaker RH. 1960. Vegetation of Soskiyou mountains, Oregon and California. Ecological Monographs, 30:
279-338
Whittaker RH. 1965. Dominance and diversity in plant communities. Science, 147: 250-260
Wilson EO, Peter FM. 1988. Biodiversity. An important collection of papers that launched public awareness of
biodiversity and its importance. National Academy Press, Washington DC, USA
Yoccoz NG, Nichols JD, Boulinier T. 2001. Monitoring of biological diversity in space and time. Trends in
Ecology and Evolution, 16: 446-453
Zahoor MK, Suhail A, Zulfaqar Z, Iqbal J, Anwar M. 2003. Biodiversity of scarab beetles (Scarabaeidae:
Coleoptera) in agroforestry area of Faislabad. Pakistan Entomologist, 25: 119-126
Zhang WJ. 2011. A Java program to test homogeneity of samples and examine sampling completeness.
Network Biology, 1(2): 127-129
68

Arthropods
Arthropods account for more than 65% of global species and 85% of animal species. On a temperate grassland,
arthropods hold a huge biomass (1,000kg/ha), seconded to plant (20,000kg/ha) and microorganisms (7,000kg/ha)
but much higher than mammals (1.2kg/ha), birds (0.3kg/ha), and nemantodes (120kg/ha). Arthropods play the
role of both pests and beneficial organisms. Some arthropods are important crop pests but others are natural
enemies. Some arthropods are important health pests but many crustaceans are important food sources of
humankinds. Arthropods govern the structures and functions of natural ecosystems, but are always ignored by
researchers. On the global scale, the surveys of mammals, birds and vascular plants were relatively perfect
because they were economically important and easily surveyed. However, arthropods, despite their ecological
and economical importance, have not yet been fully surveyed and recorded due to their difficulties to be
sampled. The research on arthropods must be further promoted. The journal, Arthropods, is inaugurated to
provide a public and appropriate platform for the publication of studies and reports on arthropods.
ARTHROPODS (ISSN 2224-4255) is an international journal devoted to the publication of articles on various
aspects of arthropods, e.g., ecology, biogeography, systematics, biodiversity (species diversity, genetic diversity,
et al.), conservation, control, etc. The journal provides a forum for examining the importance of arthropods in
biosphere (both terrestrial and marine ecosystems) and human life in such fields as agriculture, forestry, fishery,
environmental management and human health. The scope of Arthropods is wide and embraces all
arthropods-insects, arachnids, crustaceans, centipedes, millipedes, and other arthropods. Articles/short
communications on new taxa (species, genus, families, orders, etc.) and new records of arthropods are
particularly welcome.
Authors can submit their works to the email box of this journal, [email protected]. All manuscripts
submitted to Arthropods must be previously unpublished and may not be considered for publication elsewhere
at any time during review period of this journal.
In addition to free submissions from authors around the world, special issues are also accepted. The organizer of
a special issue can collect submissions (yielded from a research project, a research group, etc.) on a specific
topic, or submissions of a conference for publication of special issue.
Editorial Office: [email protected]
Publisher: International Academy of Ecology and Environmental Sciences
Address: Unit 3, 6/F., Kam Hon Industrial Building, 8 Wang Kwun Road, Kowloon Bay, Hong Kong
Tel: 00852-2138 6086
Fax: 00852-3069 1955
E-mail: [email protected]
Arthropods
ISSN 2224-4255
Volume 4, Number 2, 1 June 2015 Articles
Redescription of Harpactea korgei Brignoli, 1979 (Araneae:
Dysderidae) with the first description of the female
Recep Sulhi Özkütük, Kadir Boğaç Kunt, Gizem Karakaş, et al. 32-37
Chemical composition and insecticidal efficacy of essential oil of
Echinophora platiloba DC (Apiaceae) from Zagros foothills, Iran
Iman Sharifian, Ali Darvishzadeh 38-45
Diversity and population dynamics of phytophagous scarabaeid
beetles (Coleoptera: Scarabaeidae) in different landscapes of
Himachal Pradesh, India
Mandeep Pathania, RS Chandel, KS Verma, PK Mehta 46-68
IAEES http://www.iaees.org/
Copyright © 2022 FDOKUMEN