Lecture_COE_152_241_3.pdf - KFUPM
25
1 2/17/2016 Dr. Ashraf S. Hasan Mahmoud 1 King Fahd University of Petroleum & Minerals Computer Engineering Dept COE 241 – Data and Computer Communications Term 152 Dr. Ashraf S. Hasan Mahmoud Rm 22-420 Ext. 1724 Email: [email protected] 2/17/2016 Dr. Ashraf S. Hasan Mahmoud 2 Lecture Contents 1. Fourier Analysis {Please Refer to Fourier Series Expansion Notes} a. Fourier Series Expansion b. Fourier Transform c. Ideal Low/band/high pass filters 2. Analog and Digital Data Transmission a. Analog and Digital Data b. Analog and Digital Signals c. Analog and Digital Transmission d. Asynchronous and Synchronous Transmission 3. Transmission Impairments a. Attenuation and Attenuation Distortion b. Delay Distortion c. Noise 4. Channel Capacity a. Nyquist Formula b. Shannon Capacity Formula c. Eb/No expression
-
Upload
khangminh22 -
Category
Documents
-
view
0 -
download
0
Transcript of Lecture_COE_152_241_3.pdf - KFUPM

1
2/17/2016 Dr. Ashraf S. Hasan Mahmoud 1
King Fahd University of Petroleum & MineralsComputer Engineering Dept
COE 241 – Data and Computer CommunicationsTerm 152Dr. Ashraf S. Hasan MahmoudRm 22-420Ext. 1724 Email: [email protected]
2/17/2016 Dr. Ashraf S. Hasan Mahmoud 2
Lecture Contents1. Fourier Analysis {Please Refer to Fourier Series Expansion Notes}
a. Fourier Series Expansion b. Fourier Transform c. Ideal Low/band/high pass filters
2. Analog and Digital Data Transmissiona. Analog and Digital Datab. Analog and Digital Signalsc. Analog and Digital Transmissiond. Asynchronous and Synchronous Transmission
3. Transmission Impairmentsa. Attenuation and Attenuation Distortionb. Delay Distortionc. Noise
4. Channel Capacitya. Nyquist Formulab. Shannon Capacity Formulac. Eb/No expression

2
2/17/2016 Dr. Ashraf S. Hasan Mahmoud 3
Fourier Analysis• For Material related to
• Fourier Series Expansion,• Fourier Transform, and• Z-Transform
Refer to instructor notes in “Fourier Series Expansion” package
2/17/2016 Dr. Ashraf S. Hasan Mahmoud 4
Analog and Digital Data Transmission• The terms:
• Analogue ~ continuous• Digital ~ discrete
• They apply to:• A) Info/Data: the information to be delivered• B) Signaling: the electrical or electromagnetic
wave that propagates carrying the data• C) Transmission: the mechanism of delivering
the data by processing and propagation of signal
3
2/17/2016 Dr. Ashraf S. Hasan Mahmoud 5
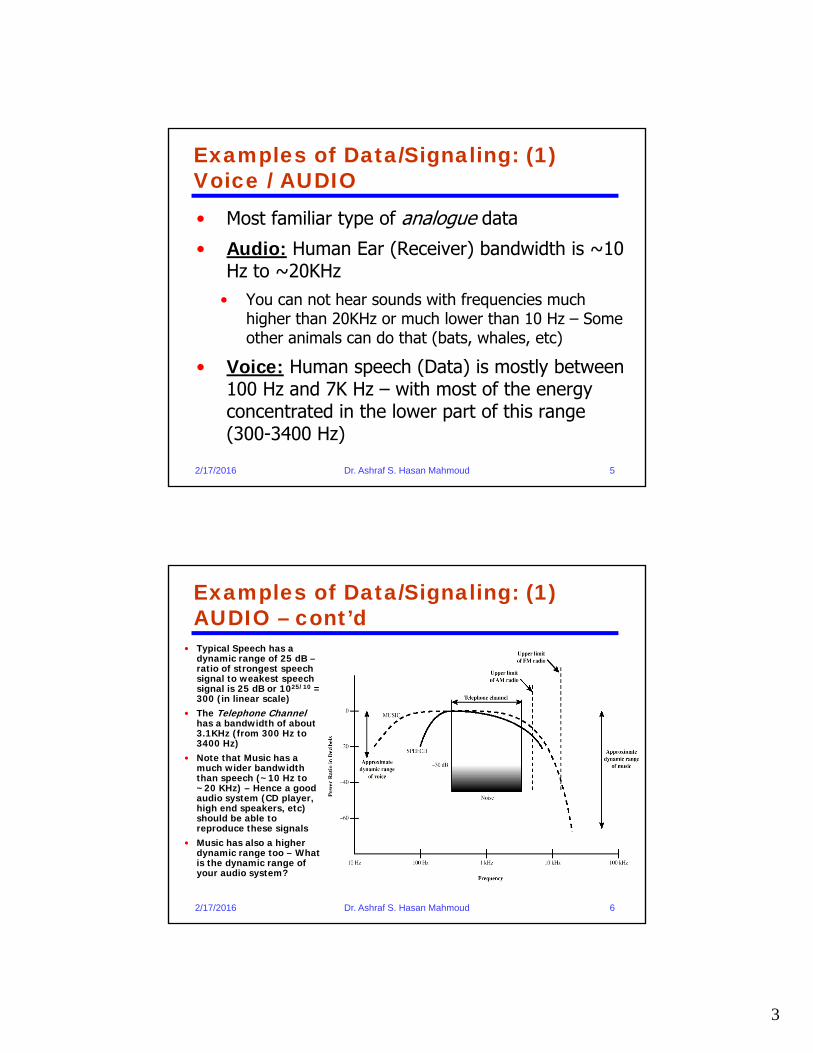
Examples of Data/Signaling: (1) Voice / AUDIO• Most familiar type of analogue data
• Audio: Human Ear (Receiver) bandwidth is ~10 Hz to ~20KHz
• You can not hear sounds with frequencies much higher than 20KHz or much lower than 10 Hz – Some other animals can do that (bats, whales, etc)
• Voice: Human speech (Data) is mostly between 100 Hz and 7K Hz – with most of the energy concentrated in the lower part of this range (300-3400 Hz)
2/17/2016 Dr. Ashraf S. Hasan Mahmoud 6
Examples of Data/Signaling: (1) AUDIO – cont’d
• Typical Speech has a dynamic range of 25 dB –ratio of strongest speech signal to weakest speech signal is 25 dB or 1025/10 = 300 (in linear scale)
• The Telephone Channelhas a bandwidth of about 3.1KHz (from 300 Hz to 3400 Hz)
• Note that Music has a much wider bandwidth than speech (~10 Hz to ~20 KHz) – Hence a good audio system (CD player, high end speakers, etc) should be able to reproduce these signals
• Music has also a higher dynamic range too – What is the dynamic range of your audio system?
4
2/17/2016 Dr. Ashraf S. Hasan Mahmoud 7
Examples of Data/Signaling: (2) VIDEO• Another common example of analog data• The original scene (source) is scanned and its
image recorded by the camera – RASTER image• In the TV: a moving electron beam scan the
screen producing the picture• For black and white: the amount of illumination
produced (on a scale from black (lowest) to white (highest) at any point is proportional to the beam intensity
• Hence the original brightness in REPRODUCED on the screen
• Video Image Time varying analog signal
Applicable to Cathode Ray Tube (CRT) monitors only; i.e. OLD technology!! Does not apply to LCD/LED/PLASMAtechnologies.
2/17/2016 Dr. Ashraf S. Hasan Mahmoud 8
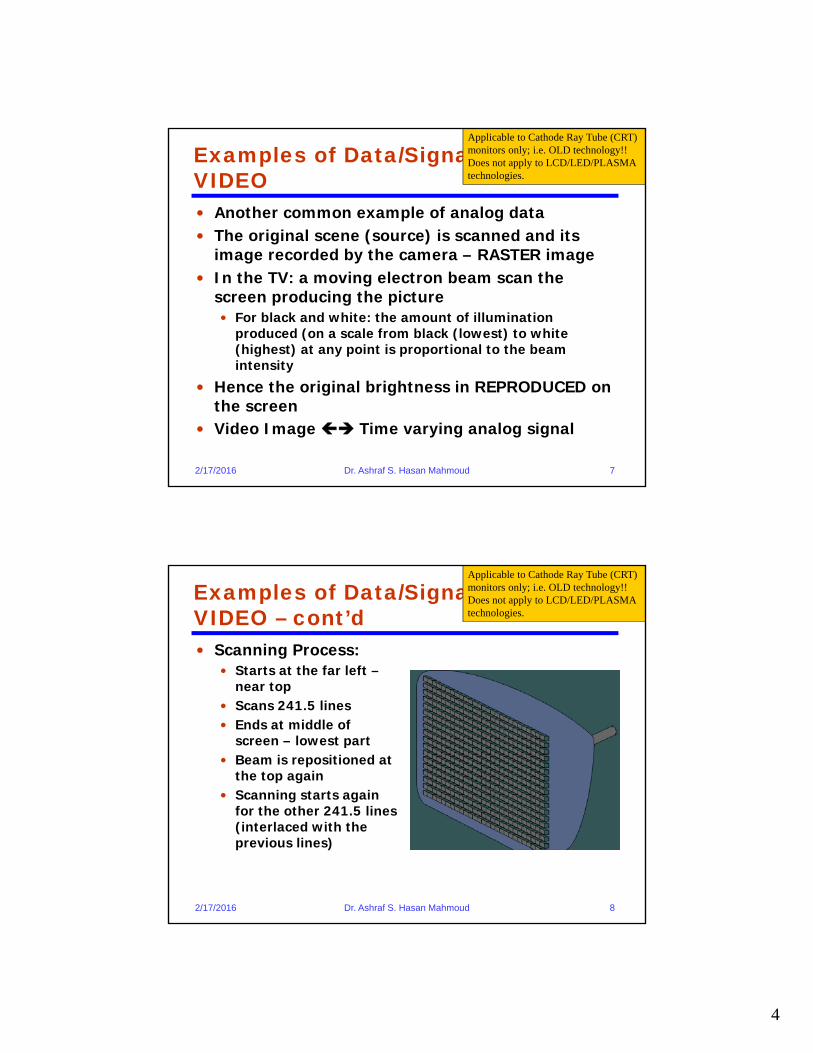
Examples of Data/Signaling: (3) VIDEO – cont’d• Scanning Process:
• Starts at the far left –near top
• Scans 241.5 lines• Ends at middle of
screen – lowest part• Beam is repositioned at
the top again• Scanning starts again
for the other 241.5 lines (interlaced with the previous lines)
Applicable to Cathode Ray Tube (CRT) monitors only; i.e. OLD technology!! Does not apply to LCD/LED/PLASMAtechnologies.

5
2/17/2016 Dr. Ashraf S. Hasan Mahmoud 9
Examples of Data/Signaling: (4) VIDEO – Example of a Video Signal
• For B/W TV you ignore the color synch bursts
• Note – the high
voltage level corresponds to “BLACK”
- the low voltage level corresponds to “WHITE”
• What is the line synch pulse?
• What is the purpose of the line blanking period?
fcv fcc fca
0.75 MHz
1.25 MHz 4.2 MHz
f0
4.799545 MHz
5.75 MHz
6 MHz
fcv fcc fca
0.75 MHz
1.25 MHz 4.2 MHz
f0
4.799545 MHz
5.75 MHz
6 MHz
|M(f)| = Magnitude spectrum of RF video signal
frequency domain
time domain
Frequency
Applicable to Cathode Ray Tube (CRT) monitors only; i.e. OLD technology!! Does not apply to LCD/LED/PLASMAtechnologies.
2/17/2016 Dr. Ashraf S. Hasan Mahmoud 10
Current Monitor Technologies• TFT LCD
• Fluorescent back-lit monitors
• LED back-lit monitors
• Plasma monitors
• Higher contrast – Deeper colors – No need to back lighting
• Organic LED (OLED) – organic compound that emits light when current is passed
• Active Matrix OLED (AMOLED)
• Currently used for mobile devices – no TVs yet!
• These monitors are handled very much similar to ROM cells!
6
Voltage attransmitting end
Voltage atreceiving end
Figure 3.10 Attenuation of Digital Signals
2/17/2016 Dr. Ashraf S. Hasan Mahmoud 11
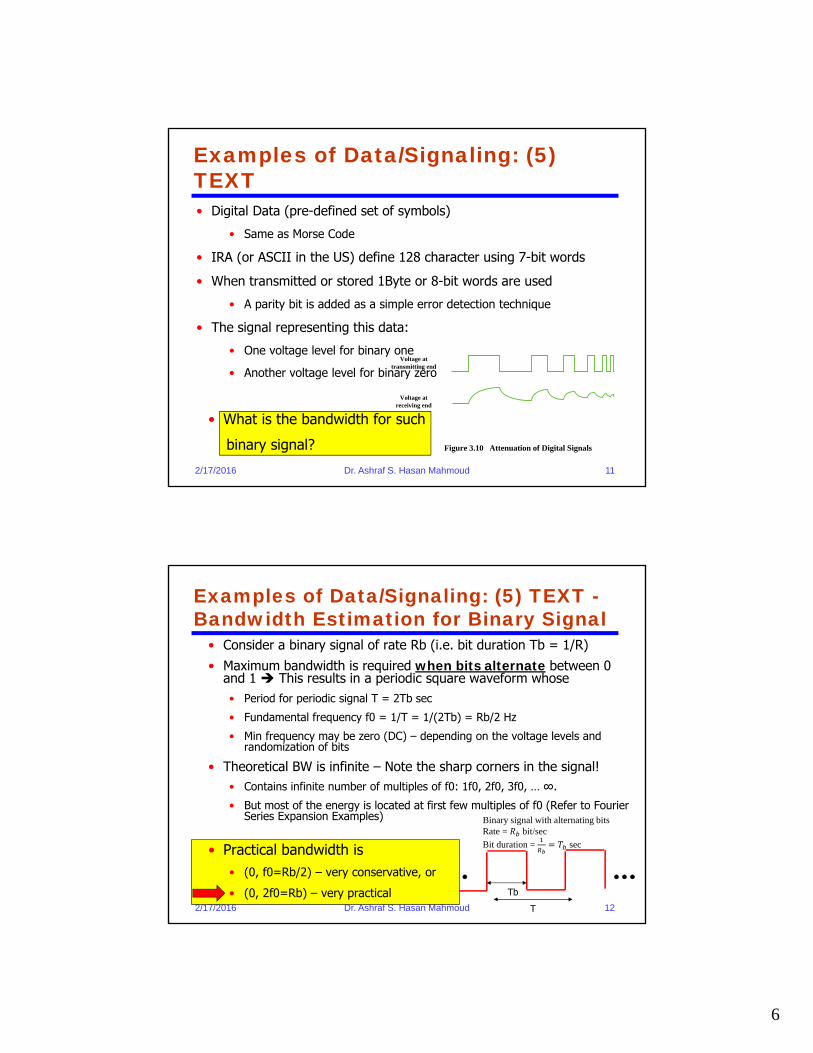
Examples of Data/Signaling: (5) TEXT• Digital Data (pre-defined set of symbols)
• Same as Morse Code
• IRA (or ASCII in the US) define 128 character using 7-bit words
• When transmitted or stored 1Byte or 8-bit words are used
• A parity bit is added as a simple error detection technique
• The signal representing this data:
• One voltage level for binary one
• Another voltage level for binary zero
• What is the bandwidth for such
binary signal?
2/17/2016 Dr. Ashraf S. Hasan Mahmoud 12
Examples of Data/Signaling: (5) TEXT -Bandwidth Estimation for Binary Signal
• Consider a binary signal of rate Rb (i.e. bit duration Tb = 1/R)• Maximum bandwidth is required when bits alternate between 0
and 1 This results in a periodic square waveform whose • Period for periodic signal T = 2Tb sec
• Fundamental frequency f0 = 1/T = 1/(2Tb) = Rb/2 Hz
• Min frequency may be zero (DC) – depending on the voltage levels and randomization of bits
• Theoretical BW is infinite – Note the sharp corners in the signal!• Contains infinite number of multiples of f0: 1f0, 2f0, 3f0, … ∞.
• But most of the energy is located at first few multiples of f0 (Refer to Fourier Series Expansion Examples)
T
Tb
Binary signal with alternating bitsRate = bit/sec
Bit duration = = sec• Practical bandwidth is • (0, f0=Rb/2) – very conservative, or
• (0, 2f0=Rb) – very practical
7
2/17/2016 Dr. Ashraf S. Hasan Mahmoud 13
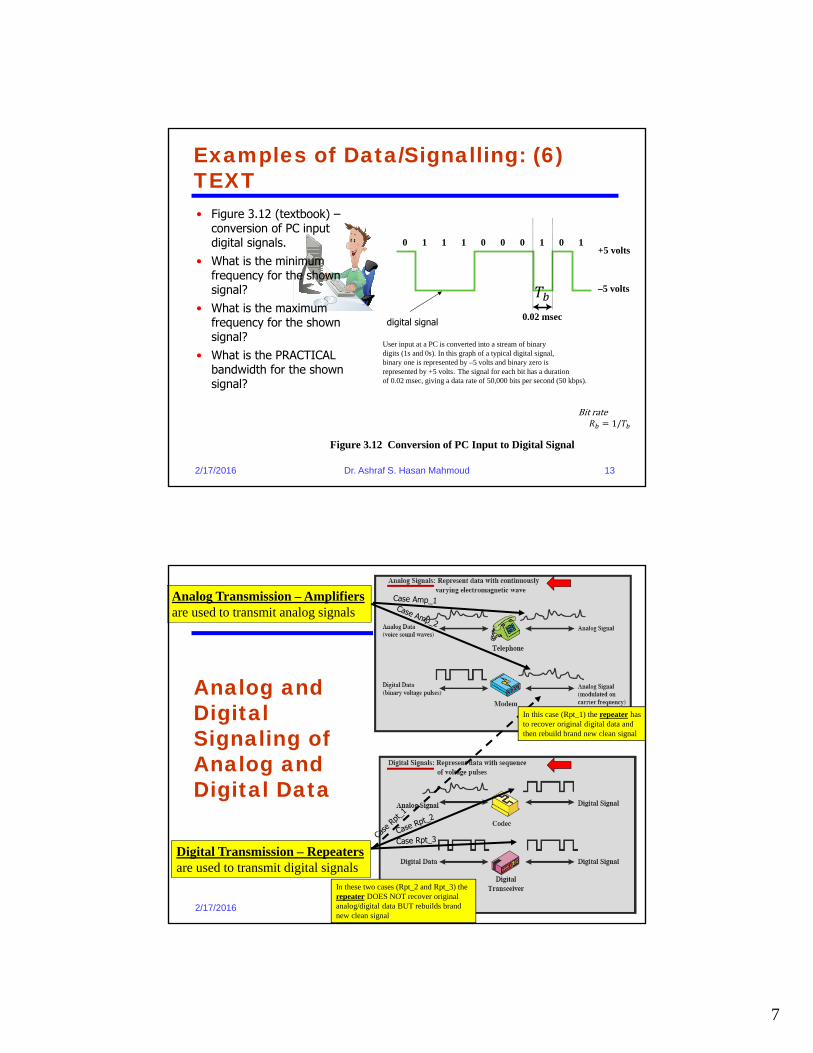
Examples of Data/Signalling: (6) TEXT
User input at a PC is converted into a stream of binarydigits (1s and 0s). In this graph of a typical digital signal,binary one is represented by –5 volts and binary zero isrepresented by +5 volts. The signal for each bit has a durationof 0.02 msec, giving a data rate of 50,000 bits per second (50 kbps).
Figure 3.12 Conversion of PC Input to Digital Signal
0
0.02 msec
1 1 1 0 0 0 1 0 1
–5 volts
+5 volts
• Figure 3.12 (textbook) –conversion of PC input digital signals.
• What is the minimum frequency for the shown signal?
• What is the maximum frequency for the shown signal?
• What is the PRACTICAL bandwidth for the shown signal?
digital signal
Bit rate= 1/
2/17/2016 Dr. Ashraf S. Hasan Mahmoud 14
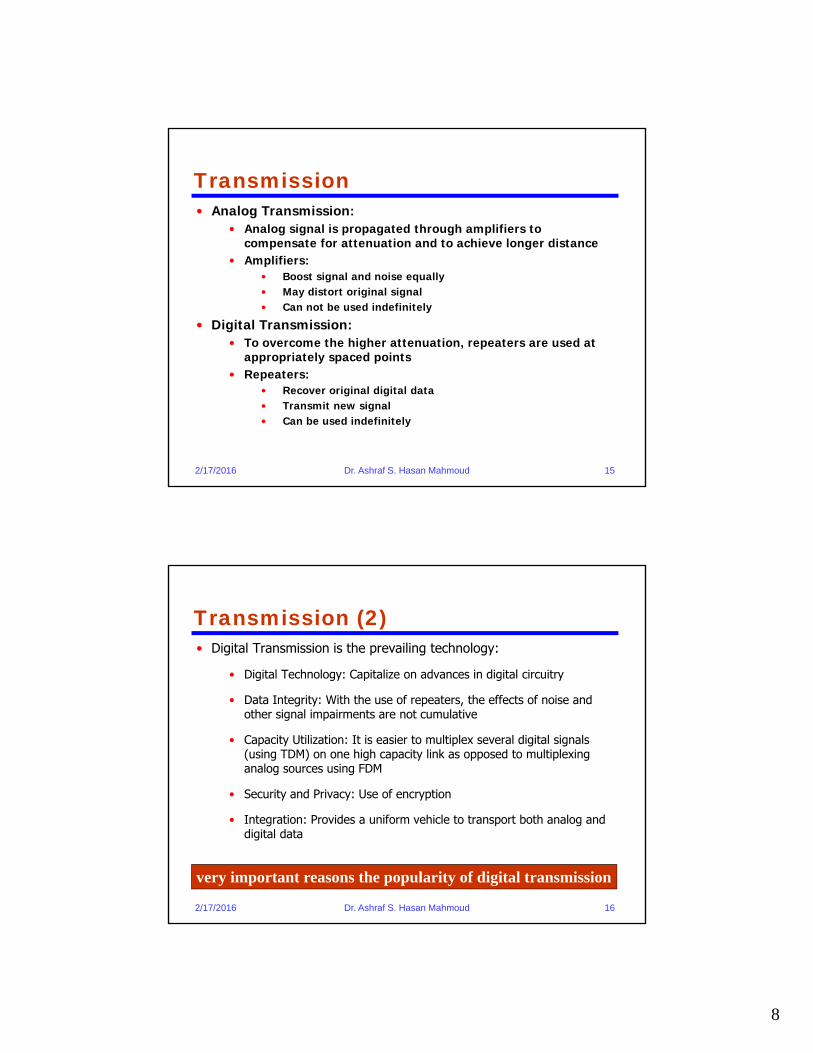
Analog and Digital Signaling of Analog and Digital Data
Analog Transmission – Amplifiersare used to transmit analog signals
Digital Transmission – Repeatersare used to transmit digital signals
In this case (Rpt_1) the repeater has to recover original digital data and then rebuild brand new clean signal
In these two cases (Rpt_2 and Rpt_3) the repeater DOES NOT recover original analog/digital data BUT rebuilds brand new clean signal
8
2/17/2016 Dr. Ashraf S. Hasan Mahmoud 15
Transmission• Analog Transmission:
• Analog signal is propagated through amplifiers to compensate for attenuation and to achieve longer distance
• Amplifiers:• Boost signal and noise equally• May distort original signal• Can not be used indefinitely
• Digital Transmission:• To overcome the higher attenuation, repeaters are used at
appropriately spaced points• Repeaters:
• Recover original digital data• Transmit new signal• Can be used indefinitely
2/17/2016 Dr. Ashraf S. Hasan Mahmoud 16
Transmission (2)• Digital Transmission is the prevailing technology:
• Digital Technology: Capitalize on advances in digital circuitry
• Data Integrity: With the use of repeaters, the effects of noise and other signal impairments are not cumulative
• Capacity Utilization: It is easier to multiplex several digital signals (using TDM) on one high capacity link as opposed to multiplexing analog sources using FDM
• Security and Privacy: Use of encryption
• Integration: Provides a uniform vehicle to transport both analog and digital data
very important reasons the popularity of digital transmission
9
2/17/2016 Dr. Ashraf S. Hasan Mahmoud 17
Asynchronous and Synchronous Transmission - Timing Requirement• Reception of digital data requires sampling of
received signal at receiver Sampling time should be known
• Clock drift (example):• If a receiver clock drifts by 1% every sample time,• Then for Tb = 1μsec, total drift after 50 bit times =
50 X 0.01 = 0.5 μsec• Hence, instead of sampling at the middle of the bit
time, the receiver will sample at the edge of the bit (I.e. receiver is out-of-synch with transmitter clock)
• For correct reception, receiver clock/carrier should be synchronized with transmitter
2/17/2016 Dr. Ashraf S. Hasan Mahmoud 18
Asynchronous Transmission• Exploits: Rx-er can remain for short period in
synch with Tx-er• Used for short stream of bits – data
transmitted one character (5 ~ 8 bits) at a time
• Synchronization is needed to be maintained for the length of short transmission
• Character is delimited (start & end) by known signal elements: start bit – stop element
• Rx-er re-synchs with the arrival of new character
10
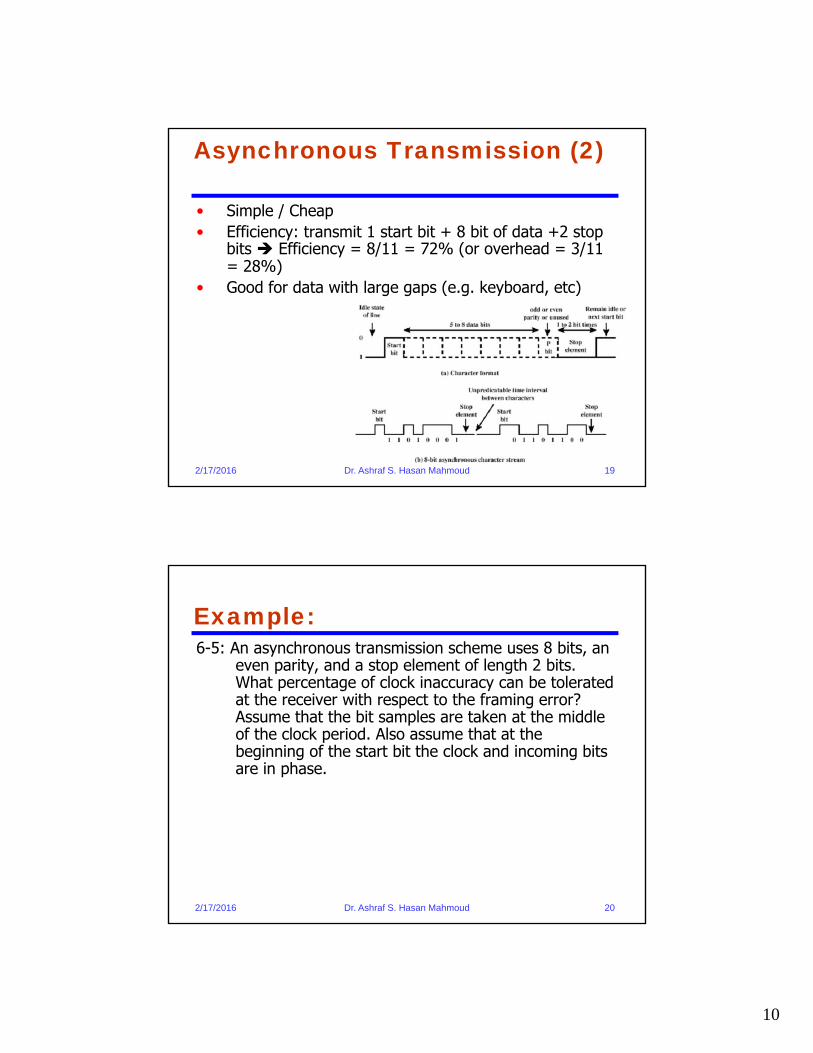
2/17/2016 Dr. Ashraf S. Hasan Mahmoud 19
Asynchronous Transmission (2)
• Simple / Cheap• Efficiency: transmit 1 start bit + 8 bit of data +2 stop
bits Efficiency = 8/11 = 72% (or overhead = 3/11 = 28%)
• Good for data with large gaps (e.g. keyboard, etc)
2/17/2016 Dr. Ashraf S. Hasan Mahmoud 20
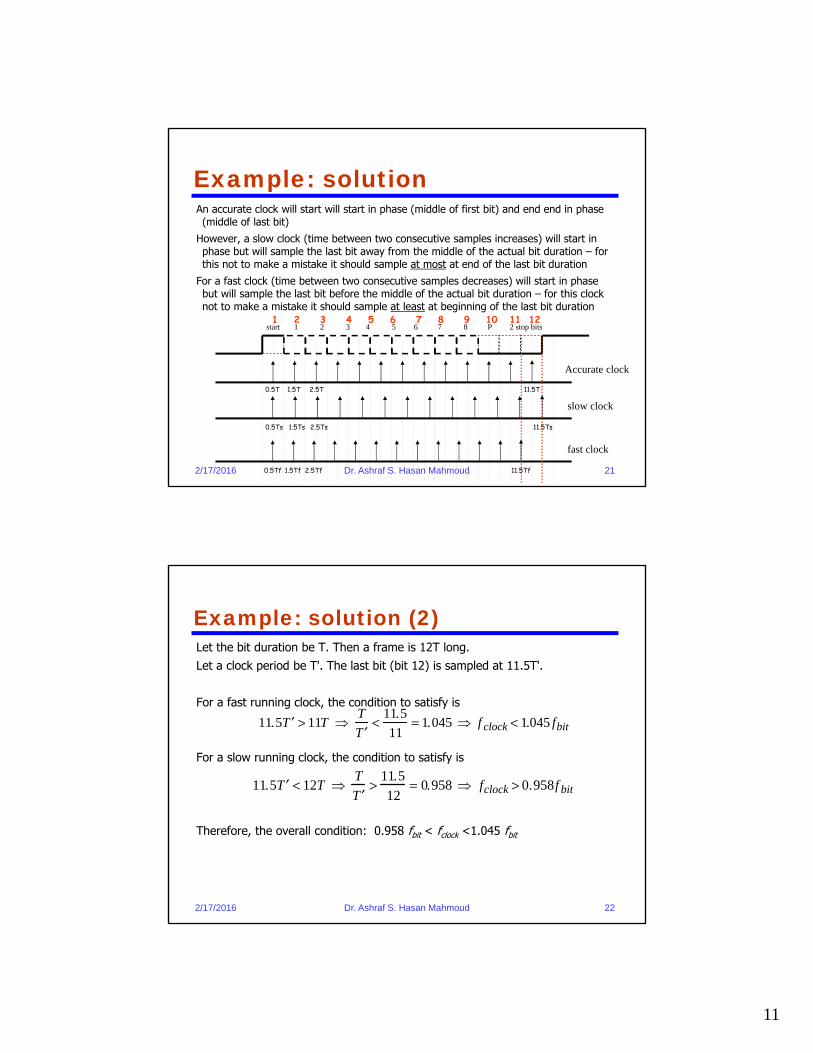
Example:6-5: An asynchronous transmission scheme uses 8 bits, an
even parity, and a stop element of length 2 bits. What percentage of clock inaccuracy can be tolerated at the receiver with respect to the framing error? Assume that the bit samples are taken at the middle of the clock period. Also assume that at the beginning of the start bit the clock and incoming bits are in phase.
11
2/17/2016 Dr. Ashraf S. Hasan Mahmoud 21
Example: solutionAn accurate clock will start will start in phase (middle of first bit) and end end in phase (middle of last bit)
However, a slow clock (time between two consecutive samples increases) will start in phase but will sample the last bit away from the middle of the actual bit duration – for this not to make a mistake it should sample at most at end of the last bit duration
For a fast clock (time between two consecutive samples decreases) will start in phase but will sample the last bit before the middle of the actual bit duration – for this clock not to make a mistake it should sample at least at beginning of the last bit duration
1 2 3 4 5 6 7 8 9 10 11 12start 1 2 3 4 5 6 7 8 P 2 stop bits
Accurate clock
slow clock
fast clock
0.5T 1.5T 2.5T 11.5T
0.5Ts 1.5Ts 2.5Ts 11.5Ts
0.5Tf 1.5Tf 2.5Tf 11.5Tf
2/17/2016 Dr. Ashraf S. Hasan Mahmoud 22
Example: solution (2)Let the bit duration be T. Then a frame is 12T long. Let a clock period be T'. The last bit (bit 12) is sampled at 11.5T'.
For a fast running clock, the condition to satisfy is
For a slow running clock, the condition to satisfy is
Therefore, the overall condition: 0.958 fbit < fclock <1.045 fbit
11.5 ′ T < 12T
T
′ T >
11.5
12= 0.958 fclock > 0.958f bit
11.5 ′ T > 11T
T
′ T <
11.5
11= 1.045 f clock < 1.045 fbit

12
2/17/2016 Dr. Ashraf S. Hasan Mahmoud 23
Synchronous Transmission• What if there is a STEADY STREAM of bits
between Tx-er and Rx-er• Still use the start/stop bits low efficiency• Use synchronous transmission
• Synchronous Techniques:• Provide SEPARATE clock signal
• Expensive and only good for short distances
• Depend on data encoding to extract clock info• E.g. Manchester encoding
2/17/2016 Dr. Ashraf S. Hasan Mahmoud 24
Synchronous Frame Format• Typical Frame Structure
Preamble bit pattern:Indicates start of frame Postamble bit pattern:
Indicates end of frameControl fields: convey control information between Tx-er and Rx-er
Data field: data to be exchanged
data field8-bitflag
8-bitflag
control field control field
• For large data blocks, synchronous transmission is far more efficient than asynchronous:
• E.g. HDLC frame (to be discussed in Chapter 7): 48 bits are used for control, preamble, and postamble – if 1000 bits are used for data efficiency = 99.4% (or overhead = 0.6%)
13
2/17/2016 Dr. Ashraf S. Hasan Mahmoud 25
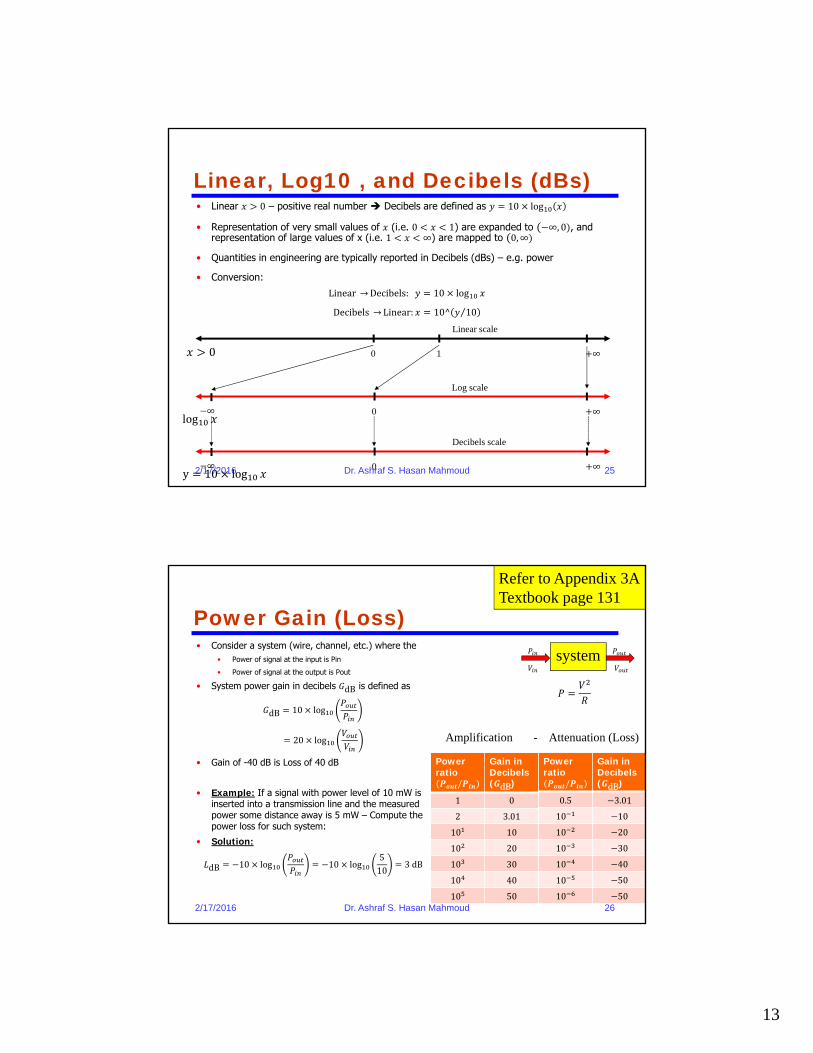
Linear, Log10 , and Decibels (dBs)• Linear > 0 – positive real number Decibels are defined as = 10 × log• Representation of very small values of (i.e. 0 < < 1) are expanded to (−∞, 0), and
representation of large values of x (i.e. 1 < < ∞) are mapped to (0, ∞)• Quantities in engineering are typically reported in Decibels (dBs) – e.g. power
• Conversion: Linear → Decibels: = 10 × logDecibels → Linear: = 10^ 10⁄0 1 +∞> 00 +∞log −∞0 +∞y = 10 × log−∞
Linear scale
Log scale
Decibels scale
2/17/2016 Dr. Ashraf S. Hasan Mahmoud 26
Power Gain (Loss)• Consider a system (wire, channel, etc.) where the
• Power of signal at the input is Pin
• Power of signal at the output is Pout
• System power gain in decibels dB is defined as
dB = 10 × log = 20 × log
• Gain of -40 dB is Loss of 40 dB
• Example: If a signal with power level of 10 mW is inserted into a transmission line and the measured power some distance away is 5 mW – Compute the power loss for such system:
• Solution:dB = −10 × log = −10 × log 510 = 3 dB
Power ratio / Gain in
Decibels ( dB)1 02 3.0110 1010 2010 3010 4010 50
Power ratio / Gain in
Decibels ( dB)0.5 −3.0110 −1010 −2010 −3010 −4010 −5010 −50
Amplification - Attenuation (Loss)
system
=
Refer to Appendix 3ATextbook page 131
14
2/17/2016 Dr. Ashraf S. Hasan Mahmoud 27
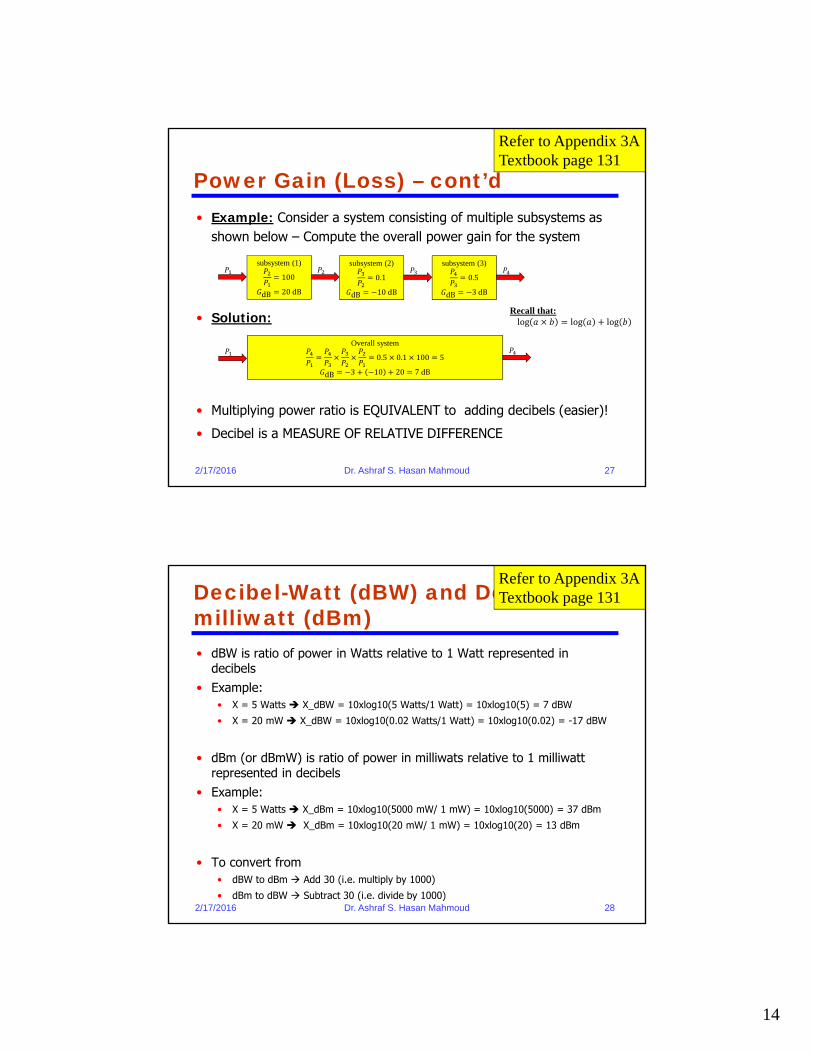
Power Gain (Loss) – cont’d• Example: Consider a system consisting of multiple subsystems as
shown below – Compute the overall power gain for the system
• Solution:
• Multiplying power ratio is EQUIVALENT to adding decibels (easier)!
• Decibel is a MEASURE OF RELATIVE DIFFERENCE
subsystem (1)= 100dB = 20 dBsubsystem (2)= 0.1dB = −10 dB
subsystem (3)= 0.5dB = −3 dBOverall system= × × = 0.5 × 0.1 × 100 = 5dB = −3 + −10 + 20 = 7 dB
Refer to Appendix 3ATextbook page 131
Recall that:log × = log + log
2/17/2016 Dr. Ashraf S. Hasan Mahmoud 28
Decibel-Watt (dBW) and Decibel-milliwatt (dBm)• dBW is ratio of power in Watts relative to 1 Watt represented in
decibels• Example:
• X = 5 Watts X_dBW = 10xlog10(5 Watts/1 Watt) = 10xlog10(5) = 7 dBW
• X = 20 mW X_dBW = 10xlog10(0.02 Watts/1 Watt) = 10xlog10(0.02) = -17 dBW
• dBm (or dBmW) is ratio of power in milliwats relative to 1 milliwattrepresented in decibels
• Example:• X = 5 Watts X_dBm = 10xlog10(5000 mW/ 1 mW) = 10xlog10(5000) = 37 dBm
• X = 20 mW X_dBm = 10xlog10(20 mW/ 1 mW) = 10xlog10(20) = 13 dBm
• To convert from • dBW to dBm Add 30 (i.e. multiply by 1000)
• dBm to dBW Subtract 30 (i.e. divide by 1000)
Refer to Appendix 3ATextbook page 131
15
2/17/2016 Dr. Ashraf S. Hasan Mahmoud 29
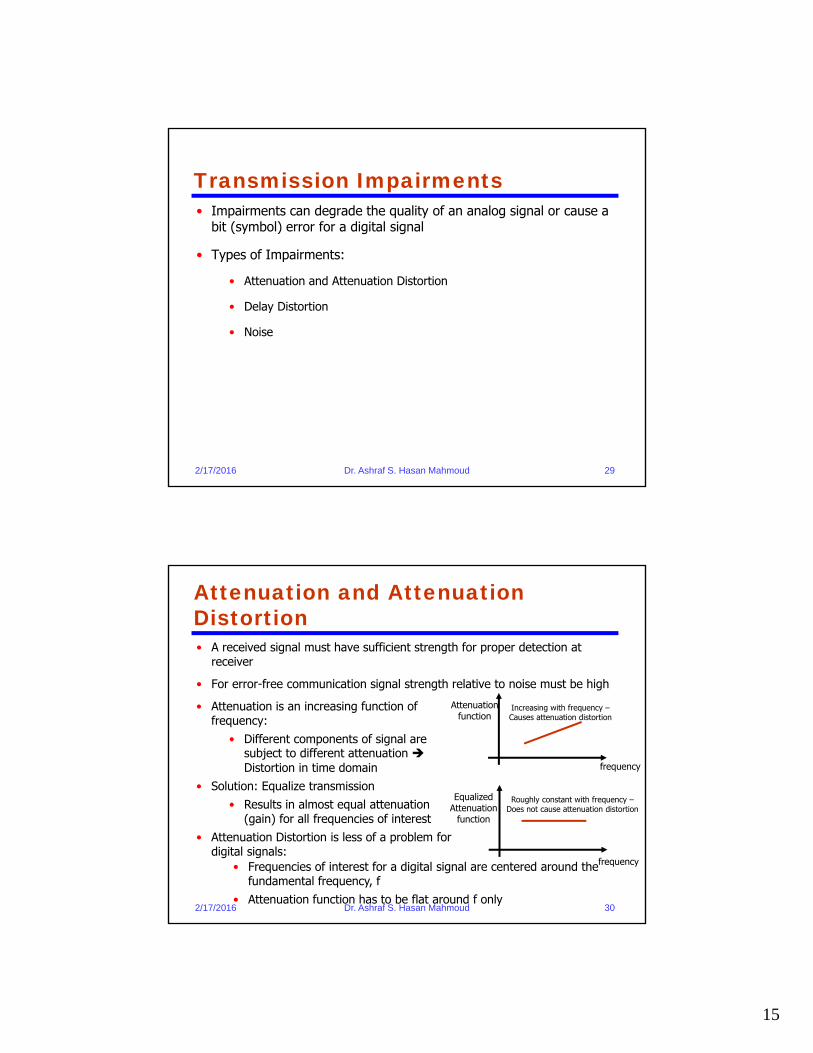
Transmission Impairments• Impairments can degrade the quality of an analog signal or cause a
bit (symbol) error for a digital signal
• Types of Impairments:
• Attenuation and Attenuation Distortion
• Delay Distortion
• Noise
2/17/2016 Dr. Ashraf S. Hasan Mahmoud 30
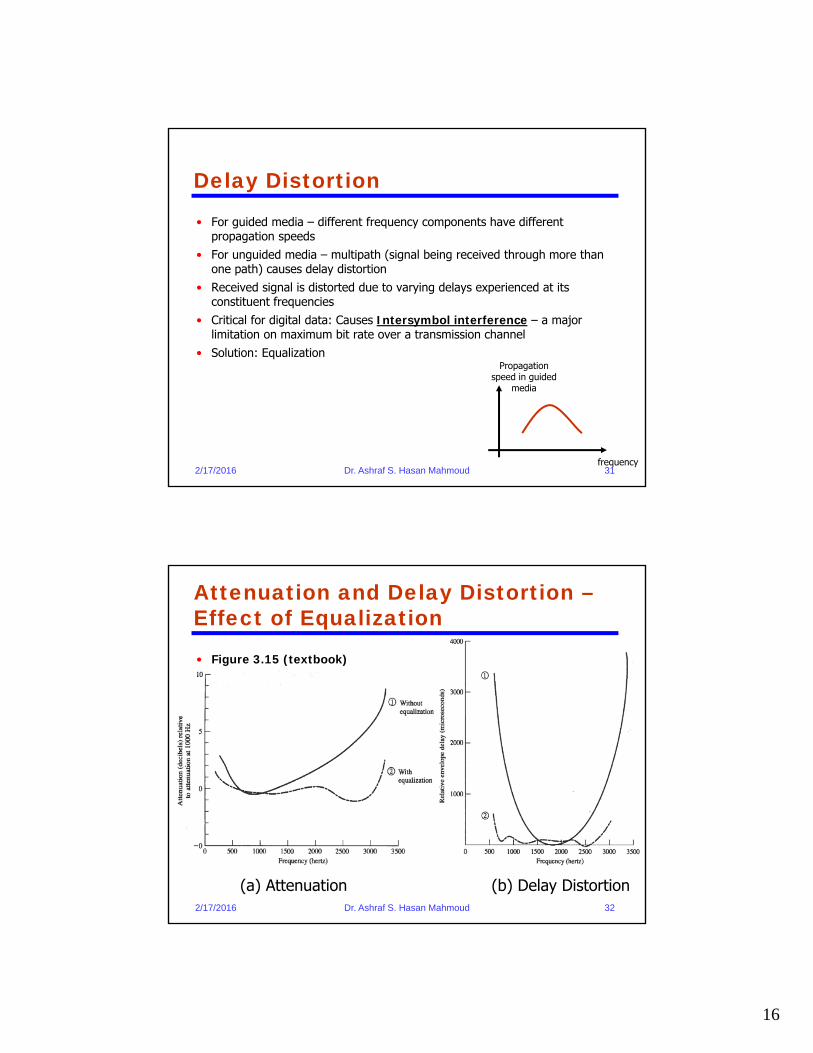
Attenuation and Attenuation Distortion• A received signal must have sufficient strength for proper detection at
receiver
• For error-free communication signal strength relative to noise must be high
frequency
Attenuationfunction
Increasing with frequency –Causes attenuation distortion
EqualizedAttenuation
function
Roughly constant with frequency –Does not cause attenuation distortion
frequency
• Attenuation is an increasing function of frequency:
• Different components of signal are subject to different attenuation Distortion in time domain
• Solution: Equalize transmission• Results in almost equal attenuation
(gain) for all frequencies of interest• Attenuation Distortion is less of a problem for
digital signals:• Frequencies of interest for a digital signal are centered around the
fundamental frequency, f• Attenuation function has to be flat around f only
16
2/17/2016 Dr. Ashraf S. Hasan Mahmoud 31
Delay Distortion
• For guided media – different frequency components have different propagation speeds
• For unguided media – multipath (signal being received through more than one path) causes delay distortion
• Received signal is distorted due to varying delays experienced at its constituent frequencies
• Critical for digital data: Causes Intersymbol interference – a major limitation on maximum bit rate over a transmission channel
• Solution: EqualizationPropagation
speed in guidedmedia
frequency
2/17/2016 Dr. Ashraf S. Hasan Mahmoud 32
Attenuation and Delay Distortion –Effect of Equalization
• Figure 3.15 (textbook)
(a) Attenuation (b) Delay Distortion

17
2/17/2016 Dr. Ashraf S. Hasan Mahmoud 33
Noise
• Major limiting factor in communication system performance
• Types of Noise:
• Thermal Noise
• Intermodulation Noise
• Crosstalk
• Impulse Noise
2/17/2016 Dr. Ashraf S. Hasan Mahmoud 34
Thermal Noise• Due to agitation of electrons
• Function of temperature (energy of electrons)
• Can not be eliminated limits communication system performance
• Noise power density (noise power found in 1 Hz) , N0, is given by
No = kT (Watts/Hz)
Where k is Boltzman constant = 1.3803x10⁻²³ J/degree Kelvin
T is the temperature in degrees Kelvin
• Hence, the thermal noise power in a bandwidth B Hz is given by
N = N0 x B = kT x B (Watts)
• In decibels:
NdB = 10logk + 10logT + 10logB
= -228.6 dBW + 10logT + 10logB
Noise PowerDensity
frequency
N0 – density level
N – noise power(area under N0 in the band B)
B Hz
18
2/17/2016 Dr. Ashraf S. Hasan Mahmoud 35
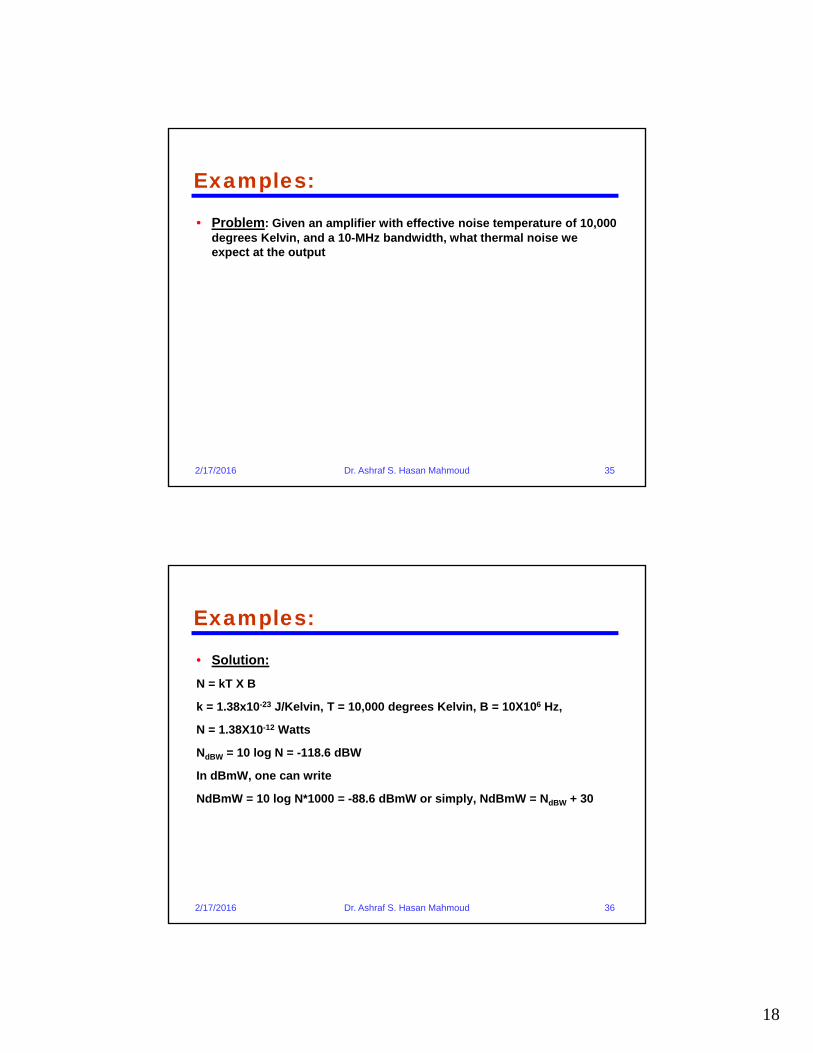
Examples:
• Problem: Given an amplifier with effective noise temperature of 10,000 degrees Kelvin, and a 10-MHz bandwidth, what thermal noise we expect at the output
2/17/2016 Dr. Ashraf S. Hasan Mahmoud 36
Examples:
• Solution:
N = kT X B
k = 1.38x10⁻²³ J/Kelvin, T = 10,000 degrees Kelvin, B = 10X106 Hz,
N = 1.38X10⁻¹² Watts
NdBW = 10 log N = -118.6 dBW
In dBmW, one can write
NdBmW = 10 log N*1000 = -88.6 dBmW or simply, NdBmW = NdBW + 30
19
2/17/2016 Dr. Ashraf S. Hasan Mahmoud 37
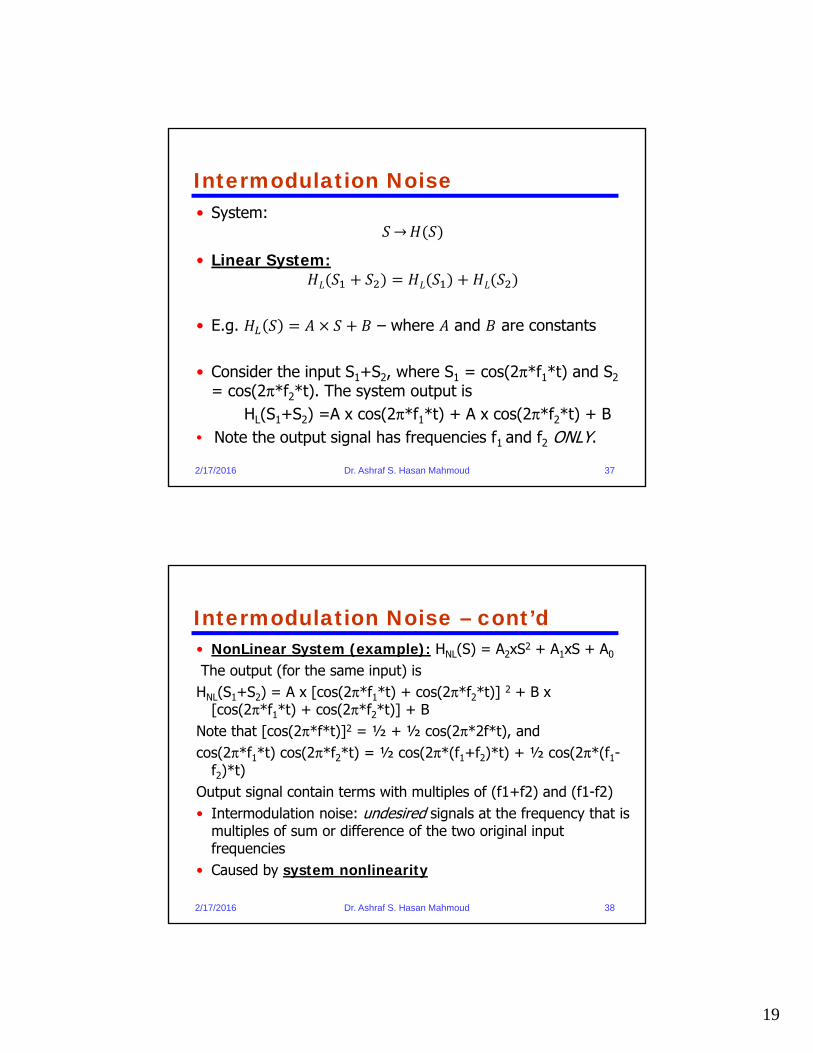
Intermodulation Noise• System: → ( )• Linear System:( + ) = ( ) + ( )• E.g. = × + – where and are constants
• Consider the input S1+S2, where S1 = cos(2π*f1*t) and S2= cos(2π*f2*t). The system output is
HL(S1+S2) =A x cos(2π*f1*t) + A x cos(2π*f2*t) + B• Note the output signal has frequencies f1 and f2 ONLY.
2/17/2016 Dr. Ashraf S. Hasan Mahmoud 38
Intermodulation Noise – cont’d• NonLinear System (example): HNL(S) = A2xS2 + A1xS + A0
The output (for the same input) isHNL(S1+S2) = A x [cos(2π*f1*t) + cos(2π*f2*t)] 2 + B x
[cos(2π*f1*t) + cos(2π*f2*t)] + BNote that [cos(2π*f*t)]2 = ½ + ½ cos(2π*2f*t), andcos(2π*f1*t) cos(2π*f2*t) = ½ cos(2π*(f1+f2)*t) + ½ cos(2π*(f1-
f2)*t) Output signal contain terms with multiples of (f1+f2) and (f1-f2)• Intermodulation noise: undesired signals at the frequency that is
multiples of sum or difference of the two original input frequencies
• Caused by system nonlinearity
20
2/17/2016 Dr. Ashraf S. Hasan Mahmoud 39
Crosstalk/Impulse Noise• Crosstalk:
• Unwanted coupling between signal paths• E.g. electrical coupling between near by twisted pair wires• Coax cables are more immune to cross talk compared to twisted
pairs
• Impulse Noise:• Unlike previous types of noise, this one is:• Noncontinuous – irregular pulses or spikes for short duration
and high amplitude• Causes:
• Lightening
• Faults or flaws in communication systems
• Major concern for digital data
2/17/2016 Dr. Ashraf S. Hasan Mahmoud 40
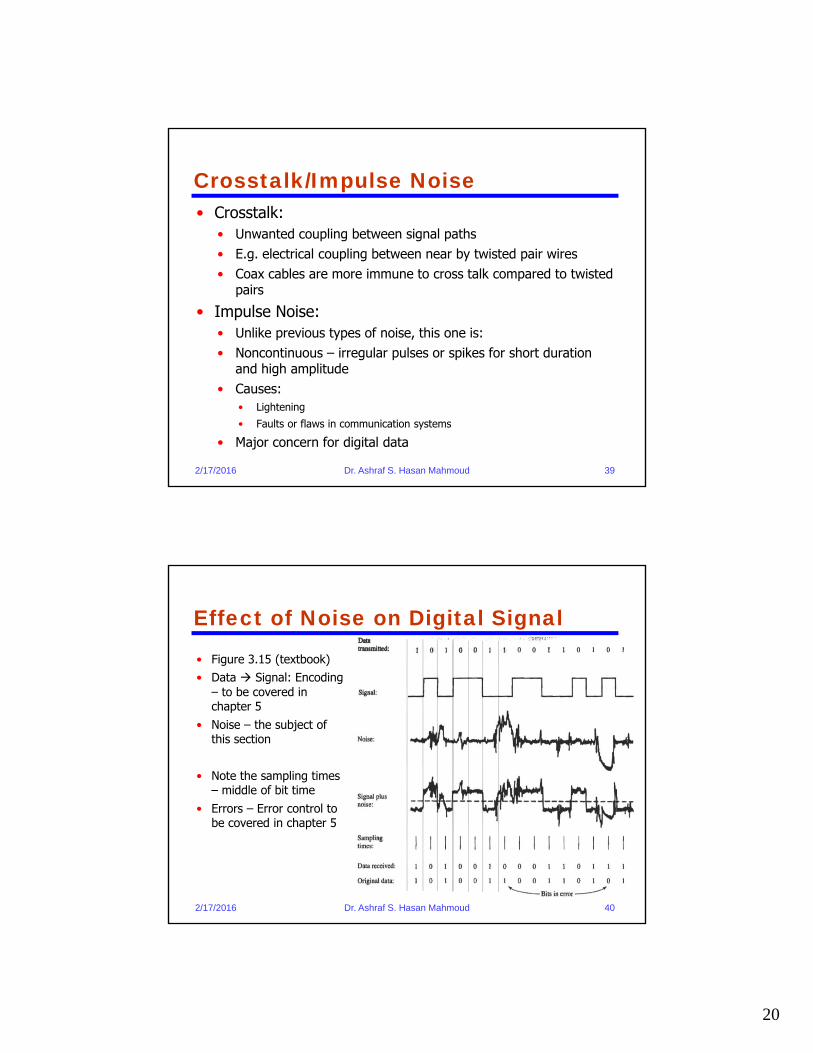
Effect of Noise on Digital Signal
• Figure 3.15 (textbook)• Data Signal: Encoding
– to be covered in chapter 5
• Noise – the subject of this section
• Note the sampling times – middle of bit time
• Errors – Error control to be covered in chapter 5
21
2/17/2016 Dr. Ashraf S. Hasan Mahmoud 41
Channel Capacity
• Terminology:
• Data Rate ( R): bit rate of channel – bits per second
• Bandwidth (B): bandwidth of transmitted signal – Hz
• Noise power (N): average noise power level for communication channel –Watt/Hz for density or Watt for noise power
• Error rate (Pe): rate at which an erroneous detection is made (detecting 0 for 1 and 1 for 0)
Rate
BandwidthB
PowerSNR
2/17/2016 Dr. Ashraf S. Hasan Mahmoud 42
Nyquist Bandwidth• For a noise-free channel data rate is limited by B of channel
• A bandwidth of 1Hz is enough to support 2 symbols/second (i.e. bauds)
• B Hz is enough to support 2B symbols/second or bauds
• Example: B = 3100 Hz (telephone channel) C = 6200 b/s
• What if we use multilevel signaling :
C = 2B log2M
where M is the number of discrete levels used
• Example: for M = 8, same telephone channel can support C = 2X3100X log28 = 18.6 kb/s
• M = 2 – receiver recognizes two signal levels 1s and 0s
• M > 2 – receiver recognizes discrete levels other than 1 and 0
• In general, multilevel signaling requires more sophisticated receiver structure and perhaps more power for the same bandwidth
22
2/17/2016 Dr. Ashraf S. Hasan Mahmoud 43
Shannon Capacity Formula
• Capacity in the presence of noise = log2(1 + )where SNR is the ratio of signal power to noise power – a measure of the
signal quality
• Example 3.6: fmin = 3 MHz, fmax = 4 MHz, SNR = 24 dB, C = ?
B = 4 – 3 = 1 MHz
SNR = 1024/10 = 251 (on the linear scale)
C = 1X10⁶ log2(1 + 251) ~ 8 X 10⁶ b/s or 8 M b/s
One can also calculate the required signaling levels, M, using Nyquist formula: C = 2B log2(M) M = 2 C/(2B) = 16
• Note the C (calculated by Shannon formula) is the theoretical (error-free) limit of the channel for the given B and SNR
dB = 10 log signal powernoise power
2/17/2016 Dr. Ashraf S. Hasan Mahmoud 44
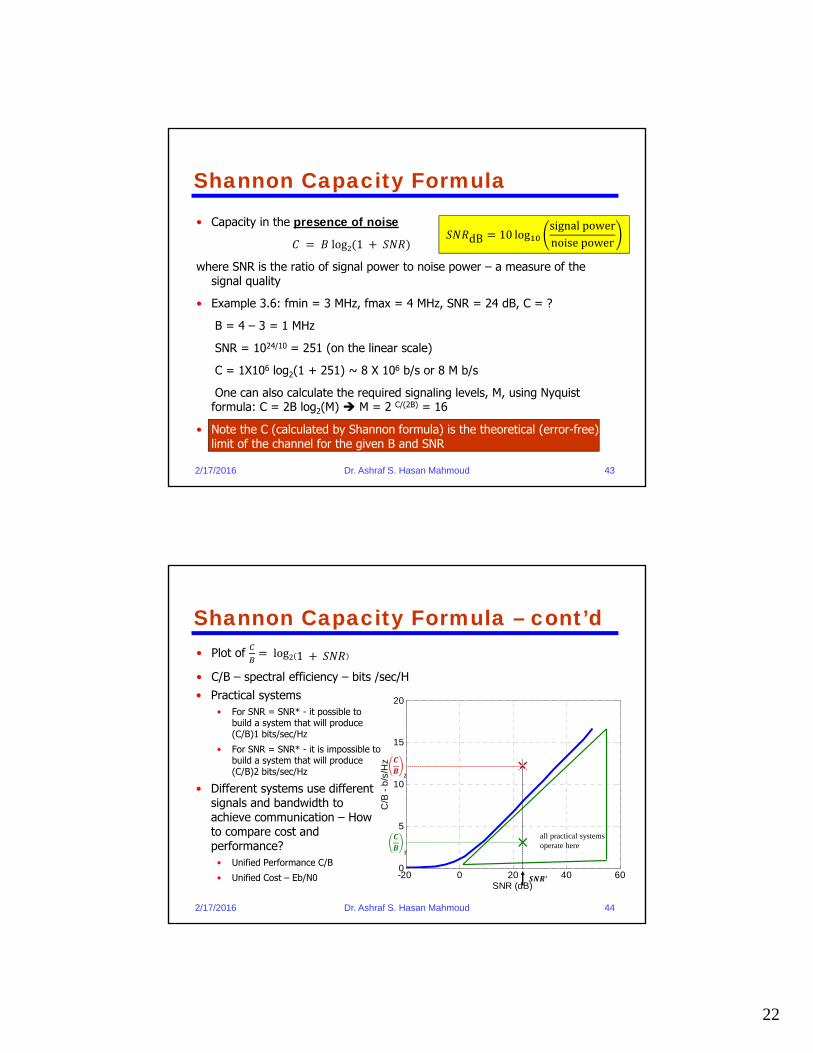
Shannon Capacity Formula – cont’d
• Practical systems• For SNR = SNR* - it possible to
build a system that will produce (C/B)1 bits/sec/Hz
• For SNR = SNR* - it is impossible to build a system that will produce (C/B)2 bits/sec/Hz
• Different systems use different signals and bandwidth to achieve communication – How to compare cost and performance?
• Unified Performance C/B
• Unified Cost – Eb/N0 -20 0 20 40 600
5
10
15
20
SNR (dB)
C/B
- b
/s/H
z
all practical systemsoperate here
∗
• Plot of = log2 1 + • C/B – spectral efficiency – bits /sec/H
23
2/17/2016 Dr. Ashraf S. Hasan Mahmoud 45
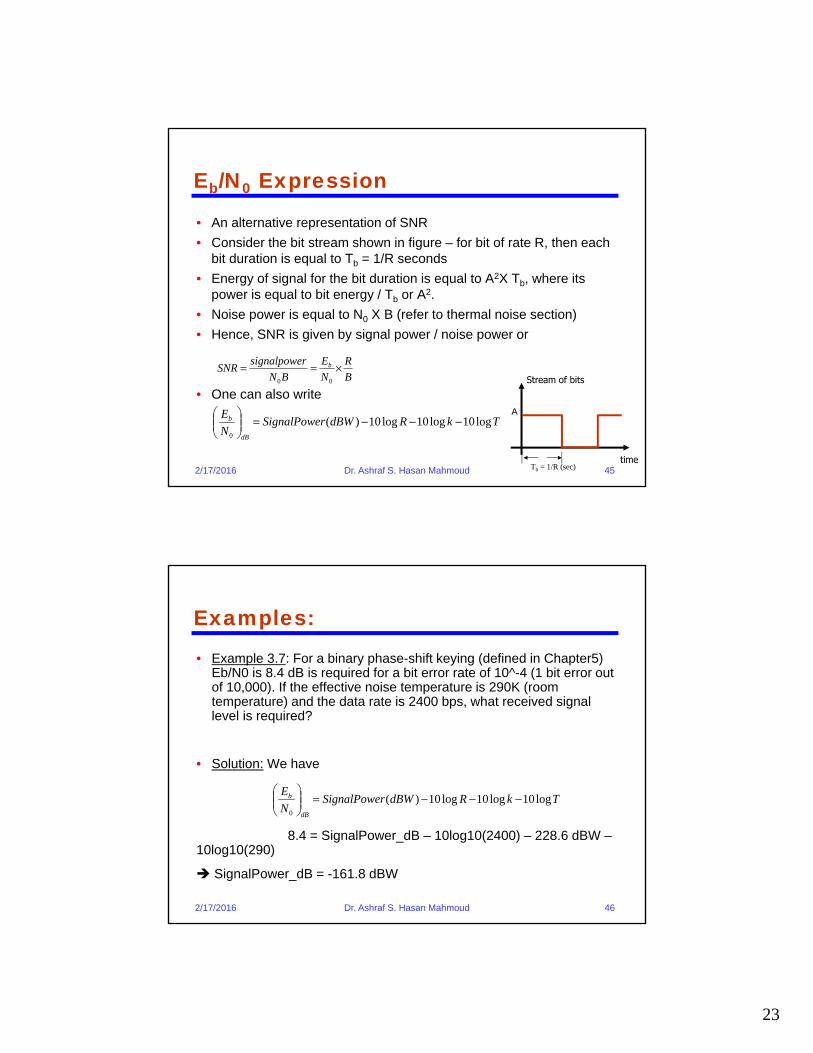
Eb/N0 Expression
• An alternative representation of SNR
• Consider the bit stream shown in figure – for bit of rate R, then each bit duration is equal to Tb = 1/R seconds
• Energy of signal for the bit duration is equal to A2X Tb, where its power is equal to bit energy / Tb or A2.
• Noise power is equal to N0 X B (refer to thermal noise section)
• Hence, SNR is given by signal power / noise power or
• One can also writeStream of bits
timeTb = 1/R (sec)
ATkRdBWrSignalPowe
N
E
dB
b log10log10log10)(0
−−−=
B
R
N
E
BN
rsignalpoweSNR b ×==
00
2/17/2016 Dr. Ashraf S. Hasan Mahmoud 46
Examples:
• Example 3.7: For a binary phase-shift keying (defined in Chapter5) Eb/N0 is 8.4 dB is required for a bit error rate of 10^-4 (1 bit error out of 10,000). If the effective noise temperature is 290K (room temperature) and the data rate is 2400 bps, what received signal level is required?
• Solution: We have
8.4 = SignalPower_dB – 10log10(2400) – 228.6 dBW –10log10(290)
SignalPower_dB = -161.8 dBW
TkRdBWrSignalPoweN
E
dB
b log10log10log10)(0
−−−=

24
2/17/2016 Dr. Ashraf S. Hasan Mahmoud 47
Examples:
• Problem: If the received signal level for a particular digital system is -151 dBW and the receiver system effective noise temperature is 1500 degrees Kelvin. What is the Eb/N0 for a link transmitting 2400 b/s
2/17/2016 Dr. Ashraf S. Hasan Mahmoud 48
Examples:
• Solution:
Eb/No = (signal power / noise power) * (B/R)
Noise power = kT X B
Hence Eb/No = (signal power) / (kT R)
= 10-151/10 / (1.38X10-23X1500X2400)
= 15.99
= 12 dB
Or (Eb/N0)dB = Signalpower_dBW – 10logk – 10logT – 10logR
= -151 -10log(1.3810-23) – 10log1500 -10log2400
= 12 dB
25
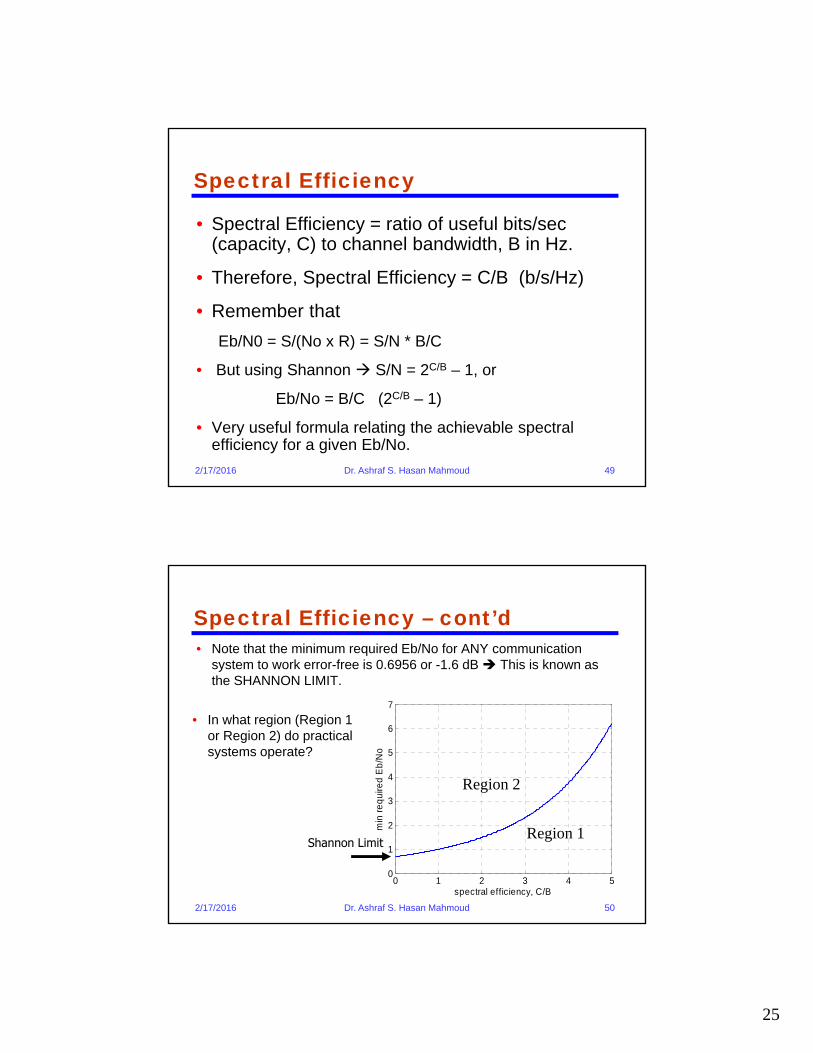
2/17/2016 Dr. Ashraf S. Hasan Mahmoud 49
Spectral Efficiency
• Spectral Efficiency = ratio of useful bits/sec (capacity, C) to channel bandwidth, B in Hz.
• Therefore, Spectral Efficiency = C/B (b/s/Hz)
• Remember that
Eb/N0 = S/(No x R) = S/N * B/C
• But using Shannon S/N = 2C/B – 1, or
Eb/No = B/C (2C/B – 1)
• Very useful formula relating the achievable spectral efficiency for a given Eb/No.
2/17/2016 Dr. Ashraf S. Hasan Mahmoud 50
Spectral Efficiency – cont’d• Note that the minimum required Eb/No for ANY communication
system to work error-free is 0.6956 or -1.6 dB This is known as the SHANNON LIMIT.
0 1 2 3 4 50
1
2
3
4
5
6
7
spectral efficiency, C/B
min
re
qu
ired
Eb
/No
Shannon Limit
• In what region (Region 1 or Region 2) do practical systems operate?
Region 2
Region 1