LECTURE NOTES For Health Science Students
417
LECTURE NOTES For Health Science Students Ecology Argaw Ambelu (BSc, MSc), Bishaw Deboch (BSc, MSc), Dechassa Lenjissa (BSc) Jimma University In collaboration with the Ethiopia Public Health Training Initiative, The Carter Center, the Ethiopia Ministry of Health, and the Ethiopia Ministry of Education 2007
Transcript of LECTURE NOTES For Health Science Students

LECTURE NOTES
For Health Science Students
Ecology
Argaw Ambelu (BSc, MSc), Bishaw Deboch (BSc, MSc),
Dechassa Lenjissa (BSc)
Jimma University
In collaboration with the Ethiopia Public Health Training Initiative, The Carter Center, the Ethiopia Ministry of Health, and the Ethiopia Ministry of Education
2007

Funded under USAID Cooperative Agreement No. 663-A-00-00-0358-00.
Produced in collaboration with the Ethiopia Public Health Training Initiative, The Carter Center, the Ethiopia Ministry of Health, and the Ethiopia Ministry of Education.
Important Guidelines for Printing and PhotocopyingLimited permission is granted free of charge to print or photocopy all pages of this publication for educational, not-for-profit use by health care workers, students or faculty. All copies must retain all author credits and copyright notices included in the original document. Under no circumstances is it permissible to sell or distribute on a commercial basis, or to claim authorship of, copies of material reproduced from this publication.
©2007 by Argaw Ambelu (BSc, MSc), Bishaw Deboch (BSc, MSc),
Dechassa Lenjissa (BSc)
All rights reserved. Except as expressly provided above, no part of this publication may be reproduced or transmitted in any form or by any means, electronic or mechanical, including photocopying, recording, or by any information storage and retrieval system, without written permission of the author or authors.
This material is intended for educational use only by practicing health care workers or students and faculty in a health care field.

i
PrefaceThe lecture note on “Ecology” is prepared inline with the
set curriculum, which is currently in use in health
professionals training institutions.
The lecture note is intended for use in an introductory
course on Ecology. It is therefore, important for students
and instructors who deal with the course to use as a
reference material.
The points in this lecture note are compiled from different
books that are published by different authors and also
from internet. Even though there are hardly enough
published materials on local problems, efforts are made
to make this material relevant to local situations
The lecture note is organized into ten chapters. The first
three chapters focus on such introductory points as the
definition and scope of ecology, environmental problems
that are induced by human activities, ecological
principles and how energy flow and materials cycle in the
ecosystem.
The next four chapters deal with radiation ecology,
Biosphere, population dynamics and Biosphere

ii
pollutions. These chapters provides foundations for the
understanding of law of thermodynamics, energy
interactions in the atmosphere, global energy balance,
components of biosphere, how the size of population
changes and what factors affect population growth and
also how different environmental media get polluted.
The text is concluded with three chapters that deal with
natural resource conservation, environmental impact
assessment and ecological informatics. Ecological
informatics is currently the vital science in the area of
ecological data analysis and interpretation.
Finally, the authors will wholeheartedly accept
suggestions from reviewers and readers to improve the
material.
Acknowledgement

iii
We would like to extend our deepest gratitude to the
Carter Center for supporting the preparation of this
lecture note.
We also extend many thanks to local and nation
reviewers.
We would also like to share our appreciation to Ato Aklilu
Mulugeta, the staff the Carter Center, for his devoted
support throughout the preparation of this lecture note.
Last but not least, we thank all our public Health Faculty
authorities for permission to work on this lecture note
besides the routine activities of the Faculty.

iv
Table of contents............................................................................Preface i
..............................................................Acknowledgement iii...............................................................Table of Contents iv
......................................................................List of Tables x....................................................................List of Figures xi
CHAPTER-ONE: .INTRODUCTION TO ECOLOGY…….. 11. .........................................Learning Objectives 1
2. ..Emergence, Definition and Scope of Ecology 1
2.1. .................Emergence and Definition 1
2.2. .................................................Scope 3
3. ..............................................Review Question 5
CHAPTER TWO: ECOLOGICAL PRINCIPLES 6
.1 ............................................Learning Objectives 6
.2 ...............................................Definition of Terms 6
.3 ..........................................................Introduction 7
.4 ................................................Biotic Community 8
.5 .........................................Ecological dominance 10
.6 ................................................................Biomes 11
.6.1 ................................Terrestrial Biomes 12
v
.6.2 ....................................Aquatic Biomes 16
.7 .........................................Ecological succession 29
.7.1 .............................................Adaptation 32
.7.2 Organism Respond to External Environment 33
.7.3 ..............Adaptive strategies of animals 34
.8 ................................................Range and Limits 35
.8.1 Liebig’s Law (Law of the Minimum) 36
.8.2 Shelford’s Law (Law of tolerance) 37
.9 .................................Habitat and Ecologic Niche 40
.9.1 ..................................................Habitat 41
.9.2 ......................................Ecologic Niche 41
.10 ...............................................Review Questions 44
.11 ........................................................Bibliography 45
CHAPTER THREE: ....................................ECOSYSTEM 46
.....................................................3.1 Learning Objectives 46.2 ....................................................... Definition of terms 46
.3 .......................................The Processes of Ecosystem 49
.4 .....................................................Types of Ecosystem 53
................................3.4.1 City as ecosystem 53..................................3.4.2 Agro-ecosystems 53

vi
.5 ...........................................Components of Ecosystem 581. ..Non-living Components of Ecosystem 58
.2 Living component of ecosystem 60
.6 ................................Structure of the ecosystem 64
.1 ..........................Trophic organization 64
.7 ....................................Functions of ecosystem 73
.7.1 .......................................Energy flow 73
.7.2 .....................Biogeochemical cycling 75
.8 ...................................Review Questions 122
.9 .............................................Bibliography 123
CHAPTER FOUR: ........................................BIOSPHERE 125.1 .................................................learning Objectives 125
.2 .............................................................Introduction 125
.3 ......................................Components of Biosphere 128
.3.1 ..........................................The Lithosphere 128
.3.2 ...............................................Hydrosphere 129
.3.3 ................................................Atmosphere 146
.4 ...................................................Review questions 161
.5 ...........................................................Bibliography 162
CHAPTER FIVE: ....................BIOSPHERE POLLUTION 163
.1 .......................................................Learning Objective 163

vii
.2 ....................................................................Definitions 164
.3 ...................................................................Introduction 165
.4 Human Activities Affecting Health and the environment 166
.4.1 Household Wastes 167........................................................5.4.2 Fresh Water 168
..............5.4.3 Land use and Agricultural development 171...................................................5.4.4 Industrialization 171
.................................................................5.4.5 Energy 172..............5.4.6 Environmental threats to human health 173
.5 ..............................Pesticides as biosphere pollutant 219
.5.1Inorganic pesticides 220
.5.2Botanical 220
.5.3Chlorinated hydrocarbons 221
.......................................5.5.4 Organophosphates 221.5.4Carbamates 222.6 ....................................Pesticide Benefites 222
.6 .........................Fertilizer as biosphere pollutants 224
.7 ...........................................Radioactive Materials 228
.1 ......................................Radioactivity 228
.2 .......Category of Radioactive Wastes 231
.8 ..................Prevention and control of Pollution 241
.9 ............................................Review questions 243
.10 .....................................................Bibliography 245

viii
CHAPTER SIX: ......................POPULATION DYNAMICS 246
.1 .....................................................Learning Objectives 246
.2 ...................................................................Introduction 247
.3 ...................Factors that cause populations to change 248
.3.1Density-Dependent Factors 248
.3.2Density –independent Factors 249
.4 .......................................................Population Growth 259
.4.1 Exponential Population Growth 260
.4.2 Sigmoid or S-shaped Population Growth262
.5 .........................................Limits to Population Growth 265
.6 ...........................................Human Population Growth 266
.6.1 major causes of Human Population change270
.6.2 Regional differences 271
.6.3 Demographic Transition 272
.6.4 Human Population Growth In Ethiopia 276
.6.5 Population Distribution 278
.7 .........................................................Review questions 281
.8 .................................................................Bibliography 282
CHAPTER SEVEN: . NATURAL RESOURCE CONSERVATION 283
.1Learning Objectives 283
.2Definition of Terms 283
ix
.3Introduction 284
.4Types of Natural Resources 286
.4.1Forest Resources 286
.4.2 Consequences of forest Destruction 288
.5 ..........................................................Mineral Resources 290
.6 .............................................................Soil Resources 291
.7 .......................................................Energy Resources 293
.7.1 Biofuel as energy source (Case study) 296
.8 .............................Conservation of Natural Resources 297
.8.1 The aim of conservation is Twofold 298
.8.2 Conservation of Natural Resources in Ethiopia 301
.8.3 Conservation of species 302
.8.4 Causes for the threats to species 303
.8.5 Importance of Saving Species 306
.8.6 Examples of Endangered species in Ethiopia 308
.8.7 Solution to the crisis of endangered species 313
.8.8 Strategies 314
.8.9 Key note 315

x
.8.10 Review questions 316
.8.11 Bibliography 317
...................CHAPTER EIGHT: RADIATION ECOLOGY 318
.1 .....................................................Learning Objectives 318
.2 ............................................ Laws of thermodynamics 318
.3 ....................................The electromagnetic Spectrum 319
.4 ...........................................Electromagnetic Radiation 320
.5 ....................Energy sources and Radiation Principles 330
.6 ..........................Energy interaction in the Atmosphere 330
.6.1 Scattering 330
.6.2 Absorption 336
.6.3 Refraction 337
.7 .................................................Global energy Balance 338
.8 ..........................................The Radiation Environment 338
.9 ...................................Composition of Solar Radiation 341
.10 Review questions 343
.11 Bibliography 344
CHAPTER NINE: .............ECOLOGICAL INFORMATICS 345
.1 .....................................................Learning Objectives 345
.2 ...................................................................Informatics 345

xi
.3 .....................................................Origin of Informatics 346
.4 ..............................Definition of Ecological Informatics 348
.5 ...........................Importance of Ecological Informatics 349
.6 .......................................Aim of Ecological Informatics 351
.7 ..................Distinct Features of Ecological Informatics 353
.8 ...................................Scope of Ecological informatics 353
.9 .........................................Ecological Informatics Links 356
.10 Review questions 358
.11 Bibliography 359
...CHAPTER TEN: Environmental Impact Assessment 360
1. Learning Objectives 3602. ......................................Definition of Terms 3613. .................................................Introduction 3634. Challenges of EIA Practice in Developing
.....................................................countries 3655. Procedure of an environmental Impact
................................................Assessment 3666. Benefits of Applying environmental Impact
...........................Assessment to Proposals 3737. Risks of not applying environmental Impact
..............Assessment properly to proposals 3748. ...................Preliminary Assessment in EIA 374
.11.1 Registration 374
.11.2 Screening 375

xii
.11.3 Project Alternatives 377
.11.4 Scoping 3799. ..................................Project cycle and EIA 38610. ...............EIA and Stakeholder Involvement 387
1. .....Why Stakeholder Involvement 38911. Impact Identification, Prediction and
...................................................Evaluation 3922. ....................... Impact Identification 3933. .........................Impact prediction 3984. ........................Impact Evaluation 4005. .Impact Mitigation and Monitoring 404
12. ......................Common types of Monitoring 41013. .................................................EIA Reports 41214. ........................................Review questions 41815. ................................................Bibliography 419

xiii
LIST OF TABLESTable 3.1. Volume of water stored in the water cycle's
reservoirs ....................................................... 89
Table 3.2. Average reservoir residence times ................. 91
Table 5.1. Major water pollutants: source, effects, and possible controls .......................................... 182
Table 5.2. .... Major air pollutants their source and effect 213
Table 6.1. World Population Number of years to add each ...................................billion (1991 estimate) 267
Table 6. 2. Population and Growth rates by major regions of .....................................................the world. 275
Table 7.1. Developing counties dependence on traditional fuels (traditional fuels as a percentage of total
.................................................primary energy 295
Table 9.1 ...................................... Impact matrix format 416
LIST OF FIGURES
Figure 2.1. . Corral reef communities and its different zones 25
Figure 2.2. Components that have direct and indirect influence on succession in an ecosystem
....................................................development 31
xiv
Figure 2.3. .. Graphical representation of law of tolerance 39
Figure 2.4. Representation of the fundamental and realized niche in terms of moisture & temperature as
......................................Environmental factors 42
Figure 3.1. Movement of energy and materials in the .........................................................ecosystem 50
Figure 3.2. .................................. Examples of food chain 65Figure 3.3. ....................................................... Food web 67Figure 3.4. ..... Different examples of pyramid of numbers 68 Figure 3.5. Examples of pyramid of biomass pyramid of
..............................................................energy 69
Figure 3.6. .......................................... Pyramid of energy 70Figure 3.7. ..................................................... Water cycle 88
Figure 3.8. .................................................. Carbon cycle 97Figure 3.9. ............................................... Nitrogen cycle 103Figure 3.10. ........................................ Phosphorous cycle 105Figure 3.11. .................................................... Sulfur cycle 109
Figure 4.1. Typical water residence times in inland water ...............................................................bodies 131
Figure 4.2. The classification of lakes according to the occurrence of thermal stratification and mixing in
..........................................................the water 136
Figure 4.3. .................. Confined and unconfined aquifers 144Figure 4.4. Temperature and atmospheric mass density of the
.............................atmosphere against altitude 147

xv
Figure 4.5. ...................... Different regions of Atmosphere 152Figure 4.6. Magnetosphere of the earth............................ 158Figure 4.7. ............................................... Van Allen’s belt 160Figure 5.1. River Awetu is degraded by untreated liquid and
solid waste discharge from Jimma Town, southwestern Ethiopia. The water is pungent and turns black just before the confluence point with the river Gilgel Gibe where the intake occurs for the
............................................town water supply 70
Figure 5.2. Feeding relationship in the aquatic environment and biomagnifications of persistent water pollutants. The number of red dots indicate the
.....................................amount of the pollutant 196
Figure 5.3. DDT concentration in the fatty tissue of organisms was biologically amplified about 10 million times in this food chain of an estuary. Dots represent DDT; arrows show small loss of DDT through respiration
....................................................and excretion 201
Figure 5.4. The extent of different materials to block different ..............................................types of radiation 229
Figure 6.1. Population growth as a function of fecundity rate. Assumes 50:50 sex ratio, one litter or clutch/female/year, no mortality, and sexual maturity at 1
..................................................................year 252

xvi
Figure 6.2. Three types of survivorship curves represent ......different mortality rates within a population 255
Figure 6.3. Age at first breeding can substantially influence population growth. This analysis assumes a 50:50 sex ratio, a fecundity rate of 2.0/adult female/year,
...............................................and no mortality 256
Figure 6.4. The relationship between population size and time when populations grow in environments where resources are unlimited (exponential growth). Population growth as a function of population size produces a J-curve, and population size presented as logarithm to the base e produces a straight
...................................................................line 262
Figure 6.5. The logistic growth equation produces a sigmoid or S-shaped curve. The carrying capacity (K) limits the number of animals in the population. The point of maximum growth is at the inflection point K/2 line ......................................................................... 265
Figure 6.6. Human population growth since 1750 and ..............................................projected till 215 269
Figure 6.7. Human population distribution over the continents......................................................................... 272
Figure 6.8. Human population distribution of Ethiopia by ..............Woreda based on 1994 census data 278
Figure 7.1 .................. Hydrological cycle in a biosphere 288

xvii
Figure 7.2. Composting process (adopted from solid waste management text) .......................................... 299
Figure 7.3. Walia Ibex found in the rugged semen mountain of ....................................................................north Ethiopia 309
Figure 7.4. This shows the picture of Grevy’s Zebra ....... 310Figure 7.5. .................... Ethiopian wolf found in highland 311Figure 7.6. Ethiopian wild ass found in hilly and stony deserts
...................................................of the country 312
Figure 7.7. Prince Ruspoli’s TURACO ............................. 313Figure 8.1. .... The illustration of electromagnetic radiation 321Figure 8.2. Different wave lengths and frequencies of
electromagnetic radiation ............................... 322
Figure 8.3. Radiation spectrum showing the location of ..........................................Ultraviolet radiation 324
Figure 8.4. ... The visible light region in the light spectrum 325Figure 8.5. ........ The infrared region in the light spectrum 328Figure 8.6. .... The microwave region in the light spectrum 329Figure 8.7. Intensity of Rayleigh scattering for visible light
regions ............................................................ 333
Figure 8.8. Scattering and wave length at different particle ..................................................................size 335
Figure 8.9. .................... Diagram of atmospheric window 337Figure 8.10. .......................... The global energy balance 339Figure 9.1. Scope of Ecological Informatics ..................... 354Figure 10.1. Project cycle integrated with EIA .................. 387

xviii
xix
Acronyms
BOD: Biochemical Oxygen Demand
CBA: Cost Benefit Analysis
CEQ: Council on Environmental Quality
CSA: Central Statistical Authority
DDT: Dichlorodiphenyltrichloroethane
DO: Dissolved Oxygen
DOD: Dissolved Oxygen Demand
EIA: Environmental Impact Assessment
EIS: Environmental Impact Statement
GIS: Geo Information Science
IDA: International Development Association
IEE: Initial environmental examination
IR: Infrared region
LD50: Lethal Dose Fifty
MAC: Maximum Allowable Concentration
NGO: Nongovernmental Organization

xx
OECD: Organization for Economic Cooperation
and development
PCBs: Polychlorinatedbiphenyl’s
PhAR: Photosynthetically Active Radiation
PPFD: Photosynthetic Photon Flux density
SIDA: Swedish International Development
Cooperation Agency
TOC:Total Organic Carbon
TOR: Terms of Reference
UNDP: United Nation Development programme
UNEP: United Nation Environmental Programme
UNESCO: United Nation Educational, Scientific and
Cultural Organization
IPCC: Intergovernmental Panel on Climate
Change
ITCZ: Intertropical convergence zone

1
CHAPTER ONEINTROUDCTION TO ECOLOGY
1. Learning Objectives
At the end of this chapter, the student will be able to:
• Define the term ecology and explain its
emergence
• Discuses the scopes of ecology
2. Emergence, definition and scope of ecology
1.2.1 Emergence and definition of ecology
Ecology is one of the popular areas of sciences in
biology. It is pluralistic science in the sense that it
depends on a wide variety of methods and approaches
rather than on a limited range of techniques and
concepts. Even if, it is thought as part of biology, one
important way in which ecology differs from most other
branches of biology is that it can be properly appreciated
or studied only through a multidisciplinary approach
involving close cooperation from expertise in several
disciplines.
Ecology

2
The emergence of ecology as a modern science starts in
the mid of 19th century by giving the proper definition. In
1866 by Ernst Haeckel referred ecology as the science of
relationships of organisms to the external world. But in
1870, again he added on the explanation of ecology as
the interaction of animals with the inorganic and organic
environment.
Final explanation and definitions have been given by
Frontier and Pichod-Viale, (1991) as a branch of life
science and is the study of interactions between living
organisms and the environment, and among living
organisms themselves in natural conditions.
The word ‘Ecology’ was coined from the Greek world
‘oikos’ meaning ‘house’ or ‘a place to live’ to designate
the study of organisms in their natural homes. Specially,
it means the study of interactions of organisms with one
another and with the physical and chemical environment.
The term “logy” is to mean study.
Another way of defining Ecology is to look at the levels of
biological organizations. The molecules of life are
organized in specific ways to form cells; cells are
Ecology

3
grouped into tissues; and tissues are arranged to
produce functional organs. The body organs are
integrated to produce organ system, and the entire
array of these systems constitutes an organism.
Organisms exist not just as a single individual, but in-
groups called population. The various populations of
organisms that interact with one another to form a
community; interdependent communities of organisms
interact with the physical environment to compose an
ecosystem. Finally, all the ecosystems of the planet are
combined to produce a level of organization known as
the biosphere. Ecology is concerned with the levels of
organization beyond that of individual organism; i.e.
populations, community ecosystem, and biosphere.
2. Scope
Whether we are talking about humans or any other kind
of organisms, certain principles govern the growth and
stability of their populations over time. These principles
influence the pattern of relationships of organisms with
one another and their environment. These patterns, in all
their varied forms, are the focuses of ecology. As a
science, ecology seeks to treat the world of nature
Ecology

4
including its human component with a single set of
concepts and principles.
Ecology deals with such questions as:
• Why natural communities are composed of certain
organisms and not others;
• How the various organisms interact with each
other and with the physical and chemical
environment; and
• How we can control and maintain these natural
communities (coexisting situations).
Nowadays, there exist different branches of ecology like:
ecosystem ecology, population ecology, radiation
ecology, disease ecology, terrestrial ecology, aquatic
ecology, microbial ecology, etc. However, we focused on
ecosystem ecology, population ecology, radiation
ecology, aquatic ecology, terrestrial ecology and other
issues related to these branches of ecology.
3. Review question
1. Define the term ecology
Ecology

5
2. What are the levels of biological organizations at
which ecological interactions occur?
3. Discuss the areas that ecology is concerned
CHAPTER TWOECOLOGICAL PRINCIPLES
.2 Learning Objectives
At the end of this chapter, the student will be able to:
• Explain biotic community and ecological
succession.
Ecology

6
• Explain habitat and ecologic niche of organisms.
• Mention the major biomes of the world and the
dominant species.
• Discuss the factors that affect the distribution of
organisms.
.2 Definition of terms
• Biomes: a large, relatively distinct terrestrial
region characterized by a similar climate, soil,
plants, and animals regardless of where it occurs
on earth.
• Ecosphere: The interrelation among and between
all the earth’s l iving organisms and the
atmosphere, lithosphere and hydrosphere that
they occupy.
• Limiting factor: An environmental factor that
restricts the growth, distribution, or abundance of
a particular population.
• Tolerance: Decreased response to a specific
factor in the environment over time.
• Niche: The totality of organism’s adaptation and
the life style to which it is fitted in its community.
Ecology

7
.3 Introduction
A biological community consists of several populations
each containing all the members of a single species in a
given area. Species are not fixed or unalterable,
however. They evolve and adapt in response to the
environment in which they live. Because environmental
conditions also are dynamic and constantly changing, the
process of evolution and adaptation for living organisms
is never compete. And yet many biological communities
are self- perpetuating, resilient, and stable over relatively
long times.
.4 Biotic community
The most familiar classification system used for grouping
plants and animals is one based upon presume
evolutionary relationships. However, ecologists tend to
arrange species on the basis of their functional
association with each other.
A natural grouping of different kinds of plants and
animals within any given habitat is termed as a biotic
Ecology

8
community. Biotic community is a broad term, which can
be used to describe natural groupings of widely different
sizes, from the various microscopic diatoms and
zooplankton swimming in a drop of pond water to the
hundreds of species of trees, wild flowers, insects, birds,
mammals etc. Biotic communities have characteristic
trophic structure and energy flow patterns and also have
a certain taxonomic unity in the sense that certain
species tend to exist together.
Individual of the same species living together within
given area is collectively called population. Such
population constitutes groups more or less isolated from
others. A population within a biotic community in certain
region is not a static entity but it is consciously changing
in size and reshuffling in hereditary characteristics in
response to environmental changes and to fluctuations in
the population of other members of the community.
The community concept is one of the most important
ecological principles. Because:
1. It emphasizes the fact that different organisms
are not arbitrarily scattered around the earth
Ecology

9
with no particular reason as to why they live
where they do together in an orderly manner.
2. By i l luminating the importance of the
community as a whole to any of its individual
parts, the community concept can be used by
man to control a particular organism, in the
sense of increasing or decreasing its numbers.
The realization that the success of any particular species
is dependent on integrity of its biotic community as a
whole has profound implications for human welfare.
.5 Ecological dominance
Although all members of a biotic community have a role
to play in the life of a community, it is obvious that
certain plants or animals exert more of an effect on the
ecosystem as a whole than do others.
Those organisms, which exert a major role in having
controlling influence on the community, are called
ecological dominants. Such dominants comprise those
keystone species, which largely control the flow of
energy through the community. If they were to be
removed from the community, much greater change in
Ecology

10
the ecosystem would result than is a non-dominant
species were to be removed.
Example: if farmers chop down dominant forest trees for
cultivation, the changes produced by the removal are:
• Loss of animal species, which depend on the trees for food and shelter
• Loss of shade loving plant
• Change in soil micro biota
• Raising of soil temperature
• Increases in soil erosion
Consequently, the stability of the ecosystem would be
disturbed. In most terrestrial biotic communities certain
plants comprise the dominant role because not only do
they provide food and shelter for other organisms but
also directly affect and modify their physical environment
in the following ways. They build up topsoil; Moderate
fluctuation of temperature; Improve moisture retention
and Affect the pH of the soil.
.6 Biomes
Ecology

11
The species composition of any particular biotic
community is profoundly affected by the physical
characteristics of the environment particularly
temperature and rainfall. For instance, the kinds of
plants and animals one will find in Simen Mountains in
Ethiopia would differ significantly from those found in the
Awash Park.
Biome can be defined as a "major regional community of
plants and animals with similar life forms and
environmental conditions. It is the largest geographical
biotic unit, and is named after the dominant type of life
form, such as tropical rain forest, grassland, or coral
reef." The dominant life forms are usually conspicuous
plants, or plant-like species such as corals. A single
biome can be widely scattered about the planet. Due to
similar pressures of natural selection, species in differ ent
parts of a biome may converge in their appearance and
behaviors, even when they do not share the same
ancestors.
.6.1 Terrestrial biomes
Ecologists have divided the terrestrial communities of the
world into general groupings called Biomes, which are
Ecology

12
areas that can be recognized by the distinctive life forms
of their dominant species. In most cases, the key
characteristic c of a biome is its dominant type of
vegetation. It could also be said that a biome is a
complex of communities’ characteristic of a regional
climatic zone. Each biome has its pattern of rainfall,
season, temperature and changes of day length all of
which combine to support a certain kind of vegetation.
Starting at the polar region the major biomes of planet
earth are:
a) Tundra
Tundra is the northern most of the world’s landmasses. It
is characterized by permanently frozen subsoil called
permafrost, which has low rainfall in the area. -----These
are bogs and lakes, which propagate mosquitoes more
than any thing else. Dominant vegetation is moss, grass
and some small perennials.
b) Taiga
This occurs in a belt south of the Tundura where climate
is milder and where rainfall is abundant relative to the
amount of evaporation. The deciduous forest, which is
the dominant vegetation in this biome, has a great variety
Ecology

13
of mammals, birds, and insects as well as modest
number of reptiles and amphibians. Because of the
annual leaf drop deciduous forest generate soils rich in
nutrients, which in turn support a multitude of soil
microbes.
c) Grassland
In regions where annual rainfall is not sufficient to sustain
the growth of trees and evaporation rates are high we
find the grass land of the world. Example of such a
biome is the savannah. The dominance of grass and
herds of grazing animals characterize all. Carnivores are
also abundant. Such biome has a higher concentration
of organic matter in its soil than does any biome, the
amount of humus being 12 times greater than that in
forested soils.
d) Desert
This is an area, which is receiving less than 10 inch of
rainfall per year. Lack of moisture is the essential factor
that shapes the desert biome.
Ecology

14
e) Tropical rain forest
It is characterized by high temperature and high annual
rainfall (100 inch or more). Year round temperature
variations is slight.
Tropical rain forest is characterized by a great diversity of
plants and animal species and by four distinct layers of
plant growth:
i. Top canopy of trees reaching 60 meters,
ii. Lower canopy reaching 30 meters,
iii. Sparse under story and
iv. Very few plants growing at ground level
Both plants and animal species exist in greater diversity
in the tropical rain forest than any where else does in the
world. Tropical rain forest soils in general are
exceedingly thin and nutrient poor relative to temperate
regions. As a result nutrients are locked in the biomass
and removal of vegetation may severely disrupt nutrient
cycling leading to ecological disaster.
This brief survey of biome characteristics should make
obvious that various regions differ in their ability to mean
Ecology

15
to an ecologically stable condition once they have
disrupted by human activities.
f) Temperate rainforest
.6.2 Aquatic Biomes
Like that of the territorial ecosystem, the aquatic
environment can be classified into different distinct
biomes based on the dominant life forms and the location
of the micro-ecosystem. The largest part of the biosphere
(the earth) is made up of aquatic biomes. It was here
that life first arose, and here it evolved for almost three
billion years, before plants and animals moved onto land.
There are two main types of Aquatic Biomes: Freshwater
and Marine. Freshwater biomes usually have a salt
concentration of less than 1%, whereas Marine biomes
have a salt concentration that averages 3%.
Aquatic biomes are classified as Rivers, Lakes,
Estuaries, Intertidal zones, Coral Reefs, Oceanic pelagic
and Abyssal zones.
a) Rivers
Ecology

16
Streams and rivers are bodies of water which
continuously flow in one direction. At the start of a
stream, or the headwaters, the water is cold and clear. It
carries little sediment and few nutrients. The channel is
usually narrow, a swift current passing over a rocky
surface. Moving downstream, after numerous tributaries
may have joined to form a river, the water is more turbid,
and carries a great deal of sediments, from the erosion of
soil, and nutrients. Near the mouth of the river, the
channel is usually wide, and the bottom is usually silt
from sediment deposition over long periods of time.
There are many factors influencing the characteristics of
a stream or river. If there is shallow water flowing rapidly
over a rough bottom, there will be a turbulent flow; deep
water flowing slowly over a smooth bottom will cause
pools of water to form. Where there is deep water
flowing rapidly over a flat bottom, smooth runs of water
are common. The nutrient content found in the water
largely determined by the terrain and vegetation
surrounding the river. Overhanging vegetation can add a
substantial amount of organic material from fallen leaves,
and the erosion of the streambed can add to the
inorganic nutrients found in the water. If a river has a
Ecology

17
turbulent flow, this constantly oxygenates the water,
whereas large rivers with murky warm waters contain
much less oxygen. The amount of water in a river
depends on the rainfall patterns and melting snow, which
causes seasonal changes in flow and oxygen content.
b) Estuaries
Standing bodies of fresh water range from an area of a
few square meters to thousands of square kilometers.
Small bodies of water are called ponds; larger bodies of
fresh water are called lakes. Except in the smallest
ponds, there is usually significant vertical layering of
physical and chemical variables. Characteristics of lakes
are discussed in detail under the chapter biosphere.
An estuary is a partially enclosed body of water
where saltwater from the sea mixes with
freshwater from rivers, streams and creeks. These
areas of transition between the land and the sea
are tidally driven, like the sea, but sheltered from
the full force of ocean wind and waves, more like
a river. Estuaries are generally enclosed in part by
the coastline, marshes and wetlands; the seaward
Ecology

18
border may be barrier islands, reefs and sand or
mud flats.
Every estuary is unique; each individual ecosystem has
different components that complete the estuarine habitat.
One estuary may be enclosed by marshes and barrier
islands, while another estuary's borders are the coastline
and reefs. Bodies of water that may be estuaries are:
sloughs, bays, harbors, sounds, inlets and bayous. Some
familiar examples of estuaries are: Chesapeake Bay, San
Francisco Bay, Boston Harbor, Tampa Bay and Puget
Sound. There are also wetlands in the Great Lakes with
estuarine-like functions. These ecosystems have a
strong tidal force and are protected from the open water
of the Great Lakes by a natural barrier, such as a mud
flat.
A plethora of organisms can be found in estuaries,
organisms specially adapted to the "brackish" estuarine
waters. Estuaries are homes to all kind of terrestrial or
land-based plants and animals, such as wood storks,
pelicans, coniferous and deciduous trees and butterflies.
Estuaries are also homes to unique aquatic plants and
animals, such as sea grass, sea turtles and sea lions.
Ecology

19
Estuaries are important for many reasons. Estuaries are
among the most biologically productive ecosystems on
the planet. More than two thirds of the fish and shellfish
we eat spend some part of their lives in estuaries. These
ecosystems also provide many other important
ecological functions; they act as filters for terrestrial
pollutants and provide protection from flooding. Estuaries
also have economic importance. These dynamic bodies
of water provide us with an important source of food, but
are also a popular tourist destination. Millions of people
visit the nation's estuaries each year to boat, swim, bird
watch and fish.
The fragile balance of these productive estuarine
environments may be easily destroyed by human
activities. Changes in water quality or alterations, by
dredging and construction, to the multiple components of
estuaries can result in harmful changes in the
ecosystem. The purpose of National Estuaries Day is to
promote the need to protect these important areas and to
learn how we can safeguard these irreplaceable
resources.
d) Intertidal zones
Ecology

20
The intertidal zone, also known as the littoral zone, in
marine aquatic environments is the area of the foreshore
and seabed that is exposed to the air at low tide and
submerged at high tide, i.e., the area between tide
marks.
Organisms in the intertidal zone are adapted to an
environment of harsh extremes. Water is available
regularly with the tides but varies from fresh with rain to
highly saline and dry salt with drying between tidal
inundations. The action of waves can dislodge residents
in the littoral zone. With the intertidal zone's high
exposure to the sun the temperature range can be
anything from very hot with full sun to near freezing in
colder climes. Some microclimates in the littoral zone are
ameliorated by local features and larger plants such as
mangroves. Adaption in the littoral zone is for making use
of nutrients supplied in high volume on a regular basis
from the sea which is actively moved to the zone by
tides. Edges of habitats, in this case land and sea, are
themselves often significant ecologies, and the littoral
zone is a prime example.
Ecology

21
A typical rocky shore can be divided into a spray zone
(also known as the supratidal zone, which is above the
spring high-tide line and is covered by water only during
storms, and an intertidal zone, which lies between the
high and low tidal extremes. Along most shores, the
intertidal zone can be clearly separated into the following
sub-zones: high tide zone, middle tide zone, and low tide
zone.
Intertidal habitats can be characterized as having either
hard or soft bottoms or substrates. Rocky intertidal
communities occur on rocky shores, such as headlands,
cobble beaches, or human-made jetties. Soft-sediment
habitats include sandy beaches, mudflats, and salt
marshes. These habitats differ in levels of ‘abiotic’, or
non-living, environmental factors. Rocky shores tend to
have higher wave action, requiring adaptations allowing
the inhabitants to cling tightly to the rocks. Soft-bottom
habitats are generally protected from large waves but
tend to have more variable salinity levels. They also offer
a third habitable dimension depth thus; many soft-
sediment inhabitants are adapted for burrowing.
Ecology

22
Coral reefs are aragonite structures produced by living
organisms, found in shallow, tropical marine waters with
little to no nutrients in the water. High nutrient levels such
as that found in runoff from agricultural areas can harm
the reef by encouraging the growth of algae.[1] In most
reefs, the predominant organisms are stony corals,
colonial cnidarians that secrete an exoskeleton of
calcium carbonate (limestone). The accumulation of
skeletal material, broken and piled up by wave action
and bioeroders, produces a massive calcareous
formation that supports the living corals and a great
variety of other animal and plant life. Although corals are
found both in temperate and tropical waters, reefs are
formed only in a zone extending at most from 30°N to
30°S of the equator; the reef-forming corals do not grow
at depths of over 30 m (100 ft) or where the water
temperature falls below 22 °C.
The building blocks of coral reefs are the generations of
reef-building corals, and other organisms that are
composed of calcium carbonate. For example, as a coral
head grows, it lays down a skeletal structure encasing
each new polyp. Waves, grazing fish (such as parrotfish),
sea urchins, sponges, and other forces and organisms
Ecology

23
break down the coral skeletons into fragments that settle
into spaces in the reef structure. Many other organisms
living in the reef community contribute their skeletal
calcium carbonate in the same manner. Coralline algae
[i.e. zooxanthelate, filamentous algae] are important
contributors to the structure of the reef in those parts of
the reef subjected to the greatest forces by waves (such
as the reef front facing the open ocean). These algae
contribute to reef-building by depositing limestone in
sheets over the surface of the reef and thereby
contributing to the structural integrity of the reef.
Ecology

24
Figure 2.1. Corral reef communities (A) and its different zones (B)
(source: Castro, et al;, 2000)
Ecology

25
f) Pelagic Zone
Oceans are divided into numerous regions depending on
the physical and biological conditions of these areas. The
pelagic zone includes all open ocean regions, and can
be subdivided into further regions categorised by depth
and light abundance. The photic zone covers the oceans
from surface level to 200 meters down. This is the region
where the photosynthesis most commonly occurs and
therefore contains the largest biodiversity in the ocean.
Since plants can only survive with photosynthesis any life
found lower than this must either rely on material floating
down from above (see marine snow) or find another
primary source; this often comes in the form of
hydrothermal vents in what is known as the aphotic zone
(all depths exceeding 200m). The pelagic part of the
photic zone is known as the epipelagic. The pelagic part
of the aphotic zone can be further divided into regions
that succeed each other vertically. The mesopelagic is
the uppermost region, with its lowermost boundary at a
thermocline of 10°C, which, in the tropics generally lies
between 700 and 1,000m. After that is the bathypelagic
lying between 10°C and 4°C, or between 700 or 1,000m
and 2,000 or 4,000m. Lying along the top of the abyssal
Ecology

26
plain is the abyssal pelagic, whose lower boundary lies at
about 6,000m. The final zone falls into the oceanic
trenches, and is known as the hadalpelagic. This lies
between 6,000m and 10,000m and is the deepest
oceanic zone.
g) Abyssal Zone
Along with pelagic aphotic zones there are also benthic
aphotic zones, these correspond to the three deepest
zones. The bathyal zone covers the continental slope
and the rise down to about 4,000m. The abyssal zone
covers the abyssal plains between 4,000 and 6,000m.
Lastly, the hadal zone corresponds to the hadalpelagic
zone which is found in the oceanic trenches. The pelagic
zone can also be split into two subregions, the neritic
zone and the oceanic zone. The neritic encompasses the
water mass directly above the continental shelves, while
the oceanic zone includes all the completely open water.
In contrast, the littoral zone covers the region between
low and high tide and represents the transitional area
between marine and terrestrial conditions. It is also
known as the intertidal zone because it is the area where
tide level affects the conditions of the region.
Ecology

27
The abyssal zone is the pelagic zone that contains the
very deep benthic communities near the bottom of
oceans. Abyss is from the Greek word meaning
bottomless sea. At depths of 2,000 to 6,000 meters
(6,560 to 19,680 feet), this zone remains in perpetual
darkness and never receives daylight. Its permanent
inhabitants – for example, the Black swallower, tripod
fish, deep-sea anglerfish, and the giant squid – are able
to withstand the immense pressures of the ocean depths,
up to 775 kilograms per square centimeter (76
megapascals or 4.92 long tons force per square inch).
Many abyssal creatures have underslung jaws to sift
through the sand to catch food. The deep trenches or
fissures that plunge down thousands of feet below the
ocean floor – for example, the midoceanic trenches such
as the Mariana Trench in the Pacific – are almost
unexplored. Only the bathyscaph Trieste has been able
to descend to these depths. These regions are also
characterized by continuous cold and lack of nutrients.
The abyssal zone has temperatures around 2 to 3
degrees Celsius.
The area below the abyssal zone is the hadal zone and
hardly any living creatures inhabit it. The zone above is
Ecology

28
the bathyal zone, and above that is the photic zone, in
which the majority of ocean life exists.
.7 Ecological SuccessionThe process by which organisms occupy a site and
gradually change environmental conditions so that other
species can replace the original inhabitants is called
ecological succession or development
Primary succession occurs when a community beings to
develop on a site previously unoccupied by living
organisms, such as on Islad, a sand or silt bed, a body of
water or a new volcanic flow.
Secondary succession occurs when an existing
community is disrupted and a new one subsequently
develops at the site. The disruption may be caused by
some natural catastrophe, such as fire or flooding, or by
a human activity, such as deforestation, plowing or
mining.
Both forms of succession usually follow an orderly
sequence of stages as organisms modify the
environment in ways that allow one species to replace
another.
Ecology

29
Eventually in either primary or secondary secession a
community develops that seemingly resists further
change. Ecologists call this a climax community,
because it appears to be the culmination of the
succession process. The different biomes of our planet
discussed earlier are examples of climax community.
In an ecosystem development many factors are involved
as positive or negative driving forces for succession.
Figure 2.2. illustrates the succession as ecosystem
development.
Ecology

30
Figure 2. 2. Components that have direct and indirect influence on succession as an ecosystem development.
Ecology

31
2.7.1 Adaptation
Specific life forms are adaptations of plants and animals
to live in a particular habitat and to behave in a particular
way. For instance the forms for four footed mammals
could be grouped as:
• Aquatic: seal, whale
• Fossorial: Mole, shrew
• Cursorial: Deer, antelopes, zebra
• Saltatorial: Rabbit, kangarro
• Scansorial: Squirrel, monkey.
• Areal: Bat.
The life form listed for mammals are largely adaptations
to particular strata (water, subterranean, ground, trees,
and air) within a community than to the habitat as a
whole; for instance, the subterranean adaptations of
mammals living in arctic tundra are similar to the
subterranean adaptations of mammals living in the
tropics. In addition to adaptation of stratum and habitat,
there occur ecologically significant adaptations for food
getting and metabolism, protection and reproduction.
Ecology

32
.2 Organisms respond to the external environment
Organisms respond to the environment in three principal
ways:
a) Morphological adaptation
The variety of teeth found in mammals, and lizards, the
variation in shape and size of gills of birds, the different
mouth parts of Insets.
b) Physiological adaptations
Structural adaptation for the digestion of food, respiration
circulation and excretion
c) Behavioral adaptation
It is the change in behavior of an organism to adapt itself
to the conditions of the environment
.3 Adaptive strategies of animals
The following rules summarize some of the adaptive
strategies of animals:
Ecology
33
a) Bergman’s rule: is connected with heat loss and
heat conservation. It states: As a rule, geographical
species possessing smaller body sizes are good
heat dissipaters. On the other hand geographical
species, which have larger body sizes, are good
heat conservers. Because of this those organisms
possessing relatively larger body sizes are found in
the warmer regions (Tropical regions).
b) Allen’s rule: just like Bergman’s rule this is
connected with heat loss and heat conservation.
According to Alen’s rule, organisms possessing
larger body sizes but relatively short appendage
extremities or protruding parts are found in cooler
regions whereas organisms possessing smaller
body sizes with larger appendages extremities or
protruding parts are found in the warmer regions.
c) Gloger’s rule: states that races of warm-blooded
animals are more dark-pigmented in the warm and
humid areas whereas organisms living in the dray
and cool areas are less pigmented.
Ecology

34
d) The egg rule: the average number of eggs in a set,
or clutch, laid by songbirds and several other kinds
of birds increases as one moves north in latitude
.8 Range and Limits
Probably no species of plant or animal is found ever
where in the world; some parts of the earth are too hot,
too dry or too something else for the organisms to
survive there. Even if the environment does not kill the
adult directly, it can effectively keep the species from
becoming established by preventing its reproduction, or it
kills off the egg, embryo or some other stage in the life
cycle.
.1 Liebig’s Law (Law of the minimum)
Justus von Liebig (1803-1873) was organic chemist
worked with plants (chemical foods).
An organism is seldom if ever exposed to a single factor
in its environment. On the contrary, it is exposed or
subjected to various factors simultaneously in its
Ecology
35
surroundings. However, some factors play greater role
than the others do.
In general, each species requires certain materials for
growth and reproduction, and can be restricted if the
environment does not provide a certain minimum amount
of each one of these materials. This phenomenon is
governed by what is known as the law of the minimum,
which states, “The rate of growth of each organism is
limited by whatever essential nutrient is present in a
minimal amount”. The law can also be stated as “the
functioning of an organism is controlled or limited by
essential environmental factor or combination of factors
present in the least favorable amount in the
environment”.
Some subsidiary principles:
Example: The yield of crops is often limited not by
nutrient required in large amounts, such as
water or carbon dioxide, but by something
needed only in trace amounts such as boron
or manganese.
.2 Shelford’s Law (Law of tolerance)
Ecology

36
For each species, there is a range of an environmental
factor with in which the species functions at or near
optimum. There are extremes, both maximum and
minimum towards which the functions of a species are
curtailed and then inhibited. In 1913, V.E. Shelford
(animal ecologist) pointed out that too much of a certain
factor would act as a limiting factor just as well as too
little of it. He stated that the distribution of each species
is determined by its range of tolerance to variation in
each environmental factor.
This led to a concept or range of tolerance. Upper and
lower limits of tolerance are intensity levels of a factor at
which only half of the organisms can survive (LD50).
These limits re sometimes difficult to determine, as for
instance with low temperature, organisms may pass into
an inactive, dormant or hibernating state form which they
may again become functional when the temperature
rises above a threshold.
The species as a whole is limited in its activities more by
conditions that produce physiological discomforts or
stresses than it is by the limits of toleration themselves.
Death verges on the limits of toleration, and the
Ecology

37
existence of the species would be seriously jeopardized
if it were frequently exposed to these extreme conditions.
For each species, there is a range in an environmental
factor within which the species function near or at
optimum. There are extremes both lower and upper
towards which the function of the species is curtailed
inhibited. Shelford pointed out that too much of a certain
factor would act as a limiting factor just as well as too
little of it as has been stated in the Liebig’s law. This
leads to a concept of range of tolerance, which states the
distributio9n of each species is determined by its range
of tolerance to variation in each environmental factor.”
Figure 2.3. Graphical representation of law of tolerance.
Ecology

38
Some subsidiary principles to this law:
a) Organisms may have a wide range of tolerance for
one factor and a narrow rang for another.
b) Organisms with wide ranges of tolerance for all
factors are likely to be most widely distributed
c) When conditions are not optimum for a species with
respect to one ecological factor, the limits of
tolerance may be reduced for other ecological
factors.
d) Frequently, it is discovered that organisms in nature
are not actually living at optimum range of particular
physical factor. In such cases, some other factor or
factors are found to have greater importance.
e) Reproduction is usually a critical period when
environmental factors are most likely to be limiting.
Terms to express the narrowness and wideness of
tolerance (prefixes)
o Steno: narrow range of tolerance (example:
stenothermic- narrow range of tolerance for
heat)
Ecology

39
o Eury: wider range of tolerance (example:
Eurythermic-wider range of tolerance)
.9 Habitat and Ecologic Niche
In describing the ecological relation of organisms, it is
useful to distinguish between where an organism lives
and what t does as part of its ecosystem. The term
habitat and ecological niche referees to two concepts
that are of prime importance in ecology.
.9.1 Habitat
The habitat of an organism is the place where it lives, a
physical area, and some specific part of the earth’s
surface, air, soil or water. It may be as large as the
ocean or a forest or as small and restricted as the
underside of a rotten log or the intestine of a termite.
However, it is always tangible, physically demarcated
region. More than one animal or plant may live in a
particular habitat.
.9.2 Ecologic Niche
Diverse assortment of organisms can live in a habitat.
Every organism is thought to have its own role within
the structure and function of a community. This status or
Ecology

40
role of organism in the community or ecosystem is
termed as ecologic niche. Ecologic niche depends on the
organism’s structural adaptations, physiologic response
and behavior.
An ecologic niche is difficult to define precisely; it is an
abstraction that includes all the physical, chemical,
physiologic and biotic factors that an organism requires
to live; but not physically demarcated space. To describe
an organism’s ecologic niche, we must know what it eats,
what eats it, what organism competes with, and how it
interacts with and is influenced by a biotic component of
the environment (like light, temperature, and moisture).
It is helpful to think of the habitat as an organism’s
address (where it lives) and of the ecologic niche as its
profession (what it does biologically). One of the
important generalizations of ecology is that no two
species may occupy the same ecologic niche.
Ecology

41
Figure 2. 4. Representation of the fundamental and realized niche in terms of moisture and temperature as environmental factors
(Source: PhysicalGeography.net)
The fundamental niche is the largest ecological niche
that an organism or species can occupy. It is based
mostly on interactions with the physical environment and
is always in the absence of competition. The realized
niche, on the other hand, is that portion of the
fundamental niche that is occupied after interactions with
other species. That is, the niche after competition. The
realized niche must be part of, but smaller than, the
fundamental niche.
Ecology
42
.10 Review Questions
1. What is biotic community?
2. What are the major biomes of our planet?
3. Describe the different kinds of ecological
successions.
4. What do we mean by climax community?
5. Explain the difference between habitat and
ecologic niche of organisms.
6. Define the low of the minimum and give an
example from your area.
Ecology

43
7. Define law of tolerance and give an example from
your area.
8. http://www.physicalgeography.net/fundamentals/
9g.html
.11 Bibliography
1. Castro, Peter and Michael Huber. 2000. Marine
Biology. 3rd ed. Boston: McGraw-Hill.
2. Kumar, H.D. Modern Concepts of Ecology. 8th
revised ed. 1997.
3. Nadakavukaren, A. Man and Environment: a Health
perspective. 3rd edition, 1992.
4. Odumy , E.P. Fundamentals of Ecology 3rd ed.
19971.
5. Smith, R.L. Ecology and Field Biology.1966.
Ecology

44
6. Edward J. Kormondy. Concepts of Ecology. 4th
edition, 2001. Prentice Hall of India , New Delhi
7. Michael Allaby. Basics of Environmental Science, 2
ND edition, Routledge , London and New York
8. Thomas M. Smith and Robert L. Smith. Elements of
Ecology. 6th edition, 2006. Pearson International
Edition.
CHAPTER THREEECOSYSTEM
.1 Learning Objectives:
At the end of this chapter, the student will be able to:
• Define the term ecosystem and different
components of ecosystem.
• Discuses biomes and biotic communities
• Describe the trophic organizations of an
ecosystem
Ecology

45
• Describe the benefits and drawbacks of agro-
ecosystem
• Characterize the unique features of city as
ecosystem
.2 Definition of terms
Ecosystem: A community and its physical and chemical
environment. An ecosystem has a living
(biotic) and nonliving (a biotic) component.
Biotic factors: living organisms in an ecosystem.
Abiotic factors: all environmental conditions required to
support life, e.g. rainfall, sunlight moisture, soil
temperature conditions required compounds
from simple inorganic substances with the aid
of energy from the sun (Photosynthetic
autotrophs) or from inorganic substance
themselves (chemosynthetic autothrophs).
Heterotrophy: organisms that ingest other organisms to
obtain organic nutrients.
Decomposers: heterotrophic bacteria and fungi that
obtain organic nutrients by breaking down the
remains of products of organisms. The
Ecology

46
activities of decomposers allow simple
compounds to be recycled back to the
autotrophs.
Food chain: linear sequence of who eats whom in an
ecosystem.
Food web: Networks of many interlocked fiid chaunbs,
encompassing proudcets, consumers,
decomposers, and detritivores.
Biogeochemical cycle: the cycling of materials through
living system and back to the earth.
Nitrification: a process by which certain soil bacteria
strip ammonia or ammonium of electrons, and
nitrite (NO2) is released as a reaction product,
then other soil bacteria use nitrite for energy
metabolism, yielding nitrate (NO3-).
Ammonification: decomposition of nitrogenous wastes
and remains of organisms by certain bacteria
and fungi.
Denitrification: reduction of nitrate or nitrite to gaseous
nitrogen( N2) and a small amount of nitrous
oxide (NO2) by soil bacteria.
Ecology

47
Eutrophication: a process by which a body of water
becomes over- enriched with nutrients, and as
a result produces an over- abundance of
plants.
Biomass: the total dry mass of all living organisms at a
given tropic level of an ecosystem.
Community: the population of all species that occupy a
habitat.
Tropic level: all organisms that are the same number of
energy transfer away from the original source
of (e.g. sun light) that enters an ecosystem.
Nitrogen fixation: among some bacteria, assimilation of
gaseous nitrogen (N2) from the air; though
reduction reactions, electrons become
attached to the nitrogen, there by forming
ammonia (NH3) or ammonium (NH4+)
.3 The processes of ecosystemEcosystem is an integrated unit comprising vegetation,
fauna, microbes and environment. It possesses well
defined soil, climate, flora and fauna and has their own
adaptations, change and tolerance. The living planet
earth, which encompasses the biosphere and its
Ecology

48
interactions with the hydrosphere and atmosphere, is
termed as ecosphere.
Ecosystems are open systems and hence, they are not
self sustaining. So, it requires continuous energy and
nutrient inputs. The functioning of an ecosystem involves
a series of cycles, like water cycle, nutrient cycle, etc.
These cycles are derived by the energy flow, the energy
being solar energy. In general, in the ecosystem there is
flow of energy and cycling of materials both of which
have consequences for community structure and the
environment.
Figre 3.1. Movement of energy (dark arrow) and
materials (open arrow) in the ecosystem
Ecology

49
(source: Environmental Biology sequence –
Ecosystems).
Ecosystems have the following basic characteristics.
i) The most characteristic of an ecosystem is that
everything is somehow related to everything else,
and such relationships including interlocking
functioning of organisms among themselves as
well as with their environment.
ii) The second characteristic is limitation, which
means limits ubiquitous and that is no individual or
species goes on growing indefinitely. Various
species control and limit their own growth in
response to over crowding or other environmental
signals and total numbers keep pace with the
resources available.
iii) Complexity of interactions. Interactions of the
various constituent elements of an ecosystem are
h i gh l y comp lex and o f t en beyond t he
comprehension of the human brain. (Man's
activities very often result in a simplification of the
communities or ecosystem.)
Ecology

50
iv) The ecosystem is a major structural and functional
unit of ecology.
v) The structure of an ecosystem is related to its
species diversity. The more complex the
ecosystem has the greater diversity of species.
vi) The function of an ecosystem is related to energy
flow and material cycling through and within the
ecosystem.
vii)The relative amount of energy needed to maintain
an ecosystem are limited to and can’t be
exceeded without causing serious undesirable
effects.
viii) Both environment and the energy fixation in any
given ecosystem are limited to and can’t be
exceeded with causing serious undesirable
effects.
Alteration in the environment represents selective
pressure upon the population to which it must adjust;
organisms unable to adjust must perish.
Ecology

51
.4 Types of ecosystem
In the broadest sense there are two major types of
ecosystems: aquatic and terrestrial. These natural
ecosystems can be further classified into semi-major
ecosystems accordingly (see terrestrial and aquatic
biomes). In addition, there are semi-natural ecosystems
which have been created by major anthropogenic inputs.
Some of these are city ecosystem and agricultural
ecosystem (agro-ecosystem).
.4.1 City as ecosystem
A city, especially an industrialized one, is an incomplete
or heterotrophic ecosystem depending on large areas
outside it for energy, food, fiber, water and other
materials. The city differs from a natural heterotrophic
ecosystem, such as an oyster reef, because it has
a) A much more intense metabolism per unit area,
requiring a large inflow of concentrated energy
(currently supplied mostly by fossil fuels).
Ecology

52
b) A large input requirement of materials such as
metals for commercial and industrial use, above
and beyond that needed to sustain life itself and
c) A large and more poisonous output of waste
products many of which are synthetic chemicals
more toxic than their natural progenitors. Thus, the
input and the output environmental are relatively
much more important to the urban system that is
the case for an autotrophic system such as a
forest.
Actually most metropolitan districts even in the dry areas
have a substantial green belt or autotrophic component
of trees, shrubs, areas of grass and in many cases, lakes
and ponds, but the organic products of this green
component do not appreciably support the people and
machines that so densely populate the urban-industrial
area. Without the huge inflows of food, fuel, electricity
and water, the machines (automobiles, factories, and so
on) would stop working. People would soon starve or
have to migrate. The Urban forests, grasslands, and
parks, of course, have tremendous aesthetic and
recreational value, and they function to attenuate
Ecology

53
temperature extremes, reduce noise and other pollution,
provide habitat for song bids and other animals and so
on. But, the labor and fuel expended in watering,
fertilizing, mowing, pruning, removing wood and leaves,
and other work required to maintain the city’s private and
public greenbelts add to the energy costs of living in the
city.
.4.2 Agro-ecosystems
Agriculture is by no means wholly beneficial to the
ecosystem because it introduces instability. Since we
devote so much effort in converting as much land as
possible to agriculture, it is important to assess its
effects. In general agriculture can be said to intrude on
ecosystem stability in two ways - by reducing species
diversity and by interfering with nutrient cycling.
.4.2.1 Reduction of species diversity
Modern farming techniques promote cultivating and
harvesting efficiency by making the land uniform and by
using uniform genetic strains of crop plants selected for
high yield. Huge fields consisting of a single high
productivity crop are more economical than many small
fields with diverse crops. Fence rows, the borders
Ecology

54
between cultivated areas, are in much of the farm lands
of the world the last refuge of many types of organisms
and these areas are, of course, reduced as farms grow
larger in the interests of efficiency. As might be expected,
such large-scale simplification of terrain patterns and
eradication of elements of food webs produce instability.
This is experienced eventually in the agricultural system
itself. Thus, reduction of habitat variety greatly disturbs
the food web involving insects, small rodents, and their
predators such as various birds and mammals.
Elimination of cover for insect eating birds, hawks, and
mammalian predators mean that the farmer is in
continual danger of crop eating insects or rodent
outbreak, since these organisms are essentially freed
from population limitation by predation.
The genetic uniformity of crops also brings danger of
instability, with virtually identical strains of crops; the
possibility of widespread losses due to plant diseases is
greatly increased. Thus in 1970, about one fifth of the
United States corn crop was lost to the southern corn
blight, and, earlier, in 1954, 75% of the Durum wheat
crop was destroyed by wheat stem rust.
Ecology
55
These two consequences of the instability of crop
ecosystems have required compensatory action by
farmers. Rodenticides, Insecticides, and herbicides are in
wholesale use, artificially preserving ecosystem stability
to ensure good crop yields. Such intrusions are, of
course, themselves dangerous because they may have
unexpected, unwanted effects.
The application of a long lasting insecticide may simply
ensure that eating the poisoned insects, perhaps
completely offsetting the beneficial effects of the
insecticide by killing insect predators, poisons insect
eating birds.
.4.2.2 Interfering with nutrient cycling
For better understanding of the occurrence of the
interference refer to biogeochemical cycling mentioned
below and chapter 5.
.5 Components of ecosystem
.5.1 Non-living components of an ecosystem
Ecology

56
The nonliving or abiotic parts of ecosystems have both
physical and chemical features. Physical features
include, for example, wind, terrain, soil moisture, water
current, temperature, soil porosity, and light level. The
chemicals of the non-living environment are all the
materials that are not, at this moment, a part of an animal
or plant e.g. water, gases, (carbon dioxide, oxygen),
minerals (iron, sulfur) and a wide variety of other complex
chemicals.
A chemical can be part of a living thing at one moment
and part of non – living environment a moment later. The
carbon in a molecule of protein can be part of a
functioning enzyme of some animal, but after the enzyme
is broken down that same carbon atom could be exhaled
as a molecule of carbon dioxide and thus becomes a part
of the gaseous abiotic environment. Chemicals move into
and out of living organisms and are used over and over
again. Some of the carbon atoms forming a protein
molecule in the muscle of your left arm may have once
been part of a chicken liver, the hide of a dinosaur, or
even of a limestone formation!
Ecology

57
Physical and chemical conditions in an ecosystem
regulate the activities of the plants and animals in that
system and may even determine which organisms can or
cannot be part of that system. At any particular time there
may be too much of one chemical substance or too little
of another for a given organism or group of organisms in
an ecosystem.
To complicate matters further, the living components of
an ecosystem have a great effect on chemical and
physical features of the environment. One of the most
important concepts of ecology is that while the physical
and chemical features of an ecosystem have an impact
on animals and plants and animals also have an impact
on their physical and chemical surroundings. Trees can
buffer the wind and make the climate cooler plants
produce oxygen for animals to breath.
.5.2 Living component of an ecosystem
Living things are made of carbon, water and a number of
other chemicals. In fact they are beautifully organized
combinations of nonliving materials-but so are
'diamonds'. A major distinction is that life is in constant
Ecology

58
complex and dynamic action. Living organisms
exchange, expel, convert, assemble, disassemble,
organize, and otherwise manipulate the constituent of
earth, air, and water. This energy-requiring manipulation
of earth, air, and water by living things enables individual
organisms to grow, reproduce, repair themselves, and
persist.
.5.2.1 Producers
All green plants are producers: they assimilate simple
chemicals from the soil, water and air, with the help of
energy from the sun, transform them by photosynthesis
into more complex energy-rich chemicals that eventually
make up the plant there by producing oxygen.
6CO2+6H2O →C6H12O6 + 6O2
At greater ocean depths, far below the limits of light
penetration, bacteria occur that are able to gain energy
from the oxidation of hydrogen sulfide that seeps from
volcanic vents in the ocean floor. Since these organisms
get their energy from chemical reactions and not from
light, they are called chemotrophs rather than
phototrophs. Except for such exceptional species, all
living things other than green plants are consumers.
Ecology

59
They consume chemical energy and nutrients derived
from other living things.
.5.2.2 Consumers Cattle graze, consuming plant material from which they
extract energy and chemical building blocks. Some of the
food energy is used for moving, some is used in
assembling chemical sub-units into new cells for the cow
or for a calf fetus, i.e. for growth or reproduction.
Similarly, an eater of cows extracts energy form the
chemicals in beef. A cow eater might use some of this
energy to dance or to swim; some is used to reassemble
beef chemicals into human chemicals (if the cow eater
happens to be human). Cows eat plants and therefore
are called herbivores. They could also be called
vegetarians. Because they get their food directly from
producers strict herbivores are also called primary
consumers. Organisms that eat plant eaters are called
secondary consumers, since their food is one step
moved from plants. They are also called carnivores.
Thus, an animal that eats a secondary consumer is
called a tertiary consumer, and so on. An organism
Ecology

60
eating plants as well as animals would qualify as a
multilevel consumer, or an omnivore (eats all).
.5.2.3 Decomposers
Decomposers are consumers that get energy and
nutrients by digesting waste matter and dead plant or
animal material. Decomposers are the organisms –
mostly bacteria and fungi-responsible for decay,
decomposition, or rotting. Sometimes animals die for
reasons other than being killed and eaten by a predator.
If their carcasses are not found and picked clean by
scavengers, they rot. The energy-rich and mineral-rich
treasure that these carcasses hold goes to bacteria and
fungi. Similarly, plants die for reasons other than being
picked and eaten by primary consumers. The chemicals
in dead plant material, the enormous volume of leaves
that forests give up every fall, for instance – also go to
the decomposers.
Decomposers play a very important role in ecosystems.
They are responsible for the completion of ecosystem
mineral cycles. By breaking down residual organic
chemicals and by using up any remaining energy,
decomposers figuratively mop up decomposing
Ecology

61
materials. They ensure that nutrients do not remain tied
up in non-functioning plant or animals mass.
Fire is also like decomposition. Fire can release chemical
energy and nutrients held in plant and animal material.
Fire also mops things up, completing cycles and closing
circles. However, fire is much more traumatic than
decomposition and is obviously different in other ways.
Many kinds of ecosystems are not compatible with
regular fires; others depend on them. Still, the net results
of fire and decomposition are the same: complex organic
material is broken down into mineral nutrients, carbon
dioxide, and water; energy is released as heat.
.6 Structure of the ecosystem
In the ecosystem, a flow of energy derived from
organism's environmental interactions led to:
o A clearly defined trophic structure with biotic
diversity and
o The cycling and exchange of materials between
the living and non-living part
.6.1 Trophic organization
Ecology

62
Ecosystems have a layered structure based on the
number of times energy is transferred from one organism
to another, away from the initial energy input into the
system. Thus, all organisms that are in the same number
of transfer steps away from the energy input are said to
be at the same trophic level.
From the trophic stand point of view, an ecosystem has
- autotrophic part in which light energy is captured
or "fixed" and used to build simple inorganic
substances into complex organic substances
such as carbohydrates, lipids, proteins, etc. and
- hetrotrophic component in which the complex
molecules undergo rearrangement, utilization
and decomposition.
The transfer of food energy from plants to animals and
then to other animals by successive stages of feeding
(trophic level) is termed as food chain.
Example: Grass → Grasshopper → Frog → Hawk
Ecology
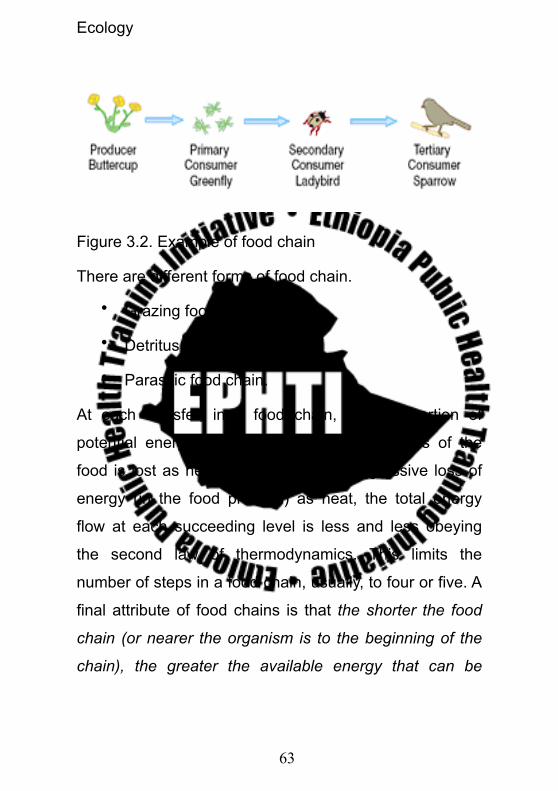
63
Figure 3.2. Example of food chain
There are different forms of food chain.
• Grazing food chain,
• Detritus food chain, and
• Parasitic food chain.
At each transfer, in a food chain, a large portion of
potential energy present in the chemical bonds of the
food is lost as heat. Because of this progressive loss of
energy (in the food process) as heat, the total energy
flow at each succeeding level is less and less obeying
the second law of thermodynamics. This limits the
number of steps in a food chain, usually, to four or five. A
final attribute of food chains is that the shorter the food
chain (or nearer the organism is to the beginning of the
chain), the greater the available energy that can be
Ecology

64
converted into biomass (living weight) and utilized in
cellular respiration.
In most cases the relationships between the organisms
involved are so complex that the chain is in the form of a
highly complicated and branching network called food
web, which is actually the existing feeding relationship in
an ecosystem.
Ecology

65
Figure 3.2. Food web: Real feeding relationship in an
ecosystem (source: Environmental Biology
sequence – Ecosystems).
In most cases the relationships between the organisms
involved are so complex that the chain is in the form of a
highly complicated and branching network called food
web, which is actually the existing feeding relationship in
an ecosystem.
An ecosystem also can be represented by ecological
pyramids. There are three general types of pyramids.
a) pyramid of numbers
This pyramid is constructed by counting the number of
individuals involved in each trophic level. The shape of
the pyramid may not be always broad at the base.
Ecology

66
Figure 3.4. Different examples of pyramid of numbers.
b) Pyramid of biomass
Pyramid of biomass is constructed by measuring the
weight of dry living matter in each trophic level. In most
cases the base is broader than the next trophic level. But
sometimes in the aquatic environment the dry weight of
the producers in a give unit of time is lesser than the
consecutive trophic levels. In such ecosystem the
producers are multiplying themselves rapidly to support
the next level.
Figure 3.5. Example of pyramid of biomass
c) Pyramid of energy
This is made by measuring the energy content of
organisms at each trophic level. The base is always
broader than the consecutive levels.
Ecology

67
Figure 3.6. Pyramid of energy
d) Pyramid of Productivity
This pyramid of productivity is often more useful, showing
the production or turnover of biomass at each trophic
level. Instead of showing a single snapshot in time,
productivity pyramids show the flow of energy through
the food chain. Typical units would be grams per meter2
per year or calories per meter2 per year. As with the
others, this graph begins with producers at the bottom
and places higher trophic levels on top.
Ecology

68
When an ecosystem is healthy, the pyramid generally
look like the standard Ecological Pyramid. This is
because in order for the ecosystem to sustain itself, there
must be more energy at lower trophic levels than there is
at higher trophic levels. This allows for organisms on the
lower levels to maintain a stable population, but to also
feed the organisms on higher trophic levels, thus
transferring energy up the pyramid. The exception to this
generalization is when portions of a food web are
supported by inputs of resources from outside of the
local community. In small, forested streams, for example,
many consumers feed on dead leaves which fall into the
stream. The productivity at the second trophic level is
therefore greater than could be supported by the local
primary production.
When energy is transferred to the next trophic level,
typically only 10% of it is used to build new biomass,
becoming stored energy (the rest going to metabolic
processes). As such, in a Pyramid of Productivity, each
step will be 10% the size of the previous step (100, 10, 1,
0.1, 0.01, 0.001 etc.).
The advantages of the Pyramid of Productivity:
Ecology

69
o It takes account of the rate of production over a
period of time.
o Two species of comparable biomass may have
very different life spans. Therefore their relative
biomasses misleading, but their productivity is
directly comparable.
o The relative energy flow within an ecosystem can
be compared using pyramids of energy; also
different ecosystems can be compared.
o There are no inverted pyramids.
o The input of solar energy can be added.
The disadvantages of the Pyramid of Productivity:
o The rate of biomass production of an organism is
required, which involves measuring growth and
reproduction through time.
o There is still the difficulty of assigning the
organisms to a specific trophic level. As well as
the organism in the food chains there is the
problem of assigning the decomposers and
detritivores to a particular trophic level.
Ecology

70
Productivity pyramids usually provide more insight into a
ecological community when the necessary information is
available.
.7 Function of ecosystem
The function of an ecosystem is related to energy flow
and material cycling through and within the ecosystem.
.7.1 Energy flow
Living things are dependent for their existence not only
on proper soil and climate conditions, but also on some
form of energy. Ultimately, most organisms depend on
the sun for the energy needed to create structures and
carry out life process. The transfer of energy through a
biological community (an ecosystem) begins when the
energy of sunlight is fixed in a green plant by
photosynthesis. Photosynthesis converts radiant energy
into useful, high-quality chemical energy in the bonds
that hold together organic molecules.
At each transfer of energy with in a food chain,
approximately 90% of the chemical energy stored in the
lower level is lost, and therefore unavailable to the higher
level (second law of thermodynamics). Since the total
Ecology

71
amount of energy entering the food chain is fixed by
photosynthetic activates of plants, more usable energy is
available to organisms occupying lower position in the
food chain than to those at higher tropic level.
Expressing this concept in simpler terms, one might say
for example:
Corn ----------------------------------------Beef ---------------------------Human
10000 units of energy 1000 of energy units 100 units of energy
By moving man one step lower in the food chain, ten
times more energy becomes directly available.
Corn -----------------------------------------------Beef
1000 units of energy 1000 units of energy
The unidirectional flow and efficiency of energy
transformation, account for the need for a continuous
source of energy to prevent collapse of an ecosystem.
A generalization exists among ecologists that on
average, about 10% of the energy available in one
trophic level will be passed on to the next; this is
primarily due to the 3 reasons given above. Therefore, it
is also reasonable to assume that in terms of biomass,
each trophic level will weigh only about 10% of the level
Ecology

72
below it, and 10x as much as the level above it. It comes
in useful in terms of human diet and feeding the world's
population, considers this. If we all ate corn, there would
be enough food for 10 xs as many of us as compared to
a world where we all eat beef (or chicken, fish, pork,
etc.). Another way of looking at it is this. Every time you
eat meat, you are taking food out of the mouths of 9
(nine) other people, who could be fed with the plant
material that was fed to the animal you are eating. Of
course, it's not quite that simple, but you get the general
idea.
.7.2 Biogeochemical cycling
All living organisms are dependent not only on a source
of energy, but also on a number of inorganic materials,
which are continuously being circulated throughout the
ecosystem. These materials provide both the physical
framework, which supports life activities and the
inorganic chemical building blocks from which living
molecules are formed. When such molecules are
synthesized or broken down, changed form one form into
another as they move through the ecosystem, the
elements or which they are composed are not lost or
Ecology

73
degraded in the same way in which energy moving
through a food chain is lost
Indeed, the manner in which inorganic materials move
through ecosystems differs fundamentally from the
movement of energy through those same systems in
that, matter, unlike energy, is conserved with in the
ecosystem, in which atoms and molecules being used
and reused identify.
The cycling of earth material through living systems and
back to the earth is called biogeochemical cycling.
Of the 92 naturally occurring chemical elements, about
40 are essential to the existence of living organisms and
hence are known as Nutrients. Some of these nutrients
are fairly abundant and are needed in relatively large
quantities by plants and animals. Such substances are
termed Macronutrients and include carbon, hydrogen,
oxygen, nitrogen, phosphorus, potassium, calcium,
magnesium, and sulfur. Others, which are equally
necessary but are required in much smaller amounts, are
called Trace elements. These include such substance
as iron, copper, manganese, zinc, chlorine, and iodine.
The perpetuation of life on this planet is ultimately
Ecology

74
dependent on the repeated recycling of these inorganic
materials in more or less circular paths form the abiotic
environment to living things and back to the environment
again. Such cycling involves a change in the elements
from an inorganic form to an organic molecule and back
again.
Biogeochemical cycles are important because they help
to retain vital nutrients in forms usable by plants and
animals and help to maintain the stability of ecosystems.
Organisms have developed various adaptations to
enable them to capture and retain nutrients. The
distribution of nutrients in different biomes reveals that
plants in both the tropical rainforest and in desert regions
have widespread, shallow root systems which permit
them quickly to absorb water and the mineral nutrients
which it carries in dissolved form before these can be lost
through rapid run-off, competition from other organisms,
or evaporation. In the tropical rainforest, for example,
virtually all the mineral nutrients are retained in plant
tissues and the topsoil of this biome is extremely nutrient
poor.
Ecology
75
If nutrient cycling did not occur, amounts of necessary
elements would constantly decrease and would make the
development of stable plant and animals populations
impossible, since there is no constant addition to the
source of nutrients form outside (as there is of energy in
the form of sunlight).
.7.2.1 Types of biogeochemical cycling
There are basically two types of biogeochemical cycles-
gaseous and sedimentary, depending upon whether the
primary source for the nutrient involved happens to be air
and water (gaseous cycles ) or soil and rocks
(sedimentary cycles).
i. Gaseous Cycles
The elements moved about by gaseous cycles, primarily
through the atmosphere but to a lesser degree in water;
recycle much more quickly and efficiently than do those
in the sedimentary cycle.
Gaseous cycles pertain to only four elements: carbon,
hydrogen, oxygen, and nitrogen. These four constitute
about 97.2% of the bulk of protoplasm and so are of vital
importance to life.
Ecology
76
An examination of two of these, cycles of carbon and
nitrogen, gives and idea of the complexity of gaseous
cycles.
ii. Sedimentary Cycles
Many of the elements that are essential for plant and
animals life occur most commonly in the from of
sedimentary rocks form which recycling takes place very
slowly. Indeed, such sedimentary cycles may extend
across long period of geologic time and for all practical
purposes constitute what are essentially one-way flows.
In comparison with gaseous cycles, sedimentary cycles
seem relatively simple in nature. Iron, calcium, and
phosphorus are examples of nutrients whose cycling
occurs via the basic sedimentary pattern.
A brief look at the phosphorous and sulfur cycle will give
an idea of the transformations involved.
.7.2.2 Nutrient cycling in the tropics
The pattern of nutrient cycling in the tropics is different
from that in the North Temperate Zone. In cold regions a
large portion of the organic matter and available nutrients
is within the soil or sediment at all times. In the tropics a
much larger percentage is in the biomass and is recycled
Ecology

77
within the organic structure of the system aided by a
number of nutrient conserving, biological adaptations that
include mutualistic symbiosis between micro-organisms
and plants. When this evolved and well-organized biotic
structure is removed, nutrients are rapidly lost by
leaching under conditions of high temperature and heavy
rainfall, especially on sites that are initially poor in
nutrients. For this reason, agriculture in particular and
environmental management in general is urgent if past
mistakes are to be corrected and if future eco-disasters
are to be avoided. At the same time, the rich species
diversity of the tropics must be preserved.
When a forest in the temperate zone is removed the soil
retains nutrients and structure and can be farmed for
many years in the conventional manner. This means
ploughing one or more times a year, planting annual
species and applying inorganic fertilizers. During the
winter, freezing temperatures help hold in nutrients and
control pests and parasites. In the tropics however forest
removal takes away the lands ability to hold and the land
is abandoned creating the pattern of shifting agriculture.
Nutrient cycling in particular and community control in
Ecology

78
general then tends to be more physical in the north and
more biological in the south.
In summary the nutrient poor tropical ecosystem is able
to maintain high productivity under natural conditions
through a variety of nutrient conserving mechanisms that
may be called "direct cycling". That means form plant
back to plant more or less by-passing the soil. When
such forests are cleared for agriculture these
mechanisms are destroyed and productivity declines
very rapidly.
Development and testing of crop plants with well
developed mycorrhizal and nitrogen fixing root system
and greater used perennial plants are ecologically sound
goals for tropical climates. As far as tropical counties are
concerned one thing is certain, which is industrialized
agro-technology of the Temperate zone cannot be
transferred unmodified to tropical regions.
.7.2.3 Interactions between nutrient cycles
The various nutrient cycles are interconnected and
depend on one another to a great extent. For example,
the burning of fossil fuels not only puts large amount of
carbon into the atmosphere, but also increases the
Ecology

79
amount of atmospheric nitrogen, phosphorus and
sulphur. This interdependence is also obvious when one
considers nutrient cycling through organisms. When an
herbivore eats a plant or a carnivore an animals, it
ingests at one go all the elements, which are found in the
organism. Clearly, biogeochemical cycles involve
complex interactions between the abiotic environment
and the living organisms and any one cycle is composed
of numerous loops and steps. The cycles discussed so
far all overlap and operate simultaneously in the same
functioning systems. The biosphere both regulates and
is regulated by various biogeochemical cycles;
decomposers and the abiotic environment determine
how well any ecosystem functions.
.7.2.4 The response of organisms to nutrient
availability
Organisms require many nutrients for healthy growth and
reproduction. Nutrient availability varies from habitat to
habitat, so that in some place a particular nutrient may
be scarce, while in other places it is abundant. When
one looks at the response of organisms to the availability
of essential nutrients, a pattern emerges. If the nutrient
Ecology
80
is present at too low a concentration for the organisms,
then the growth and the reproduction of the organisms
are affected. At these concentration the nutrient is said
to be limiting and an increase in nutrient availability will
cause and increase in the organism’s growth and
subsequent reproductive success, organisms growth or
population size rises to a point at which the particular
nutrient is no longer limiting.
However, if the nutrient abundance continues to
increase; there comes a point when the nutrient
becomes toxic. At this point growth and reproduction are
adversely affected and the organisms may even be
killed.
.7.2.5 Water cycle
The water cycle has no starting or ending point. The sun,
which drives the water cycle, heats water in the oceans.
Some of it evaporates as vapor into the air. Ice and snow
can sublimate directly into water vapor. Rising air
currents take the vapor up into the atmosphere, along
with water from evapotranspiration, which is water
transpired from plants and evaporated from the soil. The
vapor rises into the air where cooler temperatures cause
Ecology

81
it to condense into clouds. Air currents move clouds
around the globe; cloud particles collide, grow, and fall
out of the sky as precipitation. Some precipitation falls as
snow and can accumulate as ice caps and glaciers,
which can store frozen water for thousands of years.
Snow packs in warmer climates often thaw and melt
when spring arrives, and the melted water flows overland
as snowmelt. Most precipitation falls back into the
oceans or onto land, where, due to gravity, the
precipitation flows over the ground as surface runoff. A
portion of runoff enters rivers in valleys in the landscape,
with stream flow moving water towards the oceans.
Runoff, and ground-water seepage, accumulate and are
stored as freshwater in lakes. Not all runoff flows into
rivers. Much of it soaks into the ground as infiltration.
Some water infiltrates deep into the ground and
replenishes aquifers (saturated subsurface rock), which
store huge amounts of freshwater for long periods of
time. Some infiltration stays close to the land surface and
can seep back into surface-water bodies (and the ocean)
as ground-water discharge, and some ground water finds
openings in the land surface and emerges as freshwater
Ecology

82
springs. Over time, the water continues flowing, some to
reenter the ocean, where the water cycle renews itself.
The different processes are as follows:• Precipitation is condensed water vapor that falls to
the Earth's surface. Most precipitation occurs as rain, but also includes snow, hail, fog drip, and sleet. Approximately 505,000 km³ of water fall as precipitation each year, 398,000 km³ of it over the oceans.
• Canopy interception is the precipitation that is intercepted by plant foliage and eventually evaporates back to the atmosphere rather than falling to the ground.
• Snowmelt refers to the runoff produced by melting snow.
• Runoff includes the variety of ways by which water moves across the land. This includes both surface runoff and channel runoff. As it flows, the water may infiltrate into the ground, evaporate into the air, become stored in lakes or reservoirs, or be extracted for agricultural or other human uses.
Ecology

83
• Infiltration is the flow of water from the ground
surface into the ground. Once infiltrated, the water
becomes soil moisture or groundwater.
• Subsurface Flow is the flow of water underground,
in the vadose zone and aquifers. Subsurface water
may return to the surface (e.g. as a spring or by
being pumped) or eventually seep into the oceans.
Water returns to the land surface at lower elevation
than where it infiltrated, under the force of gravity or
gravity induced pressures. Groundwater tends to
move slowly, and is replenished slowly, so it can
remain in aquifers for thousands of years.
• Evaporation is the transformation of water from
liquid to gas phases as it moves from the ground or
bodies of water into the overlying atmosphere. The
source of energy for evaporation is primarily solar
radiation. Evaporation often implicitly includes
transpiration from plants, though together they are
specifically referred to as evapotranspiration.
Approximately 90% of atmospheric water comes
from evaporation, while the remaining 10% is from
transpiration. Total annual evapotranspiration
Ecology

84
amounts to approximately 505,000 km³ of water,
434,000 km³ of which evaporates from the oceans.
• Sublimation is the state change directly from solid
water (snow or ice) to water vapor.
• Advection is the movement of water in solid, liquid,
or vapor states through the atmosphere. Without
advection, water that evaporated over the oceans
could not precipitate over land.
• Condensation is the transformation of water vapor
to liquid water droplets in the air, producing clouds
and fog.
Figure 3.7. The water cycle (Source: English Wikipedia, original upload 27 April 2005)
Water reservoirs
Ecology

85
In the context of the water cycle, a reservoir represents
the water contained in different steps within the cycle.
The largest reservoir is the collection of oceans,
accounting for 97% of the Earth's water. The next largest
quantity (2%) is stored in solid form in the ice caps and
glaciers. The water contained within all living organisms
represents the smallest reservoir.
Table 3.1. Volume of water stored in the water cycle's reservoirs (Source: English Wikipedia)
Reservoir Volume of water(106 km³)
Percentof total
Oceans 1370 97.25
Ice caps & glaciers 29 2.05
Groundwater 9.5 0.68
Lakes 0.125 0.01Soil moisture 0.065 0.005Atmosphere 0.013 0.001Streams & rivers 0.0017 0.0001Biosphere 0.0006 0.00004
The volumes of water in the fresh water reservoirs,
particularly those that are available for human use, are
important water resources.
Residence times
Ecology

86
The residence time of a reservoir within the hydrologic
cycle is the average time a water molecule will spend in
that reservoir (see the adjacent table). It is a measure of
the average age of the water in that reservoir, though
some water will spend much less time than average and
some much more.
Groundwater can spend over 10,000 years beneath
Earth's surface before leaving. Particularly old
groundwater is called fossil water. Water stored in the
soil remains there very briefly, because it is spread thinly
across the Earth, and is readily lost by evaporation,
transpiration, stream flow, or groundwater recharge. After
evaporating, water remains in the atmosphere for about
9 days before condensing and falling to the Earth as
precipitation.
Table 3.2. Average reservoir residence times (Source:
English Wikipedia)
Reservoir Average residence timeOceans 3,200 yearsGlaciers 20 to 100 yearsSeasonal snow cover 2 to 6 monthsSoil moisture 1 to 2 monthsGroundwater: shallow 100 to 200 years
Ecology

87
Groundwater: deep 10,000 yearsLakes 50 to 100 yearsRivers 2 to 6 monthsAtmosphere 9 days
In hydrology, residence times can be estimated in two
ways. The more common method relies on the principle
of conservation of mass and assumes the amount of
water in a given reservoir is roughly constant. With this
method, residence times are estimated by dividing the
volume of the reservoir by the rate by which water either
enters or exits the reservoir. Conceptually, this is
equivalent to timing how long it would take the reservoir
to become filled from empty if no water were to leave (or
how long it would take the reservoir to empty from full if
no water were to enter).
An alternative method to estimate residence times,
gaining in popularity particularly for dating groundwater,
is the use of isotopic techniques. This is done in the
subfield of isotope hydrology.
Changes over time
The water cycle describes the processes that drive the
movement of water throughout the hydrosphere.
However, much more water is "in storage" for long
Ecology
88
periods of time than is actually moving through the cycle.
The storehouses for the vast majority of all water on
Earth are the oceans. It is estimated that of the
332,500,000 cubic miles (mi3) (1,386,000,000 cubic
kilometers (km3)) of the world's water supply, about
321,000,000 mi3 (1,338,000,000 km3) is stored in
oceans,or about 95%. It is also estimated that the
oceans supply about 90 percent of the evaporated water
that goes into the water cycle.
During colder climatic periods more ice caps and glaciers
form, and enough of the global water supply accumulates
as ice to lessen the amounts in other parts of the water
cycle. The reverse is true during warm periods. During
the last ice age glaciers covered almost one-third of
Earth's land mass, with the result being that the oceans
were about 400 feet (122 meters) lower than today.
During the last global "warm spell," about 125,000 years
ago, the seas were about 18 feet (5.5. meters) higher
than they are now. About three million years ago the
oceans could have been up to 165 feet (50 meters)
higher.
Ecology

89
The scientific consensus expressed in the 2007
Intergovernmental Panel on Climate Change (IPCC)
Summary for Policymakers is for the water cycle to
continue to intensify throughout the 21st century, though
this does not mean that precipitation will increase in all
regions. In subtropical land areas — places that are
already relatively dry — precipitation is projected to
decrease during the 21st century, increasing the
probability of drought. The drying is projected to be
strongest near the poleward margins of the subtropics
(for example, the Mediterranean Basin, South Africa,
southern Australia, and the Southwestern United States).
Annual precipitation amounts are expected to increase in
near-equatorial regions that tend to be wet in the present
climate, and also at high latitudes. These large-scale
patterns are present in nearly the entire climate model
simulations conducted at several international research
centers as part of the 4th Assessment of the IPCC.
Glacial retreat is also an example of a changing water
cycle, where the supply of water to glaciers from
precipitation cannot keep up with the loss of water from
melting and sublimation. Glacial retreat since 1850 has
been extensive.
Ecology

90
Human activities that alter the water cycle include:
• agriculture
• alteration of the chemical composition of the
atmosphere
• construction of dams
• deforestation and afforestation
• removal of groundwater from wells
• water abstraction from rivers
• urbanization
Effects on climate
The water cycle is powered from solar energy. 86% of
the global evaporation occurs from the oceans, reducing
their temperature by evaporative cooling. Without the
cooling effect of evaporation the greenhouse effect would
lead to a much higher surface temperature of 67 °C, and
a warmer planet.
Most of the solar energy warms tropical seas. After
evaporating, water vapor rises into the atmosphere and
is carried by winds away from the tropics. Most of this
vapour condenses as rain in the Intertropical
Ecology

91
convergence zone, also known as the ITCZ, releasing
latent heat that warms the air. This in turn drives the
atmospheric circulation.
Effects on biogeochemical cycling
While the water cycle is itself a cycle, flow of water over
and beneath the Earth is a key component of the cycling
of other biogeochemicals. Runoff is responsible for
almost all of the transport of eroded sediment and
phosphorus from land to water bodies. The salinity of the
oceans is derived from erosion and transport of dissolved
salts from the land. Cultural eutrophication of lakes is
primarily due to phosphorus, applied in excess to
agricultural fields in fertilizers, and then transported
overland and down rivers. Both runoff and groundwater
flow play significant roles in transporting nitrogen from
the land to water bodies.
.7.2.6 The carbon cycle
Carbon is the basic constituent of living organic
compound. Since energy transfer occurs as the
consumption and storage of carbohydrates and fates,
carbon moves through the ecosystem with the flow of
energy. The source of nearly all carbon found in the
Ecology

92
atmosphere and dissolved in waters of the earth is
carbon dioxide (Fig.3.4.).
Fig.3.8. The Carbon Cycle (source: Environmental
Biology sequence – Ecosystems)
From a biological perspective, the key events here are
the complementary reactions of respiration and
photosynthesis. Respiration takes carbohydrates and
oxygen and combines them to produce carbon dioxide,
water, and energy. Photosynthesis takes carbon dioxide
and water and produces carbohydrates and oxygen. The
Ecology

93
outputs of respiration are the inputs of photosynthesis,
and the outputs of photosynthesis are the inputs of
respiration. The reactions are also complementary in the
way they deal with energy. Photosynthesis takes energy
from the sun and stores it in the carbon-carbon bonds of
carbohydrates; respiration releases that energy. Both
plants and animals carry on respiration, but only plants
(and other producers) can carry on photosynthesis.
The chief reservoirs for carbon dioxide are in the oceans
and in rock. Carbon dioxide dissolves readily in water.
Once there, it may precipitate (fall out of solution) as a
solid rock known as calcium carbonate (limestone).
Corals and algae encourage this reaction and build up
limestone reefs in the process. On land and in the water,
plants take up carbon dioxide and convert it into
carbohydrates through photosynthesis. This carbon in
the plants now has three possible fates. It can be
liberated to the atmosphere by the plant through
respiration; it can be eaten by an animal, or it can be
present in the plant when the plant dies. Animals obtain
all their carbon in their food, and, thus, all carbon in
biological systems ultimately comes from plants
(autotrophs). In the animal, the carbon also has the same
Ecology

94
three possible fates. Carbon from plants or animals that
is released to the atmosphere through respiration will
either be taken up by a plant in photosynthesis or
dissolved in the oceans. When an animal or a plant dies,
two things can happen to the carbon in it. It can either be
respired by decomposers (and released to the
atmosphere), or it can be buried intact and ultimately
form coal, oil, or natural gas (fossil fuels). The fossil fuels
can be mined and burned in the future; releasing carbon
dioxide to the atmosphere. Otherwise, the carbon in
limestone or other sediments can only be released to the
atmosphere when they are subducted and brought to
volcanoes, or when they are pushed to the surface and
slowly weathered away. Humans have a great impact on
the carbon cycle because when we burn fossil fuels we
release excess carbon dioxide into the atmosphere. This
means that more carbon dioxide goes into the oceans,
and more is present in the atmosphere. The latter
condition causes global warming, because the carbon
dioxide in the atmosphere allows more energy to reach
the earth from the sun than it allows escaping from the
earth into space.
Ecology

95
This is due to CO2 absorbs infrared rays and allows heat
to stay in the atmosphere, rather than escaping into
space. How much heat is retained depends on how
much CO2 in the air. The greater the amount of CO2 in
the atmosphere, the warmer the earth becomes,
because of the green house effect. The green house
effect occurs because CO2 in the atmosphere acts as do
the glass wall of a green house. The glass wall transmit
sunlight into the green house, where it is absorbed and
reradiated as heat that does not readily exit through the
glass; as a consequence the temperature inside the
greenhouse become higher than the outside.
Carbon dioxide is released in large quantities when wood
and fossil fuels as coal, oil and natural gas are burnt.
This release of CO2 is faster than plants and an ocean,
which absorbs the gas, could handle it. It CO2 (and other
greenhouse gases) levels in the atmosphere were to
increase (due to burning of fossil fuels), the atmosphere
temperature would increase (global worming). This leads
to a rise in seal level (because of glacial melting),
submergence of coasts, change in pattern of
precipitation, and change in the habitable ranges of
organisms.
Ecology

96
.7.2.7 The Nitrogen Cycle
Nitrogen is crucial for all organisms because it is an
essential of protein and nucleic acids. The chief reservoir
of nitrogen is the atmosphere, which is about 78% of the
atmosphere, the largest gaseous reservoir of any
element. In its gas form, N2 is useless to most
organisms. Nitrogen gas can be taken from the
atmosphere (fixed) in two basic ways. First, lightning
provides enough energy to "burn" the nitrogen and fix it
in the form of nitrate, which is nitrogen with three-oxygen
attached. This process is duplicated in fertilizer factories
to produce nitrogen fertilizers.
The other form of nitrogen fixation is by nitrogen fixing
bacteria, which use special enzymes instead of the
extreme amount of energy found in lightning to fix
nitrogen. These nitrogen-fixing bacteria come in three
forms: some are free-living in the soil; some form
symbiotic, mutualistic associations with the roots of bean
plants and other legumes (rhizobial bacteria); and the
third form of nitrogen-f ixing bacteria are the
photosynthetic cyanobacteria (blue-green algae) which
are found most commonly in water. All of these fix
Ecology

97
nitrogen, either in the form of nitrate or in the form of
ammonia (nitrogen with three hydrogen attached) (Fig.
3.5).
When the plant or animals dies, decomposing bacteria
and fungi cause the body to decay so that the nitrogen
containing ammonia acids are broken down, releasing
ammonia gas ( NH3). Nitrite bacteria can convert the
ammonia into nitrate (NO2) molecules, and still other
bacteria (nitrate bacteria) in the soil can add a third
oxygen atom to nitrites to produce nitrates. At this point,
we have gone full cycle, because plants in the area now
have a useable form of nitrogen again.
Ecology

98
Fig.3.9. the Nitrogen Cycle, from Environmental Biology sequence - EcosystemsNitrogen may be removed from the nitrates in the soil by
denitrifying bacteria, and returned to the atmospheric
reservoir, from which, either nitrogen- fixing bacteria or
electrification by lighting can release it again. In the
latter case, the energy of lighting bolt passing through
the atmosphere binds nitrogen and oxygen together into
nitrate, which precipitate onto the soil from the air during
electrical storms.
.7.2.8 The Phosphorous Cycle
Ecology

99
Phosphorous cycle is an excellent example of a
sedimentary cycle. Phosphorous is necessary element
in the hereditary materials DNA, in other vital cellular
molecules and in the structure of bone on vertebral
animals.
The principle reservoir for the cycle is phosphate rock
formed in the past geologic age, although excrement
deposits contribute substantial phosphate in certain
areas of the world. Erosion by rainfall and the runoff
streams dissolved phosphate out of these reservoirs,
forming phosphorous pool in the soil (fig.3.6.)
Ecology

100
Fig.3.10. the Phosphorous Cycle, from Environmental
Biology sequence - Ecosystems
This makes phosphorous available to plants, which
absorbs it through their roots for use in cellular synthesis.
Animals obtain phosphorous from plants; upon death or
through normal excretion of waste products from the
body, they return phosphorous to the dissolved
phosphorous pool. However, in the dissolved state,
much phosphorous is lost by downhill transport into
shallow marine sediments. Some of this phosphorous is
returned to land by sea birds that deposit excrement to
the shores.
The phosphorous cycle is leaky or incomplete, in that
there is, on land loss of phosphate into insoluble forms,
and there is a gradual loss of phosphate from and into
the ocean, from which there is only poor natural return
except over geologically long periods of time.
Human intervention is a significant factor in the
phosphorous cycle. Large quantities of phosphorous are
mined and used as fertilizers and for other uses such as
in detergents.
Ecology

101
The result is that some fresh water streams and lakes
have a great excess of biologically available phosphate
from run off and sewage since, in such bodies of water,
phosphate is often a limiting factor in photosynthesis;
excessive growth of aquatic plants ensures. This
process is called Eutrophication, can totally disrupt
aquatic ecosystems with serious consequences
.7.2.9 Sulfur cycle
Sulfur is mainly found on Earth as sulfates in rocks or as
free sulfur. Sulfur also occurs in combination with several
metals such as lead and mercury, as PbS and HgS.
Sulfur appears as the yellow aspects of soil in many
regions.
Sulfur was mined early in the form of the yellow element
and used for gunpowder and fireworks. While bacteria
digest plant matter, they emit H2S, hydrogen sulfide, a
gas that has the "rotten egg" smell characteristic of
swamps and sewage. Sulfur is an essential element of
biological molecules in small quantities.
Ecology

102
Sulfur and its compounds are important elements of
industrial processes. Sulfur dioxide (SO2) is a bleaching
agent and is used to bleach wood pulp for paper and
fiber for various textiles such as wool, silk, or linen. SO2
is a colorless gas that creates a choking sensation when
breathed. It kills molds and bacteria. It is also used to
preserve dry fruits, like apples, apricots, and figs, and to
clean out vats used for preparing fermented foods such
as cheese and wine.
Sulfuric acid, H2SO4, is a very widely used chemical.
Over 30 million tone of sulfuric acid are produced every
year in the U.S. alone. The acid has a very strong affinity
for water. It absorbs water and is used in various
industrial processes as a dehydrating agent. The acid in
the automobile battery is H2SO4. It is used for "pickling"
steel, that is, to remove the oxide coating from the steel
surface before it is coated with tin or electroplated with
zinc.
Sulfur is also a biologically important atom. Although only
small amounts of sulfur are necessary for biological
systems, disulfide bridges form a critical function in giving
Ecology

103
biological important molecules specific shapes and
properties.
Sulfur is released into the atmosphere through the
burning of fossil fuels --especially high sulfur coal--and is
a primary constituent of acid rain. Sulfuric acid (H2SO4)
is the primary constituent of acid rain (see Atmospheric
System) in about all regions other than California. Sulfur
dioxide and carbonyl sulfide (COS) occur in small
quantities in the atmosphere; but due to its high
reactivity, sulfur is quickly deposited as compound
(sulfates) on land and other surfaces.
Ecology

104
Figure 3.11. the Sulfur Cycle.
An important distinction between cycling of sulfur and
cycling of nitrogen and carbon is that sulfur is "already
fixed". That is, plenty of sulfate anions (SO42-) are
available for living organisms to utilize. By contrast, the
major biological reservoirs of nitrogen atoms (N2) and
carbon atoms (CO2) are gases that must be pulled out of
the atmosphere.
Important reactions of the sulfur cycle include:
Ecology

105
Assimilative sulfate reduction - sulfate (SO42-) is
reduced to organic sulfhydryl groups (R-SH) by plants,
fungi and various prokaryotes. The oxidation states of
sulfur are +6 in sulfate and -2 in R-SH.
Desulfuration - organic molecules containing sulfur can
be desulfurated, producing hydrogen sulfide gas (H2S),
oxidation state = -2. Note the similarity to deamination.
Oxidation of hydrogen sulfide produces elemental
sulfur (So), oxidation state = 0. This reaction is done by
the photosynthetic green and purple sulfur bacteria and
some chemolithotrophs.
Further oxidation of elemental sulfur by sulfur oxidizers
produces sulfate.
• Dissimilative sulfur reduction - elemental sulfur
can be reduced to hydrogen sulfide.
• Dissimilative sulfate reduction - sulfate
reducers generate hydrogen sulfide from sulfate.
Reservoirs of sulfur
• The largest physical reservoir is the Earth's crust
wherein sulfur is found in gypsum (CaSO4) and
pyrite (FeS2).
Ecology

106
• The largest reservoir of biological useful sulfur is
found in the ocean as sulfate anions (very
concentrated at 2.6 g/L), dissolved hydrogen
sulfide gas, and elemental sulfur.
• Other reservoirs include:
o Freshwater - contains sulfate, hydrogen
sulfide and elemental sulfur;
o Land - contains sulfate;
o Atmosphere - contains sulfur oxide (SO2)
and methane sulfonic acid (CH3SO3-);
volcanic activity releases some hydrogen
sulfide into the air.
A. Given that Sulfur Is "Already Fixed", Why Bother
Studying the Sulfur Cycle?
1. Environmental impacts are diverse and important
locally even on a human time scale:
oSome of the reactions that occur in the sulfur cycle
open up new environments to life. They support
biological communities in unlikely places such as
Ecology

107
deep sea thermal vents, areas of low pH and
areas of high temperature.
oOn the other hand, certain reactions remove
needed metabolites or produce wastes that
make environments uninhabitable to some
organisms.
2. Interesting microbial chemistries, that no other
organisms do, are found in cycles such as the sulfur
cycle. They have been exploited in:
oMining,
oBioremediation,
oSynthesis of industrial chemicals.
B. Sulfur Oxidation
1. The light-induced oxidation of hydrogen sulfide for
harvesting electrons during photosynthesis has already
been discussed:
H2S -----> So + 2 H++ 2 e-
oOrganisms: The green and purple sulfur bacteria
oxidize hydrogen sulfide for photosynthesis.
Ecology

108
oHabitats:
(i) Obviously, these organisms must live in
the light. Therefore they cannot exist deep in
the oceans where light does not penetrate.
(ii) The environment must contain a source
of hydrogen sulfide, usually arising from
desulfuration of decaying organic material or
from sulfate reduction.
E.g. These organisms are often found in
waters "one level" above decaying organics
or sulfate reducers where they acquire
hydrogen sulfide bubbling up from below and
are simultaneously illuminated by the
sunlight.
2. Chemolithotrophic oxidation of hydrogen sulfide
generates energy:
oHydrogen sulfide can be oxidized to elemental sulfur:
H2S + 1/2 O2 -----> So + H2O + energyoElemental sulfur in turn can be oxidized to sulfate:
So + 1 1/2 O2 + H2O ---> SO42- + 2 H+ + energy
oHabitats/Requirements
Ecology

109
(i) Oxic or anoxic? Bacteria that oxide sulfur-
containing materials occur in both oxic and anoxic
environments. Those that live in oxic environments
perform the reactions shown above. A different
electron acceptor, such as nitrate, is utilized in anoxic
environments since the "favorite" acceptor, oxygen, is
unavailable.
(ii) pH: Note that the oxidation of sulfur in oxic
habitats produces sulfuric acid (SO42- + 2 H+ =
H2SO4). Organisms doing these reactions must be
acidophiles that can tolerate the resultant acidic
habitats.
(iii) Source of hydrogen sulfide Desulfuration of decaying organic material
releases hydrogen sulfide;
Sulfate reducers can generate hydrogen
sulfide;
Volcanic activity releases hydrogen sulfide.
For example, chemolithotrophs near
thermal vents in the deep sea harvest the
energy from this source. Thus they form the
Ecology

110
foundation of whole communities in the
deep sea where light cannot penetrate.
(iv) When is elemental sulfur (So) oxidized: Organisms
will oxidize hydrogen sulfide (H2S) until it runs out
and then begin utilizing elemental sulfur. This is
logical, since more energy can be acquired from
oxidizing hydrogen sulfide compared to elemental
sulfur. As we have seen before, use of an
alternate substrate requires the expression of
genes not previously expressed.
o Organisms:(i) Beggiatoa - historically important because it was
the first chemolithotroph identified.
(ii) Thiobacillus - an obligate acidophile, very tolerant
of low pH; in addition to oxidizing hydrogen sulfide,
this organism can extract iron from solid pyrite (FeS2)
in a two-step process in which sulfur atoms are
oxidized.
First, the organism catalyzes the oxidation of ferrous
iron, generating ferric iron
Fe2++ 1/2 O2 + 2 H+ -----> Fe3++ H2O
Ecology

111
Secondly, the ferric iron produced spontaneously
reacts with pyrite
FeS2 + 14 Fe3+ + 8 H2O -----> 15 Fe2+ + 2 SO42- + 16 H+
Note: The reaction is self-supporting, since the
ferrous iron produced in the second reaction can be
fed back into the first reaction. Thus these chain
reactions will continue until all of the pyrite is
exhausted. These reactions also generate copious
amounts of sulfuric acid (H2SO4) that acidify the
waters near coal mines, where there is plenty of
exposed pyrite (See the more extensive discussion of
acid-mine drainage in the next lecture.).
(iii) The Thiovulum/Riftia symbiosis - Riftia is a tube
worm, ~ 2 meters long, found near thermal vents in
the deep sea. Riftia contains an organ called a
trophosome that harbours Thiovolum and several
other prokaryotic genera (~4 x 10⁹ cells/gram). The
worm contains a unique hemoglobin that binds the
hydrogen sulfide generated by volcanic activity and
delivers it to the bacterial symbiont. Bacterial
oxidation of the hydrogen sulfide generates the
Ecology

112
energy that is required to fix carbon. The worm
receives the fixed carbon from the bacteria.
C. Sulfate reduction
Dissimilative sulfate reduction involves using sulfate
as a terminal electron acceptor during the energy-
generating oxidation of various materials (Table 16.6).
A specific example of sulfate reduction involves the
oxidation of molecular hydrogen (H2) that occurs in
several steps:
1. Sulfate, which is fairly stable, is activated by
reaction with ATP, forming adenosine
phosphosulfate (APS):
SO42- + ATP -----> APS + PPi
2. A hydrogenase splits molecular hydrogen, and
the electrons contained therein are used to
reduce the sulfur atom of APS, releasing sulfite
(SO32-).
APS + H2 -----> SO32- + AMP + H2OThis reaction involves an intermediate electron
carrier, cytochrome c3, that is diagnostic for
dissimilative sulfate reducers (Figure 16.32).
Ecology

113
3. Using more electrons derived from molecular
hydrogen, sulfite is reduced, producing
hydrogen sulfide:
SO32- + 6 H++ 6 e- ------> H2S + H2O + 2 OH-
Two additional points:
a. Sulfite is toxic to most organisms, so it is reduced
as soon as it is produced, i.e. organisms do not
wait until sulfate is exhausted to begin utilizing
sulfite. The hydrogen sulfide product is also toxic,
but it is a gas that escapes into the atmosphere as
it is generated.
b. The reaction generates hydroxide ions that
elevate the pH and thus aid in de-acidification.
Habitats/Requirements:a. Oxic or anoxic: The dissimilative sulfate reducers
live in anoxic environments. Recall that organisms
that utilize electron acceptors other than oxygen
usually live in anoxic habitats.
b. Best sources of sulfate: Sulfate reducers occur in
aquatic habitats, where sulfate is generally abundant.
Some occur in the anoxic layers of soils where a
lesser amount of sulfate resides.
Ecology

114
c. Autotrophs vs. organotrophs: The dissimilative
sulfate reducers are mostly organotrophs. Because of
sulfate's low reduction potential, its reduction
generates little energy. In other words, sulfate is a
poor electron acceptor. Thus, it is not practical to fix
carbon using sulfate reduction as an energy source.
As a rule, dissimilative sulfate reducers require a
carbon source, commonly acetate.
Note - Some organisms can use a variety of electron
acceptors. They exhaust the preferred acceptor first
and then switch to the next best acceptor, etc.
Rank of electron acceptors: O2 > NO3- > SO42-
d. Can the methanogens compete: Recall that
acetoclastic methanogens consume molecular
hydrogen and acetate, producing methane. Thus, a
competition exists between the dissimilative sulfate
reducers and those methanogens. In aquatic
environments, where sulfate is abundant, the
methanogens lose the competition. An additional
advantage of the dissimilative sulfate reducers over
the methanogens as a group is that the sulfate
Ecology

115
reducers have a greater affinity for molecular
hydrogen.
e. Some examples of sulfate reducers and their
habitats:
(i) Desulfovibrio - found in water-logged soils.(ii) Desulfotomaculum - cause of the "sulfide stinker",
a type of spoilage of canned foods. This is indicated
by swelling of the can as hydrogen sulfide gas is
produced and an unpleasant odor on opening the
can.
(iii) Desulfomonas - found in intestines.
(iv). Archaeglobus - a thermophilic Archea whose
optimal growth temperature is 83oC.
Note that the prefix "Desulfo" indicates a sulfate
reducer.
.8 Review questions
1. Explain the living components of ecosystem
Ecology

116
2. How do you think city ecosystem differs from the
natural ecosystem?
3. Explain agro-ecosystem and its implication to
species diversity
4. How do you explain ecosystem from the trophic
stand point of view?
5. What are the basic characteristics of ecosystem?
6. How do you understand by the phrase “ecosystem
structure” and “ecosystem function?”
.9 Bibliography
1. Kumar, H.D. Modern Concepts of Ecology. 8th
revised ed. 1997.
Ecology

117
2. Nadakavukaren, A. Man and Environment: a
Health perspective. 3rd ed 1992.
3. Odumy , E.P. Fundamentals of Ecology 3rd ed.
19971.
4. Smith, R.L. Ecology and Field Biology.1966.
5. Edward J. Kormondy. Concepts of Ecology. 4th
edition, 2001. Prentice Hall of India , New
Delhi
6. Michael Allaby. Basics of Environmental
Science, 2 ND edition, Routledge , London
and New York
7. Thomas M. Smith and Robert L. Smith.
Elements of Ecology. 6th edition. 2006.
Pearson International Edition.
8. Andrew R.W. Jackson and Julie M. Jackson.
Environmental Science. 2ND edition. 2000.
Pearson printice Hall. PhysicalGeography.net.
CHAPTER8: Introduction to the Hydrosphere.
Retrieved on 2006-10-24.
9. Environmental Literacy Council. Water Cycle.
Retrieved on 2006-10-24.
Ecology

118
10. Intergovernmental Panel on Climate Change.
Climate Change 2007: The Physical Science
Basis, WG1 Summary for Policymakers
11.U.S. Geologic Survey. GLACIER RETREAT IN
GLACIER NATIONAL PARK, MONTANA.
Retrieved on 2006-10-24.
12.Science at NASA. NASA Oceanography: The
Water Cycle. Retrieved on 2006-10-24.
Ecology

119
CHAPTER FOURBIOSPHERE
.1 Learning Objectives
o At the end of this chapter students are be able to:
o Define and understand what biosphere and its
components
o Describe the components of biosphere
o Discuss very well about natural processes affecting
water quality
o Explain how stratification in lakes are formed
o Define aquifer and explain its types.
o Describe the various atmospheric regions
.2 Introduction
A Biosphere comprises the upper strata of earth, the
lower portion of the atmosphere and the upper part of the
water bodies where living things interact and energy and
materials recycle.
It is the part of a planet's terrestrial system including air,
land and water in which life develops, and which life
processes in turn transform.
Ecology

120
It is the collective creation of a variety of organisms and
species, which form the diversity of the ecosystem. From
the broadest geophysiological point of view, the
biosphere is the global ecological system integrating all
living beings and their relationships, with their interaction
with the elements of the lithosphere (rocks), the
hydrosphere (water), and the atmosphere (air). Individual
life sciences and earth sciences may use biosphere in
more limited senses (see below).
The term was coined by the geologist Eduard Suess in
1875. The concept of biosphere is thus from geological
origin and is an indication of the impact of Darwin on
Earth sciences. The ecological concept of the biosphere
comes from the 1920s (see Vladimir I. Vernadsky),
preceding the 1935 introduction of the term ecosystem
by Arthur Transley. The biosphere is an important
concept in astronomy, geophysics, meteorology,
biogeography, evolution, geology, geochemistry, and
generally speaking all life and earth sciences.
Biosphere is often used with more restricted meanings.
For example, geochemists also give define the biosphere
as being the total sum of living organisms (usually
Ecology

121
named biomass or biota by biologists and ecologists). In
this sense, the biosphere is one of the four components
of the geochemical model, the others being the
lithosphere, hydrosphere, and atmosphere).
Some consider that the semantic and conceptual
confusion surrounding the term biosphere is reflected in
the current debates related to biodiversity, or sustainable
development.
Many appear to prefer the word ecosphere, coined in the
1960s-'70s. Others, however, claim this word is sullied by
association with the idea of ecological crisis.
.3 Components of biosphere
.3.1 The Lithosphere
It represents the rocks, sediments and the soil in which
organisms live. The lithosphere (from the Greek for
"rocky" sphere) is the solid outermost shell of a rocky
Ecology

122
planet. On the Earth, the lithosphere includes the crust
and the uppermost layer of the mantle. It floats on the
more plastic asthenosphere (the region of the Earth
between 100-200 km below the surface, but may extend
as deep as 400 km). The thickness of the lithosphere
varies from to around 1 mi (1.6 km) at the mid-ocean
ridges to approximately 130 km (80 mi) beneath older
oceanic crust. The thickness of the continental
lithospheric plates is probably around 150 kilometers (93
miles).
There are two types of lithosphere:
o The oceanic lithosphere and
o The continental lithosphere.
The pedosphere is the outermost layer of
the earth that is comprised of soil and
subject to soil formation processes. It exists
at the interface of the lithosphere,
atmosphere, hydrosphere and biosphere.
.3.2 Hydrosphere
Oceans, and smaller water bodies supporting life.
Hydrosphere (Greek hydro- means "water") in physical
Ecology

123
geography, describes collective mass of water that is
found under, on and over the surface of the Earth.
a) Characteristics of surface waters
Continental water bodies are of various types including
flowing water, lakes, reservoirs and ground waters. All
are inter-connected by the hydrological cycle with many
intermediate water bodies, both natural and artificial.
Wetlands, such as floodplains, marshes and alluvial
aquifers, have characteristics that are hydrologically
intermediate between those of rivers, lakes and
groundwaters. Wetlands and marshes are of special
ecological importance.
One of the important characteristics of a water body is
the residence time. Residence times in karstic aquifers
may vary from days to thousands of years, depending on
extent and recharge. Some karstic aquifers of the
Arabian Peninsula have water more than 10,000 years
old.
The common ranges of water residence time for various
types of water body are shown in Figure 4. 1. The
theoretical residence time for a lake is the total volume of
the lake divided by the total outflow rate (V/Q).
Ecology

124
Residence time is an important concept for water
pollution studies because it is associated with the time
taken for recovery from a pollution incident. For example,
a short residence time (as in a river) aids recovery of the
aquatic system from a pollution input by rapid dispersion
and transport of waterborne pollutants.
Long residence times, such as occur in deep lakes and
aquifers, often result in very slow recovery from a
pollution input because transport of waterborne
pollutants away from the source can take years or even
decades. Pollutants stored in sediments take a long time
to be removed from the aquatic system, even when the
water residence time of the water body is short.
Ecology

125
Figure 4. 1. Typical water residence times in inland water bodies.
The residence time of water in lakes is often more than
six months and may be as much as several hundred
years. By contrast, residence times in reservoirs are
usually less than one year.
b) Lakes and reservoirs
Ecology

126
An important factor influencing water quality in relatively
still, deep waters, such as lakes and reservoirs, is
stratification.
Stratification occurs when the water in a lake or reservoir
acts as two different bodies with different densities, one
floating on the other. It is most commonly caused by
temperature differences, leading to differences in density
(water has maximum density at 4 °C), but occasionally
by differences in solute concentrations. Water quality in
the two bodies of water is also subject to different
influences. Thus, for example, the surface layer receives
more sunlight while the lower layer is physically
separated from the atmosphere (which is a source of
gases such as oxygen) and may be in contact with
decomposing sediments, which exert an oxygen
demand. As a result of these influences it is common for
the lower layer to have a significantly decreased oxygen
concentration compared with the upper layer.
When anoxic conditions occur in bottom sediments,
various compounds may increase in interstitial waters
(through dissolution or reduction) and diffuse from the
Ecology
127
sediments into the lower water layer. Substances
produced in this way include ammonia, nitrate,
phosphate, sulfide, silicate, iron and manganese
compounds.
Thermal stratification for temperate lakes has been
studied for many years in temperate regions where,
during spring and summer, the surface layers of the
water become warmer and their density decreases. They
float upon the colder and denser layer below and there is
a resistance to vertical mixing.
o The warm surface layer is known as the epilimnion
and the colder water trapped beneath is the
hypolimnion.
o The epilimnion can be mixed by wind and surface
currents and its temperature varies little with
depth.
o Between the layers is a shallow zone, called the
metalimnion or the thermocline, where the
temperature changes from that of the epilimnion to
that of the hypolimnion.
o As the weather becomes cooler, the temperature
of the surface layer falls and the density difference
Ecology
128
between the two layers is reduced sufficiently for
the wind to induce vertical circulation and mixing
in the lake water, resulting in an “overturn”. This
can occur quite quickly.
o The frequency of overturn and mixing depends
principally on climate (temperature and wind) and
the characteristics of the lake and its surroundings
(depth and exposure to wind).
Lakes may be classified according to the frequency of
overturn as follows (Figure Below):
• Monomictic: once a year - temperate lakes that do
not freeze.
• Dimictic: twice a year - temperate lakes that do
freeze.
• Polymictic: several times a year - shallow,
temperate or tropical lakes.
• Amictic: no mixing - arctic or high altitude lakes
with permanent ice cover, and underground lakes.
• Oligomictic: poor mixing - deep tropical lakes.
Ecology

129
• Meromictic: incomplete mixing - mainly oligomictic
lakes but sometimes deep monomictic and
dimictic lakes.
Thermal stratification does not usually occur in lakes less
than about 10 m deep because wind crosses the lake
surface and water flow through the lake tend to
encourage mixing. Shallow tropical lakes may be mixed
completely several times a year. In very deep lakes,
however, stratification may persist all year, even in
tropical and equatorial regions. This permanent
stratification results in “meromixis”, which is a natural and
continuous anoxia of bottom waters.
Ecology

130
Figure 4.2. the classification of lakes according to the occurrence of thermal stratification and mixing in the water.
c) Tropical lakes
A common physical characteristic of tropical lakes is that
seasonal variations in water temperature are small, as a
result of relatively constant solar radiation. Water
temperatures are generally high but decrease with
increasing altitude. The annual water temperature
difference range is only 2-3 °C at the surface and even
Ecology
131
less at depths greater than 30 m. Density differences are
minimal because water temperature is almost constant.
o Winds and precipitation, both of which tend to be
seasonal, play an important role in mixing. The
very limited seasonal temperature variation also
results in a correspondingly low annual heat
budget in tropical lakes. However, the relative
variation in the heat budget in consecutive years
may be considerable, because the peak value of
heat s torage may resul t f rom a s ing le
meteorological event.
o In some tropical lakes, variations in water level of
several meters may result from the large
differences in rainfall between wet and dry
seasons. Such variations have pronounced effects
on dilution and nutrient supply which, in turn,
affect algal blooms, zooplankton reproduction and
fish spawning.
o During the dry season, wind velocities are
generally higher than at other times of the year
and evaporation rates are at their maximum. The
Ecology

132
resulting heat losses, together with turbulence
caused by wind action, promote mixing.
The classification of lakes based on seasonal
temperature variations at different depths is not generally
applicable to tropical lakes. A classification, which
considers size, depth and other physical characteristics,
such as the following, is more relevant.
o Large, deep lakes all have a seasonal thermocline
in addition to a deep permanent thermocline over
an anoxic water mass. Recirculation of the deep
water may occur but the responsible mechanism
is not clear.
o Large, shallow lakes have a distinct diurnal
temperature variation. Temperature is uniform in
the morning; stratification develops in the
afternoon and is destroyed during the night. The
fluctuation in water level may be considerable
relative to lake volume and the large flood plain
that results will have profound effects on the
productivity of biological life in the water.
o Crater lakes generally have a small surface area
relative to their great depth and are often
Ecology

133
stratified. Despite such lakes being in sheltered
positions, special weather conditions can cause
complete mixing of lake contents.
o High-altitude lakes in climates where there is only
a small diurnal temperature difference are
unstable and experience frequent overturns.
Where temperature differences are larger, a more
distinct pattern of stratification can be identified.
There may also be substantial losses of water by
evaporation during the night.
o River lakes are created when areas of land are
flooded by rivers in spate. When the water level in
the river goes down, the lake water flows back
towards the river. This annual or semi-annual
water exchange affects the biological and
chemical quality of the water.
o Solar lakes. In saline, dark-bottomed lakes an
anomalous stratification can develop. A lower,
strongly saline water layer may be intensely
heated by solar radiation, especially if it is well
isolated from the atmosphere by the upper layer of
Ecology

134
lighter brine. Temperatures as high as 50 °C have
been recorded in the lower levels of solar lakes.
o Temporary lakes occur in locations where the
fluctuations of water level cause a shallow lake
basin to dry up completely. In regions where there
are pronounced wet and dry seasons this can
occur annually, while in other regions the
frequency of occurrence may be medium to long
term. Temporary lakes often have an accumulation
of salts on the lake bottom.
d) Groundwater
i. Characteristics of groundwater
Groundwater is held in the pore space of sediments such
as sands or gravels or in the fissures of fractured rock
such as crystalline rock and limestone. The body of rock
or sediments containing the water is termed an aquifer
and the upper water level in the saturated body is termed
the water table. Typically, groundwater has a steady flow
pattern. Velocity is governed mainly by the porosity and
permeability of the material through which the water
flows, and is often up to several orders of magnitude less
than that of surface waters. As a result mixing is poor.
Ecology

135
The media (rock or sediment) in an aquifer are
characterized by porosity and permeability.
o Porosity is the ratio of pores and fissure volume to
the total volume of the media. It is measured as
percentage voids and denotes the storage or
water volume of the media.
o Permeability is a measure of the ease with which
fluids in general may pass through the media
under a potential gradient and indicates the
relative rate of travel of water or fluids through
media under given conditions. For water it is
termed hydraulic conductivity.
ii. Types of aquiferUnderground formations are of three basic types:
o Hard crystalline rocks: the hard crystalline rocks
include granites, gneisses, schists and quartzites and certain types of volcanic rocks such as basalts and dolerites. These formations generally have little or no original porosity, and the existence of aquifers depends on fractures and fissures in the rock mass providing porosity and pathways for groundwater movement. Although these are often further enhanced by weathering, aquifers in hard rocks are usually small
Ecology

136
and localized and not very productive. Groundwater in volcanic formations in regions of “recent” volcanic activity frequently contains fluoride and boron in concentrations that are unacceptably high for certain uses.
o Consolidated sedimentary formations: these are
often thick and extensive, and sometimes artesian. Limestone and sandstone formations may be highly porous and permeable and form some of the largest, most important and highest-yielding aquifers in the world. The permeability of these formations is largely due to fissures (fractures, faults, bedding planes). Porosity is also significant for the movement and storage of some pollutants. Dissolution of the rock can increase the permeability. The dissolution of carbonates, in particular, is responsible for the formation of karst aquifers, which can have large underground caverns and channels yielding substantial quantities of water.
o Unconsolidated sediments. Unconsolidated
sediments occur as thin, superficial deposits over other rock types or as thick sequences in the major river or lake basins. Porosity and permeability are related to grain size. Sand and gravel deposits can provide important and high-yielding aquifers, whereas silts and
Ecology

137
clays are less productive. In the largest river basins, thick sedimentary deposits may contain many layers of different materials built up over long periods of time, producing important multi-aquifer sequences.
Aquifers may be confined or unconfined (Figure 2). A
confined aquifer is overlain by an impermeable layer that
prevents recharge (and contamination) by rainfall or
surface water. Recharge of confined aquifers occurs
where the permeable rock outcrops at or near the
surface, which may be some distance from the area of
exploitation. This feature may make control of quality and
of pollution more difficult. Some aquifers are not perfectly
confined and are termed semi-confined or leaky.
Ecology

138
Figure 4.3. Confined and unconfined aquifers (After Chilton, 1996)
Unconfined aquifers are overlain by a permeable,
unsaturated zone that allows surface water to percolate
down to the water table. Consequently, they are
generally recharged over a wide area and are often
shallow with a tendency for interaction with surface
water.
Confined aquifers are less vulnerable than unconfined
aquifers to pollution outside their recharge zone because
surface water and contaminants cannot percolate to the
water table. If contamination does occur, however, it is
often difficult to remedy because confined aquifers are
usually deep and the number of points where
contaminated water may be pumped out is limited. Given
the limited outflow, contaminants may also be
increasingly concentrated in confined aquifers and this
may restrict abstraction of water. The greater vulnerability
of unconfined aquifers to contamination is a result of the
wider area over which they are recharged and in which
contamination may enter, and the greater interaction with
polluted surface water bodies, which may lead to
contaminant movement into groundwater. The risk of
Ecology

139
contamination will depend on the depth of the overlying
unsaturated layer, the rate of infiltration to the water table
and the land use in areas surrounding groundwater
sources.
.3.3 Atmosphere
The lower part of the air (Atmosphere) extending up to
50km from the surface of the earth. This portion of
atmosphere is retained by the Earth's gravity.
The temperature of the Earth's atmosphere varies with
altitude.
a) Troposphere
It is the region with in 0 – 7Km in the tr………/17 km,
temperature decreasing with height.
The troposphere is the lowermost portion of Earth's
atmosphere and the one in which clouds and most other
weather phenomena occur. The greenhouse effect also
occurs in the troposphere. The word troposphere stems
from the Greek "tropos" for "turning" or "mixing". This
region, constantly in motion, is the densest layer.This
Ecology

140
layer extends to an altitude of 16-18 km over tropical
regions, decreasing to less than 10 km over the poles,
and contains approximately 80% of the total air mass.
Generally, jets fly near the top of this layer. The
troposphere is directly below the stratosphere.The
troposphere is divided into six zonal flow regions, called
cells. These are responsible for atmospheric circulation,
and produce the prevailing winds.
Figure 4. 4. Temperature and atmospheric mass density
of the atmosphere against altitude
Ecology

141
b) Stratosphere
The region with in 7/17 - 50 km, temperature increasing
with height. The stratosphere is the layer of Earth's
atmosphere which, at the equator, is situated between
about 17 km and 50 km altitude above the surface, while
at the poles it starts at about 8 km altitude due to the
lower tropopause height caused by the lower
tropospheric temperature there. The stratosphere sits
directly above the troposphere and directly below the
mesosphere. Within this layer, temperature increases as
altitude increases; the top of the stratosphere has a
temperature of about 270 K. This top is called the
stratopause, above which temperature again decreases
with height.
The stratosphere is a region of intense interactions
among radiative, dynamical, and chemical processes, in
which horizontal mixing of gaseous components
proceeds much more rapidly than vertical mixing. The
stratosphere is warmer than the upper troposphere,
primarily because of a stratospheric ozone layer that
absorbs solar ultraviolet radiation.
Ecology

142
An interesting feature of stratospheric circulation is the
quasi-Biennial Oscillation (QBO) in the tropical latitudes,
which is driven by gravity waves that are convectively
generated in the troposphere. The QBO induces a
secondary circulation that is important for the global
stratospheric transport of tracers such as ozone or water
vapor.
In northern hemispheric winter, sudden stratospheric
warmings can often be observed which are caused by
the absorption of Rossby waves in the stratosphere.
(Rossby or planetary waves are large-scale motions in
the ocean or atmosphere whose restoring force is the
variation in Coriolis effect with latitude. The waves were
first identified in the atmosphere in the 1939 by Carl-
Gustaf Arvid Rossby who went on to explain their
motion).
c) Mesosphere
It is the region with in 50 - 80/85 km, temperature
decreasing with height. The mesosphere is the layer of
the Earth's atmosphere that is directly above the
stratosphere and directly below the thermosphere. The
mesosphere is located about 50-80/85km above Earth's
Ecology

143
surface. Within this layer, temperature decreases with
increasing altitude. Temperatures in the upper
mesosphere fall as low as 200K (about -99°F), varying
according to latitude and season. Millions of meteors
burn up daily in the mesosphere as a result of collisions
with some of the billions of gas particles contained in that
layer. The collisions create enough heat to burn the
falling objects long before they reach the ground. The
stratosphere and mesosphere are referred to as the
middle atmosphere. The mesopause, at an altitude of
about 80 km, separates the mesosphere from the
thermosphere--the 2nd outermost layer of the Earth's
atmosphere. In this case the mesosphere is an important
part of the atmosphere!
d) Thermosphere:
It’s the region within 80/85 - 640+ km, temperature
increasing with height. The thermosphere is the layer of
the Earth's atmosphere directly above the mesosphere
and directly below the exosphere. Within this layer,
ultraviolet radiation causes ionization. The thermosphere,
named from the Greek thermo for heat, begins about 80
km above the Earth. At these high altitudes, the residual
Ecology

144
atmospheric gases sort into strata according to molecular
mass (unlike the turbosphere, in which aprecaible
stratification is absent due to stirring or turbulence).
Thermospheric temperatures increase with altitude due
to absorption of highly energetic solar radiation by the
small amount of residual oxygen still present.
Temperatures are highly dependent on solar activity, and
can rise to 2,000°C. Radiation causes the scattered air
particles in this layer to become electrically charged (see
ionosphere), enabling radio waves to bounce off and be
received beyond the horizon. At the exosphere,
beginning at 500 to 1,000 km above the Earth's surface,
the atmosphere blends into space. The few particles of
gas here can reach 2,500°C (4500°F) during the day.
e) Exosphere:
Above the ionosphere, where the atmosphere thins out
into space. The boundaries between these regions are
named the tropopause, stratopause, mesopause, and
thermopause.
Ecology

145
Figure 4. 5. Different regions of Atmosphere
Ecology

146
Various atmospheric regions
Atmospheric regions are also named and described in
other ways:
a) Ionosphere
This region containing ions: approximately the
mesosphere and thermosphere up to 550 km. The
ionosphere is formed as sunlight, especially ultraviolet,
hits the upper atmosphere. It is used to reflect radio
waves for communications.
The ionosphere is the part of the atmosphere that is
ionized by solar radiation, and too tenuous to be cooled
by contact with other air. It forms the inner edge of the
magnetosphere and has practical importance because it
reflects radio waves to distant places on Earth.
The ionosphere is generally recognized to have three,
sometimes four, layers.
o The D layer is the innermost layer (approximately
50 km to 95 km above the surface of the Earth), and
mostly absorbs radio waves.
o The E layer is the middle layer and influences the
propagation of radio waves.
Ecology

147
o The F layer (or F region; approximately 160 km to
400 km above the surface of the Earth) consists of
layers of increased free-electron density caused by
the ionizing effect of solar radiation. The F layers
are responsible for most sky wave propagation of
radio, and are thickest and most reflective of radio
on the side of the Earth facing the sun.
The Earth's ionosphere, though protected from direct
solar wind scouring by the magnetosphere (and the
Earth's magnetic field), is a shield of layers that absorbs
most energetic wavelengths in the atmosphere. The
ionosphere state can be predicted by monitoring
sunspots, which increase the solar winds. The solar
wind's stream of particles (mostly high-energy protons ~
500 keV) is ejected from the Sun's upper atmosphere.
The interactions between the solar wind and the
ionosphere induce energy into the Earth's magnetic field
(and effects the telluric currents).
b) Ozone layer or ozonosphere
Ecology
148
The region approximately 10-50 km, where stratospheric
ozone is found. Note that even within this region, ozone
is a minor constituent by volume.
The ozone layer is that part of the Earth's stratosphere
which contains ozone. The total quantity of ozone in the
ozone layer is not very large; if just the ozone were
compressed to the pressure of the air at sea level, it
would be only a few millimeters thick. Ozone is notable
for its ability to absorb certain wavelengths of ultraviolet
radiation:
"The stratospheric ozone layer is important because,
among other things, it reduces the amount of solar
ultraviolet-B radiation reaching the Earth's surface. UV-B
is the main cause of basal and squamous cell skin
cancers, but not of malignant melanoma; the latter is
primarily caused by UV-A-- which is not absorbed by
ozone."
Ozone in the earth's atmosphere is generally created by
ultraviolet light striking oxygen molecules containing two
oxygen atoms (O2), splitting them into individual oxygen
atoms (atomic oxygen); the atomic oxygen then
combines with unbroken O2 to create ozone, O3. The
Ecology
149
ozone molecule is also unstable and when ultraviolet
light hits ozone it splits into a molecule of O2 and an
atom of atomic oxygen, a continuing process called the
ozone-oxygen cycle, thus creating an ozone layer in the
stratosphere.
The ozone layer can be destroyed by the presence of
atomic chlorine, fluorine or bromine in the atmosphere
leading to the so-called ozone hole in the polar
stratosphere during winter months; these elements are
found in certain stable compounds, especially
chlorofluorocarbons (CFCs) which may find their way to
the stratosphere and there be liberated by the action of
ultraviolet light on them. All the halogens mentioned are
denser than air, at least in diatomic form, so they
eventually diffuse to ground level and there are absorbed
by reacting with almost anything organic, but have plenty
of time to catalyze the breakdown of ozone in the
meantime. Chlorine in particular is capable of breaking
down approximately one hundred thousand times its
molarity of ozone.
The concentration of atmospheric ozone in the ozone
layer varies by a large factor worldwide, being thicker
Ecology

150
near the equator and thinner at the poles. Ozone levels,
over the northern hemisphere, are dropping by ~4% per
year. Approximately ~4.6% of the Earth's surface is not
covered by the ozone layer; these are the ozone holes.
c) Magnetosphere
The region where the Earth's magnetic field interacts with
the solar wind from the Sun. (A solar wind is a stream of
particles (mostly high-energy protons ~ 500 keV) which
are ejected from the upper atmosphere of a star). The
magnetic field of the Earth is surrounded by the
magnetosphere. The magnetosphere keeps most of the
particles from the sun, carried in solar wind, from hitting
the Earth. Earth's magnetic field forms an obstacle to the
solar wind, which confines its field lines and plasmas into
an elongated cavity, the magnetosphere.
Ecology

151
Figure 4.6
Magnetosphere of the earth (source: Peredo
2004)
Magnetosphere extends for tens of thousands of
kilometers, with a long tail away from the Sun.
A magnetosphere is the region around an astronomical
object, in which phenomena are dominated by its
magnetic field. Earth is surrounded by a magnetosphere,
as are the magnetized planets Jupiter, Saturn, Uranus
and Neptune. Mercury is magnetized, but too weakly to
trap plasma. Mars has patchy surface magnetization.
The magnetosphere contains magnetically trapped
plasma (gas of free ions and electrons).
Ecology

152
One distinguishes the inner radiation belt (Van allen’s
belt), is a by-product of cosmic radiation discovered in
1958 by James Van Allen using the Explorer 1 and 3
satellites, and the ring current, a large belt of lower
energy particles deposited mainly by magnetic storms,
source of a widespread magnetic field of its own. The
Van Allen radiation belt is a torus of energetic charged
particles around Earth, trapped by Earth's magnetic field.
The trapped plasma interacts with the low-density
conductive plasma of the ionosphere, the upper layer of
the atmosphere.
Figure 4.7. Van Allen’s belt
Ecology

153
Some scientists believe that without a magnetosphere,
Earth would have lost the majority of its water and
atmosphere, and resemble Mars or Mercury. However,
Venus retains a dense atmosphere even though it lacks
any magnetic field.
.4 Review questions
1. Temperature of the earth’s atmosphere varies
with altitude. Describe it by taking into the
different parts of atmosphere
2. What are the common physical characteristics
of tropical lakes?
3. What are the characteristics of ground water?
4. What is/are the main difference between
temperate and tropical lakes?
Ecology

154
5. What is the advantage of magnetosphere?
.5 Bibliography
1. M a r t i n W a l t ( 1 9 9 4 ) . I n t r o d u c t i o n t o
Geomagnetically Trapped Radiation
2. M. Carlowicz and R. Lopez (2002). Storms from
the Sun
3. D. P. Stern, M. Peredo (2004). The Exploration of
the Earth's Magnetosphere. NASA. Retrieved on
2006
Ecology

155
CHAPTER FIVEBIOSPHERE POLLUTION
5.1 Learning Objectives
At the end of this chapter, the student will be able to:
• Describe the components of the biosphere
• List the types and sources of water pollution
• Explain the effect of water pollution on human
health and on the environment.
• Mention the major air pollutants and their sources.
• Discuss the effects of air pollutants on human
health and on the environment.
• Discuss the effects of solid wastes on human
health and the environment.
• Explain the benefits and problems of pesticides.
Ecology

156
.6 Definitions of terms
1. Biosphere: narrow zone that harbors life, limited o
the waters of the earth, a fraction of its crust, and the
lower region of the surrounding air.
2. Pollutant: any substance with which an ecosystem
has had no prior evolutionary experience, in terms of
kinds or amounts, and that can accumulate to
disruptive or harmful level.
3. Pollution: Addition of some exogenous substances in
the environment, which are harmful for organisms
including human beings.
4. Biological concentration: increasing concentration
of a relatively non- degradable (stable) substance in
body tissues, beginning at low tropic levels and
moving up through those organisms that are diners,
than are dined upon in food web.
5. Environmental pollution: the introduction of
undesirable changes such as the constitution or
quality, of water, air and soil.
Ecology

157
6. Pointy- source pollution: Pollutants which enter
water ways from a specific point through a pipe, ditch,
culverts
7. Non- point source pollution: Pollutants those which
run off or seep into water ways from broad areas of
land rather than entering the water through a discrete
pipe or conduit.
8. Biochemical Oxygen Demand (BOD): the amount
of oxygen required degrading (Stabilize) wastes.
.3 Introduction
The planet earth along with its living organisms and
atmosphere (air, land, and water) which sustains life is
known as the Biosphere. The biosphere extends
vertically into the atmosphere to about 10km, downward
into the ocean to depth of about 35,00ft, and into about
23,000ft of the earth surface itself where living organisms
have been found.
The biosphere, a thin shell that encapsulates the earth, is
made up of the atmosphere (a mixture of gases
extending outward from the surface of the earth),
lithosphere (the soil mantle that wraps the core of the
Ecology
158
earth) the hydrosphere (consists of the oceans, the lakes
and streams, and the shallow ground water bodies that
inter- flow with the surface water. Due to different
activities, human is interfering with the natural
environment which in turn affects its health in various
ways.
.4 Human Activities Affecting Health and the Environment
Human activity in an ecosystem has many drawbacks,
unless we are approaching it environmentally friendly.
The atmosphere, fertile solids, freshwater recourse, the
oceans and the ecosystems they support, play a key role
in providing humans with shelter, food, safe water and
the capacity to recycle most wastes, However, pressures
exerted by humans, on the environment, in the form of
pollution, resources depletion, land use changes and
others affect environmental quality. Degradation of
environmental quality can, in turn, lead to adverse
human exposures and eventual health effects.
The pressures excreted by the driving forces are in many
instances increasing. They relate to household wastes,
Ecology

159
freshwater use, land use and agricultural development,
industrialization and energy use.
.4.1 Household wastes
Gaseous household wastes arise mainly from heating
and cooking. They contribute substantially to both
outdoor and indoor air pollution. Liquid wastes as the
byproducts of domestic activities. In most areas of
developing countries, feces are recycled for use in
agriculture or deposited on land without prior destruction
of pathogens. Not surprisingly, infectious disease such
as diarrheal diseases, schistosomiasis and hepatitis are
endemic, and some times epidemic, in such areas.
Solid waste can also create environmental health
problems. It consists mainly of non- hazardous materials
such as paper and plastic packaging materials, glass,
food scraps and other residues. However, it generally
also contains small quantities of hazardous substances
such as paints, medicines, solvents, cleaning materials
and batteries, leading to potential chemical exposures.
Production of household and municipal solid waste
continues to increase worldwide, both in absolute and
per capita terms.
Ecology

160
.4.2Fresh Water
For a large percentage of the world’s population, water
supplies are neither safe nor adequate. Currently, over
1000 million people do not have access to an adequate
supply of safe water for household consumption.
Moreover, the world’s freshwater resources are limited
and unevenly distributed over the global land mass.
Demand for water is nevertheless increasing in several
sectors: for drinking water (domestic needs), food
production (agriculture) and product manufacturing
(industry).
Global freshwater resources are threatened not only by
overexploitation, however, but also by poor management
and ecological degradation. Untreated sewage is
discharged into rivers and lakes: industrial wastes are
dumped into water bodies; and run- off from agricultural
fields treated with herbivores and pesticides is leading to
water contamination.
Industrial development, the exponential growth of human
settlement and the ever increasing use of synthetic
organic substances are also having serious adverse
Ecology

161
impacts on freshwater bodies. Many surface and ground
waters are now contaminated with nutrients, heavy
metals and persistent organic pollutants.
Ecology

162
Figure 5.1. River Awetu is degraded by untreated liquid
and solid waste discharge from Jimma Town,
southwestern Ethiopia. The water is pungent
and turns black just before the confluence
point with the river Gilgel Gibe where the
intake occurs for the town water supply
(Courtesy: Argaw).
.4.3 Land use and agricultural development
Ecology

163
Competition for land appears to be intensifying between
sectors and production systems. Agriculture, in particular,
can be expected to become an even more dominant form
of land use. Population increases and the finite extent,
to which further land can be converted to agricultural
uses, mean that per capita arable land availability is
becoming an issue.
Agricultural production carries several risks. Thus
extension and intensification of agricultural production
systems, together with fluctuation in the supply of and
demand for agricultural products are causing shifts in the
environmental determinants of the health status of local
communities.
.4.4 Industrialization
Industrialization is central to economic development and
improved prospects for human well- being. But, if proper
abatement techology is not used, industry becomes a
major source of air, water and soil pollution, hazardous
wastes and noise. Industrial workers are often at highest
risk of health impacts. Furthermore, developed countries
have exacerbated the environmental problems now
being experienced by developing countries through
Ecology

164
t ransfer of hazardous wastes industr ies and
technologies.
Major industrial impact also arises from small-scale
industry. In developing countries, small- scale industry
contributes substantially to economic development, but
can create problems for environment and health if
environmental safe guards are not used.
.4.5 Energy
Energy plays a critical role in basic human survival.
Energy has important implications for health. Energy is
also crucial to transportation and industrial processes.
However, production and use of energy, if not properly
controlled may be accompanied by adverse health and
environment impacts.
In developing countries, biomass accounts for about one-
third of all energy use, and in some of least- developed
countries, for as much as two- thirds. Open fires impair
indoor air quality, add to the risk of accidents and
jeopardize food hygiene.
In general, the adverse affects on the environment of
human activities are many and appear to be growing in
Ecology

165
intensity, and affecting larger and larger areas. Current
and future potential pressures on the environment have
major implication for health.
.4.6 Environmental Threats to Human Health
Environmental threats to human health are numerous.These threats can be divided into two:
a. Traditional hazard: is associated with lack of
development. Traditional hazards related to
poverty and “insufficient” development is wide-
ranging and includes: lack of access to safe
drinking- water; inadequate basic sanitation in the
household and the community’ indoor air pollution
from cooking and heating using coal or biomass
fuel and inadequate solid waste disposal.
b. Modern hazard: is associated with unsustainable
development. Modern hazards are related to
development that lacks health- and environment
safeguards, and to unsustainable consumption of
natural resources. They include: water pollution
from populated areas, industry and intensive
agriculture; urban air pollution from motor: cars,
Ecology

166
coal power stations and industry; climate change;
stratospheric ozone depletion and trans-
boundary pollution.
Polluted air and water, excessive levels of noise, nuclear
weapons fall- out, over crowded slums, toxic waste
dumps, inadequate or overly adequate diet, stress, food
contaminants, medical X- rays, drugs, cigarettes, unsafe
working conditions and other can be regarded as
causative agents of environmental disease. In short
environmental diseases are those diseases that are
introduced to the environment by man due to his
careless behavior. Most environmentally induced
diseases, unlike those caused by bacteria or other
pathogens, are difficult to cure but theoretically simple to
prevent. Remove the adverse environmental influence
and the ailment will disappear.
This is simply to say that by:
o Preventing discharges of poison into water and
food
o Avoiding exposure to radiation
o Keeping away from cigarette smoke
Ecology

167
o Avoiding synthetic food coloring or material
One of the problems with environmental health concern
is our limited knowledge on those toxic agents that are
actually distributed over our earth, due to different
activities by man in the ecosystem. For example, world
wide, there are about 10 million chemical compounds
that are been synthesized thus far. But only one percent
is produced commercially and is regulated.
.4.6.1 Water Pollutions
Water is one of the most important and most precious of
natural resources, and a regular and plentiful supply of
clean water is essential for the survival and health of
most living organisms. Over 72% of the earth’s surface
is covered by water but it is unfortunately unevenly
distributed. Out of the 72% of the earth’s surface water,
97.2% is in the ocean, unfit for human consumption and
too salty for irrigation with out desalination. Another 2%
of the whole water lies frozen in glaciers and in icecaps,
and is useless. The tiny usable portion left, that is about
0.8% (the water in the river, stream, lake, etc) of the total,
is neither evenly distributed nor properly used.
Ecology

168
As a consequence of rapidly expanding industrialization
and excessive population growths and most of our rivers,
lakes, stream and other water bodies are being
increasingly polluted. Water is regarded as “polluted”
when it is changed in its quality or composition, directly
or indirectly as a result of human’s activities so that it
becomes less suitable for drinking, domestic, agricultural,
and recreational, fisheries or other purposes.
.1 Source of water pollution
Water pollution can be from two major sources: the
natural source and anthropogenic sources.
Natural processes affecting water quality
Although degradation of water quality is almost invariably
the result of human activities, certain natural phenomena
can result in water quality falling below that required for
particular purposes.
o Natural events such as torrential rainfall and
hurricanes lead to excessive erosion and
Ecology
169
landslides, which in turn increase the content of
suspended material in affected rivers and lakes.
o Seasonal overturn of the water in some lakes can
bring water with little or no dissolved oxygen to the
surface. Such natural events may be frequent or
occasional.
Permanent natural conditions in some areas may make
water unfit for drinking or for specific uses, such as
irrigation. Common examples of this are;
o the salinisation of surface waters through
evaporation in arid and semi-arid regions, and
o the high salt content of some groundwaters under
certain geological conditions.
Many groundwaters are naturally high in carbonates
(hardness), thus necessitating their treatment before use
for certain industrial applications. Groundwaters in some
regions contain specific ions (such as fluoride) and toxic
elements (such as arsenic and selenium) in quantities
that are harmful to health, while others contain elements
or compounds that cause other types of problems (such
as the staining of sanitary fixtures by iron and
manganese).
Ecology

170
The nature and concentration of chemical elements and
compounds in a freshwater system are subject to change
by various types of natural process, i.e. physical,
chemical, hydrological and biological.
The major environmental factors that affect water quality
are:
o Distance from the ocean: extent of sea spray
rich in Na+, Cl-, Mg2+, SO42- and other ions.
o Climate and vegetation: regulation of erosion
and mineral weathering; concentration of
dissolved material through evaporation and
evapo- transpiration.
o Rock composition (lithology): the susceptibility of
rocks to weathering ranges from 1 for granite to
12 for limestone; it is much greater for more
highly soluble rocks (for example, 80 for rock
salt).
o Terrestrial vegetation: the production of
terrestrial plants and the way in which plant
tissue is decomposed in soil affect the amount of
organic carbon and nitrogenous compounds
found in water.
Ecology

171
o Aquatic vegetat ion: growth, death and
decomposition of aquatic plants and algae will
affect the concentration of nitrogenous and
phosphorous nutrients, pH, carbonates,
dissolved oxygen and other chemicals sensitive
to oxidation/reduction conditions. Aquatic
vegetation has a profound effect on the
chemistry of lake water and a less pronounced,
but possibly significant effect, on river water.
Anthropogenic sources
It’s understood that pollutants that arise from
anthropogenic sources are more devastating than the
natural ones.
Deforestation, intensive farming and grazing, application
of fertilizers, application of pesticides, industrialization,
urbanization, different construction works, automobiles,
etc. are examples of major sources of water pollution
Pollutants from such sources can enter waterways by a
number of different routs. These routes can be generally
Ecology

172
categorized as point source pollution and non- point
source pollution.
Factories, power plants, sewage treatment plants,
latrines that are directly connected to water bodies are
classified as point sources, because they discharge
pollution from specific locations. In contrast, non- point
sources of water pollution are scattered or diffuse, having
no specific location where they discharge into a particular
body of water. Non- point sources include runoff from
farm fields and feedlots, construction sites, roads, streets
and parking lots.
.2 Types and Effects of Water pollution
Although the types, sources and effects of water
pollutants are often interrelated, it is convenient to divide
them into major categories for discussion (Table 7.1).
The followings are some of the important sources and
effects of each type of pollutant.
Table 5.1. Major water pollutants: source, effects, and
possible controls
Ecology

173
Pollutant Main source Effects Possible controlOrganic
oxygen
demanding
waste
Human sewage,
animal wastes,
decaying plant life,
industrial waste
Overload depletes
dissolved oxygen in
water. Animal life
destroyed or migrates
away: plant life
destroyed
Provide secondary
and tertiary waste-
water treatment
minimize
agricultural runoff
Plant
nutrients
Agricultural runoff,
detergents
industrial wastes
inadequate waste
water treatment
Algal blooms and
excessive aquatic
plant growth upset
ecological balances:
eutrophication
Agricultural run off
too widespread,
diffuse for adequate
control
Pathogenic
bacteria &
virus
Presence of
sewage and
animal wastes in
water
Outbreaks of such
disease as typhoid
infectious hepatitis
Provide secondary
and tertiary waste-
water treatment
minimize
agricultural runoffInorganic
chemicals
Mining
manufacturing
irrigation, oil fields
Alter acidity, baseicity,
or salinity: also render
water toxic
Disinfect during
waste- water
treatment; stop
pollutants at sourceSynthetic
organic
chemicals
( plastics,
pesticides)
Agricultural
manufacturing and
consumer uses
Many are not
biodegradable:
chemical interactions
in environment are
poorly understood
many poisonous
Use of
biodegradable
materials: prevent
entry into water
supply at source
Ecology

174
Fossil fuels
( oils
particularly)
Machinery,
automobile waters:
pipeline breaks,
offshore blowout
and seepage,
supertanker
accidents, spills,
and wrecks:
heating
transportation,
industry agriculture
Vary, with location,
duration, and type of
fossil fuel: potential
disruption of
ecosystems:
economic,
recreational, and
aesthetic damage to
coasts
Strictly regulate oil
drilling.
Transportation
storage, collect and
reprocess engine
reprocess engine
oil and grease;
develop means to
contain spills
Sediments Natural erosion,
poor soil
conservation
practices in
agriculture, mining
construction
Fill in waterways,
reduce fish
populations
Put soil
conservation
practices to use
Ecology

175
Infectious AgentsThe most serious water pollutants in terms of human
health are pathogenic organisms. Among the most
important waterborne diseases are typhoid fever,
cholera, bacterial and amoebic dysentery, polio, hepatitis
and schistosomiasis.
The main source of these pathogens is from untreated or
improperly treated human wastes. Animal feedlots of
fields near waterways and food processing plants with
inadequate waste treatment facilities also are sources of
disease causing organisms.
Oxygen Demanding Wastes
The amount of dissolved oxygen (DO) in water is a good
indicator of water quality and the kinds of life it will
support. Oxygen is added to water by diffusion from the
air, especially when turbulence and mixing rates are
high, and by photosynthesis of green plants and algae.
Oxygen is removed from water by respiration and
chemical processes that consume oxygen.
The release of large quantities of oxygen- demanding
organic waste into watercourses often has disastrous
effects on the indigenous flora and fauna. The primary
Ecology

176
source of organic waste released into fresh water is
sewage effluent. Other sources include run- off from
urban areas and farms, and some industrial effluents.
The recent intensification of livestock production, with
largest herds concentrated in smaller areas, has
exacerbated the problem of organic pollution from farm
animal wastes. Certain industries discharge oxygen-
demanding effluents into watercourses. These include
paper and textile mills and the brewing and food-
processing industries.
Flowing rivers are the usual recipients of organic waste,
although some is discharged into lakes or offshore
directly into the sea. The organic waste provides a rich
substrate for bacteria. These multiply rapidly, depleting
the amount of dissolved oxygen present in the water. The
oxygen- depleting capacity of a given amount of organic
matter can be estimated by measuring either its
biochemical oxygen demand (BOD) or its total organic
carbon (TOC). In extreme cases, the bacteria use up all
the available oxygen and the aquatic fauna perishes.
The aerobic bacteria themselves are replaced by
anaerobic bacteria. These produce foul-smelling toxic
products such as hydrogen sulfide and ammonia.
Ecology

177
When the dissolved oxygen content of river water is
measured downstream from the point of effluent
discharged, a characteristics curve known as the
oxygen sag curve is produced. This shows clearly
that the input of organic waste severely depresses the
amount of dissolved oxygen available. It also increases
the turbidity of the water, thus reducing the amount of
light available for photosynthesis. The deposition of
organic sediments on the river bed also significantly
changes the nature of the substrate.
Immediately below the point of sewage discharge,
bacteria and predatory protozoon’s predominate. Where
pollution is severe, these micro- organisms occur in
association with certain fungi to form slimy filamentous
colonies known as sewage fungus. Conditions at this
point are usually suitable for only one macro-
invertebrate, the tubificid worm (family Tubificidae), which
is able to tolerate extremely low oxygen concentrations.
Fish are unable to survive in conditions of severe organic
pollution as the lack of oxygen causes them to suffocate.
Algae and higher plants are also absent.
Ecology

178
As conditions improve downstream, the colonies of
sewage fungi disappear and algae, followed by higher
plants, start to re-establish themselves. The Tubificid or
sludge worms are replaced by Chironomus larvae (order
Diptera), which in turn are replaced by a zone dominated
by the water hogloude Asellus (order Ispoda). Fish
usually start to reappear in the Asellus zone. Eventually,
as the level of dissolved oxygen increase and the
amount of organic sediment decreases, the clean-water
flora and fauna re-establish once more.
The decomposition of organic effluent by bacteria leads
to the eventual recovery of the river. The natural process
is known as self-purification. The rapidity and
effectiveness of this recovery process depends on a
number of different parameters. For example, the
problem of organic pollution in river is usually worse in
the hot summer months. The rate of water-flow is slower
and the volume of water carried is less, leading to an
increased concentration of organic pollutants. Higher
water temperatures decrease the solubility of oxygen and
favors bacterial growth, thus exacerbating the problem of
oxygen depletion.
Ecology

179
Plant nutrients and Eutrophication
Aquatic primary productivity is often limited by the
availability of inorganic plant nutrients. In freshwater
lakes and rivers, the limiting nutrient element is usually
phosphorus, whilst in marine waters nitrogen is often in
short supply. If small amounts of nutrients enter aquatic
ecosystems where they are normally limiting, primary
productivity is stimulated. However, severe problem can
arise when water bodies become over- enriched by
excessive nutrient input and consequently polluted.
The process of nutrient enrichment in water bodies is
known as eutrophication (from the Greek eutrophus
meaning ‘well-fed’). Eutrophication is a natural aging
process in lakes. It proceeds over a period of thousands
or tens of thousands of years, depending on the original
size and depth of the lake, the amount of sediment
imported and the amount of organic matter internally
generated. By this process of natural succession, the
lake eventually becomes a marsh and ultimately dry
land. The addition of large amounts of phosphorus (in
the form of the phosphate anion, PO43-) from a variety of
m a n - m a d e s o u r c e s c a n c a u s e a c c e l e r a t e d
Ecology

180
eutrophication to occur in lakes within a few decades.
This process is also known as cultural or artificial
eutropication.
Anthropogenic phosphate in the environment comes
largely from domestic sewage effluent, and also from
agricultural sources. Domestic sewage effluent contains
significant amount of phosphorus (and nitrogen in
various forms including the nitrate anion, NO3-, and
ammonia, NH3), even after treatment. Much of the
phosphate present in sewage comes from the use of
modern washing powders. Phosphates are widely used
as water softeners in washing powders to prevent the
formation of scum in hard- water areas.
Agriculture practices such as the use of phosphate-
containing fertilizers, the spreading of manure on bare
fields and the intensive rearing of livestock have resulted
in significant amounts of phosphates reaching
watercourses through erosion and surface run-off.
Certain industries, for example textiles and the
phosphate industry itself, also discharge phosphates into
the environment.
Ecology

181
Anthropogenic nitrogen enters the environment in
domestic sewage and in some industrial effluents, for
example those from the meat-packing industry.
However, the largest source of nitrate probably comes
from the use of nitrogen-containing fertilizers. Since their
advent in the early 1940s, nitrate fertilizers have been
extensively applied by farmers in order to increase crop
yields. Nitrates readily dissolve in water and are
therefore rapidly leached from the soil. These may
eventually contaminate ground and surface waters.
Nitrogen may also contaminate natural waters through
cross-media pollution from the air.
Nutrient pollution stimulates excessive growth of surface
algae. These form algal blooms, which are usually,
dominated by blue-green algae (Myxophyceae), for
example Anabaena flos-aquae. Sunlight is prevented
from reaching the aquatic plants underneath and these
eventually die. Large quantities of dead organic matter
from the submerged vegetation and the algal blooms
themselves become available for decomposition. This
stimulates the growth of bacterial population as
described for oxygen- demanding wastes in section II.
Ecology

182
Although eutrophication can occur in sluggish streams
bays, and estuaries, it is most common in lakes and
ponds. This is because lakes unlike flowing bodies of
water flush very slowly; thus nutrient laden wastewaters
or runoffs introduced into a lake tend to remain there for
many years.
Toxic Inorganic ChemicalsToxic, inorganic chemicals introduced into water as a
result of human activities have become the most serious
forms of water pollution. Among the chemicals of
greatest concern are heavy metals, such as mercury,
lead, tin, and cadmium. Other inorganic materials, such
as acids, salts, nitrates and chlorine that normally are not
toxic in low concentrations may become concentrated
enough to lower water quality or adversely affect
biological communities.
Mercury: Mercury is a naturally occurring metallic
element that is found in trace amounts in air, water, and
soil. It comes in three forms—elemental, inorganic, and
organic. Mercury is familiar to most of us in its elemental
form as the heavy, silvery liquid metal used in
thermometers, fluorescent light bulbs, and some
Ecology

183
switches. Inorganic mercury compounds are created
when mercury is combined with other elements, such as
chlorine, sulfur, or oxygen. It is used in some medications
and industrial compounds. Organic mercury compounds
are formed when mercury combines with carbon. The
most common organic mercury compound, methyl
mercury, is produced mainly by bacteria in water and soil.
In nature, mercury tends to be bound up in rocks and soil
and is widely dispersed. Much of it is locked away in coal
and other geological deposits, where it does not pose a
danger to living organisms.
However, human activities can release mercury from
these natural sources. When humans extract mercury
from rocks or burn fossil fuels, it is released into the
atmosphere. Airborne mercury can eventually settle into
soil and rivers, lakes, and oceans, where aquatic
microbes convert it to methyl mercury through a
biochemical reaction. Fish then absorb methyl mercury
from the water as it passes over their gills and as they
feed on other aquatic organisms. As larger fish eat
smaller ones, concentrations of the pollutant increase in
the bigger fish, a process known as bioaccumulation.
Ecology

184
Bioaccumulation refers to the net uptake of a
contaminant from all possible pathways and includes the
accumulation that might occur by direct exposure to
contaminated media as well as uptake from food. Thus,
mercury enters the food chain and becomes
concentrated.
Hg2+ Micro-organisms CH3Hg+ Micro-organisms (CH3)2Hg
Monomethyl- Dimethyl-
Mercury (soluble mercury
In water) (insoluble in
water, Volatile)
People can be exposed to mercury in a number of ways.
They may come in contact with mercury from broken
thermometers or other spills in the home or workplace.
They may breathe in airborne mercury produced by coal-
fired power plants, mining operations, or other industrial
sources. But by far the most common route of mercury
exposure in humans is eating fish contaminated by
methyl mercury. Monomethylmercury, which is soluble in
water and very toxic is the one readily absorbed by fish
but slow to be eliminated.
All forms of mercury are poisonous to humans. The
severity of effects depends largely on the amount and
Ecology

185
timing of exposure. Short-term exposure to high
concentrations of mercury vapor can cause harmful
effects on the nervous, digestive, and respiratory
systems, and the kidneys. Chronic exposure can
permanently damage the brain and kidneys. Because
fetuses, infants, and children are still developing, they
are particularly sensitive to the effects of methylmercury
on the nervous system, even at low levels of exposure,
and data are evolving in support of a link between
methylmercury exposure and increased risk of high blood
pressure and heart disease at any age.
Deposition of mercury to water bodies can also have an
adverse impact on ecosystems and wildlife. Plant and
aquatic life, as well as fish, birds, and mammalian
wildlife, can be affected by mercury exposure; however,
overarching conclusions about ecosystem health and
population effects are difficult to make. Mercury
contamination is present in all environmental media with
aquatic systems experiencing the greatest exposures
due to bioaccumulation.
Mercury can be released in the environment from natural
sources, such as volcanic and geothermal activity,
Ecology

186
marine environments or forest fires, or it can be released
from anthropogenic (man-made) sources like coal-fired
power plants and other industrial activities. Recent
studies suggest that human activity contributes 50-70%
of the mercury in the environment globally. Once mercury
enters the environment, it circulates in and out of the
atmosphere until it ends up in the bottoms of lakes and
oceans. Mercury is among a group of pollutants called
persistent bioaccumulative toxins or PBTs. These
pollutants "persist" in the environment, meaning that they
do not break down or go away. Mercury cannot be
destroyed, it cannot be combusted, and it does not
degrade. Mercury also "bioacccumulates" in the
environment, meaning it builds up in the food chain over
time.
When mercury is deposited in waterways, bacteria
convert it to methylmercury. Methylmercury builds up in
the tissue of fish, which may then be eaten by wildlife
(e.g., eagles, osprey, common loons, river otters, minks)
and by people. Because mercury is tightly bound to the
fish muscle tissue, there is no method of cooking or
preparation that will remove or reduce mercury once it is
in fish. The two organ systems most likely affected by
Ecology

187
methylmercury are the central nervous system and the
kidneys. The groups most vulnerable to the effects of
mercury toxicity include women who are pregnant or may
become pregnant, nursing mothers, and young children.
The most significant concerns regarding chronic
exposure to low concentrations of methylmercury in fish
are for neurological effects in the developing fetus and
children.
Figure 5.2. Feeding relationship in the aquatic
environment and biomagnifications of
persistent water pollutants. The number of
red dots indicate the amount of the
pollutant.
Ecology
188
Minamata bay disease (case study)In the early 1950s people in the small coastal village of
Minamata, Japan, noticed strange behavior that they
called dancing cats. Inexplicably, cats would begin
twitching, stumbling, and jerking about, as they were
drunk. Many became “ suicidal” and staggered off docks
into he ocean. The residents didn’t realize at the time,
but they were witnessing an ominous warning of an
environmental health crisis that would make the name of
their village synonymous with a deadly disease. Their
cats were suffering from brain damage that we now know
was caused by methyl mercury poisoning. In 1956, the
first human case of neurological damage was reported.
A five- year old girl who had suddenly lapsed into a
convulsive delirium was brought into the local clinic.
Within a few weeks there seemed to be an epidemic of
nervous problems including numbness, tingling
sensations, headaches, blurred vision, slurred speech,
and loss of muscle control. For an unlucky few, these
milder symptoms were followed by violent trembling
paralysis and even death. An abnormally high rate of
birth defects also occurred. Children were born with
tragic deformities; paralysis and permanent mental
Ecology

189
retardation. Lengthy investigations showed that these
symptoms were caused by mercury from fish and
seafood that formed a major part of the diet of both
humans and their cats. For years, the Chisso chemical
plant (Plastic Manufacturer) had been releasing residues
containing mercury into Minamata Bay. Since elemental
mercury is not water soluble, it was assumed that it
would sink into the bottom sediments and remain inert.
Scientists discovered, however, that bacteria living in the
sediments were able to convert metallic mercury into
soluble methyl mercury, which was absorbed from the
water and concentrated in the tissues of aquatic
organisms. People who ate fish and shellfish from the
Bay were exposed to dangerously high levels of this toxic
chemical. Altogether, more than 3,500 people were
affected and about fifty died of what became known as
Minamata-bay disease.
Organic ChemicalsThousands of different natural synthetic organic
chemicals are used in the chemical industry to make
pesticides, plastics, pigments and other products. Many
of these chemicals are highly toxic. Exposure to very low
concentrations can cause birth defects, genetic disorder,
Ecology

190
and cancer. They also can persist in the environment
because they are resistant to degradation and toxic to
the organisms that ingests them. Contamination of
surface waters and groundwater by these chemicals is a
serious threat to human health.
Important sources of toxic organic chemicals in water are
improper disposal of industrial and household wastes
and runoff or pesticide from farm fields, forests, roadside
and other places where they are used in large quantities.
Chlorinated hydrocarbons: Chlorinated hydrocarbons
are, as the name suggests, organic compounds
containing chlor ine. Manufactured chlor inated
hydrocarbons include a number of pesticides and other
compounds for example DDT, Aldrin, Dieldrin,
Toxaphene, Lindane, Chlordane, Methooxychlor, Kepone
and polychlorinated biphenyls, or PCBs as they are
known. Chlorinated hydrocarbon pesticides: These
groups are broad spectrum pesticides. In 1940, the first
c h l o r i n a t e d h y d r o c a r b o n s p e s t i c i d e , D D T
(dichlorodiphenyltrichloroethane) was manufactured for
allied use in the Second World War. It met with
unprecedented success against a number of insect-
Ecology
191
borne diseased, for example malaria in the tropics and
typhus in Italy. It had many advantages; it was cheap to
manufacture, persist in the environment and could
applied from the environment.
However, by the 1970’s, public concern over the wide
spread use of these chlorinated hydrocarbons pesticides
led to the eventual banning of many of them in the more
developed countries. The very persistence of DDT in the
environment (5-15years) which was viewed at first as an
advantage heralded its fall form public grace. For this
factor, together with its high solubility in fat, meant that it
become biomagnified up the food chain and eventually
posed a threat to the top predators, including humans.
Aquatic ecosystems become contaminated by
chlorinated hydrocarbons from direct application and also
from industrial effluent and agricultural runoff. In addition
aerial crop spraying creates an aerosol which is widely
dispersed through the atmosphere and may settle in
waters some distance form the target area of application.
Ecology
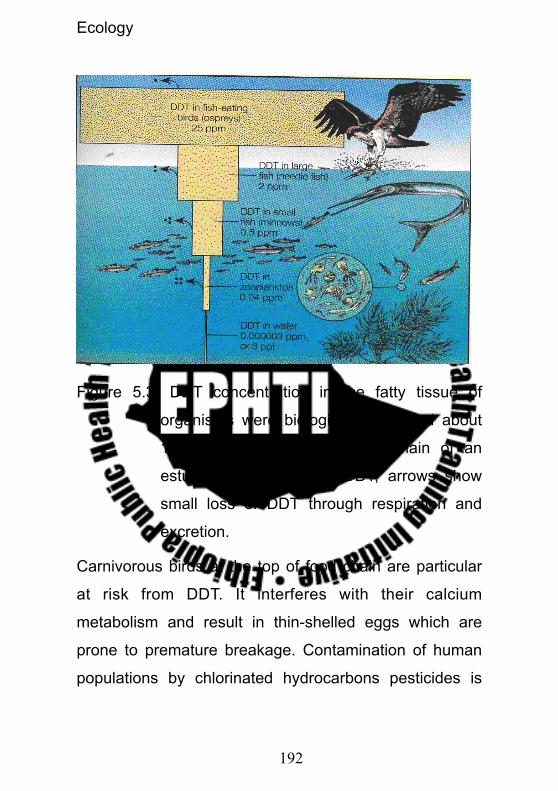
192
Figure 5.3. DDT concentration in the fatty tissue of
organisms were biologically amplified about
10 million times in this food chain of an
estuary. Dots represent DDT; arrows show
small loss of DDT through respiration and
excretion.
Carnivorous birds at the top of food chain are particular
at risk from DDT. It interferes with their calcium
metabolism and result in thin-shelled eggs which are
prone to premature breakage. Contamination of human
populations by chlorinated hydrocarbons pesticides is
Ecology

193
wide spread. For example, DDT has been detected in
human breast milk in a number of studies in different
countries. In many cases, the average concentration of
DDT (mgkg-1 in fat) was in excess of the maximum
allowable concentration (MAC; in human food stuff (0.74
mgkg-1).
Thermal PollutionThermal pollution can occur when water is used as a
coolant near a power or industrial plant and then is
returned to the aquatic environment at a higher
temperature than it was originally. Many industrial
processes create problem of thermal pollution by
discharging heat (in the form of hot water, air or effluent)
into the environment. Such industries use a lot of water
cooling purposes and return this water to a stream at a
higher temperature.
Thermal pollution can lead to a decrease in the dissolved
oxygen level in the water while also increasing the
b io log ica l demand o f aquat ic organ isms for
oxygen. Increases in water temperature can alter aquatic
organisms by (a) decreasing oxygen supply, (b) killing
Ecology

194
fish juveniles who are vulnerable to small increases in
temperature, and (c) affecting ecosystem composition.
In general the ecologic effect of thermal pollution is
thermal pollution typically decreases the level of
dissolved oxygen in the water. The decrease in levels of
dissolved oxygen can harm aquatic animals such as fish,
amphibians and copepods. Thermal pollution may also
increase the metabolic rate of aquatic animals, as
enzyme activity, meaning that these organisms will
consume more food in a shorter time than if their
environment was not changed. An increased metabolic
rate may result in food source shortages, causing a
sharp decrease in a population. Changes in the
environment may also result in a migration of organisms
to another, more suitable environment and to in-migration
of organisms that normally only live in cooler waters
elsewhere. This leads to competition for lesser
resources; the more adapted organisms moving in may
have an advantage over organisms that are not used to
the warmer temperatures. As a result one has the
problem of compromising food chains of the old and new
environments. Biodiversity can be decreased as a result.
Ecology

195
It is known that temperature changes of even one to two
degrees Celsius can cause significant changes in
organism metabolism and in adverse cellular biology
effects. Principal adverse changes can include rendering
cell walls less permeable to necessary osmosis,
coagulation of cell proteins, and alteration of enzyme
metabolism. These cellular level effects can adversely
affect mortality and reproduction.
Primary producers are affected by thermal pollution
because higher water temperature increases plant
growth rates, resulting in a shorter lifespan and species
overpopulation. This can cause an algae bloom which
reduces the oxygen levels in the water. The higher plant
density leads to an increased plant respiration rate
because the reduced light intensity decreases
photosynthesis. This is similar to the eutrophication that
occurs when watercourses are polluted with leached
agricultural inorganic fertilizers.
A large increase in temperature can lead to the
denaturing of life-supporting enzymes by breaking down
hydrogen- and disulphide bonds within the quaternary
structure of the enzymes. Decreased enzyme activity in
Ecology

196
aquatic organisms can cause problems such as the
inability to break down lipids, which leads to malnutrition.
In limited cases, thermal pollution has little deleterious
effect and may even lead to improved function of the
receiving aquatic ecosystem. This phenomenon is seen
especially in seasonal waters and is known as thermal
enrichment. An extreme case is derived from the
aggregation habits of the manatee, which often uses
power plant discharge sites during winter. Projections
suggest that manatee populations would decline upon
the removal of these discharges.
.2 Air PollutionAir pollution occurs through enrichment (contamination)
of the atmosphere or air with noxious gases and other
undesirable substances; caused largely as a result of
burning fuels and through release of gases by various
industries and automobiles.
.2.1Source of air pollutants
Ecology

197
Air pollutants come from many sources and contain
diverse chemicals. Like that of water pollution, air also
can be polluted from natural and anthropogenic sources.
Natural sources
All air contains natural contaminants such as pollen,
fungi spores, and smoke and dust particles from forest
fires and volcanic eruptions. It contains also naturally
occurring carbon monoxide (CO) from the breakdown of
methane (CH4): hydrocarbon: and hydrogen sulphide
(H2S) and methane (CH4): from the anaerobic
decomposition of organic matter.
• Anthropogenic sources
In contrast to the natural sources of air pollution, there
are contaminates of anthropogenic. Coal- burning power
plants, factories, metal smelters, vehicles are among the
main anthropogenic sources of air pollutants.
.2.2Major Air Pollutants and Their Effects
The most common and well- identified air pollutants are:
• Suspended Particulate
Ecology

198
Particulate matter is the sum of all solid and liquid
particles suspended in air many of which are hazardous.
This complex mixture includes both organic and
inorganic particles, such as dust, pollen, soot, smoke,
and liquid droplets. These particles vary greatly in size,
composition, and origin. Particles in air are either: directly
emitted, for instance when fuel is burnt and when dust is
carried by wind, or indirectly formed, when gaseous
pollutants previously emitted to air turn into particulate
matter.
This includes all particulate matters such as soot pollen
dust, ash, smoke etc. Such pollutants are easily seen
and the common man could very easily be made to be
aware of them. Major and visible damages of suspended
particulates are:
• Damage to buildings paints
• Dirt into clothing
• Obscure visibility
• Corrode metals
• When inhaled, suspended particulate irritates
the respiratory tract
Ecology

199
• Sulfur dioxide (SO2)Sulfur dioxide is a colorless, respiratory irritant, has
unpleasant odour that is detected at concentrations
greater than about 1ppm, although above 3ppm the
sense of smell is rapidly lost. It is mostly released from
industries and power- generating plants. Its tropospheric
concentrations range from less than 1ppb in locations
very remote from industrial activites to 2ppm in highly
unpolluted areas. However, concentrations of 0.1 to
0.5ppm are more typical of urban locations in
industrialized countries, while levels of around 300ppb
are the norm for rural areas in the northern hemisphere.
Once in the atmosphere, SO2 can be further oxidized to
sulfur trioxide (SO3), which reacts with water vapor or
dissolves in water droplets to form sulfuric acid (H2SO4)
which is the cause of acid rain, Sulfur dioxide.
Sulfur dioxide is a respiratory irritates and can cause
shortness of breath, enhanced likely hood of lower
respiratory tract and chronic lung disease. Even relatively
short exposure to the higher concentrations found in
polluted areas can cause temporary damage to human
health. This pollutant is rarely found alone and its
Ecology

200
potency is frequently enhanced by synergistic
interactions with other contaminants. It is a significant
ingredient in the London smogs that have claimed many
lives in the past.
This gas also Kills or leads to stunt growth of plants.
Clearly some plants are more susceptible than others.
Significant reductions in the productivity of permanent
pasture have been reported at ambient concentrations as
low as 60ppb SO2.
Sulfur dioxide is a precursor of acid precipitation. In
polluted urban environments, sulfur dioxide dissolved in
water may cause acidification in its own right, thus:
SO2 (g) + 2H2O (l)→On the other hand Sulfur dioxide Corrodes metals and
statues and impairs visibility.
• Carbon Monoxide (CO)Carbon monoxide, odorless, colorless, non- irritant but
highly toxic gas is found at high concentrations in urban
areas. It is mostly released from motor vehicles, fuel
wood combustion and industry. CO is a product of
incomplete combustion. Its effect is that it:
Ecology

201
- Binds to hemoglobin in the blood, displacing
oxygen and thereby reducing the amount of
oxygen carried in the blood stream
- Slow down mental processes and reaction time
• Nitrogen Dioxide (NO2)This is a colored gas than any other gas. It is formed
when combustion occurs at high temperatures. The
sources of (NO2) are power plants and automobile
emission.
Nitrogen dioxide:• Stunt plant growth
• Reduce visibility by its yellow brown smog it
forms
• Contribute to the formation of acid rain.
• Ozone (O3)This is one of the constituents of photochemical oxidant.
Photochemical oxidants are formed a complex series of
chemical reaction when (NO2) and hydrocarbons react
with O2 and sunlight to produce photochemical smog.
Ozone formed on the upper part of the atmosphere
(Stratosphere) provides a valuable shield for the
Ecology

202
biosphere by absorbing incoming ultraviolet radiation. In
ambient air (troposphere), however, ozone is a strong
oxidizing agent and damages vegetation, building
materials (such as paints, rubber, and plastics), and
sensitive tissues (such as eyes, and lungs).
• HydrocarbonsThose compounds containing hydrogen and carbon
atoms in various combinations are the hydrocarbon
groups. Examples aebezene, and benzo (a) pyrene,
which is potent carcinogen. A part from their long time
effect, they being catalysts for photochemical smog is the
most felt problem.
• LeadLead is a toxic metal, which is traced to automobile
emissions from leaded gasoline. Lead is a metabolic
poison and a neurotoxin that binds to essential enzymes
and cellular components and inactivates them.
.2.3 Summery of major Air Pollutants
Major air pollutants are listed and described in the
following table
Ecology

203
Table 5.2. Major air pollutants their source and effect
Pollutant Description Sources Effects Release
Carbon Monoxide (CO)
CO is an odorless, colorless, and poisonous gas produced by the incomplete burning of fossil fuels (Gasoline, oil, natural gas).
Cars, trucks, buses, small engines, and some industrial processes are major sources. Wood stoves, cigarette smoke, and forest fires are also sources of CO.
CO interferes with the blood’s ability to carry oxygen, slowing reflexes and causing drowsiness. In high concentrations, CO can cause death. Headaches and stress on the heart can result from exposure to CO.
Direct
Nitrogen Oxides (NOx)
Nitrogen and oxygen combine during combustion (burning) to form nitrogen oxides. Many nitrogen oxides are colorless and odorless gases.
NOx come from burning fuels in motor vehicles, power plants, industrial boilers and other industrial, commercial, and residential sources that burn fuels.
NOx can make the body vulnerable to respiratory infections, lung disease, and possibly cancer. NOx contributes to the brownish haze seen over congested areas and to acid rain.
NOx easily dissolves in water and forms acids which can cause metal corrosion and fading/deterioration of fabrics.
Direct
Sulfur Dioxide (SO2)
SO2 is a gas produced by chemical interactions between sulfur and oxygen.
SO2 comes largely from burning fossil fuels (gasoline, oil, natural gas). It is released from petroleum refineries, paper mills, chemical and coal burning power plants.
SO2 easily dissolves in water and forms an acid which contributes to acid rain. Lakes, forests, metals, and stone can be damaged by acid rain.
Direct
Pollutant Description Sources Effects Release
Volatile Organic Compounds (VOCs)
VOCs are organic contain carbon) compounds that vaporize easily. Gasoline, benzene, toluene, and xylene are examples of VOCs.
VOCs are emitted as gases (Fumes). Sources of VOCs include burning fuels, solvents, cleaning supplies, paints, and glues. Cars are a major source of VOCs.
VOCs contribute to smog formation and can cause serious health problems such as cancer. They may also harm plants and buildings.
Direct
Ecology

204
Particulate Matter (PM)also knownasParticle Pollution
Particulate matter is a term used to describe very small solids. Smoke, ash, soot, dust, lead, and other particles from burning fuels are examples of some of the compounds that make up particulate matter.
Some particles are directly emitted from cars, trucks, buses, factories, construction sites, tilled fields, unpaved roads, and burning wood. Other particles are indirectly formed when gases from burning fuels react with sunlight and water vapor.
Particulate matter can reduce visibility and cause a variety of respiratory problems. Particulate matter has also been linked to cancer. It can also corrode metal; erode building and sculptures, and soil fabrics.
Direct and
formed in
the air
Lead Lead is a metal found naturally in the environment as well as in manufactured products. Small solid particles of lead can become suspended in the air. Lead can then be deposited on soil and in water.
The major source of lead is metal processing with the highest levels of lead generally found near land smelters. Other sources include waste incinerators, utilities, and lead-acid battery manufacturers.
Exposure to lead can cause blood, organ and neurological damage in humans and animals. Lead can also slow down the growth rate in plants.
Direct
Ozone (O3) Ozone (O3) is a gas not usually emitted directly into the air. Ground level ozone is created by a chemical reaction between NOx and VOCs in the presence of heat and sunlight.
Motor vehicle exhaust, industrial emissions, gasoline vapors, and chemical solvents are some of the major sources of NOx and VOCs.
Ozone can irritate lung airways and cause wheezing and coughing. Repeated exposure can cause permanent lung damage. Ozone damages leaves of trees and other plants. It decreases the ability of plants to produce and store food, and reduces crop yield.
Formed in
the air
Ecology

205
.3 Land/ Soil Pollution
Humans and animals used resources that earth could
supply for existence for millions of years. Earth (Land)
being natural resources is also used for disposal of the
wastes we generate. Even in the primitive society the
hunters and gathers dispose their waste near and by
their caves.
Solid wastes are the wastes arising from human and
animal actives that are normally solid and that are
discarded as useless or unwanted.
It encompass the heterogeneous mass of throw away
from mostly urban communities as well as the more
homogenous accumulation of agricultural, industrial and
mineral wastes.
The problem of solid waste was not as bad as it is now.
In the past, the number of population ib urban and rural
communities was not so populated. But, the problem of
solid waste began when first humans congregate in
tribes, villages and communities. The practice of
throwing waste into the streets, galleries, any where in
the yard, and vacant areas led to the breeding of rats
and flies. For example, in Europe because of waste
Ecology

206
accumulation at the time of formation of large
communities resulted in increment of the rat population.
It was during that time that the great plague pandemic
killed hundreds of thousands of people in the world.
Present public health science proved that those rats, flies
and other disease vector breed in open dumps, in food
storage facilities, and in other areas and houses. One
study in USA revealed that there are 32 human diseases
which have relationship to improper solid waste
management.
o Ecological impacts of solid waste includes:
a. Water and air pollution.
b. Liquid that seeps from open dumps or poorly
engineered landfills will contaminate surface
water and ground water found in the vicinity.
c. In mining areas, the liquid leached from waste
dump may contain toxic elements such as
copper, arsenic or may contaminate water
supplies from unwanted salts of calcium and
magnesium.
Ecology

207
Some substances such as DDT, and mercury are
relatively stable, they are non- degradable and insoluble
in water. They are neither used nor eliminated, but are
stored in the body, where they may exert a cumulative
damaging effect on a variety of physiological processes
(Box 5.1.). For example, DDT is soluble in fat. It tends to
accumulate in the fatty tissues of organisms. For this
reason, like mercury, DDT is a prime candidate for
biological concentration. The DDT that becomes
concentrated in tissues of herbivores (such as insects)
becomes even more concentrated in tissues of
carnivores that eat quantities of the DDT- harboring
herbivores. The concentration proceeds at each tropic
level.
.5 Pesticides as biosphere pollutants
Pesticides are substances, which kill tests and disease
vectors of agriculture and public health importance.
Pesticides are subdivided into groups according to target
organisms.
• Insecticides; kill insects
• Rodenticides; kill rats and mice
Ecology

208
• Herbicides; kill weeds
• Nematicides; kill nematodes
Insecticides: the largest numbers of pesticides are
employed against a wide variety of insects, and include:
stomach poison (taken into the body through the mouth);
contact poisons (penetrate through the body wall); and
fumigants (enter insects through its breathing pores):
.1 Inorganic insecticides
These insecticides act as stomach poison. Lead
arsenate, Paris green, and a number of other products
containing copper, zinc, mercury, or sulfur are examples
of inorganic insecticides. Many of these products are
quite toxic to man as well as to insects.
.2 BotanicalCertain plant extracts are very effective contact poisons,
providing quick knockdown of insects. Most botanical
preparations are non- toxic to humans, and can be safely
used.
.3 Chlorinated hydrocarbons
These are contact poisons. DDT, chlordane, lindane,
endrine, alerin are some of the chlorinated hydrocarbons.
Ecology

209
These insecticides are broad- spectrum, and act primarily
on the central nervous system, causing the insect to go
through a series of conversation prior to death. They are
also persistent in the environment, breaking down very
slowly and therefore, retaining their effectiveness for a
relatively long period after application.
.4 Organophosphates
Organophosphates are broad- spectrum contact poisons.
Unlike chlorinated hydrocarbons, organophosphates are
not persistent, usually breaking down two weeks or less
after application. They are nerve poisons, which act to
inhibit the enzyme cholinesterase, causing the insect to
lose coordination and go into convulsion. Methyl
parathion, phosdrin and malathion are examples of this
group.
.5 Carbamates
These are contact poisons, which act in a manner similar
to the organophosphates. Carbamates are widely used
Ecology

210
in public health work and agriculture because of their
rapid knockdown of insects and low toxicity to mammals.
.6 Pesticide Benefits
Pesticides are applied for the sec of disease control and
crop protection from different pests. The uses are
discussed below.
.6.1 Disease control
Insects, rodents and ticks serve as vectors in the
transmission of a number of disease- causing pathogens
and parasites. Malaria, yellow fever, trypanosomiasis,
onchocerciasis and plague (Black Death) are some of
human diseases that are transmitted by disease vectors
(insects and rodents). All of these diseases can be
reduced by careful use of insecticides.
.6.2 Crop protection
Plant diseases, insects, bird predation, and competition
by weeds reduced crop yield worldwide by at least one-
third. Post- harvest losses to rodents, insects, and fungi
may as much as another 20 to 30 percent without use of
pesticides, these losses might be much higher.
Ecology

211
.6.3 Pesticide ProblemsWhile synthetic chemical pesticides have brought us
great economic and social benefits, they are also
causing a number of serious problems. Some of the
problems are:
• Killing of beneficial species
• Development of resistance;
• Environmental contamination
• Creation of new pests
• Hazards to human health especially workers who
do not use personal protection equipment during
application (See Fig 4.1.)
.6 Fertilizers as biosphere pollutant
Nowadays, for the sec of increasing production in the
agricultural activities, different nutrients are applied. By
the fact that all the applied nutrients neither utilized by
crops nor remain in the soil matrix, it will be washed
away with runoff to the surface water inducing
eutrophication and/or percolate into ground water and
will affect its natural chemical composition.
Ecology

212
"Eutrophication" is the enrichment of surface waters with
plant nutrients. While eutrophication occurs naturally, it is
normally associated with anthropogenic sources of
nutrients. The "trophic status" of lakes is the central
concept in lake management. It describes the
relationship between nutrient status of a lake and the
growth of organic matter in the lake. Eutrophication is the
process of change from one trophic state to a higher
trophic state by the addition of nutrient. Agriculture is a
major factor in eutrophication of surface waters.
The most complete global study of eutrophication was
the Organization for Economic Cooperation and
Development (OECD) Cooperative Programme on
Eutrophication carried out in the 1970s in eighteen
countries (Vollenweider et al., 1980). The sequence of
trophic state, from oligotrophic (nutrient poor) to
hypertrophic (= hypereutrophic [nutrient rich]) is shown in
Table 12.
Although both nitrogen and phosphorus contribute to
eutrophication, classification of trophic status usually
focuses on that nutrient which is limiting. In the majority
of cases, phosphorus is the limiting nutrient. While the
Ecology

213
effects of eutrophication such as algal blooms are readily
visible, the process of eutrophication is complex and its
measurement difficult. This is not the place for a major
discussion on the science of eutrophication; however the
factors noted in Table 13 indicate the types of variables
that must be taken into account.
Because of the complex interaction amongst the many
variables that play a part in eutrophication, Janus and
Vollenweider (1981) concluded that it is impossible to
develop strict boundaries between trophic classes. They
calculated, for example, the probability (as %) of
classifying a lake with total phosphorus and chlorophyll-
concentrations of 10 and 2.5 mg/m3 respectively, as:
Phosphorus Chlorophyll a
Ultra-oligotrophic 10% 6%
Oligotrophic 63% 49%Mesotrophic 26% 42%Eutrophic 1% 3%Hypertrophic 0% 0%
The symptoms and impacts of eutrophication are:
• Increase in product ion and biomass of
phytoplankton, attached algae, and macrophytes.
Ecology

214
• Shift in habitat characteristics due to change in
assemblage of aquatic plants.
• Replacement of desirable fish (e.g. salmonids in
western countries) by less desirable species.
• Produc t i on o f t ox ins by ce r ta in a lgae
(cyanobacteria).
• Increasing operating expenses of public water
supplies, including taste and odour problems,
especially during periods of algal blooms.
• Deoxygenation of water, especially after collapse
of algal blooms, usually resulting in fish kills.
• Infilling and clogging of irrigation canals with
aquatic weeds (water hyacinth is a problem of
introduction, not necessarily of eutrophication).
• Loss of recreational use of water due to slime,
weed infestation, and noxious odour from
decaying algae.
• Impediments to navigation due to dense weed
growth.
• Economic loss due to change in fish species, fish
kills, etc.
Ecology

215
.7 Radioactive Materials
.7.1 Radioactivity
Radioactivity arises naturally from the decay of
particular forms of some elements, called isotopes. Some
isotopes are radioactive, most are not, though in this
publication we concentrate on the former.
There are three kinds of radiation to consider: alpha,
beta and gamma. A fourth kind, neutron radiation,
generally only occurs inside a nuclear reactor.
Different types of radiation require different forms of
protection:
• Alpha radiation cannot penetrate the skin and can
be blocked out by a sheet of paper, but is
dangerous in the lung.
Ecology

216
• Beta radiation can penetrate into the body but can
be blocked out by a sheet of aluminium foil.
• Gamma radiation can go right through the body
and requires several centimetres of lead or
concrete, or a meter or so of water, to block it.
Figure 5.4. The extent of different materials to block
different types of radiation
All of these kinds of radiation are, at low levels, naturally
part of our environment. Any or all of them may be
present in any classification of waste.
Any activity that produces or uses radioactive materials
generates radioactive waste. Mining, nuclear power
generation, and various processes in industry, defense,
medicine, and scientific research produce byproducts
Ecology

217
that include radioactive waste. Radioactive waste can be
in gas, liquid or solid form, and its level of radioactivity
can vary. The waste can remain radioactive for a few
hours or several months or even hundreds of thousands
of years. Because it can be so hazardous and can
remain radioactive for so long, finding suitable disposal
facilities for radioactive waste is difficult. Depending on
the type of waste disposed, the disposal facility may
need to contain radiation for a very long time. Proper
disposal is essential to ensure protection of the health
and safety of the public and quality of the environment
including air, soil, and water supplies.
When radioactive materials are released into the
environment, they become dispersed and diluted, but
they may also become concentrated in living organisms
and during food chain transfers by a variety of means.
Radioactive substances may also simply accumulate in
water, accumulate in water, soils sediments, or air if the
input exceeds the rate of natural radioactive decay.
Radioactive materials have the same chemical properties
as the non- radioactive forms. Thus, radioactive iodine
(I131), for example, can be incorporated into thyroxin, the
Ecology

218
thyroid hormone, as easily as non- radioactive iodine
(I127). Strontium 90 is a radioactive substance. It is
chemically very similar to calcium, and thus tends to be
accumulated in the bones and other tissues rich in
calcium. It can also damage the blood- forming center in
the bone marrow.
.7.2 Category of radioactive wastes
Different radioactive wastes can be categorized and
defined in the following ways.
.7.2.1 High-Level Waste (HLW): it can be Spent Fuel,
which is irradiated commercial reactor fuel or
Reprocessing Waste, which is a liquid waste
from solvent extraction cycles in reprocessing.
Also the solids into which liquid wastes may
have been converted.
.7.2.2 Transuranic Waste (TRU): Waste containing
elements with atomic numbers (number of
protons) greater than 92, the atomic number of
uranium. (Thus the term "transuranic," or
"above uranium.") TRU includes only waste
material that contains transuranic elements
with half-lives greater than 20 years and
Ecology

219
concentrations greater than 100 nanocuries
per gram. If the concentrations of the half-lives
are below the limits, it is possible for waste to
have transuranic elements but not be classified
as TRU waste.
.7.2.3 Low-Level Waste (LLW): Defined by what it is
not. It is radioactive waste not classified as
high-level, spent fuel, transuranic or byproduct
material such as uranium mill tailings. LLW has
four subcategories: Classes A, B, C, and
Greater-Than Class-C (GTCC), described
below. On average, Class A is the least
hazardous while GTCC is the most hazardous.
.7.2.4 Class A: On average the least radioactive of
the four LLW classes. Primarily contaminated
with "short-lived" radionuclides. (average
concentration: 0.1 curies/cubic foot).
.7.2.5 Class B: May be contaminated with a greater
amount of "short-lived" radionuclides than
Class A. (average concentration: 2 curies/cubic
foot)
Ecology

220
.7.2.6 Class C: May be contaminated with greater
amounts of long-l ived and short- l ived
radionuclides than Class A or B. (average
concentration: 7 curies/cubic foot)
.7.2.7 GTCC: Most radioactive of the low-level
classes. (Average concentration: 300 to 2,500
curies/cubic foot).
United States of America environmental protection
agency (USEPA) has categorized radioactive wastes into
five general types.
• Spent nuclear fuel from nuclear reactors and high-
level waste from the reprocessing of spent nuclear
fuel
• Transuranic waste mainly from defense programs
• Uranium mill tailings from the mining and milling of
uranium ore
• Low-level waste
• Naturally occurring and accelerator-produced
radioactive materials.
Ecology

221
Ecology

222
The Chernobyl accident (Case study)
The greatest radioecological catastrophe with 10% of
Ukraine population involved into it occured on April 26,
1986 at a distance of 140 km from Kyiv. The
catastrophe happened because of the explosion and
radiation accident at the fourth power unit of the
C h e r n o b y l N u c l e a r P o w e r P l a n t . M e d i c a l ,
radiobiological and dosimetric problems of the post-
Chernobyl period have no analogues all over the world.
The disaster at Chernobyl NPP differs from the cases of
mass irradiation of people in other countries (Japan,
USA, Brasil, Russia) by the number of victims,
structure, complicacy of emission sources and
availability of a complex of unfavorable factors of non-
radiation character accompanying the accident.
Irradiation of persons who took part in the fire
extinguishing and in the accident works at the nuclear
power plant became the closest after-effects of the
disaster: 238 people fell ill with acute radiation disease
(final diagnosis was confirmed in 194 of them) 29 of
them died in the first months after the disaster, about 2
thousand people obtained local irradiation injury;
90,000 people had to evacuate from the towns of
Pripyat, Chernobyl and rural settlements of the 30-km
zone. Above 50,000. people were evacuated from
contaminated territories in more remote after-accident
period.
The significance of irradiation kinds varied in the
process of the accident itself and in post-accident
period: the effect of radioaction iodine and other
fragmented elements prevailed at the first stage, that of
cesium and strontium-90 isotopes in more remote
terms.
The conducted thyreodosimetric certification permitted
estimating dose loads on the thyroid gland in the
population of Kyiv, Chernigiv, Zhitomir, Cherkassy and
Vinnitsa regions. According to its results 7 million
people including 1.5 million children were enlisted in the
group of the risk of appearance of thyroid gland
diseases. Today this group already forms above 60% of
cases of struma maligna in the persons who were
children or teenagers in the period of the accident.
Examination of thyroid gland function in children who
were victims of radiation was carried out in Ukraine
from the first days of the accident. Results obtained
evidence that for the present moment such possible
radiation after-effects on the thyroid gland as the
increase of cases of hyperthyreosis, autoimmune
thyroiditis have not manifested yet, their frequency in
children does not exceed the corresponding indices in
the total population. An analysis of struma maligna
cases in children and teenagers of Ukraine operated at
the age below 18 has shown that 5 years before the
accident 59 cases of disease were registered in a given
age group while 362 cases for the period of 1986-1994.
Sick rate growth in children as to neoplasms, blood and
hemopoietic organs, congenital anomalies, the
Ecology

223
.8 Prevention and Control of Pollution
As in disease, pollution prevention is far better and more
desirable than its cure. There are various measures that
can be taken for preventing pollution. The following are
some of the measures.
a. Recycling and reuse of waste materials as
a resource
b. Waste reduction
c. Controlled use of chemicals
d. Proper disposal of wastes
e. Treatment of wastes before discharge
f. Use of cleaner energy sources, such as
sun energy, wind, hydropower energy, etc.
g. Reduce emission of air pollutants using
different techniques
h. Formulation of rules and regulations
Ecology

224
.9 Review Questions
1. What are the three main components of the
biosphere?
2. What are the types and sources of water
pollution?
3. How do you see the current hydropower plant
construction activities inline with the use of clean
energy source and ecosystem disturbance?
4. What are point- source and non- point source of
pollution? Give examples for each.
5. Give some examples of diseases that are related
to water pollution.
6. What is eutrophication? What causes it?
7. What are the major air pollutants and their effects
on the environment and human health?
8. What are the main anthropogenic sources of air
pollutants?
9. Discuss the impacts of indiscriminate disposal of
solid wastes on human health the environment
Ecology

225
10.What will happen when a large amount of oxygen-
damaging waste is discharge to water bodies?
11.What are the effects of thermal; pollution?
12.Discuss the benefits and disadvantages of
pesticides
13.Have you observed, in your locality, any changes
in pattern of disease occurrence that are related to
changes in the environment?
14.What is ‘environmental disease’? Give examples
in your setting.
Ecology

226
.10 Bibliography
1. FAO. Control of water pollution from agriculture.
http://www.fao.org/docrep/W2598E/
w2598e09.html
2. Ackefors, H. and Enell, M. 1992. Pollution loads
derived from aquaculture: land-based and water-
based systems. In: Workshop on Fish Farm
Effluents and their Control in EC Countries.
Published by the Department of Fishery Biology,
Institute for Marine Science at the Christian-
Albrechts-University of Kiel, Germany, pp. 3-4.
3. Bangay, G.E. 1976. Livestock and poultry wastes
in the Great Lakes Basin: environmental concerns
and management issues. Social Science Series
No. 15. Environment Canada.
4. USEPA. Radioactive Waste Disposal: An
Environmental Perspective. EPA 402-K-94-001
Ecology

227
CHAPTER SIXPOPULATION DYNAMICS
6.1 Learning objectives
At the end of this chapter, the student will be able to:
• List all factors that can contribute to population
change
• Mention the major causes of human population
change
• Cite factors that can govern population’s birth rate
• Understand the population growth in Ethiopia and
its future implication
• Describe environmental resistance and biotic
potential in terms of population growth
• Explain the difference between the J-shaped and
S-shaped population growth forms.
• Discuss the idea of carrying capacity in influencing
population growth.
• Discuss the impact of unchecked human
population growth
Ecology

228
6.2 Introduction
Population dynamics is the study of changes in the
number and composition of individuals in a population,
and the factors that influence those changes. Population
dynamics involves five basic components of interest to
which all changes in populations can be related: birth,
death, sex ratio, age structure, and dispersal.
An understanding of population dynamics is needed to:
a) Estimate how many animals can be harvested,
b) Understand how environmental changes affect
populations,
c) Predict when a species or population is
threatened or endangered with extinction,
d) Understand how one population might affect
another (i.e., competition or predation), and
e) Use populations as indicators of environmental
quality.
Ecology

229
Thus, an understanding of population dynamics is
necessary for understanding the structure and function of
communities and ecosystems.
6.3 Factors that cause populations to change
Population Ecologists classify factors causing changes in
populations as either density-dependent or density-
independent factors.
Density refers to the number of animals per unit area
(usually measured in animals/hectare or animals/square
kilometer).
6.3.1 Density-dependent factors:
Are factors that act on a population as a function of
density? As the density of a population increases, the
amount of resources available to each individual
decreases, and the health of individuals decreases. As
health decreases, mortality (death rate) increases and
reproduction decreases. Thus, we may talk about
density-dependent mortality or density-dependent
reproduction. Density-dependent forms of mortality
include parasites, disease, starvation, and predation.
Ecology

230
6.3.2 Density-independent factors:
Are those factors that act on a population independent of
the size of the population. Typical density-independent
causes of mortality are weather, accidents, and
environmental catastrophes like volcanoes, floods,
landslides, fire, etc.
The rate at which animals reproduce is a basic
component of population dynamics.
The rate of natural increase is the difference between
birth and death rates. It measures the degree to which a
population is growing. Since birth and death rates are
measured as the number of births (or deaths) occurring
per 1000 population, the difference is divided by 10 to
convert this rate into a percentage.
Natality refers to number of young individuals born or
hatched per unit of time. Wildlife biologists usually
express birth rates as fecundity, which is the number of
young produced per female over a given time period.
Usually one year is the time period considered, but for
Ecology

231
smaller animals, especially those that may breed several
times a year, a shorter time period may be selected.
Thus, if a population of 1,000 female grizzly bears
produced 200 young in a year, the birth rate, or fecundity,
would be 200/1,000 = 0.2.
A number of factors affect a population's birth rate:
o The amount and quality of food available
determines if an individual has enough energy to
reproduce. Animals that are in poor nutritional
condition have fewer young and/or breed less
often.
o Age at first reproduction is also an important factor
in determining birth rate. Large, long-lived animals
typically do not become sexually mature until they
are several years of age. A vole or meadow
mouse might become sexually mature and breed
for the first time at 18 days. An Asian elephant on
the other hand will typically be 9-12 years old
when it first breeds.
o The birth interval is also important in determining
birth rates. A vole might produce a litter of young
every 30 days during the breeding season, but a
Ecology

232
grizzly bear may only reproduce every 3 or 4
years.
o The average number of young produced is of
obvious importance in a population's birth rate.
Some animals such as fish or amphibians produce
100's or 1000's of eggs (not all of them hatch of
course), while many wildlife only have one young
at a time.
o Potential population growth rates are related to
fecundity rates (Fig. 1). A doubling in the fecundity
rate will more than double the population growth
rate.
Ecology

233
Figure 6.1. Population growth as a function of fecundity
rate. Assumes 50:50 sex ratio, one litter or
clutch/female/year, no mortality, and sexual
maturity at 1 year (from Shaw 1985).
Death rate or mortality rate is another important
component of population dynamics.
Ecology

234
Mortality is measured as the number of animals that die
per unit of time (usually one year) divided by the number
of animals alive at the beginning of the time period. Thus,
if 1,000 fawns are born in June, and 400 are alive the
next June, then the mortality rate is 600 (the number that
died)/1,000 = 0.6 or 60%. Survival and longevity are two
other population parameters related to mortality.
Survival is the number of animals that live through a time
period and is the converse of mortality. Thus, if the
mortality rate was 0.8 or 80% per year, then survival
would be 0.2, or 20% per year.
Longevity is the age at death of an animal. Mortality rates
are usually age- and often sex-specific, which means
that animals of different ages or sexes die at different
rates. In many species, the young and old animals die at
faster rates than the prime-age animals.
Often, males have higher mortality rates than females
because of activities associated with territorial or mating
behavior. Different species have different survivorship
functions related to life-history traits (Fig. 2).
A Type I survivorship curve would be typical of animals
that have relatively high survivorship until later in life
Ecology

235
when they become subject to age-related mortality.
Typically, these are animals with a high degree of
parental care. Many larger mammals, such as whales,
bears, and elephants, might have Type I survivorship
curves.
Some animals have fairly constant survivorship (Type II).
Some birds and most reptiles and amphibians probably
fit this pattern, although our knowledge of survivorship in
birds is not very complete because they are difficult to
study.
A Type III survivorship curve would be typical of animals
with little or no parental care and/or vulnerable young;
mortality is high in the young age classes, then low in
older animals. Insects and fish often have Type III
survivorship curves.
Ecology

236
Figure 6.2. Three types of survivorship curves represent
different mortality rates within a population.
Age structure or age composition of a population will
influence population growth. A wildlife population is
composed of individuals of different ages. The age
structure of a population refers to the number of
individuals of each age within the population. Because
ages of animals are often difficult to determine,
ecologists often place animals in age categories or age
classes. Many birds and reptiles are classified as young
Ecology

237
of the year or adult. Some birds and small mammals may
be classified as juvenile, sub-adult, or adult. Because of
age-specific mortality and fecundity rates, the age
structure of a population can greatly influence population
growth. For example, differences in age at first breeding
can significantly influence the rate of population growth
(Fig. 3).
Figure6.3. Age at first breeding can substantially
influence population growth. This
analysis assumes a 50:50 sex ratio, a
fecundity rate of 2.0/adult female/year,
Ecology

238
and no mortality (data from Shaw
1984:63).
The sex ratio of a population has important
implications for mating systems and management.
Sex ratio is the proportion of males to females in a
population. Typically, the sex ratio at birth is 50:50, but
usually sex-specific mortality results in departures from
this ratio in the adult population. Depending on the
mating system of the species, a departure from a 50:50
sex ratio may influence the population's dynamics.
In monogamous species (monogamy is a mating system
in which each male only mates with one female), a
deviation from a 50:50 sex ratio will cause a decline in
population growth.
In polygamous species (polygamy is a mating system in
which successful males mate with more than one
female), deviations from a 50:50 ratio can have major
effects on population growth. Fecundity within the
population of a polygynous species is a function of the
number of breeding-age females and males. For
example, if all females breed, a population with a ratio of
1 male to every 4 females will produce up to 1.6 times as
Ecology

239
many young as would the same size population with a
50:50 sex ratio. The same population with a 4:1 sex ratio
would produce only about 40% as many young. In some
big game species, the desire to have fast- growing
populations and the resistance to hunting females has
skewed the sex ratio to the point that there are not
enough males to breed all the females or they are bred
later in the year, which causes problems with survival of
young the following year.
Dispersal is a poorly understood component of wildlife
populations that is critical to the long-term persistence of
a species. Dispersal is the movement of an animal from
its natal area (place where it was born) to a new area
where it lives and reproduces (if it survives that long).
Dispersal is important in the persistence of populations
and species. Environments or habitats change over time,
and if an animal (species) does not disperse, it has no
ability to colonize new areas. Dispersal also functions to
prevent inbreeding and provides new genetic material for
other subpopulations. Individuals that disperse likely will
not breed with their relatives.
Ecology

240
We know that dispersal is important, but it is one of the
more difficult population parameters to study. Dispersal
usually occurs about the time an animal becomes an
adult, and is often sex-biased (one sex disperses more
often than the other). For example, female elk usually do
not disperse; but instead, adopt their mother's home
range. Male elk, on the other hand, usually disperse
when they are 2-3 years old. Dispersing animals may
move only a short distance and adopt a home range
adjacent to their natal home range, or they may move
great distances, passing many suitable areas before
establishing a new home range. Elk have been recorded
dispersing hundreds of miles.
6.4 Population Growth
The change in population size over time is known as
population growth. By monitoring population growth in
response to other factors such as habitat change or
manipulation, weather patterns, and hunting seasons,
biologists and ecologists increase their understanding of
the factors that limit populations and how management
affects a population.
Ecology
241
6.4.1Exponential population growth
This growth type occurs when no resources limit the
population. When resources are unlimited, populations
grow at the maximum rate that is biologically feasible for
the species. That rate is called the intrinsic rate of
increase and is denoted by the symbol r. Although
exponential growth is rare, it does occur under some
circumstances. Population growth by exotic species
when they first colonize a new area often resembles
exponential growth. Exponential growth is typical
characteristic of insects with short lifespan and most
annual plants.
Human population growth appears to be exponential.
Population growth in unlimited-resource environments
increases exponentially, and can be represented by the
formula:
dN/dt = rN dN/dt = rN (1)Where: dN is the change in population size
dt is the change in timer is the rate of increaseN is the population size
dN is the change in population sizedt is the change in timer is the rate of increaseN is the population size
Ecology

242
A positive value of r indicates an increasing population, a
negative value of r indicates a population that is
decreasing, and r = 0 indicates a stable population.
Exponential population growth will be a steepening curve
(often called a J-curve) if population size is graphed
against time (Fig. 6.4). However, in most cases
ecologists present populations as natural logarithms, in
which exponential population growth is a straight line
(Fig. 4b). Thus, formula (1) can be rewritten in
exponential form as:
Nt = N0ertNt = N0ert (2) Where: Nt is the population size at some future time (t)
N0 is the initial population sizee is the base of natural logarithms (2.71828)r, the rate of increase, is the power to which the
base is raised
Nt is the population size at some future time (t)N0 is the initial population sizee is the base of natural logarithms (2.71828)r, the rate of increase, is the power to which the
base is raised
Ecology

243
Figure 6.4. The relationship between population size and
t i m e w h e n p o p u l a t i o n s g r o w i n
environments where resources are
unlimited (exponential growth). Population
growth as a function of population size
produces a J-curve, and population size
presented as logarithm to the base e
produces a straight line
6.4.2 Sigmoid or S-shaped population growth
Limitations on resources and/or space cause
population growth to change. Populations rarely grow
in environments with unlimited resources. Eventually,
some resource becomes limited. It may be nest holes for
cavity-nesting birds, or food for many species, or space
Ecology

244
for territorial species. The more common situation of
population growth in resource-limited environments can
be represented by the logistic growth equation. The
logistic growth equation (3) simply adds a density-
dependent breaking mechanism to the exponential
growth equation (1).
That breaking mechanism involves the term carrying
capacity (K). The carrying capacity of a habitat is the
number of individuals that the area can support. It is the
natural limit of the population set by the resources
available. As a population approaches K, then density-
dependent mechanisms (increased mortality, decreased
reproduction) function to slow population growth.
dN/dt = rN[(K-N)/K] (3)
Note that as population size (N) approaches the carrying
capacity (K), the term inbrackets becomes an
increasingly smaller number. For example, if K = 500 and
N = 100, then [(K-N)/K] = (500-100)/500 = 0.8. If on the
other hand N = 475, then [(K-N)/K] = (500-475)/500 =
0.05. What happens if the population size is above
carrying capacity? The logistic growth equation (3)
produces a sigmoid or S-shaped curve (Fig. 5). The
Ecology
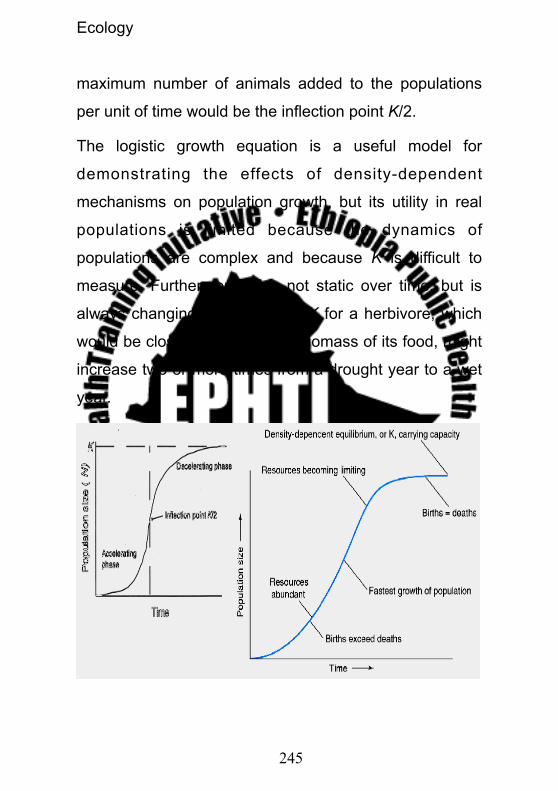
245
maximum number of animals added to the populations
per unit of time would be the inflection point K/2.
The logistic growth equation is a useful model for
demonstrating the effects of density-dependent
mechanisms on population growth, but its utility in real
populations is limited because the dynamics of
populations are complex and because K is difficult to
measure. Furthermore, K is not static over time, but is
always changing. For example, K for a herbivore, which
would be closely related to the biomass of its food, might
increase two or more times from a drought year to a wet
year.
Ecology

246
Figure 6.5. The logistic growth equation produces a
sigmoid or S-shaped curve. The carrying
capacity (K) limits the number of animals in
the population. The point of maximum growth
is at the inflection point K/2.
6.5 Limits to population growth
The maximum growth rate, which a population could
achieve in an unlimited environment, is retread to as that
population’s Biotic potential. In reality however, no
organism ever reaches its biotic potential because of one
or more factors which limit growth long before population
size attains its theoretical maximum, such limiting factors
include: food shortages, overcrowding, disease,
perdition, and accumulation of toxic wastes. Taken
together, the environmental pressures which limit a
population’s inherent capacity for growth ate termed
Environmental resistance Environmental resistance is
generally, measured as the difference between the
potential of a population and the actual rate of increase
as observed under laboratory or field conditions.
6.6 Human population growth
Ecology

247
Should we worry about human population growth or not?
Why?
Man is relatively new in this world; although there are
already animals of millions of years, modern man
evolved only four hundred thousand years ago. During
most of this period people lived from hunting and
gathering of food. Our planet could feed about ten million
people living in this way. Estimations say that ten
thousand years ago between five and ten million people
lived on earth. Our planet was at that time at or near the
maximum population it could support. The average
growth rate until then was almost zero then 0.005
percent per year.
Table 6.1. World Population Number of years to add each
billion (1991 estimate)
Billion reached
Year Years to add Average growth% since previous
Average growth% since previous
1 1800 A l l h u m a n history
0.0050.005
2 1930 130 0.50.53 1960 30 1.41.44 1975 15 1.91.95 1987 12 1.91.9
------------------------Projected----------------------------------------------------Projected----------------------------------------------------Projected----------------------------------------------------Projected----------------------------------------------------Projected----------------------------
Ecology

248
6 1998 1111 1.77 2009 1111 1.48 2020 1111 1.29 2033 1313 0.910 2946 1313 0.811 2066 2020 0.512 About 2100 3434 0.3
Anthropologists believe the human species dates back at
least 3 million years. For most of our history, these
distant ancestors lived a precarious existence as hunters
and gatherers. This way of life kept their total numbers
small, probably less than 10 million. However, as
agriculture was introduced, communities evolved that
could support more people.
World population expanded to about 300 million by A.D.
1 and continued to grow at a moderate rate, but after the
start of the Industrial Revolution in the 18th century, living
standards rose and widespread famines and epidemics
diminished in some regions. Population growth
accelerated. The population climbed to about 760 million
in 1750 and reached 1 billion around 1800 (see chart,
"World population growth, 1750–2150,")
Ecology

249
Figure 6.6. Human population growth since 1750 and
projected till 2150
In 1800, the vast majority of the world's population (86
percent) resided in Asia and Europe, with 65 percent in
Asia alone (see chart, "World population distribution by
region, 1800–2050"). By 1900, Europe's share of world
population had risen to 25 percent, fueled by the
population increase that accompanied the Industrial
Revolution. Some of this growth spilled over to the
Americas, increasing their share of the world total.
Ecology

250
World population growth accelerated after World War II,
when the population of less developed countries began
to increase dramatically. After millions of years of
extremely slow growth, the human population indeed
grew explosively, doubling again and again; a billion
people were added between 1960 and 1975; another
billion were added between 1975 and 1987. Throughout
the 20th century each additional billion has been
achieved in a shorter period of time. Human population
entered the 20th century with 1.6 billion people and left
the century with 6.1 billion.
The growth of the last 200 years appears explosive on
the historical timeline. The overall effects of this growth
on living standards, resource use, and the environment
will continue to change the world landscape long after.
6.6.1 Major causes of human population change
a) Agricultural Revolution
Agricultural revolution, ten thousand years ago, made a
great change to increase the human population. This was
a transition from hunting and gathering of food for
subsistence. It has created settlement, easy access for
Ecology

251
food and mortality reduction and increase life
expectancy.
b) Industrial revolution
Around 1750 another revolution started in England,
making an even faster growth possible: the Industrial
revolution. Giving an average growth rate of 0.84% since
the beginning of the industrial revolution, about
seventeen times the previous rate.
c) Progressing growth
With the development and spreading of modern medicine
and sanitation, the growth rate is still progressing (table
1).
6.6.2 Regional differences
The natural increase shows considerable differences
over the world. The world population as a whole grows at
the moment 1.4 per cent per year, however most growth
takes place in the less developed regions: 1,7% even 2.6
% in the least developed countries according to the
United Nations definition against 0.3 % in the more
developed regions. But even within these regions there
are considerable differences.
Ecology

252
Figure 6.7. Human population distribution over the
continents
6.6.3 Demographic transition
The pattern of population growth from high birth and
death rates to lower birth and death rates is termed as
demographic transition. But why is this growth still
accelerating in some developing countries, while it is
slowing down in others and almost has disappeared in
many developed countries? In the past the number of
births had to be great to compensate for the high
mortality.
Ecology

253
Before the industrial revolution the average life
expectancy for a newborn child was about 30 years. In
Europe as well as in the rest of the world, of course there
were great fluctuations in time. In certain periods, for
example during the plague epidemic, also called the
Black Death, during the Middle Ages, the population of
large areas diminished during many decennia. Also wars
and famines could have this effect.
Improvement in conditions because of the industrial
revolution, and better medicine and sanitation that
followed it, caused the mortality to fall. Think in this
respect of the vaccination against smallpox, invented in
the middle of the nineteenth century. This fall in mortality
stated where the industrial revolution began: in Western
Europe. Although this fall was very gradual, the fertility
remained the same, causing the gap between births and
deaths to widen, which means that the growth rate
increased. After a certain time the fertility stated to fall at
the same rate as the mortality, leveled off in the middle of
the twentieth century, the still decreasing fertility started
approaching the mortality again, resulting in a smaller
growth rate. By now also the fertility has leveled off, on or
Ecology

254
slightly above the level of the mortality, resulting in a very
low or zero growth rate.
In the developing world this fall of mortality started much
later. By that time the medical science had developed so
far that this fall could be much faster. This means that the
difference between the mortality and fertility became
much greater in a short time resulting in a much higher
population growth.
Table 6. 2. Population and Growth rates by major regions
of the world.
Region Mid 1997
Population
(million)
Growth rate
(%) 1995-2000
World 5,848.7 1.4Africa 758.4 2.6 Northern 164.7
Ecology

255
Western 2211.8 Eastern 234.3 Middle 88.1 Southern 49.5Asia(excluding Asian
part of Russian Fed)
3,538.5 1.4
Western 175.3 2.2 South Central 1,417.9 1.8 South Easter 498.0 1.6 Eastern 1,447.2 0.9North America 301.7 0.8Latin America 491.9 1.5Central America 128.3 1.9Caribbean 36.5 1.1South America 327.1 1.5Europe ( including
Russian Federation )
729.2 0.0
Northern Europe 93.6 0.1Western Europ 182.5 0.3Eastern (including
Russian Fed.)
309.2 -0.3
Southern Europe 143.9 0.2Oceania 29.1 1.3
6.6.4 Human population growth in Ethiopia
Ecology

256
Ethiopia is the second most populous country in Africa.
There has been a steady increase in the population
growth rate since 1960. Based on 1984 census data,
population growth was estimated at about 2.3 percent for
the 1960-70 period, 2.5 percent for the 1970-80 period,
and 2.8 percent for the 1980-85 period. Population
projections compiled in 1988 by the Central Statistical
Authority (CSA) projected a 2.83 percent growth rate for
1985-90 and a 2.96 percent growth rate for 1990-95. This
would result in a population of 57.9 million by 1995.
Estimated annual growth for 1995-2000 varied from 3.03
percent to 3.16 percent. Population estimates ranged
from 67.4 million to 67.8 million by the year 2000. The
CSA projected that Ethiopia's population could range
from 104 million to 115 million by the year 2015. The
International Development Association (IDA) provided a
more optimistic estimate. Based on the assumption of a
gradual fertility decline, such as might be caused by
steady economic development without high priority given
to population and family planning programs, the
population growth rate might fall to about 2.8 percent per
annum in 1995-2000 and to 2.1 percent in 2010-15,
resulting in a population of 93 million in 2015.
Ecology

257
Figure 6.8. Human population distribution of Ethiopia by
Woreda based on 1994 census data (source: Central
Statistics Authority, 1998).
6.6.5 Population distribution
The Ethiopian population has historically lived in the
highlands for the sec of sufficient rainfall, fear of major
infectious diseases like malaria and probably war. As
indicated by Kloos and his colleagues (2006), about 82%
of the population is living above 1, 500 m altitude.
Ecology

258
Variations in population growth existed among different
areas. Kefa, Sidamo, and Shewa had the highest
average growth rates for the 1967-84 periods, ranging
from 4.2 percent for Kefa to 3.5 percent for Sidamo and
Shewa.
What is the reason that shewa has least growth rate?
Why highest at Kefa and Sidamo?
The population in areas such as Harerge, Welo, and
Tigray, which had been hard hit by famine and
insurrection, grew at slow rates: 1.3 percent, 1 percent,
and 0.2 percent, respectively. Generally, the population
of most central and western administrative regions grew
more rapidly than did the population of the eastern and
northern administrative regions.
Problems of Uncontrolled (unchecked) Population
growth
Family planning is a good way of controlling the
population growth. If the population size growth beyond
the carrying capacity of the ecosystem or the country or
Ecology

259
the world, problems like food shortage, unplanned
urbanization, unemployment, illiteracy, luck of major
social services like health facility, political unrest,
environmental pollution, etc will occur.
6.7 Review questions
1. Why one need to do population dynamics study?
2. How industrial and agricultural revolutions affect
human population changes?
3. What are the main difference of density dependent
and density independent factors for population
change?
Ecology
260
4. What are the main causes for human population
increase?
5. What is the main difference between sigmoid and
exponential population growth? Which type of
population follows exponential growth?
6. If cockroach population doubles its number every
month (30 days), what is the intrinsic population
growth rate?
7. List solutions to alleviate population growth in
Ethiopia without affecting the culture and norms of
the society.
6.8 Bibliography
1. Central Statistics Authority, Ethiopia, 1998.
2. UNFPA (2004). State of world population
3. http://users.rcn.com/jkimball.ma.ultranet/
BiologyPages/P/Populations2.html, retrieved: 15
Jan. 2007
Ecology

261
CHAPTER SEVENNATURAL RESOURCE
CONSERVATION
.1 Learning objectives
At the end of this chapter, the student will be able to:
List the different types and groups of resources
Discuss the different conservation methods
Mention environmentally friendly/safe/ energy
sources
Ecology
262
.2 Definition of terms:
1. Energy: The capacity to do work
2. Mineral: Inorganic nutrient, which is mostly found
in the earth’s crust
3. Mulch: a layer of organic material applied to the
ground surface to the ground surface to retain and
conserve moisture.
4. Renewable resource: resource normally replaced
or replenished by natural processes; resources
not depleted by moderate use
5. Recycling: processing of discarded materials into
new, useful products; not the same as reuse of
materials for their original purpose, but the terms
are often used interchangeably.
6. Composting: The process of making compost by
decomposition of vegetable and other degradable
organic wastes.
.3 Introduction
A resource is any useful information, material, or service.
Within this generalization, we can differentiate between
natural resources (goods and service supplied by our
Ecology

263
environment, including sinks for wastes) and human
resources (human wisdom, experience, skill, labor, and
enterprise). It is useful to distinguish between exhaustible
(non-renewable), renewable (non-exhaustible) and
intangible resources.
Modern civilization entails the high risk of irreversible
deterioration of the environment, which accompanies
overpopulation, overproduction, over wastage and the
exploitation of ever-increasing amounts of natural
resources such as source rocks for ever-declining
proportions of useful products, e.g., minerals. Any
per tu rbat ion in the broad f ramework o f the
interrelationships between living organisms and their
environment may influence the availability of resources
to human societies.
Natural resources can be broadly classified into
biological and non-biological, and includes such
resources as minerals and industrial, agricultural, forestry
and food resources, power and energy, plant and animal,
range and water. As explained above, resources may be
renewable or non-renewable. Biological resources such
as fish are of course, ban be replenished, but such
Ecology

264
resources as nitrogen, iron and energy may also some
time be renewable through not to the same extent as
forests and fisheries.
Abstract or intangible resources include open space,
beauty, serenity, genius, information, diversity and
satisfaction. Unlike tangible resources often are
increased by use and multiplied by sharing. These non-
material resources can be important economically.
.4 Types of Natural resources
The functioning of ecosystems, including man’s survival
and happiness, depends on the availability, preservation
and recycling of natural resources such as minerals,
water, land and energy sources. These resources are,
however, not unlimited and many countries still continue
to dream of an ever increasing gross national product
based on obsolescence and wasteful practices.
.4.1 Forest resources
Forests are unevenly distributed over the earth. Large
and densely inhabited areas are sometimes poorly
covered with forest, whereas sparsely populated areas of
the humid tropics and the boreal forest belt are dominant
Ecology

265
woodland. Some 20% of the forested area belongs to the
former USSR, Africa, central and South America each,
about 15% are shared between North America and Asia
and the remaining 4% occur in Europe.
It is being destroyed rapidly all over the world. In South-
east Asia the forest is being cleared at an estimated rate
of 5 million/ha/yr., in Africa 2 million/ha/yr., in South
America 8 million/ha/yr.
To a great degree, the type and density of the natural
forest (vegetation) of Ethiopia reflect its rainfall and
temperature distribution patterns, although human use
(and misuse) has drastically altered its structure and
composition. It has been estimated that the natural
vegetation of the country before manmade changes
became significant, consisted of 34% forest (covering
most of the highlands), 20% woodland and tree savanna,
and 32% grassland and steppe. Today only 3-4% of the
land is in forest, 8% in woodland, cultivated land has
largely replace forest.
- 34% forest - 3-4%
- 20% woodland 8%
Ecology

266
.4.2 Consequences of forest destruction
Forests are important regulators of ecosystem. They
exert significant effects on the water budget and the
hydrological cycle. In areas of heavy rainfall, forest plants
intercept a large fraction of he rain. This water
evaporates quickly and returns to the hydrological cycle.
Figure 7.1. Hydrological cycle in a biosphere
Some of the water reaching the forest floor penetrates
into the soil through the litter and the loose soil surface,
and there is little surface runoff. It is only after some
period of time that the seeped water reaches the streams
and rivers. This time lag is an important device to
Ecology

267
regulate the water discharge into rivers, and tin this way,
flooding is prevented or minimized. On the other hand, in
dry periods also the forest soil continues to supply water
slowly to the streams and rivers.
Destruction of forest changes the above situation
immediately. The hydrological cycle is disrupted and the
water level of the rivers cannot be properly regulated.
This causes flooding. In dry periods, the rivers tend the
dry up, affecting irrigation and power generation. In
deforested areas, erosion of soil occurs fairly briskly,
especially on steep slopes. This remover the fertile
topsoil and also loads the rivers with much suspended
matter. Deforestation thus greatly increases the quantity
of detritus in many tropical rivers. This detritus causes
premature filling up to water reservoirs, etc.
Large-scale forest destruction often produces grave
climatic consequences, especially desertification and
aridity. This result from reduction of evaporation as the
tree canopies 9cut and removed) no longer, intercept
rainwater, and also because rapid run of precipitation
occurs in the absence of the forest cover.
Ecology

268
In Ethiopia, deforestation is very intensive and now the
cover of the forest is below 3% of the total land. The
remaining ones are nowadays at risk due to resettlement
and look for additional farmland and other purposes. To
alleviate this problem, the Government of the Federal
Democratic Republic of Ethiopia have designed strategy
that from the start of the celebration date of the Ethiopian
new millennium (2000 Eth. C.), 5 June 1999 Eth. C. each
citizen should plant two indigenous trees. This is one big
milestone in the era of the Ethiopian people to celebrate
holidays while doing ecosystem conservation and
restoration activities. As a citizen if each of us plant a
number of trees each year we can restore forest patches
as the result it is possible to balance and reduce the
excess CO2 that is released from different sources.
.5 Mineral resources
A mineral is a naturally occurring, inorganic, crystalline
solid that has a definite chemical composition and
characteristics physical propertied. There are thousands
of known and described minerals in the world. Most
economically valuable minerals exist everywhere in small
Ecology

269
amounts; the important thing is to fid them concentrated
in economically recoverable levels.
Until recently little attention was paid to conservation of
mineral resources because it was assumed that there
were plenty for centuries to come and the nothing could
be done to save them anyway. But this assumption is
dead wrong.
World industry depends on about eighty minerals, some
which exist in plentiful supplies. Three-fourth of the eighty
minerals are abundant enough to meet all of our
anticipated needs or have readily available substitutes.
At least eighteen minerals, including tin, platinum, gold,
silver, and lead, are in short supply.
.6 Soil resources
Of all the earth’s crust resources, the one we take most
for granted is soil. It can be considered on ecosystem by
itself. We are terrestrial animals and depend on soil for
life, yet most of use think of it only in negative terms. Soil
is a marvelous substance, a living resource of
astonishing beauty, complexity and fraily. Half of the soil
content is mineral, and the rest is air and water together
with a little organic matter from plant and animal residue.
Ecology
270
We face a growing scarcity of good farmland to feed the
world’s rapidly growing human population. Only about
105 of the earth’s land areas (14.78 million sq. km of a
total of 144.8 million sq. km) is currently used for
agricultural production.
With careful husbandry, soil is a renewable resources
that can be replenished and renewed indefinitely.
Agriculture is the area in which soil is most essential and
also most often lost through erosion. Therefore, the
greatest potential for soil conservation and rebuilding lies
on agricultural practices. The most important
considerations in a soil conservation program are
topography, ground cover, climate, soil type, and tillage
system.
Due to mismanagement, in Ethiopia about 2 billon tons of
soil is eroded annually, educing the country’s food
production capacity by 2-3% per annum. About 50% of
the highlands had been significantly eroded by the mid
1980s, 4% had already been lost to agriculture due to
erosion, and only 18% were relatively free from erosion.
Non-a-days terracing and plantation activities made by
Ecology

271
the extension program in different parts of the country is
a good measure for soil conservation.
.7 Energy resourcesEnergy is the ability to do work such as moving matter
over a distance or causing a heat transfer between two
objects at different temperatures.
Oil, natural gas and other petroleum products constitute
major sources of energy to fuel our economy. Other
resources of energy are heat from the sun, heat from the
earth, and the harnessing of wind, ocean and tides.
Water wheels, windmills and hot water from thermal
springs have been used as energy sources in some
countries, and of course coal has been a major source of
energy for a century or more in England.
Renewable energy resources like hydropower, the sun,
wind, tides and biomass are nor likely to make significant
contributions to the worlds’ energy for the developed
nations. But these renewable sources are expected to
play an increasingly important role in the energy use
pattern of many developing countries like Ethiopia. It is
not environmentally friendly to completely shift the
hunger for petroleum to the more abundant but still finite
Ecology

272
coal, shell and heavy oil reserves; because it will
increase the level of CO2 which is known greenhouse
gas.
In this case, biomass conversion has unique advantages
over the commonly used energy technologies. Unlike
petroleum or coal, biomass resources are renewable.
Conversion of municipal and industrial wastes into useful
fuels amounts to killing two birds with one stone; the
energy supplies are increased and the environment is
cleaned up.
Many developing countries have a substantial reliance
up on wood fuel (fuel wood and charcoal) and to a lesser
extent, crop wastes as their source of energy. Table 6.1
shows the percentage degree of reliance on this
“traditional” fuel. Countries with the highest reliance on
traditional fuels or energy sources tend to be the poorest.
Indeed, in many ways, the extents to which traditional
fuels are used as an indicator of the stage or economic
development.
Table 7.1. Developing counties dependence on
traditional fuels (traditional fuels as a percentage of
Ecology

273
total primary energy (Sources: World Bank/ UNDP
energy assessment for developing country).
Country Percentage Country Percentage Nepal Malawi TanzaniaGuinea-BissauEthiopia Sudan Paraguay NigerUgandaKenya GambiaHaitiBangladesh Solomon IslandsLiberia
939291898983838071717070706664
Senegal YemenFijiIndonesiaSri LankaBotswanaSt VincentSt LuciaCosta RicaBoliviaMoroccoZambia ZimbabweTurkey
6058554945454439383535353024
.7.1 Bio-fuel as energy source (Case study):
The primary used of wood fuel is cooking. As wood
become scares, so cooking habits may change, some
times to the detriment of nutrition. Fuel scarcity also
inhabits the introduction of new nutrition foods such as
Soya beans, due to the extra cooking time required. The
cost of such dietary changes, and the foregone benefits
from the inability to introduce new foods, is obviously
Ecology
274
complex to estimate and no empirical work appears to be
available. But it is a positive cost, which must be debited
to resource mismanagement. Apart from collection time
and nutrition effects, fuel wood scarcity has a third
impact. As the wood becomes scarce, animal dung and
crop residue are used as energy source rather than
being applied to the soil as fertilizer and soil conditioners.
Study conducted in Ethiopia in 1984 estimates that up to
90% of cattle dung produced in Eritrea, and 60% in Tigrai
and Gondar, Ethiopia, is used as fuel. This estimate is
about 7.9 million tones of dung per year. In Ethiopia,
dung is sold to urban markets.
.8 Conservation of Natural Resources
Conservation in the broadest sense has always been
one of the most important applications of ecology.
Conservation broadly means sound land or water use
planning. It is concerned with the maintenance of natural
systems with their moderate, systematic, planned and
regulated utilization and exploitation for the long-term
benefit of mankind.
Ecology

275
Unmodified natural ecosystem as well as those
ecosystems that have been changed to differing extents
through human activity may be extents through human
activity may be expected to play an important role in the
future development of environmental biology. The
unmodified ecosystems constitute a kind of protected
area and characteristically contain a rich variety of
organisms, some of which can serve as reliable
indicators for disturbance in the system. As a
consequence of increasing tampering of nature by man,
natural reserves are greatly dwindling and are becoming
the main sanctuaries for wild plants and animals.
.8.1 The aim of conservation
1. To ensure the preservation of a quality
environment that considered esthetic and
recreational as well as product needs and
2. To ensure a continuous yield of useful plants,
animals, and materials by establishing a
balanced cycle of a harvest and renewal.
Ecology

276
In addition to conservation of natural resources, man is
also greatly concerned with as much preservation of
environmental quality as is reasonably possible. The last
two decades has shown and realized that man is capable
of inducing significant alterations in the environment
either internationally or inadvertently. Lose of life by
floods, droughts, cyclones, etc. can witness this.
Concerning mineral conservation, there is great potential
for extending our supplies of economic minerals and
reducing the effect of mining and processing through
recycling. For scare and or valuable metals, their waste
products are exploited as resource using recycling
methods. On the other hand, new materials can reduce
mineral consumption or new technologies developed to
replace traditional minerals and mineral uses, by
substitution.
Composting is one way of recycling materials. The
composting process has always occurred in nature. If
organic materials are subjected to aerobic microbacterial
decomposition, the end product remaining after is humus
material commonly known as compost.
Ecology

277
Figure 7.1. Composting process (adopted from solid
waste management text)
The other method of resource conservation is by
forestation, which is actually important for soil, wildlife
and plant conservation. In fact, wild life is often a reliable
indicator of the state of health of an environment.
The historical record of resource management in much of
Ethiopia, particularly in the areas of seed/plow
agriculture, has been rather dismal, characterzed by
exploitation, crises, and lack of a harmonious relationship
between man and the environment. Formulated in 1990,
the national conservation strategy tries to develop a
more integrated and participatory approach to natural
Ecology

278
resources issues. Integrated, participatory planning is
essential if Ethiopia’s renewable and nonrenewable
resources are to be ecologically sound agricultural
systems are to be developed to support the rapidly
growing population.
In general the conservation of natural habitats and the
protection of biological diversity is important for
sustainable development at levels ranging from the
global to the local.
.8.2 Conservation of natural resources in Ethiopia
Ethiopia is a country located in the East Africa. Total area
of the country is 1,127,127 square kilometers. The land
area of the country is about 1,119,683 square kilometers.
Of this land area wild life reserves, sanctuaries and
national parks accounts for about 22,829 square
kilometers. Geologically Ethiopia has active Great Rift
Valley and rugged mountains with broad savannah. With
its major wild life reserves the country provides a
microcosm of the entire sub-Saharan ecosystem. It
contains about 5765 species of flora of which 10-21%
Ecology

279
are endemic, 242 terrestrial mammal species of which
23 are endemic, 847 bird species of which 26 are
endemic and constituting the largest in Africa, 6 endemic
reptiles and 34 endemic amphibian species
.8.3 Conservation of species
The diverse flora and fauna usually foster a sustainable
environment. Plants provide food and oxygen for human
and other animals. Macro/Micro organisms decompose
organic waste and recycle materials. Living organisms
are also the source of chemicals, medicines and
industrial products. However, biological diversity is
declining worldwide. When the last member of a species
dies, it is forever (extinct). Although extinction is a natural
process, human activities have greatly accelerated the
rate of extinctions. Pollution of all types also changes
habitats.
Hence, many countries are developing and implementing
a detailed plan to conserve biological diversity. The 1973
Ecology
280
convention on trade in endangered species of wild flora
and fauna agreement that bans hunting, trapping and
selling of any threaten/endangered species is a positive
step towards protection of wild life. Nevertheless,
enforcement of this treaty is not stringent, illegal trade
still continuous in some countries.
.8.4 Causes for the threats to species
It results from a very complex set of factors. At the top list
is destruction of wild life homes and habitats. The two
major causes are natural and anthropogenic factors.
a. Natural factors
i. Demographic uncertainty
Uncertainty resulting from the effects of random selection
Ex. Extremely skewed sex ratio
ii. Environmental uncertainty Refers to unpredictable events like change
in weather or food supply, populations of
competitors and natural catastrophes.
iii. Soil erosion
Ecology

281
It is resulted by wind or water action. The
impact of such erosion is loss of top soil
(wind) and Terrain deformation (water).
Usually where soil is poorest, species will
be fewest
iv. Genetic uncertainty
It is random variation in the gene
frequencies of a population due to some
genetic variance and uncommon alleles are
likely to be lost due to Genetic drift,
Inbreeding.
b. Anthropogenic factors
i) Human population growth and
encroachment
In Ethiopia, population increased from 42 million to 60
million over the period 1985-1998 at a growth rate of
3.09%. This usually led to:
o Increased cultivation and clearing steppe
o Increased number of livestock
o Over grazing
Ecology

282
o Destruction of forests and woody vegetation for
construction of road and bridge; wood fire
(charcoal)
o Inadequate human settlements
o Stalinization of large area as the result of irrigation
Increasing the area under cultivation results in direct
impact on survival of species.
ii) Deforestation
The acting and falling of frees for
• Fuel wood
• To clear land for cultivation or fodder
• Upland areas susceptible to water erosion
following clearance
• Only 2.7% of Ethiopia is now forested (where 40%
once was)
Principal cases is wood collection for domestic use,
Extraction of timber, Fuel wood (dominant), Home craft
iii) Increasing number of livestock
Ethiopia is famous for its livestock in Africa The increase
in number of livestock demand to more areas for grazing,
Ecology

283
competition with wild animals for limiting grazing/water
and may lead to hybridization with wild one
c) Illegal hunting and wild life tradeIn Ethiopia, wild animals are hunted for four major
reasons:
a) For traditional medicine – wild ass
b) For fame, to be considered as a hero
c) For clothing
d) Civil war
Political instability allow better access to automatic
weapons, bullets and the use of area as- military camps
which usually led to migration of wild animals and
hunting of wild animals.
.8.5 Importance of saving species
Species has many values. It contributes the natural
“character” of land. Animals contribute to a sense of
completeness/wholeness of the land scope. Animals and
plant species are of aesthetic, ecological, educational,
recreational, scientific, economic, spiritual and strategic
values to the nation and its people. Therefore, human
have obligation to protect them.
Ecology

284
A few benefits that can be derived from wild specie are:
a.Medicinal.About 40% of all modern medicines are modeled on or
synthesized from natural Compounds derived from
species. 95% known plants species have yet to be
screened for their medicinal value. Endond” is a plant
species used for prevention of Bilharzias in Ethiopia and
wild ass is animal species used as traditional medicine
for many diseases in the country
b)Agricultural.Nowadays 80,000 edible plants exist in the world.
However, we depend on only 20 species that provide
90% world food supply. Rice, corn and wheat accounts
for the largest share (50%). Teff and Enset are some of
the plant species used as main food crop in Ethiopia
c)Commercial This include eco-tourism, coffee and fish
d)Ecological
This refers to the balance of nature by the action of
purifying air, cleaning water and supplying of food.
Ecology

285
Therefore, when species become endangered the health
of the ecosystem begins to unravel.
e)Aesthetic /Recreational
Having of great capacity for inspiring creative reactions
to their beauty. It forms the basis of our multi-thousand
dollar through job incentives and tourism industry. Hence,
they usually supply essential recreational, spiritual and
quality of life values.
.8.6 Examples of Endangered species in Ethiopia
a) Walia IbexIt is a wild goat found no where in the world. Currently
the Semen National park is adopted by UNESCO as
a World Heritage site because of this species. The
present population number is about 500. Reasons to
the threats include Italian aggression in Ethiopia and
their splendid horns desired by the local people for
drinking vessels and decorate their sitting rooms.
Ecology

286
Figure 7.3. Walia Ibex found in the rugged semen
mountain of north Ethiopia
b) Grevy’s ZebraIt has narrow, black and white strips on the body surface.
Zebra lives in scattered areas in Southern Ethiopia. The
current population is only few hundreds and still in
decreasing.
The primary reason for decline is mechanized hunting
and political instability. Its trade is prohibited by
international law.
Ecology

287
Figure 7.4. This shows the picture of Grevy’s Zebra
c) Ethiopian wolf
This is endemic to the high lands of Ethiopia. The
present population is about 500. The giant mole-rat
accounts for 95.8% of their diet. The major threats to wolf
survival are include loss of habitat, domestic dog, rabies,
human persecution and competition and hybridization
with dog.
Ecology
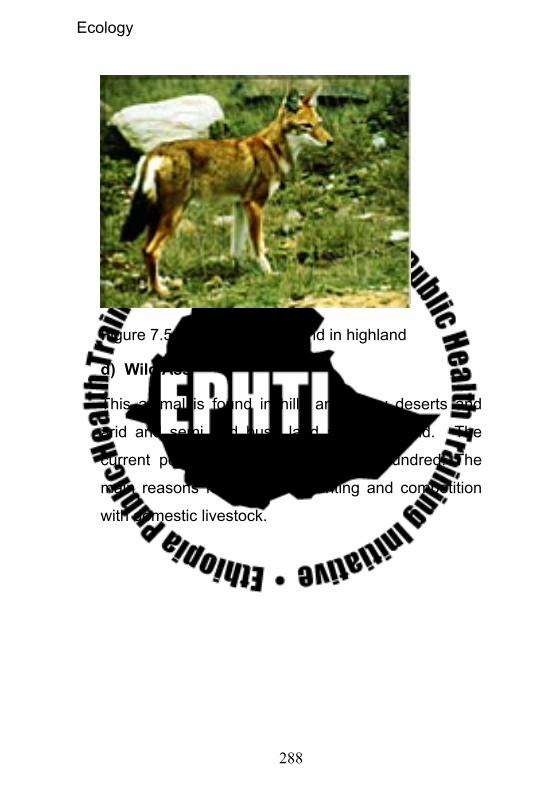
288
Figure 7.5. Ethiopian wolf found in highland
d) Wild Ass
This animal is found in hilly and stony deserts and
arid and semi arid bush land and grassland. The
current population is only about few hundred. The
main reasons for decline is hunting and competition
with domestic livestock.
Ecology

289
Figure 7.6. Ethiopian wild ass found in hilly and stony
deserts of the country
e) Prince Ruspoli’s TURACO
The bird got its name by Italian explorer, prince Ruspoli.
It is found in southern Ethiopia in areas covered with
Juniper forest
There are no breeding records, no nest records, no eggs
records but only report of feeding habit (fruits).
Ecology
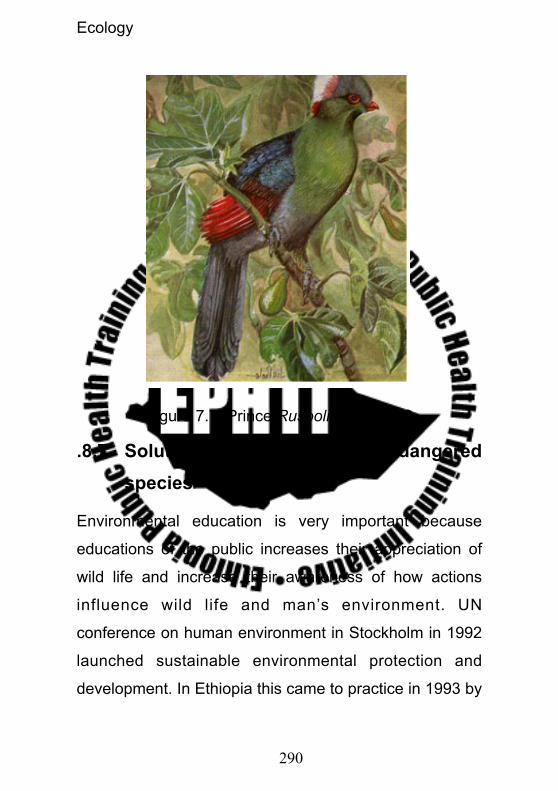
290
Figure 7.7. Prince Ruspoli’s TURACO
.8.7 Solution to the crisis of endangered species
Environmental education is very important because
educations of the public increases their appreciation of
wild life and increase their awareness of how actions
influence wild life and man’s environment. UN
conference on human environment in Stockholm in 1992
launched sustainable environmental protection and
development. In Ethiopia this came to practice in 1993 by
Ecology
291
financial and material support of SIDA. Environmental
education should constitute the entire society such as
schools, working place, Media, NGO and International
organization.
Government institutes have to be involved in setting up
of protected area and should be successful in
conservation terms. Loss of wild life from protected areas
is far less than from out side protected areas. Measures
like minimizing the human population inside the parks,
rehabilitation of the park and reestablishment of selected
species, creation of an alternative to a road which
currently goes through the park, scientific assessment of
wild life populations, stopping illegal trade of endangered
animal parts, combating deforestation, protection of wild
life areas and family planning to reduce population
growth are essential.
.8.8 Strategies
Already efforts have been realized in establishing
institute of Biodiversity of Ethiopia. In addition, captive
breeding to save endangered species and encouraging
interested parties to develop and maintain conservation
program which meet national and international standard.
Ecology

292
.9 Key note
Efforts have to be focused on habitat protection at
ecosystem level to recover species more effectively
Initiate conservation efforts before species decline to
the point where they need listing.
.10 Review questions:
1. Define the following terms
- Resources
- Exhaustible and non- exhaustible resource
(give examples for each)
Ecology

293
2. What are the current activities that understand in
our country regarding resources conservation?
3. what is the importance of recycling and reuse of
resources other than conservation of a specific
resources? Give example.
4. What are clean/environmentally friendly/ energy
sources
5. Discuss the impact of poor resource handling
practices in Ethiopia
6. What are the endangered species in Ethiopia and
design a conservation strategy to them
.11 Bibliography
1. Emmel, Thomas C., An Introduction to ecology
and population biology. 1st ed. 1973.
2. Cunningham, W.P. & Saigo, B.W. Environmental
Sciences: A Global Concern. 3rd ed. 1995.
Ecology

294
3. Kloos. H. & Zein, A. Z. The Ecology of Health And
Diseases in Ethiopia. 1993.
4. Kumar, H.D. Modern Concepts of Ecology . 8th
revised ed. 1997.
5. Nadakavukaren, A. Man and Environment: a
Health perspective. 3rd 1992.
6. Odumy , E.P. Fundamentals of Ecology 3rd ed.
19971.
7. Smith, R.L. Ecology and Field Biology.1966.
8. Solomon, P.E. et al. Biology. 4th ed. 1996.
9. Starr, C. & Taggart, R. Biology: The Unity and
Diversity of Life. 4th ed. 1978.
Ecology

295
CHAPTER EIGHTRADIATION ECOLOGY
.1 Learning Objectives
At the end of this chapter students are be able to:
• Understand the laws of thermodynamics
• Know different regions of electromagnetic spectra
• Know the use of different spectra
• Understand and explain the fates of radiation in
the atmosphere
• Explain global balance and composition of
radiation
.2 Laws of thermodynamics
Activities requiring energy in living things follow the basic
natural laws. These laws are called the laws of
thermodynamic.
The first law of thermodynamic states that living things
neither create nor destroy energy but they can transform
it from one form to the other. This implies that for life to
continue new supply of energy is required. Plants do this
by photosynthesis and animals by food ingestion.
Ecology

296
The second law second law of thermodynamics, or the
entropy law, states that every energy transformation
leads to reduction in the usable or available energy in the
system. This implies that there is no 100% transformation
into usable form but dissipates in the form of heat.
.3 The Electromagnetic Spectrum
The electromagnetic spectrum ranges from the shorter
wavelengths (including gamma and x-rays) to the longer
wavelengths (including microwaves and broadcast radio
waves). There are several regions of the electromagnetic
spectrum which are useful for remote sensing.
.4 Electromagnetic Radiation
As was noted in the previous section, the first
requirement for remote sensing is to have an energy
source to illuminate the target (unless the sensed energy
is being emitted by the target). This energy is in the form
of electromagnetic radiation. All electromagnetic radiation
has fundamental properties and behaves in predictable
Ecology

297
ways according to the basics of wave theory.
Electromagnetic radiation consists of an electrical field
(E) which varies in magnitude in a direction
perpendicular to the direction in which the radiation is
traveling, and a magnetic field (M) oriented at right
angles to the electrical field. Both these fields travel at
the speed of light (c).
Ecology

298
Figure 8.1. The illustration of electromagnetic radiation
Two characteristics of electromagnetic radiation are
particularly important for understanding remote sensing.
These are the wavelength and frequency.
Ecology
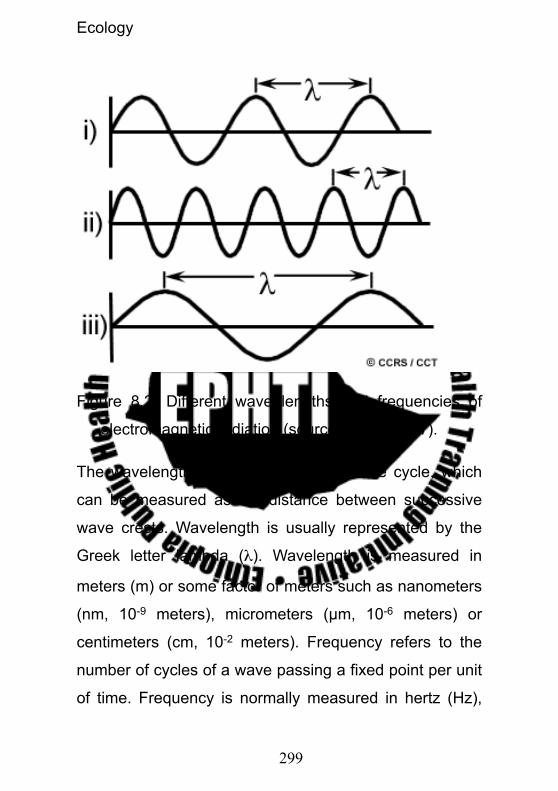
299
Figure 8.2. Different wave lengths and frequencies of
electromagnetic radiation (source: CCRS/CCT).
The wavelength is the length of one wave cycle, which
can be measured as the distance between successive
wave crests. Wavelength is usually represented by the
Greek letter lambda (λ). Wavelength is measured in
meters (m) or some factor of meters such as nanometers
(nm, 10-9 meters), micrometers (µm, 10-6 meters) or
centimeters (cm, 10-2 meters). Frequency refers to the
number of cycles of a wave passing a fixed point per unit
of time. Frequency is normally measured in hertz (Hz),
Ecology

300
equivalent to one cycle per second, and various multiples
of hertz.
Wavelength and frequency are related by the following
formula:
Therefore, the two are inversely related to each other.
The shorter the wavelength, the higher the frequency.
The longer the wavelength, the lower the frequency.
Understanding the characteristics of electromagnetic
radiation in terms of their wavelength and frequency is
crucial to understanding the information to be extracted
from remote sensing data. Next we will be examining the
way in which we categorize electromagnetic radiation for
just that purpose.
Ecology
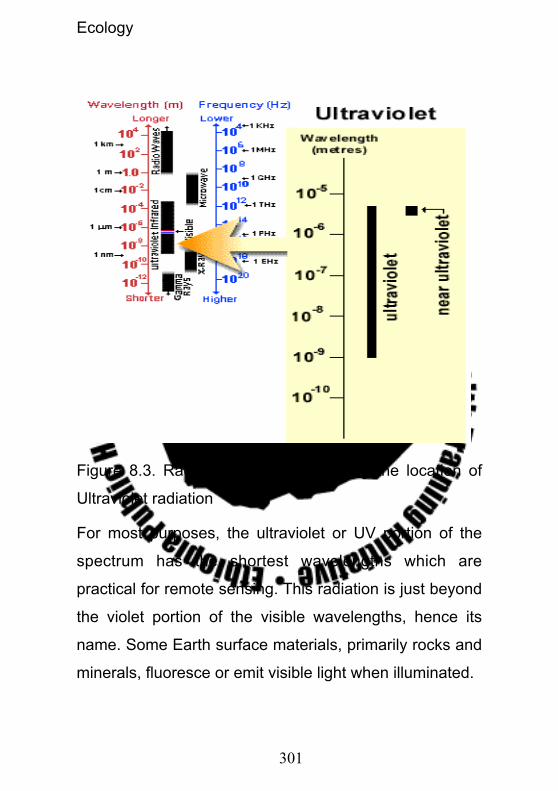
301
Figure 8.3. Radiation spectrum showing the location of
Ultraviolet radiation
For most purposes, the ultraviolet or UV portion of the
spectrum has the shortest wavelengths which are
practical for remote sensing. This radiation is just beyond
the violet portion of the visible wavelengths, hence its
name. Some Earth surface materials, primarily rocks and
minerals, fluoresce or emit visible light when illuminated.
Ecology

302
Figure 8.4. The visible light region in the light spectrum
The light which our eyes - our "remote sensors" - can
detect is part of the visible spectrum. It is important to
recognize how small the visible portion is relative to the
rest of the spectrum. There is a lot of radiation around us
which is "invisible" to our eyes, but can be detected by
other remote sensing instruments and used to our
advantage. The visible wavelengths cover a range from
approximately 0.4 to 0.7 µm. The longest visible
wavelength is red and the shortest is violet. Common
wavelengths of what we perceive as particular colors
from the visible portion of the spectrum are listed below.
Ecology

303
It is important to note that this is the only portion of the
spectrum we can associate with the concept of colors.
Violet: 0.4 - 0.446 µm
Blue: 0.446 - 0.500 µm
Green: 0.500 - 0.578 µm
Yellow: 0.578 - 0.592 µm
Orange: 0.592 - 0.620 µm
Red: 0.620 - 0.7 µm
Blue, green, and red are the primary colors or
wavelengths of the visible spectrum. They are defined as
such because no single primary color can be created
from the other two, but all other colors can be formed by
combining blue, green, and red in various proportions.
Although we see sunlight as a uniform or homogeneous
color, it is actually composed of various wavelengths of
radiation in primarily the ultraviolet, visible and infrared
portions of the spectrum. The visible portion of this
radiation can be shown in its component colors when
sunlight is passed through a prism, which bends the light
in differing amounts according to wavelength.
Ecology

304
The next portion of the spectrum of interest is the
infrared (IR) region which covers the wavelength range
from approximately 0.7 µm to 100 µm - more than 100
times as wide as the visible portion! The infrared region
can be divided into two categories based on their
radiation properties - the reflected IR, and the emitted or
thermal IR. Radiation in the reflected IR region is used
for remote sensing purposes in ways very similar to
radiation in the visible portion. The reflected IR covers
wavelengths from approximately 0.7 µm to 3.0 µm.
Ecology

305
Figure 8.5. The infrared region in the light spectrum
The thermal IR region is quite different than the visible
and reflected IR portions, as this energy is essentially the
radiation that is emitted from the Earth's surface in the
form of heat. The thermal IR covers wavelengths from
approximately 3.0 µm to 100 µm. The portion of the
spectrum of more recent interest to remote sensing is the
microwave region from about 1 mm to 1 m. This covers
the longest wavelengths used for remote sensing. The
Ecology

306
shorter wavelengths have properties similar to the
thermal infrared region while the longer wavelengths
approach the wavelengths used for radio broadcasts.
Figure 8.6. The microwave region in the light spectrum
.5 Energy sources and radiation Principles
Ecology

307
Visible light is only one of many forms of electromagnetic
energy. Radio waves, heat, ultraviolet rays, and X-rays
are other familiar forms. All this energy is inherently
similar and radiates in accordance with basic wave
theory, but mainly characterized by their wavelength, λ
(Remember: c= vλ).
.6 Energy interaction in the atmosphere
Energy that is coming from sun is passing through a long
distance. On the way the energy can be scattered,
absorbed, and/or reflected.
.6.1 Scattering
Atmospheric scattering is the unpredictable diffusion of
radiation byu particles in the atmosphere. There are
different types of scattering.
.6.1.1 Rayleigh scattering
Rayliegh scatter is common when radiation interacts with
atmospheric molecules and other tiny particles that are
much smaller in diameter than the wavelength of the
interacting radiation.
Ecology

308
The effect of Rayleigh scatter is inversely proportional to
the fourth power of wavelength.
It has much stronger tendency for short wavelengths to
be scattered by this mechanism than long wavelengths.
A blue sky is a manifestation of Rayleigh scattering. In
the absence of scattering the sky would appear black.
When the sunlight interacts with the earth’s atmosphere,
it scatters the shorter (blue) wavelengths more
dominantly than the other visible wavelengths. That is
why we see blue sky.
At sunrise and sunset the sun’s ray travel through a
longer atmospheric path length than during midday. With
the longer path, the scatter (and absorption) of short
wave lengths is so complete that we see only the less
scattered, longer wavelengths of orange or red.
In general Rayleigh scattering:
o Occurs when atmospheric particles have
diameters that are small relative to the
wavelength of radiation
Ecology

309
o Wavelength dependent – amount of
scattering changes greatly for different
regions of the spectrum
o Rayleigh scattering is in proportion to the
inverse of the fourth power of the
wavelength
o Most Rayleigh scattering occurs in upper
4.5 km of the atmosphere
o Reason for the sky being blue, and for
orange and red sunsets
Ecology

310
Figure 8.7. Intensity of Rayleigh scattering for visible
light regions
Rayleigh scattering is defined by the following equations:
Ecology

311
.6.1.2 Mie scatteringThis is a light scattering, which exists when atmospheric
particle diameters essentially equal to the wavelengths of
the energy.
o Caused by larger particles present in the
atmosphere (ex. dust, pollen, smoke, and water
droplets) with diameters roughly equivalent to
the wavelength of scattered radiation
o Occurs in the lower 4.5 km of the atmosphere
Ecology

312
o Amount of scatter is greater than Rayleigh
scatter and the wavelengths that are scattered
are longer
o Scattering is wavelength dependent
Figure 8.8. Scattering and wave length at different
particle size
.6.1.3 Non-selective scatterNon-Selective Scattering is:
o Caused by particles that are much larger than
the wavelength of scattered radiation
o Occurs in the lowest portions of the atmosphere
o All wavelengths of light are scattered - Not
wavelength dependent
o Observed as whitish or grayish haze
.6.2 Absorption
Ecology
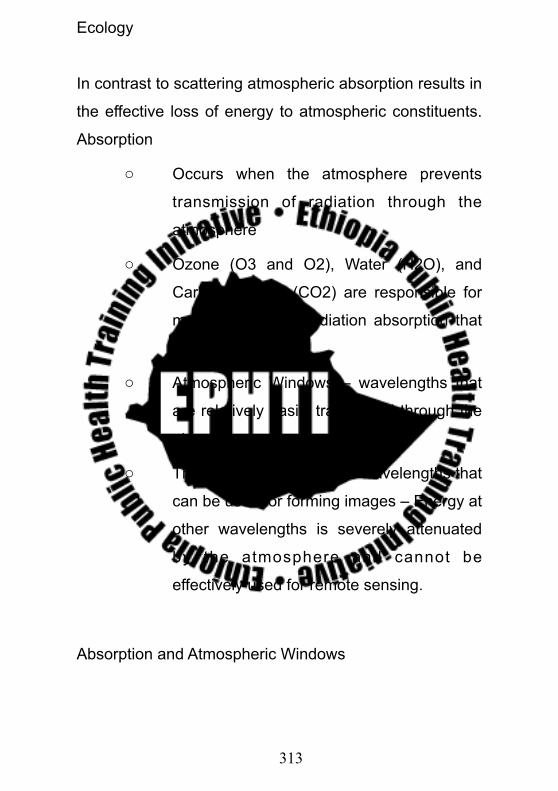
313
In contrast to scattering atmospheric absorption results in
the effective loss of energy to atmospheric constituents.
Absorption
o Occurs when the atmosphere prevents
transmission of radiation through the
atmosphere
o Ozone (O3 and O2), Water (H2O), and
Carbon Dioxide (CO2) are responsible for
most of the solar radiation absorption that
occurs
o Atmospheric Windows – wavelengths that
are relatively easily transmitted through the
atmosphere
o These windows define the wavelengths that
can be used for forming images – Energy at
other wavelengths is severely attenuated
by the atmosphere and cannot be
effectively used for remote sensing.
Absorption and Atmospheric Windows
Ecology

314
Figure 8.9. Diagram of atmospheric window
.6.3 Refraction
o Refers to the bending of light when it passes from
one medium to another (ex. lenses of cameras,
magnifying glasses)
o Occurs because the media are of differing
densities and the speed of electromagnetic
radiation varies through each
.7 Global Energy Balance
Ecology

315
The totality of the global energy balance is zero. Figure
4.9 clearly demonstrates the light energy balance and
different fates of light in the globe.
.8 The radiation environment
The biosphere receives solar radiation at wavelengths
ranging from 290 nm to about 3000 nm. Radiation at
shorter wavelengths is absorbed in the upper
atmosphere by ozone and oxygen in the air; the longer-
wavelength limit is determined by the water-vapor and
carbon-dioxide content of the atmosphere.
An average of 45% of the incoming solar energy falls
within the spectral range, 400 - 700nm, which is
photosynthetically active radiation (PhAR).
The lower end is the ultraviolet radiation (UV-A 315- 380
nm and UV-B 280 - 315).
The upper end is IR having wavelength of 750 - 4000
nm. Plants also receive thermo-radiation, which is a long
wave IR (4000 - 105nm) and themselves emit this
radiation.
Ecology

316
Figure 8.10. The global energy balance
At the outer limits of the earth's atmosphere the intensity
of radiation is 1360 W/m2 (the solar constant). Of this,
only an average of 47% reaches the earth's surface.
More than half is lost, being cast back into space as a
result of refraction and diffraction in the high atmosphere,
or scattered or absorbed by particles suspended in the
air. The totality of incoming radiation reaching a
Ecology

317
horizontal surface is called the global radiation; it is
composed both of the direct solar radiation and the
diffuse sky light. At see level, the global radiation attains
maximal values of about 1kW/m2 and intensities in the
PhAR range of 400 W/m2 (equivalent of photosynthetic
photon flux density, PPFD, of approximately 1800µmole
photons m-2S-1).
In water, radiation is more strongly attenuated than in the
atmosphere. Long wave thermoradiation is absorbed in
the above few millimeters; IR is the uppermost
centimeters, whereas UV penetrates to a meter. Visible
radiation reaches greater depths, where blue - green
twilight prevails.
The intensity of radiation in bodies of water depends on
the
o magnitude and nature of illumination above
their surface
o on the amount of reflection and back scattering
of light at or near the surface, and
Ecology

318
o on attenuation as the rays pass through the
water.
With increasing depth, the radiation intensity decreases
exponentially, since it is scattered and absorbed by the
water itself as well as by dissolved materials, suspended
particles of soil and detritus, and plankton. The layer of
water above the level at which lack of light prevents the
existence of autotrophic plants is called euphotic zone.
.9 Composition of Solar RadiationThe incoming sun radiation has the following
components
• 7 % Ultraviolet and shorter
• X-rays, gamma rays, etc.; these are
higher energy waves
• 44 % Visible light - what we can see with our
eyes - we can see from approximately 0.4 to
0.7µm
• 32 % Near infrared
• 11 % Far infrared
• About 1 % longer wavelengths - microwaves,
radio waves, etc.
Ecology

319
.10 Review questions
1. What is the source of electromagnetic radiation to
our ecosystem?
2. Discuss laws of thermodynamics in terms of
ecosystem sustainability.
3. Describe fates of sun light in different parts of
biosphere.
Ecology

320
.11 Bibliography
1. Leveque C. 2003. Ecology: From ecosystem to
b iosphere. Science publ ishers, Inc. New
Hampshire, USA.
2. Lillesand M.T. and Kiefer R.W. 2000. Remote
sensing and image interpretation. 4th Edition. John
Wiley & Sons, Inc. USA.
3. Natural Resource Canada. 2006. Introduction:
in teract ions wi th the atmosphere. ht tp: / /
c c r s . n r c a n . g c . c a / r e s o u r c e / t u t o r / f u n d a m /
chapter1/04_e.php
Ecology

321
CHAPTER NINEECOLOGICAL INFORMATICS
9.1 Learning Objectives
At the end of this chapter students are be able to:
o Define Ecological informatics
o Understand the importance of application of
informatics to ecology
o Understand the aim of ecological informatics
o Know the distinct feature of ecological informatics
9.2 Informatics
The word information derives from the Latin informare (in
+ formare), meaning to give form, shape, or character to.
It is therefore to be the formative principle of, or to imbue
with some specific character or quality.
The twentieth century has given us not only the theory of
relativity and quantum mechanics, television and motion
pictures, DNA and the genetic revolution, space
technology, and rock and roll, but also something we call
information. The twenty first century promises to be very
different due to information technology.
Ecology

322
o “Information is that which reduces uncertainty”.
(Claude Shannon)
o “Information is that which changes us”. (Gregory
Bateson)
o “Information is a semantic chameleon”. (Rene
Thom)
Information mostly deals with representation which is
different forms of models. And the central structure of
information is relation among signs, objects or things for
the sec of understanding. The relations are now
automated by computers to simplify things, save time
and get better understanding. So informatics is the use of
information by automation.
9.3 Origin of informatics
In 1962 in France, a group started a software company
called Societe pour L’Informatique et Applique (SIA).
Philippe Dreyfus, a French information system/software
pioneer, was a principal founder. Dreyfus coined the
word as a combination of “information” and “automatic.”
The word “informatique” took on the meaning,
generically, of “electronic information processing." It was
Ecology

323
accepted (1966) as an official French word by
L’Academie Francaise, something not easy to do. The
word “informatique” has now been adopted and adapted
in Europe to mean roughly “computer science.”
Also in 1962 in the U.S., Walter F. Bauer founded a
company named Informatics. Later the Association for
Computing Machinery officially applied for permission to
use the name. They wished to change ACM to Society
for Informatics. But they were turned down on the advice
of Bauer’s lawyers.
The word “informatics” has been widely used in
application contexts: medical informatics, nursing
informatics, legal informatics, chemical informatics, etc.,
and of course the currently hot bioinformatics.
The historical applications and utilizations of informatics
is as follows.
o Popularized by Soviets (Informatika)o Considered a branch of social sciences
o Other countries (including France)o Considered it to be applied computer science
o In the U.S.
Ecology

324
o Continued to use the term “computer
science”
9.4 Definition of Ecological Informatics
Ecological Informatics is defined as interdisciplinary
framework promoting the use of advanced computational
technology for the elucidation of principles of information
processing at and between all levels of complexity of
ecosystems - from genes to ecological networks -, and
aiding transparent decision-making in relation to
important issues in ecology such as sustainability,
biodiversity and global warming.
9.5 Importance of ecological informatics
Ecological concerns are critical in keeping our world
livable and sustainable. Through the period of rapid
industrial development in the 20th century, disturbance of
ecosystems has been greatly manifested in rapidly
developing countries, especially in Asia. However,
understanding ecological systems is a difficult task since
Ecology

325
ecological data, which consist of numerous variables in
the relationships of organisms and environment, embed
complexi ty and nonl inear i ty into the system.
Conventional multivariate methods are limited in the
sense that they are mainly applicable to linear data and
have less flexibility in representing ecological data; for
instance, data handling (e.g., noise and missing
samples), predicting dynamic nature, etc. This type of
information study applied to ecological systems has been
neglected or illconsidered in dealing with ecosystem
management up to the end of the last century, while
hardware for ecological engineering has drawn much
attention from the specialists involved in ecosystem
management (such as in the fields of restoration
techniques and water treatment). Recently, numerous
computational and statistical approaches have been
developed, leading to the appearance of ecological
informatics. Ecological informatics is defined as an
interdisciplinary framework promoting the use of
advanced computational technology for elucidating the
principles of information processing at and between all
levels of ecosystems (http://www.waite.adelaide.edu.au/
ISEI/). While bioinformatics reveals inherent information
Ecology

326
residing in cells and individuals (e.g., genetic
information), ecological informatics aims to address
information in various levels in ecological systems in a
transcending manner from genes to ecological networks.
Considering that bioinformatics has been expanding
rapidly, ecological informatics would correspondingly
grow fast regarding importance of environmental and
ecological issues on the global basis in the near future.
Ecological informatics helps and simplifies the following
tasks
o Habitat modeling and prediction of
organisms in an ecosystem
o Assessing the feasibility of conservation of
a given ecosystem
o Modeling the ecological threats to single or
groups of organisms
o Simplify obtaining valuable information from
bulky dataset
o Produce models that can be easily
understood by non-professionals and
Ecology

327
o Produce relationships between different
ecosystem set t ings and the l iv ing
organisms
o Others
9.6 Aim of ecological informatics
The aim of ecological informatics is to develop and
implement efficient and effective methods, tools, and
technologies in order to discover, access, interpret,
integrate and analyze complex ecological data from a
highly-distributed set of field stations, laboratories,
research sites, and individual researchers. Essentially,
ecological informatics is an interdisciplinary framework
that aims to improve the way we manage access, use,
interpret, visualize, and communicate the diversity of
ecological data in a manner useful to citizens,
researchers, students/educators, resource managers,
and policy makers.
Applications of ecological informatics include carbon
management, ecological sustainability, conservation
planning, ecological forecasting, and global climate
change, as well as computational approaches to
ecological scales and complexity, ecosystems analysis,
Ecology

328
synthesis, simulation and forecasting, ecological pattern
analysis, species prediction and management of
ecological data.
Ecological informatics brings together diverse disciplines
and toolsets, such as geographic information systems
(GIS), statistics, modeling, information technology, and
computational programming, with a more comprehensive
goal of making ecological data more useful to society.
9.7 Distinct Features of Ecological Informatics
Distinct features of ecological informatics are: data
integration across ecosystem categories and levels of
complexity, inference from data pattern to ecological
processes, and adaptive simulation and prediction of
ecosystems. Biological ly- inspired computat ion
techniques such as fuzzy logic, cellular automata,
artificial neural networks, evolutionary algorithms and
adaptive agents are considered as core concepts of
ecological informatics.
Ecology

329
9.8 Scope of Ecological Informatics
Figure 10.1 represents the current scope of ecological
informatics indicat ing that ecological data is
consecutively refined to ecological information,
ecosystem theory and ecosystem decision support by
two basic computational operations: data archival,
retrieval and visualization, and ecosystem analysis,
synthesis and forecasting.
Figure 9.1. Scope of Ecological InformaticsComputational technologies currently considered being
crucial for data archival, retrieval and visualization are:
Ecology

330
- High performance computing to provide high-speed
data access and processing, and large internal
storage (RAM);
- Object-oriented data representation to facilitate data
standardization and data integration by the
embodiment of metadata and data operations into
data structures;
- Internet to facilitate sharing of dynamic, multi-
authored data sets, and parallel posting and
retrieval of data;
- Remote sensing and GIS to facilitate spatial data
visualization and acquisition;
- Animation to facilitate pictorial visualization and
simulation. Following computational technologies
are currently considered to be crucial for
ecosystems analysis, synthesis and forecasting:
- High performance computing to provide high-speed
data access and processing and large internal
storage (RAM), and to facilitate high speed
simulations;
Ecology
331
- Internet and www to facilitate interactive and online
simulation as well as software and model sharing;
- Cellular automata to facilitate spatio-temporal and
individual-based simulation;
- Fuzzy logic to represent and process uncertain
data;
- Artificial neural networks to facilitate multivariate
nonlinear regression, ordination and clustering,
multivariate time series analysis, image analysis at
micro to macro scale;
- Genetic and evolutionary algorithms for the
discovery and evolving of multivariate nonlinear
rules, functions, differential equations and artificial
neural networks;
- Hybrid and AI models by the embodiment of
evolutionary algorithms in process-based differential
equations, the embodiment of fuzzy logic in artificial
neural networks or knowledge processing;
- Adaptive agents to facilitate adaptive simulation and
prediction of ecosystem composition and evolution.
Ecology

332
9.9 Ecological informatics links
o National Center for Ecological Analysis and
Synthesis (NCEAS) (http://www.nceas.ucsb.edu/
fmt/doc?/frames.html)
o NSF Knowledge and Distributed Intelligence
(KDI) - Eco log ica l In format ics (h t tp : / /
www.nsf.gov/cise/kdi/ideas/kn_biocomp.html)
o NSF National Ecological Observatory Network
( N E O N ) ( h t t p : / / w w w. n s f . g o v / f u n d i n g /
pgm_summ.jsp?pims_id=13440&org=DBI)
o Science Environment for Ecological Knowledge
(SEEK) (http://seek.ecoinformatics.org/)
o USGS Nat iona l B io log ica l In format ion
Infrastructure (NBII) (http://www.nbii.gov/portal/
server.pt)
o Cyberinfrastructure Partnership (http://www.ci-
partnership.org/index.html)
Ecology

333
9.10 Review questions
1. What is ecological informatics and describe its
importance?
2. How can you apply ecological informatics for
ecosystem conservation
3. Exercise ecological informatics using EXL.
Ecology

334
9.11 Bibliography
1. Olden J. D., Poff N. L. & Bledsoe B. P. (2006).
Incorporat ing ecological knowledge into
ecoinformatics: An example of modeling
hierarchically structured aquatic communities with
neural networks. Ecological informatics, 1, 33-42.
2. http://informatics.indiana.edu/rocha/i101
3. Von Baeyer, H.C. [2004]. Information: The New
Language of Science. Harvard University Press.
Ecology

335
CHAPTER TENENVIRONMENTAL IMPACT
ASSESSMENT
.1 Learning objectives
After the completion of this chapter the students will be
able to:
• Define environmental compact assessment
• Describe the general procedures of an EIA
• List the different approaches to screening
• Explain the basic steps to be followed for scoping
• Define stakeholder and public involvement in EIA
• Describe the benefits of stakeholder involvement
in EIA
• Define impact identification, impact prediction and
impact evaluation
• Describe the role of monitoring in EIA process
• Describe the aims and objectives of preparation of
EIS report
.2 Definition of terms
Ecology

336
• Environmental impact assessment is:
o a planning tool that is now generally regarded
as an integral component of sound decision
making.
o defined as a formal process used to predict the
env i ronmenta l consequences o f any
development project.
o a planning tool whose main purpose is: "to give
the environment its due place in the decision
making process by clearly evaluating the
environmental consequences of a proposed
activity before action is taken.
o a tool used to identify the environmental, social
and economic impacts of a project prior to
decision-making.
• Proponent is the person or group of persons who
wishes to establish or carry out a proposed
development activity, which is known to have
impacts on the environment.
Ecology

337
• Decision maker is the person or agency whose
decision on the proposed activity is requested by
the proponent.
• Review Commission consists of independent
experts who are able to review the Environmental
statement from a scientific/technical point of view
• Interest groups are groups that represent the
general public or non-governmental organization
who may have interest in the environment.
• Consultancy Company may be employed by either
the proponent or the competent authority.
• Environmental mitigation is measures to be taken
during implementation and operation of project to
eliminate or offset adverse environmental impacts,
or to reduce them to acceptable levels and the
action needed to implement these measures.
• Environmental Impact statement – it is the written
report of the environmental impact assessment.
• Monitoring is a general term referring the
systematic collection of data through a series of
repetitive measurements over a long period to
Ecology

338
provide information on characteristics and
functioning of environmental and social variable in
space and time.
.3 Introduction
Cost – Benefit Analysis (CBA) was the first method
applied for project evaluation. The method was
developed as a means to express all impacts in terms of
resource costs, valued in monetary terms. However the
assessment was mostly very rough and based entirely
on technical feasibility studies. The failure of a number of
major development projects, which were assessed using
CBA, resulted in considerable public dispute on the
method. The shortcomings of the technique became
more and more apparent. Consequently, efforts to
develop a new evaluation approach known as
Environmental Impact Assessment.
When EIA was first introduced, it was regarded as an
additional component of CBA, designed to incorporate all
the potential impacts that had proved to be troublesome
in CBA. Initially the technique was mainly used to
structure the collection of information, whereas the policy
setting in which the development project was proposed
Ecology

339
received relatively little attention. Gradually the technique
evolved to a comprehensive evaluation approach, in
which environmental considerations, as well as financial
and technical aspects are given their proper weight in the
decision making process.
The purpose of environmental impact assessment is to
determine and present the environmental impacts of a
proposed project, plan or policy in such a way that a
rational decision can be made about its implementation.
Furthermore, the EIA contributes to the reduction or
mitigation of adverse impacts by generating a number of
project alternatives. Project alternatives may comprise
alternative sites, alternative processes or alternative
implementation schedules. When executed in an early
phase of the planning process, EIA may contribute to an
optimization of the project design, from both an economic
and environmental point of view. For this reason, EIA is
sometimes referred to as Early Identification of
Alternatives. When applied in this way, EIA may also
contribute to the sustainability of the resource use and
environmental soundness of the executed projects.
Ecology

340
The results of the assessment have to be presented in a
proper and understandable way in a document called the
Environmental Impact Statement (EIS). This document
gives an overview of the beneficial and adverse impacts
of the proposed project and the presented project
alternatives.
An important aspect of the EIA process is the
communication between different groups. Although
different countries may have different procedures,
reflecting the various political and legal systems, the
various participants usually involved most environmental
impact assessment systems are proponent, decision
maker, review commission, interest groups and
Consultancy Company.
.4 Challenges of EIA practice in developing countries:
Environmental impact assessment in developing
countries is imposed by the financing international
organizations like World Bank and International Money
Fund. But in most cases enforcing EIA in developing
countries is difficult because:
• Absence of concrete environmental policy
Ecology

341
• Absence of technical expertise
• Absence of transparent policy
• Low public participation
In this case donor organizations (EU, WB, and OECD/
DAC) have developed their own gridline for developing
countries
.5 Procedure of an Environmental Impact Assessment
The environmental impact assessment process can
be subdivided into three main stages:
The pre- study phase
The actual impact assessment, which result in the
EIS
The post – study period, in which the information is
used to come to a decision and in which the impacts
of the project are monitored.
The impact assessment starts with the collection and
analysis of basic data on the project (including possible
project alternatives) and on the environment as far as it
is likely to be affected. The collection and analysis of the
Ecology

342
environmental data serves to provide a description of the
so-called base line conditions. In defining the baseline
conditions also the environmental effects of autonomous
developments (trends), are taken into account.
Potential impacts are identified based on the information
on baseline conditions and sources of impact. This
identification involves an estimate of the order of
magnitude of the impacts. Usually not all potential
impacts are studied in detail. For the selection of the
impacts to be studied in detail, criteria are used such as:
o Magnitude (the quantum of change)
o Extent (the affected area)
o Significance (with respect to effects)
The process of selecting relevant alternatives and
identification of the important impacts is commonly
known as scoping. The scope of the EIA, which also
includes agreement on the contents and requirements of
the EIS, is usually determined in a number of meetings
between the proponent and the decision-making
authority.
Ecology

343
Scoping is a very important part of the environmental
impact assessment procedure because it steers the
communication between the user of assessment (the
decision maker) and the proponent. The decision maker
can make sure that the right topics are addressed in the
impact assessment and that the results are presented in
such a way that they are useful in the final decision
making process, Furthermore scoping enables all
interested parties to express their concerns, As a result,
all alternatives and impacts relevant for any of the
interested parties will be take into consideration, which
increases the comprehensiveness of the assessment.
The scoping concludes the pre- study phase, which
includes the preparation of the Environmental Impact
Statement. In this phase an assessment is made of the
selected alternatives and impacts. Furthermore
measures to mitigate undesired, adverse impacts are
proposed. In draft ing the E.I.S. the fol lowing
considerations have to be taken into account:
o The information must be clearly presented:
o The information has to be presented for the
different phases of the activity
Ecology

344
o Uncertainties in the prediction of impacts have to
be made explicit;
o The information has to be structured in such a
way that the significant impacts of each alternative
are highlighted
o The EIS must have a summery, which is
understandable for non experts
In some countries, the pre- study phase is called the
initial Environmental Examination (IEE). The outcome of
the IEE is sometimes used to determine whether or not
the impacts of the proposed project are such that a full
scale EIA has to be performed.
In the post-study period the EIS is reviewed, the actual
decision is made and the impacts are monitored. The
major purpose of a review of the contents of an EIS by
an independent commission is that the decision maker
has the guarantee that the decision he makes is based
on correct information. The decision-making procedure
itself varies very much from one country to another and
is closely related to legal and political cultures and
systems.
Ecology

345
If a positive decision is made, the proposed project will
be executed and certain impacts on the environment will
occur. It is important to evaluate the impacts as they
actually occur. In this way unexpected or not predicted
effects may be detected and the prediction techniques
can be checked and improved. A monitoring system
should be set-up to discover unexpected and
unpredicted impacts.
The general outline of an environmental impact
assessment (EIA) consists mainly of the following
components:
A description of the proposed project and its
objectives. Both (component) activities and
sources of impact are described and analyzed, for
the construction phase as well as the operational
phase of the project.
A description in ecological and economical terms
of the existing situation in the area directly
affected by the project and of the natural resource
use, the description of the existing environment
should focus on those elements, which have to be
Ecology

346
known for the description of the environmental
impacts.
A description of the autonomous developments in
the area, in as far these developments may be of
importance for the contents and the conclusions of
the environmental impact study.
Identification of the potential impacts and
definition of the scope of the assessment,
including agreement on geographical boundaries,
selection of methods for environmental impact
study.
Identification of the potential impacts and
definition of the scope of the assessment,
including agreement on geographical boundaries,
selection of methods for evaluation and
presentation.
A description of the relevant project alternatives.
This may include alternative solutions for the
problem, but also alternative methods for
achieving the project objectives.
Design of the study program. This includes
selection of impacts to be studied, selection of the
Ecology

347
prediction methods that will be applied and
agreement on the depth of the study.
prediction of the impacts, Not only impacts as a
direct result of the project are considered, but also
the impacts resulting from developments which
are induced by the project, the irreversible and
irretrievable use of the natural resources is usually
estimated as well.
If adverse impacts are identified, possible
measures have to be fo rmu la ted . The
effectiveness of such measures to reduce
negative impacts should be described as well as
their feasibility and the costs and benefits
involved.
Assessment of the impacts, which includes a
comparison of the various project alternatives and
the mitigating measures, with the situation without
the project.
.6 Benefits of applying Environmental Impact Assessment to proposals:
Ecology

348
• Lower project costs in the long-term (fewer
changes at an advanced stage, lower probability
of environmental disasters and expensive clean-
ups).
• Avoidance or remedial measures are planned and
implemented in time to minimise adverse impacts.
• Better protection of the environment and
minimised social impacts through the consultative
and information gathering processes.
• Good public relations fostered through enhanced
public confidence
.7 Risks of not applying Environmental Impact Assessment properly to proposals:
• Costly mitigation and expensive clean-ups.
• Worsening environmental conditions leading to
deterioration in the natural resource base of the
economy.
• Loss of public confidence and consumer reaction
against business and industry.
Ecology

349
• Increased insurance premiums.
.8 PRELIMINARY ASSESSMENT IN EIA
.8.1 EGISTRATION
Registration is simply the formal or official notation of a
project proponent or developer’s intention to develop and
implement a project. As such be the first stage in any
project planning process, which is regulated by a
planning authority or government agency. This may be a
central planning authority, which is then responsible for
ensuring all relevant regulatory agencies. Alternatively
the project proponent may be required to register the
projects with several planning agencies including that for
environmental assessment.
.8.2 SCREENING
The objectives of screening helps to focus resources on
those projects most likely to have significant impacts,
those where the impacts are uncertain and those where
environmental management input is likely to be required.
Experience has shown that it is generally advisable to
screen a l l proposed development proposals .
Ecology

350
Requirements for screening are normally addressed in
EIA legislation and or official guidelines, and are usually
done by an EIA Authority.
Different approaches to screening have been adopted by
different agencies and governments in the world.
Screening criteria can be derived from one or a
combination of the following methods:
o Checklists: are lists of project types that must be
subjected to different levels of environmental
assessment. Checklists tend to be the most widely
used and effective screening methods. Countries
and organizations that use such check list type
approaches, include:
The World Bank; The European Union, The European development Bank and The African development Bank
o Sensitive area Criteria: focus on areas that are
environmentally sensitive e.g. Wetlands, protected
areas, game places, parks, or area of particular
cultural sensitivity.
Ecology

351
o Preliminary Assessments: are undertaken when
more information is required to determine a
screening decision (NB this is usually undertaken
at the scooping stage). Preliminary assessments
are low-cost environmental evaluations, which
make use of information that is already available.
o Exclusion Lists: according to these all proposals
are subject to EIA unless it can be shown that
should not be. Usually a number of small
insignificant project are given exemption form EIA
based on project type or size. This approach is
used by the United States of America and
elsewhere.
After the screening of a project the decision will fall into
one of the following four categories:
Full EIA required
Preliminary assessment required
EIA not required
Project proposal rejected
.8.3 PROJECT ALTERNATIVES
Ecology

352
In development and preparing a project it is the part of
the normal planning process to consider different
alternatives or options, which will achieve the project’s
objectives. It is also important to include a consideration
of what would happen without the project. It is only if we
have this information that we can determine what the
impacts of our project will be. This extends to the
environmental assessment of project alternatives. the
impacts of different alternatives are unlikely to have the
same set, or degree, of impacts.
Different project alternatives have varying characteristics,
but they can usually be placed into one, or a
combination, of the six categories listed below:
o Demand alternatives (e.g. using energy more
efficiently rather that building more generating
capacity.)
o Activity alternatives (e.g. Providing public transport
rather that increasing road capacity);
o Location alternatives; either for the entire proposal
or for components (e.g. the location of a processing
plant for a mine, or the location of tourist lodges
within different zones of a national park);
Ecology

353
o Process alternatives (e.g. the re-use of process
water in an industrial plant, waste- minimizing or
energy efficient technology, different mining
methods);
o Scheduling alternatives (where a number of
measures might play a part in an overall program, but
the order they are scheduled will contribute to the
effectives of the end result); and
o Input alternatives (e.g. raw materials, energy
sources – such as replacing diesel oil with low
sulphur fuel oil).
Frequently the consideration of alternatives is rarely
given enough attention in the environmental impact
assessment and planning process. This can often result
in mistakes being made, and opportunities for better
project designs being missed.
However, the US Council on Environmental Quality
(CEQ, 1978) highlights the importance of the
assessment of alternatives by noting that this represents
the ‘heart of the environmental impact statement’. The
regulations indicate that information of the environmental
impacts of a proposed action and its alternatives, should
Ecology

354
be represented in comparative from thus sharply defining
the issues and providing a clear basis for choice among
options by the decision maker and the public.
.8.4 SCOPING
After screening and when a decision has made for the
further environmental assessment of a project the next
stage is to determine the scope of the EIA study. This is
termed scooping which is an early and open process that
ensures relevant and focused EIA by defining:
o The main problems and issues surrounding
the project;
o The likely positive and negative impacts of
the project;
o The spatial, temporal and institutional
boundaries of the project and its impacts, d;
o The likely data requirements for undertaking
a full EIA.
Responsibility for scooping lies with the proponent, the
EIA authority or with the practitioners. In most cases the
onus is placed on the project proponent and developer,
rather than on the EIA authority which is often
Ecology

355
responsible for regulating or checking the process,
Proponents will normally only undertake scoping
themselves if they have a high level of environmental
expertise, otherwise they will commission a consultant to
do this as part of the EIA study. In most cases there will
be some reliance on previous experience, represented in
part by existing scoping documentation for a similar
proposal, sectoral guidelines and checklists. However, of
greater importance is the inspection of the site.
Scoping is usually undertaken towards the beginning of
the EIA process and is used to define the terms of
reference for the “full” EIA process in case of government
projects. Ideally, however scoping should be an ongoing
process, which should be flexible enough to continue to
address new alternatives and issues through the EIA
process. For large projects, initial scoping will coincide
with outline planning or pre-feasibility studies. For small
projects, scoping takes place as parts of the registration
and initial screening exercises.
The basic steps to be followed for scooping are:
a) Develop a communication plan
Ecology

356
b) Assemble information that will be the starting point
of discussion.
c) Make the information available to those whose
views are to be obtained.
d) Find out what issues people are concerned about.
e) Look at issues from a technical or scientific
perspective in preparation for further study.
f) Organize information according to issues including
grouping, combining and setting priorities
g) Develop a strategy for addressing and resolving
each issue
The end result of scoping may either be a formal
document such as terms of reference or an informal
document such as the proponents scooping report. The
report should contain sectors on the following.
• How scoping was undertaken;
• Identification of key issues and problems;
• Synthesis of scooping exercises-details on
potential negative and positive impacts of project.
Ecology

357
• Identification of all stakeholder groups with an
interest in the project and how these groups were
involved in scoping stage;
• Details on the spatial and temporal boundaries of
the project;
• Identification of project alternatives and
• Details on the spatial and temporal boundaries of
the project;
• Identification of project alternatives; and,
• Terms of reference for undertaking the main (full)
EIA study.
The result of scoping must be presented in a clear and
logical way so that the significance of potential impacts
can be understood clearly. The means of presentation
should also provide opportunities for feedback and
dialogue. It is also important that alternative or
supplementary techniques to “written” communication
are considered. Techniques such as video, role play,
village meetings and discussion groups may be
especially appropriate as these can make information
Ecology

358
more accessible to local people; particularly in rural
areas were literacy rates are low.
It is important that terms of reference (ToR) prepared
from a scoping exercise are systematic clear and tailored
to the specific context of each project. There is no single,
standard format for ToR. Importantly, TOR for an EIA
study must be finalized before proponent solicits
proposals to carry out the work. Once the ToR has been
prepared, they may need to submit to the relevant
environmental authority for approval. This is usually
undertaken by the proponent in collaboration with the
team responsible for the initial scoping.
The basic contents for a ToR for an EIA study are:
• An introduction: This should introduce the proponent, the project proposal, and the purpose and objectives of the study.
• Project related information: The project proposal and project alternatives should be describes here, and in sufficient detail to guide the development of a study proposal. Relevant (existing) background studies can be summarized to provide an indication of the kinds of information available to the study.
Ecology
359
• Specific EIA requirements: Environmental issues likely to be particular relevance to the project should be outlined here. These are normally identified by the scoping study. The need for the EIA to address measures for avoiding, mitigating and managing impacts must be clearly stated.
• Field Versus deskwork: Expectations regarding the level of fieldwork, such as ground truthing and updat ing ex is t ing in format ion sources, or requirements for new survey etc. should be indicated.
• Working relationship: The nature of the relationship between the EIA team, the proponent, the government and the public, must be discussed. If the EIA is to be effective in influencing project planning the TOR must specify that the EIA team work in close collaboration with other project design components, such as engineering and economic appraisal. Importantly, the TOR should indicate the range of stakeholder groups who should be involved in the EIA process (these should be identified during the scooping phase)
• Time: The duration and schedule for undertaking and reporting on the EIA process should be specified.
Ecology
360
• Reporting requirements: TOR should specify the format and main headings for the EIA study report.
.9 Project cycle and EIA
The project cycle includes the following steps.
a) Project concept
b) Pre-feasibility
c) Feasibility
d) Design and Engineering
e) Project implementation
f) Monitoring and Evaluation
Ecology

361
The United Nations Environment Program (UNEP) has
integrated the project cycle with EIA as follows (UNEP,
1988)
Figure 10.1. Project cycle integrated with EIA (UNEP,
1988)
.10 EIA AND STAKEHOLDER INVOLVEMENT
The terms stakeholder and public involvement are now
commonly used in relation to project planning and other
development activities. It is therefore important to have a
clear understanding of these and related terms. Howlett
Ecology

362
and Nagu (1997) have defined stakeholders as:‘all those
people and institutions that have interest in the
successful design, implementation and sustainability of
the project’. This includes those positively and negatively
affected by the project. Stakeholder participation involves
processes where by all those with a stake in the outcome
of a project actively participate in decisions on planning
and management. They share information and
knowledge, and may contribute to the project, so as to
enhance the success of the project and hence ultimately
their own interests.’
In this definition stakeholder is given a very broad
definition and would encompass all different government
agencies, beneficiaries, commercial companies, and all
other formal or informal groups associated with a project.
One of the key features of stake holding is that it aims to
be ‘inclusive’ rather that ‘exclusive’. As Howlett and Negu
have pointed out, it recognizes that close co-operation
among all interested parties yields better results than
planning and management that is distant, exclusive,
bureaucratic or based on power relations.
.10.1 Why stakeholder involvement?
Ecology

363
The objective of a stakeholder involvement is to provide
information about the development and its likely impacts.
Lack of information, or misinformation about the nature of
a proposed development, prevents adequate stakeholder
involvement, and can cause resentment and criticism of
the project. Further to this another objective of
stakeholder involvement is to identify issues that concern
local stakeholders and other interest groups. These
issues are often not necessarily the same as those of
concern to the proponent or EIA practitioner. Stakeholder
involvement should thus seek to establish two-way
dialogue and flow of information.
A recent review of World Bank EIA experience found that
when public participation is undertaken, this improved
project design, environmental soundness and social
acceptability.
Determining who ‘participates’ in EIA requires careful
analysis because potential stakeholders will often
represent different social groupings, religious affiliations,
genders and constituencies. Each can contribute in
different ways, and may advocate different priorities
based on individual needs, motivations and interests.
Ecology

364
Powerful, influential and wealthy groups tend to have
better access to decision-making processes, and thus
care is required to ensure their views do not prevail to
the detriment of the views and needs of poor, affected or
marginalized groups. Recognizing such issues and
balancing the needs of heterogeneous groups in crucial
is EIA. It is also essential to remember all stakeholder
groups; these would include government agencies,
development agencies, private and commercial sector. It
is important these groups are involved, and that
stakeholder involvement does not just focus on public
groups.
Stakeholder analysis is a process, which allows planners
to widen the involvement of people and institutions in
project planning. It is an important means of identifying
which stakeholders should be included within the EIA
process, and determining how the project might impact
upon the interests (or ‘stakes’) of different stakeholder
groups. To be effective, stakeholder analysis should be
undertaken during the scoping stage of EIA.
There are five main stages in stakeholder analysis:
a) Identifying and listing all potential stakeholders
Ecology

365
b) Identifying their interests in relation to project
objectives and activities
c) Assessing the likely impact of the project on each
of these interests
d) Assessing the relative importance of each
stakeholder to the success of the project
e) Drawing-up a participation matrix (see annex).
Stakeholders have varying degrees of power and access
to information. For example, within all the stakeholder
groups, gender differences are crucial and must be
seriously considered. Gender represents both a social
category (women and men and a theoretical tool for
analysis In participatory processes, the understanding of
gender relations is crucial because they are social
constructs; involving historical processes of conflict and
change.
.11 Impact Identification, Prediction and Evaluation
Ecology

366
It is important to have a clear understanding on the
difference between impact identification, prediction and
evaluation:
a) Impact identification is process designed to
ensure that all potentially significant impacts are
identified and taken into account in the EPA
process. Having established the range of impacts
associated with a development project, it is then
necessary to predict their potential magnitude and
evaluate their significance. Some impacts will be
greater than others and some will be more
significant than others.
b) Impact prediction is a process designed to
identify the magnitude of potential impacts, and
provides the basis for the assessment of
significance.
c) Impact evaluation is a process that helps to
assess the relative significance of impacts.
.11.1 Impact identification
Ecology

367
A number of ‘tools’ are available to assist in impact
identification. The simplest, and most frequently used,
are checklists of impacts, although matrices, network
diagrams and map overlays are also commonly used.
More complex tools, such as mathematical modeling and
the use of GIS systems, may also be used in certain
circumstances.
Checklists are the most basic of the tools and are used
merely to make sure nothing is missed. There are
several types that can improve on the straightforward list
and can help to draw attention to significant factors of
each element.
i. Simple checklists the simplest types of checklists
provide lists of potential impacts. These are
designed to help practitioners to avoid overlooking
potential impacts. A component of a simile
checklist prepared for use in the UK is given in the
annex.
ii. Descriptive Checklists- These provide guidance
on how to assess impacts. They can include
information on predictive techniques, data
Ecology

368
collection and locating information sources (see
annex). .
iii. Questionnaire checklist- these are based on a
set of questions, some of which might explore
indirect impacts and possible mitigation measures
(see annex).
Matrices are another commonly- used tool for impact
identification. They show environmental components (e.g
species diversity, water quality) on one axis, and
development actions (e.g. clearing land, construction,
and operation) on the other. The entries in the cell of the
matrix can either be qualitative or quantitative estimates
of impact.
Matrices are useful for the following reasons:
o They visually describe the relationship between two
sets of factors;
o They can be expanded or contracted to meet the
needs of the proposal being assessed;
o They can help to identify the impacts of different
phases of a project, such as during construction,
operation and after abandonment; and
Ecology
369
o They can help to separate site- specific impacts from
impacts affecting the region as a whole; however, it is
generally advisable to describe different aspects of a
proposal using separate matrices (see annex.)
A network diagram visually –describes the linkages
between pairs of environmental factors, providing some
indication of how an ecosystem functions. These types of
methods are referred to in several ways within the EIA
practice, for example, as impact trees, impact chains,
cause effect diagrams, or consequence diagrams.
Networks are useful for showing primary, secondary, and
tertiary impact- relationships resulting from particular
actions.
Different levels of information can be displayed in a
network diagram. The relative dependence of one factor
on the condition of another may be indicated by various
arrow widths or weights. Negative and positive feedback
loops can also be identified if the nature of the
interrelationship (e.g. directly or inversely proportional) is
indicated.
Networks have limitations:
Ecology

370
They may be an oversimplification of reality unless
re la t ionsh ips among ind iv idua l ecosystem
components are adequately understood;
Individual ecosystem or social system elements may
not be easily recognized or found in the diagram,
especially as the level of detail increases;
Like checklists and matrices, networks cannot
describe temporal aspects of ecosystem dynamics;
They are very time- consuming and difficult to
construct, although once in place they form a
fundamental reference guide for future project
planning.
Map overlays provide an effective visual aid, and are
useful for describing existing physical, social and
economic conditions and displaying the potential
changes resulting from a proposed development. They
are also very easy to use and understand. Overlays are
particularly useful when addressing questions of site and
r o u t s e l e c t i o n . T h e m e t h o d u s e s m a p s o n
transparencies, showing environmental and social
characteristics and impacts. These can then be
superimposed to provide a clear visual characterization
Ecology

371
for where impacts are likely to occur. The use of different
intensities of shading can be used to depict the
significance or magnitude of impacts to add further utility.
The development of computer mapping, and in particular
GIS, allow more information to be shown and
manipulated.
In the strictest sense, and organized system for the
management and manipulation of spatial information
may be regarded as constituting a GIS. However, the
term GIS is generally used to refer to a computer- based
system incorporating the collection, storage, retrieval,
transformation and display of spatial data.
GIS applications can bring the following benefit to impact
assessment practice:
They offer the potential for storing and accessing
large data sets;
They can consolidate data from many different
sources for use in geographic analysis;
GIS is efficient at performing multiple map overlays;
GIS can be used to generate maps for out put to hard
copy as well as display map information on screen.
Ecology

372
Limitations of GIS in EIA:
Most GISs are expensive and require highly trained
personnel for efficient operation of the system;
GISs are not specifically structured or EIA
Digital data is costly and often difficult to acquire.
.11.2 Impact prediction
The objective of prediction is to estimate the magnitude,
extent and duration of the impact in comparison with the
situation without the project/ action. The distinction
between impact magnitude and significance is an
important one, since magnitude does not always equate
with significance. An environmental impact predication
should perform the following:
Determine the initial reference or baseline state.
Forecast the future state/ conditions with and without
the project
Compare with environmental standards and
guidelines where appropriate.
Mathematical models generally incorporate detailed
mathematical representations of key processes and
interactions present in the system under study. In most
Ecology

373
cases, these models are used to describe and / or
forecast changes in properties of the system over a
period of time. Mathematical modeling is particularly
used in predicting impacts related to water and air
pollution. For example, in the case of water, the types of
mathematical models available include:
o Downstream dispersion of pollutants
o Water quality
o Dissolved Oxygen Demand (DOD)
o Biological Oxygen Demand (BOD)
o Reservoir quality
Models cannot be expected to provide good results
without high quality inputs. For example, water quality
modeling not only requires reliable data on seasonal
water flows, but also physical information, model
development time and model validation. Once modeling
results are available, they must be interpreted to
determine their environmental significance.
.11.3 Impact Evaluation
Ecology

374
Having predicted the impacts, there is needed to assess
their relative significance. Criteria for significance
include:
o The magnitude and likelihood of the impact and its
spatial and temporal extent;
o The likely degree of recovery of the affected
environment;
o The value of the affected environment;
o The level of public concern; and
o Political repercussions
Evaluating the significance of environmental impacts is
one of the most critical components of impact
assessment. The interpretation of significance bears
directly on project approvals and condition setting. At an
early stage, it also enters into screening and scooping
decisions on what level of assessment is required and
which impacts are issues wil l be addressed.
Subsequently, impact significance provides the key to
selecting alternatives.
More than other components, however, the interpretation
of significance is a continuous process. It occupies a
Ecology

375
‘fluid boundary between science and politics’. Impacts
that might be considered significant to one component of
the community may be considered unimportant by
another. Moreover, significance varies according to the
level at which its judged. What may be considered
significant at the local level may vary between different
groups. Similar differences in perceptions of significance
will be found between groups or institutions operating at
local, regional, national and international levels.
This will be evident, for example, at the screening and
scooping stages where value judgments and
interpretations are made about whether, and to what
extent, a proposal is environmentally significant. During
the more detailed phase of impact analysis, determining
whether impacts are significant and acceptable involves
predication and estimation of nature, magnitude, timing
and duration as well as the attribution of importance or
value to these findings.
Like impact prediction, various tools to assist the
evaluation of impact significance are available. Some are
highly technical and context specific, whilst others are
much more qualitative and holistic.
Ecology

376
Some good practice principles for determining impact
significance are as follows:
Use a systematic approach;
Apply criteria that are rational, defensible and
problem- relevant;
Identify the basis on which judgments are made;
Distinguish between the ecological and social
importance of impacts;
Describe the confidence levels that underlie the
attribution of significance; and
Provide a straightforward, non- technical explanation
of the approach adopted.
Impacts are likely to be significant if they:
Are extensive over space and time;
Are intensive in concentration or proportion o
assimilative capacity;
Exceed environmental standards or thresholds
Do not comply with environmental policies, land use
plans, sustainability strategy;
Ecology

377
Adversely and seriously affect ecologically sensitive
areas;
Adversely and seriously affect heritage resources,
other land uses, communities and / or indigenous
peoples, tradition and values.
One way of evaluating significance is to compare
expected impact levels with existing standards.
Environmental standards provide guidance to decision-
makers and practitioners on the minimum acceptable
levels to which a proposed project should adhere. They
also provide a quantifiable measure for use in the review
process. Many countries do not have their own
standards, and complaining them can be a time
consuming and extremely costly process. In the
meantime, internationally agreed standards such as the
World Health organization standards, The world Band
standards and others can be used as an interim
measure.
One common approach is to give ratings for each
potential impact and to produce a matrix, which
compares a range of project options. These ratings are
somewhat arbitrary but often a -5 to +5 system is used.
Ecology

378
For example consider two impacts of a project which
have been given the same rating of –3 (Significant
negative effect). The first is the permanent acquiring of
land from local people, and the second is a reduction in
livestock. Of these it is clear that the first impact is far
more serious than the latter and should be given more
weight in any final rating. This can be achieved by
ranking all potential impacts. Similarly one impact may be
so serious that it only rules out this particular project or
option. For example if an agricultural project was given a
–4 or –5 rating (severe irreversible change) for forced
resettlement of local people, this in itself would or should
result in the project being rejected.
.11.4 Impact Mitigation and Monitoring
There is now growing recognition that the proponent has
a responsibility to internalize environmental costs. This
change in attitude has encouraged governments and
agencies to require proponents to avoid or minimize
impacts so that these are kept within the acceptable
limits.
Ecology

379
Mitigation measures must be planned in an integrated
and coherent fashion to ensure that they really are
effective, that they do not conflict with each other, and
that they do not merely shift a problem from one medium
to another. There may also be beneficial effects of a
project on an impacted area, often of socioeconomic
nature; where such effects are identified, there should be
a concern to ensure that they do happen and do not
become diluted. For example, the potential local
employment benefits of a project can be encouraged
through appropriate skills training programmes for the
local people; various tenure arrangements can be used
to direct houses in new major housing schemes to local
people in need.
Mitigation seeks to Find better ways of doing things,
maximize project benefits by eliminating or minimizing
significant negative impacts identified in the earlier stage
of the EIA process, make sure that the public or
individuals do not bear costs which are greater than the
benefits which occur to them and enhance the benefits of
a proposed development by integrating mitigation
measures into the overall project design, and
Ecology

380
internalizing the mitigation costs in the overall project
costs.
It is essential to remember that not all environmental
impacts of a project are negative. This is particularly so
with projects in the renewable natural resources sector.
For instance, a soil conservation project should be
expected to have significant positive environmental
impacts. Similarly, the development of a reforestation and
plantation project could be expected to have positive
impacts on the environment. Where positive impacts
occur which they are of a social, economic or
environmental nature, it is important to see how these
can be maximized by changes to the project design and/
or the adoption of enhancement measures.
Mitigation measures can be classified into four basic
categories or types:
Avoiding the impacts altogether by not taking an
action or part of an action. This may include
abandoning the project, changing project site, route,
processes, raw materials, operating methods,
disposal reroutes or locations, timing or engineering
designs. For example, the Stigler ’s Gorge
Ecology

381
Hydropower Project was abandoned largely due to
the sever i ty o f the potent ia l downst ream
environmental and socio-economic impacts of the
dam.
Reducing or minimizing the degree or magnitude of
the action and its implementation, e.g. introducing
pollution controls , waste treatment , monitoring,
phased implementation, landscaping, training, special
social services or public education.
Rectifying the impact by repairing, rehabilitating or
restoring the affected environment after the impact
has occurred.
Compensation for damaged resources, money to
affected persons, concessions on other issues or off-
site programs to enhance some other aspect of the
environment or quality of life for the community.
Compensation, on the other hand, is concerned with
residual impacts- that is impacts which remain after
mitigate options have been exhausted.
The best type of mitigation measure is one that
completely avoids or stops the impact. Compensatory
measures are usually used as a last resort, Mitigation
Ecology

382
measures can also be classified according to their actual
nature:
• Scale- Change in the size of a proposed
project;
• Technology and design – adoption and use
of different technologies with low levels or no
impacts, or changes in project design to one
with less impact;
• Location – moving the project to a different
location where either the impacts will not occur,
or if they do where they will be less significant;
• Fuel and raw materials – change in the
material inputs into a project, e.g. avoiding the
rainy season
Mitigation measures are of little or no value unless they
are implemented. Hence, there is a clear link between
mitigation and monitoring of outcomes, if and when a
project is approved and moves to the construction and
operation stage. Monitoring must include the
effectiveness of otherwise of mitigation measures.
Therefore, mitigation measures must be devised with
monitoring in mind; they must be clear enough to allow
Ecology

383
checking of effectiveness, Uncertainties in EIA may arise
due to continual refinement and modification of project
design during and after the preparation of the EIS. A
system of monitoring and feedback can help identify
these changes and therefore manage these
uncertainties.
Monitoring is a general term referring to the systematic
collection of data through a series of repetitive
measurements over a long period to provide information
on characteristics and functioning of environmental and
social variable in space and time. It is among the best
means of converting EIA from static to an interactive
process, characterized by feedback and adjustments.
Ideally, the aims of monitoring should be formulated
clearly and explicitly and set out in explicit guidelines to
ensure that no deviation from the required monitoring
programme occurs, because changes in sampling
procedures may invalidate comparison of monitoring
data.
The design of an effective monitoring programme
involves a range of considerations;
Defining scope and aspects of coverage
Ecology

384
Establishing objectives and data requirements to
meet them;
Setting boundaries and comparison sites for
observation and sampling;
Identifying group and institutional responsibilities
Selecting key indicators to be measured; and
Deciding how the data gathered will be interpreted
and applied
.12 Common Types of Monitoring
o Base line monitoring: the measurement of
environmental parameters during a representative
pre-project period in an attempt to determine the
nature and ranges of natural variation and where
possible to establish the process of change.
o I m p a c t / e f f e c t m o n i t o r i n g : i n v o l v e s t h e
measurement of parameters (performance indicators)
during project construction and implementation in
order to detect and quantity environmental change
which may have occurred as a result of the project,
Ecology

385
the importance of feedback and continuity in the EIA
process cannot be overemphasized, Effect monitoring
provides experience for future process with a
consequent improvement in accuracy and efficient
use of resources, which can be better targeted
through a more appropriate selection of methods and
techniques.
o Compl iance moni tor ing: not d i rec ted a t
environmental parameters, but takes the form of
periodic sampling and/or continuous measurements
of levels of waste discharge, noise or similar emission
or introduction to ensure that specific conditions are
observed and standards met, Compliance monitoring
does not require baseline monitoring to which impacts
can be compared or reference or control sites.
o Mitigation monitoring: aims to determine the
su i tab i l i ty and effec t iveness o f mi t igat ion
programmes, designed to diminish or compensate for
adverse effects.f
.13 EIA Reports
The final report from an EIA is also often termed an
Environmental Impact statement (EIS). For the EIA
Ecology

386
process to achieve its objectives it is important that any
report produced is accurate, contains all the relevant
information, is clearly written and understands by the
public, non-technical people and decision makers. To
ensure the effective dissemination of the contents of EIS
it will often be useful to supplement the written word with
other information tools such as radio, video and public
meetings. The preparation of EIA reports is addressed
through sessions on the following issues:
o Preparation of environmental impact statements;
o Contents of environmental impact statements
o Presentation of environmental impact statement.
As a tool for decision-making, the findings of the EIA
process need to the communicated in a way that is
accessible to a wide range of stakeholders-from” lay
people” to decision-makers. This is in the form of
environmental impact statement (EIS) which should:
o Identify, predict and interpret the likely impacts of
the options in the proposed development project,
including the no project option;
Ecology

387
o Provide information that can be used to improve
decision-making;
o Include a plan for impact mitigation and
management; and
o Include a plan for environmental monitoring and
auditing.
There are essentially three target, or users, groups for an
EIS:
a) The project proponent or developer;
b) Government agencies with an interest, or
regulatory role, in the project
c) The general public.
Although EIA regulations often specify the minimum
contents of an EIS, they often do not provide any
standards for report presentation. More specific
guidelines for contents of an EIA are usually specified in
the terms of reference of an EIA study of a particular
project.
The typical headings of an EIS are:
a) Executive summary
Ecology

388
b) Introduction
c) Project Description
d) Project stakeholders and public involvement
e) Description of Institutional, policy and legislative
Environment
f) Description of Existing Social and Biophysical
Environment
g) Environmental planning and Design
h) Assessment of Environmental Impacts
i) Impact planning and Management
j) Economic Evaluation
k) Summary and Recommendations Appendices
When the EIS is submitted for review it should be
accompanied by a statement by the proponent on the
extent of his or her agreement with the conclusions of the
report, and of his or her commitment to implementing the
identified impact management measures, This is
important in order to ensure that the proponent does not
avoid complying with the recommendations for
environmental management.
Ecology

389
Conventionally, the media of presentation is in a written
report. However, it is often appropriate to supplement the
EIS with alternative information tools, such as local
language video, radio programmes, meetings and
workshops. These can be particularly important in a
country where there is literacy, social and/or cultural
barriers prevent people gaining access to or being able
to understand the EIS.
The impact assessment can be made using the impact
matrix (Table9.1.) This is very important part of the TOR
Ecology

390
Table 10.1. Impact matrix format
Activity Measurement Disciplines (variables) to be considered
Ecology

391
A m o u n t
(Unit)
Durati
on
C
o
n
s t
ru
c t
i o
n
p
h
a
s
e
U t i l i z a t i o n /
e x p l o i t a t i o n
phase
M a i n t e n a n c e
phase
Ecology
392
On the above boxes along with the disciplines you can fill
and mark as: has direct less significant positive effect,
has direct significant positive effect, indirect less
significant positive effect, has indirect significant positive
effect, not relevant, indirect less significant negative
effect, indirect significant negative effect, etc. The
symbols used have to give the visual overview.
.14 Review questions
1. Write the benefits of applying EIA to proposal.
2. Write the different methods of screening criteria.
Ecology

393
3. Write the six categories of project alternatives.
4. What are the steps to be followed in scoping?
5. What are the main contents in the format of terms
of reference for further EIA study?
6. Explain the main steps in the stakeholder
analysis.
7. Write the tools that are used for impact
identification?
8. Discuss the methods of impact prediction.
9. Write the types of impact mitigation measures.
10.Write the typical headings of an EIS.
11.What are the media of presentation in EIS.
.15 Bibliography
1. Swedish international development cooperation
a g e n c y ( S I D A ) , 1 9 9 8 . G u i d e l i n e s f o r
Ecology

394
Environmental Impact Assessments in
international development cooperation.
Department of natural resource and the
Environment.
2. Nathson, J. A., 1997. Basic environmental
technology, second edition, Appendix A,
Environmental Impact studies and audits. Simon
and Schuster/A Viacon Company, New Jersey,
USA. pp 404 – 410.
3. Pierce, J. Jeffrey, et al. 1998. Environmental
pol lut ion and control . Fourth edi t ion.
E n v i r o n m e n t a l I m p a c t a n d e c o n o m i c
assessment. Butterworth-Heinemann. Woburn,
USA. pp 351 – 361.
4. Maxcy Rostenau: public health and preventive
medicine: 4th edition McGraw –Hill medical
publishing devision, 1998.
5. Dade W.moeller: Environmental Health: revised
edition, Harvard university press, 1998.
6. J.m. Harrington, F.s.Gill: Occupational health, 4th
edition S.C Santra: Environmental science. New
central Book agency (P) Ltd: India, 2001.
Ecology

395
7. Chr is topher wood: Env i ronmenta l impact
assessment. Comparative review , England: long
man , 1995.
8. Oser BL: Toxicology then and now. Regul toxicol
pharmacol, 1987.
9. Gallo M: History and scope of toxicology, 5th edition:
New York: McGraw-Hill, 1996, Harvard University
Press.
Ecology