LB-145 - C-Tools
455
LB-145 Cell and Molecular Biology Lecture & Lab Course Packet (for student in Douglas Luckie's sections) This publication is a compendium of work authored by: Candace Igert, Angela Wright, Cori Fata-Hartley, Michael Haenisch, Susannah Cooper, Marjia Krha, Joseph Maleszewski, John Wilterding, Mimi Sayed, and Douglas Luckie
-
Upload
khangminh22 -
Category
Documents
-
view
1 -
download
0
Transcript of LB-145 - C-Tools
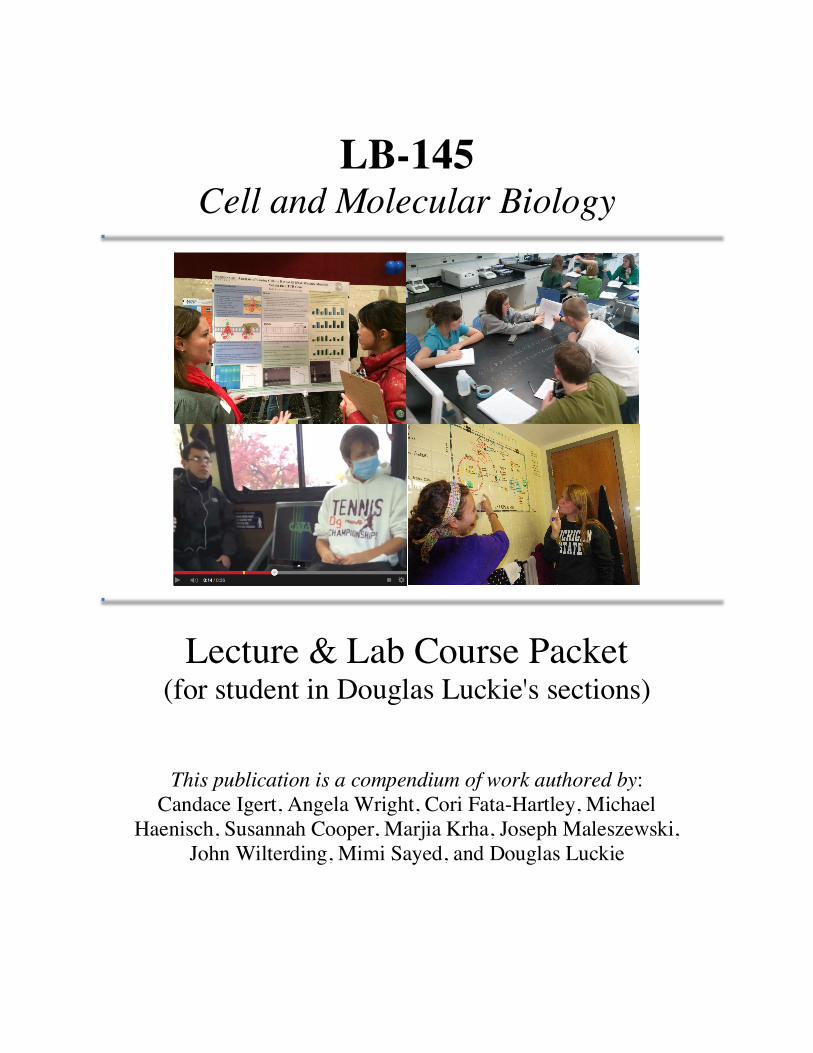
LB-145
Cell and Molecular Biology
Lecture & Lab Course Packet
(for student in Douglas Luckie's sections)
This publication is a compendium of work authored by: Candace Igert, Angela Wright, Cori Fata-Hartley, Michael
Haenisch, Susannah Cooper, Marjia Krha, Joseph Maleszewski, John Wilterding, Mimi Sayed, and Douglas Luckie

!
2
Welcome to LB-145
Welcome'to'LB'145!'The'experience'you'are'about'to'have'in'the'cell'&'molecular'biology'
course'may'turn'out'to'be'unlike'most'other'lectures/labs'that'you'will'have'while'as'an'
undergraduate.'There'will'be'a'major'emphasis'on'team'effort'in'this'class'and'your'ability'to'
work'in'a'team'is'crucial'to'your'success'in'this'course'and'beyond.'As'a'team,'you'and'your'
partners,'will'work'together'to'solve'biological'problems'in'lecture,'discuss'scientific'ideas,"
strategies,'and'pursue'research'projects'within'the'lab'to'find'answers'to'the'unique'questions'your'group'will'have'posed.''
Molecular'biology'is'quickly'becoming'an'integral'part'of'science'and'society.'With'new'
discoveries'and'ongoing'discussions'of'topics'such'as:'cloning,'genetically'modified'
foods/organisms,'DNA'fingerprinting,'genomics,'bioinformatics,'gene'patenting'(the'list'goes'
on)'it'becomes'crucial'to'understand'the'concepts'of'molecular'biology'not'only'to'have'a'
degree'in'science,'but'to'be'a'member'of'society'in'general.''
Molecular'biology'is'not'an'easy'subject'to'master.'There'are'complex'concepts'as'well'as'a'
great'deal'of'factual'information.'Nevertheless,'the'difficulty'of'this'subject'adds'to'its'appeal.'
The'staff'of'LB'145'will'work'hard'to'help'you'glean'the'information'necessary'to'achieve'in'
this'course;'however,'your'hard'work'is'the'most'essential'element'to'success.''
This'experience'will'without'a'doubt'be'exciting,'frustrating,'and'almost'overwhelming'at'
times'Obut'it'is'all'with'purpose.'We'hope'that'you'will'come'out'of'this'course'with'not'only'a'
better'understanding'of'molecular'biology,'but'also'a'better'understanding'of'the'scientific'
method'itself.''
We'look'forward'to'working'with'you'throughout'the'semester'and'if'you'have'questions'
please'do'not'hesitate'to'contact'any'one'of'the'TAs,'GAs,'or'the'Professor.'Good'luck'and'
enjoy'the'semester!''
OThe'145'Staff''
' 3

!
4

5
Contents WELCOMETOLB-145 3
SYLLABUS 7CONTRACT 17EXAMINFORMATION 27LECTUREHANDOUTS 41CHAPTERCHECKLISTS! 45
LABORATORYGUIDE 77EXPECTATIONS&EFFORTS 79WORKINGEFFECTIVELYINSMALLGROUPS 81SCHEDULEOFLABORATORYHOURS 85
CF&PCRRESEARCHSTUDIES 87CR-PCRPROJECT:GETTINGSTARTED 89LAB0–INTRODUCTIONTOTHE145RESEARCHLAB 91LAB1–POLYMERASECHAINREACTION 97LAB2–PURIFICATIONOFGENOMICDNA 105LAB3–DIYDO-IT-YOURSELF 109GENERALPRIMERS 111DNAMATERIALS&PRIMERDESIGN 129
INSTRUCTIONSONWRITING/COMMUNICATION&HANDOUTS 139INSTRUCTIONSTOAUTHORS 141SAMPLES:STUDENTPAPERS 153GRADINGRUBRICS 173
APPENDIX 205HANDOUTS 207PERFORMANCEBASEDASSESSMENTSHEETS 233PRODUCTLITERATURESHEETS 245PUBLICATIONS 257
CYSTICFIBROSIS 259POLYMERASECHAINREACTION 285DIABETES 297EDUCATIONRESEARCH 327
STUDENTLABORATORYNOTEBOOK 403

!
6
7
LB-145: CELL & MOLECULAR BIOLOGY, SPRING LB-145 = LB-145 (LECTURE) & LB-145L (LAB)
If you strive to think and communicate like a scientist in your work throughout the semester, in the end, you will be a scientist and really know biology (Think like a serious scientist, not like a pretend one). LECTURER Douglas B. Luckie, Ph.D., Associate Professor, Lyman Briggs College & Dept. of Physiology Holmes Hall Office: W-26D Phone: 353-4606 E-mail: [email protected] TEXTBOOK “Integrating Concepts in Biology” by Campbell, Heyer & Paradise, 2014, 1st Edition, Trunity Holdings Inc COURSE PACKET LB145 Course Packet [for Dr. Luckie] at Bookstores (includes: syllabus, lab manual, lab notebook, etc) COURSE WEBSITE http://msu.edu/course/lb/145 LB-145 = LB-145 (LECTURE) & LB-145L (LAB) OVERVIEW OF CLASSES There are two overreaching goals in these two connected classes.
1.) To gain a fundamental comprehension of the cellular processes necessary for life and an appreciation why it is important to understand these processes.
2.) To learn how to think like a scientist and be able to adaptively negotiate a question or problem. During the semester we will study the building blocks of cells, the gross anatomy of the cell, and the structures and organelles that perform the work necessary for cell function. We will also examine several cellular processes at the molecular level, including the central dogma of molecular biology: RNA transcription and protein translation. We will examine the bioenergetic processes necessary to sustain life; first photosynthesis, the mechanism by which plant chloroplasts capture light energy to make the carbohydrates that bring life to earth. We then discuss the mitochondria and how they break down carbohydrates to release energy. All topics will be framed within the context of the human physiology. Mastery of these topics will provide you with an understanding of modern molecular and cellular biology. LECTURE COURSE WORKLOAD LB-145 is a 5-credit course that consists of two connected classes (lecture 3 credits, laboratory 2 credits) and because it IS two classes it requires twice as many hours of work as one class. Since the lecture is a course worth 3 credits, MSU requires that you work in-class 3 hours each week, and, in addition to the in-class work, for any 3-credit lecture course, MSU expects you to spend 6-9 hours/week outside of class studying and working on assignments. There will be a certain amount of preparation that you and your research group will need to do before each class and reading that you will need to complete (with notes taken) before each lecture. You will be expected to master quite a bit of new material to expand your knowledge of life and science. Come to lecture well-prepared and carefully listen and add additional notes about all the information provided or you will forget things and feel like nobody ever explained it to you.

8
SCHEDULE Both the lecture schedule and the lab schedule are found in the subsequent pages. We reserve the right to modify the schedule if necessary. You will be given advance warning if the schedule needs to be changed. OFFICE HOURS W-26D Holmes Hall, for 1hr following lecture, and appointments upon request. ACADEMIC HONESTY It is your responsibility to know what constitutes cheating. Ignorance is not a defense. Turnitin.com will allow you and your group members to review written assignments prior to submission. If you are caught cheating you may be assigned a “0” for the assignment, or for the entire course. The policy for academic honesty at LBC can be found at http://lbc.msu.edu/current_students/academics/AcademicPolicies.cfm GRADING Your grade in LB-145 is based on the total number of points earned in the both the lecture portion (400 points) and the laboratory portion (250 points) of the course. The course will be graded on a flat scale:
4.0= 90-100% 3.5= 85-89.9% 3.0= 80-84.9% 2.5= 75-79.9% 2.0= 70-74.9% 1.5= 65-69.9% 1.0= 60-64.9% 0.0= <60
A “3.0” score is considered Excellent. It is impressive work, top of the class, and the work was done extremely well but nothing beyond what was expected.� A “3.5” is Most Excellent. Every detail of the work was done extremely well and they found additional papers and evidence beyond what they were told.� A “4.0” is Outstanding. It has the 3.0, 3.5-level elements + student impresses instructor with how much/well they did the work. They taught Prof something. Late Policy: Assignments are due in lab/lecture at the beginning of the session indicated (at time of entering room) unless otherwise specified. If an assignment is 1 day late, 1 point will be deducted from the final score. After this 24 hr grace period, the penalty becomes more severe: 20% off for two days late, 30% off for three days late, and so on. After 5 days, you will receive a “0” for the assignment. Rejected Manuscripts/Reports: Each time a paper/film is “rejected”, because it did not follow the Instructions to Authors, 1 point is deducted. This is independent of the Late Policy, both can occur. Blind Grading: Whenever possible we will score assignments "blind" and ask you not indicate your name but just list your B-PID. This enables grading to be more fair and not be impacted by subjectivity etc. *Formal Written Appeal Process: If you feel that your exam, paper, or quiz was not graded properly you must submit your complaint in writing (on paper, not via email). You must concisely explain why you object to the assigned grade and what elements of your work demonstrate you mastered the material. Please be advised that if you submit a formal grade appeal about one element of an assignment, we always re-grade your entire exam, paper or quiz and the score may increase, decrease or stay the same. For group assignments, all authors must sign the written request. How much and how well you provide evidence to support your argument is assessed and students who provide good logical arguments supported well by solid relevant evidence will earn approval (Claim, Evidence, Reasoning; you may cite pages of textbooks or even better published research papers). Avoid emotional arguments that blame others or arguments based on hearsay, e.g. “A TA told me this was correct.” If you neither make logical arguments or provide thoughtful evidence to support them, your appeal will not gain traction or be approved. All discussion concerning score changes must be completed within 7 days from the date the grade was officially posted (on the returned assignment or online). No grade changes will be considered after this time. If illness or other emergency prevents you from completing assignments on time, you must make arrangements with your instructor before the due date.
9
LB145: Biology Learning Goals Our "skills" learning goals are for you to gain practice and excel in these scientific methods:
1. Design: Apply science process skills, such as: developing hypotheses, making predictions, and designing experiments to test them (e.g. design an experiment to determine whether it's change in temperature or sunlight that causes leaves to turn red in Fall).
2. Analyze: Interpret evidence collected during experiments, looking for patterns and different ways to
represent data, and using logical and/or quantitative reasoning to defend or reject hypotheses (claims). 3. Collaborate: Confidently cooperate in teamwork, and practice team building, team communication and
leadership. (e.g. use techniques like "that's a good idea, OK, how can we improve it even more?" "Jon, you haven't spoken much, what do you think?")
4. Communicate: Conversation aimed at a variety of audiences important for scientists: (Ben says: "Their data
predicts squirrels will hit light speed!" Jen responds: "But they have zero data at that part of the graph.") 1) Speaking: practice speaking and listening to others in large & small groups. 2) Reading: practice careful and critical reading of text, identification of important points & ideas, as
well as slow deliberate reading and interpretation of figures and graphs. 3) Writing: practice composition of text, writing manuscripts, building figures and graphs. 4) Thinking: practice identifying data and evaluating author's evidence-based arguments.
5. Reflect: Develop personal learning goals and reflect on your progress throughout the semester. (e.g.
regularly consider "OK, what I am supposed to be learning here? Have I mastered that topic? What next?) Our "content" learning goals are for you to understand, describe, and provide examples of how: (this semester's topics connected to learning goals you studied previously in LB144 are underlined below)
1. Evolution of molecules, organelles, and processes led to the origin of life on the planet earth. (e.g. How is it possible to create carbon-based life on a sterile planet that has none?)
2. Some cells can capture CO2 and transform photonic energy into chemical energy (e.g. ATP) to drive cellular processes and build cellular polymers. (e.g. How does photosynthesis work? How does a chlorophyll pigment molecule capture light energy?)
3. Small organic molecules (nucleotides, amino acids, lipids, carbohydrates) when built into polymers can associate to create cellular surfaces and compartments with which to perform biochemical processes (of life). (e.g. What is a lipid and how is it used to create a cell membrane? When proteins join a membrane does that create intelligence?!)
4. Information in DNA -> becomes (transcribed) information as RNA -> becomes (translated) information in
the proteins that determine structure. (e.g. How does a cell make insulin? Transcription make mRNA?) 5. Information in the 3D structure of a molecule determines its function (and influences its evolution). (e.g. the
CFTR protein is shaped like a roll of toilet paper in the cell membrane, turns out it's an ion channel) 6. Changes in DNA (mutations that lead to new alleles) -> result in changed RNA that may lead to -> changed
protein (structure) that lead to changed function. (e.g. What DNA change leads to sickle cell anemia? or How does a three-base deletion result in the disease cystic fibrosis?)
7. _______________________________________________________________________________________
________________________________________________________________________________________________________________________________________________________________________
10
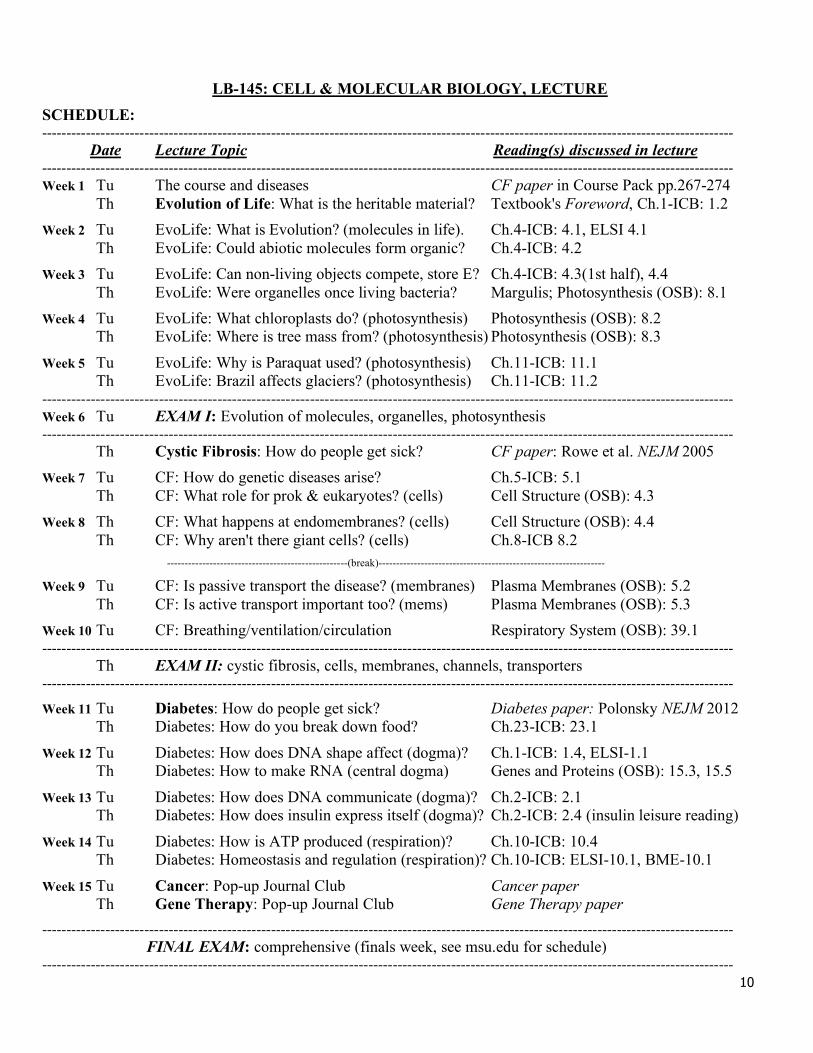
LB-145: CELL & MOLECULAR BIOLOGY, LECTURE
SCHEDULE: ---------------------------------------------------------------------------------------------------------------------------------------------- Date Lecture Topic Reading(s) discussed in lecture ---------------------------------------------------------------------------------------------------------------------------------------------- Week 1 Tu The course and diseases CF paper in Course Pack pp.267-274 Th Evolution of Life: What is the heritable material? Textbook's Foreword, Ch.1-ICB: 1.2
Week 2 Tu EvoLife: What is Evolution? (molecules in life). Ch.4-ICB: 4.1, ELSI 4.1 Th EvoLife: Could abiotic molecules form organic? Ch.4-ICB: 4.2
Week 3 Tu EvoLife: Can non-living objects compete, store E? Ch.4-ICB: 4.3(1st half), 4.4 Th EvoLife: Were organelles once living bacteria? Margulis; Photosynthesis (OSB): 8.1
Week 4 Tu EvoLife: What chloroplasts do? (photosynthesis) Photosynthesis (OSB): 8.2 Th EvoLife: Where is tree mass from? (photosynthesis) Photosynthesis (OSB): 8.3
Week 5 Tu EvoLife: Why is Paraquat used? (photosynthesis) Ch.11-ICB: 11.1 Th EvoLife: Brazil affects glaciers? (photosynthesis) Ch.11-ICB: 11.2 ---------------------------------------------------------------------------------------------------------------------------------------------- Week 6 Tu EXAM I: Evolution of molecules, organelles, photosynthesis ---------------------------------------------------------------------------------------------------------------------------------------------- Th Cystic Fibrosis: How do people get sick? CF paper: Rowe et al. NEJM 2005
Week 7 Tu CF: How do genetic diseases arise? Ch.5-ICB: 5.1 Th CF: What role for prok & eukaryotes? (cells) Cell Structure (OSB): 4.3
Week 8 Th CF: What happens at endomembranes? (cells) Cell Structure (OSB): 4.4 Th CF: Why aren't there giant cells? (cells) Ch.8-ICB 8.2
---------------------------------------------------(break)----------------------------------------------------------------
Week 9 Tu CF: Is passive transport the disease? (membranes) Plasma Membranes (OSB): 5.2 Th CF: Is active transport important too? (mems) Plasma Membranes (OSB): 5.3
Week 10 Tu CF: Breathing/ventilation/circulation Respiratory System (OSB): 39.1 ---------------------------------------------------------------------------------------------------------------------------------------------- Th EXAM II: cystic fibrosis, cells, membranes, channels, transporters ----------------------------------------------------------------------------------------------------------------------------------------------
Week 11 Tu Diabetes: How do people get sick? Diabetes paper: Polonsky NEJM 2012 Th Diabetes: How do you break down food? Ch.23-ICB: 23.1
Week 12 Tu Diabetes: How does DNA shape affect (dogma)? Ch.1-ICB: 1.4, ELSI-1.1
Th Diabetes: How to make RNA (central dogma) Genes and Proteins (OSB): 15.3, 15.5
Week 13 Tu Diabetes: How does DNA communicate (dogma)? Ch.2-ICB: 2.1 Th Diabetes: How does insulin express itself (dogma)? Ch.2-ICB: 2.4 (insulin leisure reading)
Week 14 Tu Diabetes: How is ATP produced (respiration)? Ch.10-ICB: 10.4
Th Diabetes: Homeostasis and regulation (respiration)? Ch.10-ICB: ELSI-10.1, BME-10.1
Week 15 Tu Cancer: Pop-up Journal Club Cancer paper Th Gene Therapy: Pop-up Journal Club Gene Therapy paper
---------------------------------------------------------------------------------------------------------------------------------------------- FINAL EXAM: comprehensive (finals week, see msu.edu for schedule) ----------------------------------------------------------------------------------------------------------------------------------------------

11
THE LECTURE ASSIGNMENT SCHEDULE
ATTENDANCE AND PARTICIPATION: Attendance and participation are worth 80 points. It is essential that you not only come to class but also participate in order to construct your own knowledge. While attendance is "being present" in lecture and lab, participation includes doing the reading and preparing well for class and will often be assessed by in-class clicker questions, or written quizzes and exercises. A quiz or graded exercise may occur in lecture or lab and are usually based on the reading assignment or topic for that day. These quizzes/exercises are designed to help you assess your own learning between exams and ensure you keep up with the material. They provide you with regular feedback as to how well you are mastering each topic. Quizzes may be written multiple choice or essay-style; some may be performed with your clicker. Exercises may be given as a homework assignment or a problem-solving exercise. The exercises are designed to improve your problem-solving skills and test your ability to apply new concepts.
EXAMS: There will be two midterm exams (100 points each) and a final exam (120 points) in the course. Midterm exams may be traditional multiple-choice format or may be long essay-style, perhaps with essay questions provided in advance. If you are given essay questions in advance, you are to study and discuss possible answers with your group members but when you write your own individual answer be sure the text is unique and clearly your own words/work. They will often be submitted online to http://turnitin.com/ and as a hard copy at the start of lecture. You then would frequently have in-class closed-book exam where you are required to answer some of the questions (randomly chosen) you studied on the take-home portion. During final exam week, the written final exam will be comprehensive. Because MSU requires final course grades to be submitted 48 hrs after the final exam is completed, we must use a multiple-choice format. Prior to finals week an optional Verbal Final exam may be offered.
Assignments (pts): Attendance & Participation (quizzes etc)= 80, Midterms (2)= 200, Final Exam= 120
Week Assignment Due @Lec. Lab Value
(all) Attendance and participation X X 80 6 Exam I (Multiple choice or Essay) X 100
10 Exam II (Multiple choice or Essay) X 100
16 Final Exam (Multiple choice or Verbal) X 120 Total 400 pts
12
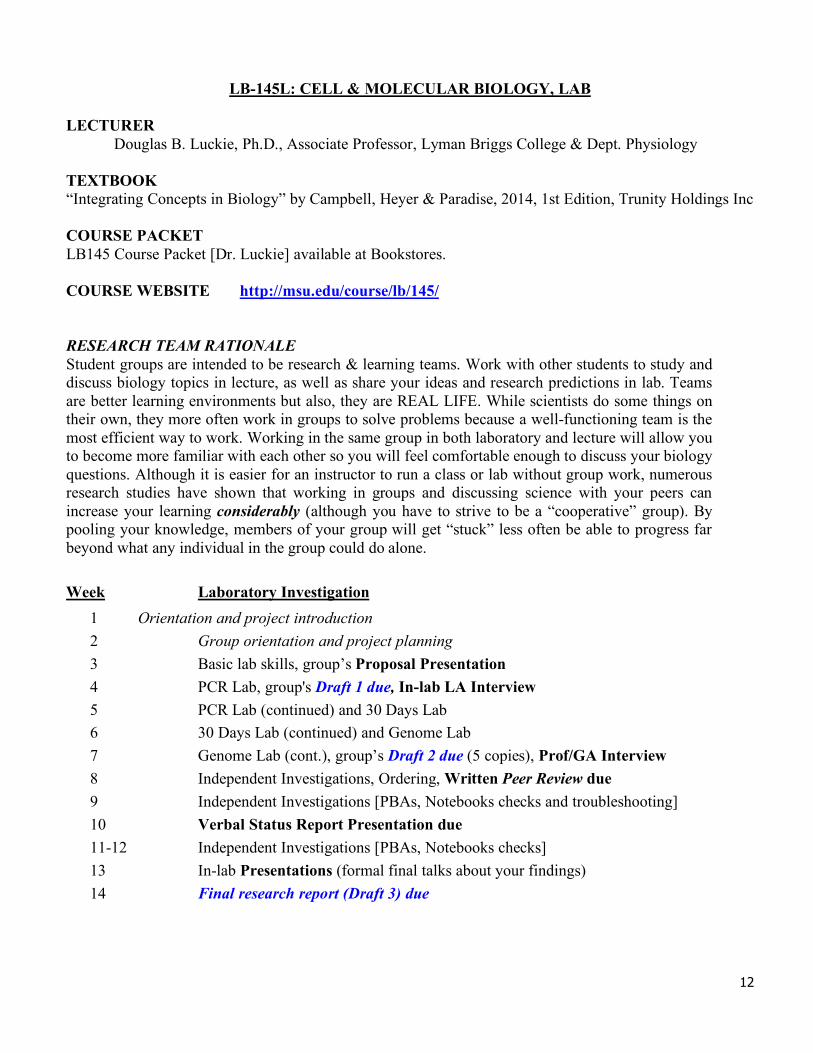
LB-145L: CELL & MOLECULAR BIOLOGY, LAB LECTURER Douglas B. Luckie, Ph.D., Associate Professor, Lyman Briggs College & Dept. Physiology TEXTBOOK “Integrating Concepts in Biology” by Campbell, Heyer & Paradise, 2014, 1st Edition, Trunity Holdings Inc COURSE PACKET LB145 Course Packet [Dr. Luckie] available at Bookstores. COURSE WEBSITE http://msu.edu/course/lb/145/ RESEARCH TEAM RATIONALE Student groups are intended to be research & learning teams. Work with other students to study and discuss biology topics in lecture, as well as share your ideas and research predictions in lab. Teams are better learning environments but also, they are REAL LIFE. While scientists do some things on their own, they more often work in groups to solve problems because a well-functioning team is the most efficient way to work. Working in the same group in both laboratory and lecture will allow you to become more familiar with each other so you will feel comfortable enough to discuss your biology questions. Although it is easier for an instructor to run a class or lab without group work, numerous research studies have shown that working in groups and discussing science with your peers can increase your learning considerably (although you have to strive to be a “cooperative” group). By pooling your knowledge, members of your group will get “stuck” less often be able to progress far beyond what any individual in the group could do alone.
Week Laboratory Investigation
1 Orientation and project introduction
2 Group orientation and project planning
3 Basic lab skills, group’s Proposal Presentation
4 PCR Lab, group's Draft 1 due, In-lab LA Interview
5 PCR Lab (continued) and 30 Days Lab
6 30 Days Lab (continued) and Genome Lab
7 Genome Lab (cont.), group’s Draft 2 due (5 copies), Prof/GA Interview
8 Independent Investigations, Ordering, Written Peer Review due
9 Independent Investigations [PBAs, Notebooks checks and troubleshooting]
10 Verbal Status Report Presentation due
11-12 Independent Investigations [PBAs, Notebooks checks]
13 In-lab Presentations (formal final talks about your findings)
14 Final research report (Draft 3) due
13
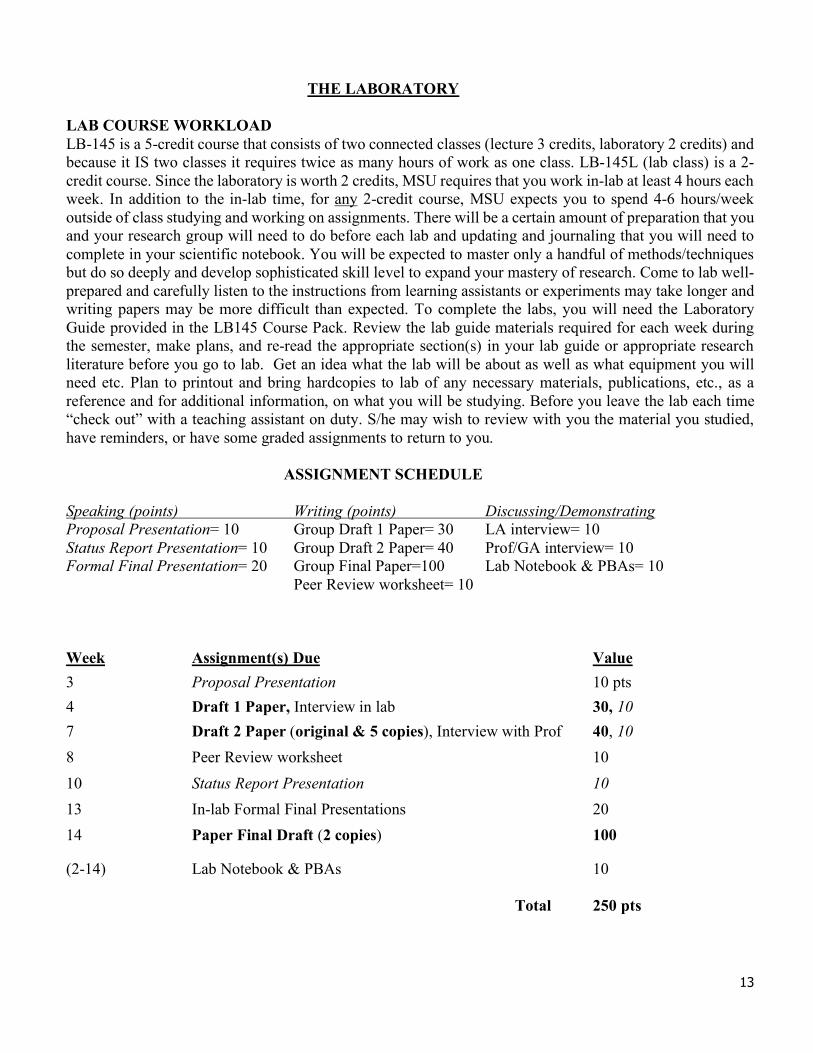
THE LABORATORY LAB COURSE WORKLOAD LB-145 is a 5-credit course that consists of two connected classes (lecture 3 credits, laboratory 2 credits) and because it IS two classes it requires twice as many hours of work as one class. LB-145L (lab class) is a 2-credit course. Since the laboratory is worth 2 credits, MSU requires that you work in-lab at least 4 hours each week. In addition to the in-lab time, for any 2-credit course, MSU expects you to spend 4-6 hours/week outside of class studying and working on assignments. There will be a certain amount of preparation that you and your research group will need to do before each lab and updating and journaling that you will need to complete in your scientific notebook. You will be expected to master only a handful of methods/techniques but do so deeply and develop sophisticated skill level to expand your mastery of research. Come to lab well-prepared and carefully listen to the instructions from learning assistants or experiments may take longer and writing papers may be more difficult than expected. To complete the labs, you will need the Laboratory Guide provided in the LB145 Course Pack. Review the lab guide materials required for each week during the semester, make plans, and re-read the appropriate section(s) in your lab guide or appropriate research literature before you go to lab. Get an idea what the lab will be about as well as what equipment you will need etc. Plan to printout and bring hardcopies to lab of any necessary materials, publications, etc., as a reference and for additional information, on what you will be studying. Before you leave the lab each time “check out” with a teaching assistant on duty. S/he may wish to review with you the material you studied, have reminders, or have some graded assignments to return to you.
ASSIGNMENT SCHEDULE Speaking (points) Writing (points) Discussing/Demonstrating Proposal Presentation= 10 Group Draft 1 Paper= 30 LA interview= 10 Status Report Presentation= 10 Group Draft 2 Paper= 40 Prof/GA interview= 10 Formal Final Presentation= 20 Group Final Paper=100 Lab Notebook & PBAs= 10 Peer Review worksheet= 10 Week Assignment(s) Due Value
3 Proposal Presentation 10 pts
4 Draft 1 Paper, Interview in lab 30, 10
7 Draft 2 Paper (original & 5 copies), Interview with Prof 40, 10
8 Peer Review worksheet 10
10 Status Report Presentation 10
13 In-lab Formal Final Presentations 20
14 Paper Final Draft (2 copies) 100
(2-14) Lab Notebook & PBAs 10 Total 250 pts
14
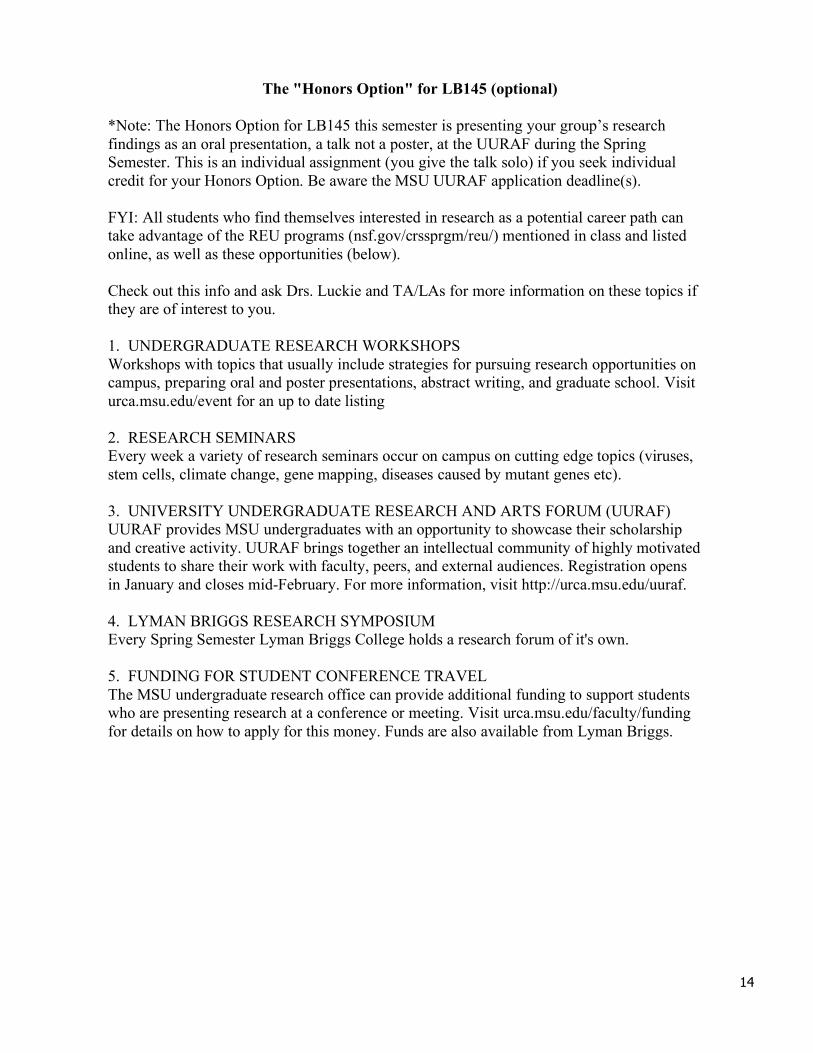
The "Honors Option" for LB145 (optional)
*Note: The Honors Option for LB145 this semester is presenting your group’s research findings as an oral presentation, a talk not a poster, at the UURAF during the Spring Semester. This is an individual assignment (you give the talk solo) if you seek individual credit for your Honors Option. Be aware the MSU UURAF application deadline(s). FYI: All students who find themselves interested in research as a potential career path can take advantage of the REU programs (nsf.gov/crssprgm/reu/) mentioned in class and listed online, as well as these opportunities (below). Check out this info and ask Drs. Luckie and TA/LAs for more information on these topics if they are of interest to you. 1. UNDERGRADUATE RESEARCH WORKSHOPS Workshops with topics that usually include strategies for pursuing research opportunities on campus, preparing oral and poster presentations, abstract writing, and graduate school. Visit urca.msu.edu/event for an up to date listing 2. RESEARCH SEMINARS Every week a variety of research seminars occur on campus on cutting edge topics (viruses, stem cells, climate change, gene mapping, diseases caused by mutant genes etc). 3. UNIVERSITY UNDERGRADUATE RESEARCH AND ARTS FORUM (UURAF) UURAF provides MSU undergraduates with an opportunity to showcase their scholarship and creative activity. UURAF brings together an intellectual community of highly motivated students to share their work with faculty, peers, and external audiences. Registration opens in January and closes mid-February. For more information, visit http://urca.msu.edu/uuraf. 4. LYMAN BRIGGS RESEARCH SYMPOSIUM Every Spring Semester Lyman Briggs College holds a research forum of it's own. 5. FUNDING FOR STUDENT CONFERENCE TRAVEL The MSU undergraduate research office can provide additional funding to support students who are presenting research at a conference or meeting. Visit urca.msu.edu/faculty/funding for details on how to apply for this money. Funds are also available from Lyman Briggs.
15
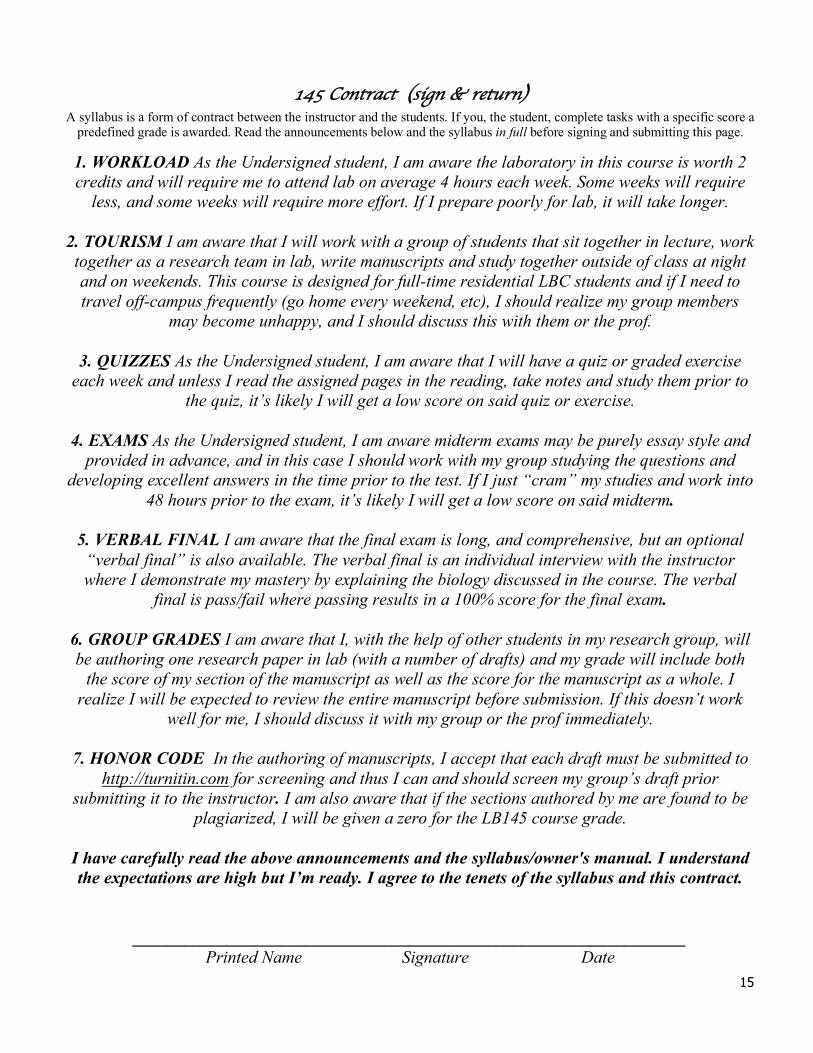
145 Contract (sign & return) A syllabus is a form of contract between the instructor and the students. If you, the student, complete tasks with a specific score a
predefined grade is awarded. Read the announcements below and the syllabus in full before signing and submitting this page.
1. WORKLOAD As the Undersigned student, I am aware the laboratory in this course is worth 2 credits and will require me to attend lab on average 4 hours each week. Some weeks will require
less, and some weeks will require more effort. If I prepare poorly for lab, it will take longer.
2. TOURISM I am aware that I will work with a group of students that sit together in lecture, work together as a research team in lab, write manuscripts and study together outside of class at night and on weekends. This course is designed for full-time residential LBC students and if I need to travel off-campus frequently (go home every weekend, etc), I should realize my group members
may become unhappy, and I should discuss this with them or the prof.
3. QUIZZES As the Undersigned student, I am aware that I will have a quiz or graded exercise each week and unless I read the assigned pages in the reading, take notes and study them prior to
the quiz, it’s likely I will get a low score on said quiz or exercise.
4. EXAMS As the Undersigned student, I am aware midterm exams may be purely essay style and provided in advance, and in this case I should work with my group studying the questions and
developing excellent answers in the time prior to the test. If I just “cram” my studies and work into 48 hours prior to the exam, it’s likely I will get a low score on said midterm.
5. VERBAL FINAL I am aware that the final exam is long, and comprehensive, but an optional
“verbal final” is also available. The verbal final is an individual interview with the instructor where I demonstrate my mastery by explaining the biology discussed in the course. The verbal
final is pass/fail where passing results in a 100% score for the final exam.
6. GROUP GRADES I am aware that I, with the help of other students in my research group, will be authoring one research paper in lab (with a number of drafts) and my grade will include both
the score of my section of the manuscript as well as the score for the manuscript as a whole. I realize I will be expected to review the entire manuscript before submission. If this doesn’t work
well for me, I should discuss it with my group or the prof immediately.
7. HONOR CODE In the authoring of manuscripts, I accept that each draft must be submitted to http://turnitin.com for screening and thus I can and should screen my group’s draft prior
submitting it to the instructor. I am also aware that if the sections authored by me are found to be plagiarized, I will be given a zero for the LB145 course grade.
I have carefully read the above announcements and the syllabus/owner's manual. I understand the expectations are high but I’m ready. I agree to the tenets of the syllabus and this contract.
________________________________________________________________ Printed Name Signature Date

!
16

17
145 Contract (sign & return) A syllabus is a form of contract between the instructor and the students. If you, the student, complete tasks with a specific score a
predefined grade is awarded. Read the announcements below and the syllabus in full before signing and submitting this page.
1. WORKLOAD As the Undersigned student, I am aware the laboratory in this course is worth 2 credits and will require me to attend lab on average 4 hours each week. Some weeks will require
less, and some weeks will require more effort. If I prepare poorly for lab, it will take longer.
2. TOURISM I am aware that I will work with a group of students that sit together in lecture, work together as a research team in lab, write manuscripts and study together outside of class at night and on weekends. This course is designed for full-time residential LBC students and if I need to travel off-campus frequently (go home every weekend, etc), I should realize my group members
may become unhappy, and I should discuss this with them or the prof.
3. QUIZZES As the Undersigned student, I am aware that I will have a quiz or graded exercise each week and unless I read the assigned pages in the reading, take notes and study them prior to
the quiz, it’s likely I will get a low score on said quiz or exercise.
4. EXAMS As the Undersigned student, I am aware midterm exams may be purely essay style and provided in advance, and in this case I should work with my group studying the questions and
developing excellent answers in the time prior to the test. If I just “cram” my studies and work into 48 hours prior to the exam, it’s likely I will get a low score on said midterm.
5. VERBAL FINAL I am aware that the final exam is long, and comprehensive, but an optional
“verbal final” is also available. The verbal final is an individual interview with the instructor where I demonstrate my mastery by explaining the biology discussed in the course. The verbal
final is pass/fail where passing results in a 100% score for the final exam.
6. GROUP GRADES I am aware that I, with the help of other students in my research group, will be authoring one research paper in lab (with a number of drafts) and my grade will include both
the score of my section of the manuscript as well as the score for the manuscript as a whole. I realize I will be expected to review the entire manuscript before submission. If this doesn’t work
well for me, I should discuss it with my group or the prof immediately.
7. HONOR CODE In the authoring of manuscripts, I accept that each draft must be submitted to http://turnitin.com for screening and thus I can and should screen my group’s draft prior
submitting it to the instructor. I am also aware that if the sections authored by me are found to be plagiarized, I will be given a zero for the LB145 course grade.
I have carefully read the above announcements and the syllabus/owner's manual. I understand the expectations are high but I’m ready. I agree to the tenets of the syllabus and this contract.
________________________________________________________________ Printed Name Signature Date

!
1
19
Owner's Manual (with lots of ideas and text stolen from great authors, Drs. Alice Dreger and Tanya Noel) Why is this an "owner's manual" instead of a syllabus?
Most syllabi contain only class schedule information. By contrast, this is more like an "owner's manual" like the sort that comes with a new car. If you read and use this manual, you will understand how this course works, and you will be able to keep the course running smoothly, and do the regular maintenance required to avoid breakdowns. Of course, this course isn’t a car. It’s more like a bus tour. I believe that a university course is in its essence not a number, and not a topic, but a group of people who share a common goal of learning about some particular thing. In this sense, a course is like a bus tour, a tour to a place which is unfamiliar to most of us. As the teacher, I am the bus driver and chief tour guide. Each member of the course starts off at “home” intellectually and emotionally and comes to the bus station which is the classroom. We agree to "take the tour" together, to get on the bus and travel together for the length of the course even though many of us may never have met before. Together we visit a number of different "places."
So why is this "owner's manual" so long? I've discovered that the more information I give students, the more comfortable
and in control they feel, and the better they learn. This packet contains lots of information. Besides telling you about the mechanics of the course, this packet tells you a lot about my teaching style. I used to provide my students with a separate "statement of teaching philosophy." It now occurs to me it is weird to separate that teaching philosophy from my teaching materials. So now my philosophy is embedded throughout this packet. My teaching style, methods, and philosophy change over time, thanks to students who tell me what works and what doesn't work. I'm counting on you to give me lots of feedback about what is working for you and what is not, and most importantly why. It is very important to me to do a good job for you. In addition to the LB145 course learning objectives provided earlier, be aware this course aligns with the following MSU Undergraduate Learning Goals:
AnalyticalThinkingAsuccessfulstudentuseswaysofknowingfrommathematics,naturalsciences,socialsciences,humanities,andartstoaccessinformationandcriticallyanalyzescomplexmaterialinordertoevaluateevidence,constructreasonedarguments,andcommunicateinferencesandconclusions.
• Acquires,analyzes,andevaluatesinformationfrommultiplesources.• Synthesizesandappliestheinformationwithinandacrossdisciplines.• Identifiesandapplies,asappropriate,quantitativemethodsfordefiningandrespondingtoproblems.• Identifiesthecredibility,useandmisuseofscientific,humanisticandartisticmethods.
EffectiveCommunicationAsuccessfulstudentusesavarietyofmediatocommunicateeffectivelywithdiverseaudiences.
• Identifieshowcontextsaffectcommunicationstrategiesandpractices.• Engagesineffectivecommunicationpracticesinavarietyofsituationsandwithavarietyofmedia.
IntegratedReasoningAsuccessfulstudentintegratesdiscipline-basedknowledgetomakeinformeddecisionsthatreflecthumanesocial,ethical,andaestheticvalues.
• Criticallyappliesliberalartsknowledgeindisciplinarycontextsanddisciplinaryknowledgeinliberalartscontexts.• Usesavarietyofinquirystrategiesincorporatingmultipleviewstomakevaluejudgments,solveproblems,answer
questions,andgeneratenewunderstandings.
20
How does this course work in terms of the day-to-day? We will meet two times a week for the lecture class and our meetings will consist
of discussions of the readings and activities related to the topics we are investigating. Do the readings assigned for the day before you come to class and spend enough time thinking about the readings before class. You should come to class ready to summarize the readings and to ask and answer questions about them. Homework and quizzes will often be given on the readings.
Always give yourself plenty of time to do your work, and feel free to contact me whenever you need help or clarification. I like teaching and not only do I feel good when you learn, often when you learn something new, I learn, too.
Generally we will stick very closely to the attached schedule, however, the point of this class is for you to learn, so if we need to change our scheduled plans to achieve that goal, we will do so. If you feel that you need things to be done somewhat differently in class in order for you to learn better, please let me know and I will work to adjust our schedule or classroom dynamics so that we can maximize learning.
So what’s my feeling about teaching? I love it! And I think it shows – my students have voted me “honorary member of the graduating class of Lyman Briggs” (“teacher of the year”) about five times in the last fifteen years, I was given the Teacher-Scholar Award of MSU, and most recently the 2015 MSU Alumni Club of Mid-Michigan Quality in Undergraduate Teaching Award (nominated by MSU faculty and alumni for teaching) and the 2017 Outstanding Faculty Award by the ASMSU Senior Class Council (nominated by MSU graduating seniors for teaching). If you hear that I am tough, I am, but that’s because I care about your learning. If I didn’t care about your learning, I would have stayed at Stanford University.
I am delighted to have recruited amazing LAs to help you do well in the course. You will find that our LAs share my love of teaching, of biology and dedication to helping you learn. But they are tough too because they want you to learn, lots. The are trained to answer your questions with responses in the form of guiding questions. Why? because it helps you learn and remember, and they know your next class (and career) will be far more difficult and demanding than this course, you know this too.
What else besides being in class will be required of you? Note that this course uses a wider range of assignments than just several exams. This spreads out risk and stress so it's lower level day to day and allows you to assess your own learning with lower-stake quizzes etc and avoid any surprises when facing the bigger exams. All points are weighted equally and in that sense, grades are pretty simple – and you can always check your total on the online D2L gradebook – but be sure to keep your own spreadsheet and alert me if my grade data has an error. • Quizzes on readings: I will frequently give short quizzes on a day’s assigned reading at the beginning of the class meeting. These quizzes accomplish two things: (1) reward you for keeping up-to-date on the readings; (2) reward you for spending enough time on the readings to really understand them. If you read carefully, you should have little problem with the quizzes. If you have a lot of trouble with short, fast quizzes, remember there are lots of bonus options in this class you can use as substitutions. If you miss a

21
quiz because you are late or absent, you will receive a "0". These cannot be made up. • In-class "carbonless" papers: A number of times this semester I will ask you in class to write a relatively short essay response to a specific question related to the course. These assignments are designed to help you reflect on the course material and to provide me with some feedback on your thinking process. If you are absent, you will receive a "0" on the "carbonless" paper. These cannot be made up. • Final exam: You may take a Verbal Final exam or just the regular written one. Learn about the Verbal Final at the front of the Course Pack where it is provided as well as at the back of the Course Pack where a research paper on it is provided. A note on grades & FERPA:
To support blind-grading we will often request that you not list your actual name but just provide your PID. Privacy, as required by MSU FERPA regulation, will be maintained by utilizing a code that is NOT your real A-PID, so we'll call it your B-PID. Your B-PID will be listed on D2L in your personal gradebook.
Backstory: In recent years university's have become very very afraid of getting
in trouble for breaking the law called FERPA (Family Educational Rights and Privacy Act). The law was created back in 1974 to protect the privacy of students and their grades. In response to it all universities created student ID numbers so instead of placing a grade next to a person's name, instructors could place it next to a student number to maintain privacy. Many universities chose to use a student's social security number to also be their student number. When identity theft became a big problem, universities then changed all their student ID numbers from social security to become some number randomly generated in house. In recent years now the student ID number itself has become protected. In fact, while other people are permitted to know your name, and even say it aloud and post it publically, the student ID number is super protected. Thus instead of using your officially MSU-issued A-PID, in this course MSU requires that we issue a new temporary student ID. We will call these the B-PID, since they are for "who you be".
Professors can use grades in two ways: they can use grades to "sort" students
into "A" students, "B" students, etc.; or they can use grades as learning incentives and rewards. Unfortunately the sorting system generally sorts according to "talents" students either have or don't have before they ever reach a particular classroom, e.g., the talent of being able to memorize and recall a lot of things. I would rather use grades to encourage students to develop their skills, to expand their minds and interests. While students are often only familiar with positive curving (sometime called a mother's curve) a number of university classes use an actual curve that raises or lowers the grading scale with the goals to only permits a few students (like just 10 in a class of 100) to earn a 4.0 and then only a few (perhaps 20) are permitted to have a 3.5 etc. Even if everyone in the class got above a 90% on an exam the grade scale would shift up until only the prescribed number of students got a 4.0 grade. This is a real "curve" and, I will never grade on a curve like this. Our grading scale with stay exactly as stated in the syllabus and each student will get whatever grade she or he has earned

22
by the end of the semester. Nothing would make me happier than if everyone worked hard and learned a lot and got 4.0's. I would feel that we had achieved something great if everyone got a 4.0. Table 1- University-level grading system: The table below describes the relationships between grades, percent, and performance in the University-level grading system used in the LB-145 and LB-145L courses. The first column describes the letter/number grade. The second column describes the percentage associated with that grade. The third column describes the performance-level required to earn that grade.
Remember, if at any point you feel confused or distressed about your grades,
carefully review the syllabus and then please come and talk to me.
Course Structure ThiscoursewilluseapublicwebsiteandonlinetoolslikeTurnitin,CATME,Desire2Learn,andTopHat.Thecoursewebsitemayincludeonlinelessons,coursematerials,andadditionalresources.Activitiesmayconsistofreadings,discussionforums,email,journaling,wikis,andotheronlineactivities.YouwillneedyourMSUNetIDtologintothecoursetoaccessthegradesonD2L(http://d2l.msu.edu).
TechnicalAssistanceIfyouneedtechnicalassistanceatanytimeduringthecourseyoucan:
• VisittheDesire2LearnHelpSite(http://help.d2l.msu.edu/)
• VisittheTopHatSupportSite(https://success.tophat.com/s/)
LetterGrade Percentage Performance
A(4.0) 90to100%
OutstandingWork- A “4.0” is Outstanding. It literally stands out. It has the characteristics described for 3.0 and 3.5-level elements but in addition, the work by itself impressed with how much & well it was done. The student taught Prof something original.
B+(3.5) 85to89.9%MostExcellentWork- A “3.5” is Most Excellent. Every detail of the work was done extremely well and they found additional papers and evidence beyond what they were told.
B(3.0) 80to84.9%ExcellentWork-A“3.0”scoreisconsideredExcellent.Itisimpressivework,topoftheclass,andtheworkwasdoneextremelywellbutnothingbeyondwhatwasexpected.
C+(2.5) 75to79.9%PrettyGoodWork-A"2.5"isPrettyGood,thestudentdidtheminimumworkrequiredanddidaprettygoodjob,thisisexpectedattheuniversitylevelandaveragefortheclass.
C(2.0) 70to74.9% AverageWork-A"2.0"isaverage,thestudentdidtheminimumworkrequired.
D+(1.5) 65to69.9% BelowAverageWork-thestudentdidlessthanminimumworkrequired.
D(1.0) 60to64.9% PoorWork-thestudentdidlessthanminimumworkrequiredandofpoorquality.
F(0.0) 0to59.9% FailingWork-thestudentdidfarlessthanminimumworkrequiredandverypoorquality.

23
ResourcePersonswithDisabilities(RCPD)• Tomakeanappointmentwithaspecialist,contact:(517)353-9642
OrTTY:(517)355-1293
• WebsiteforRCPD:http://MYProfile.rcpd.msu.edu
Definitions, terms, transparency
Admission: I believe caffeine and sugar increase attention and learning but have no empirical data to support this, except for donuts, that is documented but just for 15 minutes post eating. I like the drink called the Cortado (it’s coffee, like a tiny latte) but particularly enjoy the moment I pour cane sugar out of the brown paper packet on top of the frothed milk and watch it sink into the drink. When you come to office hours, unless there’s a rush, I’ll likely offer you an espresso. Just sayin'. Attendance: Student learning is impacted by many things, yet education research has robustly shown it is significantly impacted by these three things: class size, teacher quality and attendance. You are, of course, permitted to skip any class meeting you wish but often a single clicker point is made available to you, to encourage attendance since it correlates with learning. Attendance at the meeting of a class will be defined as being physically present in the room for the full time period of the class meeting. Thus be present, in your seat with you notebook open and pen in hand, at the very beginning when the clock in room strikes the hour and class begins, still there during/throughout the entire duration of the class, as well as at the very end of the official time period (feel free to come and go to visit the restroom, just not off vacationing elsewhere). It’s only fair to treat students who arrive late exactly the same as those who depart early. We will often reward students for attendance by using technology to record your presence. If you fail at using your device to click-in for attendance at the beginning middle or end of class, due to whatever reason, be aware we do not micromanage the attendance data (no appeals). Making the choice to schedule another course that has a start or finish time that is proximal or even overlaps with this class is, of course, your choice and entirely acceptable. Yet this will not change the definition of attendance or waive it. University students are adults and literally everything in a course is optional, yet if you want points, in this case for attendance (and more importantly to learn) you have to be there. Opera: Do you like the Opera? I am sucker for a good Italian opera with tenors belting out classic arias or whatever. Yet, related to attendance, while strolling into class 3, 5, 7, 15 minutes late may feel like a choice, e.g. “I’m an adult”, sure, but distracting the learning of other students in the room, who paid thousands of dollars for the class, is a problem and it does impact their learning. Part of my job is to protect student learning from distraction. If ten students turn up late to a class each day it meets and they arrive at different moments, e.g. 3, 5, 7, 15 minutes late, the students in the room are distracted regularly and significantly. Consider how distracting that is when people come in and you’re trying to watch a movie at the cinema. Thus please avoid trickling in and instead gather with other late arrivers and usher yourselves in all at one moment whenever possible. Participation: It turns out participation is different than attendance. It refers to a student who is actively working to learn the materials discussed in the course. Students who are
24
active participants do not merely talk during class but also prepare in advance for class. This means carefully completing the readings, taking notes on them (best for learning, do this by hand written notes on paper) and preparing for the upcoming class meeting by reviewing notes and highlighting any questions you thought of while preparing for class. To reward this behavior, which enhances learning, often there will be a pop quiz or problem or writing exercise during class which is scored. Also there are clicker questions during lecture and you earn a point each time you chose a correct answer. You only need to get half of all clicker points to earn a perfect 100% score for participation. And, if you go above that level, all those extra clicker points become extra credit for you and help fill in for points you lost on any other assignment in the course. If you prepare for class you’ll get lots of points and if you don’t you get less. This helps increase the number of people that ultimately decide they need to study the material prior to class and as a result also learn more when discussing the material again in class. If you prepare, class is fun and interesting. If you don’t it becomes confusing and frustrating, as it feels like everyone else seems to know all the answers while you don’t even understand the questions. Viewing Star Wars & The Matrix on your laptop during class: I was a youngster in 1977 when the first Star Wars film came out and really enjoyed it. Also really thought The Matrix was fantastic back when it came out. Yet, even though I love those films, I am aware it is incredibly distracting to other students when someone near them in class has open their laptop’s massive vivid screen displaying films or email or Instagram or Twitter or working on the paper due next class, or more likely all of the above simultaneously. Thus while you can temporarily open a laptop to use it as a clicker or check the textbook for a few minutes, if your want to just leave it open for long periods sit in a seat where no students can be behind you. Similar to sitting in class and opening a big paper newspaper, how often have you been in a class when that happens?, opening a big screen that is like a vivid active billboard is not permitted if it distracts others. On the other hand, small tablets that lay flay in front of you, like a notebook, may be used wherever and wherever you like, since they are not as “in your face” as a near vertical screen can be. But don’t prop up your tablet like a laptop. You are allowed to distract yourself but not others (see additional info in Tips from Tanya below). Random calling in lecture: How often have you been in a big lecture class that has about 8 students sitting down near the front, who are the only people who ever are called upon to answer the professor’s questions in lecture? The other 100+ students throughout the entire semester will generally never speak aloud during lecture. After awhile you get used to it. Everyone knows that “those students” answer questions, so we don’t have to, cool. Yet, deep down you know, while it’s comfortable to never have to answer a question, it likely reduces your learning, heck some folks fall asleep. My wife tells a story about a small class where the Prof always asked these incredibly difficult questions that nobody ever even understood. Then one day, near the end of the semester, she did the reading prior to class and during class realized that ever single question the Prof asked was directly out of the reading. She was embarrassed because she realized the Prof must know nobody does the reading, given no student ever even understood the questions he asked even though they were right out of the first pages of each reading. Because our goal in this class is learning we will use random calling in lecture to help everyone increase their learning and gain skills at communication/public speaking. Blind grading: When a computer scores a scantron bubble sheet from a multiple choice exam, it is objective, it doesn’t have a pre-conception as to which students are smart, or
25
are nice to it, etc, so it treats everyone the same and just rewards correct answers. Unfortunately, human graders are less objective. LAs, GTAs, and Profs, are all unable to be perfectly objective when they have already had interactions with the person whose work they are grading. While they try hard to be so, education research shows that even knowing what the person’s name is will impact the grader and grade (even if they never met the person). Thus imagine if they know the person reasonably well. If they have read prior papers, knew the person’s prior grades, or had a number of positive (or negative) conversations with a student. Wow, that will cause major problems when trying to be objective while grading even for the best teacher ever. Unless the grader is blind to the identity of the author. Professional journals and grant review panels use single blind or double blind systems to avoid subjective evaluation. We will use this in our class too. ---"Tips from Tanya": Some points for students about technology in the classroom Author: Dr. Tanya Noel Almost everyone has a smartphone, laptop, tablet, or combination of these devices with them during their waking hours (and beyond, in some cases). There is huge potential for distraction using these devices – which is fine if you’re waiting in a long, boring line or on the bus, but can be problematic in the classroom. Be aware of: ◦ There have been studies that have shown “multi-tasking” in class is detrimental to
learning. (Actually, the evidence overwhelmingly suggests humans can’t really multi-task … or, at least, can’t multi-task well!) If you’re trying to go back and forth between course-related stuff and other websites (or assignments for other courses, etc.), this will affect how well you’re learning/working.
◦ Notifications (e.g., beeps/vibrations for new emails, text messages, etc.) are
highly distracting, and feed into “reward systems” in the brain that can reinforce behaviors like frequently checking your phone, Facebook, etc. (You know that uncomfortable feeling that makes you check your phone/email? Your brain gets a dopamine hit when you give into that urge … and makes it more likely to continue the behavior leading to the reward.) Consider turning off these notifications, at least during class and other times when you want to be able to focus uninterrupted. (Some people have found turning off notifications altogether has helped them not only focus, but reduced their stress levels!)
◦ Online videos are highly distracting in class to students nearby. (They’re
obviously distracting to the person with the device, but they chose to be distracted!) If you really have to watch video in class, please make sure the sound is off (or you’re wearing headphones), and sit somewhere out of sight of others (e.g., back corner of room).
◦ Note-taking on computers (vs. by hand) is associated with lower-quality
learning/test scores. Results from some recent studies (admittedly under some very specific conditions) have supported the idea that writing notes by hand on paper is superior to taking notes on the computer. There are a number of hypotheses about this, but many experts agree that taking notes by hand involves more thinking about what’s important and worth writing down (as you can’t transcribe every word spoken by the professor). On the computer, it is tempting to try to record everything verbatim, with the brain not processing much of the information. Interestingly, one study found that an activity akin to live-
26
tweeting course content was associated with learning – perhaps the effort required to distill information into 140 character tweets is similar to the type of cognition involved in making good hand-written notes! If you take notes by computer, develop the habit of summarizing important points, and/or noting things you want to look up outside of class (and why). It’s probably helpful to review your notes regularly, summarizing and integrating material.
References:
Barry S, Murphy K, Drew S. 2015. From deconstructive misalignment to constructive
alignment: Exploring student uses of mobile technologies in university classrooms. Comput. Educ. 81:202–210.
Dahlstrom E, Bichsel J. 2014. Educause Center for Applied Research (ECAR) Study of Undergraduate Students and Information Technology, 2014. Res. Pap. [accessed 2015 June 21] http://net.educause.edu/ir/library/pdf/ers1407/ers1407.pdf
Fried CB. 2008. In-class laptop use and its effects on student learning. Comput. Educ. 50:906–914.
Gaudreau P, Miranda D, Gareau A. 2014. Canadian university students in wireless classrooms: What do they do on their laptops and does it really matter? Comput. Educ. 70:245–255.
Kuznekoff JH, Munz S, Titsworth S. 2015. Mobile Phones in the Classroom: Examining the Effects of Texting, Twitter, and Message Content on Student Learning. Commun. Educ.:1–22.
Mueller PA, Oppenheimer DM. 2014. The Pen Is Mightier Than the Keyboard: Advantages of Longhand Over Laptop Note Taking. Psychol. Sci. 25:1159–1168.
Murphy Paul A. May 3 2013. You’ll Never Learn!: Students can’t resist multitasking, and it’s impairing their memory. Slate. [accessed 2015 June 30] http://www.slate.com/articles/health_and_science/science/2013/05/multitasking_while_studying_pided_attention_and_technological_gadgets.html
Ravizza SM, Hambrick DZ, Fenn KM. 2014. Non-academic internet use in the classroom is negatively related to classroom learning regardless of intellectual ability. Comput. Educ. 78:109–114.
Samson P. 2010. Deliberate engagement of laptops in large lecture classes to improve attentiveness and engagement. Comput. Educ. 20:1–19.
Sana F, Weston T, Cepeda NJ. 2013. Laptop multitasking hinders classroom learning for both users and nearby peers. Comput. Educ. 62:24–31.
Shirky, C. Sept. 8 2014. Why I Just Asked My Students To Put Their Laptops Away. Medium. [accessed 2015 June 30] https://medium.com/@cshirky/why-i-just-asked-my-students-to-put-their-laptops-away-7f5f7c50f368
Weaver BE, Nilson LB. 2005. Laptops in class: What are they good for? What can you do with them? New Dir. Teach. Learn.:3–13.
Weinschenk, S. Sept. 11 2012. Why We’re All Addicted to Texts, Twitter and Google. Psychology Today [accessed 2015 June 30] https://www.psychologytoday.com/blog/brain-wise/201209/why-were-all-addicted-texts-twitter-and-google

Exam Information

!
2
Exams
What to Expect
In LB 145, we attempt to use various methods of assessment to evaluate your effort and learning during the course. These include homework assignments, quizzes in recitation, writing papers as a group and individually and three exams (2 midterms and a final). While the exams are not the sole source of how your learning is evaluated (and scored for grades) they are a significant part of the course and we would like you to do very well on them. As a result, we have provided some information in the next few pages to help you do well on exams.
The first midterm exam will likely be a multiple-choice exam designed to test basic knowledge and application of course content. The second midterm exam will likely be essay style. In the pages that follow we have provide you a sample midterm exam and information on the optional verbal final exam.
Your Responsibilities
You are expected to read assignments and exam essay questions ahead of the exam and work individually and with your classmates to develop good answers for all the questions provided (you will be required to answer all of them for the exam). Make sure you really address the question and topic fully. Make an outline of your answer and make a first draft and second draft to be sure you have a 4.0 level response. Re-read the question frequently to be sure you are still really answering what it asks. Ask Dr. Luckie what the question means or if you got it all before assuming you did. If you don’t read these essays and do this work prior to the exam, you shouldn’t be surprised if you become overwhelmed and recieve a poor grade.
2

!
Final Exam
1

!
2

The Verbal Final What is it? Throughout the course of LB145, we strive to assess your learning and understanding of the material. This is done using homework assignments, quizzes, PBAs, papers, and several exams. The Verbal Final is a very unique method that we employ which most students may not be familiar with. In this case, it is an optional way to take the final exam and earn a 100% if you pass the exam with no limit on the number of attempts allowed. There is no penalty for not taking it or not passing, you simply must then take the normal final exam. A Verbal Final is a test of not only your knowledge on the subject matter but also how well you understand the concepts behind it using critical thinking. Material covered is the same as for the final exam but you will answer questions one-on-one verbally and with illustrations you draw. This year, to be able to schedule a verbal final with Dr. Luckie, you must first pass with an LA and have a Verbal Final Receipt filled out and signed. When the last two weeks of class arrives, anyone who has not previously done a verbal final will not be allowed to schedule one with an LA or Dr. Luckie. In the last week of class, if you have not previously tried with Dr. Luckie you cannot schedule a time with him. This is in place to reward students who have been working hard since time slots opened. Everyone should take advantage of this opportunity. Even if you do not pass with Dr. Luckie, you will have already been studying the material for the final exam as a result of your preparations and will have gained a greater understanding of the material. It is beneficial to everyone who participates and you can read about the evidence that it will increase your learning in LB145 as well as upper-level science courses in the Luckie et al. 2013 research paper from the journal CBE-Life Science Education, proof of paper in the Appendix.
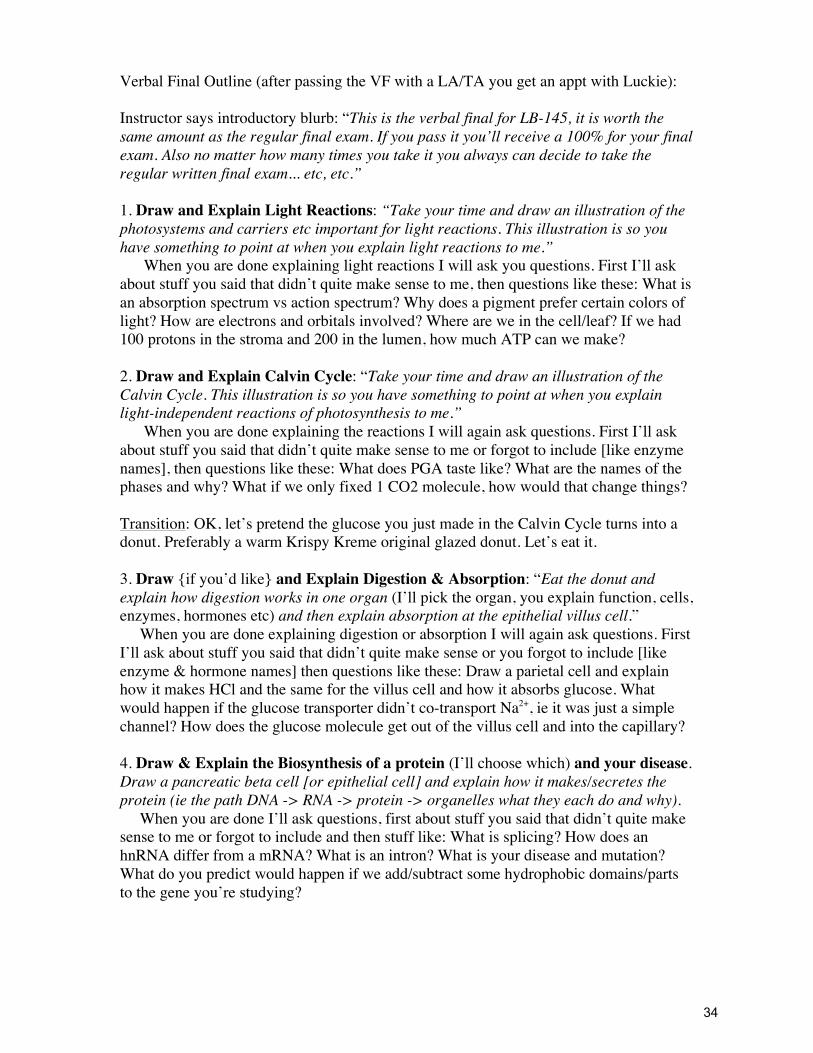
Verbal Final Outline (after passing the VF with a LA/TA you get an appt with Luckie): Instructor says introductory blurb: “This is the verbal final for LB-145, it is worth the same amount as the regular final exam. If you pass it you’ll receive a 100% for your final exam. Also no matter how many times you take it you always can decide to take the regular written final exam... etc, etc.” 1. Draw and Explain Light Reactions: “Take your time and draw an illustration of the photosystems and carriers etc important for light reactions. This illustration is so you have something to point at when you explain light reactions to me.” When you are done explaining light reactions I will ask you questions. First I’ll ask about stuff you said that didn’t quite make sense to me, then questions like these: What is an absorption spectrum vs action spectrum? Why does a pigment prefer certain colors of light? How are electrons and orbitals involved? Where are we in the cell/leaf? If we had 100 protons in the stroma and 200 in the lumen, how much ATP can we make? 2. Draw and Explain Calvin Cycle: “Take your time and draw an illustration of the Calvin Cycle. This illustration is so you have something to point at when you explain light-independent reactions of photosynthesis to me.” When you are done explaining the reactions I will again ask questions. First I’ll ask about stuff you said that didn’t quite make sense to me or forgot to include [like enzyme names], then questions like these: What does PGA taste like? What are the names of the phases and why? What if we only fixed 1 CO2 molecule, how would that change things? Transition: OK, let’s pretend the glucose you just made in the Calvin Cycle turns into a donut. Preferably a warm Krispy Kreme original glazed donut. Let’s eat it. 3. Draw {if you’d like} and Explain Digestion & Absorption: “Eat the donut and explain how digestion works in one organ (I’ll pick the organ, you explain function, cells, enzymes, hormones etc) and then explain absorption at the epithelial villus cell.” When you are done explaining digestion or absorption I will again ask questions. First I’ll ask about stuff you said that didn’t quite make sense or you forgot to include [like enzyme & hormone names] then questions like these: Draw a parietal cell and explain how it makes HCl and the same for the villus cell and how it absorbs glucose. What would happen if the glucose transporter didn’t co-transport Na2+, ie it was just a simple channel? How does the glucose molecule get out of the villus cell and into the capillary? 4. Draw & Explain the Biosynthesis of a protein (I’ll choose which) and your disease. Draw a pancreatic beta cell [or epithelial cell] and explain how it makes/secretes the protein (ie the path DNA -> RNA -> protein -> organelles what they each do and why). When you are done I’ll ask questions, first about stuff you said that didn’t quite make sense to me or forgot to include and then stuff like: What is splicing? How does an hnRNA differ from a mRNA? What is an intron? What is your disease and mutation? What do you predict would happen if we add/subtract some hydrophobic domains/parts to the gene you’re studying?
34
Verbal Final with TA
Student ________________________ Date ___________________
(Start time ____:____ End time ____:____)
The student made a good effort and just needs to study these areas:
◊ Light Reactions
◊ Calvin Cycle
◊ Digestion
◊ Absorption
◊ Circulation
◊ Central Dogma
As well as ______________________________________________________________
The student made a great effort and needs to practice in these areas:
◊ Light Reactions
◊ Calvin Cycle
◊ Digestion
◊ Absorption
◊ Circulation
◊ Central Dogma
As well as ______________________________________________________________
The student made an outstanding effort and passed. There is no way
they will fail when facing Dr. Luckie.
Teaching Assistant/Learning Assistant NAME __________________________________
3

!
3

Verbal Final with TA
Student ________________________ Date ___________________
(Start time ____:____ End time ____:____)
The student made a good effort and just needs to study these areas:
◊ Light Reactions
◊ Calvin Cycle
◊ Digestion
◊ Absorption
◊ Circulation
◊ Central Dogma
As well as ______________________________________________________________
The student made a great effort and needs to practice in these areas:
◊ Light Reactions
◊ Calvin Cycle
◊ Digestion
◊ Absorption
◊ Circulation
◊ Central Dogma
As well as ______________________________________________________________
The student made an outstanding effort and passed. There is no way
they will fail when facing Dr. Luckie.
Teaching Assistant/Learning Assistant NAME __________________________________
3

!
4

Lecture Handouts
41

!!
!!
4

Lecture'!What'to'Expect'!
LB$145!is!fundamentally!the!examination!of!what!processes!go!on!inside!a!cell!and!lead!to!life.!In!the!first!few!meetings!of!the!course,!we!study!the!gross!anatomy!of!the!cell!and!review!the!different!structures!inside!eukaryotic!and!prokaryotic!cells.!For!the!remainder!of!the!course,!we!focus!on!the!eukaryotic!cell!and!move!from!organelle!to!organelle!deeply!examining!each!and!how!it!works!(organelle!anatomy!&!physiology).!Specifically,!in!the!first!half!of!the!course!we’ll!focus!on!plant!chloroplasts!and!how!they!can!capture!light!energy!and!use!it!to!MAKE!carbohydrates!(photosynthesis).!In!the!second!half!of!the!course,!we’ll!examine!mitochondria!and!what!happens!inside!them!to!BREAKDOWN!carbohydrates!and!create!energy!to!sustain!life!(metabolism$respiration),!as!well!as!examining!the!nucleus,!ribosomes!and!endomembrane!system!where!the!function!of!DNA,!RNA!and!proteins!is!defined!(protein!synthesis).!We!will!also!discuss!Physiology!to!add!a!larger!scale!context!to!what!cells!are!doing.!!
Class!meetings!on!Tuesdays!and!Thursdays!will!involve!plenty!of!lectures,!but!also!readings,!story$telling,!student!presentations,!discussions,!problem$solving,!‘biology!theatre,’!demonstrations!and!more.!You!will!be!a!part!of!a!‘study/research!group’!that!should!learn!together!in!lecture,!lab,!and!study!together!outside!of!class.!We!will!cover!an!enormous!amount!of!biology!but!we’ll!try!to!make!class!as!active!and!cooperative!as!possible.!The!grading!scale!for!the!course!will!be!a!flat!scale!(ie!“no!curve”!80$84.9%=!3.0,!85$89.9%=!3.5,!>90%!=!4.0).!Thus!your!grade!will!not!be!harmed!by!other!students!doing!well.!In!fact,!I!will!have!no!hesitation!giving!a!4.0!to!every!student!in!the!class!(this!literally!is!our!goal).!!
There!will!be!in$class!quizzes!and!writing!assignments!that!are!due!at!the!end!of!each!class.!You!will!occasionally!be!given!a!handout!(some!which!are!included!in!this!course!packet)!yet!you!will!always!be!expected!to!take!copious!notes!while!reading!the!textbook!and!during!lecture.!There!will!be!two!midterm!examinations!and!a!comprehensive!final!examination!during!finals!week.!!
Your'Responsibilities'!
You!are!expected!to!read!assignments!ahead!of!the!class!meeting!scheduled!to!address!that!topic,!take!detailed!notes,!and!study!them.!In!lecture!we!will!often!discuss!only!particular!parts!of!a!chapter!or!even!topics!that!build!upon!the!reading!(not!review!it).!If!you!don’t!read!prior!to!the!class!meeting,!you!shouldn’t!be!surprised!if!you!become!lost!during!the!discussions.!If!on!the!other!hand!you!actually!read,!take!notes!and!study!prior!to!each!lecture!you!will!become!one!of!those!really!smart!students,!who!just!seems!to!know!everything!in!class.!!
4

!
44
Chapter Checklists
45
Chapter Checklists for each lecture I strongly suggest attaching a sheet for the current week to your “work wall” where you can see
it at a glance and literally check off items as you complete them.
Before first day of class:
Obtain supplies for course: online textbook, course pack, carbonless-paper notebook, lecture notebook and TopHat online homework system. *See course website for more details (msu.edu/course/lb/145/).
1. _______ Buy ($25) the LB145 Lecture & Lab Course Packet (for students in Luckie's sections) at the Collegeville Textbook Store at 321 E. Grand River Ave in East Lansing (ctcmsu.com, 517-922-0013). This Course Pack contains the syllabus, lecture handouts, learning objectives, lab manual, lab notebook, scientific papers and more. A pdf of the Course Packet is also available on the course website for easy 24/7 access.
2. _______ Buy ($35) our online Integrating Concepts in Biology (ICB) textbook. Do not buy an expensive $259 Biology textbook! Please just buy this $35 online textbook. Note: this textbook is custom-assembled just for this class, so be sure to buy Luckie's version of the ICB textbook (trunity.org/textbooks/52632).
3. _______ Buy ($7) a Carbonless-Paper Notebook for in-class writing exercises (you write, it also makes a copy, you can turn in one copy and keep the other): Buy this cheap online (Amazon $6.99), or you can always find one at the SBS bookstore at 421 E. Grand River Ave in East Lansing, in the "Lab Notebook" section (sbsmsu.com, (517) 351-4210).
4. _______ Buy ($20) access to TopHat online homework & clicker system. Do not spend $100+ for an online homework system like Mastering Chemistry/Biology and then also buy a $50 clicker you might break or lose. Please just buy the $20 TopHat online homework system for the semester, which also permits you to use your phone/tablet/laptop as a clicker. Click the TopHat.com link on course website.
5. _______ Buy ($5) a traditional paper Lecture Notebook. Can be spiral bound or 3-ring bound as long as there is real paper that you'll write on lots (mostly for taking notes when doing the readings prior to lecture). Be sure to write all notes by hand because it greatly increases your learning.1
1 Mueller PA, Oppenheimer DM. 2014. The Pen Is Mightier Than the Keyboard: Advantages of Longhand Over
Laptop Note Taking. Psychol. Sci. 25:1159–1168. (https://www.npr.org/2016/04/17/474525392/attention-students-put-your-laptops-away)

Chapter Checklists
46

Chapter Checklists
47
Week 1
(Preparing for the first day of class) Tuesday's lecture:
Budgeting homework time (45 min): Read the 1995 Review paper on Cystic Fibrosis by Welsh and Smith on pages 267-274 of your Course Pack. Take a few handwritten notes in your notebook that focus on defining the normal functions of the CFTR protein and what happens to it that leads to the disease.
(Preparing for the second day of class) Thursday's lecture:
Budgeting homework time (70 min): Ch. 1, section 1.2 is approximately 2600 words in length. At what's considered slow reading speed, 200 words per minute, reading section 1.2 should take 13 minutes. But when done properly, when you pause to review figures, read and think about a few of the Integrating Questions, and take careful notes, if you focus (avoid distraction) it should take you approx. 70 minutes.
1. _______ For the first lecture, read the 1-page Foreword written by the very famous Dr. Bruce Alberts, review the Student Resources in Chapter 0, and then begin reading Chapter 1: Heritable Material of our textbook, Integrating Concepts in Biology (ICB). Read the single Introduction page, and the short section 1.1 of Chapter 1, but you do not need to take notes on any of those pages.
2. _______ Then slowly read the section we will discuss most during lecture, section 1.2 "What is the heritable material?" As you read section 1.2 on your computer or tablet be sure to take handwritten notes in your lecture notebook (handwritten notes lead to much greater learning2).
3. _______ Try to answer at least one Integrating Question (IQ) in each set. As you read the ICB textbook always attempt to answer at least one of the yellow Integrating Questions each time you get to a set of them. It will help you test yourself to determine if you got the meaning, or not, while reading the last few paragraphs. Just like taking handwritten notes, this too will greatly increase your learning. If you desire a high grade in the course, try to answer more IQs. NOTE: Assume you will be asked a question in lecture which is directly from one of the IQs.
4. _______ Trifecta: Prepare to explain (aloud) Figures 1.2, 1.3 and Table 1.1 in class. As you read a section from the ICB textbook always attempt to pause and study each figure/drawing/table that is discussed. Some of them are just pictures or drawings and may not require lots of thinking, but others are graphs or tables that contain actual data from research experiments. Spend more time looking at these. In class, during lecture, students will be randomly chosen to explain a Figure or Table aloud (LA will hand you a microphone) so prepare for when your name is called to be sure you are ready. Some students avoid stress by just writing out in their notebook an explanation of the Purpose, Methods and Findings of each data figure (we call these three things the Trifecta). If it's already written down then you can just read aloud what you wrote, like: "Purpose: Dr. Griffith wanted to determine...., Methods: his group worked with mice and pneumonia bacteria called...., Findings: in the end they found evidence that ...".
5. ________ Advanced TIP reported from prior student: "The way the textbook explained this figure did not make sense to me, so I scrolled down to the bottom of the page and clicked on link to the original paper and read about the same figure in that. The way the paper explained it made so much more sense and cleared up what I was confused about. Tell other students about this!"
2 Mueller PA, Oppenheimer DM. 2014. The Pen Is Mightier Than the Keyboard: Advantages of Longhand Over Laptop Note Taking. Psychol. Sci. 25:1159–1168. (https://www.npr.org/2016/04/17/474525392/attention-students-put-your-laptops-away)

Chapter Checklists
48

Chapter Checklists
49
Week 2
(Preparing for) Tuesday's lecture:
Budgeting homework time (45 min): Ch. 4, section 4.1 is about 1250 words in length and ELSI 4.1 is 1100 words thus the total is 2350 words. At 200 words per minute, reading section 1.2 & ELSI should take 12 minutes, but when done properly, when you pause to review figures, read and think about a few of the Integrating & Review Questions, and take careful notes, this homework assignment should take you more like 45 minutes (and longer if you are distracted by texts, friends, email etc.).
1. _______ For the second lecture, read the introduction page of Chapter 4: Evolution and Origin of Cells in the ICB textbook, but you do not need to take notes on that page. Then slowly read section 4.1 "What is Evolution?" and as you read it on your computer be sure to take handwritten notes*. Last, read the section Ethical, Legal, Social Implications (ELSI) 4.1: "Are evolution and religion compatible?" You do not need to take notes on the ELSI reading, just think about it.
2. _______ Try to answer some Integrating Question and Review Questions. As you read the ICB textbook always attempt to answer at least one of the yellow Integrating Questions each time you get to a set of them. Also answer the green Review questions.
3. _______ (Trifecta): Prepare to explain (aloud) Figures 4.1, 4.2 and ELSI Figure 4.1 in class. As you read a section from the ICB textbook always attempt to pause and study each figure/drawing/table that is discussed. In class, during lecture, you may be randomly chosen to explain these aloud (the LA will hand you a microphone so everyone can hear you in lecture) so prepare well.
4. _______ Advanced TIP: scroll down to the bottom of the page and click on the link to an original version of Darwin's Origin of Species, peek at it, and look at some of the other research papers in the Bibliography to get used to, and in a habit of, doing this.
(Preparing for) Thursday's lecture:
Budgeting homework time (70 min): In Ch. 4, the first 2/3's of section 4.2 is 3000 words in length which should take 15 minutes if you just read it. But when done properly, when you pause to review figures, read and think about a few of the Integrating Questions, and take careful notes, this homework assignment should take you more like 70 minutes (and that's if you are not distracted).
1. _______ For the third lecture of the semester, read Chapter 4's section 4.2 "Could abiotic molecules form biologically important molecules before life evolved?" and as you read it on your computer be sure to take handwritten notes*. You should focus mostly, and only take detailed notes for, the first 2/3s of the section. You can stop taking notes once you complete the yellow Integrating Questions 5 & 6. Read the remaining section regarding RNA and directed evolution, but no notes needed on this, just be amazed at what is said.
2. _______ Try to answer some Integrating Question and Review Questions. As you read the ICB textbook
always attempt to answer at least one of the yellow Integrating Questions each time you get to a set of them. Also try to answer the green Review questions.
3. _______ (Trifecta): Prepare to explain (aloud) Figures 4.5, 4.6, and 4.8 in class (Purpose, Methods, Findings)
4. _______ Advanced: Click on "Explore More on Abiotic Production of Organic Molecules" to learn a little about research published in 2016. Just take a peek, read the abstract.

Chapter Checklists
50

Chapter Checklists
51
Week 3
(Preparing for) Tuesday's lecture:
Budgeting homework time (70 min): In Ch. 4, the first half of section 4.3 is 2000 words in length and section 4.4 is 1500 words, totaling 3500. This should take 17 minutes if you just read it. But when done properly, when you pause to review quite a few figures, read and think about a few of the Integrating Questions, and take careful notes, this homework assignment should take you more like 70 minutes (if you are focused). Special Allowance: Your group can divide up the Trifectas for this lecture.
1. _______ For Tuesday's lecture, read Chapter 4's section 4.3(1st half) in the ICB textbook, and then section 4.4. For section 4.3 "Can non-living objects compete and grow?" you only need to carefully read and take notes on items up to and including information related to Figure 4.13. Then stop taking notes and just read the rest to learn about research on vesicles competing with each other. Explore Bio-Math Exploration 4.2 if you find it interesting. Then read and take notes on all of the short reading in section 4.4 "Can non-living objects harvest and store energy?". Be sure to take handwritten notes.
2. _______ Try to answer some Integrating Question and Review Questions. As you read the ICB
textbook always attempt to test yourself a little, answer at least one of each set.
3. _______ (Trifecta): Prepare to explain (aloud) Figures 4.11, 4.12, 4.13 and 4.17 in class. *Special Allowance today*: If you wish your group can designate who will be responsible for each figure and thus split up the responsibility and reduce the load (Purpose, Methods, Findings).
(Preparing for) Thursday's lecture:
Budgeting homework time (60 min): In the Chapter Photosynthesis (OSB) section 8.1 is 1624 words but has quite a few figures. This should take 8 minutes if you just read it. But when done properly, when you pause to review figures and take good notes, this assignment should take you more like 45 minutes. Give yourself at least 10 more minutes to google and read about Lynn Margulis and take a few notes.
1. _______ For Thursday's lecture, first google "Lynn Margulis" to find, read about, and take notes on, the endosymbiotic hypothesis. Then in the chapter Photosynthesis (OSB), read section 8.1 "Overview of Photosynthesis" and take handwritten notes.
2. _______ (Tip): Prepare to explain (aloud) the anatomy of a chloroplast, and Figure 6, in class.
3. _______ Advanced: Take a peek at section 8.2, in particular study Figure 7. Be ready to act out this process in class.

Chapter Checklists
52
Chapter Checklists
53
Week 4
(Preparing for) Tuesday's lecture:
Budgeting homework time (60 min): Photosynthesis (OSB) section 8.2 is 2603 words in length, but has quite a few figures. This should take 13 minutes if you just read it. But when done properly, when you pause to review figures and take careful notes, this assignment should take you more like 60 minutes.
1. _______ For Tuesday's lecture, in the chapter Photosynthesis (OSB) read section 8.2 "The Light-Dependent Reactions of Photosynthesis" and as you read it on your computer be sure to take handwritten notes in your lecture notebook.
2. _______ (Tip): While you are reading focus mostly and take notes regarding Figures 5, 7, and 8.
We will discuss these in class.
3. _______ Advanced: Take a peek at section 8.3, in particular study Figure 1. Take a sneak peek at "Chapter 11: Photosynthesis", section 11.1, study Figures 11.2 and 11.3.
(Preparing for) Thursday's lecture:
Budgeting homework time (60 min): Photosynthesis (OSB) section 8.3 is 1573 words in length, and does not have many figures. This should take 13 minutes if you just read it. But the video is 12 minutes and when done properly, when you pause to review figures and take careful notes, this assignment should take you more like 60 minutes.
1. _______ For Thursday's lecture, read section 8.3 "Using Light Energy to Make Organic Molecules" (1573 words) in the chapter Photosynthesis (OSB) and take handwritten notes.
2. _______ (flipped classroom) Watch the 12min lecture by Mr. Andersen provided where he gives quickly reviews Photosynthesis. Add to your notes any interesting points he makes that helped you better understand the parts of the cell and what they do.
3. _______ (Tip): While reading, focus mostly and take notes regarding Figures 1, and 2. We will discuss these in class.
4. _______ Advanced: Take a sneak peek at "Chapter 11: Photosynthesis", section 11.1, in particular study Figures 11.4.

Chapter Checklists
54
Chapter Checklists
55
Week 5
(Preparing for) Tuesday's lecture:
Budgeting homework time (70 min): Chapter 11 section 11.1 is long with many figures that require thinking and notetaking. The first 2/3's of it is the most important part and just reading that part, which is 3800 words, should take 21 minutes or longer. The data figures are important while those that are just drawings, like 11.3, 11.6, 11.7, 11.9, are not. Of course, when done properly, when you pause to review figures, try Integrating Questions, and take notes, this assignment will take you more like 70 minutes. Special Allowance: Your group can divide up the Trifectas for this lecture.
1. _______ For Tuesday's lecture, read Chapter 11: Photosynthesis, section 11.1 "Why is paraquat used in America but illegal in Europe?" and as you read it on your computer be sure to take handwritten notes in your lecture notebook. Please read carefully and take good notes for the first 2/3s of the section (which is about 3800 words). You can stop taking notes when you come to the yellow box of Integrating Questions #11-14. Then just read the last 1/3 of the section for deeper thought and better understanding.
2. _______ Try to answer some Integrating Questions and Review Questions. As you read the ICB textbook always attempt to test yourself a little, answer at least one of each set.
3. _______ (Trifecta): Prepare to explain (aloud) Figures 11.1B, 11.2A, B, C, 11.4, 11.5, and 11.8A
in class. *Special Allowance today*: If you wish your group can designate who will be responsible for each figure and thus split up the responsibility and reduce the load (Purpose, Methods, Findings).
4. _______ Advanced: Take a peek at section 8.3, in particular study Figure 1. Take a sneak peek at "Chapter 11: Photosynthesis", section 11.2.
(Preparing for) Thursday's lecture:
Budgeting homework time (70 min): Chapter 11 section 11.2 is 3593 words in length with several data figures that require thinking and notetaking for the Trifecta. Reading at 200 words per minute would mean the section might take 18 minutes to read. Of course, when done properly, when you pause to review figures, try Integrating Questions, and take notes, this assignment will take you more like 70 minutes. It could be shorter if you have been doing homework regularly, ie. training like an athlete, and getting much better at this now that it is week 5.
1. _______ For Thursday's lecture, read Chapter 11: Photosynthesis, section 11.2 "How does Brazil’s rainforest affect Greenland’s glaciers?" (3593 words), and take handwritten notes in your lecture notebook.
2. _______ Try to answer some Integrating Questions and Review Questions. As you read the ICB textbook always attempt to test yourself a little, answer at least one of each set.
3. _______ (Trifecta): Prepare to explain (aloud) Figures 11.11 (just pick one graph), 11.12, 11.13,
and 11.15 (Purpose, Methods, Findings).

Chapter Checklists
56

Chapter Checklists
57
Week 6
Tuesday lecture:
EXAM I
(Preparing for) Thursday's lecture:
Budgeting homework time (75 min): This is a professional Review Paper that is 4500 words in length from an important medical journal so it will take some time to read, but if you have gained some understanding about CF while working in the lab this semester you should be able to more quickly grasp most of what is discussed. If you struggle with the text, focus on each figure and determine what it is trying to explain. Scientists almost always first focus on the figures.
1. _______ For Thursday's lecture, read Steven Rowe et al's review paper "Mechanisms of Disease" on Cystic Fibrosis published in New England Journal of Medicine back in 2005. This paper is provided at the back (around page 275) of your Course Pack. You do not need to take notes from all, simply read for your own learning and to help you with your research.
2. _______ Write out in your lecture notebook your explanation for Figures 1, 3, and 5.
3. _______ (Tip): Prepare to explain (aloud) Figures 1, 3, and 5 in class. While reading, focus mostly on the figures. We will discuss these in class. Be prepared to state aloud what each figure is trying to explain or communicate. Prioritize Figures 1, 3, and 5 as most important to understand and be able to explain in class.

Chapter Checklists
58

Chapter Checklists
59
Week 7
(Preparing for) Tuesday's lecture:
Budgeting homework time (60 min): Chapter 5 section 5.1 is 2090 words in length with several data tables and figures that require thinking and notetaking for the Trifecta. Reading at 200 words per minute would mean the section might take 10 minutes to read. Of course, when done properly, when you pause to review figures, try Integrating Questions, and take notes, this assignment will take you more like 60 minutes. It could be shorter if you have been doing homework regularly, ie. training like an athlete, and getting stronger, better, faster at this now that it is week 7.
1. _______ For Tuesday's lecture, read Chapter 5: Evolution Applied, section 5.1: "How do genetic diseases arise?" and as you read it be sure to take handwritten notes.
2. _______ Try to answer some Integrating Questions and Review Questions. As you read the ICB textbook
always attempt to test yourself a little, answer at least one of each set. 3. _______ (Trifecta): Prepare to explain (aloud) Figure 5.1, and Tables 5.1, 5.2 and 5.3 in class (Purpose,
Methods, Findings). 4. _______ Advanced: Take a peek at several of the published research papers in the Bibliography at the
bottom of the page. This may help you understand how to make taq polymerase function more efficiently in your own PCR research project.
(Preparing for) Thursday's lecture:
Budgeting homework time (60 min): The Chapter Cell Structure (OSB) section 4.3 is 3060 words in length with a number of art figures (no data figures for trifectas). Reading at 200 words per minute would mean the section might take 15 minutes to read. But the video is 14 minutes and when done properly, when you pause to review figures and take careful notes, this assignment should take you more like 60 minutes.
1. _______ For Thursday's lecture, read section 4.2 "Prokaryotic Cells" and 4.3 "Eukaryotic Cells" in chapter Cell Structure (OSB). For section 4.3 (3060 words) take handwritten notes in your notebook.
2. _______ Compare and contrast the anatomy of a Prokaryote versus Eukaryote. Then also a plant cells
versus an animal cell. Which seems most advanced, why? 3. _______ (flipped classroom) Watch the 14min lecture by Mr. Andersen provided where he gives you a
tour of the cell. Add to your notes any interesting points he makes that helped you better understand the parts of the cell and what they do.
4. _______ While reading, focus mostly and take notes regarding Figures 2 & 3, and 4 & 5, and note the
building block of cell walls/wood in Figure 9. We will discuss these in class. Generally, you need to learn the names and functions of each organelle. It's best to create hand-made flash cards with the name on one side and the function on the other. Also add interesting facts, like a drug user would be expected to have more of which organelle? Use these to study prior to class and then prior to the exam too.
5. _______ Advanced: Take a sneak peek at section 4.4, in particular study Figure 1.

Chapter Checklists
60
Chapter Checklists
61
Week 8
(Preparing for) Tuesday's lecture:
Budgeting homework time (30 min): The Chapter Cell Structure (OSB) section 4.4 is 1430 words in length with a number of art figures (no data figures for trifectas). Reading at 200 words per minute would mean the section might take 7 minutes to read. When done properly, when you pause to review figures and take careful notes, this assignment should take you more like 30 minutes.
1. _______ For Tuesday's lecture, read section 4.4 "The Endomembrane System and Proteins" in chapter Cell Structure (OSB) (1430 words). Take handwritten notes in your lecture notebook.
2. _______ Compare and contrast the anatomy of a Prokaryote versus Eukaryote. What's similar, what's
different. Then also compare a plant cells versus an animal cell. Which one is a eukaryote, why, which cell type do you think seems the most advanced, evolutionarily, why?
3. _______ While reading, focus most on Figure 1. We will discuss this process of biosynthesis in class.
Generally, you need to learn the names and functions of each organelle in the endomembrane system. In particular what are the functions of that organelle in general as well as in particular during the biosynthesis of a protein. It's best to create hand-made flash cards with the name on one side and the function on the other. Also add interesting facts, like where does CFTR go and what happens to it during its expression from a gene and conversion into a functioning protein, where does it end up? What about insulin, what happens when it is made, does it do the exact same thing? Use these to study prior to class and then prior to exam too.
4. _______ Advanced: Take a sneak peek at section 8.2 for Thursday.
(Preparing for) Thursday's lecture:
Budgeting homework time (60 min): Chapter 8, section 8.2 (first half) is 2498 words in length with four data tables and figures that require thinking and notetaking for the Trifecta. Reading at 200 words per minute would mean the section might take 13 minutes to read. Of course, when done properly, when you pause to review figures, try Integrating Questions, and take notes, this assignment will take you more like 60 minutes.
1. _______ For Thursday's lecture, read Chapter 8: Cell Structure and Function, section 8.2: "Why aren't there giant cells?" and as you read it be sure to take handwritten notes on the first half (2498 words). You can stop taking detailed notes when you begin reading the light blue box denoting the second section on "Calculated cell limitations". Just read that short section for deeper understanding.
2. _______ Try to answer some Integrating Questions and Review Questions. As you read the ICB textbook always attempt to test yourself a little, answer at least one of each set.
3. _______ (Trifecta): Prepare to explain (aloud) Figures 8.14, 8.15 and 8.16 in class (Purpose, Methods, Findings)
4. _______ Advanced: Take a peek at some of the published research papers in the Bibliography at the bottom of the page with the goal to find the original figure you studied here in the reading and where it is in the paper?

Chapter Checklists
62

Chapter Checklists
63
Week 9
(Preparing for) Tuesday's lecture:
Budgeting homework time (70 min): Section 5.2 of Structure and Function of Plasma Membranes
(OSB) is 3856 words in length with a number of art figures (yet no data figures for trifectas). Reading at 200 words per minute would mean the section might take 20 minutes to read. But the two videos are 6 & 8 minutes each, and when done properly, when you pause to review figures and take careful notes, this assignment should take you more like 70 minutes.
1. _______ For Tuesday's lecture, skim section 5.1 "Components and Structure" in the chapter Structure
and Function of Plasma Membranes (OSB) then carefully and slowly read section 5.2 "Passive Transport" (3856 words) and for that one please take handwritten notes in your lecture notebook.
2. _______ (flipped classroom) Watch the 6-min lecture by Mr. Andersen on membrane structure. You do not need to take notes on this.
3. _______ Then review section 5.2 again, now focus and take notes regarding Figures 1, 2, 3 and 5. We will discuss these in class.
4. _______ (flipped classroom) Watch the 8-min lecture by Mr. Andersen provided where he gives you an explanation of the topics: diffusion and osmosis. Add to your notes any interesting points he makes that helped you better understand what they are all about.
5. _______ Advanced: Take a sneak peek at the next section 5.3, in particular Figure 1.
(Preparing for) Thursday's lecture:
Budgeting homework time (30 min): Section 5.3 of Structure and Function of Plasma Membranes
(OSB) is 1532 words in length with four art figures (no data figures for trifectas). Reading at 200 words per minute would mean the section might take 8 minutes to read. If done properly, when you pause to review figures and take careful notes, this assignment should take you more like 30 minutes.
1. _______ For Thursday's lecture, read section 5.3 "Active Transport" in the chapter Structure and
Function of Plasma Membranes (OSB) (1532 words) and take handwritten notes in your notebook.
2. _______ While reading, be sure you can explain Figures 1 and 3. We will discuss these in class.
3. _______ Advanced: What is one way to determine whether ion movement is due to passive transport or active transport? Does this hold true for CFTR?

Chapter Checklists
64
Chapter Checklists
65
Week 10
(Preparing for) Tuesday's lecture:
Budgeting homework time (60 min): Read "Systems of Gas Exchange" in the chapter The Respiratory
System (OSB) with several art figures (no data figures for trifectas). Yet you can focus on the important part, the second half, on "Mammalian Systems" which is only 1400 words. Reading at 200 words per minute would mean the whole section might take 13 minutes to read. If done properly, when you pause to review figures and take careful notes just in the "Mammalian Systems" section, this assignment should take you no more than 30 minutes of reading time. Then watch the 20-minute Khan Academy video to really get a good understanding of pulmonary anatomy & function, and take a few notes. Total estimated time is for homework is 60 minutes.
1. _______ For Tuesday's lecture, read section 39.1: Systems of Gas Exchange, in the chapter The
Respiratory System (OSB) (2350 words). Take handwritten notes in your lecture notebook on the second half of the reading, starting at the section "Mammalian Systems".
2. _______ (flipped classroom) Watch the really helpful 20-min lecture from the Khan Academy
provided where he gives you an explanation of the topics of ventilation and respiration. Add to your notes any interesting points he makes that helped you better understand what they are all about.
3. _______ Advanced: Take a sneak peek at the images and movies in this chapter's section on "Breathing" on the mechanics of breathing particularly related to humans.
Thursday lecture:
EXAM II

Chapter Checklists
66

Chapter Checklists
67
Week 11
(Preparing for) Tuesday's lecture:
Budgeting homework time (60 min): This is a professional Review paper that is 3700 words in length from an important medical journal so it will take some time to read, but if you have gained some understanding about genetics and diseases while working in the lab this semester you should be able to more quickly grasp most of what is discussed. If you struggle with the text, focus on each figure and determine what it is trying to explain. Scientists almost always first focus on the figures.
1. _______ For Tuesday's lecture, read Kenneth Polonsky's review paper on "The Past 200 Years in Diabetes" published in New England Journal of Medicine in 2012. This paper is provided at the back of your Course Pack. You do not need to take notes from all the written text, simply read for your own learning and to help you with your research.
2. _______ While reading, focus mostly on the figures. We will discuss these in class. Be prepared to state aloud what each figure is trying to explain or communicate.
3. _______ Write out in your notebook your explanation for Figure 2 and how that structure relates to what you learned about the biosynthesis of a protein back in the reading and lecture about Endomembranes. Describe how you predict the insulin protein is made DNA -> RNA -> protein and the path it takes via which organelles and what happens to it at each?
(Preparing for) Thursday's lecture:
Budgeting homework time (70 min): Chapter 23, section 23.1 is 3891 words in length with 10 figures and three of which are data tables/figures that will require thinking and notetaking for the Trifecta. On the other hand, these Figures and Tables are not important, Figure 23.4, the second half of Table 23.2, the parietal cell video, and Figure 23.5. When done properly, when you pause to review important figures/tables, try Questions, and take notes, this assignment should take you more like 70 minutes.
1. _______ For Thursday's lecture, read Chapter 23: Cells in Tissues, first review the introductory page, and then carefully read section 23.1: "How do you break down and absorb nutrients from the food you eat?" (3891 words). As you read it be sure to take handwritten notes.
2. _______ Try to answer these Integrating Questions : #1 about da Vinci, #3 about Prout's research and #7 on Muallem's work and be prepared to share your answers in class.
3. _______ (Trifecta): Prepare to explain (aloud) Tables 23.1, 23.2(first half) and Figure 23.7 in
class (Purpose, Methods, Findings).

Chapter Checklists
68

Chapter Checklists
69
Week 12
(Preparing for) Tuesday's lecture:
Budgeting homework time (60 min): Read ELSI 1.1 and the first 2/3 of section 1.4 in "Chapter 1: Heritable Material." While this is about 3700 words in both the readings combined, only the 2700 words in section 1.4 need careful reading and notetaking. Also, there are no traditional Trifectas to prepare for, just three simple questions posed below to be ready to answer aloud in class.
1. _______ For Tuesday's lecture, revisit Chapter 1: Heritable Material and read section ELSI 1.1: "Who Owns Your DNA?" (975 words), and then read the first 2/3's of section 1.4 "How does DNA's shape affect its function?" Take notes on section 1.4 all the way up until it switches to the new light blue box topic of "DNA Replication" (2700 words). Read on, don't need to take notes.
2. _______ Try to answer some Integrating Questions and Review Questions.
3. _______ (Tip): Prepare to explain (aloud) in class: 1. What's difference between the chemical structure of DNA vs RNA, 2. What's incorrect in Figure 1.10?, 3. What's incorrect in Figure 1.13?
(Preparing for) Thursday's lecture:
Budgeting homework time (50 min): Read two sections in the chapter Genes and Protein (OSB). Section 15.5 is 2500 words in length and requires careful reading and notetaking. There are no traditional Trifectas, just three simple questions and a task posed below to be ready to answer in class.
1. _______ For Thursday's lecture, read chapter Genes and Proteins (OSB), first review 15.3: "Eukaryotic Transcription" but don't take notes. Then carefully read section 15.5 "Ribosomes and Protein Synthesis" (2501 words) and as you read it take handwritten notes.
2. _______ (Tip): Prepare to explain (aloud) in class: 1. What happens when a gene is going to be expressed?, 2. What happens when a gene is transcribed? 3. Where does folding occur, what if it goes wrong? Also, prepare for this: If Figure 2 is projected on the screen in class be able to go to the board and explain how translation works, using it.

Chapter Checklists
70

Chapter Checklists
71
Week 13
(Preparing for) Tuesday's lecture:
Budgeting homework time (60 min): Chapter 2, section 2.1 (first half) is 2257 words in length with three data tables and figures that require thinking and notetaking for the Trifecta. Reading at 200 words per minute would mean the section might take 12 minutes to read. Yet figures 2.5 and 2.6 are challenging and require time to think and read about them for the Trifecta. Of course, when done properly, when you pause to review figures, try Integrating Questions, and take notes, this assignment will take you more like 60 minutes.
1. _______ For Tuesday's lecture, review the introductory page of Chapter 2: Central Dogma.
Then carefully read section 2.1: "How does DNA communicate information to the cell?" (2257 words) and take handwritten notes in your lecture notebook.
2. _______ Try to answer some Integrating Questions and Review Questions.
3. _______ (Trifecta): Prepare to explain (aloud) Figures 2.3, 2.5 and 2.6 in class (Purpose, Methods, Findings).
(Preparing for) Thursday lecture:
Budgeting homework time (60 min): Chapter 2, section 2.4 is 2673 words in length with several exercises that require you to use NCBI to look for the insulin gene, find introns, and then the ORF finder to understand the gene further. Reading at 200 words per minute would mean the section might take 12 minutes to read. Yet integrating questions 35-38 are challenging and require time to think and perform what they request of you. Of course, when done properly, when you really try to do the Integrating Questions, and take notes, this assignment will take you more like 60 minutes.
1. _______ For Thursday's lecture, read another section of Chapter 2: Central Dogma. Carefully read section 2.4: "Can cells pick and choose information? (2257 words) and take handwritten notes in your lecture notebook.
2. _______ Perform the exercises outlined in Integrating Questions 35-38 and then answer the remaining IQs and Review Questions.
3. _______ (Tip): Prepare to explain (aloud) in class: how to use online tools at NCBI and OMIM to find the DNA, RNA and amino acid sequence of any gene, with insulin as an example.
(optional leisure reading for those who are interested and haven't noticed this yet): Ch.22-ICB: section 22.1, "How do genetic diseases affect cells and organisms" which has a great section on the genetic disease Sickle Cell Anemia.

Chapter Checklists
72
Chapter Checklists
73
Week 14
(Preparing for) Tuesday's lecture:
Budgeting homework time (60 min): Chapter 10, section 10.4 (first half) is 3000 words in length with three data figures that require thinking and notetaking for the Trifecta. Reading at 200 words per minute would mean the section might take 15 minutes to read. Yet all three trifecta figures will require time to think and read about them for class. Thus, when you pause to review figures, try Integrating Questions, and take notes, this assignment will take you more like 60 minutes.
1. _______ For Tuesday's lecture, read the introductory page of Chapter 10: Cellular Respiration and read section "10.4: How is ATP produced?" Take notes on section 10.4 all the way up until Figure 10.22 (2900 words). After that please read but do not take notes.
2. _______ Try to answer some Integrating Questions and Review Questions.
3. _______ (Trifecta): Prepare to explain (aloud) Figures 10.20, 10.21 and 10.22 in class (Purpose, Methods, Findings)
(Preparing for) Thursday's lecture:
Budgeting homework time (20 min):
1. _______ For Thursday's lecture, read ELSI 10.1 (1000 words) and BME-10.1 (385 words). No notes necessary.
Week 15
This week is comprised of a Pop-up Journal Club on Cancer, and then one on Gene Therapy.
(Preparing for) Tuesday lecture: Pop-up Journal Club on Cancer
Budgeting homework time (30 min): You'll be pointed to an online paper that's three pages long to read and bring a hard copy to class.
(Preparing for) Thursday lecture: Pop-up Journal Club on Gene Therapy
Budgeting homework time (30 min): You'll be provided the hard copy of a gene therapy paper to read for Thursday's class.

!
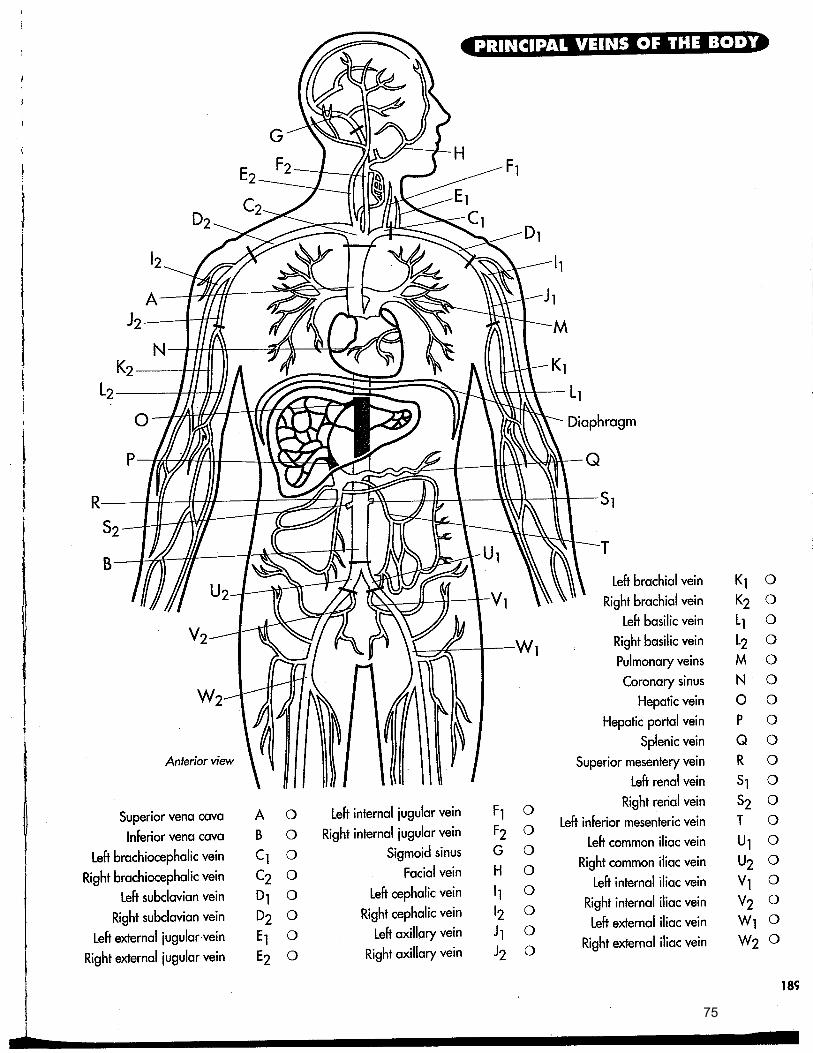


LB#145'Laboratory(Guide(
((
Phase(I:(Designing(a(PCR(Assay(&(
Phase(2:(Using(PCR(to(detect(CF('
Igert,'Wright,'Fata#Hartley,'Haenisch,'Cooper,'Krha,'Maleszewski,'Wilterding,'Sayed,'Luckie'

Laboratory : Expectations & Effort
Time%Commitment*%“Don’t%be%a%tourist”%%
• Remember&that&the&laboratory&is&an&entire&class&all&by&itself,&and&is&worth&2&of&the&5&credits&in&LB9145.&This&means&that&you&should&be&prepared&to&spend&6&hours&per&week&in&the&LB9145&laboratory&as&well&as&time&outside&of&the&lab&with&your&group&each&week&–&so&plan&ahead.&
&
• The&above&also&means&that&if&you&explain&to&your&research&team&that&you&are&“busy”&with&social&events&every&evening&and&intend&to&go&home&each&weekend,&realize&you&won’t&succeed&in&this&course.&Do&NOT&be&a&TOURIST&9&make&college&a&priority&in&your&life.&
&
The%LB*145%Laboratory%is%a%Research%Team%Lab%%
• Your&research&group&will&need&to&meet&outside&of&class&at&least&twice&a&week&to&coordinate&the&projects&and&the&papers&you&write&as&a&group.&It&is&essential&that&you&read&and&prepare&prior&to&coming&to&lab&each&week,&because&the&experiments&require&a&good&amount&of&organization&to&complete&in&a&timely&manner.&
&
• Please&familiarize&yourself&with&the&concept&behind&this&lab&–&it&will&help&you&to&keep&your&“eyes&on&the&prize”&as&the&semester&progresses.&
&
• Attendance&will&be&taken&at&the&beginning&of&each&lab,&so&it&is&important&that&you&arrive&ON&TIME.&
&
• The&key&to&sucess&in&the&laboratory&class&is&to&think&and&work&like&a&scientist&(in&fact¬&like&a&student)&that&means&do¬&behave&like&this&is&just&a&class&but&strive&to&work&as&though&you&are&a&professional&scientist&and&this&is&your&own&research&lab&and&project&(which&it&is).&
�8
Research Group Roles in the Laboratory
5IF�3FTFBSDI�5FBNT�JO�-#-����XJMM�VTVBMMZ�DPOTJTU�PG���JOEJWJEVBMT��:PV�BSF�FYQFDUFE�UP�IFMQ�PVU�JO�BMM�UBTLT�CVU�ZPV�XJMM�IBWF�POF�TQFDJBMUZ�ZPVS�QSJNBSZ�KPC�PS�SPMF�JO�UIF�UFBN���*G�ZPVS�UFBN�DPOTJTUT�PG���JOEJWJEVBMT�FMJNJOBUF�UIF�i1SJNBSZ�*OWFTUJHBUPSw�BOE�EJWJEF�UIPTF�SFTQPOTJCJMJUJFT�BNPOH�UIF�UFBN�NFNCFST�
Primary Investigator (PI) - Plan!
5IF�QSJNBSZ�JOWFTUJHBUPS�XJMM�CF�SFTQPOTJCMF�GPS�PSHBOJ[JOH�NFFUJOH�UJNFT �PWFSBMM�QSPKFDU�QMBOOJOH �BT�XFMM�BT�JNQMFNFOUJOH�USPVCMFTIPPUJOH�UFDIOJRVFT�UISPVHIPVU�UIF�JOWFTUJHBUJPOT��*U�JT�ZPVS�KPC�UP�BMTP�CF�TVSF�BMM�NFNCFST�QBSUJDJQBUF�JO�EJTDVTTJPOT�BOE�ZPV�SFDPSE�OPUFT��"TL�RVFTUJPOT�XIFO�B�NFN-CFS�IBTO�U�TQPLFO �i8IBU�EP�ZPV�UIJOL �+FO w��*O�BEEJUJPO�UP�TIBSJOH�UIF�GJOBM�HSBEF�GPS�FBDI�HSPVQ�QBQFS �UIF�1*�JT�BTTJHOFE�BOE�HSBEFE�GPS�XSJUJOH�TQFDJGJD�TFDUJPOT�PG�UIF�QBQFS�BT�XFMM�BT�FEJUPSJBM�EV-UJFT�PO�BMM�TFDUJPOT�JO�DSFBUJOH�BMM�DPNQMFUF�QBQFST�
Protocol Expert (PE) - Protocols!
5IJT�JOEJWJEVBM�JT�SFTQPOTJCMF�GPS�PWFSTFFJOH�UIF�DSFBUJPO�PG�TDJFOUJGJD�QSPUPDPMT�GPS�FBDI�XFFL�T�JOEF-QFOEFOU�JOWFTUJHBUJPO�XSJUUFO�FYQFSJNFOUT�BOE�TUFQT�ZPV�QMBO�UP�EP��*U�JT�ZPVS�KPC�UP�XPSSZ�BCPVU�XIFUIFS�UIF�QSPUPDPM�JT�BQQSPQSJBUF�BOE�CFJOH�GPMMPXFE�FYBDUMZ�EVSJOH�UIF�FYQFSJNFOU��*O�BEEJUJPO�UP�TIBSJOH�UIF�HSBEF�GPS�FBDI�GVMM�ESBGU�QBQFS �UIF�1&�JT�BTTJHOFE�BOE�HSBEFE�GPS�XSJUJOH�TFDUJPOT�PG�UIF�QBQFS�BT�XFMM�BT�FEJUPSJBM�EVUJFT�PO�BMM�TFDUJPOT�JO�DSFBUJOH�BMM�DPNQMFUF�QBQFST�
Data Recorder/Documentarian (DRD) - Notebooks!
5IF�EBUB�SFDPSEFE�JT�SFTQPOTJCMF�GPS�SFDPSEJOH�BOE�PSHBOJ[JOH�UIF�SFTVMUT�BOE�UBLJOH�NBOZ�QJDUVSFT�UP�EPDVNFOU�UIF�UFBN�T�FGGPSUT��*U�JT�ZPVS�KPC�UP�CF�TVSF�FWFSZPOF�JT�LFFQJOH�UIFJS�OPUFCPPL�VQ�UP�EBUF�BOE�EBUB�JT�CFJOH�SFDPSEFE�QSPQFSMZ��*O�BEEJUJPO�UP�TIBSJOH�UIF�HSBEF�GPS�FBDI�GVMM�ESBGU�QBQFS �UIF�%3%�JT�BTTJHOFE�BOE�HSBEFE�GPS�XSJUJOH�TFDUJPOT�PG�UIF�QBQFS�BT�XFMM�BT�FEJUPSJBM�EVUJFT�PO�BMM�TFDUJPOT�JO�DSFBUJOH�BMM�DPNQMFUF�QBQFST�
Laboratory Technician (LT) - Hardware!
5IJT�JOEJWJEVBM�JT�SFTQPOTJCMF�GPS�MFBSOJOH�UIF�NBOZ�FYQFSJNFOUBM�QSPDFEVSFT�BOE�CFDPNJOH�BO�FY-QFSU�PO�IPX�UP�VTF�UIF�WBSJPVT�QJFDFT�PG�FRVJQNFOU��*U�JT�ZPVS�KPC�UP�SFBE�NBOVBMT�BOE�HFU�UIF�SJHIU�FRVJQNFOU�UP�XPSL�QSPQFSMZ��*O�BEEJUJPO�UP�TIBSJOH�UIF�HSBEF�GPS�FBDI�GVMM�ESBGU�QBQFS �UIF�-5�JT�BT-TJHOFE�BOE�HSBEFE�GPS�XSJUJOH�DFSUBJO�TFDUJPOT�PG�UIF�QBQFS�BT�XFMM�BT�FEJUPSJBM�EVUJFT�PO�BMM�TFDUJPOT�JO�DSFBUJOH�BMM�DPNQMFUF�QBQFST�
7 9
Working Effectively in Small Groups
"T�ZPV�LOPX �B�HSFBU�EFBM�PG�UIF�MFBSOJOH�UIBU�PDDVST�JO�PVS�DMBTT�JT�CBTFE�VQPO�ZPVS�JOUFSBDUJPOT�XJUI�ZPVS�QFFST�JO�TNBMM�HSPVQT��#VU�XPSLJOH�XFMM�JO�TNBMM�HSPVQT�EPFT�OPU�IBQQFO�CZ�NBHJD��5IFSF�BSF�UIJOHT�UIBU�*�IBWF�UP�EP�BT�BO�JOTUSVDUPS�UP�NBLF�TVSF�UIBU�ZPV�BSF�HFUUJOH�UIF�NPTU�PVU�PG�ZPVS�FYQFSJFODF �TVDI�BT�JEFOUJGZJOH�DPOGMJDUT�CFUXFFO�HSPVQ�NFNCFST�UIBU�NJHIU�IJOEFS�ZPVS�XPSL�BOE�IBWJOH�5"T�MJTUFOJOH�DMPTFMZ�UP�XIBU�ZPV�BSF�TBZJOH�BT�UIFZ�TUSPMM�BSPVOE�UIF�MBC�SPPN�TP�UIBU�XF�DBO�IFMQ�ZPV�HFU�UIF�NPTU�GSPN�ZPVS�EJTDVTTJPOT�PS�LFFQ�ZPV�PO�USBDL�
:PV �UPP �IBWF�UP�XPSL�UP�NBLF�ZPVS�HSPVQT�BMM�UIBU�UIFZ�DBO�CF��#FMPX �BSF�TPNF�TVHHFTUJPOT�PG�FG-GFDUJWF�TNBMM�HSPVQ�XPSL��4PNF�PG�UIFTF�XJMM�BMTP�DMBSJGZ�NZ�FYQFDUBUJPOT�PG�ZPV�JO�ZPVS�HSPVQT��-PPL�UIJT�PWFS�DBSFGVMMZ�BOE�SBJTF�RVFTUJPOT�JO�DMBTT�PS�UP�NF�QSJWBUFMZ�
Individuals in Groups
5IFSF�BSF�UXP�UIJOHT�UIBU�IBQQFO�JO�TNBMM�HSPVQT��*OEJWJEVBM�TUVEFOUT�TIBSF�UIFJS�UIPVHIUT �CVU�UIPTF�UIPVHIUT�BSF�BMTP�SFBDUFE�UP�CZ�POF�PS�NPSF�TUVEFOUT��5IF�HSPVQ�TVDDFFET�POMZ�JOTPGBS�BT�FBDI�JOEJWJEVBM�EPFT�BDUVBMMZ�TIBSF�UIFJS�UIPVHIUT��BO�JOEJWJEVBM�XIP�JT�OPU�USZJOH�UIFJS�CFTU�XJMM�EJNJOJTI�UIF�HSPVQ�T�FYQFSJFODF��8IFO�*�FWBMVBUF�ZPVS�HSPVQ�QBSUJDJQBUJPO�WJB�(&"�GPSNT�BOE�5"�GFFECBDL �*�XJMM�UBLF�JOUP�BDDPVOU�UIF�RVBMJUZ�PG�ZPVS�HSPVQ�JOUFSBDUJPOT��IPX�XFMM�ZPV�EJE�PO�ZPVS�PXO�JO�ZPVS�HSPVQ�BOE�IPX�XFMM�UIF�HSPVQ�EJE�PWFSBMM��*U�JT�VQ�UP�FBDI�JOEJWJEVBM �BOE�JO�QBSUJDVMBS�UIF�1* �UP�FODPVSBHF�UFBNNBUFT�UP�XPSL�UPHFUIFS�UP�NBYJNJ[F�ZPVS�MFBSOJOH��*G�TPNFPOF�JT�OPU�EPJOH�UIF�SFBE-JOH�PS�JT�OPU�QBSUJDJQBUJOH�JO�MBC�FOPVHI �EJTDVTT�UIF�QSPCMFN�BOE�TFF�XIBU�ZPV�DBO�EP�UP�IFMQ�UIBU�QFSTPO��:PV�BSF�BMM�JO�ZPVS�HSPVQT�UPHFUIFS�
Group Process
(SPVQT�BSF�SFBMMZ�QSPDFTTFT �TUFQT�UPXBSE�B�HPBM��5IFSF�BSF�UXP�UZQFT�PG�HPBMT�UPXBSE�XIJDI�ZPV�BSF�TUSJWJOH�JO�PVS�DMBTT��5IF�GJSTU�JT�HSPXUI�BT�BO�JOEJWJEVBM��(SPVQ�XPSL�TIPVME�MFBWF�ZPV�GFFMJOH�UIBU�ZPV�VOEFSTUBOE�UIF�NBUFSJBM�CFUUFS�UIBO�ZPV�DPVME�IBWF�IBE�ZPV�XPSLFE�POMZ�PO�ZPVS�PXO��5IF�TFDPOE�HPBM�IBT�UP�EP�XJUI�UFBNXPSL��)BWF�ZPV �BOE�UIF�HSPVQ �MFBSOFE�TPNFUIJOH�BCPVU�HSPVQ�QSPCMFN�TPMWJOH�UISPVHI�ZPVS�XPSL�UPHFUIFS �%P�ZPV�LOPX�IPX�UP�CFUUFS�DPNNVOJDBUF�XJUI�PUIFST�GSPN�EJGGFSFOU�CBDLHSPVOET�BOE�XIP�IPME�EJGGFSFOU�QFSTQFDUJWFT �*G�TP �ZPV�IBWF�BDIJFWFE�UIF�TFDPOE�HPBM�
*O�PSEFS�UP�NBLF�UIF�HSPVQ�QSPDFTT�XPSL�FGGFDUJWFMZ �QMFBTF�GPMMPX�UIFTF�HVJEFMJOFT�
� t� &WFSZPOF�TIPVME�QBSUJDJQBUF�JO�ZPVS�HSPVQ�� t� &WFSZPOF�T�DPOUSJCVUJPOT�TIPVME�CF�XFMDPNFE�� t� &WFSZPOF�TIPVME�CF�IFBSE��-JTUFO�UP�BOE�IFBS�POF�BOPUIFS��BTL�RVFTUJPOT�JG�ZPV�EP�OPU�VOEFS-
TUBOE�XIBU�B�HSPVQ�NFNCFS�IBT�TBJE�� t� /P�POF�TIPVME�EPNJOBUF�HSPVQ�QSPDFTTFT�� t� "�SFDPSEFS�TIPVME�UBLF�OPUFT�GPS�UIF�HSPVQ�EVSJOH�B�NFFUJOH��*G�ZPVS�HSPVQ�NFFUT�NPSF�UIBO�
PODF �UIF�SFDPSEFS�SPMF�TIPVME�CF�TIBSFE�FRVBMMZ�CZ�BMM�NFNCFST�UISPVHI�UJNF�
1

!
Names: _____________________ _____________________ _____________________ _____________________
Section #: ____________________
Team Ground Rules Contract Form Adapted from Dr. Deborah Allen, Univ. of Delaware and Dr. Rique Campa, MSU
Team Assignment Purpose: To establish team norms in order to promote constructive & productive teamwork. Directions: To work best groups require that all team members clearly understand their responsibilities to one another. These team ground rules describe the general responsibilities of every member to the team. You can adopt additional ground rules if your group believes they are needed. Your signature on this contract form signifies your commitment to adhere to these rules and expectations. Some questions to discuss when thinking about these rules: 1) What are your professional goals (i.e., what would you like to do following graduation)? How
will working in a team help you achieve some of your professional goals? 2) Besides class time, when are you available to work with your team members (exchange your
class and work schedules)? 3) What is the best method(s) and time for your team members to contact you? Share the
necessary phone number(s), e-mail addresses, etc... NOTE: This contact information is private, so should not be shared with others outside of your team, and should only be used for class-related communication.
All group members agree to:
1. Come to class and team meetings on time. 2. Come to class and team meetings with assignments and other necessary preparations
correctly and thoughtfully completed. Additional ground rules (add as many as you like; see examples on appendix of Smith (2007)):
Example: We will always meet on these two days each week at these times ___________
If a member of the team repeatedly fails to meet these ground rules, other members of the group are expected to take the actions below. When filling in the “If not resolved” sections, think about how, when, and who will communicate dissatisfaction to offending team members. Reflect back on what you’ve learned thus far about your teammates in terms of what previous team experiences they have had, how you have worked together as a group thus far, and how each member tends to feel and deal with conflict. Step 1: If not resolved, what will your team do? How? When?: Step 2: Meet as a team with your lab instructor. If not resolved, what will your team do? How? When?: Step 3: The quit or fire clause: If the steps above have been completed without resolving the problem, any team member may quit the team. Alternatively, if all other team members are in agreement, the offending team member may be fired from the team. In either case, the individual no longer working as part of a team is required to complete the remaining class activities and assignments individually. The LB145 teaching team reserves the right to make final decisions to resolve difficulties that arise within a team. Before this becomes necessary, the team should try to find a fair and equitable solution to the problem. Group Name:______________ Member’s Names (printed), Signatures, and date: 1.____________________________ 2.____________________________ 3.____________________________ 4.____________________________
4

85
LB-145LaboratorySchedule(Spring2019)LabalwaysmeetsinroomC-5HolmesHall

!

CF & PCR Research Studies

!

!
!CF#PCR Project: Getting*Started !Assignment: Develop a PCR-based DNA diagnostic assay for a mutant form of the gene that causes a cystic fibrosis.
What’s your research question?
I want to design a PCR test for the R117H mutation in CFTR that causes a mild form of cystic fibrosis.
!
I want to design a multiple site PCR assay for the top ten mutations that cause 99% of all cases of cystic fibrosis.
!I want to design PCR primers that will allow me to find if the CFTR gene has an intron junction mutation that causes alternative splicing.
I am designing a PCR assay for the nonsense mutation(W1282X) that causes CF in the Ashkenazi Jews. Dude, I want to do something way cooler ....
Review what previous students have done in their PCR research projects
on the course website.
!

!
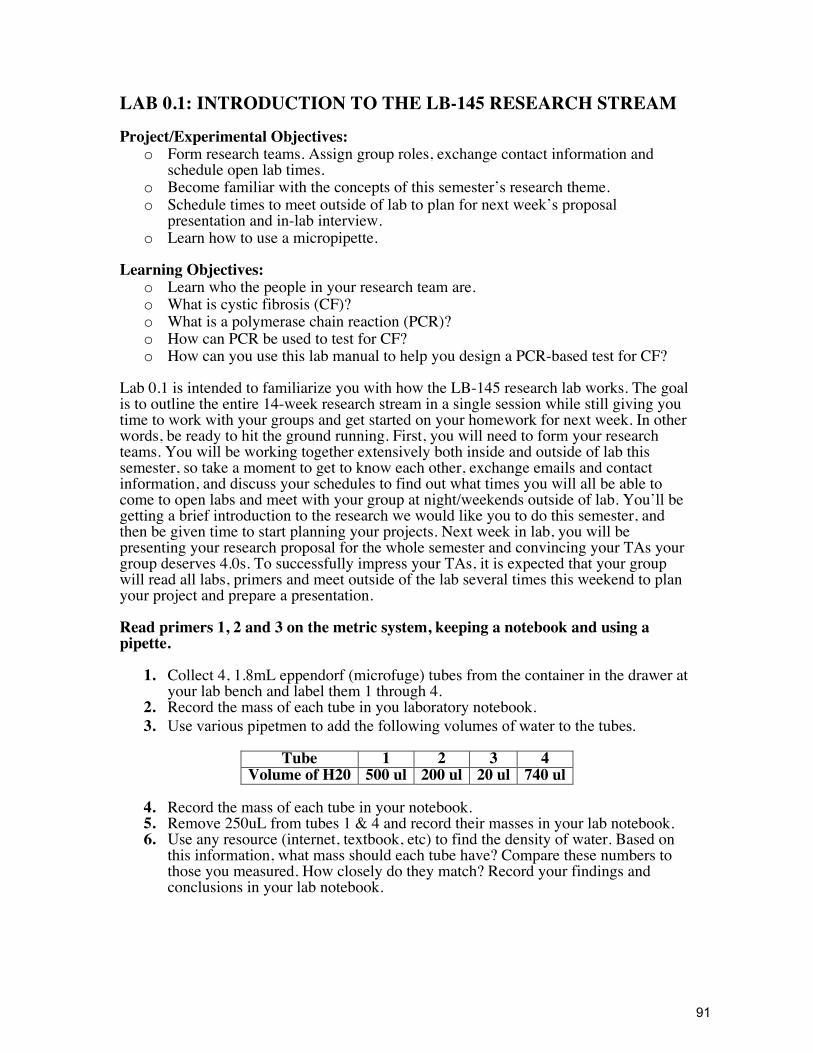
LAB 0.1: INTRODUCTION TO THE LB-145 RESEARCH STREAM Project/Experimental Objectives:
o Form research teams. Assign group roles, exchange contact information and schedule open lab times.
o Become familiar with the concepts of this semester’s research theme. o Schedule times to meet outside of lab to plan for next week’s proposal
presentation and in-lab interview. o Learn how to use a micropipette.
Learning Objectives:
o Learn who the people in your research team are. o What is cystic fibrosis (CF)? o What is a polymerase chain reaction (PCR)? o How can PCR be used to test for CF? o How can you use this lab manual to help you design a PCR-based test for CF?
Lab 0.1 is intended to familiarize you with how the LB-145 research lab works. The goal is to outline the entire 14-week research stream in a single session while still giving you time to work with your groups and get started on your homework for next week. In other words, be ready to hit the ground running. First, you will need to form your research teams. You will be working together extensively both inside and outside of lab this semester, so take a moment to get to know each other, exchange emails and contact information, and discuss your schedules to find out what times you will all be able to come to open labs and meet with your group at night/weekends outside of lab. You’ll be getting a brief introduction to the research we would like you to do this semester, and then be given time to start planning your projects. Next week in lab, you will be presenting your research proposal for the whole semester and convincing your TAs your group deserves 4.0s. To successfully impress your TAs, it is expected that your group will read all labs, primers and meet outside of the lab several times this weekend to plan your project and prepare a presentation. Read primers 1, 2 and 3 on the metric system, keeping a notebook and using a pipette.
1. Collect 4, 1.8mL eppendorf (microfuge) tubes from the container in the drawer at your lab bench and label them 1 through 4.
2. Record the mass of each tube in you laboratory notebook. 3. Use various pipetmen to add the following volumes of water to the tubes.
Tube 1 2 3 4
Volume of H20 500 ul 200 ul 20 ul 740 ul
4. Record the mass of each tube in your notebook. 5. Remove 250uL from tubes 1 & 4 and record their masses in your lab notebook. 6. Use any resource (internet, textbook, etc) to find the density of water. Based on
this information, what mass should each tube have? Compare these numbers to those you measured. How closely do they match? Record your findings and conclusions in your lab notebook.
1

“CF & PCR” Research Project Scientific Method Learning Objectives
Science Skill Your Learning Objectives (can you do this?)
System Identification
• Identify and define experimental system.
Question Asking • Ask thoughtful and probing questions about an experimental system.
Hypothesis Formation
• Identify and assess a hypothesis. • Develop hypotheses based on previous
observations. • Distinguish hypotheses from predictions.
Experimental Design
• Evaluate an experimental design. • Identify variables and controls. • Develop an experiment to address a given
hypothesis with appropriate variables and controls.
• Make predictions based on hypothesis.
Data Analysis and Interpretation
• Evaluate data from a given experiment by determining the results of control and experimental treatments and relating the results to the experimental question or hypothesis.
• Formulate conclusions based on data. • Create a model to explain the data.

LAB 0.2: INTRODUCTION TO THE LB-145 RESEARCH LAB
Experimental Objectives:
1.) Make a dilution series.
2.) Measure the absorbance of the dilution series.
3.) Make a Beer’s Law plot (aka: graph or standard curve) of the data.
4.) Keep a notebook that would allow a 144 student to repeat the experiment.
Learning Objectives:
1.) Learn to use standard equipment including spectrophotometers, micropipetters,
pipette aids and graphing programs.
2.) Learn how to keep a laboratory notebook.
3.) Understand the technique and mathematics associated with a dilution series.
4.) Be able to pipette solutions accurately.
5.) Be able to create a graph using Excel.
Lab 0.2 is intended to familiarize you with basic lab practices, skills, techniques and equipment.
Good scientists are always careful and conscientious (look it up). You should make every
attempt to limit human error as a variable in your experiments. Many mistakes can be avoided if
you take your time and pay careful attention to the task at hand. Citing “human error” is
NEVER an acceptable explanation for unexpected results. Good record keeping is also a
critical component of scientific research if you are to have result to interpret. This lab is
intended to introduce the sound practices that should be used throughout this semester as well as
in any laboratory setting you may encounter during your education and career.
Top 10 Laboratory Survival Rules/Tips
Safety- First.
1.) Imagine you’re a responsible adult and act accordingly.
2.) If something is wrong (ie: a common reagent is low, an alarm is going off, or a piece of
equipment is broken), report it to a TA.
3.) If you were never expressly told to do something, ask a TA before you do.
Courtesy- You’re not the only one in here.
4.) Do not change the location of any common equipment, supplies, or reagents; and put
things back promptly when you are finished with them.
5.) Clean up your own mess promptly.
Integrity- Or lose credibility as a scientist.
6.) Assume nothing. If you do not have a good answer, be honest and try to find one.
7.) Honesty is the best policy. Don’t cover-up your mistakes- that can only make them
worse. Trust your data- NEVER modify it to fit your expectations. Unexpected results
are often the most interesting results.
Perseverance- If you want something done…
8.) If at first you don’t succeed, modify your protocol and try again.
9.) If you don’t know what something means, look it up. This is the information age.
10.) Stop working when you are finished, not when time is up.

Read Primers 1-6. Be sure to understand how to use the equipment and do the calculations.
Dilution Procedure: This experiment is your first experiment in LB-145. Record all information
in your lab notebook. This procedure requires distilled H2O and bromophenol blue solution.
1.) Obtain 8 clean, dry test tubes. Label the tubes 1 through 8.
2.) Using the pipette filler, draw up 1 ml distilled H2O. Dispense the 1 ml in a single tube.
3.) Repeat for all 8 tubes so that each tube contains 1 ml. Each team member should fill 2
tubes.
4.) Using a micropipetter, draw up 1 ml of blue solution (Bromophenol blue). Dispense the
blue solution into tube #1.
5.) Vortex the tube gently. Be careful not to allow the liquid to splash out of the tube.
6.) Change the pipette tip. This is very important during a dilution series. Draw up 1ml of
the solution in tube #1, dispense it into tube #2, and gently votex tube #2 as before.
7.) Change the pipette tip. This is very important during a dilution series. Draw up 1ml of
the solution in tube #2 dispense it into tube #3, and gently votex tube #3 as before.
8.) Continue in the same manner for every tube. Each team member should perform 2
dilutions. The last tube should contain 2 ml while tubes 1 through 7 should have 1 ml.
9.) Transfer 1 ml of solvent (in this case, distilled H2O) to a spectrophotometer cuvette.
This will serve as a blank. Check to make sure 1mL is a large enough volume for the
cuvettes you are using.
10.) Transfer 1 ml of solution from tubes 1 through 8 to 8 cuvettes. Using the protocol on
the next page, read the absorbance of each solution at a wavelength of 450nm. Record
the data IN YOUR NOTEBOOK.
Tube Absorbance at 450nm Concentration
Blank NA
1
2
3
4
5
6
7
8
Math Minute: Assume the
blue solution contains
10mg/ml bromophenol blue.
Determine the concentration
of crystal violet in each tube.
Record in the table and your
notebook.
4
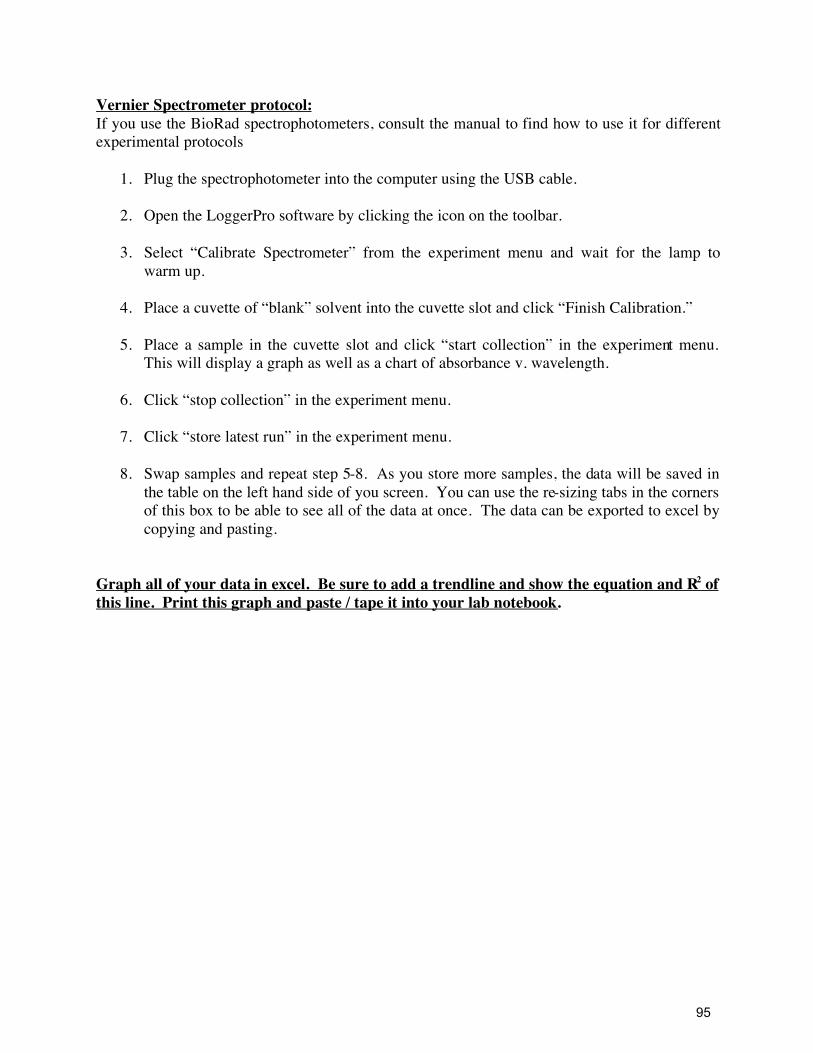
Vernier Spectrometer protocol:
If you use the BioRad spectrophotometers, consult the manual to find how to use it for different
experimental protocols
1. Plug the spectrophotometer into the computer using the USB cable.
2. Open the LoggerPro software by clicking the icon on the toolbar.
3. Select “Calibrate Spectrometer” from the experiment menu and wait for the lamp to
warm up.
4. Place a cuvette of “blank” solvent into the cuvette slot and click “Finish Calibration.”
5. Place a sample in the cuvette slot and click “start collection” in the experiment menu.
This will display a graph as well as a chart of absorbance v. wavelength.
6. Click “stop collection” in the experiment menu.
7. Click “store latest run” in the experiment menu.
8. Swap samples and repeat step 5-8. As you store more samples, the data will be saved in
the table on the left hand side of you screen. You can use the re-sizing tabs in the corners
of this box to be able to see all of the data at once. The data can be exported to excel by
copying and pasting.
Graph all of your data in excel. Be sure to add a trendline and show the equation and R2 of
this line. Print this graph and paste / tape it into your lab notebook.

!

LAB 1: POLYMERASE CHAIN REACTION (PCR) Note: You will be analyzing your PCR results by Gel Electrophoresis. Please review gel electrophoresis in your textbook (Ch. 20).
Adapted from the original author: John Urbance, Ph.D. by Doug Luckie, Ph.D., and Mike Haenisch
Learning Objectives:
1. Learn how to design a PCR reaction cocktail and what each ingredient does.
2. To learn enough about PCR to design your own primers to target a !"#$" mutation.
3. Learn how to calculate annealing temperatures for primers given only the DNA sequence.
4. To learn to troubleshoot and optimize PCR reactions to help you in your research.
5. To develop a PCR reaction to be used as a positive control during your research.
Experimental Objectives:
1. To learn how to set up and run PCR reactions and the role of the reaction ingredients.
2. Learn how to mix a PCR reaction cocktail with correct concs diluted from stock solutions.
3. Learn how to mix and make an agarose gel for electrophoresis.
4. To further gain expertise in working with DNA laboratory equipment (e.g. micropipettors,
thermocycler, agarose gels).
Introduction
Have you ever wondered how forensic scientists get enough DNA from a single drop of dried
blood or from a single hair to conduct investigations? Or how, out of the millions of base pairs that
make up an organism’s genome, scientists isolate a particular gene, or set of genes, for analysis?
They can accomplish these things (and many others) by “amplifying” the targeted region of the
genome using a technique called the Polymerase Chain Reaction (PCR). In PCR we essentially
replicate the desired target region of the DNA in a test tube using the same enzyme that the cell
uses for DNA replication (DNA polymerase). These days, there are very few genetic analyses that
don’t include a PCR step somewhere in the process. It is arguably the most important technique in
the molecular biologist’s repertoire (important enough to win its inventor, Kary Mullis, the Nobel
Prize) and has become a ubiquitous and powerful tool in diagnostics, forensics and research
biology. PCR is an method of synthesizing (“amplifying”) large quantities of a targeted region of
DNA in vitro. The DNA is synthesized the same way that cells do it—using a DNA polymerase
(the enzyme that cells use to replicate their DNA). Once amplified, PCR products can simply be
visualized by agarose gel electrophoresis or can be further analyzed by subsequent enzymatic
digestion for DNA fingerprinting, by cloning or by DNA sequencing.
PCR works by using a thermostable DNA polymerase (Taq polymerase) and short DNA fragments,
called ‘primers’, to direct the synthesis of a specifically-targeted region of the genomic DNA. The
synthesis reaction is repeated numerous times called ‘cycles’. The products of previous synthesis
cycles serve as template for the next cycle. This results in an exponential amplification of the
targeted region of DNA—every cycle will double the copy number of the target region.
This repeated cycling is made possible by the use of Taq polymerase, a thermostable (heat-tolerant)
DNA polymerase isolated from the thermophilic bacterium Thermus aquaticus, originally isolated
from a hot springs in Yellowstone National Park (ambient temperature 80oC!). Because it comes
from a heat-adapted bacterium, Taq polymerase can withstand the repeated, high-temperature DNA
denaturation steps (94oC) that are part of the PCR procedure.
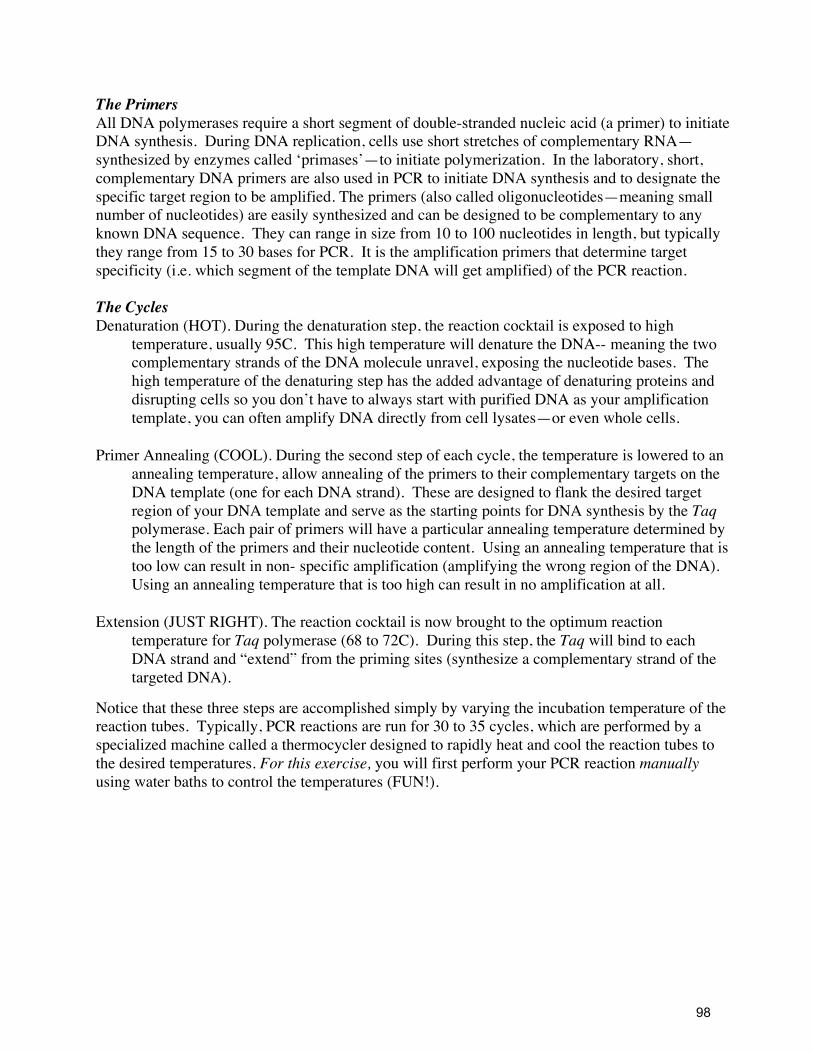
The Primers
All DNA polymerases require a short segment of double-stranded nucleic acid (a primer) to initiate
DNA synthesis. During DNA replication, cells use short stretches of complementary RNA—
synthesized by enzymes called ‘primases’—to initiate polymerization. In the laboratory, short,
complementary DNA primers are also used in PCR to initiate DNA synthesis and to designate the
specific target region to be amplified. The primers (also called oligonucleotides—meaning small
number of nucleotides) are easily synthesized and can be designed to be complementary to any
known DNA sequence. They can range in size from 10 to 100 nucleotides in length, but typically
they range from 15 to 30 bases for PCR. It is the amplification primers that determine target
specificity (i.e. which segment of the template DNA will get amplified) of the PCR reaction.
The Cycles
Denaturation (HOT). During the denaturation step, the reaction cocktail is exposed to high
temperature, usually 95C. This high temperature will denature the DNA-- meaning the two
complementary strands of the DNA molecule unravel, exposing the nucleotide bases. The
high temperature of the denaturing step has the added advantage of denaturing proteins and
disrupting cells so you don’t have to always start with purified DNA as your amplification
template, you can often amplify DNA directly from cell lysates—or even whole cells.
Primer Annealing (COOL). During the second step of each cycle, the temperature is lowered to an
annealing temperature, allow annealing of the primers to their complementary targets on the
DNA template (one for each DNA strand). These are designed to flank the desired target
region of your DNA template and serve as the starting points for DNA synthesis by the Taq
polymerase. Each pair of primers will have a particular annealing temperature determined by
the length of the primers and their nucleotide content. Using an annealing temperature that is
too low can result in non- specific amplification (amplifying the wrong region of the DNA).
Using an annealing temperature that is too high can result in no amplification at all.
Extension (JUST RIGHT). The reaction cocktail is now brought to the optimum reaction
temperature for Taq polymerase (68 to 72C). During this step, the Taq will bind to each
DNA strand and “extend” from the priming sites (synthesize a complementary strand of the
targeted DNA).
Notice that these three steps are accomplished simply by varying the incubation temperature of the
reaction tubes. Typically, PCR reactions are run for 30 to 35 cycles, which are performed by a
specialized machine called a thermocycler designed to rapidly heat and cool the reaction tubes to
the desired temperatures. For this exercise, you will first perform your PCR reaction manually
using water baths to control the temperatures (FUN!).
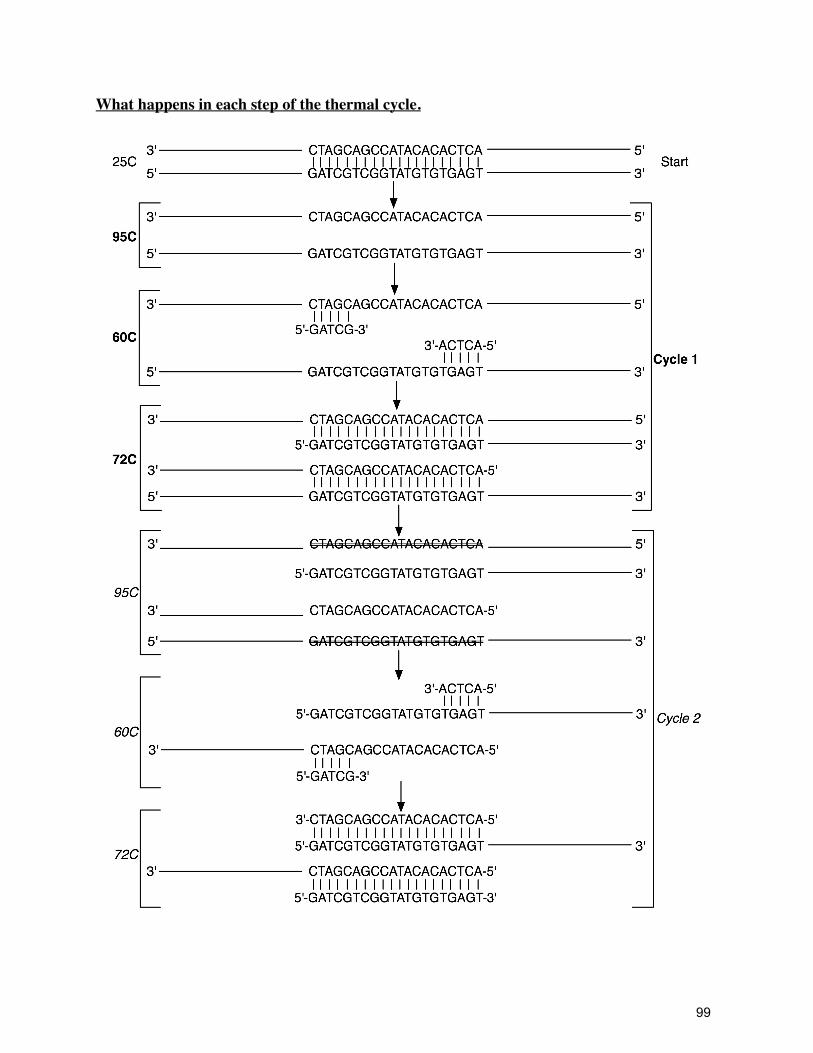
What happens in each step of the thermal cycle.
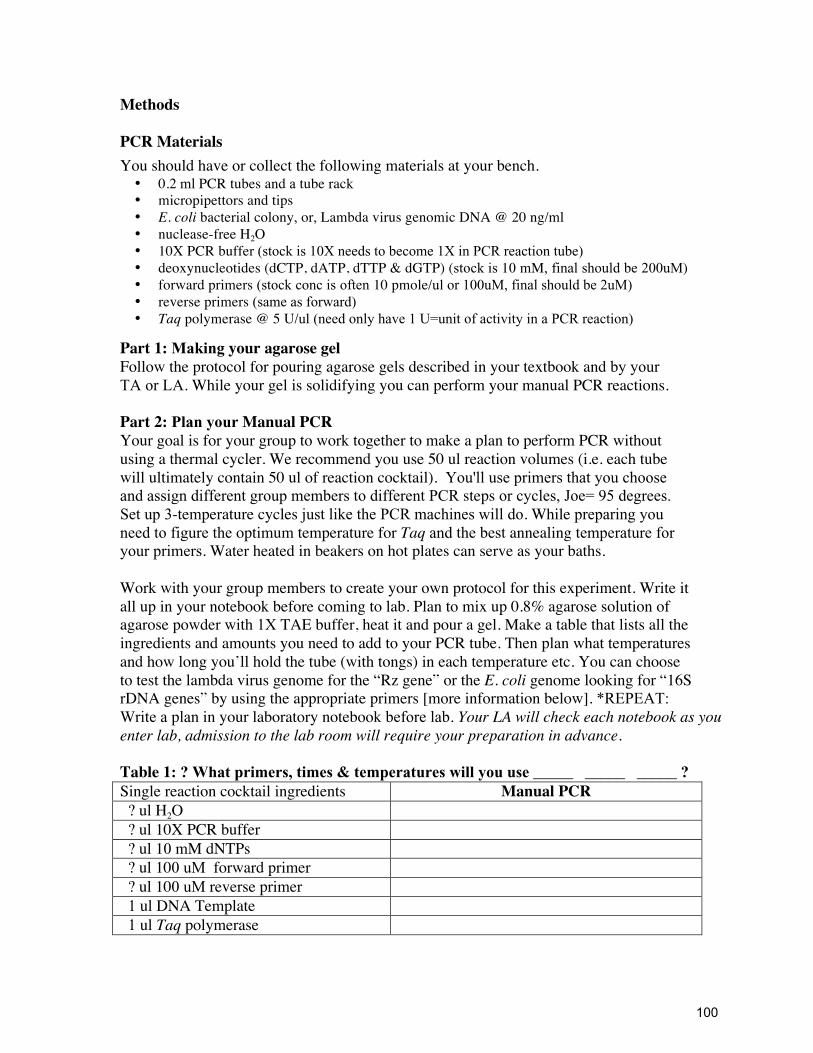
!
Methods
!
PCR Materials
You should have or collect the following materials at your bench. • 0.2 ml PCR tubes and a tube rack
• micropipettors and tips
• E. coli bacterial colony, or, Lambda virus genomic DNA @ 20 ng/ml
• nuclease-free H2O
• 10X PCR buffer (stock is 10X needs to become 1X in PCR reaction tube) • deoxynucleotides (dCTP, dATP, dTTP & dGTP) (stock is 10 mM, final should be 200uM)
• forward primers (stock conc is often 10 pmole/ul or 100uM, final should be 2uM) • reverse primers (same as forward) • Taq polymerase @ 5 U/ul (need only have 1 U=unit of activity in a PCR reaction)
Part 1: Making your agarose gel
Follow the protocol for pouring agarose gels described in your textbook and by yourTA or LA. While your gel is solidifying you can perform your manual PCR reactions.
Part 2: Plan your Manual PCR
Your goal is for your group to work together to make a plan to perform PCR without
using a thermal cycler. We recommend you use 50 ul reaction volumes (i.e. each tube
will ultimately contain 50 ul of reaction cocktail). You'll use primers that you choose
and assign different group members to different PCR steps or cycles, Joe= 9 5 degrees. Set up 3 -temperature cycles just like the PCR machines will do. While preparing you
need to figure the optimum temperature for Taq and the best annealing temperature for your primers. Water heated in beakers on hot plates can serve as your baths.
Work with your group members to create your own protocol for this experiment. Write it
all up in your notebook before coming to lab. Plan to mix up 0.8% agarose solution of
agarose powder with 1X TAE buffer, heat it and pour a gel. Make a table that lists all the
ingredients and amounts you need to add to your PCR tube. Then plan what temperatures
and how long you’ll hold the tube (with tongs) in each temperature etc. You can choose
to test the lambda virus genome for the “Rz gene” or the E. coli genome looking for “16S
rDNA genes” by using the appropriate primers [more information below]. *REPEAT: Write a plan in your laboratory notebook before lab. Your LA will check each notebook as you
enter lab, admission to the lab room will require your preparation in advance.
Table 1: ? What primers, times & temperatures will you use _____ _____ _____ ?
Single reaction cocktail ingredients Manual PCR
? ul H2O
? ul 10X PCR buffer
? ul 10 mM dNTPs
? ul 100 uM forward primer
? ul 100 uM reverse primer
1 ul DNA Template
1 ul Taq polymerase
1

!
Stuff you need to know to do this lab
What’s in the reaction cocktail?
You must create a reaction cocktail in your tube that provides everything the enzyme (in
this case Taq polymerase) needs to function as it would in the cell during DNA
Replication. Below is an inventory of what is required.
• Taq Buffer: Each cellular enzyme has a specific salt concentration and pH (and
temperature) required for its optimum performance. At 1X your PCR reaction buffer
provides the proper salt (KCl) concentration and pH (~8.5) for Taq polymerase.
• dNTPs: (i.e. nucleotide bases) DNA is a polymer of these four nucleotides
[A,T,G,C]. They are the building blocks polymerase uses to synthesize new DNA.
• Oligonucleotide primers: Their roles in DNA replication and in PCR were described
above. PCR usually requires two primers, one targeted to each DNA strand.
• DNA Template: In the cell, DNA polymerases use denatured, genomic DNA as a
template upon which to synthesize complementary DNA strands.
• Taq polymerase: You can’t carry out an enzymatic reaction without the enzyme.
What’s primers are available?
E. coli ribosome 16S gene primers
These are two sets of primers that amplify different segments of the small subunit rRNA
gene (16S rDNA) of E. coli. Figure 1 illustrates the 1542 bp 16S rDNA gene, the target
sites of the two primer pairs and the resulting sizes of the PCR products.
!
!
!
Primer E. coli
positions
5’ -> 3’ sequence
8F 8-27 AGA GTT TGA TCC TGG CTC AG
11F 11-27 GTT TGA TCC TGG CTC AG
1512R (1492R) 1492-1512 ACG GTT ACC TTG TTA CGA CTT
529R 515-529 CGC GGC TGC TGG CAC
1 1
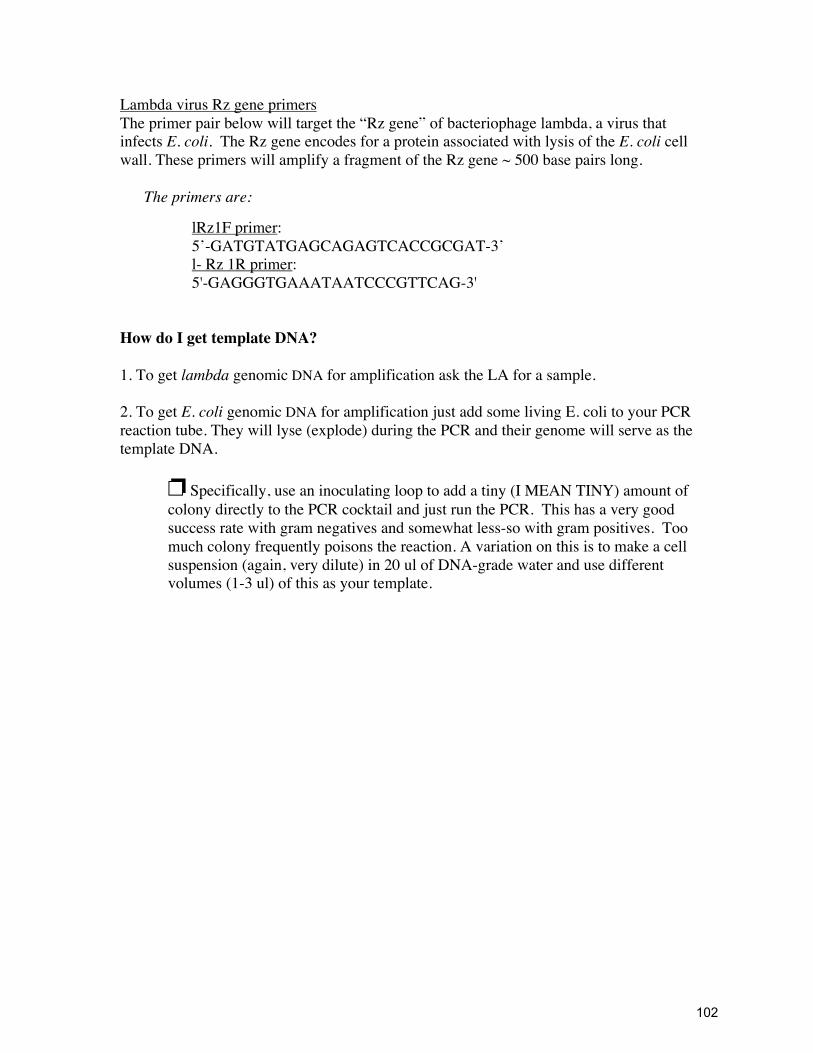
!
Lambda virus Rz gene primers
The primer pair below will target the “Rz gene” of bacteriophage lambda, a virus that
infects E. coli. The Rz gene encodes for a protein associated with lysis of the E. coli cell
wall. These primers will amplify a fragment of the Rz gene ~ 500 base pairs long.
The primers are:
lRz1F primer:
5’-GATGTATGAGCAGAGTCACCGCGAT-3’
l- Rz 1R primer:
5'-GAGGGTGAAATAATCCCGTTCAG-3'
How do I get template DNA?
1. To get lambda genomic DNA for amplification ask the LA for a sample.
2. To get E. coli genomic DNA for amplification just add some living E. coli to your PCR
reaction tube. They will lyse (explode) during the PCR and their genome will serve as the
template DNA.
! Specifically, use an inoculating loop to add a tiny (I MEAN TINY) amount of
colony directly to the PCR cocktail and just run the PCR. This has a very good
success rate with gram negatives and somewhat less-so with gram positives. Too
much colony frequently poisons the reaction. A variation on this is to make a cell
suspension (again, very dilute) in 20 ul of DNA-grade water and use different
volumes (1-3 ul) of this as your template.
1
Troubleshooting Your Research
'JHVSF�PVU�IPX�UP�NBLF�FYQFSJNFOUT�XPSL�CFUUFS�GPS�ZPVS�SFTFBSDI (see Troubleshooting Primer)
%BUF�� � � � � � � � /BNF�� � � � �
&YQFSJNFOU�1FSGPSNFE��� � � � � � � �
(PBM�PG�UIF�&YQFSJNFOU��� � � � � � � �
%JE�UIF�FYQFSJNFOU�XPSL ��*G�OPU �XIBU�XFOU�XSPOH ��%FTDSJCF�UIF�TQFDJGJD�EFUBJMT�PG�UIF�QSPCMFN�DPMPST �WPMVNFT �JODVCBUJPOT �FUD���
*G�ZPV�XFSF�UP�SFQFBU�UIJT�FYQFSJNFOU �XIBU�XPVME�ZPV�EP�UP�BEESFTT�BOZ�QSPCMFNT ��)PX�XPVME�ZPV�JNQSPWF�UIJT�FYQFSJNFOU�JO�UIF�GVUVSF ��#F�TQFDJGJD�
1

1 4
105
LAB 2: (DESIGN PROTOCOL) PURIFICATION OF GENOMIC DNA
Note: You find protocols supplied by professional researchers for use of Chelex
Learning Objectives:
1. To better understand the nature of science today: finding existing protocols for commonly used techniques provided by fellow scientists.
2. To be able to follow and optimize existing protocol and make it work for you. Experimental Objectives:
1. Isolate enough DNA from cells to support/be used in your PCR research experiments. Introduction During your LB-145L PCR research project this semester you'll need genomic DNA from cells to serve as template. This is the lab when you get that DNA. NOTE: This is NOT a cookbook lab designed solely to teach you how to do something, it is also your opportunity to actually get enough genomic DNA from living cells for your research for the whole semester.
This laboratory will serve as your opportunity to practice working with modern DNA protocols developed by others and optimize them for yourself. You must both determine how to mix up an appropriate stock solution of Chelex-100 chelating resin, as well as develop a protocol to use that solution to extract DNA from human cheek cells from saliva or buccal swabbing (which also requires a protocol for collecting cells). The genome, literally human chromosomes, will serve as an excellent “template” for your PCR research. Protect the DNA you isolate, keep it cold so enzymes don’t degrade it. This is your very precious material for the semester.
Methods We currently plan to provide you with the Chelex resin from the company Sigma Inc. Check with the LA to confirm which vendor and what reagents are provided (in case there are more). Prior to coming to lab, visit the vendor’s website and search the internet for existing protocols provided by other scientists for using Chelex to do genome purification from saliva with cheek, or buccal, cells. Work with your group to review the protocol(s), choose one, and then distill it down to the basic steps you’ll have to perform that seem the most appropriate to your project. Write up the protocol in your laboratory notebook.
**Your LA will check each person’s notebook as you enter lab, admission to the lab room will require your preparation in advance**.

!
1

Troubleshooting Your Research
'JHVSF�PVU�IPX�UP�NBLF�FYQFSJNFOUT�XPSL�CFUUFS�GPS�ZPVS�SFTFBSDI (see Troubleshooting Primer)
%BUF�� � � � � � � � /BNF�� � � � �
&YQFSJNFOU�1FSGPSNFE��� � � � � � � �
(PBM�PG�UIF�&YQFSJNFOU��� � � � � � � �
%JE�UIF�FYQFSJNFOU�XPSL ��*G�OPU �XIBU�XFOU�XSPOH ��%FTDSJCF�UIF�TQFDJGJD�EFUBJMT�PG�UIF�QSPCMFN�DPMPST �WPMVNFT �JODVCBUJPOT �FUD���
*G�ZPV�XFSF�UP�SFQFBU�UIJT�FYQFSJNFOU �XIBU�XPVME�ZPV�EP�UP�BEESFTT�BOZ�QSPCMFNT ��)PX�XPVME�ZPV�JNQSPWF�UIJT�FYQFSJNFOU�JO�UIF�GVUVSF ��#F�TQFDJGJD�
1

!
1

!
!LAB 3: “30 Days” A Socio'Psychological Independent!Investigation Authors: Dr.!Douglas!Luckie,!Ph.D.!and!Marija!Krha,!M.S.!!
EXTRA&CREDIT!&This&is&NOT&MANDATORY!
Learning&Objectives: 1. To better connect your learning to other courses and HPS disciplines. 2. To personally experience some aspect of your malady and to connect your
research to real-world impacts.
Experimental&Objectives: 1. To gain a greater focus and ability to write/speak about your disease as a result
of a more profound understanding of the field of your research program. Introduction&In the “30 Days” laboratory, each research group is expected to design and perform a sociological or psychological experiment where every individual in the research team experiences an aspect of the daily life of someone who has your chosen disease. This experiment is inspired by Morgan Spurlock, an American documentary filmmaker, best known for the documentary film Super Size Me, in which he demonstrated negative health effects of McDonald's food by eating nothing but meals from McDonald's three times a day, every day, for 30 days. Spurlock was also the executive producer and star of the television show 30 Days (http://www.fxnetworks.com/shows/originals/30days/). In each episode, a person (which in some cases, is Spurlock himself) or a group of people spend 30 days immersing themselves in a mode of life markedly different from their norm (being in prison, a devout Christian living in a Muslim family, a homophobe staying with a homosexual person, etc). In the premiere episode of the first season, "Minimum Wage," Spurlock and his fiancée lived for 30 days in the Bottoms neighborhood of Columbus, Ohio, earning minimum wage, with no access to outside funds. Morgan Spurlock uses a couple approaches: 1. Morgan himself lives a period of time "in the shoes" of someone else. 2. Morgan films "somebody else" doing the same thing. You might vary from this, and might follow the daily activities of some who actually has a disease as well as discuss the impact the experience has on you. Developing&an&Experiment&First, individually, on your own, spend a few days coming up with some topics you think might be interesting for your group. Then consider how you might approach those topics using Morgan Spurlock's "30 Days" approach. For inspiration, go to Morgan Spurlock's
1
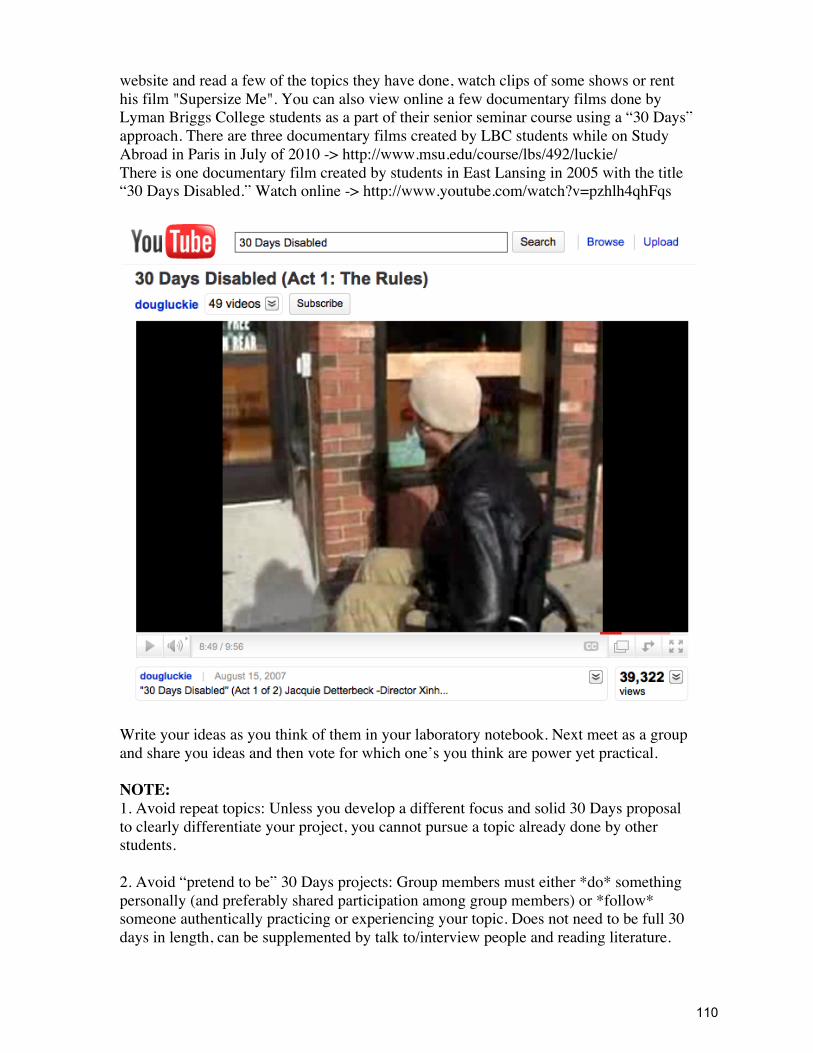
website and read a few of the topics they have done, watch clips of some shows or rent his film "Supersize Me". You can also view online a few documentary films done by Lyman Briggs College students as a part of their senior seminar course using a “30 Days” approach. There are three documentary films created by LBC students while on Study Abroad in Paris in July of 2010 -> http://www.msu.edu/course/lbs/492/luckie/ There is one documentary film created by students in East Lansing in 2005 with the title “30 Days Disabled.” Watch online -> http://www.youtube.com/watch?v=pzhlh4qhFqs
Write your ideas as you think of them in your laboratory notebook. Next meet as a group and share you ideas and then vote for which one’s you think are power yet practical. NOTE: 1. Avoid repeat topics: Unless you develop a different focus and solid 30 Days proposal to clearly differentiate your project, you cannot pursue a topic already done by other students. 2. Avoid “pretend to be” 30 Days projects: Group members must either *do* something personally (and preferably shared participation among group members) or *follow* someone authentically practicing or experiencing your topic. Does not need to be full 30 days in length, can be supplemented by talk to/interview people and reading literature.
11

General Primers (in this case the word primer means an introduction)
111

11
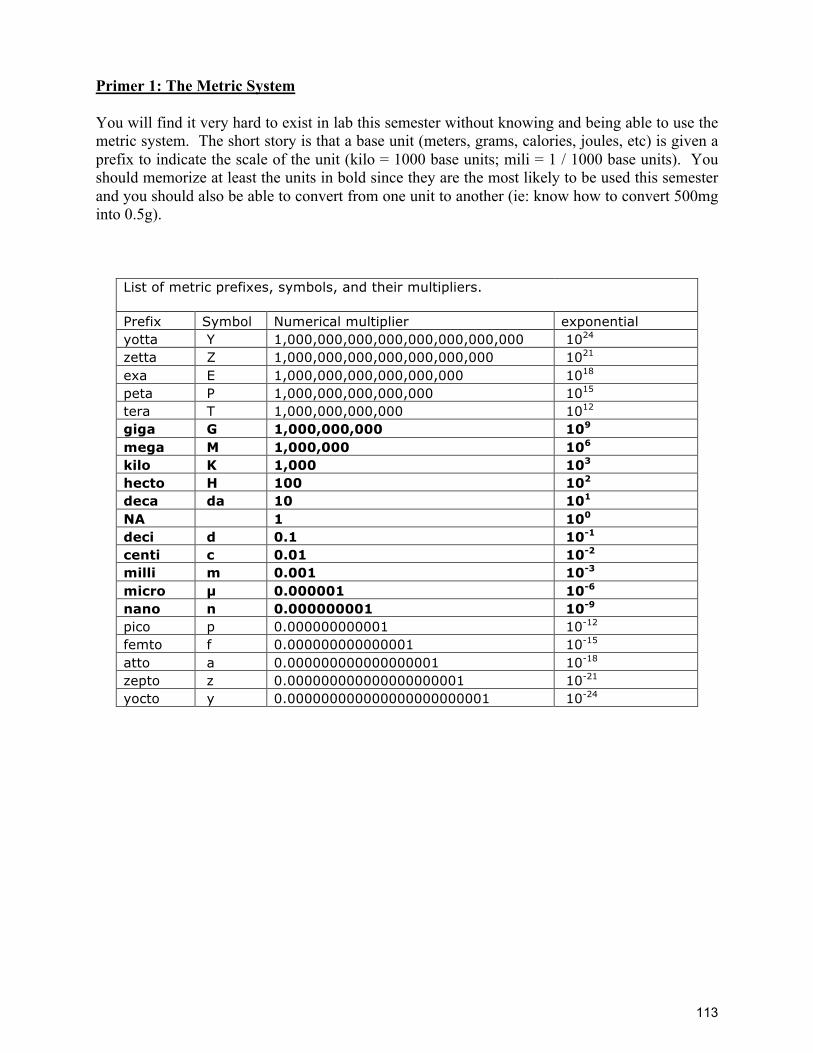
Primer 1: The Metric System
You will find it very hard to exist in lab this semester without knowing and being able to use the
metric system. The short story is that a base unit (meters, grams, calories, joules, etc) is given a
prefix to indicate the scale of the unit (kilo = 1000 base units; mili = 1 / 1000 base units). You
should memorize at least the units in bold since they are the most likely to be used this semester
and you should also be able to convert from one unit to another (ie: know how to convert 500mg
into 0.5g).
List of metric prefixes, symbols, and their multipliers.
Prefix Symbol Numerical multiplier exponential
yotta Y 1,000,000,000,000,000,000,000,000 1024
zetta Z 1,000,000,000,000,000,000,000 1021
exa E 1,000,000,000,000,000,000 1018
peta P 1,000,000,000,000,000 1015
tera T 1,000,000,000,000 1012
giga G 1,000,000,000 109
mega M 1,000,000 106
kilo K 1,000 103
hecto H 100 102
deca da 10 101
NA 1 100
deci d 0.1 10-1
centi c 0.01 10-2
milli m 0.001 10-3
micro ! 0.000001 10-6
nano n 0.000000001 10-9
pico p 0.000000000001 10-12
femto f 0.000000000000001 10-15
atto a 0.000000000000000001 10-18
zepto z 0.000000000000000000001 10-21
yocto y 0.000000000000000000000001 10-24
11
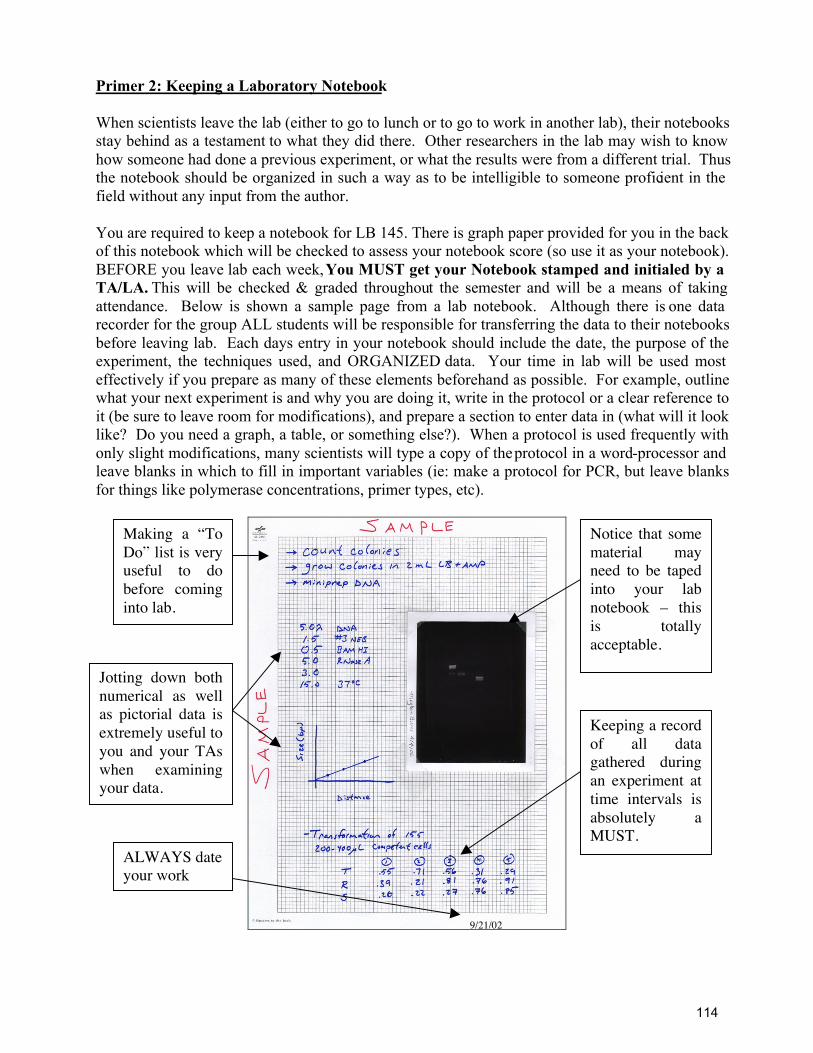
Primer 2: Keeping a Laboratory Notebook
When scientists leave the lab (either to go to lunch or to go to work in another lab), their notebooks
stay behind as a testament to what they did there. Other researchers in the lab may wish to know
how someone had done a previous experiment, or what the results were from a different trial. Thus
the notebook should be organized in such a way as to be intelligible to someone proficient in the
field without any input from the author.
You are required to keep a notebook for LB 145. There is graph paper provided for you in the back
of this notebook which will be checked to assess your notebook score (so use it as your notebook).
BEFORE you leave lab each week, You MUST get your Notebook stamped and initialed by a
TA/LA. This will be checked & graded throughout the semester and will be a means of taking
attendance. Below is shown a sample page from a lab notebook. Although there is one data
recorder for the group ALL students will be responsible for transferring the data to their notebooks
before leaving lab. Each days entry in your notebook should include the date, the purpose of the
experiment, the techniques used, and ORGANIZED data. Your time in lab will be used most
effectively if you prepare as many of these elements beforehand as possible. For example, outline
what your next experiment is and why you are doing it, write in the protocol or a clear reference to
it (be sure to leave room for modifications), and prepare a section to enter data in (what will it look
like? Do you need a graph, a table, or something else?). When a protocol is used frequently with
only slight modifications, many scientists will type a copy of the protocol in a word-processor and
leave blanks in which to fill in important variables (ie: make a protocol for PCR, but leave blanks
for things like polymerase concentrations, primer types, etc).
Notice that some
material may
need to be taped
into your lab
notebook – this
is totally
acceptable.
Making a “To
Do” list is very
useful to do
before coming
into lab.
Jotting down both
numerical as well
as pictorial data is
extremely useful to
you and your TAs
when examining
your data.
Keeping a record
of all data
gathered during
an experiment at
time intervals is
absolutely a
MUST.
9/21/02
ALWAYS date
your work
114
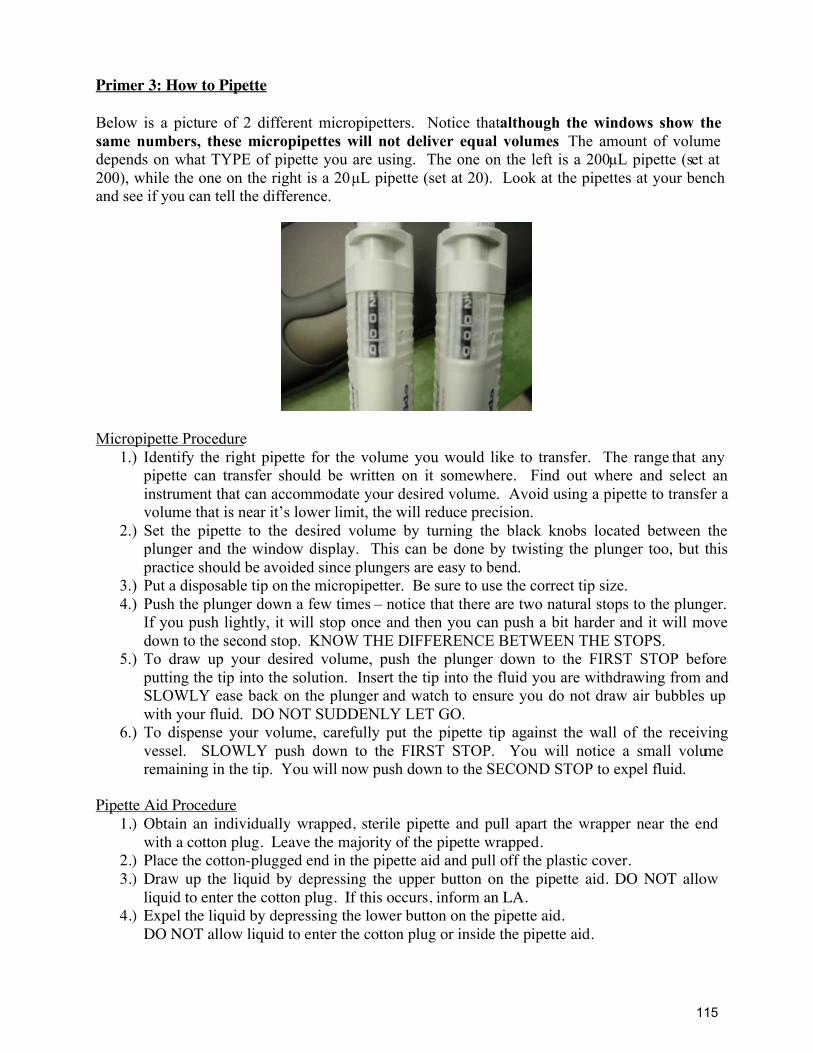
Primer 3: How to Pipette
Below is a picture of 2 different micropipetters. Notice that although the windows show the
same numbers, these micropipettes will not deliver equal volumes. The amount of volume
depends on what TYPE of pipette you are using. The one on the left is a 200 !L pipette (set at
200), while the one on the right is a 20 !L pipette (set at 20). Look at the pipettes at your bench
and see if you can tell the difference.
Micropipette Procedure
1.) Identify the right pipette for the volume you would like to transfer. The range that any
pipette can transfer should be written on it somewhere. Find out where and select an
instrument that can accommodate your desired volume. Avoid using a pipette to transfer a
volume that is near it’s lower limit, the will reduce precision.
2.) Set the pipette to the desired volume by turning the black knobs located between the
plunger and the window display. This can be done by twisting the plunger too, but this
practice should be avoided since plungers are easy to bend.
3.) Put a disposable tip on the micropipetter. Be sure to use the correct tip size.
4.) Push the plunger down a few times – notice that there are two natural stops to the plunger.
If you push lightly, it will stop once and then you can push a bit harder and it will move
down to the second stop. KNOW THE DIFFERENCE BETWEEN THE STOPS.
5.) To draw up your desired volume, push the plunger down to the FIRST STOP before
putting the tip into the solution. Insert the tip into the fluid you are withdrawing from and
SLOWLY ease back on the plunger and watch to ensure you do not draw air bubbles up
with your fluid. DO NOT SUDDENLY LET GO.
6.) To dispense your volume, carefully put the pipette tip against the wall of the receiving
vessel. SLOWLY push down to the FIRST STOP. You will notice a small volume
remaining in the tip. You will now push down to the SECOND STOP to expel fluid.
Pipette Aid Procedure
1.) Obtain an individually wrapped, sterile pipette and pull apart the wrapper near the end
with a cotton plug. Leave the majority of the pipette wrapped.
2.) Place the cotton-plugged end in the pipette aid and pull off the plastic cover.
3.) Draw up the liquid by depressing the upper button on the pipette aid. DO NOT allow
liquid to enter the cotton plug. If this occurs, inform an LA.
4.) Expel the liquid by depressing the lower button on the pipette aid.
DO NOT allow liquid to enter the cotton plug or inside the pipette aid.
11
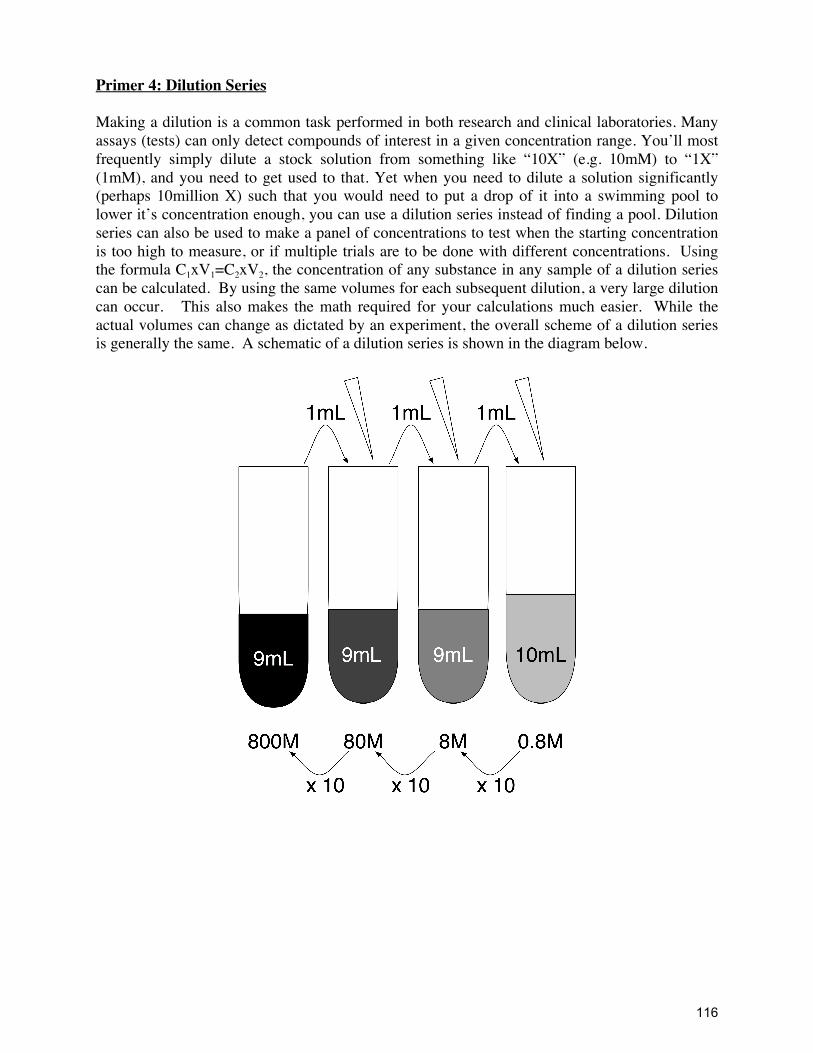
Primer 4: Dilution Series
Making a dilution is a common task performed in both research and clinical laboratories. Many
assays (tests) can only detect compounds of interest in a given concentration range. You’ll most
frequently simply dilute a stock solution from something like “10X” (e.g. 10mM) to “1X”
(1mM), and you need to get used to that. Yet when you need to dilute a solution significantly
(perhaps 10million X) such that you would need to put a drop of it into a swimming pool to
lower it’s concentration enough, you can use a dilution series instead of finding a pool. Dilution
series can also be used to make a panel of concentrations to test when the starting concentration
is too high to measure, or if multiple trials are to be done with different concentrations. Using
the formula C1xV1=C2xV2, the concentration of any substance in any sample of a dilution series
can be calculated. By using the same volumes for each subsequent dilution, a very large dilution
can occur. This also makes the math required for your calculations much easier. While the
actual volumes can change as dictated by an experiment, the overall scheme of a dilution series
is generally the same. A schematic of a dilution series is shown in the diagram below.
11

Primer 5: Spectrophotometry, Beer’s Law and Standard Curves Mike Haenisch
Spectrophotometry is one of the most fundamental and most widely used techniques in modern biology labs. You will use spectrophotometers this semester to quantify DNA from cell extracts and evaluate its purity. This section will first discuss how the absorbance of light is measured at specific wavelengths, then how this can be used to identify compounds based on which wavelengths of light they absorb most strongly, and finally how we can use this information to quantify compounds in biological and chemical samples.
As shown below, broad-spectrum light (many wavelengths) is emitted from a bulb and the wavelengths are separated into different directions by a grating or prism. By rotating the prism, it is possible to angle a different wavelength of light towards the selection slot. Only the desired wavelength passes through the slot and eventually to the sample in the cuvette. Light that is not absorbed by the sample passes through to a photocell which generates an electric current when struck by light. The higher the intensity of the light that strikes the photocell, the stronger the electrical current that is generated (just like solar power). The strength of the current is converted into a display that can be recorded.
Every compound absorbs specific wavelengths of light. The wavelengths absorbed depend on the types of chemical bonds in a compound. Measuring the absorbance of any compound over a range of wavelengths generates a type of fingerprint for that compound called an absorption spectrum. Below are the absorption spectra of several photosynthetic pigments (Taken from Campbell). You can see that these pigments absorb red and blue light most strongly.
Chlorophyll a Chlorophyll b Chlorophyll b
Carotenoids
11
Primer 6: Graphing in Excel Mike Haenisch
1.) Input your data into excel.
2.) Use your cursor to highlight the data and then open the “chart wizard” either by clicking the
button on the toolbar, or by clicking chart in the insert menu. The “Chart Wizard” will
guide you through most of the rest of the process.
3.) To make a standard curve, select “XY (scatter)” from the chart type options and click
“Next”.
4.) The third window of the wizard allows you to give the chart a title and label the axes. Be
sure to use units on your axes. This would also be a good time to check that the independent
variable (the one that we have control over) is on the x-axis. If it isn’t, then switch the
position of your data columns right to left (ie: conc on the left, or ABS on the left).
5.) The fourth and final window gives you the option to create your graph as an object in the
spreadsheet or as a new sheet. If you make the graph as a new sheet, it will show up as a
new tab at the bottom of your screen. You can move between sheets and graphs by clicking
on these tabs.
6.) A trendline can be added by right clicking on a datapoint and selecting “add trendline” from
the drop-down menu. You can also select your data and select “add trendline” from the
chart menu. This will open the trendline wizard. The style of trendline you use will depend
on the type of data you have, so choose carefully. Use the options tab to further format
your graph. You should always show the equation and R2 of your trendline, but the
intercept may not always be set to a constant.
7.) Generally, double-clicking on the various areas of the graph will allow you to change its
features (colors, styles, scales, gridlines and much more). Figures don’t need to be fancy,
but they need to be presentable.
11

Primer 7: Analysis of Gel Electrophoresis David Maison
If you’re very lucky, then sometime this semester you will have a band in your gel from
something other than your DNA ladder (hopefully from your PCR reactions). Having a band is
good evidence that your PCR reactions worked, but it’s not conclusive. Based on how you
designed your primers, you should know how large of a PCR product should be in the gel. This
primer will explain how to use the molecular weight marker (DNA ladder) to determine the size
of a band in your gel.
Semi-Log Plots
Sometimes the only ways to see whether bands have changed, are unknown, or are the size you
are looking for, is to use a visual analysis. In gel electrophoresis, the creation, and use, of a semi-
log plot is a frequent and simple method for doing this.
A semi-logarithmic plot is used if one range of numbers is spread out over numerous orders of
magnitude. It is important to note that applying the logarithmic scale is essential to standardize
the graph. This creates a linear scale and allows determination of unknown bands.
Gel Electrophoresis and Plotting
When plotting a semi-log plot from your gel electrophoresis product, the y-axis corresponds to
the base pair equivalent size of the molecule and is expressed in a logarithmic scale. This is
because the bands can often range in size from 101 to 105 (104 for CFTR). The y-axis is
partitioned into cycles, which are separated from one another by a factor of 10. The x-axis,
migration distance when pertaining to DNA in gel, is expressed in a linear, non-logarithmic
scale, often in equivalent centimeter intervals.
The standard curve (the line that is formed by plotting these two variables from your molecular
weight standard) is what you will be using to determine the band size, of your unknowns. Since
all of the bands in the molecular weight standard are of a known size, their migration pattern can
be used to determine the size of unknown bands. The distance traveled by the DNA running in
gel electrophoresis is not only proportional to the size of the DNA, but also the time the gel was
allowed to run. As a consequence to this, the same DNA run on different gels will not be directly
comparable.
11

Methods to Use: A rough estimate of size can be made by comparing your band to the ladder on the gel (light
arrows), but you should always make a standard curve to accurately analyze your results.
STANDARDIZED CURVE ON PAPER:
1) Measure the distance from the well to each band in the ladder.
2) Plot this distance (x-axis) verses band size (y-axis) on the semi-log paper in the back of your
notebook and draw the best-fit straight line through the points. This is your standard curve.
3) Measure the distance your unknown band migrated and find that distance on your standard
curve. Follow the gridlines up until you intercept the best-fit line, then follow the grid over
to find the size of your unknown.
4) Enter this same data in excel and use the trendline function to solve for the equation of the
best-fit line. You can use this equation to solve for your unknown band size will give you a
more accurate result.
(Figure 1 – Sequence for producing semi-log plot from gel electrophoresis product)
(Figure 2 – semi-log plot generated from Microsoft Excel)
1
Primer 8: Introduction to the Troubleshooting Process
So you’ve researched your topic, planned an experiment, prepped all the necessary
material, sat at the bench for 4.5 straight hours following every step of the protocol to the
letter, and after all of that… the data you collected defies the laws of physics. Don’t feel
bad. You’d be surprised how many times a day researchers break the “laws of physics.”
We’ve all come to expect it, but since you’re new to this, we’re going to assume that you
might be wondering what to do next.
The fact of the matter is that much of the actual scientific process is not spent analyzing
data, but rather is spent trying to find ways to make experiments work in a way that
provides any sort of useful data at all, and doing tests to make sure that the data that is
being generated is a reliable representation of reality. Confirming that your data
represents reality is why we have controls, but to get stuff to work or any useful data, we
need to “troubleshoot” our experiments. This is the creative side of laboratory science
that does use logic and the scientific method, but there isn’t always a well defined process
that will inevitably lead you to a successful experiment. On the other hand, there are
some things you can do that should help.
1. Try to identify all the things in your experiment that did work. This is not just meant
to make you feel better, it’s important to identify which aspects of your experiment
should NOT be changed.
2. Next identify where you noticed things beginning to not work well in your
experiment. The problem must somewhere in-between “did work” & “didn’t”.
3. Sit down and look at the protocol in-between what did and did not work. At each step
of the protocol, ask yourself, what could go wrong at this step? How can you tell if
this is what actually went wrong? Generate a list of possible problems, ways to tell if
those are the actual problems, and ways to fix the problems. What you should end up
with is a list of experiments that you can do to try to isolate and fix the problem.
Take that list to your TA and see if they have any advice on how best to proceed.
For example, lets say you did PCR on the 16S ribosome gene of E. coli that was
supposed to generate a 500 base pair long fragment but you didn’t have anything that
looked like a DNA band on the 500bp region of your DNA agarose gel.
1. What worked: If you knew where the 500bp region of your gel was, that means you
had a MW ladder that worked, therefore, your DNA gel was made and run properly.
2. Where is problem: The PCR product did not show up. The problem was before this.
3. Possible problem(s) Solution(s)
PCR ingredients wrong
concentrations.
Review your protocols and notes, review the Lab Guide and
internet for proper concs, show your findings to your LA.
One of the PCR
ingredients could be bad.
Check if other groups in your section used the same material
as you, and their reaction worked on a different gene.
Your primers could be
bad.
Check to see if anyone had success with them. If designed
by you evaluate sequences again, you may need to redesign.
You may not have had
enough clean template.
“Dirty” DNA doesn’t always amplify. Check your DNA
sample’s quality and try to improve it with an extraction.
There may be a problem
in your PCR cycle.
Change the variables (time and temperature) to increase the
probability of annealing and amplification.
1 1

Primer 9: Find Me a Project! Helpful Guide by Zach Gaudette
1

1
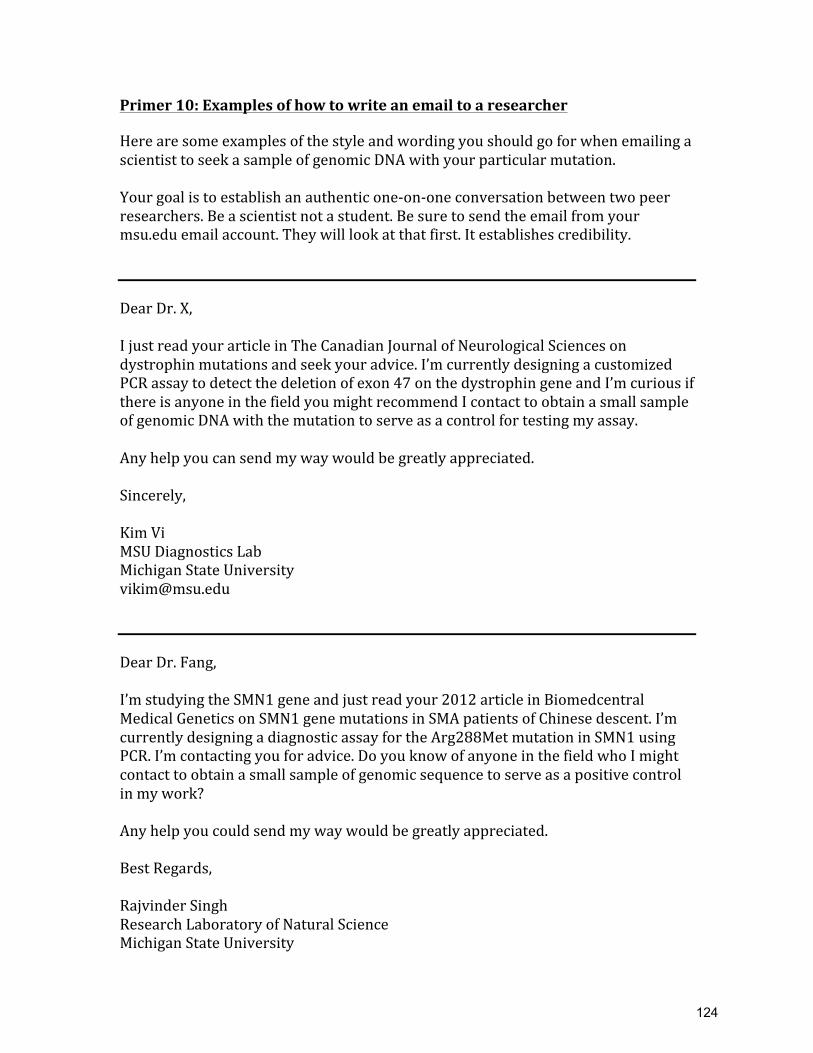
Primer&10:&Examples&of&how&to&write&an&email&to&a&researcher!!Here!are!some!examples!of!the!style!and!wording!you!should!go!for!when!emailing!a!scientist!to!seek!a!sample!of!genomic!DNA!with!your!particular!mutation.!!Your!goal!is!to!establish!an!authentic!one>on>one!conversation!between!two!peer!researchers.!Be!a!scientist!not!a!student.!Be!sure!to!send!the!email!from!your!msu.edu!email!account.!They!will!look!at!that!first.!It!establishes!credibility.!!!!Dear!Dr.!X,!!I!just!read!your!article!in!The!Canadian!Journal!of!Neurological!Sciences!on!dystrophin!mutations!and!seek!your!advice.!I’m!currently!designing!a!customized!PCR!assay!to!detect!the!deletion!of!exon!47!on!the!dystrophin!gene!and!I’m!curious!if!there!is!anyone!in!the!field!you!might!recommend!I!contact!to!obtain!a!small!sample!of!genomic!DNA!with!the!mutation!to!serve!as!a!control!for!testing!my!assay.!!Any!help!you!can!send!my!way!would!be!greatly!appreciated.!!Sincerely,!!Kim!Vi!MSU!Diagnostics!Lab!Michigan!State!University!vikim@msu.edu!!!!Dear!Dr.!Fang,!!I’m!studying!the!SMN1!gene!and!just!read!your!2012!article!in!Biomedcentral!Medical!Genetics!on!SMN1!gene!mutations!in!SMA!patients!of!Chinese!descent.!I’m!currently!designing!a!diagnostic!assay!for!the!Arg288Met!mutation!in!SMN1!using!PCR.!I’m!contacting!you!for!advice.!Do!you!know!of!anyone!in!the!field!who!I!might!contact!to!obtain!a!small!sample!of!genomic!sequence!to!serve!as!a!positive!control!in!my!work?!!Any!help!you!could!send!my!way!would!be!greatly!appreciated.!!Best!Regards,!!Rajvinder!Singh!Research!Laboratory!of!Natural!Science!Michigan!State!University!
1 4
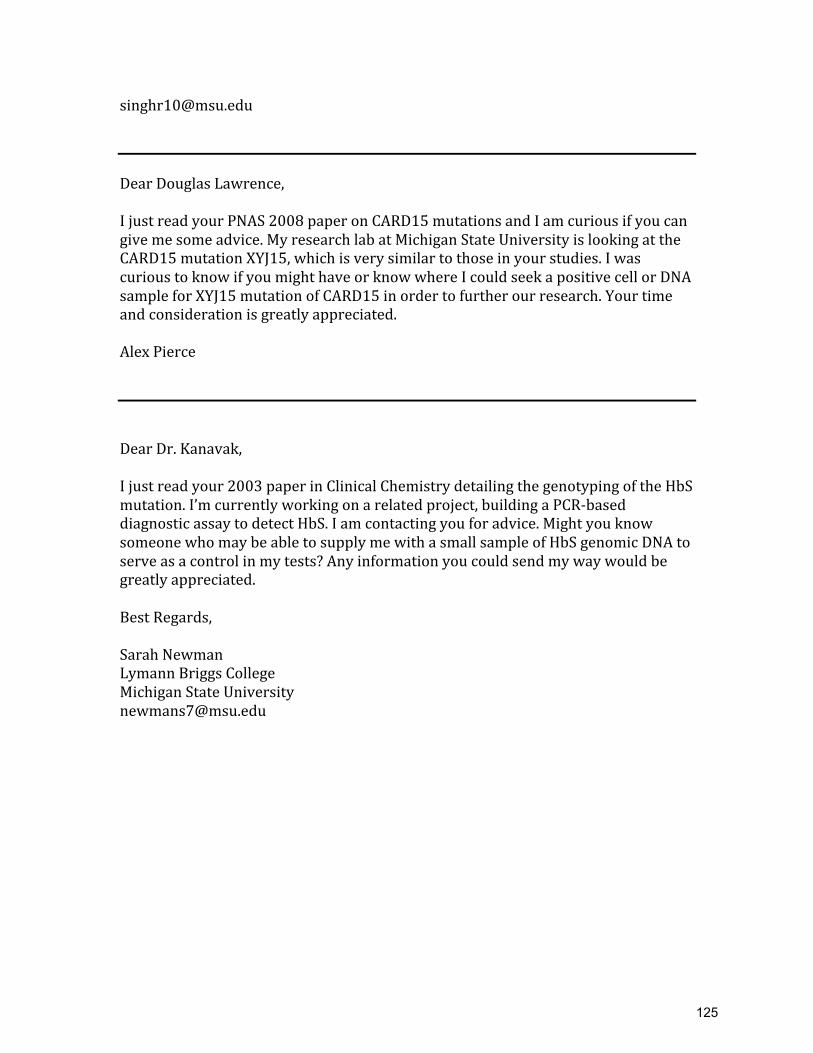
[email protected]!!!!Dear!Douglas!Lawrence,!!I!just!read!your!PNAS!2008!paper!on!CARD15!mutations!and!I!am!curious!if!you!can!give!me!some!advice.!My!research!lab!at!Michigan!State!University!is!looking!at!the!CARD15!mutation!XYJ15,!which!is!very!similar!to!those!in!your!studies.!I!was!curious!to!know!if!you!might!have!or!know!where!I!could!seek!a!positive!cell!or!DNA!sample!for!XYJ15!mutation!of!CARD15!in!order!to!further!our!research.!Your!time!and!consideration!is!greatly!appreciated.!!Alex!Pierce!!!!!Dear!Dr.!Kanavak,!!I!just!read!your!2003!paper!in!Clinical!Chemistry!detailing!the!genotyping!of!the!HbS!mutation.!I’m!currently!working!on!a!related!project,!building!a!PCR>based!diagnostic!assay!to!detect!HbS.!I!am!contacting!you!for!advice.!Might!you!know!someone!who!may!be!able!to!supply!me!with!a!small!sample!of!HbS!genomic!DNA!to!serve!as!a!control!in!my!tests?!Any!information!you!could!send!my!way!would!be!greatly!appreciated.!!Best!Regards,!!Sarah!Newman!Lymann!Briggs!College!Michigan!State!University!newmans7@msu.edu!!
1

Primer 11: How to read a research paper like a (busy) scientist By Candace R. Igert At some point during the semester, you are going to need to read a research paper. If you are striving to do well in this course, you will likely be reading a lot of research papers or journals. Just like everything else in science, there is an effective method to make this less painful and time-consuming. Below is a set of steps an experienced scientist will take when reading a journal or even deciding if it is relevant to what they are looking for. The scientist’s goal is getting important information fast. They do not read from beginning to end, but skip around. Step 1: A scientist will read the title. This may sound simple and kind of silly to have it as a step, but the title of a paper can tell you what species/cells were used, what technique was used, what was found, and/or what the research aims were. Sometimes, by this information alone, you can decide if a paper is useful or relevant. Step 2: A scientist will then look at the authors and whom they are affiliated with. This step can help to give credibility to the article or to give you a better idea of what the paper is about. If after reading X amount of journals on CF, you may know that Dr. Smith is an expert on only one aspect of CF or perhaps Dr. Smith works at Harvard, his lends credibility to his/her work. Scientists read slowly and carefully when they determine if the paper is important and/or done by outstanding people. Step 3: A scientist will now read critically read the abstract. At this point, a scientist would read the abstract and glean as much information from it as possible such as the research question, the hypothesis, the predictions, the methods used, the outcome, and how it is interpreted (in other words, what does all of it mean?). All of these aspects are not always apparent or present in every abstract as each journal has different requirements in layout. A great abstract will often share the most important findings and data. Step 4: A scientist will read the Introduction if not familiar with the topic. If the subject that this journal focuses on is not one that you are familiar with, reading the introduction is a way to quickly get yourself up to speed. Perhaps you are familiar with the topic then read the introduction until you catch yourself shaking your head in confirmation or going “Yea, I know this.” Step 5: A scientist will then go on to look at the figures and tables. Using the figure and table legends, which are usually pretty extensive and descriptive, a scientist will try to discern what is shown in each figure including what it means in terms of the research aims and interpret data presented in tables. If you come upon something you do not understand by just reading the legend, proceed to Step 5. Step 6: A scientist will then read the text to clarify. When a scientist finds that s/he does not understand a figure or table and needs further explanation, s/he will locate where that figure is referenced in the text and read that portion for
1
clarification. S/he will first just scan the Results section to find where that figure or table is cited e.g. “(Figure 3)”. Step 7: When relevant, a scientist will finally read the discussion. After reading the title, looking at the authors and their affiliates, critically reading the abstract, and understanding the figures, you may wonder what they concluded from all of that, what they think went wrong/can be fixed in the future, or where they plan to take their research in the future. If this is the case then read the discussion/conclusion. What information you gain or want from a paper will vary depending on your research needs at that point in time. If you are looking for a primer sequence, then you may skip Step 4 and read the Methods sections to see if their sequence is listed. As you learn how to read papers, you will also learn how to effectively customize the process depending on the occasion. ** Disclaimer: If asked to read a research paper for a class, it is probably best not to only employ this method.
1
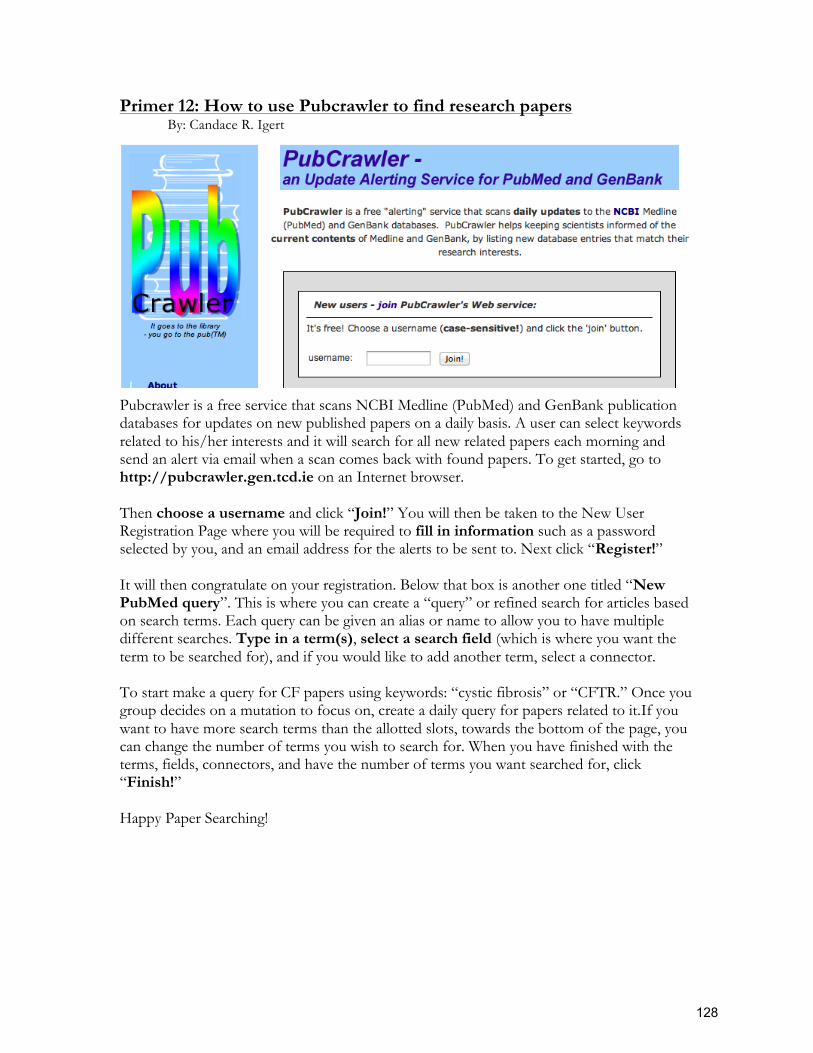
Primer 12: How to use Pubcrawler to find research papers By: Candace R. Igert Pubcrawler is a free service that scans NCBI Medline (PubMed) and GenBank publication databases for updates on new published papers on a daily basis. A user can select keywords related to his/her interests and it will search for all new related papers each morning and send an alert via email when a scan comes back with found papers. To get started, go to http://pubcrawler.gen.tcd.ie on an Internet browser. Then choose a username and click “Join!” You will then be taken to the New User Registration Page where you will be required to fill in information such as a password selected by you, and an email address for the alerts to be sent to. Next click “Register!” It will then congratulate on your registration. Below that box is another one titled “New PubMed query”. This is where you can create a “query” or refined search for articles based on search terms. Each query can be given an alias or name to allow you to have multiple different searches. Type in a term(s), select a search field (which is where you want the term to be searched for), and if you would like to add another term, select a connector. To start make a query for CF papers using keywords: “cystic fibrosis” or “CFTR.” Once you group decides on a mutation to focus on, create a daily query for papers related to it.If you want to have more search terms than the allotted slots, towards the bottom of the page, you can change the number of terms you wish to search for. When you have finished with the terms, fields, connectors, and have the number of terms you want searched for, click “Finish!” Happy Paper Searching! !
1

Primer Design (in this case the word primer means “oligonucleotide”)
1

1
Introduction to “Primer Design” for PCR Jayme Olsen
Oligonucleotides, also referred to as primers, are short single strands of nucleic acids that are
synthesized from either DNA or RNA in order to bind to a complementary strand. Primers have
a target area where they bind and act as the starting point for polymerase to extend from, and
thus determine what segment of DNA gets amplified. DNA consists of a double stranded helix.
One strand of the DNA is named the “sense” strand and the other strand is the “anti-sense”
strand. These two DNA strands are complements of each other. During PCR, the denaturing
step will break the hydrogen bonds, separating the two strands. This allows the primers to anneal
to the target region on the DNA during the annealing step. One primer is designed to anneal to
the sense strand and the other primer needs to bind to the anti-sense strand.
When designing primers for PCR it is necessary to take into consideration things like: how many
primers are needed, the length of the primer, the 5’ and 3’end, the mutation location in primer,
the primer melting/annealing temperature, the G-C content, “primer dimmer” and the distance
between the forward and reverse primers.
How Many Primers?
When ordering oligonucleotides for your particular CFTR mutation 3 or 4 primers should be
used. Since experiments often fail you cannot design a good PCR diagnostic test where failing (a
negative result) is considered a dependable diagnosis. You don’t want to tell the parents with a
baby who might have CF: “We didn’t get a band on the gel so she maybe doesn’t have CF, or we
just screwed up the gel.” Your goal is to design an assay that can diagnose either: (i) if the
mutation *is* present by seeing a band on the gel (ie getting a positive result) or (ii) if the normal
DNA sequence is present you can see a different band on the gel. If you attempt to make only 3
primers: The wild-type primer could anneal to the anti-sense strand if the mutation is not present
on the DNA. The mutant primer could be identical to the wild-type primer, annealing to the anti-
sense strand, but with the mutation sequence that will allow it to only anneal if the mutation is
present in the DNA. The reverse primer could then be the same for both the wild-type and
mutant primer. It will anneal downstream in the opposite direction on the sense strand. With
three primers the bands are the same size on the gel, if you use 4 primers you can also design the
experiment so two bands of different lengths/sizes show up on the gel.
Length
The length of the primers need to between 15 and 30 base pairs so that they are long enough for
adequate specificity and short enough for them to anneal to the DNA template.
The 5’ and 3’end
The primers need to be designed so that the 3’ end of the forward primer will extend toward the
reverse primer. The 3’ end of the reverse primer need to also extend toward the forward primer.
The 3’ ends of the forward and reverse primers should be facing each other from opposite DNA
strands. This will facilitate the continued replication of the desired strand of DNA. If, for
instance, the 3’ ends do not elongate in opposite directions (i.e., toward each other) replication
will not work and a PCR product will not be obtained.
1 1

Mutation Location
The best way to distinguish the genotype is to put the mutation on the 3’ end of the primer.
Placing the mutation closer to the 5’ end of the primer may allow for hairpins to occur, where the
primer skips over the mutant base pair and will re-anneal around it.
Primer Melting Temperature (pretty much the same as the annealing temperature)
The Primer Melting Temperature (Tm) is important for the annealing phase of PCR. Preferred
temperatures should be between 50°C and 65°C. The forward and reverse primer melting
temperatures should be no more than 2° different. To calculate the Tm see the next page on
Calculating Annealing Temperatures.
G-C Content
The G-C content of the primer sequence should be relatively high as it has a direct relationship
with the Tm. There should be a base composition of G-C of about 50%-60%. The 3’ end of the
primer should finish with at least one G or C to promote efficiency in annealing due to the
stronger bonding.
Distance between the Forward and Reverse
The forward primer and the reverse primer should be between 300 and 2,000 base pairs apart.
This distance determines how big the band will be in your gel. Larger bands are easier to see.
If they are too close, the amplified region the product will be too small and run off the gel and if
they are too big, the product will not make it out of the well. Refer to Ch. 20 in your book.
Beware of “Primer Dimer”
Primer Dimer is an artifact of PCR where primers bind to each or to themselves other instead of
the template DNA and thus act as their own template to make a small PCR product and appear
faintly on an electrophoresis gel. To avoid “primer dimers”, be sure there are not many
complementary areas in the base sequence of your forward and reverse primers where the primer
strands would be able to bind to each other instead of the gene.
Things to Avoid
• To avoid non-specific binding, design the primers with high annealing temperatures.
• To make sure the primers designed will only bind to the target area submit the sequence
to the BLAST website.
• The MgCl2 and pH conditions can also be adjusted for improved amplified product.
• Watch out for runs of singles bases of G’s, C’s, A’s, and T’s when developing primers
because they can allow mis-priming.
• Keep in mind that the more nucleotide bases that the primer is made up of, the more
expensive they are. The shorter the primers are, the less specificity they have in PCR.
1
Introduction to Calculating PCR annealing temperatures of oligonucleotide primers
The most crucial factors that need to be optimized in a PCR reaction are the magnesium
concentration, enzyme concentration, DNA concentration and annealing temperature of the
primer. The G+C content of the primers should generally be 40-60% and care should be taken to
avoid sequences that produce internal secondary structures as well as “primer dimer” where
primers bind to each other. The annealing temperature for a PCR cycle is generally 3-5 degrees
Celsius below the melting temperature (Tm) of the primer. There are several formulas for
calculating melting temperatures. In all cases these calculations will give you a good starting
point for determining appropriate annealing temperatures for PCR primers. The exact optimum
annealing temperature must be determined empirically, however. There are numerous websites
that help with primer design and annealing temperature calculations, search for them. Here's
Promega’s website at http://www.promega.com/BioMath.
Basic Melting Temperature Calculations
1) The simplest "rule of thumb" formula is as follows:
Tm=4°C x (#G’s + C’s in the primer) + 2°C x (# A’s + T’s).
2) This formula is valid for oligos of less than 14 bases and assumes that the reaction is carried
out in 50mM monovalent cations. For longer primers the formula is modified.
Tm= 64.9°C + 41°C x (number of G’s and C’s in the primer -16.4)/N
Where N is the length of the primer. For example, Promega’s T7 promoter primer
(TAATACGACTCACTATAGGG) is a 20-mer that has 5 T’s, 7 A’s, 4 C’s, and 4 G’s. Thus, its
melting temperature would be:
64.9°C + 41°C x (8-16.4)/20= 47.7° C
3) A third formula calculates the Tm with salt concentrations taken into consideration:
Tm = 81.5 +16.6 • (log10[Na+]) + 0.41 • (%G+C) – 675/n
Where [Na+] is the molar salt concentration ; [K+] = [Na+] and n = number of bases in the
oligonucleotide primer.
Other useful formulae are:
• Nanogram of primer = picomole of primer x 0.325 x # bases
• MicroMolar concentration of primer = picomoles of primer/ volume (!L) in which the
primer is dissolved.
1

ADVANCED APPROACH: Introduction to The Yaku-Bonczyk Primer Design Method Vincent Cracolici
The What?
The Yaku-Bonczyk method is an advanced protocol by which primers can be designed in
order to increase PCR stringency as well as decrease the chance of false positives or negatives
seen in a gel. In 2008, Yaku et al presented this design method; it was then further investigated
by LB 145 student Sarah Bonczyk in spring 2009. By slightly altering the “classic” 3’ single
base pair difference between wild-type and mutant primers, a research team can drastically
increase primer discrimination against nonspecific binding. Similar results were shown by
Wittwer et al (1993).
How does it work?
The standard method of primer design for a genetic mutation, like one on CFTR,
typically involves two forward primers which are identical save for the base pair nearest the 3’
end: one primer is complementary to wild-type DNA and the other to mutant DNA. However,
the single base-pair mismatch between these two primers is often not enough to ensure that the
wild-type primer will not anneal to and extend mutant DNA, and vice versa.
The Yaku-Bonczyk method differs from the standard because the primers are designed to
better discriminate against non-complementary DNA by always incorporating an intentional
mismatch into the primer. The Yaku-Bonczyk method involves the most 3’ base pair of each
forward primer again being complementary to the mutant/wild-type DNA it is seeking, the
second base pairs in are designed to always anneal to either type of DNA, and the third base
pairs in are designed as an intentional mismatch that will never anneal to either type of DNA (see
illustration).
If a primer and its complementary DNA strand anneal to each other, the single mismatch
three base pairs in from the 3’ end is not enough to prevent extension and will result in only a
small hairpin in the sequence. Additionally, if a primer and a non-target DNA strand anneal to
each other, the complementary match at the second base pair from the 3’ end of the primer is not
strong enough to pull the two strands together and is unlikely to allow for extension. Therefore,
nonspecific binding is decreased.
Points to Ponder…
-The intentional mismatch that exists on all the primers three base pairs in from the 3’ end
provides an excellent opportunity to boost your primer’s G/C content.
-Should this intentional mismatch still be included in the calculations of annealing temperatures?
-Remember to consider purine/pyrimidine interactions with themselves and each other in
designing the intentional mismatch.
1 4
The Yaku-Bonczyk Method
Primer: 5’ AACGTGGTCXYZ 3’
X: Should be designed to NEVER anneal to mutant OR wild-type DNA
Y: Should be designed to ALWAYS anneal to mutant AND wild-type DNA
Z: Should be site specific: anneal to EITHER mutant OR wild-type DNA
A primer designed with the Yaku-Bonczyk method will anneal to and extend target DNA despite
the intentional mismatch. The force of the single repulsion will not hinder the primer as a whole.
A primer designed with the Yaku-Bonczyk method will not anneal to nor extend non-target DNA
as a result of the two mismatches. The attraction at the second base pair in on the primer is not
enough to allow for extension at the 3’ end.
1

ADVANCED APPROACH: Mutation Construction through Site-Directed Mutagenesis Mitchell Wood
Introduction:
PCR is a powerful tool in molecular biology, specifically for genotypic identification of a
given sample of DNA. Some novel mutations in the CFTR gene have only been noticed in a few
patients; therefore the number of DNA samples with that genotype is limited. Genetic tests that
are generated should cover all mutations known in the CFTR gene, including these novel ones.
But to test for these rare mutations positive controls must be found, or generated, to experiment
upon before the test is given to a patient. As an alternative to contacting researchers across the
globe for positive control samples, a relatively simple alternative is to use PCR to replicate DNA
with this rare mutation. This process is called Site-Directed Mutagenesis, which in principle uses
imperfect stringency in primer annealing to direct a mutation into the replicated DNA.
Methods:
The length of the primer with the forced mutation is the foremost limitation of the
replicated DNA. When the primer anneals and is replicated with the intentional mismatch, the
resulting PCR product will begin with the 5’ end of the primer. Therefore, the length of the
primer used in the allele specific positive control test can not exceed the length of the site-
directed mutagenesis primer. However, the length of the allele-specific primer must not be too
short (under ~18 base pairs) otherwise it is more probable for non-specific binding on non target
DNA. To minimize the complications that come with a lengthy primer, the forced mutation can
be placed as close to the 3’ end of the oligo as possible in order to leave the remaining length to
fit the allele specific primer. Refer to Yaku et al. (2008) for ideas and clarification.
1. Design allele specific primers.
2. To design mutagenic primers, add several nucleotides to the 3’ end of your allele specific
primers (the exact number should be determined by Yaku et al (2008)).
3. Predict the sequence of the PCR product and confirm that it is the one you want.
5’-TAC ACG CCC AAG TAC GGT TCC ACA-3’ !Primer with mutation
3’-CCG TCG ATG TGC GGG TTC ATG CCA AAG TGT CTG-5’ !DNA Template
Replication with above primer will yield a new DNA template with the forced mutation, but the
DNA segment will only be the length between the forward and reverse primers from above.
Therefore the direction of the replication in the next ASPCR will have to be closely watched.
5’-TAC ACG CCC AAG TAC GGT TG-3’!ASPCR Primer using Yaku Method.
3’-ATG TGC GGG TTC ATG CCA ACG TGT CTG-5’ ! Complement to primer with
forced mutation.
1
ORDERING: When do we order our DNA primers?
Please prepare to bring all your DNA primer sequences to lab at the start of Week 4.
We’d like to help check over the DNA sequences each group has designed and plans to order for their PCR primers during Week 4 in lab (*before you order them). For both sets of primers, see #1 & 2 below, bring the DNA sequences you created and be prepared to draw in chalk on your benchtop both the genome/gene sequence (ie. template) and where the primers will bind to appropriate complementary sequences during the annealing phase of PCR.
1. Show us your set of two “control” PCR primers: These are DNA primer sequences that you have obtained from a published research paper where the authors designed primers to diagnose the same mutation as the one your group chose on the CFTR gene. Bring the original paper in hard copy and bring the full DNA sequence of the CFTR gene and DNA sequence of the primers that target your mutation (bring on your computers). Your group is expected to order these two primers first after getting feedback from TAs/Luckie. Then you will attempt to repeat the Methods provided by the authors of the paper to make their primers/their assay work in your hands. Scientists do this quite frequently.
2. Show us your set of “designed” primers: Please also bring your set of designed primers that your group has custom-designed to be used to diagnose your specific mutation. These are primers your group created on your own and are not published anywhere.
NOTE: Once your group successfully gets your control primers to work in your experiments (above in #1), and presents evidence in your gel photos and graphs (see Primer 7) to support it, then your group may order your set of designed PCR primers and turn your focus to completing the final experiments necessary to create you own custom diagnostic assay.
We also ask that all primers be shipped to one address (see below). That way we can track for sure and know if the primers have arrived or not.
All oligonucleotides/primers should be shipped to this address:
ani oc (for Student Name-LB145) Lyman Briggs College-MSU
919 E. Shaw Lane, E35 Holmes Hall East Lansing, MI 48825-1107
1

!
1

Writing Information
1

14
Instructions to Authors
Follow these instructions or your paper will be returned to you, and incur late penalties.
0OF�PG�UIF�MFBSOJOH�PCKFDUJWFT�PG�ZPVS�SFTFBSDI�QSPKFDU�JO�UIF�DPVSTF�JT�UP�EFWFMPQ�ZPVS�TDJFOUJGJD�XSJUJOH�TLJMMT��*O�TDJFODF �XSJUJOH�JT�UIF�NPTU�JNQPSUBOU�NFBOT�PG�DPNNVOJDBUJOH�SFTFBSDI�GJOEJOHT��.BKPS�TDJFOUJGJD�GJOEJOHT�BSF�SBSFMZ�LFQU�TFDSFU��*OTUFBE �TDJFOUJTUT�TIBSF�UIFJS�JEFBT�BOE�SFTVMUT�XJUI�PUIFS�TDJFOUJTUT �FODPVSBHJOH�DSJUJDBM�SFWJFX�BOE�BMUFSOBUF�JOUFSQSFUBUJPOT�GSPN�DPMMFBHVFT�BOE�UIF�FOUJSF�TDJFOUJGJD�DPNNVOJUZ��*O�NPTU�DBTFT �TDJFOUJTUT�SFQPSU�UIF�SFTVMUT�PG�UIFJS�SFTFBSDI�BDUJWJUJFT�JO�TDJFOUJGJD�KPVSOBMT�JO�B�TUBOEBSE�XSJUUFO�GPSNBU��*O�UIJT�DPVSTF �ZPV�XJMM�QSBDUJDF�XSJUJOH�VTJOH�UIJT�TBNF�TUBOEBSE�TDJFOUJGJD�GPSNBU�BOE�TUZMF�
4.0 TIP: Write like a scientist.�8SJUF�ZPVS�QBQFST�TP�UIBU�BOZPOF�XIP�SFBET�ZPVS�NBOVTDSJQU�DPVME�OPU�UFMM�JU�XBT�GSPN�B�TUVEFOU �CVU�BTTVNFT�JU�NVTU�IBWF�CFFO�GSPN�B�TDJFOUJTU�JO�B�MBC�BU�.46��
"�TDJFOUJGJD�QBQFS�JODMVEFT�UIF�GPMMPXJOH��B�TITLE�TUBUFNFOU�PG�UIF�RVFTUJPO�PS�QSPCMFN �BO�AB-STRACT�TIPSU�TVNNBSZ �BO�INTRODUCTION�CBDLHSPVOE�BOE�TJHOJGJDBODF�PG�UIF�QSPCMFN �a METHODS�TFDUJPO�SFQPSU�PG�FYBDUMZ�XIBU�ZPV�EJE �B�RESULTS�TFDUJPO�QSFTFOUBUJPO�PG�EBUB �a DISCUSSION�TFDUJPO�JOUFSQSFUBUJPO�BOE�EJTDVTTJPO�PG�ZPVS�SFTVMUT �BOE�REFERENCES�CPPLT�BOE�QFSJPEJDBMT�VTFE��%BUB�JT�BMTP�SFQSFTFOUFE�CZ�FIGURES�BOE�TABLES�
5ISPVHIPVU�UIF�MBCPSBUPSZ �ZPV�XJMM�QSBDUJDF�TDJFOUJGJD�SFTFBSDI�BOE�XSJUJOH��:PVS�QBQFST�XJMM�CF�SFWJFXFE�CZ�UIF�DPVSTF�QSPGFTTPS �5"T �BOE�ZPVS�QFFST�JO�PSEFS�UP�QPJOU�PVU�ZPVS�BSFBT�PG�XFBLOFTT�BOE�NBLF�TVHHFTUJPOT�GPS�GVUVSF�JNQSPWFNFOUT��#Z�UIF�UJNF�ZPV�IBWF�DPNQMFUFE�UIF�DPVSTF �ZPV�XJMM�IBWF�TVCNJUUFE�UIF�FRVJWBMFOU�PG�UXP�GVMM�TDJFOUJGJD�QBQFST��*G�ZPV�BSF�OPU�DFSUBJO�BCPVU�UIF�MFWFM�PG�JOEFQFOEFODF�BOE�XIBU�DPOTUJUVUFT�QMBHJBSJTN�JO�UIJT�QSPHSBN �BTL�ZPVS�JOTUSVDUPS�UP�DMBSJGZ�UIF�DMBTT�QPMJDZ��Plagiarism will not be taken lightly and will be evaluated by instructors and software at turnitin.com. See syllabus for more info.
Predictions��4DJFODF�JT�OPU�BCPVU�FYQMBOBUJPO,�CVU�JO�GBDU�JU�JT�BCPVU�UIF�BCJMJUZ�UP�QSFEJDU��"MM�TDJFO-UJTUT�NVTU�IBWF�NPEFMT�PS�IZQPUIFTFT�UIBU�DBO�CF�VTFE�UP�UIFO�NBLF�QSFEJDUJPOT�PG�XIBU�XJMM�PDDVS��5IVT�QSFEJDUJPO�JT�B�WFSZ�JNQPSUBOU�QBSU�PG�XSJUJOH�ZPV�QBQFST��"T�B�SFTVMU�JO�ZPVS�FBSMZ�%3"'5��BOE�%3"'5��JO�NBOZ�DBTFT�ZPVS�QSFEJDUJPOT�NBZ�CF�BMM�UIF�EBUB�ZPV�IBWF�PO�B�DFSUBJO�FYQFSJ-NFOU�BOE�UIVT�UIFZ�TIPVME�CF�XFMM�TVQQPSUFE�CZ�QBQFST�GSPN�UIF�MJUFSBUVSF��6TF�GVUVSF�UFOTF�XIFO�EJTDVTTJOH�1SFEJDUJPOT��*O�HFOFSBM�XIFUIFS�JU�T�JO�UIF�"CTUSBDU �*OUSPEVDUJPO �3FTVMUT�PS�%JTDVTTJPO �XIFOFWFS�ZPV�EJTDVTT�TPNFUIJOH�UIBU�ZPV�QSFEJDU�JU�TIPVME�CF�JO�UIF�GPSNBU�PG��
“We predict..[what].. because..[rationale].. (citation of paper).”
**/PUF��"�IZQPUIFTJT�JT�EJGGFSFOU�UIBO�B�QSFEJDUJPO��5IF�IZQPUIFTJT�JT�UIF�NPEFM�UIBU�FYQMBJOT�IPX�ZPV�CFMJFWF�UIJOHT�BSF�XPSLJOH�F�H��XF�IZQPUIFTJ[F�FMFDUSJDJUZ�TQBSLT�HBT�JO�UIF�DZMJOEFST�PG�B�DBS�FOHJOF�XIJMF�UIF�QSFEJDUJPO�JT�XIBU�ZPV�UIJOL�TIPVME�IBQQFO�EVSJOH�UIF�FYQFSJNFOU�F�H��JG�IZESPHFO�HBT�JT�JOKFDUFE�JOUP�UIF�DZMJOEFS�PG�B�GVODUJPOJOH�FOHJOF�XF�QSFEJDU�UIFSF�TIPVME�CF�B�TJHOJGJDBOU�FYQMPTJPO�
141

Overview of Manuscript Sequence & Format (This is what professional journals expect)
� ��� 1BHF�POF�JT�UIF�5JUMF�1BHF�Ǚ����DIBSBDUFST�JO�UJUMF� ��� 1BHF�UXP�XJMM�IBWF�0/-:�UIF�"CTUSBDU�Ǚ����XPSET� ��� 1BHF�UISFF�XJMM�TUBSU�XJUI�UIF�*OUSPEVDUJPO��5IF�.FUIPET �3FTVMUT �BOE�%JTDVTTJPO�TFDUJPOT�DBO�
GPMMPX�XJUIPVU�TUBSUJOH�B�OFX�QBHF�GPS�FBDI�POF�BMUIPVHI�ZPV�NBZ�TUBSU�B�OFX�QBHF�JG�ZPV�BSF�OFBS�UIF�CPUUPN�PG�UIF�DVSSFOU�QBHF��$MFBSMZ�MBCFM�FBDI�TFDUJPO�XJUI�UIF�TFDUJPO�IFBEJOHT�FY��*OUSPEVDUJPO�BOE�XIP�BVUIPSFE�JU�8SJUUFO�CZ��+JMM�4BOEFST �3FWJTFE�CZ��#PC�3PCFSUT�
� ��� 5IF Introduction�XJMM�QSPWJEF�UIF�SFBEFS�XJUI�UIF�CBDLHSPVOE�JOGPSNBUJPO�OFDFTTBSZ�UP�VOEFS-TUBOE�UIF�SFTU�PG�UIF�QBQFS�
� ��� Methods�TFDUJPO�XJMM�MJTU�NBUFSJBMT�VTFE�#PVHIU�7JUBNJO�$�XJUI�3PTF�IJQT�GSPN�UIF�(FOFSBM�/VUSJUJPO�4UPSF�(/$�����&��(SBOE�3JWFS�&BTU�-BOTJOH�.*�IPX�TUPDL�TPMVUJPOT�XFSF�QSF-QBSFE�BOE�FYQMBJO�FYBDUMZ�XIBU�ZPV�EJE�JO�ZPVS�SFTFBSDI��"GUFS�SFBEJOH�UIF�.FUIPET�TFDUJPO �BO�JODPNJOH�TUVEFOU�TIPVME�CF�BCMF�UP�SFQFBU�ZPVS�XPSL���3FGFSFODF�UIF�PSJHJOBM�QSPUPDPM�
� ��� 5IF�Results�TFDUJPO�GPMMPXT�.FUIPET���5IJT�TFDUJPO�XJMM�DMFBSMZ�BOE�TVDDJODUMZ�TUBUF�XIBU�ZPV�PCTFSWFE�VQPO�QFSGPSNJOH�FBDI�FYQFSJNFOU�
� ��� 5IF�Discussion�TFDUJPO�GPMMPXT�3FTVMUT���*O�UIJT�TFDUJPO�ZPV�XJMM�EJTDVTT�UIF�TJHOJGJDBODF�PG�SF-TVMUT�BOE�IPX�ZPVS�SFTVMUT�SFMBUF�XJUI�SFTFBSDI�QFSGPSNFE�CZ�PUIFST�
� ��� 5IF�References�TFDUJPO�GPMMPXT�UIF�%JTDVTTJPO���5IJT�JT�B�MJTU�PG�UIF�SFGFSFODFT�DJUFE�XJUIJO�UIF�QBQFS�
� ��� 4UBSU�B�OFX�QBHF�XJUI�UIF�Figures�TFDUJPO�BGUFS�UIF�3FGFSFODFT���'JHVSFT�XJMM�CF�TFRVFOUJBMMZ�OVNCFSFE�JO�UIF�PSEFS�UIBU�UIFZ�XFSF�DJUFE�JO�UIF�3FTVMUT�TFDUJPO�GJHVSFT�BSF�NPTU�BMXBZT�DJUFE�0/-:�JO�UIF�3FTVMUT�TFDUJPO �OPU�JO�.FUIPET �OPU�JO�%JTDVTTJPO��0OF�GJHVSF�QFS�QBHF�XJUI�FYUFOTJWF�GJHVSF�MFHFOE�QBSBHSBQI�0/-:�BU�UIF�CPUUPN�PG�UIF�GJHVSF���5IF�GJSTU�TFOUFODF�PG�B�GJH-VSF�MFHFOE�JT�JUT�UJUMF���'PMMPX�UIF�UJUMF�XJUI�TFOUFODFT�FYQMBJOJOH�UIF�GJHVSF�BT�JG�TPNFPOF�EJE�OPU�IBWF�UIF�3FTVMUT�TFDUJPO�PS�JO�GBDU�BOZ�PUIFS�QBSU�PG�UIF�QBQFS�BWBJMBCMF�BT�B�SFGFSFODF�
����� 5IF�Tables�TFDUJPO�XJMM�GPMMPX�UIF�'JHVSFT�TFDUJPO��5BCMFT�HFU�B�UJUMF�0/-:�PO�UIF�UPQ�XJUI�TPNF�FYQMBOBUJPO��5BCMFT�XJMM�CF�TFRVFOUJBMMZ�OVNCFSFE�JO�UIF�PSEFS�UIBU�UIFZ�XFSF�DJUFE�JO�UIF�3FTVMUT�TFDUJPO�5BCMFT�BSF�NPTU�BMXBZT�DJUFE�0/-:�JO�UIF�3FTVMUT��0OF�UBCMF�QFS�QBHF�
����� 'JHVSFT�BOE�UBCMFT�.645�CF�DSFBUFE�PO�B�DPNQVUFS�VOMFTT�PUIFSXJTF�JOTUSVDUFE������ "GUFS�UIF�5BCMFT�TFDUJPO �B�TJOHMF�XIJUF�QBHF�XJMM�GPMMPX�FOUJUMFE �Appendix���5IFO�BQQFOE�BOZ�
MBCPSBUPSZ�OPUFCPPL�QBHFT�UIBU�JOEJDBUF�TJHOFE�EBUB�GPS�BMM�NFNCFST�QIPUPDPQJFT�GSPN�ZPVS�OPUFCPPL�BOE�B�QIPUPDPQZ�PG�UIF�GJSTU�QBHF�PG�BOZ�BSUJDMFT�DJUFE�BOE�SFGFSFODFE�JO�SFQPSU�
����� %PVCMF�TQBDF�PS�����TQBDF�UZQFGBDF�JT�SFRVJSFE���1SFGFSSFE�GPOU�TJ[F�JT����QPJOU�
*Once returned, rejected papers (like late papers) lose one point in the first 24 hrs grace period but then the penalty becomes more severe: 10% off for 2 days late, 20% off for 3 days, and so on. After 5 days, you will receieve a “0”. Unlike late papers, a rejected paper also loses 1 pt per rejection.
"�NPSF�EFUBJMFE�EFTDSJQUJPO�PG�FBDI�TFDUJPO�PG�B�TDJFOUJGJD�QBQFS�GPMMPXT�BMTP �SFWJFX�UIF�QVCMJTIFE�QBQFST�QSPWJEFE�JO�UIF�DPVSTF�QBDLFU�GPS�FYBNQMFT���"T�ZPV�XSJUF�ZPVS�QBQFS �DMFBSMZ�MBCFM�FBDI�TFD-UJPO�FYDFQU�UIF�UJUMF�QBHF �QMBDJOH�UIF�UJUMF�PG�UIF�TFDUJPO�PO�B�TFQBSBUF�MJOF �DFOUFSFE �CPME �CVU�OPU�VOEFSMJOFE�MJLF�TIPXO�CFMPX�
14

Title Page and Title
5IF�UJUMF�QBHF�JT�UIF�GJSTU�QBHF�PG�UIF�QBQFS�BOE�JODMVEFT�UIF�UJUMF�PG�UIF�QBQFS �ZPVS�OBNF �UIF�DPVSTF�UJUMF �ZPVS�MBC�UJNF �ZPVS�MBC�JOTUSVDUPST��OBNFT �UIF�EVF�EBUF�GPS�UIF�QBQFS �BOE�ZPVS�HSPVQT��XFC-TJUF�BEESFTT��5IF�UJUMF�TIPVME�CF�BT�TIPSU�BT�QPTTJCMF�BOE�BT�MPOH�BT�OFDFTTBSZ�UP�DPNNVOJDBUF�UP�UIF�SFBEFS�UIF�RVFTUJPO�CFJOH�BOTXFSFE�JO�UIF�QBQFS���$POTJEFS�UIF�GPMMPXJOH�UJUMFT�GPS�B�QBQFS�UIBU�EF-TDSJCFT�UIF�NPMFDVMBS�NFDIBOJTN�PG�BO�BOUJWJSBM�ESVH�
� ��� i*OIJCJUJPO�PG�.FOHPWJSVT�3FQMJDBUJPO�CZ�%JQZSJEBNPMFw� ��� i"OUJWJSBM�"DUJPO�PG�%JQZSJEBNPMFw� ��� i"�4UVEZ�&YBNJOJOH�UIF�*OIJCJUPSZ�&GGFDUT�PG�UIF�%SVH�%JQZSJEBNPMF�PO�.FOHPWJSVT�
3FQMJDBUJPOw
5JUMF���JT�TIPSU�BOE�DPNNVOJDBUFT�UIF�RVFTUJPO�CFJOH�JOWFTUJHBUFE���*U�DPOWFZT�UIF�NFDIBOJTN�PG�BD-UJPO�JOIJCJUJPO�PG�SFQMJDBUJPO �UIF�OBNF�PG�UIF�WJSVT�CFJOH�JOIJCJUFE�.FOHPWJSVT �BOE�UIF�OBNF�PG�UIF�ESVH�EPJOH�UIF�JOIJCJUJOH�%JQZSJEBNPMF��5JUMF���JT�TIPSU�CVU�UPP�WBHVF�GPS�UIF�SFBEFS�UP�LOPX�UIF�TVCKFDU�NBUUFS�PG�UIF�QBQFS���5JUMF���JT�UPP�MPOH��5IF�XPSET�i"�4UVEZ�&YBNJOJOHw�BSF�TVQFSGMVPVT �BOE�i%SVHw�BOE�JT�SFEVOEBOU�
1MBDF�UIF�UJUMF�BCPVU���DN�GSPN�UIF�UPQ�PG�UIF�UJUMF�QBHF���1MBDF�iCZw�BOE�ZPVS�OBNFT�JO�UIF�DFOUFS�PG�UIF�QBHF �BOE�QMBDF�UIF�DPVSTF�UJUMF �MBC�UJNF �MBC�JOTUSVDUPST��OBNFT �EVF�EBUF �BOE�ZPVS�HSPVQT��XFCTJUF�BEESFTT �FBDI�PO�B�TFQBSBUF�DFOUFSFE�MJOF �BU�UIF�CPUUPN�PG�UIF�QBHF���-FBWF�BCPVU���DN�PG�XIJUF�TQBDF�CFMPX�UIJT�JOGPSNBUJPO�
Abstract
5IF�BCTUSBDU�JT�QMBDFE�BU�UIF�CFHJOOJOH�PG�UIF�TFDPOE�QBHF�PG�UIF�QBQFS �BGUFS�UIF�UJUMF�QBHF��5IF�BC-TUSBDU�TVNNBSJ[FT�UIF�RVFTUJPO�CFJOH�JOWFTUJHBUFE�JO�UIF�QBQFS �UIF�NFUIPET�VTFE�JO�UIF�FYQFSJNFOU �UIF�SFTVMUT �BOE�UIF�DPODMVTJPOT�ESBXO��5IF�SFBEFS�TIPVME�CF�BCMF�UP�EFUFSNJOF�UIF�NBKPS�UPQJDT�JO�UIF�QBQFS�XJUIPVU�SFBEJOH�UIF�FOUJSF�QBQFS��"T�NFOUJPOFE�QSFWJPVTMZ �QSFEJDUJPOT�BSF�BO�FTTFOUJBM�FMFNFOU�PG�TDJFODF�BOE�UIVT�TIPVME�BQQFBS�JO�UIF�"CTUSBDU�PG�%3"'5��BOE�%3"'5��BOE�JO�UIF�GPS-mat: “We predict..[what].. because..[rationale].. (citation of paper).”
Introduction
4UBSU�UIF�JOUSPEVDUJPO�PO�QBHF�UISFF���5IF�JOUSPEVDUJPO�TIPVME�HFOFSBMMZ�CF�TIPSU �POMZ�����QBSB-HSBQIT�JO�MFOHUI�BOE�GPDVT�BSF�CBDLHSPVOE�JOGPSNBUJPO�PG�UIF�GPMMPXJOH�UZQFT�
� ��� %FTDSJCF�UIF�RVFTUJPO�BOE�IZQPUIFTJT�CFJOH�JOWFTUJHBUFE�BOE�CBDLHSPVOE�PO�UIF�JNQPSUBODF�PG�UIF�UPQJD�
� ��� 3FWJFX�UIF�CBDLHSPVOE�JOGPSNBUJPO�UIBU�XJMM�BMMPX�UIF�SFBEFS�UP�VOEFSTUBOE�UIF�QVSQPTF�BOE�UPQJDT�PG�UIF�QBQFS��5IFSF�JT�VTVBMMZ�B�QBSBHSBQI�PO�UIF�TQFDJNFOT�TUVEJFE �BMTP�POF�UIBU�QSP-WJEFT�FWJEFODF�UP�TVQQPSU�UIF�IZQPUIFTJT�QPTFE��"�IZQPUIFTJT�JT�BO�FEVDBUFE�HVFTT��UIF� *OUSPEVDUJPO�TIPVME�QSPWJEF�UIF�iFEVDBUJPO�w�*ODMVEF�POMZ�JOGPSNBUJPO�UIBU�EJSFDUMZ�QSFQBSFT�UIF�SFBEFS�UP�VOEFSTUBOE�UIF�RVFTUJPO�JOWFTUJHBUFE��.PTU�PG�UIJT�JOGPSNBUJPO�TIPVME�DPNF�
14

GSPN�PVUTJEF�TPVSDFT �TVDI�BT�TDJFOUJGJD�KPVSOBMT�PS�CPPLT�EFBMJOH�XJUI�UIF�UPQJD�ZPV�BSF� JOWFTUJHBUJOH�*
� ��� *O�B�QBSBHSBQI�TUBUF�CBDLHSPVOE�JOGPSNBUJPO�PO�UIF�NFUIPET�DIPTFO�UP�JOWFTUJHBUF�UIF�IZQPUI-FTJT���&YQMBJO�IPX�UIFTF�NFUIPET�XJMM�BEESFTT�UIF�RVFTUJPO�BOE�EFTDSJCF�UIF�QSFEJDUFE�PVUDPNFT��8IZ�XFSF�UIFZ�DIPTFO
� ��� *O�UIF�MBTU�QBSBHSBQI�CSJFGMZ�TUBUF�B�IJOU�PG�UIF�SFTVMUT�BOE�DPODMVTJPOT�PG�UIF�JOWFTUJHBUJPOT�PS�QSFEJDUJPOT��5IJT�HFOFSBMMZ�DPNFT�POMZ�BU�UIF�WFSZ�FOE�PG�UIF�*OUSPEVDUJPO�
*"MM�TPVSDFT�PG�JOGPSNBUJPO�NVTU�CF�SFGFSFODFE�BOE�JODMVEFE�JO�UIF�3FGFSFODFT�TFDUJPO�PG�UIF�QBQFS �CVU�UIF�JOUSPEVDUJPO�NVTU�CF�JO�ZPVS�PXO�XPSET��No "quotations" are permitted in any part of the paper.�3FGFS�UP�UIF�SFGFSFODFT�XIFO�BQQSPQSJBUF��"T�ZPV�EFTDSJCF�ZPVS�JOWFTUJHBUJPO �JODMVEF�POMZ�UIF�RVFTUJPO�BOE�IZQPUIFTJT�UIBU�ZPV�BDUVBMMZ�JOWFTUJHBUFE��*U�JT�B�HPPE�JEFB�UP�XSJUF�EPXO�FBDI�JUFN�RVFTUJPO �IZQPUIFTJT �TVQQPSUJOH�FWJEFODF �QSFEJDUJPO�CFGPSF�ZPV�CFHJO�UP�XSJUF�ZPVS�JOUSPEVDUJPO�
8SJUF�UIF�JOUSPEVDUJPO�JO�QBTU�UFOTF�XIFO�SFGFSSJOH�UP�FMFNFOUT�PG�ZPVS�FYQFSJNFOUBM�JOWFTUJHBUJPO�UIBU�BSF�DPNQMFUFE��8IFO�SFMBUJOH�UIF�CBDLHSPVOE�JOGPSNBUJPO �VTF�QSFTFOU�UFOTF�XIFO�SFGFSSJOH�UP�BOPUIFS�JOWFTUJHBUPS�T�QVCMJTIFE�XPSL��6TF�GVUVSF�UFOTF�XIFO�EJTDVTTJOH�1SFEJDUJPOT�
Methods
5IF�.FUIPET�TFDUJPO�EFTDSJCFT�ZPVS�FYQFSJNFOU�JO�TVDI�B�XBZ�UIBU�JU�NBZ�CF�SFQFBUFE�FYBDUMZ��.BLF�UIF�.FUIPET�QSPGFTTJPOBM�KVTU�MJLF�JO�QVCMJTIFE�QBQFST �CVU�UBSHFU�BT�ZPVS�BVEJFODF�B�TUVEFOU�JO� -#������5IF�NBKPSJUZ�PG�UIF�JOGPSNBUJPO�JO�UIJT�TFDUJPO�DPNFT�GSPN�UIF�1SPDFEVSFT�PS�1SPUPDPMT�TFDUJPO�PG�UIF�-BCPSBUPSZ�Guide�BOE�JO�ZPVS�QBQFS �UIJT�JOGPSNBUJPO�TIPVME�OPU�CF�B�MJTU�PG�TUFQT��8SJUF�UIF�.FUIPET�TFDUJPO�JO�B�QBSBHSBQI�GPSNBU�JO�QBTU�UFOTF��#F�TVSF�UP�JODMVEF�MFWFMT�PG�USFBUNFOU �OVNCFST�PG�SFQMJDBUJPOT �BOE�DPOUSPM�PG�USFBUNFOUT��*G�ZPV�BSF�XPSLJOH�XJUI�MJWJOH�PSHBOJTNT �JODMVEF�UIF�TQFDJFT�BOE�UIF�TFY�PG�UIF�SFTFBSDI�PSHBOJTN��%P�OPU�JODMVEF�GBJMFE�BUUFNQUT�VOMFTT�PUIFS� JOWFTUJHBUPST�NBZ�XJTI�UP�USZ�UIF�UFDIOJRVF�VTFE��%P�OPU�USZ�UP�KVTUJGZ�ZPVS�QSPDFEVSFT�JO�UIJT�TFDUJPO�PG�UIF�SFQPSU�
*G�ZPV�EFTDSJCF�BO�FYQFSJNFOU�GSPN�UIF�MBC�guide �VOMFTT�JOTUSVDUFE�PUIFSXJTF �ZPV�NBZ�TJNQMZ�SFGFS�UP�UIF�QSPDFEVSFT�MJTUFE�JO�UIF�guide�BOE�QBHF�OVNCFST��6OEFS�UIPTF�DJSDVNTUBODFT �ZPVS�.FUIPET�TFDUJPO�TIPVME�QPJOU�PVU�DIBOHFT�JO�QSPDFEVSF�UIBU�BSF�OPU�JOEJDBUFE�JO�UIF�-BC�.BOVBM��8IFO�XSJUJOH�B�GVMM�.FUIPET�TFDUJPO�XJUI�OP�SFGFSFODF�UP�UIF�-BC�Guide �XSJUF�UIFTF�QSPDFEVSFT�DPODJTFMZ �CVU�JO�QBSBHSBQI�GPSN��5IF�EJGGJDVMUZ�DPNFT�BT�ZPV�EFDJEF�UIF�MFWFM�PG�EFUBJM�UP�JODMVEF�JO�ZPVS�QBSBHSBQIT��:PV�NVTU�EFUFSNJOF�XIJDI�EFUBJMT�BSF�FTTFOUJBM�GPS�UIF�JOWFTUJHBUPS�UP�SFQFBU�UIF�FYQFSJNFOU��'PS�FYBNQMF �JG�JO�ZPVS�FYQFSJNFOU�ZPV�JODVCBUFE�QPUBUP�QJFDFT�JO�EJG-GFSFOU�DPODFOUSBUJPOT�PG�TVDSPTF�TPMVUJPO �JU�XPVME�OPU�CF�OFDFTTBSZ�UP�FYQMBJO�UIBU�UIF�QJFDFT�XFSF�JODVCBUFE�JO�QMBTUJD�DVQT�MBCFMFE�XJUI�B�XBY�NBSLJOH�QFODJM��*O�UIJT�DBTF �UIF�NPMBSJUZ�PG�UIF�TVDSPTF�TPMVUJPOT �UIF�TJ[F�PG�UIF�QPUBUP�QJFDFT�BOE�IPX�UIFZ�XFSF�PCUBJOFE �BOE�UIF�BNPVOU�PG�JODVCBUJPO�TPMVUJPO�BSF�JNQPSUBOU�JUFNT�UP�JODMVEF
144

Results
5IF�3FTVMUT�TFDUJPO�DPOTJTUT�PG�UXP�DPNQPOFOUT�����POF�PS�NPSF�QBSBHSBQIT�UIBU�EFTDSJCF�UIF�SFTVMUT�PG�FBDI�FYQFSJNFOU�UFTU�BOE�JODMVEF�UIF�BDUVBM�EBUB�XJUI�PCTFSWBUJPOT �TQFDJGJD�OVNCFST�<BOE�VOJUT>�BOE�NBUI ���SFGFSFODF�UP�GJHVSFT�HSBQIT �EJBHSBNT �QJDUVSFT �BOE�SFGFSFODF�UP�UBCMFT�
*O�SFGFSFODJOH�GJHVSFT �SFNFNCFS�UP�OVNCFS�GJHVSFT�BOE�UBCMFT�DPOTFDVUJWFMZ�JO�UIF�PSEFS�UIBU�UIFZ�BSF�NFOUJPOFE�JO�UIJT�TFDUJPO���3FGFS�UP�GJHVSFT�BOE�UBCMFT�XJUIJO�UIF�QBSBHSBQI�BT�ZPV�EFTDSJCF�ZPVS�SFTVMUT �VTJOH�UIF�XPSE�'JHVSF�PS�5BCMF�JO�QBSFOUIFTFT �GPMMPXFE�CZ�JUT�OVNCFS �GPS�FYBNQMF �i'JHVSF���w�"WPJE�DJUJOH�B�GJHVSF�XJUI�B�GVMM�TFOUFODF�PS�TUBUFNFOU�TVDI�BT �iQMFBTF�TFF�GJHVSF���GPS�HSBQIFE�EBUB�QPJOUTw�PS�FWFO�KVTU�iQMFBTF�TFF�UBCMF���w��%0�/05�QMBDF�FBDI�GJHVSF�PS�UBCMF�BU�UIF�FOE�PG�FBDI�QBSBHSBQI�JO�XIJDI�JU�JT�DJUFE���1MBDF�GJHVSFT�BOE�UBCMFT�BGUFS�UIF�3FGFSFODFT�TFDUJPO��*G�ZPV�IBWF�QFS-GPSNFE�B�TUBUJTUJDBM�BOBMZTJT�PG�ZPVS�EBUB �TVDI�BT�DIJ�TRVBSFE �JODMVEF�UIJT�EBUB�JO�UIF�3FTVMUT�TFDUJPO���&YQMBJO�XIBU�DBMDVMBUJPOT�ZPV�EJE�BOE�UIF�SFTVMU�BOE�EJSFDU�UIF�SFBEFS�UP�UIF�.FUIPET�TFDUJPO�GPS�NPSF�EFUBJMT���5IFO�TIPX�BO�FYBNQMF�PG�UIF�SFTVMUT�BOE�SFGFS�UIF�SFBEFS�UP�B�UBCMF�XJUI�BMM�UIF�EBUB�
5IF�NPTU�DPNNPO�FSSPS�B�TUVEFOU�NBLFT�JT�POMZ�NBLJOH�HFOFSBM�DPNNFOUT�BOE�OPU�JODMVEJOH�BDUVBM�EBUB�JF�UIF�SFTVMUT�JO�UIF�3FTVMUT��3FTVMUT�TIPVME�JODMVEF�EFUBJMFE�PCTFSWBUJPOT�XIBU�EJE�ZPV�TFF��PEPS �UFYUVSF �FUD��BOE�TQFDJGJD�GJOEJOHT�XIBU�EJE�ZPV�SFDPSE�����HSBNT ����EFHSFFT�$ �����JODSFBTF ��� ����DFMMT�FUD���3FQPSU�ZPVS�EBUB�BT�BDDVSBUFMZ�BT�QPTTJCMF�JO�UIF�PSEFS�UIBU�UIFZ�IBQQFOFE��*U�JT�JN-QPSUBOU�UP�IBWF�TFQBSBUF�QBSBHSBQIT�BOE�UPQJD�TFOUFODFT�UIBU�JOUSPEVDF�UIF�SFTVMUT�PG�FBDI�UFTU�CVU�EP�OPU�TQFOE�NVDI�UJNF�EJTDVTTJOH�UIF�NFBOJOH�PG�ZPVS�GJOEJOHT �TBWF�UIBU�GPS�UIF�%JTDVTTJPO�
'PS�iPredicted Resultsw���XIJDI�XJMM�CF�UIF�POMZ�GPDVT�PG�%SBGU���BOE�XJMM�CF�JODMVEFE�JO�TVCTFRVFOU�ESBGUT���UIFTF�BSF�XIBU�ZPV�QSFEJDU�PS�FYQFDU�XJMM�IBQQFO �BOE�UIFTF�QSFEJDUJPOT�NVTU�CF�CBTFE�VQPO�UIF�QSJNBSZ�MJUFSBUVSF�ZPV�IBWF�HBUIFSFE�UISPVHIPVU�ZPVS�SFTFBSDI�PO�ZPVS�UPQJD�UIFTJT��8IFO�JO-DMVEJOH�QSFEJDUJPOT�GPMMPX�UIJT�GPSNBU� “We predict..[what].. because..[rationale].. (citation of a published paper or source).”
Discussion
5IF�%JTDVTTJPO�TFDUJPO�JT�XIFSF�ZPV�XJMM�BOBMZ[F�BOE�JOUFSQSFU�UIF�SFTVMUT�PG�ZPVS�FYQFSJNFOUT���5IF�%JTDVTTJPO�TIPVME�TIPX�B�QPTTJCMF�SFMBUJPOTIJQ�CFUXFFO�PCTFSWFE�GBDUT�UIPTF�PCTFSWFE�CZ�ZPV�BOE�UIPTF�PCTFSWFE�CZ�PUIFST�BOE�SFQPSUFE�JO�QVCMJTIFE�SFTFBSDI�QBQFST���8SJUF�BT�DMFBSMZ�BOE�TVDDJODUMZ�BT�QPTTJCMF��"�HPPE�%JTDVTTJPO�XJMM�JODMVEF�UIF�GPMMPXJOH�
� ��� 4VNNBSJ[F�UIF�*OUSPEVDUJPO�BOE�SFTUBUF�UIF�RVFTUJPO�BOE�IZQPUIFTJT�CFJOH�BEESFTTFE�� ��� #SJFGMZ�TVNNBSJ[F�UIF�SFTVMUT�PG�UIF�FYQFSJNFOUT���%P�OPU�JODMVEF�EFUBJMT�SFHBSEJOH�NFUIPET�� ��� *OUFSQSFU�UIF�SFTVMUT���&YQMBJO�IPX�UIF�SFTVMUT�BOTXFS�UIF�RVFTUJPOT�QPTFE���4UBUF�XIFUIFS�ZPVS�
SFTVMUT�TVQQPSU�PS�SFGVUF�ZPVS�IZQPUIFTJT��%P�OPU�VTF�UIF�XPSE�iQSPWFw�JO�ZPVS�DPODMVTJPOT���:PVS�SFTVMUT�XJMM�TVQQPSU �WFSJGZ �PS�DPOGJSN�ZPVS�IZQPUIFTJT��5IFZ�BMTP�NBZ�OFHBUF �SFGVUF �PS�DPOUSBEJDU�ZPVS�IZQPUIFTJT��5IF�XPSE�QSPWF�JT�OPU�BQQSPQSJBUF�JO�TDJFOUJGJD�XSJUJOH�
� ��� %JTDVTT�IPX�ZPVS�SFTVMUT�BOE�JOUFSQSFUBUJPOT�SFMBUF�XJUI�QSFWJPVTMZ�QVCMJTIFE�SFTFBSDI���5IJT�XJMM�SFRVJSF�ZPV�UP�DJUF�PVUTJEF�SFGFSFODFT���4PNF�NBZ�DPNF�GSPN�UIF�*OUSPEVDUJPO �XIJMF�ZPV�XJMM�BMTP�GJOE�OFX�SFGFSFODFT�UIBU�TQFDJGJDBMMZ�SFMBUF�UP�ZPVS�GJOEJOHT��:PV�DBO�TQFDVMBUF�BOE�QSP-QPTF�UIFPSFUJDBM�JNQMJDBUJPOT�PG�ZPVS�XPSL�
14
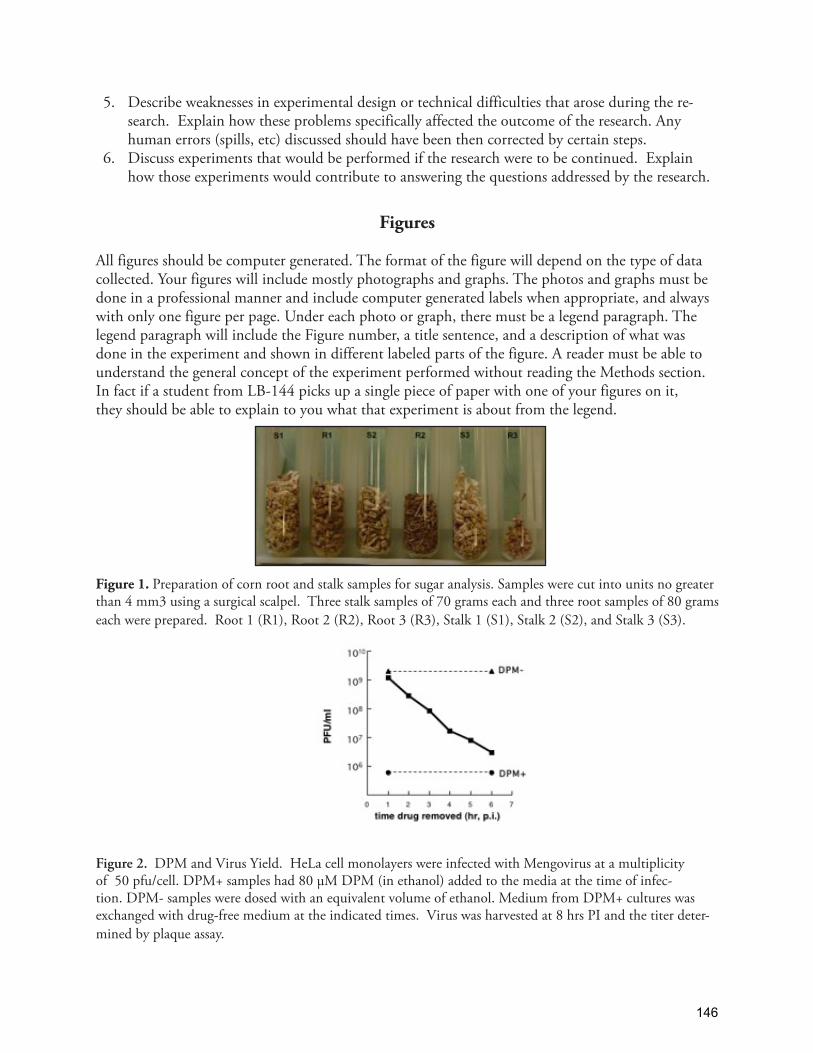
� ��� %FTDSJCF�XFBLOFTTFT�JO�FYQFSJNFOUBM�EFTJHO�PS�UFDIOJDBM�EJGGJDVMUJFT�UIBU�BSPTF�EVSJOH�UIF�SF-TFBSDI���&YQMBJO�IPX�UIFTF�QSPCMFNT�TQFDJGJDBMMZ�BGGFDUFE�UIF�PVUDPNF�PG�UIF�SFTFBSDI��"OZ�IVNBO�FSSPST�TQJMMT �FUD�EJTDVTTFE�TIPVME�IBWF�CFFO�UIFO�DPSSFDUFE�CZ�DFSUBJO�TUFQT�
� ��� %JTDVTT�FYQFSJNFOUT�UIBU�XPVME�CF�QFSGPSNFE�JG�UIF�SFTFBSDI�XFSF�UP�CF�DPOUJOVFE���&YQMBJO�IPX�UIPTF�FYQFSJNFOUT�XPVME�DPOUSJCVUF�UP�BOTXFSJOH�UIF�RVFTUJPOT�BEESFTTFE�CZ�UIF�SFTFBSDI�
Figures
"MM�GJHVSFT�TIPVME�CF�DPNQVUFS�HFOFSBUFE��5IF�GPSNBU�PG�UIF�GJHVSF�XJMM�EFQFOE�PO�UIF�UZQF�PG�EBUB�DPMMFDUFE��:PVS�GJHVSFT�XJMM�JODMVEF�NPTUMZ�QIPUPHSBQIT�BOE�HSBQIT��5IF�QIPUPT�BOE�HSBQIT�NVTU�CF�EPOF�JO�B�QSPGFTTJPOBM�NBOOFS�BOE�JODMVEF�DPNQVUFS�HFOFSBUFE�MBCFMT�XIFO�BQQSPQSJBUF �BOE�BMXBZT�XJUI�POMZ�POF�GJHVSF�QFS�QBHF��6OEFS�FBDI�QIPUP�PS�HSBQI �UIFSF�NVTU�CF�B�MFHFOE�QBSBHSBQI��5IF�MFHFOE�QBSBHSBQI�XJMM�JODMVEF�UIF�'JHVSF�OVNCFS �B�UJUMF�TFOUFODF �BOE�B�EFTDSJQUJPO�PG�XIBU�XBT�EPOF�JO�UIF�FYQFSJNFOU�BOE�TIPXO�JO�EJGGFSFOU�MBCFMFE�QBSUT�PG�UIF�GJHVSF��"�SFBEFS�NVTU�CF�BCMF�UP�VOEFSTUBOE�UIF�HFOFSBM�DPODFQU�PG�UIF�FYQFSJNFOU�QFSGPSNFE�XJUIPVU�SFBEJOH�UIF�.FUIPET�TFDUJPO��*O�GBDU�JG�B�TUVEFOU�GSPN�-#�����QJDLT�VQ�B�TJOHMF�QJFDF�PG�QBQFS�XJUI�POF�PG�ZPVS�GJHVSFT�PO�JU �UIFZ�TIPVME�CF�BCMF�UP�FYQMBJO�UP�ZPV�XIBU�UIBU�FYQFSJNFOU�JT�BCPVU�GSPN�UIF�MFHFOE�
Figure 1.�1SFQBSBUJPO�PG�DPSO�SPPU�BOE�TUBML�TBNQMFT�GPS�TVHBS�BOBMZTJT��4BNQMFT�XFSF�DVU�JOUP�VOJUT�OP�HSFBUFS�UIBO���NN��VTJOH�B�TVSHJDBM�TDBMQFM���5ISFF�TUBML�TBNQMFT�PG����HSBNT�FBDI�BOE�UISFF�SPPU�TBNQMFT�PG����HSBNT�FBDI�XFSF�QSFQBSFE���3PPU���3� �3PPU���3� �3PPU���3� �4UBML���4� �4UBML���4� �BOE�4UBML���4��
Figure 2.��%1.�BOE�7JSVT�:JFME���)F-B�DFMM�NPOPMBZFST�XFSF�JOGFDUFE�XJUI�.FOHPWJSVT�BU�B�NVMUJQMJDJUZ� PG�����QGV�DFMM��%1.��TBNQMFT�IBE�����.�%1.�JO�FUIBOPM�BEEFE�UP�UIF�NFEJB�BU�UIF�UJNF�PG�JOGFD-UJPO��%1.��TBNQMFT�XFSF�EPTFE�XJUI�BO�FRVJWBMFOU�WPMVNF�PG�FUIBOPM��.FEJVN�GSPN�%1.��DVMUVSFT�XBT�FYDIBOHFE�XJUI�ESVH�GSFF�NFEJVN�BU�UIF�JOEJDBUFE�UJNFT���7JSVT�XBT�IBSWFTUFE�BU���IST�1*�BOE�UIF�UJUFS�EFUFS-NJOFE�CZ�QMBRVF�BTTBZ�
14

Tables
8IJMF�'JHVSFT�BSF�PGUFO�VTFE�JO�QBQFST�HSBQIT �QIPUPHSBQIT �HFM�JNBHFT�UBCMFT�BSF�SBSF��5BCMFT�TIPVME�POMZ�CF�VTFE�XIFO�BMM�UIF�EBUB�CFJOH�QSFTFOUFE�DBOOPU�CF�SFQPSUFE�JO�B�TJNQMF�BOE�DPNQSF-IFOTJCMF�NBOOFS�JO�UIF�3FTVMUT�TFDUJPO��5IF�UJUMF�BQQFBST�BU�UIF�UPQ�PG�UIF�UBCMF��UIFSF�JT�OP�MFHFOE��"�GPPUOPUF�NBZ�CF�OFDFTTBSZ�UP�DMBSJGZ�BO�JNQPSUBOU�QPJOU�JO�UIF�UBCMF�
5BCMF����.FOHPWJSVT�QMBRVF�QIFOPUZQFT�JO�UIF�QSFTFODF�PG�%1.�� � � � �
$PODFOUSBUJPO ��.�%1.
1MBRVF�3FEVDUJPO��a 3FMBUJWF�1MBRVF�4J[Fb
80 100 /�"60 98 NJOVUF�� �� �20 68 ��10 �� ��0 0 ����
a�7BMVFT�SFQSFTFOU�UIF�BWFSBHF�PG�UXP�FYQFSJNFOUT�FBDI�EPOF�JO�USJQMJDBUF�
b �1MBRVFT�JO�UIF�BCTFODF�PG�%1.�BWFSBHFE�BCPVU��NN�JO�EJBNFUFS�
Reference Citation Formatting
"�3FGFSFODFT�TFDUJPO�MJTUT�POMZ�UIPTF�SFGFSFODFT�DJUFE�JO�UIF�QBQFS��:PV�XJMM�DJUF�BMM�UIF�SFGFSFODFT�ZPV�VTFE�XIFO�ZPV�XSPUF�ZPVS�QBQFS��*O�UIF�UFYU�PG�UIF�QBQFS �DJUF�UIF�SFGFSFODFT�VTJOH�UIF�BVUIPS�T�OBNF�BOE�QVCMJDBUJPO�ZFBS��*G�UIFSF�BSF�UXP�BVUIPST�ZPV�NVTU�TUBUF�CPUI�PG�UIFJS�OBNFT�JG�UIFSF�BSF�HSFBUFS�UIBO�UXP�BVUIPST �TUBUF�UIF�GJSTU�BVUIPST�OBNF�GPMMPXFE�CZ�FU�BM�
14

'PS�FYBNQMF��8F�QSFEJDU�UIBU�UIF�����BMDPIPM�TPMVUJPO�XJMM�LJMM�BMM�PG�UIF�/*)��5��DFMMT�JO�PVS�DVM-UVSF�GMBTL�CFDBVTF�4NJUI�QFSGPSNFE�B�TJNJMBS�FYQFSJNFOU�JO�IJT�QBQFS�XJUI�BOPUIFS�DFMM�UZQF�4NJUI�FU�BM �������*O�QSFWJPVT�SFTFBSDI�UIF�Q���QSPUFJO�XBT�BTTPDJBUFE�XJUI�JODSFBTFE�DFMM�HSPXUI�JO�$����DFMMT�+PIOTPO �������#FOFOTPO�BOE�,PSUFNFZFS �������)BFOJTDI�FU�BM ������
Types of Literature:
5IF�WBTU�DPMMFDUJPO�PG�TDJFOUJGJD�MJUFSBUVSF�DBO�CF�HFOFSBMMZ�EJWJEFE�JOUP�UISFF�DBUFHPSJFT�CBTFE�PO�IPX�ADMPTF��UIFZ�BSF�UP�UIF�PSJHJOBM�FYQFSJNFOUT�BOE�EFTDSJQUJPOT�PG�TDJFOUJGJD�QIFOPNFOB���1) Primary literature��5IF�CVML�PG�TDJFOUJGJD�KPVSOBM�BSUJDMFT�BSF�QSJNBSZ �NFBOJOH�UIBU�UIFZ�SFQPSU�UIF�GJOEJOHT�PG�TQFDJGJD�FYQFSJNFOUT�PS�EFTDSJQUJWF�TUVEJFT���2) Secondary literature��'SPN�UJNF�UP�UJNF�JOWFTUJHB-UPST�XSJUF�SFWJFX�BSUJDMFT�PS�CPPLT�UIBU�TVNNBSJ[F�XIBU�JT�BOE�JT�OPU�LOPXO�BCPVU�B�QBSUJDVMBS�UPQJD���3BUIFS�UIBO�DPOEVDUJOH�OFX�FYQFSJNFOUT �UIFTF�BVUIPST�SFMZ�IFBWJMZ�PO�UIF�QSJNBSZ�MJUFSBUVSF �UIFSF-GPSF�UIFTF�SFWJFX�BSUJDMFT�BOE�CPPLT�BSF�DPOTJEFSFE�B�QBSU�PG�UIF�TFDPOEBSZ�MJUFSBUVSF���3) Tertiary literature��.PSF�HFOFSBM�UFYUT�UIBU�TVNNBSJ[F�XIBU�IBT�CFFO�SFQPSUFE�JO�SFWJFX�BSUJDMFT�DPNQSJTF�UIF�UFSUJBSZ�MJUFSBUVSF���
.PTU�OFX�SFTFBSDI�SFMJFT�IFBWJMZ�PO�QSFWJPVT�XPSL�SFQPSUFE�JO�QSJNBSZ�MJUFSBUVSF���)PXFWFS �SFWJFX�BSUJDMFT�DBO�CF�FYUSFNFMZ�IFMQGVM�JO�VOEFSTUBOEJOH�IPX�ZPVS�SFTFBSDI�QSPKFDU�GJUT�JOUP�UIF�MBSHFS�TDPQF�PG�TDJFOUJGJD�JOWFTUJHBUJPO �BOE�DBO�CF�VTFE�BT�B�TPVSDF�UP�MPDBUF�QSJNBSZ�MJUFSBUVSF�SFGFSFODFT�GPS�UIF�UPQJD�PG�JOUFSFTU�
/PUF�UIBU�XFCTJUFT�XFSF�OPU�JODMVEFE�JO�UIF�BCPWF�EFTDSJQUJPO�PG�TDJFOUJGJD�MJUFSBUVSF�TPVSDFT���5IJT�JT�CFDBVTF�UIFZ�BSF�OPU�SFGFSFFE���UIBU�JT �KVTU�BCPVU�BOZPOF�DBO�QVCMJTI�TPNFUIJOH�PO�UIF�XFC�XJUIPVU�TPNF�JNQBSUJBM�SFBEFS�SFWJFXJOH�JU�CFGPSFIBOE���8FC�QBHFT�BSF�PGUFO�XPOEFSGVM�TPVSDFT�PG�JOGPSNBUJPO �CVU�UIFZ�DBO�KVTU�BT�PGUFO�CF�SFQMFUF�XJUI�CBE�JOGPSNBUJPO���"U�UIJT�QPJOU �JU�JT�WFSZ�EJG-GJDVMU�UP�EFUFSNJOF�UIF�SFMJBCJMJUZ�PG�XFC�TPVSDFT�BOE �JO�HFOFSBM �UIFZ�TIPVME�HFOFSBMMZ�POMZ�CF�VTFE�BT�B�TUBSUJOH�QPJOU�BCPVU�B�QBSUJDVMBS�UPQJD��Thus websites are only allowed as citations in DRAFT1 manuscripts.
Examples of Proper Citation Formatting for the listings in your Reference section:+PVSOBM�BSUJDMFT�
Single Author:
#FMTLZ �"��+����������%PFT�IFSCJWPSZ�CFOFGJU�QMBOUT �"�SFWJFX�PG�UIF�FWJEFODF��"NFSJDBO�/BUVSBMJTU���������o����
Two Authors:
#SPXO �+��)��BOE�%��8��%BWJETPO����������$PNQFUJUJPO�CFUXFFO�TFFE�FBUJOH�SPEFOUT�BOE�BOUT�JO�EFTFSU�FDPTZTUFNT��4DJFODF���������o����
Multiple Authors:
'SFF �$��"� �+��3��#FEEJOHUPO �BOE�+��)��-BXUPO����������0O�UIF�JOBEFRVBDZ�PG�TJNQMF�NPEFMT�PG�NVUVBM�JOUFSGFSFODF�GPS�QBSBTJUJTN�BOE�QSFEBUJPO��+PVSOBM�PG�"OJNBM�&DPMPHZ��������o����
*G�UIF�TPVSDF�XBT�QVCMJTIFE�JO�BO�POMJOF�KPVSOBM do not cite the URL, treat it the same as printed�
14
Thomas, J. A., M. G. Telfer, D. B. Roy, C. D. Preston, J. J. D. Greenwood, J. Asher, R. Fox, R. T. Clarke, and J. H. Lawton. 2004. Comparative losses of British butterflies, birds, and plants and the global extinction crisis. Science 303: 1879-1881
Books:
Chapter within a book:
Goldberg, D. E. 1990. Components of resource competition in plant communities. Pp. 27-50 in J. B. Grace and D. Tilman, eds., Perspectives on Plant Competition. Academic Press, San Diego.
An entire book:
Hynes, H. B. N. 1970. The Ecology of Running Waters. University of Toronto Press, Toronto.
Theses:
Watson, D. 1987. Aspects of the population ecology of Senecio vulgaris L. Ph.D. thesis, University of Liverpool.
The textbook:
Campbell NA. and Reese JB. 2007. Biology – 8th ed., Chapter 13 “Mendel and the Gene”. Benjamin Cummings, CA.
The Lab Manual:
Igert, et al. 2013. LB145 Course Pack. MSU Printing Services, East Fee Hall. Michigan State University, East Lansing, MI
A Web Site: [only allowed in DRAFT1 manuscripts and follows a text citation (Author(s), Year published).]
Anonymous. 2002. Wisconsin Fast Plants Web Site. http://www.fastplants.org /Introduction/ Introduction.htm, last accessed 7/10/02
References (used in the creation of this appendix):
McMillian, V.E. 2001. Writing Papers in the Biological Sciences, 3rd ed. St. Martin’s Press, Inc., New York.
Appendix
Note everything you place in your appendix will be discarded during grading. An Appendix section includes only materials that are not actually required in the paper and could be thrown away with no effect to the paper. Often special extra information is included here. In LB-145 you are expected to place any laboratory notebook pages that indicated signed data for all members (photocopies from your notebook) and a photocopy of the first page of any articles cited and referenced in the report.
14

Reminders
Before writing your paper, refer to the following hints to make your paper stronger:
1. Write clearly in short, logical, but not choppy sentences.
2. Use past tense in the Abstract, Methods, and Results sections when discussing things
that have been completed. Also uuse past tense in the Introduction and Discussion
sections when referring to your experiment. Use future tense when making predictions
about future experiments.
3. Write in grammatically correct English, but use METRIC UNITS.
4. When referring to the scientific name of an organism, the genus and species should be
italicized, the first letter of the genus is capitalized, but the species is in lower case; for
example Drosophila melanogaster.
Making a Website
Making a webpage is a useful skill to have and is not as hard as you might think. This
primer is intended as a walkthrough for the basic beginner. Anyone looking for a more
advanced explanation should enroll in a web design course already.
There are many “places” on the internet where you can load your webpage (each website
name corresponds to a file on a computer somewhere in the world) but we’d like you to
load your file onto MSU’s computers through their AFS system. For the uninitiated, the
basic idea of this system is that MSU has provided hard-drive space that users (students
and faculty) can access and use from any computer connected to the internet. Most
people use this to store and back-up files or run webpages. If you’d like more info on
what this system is and how it works, go to the ATS helpdesk website at help.msu.edu.
The first step is to generate your file and save it as an html. There are many programs
that can do this for you, but most versions of MS Word made in the last decade have a
“save as webpage” or “save as html” function in the file menu. You should title your
document “index” (you need at least one index file in the Web folder for MSU to be able
to run your web page, so this might as well be it), unless you would like to make another
index file that has hyperlinks to the document you are currently trying to upload. If you
have images in your file (which you really should have) then Word will automatically
make a separate folder titled “index_files” in which all of the images are stored. You will
need to create a folder with the same name in your AFS space and upload all of these
files into it.
Go to netfiles.msu.edu and log in with your MSU netID. Click on the “Web” folder
which should be near the bottom of the file/folder list in the middle of the page. Select
“Upload file(s)” from the options on the left. Click on the “Browse”” button, locate your
index.htm file and click “Upload file(s)”. To create your image folder, click on the
“Create a new folder” option on the left side of the screen and enter the name EXACTLY
the same as the one generated by Word (index_files). Click on the folder and repeat the
file uploading process until of the folder”s contents are in your AFS space.
Now test your website by going to www.msu.edu/~yournetID. If you are having
problems getting things to work, contact the ATS help-desk or a resident computer whiz.
1

Supplemental Requirements: 2019 Final Research Paper
Here are special requirements for your final paper in addition to those listed in the Instructions to Authors.
TIP: Please re-read the “Instructions to Authors” (I to A) and carefully review the requirements of the research project to raise your score.
These are requirements specific to the final draft of your paper: (Title Page, Methods and sections not mentioned are unaffected).
• Introduction section is limited to 3 pages (ie. no more than 3 pages long). • Abstract section is expanded to a maximum of 350 words (ie. no longer 250 words). • Results section should be no longer than 2 pages. Should include only actual
findings/outcomes of experiments. No predicted results should remain here. • Discussion section must be limited to no more than 4 pages. It can include original
predictions and ultimate findings. • Future Directions should be a separate section, 1 page in length, with it’s own title. • Figures and Tables are limited to no more than 8 in total (figures and tables
combined, e.g. 6 figures and 2 tables; or 1 figure and 7 tables etc). A single figure may have multiple images or graphs but they must be clearly viewable, labeled and well-documented in the one legend at the bottom. No predicted figures or tables.
• Appendix must include photocopies of pages from your laboratory notebook during the weeks since submission of DRAFT2 (can be from just one member of your group with best notebook). The scientific notebook should look like a personal journal that shows the date, purpose, and methods of each day you visited lab as well as any gel photos, recorded data etc that serve as evidence of all your work (see Course Packet for more info on keeping a Notebook).
⇒ 30 Days projects (not required) level of excellence will be the *extra credit* element used to determine if your group receives up to 10 extra points.
⇒ Two copies of the final Research Manuscript are required at time of submission. One will have an attached appendix (appendix not bound). Spiral-bound final papers are preferred, yet TAs will still reject poorly prepared papers even when bound thus be sure the paper is complete before binding. Grading criteria will be the same as indicated in the rubric unless altered by this document. Utilize the grading sheets to determine if your paper has all the expected elements as well as will receive an excellent score.
⇒ Website: Please do not create a website of your own design or by using a web-based company to whip up a website from their templates (don’t use weebly.com or wix.com or wordpress.com etc), instead just convert an abbreviated version of your group’s final manuscript into a single page html document that will function as a single page website (with an added link to your 30 Days movie). Review details at end of grading rubric precisely describing the website, as well as the information in the course pack on how to use netfiles.msu.edu to move files around and place your website online in your MSU web folder.
BONUS: Manuscripts submitted early gain +1 bonus point per day up to a max of 10.
1 1

!
1

!!!
Samples: Student Paper
1

1 4
Genotypic Identification of CF Patients with the R553X
Mutation using IB3 and S9 Cell Lines and Allele Specific PCR
By: Sarah Bonczyk, Nathan Johns, Elizabeth LeMieux, and Mitch Wood
LB 145 Cell and Molecular Biology
Tuesday 7 PM
Ashley Coulter and Jason Mashni
4/24/2009
http://teamhouselb145.tripod.com/
(Title page written by: Nathan Johns
Revised by: Mitch Wood,
Finalized by: Liz LeMieux)
1
Abstract
Written by: Nathan Johns
Revised by: Mitch Wood
Finalized by: Liz LeMieux
The R553X mutation of the cystic fibrosis transmembrane conductance regulator (CFTR)
accounts for 0.7% of all cystic fibrosis cases (Hull et al, 1993). The mutation involves a single
base pair substitution in the 553rd
amino acid from CGA (Arginine) to TGA, a stop codon,
leading to a truncated protein (Bal et al, 1991). Allele specific polymerase chain reaction
(ASPCR) was used to determine whether samples of DNA are wild-type, heterozygous, or
homozygous for the R553X mutation in the CFTR gene. DNA was extracted from epithelial
bronchial cells of known CF patients (Qiagen Inc, 2007). We hypothesized that by controlling
annealing temperatures and salt concentrations in the PCR reaction, a single base pair mismatch
can be used to determine the presence of the R553X mutation, based on previous PCR diagnostic
testing (Chavanas et al, 1996). The resulting amplified DNA was then analyzed using agarose
gel electrophoresis to determine the genotype of the DNA. We were able to determine whether
samples were heterozygous, homozygous wild-type, or homozygous for the mutation by the
presence or absence of bands 1,056 base pairs long and based on which forward primer used
(Wu et al, 1989). Research surveys were distributed and analyzed in order to examine different
public opinion on genetic testing between students of various studies at Michigan State
University. Results showed no significant difference in opinions on genetic testing among
various residential colleges. These tests are significant in helping doctors diagnose cystic fibrosis
patients for specific mutations faster and more accurately than previous testing.
1
Introduction
Written by: Nathan Johns
Revised by: Mitch Wood
Finalized by: Liz LeMieux
Cystic fibrosis (CF) is an autosomal recessive disease caused by mutations in the gene
coding for the cystic fibrosis transmembrane conductance regulator (CFTR) protein. The role of
the CFTR protein is to serve as a chloride ion channel in epithelial cells (Rowe et al, 2008).
Epithelial cells with a CFTR mutation, most often in the lungs, pancreas, and intestines, secrete
large amounts of mucus, which builds up and creates complications in the affected tissues
(Welsh and Smith, 1995). Mucus buildup in the respiratory tract often leads to pulmonary
infection, the most common cause of death in CF patients (Golshahi et al, 2008). Current
treatments attempt to remove this mucus in the lungs and avoid affection, often by using
percussive therapy and antibiotics (Welsh and Smith, 1995).
Over one thousand mutations in the CFTR gene are identified to cause CF, with the
!F508 mutation, a deletion of three base pairs at position 508, being the most common, and
accounting for approximately 70% of all cases (Teem et al, 1993). The R553X mutation is the
sixth most common, accounts for 0.7% of cases, being most prevalent in German communities
(Hull et al, 1993). R553X is a nonsense mutation caused by a C to T substitution at the 553rd
amino acid. This changes what would normally be arginine to a stop codon (Hull et al, 1993). A
nonsense mutation is a mutation that causes the DNA sequence to result in a premature stop
codon, or a nonsense codon in the mRNA which results in a truncated, incomplete and
nonfunctioning protein. In the case of R553X, research has shown that the premature stop codon
often results in exon skipping in RNA translation (Aznarez et al, 2007). The loss of the exon
causes an unstable mRNA of the truncated protein and therefore does not undergo the process of
translation (Aznarez et al, 2007). The R553X mutation is a class I mutation because of the
unstable mRNA synthesized in the nucleus caused by nonsense alleles. (Gambardella et al. 2006)
Polymerase chain reaction (PCR) is a technique used to amplify a desired section of DNA
(Saiki et al, 1988). In PCR, DNA is heated during a denaturing step in order to break the
hydrogen bonds between nucleotide bases to separate complimentary 5’ and 3’ strands. Once
1

Methods
Written by: Liz LeMieux
Revised by: Sarah Bonczyk
Finalized by: Mitch Wood
Primers
Before the PCR tests were run, primers for the PCR tests were designed using the Cystic
Fibrosis Mutation Database. Forward and reverse allele-specific primers that worked with both
the wild type and with the mutation were needed. FPrimer1 is a forward primer ending in
Guanine, complementary to the wild type amino acid where the mutation should be present. The
second of the forward primers, Fprimer2, seeks the mutant type base sequence at the mutation
site, base pair number 1789, which results in the primer ending in Adenine. The reverse primer,
Rprimer, was designed to bind to the DNA strand 1,022 base pairs past the mutation site between
base pairs 2828 and 2811 and was used in both tests. Fprimer1 is 16 base pairs long with the
sequence of: GACTCACCTCCAGTTG and should properly bind to the wild type gene sequence
of CAACTGGAGGTGAGTC. Fprimer2, the mutant seeking primer, is also 16 base pairs long
with the sequence of: GACTCACCTCCAGTTA; the only difference from the previous forward
primer is the last base pair, which should properly bind to the mutant R553X gene sequence of
TAACTGGAGGTGAGTC. The reverse primer that will be used for both tests is 18 base pairs
long with the sequence of: CATGAGAGAAGAGAC, which should bind to the gene sequence of
TCTGTCTCTTCTCTCATG, which is the same in both mutant and wild type genes. All of the
primers are written in 5’ to 3’. These primers were ordered from the biological laboratory
company Integrated DNA Technologies (IDT).
After the primers were designed, the annealing temperatures at which the primers would
bind were determined by first calculating the theoretical melting temperatures of each primer
using the following formula:
Tm=64.9° C + 41° C x (number of G’s and C’s in the primer – 16.4)/N
where N is the length of the primer (Wright et al, 2009). The calculated theoretical melting
temperatures were: Fprimer1- 45.94°C, Fprimer2 – 43.36°C, and Rprimer – 45.77°C. Based on
these calculations, an annealing temperature of 42°C was used in the PCR tests.
1

DNA Purification
DNA Purification was used to collect DNA from cultured cells of both mutant type and
wild type samples to be used in PCR. Two different sources of Human DNA came from Human
bronchial epithelial cells from a CF patient without the R553X mutation (IB3 stock cells) while
another set of stock cells was found to obtain the R553X mutation, therefore were used as the
mutant type test (S9 cells). Each of these stock cells were used to contrast the effectiveness of the
allele specific primers. (Gambardella et al, 2006) Before beginning purification, all reaction
vessels were kept on ice until used and frozen cultured cells were allowed to thaw in a water bath
set to 37°C. Then, 200ul of the sample (either human bronchial epithelial cells without the
mutation or cells from a CF patient with the mutation, depending on the PCR test being done)
was added to a capture column and was incubated at room temperature for 30 minutes.
Afterwards, 400ul of DNA Purification Solution 1 was added to the sample. The resulting
mixture was incubated for 1 minute at room temperature. After incubation, the mixture was
centrifuged for ten seconds at 2,000-12,000 times the force of gravity (xg). The capture column
was then transferred into a new waste collection tube. Another 400ul of DNA Purification
Solution 1 was added to the mixture and the solution was incubated at room temperature for 1
minute. The solution was then centrifuged again for ten seconds at 2,000-12,000 x g. Then, 200ul
of DNA Elution Solution 2 was added and the mixture was centrifuged for ten seconds at 2,000-
12,000 x g. The capture column was transferred to a clear DNA collection cube and 100ul of
DNA Elution Solution 2 was added. The solution was incubated for ten minutes at 99°C and then
centrifuged for 20 seconds at 2,000-12,000 x g. (Quigen Inc. 2007)
PCR
To analyze DNA obtained from the purification process, two different Polymerase Chain
Reaction (PCR) tests were designed. Test #1used Fprimer1 and the Rprimer. Test #2 used
Fprimer2 and the Rprimer. For each of the tests, the combination of 2.0ul of the target DNA
template obtained through DNA purification, 5.0ul 10X PCR buffer, 0.2ul Taq polymerase, 2.0ul
forward primer (100 uM), 2.0ul reverse primer (100 uM), 1.0ul 10mM deoxynucleotide building
blocks (dNTP) of DNA and 40.4ul water was added to a test tube on ice. The combination was
mixed and spun down in a centrifuge. Once the sample was placed in the Labnet thermocycler,
the cocktail went through five steps: initial denaturation, denaturation, primer annealing,
extension and final extension. In the initial denaturation stage the temperature was raised to 94°
1

Predicted Results
Authored by: Kevin Werner
In this experiment for the template used in PCR, genomic DNA will be extracted
and purified from human cells. Cultured cells from Crohn’s Disease patients with the
R702W-CARD15 mutation, without the mutation, and heterozygous for the mutation will
be obtained from CRISI Inc (Sacramento, CA). For our diagnostic assay, PCR will be
used to amplify a DNA segment at a locus containing the R702W mutation on the
CARD15 gene that causes a form of Crohn’s Disease using a specialized approach for
detecting SNPs developed by Hidenobu Yaku (Yaku et al, 2008). The resulting PCR
products will be analyzed using agarose gel electrophoresis in either a traditional TBE or
fast LB buffer system.
Primer Design
We predict PCR of the genomic DNA will amplify the anticipated products from the
R702W locus on the CARD15 gene on chromosome 16 (Figure 1). This will occur
because of carefully selected primer design, reactant concentrations, and PCR
temperatures and times (Saiki et al, 1998). Thus primers R (annealing at 20,866 base
pairs to 20,887 base pairs on the CARD15 gene) and CDF (annealing at 19,866 base pairs
to 19,881 pairs on the CARD 15 gene) will amplify a 1021 base pair product, and primers
R and WTF (annealing at 19,866 base pairs to 19,881 base pairs on the CARD15 gene)
will amplify a 1021 base pair product (Wright, et al. 2010) (Figure 2). Also, the forward
primers CDF (forward primer designed to anneal to mutant type template) or WTF
(forward primer designed to anneal to wild type template) will not anneal when their
1
! !
bases are not completly complimentary to the DNA template bases at the respective
annealing loci of the primers, preventing amplification from occurring (Schochetman et
al, 1988). The forward primers are known as discriminating primers because they are
designed to be completely complimentary to either the mutant type or wild type
genotype, but not both (Wittwer et al, 1993). Hence it is also predicted that heterozygous
DNA will allow for some amplification with both of the discriminating primers. It then
follows that amplification of DNA template from the CDF discriminating primer supports
the presence of the R702W mutation, which could cause a maladaptive pro-inflammatory
response in Paneth cells along with other genetic and environmental factors (Figure 3)
(Lala et al, 2003).
We did a preliminary PCR amplification of the 1542 base pair long 16S rDNA
locus of!Escherichia coli to use as a control throughout our experiment (Haffar et al,
2010). The bands we produced during gel electrophoresis exhibited non-specific binding
that we were able to reduce by raising the annealing temperature (Figure 4) (Livak et al,
2010). Also, the validity our concentrations of forward primer, reverse primer, dNTPs,
buffer, and taq polymerase will supported by these experiments, thus supporting the
validity of our Crohn’s experiment.
Genomic Purification
In our preliminary research and assay design we found that DNA is extracted
from samples in four steps: cell lysis, membrane disruption with a detergent, protein
removal, and precipitation (Qiagen 2010) (Figure 5). We predict DNA yield of purified
samples will be in the range of 3-8 !g, because this is the normal theoretical yield of
1 1

understanding of issues like genetic testing significantly more than any other surveyed group
(Figure 6). Using the 1-10 scale for all questions pertaining to genetic testing, all surveyed
groups on average responded above the median answer of 5, from which it can be interpreted
that Michigan State University students tend to be supportive and knowledgeable about genetics
(Table 2).
Discussion
Written by: Mitchell Wood
Revised by: Nathan Johns
Finalized by: Sarah Bonczyk
Experiment Summary
Cystic fibrosis, the most common autosomal recessive disease in Caucasians (Aznarez et
al, 2007), has dramatic effects on multiple organs, including the lungs, pancreas, intestines, and
liver (Welsh and Smith, 1995), due to mutations of the CFTR gene on chromosome seven,
causing defects in sodium and chloride transport in epithelial cells (Aznarez et al, 2007). The
R553X mutation is a specific variation of cystic fibrosis, involving a single base pair substitution
at the 1789th
base pair in the 553rd
amino acid, from cytosine to thymine (Hull et al, 1993). The
subsequent change from the amino acid arginine to a premature stop codon causes early
truncation of the CFTR protein, thus altering the folding sequence (Gambardella et al. 2006).
Although PCR has been proven effective for diagnosing genetic disorders such as cystic fibrosis
(O’Leary et al, 1997), the question we are addressing is whether or not a PCR test can be
designed to identify this specific mutation. We hypothesized that allele specific primers and a
single base pair mismatch could be used to develop an accurate diagnostic test for patients with
the R553X mutation using experimentally determined optimal conditions of PCR in terms of
annealing temperature, primer concentration, and salt concentration.
In addition to primer design, we bridged the gap between laboratory experiments and the
sociology behind diagnosing genetic diseases by surveying student opinion on genetic screening
and the effects of genetic diseases on the human race in the long run. In recent years modern
medicine has extended the life expectancy of people with cystic fibrosis allowing those affected
to live to childbearing age (Ratjen 2008), meaning CF genes are more likely to be passed down
to future generations. Samples were taken from Lyman Briggs, James Madison, the College of
1

Natural Science, and general university students. It was hypothesized that Lyman Briggs students
would be more supportive of genetic testing due in part to their background in required
integrated studies and their greater understanding of how the frequency of a genetic disease
could impact a gene pool (Singer et al, 2008).
Original Predictions
By amplifying DNA from IB3 human bronchial epithelial cells from a CF patient and S9
epithelial cells from a leukemia patient via allele specific PCR, the length of the amplified DNA
was interpreted through gel electrophoresis to show the presence or absence of the R553X
mutation. Two different forward primers, Fprimer1 and Fprimer2, were designed to discriminate
between the wild-type and mutant CFTR genes through allele specificity based on a single base
pair mismatch on the 3’ end. The mismatch was positioned on the 3’ end of the primers to more
effectively reduce the amplified product by decreasing DNA polymerase and dNTP binding
efficiency (Yaku et al, 2008). Successful annealing of the primers and the subsequent extension
phase was hypothesized to result in a band of 1,056 base pairs, thus indicating a positive test.
The lack of a band was hypothesized to indicate a disruption in the extension phase due to the
single base pair mismatch (Chavanas et al, 1996). A homozygous wild-type genotype was
expected to show a band of 1,056 base pairs when using Fprimer1 and show no band when using
Fprimer2. In contrast, a homozygous mutant genotype was expected to show a band of 1,056
base pairs when using Fprimer2 and show no band when using Fprimer1. Lastly for
heterozygous genotypes, faint bands 1,056 base pairs long were expected to appear in both tests,
using either Fprimer1 or Fprimer2 due to the replication of both genotypes during PCR, causing
neither set of forward primers to completely discriminate against the specific mutation site
(Chavanas et al, 1996).
Results and Ultimate Findings
In order to determine optimal PCR conditions, multiple experimental trials were run with
adjustments in DNA concentration and primer concentration. In addition, multiple experiments
were run to establish the optimal annealing temperature, which can directly affect the annealing
rates of designed primers (Elnifro et al, 2000) and magnesium chloride (MgCl2) concentration to
alter magnesium ion concentrations, which directly affect DNA polymerase activity in PCR
(Ignatov et al, 2002). The optimal annealing temperature was determined to be 46ºC based off
of the calculated primer melting temperatures (see Methods section) and which annealing
1
References
Written by: Mitchell Wood
Revised by: Nathan Johns
Finalized by: Sarah Bonczyk
Aznarez, I., J. Zielenski, J.M. Rommens, B.J. Biencome, and L.C. Tsui. 2007. Exon skipping
through the creation of a putative exonic splicing silencer as a consequence of the cystic
fibrosis mutation R553X. Journal of Medical Genetics. 44(5): 341-346.
Bal J., M. Stuhrmann, M. Schloesser, J. Schmidtke, and J. Reiss. 1991. A cystic fibrosis patient
homozygous for the nonsense mutation R553X. Journal of Medical Genetics. 28(10):715-
717.
Chavanas, S., L. Pulkkinen, Y. Gache, F. Smith, W.H. McLean, J. Uitto, J. Ortonne, and G.
Meneguzzi. 1996. A Homozygous Nonsense Mutation in the PLEC1 Gene in Patients With
Epidermolysis Bullosa Simplex with Muscular Dystrophy. The American Society for Clinical
Investigation, Inc. 98(10): 2196-2200.
Elnifro, E.M., A.M. Ashshi, R.J. Cooper, P.E Klapper. 2000. Multiplex PCR: Optimization and
Application in Diagnostic Virology. Clinical Microbiology Reviews. 13(4):559-570.
Gambardella, S., M. Biancolella, M.R. D’Apice, F. Amati, F. Sangiuolo, A. Farcomeni, G.
Chillemi, S. Bueno, A. Desideri, and G. Novelli. 2006. Gene expression profile study in
CFTR mutated bronchial cell lines. Clinical and Experimental Medicine. 6(4):157-165.
Golshahi, L., K. Seed, J. Dennis, W. Finlay. 2008. Journal of Aerosol Medicine and Pulmonary
Drug Delivery. 21(4):351-359.
Hull, J., S. Shackelton, and A. Harris. 1993. Short Communication: The Stop Mutation R553X in
the CFTR Gene Results in Exon Skipping. Genomics. 19:362-364.
Ignatov, K.B., A.I. Miroshnikov, V.M. Kramarov. 2002. A New Approach to Enhanced PCR
Specificity. Russian Journal of Bioorganic Chemistry. 29(4):368-371.
Jacobsen, P.B., H.B. Vadimarsdottir, K.L. Brown, K. Offit, 1997. Decision-Making About
Gentic Testing Among Women at Familial Risk for Breast Cancer. Journal of
Biobehavioral Medicine. 59(5): 459-466.
Lynch, H.T, P. Watson, T.G. Shaw, J.F. Lynch, A.E. Harty, B.A. Franklin, C.R. Kapler, S.T.
Tinley, B. Liu. 1998. Clinical impact of molecular genetic diagnosis, genetic counseling,
and management of hereditary cancer. Cancer. 86(11): 2449-2456.
Mones, L., P. Kulhanek, J. Florian, I. Simon, M. Fuxreiter. 2007. Probing the Two-Metal Ion
Mechanism in the Restriction Endonuclease BamHI. Biochemistry. 46:14514-14523.
1 4

! !
Predicted Figures:
Authored by: Kevin Werner
Figure 1 – Predicted results of from amplified products using gel electrophoresis. The
non-discriminating oligonucleotide reverse primer, R, is 2% 3’-
GTGGCTGCAGGGTTACAACTA-5’. The discriminating oligonucleotide forward
primer CDF is 2% 5’-CGGGACGAGGCCGCG-3’. The discriminating oligonucleotide
forward primer WTF is 2% 5’-GCGGGACGAGACCGCG-3’. The predicted binding site
is on chromosome 16 on the CARD 15 gene from position 19,866 b.p. to 19,881 b.p. for
the forward primer CDF, from position 19,866 b.p. to 19,881 b.p. for the forward primer
WTF, and from position 20,866 b.p. to 20,887 b.p. for the reverse primer R with respect
to the CARD 15 gene. It is predicted there will be a yield of 1.7 billion copies of the
target DNA, along with a negligible amount of much larger DNA fragments (a by-
product of PCR), and the original DNA template. The denaturing temperature will be set
at 95°C, the annealing temperature at 55°C, and the extension temperature at 72°C. An
initial denaturing time of two minutes will be used, then the times will be 30 seconds
denaturing, 45 seconds annealing, one minute extending, and a final extension of 7
minutes for 30 cycles. The agarose gel contains 10% agarose. All bands are predicted to
appear at 1021 base pairs beside the ladder. Bromphenol blue dye will be added to the gel
to indicate when the gel electrophoresis is complete. L is the molecular marker or ladder,
and the DNA templates WT, CD, and H are 2% DNA purified products from a wild type,
mutant, and heterozygous genotype, respectively.
1
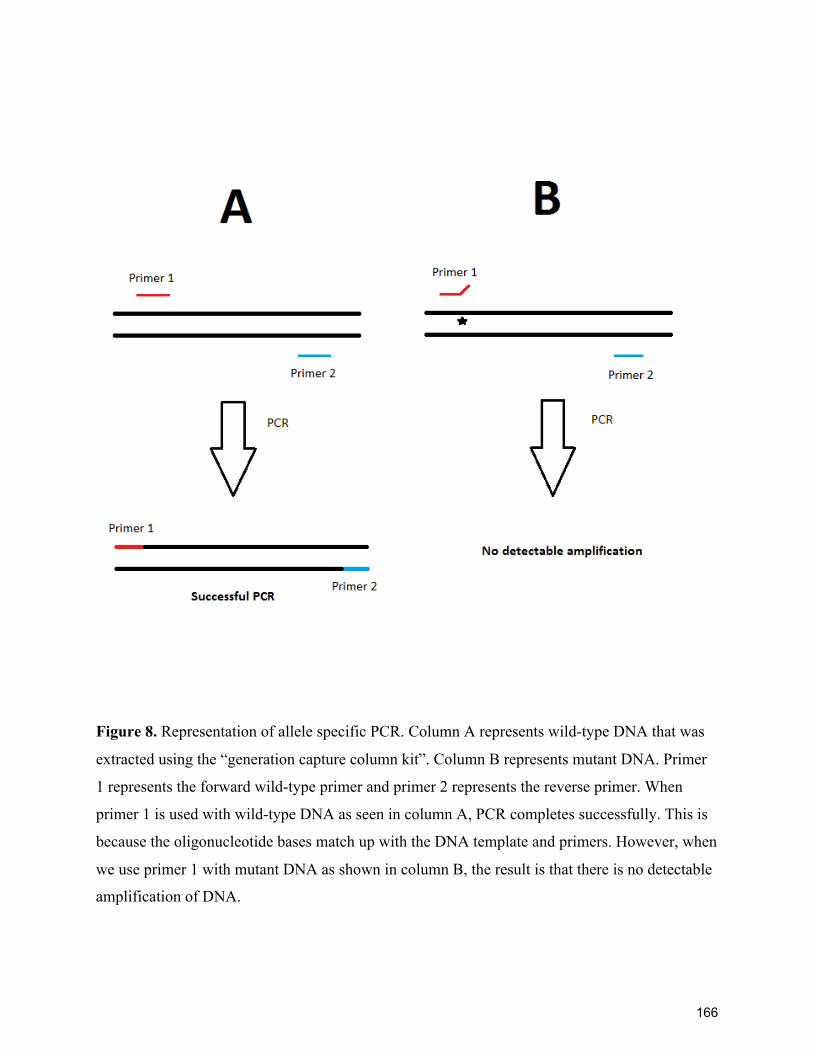
Figure 8. Representation of allele specific PCR. Column A represents wild-type DNA that was
extracted using the “generation capture column kit”. Column B represents mutant DNA. Primer
1 represents the forward wild-type primer and primer 2 represents the reverse primer. When
primer 1 is used with wild-type DNA as seen in column A, PCR completes successfully. This is
because the oligonucleotide bases match up with the DNA template and primers. However, when
we use primer 1 with mutant DNA as shown in column B, the result is that there is no detectable
amplification of DNA.
1
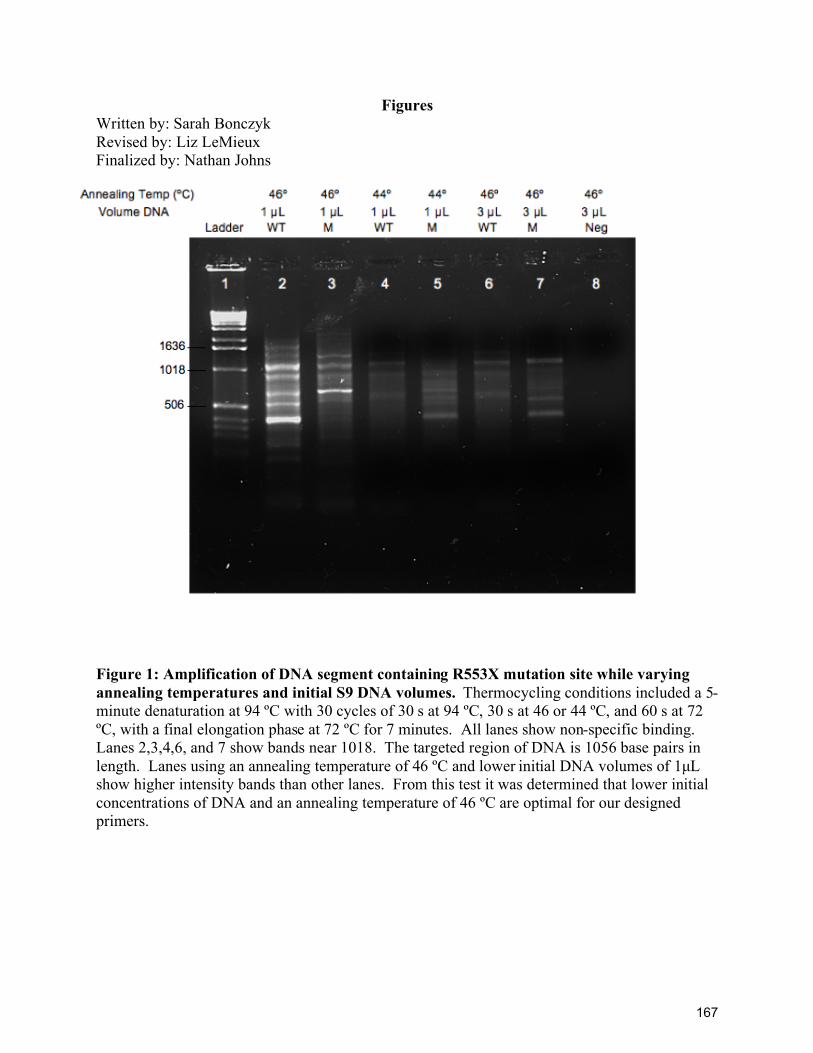
Figures
Written by: Sarah Bonczyk
Revised by: Liz LeMieux
Finalized by: Nathan Johns
Figure 1: Amplification of DNA segment containing R553X mutation site while varying
annealing temperatures and initial S9 DNA volumes. Thermocycling conditions included a 5-
minute denaturation at 94 ºC with 30 cycles of 30 s at 94 ºC, 30 s at 46 or 44 ºC, and 60 s at 72
ºC, with a final elongation phase at 72 ºC for 7 minutes. All lanes show non-specific binding.
Lanes 2,3,4,6, and 7 show bands near 1018. The targeted region of DNA is 1056 base pairs in
length. Lanes using an annealing temperature of 46 ºC and lower initial DNA volumes of 1µL
show higher intensity bands than other lanes. From this test it was determined that lower initial
concentrations of DNA and an annealing temperature of 46 ºC are optimal for our designed
primers.
1

#
#
Figure 2. PCR amplification of the DMD gene from human DNA at an annealing temperature of
48ºC. !"#After PCR amplification, gel electrophoresis was conducted in a 0.8% TBE gel run at 115V
for 30 minutes to detect amplified regions of DNA. M is the molecular marker (1.25ng) 1-Kb Plus
Ladder. Lanes 1 and 2 correspond to wild-type DNA samples tested with the wild-type
forward/reverse primer set (T/TR). 10!L (1.5ng) of wild-type DNA was added to each of these
lanes, and the expected amplification of a 765bp long fragment was observed. Lane 3 corresponds
to a wild-type DNA sample amplified with the mutant forward/reverse primer set (T/MR). 10!L
(1.5ng) of DNA was added to this lane and a PCR product of 589bp long was observed. For each
one of the lanes, non-specific binding was also seen#$%&#&'(#()*(+&(,#$-.,#/-0#1%2&(#,20&2.+&"
3" Semi-log plot for 1.25ng of 1-Kb Plus ladder. Each point of the graph depicts the#0*(+242+
distance traveled by each band of the 1-Kb Plus ladder with respect to its well. An R2 value of
0.98702 (p<0.05) was obtained for the logarithmic trend line of the plotted traveled distances. The
equation obtained from the trend line was used to calculate the traveled distances of the bands from
lanes 1, 2, and 3 to get more accurate band size values. Values of 757.83 ± 8.75bp, 775.33 ± 8.75bp
and 589.03 ± 5.21bp were obtained for lanes 1, 2, and 3 respectively.
#
#
#
##
12,000
2,000
1,650
1000
850
650
500
B
$#%#"&''(!)*!+,!#
-.#%#'+/,0'!#
'#
!'''#
1'''#
2'''#
,'''#
"''''#
"!'''#
"1'''#
"2'''#
'# !# 1# 2# ,#
!"#$%&#'()*+,$)-./0)
!+1('2"3)4+56'3%$)-%70)
A
#
1 2 3
M T/TR T/TR T/MR
0.025!g/!L 1.5ng 1.5ng 1.5ng
1.
1
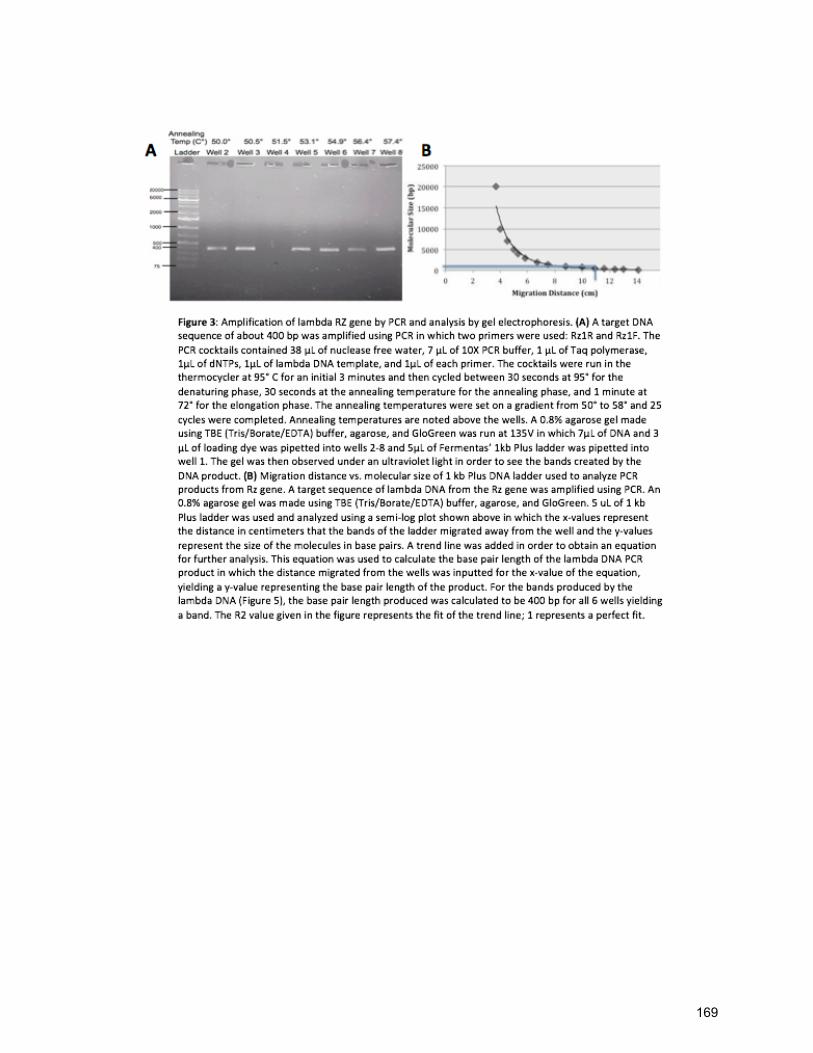
!
1

#
#
Figure 5. Correlation between the degenerative nature of Duchenne muscular dystrophy and the
deteriorating socio-psychological state associated with the disease. Duchenne muscular dystrophy’s
symptoms were progressively added to each one of the researchers’ lifestyles every week for a five-
week period. At the end of each week, each researcher completed the Disability Index of Stanford
University’s Health Assessment Questionnaire (HAQ) in order to gauge the severity of disability
that the researchers were living with. The HAQ gives scores between 0 and 60, with zero pertaining
to no disability at all and sixty symbolizing complete disability and immobility. In addition to the
HAQ, each researcher completed a survey that measured, on a scale of 0 to 3, the socio-
psychological impact on the researcher as each symptom was added. A linear regression for the
individual Disability Index scores is shown in blue while the linear regression for the Socio-
psychological impact test scores is shown in red. An R2
value of 0.90525 (p<0.05) was obtained for
the Disability Index score and an R2 value of 0.98155 (p<0.05) was obtained for the socio-
psychological impact test.
$#%#&'()"&*#+#'(,,!"#
-.#%#'(/')!)#
$#%#'()0"1*#+#'('"20#
-.#%#'(/,&))#
'#
'()#
&#
&()#
!#
!()#
1#
1()#
'#
&'#
!'#
1'#
"'#
)'#
0'#
'# &# !# 1# "# )#
!"#$"%&'#(")"*$#+),-.
%+#/,
-01$2$13+),4$&+5$)$/',-0167,!#"86,
966:,
1

!
!
!
!
Table 1. Chi-square test on adverse reactions to CF symptoms in public locations.
Location Total People
Observed
Expected
Frequency*
People
Observed
with
Reaction
People
Expected
with
Reaction
(O-E)2/E
Elevator 40 .717 27 28.68 .0984
Cafeteria 25 .717 17 17.93 .0482
Study Lounge 15 .717 9 10.75 .284
Restaurant 10 .717 6 7.17 .191
Total 90 .717 59 64.53 X2=.6216
n=4 df=3
p value
associated with
X2=.90
!
*Values representative of the results of question one of Figure 5.
1 1

!
1
Grading Rubrics
1

!
1 4

(for) Research Papers
1

!
1
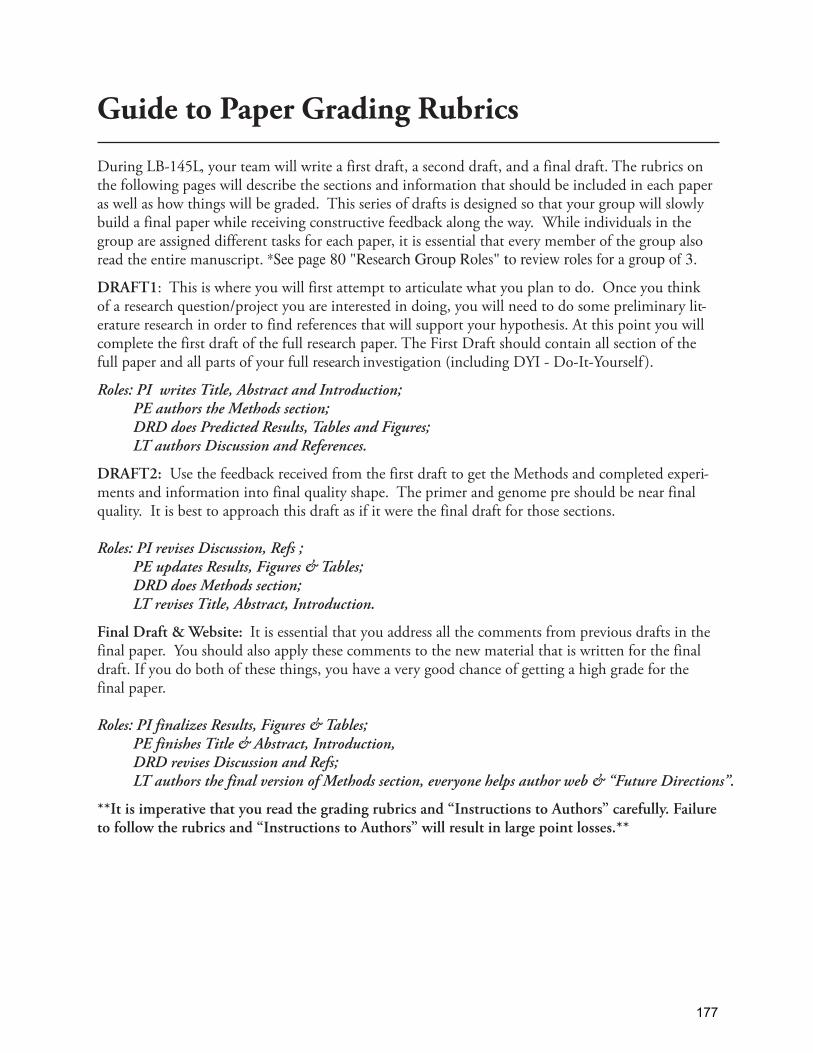
Guide to Paper Grading Rubrics
%VSJOH�LB-145L �ZPVS�UFBN�XJMM�XSJUF�B�GJSTU�ESBGU �B�TFDPOE�ESBGU �BOE�B�GJOBM�ESBGU��5IF�SVCSJDT�PO�UIF�GPMMPXJOH�QBHFT�XJMM�EFTDSJCF�UIF�TFDUJPOT�BOE�JOGPSNBUJPO�UIBU�TIPVME�CF�JODMVEFE�JO�FBDI�QBQFS�BT�XFMM�BT�IPX�UIJOHT�XJMM�CF�HSBEFE���5IJT�TFSJFT�PG�ESBGUT�JT�EFTJHOFE�TP�UIBU�ZPVS�HSPVQ�XJMM�TMPXMZ�CVJME�B�GJOBM�QBQFS�XIJMF�SFDFJWJOH�DPOTUSVDUJWF�GFFECBDL�BMPOH�UIF�XBZ���8IJMF�JOEJWJEVBMT�JO�UIF�HSPVQ�BSF�BTTJHOFE�EJGGFSFOU�UBTLT�GPS�FBDI�QBQFS �JU�JT�FTTFOUJBM�UIBU�FWFSZ�NFNCFS�PG�UIF�HSPVQ�BMTP�SFBE�UIF�FOUJSF�NBOVTDSJQU� *See page 80 "Research Group Roles" to review roles for a group of 3.
DRAFT1���5IJT�JT�XIFSF�ZPV�XJMM�GJSTU�BUUFNQU�UP�BSUJDVMBUF�XIBU�ZPV�QMBO�UP�EP���0ODF�ZPV�UIJOL�PG�B�SFTFBSDI�RVFTUJPO�QSPKFDU�ZPV�BSF�JOUFSFTUFE�JO�EPJOH �ZPV�XJMM�OFFE�UP�EP�TPNF�QSFMJNJOBSZ�MJU-FSBUVSF�SFTFBSDI�JO�PSEFS�UP�GJOE�SFGFSFODFT�UIBU�XJMM�TVQQPSU�ZPVS�IZQPUIFTJT��"U�UIJT�QPJOU�ZPV�XJMM�DPNQMFUF�UIF�GJSTU�ESBGU�PG�UIF�GVMM�SFTFBSDI�QBQFS��5IF�'JSTU�%SBGU�TIPVME�DPOUBJO�BMM�TFDUJPO�PG�UIF�GVMM�QBQFS�BOE�BMM�QBSUT�PG�ZPVS�GVMM�research�JOWFTUJHBUJPO�JODMVEJOH�%:*���%P�*U�:PVSTFMG �
Roles: PI writes Title, Abstract and Introduction; PE authors the Methods section; DRD does Predicted Results, Tables and Figures; LT authors Discussion and References.
DRAFT2:��6TF�UIF�GFFECBDL�SFDFJWFE�GSPN�UIF�GJSTU�ESBGU�UP�HFU�UIF�.FUIPET�BOE�DPNQMFUFE�FYQFSJ-NFOUT�BOE�JOGPSNBUJPO�JOUP�GJOBM�RVBMJUZ�TIBQF���5IF�primer and genome pre�TIPVME�CF�OFBS�GJOBM�RVBMJUZ���*U�JT�CFTU�UP�BQQSPBDI�UIJT�ESBGU�BT�JG�JU�XFSF�UIF�GJOBM�ESBGU�GPS�UIPTF�TFDUJPOT�
Roles: PI revises Discussion, Refs ; PE updates Results, Figures & Tables; DRD does Methods section; LT revises Title, Abstract, Introduction.
Final Draft & Website:��*U�JT�FTTFOUJBM�UIBU�ZPV�BEESFTT�BMM�UIF�DPNNFOUT�GSPN�QSFWJPVT�ESBGUT�JO�UIF�GJOBM�QBQFS���:PV�TIPVME�BMTP�BQQMZ�UIFTF�DPNNFOUT�UP�UIF�OFX�NBUFSJBM�UIBU�JT�XSJUUFO�GPS�UIF�GJOBM�ESBGU��*G�ZPV�EP�CPUI�PG�UIFTF�UIJOHT �ZPV�IBWF�B�WFSZ�HPPE�DIBODF�PG�HFUUJOH�B�IJHI�HSBEF�GPS�UIF�GJOBM�QBQFS��
Roles: PI finalizes Results, Figures & Tables; PE finishes Title & Abstract, Introduction, DRD revises Discussion and Refs; LT authors the final version of Methods section, everyone helps author web & “Future Directions”.
**It is imperative that you read the grading rubrics and “Instructions to Authors” carefully. Failure to follow the rubrics and “Instructions to Authors” will result in large point losses.**
1

!
1
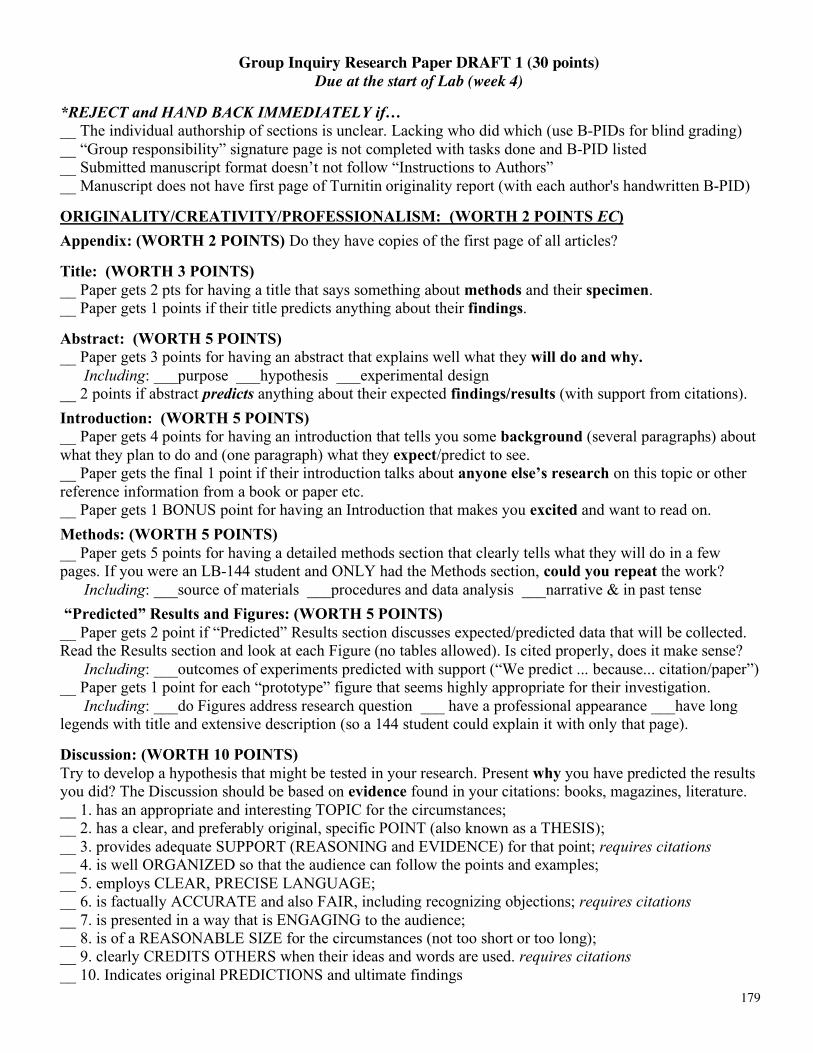
179
Group Inquiry Research Paper DRAFT 1 (30 points) Due at the start of Lab (week 4)
*REJECT and HAND BACK IMMEDIATELY if… __ The individual authorship of sections is unclear. Lacking who did which (use B-PIDs for blind grading) __ “Group responsibility” signature page is not completed with tasks done and B-PID listed __ Submitted manuscript format doesn’t not follow “Instructions to Authors” __ Manuscript does not have first page of Turnitin originality report (with each author's handwritten B-PID)
ORIGINALITY/CREATIVITY/PROFESSIONALISM: (WORTH 2 POINTS EC)
Appendix: (WORTH 2 POINTS) Do they have copies of the first page of all articles? Title: (WORTH 3 POINTS) __ Paper gets 2 pts for having a title that says something about methods and their specimen. __ Paper gets 1 points if their title predicts anything about their findings. Abstract: (WORTH 5 POINTS) __ Paper gets 3 points for having an abstract that explains well what they will do and why. Including: ___purpose ___hypothesis ___experimental design __ 2 points if abstract predicts anything about their expected findings/results (with support from citations).
Introduction: (WORTH 5 POINTS) __ Paper gets 4 points for having an introduction that tells you some background (several paragraphs) about what they plan to do and (one paragraph) what they expect/predict to see. __ Paper gets the final 1 point if their introduction talks about anyone else’s research on this topic or other reference information from a book or paper etc. __ Paper gets 1 BONUS point for having an Introduction that makes you excited and want to read on.
Methods: (WORTH 5 POINTS) __ Paper gets 5 points for having a detailed methods section that clearly tells what they will do in a few pages. If you were an LB-144 student and ONLY had the Methods section, could you repeat the work? Including: ___source of materials ___procedures and data analysis ___narrative & in past tense
“Predicted” Results and Figures: (WORTH 5 POINTS) __ Paper gets 2 point if “Predicted” Results section discusses expected/predicted data that will be collected. Read the Results section and look at each Figure (no tables allowed). Is cited properly, does it make sense? Including: ___outcomes of experiments predicted with support (“We predict ... because... citation/paper”) __ Paper gets 1 point for each “prototype” figure that seems highly appropriate for their investigation. Including: ___do Figures address research question ___ have a professional appearance ___have long legends with title and extensive description (so a 144 student could explain it with only that page). Discussion: (WORTH 10 POINTS) Try to develop a hypothesis that might be tested in your research. Present why you have predicted the results you did? The Discussion should be based on evidence found in your citations: books, magazines, literature. __ 1. has an appropriate and interesting TOPIC for the circumstances; __ 2. has a clear, and preferably original, specific POINT (also known as a THESIS); __ 3. provides adequate SUPPORT (REASONING and EVIDENCE) for that point; requires citations __ 4. is well ORGANIZED so that the audience can follow the points and examples; __ 5. employs CLEAR, PRECISE LANGUAGE; __ 6. is factually ACCURATE and also FAIR, including recognizing objections; requires citations __ 7. is presented in a way that is ENGAGING to the audience; __ 8. is of a REASONABLE SIZE for the circumstances (not too short or too long); __ 9. clearly CREDITS OTHERS when their ideas and words are used. requires citations __ 10. Indicates original PREDICTIONS and ultimate findings

!
1

!"#$%&'()*&$+*,-,.,/01'2,3+4/%#)'543)'67(89:';<''
!!"##$%&'#&()')&**#'#+'#&*',-+.#'+,'$./'0-(##*.'0+-1'#&$#'()'#+'2*'#3-.*4'(.',+-'$'5-$4*6!!'
!"#$%&#'()&*+,-(&)"#%./&#*&.)"#&),$&)#.()#.00*1/&)#12#$%'33#4.('+5*,0$#46#-*1'0#,+#(17#+'84,$$,(-#21*#
-*.),(-9#!#5.(#&:03.,(#.(6#0.*$#12#,$#$1#;*9#<'5=,&#.()#!#.4#7,33,(-#.()#&:5,$&)#$1#),+5'++#$%&#*&+&.*5%#1(#.#
414&($>+#(1$,5&9##!(#.)),$,1(#$1#$%&#.81/&"#!#.4#/&*,26,(-#$%.$#.+#.#4&48&*#12#$%&#<64.(#?*,--+#5144'(,$6"#
!#%./&#%&3)#46+&32#.()#46#0&&*+#$1#$%&#%,-%&+$#4&.+'*&+#12#%1(&+$6#.()#,($&-*,$69#@6#-*1'0#%.+#(&,$%&*#
-,/&(#(1*#*&5&,/&)#.(6#'(.'$%1*,A&)#.++,+$.(5&#,(#51403&$,(-#$%,+#71*=#.()#7&#+'84,$$&)#1'*#4.('+5*,0$#$1#
%$$0BCC$'*(,$,(9514C#21*#+5*&&(,(-9##
"#$%&'=4>)'?????????????????????????????'74/)'??????????'
#Primary Investigator: D.4&#EEEEEEEEEEEEEEEEEEEEEEE#F,-(.$'*&#EEEEEEEEEEEEEEEEEEEEEEEE#
#
!#)&/&310&)C*&/,+&)#$%&+&#+&5$,1(+#12#$%�.0&*B#EEEEEEEEEEEEEEEEEEEEEEEEEEEEEEEEEEEEEEEEEEEE#
#
F,(5&#$%&#G*101+.3"#!#0&*21*4&)#$%&+&#)'$,&+#,(+,)&#.()#1'$+,)#3.8#$17.*)+#$%죋&$,1(#12#$%,+#0.*$#12#
1'*#-*1'0#*&+&.*5%#0*1H&5$#I&9-9#.++.6+"#4&&$,(-+"#-*17,(-C8'6,(-#03.($+"#&$5J#
#
EEEEEEEEEEEEEEEEEEEEEEEEEEEEEEEEEEEEEEEEEEEEEEEEEEEEEEEEEEEEEEEEEEEEEEEEEEEEEEEEE#
#Protocol Expert: D.4&#EEEEEEEEEEEEEEEEEEEEEEE#F,-(.$'*&#EEEEEEEEEEEEEEEEEEEEEEEE
#
!#)&/&310&)C*&/,+&)#$%&+&#+&5$,1(+#12#$%�.0&*B#EEEEEEEEEEEEEEEEEEEEEEEEEEEEEEEEEEEEEEEEEEEE#
#
F,(5&#$%&#G*101+.3"#!#0&*21*4&)#$%&+&#)'$,&+#,(+,)&#.()#1'$+,)#3.8#$17.*)+#$%죋&$,1(#12#$%,+#0.*$#12#
1'*#-*1'0#*&+&.*5%#0*1H&5$#I&9-9#.++.6+"#4&&$,(-+"#-*17,(-C8'6,(-#03.($+"#&$5J#
#
EEEEEEEEEEEEEEEEEEEEEEEEEEEEEEEEEEEEEEEEEEEEEEEEEEEEEEEEEEEEEEEEEEEEEEEEEEEEEEEEE#
#Data Recorder: D.4&#EEEEEEEEEEEEEEEEEEEEEEE#F,-(.$'*&#EEEEEEEEEEEEEEEEEEEEEEEE
#
!#)&/&310&)C*&/,+&)#$%&+&#+&5$,1(+#12#$%�.0&*B#EEEEEEEEEEEEEEEEEEEEEEEEEEEEEEEEEEEEEEEEEEEE#
#
F,(5&#$%&#G*101+.3"#!#0&*21*4&)#$%&+&#)'$,&+#,(+,)&#.()#1'$+,)#3.8#$17.*)+#$%죋&$,1(#12#$%,+#0.*$#12#
1'*#-*1'0#*&+&.*5%#0*1H&5$#I&9-9#.++.6+"#4&&$,(-+"#-*17,(-C8'6,(-#03.($+"#&$5J#
#
EEEEEEEEEEEEEEEEEEEEEEEEEEEEEEEEEEEEEEEEEEEEEEEEEEEEEEEEEEEEEEEEEEEEEEEEEEEEEEEEE#
#Laboratory Technician: D.4&#EEEEEEEEEEEEEEEEEEEEEEE#F,-(.$'*&#EEEEEEEEEEEEEEEEEEEEEEEE
#
!#)&/&310&)C*&/,+&)#$%&+&#+&5$,1(+#12#$%�.0&*B#EEEEEEEEEEEEEEEEEEEEEEEEEEEEEEEEEEEEEEEEEEEE#
#
F,(5&#$%&#G*101+.3"#!#0&*21*4&)#$%&+&#)'$,&+#,(+,)&#.()#1'$+,)#3.8#$17.*)+#$%죋&$,1(#12#$%,+#0.*$#12#
1'*#-*1'0#*&+&.*5%#0*1H&5$#I&9-9#.++.6+"#4&&$,(-+"#-*17,(-C8'6,(-#03.($+"#&$5J#
#
EEEEEEEEEEEEEEEEEEEEEEEEEEEEEEEEEEEEEEEEEEEEEEEEEEEEEEEEEEEEEEEEEEEEEEEEEEEEEEEEE#
#
1 1

!
1

!"#$%&'()$*"+&,-.-/"01&2/%-"&3,456&7&89:&%#*(;.<&
!"#$%&$&'#$(&%)&$*+$,%-$./##0$�1$!
2345467$%89$:;<!$=;6>$?@@4!?;74,A$B+C$
""!#$%&'!()*+!,!-$./+0!1$%+!$2/3/%)4!5/'(!)..+%6/7!)%6!8!.($'$-$./+0 without appendix9!""!:;2$<.!2+0.$%0/=/4/'>?!0/3%)'<2+!.)3+!/0!%$'[email protected]+'+6!
""!A(+!/%6/*/6<)4!2+0.$%0/=4+!B$2!+)-(!0+-'/$%!/0!<%-4+)2!1/+!:2+*/0+6!=>!C/@!D@/'(?9E!
""!D<=@/''+6!@)%<0-2/.'!B$2@)'!6$+0%&'!B$44$5!:F%0'2<-'/$%0!'$!G<'($20?!
""!D<=@/''+6!@)%<0-2/.'!()0!%$'!>+'!=++%!<.4$)6+6!'$!(''.HII'<2%/'/%E-$@I!1()*+!2+-+/.'J9!
===================================================================================&
!
>,'!'?4@'6ABC,D46'E'6AB2,>5DFF'>?4@'FGH&&8I>,6J&K2&6>&L&2>'?6F&M462<&
""!K).+2!3+'0!LM,!.'0!B$2!()*/%3!+7.+2/@+%')4!6+0/3%!'()'!/0!*+2>!-2+)'/*+!)%6!<%/N<+!M$2M!+7'2+@+4>!
.2$B+00/$%)4!/+!/B!'(+>!')O+!.2+*/$<0!2+0+)2-(P!-/'+!/'!5+44P!)%6!+7'+%6!/'!/%!)%!/@.2+00/*+!0-/+%'/B/-!0'>4+E!
===================================================================================&
&
422D?3'N&
""!#$!'(+>!()*+!-$./+0!$B!0/3%+6!6)')!!"#!'(+!1st page of )2'/-4+0!'(+>&*+!-/'+6 in ReferencesJ!!!
6*;O-H&&8I>,6J&P&2>'?6F<&
""!K).+2!3+'0!Q!.'0!B$2!()*/%3!)!'/'4+!'()'!0)>0!0$@+'(/%3!)=$<'!Q-;1#R.!)%6!'(+/2!.%-0*Q-(E!
""!K).+2!3+'0!L!.$/%'0!/B!'(+/2!'/'4+!.2+6/-'0!)%>'(/%3!)=$<'!'(+/2!S*(R*(T.E!!
4U.;"/0;H&&8I>,6J&P&2>'?6F<&
""!K).+2!3+'0!R!.$/%'0!B$2!()*/%3!)%!)=0'2)-'!'()'!+7.4)/%0!5+44!5()'!'(+>!V*OO&#"&R*R&R#&/(R&V1+W&
! $"%&'#(")H!""".<2.$0+!!"""(>.$'(+0/0!!"""+7.!6+0/3%!!"""$<'-$@+0I6)')!!"""0/3%/B/-)%-+!/%!0-/+%-+!
""!K).+2!3+'0!Q!.$/%'0!/B!'(+!)=0'2)-'!6/0-<00+0!*both*!)-'<)4!!"#!.2+6/-'+6!S*(R*(T.B"-.$O;.E!""!D<='2)-'!.$/%'0!/B!)<'($20!@)O+!-4)/@0!$2!)00+2'/$%0!5/'($<'!)%>!+*/6+%-+!'$!0<..$2'!'($0+!.2+6/-'/$%0E!!
'(;"#R$0;*#(H&&8I>,6J&X&2>'?6F<&
""!K).+2!3+'0!Q!.$/%'0!B$2!()*/%3!)%!/%'2$6<-'/$%!'()'!'+440!>$<!0$@+!U/0YT"#$(R!10+*+2)4!.)2)32).(09!)=$<'!
5()'!'(+>!.4)%!'$!6$E!
!
K).+2!3+'0!SE,!.$/%'!B$2!+)-(!$B!'(+0+!.2+0+%'!/%!'(+!F%'2$6<-'/$%H!
""!LE!()0!)%!)..2$.2/)'+!)%6!/%'+2+0'/%3!ATKFU!B$2!'(+!-/2-<@0')%-+0V!
""!QE!()0!)!-4+)2P!)%6!.2+B+2)=4>!$2/3/%)4P!0.+-/B/-!KTFWA!1)40$!O%$5%!)0!)!AXYDFD9V!
""!RE!.2$*/6+0!)6+N<)'+!DZKKT[A!1[YGDTWFW;!)%6!Y\F#YWUY9!B$2!'()'!.$/%'V*+,-'(+,.*%(/!/(0".!
""!8E!/0!5+44!T[;GWF]Y#!0$!'()'!'(+!)<6/+%-+!-)%!B$44$5!'(+!.$/%'0!)%6!+7)@.4+0V!
""!,[email protected]$>0!U^YG[P!K[YUFDY!^GW;ZG;YV!
""!_E!/0!B)-'<)44>!GUUZ[GAY!)%6!)40$!`GF[P!/%-4<6/%3!2+-$3%/a/%3!$=b+-'/$%0V*+,-'(+,.*%(/!/(0".!
""!cE!/0!.2+0+%'+6!/%!)!5)>!'()'!/0!YW;G;FW;!'$!'(+!)<6/+%-+V!
""!dE!/0!$B!)![YGDTWGe^Y!DF]Y!B$2!'(+!-/2-<@0')%-+0!1%$'!'$$!0($2'!$2!'$$!4$%39V!
""!fE!-4+)24>!U[Y#FAD!TAXY[D!5(+%!'(+/2!/6+)0!)%6!5$260!)2+!<0+6V*+,-'(+,.*%(/!/(0".!
""!LSE!F%6/-)'+0!$2/3/%)4!K[Y#FUAFTWD!)%6!0$@+!(/%'!$B!B/%6/%30!!
G-;1#R.H&8I>,6J&L&2>'?6F<&61-&@#&'*9(&.-0;*#(&Q$.;&/%%-/"&0#Q%O-;-&S#"&4@@&-Z%-"*Q-(;.&/(R&
"-/R+&S#"&%$UO*0/;*#(W&
""!G2+!'(+2+!)44!'(+!.2$'$-$40!%+-+00)2>!'$!2+.+)'!'(+/2!+7.+2/@+%'0!+7)-'4>!B$2!'(+/[email protected]+'+6!2+0+)2-(J!
""!G2+!'(+2+!)44!'(+!2+-/.+0!)%6!.2$'$-$40!-4)2/B/+6!B$2!'(+/2!2+0+)2-(!6<2/%3!'(+!<.-$@/%3!5++O0J&
""!FB!)%!^eML88!0'<6+%'!TW^g!()6!'(+!h+'($60!0+-'/$%!)%6!)!-$<20+!.)-OP!0#$OR&;1-+&"-%-/;!'(+!5$2OJ!
! $"%&'#(")H!"""0$<2-+!$B!@)'+2/)40!!""".2$-+6<2+0!!___6)')!)%)4>0/0!!"""%)22)'/*+!i!/%!.)0'!'+%0+!!
1

!"#$%&#'()*+!,-(.(/+01,23(
!!"#$%&'"(&)*"+"%,-.)*"-/"0&*12)*"*&3)-,."4-*31**&*"$3)1$2"/-.4-.(*"$2,.(*-4&")5&"&6%&3)&47%'&4-3)&4"4$)$")5$)"
8$*"3,22&3)&49"0&$4")5&"0&*12)*"*&3)-,."$.4"2,,:"$)"&$35"3-)&4";-(1'&",'"<$=2&*>"-*"-)"3-)&4"%',%&'2?@""
" !"#$%&'"(A"!!!,1)3,B&*",/"&6%&'-B&.)*"*)$)&4@""!!!has $3)1$2"CD*"/',B"4$)$@"!!!3-)&"/-(1'&*7)$=2&*"%',%&'2?@"!!"E1=)'$3)"%,-.)*"-/"$1)5,'*"B$:&"32$-B*",'"$**&')-,.*"8-)5,1)"$.?"&F-4&.3&"),"*1%%,')")5,*&"%'&4-3)-,.*9"
"
456$7"#8,9:%"#'()*+!,-(;(/+01,23(
!!"#$%&'"(&)*"G"%,-.)"/,'"&$35"$3)1$2"H.,)"%'&4-3)&4I"/-(1'&")5$)"*&&B*"5-(52?"$%%',%'-$)&"$.4"%',/&**-,.$2"/,'"
-.F&*)-($)-,.9 At week 6, should have completed/actual 30 Days research figures and those from Genomic Prep."!"#$%&'"(A"!!!4,";7<"$44'&**"'&*&$'35"J1&*)-,.@""!!!"5$F&"$"%',/&**-,.$2"$%%&$'$.3&@"!!!5$F&"2,.("
2&(&.4*"8-)5")-)2&"$.4"&6)&.*-F&"4&*3'-%)-,."H*,"$"G++"*)14&.)"3,124"&6%2$-."-)"8-)5",.2?")5$)"%$(&I@(
!!"K/")5&?"5$F&"LM"%5,),('$%5*",/"'&*&$'35"'&*12)*"/',B"$.?"&6%&'-B&.),"*1=)'$3)"%,-.)*"H.,"&F-4&.3&I9"!!"#$%&'"(&)*"1%"),"N"O)*+,-."%,-.)*"-/";-(1'&*"3,B%2&)&2?"0MPQR""
<5#=$##5>?'()*+!,-(@A(/+01,23(
Try to develop a hypothesis that might be tested in your research. Present why you believe you have found
those results or predicted the results you did? The Discussion should be based on evidence found in your
experiments and citations: books, magazines, literature."!!"G9"5$*"$."$%%',%'-$)&"$.4"-.)&'&*)-.("<M#KP"/,'")5&"3-'31B*)$.3&*S"
!!"N9"5$*"$"32&$'>"$.4"%'&/&'$=2?",'-(-.$2>"*%&3-/-3"#MKL<"H$2*,":.,8."$*"$"<TUEKEIS"
!!"V9"%',F-4&*"$4&J1$)&"EW##M0<"H0UXEMLKLY"$.4"UZK[ULPUI"/,'")5$)"%,-.)S/012%'013/#'454'6"3"
!!"+9"-*"8&22"M0YXLK\U["*,")5$)")5&"$14-&.3&"3$."/,22,8")5&"%,-.)*"$.4"&6$B%2&*S"
!!"]9"&B%2,?*"P^UX0>"#0UPKEU"^XLYWXYUS"
!!"_9"-*"/$3)1$22?"XPPW0X<U"$.4"$2*,";XK0>"-.3214-.("'&3,(.-`-.(",=a&3)-,.*S"012%'013/#'454'6"3"
!!"b9"-*"%'&*&.)&4"-."$"8$?")5$)"-*"ULYXYKLY"),")5&"$14-&.3&S"
!!"c9"-*",/"$"0UXEMLXd^U"EK\U"/,'")5&"3-'31B*)$.3&*"H.,)"),,"*5,')",'"),,"2,.(IS"
!!"e9"32&$'2?"P0U[K<E"M<TU0E"85&.")5&-'"-4&$*"$.4"8,'4*"$'&"1*&4S"012%'013/#'454'6"3"
!!"Gf9"K.4-3$)&*",'-(-.$2"#0U[KP<KMLE"$.4"12)-B$)&"/-.4-.(*"
"
"
B>CD%"&"E("FD"75C"?&#'()G(/+01,23(/9D"7(C$#&(H9I"(!"#$%&'($!)(D7>J"##5>?(K$9%5&L(J>7(=>CD%"&"E(M>7N(
J7>C(D7"I5>$#(M""N#O At week 7 30 Days research should be mostly complete, genomic prep also complete.(!!"[,&*")5&"K.)',413)-,.>"0&*12)*"$.4"[-*31**-,."*&3)-,.*"5$F&"$"%',/&**-,.$2"3,B%2&)&"J1$2-)?"/,'"$22"3,B%2&)&4"
&6%&'-B&.)*"-.")5&"'&*&$'35@"
!!"[,")5&";-(1'&*"H%5,),('$%5*>"('$%5*>"4'$8-.(*"&)3I"$.4"<$=2&*"/,'"$22"3,B%2&)&4"'&*&$'35"$%%&$'"
3,B%2&)&"$.4"'&$4?"/,'"%1=2-3$)-,.@"
1 4

!"#$%&'!()*'%+*,-,.,/01!2,3+4/&$)!543)!67(89:!;<!!
!!"##$%&'#&()'$*+'#&,'-./-(%')&,,#'#0'#&,'1-0*#'01'$*2'3-(##,*'30-4'#&$#'()'#0'/,'#.-*,+'(*'10-'$'5-$+,6!!'
!"#$%&#'()&*+,-(&)"#%./&#*&.)"#&),$&)#.()#.00*1/&)#12#$%'33#4.('+5*,0$#46#-*1'0#,+#(17#+'84,$$,(-#21*#
-*.),(-9#!#5.(#&:03.,(#.(6#0.*$#12#,$#$1#;*9#<'5=,&#.()#!#.4#7,33,(-#.()#&:5,$&)#$1#),+5'++#$%&#*&+&.*5%#1(#.#
414&($>+#(1$,5&9##!(#.)),$,1(#$1#$%&#.81/&"#!#.4#/&*,26,(-#$%.$#.+#.#4&48&*#12#$%&#<64.(#?*,--+#5144'(,$6"#
!#%./&#%&3)#46+&32#.()#46#0&&*+#$1#$%&#%,-%&+$#4&.+'*&+#12#%1(&+$6#.()#,($&-*,$69#@6#-*1'0#%.+#(&,$%&*#
-,/&(#(1*#*&5&,/&)#.(6#'(.'$%1*,A&)#.++,+$.(5&#,(#51403&$,(-#$%,+#71*=#.()#7&#+'84,$$&)#1'*#4.('+5*,0$#$1#
%$$0BCC$'*(,$,(9514C#21*#+5*&&(,(-9##
#$%&'!=4>)!?????????????????????????????!74/)!??????????!
#Primary Investigator: D.4&#EEEEEEEEEEEEEEEEEEEEEEE#F,-(.$'*&#EEEEEEEEEEEEEEEEEEEEEEEE#
#
!#7.+#*&+01(+,83*#$%&+&#+&5$,1(+#12#;GHIJKB#EEEEEEEEEEEEEEEEEEEEEEEEEEEEEEEEEEEEEEEEEEEE#
#
F,(5&#;GHIJL"#!#0&*21*4&)#$%&+&#)'$,&+#,(+,)&#.()#1'$+,)#3.8#$17.*)+#$%죋&$,1(#12#$%,+#0.*$#12#1'*#
-*1'0#*&+&.*5%#0*1M&5$#N&9-9#.++.6+"#4&&$,(-+"#-*17,(-C8'6,(-#03.($+"#&$5O#
#
EEEEEEEEEEEEEEEEEEEEEEEEEEEEEEEEEEEEEEEEEEEEEEEEEEEEEEEEEEEEEEEEEEEEEEEEEEEEEEEEE#
#Protocol Expert: D.4&#EEEEEEEEEEEEEEEEEEEEEEE#F,-(.$'*&#EEEEEEEEEEEEEEEEEEEEEEEE
#
!#7.+#*&+01(+,83*#$%&+&#+&5$,1(+#12#;GHIJKB#EEEEEEEEEEEEEEEEEEEEEEEEEEEEEEEEEEEEEEEEEEEE#
#
F,(5&#;GHIJL"#!#0&*21*4&)#$%&+&#)'$,&+#,(+,)&#.()#1'$+,)#3.8#$17.*)+#$%죋&$,1(#12#$%,+#0.*$#12#1'*#
-*1'0#*&+&.*5%#0*1M&5$#N&9-9#.++.6+"#4&&$,(-+"#-*17,(-C8'6,(-#03.($+"#&$5O#
#
EEEEEEEEEEEEEEEEEEEEEEEEEEEEEEEEEEEEEEEEEEEEEEEEEEEEEEEEEEEEEEEEEEEEEEEEEEEEEEEEE#
#Data Recorder: D.4&#EEEEEEEEEEEEEEEEEEEEEEE#F,-(.$'*&#EEEEEEEEEEEEEEEEEEEEEEEE
#
!#7.+#*&+01(+,83*#$%&+&#+&5$,1(+#12#;GHIJKB#EEEEEEEEEEEEEEEEEEEEEEEEEEEEEEEEEEEEEEEEEEEE#
#
F,(5&#;GHIJL"#!#0&*21*4&)#$%&+&#)'$,&+#,(+,)&#.()#1'$+,)#3.8#$17.*)+#$%죋&$,1(#12#$%,+#0.*$#12#1'*#
-*1'0#*&+&.*5%#0*1M&5$#N&9-9#.++.6+"#4&&$,(-+"#-*17,(-C8'6,(-#03.($+"#&$5O#
#
EEEEEEEEEEEEEEEEEEEEEEEEEEEEEEEEEEEEEEEEEEEEEEEEEEEEEEEEEEEEEEEEEEEEEEEEEEEEEEEEE#
#Laboratory Technician: D.4&#EEEEEEEEEEEEEEEEEEEEEEE#F,-(.$'*&#EEEEEEEEEEEEEEEEEEEEEEEE
#
!#7.+#*&+01(+,83*#$%&+&#+&5$,1(+#12#;GHIJKB#EEEEEEEEEEEEEEEEEEEEEEEEEEEEEEEEEEEEEEEEEEEE#
#
F,(5&#;GHIJL"#!#0&*21*4&)#$%&+&#)'$,&+#,(+,)&#.()#1'$+,)#3.8#$17.*)+#$%죋&$,1(#12#$%,+#0.*$#12#1'*#
-*1'0#*&+&.*5%#0*1M&5$#N&9-9#.++.6+"#4&&$,(-+"#-*17,(-C8'6,(-#03.($+"#&$5O#
#
EEEEEEEEEEEEEEEEEEEEEEEEEEEEEEEEEEEEEEEEEEEEEEEEEEEEEEEEEEEEEEEEEEEEEEEEEEEEEEEEE#
#
1

!
1
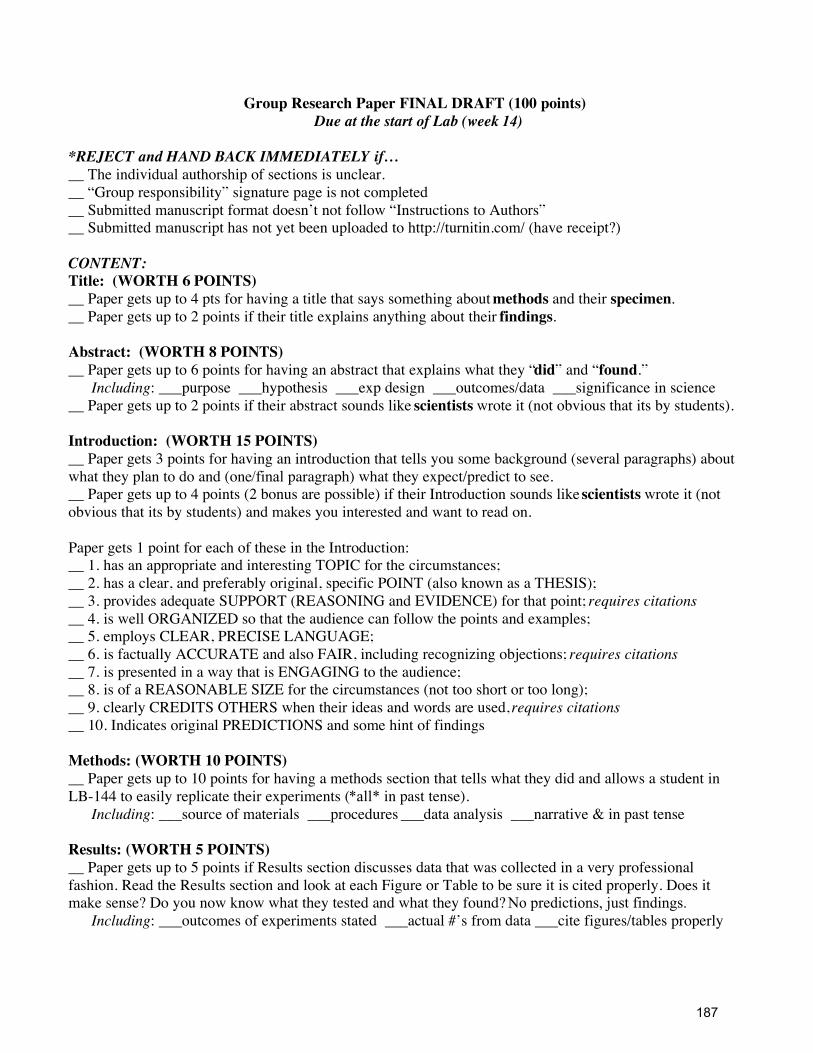
!"#$%&'()(*"+,&-*%("&./012&3'1.4&5677&%#89:);&
!"#$%&$&'#$(&%)&$*+$,%-$./##0$141$!
2345467$%89$:;<!$=;6>$?@@4!?;74,A$B+C$
""!#$%!&'(&)&(*+,!+*-$./0$&1!.2!0%3-&.'0!&0!*'3,%+/4!
""!56/.*1!/%01.'0&7&,&-89!0&:'+-*/%!1+:%!&0!'.-!3.;1,%-%(!
""!<*7;&--%(!;+'*03/&1-!2./;+-!(.%0'=-!'.-!2.,,.>!5?'0-/*3-&.'0!-.!@*-$./09!
""!<*7;&--%(!;+'*03/&1-!$+0!'.-!8%-!7%%'!*1,.+(%(!-.!$--1ABB-*/'&-&'43.;B!C$+)%!/%3%&1-DE!
&
6D<74<7E$
48:<(=&&5>?'4@&A&-?/04B;&
""!F+1%/!:%-0!*1!-.!G!1-0!2./!$+)&':!+!-&-,%!-$+-!0+80!0.;%-$&':!+7.*-!C(:,#D)!+'(!-$%&/!)%(+8C(94!
""!F+1%/!:%-0!*1!-.!H!1.&'-0!&2!-$%&/!-&-,%!%I1,+&'0!+'8-$&':!+7.*-!-$%&/!E89D89F)4!
!
1G):"*+:=&&5>?'4@&H&-?/04B;&
""!F+1%/!:%-0!*1!-.!J!1.&'-0!2./!$+)&':!+'!+70-/+3-!-$+-!%I1,+&'0!>$+-!-$%8!5D8D9!+'(!5E#$9D49!
! !"#$%&'"(A!"""1*/1.0%!!"""$81.-$%0&0!!"""%I1!(%0&:'!!""".*-3.;%0B(+-+!!"""0&:'&2&3+'3%!&'!03&%'3%!
""!F+1%/!:%-0!*1!-.!H!1.&'-0!&2!-$%&/!+70-/+3-!0.*'(0!,&K%!)+8(9:8):)!>/.-%!&-!C'.-!.7)&.*0!-$+-!&-0!78!0-*(%'-0E4!
!
/9:"#D$+:8#9=&&5>?'4@&6I&-?/04B;&
""!F+1%/!:%-0!L!1.&'-0!2./!$+)&':!+'!&'-/.(*3-&.'!-$+-!-%,,0!8.*!0.;%!7+3K:/.*'(!C0%)%/+,!1+/+:/+1$0E!+7.*-!
>$+-!-$%8!1,+'!-.!(.!+'(!C.'%/final!1+/+:/+1$E!>$+-!-$%8!%I1%3-B1/%(&3-!-.!0%%4!""!F+1%/!:%-0!*1!-.!G!1.&'-0!CH!7.'*0!+/%!1.00&7,%E!&2!-$%&/!?'-/.(*3-&.'!0.*'(0!,&K%!)+8(9:8):)!>/.-%!&-!C'.-!
.7)&.*0!-$+-!&-0!78!0-*(%'-0E!+'(!;+K%0!8.*!&'-%/%0-%(!+'(!>+'-!-.!/%+(!.'4!
!
F+1%/!:%-0!M!1.&'-!2./!%+3$!.2!-$%0%!&'!-$%!?'-/.(*3-&.'A!
""!M4!$+0!+'!+11/.1/&+-%!+'(!&'-%/%0-&':!#NF?O!2./!-$%!3&/3*;0-+'3%0P!
""!H4!$+0!+!3,%+/Q!+'(!1/%2%/+7,8!./&:&'+,Q!01%3&2&3!FN?R#!C+,0.!K'.>'!+0!+!#ST<?<EP!
""!L4!1/.)&(%0!+(%U*+-%!<VFFNW#!CWT@<NR?R6!+'(!TX?YTROTE!2./!-$+-!1.&'-P!)*+%')*,-#'./.'0",!
""!G4!&0!>%,,!NW6@R?ZTY!0.!-$+-!-$%!+*(&%'3%!3+'!2.,,.>!-$%!1.&'-0!+'(!%I+;1,%0P!
""![4!%;1,.80!O\T@WQ!FWTO?<T!\@R6V@6TP!
""!J4!&0!2+3-*+,,8!@OOVW@#T!+'(!+,0.!]@?WQ!&'3,*(&':!/%3.:'&^&':!.7_%3-&.'0P-)*+%')*,-#'./.'0",!
""!`4!&0!1/%0%'-%(!&'!+!>+8!-$+-!&0!TR6@6?R6!-.!-$%!+*(&%'3%P!
""!a4!&0!.2!+!WT@<NR@b\T!<?ZT!2./!-$%!3&/3*;0-+'3%0!C'.-!-..!0$./-!./!-..!,.':EP!
""!c4!3,%+/,8!OWTY?#<!N#STW<!>$%'!-$%&/!&(%+0!+'(!>./(0!+/%!*0%(Q!)*+%')*,-#'./.'0",!
""!Md4!?'(&3+-%0!./&:&'+,!FWTY?O#?NR<!+'(!0.;%!$&'-!.2!2&'(&':0!
!
J(:,#D)=&5>?'4@&67&-?/04B;&
""!F+1%/!:%-0!*1!-.!Md!1.&'-0!2./!$+)&':!+!;%-$.(0!0%3-&.'!-$+-!-%,,0!>$+-!-$%8!(&(!+'(!+,,.>0!+!0-*(%'-!&'!
\beMGG!-.!%+0&,8!/%1,&3+-%!-$%&/!%I1%/&;%'-0!C*all* &'!1+0-!-%'0%E4!! !"#$%&'"(A!"""0.*/3%!.2!;+-%/&+,0!!"""1/.3%(*/%0!___(+-+!+'+,80&0!!"""'+//+-&)%!f!&'!1+0-!-%'0%!!
'()$<:)=&5>?'4@&I&-?/04B;&
""!F+1%/!:%-0!*1!-.![!1.&'-0!&2!W%0*,-0!0%3-&.'!(&03*00%0!(+-+!-$+-!>+0!3.,,%3-%(!&'!+!)%/8!1/.2%00&.'+,!
2+0$&.'4!W%+(!-$%!W%0*,-0!0%3-&.'!+'(!,..K!+-!%+3$!]&:*/%!./!#+7,%!-.!7%!0*/%!&-!&0!3&-%(!1/.1%/,84!Y.%0!&-!
;+K%!0%'0%D!Y.!8.*!'.>!K'.>!>$+-!-$%8!-%0-%(!+'(!>$+-!-$%8!2.*'(D No predictions, just findings.!! !"#$%&'"(A!""".*-3.;%0!.2!%I1%/&;%'-0!0-+-%(!!"""+3-*+,!g=0!2/.;!(+-+!"""3&-%!2&:*/%0B-+7,%0!1/.1%/,8!
!
1

!"#$%&'()*+,&'-./012)3.45.6178)9:.
!!"#$%&'"(&)*"+%"),"-."%,/0)*"/1"2/(+'&*"$03"4$56&*"72849"$'&":&';"%',1&**/,0$6"$03"'&$66;"<="3,>+?&0)")@&/'"
&:/3&0>&A"B1")@&;"@$:&"C="%@,),('$%@*",1"$>)+$6"'&*+6)*",1"&D%&'/?&0)*"*+5)'$>)"E"%,/0)*"70,"&:/3&0>&9A"
!"#$%&'"(F"!!!3,"284"$33'&**"'&*&$'>@"G+&*)/,0""!!!"@$:&"$"%',1&**/,0$6"$%%&$'$0>&"!!!@$:&"6,0("
6&(&03*"H/)@")/)6&"$03"&D)&0*/:&"3&*>'/%)/,0" ____No PREDICTED FIGURES allowed in Final paper"!!"#$%&'"(&)*"+%"),"I"J=CKL"%,/0)*"/1"2/(+'&*">,?%6&)&6;"M=NOP ".
;"'<$''"=>-./012)[email protected])9:.
!!"#$%&'"(&)*"+%"),"I"%,/0)*"/1"they develop an excellent hypothesis that they evaluate.
!!"#$%&'"(&)*"+%"),"Q"%,/0)*"71,'":$'/,+*"),%/>*"$03"<BR9"/1"they present again a brief summary of their intro,
methods and results and then proceed to interpret these (what’s it mean?)
Also 2 points for each of these."
!!"-A"@$*"$0"$%%',%'/$)&"$03"/0)&'&*)/0("4=#BN"1,'")@&">/'>+?*)$0>&*S"
!!"IA"@$*"$">6&$'T"$03"%'&1&'$56;",'/(/0$6T"*%&>/1/>"#=BC4"7$6*,"U0,H0"$*"$"4VWLBL9S")*+%')*,-#'./.'0","
!!"QA"%',:/3&*"$3&G+$)&"LK##=M4"7MWXL=CBCY"$03"WZB<WCNW9"1,'")@$)"%,/0)S"
!!"[A"/*"H&66"=MYXCB\W<"*,")@$)")@&"$+3/&0>&">$0"1,66,H")@&"%,/0)*"$03"&D$?%6&*S"
!!"EA"&?%6,;*"N]WXMT"#MWNBLW"]XCYKXYWS"
!!"^A"/*"1$>)+$66;"XNNKMX4W"$03"$6*,"2XBMT"/0>6+3/0("'&>,(0/_/0("'&$*,0$56&",5`&>)/,0*S")*+%')*,-
#'./.'0","
!!"aA"/*"%'&*&0)&3"/0"$"H$;")@$)"/*"WCYXYBCY"),")@&"$+3/&0>&S"
!!"bA"/*",1"$"MWXL=CXJ]W"LB\W"1,'")@&">/'>+?*)$0>&*"70,)"),,"*@,')",'"),,"6,0(9S"
!!"cA">6&$'6;"NMW<B4L"=4VWML"H@&0")@&/'"/3&$*"$03"H,'3*"$'&"+*&3S")*+%')*,-#'./.'0","
!!"-.A"B03/>$)&*",'/(/0$6"#MW<BN4B=CL"$03"+6)/?$)&"1/03/0(*"
"
;"'<$''"=>.A.B!$C$%&.;"%&<C"=>'D.'$+'&<C"=>-./012)3.E.6178)9:.
!!"#$%&'"(&)*"+%"),"I"%,/0)*"1,'"&$>@"$**$;")@$)"3/30d)"H,'U">,?%6&)&6;"H@&'&")@&;")',+56&*@,,)"/)"H&66"$03"
%',%,*&"3&)$/6&3"%6$0*"),"'&*,6:&")@&"%',56&?"$03"(&)"+*&1+6"'&*+6)*"/0"1+)+'&"'&*&$'>@"&D%&'/?&0)*. What
didn’t work well, why is it likely it failed, how would you re-design your experiment(s) or whole research
project if you had six weeks longer to work and it was very worthwhile for your grade. "
310.F11;./GHIJ7)K.L.GHI8)7)K:.0I9.)3M.2M9MI2N3 & 30 Days: ./012)3.45.6178)9:..
.
;"O.P&%Q.!"#.C%"*,'(&RS&%"T&>C'[email protected]...;"O.$%&'.<=TS,&R.C%"*,'.&RS'..
!"#$%&'()*+*,%()-%&'(.+*,%/0%*#$+1%1$2$(13#%()-%30 Days experiment7 %80%*#$,%6(-$%(%2+)3$1$%$00/1*%()-%-+-%6(),%*1+(.2%()-%3/)*1/.2%()-%9$1$%1+:/1/'2%+)%*#$+1%1$2$(13#%-$2+:)%()-%$4$3'*+/)%*#$,%9+..%;$%
:$)$1/'2.,%1$9(1-$-<%80%/)%*#$%/*#$1%#()-=%*#$+1%:1/'5%-+-%>$1,%0$9%$45$1+6$)*2=%*1+(.2=%3/)*1/.2%()-%
+)%:$)$1(.%+*?2%3.$(1%*#$+1%$00/1*%9(2%6+)+6(.=%*#$+1%23/1$%9+..%;$%6+)+6(.<@%%
A+$9%*#$+1%:1(5#2%()-%3#$3B%+0%*#$,%#(>$%6'.*+5.$%*1+(.2%+)-+3(*$-%()-%+)3.'-$%2*(*+2*+32%9+*#%-(*(<."
;1.)3MK.3IZM.I.0M[6IFM\........KM9.(.81./012)[email protected])9:.
"
CDEFGHIE7%8)%(--+*+/)=%9$%1$&'$2*%,/'%31$(*$%(%2+):.$J5(:$%9$;2+*$%*#(*%3/)*(+)2%2/6$%
+)0/16(*+/)%01/6%,/'1%0+)(.%5(5$1%0/1%5';.+3(*+/)%/)%*#$%9$;<%"#$%+)0/%1$&'$2*$-%+27%"+*.$=%H'*#/12=%
H;2*1(3*=%K%L+:'1$%/1%"(;.$%M*#$%;$2*%/)$%*#(*%2#/92%*#$%6/2*%+65/1*()*%0+)-+):N=%()-%,/'1%0'..%
O+23'22+/)%2$3*+/)<%P(6$%*#$%#*6.%5(:$%0/1%,/'1%:1/'5%+$<%Q25(,2B1(0*<#*6.Q%()-%.+2*%*#$%RST%0/1%'2%
*/%>+$9%+*%/)%*#$%3/>$15(:$%/0%,/'1%5(5$1<%"#+2%9$;5(:$%9+..%;$%5.(3$-%+)%(%5';.+3%9$;2+*$%*/%
Q5';.+2#Q%,/'1%1$2'.*2<%U*'-$)*2%+)%*#$%0'*'1$%M(2%,/'%-+-N%9+..%1$(-%(;/'*%,/'1%9/1B%()-%;$%+)%(9$%
M(2%9$..%(2%3+*$%()-%$4*$)-%,/'1%5';.+2#$-%1$2$(13#N<%Uee Webpage instructions at end of "I to A"<%
1

!"#$%&'()*&$+*,-,.,/01'2,3+4/%#)'543)'67,+4.'8(97:;''
!!"##$%&'#&()')&**#'#+'#&*',-+.#'+,'$./'0-(##*.'0+-1'#&$#'()'#+'2*'#3-.*4'(.',+-'$'5-$4*6!!'
!"#$%&#'()&*+,-(&)"#%./&#*&.)"#&),$&)#.()#.00*1/&)#12#$%'33#4.('+5*,0$#46#-*1'0#,+#(17#+'84,$$,(-#21*#
-*.),(-9#!#5.(#&:03.,(#.(6#0.*$#12#,$#$1#;*9#<'5=,&#.()#!#.4#7,33,(-#.()#&:5,$&)#$1#),+5'++#$%&#*&+&.*5%#1(#.#
414&($>+#(1$,5&9##!(#.)),$,1(#$1#$%&#.81/&"#!#.4#/&*,26,(-#$%.$#.+#.#4&48&*#12#$%&#<64.(#?*,--+#5144'(,$6"#
!#%./&#%&3)#46+&32#.()#46#0&&*+#$1#$%&#%,-%&+$#4&.+'*&+#12#%1(&+$6#.()#,($&-*,$69#@6#-*1'0#%.+#(&,$%&*#
-,/&(#(1*#*&5&,/&)#.(6#'(.'$%1*,A&)#.++,+$.(5&#,(#51403&$,(-#$%,+#71*=#B,&9#C&#'+&)#(1#).$."#,4.-&+"#$&:$#&$5#
2*14#1$%&*#-*1'0+#1*#2*14#0'83,+%&)#*&+1'*5&+#,(#0*,($"#,($&*(&$#1*#1$%&*#)14.,(+D9##
"#$%&'<4=)'>>>>>>>>>>>>>>>>>>>>>>>>>>>>>'84/)'>>>>>>>>>>'
#Primary Investigator: E.4&#FFFFFFFFFFFFFFFFFFFFFFF#G,-(.$'*&#FFFFFFFFFFFFFFFFFFFFFFFF#
#
!#*&/,+&)#$%&+&#+&5$,1(+#12#$%�.0&*H#FFFFFFFFFFFFFFFFFFFFFFFFFFFFFFFFFFFFFFFFFFFFFFFFFFF#
#
G,(5&#;IJKL#M"#!#0&*21*4&)#$%&+&#)'$,&+#,(+,)&#.()#1'$+,)#3.8#$17.*)+#$%죋&$,1(#12#$%,+#0.*$#12#1'*#
-*1'0#*&+&.*5%#0*1N&5$#B&9-9#.++.6+"#4&&$,(-+"#-*17,(-O8'6,(-#03.($+"#&$5D#
#
FFFFFFFFFFFFFFFFFFFFFFFFFFFFFFFFFFFFFFFFFFFFFFFFFFFFFFFFFFFFFFFFFFFFFFFFFFFFFFFFF#
#Protocol Expert: E.4&#FFFFFFFFFFFFFFFFFFFFFFF#G,-(.$'*&#FFFFFFFFFFFFFFFFFFFFFFFF
#
!#*&/,+&)#$%&+&#+&5$,1(+#12#$%�.0&*H#FFFFFFFFFFFFFFFFFFFFFFFFFFFFFFFFFFFFFFFFFFFFFFFFFFF#
#
G,(5&#;IJKL#M"#!#0&*21*4&)#$%&+&#)'$,&+#,(+,)&#.()#1'$+,)#3.8#$17.*)+#$%죋&$,1(#12#$%,+#0.*$#12#1'*#
-*1'0#*&+&.*5%#0*1N&5$#B&9-9#.++.6+"#4&&$,(-+"#-*17,(-O8'6,(-#03.($+"#&$5D#
#
FFFFFFFFFFFFFFFFFFFFFFFFFFFFFFFFFFFFFFFFFFFFFFFFFFFFFFFFFFFFFFFFFFFFFFFFFFFFFFFFF#
#Data Recorder: E.4&#FFFFFFFFFFFFFFFFFFFFFFF#G,-(.$'*&#FFFFFFFFFFFFFFFFFFFFFFFF
#
!#*&/,+&)#$%&+&#+&5$,1(+#12#$%�.0&*H#FFFFFFFFFFFFFFFFFFFFFFFFFFFFFFFFFFFFFFFFFFFFFFFFFFF#
#
G,(5&#;IJKL#M"#!#0&*21*4&)#$%&+&#)'$,&+#,(+,)&#.()#1'$+,)#3.8#$17.*)+#$%죋&$,1(#12#$%,+#0.*$#12#1'*#
-*1'0#*&+&.*5%#0*1N&5$#B&9-9#.++.6+"#4&&$,(-+"#-*17,(-O8'6,(-#03.($+"#&$5D#
#
FFFFFFFFFFFFFFFFFFFFFFFFFFFFFFFFFFFFFFFFFFFFFFFFFFFFFFFFFFFFFFFFFFFFFFFFFFFFFFFFF#
#Laboratory Technician: E.4&#FFFFFFFFFFFFFFFFFFFFFFF#G,-(.$'*&#FFFFFFFFFFFFFFFFFFFFFFFF
#
!#*&/,+&)#$%&+&#+&5$,1(+#12#$%�.0&*H#FFFFFFFFFFFFFFFFFFFFFFFFFFFFFFFFFFFFFFFFFFFFFFFFFFF#
#
G,(5&#;IJKL#M"#!#0&*21*4&)#$%&+&#)'$,&+#,(+,)&#.()#1'$+,)#3.8#$17.*)+#$%죋&$,1(#12#$%,+#0.*$#12#1'*#
-*1'0#*&+&.*5%#0*1N&5$#B&9-9#.++.6+"#4&&$,(-+"#-*17,(-O8'6,(-#03.($+"#&$5D#
#
FFFFFFFFFFFFFFFFFFFFFFFFFFFFFFFFFFFFFFFFFFFFFFFFFFFFFFFFFFFFFFFFFFFFFFFFFFFFFFFFF##
1

!
1

Characteristics of a 4.0 Final Manuscript
� ��� 3FBET�MJLF�B�TDJFOUJTU�XSPUF�JU��5IF�BVUIPS�JT�DMFBSMZ�XFMM�SFBE�PO�UIF�UPQJDT�UIFZ�TUVEJFE �VO-EFSTUBOET�UIFJS�HPBMT�BOE�NFUIPEPMPHJFT�BOE�DPNNVOJDBUFT�UIBU�XFMM�JO�B�DPODJTF �TNBSU �DPNQPTJUJPO�
� ��� 3FGFSFODFT�TFDUJPO�DPOUBJOT�TDJFOUJGJD�SFTFBSDI�QBQFST �SFDFOU�CPPLT�BOE�OFXT�BSUJDMFT�� ��� 'JHVSFT�MPPLT�QSPGFTTJPOBM�XJUI�DMFBS�BOE�EFUBJMFE�MFHFOET�� ��� *OUSPEVDUJPO�BOE�%JTDVTTJPO�TFDUJPOT�IBWF�OVNFSPVT�DJUBUJPOT�BOE�UIFZ�BSF�VTFE�SFHVMBSMZ�FWFSZ�
GFX�TFOUFODFT��"MM�TFDUJPOT�BSF�DMFBSMZ�CSPLFO�VQ�JOUP�TVC�TFDUJPOT �XJUI�TVC�UJUMFT �UIBU�GPDVT� PO�FBDI�TUFQ�PG�UIF�QSPKFDU�TVDI�BT��2VBOUJUBUJPO�PG�%/"�'PVOE �%/"�QVSJGJDBUJPO �1$3�BOBMZTJT�
� ��� &BDI�TUFQ�JO�UIF�SFTFBSDI�QSPKFDU�JT�BEESFTTFE�JOEJWJEVBMMZ�BOE�UIPSPVHIMZ�XJUI�DPOUFYU�iXIZ�BOE�IPX�JU�XBT�EPOFw�BT�XFMM�BT�FWJEFODF�iQIPUPHSBQIT w�EBUB�TFUT �NBUIFNBUJDBM�BOBMZTJT�
� ��� &SSPS�BOBMZTJT�JT�TDJFOUJGJD�BOE�UIPVHIUGVM��DJUJOH�EJGGJDVMUJFT�GPVOE�CZ�PUIFS�SFTFBSDIFST�JO�QVCMJ-DBUJPOT �MJNJUBUJPOT�PS�QPTTJCJMJUJFT�UIBU�FYQMBJO�QSPCMFNT�JO�EBUB�DPMMFDUJPO��
Characteristics of a 0.0 Final Manuscript
� ��� 3FBET�MJLF�B�IJHI�TDIPPM�TUVEFOU�XSPUF�JU��5IF�BVUIPS�JT�DMFBSMZ�IBT�OPU�SFBE�BCPVU�UIF�UPQJDT�UIFZ�TUVEJFE�FWFO�NBUFSJBM�QSFTFOUFE�JO�UIF�DPVSTF�QBDL �BOE�EPFT�/05�VOEFSTUBOE�UIFJS�QSPKFDU�PS�DPNNVOJDBUF�XFMM�JO�B�DPNQPTJUJPO�
� ��� 3FGFSFODFT�TFDUJPO�DPOUBJOT�BOPOZNPVT�XFCTJUFT�BOE�DJUBUJPOT�BSF�OPU�DPNQMFUF�� ��� 'JHVSFT�MPPLT�JODPNQMFUF�XJUI�TIPSU�DPOGVTJOH�MFHFOET�� ��� *OUSPEVDUJPO�BOE�%JTDVTTJPO�TFDUJPOT�IBWF�WFSZ�GFX�DJUBUJPOT�BOE�BMM�TFDUJPOT�BSF�KVTU�MPOH�QBSB-
HSBQIT�XJUI�OP�UPQJD�TFOUFODFT�BOE�OP�TVC�IFBEJOHT�� ��� &BDI�TUFQ�JO�UIF�SFTFBSDI�QSPKFDU�JT�/05�BEESFTTFE�JOEJWJEVBMMZ�BOE�UIF�BVUIPS�TFFNT�POMZ�GP-
DVTFE�PO�RVJDLMZ�CFJOH�EPOF�� ��� &SSPS�BOBMZTJT�JT�USJWJBM�XIFSF�BMM�UIF�IVNBO�FSSPS�JUFNT�MJTUFE�DPVME�FBTJMZ�IBWF�CFFO�GJYFE�CZ�
VTJOH�DPOUSPMT�PS�EPJOH�SFQMJDBUJPOT�PS�FWFO�DPNJOH�UP�MBC�NPSF�UIBO�PODF�B�XFFL�BOE�QBZJOH�BUUFOUJPO��
1 1

1

(for) Presentations
1

!
1 4
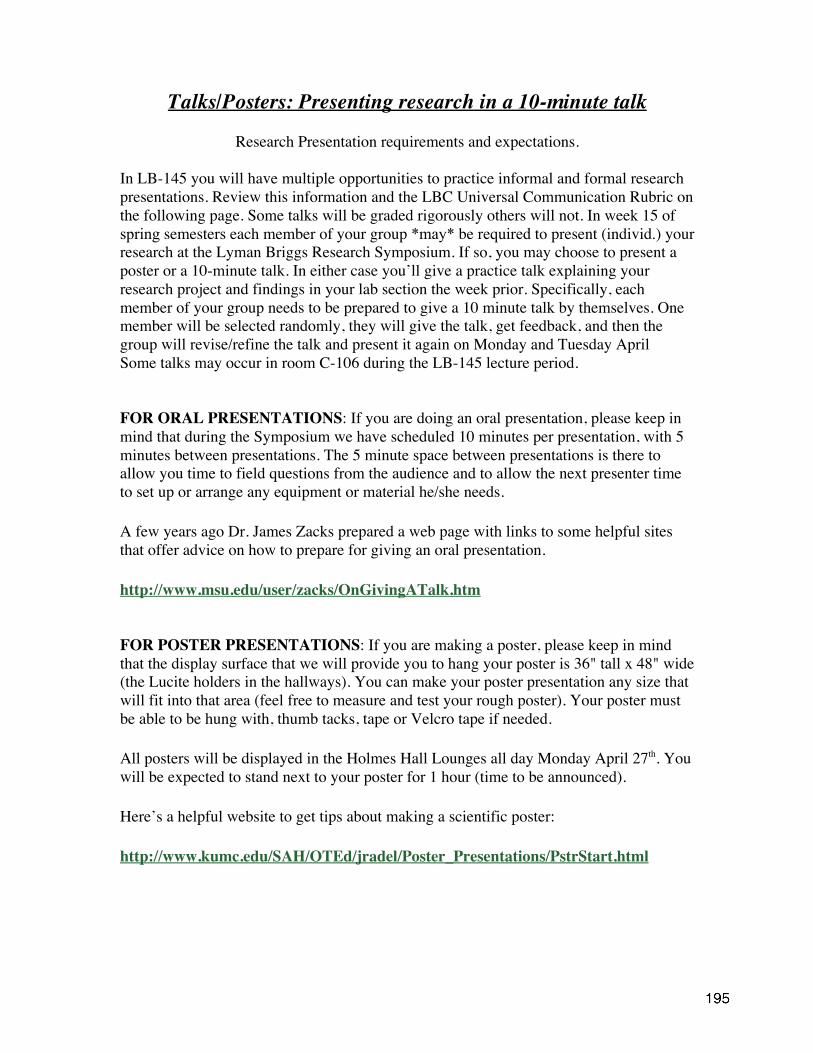
Talks/Posters: Presenting research in a 10-minute talk
Research Presentation requirements and expectations.
In LB-145 you will have multiple opportunities to practice informal and formal research
presentations. Review this information and the LBC Universal Communication Rubric on
the following page. Some talks will be graded rigorously others will not. In week 15 of
spring semesters each member of your group *may* be required to present (individ.) your
research at the Lyman Briggs Research Symposium. If so, you may choose to present a
poster or a 10-minute talk. In either case you’ll give a practice talk explaining your
research project and findings in your lab section the week prior. Specifically, each
member of your group needs to be prepared to give a 10 minute talk by themselves. One
member will be selected randomly, they will give the talk, get feedback, and then the
group will revise/refine the talk and present it again on Monday and Tuesday April
Some talks may occur in room C-106 during the LB-145 lecture period.
FOR ORAL PRESENTATIONS: If you are doing an oral presentation, please keep in
mind that during the Symposium we have scheduled 10 minutes per presentation, with 5
minutes between presentations. The 5 minute space between presentations is there to
allow you time to field questions from the audience and to allow the next presenter time
to set up or arrange any equipment or material he/she needs.
A few years ago Dr. James Zacks prepared a web page with links to some helpful sites
that offer advice on how to prepare for giving an oral presentation.
http://www.msu.edu/user/zacks/OnGivingATalk.htm
FOR POSTER PRESENTATIONS: If you are making a poster, please keep in mind
that the display surface that we will provide you to hang your poster is 36" tall x 48" wide
(the Lucite holders in the hallways). You can make your poster presentation any size that
will fit into that area (feel free to measure and test your rough poster). Your poster must
be able to be hung with, thumb tacks, tape or Velcro tape if needed.
All posters will be displayed in the Holmes Hall Lounges all day Monday April 27th. You
will be expected to stand next to your poster for 1 hour (time to be announced).
Here’s a helpful website to get tips about making a scientific poster:
http://www.kumc.edu/SAH/OTEd/jradel/Poster_Presentations/PstrStart.html
luckie
195

!
1
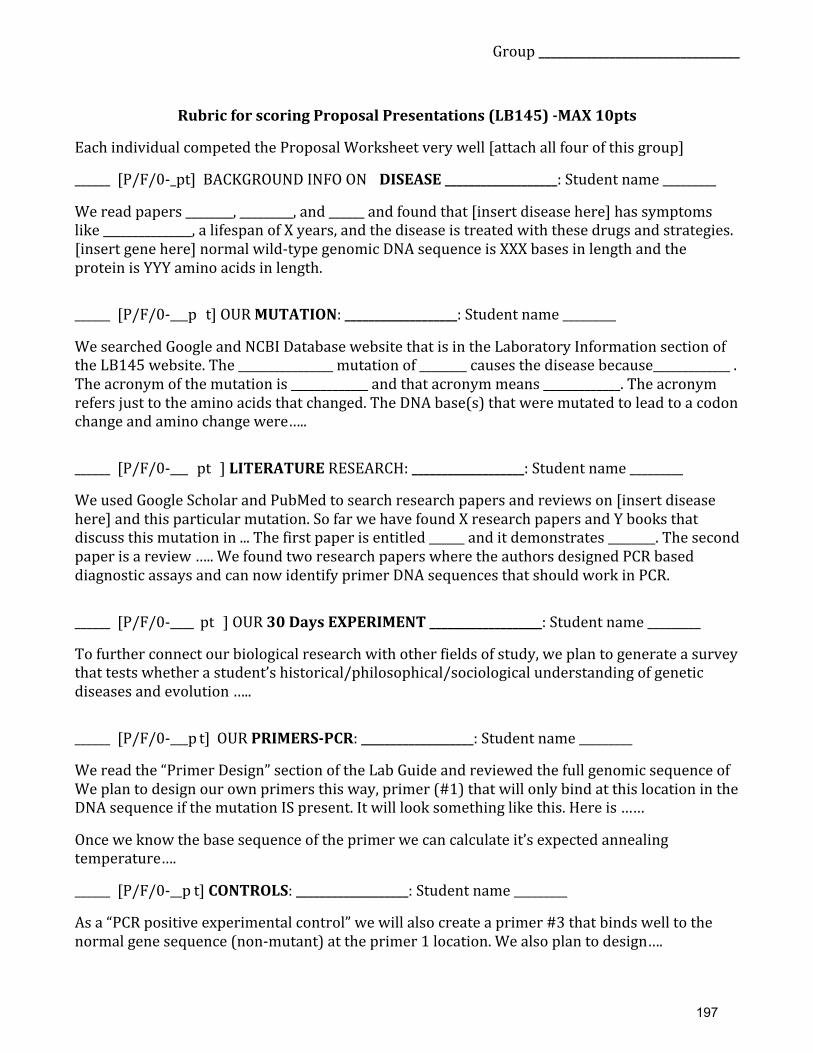
Group!__________________________________!
!
Rubric!for!scoring!Proposal!Presentations!(LB145)!;MAX!10pts!
Each*individual*competed*the*Proposal*Worksheet*very*well*[attach*all*four*of*this*group]*
______**[P/F/0A pt]**BACKGROUND*INFO*ON* DISEASE!___________________:*Student*name*_________*
We*read*papers*________,*_________,*and*______*and*found*that*[insert*disease*here]*has*symptoms*like*_______________,*a*lifespan*of*X*years,*and*the*disease*is*treated*with*these*drugs*and*strategies.*[insert*gene*here]*normal*wildAtype*genomic*DNA*sequence*is*XXX*bases*in*length*and*the*protein*is*YYY*amino*acids*in*length.***
______**[P/F/0A p t]*OUR*MUTATION:*___________________:*Student*name*_________*
We*searched*Google*and*NCBI*Database*website*that*is*in*the*Laboratory*Information*section*of*the*LB145*website.*The*________________*mutation*of*________*causes*the*disease*because_____________*.*The*acronym*of*the*mutation*is*_____________*and*that*acronym*means*_____________.*The*acronym*refers*just*to*the*amino*acids*that*changed.*The*DNA*base(s)*that*were*mutated*to*lead*to*a*codon*change*and*amino*change*were…..**
______**[P/F/0A ]*LITERATURE*RESEARCH:!___________________:*Student*name*_________*
We*used*Google*Scholar*and*PubMed*to*search*research*papers*and*reviews*on*[insert*disease*here]*and*this*particular*mutation.*So*far*we*have*found*X*research*papers*and*Y*books*that*discuss*this*mutation*in*...*The*first*paper*is*entitled*______*and*it*demonstrates*________.*The*second*paper*is*a*review*…..*We*found*two*research*papers*where*the*authors*designed*PCR*based*diagnostic*assays*and*can*now*identify*primer*DNA*sequences*that*should*work*in*PCR.**
______**[P/F/0A t ]*OUR*30!Days!EXPERIMENT*___________________:*Student*name*_________*
To*further*connect*our*biological*research*with*other*fields*of*study,*we*plan*to*generate*a*survey*that*tests*whether*a*student’s*historical/philosophical/sociological*understanding*of*genetic*diseases*and*evolution*…..**
______**[P/F/0 p t]* OUR*PRIMERS;PCR:*___________________:*Student*name*_________*
We*read*the*“Primer*Design”*section*of*the*Lab*Guide*and*reviewed*the*full*genomic*sequence*of*We*plan*to*design*our*own*primers*this*way,*primer*(#1)*that*will*only*bind*at*this*location*in*the*DNA*sequence*if*the*mutation*IS*present.*It*will*look*something*like*this.*Here*is*……*
Once*we*know*the*base*sequence*of*the*primer*we*can*calculate*it’s*expected*annealing*temperature….*
______**[P/F/0A p t]*CONTROLS:*___________________:*Student*name*_________*
As*a*“PCR*positive*experimental*control”*we*will*also*create*a*primer*#3*that*binds*well*to*the*normal*gene*sequence*(nonAmutant)*at*the*primer*1*location.*We*also*plan*to*design….*
*
1

!
1
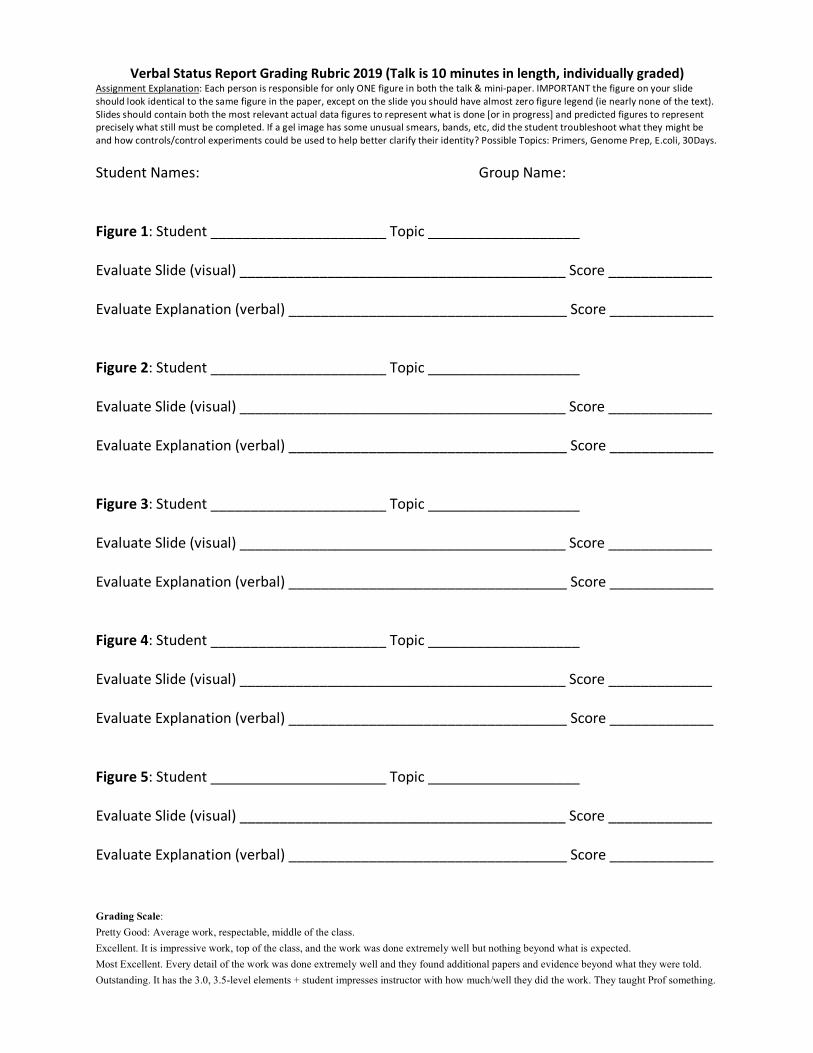
Grading Scale: Pretty Good: Average work, respectable, middle of the class. Excellent. It is impressive work, top of the class, and the work was done extremely well but nothing beyond what is expected. Most Excellent. Every detail of the work was done extremely well and they found additional papers and evidence beyond what they were told. Outstanding. It has the 3.0, 3.5-level elements + student impresses instructor with how much/well they did the work. They taught Prof something.
Verbal Status Report Grading Rubric 2019 (Talk is 10 minutes in length, individually graded) Assignment Explanation: Each person is responsible for only ONE figure in both the talk & mini-paper. IMPORTANT the figure on your slide should look identical to the same figure in the paper, except on the slide you should have almost zero figure legend (ie nearly none of the text). Slides should contain both the most relevant actual data figures to represent what is done [or in progress] and predicted figures to represent precisely what still must be completed. If a gel image has some unusual smears, bands, etc, did the student troubleshoot what they might be and how controls/control experiments could be used to help better clarify their identity? Possible Topics: Primers, Genome Prep, E.coli, 30Days.
Student Names: Group Name: Figure 1: Student ______________________ Topic ___________________ Evaluate Slide (visual) _________________________________________ Score _____________ Evaluate Explanation (verbal) ___________________________________ Score _____________ Figure 2: Student ______________________ Topic ___________________ Evaluate Slide (visual) _________________________________________ Score _____________ Evaluate Explanation (verbal) ___________________________________ Score _____________ Figure 3: Student ______________________ Topic ___________________ Evaluate Slide (visual) _________________________________________ Score _____________ Evaluate Explanation (verbal) ___________________________________ Score _____________ Figure 4: Student ______________________ Topic ___________________ Evaluate Slide (visual) _________________________________________ Score _____________ Evaluate Explanation (verbal) ___________________________________ Score _____________ Figure 5: Student ______________________ Topic ___________________ Evaluate Slide (visual) _________________________________________ Score _____________ Evaluate Explanation (verbal) ___________________________________ Score _____________

200

Progress'Report'!
Group!Name:!___________________!! ! ! Lab!Section:!___________________!
!Fill!out!with!Group!
Progress!Fill!in:!Complete'''Incomplete'''Haven’t'Started'''Paper'
'Section'
'Progress'
If'not'complete,''Who'is'working'on'it?'
Title! ! !
Abstract! ! !
Introduction! ! !
Methods! ! !
Results! ! !
Discussion! ! !
References! ! !
Figures!and!Tables! ! !
!
!
!Lab'
'Phase'1'
'Progress'
If'not'complete,'Who'is'working'on'it?'
E.!coli/λ!gel! ! !
+!Analysis! ! !
Genome!Prep!gel! ! !
+!Analysis! ! !
Published!Primers! ! !
+!Analysis! ! !
'Phase'2'
'Progress'
If'not'complete,'Who'is'working'on'it?'
Customized!Primers! ! !
+!Analysis! ! !
Mt!DNA?! ! !
'Phase'3'
'Progress'
If'not'complete,'Who'is'working'on'it?'
30Nday!Experiment! ! !
+Analysis! ! !
Movie! ! !
Website! ! !
!
2 1

!
2

Final&Talk:&15,minutes&(Introduction,&8&figures,&future&directions&and&film).&Group Name is _________________ Lab Section Name is ______________
Introduction slide(s): Shared responsibility, Score (out of 5 pts) _______________ Does it have: ___good purpose ___good hypothesis ___experimental design ___significance in science
Primary Investigator is responsible for presenting and explaining two figure/table slides Student’s Name _______________ Score (out of 10 pts) _______________ Figure/Table 1: ___did its appearance and its presentation address research question ___ have a professional nature
__ deserve Bonus points for being super-spectacular? Figure/Table 2: ___did its appearance and its presentation address research question ___ have a professional nature
__ deserve Bonus points for being super-spectacular? ___ did the student carefully review each figure, its methods, findings and meaning/interpretations
___ did they discuss how controls/control experiments were used to clarify findings
&Laboratory Technician is responsible for presenting and explaining two figure/table slides Student’s Name _______________ Score (out of 10 pts) _______________ Figure/Table 3: ___did its appearance and its presentation address research question ___ have a professional nature
__ deserve Bonus points for being super-spectacular? Figure/Table 4: ___did its appearance and its presentation address research question ___ have a professional nature
__ deserve Bonus points for being super-spectacular? ___ did the student carefully review each figure, its methods, findings and meaning/interpretations
___ did they discuss how controls/control experiments were used to clarify findings
Data Recorder is responsible for presenting and explaining two figure/table slides Student’s Name _______________ Score (out of 10 pts) _______________ Figure/Table 5: ___did its appearance and its presentation address research question ___ have a professional nature
__ deserve Bonus points for being super-spectacular? Figure/Table 6: ___did its appearance and its presentation address research question ___ have a professional nature
__ deserve Bonus points for being super-spectacular? ___ did the student carefully review each figure, its methods, findings and meaning/interpretations
___ did they discuss how controls/control experiments were used to clarify findings
Protocol Expert is responsible for presenting and explaining two figure/table slides Student’s Name _______________ Score (out of 10 pts) _______________ Figure/Table 7: ___did its appearance and its presentation address research question ___ have a professional nature
__ deserve Bonus points for being super-spectacular? Figure/Table 8: ___did its appearance and its presentation address research question ___ have a professional nature
__ deserve Bonus points for being super-spectacular? ___ did the student carefully review each figure, its methods, findings and meaning/interpretations
___ did they discuss how controls/control experiments were used to clarify findings
&Conclusion slides: Shared responsibility, Score (out of 5 pts) _______________ Does it have: ___good findings ___good future directions ___good film 2

!
2 4
Appendix
2

!
2

Handouts
2

!
2

!"#$#%#&#'!($)*$+$,))-$"./)!"#(0($$
$
!12$+3245678$"24597:2$-5695;874<$=2>582?$1<@;912?5?$7?$A!"#$%#!#&'$"$()*!%!#&+%",+-"
!%"+./$-'!#&+%0")1$%+2$%+%0"+-"/3&$%#&,&3")-+.*$2"#1!#"3!%".$"#$/#$4".5",6-#1$-"
&%'$/#&7!#&+%BC A hypothesis is a possible answer to a question, from which predictions
can be made and tested. There can be multiple hypotheses used to answer a single
question and for each hypothesis, multiple predictions can usually be made.
The foundation for high quality, biological research is a good hypothesis. A good
hypothesis is more than just an educated guess.
THE HYPOTHESIS SCORE CARD…
A good hypothesis must:
1.) explain how or why: provide a mechanism
2.) be compatible with and based upon the existing body of
evidence.
3.) link an effect to a variable.
4.) state the expected effect.
5.) be testable.
6.) have at least two outcomes.
7.) have the potential to be refuted.
Hypotheses can be scored based on these elements. When considering a hypothesis, give
one point for each of the elements. An accomplished hypothesis will have a score of 7.
An incomplete or developing hypothesis will have a score of 5-6. A score below 5 is an
attempted hypothesis or not a hypothesis. You should use this scoring procedure when
developing your own hypotheses or when evaluating hypotheses of others.
$
$
2

!
21
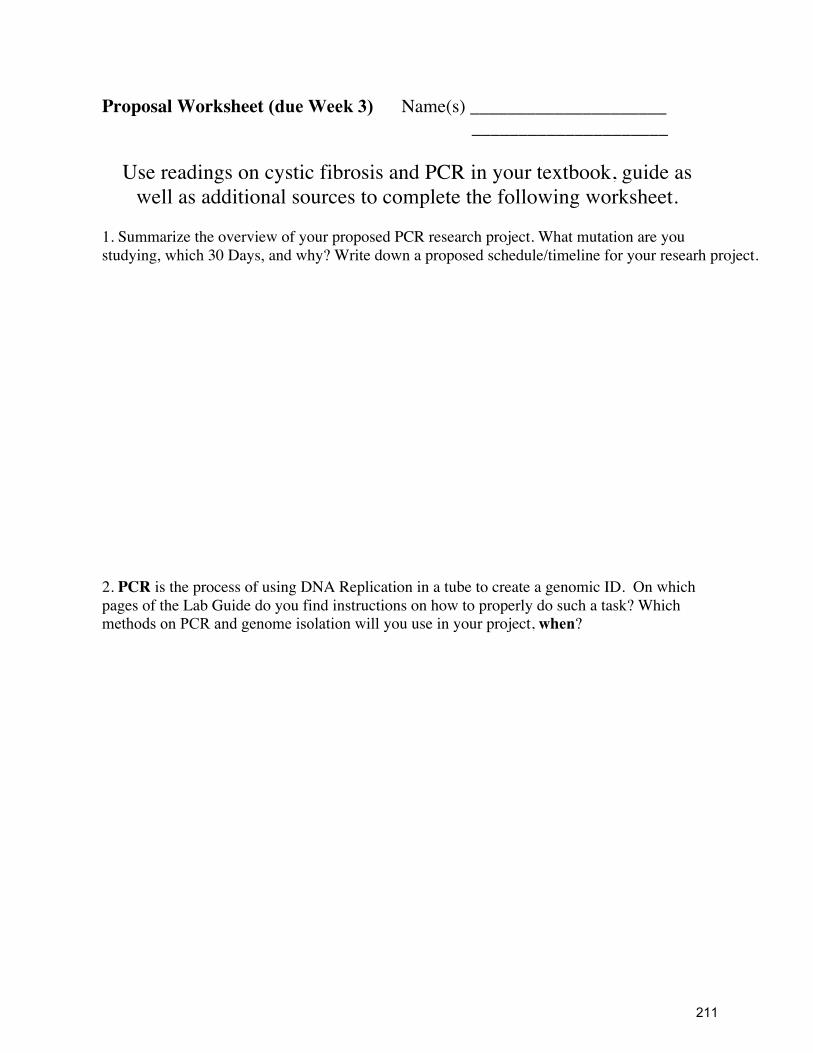
Proposal Worksheet (due Week ) Name(s) _____________________
_____________________
Use readings on cystic fibrosis and PCR in your textbook, guide as
well as additional sources to complete the following worksheet.
1. Summarize the overview of your proposed PCR research project. What mutation are you
studying, which 30 Days, and why? Write down a proposed schedule/timeline for your researh project.
2. PCR is the process of using DNA Replication in a tube to create a genomic ID. On which
pages of the Lab Guide do you find instructions on how to properly do such a task? Which
methods on PCR and genome isolation will you use in your project, when?
211

3. To do PCR which materials will you need, and why? How will you design/choose your
particular primers?
4. What resources beyond the Laboratory Guide will be helpful in completing your research
project (list ALL relevant items you need to search for: papers, supplies, experts)? Costs $?
21

Group Interview (due Week 3)
%VSJOH�UIF�MBC�QFSJPE �ZPVS�HSPVQ�XJMM�QBSUJDJQBUF�JO�BO�JOUFSWJFX�XJUI�BO�-"�5"���5IF�QVSQPTF�PG�UIF�JOUFSWJFX�JT�UP�EFUFSNJOF�JG�ZPV�IBWF�B�XFMM�QSFQBSFE�SFTFBSDI�QMBO.��#FMPX�JT�B�MJTU�PG�TBNQMF�RVFTUJPOT�ZPVS�HSPVQ�TIPVME�CF�QSFQBSFE�UP�BOTXFS�EVSJOH�UIF�JOUFSWJFX���&BDI�NFNCFS�PG�UIF�HSPVQ�XJMM�CF�BTLFE�RVFTUJPOT�BCPVU�ZPVS�QMBO �BMM�NFNCFST�NVTU�CF�QSFQBSFE�
4UVEFOU�/BNFT�
(SPVQ�/BNF�
-BC�"TTJHONFOU�
*OUFSWJFXFS�
8IBU�JT�UIF�PWFSBMM�QVSQPTF�PG�-BCs�1, 2, and DIY� BOE�FBDI�QSPUPDPM ��8IBU�UZQFT�PG�QSPUPDPMT�XJMM�you be perGPSNFE�EVSJOH�UIFTF�MBCT �8IBU�OFX�POFT ���QPJOUT
���5IF�JOUFSWJFX�NBZ�TUPQ�IFSF�JG�UIF�HSPVQ�JT�DMFBSMZ�OPU�QSFQBSFE���
8IBU�JT�UIF�IZQPUIFTJT�PS�RVFTUJPO�CFJOH�BEESFTTFE�CZ�UIF�SFTFBSDI ����QPJOUT
8IBU�EPFT�UIF�HSPVQ�QSFEJDU�UIF�PVUDPNF�XJMM�CF�BOE�XIZ ����QPJOUT
"SF�UIF�FYQFSJNFOUT�XFMM�QMBOOFE ��%P�UIFZ�BEESFTT�UIF�IZQPUIFTJT�PS�SFTFBSDI�RVFTUJPO�JO�BO�BQQSP-QSJBUF�NBOOFS ����QPJOUT�
8IBU�UZQFT�PG�DPOUSPMT�XJMM�CF�VTFE�JO�UIF�FYQFSJNFOUT ����QPJOUT
21
luckie
4
luckie
30 Days

214

TURN IN TWO COPIES (One with your name, one without) NAME _________________________
PEER REVIEW of DRAFT 2 (10 points)
Due at the start of your assigned Lab in week 7
TITLE OF PAPER-> _______________________________________________________
_______________________________________________________________________
‘GROUP NAME’ OF AUTHORS ->____________________________________________
Your peer review will be graded on both the quantity and quality of comments you write
on this worksheet. This worksheet should take approximately one hour to complete.
Evaluate the paper’s TITLE: (1pt)
A. How many characters does the paper have in its title?
B. What are the names of the specimens they are investigating?
C. Based only on the words in the paper’s title, explain in 3 sentences what their research project is doing
(methods) studying (specimen) and has found.
21
luckie
PID
luckie
8

Evaluate the paper’s ABSTRACT: (1pt)
A. How many words does the paper have in its abstract? What is the word limit?
B. In three sentences, state what the authors did and what they found.
C. In your own words, explain what hypotheses these scientists are testing in their research? Does their data
support it or refute it. Why? Or Why Not?
21

Evaluate the paper’s INTRODUCTION: (2pts)
A. Are you interested in learning more about this topic after reading the Introduction section?
B. Does the introduction discuss anyone else’s research on this topic or other reference information from a
book or paper etc? How many different citations are used?
C. What is their hypothesis, what question(s) are they investigating?
D. Identify the topic and purpose of the first 4 paragraphs in the Introduction. What topic of material are they
discussing in each paragraph and why is it useful to the research project they plan to explain?
Paragraph 1: Topic?
Purpose?
Paragraph 2: Topic?
Purpose?
Paragraph 3: Topic?
Purpose?
Paragraph 4: Topic?
Purpose?
21

Evaluate the paper’s FIGURES/TABLES: (2pt)
A. Do all the figures and tables make sense and appear professional and are actually USED (ie cited) in the
Results or other sections of the paper?
Look at the first 4 figures separately and decide, if you were a student in LB-144 and ONLY read this figure
and it’s legend and NO other part of the manuscript, could you explain it to your mom? If not indicate why
and list suggestions for improvement.
Evaluate Figure 1: If you ONLY read this figure and it’s legend “Can you explain it to Mom”?
Suggestions for improvement:
Evaluate Figure 2: If you ONLY read this figure and it’s legend “Can you explain it to Mom”?
Suggestions for improvement:
Evaluate Figure 3: If you ONLY read this figure and it’s legend “Can you explain it to Mom”?
Suggestions for improvement:
Evaluate Figure 4: If you ONLY read this figure and it’s legend “Can you explain it to Mom”?
Suggestions for improvement:
21

Evaluate the paper’s DISCUSSION: (4pts) Answer these questions using the paper’s Discussion section as your ONLY source of information.
__ 1. What is the paper’s TOPIC;
__ 2. What is the paper’s clear, and preferably original, specific POINT (also known as a THESIS);
__ 3. What is the paper’s adequate SUPPORT (REASONING and EVIDENCE) for that point;
__ 4. How the paper’s discussion is ORGANIZED so that the audience can follow the points and examples;
__ 5. Two examples of where the paper employs CLEAR, PRECISE LANGUAGE;
__ 6. Two examples of where the paper is factually ACCURATE and also FAIR, including recognizing
reasonable objections;
__ 7. Two examples of where the paper is presented in a way that is ENGAGING to the audience;
__ 8. Evidence that the paper is of a REASONABLE SIZE for the circumstances (not too short or too long);
__ 9. One example of where the paper clearly CREDITS OTHERS when their ideas and words are used.
__ 10. Two examples of where the paper indicates original PREDICTIONS and ultimate findings
21

2

LB-145 Interview Receipt
4UVEFOU�/BNFT�@@@@@@@@@@@@@@@@@@@@@@@@@@@@@@@@@
(SPVQ�/BNF�@@@@@@@@@@@�
-BC�"TTJHONFOU�@@@@@@@@@@@@@@@@@@@
*/5&37*&8�PG�4UVEFOU�1SFQBSBUJPO�BOE�1MBO
5IJT�HSPVQ�IBT�TVDDFTTGVMMZ�DPNQMFUFE�UIFJS�JOUFSWJFX�BOE�NZ�QSPDFFE�BOE�CFHJO�UIFJS�JOEFQFOEFOU�SFTFBSDI�
2 1

2

LB-145 Prof/GA Interview
4UVEFOU�/BNFT�@@@@@@@@@@@@@@@@@@@@@@@@@@@@@@@@@@@@@@@@@@@@@@@@@@@@@@
(SPVQ�/BNF�@@@@@@@@@@@@@@@@@@@@@@@��-BC�"TTJHONFOU�@@@@@@@@@@@@@@@@@@@
*/5&37*&8�PG�4UVEFOU�1SFQBSBUJPO�BOE�1MBO����QPJOUT
"TL�FBDI�NFNCFS�HFOFSBM�RVFTUJPOT�BCPVU�UIF�MBCPSBUPSJFT�BOE�QSPUPDPMT�JO�UIF�$PVSTF�1BDLFU�XSJUF�EPXO�SFTQPOTFT��5IFO�BTL�TPNFPOF��8IBU�UFTUT�BSF�EPOF�JO�FBDI�PG�ZPVS�MBCT �IPX�XIBU�JT�ZPVS�%P�*U�:PVSTFMG�-BC �DSFBUJWF �PSJHJOBM�BTTBZ���QPJOUT�FUD
���ZPV�NBZ�TUPQ�ZPVS�JOUFSWJFX�IFSF�JG�UIFZ�SF�DMFBSMZ�OPU�ZFU�QSFQBSFE���
8IBU�EP�UIFZ�QSPQPTF�BT�UIFJS�MPOH�UFSN�SFTFBSDI�RVFTUJPOT
______________________________________________________
"TL�RVFTUJPO�UP�EFUFSNJOF�UIFTF�JUFNT�
(SPVQ�DMFBSMZ�VOEFSTUBOET�UIF�RVFTUJPOT�UIFJS�SFTFBSDI�JT�BTLJOH�BOE�FYQMBJOFE�XIBU�UIFZ�UIJOL�XJMM�IBQQFO�IZQPUIFTJT�QSFEJDUJPOT���QPJOUT�
(SPVQ�IBT�HPPE�HFOFSBM�QMBOT�GPS�UIFJS�SFTFBSDI�EVSJOH�UIF�UISFF�JOEFQFOEFOU�SFTFBSDI�XFFLT�XIBU�BSF�ZPV�EPJOH�EVSJOH�XFFL�� �� �� ���QPJOUT
(SPVQ�JEFOUJGJFE�BQQSPQSJBUF�ADPOUSPM��FYQFSJNFOUT�BOE�SFQMJDBUJPOT�UIFZ�IBWF�QMBOOFE�UP�TIPX�UIF�SFBHFOUT�BOE�BTTBZT�GVODUJPOFE�QSPQFSMZ���QPJOUT�
(SPVQ�DMFBSMZ�VOEFSTUBOET�UIF�EJGGFSFOU�NFUIPET�UIFZ�QMBO�UP�VTF�FBDI�XFFL�JF�iPCRw �i1Si-mer design�and other "TTBZT�Genome Prep, Gelsw ��i%P�*U�:PVSTFMG�NFUIPETw���QPJOUT�
2

!
2 4
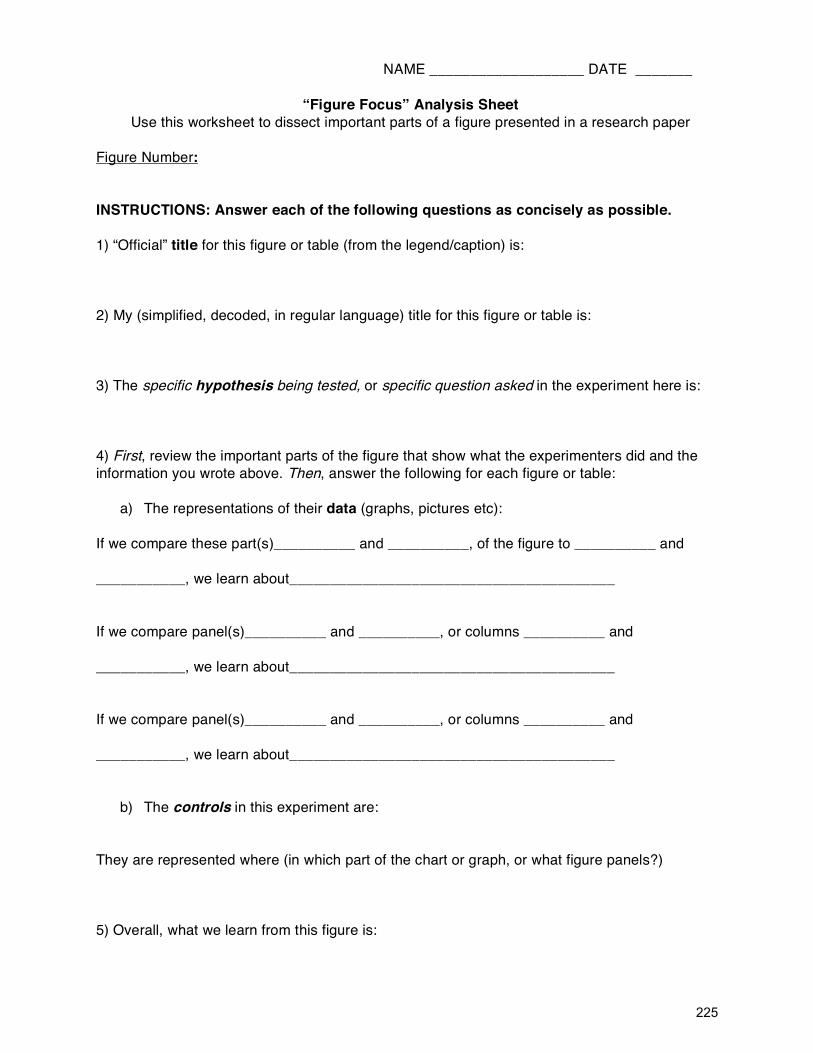
NAME ___________________ DATE _______
“Figure Focus” Analysis Sheet
Use this worksheet to dissect important parts of a figure presented in a research paper
Figure Number:
INSTRUCTIONS: Answer each of the following questions as concisely as possible.
1) “Official” title for this figure or table (from the legend/caption) is:
2) My (simplified, decoded, in regular language) title for this figure or table is:
3) The specific hypothesis being tested, or specific question asked in the experiment here is:
4) First, review the important parts of the figure that show what the experimenters did and the
information you wrote above. Then, answer the following for each figure or table:
a) The representations of their data (graphs, pictures etc):
If we compare these part(s)__________ and __________, of the figure to __________ and
___________, we learn about________________________________________
If we compare panel(s)__________ and __________, or columns __________ and
___________, we learn about________________________________________
If we compare panel(s)__________ and __________, or columns __________ and
___________, we learn about________________________________________
b) The controls in this experiment are:
They are represented where (in which part of the chart or graph, or what figure panels?)
5) Overall, what we learn from this figure is:
2

!
2

NAME ______________________________ DATE _______________
“Figure Focus” Analysis Sheet Use this worksheet to dissect important parts of a figure presented in a research paper
Figure Number: INSTRUCTIONS: Answer each of the following questions as concisely as possible. 1) “Official” title for this figure or table (from the legend/caption) is: 2) My (simplified, decoded, in regular language) title for this figure or table is: 3) The specific hypothesis being tested or specific question asked in the experiment here is: 4) First, review the important parts of the figure that show what experimenters did and the information
you wrote above. Then, answer the following for each figure or table:
a) The representations of their data (graphs, pictures, etc.):
If we compare these part(s) ______________ and _____________, of the figure to ____________ and
____________, we learn about __________________________________________________________
If we compare these panels ______________ and _____________, or columns ____________ and
____________, we learn about __________________________________________________________
If we compare these panels ______________ and _____________, or columns ____________ and
____________, we learn about __________________________________________________________
b) The controls in this experiment are:
They are represented where (in which part of the chart or graph, or what figure panels?)
5) Overall, what we learn from this figure is:
2

!
2
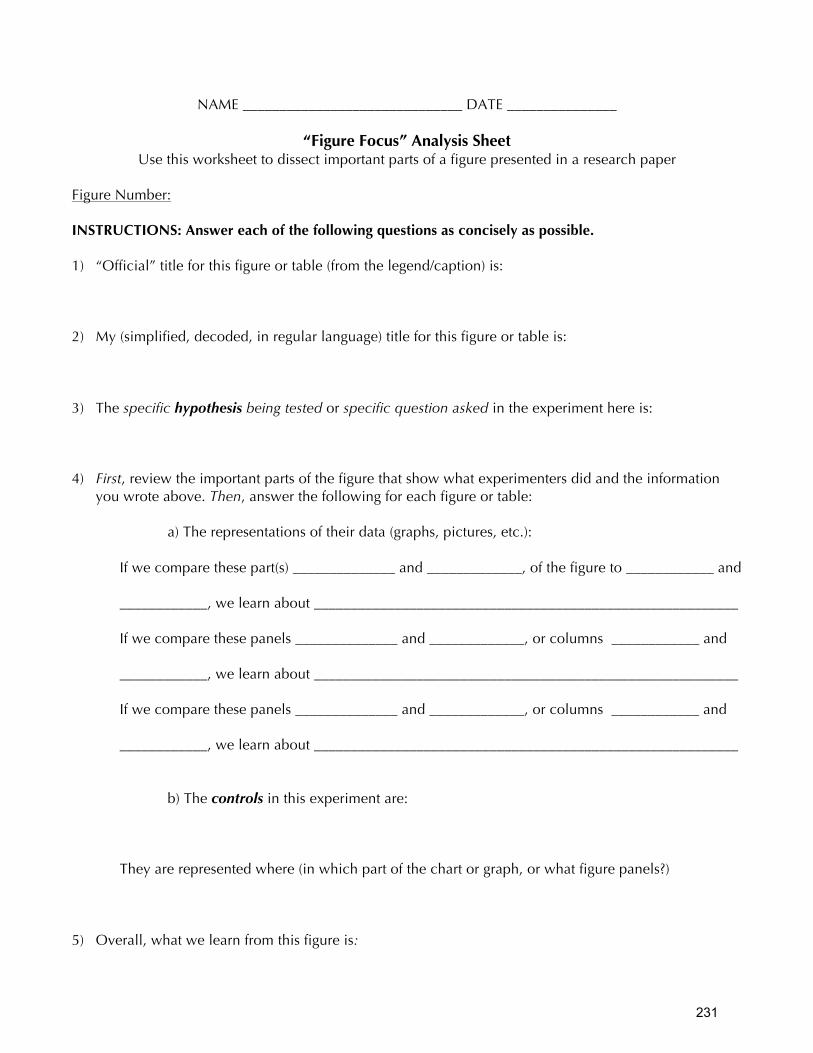
NAME ______________________________ DATE _______________
“Figure Focus” Analysis Sheet Use this worksheet to dissect important parts of a figure presented in a research paper
Figure Number: INSTRUCTIONS: Answer each of the following questions as concisely as possible. 1) “Official” title for this figure or table (from the legend/caption) is: 2) My (simplified, decoded, in regular language) title for this figure or table is: 3) The specific hypothesis being tested or specific question asked in the experiment here is: 4) First, review the important parts of the figure that show what experimenters did and the information
you wrote above. Then, answer the following for each figure or table:
a) The representations of their data (graphs, pictures, etc.):
If we compare these part(s) ______________ and _____________, of the figure to ____________ and
____________, we learn about __________________________________________________________
If we compare these panels ______________ and _____________, or columns ____________ and
____________, we learn about __________________________________________________________
If we compare these panels ______________ and _____________, or columns ____________ and
____________, we learn about __________________________________________________________
b) The controls in this experiment are:
They are represented where (in which part of the chart or graph, or what figure panels?)
5) Overall, what we learn from this figure is:
2 1

!
2

Performance Based Assessment Sheets
2

!
2 4
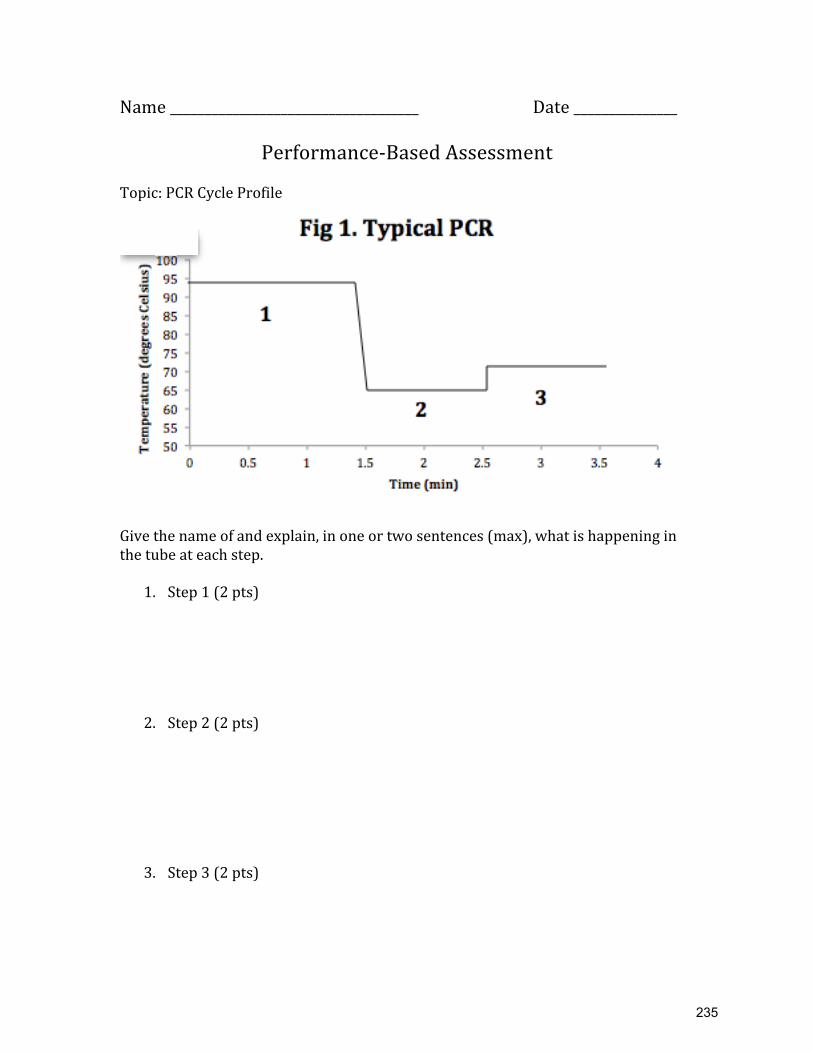
Name%____________________________________% %%%%%%%%%%%%%%%%%%%Date%_______________%%
Performance/Based%Assessment%%Topic:%PCR%Cycle%Profile%
%%Give%the%name%of%and%explain,%in%one%or%two%sentences%(max),%what%is%happening%in%the%tube%at%each%step.%%
1. Step%1%(2%pts)%%%%%%%%
2. Step%2%(2%pts)%%%%%%%%
3. Step%3%(2%pts)%%
2

!
2

Name%____________________________________% % % Date%_______________%%
Performance/Based%Assessment%%Topic:%Primer%Role%in%PCR%%Briefly%explain%what%role(s)%the%primers%play%in%the%PCR%reaction.%%%%%%%%%%%%%%%%%%%%%%%%%%%%%%%%%%%%%%%
2

!
2
Name%____________________________________% % % Date%_______________%%
Performance/Based%Assessment%%Topic:%PCR%Temperatures%%Why%can%an%enzymatic%PCR%reaction%still%function%given%the%extremely%high%temperatures%needed%to%carry%out%the%process?%%%%%%%%%%%%%%%%%%%%%%%%%%%%%%%%%%%%%%
2

!
24
Name%____________________________________% % % Date%_______________%%
Performance/Based%Assessment%%Topic:%PCR%Ingredients%%PCR%synthesizes%DNA%strands%using%taq,%a%DNA%polymerase.%What%ingredient%of%the%PCR%reaction%cocktail%is,%in%fact,%the%substrate%for$taq%enzyme?%%A.%Reaction%Buffer%%B.%The%primers%%C.%Deoxynucleotides%%D.%Magnesium%%E.%Taq%polymerase%doesn’t%need%a%substrate%%%%%%%%%%%%%%%%%%%%%%%%%%%%
241

!
24
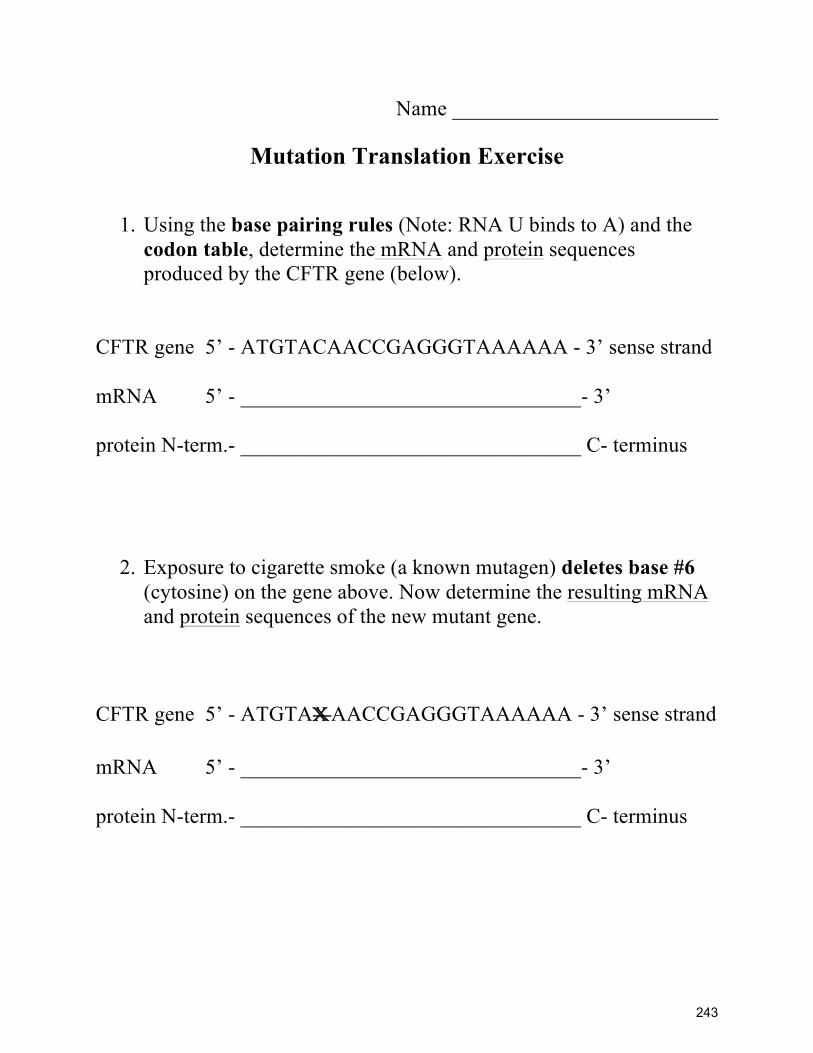
Name _________________________
Mutation Translation Exercise
1. Using the base pairing rules (Note: RNA U binds to A) and the codon table, determine the mRNA and protein sequences produced by the CFTR gene (below).
CFTR gene 5’ - ATGTACAACCGAGGGTAAAAAA - 3’ sense strand
mRNA 5’ - ________________________________- 3’
protein N-term.- ________________________________ C- terminus
2. Exposure to cigarette smoke (a known mutagen) deletes base #6 (cytosine) on the gene above. Now determine the resulting mRNA and protein sequences of the new mutant gene.
CFTR gene 5’ - ATGTAXAACCGAGGGTAAAAAA - 3’ sense strand
mRNA 5’ - ________________________________- 3’
protein N-term.- ________________________________ C- terminus
24

244

Product Literature Sheets
24

!
24
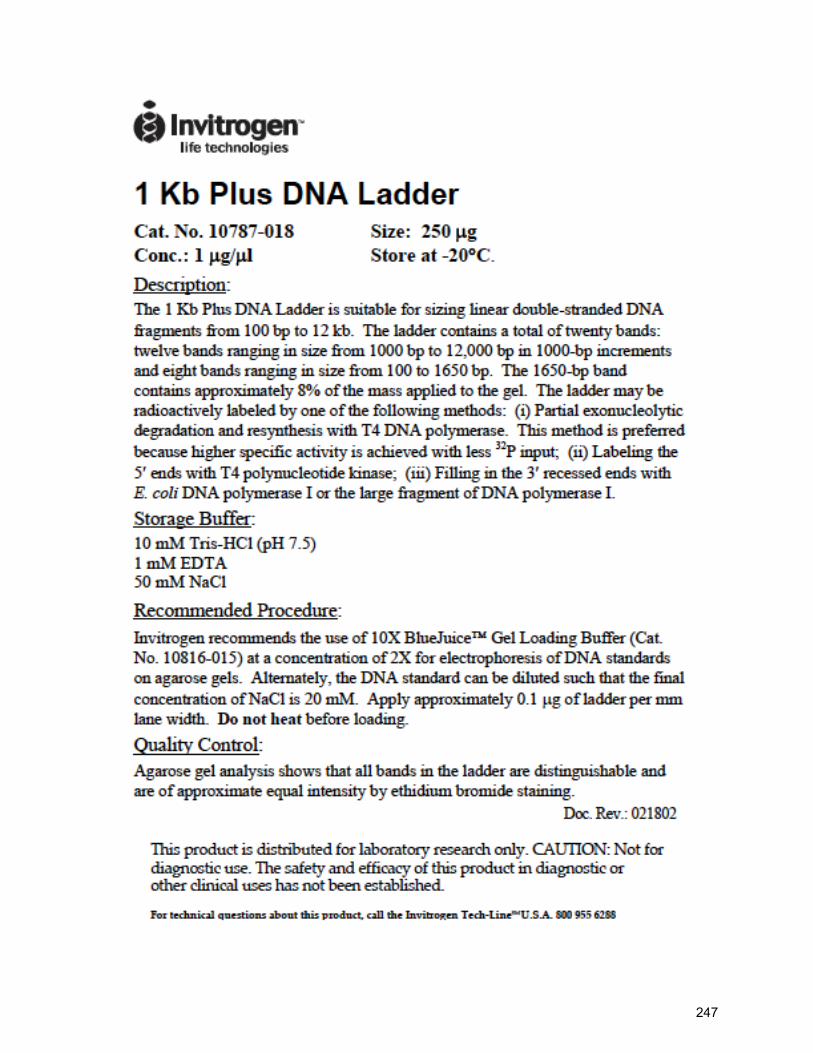
!!
24
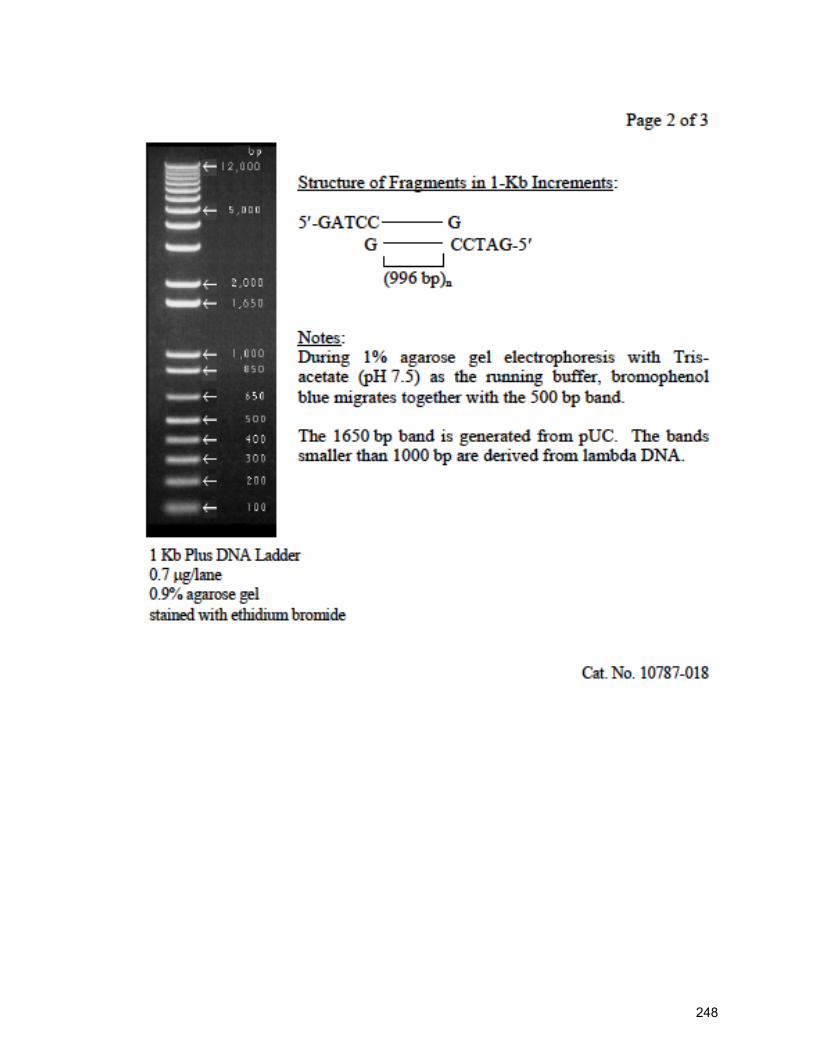
!!!!!!!!!!!!!!!
24

!!!!!!!!!!!!!!!!!!!!!!!!!!!!!!!!!!!!!!!!!!!!!!
24
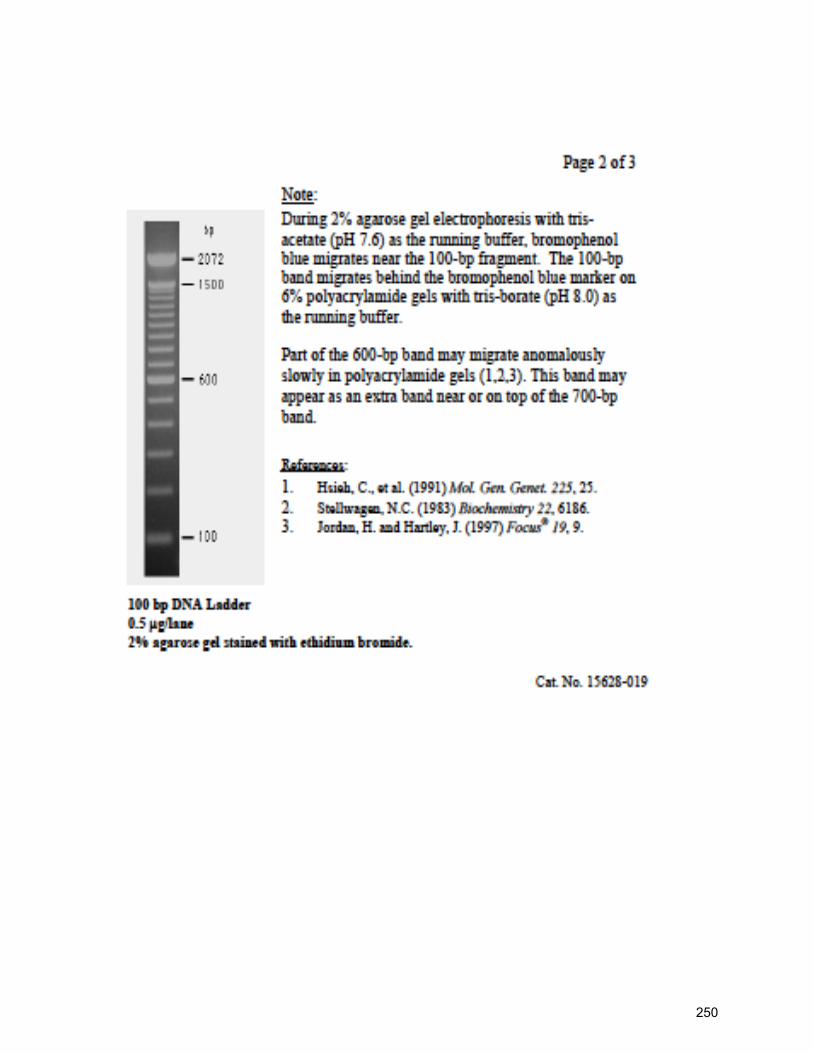
!
!!!!!!!!!!!!!
2
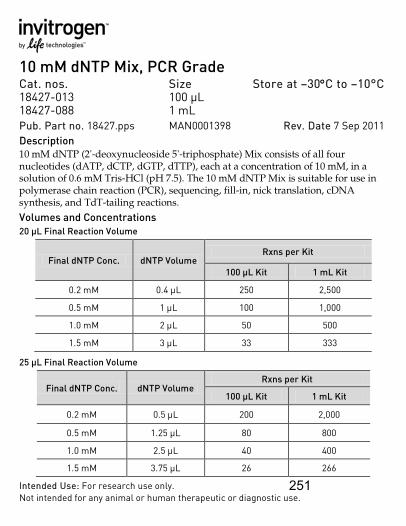
10 mM dNTP Mix, PCR Grade Cat. nos. Size Store at –30°C to −10°C 18427-013 100 µL 18427-088 1 mL Pub. Part no. 18427.pps MAN0001398 Rev. Date 7 Sep 2011 Description 10 mM dNTP (2'-deoxynucleoside 5'-triphosphate) Mix consists of all four nucleotides (dATP, dCTP, dGTP, dTTP), each at a concentration of 10 mM, in a solution of 0.6 mM Tris-HCl (pH 7.5). The 10 mM dNTP Mix is suitable for use in polymerase chain reaction (PCR), sequencing, fill-in, nick translation, cDNA synthesis, and TdT-tailing reactions. Volumes and Concentrations 20 µL Final Reaction Volume
Final dNTP Conc. dNTP Volume Rxns per Kit
100 µL Kit 1 mL Kit
0.2 mM 0.4 µL 250 2,500
0.5 mM 1 µL 100 1,000
1.0 mM 2 µL 50 500
1.5 mM 3 µL 33 333
25 µL Final Reaction Volume
Final dNTP Conc. dNTP Volume Rxns per Kit
100 µL Kit 1 mL Kit
0.2 mM 0.5 µL 200 2,000
0.5 mM 1.25 µL 80 800
1.0 mM 2.5 µL 40 400
1.5 mM 3.75 µL 26 266
Intended Use: For research use only. Not intended for any animal or human therapeutic or diagnostic use.
251

2 50 µL Final Reaction Volume
Final dNTP Conc. dNTP Volume Rxns per Kit 100 µL Kit 1 mL Kit
0.2 mM 1 µL 100 1,000 0.5 mM 2.5 µL 40 400 1.0 mM 5 µL 20 200 1.5 mM 7.5 µL 13 133
100 µL Final Reaction Volume
Final dNTP Conc. dNTP Volume Rxns per Kit
100 µL Kit 1 mL Kit 0.2 mM 2 µL 50 500 0.5 mM 5 µL 20 200 1.0 mM 10 µL 10 100 1.5 mM 15 µL 6 66
Additional Products Product Volume Catalog no. 2.5 mM dNTP Mix 1 mL R725-01 100 mM dNTP Set 4 × 250 µL 10297-018 100 mM dNTP Set 4 × 2.5 mL 10297-117
Reference Saiki, R.K., Gelfand, D.H., Stoffel, S., Scharf, S.J., Higuchi, R., Horn, G.T., Mullis, K.B., and Erlich, H.A. (1988) Science 239, 487. Certificate of Analysis The Certificate of Analysis (CofA) is available at www.invitrogen.com/cofa, and it is searchable by product lot number, which is printed on each box. Limited Use Label License No. 358: Research Use Only The purchase of this product conveys to the purchaser the limited, non-transferable right to use the purchased amount of the product only to perform internal research for the sole benefit of the purchaser. No right to resell this product or any of its components is conveyed expressly, by implication, or by estoppel. This product is for internal research purposes only and is not for use in commercial applications of any kind, including, without limitation, quality control and commercial services such as reporting the results of purchaser’s activities for a fee or other form of consideration. For information on obtaining additional rights, please contact [email protected] or Out Licensing, Life Technologies, 5791 Van Allen Way, Carlsbad, California 92008. ©2011 Life Technologies Corporation. All rights reserved. The trademarks mentioned herein are the property of Life Technologies Corporation or their respective owners. For support visit www.lifetechnologies.com/support or email [email protected] www.lifetechnologies.com 252

Taq DNA Polymerase, recombinant Cat. nos. Size Conc. 5 U/µL 10342-053 100 units Store at −30°C to −10°C 10342-020 500 units 10342-046 1,500 units 10342-178 5,000 units Pub. Part no. 10342.pps MAN0000814 Rev. Date 18 November 2011
Description Taq DNA Polymerase is purified from E. coli. expressing a cloned Thermus aquaticus DNA polymerase gene. This enzyme has a 5' 3' DNA polymerase and a 5' 3' exonuclease activity but lacks a 3' 5' exonuclease activity. The enzyme consists of a single polypeptide with a molecular weight of approximately 94 kDa. Taq DNA polymerase is heat-stable and synthesizes DNA at elevated temperatures from single-stranded templates in the presence of a primer.
Contents
Kit Size
Component 100 U 500 U 1,500 U 5,000 U
Taq DNA Polymerase 20 µL 100 µL 300 µL 1000 µL
10X PCR Buffer, Minus Mg++ 1.25 mL 2.5 mL 7.5 mL 20 mL
50 mM Magnesium Chloride 1 mL 1 mL 3 mL 10 mL
Storage Buffer 20 mM Tris-HCl (pH 8.0), 0.1 mM EDTA, 1 mM DTT, 50% (v/v) glycerol, stabilizers.
Product Use: For research use only. Not intended for any animal or human therapeutic or diagnostic use.
253

2
10X PCR Buffer 200 mM Tris-HCl (pH 8.4), 500 mM KCl.
The supplied PCR Buffer is a 10X concentrate and should be diluted for use.
Unit Definition One unit incorporates 10 nmol of deoxyribonucleotide into DNA in 30 minutes at 74°C.
Basic PCR Protocol The following basic protocol serves as a general guideline and a starting point for any PCR amplification. Optimal reaction conditions (incubation times and temperatures, concentration of Taq DNA Polymerase, primers, MgCl2, and template DNA) vary and need to be optimized.
Critical parameters and troubleshooting information are documented in Innis et al., 1988. Assemble PCR reactions in a DNA-free environment. We recommend the use of clean dedicated automatic pipettors and aerosol resistant barrier tips. Always keep the control DNA and other templates to be amplified isolated from the other components.
1. Add the following components to a sterile 0.5-ml microcentrifuge tube sitting on ice: Components Volume Final Concentration 10X PCR buffer minus Mg++ 10 µL 1X 10 mM dNTP mixture 2 µL 0.2 mM each 50 mM MgCl2 3 µL 1.5 mM Primer mix (10 µM each) 5 µL 0.5 µM each Template DNA 1–20 µL n/a Taq DNA Polymerase (5 U/µL) 0.2–0.5 µL 1.0–2.5 units Autoclaved distilled water to 100 µL n/a
We recommend preparing a master mix for multiple reactions, to minimize reagent loss and enable accurate pipetting.
2. Mix contents of tube and overlay with 50 µL of mineral or silicone oil. 3. Cap tubes and centrifuge briefly to collect the contents to the bottom.
Continued on the next page
254
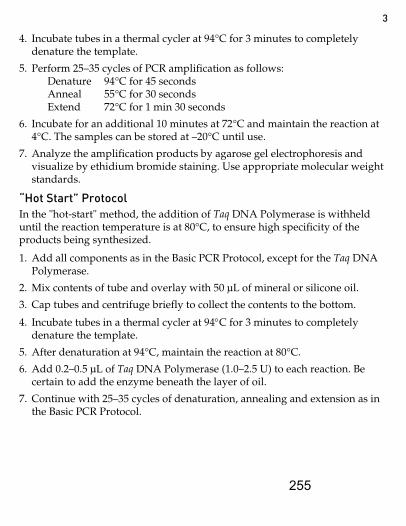
3
4. Incubate tubes in a thermal cycler at 94°C for 3 minutes to completely denature the template.
5. Perform 25–35 cycles of PCR amplification as follows: Denature 94°C for 45 seconds Anneal 55°C for 30 seconds Extend 72°C for 1 min 30 seconds 6. Incubate for an additional 10 minutes at 72°C and maintain the reaction at
4°C. The samples can be stored at –20°C until use.
7. Analyze the amplification products by agarose gel electrophoresis and visualize by ethidium bromide staining. Use appropriate molecular weight standards.
“Hot Start” Protocol In the "hot-start" method, the addition of Taq DNA Polymerase is withheld until the reaction temperature is at 80°C, to ensure high specificity of the products being synthesized.
1. Add all components as in the Basic PCR Protocol, except for the Taq DNA Polymerase.
2. Mix contents of tube and overlay with 50 µL of mineral or silicone oil. 3. Cap tubes and centrifuge briefly to collect the contents to the bottom.
4. Incubate tubes in a thermal cycler at 94°C for 3 minutes to completely denature the template.
5. After denaturation at 94°C, maintain the reaction at 80°C. 6. Add 0.2–0.5 µL of Taq DNA Polymerase (1.0–2.5 U) to each reaction. Be
certain to add the enzyme beneath the layer of oil.
7. Continue with 25–35 cycles of denaturation, annealing and extension as in the Basic PCR Protocol.
255
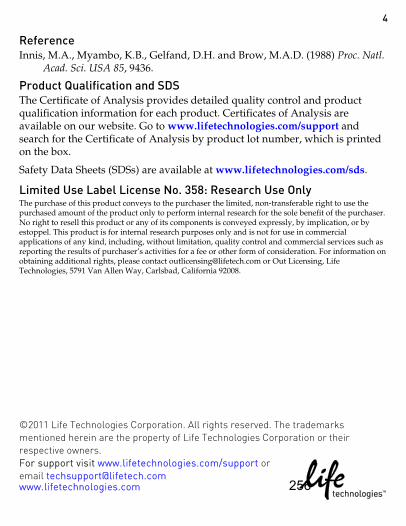
4
Reference Innis, M.A., Myambo, K.B., Gelfand, D.H. and Brow, M.A.D. (1988) Proc. Natl.
Acad. Sci. USA 85, 9436.
Product Qualification and SDS The Certificate of Analysis provides detailed quality control and product qualification information for each product. Certificates of Analysis are available on our website. Go to www.lifetechnologies.com/support and search for the Certificate of Analysis by product lot number, which is printed on the box.
Safety Data Sheets (SDSs) are available at www.lifetechnologies.com/sds.
Limited Use Label License No. 358: Research Use Only The purchase of this product conveys to the purchaser the limited, non-transferable right to use the purchased amount of the product only to perform internal research for the sole benefit of the purchaser. No right to resell this product or any of its components is conveyed expressly, by implication, or by estoppel. This product is for internal research purposes only and is not for use in commercial applications of any kind, including, without limitation, quality control and commercial services such as reporting the results of purchaser’s activities for a fee or other form of consideration. For information on obtaining additional rights, please contact [email protected] or Out Licensing, Life Technologies, 5791 Van Allen Way, Carlsbad, California 92008.
©2011 Life Technologies Corporation. All rights reserved. The trademarks mentioned herein are the property of Life Technologies Corporation or their respective owners. For support visit www.lifetechnologies.com/support or email [email protected] www.lifetechnologies.com 256

Research Publications
257

!
258

Cystic Fibrosis
259

!
260
August 2011, Scientifi cAmerican.com 69
A BREATH OF FRESH AIR
Fundamental understanding of basic biology has set the stage for new treatments for cystic fi brosis
By Steven M. Rowe, J. P. Clancy and Eric J. Sorscher
Eric J. Sorscher is a professor of medicine and a professor of physiology and biophysics at the University of Alabama at Birmingham.
Steven M. Rowe is an assistant professor of medicine, pediatric pulmonology, and physiology and biophysics at the University of Alabama at Birmingham.
Eric J. Sorscher
J. P. Clancy is a professor of pediatric pulmonary medicine at Cincinnati Children’s Hospital Center and the University of Cincinnati.
M E D I C I N E
Illustration by John Hendrix
sad0811Sors3p.indd 69 6/21/11 6:42 PM
261

70 Scientific American, August 2011
IN 1989 WHEN SCIENTISTS DISCOVERED THE DEFECTIVE GENE THAT CAUSES CYSTIC FIBROSIS, a serious hereditary disorder that primarily strikes children of European descent, it seemed as though a long-hoped-for cure might soon follow. After all, tests in many labo-ratories showed that providing normal copies of the gene should enable patients to make healthy copies of the protein specified by the gene. If successful, that feat would go a long way toward restoring health in the tens of thousands of people around the world who suf-fered from cystic fibrosis and typically died in their late 20s. (Half of all patients now live
to their late 30s or beyond.) The question was whether researchers would be able to reliably in-sert the correct gene into the proper tissues in patients’ bodies to rid them of the illness forever.
That task proved harder than anyone had believed. Al-though scientists successfully engineered viruses to ferry cop-ies of the correct gene into patients’ cells, the viruses did not do the job well. By the late 1990s additional unexpected complica-tions made it increasingly obvious that another approach to ad-dressing the fundamental problem in cystic fibrosis would need to be found.
Meanwhile cell biologists and their colleagues undertook the long, challenging task of determining exactly what the nor-mal protein looked like, how it functioned and how defects led to the symptoms of cystic fibrosis. These efforts included un-derstanding the protein’s three-dimensional shape in increas-ingly fine detail as well as the various ways the abnormal pro-tein failed in its cellular duties. Instead of creating normal pro-teins by replacing the broken gene with an effective one—as was gene therapy’s goal—this group of researchers focused on a different objective: finding a drug that allowed the deficient protein to work better. A fruitful search might give people with cystic fibrosis many additional years of a healthier life.
Today it looks as though the gradual but steady approach is paying off. Several new compounds are in the final stages of be-ing tested for use in the treatment of cystic fibrosis—and one of them looks particularly promising for certain patients. If suc-cessful, it would be the first medication that targets the under-
lying cause of the disease, as opposed to dealing with symp-toms. But that is not all. Preliminary studies indicate that these potential new treatments may also work against other, more common conditions, such as bronchitis, chronic sinusitis and pancreatitis, among others.
A Problem with SAlt THE STORY OF HOW these drugs were identified begins with a dogged search to understand the basic biology of cystic fibrosis. The disease has long been known to result generally from a fail-ure in the ability of certain body tissues to transport salt (sodi-um chloride) across the membranes that envelop cells. The cells in these tissues extrude the chloride part of the salt to help maintain the right balance between their fluid-filled interior and the watery exterior environment. As the chloride ions ac-cumulate on the outside of the cell, water molecules follow suit, diffusing across the membrane to the outside. When the cell is finished constructing these tiny chloride channels, it inserts them into the membrane, where each protein forms a passage-way that spans the cell border.
The gene that in 1989 was found to cause cystic fibrosis codes for one of these proteins, known as the cystic fibrosis transmembrane conductance regulator, or CFTR. The normal version of this molecule is made of a precise sequence of ap-
I N B R I E F
�Ăåï�`� �Uà¹å�å� is a serious hereditary m�å¹àmyà� ï�Dï� �¨¨å� `yàïD�´� ¹à�D´å� �´� ï�y�U¹mĂ�Ā�ï��D�åï�`§Ă�®ù`ùå�ï�Dï��´ïyà�yàyå�Ā�ï��ï�y�DU�¨�ïĂ�ï¹�m��yåï��¹¹m�¹à�UàyDï�yÎ�
=�y´�àyåyDà`�yàå�m�å`¹ÿyàym�ï�y��y´y� ï�Dï� Dùåyå� Ăåï�`��Uà¹å�å��´�Àµ~µj�D� ¹´���¹Èym��¹à� `ùày��´� ï�y� �¹à®� ¹�� �y´y�ï�yàDÈĂ�åyy®ym�ȹåå�U¨yÎ�
5�yày�Āyày�åyïUD`§åÎ�ùï�D� yĀ�D´m�m����yày´ï�DÈÈà¹D`���å�´¹Ā�ȹ�åym�ï¹�my¨�ÿyà�ï�y� �àåï� ®ym�`Dï�¹´å� ï�Dï� Dmmàyåå� ï�y��ù´mD®y´ïD¨� Dùåyå�¹��ï�y�m�å¹àmyàÎ
5�y��¹¹m�D´m��àù���m®�´�åïàDï�¹´�Ā�¨¨�Èà¹UDU¨Ă�Uy��´� ï¹�`¹´å�myà�Ā�yï�yà� ï¹�DÈÈà¹ÿy�D�màù��UDåym�¹´�ï��å� ¨Dïyåï�ày�åyDà`��ï��å�ĂyDàÎ
sad0811Sors3p.indd 70 6/21/11 6:42 PM
262

August 2011, ScientificAmerican.com 71Illustration by AXS Biomedical Animation Studio
proximately 1,500 amino acids folded intricately and gracefully into a series of three-dimensional loops and sheets that spiral or plunge to form a number of different subsections. The flow of water molecules elicited by the movement of chloride ions through the channel helps to move the mucus that coats the surfaces of the body’s airways, as well as the many ducts found in the intestines, pancreas and liver. The CFTR channel can also transport certain other ions, such as bicarbonate.
Here is where the trouble starts. Mutation of the gene re-sults in the body lacking a proper CFTR channel. As a result, people with cystic fibrosis produce a sticky mucus that is so
thick it interferes with many physiological processes. In the lungs, the gel-like mucus hampers the diffusion of oxygen into the air sacs and makes the simple act of breathing, as one of our young patients described it, like “trying to breathe with someone’s hands over your face.” Furthermore, the viscous buildup becomes an ideal breeding ground for serious infec-tions by harmful bacteria, often Pseudomonas aeruginosa. In the pancreas, the thick and immobile secretions prevent the passage of digestive enzymes through various ducts into the in-testines, interfering with proper digestion and, as a result, fre-quently causing people with cystic fibrosis to be underweight
Pathways to TroubleTo survive, cells constantly adjust their internal environment, such as by actively moving chloride ions out of the cell through a membrane-spanning protein called the CFTR channel. Mutations �³�î�x��x³x� ¸l�³���¸ß�î��ä� �D³³x§� D³�§xDl�î¸� āäî�`��U߸ä�äÍ�
Normal Chloride ChannelAs chloride ions accumulate on the outside of `y¨¨åj�ĀDïyà�®¹¨y`ù¨yå�m��ùåy��๮��´å�my�ï�y�cell across the membrane to the exterior. This �ù�m��ĂmàDïyå�ï�y�®ù`ùå�ï�Dï�UDï�yå�ï�y�åùà-faces of cells in the lungs, intestines and other organs. The mucus traps pollutants and bac-ïyà�D�å¹�ï�yĂ�`D´�Uy�åĀyÈï�¹ùï�¹��ï�y�U¹mĂÎ�
Abnormal Chloride Channel $ùïDï�¹´å��´�ï�y�`Ăåï�`��Uà¹å�å��y´y�`Dùåy��¨¨´yåå��´�åyÿyàD¨�ĀDĂåj�åù`��Då�UĂ�¨yDm�´��ï¹�production of CFTR channels that are perma-´y´ï¨Ă�U¨¹`§ym�ÊaËj�ïàù´`Dïym�Êb) or misfolded ÊcËÎ�5�y�àyåù¨ïi�D´�DU´¹à®D¨¨Ă�ï��`§�®ù`ùå�ï�Dï�ïàDÈå�UD`ïyà�D��´�ȨD`y�Ê�´`àyDå�´���´�y`-ï�¹´�à�å§Ë�D´m�U¨¹`§å�å®D¨¨yà�D�àĀDĂåj�Èàyÿy´ï-�´��´¹à®D¨�¹āĂ�y´Dï�¹´�¹��U¨¹¹mÎ�
Help Is on the Way An experimental drug called VX-770 may help ease the illness for some but not all patients. The compound opens the CFTR channel in those individuals whose chloride channel is blocked shut. Other agents are being developed to tackle the problems of truncated or misfolded CFTR proteins.
Misfolded CFTR
5��`§�®ù`ùå�Uù�¨mùÈ
Chloride ion
�ù´`ï�¹´�´��`�¨¹à�my�`�D´´y¨�Ê��52Ë
Thin mucus
VX-770
Truncated CFTR
A N AT O M Y O F G E N E D E F E C T
Water molecule
Blocked CFTRa
b
c
sad0811Sors3p.indd 71 6/21/11 6:42 PM
1 2633

72 Scientific American, August 2011
or undernourished. Meanwhile bile becomes trapped in the liv-er, so fats are not properly processed, and blockages in the in-testines lead to constipation and sometimes even a life-threat-ening shutdown of the entire gastrointestinal tract.
Before the advent of antibiotics to treat recurrent lung in-fections and the discovery of better nutritional therapy, most children with cystic fibrosis died in infancy. Over the past few decades advances in medical and supportive care have substan-tially prolonged the lives of individuals with the disease. Some of the treatments can seem rough to the uninitiated: parents or others are taught how to vibrate or pound their children’s chest to help move the thick secretions in the lungs and dislodge any mucus plugs. Several drugs have been developed that open the airways, suppress infection or help thin the airway secretions. Supplemental vitamins and enzymes aid the digestive process. It is as a result of these and other measures that half of all cys-tic fibrosis patients now live to 37 years of age or older. None of these treatments, however, addresses the underlying cause: the insufficient flow of chloride and other ions out of cells.
Three PaThways THE FIRST STEP in finding a drug that might restore at least some function to a deficient chloride channel was to better under-stand on a microscopic level the precise details of what goes wrong. Geneticists have tested DNA samples from cystic fibro-sis patients around the world and have so far discovered more than 1,600 different mutations in the CFTR gene that lead to serious illness. The deleterious effects on the resulting CFTR protein can be divided into several groups. In three of the best-studied categories, the channel never gets put in place in the cell membrane, or a truncated channel is synthesized (and the directions for making it are rapidly degraded), or a channel of
normal length is made but is unable to open or transport chlo-ride or other ions. A single drug developed to repair one of these problems might not be of much help for the other two. Therefore, it is likely that to help the entire population of cystic fibrosis patients, different drugs will need to be developed—each based on the genetic defect responsible for an individual’s condition.
A completely missing chloride channel at the cell surface stems from the most common genetic mutation, which results in the deletion of just one of the channel’s 1,500 amino acid building blocks. Because the missing amino acid is phenylala-nine (designated “F” in protein parlance) and is the 508th ami-no acid in the chain, the mutation is referred to as F508del.
The F508del mutation causes disease in a fashion that was at first surprising. Despite the mutation, the cell is able to build a chloride channel, amino acid by amino acid. The final prod-uct is equipped to transport chloride ions to a limited extent. But the cell’s own molecular quality-control apparatus pre-vents it from doing so. The cell has several hundred helper pro-teins and enzymes that ferry the nascent CFTR molecules around the cell, inspect the ways they are being folded and help to insert CFTRs in the cell membrane. Even seemingly minor defects in folding—such as the F508 omission—can be rapidly recognized, leading the cell to quickly destroy the mutant. As a result, the somewhat functional chloride channel never even makes it to the cell membrane.
Because F508del is the most common cause of cystic fibro-sis, numerous facilities around the world (including our own) are trying to locate the precise cellular checkpoints at which the F508del CFTR molecule fails to “make the grade” and is routed to the recycling bin. The goal is to aid in the discovery of compounds that will ease cystic fibrosis by helping the protein
fold correctly and avoiding its destruction without interfering with the ability of the cells to recognize and eliminate other aberrant amino acid chains.
Figuring out how to adjust the cell’s quality- control systems could offer benefits beyond treating cystic fibrosis. A number of chronic diseases—such as defects in cholesterol me-tabolism and some lung disorders (among them, alpha-1-antitrypsin deficiency)—occur because of protein misfolding. In at least cer-tain diseases, evidence is growing that the true culprit is not the altered function of the protein per se but rather the propensity of the quality-control mechanism to degrade the ab-normal molecule or deposit it in a tangled clump. It is conceivable that a number of slightly mis folded, mutant proteins would re-tain significant function if they were spared and allowed to do their intended jobs. Thera-pies that tackle the quality-control mecha-nism might therefore provide valuable insight into the biology and treatment of a wide range of diseases.
Mutations that result in abnormally fore-shortened CFTR channels account for about 10 percent of cystic fibrosis cases worldwide. One so
urce
: cys
tic
fibr
osi
s fo
unda
tio
n p
atie
nt
regi
stry
: an
nua
l da
ta r
epo
rt 2
009
Graphic by Jen Christiansen
Steady Progress 0x¸Ç§x�ÿ�î�� āäî�`��U߸ä�ä�Dßx�D§ßxDlā�§�þ�³��§¸³�xß�î�D³¦ä�î¸�³xÿ�lßø�ä� D³l�³xÿ�DÇÇ߸D`�xä�î¸�lx§�þxß�³�� DßxÍ�øî�D�x³îä�î�Dî�Dllßxää�î�x�ø³lxß��§ā�³��U�¸§¸��`D§� Døäx�ÿ¸ø§l�D§ä¸��x§Ç�îßxx³l¸øä§āÍ
S T E P B Y S T E P
1994 A drug called dornase alpha im-proves pulmonary function by breaking down thick mucus in the lungs
1997 Routine spraying of the antibiotic tobra mycin into the lungs helps to control infections
2002 The Cystic Fibrosis Foundation launches a quality-improvement pro-gram that standard-izes treatment of U.S. patients
2009 Mandatory screening of new-borns across the 7Î3Î��¹à�`Ăåï�`��Uà¹å�å� allows for earlier detection and treatment
sad0811Sors3p.indd 72 6/21/11 6:42 PM
264
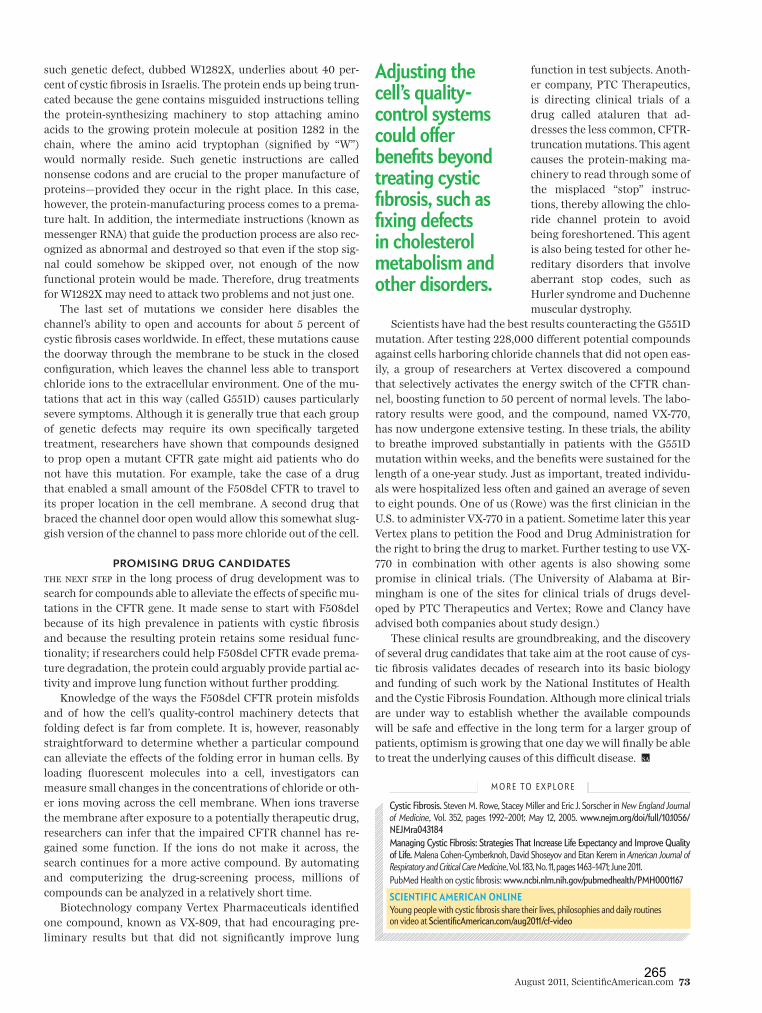
August 2011, ScientificAmerican.com 73
such genetic defect, dubbed W1282X, underlies about 40 per-cent of cystic fibrosis in Israelis. The protein ends up being trun-cated because the gene contains misguided instructions telling the protein-synthesizing machinery to stop attaching amino acids to the growing protein molecule at position 1282 in the chain, where the amino acid tryptophan (signified by “W”) would normally reside. Such genetic instructions are called nonsense codons and are crucial to the proper manufacture of proteins—provided they occur in the right place. In this case, however, the protein-manufacturing process comes to a prema-ture halt. In addition, the intermediate instructions (known as messenger RNA) that guide the production process are also rec-ognized as abnormal and destroyed so that even if the stop sig-nal could somehow be skipped over, not enough of the now functional protein would be made. Therefore, drug treatments for W1282X may need to attack two problems and not just one.
The last set of mutations we consider here disables the channel’s ability to open and accounts for about 5 percent of cystic fibrosis cases worldwide. In effect, these mutations cause the doorway through the membrane to be stuck in the closed configuration, which leaves the channel less able to transport chloride ions to the extracellular environment. One of the mu-tations that act in this way (called G551D) causes particular ly severe symptoms. Although it is generally true that each group of genetic defects may require its own specifically targeted treatment, researchers have shown that compounds designed to prop open a mutant CFTR gate might aid patients who do not have this mutation. For example, take the case of a drug that enabled a small amount of the F508del CFTR to travel to its proper location in the cell membrane. A second drug that braced the channel door open would allow this somewhat slug-gish version of the channel to pass more chloride out of the cell.
Promising Drug CanDiDatesTHE NEXT STEP in the long process of drug development was to search for compounds able to alleviate the effects of specific mu-tations in the CFTR gene. It made sense to start with F508del because of its high prevalence in patients with cystic fibrosis and because the resulting protein retains some residual func-tionality; if researchers could help F508del CFTR evade prema-ture degradation, the protein could arguably provide partial ac-tivity and improve lung function without further prodding.
Knowledge of the ways the F508del CFTR protein misfolds and of how the cell’s quality-control machinery detects that folding defect is far from complete. It is, however, reasonably straight forward to determine whether a particular compound can alleviate the effects of the folding error in human cells. By loading fluorescent molecules into a cell, investigators can measure small changes in the concentrations of chloride or oth-er ions moving across the cell membrane. When ions traverse the membrane after exposure to a potentially therapeutic drug, researchers can infer that the impaired CFTR channel has re-gained some function. If the ions do not make it across, the search continues for a more active compound. By automating and computerizing the drug-screening process, millions of compounds can be analyzed in a relatively short time.
Biotechnology company Vertex Pharmaceuticals identified one compound, known as VX-809, that had encouraging pre-liminary results but that did not significantly improve lung
function in test subjects. Anoth-er company, PTC Therapeutics, is directing clinical trials of a drug called ataluren that ad-dresses the less common, CFTR-truncation mutations. This agent causes the protein-making ma-chinery to read through some of the misplaced “stop” instruc-tions, thereby allowing the chlo-ride channel protein to avoid being foreshortened. This agent is also being tested for other he-reditary disorders that involve aberrant stop codes, such as Hurler syndrome and Du chenne muscular dystrophy.
Scientists have had the best results counteracting the G551D mutation. After testing 228,000 different potential compounds against cells harboring chloride channels that did not open eas-ily, a group of researchers at Vertex discovered a compound that selectively activates the energy switch of the CFTR chan-nel, boosting function to 50 percent of normal levels. The labo-ratory results were good, and the compound, named VX-770, has now undergone extensive testing. In these trials, the ability to breathe improved substantially in patients with the G551D mutation within weeks, and the benefits were sustained for the length of a one-year study. Just as important, treated individu-als were hospitalized less often and gained an average of seven to eight pounds. One of us (Rowe) was the first clinician in the U.S. to administer VX-770 in a patient. Sometime later this year Vertex plans to petition the Food and Drug Administration for the right to bring the drug to market. Further testing to use VX-770 in combination with other agents is also showing some promise in clinical trials. (The University of Alabama at Bir-mingham is one of the sites for clinical trials of drugs devel-oped by PTC Therapeutics and Vertex; Rowe and Clancy have advised both companies about study design.)
These clinical results are groundbreaking, and the discovery of several drug candidates that take aim at the root cause of cys-tic fibrosis validates decades of research into its basic biology and funding of such work by the National Institutes of Health and the Cystic Fibrosis Foundation. Although more clinical trials are under way to establish whether the available compounds will be safe and effective in the long term for a larger group of patients, optimism is growing that one day we will finally be able to treat the underlying causes of this difficult disease.
m o r e t o e x p l o r e
Cystic Fibrosis. Steven m. rowe, Stacey miller and eric J. Sorscher in New England Journal of Medicine, Vol. 352, pages 1992–2001; may 12, 2005. www.nejm.org/doi/full/10.1056/NEJMra043184 Managing Cystic Fibrosis: Strategies That Increase Life Expectancy and Improve Quality of Life. malena Cohen-Cymberknoh, David Shoseyov and eitan Kerem in American Journal of Respiratory and Critical Care Medicine, Vol. 183, No. 11, pages 1463–1471; June 2011. 0ùU$ym��yD¨ï��¹´�`Ăåï�`��Uà¹å�åi www.ncbi.nlm.nih.gov/pubmedhealth/PMH0001167
SCIENTIFIC AMERICAN ONLINE ?¹ù´��Èy¹È¨y�Ā�ï��`Ăåï�`��Uà¹å�å�å�Dày�ï�y�à�¨�ÿyåj�È��¨¹å¹È��yå�D´m�mD�¨Ă�à¹ùï�´yå� on video at 3`�y´ï��`�®yà�`D´Î`¹®ëDù�÷ĈÀÀë ��ÿ�my¹
Adjusting the cell’s quality-control systems `¹ù¨m�¹�yà�Uy´y�ïå�UyĂ¹´m�treating cystic �Uà¹å�åj�åù`��Då��ā�´��my�y`ïå� in cholesterol metabolism and other disorders.
sad0811Sors3p.indd 73 6/21/11 6:42 PM
265

!
266

Woe to that child which whenkissed on the forehead tastessalty. He is bewitched and soon
must die. This adage, from northernEuropean folklore, is an early referenceto the common genetic disease recog-nized today as cystic fibrosis. As thesaying implies, the disorder once rou-tinely killed children in infancy and isoften identifiable by excessive salt insweat. A salty brow is one of the morebenign manifestations. The inheritedgenetic abnormality can also destroy thelungs and cause serious impairment ofthe pancreas, intestines and liver. Ad-vances in therapy over the past few de-cades have brightened the outlook fora‹icted children, enabling more thanhalf of them to survive into their latetwenties or beyond. But none of the ap-proved treatments can yet correct thebiochemical abnormality at the root ofthe condition, and none can removethe specter of an early death.
Hoping to do better, investigators be-gan trying in the early 1980s to identifythe specific genetic derangement thatgives rise to cystic fibrosis. After almosta decade of struggle, they isolated thea›ected gene and pinpointed the muta-tion that most often leads to the dis-ease. At the time, they could only guessat the gene’s normal function—that is,at the role played by the protein pro-duced from the healthy DNA. Sincethen, in an exciting series of discoveries,researchers have learned that the pro-tein serves as a channel through whichchloride, one component of salt, entersand leaves cells. They also have ex-plained how damage to the gene blockschloride transport, and they are explor-ing how the loss of chloride movementbrings on the overt signs of cystic fi-brosis. As was hoped, such findings aresuggesting new ideas for therapy, someof which may one day cure the disorder.
The molecular advances that have ledto this promising moment in medicalhistory could not have been achievedwithout the pioneering e›orts of physi-cians, many of whom gleaned their ini-
tial understanding of cystic fibrosis atthe bedside. Indeed, for decades, clini-cal research yielded more informationabout the nature of the disease thandid biochemical investigation.
One of the first major contributionscame in 1938 from Dorothy H. Ander-sen of Columbia University. After per-forming autopsies on infants and chil-dren and reviewing the youngsters’ casehistories, Andersen provided the firstcomprehensive description of the symp-toms of cystic fibrosis and of the chang-es produced in organs. Those changes,she noted, almost always included de-struction of the pancreas (even in in-fants) and, often, infection of and dam-age to the lung airways. Andersen alsogave the disease its name, calling it“cystic fibrosis of the pancreas,” on thebasis of microscopic features she ob-served in pancreatic tissue.
By the late 1940s physicians had fur-ther realized that ductal systems andother passageways in the organs a›ect-ed by cystic fibrosis generally becomeclogged with unusually thick secretions.In the pancreas, for instance, ducts thatdeliver digestive enzymes to the intes-tines almost always become occluded,impairing the body’s ability to breakdown food and extract nutrients from it.
In the lung it is the bronchial tubesand bronchioles that become obstruct-ed. Those passages are usually bathedby a thin layer of mucus that traps in-haled particles and carries them to thethroat for removal. But in patients withcystic fibrosis, the mucus is excessivelythick and resistant to removal. Thischange by itself can narrow air pas-sages and impair breathing. Moreover,when bacteria remain in the air passag-es, they can establish infections readily.These infections, which tend to recur,harm lung tissue by recruiting immunecells that secrete injurious chemicalsand enzymes. As time goes by, chronicinfection progressively destroys thebronchial passages and, together withthe plugging of airways, ultimately leadsto respiratory failure.
By 1946 studies of patients had alsorevealed something about the geneticsof cystic fibrosis. After examining thepattern of disease inheritance in fami-lies, researchers deduced that cystic fi-brosis was a recessive condition, proba-bly caused by mutation of a single gene.If an infant inherited a damaged copy ofthe gene from both parents and there-fore made no normal molecules of theprotein specified by the gene, the childbecame ill; however, receipt of one goodcopy and one damaged copy did notproduce disease.
Cystic fibrosis is now known to beamong the most common genetic dis-eases and to strike mostly whites. About5 percent of white Americans are asymp-tomatic carriers, harboring a single mu-tant version of the gene in their cells.One child in approximately 2,500 ofEuropean descent carries two defectivecopies and has the disease. In the U.S.such numbers translate into about 1,000new cases a year and a total of some30,000 people who live with the disor-der today.
Help from a Heat Wave
Roughly seven years after the inheri-tance pattern was delineated, New
York City baked in a heat wave. Hospi-tals saw a disproportionate number ofchildren with cystic fibrosis, who appar-ently became dehydrated more readilythan other youngsters. Paul di Sant’Ag-nese and his colleagues at ColumbiaUniversity then found that boys andgirls with cystic fibrosis lose an exces-sive amount of salt in sweat. The rea-son for the increased saltiness wouldnot be discerned for many years, butthe observation had great clinical val-ue. It resulted in development of a testthat remains the cornerstone of diag-nosis: measurement of the chloridecontent in perspiration.
Over the years, such clinical work hasled to earlier, more accurate diagnosisand better treatments. For example,pancreatic failure is rarely life-threaten-
52 SCIENTIFIC AMERICAN December 1995
Cystic FibrosisThe genetic defects underlying this lethal disease
have now been shown to eliminate or hobble a critical channelthrough which a constituent of salt enters and leaves cells
by Michael J. Welsh and Alan E. Smith
ABRA
HAM
MEN
ASHE
267
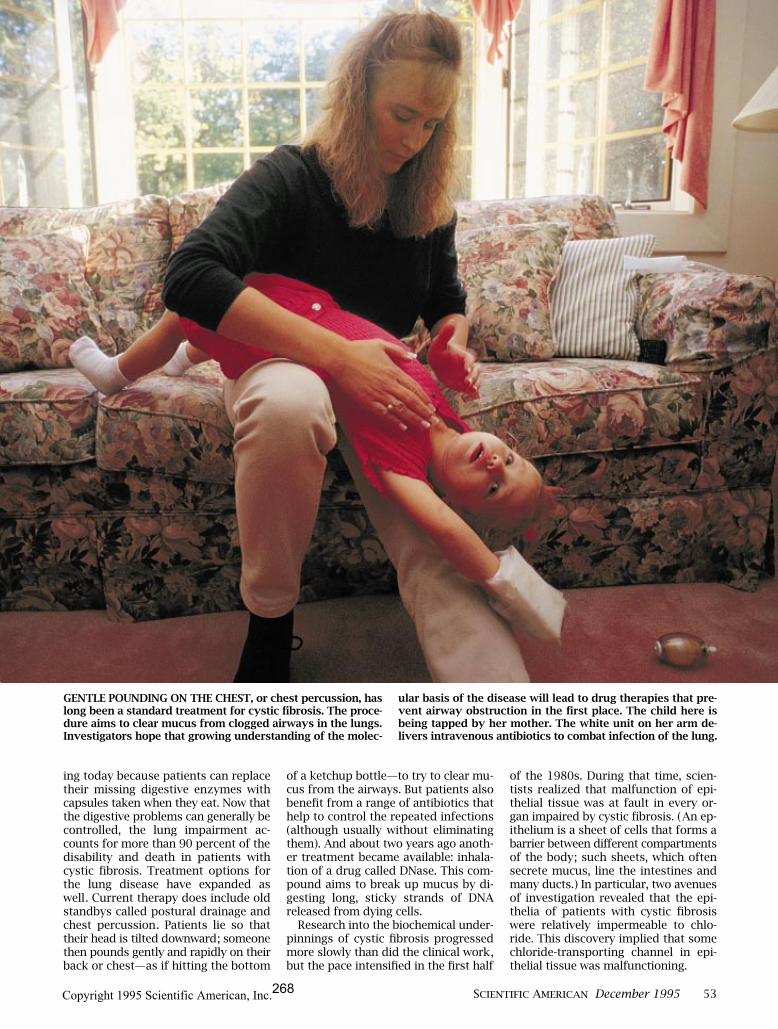
ing today because patients can replacetheir missing digestive enzymes withcapsules taken when they eat. Now thatthe digestive problems can generally becontrolled, the lung impairment ac-counts for more than 90 percent of thedisability and death in patients withcystic fibrosis. Treatment options forthe lung disease have expanded aswell. Current therapy does include oldstandbys called postural drainage andchest percussion. Patients lie so thattheir head is tilted downward; someonethen pounds gently and rapidly on theirback or chest—as if hitting the bottom
of a ketchup bottle—to try to clear mu-cus from the airways. But patients alsobenefit from a range of antibiotics thathelp to control the repeated infections(although usually without eliminatingthem). And about two years ago anoth-er treatment became available: inhala-tion of a drug called DNase. This com-pound aims to break up mucus by di-gesting long, sticky strands of DNAreleased from dying cells.
Research into the biochemical under-pinnings of cystic fibrosis progressedmore slowly than did the clinical work,but the pace intensified in the first half
of the 1980s. During that time, scien-tists realized that malfunction of epi-thelial tissue was at fault in every or-gan impaired by cystic fibrosis. (An ep-ithelium is a sheet of cells that forms abarrier between di›erent compartmentsof the body; such sheets, which oftensecrete mucus, line the intestines andmany ducts.) In particular, two avenuesof investigation revealed that the epi-thelia of patients with cystic fibrosiswere relatively impermeable to chlo-ride. This discovery implied that somechloride-transporting channel in epi-thelial tissue was malfunctioning.
SCIENTIFIC AMERICAN December 1995 53
GENTLE POUNDING ON THE CHEST, or chest percussion, haslong been a standard treatment for cystic fibrosis. The proce-dure aims to clear mucus from clogged airways in the lungs.Investigators hope that growing understanding of the molec-
ular basis of the disease will lead to drug therapies that pre-vent airway obstruction in the first place. The child here isbeing tapped by her mother. The white unit on her arm de-livers intravenous antibiotics to combat infection of the lung.
268
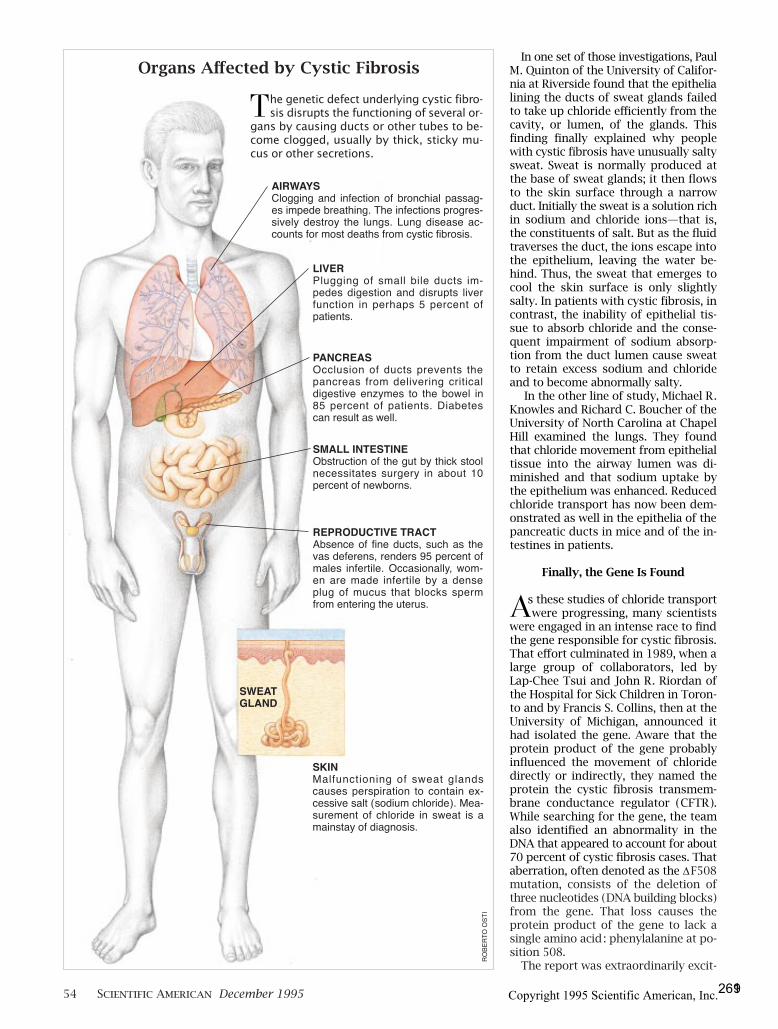
In one set of those investigations, PaulM. Quinton of the University of Califor-nia at Riverside found that the epithelialining the ducts of sweat glands failedto take up chloride e¤ciently from thecavity, or lumen, of the glands. Thisfinding finally explained why peoplewith cystic fibrosis have unusually saltysweat. Sweat is normally produced atthe base of sweat glands; it then flowsto the skin surface through a narrowduct. Initially the sweat is a solution richin sodium and chloride ions—that is,the constituents of salt. But as the fluidtraverses the duct, the ions escape intothe epithelium, leaving the water be-hind. Thus, the sweat that emerges tocool the skin surface is only slightlysalty. In patients with cystic fibrosis, incontrast, the inability of epithelial tis-sue to absorb chloride and the conse-quent impairment of sodium absorp-tion from the duct lumen cause sweatto retain excess sodium and chlorideand to become abnormally salty.
In the other line of study, Michael R.Knowles and Richard C. Boucher of theUniversity of North Carolina at ChapelHill examined the lungs. They foundthat chloride movement from epithelialtissue into the airway lumen was di-minished and that sodium uptake bythe epithelium was enhanced. Reducedchloride transport has now been dem-onstrated as well in the epithelia of thepancreatic ducts in mice and of the in-testines in patients.
Finally, the Gene Is Found
As these studies of chloride transport were progressing, many scientists
were engaged in an intense race to findthe gene responsible for cystic fibrosis.That e›ort culminated in 1989, when alarge group of collaborators, led byLap-Chee Tsui and John R. Riordan ofthe Hospital for Sick Children in Toron-to and by Francis S. Collins, then at theUniversity of Michigan, announced ithad isolated the gene. Aware that theprotein product of the gene probablyinfluenced the movement of chloridedirectly or indirectly, they named theprotein the cystic fibrosis transmem-brane conductance regulator (CFTR).While searching for the gene, the teamalso identified an abnormality in theDNA that appeared to account for about70 percent of cystic fibrosis cases. Thataberration, often denoted as the ∆F508mutation, consists of the deletion ofthree nucleotides (DNA building blocks)from the gene. That loss causes theprotein product of the gene to lack asingle amino acid: phenylalanine at po-sition 508.
The report was extraordinarily excit-
The genetic defect underlying cystic fibro-sis disrupts the functioning of several or-
gans by causing ducts or other tubes to be-come clogged, usually by thick, sticky mu-cus or other secretions.
AIRWAYSClogging and infection of bronchial passag-es impede breathing. The infections progres-sively destroy the lungs. Lung disease ac-counts for most deaths from cystic fibrosis.
LIVERPlugging of small bile ducts im-pedes digestion and disrupts liverfunction in perhaps 5 percent ofpatients.
PANCREASOcclusion of ducts prevents thepancreas from delivering criticaldigestive enzymes to the bowel in85 percent of patients. Diabetescan result as well.
SMALL INTESTINEObstruction of the gut by thick stoolnecessitates surgery in about 10percent of newborns.
REPRODUCTIVE TRACTAbsence of fine ducts, such as thevas deferens, renders 95 percent ofmales infertile. Occasionally, wom-en are made infertile by a denseplug of mucus that blocks spermfrom entering the uterus.
SKINMalfunctioning of sweat glandscauses perspiration to contain ex-cessive salt (sodium chloride). Mea-surement of chloride in sweat is amainstay of diagnosis.
SWEAT GLAND
Organs A›ected by Cystic Fibrosis
54 SCIENTIFIC AMERICAN December 1995
ROBE
RTO
OST
I
2619
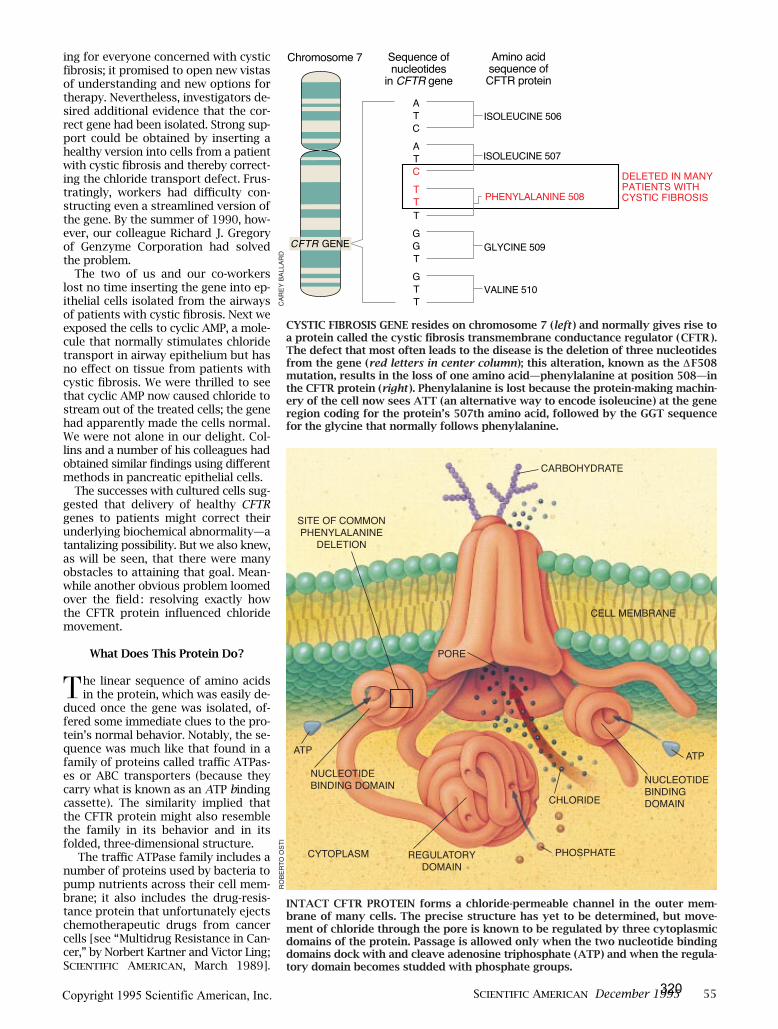
ing for everyone concerned with cysticfibrosis; it promised to open new vistasof understanding and new options fortherapy. Nevertheless, investigators de-sired additional evidence that the cor-rect gene had been isolated. Strong sup-port could be obtained by inserting ahealthy version into cells from a patientwith cystic fibrosis and thereby correct-ing the chloride transport defect. Frus-tratingly, workers had di¤culty con-structing even a streamlined version ofthe gene. By the summer of 1990, how-ever, our colleague Richard J. Gregoryof Genzyme Corporation had solvedthe problem.
The two of us and our co-workerslost no time inserting the gene into ep-ithelial cells isolated from the airwaysof patients with cystic fibrosis. Next weexposed the cells to cyclic AMP, a mole-cule that normally stimulates chloridetransport in airway epithelium but hasno e›ect on tissue from patients withcystic fibrosis. We were thrilled to seethat cyclic AMP now caused chloride tostream out of the treated cells; the genehad apparently made the cells normal.We were not alone in our delight. Col-lins and a number of his colleagues hadobtained similar findings using di›erentmethods in pancreatic epithelial cells.
The successes with cultured cells sug-gested that delivery of healthy CFTRgenes to patients might correct theirunderlying biochemical abnormality—atantalizing possibility. But we also knew,as will be seen, that there were manyobstacles to attaining that goal. Mean-while another obvious problem loomedover the field: resolving exactly howthe CFTR protein influenced chloridemovement.
What Does This Protein Do?
The linear sequence of amino acidsin the protein, which was easily de-
duced once the gene was isolated, of-fered some immediate clues to the pro-tein’s normal behavior. Notably, the se-quence was much like that found in afamily of proteins called tra¤c ATPas-es or ABC transporters (because theycarry what is known as an ATP bindingcassette). The similarity implied thatthe CFTR protein might also resemblethe family in its behavior and in itsfolded, three-dimensional structure.
The tra¤c ATPase family includes anumber of proteins used by bacteria topump nutrients across their cell mem-brane; it also includes the drug-resis-tance protein that unfortunately ejectschemotherapeutic drugs from cancercells [see “Multidrug Resistance in Can-cer,” by Norbert Kartner and Victor Ling;SCIENTIFIC AMERICAN, March 1989].
SCIENTIFIC AMERICAN December 1995 55
Chromosome 7
ATCATCTTTGG T GTT
Sequence ofnucleotides
in CFTR gene
ISOLEUCINE 506
ISOLEUCINE 507
VALINE 510
GLYCINE 509
Amino acidsequence ofCFTR protein
DELETED IN MANYPATIENTS WITH CYSTIC FIBROSISPHENYLALANINE 508
CFTR GENE
PORE
CARBOHYDRATE
CELL MEMBRANE
NUCLEOTIDEBINDINGDOMAIN
REGULATORYDOMAIN
ATP
PHOSPHATE
CHLORIDE
SITE OF COMMON PHENYLALANINE
DELETION
CYTOPLASM
CARE
Y BA
LLAR
D
INTACT CFTR PROTEIN forms a chloride-permeable channel in the outer mem-brane of many cells. The precise structure has yet to be determined, but move-ment of chloride through the pore is known to be regulated by three cytoplasmicdomains of the protein. Passage is allowed only when the two nucleotide bindingdomains dock with and cleave adenosine triphosphate (ATP) and when the regula-tory domain becomes studded with phosphate groups.
ROBE
RTO
OST
I
CYSTIC FIBROSIS GENE resides on chromosome 7 (left ) and normally gives rise toa protein called the cystic fibrosis transmembrane conductance regulator (CFTR).The defect that most often leads to the disease is the deletion of three nucleotidesfrom the gene (red letters in center column); this alteration, known as the ∆F508mutation, results in the loss of one amino acid—phenylalanine at position 508—inthe CFTR protein (right ). Phenylalanine is lost because the protein-making machin-ery of the cell now sees ATT (an alternative way to encode isoleucine) at the generegion coding for the protein’s 507th amino acid, followed by the GGT sequencefor the glycine that normally follows phenylalanine.
NUCLEOTIDEBINDING DOMAIN
ATP
320
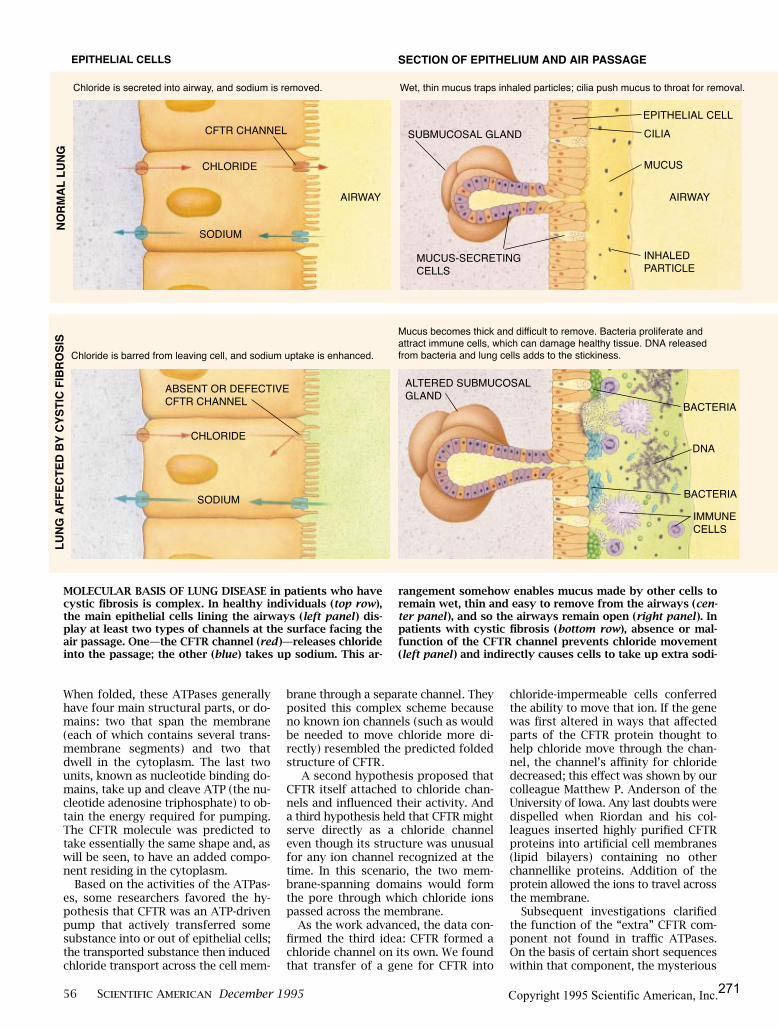
When folded, these ATPases generallyhave four main structural parts, or do-mains: two that span the membrane(each of which contains several trans-membrane segments) and two thatdwell in the cytoplasm. The last twounits, known as nucleotide binding do-mains, take up and cleave ATP (the nu-cleotide adenosine triphosphate) to ob-tain the energy required for pumping.The CFTR molecule was predicted totake essentially the same shape and, aswill be seen, to have an added compo-nent residing in the cytoplasm.
Based on the activities of the ATPas-es, some researchers favored the hy-pothesis that CFTR was an ATP-drivenpump that actively transferred somesubstance into or out of epithelial cells;the transported substance then inducedchloride transport across the cell mem-
brane through a separate channel. Theyposited this complex scheme becauseno known ion channels (such as wouldbe needed to move chloride more di-rectly) resembled the predicted foldedstructure of CFTR.
A second hypothesis proposed thatCFTR itself attached to chloride chan-nels and influenced their activity. Anda third hypothesis held that CFTR mightserve directly as a chloride channeleven though its structure was unusualfor any ion channel recognized at thetime. In this scenario, the two mem-brane-spanning domains would formthe pore through which chloride ionspassed across the membrane.
As the work advanced, the data con-firmed the third idea: CFTR formed achloride channel on its own. We foundthat transfer of a gene for CFTR into
chloride-impermeable cells conferredthe ability to move that ion. If the genewas first altered in ways that a›ectedparts of the CFTR protein thought tohelp chloride move through the chan-nel, the channel’s a¤nity for chloridedecreased; this e›ect was shown by ourcolleague Matthew P. Anderson of theUniversity of Iowa. Any last doubts weredispelled when Riordan and his col-leagues inserted highly purified CFTRproteins into artificial cell membranes(lipid bilayers) containing no otherchannellike proteins. Addition of theprotein allowed the ions to travel acrossthe membrane.
Subsequent investigations clarifiedthe function of the “extra” CFTR com-ponent not found in tra¤c ATPases.On the basis of certain short sequenceswithin that component, the mysterious
56 SCIENTIFIC AMERICAN December 1995
MOLECULAR BASIS OF LUNG DISEASE in patients who havecystic fibrosis is complex. In healthy individuals (top row),the main epithelial cells lining the airways (left panel ) dis-play at least two types of channels at the surface facing theair passage. One—the CFTR channel (red )—releases chlorideinto the passage; the other (blue) takes up sodium. This ar-
rangement somehow enables mucus made by other cells toremain wet, thin and easy to remove from the airways (cen-ter panel ), and so the airways remain open (right panel ). Inpatients with cystic fibrosis (bottom row), absence or mal-function of the CFTR channel prevents chloride movement(left panel ) and indirectly causes cells to take up extra sodi-
EPITHELIAL CELLS SECTION OF EPITHELIUM AND AIR PASSAGE
Mucus becomes thick and difficult to remove. Bacteria proliferate and attract immune cells, which can damage healthy tissue. DNA released from bacteria and lung cells adds to the stickiness.
Chloride is secreted into airway, and sodium is removed. Wet, thin mucus traps inhaled particles; cilia push mucus to throat for removal.
Chloride is barred from leaving cell, and sodium uptake is enhanced.
NORM
AL L
UNG
LUNG
AFF
ECTE
D BY
CYS
TIC
FIBR
OSI
S
AIRWAY
CHLORIDE
CFTR CHANNEL
SODIUM
MUCUS-SECRETINGCELLS
EPITHELIAL CELLSUBMUCOSAL GLAND CILIA
INHALEDPARTICLE
MUCUS
AIRWAY
CHLORIDE
SODIUM
ABSENT OR DEFECTIVECFTR CHANNEL
ALTERED SUBMUCOSALGLAND
IMMUNECELLS
DNA
BACTERIA
BACTERIA
271
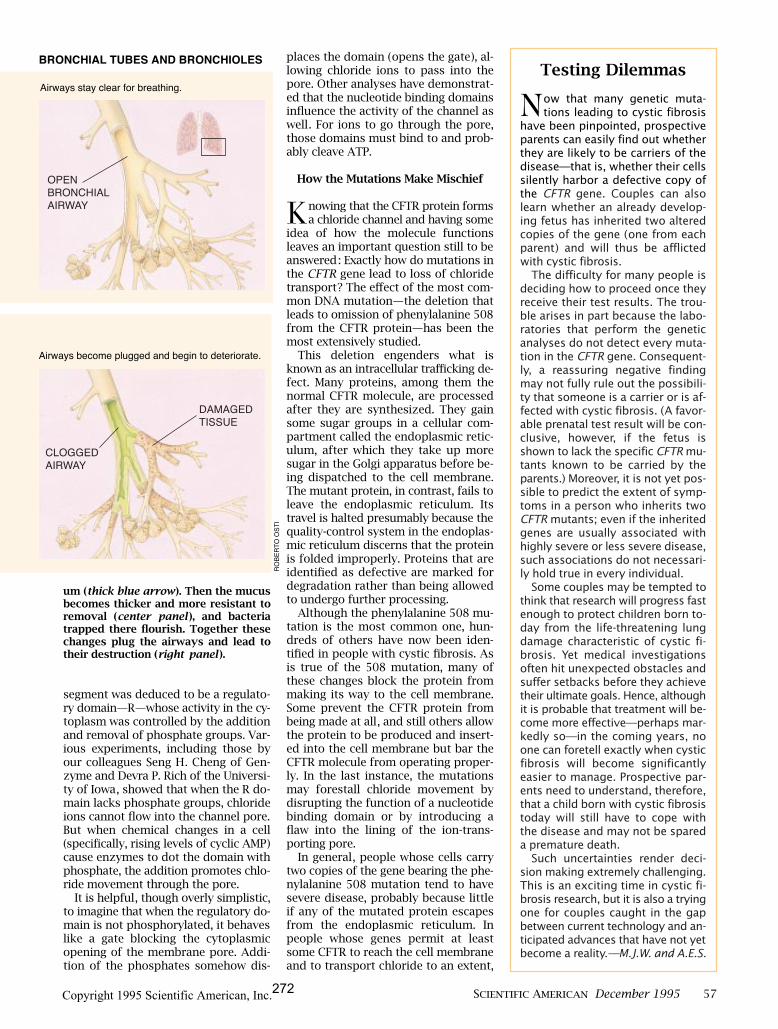
segment was deduced to be a regulato-ry domain—R—whose activity in the cy-toplasm was controlled by the additionand removal of phosphate groups. Var-ious experiments, including those byour colleagues Seng H. Cheng of Gen-zyme and Devra P. Rich of the Universi-ty of Iowa, showed that when the R do-main lacks phosphate groups, chlorideions cannot flow into the channel pore.But when chemical changes in a cell(specifically, rising levels of cyclic AMP)cause enzymes to dot the domain withphosphate, the addition promotes chlo-ride movement through the pore.
It is helpful, though overly simplistic,to imagine that when the regulatory do-main is not phosphorylated, it behaveslike a gate blocking the cytoplasmicopening of the membrane pore. Addi-tion of the phosphates somehow dis-
places the domain (opens the gate), al-lowing chloride ions to pass into thepore. Other analyses have demonstrat-ed that the nucleotide binding domainsinfluence the activity of the channel aswell. For ions to go through the pore,those domains must bind to and prob-ably cleave ATP.
How the Mutations Make Mischief
Knowing that the CFTR protein formsa chloride channel and having some
idea of how the molecule functionsleaves an important question still to beanswered: Exactly how do mutations inthe CFTR gene lead to loss of chloridetransport? The e›ect of the most com-mon DNA mutation—the deletion thatleads to omission of phenylalanine 508from the CFTR protein—has been themost extensively studied.
This deletion engenders what isknown as an intracellular tra¤cking de-fect. Many proteins, among them thenormal CFTR molecule, are processedafter they are synthesized. They gainsome sugar groups in a cellular com-partment called the endoplasmic retic-ulum, after which they take up moresugar in the Golgi apparatus before be-ing dispatched to the cell membrane.The mutant protein, in contrast, fails toleave the endoplasmic reticulum. Itstravel is halted presumably because thequality-control system in the endoplas-mic reticulum discerns that the proteinis folded improperly. Proteins that areidentified as defective are marked fordegradation rather than being allowedto undergo further processing.
Although the phenylalanine 508 mu-tation is the most common one, hun-dreds of others have now been iden-tified in people with cystic fibrosis. Asis true of the 508 mutation, many ofthese changes block the protein frommaking its way to the cell membrane.Some prevent the CFTR protein frombeing made at all, and still others allowthe protein to be produced and insert-ed into the cell membrane but bar theCFTR molecule from operating proper-ly. In the last instance, the mutationsmay forestall chloride movement bydisrupting the function of a nucleotidebinding domain or by introducing aflaw into the lining of the ion-trans-porting pore.
In general, people whose cells carrytwo copies of the gene bearing the phe-nylalanine 508 mutation tend to havesevere disease, probably because littleif any of the mutated protein escapesfrom the endoplasmic reticulum. Inpeople whose genes permit at leastsome CFTR to reach the cell membraneand to transport chloride to an extent,
SCIENTIFIC AMERICAN December 1995 57
um (thick blue arrow). Then the mucusbecomes thicker and more resistant to removal (center panel ), and bacteriatrapped there flourish. Together thesechanges plug the airways and lead totheir destruction (right panel ).
BRONCHIAL TUBES AND BRONCHIOLES
Airways stay clear for breathing.
Airways become plugged and begin to deteriorate.
ROBE
RTO
OST
I
Testing Dilemmas
Now that many genetic muta-tions leading to cystic fibrosis
have been pinpointed, prospectiveparents can easily find out whetherthey are likely to be carriers of thedisease—that is, whether their cellssilently harbor a defective copy ofthe CFTR gene. Couples can alsolearn whether an already develop-ing fetus has inherited two alteredcopies of the gene (one from eachparent) and will thus be afflictedwith cystic fibrosis.
The difficulty for many people isdeciding how to proceed once theyreceive their test results. The trou-ble arises in part because the labo-ratories that perform the geneticanalyses do not detect every muta-tion in the CFTR gene. Consequent-ly, a reassuring negative findingmay not fully rule out the possibili-ty that someone is a carrier or is af-fected with cystic fibrosis. (A favor-able prenatal test result will be con-clusive, however, if the fetus isshown to lack the specific CFTR mu-tants known to be carried by theparents.) Moreover, it is not yet pos-sible to predict the extent of symp-toms in a person who inherits twoCFTR mutants; even if the inheritedgenes are usually associated withhighly severe or less severe disease,such associations do not necessari-ly hold true in every individual.
Some couples may be tempted tothink that research will progress fastenough to protect children born to-day from the life-threatening lungdamage characteristic of cystic fi-brosis. Yet medical investigationsoften hit unexpected obstacles andsuffer setbacks before they achievetheir ultimate goals. Hence, althoughit is probable that treatment will be-come more effective—perhaps mar-kedly so—in the coming years, noone can foretell exactly when cysticfibrosis will become significantlyeasier to manage. Prospective par-ents need to understand, therefore,that a child born with cystic fibrosistoday will still have to cope withthe disease and may not be spareda premature death.
Such uncertainties render deci-sion making extremely challenging.This is an exciting time in cystic fi-brosis research, but it is also a tryingone for couples caught in the gapbetween current technology and an-ticipated advances that have not yetbecome a reality.—M.J.W. and A.E.S.
OPENBRONCHIALAIRWAY
CLOGGEDAIRWAY
DAMAGEDTISSUE
272

the residual activity can make for some-what less severe symptoms. These pat-terns do not always hold, however, andso making predictions in individual cas-es remains problematic. Indeed, two pa-tients with exactly the same mutationsin both copies of their CFTR gene candi›er significantly in the extent of organdamage they su›er. This divergencearises because other genetic and envi-ronmental factors that remain poorlyunderstood can probably influence thecourse of the disease.
It is humbling to note that burgeon-ing understanding of the genetic defectshas not yet fully explained how disor-dered chloride transport in the lungepithelium alters sodium transport andhow those changes result in the accu-mulation of mucus in the bronchial pas-
sages. It has also been discovered thatsubmucosal glands—mucus producersthat lie below the surface epithelium—produce a large amount of the CFTRprotein. What role do these glands playin the disease? Scientists are furtherpuzzled by the fact that the airways ofpatients with cystic fibrosis are predis-posed to infection by some bacteriamore than by others. For instance, in-fections by Pseudomonas aeruginosaand Staphylococcus aureus are particu-larly common. An understanding ofwhy certain organisms thrive is onlynow beginning to emerge.
Investigators wonder as well whetherthe CFTR protein has functions beyondits role as a chloride channel. Amongthe possibilities being considered is thatCFTR may help regulate chloride chan-nels distinct from CFTR. Researchershave also posited that the moleculemay indirectly alter the mix of sugarson the epithelial surface in ways thatfavor colonization by certain bacteria.
Strategies for Treatment
In spite of the unanswered questions,the knowledge gained since 1989 has
already suggested several avenues forattacking cystic fibrosis. One is to com-pensate for the loss of the CFTR chlo-ride channel by increasing the activityof a di›erent class of chloride channel.For instance, channels controlled bycalcium ions are known to exist in thelumen-facing surface of epithelial cells.Those molecules usually fail to coun-teract the loss of the CFTR channel,but perhaps their chloride conductancecan be increased artificially. This possi-bility is being tested in patients.
One day doctors also might deliverpurified CFTR proteins to the cells thatneed them. Studies of cells in culturehave shown that the protein moleculescan correct chloride flow in cells carry-ing a mutant CFTR gene. In theory, an-other tactic would be to administerdrugs able to escort mutant CFTR mol-ecules from the endoplasmic reticulumthrough the Golgi apparatus and intothe cell membrane. This idea seemsworth pursuing because ∆F508 mutantCFTR proteins that become stuck in theendoplasmic reticulum usually functionfairly well when experimentally insert-ed into the outer membrane of cells. Atpresent, however, we know of no drugsthat can correct the intracellular traf-ficking abnormality. A di›erent ap-proach, not yet tested, would be to usedrugs to increase the activity of anymutant CFTR channels that do findtheir way into the cell membrane.
The treatment option attracting themost attention, however, is gene thera-
py, which aims to deliver a normal copyof the CFTR gene to the cells that needit. If all goes well, the DNA inserted intotarget cells should direct synthesis ofthe normal CFTR protein and reversethe primary biochemical abnormalityat the root of cystic fibrosis. Introduc-tion of the gene is a favored approachbecause it should replace all functionsof the CFTR protein, including any thathave not yet been recognized.
The best-studied method of genetherapy exploits the ability of virusesto enter cells, bringing their DNA withthem. We and others have paid specialattention to adenoviruses as gene carri-ers, or vectors, because those microbesare naturally able to infect human air-ways but will usually produce relativelyinnocuous disease, such as the commoncold. The adenoviruses are altered intwo ways: certain viral genes are re-moved to prevent the virus from repro-ducing in cells and causing symptoms.And the excised DNA is replaced with anormal CFTR gene. Our group, as wellas those of Ronald G. Crystal, then atthe National Heart, Lung and Blood In-stitute, and James M. Wilson, then atthe University of Michigan, has demon-strated that such vectors can deliver theCFTR gene to cultured epithelial cellsand to airway cells in animals. What ismore, the cells use the DNA to synthe-size CFTR molecules that function ashealthy chloride channels.
On the basis of such experiments,several research groups have begun at-tempting to deliver the CFTR gene topatients via genetically engineered ade-novirus vectors. The aim of these earlyexperiments is primarily to assess safe-ty. Even so, we and others have alsotested the ability of a CFTR-bearing ade-novirus to correct chloride transport inthe nasal epithelium of patients. Wechose the nasal epithelium because it issimilar to that of the bronchial passag-es but is easier to reach.
Our first test was encouraging. Forexperimental purposes, we applied thealtered virus directly to a small patch ofepithelium in the nose. The treatmentpartially corrected chloride transportfor a time. Since then, however, a similarstudy by us has been less successful,and one by another group showed noincrease in chloride flow. These findingsindicate that adenoviral vectors need tobe improved substantially before theycan serve as gene-delivery agents intherapy.
Even if ways are found to increasethe e¤ciency of gene delivery by the vi-ruses, another challenge would remain.Most cells in epithelial tissue are re-placed every few months. Therefore,gene therapy would probably have to
58 SCIENTIFIC AMERICAN December 1995
BACTERIA that often cause severe infec-tions in the lungs of patients with cys-tic fibrosis include Staphylococcus au-reus (top) and Pseudomonas aeruginosa(bottom). Once the infections are estab-lished, they almost invariably recur.
DAVI
D M
. PHI
LLIP
S Po
pula
tion
Coun
cil, S
cienc
e So
urce
TONY
BRA
IN S
cienc
e Ph
oto
Libr
ary
273

be administered a few times a year—atleast until the rare, long-lived cells thatgive rise to the replacement cells canbe induced to take up a normal CFTRgene permanently. Aside from inconve-nience and expense, the need for multi-ple treatments is a concern because peo-ple respond to adenoviruses by mount-ing an immune response that ultimatelyeliminates the microbes and preventsrepeated infection. For gene therapy tobe successful, investigators will have tofind ways to “hide” the adenovirusesfrom the immune system or to create
viral or other vectors that do not elicitan immune response.
One appealing alternative to relyingon viruses would be to coat the thera-peutic gene with fatty molecules thatare not recognized by the immune sys-tem but that nonetheless enable theDNA to enter cells. Recent studies con-ducted on human patients by Eric Al-ton and his co-workers at the RoyalBrompton Hospital in London suggestthis approach can restore chloride per-meability to airway epithelium, althoughthis group, like ours, has so far studied
only nasal tissue. Moreover, delivery ofgenes by nonviral systems needs to bemade more e¤cient.
Scientists have much to learn beforethey understand exactly how loss of theCFTR protein leads to the manifesta-tions of cystic fibrosis. And a host oftechnical challenges must be eliminat-ed before any therapy will routinelycompensate for that loss. Nevertheless,progress is being made on many fronts.It is di¤cult not to be optimistic thatthe ongoing work will produce improvedtherapies within the next several years.
SCIENTIFIC AMERICAN December 1995 59
The Authors
MICHAEL J. WELSH and ALAN E. SMITH have collab-orated for several years. Welsh, a Howard Hughes Med-ical Institute investigator, is professor of medicine andof physiology and biophysics at the University of IowaCollege of Medicine. He earned his M.D. at Iowa in1974 and held fellowships at the University of Califor-nia, San Francisco, and the University of Texas MedicalSchool at Houston before returning to Iowa in 1981.Smith is senior vice president of research at GenzymeCorporation in Framingham, Mass. He has also beenhead of the biochemistry division of the National Insti-tute for Medical Research in Mill Hill, England, and sci-entific director and vice president of Integrated Genet-ics, also in Framingham.
Further Reading
CYSTIC FIBROSIS: MOLECULAR BIOLOGY AND THERAPEUTIC IMPLICATIONS. FrancisS. Collins in Science, Vol. 256, pages 774–779; May 8, 1992.
CYSTIC FIBROSIS TRANSMEMBRANE CONDUCTANCE REGULATOR: A CHLORIDECHANNEL WITH NOVEL REGULATION. M. J. Welsh, M. P. Anderson, D. P. Rich, H.A. Berger, G. M. Denning, L. S. Ostedgaard, D. N. Sheppard, S. H. Cheng, R. J.Gregory and A. E. Smith in Neuron, Vol. 8, No. 5, pages 821–829; May 1992.
THE CYSTIC FIBROSIS TRANSMEMBRANE CONDUCTANCE REGULATOR. J. R. Riordanin Annual Review of Physiology, Vol. 55, pages 609–630; 1993.
MOLECULAR MECHANISMS OF CFTR CHLORIDE CHANNEL DYSFUNCTION IN CYSTICFIBROSIS. M. J. Welsh and A. E. Smith in Cell, Vol. 73, No. 7, pages 1251–1254;July 2, 1993.
CYSTIC FIBROSIS. M. J. Welsh, L. C. Tsui, T. F. Boat and A. L. Beaudet in Metabolicand Molecular Basis of Inherited Disease. Edited by C. R. Scriver, A. L. Beaudet,W. S. Sly and D. Valle. McGraw-Hill, 1994.
The lung disease characteristic of cystic fibrosis can be at-tacked at many levels. Potential strategies range from re-
versing the genetic defect at the root of the pulmonaryproblems to replacing a failed lung with a healthy one.
Some Strategies for Treating Lung Abnormalities
ABNORMALITY APPROACH STATUS
Mutation in CFTR gene Provide normal gene through gene Gene therapy is being tested intherapy; provide normal CFTR protein preliminary clinical trials; methods for to cells protein delivery are inefficient
Defective delivery of CFTR Supply drugs able to escort protein to No candidate “escorts” have been protein to outer cell membrane cell membrane of epithelial cells identified
Defective movement of chloride Deliver drugs that increase activity of Such drugs are being testedions through CFTR channels in other classes of chloride channel in preliminary clinical trialscell membrane in epithelial cells
Clogging of air passages Pound back and chest to help clear Chest percussion is standard therapy; by viscous mucus secretions; administer DNase and DNase is now in wide use, and similar
other drugs to liquefy secretions drugs are being tested in animals
Development of recurrent infections Deliver antibiotics to destroy bacteria Antibiotics are in wide use; antibodiesthat can damage lungs or provide antibodies (special molecules are being tested in preliminary
of immune system) to remove microbes clinical trials
Tissue damage caused by immune Administer drugs that reduce harmful Steroidal anti-inflammatory drugs are response to bacteria effects of immune response sometimes used; nonsteroidal anti-
inflammatory agents (mainly ibuprofen) are being tested
Destruction of lung Transplant healthy lung Transplantation is sometimes an option
2 274

review article
The
new england journal
of
medicine
n engl j med
352;19
www.nejm.org may
12, 2005
1992
mechanisms of disease
Cystic Fibrosis
Steven M. Rowe, M.D., Stacey Miller, B.S., and Eric J. Sorscher, M.D.
From the Gregory Fleming James CysticFibrosis Research Center (S.M.R., S.M.,E.J.S.), and the Departments of Medicine(S.M.R., E.J.S.), Pediatrics (S.M.R.), Genet-ics (E.J.S.), and Physiology and Biophysics(E.J.S.), University of Alabama at Birming-ham, Birmingham. Address reprint re-quests to Dr. Sorscher at the Gregory Flem-ing James Cystic Fibrosis Research Center,University of Alabama at Birmingham, 15303rd Ave. S., MCLM 796, Birmingham, AL35294, or at [email protected].
Dr. Rowe and Ms. Miller contributed equal-ly to this article.
N Engl J Med 2005;352:1992-2001.
Copyright © 2005 Massachusetts Medical Society.
dvances in the care of patients with cystic fibrosis have im-
proved survival, and as a result, patients with the disease now often live be-yond the third decade.
1
In addition, developments in the understanding ofthe genetics and molecular mechanisms of cystic fibrosis have led to new targets fortreatment and an increasingly hopeful outlook. This review summarizes the mecha-nisms underlying the disease, the sequelae stemming from the absence of a function-ing cystic fibrosis transmembrane conductance regulator (CFTR), and the therapeuticstrategies devised to correct these abnormalities. Progress in the supportive care of pa-tients with the disease has been reviewed elsewhere.
2-4
In 1949, Lowe et al. postulated that cystic fibrosis must be caused by a defect in a singlegene (and therefore a single protein) on the basis of the autosomal recessive pattern ofinheritance of the disease.
5
The characterization of the molecular mechanism, there-fore, included early attempts to identify the causative protein. High levels of salt in thesweat of patients with cystic fibrosis suggested an abnormality in fluid and electrolytetransport in the sweat gland, and Quinton established that sweat ducts in such patientsare impermeable to chloride.
6
Studies of nasal epithelium and subsequent membranepatch-clamp analysis of epithelial cells from the airways of patients with cystic fibrosisprovided conclusive evidence of a defect in chloride permeability of plasma membranesin the lung.
7-10
These findings, which were confirmed by several laboratories world-wide, led to the hypothesis that a defective chloride channel situated in the apical mem-branes of the lung surface or glandular epithelium accounts for respiratory failure andthat this abnormality could explain the other clinical manifestations of cystic fibrosis.
Soon after the discovery of abnormal chloride transport in cystic fibrosis, Collins,Riordan, Tsui, and colleagues identified the gene that is responsible for the diseasewith the use of linkage-based techniques, independently of any prior knowledge of thestructure of the cystic fibrosis protein.
11-13
With a measure of circumspection, theynamed the gene product CFTR, since the predicted protein sequence did not resembleother ion channels. This name posed a problem for those who thought that a chloridechannel was primarily responsible for the clinical manifestations of cystic fibrosis.
The hypothesized structure of CFTR placed it squarely in the ATP-binding cassette(ABC), or traffic ATPase, gene family. As is characteristic of this gene family, CFTR pro-tein contains 2 ATP-hydrolysis domains (also termed nucleotide-binding domains) and12 membrane-spanning alpha helixes (Fig. 1). ABC proteins were known to functionas mediators of organic solute transport and included, for example, the genes that en-code multidrug resistance (e.g.,
MDRs
, or P-glycoprotein genes), a gene that encodes
a
historical background
structure and function of cftr
Copyright © 2005 Massachusetts Medical Society. All rights reserved. Downloaded from www.nejm.org at MICHIGAN STATE UNIV LIB on November 25, 2008 . 275

n engl j med
352;19
www.nejm.org may
12, 2005
mechanisms of disease
1993
chloroquine resistance in
Plasmodium falciparum,
and a number of prokaryotic and eukaryotic smallnutrient and molecular transporters.
14
Becausethere was no reason to suspect that the cystic fibro-sis chloride channel should require ATP hydrolysis,and since the ABC protein family was not charac-teristic of other ion transporters, the possibility wasleft open that CFTR might indirectly regulate cel-lular chloride permeability by other means, ratherthan act as a chloride channel itself.
These findings caused a measure of scientificdrama that was ultimately resolved in two ways.First, Welsh and colleagues showed that the expres-sion of
CFTR
in cells that lacked chloride channelsled to the appearance of a new chloride permeabil-ity pathway.
15
In a formal sense, these studies stilldid not distinguish between the role of CFTR as achloride channel and its role as a regulator of anionconductance that was unmasked by the expressionof
CFTR
in cells lacking chloride channels. The sub-sequent observations that point mutations in the
CFTR
gene caused subtle alterations in ion-channelselectivity, single-channel conductance, channelgating, and other properties of CFTR supported adirect role of the CFTR protein as a chloride chan-nel. Bear et al. made a second major contributionwhen they synthesized CFTR in cell-free systems,reconstituted the polytopic membrane protein inlipid bilayers,
16
and definitively established thatpurified CFTR could act (at least in part) as an ionchannel regulated by cyclic AMP (cAMP). These ex-periments thus reconciled a scientific debate con-cerning the relationship between CFTR and epithe-lial ion transport.
Numerous laboratories have now establishedthat CFTR conducts chloride across the cell mem-brane and is regulated by protein kinase A (PKA) ina cAMP-dependent fashion. The PKA sites withinthe protein serve as targets for phosphorylation.ATP hydrolysis is mediated by nucleotide-bindingdomains within the full-length ion channel. A num-ber of other cellular functions have been ascribedto CFTR: it down-regulates transepithelial sodiumtransport, in particular the epithelial sodium chan-nel
7,17
; it also regulates calcium-activated chloridechannels and potassium channels and may serve im-portant functions in exocytosis and the formationof molecular complexes in the plasma membrane.
In the apical plasma membrane, CFTR is part ofa multiprotein assembly. The final three amino acids(threonine, arginine, and leucine) anchor the pro-tein to PDZ-type receptors (PDZ domains occur in
intracellular signaling proteins and other proteinsassociated with the plasma membrane), in closeproximity to a number of membrane receptors, ionchannels, and the cytoskeleton.
18
Thus, it appearsthat the role of CFTR in epithelial cells may extendwell beyond chloride permeability. In human cysticfibrosis, and in mice with targeted deletions of the
Cftr
gene,
19
the absence of CFTR influences the ex-pression of several other gene products, includingproteins important in inflammatory responses,maturational processing, ion transport, and cellsignaling. These other proteins are potential modi-fiers of the cystic fibrosis phenotype and may helpexplain the substantial differences in clinical severityamong patients with the same mutations in
CFTR.
Figure 1. Hypothesized Structure of CFTR.
The protein contains 1480 amino acids and a number of discrete globular and transmembrane domains. Acti-vation of CFTR relies on phosphorylation, particularly through protein kinase A but probably involving other kinases as well. Channel activity is governed by the two nucleotide-binding domains, which regulate channel gating. The carboxyl terminal (consisting of threonine, arginine, and leucine [TRL]) of CFTR is anchored through a PDZ-type–binding interaction with the cytoskeleton and is kept in close approximation (dashed arrows) to a number of important proteins. These associated proteins influence CFTR functions, including conductance, regu-lation of other channels, signal transduction, and local-ization at the apical plasma membrane. Each membrane-spanning domain contains six membrane-spanning alpha helixes, portions of which form a chloride-conduc-tance pore. The regulatory domain is a site of protein kinase A phosphorylation. The common
Δ
F508 mutation occurs on the surface of nucleotide-binding domain 1.
TRL
Signal-transduction
proteinsCytoskeleton
Other ionchannels
Extracellular
Intracellular
Membrane-spanning domain 1
Membrane-spanningdomain 2
Nucleotide-binding
domain 1
Nucleotide-binding domain 2
Regulatory domain(phosphorylation site)
∆F508
Apicalplasma
membrane
Copyright © 2005 Massachusetts Medical Society. All rights reserved. Downloaded from www.nejm.org at MICHIGAN STATE UNIV LIB on November 25, 2008 . 276
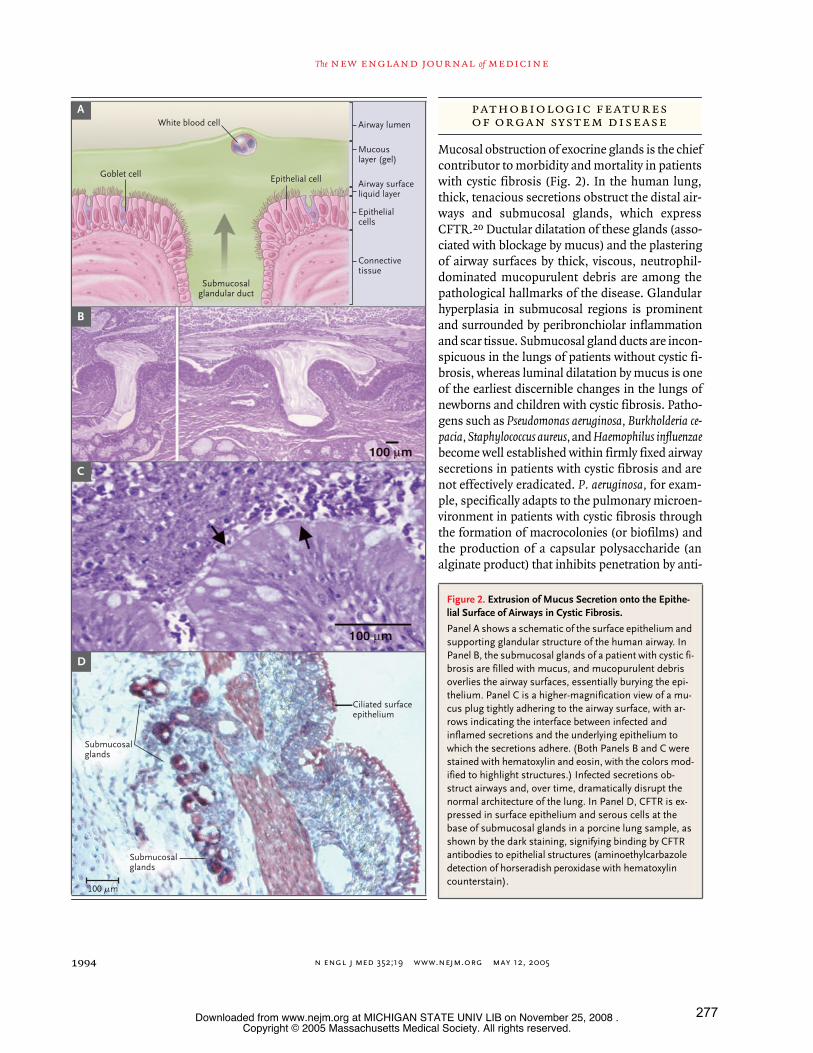
n engl j med
352;19
www.nejm.org may
12
,
2005
The
new england journal
of
medicine
1994
Mucosal obstruction of exocrine glands is the chiefcontributor to morbidity and mortality in patientswith cystic fibrosis (Fig. 2). In the human lung,thick, tenacious secretions obstruct the distal air-ways and submucosal glands, which expressCFTR.
20
Ductular dilatation of these glands (asso-ciated with blockage by mucus) and the plasteringof airway surfaces by thick, viscous, neutrophil-dominated mucopurulent debris are among thepathological hallmarks of the disease. Glandularhyperplasia in submucosal regions is prominentand surrounded by peribronchiolar inflammationand scar tissue. Submucosal gland ducts are incon-spicuous in the lungs of patients without cystic fi-brosis, whereas luminal dilatation by mucus is oneof the earliest discernible changes in the lungs ofnewborns and children with cystic fibrosis. Patho-gens such as
Pseudomonas aeruginosa, Burkholderia ce-pacia, Staphylococcus aureus,
and
Haemophilus influenzae
become well established within firmly fixed airwaysecretions in patients with cystic fibrosis and arenot effectively eradicated.
P. aeruginosa,
for exam-ple, specifically adapts to the pulmonary microen-vironment in patients with cystic fibrosis throughthe formation of macrocolonies (or biofilms) andthe production of a capsular polysaccharide (analginate product) that inhibits penetration by anti-
pathobiologic featuresof organ system disease
Airway surfaceliquid layer
Mucouslayer (gel)
White blood cell
Submucosalglandular duct
Goblet cell
A
B
C
D
Airway lumen
Connectivetissue
Epithelialcells
Epithelial cell
Ciliated surfaceepithelium
Submucosalglands
Submucosalglands
100 mm
Figure 2. Extrusion of Mucus Secretion onto the Epithe-lial Surface of Airways in Cystic Fibrosis.
Panel A shows a schematic of the surface epithelium and supporting glandular structure of the human airway. In Panel B, the submucosal glands of a patient with cystic fi-brosis are filled with mucus, and mucopurulent debris overlies the airway surfaces, essentially burying the epi-thelium. Panel C is a higher-magnification view of a mu-cus plug tightly adhering to the airway surface, with ar-rows indicating the interface between infected and inflamed secretions and the underlying epithelium to which the secretions adhere. (Both Panels B and C were stained with hematoxylin and eosin, with the colors mod-ified to highlight structures.) Infected secretions ob-struct airways and, over time, dramatically disrupt the normal architecture of the lung. In Panel D, CFTR is ex-pressed in surface epithelium and serous cells at the base of submucosal glands in a porcine lung sample, as shown by the dark staining, signifying binding by CFTR antibodies to epithelial structures (aminoethylcarbazole detection of horseradish peroxidase with hematoxylin counterstain).
Copyright © 2005 Massachusetts Medical Society. All rights reserved. Downloaded from www.nejm.org at MICHIGAN STATE UNIV LIB on November 25, 2008 . 277

n engl j med
352;19
www.nejm.org may
12, 2005
mechanisms of disease
1995
microbial agents and confers the mucoid pheno-type.
21,22
Pulmonary inflammation is another major causeof the decline in respiratory function in patientswith cystic fibrosis and may precede the onset ofchronic infection. Elevated levels of interleukin-8,interleukin-6, tumor necrosis factor
a
, and leuko-triene B
4
, along with reduced levels of antiinflam-matory cytokines and proteases, have been foundin the airways of patients with cystic fibrosis. Toll-like receptors, which recognize a variety of inflam-matory mediators (including neutrophil elastase,bacterial lipopolysaccharide, and other microbialproducts), mediate inflammatory effects in part byactivating the transcription factor nuclear factor-
k
B,which governs a molecular pathway that inducesthe production of inflammatory proteins and cyto-kines.
23-26
Recently, an elevated ratio of arachidon-ic acid to docosahexaenoic acid was found in mu-cosal scrapings from patients with cystic fibrosis,as compared with scrapings from normal personsand from patients with inflammatory bowel disease;thus, the altered ratio cannot be explained by sys-temic inflammation alone.
27
These and other in-flammatory mediators such as mannose-bindingprotein and alpha
1
-antitrypsin influence the pro-gression of lung disease.
27-32
The absence of normal CFTR activity in patientswith cystic fibrosis also engenders obstruction inother organs. Mucinous impaction and thick con-cretions within pancreatic ducts lead to chronic fi-brosis, fatty replacement of the gland, or both andto formes frustes of the disease in a large subgroupof patients with a previous diagnosis of idiopathicor alcoholic pancreatitis.
33,34
Nearly 10 percent ofpatients with the disease are born with intestinalobstruction (meconium ileus), a fatal condition ifleft untreated. Men with cystic fibrosis are frequent-ly infertile because of glandular obstruction of thevas deferens in utero, which causes involution of thewolffian duct, vas deferens, and associated struc-tures.
CFTR
mutations can also cause infertility inotherwise normal men as a result of the cystic fi-brosis variant, called congenital bilateral absenceof the vas deferens.
35
Similar obstruction of bilecanaliculi frequently causes hepatic damage and,in some patients, overt cirrhosis.
There is widespread agreement that defects in iontransport, salt homeostasis, or both are intimately
linked to organ damage in cystic fibrosis. The pre-cise molecular basis for this connection, however,is unknown. Conversely, sweat glands in patientswith cystic fibrosis, which usually do not becomeobstructed or show major pathologic abnormali-ties, have pronounced abnormalities in sodiumchloride homeostasis that are well understood. Inhuman sweat glands, primary secretion elaboratedin the glandular coil is modified as it traverses thesweat duct, before emerging on the surface of theskin. Under normal conditions, sodium (followedby chloride counter-ion) is avidly reabsorbed fromthe ductular lumen, primarily through apical so-dium channels and CFTR (Fig. 3). In patients withcystic fibrosis, the absence of functioning CFTRrestricts reabsorption of chloride, thereby limitingthe amount of salt that can be reclaimed. Becausethere is no other pathway for effective chloride re-absorption in the duct, sodium is also poorly ab-sorbed, and sweat emerging on the skin surfacecontains a high level of salt. By the same token, incystic fibrosis, the transepithelial potential differ-ence across the sweat duct (the lumen-negativetransepithelial voltage) is two to three times thenormal value. The increased lumen-negative sur-face charge is caused by an inability to reabsorbchloride despite the continued existence of path-ways for sodium uptake.
Abnormalities of salt and fluid metabolism havealso been examined in vivo in human and murinelungs. Knowles et al. popularized a method formeasuring the transepithelial potential differenceacross nasal and lower airways in human subjectswith the use of mucosal superperfusion.
36
This invivo bioelectric measurement reveals virtually patho-gnomonic defects and can be used as a diagnostictest for cystic fibrosis. For example, under basalconditions, the transepithelial potential differencedue to sodium uptake is two to three times as great(lumen negative) in patients with cystic fibrosis asin persons without the disease.
A traditional way of explaining airway mucosalobstruction (the low-volume model) argues persua-sively that pulmonary surface epithelium in cysticfibrosis behaves in a fashion essentially oppositethat of the sweat duct (Fig. 4). In this model, the ab-sence of CFTR leads to overactivity of sodium ab-sorption through the epithelial sodium channel(Fig. 4D). The mucosal surface has a more nega-
mechanism underlyingthe sweat-gland abnormality
bioelectric measurementsin the lung
Copyright © 2005 Massachusetts Medical Society. All rights reserved. Downloaded from www.nejm.org at MICHIGAN STATE UNIV LIB on November 25, 2008 . 278
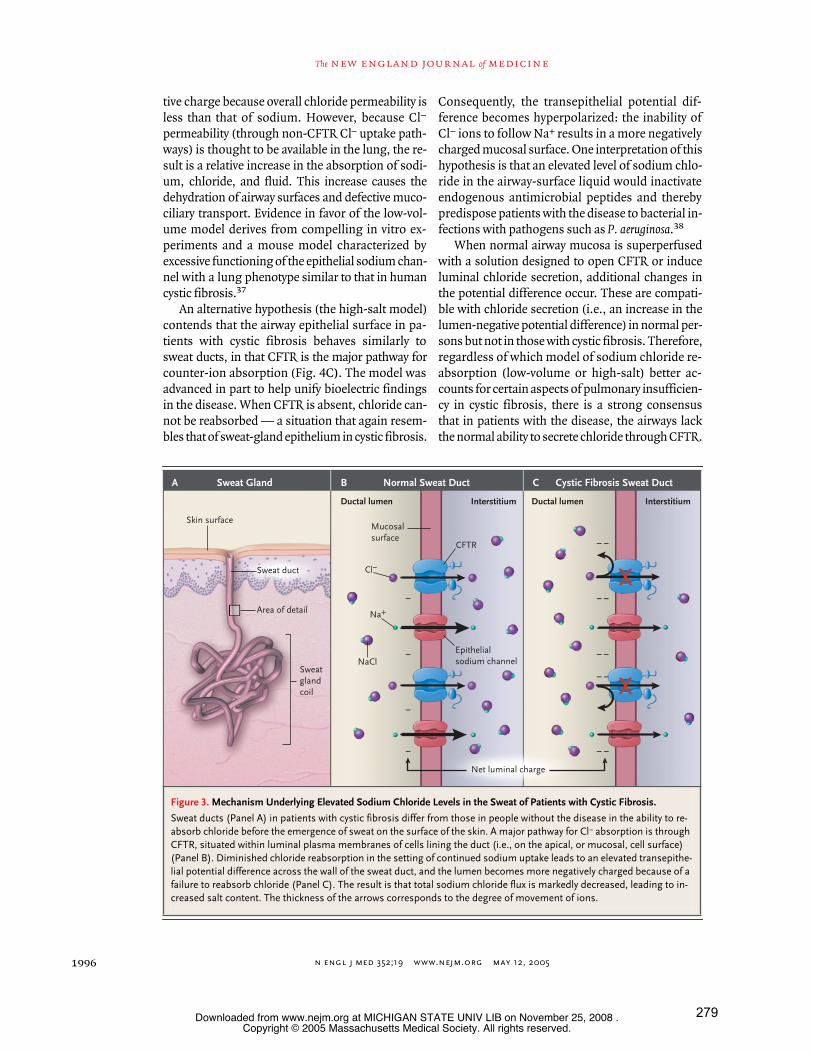
n engl j med
352;19
www.nejm.org may
12
,
2005
The
new england journal
of
medicine
1996
tive charge because overall chloride permeability isless than that of sodium. However, because Cl
¡
permeability (through non-CFTR Cl
¡
uptake path-ways) is thought to be available in the lung, the re-sult is a relative increase in the absorption of sodi-um, chloride, and fluid. This increase causes thedehydration of airway surfaces and defective muco-ciliary transport. Evidence in favor of the low-vol-ume model derives from compelling in vitro ex-periments and a mouse model characterized byexcessive functioning of the epithelial sodium chan-nel with a lung phenotype similar to that in humancystic fibrosis.
37
An alternative hypothesis (the high-salt model)contends that the airway epithelial surface in pa-tients with cystic fibrosis behaves similarly tosweat ducts, in that CFTR is the major pathway forcounter-ion absorption (Fig. 4C
)
. The model wasadvanced in part to help unify bioelectric findingsin the disease. When CFTR is absent, chloride can-not be reabsorbed — a situation that again resem-bles that of sweat-gland epithelium in cystic fibrosis.
Consequently, the transepithelial potential dif-ference becomes hyperpolarized: the inability ofCl
¡
ions to follow Na
+
results in a more negativelycharged mucosal surface. One interpretation of thishypothesis is that an elevated level of sodium chlo-ride in the airway-surface liquid would inactivateendogenous antimicrobial peptides and therebypredispose patients with the disease to bacterial in-fections with pathogens such as
P. aeruginosa
.
38
When normal airway mucosa is superperfusedwith a solution designed to open CFTR or induceluminal chloride secretion, additional changes inthe potential difference occur. These are compati-ble with chloride secretion (i.e., an increase in thelumen-negative potential difference) in normal per-sons but not in those with cystic fibrosis. Therefore,regardless of which model of sodium chloride re-absorption (low-volume or high-salt) better ac-counts for certain aspects of pulmonary insufficien-cy in cystic fibrosis, there is a strong consensusthat in patients with the disease, the airways lackthe normal ability to secrete chloride through CFTR.
Figure 3. Mechanism Underlying Elevated Sodium Chloride Levels in the Sweat of Patients with Cystic Fibrosis.
Sweat ducts (Panel A) in patients with cystic fibrosis differ from those in people without the disease in the ability to re-absorb chloride before the emergence of sweat on the surface of the skin. A major pathway for Cl
¡
absorption is through CFTR, situated within luminal plasma membranes of cells lining the duct (i.e., on the apical, or mucosal, cell surface) (Panel B). Diminished chloride reabsorption in the setting of continued sodium uptake leads to an elevated transepithe-lial potential difference across the wall of the sweat duct, and the lumen becomes more negatively charged because of a failure to reabsorb chloride (Panel C). The result is that total sodium chloride flux is markedly decreased, leading to in-creased salt content. The thickness of the arrows corresponds to the degree of movement of ions.
A Sweat Gland B Normal Sweat Duct C Cystic Fibrosis Sweat Duct
Ductal lumen
Skin surface
Net luminal charge
Interstitium
Epithelialsodium channel
Ductal lumen Interstitium
CFTR
Na+
NaCl
_
_
_
_
_
_
_
_
_
_
_
_
_
_
Sweat duct
Area of detail
Sweatglandcoil
Cl¡
Mucosalsurface
x
x
Copyright © 2005 Massachusetts Medical Society. All rights reserved. Downloaded from www.nejm.org at MICHIGAN STATE UNIV LIB on November 25, 2008 . 279

n engl j med
352;19
www.nejm.org may
12, 2005
mechanisms of disease
1997
Compounds such as adenosine, genistein, andphosphodiesterase inhibitors augment residualchloride secretion by mutant CFTR channels andform the basis of clinical experiments to restorefunction in patients with cystic fibrosis. A unifiedmodel of organ-system pathophysiology emanatesnaturally from a universally acknowledged defectin chloride secretion in the disease.
Abnormalities in sodium chloride absorption orantimicrobial peptide function that are invoked toexplain specific pulmonary defects in cystic fibrosisare unlikely to contribute to disease-related damagein other organs. In the pancreas, there is no evi-dence of either sodium hyperabsorption or overac-
tivity of the epithelial sodium channel, and abnor-malities of antimicrobial peptides are not believedto contribute to exocrine pancreatic insufficiencyin cystic fibrosis. In the intestine, neither immunealterations nor increased susceptibility to clinicallyapparent infection has been implicated. In tissuesin which sodium transport has been examined (e.g.,in samples of rectal mucosa and proximal ileumfrom patients with cystic fibrosis and in the ob-structed intestine in the mouse model of the dis-ease
39
), the activity of sodium-uptake pathways isvariable and in some cases is decreased. By con-trast, virtually every tissue that is affected by thedisease is defective in chloride and fluid secretion.It is generally believed that in pancreatic ducts, thefailure of the release of anions (including those ofchloride and bicarbonate) due to CFTR dysfunc-tion and deficient fluid secretion impairs flushing
glandular secretion and small-airway physiology
Figure 4. Models Explaining the Transepithelial Potential Difference across the Airway Epithelium in Cystic Fibrosis.
Under normal conditions, sodium chloride is absorbed from the airways (Panel A). The first step of this process uses sodium and chloride ab-sorptive pathways present in the luminal (apical) membranes of airway-surface epithelial cells, designated as the mucosal surface (Panel B). In a bioelectric assay (a measurement of the transepithelial potential difference), the lumen is negative in part because of the relative im-permeability of chloride as compared with sodium. The relative contribution of CFTR and other non-CFTR Cl
¡
permeability pathways is not known. The transepithelial potential difference is markedly hyperpolarized (i.e., the lumen is much more negatively charged) in cystic fibrosis. Two models have been proposed to explain this difference. In the high-salt model (Panel C), the situation resembles that of the sweat duct, in which the absence of CFTR leads to the inability to reabsorb chloride ion from airway-surface liquid. Because of the continued activity of sodium ion reabsorption, which is dependent on epithelial sodium channels, the airway surface negativity is increased (lumen-negative). According to this model, although a large charge separation is observed (with positively charged sodium ions moving across the airway wall and negatively charged chloride ions remaining behind), the net sodium chloride reabsorption decreases because of the inability to reabsorb chloride counter-ions. In the low-volume model (Panel D), both sodium and chloride are hyperabsorbed. The airways of patients with cystic fibrosis are slightly less permeable to chloride ions than they are to sodium ions, a process that leads to an increased transepithelial potential difference. This model predicts a depletion in the volume of airway-surface liquid (shown in blue). The thickness of the arrows corresponds to the degree of movement of ions.
A Airway Anatomy B Normal Airway Epithelium C D Low-Volume ModelHigh-Salt Model
Airway lumen
Net luminal charge
Interstitium Airway lumen Interstitium Airway lumen Interstitium
Epithelialsodiumchannel
CFTR
Airwaysurfaceliquid
Cl¡
Na+
NaCl
_
_
_
_ __
__
__
__ __
__
__
__
__
__
Other chlorideabsorptivepathways
Area ofdetail
Mucosalsurface
x
x
x
Copyright © 2005 Massachusetts Medical Society. All rights reserved. Downloaded from www.nejm.org at MICHIGAN STATE UNIV LIB on November 25, 2008 . 280

n engl j med
352;19
www.nejm.org may
12
,
2005
The
new england journal
of
medicine
1998
of the exocrine glands, causing an accumulation ofmucus, obstruction, and consequent end-organdamage. A pronounced abnormality in chloridesecretion by intestinal tissues has been well docu-mented in cystic fibrosis and provides a compellingexplanation for end-organ dysfunction. Similar ar-guments can be made regarding the hyperviscoussecretions in the liver, vas deferens, and other glandsin cystic fibrosis.
New tools have emerged for testing the hypoth-esis that defective chloride secretion in airways isalso a fundamental cause of pulmonary failure incystic fibrosis. The finding of dilated glandularstructures (which occurs very early in cystic fibrosis–
associated lung disease) implicates abnormal clear-ance of glandular mucus from the ducts (a processreminiscent of the situation in the pancreas, liver,and intestine in cystic fibrosis). The levels of CFTRin airway serous glandular cells are among the high-est of any cell type in the body (Fig. 2D).
20
In thesmall airways, where surface epithelial cells con-tribute to the production of mucus, an analogousdefect in chloride and fluid secretion could resultin decreased surface liquid in airways and similarmucosal obstruction.
These considerations have led to the idea thatlung disease in cystic fibrosis is primarily attribut-able to a failure of CFTR-dependent flushing ofmucous secretion from the glands, small airways,or both. Joo et al. have directly measured glandularsecretions in lung tissues in cystic fibrosis.
40,41
Their studies suggest fundamental abnormalitiesin the mobilization and clearance of mucus fromsubmucosal glands (a process that is also crucial inthe distal small airways). Similar conclusions havebeen reached by Verkman and colleagues.
42,43
At-tempts to activate CFTR-independent chlorideconductance with secretagogues such as uridine5'-triphosphate or related compounds (which mayrestore or enhance mucociliary clearance) haveyielded encouraging results in clinical trials.
44,45
Models based on defects in glandular and airwaysecretion as primary contributors to respiratorydecline therefore continue to represent a vital andunifying means for understanding pulmonary de-struction due to defects in CFTR.
The
CFTR
gene encompasses approximately 180,000base pairs on the long arm of chromosome 7. Theprotein contains 1480 amino acids (Fig. 1). Morethan 1000 disease-associated mutations have beendescribed in the coding sequence, messenger RNAsplice signals, and other regions. These mutationscan be classified on the basis of the mechanism bywhich they are believed to cause disease (Fig. 5).The most common mutation, which is termed
Δ
F508 and is present in approximately 70 percentof defective
CFTR
alleles and in 90 percent of pa-tients with cystic fibrosis in the United States, iscategorized as a class II defect. CFTR with the
Δ
F508mutation lacks a phenylalanine (F) residue at posi-tion 508. The defective protein retains substantialchloride-channel function in cell-free lipid mem-
mutations in cftrand their consequences
Figure 5. Categories of
CFTR
Mutations.
Classes of defects in the
CFTR
gene include the absence of synthesis (class I); defective protein maturation and premature degradation (class II); disordered regulation, such as diminished ATP binding and hydrolysis (class III); defec-tive chloride conductance or channel gating (class IV); a reduced number of CFTR transcripts due to a promoter or splicing abnormality (class V); and accelerated turnover from the cell surface (class VI).
46
Class III
Class IV Class VI
Class II
Class VClass I x
x
x
x
Cl-
Acceleratedturnover
Golgicomplex
Proteosome
Endoplasmicreticulum
Nucleus
CFTRCFTR
Copyright © 2005 Massachusetts Medical Society. All rights reserved. Downloaded from www.nejm.org at MICHIGAN STATE UNIV LIB on November 25, 2008 . 281
n engl j med
352;19
www.nejm.org may
12, 2005
mechanisms of disease
1999
branes. When synthesized by the normal cellularmachinery, however, the protein is rapidly recog-nized as misfolded and is degraded shortly after syn-thesis, before it can reach its crucial site of action atthe cell surface. Like
Δ
F508, several other clinicallyimportant mutations — such as N1303K, G85E,and G91R — lead to misfolded CFTR protein thatis prematurely degraded.
About 5 to 10 percent of
CFTR
mutations are dueto premature truncation or nonsense alleles (desig-nated by “X,” such as G542X, a class I mutation).As a result of a genetic founder effect, prematurelytruncated CFTR is particularly prevalent amongpersons of Ashkenazi Jewish descent. Other
CFTR
mutations encode properly processed, full-lengthCFTR protein that lacks normal ion-channel activ-ity. For example, the G551D mutation (class III) isbelieved to possess little or no chloride-channelfunction in vivo because of abnormal function of anucleotide-binding domain, resulting in disorderedregulation. The A455E mutation (class IV) exhibitsonly partial CFTR ion-channel activity, a feature thatprobably explains a less severe pulmonary pheno-type.
47
Other mutation classes include reducednumbers of CFTR transcripts (class V) and defec-tive CFTR stability at the cell surface (class VI).
48-50
Insight into the cellular consequences of defectiveCFTR suggests a role for tailored therapies, a pre-dominant theme in clinical research on cystic fibro-sis. For example, robotic drug screening of morethan a million random compounds has led to thediscovery of compounds that correct the
Δ
F508 ab-normality by restoring
the mutant protein to itsnormal position at the cell surface (thereby partial-ly restoring chloride-channel function).
51,52
Therecently elucidated crystal structure of nucleotide-binding domain 1 localizes the crucial phenylala-nine 508 residue to a loop on the external surfaceof the domain. Because of this structure, drug-screening laboratories can test the specificity of
Δ
F508-correcting compounds by co-crystallizationwith the CFTR protein.
53
Curcumin, a nontoxiccompound and the major constituent of the spice
tumeric, has been shown to correct
Δ
F508 process-ing in a number of in vitro model systems and pro-long life in mice that are homozygous for the
Δ
F508mutation.
54,55
New compounds that correct thisfundamental processing abnormality in CFTRshould undergo clinical testing in the near future.
A number of agents have also been shown tosuppress premature stop codons in
CFTR
(class I)mutations, including the surprising finding thatribosomally active drugs such as gentamicin maybe capable of correcting premature stop codons inhuman subjects.
56,57
This same concept has beenapplied to other diseases caused by premature stopcodons, including Duchenne’s muscular dystrophy,Hurler’s syndrome, and disorders resulting frommutations in the p53 tumor-suppressor gene.
58-60
High-throughput screening programs specificallydesigned to identify drugs that activate residualCFTR activity (class III and IV mutations) have alsobeen successful.
61-64
Important advances have improved our understand-ing of the role of the CFTR protein in the progres-sion of suppurative pulmonary failure in cystic fibro-sis. These discoveries are ushering in a new era oftranslational research that incorporates specifictherapeutic targets and new cellular pathways.Progress in research on cystic fibrosis will continueto rely on an improved understanding of CFTRfunction and its relationship to mucociliary clear-ance, airway secretion, and other ion channels. Clin-ical advances directed at the correction of CFTRfunction predict an optimistic future for patientswith cystic fibrosis and their families.
Dr. Sorscher is coinventor of a method of making and usinghuman papillomavirus vectors for transduction of host cells and acoinventor of a method of activating chloride secretion. Patentson these methods are unlicensed and held by the University ofAlabama.
We are indebted to Drs. J.P. Clancy, James Hagood, Jeff Wine,Jonathan Widdecome, Paul Quinton, Michael Welsh, and Garry Cut-ting for their useful discussion and suggestions; to Drs. Zsuzsa Be-bok and David Kelly for their scientific contributions to the figures;to Mikelle Foster, Jane Schell, and David Fischer for assistance in thepreparation of the manuscript; and to Chris Valarie, Anne Marie Sei-bel, and Hughes Evans for initiating some of the analysis describedin the article.
interventions tailoredto specific cftr defects
summary
references
1.
Cystic Fibrosis Foundation National Pa-tient Registry Annual Data Report 2003. Be-thesda, Md.: Cystic Fibrosis Foundation,2004.
2.
Gibson RL, Burns JL, Ramsey BW. Patho-physiology and management of pulmonaryinfections in cystic fibrosis. Am J Respir CritCare Med 2003;168:918-51.
3.
Ratjen F, Doring G. Cystic fibrosis. Lan-cet 2003;361:681-9.
4.
Yankaskas JR, Marshall BC, Sufian B,Simon RH, Rodman D. Cystic fibrosis adult
Copyright © 2005 Massachusetts Medical Society. All rights reserved. Downloaded from www.nejm.org at MICHIGAN STATE UNIV LIB on November 25, 2008 . 282
n engl j med
352;19
www.nejm.org may
12
,
2005
The
new england journal
of
medicine
2000
care: consensus conference report. Chest2004;125:Suppl:1S-39S.
5.
Lowe CU, May CD, Reed SC. Fibrosis ofthe pancreas in infants and children: a sta-tistical study of clinical and hereditary fea-tures. Am J Dis Child 1949;78:349-74.
6.
Quinton PM. Missing Cl conductance incystic fibrosis. Am J Physiol 1986;251:C649-C652.
7.
Knowles M, Gatzy J, Boucher R. Relativeion permeability of normal and cystic fibro-sis nasal epithelium. J Clin Invest 1983;71:1410-7.
8.
Welsh MJ, Liedtke CM. Chloride andpotassium channels in cystic fibrosis airwayepithelia. Nature 1986;322:467-70.
9.
Welsh MJ. An apical-membrane chlo-ride channel in human tracheal epithelium.Science 1986;232:1648-50.
10.
Schoumacher RA, Shoemaker RL, HalmDR, Tallant EA, Wallace RW, Frizzell RA.Phosphorylation fails to activate chloridechannels from cystic fibrosis airway cells.Nature 1987;330:752-4.
11.
Riordan JR, Rommens JM, Kerem B, etal. Identification of the cystic fibrosis gene:cloning and characterization of comple-mentary DNA. Science 1989;245:1066-73.[Erratum, Science 1989;245:1437.]
12.
Kerem B, Rommens JM, Buchanan JA,et al. Identification of the cystic fibrosisgene: genetic analysis. Science 1989;245:1073-80.
13.
Rommens JM, Iannuzzi MC, Kerem B,et al. Identification of the cystic fibrosisgene: chromosome walking and jumping.Science 1989;245:1059-65.
14.
Borst P, Elferink RO. Mammalian ABCtransporters in health and disease. AnnuRev Biochem 2002;71:537-92.
15.
Rich DP, Anderson MP, Gregory RJ, etal. Expression of cystic fibrosis transmem-brane conductance regulator corrects defec-tive chloride channel regulation in cystic fi-brosis airway epithelial cells. Nature 1990;347:358-63.
16. Bear CE, Li CH, Kartner N, et al. Purifi-cation and functional reconstitution of thecystic fibrosis transmembrane conductanceregulator (CFTR). Cell 1992;68:809-18.17. Kunzelmann K, Schreiber R, NitschkeR, Mall M. Control of epithelial Na+ con-ductance by the cystic fibrosis transmem-brane conductance regulator. Pflugers Arch2000;440:193-201.18. Short DB, Trotter KW, Reczek D, et al.An apical PDZ protein anchors the cystic fi-brosis transmembrane conductance regula-tor to the cytoskeleton. J Biol Chem 1998;273:19797-801.19. Xu Y, Clark JC, Aronow BJ, et al. Tran-scriptional adaptation to cystic fibrosis trans-membrane conductance regulator deficien-cy. J Biol Chem 2003;278:7674-82.20. Engelhardt JF, Yankaskas JR, Ernst SA,et al. Submucosal glands are the predomi-nant site of CFTR expression in the humanbronchus. Nat Genet 1992;2:240-8.
21. Wyckoff TJ, Thomas B, Hassett DJ, Woz-niak DJ. Static growth of mucoid Pseudomo-nas aeruginosa selects for non-mucoid vari-ants that have acquired flagellum-dependentmotility. Microbiology 2002;148:3423-30.22. Whiteley M, Bangera MG, BumgarnerRE, et al. Gene expression in Pseudomonasaeruginosa biofilms. Nature 2001;413:860-4.23. Sagel SD, Sontag MK, Wagener JS,Kapsner RK, Osberg I, Accurso FJ. Inducedsputum inflammatory measures correlatewith lung function in children with cystic fi-brosis. J Pediatr 2002;141:811-7.24. Konstan MW, Davis PB. Pharmacologi-cal approaches for the discovery and devel-opment of new anti-inflammatory agentsfor the treatment of cystic fibrosis. Adv DrugDeliv Rev 2002;54:1409-23.25. Koehler DR, Downey GP, Sweezey NB,Tanswell AK, Hu J. Lung inflammation as atherapeutic target in cystic fibrosis. Am JRespir Cell Mol Biol 2004;31:377-81.26. Muir A, Soong G, Sokol S, et al. Toll-likereceptors in normal and cystic fibrosis air-way epithelial cells. Am J Respir Cell MolBiol 2004;30:777-83.27. Freedman SD, Blanco PG, Zaman MM,et al. Association of cystic fibrosis with ab-normalities in fatty acid metabolism. N EnglJ Med 2004;350:560-9.28. Garred P, Pressler T, Madsen HO, et al.Association of mannose-binding lectin geneheterogeneity with severity of lung diseaseand survival in cystic fibrosis. J Clin Invest1999;104:431-7.29. Puchelle E, De Bentzmann S, Hubeau C,Jacquot J, Gaillard D. Mechanisms involvedin cystic fibrosis airway inflammation. Pedi-atr Pulmonol 2001;Suppl 23:143-5.30. Sagel SD, Accurso FJ. Monitoring in-flammation in CF: cytokines. Clin Rev Aller-gy Immunol 2002;23:41-57.31. Hilliard JB, Konstan MW, Davis PB. In-flammatory mediators in CF patients. Meth-ods Mol Med 2002;70:409-31.32. Frangolias DD, Ruan J, Wilcox PJ, et al.Alpha 1-antitrypsin deficiency alleles in cyst-ic fibrosis lung disease. Am J Respir Cell MolBiol 2003;29:390-6.33. Cohn JA, Friedman KJ, Noone PG,Knowles MR, Silverman LM, Jowell PS. Rela-tion between mutations of the cystic fibrosisgene and idiopathic pancreatitis. N Engl JMed 1998;339:653-8.34. Sharer N, Schwarz M, Malone G, et al.Mutations of the cystic fibrosis gene in pa-tients with chronic pancreatitis. N Engl JMed 1998;339:645-52.35. Chillón M, Casals T, Mercier B, et al.Mutations in the cystic fibrosis gene in pa-tients with congenital absence of the vasdeferens. N Engl J Med 1995;332:1475-80.36. Knowles M, Gatzy J, Boucher R. In-creased bioelectric potential differenceacross respiratory epithelia in cystic fibrosis.N Engl J Med 1981;305:1489-95.37. Mall M, Grubb BR, Harkema JR, O’NealWK, Boucher RC. Increased airway epithe-
lial Na+ absorption produces cystic fibrosis-like lung disease in mice. Nat Med 2004;10:487-93.38. Smith JJ, Travis SM, Greenberg EP,Welsh MJ. Cystic fibrosis airway epitheliafail to kill bacteria because of abnormal air-way surface fluid. Cell 1996;85:229-36.39. Grubb BR. Ion transport across the nor-mal and CF neonatal murine intestine. Am JPhysiol 1999;277:G167-G174.40. Joo NS, Irokawa T, Wu JV, Robbins RC,Whyte RI, Wine JJ. Absent secretion to vaso-active intestinal peptide in cystic fibrosis air-way glands. J Biol Chem 2002;277:50710-5.41. Joo NS, Saenz Y, Krouse ME, Wine JJ.Mucus secretion from single submucosalglands of pig: stimulation by carbachol andvasoactive intestinal peptide. J Biol Chem2002;277:28167-75.42. Jayaraman S, Joo NS, Reitz B, Wine JJ,Verkman AS. Submucosal gland secretionsin airways from cystic fibrosis patients havenormal [Na(+)] and pH but elevated viscosity.Proc Natl Acad Sci U S A 2001;98:8119-23.43. Verkman AS, Song Y, Thiagarajah JR.Role of airway surface liquid and submuco-sal glands in cystic fibrosis lung disease. AmJ Physiol Cell Physiol 2003;284:C2-C15.44. Olivier KN, Bennett WD, Hohneker KW,et al. Acute safety and effects on mucociliaryclearance of aerosolized uridine 5'-triphos-phate +/¡ amiloride in normal human adults.Am J Respir Crit Care Med 1996;154:217-23.45. Deterding RR, La Vange L, Mathews D,et al. Safety and efficacy of INS37217 inhala-tion solution, a novel P2Y2 receptor agonist,in patients with mild cystic fibrosis: resultsof a phase 2 multi-center study. Pediatr Pul-monol Suppl 2004;38:249. abstract.46. Zeitlin PL. Pharmacologic restoration ofdelta F508 CFTR-mediated chloride current.Kidney Int 2000;57:832-7.47. Gan KH, Veeze HJ, van den OuwelandAM, et al. A cystic fibrosis mutation associ-ated with mild lung disease. N Engl J Med1995;333:95-9.48. Welsh MJ, Smith AE. Molecular mecha-nisms of CFTR chloride channel dysfunc-tion in cystic fibrosis. Cell 1993;73:1251-4.49. Zielenski J, Tsui LC. Cystic fibrosis: ge-notypic and phenotypic variations. AnnuRev Genet 1995;29:777-807.50. Haardt M, Benharouga M, LechardeurD, Kartner N, Lukacs GL. C-terminal trunca-tions destabilize the cystic fibrosis trans-membrane conductance regulator withoutimpairing its biogenesis: a novel class of mu-tation. J Biol Chem 1999;274:21873-7.51. Verkman AS, Pedemonte N, Du K, et al.Small-molecule activators (potentiators andcorrectors) of DF508-CFTR identified byhigh-throughput screening. Pediatr Pul-monol Suppl 2003;36:290. abstract.52. Verkman AS. Drug discovery in aca-demia. Am J Physiol Cell Physiol 2004;286:C465-C474.53. Lewis HA, Buchanan SG, Burley SK, etal. Structure of nucleotide-binding domain 1
Copyright © 2005 Massachusetts Medical Society. All rights reserved. Downloaded from www.nejm.org at MICHIGAN STATE UNIV LIB on November 25, 2008 . 3

n engl j med 352;19 www.nejm.org may 12, 2005
mechanisms of disease
2001
of the cystic fibrosis transmembrane conduc-tance regulator. EMBO J 2004;23:282-93.54. Zeitlin P. Can curcumin cure cystic fi-brosis? N Engl J Med 2004;351:606-8.55. Egan ME, Pearson M, Weiner SA, et al.Curcumin, a major constituent of turmeric,corrects cystic fibrosis defects. Science 2004;304:600-2.56. Clancy JP, Bebok Z, Ruiz F, et al. Evi-dence that systemic gentamicin suppressespremature stop mutations in patients withcystic fibrosis. Am J Respir Crit Care Med2001;163:1683-92.57. Wilschanski M, Yahav Y, Yaacov Y, et al.Gentamicin-induced correction of CFTRfunction in patients with cystic fibrosis andCFTR stop mutations. N Engl J Med 2003;349:1433-41.58. Keeling KM, Brooks DA, Hopwood JJ, Li
P, Thompson JN, Bedwell DM. Gentamicin-mediated suppression of Hurler syndromestop mutations restores a low level of alpha-L-iduronidase activity and reduces lysoso-mal glycosaminoglycan accumulation. HumMol Genet 2001;10:291-9.59. Wagner KR, Hamed S, Hadley DW, et al.Gentamicin treatment of Duchenne andBecker muscular dystrophy due to nonsensemutations. Ann Neurol 2001;49:706-11.60. Keeling KM, Bedwell DM. Clinically rel-evant aminoglycosides can suppress disease-associated premature stop mutations in theIDUA and P53 cDNAs in a mammaliantranslation system. J Mol Med 2002;80:367-76.61. Galietta LV, Jayaraman S, Verkman AS.Cell-based assay for high-throughput quan-titative screening of CFTR chloride trans-
port agonists. Am J Physiol Cell Physiol2001;281:C1734-42.62. Galietta LJ, Springsteel MF, Eda M, et al.Novel CFTR chloride channel activators iden-tified by screening of combinatorial librariesbased on flavone and benzoquinoliziniumlead compounds. J Biol Chem 2001;276:19723-8.63. Ma T, Vetrivel L, Yang H, et al. High-affinity activators of cystic fibrosis trans-membrane conductance regulator (CFTR)chloride conductance identified by high-throughput screening. J Biol Chem 2002;277:37235-41.64. Gill S, Gill R, Lee SS, et al. Flux assays inhigh throughput screening of ion channelsin drug discovery. Assay Drug Dev Technol2003;1:709-17.Copyright © 2005 Massachusetts Medical Society.
journal editorial fellow
The Journal’s editorial office invites applications for a one-year research fellowship beginning in July 2006 from individuals at any stage of training. The editorial fellow will work on Journal projects
and will participate in the day-to-day editorial activities of the Journal but is expected in addition to have his or her own independent
projects. Please send curriculum vitae and research interests to the Editor-in-Chief, 10 Shattuck St., Boston, MA 02115
(fax, 617-739-9864), by September 30, 2005.
Copyright © 2005 Massachusetts Medical Society. All rights reserved. Downloaded from www.nejm.org at MICHIGAN STATE UNIV LIB on November 25, 2008 . 4

Polymerase Chain Reaction
5

!
6

CLIN. CHEM. 39/5, 804-809 (1993)
Rapid Cycle Allele-Specific Amplification: Studies with the Cystic Fibrosis
SF508 Locus
Carl T. Wittwer,”5 Bruce C. Marshall,2 Gudrun H. Reed,3 and Joshua L. Cherry4
Rapid cycle DNA amplification is a polymerase chain
reaction technique with improved product specificity and
cycle times of 20-60 s, allowing complete 30-cycle
reactions in 10-30 mm. The presence or absence of the
SF505 deletion and wild-type allele was determined in
104 cystic fibrosis patients by rapid cycle DNA amplifi-
cation. In separate allele-specific assays, sequences on
both sides of the i F508 locus were amplified with the 3’
end of a discriminating primer at the i Fso8 locus, with
either a 3-bp or a 1-bp mismatch. With rapid cycling
(35-s cycles), single-base discrimination was achieved
over a broad range of annealing temperatures (50 #{176}Cor
lower); with conventional cycling and “hot starts” (160-s
cycles), only annealing temperatures of 61-62 #{176}Csuffi-
ciently discriminated between alleles. With rapid cycling,
genotype could still be assessed with annealing temper-
atures as low as 25 #{176}C.We conclude that faster temper-
ature cycling can improve the results of allele-specific
amplification.
IndexIng Terms: polymerase chain reaction heritable disordersDNA probes . screening
Systematic study of the times required for in vitro
DNA amplification reveals interesting facts (1). Thirty
cycles can routinely be completed in 15 min or less.
Sample denaturation and annealing times of “0”-l s not
only are sufficient, but appear to improve the specificity
of reaction. Limitations on the speed of DNA amplifica-
tion arise not from kinetic requirements of the underly-
ing reactions, but rather from the instrumentation usu-
ally used for temperature cycling. The fastest system
reported makes use of capillary tubes as containers and
air as the heat-transfer medium (1-3). Specificity of
reaction is particularly important in allele-specific am-
plification. Single-base mismatches at the 3’ end of one
primer may or may not be amplified, depending on the
type of mismatch and reaction conditions (4). The po-
tential advantages of rapid temperature cycling for
allele-specific amplification in clinical diagnostics have
not previously been tested.
Cystic fibrosis is the most common autosomal reces-
sive disease in Caucasians, with a carrier rate of -1:25
(5). A 3-bp deletion within the cystic fibrosis transmem-
brane conductance regulator gene produces a phenylal-
anine deletion at residue 508 (SF508) and occurs in
Departments of’ Pathology,2 Medicine, and4 Human Genetics,
University of Utah Medical School, Salt Lake City, UT 84132.3Associated Regional and University Pathologists, Inc., 500
Chipeta Way, Salt Lake City, UT 84108. for correspondence.
Received September 17, 1992; accepted December 3, 1992.
804 CLINICAL CHEMISTRY, Vol. 39, No. 5, 1993
70-75% of cystic fibrosis chromosomes (6). In anticipa-
tion of mass screening, much attention has been di-
rected toward simple, reliable, and inexpensive assays
for this mutation. Most methods are based on the
polymerase chain reaction. Alleles are detected by se-
quencing (7), allele-specific oligonucleotides (8), restric-
tion enzymes (9), size-fractionation on polyacrylamide
gels (10), or allele-specific amplification (11). Allele-
specific amplification with direct visualization on aga-
rose gels with ethidium bromide requires the least effort
and postamplification processing.
We have applied rapid cycle DNA amplification to the
allele-specific amplification of z F508 in 104 patients
with cystic fibrosis. For validation, two independent
allele-specific amplifications were developed, each for
both i F508 and wild-type alleles. The differential ampli-
fications were based on either a 3-bp mismatch or a
single base pair mismatch. Temperature cycle condi-
tions for discriminating the single-base mismatch were
rigorously determined for both rapid cycling and con-
ventional temperature cycling.
Materials and Methods
Patients with cystic fibrosis were recruited from the
Intermount.ain Cystic Fibrosis Center at the University of
Utah. After informed consent, acidlcitrate/dextrose-antico-
agulated peripheral blood was obtained for purification of
genomic DNA. Leukocyte nudei were digested in 10 g’ L
sodium dodecyl sulfate and 100-500 mgfL proteinase K at
60#{176}Cfor 1 h, extracted with phenol/chloroform, and etha-
nol-precipitated (12). DNA was resuspended in 10 mmol/L
Tiis-0.1 mmol/L EDTA by boiling.
DNA amplification reactions were performed with 10
mmol/L Tris, pH 8.3 (at 25#{176}C),3 mmol/L MgCl2, 50
mmol/L KC1, 500 mgfL bovine serum albumin, 10 g/L
Ficoll 400, 1 mmol/L tartrazine, and 0.5 .tmol of each
primer, 200 mol of each dNTP, 50 ng of human
genomic DNA, and 0.4 U of Taq polymerase per 10 L.
One unit (U) of polymerase activity was the amount of
enzyme required to incorporate 10 nmol of [3H]dTTP in
30 min at 80#{176}C, as defined by the manufacturer
(Promega, Madison, WI). Mse I was from New England
Biolabs (Beverly, MA).
Oligonucleotide primers were synthesized from the
phosphoramidites (Gene Assembler Plus; Pharmacia-
LKB, Piscataway, NJ). Two amplification primer sets
were synthesized, one on each side of the SF508 mutatio
locus. Primer 1 (GACTTCACTTCTAATGATGA) w
located at the 5’ end of exon 10 of the cystic fibrosis gen
(6). The 3’ end of primer 2 (primer 2cf: TCATCATAG
GAAACACCAAT, or primer 2wt: TCATCATAGGAAA
CACCAAA) annealed at the i F508 mutation locus
7

A
B
Discriminating Primer
DNA Template
CLINICAL CHEMISTRY, Vol. 39, No. 5, 1993 805
Primers 2cf and 2wt differed from each other only at the
3’ base. The other amplification set utilized primer 3
(CTCTTCTAGTTGGCATGC F) located at the 3’ end of
exon 10 and either primer 4cf (CCATTAAAGAAAATA-
TCATTGG) or primer 4wt (CCA11 AAAGAAAATAT-
CATCTT). Primers 4cf and 4wt differed from each other
by three bases at the 3’ end.
Temperature cycling equipment included a conven-
tional heat block instrument (DNA Thermal Cycler;
Perkin-Elmer Cetus, Norwalk, CT), a second-genera-
tion heat block instrument (System 9600; Perkin-
Elmer Cetus), and a hot-air cycler (Idaho Technology,
Idaho Falls, ID). A custom hot-air cycler was also used
for some experiments (1); the temperature/time pro-
files of the commercial and custom air cyclers were
similar. When the conventional heat block instrument
was used, all reaction components except the enzyme
were mixed (90 L) and heated to 80#{176}C.A 10-fold-
concentrated enzyme solution at 80#{176}Cwas rapidly
added and mixed for a “hot start” (13). The reaction
mixture was then overlaid with 60 L of mineral oil at
80#{176}C.Cycling was performed in “STEP cycle” mode for
35 cycles with denaturation at 94 #{176}Cfor 35 s, annealing
for 35 a at various temperatures, and elongation at
72#{176}Cfor 45 a. These times are the minimal denatur-
ation and annealing times necessary for the sample to
reach temperature in this system (1). The temperature
of a 20-FL sample in a MicroAmp” tube was monitored
in the second-generation heat block instrument. Al-
though annealing times of <10 s are “not recommend-
ed,” we used a 1-s annealing time to minimize the time
spent at the annealing temperature. When the air-
cycling instrument was used, 10-FL samples were
placed in 0.5 mm (i.d.) glass capillary tubes (Idaho
Technology). The tubes were used as supplied by the
manufacturer without siliconization, and hot starts
were not attempted. Thirty-five cycles were performed
with denaturation at 94 #{176}Cfor “0” s, annealing for “0”
s at 45#{176}Cunless otherwise specified, and elongation at
72 #{176}Cfor 10 a. For annealing temperatures of 40 #{176}C,
the cycler was placed in a cold room at 2 #{176}C.
Amplification products (10 L) were fractionated by
electrophoresis in 1.5% agarose gels unless otherwise
stated and made visible by ethidium bromide staining
and transffluxnination with ultraviolet light. The size
markers either were a Hae III digest of #{231}bx 174 RF or
were produced by cleavage of pUCBM21 DNA with Hpa
I and Dra I + Hindu (DNA molecular weight marker
VIII; Boehringer Mannheim, Indianapolis, IN). The
sample temperature in all systems was monitored with
a 0.2 mm (o.d.) thermocouple with a 0.005-s time con-
stant (IT-23; Sensortek, Clifton, NJ), placed in the
center of a mock sample.
Results
The expected products were amplified from the cystic
fibrosis locus in genomic DNA with rapid cycling (Fig-
ure 1). Primer pairs 1 and 2cf72wt amplify a 147/150-bp
roduct and primer pairs 3 and 4cf74wt amplify a 80/
3-bp product. The identity of the amplification product
cf/cf cf/wt wt/wt
Cf wt cf wt cf wt
Fig. 1. Allele-specific amplification of (of) and wild-type (wt)sequences utilizing a single-base mismatch (A) and a 3-bp mis-match (B)
(A) Pnmer 1 was combined with either primer 2cf or primer 2wt and
amplification performed as described. (B) Primer 3 was combined with either
primer 4cf or primer 4wt. Genomic DNA was either homozygous tF (cVcf),
heterozygous (cf/wt), or homozygous wild-type (wt/wt). Leftmost sam-ple: molecular size marker (Hae Ill digest of 4’ x 174 AF)
was confirmed by restriction enzyme digestion; e.g.,
digestion of the primer 1/primer 2wt product with Mse I
gave bands at --58, 54, and 34 bp (data not shown). The
amplifications were allele specific; when there was a
mismatch at the 3’ end of the discriminating primer, no
observable amplification occurred.
The validity of genotype determinations in 104 cystic
fibrosis patients was tested by the concordance of the
two independent allele-specific amplifications. In the
initial testing, performed without knowledge of the
results of the other test, 103/104 of the genotypes
concurred. The exception was a case that appeared
heterozygous with primers 1 and 2cf/2wt, but homozy-
gous Fse8 with primers 3 and 4cf/4wt. When a sample
of the original DNA stock was rediluted, the discrep-
ancy could not be repeated and the patient tested
homozygous for i F508. The parents were both hetero-
zygous for F508. Sixty of the 104 patients were ho-
mozygous SF505 (57.7%), 35 were heterozygous (33.6%),
and 9 (8.7%) were homozygous wild type. The fre-
quency of the i F508 allele was 0.75 in our cystic fibrosis
population.
The allele-specific amplification dependent on a single
base change (primer 1, primer 2cf/2wt) was optimized
for both rapid and conventional temperature cycling.
Figure 2 shows amplification products obtained with
conventional temperature cycling and hot starts at
8

9
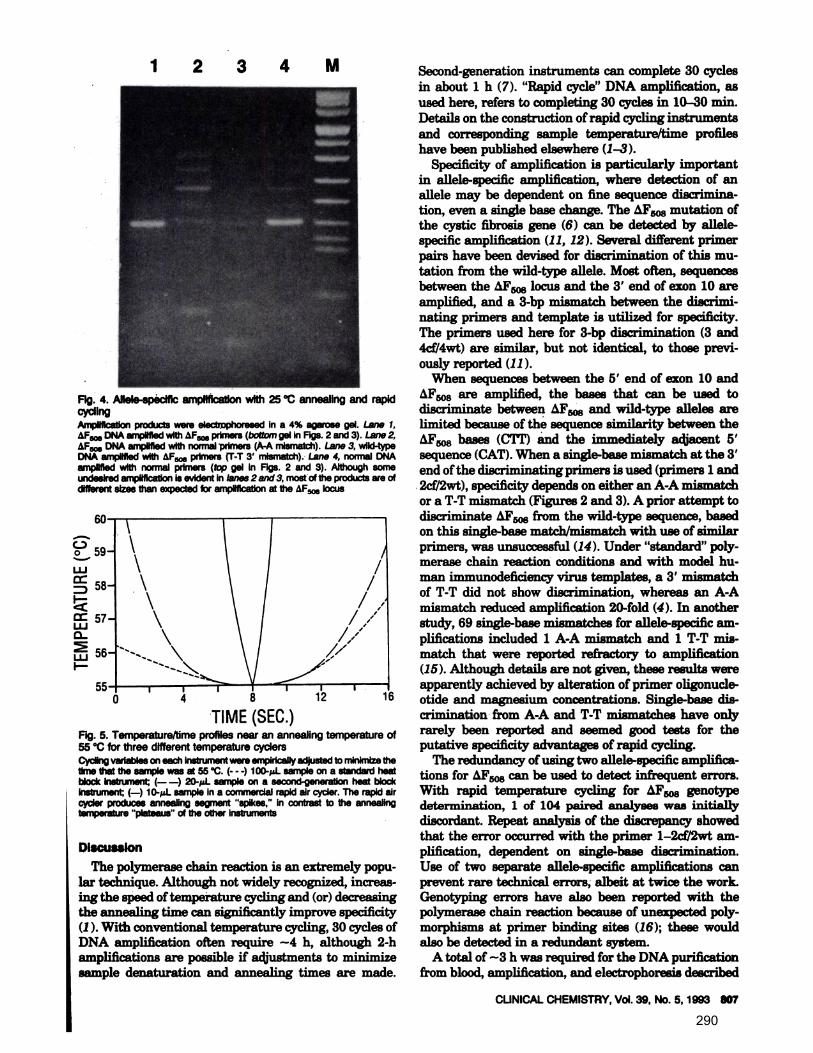
CLINICAL CHEMISTRY, Vol. 39, No.5,1993 807
1 2 3 4 M
FIg. 4. Allele-specifIc amplification wIth 25#{176}Cannealing and rapidcycling
Amplification products were electrophoresed in a 4% agarose gel. Lane 1,AF DNA amplified with primers (bottom gel in Figs. 2 and 3). Lane 2, DNA amplified with normal primers (A-A mismatch). Lane 3, wild-type
DNA amplified with AF primers (T-T 3’ mismatch). Lane 4, normal DNA
amplIfied with normal primers (top gel In Figs. 2 and 3). Although some
undesired amplification is e’,ndent in lanes 2 and 3, most of the products are of
different sizes than expected for amplification at the locus
C )0
LU
LU0
LUI-
TIME (SEC.)Fig. 5. Temperature/time profiles near an annealing temperature of55#{176}Cfor three different temperature cyclers
Cycling variables on each Instrument were empiricaily adjusted to minimize thetlare that the sample was at 55#{176}C.(-- -) 10O- L sample on a standard heat
block Instrument (- -) 20-pL sample on a second-generation heat block
Instrument (-) 1O- L sample In a commercial rapid air cycler. The rapid alr
cycler produces annealing segment ‘spikes,” In contrast to the annealingtemperature “plateaus” of the other instruments
Discussion
The polymerase chain reaction is an extremely popu-
lar technique. Although not widely recognized, increas-
ing the speed of temperature cycling and (or) decreasing
the annealing time can significantly improve specificity
(1). With conventional temperature cycling, 30 cycles of
DNA amplification often require -4 h, although 2-h
amplifications are possible if adjustments to minimize
sample denaturation and annealing times are made.
Second-generation instruments can complete 30 cycles
in about 1 h (7). “Rapid cycle” DNA amplification, as
used here, refers to completing 30 cycles in 10-30 mm.
Details on the construction of rapid cycling instruments
and corresponding sample temperature/time profiles
have been published elsewhere (1-3).
Specificity of amplification is particularly important
in allele-specific amplification, where detection of an
allele may be dependent on fine sequence discrimina-
tion, even a single base change. The Fsos mutation of
the cystic fibrosis gene (6) can be detected by allele-
specific amplification (11, 12). Several different primer
pairs have been devised for discrimination of this mu-
tation from the wild-type allele. Most often, sequences
between the locus and the 3’ end of exon 10 are
amplified, and a 3-bp mismatch between the discrimi-
nating primers and template is utilized for specificity.
The primers used here for 3-bp discrimination (3 and
4cf/4wt) are imi1ar, but not identical, to those previ-
ously reported (11).
When sequences between the 5’ end of exon 10 and
AF508 are amplified, the bases that can be used to
discriminate between and wild-type alleles are
limited because of the sequence similrnity between the
IXFso8 bases (CTT) and the immediately adjacent 5’
sequence (CAT). When a single-base mismatch at the 3’
end of the discriminating primers is used (primers 1 and
2cf/2wt), specificity depends on either an A-A mismatch
or a T-T mismatch (Figures 2 and 3). A prior attempt to
discriminate AF from the wild-type sequence, based
on this single-base match/mismatch with use of similar
primers, was unsuccessful (14). Under “standard” poly-
merase chain reaction conditions and with model hu-
man immunodeficiency virus templates, a 3’ mismatch
of T-T did not show discrimination, whereas an A-A
mismatch reduced amplification 20-fold (4). In another
study, 69 single-base mismatches for allele-specific am-
plifications included 1 A-A mismatch and 1 T-T mis-
match that were reported refractory to amplification
(15). Although details are not given, these results were
apparently achieved by alteration of primer oligonucle-
otide and magnesium concentrations. Single-base dis-
crimination from A-A and T-T mismatches have only
rarely been reported and seemed good tests for the
putative specificity advantages of rapid cycling.
The redundancy of using two allele-specific amplifica-
tions for SF508 can be used to detect infrequent errors.
With rapid temperature cycling for SF508 genotype
determination, 1 of 104 paired analyses was initially
discordant. Repeat analysis of the discrepancy showed
that the error occurred with the primer 1-2cf/2wt am-
plification, dependent on single-base discrimination.
Use of two separate allele-specific amplifications can
prevent rare technical errors, albeit at twice the work.
Genotyping errors have also been reported with the
polymerase chain reaction because of unexpected poly-
morphisms at primer binding sites (16); these would
also be detected in a redundant system.
A total of -‘3 h was required for the DNA purification
from blood, amplification, and electrophoresis described
0

here. The DNA purification was the most time-consum-
ing step (2 h). Although the genotyping system de-
scribed here is rapid and inexpensive, it is not ideal for
population screening. Current capillary-based systems
are awkward when large numbers of samples are ma-
nipulated. Automated systems that detect not only
but also multiple cystic fibrosis mutations (for a
90% detection rate) are desirable for population screen-
ing (17).
Nevertheless, an understanding of the factors contrib-
uting to “nonspecific” amplification is important not
only for testing, but also for any allele-specific
amplification and for polymerase chain reaction tech-
niques in general. Single-base discrimination with con-
ventional cycling and hot starts (13, 18) was possible
onlyinanarrowannealingrangeof6l-62 #{176}C(Figure2).
At 60#{176}C,the T-T mismatch failed to prevent amplifica-
tion. At 55#{176}C,both the T-T and A-A mismatches were
extended with good efficiency, leading to complete fail-
ure of the test for genotype.
With rapid cycling, optimal annealing temperatures
for single-base discrimination were about 15 #{176}Clower
than for conventional cycling (Figure 3). Whereas
conventional cycling required a precise annealing tem-
perature of 61-62 #{176}C,a wide range of annealing tem-
peratures at 50 #{176}Cwas acceptable with rapid cycling.
Although the claimed precision of most instruments is
better than 1#{176}C,temperature variations greater than
this have been reported (19). A wide range of accept-
able annealing temperatures increases tolerance for
calibration errors, minor compositional differences be-
tween samples, and sample-to-sample temperature
variations. Surprisingly, any annealing temperature
between 25#{176}Cto 50#{176}Ccould be used to genotype with
rapid cycling. Even with annealing at 25#{176}C,the m jor
undesired amplification products from rapid cycling
were of a different size from those expected for the
cystic fibrosis locus (Figure 4). In contrast, single-base
specificity was entirely lost at an annealing tempera-
ture of 55#{176}Cwith conventional cycling, even with hot
starts (Figure 2).
It is interesting that the optimal annealing tempera-
tures for conventional and rapid cycling are so dispar-
ate. The shape of the sample temperature/time curve
near the annealing temperature is very different for
rapid and conventional cycling (Figure 5). Both the
temperature transition rates and the minimum amount
of time that can be spent at the annealing temperature
vary greatly. Sample annealing times of <1 s can be
achieved with rapid cycling; the minimal annealing
times in conventional cycling are 10 times longer, even
with second-generation instrumentation. The short an-
nealing times and (or) the rapid temperature transitions
must be important for the single-base specificity of rapid
cycling.
Nonspecific amplification in the polymerase chain
reaction usually refers to either template-independent
amplification (primer dimers or oligomers) or amplifica-
tion of template regions other than the desired target.
Amplification of such nontarget sequences generally
808 CUNICAL CHEMISTRY, Vol. 39, No. 5, 1993
leads to products of sizes different from the desired
sequence. Hot starts have been used to minimize this
kind of undesired amplification and allow single-copy
detection after amplification with ethidium bromide
staining (18). Nevertheless, hot starts will not prevent
undesired amplification if the annealing temperature
during cycling is too low (Figure 2).
With allele-specific amplification, an additional kind
of nonspecific amplification can occur. A mismatched
primer may anneal at the expected sequence but extend
through the mismatch, giving a product of the same size
as a perfectly matched primer. This kind of undesired
amplification means failure of the method as a test for
genotype. Rapid cycling strongly disfavors extension of
a mismatched primer annealed at the expected site and
should be useful in the design and implementation of
other allele-specific amplifications.
A detailed study of the required annealing times for
different annealing temperatures in DNA amplification
and their effect on product yield and specificity has not
been performed. A rigorous analysis based on annealing
kinetics and polymerase extension rates is also conceiv-
able. However, such studies are limited by current
instrumentation. Conventional temperature cyclers
have long transition times, whereas current rapid cy-
cling instruments lack full control of temperature tran-
sition rates.
We gratefully acknowledge Idaho Technology for providing a
commercial hot-air rapid cycler and Associated Regional Univer-
sity Pathologists, Inc., for financial assistance. The University of
Utah has applied for a patent on rapid air cycling instrumentation.
This technology has been licensed to Idaho Technology, in which
C.T.W. holds equity interest.
References
1. Wittwer CT, Garling DJ. Rapid cycle DNA amplification: time
and temperature optimization. BioTechniques 1991;10:76-83.
2. Wittwer CT, Fillmore GC, Hillyard DR Automated polymerase
chain reaction in capillary tubes with hot air. Nucleic Acids Res
1989;17:4353-7.3. Wittwer CT, Fillmore GC, Garling DJ. Minimizing the time
required for DNA amplification by efficient heat transfer to small
samples. Anal Biochem 1990;186:328-31.
4. Kwok S, Kellogg DE, McKinney N, Spssic D, Coda L, Levenson
C, Sninsky JJ. Effects of primer-template mismatches on the
polymerase chain reaction: human immunodeficiency virus type 1
model studies. Nucl Acids Res 1990;18:999-1005.5. Collins FS. Cystic fibrosis: molecular biology and therapeutic
implications. Science 1992;256:774-9.6. Riordan JR. Rommens JM, Kerem B, Alon N, Rozmahel R,
Grzelczak Z, et al. Identification of the cystic fibrosis gene: cloning
and characterization of complementary DNA. Science 1989;245:
1066-73.
7. Jalanko A, Kere J, Savilahti E, Schwartz M, Syvanen A-C,
Ranki M, S#{246}derlundH. Screening for defined cystic fibrosis muta-
tions by solid-phase minisequencing. Clin Chem 1992;38:39-43.
8. Kerem BS, Rommens JM, Buchanan JA, Markiewicz D, CoxTK, Chakravarti A, et al. Identification of the cystic fibrosis gene:
genetic analysis. Science 1989;245:1073-80.9. Friedman KJ, Highamith WE, Silverman LM. Detecting mul-
tiple cystic fibrosis mutations by polymerase chain reaction-medi-
ated site-directed mutagenesis. Clin Chem 1991;37:753-5.10. Taylor GR, Noble JS, Hall JL, Quirk.e P, Stewart AD, Mueller
RF. Rapid screening for deletion in cystic fibrosis [Letter].
Lancet 1989ii:1345.
11. Ballabio A, Gibbs RA, Caskey CT. PCR test for cystic fibrosisdeletion [Letter). Nature 1990;343:220.
12. Thomas SM, Moreno RF, Tilzer LL. DNA extraction with
1
CLINICAL CHEMISTRY, Vol.39, No.5,1993 809
organic solvents in gel barrier tubes. Nud Acids Res 1989; 13:5411.13. Mullis KB. The polymeraae chain reaction in an anemic mode:
how to avoid cold oligodeoxyribonuclear fusion. PCR Methods AppI
1991;1:1-4.14 Wagner M, Schloesaer M, Reisa J. Direct gene diagnosis of
cystic fibrosis by allele-specific polymerase chain reactions. Mol
Biol Med 1990;7:359-64.15. Sommer SS, Groszbach AR, Bottema CD1C PCR amplification
of specific alleles (PASA) is a general method for rapidly detecting
known single-base changes. BioTechniques 1992;12:82-7.
16. Fujimura PLC, Northrup H, Beaudet AL, O’Brien WE. Geno-
typing errors with the polymerase chain reaction [Letter). N Engl
J Med 1990;322:61.17. Silverman LM, Highsmith WE. Automation and the single-
gene disorder cystic fibrosis as a model [Editorial]. Clin Chem1992;38:7-8.
18. Chow Q, Russell M, Birch DE, Raymond J, Bloch W. Preven-tion of pre-PCR mispriming and primer dimerization improves
low-copy-number amplifications. Nucl Acids Res 1992;20:1717-
23.19. Linz U. Thermocyder temperature variation invalidates PCRresults. BioTechniques 1990;8:286-93.
2

Proc. Nati. Acad. Sci. USAVol. 86, pp. 2757-2760, April 1989Genetics
Allele-specific enzymatic amplification of f8-globin genomic DNA fordiagnosis of sickle cell anemia
(genetic diseases/base-pair nismatch/DNA polymerase/oligodeoxyribonucleotide/polymerase chain reaction)
DAN Y. Wu*, Luis UGOZZOLIt, BIJAY K. PALt, AND R. BRUCE WALLACE*
*Department of Molecular Biochemistry, Beckman Research Institute of the City of Hope, Duarte, CA 91010; tLaboratorio di Immunogenetica, IstitutoNazionale per la Ricerca sul Cancro, Genoa, Italy; and tDepartment of Biological Sciences, California State Polytechnic University, Pomona, CA 91768
Communicated by Eugene Roberts, December 27, 1988 (received for review December 12, 1988)
ABSTRACT A rapid nonradioactive approach to the di-agnosis of sickle cell anemia is described based on an allele-specific polymerase chain reaction (ASPCR). This methodallows direct detection of the normal or the sickle cell g3-globinallele in genomic DNA without additional steps of probehybridization, ligation, or restriction enzyme cleavage. Twoallele-specific oligonucleotide primers, one specific for thesickle cell allele and one specific for the normal allele, togetherwith another primer complementary to both alleles were usedin the polymerase chain reaction with genomic DNA templates.The allele-specific primers differed from each other in theirterminal 3' nucleotide. Under the proper annealing tempera-ture and polymerase chain reaction conditions, these primersonly directed amplification on their complementary allele. In asingle blind study of DNA samples from 12 individuals, thismethod correctly and unambiguously allowed for the determi-nation of the genotypes with no false negatives or positives. IfASPCR is able to discriminate all allelic variation (bothtransition and transversion mutations), this method has thepotential to be a powerful approach for genetic disease diag-nosis, carrier screening, HLA typing, human gene mapping,forensics, and paternity testing.
Sickle cell anemia is the prototype ofa genetic disease causedby a single base-pair mutation, an A -* T transversion in thesequence encoding codon 6 of the human f3-globin gene. Inhomozygous sickle cell anemia, the substitution of a singleamino acid (Glu -* Val) in the B-globin subunit of hemoglobinresults in a reduced solubility of the deoxyhemoglobinmolecule and erythrocytes assume irregular shapes. Thesickled erythrocytes become trapped in the microcirculationand cause damage to multiple organs.Kan and Dozy (1) were the first to describe the diagnosis
of sickle cell anemia in the DNA of affected individuals basedon the linkage of the sickle cell allele to an Hpa I restrictionfragment length polymorphism. Later, it was shown that themutation itself affected the cleavage site of both Dde I andMst II and could be detected directly by restriction enzymecleavage (2, 3). Conner et al. (4) described a more generalapproach to the direct detection of single nucleotide variationby the use of allele-specific oligonucleotide hybridization. Inthis method, a short synthetic oligonucleotide probe specificfor one allele only hybridizes to that allele and not to othersunder appropriate conditions.
All of the above approaches are technically challenging,require a reasonably large amount of DNA, and are not veryrapid. The polymerase chain reaction (PCR) developed bySaiki et al. (5) provided a method to rapidly amplify smallamounts of a particular target DNA. The amplified DNAcould then be readily analyzed for the presence of DNAsequence variation (e.g., the sickle cell mutation) by allele-
specific oligonucleotide hybridization (6), restriction enzymecleavage (5, 7), ligation of oligonucleotide pairs (8, 9), orligation amplification (10). PCR increased the speed ofanalysis and reduced the amount of DNA required for it butdid not change the method of analysis of DNA sequencevariation. In this paper, we investigated whether PCR couldbe done in an allele-specific manner such that the presence orabsence of an amplified fragment provides direct determina-tion of genotype.PCR utilizes two oligonucleotide primers that hybridize to
opposing strands ofDNA at positions spanning a sequence ofinterest. A DNA polymerase [either the Klenow fragment ofEscherichia coli DNA polymerase I (5) or Thermus aquaticusDNA polymerase (11)] is used for sequential rounds oftemplate-dependent synthesis of the DNA sequence. Prior tothe initiation of each new round, the DNA is denatured andfresh enzyme is added in the case of the E. coli enzyme. Inthis manner, exponential amplification of the target se-quences is achieved. We reasoned that if the 3' nucleotide ofone of the primers formed a mismatched base pair with thetemplate due to the existence of single nucleotide variation,amplification would take place with reduced efficiency.Specific primers would then direct amplification only fromtheir homologous allele. After multiple rounds of amplifica-tion, the formation of an amplified fragment would indicatethe presence of the allele in the initial DNA.
MATERIALS AND METHODS
Oligonucleotide Synthesis. Oligonucleotides were synthe-sized on an Applied Biosystems 380B DNA synthesizer bythe phosphoramidite method. They were purified by electro-phoresis on a urea/polyacrylamide gel followed by high-performance liquid chromatography as described (12).
Source and Isolation of Human DNA. All genomic DNAsamples with the exception of the f-thalassemia DNA wereisolated from the peripheral blood of appropriate individuals.The 18-globin genotype of these individuals was previouslydetermined by hybridization with allele-specific oligonucle-otide probes (4) as well as by hemoglobin electrophoresis.Thalassemia major DNA was obtained from an Epstein-Barrvirus-transformed lymphocyte cell line obtained from theNational Institute of General Medical Sciences Human Ge-netic Mutant Cell Repository (Camden, NJ). ThalassemiaDNA was isolated from the cultured cells. All DNA prepa-rations were performed according to a modified Triton X-100procedure followed by proteinase K and RNase A treatment(13). The average yield of genomic DNA was -25 ,ug per mlof blood.PCR. Hf314A (5'-CACCTGACTCCTGA) and BGP2 (5'-
AATAGACCAATAGGCAGAG) at a concentration of 0.12,uM were used as the primer set for the amplification of the
Abbreviations: PCR, polymerase chain reaction; ASPCR, allele-specific PCR.
2757
The publication costs of this article were defrayed in part by page chargepayment. This article must therefore be hereby marked "advertisement"in accordance with 18 U.S.C. §1734 solely to indicate this fact.
luckie
293
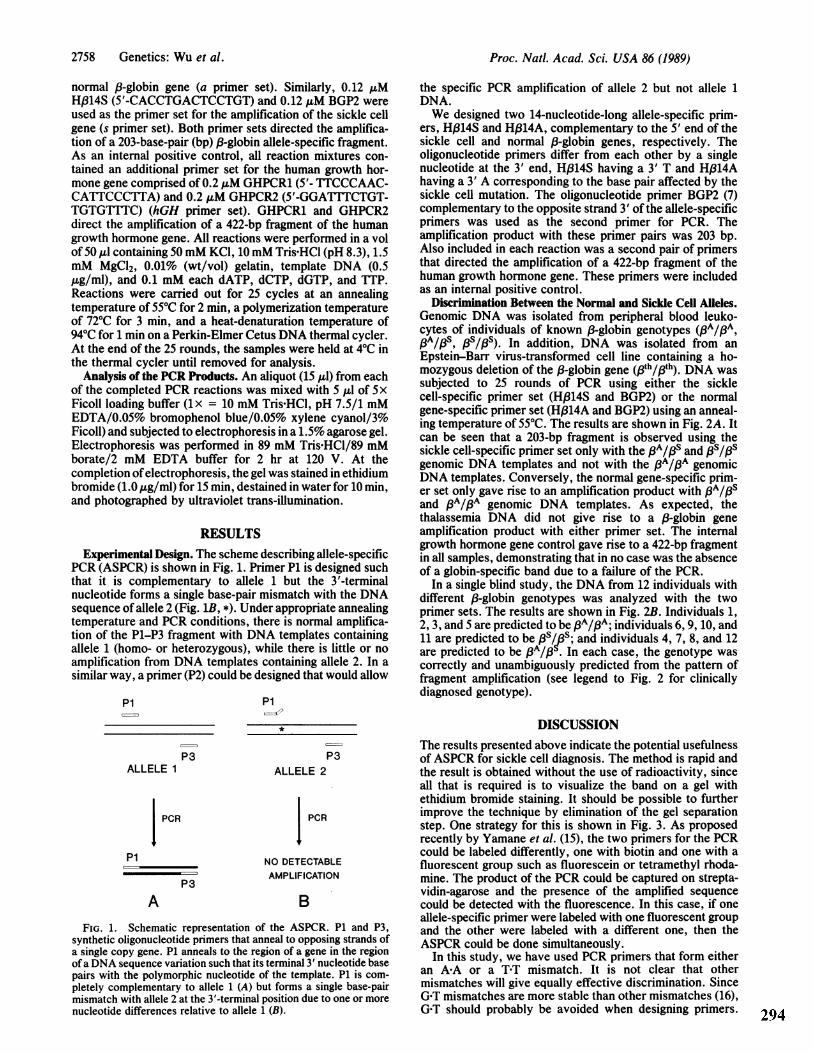
Proc. Natl. Acad. Sci. USA 86 (1989)
normal /3-globin gene (a primer set). Similarly, 0.12 gMH,314S (5'-CACCTGACTCCTGT) and 0.12 ,uM BGP2 wereused as the primer set for the amplification of the sickle cellgene (s primer set). Both primer sets directed the amplifica-tion of a 203-base-pair (bp) f3-globin allele-specific fragment.As an internal positive control, all reaction mixtures con-tained an additional primer set for the human growth hor-mone gene comprised of 0.2 ,uM GHPCR1 (5'- TTCCCAAC-CATTCCCTTA) and 0.2 uM GHPCR2 (5'-GGATTTCTGT-TGTGTTTC) (hGH primer set). GHPCR1 and GHPCR2direct the amplification of a 422-bp fragment of the humangrowth hormone gene. All reactions were performed in a volof 50 pl containing 50mM KCl, 10mM Tris HCl (pH 8.3), 1.5mM MgCl2, 0.01% (wt/vol) gelatin, template DNA (0.5tug/ml), and 0.1 mM each dATP, dCTP, dGTP, and TTP.Reactions were carried out for 25 cycles at an annealingtemperature of 55° C for 2 min, a polymerization temperatureof 72° C for 3 min, and a heat-denaturation temperature of94° C for 1 min on a Perkin-Elmer Cetus DNA thermal cycler.At the end of the 25 rounds, the samples were held at 4° C inthe thermal cycler until removed for analysis.
Analysis of the PCR Products. An aliquot (15 ,u1) from eachof the completed PCR reactions was mixed with 5 u1l of 5 xFicoll loading buffer (lx = 10 mM Tris HCl, pH 7.5/1 mMEDTA/0.05% bromophenol blue/0.05% xylene cyanol/3%Ficoll) and subjected to electrophoresis in a 1.5% agarose gel.Electrophoresis was performed in 89 mM Tris.HCl/89 mMborate/2 mM EDTA buffer for 2 hr at 120 V. At thecompletion ofelectrophoresis, the gel was stained in ethidiumbromide (1.0,ug/ml) for 15 min, destained in water for 10 min,and photographed by ultraviolet trans-illumination.
RESULTS
Experimental Design. The scheme describing allele-specificPCR (ASPCR) is shown in Fig. 1. Primer P1 is designed suchthat it is complementary to allele 1 but the 3'-terminalnucleotide forms a single base-pair mismatch with the DNAsequence of allele 2 (Fig. 1B, *). Under appropriate annealingtemperature and PCR conditions, there is normal amplifica-tion of the P1-P3 fragment with DNA templates containingallele 1 (homo- or heterozygous), while there is little or noamplification from DNA templates containing allele 2. In asimilar way, a primer (P2) could be designed that would allow
P1
P3ALLELE 1
PCR
P1
P3
A
P1
P3
ALLELE 2
PCR
NO DETECTABLE
AMPLIFICATION
B
FIG. 1. Schematic representation of the ASPCR. P1 and P3,synthetic oligonucleotide primers that anneal to opposing strands ofa single copy gene. P1 anneals to the region of a gene in the regionof a DNA sequence variation such that its terminal 3' nucleotide base
pairs with the polymorphic nucleotide of the template. P1 is com-
pletely complementary to allele 1 (A) but forms a single base-pairmismatch with allele 2 at the 3'-terminal position due to one or more
nucleotide differences relative to allele 1 (B).
the specific PCR amplification of allele 2 but not allele 1DNA.We designed two 14-nucleotide-long allele-specific prim-
ers, HP314S and Hf314A, complementary to the 5' end of thesickle cell and normal P3-globin genes, respectively. Theoligonucleotide primers differ from each other by a singlenucleotide at the 3' end, HP14S having a 3' T and Hf314Ahaving a 3' A corresponding to the base pair affected by thesickle cell mutation. The oligonucleotide primer BGP2 (7)complementary to the opposite strand 3' of the allele-specificprimers was used as the second primer for PCR. Theamplification product with these primer pairs was 203 bp.Also included in each reaction was a second pair of primersthat directed the amplification of a 422-bp fragment of thehuman growth hormone gene. These primers were includedas an internal positive control.
Discrimination Between the Normal and Sickle Cell Alleles.Genomic DNA was isolated from peripheral blood leuko-cytes of individuals of known 3-globin genotypes (pBA/p8A,p8A/pS, pSp5S). In addition, DNA was isolated from anEpstein-Barr virus-transformed cell line containing a ho-mozygous deletion of the /3-globin gene (pth/pth). DNA wassubjected to 25 rounds of PCR using either the sicklecell-specific primer set (HP14S and BGP2) or the normalgene-specific primer set (HP14A and BGP2) using an anneal-ing temperature of 55° C. The results are shown in Fig. 2A. Itcan be seen that a 203-bp fragment is observed using thesickle cell-specific primer set only with the PA/Ps and Ps/Psgenomic DNA templates and not with the pA/pA genomicDNA templates. Conversely, the normal gene-specific prim-er set only gave rise to an amplification product with pA/pSand pA/pA genomic DNA templates. As expected, thethalassemia DNA did not give rise to a f3-globin geneamplification product with either primer set. The internalgrowth hormone gene control gave rise to a 422-bp fragmentin all samples, demonstrating that in no case was the absenceof a globin-specific band due to a failure of the PCR.
In a single blind study, the DNA from 12 individuals withdifferent /3-globin genotypes was analyzed with the twoprimer sets. The results are shown in Fig. 2B. Individuals 1,2, 3, and 5 are predicted to be BA/,pA; individuals 6, 9, 10, and11 are predicted to be Ps/s; and individuals 4, 7, 8, and 12are predicted to be PA/p . In each case, the genotype wascorrectly and unambiguously predicted from the pattern offragment amplification (see legend to Fig. 2 for clinicallydiagnosed genotype).
DISCUSSION
The results presented above indicate the potential usefulnessof ASPCR for sickle cell diagnosis. The method is rapid andthe result is obtained without the use of radioactivity, sinceall that is required is to visualize the band on a gel withethidium bromide staining. It should be possible to furtherimprove the technique by elimination of the gel separationstep. One strategy for this is shown in Fig. 3. As proposedrecently by Yamane et al. (15), the two primers for the PCRcould be labeled differently, one with biotin and one with afluorescent group such as fluorescein or tetramethyl rhoda-mine. The product of the PCR could be captured on strepta-vidin-agarose and the presence of the amplified sequencecould be detected with the fluorescence. In this case, if oneallele-specific primer were labeled with one fluorescent groupand the other were labeled with a different one, then theASPCR could be done simultaneously.
In this study, we have used PCR primers that form eitheran A-A or a T-T mismatch. It is not clear that othermismatches will give equally effective discrimination. SinceG-T mismatches are more stable than other mismatches (16),G-T should probably be avoided when designing primers.
2758 Genetics: Wu et al.
luckie
294
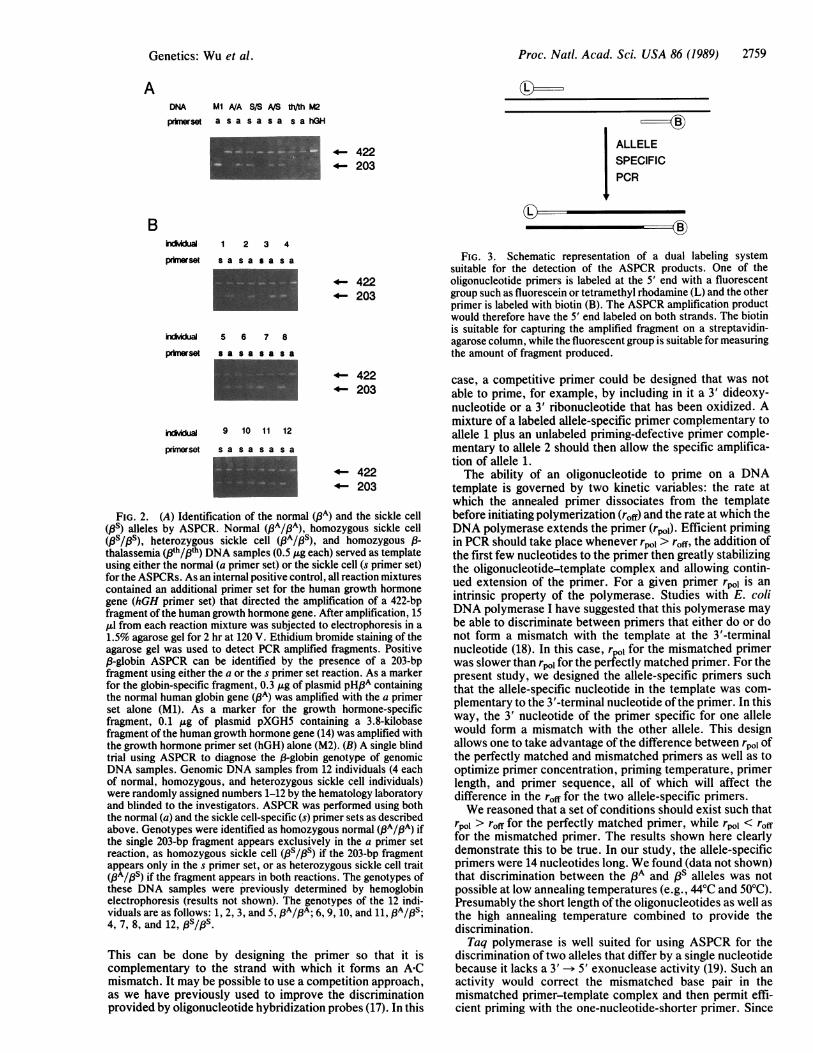
Proc. Natl. Acad. Sci. USA 86 (1989) 2759
ADNA M1 A/A S/S AIS th M2
prmeset a sassasa sahGH
4- 4224- 203 I
B
ALLELE
SPECIFICPCR
prmeset
Sset
primdual
prerset
1 2 3 4
sa sa aa sa
5 6 7 8
4- 4224- 203
4- 4224- 203
9 10 11 12
4- 4224- 203
FIG. 2. (A) Identification of the normal (13A) and the sickle cell(Ps) alleles by ASPCR. Normal (1A//3A), homozygous sickle cell
(,S/Ps), heterozygous sickle cell (p3A/pS), and homozygous f3-
thalassemia (pth/pth) DNA samples (0.5 g&g each) served as templateusing either the normal (a primer set) or the sickle cell (s primer set)for the ASPCRs. As an internal positive control, all reaction mixturescontained an additional primer set for the human growth hormonegene (hGH primer set) that directed the amplification of a 422-bpfragment ofthe human growth hormone gene. After amplification, 15,ul from each reaction mixture was subjected to electrophoresis in a
1.5% agarose gel for 2 hr at 120 V. Ethidium bromide staining of theagarose gel was used to detect PCR amplified fragments. PositiveP3-globin ASPCR can be identified by the presence of a 203-bpfragment using either the a or the s primer set reaction. As a markerfor the globin-specific fragment, 0.3 jug of plasmid pHPA containingthe normal human globin gene (pA) was amplified with the a primerset alone (Ml). As a marker for the growth hormone-specificfragment, 0.1 ,ug of plasmid pXGH5 containing a 3.8-kilobasefragment of the human growth hormone gene (14) was amplified withthe growth hormone primer set (hGH) alone (M2). (B) A single blindtrial using ASPCR to diagnose the /-globin genotype of genomicDNA samples. Genomic DNA samples from 12 individuals (4 eachof normal, homozygous, and heterozygous sickle cell individuals)were randomly assigned numbers 1-12 by the hematology laboratoryand blinded to the investigators. ASPCR was performed using boththe normal (a) and the sickle cell-specific (s) primer sets as describedabove. Genotypes were identified as homozygous normal (pA/pA) ifthe single 203-bp fragment appears exclusively in the a primer setreaction, as homozygous sickle cell (js5/,s) if the 203-bp fragmentappears only in the s primer set, or as heterozygous sickle cell trait(pSA/p3S) if the fragment appears in both reactions. The genotypes ofthese DNA samples were previously determined by hemoglobinelectrophoresis (results not shown). The genotypes of the 12 indi-viduals are as follows: 1, 2, 3, and 5, ,PA/PA; 6, 9, 10, and 11, pA/pS;4, 7, 8, and 12, ps/ps
This can be done by designing the primer so that it iscomplementary to the strand with which it forms an ANCmismatch. It may be possible to use a competition approach,as we have previously used to improve the discriminationprovided by oligonucleotide hybridization probes (17). In this
FIG. 3. Schematic representation of a dual labeling systemsuitable for the detection of the ASPCR products. One of theoligonucleotide primers is labeled at the 5' end with a fluorescentgroup such as fluorescein or tetramethyl rhodamine (L) and the otherprimer is labeled with biotin (B). The ASPCR amplification productwould therefore have the 5' end labeled on both strands. The biotinis suitable for capturing the amplified fragment on a streptavidin-agarose column, while the fluorescent group is suitable for measuringthe amount of fragment produced.
case, a competitive primer could be designed that was notable to prime, for example, by including in it a 3' dideoxy-nucleotide or a 3' ribonucleotide that has been oxidized. Amixture of a labeled allele-specific primer complementary toallele 1 plus an unlabeled priming-defective primer comple-mentary to allele 2 should then allow the specific amplifica-tion of allele 1.The ability of an oligonucleotide to prime on a DNA
template is governed by two kinetic variables: the rate atwhich the annealed primer dissociates from the templatebefore initiating polymerization (roff) and the rate at which theDNA polymerase extends the primer (rpol). Efficient primingin PCR should take place whenever r.1> roff, the addition ofthe first few nucleotides to the primer then greatly stabilizingthe oligonucleotide-template complex and allowing contin-ued extension of the primer. For a given primer r.1 is anintrinsic property of the polymerase. Studies with E. coliDNA polymerase I have suggested that this polymerase maybe able to discriminate between primers that either do or donot form a mismatch with the template at the 3'-terminalnucleotide (18). In this case, rpol for the mismatched primerwas slower than r.1 for the perfectly matched primer. For thepresent study, we designed the allele-specific primers suchthat the allele-specific nucleotide in the template was com-plementary to the 3'-terminal nucleotide ofthe primer. In thisway, the 3' nucleotide of the primer specific for one allelewould form a mismatch with the other allele. This designallows one to take advantage of the difference between rpol ofthe perfectly matched and mismatched primers as well as tooptimize primer concentration, priming temperature, primerlength, and primer sequence, all of which will affect thedifference in the roff for the two allele-specific primers.We reasoned that a set of conditions should exist such that
rpol > r1,ff for the perfectly matched primer, while r.1 < rofffor the mismatched primer. The results shown here clearlydemonstrate this to be true. In our study, the allele-specificprimers were 14 nucleotides long. We found (data not shown)that discrimination between the pA and 8s alleles was notpossible at low annealing temperatures (e.g., 440C and 50'C).Presumably the short length ofthe oligonucleotides as well asthe high annealing temperature combined to provide thediscrimination.Taq polymerase is well suited for using ASPCR for the
discrimination of two alleles that differ by a single nucleotidebecause it lacks a 3' -- 5' exonuclease activity (19). Such an
activity would correct the mismatched base pair in themismatched primer-template complex and then permit effi-cient priming with the one-nucleotide-shorter primer. Since
Genetics: Wu et al.

2760 Genetics: Wu et al.
the specificity of the ASPCR is determined in the initialseveral cycles of PCR, the fact that the primer remainsuncorrected enhances the discrimination of the reaction.PCR is an exponential reaction; the yield of product is very
dependent on the efficiency of each round (5). Only very
minor changes in the efficiency ofeach round ofamplificationhave profound effects on the overall yield after many rounds.For example, if the efficiency of the reaction with theperfectly matched primer is 90% and with the mismatchedprimer is 60%, there would be 73-fold more product producedin the reaction with perfectly matched primer than with themismatched primer.The ASPCR should find application in the fields of genetic
diagnosis, carrier screening, HLA typing, and any othernucleic acid-based diagnostic in which the precise DNAsequence ofthe priming site is diagnostic for the target. In thecase of HLA typing, recent advances have used PCR ampli-fication followed by allele-specific oligonucleotide hybridiza-tion for the determination ofDR, DQ, and DP alleles (6, 20-22). It should be possible to use ASPCRfor the direct analysisof HLA types.We have recently proposed a process for the simultaneous
determination of multiple polymorphic loci based on theconcept of producing locus-specific amplification productseach with a unique length (23). In such a system, sinceASPCR would produce allele-specific products, the simulta-neous analysis of the genotype of the target DNA at multipleloci should be possible.
This work was supported by Grant DCB-8515365 from the Na-tional Science Foundation (R.B.W.). D.Y.W. is a M.D./Ph.D.candidate at Loma Linda University. R.B.W. is a member of theCancer Center of the City of Hope (NIH CA33572). L.U. is a fellowof AIRC (Associazione Italiana per la Ricerca sul Cancro).
1. Kan, Y. W. & Dozy, A. M. (1978) Lancet Ui, 910-912.2. Geever, R. F., Wilson, L. B., Nallaseth, F. S., Milner, P. F.,
Proc. Nat!. Acad. Sci. USA 86 (1989)
Bittner, M. & Wilson, J. T. (1981) Proc. Nat!. Acad. Sci. USA78, 5081-5085.
3. Chang, J. C. & Kan, Y. W. (1982) N. Engl. J. Med. 307, 30-32.4. Conner, B. J., Reyes, A. A., Morin, C., Itakura, K., teplitz,
R. L. & Wallace, R. B. (1983) Proc. Nat!. Acad. Sci. USA 80,278-282.
5. Saiki, R. K., Scharf, S., Falcona, F., Mullis, K., Horn, G. T.,Erlich, H. A. & Arnheim, N. (1985) Science 230, 1350-1354.
6. Saiki, R. K., Bugawan, T. L., Horn, G. T., Mullis, K. B. &Erlich, H. A. (1986) Nature (London) 324, 163-166.
7. Chehab, F. F., Doherty, M., Cai, S., Kan, Y. W., Cooper, S.& Rubin, E. M. (1987) Nature (London) 329, 293-294.
8. Landegren, U., Kaiser, R., Sanders, J. & Hood, L. (1988)Science 241, 1077-1080.
9. Wu, D. Y. & Wallace, R. B. (1989) Gene, in press.10. Wu, D. Y. & Wallace, R. B. (1989) Genomics, in press.11. Saiki, R. K., Gelfanld, D. H., Stoffel, S.. Scsharf, S. J.,9 H"' chi,
R., Horn, G. T., Mullis, K. B. & Erlich, H. A. (1988) Science239, 487-491.
12. Dembek, P., Miyoshi, K. & Itakura, K. (1981) J. Am. Chem.Soc. 103, 706-708.
13. Bell, G. I., Karam, J. H. & Rutter, W. J. (1981) Proc. Nat!.Acad. Sci. USA 78, 5759-5763.
14. Selden, R. F., Howie, K. B., Rowe, M. E., Goodman, H. M.& Moore, D. D. (1986) Mol. Cell Biol. 6, 3173-3179.
15. Yamane, A., Nakagami, S., Kawasoe, T. & Miyoshi, K. (1988)Nucleic Acids Res. 20, 91.
16. Kidd, V. J., Wallace, R. B., Itakura, K. & Woo, S. L. C.(1983) Nature (London) 304, 230-.234.
17. Nozari, G., Rahbar, S. & Whllace, R. IE. (1986) Gene 43, 23-28.
18. Atkinson, M. R., Deutscher, M. P., Kornberg, A., Russel,A. F. & Moffet, J. G. (1969) Biochemistry 8, 4897-4904.
19. Tindall, K. R. & Kunkel, T. A. (1988) Biochemistry 27, 6008-6013.
20. Morel, P. A., Dorman, J. S., Todd, J. A., McDevitt, H. 0. &Trucco, M. (1988) Proc. Natl. Acad. Sci. USA 85, 8111-8115.
21. Angelini, G., Bugawan, T., Delfino, L., Erlich, H. & Ferrara,G. B. (1988) Hum. Immunol. 23, 77.
22. Scharf, S., Saiki, R. & Erlich, H. (1988) Hum. Immunol. 23,143.
23. Skolnick, M. H. & Wallace, R. B. (1988) Genomics 2,273-279.
6

Diabetes
luckie
297

luckie
298
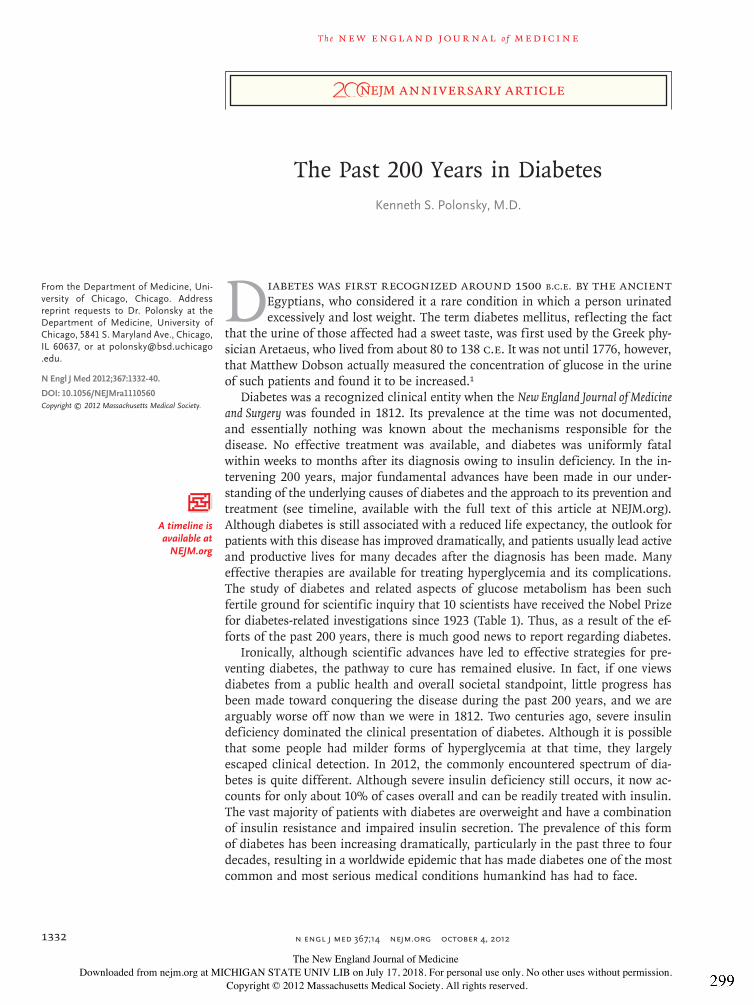
T h e n e w e ngl a nd j o u r na l o f m e dic i n e
n engl j med 367;14 nejm.org october 4, 20121332
anniversary article
The Past 200 Years in DiabetesKenneth S. Polonsky, M.D.
From the Department of Medicine, Uni-versity of Chicago, Chicago. Address reprint requests to Dr. Polonsky at the Department of Medicine, University of Chicago, 5841 S. Maryland Ave., Chicago, IL 60637, or at [email protected] .edu.
N Engl J Med 2012;367:1332-40.
DOI: 10.1056/NEJMra1110560Copyright © 2012 Massachusetts Medical Society.
Diabetes was first recognized around 1500 b.c.e. by the ancient Egyptians, who considered it a rare condition in which a person urinated excessively and lost weight. The term diabetes mellitus, reflecting the fact
that the urine of those affected had a sweet taste, was first used by the Greek phy-sician Aretaeus, who lived from about 80 to 138 c.e. It was not until 1776, however, that Matthew Dobson actually measured the concentration of glucose in the urine of such patients and found it to be increased.1
Diabetes was a recognized clinical entity when the New England Journal of Medicine and Surgery was founded in 1812. Its prevalence at the time was not documented, and essentially nothing was known about the mechanisms responsible for the disease. No effective treatment was available, and diabetes was uniformly fatal within weeks to months after its diagnosis owing to insulin deficiency. In the in-tervening 200 years, major fundamental advances have been made in our under-standing of the underlying causes of diabetes and the approach to its prevention and treatment (see timeline, available with the full text of this article at NEJM.org). Although diabetes is still associated with a reduced life expectancy, the outlook for patients with this disease has improved dramatically, and patients usually lead active and productive lives for many decades after the diagnosis has been made. Many effective therapies are available for treating hyperglycemia and its complications. The study of diabetes and related aspects of glucose metabolism has been such fertile ground for scientific inquiry that 10 scientists have received the Nobel Prize for diabetes-related investigations since 1923 (Table 1). Thus, as a result of the ef-forts of the past 200 years, there is much good news to report regarding diabetes.
Ironically, although scientific advances have led to effective strategies for pre-venting diabetes, the pathway to cure has remained elusive. In fact, if one views diabetes from a public health and overall societal standpoint, little progress has been made toward conquering the disease during the past 200 years, and we are arguably worse off now than we were in 1812. Two centuries ago, severe insulin deficiency dominated the clinical presentation of diabetes. Although it is possible that some people had milder forms of hyperglycemia at that time, they largely escaped clinical detection. In 2012, the commonly encountered spectrum of dia-betes is quite different. Although severe insulin deficiency still occurs, it now ac-counts for only about 10% of cases overall and can be readily treated with insulin. The vast majority of patients with diabetes are overweight and have a combination of insulin resistance and impaired insulin secretion. The prevalence of this form of diabetes has been increasing dramatically, particularly in the past three to four decades, resulting in a worldwide epidemic that has made diabetes one of the most common and most serious medical conditions humankind has had to face.
A timeline is available at
NEJM.org
The New England Journal of Medicine Downloaded from nejm.org at MICHIGAN STATE UNIV LIB on July 17, 2018. For personal use only. No other uses without permission.
Copyright © 2012 Massachusetts Medical Society. All rights reserved.
luckie
299
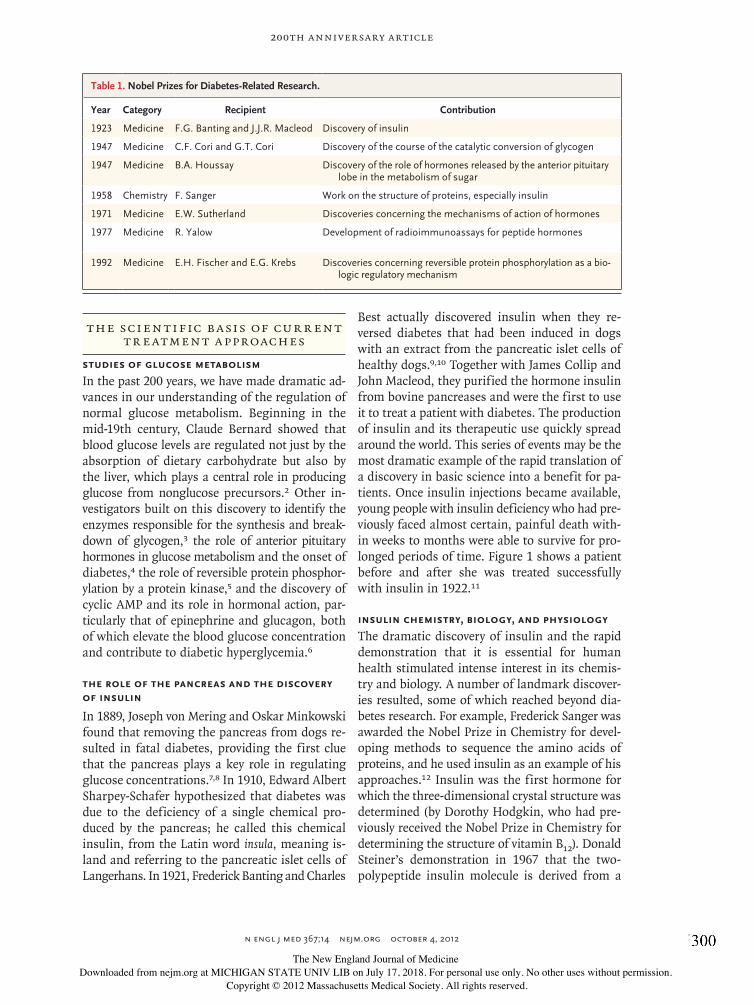
200th anniversary article
n engl j med 367;14 nejm.org october 4, 2012 1333
The Scien tific B a sis of Cur r en t Tr e atmen t A pproaches
Studies of Glucose MetabolismIn the past 200 years, we have made dramatic ad-vances in our understanding of the regulation of normal glucose metabolism. Beginning in the mid-19th century, Claude Bernard showed that blood glucose levels are regulated not just by the absorption of dietary carbohydrate but also by the liver, which plays a central role in producing glucose from nonglucose precursors.2 Other in-vestigators built on this discovery to identify the enzymes responsible for the synthesis and break-down of glycogen,3 the role of anterior pituitary hormones in glucose metabolism and the onset of diabetes,4 the role of reversible protein phosphor-ylation by a protein kinase,5 and the discovery of cyclic AMP and its role in hormonal action, par-ticularly that of epinephrine and glucagon, both of which elevate the blood glucose concentration and contribute to diabetic hyperglycemia.6
The Role of the Pancreas and the Discovery of Insulin
In 1889, Joseph von Mering and Oskar Minkowski found that removing the pancreas from dogs re-sulted in fatal diabetes, providing the first clue that the pancreas plays a key role in regulating glucose concentrations.7,8 In 1910, Edward Albert Sharpey-Schafer hypothesized that diabetes was due to the deficiency of a single chemical pro-duced by the pancreas; he called this chemical insulin, from the Latin word insula, meaning is-land and referring to the pancreatic islet cells of Langerhans. In 1921, Frederick Banting and Charles
Best actually discovered insulin when they re-versed diabetes that had been induced in dogs with an extract from the pancreatic islet cells of healthy dogs.9,10 Together with James Collip and John Macleod, they purified the hormone insulin from bovine pancreases and were the first to use it to treat a patient with diabetes. The production of insulin and its therapeutic use quickly spread around the world. This series of events may be the most dramatic example of the rapid translation of a discovery in basic science into a benefit for pa-tients. Once insulin injections became available, young people with insulin deficiency who had pre-viously faced almost certain, painful death with-in weeks to months were able to survive for pro-longed periods of time. Figure 1 shows a patient before and after she was treated successfully with insulin in 1922.11
Insulin Chemistry, Biology, and PhysiologyThe dramatic discovery of insulin and the rapid demonstration that it is essential for human health stimulated intense interest in its chemis-try and biology. A number of landmark discover-ies resulted, some of which reached beyond dia-betes research. For example, Frederick Sanger was awarded the Nobel Prize in Chemistry for devel-oping methods to sequence the amino acids of proteins, and he used insulin as an example of his approaches.12 Insulin was the first hormone for which the three-dimensional crystal structure was determined (by Dorothy Hodgkin, who had pre-viously received the Nobel Prize in Chemistry for determining the structure of vitamin B12). Donald Steiner’s demonstration in 1967 that the two-polypeptide insulin molecule is derived from a
Table 1. Nobel Prizes for Diabetes-Related Research.
Year Category Recipient Contribution
1923 Medicine F.G. Banting and J.J.R. Macleod Discovery of insulin
1947 Medicine C.F. Cori and G.T. Cori Discovery of the course of the catalytic conversion of glycogen
1947 Medicine B.A. Houssay Discovery of the role of hormones released by the anterior pituitary lobe in the metabolism of sugar
1958 Chemistry F. Sanger Work on the structure of proteins, especially insulin
1971 Medicine E.W. Sutherland Discoveries concerning the mechanisms of action of hormones
1977 Medicine R. Yalow Development of radioimmunoassays for peptide hormones
1992 Medicine E.H. Fischer and E.G. Krebs Discoveries concerning reversible protein phosphorylation as a bio-logic regulatory mechanism
The New England Journal of Medicine Downloaded from nejm.org at MICHIGAN STATE UNIV LIB on July 17, 2018. For personal use only. No other uses without permission.
Copyright © 2012 Massachusetts Medical Society. All rights reserved.
luckie
300
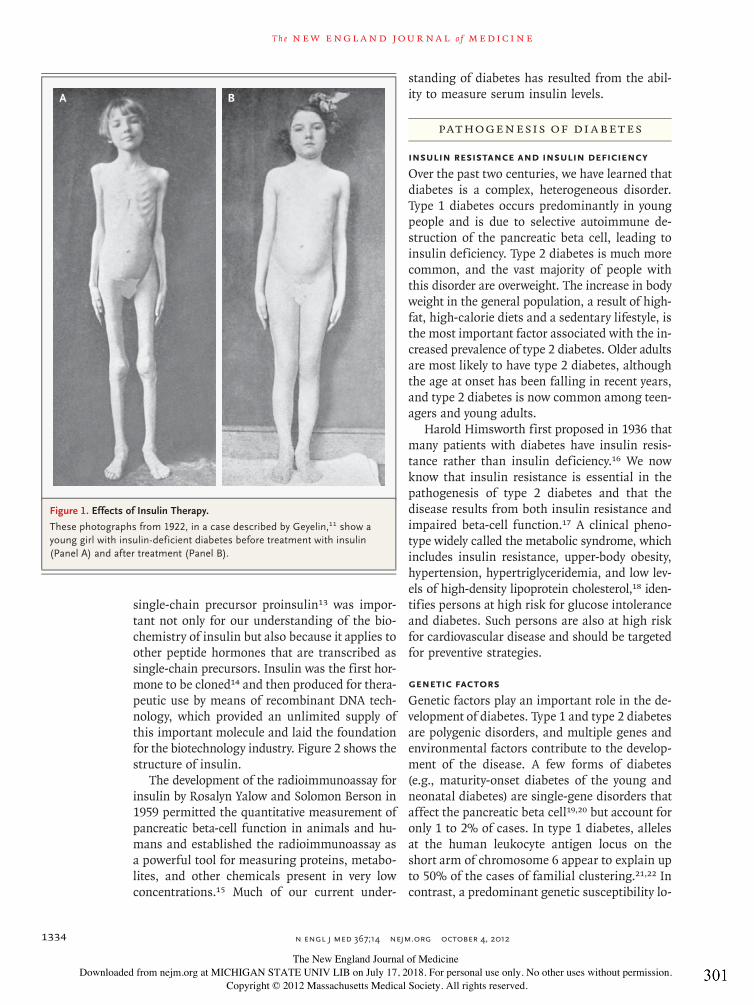
T h e n e w e ngl a nd j o u r na l o f m e dic i n e
n engl j med 367;14 nejm.org october 4, 20121334
single-chain precursor proinsulin13 was impor-tant not only for our understanding of the bio-chemistry of insulin but also because it applies to other peptide hormones that are transcribed as single-chain precursors. Insulin was the first hor-mone to be cloned14 and then produced for thera-peutic use by means of recombinant DNA tech-nology, which provided an unlimited supply of this important molecule and laid the foundation for the biotechnology industry. Figure 2 shows the structure of insulin.
The development of the radioimmunoassay for insulin by Rosalyn Yalow and Solomon Berson in 1959 permitted the quantitative measurement of pancreatic beta-cell function in animals and hu-mans and established the radioimmunoassay as a powerful tool for measuring proteins, metabo-lites, and other chemicals present in very low concentrations.15 Much of our current under-
standing of diabetes has resulted from the abil-ity to measure serum insulin levels.
Patho genesis of Di a be tes
Insulin Resistance and Insulin DeficiencyOver the past two centuries, we have learned that diabetes is a complex, heterogeneous disorder. Type 1 diabetes occurs predominantly in young people and is due to selective autoimmune de-struction of the pancreatic beta cell, leading to insulin deficiency. Type 2 diabetes is much more common, and the vast majority of people with this disorder are overweight. The increase in body weight in the general population, a result of high-fat, high-calorie diets and a sedentary lifestyle, is the most important factor associated with the in-creased prevalence of type 2 diabetes. Older adults are most likely to have type 2 diabetes, although the age at onset has been falling in recent years, and type 2 diabetes is now common among teen-agers and young adults.
Harold Himsworth first proposed in 1936 that many patients with diabetes have insulin resis-tance rather than insulin deficiency.16 We now know that insulin resistance is essential in the pathogenesis of type 2 diabetes and that the disease results from both insulin resistance and impaired beta-cell function.17 A clinical pheno-type widely called the metabolic syndrome, which includes insulin resistance, upper-body obesity, hypertension, hypertriglyceridemia, and low lev-els of high-density lipoprotein cholesterol,18 iden-tifies persons at high risk for glucose intolerance and diabetes. Such persons are also at high risk for cardiovascular disease and should be targeted for preventive strategies.
Genetic FactorsGenetic factors play an important role in the de-velopment of diabetes. Type 1 and type 2 diabetes are polygenic disorders, and multiple genes and environmental factors contribute to the develop-ment of the disease. A few forms of diabetes (e.g., maturity-onset diabetes of the young and neonatal diabetes) are single-gene disorders that affect the pancreatic beta cell19,20 but account for only 1 to 2% of cases. In type 1 diabetes, alleles at the human leukocyte antigen locus on the short arm of chromosome 6 appear to explain up to 50% of the cases of familial clustering.21,22 In contrast, a predominant genetic susceptibility lo-
A B
Figure 1. Effects of Insulin Therapy.
These photographs from 1922, in a case described by Geyelin,11 show a young girl with insulin-deficient diabetes before treatment with insulin (Panel A) and after treatment (Panel B).
The New England Journal of Medicine Downloaded from nejm.org at MICHIGAN STATE UNIV LIB on July 17, 2018. For personal use only. No other uses without permission.
Copyright © 2012 Massachusetts Medical Society. All rights reserved.
luckie
301

200th anniversary article
n engl j med 367;14 nejm.org october 4, 2012 1335
cus for type 2 diabetes has not been found. Ge-netic studies have identified over 40 genetic vari-ants that increase the risk of type 2 diabetes, but in the aggregate these variants account for only about 10% of the heritability of the disorder.23,24
Individually, persons with these variants have an increased risk of diabetes of 10 to 15%, as com-pared with persons without the variants. The multiplicity of genes that contribute to the risk of type 2 diabetes makes it difficult to determine this risk precisely or to develop selective preven-tive or therapeutic strategies based on the ge-netic profile.
Pr e v en tion a nd Tr e atmen t of Di a be tes
The approach to the prevention and treatment of diabetes has been transformed since the discov-ery of insulin, which led to the rapid development of a widely available and lifesaving new treatment and initiated a series of advances that have fun-damentally enhanced the daily lives of patients with diabetes and dramatically extended their life expectancy. Many advances have resulted from important clinical trials that were reported in the Journal and elsewhere.25-49 Some highlights of these studies include the use of biosynthetic hu-
man insulin, which has virtually eliminated local reactions at the injection site; insulin syringes and needles that are small and convenient to use and have reduced the pain of injections; home glucose monitoring,25 which together with measurements of glycated hemoglobin,26 allows therapy to be altered on the basis of accurate assessments of glucose control; and insulin pumps27 driven by computer algorithms28 that adjust insulin doses on the basis of the continuous measurement of glucose levels to achieve glucose concentrations within the physiologic range (Fig. 3). Preventive strategies and treatments for diabetic complica-tions have undergone impressive improvements. The beneficial effects of angiotensin-receptor blockade, angiotensin-converting–enzyme inhibi-tion, and protein restriction in preventing diabetic nephropathy have been shown.29-34 Advances in kidney transplantation have extended the lives of patients with advanced diabetic kidney disease, and laser photocoagulation has preserved the vi-sion of millions of patients with diabetic retinopa-thy.35 Advances in islet-cell and pancreas trans-plantation have also been impressive.36,37 Recent evidence exemplified by the results of two ran-domized, controlled clinical trials reported this past spring in the Journal suggests that bariatric surgery to induce weight loss in patients with
ValPhe Arg Gln His Leu Cys Gly Gly His Leu Val Glu Ala Leu Tyr Leu Val Cys Gly Glu Arg GlyPhePhe
PheTyr
Thr
Pro
Lys
Thr
Arg
Arg
Glu
Ala
GluAsp
LeuGlnValGlyGlnValGluLeuGlyGlyGlyProGlyAlaGlySerLeuGlnFroLeuAla
Leu
Glu
Gly
Ser
Leu
Gln
LysLysArg
Gly lle Val Glu Gln Cys Cys
A chain
B chain
C-terminal
N-terminal
Thr Ser lle Cys Ser Leu Tyr Gln Leu Glu Asn Tyr Cys Asn
4050
60
30
2010
8070
S S
S
SS
SDisulfide bonds
C-peptide
His Leu Val Glu Ala Leu Tyr Leu
10
Insulin
Figure 2. The Structure of Human Proinsulin.
Proinsulin is converted to insulin by proteolytic converting enzymes that remove the connecting peptide (C-peptide) and the lysine-arginine (Lys-Arg) and arginine-arginine (Arg-Arg) sequences of dibasic amino acids, leaving the mature insulin molecule, which consists of A and B chains connected by disulfide bonds.
The New England Journal of Medicine Downloaded from nejm.org at MICHIGAN STATE UNIV LIB on July 17, 2018. For personal use only. No other uses without permission.
Copyright © 2012 Massachusetts Medical Society. All rights reserved.
luckie
302

T h e n e w e ngl a nd j o u r na l o f m e dic i n e
n engl j med 367;14 nejm.org october 4, 20121336
Current TherapeuticsEarly Therapeutics
Detection devices
Insulin syringes
Insulin preparations
Insulin pumps
Detection of diabetes has progressed from use of the saccharometer in the 1800s to measure urine density (a proxy for urinary glucose content) to instruments that monitor blood glucose levels at home.
Insulin syringes wereinitially glass and wereused on multiple occasions,with needles that were also reused. Insulin pens, which became available in the 1990s, allow patients to vary the injected dose and to administer insulin discreetly.
The first highly refined form of insulin was extracted from porcine or bovine pancreas. Recombinant human insulin is nowreadily available.
The first insulin pumps, such as the Mill Hill infuser (near right), were invented in 1976 and weighed more than 0.5 kg. Current pumps are much smaller and more portable. Pumps that simultaneously infuse insulin and monitor glucose, allowing instantaneous feedback, are currently under investigation.
Figure 3. Milestones in Diabetes Diagnosis and Management.
Photographs of the saccharometer and the early insulin preparation are from the Science Museum collection at the Science & Society Picture Library.
The New England Journal of Medicine Downloaded from nejm.org at MICHIGAN STATE UNIV LIB on July 17, 2018. For personal use only. No other uses without permission.
Copyright © 2012 Massachusetts Medical Society. All rights reserved.
luckie
303
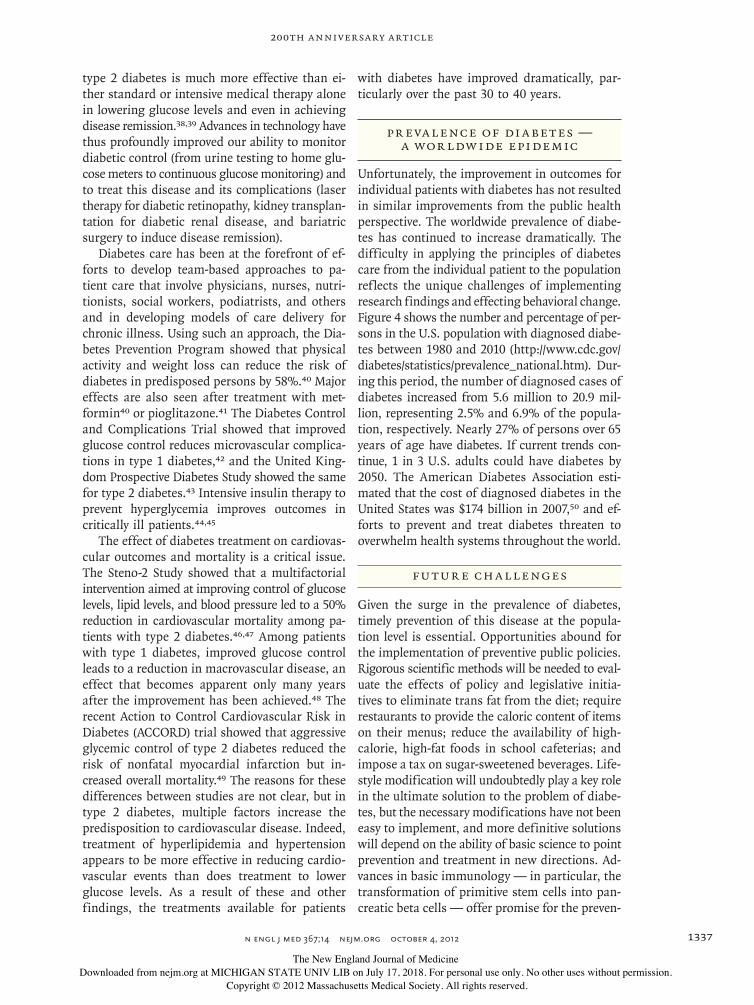
200th anniversary article
n engl j med 367;14 nejm.org october 4, 2012 1337
type 2 diabetes is much more effective than ei-ther standard or intensive medical therapy alone in lowering glucose levels and even in achieving disease remission.38,39 Advances in technology have thus profoundly improved our ability to monitor diabetic control (from urine testing to home glu-cose meters to continuous glucose monitoring) and to treat this disease and its complications (laser therapy for diabetic retinopathy, kidney transplan-tation for diabetic renal disease, and bariatric surgery to induce disease remission).
Diabetes care has been at the forefront of ef-forts to develop team-based approaches to pa-tient care that involve physicians, nurses, nutri-tionists, social workers, podiatrists, and others and in developing models of care delivery for chronic illness. Using such an approach, the Dia-betes Prevention Program showed that physical activity and weight loss can reduce the risk of diabetes in predisposed persons by 58%.40 Major effects are also seen after treatment with met-formin40 or pioglitazone.41 The Diabetes Control and Complications Trial showed that improved glucose control reduces microvascular complica-tions in type 1 diabetes,42 and the United King-dom Prospective Diabetes Study showed the same for type 2 diabetes.43 Intensive insulin therapy to prevent hyperglycemia improves outcomes in critically ill patients.44,45
The effect of diabetes treatment on cardiovas-cular outcomes and mortality is a critical issue. The Steno-2 Study showed that a multifactorial intervention aimed at improving control of glucose levels, lipid levels, and blood pressure led to a 50% reduction in cardiovascular mortality among pa-tients with type 2 diabetes.46,47 Among patients with type 1 diabetes, improved glucose control leads to a reduction in macrovascular disease, an effect that becomes apparent only many years after the improvement has been achieved.48 The recent Action to Control Cardiovascular Risk in Diabetes (ACCORD) trial showed that aggressive glycemic control of type 2 diabetes reduced the risk of nonfatal myocardial infarction but in-creased overall mortality.49 The reasons for these differences between studies are not clear, but in type 2 diabetes, multiple factors increase the predisposition to cardiovascular disease. Indeed, treatment of hyperlipidemia and hypertension appears to be more effective in reducing cardio-vascular events than does treatment to lower glucose levels. As a result of these and other findings, the treatments available for patients
with diabetes have improved dramatically, par-ticularly over the past 30 to 40 years.
Pr e va lence of Di a be tes — A Wor ldw ide Epidemic
Unfortunately, the improvement in outcomes for individual patients with diabetes has not resulted in similar improvements from the public health perspective. The worldwide prevalence of diabe-tes has continued to increase dramatically. The difficulty in applying the principles of diabetes care from the individual patient to the population reflects the unique challenges of implementing research findings and effecting behavioral change. Figure 4 shows the number and percentage of per-sons in the U.S. population with diagnosed diabe-tes between 1980 and 2010 (http://www.cdc.gov/diabetes/statistics/prevalence_national.htm). Dur-ing this period, the number of diagnosed cases of diabetes increased from 5.6 million to 20.9 mil-lion, representing 2.5% and 6.9% of the popula-tion, respectively. Nearly 27% of persons over 65 years of age have diabetes. If current trends con-tinue, 1 in 3 U.S. adults could have diabetes by 2050. The American Diabetes Association esti-mated that the cost of diagnosed diabetes in the United States was $174 billion in 2007,50 and ef-forts to prevent and treat diabetes threaten to overwhelm health systems throughout the world.
Fu t ur e Ch a llenges
Given the surge in the prevalence of diabetes, timely prevention of this disease at the popula-tion level is essential. Opportunities abound for the implementation of preventive public policies. Rigorous scientific methods will be needed to eval-uate the effects of policy and legislative initia-tives to eliminate trans fat from the diet; require restaurants to provide the caloric content of items on their menus; reduce the availability of high-calorie, high-fat foods in school cafeterias; and impose a tax on sugar-sweetened beverages. Life-style modification will undoubtedly play a key role in the ultimate solution to the problem of diabe-tes, but the necessary modifications have not been easy to implement, and more definitive solutions will depend on the ability of basic science to point prevention and treatment in new directions. Ad-vances in basic immunology — in particular, the transformation of primitive stem cells into pan-creatic beta cells — offer promise for the preven-
The New England Journal of Medicine Downloaded from nejm.org at MICHIGAN STATE UNIV LIB on July 17, 2018. For personal use only. No other uses without permission.
Copyright © 2012 Massachusetts Medical Society. All rights reserved.
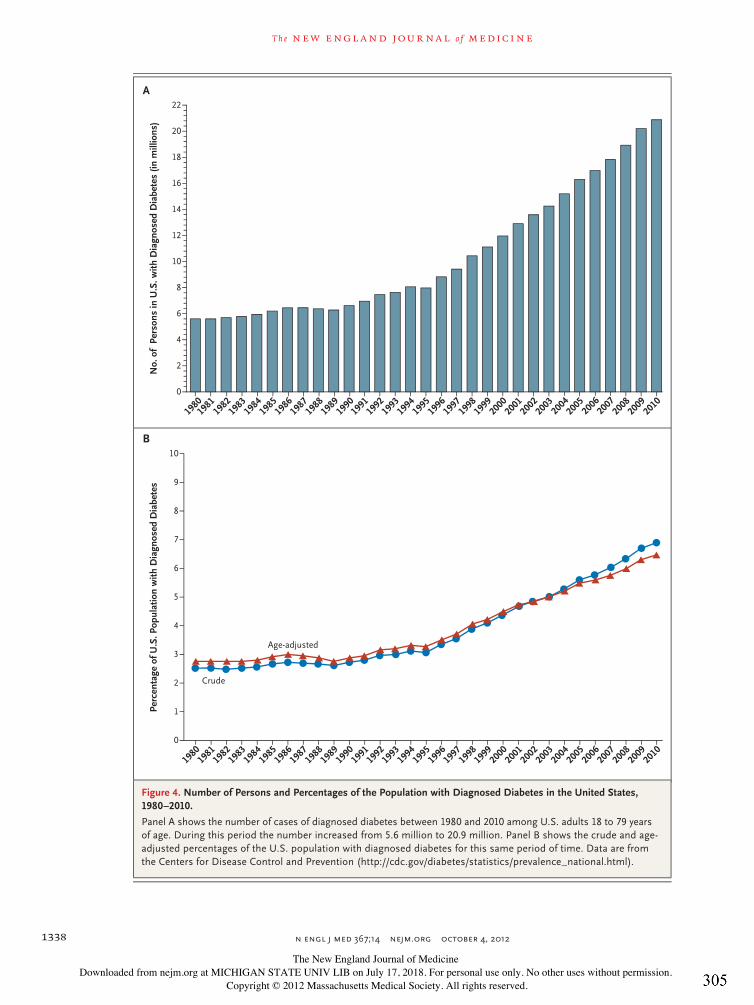
T h e n e w e ngl a nd j o u r na l o f m e dic i n e
n engl j med 367;14 nejm.org october 4, 20121338
B
A
Perc
enta
ge o
f U.S
. Pop
ulat
ion
with
Dia
gnos
ed D
iabe
tes
10
8
9
7
6
4
3
1
5
2
0
1980
1981
1982
1983
1984
1985
1986
1987
1988
1989
1990
1991
1992
1993
1994
1995
1996
1997
1998
1999
2000
2001
2002
2003
2004
2005
2006
2007
2008
2009
2010
1980
1981
1982
1983
1984
1985
1986
1987
1988
1989
1990
1991
1992
1993
1994
1995
1996
1997
1998
1999
2000
2001
2002
2003
2004
2005
2006
2007
2008
2009
2010
No.
of
Pers
ons
in U
.S. w
ith D
iagn
osed
Dia
bete
s (in
mill
ions
)
22
8
10
12
14
16
18
20
6
4
2
0
Age-adjusted
Crude
Figure 4. Number of Persons and Percentages of the Population with Diagnosed Diabetes in the United States, 1980–2010.
Panel A shows the number of cases of diagnosed diabetes between 1980 and 2010 among U.S. adults 18 to 79 years of age. During this period the number increased from 5.6 million to 20.9 million. Panel B shows the crude and age-adjusted percentages of the U.S. population with diagnosed diabetes for this same period of time. Data are from the Centers for Disease Control and Prevention (http://cdc.gov/diabetes/statistics/prevalence_national.html).
The New England Journal of Medicine Downloaded from nejm.org at MICHIGAN STATE UNIV LIB on July 17, 2018. For personal use only. No other uses without permission.
Copyright © 2012 Massachusetts Medical Society. All rights reserved.
luckie
305
200th anniversary article
n engl j med 367;14 nejm.org october 4, 2012 1339
tion and treatment of autoimmunity in patients with type 1 diabetes. Advances in the identifica-tion of diabetes-susceptibility genes should clar-ify the relative role of insulin resistance and beta-cell dysfunction and identify molecular pathways and new drug targets, leading to more effective approaches to the prevention and treatment of type 2 diabetes. Although the challenges are still
substantial, if we build on past accomplishments, there is every reason for optimism that another breakthrough as dramatic as the discovery of in-sulin will occur in the foreseeable future, with a similarly dramatic impact.
Disclosure forms provided by the author are available with the full text of this article at NEJM.org.
References
1. Dobson M. Nature of the urine in dia-betes. Medical Observations and Enquiries 1776;5:218-30.2. Robin ED. Claude Bernard: pioneer of regulatory biology. JAMA 1979;242:1283-4.3. Cori CF, Cori GT. Carbohydrate metab-olism. Annu Rev Biochem 1946;15:193-218.4. Houssay BA, Smyth FS, Foglia VG, Houssay AB. Comparative diabetogenic action of the hypophysis from various animals. J Exp Med 1942;75:93-106.5. Fischer EH. Phosphorylase and the origin of reversible protein phosphoryla-tion. Biol Chem 2010;391:131-7.6. Sutherland EW. Studies on the mech-anism of hormone action. Science 1972; 177:401-8.7. von Mering J, Minkowski O. Diabetes mellitus nach Pankreasextirpation. Arch Exp Pathol Pharmacol 1890;26:371-87.8. Brogard JM, Vetter T, Bickle JF. Dis-covery of pancreatic diabetes in Stras-bourg. Diabete Metab 1992;18:104-14. (In French.)9. Banting FG, Best CH, Collip JB, Campbell WR, Fletcher AA. Encore: pan-creatic extracts in the treatment of diabe-tes mellitus: preliminary report, 1922. CMAJ 1991;145:1281-6.10. Bliss M. The discovery of insulin. Chi-cago: University of Chicago Press, 2007.11. Geyelin HR, Harrop G, Murray MF, Corwin E. The use of insulin in juvenile diabetes. J Metabolic Res 1922;2:767-92.12. Sanger F. The free amino groups of insulin. Biochem J 1945;39:507-15.13. Steiner DF, Oyer PC. The biosynthesis of insulin and a probable precursor of in-sulin by a human islet cell adenoma. Proc Natl Acad Sci U S A 1967;57:473-80.14. Ullrich A, Shine J, Pictet R, Tischer E, Rutter WJ, Goodman HM. Rat insulin genes: construction of plasmids contain-ing coding sequences. Science 1977;196: 1313-9.15. Yalow RS, Berson SA. Assay of plasma insulin in human subjects by immunologi-cal methods. Nature 1959;184:Suppl 21: 1648-9.16. Himsworth HP. Diabetes mellitus: its differentiation into insulin-sensitive and insulin-insensitive types. Lancet 1936;1: 127-30.17. Cavaghan MK, Ehrmann DA, Polon-
sky KS. Interactions between insulin re-sistance and insulin secretion in the de-velopment of glucose intolerance. J Clin Invest 2000;106:329-33.18. Reaven GM. Why Syndrome X? From Harold Himsworth to the insulin resis-tance syndrome. Cell Metab 2005;1:9-14.19. Fajans SS, Bell GI, Polonsky KS. Mo-lecular mechanisms and clinical patho-physiology of maturity-onset diabetes of the young. N Engl J Med 2001;345:971-80.20. Støy J, Steiner DF, Park SY, Ye H, Phil-ipson LH, Bell GI. Clinical and molecular genetics of neonatal diabetes due to mu-tations in the insulin gene. Rev Endocr Metab Disord 2010;11:205-15. [Erratum, Rev Endocr Metab Disord 2012;13:79-81.]21. Nerup J, Platz P, Andersen OO, et al. HL-A antigens and diabetes mellitus. Lancet 1974;2:864-6.22. Ounissi-Benkalha H, Polychronakos C. The molecular genetics of type 1 diabetes: new genes and emerging mechanisms. Trends Mol Med 2008;14:268-75.23. Stolerman ES, Florez JC. Genomics of type 2 diabetes mellitus: implications for the clinician. Nat Rev Endocrinol 2009;5: 429-36.24. Ahlqvist E, Ahluwalia TS, Groop L. Genetics of type 2 diabetes. Clin Chem 2011;57:241-54.25. The Juvenile Diabetes Research Foun-dation Continuous Glucose Monitoring Study Group. Continuous glucose moni-toring and intensive treatment of type 1 diabetes. N Engl J Med 2008;359:1464-76.26. Nathan DM, Singer DE, Hurxthal K, Goodson JD. The clinical information value of the glycosylated hemoglobin as-say. N Engl J Med 1984;310:341-6.27. Tamborlane WV, Sherman RS, Genel M, Felig P. Reduction to normal of plasma glucose in juvenile diabetes by subcutane-ous administration of insulin with a por-table infusion pump. N Engl J Med 1979; 300:573-8.28. Bergenstal RM, Tamborlane WV, Ah-mann A, et al. Effectiveness of sensor-augmented insulin-pump therapy in type 1 diabetes. N Engl J Med 2010;363:311-20. [Erratum, N Engl J Med 2010;363:1092.]29. Barnett AH, Bain SC, Bouter P, et al. Angiotensin-receptor blockade versus con-verting-enzyme inhibition in type 2 diabe-
tes and nephropathy. N Engl J Med 2004;351:1952-61. [Erratum, N Engl J Med 2005;352:1731.]30. Lewis EJ, Hunsicker LG, Bain RP, Ro-hde RD. The effect of angiotensin-con-verting–enzyme inhibition on diabetic nephropathy. N Engl J Med 1993;329:1456-62. [Erratum, N Engl J Med 1993;330:152.]31. Brenner BM, Cooper ME, de Zeeuw D, et al. Effects of losartan on renal and car-diovascular outcomes in patients with type 2 diabetes and nephropathy. N Engl J Med 2001;345:861-9.32. Lewis EJ, Hunsicker LG, Clarke WR, et al. Renoprotective effect of the angio-tensin-receptor antagonist irbesartan in patients with nephropathy due to type 2 diabetes. N Engl J Med 2001;345:851-60.33. Parving H-H, Lehnert H, Bröchner-Mortensen J, Gomis R, Andersen S, Arner P. The effect of irbesartan on the develop-ment of diabetic nephropathy in patients with type 2 diabetes. N Engl J Med 2001; 345:870-8.34. Klahr S, Levey AS, Beck GJ, et al. The effects of dietary protein restriction and blood-pressure control on the progres-sion of chronic renal disease. N Engl J Med 1994;330:877-84.35. Frank RN. Diabetic retinopathy. N Engl J Med 2004;350:48-58.36. Shapiro AM, Ricordi C, Hering BJ, et al. International trial of the Edmonton protocol for islet transplantation. N Engl J Med 2006;355:1318-30.37. Fioretto P, Steffes MW, Sutherland DE, Goetz FC, Mauer M. Reversal of lesions of diabetic nephropathy after pancreas trans-plantation. N Engl J Med 1998;339:69-75.38. Mingrone G, Panunzi S, De Gaetano A, et al. Bariatric surgery versus conven-tional medical therapy for type 2 diabetes. N Engl J Med 2012;366:1577-85.39. Schauer PR, Kashyap SR, Wolski K, et al. Bariatric surgery versus intensive med-ical therapy in obese patients with diabe-tes. N Engl J Med 2012;366:1567-76.40. Knowler WC, Barrett-Connor E, Fowler SE, et al. Reduction in the incidence of type 2 diabetes with lifestyle intervention or met-formin. N Engl J Med 2002;346:393-403.41. DeFronzo RA, Tripathy D, Schwenke DC, et al. Pioglitazone for diabetes pre-vention in impaired glucose tolerance.
The New England Journal of Medicine Downloaded from nejm.org at MICHIGAN STATE UNIV LIB on July 17, 2018. For personal use only. No other uses without permission.
Copyright © 2012 Massachusetts Medical Society. All rights reserved.

n engl j med 367;14 nejm.org october 4, 20121340
200th anniversary article
N Engl J Med 2011;364:1104-15. [Erratum, N Engl J Med 2011;365:189, 869.]42. The Diabetes Control and Complica-tions Trial Research Group. The effect of intensive treatment of diabetes on the de-velopment and progression of long-term complications in insulin-dependent diabe-tes mellitus. N Engl J Med 1993;329:977-86.43. UK Prospective Diabetes Study (UKPDS) Group. Effect of intensive blood-glucose control with metformin on com-plications in overweight patients with type 2 diabetes (UKPDS 34). Lancet 1998; 352:854-65.44. Van den Berghe G, Wouters P, Week-
ers F, et al. Intensive insulin therapy in critically ill patients. N Engl J Med 2001; 345:1359-67.45. Van den Berghe G, Wilmer A, Her-mans G, et al. Intensive insulin therapy in the medical ICU. N Engl J Med 2006;354: 449-61.46. Gaede P, Vedel P, Larsen N, Jensen GVH, Parving H-H, Pedersen O. Multifac-torial intervention and cardiovascular disease in patients with type 2 diabetes. N Engl J Med 2003;348:383-93.47. Gaede P, Lund-Anderson H, Parving H-H, Pedersen O. Effect of a multifacto-rial intervention on mortality in type 2
diabetes. N Engl J Med 2008;358:580- 91.48. Nathan DM, Cleary PA, Backlund JY, et al. Intensive diabetes treatment and cardiovascular disease in patients with type 1 diabetes. N Engl J Med 2005;353: 2643-53.49. The ACCORD Study Group. Long-term effects of intensive glucose lowering on cardiovascular outcomes. N Engl J Med 2011;364:818-28.50. American Diabetes Association. Eco-nomic costs of diabetes in the US in 2007. Diabetes Care 2008;31:596-615.Copyright © 2012 Massachusetts Medical Society.
The New England Journal of Medicine Downloaded from nejm.org at MICHIGAN STATE UNIV LIB on July 17, 2018. For personal use only. No other uses without permission.
Copyright © 2012 Massachusetts Medical Society. All rights reserved.
luckie
307

luckie
308

REVIEW
https://doi.org/10.1083/jcb.201802095 1J. Cell Biol. 2018Rockefeller University Press
Insulin is the paramount anabolic hormone, promoting carbon energy deposition in the body. Its synthesis, quality control, delivery, and action are exquisitely regulated by highly orchestrated intracellular mechanisms in different organs or “stations” of its bodily journey. In this Beyond the Cell review, we focus on these five stages of the journey of insulin through the body and the captivating cell biology that underlies the interaction of insulin with each organ. We first analyze insulin’s biosynthesis in and export from the β-cells of the pancreas. Next, we focus on its first pass and partial clearance in the liver with its temporality and periodicity linked to secretion. Continuing the journey, we briefly describe insulin’s action on the blood vasculature and its still-debated mechanisms of exit from the capillary beds. Once in the parenchymal interstitium of muscle and adipose tissue, insulin promotes glucose uptake into myofibers and adipocytes, and we elaborate on the intricate signaling and vesicle traffic mechanisms that underlie this fundamental function. Finally, we touch upon the renal degradation of insulin to end its action. Cellular discernment of insulin’s availability and action should prove critical to understanding its pivotal physiological functions and how their failure leads to diabetes.
The cell biology of systemic insulin functionVictoria L. Tokarz1,2*, Patrick E. MacDonald3*,, and Amira Klip1,2,4,
Rockefeller University Press
IntroductionPreceded by valiant efforts in Berlin, Strasbourg, Baltimore, and Bucharest, insulin was discovered in Toronto in 1921 by Fredrick Banting and Charles Best, with auspicious advice and support from John Macleod, and its purification was made pos-sible by James Collip. The story of its discovery is legendary and was awarded the Nobel Prize in Physiology or Medicine in 1923 (Karamitsos, 2011), but the journey of this hormone in the body has not been “romanced” as much. Insulin is the paramount anabolic hormone (promoting dietary carbon source deposi-tion), and its synthesis, quality control, delivery, and action are exquisitely regulated in different organs or “stations” of its bodily journey. These functions are enacted by highly orches-trated intracellular mechanisms, starting with production in the β-cells of the pancreas, on to its partial clearance by the liver hepatocytes, followed by its delivery and action on the vascular endothelium and its functions at level of the brain, muscle fibers, and adipocytes (major action sites), and ending with insulin degradation in the kidney. As such, the journey of insulin in the body is a superb example of integrated cel-lular physiology.
In this Beyond the Cell review, we focus on five stages of the journey of insulin through the body and the captivating cell biol-ogy that underlies its connections with each organ. We analyze insulin’s biosynthesis in and release from β-cells of the pancreas, its first pass and partial clearance in the liver, its action on the
blood vasculature and exit from the capillary beds, its action in the central nervous system in brief, followed by its stimulation of muscle and adipose cell glucose uptake, and its degradation in the kidney to finalize its action (Fig. 1).
By necessity, many aspects of the metabolic actions of insulin are not reviewed here; rather, we present the most current pic-ture of each phenomenon, highlighting up-to-date concepts and spatial-temporal coordinates. By applying a cell biology lens to the five fundamental stages in insulin’s journey in the body, we hope to render an integrated view of insulin “within and beyond the cell.” Of major relevance, though not individually discussed here, defects in each station of the hormone’s journey in the body have been correlated and often causally related to insulin resis-tance, hypertension, and type 2 diabetes (Taniguchi et al., 2006; Hoehn et al., 2008; Odegaard and Chawla, 2013; Boucher et al., 2014; DeFronzo et al., 2015; Samuel and Shulman, 2016; Haeusler et al., 2018; also see other important highlights in the text box).
Biosynthesis and export of insulin in pancreatic β-cellsInsulin synthesis, processing, and packaging in pancreatic β-cellsHumans have a single insulin gene, INS (rodents have two, ins1 and ins2), located on chromosome 11, the transcription of which is controlled largely by upstream enhancer elements that bind key transcription factors that include IDX1 (PDX1), MafA, and NeuroD1 along with numerous coregulators (Artner and Stein, 2008). In the insulin-producing pancreatic β-cells, these are
© 2018 Tokarz et al. This article is distributed under the terms of an Attribution–Noncommercial–Share Alike–No Mirror Sites license for the first six months after the publication date (see http:// www .rupress .org/ terms/ ). After six months it is available under a Creative Commons License (Attribution–Noncommercial–Share Alike 4.0 International license, as described at https:// creativecommons .org/ licenses/ by -nc -sa/ 4 .0/ ).
1Cell Biology Program, The Hospital for Sick Children, Toronto, Ontario, Canada; 2Department of Physiology, University of Toronto, Toronto, Ontario, Canada; 3Department of Pharmacology, University of Alberta, Edmonton, Alberta, Canada; 4Department of Biochemistry, University of Toronto, Toronto, Ontario, Canada.
*V.L. Tokarz and P.E. MacDonald contributed equally to this paper; Correspondence to Amira Klip: amira@ sickkids .ca.
on April 10, 2018jcb.rupress.org Downloaded from http://doi.org/10.1083/jcb.201802095Published Online: 5 April, 2018 | Supp Info:
luckie
309
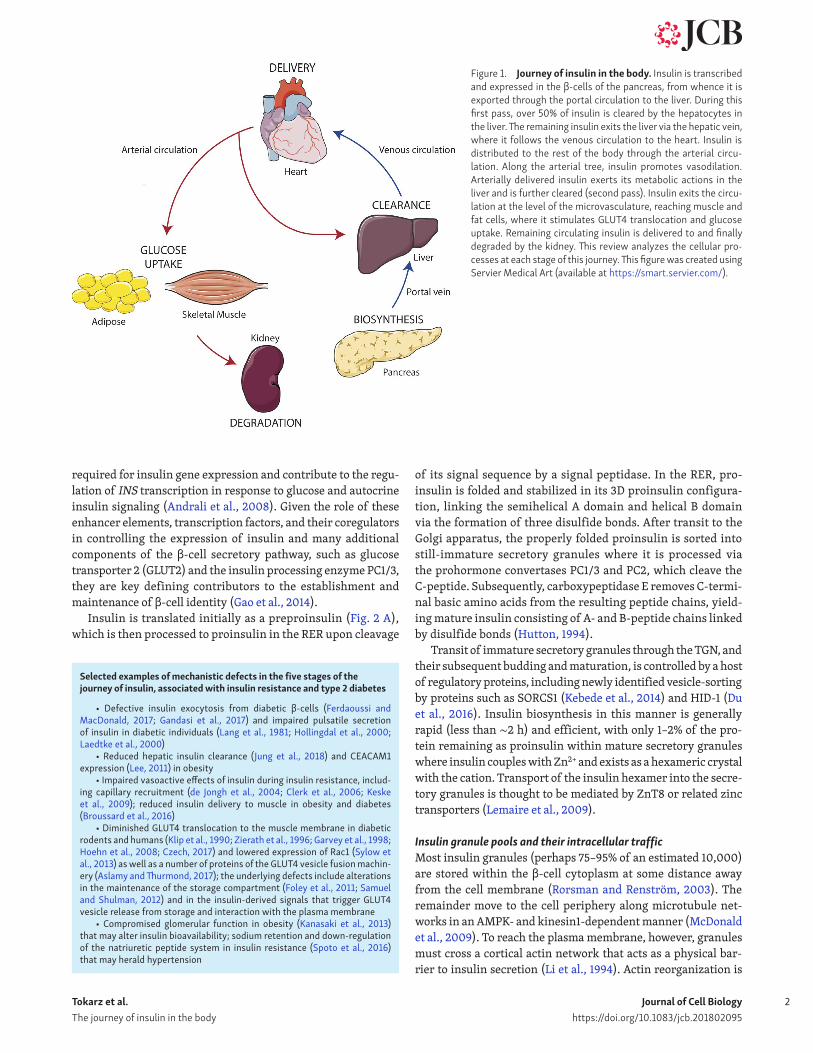
Tokarz et al. The journey of insulin in the body
Journal of Cell Biologyhttps://doi.org/10.1083/jcb.201802095
2
required for insulin gene expression and contribute to the regu-lation of INS transcription in response to glucose and autocrine insulin signaling (Andrali et al., 2008). Given the role of these enhancer elements, transcription factors, and their coregulators in controlling the expression of insulin and many additional components of the β-cell secretory pathway, such as glucose transporter 2 (GLUT2) and the insulin processing enzyme PC1/3, they are key defining contributors to the establishment and maintenance of β-cell identity (Gao et al., 2014).
Insulin is translated initially as a preproinsulin (Fig. 2 A), which is then processed to proinsulin in the RER upon cleavage
of its signal sequence by a signal peptidase. In the RER, pro-insulin is folded and stabilized in its 3D proinsulin configura-tion, linking the semihelical A domain and helical B domain via the formation of three disulfide bonds. After transit to the Golgi apparatus, the properly folded proinsulin is sorted into still-immature secretory granules where it is processed via the prohormone convertases PC1/3 and PC2, which cleave the C-peptide. Subsequently, carboxypeptidase E removes C-termi-nal basic amino acids from the resulting peptide chains, yield-ing mature insulin consisting of A- and B-peptide chains linked by disulfide bonds (Hutton, 1994).
Transit of immature secretory granules through the TGN, and their subsequent budding and maturation, is controlled by a host of regulatory proteins, including newly identified vesicle-sorting by proteins such as SOR CS1 (Kebede et al., 2014) and HID-1 (Du et al., 2016). Insulin biosynthesis in this manner is generally rapid (less than ∼2 h) and efficient, with only 1–2% of the pro-tein remaining as proinsulin within mature secretory granules where insulin couples with Zn2+ and exists as a hexameric crystal with the cation. Transport of the insulin hexamer into the secre-tory granules is thought to be mediated by ZnT8 or related zinc transporters (Lemaire et al., 2009).
Insulin granule pools and their intracellular trafficMost insulin granules (perhaps 75–95% of an estimated 10,000) are stored within the β-cell cytoplasm at some distance away from the cell membrane (Rorsman and Renström, 2003). The remainder move to the cell periphery along microtubule net-works in an AMPK- and kinesin1-dependent manner (McDonald et al., 2009). To reach the plasma membrane, however, granules must cross a cortical actin network that acts as a physical bar-rier to insulin secretion (Li et al., 1994). Actin reorganization is
Selected examples of mechanistic defects in the five stages of the journey of insulin, associated with insulin resistance and type 2 diabetes
• Defective insulin exocytosis from diabetic β-cells (Ferdaoussi and MacDonald, 2017; Gandasi et al., 2017) and impaired pulsatile secretion of insulin in diabetic individuals (Lang et al., 1981; Hollingdal et al., 2000; Laedtke et al., 2000)
• Reduced hepatic insulin clearance (Jung et al., 2018) and CEA CAM1 expression (Lee, 2011) in obesity
• Impaired vasoactive effects of insulin during insulin resistance, includ-ing capillary recruitment (de Jongh et al., 2004; Clerk et al., 2006; Keske et al., 2009); reduced insulin delivery to muscle in obesity and diabetes (Broussard et al., 2016)
• Diminished GLUT4 translocation to the muscle membrane in diabetic rodents and humans (Klip et al., 1990; Zierath et al., 1996; Garvey et al., 1998; Hoehn et al., 2008; Czech, 2017) and lowered expression of Rac1 (Sylow et al., 2013) as well as a number of proteins of the GLUT4 vesicle fusion machin-ery (Aslamy and Thurmond, 2017); the underlying defects include alterations in the maintenance of the storage compartment (Foley et al., 2011; Samuel and Shulman, 2012) and in the insulin-derived signals that trigger GLUT4 vesicle release from storage and interaction with the plasma membrane
• Compromised glomerular function in obesity (Kanasaki et al., 2013) that may alter insulin bioavailability; sodium retention and down-regulation of the natriuretic peptide system in insulin resistance (Spoto et al., 2016) that may herald hypertension
Figure 1. Journey of insulin in the body. Insulin is transcribed and expressed in the β-cells of the pancreas, from whence it is exported through the portal circulation to the liver. During this first pass, over 50% of insulin is cleared by the hepatocytes in the liver. The remaining insulin exits the liver via the hepatic vein, where it follows the venous circulation to the heart. Insulin is distributed to the rest of the body through the arterial circu-lation. Along the arterial tree, insulin promotes vasodilation. Arterially delivered insulin exerts its metabolic actions in the liver and is further cleared (second pass). Insulin exits the circu-lation at the level of the microvasculature, reaching muscle and fat cells, where it stimulates GLUT4 translocation and glucose uptake. Remaining circulating insulin is delivered to and finally degraded by the kidney. This review analyzes the cellular pro-cesses at each stage of this journey. This figure was created using Servier Medical Art (available at https:// smart .servier .com/ ).
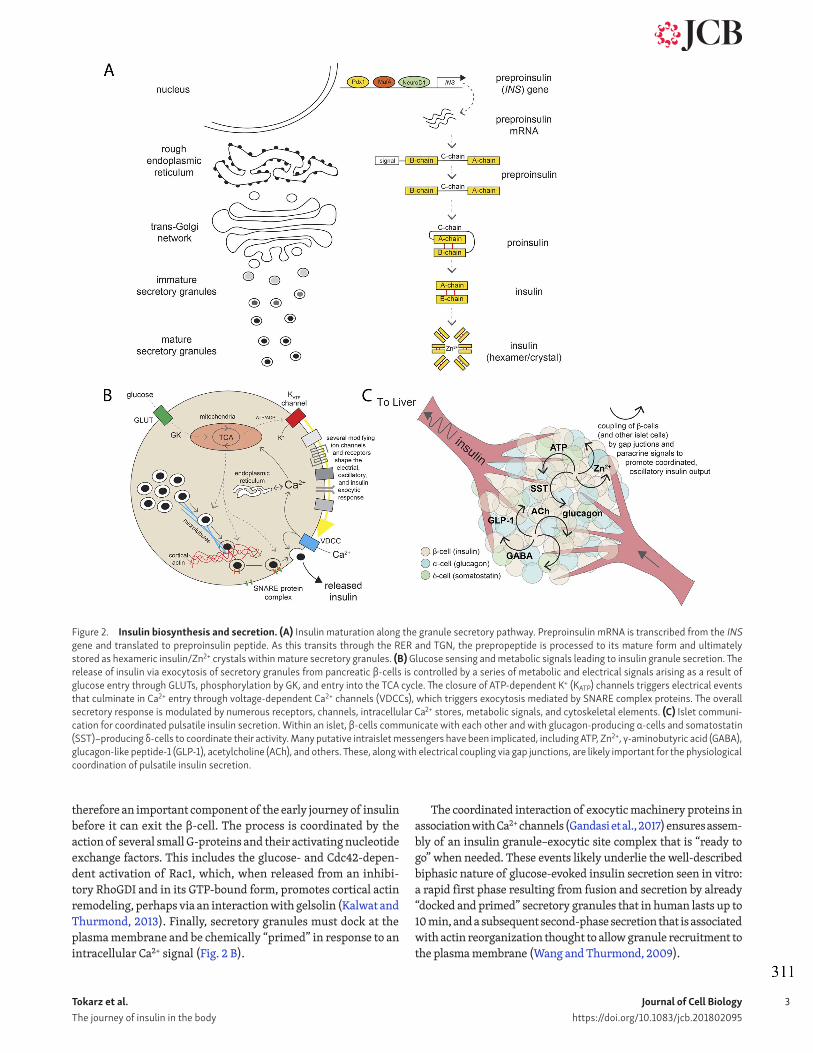
Tokarz et al. The journey of insulin in the body
Journal of Cell Biologyhttps://doi.org/10.1083/jcb.201802095
3
therefore an important component of the early journey of insulin before it can exit the β-cell. The process is coordinated by the action of several small G-proteins and their activating nucleotide exchange factors. This includes the glucose- and Cdc42-depen-dent activation of Rac1, which, when released from an inhibi-tory RhoGDI and in its GTP-bound form, promotes cortical actin remodeling, perhaps via an interaction with gelsolin (Kalwat and Thurmond, 2013). Finally, secretory granules must dock at the plasma membrane and be chemically “primed” in response to an intracellular Ca2+ signal (Fig. 2 B).
The coordinated interaction of exocytic machinery proteins in association with Ca2+ channels (Gandasi et al., 2017) ensures assem-bly of an insulin granule–exocytic site complex that is “ready to go” when needed. These events likely underlie the well-described biphasic nature of glucose-evoked insulin secretion seen in vitro: a rapid first phase resulting from fusion and secretion by already “docked and primed” secretory granules that in human lasts up to 10 min, and a subsequent second-phase secretion that is associated with actin reorganization thought to allow granule recruitment to the plasma membrane (Wang and Thurmond, 2009).
Figure 2. Insulin biosynthesis and secretion. (A) Insulin maturation along the granule secretory pathway. Preproinsulin mRNA is transcribed from the INS gene and translated to preproinsulin peptide. As this transits through the RER and TGN, the prepropeptide is processed to its mature form and ultimately stored as hexameric insulin/Zn2+ crystals within mature secretory granules. (B) Glucose sensing and metabolic signals leading to insulin granule secretion. The release of insulin via exocytosis of secretory granules from pancreatic β-cells is controlled by a series of metabolic and electrical signals arising as a result of glucose entry through GLUTs, phosphorylation by GK, and entry into the TCA cycle. The closure of ATP-dependent K+ (KATP) channels triggers electrical events that culminate in Ca2+ entry through voltage-dependent Ca2+ channels (VDCCs), which triggers exocytosis mediated by SNA RE complex proteins. The overall secretory response is modulated by numerous receptors, channels, intracellular Ca2+ stores, metabolic signals, and cytoskeletal elements. (C) Islet communi-cation for coordinated pulsatile insulin secretion. Within an islet, β-cells communicate with each other and with glucagon-producing α-cells and somatostatin (SST)–producing δ-cells to coordinate their activity. Many putative intraislet messengers have been implicated, including ATP, Zn2+, γ-aminobutyric acid (GABA), glucagon-like peptide-1 (GLP-1), acetylcholine (ACh), and others. These, along with electrical coupling via gap junctions, are likely important for the physiological coordination of pulsatile insulin secretion.
luckie
311

Tokarz et al. The journey of insulin in the body
Journal of Cell Biologyhttps://doi.org/10.1083/jcb.201802095
4
The orderly arrival, priming, docking, and fusion of granules is exquisitely coordinated in response to physiological inputs initiated by glucose and decoded by the β-cell, as described next.
Sensing glucose: Metabolism-controlled electrical signals and Ca2+ activityGlucose is the paramount metabolic signal eliciting insulin secretion, and a consensus model reveals a relay of chemical to electrical on to mechanical signals (Fig. 2 B). In brief, glucose enters through the cell membrane glucose transporters GLUT2 in rodents and GLUT1 in humans (McCulloch et al., 2011). Glu-cose is rapidly phosphorylated by glucokinase (GK) to generate glucose-6-phosphate, which, through glycolysis, feeds the mito-chondrial TCA cycle. GK, an isoform of hexokinase, effectively generates downstream signaling metabolites (i.e., ATP and pyru-vate) within a range of glucose concentrations that matches the normal physiological range for plasma glucose homeostasis (Meglasson et al., 1983). For this reason, the tandem GLUT1/2 and GK is often referred to as a glucose-sensor controlling blood sugar levels. Mutations that alter the glucose-dependent activity of GK effectively adjust the set point for whole-body glucose homeosta-sis (Gloyn et al., 2003).
Pyruvate generated from glycolysis enters the mitochondria via mitochondrial pyruvate carriers (Patterson et al., 2014), where the TCA cycle–dependent generation of NADH promotes the export of H+ from the mitochondrial matrix by the electron transport chain, and then generation of ATP from ADP by ATP synthase, which itself appears dependent on mitochondrial Ca2+ uptake (Tarasov et al., 2013). Subsequent increases in the cytoso-lic ATP/ADP ratio control cell membrane potential by inhibiting ATP-sensitive K+ (KATP) channels, eliciting a membrane depolar-ization that is modulated by a number of additional ion channels (Fig. 2 B). This represents the conversion of chemical to electrical signaling. When the membrane potential depolarizes sufficiently (approximately −50 mV), the activation of voltage-dependent Na+ and Ca2+ channels cause repetitive action potential spik-ing and a rise in intracellular Ca2+ (Rorsman et al., 2012). Ca2+ thus becomes the “currency" that triggers granule fusion with the plasma membrane. The increase in cytosolic Ca2+ is rapidly reversed by very active Ca2+ pumps such as the ER sarco-ER Ca2+-ATPase (SER CA), and the use of ATP in the entire process might feed back to activate AMPK and promote insulin granule migration toward the cell periphery. Additional important feed-back between Ca2+ and intracellular signals should be noted. For example, feedback from oscillatory Ca2+ signals controls mito-chondrial ATP generation (Tarasov et al., 2012), and recent work shows that Ca2+ oscillations and the ER protein TMEM24 interact at ER–plasma membrane contact sites to maintain phosphatidy-linositol levels required for β-cell signaling and insulin secretion (Lees et al., 2017).
Importantly, cells across the entire islet, and islets across the entire pancreas, coordinate their Ca2+ signals to effect insulin secretion that occurs as rhythmic oscillations. Although pancre-atic β-cells are electrically excitable in response to glucose, they do not work in isolation: they talk to each other. The electrical and Ca2+-responses of β-cells within an islet are synchronized (Zarkovic and Henquin, 2004) and perhaps even coordinated
by pacemaker (or “hub”) β-cells within the islet (Johnston et al., 2016). Gap junction coupling between β-cells via connexin36 plays a critical role, the loss of which results in dysregulation of insulin secretion (Ravier et al., 2005). Paracrine and autocrine signaling among β-cells also likely contributes to the coordina-tion and amplification of electrical and Ca2+ responses. Transmit-ter molecules secreted by β-cells themselves, such as ATP (Gylfe et al., 2012), among others, likely modulate the excitatory activity of nearby β-cells, thus controlling islet Ca2+ and insulin secretory responses (Fig. 2 C).
Thus, communication between cells within an islet likely con-tributes to the well-described phenomenon of insulin secretory oscillations, which occur in healthy humans with a periodicity of 5–10 min (Satin et al., 2015). The electrical activity and intra-cellular Ca2+ responses in β-cells within rodent and human islets also oscillates, ranging from tens of seconds to ∼5 min (Dean and Matthews, 1970; Henquin et al., 1982). Further information is provided in Fig. 2 B and in recent modeling that integrates metabolic, electrical, and Ca2+ feedback to produce these oscil-lations (Bertram et al., 2018). Importantly, this translates into oscillations of insulin secretion from isolated islets, again with a periodicity of 1–5 min (Bergsten et al., 1994).
On top of this, the translation of this single-islet oscillatory activity into a pulsatile release of insulin from the whole pan-creas in vivo requires coordination among many individual islets (perhaps a million within a human pancreas). It is not entirely clear how islets within a pancreas communicate in order to synchronize their oscillations. Strong recent evidence suggests a key role for an intrapancreatic neural network, which could coordinate activity among disparate islet populations. This “neu-roinsular network” was most recently demonstrated by elegant 3D imaging techniques in rodent (Tang et al., 2018a) and human (Tang et al., 2018b) pancreata.
The glucose-dependent increase in cytosolic ATP/ADP, closure of KATP channels, and initiation of electrical activity to increase Ca2+ and trigger insulin exocytosis has been a useful consen-sus model for regulated insulin secretion for more than 35 yr. However, this model oversimplifies the physiological regulation of insulin secretion. It has been long recognized that additional signals from gut-derived hormones, autonomic inputs, glucose metabolism itself, and paracrine signals from neighboring α- and δ-cells impinge on this model to exert important control on insu-lin secretion (Fig. 2 C). Many of these signals “amplify” the secre-tory response, either by modulating the electrical/Ca2+ responses of β-cells or by controlling the efficacy of Ca2+-triggered insulin exocytosis. For example, the gut-derived hormones glucagon-like peptide-1 and glucose-dependent insulinotropic polypeptide together mediate the “incretin” effect whereby nutrient sens-ing in the gut signals to islets to augment the insulin secretory response to glucose (Drucker et al., 2017). These hormones act on classical G-protein–coupled receptors via Gαs-activation of ade-nylate cyclase to increase cAMP, which causes PKA-dependent phosphorylation of the exocytic machinery and PKA-indepen-dent effects mediated by Epac2A to promote the release of Ca2+ from intracellular stores (Kolic and MacDonald, 2015). Recently, Epac2A was also shown to regulate insulin granule priming (Alenkvist et al., 2017).
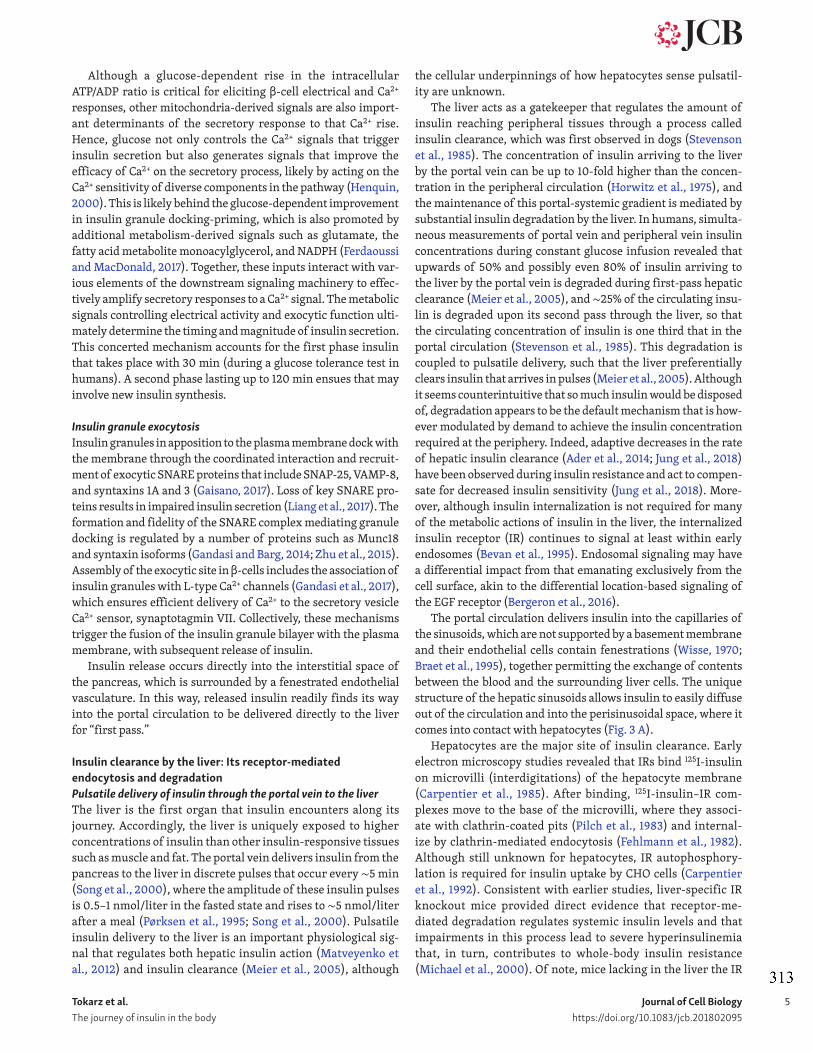
Tokarz et al. The journey of insulin in the body
Journal of Cell Biologyhttps://doi.org/10.1083/jcb.201802095
5
Although a glucose-dependent rise in the intracellular ATP/ADP ratio is critical for eliciting β-cell electrical and Ca2+ responses, other mitochondria-derived signals are also import-ant determinants of the secretory response to that Ca2+ rise. Hence, glucose not only controls the Ca2+ signals that trigger insulin secretion but also generates signals that improve the efficacy of Ca2+ on the secretory process, likely by acting on the Ca2+ sensitivity of diverse components in the pathway (Henquin, 2000). This is likely behind the glucose-dependent improvement in insulin granule docking-priming, which is also promoted by additional metabolism-derived signals such as glutamate, the fatty acid metabolite monoacylglycerol, and NAD PH (Ferdaoussi and MacDonald, 2017). Together, these inputs interact with var-ious elements of the downstream signaling machinery to effec-tively amplify secretory responses to a Ca2+ signal. The metabolic signals controlling electrical activity and exocytic function ulti-mately determine the timing and magnitude of insulin secretion. This concerted mechanism accounts for the first phase insulin that takes place with 30 min (during a glucose tolerance test in humans). A second phase lasting up to 120 min ensues that may involve new insulin synthesis.
Insulin granule exocytosisInsulin granules in apposition to the plasma membrane dock with the membrane through the coordinated interaction and recruit-ment of exocytic SNA RE proteins that include SNAP-25, VAMP-8, and syntaxins 1A and 3 (Gaisano, 2017). Loss of key SNA RE pro-teins results in impaired insulin secretion (Liang et al., 2017). The formation and fidelity of the SNA RE complex mediating granule docking is regulated by a number of proteins such as Munc18 and syntaxin isoforms (Gandasi and Barg, 2014; Zhu et al., 2015). Assembly of the exocytic site in β-cells includes the association of insulin granules with L-type Ca2+ channels (Gandasi et al., 2017), which ensures efficient delivery of Ca2+ to the secretory vesicle Ca2+ sensor, synaptotagmin VII. Collectively, these mechanisms trigger the fusion of the insulin granule bilayer with the plasma membrane, with subsequent release of insulin.
Insulin release occurs directly into the interstitial space of the pancreas, which is surrounded by a fenestrated endothelial vasculature. In this way, released insulin readily finds its way into the portal circulation to be delivered directly to the liver for “first pass.”
Insulin clearance by the liver: Its receptor-mediated endocytosis and degradationPulsatile delivery of insulin through the portal vein to the liverThe liver is the first organ that insulin encounters along its journey. Accordingly, the liver is uniquely exposed to higher concentrations of insulin than other insulin-responsive tissues such as muscle and fat. The portal vein delivers insulin from the pancreas to the liver in discrete pulses that occur every ∼5 min (Song et al., 2000), where the amplitude of these insulin pulses is 0.5–1 nmol/liter in the fasted state and rises to ∼5 nmol/liter after a meal (Pørksen et al., 1995; Song et al., 2000). Pulsatile insulin delivery to the liver is an important physiological sig-nal that regulates both hepatic insulin action (Matveyenko et al., 2012) and insulin clearance (Meier et al., 2005), although
the cellular underpinnings of how hepatocytes sense pulsatil-ity are unknown.
The liver acts as a gatekeeper that regulates the amount of insulin reaching peripheral tissues through a process called insulin clearance, which was first observed in dogs (Stevenson et al., 1985). The concentration of insulin arriving to the liver by the portal vein can be up to 10-fold higher than the concen-tration in the peripheral circulation (Horwitz et al., 1975), and the maintenance of this portal-systemic gradient is mediated by substantial insulin degradation by the liver. In humans, simulta-neous measurements of portal vein and peripheral vein insulin concentrations during constant glucose infusion revealed that upwards of 50% and possibly even 80% of insulin arriving to the liver by the portal vein is degraded during first-pass hepatic clearance (Meier et al., 2005), and ∼25% of the circulating insu-lin is degraded upon its second pass through the liver, so that the circulating concentration of insulin is one third that in the portal circulation (Stevenson et al., 1985). This degradation is coupled to pulsatile delivery, such that the liver preferentially clears insulin that arrives in pulses (Meier et al., 2005). Although it seems counterintuitive that so much insulin would be disposed of, degradation appears to be the default mechanism that is how-ever modulated by demand to achieve the insulin concentration required at the periphery. Indeed, adaptive decreases in the rate of hepatic insulin clearance (Ader et al., 2014; Jung et al., 2018) have been observed during insulin resistance and act to compen-sate for decreased insulin sensitivity (Jung et al., 2018). More-over, although insulin internalization is not required for many of the metabolic actions of insulin in the liver, the internalized insulin receptor (IR) continues to signal at least within early endosomes (Bevan et al., 1995). Endosomal signaling may have a differential impact from that emanating exclusively from the cell surface, akin to the differential location-based signaling of the EGF receptor (Bergeron et al., 2016).
The portal circulation delivers insulin into the capillaries of the sinusoids, which are not supported by a basement membrane and their endothelial cells contain fenestrations (Wisse, 1970; Braet et al., 1995), together permitting the exchange of contents between the blood and the surrounding liver cells. The unique structure of the hepatic sinusoids allows insulin to easily diffuse out of the circulation and into the perisinusoidal space, where it comes into contact with hepatocytes (Fig. 3 A).
Hepatocytes are the major site of insulin clearance. Early electron microscopy studies revealed that IRs bind 125I-insulin on microvilli (interdigitations) of the hepatocyte membrane (Carpentier et al., 1985). After binding, 125I-insulin–IR com-plexes move to the base of the microvilli, where they associ-ate with clathrin-coated pits (Pilch et al., 1983) and internal-ize by clathrin-mediated endocytosis (Fehlmann et al., 1982). Although still unknown for hepatocytes, IR autophosphory-lation is required for insulin uptake by CHO cells (Carpentier et al., 1992). Consistent with earlier studies, liver-specific IR knockout mice provided direct evidence that receptor-me-diated degradation regulates systemic insulin levels and that impairments in this process lead to severe hyperinsulinemia that, in turn, contributes to whole-body insulin resistance (Michael et al., 2000). Of note, mice lacking in the liver the IR
luckie
313

Tokarz et al. The journey of insulin in the body
Journal of Cell Biologyhttps://doi.org/10.1083/jcb.201802095
6
substrates 1 and 2 (IRS1,2; adaptor proteins that can bind to the IR to initiate signal transduction) have less severe hyperinsu-linemia (Dong et al., 2008) than mice lacking the IR (Michael et al., 2000; Cohen et al., 2007), suggesting that canonical insulin signaling via IRS1,2 may not participate in insulin clearance. However, there is no direct mechanistic proof of this or of the involvement of other classical insulin signals.
After insulin binds to its receptor on the hepatocyte surface, endocytosis of the receptor–ligand complex causes a concomi-tant loss of surface IR (Goodner et al., 1988), which is followed by rapid recycling and reinsertion of intact, unbound IRs in the plasma membrane (Goodner et al., 1988). These findings are concordant with the physiological intervals of pulsatile delivery, suggesting that hepatocyte IR internalization and reinsertion into the membrane is adaptively entrained to insulin delivery
(Meier et al., 2005). In contrast to IR recycling, the fate of inter-nalized insulin differs, as we will describe.
CEA CAM1 and insulin-degrading enzyme (IDE): Hepatic molecules driving insulin clearanceAlthough hepatocytes are not exclusive in their ability to inter-nalize insulin, they highly express the transmembrane glycopro-tein CEA CAM1 (carcinoembryonic antigen–related cell adhesion molecule 1), which mediates rapid and effective IR-mediated insulin endocytosis (Najjar, 2002). Mechanistically, CEA CAM1 is phosphorylated by the IR, enhancing the formation of an insulin–IR–CEA CAM1 complex (Najjar et al., 1995; Fig. 3 B). It is hypoth-esized that a so-far-unidentified adaptor protein targets the tripartite complex to the AP2 adaptor complex for clathrin-medi-ated endocytosis (Najjar, 2002). Tests in nonhepatic cells, on the other hand, show that the IR target protein SHC binds dynamin (a GTPase required for the scission of endocytic vesicles), and this complex contributes to IR internalization (Baron et al., 1998). It is tempting to hypothesize that, in hepatocytes, SHC might be the protein linking the IR to CEA CAM1 and thus brings the com-plex to dynamin-rich regions prone for endocytosis. Consistent with the crucial role of CEA CAM1 in hepatic insulin clearance, impairments in insulin-stimulated hepatic CEA CAM1 phos-phorylation or whole-body depletion of hepatic CEA CAM1 cause severe hyperinsulinemia and, consequently, insulin resistance and hyperglycemia (Poy et al., 2002; Russo et al., 2017). Notably, hepatocytes from these mice have impaired insulin-dependent IR endocytosis, which can be rescued by liver-specific reexpression of CEA CAM1 (Poy et al., 2002; Russo et al., 2017). Hence, the level of CEA CAM1 at the plasma membrane and its phosphorylation may impart physiological fine-tuning regulation to the process of insulin clearance.
The majority of insulin that binds to hepatic IRs is degraded (Duckworth, 1988). The degradation process begins on the mem-brane immediately after insulin binding, where some insulin is reported to be partially degraded by extracellular IDE before inter-nalization (Yokono et al., 1982). After internalization, additional IDE is thought to be targeted to endosomal membranes through its interaction with phosphatidylinositol phosphates (Song et al., 2017), where it begins to degrade receptor-bound insulin in endo-somes (Yonezawa et al., 1988) before acidification occurs (Hamel et al., 1991). As endosomes acidify, any remaining insulin or par-tially degraded insulin that escaped complete degradation by IDE dissociates from the IR (Murphy et al., 1984; Fig. 3 B). Ultimately, these degradation products and any remaining intact insulin are delivered to lysosomes for complete proteolysis (Duckworth, 1988), although lysosomal degradation of insulin is thought to play a minor role in insulin clearance (Duckworth et al., 1981).
Although the in vitro data strongly indicate that IDE is essen-tial for hepatocyte insulin degradation, the role of IDE in hepatic insulin clearance in vivo is controversial, as some studies report that loss of IDE results in hyperinsulinemia (Farris et al., 2003; Abdul-Hay et al., 2011), whereas others observed no changes in systemic circulating insulin in the absence of the enzyme (Steneberg et al., 2013).
Insulin that is not degraded in the liver exits through the hepatic vein, reaching the heart, which pumps insulin into the
Figure 3. Insulin clearance in the liver. (A) Insulin is delivered to the hepatic sinusoid, where it freely accesses the liver hepatocytes through the fenestrated sinusoidal endothelium. (B) Proposed mechanism for insu-lin degradation in hepatocytes. Insulin binds to the IR and forms a complex with CEA CAM1. Prior to internalization, extracellular IDE begins to degrade receptor-bound insulin. After internalization, endosomal IDE degrades recep-tor-bound insulin and, once the endosome acidifies and the complex disso-ciates, also frees insulin. Any remaining insulin or insulin fragments progress toward lysosomes for their complete proteolytic degradation.

Tokarz et al. The journey of insulin in the body
Journal of Cell Biologyhttps://doi.org/10.1083/jcb.201802095
7
arterial circulation to be delivered to its target tissues (e.g., skel-etal muscle, liver, adipose tissue, and the brain). It is important to note that insulin returns to the liver, this time via the hepatic artery, which pours again into the hepatic sinusoid, where the hormone is subject to a second round of insulin degradation (sec-ond pass) within hepatocytes.
Beyond first- and second-pass insulin clearance, the hepato-cytes are essential metabolic responders to insulin, where one of the major actions of the hormone is to suppress gluconeogen-esis and glycogenolysis (Lin and Accili, 2011). This ensures that a portion of dietary glucose is effectively stored in the liver and is only released to the rest of the body upon cessation of insu-lin action (between meals) or upon metabolic demand enacted by other “counterregulatory” hormones (Samuel and Shulman, 2018). This is a vast area of study that is however not further discussed here.
Insulin interaction with the vasculatureHemodynamic insulin action on arteries and arteriolesThe peripheral actions of insulin begin inside the vessels of the systemic circulation, where the hormone exerts its hemodynamic effects on endothelial cells to promote blood flow and ensure its delivery to peripheral tissues (Barrett et al., 2009). Endothelial cells line each blood vessel and constitute a crucial interface between the circulation and the tissue parenchyma. In large blood vessels such as the aorta and large arteries, insulin acts on the IR of endothelial cells, causing phosphorylation of the major endothelial IR substrate, IRS2. This leads to activation of class I phosphatidylinositol 3-kinase (PI3K), which signals downstream to the serine and threonine kinase Akt/PKB. In turn, Akt activates endothelial NO synthase to catalyze the conversion of l-arginine to NO (Palmer et al., 1988; Zeng et al., 2000). NO is a potent vaso-dilator that rapidly diffuses to the vessels’ outer layer of smooth muscle cells, where it activates intracellular guanylate cyclase to increase cyclic guanosine monophosphate production (Arnold et al., 1977). Cyclic guanosine monophosphate–dependent reductions in intracellular Ca2+ concentration (Carvajal et al., 2000) prevent phosphorylation of myosin light chain required for cytoskeletal cross-bridge formation and contraction (Lee et al., 1997; Mizuno et al., 2008), thereby resulting in vessel relaxation (Fig. 4 A).
As a consequence of endothelial NO production, insulin stim-ulates dilation of arteries and arterioles (Steinberg et al., 1994; Vincent et al., 2002). Within minutes, vasodilation of precap-illary arterioles irrigates previously collapsed capillaries with blood carrying insulin (capillary recruitment), thereby pro-moting insulin delivery to the tissue (Vincent et al., 2002). With continued insulin circulation (∼30 min), the hormone induces relaxation of larger, upstream resistance vessels to further pro-mote limb blood flow (Baron et al., 1996). Insulin action in target tissues is temporally linked to these vascular effects (Barrett et al., 2009); in particular, the full stimulation of skeletal muscle glucose uptake in vivo is contingent on prior NO-mediated vaso-dilation (Vincent et al., 2003; Bradley et al., 2013).
Insulin transit across the microvascular endotheliumOnce insulin arrives at the capillaries of skeletal muscle and adi-pose tissue, it must exit the circulation to reach the parenchymal
cells (muscle fibers and adipocytes). Unlike the fenestrated cap-illaries of the liver, the capillary endothelium in skeletal and adipose tissues is continuous, functioning as a stringent barrier between the circulation and the interstitial space. Each capillary is constituted by a single layer of endothelial cells, supported by interendothelial junctions that selectively restrict the passage of contents between the blood and the tissue. Bergman et al. first reported a delay in muscle insulin action relative to the rise in insulin in the circulation (Kolka and Bergman, 2012), and sev-eral studies have documented that the capillary endothelium is a barrier to insulin delivery to muscle in vivo, maintaining a disequilibrium between circulating and interstitial insulin levels (Jansson et al., 1993; Herkner et al., 2003).
Insulin may cross the tight capillary endothelia by two poten-tial routes: transcellular (through individual cells) or paracellular (between neighboring endothelial cells; Fig. 4 B). Although there
Figure 4. Insulin interactions with the vasculature. (A) Endothelial insu-lin signaling leading to vasodilation in the macrovasculature. The endothelial cell IR engages its major substrate in these cells, IRS2, leading downstream to activation of Akt. Akt phosphorylates endothelial NO synthase (eNOS), which catalyzes the production of NO from l-arginine. NO freely diffuses to the underlying vascular smooth muscle layer, where it leads to cyclic guano-sine monophosphate production to induce vasorelaxation. (B) Possible routes for insulin exit across microvascular endothelial cells toward the interstitial space in muscle and fat tissue. Insulin may cross the microvascular capil-lary endothelium either paracellularly (between adjacent endothelial cells) or transcellularly (through individual endothelial cells). For the transcellular route, both receptor-mediated and fluid-phase mechanisms of transport have been proposed.
luckie
315

Tokarz et al. The journey of insulin in the body
Journal of Cell Biologyhttps://doi.org/10.1083/jcb.201802095
8
is evidence that expression of the IR or vascular insulin signaling is required for overall insulin egress from the circulation toward tissues (Kubota et al., 2011; Majumdar et al., 2012; Meijer et al., 2016; Konishi et al., 2017), opposing studies challenge a recep-tor-mediated (Vicent et al., 2003; Duncan et al., 2008; Williams et al., 2018) or saturable process (Steil et al., 1996). To this day, the exact route (intracellular vs. paracellular) and supporting mechanisms remain a matter of debate (Lee and Klip, 2016). The impasse in discerning this route lies in the limitation to differen-tiate in vivo between a distinctly local role of the endothelial IR in the cellular transport of insulin across the endothelium from its complementary role in capillary recruitment. Recent studies that have bypassed the hemodynamic concerns have also yielded opposite results. Thus, even with chemically induced vasodila-tion, a new endothelial cell-specific IR knockout mouse model (Konishi et al., 2017) shows defective insulin delivery and action. In contrast, sophisticated imaging of the muscle distribution of somewhat high doses of fluorescent insulin injected into the circulation was best fitted to a model of distribution that does not obey saturation kinetics, suggesting that the IR may not be a major conduit under these conditions (Williams et al., 2018).
Controversy about the mechanism of insulin transit across the microvasculature also arises upon scrutiny in vitro, as cell culture studies have rendered inconsistent results regarding the precise role of the endothelial IR in the uptake of fluorescently conjugated insulin, potentially dependent on their niche origin: microvascular (Azizi et al., 2015) or macrovascular (Wang et al., 2008). Moreover, imaging the internalized insulin, needed to establish the hormone’s intracellular route, has required the use of supraphysiological doses of insulin to achieve detectable levels (Wang et al., 2008; Azizi et al., 2015), confounding the identifi-cation of the physiological mechanism. On the other hand, the uptake of physiological levels of 125I-insulin into microvascular endothelial cells has uniformly revealed participation of the IR (Jialal et al., 1984; Gray et al., 2017; Jaldin-Fincati et al., 2018). This includes the transfer of insulin across cells of the blood–brain barrier (Jialal et al., 1984; Gray et al., 2017), an important conduit for the now-recognized neuronal actions of the hormone evinced by the neuron-specific IR gene depletion (Brüning et al., 2000). How internalized insulin is spared from degradation in endothelial cells, as opposed to its fate in hepatocytes (described in Insulin clearance by the liver: Its receptor-mediated endocy-tosis and degradation), remains unsolved. Potentially, this may involve routing of insulin into sorting tubules akin to those recently described for transferrin receptor-mediated transcyto-sis through blood–brain endothelia (Villaseñor et al., 2017).
Central insulin action: Brief focus on the brainEmerging from the circulation, insulin begins its multifaceted action on central and peripheral tissues. As outlined above, insu-lin crosses the blood–brain barrier through a receptor-mediated process (Woods et al., 2003). Thought to be insulin unrespon-sive in the past, the central nervous system is well recognized to be exquisitely responsive to the incoming hormone (Porte et al., 2005). The concentration of insulin in the cerebrospinal fluid is one third that in the circulation, but it nonetheless fluctuates according to the latter and acts on IR on neurons and glial cells.
Notable among the evoked central functions is the regulation of appetite and energy expenditure (Filippi et al., 2013; García-Cáceres et al., 2016). Insulin regulates appetite by reducing expression of neuropeptide Y and Agouti-related peptide (orex-igenic) and, conversely, elevating expression of pro-opiomelano-cortin (anorexigenic; Schwartz et al., 2000). Insulin also exerts trophic and developmental actions on neurons and glial cells, and new evidence suggests it modulates cognition, memory, and mood (Lee et al., 2016). Conversely, central defects in insulin action are emerging as a potential contributor to the development of Alzheimer’s disease (Griffith et al., 2018), possibly as a result of abnormal phosphorylation of tau protein (Kleinridders et al., 2014). Insulin acting centrally also evokes efferent inputs into peripheral tissue metabolism (Ferris and Kahn, 2016), contrib-uting to the suppression of gluconeogenesis in the liver and the counterregulatory response to hypoglycemia (Diggs-Andrews et al., 2010). Acting centrally on IR, insulin contributes to thermo-regulation by activating heat-liberating mechanisms in brown adipose tissue (Kleinridders et al., 2014).
The cellular mechanisms underlying each of these complex, integrated responses are still to be elucidated, especially in so far as identification of the specific intra- and intercellular neuronal responses that are likely to be carefully decoded through spatial, temporal, and amplitude parameters. Although rich information is being gathered through electrophysiological approaches (van der Heide et al., 2005; Könner et al., 2007; Korol et al., 2018), there is a rich opportunity to explore additional mechanisms through the advent of real-time intravital imaging of the central nervous system (Forli et al., 2018).
Insulin in action: Stimulation of glucose uptake in muscle and fat cellsThe actions of insulin on the parenchyma of peripheral tissues are diverse, and paramount among them is the regulation of glu-cose metabolism. The major function of insulin in muscle and adipose tissues is to increase their uptake of carbon sources and store them for the energetic needs of tissue. With glucose trans-port into these tissues being rate limiting for its storage (as glyco-gen and triglycerides, respectively), it is no surprise that insulin regulates glucose uptake. This is brought about by an exquisite series of signals that cooperate in bringing glucose transporters (GLUT4 isoform) to the cell surface. This process is generically known as GLUT4 translocation, and 30 years of research has revealed regulation at a number of stages in this intracellular process (Bryant and Gould, 2011; Kandror and Pilch, 2011; Stöckli et al., 2011; Bogan, 2012; Leto and Saltiel, 2012; Klip et al., 2014; Jaldin-Fincati et al., 2017).
GLUT4 translocation takes places within minutes of insulin binding to its receptors at the surface of myocytes and adipo-cytes and does not involve internalization of the hormone. Major aspects of GLUT4 translocation are illustrated in Fig. 5.
The unique GLUT4 compartmentThe molecular signature of GLUT4 allows it to be diverted away from the continuously recycling pathway (a ubiquitous intracel-lular route that constantly removes and returns membrane pro-teins by internalization toward endosomes and reexternalization)
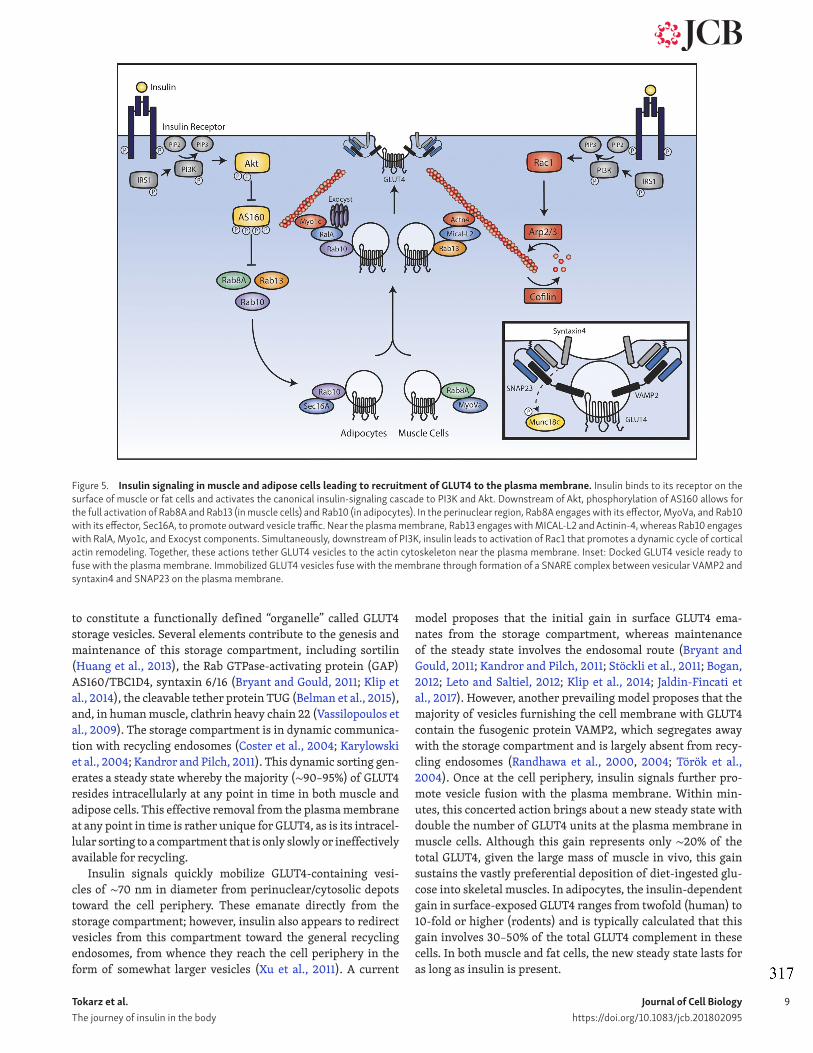
Tokarz et al. The journey of insulin in the body
Journal of Cell Biologyhttps://doi.org/10.1083/jcb.201802095
9
to constitute a functionally defined “organelle” called GLUT4 storage vesicles. Several elements contribute to the genesis and maintenance of this storage compartment, including sortilin (Huang et al., 2013), the Rab GTPase-activating protein (GAP) AS160/TBC1D4, syntaxin 6/16 (Bryant and Gould, 2011; Klip et al., 2014), the cleavable tether protein TUG (Belman et al., 2015), and, in human muscle, clathrin heavy chain 22 (Vassilopoulos et al., 2009). The storage compartment is in dynamic communica-tion with recycling endosomes (Coster et al., 2004; Karylowski et al., 2004; Kandror and Pilch, 2011). This dynamic sorting gen-erates a steady state whereby the majority (∼90–95%) of GLUT4 resides intracellularly at any point in time in both muscle and adipose cells. This effective removal from the plasma membrane at any point in time is rather unique for GLUT4, as is its intracel-lular sorting to a compartment that is only slowly or ineffectively available for recycling.
Insulin signals quickly mobilize GLUT4-containing vesi-cles of ∼70 nm in diameter from perinuclear/cytosolic depots toward the cell periphery. These emanate directly from the storage compartment; however, insulin also appears to redirect vesicles from this compartment toward the general recycling endosomes, from whence they reach the cell periphery in the form of somewhat larger vesicles (Xu et al., 2011). A current
model proposes that the initial gain in surface GLUT4 ema-nates from the storage compartment, whereas maintenance of the steady state involves the endosomal route (Bryant and Gould, 2011; Kandror and Pilch, 2011; Stöckli et al., 2011; Bogan, 2012; Leto and Saltiel, 2012; Klip et al., 2014; Jaldin-Fincati et al., 2017). However, another prevailing model proposes that the majority of vesicles furnishing the cell membrane with GLUT4 contain the fusogenic protein VAMP2, which segregates away with the storage compartment and is largely absent from recy-cling endosomes (Randhawa et al., 2000, 2004; Török et al., 2004). Once at the cell periphery, insulin signals further pro-mote vesicle fusion with the plasma membrane. Within min-utes, this concerted action brings about a new steady state with double the number of GLUT4 units at the plasma membrane in muscle cells. Although this gain represents only ∼20% of the total GLUT4, given the large mass of muscle in vivo, this gain sustains the vastly preferential deposition of diet-ingested glu-cose into skeletal muscles. In adipocytes, the insulin-dependent gain in surface-exposed GLUT4 ranges from twofold (human) to 10-fold or higher (rodents) and is typically calculated that this gain involves 30–50% of the total GLUT4 complement in these cells. In both muscle and fat cells, the new steady state lasts for as long as insulin is present.
Figure 5. Insulin signaling in muscle and adipose cells leading to recruitment of GLUT4 to the plasma membrane. Insulin binds to its receptor on the surface of muscle or fat cells and activates the canonical insulin-signaling cascade to PI3K and Akt. Downstream of Akt, phosphorylation of AS160 allows for the full activation of Rab8A and Rab13 (in muscle cells) and Rab10 (in adipocytes). In the perinuclear region, Rab8A engages with its effector, MyoVa, and Rab10 with its effector, Sec16A, to promote outward vesicle traffic. Near the plasma membrane, Rab13 engages with MIC AL-L2 and Actinin-4, whereas Rab10 engages with RalA, Myo1c, and Exocyst components. Simultaneously, downstream of PI3K, insulin leads to activation of Rac1 that promotes a dynamic cycle of cortical actin remodeling. Together, these actions tether GLUT4 vesicles to the actin cytoskeleton near the plasma membrane. Inset: Docked GLUT4 vesicle ready to fuse with the plasma membrane. Immobilized GLUT4 vesicles fuse with the membrane through formation of a SNA RE complex between vesicular VAMP2 and syntaxin4 and SNAP23 on the plasma membrane.
luckie
317
Tokarz et al. The journey of insulin in the body
Journal of Cell Biologyhttps://doi.org/10.1083/jcb.201802095
10
The GLUT4 polypeptide has a very long lifetime (∼40 h); hence, its continuous removal from the membrane allows for multiple rounds of endocytosis, sorting, and translocation. It is understood that insulin promotes GLUT4 exit from retention in the storage compartment (Xu and Kandror, 2002; Coster et al., 2004; Martin et al., 2006; Bogan et al., 2012) and also regulates GLUT4 vesicle tethering, docking, and fusion with the plasma membrane through mechanisms that borrow principles from those of synaptic vesicle and insulin granule fusion.
Insulin signals involved in GLUT4 translocationThe connection between IR-derived signals (Klip et al., 2014) and the elements that mobilize GLUT4 vesicles and enact their fusion with the membrane is beginning to unravel. Insulin activates the IR tyrosine kinase activity toward autophosphorylation by induc-ing structural rearrangement of the transmembrane domains to bring them into close proximity with each other (Gutmann et al., 2018), and the consequent activation of the IR tyrosine kinase toward phosphorylation of its major substrates IRS1,2 (Copps and White, 2012). Phosphorylation sites on IRS1,2 constitute entropic information to attract class I PI3K, which rapidly gen-erates membrane domains enriched in PI(3,4,5)P3 (PIP3) within minutes (Ruderman et al., 1990). Two major consequences of the PIP3 burst relevant for GLUT4 translocation are activation of the kinases Akt1, 2 (Brozinick and Birnbaum, 1998; Wang et al., 1999) and of the Rho-family GTPase Rac1 (Chiu et al., 2011).
For the first signal, PIP3 attracts the PH domain of Akt, which makes the protein available for phosphorylation by two kinases, PDK-1, and mTORC2. Activated Akt1,2 migrates to the cytosol and intracellular membranes (Zheng and Cartee, 2016), where it phosphorylates AS160, a substrate of 160 kD more appropriately named TBC1D4 (Sano et al., 2003; Lansey et al., 2012). The TBC domain of AS160/TBC1D4 defines its GAP activity toward Rab family small GTPases. Phosphorylation of AS160/TBC1D4 inhib-its its GAP activity; hence, insulin signaling leads to inactivation of an inhibitor of Rab GTPases. This realization constituted the first involvement of elements capable of specifically regulating vesicle traffic in the pathway, as Rab GTPases regulate vesicle fis-sion, destination, and fusion. AS160/TBC1D4 targets a cluster of Rabs, particularly the phylogenetically related Rabs 8A, 10, and 13. In addition, these three GTPases are stabilized by the holdase chaperone RAB IF/MSS4 (Gulbranson et al., 2017). As a result of AS160/TBC1D4 inactivation, these Rab GTPases prevail in their active, GTP-loaded state; hence, their regulation is largely via inhibition of their GAP (whereas their currently incompletely identified guanine nucleotide exchange factors (GEFs) might be constitutively active, as in the case of the Sec10, the GEF for Rab10 (Sano et al., 2011; Fig. 5).
In parallel to activation of this “Akt cascade,” the burst in plasma membrane–associated PIP3 leads to activation of GEFs (and possibly inhibition of GAPs) for Rac1 (Takenaka et al., 2014, 2016). The resulting Rac1 activation leads to a dynamic remod-eling of cortical actin filaments via cycles of actin filament branching enacted by Arp2/3 and actin severing enacted by cofi-lin, which is best mapped in muscle cells (Chiu et al., 2010) and tissue (Sylow et al., 2013; Fig. 5).
From signals to effectors: Mechanical elements of GLUT4 vesicle translocationRab GTPases lie at the crux of signal transmission to mechanical transduction, as several Rab GTPase effectors collude with actin filaments (whether those remodeling at the cell cortex and/or other filamentous configurations) to de facto mobilize GLUT4 to the plasma membrane. In adipocytes, Rab10 is the preferred GTPase in GLUT4 translocation (Sano et al., 2008), whereas in muscle cells, it is Rab8A and Rab13 (Ishikura et al., 2007; Sun et al., 2010, 2014, 2016). Although Rab10, Rab8A, and Rab13 have been studied the most, other Rab family GTPases contribute to the overall GLUT4 traffic, such as Rab28, which is also a substrate of AS160/TBC1D4; Rab14, involved in intracellular GLUT4 sorting; Rabs 4 and 11, involved in constitutive GLUT4 cycling; and Rab5, involved in early GLUT4 endocytosis (Jaldin-Fincati et al., 2017).
In adipocytes, Rab10 promotes GLUT4 mobilization from the perinuclear region toward the plasma membrane (Sano et al., 2007; Bruno et al., 2016), specifically by interacting with Sec16A (Sano et al., 2007; Bruno et al., 2016). In addition, a function for Rab10 at the cell periphery was also proposed (Chen and Lippincott-Schwartz, 2013), as will be discussed.
In muscle cells, the perinuclear Rab8A engages its effector Myosin Va thereby promoting GLUT4 exit from the storage com-partment (Sun et al., 2014). This processive molecular motor allows migration of GLUT4 vesicles along actin filaments toward the cell periphery. Rab13 is more peripherally located, and its effector is the cortically located protein MIC AL-L2, which in turn binds the cortical cytoskeleton protein α-actinin4. In response to insulin, these three proteins can be visualized near the cell surface along with GLUT4 and cortical actin (Sun et al., 2016). In this way, Rab8A and Rab13 ensure GLUT4 vesicle mobilization toward the periphery and tethering to cytoskeletal elements in this region, respectively.
In addition to the Rab13–MIC AL-L2–α-actinin4 connection, GLUT4 vesicles tether to actin filaments via Myosin 1c (Bose et al., 2002; Boguslavsky et al., 2012). This restricts GLUT4 mobil-ity beneath the membrane, a phenomenon nicely documented through total internal reflection fluorescence microscopy of muscle and adipose cells (Bai et al., 2007; Xiong et al., 2010; Boguslavsky et al., 2012; Lizunov et al., 2012). GLUT4 vesicle retention near the membrane also involves the exocyst subunit Exo70 (Lizunov et al., 2012). Tethering may be regulated by insu-lin, as stimulation leads to phosphorylation of Exo84 (Uhm et al., 2017). In addition, active Rab10 binds to Exoc6/6b (Sano et al., 2015), and the Rab10 effector RalA and its GEF, Rlf, interact with exocyst components (Karunanithi et al., 2014).
The GLUT4 vesicle fusion machineryGLUT4 vesicles immobilized at the cell periphery rapidly fuse with the membrane. This is brought about through formation of a SNA RE complex between VAMP2 on the vesicles and syn-atxin4 and SNAP23 on the plasma membrane (Cheatham et al., 1996; Foster and Klip, 2000; Thurmond and Pessin, 2001). The formation of the SNA RE complex is regulated by a fine balance of a number of proteins such as Munc18c, Synip, and Doc2b, which receive input emanating from Akt and the phosphatase

Tokarz et al. The journey of insulin in the body
Journal of Cell Biologyhttps://doi.org/10.1083/jcb.201802095
11
PTP-1B (Yamada et al., 2005; Fukuda et al., 2009; Bakke et al., 2013; Garrido-Sanchez et al., 2013; Fig. 5).
The kinetics, stoichiometry, and upstream regulation of the fusion step still need to be fully investigated. Intriguingly, there are studies of additional participation of Ca2+-regulated proteins such as Doc2b, Tctex1d2, and E-Syt1 (Lalioti et al., 2009; Friedrich et al., 2010; Shimoda et al., 2015), and insulin-dependent Ca2+-spikes have been recorded in muscle cells (Contreras-Ferrat et al., 2014), suggesting that the ion may impart some fine-tuning to the fidelity and timeliness of GLUT4 vesicle fusion. Lastly, and importantly, the fusion event requires insulin-induced actin polymerization, evincing the contribution of the actin cytoskeleton at different steps in the process of GLUT4 translocation (Lopez et al., 2009).
The end: Insulin degradation in the kidneyInsulin is no longer detectable in the circulation 30 min after its release from the pancreas, and its half-life once in the circula-tion is ∼6 min (Robbins et al., 1985; Marino, 2009). In addition to its clearance by the liver (50% in first and another 25% in second pass), the hormone is also slowly internalized by most cells, including myoblasts and adipocytes, where it is routed to the lysosome for degradation. This is a mechanism to end insu-lin action, but it accounts for the destruction of only a fraction of the circulating insulin. The brunt of the degradation of the circulating hormone remaining after second pass through the liver occurs when it reaches the kidney. Here, its fate is three-some. Upon filtration at the level of the glomeruli, insulin enters the luminal space and reaches the proximal tubule, from whence it is rapidly reabsorbed by the renal epithelial cells. This reabsorption involves saturable binding to low-affinity, high-capacity sites at the brush border membrane, which are demonstrated to be not the IR (Meezan et al., 1988; Sato et al., 1991; Nielsen, 1993, 1994) but possibly scavenger receptors such as megalin (member of the low-density lipoprotein receptor family; Christensen et al., 1998; Kolman et al., 2009) and cubi-lin, proteins that recover a number of proteins by endocytosis. Insulin thus internalized enters the retroendocytic pathway, where it dissociates from its binding sites to proceed to lyso-somes for degradation.
Second, about an equal amount of insulin also enters renal tubular cells from the contraluminal side facing the renal per-itubular capillaries, especially in the convoluted tubule (Rabkin et al., 1984). Here, IRs on the epithelial cells bind insulin and transport it intracellularly for degradation (Nielsen et al., 1987). In addition, these IR are important sites sensing the hormone to stimulate important functions such as reabsorption of sodium, phosphate, and glucose (Rabkin et al., 1984; Hale and Coward, 2013). It has been proposed that these two renal mechanisms of insulin internalization are responsible for clearing up to 6–8 U insulin per day (Palmer and Henrich, 2017) amounting to up to 25% of the insulin secreted by the pancreas, or ∼50% of the circulating insulin, although this might be an overestimation. Nonetheless, renal insulin clearance may explain the curious fact that type 1 diabetic patients with onset renal failure can end up reducing their requirement for injected insulin (Rubenstein and Spitz, 1968; Rabkin et al., 1984).
Third, though most of the internalized insulin is degraded by the above pathways, a small fraction is reabsorbed back to the renal circulation through retroendocytosis (Dahl et al., 1989). Notably, alterations in insulin renal clearance prolong the permanence of insulin in the blood (Dahl et al., 1989), evincing the importance of this process to insulin’s half-life in the circulation.
Concluding remarksWe have analyzed the fundamental physiological journey of insulin in the body by alternating a bird’s-eye view of the integrative phenomenon with close-ups into the key cellular processes of the hormone’s secretion, partial clearance in the liver, distribution to the circulation and exit to target tissues, its action to promote glucose uptake in muscle and fat, and ultimately its degradation in the kidney. In spite of the depth of knowledge available to us on each of these cellular stages in the journey, there are many mechanistic and integrated aspects that remain unknown. However, the current knowl-edge already allows us to understand how each stage is in com-munication with the other. The temporal periodicity of insu-lin secretion out of the pancreas is sensed by the hepatocytes, which synchronously clear a portion of the secreted insulin; insulin action on the macrovasculature allows recruitment of the microcirculation for full enactment of insulin delivery to tissues; and insulin action in the liver, muscle, and fat cells results in a lowering of blood glucose, thus terminating the prime stimulus for insulin secretion. In pace with insulin action, the kidney engages in its subsequent degradation, put-ting an end to the hormone’s action with just the right time delay to ensure optimal metabolic homeostasis.
AcknowledgmentsWe thank profusely the input received for the analysis pre-sented herein from Drs. Sonia M. Najjar, Alan D. Cherrington, and Philip J. Bilan.
Work in P.E. MacDonald’s laboratory on insulin secretion is funded by the Canadian Institutes of Health Research (founda-tion grant FRN 148451). Work in A. Klip’s laboratory on insu-lin delivery and action is funded by the Canadian Institutes of Health Research (foundation grant FRN: FND-143203). A. Klip is the recipient of the Tier I Canada Research Chair “Cell Biology of Insulin Action.” V. Tokarz was supported by the University of Toronto (Ontario Graduate Scholarship) and The Hospital for Sick Children (Restracomp Scholarship).
The authors declare no competing financial interests.A. Klip conceived the subject and format of this article; V.L.
Tokarz, P.E. MacDonald, and A. Klip analyzed the literature, dis-cussed the material, wrote the article, and conceived the figures. V.L. Tokarz produced the majority of the figures.
Submitted: 15 February 2018Revised: 21 March 2018Accepted: 23 March 2018
luckie
319

Tokarz et al. The journey of insulin in the body
Journal of Cell Biologyhttps://doi.org/10.1083/jcb.201802095
12
ReferencesAbdul-Hay, S.O., D. Kang, M. McBride, L. Li, J. Zhao, and M.A. Leissring. 2011.
Deletion of insulin-degrading enzyme elicits antipodal, age-dependent effects on glucose and insulin tolerance. PLoS One. 6:e20818. https:// doi .org/ 10 .1371/ journal .pone .0020818
Ader, M., D. Stefanovski, S.P. Kim, J.M. Richey, V. Ionut, K.J. Catalano, K. Huck-ing, M. Ellmerer, G. Van Citters, I.R. Hsu, et al. 2014. Hepatic insulin clearance is the primary determinant of insulin sensitivity in the nor-mal dog. Obesity (Silver Spring). 22:1238–1245. https:// doi .org/ 10 .1002/ oby .20625
Alenkvist, I., N.R. Gandasi, S. Barg, and A. Tengholm. 2017. Recruitment of Epac2A to Insulin Granule Docking Sites Regulates Priming for Exocy-tosis. Diabetes. 66:2610–2622. https:// doi .org/ 10 .2337/ db17 -0050
Andrali, S.S., M.L. Sampley, N.L. Vanderford, and S. Ozcan. 2008. Glucose regulation of insulin gene expression in pancreatic beta-cells. Biochem. J. 415:1–10. https:// doi .org/ 10 .1042/ BJ20081029
Arnold, W.P., C.K. Mittal, S. Katsuki, and F. Murad. 1977. Nitric oxide activates guanylate cyclase and increases guanosine 3′:5′-cyclic monophosphate levels in various tissue preparations. Proc. Natl. Acad. Sci. USA. 74:3203–3207. https:// doi .org/ 10 .1073/ pnas .74 .8 .3203
Artner, I., and R. Stein. 2008. Transcriptional regulation of insulin gene expression. In Pancreatic Beta Cell in Health and Disease. Springer, Tokyo. 13–30.
Aslamy, A., and D.C. Thurmond. 2017. Exocytosis proteins as novel targets for diabetes prevention and/or remediation? Am. J. Physiol. Regul. Integr. Comp. Physiol. 312:R739–R752. https:// doi .org/ 10 .1152/ ajpregu .00002 .2017
Azizi, P.M., R.E. Zyla, S. Guan, C. Wang, J. Liu, S.-S. Bolz, B. Heit, A. Klip, and W.L. Lee. 2015. Clathrin-dependent entry and vesicle-mediated exocy-tosis define insulin transcytosis across microvascular endothelial cells. Mol. Biol. Cell. 26:740–750. https:// doi .org/ 10 .1091/ mbc .E14 -08 -1307
Bai, L., Y. Wang, J. Fan, Y. Chen, W. Ji, A. Qu, P. Xu, D.E. James, and T. Xu. 2007. Dissecting multiple steps of GLUT4 trafficking and identifying the sites of insulin action. Cell Metab. 5:47–57. https:// doi .org/ 10 .1016/ j .cmet .2006 .11 .013
Bakke, J., A. Bettaieb, N. Nagata, K. Matsuo, and F.G. Haj. 2013. Regulation of the SNA RE-interacting protein Munc18c tyrosine phosphorylation in adipocytes by protein-tyrosine phosphatase 1B. Cell Commun. Signal. 11:57. https:// doi .org/ 10 .1186/ 1478 -811X -11 -57
Baron, A.D., G. Brechtel-Hook, A. Johnson, J. Cronin, R. Leaming, and H.O. Steinberg. 1996. Effect of perfusion rate on the time course of insulin-me-diated skeletal muscle glucose uptake. Am. J. Physiol. 271:E1067–E1072.
Baron, V., F. Alengrin, and E. Van Obberghen. 1998. Dynamin associates with Src-Homology Collagen (Shc) and becomes tyrosine phosphorylated in response to insulin. Endocrinology. 139:3034–3037. https:// doi .org/ 10 .1210/ endo .139 .6 .6131
Barrett, E.J., E.M. Eggleston, A.C. Inyard, H. Wang, G. Li, W. Chai, and Z. Liu. 2009. The vascular actions of insulin control its delivery to muscle and regulate the rate-limiting step in skeletal muscle insulin action. Diabeto-logia. 52:752–764. https:// doi .org/ 10 .1007/ s00125 -009 -1313 -z
Belman, J.P., R.R. Bian, E.N. Habtemichael, D.T. Li, M.J. Jurczak, A. Alcázar-Román, L.J. McNally, G.I. Shulman, and J.S. Bogan. 2015. Acetylation of TUG protein promotes the accumulation of GLUT4 glucose transport-ers in an insulin-responsive intracellular compartment. J. Biol. Chem. 290:4447–4463. https:// doi .org/ 10 .1074/ jbc .M114 .603977
Bergeron, J.J.M., G.M. Di Guglielmo, S. Dahan, M. Dominguez, and B.I. Pos-ner. 2016. Spatial and Temporal Regulation of Receptor Tyrosine Kinase Activation and Intracellular Signal Transduction. Annu. Rev. Biochem. 85:573–597. https:// doi .org/ 10 .1146/ annurev -biochem -060815 -014659
Bergsten, P., E. Grapengiesser, E. Gylfe, A. Tengholm, and B. Hellman. 1994. Synchronous oscillations of cytoplasmic Ca2+ and insulin release in glu-cose-stimulated pancreatic islets. J. Biol. Chem. 269:8749–8753.
Bertram, R., L.S. Satin, and A.S. Sherman. 2018. Closing in on the Mechanisms of Pulsatile Insulin Secretion. Diabetes. 67:351–359. https:// doi .org/ 10 .2337/ dbi17 -0004
Bevan, A.P., J.W. Burgess, P.G. Drake, A. Shaver, J.J. Bergeron, and B.I. Posner. 1995. Selective activation of the rat hepatic endosomal insulin recep-tor kinase. Role for the endosome in insulin signaling. J. Biol. Chem. 270:10784–10791. https:// doi .org/ 10 .1074/ jbc .270 .18 .10784
Bogan, J.S. 2012. Regulation of glucose transporter translocation in health and diabetes. Annu. Rev. Biochem. 81:507–532. https:// doi .org/ 10 .1146/ annurev -biochem -060109 -094246
Bogan, J.S., B.R. Rubin, C. Yu, M.G. Löffler, C.M. Orme, J.P. Belman, L.J. McNally, M. Hao, and J.A. Cresswell. 2012. Endoproteolytic cleavage of
TUG protein regulates GLUT4 glucose transporter translocation. J. Biol. Chem. 287:23932–23947. https:// doi .org/ 10 .1074/ jbc .M112 .339457
Boguslavsky, S., T. Chiu, K.P. Foley, C. Osorio-Fuentealba, C.N. Antonescu, K.U. Bayer, P.J. Bilan, and A. Klip. 2012. Myo1c binding to submembrane actin mediates insulin-induced tethering of GLUT4 vesicles. Mol. Biol. Cell. 23:4065–4078. https:// doi .org/ 10 .1091/ mbc .E12 -04 -0263
Bose, A., A. Guilherme, S.I. Robida, S.M.C. Nicoloro, Q.L. Zhou, Z.Y. Jiang, D.P. Pomerleau, and M.P. Czech. 2002. Glucose transporter recycling in response to insulin is facilitated by myosin Myo1c. Nature. 420:821–824. https:// doi .org/ 10 .1038/ nature01246
Boucher, J., A. Kleinridders, and C.R. Kahn. 2014. Insulin receptor signaling in normal and insulin-resistant states. Cold Spring Harb. Perspect. Biol. 6:a009191. https:// doi .org/ 10 .1101/ cshperspect .a009191
Bradley, E.A., S.M. Richards, M.A. Keske, and S. Rattigan. 2013. Local NOS inhibition impairs vascular and metabolic actions of insulin in rat hindleg muscle in vivo. Am. J. Physiol. Endocrinol. Metab. 305:E745–E750. https:// doi .org/ 10 .1152/ ajpendo .00289 .2013
Braet, F., R. De Zanger, M. Baekeland, E. Crabbé, P. Van Der Smissen, and E. Wisse. 1995. Structure and dynamics of the fenestrae-associated cyto-skeleton of rat liver sinusoidal endothelial cells. Hepatology. 21:180–189.
Broussard, J.L., A.V.B. Castro, M. Iyer, R.L. Paszkiewicz, I.A. Bediako, L.S. Szczepaniak, E.W. Szczepaniak, R.N. Bergman, and C.M. Kolka. 2016. Insulin access to skeletal muscle is impaired during the early stages of diet-induced obesity. Obesity (Silver Spring). 24:1922–1928. https:// doi .org/ 10 .1002/ oby .21562
Brozinick, J.T. Jr., and M.J. Birnbaum. 1998. Insulin, but not contraction, acti-vates Akt/PKB in isolated rat skeletal muscle. J. Biol. Chem. 273:14679–14682. https:// doi .org/ 10 .1074/ jbc .273 .24 .14679
Brüning, J.C., D. Gautam, D.J. Burks, J. Gillette, M. Schubert, P.C. Orban, R. Klein, W. Krone, D. Müller-Wieland, and C.R. Kahn. 2000. Role of brain insulin receptor in control of body weight and reproduction. Science. 289:2122–2125. https:// doi .org/ 10 .1126/ science .289 .5487 .2122
Bruno, J., A. Brumfield, N. Chaudhary, D. Iaea, and T.E. McGraw. 2016. SEC16A is a RAB10 effector required for insulin-stimulated GLUT4 trafficking in adipocytes. J. Cell Biol. 214:61–76. https:// doi .org/ 10 .1083/ jcb .201509052
Bryant, N.J., and G.W. Gould. 2011. SNA RE proteins underpin insulin-regu-lated GLUT4 traffic. Traffic. 12:657–664. https:// doi .org/ 10 .1111/ j .1600 -0854 .2011 .01163 .x
Carpentier, J.L., M. Fehlmann, E. Van Obberghen, P. Gorden, and L. Orci. 1985. Redistribution of 125I-insulin on the surface of rat hepatocytes as a function of dissociation time. Diabetes. 34:1002–1007. https:// doi .org/ 10 .2337/ diabetes .34 .10 .1002
Carpentier, J.L., J.P. Paccaud, P. Gorden, W.J. Rutter, and L. Orci. 1992. Insu-lin-induced surface redistribution regulates internalization of the insu-lin receptor and requires its autophosphorylation. Proc. Natl. Acad. Sci. USA. 89:162–166. https:// doi .org/ 10 .1073/ pnas .89 .1 .162
Carvajal, J.A., A.M. Germain, J.P. Huidobro-Toro, and C.P. Weiner. 2000. Molec-ular mechanism of cGMP-mediated smooth muscle relaxation. J. Cell. Physiol. 184:409–420. https:// doi .org/ 10 .1002/ 1097 -4652(200009)184: 3 %3C409:: AID -JCP16 %3E3 .0 .CO;2 -K
Cheatham, B., A. Volchuk, C.R. Kahn, L. Wang, C.J. Rhodes, and A. Klip. 1996. Insulin-stimulated translocation of GLUT4 glucose transporters requires SNA RE-complex proteins. Proc. Natl. Acad. Sci. USA. 93:15169–15173. https:// doi .org/ 10 .1073/ pnas .93 .26 .15169
Chen, Y., and J. Lippincott-Schwartz. 2013. Insulin triggers surface-directed trafficking of sequestered GLUT4 storage vesicles marked by Rab10. Small GTPases. 4:193–197. https:// doi .org/ 10 .4161/ sgtp .26471
Chiu, T.T., N. Patel, A.E. Shaw, J.R. Bamburg, and A. Klip. 2010. Arp2/3- and cofilin-coordinated actin dynamics is required for insulin-mediated GLUT4 translocation to the surface of muscle cells. Mol. Biol. Cell. 21:3529–3539. https:// doi .org/ 10 .1091/ mbc .E10 -04 -0316
Chiu, T.T., T.E. Jensen, L. Sylow, E.A. Richter, and A. Klip. 2011. Rac1 signalling towards GLUT4/glucose uptake in skeletal muscle. Cell. Signal. 23:1546–1554. https:// doi .org/ 10 .1016/ j .cellsig .2011 .05 .022
Christensen, E.I., H. Birn, P. Verroust, and S.K. Moestrup. 1998. Membrane receptors for endocytosis in the renal proximal tubule. Int. Rev. Cytol. 180:237–284. https:// doi .org/ 10 .1016/ S0074 -7696(08)61772 -6
Clerk, L.H., M.A. Vincent, L.A. Jahn, Z. Liu, J.R. Lindner, and E.J. Barrett. 2006. Obesity blunts insulin-mediated microvascular recruitment in human forearm muscle. Diabetes. 55:1436–1442. https:// doi .org/ 10 .2337/ db05 -1373
Cohen, S.E., E. Kokkotou, S.B. Biddinger, T. Kondo, R. Gebhardt, J. Kratzsch, C.S. Mantzoros, and C.R. Kahn. 2007. High circulating leptin recep-tors with normal leptin sensitivity in liver-specific insulin receptor
Tokarz et al. The journey of insulin in the body
Journal of Cell Biologyhttps://doi.org/10.1083/jcb.201802095
13
knock-out (LIR KO) mice. J. Biol. Chem. 282:23672–23678. https:// doi .org/ 10 .1074/ jbc .M704053200
Contreras-Ferrat, A., S. Lavandero, E. Jaimovich, and A. Klip. 2014. Calcium signaling in insulin action on striated muscle. Cell Calcium. 56:390–396. https:// doi .org/ 10 .1016/ j .ceca .2014 .08 .012
Copps, K.D., and M.F. White. 2012. Regulation of insulin sensitivity by serine/threonine phosphorylation of insulin receptor substrate proteins IRS1 and IRS2. Diabetologia. 55:2565–2582. https:// doi .org/ 10 .1007/ s00125 -012 -2644 -8
Coster, A.C.F., R. Govers, and D.E. James. 2004. Insulin stimulates the entry of GLUT4 into the endosomal recycling pathway by a quantal mechanism. Traffic. 5:763–771. https:// doi .org/ 10 .1111/ j .1600 -0854 .2004 .00218 .x
Czech, M.P. 2017. Insulin action and resistance in obesity and type 2 diabetes. Nat. Med. 23:804–814. https:// doi .org/ 10 .1038/ nm .4350
Dahl, D.C., T. Tsao, W.C. Duckworth, M.J. Mahoney, and R. Rabkin. 1989. Ret-roendocytosis of insulin in a cultured kidney epithelial cell line. Am. J. Physiol. 257:C190–C196. https:// doi .org/ 10 .1152/ ajpcell .1989 .257 .2 .C190
Dean, P.M., and E.K. Matthews. 1970. Glucose-induced electrical activity in pancreatic islet cells. J. Physiol. 210:255–264. https:// doi .org/ 10 .1113/ jphysiol .1970 .sp009207
DeFronzo, R.A., E. Ferrannini, L. Groop, R.R. Henry, W.H. Herman, J.J. Holst, F.B. Hu, C.R. Kahn, I. Raz, G.I. Shulman, et al. 2015. Type 2 diabetes mel-litus. Nat. Rev. Dis. Primers. 1:15019. https:// doi .org/ 10 .1038/ nrdp .2015 .19
de Jongh, R.T., E.H. Serné, R.G. IJzerman, G. de Vries, and C.D.A. Stehouwer. 2004. Impaired microvascular function in obesity: implications for obe-sity-associated microangiopathy, hypertension, and insulin resistance. Circulation. 109:2529–2535. https:// doi .org/ 10 .1161/ 01 .CIR .0000129772 .26647 .6F
Diggs-Andrews, K.A., X. Zhang, Z. Song, D. Daphna-Iken, V.H. Routh, and S.J. Fisher. 2010. Brain insulin action regulates hypothalamic glucose sensing and the counterregulatory response to hypoglycemia. Diabetes. 59:2271–2280. https:// doi .org/ 10 .2337/ db10 -0401
Dong, X.C., K.D. Copps, S. Guo, Y. Li, R. Kollipara, R.A. DePinho, and M.F. White. 2008. Inactivation of hepatic Foxo1 by insulin signaling is required for adaptive nutrient homeostasis and endocrine growth regulation. Cell Metab. 8:65–76. https:// doi .org/ 10 .1016/ j .cmet .2008 .06 .006
Drucker, D.J., J.F. Habener, and J.J. Holst. 2017. Discovery, characterization, and clinical development of the glucagon-like peptides. J. Clin. Invest. 127:4217–4227. https:// doi .org/ 10 .1172/ JCI97233
Du, W., M. Zhou, W. Zhao, D. Cheng, L. Wang, J. Lu, E. Song, W. Feng, Y. Xue, P. Xu, and T. Xu. 2016. HID-1 is required for homotypic fusion of imma-ture secretory granules during maturation. eLife. 5:241. https:// doi .org/ 10 .7554/ eLife .18134
Duckworth, W.C. 1988. Insulin degradation: mechanisms, products, and sig-nificance. Endocr. Rev. 9:319–345. https:// doi .org/ 10 .1210/ edrv -9 -3 -319
Duckworth, W.C., K.R. Runyan, R.K. Wright, P.A. Halban, and S.S. Solomon. 1981. Insulin degradation by hepatocytes in primary culture. Endocrinol-ogy. 108:1142–1147. https:// doi .org/ 10 .1210/ endo -108 -4 -1142
Duncan, E.R., P.A. Crossey, S. Walker, N. Anilkumar, L. Poston, G. Douglas, V.A. Ezzat, S.B. Wheatcroft, A.M. Shah, M.T. Kearney, and M.I. Kearney. 2008. Effect of endothelium-specific insulin resistance on endothelial function in vivo. Diabetes. 57:3307–3314. https:// doi .org/ 10 .2337/ db07 -1111
Farris, W., S. Mansourian, Y. Chang, L. Lindsley, E.A. Eckman, M.P. Frosch, C.B. Eckman, R.E. Tanzi, D.J. Selkoe, and S. Guenette. 2003. Insulin-de-grading enzyme regulates the levels of insulin, amyloid beta-protein, and the beta-amyloid precursor protein intracellular domain in vivo. Proc. Natl. Acad. Sci. USA. 100:4162–4167. https:// doi .org/ 10 .1073/ pnas .0230450100
Fehlmann, M., J.L. Carpentier, A. Le Cam, P. Thamm, D. Saunders, D. Bran-denburg, L. Orci, and P. Freychet. 1982. Biochemical and morphological evidence that the insulin receptor is internalized with insulin in hepato-cytes. J. Cell Biol. 93:82–87. https:// doi .org/ 10 .1083/ jcb .93 .1 .82
Ferdaoussi, M., and P.E. MacDonald. 2017. Toward Connecting Metabolism to the Exocytotic Site. Trends Cell Biol. 27:163–171. https:// doi .org/ 10 .1016/ j .tcb .2016 .10 .003
Ferris, H.A., and C.R. Kahn. 2016. Unraveling the Paradox of Selective Insulin Resistance in the Liver: the Brain-Liver Connection. Diabetes. 65:1481–1483. https:// doi .org/ 10 .2337/ dbi16 -0010
Filippi, B.M., M.A. Abraham, J.T.Y. Yue, and T.K.T. Lam. 2013. Insulin and glu-cagon signaling in the central nervous system. Rev. Endocr. Metab. Disord. 14:365–375. https:// doi .org/ 10 .1007/ s11154 -013 -9258 -4
Foley, K., S. Boguslavsky, and A. Klip. 2011. Endocytosis, recycling, and regu-lated exocytosis of glucose transporter 4. Biochemistry. 50:3048–3061. https:// doi .org/ 10 .1021/ bi2000356
Forli, A., D. Vecchia, N. Binini, F. Succol, S. Bovetti, C. Moretti, F. Nespoli, M. Mahn, C.A. Baker, M.M. Bolton, et al. 2018. Two-Photon Bidirectional Control and Imaging of Neuronal Excitability with High Spatial Resolu-tion In Vivo. Cell Reports. 22:3087–3098. https:// doi .org/ 10 .1016/ j .celrep .2018 .02 .063
Foster, L.J., and A. Klip. 2000. Mechanism and regulation of GLUT-4 vesicle fusion in muscle and fat cells. Am. J. Physiol. Cell Physiol. 279:C877–C890. https:// doi .org/ 10 .1152/ ajpcell .2000 .279 .4 .C877
Friedrich, R., A. Yeheskel, and U. Ashery. 2010. DOC2B, C2 domains, and cal-cium: A tale of intricate interactions. Mol. Neurobiol. 41:42–51. https:// doi .org/ 10 .1007/ s12035 -009 -8094 -8
Fukuda, N., M. Emoto, Y. Nakamori, A. Taguchi, S. Miyamoto, S. Uraki, Y. Oka, and Y. Tanizawa. 2009. DOC2B: a novel syntaxin-4 binding pro-tein mediating insulin-regulated GLUT4 vesicle fusion in adipocytes. Diabetes. 58:377–384. https:// doi .org/ 10 .2337/ db08 -0303
Gaisano, H.Y. 2017. Recent new insights into the role of SNA RE and associated proteins in insulin granule exocytosis. Diabetes Obes. Metab. 19(Suppl 1):115–123. https:// doi .org/ 10 .1111/ dom .13001
Gandasi, N.R., and S. Barg. 2014. Contact-induced clustering of syntaxin and munc18 docks secretory granules at the exocytosis site. Nat. Commun. 5:3914. https:// doi .org/ 10 .1038/ ncomms4914
Gandasi, N.R., P. Yin, M. Riz, M.V. Chibalina, G. Cortese, P.-E. Lund, V. Matveev, P. Rorsman, A. Sherman, M.G. Pedersen, and S. Barg. 2017. Ca2+ chan-nel clustering with insulin-containing granules is disturbed in type 2 diabetes. J. Clin. Invest. 127:2353–2364. https:// doi .org/ 10 .1172/ JCI88491
Gao, T., B. McKenna, C. Li, M. Reichert, J. Nguyen, T. Singh, C. Yang, A. Pan-nikar, N. Doliba, T. Zhang, et al. 2014. Pdx1 maintains β cell identity and function by repressing an α cell program. Cell Metab. 19:259–271. https:// doi .org/ 10 .1016/ j .cmet .2013 .12 .002
García-Cáceres, C., C. Quarta, L. Varela, Y. Gao, T. Gruber, B. Legutko, M. Jas-troch, P. Johansson, J. Ninkovic, C.-X. Yi, et al. 2016. Astrocytic Insulin Signaling Couples Brain Glucose Uptake with Nutrient Availability. Cell. 166:867–880. https:// doi .org/ 10 .1016/ j .cell .2016 .07 .028
Garrido-Sanchez, L., X. Escote, L. Coin-Aragüez, J.C. Fernandez-Garcia, R. El Bekay, J. Vendrell, E. Garcia-Fuentes, and F.J. Tinahones. 2013. Munc18c in adipose tissue is downregulated in obesity and is associated with insu-lin. PLoS One. 8:e63937. https:// doi .org/ 10 .1371/ journal .pone .0063937
Garvey, W.T., L. Maianu, J.H. Zhu, G. Brechtel-Hook, P. Wallace, and A.D. Baron. 1998. Evidence for defects in the trafficking and translocation of GLUT4 glucose transporters in skeletal muscle as a cause of human insulin resistance. J. Clin. Invest. 101:2377–2386. https:// doi .org/ 10 .1172/ JCI1557
Gloyn, A.L., K. Noordam, M.A.A.P. Willemsen, S. Ellard, W.W.K. Lam, I.W. Campbell, P. Midgley, C. Shiota, C. Buettger, M.A. Magnuson, et al. 2003. Insights into the biochemical and genetic basis of glucokinase activation from naturally occurring hypoglycemia mutations. Diabetes. 52:2433–2440. https:// doi .org/ 10 .2337/ diabetes .52 .9 .2433
Goodner, C.J., I.R. Sweet, and H.C. Harrison Jr. 1988. Rapid reduction and return of surface insulin receptors after exposure to brief pulses of insulin in perifused rat hepatocytes. Diabetes. 37:1316–1323. https:// doi .org/ 10 .2337/ diab .37 .10 .1316
Gray, S.M., K.W. Aylor, and E.J. Barrett. 2017. Unravelling the regulation of insulin transport across the brain endothelial cell. Diabetologia. 60:1512–1521. https:// doi .org/ 10 .1007/ s00125 -017 -4285 -4
Griffith, C.M., T. Eid, G.M. Rose, and P.R. Patrylo. 2018. Evidence for altered insulin receptor signaling in Alzheimer’s disease. Neuropharmacolo-gy.:S0028-3908(18)30008-X. https:// doi .org/ 10 .1016/ j .neuropharm .2018 .01 .008
Gulbranson, D.R., E.M. Davis, B.A. Demmitt, Y. Ouyang, Y. Ye, H. Yu, and J. Shen. 2017. RAB IF/MSS4 is a Rab-stabilizing holdase chaperone required for GLUT4 exocytosis. Proc. Natl. Acad. Sci. USA. 114:E8224–E8233. https:// doi .org/ 10 .1073/ pnas .1712176114
Gutmann, T., K.H. Kim, M. Grzybek, T. Walz, and Ü. Coskun. 2018. Visual-ization of ligand-induced transmembrane signaling in the full-length human insulin receptor. J. Cell Biol.:jcb.201711047.
Gylfe, E., E. Grapengiesser, H. Dansk, and B. Hellman. 2012. The neurotrans-mitter ATP triggers Ca2+ responses promoting coordination of pancre-atic islet oscillations. Pancreas. 41:258–263. https:// doi .org/ 10 .1097/ MPA .0b013e3182240586
Haeusler, R.A., T.E. McGraw, and D. Accili. 2018. Biochemical and cellular properties of insulin receptor signalling. Nat. Rev. Mol. Cell Biol. 19:31–44. https:// doi .org/ 10 .1038/ nrm .2017 .89
Hale, L.J., and R.J.M. Coward. 2013. Insulin signalling to the kidney in health and disease. Clin. Sci. (Lond.). 124:351–370. https:// doi .org/ 10 .1042/ CS20120378
luckie
321
Tokarz et al. The journey of insulin in the body
Journal of Cell Biologyhttps://doi.org/10.1083/jcb.201802095
14
Hamel, F.G., M.J. Mahoney, and W.C. Duckworth. 1991. Degradation of intraendosomal insulin by insulin-degrading enzyme without acidifi-cation. Diabetes. 40:436–443. https:// doi .org/ 10 .2337/ diab .40 .4 .436
Henquin, J.C. 2000. Triggering and amplifying pathways of regulation of insulin secretion by glucose. Diabetes. 49:1751–1760. https:// doi .org/ 10 .2337/ diabetes .49 .11 .1751
Henquin, J.C., H.P. Meissner, and W. Schmeer. 1982. Cyclic variations of glucose-induced electrical activity in pancreatic B cells. Pflugers Arch. 393:322–327. https:// doi .org/ 10 .1007/ BF00581418
Herkner, H., N. Klein, C. Joukhadar, E. Lackner, H. Langenberger, M. Frossard, C. Bieglmayer, O. Wagner, M. Roden, and M. Müller. 2003. Transcapil-lary insulin transfer in human skeletal muscle. Eur. J. Clin. Invest. 33:141–146. https:// doi .org/ 10 .1046/ j .1365 -2362 .2003 .01106 .x
Hoehn, K.L., C. Hohnen-Behrens, A. Cederberg, L.E. Wu, N. Turner, T. Yuasa, Y. Ebina, and D.E. James. 2008. IRS1-independent defects define major nodes of insulin resistance. Cell Metab. 7:421–433. https:// doi .org/ 10 .1016/ j .cmet .2008 .04 .005
Hollingdal, M., C.B. Juhl, S.M. Pincus, J. Sturis, J.D. Veldhuis, K.S. Polonsky, N. Pørksen, and O. Schmitz. 2000. Failure of physiological plasma glucose excursions to entrain high-frequency pulsatile insulin secretion in type 2 diabetes. Diabetes. 49:1334–1340. https:// doi .org/ 10 .2337/ diabetes .49 .8 .1334
Horwitz, D.L., J.I. Starr, M.E. Mako, W.G. Blackard, and A.H. Rubenstein. 1975. Proinsulin, insulin, and C-peptide concentrations in human portal and peripheral blood. J. Clin. Invest. 55:1278–1283. https:// doi .org/ 10 .1172/ JCI108047
Huang, G., D. Buckler-Pena, T. Nauta, M. Singh, A. Asmar, J. Shi, J.Y. Kim, and K.V. Kandror. 2013. Insulin responsiveness of glucose transporter 4 in 3T3-L1 cells depends on the presence of sortilin. Mol. Biol. Cell. 24:3115–3122. https:// doi .org/ 10 .1091/ mbc .E12 -10 -0765
Hutton, J.C. 1994. Insulin secretory granule biogenesis and the proinsu-lin-processing endopeptidases. Diabetologia. 37(Suppl 2):S48–S56.
Ishikura, S., P.J. Bilan, and A. Klip. 2007. Rabs 8A and 14 are targets of the insulin-regulated Rab-GAP AS160 regulating GLUT4 traffic in muscle cells. Biochem. Biophys. Res. Commun. 353:1074–1079. https:// doi .org/ 10 .1016/ j .bbrc .2006 .12 .140
Jaldin-Fincati, J.R., M. Pavarotti, S. Frendo-Cumbo, P.J. Bilan, and A. Klip. 2017. Update on GLUT4 Vesicle Traffic: A Cornerstone of Insulin Action. Trends Endocrinol. Metab. 28:597–611. https:// doi .org/ 10 .1016/ j .tem .2017 .05 .002
Jaldin-Fincati, J.R., R.V.S. Pereira, P.J. Bilan, and A. Klip. 2018. Insulin uptake and action in microvascular endothelial cells of lymphatic and blood origin. Am. J. Physiol. Endocrinol. Metab.:ajpendo.00008.2018. https:// doi .org/ 10 .1152/ ajpendo .00008 .2018
Jansson, P.-A.E., J.P. Fowelin, H.P. von Schenck, U.P. Smith, and P.N. Lönnroth. 1993. Measurement by microdialysis of the insulin concentration in sub-cutaneous interstitial fluid. Importance of the endothelial barrier for insulin. Diabetes. 42:1469–1473. https:// doi .org/ 10 .2337/ diab .42 .10 .1469
Jialal, I., G.L. King, S. Buchwald, C.R. Kahn, and M. Crettaz. 1984. Processing of insulin by bovine endothelial cells in culture. Internalization without degradation. Diabetes. 33:794–800. https:// doi .org/ 10 .2337/ diab .33 .8 .794
Johnston, N.R., R.K. Mitchell, E. Haythorne, M.P. Pessoa, F. Semplici, J. Ferrer, L. Piemonti, P. Marchetti, M. Bugliani, D. Bosco, et al. 2016. Beta Cell Hubs Dictate Pancreatic Islet Responses to Glucose. Cell Metab. 24:389–401. https:// doi .org/ 10 .1016/ j .cmet .2016 .06 .020
Jung, S.-H., C.-H. Jung, G.M. Reaven, and S.H. Kim. 2018. Adapting to insulin resistance in obesity: role of insulin secretion and clearance. Diabetolo-gia. 61:681–687.
Kalwat, M.A., and D.C. Thurmond. 2013. Signaling mechanisms of glucose-in-duced F-actin remodeling in pancreatic islet β cells. Exp. Mol. Med. 45:e37. https:// doi .org/ 10 .1038/ emm .2013 .73
Kanasaki, K., M. Kitada, M. Kanasaki, and D. Koya. 2013. The biological con-sequence of obesity on the kidney. Nephrol. Dial. Transplant. 28(Suppl 4):iv1–iv7. https:// doi .org/ 10 .1093/ ndt/ gft098
Kandror, K.V., and P.F. Pilch. 2011. The sugar is sIRVed: sorting Glut4 and its fellow travelers. Traffic. 12:665–671. https:// doi .org/ 10 .1111/ j .1600 -0854 .2011 .01175 .x
Karamitsos, D.T. 2011. The story of insulin discovery. Diabetes Res. Clin. Pract. 93(Suppl 1):S2–S8. https:// doi .org/ 10 .1016/ S0168 -8227(11)70007 -9
Karunanithi, S., T. Xiong, M. Uhm, D. Leto, J. Sun, X.-W. Chen, and A.R. Saltiel. 2014. A Rab10: RalA G protein cascade regulates insulin-stimulated glu-cose uptake in adipocytes. Mol. Biol. Cell. 25:3059–3069. https:// doi .org/ 10 .1091/ mbc .E14 -06 -1060
Karylowski, O., A. Zeigerer, A. Cohen, and T.E. McGraw. 2004. GLUT4 is retained by an intracellular cycle of vesicle formation and fusion with
endosomes. Mol. Biol. Cell. 15:870–882. https:// doi .org/ 10 .1091/ mbc .E03 -07 -0517
Kebede, M.A., A.T. Oler, T. Gregg, A.J. Balloon, A. Johnson, K. Mitok, M. Rabaglia, K. Schueler, D. Stapleton, C. Thorstenson, et al. 2014. SOR CS1 is necessary for normal insulin secretory granule biogenesis in meta-bolically stressed β cells. J. Clin. Invest. 124:4240–4256. https:// doi .org/ 10 .1172/ JCI74072
Keske, M.A., L.H. Clerk, W.J. Price, L.A. Jahn, and E.J. Barrett. 2009. Obesity blunts microvascular recruitment in human forearm muscle after a mixed meal. Diabetes Care. 32:1672–1677. https:// doi .org/ 10 .2337/ dc09 -0206
Kleinridders, A., H.A. Ferris, W. Cai, and C.R. Kahn. 2014. Insulin action in brain regulates systemic metabolism and brain function. Diabetes. 63:2232–2243. https:// doi .org/ 10 .2337/ db14 -0568
Klip, A., T. Ramlal, P.J. Bilan, G.D. Cartee, E.A. Gulve, and J.O. Holloszy. 1990. Recruitment of GLUT-4 glucose transporters by insulin in diabetic rat skeletal muscle. Biochem. Biophys. Res. Commun. 172:728–736. https:// doi .org/ 10 .1016/ 0006 -291X(90)90735 -6
Klip, A., Y. Sun, T.T. Chiu, and K.P. Foley. 2014. Signal transduction meets vesicle traffic: the software and hardware of GLUT4 translocation. Am. J. Physiol. Cell Physiol. 306:C879–C886. https:// doi .org/ 10 .1152/ ajpcell .00069 .2014
Kolic, J., and P.E. MacDonald. 2015. cAMP-independent effects of GLP-1 on β cells. J. Clin. Invest. 125:4327–4330. https:// doi .org/ 10 .1172/ JCI85004
Kolka, C.M., and R.N. Bergman. 2012. The barrier within: endothelial trans-port of hormones. Physiology (Bethesda). 27:237–247.
Kolman, P., A. Pica, N. Carvou, A. Boyde, S. Cockcroft, A. Loesch, A. Pizzey, M. Simeoni, G. Capasso, and R.J. Unwin. 2009. Insulin uptake across the luminal membrane of the rat proximal tubule in vivo and in vitro. Am. J. Physiol. Renal Physiol. 296:F1227–F1237. https:// doi .org/ 10 .1152/ ajprenal .90351 .2008
Konishi, M., M. Sakaguchi, S.M. Lockhart, W. Cai, M.E. Li, E.P. Homan, C. Rask-Madsen, and C.R. Kahn. 2017. Endothelial insulin receptors dif-ferentially control insulin signaling kinetics in peripheral tissues and brain of mice. Proc. Natl. Acad. Sci. USA. 114:E8478–E8487. https:// doi .org/ 10 .1073/ pnas .1710625114
Könner, A.C., R. Janoschek, L. Plum, S.D. Jordan, E. Rother, X. Ma, C. Xu, P. Enriori, B. Hampel, G.S. Barsh, et al. 2007. Insulin action in AgRP-ex-pressing neurons is required for suppression of hepatic glucose produc-tion. Cell Metab. 5:438–449. https:// doi .org/ 10 .1016/ j .cmet .2007 .05 .004
Korol, S.V., A. Tafreshiha, A.K. Bhandage, B. Birnir, and Z. Jin. 2018. Insulin enhances GABAAreceptor-mediated inhibitory currents in rat central amygdala neurons. Neurosci. Lett. 671:76–81. https:// doi .org/ 10 .1016/ j .neulet .2018 .02 .022
Kubota, T., N. Kubota, H. Kumagai, S. Yamaguchi, H. Kozono, T. Takahashi, M. Inoue, S. Itoh, I. Takamoto, T. Sasako, et al. 2011. Impaired insulin signaling in endothelial cells reduces insulin-induced glucose uptake by skeletal muscle. Cell Metab. 13:294–307. https:// doi .org/ 10 .1016/ j .cmet .2011 .01 .018
Laedtke, T., L. Kjems, N. Pørksen, O. Schmitz, J. Veldhuis, P.C. Kao, and P.C. Butler. 2000. Overnight inhibition of insulin secretion restores pulsa-tility and proinsulin/insulin ratio in type 2 diabetes. Am. J. Physiol. Endo-crinol. Metab. 279:E520–E528. https:// doi .org/ 10 .1152/ ajpendo .2000 .279 .3 .E520
Lalioti, V., G. Muruais, A. Dinarina, J. van Damme, J. Vandekerckhove, and I.V. Sandoval. 2009. The atypical kinase Cdk5 is activated by insulin, regu-lates the association between GLUT4 and E-Syt1, and modulates glucose transport in 3T3-L1 adipocytes. Proc. Natl. Acad. Sci. USA. 106:4249–4253. https:// doi .org/ 10 .1073/ pnas .0900218106
Lang, D.A., D.R. Matthews, M. Burnett, and R.C. Turner. 1981. Brief, irregular oscillations of basal plasma insulin and glucose concentrations in dia-betic man. Diabetes. 30:435–439. https:// doi .org/ 10 .2337/ diab .30 .5 .435
Lansey, M.N., N.N. Walker, S.R. Hargett, J.R. Stevens, and S.R. Keller. 2012. Deletion of Rab GAP AS160 modifies glucose uptake and GLUT4 trans-location in primary skeletal muscles and adipocytes and impairs glucose homeostasis. Am. J. Physiol. Endocrinol. Metab. 303:E1273–E1286. https:// doi .org/ 10 .1152/ ajpendo .00316 .2012
Lee, W. 2011. The CEA CAM1 expression is decreased in the liver of severely obese patients with or without diabetes. Diagn. Pathol. 6:40. https:// doi .org/ 10 .1186/ 1746 -1596 -6 -40
Lee, W.L., and A. Klip. 2016. Endothelial Transcytosis of Insulin: Does It Con-tribute to Insulin Resistance? Physiology (Bethesda). 31:336–345.
Lee, M.R., L. Li, and T. Kitazawa. 1997. Cyclic GMP causes Ca2+ desensitiza-tion in vascular smooth muscle by activating the myosin light chain
Tokarz et al. The journey of insulin in the body
Journal of Cell Biologyhttps://doi.org/10.1083/jcb.201802095
15
phosphatase. J. Biol. Chem. 272:5063–5068. https:// doi .org/ 10 .1074/ jbc .272 .8 .5063
Lee, S.-H., J.M. Zabolotny, H. Huang, H. Lee, and Y.-B. Kim. 2016. Insulin in the nervous system and the mind: Functions in metabolism, memory, and mood. Mol. Metab. 5:589–601. https:// doi .org/ 10 .1016/ j .molmet .2016 .06 .011
Lees, J.A., M. Messa, E.W. Sun, H. Wheeler, F. Torta, M.R. Wenk, P. De Camilli, and K.M. Reinisch. 2017. Lipid transport by TMEM24 at ER-plasma mem-brane contacts regulates pulsatile insulin secretion. Science. 355:6171.
Lemaire, K., M.A. Ravier, A. Schraenen, J.W.M. Creemers, R. Van de Plas, M. Granvik, L. Van Lommel, E. Waelkens, F. Chimienti, G.A. Rutter, et al. 2009. Insulin crystallization depends on zinc transporter ZnT8 expres-sion, but is not required for normal glucose homeostasis in mice. Proc. Natl. Acad. Sci. USA. 106:14872–14877. https:// doi .org/ 10 .1073/ pnas .0906587106
Leto, D., and A.R. Saltiel. 2012. Regulation of glucose transport by insulin: traffic control of GLUT4. Nat. Rev. Mol. Cell Biol. 13:383–396. https:// doi .org/ 10 .1038/ nrm3351
Li, G., E. Rungger-Brändle, I. Just, J.C. Jonas, K. Aktories, and C.B. Wollheim. 1994. Effect of disruption of actin filaments by Clostridium botulinum C2 toxin on insulin secretion in HIT-T15 cells and pancreatic islets. Mol. Biol. Cell. 5:1199–1213. https:// doi .org/ 10 .1091/ mbc .5 .11 .1199
Liang, T., T. Qin, L. Xie, S. Dolai, D. Zhu, K.J. Prentice, M. Wheeler, Y. Kang, L. Osborne, and H.Y. Gaisano. 2017. New Roles of Syntaxin-1A in Insulin Granule Exocytosis and Replenishment. J. Biol. Chem. 292:2203–2216. https:// doi .org/ 10 .1074/ jbc .M116 .769885
Lin, H.V., and D. Accili. 2011. Hormonal regulation of hepatic glucose produc-tion in health and disease. Cell Metab. 14:9–19. https:// doi .org/ 10 .1016/ j .cmet .2011 .06 .003
Lizunov, V.A., K.G. Stenkula, I. Lisinski, O. Gavrilova, D.R. Yver, A. Chadt, H. Al-Hasani, J. Zimmerberg, and S.W. Cushman. 2012. Insulin stim-ulates fusion, but not tethering, of GLUT4 vesicles in skeletal muscle of HA-GLUT4-GFP transgenic mice. Am. J. Physiol. Endocrinol. Metab. 302:E950–E960. https:// doi .org/ 10 .1152/ ajpendo .00466 .2011
Lopez, J.A., J.G. Burchfield, D.H. Blair, K. Mele, Y. Ng, P. Vallotton, D.E. James, and W.E. Hughes. 2009. Identification of a distal GLUT4 trafficking event controlled by actin polymerization. Mol. Biol. Cell. 20:3918–3929. https:// doi .org/ 10 .1091/ mbc .E09 -03 -0187
Majumdar, S., A.J. Genders, A.C. Inyard, V. Frison, and E.J. Barrett. 2012. Insulin entry into muscle involves a saturable process in the vascular endothelium. Diabetologia. 55:450–456. https:// doi .org/ 10 .1007/ s00125 -011 -2343 -x
Marino, M.2009. Diabetes drugs: Insulin. https:// www .diabetesselfmanagement .com/ blog/ diabetes -drugs -insulin/ (accessed March 15, 2018).
Martin, O.J., A. Lee, and T.E. McGraw. 2006. GLUT4 distribution between the plasma membrane and the intracellular compartments is maintained by an insulin-modulated bipartite dynamic mechanism. J. Biol. Chem. 281:484–490. https:// doi .org/ 10 .1074/ jbc .M505944200
Matveyenko, A.V., D. Liuwantara, T. Gurlo, D. Kirakossian, C. Dalla Man, C. Cobelli, M.F. White, K.D. Copps, E. Volpi, S. Fujita, and P.C. Butler. 2012. Pulsatile portal vein insulin delivery enhances hepatic insulin action and signaling. Diabetes. 61:2269–2279. https:// doi .org/ 10 .2337/ db11 -1462
McCulloch, L.J., M. van de Bunt, M. Braun, K.N. Frayn, A. Clark, and A.L. Gloyn. 2011. GLUT2 (SLC2A2) is not the principal glucose transporter in human pancreatic beta cells: implications for understanding genetic association signals at this locus. Mol. Genet. Metab. 104:648–653. https:// doi .org/ 10 .1016/ j .ymgme .2011 .08 .026
McDonald, A., S. Fogarty, I. Leclerc, E.V. Hill, D.G. Hardie, and G.A. Rutter. 2009. Control of insulin granule dynamics by AMPK dependent KLC1 phosphorylation. Islets. 1:198–209. https:// doi .org/ 10 .4161/ isl .1 .3 .9608
Meezan, E., D.J. Pillion, and A. Elgavish. 1988. Binding and degradation of 125I-insulin by isolated rat renal brush border membranes: evidence for low affinity, high capacity insulin recognition sites. J. Membr. Biol. 105:113–129. https:// doi .org/ 10 .1007/ BF02009165
Meglasson, M.D., P.T. Burch, D.K. Berner, H. Najafi, A.P. Vogin, and F.M. Matschinsky. 1983. Chromatographic resolution and kinetic character-ization of glucokinase from islets of Langerhans. Proc. Natl. Acad. Sci. USA. 80:85–89. https:// doi .org/ 10 .1073/ pnas .80 .1 .85
Meier, J.J., J.D. Veldhuis, and P.C. Butler. 2005. Pulsatile insulin secretion dic-tates systemic insulin delivery by regulating hepatic insulin extraction in humans. Diabetes. 54:1649–1656. https:// doi .org/ 10 .2337/ diabetes .54 .6 .1649
Meijer, R.I., S.M. Gray, K.W. Aylor, and E.J. Barrett. 2016. Pathways for insulin access to the brain: the role of the microvascular endothelial cell. Am.
J. Physiol. Heart Circ. Physiol. 311:H1132–H1138. https:// doi .org/ 10 .1152/ ajpheart .00081 .2016
Michael, M.D., R.N. Kulkarni, C. Postic, S.F. Previs, G.I. Shulman, M.A. Magnu-son, and C.R. Kahn. 2000. Loss of insulin signaling in hepatocytes leads to severe insulin resistance and progressive hepatic dysfunction. Mol. Cell. 6:87–97. https:// doi .org/ 10 .1016/ S1097 -2765(05)00015 -8
Mizuno, Y., E. Isotani, J. Huang, H. Ding, J.T. Stull, and K.E. Kamm. 2008. Myo-sin light chain kinase activation and calcium sensitization in smooth muscle in vivo. Am. J. Physiol. Cell Physiol. 295:C358–C364. https:// doi .org/ 10 .1152/ ajpcell .90645 .2007
Murphy, R.F., S. Powers, and C.R. Cantor. 1984. Endosome pH measured in single cells by dual fluorescence flow cytometry: rapid acidification of insulin to pH 6. J. Cell Biol. 98:1757–1762. https:// doi .org/ 10 .1083/ jcb .98 .5 .1757
Najjar, S.M. 2002. Regulation of insulin action by CEA CAM1. Trends Endocri-nol. Metab. 13:240–245. https:// doi .org/ 10 .1016/ S1043 -2760(02)00608 -2
Najjar, S.M., N. Philippe, Y. Suzuki, G.A. Ignacio, P. Formisano, D. Accili, and S.I. Taylor. 1995. Insulin-stimulated phosphorylation of recom-binant pp120/HA4, an endogenous substrate of the insulin receptor tyrosine kinase. Biochemistry. 34:9341–9349. https:// doi .org/ 10 .1021/ bi00029a009
Nielsen, S. 1993. Sorting and recycling efficiency of apical insulin binding sites during endocytosis in proximal tubule cells. Am. J. Physiol. 264:C810–C822. https:// doi .org/ 10 .1152/ ajpcell .1993 .264 .4 .C810
Nielsen, S. 1994. Endocytosis in renal proximal tubules. Experimental electron microscopical studies of protein absorption and membrane traffic in isolated, in vitro perfused proximal tubules. Dan. Med. Bull. 41:243–263.
Nielsen, S., J.T. Nielsen, and E.I. Christensen. 1987. Luminal and basolateral uptake of insulin in isolated, perfused, proximal tubules. Am. J. Physiol. 253:F857–F867.
Odegaard, J.I., and A. Chawla. 2013. Pleiotropic actions of insulin resistance and inflammation in metabolic homeostasis. Science. 339:172–177. https:// doi .org/ 10 .1126/ science .1230721
Palmer, B.F., and W.L. Henrich. 2017. Carbohydrate and insulin metabo-lism in chronic kidney disease. https:// www .uptodate .com/ contents/ carbohydrate -and -insulin -metabolism -in -chronic -kidney -disease (accessed March 15, 2018).
Palmer, R.M.J., D.S. Ashton, and S. Moncada. 1988. Vascular endothelial cells synthesize nitric oxide from L-arginine. Nature. 333:664–666. https:// doi .org/ 10 .1038/ 333664a0
Patterson, J.N., K. Cousteils, J.W. Lou, J.E. Manning Fox, P.E. MacDonald, and J.W. Joseph. 2014. Mitochondrial metabolism of pyruvate is essen-tial for regulating glucose-stimulated insulin secretion. J. Biol. Chem. 289:13335–13346. https:// doi .org/ 10 .1074/ jbc .M113 .521666
Pilch, P.F., M.A. Shia, R.J. Benson, and R.E. Fine. 1983. Coated vesicles par-ticipate in the receptor-mediated endocytosis of insulin. J. Cell Biol. 96:133–138. https:// doi .org/ 10 .1083/ jcb .96 .1 .133
Pørksen, N., S. Munn, J. Steers, S. Vore, J. Veldhuis, and P. Butler. 1995. Pulsa-tile insulin secretion accounts for 70% of total insulin secretion during fasting. Am. J. Physiol. 269:E478–E488.
Porte, D. Jr., D.G. Baskin, and M.W. Schwartz. 2005. Insulin signaling in the central nervous system: a critical role in metabolic homeostasis and dis-ease from C. elegans to humans. Diabetes. 54:1264–1276. https:// doi .org/ 10 .2337/ diabetes .54 .5 .1264
Poy, M.N., Y. Yang, K. Rezaei, M.A. Fernström, A.D. Lee, Y. Kido, S.K. Erickson, and S.M. Najjar. 2002. CEA CAM1 regulates insulin clearance in liver. Nat. Genet. 30:270–276. https:// doi .org/ 10 .1038/ ng840
Rabkin, R., M.P. Ryan, and W.C. Duckworth. 1984. The renal metabolism of insulin. Diabetologia. 27:351–357. https:// doi .org/ 10 .1007/ BF00304849
Randhawa, V.K., P.J. Bilan, Z.A. Khayat, N. Daneman, Z. Liu, T. Ramlal, A. Volchuk, X.R. Peng, T. Coppola, R. Regazzi, et al. 2000. VAMP2, but not VAMP3/cellubrevin, mediates insulin-dependent incorporation of GLUT4 into the plasma membrane of L6 myoblasts. Mol. Biol. Cell. 11:2403–2417. https:// doi .org/ 10 .1091/ mbc .11 .7 .2403
Randhawa, V.K., F.S.L. Thong, D.Y. Lim, D. Li, R.R. Garg, R. Rudge, T. Galli, A. Rudich, and A. Klip. 2004. Insulin and hypertonicity recruit GLUT4 to the plasma membrane of muscle cells by using N-ethylmaleimide-sen-sitive factor-dependent SNA RE mechanisms but different v-SNA REs: role of TI-VAMP. Mol. Biol. Cell. 15:5565–5573. https:// doi .org/ 10 .1091/ mbc .E04 -03 -0266
Ravier, M.A., M. Güldenagel, A. Charollais, A. Gjinovci, D. Caille, G. Söhl, C.B. Wollheim, K. Willecke, J.-C. Henquin, and P. Meda. 2005. Loss of connexin36 channels alters beta-cell coupling, islet synchronization of glucose-induced Ca2+ and insulin oscillations, and basal insulin release. Diabetes. 54:1798–1807. https:// doi .org/ 10 .2337/ diabetes .54 .6 .1798
luckie
323
Tokarz et al. The journey of insulin in the body
Journal of Cell Biologyhttps://doi.org/10.1083/jcb.201802095
16
Robbins, D.C., S.E. Shoelson, H.S. Tager, P.M. Mead, and D.H. Gaynor. 1985. Products of therapeutic insulins in the blood of insulin-dependent (type I) diabetic patients. Diabetes. 34:510–519. https:// doi .org/ 10 .2337/ diab .34 .5 .510
Rorsman, P., and E. Renström. 2003. Insulin granule dynamics in pancreatic beta cells. Diabetologia. 46:1029–1045. https:// doi .org/ 10 .1007/ s00125 -003 -1153 -1
Rorsman, P., M. Braun, and Q. Zhang. 2012. Regulation of calcium in pan-creatic α- and β-cells in health and disease. Cell Calcium. 51:300–308. https:// doi .org/ 10 .1016/ j .ceca .2011 .11 .006
Rubenstein, A.H., and I. Spitz. 1968. Role of the kidney in insulin metabolism and excretion. Diabetes. 17:161–169. https:// doi .org/ 10 .2337/ diab .17 .3 .161
Ruderman, N.B., R. Kapeller, M.F. White, and L.C. Cantley. 1990. Activation of phosphatidylinositol 3-kinase by insulin. Proc. Natl. Acad. Sci. USA. 87:1411–1415. https:// doi .org/ 10 .1073/ pnas .87 .4 .1411
Russo, L., H.T. Muturi, H.E. Ghadieh, S.S. Ghanem, T.A. Bowman, H.L. Noh, S. Dagdeviren, G.Y. Dogbey, J.K. Kim, G. Heinrich, and S.M. Najjar. 2017. Liver-specific reconstitution of CEA CAM1 reverses the metabolic abnormalities caused by its global deletion in male mice. Diabetologia. 60:2463–2474. https:// doi .org/ 10 .1007/ s00125 -017 -4432 -y
Samuel, V.T., and G.I. Shulman. 2012. Mechanisms for insulin resistance: common threads and missing links. Cell. 148:852–871. https:// doi .org/ 10 .1016/ j .cell .2012 .02 .017
Samuel, V.T., and G.I. Shulman. 2016. The pathogenesis of insulin resistance: integrating signaling pathways and substrate flux. J. Clin. Invest. 126:12–22. https:// doi .org/ 10 .1172/ JCI77812
Samuel, V.T., and G.I. Shulman. 2018. Nonalcoholic Fatty Liver Disease as a Nexus of Metabolic and Hepatic Diseases. Cell Metab. 27:22–41. https:// doi .org/ 10 .1016/ j .cmet .2017 .08 .002
Sano, H., S. Kane, E. Sano, C.P. Mîinea, J.M. Asara, W.S. Lane, C.W. Garner, and G.E. Lienhard. 2003. Insulin-stimulated phosphorylation of a Rab GTPase-activating protein regulates GLUT4 translocation. J. Biol. Chem. 278:14599–14602. https:// doi .org/ 10 .1074/ jbc .C300063200
Sano, H., L. Eguez, M.N. Teruel, M. Fukuda, T.D. Chuang, J.A. Chavez, G.E. Lienhard, and T.E. McGraw. 2007. Rab10, a target of the AS160 Rab GAP, is required for insulin-stimulated translocation of GLUT4 to the adipo-cyte plasma membrane. Cell Metab. 5:293–303. https:// doi .org/ 10 .1016/ j .cmet .2007 .03 .001
Sano, H., W.G. Roach, G.R. Peck, M. Fukuda, and G.E. Lienhard. 2008. Rab10 in insulin-stimulated GLUT4 translocation. Biochem. J. 411:89–95. https:// doi .org/ 10 .1042/ BJ20071318
Sano, H., G.R. Peck, A.N. Kettenbach, S.A. Gerber, and G.E. Lienhard. 2011. Insulin-stimulated GLUT4 protein translocation in adipocytes requires the Rab10 guanine nucleotide exchange factor Dennd4C. J. Biol. Chem. 286:16541–16545. https:// doi .org/ 10 .1074/ jbc .C111 .228908
Sano, H., G.R. Peck, S. Blachon, and G.E. Lienhard. 2015. A potential link between insulin signaling and GLUT4 translocation: Association of Rab10-GTP with the exocyst subunit Exoc6/6b. Biochem. Biophys. Res. Commun. 465:601–605. https:// doi .org/ 10 .1016/ j .bbrc .2015 .08 .069
Satin, L.S., P.C. Butler, J. Ha, and A.S. Sherman. 2015. Pulsatile insulin secre-tion, impaired glucose tolerance and type 2 diabetes. Mol. Aspects Med. 42:61–77. https:// doi .org/ 10 .1016/ j .mam .2015 .01 .003
Sato, H., K. Yoshioka, T. Terasaki, and A. Tsuji. 1991. Receptor-mediated endocytosis of A14-125I-insulin by the nonfiltering perfused rat kid-ney. Biochim. Biophys. Acta. 1073:442–450. https:// doi .org/ 10 .1016/ 0304 -4165(91)90213 -Z
Schwartz, M.W., S.C. Woods, D. Porte Jr., R.J. Seeley, and D.G. Baskin. 2000. Central nervous system control of food intake. Nature. 404:661–671. https:// doi .org/ 10 .1038/ 35007534
Shimoda, Y., S. Okada, E. Yamada, J.E. Pessin, and M. Yamada. 2015. Tctex1d2 Is a Negative Regulator of GLUT4 Translocation and Glucose Uptake. Endocrinology. 156:3548–3558. https:// doi .org/ 10 .1210/ en .2015 -1120
Song, E.S., H. Jang, H.-F. Guo, M.A. Juliano, L. Juliano, A.J. Morris, E. Galperin, D.W. Rodgers, and L.B. Hersh. 2017. Inositol phosphates and phospho-inositides activate insulin-degrading enzyme, while phosphoinositides also mediate binding to endosomes. Proc. Natl. Acad. Sci. USA. 114:E2826–E2835. https:// doi .org/ 10 .1073/ pnas .1613447114
Song, S.H., S.S. McIntyre, H. Shah, J.D. Veldhuis, P.C. Hayes, and P.C. Butler. 2000. Direct measurement of pulsatile insulin secretion from the portal vein in human subjects. J. Clin. Endocrinol. Metab. 85:4491–4499.
Spoto, B., A. Pisano, and C. Zoccali. 2016. Insulin resistance in chronic kid-ney disease: a systematic review. Am. J. Physiol. Renal Physiol. 311:F1087–F1108. https:// doi .org/ 10 .1152/ ajprenal .00340 .2016
Steil, G.M., M. Ader, D.M. Moore, K. Rebrin, and R.N. Bergman. 1996. Tran-sendothelial insulin transport is not saturable in vivo. No evidence for a
receptor-mediated process. J. Clin. Invest. 97:1497–1503. https:// doi .org/ 10 .1172/ JCI118572
Steinberg, H.O., G. Brechtel, A. Johnson, N. Fineberg, and A.D. Baron. 1994. Insulin-mediated skeletal muscle vasodilation is nitric oxide dependent. A novel action of insulin to increase nitric oxide release. J. Clin. Invest. 94:1172–1179. https:// doi .org/ 10 .1172/ JCI117433
Steneberg, P., L. Bernardo, S. Edfalk, L. Lundberg, F. Backlund, C.-G. Ostenson, and H. Edlund. 2013. The type 2 diabetes-associated gene ide is required for insulin secretion and suppression of α-synuclein levels in β-cells. Diabetes. 62:2004–2014. https:// doi .org/ 10 .2337/ db12 -1045
Stevenson, R.W., A.D. Cherrington, and K.E. Steiner. 1985. The relationship between plasma concentration and disappearance rate of immunoreac-tive insulin in the conscious dog. Horm. Metab. Res. 17:551–553. https:// doi .org/ 10 .1055/ s -2007 -1013604
Stöckli, J., D.J. Fazakerley, and D.E. James. 2011. GLUT4 exocytosis. J. Cell Sci. 124:4147–4159. https:// doi .org/ 10 .1242/ jcs .097063
Sun, Y., P.J. Bilan, Z. Liu, and A. Klip. 2010. Rab8A and Rab13 are activated by insulin and regulate GLUT4 translocation in muscle cells. Proc. Natl. Acad. Sci. USA. 107:19909–19914. https:// doi .org/ 10 .1073/ pnas .1009523107
Sun, Y., T.T. Chiu, K.P. Foley, P.J. Bilan, and A. Klip. 2014. Myosin Va mediates Rab8A-regulated GLUT4 vesicle exocytosis in insulin-stimulated mus-cle cells. Mol. Biol. Cell. 25:1159–1170. https:// doi .org/ 10 .1091/ mbc .E13 -08 -0493
Sun, Y., J. Jaldin-Fincati, Z. Liu, P.J. Bilan, and A. Klip. 2016. A complex of Rab13 with MIC AL-L2 and α-actinin-4 is essential for insulin-depen-dent GLUT4 exocytosis. Mol. Biol. Cell. 27:75–89. https:// doi .org/ 10 .1091/ mbc .E15 -05 -0319
Sylow, L., T.E. Jensen, M. Kleinert, K. Højlund, B. Kiens, J. Wojtaszewski, C. Prats, P. Schjerling, and E.A. Richter. 2013. Rac1 signaling is required for insulin-stimulated glucose uptake and is dysregulated in insulin-resis-tant murine and human skeletal muscle. Diabetes. 62:1865–1875. https:// doi .org/ 10 .2337/ db12 -1148
Takenaka, N., N. Yasuda, Y. Nihata, T. Hosooka, T. Noguchi, A. Aiba, and T. Satoh. 2014. Role of the guanine nucleotide exchange factor in Akt2-me-diated plasma membrane translocation of GLUT4 in insulin-stimulated skeletal muscle. Cell. Signal. 26:2460–2469. https:// doi .org/ 10 .1016/ j .cellsig .2014 .07 .002
Takenaka, N., Y. Nihata, and T. Satoh. 2016. Rac1 Activation Caused by Membrane Translocation of a Guanine Nucleotide Exchange Factor in Akt2-Mediated Insulin Signaling in Mouse Skeletal Muscle. PLoS One. 11:e0155292. https:// doi .org/ 10 .1371/ journal .pone .0155292
Tang, S.-C., L. Baeyens, C.-N. Shen, S.-J. Peng, H.-J. Chien, D.W. Scheel, C.E. Chamberlain, and M.S. German. 2018b. Human pancreatic neuro-in-sular network in health and fatty infiltration. Diabetologia. 61:168–181. https:// doi .org/ 10 .1007/ s00125 -017 -4409 -x
Tang, S.-C., C.-N. Shen, P.-Y. Lin, S.-J. Peng, H.-J. Chien, Y.-H. Chou, C.E. Cham-berlain, and P.J. Pasricha. 2018a. Pancreatic neuro-insular network in young mice revealed by 3D panoramic histology. Diabetologia. 61:158–167. https:// doi .org/ 10 .1007/ s00125 -017 -4408 -y
Taniguchi, C.M., B. Emanuelli, and C.R. Kahn. 2006. Critical nodes in sig-nalling pathways: insights into insulin action. Nat. Rev. Mol. Cell Biol. 7:85–96. https:// doi .org/ 10 .1038/ nrm1837
Tarasov, A.I., E.J. Griffiths, and G.A. Rutter. 2012. Regulation of ATP produc-tion by mitochondrial Ca(2+). Cell Calcium. 52:28–35. https:// doi .org/ 10 .1016/ j .ceca .2012 .03 .003
Tarasov, A.I., F. Semplici, D. Li, R. Rizzuto, M.A. Ravier, P. Gilon, and G.A. Rut-ter. 2013. Frequency-dependent mitochondrial Ca(2+) accumulation regulates ATP synthesis in pancreatic β cells. Pflugers Arch. 465:543–554. https:// doi .org/ 10 .1007/ s00424 -012 -1177 -9
Thurmond, D.C., and J.E. Pessin. 2001. Molecular machinery involved in the insulin-regulated fusion of GLUT4-containing vesicles with the plasma membrane (review). Mol. Membr. Biol. 18:237–245. https:// doi .org/ 10 .1080/ 09687680110082400
Török, D., N. Patel, L. Jebailey, F.S. Thong, V.K. Randhawa, A. Klip, and A. Rudich. 2004. Insulin but not PDGF relies on actin remodeling and on VAMP2 for GLUT4 translocation in myoblasts. J. Cell Sci. 117:5447–5455. https:// doi .org/ 10 .1242/ jcs .01421
Uhm, M., M. Bazuine, P. Zhao, S.-H. Chiang, T. Xiong, S. Karunanithi, L. Chang, and A.R. Saltiel. 2017. Phosphorylation of the exocyst protein Exo84 by TBK1 promotes insulin-stimulated GLUT4 trafficking. Sci. Signal. 10:5085.
van der Heide, L.P., A. Kamal, A. Artola, W.H. Gispen, and G.M.J. Ramak-ers. 2005. Insulin modulates hippocampal activity-depen-dent synaptic plasticity in a N-methyl-d-aspartate receptor and
Tokarz et al. The journey of insulin in the body
Journal of Cell Biologyhttps://doi.org/10.1083/jcb.201802095
17
phosphatidyl-inositol-3-kinase-dependent manner. J. Neurochem. 94:1158–1166. https:// doi .org/ 10 .1111/ j .1471 -4159 .2005 .03269 .x
Vassilopoulos, S., C. Esk, S. Hoshino, B.H. Funke, C.-Y. Chen, A.M. Plocik, W.E. Wright, R. Kucherlapati, and F.M. Brodsky. 2009. A role for the CHC22 clathrin heavy-chain isoform in human glucose metabolism. Science. 324:1192–1196. https:// doi .org/ 10 .1126/ science .1171529
Vicent, D., J. Ilany, T. Kondo, K. Naruse, S.J. Fisher, Y.Y. Kisanuki, S. Bursell, M. Yanagisawa, G.L. King, and C.R. Kahn. 2003. The role of endothelial insulin signaling in the regulation of vascular tone and insulin resis-tance. J. Clin. Invest. 111:1373–1380. https:// doi .org/ 10 .1172/ JCI15211
Villaseñor, R., M. Schilling, J. Sundaresan, Y. Lutz, and L. Collin. 2017. Sort-ing Tubules Regulate Blood-Brain Barrier Transcytosis. Cell Reports. 21:3256–3270. https:// doi .org/ 10 .1016/ j .celrep .2017 .11 .055
Vincent, M.A., D. Dawson, A.D.H. Clark, J.R. Lindner, S. Rattigan, M.G. Clark, and E.J. Barrett. 2002. Skeletal muscle microvascular recruitment by physiological hyperinsulinemia precedes increases in total blood flow. Diabetes. 51:42–48. https:// doi .org/ 10 .2337/ diabetes .51 .1 .42
Vincent, M.A., E.J. Barrett, J.R. Lindner, M.G. Clark, and S. Rattigan. 2003. Inhibiting NOS blocks microvascular recruitment and blunts muscle glucose uptake in response to insulin. Am. J. Physiol. Endocrinol. Metab. 285:E123–E129. https:// doi .org/ 10 .1152/ ajpendo .00021 .2003
Wang, Z., and D.C. Thurmond. 2009. Mechanisms of biphasic insulin-granule exocytosis - roles of the cytoskeleton, small GTPases and SNA RE pro-teins. J. Cell Sci. 122:893–903. https:// doi .org/ 10 .1242/ jcs .034355
Wang, H., A.X. Wang, Z. Liu, and E.J. Barrett. 2008. Insulin signaling stim-ulates insulin transport by bovine aortic endothelial cells. Diabetes. 57:540–547. https:// doi .org/ 10 .2337/ db07 -0967
Wang, Q., R. Somwar, P.J. Bilan, Z. Liu, J. Jin, J.R. Woodgett, and A. Klip. 1999. Protein kinase B/Akt participates in GLUT4 translocation by insulin in L6 myoblasts. Mol. Cell. Biol. 19:4008–4018. https:// doi .org/ 10 .1128/ MCB .19 .6 .4008
Williams, I.M., F.A. Valenzuela, S.D. Kahl, D. Ramkrishna, A.R. Mezo, J.D. Young, K.S. Wells, and D.H. Wasserman. 2018. Insulin exits skeletal muscle capillaries by fluid-phase transport. J. Clin. Invest. 128:699–714. https:// doi .org/ 10 .1172/ JCI94053
Wisse, E. 1970. An electron microscopic study of the fenestrated endothelial lining of rat liver sinusoids. J. Ultrastruct. Res. 31:125–150. https:// doi .org/ 10 .1016/ S0022 -5320(70)90150 -4
Woods, S.C., R.J. Seeley, D.G. Baskin, and M.W. Schwartz. 2003. Insulin and the blood-brain barrier. Curr. Pharm. Des. 9:795–800. https:// doi .org/ 10 .2174/ 1381612033455323
Xiong, W., I. Jordens, E. Gonzalez, and T.E. McGraw. 2010. GLUT4 is sorted to vesicles whose accumulation beneath and insertion into the plasma
membrane are differentially regulated by insulin and selectively affected by insulin resistance. Mol. Biol. Cell. 21:1375–1386. https:// doi .org/ 10 .1091/ mbc .E09 -08 -0751
Xu, Z., and K.V. Kandror. 2002. Translocation of small preformed vesicles is responsible for the insulin activation of glucose transport in adipose cells. Evidence from the in vitro reconstitution assay. J. Biol. Chem. 277:47972–47975. https:// doi .org/ 10 .1074/ jbc .C200486200
Xu, Y., B.R. Rubin, C.M. Orme, A. Karpikov, C. Yu, J.S. Bogan, and D.K. Toomre. 2011. Dual-mode of insulin action controls GLUT4 vesicle exocytosis. J. Cell Biol. 193:643–653. https:// doi .org/ 10 .1083/ jcb .201008135
Yamada, E., S. Okada, T. Saito, K. Ohshima, M. Sato, T. Tsuchiya, Y. Uehara, H. Shimizu, and M. Mori. 2005. Akt2 phosphorylates Synip to regulate docking and fusion of GLUT4-containing vesicles. J. Cell Biol. 168:921–928. https:// doi .org/ 10 .1083/ jcb .200408182
Yokono, K., R.A. Roth, and S. Baba. 1982. Identification of insulin-degrading enzyme on the surface of cultured human lymphocytes, rat hepatoma cells, and primary cultures of rat hepatocytes. Endocrinology. 111:1102–1108. https:// doi .org/ 10 .1210/ endo -111 -4 -1102
Yonezawa, K., K. Yokono, K. Shii, J. Hari, S. Yaso, K. Amano, T. Sakamoto, Y. Kawase, H. Akiyama, M. Nagata, et al. 1988. Insulin-degrading enzyme is capable of degrading receptor-bound insulin. Biochem. Biophys. Res. Commun. 150:605–614. https:// doi .org/ 10 .1016/ 0006 -291X(88)90436 -6
Zarkovic, M., and J.-C. Henquin. 2004. Synchronization and entrainment of cytoplasmic Ca2+ oscillations in cell clusters prepared from single or multiple mouse pancreatic islets. Am. J. Physiol. Endocrinol. Metab. 287:E340–E347. https:// doi .org/ 10 .1152/ ajpendo .00069 .2004
Zeng, G., F.H. Nystrom, L.V. Ravichandran, L.N. Cong, M. Kirby, H. Mostowski, and M.J. Quon. 2000. Roles for insulin receptor, PI3-kinase, and Akt in insulin-signaling pathways related to production of nitric oxide in human vascular endothelial cells. Circulation. 101:1539–1545. https:// doi .org/ 10 .1161/ 01 .CIR .101 .13 .1539
Zheng, X., and G.D. Cartee. 2016. Insulin-induced Effects on the Subcellular Localization of AKT1, AKT2 and AS160 in Rat Skeletal Muscle. Sci. Rep. 6:39230. https:// doi .org/ 10 .1038/ srep39230
Zhu, D., L. Xie, N. Karimian, T. Liang, Y. Kang, Y.-C. Huang, and H.Y. Gaisano. 2015. Munc18c mediates exocytosis of pre-docked and newcomer insu-lin granules underlying biphasic glucose stimulated insulin secretion in human pancreatic beta-cells. Mol. Metab. 4:418–426. https:// doi .org/ 10 .1016/ j .molmet .2015 .02 .004
Zierath, J.R., L. He, A. Gumà, E. Odegoard Wahlström, A. Klip, and H. Wall-berg-Henriksson. 1996. Insulin action on glucose transport and plasma membrane GLUT4 content in skeletal muscle from patients with NID DM. Diabetologia. 39:1180–1189. https:// doi .org/ 10 .1007/ BF02658504
luckie
325

!
3 6

Education Research (on LB145)
3 7

!
3 8
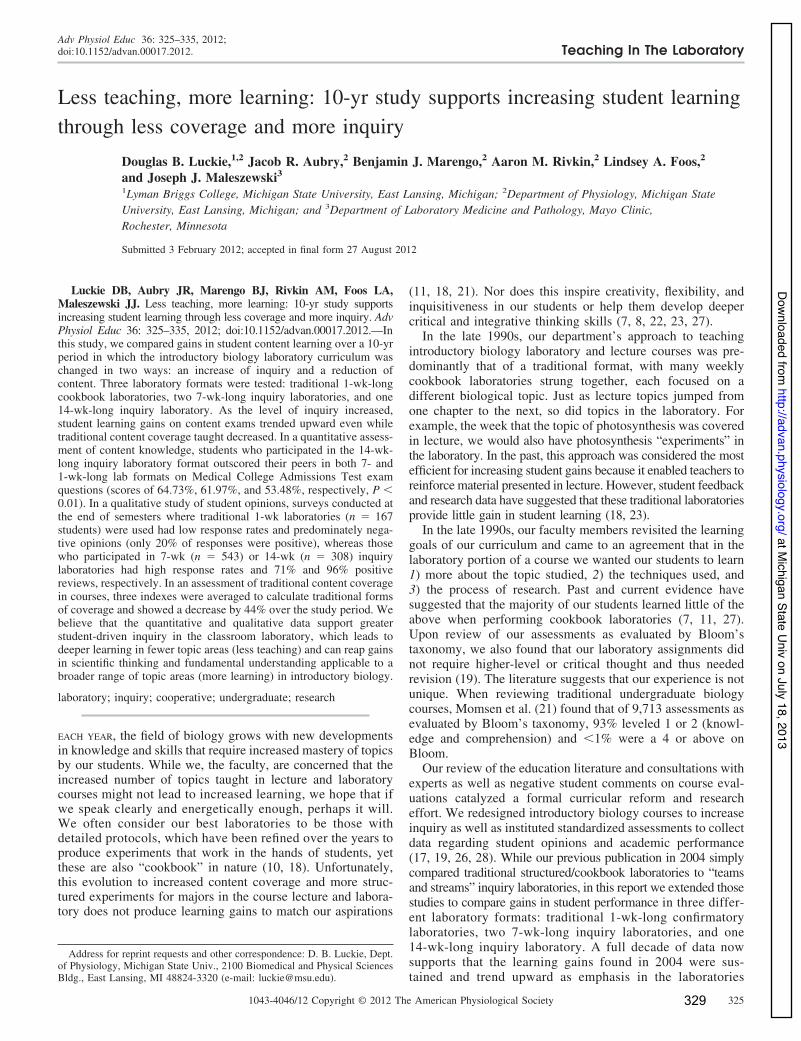
Teaching In The Laboratory
Less teaching, more learning: 10-yr study supports increasing student learningthrough less coverage and more inquiry
Douglas B. Luckie,1,2 Jacob R. Aubry,2 Benjamin J. Marengo,2 Aaron M. Rivkin,2 Lindsey A. Foos,2
and Joseph J. Maleszewski31Lyman Briggs College, Michigan State University, East Lansing, Michigan; 2Department of Physiology, Michigan StateUniversity, East Lansing, Michigan; and 3Department of Laboratory Medicine and Pathology, Mayo Clinic,Rochester, Minnesota
Submitted 3 February 2012; accepted in final form 27 August 2012
Luckie DB, Aubry JR, Marengo BJ, Rivkin AM, Foos LA,Maleszewski JJ. Less teaching, more learning: 10-yr study supportsincreasing student learning through less coverage and more inquiry. AdvPhysiol Educ 36: 325–335, 2012; doi:10.1152/advan.00017.2012.—Inthis study, we compared gains in student content learning over a 10-yrperiod in which the introductory biology laboratory curriculum waschanged in two ways: an increase of inquiry and a reduction ofcontent. Three laboratory formats were tested: traditional 1-wk-longcookbook laboratories, two 7-wk-long inquiry laboratories, and one14-wk-long inquiry laboratory. As the level of inquiry increased,student learning gains on content exams trended upward even whiletraditional content coverage taught decreased. In a quantitative assess-ment of content knowledge, students who participated in the 14-wk-long inquiry laboratory format outscored their peers in both 7- and1-wk-long lab formats on Medical College Admissions Test examquestions (scores of 64.73%, 61.97%, and 53.48%, respectively, P !0.01). In a qualitative study of student opinions, surveys conducted atthe end of semesters where traditional 1-wk laboratories (n " 167students) were used had low response rates and predominately nega-tive opinions (only 20% of responses were positive), whereas thosewho participated in 7-wk (n " 543) or 14-wk (n " 308) inquirylaboratories had high response rates and 71% and 96% positivereviews, respectively. In an assessment of traditional content coveragein courses, three indexes were averaged to calculate traditional formsof coverage and showed a decrease by 44% over the study period. Webelieve that the quantitative and qualitative data support greaterstudent-driven inquiry in the classroom laboratory, which leads todeeper learning in fewer topic areas (less teaching) and can reap gainsin scientific thinking and fundamental understanding applicable to abroader range of topic areas (more learning) in introductory biology.
laboratory; inquiry; cooperative; undergraduate; research
EACH YEAR, the field of biology grows with new developmentsin knowledge and skills that require increased mastery of topicsby our students. While we, the faculty, are concerned that theincreased number of topics taught in lecture and laboratorycourses might not lead to increased learning, we hope that ifwe speak clearly and energetically enough, perhaps it will.We often consider our best laboratories to be those withdetailed protocols, which have been refined over the years toproduce experiments that work in the hands of students, yetthese are also “cookbook” in nature (10, 18). Unfortunately,this evolution to increased content coverage and more struc-tured experiments for majors in the course lecture and labora-tory does not produce learning gains to match our aspirations
(11, 18, 21). Nor does this inspire creativity, flexibility, andinquisitiveness in our students or help them develop deepercritical and integrative thinking skills (7, 8, 22, 23, 27).
In the late 1990s, our department’s approach to teachingintroductory biology laboratory and lecture courses was pre-dominantly that of a traditional format, with many weeklycookbook laboratories strung together, each focused on adifferent biological topic. Just as lecture topics jumped fromone chapter to the next, so did topics in the laboratory. Forexample, the week that the topic of photosynthesis was coveredin lecture, we would also have photosynthesis “experiments” inthe laboratory. In the past, this approach was considered the mostefficient for increasing student gains because it enabled teachers toreinforce material presented in lecture. However, student feedbackand research data have suggested that these traditional laboratoriesprovide little gain in student learning (18, 23).
In the late 1990s, our faculty members revisited the learninggoals of our curriculum and came to an agreement that in thelaboratory portion of a course we wanted our students to learn1) more about the topic studied, 2) the techniques used, and3) the process of research. Past and current evidence havesuggested that the majority of our students learned little of theabove when performing cookbook laboratories (7, 11, 27).Upon review of our assessments as evaluated by Bloom’staxonomy, we also found that our laboratory assignments didnot require higher-level or critical thought and thus neededrevision (19). The literature suggests that our experience is notunique. When reviewing traditional undergraduate biologycourses, Momsen et al. (21) found that of 9,713 assessments asevaluated by Bloom’s taxonomy, 93% leveled 1 or 2 (knowl-edge and comprehension) and !1% were a 4 or above onBloom.
Our review of the education literature and consultations withexperts as well as negative student comments on course eval-uations catalyzed a formal curricular reform and researcheffort. We redesigned introductory biology courses to increaseinquiry as well as instituted standardized assessments to collectdata regarding student opinions and academic performance(17, 19, 26, 28). While our previous publication in 2004 simplycompared traditional structured/cookbook laboratories to “teamsand streams” inquiry laboratories, in this report we extended thosestudies to compare gains in student performance in three differ-ent laboratory formats: traditional 1-wk-long confirmatorylaboratories, two 7-wk-long inquiry laboratories, and one14-wk-long inquiry laboratory. A full decade of data nowsupports that the learning gains found in 2004 were sus-tained and trend upward as emphasis in the laboratories
Address for reprint requests and other correspondence: D. B. Luckie, Dept.of Physiology, Michigan State Univ., 2100 Biomedical and Physical SciencesBldg., East Lansing, MI 48824-3320 (e-mail: [email protected]).
Adv Physiol Educ 36: 325–335, 2012;doi:10.1152/advan.00017.2012.
3251043-4046/12 Copyright © 2012 The American Physiological Society
at Michigan State U
niv on July 18, 2013http://advan.physiology.org/
Dow
nloaded from
3 9
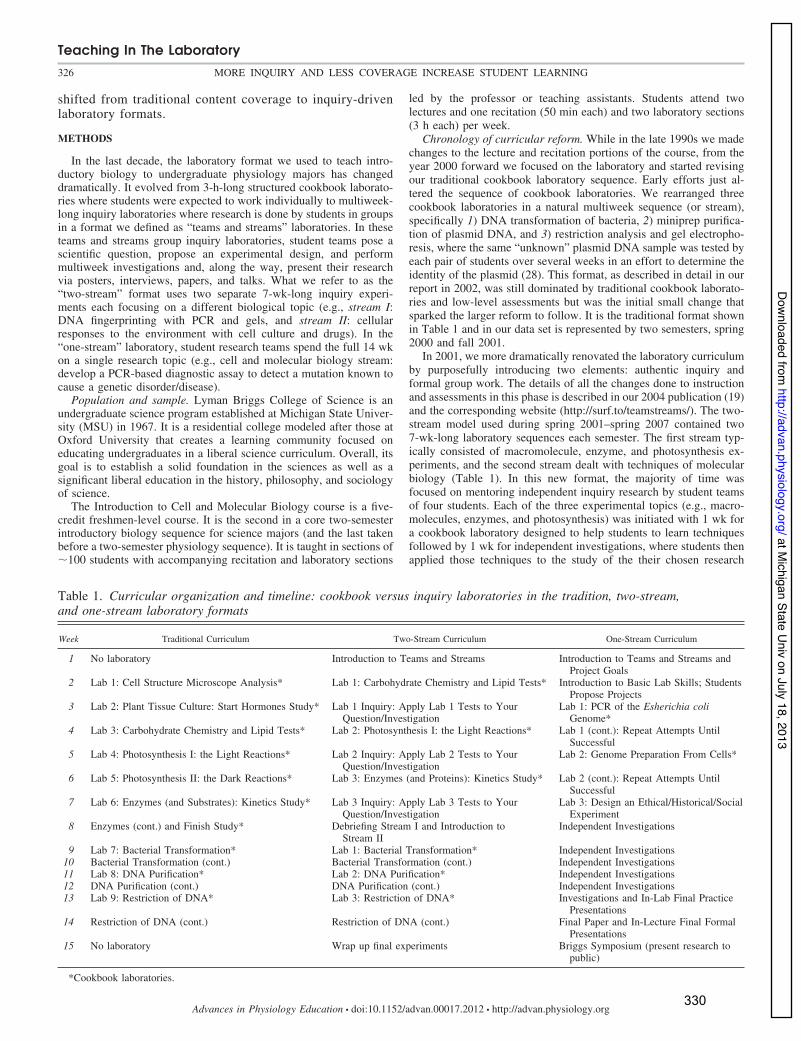
shifted from traditional content coverage to inquiry-drivenlaboratory formats.
METHODS
In the last decade, the laboratory format we used to teach intro-ductory biology to undergraduate physiology majors has changeddramatically. It evolved from 3-h-long structured cookbook laborato-ries where students were expected to work individually to multiweek-long inquiry laboratories where research is done by students in groupsin a format we defined as “teams and streams” laboratories. In theseteams and streams group inquiry laboratories, student teams pose ascientific question, propose an experimental design, and performmultiweek investigations and, along the way, present their researchvia posters, interviews, papers, and talks. What we refer to as the“two-stream” format uses two separate 7-wk-long inquiry experi-ments each focusing on a different biological topic (e.g., stream I:DNA fingerprinting with PCR and gels, and stream II: cellularresponses to the environment with cell culture and drugs). In the“one-stream” laboratory, student research teams spend the full 14 wkon a single research topic (e.g., cell and molecular biology stream:develop a PCR-based diagnostic assay to detect a mutation known tocause a genetic disorder/disease).
Population and sample. Lyman Briggs College of Science is anundergraduate science program established at Michigan State Univer-sity (MSU) in 1967. It is a residential college modeled after those atOxford University that creates a learning community focused oneducating undergraduates in a liberal science curriculum. Overall, itsgoal is to establish a solid foundation in the sciences as well as asignificant liberal education in the history, philosophy, and sociologyof science.
The Introduction to Cell and Molecular Biology course is a five-credit freshmen-level course. It is the second in a core two-semesterintroductory biology sequence for science majors (and the last takenbefore a two-semester physiology sequence). It is taught in sections of#100 students with accompanying recitation and laboratory sections
led by the professor or teaching assistants. Students attend twolectures and one recitation (50 min each) and two laboratory sections(3 h each) per week.
Chronology of curricular reform. While in the late 1990s we madechanges to the lecture and recitation portions of the course, from theyear 2000 forward we focused on the laboratory and started revisingour traditional cookbook laboratory sequence. Early efforts just al-tered the sequence of cookbook laboratories. We rearranged threecookbook laboratories in a natural multiweek sequence (or stream),specifically 1) DNA transformation of bacteria, 2) miniprep purifica-tion of plasmid DNA, and 3) restriction analysis and gel electropho-resis, where the same “unknown” plasmid DNA sample was tested byeach pair of students over several weeks in an effort to determine theidentity of the plasmid (28). This format, as described in detail in ourreport in 2002, was still dominated by traditional cookbook laborato-ries and low-level assessments but was the initial small change thatsparked the larger reform to follow. It is the traditional format shownin Table 1 and in our data set is represented by two semesters, spring2000 and fall 2001.
In 2001, we more dramatically renovated the laboratory curriculumby purposefully introducing two elements: authentic inquiry andformal group work. The details of all the changes done to instructionand assessments in this phase is described in our 2004 publication (19)and the corresponding website (http://surf.to/teamstreams/). The two-stream model used during spring 2001–spring 2007 contained two7-wk-long laboratory sequences each semester. The first stream typ-ically consisted of macromolecule, enzyme, and photosynthesis ex-periments, and the second stream dealt with techniques of molecularbiology (Table 1). In this new format, the majority of time wasfocused on mentoring independent inquiry research by student teamsof four students. Each of the three experimental topics (e.g., macro-molecules, enzymes, and photosynthesis) was initiated with 1 wk fora cookbook laboratory designed to help students to learn techniquesfollowed by 1 wk for independent investigations, where students thenapplied those techniques to the study of the their chosen research
Table 1. Curricular organization and timeline: cookbook versus inquiry laboratories in the tradition, two-stream,and one-stream laboratory formats
Week Traditional Curriculum Two-Stream Curriculum One-Stream Curriculum
1 No laboratory Introduction to Teams and Streams Introduction to Teams and Streams andProject Goals
2 Lab 1: Cell Structure Microscope Analysis* Lab 1: Carbohydrate Chemistry and Lipid Tests* Introduction to Basic Lab Skills; StudentsPropose Projects
3 Lab 2: Plant Tissue Culture: Start Hormones Study* Lab 1 Inquiry: Apply Lab 1 Tests to YourQuestion/Investigation
Lab 1: PCR of the Esherichia coliGenome*
4 Lab 3: Carbohydrate Chemistry and Lipid Tests* Lab 2: Photosynthesis I: the Light Reactions* Lab 1 (cont.): Repeat Attempts UntilSuccessful
5 Lab 4: Photosynthesis I: the Light Reactions* Lab 2 Inquiry: Apply Lab 2 Tests to YourQuestion/Investigation
Lab 2: Genome Preparation From Cells*
6 Lab 5: Photosynthesis II: the Dark Reactions* Lab 3: Enzymes (and Proteins): Kinetics Study* Lab 2 (cont.): Repeat Attempts UntilSuccessful
7 Lab 6: Enzymes (and Substrates): Kinetics Study* Lab 3 Inquiry: Apply Lab 3 Tests to YourQuestion/Investigation
Lab 3: Design an Ethical/Historical/SocialExperiment
8 Enzymes (cont.) and Finish Study* Debriefing Stream I and Introduction toStream II
Independent Investigations
9 Lab 7: Bacterial Transformation* Lab 1: Bacterial Transformation* Independent Investigations10 Bacterial Transformation (cont.) Bacterial Transformation (cont.) Independent Investigations11 Lab 8: DNA Purification* Lab 2: DNA Purification* Independent Investigations12 DNA Purification (cont.) DNA Purification (cont.) Independent Investigations13 Lab 9: Restriction of DNA* Lab 3: Restriction of DNA* Investigations and In-Lab Final Practice
Presentations14 Restriction of DNA (cont.) Restriction of DNA (cont.) Final Paper and In-Lecture Final Formal
Presentations15 No laboratory Wrap up final experiments Briggs Symposium (present research to
public)
*Cookbook laboratories.
Teaching In The Laboratory326 MORE INQUIRY AND LESS COVERAGE INCREASE STUDENT LEARNING
Advances in Physiology Education • doi:10.1152/advan.00017.2012 • http://advan.physiology.org
at Michigan State U
niv on July 18, 2013http://advan.physiology.org/
Dow
nloaded from
3 0

question. Later, these revisions were applied throughout the biologycurriculum in Lyman Briggs College of MSU. The methods used bytwo faculty members who converted cookbook laboratories to teamsand streams inquiry laboratories for another course, Introduction toOrganismal Biology, have been described in a recent publication (26).
During semesters from fall 2007 to spring 2011, we implementeda new one-stream inquiry format, allowing student groups to focus onone project for the full 14 wk of a semester. It was designed tonaturally allow more time for student teams to repeat and reviseexperiments and gain experience at troubleshooting. In this one-stream format, only two of the laboratory weeks remained cookbookand were used to teach the students laboratory protocols and tech-niques such as PCR, gel electrophoresis, and genome purification. Anexample of this one-stream semester-long laboratory sequence isdescribed in Table 1. After the two introductory cookbook laborato-ries used to teach techniques, students were given more freedom andwere able to choose their experiment’s direction with careful moni-toring. This one-stream format also allowed students more time toread scientific publications related to their research topic and applytheir findings to their own research. For example, students whopursued PCR projects had more time to read research papers on PCRand then design and redesign their experiments to include bettercontrols, replications, and adjustments to variables (reagent concen-trations, temperature, etc). Instructors also had more opportunities tochallenge students to spend time troubleshooting and problem solving,e.g., careful analysis of their gel results with peers in their researchgroup. Teaching assistants were trained to respond to student ques-tions with answers in the form of guiding questions and always directthe individual student to return and confer with their group to seekanswers, rather than literally telling students what to correct.
Revisions in assessment. Changes in the way that the students weretaught in the reformed laboratory course (in both two-stream andone-stream formats) were accompanied by changes in the way thatstudent learning was assessed. New assessments, such as interviews,concept mapping, and peer reviews, were introduced in an attempt toevaluate student learning at higher cognitive levels than those previ-ously used. Quizzes and exams were modified to include moreshort-answer responses rather than just multiple-choice responses.Evaluation of a student’s laboratory research results as well as theircontent understanding had always been dominated by writing, yet howwe implemented writing assignments changed from requiring eachstudent to author many short laboratory reports to expecting a groupto generate many drafts of a single research manuscript. Thesechanges were described in detail in our 2004 publication (19) and thecorresponding website (http://surf.to/teamstreams).
Collection of data on student performance and opinion. Twosources were used as primary data sets for analysis of student opinionand performance during the experiment. Content exams with ques-tions derived verbatim from Medical College Admissions Test(MCAT) practice tests were used as a standardized posttest eachsemester. This served as a comparative measure of student learning.Student feedback via extended written responses on end-of-semestercourse evaluation forms was used to evaluate student opinions andassess affective or qualitative elements in response to different labo-ratory formats.
Quantitative data. We developed and administered a small, stan-dardized exam named the medical assessment test (MAT) as a posttestduring the final week of all semesters. Our MAT exam was built froma subset of unaltered MCAT practice test questions developed, vali-dated, and purchased from the Association of American MedicalColleges. This MCAT-style exam was a 40-question multiple-choicetest composed of relevant and rich passage-style questions (31). TheMAT exam instrument consisted of questions from five generalcategories: cell structure and function, oncogenes/cancer, respiration,microbiology, and DNA structure and function. Student performanceon the MAT exam was tracked and compared with the laboratory
format used each semester. The MAT instrument has been used sincethe year 2000 and can be found online (http://surf.to/teamstreams/).
To attempt to calibrate variation that would naturally occur semes-ter to semester due to shifts in student cohort academic ability, studentACT science scores were used to normalize MAT data. The averageACT score for all students in each course was used to calibrate MATcomparisons between semesters. Normalized MAT scores were cal-culated for fall 2000 to fall 2011 semesters to generate the data shownin Fig. 1. Scores were normalized by setting the highest courseaverage ACT score to 100% and converting the remaining courseaverage ACT scores to appropriate relative percentages. These per-centages were then used to determine the appropriate multipliersneeded to adjust each semester’s MAT score proportionally to nor-malize all results.
In addition, since every MAT exam question was carefully codedfor topic, we were able to compare what percentage of questions onthe exam were covered in any formal way during any part of thecourse each semester. While the MAT exam itself remained un-changed, the percentage of questions covered by traditional teachingmethods from course to course decreased greatly during the 10-yrstudy.
Qualitative data. The course evaluation form used in this study wasthe Student Instruction Rating Survey (SIRS) form commonly used atMSU. Rather than interviewing all students in the study, we focusedour attention on the comments section on each student’s SIRS form.The back of each form is entirely for free response feedback. Tointerpret the student feedback on these forms, each individual’swritten opinions were examined and coded depending on the nature ofthe comments. Individual quotes that were noticeably frequent or typicalamong students in the class each semester are shown in Table 2. Inaddition, we studied the frequency of positive versus negativefeedback on the topics of the course laboratory (laboratory) orcourse lecture (class) as well as for each of coded category (groups,laboratory skills, mental skills, and inquiry) from student surveysover the semesters studied (see Tables S3 and S4 in the Supple-mental Material).1
Analysis of content coverage. To evaluate the changes in traditionalcoverage that occurred over the 10-yr period, past syllabi wereanalyzed regarding topics covered in the laboratories and lecturesfrom spring 2000 to fall 2011. We quantitated content coverage andcompared that with performance scores over the decade. We quanti-tated topics covered in laboratories by counting the number of weekscommitted purely to cookbook laboratories (Table 1, laboratoriesmarked by asterisks). To quantitate “pages covered,” the pages thatwere required readings of the textbook for the course were counted foreach semester. Finally, and perhaps most interestingly, while theMAT exam was originally created based on what was covered in thecourse back in the late 1990s, in 2011 we no longer have formalinstruction on a number of the topics still tested on the MAT. Wetherefore determined the number of exam questions that were ontopics covered in class lecture for each semester. As a result, we coulddocument “MAT coverage,” i.e., the percentage of the MAT examthat the instructor covered each semester, and compare that over time.We then could also calculate student performance on MAT questionsthat were or were not addressed in the course.
Data analysis. Significant differences between group means ofmeasured variables were determined using general linear modelANOVAs and t-tests. Post hoc comparisons were done using Tukey’shonestly significant difference test. For all statistical tests, differenceswere considered statistically significant at P values of !0.05. Data arepresented as arithmetic means $ SE.
Institutional human subjects review. With the approval of theInstitutional Review Board of MSU (nos. X00-475 and 10-543),
1 Supplemental Material for this article is available at the Advances inPhysiology Education website.
Teaching In The Laboratory327MORE INQUIRY AND LESS COVERAGE INCREASE STUDENT LEARNING
Advances in Physiology Education • doi:10.1152/advan.00017.2012 • http://advan.physiology.org
at Michigan State U
niv on July 18, 2013http://advan.physiology.org/
Dow
nloaded from
3 1

student data were collected from the 1,018 students who completedour Introduction to Cell and Molecular Biology course at MSU from2000 to 2011. All students were enrolled at MSU; the researchprogram was described to all participants, and participant consent wasobtained.
RESULTS
In 2004, we reported results from 4 yr of data collection thatsimply compared two curriculums: traditional cookbook labo-ratories versus a form of inquiry laboratory we termed “teamsand streams.” We have now revisited the original data set andadded all the years since that publication to create an evenmore robust longitudinal study.
Curricular change. Before 2000, we implemented onlytraditional cookbook approaches in our weekly course labora-tories. A reform of both curriculum and assessments generatedthe nontraditional laboratory formats tested, two versions of teamsand streams inquiry laboratories. The reformed inquiry formatsimplemented in the laboratory raised the time committed forinquiry over the semester from what was 20% in 2000 to %60%today (Table 1).
Quantitative results. We administered a standardized con-tent exam, the MAT, during the final week of semesters fromthe years of 2000 to 2011. Our MAT exam was built fromMCAT practice test questions developed, validated, and pur-
chased from the Association of American Medical Colleges.The normalized MAT scores from each semester indicated thatstudents who participated in the inquiry formats of the courselaboratory made significant gains in learning. One-stream in-quiry laboratory semester score averages (64.73%) were foundto be significantly higher than two-stream inquiry laboratoryscores (61.97%, P ! 0.01), and students in both scoredsignificantly higher than those in the traditional course labora-tory (53.48%, P ! 0.0001; Fig. 1). Raw MAT scores for allsemesters were normalized for variations in each cohort’s prioracademic performance using ACT scores (Fig. 1, insets).
In addition, when the student performance data were pooledinto three bins based on the laboratory format used, a stepwisemovement of the distribution became apparent (Fig. 2). Themode for performance of students who participated in the fullsemester-long one-stream laboratory was 70%, whereas thetwo-stream laboratory format had a mode of 65% and thecookbook laboratory format mode was much lower, at 45%.Not surprisingly, higher levels of content mastery, for example,scores of 75% and 80%, were more frequent among studentswho participated in one-stream laboratories than the other twoformats (Fig. 2).
We examined student performance on each subtopic areaevaluated on the MAT instrument. The data showed a positive
Fig. 1. Normalized medical assessment test (MAT) student score results from 15 semesters. Moving chronologically left to right is a comparison of thenormalized class average score on MAT exams from semesters from 2000 to the present. Course instructors varied in the semesters shown, and these results arefrom semesters in which the MAT instrument was used as a summative evaluation in the last week of classes. The “teams and streams” (TS) inquiry laboratorieswere first introduced in spring (S)2001, and in fall (F)2001, the instructor then reverted back to traditional cookbook laboratories. TS laboratories were used againin fall 2002 and continued to be used until the present. Blue indicates a traditional cookbook laboratory, red indicates a two-stream version of the TS laboratoriesformat used until fall 2007, and green indicates a one-stream version of the TS lab format used ever since. Top inset: for comparison, MAT scores in all semestersare shown before normalization. Bottom inset: class average scores on the ACT for the semesters studied are represented and were used to normalize MAT scores.Error bars are SEs. Student scores from both TS laboratories formats were found to be statistically significant from students who participated in the traditionalcookbook laboratory format (**P ! 0.0001 by ANOVA). Scores of students who participated in the two-stream format were also significantly different fromthose in the one-stream laboratory format (*P ! 0.01 by ANOVA).
Teaching In The Laboratory328 MORE INQUIRY AND LESS COVERAGE INCREASE STUDENT LEARNING
Advances in Physiology Education • doi:10.1152/advan.00017.2012 • http://advan.physiology.org
at Michigan State U
niv on July 18, 2013http://advan.physiology.org/
Dow
nloaded from
3 2
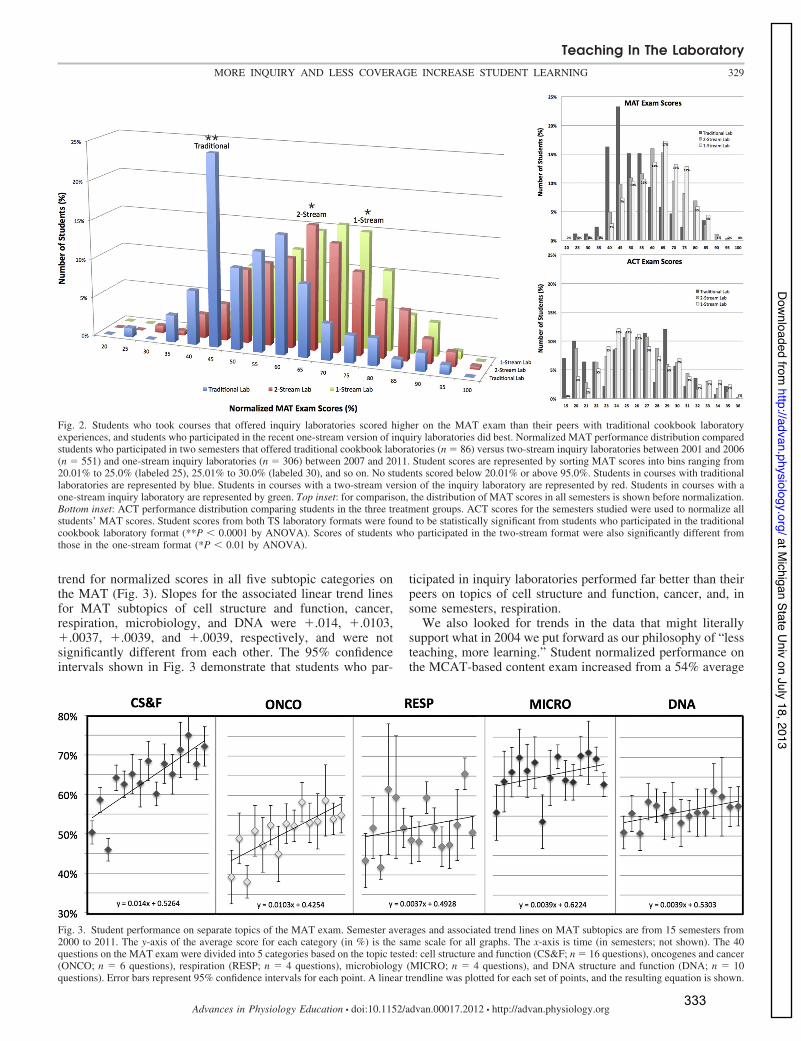
trend for normalized scores in all five subtopic categories onthe MAT (Fig. 3). Slopes for the associated linear trend linesfor MAT subtopics of cell structure and function, cancer,respiration, microbiology, and DNA were &.014, &.0103,&.0037, &.0039, and &.0039, respectively, and were notsignificantly different from each other. The 95% confidenceintervals shown in Fig. 3 demonstrate that students who par-
ticipated in inquiry laboratories performed far better than theirpeers on topics of cell structure and function, cancer, and, insome semesters, respiration.
We also looked for trends in the data that might literallysupport what in 2004 we put forward as our philosophy of “lessteaching, more learning.” Student normalized performance onthe MCAT-based content exam increased from a 54% average
Fig. 2. Students who took courses that offered inquiry laboratories scored higher on the MAT exam than their peers with traditional cookbook laboratoryexperiences, and students who participated in the recent one-stream version of inquiry laboratories did best. Normalized MAT performance distribution comparedstudents who participated in two semesters that offered traditional cookbook laboratories (n " 86) versus two-stream inquiry laboratories between 2001 and 2006(n " 551) and one-stream inquiry laboratories (n " 306) between 2007 and 2011. Student scores are represented by sorting MAT scores into bins ranging from20.01% to 25.0% (labeled 25), 25.01% to 30.0% (labeled 30), and so on. No students scored below 20.01% or above 95.0%. Students in courses with traditionallaboratories are represented by blue. Students in courses with a two-stream version of the inquiry laboratory are represented by red. Students in courses with aone-stream inquiry laboratory are represented by green. Top inset: for comparison, the distribution of MAT scores in all semesters is shown before normalization.Bottom inset: ACT performance distribution comparing students in the three treatment groups. ACT scores for the semesters studied were used to normalize allstudents’ MAT scores. Student scores from both TS laboratory formats were found to be statistically significant from students who participated in the traditionalcookbook laboratory format (**P ! 0.0001 by ANOVA). Scores of students who participated in the two-stream format were also significantly different fromthose in the one-stream format (*P ! 0.01 by ANOVA).
Fig. 3. Student performance on separate topics of the MAT exam. Semester averages and associated trend lines on MAT subtopics are from 15 semesters from2000 to 2011. The y-axis of the average score for each category (in %) is the same scale for all graphs. The x-axis is time (in semesters; not shown). The 40questions on the MAT exam were divided into 5 categories based on the topic tested: cell structure and function (CS&F; n " 16 questions), oncogenes and cancer(ONCO; n " 6 questions), respiration (RESP; n " 4 questions), microbiology (MICRO; n " 4 questions), and DNA structure and function (DNA; n " 10questions). Error bars represent 95% confidence intervals for each point. A linear trendline was plotted for each set of points, and the resulting equation is shown.
Teaching In The Laboratory329MORE INQUIRY AND LESS COVERAGE INCREASE STUDENT LEARNING
Advances in Physiology Education • doi:10.1152/advan.00017.2012 • http://advan.physiology.org
at Michigan State U
niv on July 18, 2013http://advan.physiology.org/
Dow
nloaded from
3 3
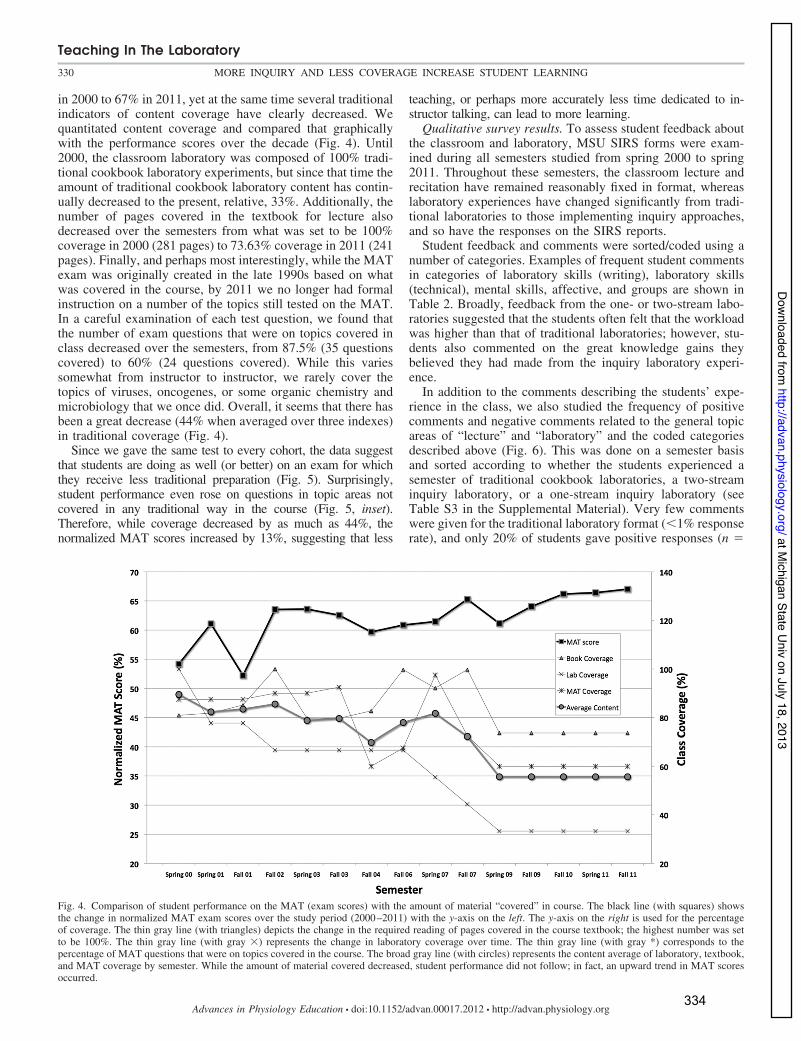
in 2000 to 67% in 2011, yet at the same time several traditionalindicators of content coverage have clearly decreased. Wequantitated content coverage and compared that graphicallywith the performance scores over the decade (Fig. 4). Until2000, the classroom laboratory was composed of 100% tradi-tional cookbook laboratory experiments, but since that time theamount of traditional cookbook laboratory content has contin-ually decreased to the present, relative, 33%. Additionally, thenumber of pages covered in the textbook for lecture alsodecreased over the semesters from what was set to be 100%coverage in 2000 (281 pages) to 73.63% coverage in 2011 (241pages). Finally, and perhaps most interestingly, while the MATexam was originally created in the late 1990s based on whatwas covered in the course, by 2011 we no longer had formalinstruction on a number of the topics still tested on the MAT.In a careful examination of each test question, we found thatthe number of exam questions that were on topics covered inclass decreased over the semesters, from 87.5% (35 questionscovered) to 60% (24 questions covered). While this variessomewhat from instructor to instructor, we rarely cover thetopics of viruses, oncogenes, or some organic chemistry andmicrobiology that we once did. Overall, it seems that there hasbeen a great decrease (44% when averaged over three indexes)in traditional coverage (Fig. 4).
Since we gave the same test to every cohort, the data suggestthat students are doing as well (or better) on an exam for whichthey receive less traditional preparation (Fig. 5). Surprisingly,student performance even rose on questions in topic areas notcovered in any traditional way in the course (Fig. 5, inset).Therefore, while coverage decreased by as much as 44%, thenormalized MAT scores increased by 13%, suggesting that less
teaching, or perhaps more accurately less time dedicated to in-structor talking, can lead to more learning.
Qualitative survey results. To assess student feedback aboutthe classroom and laboratory, MSU SIRS forms were exam-ined during all semesters studied from spring 2000 to spring2011. Throughout these semesters, the classroom lecture andrecitation have remained reasonably fixed in format, whereaslaboratory experiences have changed significantly from tradi-tional laboratories to those implementing inquiry approaches,and so have the responses on the SIRS reports.
Student feedback and comments were sorted/coded using anumber of categories. Examples of frequent student commentsin categories of laboratory skills (writing), laboratory skills(technical), mental skills, affective, and groups are shown inTable 2. Broadly, feedback from the one- or two-stream labo-ratories suggested that the students often felt that the workloadwas higher than that of traditional laboratories; however, stu-dents also commented on the great knowledge gains theybelieved they had made from the inquiry laboratory experi-ence.
In addition to the comments describing the students’ expe-rience in the class, we also studied the frequency of positivecomments and negative comments related to the general topicareas of “lecture” and “laboratory” and the coded categoriesdescribed above (Fig. 6). This was done on a semester basisand sorted according to whether the students experienced asemester of traditional cookbook laboratories, a two-streaminquiry laboratory, or a one-stream inquiry laboratory (seeTable S3 in the Supplemental Material). Very few commentswere given for the traditional laboratory format (!1% responserate), and only 20% of students gave positive responses (n "
Fig. 4. Comparison of student performance on the MAT (exam scores) with the amount of material “covered” in course. The black line (with squares) showsthe change in normalized MAT exam scores over the study period (2000–2011) with the y-axis on the left. The y-axis on the right is used for the percentageof coverage. The thin gray line (with triangles) depicts the change in the required reading of pages covered in the course textbook; the highest number was setto be 100%. The thin gray line (with gray ') represents the change in laboratory coverage over time. The thin gray line (with gray *) corresponds to thepercentage of MAT questions that were on topics covered in the course. The broad gray line (with circles) represents the content average of laboratory, textbook,and MAT coverage by semester. While the amount of material covered decreased, student performance did not follow; in fact, an upward trend in MAT scoresoccurred.
Teaching In The Laboratory330 MORE INQUIRY AND LESS COVERAGE INCREASE STUDENT LEARNING
Advances in Physiology Education • doi:10.1152/advan.00017.2012 • http://advan.physiology.org
at Michigan State U
niv on July 18, 2013http://advan.physiology.org/
Dow
nloaded from
3 4
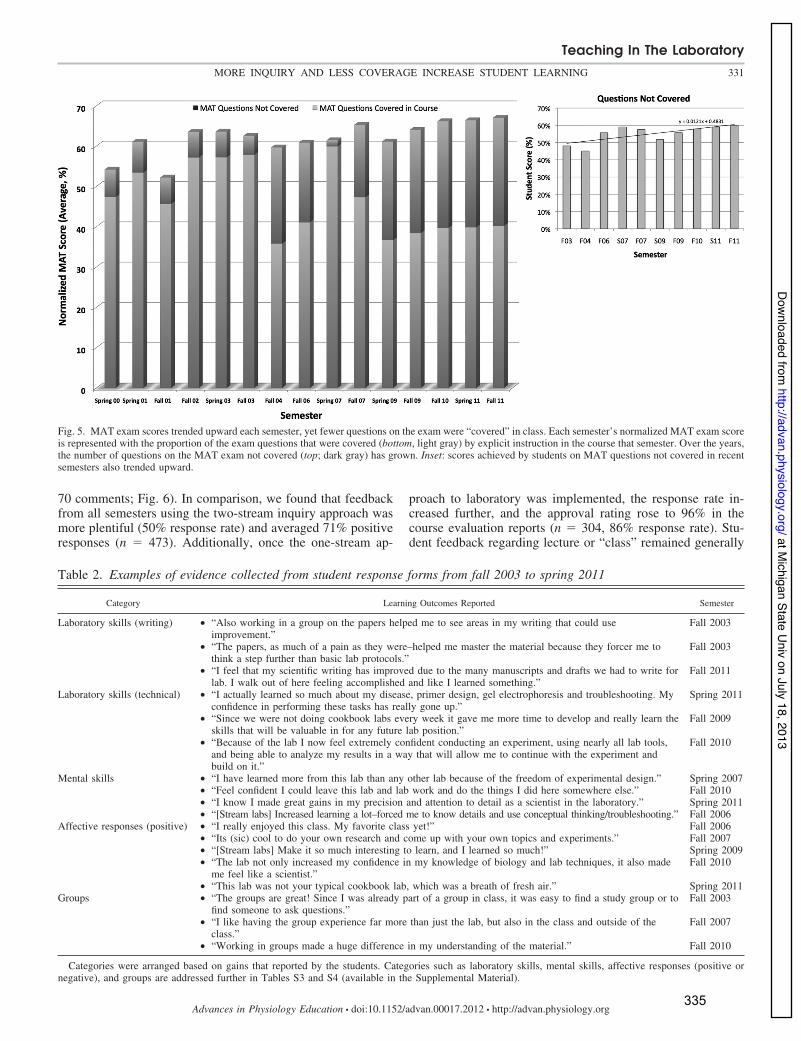
70 comments; Fig. 6). In comparison, we found that feedbackfrom all semesters using the two-stream inquiry approach wasmore plentiful (50% response rate) and averaged 71% positiveresponses (n " 473). Additionally, once the one-stream ap-
proach to laboratory was implemented, the response rate in-creased further, and the approval rating rose to 96% in thecourse evaluation reports (n " 304, 86% response rate). Stu-dent feedback regarding lecture or “class” remained generally
Fig. 5. MAT exam scores trended upward each semester, yet fewer questions on the exam were “covered” in class. Each semester’s normalized MAT exam scoreis represented with the proportion of the exam questions that were covered (bottom, light gray) by explicit instruction in the course that semester. Over the years,the number of questions on the MAT exam not covered (top; dark gray) has grown. Inset: scores achieved by students on MAT questions not covered in recentsemesters also trended upward.
Table 2. Examples of evidence collected from student response forms from fall 2003 to spring 2011
Category Learning Outcomes Reported Semester
Laboratory skills (writing) • “Also working in a group on the papers helped me to see areas in my writing that could useimprovement.”
Fall 2003
• “The papers, as much of a pain as they were–helped me master the material because they forcer me tothink a step further than basic lab protocols.”
Fall 2003
• “I feel that my scientific writing has improved due to the many manuscripts and drafts we had to write forlab. I walk out of here feeling accomplished and like I learned something.”
Fall 2011
Laboratory skills (technical) • “I actually learned so much about my disease, primer design, gel electrophoresis and troubleshooting. Myconfidence in performing these tasks has really gone up.”
Spring 2011
• “Since we were not doing cookbook labs every week it gave me more time to develop and really learn theskills that will be valuable in for any future lab position.”
Fall 2009
• “Because of the lab I now feel extremely confident conducting an experiment, using nearly all lab tools,and being able to analyze my results in a way that will allow me to continue with the experiment andbuild on it.”
Fall 2010
Mental skills • “I have learned more from this lab than any other lab because of the freedom of experimental design.” Spring 2007• “Feel confident I could leave this lab and lab work and do the things I did here somewhere else.” Fall 2010• “I know I made great gains in my precision and attention to detail as a scientist in the laboratory.” Spring 2011• “[Stream labs] Increased learning a lot–forced me to know details and use conceptual thinking/troubleshooting.” Fall 2006
Affective responses (positive) • “I really enjoyed this class. My favorite class yet!” Fall 2006• “Its (sic) cool to do your own research and come up with your own topics and experiments.” Fall 2007• “[Stream labs] Make it so much interesting to learn, and I learned so much!” Spring 2009• “The lab not only increased my confidence in my knowledge of biology and lab techniques, it also made
me feel like a scientist.”Fall 2010
• “This lab was not your typical cookbook lab, which was a breath of fresh air.” Spring 2011Groups • “The groups are great! Since I was already part of a group in class, it was easy to find a study group or to
find someone to ask questions.”Fall 2003
• “I like having the group experience far more than just the lab, but also in the class and outside of theclass.”
Fall 2007
• “Working in groups made a huge difference in my understanding of the material.” Fall 2010
Categories were arranged based on gains that reported by the students. Categories such as laboratory skills, mental skills, affective responses (positive ornegative), and groups are addressed further in Tables S3 and S4 (available in the Supplemental Material).
Teaching In The Laboratory331MORE INQUIRY AND LESS COVERAGE INCREASE STUDENT LEARNING
Advances in Physiology Education • doi:10.1152/advan.00017.2012 • http://advan.physiology.org
at Michigan State U
niv on July 18, 2013http://advan.physiology.org/
Dow
nloaded from
3 5
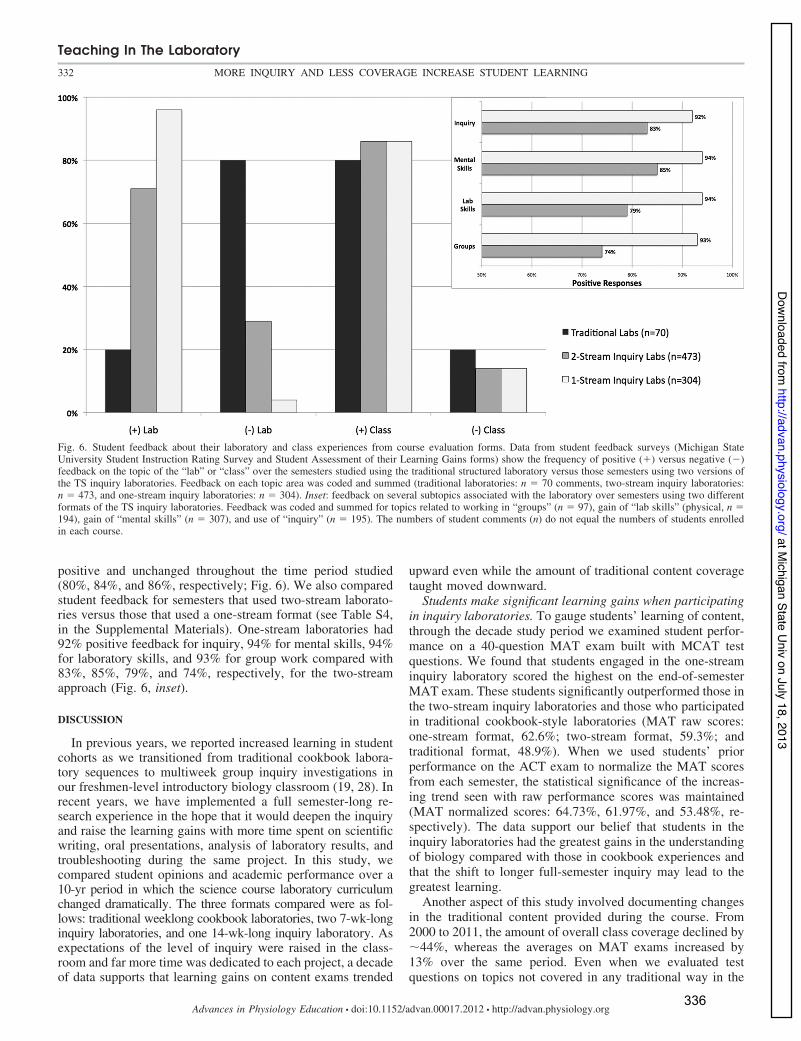
positive and unchanged throughout the time period studied(80%, 84%, and 86%, respectively; Fig. 6). We also comparedstudent feedback for semesters that used two-stream laborato-ries versus those that used a one-stream format (see Table S4,in the Supplemental Materials). One-stream laboratories had92% positive feedback for inquiry, 94% for mental skills, 94%for laboratory skills, and 93% for group work compared with83%, 85%, 79%, and 74%, respectively, for the two-streamapproach (Fig. 6, inset).
DISCUSSION
In previous years, we reported increased learning in studentcohorts as we transitioned from traditional cookbook labora-tory sequences to multiweek group inquiry investigations inour freshmen-level introductory biology classroom (19, 28). Inrecent years, we have implemented a full semester-long re-search experience in the hope that it would deepen the inquiryand raise the learning gains with more time spent on scientificwriting, oral presentations, analysis of laboratory results, andtroubleshooting during the same project. In this study, wecompared student opinions and academic performance over a10-yr period in which the science course laboratory curriculumchanged dramatically. The three formats compared were as fol-lows: traditional weeklong cookbook laboratories, two 7-wk-longinquiry laboratories, and one 14-wk-long inquiry laboratory. Asexpectations of the level of inquiry were raised in the class-room and far more time was dedicated to each project, a decadeof data supports that learning gains on content exams trended
upward even while the amount of traditional content coveragetaught moved downward.
Students make significant learning gains when participatingin inquiry laboratories. To gauge students’ learning of content,through the decade study period we examined student perfor-mance on a 40-question MAT exam built with MCAT testquestions. We found that students engaged in the one-streaminquiry laboratory scored the highest on the end-of-semesterMAT exam. These students significantly outperformed those inthe two-stream inquiry laboratories and those who participatedin traditional cookbook-style laboratories (MAT raw scores:one-stream format, 62.6%; two-stream format, 59.3%; andtraditional format, 48.9%). When we used students’ priorperformance on the ACT exam to normalize the MAT scoresfrom each semester, the statistical significance of the increas-ing trend seen with raw performance scores was maintained(MAT normalized scores: 64.73%, 61.97%, and 53.48%, re-spectively). The data support our belief that students in theinquiry laboratories had the greatest gains in the understandingof biology compared with those in cookbook experiences andthat the shift to longer full-semester inquiry may lead to thegreatest learning.
Another aspect of this study involved documenting changesin the traditional content provided during the course. From2000 to 2011, the amount of overall class coverage declined by#44%, whereas the averages on MAT exams increased by13% over the same period. Even when we evaluated testquestions on topics not covered in any traditional way in the
Fig. 6. Student feedback about their laboratory and class experiences from course evaluation forms. Data from student feedback surveys (Michigan StateUniversity Student Instruction Rating Survey and Student Assessment of their Learning Gains forms) show the frequency of positive (&) versus negative (()feedback on the topic of the “lab” or “class” over the semesters studied using the traditional structured laboratory versus those semesters using two versions ofthe TS inquiry laboratories. Feedback on each topic area was coded and summed (traditional laboratories: n " 70 comments, two-stream inquiry laboratories:n " 473, and one-stream inquiry laboratories: n " 304). Inset: feedback on several subtopics associated with the laboratory over semesters using two differentformats of the TS inquiry laboratories. Feedback was coded and summed for topics related to working in “groups” (n " 97), gain of “lab skills” (physical, n "194), gain of “mental skills” (n " 307), and use of “inquiry” (n " 195). The numbers of student comments (n) do not equal the numbers of students enrolledin each course.
Teaching In The Laboratory332 MORE INQUIRY AND LESS COVERAGE INCREASE STUDENT LEARNING
Advances in Physiology Education • doi:10.1152/advan.00017.2012 • http://advan.physiology.org
at Michigan State U
niv on July 18, 2013http://advan.physiology.org/
Dow
nloaded from
3 6
course, student performance still increased. We believe thatthese data may help lessen a concern of our colleagues thatthey should at least “touch on” certain topics. Our data suggestthat a more efficient use of time is mastering fewer topicsdeeply while fostering the development of critical thinkingskills that enable the student to apply known information (withgreater confidence) to new topics. We believe that these skillsof critical thinking and transference are necessary for becom-ing a productive scientist as well as being useful in makinginformed life decisions.
Students appreciate the change to inquiry experiences. Stu-dent opinion was a motivator of change for our faculty. In thelate 1990s, students’ opinions about their laboratory experiencewere less than enthusiastic. Students asked biology facultyadvisors whether they should leave the Physiology majorbecause “I don’t think I could do that stuff, like in intro bio lab,for my career.” Comments on course evaluations were fre-quently just “labs are boring and time consuming.” Duringinterviews, students told us that it wasn’t how they imaginedscience would be. Upon reflection, we agreed that “real sci-ence” was very different than the way we were teaching it. Thisled to the decade of changes that were evaluated and presentedin this study. Looking backward in time, through the analysisof course evaluation forms, noticeable differences were ob-served between students who participated in each format oflaboratory curricula. When examining the positive commentsversus negative comments related to the laboratory, only 20%of students left positive comments regarding the early tradi-tional cookbook laboratories. However, as the format of thelaboratory changed, the number of positive responses increasedto 71% of all responses for the two-stream format and 96% ofall responses for the one-stream format of laboratories. Thequalitative data showed positive changes in both the responserate on the topic of the laboratory as well as student opinionstoward traditional versus active inquiry forms of pedagogy.The student responses strongly support that the students be-lieved the changes in the laboratory curriculum were beneficialto their learning.
Challenges for instructors when changing to inquiry laboratories.Often faculty members find it hard to step out of their comfortzone to teach an inquiry laboratory and may find this especiallydifficult since they were not taught this way (25). However,this change in the curriculum has proven to be beneficial in avariety of classrooms and results in better test scores andincreased learning in the long term (4, 5, 30). We found thatchanging the classroom laboratory from cookbook to inquirywas uncomfortable at first but ultimately liberating to facultyinstructors. At each step in the process, our faculty membersdiscovered the classroom laboratory became a more familiarenvironment, just like working with students in their ownresearch laboratory. Once we became accustomed to runninginquiry laboratories, we found the day-to-day operation of thelaboratory to be much easier and in fact less expensive than thetraditional “different laboratory each week” paradigm. The in-credible effort associated just with preparing supplies and trainingteaching assistants each week for the next cookbook laboratorybecame a distant memory. Graduate students who serve asteaching assistants also spend a great amount of time work-ing in their own, real laboratory, and although they too resistchange, this is the type of change they can more quicklyappreciate. Perhaps surprisingly, a recent study (9) has even
documented that graduate students who teach in inquirylaboratories tend to master the critical thinking and practiceof experimental design more quickly during their graduatestudies.
How physiology majors respond to inquiry laboratories. Ourstudents are a population dominated by Premed and Physiologymajors, many with differing views of which teaching approachstimulates their learning most. A number of studies (3, 5, 14,15, 18, 29, 30) have found that students find an inquiry-basedresearch experience more beneficial than traditional cookbooklaboratories. Furthermore, students tend to believe that theirknowledge is not tested by cookbook laboratories (12). Studentopinions certainly played a role in stimulating our faculty toswitch to a creative, active, inquiry-based classroom labora-tory, and we hoped this premed motivation might also helpstudents engage with and value their performance on ourstandardized MAT posttest exam, even though it had no impacton their course grade. Given that exams like the MCAT includea number of higher-level thinking problems (31), superficialcontent coverage may not help students prepare well. If stu-dents have more time to focus on one topic in a laboratory andon the process of doing science, greater scientific literacy canbe gained. Some studies (13, 15) have found that studentsexperiencing inquiry laboratories become better able to inte-grate their knowledge and move seamlessly between publishedresearch and topics discussed in class, resulting in higherlearning.
Less teaching, more learning. We define our use of the term“less teaching” as moving the burden of active effort from theteacher to the student. Given that active and collaborativeconstruction of knowledge “works” (20) and represents astudent-centered classroom, having instructors do all the workdoes not make sense. A number of studies (16, 24) havesuggested that depth instead of breadth of coverage in intro-ductory science classes correlates well with later success.
The research literature suggests our findings apply not onlyto introductory biology courses but also to upper-level classes.In many physiology classes, there is likely too much coverageto allow deep learning, and, as a result, many students rejectmeaningful learning and resort to using rote memorization tosucceed. However, evidence presented in the literature sug-gests if less content was covered and students experienced anactive learning environment, they could achieve greater gainsin knowledge (6, 7, 30).
Conclusions. One of the goals of attempting the 14-wk-longone-stream inquiry laboratory was to give students more free-dom to develop their own ideas and opportunities to trouble-shoot and experience the process of improving their experi-mental design. The time that students devote to designing (andredesigning) their experiments can be extraordinarily beneficialand has been linked to a greater understanding and improvedtest scores (2). This greater freedom, combined with the chal-lenges of an ill-structured problem, brings both “pain and gain”that rarely occurs in traditional cookbook laboratories. Thischallenging environment can ultimately help students makegreater gains in learning and in the mastery of scientificlaboratory skills (1, 23). Overall, our findings align well withthe literature that suggests that by participating in a labora-tory curriculum that is enriched for problem solving andauthentic inquiry, students have a greater chance to gainmore interest in biological research, increase learning, im-
Teaching In The Laboratory333MORE INQUIRY AND LESS COVERAGE INCREASE STUDENT LEARNING
Advances in Physiology Education • doi:10.1152/advan.00017.2012 • http://advan.physiology.org
at Michigan State U
niv on July 18, 2013http://advan.physiology.org/
Dow
nloaded from
3 7
prove critical thinking and analysis, and become bettersuited for future endeavors (27).
Over the years, faculty instructors in our department whomade the change from teaching cookbook laboratories reportedthat using multiweek inquiry laboratories, especially the one-stream format, “felt more natural, like work done in my ownlab.” In our own basic science research, we take great care andtime exploring our research topic deeply; we spend months/years performing experiments, reading literature, and thinkingabout our research. When students experience a similar oppor-tunity in the classroom, the education research literature sup-ports our own intuition, specifically that more time on task toachieve deeper understanding in fact “works.” Students gaindeeper more meaningful understanding of topics, techniques,and the process of doing science and can respond to probingquestions like “OK, now design for me an experiment to testthat idea.” Pursuing longer inquiry experiences with more timeyields more formal and informal opportunities for students totalk and write about science, which, not surprisingly, allowsstudents to also makes gains in communication skills likescientific writing and public speaking (10).
While the curricular revisions reported in this study aresimilar to other reports in the literature, many scientific edu-cators have yet to be convinced to change their teaching to bea more active, student-driven laboratory. The majority ofundergraduate laboratory experiences in the United Statesremain predominately the traditional cookbook style. We hopewith this publication and the support of others completingsimilar research with both qualitative and quantitative studies,more of our peers in science will begin to examine thesefindings with interest and make progress moving deliberatelyto challenge students with active, engaging teaching methodsand, in particular, using more inquiry in the classroom labora-tory.
ACKNOWLEDGMENTS
The authors thank Dr. John Wilterding, Dr. Jim Zablotny, Dr. Jim Smith,Dr. Chuck Elzinga, Dr. Sarah Loznak, Dr. Marija Krha-Massey, Dr. DianeEbert-May, Dr. Merle Heideman, Dr. Joyce Parker, Dr. John Merrill, Dr. JanetBatzli, Dr. Karl Smith, Dr. Seth Hootman, Dr. Tom Adams, Dr. Mimi Sayed,and Dr. Duncan Sibley for helpful discussions about teaching and learning andassistance during this study. The authors also thank the many teachingassistants who promoted and implemented these renovations in curriculum andmade a fantastic environment for learning in the classroom laboratories.
GRANTS
This work was supported by grants from the Cystic Fibrosis Foundation andPennsylvania Cystic Fibrosis, Incorporated (to D. B. Luckie), for the physiol-ogy cystic fibrosis research program and by grants (to D. B. Luckie) fromMichigan State University and the National Science Foundation for theeducation research program.
DISCLOSURES
No conflicts of interest, financial or otherwise, are declared by the author(s).
AUTHOR CONTRIBUTIONS
Author contributions: D.B.L. and J.J.M. conception and design of research;D.B.L. and J.J.M. performed experiments; D.B.L., J.R.A., B.J.M., A.M.R., L.A.F.,and J.J.M. analyzed data; D.B.L., J.R.A., B.J.M., A.M.R., L.A.F., andJ.J.M. interpreted results of experiments; D.B.L., J.R.A., B.J.M., A.M.R.,and L.A.F. prepared figures; D.B.L., J.R.A., B.J.M., A.M.R., and L.A.F.drafted manuscript; D.B.L., J.R.A., B.J.M., A.M.R., L.A.F., and J.J.M.
edited and revised manuscript; D.B.L., J.R.A., B.J.M., A.M.R., L.A.F., andJ.J.M. approved final version of manuscript.
REFERENCES
1. Anjur SS. Student-centered physiology in high schools. Adv Physiol Educ35: 161–167, 2011.
2. Aronson BD, Silveira LA. From genes to proteins to behavior: a labo-ratory project that enhances student understanding in cell and molecularbiology. CBE Life Sci Educ 8: 291–308, 2009.
3. Casem ML. Student perspectives on curricular change: lessons from anundergraduate lower-division biology core. CBE Life Sci Educ 5: 65–75,2006.
4. Casotti G, Rieser-Danner L, Knabb MT. Successful implementation ofinquiry-based physiology laboratories in undergraduate major and nonma-jor courses. Adv Physiol Educ 32: 286–296, 2008.
5. Derting TL, Ebert-May D. Learner-centered inquiry in undergraduatebiology: positive relationships with long-term student achievement. CBELife Sci Educ 9: 462–472, 2010.
6. DiCarlo SE. Cell biology should be taught as science is practised. Nat RevMol Cell Biol 7: 290–296, 2006.
7. DiCarlo SE. Too much content, not enough thinking, and too little fun!Adv Physiol Educ 33: 257–64, 2009.
8. Donovan MS, Bransford JD, Pellegrino JW. How People Learn:Bridging Research and Practice. Washington, DC: National Academy,1999.
9. Feldon DF, Peugh J, Timmerman BE, Maher MA, Hurst M, Strick-land D, Gilmore JA, Stiegelmeyer C. Graduate students’ teachingexperiences improve their methodological research skills. Science 333:1037–1039, 2011.
10. FitzPatrick KA, Campisi J. A multiyear approach to student-driveninvestigations in exercise physiology. Adv Physiol Educ 33: 349–355,2009.
11. Handelsman J, Ebert-May D, Beichner R, Bruns P, Chang A, DeHaanR, Gentile J, Lauffer S, Stewart J, Tilghman SM, Wood WB. Educa-tion. Scientific teaching. Science 304: 521–522, 2004.
12. Henige K. Undergraduate student attitudes and perceptions toward low-and high-level inquiry exercise physiology teaching laboratory experi-ences. Adv Physiol Educ 35: 197–205, 2011.
13. Hoskins SG, Stevens LM. Learning our LIMITS: less is more in teachingscience. Adv Physiol Educ 33: 17–20, 2009.
14. Howard DR, Miskowski JA. Using a module-based laboratory to incor-porate inquiry into a large cell biology course. Cell Biol Educ 4: 249–260,2005.
15. Jensen JL, Lawson A. Effects of collaborative group composition andinquiry instruction on reasoning gains and achievement in undergraduatebiology. CBE Life Sci Educ 10: 64–73, 2011.
16. Knight JK, Wood WB. Teaching more by lecturing less. Cell Biol Educ4: 298–310, 2005.
17. Krontiris-Litowitz J. Articulating scientific reasoning improves studentlearning in an undergraduate anatomy and physiology course. CBE LifeSci Educ 8: 309–315, 2009.
18. Lord T, Orkwiszewski T. Moving from didactic to inquiry-based instruc-tion in a science laboratory. Am Biol Teacher 68: 342–345, 2006.
19. Luckie DB, Maleszewski JJ, Loznak SD, Krha M. Infusion of collab-orative inquiry throughout a biology curriculum increases student learn-ing: a four-year study of “Teams and Streams”. Adv Physiol Educ 28:199–209, 2004.
20. Luckie D, Harrison SH, Ebert-May D. Model-based reasoning: usingvisual tools to reveal student learning. Adv Physiol Educ 35: 59 – 67,2011.
21. Momsen JL, Long TM, Wyse SA, Ebert-May D. Just the facts?Introductory undergraduate biology courses focus on low-level cognitiveskills. CBE Life Sci Educ 9: 435–440, 2010.
22. Morgan E. BIO2010: Transforming Undergraduate Education for Future Re-search Biologists (online). http://www.nap.edu/openbook.php?isbn"0309085357[21 Oct. 2011].
23. Myers MJ, Burgess AB. Inquiry-based laboratory course improves stu-dents’ ability to design experiments and interpret data. Adv Physiol Educ27: 26–33, 2003.
24. Schwartz MS, Sadler PM, Sonnert G, Tai RH. Depth versus breadth:how content coverage in high school science courses relates to latersuccess in college science coursework. Sci Educ 93: 798–826, 2009.
Teaching In The Laboratory334 MORE INQUIRY AND LESS COVERAGE INCREASE STUDENT LEARNING
Advances in Physiology Education • doi:10.1152/advan.00017.2012 • http://advan.physiology.org
at Michigan State U
niv on July 18, 2013http://advan.physiology.org/
Dow
nloaded from
3 8
25. Silverthorn DU, Thorn PM, Svinicki MD. It’s difficult to change theway we teach: lessons from the Integrative Themes in Physiology curric-ulum module project. Adv Physiol Educ 30: 204–214, 2006.
26. Smith J, Cheruvelil K. Using inquiry and tree-thinking to “Marchthrough the animal phyla”: teaching introductory comparative biol-ogy in an evolutionary context. Evol Educ Outreach 2: 429 – 444,2009.
27. Treacy DJ, Sankaran SM, Gordon-Messer S, Saly D, Miller R, IsaacSR, Kosinski-Collins MS. Implementation of a project-based molecularbiology laboratory emphasizing protein structure-function relationships ina large introductory biology laboratory course. CBE Life Sci Educ 10:18–24, 2011.
28. Wilterding JH, Luckie DB. “Stream”-lined education: increasing stu-dent-initiated learning with an investigative DNA “stream”. J Coll SciTeach 31: 303–307, 2002.
29. Wood WB. Inquiry-based undergraduate teaching in the life sciences atlarge research universities: a perspective on the Boyer Commission Re-port. Cell Biol Educ 2: 112–116, 2003.
30. Wright RL, Klymkowsky MW. Points of view: content versus process:is this a fair choice?: undergraduate biology courses for nonscientists:toward a lived curriculum. Cell Biol Educ 4: 189–196, 2005.
31. Zheng AY, Lawhorn JK, Lumley T, Freeman Assessment S. Applica-tion of Bloom’s taxonomy debunks the “MCAT myth”. Science 319:414–415, 2008.
Teaching In The Laboratory335MORE INQUIRY AND LESS COVERAGE INCREASE STUDENT LEARNING
Advances in Physiology Education • doi:10.1152/advan.00017.2012 • http://advan.physiology.org
at Michigan State U
niv on July 18, 2013http://advan.physiology.org/
Dow
nloaded from
3 9

!
340

July 12, 2013 19:57 CBE-12-04-0050 cbe-lse
CBE—Life Sciences EducationVol. 12, 1–15, Fall 2013
Article1
Verbal Final Exam in Introductory Biology Yields Gains inStudent Content Knowledge and Longitudinal Performance
2
3
Douglas B. Luckie,* Aaron M. Rivkin,* Jacob R. Aubry,* Benjamin J. Marengo,*Leah R. Creech,† and Ryan D. Sweeder†
4
5
*Department of Physiology, Michigan State University, East Lansing, MI 48825; †STEM Learning Laboratory,Lyman Briggs College, Department of Physiology, Michigan State University, East Lansing, MI 48824-3320
67
Submitted April 25, 2012; Revised May 7, 2013; Accepted May 8, 20138Monitoring Editor: Michelle Kathleen Smith9
We studied gains in student learning over eight semesters in which an introductory biology coursecurriculum was changed to include optional verbal final exams (VFs). Students could opt to demon-strate their mastery of course material via structured oral exams with the professor. In a quantitativeassessment of cell biology content knowledge, students who passed the VF outscored their peers onthe medical assessment test (MAT), an exam built with 40 Medical College Admissions Test (MCAT)questions (66.4% [n = 160] and 62% [n = 285], respectively; p < 0.001);. The higher-achieving stu-dents performed better on MCAT questions in all topic categories tested; the greatest gain occurredon the topic of cellular respiration. Because the VF focused on a conceptually parallel topic, pho-tosynthesis, there may have been authentic knowledge transfer. In longitudinal tracking studies,passing the VF also correlated with higher performance in a range of upper-level science courses,with greatest significance in physiology, biochemistry, and organic chemistry. Participation had awide range but not equal representation in academic standing, gender, and ethnicity. Yet studentsnearly unanimously (92%) valued the option. Our findings suggest oral exams at the introductorylevel may allow instructors to assess and aid students striving to achieve higher-level learning.
1011121314151617181920212223
INTRODUCTION24
The spoken word is a unique device. Our words can affect
Q1
Q2
25others’ behavior in dramatic ways and can profoundly af-26fect our own thoughts and learning. Whether one reviews27the classic work of Piaget and Vygotsky or other literature of28cognitive development (Inhelder and Piaget, 1958; Vygotsky,291962; Bruner, 1973), learning (Posner et al., 1982; Guest and30Murphy, 2000; Krontiris-Litowitz, 2009), memory (Baddeley31and Hitch, 1974), or metacognition (Schunk, 1986; Pintrich,321988; Labuhn et al., 2010), the data support that the action33of speaking thoughts aloud strongly impacts one’s own un-34
DOI: 10.1187/cbe.12-04-0050Address correspondence to: Douglas Luckie ([email protected]).
c⃝ 2013 D. B. Luckie et al. CBE—Life Sciences Education c⃝ 2013The American Society for Cell Biology. This article is distributedby The American Society for Cell Biology under license fromthe author(s). It is available to the public under an Attribution–Noncommercial–Share Alike 3.0 Unported Creative Commons Li-cense (http://creativecommons.org/licenses/by-nc-sa/3.0).“ASCB R⃝” and “The American Society for Cell Biology R⃝” are regis-tered trademarks of The American Society for Cell Biology.
derstanding and mastery. In fact, for many years, the liter- 35ature has even suggested that a student who speaks aloud 36his or her answer to a question will have higher retention 37and comprehension than the student who silently thinks the 38same answer (Gagne and Smith, 1962; Carmean and Wier, 391967; Bruner, 1973). Overt verbalization is a powerful tool 40for learning and increases self-evaluative judgment and cog- 41nitive commitment (Wilder and Harvey, 1971; Schunk, 1986; 42Labuhn et al., 2010). 43
The literature suggests that exams and other high-stakes 44assessments tend to drive student learning in the classroom 45(Tobias, 1992; Tobias and Raphael, 1997). The data are per- 46suasive, and upon reflection, most experienced instructors 47would concede this is very likely to be true. No matter how 48much time and energy a professor puts into challenging stu- 49dents to think critically, no matter how much we implore 50them to think like a scientist, if the exams they face do not 51test higher-level thinking and problem solving, students are 52not likely to master the material (Traub and MacRury, 1990; 53Momsen et al., 2010). Students perceive that the information 54on our high-stakes assessments is what we truly value 55(Entwistle and Entwistle, 1992), and the exam format itself can 56change how students study and approach problem solving. 57
1
341

July 12, 2013 19:57 CBE-12-04-0050 cbe-lse
D. B. Luckie et al.
As instructors, our exams and other assessments certainly58also impact us. We genuinely want our students to learn59things that Benjamin Bloom (1956) would have considered60higher level, but we struggle with how to assess it. Con-61sider this learning goal: to think like a scientist and be able62to adaptively negotiate a question or problem. It is an ap-63propriate learning goal, but if we attempt to align it with our64traditional assessments (quizzes, exams, homework, etc.), we65rarely find robust sources of evidence that demonstrate mas-66tery (Momsen et al., 2010). In mentoring our graduate stu-67dents, we tend to teach with a questioning style much like68that of Socrates (Stumpf, 1983). We interact one-on-one and69ask questions to evaluate as well as to determine how to best70guide our students. In this setting, we orally assess whether71our students are mastering or achieving “how to think like a72scientist” (Paul and Elder, 2006).73
A number of years ago, a new assessment was introduced74in our biology classroom, a structured clinical interview or75oral exam with Socratic questioning called the “verbal final”76(VF). It was used to assess higher-level thinking, while at77the same time allowing verbalization to better impact learn-78ing. We observed students’ ability to think critically about79topics taught and adaptively negotiate a posed question or80problem as addressed in the literature (Schubert et al., 1999;81Thorburn and Collins, 2006). The assessment was predicted toQ3
82allow students to also participate in a metacognitive process83as they grappled with the topic and how to explain it to others84(Baddeley and Hitch, 1974). The buy-in from students created85a novel culture of learning outside the classroom driven by86this high-stakes assessment (DiCarlo, 2009) and appears to87have a lasting impact on student learning.88
METHODS89
Population and Context90
Lyman Briggs College is an undergraduate science pro-91gram established at Michigan State University (MSU) in 196792(Sweeder et al., 2012). It is a residential college modeled after93those at Oxford University in the United Kingdom and hasQ4
94a focus of educating undergraduates in a liberal science cur-95riculum defined as a “solid foundation in the sciences and a96significant liberal education in the history, philosophy, and97sociology of science.” Introduction to Cell and Molecular Bi-98ology (Bio II) is a five-credit, freshmen-level course. It is the99second in a core two-semester introductory biology sequence100for science majors. It has an enrollment of ∼100 students and101each student attends two lectures and one recitation (50 min102each) and two laboratory sections (3 h each) per week.103
With the approval of MSU Institutional Review Board (IRB104X00-475 and 10-543), student data were collected from 445105students who completed our Introduction to Cell and Molec-106ular Biology course at MSU; the data were from cohorts in107the eight semesters studied between the years 2002 and 2011.108All students were enrolled at MSU, and participant consent109was obtained while students were enrolled in the course. The110registrar provided ACT science and composite scores and de-111mographic data for 407 of the 445 students who participated.Q5
112With the approval of MSU-IRB (IRB 07-446), student data113were also collected for longitudinal tracking and compari-114
son purposes from all 21,528 students who completed select 115upper-level science courses at MSU from 1997 to 2010. 116
The VF process is structured to incentivize students to par- 117ticipate with high reward and to decrease anxiety by hav- 118ing no penalty. The 1-h exam is graded on a pass/not-pass 119basis. Students who pass the VF earn a 100% for the final 120exam score in the course. Students may retake the VF a num- 121ber of times. If they do not pass, they take the written final 122exam. In addition to the method listed below (and in greater 123detail in the Supplemental Material), we have made addi- 124tional resources available, including audio and video record- 125ings of students taking the VF, on the public VF website 126(www.msu.edu/∼luckie/verbalfinals). 127
VF Protocol 128
During the exam process, instructors keep notes of questions 129asked and student errors that occur (Figure 1). They also make 130an effort to frequently use the phrase “What do you predict 131is likely?” to communicate being open to imperfect answers 132as long as students provide reasonable support for their pre- 133dictions. If students are performing at a very high level, then 134assessment of even more advanced concepts, such as experi- 135mental design, can be attempted ; for example, “Okay, great 136prediction, now design an experiment to test that prediction, 137what could you try?” 138
At the beginning of the exam, the instructor reads an intro- 139ductory statement aloud to outline what is expected and give 140the guidelines for the process. After this, several topics are dis- 141cussed in sequence. Below are the topics discussed in the VF 142used for this study (photosynthesis, digestion/absorption, 143central dogma/biosynthesis). 144
Phase 1. Explanation of Process of Photosynthesis 145
Light Reactions. The first phase of the exam is designed to 146require the student to draw and explain the light reactions of 147photosynthesis. At the start of the official exam time period, 148the student is told to draw an illustration of the photosystems 149and carriers important for light reactions. This illustration 150serves as an aid as the student explains the process. After the 151student is done, the instructor asks probing questions; first 152about whatever the student said that might not have been 153completely clear or accurate, then to determine the depth of 154student understanding. Example questions are: What is an 155absorption spectrum? How do the pigments absorb light in 156a photosystem? If there were 100 protons in the stroma and 157200 in the thylakoid lumen how much ATP do you predict 158would be made? What do you predict would happen if we 159put a hole in the membrane? 160
When the student successfully completes phase 1, he or she 161is told of any strikes (significant errors) he or she may have 162accrued. If there are fewer than three strikes and time remains 163in the hour, the student may proceed. 164
Calvin Cycle. The student is instructed to draw and explain 165the Calvin cycle, including names of enzymatic and structural 166compounds. When the student is done explaining the process, 167the instructor again asks questions to clarify and check for 168errors and omissions, and then follows this up with probing 169
2 CBE—Life Sciences Education
342
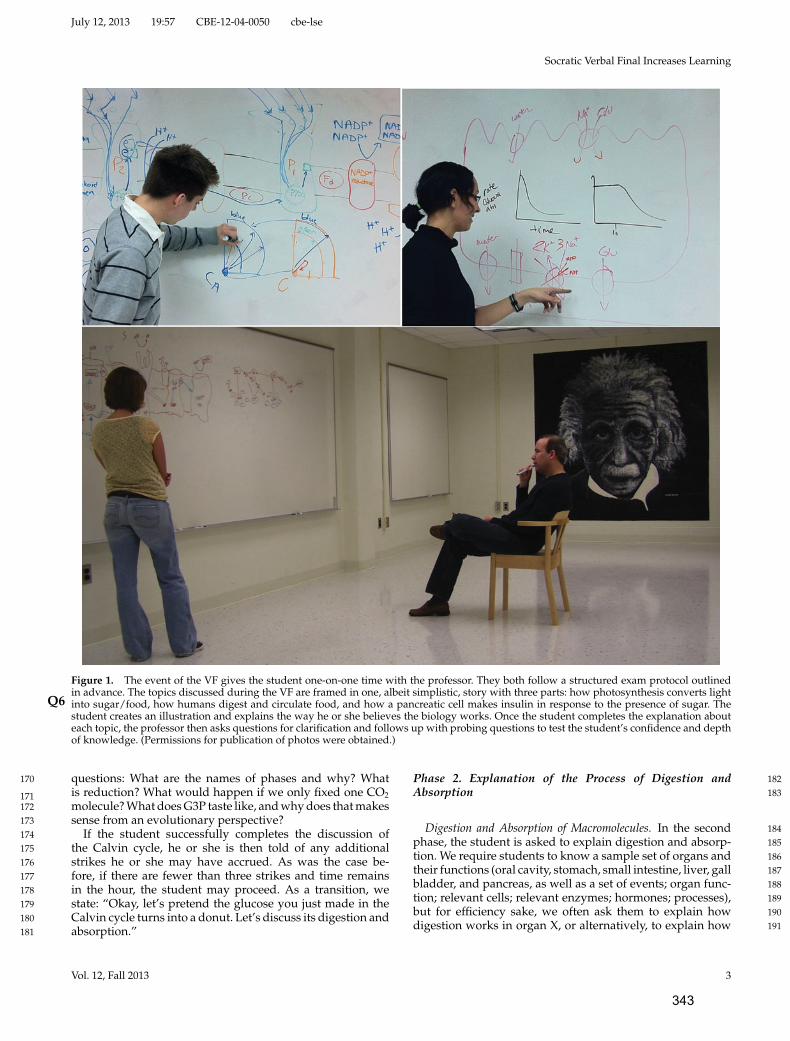
July 12, 2013 19:57 CBE-12-04-0050 cbe-lse
Socratic Verbal Final Increases Learning
Figure 1. The event of the VF gives the student one-on-one time with the professor. They both follow a structured exam protocol outlinedin advance. The topics discussed during the VF are framed in one, albeit simplistic, story with three parts: how photosynthesis converts lightinto sugar/food, how humans digest and circulate food, and how a pancreatic cell makes insulin in response to the presence of sugar. Thestudent creates an illustration and explains the way he or she believes the biology works. Once the student completes the explanation abouteach topic, the professor then asks questions for clarification and follows up with probing questions to test the student’s confidence and depthof knowledge. (Permissions for publication of photos were obtained.)
questions: What are the names of phases and why? What170is reduction? What would happen if we only fixed one CO2
Q6
171molecule? What does G3P taste like, and why does that makes172sense from an evolutionary perspective?173
If the student successfully completes the discussion of174the Calvin cycle, he or she is then told of any additional175strikes he or she may have accrued. As was the case be-176fore, if there are fewer than three strikes and time remains177in the hour, the student may proceed. As a transition, we178state: “Okay, let’s pretend the glucose you just made in the179Calvin cycle turns into a donut. Let’s discuss its digestion and180absorption.”181
Phase 2. Explanation of the Process of Digestion and 182Absorption 183
Digestion and Absorption of Macromolecules. In the second 184phase, the student is asked to explain digestion and absorp- 185tion. We require students to know a sample set of organs and 186their functions (oral cavity, stomach, small intestine, liver, gall 187bladder, and pancreas, as well as a set of events; organ func- 188tion; relevant cells; relevant enzymes; hormones; processes), 189but for efficiency sake, we often ask them to explain how 190digestion works in organ X, or alternatively, to explain how 191
Vol. 12, Fall 2013 3
343
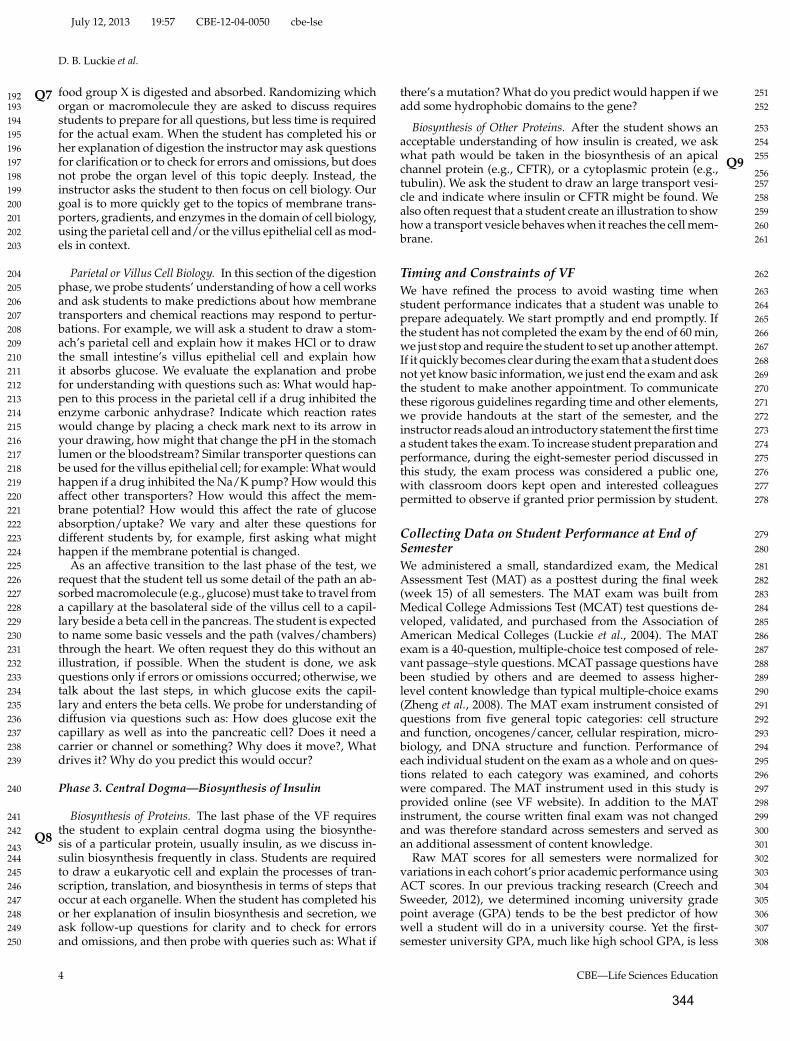
July 12, 2013 19:57 CBE-12-04-0050 cbe-lse
D. B. Luckie et al.
food group X is digested and absorbed. Randomizing whichQ7192organ or macromolecule they are asked to discuss requires193students to prepare for all questions, but less time is required194for the actual exam. When the student has completed his or195her explanation of digestion the instructor may ask questions196for clarification or to check for errors and omissions, but does197not probe the organ level of this topic deeply. Instead, the198instructor asks the student to then focus on cell biology. Our199goal is to more quickly get to the topics of membrane trans-200porters, gradients, and enzymes in the domain of cell biology,201using the parietal cell and/or the villus epithelial cell as mod-202els in context.203
Parietal or Villus Cell Biology. In this section of the digestion204phase, we probe students’ understanding of how a cell works205and ask students to make predictions about how membrane206transporters and chemical reactions may respond to pertur-207bations. For example, we will ask a student to draw a stom-208ach’s parietal cell and explain how it makes HCl or to draw209the small intestine’s villus epithelial cell and explain how210it absorbs glucose. We evaluate the explanation and probe211for understanding with questions such as: What would hap-212pen to this process in the parietal cell if a drug inhibited the213enzyme carbonic anhydrase? Indicate which reaction rates214would change by placing a check mark next to its arrow in215your drawing, how might that change the pH in the stomach216lumen or the bloodstream? Similar transporter questions can217be used for the villus epithelial cell; for example: What would218happen if a drug inhibited the Na/K pump? How would this219affect other transporters? How would this affect the mem-220brane potential? How would this affect the rate of glucose221absorption/uptake? We vary and alter these questions for222different students by, for example, first asking what might223happen if the membrane potential is changed.224
As an affective transition to the last phase of the test, we225request that the student tell us some detail of the path an ab-226sorbed macromolecule (e.g., glucose) must take to travel from227a capillary at the basolateral side of the villus cell to a capil-228lary beside a beta cell in the pancreas. The student is expected229to name some basic vessels and the path (valves/chambers)230through the heart. We often request they do this without an231illustration, if possible. When the student is done, we ask232questions only if errors or omissions occurred; otherwise, we233talk about the last steps, in which glucose exits the capil-234lary and enters the beta cells. We probe for understanding of235diffusion via questions such as: How does glucose exit the236capillary as well as into the pancreatic cell? Does it need a237carrier or channel or something? Why does it move?, What238drives it? Why do you predict this would occur?239
Phase 3. Central Dogma—Biosynthesis of Insulin240
Biosynthesis of Proteins. The last phase of the VF requires241the student to explain central dogma using the biosynthe-242sis of a particular protein, usually insulin, as we discuss in-Q8
243sulin biosynthesis frequently in class. Students are required244to draw a eukaryotic cell and explain the processes of tran-245scription, translation, and biosynthesis in terms of steps that246occur at each organelle. When the student has completed his247or her explanation of insulin biosynthesis and secretion, we248ask follow-up questions for clarity and to check for errors249and omissions, and then probe with queries such as: What if250
there’s a mutation? What do you predict would happen if we 251add some hydrophobic domains to the gene? 252
Biosynthesis of Other Proteins. After the student shows an 253acceptable understanding of how insulin is created, we ask 254what path would be taken in the biosynthesis of an apical 255channel protein (e.g., CFTR), or a cytoplasmic protein (e.g., Q9
256tubulin). We ask the student to draw an large transport vesi- 257cle and indicate where insulin or CFTR might be found. We 258also often request that a student create an illustration to show 259how a transport vesicle behaves when it reaches the cell mem- 260brane. 261
Timing and Constraints of VF 262
We have refined the process to avoid wasting time when 263student performance indicates that a student was unable to 264prepare adequately. We start promptly and end promptly. If 265the student has not completed the exam by the end of 60 min, 266we just stop and require the student to set up another attempt. 267If it quickly becomes clear during the exam that a student does 268not yet know basic information, we just end the exam and ask 269the student to make another appointment. To communicate 270these rigorous guidelines regarding time and other elements, 271we provide handouts at the start of the semester, and the 272instructor reads aloud an introductory statement the first time 273a student takes the exam. To increase student preparation and 274performance, during the eight-semester period discussed in 275this study, the exam process was considered a public one, 276with classroom doors kept open and interested colleagues 277permitted to observe if granted prior permission by student. 278
Collecting Data on Student Performance at End of 279Semester 280
We administered a small, standardized exam, the Medical 281Assessment Test (MAT) as a posttest during the final week 282(week 15) of all semesters. The MAT exam was built from 283Medical College Admissions Test (MCAT) test questions de- 284veloped, validated, and purchased from the Association of 285American Medical Colleges (Luckie et al., 2004). The MAT 286exam is a 40-question, multiple-choice test composed of rele- 287vant passage–style questions. MCAT passage questions have 288been studied by others and are deemed to assess higher- 289level content knowledge than typical multiple-choice exams 290(Zheng et al., 2008). The MAT exam instrument consisted of 291questions from five general topic categories: cell structure 292and function, oncogenes/cancer, cellular respiration, micro- 293biology, and DNA structure and function. Performance of 294each individual student on the exam as a whole and on ques- 295tions related to each category was examined, and cohorts 296were compared. The MAT instrument used in this study is 297provided online (see VF website). In addition to the MAT 298instrument, the course written final exam was not changed 299and was therefore standard across semesters and served as 300an additional assessment of content knowledge. 301
Raw MAT scores for all semesters were normalized for 302variations in each cohort’s prior academic performance using 303ACT scores. In our previous tracking research (Creech and 304Sweeder, 2012), we determined incoming university grade 305point average (GPA) tends to be the best predictor of how 306well a student will do in a university course. Yet the first- 307semester university GPA, much like high school GPA, is less 308
4 CBE—Life Sciences Education
344
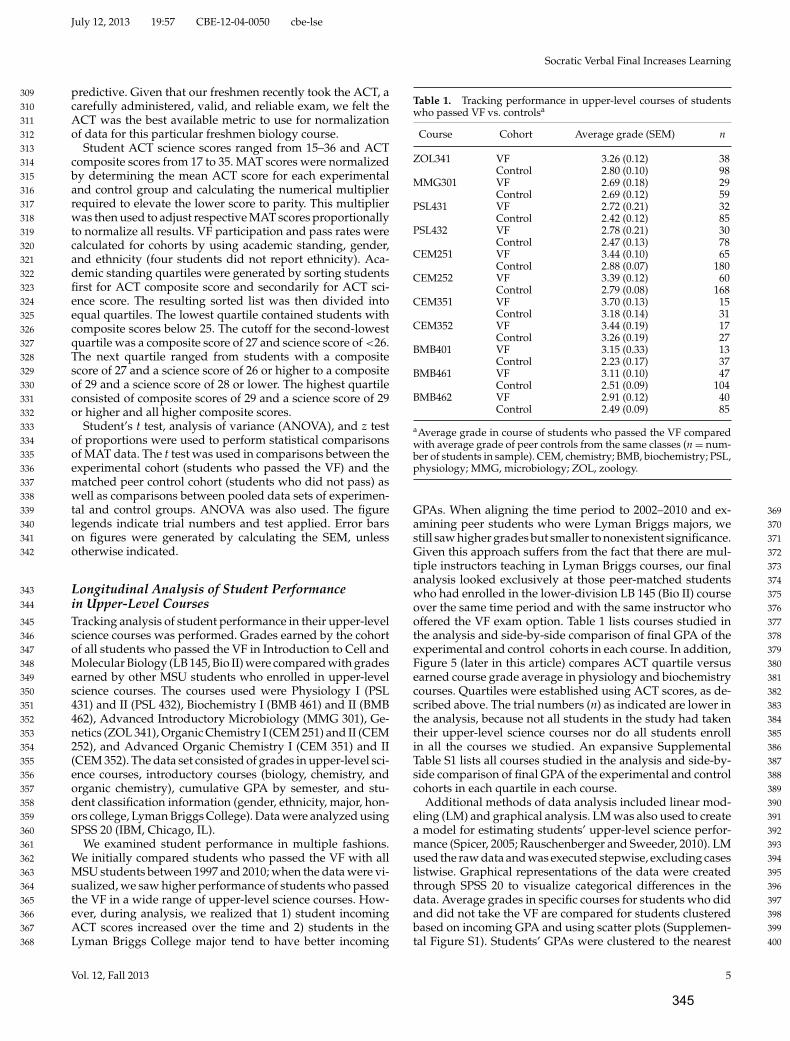
July 12, 2013 19:57 CBE-12-04-0050 cbe-lse
Socratic Verbal Final Increases Learning
predictive. Given that our freshmen recently took the ACT, a309carefully administered, valid, and reliable exam, we felt the310ACT was the best available metric to use for normalization311of data for this particular freshmen biology course.312
Student ACT science scores ranged from 15–36 and ACT313composite scores from 17 to 35. MAT scores were normalized314by determining the mean ACT score for each experimental315and control group and calculating the numerical multiplier316required to elevate the lower score to parity. This multiplier317was then used to adjust respective MAT scores proportionally318to normalize all results. VF participation and pass rates were319calculated for cohorts by using academic standing, gender,320and ethnicity (four students did not report ethnicity). Aca-321demic standing quartiles were generated by sorting students322first for ACT composite score and secondarily for ACT sci-323ence score. The resulting sorted list was then divided into324equal quartiles. The lowest quartile contained students with325composite scores below 25. The cutoff for the second-lowest326quartile was a composite score of 27 and science score of <26.327The next quartile ranged from students with a composite328score of 27 and a science score of 26 or higher to a composite329of 29 and a science score of 28 or lower. The highest quartile330consisted of composite scores of 29 and a science score of 29331or higher and all higher composite scores.332
Student’s t test, analysis of variance (ANOVA), and z test333of proportions were used to perform statistical comparisons334of MAT data. The t test was used in comparisons between the335experimental cohort (students who passed the VF) and the336matched peer control cohort (students who did not pass) as337well as comparisons between pooled data sets of experimen-338tal and control groups. ANOVA was also used. The figure339legends indicate trial numbers and test applied. Error bars340on figures were generated by calculating the SEM, unless341otherwise indicated.342
Longitudinal Analysis of Student Performance343in Upper-Level Courses344
Tracking analysis of student performance in their upper-level345science courses was performed. Grades earned by the cohort346of all students who passed the VF in Introduction to Cell and347Molecular Biology (LB 145, Bio II) were compared with grades348earned by other MSU students who enrolled in upper-level349science courses. The courses used were Physiology I (PSL350431) and II (PSL 432), Biochemistry I (BMB 461) and II (BMB351462), Advanced Introductory Microbiology (MMG 301), Ge-352netics (ZOL 341), Organic Chemistry I (CEM 251) and II (CEM353252), and Advanced Organic Chemistry I (CEM 351) and II354(CEM 352). The data set consisted of grades in upper-level sci-355ence courses, introductory courses (biology, chemistry, and356organic chemistry), cumulative GPA by semester, and stu-357dent classification information (gender, ethnicity, major, hon-358ors college, Lyman Briggs College). Data were analyzed using359SPSS 20 (IBM, Chicago, IL).360
We examined student performance in multiple fashions.361We initially compared students who passed the VF with all362MSU students between 1997 and 2010; when the data were vi-363sualized, we saw higher performance of students who passed364the VF in a wide range of upper-level science courses. How-365ever, during analysis, we realized that 1) student incoming366ACT scores increased over the time and 2) students in the367Lyman Briggs College major tend to have better incoming368
Table 1. Tracking performance in upper-level courses of studentswho passed VF vs. controlsa
Course Cohort Average grade (SEM) n
ZOL341 VF 3.26 (0.12) 38Control 2.80 (0.10) 98
MMG301 VF 2.69 (0.18) 29Control 2.69 (0.12) 59
PSL431 VF 2.72 (0.21) 32Control 2.42 (0.12) 85
PSL432 VF 2.78 (0.21) 30Control 2.47 (0.13) 78
CEM251 VF 3.44 (0.10) 65Control 2.88 (0.07) 180
CEM252 VF 3.39 (0.12) 60Control 2.79 (0.08) 168
CEM351 VF 3.70 (0.13) 15Control 3.18 (0.14) 31
CEM352 VF 3.44 (0.19) 17Control 3.26 (0.19) 27
BMB401 VF 3.15 (0.33) 13Control 2.23 (0.17) 37
BMB461 VF 3.11 (0.10) 47Control 2.51 (0.09) 104
BMB462 VF 2.91 (0.12) 40Control 2.49 (0.09) 85
aAverage grade in course of students who passed the VF comparedwith average grade of peer controls from the same classes (n = num-ber of students in sample). CEM, chemistry; BMB, biochemistry; PSL,physiology; MMG, microbiology; ZOL, zoology.
GPAs. When aligning the time period to 2002–2010 and ex- 369amining peer students who were Lyman Briggs majors, we 370still saw higher grades but smaller to nonexistent significance. 371Given this approach suffers from the fact that there are mul- 372tiple instructors teaching in Lyman Briggs courses, our final 373analysis looked exclusively at those peer-matched students 374who had enrolled in the lower-division LB 145 (Bio II) course 375over the same time period and with the same instructor who 376offered the VF exam option. Table 1 lists courses studied in 377the analysis and side-by-side comparison of final GPA of the 378experimental and control cohorts in each course. In addition, 379Figure 5 (later in this article) compares ACT quartile versus 380earned course grade average in physiology and biochemistry 381courses. Quartiles were established using ACT scores, as de- 382scribed above. The trial numbers (n) as indicated are lower in 383the analysis, because not all students in the study had taken 384their upper-level science courses nor do all students enroll 385in all the courses we studied. An expansive Supplemental 386Table S1 lists all courses studied in the analysis and side-by- 387side comparison of final GPA of the experimental and control 388cohorts in each quartile in each course. 389
Additional methods of data analysis included linear mod- 390eling (LM) and graphical analysis. LM was also used to create 391a model for estimating students’ upper-level science perfor- 392mance (Spicer, 2005; Rauschenberger and Sweeder, 2010). LM 393used the raw data and was executed stepwise, excluding cases 394listwise. Graphical representations of the data were created 395through SPSS 20 to visualize categorical differences in the 396data. Average grades in specific courses for students who did 397and did not take the VF are compared for students clustered 398based on incoming GPA and using scatter plots (Supplemen- 399tal Figure S1). Students’ GPAs were clustered to the nearest 400
Vol. 12, Fall 2013 5
345

July 12, 2013 19:57 CBE-12-04-0050 cbe-lse
D. B. Luckie et al.
Figure 2. Performance of students who passed the VF vs. peers on a standardized MAT content exam. The blue bar corresponds to thecollective normalized average on the MAT of students who passed the VF each semester. Likewise, the red bar illustrates normalized MATscores of peers who did not pass the VF. Fall 2002 (n = 77 students, 31 passed:46 not), Fall 2006 (n = 63, 21:42), Fall 2007 (n = 64, 20:44), Spring2009 (n = 70, 16:54), Fall 2009 (n = 42, 13:29), Fall 2010 (n = 19, 11:8), Spring 2011 (n = 77, 29:42), and Fall 2011 (n = 33, 19:14). The insetcompares average MAT scores of all semesters pooled for those who passed the VF (n = 160) and those who did not (n = 285). *, p < 0.05;**, p < 0.001; t test compared students who passed the VF with cohorts who did not for each course/semester and for pooled data in inset.
quarter grade in the plots, and the error bars represent the401SEM.402
Collecting Student Opinion Data via Student403Self-Report on Course Evaluation Forms404
End-of-semester course evaluation surveys were used to eval-405uate student opinion and assess affective or qualitative ele-406ments in response to the optional VF. We evaluated the course407using the Student Assessment of Learning Gains (SALG;408Seymour et al. 2000). Beginning in 2009, a new prompt, “Do409you think the VF option helps student learning?,” was added410to the course evaluation form administered at the end of each411semester in Bio II. Response choices were: 1—no help, 2—a lit-412tle help, 3—moderate help, 4—much help, 5—great help, 6—413not applicable. In addition, in Fall 2010 and 2011, the prompt414“Do you think the VF option helps student learning, if so415why?” also solicited student feedback via extended written416responses. We reviewed the Likert-scale responses to ques-417tions posed on the topic of the VF and the written comments418prompted by extended-response questions. While only sam-419ple feedback is presented in this report, comprehensive stu-420dent feedback from five semesters (Spring 2009: n = 72; Fall4212009: n = 43; Fall 2010: n = 20; Spring 2011: n = 77; and Fall4222011: n = 34) is also provided online (see VF website). All stu-423dent comments are hyperlinked to their full SALG feedback424form online.425
RESULTS 426
Students Who Passed the VF Scored Higher on MCAT 427Questions 428
During the VF, students demonstrated their mastery of 429course material via a structured oral exam with the professor 430(Figure 1). Students who passed the VF performed better 431than their peers on MCAT questions included on an end- 432of-semester standardized MAT instrument (Figure 2; MAT 433scores were normalized with ACT performance). The aver- 434age normalized MAT score for all students who participated 435and passed the VF was 66.4% (n = 160), while the mean of 436peers who did not pass the VF was 62% (n = 285; p < 0.001; 437Figure 2, inset). In addition, when the student performance 438data were replotted in a frequency distribution, a rightward 439shift was apparent (Figure 3). The mode for performance of 440students who passed the VF was 72.5%, while those who did 441not pass had a mode of 65%. Higher levels of content mas- 442tery, for example, MAT scores of 80–90%, were more frequent 443among students who passed the VF. 444
Students Who Passed the VF Scored Higher on Every 445Topic Area and Made Greatest Gains on Cellular 446Respiration Q10
447When performance on the MAT exam was examined, those 448who passed the VF did significantly better than peers on every 449topic (DNA, cell biology, respiration, cancer, and microbiol- 450ogy; Figure 4). The greatest gain in performance on the MAT 451
6 CBE—Life Sciences Education
346
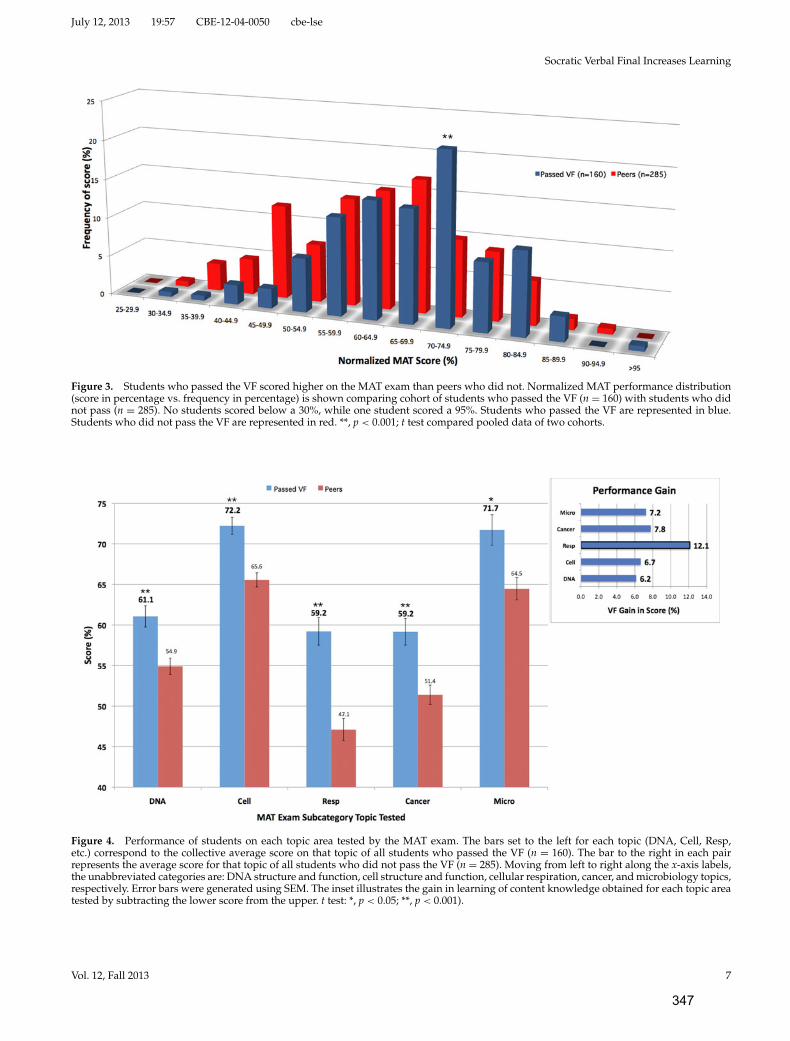
July 12, 2013 19:57 CBE-12-04-0050 cbe-lse
Socratic Verbal Final Increases Learning
Figure 3. Students who passed the VF scored higher on the MAT exam than peers who did not. Normalized MAT performance distribution(score in percentage vs. frequency in percentage) is shown comparing cohort of students who passed the VF (n = 160) with students who didnot pass (n = 285). No students scored below a 30%, while one student scored a 95%. Students who passed the VF are represented in blue.Students who did not pass the VF are represented in red. **, p < 0.001; t test compared pooled data of two cohorts.
Figure 4. Performance of students on each topic area tested by the MAT exam. The bars set to the left for each topic (DNA, Cell, Resp,etc.) correspond to the collective average score on that topic of all students who passed the VF (n = 160). The bar to the right in each pairrepresents the average score for that topic of all students who did not pass the VF (n = 285). Moving from left to right along the x-axis labels,the unabbreviated categories are: DNA structure and function, cell structure and function, cellular respiration, cancer, and microbiology topics,respectively. Error bars were generated using SEM. The inset illustrates the gain in learning of content knowledge obtained for each topic areatested by subtracting the lower score from the upper. t test: *, p < 0.05; **, p < 0.001).
Vol. 12, Fall 2013 7
347

July 12, 2013 19:57 CBE-12-04-0050 cbe-lse
D. B. Luckie et al.
Figure 5. Just attempting the VF mayincrease student learning. Students whomade a greater number of attempts at theVF (but did not pass) may benefit and in-crease their learning. Students who didnot pass the VF were required to takethe traditional written final exam of thecourse. Thus, for this cohort, both the MATand final exam scores were used to assesstheir content knowledge. The number ofattempts made by students is comparedwith their exam performance. MAT scoresare represented by the red line with squaresymbols; the green line with triangle sym-bols indicates final exam scores. SEM is in-dicated, and differences are not statisticallysignificant.
was on questions related to the topic of cellular respiration452(Figure 4, inset). The VF focuses upon the topics of DNA, cell453biology, photosynthesis, and digestion. While cellular respi-Q11
454ration is not discussed on the VF, the conceptually similar455topic of photosynthesis is given the greatest amount of time456and has the most in-depth treatment in the VF. This gain may457be evidence of transfer of knowledge of photosynthesis to aid458in solving problems on respiration.459
Just Attempting the VF Once May Increase Student460Learning461
In only three semesters were records retained that indicated462number of attempts for students who did not pass the VF.463When examining these data, we see correlating increases in464average performance on the MAT with number of VF at-465tempts. While the trial numbers are quite low, the trend in466the data supports a hypothesis that just participating in the467process may lead to increased learning (Figure 5). Because468these students participated but did not ultimately pass the469VF, they were required to take the written final exam. So,470for this cohort, the standardized final exam was a second471assessment to compare with and complement the MAT. The472performance of students had a near identical trend. With one473exception, performance on both the written final exam and474MAT instrument increased, suggesting a dosage effect is pos-475sible as students make more attempts to pass the VF. If one476views each attempt as a formative rather than summative477assessment, then the process would be expected to improve478student understanding.479
Students Who Passed the VF Performed Better480in Upper-Level Science Courses481
We tracked student performance in later years, when they482took their upper-level science courses. Several rounds of anal-483yses were performed. First, grades earned in upper-level sci-Q12
484ence courses by the cohort of all students who passed the485VF (n = 160) were compared with those earned in the same486courses by all other students from 1997–2010 (n = 21,528). This487
approach showed greater performance by the VF “passers” 488in all courses; however, the increase in incoming ACT scores 489over the time period may have conflated these results. Ad- 490ditional studies were done and final analysis was performed 491comparing two tightly matched cohorts: all students who 492passed the VF in the same course (Bio II) and other students 493who had taken Bio II the same semesters with the same in- 494structor. This method again showed higher grades earned by 495VF passers than “nonpassers” (Table 1). This analysis, while 496promising, has the potential to be biasing the VF cohort to- 497ward students of higher academic potential, as the upper 498quartiles of students pass at higher rates. An expansive sup- 499plemental table lists courses studied in the analysis and side- 500by-side comparison of final GPA of the experimental and con- 501trol cohorts in each quartile in each course (Table S1). Figure 6 502illustrates a comparison quartile-by-quartile performance on 503course grade in biochemistry and physiology courses. Al- 504though many quartiles suffer from low n values, we note 505consistently higher grades earned by the VF passers across 506the board and significance in physiology and biochemistry 507courses. 508
Higher performance in later classes does not demonstrate 509causation, as it is possible that the results may reflect intrinsic 510differences in motivation, study skills, and so on. We used 511LM as a means to dissect this possibility and modeled stu- 512dent performance in the upper-level courses while normal- 513izing for incoming university GPA and gender. In this LM 514approach, we found the VF to only show statistical signifi- 515cance for organic chemistry, CEM 351 (Figure S1). However, 516the low number of students in this path (n = 41) suggests 517caution in interpreting these results. On the other hand, pass- 518ing the VF results in a higher incoming GPA, thus masking 519its impact somewhat. Using pre–biology course predictors to 520estimate upper-level science grades resulted in weak models 521that explained only a small portion of the variance. 522
Participation Balance from a Perspective of Academic 523Ability, Gender, and Ethnicity 524
Overall, of the 445 students in the study, 160 (36%) passed 525the VF. In an attempt to tease apart participation from pass 526
8 CBE—Life Sciences Education
348

July 12, 2013 19:57 CBE-12-04-0050 cbe-lse
Socratic Verbal Final Increases Learning
Figure 6. A comparison of students who passed the VF vs. peers in upper-level science courses. Performance differences in upper-levelscience courses comparing students who passed VF with matched peer controls who were in the same major over the time period and tookthe LB145 course with same instructor. Average course GPA (trial numbers [n], pairs left to right) in PSL 431 (Physiology I: n = 27/5, 18/13,14/7, 15/7), BMB 401 (Basic Biochemistry: n = 9/3, 9/2, 7/3, 9/5), and BMB 461 (Advanced Biochemistry I: n = 31/8, 17/14, 21/12, 20/13) forVF passers and nonpassers by ACT quartiles. ANOVA: **, p < 0.01; *, p < 0.05.
rates, we also evaluated three semesters in which records527were retained that indicated students who participated in the528VF but never passed. Of the 174 students in those courses, 70529(40%) passed the VF, 29 (17%) participated but did not pass,530and 75 (43%) did not participate.531
To evaluate participation balance from a perspective of532academic ability, we stratified students in quartiles by ACT533scores. We found the percentage of students who passed the534VF was higher in the upper half of distribution, yet a good535representation of students from all academic ability levels536passed (Figure 7, top). In the three semesters with participa-537tion information, participation in each quartile ranged from53819.6 to 30.8%. Albeit from just a sample of the larger data set,539these data indicate participation in the VF occurred from stu-540dents in all levels (Figure 7, top, bottom graph). Students from541all quartiles chose to participate, and the pass rates for the top542three quartiles were statistically equivalent, not skewed to the543top quartile. The full range of students, not just the academi-544cally elite, availed themselves of this optional assessment.545
When evaluating gender, we found a reasonable balance.546While there were no statistical differences overall between547the rate of male and female students attempting or passing548the VF (Figure 7, bottom), it was interesting that there was549a difference between the rate of male and female students550attempting the VF in the third quartile (although the rate of551passing within this quartile was no different).552
Participation balance from ethnic groups was also evalu-553ated. We note that students who self-identified as African554American and Asian had pass rates of 10 and 18% respec-555tively, which while not statistically significant, trended below556average. This finding gives pause. The pass rate of another557ethnicity group, students who self-identified as “two or more558races” was 60%, the highest of all cohorts. Given the error559introduced by diametrical performance in overlapping cate-560gories and small sample size, we do not yet have enough data561to make any statistically significant conclusions regarding562potential cultural bias but have made this a focus of future563study.564
Student Feedback Suggests That the VF Is Valued565and Increases Study566
When a challenging intervention is added to a curriculum,567the student response can be an important determinant of its568
success. The student response has been nearly unanimous 569in its support for the VF. Starting in 2009, we added new 570prompts about the VF on the course evaluation forms. Stu- 571dent feedback in response to the question “Do you think the 572VF option helps student learning?” was unanimously posi- 573tive (“great or much help”: 92%; “moderate or little help”: 5748%; “no help”: 0%; n = 243). We are analyzing student quota- 575tions as being supportive of predictions from the educational 576literature or alternative explanations for their learning gains. 577Representative exemplar comments are provided in Table S2 578from both VF participants and abstainers; comprehensive stu- 579dent feedback is available online (Table S2; see VF website). 580Students’ informal feedback suggested that they recognized 581the VF had value, because it increased the amount of time they 582spent studying, changed the way they studied, and required 583them to verbalize their thinking. Further study is needed to 584determine the extent to which these variables can explain the 585gains students made. 586
DISCUSSION 587
Over the past decade, the biology group in our residential 588college has adopted a number of best practices for teach- 589ing, among them inquiry laboratories, active and cooperative 590learning, and a more diverse set of assessments (Luckie et al., 5912004, 2011, 2012; Smith and Cheruvelil, 2009, Fata-Hartley, 5922011). During this process, we also had opportunities to in- 593terview students and became more keenly aware of how lit- 594tle they were actually learning. Even when we spoke to our 595“best” students, those who did extremely well on traditional 596exams, we often found shocking gaps in their knowledge 597on the most fundamental topics. These realizations were a 598catalyst for change. They were also somewhat liberating, 599because they freed instructors from a belief that coverage 600equaled learning (DiCarlo, 2009; Schwartz et al., 2009; Knight Q13
601and Wood, 2005; Morgan, 2003; Wright and Klymkowsky, 6022005). We decided to cover fewer topics but to dwell in each 603longer and have discussions that went deeper. We also iden- 604tified the fundamental ideas or concepts that we were really 605teaching, or more accurately, that we really wanted the stu- 606dents to learn, underneath the conventional notion that stu- 607dents needed to know certain chapters or topics (Boyer, 1998; 608Ausubel, 2000). 609
Vol. 12, Fall 2013 9
349
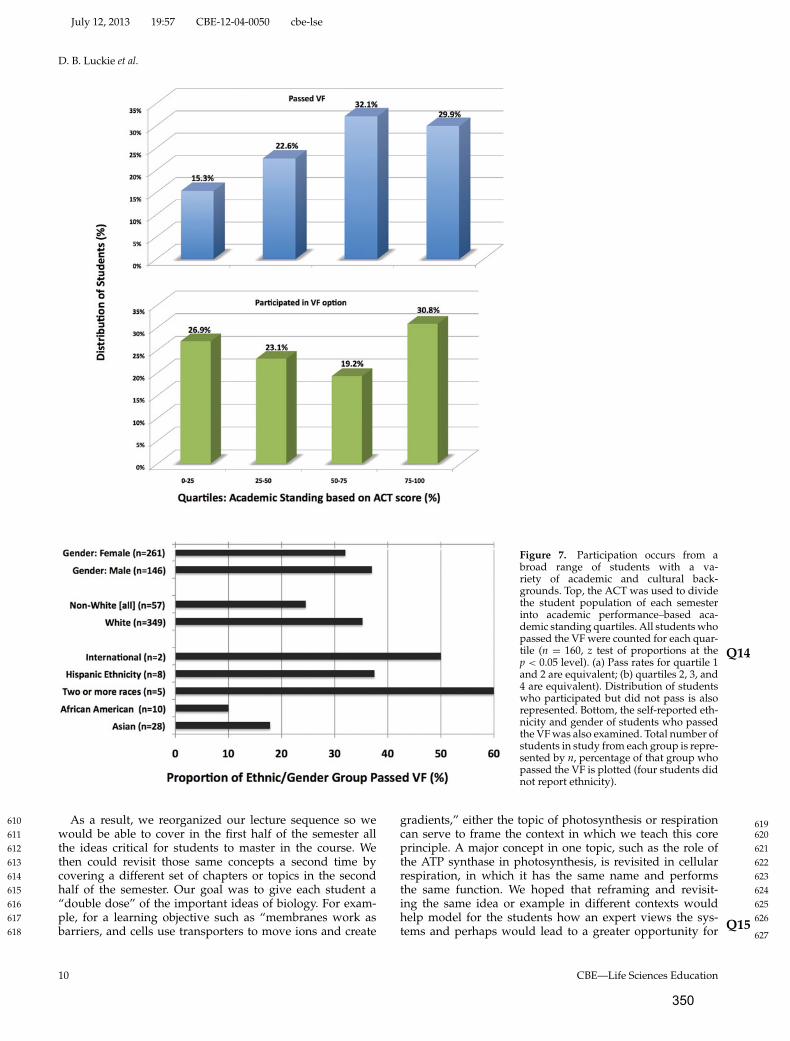
July 12, 2013 19:57 CBE-12-04-0050 cbe-lse
D. B. Luckie et al.
Figure 7. Participation occurs from abroad range of students with a va-riety of academic and cultural back-grounds. Top, the ACT was used to dividethe student population of each semesterinto academic performance–based aca-demic standing quartiles. All students whopassed the VF were counted for each quar-tile (n = 160, z test of proportions at thep < 0.05 level). (a) Pass rates for quartile 1and 2 are equivalent; (b) quartiles 2, 3, and4 are equivalent). Distribution of studentswho participated but did not pass is alsorepresented. Bottom, the self-reported eth-nicity and gender of students who passedthe VF was also examined. Total number ofstudents in study from each group is repre-sented by n, percentage of that group whopassed the VF is plotted (four students didnot report ethnicity).
As a result, we reorganized our lecture sequence so we610would be able to cover in the first half of the semester all611the ideas critical for students to master in the course. We612then could revisit those same concepts a second time by613covering a different set of chapters or topics in the second614half of the semester. Our goal was to give each student a615“double dose” of the important ideas of biology. For exam-616ple, for a learning objective such as “membranes work as617barriers, and cells use transporters to move ions and create618
gradients,” either the topic of photosynthesis or respiration
Q14
619can serve to frame the context in which we teach this core 620principle. A major concept in one topic, such as the role of 621the ATP synthase in photosynthesis, is revisited in cellular 622respiration, in which it has the same name and performs 623the same function. We hoped that reframing and revisit- 624ing the same idea or example in different contexts would 625help model for the students how an expert views the sys- 626tems and perhaps would lead to a greater opportunity for Q15
627
10 CBE—Life Sciences Education
0

July 12, 2013 19:57 CBE-12-04-0050 cbe-lse
Socratic Verbal Final Increases Learning
knowledge transfer, which is further deepened by the VF628experience.629
This reorganization of topics taught in our introductory bi-630ology course enabled this experiment with the VF to occur.631Because we discussed all of the important concepts during632the first half of the course, we could administer a VF (repeat-633edly) to all interested students throughout the entire second634half of the semester. The topics discussed during the VF were635framed in one story with three parts: how photosynthesis636coverts CO2 into sugar/food, how humans digest and circu-637late sugar/food, and how a pancreatic cell makes insulin in638response to the presence of sugar. The emphasis for greatestQ16
639depth was focused on the beginning and end of the story,640photosynthesis and central dogma, while the middle part641was used as an affective bridge and opportunity to examine642examples of cell biology in context.643
Student Content Knowledge Increased644
One goal in this research was to assess student learning and645generate data that would be of the relevance and rigor most646convincing to scientific colleagues. One important motiva-647tor for many of our students is to do well on the MCAT or648Graduate Record Exam. They have a great desire to do well649on placement exams and profess a desire to learn material650in depth and to retain that knowledge beyond the semester.651We have also found our science colleagues value student per-652formance on those same exams, in particular the MCAT, far653more than any other test we might find or create. As a result,654in order to gauge student learning of content, throughoutQ17
655the study period, we examined student performance on a 40-656question MAT exam built with MCAT test questions (Luckie657et al., 2004). Given that Zheng et al. (2008) demonstrated the658MCAT assesses more than just lower-level knowledge and659that it is a recognized exam for which performance is valued660by our students and faculty peers, use of validated reliable661passage questions derived from it seemed appropriate.662
We found that students who engaged in the process and663passed the VF scored the highest on end-of-semester MAT664exams. These students significantly outperformed their peers665who never participated in the process and those who made666attempts but never passed the exam (passed VF: 66%; made667attempt: 58–63%; no attempt: 57% score). Those who passed668the VF appear to have more content knowledge. We also saw669correlating increases in average performance on the MAT670with number of VF attempts. With one exception, perfor-671mance on both the course final exam and MAT instrument672trend upward, suggesting a dosage effect is possible as stu-673dents make more attempts to pass the VF. These data tend674to support that the Socratic-styled VF is a useful assessment675and learning aid.676
Interestingly, students made significant gains in all topic ar-677eas tested, and the greatest gain in performance on the MAT678was on questions related to the topic of cellular respiration.679This topic is discussed in lecture but not during the VF. While680cellular respiration is not discussed on the VF, the concep-Q18
681tually similar topic of photosynthesis is given the greatest682amount of time and has the most in-depth treatment in the683VF. We believe that this finding may be evidence of knowl-684edge transfer, a goal in all teaching but a rather difficult task685for students (McKeough et al., 1995; Perkins, 1999; Schon-686born and Bogeholz, 2009). Instructors always hope that, if a687
student masters the fundamentals and learns some examples, 688he or she can use that understanding to make predictions and 689solve problems on related but different topics or tasks. In lit- 690erature reporting testing of this idea, knowledge transfer is 691rarely noted to occur (McKeough et al., 1995; Schonborn and 692Bogeholz, 2009). Students who passed the VF performed bet- 693ter on a broad range of topics, which suggests that they were 694better able to grasp the fundamentals and apply their knowl- 695edge more efficiently to novel situations; this is an indicator 696of higher-level learning. 697
We predicted that students who participated in the VF op- 698tion might make gains in their understanding of biology 699through the experience, which is a form of cognitive ap- 700prenticeship (Brown et al., 1989; Collins et al., 1989). The VF 701clearly helped them in the course itself, but the idea that the 702experience may help students integrate and transfer knowl- 703edge, combined with long-term effects found by Derting and 704others, might predict greater success in upper-level classes 705(Derting and Ebert-May, 2010). We therefore did a longitudi- 706nal tracking study to follow how the students did in other 707science courses. Several rounds of analyses were performed 708that showed greater performance by the VF passers in a num- 709ber of courses. An expansive supplemental table lists courses 710studied in the analysis and side-by-side comparison of final 711GPA of the experimental and control cohorts in each quar- 712tile in each course (Table S1). Passing the VF correlated with 713higher performance in later classes. 714
Students Reported Gains But Not All Participate 715
Evidence collected indicates that students support the VF as a 716valued option. Student comments also present opinions that 717parallel those from learning theory in the literature. Students 718believe preparation for the VF increases study time, engage- 719ment, revisiting concepts in different contexts, and making 720connections between ideas from different topics. This partic- 721ular intervention is not controversial and has a positive effect 722on the affective elements of the classroom. 723
Analysis revealed that, while the percentage of students 724who passed the VF is higher in the upper half of distribution, 725a good representation of students from all academic stand- 726ing levels passed. In addition, a good balance of students 727from all quartiles chose to participate in this alternative path. 728Regarding gender, there is evidence of near balance. The ma- 729jority of students who passed the VF over the study period 730were female (61%), and while slightly lower, this percentage 731was not statistically different from their proportion of en- 732rolled students (64%). When evaluating ethnic background, 733there is more concern. African-American and Asian students 734had below-average participation rates, and while the high 735pass rate of students who self-identified themselves as “two 736or more races” muddles the data, it seems likely stereotype Q19
737threat is impacting participation of students from minority 738groups. 739
The existence of stereotype threat, speech impairments, test 740anxiety, and other barriers to success is a strong argument to 741keep the VF an optional path with no negative consequences Q20
742(Steele, 1995, 2002; Spangler, 1997; Spencer et al., 1999) but 743more needs to be done. We purposefully designed the process 744to lower test anxiety and give each student the best chance 745to engage his or her higher-level thinking without concern 746that failure would be catastrophic for his or her grade. Rather 747
Vol. 12, Fall 2013 11
1
July 12, 2013 19:57 CBE-12-04-0050 cbe-lse
D. B. Luckie et al.
than making an oral assessment mandatory in an attempt to748increase learning for more students, we recognize its limita-749tions, and our focus is to make it an event wherein demon-750stration of mastery only leads to rewards. New studies are751in the works to test potential stereotype threat effects on par-752ticipation. Using a private rather than public setting (e.g.,753closing classroom doors) may alter the participation and per-754formance for female or African-American students. We also755would like to understand how the presence of a female or756nonmajority instructor administering the VF might improve757participation.758
Time on Task May Be the Mechanism759
Overt verbalization and previously discussed theoretical760mechanisms likely contribute to the learning gains seen.761Yet an additional mechanism leading to this improvement762may simply be time on task (Peters, 2004; Guillaume and763Khachikian, 2011), and student self-report feedback supports764this rationale. If students spend more time on any topic or765task, it is likely they will gain more mastery in it. Interestingly,766some education psychology research suggests that when stu-767dents believe they are pursuing knowledge mastery expertise768as a goal, rather than just high performance on an assessment,769they will spend far more time, persist longer, and use more770elaborate study strategies to succeed (Nolen and Haladyna,Q21
7711990). This certainly could be true for the VF. The amount772of time students spend preparing for the VF appears to be773great. Student practice at available classroom whiteboards is774evidenced by illustrations of photosynthesis found through-775out the residential college each morning. Students report that776they form study groups to practice together, ask students who777have just passed the exam to be visiting experts in their study778groups, and even recruit help from upper-level students who779passed the VF in previous semesters. Teaching assistants also780arrange practice VF appointments with interested students.781Hence, we believe that time on task is a critical factor in stu-782dent success.783
Given that our goal is increased student learning, we view784increasing the motivation of the students as a positive change.785We are presenting the students with a different assessment786approach that challenges and encourages them to spend787more time preparing than they would otherwise. This ac-788tivity is very public and creates an engaged culture focused789on academics and learning that benefits all parties involved790(DiCarlo, 2009). Logistical constraints in allowing students791to retake exams make it difficult with most tests (Henderson792and Dancy, 2007), but the VF is conducive to this philosophy.793
Limited Faculty Time Leads to Solutions794
While our colleagues may agree it is debatable whether tra-795ditional final exams are good methods to evaluate learn-796ing (John Harvard’s Journal, 2010) and alternative assess-797ments may be worth considering, it is difficult for faculty798members to make changes in their teaching practices due to799many factors, including limited time (Silverthorn et al., 2006;800Henderson and Dancy, 2007; Ebert-May et al., 2011). In theQ22
801interests of efficiency, instructors implementing the VF have802tested a number of different models that, when combined,803may offer solutions. During the first few weeks of imple-804menting the VF, the instructor administers exams on only805
one day of the week. Limitations are also set during the final 806weeks; for example, no new students can start the process 807after a certain deadline, and no more VF appointments are 808permitted after a certain final date (several days prior the 809written final exam). These strategies can limit the time the 810faculty member’s time commitment to 5–10 h per week. 811
Additional time-saving approaches have included one re- 812cently used by R.D.S. in his chemistry course, in which each 813student only gets one chance to take the VF with the professor 814(Sweeder and Jeffery, 2012). Also, one published approach fo- 815cuses on the learning benefits of verbal exams administered 816to students as a group (Boe, 1996; Guest and Murphy, 2000). 817Either of these alternative approaches alone or in combina- 818tion could dramatically decrease the time commitment from 819a faculty member. Alternatively, one could test whether many 820of the benefits of the VF could still be retained in a nonver- 821bal format. One expert suggested that the kinds of questions 822asked during the oral exam are quite sophisticated, but they 823could be asked on a written exam that gave students the op- 824portunity to revise their work continuously until their work 825was correct. For some faculty members, the written exam idea 826may well be more desirable and efficient in terms of faculty 827time. 828
One very promising and effective approach has been the 829use of teaching assistants. In recent semesters, we required 830that students pass with a teaching assistant prior to getting 831an appointment with the professor. Our teaching assistants, 832called learning assistants (LAs), are undergraduates who par- 833ticipated in the VF process when students. Because they 834were outstanding students who demonstrated great inter- 835est in teaching others the biology topics they were passionate 836about, they were selected to be LAs. We have found LAs can 837be trained to be rigorous in their administration of the VF 838and can carry the lion’s share of the load. They become just as 839invested in the process as when they were students (and the 840success of their students is a point of pride). This assistance by 841LAs enables faculty time to be much more protected, because 842well-prepared students can pass with the faculty on the first 843attempt. In addition to helping protect limited faculty time, 844this approach may provide two other benefits. 845
The participation by undergraduate teaching assistants in 846the VF process may increase participation from reluctant (and 847minority) students and may yield learning gains for the un- 848dergraduate LA students themselves. Our LAs are far more 849approachable and diverse than the typical professor. More 850than half are female, and a significant number are of non- 851majority ethnicity. They can serve as a less threatening start- 852ing point for reluctant students and as learning coaches in 853the shared goal that students master the material and pass 854the test. Our LAs have also shared with us that participating 855greatly solidifies their own understanding of the material and 856connects it to other courses. Here are some of their reflections 857regarding their own learning: 858
“I learned a lot from the students. They do so much 859extra studying which causes them to learn much more 860than what I will ask them . . . they tell me things that I 861did not know.” 862
“I believe that the verbal final exam experience has 863greatly increased my learning as an LA who adminis- 864tered the exams. Students will inevitably discover, and 865bring to the LA’s attention, information that neither 866
12 CBE—Life Sciences Education
2
July 12, 2013 19:57 CBE-12-04-0050 cbe-lse
Socratic Verbal Final Increases Learning
person knew before. Every year, I become a better ver-867bal final exam proctor simply because my students are868teaching me biology.”869
“I believe administering the VF broadened my un-870derstanding of the material. Questioning and evalu-871ation presents another facet to the learning process; ad-872ditionally, discourse with students often challenge[s]873our understanding and require[s] constant de- and re-874construction.”875
“Giving verbal finals has in some ways increased my876learning. I think the biggest thing is just going over the877material that I learned in 145 again, but also seeing how878I’ve learned more about certain topics in other classes879like PSL and BMB. Students ask a lot of questions and880sometimes make you think about/look up things as881well.”882
“I certainly had information re-introduced that I had883forgotten since last taking LB 145. Everything came884back quickly after some reviewing (probably because885it was so ingrained the first time), but going over the886verbal final material once more solidify [sic] certain887concepts once again. Just after reviewing them for LB888145, these systems were discussed in my comparative889anatomy course.”890
Limitations of the Study891
As one considers the implications of this work, it is impor-892tant to recognize some of the limitations. The course itself893was offered to students who were in a science-themed resi-894dential college program, so all of the enrolled students were895science majors. Although there is no reason to suspect that896nonmajors would be any less capable of succeeding on a VF,897the participation rate in a general biology class may be antici-898pated to decrease, as many students may not be as interested899in gaining a deeper level of understanding of biology if they900do not see an apparent benefit to their long-term career plans.901
While ACT normalization helps equalize for motiva-902tion and background knowledge in the data presented in903Figures 2–4, the higher level of performance of students in904upper-level courses in Figure 6 should be interpreted cau-905tiously. The statistically higher grades earned by the VF906passers in all quartiles indicate only a correlation, not a cau-907sation. Taking the VF may more accurately represent a high908level of motivation, dedication, or other characteristic that909also leads to success in the upper-level science courses. Except910in one case, CEM351, the more powerful statistical approach911of using linear modeling did not show the VF as being a cru-912cial indicator of success; however, it relied on the students’913college GPA entering each course. This GPA would already914reflect learning gains and concomitant inflation as a result of915passing the VF (through the elevated biology grade earned916and other classes it may have impacted); thus some evidence917of impact would have been removed.918
CONCLUSIONS919
An optional VF has provided an alternate venue for assessing920student understanding in our introductory biology course. As921one might predict, in a quantitative assessment of cell biology922content knowledge, students who passed the VF outscored923their peers on related MCAT exam questions. The higher-924
achieving students performed better on MCAT exam ques- 925tions from all topic categories tested. Success on the VF also 926correlated with enhanced success in multiple, subsequent, 927upper-level science courses. 928
While we provide detailed Methods to enable other instruc- 929tors to understand the process we used in our course, these 930will not be very helpful to faculty members who do not teach 931a similar course. Perhaps more helpful are just the princi- 932ples that the VF offers. We believe some important elements 933are these: 1) having students verbalize processes as they il- 934lustrate them; 2) allowing students to first explain a process 935and, when ready, to accept questions; 3) focusing on just a few 936topics that contain the most important fundamental concepts; 9374) enabling students to understand they can repeat attempts 938and ultimately take the written final exam no matter whether 939they pass or not; and 5) using a transparent protocol with 940a clear rationale for when something is incorrect and giving 941opportunities to revise. 942
The evidence evaluated in this study supports that Socratic- 943styled oral exams can allow instructors to assess and aid stu- 944dents striving to achieve higher-level learning. The interven- 945tion is a significant one, but student feedback demonstrates it 946has no negative effect on the affective atmosphere of the class- 947room. In fact, the opposite is true; students who participated 948in the option reported it increased their study and learning, 949and those who chose to not participate remained supportive 950of the option. 951
While the affective (happiness) element of students is often 952carefully tracked in teaching, another rarely tracked element 953important to the success of student learning is the affective 954state of the instructor. First and foremost, if you employ a ver- Q23
955bal exam ask your students questions about the topics taught 956in the class, you will get a much better idea of what they 957learned and their level of mastery. But perhaps equally im- 958portant, you will also have enjoyable experiences listening to 959your students thoughtfully and passionately explain to you 960the processes taught in your course. You will get opportuni- 961ties to correct, clarify, and raise each student’s understanding 962of the material. And you will find great satisfaction when stu- 963dents show increased mastery about the topics so important 964to their understanding of the discipline. 965
We hope this publication and other qualitative and quan- 966titative studies (Dressel, 1991; Bairan and Farnsworth, 1997; 967Schubert et al., 1999; Mills et al., 2000; Ehrlich, 2007; Elfes, 2007) Q24
968help provide evidence and inspiration to our peers in science 969on the benefits of moving deliberately to challenge students 970with active, engaging teaching methods and, in particular, to 971use more higher-level assessments in the classroom. 972
ACKNOWLEDGMENTS 973
We thank Amanda (Gnau) Seguin for the creative idea that enabled 974the study presented in this article. We thank Drs. Joseph Maleszewski, 975John Wilterding, James Smith, Cori Fata-Hartley, Diane Ebert-May, 976Janet Batzli, John Merrill, Merle Heideman, Karl Smith, Mimi Sayed, 977Sarah Loznak, and Duncan Sibley for helpful discussions about teach- 978ing and learning and assistance during this study. We also thank 979the many LAs who promoted and supported these interventions. 980Our cystic fibrosis research laboratory is supported by Cystic Fi- 981brosis Foundation and Pennsylvania Cystic Fibrosis grants for our 982physiology cystic fibrosis research program; our STEM Learning lab- 983oratory is supported by Lilly and Quality grants from MSU and 984
Vol. 12, Fall 2013 13
3

July 12, 2013 19:57 CBE-12-04-0050 cbe-lse
D. B. Luckie et al.
Course Curriculum and Laboratory Improvement and Transform-985ing Undergraduate Education in Science grants from the National986Science Foundation for our education research program.987
988 REFERENCES989
Baddeley AD, Hitch G (1974). Working memory. In: The Psychology990of Learning and Motivation: Advances in Research and Theory, ed.991GH Bower, New York: Academic, 8, 47–89.992
Bairan A, Farnsworth B (1997). Oral exams: an alternative evaluation993method. Nurse Educ 22, 6–7.994
Bloom BS (ed.) (1956). Taxonomy of Educational Objectives: Book 1,995Cognitive Domain, New York: Longman.996
Boe BL 1996. Diversity in assessment procedures. Paper presentedQ25997at the 48th American Association of Colleges for Teacher Education998Conference, held 21–24 February 1996, in Chicago, IL.999
Brown JS, Collins A, Duguid P (1989). Situated cognition and the1000culture of learning. Educ Res 18, 32–42.1001
Bruner JS (1973). The Relevance of Education, New York: Norton.1002
Carmean SL, Wier MW (1967). Effects of verbalization on discrimina-1003tion learning and retention. J Verbal Learn Verbal Behav 6, 545–550.1004
Collins A, Brown JS, Newman SE (1989). Cognitive apprenticeship:1005teaching the crafts of reading, writing, and mathematics. In: Know-1006ing, Learning, and Instruction: Essays in Honor of Robert Glaser, ed.1007LB Resnick, Hillsdale, NJ: Lawrence Erlbaum, 453–494.1008
Creech LR, Sweeder RD (2012). Gender performance differences in1009life science courses. CBE Life Sci Educ 11, 396–391.1010
Derting TL, Ebert-May D (2010). Learner-centered inquiry in un-1011dergraduate biology: positive relationships with long-term student1012achievement. CBE Life Sci Educ 9, 462–472.1013
DiCarlo SE (2009). Too much content, not enough thinking, and too1014little fun! Adv Physiol Educ 33, 257–264.1015
Dressel JH 1991. The formal oral group exam: challenges and1016possibilities—the oral exam and critical thinking. Paper presented1017at the 81st Annual Meeting of the National Council of Teachers ofQ261018English, held 22–27 November 1991, in Seattle, WA.1019
Ebert-May D, Derting TL, Hodder J, Momsen JL, Long TM, Jardeleza1020SE (2011). What we say is not what we do: effective evaluation of1021faculty professional development programs. BioScience 61, 550–558.1022
Ehrlich R (2007). Giving bonus points based on oral exams. Am J1023Phys 75, 374.1024
Elfes C (2007). Oral exam tests your decision-making skills. Practi-1025tioner 251, 44–45.1026
Entwistle A, Entwistle N (1992). Experiences of understanding in1027revising for degree examinations. Learn Instruct 2, 1–22.1028
Fata-Hartley C (2011). Resisting rote: the importance of active learn-1029ing for all course learning objectives. J Coll Sci Teach 40, 36–39.1030
Gagne RM, Smith EC (1962). A study of effects of verbalization on1031problem solving. J Exp Psychol 63, 12–18.1032
Guest K, Murphy D (2000). In support of memory retention: a coop-1033erative oral final exam. Education 121, 350.1034
Guillaume DW, Khachikian CS (2011). The effect of time-on-task on1035student grades and grade expectations. Assess Eval High Educ 36,1036251–261.1037
John Harvard’s Journal (2010). Bye-bye, blue books? Harvard Mag-1038azine Jul–Aug, 64–65. http://harvardmagazine.com/2010/07/bye1039-bye-blue-books.Q271040Henderson C, Dancy MH (2007). Barriers to the use of research-1041based instructional strategies: the influence of both individual and1042situational characteristics. Phys Rev ST Phys Educ Res 3, 020102.1043
Inhelder B, Piaget J (1958). The Growth of Logical Thinking from 1044Childhood to Adolescence, New York: Basic. 1045
Krontiris-Litowitz J (2009). Articulating scientific reasoning improves 1046student learning in an undergraduate anatomy and physiology 1047course. CBE Life Sci Educ 8, 309–315. 1048
Labuhn AS, Zimmerman BJ, Hasselhorn M (2010). Enhancing stu- 1049dents’ self-regulation and mathematics performance: the influence 1050of feedback and self-evaluative standards. Metacogn Learn 5, 173– 1051194. 1052
Luckie D, Harrison SH, Ebert-May D (2011). Model-based reasoning: 1053using visual tools to reveal student learning. Adv Physiol Educ 35, 105459–67. 1055
Luckie DB, Aubry JR, Marengo BJ, Rivkin AM, Foos LA, Maleszewski 1056JJ (2012). Less teaching, more learning: 10-yr study supports increas- 1057ing student learning through less coverage and more inquiry. Adv 1058Physiol Educ 36, 325–35. 1059
Luckie DB, Maleszewski JJ, Loznak SD, Krha M (2004). Infusion of 1060collaborative inquiry throughout a biology curriculum increases stu- 1061dent learning: a four-year study of “Teams and Streams.” Adv Physiol 1062Educ 28, 199–209. 1063
McKeough A, Lupart JL, Marini A (1995). Teaching for Transfer: Q281064Fostering Generalization in Learning, New York: Psychology Press. 1065
Mills PA, Sweeny WV, DeMeo S, Marino R, Clarkson S (2000). Using 1066poster sessions as an alternative to written examination—the poster 1067exam. J Chem Educ 77, 1158–1161. 1068
Momsen JL, Long TM, Wyse SA, Ebert-May D (2010). Just the facts? 1069Introductory undergraduate biology courses focus on low-level cog- 1070nitive skills. CBE Life Sci Educ 9, 435–40. 1071
Paul R, Elder L (2006). The Art of Socratic Questioning, Dillon Beach, 1072CA: Foundation for Critical Thinking. 1073
Perkins D (1999). The many faces of constructivism. Educ Leadership Q29107457, 6–11. 1075
Peters E (2004). Maximize student time on task. Science Scope 28, 107638–39. 1077
Pintrich PR (1998). A process-oriented view of student motivation 1078and cognition. In: Improving Teaching and Learning through Re- 1079search: New Directions for Institutional Research, ed. J Stakr and L 1080Mets, San Francisco: Jossey Bass, 57, 65–79. 1081
Posner GJ, Strike KA, Hewson PW, Gertzog WA (1982). Accommoda- 1082tion of a scientific conception: toward a theory of conceptual change. 1083Sci Educ 66, 211–227. 1084
Rauschenberger MM, Sweeder RD (2010). Gender performance dif- 1085ferences in biochemistry. Biochem Mol Bio Ed 38, 380–384. 1086
Schonborn KJ, Bogeholz S (2009). Knowledge transfer in biology and 1087translation across external representations: experts’ views and chal- 1088lenges for learning. Int J Sci Math Educ 7, 931–955. 1089
Schubert A, Tetzlaff JE, Tan M, Ryckman JV, Mascha E (1999). Con- 1090sistency, inter-rater reliability, and validity of 441 consecutive mock 1091oral examinations in anesthesiology: implications for use as a tool for 1092assessment of residents. Anesthesiology 91, 288–298. 1093
Schunk DH (1986). Verbalization and children’s self-regulated learn- 1094ing. Contemp Educ Psychol 11, 347–369. 1095
Seymour E, Wiese D, Hunter A, Daffinrud SM (2000). Creating a Q301096better mousetrap: on-line student assessment of their learning gains. 1097Paper presented at the National Meeting of the American Chemical 1098Society, in San Francisco, CA. 1099
Silverthorn DU, Thorn PM, Svinicki MD (2006). It’s difficult to change 1100the way we teach: lessons from the Integrative Themes in Physiology 1101curriculum module project. Adv Physiol Educ 30, 204–214. 1102
Smith J, Cheruvelil K (2009). Using inquiry and tree-thinking 1103to “March through the animal phyla”: teaching introductory 1104comparative biology in an evolutionary context. Evol Educ Outreach 11052, 429–444. 1106
14 CBE—Life Sciences Education
4

July 12, 2013 19:57 CBE-12-04-0050 cbe-lse
Socratic Verbal Final Increases Learning
Spangler G (1997). Psychological and physiological responses during1107an exam and their relation to personality characteristics. Psychoneu-1108roendocrinology 22, 423–441.1109
Spencer S, Steele CM, Quinn D (1999). Stereotype threat and women’s1110math performance. J Exp Soc Psych 35, 4–28.1111
Spicer J (2005). Making Sense of Multivariate Data Analysis, Thou-1112sand Oaks, CA: Sage.1113
Steele CM, Aronson J (1995). Stereotype threat and the intellectual testQ311114performance of African Americans. J Pers Soc Psychol 69, 797–811.1115
Steele CM, Spencer SJ, Aronson J (2002). Contending with groupQ321116image: the psychology of stereotype and social identity threat. Adv1117Exp Soc Psych 34, 379–440.1118
Stumpf SE (1983). Philosophy: History and Problems, New York:1119McGraw-Hill.1120
Sweeder RD, Jeffery KA (2012). A comprehensive general chemistryQ331121demonstration. J Chem Educ 90, 96–98.1122
Sweeder RD, Jeffery KA, McCright AM (2012). Lyman Briggs College:1123an innovative living-learning community for STEM education. Qual1124Approach High Educ 3, 7–14.1125
Thorburn M, Collins D (2006). Accuracy and authenticity of oral and 1126written assessments in high-stakes school examinations. Curriculum 1127J 17, 3–25. 1128
Tobias S (1992). Revitalizing Undergraduate Science: Why 1129Some Things Work and Most Don’t, Tucson, AZ: Research 1130Corporation. 1131
Tobias S, Raphael J (1997). The Hidden Curriculum—Faculty- 1132Made Tests in Science, Part 1: Lower-Division Courses, New York: 1133Plenum. 1134
Traub RE, MacRury K (1990). Multiple-choice vs. free response in 1135the testing of scholastic achievement. In: Test und tends 8: jahrbuch 1136der padagogischen diagnostik, ed. K Ingenkamp and RS Jager, Wein- 1137heim, Germany: Beltz Verlag, 128–159. 1138
Vygotsky LS (1962). Thought and Language, Cambridge, MA: MIT 1139Press. 1140
Wilder L, Harvey DJ (1971). Overt and covert verbalization in prob- 1141lem solving. Commun Monogr 38, 171–176. 1142
Zheng AY, Lawhorn JK, Lumley T, Freeman S (2008). Assessment. 1143Application of Bloom’s taxonomy debunks the “MCAT myth.” Sci- 1144ence 319, 414–415. 1145
Vol. 12, Fall 2013 15
5

July 12, 2013 19:57 CBE-12-04-0050 cbe-lse
D. B. Luckie et al.
HIGHLIGHT:1146
The authors studied gains in student learning when curriculum was changed to include an optional verbal final exam (VF).1147Students who passed the VF outscored peers on MCAT questions (66.4% [n=160] and 62% [n=285], respectively; p < 0.001),1148and passing the VF also correlated with higher performance in a range of upper-level science courses.1149
16 CBE—Life Sciences Education
6
July 12, 2013 19:57 CBE-12-04-0050 cbe-lse
Queries
Q1: AQ: Should second affiliation read: “STEM Learning Laboratory, Lyman Briggs College, and Department ofPhysiology”? Also, are affiliations correct as set?
Q2: AQ: This article has been lightly edited for grammar, style, and usage. Please compare it with your originaldocument and make changes on these pages. Please limit your corrections to substantive changes that affectmeaning. If no change is required in response to a question, please write “OK as set” in the margin. CopyEditor
Q3: AQ: Is “predicated” meant here? Please check sentence.Q4: AQ: Okay to add?Q5: AQ: Okay?Q6: AQ: Okay to add?Q7: AQ: Okay as edited?Q8: AQ: Okay edits here?Q9: AQ: Please define.Q10: AQ: Okay as edited?Q11: AQ: Okay as edited?Q12: AQ: Okay to add?Q13: AQ: Please add references to list for these citations and Boyer (1998) and Ausubel (2000) below.Q14: AQ: No (a) and (b) seen on top part of figure. Please check.Q15: AQ: Okay?Q16: AQ: Okay to add?Q17: AQ: Not clear whether this phrase applies to gauging student learning or examining student performance.Q18: AQ: Okay as edited? Please note this repeats text from earlier in the article.Q19: AQ: Change to “muddies”?Q20: AQ: Please add references to list for Steele citations. Or are Steele and Aronson and Steele et al. meant here?Q21: AQ: Please add reference to list for this citation.Q22: AQ: Please check edits here.Q23: AQ: Okay to add?Q24: AQ: Okay as cited?Q25: AQ: Okay to place here? Or “48th Annual”?Q26: AQ: Okay?Q27: AQ: Give recent access date.Q28: AQ: Okay as edited?Q29: AQ: Okay pages as added?Q30: AQ: Please supply dates for meeting.Q31: AQ: Please cite in text.Q32: AQ: Please cite in text.Q33: AQ: Okay as updated?
7

!
8

SAFETY IN THE LABORATORY, AN INFORMED CONSENT STATEMENT
FOR STUDENTS IN LYMAN BRIGGS COLLEGE CLASSES
Regulations and guidelines, however well conceived, are not sufficient to achieve
safe laboratory practice. It is the skill, knowledge and basic common sense of the
individual laboratory worker that is crucial to a safe laboratory situation. To this end,
I assume the following responsibilities:
1. To make myself aware, to the best of my ability, of all safety instructions
supplied by the instructor in charge of my laboratory section and to read all
safety instructions issued to me. To be familiar with the Right-to Know
information, Material Safety Data Sheets, and Disposal of Hazardous Waste
Documents. If new hazards come to my attention, I will communicate these to
the instructor in charge of my laboratory, to the person in overall charge of the
laboratory instruction program, or to the unit safety committee.
2. To comply fully with all established safety regulations and practices. This
applies especially, but is not restricted, to hazards connected with biological
materials, chemicals, radioactive materials, electrical devices, mechanical
projectiles, devices involving heat or flames, glassware and other breakable
materials, and laser and other bright light sources.
3. To consult the laboratory or course instructor for advice in circumstances where
safe practice is in doubt.
4. To limit laboratory work strictly to projects and procedures that are scheduled,
described and authorized by the course syllabus, laboratory manual or
instruction sheets, by the person in charge of my laboratory, or by my
instructor.
5. To warn visitors to the laboratory of existing hazards, and when necessary to
inform them of School and University safety rules and regulations. Unoccupied
laboratories must be locked.
I have read and understand the above responsibilities and agree to observe them in
my work in this laboratory. I recognize that I will be working with potentially
hazardous materials and/or equipment and risk is involved if safety regulations are
not adhered to.
__________________________ _________________________
Student Signature Date
__________________________ _________________________
Student Number Course/Sect & Semester/Year
luckie
359

luckie
360

_______________________________________________________________________________________________ _______________________________________________________________________________________________ _______________________________________________________________________________________________
_______________________________________________________________________________________________ _______________________________________________________________________________________________
_______________________________________________________________________________________________ _______________________________________________________________________________________________
___________________________________________________________ _____________________________
Michigan State University Release of Information Authorization form
Student Name ____________________________________________ Student Number _____________________
I hereby authorize Michigan State University to release the following educational record information:
to (provide name and address of person/agency to receive information): _____________________________________
for the purpose of:________________________________________________________________________________
I understand that I have the right not to consent to the release of my education records and I have the right to receive a copy of such records upon request.
Time limit (consult with the department/office to determine the most appropriate option):
__________ I understand this consent is in effect this one instance; once this request is fulfilled, the consent will be null and void.
__________ I understand this consent shall remain in effect until revoked by me, in writing, and delivered to Michigan State University. However, any revocation shall not affect disclosures previously made by Michigan State University prior to the receipt of any such written revocation.
Student’s Signature Date
Information released to a third party pursuant to this authorization is subject to the confidentiality provisions provided under the Family Educational Rights and Privacy Act (FERPA) and may not be made available to any other party without the written consent of the student.
luckie
361

luckie
362

ByGeorgeEdwardHyde,Esquire
Draconian Contract
v Purpose To establish contractually binding ground rules for a team if the previously existing contract generated by the group is unclear and inadequately detailed.
v Professional Agreement
As a member of this Research Team, I agree to do my part of the project—based on my designated Team Role (Pg.21). In addition to doing my part, I agree to putting in an equal work effort in order to pull my weight for the team. Also, I agree to bring an outstanding work ethic to the team—so that we may achieve a 4.0 level grade in the course. Therefore, I agree to take on all of the course work that a 4.0 level grade entails. Finally, I agree to treat my teammates with the upmost respect—by uphold all terms of this binding contract.
v Clause I -Established Meeting and Communication Expectations: Ground
rules that will set up a known time for students to meet—thus allowing them to guarantee that additional out of lab hours will be put it for this course. In addition, to set up a known communication plan that includes the means of communication that will be utilized (with the preference included). Finally, establishing time and place to meet prior to the beginning of lab.
A. Team Meeting
1. As a team we will meet bi-weekly for laboratory. The location of the meeting will be the East Lounge of East Holmes Hall.
I. Sunday – 9am to 10am a. Prepare for the upcoming weeks lab. b. Discuss the assigned pre-readings. c. Formulate a plan for use of in lab hours.
i. See Appendix for Plan Worksheet d. Observe Proposed Animal Communication Behavior
II. Friday – 6pm to 7pm a. Discuss what was presented in lab that week.
i. Lecture topic notes ii. Assignments
b. Gather data from Observations i. Work on Manuscript and Documentary
Ø Divide and Conquer using Team Roles (Pg.21)
c. Formulate a plan for the next meeting i. See Appendix for Meeting Plan Worksheet
2. All members MUST attend the Team Meetings. I. In the case where a member will be unable to attend, they must
contact all members 24 hours in advance. a. Maximum Excused Absences = 2 meetings
luckie
363

DC201
3 6 4
II. If a member does not contact the team 24 hours in advance, or misses more than 2 meetings—Go To Clause II.
B. Team Communication
1. As a team we will communicate through the following means in order…
I. Cell Phone Group Message a. ALL members will respond to a given message within an
HOUR of message being delivered. i. If a member does not follow the ground rules—Go
To Clause II. II. Team Email—using strictly @msu.edu
a. ALL members will respond to a given message within an HOUR of message being delivered.
i. If a member does not follow the ground rules—Go To Clause II.
C. Pre Lab Meetings 1. ALL members will show up to each scheduled lab class meeting
I. Prior to lab beginning, ALL members will meet 10 minutes before regular class, and 15 minutes before class when important assignments are due (i.e. Manuscripts)
a. Location = Directly Outside of C4 Holmes Hall
v Clause II -Meeting and Communication Breach of Contract Incidents: Ground rules to establish a known protocol concerning how the team will deal with a breach of contract. A breach of contract, by definition, is time when a binding agreement has not been honored by one or more parties involved in the agreement. When breach of contract has occurred, a statement must be filed with the LB144 teaching assistant (TA) that states how the contract was breached and who has not honored the agreement.
A. Not Attending Meetings
1. As stated in Clause IA Paragraph 2 Subset I—Any member who is not able to attend a scheduled mandatory meeting must contact his/her team 24 hours in advance. Also, any member is allowed 2, and ONLY 2, excused absences from the mandatory meetings. While Clause IC Paragraph 1 states the team will meet prior to lab.
I. If any member fails to uphold this portion of the agreement a breach of contract has occurred.
a. First Incident Claim
i. If any member fails to contact the team 24 hours in advance of missing a mandatory team meeting or has missed a total of 3 team meetings or has missed a pre lab meeting, the team must declare this breach of contract BOTH in the CATME feedback surveys as well as in writing. The CATME feedback surveys will occur regularly throughout the
DC20
365
semester. A hard copy of written notice must be given directly to the offender(s) and a hard copy also provided to the TA in lab section. The hard copy allows the LB144 Teaching Team to date and file the initial claim for record.
Ø The form for breach of contract written claims can be found in the Appendix. § A new clam is not permitted for 2
weeks. b. Second Incident Claim
i. If any member fails to contact the team 24 hours in advance of missing a mandatory team meeting (for the Second Time) or has missed a total of 4 team meetings or has missed a pre lab meeting, the team must declare this breach of contract BOTH in the CATME feedback surveys as well as in writing. The CATME feedback surveys will occur regularly throughout the semester. While the writing must be given directly to the offender(s) and a hard copy provided to the TA in class. The hard copy allows the LB144 Teaching Team to date and file the claim for record.
Ø The form for breach of contract written claims can be found in the Appendix.
ii. In addition, the team and TA must arrange a date for a Face-to-Face Encounter—in which ALL team members MUST attend.
Ø Failure to attend the Face-to-Face encounter will result in immediate dismissal of the member(s) from the team—Go To Clause IV. § A new claim is not permitted for 2
weeks. c. Third (and Final) Incident Claim
i. If any member fails to contact the team 24 hours in advance of missing a mandatory team meeting (for the Third Time) or has missed a total of 5 team meetings or has missed a pre lab, the team must declare this breach of contract BOTH in the CATME feedback surveys as well as in writing. The CATME feedback surveys will occur regularly throughout the semester. While the writing must be given directly to the offender(s) and a hard copy provided to the TA in class. The hard copy allows the LB144 Teaching Team to date and file the claim for record.
Ø The form for breach of contract written claims can be found in the Appendix.
DC201
366
ii. In addition, a hard copy of the claim must be provided to the professor (Dr. Luckie). The professor hard copy must comprehensively detail all past events, which led to all prior claims, and the current event.
Ø The professor form for breach of contract written claim can be found in the Appendix.
iii. In addition, the team must contact the professor to setup a mandatory Face-to-Face encounter—in which ALL members must attend.
Ø Failure to attend the Face-to-Face encounter will result in immediate dismissal of the member(s) from the team—Go To Clause IV.
Ø If the professor agrees with the claims… § Divorce Clause proceedings begin
immediately and can only be completed 2 weeks after the professor meeting.
Ø If the professor does not agree with the claims… § The team will remain with all members
in good standing. Unless the team decides to initiate the Divorce clause themselves—which at that point can only be completed 4 weeks after the professor meeting.
B. Not Following Communication Norms
1. As stated in Clause IB—any member of the must communicate in a timely and respectable fashion. The time period for all response must be within an hour of the original message.
I. If any member fails to uphold this portion of the agreement a breach of contract has occurred.
a. First Incident Claim
i. If any member fails to respond to a group message within an hour, the team must declare the breach of contract to the LB144 TA. In order for the team to successfully submit a claim they must provide a hard copy to the offender(s) and provide a hard copy to the TA, along with a screenshot proving a lack of communication, during class. The hard copy allows the LB144 Teaching Team to date and file the initial claim for record.
Ø The form for breach of contract can be found in the Appendix. § A new claim is not permitted for 2
weeks.

DC201
36
b. Second Incident Claim i. If any member fails to respond to a group message
within an hour, the team must declare the breach of contract to the LB144 TA. In order for the team to successfully submit a claim they must provide a hard copy to the offender(s) and provide a hard copy to the TA, along with a screenshot proving a lack of communication, during class. The hard copy allows the LB144 Teaching Team to date and file the claim for record.
Ø The form for breach of contract can be found in the Appendix.
ii. In addition, the team and TA must arrange a date for a Face-to-Face encounter—in which ALL members must attend.
Ø Failure to attend the Face-to-Face Encounter will result in immediate dismissal of the member(s) from the team—Go To Clause IV. § A new clam is not permitted for 2
weeks c. Third (and Final) Incident Claim
i. If any member fails to respond to a group message within an hour, the team must declare the breach of contract to the LB144 TA. In order for the team to successfully submit a claim they must provide a hard copy to the offenders(s) and provide a hard copy to the TA, along with a screenshot proving a lack of communication, during class. The hard copy allows the Lb144 Teaching Team to date and file the claim for record.
Ø The form for breach of contract can be found in the Appendix.
ii. In addition, a hard copy of the claim must be provided to the professor (Dr. Luckie). The professor hard copy must comprehensively detail all past events, which led to all prior claims, and include all screenshots provided to the TA.
Ø The professor form for breach of contract can be found in the Appendix.
iii. In addition, the team must contact the professor to setup a mandatory Face-to-Face encounter—in which ALL members must attend.
Ø Failure to attend the Face-to-Face encounter will result in immediate dismissal of the
DC201
36
member(s) from the team—Go To Clause IV.
Ø If the professor agrees with the claims… § Divorce Clause proceedings begin
immediately and can only be completed 2 weeks after the professor meeting.
Ø If the professor does not agree with the claims… § The team will remain with ALL
members in good standing—in which the professor drafts a new communication clause. Unless the team decides to initiate the Divorce clause themselves—which can only be completed 4 weeks after the professor meeting.
v Clause III- Break of Contract Grievances related to Performance
Expectations: Ground rules to establish a known protocol concerning how the team will deal with grievances. A grievance, by definition, is a feeling of being wronged (or treated unfairly)—in which a statement is made stating HOW one was wronged and WHY one is not satisfied with an occurrence. Thus, in LB144 a grievance can occur from the following situations listed in this clause.
A. Performance Expectations
1. As stated by the Professional Agreement section of this contract—ALL members who sign this document agreed to …
I. Do their part based on Team Roles (Pgs. CoursePack) II. Put forth Equal Work Effort.
III. Work Ethic equivalent to achieve a 4.0-level grade. a. Completing all work needed for a 4.0-level grade.
IV. Respect all terms of the contract.
2. Failure to uphold any of the four previously stated Professional Agreements may lead to grievances within the team.
I. First Incident Claim
a. If an individual feels any of the Professional Agreements are not being fulfilled, they must declare it in the CATME feedback survey, provide a written hard copy for the TA, and have an interventional meeting (5 minutes maximum) in lab. The hard copy allows the LB144 Teaching Team to date and file the initial grievance for record.
i. A new grievance is not permitted for 2 weeks. Ø The grievance claim form can be found in the
Appendix.
DC201
369
II. Second Incident Claim a. If an individual feels any of the Professional Agreements
are not being fulfilled, they must declare it in the CATME feedback survey, provide a written hard copy for the TA, and have an interventional meeting (5 minutes maximum) in lab. The hard copy allows the LB144 Teaching Team to date and file the initial grievance for record.
i. A new grievance is not permitted for 2 weeks. Ø The grievance claim form can be found in the
Appendix. b. In addition, the team and TA must arrange a date for a
Face-to-Face Encounter—in which ALL members must attend.
i. Failure to attend the Face-to-Face Encounter will result in immediate dismal of the member(s) from the team—Go To Clause IV.
Ø A new grievance is not permitted for 2 weeks.
III. Third (and Final) Incident Claim a. If an individual feels any of the Professional Agreements
are not being fulfilled, they must declare it in the CATME feedback survey, provide a written hard copy for the TA, and have an interventional meeting (5 minutes maximum) in lab. The hard copy allows the LB144 Teaching Team to date and file the initial grievance for record.
i. The grievance claim form can be found in the Appendix
b. In addition, a hard copy of the claim must be provided to the professor (Dr. Luckie). The professor hard copy must comprehensively detail all past events, which lead to prior grievances, and the current event.
i. The professor grievance claim form can be found in the Appendix.
c. In addition, the team and professor must arrange a date for a Face-to-Face Encounter—in which ALL members must attend.
i. Failure to attend the Face-to-Face Encounter will result in immediate dismal of the member(s) from the team—Go To Clause IV.
ii. If the Professor agrees with the claim…

DC201
3 0
Ø Divorce Clause begins immediately and can only be completed 2 weeks after the professor meeting.
iii. If the Professor does not agree with the claim… Ø The team will remain with ALL members in
good standings. Unless the team decides to initiate the Divorce Clause themselves—which can only be completed 4 weeks after the professor meeting.
v Clause IV: Prenuptial agreement basis for “Divorce” proceedings. In any case
where a team feels that the environment is no longer suitable—and a member is “fired” or decides to leave. The intellectual property of the group must be distributed, which is outlined in this clause.
A. QUITTING In the case where a Team Member decides to willingly
separate from their group… 1. ALL Intellectual Property is maintained within the Team.
I. Deciding to separate from your team is equivalent to deciding to separate from a company. As is the case with a corporation, all products you created are retained by the company you departed. You have no rights to those products. All you the intellectual property—including your own work is retained by the remained group members. You therefore must start the lab over from zero as a group of 1 person. You cannot plagiarize your own prior writing, use your prior citations, methods, experimental design etc.
a. In short, you must start an entirely NEW and DIFFERENT research project.
B. FIRING In the case where a Team Member is fired from the Team…
1. ALL Intellectual Property is maintained with the Member of the Team who was fired.
I. Deciding to fire a member is equivalent to the team as a whole deciding to separate from the individual and all of their intellectual property. The party who was fired in this case gains the rights of the corporation when all the other group members quit. The remaining group members must, therefore, start from the lab over from Square 1 and cannot use/plagiarize their own prior writing, prior citations, methods, experimental design etc
C. MISC/OTHER In any case of Divorce, one party maintains all
intellectual property and the other party loses all intellectual property—having to start over. Depending on the week in which the divorce is finalized, all graded assignments prior to the divorce will remain. However, the party that is required to start over will have lost the opportunity to have the feedback from these assignments for their NEW research project.

DC201
3 1
1. Example I. A team member decides to separate from the team after the
Proposal and Half-Draft of the Research manuscript. As stated previously, this team member will be giving up all rights to all intellectual property of the team. In addition, all grades for these assignments will be maintained after the divorce. However, since the individual member must start a new and entirely different research project they have lost the opportunity to receive feedback at either the Proposal and Half-Draft stage of authorship of manuscript. Therefore, the first official graded assignment under this new research project will be the Draft1 of the manuscript.
D. ONLY SOLO In the case of any form of divorce—any party who either
separates from the group, or is fired, MUST finish the semester as an INDIVIDUAL. Forming a new group or joining a pre-existing group is NOT permitted.

!
luckie
372

3 3
ont act Appendix

DC201
3 4
Sunday Team Meeting Plan Worksheet
Name(s): _______________________________________________________________
Section: ____________________ Date: _________________________
Course-Pack Readings (Pages): ____________________
Reading Summary:
_______________________________________________________________________
_______________________________________________________________________
_______________________________________________________________________
_______________________________________________________________________
Observations:
_______________________________________________________________________
_______________________________________________________________________
_______________________________________________________________________
_______________________________________________________________________
Detailed Plan for Use of In-Lab Hours:
_______________________________________________________________________
_______________________________________________________________________
_______________________________________________________________________
_______________________________________________________________________
_______________________________________________________________________
_______________________________________________________________________
TA Signature: X__________________________________

DC201
3 5
Friday Team Meeting Plan Worksheet
Name(s): _______________________________________________________________
Section: ____________________ Date: ________________________
Homework:
_______________________________________________________________________
_______________________________________________________________________
Describe Lecture Topic:
_______________________________________________________________________
_______________________________________________________________________
_______________________________________________________________________
_______________________________________________________________________
Manuscript & Documentary—What was Worked On and By Who?
_______________________________________________________________________
_______________________________________________________________________
_______________________________________________________________________
_______________________________________________________________________
Next Meeting Agenda:
_______________________________________________________________________
_______________________________________________________________________
_______________________________________________________________________
_______________________________________________________________________
TA Signature: X__________________________________
DC201
3 6
TA Breach of Contract Form
Names: _________________________________________________________________
Offender(s): _____________________________________________________________
Claim: _____ First _____ Second _____ Third
Reason: _____Team Meeting _____ Communication _____ Pre-Lab
Date Occurred: ____________________
Description:
_______________________________________________________________________
_______________________________________________________________________
_______________________________________________________________________
_______________________________________________________________________
_______________________________________________________________________
_______________________________________________________________________
Section: ________ TA: _____________________________________
Student Signature: X ______________________________________________________
TA Signature: X _________________________________________________________
Date Issued: _______________________
Next Claim Issue Date (2 weeks): ________________________

DC201
3
Professor Breach of Contract Form
Names: _________________________________________________________________
Offender(s): _____________________________________________________________
Date Occurred: ____________________ Section: __________
Description:
_______________________________________________________________________
_______________________________________________________________________
_______________________________________________________________________
_______________________________________________________________________
_______________________________________________________________________
_______________________________________________________________________
_______________________________________________________________________
_______________________________________________________________________
_______________________________________________________________________
_______________________________________________________________________
_______________________________________________________________________
_______________________________________________________________________
_______________________________________________________________________
Student Signature: X ______________________________________________________
Date Issued: _______________________
Next Claim Issue Date (2 weeks): ________________________

DC201
3
TA Grievance Form
Names: _________________________________________________________________
Offender(s): _____________________________________________________________
Claim: _____ First _____ Second _____ Third
Date Occurred: ____________________
Description:
_______________________________________________________________________
_______________________________________________________________________
_______________________________________________________________________
_______________________________________________________________________
_______________________________________________________________________
_______________________________________________________________________
Section: ________ TA: _____________________________________
Student Signature: X ______________________________________________________
TA Signature: X _________________________________________________________
Date Issued: _______________________
Next Claim Issue Date (2 weeks): ________________________

DC201
3 9
Professor Grievance Form
Names: _________________________________________________________________
Offender(s): _____________________________________________________________
Date Occurred: ____________________ Section: __________
Description:
_______________________________________________________________________
_______________________________________________________________________
_______________________________________________________________________
_______________________________________________________________________
_______________________________________________________________________
_______________________________________________________________________
_______________________________________________________________________
_______________________________________________________________________
_______________________________________________________________________
_______________________________________________________________________
_______________________________________________________________________
_______________________________________________________________________
_______________________________________________________________________
Student Signature: X ______________________________________________________
Date Issued: _______________________
Next Claim Issue Date (2 weeks): ________________________
DC201
3 0
Divorce Form
Name: _________________________________________________________________
Divorce Type: (Please Check One)
_____ I, ______________________, willingly have decided to separate from my group.
_____ As a team, we have decided to fire ____________________________________ .
Reason:
_______________________________________________________________________
_______________________________________________________________________
_______________________________________________________________________
_______________________________________________________________________
_______________________________________________________________________
_______________________________________________________________________
Date Issued: ____________________ Effective Date: _________________
Signature of ALL Team Members:
X __________________________________________
X __________________________________________
X __________________________________________
X __________________________________________
Signature of TA:
X __________________________________________
Signature of Professor:
X __________________________________________

CFTRModelPoster(cutoutandpiecetogetheraposter)
luckie
381

!
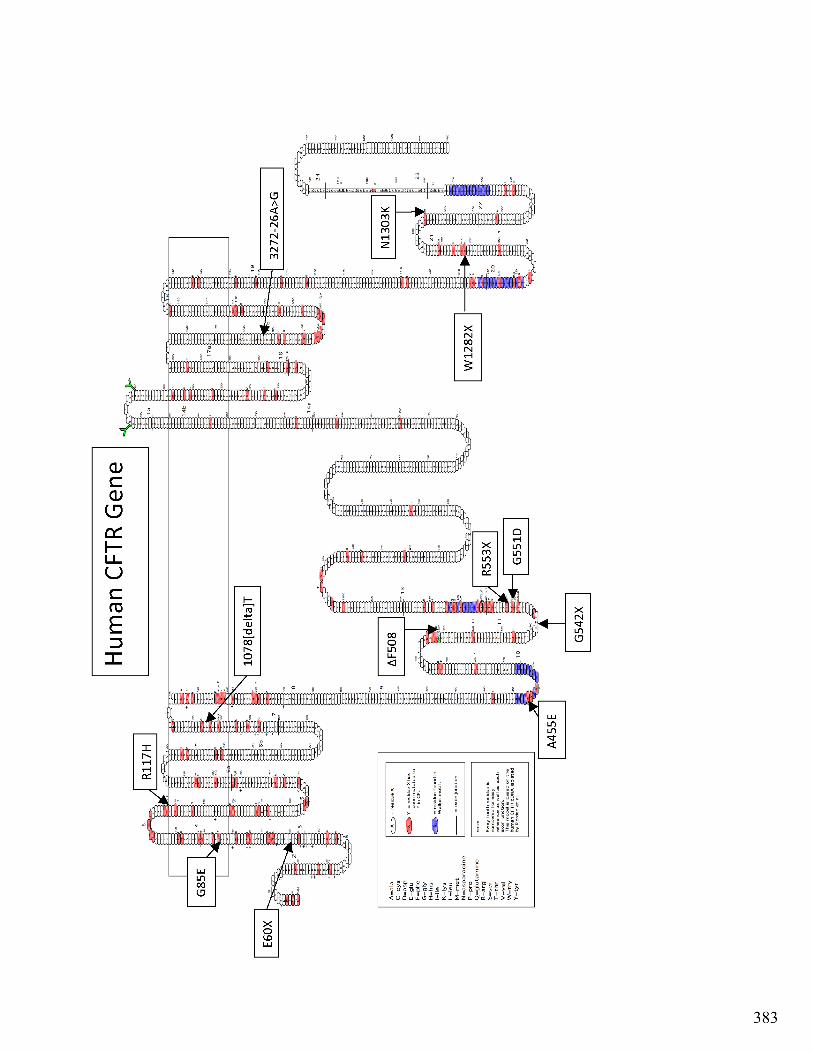
luckie
383

102
luckie
384

+
ALFFWRFMFYGIFLYLGEVTKAVQ
YP
Y L G L C L L F I V R T L L LY G H P A I F G L H H ISNNLNKFDEGLALAHFVWIAPLQVALLMGLI
W
EL
Q
L
A S A F C G L G F L I V L A L F Q A G L G R M M M K Y R D Q R
80
90
12
0
13
0
14
0
19
0
20
0
21
0
22
0
23
0
24
0
25
0
ERK
H
C,H
,
T
Y,Q
W
R
4
6a
RRC
+ +
+
++
+
+KAAYVRYFNSSAFFFSGFFVVFLSVLPYAL
IK
G
I I L R K I F T T I S F C I V L R M A V T R Q F P W A V Q T
30
0
31
0
32
0
33
0 34
0
35
0
36
0
de
l,L
E,R
W K H,L
,P
K V 35
2
K
K
+ + + +
CLAR
I P
,C
WLRLR
CL
D
11
0
PL LLGRIIA
SD
N K E E R S I A I
10
0
TL
F
K
L
D R
SN
,G
KS
R E R

102
luckie
386

I L
S
D
I
YQ
I
S
V
P
DADNLEKLEEWDRELLIN SR
G M Q M R I A M F S I Y K K
T
L
KL
S
S
RVLDKISIGQLVSLL
L
A G K I S E R L V I T S E M I E N I Q S
V
K
AY
C
W
EEAMEKL Q QK E Y K T L E Y N L T T T E V V M E N V T A F W E E G F G E L F E K A K
10
40
50
60
70
15
0
16
0
17
0
18
0
26
0
27
0
28
0
38
0
39
0
40
0
41
0
S
R
G
35
9
A=
ala
C=
cys
D=
asp
X=
re
sid
ue
X
X
C,L
G
E
K
A
SV
V
S
K
L F F S W T R P
20
2
L
C
MQRSPL
W V,K
,I
-+
-
+R K G Y QR L E L
30
E
R
-+ +
++ - - - --G
ASKKNPK
SLN
+ +
+++ -
MIENLRQTELKLTRW Y D S L G A I N K I Q D F
29
0
37
0
Q
7
8
- +
P
R
S
Q
C
V
V
6b

102
luckie
388
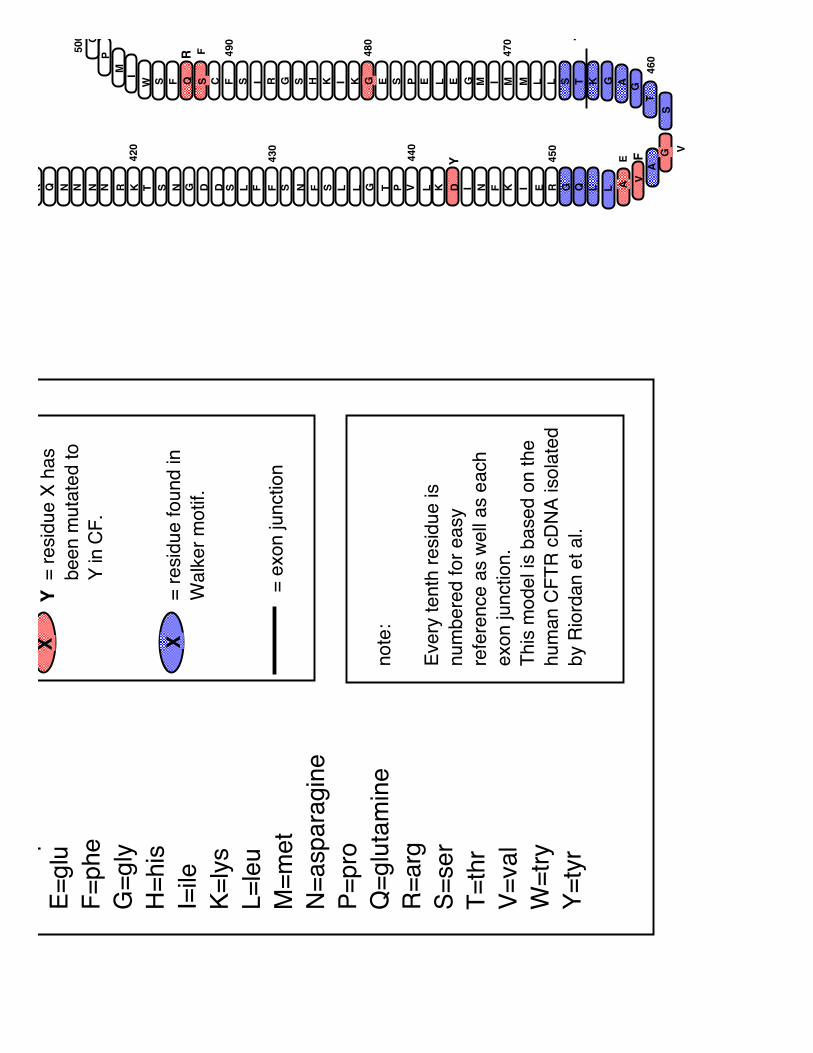
K Q N N N N R K T S N G D D S L F F S N F S L L G T P V L K D I N F K I E R G Q L L A
V
A
GS
T
G
AGKTSLLMMIMGELEPSEGKIKHSGRISFCSQFSW
I
M
P
G
42
0
43
0
44
0
45
0
46
0
47
0
48
0
49
0
50
0
E
V
F
1
p
E=
glu
F=
ph
e
G=
gly
H=
his
I=ile
K=
lys
L=
leu
M=
me
t
N=
asp
ara
gin
e
P=
pro
Q=
glu
tam
ine
R=
arg
S=
se
r
T=
thr
V=
va
l
W=
try
Y=
tyr
XY
= r
esid
ue
X h
as
be
en
mu
tate
d t
o
Y in
CF
.
X=
re
sid
ue
fo
un
d in
Wa
lke
r m
otif.
= e
xo
n ju
nctio
n
no
te:
Eve
ry t
en
th r
esid
ue
is
nu
mb
ere
d f
or
ea
sy
refe
ren
ce
as w
ell
as e
ach
exo
n ju
nctio
n.
Th
is m
od
el is
ba
se
d o
n t
he
hu
ma
n C
FT
R c
DN
A iso
late
d
by R
iord
an
et
al.
Y
F
R

102
luckie
390
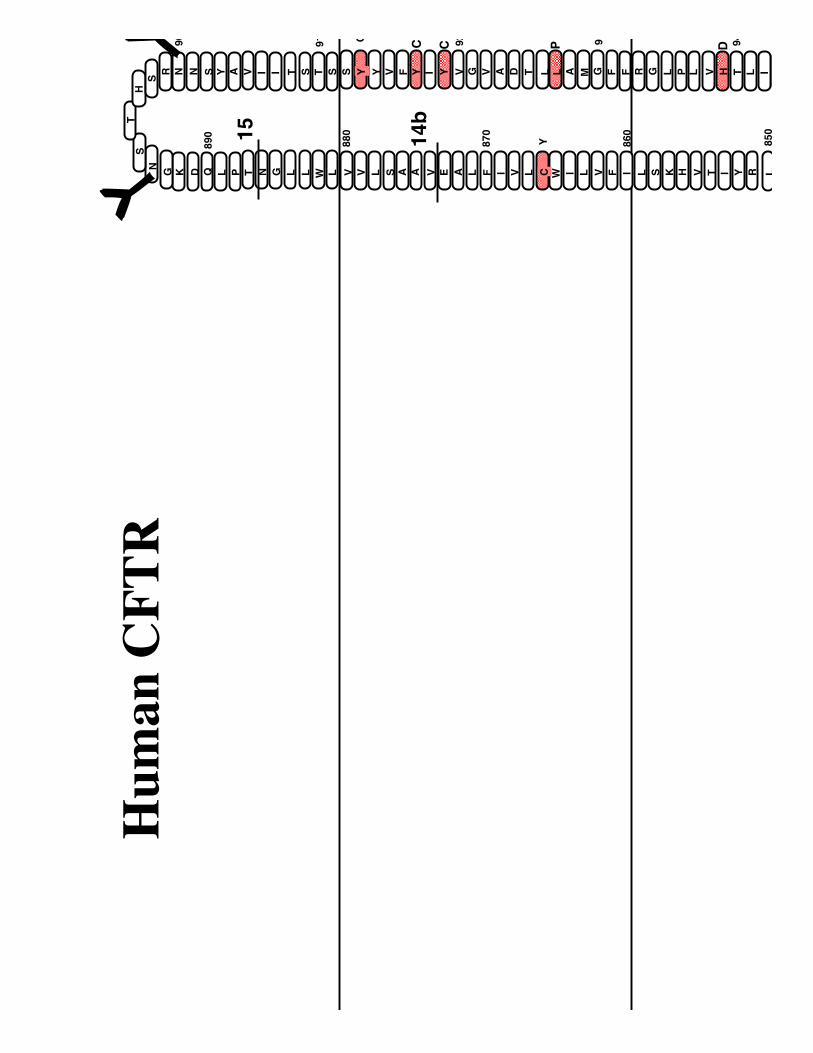
LRYITVHKSLIFVLIWCLVIFLAEVAASLVVLWLLGNTPLQDKG
N
ST
H
S
R N N S Y A V I I T S T S S Y Y V F Y I Y V G V A D T L L A M G F F R G L P L V H T L I8
50
86
0
87
0
88
0
89
0
90
91
92
93
94
Y
C
15
Hu
ma
n C
FT
R
C C P D
14b

102
luckie
392
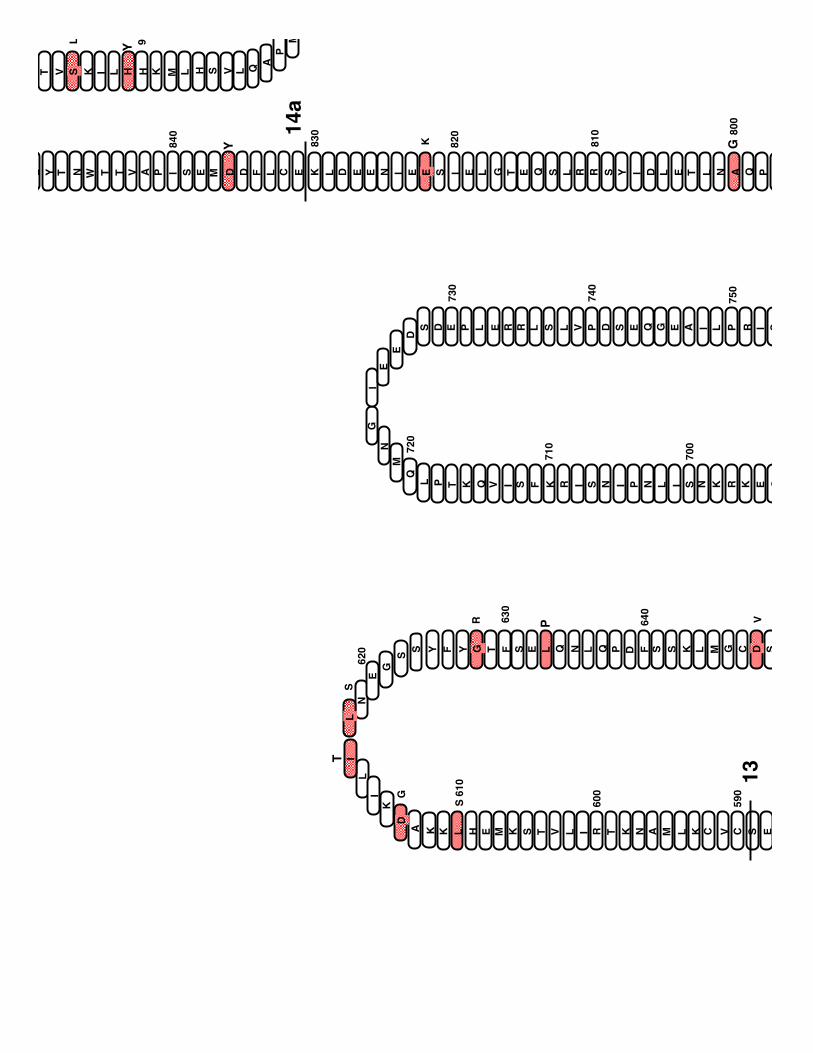
ESCVCKLMANKTRILVTSKMEHLKKA
D
L
IL
N
IE
KG
S
S Y F Y G T F S E L Q N L Q P D F S S K L M G C D SGEKRKNSILNPINSIRKFSIVQKTPL
Q
M
N
GI
E
E
D
S D E P L E R R L S L V P D S E Q G E A I L P R I SAPQANLTELDIYSRRLSQETGLEISEEINEEDLKECLFDDMESIPAVTTWNTYL
T V S K I L H H K M L H S V L Q
A
P
M
59
0
60
0
S 6
10
62
0
63
0
64
0
70
0
71
0
72
0
73
0
74
0
75
08
00
81
0
82
0
83
0
84
0
95
G
S
R V
K
L
13
14a
T
P
GY
Y

102
luckie
394

GT
I
K E
N I I F G V S Y D E Y R Y R S V I K A C Q L E E D I S K F A E K D N
I
V
L
GE
G
G
ITLSGGQRARISLARAVYKDADLYLLDSPGYLDVLTEKEIF
S F D Q F S A E R R N S I L T E T L H
R
F
S
LE
G
D
A
P
VSWTETKKQSFKQTGEFGS V I S T G P T L Q A R R R Q S V
L N
L
M
T
H
S
V
N
Q
G
QNIHRKTTASTRKVSLA
0
51
0
52
0
53
0 54
0
55
0
56
0
57
0
58
0
65
0
66
0
67
0
68
0
69
0
76
0
77
07
80
79
0
C
Q
S,T
de
l
de
l*
F,I
E
R,N
,I,R
S,D
Q,G
ST
K,T
,S
NC,H
H
L
10
11
12
S
ED,N
SNGR
F

102
luckie
396

AILDDLLPLTIFDFIQLLLIVIGAIAVVAVL
QP
Y I F V A T V P V I V A F I M L R A Y F L Q T S Q Q L K Q L ELSTLRWFQMRIEMIFVIFFIAVTFISILTTG
E
GE
G
R
V G I I L T L A M N I M S T L W A V N S I I D V D S L M R SQ
00
10
20
30
40
99
0
10
00
10
10
10
20
10
30
10
40
11
00
11
10
11
20
11
30
11
40
11
50
C
R,K
17a
18
19
R
RPR
R V H P

102
luckie
398
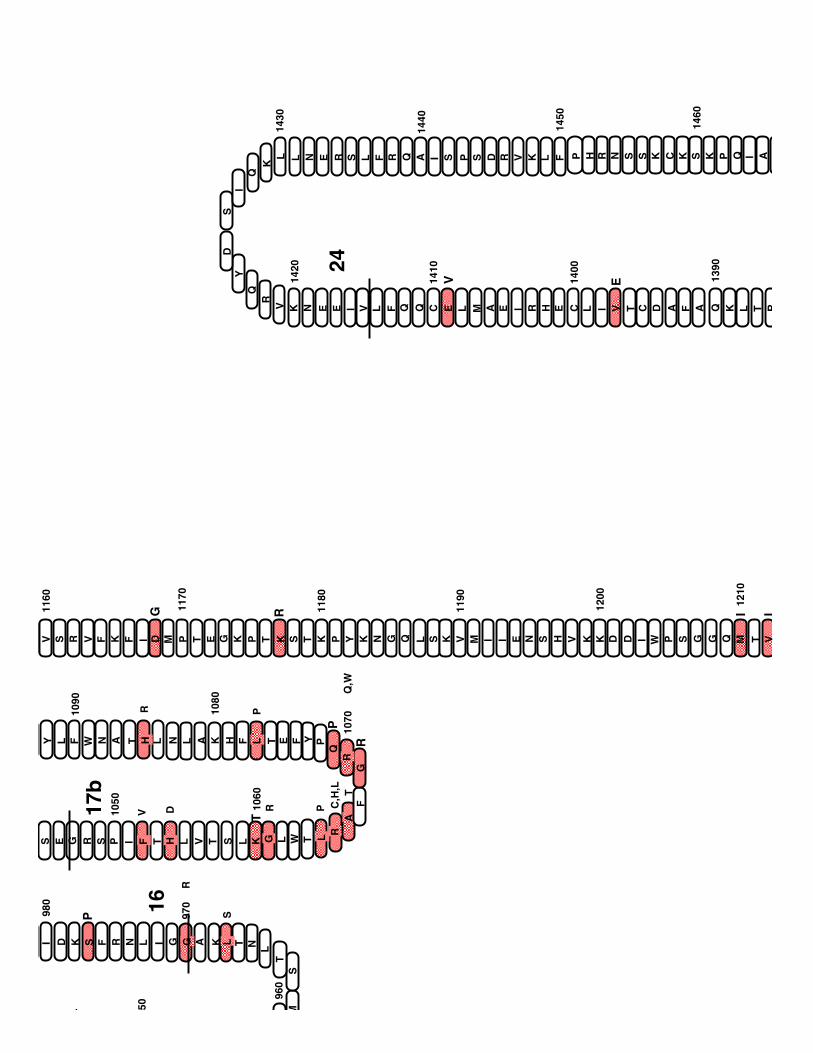
MS
T
L
NTLKAGGILNRFSKDIS E G R S P I F T H L V T S L K G L W T L
R
A
FG
R
Q
PYFETLFHKALNLHTANWFLY
RTLKQAFADCTVILCEHRIEAMLECQQFLVIEENKV
R
Q
Y
DS
I
Q
K
L L N E R S L F R Q A I S P S D R V K L F P H R N S S K C K S K P Q I A A
V S R V F K F I D M P T E G K P T K S T K P Y K N G Q L S K V M I I E N S H V K K D D I W P S G G Q M T V
50
96
0
97
0
98
0
10
50
10
60
10
701
08
0
10
90
11
60
11
70
11
80
11
90
12
00
12
10
13
90
14
00
14
10
14
20
14
30
14
40
14
50
14
60
L
S
R
V D R P C,H
,L
TQ
,W
PR
24
16
P
T
R
P
G R I I
EV
17b

102
luckie
400
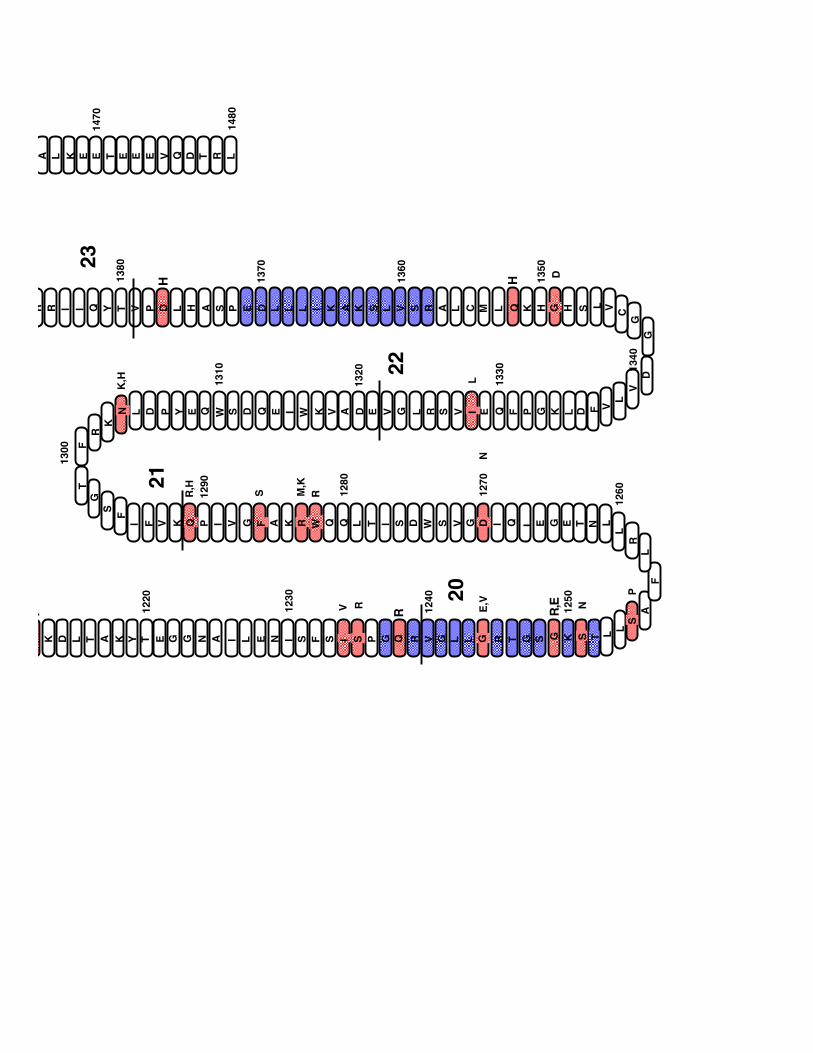
F
R
K
N L D P Y E Q W S D Q E I W K V A D E V G L R S V I E Q F P G K L D F V
L
V
DG
G
C
VLSHGHKQLMCLARSVLSKAKILLLDEPSAHLDPVTYQIIRRA L K E E T E E E V Q D T R L
K D L T A K Y T E G G N A I L E N I S F S I S P G Q R V G L L G R T G S G K S T L
L
S
A
F
L
R
L
LNTEGEIQIDGVSWDSITLQQWRKAFGVIPQKVFI
F
S
G
T
12
20
12
30
12
40
12
50
12
60
12
70
12
80
12
90
13
00
13
10
13
20
13
30 13
40
13
50
13
60
13
70
13
80
14
70
14
80
V R E,V N
P
N
RM,K
SR,H
K,H L
D
22
20
21
23
I R R,E
HH

102
luckie
402

Student Laboratory Notebook
40

4 4

1
4

2
4

3
4

4
4

5
4

6
41

7
411

8
41

9
41

10
414

11
41

12
41

13
41

14
41

15
41

16
42

17
421

18
42

19
42

20
4 4

21
4

22
4

23
4

24
4

25
4

26
43

27
431

28
43

29
43

30
4 4

31
4

32
4

33
4

34
4

35
4

36
44

37
441

38
44

39
44

40
444

41
44

42
44

43
44

44
44

45
44

46
45

47
451

48
45

49
45

50
4 4

!