Lazard Asset Management Presentation TEMPLATE - Granicus
61
City of Sarasota Firefighters Lazard International Equity Select Plus ADR (ACW ex-US) This presentation and all research and materials enclosed are property of Lazard Asset Management LLC. Information and opinions presented have been obtained or derived from sources believed by Lazard to be reliable. Lazard makes no representation as to their accuracy or completeness. All opinions expressed herein are as of the date of this presentation and are subject to change. April 24, 2019 Frank Sposato Director, Institutional Marketing Michael Powers Managing Director, Portfolio Manager/Analyst ITEM 6.3. PAGE 1 OF 61
-
Upload
khangminh22 -
Category
Documents
-
view
0 -
download
0
Transcript of Lazard Asset Management Presentation TEMPLATE - Granicus

City of Sarasota FirefightersLazard International Equity Select Plus ADR (ACW ex-US)
This presentation and all research and materials enclosed are property of Lazard Asset Management LLC.
Information and opinions presented have been obtained or derived from sources believed by Lazard to be reliable. Lazard makes no representation as to their accuracy or completeness. All opinions
expressed herein are as of the date of this presentation and are subject to change.
April 24, 2019
Frank SposatoDirector, Institutional Marketing
Michael PowersManaging Director, Portfolio Manager/Analyst
ITEM 6.3. PAGE 1 OF 61
1 Lazard Asset Management
Table of Contents
I. Firm Overview, Investment Process, Philosophy and Objectives
II. Market Overview & Portfolio Review
III. Outlook
IV. Emerging Markets Equity Portfolio
V. Summary
VI. Appendix
- Biographies
- Disclosures

TABTAB

3 Lazard Asset Management
Lazard Asset Management
1 As of 31 December 2018. Includes those of Lazard Asset Management LLC (New York) and its affiliates, but do not include those of Lazard Frères Gestion (Paris) or other asset
management businesses of Lazard Ltd.
1848 850+ 340+ 16 $192.8Lazard Founded Employees1 Investment Personnel Countries Billion AUM1
NORTH AMERICA
Boston
Montreal
New York
San Francisco
Toronto
EUROPE
Amsterdam
Brussels
Dublin
Frankfurt
Geneva
Hamburg
London
Madrid
Milan
Zurich
Hong Kong
Melbourne
Seoul
Singapore
Sydney
Tokyo
ASIA PACIFICDubai
MIDDLE EAST

4 Lazard Asset Management
Lazard conducts two primary businesses:
Asset Management
Financial Advisory
Our central focus is on providing advice, whether it is in the form of investment management,
or in connection with a wide range of strategic and financial matters
Business Model
Lazard’s advisory model differentiates us from many global financial institutions

5 Lazard Asset Management
Lazard’s Investment Organization
Investment CouncilOversight Committee
Senior investment professionals focused on:
• Providing investment leadership and sharing insight
• Continuous improvement of investment communication,
technology and culture
Management group for our investment platform responsible for :
• Oversight and reviewing of existing investment strategies
• Establishing reporting lines for investment professionals
• Approving new investment strategies
Global Management Committee
Senior management group responsible for:
• Making senior-level business decisions for the firm
• Overseeing matters related to the overall business
Chief Executive Officer

6 Lazard Asset ManagementLazard Asset Management
Assets Under Management
1 As of 31 December 2018. Assets under management include those of Lazard Asset Management LLC (New York) and its affiliates, but do not include those of Lazard Frères Gestion
(Paris) or other asset management businesses of Lazard Ltd.
2 Represents clients invested in hedge funds, mutual funds, and other investment vehicles for which client type is not reported.
By Client Type By Investment Mandate
Global Equity13.1%
International Equity23.5%
Emerging Markets Equity
21.0%
European Equity2.2%
Asia-Pacific Equity3.9%
US Equity11.9%
Convertibles1.8%
Fixed Income12.8%
Real Assets6.2%
Multi Asset2.9% Alternatives
0.7%
Corporate39.6%
Insurance4.5%
Public/ Government
20.9%Labor/Taft-Hartley3.3%
Endowments &
Foundations3.6%
Individual9.5%
Financial Intermediaries²
18.6%
Total Firm Assets Under Management1: $192.8 billion

7 Lazard Asset Management
Global/International EquityAssets Under Management
As of 31 December 2018.
Global Equity $25.7
Global Listed Infrastructure$11.8
International Equity $45.2
Emerging Markets Equity$41.9
European Equity $3.0
U.K. Equity $1.4
Australian Equity $4.5
Japanese Equity$2.9 Korean Equity
$0.1
Asian Equity $0.1
Lazard Global/International Equity Assets (in US$ billions)
Total Global/International Equity Assets:
$136.5 billion; 70.8% of Total Firm Assets

8 Lazard Asset Management
Sector ExpertiseLazard Equity Investment Resources
As of 31 December 2018.
Consumer
Aaron Binsted
Christopher Blake
Thomas Boyle
Rohit Chopra
Elizabeth Chung
Nathan Cockrell
Myla Cruz
Marina Erskine-Leacock
William Gore-Randall
Brock Harris
Jay Levy
Jake (Jaeyub) Myung
Dennis Neveling
Rob Osborn
William Parry
Sookyum (Celine) Woo
Shuichi Yoshimura
Financials
David Alcaly
Catalina Araya
Nigel Barrett
Dmitri Batsev
Daniel Breslin
Adrian Cheung
Elias Chrysostomou
Philipp Hofflin
Jay Leupp
Mark Lien
Jonathan Morris
Stephen Russell
Rahwa Senay
Monika Shrestha
Ronald Temple
Health Care
Thurl Abrahams
Jelena Boskovic
Rhett Brown
John Mariano
Henry (Ross) Seiden
Nicholas Sordoni
Industrials
Matthew Bills
Jimmie Bork
Antoine Champenier
Michael DeBernardis
Lada Emelianova
Peter Gillespie
Kevin Matthews
Erik McKee
Keith Mori
Andrei Morosanu
Kevin O'Hare
David Pizzimenti
Daniel Rozier
Jason Tin
Philippe Tison
Power
Georg Benes
Bertrand Cliquet
James Donald
Alistair Godrich
Peter Hunsberger
Eugene Krishnan
Matthew Landy
Neil Millar
Jacob (Ryan) Mims
John Mulquiney
Warryn Robertson
Anthony Rohrlach
Ben Wulfsohn
Technology, Media, Telecom
Giles Edwards
Donald Floyd
Jenny Hardy
Robert Horton
Alex Ingham
Ario Kishida
Edward Lund
Bret Miller
Takayuki Natsume
Paul Rogers
Christopher Whitney
Tim Zhao

9 Lazard Asset Management
Portfolio ManagementLazard International Equity Select
Portfolio Management Team
Team membership is current as of the date of this document. Personnel data are calculated as of year-end 2017; YTD 2018 experience/tenure is not reflected.
Focused Resources
Europe AsiaUS
Regional Resources
Joined
Lazard
Years in
Industry
Michael G. Fry
Managing Director,
Portfolio Manager/Analyst
2005 37
Michael Bennett
Managing Director,
Portfolio Manager/Analyst
1992 32
Giles Edwards, CFA, ACMA
Director,
Portfolio Manager/Analyst
2008 15
Kevin J. Matthews, CFA
Managing Director,
Portfolio Manager/Analyst
2001 17
Michael Powers
Managing Director,
Portfolio Manager/Analyst
1990 28
Emerging MarketsYears in
Industry
Years at
Lazard
Thomas Boyle 21 8
Rohit Chopra 22 19
Elizabeth Chung 24 8
Myla Cruz 10 10
James Donald 35 22
Lada Emelianova 20 8
Donald Floyd 23 7
Peter Gillespie 26 11
Robert Horton 25 7
Arif Joshi 20 8
Mark Lien 28 10
John Mariano 20 8
Andrei Morosanu 19 19
Kevin O'Hare 27 17
Stephen Russell 21 7
Monika Shrestha 21 15
Sookyum (Celine) Woo 14 8
Ben Wulfsohn 27 17
InternationalYears in
Industry
Years at
Lazard
Eduardo Abreu 13 10
Aaron Barnfather 24 10
Nigel Barrett 29 11
Jimmie Bork 7 2
Jelena Boskovic 11 8
Antoine Champenier 1 1
Elias Chrysostomou 16 8
Nathan Cockrell 23 11
Marina Erskine-Leacock 17 14
Robert Failla 25 15
Alistair Godrich 10 10
Jenny Hardy 7 3
Peter Hunsberger 29 27
Robin Jones 16 15
Ario Kishida 29 7
Mark Little 26 21
Edward Lund 3 3
Neil Millar 12 12
Jonathan Morris 29 10
Dennis Neveling 12 12
John Reinsberg 37 26
Daniel Rozier 7 7
Adam Rubinstein 13 13
Paul Selvey-Clinton 12 4
Jeremy Taylor 22 15
Barnaby Wilson 20 19

10 Lazard Asset Management
Investment Philosophy, Objectives and Process
Our Investment Philosophy
Focus on those companies that are financially
productive and inexpensively valued
Add value through stock selection and portfolio
management
Our Investment Objectives
Outperform relevant benchmark over a full market
cycle
Participate in rising markets; preserve capital in
falling markets
Outperform our investment competitors
Seek consistent results
Our Investment Process
Portfolio
Construction
Idea
Sourcing
Fundamental
Analysis
Extensive Company Research
Risk/Reward Analysis
Lazard’s investment process for research and portfolio
construction is presented here as sequential steps; in practice
the process is neither static, nor sequential, but ongoing.
Lazard's investment process is presented here in sequential steps for illustrative purposes only. In practice, the process is not sequential and will, as needed, weigh certain criteria over others.

11 Lazard Asset Management
A Solid FoundationThree Levels of Risk Monitoring
Stock – accounting validation
Diversification
Portfolio construction
• Corporate governance
• Macro environment
• Political factors
Monitors investment strategy
and portfolio
Multi-factor sensitivity analysis
Liquidity analysis
Attribution analysis
Risk Management TeamOversight CommitteeInternational Equity Select
Portfolio Management Team
Risk Management

12 Lazard Asset Management
Environmental, Social and Governance
1. ESG analysis is a critical component of our investment philosophy as ESG considerations can
affect a company’s valuation and financial productivity
2. LAM analysts integrate ESG analysis into their research and decision-making process
3. We are signatory to the Principals of Responsible Investment (PRI) and other corporate
governance codes
Engagement Period: February 2016 - 2017
Securities identified in this document are not necessarily held by Lazard Asset Management for all client portfolios, and should not be considered as a recommendation or solicitation to
purchase, sell or hold these securities. It should also not be assumed that any investment in these securities was or will be profitable.
Action
Lazard met with the Wolters Kluwer CEO and CFO in Lazard’s London office to discuss the company’s
human capital strategy (February 2016).
Lazard had a conference call with Wolters senior legal counsel to discuss the nomination of Ann Ziegler to
Supervisory Board of Directors (February 2017). After reviewing her professional background, we voted for
her nomination at the 2017 AGM because we believed her global experience will enhance the firm’s
Supervisory Board.
Ziegler won election to the Supervisory Board at the 2017 AGM; the board’s gender diversity is now 43%, or
3 of 7 members.
Issue
Wolters Kluwer, as an information services company, must be able to attract and retain the right talent to
deliver continued financial performance.
Wolters Kluwer’s nomination for the Supervisory Board of Directors, Ann Ziegler, also serves on the board of
directors at Hanesbrands and Groupon. As a result ISS, a proxy services and research provider, raised the
potential issue that she is overboarded.
Example: Wolters Kluwer

13 Lazard Asset Management
Distinguishing FeaturesLazard International Equity Strategies
• Robust bottom up relative value culture and process
Buy stocks, not markets
Relative Value trade-off between financial productivity and valuation
Borderless alpha generation
Strong emerging markets expertise
• Exploiting market inefficiencies
Sustainability of returns
Structural change
Short term focus on news flow
• Flexibility of implementation
Market Cap
Geography
Sectors
• Historically consistent and attractive pattern of performance
Downside protection with upside participation
Attractive risk-adjusted returns
Information and opinions are current as of the date of this document.

TABTAB

15 Lazard Asset Management
International Market Summary – 2019Q1
Information and opinions as of 31 March 2019 and are subject to change. All data in USD.
The indices listed above are unmanaged and have no fees. It is not possible to invest in an index.
The performance quoted represents past performance. Past performance is not a reliable indicator of future results.
Source: Lazard, MSCI
Markets:
• Markets recouped most of their 4Q losses with a very strong 1Q
− Economic uncertainty, unresolved geopolitical risks & lower earnings
+ Central banks back to accommodative mode
MSCI EAFE Index: +10.0% QTD
MSCI ACW ex-US Index: +10.3% QTD
• High quality EAFE stocks did well
• But were led by growth and more expensive securities
• Growth dominance returned in Emerging markets
Long term cautious, but policymakers driving investor optimism

16 Lazard Asset Management
MSCI ACWI ex-USMarket Performance (US Dollar) – 2019Q1
As of 31 March 2019
The performance quoted represents past performance. Past performance is not a reliable indicator of future results. Allocations and security selection are subject to change.
For illustrative purposes only. This information is not representative of any product or strategy managed by Lazard. The index is unmanaged and has no fees. One cannot invest directly in
an index.
Source: MSCI
-3.2
4.4
4.9
6.7
6.9
7.0
7.2
7.4
8.1
9.0
9.9
10.0
10.3
10.7
11.4
11.4
11.9
12.2
13.6
13.7
14.6
15.4
15.6
17.7
-5 0 5 10 15 20
Turkey
South Africa
South Korea
Japan
Germany
Spain
India
Sweden
Brazil
Taiwan
MSCI Emerging Markets
MSCI EAFE
MSCI ACWI ex-US
France
Ireland
Australia
United Kingdom
Russia
Netherlands
USA
Italy
Canada
Hong Kong
China
MSCI ACWI ex-US Sector Performance MSCI Country Performance
6.9
7.7
8.2
10.2
10.3
11.0
11.2
11.2
11.3
12.4
14.4
14.7
0 2 4 6 8 10 12 14 16
Communication Services
Financials
Utilities
Industrials
MSCI ACWI ex-US
Health Care
Consumer Staples
Consumer Discretionary
Materials
Energy
Real Estate
Information Technology
No Definitive Cyclical/Defensive Theme

17 Lazard Asset Management
Foreign Currencies – 2019Q1
As of 31 March 2019
Currencies presented constitute Bloomberg’s “Major Currencies” and versus USD.
The MSCI EAFE Currency Index and the MSCI EM Currency Index sets the weights of each currency equal to the relevant weight in the MSCI EAFE Index and MSCI EM Index,
respectively.
The indices listed are unmanaged and have no fees. It is not possible to invest in an index.
The performance quoted represents past performance. Past performance is not a reliable indicator of future results.
Source: Bloomberg
Foreign currencies continued to stabilize
2.2 2.21.6
1.3 1.10.7 0.5
0.2
-0.4 -0.6-1.1 -1.1 -1.2 -1.3
-1.7-2.2 -2.2
-4.7
-6
-5
-4
-3
-2
-1
0
1
2
3
British
Po
und
Ca
nad
ian
Dolla
r
MS
CI
EM
Curr
ency Ind
ex
Ne
w Z
eala
nd D
olla
r
Me
xic
an P
eso
Austr
alia
n D
olla
r
Sin
gapo
re D
olla
r
No
rwe
gia
n K
rone
Taiw
an
ese D
olla
r
MS
CI
EA
FE
Curr
ency I
nde
x
Japa
nese Y
en
South
Afr
ican R
and
Bra
zili
an
Rea
l
Sw
iss F
ranc
South
Kore
an
Wo
n
Da
nis
h K
ron
e
Euro
Sw
edis
h K
rona
18 Lazard Asset Management
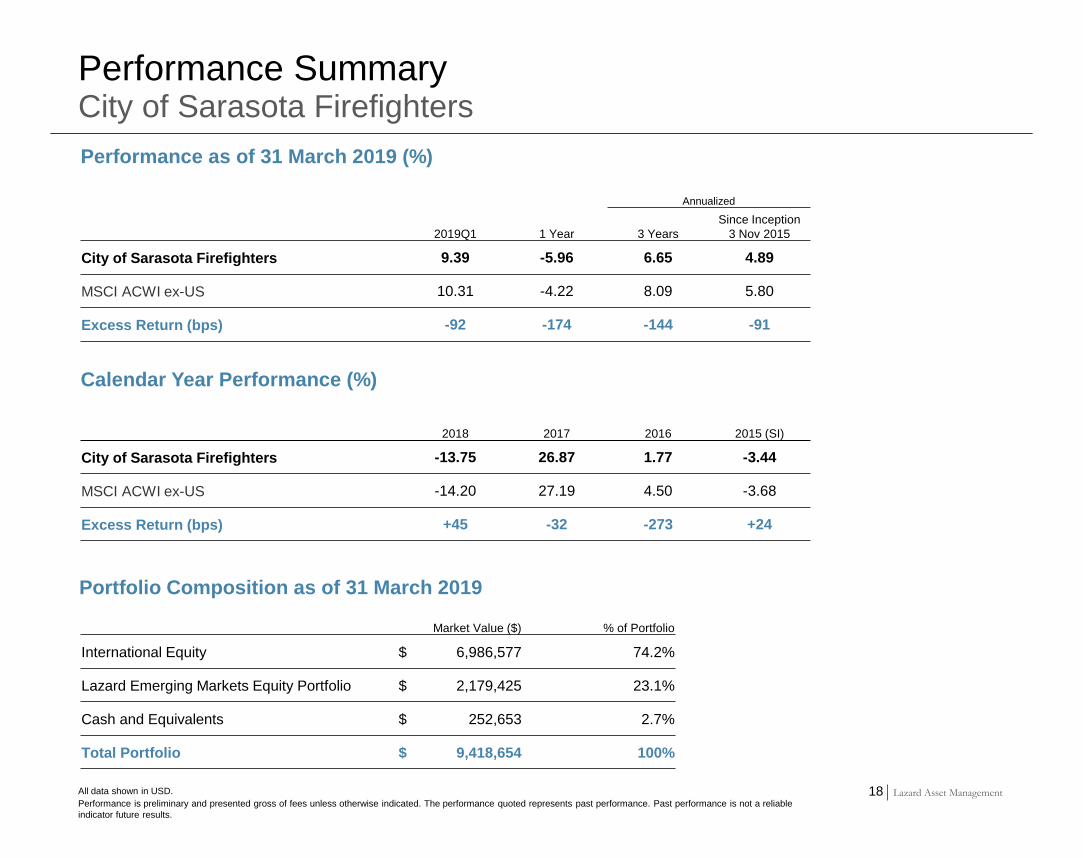
City of Sarasota FirefightersPerformance Summary
All data shown in USD.
Performance is preliminary and presented gross of fees unless otherwise indicated. The performance quoted represents past performance. Past performance is not a reliable
indicator future results.
Performance as of 31 March 2019 (%)
Portfolio Composition as of 31 March 2019
Market Value ($) % of Portfolio
International Equity $ 6,986,577 74.2%
Lazard Emerging Markets Equity Portfolio $ 2,179,425 23.1%
Cash and Equivalents $ 252,653 2.7%
Total Portfolio $ 9,418,654 100%
Annualized
2019Q1 1 Year 3 Years
Since Inception
3 Nov 2015
City of Sarasota Firefighters 9.39 -5.96 6.65 4.89
MSCI ACWI ex-US 10.31 -4.22 8.09 5.80
Excess Return (bps) -92 -174 -144 -91
2018 2017 2016 2015 (SI)
City of Sarasota Firefighters -13.75 26.87 1.77 -3.44
MSCI ACWI ex-US -14.20 27.19 4.50 -3.68
Excess Return (bps) +45 -32 -273 +24
Calendar Year Performance (%)

19 Lazard Asset ManagementLazard Asset Management
Composite Performance Summary Lazard International Equity Select ADR
All data in USD.
1. Data represented is from when Michael Fry joined the team as the lead portfolio manager.
Performance is preliminary and presented gross of fees. Please refer to “GIPS® Composite Information” for additional information, including net-of-fee results. The performance quoted
represents past performance. Past performance is not a reliable indicator of future results.
Performance as of 31 March 2019 (%)
Annualized
2019Q1 1 Year 3 Years 5 Years
Since
1 May 2010¹ 10 Years
Since Inception
1 Jan 1994
Lazard International Equity Select ADR 10.10 -3.50 6.37 3.23 7.00 9.57 7.00
MSCI EAFE Index 9.98 -3.71 7.27 2.33 5.07 8.96 4.98
Excess Return (bps) +12 +21 -90 +90 +193 +61 +202
Calendar Year Performance (%)
2018 2017 2016 2015 2014 2013 2012 2011
Lazard International Equity Select ADR -12.35 26.61 -3.22 5.79 -5.76 22.52 22.20 -4.81
MSCI EAFE -13.79 25.03 1.00 -0.81 -4.90 22.78 17.32 -12.14
Excess Return (bps) +144 +158 -422 +660 -86 -26 +488 +733

20 Lazard Asset Management
Lazard International Equity Select ADR vs. MSCI EAFE IndexAttribution by Sector
As of 31 March 2019. All data shown in USD and reflects rounding.
1 Active weight reflects the Lazard International Equity Select ADR average weight subtracted by the MSCI EAFE Index average weight.
The allocations mentioned are based upon a portfolio that represents the proposed investment for a fully discretionary account. Allocations are subject to change.
Attribution is based upon a representative portfolio and is versus the benchmark noted. Attribution analysis is provided for illustrative purposes only, as values are calculated based on
returns gross of fees. Performance would be lower if fees and expenses were included. Past performance is not a reliable indicator of future results. This information is for illustrative
purposes only and is supplemental to the “GIPS® Composite Information.”
Source: Lazard, MSCI
2019Q1:
Financials
Comm.
Services
Information
Technology
Consumer
Staples Industrials Energy Materials
Consumer
Discretionary Health Care Utilities Real Estate Cash Total
Active Weight (%)1 -2.1 3.1 0.4 -3.8 7.7 0.5 -4.5 -2.0 -2.4 -1.7 -1.7 6.3
Sector Allocation (bps) 6 -19 3 -6 5 0 -13 5 -2 1 -6 -58 -84
Stock Selection (bps) 49 51 27 32 8 3 13 -11 -20 -27 -29 0 98
Total Effect (bps) 56 32 31 27 13 3 0 -6 -22 -27 -35 -58 13
56
32 3127
13
3 0
-6
-22-27
-35
-58
13
-80
-60
-40
-20
0
20
40
60
80
(bps)

21 Lazard Asset Management
Lazard International Equity Select Plus ADR (ACW ex-US) vs. MSCI ACWI ex-US
Attribution by Region
As of 31 March 2019. All data shown in USD and reflects rounding.
1 Active weight reflects the Lazard International Equity Select Plus ADR (ACW ex-US) average weight subtracted by the MSCI ACWI ex-US average weight.
*During the 1st quarter of 2019, the portfolio's annualized weighted emerging market return was +7.5% versus +9.9% for the MSCI Emerging Markets Index .
The allocations mentioned are based upon a portfolio that represents the proposed investment for a fully discretionary account. Allocations are subject to change.
Attribution is based upon a representative portfolio and is versus the benchmark noted. Attribution analysis is provided for illustrative purposes only, as values are calculated based on
returns gross of fees. Performance would be lower if fees and expenses were included. Past performance is not a reliable indicator of future results.
Source: Lazard, MSCI
Continental
Europe Asia ex-Japan United Kingdom Middle East North America Japan Emerging Markets Cash Total
Active Weight (%)1 7.8 -3.4 3.9 -0.4 -2.6 -7.8 -2.6 5.1
Region Allocation (bps) 1 -6 6 -1 -11 27 1 -52 -35
Stock Selection (bps) 41 17 4 0 -13 -51 -48 0 -49
Total Effect (bps) 42 11 10 -1 -23 -23 -47 -52 -84
42
11 10
-1
-23 -23
-47-52
-84-100
-80
-60
-40
-20
0
20
40
60
(bps)2019Q1:

22 Lazard Asset Management
Lazard International Equity SelectUK Holdings – High Relative Exposure
Source: Most Recent Annual Reports, Factset, Lazard Estimates
Holdings as of 31 March 2019
The securities mentioned are not necessarily held by Lazard for all client portfolios, and their mention should not be considered a recommendation or solicitation to purchase or sell these
securities. It should not be assumed that any investment in these securities was, or will prove to be, profitable, or that the investment decisions we make in the future will be profitable or
equal to the investment performance of securities referenced herein. There is no assurance that any securities referenced herein are currently held in the portfolio or that securities sold
have not been repurchased. The securities mentioned may not represent the entire portfolio.
Most of “UK” Exposure is Outside the UK
0% 20% 40% 60% 80% 100%
Prudential
Aon
Royal Dutch Shell
Ashtead
Ferguson
Compass
RELX
Informa
Unilever
% of Revenue Generated Outside of the United Kingdom

23 Lazard Asset Management
Brexit: Uncertainty Continues
Timeline of Key Upcoming Events
Information and opinions as of 12 April 2019 and are subject to change.
Source: Lazard, Bloomberg, Financial Times
Brexit Scenarios & Expectations:
Stock Selection Remains Primary Alpha Source
Irish Border Dilemma/Customs Union?
• 1998 Good Friday Agreement eliminated hard
border
• EU wants to control goods flowing across the
border
• UK/Ireland wants to avoid a hard border
a) Hard border in Ireland; separates Irish union
b) Hard border in sea; separates the UK
c) Soft border continues; EU loses control
No Deal
Hard
Brexit
Soft
Brexit Remain
UK stocks ↓↓ ↓ ↑ ↑↑
UK Currency ↓↓ ↓ ↑ ↑↑
LAM/UK
Performance × ××
April 10 May 7 May 23 June 30 Oct 31
Deadline for UK registering to
Participate in EU Parliament Elections
(Critical to Participate)
EU Council Meeting
EU Parliamentary Elections
• UK can’t remain EU member without participating
First review period of current Article 50
extension• Leaving on this
date is possible
Current Article 50 Deadline
Leave EU
With Article 50 deadline pushed further out, other options come back on the table including another referendum

24 Lazard Asset Management
Japan – Low Relative Exposure
Information and opinions as of 31 March 2019 and are subject to change.
Source: Lazard, Factset Market Aggregates, MSCI
Japanese stocks financial productivity continues to be low by global standards
Attribution driven by stock selection
• Employment is strong
• BOJ remains accommodative
• Corporate governance and shareholder
returns are slowly improving
• Japan has benefited from global growth
• Inflationary pressure is still intangible
• Rising cash balances are hurting ROEs
• Next consumption tax rise is on the horizon
• Japan returns are hurt by slowing global
growth
Negatives:Positives:
-45%
-40%
-35%
-30%
-25%
-20%
-15%
-10%
-5%
0%
Dec
-10
Mar
-11
Jun
-11
Sep
-11
Dec
-11
Mar
-12
Jun
-12
Sep
-12
Dec
-12
Mar
-13
Jun
-13
Sep
-13
Dec
-13
Mar
-14
Jun
-14
Sep
-14
Dec
-14
Mar
-15
Jun
-15
Sep
-15
Dec
-15
Mar
-16
Jun
-16
Sep
-16
Dec
-16
Mar
-17
Jun
-17
Sep
-17
Dec
-17
Mar
-18
Jun
-18
Sep
-18
Dec
-18
Mar
-19
Japan NTM ROE / EAFE NTM ROE

25 Lazard Asset Management
-30%
-25%
-20%
-15%
-10%
-5%
0%
5%
Dec
-08
Mar
-09
Jun
-09
Sep
-09
Dec
-09
Mar
-10
Jun
-10
Sep
-10
Dec
-10
Mar
-11
Jun
-11
Sep
-11
Dec
-11
Mar
-12
Jun
-12
Sep
-12
Dec
-12
Mar
-13
Jun
-13
Sep
-13
Dec
-13
Mar
-14
Jun
-14
Sep
-14
Dec
-14
Mar
-15
Jun
-15
Sep
-15
Dec
-15
Mar
-16
Jun
-16
Sep
-16
Dec
-16
Mar
-17
Jun
-17
Sep
-17
Dec
-17
Mar
-18
Jun
-18
Sep
-18
Dec
-18
Mar
-19
MSCI Emerging Markets/MSCI EAFE PE FY1 Average
Emerging Markets – Low Exposure
Information and opinions as of 31 March 2019 and are subject to change.
Source: Lazard, FactSet, MSCI
EM discount to DM valuations elevated vs 10 year average
Stock Specific Opportunities in Both EM and DM
• Trade war concerns for export countries
• Fragile currencies vulnerable to US$ strength
• China slowdown
• Trade war resolution
• Currency stability
• China stimulus
Opportunities:Risks:

26 Lazard Asset Management
Purchases and Sales – 2019Q1Lazard International Equity Select Plus ADR (ACW ex-US)
Purchases
• Royal DSM
• Sanofi
• Suzuki
As of 31 March 2019
Securities mentioned are based upon a portfolio which represents the proposed investments for a fully discretionary account and are subject to change. This information is for illustrative
purposes only and is supplemental to the “GIPS® Composite Information.”
The securities identified are not necessarily held by Lazard Asset Management and should not be considered a recommendation or solicitation to purchase or sell these securities. It should
not be assumed that any of the referenced securities were or will prove to be profitable, or that the investment decisions we make in the future will be profitable or equal to the investment
performance of securities referenced herein. There is no assurance that any securities referenced herein are currently held in the account’s portfolio or that securities sold have not been
repurchased. The securities discussed may not represent the account’s entire portfolio.
Sales
• ABB

27 Lazard Asset Management
Portfolio DirectionSector and Regional Active Weights
As of 31 March 2019
1 Represents the Portfolio re-weighted excluding Lazard Emerging Markets Equity Portfolio and cash.
The allocations mentioned are based upon a portfolio that represents the proposed investment for a fully discretionary account. Allocations are subject to change.
Allocations are subject to change.
Source: Lazard, MSCI
Sector¹ vs
MSCI EAFE
31 Dec
2018
31 Mar
2019
YTD Change in
Active Weight
Health Care -2.2 0.2 2.4
Consumer Staples -3.9 -2.9 1.0
Financials -1.3 -1.0 0.3
Information
Technology1.0 1.3 0.3
Energy 0.7 0.7 0.0
Consumer
Discretionary-1.2 -1.2 0.0
Materials -4.1 -4.6 -0.5
Real Estate -1.3 -1.8 -0.5
Communication
Services3.9 3.1 -0.8
Industrials 9.4 8.4 -1.0
Utilities -1.2 -2.2 -1.0
Region vs
MSCI ACWI ex-US
31 Dec
2018
31 Mar
2019
YTD Change in
Active Weight
Continental
Europe7.4 9.9 2.5
United Kingdom 3.4 4.0 0.6
Japan -8.0 -7.5 0.5
Middle East -0.4 -0.4 0.0
Emerging Markets -3.0 -3.2 -0.2
Asia ex-Japan -3.2 -3.9 -0.7
North America -2.3 -3.1 -0.8
Cash &
Equivalents5.9 4.0 -1.9
International Equity Select Plus ADR (ACW ex-US) (%)

28 Lazard Asset Management
Lazard International Equity Select Plus ADR (ACW ex-US)Holdings by Sector
As of 31 March 2019
1 Represents the Portfolio re-weighted excluding the Lazard Emerging Markets Equity Portfolio and cash. Cash is 4.0% of the portfolio.
Allocations and securities mentioned are based upon a portfolio which represents the proposed investments for a fully discretionary account. Allocations and security selection are
subject to change. This information is for illustrative purposes only and is supplemental to the “GIPS® Composite Information.”
The securities mentioned are not necessarily held by Lazard for all client portfolios, and their mention should not be considered a recommendation or solicitation to purchase or sell
these securities. It should not be assumed that any investment in these securities was, or will prove to be, profitable, or that the investment decisions we make in the future will be
profitable or equal to the investment performance of securities referenced herein. There is no assurance that any securities referenced herein are currently held in the portfolio or that
securities sold have not been repurchased. The securities mentioned may not represent the entire portfolio.
Source: Lazard, MSCI
% of
Lazard
% of MSCI
ACWI ex-US
Emerging Markets 22.9 26.1
Lazard Emerging Markets Equity Portfolio (Instl)
-4.6
-2.9
-2.2
-1.8
-1.2
-1.0
0.2
0.7
1.3
3.1
8.4
-10 -5 0 5 10
Materials
ConsumerStaples
Utilities
Real Estate
ConsumerDiscretionary
Financials
Health Care
Energy
InformationTechnology
CommunicationServices
Industrials
Active Weight (%)
% of
Lazard¹
% of MSCI
EAFE
Communication
Services 8.5 5.4
Informa
Rogers
Telenor
Ubisoft
Vivendi
Consumer
Discretionary 9.8 11.0
Compass
Michelin
Richemont
Ryohin Keikaku
Suzuki
Volkswagen
Consumer Staples 8.9 11.8
Anheuser-Busch InBev
Carlsberg
Kao
Unilever
Energy 6.5 5.8
Equinor
Royal Dutch Shell
Suncor
Financials 17.9 18.9
ABN AMRO
AIA
Aon
DBS
Nordea
Prudential
Sampo
SMFG
Health Care 11.5 11.3
Genmab
Medtronic
Novartis
Sanofi
Sonova
% of
Lazard¹
% of MSCI
EAFE
Industrials 22.8 14.4
Ashtead
Assa Abloy
Canadian National Railway
Ferguson
Komatsu
Makita
RELX
Ryanair
Safran
VINCI
Wolters Kluwer
Information
Technology 7.6 6.3
Accenture
SAP
Materials 2.9 7.5
BHP
Royal DSM
Real Estate 2.1 3.9
Daiwa House
Utilities 1.5 3.7
Red Electrica
Total Portfolio 100.0 100.0

29 Lazard Asset Management
Lazard International Equity Select Plus ADR (ACW ex-US)Holdings by Country
As of 31 March 2019
Allocations and securities mentioned are based upon a portfolio which represents the proposed investments for a fully discretionary account. Allocations and security selection are subject to
change. This information is for illustrative purposes only and is supplemental to the “GIPS® Composite Information.”
The securities mentioned are not necessarily held by Lazard for all client portfolios, and their mention should not be considered a recommendation or solicitation to purchase or sell these
securities. It should not be assumed that any investment in these securities was, or will prove to be, profitable, or that the investment decisions we make in the future will be profitable or equal to
the investment performance of securities referenced herein. There is no assurance that any securities referenced herein are currently held in the portfolio or that securities sold have not been
repurchased. The securities mentioned may not represent the entire portfolio.
Source: Lazard, MSCI
-7.5
-3.9
-3.2
-3.1
-0.4
4.0
9.9
-15 -5 5 15
Japan
Asia ex-Japan
EmergingMarkets
North America
Middle East
United Kingdom
ContinentalEurope
Active Weight (%)
% of
Lazard
% of MSCI
ACWI ex-US
Australia 1.5 4.7
BHP
Austria 0.0 0.2
Belgium 2.1 0.7
Anheuser-Busch InBev
Canada 3.7 6.8
Canadian National Railway
Rogers
Suncor
Denmark 1.8 1.2
Carlsberg
Genmab
Finland 1.7 0.7
Sampo
France 9.6 7.6
Michelin
Safran
Sanofi
Ubisoft
VINCI
Vivendi
Germany 4.4 5.8
SAP
Volkswagen
Hong Kong 1.5 2.8
AIA
Ireland 6.2 0.4
Accenture
Medtronic
Ryanair
Israel 0.0 0.4
Italy 0.0 1.6
% of
Lazard
% of MSCI
ACWI ex-US
Japan 8.6 16.1
Daiwa House
Kao
Komatsu
Makita
Ryohin Keikaku
SMFG
Suzuki
Netherlands 3.7 2.4
ABN AMRO
Royal DSM
Wolters Kluwer
New Zealand 0.0 0.2
Norway 2.1 0.5
Equinor
Telenor
Portugal 0.0 0.1
Singapore 1.5 0.9
DBS
Spain 1.1 2.0
Red Electrica
Sweden 3.3 1.8
Assa Abloy
Nordea
% of
Lazard
% of MSCI
ACWI ex-US
Switzerland 4.7 6.0
Novartis
Richemont
Sonova
United Kingdom 15.5 11.5
Aon
Ashtead
Compass
Ferguson
Informa
Prudential
RELX
Royal Dutch Shell
Unilever
Total Developed 73.1 73.9
Emerging Markets 22.9 26.1
Lazard Emerging Markets Equity Portfolio (Instl)
Cash & Equivalents 4.0 0.0
Total Portfolio 100.0 100.0

TABTAB

31 Lazard Asset Management
Outlook
Information and opinions as of 31 March 2019 and are subject to change.
• Moderately Defensive
• High quality
• Late cycle; global economic uncertainty
• UK Brexit unresolved
• US/China trade-war unresolved
• Global political unrest continues
• Earnings estimates have come down
• Will central bank intervention work yet again?
Portfolio Positioning
• Relative Value
• Stock Specific Thesis

32 Lazard Asset Management32 Lazard Asset Management
Manufacturing Purchasing Managers Indices
As of 31 March 2019.
Source: Factset, Markit, Nikkei, Caixin
EZ
UK
US
China
Japan
Global manufacturing activity is mixed
46
48
50
52
54
56
58
60
62
Jun
-16
Jul-
16
Au
g-1
6
Sep
-16
Oct
-16
No
v-1
6
Dec
-16
Jan
-17
Feb
-17
Mar
-17
Ap
r-1
7
May
-17
Jun
-17
Jul-
17
Au
g-1
7
Sep
-17
Oct
-17
No
v-1
7
Dec
-17
Jan
-18
Feb
-18
Mar
-18
Ap
r-1
8
May
-18
Jun
-18
Jul-
18
Au
g-1
8
Sep
-18
Oct
-18
No
v-1
8
Dec
-18
Jan
-19
Feb
-19
Mar
-19
US UK Eurozone Japan China Expansion/Contraction

33 Lazard Asset ManagementLazard Asset Management
Relative Value MSCI Regions
As of 31 March 2019.
1 Forward Price/Earnings is defined as Price/Earnings FY1 and Forward Return on Equity as Return on Equity NTM.
The figures above represent expected returns. Expected returns do not represent a promise or guarantee of future results and are subject to change.
Source: Lazard, Factset, MSCI
Forward P/E1 Forward ROE (%)1 Dividend Yield (%)
EAFE 13.7 11.0 3.4
US 17.4 17.2 2.0
United Kingdom 12.9 12.6 4.7
Continental Europe 14.1 12.1 3.4
Asia ex-Japan 15.6 10.3 3.9
Japan 12.9 9.0 2.4
Emerging Markets 12.7 12.2 2.7
Market appreciation drove valuations higher

34 Lazard Asset Management
Global ValuationsForward P/E
As of 31 March 2019
Forward Price/Earnings is defined as Price/Earnings FY1.
The indices listed above are unmanaged and have no fees. It is not possible to invest directly in an index.
Source: Lazard, FactSet, MSCI
7.5
10.0
12.5
15.0
17.5
20.0
22.5
MSCI United States MSCI EAFE MSCI United Kingdom MSCI Europe Ex-United Kingdom MSCI Japan MSCI Emerging Markets
US
Europe
Japan
EM
EAFE
UK
Market appreciation drove valuations higher

35 Lazard Asset Management
MSCI EAFE vs MSCI USA
As of 31 March 2019
Source: Factset, MSCI
EAFE near deepest discount to US in 20 years
-25.0%
-20.0%
-15.0%
-10.0%
-5.0%
0.0%
5.0%
10.0%
15.0%
20.0%M
ar-9
9
Sep
-99
Mar
-00
Sep
-00
Mar
-01
Sep
-01
Mar
-02
Sep
-02
Mar
-03
Sep
-03
Mar
-04
Sep
-04
Mar
-05
Sep
-05
Mar
-06
Sep
-06
Mar
-07
Sep
-07
Mar
-08
Sep
-08
Mar
-09
Sep
-09
Mar
-10
Sep
-10
Mar
-11
Sep
-11
Mar
-12
Sep
-12
Mar
-13
Sep
-13
Mar
-14
Sep
-14
Mar
-15
Sep
-15
Mar
-16
Sep
-16
Mar
-17
Sep
-17
Mar
-18
Sep
-18
Mar
-19
P/E
Pre
miu
m o
r D
isco
un
t
MSCI EAFE Premium to MSCI US
MSCI EAFE Discount to MSCI US
Average

36 Lazard Asset ManagementLazard Asset Management
-40
-30
-20
-10
0
10
20
30
40
50
601
970
19
711
972
19
731
974
19
751
976
19
771
978
19
791
980
19
811
982
19
831
984
19
851
986
19
871
988
19
891
990
1991
19
921
993
19
941
995
19
961
997
19
9819
992
000
20
012
002
20
032
004
20
052
006
2007
20
082
009
20
102
011
20
122
013
20
142
015
20
162
017
20
182
019
Q1
MSC
I EA
FE -
MSC
I US
Tota
l Ret
urn
MSCI EAFE vs MSCI US: Time for a Change?
As of 31 March 2019. Returns since 1969 are annualized.
Information and opinions are as of the date of this communication and are subject to change.
The performance quoted represents past performance. Past performance is not a reliable indicator of future results. This information is for illustrative purposes only and does not represent
any product or strategy managed by Lazard. It is not possible to invest directly in an index.
Certain information included herein is derived by Lazard in part from an MSCI index or indices (the “Index Data”). However, MSCI has not reviewed this product or report, and does not
endorse or express any opinion regarding this product or report or any analysis or other information contained herein or the author or source of any such information or analysis. MSCI
makes no express or implied warranties or representations and shall have no liability whatsoever with respect to any Index Data or data derived therefrom.
Source: MSCI, Lazard
MSCI US Outperforms (23 Times)
EAFE and US Have Taken Turns Outperforming
MSCI EAFE Outperforms (26 Times)
Since Dec 1969: MSCI US +9.2 %MSCI EAFE +8.6 %
Last period of EAFE
dominance

37 Lazard Asset Management
The Great Debate Continues
Information and opinions are as of the date of this document and are subject to change.
Growth has been the flavor of the decade
A handful of technology businesses transformed the ecosystem and
reinforced that bet
The valuation gap between growth and value has seldom been wider
Value has been under-owned and out of favor for a decade – history
suggests that it may be time for a turn!

38 Lazard Asset Management
-1200
-1000
-800
-600
-400
-200
0
200
400
600
800
Dec
-08
Mar
-09
Jun
-09
Sep
-09
Dec
-09
Mar
-10
Jun
-10
Sep
-10
Dec
-10
Mar
-11
Jun
-11
Sep
-11
Dec
-11
Mar
-12
Jun
-12
Sep
-12
Dec
-12
Mar
-13
Jun
-13
Sep
-13
Dec
-13
Mar
-14
Jun
-14
Sep
-14
Dec
-14
Mar
-15
Jun
-15
Sep
-15
Dec
-15
Mar
-16
Jun
-16
Sep
-16
Dec
-16
Mar
-17
Jun
-17
Sep
-17
Dec
-17
Mar
-18
Jun
-18
Sep
-18
Dec
-18
Mar
-19
bp
s
Quarterly SpreadEAFE Growth – EAFE Value
As of 31 March 2019.
Quarterly total returns.
Source: Lazard, Factset, MSCI
The performance quoted represents past performance. Past performance is not a reliable indicator of future results. The indices mentioned are unmanaged and has no fees. One cannot
invest directly in an index. All data is in USD.
Information and opinions presented have been obtained or derived from sources believed by Lazard to be reliable. Lazard makes no representation as to their accuracy or completeness.
All opinions expressed herein are as of the published date and are subject to change.
Growth continues to dominate
Growth Outperforms
Value Outperforms
+ 2sd
- 2sd

39 Lazard Asset Management
Market Environment is Shifting
Interest Rates and GDP
As of 31 March 2019.
Top Chart: Regional aggregate is calculated using real GDP weighted averages, fixed to 2017. Countries included are those that make up the MSCI EAFE Index. GDP data is
as of December 2018
Source: Factset, Factset Market Aggregates
EPS Growth Estimates (NTM)
Convergence should drive focus on fundamentals and valuation
0.0
0.5
1.0
1.5
2.0
2.5
3.0
Dec-13 Jul-14 Feb-15 Sep-15 Apr-16 Nov-16 Jun-17 Jan-18 Aug-18 Mar-19
%
EAFE Aggregate Real GDP Growth EAFE Aggregate Government Yield - 10 Year
4
6
8
10
12
14
16
18
Mar-18 Apr-18 May-18 Jun-18 Jul-18 Aug-18 Sep-18 Oct-18 Nov-18 Dec-18 Jan-19 Feb-19 Mar-19
%
MSCI EAFE MSCI EM MSCI USA

TABTAB

41 Lazard Asset Management
Key Observations: Q1 2019
As of 31 March 2019
Source: China Federation of Logistics & Purchasing, Haver Analytics, MSCI, Factset
EM Equities Rebound 10% in Q1
• Optimism on trade deal lifts global markets
• No planned rate hikes by Federal Reserve in 2019
provides favorable backdrop for EM
• Oil recovers on tighter supply despite slowing
global demand and increased US shale production
• Value lags (8%) EM Index while Growth bounces
back (12%), led by China (18%) and consumer
discretionary securities (20%)
Sentiment in China Improves Significantly
• Some of the hardest hit stocks in 2018 (consumer
disc, IT, healthcare) lead the market in 2019
• Policy leaders continue to balance efforts to
support the economy (~RMB 2 trillion tax cuts,
improved credit flow to private sector) with
continued attention to financial risks and
environmental controls
• MSCI announces weight of A-shares will increase
in three steps over 2019
49
49.5
50
50.5
95
100
105
110
115
120
125
130
135
Jan 2019 Feb 2019 Mar 2019
PM
I 50+
=E
xp
an
sio
n
Ind
ex 1
00 =
31 D
ec 2
018
China’s markets rebounded, PMI improves
MSCI China A MSCI China PMI - China
34.3
17.7
12.2 12.08.1 7.8
-0.4-3.2
-10
-5
0
5
10
15
20
25
30
35
40
CrudeOil
MSCIChina
MSCIRussia
MSCIEM
Growth
MSCIBrazil
MSCIEM
Value
USDollar
MSCITurkey
Oil led all markets, while USD was flat in Q1(%)

42 Lazard Asset Management
Growth Has Outperformed Value Since 2012
As of 31 December 2018
Source: MSCI
80
90
100
110
120
130
140
97 98 99 00 01 02 03 04 05 06 07 08 09 10 11 12 13 14 15 16 17 18
Ind
ex 2
8 F
eb 1
99
7 =
10
0
MSCI EM Growth/Value Performance
Growth underperforms Value: -38.6%
Growth outperforms Value: +39.0%
Growth outperformsValue: +35.8%
5
10
15
20
25
2010 2011 2012 2013 2014 2015 2016 2017 2018
P/E
(LTM
)
Valuation Levels have Diverged since 2011
MSCI EM Growth MSCI EM Value MSCI EM

43 Lazard Asset Management
Institutional SharesLazard Emerging Markets Equity Portfolio Performance
Reporting Date: 31 March 2019.
All data in USD
The performance quoted represents past performance. Past performance does not guarantee future results. The current performance may be lower or higher than the performance
data quoted. An investor may obtain performance data current to the most recent month-end online at www.LazardAssetManagement.com. The investment return and principal value
of the Portfolio will fluctuate; an investor’s shares, when redeemed, may be worth more or less than their original cost. The MSCI Emerging Markets Index is comprised of emerging
market securities in countries open to non-local investors. The index is unmanaged and has no fees. One cannot invest directly in an index
Annual Performance (%)
Annualized Performance (%)Annualized
2019 Q1 1 Year 3 Years 5 Years 10 Years
Since Inception
18 Jul 1994
Lazard Emerging Markets Equity Portfolio 7.53 -13.69 7.72 0.87 8.27 6.45
MSCI Emerging Markets Index 9.92 -7.41 10.68 3.68 8.94 5.49
Excess Return (bps) -239 -628 -296 -281 -67 +96
2018 2017 2016 2015 2014 2013 2012 2011 2010 2009 2008
Lazard Emerging Markets Equity
Portfolio-18.09 28.02 20.52 -20.16 -4.16 -0.80 22.36 -17.75 22.81 69.82 -47.88
MSCI Emerging Markets Index -14.58 37.28 11.19 -14.92 -2.19 -2.60 18.22 -18.42 18.88 78.50 -53.33
Excess Return (bps) -351 -926 +933 -524 -197 +180 +414 +67 +393 -868 +545

44 Lazard Asset Management
2019 Q1 Drivers of Underperformance
As of 31 March 2019.
\All data shown in USD.
Attribution is based upon a representative portfolio and is versus the benchmark noted. Attribution analysis is provided for illustrative purposes only, as values are calculated based on
returns gross of fees. Performance would be lower if fees and expenses were included. Past performance is not a reliable indicator of future results. The allocations mentioned are based
upon a portfolio that represents the proposed investment for a fully discretionary account. Allocations and security selection are subject to change.
South Africa:Overweight underperforming market; poor security selection in
communication services, consumer discretionary and consumer staples
-130 bps
China:Underweight outperforming market; poor security selection in communication services and financials
No exposure to Alibaba and Tencent (-100 bps)
-200 bps
Indonesia:Overweight
underperforming market; security selection within
financials
-25 bps
Brazil:Poor security selectionin the financial sector
-30 bps

45 Lazard Asset Management
Lazard Emerging Markets Equity PortfolioTop Contributors/Detractors by Performance Contribution
As of 31 March 2019.
Contribution data is based upon a representative portfolio. Contribution analysis is provided for illustrative purposes only, as values are calculated based on returns gross of fees. The
performance quoted represents past performance. Past performance does not guarantee future results.
Attribution is based upon the Lazard Emerging Markets Equity Portfolio and is versus the benchmark noted. Attribution analysis is provided for illustrative purposes only, as values are
calculated based on returns gross of fees. Performance would be lower if fees and expenses were included. Past performance is not a reliable indicator of future results.
The securities mentioned are not necessarily held by the Portfolio, and their mention should not be considered a recommendation or solicitation to purchase or sell these securities. It
should not be assumed that any investment in these securities was, or will prove to be, profitable, or that the investment decisions we make in the future will be profitable or equal to the
investment performance of securities referenced herein. There is no assurance that any securities referenced herein are currently held in the Portfolio or that securities sold have not
been repurchased. The securities mentioned may not represent the entire Portfolio.
Anhui Conch27
Coway28
China Mobile 28
Banco do Brasil 29
Axis Bank 46
LUKOIL 47
SK hynix 49
Samsung Electronics
52
Weichai Power55
Sberbank 68
Astra International -12
KB Financial -12
Vodacom -16
Shoprite Holdings -21
Hero Motocorp -26
-50 0 50 100bpsbps
Top Contributors: +431
Bottom Detractors: -87
2019 Q1 Key Contributors
• Stock selection in the Materials and Industrials
sectors and in Korea, Russia and Turkey helped
performance.
• Lower-than-index exposure to Malaysia was additive.
Key Detractors
• Stock selection within the Consumer Discretionary,
Communication Services, and IT sectors detracted
from returns, as well as in China, Brazil and South
Africa.
• Lower-than-index exposure to China as well as
greater-than-index exposure to Indonesia detracted
as well.

46 Lazard Asset Management
Lazard Emerging Markets Equity PortfolioHelped/Hurt
As of 31 March 2019.
The allocations and specific securities mentioned are based upon the Lazard Emerging Markets Equity Portfolio. Allocations and security selection are subject to change. The
securities mentioned are not necessarily held by Lazard for all client portfolios, and their mention should not be considered a recommendation or solicitation to purchase or sell these
securities. It should not be assumed that any investment in these securities was, or will prove to be, profitable, or that the investment decisions we make in the future will be profitable
or equal to the investment performance of securities referenced herein. There is no assurance that any securities referenced herein are currently held in the portfolio or that securities
sold have not been repurchased. The securities mentioned may not represent the entire portfolio.
2019 Q1
What Helped
Sberbank, a Russia bank, announced strong results and shares
were also boosted by positive sentiment regarding Russia on
the back of rising oil prices and the potential for the removal of
some sanctions.
Samsung Electronics and SK Hynix, a Korean manufacturer of
electronic goods and a Korean semiconductor manufacturer,
respectively, rebounded from weakness in 2018 as the market
began to bottom-fish Asian technology stocks and on
expectations that semiconductor sales would bottom in the first
half of 2019.
Axis Bank, an Indian private sector bank, climbed on the
expectation of improving credit costs and strong retail growth
led by the new CEO.
Weichai Power, a Chinese manufacturer of large diesel
engines, issued a positive profit alert for 2018 and guided for a
stable markets in 2019.
What Hurt
Hero Motocorp, an Indian manufacturer and distributor of
motorcycles, experienced margin compression as a result of
tough market competition.
Shares of Shoprite, a South African supermarket chain, fell after
management issued a profit warning.
Vodacom, a South African telecom services company,
announced weak results and the market remained concerned
about the lack of demand elasticity for data services.
KB Financial Group, a Korean financial services company,
reported weaker fourth quarter results due to higher-than-
expected spending on its early retirement program and a
weaker macroeconomic environment.
Astra International, a diversified Indonesian company operating
primarily across the automotive, heavy equipment and mining,
and financial services segments, reported weaker fourth quarter
results as election uncertainty and tighter monetary policy have
weighed on commercial vehicle demand.

47 Lazard Asset Management
Lazard Emerging Markets Equity PortfolioRelative Weights vs. Index¹
As of 31 March 2019.
1. Index is defined as the MSCI Emerging Markets Index.
The countries shown are countries Lazard Emerging Markets Equity Portfolio holds a position in.
Allocations are based upon the Lazard Emerging Markets Equity Portfolio. Allocations and security selection are subject to change.
Source: Lazard, MSCI
33.0
11.3
2.2
2.3
1.1
9.2
0.1
7.2
13.0
2.7
0.3
0.0
0.5
5.9
2.2
3.8
-12.3
-5.9
-1.4
-0.7
-0.4
0.7
0.9
0.9
1.0
1.2
1.3
1.5
1.5
1.5
1.9
3.6
6.1
-15 -10 -5 0 5 10 15 20
China
Taiwan
Malaysia
Thailand
Philippines
India
Egypt
Brazil
Korea
Pakistan
Mexico
Hungary
Argentina
Turkey
South Africa
Indonesia
Russia
13.4
3.2
2.6
2.5
7.4
5.4
6.4
12.3
8.1
24.2
14.6
-6.4
-3.2
-1.9
-1.5
-1.4
-0.2
0.2
0.3
2.5
3.3
4.6
-20 -10 0 10 20 30
Consumer Discretionary
Real Estate
Health Care
Utilities
Materials
Industrials
Consumer Staples
Communication Services
Energy
Financials
Information Technology
Sector Country
(%) (%)
Index Weight (%) Active Weight (%)

48 Lazard Asset Management
Lazard Emerging Markets Equity PortfolioTrading Activity and Top Ten Positions
As of 31 March 2019.
The allocations and specific securities mentioned are based upon the Lazard Emerging Markets Equity Portfolio. Allocations and security selection are subject to change. The securities
mentioned are not necessarily held by the Portfolio, and their mention should not be considered a recommendation or solicitation to purchase or sell these securities. It should not be
assumed that any investment in these securities was, or will prove to be, profitable, or that the investment decisions we make in the future will be profitable or equal to the investment
performance of securities referenced herein. There is no assurance that any securities referenced herein are currently held in the Portfolio or that securities sold have not been
repurchased. The securities mentioned may not represent the entire Portfolio.
We continue to find very attractive relative value in the existing portfolio holdings
% of
Lazard
China Construction Bank 4.6
Samsung Electronics 4.4
Sberbank 3.5
TSMC 3.5
Banco do Brasil 3.4
SK hynix 3.0
NetEase 2.7
China Mobile 2.7
Axis Bank 2.5
LUKOIL 2.1
Total 32.1
Total Number of Holdings 76
Top Ten Positions2019 Q1 Buys/Sells
Bought
Coal India
Oil & Natural Gas
Sold
Petrobras Distribuidora
Sabesp

49 Lazard Asset Management
Lazard Emerging Markets Equity PortfolioHoldings by Country
As of 31 March 2019.
The allocations and specific securities mentioned are based upon the Lazard Emerging Markets Equity Portfolio. Allocations and security selection are subject to change.
The securities mentioned are not necessarily held by the Portfolio, and their mention should not be considered a recommendation or solicitation to purchase or sell these securities. It
should not be assumed that any investment in these securities was, or will prove to be, profitable, or that the investment decisions we make in the future will be profitable or equal to
the investment performance of securities referenced herein. There is no assurance that any securities referenced herein are currently held in the Portfolio or that securities sold have
not been repurchased. The securities mentioned may not represent the entire Portfolio.
Please note that cash is not viewed as a strategic asset class.
Source: Lazard, MSCI
0.0
11.8
13.8
74.4
3.7
13.6
22.6
60.1
0 20 40 60 80
Cash andEquivalents
Latin America
Europe/MiddleEast/Africa
South/East Asia
(%)Portfolio
MSCI Emerging Markets Index
% of
Lazard
% of MSCI
EM Index
Czech Republic 0.0 0.2
Egypt 1.1 0.1
Commercial International
Bank
Greece 0.0 0.2
Hungary 1.9 0.3
OTP Bank
Poland 0.0 1.1
Qatar 0.0 0.9
Russia 9.8 3.8
ALROSA
Gazprom
LUKOIL
Magnit
Mobile TeleSystems
Sberbank
South Africa 7.8 5.9
Bidvest
Imperial Logistics
Life Healthcare Group
Motus Holdings
Nedbank
PPC
Sanlam
Shoprite
Standard Bank
Vodacom
Woolworths
Turkey 2.1 0.5
Koc Holding
Tupras
United Arab Emirates 0.0 0.7
Total Europe/Middle
East/Africa
22.6 13.8
Argentina 1.5 0.0
YPF
% of
Lazard
% of MSCI
EM IndexBrazil 8.2 7.2
Ambev
Banco do Brasil
BB Seguridade
CCR
Cielo
Chile 0.0 1.0
Colombia 0.0 0.5
Mexico 3.9 2.7
America Movil
Grupo Mexico
Kimberly-Clark de Mexico
Ternium
Peru 0.0 0.4
Total Latin America 13.6 11.8
China 20.7 33.0
AAC Technologies
Anhui Conch
ASM Pacific Technology
Baidu
China Construction Bank
China Merchants Bank
China Mobile
China Shenhua Energy
CNOOC
ENN Energy
Hengan International Group
NetEase
Weichai Power
India 9.9 9.2
Axis Bank
Bajaj Auto
Bharat Petroleum
Coal India
HCL Technologies
Hero Motocorp
Infosys
Oil & Natural Gas
Tata Consultancy Services
UPL
% of
Lazard
% of MSCI
EM Index
Indonesia 5.8 2.2
Astra International
Bank Mandiri
Semen Indonesia
Telekomunikasi Indonesia
Korea 14.0 13.0
HANWHA LIFE INSURANCE
Hyundai Mobis
KB Financial Group
KT & G
Samsung Electronics
Shinhan Financial Group
SK hynix
WOONGJIN COWAY
Malaysia 0.8 2.2
British American Tobacco Malaysia
Pakistan 1.2 0.0
Habib Bank
Oil & Gas Development
Pakistan Petroleum
Philippines 0.7 1.1
PLDT
Taiwan 5.4 11.3
Catcher Technology
Hon Hai Precision Industry
Taiwan Semiconductor Manufacturing
Thailand 1.6 2.3
Kasikornbank
Siam Cement
Total South/East Asia 60.1 74.4
Cash and Equivalents 3.7 0.0
Total Portfolio 100.0 100.0

50 Lazard Asset Management
Lazard Emerging Markets Equity PortfolioHoldings by Sector
As of 31 March 2019.
The allocations and specific securities mentioned are based upon the Lazard Emerging Markets Equity Portfolio. Allocations and security selection are subject to change.
The securities mentioned are not necessarily held by the Portfolio, and their mention should not be considered a recommendation or solicitation to purchase or sell these securities. It
should not be assumed that any investment in these securities was, or will prove to be, profitable, or that the investment decisions we make in the future will be profitable or equal to
the investment performance of securities referenced herein. There is no assurance that any securities referenced herein are currently held in the Portfolio or that securities sold have
not been repurchased. The securities mentioned may not represent the entire Portfolio.
Please note that cash is not viewed as a strategic asset class.
Source: Lazard, MSCI
0.0
3.2
2.6
2.5
5.4
7.4
6.4
13.4
8.1
12.3
14.6
24.2
3.7
0.7
1.0
5.2
5.9
6.6
7.0
10.6
12.6
19.2
27.5
0 10 20 30
Cash and Equivalents
Real Estate
Health Care
Utilities
Industrials
Materials
Consumer Staples
ConsumerDiscretionary
Energy
CommunicationServices
InformationTechnology
Financials
(%)
Portfolio
MSCI Emerging Markets Index
% of
Portfolio
% of MSCI
EM Index
Communication Services 12.6 12.3
America Movil
Baidu
China Mobile
Mobile TeleSystems
NetEase
PLDT
Telekomunikasi Indonesia
Vodacom
Consumer Discretionary 7.0 13.4
Astra International
Bajaj Auto
Hero Motocorp
Hyundai Mobis
Motus Holdings
Woolworths
WOONGJIN COWAY
Consumer Staples 6.6 6.4
Ambev
British American Tobacco Malaysia
Hengan International Group
Kimberly-Clark de Mexico
KT & G
Magnit
Shoprite
% of
Portfolio
% of MSCI
EM Index
Energy 10.6 8.1
Bharat Petroleum
China Shenhua Energy
CNOOC
Coal India
Gazprom
LUKOIL
Oil & Gas Development
Oil & Natural Gas
Pakistan Petroleum
Tupras
YPF
Financials 27.5 24.2
Axis Bank
Banco do Brasil
Bank Mandiri
BB Seguridade
China Construction Bank
China Merchants Bank
Commercial International Bank
Habib Bank
HANWHA LIFE INSURANCE
Kasikornbank
KB Financial Group
Nedbank
OTP Bank
Sanlam
Sberbank
Shinhan Financial Group
Standard Bank
Health Care 0.7 2.6
Life Healthcare Group
% of
Portfolio
% of MSCI
EM Index
Industrials 5.2 5.4
Bidvest Group
CCR
Imperial Logistics
Koc
Weichai Power
Information Technology 19.2 14.6
AAC Technologies
ASM Pacific Technology
Catcher Technology
Cielo
HCL Technologies
Hon Hai Precision Industry
Infosys
Samsung Electronics
SK hynix
Taiwan Semiconductor Manufacturing
Tata Consultancy Services
Materials 5.9 7.4
ALROSA
Anhui Conch
Grupo Mexico
PPC
Semen Indonesia
Siam Cement
Ternium
UPL
Real Estate 0.0 3.2
Utilities 1.0 2.5
ENN Energy
Cash and Equivalents 3.7 0.0
Total Portfolio 100.0 100.0

51 Lazard Asset Management
10.0
12.7 13.7
0
6
12
18
14.2
12.2 11.0
0
6
12
18Forward Looking:
Dividend
Yield (%)
3.8
2.6
3.4
0
1
2
3
4
Price/
Cash Flow
5.6
7.8
8.9
0
4
8
12
Return
on Equity (%)
15.7
12.4
10.9
0
5
10
15
20
Price/
Earnings
9.7
13.2
14.7
0
5
10
15
20
Trailing One-Year:
Forward Price/
Earnings¹
Forward Return on
Equity %
Free Cash
Flow Yield (%)
8.3
5.65.3
0
2
4
6
8
10
Investment Characteristics
As of 31 March 2019.
1 Forward P/E is defined as P/E FY1
Investment characteristics are based upon the Lazard Emerging Markets Equity Portfolio. Forward-looking figures represent expected returns. Expected returns do not represent a promise
or guarantee of future results and are subject to change.
Source: Lazard, MSCI, I/B/E/S
Portfolio remains attractively priced with superior financial productivity
Lazard Emerging Markets Equity Portfolio
MSCI Emerging Markets Index
Lazard Emerging Markets Equity Portfolio
MSCI EAFE Index

TABTAB

53 Lazard Asset Management
Summary
Robust bottom-up relative value investment process
Favorable trade-off between valuation and financial productivity
Focus on both valuation and financial productivity helps avoid "value traps"
Borderless alpha generation capability
Seeks to provide a strong pattern of performance
Aims to achieve downside protection, good upside participation
Seeks attractive risk adjusted returns
Complete opportunity set
Use full capitalization spectrum to seek attractive ideas
Strong emerging markets expertise
Information and opinions are current as of the date of this document.

TABTAB

55 Lazard Asset Management
BiographiesInternational Equity Select Management Team
Michael G. Fry Managing Director, Portfolio Manager/Analyst
Lazard Asset Management Limited (London)
Michael G. Fry is a Portfolio Manager/Analyst on various international equity teams. He began working in the investment field in 1981. Prior to joining
Lazard in 2005, Michael was Head of Global Equity Portfolio Management, Global Head of Equity Research and Head of Australian Equities with UBS
Global Asset Management, and was also previously with Armstrong Jones Fund Management, Schroder Investment Management, and Price Waterhouse in
Australia. He has a BE from Flinders University, Australia. Michael is a member of the Institute of Chartered Accountants in Australia and an associate of
the Financial Services Institute of Australasia.
Michael A. BennettManaging Director, Portfolio Manager/Analyst
Lazard Asset Management LLC (New York)
Michael Bennett is a Managing Director of Lazard Asset Management and a Portfolio Manager/Analyst on various international equity teams. He also
coordinates the activities of Lazard Asset Management's Investment Council. Michael began working in the investment field in 1986. Prior to joining Lazard
in 1992, Michael was with G.E. Investment Corporation, Keith Lippert Associates and became a CPA while at Arthur Andersen. He has an MBA from
University of Chicago and a BS in Accounting from New York University.
Giles Edwards, CFA, ACMADirector, Portfolio Manager/Analyst
Lazard Asset Management LLC (London)
Giles Edwards is a Portfolio Manager/Analyst on the International Equity, International Equity Select, and International Concentrated teams. Prior to
joining the investment teams, he was a Research Analyst with a background in media, automotive, and services. Prior to joining Lazard in 2008, Giles was a
Management Accountant at BSkyB, completing his CIMA qualifications. He has a BA (Hons) in Politics and Economics from the University of Newcastle
upon Tyne.
Kevin J. Matthews, CFAManaging Director, Portfolio Manager/Analyst
Lazard Asset Management LLC (New York)
Kevin Matthews is a Portfolio Manager/Analyst on various international equity teams. Prior to joining the investment teams, he was a Research Analyst
with a background in financials, automotive, aerospace, and capital goods sectors. He began working in the investment field in 2001 when he joined Lazard.
Kevin has a BA in Politics and Philosophy from St. Chad's College, Durham University. He is a Mentor/Supporter at Minds Matter NYC, a Member of the
Board of HERE Theatre, a Corporate Leader at the Council on Foreign Relations, a WSET Advanced Level holder, and an Ironman Triathlete.
Michael PowersManaging Director, Portfolio Manager/Analyst
Lazard Asset Management LLC (New York)
Michael Powers is a Portfolio Manager/Analyst on various international equity teams. He began working in the investment field in 1990 when he joined
Lazard. Michael has an MBA from Long Island University and a BA from Brown University.

56 Lazard Asset Management
BiographiesEmerging Markets Equity Management Team
James Donald, CFAManaging Director, Portfolio Manager/Analyst and Head of Emerging Markets
Lazard Asset Management LLC (New York)
James Donald is a Managing Director and Head of Emerging Markets and Portfolio Manager/Analyst on the Emerging
Markets Equity team. He is also a member of the International Equity Select with Emerging Markets team. Since joining
Lazard in 1996, James has been instrumental in developing and coordinating the emerging markets activities at Lazard. He
began working in the investment field in 1983. Prior to joining Lazard, James was a Portfolio Manager with Mercury Asset
Management. He has a BA (Hons) in history from the University of Western Ontario.
James is a board member of EMpower, a charity of investment professionals focused on adolescents, healthcare, and
women's issues in emerging markets countries, as well as a member of the 20-20 Investments Association, an investor group
that is focused on emerging markets..
Rohit ChopraManaging Director, Portfolio Manager/Analyst
Lazard Asset Management LLC (New York)
Rohit Chopra is a Portfolio Manager/Analyst on the Emerging Markets Equity team, focusing on consumer and
telecommunications research and analysis. He began working in the investment field in 1996. Prior to joining the Firm in
1999, Rohit was with Financial Resources Group, Deutsche Bank and Morgan Stanley. He has a BS in Finance and
Information Systems from New York University and also studied at the London School of Economics and Political Science.
Rohit has been accepted as a Young Global Leader (YGL) in 2016 by the World Economic Forum, which engages the top
political, business, and other leaders of society to shape the global future.
Monika Shrestha Director, Portfolio Manager/Analyst
Lazard Asset Management LLC (New York)
Monika Shrestha is a Portfolio Manager/Analyst on the Emerging Markets Equity team, responsible for research coverage of
companies in the financials sector. She began working in the investment field in 1997. Prior to joining Lazard in 2003,
Monika was a principal at Waterview Advisors and a Corporate Finance Analyst with Salomon Smith Barney. She has an
MBA from Harvard Business School, a BSE in Computer Science and Engineering and a BS in Economics (with a
concentration in Finance) from the University of Pennsylvania.

57 Lazard Asset Management
Emerging Markets Equity Management Team
Biographies
Elizabeth S. ChungDirector, Research Analyst
Lazard Asset Management LLC (New York)
Elizabeth Chung is a Research Analyst on the Emerging Markets Equity team, responsible for research coverage of
companies in the telecommunications and consumer sectors. She began working in the investment field in 1994 as a senior
associate at Scudder, Stevens & Clark. Prior to joining Lazard in 2010, Elizabeth was a Director and Investment Analyst at
UBS Global Asset Management where she was a member of a team that managed various international equity strategies.
Prior to UBS, Elizabeth was responsible for Asia ex-Japan research sales at Credit Suisse and Merrill Lynch. She has an MBA
in Finance and Accounting from the Columbia Business School and a BA in International Relations from Boston University.
Lada EmelianovaSenior Vice President, Research Analyst
Lazard Asset Management LLC (New York)
Lada Emelianova is a Research Analyst on the Emerging Markets Equity team, responsible for research coverage of
companies in the materials sector. She began working in the investment field in 1998 as a senior investment analyst in the
Alternative Assets group at CIBC World Markets. Prior to joining Lazard in 2010, Lada was a Portfolio Manager at Newgate
Capital Management responsible for their EMEA investments. She also co-managed Newgate's Global Resource Fund. Prior
to Newgate, Lada was an analyst at Libra Advisors LLC, an equity long/short hedge fund. She has a MALD degree in
International Business and Finance from the Fletcher School of Law and Diplomacy at Tufts University and Harvard
University, as well as a MA in Natural Resource Management from Tufts University. She also has a MS, Summa Cum Laude,
in Seismology and Geophysics from Moscow State University.
Donald FloydDirector, Research Analyst
Lazard Asset Management LLC (New York)
Donald Floyd is a Research Analyst on the Emerging Markets Equity team, responsible for research coverage of companies
in the technology and industrials sectors. Donald began working in the investment field in 1995. Prior to joining Lazard in
2011, he worked at Royal Bank of Scotland and Citigroup in AsiaPAC Equity Sales focusing on the technology sector with a
Taiwan/China bias. Prior to that, Donald was Head of Asia Technology Research at Lehman Brothers and CLSA based in
Taiwan. Previously, he worked in the industry at Teradyne and M.I.T.'s Artificial Intelligence Lab. Donald has an MBA from
Babson College and a BS in Electrical Engineering from Carnegie Mellon University.

58 Lazard Asset Management
Emerging Markets Equity Management Team
Biographies
Ben Wulfsohn, CFADirector, Research Analyst
Lazard Asset Management LLC (New York)
Ben Wulfsohn is a Research Analyst on the Emerging Markets Equity and Emerging Markets Small Cap Equity teams. He is
responsible for research coverage of the emerging markets utilities, energy and healthcare sectors, as well as client
communications. Ben began working in the investment industry in 1991. Prior to joining Lazard in 2001, Ben was Director
of Marketing Support with Weiss, Peck & Greer, LLC and an Investment Consultant for Segal Advisors, Inc. He has a BSC
(Hons) in Physics from the University of London, Queen Mary College.
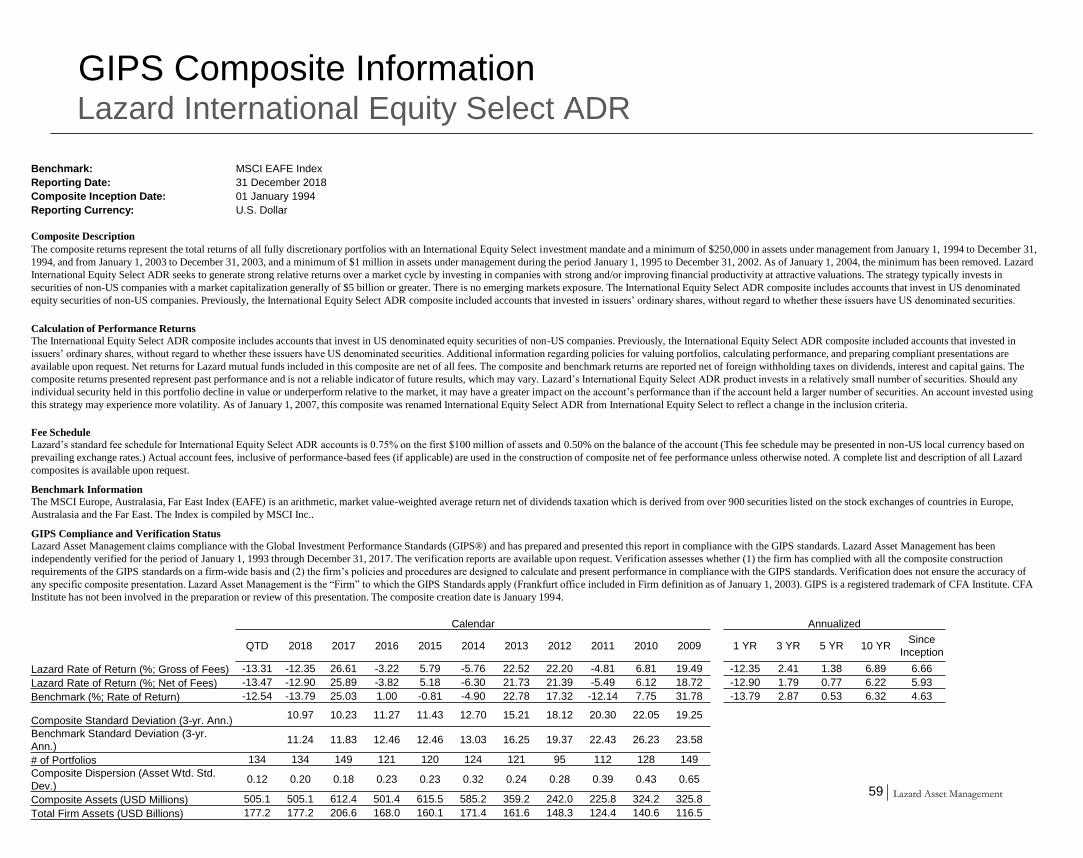
59 Lazard Asset ManagementLazard Asset Management
GIPS Composite InformationLazard International Equity Select ADR
Benchmark: MSCI EAFE Index
Reporting Date: 31 December 2018
Composite Inception Date: 01 January 1994
Reporting Currency: U.S. Dollar
Composite Description
The composite returns represent the total returns of all fully discretionary portfolios with an International Equity Select investment mandate and a minimum of $250,000 in assets under management from January 1, 1994 to December 31,
1994, and from January 1, 2003 to December 31, 2003, and a minimum of $1 million in assets under management during the period January 1, 1995 to December 31, 2002. As of January 1, 2004, the minimum has been removed. Lazard
International Equity Select ADR seeks to generate strong relative returns over a market cycle by investing in companies with strong and/or improving financial productivity at attractive valuations. The strategy typically invests in
securities of non-US companies with a market capitalization generally of $5 billion or greater. There is no emerging markets exposure. The International Equity Select ADR composite includes accounts that invest in US denominated
equity securities of non-US companies. Previously, the International Equity Select ADR composite included accounts that invested in issuers’ ordinary shares, without regard to whether these issuers have US denominated securities.
Calculation of Performance Returns
The International Equity Select ADR composite includes accounts that invest in US denominated equity securities of non-US companies. Previously, the International Equity Select ADR composite included accounts that invested in
issuers’ ordinary shares, without regard to whether these issuers have US denominated securities. Additional information regarding policies for valuing portfolios, calculating performance, and preparing compliant presentations are
available upon request. Net returns for Lazard mutual funds included in this composite are net of all fees. The composite and benchmark returns are reported net of foreign withholding taxes on dividends, interest and capital gains. The
composite returns presented represent past performance and is not a reliable indicator of future results, which may vary. Lazard’s International Equity Select ADR product invests in a relatively small number of securities. Should any
individual security held in this portfolio decline in value or underperform relative to the market, it may have a greater impact on the account’s performance than if the account held a larger number of securities. An account invested using
this strategy may experience more volatility. As of January 1, 2007, this composite was renamed International Equity Select ADR from International Equity Select to reflect a change in the inclusion criteria.
Fee Schedule
Lazard’s standard fee schedule for International Equity Select ADR accounts is 0.75% on the first $100 million of assets and 0.50% on the balance of the account (This fee schedule may be presented in non-US local currency based on
prevailing exchange rates.) Actual account fees, inclusive of performance-based fees (if applicable) are used in the construction of composite net of fee performance unless otherwise noted. A complete list and description of all Lazard
composites is available upon request.
Benchmark Information
The MSCI Europe, Australasia, Far East Index (EAFE) is an arithmetic, market value-weighted average return net of dividends taxation which is derived from over 900 securities listed on the stock exchanges of countries in Europe,
Australasia and the Far East. The Index is compiled by MSCI Inc..
GIPS Compliance and Verification Status
Lazard Asset Management claims compliance with the Global Investment Performance Standards (GIPS®) and has prepared and presented this report in compliance with the GIPS standards. Lazard Asset Management has been
independently verified for the period of January 1, 1993 through December 31, 2017. The verification reports are available upon request. Verification assesses whether (1) the firm has complied with all the composite construction
requirements of the GIPS standards on a firm-wide basis and (2) the firm’s policies and procedures are designed to calculate and present performance in compliance with the GIPS standards. Verification does not ensure the accuracy of
any specific composite presentation. Lazard Asset Management is the “Firm” to which the GIPS Standards apply (Frankfurt office included in Firm definition as of January 1, 2003). GIPS is a registered trademark of CFA Institute. CFA
Institute has not been involved in the preparation or review of this presentation. The composite creation date is January 1994.
Calendar Annualized
QTD 2018 2017 2016 2015 2014 2013 2012 2011 2010 2009 1 YR 3 YR 5 YR 10 YRSince
Inception
Lazard Rate of Return (%; Gross of Fees) -13.31 -12.35 26.61 -3.22 5.79 -5.76 22.52 22.20 -4.81 6.81 19.49 -12.35 2.41 1.38 6.89 6.66
Lazard Rate of Return (%; Net of Fees) -13.47 -12.90 25.89 -3.82 5.18 -6.30 21.73 21.39 -5.49 6.12 18.72 -12.90 1.79 0.77 6.22 5.93
Benchmark (%; Rate of Return) -12.54 -13.79 25.03 1.00 -0.81 -4.90 22.78 17.32 -12.14 7.75 31.78 -13.79 2.87 0.53 6.32 4.63
Composite Standard Deviation (3-yr. Ann.)10.97 10.23 11.27 11.43 12.70 15.21 18.12 20.30 22.05 19.25
Benchmark Standard Deviation (3-yr.
Ann.)11.24 11.83 12.46 12.46 13.03 16.25 19.37 22.43 26.23 23.58
# of Portfolios 134 134 149 121 120 124 121 95 112 128 149
Composite Dispersion (Asset Wtd. Std.
Dev.)0.12 0.20 0.18 0.23 0.23 0.32 0.24 0.28 0.39 0.43 0.65
Composite Assets (USD Millions) 505.1 505.1 612.4 501.4 615.5 585.2 359.2 242.0 225.8 324.2 325.8
Total Firm Assets (USD Billions) 177.2 177.2 206.6 168.0 160.1 171.4 161.6 148.3 124.4 140.6 116.5

60 Lazard Asset Management60 Lazard Asset Management
Important Information
Equity securities will fluctuate in price; the value of your investment will thus fluctuate, and this may result in a loss. Securities in certain non-domestic countries may be less liquid, more
volatile, and less subject to governmental supervision than in one’s home market. The values of these securities may be affec ted by changes in currency rates, application of a country’s
specific tax laws, changes in government administration, and economic and monetary policy. Emerging market securities carry special risks, such as less developed or less efficient
trading markets, a lack of company information, and differing auditing and legal standards. The securities markets of emerging market countries can be extremely volatile; performance
can also be influenced by political, social, and economic factors affecting companies in emerging market countries.
Certain information included herein is derived by Lazard in part from an MSCI index or indices (the “Index Data”). However, MSCI has not reviewed this product or report, and does not
endorse or express any opinion regarding this product or report or any analysis or other information contained herein or the author or source of any such information or analysis. MSCI
makes no express or implied warranties or representations and shall have no liability whatsoever with respect to any Index Data or data derived therefrom. The MSCI Index Data may
not be further redistributed or used as a basis for other indices or any securities or financial products.
This material is for informational purposes only. It is not intended to, and does not constitute financial advice, fund management services, an offer of financial products or to enter into
any contract or investment agreement in respect of any product offered by Lazard Asset Management and shall not be considered as an offer or solicitation with respect to any product,
security, or service in any jurisdiction or in any circumstances in which such offer or solicitation is unlawful or unauthorized or otherwise restricted or prohibited.
This document is provided by Lazard Asset Management LLC or its affiliates (“Lazard”) for informational purposes only. Nothing herein constitutes investment advice or a
recommendation relating to any security, commodity, derivative, investment management service or investment product. Investments in securities, derivatives and commodities involve
risk, will fluctuate in price, and may result in losses. Certain assets held in Lazard’s investment portfolios, in particular alternative investment portfolios, can involve high degrees of risk
and volatility when compared to other assets. Similarly, certain assets held in Lazard’s investment portfolios may trade in less liquid or efficient markets, which can affect investment
performance. Past performance does not guarantee future results.
This document is intended only for persons residing in jurisdictions where its distribution or availability is consistent with local laws and Lazard’s local regulatory authorizations. The
Lazard entities that have issued this document are listed below, along with important limitations on their authorized activit ies.
Australia: Issued by Lazard Asset Management Pacific Co., ABN 13 064 523 619, AFS License 238432, Level 39 Gateway, 1 Macquarie Place, Sydney NSW 2000, which is licensed
by the Australian Securities and Investments Commission to carry on a financial services business. This document is intended for wholesale investors only. Canada: Issued by Lazard
Asset Management (Canada) Inc., 30 Rockefeller Plaza, New York, NY 10112 and 130 King Street West, Suite 1800, Toronto, Ontario M5X 1E3, a registered portfolio manager
providing services to non-individual permitted clients. Dubai: Issued and approved by Lazard Gulf Limited, Gate Village 1, Level 2, Dubai International Financial Centre, PO Box
506644, Dubai, United Arab Emirates. Registered in Dubai. International Financial Centre 0467. Authorised and regulated by the Dubai Financial Services Authority to deal with
Professional Clients only. EU Member States: Issued by Lazard Asset Management (Deutschland) GmbH, Neue Mainzer Strasse 75, D-60311 Frankfurt am Main. Hong Kong: Issued
by Lazard Asset Management (Hong Kong) Limited (AQZ743), One Harbour View Street, Central, Hong Kong. Lazard Asset Management (Hong Kong) Limited is a corporation licensed
by the Hong Kong Securities and Futures Commission to conduct Type 1 (dealing in securities) and Type 4 (advising on securities) regulated activities only on behalf of “professional
investors” as defined under the Hong Kong Securities and Futures Ordinance (Cap. 571 of the Laws of Hong Kong) and its subsid iary legislation. Korea: Issued by Lazard Korea Asset
Management Co. Ltd., 10F Seoul Finance Center, 136 Sejong-daero, Jung-gu, Seoul, 100-768. People’s Republic of China: Issued by Lazard Asset Management. Lazard Asset
Management does not carry out business in the P.R.C and is not a licensed investment adviser with the China Securities Regulatory Commission or the China Banking Regulatory
Commission. This document is for reference only and for intended recipients only. The information in this document does not constitute any specific investment advice on China capital
markets or an offer of securities or investment, tax, legal or other advice or recommendation or, an offer to sell or an invitation to apply for any product or service of Lazard Asset
Management. Singapore: Issued by Lazard Asset Management (Singapore) Pte. Ltd., 1 Raffles Place, #15-02 One Raffles Place Tower 1, Singapore 048616. Company Registration
Number 201135005W, which provides services only to “institutional investors” or “accredited investors” as defined under the Securities and Futures Act, Chapter 289 of
Singapore. Switzerland: Issued by Lazard Asset Management Schweiz AG, Usteristrasse 9, CH-8001 Zurich. United Kingdom: Issued or approved by Lazard Asset Management Ltd.,
50 Stratton Street, London W1J 8LL. Registered in England Number 525667. Authorised and regulated by the Financial Conduct Authority (FCA), providing services only to persons
classified as eligible counterparties or professional clients under the rules of the FCA. United States: Issued by Lazard Asset Management LLC, 30 Rockefeller Plaza, New York, NY
10112.