Laser desorption time-of-flight mass spectrometry of vacuum ...
17
A&A 592, A67 (2016) DOI: 10.1051/0004-6361/201527937 c ESO 2016 Astronomy & Astrophysics Laser desorption time-of-flight mass spectrometry of vacuum UV photo-processed methanol ice D. M. Paardekooper, J.-B. Bossa, and H. Linnartz Raymond and Beverly Sackler Laboratory for Astrophysics, Leiden Observatory, Leiden University, PO Box 9513, 2300 RA Leiden, The Netherlands e-mail: [email protected] Received 9 December 2015 / Accepted 10 May 2016 ABSTRACT Context. Methanol in the interstellar medium mainly forms upon sequential hydrogenation of solid CO. With typical abundances of up to 15% (with respect to water) it is an important constituent of interstellar ices where it is considered as a precursor in the formation of large and complex organic molecules (COMs), e.g. upon vacuum UV (VUV) photo-processing or exposure to cosmic rays. Aims. This study aims at detecting novel complex organic molecules formed during the VUV photo-processing of methanol ice in the laboratory using a technique more sensitive than regular surface diagnostic tools. In addition, the formation kinetics of the main photo-products of methanol are unravelled for an astronomically relevant temperature (20 K) and radiation dose. Methods. The VUV photo-processing of CH 3 OH ice is studied by applying laser desorption post-ionisation time-of-flight mass spectrometry (LDPI TOF-MS), and analysed by combining molecule-specific fragmentation and desorption features. Results. The mass spectra correspond to fragment ions originating from a number of previously recorded molecules and from new COMs, such as the series (CO) x H + y , with x = 3 and y< 3x - 1, to which prebiotic glycerin belongs. The formation of these large COMs has not been reported in earlier photolysis studies and suggests that such complex species may form in the solid state under interstellar conditions. Key words. astrobiology – astrochemistry – molecular processes – methods: laboratory: solid state – ISM: molecules – ultraviolet: ISM 1. Introduction In the interstellar medium, methanol (CH 3 OH) is considered to be an important solid state precursor species in the forma- tion of complex organic molecules (COMs; van Dishoeck 2014). Methanol is mainly formed through sequential hydrogenation of CO ice on top of cold dust grains, a process well studied in the laboratory (Watanabe & Kouchi 2002; Fuchs et al. 2009; Chuang et al. 2016). This is fully consistent with astronomical obser- vations, indicating that solid CH 3 OH is abundant and predomi- nately mixed with CO inside the ice mantle (Cuppen et al. 2011; Boogert et al. 2015). Upon (non)energetic processing, such interstellar ices be- come chemically active. Typically, atom-addition reactions or recombination reactions of fragments formed upon vacuum UV (VUV) irradiation, cosmic ion bombardment, or electron-impact result in the formation of new species. These processes have been simulated in different laboratories (Gerakines et al. 1996; Baratta et al. 2002; Bennett & Kaiser 2007; Öberg et al. 2009; Hama & Watanabe 2013; Islam et al. 2014; Boamah et al. 2014; Maity et al. 2014, 2015; Linnartz et al. 2015; Chuang et al. 2016; Mrad et al. 2016). These studies apply infrared (IR) spectroscopy (transmission or reflection) and temperature pro- grammed desorption (TPD) combined with either quadrupole mass spectrometry (QMS), single photon ionisation time-of- flight mass spectrometry (SPI TOF-MS), or gas chromatography coupled to mass spectrometry (GC-MS). Several recent studies have shown how new products form upon processing of CH 3 OH rich ices. In Baratta et al. (2002), Bennett & Kaiser (2007), Islam et al. (2014), Boamah et al. (2014), Maity et al. (2014, 2015), Henderson & Gudipati (2015) the role of electron or ion bombardment has been studied and in Gerakines et al. (1996), Hudson & Moore (2000), Baratta et al. (2002), Moore & Hudson (2005), Öberg et al. (2009), Islam et al. (2014), Henderson & Gudipati (2015), Mrad et al. (2016) VUV photolysis has been characterised. An overview of species detected in recent labo- ratory studies focusing on methanol ice processing is shown in the first four columns of Table 1. It is clear that all these solid state processes offer pathways towards molecular complexity in space. The techniques used for these identifications are powerful, sophisticated, and reliable. They have provided detailed insights into the processes at play, but every detection scheme comes with limitations, especially when low temperatures are involved. In situ IR spectroscopy, for example, holds the risk of overlapping bands or non-detections because of IR inactive modes. Ice de- struction is inherent to TPD, which in parallel – like GC-MS – may induce thermally induced reactions. Recently, complemen- tary detection schemes have become available that attempt to obtain new information from different perspectives on processed interstellar ice analogues (Paardekooper et al. 2014; Henderson & Gudipati 2015; Bossa et al. 2015). In the present study, we apply laser desorption post- ionisation time-of-flight mass spectrometry (LDPI TOF-MS) to gain additional insights into the photo-products of VUV pro- cessed CH 3 OH ice. This technique has distinct advantages over the traditional techniques: (i) Compared to infrared Article published by EDP Sciences A67, page 1 of 17
-
Upload
khangminh22 -
Category
Documents
-
view
1 -
download
0
Transcript of Laser desorption time-of-flight mass spectrometry of vacuum ...

A&A 592, A67 (2016)DOI: 10.1051/0004-6361/201527937c© ESO 2016
Astronomy&Astrophysics
Laser desorption time-of-flight mass spectrometryof vacuum UV photo-processed methanol ice
D. M. Paardekooper, J.-B. Bossa, and H. Linnartz
Raymond and Beverly Sackler Laboratory for Astrophysics, Leiden Observatory, Leiden University, PO Box 9513, 2300 RA Leiden,The Netherlandse-mail: [email protected]
Received 9 December 2015 / Accepted 10 May 2016
ABSTRACT
Context. Methanol in the interstellar medium mainly forms upon sequential hydrogenation of solid CO. With typical abundances ofup to 15% (with respect to water) it is an important constituent of interstellar ices where it is considered as a precursor in the formationof large and complex organic molecules (COMs), e.g. upon vacuum UV (VUV) photo-processing or exposure to cosmic rays.Aims. This study aims at detecting novel complex organic molecules formed during the VUV photo-processing of methanol ice inthe laboratory using a technique more sensitive than regular surface diagnostic tools. In addition, the formation kinetics of the mainphoto-products of methanol are unravelled for an astronomically relevant temperature (20 K) and radiation dose.Methods. The VUV photo-processing of CH3OH ice is studied by applying laser desorption post-ionisation time-of-flight massspectrometry (LDPI TOF-MS), and analysed by combining molecule-specific fragmentation and desorption features.Results. The mass spectra correspond to fragment ions originating from a number of previously recorded molecules and from newCOMs, such as the series (CO)xH+
y , with x = 3 and y < 3x − 1, to which prebiotic glycerin belongs. The formation of these largeCOMs has not been reported in earlier photolysis studies and suggests that such complex species may form in the solid state underinterstellar conditions.
Key words. astrobiology – astrochemistry – molecular processes – methods: laboratory: solid state – ISM: molecules –ultraviolet: ISM
1. Introduction
In the interstellar medium, methanol (CH3OH) is consideredto be an important solid state precursor species in the forma-tion of complex organic molecules (COMs; van Dishoeck 2014).Methanol is mainly formed through sequential hydrogenation ofCO ice on top of cold dust grains, a process well studied in thelaboratory (Watanabe & Kouchi 2002; Fuchs et al. 2009; Chuanget al. 2016). This is fully consistent with astronomical obser-vations, indicating that solid CH3OH is abundant and predomi-nately mixed with CO inside the ice mantle (Cuppen et al. 2011;Boogert et al. 2015).
Upon (non)energetic processing, such interstellar ices be-come chemically active. Typically, atom-addition reactions orrecombination reactions of fragments formed upon vacuum UV(VUV) irradiation, cosmic ion bombardment, or electron-impactresult in the formation of new species. These processes havebeen simulated in different laboratories (Gerakines et al. 1996;Baratta et al. 2002; Bennett & Kaiser 2007; Öberg et al. 2009;Hama & Watanabe 2013; Islam et al. 2014; Boamah et al.2014; Maity et al. 2014, 2015; Linnartz et al. 2015; Chuanget al. 2016; Mrad et al. 2016). These studies apply infrared (IR)spectroscopy (transmission or reflection) and temperature pro-grammed desorption (TPD) combined with either quadrupolemass spectrometry (QMS), single photon ionisation time-of-flight mass spectrometry (SPI TOF-MS), or gas chromatographycoupled to mass spectrometry (GC-MS). Several recent studieshave shown how new products form upon processing of CH3OH
rich ices. In Baratta et al. (2002), Bennett & Kaiser (2007),Islam et al. (2014), Boamah et al. (2014), Maity et al. (2014,2015), Henderson & Gudipati (2015) the role of electron or ionbombardment has been studied and in Gerakines et al. (1996),Hudson & Moore (2000), Baratta et al. (2002), Moore & Hudson(2005), Öberg et al. (2009), Islam et al. (2014), Henderson &Gudipati (2015), Mrad et al. (2016) VUV photolysis has beencharacterised. An overview of species detected in recent labo-ratory studies focusing on methanol ice processing is shown inthe first four columns of Table 1. It is clear that all these solidstate processes offer pathways towards molecular complexity inspace. The techniques used for these identifications are powerful,sophisticated, and reliable. They have provided detailed insightsinto the processes at play, but every detection scheme comes withlimitations, especially when low temperatures are involved. Insitu IR spectroscopy, for example, holds the risk of overlappingbands or non-detections because of IR inactive modes. Ice de-struction is inherent to TPD, which in parallel – like GC-MS –may induce thermally induced reactions. Recently, complemen-tary detection schemes have become available that attempt toobtain new information from different perspectives on processedinterstellar ice analogues (Paardekooper et al. 2014; Henderson& Gudipati 2015; Bossa et al. 2015).
In the present study, we apply laser desorption post-ionisation time-of-flight mass spectrometry (LDPI TOF-MS) togain additional insights into the photo-products of VUV pro-cessed CH3OH ice. This technique has distinct advantagesover the traditional techniques: (i) Compared to infrared
Article published by EDP Sciences A67, page 1 of 17

A&A 592, A67 (2016)
Table 1. Overview of recent studies focusing on energetically processing methanol ice using a variety of detection techniques.
Öberg et al.1 Boamah et al.2 Maity et al.3 Henderson & Gudipati4 This work(2009) (2014) (2015) (2015)
Energetic processing: VUV 20 eV electrons 2 keV electrons 2 keV electrons, VUVA VUVDetection technique(s): TPD/QMS TPD/QMS TPD/SPI TOF-MS 2S-LAIMSB LDPI TOF-MS
Molecule and IR and IRCarbon monoxide (CO) Y Y Y? YMethane (CH4) Y Y Y YEthane (C2H6) Y? ?Carbon dioxide (CO2) Y Y Y? YFormaldehyde (H2CO) Y Y Y Y YDimethyl ether (CH3OCH3) Y Y Y YAcetaldehyde (CH3CHO) Y Y Y Y? YMethyl formate (HCOOCH3) Y? Y Y Y? YEthanol (CH3CH2OH) Y Y Y YWater (H2O) Y YKetene (H2CCO) YFormic acid (HCOOH) Y? Y?Acetic acid (CH3COOH) Y? Y? YGlycolaldehyde (HOCH2CHO) Y? Y? Y YMethoxymethanol (CH3OCH2OH) Y Y Y?Ethylene glycol (CH2OH)2 Y Y Y YGlycolic acid (HOCH2COOH) Y?Glycerin (HOCH2CHOHCH2OH) Y? Y Y
Notes. (1) Öberg et al. (2009). (2) Boamah et al. (2014). (3) Maity et al. (2014). (4) Henderson & Gudipati (2015). (A) In this study, 2 keV electronsare also used as energetic processing yielding a high degree of complexity, such as ethenone, glycolaldehyde, methyl acetate, ethyl acetate, andCH3CO, as well as other species that are only tentatively identified. (B) 2S-LAIMS: two-step laser ablation and ionisation mass spectrometry.
spectroscopy, this technique has an improved sensitivity (sev-eral orders of magnitude) and for a number of applications, themethod is also more molecule selective. In addition, since ioni-sation is realised through energetic electrons, a quantitative anal-ysis becomes possible since electron-impact cross sections ofdifferent species are known from literature; (ii) Compared to reg-ular TPD methods the total composition of the ice at any giventemperature can be tracked; and (iii) Any thermally induced re-actions during TPD can be largely excluded. However, the inter-pretation of the LDPI TOF-MS data, is not straightforward andthis is discussed below.
This paper is organised as follows. Section 2 presents a briefdescription of the experimental set-up and provides a detaileddescription of the data analysis performed. Section 3 presentsthe qualitative and quantitative interpretation of the experimen-tal results. In Sect. 4, the results are compared to conclusionsfrom other studies available in the literature. In Sect. 5, the as-trophysical implications are discussed and the main findings aresummarised. In the Appendix the difference spectra are shownfor all the species identified in this study.
2. Experiments and analysis
2.1. Experiments
The experiments were carried out in our ultrahigh vacuum(UHV) set-up, MATRI2CES (Mass Analytical Tool to studyReactions in Interstellar ICES), previously described in de-tail by Paardekooper et al. (2014). MATRI2CES consists oftwo UHV chambers, the main chamber for ice preparation andice processing and a time-of-flight chamber. The base pres-sure of these chambers is in the 10−10 mbar range. In the
main chamber a gold-coated copper substrate is in thermal con-tact with a closed-cycle helium cryostat, enabling substrate-temperatures down to 20 K. An accurate temperature control isachieved using a thermocouple and heating element, combinedwith a LakeShore-temperature regulator (model 331). Ices aregrown on the substrate by leaking in gas-phase species throughan all-metal needle valve attached to a capillary. Residualgasses trapped in liquid samples such as methanol, CH3OH(Sigma Aldrich, 99.8%), and 13-methanol 13CH3OH (SigmaAldrich, 99%) are removed by several freeze-pump-thaw cy-cles. The deposition rate of methanol was determined in advanceby HeNe laser interference measurements (Baratta & Palumbo1998), using a refractive index of n = 1.33 (Weast 1972). Thesubstrate is stationary during deposition of the ice. Typical depo-sition times are 5 min and the ice growth is stopped when an icethickness of ∼13.5 nm is reached; this corresponds to ∼40 mono-layers (1 ML = 1015 molecules cm−2).
MATRI2CES deploys LDPI TOF-MS as a detection schemeto study new molecules formed in the VUV photo-processed ice.Desorption of the ice sample is induced using the unfocused,skimmed beam (∼1 mm) of the third harmonic of a Nd:YAGlaser (355 nm with a pulse length of 4−5 ns). An attenuatoris used to reduce the energy of the laser pulses. Typical laserpulse energies are of the order of 30 mJ cm−2. The desorbedspecies are subsequently ionised by an electron gun, with a meanenergy of either 35 or 70 eV. Since this energy exceeds theionisation potential of molecules, this predominately results indissociative ionisation. The generated ions are extracted by ionoptics, situated in close proximity to the substrate. Subsequently,ions enter a field-free flight tube, which allows the ions to driftand to separate based on their mass-to-charge ratios (m/z), afterwhich they are detected by a micro-channel plate (MCP). In the
A67, page 2 of 17

D. M. Paardekooper et al.: LDPI TOF-MS of VUV processed CH3OH ice
Fig. 1. Spectral energy distribution of the VUV lamp (116–170 nm)described in the text (Ligterink et al. 2015).
current configuration the mass resolution (M/∆M) is about 400(Paardekooper et al. 2014). Multiple desorption events for eachice sample are possible, since the cryostat is situated on topof two UHV translators, i.e. different surface areas are probedfor subsequent desorption events. Typically 220 ablation eventsare measured along a column of 20 mm and this is repeatedfor nine columns. This guarantees that only the VUV photopro-cessed ice region is studied (in principle it is possible to monitora larger surface area). The columns are separated by 1.25 mm,i.e. there is no overlap of laser ablated ice surfaces between dif-ferent columns. However, along one column subsequent ablationspots do overlap. This could cause problems as the beam is un-focused and the same ice spot is hit by overlapping laser pulses.However, no substantial changes were found for lower laser rep-etition rates and identical translation speed, i.e. for conditionswhere the spatial overlap decreases. Therefore, the data acquisi-tion is operated for 220 spots, and this high number allows theS/N to increase. Throughout the article, we will use “mass spec-tra” when referring to LDPI TOF-MS data.
Vacuum UV photo-processing is performed using a flowingH2 microwave discharge lamp. Typical settings are 0.85 mbarand 80 W of applied microwave power. The lamp is attached toa MgF2 UHV window directly facing the substrate; the distancebetween the window and the substrate is 14 cm. In a number ofrecent studies the spectral emission distribution of this lamp hasbeen characterised in detail (Chen et al. 2014; Es-sebbar et al.2015; Ligterink et al. 2015). The spectral energy distributionis shown in Fig. 1. The flux at sample location is (3 ± 1) ×1013 photons cm−2 s−1; the spectral energy distribution peaksat Lyman-α (∼121 nm) and around 160 nm. The VUV irradi-ation can be stopped at different times, i.e. for different totalfluences, after which a mass spectrum can be recorded. Thismethod can also characterise the photolysis kinetics of the pre-cursor methanol and reaction products. Typical irradiation timesamount to a few hours, i.e. much shorter than in other photoly-sis experiments (Bernstein et al. 2002; Muñoz Caro et al. 2002;Mrad et al. 2016).
2.2. Analysis
The acquired mass spectra are first discussed in a qualitative way,as a quantitative interpretation is complicated by the fragmen-tation upon electron-impact ionisation. We follow a three-stepapproach. First, MATRI2CES is used to record the referencefragmentation patterns of the majority of the species expected
to form upon VUV photolysis of methanol ice. These mea-surements are performed for two electron-impact energies, 35and 70 eV. This is described in Sect. 2.2.1. The second step,described in Sect. 2.2.2, is to obtain mass spectra of irradiatedmethanol ice at elevated temperatures. Since different moleculessublime at different temperatures, we can link the relative de-crease in intensity for the mass peaks with temperature to spe-cific molecules. This step determines which species should beconsidered for the inclusion in the quantitative fit of the massspectra, recorded for 20 K. By combining all the information inthe final step, the low-temperature photolysis data of methanolcan be interpreted to obtain the abundances and kinetics of indi-vidual species; the fitting procedure is described in Sect. 2.2.3.
2.2.1. Reference experiments
The NIST database1 provides a guideline for the fragmentationof species at 70 eV electron-impact energy. For a more preciseanalysis it is necessary to derive set-up specific dissociative ion-isation patterns (Schwarz-Selinger et al. 2001). Therefore, wemeasured the fragmentation pattern of most of the species thatwe expect to form during the VUV irradiation of CH3OH icein MATRI2CES. The candidate species (Table 2) were selectedbased on studies of processed CH3OH ice available in the lit-erature (Öberg et al. 2009; Boamah et al. 2014; Maity et al.2015). Using two different ionisation energies (35 and 70 eV)provides additional information. Owing to experimental limita-tions, the reference fragmentation patterns of species with neg-ligible vapour pressure could not be recorded. The maximumnumber of fragment ions is produced at 70 eV since the deBroglie wavelength of the electrons is similar to the intramolec-ular bond length. A lower electron energy (35 eV) was also usedsince the fragmentation patterns differ from 70 eV while main-taining a relative high ion yield. Attempts to record mass spec-tra for electron energies near the ionisation potential (10–15 eV)were not successful because for these low energies both the elec-tron densities and corresponding cross sections rapidly drop.
2.2.2. Experiments at elevated temperature
Additional information is obtained by taking into account thatdifferent ice constituents desorb at different temperatures. Forthis, we recorded a mass spectrum (70 eV) after irradiatingmethanol ice (20 K) for 64 min. Subsequently, the VUV irra-diated ice was slowly (2.5 K min−1) heated to 50 K, and was leftto settle for 15 min. At this elevated temperature, CO and CH4thermally desorb, but molecules trapped inside the methanol ma-trix do not. Changes in the resulting mass spectrum summarisedin the mass difference graphs reflect the loss of evaporated iceconstituents (see the Appendix). The decline of the dominantpeaks of the reference fragmentation patterns confirms the pres-ence of this molecule in the methanol irradiated ice. In this way,more species can be positively identified by using selected setsof temperatures that include the thermal desorption values of alarge number of species (see Table 2). Here temperature rangesof 20–50, 50–100, 100–125, 125–150, 150–175, and 175–210 Kare probed separately.
2.2.3. Fitting
Mass spectra are measured for different VUV fluences. A base-line correction is performed by fitting a baseline through an array
1 http://webbook.nist.gov/chemistry/
A67, page 3 of 17

A&A 592, A67 (2016)
Table 2. Properties and sample purities of potential photoproducts of VUV-irradiated methanol ice.
Molecule Chemical formula Sample purity Tdes
Carbon monoxide CO 99.997% (Praxair) 28 KMethane CH4 99.999% (Praxair) 30 KEthane C2H6 99% (Fluka) 60 KCarbon dioxide CO2 99.996% (Praxair) 85 KFormaldehyde H2CO 95% (Sigma Aldrich)1 95 KDimethyl ether CH3OCH3 >99.9% (Fluka) 95 KAcetaldehyde CH3CHO >99.5% (Sigma Aldrich) 105 KMethyl formate HCOOCH3 99% (Sigma Aldrich) 120 KMethanol CH3OH 99.8% (Sigma Aldrich) 130 KFormic acid HCOOH >95% (Sigma Aldrich) 130 KEthanol CH3CH2OH >99.8% (Sigma Aldrich) 145 KWater H2O milliQ-grade 155 KAcetic acid CH3COOH >99.8% (Sigma Aldrich) 155 KGlycolaldehyde HOCH2CHO Dimer (Sigma Aldrich)2 166 KEthylene glycol (CH2OH)2 99.8% (Sigma Aldrich) 198 KGlycolic acid HOCH2COOH 99% (Sigma Aldrich)3 235 KGlycerin HOCH2CHOHCH2OH >99.5% (Sigma Aldrich)3 235 K
Notes. (1) Gas phase monomer obtained by heating paraformaldehyde to 50 ◦C under vacuum. (2) Gas phase monomer obtained by heatingglycolaldehyde dimer to 80 ◦C under vacuum (Hudson et al. 2005). (3) Glycolic acid and glycerin have a low vapour pressure at room temperature;owing to experimental constraints it was not possible to obtain their reference mass spectra.
of points where no mass signal is recorded. Subsequent integra-tion of the individual peaks yields the total intensity of everysingle mass. Each of these mass spectra can be regarded as a lin-ear combination of fragment ions from n individual compoundspresent in the ablated material,
MSt,E =
n∑i=1
ai × σi,E × MSi,E, (1)
where MSt,E is the mass spectrum acquired after a specific irra-diation time t, i.e. specific VUV fluence, and electron energy E;ai corresponds to the fitted mole fraction of a constituent i;and σi,E and MSi,E are the corresponding electron-impact crosssection and the reference mass spectrum, respectively. The fit-ting procedure is performed with Matlab 7.9.0 (R2009b) usingthe Nelder-Mead optimisation algorithm (Lagarias et al. 1998).
This method has recently been applied to interpret the VUVphoto-processing of methane (CH4; Paardekooper et al. 2014;Bossa et al. 2015). The method is here extended to fit Eq. (1) tothe mass spectra recorded for two different electron energies, E.As the two different electron energies result in different fragmen-tation patterns, this adds extra constraints to the fit. Candidatespecies for the fitting library are selected based on their pres-ence in experiments performed at elevated temperatures (seeSect. 2.2.2).
This procedure comes with the shortcoming that possibly notall formed constituents are actually included in the fit, but we ex-plicitly assume that these missing species are not formed in highabundances and consequently we expect that the overall accu-racy of the fit is not strongly affected.
3. Experimental results
This section is divided into two parts. Section 3.1 describesa qualitative interpretation of the obtained mass spectra.
0 20 40 60 80 100 120 140
0.0
0.1
0.2
0.3
0.4
0.5
n=1 n=3 n=4
Inte
nsity
(V)
m/z
CH3OH (70 eV)CH3OH (35 eV)
(CH3OH)nH+
n=2
Fig. 2. Reference mass spectra of ∼13.5 nm-thick CH3OH ice depositedat 20 K, using 35 eV (red) and 70 eV (blue) electrons as an ionisationsource.
Section 3.2 continues with a quantitative interpretation based onthe approach described in Sect. 2.2.
3.1. Qualitative analysis
3.1.1. Unprocessed CH3OH ice
The mass spectra of unprocessed CH3OH ice upon 35 and 70 eVelectron impact ionisation are shown in Fig. 2. Clear differencesare visible in the number of ions detected and the relative in-tensities for the different fragmentation channels. Comparingthe 70 eV mass spectrum to the NIST database, the observedfragmentation pattern is in agreement within 15%. Such a smallmismatch is expected for different experimental set-ups, as the
A67, page 4 of 17
D. M. Paardekooper et al.: LDPI TOF-MS of VUV processed CH3OH ice
0 10 20 30 40 50 60 70 80 90 100
0.05
0.10
0.15
0.20
0.25
010
30
100
250
m/z
Inte
nsity
(V)
Flue
nce (1
015ph
otons
cm-2)
Reference
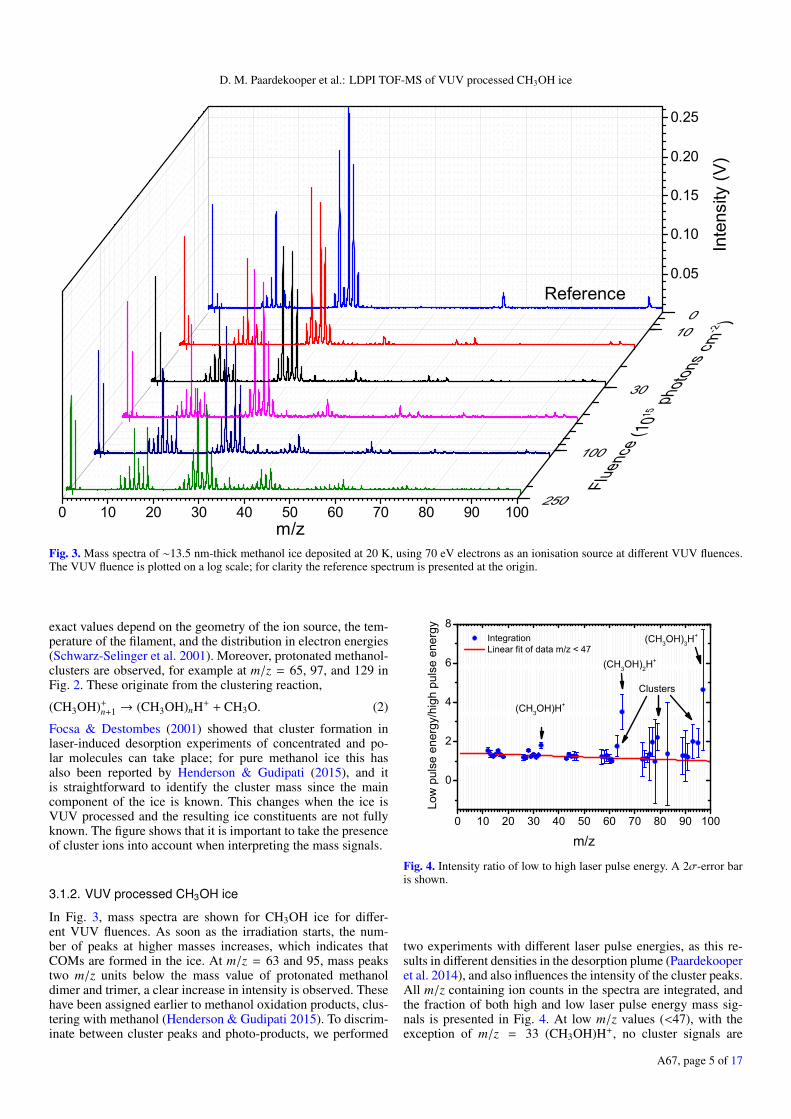
Fig. 3. Mass spectra of ∼13.5 nm-thick methanol ice deposited at 20 K, using 70 eV electrons as an ionisation source at different VUV fluences.The VUV fluence is plotted on a log scale; for clarity the reference spectrum is presented at the origin.
exact values depend on the geometry of the ion source, the tem-perature of the filament, and the distribution in electron energies(Schwarz-Selinger et al. 2001). Moreover, protonated methanol-clusters are observed, for example at m/z = 65, 97, and 129 inFig. 2. These originate from the clustering reaction,
(CH3OH)+n+1 → (CH3OH)nH+ + CH3O. (2)
Focsa & Destombes (2001) showed that cluster formation inlaser-induced desorption experiments of concentrated and po-lar molecules can take place; for pure methanol ice this hasalso been reported by Henderson & Gudipati (2015), and itis straightforward to identify the cluster mass since the maincomponent of the ice is known. This changes when the ice isVUV processed and the resulting ice constituents are not fullyknown. The figure shows that it is important to take the presenceof cluster ions into account when interpreting the mass signals.
3.1.2. VUV processed CH3OH ice
In Fig. 3, mass spectra are shown for CH3OH ice for differ-ent VUV fluences. As soon as the irradiation starts, the num-ber of peaks at higher masses increases, which indicates thatCOMs are formed in the ice. At m/z = 63 and 95, mass peakstwo m/z units below the mass value of protonated methanoldimer and trimer, a clear increase in intensity is observed. Thesehave been assigned earlier to methanol oxidation products, clus-tering with methanol (Henderson & Gudipati 2015). To discrim-inate between cluster peaks and photo-products, we performed
0 10 20 30 40 50 60 70 80 90 100
0
2
4
6
8
Clusters
(CH3OH)3H+
(CH3OH)2H+
IntegrationLinear fit of data m/z < 47
Low
puls
een
ergy
/hig
hpu
lse
ener
gy
m/z
(CH3OH)H+
Fig. 4. Intensity ratio of low to high laser pulse energy. A 2σ-error baris shown.
two experiments with different laser pulse energies, as this re-sults in different densities in the desorption plume (Paardekooperet al. 2014), and also influences the intensity of the cluster peaks.All m/z containing ion counts in the spectra are integrated, andthe fraction of both high and low laser pulse energy mass sig-nals is presented in Fig. 4. At low m/z values (<47), with theexception of m/z = 33 (CH3OH)H+, no cluster signals are
A67, page 5 of 17

A&A 592, A67 (2016)
50 55 60 65 70 75 80 85 90 95 1000.005
0.010
0.015
0.020Cluster might partially contribute
Inte
nsity
(V)
m/z
Cluster mainly contributes
Fig. 5. Mass spectrum of ∼13.5 nm-thick methanol ice depositedat 20 K, photo-processed for 128 min corresponding with a fluence of(2.3 ± 0.8) × 1017 photons cm−2 using 70 eV electrons as an ionisationsource.
present. The signals in that region originate from photoproductspresent in the ice. Therefore, by linearly extrapolating the reli-able low-mass products (<47), it is possible to discriminate be-tween mass peaks originating from clusters and from products.Based on this approach, we attribute the origin of the followingmasses predominantly to clusters: m/z = 33, 63, 65, 75, 79, 93,95, and 97. We can directly assign 33, 65, and 97 to the pro-tonated methanol clusters, (CH3OH)nH+. From previous work(Henderson & Gudipati 2015), m/z values at 59, 61, 73, 77, 89and 91 are also expected to contain at least small cluster con-tributions. For our experimental conditions, however, we do notfind strong experimental evidence of clustering at these m/z val-ues. The remaining peaks are direct evidence of the formation ofnew species, including larger COMs, which is the topic of thisstudy.
In Fig. 5, a mass spectrum is shown where the methanol icehas been processed with VUV photons for 128 min leading to afluence of (2.3 ± 0.8) × 1017 photons cm−2. Mass signals fromcluster ions are indicated and it is clear that new mass peaks aredetected in the range of m/z = 85...91. These peaks likely orig-inate from (CO)xH+
y , with x = 3 and y < 3x − 1. This resultproves that the parent molecules leading to these fragment ionscontain at least a total of six carbon or oxygen atoms. This find-ing is important as to date no low temperature (20 K) in situstudies have reported COMs in this size range upon relativelyshort VUV photolysis of pure methanol ice. Previous results, in-cluding the findings in the recent study by Mrad et al. (2016),were realised after irradiation of an ice mixture for days, usinggas chromatography to identify the chemical components of theresulting residue (Muñoz Caro et al. 2002; Bernstein et al. 2002;Briggs et al. 1992). The present study shows in situ and in realtime that large complex species are indeed formed. Other stud-ies on the processing of methanol ice with electrons (Boamahet al. 2014; Maity et al. 2015; Kaiser et al. 2015), using QMSor SPI TOF-MS combined with TPD, find larger species as well,but as in the case of the GC-MS studies special care is needed toexclude that new species are thermally formed during the warm-up phase.
0 10 20 30 40 50 60 70 80 90 100
10-4 10-3 10-2
10-4
10-3
10-2 13CH3OH + VUV
CH3OH + VUV
Inte
nsity
(V)
m/z
Integratedintensity (V
) [ 13CH
3 OH
]
Integratedintensity (V) [12CH3OH]
CHy+
CHyO+
C2HyO+
C2HyO2+
Fig. 6. Mass spectrum of ∼13.5 nm-thick methanol ice (CH3OH and13CH3OH) deposited at 20 K, using 70 eV electrons as an ionisationsource, irradiated for 64 min and corresponding fluence: (1.2 ± 0.4) ×1017 photons cm−2. The inset depicts the correlation of the peak inten-sities between the two experiments, i.e. 12CHy vs. 13CHy.
3.1.3. VUV processed CH3OH and 13CH3OH ice
Figure 6 presents the mass spectra of VUV photo-processedCH3OH and 13CH3OH ices. The 12C → 13C isotopic shifts area guide in determining the number of carbon atoms reflected byparticular peaks. This supports, for example, the assignment ofthe cluster m/z = 65 to (CH3OH)2H+ since this mass shifts tom/z = 67. The mass peak at m/z = 75 shifts to m/z = 78, indicat-ing that the corresponding fragment ion consists of three carbonand two oxygen atoms.
The peak intensities shown in Fig. 6 are integrated, andare correlated with respect to the isotopic shift, CnOmH+
y and13CnOmH+
y , with n = 1..2 and m = 0...n. For example, one datapoint is the integrated area of 12CH+ with respect to 13CH+; an-other is 12C2H2O+ with respect to 13C2H2O+. The correspond-ing correlation diagram is shown in the inset of Fig. 6, and con-firms a good correlation between carbon content and the chosenassignment.
3.2. Quantitative analysis
A quantitative interpretation of the data presented in the previousparagraphs is not straightforward. Different photo-products frag-ment into similar masses upon electron impact ionisation, whichcomplicates the analysis. However, as explained in Sect. 2.2.3,it is possible to incorporate another molecule-specific parameteras a diagnostic tool, namely the desorption temperature. In theparagraphs below, the photo-products are assigned using this ex-tra information, and the mass spectra are interpreted in terms ofthe set-up specific reference fragmentation patterns. This allowsa fitting library to be created for both the 35 and 70 eV electron-impact ionisation experiments. The resulting data are used as in-put to interpret the mass spectra of the photo-processed methanolice at 20 K and to determine which new species are formed.
3.2.1. Assignment of photolysis products
In order to confirm the presence of different photoproducts, wehave conducted experiments in which we first VUV irradiate
A67, page 6 of 17

D. M. Paardekooper et al.: LDPI TOF-MS of VUV processed CH3OH ice
0 10 20 30 40 50 60 70 80 90 100
0.05
0.10
0.15
0.20
20 (low)50 (low)
100 (low)125 (low)
150 (low)150 (high)
175 (high)200 (high)
210 (high)
m/z
Inte
nsity
(V)
Tempe
ratur
e (K)
Fig. 7. Overview of the mass spectra of VUV processed methanol ice acquired at different temperatures, using 70 eV electrons as an ionisa-tion source. The fluence level is noted in brackets. Low fluence corresponds to (1.2 ± 0.4) × 1017 photons cm−2 and high fluence to (5 ± 2) ×1017 photons cm−2 (estimated). The high-fluence experiment follows a different experimental procedure: simultaneous deposition (∼240 ML) andphotolysis (4 h).
CH3OH ice at 20 K for 64 min, corresponding to a fluence of(1.2 ± 0.4) × 1017 photons cm−2. Subsequently, before and afterincreasing the substrate temperature, mass spectra are recordedusing 70 eV electrons as an ionisation source. The strategy is tovisualise the thermally induced decrease in the dominant peaksin the reference fragmentation pattern and to link this to a spe-cific reaction product, based on the temperature range wherea decrease is observed. In addition to the decrease caused bydesorption, other changes in the ice can also affect the peak in-tensities, such as local rearrangement and phase changes of theice structure. The desorption temperature of different species islisted in Table 2. The desorption profiles are typically wide andcan therefore cause overlap between temperature gaps.
To strengthen the assignment of species with desorption tem-peratures higher than methanol (∼130 K) we conducted an ex-periment following a different procedure. After reaching a sub-strate temperature of 20 K, we deposited methanol with a slowdeposition rate (∼1 ML/min) for a duration of 4 h, while simul-taneously exposing the sample to VUV photons. In our experi-mental conditions this approach yields a higher energy depositper molecule and a thicker layer of processed ice (∼240 ML).In turn, a larger abundance of COMs is obtained. Subsequently,the temperature was ramped up to 150, 175, 200, and 210 K.Mass spectra were recorded for all temperatures. Figure 7 pro-vides an overview of both low- and high-fluence experiments.Up to 150 K, the spectra show the previously mentioned proto-nated methanol clusters. Above this temperature, these signalsnearly vanish.
In order to characterise new photoproducts, we comparethe difference in absolute intensity of individual mass peaks
to reference mass spectra between 20 and 50 K (A), 50 and100 K (B), 100 and 125 K (C), 125 and 150 K (D), 150and 175 K (E), and 175 and 210 K (F). All figures with the re-sulting mass difference spectra are summarised in the Appendix.Here only one figure is shown as an illustrating example (Fig. 8),covering 150 to 175 K (i.e. range E).
Figure 8 compares the reference fragmentation patterns ofwater, glycolaldehyde, and acetic acid with the absolute differ-ence between the mass spectra obtained at 150 and 175 K. Thesespecies are selected based on their desorption temperature in thistemperature range (see also Table 2). It is clear that H2O desorbsfrom the substrate; therefore, we confirm that H2O is formed dur-ing the irradiation of CH3OH-ice. The majority of the intensitydifferences is in agreement with the fragmentation patterns ofglycolaldehyde and acetic acid, although differences are foundfor m/z = 29, 31, 44, 45, and 46. These may be due to remainingethanol still present at 150 K (Öberg et al. 2009). In the sec-tions below, the different temperature regimes with correspond-ing desorbing molecules are discussed separately.
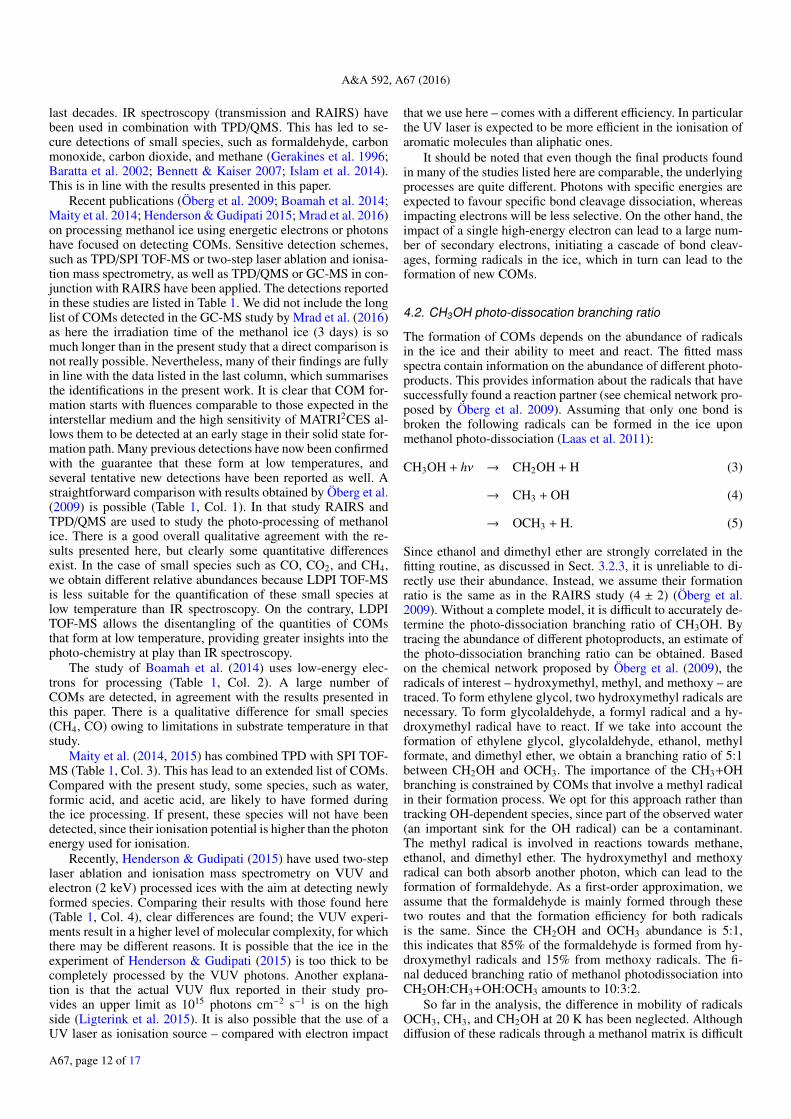
A (20–50 K): identification of CO and CH4
The difference in peak intensity between the spectra acquiredat 20 and 50 K is compared with the reference fragmentation pat-terns of CO and CH4 (Fig. A.1). After this temperature increase,a minor intensity decrease is observed in the mass range 12to 16, indicating that part of the CH4 formed in the ice has des-orbed. We do not observe a clear decrease at m/z = 28, al-though it is expected that CO forms during photo-processing.Methane and carbon monoxide have been detected previouslyin photolysis studies using IR spectroscopy (Gerakines et al.1996; Öberg et al. 2009). The limited decrease in intensity
A67, page 7 of 17

A&A 592, A67 (2016)
12 14 16 18 24 26 28 30 32
0.000
0.004
0.008
0.012
Signal strength (V)
Si
gnal
stre
ngth
(V)
m/z
Water Glycolaldehyde Acetic acid I150K-I175K
42 44 46 56 58 60 62
0.000
0.001
0.002
0.003
0.004
E
m/zFig. 8. Ion mass fragmentation signals (black, red, and blue filled boxes) and integrated mass difference signal (open boxes) for T = 150 and 175 Kare shown for the m/z peaks that correspond to ion fragment masses of water, glycolaldehyde, and acetic acid for 70 eV electron impact. The deriveduncertainty level is indicated for each difference signal.
observed in our experiment is due to the large fraction of thespecies trapped in the methanol matrix; this has previously beenobserved with reflection-absorption IR spectroscopy (RAIRS)studies. At higher temperatures (100 K, as depicted in Fig. A.2)m/z = 28 clearly decreases. Some other m/z values show a minordecrease; it is expected that this is caused by local rearrangementin the ice structure.
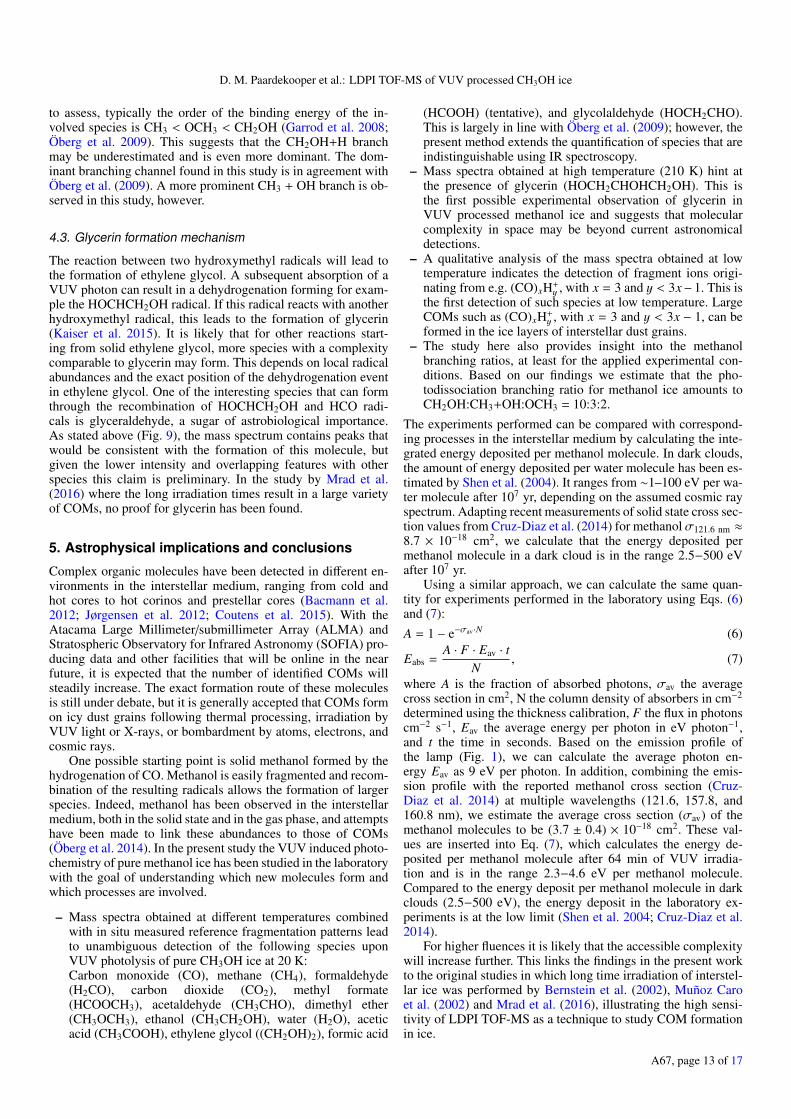
B (50–100 K): identification of H2CO, CH3OCH3, and CO2
Figure A.2 presents the difference in integrated intensity be-tween mass spectra obtained at 50 and 100 K compared withreference fragmentation patterns of formaldehyde, dimethylether, and carbon dioxide. A decrease in the main fragmentationpeaks of formaldehyde is observed. We also observe a decreaseat m/z = 44, 45, and 46 indicating that CH3OCH3 has starteddesorbing from the ice. The decrease at m/z = 44 is consistentwith the presence of carbon dioxide. Moreover, signal decreasesat m/z = 26, 27, 42, and 43 are observed; m/z = 26 and 27possibly originate from the fragmentation of ethane (C2H6), butan unambiguous assignment is not possible since the fragmen-tation pattern does not fully match. The decreased intensity atm/z = 42 and 43 is unexpected and not fully understood. Themolecules H2CO and CO2 have been observed in several pho-tolysis studies (Gerakines et al. 1996; Öberg et al. 2009) andCH3OCH3 has been detected by Öberg et al. (2009).
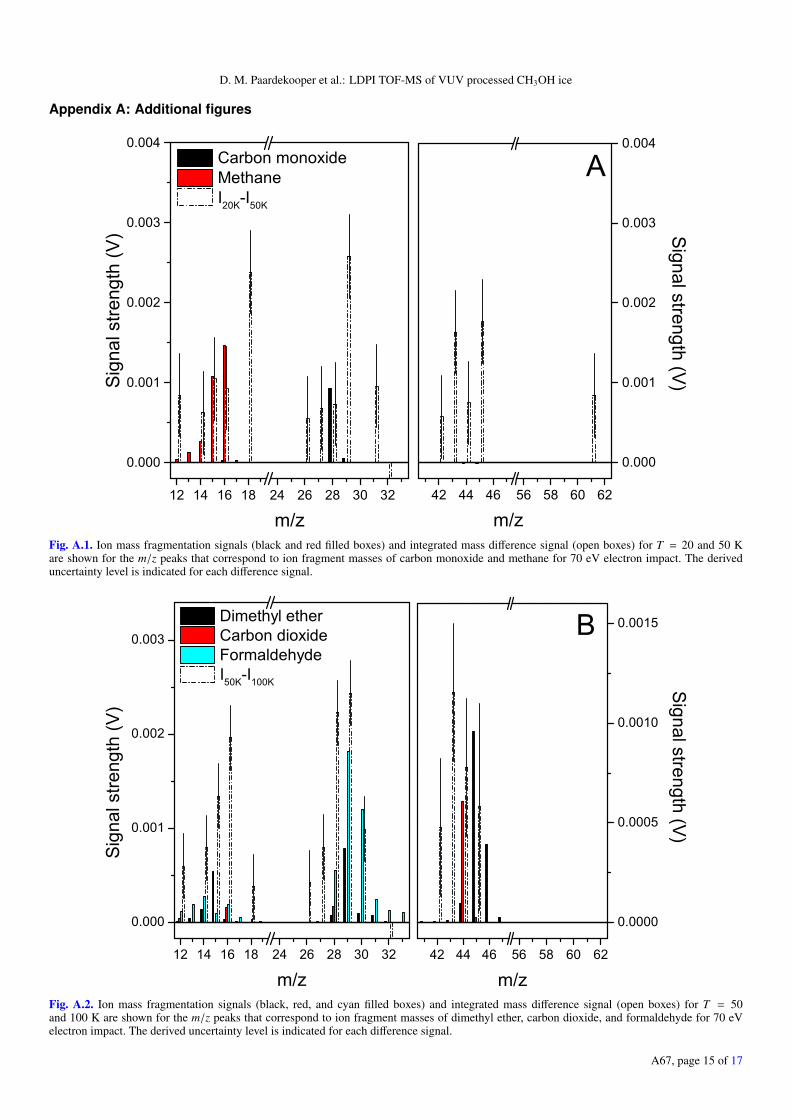
C (100–125 K): identification of HCOOCH3 and CH3CHO
Figure A.3 presents the changes in mass spectra during thetemperature increase from 100 to 125 K compared to the
reference fragmentation patterns of HCOOCH3, CH3CHO, andCH3OCH3. An intensity decrease at m/z = 44, 45, 46, and 58up to 63 is observed. Part of this decrease is explained by thedesorption of methyl formate for m/z = 59, 60, and 61, inagreement with the reported desorption temperature. We ten-tatively assign the decrease at m/z = 44 to the desorption ofacetaldehyde (CH3CHO), although it is clear that only a minoramount of this species is formed, in agreement with Öberg et al.(2009). It should be noted that during this temperature increase,a phase change to crystalline CH3OH occurs (Bolina et al. 2005;Isokoski et al. 2014). Owing to this local rearrangement of theice structure, trapped species can be released to the gas phase(Maity et al. 2015). The local density of different species in theplume changes, and this affects the intensities at m/z = 61 and 63(not depicted). The decrease at m/z in the 44–46 range is at-tributed to remaining dimethyl ether, which is expected to be stillpresent in the ice. The desorption profiles are typically wide andtherefore can contribute in two different temperature regimes,determined by the boundary values chosen here.
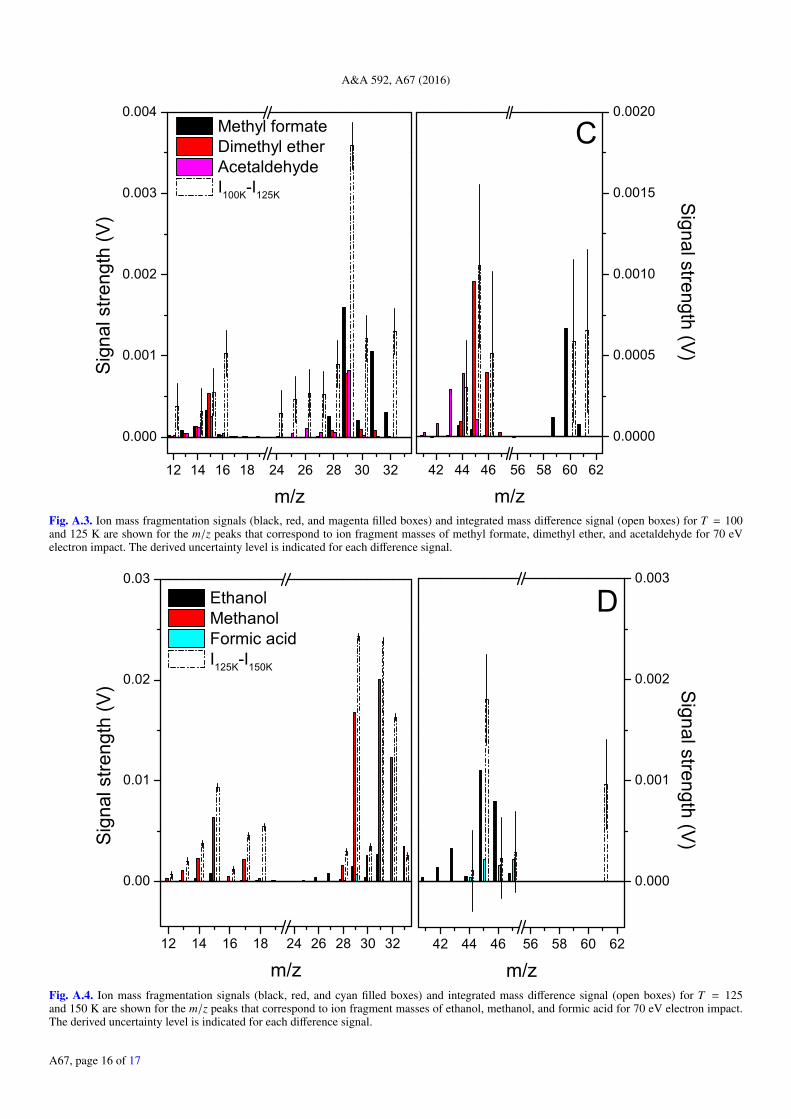
D (125–150 K): identification of CH3OH, CH3CH2OH andHCOOH
After the temperature increase from 125 to 150 K, most of themethanol desorbs. As the ice is mainly made up of methanol,the remaining volatiles trapped in the matrix will desorb aswell. The difference in intensity is depicted in Fig. A.4 and iscompared to the reference fragmentation patterns of methanol,ethanol, and formic acid. We observe a clear decrease form/z = 45 and 46, the prominent peaks in the high-mass range
A67, page 8 of 17
D. M. Paardekooper et al.: LDPI TOF-MS of VUV processed CH3OH ice
of the fragmentation pattern of ethanol (CH3CH2OH). As ex-pected, a decrease in intensity is observed for masses associatedwith methanol and the methanol clusters (see Fig. 7). A signaldecrease at m/z = 47 is tentatively assigned as being due to asmall desorbing portion of protonated formic acid. In the low-mass region, m/z = 12 to 18, a clear decrease is observed. Co-desorption of H2O with the methanol matrix explains this.
E (150–175 K): identification of H2O, HOCH2CHO,CH3COOH, and CH3OCH2OH
In Fig. 8, the fragmentation patterns of water, glycolaldehyde,and acetic acid are compared to the changes in the mass spectraafter the temperature increase from 150 to 175 K. The formationof water upon energetic processing of methanol has been ob-served before (Henderson & Gudipati 2015). Contributions frombackground deposition can be largely excluded, which has beenconfirmed by a background experiment. We assign the signal de-crease at m/z = 42 and 56, 58, and 60 to the desorption of glyco-laldehyde (HOCH2CHO), and the decrease at m/z = 61, 60, 43,and 45 to the desorption of acetic acid (CH3COOH). Referencespectra of acetic acid show the appearance at m/z = 61 assignedto protonated acetic acid (CH3COOH)H+. This mass peak hasalso been observed in VUV photoionisation studies of acetic acidclusters (Guan et al. 2012). An additional intensity decrease isobserved at m/z = 45 and 46, which can be explained by thedesorption of the remaining ethanol.
Efforts have been made to confirm the formation ofmethoxymethanol (CH3OCH2OH), which is expected to ther-mally desorb around 170 K. In previous studies (Boamah et al.2014; Maity et al. 2015) a preliminary detection was claimed,following rather restricted literature information on the fragmen-tation pattern (Johnson & Stanley 1991). The published massspectrum shows intense peaks at m/z = 29, 30, 31, 33, 45,and 61, but has a low signal at the molecular ion mass, m/z = 62.In the 150−175 K temperature window, we do find a decrease inthe dominant peaks consistent with methoxymethanol, indicat-ing that it may be formed. However, we are cautious about thisidentification, since the published mass spectrum shows only aminor molecular ion peak and it is not possible to measure thefull reference fragmentation pattern.F (175–210 K): identification of (CH2OH)2 andHOCH2CHOHCH2OH
During the temperature increase from 175 to 210 K, the amountof detected ions further decreases. The intensity decrease in theprominent m/z values is compared to the fragmentation patternof ethylene glycol and acetic acid in Fig. A.5. The decrease atm/z = 62 indicates that ethylene glycol ((CH2OH)2) has des-orbed. Based on the desorption temperatures of the moleculesthat we take explicitly into account, no decline for other speciesis expected. However, we do observe an intensity decreasefor other masses, indicating that it is likely that more speciesare present. The observed decrease is in agreement with thefragmentation pattern of acetic acid, which thermally desorbsaround 155 K (outside this range).
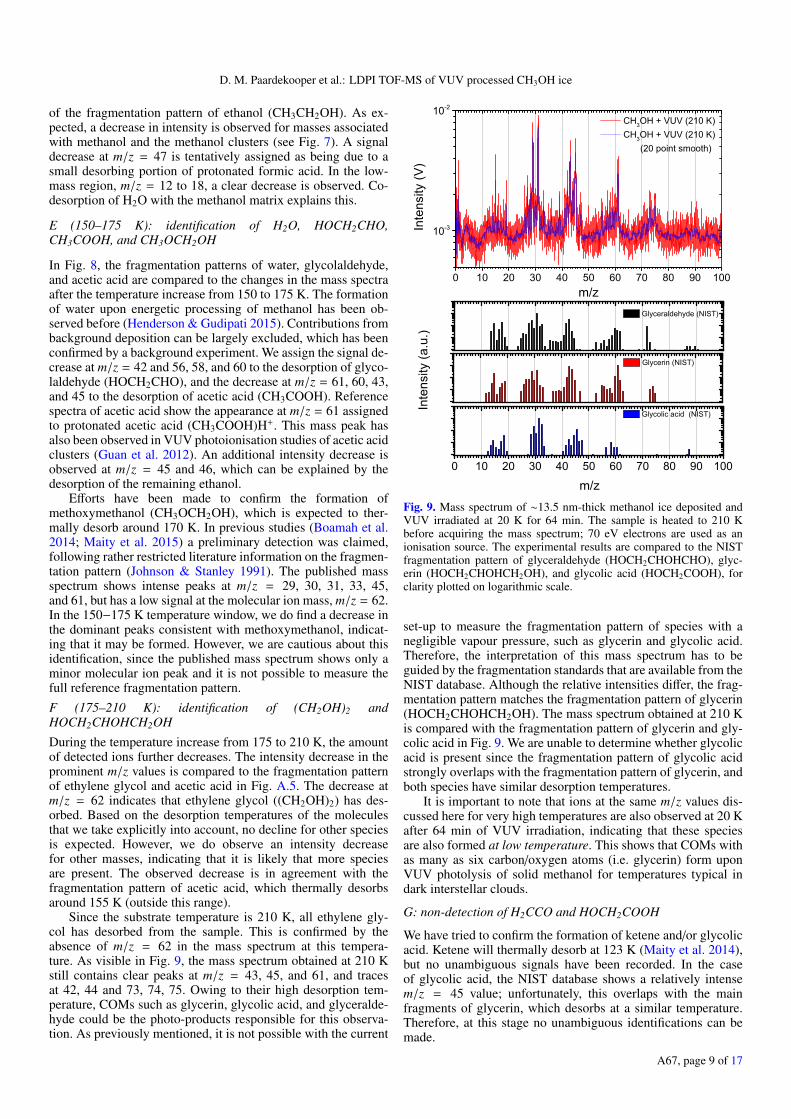
Since the substrate temperature is 210 K, all ethylene gly-col has desorbed from the sample. This is confirmed by theabsence of m/z = 62 in the mass spectrum at this tempera-ture. As visible in Fig. 9, the mass spectrum obtained at 210 Kstill contains clear peaks at m/z = 43, 45, and 61, and tracesat 42, 44 and 73, 74, 75. Owing to their high desorption tem-perature, COMs such as glycerin, glycolic acid, and glyceralde-hyde could be the photo-products responsible for this observa-tion. As previously mentioned, it is not possible with the current
0 10 20 30 40 50 60 70 80 90 100
10-3
10-2
Glycerin (NIST)
Inte
nsity
(a.u
.)
CH3OH + VUV (210 K) CH3OH + VUV (210 K)
(20 point smooth)
Glyceraldehyde (NIST)
Glycolic acid (NIST)
m/z
Inte
nsity
(V)
0 10 20 30 40 50 60 70 80 90 100
m/z
Fig. 9. Mass spectrum of ∼13.5 nm-thick methanol ice deposited andVUV irradiated at 20 K for 64 min. The sample is heated to 210 Kbefore acquiring the mass spectrum; 70 eV electrons are used as anionisation source. The experimental results are compared to the NISTfragmentation pattern of glyceraldehyde (HOCH2CHOHCHO), glyc-erin (HOCH2CHOHCH2OH), and glycolic acid (HOCH2COOH), forclarity plotted on logarithmic scale.
set-up to measure the fragmentation pattern of species with anegligible vapour pressure, such as glycerin and glycolic acid.Therefore, the interpretation of this mass spectrum has to beguided by the fragmentation standards that are available from theNIST database. Although the relative intensities differ, the frag-mentation pattern matches the fragmentation pattern of glycerin(HOCH2CHOHCH2OH). The mass spectrum obtained at 210 Kis compared with the fragmentation pattern of glycerin and gly-colic acid in Fig. 9. We are unable to determine whether glycolicacid is present since the fragmentation pattern of glycolic acidstrongly overlaps with the fragmentation pattern of glycerin, andboth species have similar desorption temperatures.
It is important to note that ions at the same m/z values dis-cussed here for very high temperatures are also observed at 20 Kafter 64 min of VUV irradiation, indicating that these speciesare also formed at low temperature. This shows that COMs withas many as six carbon/oxygen atoms (i.e. glycerin) form uponVUV photolysis of solid methanol for temperatures typical indark interstellar clouds.
G: non-detection of H2CCO and HOCH2COOH
We have tried to confirm the formation of ketene and/or glycolicacid. Ketene will thermally desorb at 123 K (Maity et al. 2014),but no unambiguous signals have been recorded. In the caseof glycolic acid, the NIST database shows a relatively intensem/z = 45 value; unfortunately, this overlaps with the mainfragments of glycerin, which desorbs at a similar temperature.Therefore, at this stage no unambiguous identifications can bemade.
A67, page 9 of 17

A&A 592, A67 (2016)
12 14 16 18 24 26 28 30 320
20
40
60
80
100
Formaldehyde Methane Carbon monoxide
Methanol Methyl formate Dimethyl ether
Acetic acid Water Ethanol
D (70 eV)C (70 eV)
B (35 eV)
Inte
nsity
(%)
m/z
Formic acid Carbon dioxide Ethylene glycol Glycolaldehyde
A (35 eV)
42 44 46 56 58 60 620
5
10
15
20
Inte
nsity
(%)
m/z
12 14 16 18 24 26 28 30 320
20
40
60
80
100
Inte
nsity
(%)
m/z42 44 46 56 58 60 62
0
5
10
15
20
Inte
nsity
(%)
m/zFig. 10. Fit of the different species contributing to the mass spectra obtained after 64 min VUV photolysis of CH3OH at 20 K. The thin bars atdifferent masses represent the integrated area of all individual mass peaks. The mass spectra are fitted simultaneously for two different electron-impact ionisation energies (35 eV, A+B and 70 eV, C+D). The fragmentation patterns of all individual species have been measured in referenceexperiments; see Table 3 for electron-impact ionisation cross sections.
Table 3. Electron-impact cross sections of species considered in thefitting routine.
Molecule Chemical formula σ70 eV σ35 eV Ref.Carbon monoxide CO 2.44 1.43 aMethane CH4 3.524 2.692 bCarbon dioxide CO2 3.15 1.41 aFormaldehyde H2CO 4 3.2 cDimethyl ether CH3OCH3 8 4.2 dMethyl formate HCOOCH3 6.9 4.6 eMethanol CH3OH 4.44 2.98 fEthanol CH3CH2OH 7.31 4.94 fWater H2O 2.275 1.515 gFormic acid HCOOH 4.6 3.43 cAcetic acid CH3COOH 7.73 5.09 cGlycolaldehyde HOCH2CHO 7.3 5.11 hEthylene glycol (CH2OH)2 6.17 4.15 c
References. a: Hudson et al. (2004); b: Kim et al. (1997); c: Bhutadiaet al. (2012); d: Sugohara et al. (2013); e: Hudson et al. (2006); f :Hudson et al. (2003); g: Kim & Rudd (1994); h: Bull & Harland (2008).
3.2.2. Fitting library
By fitting low-temperature data it is possible to obtain kineticgrowth curves for individual species, which can aid in under-standing the photo-chemistry at play. The selection of candidatesfor the fitting library is based on the experiments performed atelevated temperatures and is listed in Table 3. Since most ofthese molecules lead to identical fragment ions, this fitting pro-cedure is delicate and the output has to be interpreted with care.It should be noted that not all possible reaction products are
included in the fit; it is likely that minor abundances of largerspecies are missed. Our approach is the following. We start witha selection of the fitting library, based on the species detected inRAIRS studies with a high abundance: ≥1% (Öberg et al. 2009).Depending on the discrepancy between the fit and the data, ad-ditional species are selected to obtain a complete fit to all peaks.
Most species contain fragment ions below m/z = 33,while the larger fragment ions are strongly species depen-dent. By applying different weighting ratios to these m/z re-gions in the optimisation routine, it is guaranteed that the in-formation provided by higher masses is taken into accountappropriately. We increase the weighting of m/z = 43, 58(glycolaldehyde), and 62 (ethylene glycol). Despite the ratherlarge uncertainties, we have noticed in the fitting procedureanti-correlations between glycolaldehyde/methanol and betweendimethyl ether/ethanol. The final fitting library is presented inTable 3 and does not contain acetaldehyde since the amounts de-tected are negligible. Methoxymethanol has also been excluded.The mass spectrum is first fitted using the library without glyco-laldehyde. In a subsequent fit using a library containing glyco-laldehyde, the methanol abundance is allowed to vary between90% and 100%, while no further constraints are applied. Usingthis approach, the anti-correlation is prevented. Since dimethylether and ethanol have been detected using RAIRS (Öberg et al.2009), their typical formation ratio is known.
3.2.3. Fit
Figure 10 shows the final fit of the mass spectrum of methanolafter 64 min of VUV photolysis at 20 K, simultaneously fitted for
A67, page 10 of 17

D. M. Paardekooper et al.: LDPI TOF-MS of VUV processed CH3OH ice
0.00 0.25 0.50 0.75 1.00 1.25
0.0
0.1
0.2
0.3
0.00 0.25 0.50 0.75 1.00 1.25
0.00
0.01
0.02
0.03
0.00 0.25 0.50 0.75 1.00 1.25
0.000
0.005
0.010
0.015
0.00 0.25 0.50 0.75 1.00 1.25
0.000
0.005
0.010
0.015 DC
A Formaldehyde Carbon monoxide Methane
Glycolaldehyde Acetic acid Formic acid
S
igna
l (ar
b.)
VUV fluence (1017 photons cm-2)
Methanol Water B
Sig
nal (
arb.
)
VUV fluence (1017 photons cm-2)
Ethanol + dimethyl ether Methyl formate Ethylene glycol Dimethyl Ether Ethanol
Sig
nal (
arb.
)
VUV fluence (1017 photons cm-2)
Sig
nal (
arb.
)
VUV fluence (1017 photons cm-2)
Fig. 11. Formation efficiency of COMs as a function of VUV photon fluence. The error bar is based on the standard deviation, determined usingeight measurements performed at 32 min of VUV photo-processing. Electron impact ionisation cross sections are taken into account, which allowscomparison of the relative yields.
two electron energies (35 and 70 eV) using Eq. (1). Mass spec-tra (A, B) were obtained using 35 eV electrons as an ionisationsource, while mass spectra (C, D) were obtained using 70 eVelectrons. The influence of changing the electron energy isclearly noticeable; 70 eV yields more severe fragmentation. Thethin bars at different masses represent the integrated area of allindividual mass peaks. Both spectra have been normalised tothe mass peak with highest intensity. The different colours showthe reference fragmentation pattern of different species and theircontribution to the fit.
The final fit obtained is good, although isolated discrepanciesexist. The m/z = 61 signal can only have a minor contributionfrom a cluster ion, so we expect that this discrepancy mainlyoriginates from a photoproduct. One potential candidate is glyc-erin; the fragmentation pattern (Fig. 9) has a strong fragment ionat m/z = 61.
3.2.4. Kinetics
Figure 11 presents the kinetic growth curve of new speciesthat formed during the VUV photo-processing. The verticalscales are different for the four graphs shown here. As ex-pected, methanol is consumed and leads to the formation of otherspecies. Small species such as formaldehyde, methane, carbonmonoxide, carbon dioxide, and water are formed. The amountof water detected is surprisingly high. We performed a referenceexperiment (no VUV processing) for 4 h and we find that theamount of water deposition from background gas is negligible.
The formation of COMs such as methyl formate, ethyleneglycol, dimethyl ether, and ethanol is shown in Fig. 11C. As
mentioned in Sect. 3.2.2, there is an anti-correlation when fittingcontributions from dimethyl ether and ethanol. This is clearlyvisible in the graph, where also their combined intensity isdepicted. Since these species are distinguishable with infraredspectroscopy (Öberg et al. 2009), the exact formation ratio canbe estimated. In Fig. 11D, the growth of glycolaldehyde, aceticacid, and formic acid is shown. Glycolaldehyde is detected, butthe error bars are large owing to an increased uncertainty in thefit. Acetic acid and formic acid are better constrained and areclearly formed during the irradiation.
After the fitting procedure we would expect that at zero flu-ence the signal for all species except methanol should be zero.However, we note that the value relative to glycolaldehyde isdifferent from zero before the photolysis starts. In fact, bothmethanol and glycolaldehyde have similar fragmentation pat-terns. In both cases the three most intense peaks are in m/z val-ues of 29, 31, and 32. In the fitting routine we find that in somecases the glycolaldehyde fits part of the methanol mass data. Itshould be noted that IR spectroscopy suffers from the overlap ofvibrational modes for these species and, consequently, it is hardto monitor the kinetics. This validates the efforts of employingdifferent experimental techniques on the same systems.
4. Discussion
4.1. Comparison with previous experiments
As stated in the introduction, the VUV processing of methanolice has been studied using a variety of detection schemes over the
A67, page 11 of 17
A&A 592, A67 (2016)
last decades. IR spectroscopy (transmission and RAIRS) havebeen used in combination with TPD/QMS. This has led to se-cure detections of small species, such as formaldehyde, carbonmonoxide, carbon dioxide, and methane (Gerakines et al. 1996;Baratta et al. 2002; Bennett & Kaiser 2007; Islam et al. 2014).This is in line with the results presented in this paper.
Recent publications (Öberg et al. 2009; Boamah et al. 2014;Maity et al. 2014; Henderson & Gudipati 2015; Mrad et al. 2016)on processing methanol ice using energetic electrons or photonshave focused on detecting COMs. Sensitive detection schemes,such as TPD/SPI TOF-MS or two-step laser ablation and ionisa-tion mass spectrometry, as well as TPD/QMS or GC-MS in con-junction with RAIRS have been applied. The detections reportedin these studies are listed in Table 1. We did not include the longlist of COMs detected in the GC-MS study by Mrad et al. (2016)as here the irradiation time of the methanol ice (3 days) is somuch longer than in the present study that a direct comparison isnot really possible. Nevertheless, many of their findings are fullyin line with the data listed in the last column, which summarisesthe identifications in the present work. It is clear that COM for-mation starts with fluences comparable to those expected in theinterstellar medium and the high sensitivity of MATRI2CES al-lows them to be detected at an early stage in their solid state for-mation path. Many previous detections have now been confirmedwith the guarantee that these form at low temperatures, andseveral tentative new detections have been reported as well. Astraightforward comparison with results obtained by Öberg et al.(2009) is possible (Table 1, Col. 1). In that study RAIRS andTPD/QMS are used to study the photo-processing of methanolice. There is a good overall qualitative agreement with the re-sults presented here, but clearly some quantitative differencesexist. In the case of small species such as CO, CO2, and CH4,we obtain different relative abundances because LDPI TOF-MSis less suitable for the quantification of these small species atlow temperature than IR spectroscopy. On the contrary, LDPITOF-MS allows the disentangling of the quantities of COMsthat form at low temperature, providing greater insights into thephoto-chemistry at play than IR spectroscopy.
The study of Boamah et al. (2014) uses low-energy elec-trons for processing (Table 1, Col. 2). A large number ofCOMs are detected, in agreement with the results presented inthis paper. There is a qualitative difference for small species(CH4, CO) owing to limitations in substrate temperature in thatstudy.
Maity et al. (2014, 2015) has combined TPD with SPI TOF-MS (Table 1, Col. 3). This has lead to an extended list of COMs.Compared with the present study, some species, such as water,formic acid, and acetic acid, are likely to have formed duringthe ice processing. If present, these species will not have beendetected, since their ionisation potential is higher than the photonenergy used for ionisation.
Recently, Henderson & Gudipati (2015) have used two-steplaser ablation and ionisation mass spectrometry on VUV andelectron (2 keV) processed ices with the aim at detecting newlyformed species. Comparing their results with those found here(Table 1, Col. 4), clear differences are found; the VUV experi-ments result in a higher level of molecular complexity, for whichthere may be different reasons. It is possible that the ice in theexperiment of Henderson & Gudipati (2015) is too thick to becompletely processed by the VUV photons. Another explana-tion is that the actual VUV flux reported in their study pro-vides an upper limit as 1015 photons cm−2 s−1 is on the highside (Ligterink et al. 2015). It is also possible that the use of aUV laser as ionisation source – compared with electron impact
that we use here – comes with a different efficiency. In particularthe UV laser is expected to be more efficient in the ionisation ofaromatic molecules than aliphatic ones.
It should be noted that even though the final products foundin many of the studies listed here are comparable, the underlyingprocesses are quite different. Photons with specific energies areexpected to favour specific bond cleavage dissociation, whereasimpacting electrons will be less selective. On the other hand, theimpact of a single high-energy electron can lead to a large num-ber of secondary electrons, initiating a cascade of bond cleav-ages, forming radicals in the ice, which in turn can lead to theformation of new COMs.
4.2. CH3OH photo-dissocation branching ratio
The formation of COMs depends on the abundance of radicalsin the ice and their ability to meet and react. The fitted massspectra contain information on the abundance of different photo-products. This provides information about the radicals that havesuccessfully found a reaction partner (see chemical network pro-posed by Öberg et al. 2009). Assuming that only one bond isbroken the following radicals can be formed in the ice uponmethanol photo-dissociation (Laas et al. 2011):
CH3OH + hν → CH2OH + H (3)
→ CH3 + OH (4)
→ OCH3 + H. (5)
Since ethanol and dimethyl ether are strongly correlated in thefitting routine, as discussed in Sect. 3.2.3, it is unreliable to di-rectly use their abundance. Instead, we assume their formationratio is the same as in the RAIRS study (4 ± 2) (Öberg et al.2009). Without a complete model, it is difficult to accurately de-termine the photo-dissociation branching ratio of CH3OH. Bytracing the abundance of different photoproducts, an estimate ofthe photo-dissociation branching ratio can be obtained. Basedon the chemical network proposed by Öberg et al. (2009), theradicals of interest – hydroxymethyl, methyl, and methoxy – aretraced. To form ethylene glycol, two hydroxymethyl radicals arenecessary. To form glycolaldehyde, a formyl radical and a hy-droxymethyl radical have to react. If we take into account theformation of ethylene glycol, glycolaldehyde, ethanol, methylformate, and dimethyl ether, we obtain a branching ratio of 5:1between CH2OH and OCH3. The importance of the CH3+OHbranching is constrained by COMs that involve a methyl radicalin their formation process. We opt for this approach rather thantracking OH-dependent species, since part of the observed water(an important sink for the OH radical) can be a contaminant.The methyl radical is involved in reactions towards methane,ethanol, and dimethyl ether. The hydroxymethyl and methoxyradical can both absorb another photon, which can lead to theformation of formaldehyde. As a first-order approximation, weassume that the formaldehyde is mainly formed through thesetwo routes and that the formation efficiency for both radicalsis the same. Since the CH2OH and OCH3 abundance is 5:1,this indicates that 85% of the formaldehyde is formed from hy-droxymethyl radicals and 15% from methoxy radicals. The fi-nal deduced branching ratio of methanol photodissociation intoCH2OH:CH3+OH:OCH3 amounts to 10:3:2.
So far in the analysis, the difference in mobility of radicalsOCH3, CH3, and CH2OH at 20 K has been neglected. Althoughdiffusion of these radicals through a methanol matrix is difficult
A67, page 12 of 17
D. M. Paardekooper et al.: LDPI TOF-MS of VUV processed CH3OH ice
to assess, typically the order of the binding energy of the in-volved species is CH3 < OCH3 < CH2OH (Garrod et al. 2008;Öberg et al. 2009). This suggests that the CH2OH+H branchmay be underestimated and is even more dominant. The dom-inant branching channel found in this study is in agreement withÖberg et al. (2009). A more prominent CH3 + OH branch is ob-served in this study, however.
4.3. Glycerin formation mechanism
The reaction between two hydroxymethyl radicals will lead tothe formation of ethylene glycol. A subsequent absorption of aVUV photon can result in a dehydrogenation forming for exam-ple the HOCHCH2OH radical. If this radical reacts with anotherhydroxymethyl radical, this leads to the formation of glycerin(Kaiser et al. 2015). It is likely that for other reactions start-ing from solid ethylene glycol, more species with a complexitycomparable to glycerin may form. This depends on local radicalabundances and the exact position of the dehydrogenation eventin ethylene glycol. One of the interesting species that can formthrough the recombination of HOCHCH2OH and HCO radi-cals is glyceraldehyde, a sugar of astrobiological importance.As stated above (Fig. 9), the mass spectrum contains peaks thatwould be consistent with the formation of this molecule, butgiven the lower intensity and overlapping features with otherspecies this claim is preliminary. In the study by Mrad et al.(2016) where the long irradiation times result in a large varietyof COMs, no proof for glycerin has been found.
5. Astrophysical implications and conclusions
Complex organic molecules have been detected in different en-vironments in the interstellar medium, ranging from cold andhot cores to hot corinos and prestellar cores (Bacmann et al.2012; Jørgensen et al. 2012; Coutens et al. 2015). With theAtacama Large Millimeter/submillimeter Array (ALMA) andStratospheric Observatory for Infrared Astronomy (SOFIA) pro-ducing data and other facilities that will be online in the nearfuture, it is expected that the number of identified COMs willsteadily increase. The exact formation route of these moleculesis still under debate, but it is generally accepted that COMs formon icy dust grains following thermal processing, irradiation byVUV light or X-rays, or bombardment by atoms, electrons, andcosmic rays.
One possible starting point is solid methanol formed by thehydrogenation of CO. Methanol is easily fragmented and recom-bination of the resulting radicals allows the formation of largerspecies. Indeed, methanol has been observed in the interstellarmedium, both in the solid state and in the gas phase, and attemptshave been made to link these abundances to those of COMs(Öberg et al. 2014). In the present study the VUV induced photo-chemistry of pure methanol ice has been studied in the laboratorywith the goal of understanding which new molecules form andwhich processes are involved.
– Mass spectra obtained at different temperatures combinedwith in situ measured reference fragmentation patterns leadto unambiguous detection of the following species uponVUV photolysis of pure CH3OH ice at 20 K:Carbon monoxide (CO), methane (CH4), formaldehyde(H2CO), carbon dioxide (CO2), methyl formate(HCOOCH3), acetaldehyde (CH3CHO), dimethyl ether(CH3OCH3), ethanol (CH3CH2OH), water (H2O), aceticacid (CH3COOH), ethylene glycol ((CH2OH)2), formic acid
(HCOOH) (tentative), and glycolaldehyde (HOCH2CHO).This is largely in line with Öberg et al. (2009); however, thepresent method extends the quantification of species that areindistinguishable using IR spectroscopy.
– Mass spectra obtained at high temperature (210 K) hint atthe presence of glycerin (HOCH2CHOHCH2OH). This isthe first possible experimental observation of glycerin inVUV processed methanol ice and suggests that molecularcomplexity in space may be beyond current astronomicaldetections.
– A qualitative analysis of the mass spectra obtained at lowtemperature indicates the detection of fragment ions origi-nating from e.g. (CO)xH+
y , with x = 3 and y < 3x− 1. This isthe first detection of such species at low temperature. LargeCOMs such as (CO)xH+
y , with x = 3 and y < 3x − 1, can beformed in the ice layers of interstellar dust grains.
– The study here also provides insight into the methanolbranching ratios, at least for the applied experimental con-ditions. Based on our findings we estimate that the pho-todissociation branching ratio for methanol ice amounts toCH2OH:CH3+OH:OCH3 = 10:3:2.
The experiments performed can be compared with correspond-ing processes in the interstellar medium by calculating the inte-grated energy deposited per methanol molecule. In dark clouds,the amount of energy deposited per water molecule has been es-timated by Shen et al. (2004). It ranges from ∼1–100 eV per wa-ter molecule after 107 yr, depending on the assumed cosmic rayspectrum. Adapting recent measurements of solid state cross sec-tion values from Cruz-Diaz et al. (2014) for methanolσ121.6 nm ≈
8.7 × 10⁻¹⁸ cm2, we calculate that the energy deposited permethanol molecule in a dark cloud is in the range 2.5−500 eVafter 107 yr.
Using a similar approach, we can calculate the same quan-tity for experiments performed in the laboratory using Eqs. (6)and (7):A = 1 − e−σav·N (6)
Eabs =A · F · Eav · t
N, (7)
where A is the fraction of absorbed photons, σav the averagecross section in cm2, N the column density of absorbers in cm−2
determined using the thickness calibration, F the flux in photonscm−2 s−1, Eav the average energy per photon in eV photon−1,and t the time in seconds. Based on the emission profile ofthe lamp (Fig. 1), we can calculate the average photon en-ergy Eav as 9 eV per photon. In addition, combining the emis-sion profile with the reported methanol cross section (Cruz-Diaz et al. 2014) at multiple wavelengths (121.6, 157.8, and160.8 nm), we estimate the average cross section (σav) of themethanol molecules to be (3.7 ± 0.4) × 10−18 cm2. These val-ues are inserted into Eq. (7), which calculates the energy de-posited per methanol molecule after 64 min of VUV irradia-tion and is in the range 2.3−4.6 eV per methanol molecule.Compared to the energy deposit per methanol molecule in darkclouds (2.5−500 eV), the energy deposit in the laboratory ex-periments is at the low limit (Shen et al. 2004; Cruz-Diaz et al.2014).
For higher fluences it is likely that the accessible complexitywill increase further. This links the findings in the present workto the original studies in which long time irradiation of interstel-lar ice was performed by Bernstein et al. (2002), Muñoz Caroet al. (2002) and Mrad et al. (2016), illustrating the high sensi-tivity of LDPI TOF-MS as a technique to study COM formationin ice.
A67, page 13 of 17

A&A 592, A67 (2016)
Acknowledgements. This work was supported by NOVA, the NetherlandsResearch School for Astronomy, and a VICI grant from the NetherlandsOrganisation for Scientific Research (NWO). J.-B.B. is grateful for supportfrom the Marie Sklodowska Curie actions and the Intra-European Fellowship(FP7-PEOPLE-2011-IEF-299258). We thank M. J. A. Witlox for his significantrole in the construction of the instrument. The authors thank Gleb Fedoseev andAlan Heays for stimulating discussions.
ReferencesBacmann, A., Taquet, V., Faure, A., Kahane, C., & Ceccarelli, C. 2012, A&A,
541, L12Baratta, G. A., & Palumbo, M. E. 1998, J. Opt. Soc. Am. A, 15, 3076Baratta, G. A., Leto, G., & Palumbo, M. E. 2002, A&A, 384, 343Bennett, C. J., & Kaiser, R. I. 2007, ApJ, 661, 899Bernstein, M. P., Dworkin, J. P., Sandford, S. A., Cooper, G. W., & Allamandola,
L. J. 2002, Nature, 416, 401Bhutadia, H., Vinodkumar, M., & Antony, B. 2012, J. Phys. Conf. Ser., 388,
052071Boamah, M. D., Sullivan, K. K., Shulenberger, K. E., et al. 2014, Faraday
Discuss., 168, 249Bolina, A. S., Wolff, A. J., & Brown, W. A. 2005, J. Chem. Phys., 122, 044713Boogert, A. C. A., Gerakines, P. A., & Whittet, D. C. B. 2015, ARA&A, 53, 541Bossa, J.-B., Paardekooper, D. M., Isokoski, K., & Linnartz, H. 2015, Phys.
Chem. Chem. Phys., 17, 17346Briggs, R., Ertem, G., Ferris, J. P., et al. 1992, Origins. Life. Evol. B., 22, 287Bull, J. N., & Harland, P. W. 2008, Int. J. Mass Spectrom., 273, 53Chen, Y.-J., Chuang, K.-J., Muñoz Caro, G. M., et al. 2014, ApJ, 781, 15Chuang, K.-J., Fedoseev, G., Ioppolo, S., van Dishoeck, E. F., & Linnartz, H.
2016, MNRAS, 455, 1702Coutens, A., Persson, M. V., Jørgensen, J. K., Wampfler, S. F., & Lykke, J. M.
2015, A&A, 576, A5Cruz-Diaz, G. A., Muñoz Caro, G. M., Chen, Y.-J., & Yih, T.-S. 2014, A&A,
562, A119Cuppen, H. M., Penteado, E. M., Isokoski, K., van der Marel, N., & Linnartz, H.
2011, MNRAS, 417, 2809Es-sebbar, E.-t., Bénilan, Y., Fray, N., et al. 2015, ApJS, 218, 19Focsa, F., & Destombes, J. 2001, Chem. Phys. Lett., 347, 390Fuchs, G. W., Cuppen, H. M., Ioppolo, S., et al. 2009, A&A, 505, 629Garrod, R. T., Weaver, S. L. W., & Herbst, E. 2008, ApJ, 682, 283Gerakines, P. A., Schutte, W. A., & Ehrenfreund, P. 1996, A&A, 312, 289Guan, J., Hu, Y., Zou, H., et al. 2012, J. Chem. Phys., 137, 124308Hama, T., & Watanabe, N. 2013, Chem. Rev., 113, 8783Henderson, B. L., & Gudipati, M. S. 2015, ApJ, 800, 66
Hudson, R. L., & Moore, M. H. 2000, Icarus, 145, 661Hudson, J. E., Hamilton, M. L., Vallance, C., & Harland, P. W. 2003, Phys.
Chem. Chem. Phys., 5, 3162Hudson, J. E., Vallance, C., & Harland, P. W. 2004, J. Phys. B, 37, 445Hudson, R. L., Moore, M. H., & Cook, A. M. 2005, Adv. Space Res., 36, 184Hudson, J. E., Weng, Z. F., Vallance, C., & Harland, P. W. 2006, Int. J. Mass
Spectrom., 248, 42Islam, F., Baratta, G. A., & Palumbo, M. E. 2014, A&A, 561, A73Isokoski, K., Bossa, J.-B., Triemstra, T., & Linnartz, H. 2014, Phys. Chem.
Chem. Phys., 16, 3456Johnson, R. A., & Stanley, A. E. 1991, Appl. Spectrosc., 45, 218Jørgensen, J. K., Favre, C., Bisschop, S. E., et al. 2012, ApJ, 757, L4Kaiser, R. I., Maity, S., & Jones, B. M. 2015, Angew. Chem., 127, 197Kim, Y.-K., & Rudd, M. E. 1994, Phys. Rev. A, 50, 3954Kim, Y.-K., Hwang, W., Weinberger, N., Ali, M., & Rudd, M. 1997,
J. Chem. Phys., 106, 1026Laas, J. C., Garrod, R. T., Herbst, E., & Widicus Weaver, S. L. 2011, ApJ, 728,
71Lagarias, J., Reeds, J., Wright, M., & Wright, P. 1998, SIAM. J. Optim., 9, 112Ligterink, N. F. W., Paardekooper, D. M., Chuang, K.-J., et al. 2015, A&A, 584,
A56Linnartz, H., Ioppolo, S., & Fedoseev, G. 2015, Int. Rev. Phys. Chem., 34, 205Maity, S., Kaiser, R. I., & Jones, B. M. 2014, Faraday Discuss., 168, 485Maity, S., Kaiser, R. I., & Jones, B. M. 2015, Phys. Chem. Chem. Phys., 17, 3081Moore, M. H., & Hudson, R. L. 2005, in Astrochemistry: Recent Successes and
Current Challenges, eds. D. C. Lis, G. A. Blake, & E. Herbst, IAU Symp.,231, 247
Mrad, N. A., Duvernay, F., Chiavassa, T., & Danger, G. 2016, MNRAS,DOI: 10.1093/mnras/stw346
Muñoz Caro, G. M., Meierhenrich, U. J., Schutte, W. A., et al. 2002, Nature,416, 403
Öberg, K. I., Garrod, R. T., van Dishoeck, E. F., & Linnartz, H. 2009, A&A, 504,891
Öberg, K. I., Lauck, T., & Graninger, D. 2014, ApJ, 788, 68Paardekooper, D. M., Bossa, J.-B., Isokoski, K., & Linnartz, H. 2014,
Rev. Sci. Instrum., 85, 104501Schwarz-Selinger, T., Preuss, R., Dose, V., & von der Linden, W. 2001,
J. Mass Spectrom., 36, 866Shen, C. J., Greenberg, J. M., Schutte, W. A., & van Dishoeck, E. F. 2004, A&A,
415, 203Sugohara, R. T., Homem, M. G. P., Iga, I., et al. 2013, Phys. Rev. A, 88, 022709van Dishoeck, E. F. 2014, Faraday Discuss., 168, 9Watanabe, N., & Kouchi, A. 2002, ApJ, 571, L173Weast, R. 1972, Handbook of Chemistry and Physics 53rd edn. (Chemical
Rubber Pub.), 207
A67, page 14 of 17
D. M. Paardekooper et al.: LDPI TOF-MS of VUV processed CH3OH ice
Appendix A: Additional figures
12 14 16 18 24 26 28 30 32
0.000
0.001
0.002
0.003
0.004
Signal strength (V)
m/z
Si
gnal
stre
ngth
(V)
m/z
Carbon monoxide Methane I20K-I50K
42 44 46 56 58 60 62
0.000
0.001
0.002
0.003
0.004
A
Fig. A.1. Ion mass fragmentation signals (black and red filled boxes) and integrated mass difference signal (open boxes) for T = 20 and 50 Kare shown for the m/z peaks that correspond to ion fragment masses of carbon monoxide and methane for 70 eV electron impact. The deriveduncertainty level is indicated for each difference signal.
12 14 16 18 24 26 28 30 32
0.000
0.001
0.002
0.003
Signal strength (V)
Dimethyl ether Carbon dioxide Formaldehyde I50K-I100K
Sign
al s
treng
th (V
)
m/z42 44 46 56 58 60 62
0.0000
0.0005
0.0010
0.0015B
m/zFig. A.2. Ion mass fragmentation signals (black, red, and cyan filled boxes) and integrated mass difference signal (open boxes) for T = 50and 100 K are shown for the m/z peaks that correspond to ion fragment masses of dimethyl ether, carbon dioxide, and formaldehyde for 70 eVelectron impact. The derived uncertainty level is indicated for each difference signal.
A67, page 15 of 17
A&A 592, A67 (2016)
12 14 16 18 24 26 28 30 32
0.000
0.001
0.002
0.003
0.004 Methyl formate Dimethyl ether Acetaldehyde I100K-I125K Signal strength (V)
Si
gnal
stre
ngth
(V)
m/z42 44 46 56 58 60 62
0.0000
0.0005
0.0010
0.0015
0.0020
C
m/zFig. A.3. Ion mass fragmentation signals (black, red, and magenta filled boxes) and integrated mass difference signal (open boxes) for T = 100and 125 K are shown for the m/z peaks that correspond to ion fragment masses of methyl formate, dimethyl ether, and acetaldehyde for 70 eVelectron impact. The derived uncertainty level is indicated for each difference signal.
12 14 16 18 24 26 28 30 32
0.00
0.01
0.02
0.03
Signal strength (V)
Sign
al s
treng
th (V
)
m/z
Ethanol Methanol Formic acid I125K-I150K
42 44 46 56 58 60 62
0.000
0.001
0.002
0.003
D
m/zFig. A.4. Ion mass fragmentation signals (black, red, and cyan filled boxes) and integrated mass difference signal (open boxes) for T = 125and 150 K are shown for the m/z peaks that correspond to ion fragment masses of ethanol, methanol, and formic acid for 70 eV electron impact.The derived uncertainty level is indicated for each difference signal.
A67, page 16 of 17

D. M. Paardekooper et al.: LDPI TOF-MS of VUV processed CH3OH ice
12 14 16 18 24 26 28 30 32
0.000
0.005
0.010
0.015Signal strength (V)
Si
gnal
stre
ngth
(V)
m/z
Ethylene glycol Acetic acid I175K-I210K
42 44 46 56 58 60 62
0.000
0.002
0.004
0.006
F
m/zFig. A.5. Ion mass fragmentation signals (black and red filled boxes) and integrated mass difference signal (open boxes) for T = 175 and 210 Kare shown for the m/z peaks that correspond to ion fragment masses of ethylene glycol and acetic acid for 70 eV electron impact. The deriveduncertainty level is indicated for each difference signal.
A67, page 17 of 17