Spectrometric study of the oligodeoxyribonucleotide protonation in aqueous solution
Enhancement of Sensitivity and Resolution ofSurface-Enhanced Laser Desorption/IonizationTime-of-Flight Mass Spectrometric Records
for Serum Peptides Using Time-SeriesAnalysis Techniques
Dariya I. Malyarenko,1,5* William E. Cooke,2 Bao-Ling Adam,3† Gunjan Malik,3
Haijian Chen,2,5 Eugene R. Tracy,2 Michael W. Trosset,4 Maciek Sasinowski,5
O. John Semmes,3 and Dennis M. Manos1,2
Background: Measurement of peptide/protein concen-trations in biological samples for biomarker discoverycommonly uses high-sensitivity mass spectrometerswith a surface-processing procedure to concentrate theimportant peptides. These time-of-flight (TOF) instru-ments typically have low mass resolution and consider-able electronic noise associated with their detectors. Thenet result is unnecessary overlapping of peaks, apparentmass jitter, and difficulty in distinguishing mass peaksfrom background noise. Many of these effects can bereduced by processing the signal using standard time-series background subtraction, calibration, and filteringtechniques.Methods: Surface-enhanced laser desorption/ionization(SELDI) spectra were acquired on a PBS II instrumentfrom blank, hydrophobic, and IMAC-Cu ProteinChip®
arrays (Ciphergen Biosystems, Inc.) incubated with cal-ibration peptide mixtures or pooled serum. TOF datawere recorded after single and multiple laser shots atdifferent positions. Correlative analysis was used fortime-series calibration. Target filters were used to sup-
press noise and enhance resolution after baseline re-moval and noise rescaling.Results: The developed algorithms compensated for theelectronic noise attributable to detector overload, re-moved the baseline caused by charge accumulation,detected and corrected mass peak jitter, enhanced signalamplitude at higher masses, and improved the resolu-tion by using a deconvolution filter.Conclusions: These time-series techniques, when ap-plied to SELDI-TOF data before any peak identificationprocedure, can improve the data to make the peakidentification process simpler and more robust. Theseimprovements may be applicable to most TOF instru-mentation that uses analog (rather than counting)detectors.© 2005 American Association for Clinical Chemistry
Current efforts in clinical research rely on the integrationof proteomic technologies in the search for specific pro-teins or peptides (called biomarkers) that are associatedwith disease. Recent evidence suggests that single bio-markers may not be effective in improving detection,diagnosis, and prognosis. Thus, rather than focusingon the discovery of a single biomarker, protein profilingcan maximize the use of samples collected from patientsby mining larger segments of the proteome. When se-quenced and identified (from databases or de novo), theseprotein biomarkers may also serve to elucidate potentialnew drug targets. Because diagnostics and drug designgenerally involve labor-intensive procedures, both fordevelopment and validation, highly parallel methods ofpreliminary screening are desirable. By shortening thepreliminary research, these methods may allow for rapid
Departments of 1 Applied Science, 2 Physics, and 4 Mathematics, the Col-lege of William and Mary, Williamsburg, VA.
3 Department of Microbiology and Molecular Cell Biology, Eastern Vir-ginia Medical School, Norfolk, VA.
5 INCOGEN, Inc., Williamsburg, VA.*Address correspondence to this author at: Department of Applied Science,
the College of William and Mary, Williamsburg, VA 23187-8795. Fax 757-221-3540; e-mail [email protected].
†Current affiliation: Center for Biotechnology and Genomic Medicine,Medical College of Georgia, Augusta, GA 30912.
Received May 15, 2004; accepted October 22, 2004.Previously published online at DOI: 10.1373/clinchem.2004.037283
Clinical Chemistry 51:1000–000 (2005) Proteomics and
Protein Markers
1
Papers in Press. First published November 18, 2004 as doi:10.1373/clinchem.2004.037283
Copyright © 2004 by The American Association for Clinical Chemistry

development of tools for diagnosis and prognosis, whichcan be tailored for individual patients. This could facili-tate the development of better strategies for treatment andoffer higher recovery rates for patients. Measuring cancer-related changes in serum also may reduce unnecessarybiopsies (1–4).
Laser desorption and ionization methods, includingmatrix-assisted laser desorption/ionization (MALDI)6
and surface-enhanced laser desorption/ionization(SELDI), can detect unfragmented singly charged “par-ent” ions with masses up to hundreds of kilodaltons incomplex mixtures (5, 6) for concentrations below fmol.Although two-dimensional polyacrylamide gel electro-phoresis (PAGE) imaging provides an alternative ap-proach for proteomics to measure relative concentrationsof proteins [see, e.g., Ref. (7 )], PAGE has inferior massresolution and sensitivity and does not provide informa-tion in the mass range �20 kDa.
SELDI time-of-flight mass spectrometry (TOF-MS) isperformed with chromatographic (on-chip) purification ofthe samples (6 ). Like MALDI, this technique ionizes thesample by use of a light-absorbing matrix that is added tothe spot surface after the purification step. Similar toMALDI, SELDI results depend on sample preparationand the protocols for laser irradiation (5, 8). Moreover, thelarge quantity of matrix typically produces multiplechemical adducts and neutral losses that also appear inthe corresponding MS spectra in addition to parent pep-tides. SELDI does not deploy reflectron or quadrupoleelements for mass focusing (9 ) and therefore provides farlower resolution than the highest resolution TOF instru-ments (5, 9, 10). Unlike two-dimensional PAGE, ionyields from SELDI are not easily related to the actualrelative concentrations of individual peptides or proteinson the surface. This is because the relative intensities ofSELDI peaks depend on interactions between proteins,between the proteins and the matrix, and between theproteins and the chip surface (5, 8, 11). However, whenstrict experimental protocols are followed, SELDI intensi-ties are reproducible (4, 12, 13).
For diagnostic applications, the goal of MS is to findspectral patterns that indicate the presence or absence of adisease (2–4). The detection of patterns in the multitudeof mass peaks that arise from complex clinical samplesdepends on the uniformity of instrumental response inboth mass and intensity. Hence, the instrument must bethoroughly calibrated. The fundamental weaknesses ofSELDI are excessive background noise, reduced signal-to-noise at high masses, misassignment of peak masses,formation of multiple chemical adducts, and substantialoverlap of peaks resulting from low resolution. All of
these effects make it much more difficult to distinguishand identify peaks in the mass spectrum (2–4, 12–14).Furthermore, high concentrations of low-mass species(e.g., matrix or contaminants) frequently overload thedetector and obscure the peptide peaks �2 kDa, whichmay be medically important. An improvement in thequality of current SELDI data and an understanding of itssignal to noise are therefore essential steps for proteinprofile screening (12–14) and for the identification ofbiomarker peptides (2–4).
To become a viable (inexpensive, noninvasive, rapid)tool for clinical diagnostics, SELDI must provide ionsignals that quantify the relative amounts of peptide orproteins that correlate with a specific medical condition.These operational requirements challenge MS electronicsand data analysis methods. MS for heavy molecules wasnot originally targeted at measuring relative amounts ofanalytes over a broad concentration range (5 ). Instead, theengineering effort was initially focused on improving theultimate sensitivity while maintaining as much as possi-ble the assignment of a mass number (5, 9). Much of therecent research effort has been invested in the design ofstable sample preparation protocols to ensure spectrumreproducibility (4, 6, 8, 11–14) but with the exception ofcareful isotopic labeling methods (15 ), even these morerepeatable mass spectra have not yet shown a directcorrelation between observed ion yields and the actualrelative concentrations of the analytes. This is becausemaintaining constant instrument gain over several ordersof magnitude in mass and concentration is still notpossible with the current choices of detectors and elec-tronics.
Here we describe a set of calibration and filteringprocedures that correct for instrumental artifacts in SELDIspectra before analysis and interpretation of the data.Following these procedures should ensure that the datarecorded from different instruments and in differentlaboratories with the same protocol for sample prepara-tion can be compared directly. In these studies, wecharacterized the response of the PBS II instrument, usingseveral ProteinChip® arrays with different surface chem-istries. SELDI-TOF spectra were recorded after single andmultiple laser shots for various hardware settings andseveral chip surfaces. We characterized the sources ofSELDI baseline shifts, peak broadening, and apparentjitter in peak position. Using optimal smoothing andtarget-filtering methods that were developed by the time-series analysis and spectroscopy community (16–18), wecreated algorithms for subtracting baselines, for removingsmall jitters in peak timing, and for enhancing instrumentresolution. We suggest that the improved practices de-scribed here for data acquisition, calibration, preprocess-ing, and filtering should become a part of the experimen-tal routine for TOF-MS profiling of peptide expression.They suppress instrumental artifacts and automaticallyreduce the number of variables (through noise filtering)for classification of diseases from MS data. This is an
6 Nonstandard abbreviations: MALDI, matrix-assisted laser desorption/ionization; SELDI, surface-enhanced v laser desorption/ionization; PAGE,polyacrylamide gel electrophoresis; TOF, time-of-flight; and MS, mass spec-trometry.
2 Malyarenko et al.: Enhancement of SELDI Resolution and Sensitivity

important prerequisite for finding the most significantfeatures (biomarkers) in a consistent statistical analysis ofSELDI-MS data. Further improvements are possible andare easily incorporated into the methodology.
Materials and Methodscalibration samples and m/z axisThe five-in-one protein (�-galactosidase, cytochrome C,myoglobin, glyceraldehyde-3-phosphate dehydrogenase,and albumin) calibration mixture was obtained fromCiphergen Biosystems, Inc. and was applied to a hydro-phobic chip (NP20) according to a protocol specified bythe manufacturer. Ciphergen’s proprietary ProteinChipsoftware uses these spectra to automatically calibrate theinstrument by a linear regression to fit time positions ofthe dominant peaks to their known mass values. Thefitting function is a three-parameter quadratic function sothat the mass eventually increases as the square of themeasured TOF arrival time. Because the instrument sam-ples a spectrum at a constant rate (every 4 ns for PBS II),this leads to a decreasing sample density per unit mass.Thus, the higher masses appear compressed in a spectrumviewed in the time domain.
serum processing and storageThe donor samples were collected at Eastern VirginiaMedical School from properly consenting individualsaccording to a protocol approved by the Eastern VirginiaMedical School Institutional Review Board. Venipuncturewas performed, and blood was collected into a 10-mLVacutainer® serum separator tube. The blood was clottedin a refrigerator at 3–6 °C for 30 min and then centrifugedat 3000 rpm for 15 min. The serum was immediatelydecanted, aliquoted, and stored at �80 °C. These sampleswere stored for 5–8 months before SELDI analysis with-out freeze-thaw cycles. Before the SELDI analysis, thesamples were thawed and divided into 40- to 50-�Laliquots. Serum samples for SELDI analysis were pre-pared as described previously (4 ).
seldi acquisition conditionsTOF spectra after single and multiple shots for blankchips (i.e., bare aluminum, no sample or matrix), calibra-tion mixtures on hydrophobic chips (NP20), and pooledserum on IMAC-Cu chip were acquired. All chips hadeight spots, labeled A-H. Each spot was subdivided into100 sections, called subpositions, as illustrated in Fig. 1 ofthe Data Supplement that accompanies the online versionof this article at http://www.clinchem.org/content/vol51/issue1/. For the blank chip, all shots were per-formed at subposition 20. For single shots with pooledserum, no warming shots were done and subpositions20–80 were scanned. For average spectra with pooledserum, 30 shots per subposition with two warming shots(at a laser intensity of 240), were performed, scanningsubpositions 20–80 with a 4-subposition step (16 stepsand 192 shots overall). Multiple acquisitions were done
with sensitivity settings of 7 and 3, detector voltages of1600 and 1200 V, and laser intensity settings at 210 and180. Raw data records and records processed by theinstrument’s default variable width moving average filterwere analyzed. The default moving average filter has avariable (mass-dependent) window width according tomanufacturer’s supplied table. This dependence is ap-proximately linear on m/z scale, and intermediate valuesfor window width are calculated by linear interpolationbetween tabulated values.
strategy of customized data processingWe recommend practices based on time-series analysis ofthe MS data in three basic areas: characterization andreduction of noise; calibration of peak timing; and reso-lution enhancement.
Noise characterization and reduction. For noise reduction, wepresent ways to remove the baseline, to remove some ofthe nonlinear effects attributable to detector saturation,and to rescale the signal to maintain a constant noise level.Most of the linear baseline arises from a constant offsetand the accumulation of a slowly decaying charge by thedetector electronics. The measured signal can thus bemodeled as:
sn � yn � c � a �k � 0
n � 1
e�k/�yn � k (1)
where yn is the incoming ion signal, and sn is the observedcombination of incoming signal plus accumulated chargeand constant offset, c. The constant a represents thefraction of signal that accumulates, and � represents thenumber of time steps that this accumulated charge takesto decay. This model can be inverted by finding thebaseline, bn, as follows:
bn � c � a �k � 0
n � 1
�1 � a�ke�k/��sn � k � c� (2)
� c � a�sn � c� � �1 � a�e�1/��bn � 1 � c�
In addition to this slow change, the baseline shifts as astep function after a large event saturates the detector.This step function has a constant value from the timestarting at the first saturation event, t0, and ending at rn
after times steps afterward by returning to zero. Thevariable n describes the number of saturated data pointsin the peak, and r is a recovery rate, in time points persaturation, that depends on the gain settings of an indi-vidual instrument.
The random noise can be reduced at high masses byuse of the default moving average filter, but we recom-mend rescaling the signal by the square root of thenumber of points in the moving average window toregain a constant level of random noise. The defaultsettings for variable width moving average depend only
Clinical Chemistry 51, No. 1, 2005 3
weakly on the mass calibration; therefore, the same rescal-ing factor can be used for all records.
Calibration of peak timing. To improve the peak timingresolution, we recalibrated the mass transformation set-tings at each laser subposition by introducing small timeshifts to maximize the cross-correlation between spectranear sharp spectral features before the average spectrumwas computed. The same technique can be used forautomatic alignment of the peaks in different spectrabefore classification.
Resolution enhancement. For resolution enhancement, weused a deconvolution filter to smooth and shape thesignal so that individual mass peaks were easier toresolve. Our filter design, which simultaneously reducesthe noise and narrows the incoming signal into ourdesired target shape, uses filter coefficients, ak, implicitlydefined by the following equations (16 ):
�k � 1
M � 1
ak�rt � k � �qt � k� � gt
(3)
gt � �k � 1
M � 1
dkbk � t
where dk is the observed initial signal wavelet; bk is thedesired target signal; gt is the cross-correlation betweenthe desired and observed wavelets (defined in the aboveequation); rt � k is a matrix formed from the autocorrela-tion function of the observed wavelet; qt � k is a matrixformed from an estimation of the noise autocorrelationfunction; M is the number of points in the initial targetregion; and � is a weighting factor that determines therelative importance of noise suppression to shaping. Foreach time point in the TOF record, this filter can beapplied to all incoming signals, st, as:
yt � �k � 1
M � 1
akst � k (4)
The filtered signal, yt, at time t depends only on theincoming signal, st-k, from the earlier times (t-k, lowermasses). One could equivalently create a filter that de-pends only on the signal at later times (higher masses) orone that is symmetric. The low mass edge of the masspeaks is sharper because of the absence of adducts and thenatural skew of isotopic distributions (19 ), and we findthat this choice of filters best uses the inherent instrumentresolution. We used five filters of different widths andproduced a net filtered signal by taking the fifth root ofthe product of the outputs of these five filters to dramat-ically reduce the noise and simultaneously increase theresolution. The choices of settings for artifact suppressionwill be optimized in future work.
In the present work, we chose a target region in the
vicinity of a sodium atomic peak (mass range, 15–28 Da)for the filter construction. The full width of the skewedtarget peak in time was 19 points, whereas the broadenedpeak wavelet was 30 points wide and showed a signal-to-noise ratio of �20. The lengths of the five filters were150, 147, 143, 135, and 129 points; and the optimum valuefor � (minimizing artifacts in the filtered signal) was 6.5.
computational resourcesThe algorithms for the data analysis were implemented inMatlab 6.12, and all calculations were performed on aUnix SunBlade workstation (500 MHz CPU, 384M ofRAM). The target filter for TOF data is the subject of apatent application. The rights to scripts and implementa-tion details belong to INCOGEN, Inc., but are availablefor academic users on request by sending an e-mail [email protected].
Results and DiscussionA brief description of the techniques for sample prepara-tion, data acquisition, and theoretical parameter estima-tion is given in the Materials and Methods. Below we beginour overview of results with a description of the sourcesof systematic noise in the PBS II data. This appears as abaseline signal (linear and nonlinear) or as random vari-ations. We next suggest a method of dejittering betweensubpositions during acquisition from a single spot andbetween patient records from large data sets to correctpeak timing and improve resolution of average recordsafter multiple laser shots. We then follow with severalexperimental examples of resolution enhancementthrough deconvolution and noise suppression of experi-mental SELDI records using smoothing and shapingtarget filters.
characterization and reduction of noiseThe SELDI-TOF instrument registers ion abundances asrecords of voltages induced in the detector when the ionsarrive. For analog detectors, these voltages are sampled intime with a constant dwell period (4 ns for the PBS IIinstrument). The basic premise of a TOF measurement isthat each arriving ion produces a signal at its arrival timebut does not affect signals at other times. Moreover,because the signals are the sum of the charges arriving ata specified time, they should always be positive. Never-theless, in most SELDI-TOF spectra, the peak signalsusually ride on top of a large, relatively smooth back-ground. The details of this background vary with theinstrument settings and with the size and characteristicsof the signal, but it is not unusual to observe backgroundat 20% of the peak signal and to have that backgroundpersist for more than 15 000 data points. The instrumentcan attempt to subtract this baseline without a physicalmodel by use of a segmented convex hull algorithmsupplied in a proprietary software package from Cipher-gen, Inc (20 ), but this method often subtracts signal foroverlapping broad clusters at low and high masses. Such
4 Malyarenko et al.: Enhancement of SELDI Resolution and Sensitivity
errors could compromise later comparisons of relativeintensities.
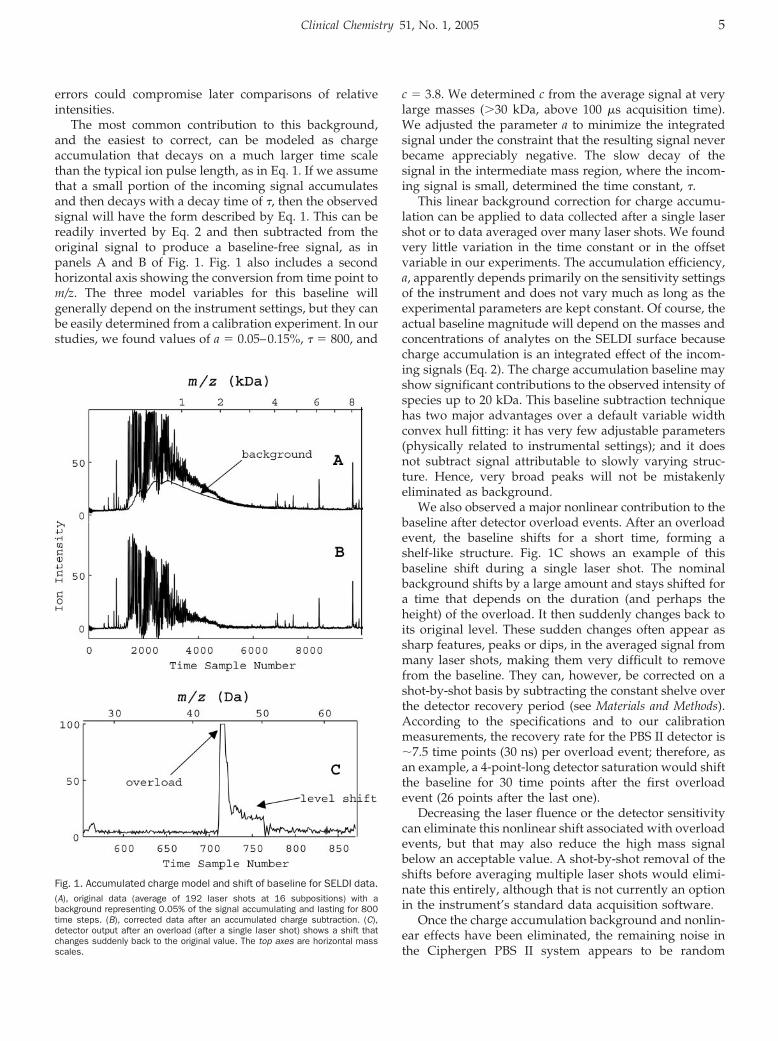
The most common contribution to this background,and the easiest to correct, can be modeled as chargeaccumulation that decays on a much larger time scalethan the typical ion pulse length, as in Eq. 1. If we assumethat a small portion of the incoming signal accumulatesand then decays with a decay time of �, then the observedsignal will have the form described by Eq. 1. This can bereadily inverted by Eq. 2 and then subtracted from theoriginal signal to produce a baseline-free signal, as inpanels A and B of Fig. 1. Fig. 1 also includes a secondhorizontal axis showing the conversion from time point tom/z. The three model variables for this baseline willgenerally depend on the instrument settings, but they canbe easily determined from a calibration experiment. In ourstudies, we found values of a � 0.05–0.15%, � � 800, and
c � 3.8. We determined c from the average signal at verylarge masses (�30 kDa, above 100 �s acquisition time).We adjusted the parameter a to minimize the integratedsignal under the constraint that the resulting signal neverbecame appreciably negative. The slow decay of thesignal in the intermediate mass region, where the incom-ing signal is small, determined the time constant, �.
This linear background correction for charge accumu-lation can be applied to data collected after a single lasershot or to data averaged over many laser shots. We foundvery little variation in the time constant or in the offsetvariable in our experiments. The accumulation efficiency,a, apparently depends primarily on the sensitivity settingsof the instrument and does not vary much as long as theexperimental parameters are kept constant. Of course, theactual baseline magnitude will depend on the masses andconcentrations of analytes on the SELDI surface becausecharge accumulation is an integrated effect of the incom-ing signals (Eq. 2). The charge accumulation baseline mayshow significant contributions to the observed intensity ofspecies up to 20 kDa. This baseline subtraction techniquehas two major advantages over a default variable widthconvex hull fitting: it has very few adjustable parameters(physically related to instrumental settings); and it doesnot subtract signal attributable to slowly varying struc-ture. Hence, very broad peaks will not be mistakenlyeliminated as background.
We also observed a major nonlinear contribution to thebaseline after detector overload events. After an overloadevent, the baseline shifts for a short time, forming ashelf-like structure. Fig. 1C shows an example of thisbaseline shift during a single laser shot. The nominalbackground shifts by a large amount and stays shifted fora time that depends on the duration (and perhaps theheight) of the overload. It then suddenly changes back toits original level. These sudden changes often appear assharp features, peaks or dips, in the averaged signal frommany laser shots, making them very difficult to removefrom the baseline. They can, however, be corrected on ashot-by-shot basis by subtracting the constant shelve overthe detector recovery period (see Materials and Methods).According to the specifications and to our calibrationmeasurements, the recovery rate for the PBS II detector is�7.5 time points (30 ns) per overload event; therefore, asan example, a 4-point-long detector saturation would shiftthe baseline for 30 time points after the first overloadevent (26 points after the last one).
Decreasing the laser fluence or the detector sensitivitycan eliminate this nonlinear shift associated with overloadevents, but that may also reduce the high mass signalbelow an acceptable value. A shot-by-shot removal of theshifts before averaging multiple laser shots would elimi-nate this entirely, although that is not currently an optionin the instrument’s standard data acquisition software.
Once the charge accumulation background and nonlin-ear effects have been eliminated, the remaining noise inthe Ciphergen PBS II system appears to be random
Fig. 1. Accumulated charge model and shift of baseline for SELDI data.(A), original data (average of 192 laser shots at 16 subpositions) with abackground representing 0.05% of the signal accumulating and lasting for 800time steps. (B), corrected data after an accumulated charge subtraction. (C),detector output after an overload (after a single laser shot) shows a shift thatchanges suddenly back to the original value. The top axes are horizontal massscales.
Clinical Chemistry 51, No. 1, 2005 5
fluctuations in the detector. These can be reduced consid-erable by averaging: either over many laser shots or overmany time points. Of course, averaging over samplepoints may decrease the instrument’s resolution. Mostanalog TOF devices sample at constant time intervals sothat the time measurement precision, T/�t, grows with-out bound. Once this precision is sufficiently high, anyindividual mass peak will be distributed over many dwelltimes. This decreases the signal-to-noise ratio because theinherent random fluctuations per dwell time are constant.Thus, for the high masses, integrating or averaging overmany dwell times is a natural correction for random noisethat may not decrease the resolution. The default Cipher-gen PBS II signal-processing routine (20 ) uses a variablewidth moving average filter in the mass domain to gainthis increase in the high-mass signal to noise.
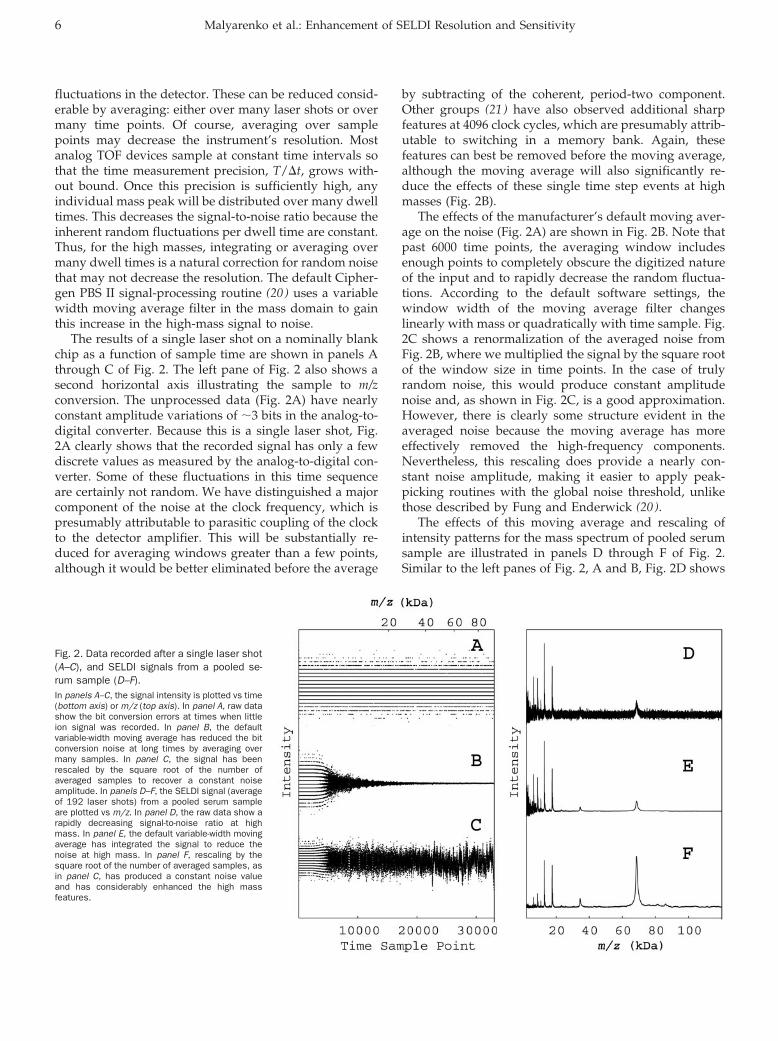
The results of a single laser shot on a nominally blankchip as a function of sample time are shown in panels Athrough C of Fig. 2. The left pane of Fig. 2 also shows asecond horizontal axis illustrating the sample to m/zconversion. The unprocessed data (Fig. 2A) have nearlyconstant amplitude variations of �3 bits in the analog-to-digital converter. Because this is a single laser shot, Fig.2A clearly shows that the recorded signal has only a fewdiscrete values as measured by the analog-to-digital con-verter. Some of these fluctuations in this time sequenceare certainly not random. We have distinguished a majorcomponent of the noise at the clock frequency, which ispresumably attributable to parasitic coupling of the clockto the detector amplifier. This will be substantially re-duced for averaging windows greater than a few points,although it would be better eliminated before the average
by subtracting of the coherent, period-two component.Other groups (21 ) have also observed additional sharpfeatures at 4096 clock cycles, which are presumably attrib-utable to switching in a memory bank. Again, thesefeatures can best be removed before the moving average,although the moving average will also significantly re-duce the effects of these single time step events at highmasses (Fig. 2B).
The effects of the manufacturer’s default moving aver-age on the noise (Fig. 2A) are shown in Fig. 2B. Note thatpast 6000 time points, the averaging window includesenough points to completely obscure the digitized natureof the input and to rapidly decrease the random fluctua-tions. According to the default software settings, thewindow width of the moving average filter changeslinearly with mass or quadratically with time sample. Fig.2C shows a renormalization of the averaged noise fromFig. 2B, where we multiplied the signal by the square rootof the window size in time points. In the case of trulyrandom noise, this would produce constant amplitudenoise and, as shown in Fig. 2C, is a good approximation.However, there is clearly some structure evident in theaveraged noise because the moving average has moreeffectively removed the high-frequency components.Nevertheless, this rescaling does provide a nearly con-stant noise amplitude, making it easier to apply peak-picking routines with the global noise threshold, unlikethose described by Fung and Enderwick (20 ).
The effects of this moving average and rescaling ofintensity patterns for the mass spectrum of pooled serumsample are illustrated in panels D through F of Fig. 2.Similar to the left panes of Fig. 2, A and B, Fig. 2D shows
Fig. 2. Data recorded after a single laser shot(A–C), and SELDI signals from a pooled se-rum sample (D–F).In panels A–C, the signal intensity is plotted vs time(bottom axis) or m/z (top axis). In panel A, raw datashow the bit conversion errors at times when littleion signal was recorded. In panel B, the defaultvariable-width moving average has reduced the bitconversion noise at long times by averaging overmany samples. In panel C, the signal has beenrescaled by the square root of the number ofaveraged samples to recover a constant noiseamplitude. In panels D–F, the SELDI signal (averageof 192 laser shots) from a pooled serum sampleare plotted vs m/z. In panel D, the raw data show arapidly decreasing signal-to-noise ratio at highmass. In panel E, the default variable-width movingaverage has integrated the signal to reduce thenoise at high mass. In panel F, rescaling by thesquare root of the number of averaged samples, asin panel C, has produced a constant noise valueand has considerably enhanced the high massfeatures.
6 Malyarenko et al.: Enhancement of SELDI Resolution and Sensitivity

the unprocessed data and Fig. 2E shows the result afterapplication of the variable width moving average, whichenhances the high mass peaks but attenuates the noisenonlinearly. Fig. 2F shows the result of rescaling donesimilar to Fig. 2C. Although the noise is visible only in thelow mass region of Fig. 2E, it is relatively constant (butvery small) throughout Fig. 2F. In Fig. 2F, the singlycharged albumin peak (68 kDa) and doubly chargedalbumin (34 kDa) are clearly visible well above the noise.Apparent differences in mass numbers from the expectedfor albumin are attributable to mass axis calibration errorsoutside the mass focusing range. It is important to realizethat noise rescaling does not change the local signal-to-noise ratio because both noise and signal are multipliedby the same factor. However, when the constant noise isrecovered in the broad mass range by rescaling, the peakmagnitudes are proportional to the signal-to-noise ratiofor that feature.
The default window width of the moving average filtergrows with increasing mass so that it is always �20% ofthe typical feature width expected by the manufacturer.We found the default settings for moving average to beconsistent with our own measurements of typical increas-ing edges of mass features, as shown in Fig. 2 of the onlineData Supplement. Because instrumental broadening andisotopic broadening cause peaks to spread out more to thehigh mass side (5, 8, 22), we measured the low mass edgeof a variety of peaks in the spectra from the pooled sera bymeasuring the width from half height on the low massside to the maximum height. As shown in Fig. 2 of theonline Data Supplement, the instrument resolution in thismass-focusing region is nearly constant, although thepeaks are broader than predicted by isotopic low-masshalf-width, calculated using Protein Prospector® (19 ). Wecan therefore expect that application of time series anal-ysis techniques relying on the constant instrumental res-olution, such as correlation and convolution filters, wouldbe warranted in the mass-focusing range.
calibration of peak timingBecause TOF measurements relate the mass of an ion tothe time that ion takes to reach the detector, the calibra-
tion that relates the arrival time to the actual ionic mass isa crucial characterization step. The Ciphergen softwarereadily calculates the appropriate calibration constantsbased on the designation of specific known peptide peaks.The calibration model assumes a quadratic relationshipbetween the arrival time and the ionic mass. However,these calibration constants are very sensitive to changes inthe electronic timing or in the flight path distance. SELDIand MALDI measurements are particularly vulnerable tothese types of errors because the ions are created in afast-moving plume that may change from laser shot tolaser shot (5, 11, 18). The effect of the dispersion ofvelocities in the plume has been minimized in the Cipher-gen instrument by use of time-lag mass focusing, butvariations in the average plume velocity can still intro-duce a calibration error. Moreover, the laser beam movesover a relatively large distance (see Fig. 1 in the onlineData Supplement), altering the net flight time and intro-ducing additional calibration shifts. Some SELDI instru-ments now ship with calibration software that corrects forsmall changes among the different sample spots. Evenwithin a particular sample spot, however, one expectssome variation. For a typical MALDI plume velocity of500 m/s, the average time shift attributable to local heightvariations on the sample would be 2 ns/�m. BecauseSELDI samples consist of a collection of randomly ori-ented crystals tens of micrometers thick, one anticipatestime shifts larger than the dwell time. In our single-laser-shot measurements, we found that shot-to-shot variationsat a single subposition were small, typically much lessthan the line width of the narrowest features in thetime-lag-focused mass region. However, when we movedthe laser between subpositions, we observed significantapparent shifts in the calibration timing.
The collection of traces in Fig. 3A, taken at differentsubpositions on the same sample spot, illustrates whatappears to be erratic time shifts. The amplitudes also varybecause each of these traces comes from a differentsubposition on a spot (see Fig. 1 in the online DataSupplement) with apparently different surface coverageby the sample. Adding approximately 20 of these traceswould typically generate a complete spectrum. The small
Fig. 3. Example of dejittering.(A), several spectra obtained at various subposi-tions within the same sample spot showing jitter inpeak position. The variation in peak amplitude istypical for single subposition spectra resulting fromirregular sample coverage of the chip spot. Anautocorrelation dejittering technique enhances theresolution of a high mass doublet (B) and simulta-neously improves the lower mass feature (C). F
represent data before autocalibration.
Clinical Chemistry 51, No. 1, 2005 7

shifts would unnecessarily broaden any features anddecrease their peak amplitude. We corrected these shiftsby introducing a subposition-dependent time shift de-rived by maximizing the cross-correlation between eachindividual trace and the average trace over the narrowdoublet near the time point 9860 (8464 Da). When 12 ofthese shifted traces were then averaged, they produced aspectrum with improved resolution, as shown in Fig. 3B.In addition, the same time shifts can change the masslocation of the peak at 4130 Da (time point 6895), as shownin Fig. 3C, and simultaneously improve the mass resolu-tion there. The real benefit of using this correlative pro-cedure (18 ) to correct for calibration changes betweensubpositions is that it does not require a known mass; itneeds only a single feature with relatively narrow struc-ture and can be easily automated (18 ). This autocalibra-tion procedure provides an obvious improvement incorrecting peak location and intensity. In addition toautocalibration during acquisition, a similar approach canbe used for detecting and correcting shifts among differ-ent spots and chips, and hence for proper alignment ofvariables in the data matrix before classification.
target filter deconvolutionWe found that target filter deconvolution can dramati-cally enhance the resolution in SELDI-TOF data, unmask-ing nearly obscured features to identify them clearly aspeaks. As described in the Materials and Methods, the ideabehind this filtering technique is to fit a part of the recordthat has a single peak on a noisy background (16 ). If thispeak has a shape characteristic of the instrument functionand also has a high signal-to-noise ratio, we can use it tocreate a filter that maps the instrument function into awavelet of arbitrary shape. Typically, the desired shape isa symmetric peak with a narrower line width. The bestfilter also takes the spectrum of the noise into accountimplicitly weighted by the factor � (Eq. 3). The physicalmeaning of � is the ratio of the filtered noise within thebandwidth of the signal wavelet to the integrated signal.For large values of �, the filter only suppresses noise anddoes not reshape the signal. After designing the best-fitfilter, we then apply it to the entire mass-focusing region,assuming a constant instrumental function and stationarynoise. This type of approach may seem to be unwarrantedin a TOF spectrum because the resolution changes sorapidly with mass, but most of this variation is simplyattributable to the transformation from time to mass. Infact, the instrumental resolution of peaks from masses assmall as sodium (23 Da) up to �12 kDa is nearly constantin time (see Fig. 2 in the online Data Supplement). As alsoshown Fig. 2 of the online Data Supplement, this filterwould not be appropriate outside the mass-focusingrange because the instrumental function changes rapidly.However, in a future report, we will show that we canextend the range of a best-fit filter by use of appropriaterescaling of the coefficients.
Even in the best cases, the deconvolution process
introduces some artifacts, or spurious peaks, into thefiltered signal. The fraction of the signal that is transferredto the artifacts increases for small length filters, for largedecreases in linewidth, or for small weighting parameters,�. Artifacts are distinct from the filtered signal in that theirposition, amplitude, and width change when the filterlength is altered. The phase of the artifacts depends on thefilter length; we therefore have geometrically averagedthe output of multiple filters with different lengths todetect and eliminate these artifacts.
With the conditions listed in the Materials and Methods,we increased the resolution of the filtered signal by afactor of 2 from the raw signal and simultaneouslyincreased its signal-to-noise ratio by a factor of 2. We usedatomic sodium peaks from the very low mass region tocreate our filters because the observed shape of thisatomic ion represents the instrument line shape function;we then successfully applied these filters to peptides asheavy as 9 kDa. This process is successful because theCiphergen TOF mass spectrometer uses mass focusingthat produces a nearly constant time resolution over awide range of masses, from simple atomic ions of mass 23Da up to nearly 12 kDa (see Fig. 2 in the online DataSupplement). Thus, when viewed as a time series ratherthan as a mass spectrum, standard time-series techniquesfor noise reduction and signal deconvolution becomeextremely valuable.
The net effect of resolution enhancement via targetfiltering in the mass-focusing range is that some spectrathat appeared to have slight shoulders on large peaks canbe deconvoluted to identify clear satellite peaks. Exam-ples of how this filter deconvolutes data from a pooledsera sample are shown in Fig. 4. The sodium ion targetregion is shown in Fig. 4A. The SELDI instrument assignsthis ion a mass of 19, although its mass determination iscalibrated by use of much heavier peptides from a cali-bration mixture (see Materials and Methods). Because theinstrument is not well calibrated for low masses, we haveidentified this monoatomic peak as sodium by use of anindependent compositional analysis of the SELDI chips.Sodium occurs only as a single isotope; therefore, this lowmass peak should accurately reproduce the instrumentfunction. The crosses in Fig. 4A show the SELDI data,whereas the diamonds show the desired wavelet formand the solid line shows the filtered result.
In panels B, C, and D of Fig. 4, the raw data arerepresented by crosses and the signals deconvoluted bythe filter by solid lines. In Fig. 4C, the small structure near6400 Da actually consists of four distinct peaks. Similarly,the structure near 8700 Da in Fig. 4D shows also consistsof four distinct peaks. The peaks Fig. 4D correspond tosmall sinapinic acid adducts of large intensity peptidepeaks preceding them on the left by 223 mass units (notshown). The increase in resolution suggests a clear chem-ical interpretation of deconvoluted features simply from avisual inspection. The masses of the peaks to the right ofthe highest intensity parent ion are separated by multiples
8 Malyarenko et al.: Enhancement of SELDI Resolution and Sensitivity

of the sodium mass (22 Da) and thus represent sodiumadducts. The two peaks to the left of a parent are shiftedby �18 Da, suggesting neutral losses of water or ammo-nia, or by �44 Da, suggesting neutral loss of carbondioxide. Interestingly, the majority of small peaks in thesera spectrum can be identified as adducts or neutrallosses of a relatively small number of distinct peptides.
One potential danger with deconvolution filters is thatthey can introduce artifacts in the vicinity of large peaks,which might be mistaken for real satellite features. Con-sequently, small peaks in the vicinity of larger structuresin a deconvoluted signal should be questioned. However,because our filter uses only data from lower masses togenerate the deconvoluted spectrum (Eq. 4), most artifactsshould primarily occur on the high mass side of largepeaks. One easy check for the legitimacy of a smallstructure is to create a reversed filter that uses only signalfrom higher masses. These filters have inherently lessresolution because of the tendency of various broadeningmechanisms to skew peaks toward higher masses(5, 8, 22), but their artifacts will occur at different masses.Fig. 3 in the online Data Supplement shows a deconvo-luted structure obtained with use of both high and lowmass filters and has only one small feature that is anartifact. The small peak at 9820 Da in the filtered signal inFig. 3 of the online Data Supplement (solid line) isapparently an artifact attributable to the preceding pep-tide parent peak at 9650 Da, which has an amplitude thatis 100 times higher. This feature disappears when the dataare filtered with the filter that uses only higher masses(dashed line in Fig. 3 of the online Data Supplement). Ingeneral, peaks identified by use of both filtering directionsare valid; in those cases, the preferred spectrum will bethe output of the low-mass filter only.
As a second test of the validity of our deconvolutionfilter, we constructed simulated data similar to the dou-blet in Fig. 4B. The unbroadened simulated peaks areshown in Fig. 5 as a thin line, the broadened data ascrosses, and the filtered data as a thick solid line. In thethree cases (panels A–C), we varied the separation be-tween the two simulated peaks by approximately one
third of a linewidth from the case where the smaller peakappears as a slight bump (Fig. 5A) to where it is clearlyvisible (Fig. 5C). In all three cases, the filter outputaccurately located the known position of the underlyingsimulated data. Note that filter coefficients used on thesimulated data were calculated from the experimentalatomic shape in Fig. 4A.
In summary, w have shown that processing of SELDI-TOF data in the time domain substantially improves thedata reproducibility to enhance data interpretation and toease comparisons among data sets. These time-seriesanalysis techniques, as tailored for SELDI data, can pro-vide automatic, real-time correction of artifacts intro-duced by SELDI hardware and can suppress instrumentalnoise, correct peak timing errors, enhance high masssignals, and deconvolute overlapped peaks. Further im-
Fig. 4. Use of the atomic sodium target to construct a filter.In (A), the SELDI data (✚ ) for a pooled serum are filtered (solid line) to a shape close to the target (�). Applying this filter to data later in the time series reveals thedoublet structure at 5300 Da (B) and quartets at 6370 Da (C) and 8700 Da (D).
Fig. 5. A doublet, similar to that observed experimentally in Fig. 4B,modeled as the sum of two gaussian lines (thin line) with increasingseparation (A–C).The filter constructed for the data in Fig. 4A successfully deconvoluted thesimulated broadened data (✚ ) to produce a filtered spectrum (thick solid line).This correctly reproduces the time positions of the original model peaks.
Clinical Chemistry 51, No. 1, 2005 9

provements, such as extrapolating these techniques todata outside the mass-focusing region and automating theoptimization of the filtering parameters, will be addressedin future work.
This work was supported by the Virginia CommonwealthResearch Technology Fund (IN2002-03), an SBIR awardfrom the National Cancer Institutes (CA101479), and agrant from the National Cancer Institutes Early DetectionResearch Network (CA85087). We are grateful to staffmembers at INCOGEN, Inc., for organizing the data-sharing site and the raw SELDI data archives.
References1. Wright GL Jr, Cazares LH, Leung S-M, Nasim S, Adam B-L, Yip T-T,
et al. Surface enhanced laser desorption/ionization (SELDI) massspectrometry: a novel protein biochip technology for detection ofprostate cancer biomarkers in complex protein mixtures. ProstCancer Prost Dis 1999;2:264–76.
2. Ball G, Mian S, Holding F, Allibone RO, Lowe J, Ali S, et al. Anintegrated approach utilizing artificial neural networks and SELDImass spectrometry for the classification of human tumors andrapid identification of potential biomarkers. Bioinformatics 2002;18:395–404.
3. Petricoin EF III, Ardekani AM, Hitt BA, Levine PJ, Fusaro VA,Steinberg SM, et al. Use of proteomic patterns in serum to identifyovarian cancer. Lancet 2002;359:572–7.
4. Adam B-L, Qu Y, Davis JW, Ward MD, Clements MA, Cazares LH,et al. Serum protein fingreprinting coupled with a pattern-matchingalgorithm distinguishes prostate cancer from benign prostatehyperplasia and healthy men. Cancer Res 2002;62:1609–14.
5. Cotter RJ. Time-of-flight mass spectrometry. Washington, DC:ACS, 1997:326pp.
6. Merchant M, Weinberger SR. Recent advancements in surface-enhanced laser desorption/ionization-time of flight-mass spec-trometry. Electrophoresis 2000;21:1164–7.
7. Emmert-Buck MR, Gillespie JW, Paweletz CP, Ornstein DK, BasrurV, Apella E, et al. An approach to proteomic analysis of humantumors. Mol Carcinog 2000;27:158–65.
8. Schiller J, Arnold K. Mass spectrometry in structural biology. In:Meyers RA, ed. Encyclopedia of analytical chemistry. New York:Wiley, 2000:1–26.
9. Jayaram R. Mass spectrometry, theory and applications. NewYork: Plenum Press, 1966:43–118.
10. Loboda AV, Krutchisky AN, Bromorski M, Ens W, Standing KG. Atandem quadrupole/time-of-flight mass spectrometer with a ma-trix-assisted laser desorption/ionization source: design and per-formance. Rapid Commun Mass Spectrom 2000;14:1047–57.
11. Gusev AI, Wilkinson WR, Proctor A, Hercules DM. Improvement ofsignal reproducibility and matrix/comatrix effects in MALDI analy-sis. Anal Chem 1995;65:1034–41.
12. Cordingley HC, Roberts SLL, Tooke P, Armitage JR, Lane PW, WuW, et al. Multifactorial screening design and analysis of SELDI-TOFProteinChip® array optimization experiments. Biotechniques2003;34:364–73.
13. Baggerly KA, Morris JS, Coombes KR. Reproducibility of SELDI-TOFprotein patterns in serum: comparing data sets from differentexperiments. Bioinformatics 2004;20:777–85.
14. Coombes KR, Fritsche HA, Clarke C, Chen J-N, Baggerly KA, MorrisJS, et al. Quality control and peak finding for proteomics datacollected from nipple aspirate fluid by surface-enhanced laserdesorption and ionization. Clin Chem 2003;49:1615–23.
15. Gygi SP, Aebersold R. Using mass spectrometry for quantitativeproteomics. Proteomics: Trends Guide 2000;July:31–6.
16. Robinson EA, Treitel S. Statistical communication and detection.London: Griffin, 1967:249–83.
17. Marshall AG. Fourier transform in NMR, optical and mass spec-trometry. New York: Elsevier, 1990:450pp.
18. Nicola AJ, Gusev AI, Proctor A, Hercules DM. Automation of datacollection for matrix-assisted laser desorption /ionization massspectrometry using a correlative analysis algorithm. Anal Chem1998;70:3213–9.
19. Senko MW, Beu SC, McLafferty FW. Determination of monoiso-topic masses and ion populations for large biomolecules fromresolved isotopic distributions. J Am Soc Mass Spectrom 1995;6:229–33 (http://prospector.ucsf.edu/ucsfhtml4.0/msiso.htm;accessed October 1, 2004).
20. Fung ET, Enderwick C. ProteinChip clinical proteomics: computa-tional challenges and solutions. Biotechniques 2002;32(Suppl):34–41.
21. Baggerly KA, Morris JS, Wang J, Gold D, Xiao L-C, Coombes KR. Acomprehensive approach to the analysis of matrix-assited laserdesorption/ionization-time of flight proteomics spectra from se-rum samples. Proteomics 2003;3:1667–72.
22. Zenobi R, Knochenmuss R. Ion formation in MALDI mass spec-trometry. Mass Spectrom Rev 1999;17:337–66.
10 Malyarenko et al.: Enhancement of SELDI Resolution and Sensitivity
Copyright © 2022 FDOKUMEN