
Large-scale mass wasting on the miocene continental margin ...
85
Louisiana State University Louisiana State University LSU Digital Commons LSU Digital Commons Faculty Publications Department of Geology and Geophysics 1-1-2020 Large-scale mass wasting on the miocene continental margin of Large-scale mass wasting on the miocene continental margin of Western India Western India Sarah K. Dailey Louisiana State University Peter D. Clift Louisiana State University Denise K. Kulhanek Texas A&M University Jerzy Blusztajn Woods Hole Oceanographic Institution Claire M. Routledge University College London See next page for additional authors Follow this and additional works at: https://digitalcommons.lsu.edu/geo_pubs Recommended Citation Recommended Citation Dailey, S., Clift, P., Kulhanek, D., Blusztajn, J., Routledge, C., Calvès, G., O'Sullivan, P., Jonell, T., Pandey, D., Andò, S., Coletti, G., Zhou, P., Li, Y., Neubeck, N., Bendle, J., Aharonovich, S., Griffith, E., Gurumurthy, G., Hahn, A., Iwai, M., Khim, B., Kumar, A., Kumar, A., Liddy, H., Lu, H., Lyle, M., Mishra, R., Radhakrishna, T., Saraswat, R., Saxena, R., Scardia, G., Sharma, G., & Singh, A. (2020). Large-scale mass wasting on the miocene continental margin of Western India. Bulletin of the Geological Society of America, 132 (1-2), 85-112. https://doi.org/10.1130/B35158.1 This Article is brought to you for free and open access by the Department of Geology and Geophysics at LSU Digital Commons. It has been accepted for inclusion in Faculty Publications by an authorized administrator of LSU Digital Commons. For more information, please contact [email protected].
-
Upload
khangminh22 -
Category
Documents
-
view
2 -
download
0
Transcript of Large-scale mass wasting on the miocene continental margin ...

Louisiana State University Louisiana State University
LSU Digital Commons LSU Digital Commons
Faculty Publications Department of Geology and Geophysics
1-1-2020
Large-scale mass wasting on the miocene continental margin of Large-scale mass wasting on the miocene continental margin of
Western India Western India
Sarah K. Dailey Louisiana State University
Peter D. Clift Louisiana State University
Denise K. Kulhanek Texas A&M University
Jerzy Blusztajn Woods Hole Oceanographic Institution
Claire M. Routledge University College London
See next page for additional authors
Follow this and additional works at: https://digitalcommons.lsu.edu/geo_pubs
Recommended Citation Recommended Citation Dailey, S., Clift, P., Kulhanek, D., Blusztajn, J., Routledge, C., Calvès, G., O'Sullivan, P., Jonell, T., Pandey, D., Andò, S., Coletti, G., Zhou, P., Li, Y., Neubeck, N., Bendle, J., Aharonovich, S., Griffith, E., Gurumurthy, G., Hahn, A., Iwai, M., Khim, B., Kumar, A., Kumar, A., Liddy, H., Lu, H., Lyle, M., Mishra, R., Radhakrishna, T., Saraswat, R., Saxena, R., Scardia, G., Sharma, G., & Singh, A. (2020). Large-scale mass wasting on the miocene continental margin of Western India. Bulletin of the Geological Society of America, 132 (1-2), 85-112. https://doi.org/10.1130/B35158.1
This Article is brought to you for free and open access by the Department of Geology and Geophysics at LSU Digital Commons. It has been accepted for inclusion in Faculty Publications by an authorized administrator of LSU Digital Commons. For more information, please contact [email protected].

Authors Authors Sarah K. Dailey, Peter D. Clift, Denise K. Kulhanek, Jerzy Blusztajn, Claire M. Routledge, GérÔme Calvès, Paul O'Sullivan, Tara N. Jonell, Dhananjai K. Pandey, Sergio Andò, Giovanni Coletti, Peng Zhou, Yuting Li, Nikki E. Neubeck, James A.P. Bendle, Sophia Aharonovich, Elizabeth M. Griffith, Gundiga P. Gurumurthy, Annette Hahn, Masao Iwai, Boo Keun Khim, Anil Kumar, A. Ganesh Kumar, Hannah M. Liddy, Huayu Lu, Mitchell W. Lyle, Ravi Mishra, Tallavajhala Radhakrishna, Rajeev Saraswat, Rakesh Saxena, Giancarlo Scardia, Girish K. Sharma, and Arun D. Singh
This article is available at LSU Digital Commons: https://digitalcommons.lsu.edu/geo_pubs/293
UC San DiegoUC San Diego Previously Published Works
TitleLarge-scale mass wasting on the Miocene continental margin of western India
Permalinkhttps://escholarship.org/uc/item/7174d6xp
JournalGEOLOGICAL SOCIETY OF AMERICA BULLETIN, 132(1-2)
ISSN0016-7606
AuthorsDailey, Sarah KClift, Peter DKulhanek, Denise Ket al.
Publication Date2020
DOI10.1130/B35158.1 Peer reviewed
eScholarship.org Powered by the California Digital LibraryUniversity of California


1
Large-scale Mass Wasting on the Miocene Continental Margin of Western 1
India 2
3
Sarah K. Dailey1, Peter D. Clift1, Denise K. Kulhanek2, Jerzy Blusztajn3, Claire M. Routledge4, 4
Gérôme Calvès5, Paul O’Sullivan6, Tara N. Jonell7, Dhananjai K. Pandey8, Sergio Andò9, 5
Giovanni Coletti9, Peng Zhou1, Yuting Li1, Nikki E. Neubeck1, James A.P. Bendle10, Sophia 6
Bratenkov11, Elizabeth M. Griffith12, Gundiga P. Gurumurthy13, Annette Hahn14, Masao Iwai15, 7
Boo-Keun Khim16, Anil Kumar17, A. Ganesh Kumar18, Hannah M. Liddy19, Huayu Lu20, 8
Mitchell W. Lyle21, Ravi Mishra8, Tallavajhala Radhakrishna22, Rajeev Saraswat23, Rakesh 9
Saxena24, Giancarlo Scardia25, Girish K. Sharma26, Arun D. Singh27, Stephan Steinke28, Kenta 10
Suzuki29, Lisa Tauxe30, Manish Tiwari9, Zhaokai Xu31, and Zhaojie Yu32 11
12
1 - Department of Geology and Geophysics, Louisiana State University, E253 Howe-Russell-Kniffen 13 Geoscience Complex, Baton Rouge LA 70803, USA 14 2 - International Ocean Discovery Program, Texas A&M University, 1000 Discovery Drive, College 15 Station, TX 77845, USA 16 3 – Department of Geology and Geophysics, Woods Hole Oceanographic Institution, Woods Hole, MA 17 02543, USA 18 4 - Department of Earth Sciences, University College London, Gower Street, London, WC1E 6BT, 19 United Kingdom 20 5 - Université Toulouse 3, Paul Sabatier, Géosciences Environnement Toulouse, 14 avenue Edouard 21 Belin, 31400, Toulouse, France 22 6 - GeoSep Services, 1521 Pine Cone Road, Moscow, Idaho 83843 USA 23 7 - School of Earth and Environmental Sciences, University of Queensland, QLD 4072, Australia 24 8 - National Centre for Antarctic and Ocean Research (NCAOR), Vasco da Gama, Goa 403804, India 25 9 - Department of Earth and Environmental Sciences, University of Milano Bicocca, Piazza della Scienza 26 4, 20126 Milan, Italy 27 10 - School of Geography, Earth and Environmental Sciences, University of Birmingham, Edgbaston, 28 Birmingham B15 2TT, United Kingdom 29 11 - Department of Earth and Planetary Sciences, Macquarie University, 202/1 Botany Rd., Sydney 30 NSW 2017, Australia 31

2
12 - School of Earth Sciences, Ohio State University, 275 Mendenhall Lab, 25 South Oval Mall, 32 Columbus OH, 43210, USA 33 13 - Manipal Centre for Natural Sciences, Manipal University, Manipal 576104, India 34 14 – MARUM, University of Bremen, Leobener Strasse, Bremen 28359, Germany 35 15 - Department of Natural Environmental Science, Kochi University, 2-5-1 Akebono-cho, Kochi 780-36 8520, Japan 37 16 - Division of Earth Environmental System, Pusan National University, Jangjeon-dong, Geumjeong-38 gu, Busan 609-73, Korea 39 17 - Department of Science and Technology Wadia Institute of Himalayan Geology, 33 GMS Road, 40 Dehradun, Uttrakhand 248001, India 41 18 - Marine Biotechnology Department, National Institute of Ocean Technology, Velachery-Tambaram 42 Main Road, Pallikaranai, Chennai 600100, India 43 19 - The Earth Institute, Columbia University, Hogan Hall, 2910 Broadway, Level A, New York NY 44 10025, USA 45 20 - School of Geographical and Oceanographical Sciences, Nanjing University, 163 Xianlin Avenue, 46 Nanjing 210023, P.R. China 47 21 - College of Earth, Ocean and Atmospheric Sciences, Oregon State University, 104 CEOAS 48 Administration Building, Corvallis OR 97331, USA 49 22 - Geosciences Division, National Centre for Earth Science Studies, Aakkulam Trivandrum 695031, 50 India 51 23 - Geological Oceanography Division, National Institute of Oceanography, Dona Paula, Goa 403004, 52 India 53 24 – ONGC, 11 High, Bandra-Sion Link Road, Mumbai 400017, India 54 25 - Instituto de Geociências e Ciências Exatas, Universidade Estadual Paulista, 1515 Avenida 24-A, Rio 55 Claro SP 13506-900, Brazil 56 26 - Department of Geology, Kumaun University, Nainital 263002, India 57 27 - Department of Geology, Banaras Hindu University, Varanasi Uttar Pradesh 221005, India 58 28 - Department of Geological Oceanography and State Key Laboratory of Marine Environmental 59 Science, Xiamen University, Xiamen 361102, P.R. China 60 29 - Graduate School of Environmental Science, Hokkaido University, N10W5, Kita-ku, Sapporo 060-61 0810, Japan 62 30 - Scripps Institution of Oceanography, 9500 Gilman Drive, La Jolla CA 92093-0220, USA 63 31 - Key Laboratory of Marine Geology and Environment, Institute of Oceanology, Chinese Academy of 64 Sciences, 7 Nanhai Road, Qingdao Shandong 266071, P.R. China 65 32 - University of Paris XI (Orsay), Bâtiment 504, Orsay Cedex 91405, France 66 67 68

3
Abstract 69
A giant mass transport complex was recently discovered in the eastern Arabian Sea, 70
exceeding in volume all but one other known complex on passive margins worldwide. The 71
complex, named the Nataraja Slide, was drilled by International Ocean Discovery Program 72
(IODP) Expedition 355 in two locations where it is ~300 m (Site U1456) and ~200 m thick (Site 73
U1457). The top of this mass transport complex is defined by the presence of both reworked 74
microfossil assemblages and deformation structures, such as folding and faulting. The deposit 75
consists of two main phases of mass wasting, each which consists of smaller pulses, with 76
generally fining-upward cycles, all emplaced just prior to 10.8 Ma. The base of the deposit at 77
each site is composed largely of matrix-supported carbonate breccia that is interpreted as the 78
product of debris flows. In the first phase, these breccias alternate with well-sorted calcarenites 79
deposited from a high energy current, coherent limestone blocks that are derived directly from 80
the Indian continental margin, and a few clastic mudstone beds. In the second phase, at the top of 81
the deposit, muddy turbidites dominate and become increasingly more siliciclastic. At Site 82
U1456, where both phases are seen, a 20 m section of hemipelagic mudstone is present, overlain 83
by a ~40 m thick section of calcarenite and slumped interbedded mud and siltstone. Bulk 84
sediment geochemistry, heavy- mineral analysis, clay mineralogy, isotope geochemistry, and 85
detrital zircon U-Pb ages constrain the provenance of the clastic, muddy material to being 86
reworked Indus-derived sediment, with input from western Indian rivers (e.g., Narmada and 87
Tapti Rivers), and some material from the Deccan Traps. The carbonate blocks found within the 88
breccias are shallow-water limestones from the outer western Indian continental shelf that was 89
oversteepened from enhanced clastic sediment delivery during the mid-Miocene. The final 90
emplacement of the material was likely related to seismicity as there are modern analogues for 91
Cross-Out
Inserted Text
-
Sticky Note
hyphenate throughout
Highlight
Cross-Out
Sticky Note
based on what?
Highlight
Sticky Note
hyphen
Cross-Out
Inserted Text
-
Highlight
Sticky Note
hyphens
Cross-Out
Inserted Text
,
Cross-Out
Inserted Text
, which
Highlight
Sticky Note
not clear what this means?

4
intraplate earthquakes close to the source of the slide. Although we hypothesize this area is at 92
low risk for future mass wasting events, it should be noted that other oversteepened continental 93
margins around the world could be at risk for mass failure as large as the Nataraja Slide. 94
95
INTRODUCTION 96
Large-scale mass wasting of continental margins is an important process in controlling 97
the geomorphology of continental slopes fringing all ocean basins (Coleman and Prior, 1988). 98
The scale of large mass transport complexes (MTCs) makes them significant as geohazards, 99
directly through mass wasting (Dan et al., 2007; Yamada et al., 2012), by generating tsunamis 100
(Tappin et al., 2001), as well as posing risks for seafloor infrastructure such as oil and gas 101
platforms, pipelines (Bea et al., 1983), and communication cables (Hsu et al., 2008). Moreover, 102
the emplacement of MTCs can have significant influence on the stratigraphy of deep ocean 103
basins, as well as for the continental margin from which it was derived. 104
Although the largest mass transport deposits are associated with active margins (Burg et 105
al., 2008), where earthquakes are more common and can act as triggers for emplacement, passive 106
margins are also recognized to host some of the largest gravitational collapses in the modern 107
oceans (Embley and Jacobi, 1977). Seismic surveying in the eastern Arabian Sea offshore 108
western India has identified one of the largest such complexes, totaling around 19,000 km³ 109
(Calvès et al., 2015). Mapping of the deposit by seismic methods suggests that it may be up to 110
800 m thick in places (Calvès et al., 2015). In 2015 this deposit was drilled by International 111
Ocean Discovery Program (IODP) during Expedition 355. During the expedition, the MTC was 112
sampled on its southern edge, where the thicknesses were considerably thinner (Pandey et al., 113
2016c)(Fig. 1). The deposit, named the Nataraja Slide, shows substantial run out from its inferred 114
Highlight
Highlight
Cross-Out
Highlight
Sticky Note
this is not a common acronym (or if it is, only to a small group of geoscientists). Make your paper as easy to read as possible.
Cross-Out
Highlight
Inserted Text
the?
Inserted Text
5
source regions offshore Saurashtra (Fig. 1), being emplaced ~500 km into the Indian Ocean. In 115
this study, we examine the sedimentary rocks recovered by IODP in order to infer the 116
depositional mechanisms active during emplacement. We further make inferences about what 117
processes triggered its formation, which is dated as being just before 10.8 Ma (Pandey et al., 118
2016a). Are MTCs of this magnitude formed by the same processes that we see at much smaller 119
scales, or are these mega-scale complexes unique in their modes of emplacement and triggers? 120
Given the profound potential geohazards for human settlements in coastal regions, understanding 121
the origins and impacts of the Nataraja Slide MTC are of both great scientific and societal 122
significance. 123
124
GEOLOGY OF LARGE MTCS 125
Mass transport complexes are an extreme form of gravity induced sediment transport 126
(Hampton et al., 1996). Most submarine gravity driven sediment transport involves redeposition 127
of individual sediment particles suspended in water (e.g., in a turbidity current) or as a fluidized 128
sediment suspension (e.g., a debris flow or mud flow)(Pickering et al., 1986; Talling et al., 129
2012). Sediment may also be mobilized when the proportion of water is very low, such as a 130
slow- moving sediment grain flow or creep (Carter, 1975; Lowe, 1976). However, large volumes 131
of material can also be transported rapidly (hours to days) in the form of slope failures where 132
coherent masses of material can be transported by sliding, rolling, falling, and/or slumping 133
(Coleman and Prior, 1988). Slumps involve displacement of a stratigraphic package above a 134
concave-upward detachment surface and can leave the slumped material in a relatively 135
undisturbed state after removal from an area that then shows an arcuate scar (Hampton et al., 136
1996; Moore, 1961). Slumps differ from slides in that motion is along a pre-existing weakness, 137
Highlight
Sticky Note
i think i know what you mean but this doesn't quite make sense
Sticky Note
what method?
Sticky Note
please take this out of question form
Cross-Out
Cross-Out
Highlight
Highlight
Inserted Text
Cross-Out

6
such as a bedding plane or joint surface, but the displaced package can move as a coherent mass, 138
or can be become disaggregated depending on the length and speed of transport. Significant 139
progress has been made in understanding mass transport through outcrop studies, such as the 140
Carboniferous (Pennsylvanian) Ross Slide of Ireland (Martinsen and Bakken, 1990; Strachan, 141
2002), the Eocene of the Pyrenean foreland basin (Farrell, 1984), and the Pliocene of Sicily 142
(Trincardi and Argnani, 1990). In all examples, each MTC was emplaced over a sharply defined 143
basal décollement once the deposit reached the lower slope after erosive mass wasting of the 144
steeper upper slope. 145
The geometry and internal structure of any gravitationally driven slump, slide or debris 146
flow reflect the mechanism of failure and the morphology of the slope where the transport occurs 147
(Lucente and Pini, 2003). The style of deformation and the mode of transport are controlled by 148
sediment and rock rheology that in turn are dependent on the lithology and strain rate. For this 149
reason, the largest MTCs are different from shallow debris flows and slumps because they 150
incorporate both lithified and unconsolidated materials. There are few exposures of very large 151
MTCs and those in the oceans are hard to access, especially through drilling. MTCs are often 152
seismically homogeneous (Vardy et al., 2010) but can show important changes in sediment 153
facies with depth and with distance from their source. For example, swath bathymetric mapping 154
of the Ebro margin in the western Mediterranean featuring the pre-11 ka BIG’95 Slide shows 155
that only finer sediments have reached the most distal areas, yet coherent rafts of continental 156
margin sedimentary rock are seen at the base of the slope (Lastras et al., 2004). Analysis of the 157
geometry and distribution of sedimentary facies and structures can be used to reconstruct the 158
evolving sedimentary and deformational strain history of any individual MTC. By doing so, it is 159
possible to derive a kinematic model of emplacement that can be compared with other examples. 160
Sticky Note
much of this belongs in the Intro, where it's hard to see a broad-scale significance to your study (yes, hazards, but this is a more coherent scientific rationale).

7
The Storegga Slide in offshore Norway is one of the best studied large-volume mass 161
transport complex. This MTC is entirely siliciclastic and its generation has been linked to sliding 162
on contourite sand and silts that became overpressured as a result of rapid burial by glacial 163
maximum aged debris flow sediments (Bryn et al., 2005). However, rapid sedimentation on any 164
clastic margin receiving sediment from the continent would provide weak layers on which 165
sliding could occur. Overpressuring has also been linked to growth and migration of silica 166
diagenetic fronts (Davies and Clark, 2006). Slope oversteepening increases the chances of mass 167
wasting simply by the consequence of rapid sediment delivery, although the tendency may be 168
heightened by the pre-existing basement structure of the continental margin (Lastras et al., 2004). 169
Slope oversteepening by itself cannot explain large-scale mass wasting because giant MTCs on 170
European continental margins are mostly associated with low gradient glacial margins. In 171
contrast, turbidity currents appear to dominate on steeper non-glacial margins which might 172
otherwise be expected to suffer mass wasting due to their gradient (Leynaud et al., 2009). In 173
these cases, differences in the sediment types and the timing of sediment delivery favor 174
gravitational instabilities at different times, with non-glaciated margins tending to mass waste 175
more during sealevel lowstands, where the opposite more often occurs on glaciated margins. 176
Modelling indicates that continental margins with more cohesive clay-rich sediments tend to 177
experience coherent sliding more frequently than sand-rich margins whose gravitational slides 178
tend to disintegrate into turbidity currents (Elverhoi et al., 2010). 179
The triggering of MTC emplacement can be attributed to a number of potential processes, 180
including seismicity (Moernaut et al., 2007; Piper et al., 1985), volcanic eruptions (Carracedo, 181
1999) and meteorite impacts (Klaus et al., 2000; Parnell, 2008). Dissociation of gas hydrates 182
during times of warming seawater could have aided liquefaction in the case of Storegga Slide 183
Inserted Text
es
Highlight
Sticky Note
what does this mean?
Highlight
Cross-Out
Inserted Text
-
Highlight
Cross-Out
Inserted Text
that
Highlight
Sticky Note
mass-transport events
Cross-Out

8
(Mienert et al., 2005), with seismicity possibly related to post-glacial isostatic rebound providing 184
the final impetus for redeposition (Evans et al., 2002). In the eastern Mediterranean Sea, MTC 185
emplacement has also be linked to biogenic gas and slope oversteepening acting individually or 186
in tandem with one another (Frey Martinez et al., 2005). 187
Mechanisms for MTC emplacement differ between clastic and carbonate margins. This is 188
because carbonate sediment production occurs in situ and can result in steep platform margins, 189
sometimes almost vertically where reef complexes develop in outer shelf areas. Carbonate 190
production is strongly linked to sealevel and was fastest when sealevel was high after the onset 191
of Northern Hemispheric Glaciation (NHG, ~2.4 Ma)(Schlager et al., 1994). Many carbonate 192
MTCs are linked to platform margin collapse and result in deposits with numerous coherent 193
blocks suspended within a more fluidized matrix. Seismic mapping around the Great Bahama 194
Bank has identified coherent Plio-Pleistocene sedimentary rock rafts 0.5–2.0 km in length, 0.3–195
1.5 km in width, and 50 m in thickness (Principaud et al., 2015). Adjacent deposits have also 196
been observed on the Florida margin (Mullins et al., 1986), as well as offshore Nicaragua (Hine, 197
1992), all with a similar Plio-Pleistocene age. Plio-Pleistocene MTCs are larger than most known 198
older examples because the rapidly changing sealevel since the start of the NHG enhanced 199
carbonate production and induced gravitational instability as sealevel rose and fell (Schlager et 200
al., 1994). Among these older deposits, only the Cretaceous Ayabacas MTC of Peru is 201
noteworthy for its large volume, long run out and presence of slide blocks measuring kilometers 202
in length (Callot et al., 2008). 203
204
GEOLOGICAL SETTING 205
Highlight
Cross-Out
Sticky Note
=? - again, make it easy for your reader to follow your discussion
9
The Nataraja Slide lies within the Laxmi Basin offshore the western continental margin 206
of India (Fig. 1A and B). The Laxmi Basin is separated from the main Arabian Basin by the 207
Laxmi Ridge (Fig. 1). The Laxmi Basin is a rift basin that formed between India and the Laxmi 208
Ridge prior to the opening of the main Arabian Sea in the early Paleocene (Bhattacharya et al., 209
1994), where the ridge is generally interpreted to be a rifted fragment of Indian continental crust 210
(Pandey et al., 1995). The age of rifting is somewhat controversial, but likely just predates the 211
emplacement of the Deccan Traps flood basalts in the latest Cretaceous, based on analysis of 212
magnetic anomalies (Bhattacharya et al., 1994) and the geochemistry of the basalts sampled at 213
IODP Site U1457 (Pandey et al., 2016b). The sediments in the Laxmi Basin can be divided into 214
three major units described below. The oldest, dated as Lower Paleocene, largely comprises red-215
brown mudstones eroded from peninsular India and sampled at IODP Site U1457 (Pandey et al., 216
2016b). These deposits are overlain by the Nataraja Slide and by younger distal turbidite 217
sandstones and siltstones, as well as hemipelagic mudstones that form the Indus submarine fan. 218
These latter sediments were supplied through the Indus River via erosion from the western 219
Himalaya and Karakoram (Pandey et al., 2016c). The age of the Indus Fan in the Laxmi Basin is 220
not well defined, although within the main Arabian basin the fan is typically considered to date 221
from at least 45 Ma, continuing to the present time (Clift et al., 2001). It is within these deposits 222
that the Nataraja Slide (MTC) was emplaced just before 10.8 Ma. 223
Towards the east, the Laxmi Basin is bounded by the rifted passive margin of India, 224
which has been supplied by sediment from the erosion of the peninsula via a number of 225
significant rivers that drain towards the west (e.g., Mahi, Tapti, and Narmada). Oil exploration 226
drilling has furthermore identified significant repeated buildups of carbonate on the shelf, 227
especially towards the shelf edge where the supply of clastic material was more limited (Rao and 228
Inserted Text
n Early Paleocene
Cross-Out
Sticky Note
again, based on what?

10
Talukdar, 1980; Wandrey, 2004). It is generally presumed that extensional deformation in the 229
area ceased after the rifting that formed the Laxmi Basin. The area has been largely seismically 230
inactive except towards the north where the Rann of Kutch forms an active structure within the 231
Indian Craton. This structure is linked to flexure of the plate as a result of the collision between 232
India and Asia (Bilham et al., 2003; Biswas, 2005), presumed to have started in the Eocene 233
(Najman et al., 2010) or even earlier (DeCelles et al., 2014). Towards the north, the Indian 234
peninsula is cut by the NE-SW trending Cambay Basin which formed as an initial early 235
Cretaceous rift that was then reactivated in the Cenozoic and experienced significant inversion in 236
the early Miocene (Chowdhary, 2004). 237
The MTC run-out distance is estimated to be about 550 km, with a length of 338 km and 238
a maximum width of 193 km (Calvès et al., 2015). Prior work on the Nataraja Slide found this 239
MTC to be acoustically homogenous in seismic lines, with few identified rafts present, and to 240
have a flat, rather than significantly angular erosive base over older deposits (Fig. 2)(Calvès et 241
al., 2015; Pandey et al., 2016c). However, closer inspection in the vicinity of the drilling sites 242
finds this is not always the case. In the case of IODP Site U1456 where the slide is somewhat 243
thicker, there is a significant missing section of submarine fan turbidites from ~15.6 to 10.8 Ma 244
(Pandey et al., 2016a). In that area the upper part of the deposit appears to be more acoustically 245
washed out and homogenous, but the lower regions are marked by strong reflections that show 246
limited lateral continuity suggestive of some internal structure within the deposit. This raises the 247
possibility that this is not simply a single depositional package (Fig. 2). Such strong reflections 248
are reminiscent of coherent slide blocks seen in seismic images of other MTCs (Gamboa et al., 249
2012; Krastel et al., 2012; Principaud et al., 2015). The same is not true at the more distal Site 250
Sticky Note
references?
Cross-Out
Cross-Out
Inserted Text
-
Inserted Text
,
Sticky Note
the run-out distance?
Inserted Text
Highlight
Sticky Note
look through the ms please to find places where the space is missing between different parenthetical items.
Cross-Out
Cross-Out
Inserted Text
is missing
Highlight
Sticky Note
not clear what the various "this"s are referring to?

11
U1457 location where the MTC onlaps the Laxmi Ridge and its acoustic character is more 251
uniform. 252
253
METHODS 254
Sedimentary cores were collected and initially described during IODP Expedition 355, 255
but several cores are re-examined in order to obtain more detailed descriptions of critical 256
sedimentary structures and facies. In addition to preparing sedimentary logs designed to 257
highlight the contrasting sedimentary facies, samples for sediment petrography were examined to 258
allow investigation into the different sediment types at both the macro and microscopic scale. 259
These methods allowed us to better define the depositional processes that operated during 260
Nataraja Slide emplacement and to provide constraints on the origin(s) of the MTC. 261
Geochemical methods were employed in order to further constrain the provenance of the 262
materials, and in particular, to verify the proposed western Indian continental margin source for 263
much of the MTC argued by Calvès et al. (2015). This approach is predicated on the fact that 264
source rocks of MTC deposits have different bulk geochemical compositions and that Himalayan 265
sources can be effectively discriminated from peninsular sources when considering provenance 266
due to different bedrock source compositions and contrasting chemical weathering histories. 267
Forty-four samples were selected for determination of major element composition, 268
together with select trace elements (Ni, Ba, V, Zr, Sc, Y, Sr). These were determined by 269
inductively coupled plasma emission spectrometry (ICP-ES) at Boston University, with precision 270
quantified to be better than 2% of the measured value for all elements. Accuracy was constrained 271
by analysis of certified Standard Reference Materials (BHVO-2) and results were accurate within 272
precision. Table 1 provides analyses of samples as well as repeated analyses of the standard. 273
Sticky Note
references?
Sticky Note
what sort of geochemical methods?
Sticky Note
do you mean the sediments in the deposit?
Sticky Note
references?

12
The neodymium (Nd) isotope compositions of sediments are generally considered to be 274
minimally affected by chemical weathering, such that source terranes faithfully translate their 275
isotopic signature to eroded sediments (i.e., Goldstein et al. (1984)) and can be utilized for 276
sedimentary provenance studies. Strontium (Sr) isotopes are additionally considered, while 277
recognizing that Sr isotope compositions may be affected by chemical alteration largely during 278
transport across flood plains (Derry and France-Lanord, 1996). Together these isotopic systems 279
have a record of being powerful provenance proxies in the Arabian Sea (e.g., (Clift and 280
Blusztajn, 2005; Clift et al., 2008a)). Care was taken to decarbonate samples prior to analysis 281
with 20% acetic acid because Sr isotope compositions are strongly controlled by carbonate 282
compositions and this study targets the siliciclastic sediment compositions only. Decarbonation 283
lasted for six days until no further fizzing was observed when samples were exposed to 284
unreacted acid. Samples were washed by deionized water before being ground into powders. 285
Twenty-five samples were selected throughout the Nataraja Slide/MTC at Sites U1456 and 286
U1457 for the determination of 143Nd/144Nd and 87Sr/86Sr values. Isotopic compositions were 287
determined by Finnigan Neptune multi-collector inductively coupled plasma mass spectrometer 288
(MC-ICP-MS) at the Woods Hole Oceanographic Institute for both Nd and Sr isotopes. Nd and 289
Sr isotope analyses were corrected against La Jolla Nd standard 143Nd/144Nd=0.511847 and 290
NBS987 standard 87Sr/86Sr=0.710240. Procedural blanks were 20–25 pg for Sr and 50–70 pg for 291
Nd. We calculate the parameter ϵNd after (DePaolo and Wasserburg, 1976) using a 143Nd/144Nd 292
value of 0.512638 for the Chondritic Uniform Reservoir (CHUR) (Hamilton et al., 1983). 293
Results are presented in Table 2. 294
Heavy-mineral analysis was applied to study the mineralogy of the MTC deposits in 295
order to further constrain the source of the materials and to estimate the potential impact of 296
Cross-Out
Cross-Out
Cross-Out
Cross-Out
Cross-Out
Inserted Text
in
Cross-Out
Inserted Text
isotopic?
Cross-Out
Inserted Text
used

13
diagenetic dissolution. Sediment left after thin section preparation was gently crushed in water 297
with mortar and pestle and wet-sieved using a standard 500 m steel sieve and a special 298
handmade 15 m tissue-net sieve. A wide size window (15–500 m) was chosen to include a 299
large range of the size distribution (Garzanti et al., 2009). A gravimetric separation of dense 300
grains was achieved with a centrifuge using Na-polytungstate (density 2.90 g/cm3), and heavy 301
minerals recovered by partial freezing in liquid nitrogen. An appropriate amount of the dense 302
fraction thus obtained was split with a micro-riffle box and mounted with Canada balsam. Heavy 303
minerals were counted under a polarizing microscope with the area method (Mange and Maurer, 304
1992). Grains of uncertain character were systematically checked and identified by an inViaTM 305
Renishaw Raman spectrometer, equipped with a 532 nm laser and a 50x LWD objective (Andò 306
and Garzanti, 2014). Heavy-mineral and transparent-heavy-mineral concentrations (HMC and 307
tHMC indices of Garzanti and Andò (2007), representing fundamental parameters for 308
unravelling provenance and detecting hydraulic-sorting effects and diagenesis, allow us to 309
distinguish poor (tHMC < 1), and very rich (tHMC > 10) transparent-heavy-mineral suites. The 310
resulting assemblages were compared with those of modern sediments of the Tapti River 311
(sampled at 21°08’40.7” N, 72°44’08.1”E) and Indus River. Results are presented in Table 3. 312
U-Pb dating of detrital zircon has been widely used for provenance analysis in siliciclastic 313
systems because zircon is a common mineral in continental rocks of many compositions and is 314
chemically and mechanically resistant to weathering during transport (Carter and Bristow, 2003). 315
Furthermore, zircon has a closure temperature of ~750°C for the U/Pb isotope system (Hodges, 316
2003), making it very robust and unsusceptible to change during multiple stages of recycling. 317
Mineral separation and grain mounting were performed at GeoSep Services (GSS) Laboratory, 318
Moscow, ID. Only one sample was analyzed for zircon U-Pb dating because much of the core 319
Cross-Out
Sticky Note
i think by now with bzillions of zircon studies and papers, you dont really need to have this in...

14
lacked suitable layers for this method. Zircons were separated via hand picking and used for age 320
dating as described by Donelick et al. (2005). This process enhances the recovery of all possible 321
grain sizes while minimizing the potential loss of smaller grains within a sample by the use of 322
water-table devices. The method used by Donelick et al. (2005) further ensures the preservation 323
of complete grains by minimizing grain breakage and/or fracturing that can be associated with 324
traditional procedures of isolating individual grains from whole rock samples. Recovered zircon 325
were mostly medium silt to fine sand-sized grains. Epoxy wafers containing zircon grains for 326
laser ablation inductively coupled plasma mass spectrometry (LA-ICP-MS) were polished 327
manually using 3.0 μm and 0.3 μm Al2O3 slurries to expose internal zircon grain surfaces. The 328
polished grain surfaces were washed in 5.5 M HNO3 for 20 sec. at 21°C in order to clean the 329
surfaces prior to introduction into the laser system sample cell. 330
A total of 51 individual zircon grains were targeted for data collection using a New Wave 331
YP213 213 nm solid state laser ablation system with a 20 μm diameter laser spot size, 5 Hz laser 332
firing rate, and ultra-high purity He as the carrier gas. Isotopic analyses of the ablated zircons 333
were performed using a ThermoScientific Element 2 magnetic sector mass spectrometer using 334
high purity Ar as the plasma gas. Ages from the ratios 207Pb/235U, 206Pb/238U, and 207Pb/206Pb 335
were calculated for each data scan and checked for concordance. Concordance was defined as 336
overlap of all three ages at the 1σ level. If the number of concordant data scans for a spot was 337
greater than zero, the more precise age from the concordant-scan-weighted ratio 207Pb/235U, 338
206Pb/238U, or 207Pb/206Pb was chosen as the preferred age, and whichever exhibited the lower 339
relative error. If zero concordant data scans were observed, the common Pb-corrected age based 340
on isotopic sums of all acceptable scans was chosen as the preferred age. Results of zircon U-Pb 341
dating are shown in Table 4. 342
Sticky Note
i'm a little confused by the use of this paper as a reference, as it's dominantly about AFT. it does indeed have the suggestion to only use a jaw crusher and to not use the water table, but I dont see anything about suggestions for dating zircon? I think you'd be better off just stating what methods you used.
Sticky Note
you do need a statement about machine precision and the internal propagated errors. I see in the table that you are suggesting the Precambrian ages are precise to two significant figures, and this is pretty much impossible using ICPMS.

15
Clay mineralogy was examined for provenance purposes based on the concept that different 343
environmental conditions and source terranes can produce characteristic assemblages. This 344
allows us to separate material derived from the Indus River from material more closely linked to 345
peninsular India. Although there may have been some change in mineralogy during initial 346
diagenesis, the relatively shallow burial depths of these cores means that there is no significant 347
thermal diagenesis and we can consider the observed mineralogy to be largely representative of 348
that at the time of sedimentation. 349
Clay mineralogy was determined by using X-Ray Powder Diffraction (XRD) at Louisiana 350
State University using a Panalytical Empyrean X-Ray Diffractometer. Forty selected samples 351
within the MTC were soaked in water until there was no flocculation, with Na3PO4 added to de-352
flocculate when necessary. Samples were centrifuged for separation of the <2 μm material. Four 353
XRD patterns were generated from each oriented sample smear. The first pattern was collected 354
from the sample in air-dried conditions. The second XRD pattern was generated from a 355
glycolated sample after the slide was then placed in a desiccator with ethylene glycol for a 356
minimum of 8 h at 25°C. t. The third and fourth XRD datasets were collected after the sample 357
was subjected to heat treatments of 300°C for 1 h, and then 550°C for 1 h, respectively. XRD 358
analysis began immediately after glycolation, and immediately after the first heat treatment. In 359
this study we use the semi-quantitative method of Biscaye (1965) to estimate the clay 360
assemblage, which is based on peak-intensity factors determined from calculated XRD patterns 361
as measured by MACDIFF software. For clay minerals present in amounts >10 wt% uncertainty 362
is estimated as better than ±5 wt% at the 95% confidence level. Uncertainty of peak area 363
measurement based on repeated measurements is typically <5%. Data are presented as relative 364
concentrations of the total clay assemblage in Table 5. 365

16
366
DEFINING THE TOP AND BASE 367
Microfossil assemblages within the sediments provide constraints on the age of 368
emplacement. The oldest sediment overlying the MTC was dated at around 10.8 Ma based on 369
nannofossil assemblages and paleomagnetic stratigraphy (Pandey et al., 2016c). In Hole U1456D 370
the first appearance of Discoaster hamatus (10.55 Ma) marks the top of Zone NN8 (Pandey et 371
al., 2016a), while in Hole U1457C the interval 859.49–995.93 mbsf contains Catinaster coalitus, 372
which has a total age range of 9.69–10.89 Ma (Pandey et al., 2016b). The presence of Discoaster 373
bellus (first appearance at 10.40 Ma) within this interval also constrains the age to between 9.69 374
and 10.40 Ma. Much of the interval from 1009.21 to 1054.34 mbsf at Site U1457 contains a 375
mixture of different nannofossil species. 376
Above the MTC there is a coherent assemblage of nannofossils suggestive of hemipelagic 377
sedimentation and not the mixed assemblage of early Neogene and Paleogene forms found 378
within the MTC, as might be associated with a reworked deposit. We use this noticeable change 379
in nannofossil assemblage as a criteria for defining the top of the MTC. In this study we define 380
both a sedimentary and biostratigraphic top from the core, as well as the top inferred from the 381
strong reflector in the seismic image, typically associated with massive carbonate beds. The 382
sedimentary top of the deposit marks the transition from sediment that is clearly slumped or 383
tilted in the core and appears to have been affected by syn-sedimentary deformation (Figs. 3 and 384
4) while the biostratigraphic top represents the transition from reworked into pristine nannofossil 385
assemblages. The difference in depth, ~35 m, is significant and could represent continued 386
slumping and reworking of young sediments after the initial emplacement of the main MTC 387
bodies. 388
Sticky Note
this information belongs far back up in the manuscript
Cross-Out
Inserted Text
is
Inserted Text
that

17
The base of the complex is easily established in both drilling sites, being marked by the 389
presence of carbonate breccias immediately overlying fine-grained sediments (Figs. 3 and 5). 390
The depth of this contact is 1101.65 and 1054.1 mbsf at Sites U1456 and U1457, respectively. A 391
key observation is that in the thicker Site U1456 section there is a 20-m-thick interval in which 392
normal hemipelagic sedimentation was briefly reestablished, based on the lack of reworking in 393
the nannofossil assemblages. This spans from around 956 to 935 mbsf (Figs. 3 and 6). This 394
shows that the MTC must have been emplaced in at least two phases separated by a pause, 395
despite the fact that this is not apparent in the seismic image. What is surprising is that the top of 396
this hemipelagic hiatus in mass wasting is not marked by a fresh influx of clearly reworked 397
brecciated carbonate material. Much of the hemipelagic interval comprises massive or parallel-398
laminated mudstones with a couple of medium-bedded to massive sandstones representing less 399
than 10% of the section (Fig. 6A). This is only moderately different from the material which lies 400
above the hemipelagic layer that is characterized by mudstones interbedded with thin beds of 401
siltstone. Above the hemipelagic layer, however, there is clear evidence for slump folding, tilted 402
bedding and microfaulting, which testifies to the redeposited character of these sequences, as 403
well as the mixed nannofossil assemblage. It is only in the somewhat shallower part of the 404
section at Site U1456 there is evidence for a fresh influx of very coarse redeposited carbonate 405
debris flow material, above 874.2 mbsf (Fig. 3A). 406
At both sites, the topmost part of the deposit largely comprises fine-grained, bioturbated 407
claystones and clay-rich siltstones that are otherwise hard to distinguish from the background 408
deposits of the Indus submarine fan, especially when they are not deformed. Tilted bedding is 409
suggestive of deformation but might be interpreted as being coring related. The presence of 410
Cross-Out
Inserted Text
is only in the shallower part of ...
18
slump folds close to the sedimentary top of each drilled section is, however, more conclusive in 411
demonstrating continued mass wasting above the coarser grained basal units. 412
413
SEDIMENTARY FACIES 414
The sedimentary facies within the MTC were determined on the basis of core 415
descriptions and, in particular, the analysis of sedimentary structures that give clues to the 416
depositional processes that were operating during emplacement. We here describe the major 417
sediment types and provide interpretations of the depositional mechanisms. These are 418
summarized in Figure 3. 419
420
Limestones 421
Short intervals of the MTC comprise coherent sections of fine-grained limestone that 422
show little evidence for the action of high energy reworking depositional processes. Limestones 423
are found at Site U1456 within the lower part of the section around 1050 mbsf depth (Fig. 3). 424
The limestones are typically massive and generally fine-grained micrite with moderate amounts 425
of clay that give them an off-white color. Heavily bioturbated sediment with vertical Zoophycos 426
trace fossils are typical of sedimentation in moderately deep water, often close to the shelf edge 427
(Fig. 7A)(Ekdale et al., 1984; Seilacher, 1967). Figure 7B shows a massive micritic limestone 428
with some evidence of bioturbation, but which indicates minor recrystallization along stylolites, 429
highlighted by thin clay-rich partings. Neither deposit contains indication of strong current 430
activity, such as ripples or laminations, or even a well sorted granular texture, but rather 431
sedimentation in a low energy carbonate-rich environment probably below storm-wave base 432
(<40 m)(Peters and Loss, 2012). Short intervals of limestone are also found at Site U1457 very 433
Cross-Out
Highlight
Highlight
Highlight

19
close to the base of the MTC ~1050 mbsf. These are granular and porous and may be the product 434
of higher energy sedimentation in relatively shallow water depths (<30 m). Again, the limestones 435
are tan-colored rather than being pure white that is indicative of a modest clay content. Given the 436
modern significant water depth (3523 m at Site U1457) we propose that these limestones 437
represent coherent blocks of relatively shallow water material that were emplaced as part of the 438
brecciated units near the base of the MTC. 439
440
Carbonate Breccia Debrites 441
The vast majority of the carbonate sediment in the MTC are breccia clasts found mostly 442
in the bottom part of the deposit at Site U1456 (970–1101 mbsf), with further yet more limited 443
clasts in the upper part of the MTC at the same site. They are also found immediately above the 444
base of the MTC at Site U1457 (Fig. 3). These breccias are thick-bedded, ranging close to 20 m 445
thick for individual beds separated by finer grained units. At Site U1456 there are multiple such 446
breccia units, stacked on top of each other, that are preferentially developed towards the base of 447
the sequence. The breccias are sometimes overlain by calcarenites (described below) or by 448
mudstones with a sharp boundary between the two lithologies. The breccias are extremely 449
poorly-sorted and the individual clasts are angular to sub-angular. Clast size ranges up to and 450
greater than the width of the core (>10 cm). There is usually no trend towards fining or 451
coarsening upwards within individual units, although one coarsening upwards sequence is seen 452
in Section U1456D-43R-1 (860 mbsf). The fabric of the sediment is rarely clast-supported (Fig. 453
8A) but is normally suspended in a dark muddy matrix (Fig. 8B). 454
The limestone clasts are pale tan to bright white with the interior showing a very fine-455
grained or slightly granular sediment classified as micrite or more rarely packstone and 456
Cross-Out
Inserted Text
, which
Highlight
Highlight
Sticky Note
not sure what you mean?
Cross-Out
Inserted Text
is
Highlight
Cross-Out
Cross-Out
Inserted Text
are
Cross-Out
Cross-Out
Cross-Out
Cross-Out
Inserted Text
Highlight
Cross-Out
Inserted Text

20
wackestone (Dunham, 1962). In the part of the section densest in limestone clasts (~1036 mbsf at 457
Site U1457), clasts are seen to indent one another both in core surfaces (Fig. 8A), as well as in 458
microscope thin sections (Fig. 9D). We interpret this as a result of dissolution during diagenesis 459
and burial. 460
The vast majority of the carbonate rocks redeposited in the debris flows appear to have 461
been lithified prior to their resedimentation. In combination with the observation of angular 462
clasts, we see coherent rafts of sediment (>10 cm width) floating within finer grained material 463
(Fig. 8B). There is some evidence that some of the carbonate sediment was not lithified during 464
emplacement because soft sediment folding of the deposits, such as seen in muddy limestones 465
(Fig. 10A) can be observed. However, these deformed deposits only represent a relatively small 466
part of the total sequence. It is clear that brittle deformation is important locally, especially 467
between and within the more coherent carbonate blocks. Slickensides especially testify to rapid 468
brittle deformation of the carbonate rocks during their emplacement (Fig. 8C). Most of the debris 469
flow units are extremely poorly-sorted but sometimes are represented by coarse sandstones 470
devoid of larger clasts (Fig. 8D). In these, larger granular clasts are supported in a muddy 471
sandstone matrix with no clear grading within the unit. 472
Although limestone fragments dominate the debris flows, it is noteworthy that in places 473
there is evidence for reworking of volcanic rocks into the flows (Fig. 10B). These clasts are 474
weathered red-brown and are sub-rounded. The largest single clast was found at 879 mbsf at Site 475
U1456 within a poorly indurated conglomeratic part of the debris flow sequence. The clast is an 476
8-cm-wide fragment of vesicular aphyric basalt that is presumed to be derived by erosion from 477
the Deccan Plateau volcanic sequences exposed across peninsular India. The clasts were likely 478
Highlight
Cross-Out
Cross-Out
Inserted Text
Inserted Text
deposit

21
eroded on to and then reworked across the continental shelf because being redeposited in the 479
MTC. 480
The limestone, from which the carbonate clasts were derived, formed as a typical 481
shallow-water deposit in a biologically productive zone mostly starved of clastic sediment input. 482
Original water depths were within the photic zone on the continental shelf or within a back-reef 483
setting (<50 m), with only moderate amounts of current activity, since we see no evidence for 484
strong sorting or high energy deposits such as oolites or grainstones (Dunham, 1962). These 485
original rocks have mostly been broken and reworked as debris flow deposits during the 486
emplacement of the MTC. The muddy matrix has a separate provenance, either from the deep-487
water slope of peninsular India or from the Indus Fan itself, as discussed below. 488
489
Calcarenites 490
Calcarenite is present in each carbonate section, in the form of massive, well-sorted units 491
suggestive of high energy current transport. Beds of calcarenite are several meters thick and 492
generally massive and structureless, although they can develop a sub-horizontal fabric suggestive 493
of current flow. Where the deposits are finer (Fig. 10D), there is a shear-type fabric developed 494
within the calcareous siltstones. In the coarser grained units (Fig. 10C) there is some evidence 495
for internal soft sediment deformation, although generally the units are homogenous and 496
comprise uniform, gray, coarse-grained sandstone. They are well-sorted and clast-supported, 497
with very little muddy matrix, suggestive of a high energy depositional regime. The majority of 498
the clasts are carbonate, although there are a significant number of dark grains of organic carbon 499
origin. These calcarenites often have sharp tops that are interpreted to reflect erosion of the 500
deposit prior to the emplacement of overlying units. Figure 10D shows a calcareous siltstone 501
Highlight
Cross-Out
Inserted Text
is
Cross-Out
Highlight
Cross-Out
Inserted Text
Cross-Out
Inserted Text
Highlight
Cross-Out
Inserted Text
are

22
sharply overlain by conglomeratic sandstones deposited as debris flows. Very few sedimentary 502
structures are seen within these deposits, so that we infer sedimentation in an upper flow regime 503
resulting in relatively laminar deposits without any current ripples or finer interbeds. Sediment 504
concentrations are inferred to have been very high during deposition, which terminated rapidly. 505
506
Turbidites and Hemipelagic Mudstones 507
Apart from the carbonate-dominated debris flows, minor turbidite sandstones and 508
dominant siltstones and mudstones make up the largest part of the MTC. These are also 509
interbedded with associated hemipelagic mudstones. In the coarsest sandstones, each turbidite 510
shows a classic fining upward sequence (Fig. 11A), with largest carbonate fragments suspended 511
in a dark clastic mud matrix. Locally, there are sub-horizontal lamination although sedimentary 512
structures are poorly developed, with up-section fining dominating characteristic of these 513
deposits. In the upper parts of the MTC at both sites, muds show lamination and interbedding of 514
modest amounts of muddy silt (Fig. 11B). Elsewhere, the deposits are massive, dark gray 515
mudstones with few sedimentary structures. These contrast with the draping mudstones that 516
overlie the catastrophically emplaced MTC where typical deep-water trace fossil assemblages 517
(i.e., Zoophycos;(Fig. 11C) characterize the hemipelagic sedimentation and eliminate the 518
possibility of large-scale mass wasting. This is in contrast to the muddy upper sections of the 519
MTC itself, where there is evidence for laminar current flow that follows the initial emplacement 520
of the carbonate debris flow deposits at the base of each cycle. In general, the grain sizes are 521
relatively limited, with only few a thin-bedded sandstones and occasional siltstones developed 522
within what is otherwise a dominantly (95%) muddy sequence. Distinguishing muddy sediment 523
Highlight
Highlight
Sticky Note
not sure what you mean? fining upwards is the dominant characteristic?

23
with the MTC from the hemipelagic interval within Site U1456 is difficult without the help of 524
micropaleontology evidence. 525
Syn-sedimentary deformation within the muddy turbidities include folds, micro-faults, 526
and tilted bedding (Fig. 11D) and are particularly easy to see in well-laminated sequences. Dip of 527
lamina can be high (>50°), indicating significant deformation of the muddy units after 528
sedimentation. In addition to ductile structures, there is evidence for compressional reverse 529
faulting. Significant dips and deformation are evidence for incorporation as part of the MTC 530
rather than the subsequent hemipelagic sedimentation of the Indus Fan, which is only gently 531
inclined like the seafloor or the top of the MTC (~1.2˚ according to Calvès et al. (2015)). 532
533
Micro-Facies 534
Petrographic analysis can be used to help interpret paleoenvironment and depositional 535
mechanisms from facies identified in the cores. Figure 9A shows a silty laminated mudstone 536
from the upper part of the MTC at Site U1457 that is interpreted here as a turbidite deposit. The 537
massive calcarenite beds that overlie debris flow conglomerates are seen to be relatively poorly 538
sorted and matrix supported, at least in places, in thin section (Fig. 9B). Clasts are rarely 539
composed of calcite crystals but are dominated by a variety of finer limestone facies, especially 540
micrite. Aggregates of dolomite crystals are observed (Fig. 9C) and interpreted to represent 541
diagenetic alteration of original calcite via interaction with magnesium-rich waters prior to 542
resedimentation. Their presence is suggestive of redeposition from shallow water areas where 543
this mineral generally forms. 544
There are large numbers of microfossils and their fragments within the breccia limestone 545
clasts. Foraminifers are abundant (Figs. 12A, 12B, 12F). In addition, we also confirm the 546
Highlight
Highlight
Cross-Out
Cross-Out
Cross-Out
Inserted Text
are
Highlight

24
presence of crinoid fragments (Fig. 12D), bryozoans, and rare radiolarians (Fig. 12E). The 547
skeletal assemblage of most limestone clasts is dominated by calcareous red algae and benthic 548
foraminifera (including both miliolids and large rotaliids; Fig. 12C). Rare echinoderms, mollusks 549
and hermatypic coral fragments are also present. Some skeletal grains, originating from a 550
shallow-water environment (coralline algae, large echinoid spines, large benthic foraminifera), 551
also occur within the matrix (Figs. 12H, 12I). The occurrence of what is likely to be Lockhartia, 552
together with the peyssoneliacean red-alga Polystrata alba, suggests that at least part of the 553
eroded limestone was of Paleogene age (Fig. 12C)(Bassi and Nebelsick, 2000; BouDagher-554
Fadel, 2018). The matrix is largely dominated by planktonic foraminifera with minor 555
contribution from small rotaliids (Figs. 12G). 556
These characteristics suggest that the MTC involved both lithified inner platform deposits 557
(the source of limestone fragments) and outer platform deposits still composed of loose grains 558
(the source of the muddy matrix with planktonic foraminifera). 559
560
DEPOSITIONAL MECHANISMS 561
Most sediment within the MTC are either debris flow deposits, well-sorted calcarenites, 562
or dominantly clastic turbiditic siltstones and mudstones. Both phases of the MTC at Site U1456 563
(Fig. 3) show large-scale fining upwards cycles, with a dominance of carbonate debris flows 564
towards the base grading into more siliciclastic turbidite sedimentation towards the top. Smaller, 565
shorter phases of fining upwards cycles are further observed within the two overall fining 566
upwards cycles at Site U1456. For example, the upper part of Phase 1 (Fig. 3), comprises a basal 567
unit from between 999.2 and 984.0 mbsf that is dominated by rafted carbonate sheets and 568
carbonate debris flow material (Figs. 3 and 6B). This interval is likely a second pulse after the 569
Highlight
Highlight
Highlight
Highlight
Highlight
25
initial Phase 1 event. Above 984.0 mbsf there is a transition to massive thick-bedded calcarenite 570
with slump folds, although this is truncated sharply at 973 mbsf by mudstones that rapidly 571
transition into the hemipelagic sediment described above (Fig. 6B). This implies that the basal 572
Phase 1 unit, especially at Site U1456 comprises a series of pulses rather than one single gigantic 573
deposit as might have been implied by the seismic data alone (c.f.(Calvès et al., 2015)(Fig. 2). 574
The base of Phase 1 at both sites is characterized by a thick-bedded sequence of debris 575
flow calcareous breccias and rafts of undeformed shallow water carbonate (Fig. 5). These are not 576
surprisingly the thickest such deposits within the entire drilled section. Although Site U1456 is in 577
a more central location within the basin, the oldest debris flow breccia at the base of Phase 1 is 578
thinner in this location than at Site U1457 and transitions more rapidly up into thick-bedded 579
breccia and interbedded calcarenites. Both sections, however, do show an overall fining upward 580
between the base and overlying mudstone units. The initial debris flow sedimentation appears to 581
be ~94 m thick at Site U1456 (1101.6–1007.2 mbsf) and ~48 m thick at Site U1457 (1006.4–582
1054.3 mbsf; Figs. 3 and 5). 583
In general, calcarenites alternate with debris flow conglomerates (Fig. 5A) indicating 584
alternating depositional mechanisms within a single emplacement episode. Individual debris 585
flow events are followed by high energy upper flow regime periods of sedimentation where 586
massive well-sorted calcarenites were deposited before being followed by another debris flow 587
unit. However, presumably all this material was emplaced over a relatively short period of time. 588
The carbonate-dominated debris flows form the initial erosive base of the MTC, followed by 589
mud-dominated turbidite sedimentation and hemipelagic fallout representing the tail of the MTC. 590
At Site U1456 this sequence is then repeated after the hemipelagic break. Soft sediment 591
deformation is commonly seen in the more laminated sections indicative of slumping after 592
Inserted Text
,
Highlight
Highlight
Highlight
Highlight
Highlight
Sticky Note
probably by now you are getting the message about hyphens, so I'll leave off highlighting each place where one is required

26
sedimentation. It seems unlikely that poorly consolidated mudstones and siltstones could have 593
been emplaced hundreds of kilometers in a semi-coherent form, unlike the well-lithified 594
limestone clasts seen close to the base of each section. 595
596
GEOCHEMISTRY 597
Bulk Geochemistry 598
We use a CN-A-K ternary diagram to illustrate major element geochemistry of MTC 599
samples compared to sediments from the Indus Canyon and delta. The sediment from the MTC 600
largely plots within the range of the Indus Canyon and trends towards higher values of Al2O3 601
(Fig. 13A). MTC samples appear to have higher values that trend towards the illite end-members 602
and may be more depleted in biotite and feldspars compared to the delta. This is likely a result of 603
sediment transport, similar to what has been observed in the Indus Canyon (Li et al., 2018). 604
Sediments in the muddy upper part of the MTC at Site U1457 largely plot with low 605
Chemical Index of Alteration (CIA), which is a proxy of the state of weathering of a sediment 606
compared to pristine bedrock (Nesbitt et al., 1980). The muddy upper MTC samples trend more 607
towards the Quaternary Indus Delta field compared to the lower parts of both Phase 1 and Phase 608
2, which show more overlap with western Indian Shelf sediments, largely derived from rivers 609
draining the Deccan Plateau (Kurian et al., 2013). This plot implies that the upper muddy 610
sediments at Site U1457 had a dominant source from the Indus River/Fan and little inputs from 611
western peninsular India. 612
The sediment in the MTC can also be characterized using other major element 613
discrimination diagrams. Figure 13B shows the scheme of Herron (1988) in which the Phase 1 614
and Phase 2 samples largely plot within the Fe shale field, with a few slightly depleted in Fe and 615

27
plotting as shales. Again, we plot these samples along with the western Indian Shelf, Indus 616
Canyon and delta sediments. Samples from the upper muddy top to Phase 1 at Site U11457 form 617
a cluster within the range of the Indus Canyon sediments, suggesting a dominant provenance of 618
reworked Indus material. Comparison with sediment from the western Indian shelf shows a 619
significant difference, with the shelf sediment typically plotting with much higher Fe contents, 620
similar to the lower Phase 1 and 2 sediments. We infer that the bulk of the sediment in the lower 621
MTC comprises mostly Indian margin sediment with muddy top dominated by sediment eroded 622
and redeposited from the Indus Fan. 623
624
Nd and Sr Isotopes 625
We use Sr and Nd isotope values to constrain the provenance of siliciclastic sediment in 626
the MTC. By cross-plotting Nd and Sr isotopic compositions from source regions such as the 627
Deccan Traps, peninsular Indian rivers, Transhimalaya, Karakoram, Greater Himalaya, Kirthar 628
and Sulaiman Ranges, and modern/Quaternary Indus-derived sediment allows the origin of the 629
sediment to be further constrained (Fig. 14). This diagram shows that the MTC samples form a 630
relatively discrete cluster with one exception that has especially positive Nd values that fall 631
within the Deccan and Transhimalayan arrays. When we compare these data with potential 632
sources, it is clear that the bulk of the sediments lie within the isotopic range defined by the 633
Indus submarine fan sediments at the same drilling sites (Clift et al., 2018). This is consistent 634
with the argument that much of this material may be reworked Indus-derived sediment. 635
However, we note that it is impossible to exclude mixing of sediment from the peninsular Tapti 636
or Narmada Rivers. The isotope compositions by themselves do not allow us to quantify the 637
degree of reworking from these sources as they are similar to the Indus. Although the MTC 638

28
samples plot with higher Nd values compared to the Quaternary Indus Canyon, as well as the 639
Kirthar and Sulaiman ranges, such a composition could largely be explained through temporal 640
variation in the Indus River itself (Clift and Blusztajn, 2005; Clift et al., 2018). The one very 641
positive Nd sample is anomalous and plots with even more positive values than the Tapti River. 642
This is strongly suggestive of erosion from peninsular India and is corroborated by the presence 643
of vesicular Deccan Plateau basalt fragments as previously noted. 644
We can look at the stratigraphic variation in isotopic compositions through time at both 645
sites (Fig. 15). In both cases, Nd isotope compositions plot within error of the Quaternary Indus 646
or with slightly more positive Nd values. We note that the most positive Nd values in each 647
borehole are found within the debris flow conglomerate units bearing basaltic clasts at the base 648
of the lower part of the MTC. This is especially true at Site U1456 (Fig. 15A). Variations in 649
87Sr/86Sr also mirror this general evolution. 650
The provenance of the coarse-grained carbonate debris flow deposits is different from 651
those of the finer grained sediments overlying them. The fine-grained sediments may represent 652
recycling of pre-existing fan sediments into the top of the MTC, while the debris flow deposits 653
are more closely associated with mass wasting from the western Indian continental margin. It is 654
possible that some Indus River sediment could have been transported east along the shelf, carried 655
by longshore currents from the river mouth, and deposited offshore Saurashtra before being 656
redeposited as part of the MTC. However, there is no evidence that significant Indus sediment 657
travels farther east than the Rann of Kutch (Khonde et al., 2017; Kurian et al., 2013). The 658
simplest interpretation is that the upper muddy layers of the MTC represent entrained and 659
reworked Indus Fan material. 660
661

29
Heavy Mineral Analysis 662
The heavy-mineral assemblages help to constrain the source area of the MTC. The 663
concentration of heavy minerals in all samples is very low suggesting a strong depletion due to 664
intrastratal dissolution of unstable silicates (Garzanti, 2017). Consequently, a relative enrichment 665
of ultrastable minerals is observed (ZTR index of Hubert (1962)). The two samples (U1456E-666
15R-1W, 61-63 cm and U146E-17R-4W, 131-133 cm), analyzed from the carbonate breccia 667
present extremely low HMC (0.04–0.05%) with common augitic clinopyroxene (~6%) and rare 668
spinel (2–3%). The minerals also show corroded surficial textures, indicating a strong diagenetic 669
overprinting (Ando et al., 2012). A similar fingerprint is detected in Sample U1456E-7R-1, 80-670
82 cm where green and brown augite are abundant (48%). In all these samples, there are 671
common garnets associated either with apatite, titanite, epidote, zircon, tourmaline, and 672
metamorphic Ca-amphiboles, potentially derived from recycled sediments from the Himalaya-673
derived Indus Fan turbidites eroded by the MTC. Notwithstanding diagenetic dissolution, the 674
highly unstable augitic clinopyroxene (volcanic origin) always dominates over metamorphic 675
amphiboles, suggesting a sizable contribution to the MTC from the Indian passive margin, and 676
especially from Deccan Plateau basaltic lavas. Sample U1456E-4R-1W, 110-111 cm is a 677
calcarenite within which hydraulic sorting and high-energy currents preferentially selected the 678
available heavy minerals suite derived from the MTC, concentrating platy heavy minerals such 679
as chloritoid, Ca-amphiboles and tourmaline (lighter). The sample is partially depleted in denser 680
garnet. This assemblage is completed with the presence of abundant apatite, common titanite, 681
epidote and spinel with trace of kyanite, andalusite and staurolite. 682
Sample U1457C-88R-4W, 58-60 cm was deposited far from the Indian Passive margin 683
and the mineralogy reflects a dominant contribution from recycled minerals derived from the 684
Cross-Out
Inserted Text
are
Inserted Text
or?

30
erosion and re-deposition of the Indus Fan turbidites. The tHMC is very low (0.08%), and 685
mineralogy is dominated by abundant epidote and garnet with common apatite and titanite. Ca-686
amphiboles dominate over clinopyroxenes, with a ratio 8:1, pointing to a major contribution 687
from the Indus River and the Himalaya in this sample. The assemblage also includes tourmaline, 688
zircon, chloritoid, Cr-spinel and trace of and kyanite, staurolite and andalusite. 689
The modern Tapti River was analyzed close to its mouth. The sample contains a very rich 690
assemblage of heavy minerals (tHMC 17%) with dominant augitic clinopyroxenes (92%) and 691
subordinate amount of metamorphic heavy-mineral, Ca-amphiboles, epidote, garnet and 692
sillimanite. This mineralogical signature differs from the observed suite of orogenic heavy 693
minerals observed in the modern Indus River and his delta (Garzanti et al., 2005). 694
The heavy mineral assemblage in the MTC and the very low concentration of heavy 695
minerals points to different sources for the siliciclastic sediments, i.e., partially derived axially 696
from the Himalayas via the Indus River (especially at Site U1457C) and partially derived 697
transversally from the Indian peninsula (especially at Site U1456). 698
699
Zircon U-Pb Ages 700
To further constrain provenance, we compare detrital zircon U-Pb ages with existing data 701
from the Indus river mouth (Clift et al., 2004), Indus Fan turbidites above and below the MTC 702
(Clift et al., 2018), and with bedrock data from potential sources in the river catchment (Fig. 703
16)(DeCelles et al., 2000; Gehrels et al., 2011). Although the zircon ages from source bedrock 704
overlap with each other, each source regions demonstrates strong preferential age spectra that 705
can be used to discriminate between them. Zircons from Nanga Parbat, Kohistan, the 706
Transhimalaya, and the Karakoram generally have younger ages (<300 Ma) than those from the 707
Highlight
Sticky Note
?

31
Himalayan ranges (Alizai et al., 2011)(Fig. 16). Both the Greater and Tethyan Himalaya have U-708
Pb age peaks at 300–750 Ma and 750–1250 Ma, with older ages at ~1850 Ma characterizing the 709
Lesser Himalaya 710
The volume of sample available for U-Pb dating from Core U1457C-7R (the only suitable 711
sediment seen in the MTC) was extremely limited such that only 51 grains yielded concordant 712
ages, which is somewhat lower than the 113 minima suggested by Vermeesch (2004) for a 713
sample with complex provenance. Nonetheless, some inferences concerning provenance can be 714
made. What is clear is that young ages dominate with 17 grains dated at less than 100 Ma (Fig. 715
16). The age spectrum bears most similarity with Indus Fan turbidites dated at 7.8, 8.3, and 15.6 716
Ma, but all are in contrast with the ages from the modern river. The match between these young 717
grains and sources in the Karakoram and Kohistan argue for the sand to be an Indus-derived 718
sediment and not from sediment transported from the Indian peninsula where zircon ages are 719
Paleozoic or typically much older. This conclusion is consistent with the Nd and Sr isotope data 720
from the upper parts of the MTC. The analyzed sandstone was sampled below the 721
sediment/structurally defined top of the MTC but above the carbonate-dominated debris flow 722
facies at the base of the complex, i.e., within the muddy but slumped top of the MTC. This 723
implies that the upper parts of the MTC are Indus Fan sediments entrained in the tail of the MTC 724
during emplacement. 725
726
Clay Mineralogy 727
The clay mineral assemblages within the MTC can be used to assess provenance by 728
semiquantitative analysis and comparison with existing data from other sources. When plotted on 729
the ternary diagram of (illite+chlorite), kaolinite, and smectite (Fig. 17) there is significant 730
Inserted Text
.
Highlight
Sticky Note
and orders of magnitude less that suggested (more recently) by the Gehrels group
Cross-Out
Inserted Text
um
Inserted Text
-grain
32
overlap between the new MTC data and other Arabian Sea sediments (Rao and Rao, 1995). In 731
general, the MTC clays are low in kaolinite and form an array between the smectite and 732
(illite+chlorite) end members. In this respect, they show a similar character to sediments from the 733
Indus fan and have significant overlap with Quaternary clays from the Indus Canyon (Li, 2018). 734
Samples from Phase 1 of the MTC have very high smectite contents, similar to the Paleocene 735
sediments overlying basement at Site U1457, suggestive of a volcanic source. They are close to 736
sediments recovered from the inner shelf offshore Saurashtra and from the Gulf of Cambay. 737
Phase 2 sediments and the hemipelagic layer are slightly less smectite rich but overlap with the 738
Holocene Indus Shelf, as well as some modern Indian Shelf sediments. We note that the bulk of 739
the muddy upper Phase 1 sediments plot with higher (illite+chlorite) values and they also tend to 740
have slightly higher kaolinite compared with analyses of sediments from the Indus floodplains 741
(Alizai et al., 2012). These sediments are similar to the assemblage recognized from the outer 742
Saurashtra margin (Rao and Rao, 1995) and are similar to many clay assemblages within Indus 743
Fan turbidite sequences. Overall, the MTC deposits have lower kaolinite compared with most 744
Western Indian shelf deposits but some samples plot closely to the shelf. It is also noteworthy 745
that the MTC assemblages generally show lower (illite+chlorite) compared with many of the 746
Miocene-Recent Indus submarine fan deposits, which likely indicates a mixed provenance of 747
Indus and Indian peninsular sediment. However, because illite and chlorite are the product of 748
physical weathering rather than chemical weathering their relatively high contribution to the 749
MTC could also indicate reduced chemical weathering of fan sources since MTC emplacement. 750
These data are consistent with a dominant recycling of Indus Fan deposits in the upper muddy 751
parts of the MTC, but with greater involvement of clays derived from the Western Indian margin 752
33
in the lower part, especially in Phase 1. The similarity with modern nearshore sediments offshore 753
Saurashtra and Cambay is consistent with an origin in this part of the margin. 754
Clay mineralogy shows significant variation with depth (Fig. 15). At Site U1456 the 755
carbonate-rich part of the section shows particularly high smectite contents and relatively low 756
(illite+chlorite) values. Smectite only becomes less abundant than these two physically 757
weathered clays above the upper Phase 2 carbonate debris flow unit. At Site U1457 the 758
carbonate-rich part of the section similarly is smectite-rich, but immediately above this level the 759
sediments become dominated by an (illite+chlorite) assemblage similar to the Indus Fan. It is 760
noteworthy that the Paleocene sediments beneath the MTC at Site U1457 are ~100% smectite, 761
possibly reflecting chemical weathering of the underlying basaltic basement. Clay mineralogy 762
supports the Nd and Sr isotope compositions in showing a characteristic difference between the 763
carbonate-dominated sections that indicate similarity to the western Indian margin, whereas the 764
mudstone dominated sequences further upsection in the MTC are most similar to compositions 765
associated with the Indus Fan. 766
767
SEDIMENT BUDGET 768
To assess the potential of sediment delivery rates and margin oversteepening as triggering 769
mechanisms of the MTC, a sediment budget from the western Indian margin was generated using 770
standard two-dimensional backstripping methods from seismic profile data (Clift, 2006; Kusznir 771
et al., 1995). This was to primarily test the hypothesis that the rapid accumulation of sediment on 772
the continental margin resulted in an unstable stratigraphy that was then more liable to mass 773
wasting events like the Nataraja MTC. There is strong evidence that the Western Indian 774
continental margin is gravitationally unstable as a result of the large-scale compressional thrusts 775

34
seen in seismic profiles towards the base of the continental slope seen between the Saurashtra 776
shelf and Bombay High (Fig. 1)(Calvès et al., 2015; Nair and Pandey, 2018). These features are 777
often associated with slopes prone to gravitational collapse, which in this region, has yet to 778
manifest in the dramatic fashion of the Nataraja MTC. In order to estimate the mass flux of the 779
margin, we use the cross-margin seismic reflection profile of Nair and Pandey (2018)(Figs. 1 and 780
18). Their northernmost profile lies immediately south of the scarp region identified by Calvès et 781
al. (2015) and which we consider to be potentially representative of the sedimentation in the 782
source regions of the MTC prior to its redeposition. For the purpose of this study, we use the age 783
control provided by Nair and Pandey (2018), at least for the continental shelf and slope areas 784
(Fig. 18A). West of the toe of the slope sedimentation is linked to the Indus Fan and may not be 785
representative of the mass flux to the Saurashtra Shelf. Figure 18A shows the interpretation of 786
Nair and Pandey (2018) with a conversion from their seismic travel time scale to depth made on 787
the basis of multichannel seismic stacking velocities derived from the Indus shelf, as used by 788
Clift et al. (2002)(Table 6). We do this because of the absence of such data from the Saurashtra 789
region itself. We prefer to use velocity data from the Indus continental shelf rather than from the 790
deep basin because as the sediment thicknesses are much greater under the continental shelf, they 791
are more comparable to those seen offshore the Indus River mouth. Based on the lateral 792
variability in velocities seen on the Indus Shelf, we estimate that this conversion may introduce 793
uncertainties as high as ±20% (Clift, 2006). Stratigraphic ages are then assigned numerical ages 794
based on the timescale of Gradstein et al. (2012). 795
The depth-converted line was then backstripped using standard decompaction methods 796
(Kusznir et al., 1995; Sclater and Christie, 1980). This was done to restore each dated sediment 797
layer to its original thickness prior to burial. Knowledge of the sediment type is important to this 798

35
calculation because shales experience much greater loss of porosity during burial than do 799
sandstones (Sclater and Christie, 1980), and in this case, we used lithological data from Wandrey 800
(2004) and Rao and Talukdar (1980). These studies show a mixed Cenozoic sequence dominated 801
by silty muds and carbonates offshore Saurashtra. The decompaction process involves 802
accounting for the loss of porosity of the sediment during burial, which would otherwise result in 803
an underestimation of deposited volumes for the older, deeper buried sediment packages. After 804
the original, uncompacted volume of sediment in each dated interval has been determined, the 805
mass of rock delivered during that time period can be calculated. Errors in lithology and 806
compaction history are much smaller than the time-depth conversion and rarely exceed 5%. 807
In this study two-dimensional decompaction was calculated using the program Flex-808
Decomp™ (Kusznir et al., 1995). It must be assumed that the analyzed profile is representative 809
of the total mass flux to the margin since rifting of the Arabian Sea ~66 Ma (Bhattacharya et al., 810
1994). Because we only have one profile close to the area of mass wasting, and no estimate of 811
the total sediment mass offshore Saurashtra, it is not possible to make a volume calculation. 812
However, the two-dimensional budget does at least allow us to estimate the volumes of sediment 813
delivered per kilometer of margin close to the source of the MTC. Our results show a clear trend 814
to increasing mass flux after 26 Ma (Fig. 18B), with a peak between 16 and 11 Ma. Because the 815
resolution of the budget is constrained by the presence of the dated horizons, it is not possible to 816
accurately say when the peak sediment flux was achieved, but this analysis confirms that the 817
Middle Miocene was a time of rapid sedimentation offshore Saurashtra, a pattern that it shares 818
with many other Asian delta systems. As a result, it seems likely that the pulse was caused by 819
faster erosion driven by heavy summer monsoon rains (Clift, 2006). We suggest that much of the 820
gravitational instability on the western Indian margin was caused by rapid sedimentation in the 821

36
Middle Miocene causing oversteepening of the shelf edge, comprising large thicknesses of 822
sediment liable to incomplete dewatering during burial. The reducing sedimentation rates after 823
11 Ma may explain why a second such slide has not been emplaced in this part of the margin. 824
825
SEISMICITY 826
As well as an over-steepened continental margin caused by increased sediment flux, we 827
investigate the possible triggering of the MTC as a result of seismic activities that are often 828
implicated in the emplacement of large mass wasting complexes (Kastens, 1984). Figure 1 shows 829
the location of earthquakes greater than 4.5 magnitude since 1960 in the vicinity of the source 830
region for the MTC. There is some seismicity related to the plate boundary west of the Indus 831
delta and there are small amounts of activity in the Saurashtra Peninsula itself, immediately 832
opposite the scar in the continental shelf. It is apparent that the greatest concentration of seismic 833
activity is however around the Rann of Kutch, where historic intraplate events up to 7.7 834
magnitude have been recorded (Bilham, 1999). This activity reflects reactivation of earlier rift-835
related faults due to compression linked to the India-Eurasia collision (Bilham et al., 2003; 836
Biswas, 2005). This part of the Indian plate is a weak zone and may well have been active as a 837
seismic hotspot for significant periods of time. We suggest that it is the relative proximity of the 838
Saurashtra margin to this tectonic feature (<300 km) which may have initiated the mass wasting 839
in that region, rather than further south along the margin where sediment flux was also high. 840
841
SYNTHESIS AND CONCLUSIONS 842
This study, made possible through drilling, reveals for the first time the internal structure 843
and origin of the Nataraja MTC, and extends our understanding based on the earlier seismic 844
Cross-Out
Inserted Text
is
Cross-Out
Cross-Out
Cross-Out

37
surveying of the deposit. At Site U1456, there is clear evidence that the MTC was emplaced in 845
two major phases separated by a significant break (Fig. 19). Even the larger, earlier Phase 1 can 846
be broken down into at least two stages, indicative of pulsed emplacement. The basal part of 847
each drilled section of the complex comprises debris flow carbonate breccias and larger rafts of 848
shallow water limestone, which can be traced back to collapse of the carbonate edge of the 849
continental shelf offshore Saurashtra. The MTC is emplaced as a number of fining upward 850
sequences with debris flow breccias, overlain by well sorted, coarse calcarenite deposited by 851
high velocity currents following in the wake of the initial mass wasting landslide. These are 852
overlain by muddy and turbiditic deposits, which are increasingly siliciclastic in character. At 853
Site U1457, only a thinner section of the earlier Phase 1 appears to be preserved, but a second 854
Phase 2 is apparent at Site U1456. Again, there was an emplacement of carbonate-rich debris 855
flows, although these were preceded and followed by muddy turbidite deposits, largely reworked 856
from pre-existing sediments of the Indus Fan. The top of each drilled sequence shows a 857
separation between sediment where the biostratigraphy is mixed and where slumping continues 858
to occur in the aftermath of the original depositional event. 859
Nd and Sr isotopic data, together with heavy-mineral assemblages, show that the 860
siliciclastic fraction of the deposit is associated with the western Indian continental margin, at 861
least in the debris flow part of the deposits although the overlying muddy turbidite units share the 862
same characteristics as the Indus submarine fan and suggest entrainment of sediment already 863
deposited in Laxmi Basin in the wake of the carbonate-rich debris flows that formed the MTC in 864
the first place. Limited zircon data at Site U1457 also show the clear signature of the Indus 865
River, although this applies only to the muddy units overlying the carbonate debris flows. We 866
envisage that enhanced sediment delivery to the western Indian continental margin driven by 867

38
strong monsoon during the middle Miocene resulted in an oversteepened continental margin that 868
was in a gravitationally unstable state. Exactly what triggered the collapse is not clear, but may 869
well be related to seismic activity in the nearby Rann of Kutch where large earthquakes continue 870
to the present day. Compressional deformation structures in the western Indian continental 871
margin south of Saurashtra suggest that this region too is in a compressional and potentially 872
unstable situation. However, decreasing sediment flux to the continental margin since the middle 873
Miocene has lessened the instability of the continental slope and reduced the chance of mass 874
wasting, especially further south away from potential seismic triggers. The western Indian 875
margin, however, has also experienced the increasing sedimentation rates linked to the onset of 876
northern hemisphere glaciation and so the potential for significant geohazard still exists. 877
Nonetheless, the fact that there has been no similar large event since 10.8 Ma does argue for this 878
being relatively low risk at the present time. 879
880
Acknowledgments 881
This work was made possible by samples given by International Ocean Discovery 882
Program. Project funding came from the Charles T. McCord Jr Chair in Petroleum Geology at 883
LSU. We thank Alan Roberts and Nick Kusznir for use of FlexDecomp software. 884
885
886

39
Figure Captions 887
Figure 1. A) Shaded topographic and bathymetric map of the Arabian Sea showing the location 888
of the core sites discussed in this study (yellow dots). Base map from GeoMapApp. Dashed 889
yellow lines show proposed continent-ocean boundaries. Dashed white lines show oceanic 890
transform faults. Numbered red circles indicate existing scientific boreholes from Deep Sea 891
Drilling Project (DSDP) and Ocean Drilling Program (ODP). Pink squares show major cities. 892
Magnetic anomalies (thin gray numbered lines) are from Miles et al. (1993). Green-filled circles 893
show earthquakes >4.5 magnitude since 1960 recorded by US Geological Survey. B) Close-up 894
map of Laxmi Basin showing the precise location of the drill sites. A pink dashed line shows the 895
extent of the Nataraja MTC (Calvès et al., 2015). Light blue lines show locations of seismic 896
profiles shown in Figure 2. 897
898
Figure 2. Seismic profiles of the core sites (left) with interpretation (right) showing the mass-899
transport complex in the immediate vicinity of (A) IODP Site U1456 and (B) IODP Site U1457. 900
Modified from Pandey et al. (2016c). See Figure 1 for locations of lines. 901
902
Figure 3. Summary stratigraphic columns showing the lithologies and interpreted facies of the 903
mass-transport complex at (A) IODP Site U1456 and (B) IODP Site U1457. Black shading in 904
second column indicates recovery, with white showing lost section. mbsf = meters below 905
seafloor. 906
907
Figure 4. (A) Sedimentary log showing the top of the deposit, U1456D-33R to U1456D-42R; (B) 908
Sedimentary log showing the top of the deposit, U1457C-69R to U1457C-78R. Black shading in 909
Sticky Note
please put all these symbols into an explanation in the figure itself

40
second column indicates recovery, with white showing lost section. mbsf = meters below 910
seafloor. 911
912
Figure 5. (A) Sedimentary log showing the bottom of the MTC, U1456E-16R to U1456E-19R; 913
(B) Sedimentary log showing bottom of the MTC, U1457C-86R to U1457C-92R. Lithological 914
patterns and sedimentary structures same as Figure 4. Black shading in second column indicates 915
recovery, with white showing lost section. mbsf = meters below seafloor. 916
917
Figure 6. (A) Sedimentary log showing the deposit above and within the hemipelagic layer, 918
U1456D-50R to U1456D- 53R. As shown, soft sediment deformation occurs until pelagic layer 919
begins; (B) Sedimentary log showing the second pulse of carbonate debris flow material, 920
U1456D-56R to U1456D-61R. Lithological patterns and sedimentary structures same as Figure 921
4. Black shading in second column indicates recovery, with white showing lost section. mbsf = 922
meters below seafloor. 923
924
Figure 7. (A) Limestone with burrows (20 cm long), U1456E-12R-1, 42-47 cm (1045 mbsf); (B) 925
Stylolite in limestone, U1456E-10R-3, 30-40 cm (1030 mbsf). Vertical scale is in cm below the 926
section top. See locations on Figure 3. 927
928
Figure 8. (A) Coarse carbonate breccia with mudstone matrix, U1457C-90R-2, 75-83 cm (1036 929
mbsf); (B) Debris flow conglomerate with faulted mudstone raft (larger faults shown with white 930
lines), U1456E-9R-4, 78-88 cm (1021 mbsf); (C) Core photograph of slickensides on a fault 931
within silty claystone, U1456E-9R-4, 37-51 cm (1021 mbsf), (D) Coarse sandy, calcarenite, 932

41
U1457C-88R-5, 38-48 cm (1022 mbsf). Vertical scale is in cm below the section top. See 933
location on Figure 3. 934
935
Figure 9. Thin section plane polarized photomicrographs of (A) Laminated sandy siltstone with 936
quartz grains, U1457C-85R-1, 22-26 cm (997 mbsf). Note the finer muddy center of the image 937
and the poorly sorted silt interbeds on either side with dominant quartz clasts; (B) Calcarenite, 938
U1456D- 60R-1, 13-17 cm (1006 mbsf); (C) Euhedral calcite/dolomite crystals within larger 939
grain, U1456E-15R-1, 12-16 cm (1073 mbsf); (D) Suture grain contact of carbonate clasts in 940
breccia, U1456D-45R-4-52-57 cm (870 mbsf). See location on Figure 3. 941
942
Figure 10. (A) Slump folded calcareous siltstone, U1456D-58R-2, 43-53 cm (989 mbsf); (B) 943
Deccan vesicular basalt clast, U1456D-46R-1, 16-25 cm (879 mbsf); (C) Massive calcarenite 944
with ductile folded layer U1456D-41R-3A, 114-124 cm (841 mbsf); (D) Sharp contact between 945
calcarenite and calcareous siltstone, U1457C-88R-7, 61-70 cm (1025 mbsf). Vertical scale is in 946
cm below the section top. See location on Figure 3. 947
948
Figure 11. (A) Sandy siltstone showing gradual normal grading, U1457C-71R-3, 101-115 cm 949
(865 mbsf) (B) Tilted, laminated turbidite deposit U1457C- 73R-2, 140-148 cm (881 mbsf); (C) 950
Mudstone with Zoophycos burrows (one outlined for clarity), U1457C-68R-1, 42-52 cm (832 951
mbsf); (D) Steeply dipping laminated mudstone showing reverse faulting, U1456D-46R-3A, 952
139-148 cm (883 mbsf). Vertical scale is in cm below the section top. See location on Figure 3 953
954
42
Figure 12. Thin section plane polarized photomicrographs of (A) Uniserial benthic foraminifer in 955
breccia clast, U1456E-15R-1, 12-16 cm (1072 mbsf); (B) Siltstone with planktonic foraminifers, 956
U1456D-58R-2, 40-44 cm (989 mbsf); (C) Limestone clast with a specimen of Lockhartia, 957
U1456E-17R-4, 131-133 cm (1086 mbsf); (D) Echinoderm spine in carbonate clast, U1456D-958
61R-2, 44-48 cm (1017 mbsf); (E) Foraminifer fragments in siltstone, U1456D-58R-2, 40-44 cm 959
(989 mbsf); (F) Planktic foraminifers and bioclasts in carbonate breccia, U1457C-90R-1-6-10 cm 960
(1034 mbsf). G) Planktonic foraminifer, U456E-7R-1, 80-82 cm (999 mbsf); H) Fragments of 961
coralline algae (white arrows) included in the planktonic-foraminifer-dominated matrix; Plk = 962
planktonic foraminifer, U1457C-88R-4, 58-60 cm (1021 mbsf); I) Orthophragminid fragment 963
(white arrow) included in the planktonic-foraminifer-dominated-matrix; Dl = dolomite crystal, 964
U1457C-88R-4, 58-60 cm (1021 mbsf). See locations on Figure 3. 965
966
Figure 13. (A) Geochemical signature of the analyzed samples illustrated by a CN-A-K ternary 967
diagram (Fedo et al., 1995). CN denotes the mole weight of Na2O and CaO* (CaO* represent the 968
CaO associated with silicate, excluding all the carbonate (Singh et al., 2005)). A and K indicate 969
the content of Al2O3 and K2O respectively. CIA values are calculated and shown on the left side, 970
with values correlated with on the CN-A-K ternary. Samples from the delta have the lowest CIA 971
values and indicate high contents of CaO and Na2O and plagioclase. Abbreviations: sm 972
(smectite), pl (plagioclase), ksp (K-feldspar), il (illite), m (muscovite). B) Geochemical 973
classification of sediments from the Indus delta (Clift et al., 2010), Indus Canyon (Li et al., 2018) 974
and western Indian Peninsular shelf north of Goa (Kurian et al., 2013) following the scheme of 975
Herron (1988). Phase 1 and Phase 2 sediments, together with the hemipelagic drape are the 976
materials of the MTC. 977

43
978
Figure 14. Cross plot of Sr versus Nd isotope data from the MTC, adjacent drill sites, major 979
source regions onshore, and modern Mahi, Tapti, and Narmada River sediments (Goswami et al., 980
2012). Kirthar and Sulaiman data is from Zhuang et al. (2015). Deccan Plateau data are from 981
GEOROC compilation (http://georoc.mpch-mainz.gwdg.de/georoc/). Transhimalaya data are 982
from Rolland et al. (2002), Singh et al. (2002), and Khan et al. (1997). Greater Himalayan data 983
are from Ahmad et al.(2000), Deniel et al. (1987), Inger et al. (1993) and Parrish and Hodges 984
(1996). Karakoram data are from Crawford and Searle (1992) and Schärer et al. (1990), 985
986
Figure 15. Downhole plots of Nd and Sr isotope compositions and clay mineralogy of 987
siliciclastic sediments from IODP sites (A) U1456 and (B) U1457. Gray vertical bar shows 988
compositional range of Quaternary sediments in the Indus Delta (Clift et al., 2010; Clift et al., 989
2008b), as well as modern Tapti and Narmada River sediments (Goswami et al., 2012). Deccan 990
Plateau volcanic rocks plot outside this range at more positive Nd values and lower 87Sr/86Sr 991
values. Nd and Sr isotope analyses include errors recently suggested by Jonell et al. (2018) for 992
bulk sediment compositions. Error bars encompass the total expected error for any bulk sample 993
as a result of variable grain size and mineralogy, and analytical error contributed during sample 994
preparation, homogenization, and analysis. 995
996
Figure 16. Kernel density estimate (KDE) plots for detrital zircon U-Pb ages for the Nataraja 997
MTC compared to major source terrains in the western Himalayas, from the compilation of 998
Alizai et al. (2011), as well as a modern sand from the river mouth (Clift et al., 2004) and select 999
Indus Fan turbidites also from IODP Sites U1456 and U1457 (Clift et al., 2018). Deccan zircons 1000
Sticky Note
zircon is a singular noun, like quartz

44
at ~65 Ma would plot within the Karakoram-Kohistan range but the inset box at the top shows 1001
that grains <100 Ma from the MTC do not cluster at this age and are better match to sources in 1002
the Indus suture zone. Data from the Tethyan, Greater and Lesser Himalaya are compiled from 1003
DeCelles et al. (2004). Karakoram data is from Le Fort et al. (1983), Parrish and Tirrul (1989), 1004
Schärer et al. (1990), Fraser et al. (2001) and Ravikant et al. (2009). Nanga Parbat data is from 1005
Zeitler and Chamberlain (1991) and Zeitler et al. (1993), Transhimalayan data is from Honegger 1006
et al. (1982), Schärer et al. (1984), Krol et al. (1996), Weinberg and Dunlap (2000), Zeilinger et 1007
al. (2001), Dunlap and Wysoczanski (2002), (Singh et al., 2007), and Ravikant et al. (2009). 1008
1009
Figure 17. Ternary diagram of clay minerals from IODP Site U1456 and U1457 indicates a clay 1010
mineral assemblage consisting mostly of smectite, chlorite and illite. Clay mineral data from 1011
source regions are plotted to compare their clay assemblages. Data from western Indian shelf 1012
modern sediments are from Rao and Rao (1995), Indus canyon data is from Li et al. (2018), 1013
Indus flood plain and delta data is from Alizai et al. (2012), and Indus Fan data is from Peng 1014
Zhou (unpublished). 1015
1016
Figure 18. (A) Interpretation of the depth-converted seismic section of the western Indian 1017
continental shelf immediately to the south of the source region for the Nataraja Slide based on 1018
the seismic profile of Nair and Pandey (2018) and using the seismic velocities shown in Table 5; 1019
and (B) A calculated sediment budget for the Indian shelf derived from two-dimensional 1020
sediment backstripping of this profile derived from FlexDecomp software. 1021
1022

45
Figure 19. Schematic cartoon illustrating the over-steepened Indian margin (A), the first phase 1023
of emplacement of the Nataraja MTC (B) separated by a short time of quiescence with 1024
hemipelagic sedimentation (C) from the second smaller phase of emplacement (D). 1025
1026
Table 1. Bulk sediment geochemistry analyzed by ICP-ES. 1027
1028
Table 2. Neodymium and strontium isotope data. 1029
1030
Table 3. Heavy mineral data. HM = heavy minerals; tHM = transparent heavy minerals. The 1031
ZTR index is the sum of zircon, tourmaline and rutile over total transparent heavy minerals 1032
(Hubert, 1962) and is classically used to estimate the mineralogical durability of the assemblage 1033
(i.e., the extent of recycling and/or intrastratal dissolution). 1034
1035
Table 4. U-Pb zircon data for sample U1456C-71R-1, 110 cm. 1036
1037
Table 5. Quantitative estimates of major clay mineral assemblages. 1038
1039
Table 6. Seismic interval velocities for the main stratigraphic units interpreted by Nair and 1040
Pandey (2018) used to depth convert the seismic profile before backstripping. 1041
1042 1043 1044

46
References 1045
Ahmad, T., Harris, N., Bickle, M., Chapman, H., Bunbury, J., and Prince, C., 2000, Isotopic 1046 constraints on the structural relationships between the Lesser Himalayan Series and the 1047 High Himalayan Crystalline Series, Garhwal Himalaya: Geological Society of America 1048 Bulletin, v. 112, no. 3, p. 467-477. 1049
Alizai, A., Carter, A., Clift, P. D., VanLaningham, S., Williams, J. C., and Kumar, R., 2011, 1050 Sediment provenance, reworking and transport processes in the Indus River by U-Pb 1051 dating of detrital zircon grains: Global and Planetary Change, v. 76, p. 33-55. 1052 doi:10.1016/j.gloplacha.2010.11.008. 1053
Alizai, A., Hillier, S., Clift, P. D., and Giosan, L., 2012, Clay mineral variations in Holocene 1054 terrestrial sediments from the Indus Basin; a response to SW Asian Monsoon variability: 1055 Quaternary Research, v. 77, no. 3, p. 368–381. doi:10.1016/j.yqres.2012.01.008. 1056
Andò, S., and Garzanti, E., 2014, Raman spectroscopy in heavy-mineral studies. In Sediment 1057 Provenance Studies, in Scott, R. A., Smyth, H. R., Morton, A. C., and Richardson, N., 1058 eds., Sediment Provenance Studies in Hydrocarbon Exploration and Production, Volume 1059 386: London, Geological Society, p. 395–412. 1060
Ando, S., Garzanti, E., Padoan, M., and Limonta, M., 2012, Corrosion of heavy minerals during 1061 weathering and diagenesis: a catalogue for optical analysis: Sedimentary Geology, v. 280, 1062 p. 165–178. 1063
Bassi, D., and Nebelsick, J. H., 2000, Calcareous algae from the lower Oligocene Gornji Grad 1064 beds of Northern Slovenia: Rivista Italiana di Paleontologia e Stratigrafia, v. 106, p. 1065 99-122. 1066
Bea, R. G., Sircar, P., and Niedoroda, A. W., 1983, Wave-induced slides in South Pass Block 70, 1067 Mississippi Delta: Journal of Geotechnical Engineering, v. 109, p. 619–644. 1068
Bhattacharya, G. C. B., Chaubey, A. K., Murty, G. P. S., Srinivas, S., Sarma, K. V., 1069 Subrahmanyam, V., and Krishna, K. S., 1994, Evidence for seafoor spreading in the 1070 Laxmi Basin, northeastern Indian Ocean: Earth and Planetary Science Letters, v. 125, p. 1071 211-220. 1072
Bilham, R., 1999, Slip parameters for the Rann of Kachchh, India, 16 June 1819, earthquake, 1073 quantified from contemporary accounts, in Stewart, I. S., and Vita-Finzi, C., eds., Coastal 1074 Tectonics, Volume 146: London, Geological Society, p. 295-319. 1075
Bilham, R., Bendick, R., and Wallace, K., 2003, Flexure of the Indian Plate and intraplate 1076 earthquakes: Proceedings of the Indian Academy of Sciences (Earth and Planetary 1077 Sciences), v. 112,, p. 1–14. 1078
Biswas, S. K., 2005, A review of structure and tectonics of Kutch basin, western India, with 1079 special reference to earthquakes: Current science, v. 88, no. 10, p. 1592-1600. 1080
BouDagher-Fadel, M., 2018, Evolution and geological significance of larger benthic 1081 foraminifera, London, UCL Press, 702 p. 1082
Bryn, P., Berg, K., Stoker, M. S., Haflidason, H., and Solheim, A., 2005, Contourites and their 1083 relevance for mass wasting along the Mid-Norwegian Margin.: Marine and Petroleum 1084 Geology, v. 22, p. 85-96. 1085
Burg, J. P., Bernoulli, D., Smit, J., Dolati, A., and Bahroudi, A., 2008, A giant catastrophic mud‐1086 and‐debris flow in the Miocene Makran: Terra Nova, v. 20, no. 3, p. 188-193. 1087

47
Callot, P., Sempere, T., Odonne, F., and Robert, E., 2008, Giant submarine collapse of a 1088 carbonate platform at the Turonian-Coniacian transition: the Ayabacas formation, 1089 southern Peru: Basin Research, v. 20, p. 333–357. 1090
Calvès, G., Huuse, M., Clift, P. D., and Brusset, S., 2015, Giant fossil mass wasting off the coast 1091 of West India: The Nataraja submarine slide: Earth and Planetary Science Letters, v. 432, 1092 p. 265–272. doi:10.1016/j.epsl.2015.10.022. 1093
Carracedo, J. C., 1999, Growth, structure, instability and collapse of Canarian volcanoes and 1094 comparisons with Hawaiian volcanoes: Journal of Volcanology and Geothermal 1095 Research, v. 94, no. 1-4, p. 1-19. 1096
Carter, A., and Bristow, C. S., 2003, Linking hinterland evolution and continental basin 1097 sedimentation by using detrital zircon thermochronology; a study of the Khorat Plateau 1098 basin, eastern Thailand: Basin Research, v. 15, p. 271–285. 1099
Carter, R. M., 1975, A discussion and classification of subaqueous mass-transport with particular 1100 application to grain-flow, slurry-flow, and fluxoturbidites: Earth-Science Reviews, v. 11, 1101 no. 2, p. 145-177. 1102
Chowdhary, L. R., 2004, Petroleum Geology of the Cambay Basin, Gujarat., India, Indian 1103 Petroleum Publishers, 171 p. 1104
Clift, P., Gaedicke, C., Edwards, R., Lee, J., II, Hildebrand, P., Amjad, S., White, R. S., and 1105 Schlueter, H.-U., 2002, The stratigraphic evolution of the Indus Fan and the history of 1106 sedimentation in the Arabian Sea: Marine Geophysical Researches, v. 23, no. 3, p. 223-1107 245. 1108
Clift, P. D., 2006, Controls on the erosion of Cenozoic Asia and the flux of clastic sediment to 1109 the ocean: Earth and Planetary Science Letters, v. 241, no. 3-4, p. 571-580. 1110
Clift, P. D., and Blusztajn, J. S., 2005, Reorganization of the western Himalayan river system 1111 after five million years ago: Nature, v. 438, no. 7070, p. 1001-1003. 1112
Clift, P. D., Campbell, I. H., Pringle, M. S., Carter, A., Zhang, X., Hodges, K. V., Khan, A. A., 1113 and Allen, C. M., 2004, Thermochronology of the modern Indus River bedload; new 1114 insight into the control on the marine stratigraphic record: Tectonics, v. 23, no. TC5013. 1115 doi:10.1029/2003TC001559. 1116
Clift, P. D., Giosan, L., Blusztajn, J., Campbell, I. H., Allen, C. M., Pringle, M., Tabrez, A., 1117 Danish, M., Rabbani, M. M., Carter, A., and Lückge, A., 2008a, Holocene erosion of the 1118 Lesser Himalaya triggered by intensified summer monsoon: Geology, v. 36, no. 1, p. 79–1119 82. doi: 10.1130/G24315A.1. 1120
Clift, P. D., Giosan, L., Carter, A., Garzanti, E., Galy, V., Tabrez, A. R., Pringle, M., Campbell, 1121 I. H., France-Lanord, C., Blusztajn, J., Allen, C., Alizai, A., Lückge, A., Danish, M., and 1122 Rabbani, M. M., 2010, Monsoon control over erosion patterns in the Western Himalaya: 1123 possible feed-backs into the tectonic evolution, in Clift, P. D., Tada, R., and Zheng, H., 1124 eds., Monsoon evolution and tectonic-climate linkage in Asia, Volume 342: London, 1125 Geological Society, p. 181–213. 1126
Clift, P. D., Hodges, K., Heslop, D., Hannigan, R., Hoang, L. V., and Calves, G., 2008b, Greater 1127 Himalayan exhumation triggered by Early Miocene monsoon intensification: Nature 1128 Geoscience, v. 1, p. 875-880. doi:10.1038/ngeo351. 1129
Clift, P. D., Shimizu, N., Layne, G., Gaedicke, C., Schlüter, H. U., Clark, M. K., and Amjad, S., 1130 2001, Development of the Indus Fan and its significance for the erosional history of the 1131 western Himalaya and Karakoram: Geological Society of America Bulletin, v. 113, p. 1132 1039–1051. 1133

48
Clift, P. D., Zhou, P., Stockli, D. F., and Blusztajn, J., 2018, An Erosional Record of Regional 1134 Exhumation of the Western Himalaya and Karakoram: Nature Communications, v. in 1135 review. 1136
Coleman, J., and Prior, D., 1988, Mass wasting on continental margins: Annual Review of Earth 1137 and Planetary Sciences, v. 16, no. 1, p. 101-119. 1138
Crawford, M. B., and Searle, M. P., 1992, Field relationships and geochemistry of pre-collisional 1139 (India-Asia) granitoid magmatism in the central Karakoram, northern Pakistan: 1140 Tectonophysics, v. 206, no. 1-2, p. 171-192. 1141
Dan, G., Sultan, N., and Savoye, B., 2007, The 1979 Nice harbour catastrophe revisited: trigger 1142 mechanism inferred from geotechnical measurements and numerical modelling: Marine 1143 Geology, v. 245, p. 40–64. 1144
Davies, R., and Clark, I., 2006, Submarine slope failure primed and triggered by silica and its 1145 diagenesis: Basin Research, v. 18, p. 339-350. 1146
DeCelles, P. G., Gehrels, G. E., Najman, Y., Martin, A. J., Carter, A., and Garzanti, E., 2004, 1147 Detrital geochronology and geochemistry of Cretaceous-Early Miocene strata of Nepal: 1148 implications for timing and diachroneity of initial Himalayan orogenesis: Earth and 1149 Planetary Science Letters, v. 227, no. 3-4, p. 313-330. 1150
DeCelles, P. G., Gehrels, G. E., Quade, J., LaReau, B., and Spurlin, M., 2000, Tectonic 1151 implications of U-Pb zircon ages of the Himalayan orogenic belt in Nepal: Science, v. 1152 288, no. 5465, p. 497-499. doi:10.1126/science.288.5465.497. 1153
DeCelles, P. G., Kapp, P., Gehrels, G. E., and Ding, L., 2014, Paleocene-Eocene foreland basin 1154 evolution in the Himalaya of southern Tibet and Nepal: Implications for the age of initial 1155 India-Asia collision: Tectonics, v. 33, p. 824–849. doi:10.1002/ 2014TC003522. 1156
Deniel, C., Vidal, P., Fernandez, A., Fort, P., and Peucat, J.-J., 1987, Isotopic study of the 1157 Manaslu granite (Himalaya, Nepal): inferences on the age and source of Himalayan 1158 leucogranites: Contributions to Mineralogy and Petrology, v. 96, no. 1, p. 78-92. 1159
Derry, L. A., and France-Lanord, C., 1996, Neogene Himalayan weathering history and river 1160 87Sr/86Sr; impact on the marine Sr record: Earth and Planetary Science Letters, v. 142, p. 1161 59-74. 1162
Donelick, R. A., O’Sullivan, P. B., and Ketcham, R. A., 2005, Apatite fission-track analysis: 1163 Reviews in Mineralogy and Geochemistry, v. 58, no. 1, p. 49-94. 1164
Dunham, R. J., 1962, Classification of carbonate rocks according to depositional texture, in Ham, 1165 W. E., ed., Classification of Carbonate Rocks, Volume 1, American Association of 1166 petroleum geology, p. 108–121. 1167
Dunlap, W. J., and Wysoczanski, R., 2002, Thermal evidence for Early Cretaceous 1168 metamorphism in the Shyok suture zone and age of the Khardung volcanic rocks, 1169 Ladakh, India: Journal of Asian Earth Sciences, v. 20, no. 5, p. 481-490. 1170
Ekdale, A. A., Bromley, R. G., and Pemberton, S. G., 1984, Ichnology. Trace fossils in 1171 sedimentation and stratigraphy, Tulsa, OK, Society of Economic Palaeontologists and 1172 Mineralogists, Short Course, 317 p. 1173
Elverhoi, A., Breien, H., Blasio, F. V. D., Harbitz, C. B., and Pagliardi, M., 2010, Submarine 1174 landslides and the importance of the initial sediment composition for run-out length and 1175 final deposit: Ocean Dynamics, v. 60, p. 1027–1046. doi 10.1007/s10236-010-0317-z. 1176
Embley, R. W., and Jacobi, R. D., 1977, Distribution and morphology of large submarine 1177 sediment slides and slumps on Atlantic continental margins: Marine Georesources & 1178 Geotechnology, v. 2, no. 1-4, p. 205-228. 1179

49
Evans, D., McGiveron, S., Harrison, Z., Bryn, P., and Berg, K., 2002, Along-slope variation in 1180 the late Neogene evolution of the mid-Norwegian margin in response to uplift and 1181 tectonism, in Dore, A. G., Cartwright, J. A., Stoker, S., Turner, J. P., and White, N., eds., 1182 Exhumation of the North Atlantic Margin: Timing, Mechanisms and Implications for 1183 Petroleum Exploration, Volume 196: London, Geological Society, p. 139-151. 1184
Farrell, S. G., 1984, A dislocation model applied to slump structures, Ainsa Basin, South Central 1185 Pyrenees: Journal of Structural Geology, v. 6, p. 727-736. 1186
Fedo, C. M., Nesbitt, H. W., and Young, G. M., 1995, Unraveling the effects of potassium 1187 metasomatism in sedimentary rocks and paleosols, with implications for paleoweathering 1188 conditions and provenance: Geology, v. 23, p. 921–924. 1189
Fraser, J. E., Searle, M. P., Parrish, R. R., and Noble, S. R., 2001, Chronology of deformation, 1190 metamorphism, and magmatism in the southern Karakoram Mountains: Geological 1191 Society of America Bulletin, v. 113, no. 11, p. 1443-1455. 1192
Frey Martinez, J., Cartwright, J., and Hall, B., 2005, 3D seismic interpretation of slump 1193 complexes: examples from the continental margin of Israel: Basin Research, v. 17, p. 83-1194 108. 1195
Gamboa, D., Alves, T., and Cartwright, J., 2012, Seismic-Scale Rafted and Remnant Blocks over 1196 Salt Ridges in the Espírito Santo Basin, Brazil, in Yamada, Y., Kawamura, K., Ken 1197 Ikehara, Ogawa, Y., Urgeles, R., Mosher, D., Chaytor, J., and Strasser, M., eds., 1198 Submarine Mass Movements and Their Consequences: Dordrecht, Springer, p. 629-638. 1199
Garzanti, E., 2017, The maturity myth in sedimentology and provenance analysis: Journal of 1200 Sedimentary Research, v. 87, p. 353-365. 1201
Garzanti, E., and Andò, S., 2007, Heavy-mineral concentration in modern sands: implications for 1202 provenance interpretation, in Mange, M., and Wright, D., eds., Heavy Minerals in Use, 1203 Volume 58: Amsterdam, Elsevier, p. 517-545. 1204
Garzanti, E., Andò, S., and Vezzoli, G., 2009, Grain-size dependence of sediment composition 1205 and environmental bias in provenance studies: Earth and Planetary Science Letters, v. 1206 277, no. 3-4, p. 422-432. 1207
Garzanti, E., Vezzoli, G., Ando, S., Paparella, P., and Clift, P. D., 2005, Petrology of Indus River 1208 sands; a key to interpret erosion history of the western Himalayan syntaxis: Earth and 1209 Planetary Science Letters, v. 229, no. 3-4, p. 287-302. DOI: 10.1016/j.epsl.2004.11.008. 1210
Gehrels, G. E., Kapp, P., DeCelles, P., Pullen, A., Blakely, R., Weislgel, A., Ding, L., Guynn, J., 1211 Marin, A., McQuarrie, N., and Yin, A., 2011, Detrital zircon geochronology of pre-1212 Tertiary strata in the Tibetan-Himalayan orogen: Tectonics, v. 30, no. TC5016. 1213 doi:10.1029/2011TC002868. 1214
Goldstein, S. L., O'Nions, R. K., and Hamilton, P. J., 1984, A Sm-Nd isotopic study of 1215 atmospheric dusts and particulates from major river systems: Earth and Planetary Science 1216 Letters, v. 70, no. 2, p. 221-236. 1217
Goswami, V., Singh, S. K., Bhushan, R., and Rai, V. K., 2012, Temporal variations in 87Sr/86Sr 1218 and eNd in sediments of the southeastern Arabian Sea: Impact of monsoon and surface 1219 water circulation: Geochemistry Geophysics Geosystems, v. 13, no. Q01001. 1220 doi:10.1029/2011GC003802. 1221
Gradstein, F. M., Ogg, G., and Schmitz, M., 2012, The Geologic Time Scale 2012, New York, 1222 Elsevier. 1223
Hampton, M. A., Lee, H. J., and Locat, J., 1996, Submarine landslides: Reviews of Geophysics, 1224 v. 34, no. 1, p. 33-59. doI:10.1029/95RG03287 1225
50
Herron, M. M., 1988, Geochemical classification of terrigenous sands and shales from core or 1226 log data: Journal of Sedimentary Petrology, v. 58, p. 820–829. 1227
Hine, A. C., 1992, Megabreccia shedding from modern, low-relief carbonate platforms, 1228 Nicaraguan Rise: Geological Society of America Bulletin, v. 104, p. 928–943. 1229
Hodges, K., 2003, Geochronology and thermochronology in orogenic systems, in Rudnick, R., 1230 ed., The Crust: Amsterdam, Elsevier-Science, p. 263-292. 1231
Honegger, K., Dietrich, V., Frank, W., Gansser, A., Thoni, M., and Trommsdorf, V. F., 1982, 1232 Magmatism and metamorphism in the Ladakh Himalayas (The Indus-Tsangpo suture 1233 zone): Earth and Planetary Science Letters, v. 60, p. 178-194. 1234
Hsu, S.-K., Kuo, J., Lo, C.-L., Tsai, C.-H., Doo, W.-B., Ku, C.-Y., and Sibuet, J.-C., 2008, 1235 Turbidity currents, submarine landslides and the 2006 Pingtung earthquake off SW 1236 Taiwan: Terrestrial Atmospheric and Ocean Sciences, v. 19, no. 6, p. 767–772. . 1237 doi:10.3319/TAO.2008.19.6.767(PT). 1238
Hubert, J. F., 1962, A zircon–tourmaline–rutile maturity index and the interdependence of 1239 the composition of heavy mineral assemblages with the gross composition and texture of 1240 sandstones: Journal of Sedimentary Petrology, v. 32, p. 440-450. 1241 Inger, S., and Harris, N., 1993, Geochemical constraints on leucogranite magmatism in the 1242
Langtang Valley, Nepal Himalaya: Journal of Petrology, v. 34, no. 2, p. 345-368. 1243 Kastens, K. A., 1984, Earthquakes as a triggering mechanism for debris flows and turbidites on 1244
the Calabrian Ridge: Marine Geology, v. 55, no. 1-2, p. 13-33. 1245 Khan, M. A., Stern, R. J., Gribble, R. F., and Windley, B. F., 1997, Geochemical and isotopic 1246
constraints on subduction polarity, magma sources, and palaeogeography of the Kohistan 1247 intra-oceanic arc, northern Pakistan Himalaya: Journal of the Geological Society, 1248 London, v. 154, p. 935–946. 1249
Khonde, N., Singh, S. K., Maurya, D. M., Rai, V. K., Chamyal, L. S., and Giosan, L., 2017, 1250 Tracing the Vedic Saraswati River in the Great Rann of Kachchh: Scientific Reports, v. 1251 7, no. 5476. doi:10.1038/s41598-017-05745-8. 1252
Klaus, A., Norris, R. D., Kroon, D., and Smit, J., 2000, Impact-induced mass wasting at the KT 1253 boundary: Blake Nose, western North Atlantic: Geology, v. 28, no. 4, p. 319-322. 1254
Krastel, S., Wynn, R. B., Georgiopoulou, A., Geersen, J., Henrich, R. d., Meyer, M., and 1255 Schwenk, T., 2012, Large-Scale Mass Wasting on the Northwest African Continental 1256 Margin: Some General Implications for Mass Wasting on Passive Continental Margins, 1257 in Yamada, Y., Kawamura, K., Ken Ikehara, Ogawa, Y., Urgeles, R., Mosher, D., 1258 Chaytor, J., and Strasser, M., eds., Submarine Mass Movements and Their Consequences: 1259 Dordrecht, Springer, p. 189-200. 1260
Krol, M. A., Zeitler, P. K., and Copeland, P., 1996, Episodic unroofing of the Kohistan 1261 Batholith, Pakistan: Implications from K-feldspar thermochronology: Journal of 1262 Geophysical Research-Solid Earth, v. 101, no. B12, p. 28149-28164. 1263
Kurian, S., Nath, B. N., Kumar, N. C., and Nair, K. K. C., 2013, Geochemical and Isotopic 1264 Signatures of Surficial Sediments from the Western Continental Shelf of India: Inferring 1265 Provenance, Weathering, and the Nature of Organic Matter Geochemical and Isotopic 1266 Signatures of Sediments From The Indian West Coast: Journal of Sedimentary Research, 1267 v. 83, no. 6, p. 427-442. doi:10.2110/jsr.2013.36. 1268
Kusznir, N. J., Roberts, A. M., and Morley, C. K., 1995, Forward and reverse modelling of rift 1269 basin formation, in Lambiase, J. J., ed., Hydrocarbon Habitat in Rift Basins, Volume 80: 1270 London, Geological Society, p. 33–56. 1271

51
Lastras, G., Canals, M., Urgeles, R., De Batist, M., Calafat, A. M., and Casamor, J. L., 2004, 1272 Characterisation of the recent BIG’95 debris flow on the Ebro margin, Western 1273 Mediterranean Sea, after a variety of seismic reflection data: Marine Geology, v. 213, p. 1274 235-255. doi:10.1016/j.margeo.2004.10.008. 1275
Le Fort, P., Debon, F., and Sonet, J., 1983, Petrography, geochemistry and geochronology of 1276 some samples from the Karakoram Batholith (N. Pakistan), in Shams, F. A., ed., Granites 1277 of the Himalayas, Karakoram and Hindu Kush: Lahore, Pakistan, Punjab University, p. 1278 377–387. 1279
Leynaud, D., Mienert, J., and Vanneste, M., 2009, Submarine mass movements on glaciated and 1280 non-glaciated European continental margins: A review of triggering mechanisms and 1281 preconditions to failure: Marine and Petroleum Geology, v. 26, no. 5, p. 618-632. 1282
Li, Y., 2018, Signal propagation, provenance, and climate records in the Indus Submarine 1283 Canyon since the Last Deglacial [PhD PhD]: Louisiana State University. 1284
Li, Y., Clift, P. D., Böning, P., Blusztajn, J., Murray, R. W., Ireland, T., Pahnke, K., and Giosan, 1285 L., 2018, Continuous Signal Propagation in the Indus Submarine Canyon since the Last 1286 Deglacial: Marine Geology, v. 406, p. 159–176. doi:10.1016/j.margeo.2018.09.011. 1287
Lowe, D. R., 1976, Grain flow and grain flow deposits: Journal of Sedimentary Research, v. 46, 1288 no. 1. 1289
Lucente, C. C., and Pini, G. A., 2003, Anatomy and emplacement mechanism of a large 1290 submarine slide within a Miocene foredeep in the northern Apennines, Italy: a field 1291 perspective: American Journal of Science, v. 303, p. 565-602. 1292
Mange, M. A., and Maurer, H. F. W., 1992, Heavy minerals in colour, London, Chapman and 1293 Hall, 147 p. 1294
Martinsen, O. J., and Bakken, B., 1990, Extensional and compressional zones in slumps and 1295 slides in the Namurian of County Clare, Ireland: Journal of the Geological Society of 1296 London, v. 147, p. 153-164. 1297
Mienert, J., Vanneste, M., Bünz, S., Andreassen, K., Haflidason, H., and Sejrup, H. P., 2005, 1298 Ocean warming and gas hydrate stability on the mid-Norwegian margin at the Storegga 1299 Slide: Marine and Petroleum Geology, v. 22, no. 1-2, p. 233-244. 1300
Miles, P. R., and Roest, W. R., 1993, Earliest seafoor spreading magnetic anomalies in the north 1301 Arabian Sea and the ocean-continent transition: Geophysical Journal International, v. 1302 115, p. 1025-1031. 1303
Moernaut, J., De Batist, M., Charlet, F., Heirman, K., Chapron, E., Pino, M., Brümmer, R., and 1304 Urrutia, R., 2007, Giant earthquakes in South-Central Chile revealed by Holocene mass-1305 wasting events in Lake Puyehue: Sedimentary Geology, v. 195, no. 3-4, p. 239-256. 1306
Moore, D. G., 1961, Submarine slumps: Journal of Sedimentary Research, v. 31, no. 3, p. 343-1307 357. 1308
Mullins, H. T., Gardulski, A. F., and Hine, A. C., 1986, Catastrophic collapse of the west Florida 1309 carbonate platform margin: Geology v. 14, p. 167–170. 1310
Nair, N., and Pandey, D. K., 2018, Cenozoic sedimentation in the Mumbai Offshore Basin: 1311 Implications for tectonic evolution of the western continental margin of India: Journal of 1312 Asian Earth Sciences, v. 152, p. 132-144. doi:10.1016/j.jseaes.2017.11.037. 1313
Najman, Y., Appel, E., Boudagher‐Fadel, M., Bown, P., Carter, A., Garzanti, E., Godin, L., Han, 1314 J., Liebke, U., Oliver, G., Parrish, R., and Vezzoli, G., 2010, Timing of India‐Asia 1315 collision: Geological, biostratigraphic, and palaeomagnetic constraints: Journal of 1316 Geophysical Research, v. 115, no. B12416. doi:10.1029/2010JB007673. 1317

52
Nesbitt, H. W., Markovics, G., and Price, R. C., 1980, Chemical processes affecting alkalis and 1318 alkaline earths during continental weathering: Geochimica et Cosmochimica Acta, v. 44, 1319 p. 1659–1666. 1320
Pandey, D. K., Clift, P. D., Kulhanek, D. K., Andò, S., Bendle, J. A. P., Bratenkov, S., Griffith, 1321 E. M., Gurumurthy, G. P., Hahn, A., Iwai, M., Khim, B.-K., Kumar, A., Kumar, A. G., 1322 Liddy, H. M., Lu, H., Lyle, M. W., Mishra, R., Radhakrishna, T., Routledge, C. M., 1323 Saraswat, R., Saxena, R., Scardia, G., Sharma, G. K., Singh, A. D., Steinke, S., Suzuki, 1324 K., Tauxe, L., Tiwari, M., Xu, Z., and Yu, Z., 2016a, Site U1456, in Pandey, D. K., Clift, 1325 P. D., and Kulhanek, D. K., eds., Arabian Sea Monsoon. Proceedings of the International 1326 Ocean Discovery Program, Volume 355: College Station, TX, International Ocean 1327 Discovery Program. 1328
-, 2016b, Site U1457, in Pandey, D. K., Clift, P. D., and Kulhanek, D. K., eds., Arabian Sea 1329 Monsoon. Proceedings of the International Ocean Discovery Program, Volume 355: 1330 College Station, TX, International Ocean Discovery Program. 1331
Pandey, D. K., Clift, P. D., Kulhanek, D. K., and Expedition 355 Scientists, 2016c, Arabian Sea 1332 Monsoon: Proceedings of the International Ocean Discovery Program, v. 355. 1333 doi:10.14379/iodp.proc.355.2016. 1334
Pandey, O. P., Agrawal, P. K., and Negi, J. G., 1995, Lithospheric structure beneath Laxmi 1335 Ridge and late Cretaceous geodynamic events: Geo-Marine Letters, v. 15, p. 85-91. 1336
Parnell, J., 2008, Global mass wasting at continental margins during Ordovician high meteorite 1337 influx: Nature Geoscience, v. 2, p. 57. doi:10.1038/ngeo386. 1338
Parrish, R. R., and Hodges, K. V., 1996, Isotopic constraints on the age and provenance of the 1339 Lesser and Greater Himalayan sequences, Nepalese Himalaya: Geological Society of 1340 America Bulletin, v. 108, no. 7, p. 904-911. 1341
Parrish, R. R., and Tirrul, R., 1989, U-Pb age of the Baltoro Granite, Northwest Himalaya, and 1342 implications for monazite U-Pb systematics: Geology, v. 17, p. 1076–1079. 1343
Peters, S. E., and Loss, D. P., 2012, Storm and fair-weather wave base: A relevant distinction?: 1344 Geology, v. 40, no. 6, p. 511-514. 1345
Pickering, K., Stow, D., Watson, M., and Hiscott, R., 1986, Deep-water facies, processes and 1346 models: a review and classification scheme for modern and ancient sediments: Earth-1347 Science Reviews, v. 23, no. 2, p. 75-174. 1348
Piper, D. J., Shor, A. N., Farre, J. A., O'Connell, S., and Jacobi, R., 1985, Sediment slides and 1349 turbidity currents on the Laurentian Fan: Sidescan sonar investigations near the epicenter 1350 of the 1929 Grand Banks earthquake: Geology, v. 13, no. 8, p. 538-541. 1351
Principaud, M., Mulder, T., Gillet, H., and Borgomano, J., 2015, Large-scale carbonate 1352 submarine mass-wasting along the northwestern slope of the Great Bahama Bank 1353 (Bahamas): Morphology, architecture, and mechanisms: Sedimentary Geology, v. 317, p. 1354 27-42. doi:10.1016/j.sedgeo.2014.10.008. 1355
Rao, R. P., and Talukdar, S. N., 1980, Petroleum geology of Bombay High field, India, in 1356 Halbouty, M. T., ed., Giant oil and gas fields of the decade: 1968–1978, Volume 30, 1357 American Association of Petroleum Geologists, p. 487–506. 1358
Rao, V. P., and Rao, B. R., 1995, Provenance and distribution of clay minerals in the sediments 1359 of the western continental shelf and slope of India: Continental Shelf Research, v. 15, no. 1360 14, p. 1757-1771. doi:10.1016/0278-4343(94)00092-2. 1361

53
Ravikant, V., Wu, F. Y., and Ji, W. Q., 2009, Zircon U-Pb and Hf isotopic constraints on 1362 petrogenesis of the Cretaceous-Tertiary granites in eastern Karakoram and Ladakh, India: 1363 Lithos, v. 110, p. 153-166. 1364
Rolland, Y., Picard, C., Pecher, A., Lapierre, H., Bosch, D., and Keller, F., 2002, The Cretaceous 1365 Ladakh arc of NW himalaya—slab melting and melt–mantle interaction during fast 1366 northward drift of Indian Plate: Chemical Geology, v. 182, p. 139–178. 1367
Schärer, U., Copeland, P., Harrison, T. M., and Searle, M. P., 1990, Age, cooling history, and 1368 origin of post-collisional leucogranites in the Karakoram Batholith; a multi-system 1369 isotope study: The Journal of Geology, v. 98, no. 2, p. 233-251. 1370
Schärer, U., Xu, R.-H., and Allègre, C. J., 1984, U-Pb geochronology of Gangdese 1371 (Transhimalaya) plutonism in the Lhasa-Xigaze region, Tibet: Earth and Planetary 1372 Science Letters, v. 69, no. 2, p. 311-320. 1373
Schlager, W., Reijmer, J. J. G., and Droxler, A., 1994, Highstand shedding of carbonate 1374 platforms: Journal of Sedimentary Research, v. 64, no. 3b, p. 270-281. 1375 doi:10.1306/D4267FAA-2B26-11D7-8648000102C1865D. 1376
Sclater, J. G., and Christie, P. A. F., 1980, Continental stretching: an explanation of the post 1377 Mid-Cretaceous subsidence of the central North Sea basin: Journal of Geophysical 1378 Research, v. 85, p. 3711–3739. 1379
Seilacher, A., 1967, Bathymetry of trace fossils: Marine Geology, v. 5, p. 413–428. 1380 Singh, M., Sharma, M., and Tobschall, H. J., 2005, Weathering of the Ganga alluvial plain, 1381
northern India: implications from fluvial geochemistry of the Gomati River: Applied 1382 Geochemistry, v. 20, p. 1-21. 1383
Singh, S., Kumar, R., Barley, M. E., and Jain, A. K., 2007, SHRIMP U–Pb ages and depth of 1384 emplacement of Ladakh batholith, eastern Ladakh, India: Journal of Asian Earth 1385 Sciences, v. 30, no. 3, p. 490–503. 1386
Singh, S. K., and France-Lanord, C., 2002, Tracing the distribution of erosion in the 1387 Brahmaputra watershed from isotopic compositions of stream sediments: Earth and 1388 Planetary Science Letters, v. 202, no. 3-4, p. 645-662. 1389
Strachan, L. J., 2002, Slump-initiated and controlled syndepositional sandstone remobilisation: 1390 an example from the Namurian of County Clare, Ireland: Sedimentology, v. 49, p. 25-41. 1391
Talling, P. J., Masson, D. G., Sumner, E. J., and Malgesini, G., 2012, Subaqueous sediment 1392 density flows: Depositional processes and deposit types: Sedimentology, v. 59, no. 7, p. 1393 1937-2003. 1394
Tappin, D. R., Watts, P., McMurtry, G. M., Lafoy, Y., and Matsumoto, T., 2001, The Sissano, 1395 Papua New Guinea tsunami of July 1998 – offshore evidence on the source mechanism: 1396 Marine Geology, v. 17, p. 1–23. 1397
Trincardi, F., and Argnani, A., 1990, Gela Submarine slide: a major basin-wide event in the Plio-1398 Quatemary foredeep of Sicily: Geo-marine Letters, v. 10, p. 13-21. 1399
Vardy, M. E., Pinson, L. J., Bull, J. M., Dix, J. K., Henstock, T. J., Davis, J. W., and Gutowski, 1400 M., 2010, 3D seismic imaging of buried Younger Dryas mass movement flows: Lake 1401 Windermere, UK: Geomorphology, v. 118, no. 1-2, p. 176-187. 1402
Vermeesch, P., 2004, How many grains are needed for a provenance study?: Earth and Planetary 1403 Science Letters, v. 224, p. 351–441. 1404
Wandrey, C. J., 2004, Bombay Geologic Province Eocene to Miocene Composite Total 1405 Petroleum System, India: US Geological Survey, Department of the Interior, 2208-F. 1406

54
Weinberg, R. F., and Dunlap, W. J., 2000, Growth and Deformation of the Ladakh Batholith, 1407 Northwest Himalayas: Implications for Timing of Continental Collision and Origin of 1408 Calc‐Alkaline Batholiths: Journal of Geology, v. 108, p. 303–320. DOI: 10.1086/314405. 1409
Yamada, Y., Kawamura, K., Ikehara, K., Ogawa, Y., Urgeles, R., Mosher, D., Chaytor, J., and 1410 Strasser, M., 2012, Submarine mass movements and their consequences, in Lykousis, V., 1411 Sakellariou, D., and Locat, J., eds., Submarine mass movements and their consequences, 1412 Springer, p. 1-12. 1413
Zeilinger, G., Burg, J. P., Schaltegger, U., and Seward, D., 2001, New U/ Pb and fission track 1414 ages and their implication for the tectonic history of the lower Kohistan Arc Complex, 1415 northern Pakistan: Journal of Asian Earth Sciences, v. 19, no. 3S, p. 79-81. 1416
Zeitler, P. K., and Chamberlain, C. P., 1991, Petrogenetic and Tectonic Significance of Young 1417 Leukogranites from the Northwestern Himalaya, Pakistan: Tectonics, v. 10, no. 4, p. 729-1418 741. 1419
Zeitler, P. K., Chamberlain, C. P., and Smith, H. A., 1993, Synchronous Anatexis, 1420 Metamorphism, and Rapid Denudation at Nanga-Parbat (Pakistan Himalaya): Geology, v. 1421 21, no. 4, p. 347-350. 1422
Zhuang, G., Najman, Y., Guillot, S., Roddaz, M., Antoine, P.-O., Métaise, G., Carter, A., 1423 Marivaux, L., and Solangig, S. H., 2015, Constraints on the collision and the pre-collision 1424 tectonic configuration between India and Asia from detrital geochronology, 1425 thermochronology, and geochemistry studies in the lower Indus basin, Pakistan: Earth 1426 and Planetary Science Letters, v. 432, p. 363–373. doi:10.1016/j.epsl.2015.10.026. 1427
1428

Figure 1Dailey et al.
Bay of B
engalArabian Sea
Laxmi Ridge
222
223
721722731
U1456
720
219
Laccadive Ridge
Deccan Plateau
Carlsberg Ridge
ARABIA
Karakoram
Hindu K
ush
Indusdelta
36ºN
34ºN
32ºN
30ºN
28ºN
26ºN
24ºN
22ºN
20ºN
18ºN
16ºN
14ºN
12ºN
10ºN
54ºE 58ºE 62ºE 66ºE 70ºE 74ºE 78ºE 82ºE 86ºE
U1457
23
24
25
26
27
26
24
23
?
?
?
?
?
?
??
?
Indo-Gangetic Plain
LaxmiBasin
Gulf of Oman
MakranIn
dus
Rive
r
Western G
hats
Muscat
Karachi
Goa
Murray Ridg
e
N armada
50004000
01000
-1000-1500-2000-2500-3000
2000
Topography (m)
Tapti
221
Mahi
Fig. 18
SiteU1456
Laxmi Ridge
Laxmi
Basin
3500
30002500
1500500
Indian Shelf
27
26
WadiaGuyot
RamanGuyot
Cam
bay
Basi
nGujarat-
Saurashtra Margin
Rann ofKutch
Bombay High
Bombay High Nanga Parbat
Sula
iman
Kirth
ar
Lesser Himalaya
Greater Himalaya
Transhimalaya
Mumbai
AB
Site U1457
Fig. 2A
Fig. 2B
Gulf ofCambay
Figure 1

Shotpoint2000 2100 2200 2300 2400 2500 2600
5.0
5.5
6.0
TWT
(s)
Shotpoint2000 2100 2200 2300 2400 2500 2600
(A) Site U1456
(B) Site U1457
11424 11585 11746 11907 12068
U1456
11424 11585 11746 11907 12068
6.0
5.5
TWT
(s)
Shotpoint11424 11585 11746 11907 12068
Shotpoint
Basement
Paleocene-Middle Miocene
MTC Phase 2 (Nataraja Slide)
Upper Miocene
MTC Phase 1 (Nataraja Slide)Pliocene
Upper Miocene-Pliocene
Lower Pleistocene
MTC
MTC
Figure 2Dailey et al.
Figure 2

Dep
th (m
bsf)
Figure 3Dailey et al.
ClaySilt
SandCongl.
800
850
900
950
1000
1050
1100
(A) Site U1456
Debris Flow
Coherent Slide
Slump
Turbidites
Hemipelagic
1100
1050
1000
950
900
850
ClaySilt
SandCong
Sedimentary top
MTC Base
(B) Site U1457
Volcaniclastic
Dominant lithology and facies Limestone
Clay/Claystone
Silt/Siltstone
Sand/Sandstone
Gravel
Calcarenite
Carbonate Breccia
Volcanic Rock
Biostratigraphictop
Phase 1
Phase 2
Biostratigraphic top
Figure 6B
Figure 4A
Sedimentary top
Figure 4B
Figure 5A
Figu
re 5
B
MTC Base
Recov
ery
Recov
ery
Facies
Facies
Lithology
Lithology
Fig. 7A
Fig. 7B Fig. 8AFig. 8B+C
Fig. 8D
Fig. 9A
Fig. 9B
Fig. 9C
Fig. 9D
Fig. 6A HemipelagicSedimentation
Fig.10A+12B,E
Fig. 10B
Fig. 10C
Fig. 10D
Fig.11A
Fig.11BFig.11D
Fig.12A
Fig.12FFig.12D
Zircon U-Pb sample
Fig.12C
Fig.12GFig. 12H,I
Figure 3

800
840
34R
35R
36R
37R
38R
39R
40R
41R
Dep
th (m
bsf)
33R760
820
780
Lithology and sedimentary structuresCarbonate ooze/stone
Clay/Claystone
Silt/Siltstone
Calcarenite Parallel Laminations
Burrows
Wavy Laminations
Slump Fold
Small Scale Fault
Tilted Bedding
Breccia
Sand/Sandstone
Sedimentarytop of the MTC
Figure 4Dailey et al.
42R
Conglom.
ClaySilt Sand
CMF860
860
90070
R71
R69
R
880
ClaySilt Sand
CMF940
72R
73R
840
Sedimentarytop of the MTC
920
74R
75R
76R
77R
78R
(A) Site U1456 (B) Site U1457
Biostratigraphictop of the MTC
Zirconsample
Biostratigraphic top of the MTC at 1009 mbsf
Seismictop
Recov
ery
Recov
ery
Fig. 10C
Fig.11A
Fig.11B
Fig.11D
Figure 4

Dep
th (m
bsf)
Figure 5Dailey et al.
1105
17R
18R
16R
1085
107519
R
1095
Conglom.
ClaySilt Sand
CMF
Sedimentarybottom of the MTC
91R
92R
1050
1040
86R
1030
87R
88R1020
89R
1010
90R
Conglom.
ClaySilt Sand
CMF
Sedimentarybottom of the MTC
(A) Site U1456 (B) Site U1457
Recov
ery
Recov
ery
Lithology Lithology
Fig. 8D
Fig. 8A
Fig. 9C
Fig. 10D
Fig.12C,F
Figure 5

50R
Dep
th (m
bsf)
918
Figure 6Dailey et al.
51R Top of
hemipelagiclayer
938
ClaySilt Sand
CMF
922
930
926
934
942
946
52R
950
954
53R
(A) Site U1456 (B) Site U1456
980
990
57R
58R
985
975
59R
1000
Conglom.
ClaySilt Sand
CMF
56R
995
6R
Top of 1st carbonate pulse
Recov
ery
Lithology
Recov
ery
Lithology
Figs. 10A+12B
Figure 6

Figure 7

Figure 8

Figure 9

Figure 10

Figure 11

Figure 12

log
(Fe 2
O3/K
2O)
1
0
-1210.5 1.5
Fe shaleFe sand
Shale
Wac
ke
Lith-arenite
Arkose
Sublith-arenite
Subarkose
Quartzarenite
B)
log (SiO2/Al2O3)
Indusdelta
Induscanyon
Figure 13Dailey et al.
ksp
bt
il
kao, chl, gb
smm
pl
K2OCaO+Na2O
CIA
100
90
80
70
60
50
40
Al2O3
Indus delta
Induscanyon
A)
ksp
Western Indian ShelfPaleoceneHemipelagic UnitPhase 2Phase 1 (U1456)Phase 1 (U1457)Phase 1 upper (U1457)
Figure 13

Nar
mad
a
Tapt
i
Tapt
i
Nar
mad
a
Indu
s
Nar
mad
aTapt
i
A) Site U1456 87Sr/86SrEpsilon Nd
Sediment-basedslide top
Seismic-basedslide top
B) Site U1457 Epsilon Nd
Slide base
Figure 14Dailey et al.
Dep
th (m
bsf)
ClaySilt
SandCongl.
800
850
900
950
1000
1050
1100
850
900
950
1000
1050
1100Clay
SiltSand
Congl.
-10 -6 -2-4-12 -8 0 0.71 0.730.72
Dep
th (m
bsf)
-10 -6 -2-4-12 -8 0
Slide base
Sediment-basedslide top
Deccan?
Tapt
i
Nar
mad
a
0.71 0.730.72 20 40 60 80 100
20 40 60 80 100
Clay (%)
87Sr/86Sr Clay (%)
SmectiteIllite+Chlorite
SmectiteIllite+Chlorite
Phase 2
Phase 1
Indu
sIn
dus
Figure 14

0.70 0.71 0.72 0.73 0.74 0.75
0
-10
-20
-5
-15
87Sr/86Sr
Transhimalaya
GreaterHimalaya
Nd
<15 ka Indus delta
Sites U1456 & U1457 fan
Mahi
Narmada
Nataraja MTC
Figure 15Dailey et al.
Peninsular rivers
Deccan
KirtharSulaimanforeland
Tapti
Quat. Indus canyon
Karakoram
Figure 15

ModernIndus
Indus Fan 7.8 Ma
Indus Fan 8.3 Ma
Indus Fan 15.6 Ma
U1457C-71RNataraja MTC
TethyanHimalaya
GreaterHimalaya
Karakoram
LesserHimalaya
Kohistan
n=96
n=133
n=121
n=119
n=51
n=3912
n=822
n=259
n=200
0 1000 2000 3000 4000
Age [Ma]
n=1084
Figure 16Dailey et al.
Karako
ram/
Kohist
anTeth
yan-G
reater
Himala
yaLe
sser
Himala
ya
0 20 40 60 80 100
Deccan Plateau
Age [Ma]
U1456C-71RNataraja MTC
Figure 16

Illite+Chlorite
SmectiteKaolinite
Figure 17Dailey et al.
Indus CanyonIndus shelf/deltaIndus floodplains
W. Indian Shelf
SaurashtraShelf
Western Indian ShelfPaleoceneHemipelagic UnitPhase 2Phase 1 (U1456)Phase 1 (U1457)Phase 1 upper (U1457)
Indus Fan
Gulf ofCambay
Figure 17

Age (Ma)0 10 20 30 40 50 60 70
Sedi
men
tatio
n R
ate
(km
3 /km
of m
argi
n/m
.y.)
0
20
40
60
80
Figure 18Dailey et al
0
1
2
3
4
5
6
70 50 100 150 200 250
Distance (km)
Dep
th (k
m)
SeafloorTop MioceneTop M. MioceneTop L. Miocene
Top L. OligoceneTop L. EoceneTop U. PaleoceneBasement
A)
B)
Fan-SlopeBoundary
Figure 18

penedoversteepgmargin
ak layersecond weaein carbonate
pplatformincippi ient slide
turbidite
incipppi ient slide
plankton yerweak laynatein carbon
pplatform
1Erosion of the underlying sediment as carbonate block moves downslope and begins to break up
First phase continues downslope and begins to turn into debris flow at front of the carbonate blocks
2
Hemipelagic rain deposited onto first phase
3
5 Smaller, secondphase movesdownslope
Continued slumping followingfirst phase
4
Figure 19Dailey et al
A B
C D
Figure 19


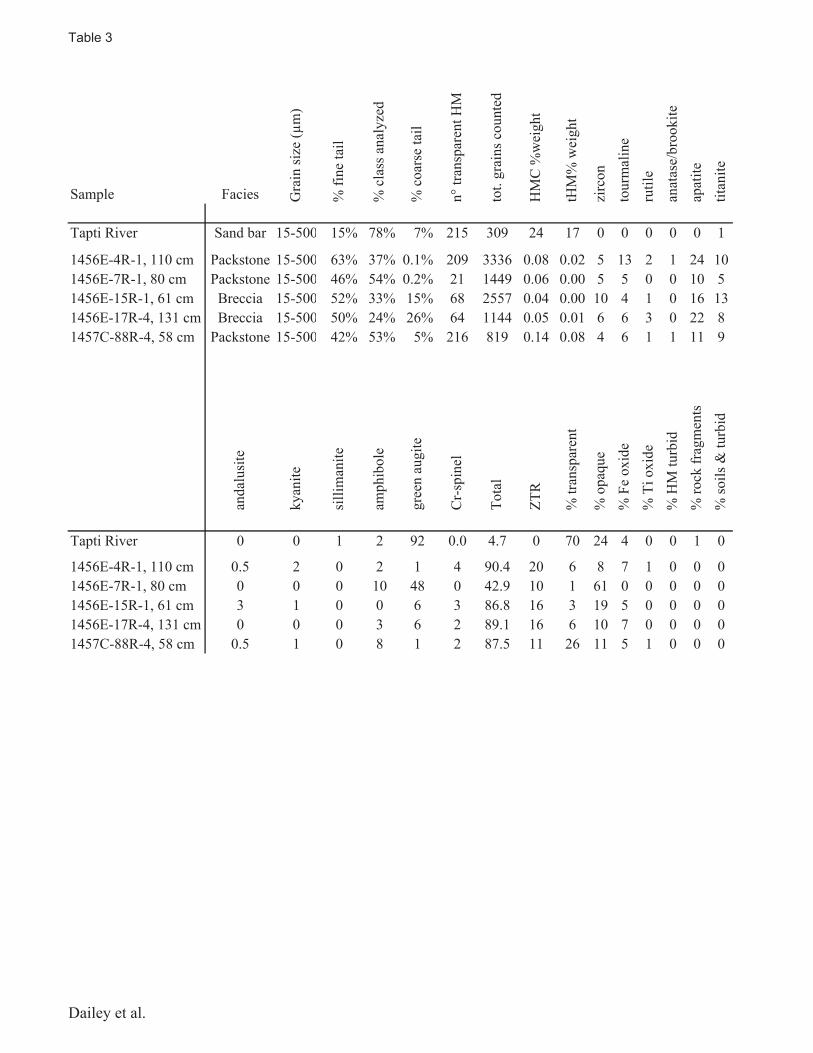

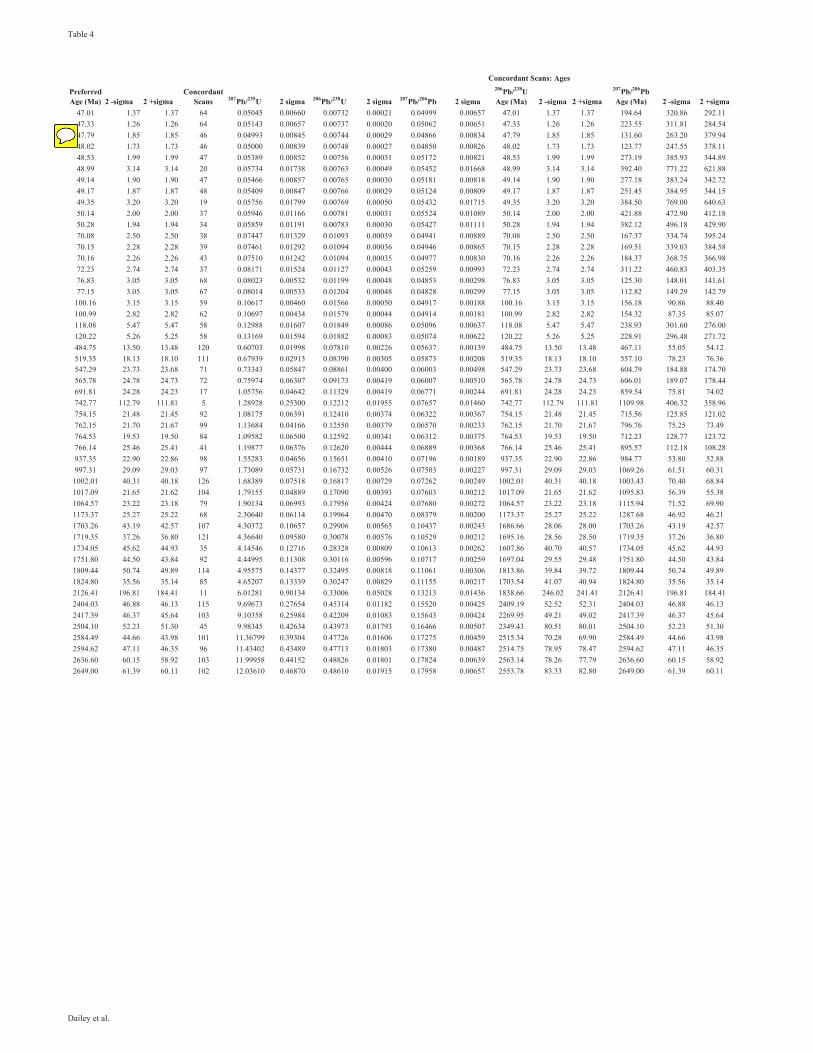
Sticky Note
It's difficult to accept that you have precision to two significant figures. in the younger grains I could believe one sig. fig., but the industry standard is a minimum of 1% analysis error, and thus the 100 Ma grains cannot be as precise as x.xx. Indeed they should be listed as xxx Ma +/- x Ma (or xxxx Ma +/- xx Ma).