Large-scale identification of hot spots for soil carbon demand under climate change and bioenergy...
10
Large-scale identification of hot spots for soil carbon demand under climate change and bioenergy production Uwe Franko 1 *, Felix Witing 2 , Greta Ja ¨ ckel 3 , and Martin Volk 4 1 UFZ – Helmholtz-Centre for Environmental Research, Department of Soil Physics, Theodor-Lieser-Straße 4, 06120 Halle/Saale, Germany 2 UFZ – Helmholtz-Centre for Environmental Research, Department of Bioenergy, Permoserstr. 15, 04318 Leipzig, Germany 3 UFZ – Helmholtz-Centre for Environmental Research, Department of Coordination and Integration of Water Sciences, Permoserstr. 15, 04318 Leipzig, Germany 4 UFZ – Helmholtz-Centre for Environmental Research, Department of Computational Landscape Ecology, Permoserstr. 15, 04318 Leipzig, Germany Abstract Global change scenarios predict an increased risk for declining amounts of soil organic matter (SOM) for Central Germany. Within this region the production of bioenergy is one important strat- egy to counteract the rising anthropogenic CO 2 -emissions. Both issues have a close connection: SOM is an important basis for soil productivity and requires a steady reproduction flux. Bioenergy production requires productive soils and partly consumes plant biomass C. Therefore, the avail- able amount for SOM reproduction is reduced. This study provides a methodology for the large- scale identification of areas with possible conflicts between bioenergy production and SOM re- production based on (1) the prediction of climate change impact on SOM reproduction and (2) an analysis of the regional distribution of biogas plants. With the C demand index (CDI) and the ca- pacity index (CAP), two indicators were developed which enable the identification of hot spots of high carbon demand for SOM reproduction due to climate change and the usage of bioenergy. As a result of low data requirements, the indicators are widely applicable and transferable to oth- er large-scale studies. The proposed methodology was applied to Central Germany as a pilot re- gion. Results indicate a growing demand (10–40%) of fresh organic C from biomass for SOM production in comparison to the current level. The analysis reveals that the bioenergy C demand is not evenly distributed within the study region. It also shows some regional clustering. Further- more, the analysis identifies certain hot spots of a high C demand, where a high capacity of bio- gas production may conflict with rising demands for biomass to mitigate climate change effects on SOM storage. The hot spot areas—identified and selected on a large scale—can subse- quently be analyzed in more detail on a local to farm scale by using high-resolution data and models which enable the quantification of soil C dynamics. Key words: climate change / soil organic matter reproduction / carbon competition / bioenergy crop production / carbon demand index / capacity index / bioenergy production units Accepted October 16, 2014 1 Introduction Soils store at least three times as much C (in SOM) as can either be found in the atmosphere or in living plants (Schmidt et al., 2011). According to their usage, they may be turned into a source or a sink of C. Therefore, they have an important impact on the climate change dynamics (Freibauer et al., 2004). Climate change is altering the turnover conditions for soil organic matter (SOM). In many cases an accelerated turnover is expected. Additional C sources may be required to sustain the current level of SOM (Schimel et al., 1994), but many C sources that are suitable for SOM reproduction could as well be used for the production of bioenergy in order to re- duce the trace gas emissions. It is far beyond doubt that future societal and economic devel- opment requires alternative energy sources like bioenergy. Since such a development will change the structure of agri- culture, it may have an impact on the ecosystem services and, thus, needs to be taken into account, too. With regard to the N cycle, Gebel et al. (2013) could show that bioenergy cropping in general would lead to a reduced N leaching for the German Federal State of Saxony. To a great part, produc- tion of bioenergy consumes biomass from crops on arable fields as well as OM from agricultural waste (such as slurry, manure, and straw), and is hence changing the reproduction cycle of SOM. In biogas plants, OM is fermented into meth- ane (CH 4 ) which is subsequently used for the production of bioenergy. Most commonly, agricultural biomass is used as (co)substrate for the fermentation process (Weiland, 2010) and, thus, removed from the traditional matter cycling. There- fore, whenever C from agricultural biomass is used for the production of biogas, a lack of available C for the organic amendments of the soil is created: any unit energy produced ª 2015 WILEY-VCH Verlag GmbH & Co. KGaA, Weinheim www.plant-soil.com J. Plant Nutr. Soil Sci. 2015, 000, 1–10 DOI: 10.1002/jpln.201400241 1 * Correspondence: Dr. U. Franko; e-mail: [email protected]
Transcript of Large-scale identification of hot spots for soil carbon demand under climate change and bioenergy...
Large-scale identification of hot spots for soil carbon demand underclimate change and bioenergy productionUwe Franko1*, Felix Witing2, Greta Jackel3, and Martin Volk4
1 UFZ – Helmholtz-Centre for Environmental Research, Department of Soil Physics, Theodor-Lieser-Straße 4, 06120 Halle/Saale, Germany2 UFZ – Helmholtz-Centre for Environmental Research, Department of Bioenergy, Permoserstr. 15, 04318 Leipzig, Germany3 UFZ – Helmholtz-Centre for Environmental Research, Department of Coordination and Integration of Water Sciences, Permoserstr. 15,
04318 Leipzig, Germany4 UFZ – Helmholtz-Centre for Environmental Research, Department of Computational Landscape Ecology, Permoserstr. 15, 04318 Leipzig,
Germany
Abstract
Global change scenarios predict an increased risk for declining amounts of soil organic matter(SOM) for Central Germany. Within this region the production of bioenergy is one important strat-egy to counteract the rising anthropogenic CO2-emissions. Both issues have a close connection:SOM is an important basis for soil productivity and requires a steady reproduction flux. Bioenergyproduction requires productive soils and partly consumes plant biomass C. Therefore, the avail-able amount for SOM reproduction is reduced. This study provides a methodology for the large-scale identification of areas with possible conflicts between bioenergy production and SOM re-production based on (1) the prediction of climate change impact on SOM reproduction and (2) ananalysis of the regional distribution of biogas plants. With the C demand index (CDI) and the ca-pacity index (CAP), two indicators were developed which enable the identification of hot spots ofhigh carbon demand for SOM reproduction due to climate change and the usage of bioenergy.As a result of low data requirements, the indicators are widely applicable and transferable to oth-er large-scale studies. The proposed methodology was applied to Central Germany as a pilot re-gion. Results indicate a growing demand (10–40%) of fresh organic C from biomass for SOMproduction in comparison to the current level. The analysis reveals that the bioenergy C demandis not evenly distributed within the study region. It also shows some regional clustering. Further-more, the analysis identifies certain hot spots of a high C demand, where a high capacity of bio-gas production may conflict with rising demands for biomass to mitigate climate change effectson SOM storage. The hot spot areas—identified and selected on a large scale—can subse-quently be analyzed in more detail on a local to farm scale by using high-resolution data andmodels which enable the quantification of soil C dynamics.
Key words: climate change / soil organic matter reproduction / carbon competition / bioenergy crop production /carbon demand index / capacity index / bioenergy production units
Accepted October 16, 2014
1 Introduction
Soils store at least three times as much C (in SOM) as caneither be found in the atmosphere or in living plants (Schmidtet al., 2011). According to their usage, they may be turnedinto a source or a sink of C. Therefore, they have an importantimpact on the climate change dynamics (Freibauer et al.,2004). Climate change is altering the turnover conditions forsoil organic matter (SOM). In many cases an acceleratedturnover is expected. Additional C sources may be requiredto sustain the current level of SOM (Schimel et al., 1994), butmany C sources that are suitable for SOM reproduction couldas well be used for the production of bioenergy in order to re-duce the trace gas emissions.
It is far beyond doubt that future societal and economic devel-opment requires alternative energy sources like bioenergy.
Since such a development will change the structure of agri-culture, it may have an impact on the ecosystem servicesand, thus, needs to be taken into account, too. With regard tothe N cycle, Gebel et al. (2013) could show that bioenergycropping in general would lead to a reduced N leaching forthe German Federal State of Saxony. To a great part, produc-tion of bioenergy consumes biomass from crops on arablefields as well as OM from agricultural waste (such as slurry,manure, and straw), and is hence changing the reproductioncycle of SOM. In biogas plants, OM is fermented into meth-ane (CH4) which is subsequently used for the production ofbioenergy. Most commonly, agricultural biomass is used as(co)substrate for the fermentation process (Weiland, 2010)and, thus, removed from the traditional matter cycling. There-fore, whenever C from agricultural biomass is used for theproduction of biogas, a lack of available C for the organicamendments of the soil is created: any unit energy produced
ª 2015 WILEY-VCH Verlag GmbH & Co. KGaA, Weinheim www.plant-soil.com
J. Plant Nutr. Soil Sci. 2015, 000, 1–10 DOI: 10.1002/jpln.201400241 1
* Correspondence: Dr. U. Franko; e-mail: [email protected]
by the burning of bio-methane is directly connected to bio-mass-carbon, which is no longer available for SOM reproduc-tion.
Biogas production is a widespread industry within Germany.With more than 7,500 agricultural biogas plants, Germanycovers roughly 75% of all biogas plants within Europe (BMU,2013; Strauch and Krassowski, 2012). The contribution ofbiogas to renewable power production in Germany is on thesame level as solar energy (» 25 TWh y–1), but with the bene-fit of the additional usage of surplus heat (» 12 TWh y–1), bio-gas becomes the second most important source for renew-able power after wind energy (» 50 TWh y–1; BMU, 2013).During the last 10 y a high increase rate in the usage of bio-gas could be observed: the installed electric capacity of bio-gas plants in Germany has multiplied tenfold since 2003(FvB, 2013). The political framework in Germany is currentlychanging (EEG, 2014) and the future development of biogasis yet unclear. Nevertheless, the benefits of biogas such asenergy autarky, flexibility and usability (heat, electricity, andfuel) are well known and an increasing usage within manyother countries (e.g., Great Britain, Italy, France, China) canbe observed. However, with a growing use of agricultural sub-strates, a risk of a greater competition with the matter demandfor SOM reproduction emerges.
In a first step of this study, we analyzed the expected changesof SOM turnover conditions by combining predicted climatechange pattern with the soil properties in Central Germany.This allows a classification of regions according to their futurerequirement of organic amendments to sustain SOM storage.
In a second step we combined these results with data of cur-rent regional biogas production capacities aiming at the iden-tification of potential conflicts of plant biomass usage. Each ofthese steps involved the definition of an indicator as well asthe development of an assessment scheme used to classifysub regions according to their conflict potential between mat-ter demand for SOM reproduction and for the production of bi-oenergy.
Due to the complexity of involved processes and a lack ofsuitable methods and data on large scales, this methodologydoes not provide a quantification of the soil C dynamics. How-ever, in a first step it enables the large-scale identification ofhot spot areas which can be subsequently analyzed in moredetail. The next detail level could be the farm scale, usinghigh-resolution data and models which allow a quantificationof soil C dynamics.
2 Material and methods
2.1 Study area
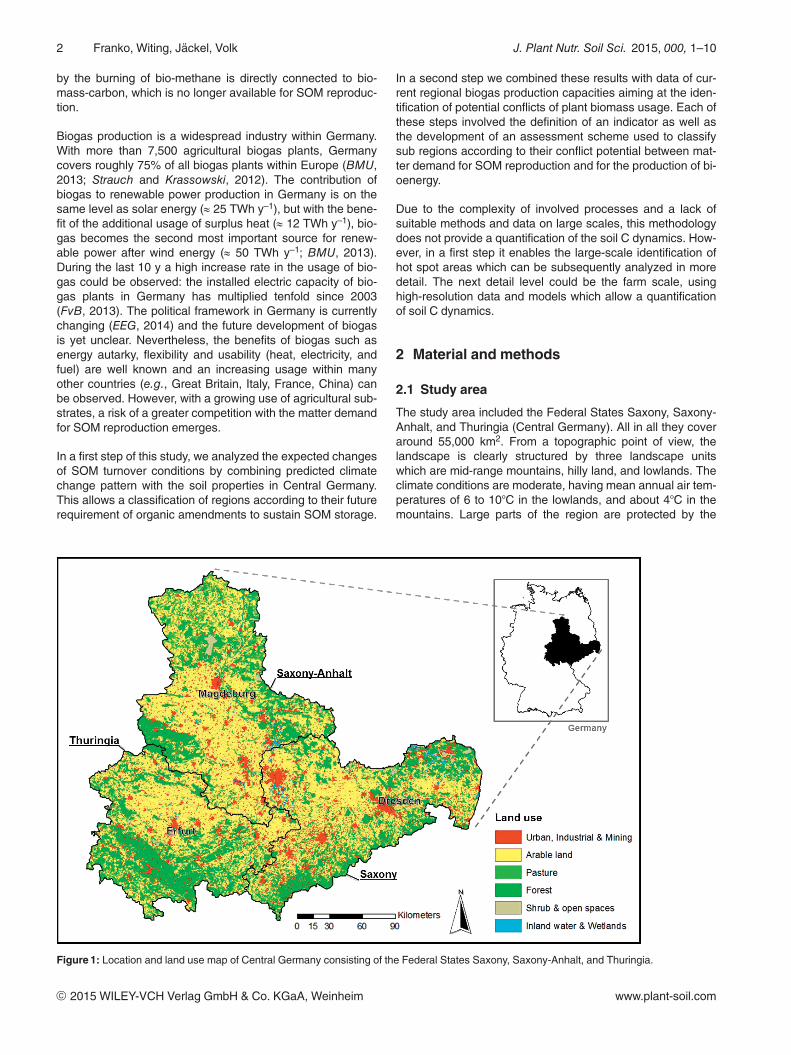
The study area included the Federal States Saxony, Saxony-Anhalt, and Thuringia (Central Germany). All in all they coveraround 55,000 km2. From a topographic point of view, thelandscape is clearly structured by three landscape unitswhich are mid-range mountains, hilly land, and lowlands. Theclimate conditions are moderate, having mean annual air tem-peratures of 6 to 10�C in the lowlands, and about 4�C in themountains. Large parts of the region are protected by the
ª 2015 WILEY-VCH Verlag GmbH & Co. KGaA, Weinheim www.plant-soil.com
Figure 1: Location and land use map of Central Germany consisting of the Federal States Saxony, Saxony-Anhalt, and Thuringia.
2 Franko, Witing, Jackel, Volk J. Plant Nutr. Soil Sci. 2015, 000, 1–10
mountain ranges. They show (sub-)continental climate condi-tions with the lowest precipitation amounts in Germany withvalues of 300 to 500 mm in the lowlands (in the non-protectedlandscape around 700 mm) and increasing values > 1,000 mmin the mountains.
Except for the mountain regions, which reach altitudes of> 1,100 m in the NW, S, and SE, the study area is dominatedby arable land-use (Fig. 1). This is due to the very fertile soilswhich cover a large part of the study area. In average, around57% of the region is agriculturally used, for Saxony-Anhalt theamount is even up to 60% (Hauck and Priess, 2013). Theconsiderable increase of bioenergy crop cultivation leads toan intense land-use change. The percentage of areas wherebioenergy crops are grown is currently around 20%, with onlya slight increase of maize cultivation. In general, the propor-tion of agricultural land decreases (Hauck and Priess, 2013).Forests cover presently between 25% (Saxony-Anhalt) and33% (Thuringia) of the region with an increasing trend due toafforestation programs. Saxony has the highest populationdensity with 224 per km2 (corresponding to the average num-ber of Germany), whereas Thuringia and Saxony-Anhaltshow only slightly more than half this number.
2.2 Regional pattern of installed biogas capacitiesfor bioenergy production
Central Germany has a high density of biogas plants with dif-ferent capacities. Das et al. (2012) identified the positions andinstalled capacities of plants using data offered by the trans-mission system operator ‘‘50Hertz Transmission GmbH’’.Here, information on supply positions were brought togetherforming a network-grid. The grid data were used to identifyBiomass-Providing Units (BPU) which separate catchmentsfor agricultural substrates from competing biogas plants es-tablished by a Voronoi diagram. The seeds for the Voronoidiagram had the positions of the biogas plants. Plants withina distance < 1 km away from each other were combined, asthey largely share the same catchment for agricultural sub-strates. In each BPU the installed capacities of combinedplants were aggregated for the calculation of the capacity in-dex (CAP, see section ‘‘Indicator development’’). For theanalysis and differentiation of the indicator results, BPUswere classified into 5 classes of installed capacities within aBPU (< 150 kW, 150–300 kW, 301–500 kW, 501–1,000 kW,> 1,000 kW). The analysis was restricted to the area of thementioned three Federal States using only BPUs whose areais situated within the study region—at least 90% of it.
2.3 Climate scenarios
For this study, we used regional climate models deliveringdownscaled climate data from the IPCC scenarios A1B, A2,and B1 as prognosis for the period 2001–2100 in addition tothe retrospective C20 control run data for 1961–2000 calcula-tions. The regional climate models were REMO (dynamicdownscaling) and WETTREG (statistical downscaling), thelatter with three different subsets for wet, normal and moistconditions. For all resulting data sets, the annual sum of rain-fall, and the average of air temperature were calculated for a
grid with cell size 10 km x 10 km for the region of Central Ger-many (Federal States Saxony, Saxony-Anhalt, and Thurin-gia).
2.4 Soil texture
We used clay and silt contents as well as climate data to as-sess the SOM turnover activity. The regional pattern of soiltexture was taken from the Soil Map of Germany (BUK1000;scale 1:1,000,000; Hartwich et al., 1998), which includes 72soil mapping units in total. The mapping units are summa-rized to seven soil associations. This is a genetic-oriented ap-proach, in which soils are grouped according to their differentparent material and conditions which are relevant for soil for-mation (topography, climate, etc.) in a particular landscape.
In total, 49 of these 72 different soil mapping units could befound in our study area. Each soil unit was assigned a char-acteristic soil profile (‘‘Leitprofil’’) where soil texture was de-rived by using the guidelines for soil mapping (Eckelmann etal., 2005).
Table 1 shows the six soil associations occurring in the studyarea together with a selection of assigned soil mapping unitswhich are typical for Central Germany. The complete datasetis given by Franko et al. (2014; available at: http://dx.doi.org/10.6084/m9.figshare.1157387). The soil mapping units (Ta-ble 1) are characterized by their texture (clay and silt con-tents), which is not only required for the assessment of SOMturnover (cf. section 2.5), but also provides the least requiredamount of information for a spatial differentiation of landscape(not all soil associations are homogeneous) for the regionalclassification of C demand.
Large parts of the arable land in the study area are located onloess sediments. Thus, 31.9% cover of it, mostly Luvisols, butalso Chernozems can be found. All of these soils show highclay and silt contents reaching from more than 50% up to90%.
Mountain and hill soils from solid rocks, their weathering prod-ucts, as well as redeposited material show the largest per-centage of the total area (34.1%). Most of these soils alsoproof high contents of clay and silt.
In addition, soils in broad river valleys and in undulating low-lands and hilly areas represent a noteworthy fraction andhave the lowest clay and silt contents [complete dataset pro-vided by Franko et al. (2014); available at: http://dx.doi.org/10.6084/m9.figshare.1157387].
2.5 Assessment of SOM turnover
Turnover of OM in soil is controlled by land management andsite conditions. All models of SOM turnover consider site con-ditions which are given by soil properties and climate specifi-cally. Only some approaches are known where this is also ausable model output. ICBM (Bolinder et al., 2007; 2008) gen-erates a result called re_clim that allows the comparison ofturnover conditions of different environments and the CANDY
ª 2015 WILEY-VCH Verlag GmbH & Co. KGaA, Weinheim www.plant-soil.com
J. Plant Nutr. Soil Sci. 2015, 000, 1–10 Identification of soil carbon demand hot spots 3
model (Franko, 1997) calculates the ‘‘Biologic Active Time’’(BAT) to quantify site conditions. For this study we decided toapply the CANDY approach which was successfully used inseveral studies before (Franko et al., 1997; Franko et al.,2007; Kuka et al., 2007; Smith et al., 2007). The BAT ap-proach provides an absolute measure offering time units. Itcan be approximated by using aggregated data. The ap-proach applies the simplified meta-model after Franko andOelschlagel (1995). This was successfully validated with theCCB model by using datasets from long-term experiments inEurope (Franko et al., 2011). Following this approach, the an-nual sum of BAT is calculated depending on rainfall, air tem-perature, and soil texture.
BAT = A + B * P6 + C * Temp + D * Rain, (1)
where P6 is the amount of particles with a diameter < 6.3 mmand A, B, C, D are parameters which depend on the actualsoil texture as described by Franko and Oelschlagel (1995).Clay and silt contents from the soil map were used to calcu-late P6 assuming a lognormal distribution of particles whichleads to:
P6 = clay + ln(6.3/2) * silt / ln(63/2) or P6 = clay + 0.33258 * silt. (2)
BAT calculations were made by using climate data from1961–2000 to characterize the current climate conditionsand, based on the average climate data over the IPCC sce-narios, A1B, A2, and B1 from 2000–2100 represent the futureclimate.
Because climate data and soil data have a different geometricpattern, the BAT values were calculated for each geometricunit from the intersection of both information layers and thenaggregated on the BPU level.
SOM is usually distributed into pools of different turnover time(Ludwig et al., 2008). Part of SOM is poorly affected by soilmanagement (Puhlmann et al., 2006). The purpose of thisstudy was to find a solution which is independent from thecurrent SOM level and the internal structure of the SOM. Fol-lowing the theoretical base of the CCB model (Franko et al.,2011), we found a relation between the SOM level in steadystate and the quotient of the C reproduction flux (Crep) fromthe input of the management dependent fresh OM and theBAT (Franko, 1997):
SOM ~ Crep / BAT (3)
ª 2015 WILEY-VCH Verlag GmbH & Co. KGaA, Weinheim www.plant-soil.com
Table 1: Soil associations with their most important soil mapping units (including their clay and silt contents) in the study area [according to theRevised FAO Legend (1990)]. The full dataset is given by Franko et al. (2014; available at: http://dx.doi.org/10.6084/m9.figshare.1157387).
Unit Nr. Soil association % Clay % Silt Percent oftotal area
A: Bog soils 1.4
6 Eutric Histosols 25 60 1.3
B: Soils in broad river valleys including terraces and lowlands 17.8
8 Fluvisols / Gleysols 15 75 5.8
12 Gleysols 11 25 5.6
C: Soils in undulating lowlands and hilly areas 11.9
19 Haplic Luvisols / Eutric Podzoluvisols / Stagnic Luvisols 19 31 1.7
32 Eutric Cambisols / Luvic Arenosols 5 16 2.8
D: Soils in loess areas 31.9
36 Haplic Chernozems 15 75 6.4
46 Haplic Luvisols / Eutric Podzoluvisols / Eutric Cambisols 15 60 3.9
E: Mountain and hill soils from solid rocks, their weathering products, and redeposited material 34.1
51 Vertic Cambisols / Stagnic Gleysols 60 20 4.4
55 Dystric Cambisols (from acid igneous and metamorphic rocks) 21 21 4.2
57 Spodic Cambisols (from acid igneous and metamorphic rocks) 4 6 3.3
59 Spodic Cambisols (from hard argillaceous and silty slates with greywacke, sandstone,quartzite, and phyllite)
26 45 6.0
F: Anthrosols, settlements, and surface water 3
71 Soils redeposited by man and large open-cast mines 5 15 1.8
4 Franko, Witing, Jackel, Volk J. Plant Nutr. Soil Sci. 2015, 000, 1–10
This indicator characterizes the soil management regardingSOM reproduction. It has no direct connection to the currentlevel of SOM storage, but indicates changes in the SOM re-production due to changes in management and/or climate.
2.6 Indicator development: biomass demand
Using agricultural biomass for the production of bioenergylimits the amount of organic C available for SOM reproduc-tion. The demand of a biogas plant regarding agricultural sub-strates and the consumption of biomass-C can be directly re-lated to the installed capacity of the plant (Walla and Schnee-berger, 2008). To differentiate the possible effects of biogasplants on SOM reproduction, also the agricultural area avail-able for biomass provision has to be considered. When pre-paring a regional analysis, we defined a capacity index (CAP)for each BPU:
CAP = IC / AA. (4)
CAP represents the installed capacity (IC) in kW per availableagricultural area (AA) in ha within a BPU. The available agri-cultural area was determined by using CORINE Land Coverdata (Umweltbundesamt, 2009; Keil et al., 2010) and consid-ering all forms of arable land and pasture. CAP is used as anindicator describing the intensity of matter demand for the bio-gas production. We used the breaks of the 1st and 3rd quartileof the lognormal distribution to identify three classes: low(CAP £ 0.042), medium (0.042 < CAP £ 0.131) and high(CAP > 0.131).
2.7 Indicator development: climate change impact
Climate change has led to changes in rainfall and air tem-perature and will therefore influence the turnover conditions.If the current SOM level is kept the management has to bechanged to make sure that Crep/BAT remains constant. Wedefined a Carbon Demand Index (CDI) as a factor which re-lates the required C demand for a steady SOM reproductionin future (Crep(future)) to the C reproduction flux in the past(Crep(past)):
Crep (future) = CDI * Crep (past) . (5)
CDI can be calculated from the turnover conditition values infuture (BATfuture) and past (BATpast):
CDI = BATfuture / BATpast (6)
The distribution of the CDI data is nearly Gaussian. Using thebreaks of the 1st and 3rd quartile we could identify threeclasses: low: (CDI £ 1.139); medium: (1.139 < CDI £ 1.182)and high: (CDI > 1.182).
2.8 Regional assessment (hot spot analysis)
CDI and CAP indicators are calculated on BPU-level, whichenables a spatially comprehensive assessment of the compe-tition for fresh OM regarding SOM reproduction and bioen-ergy production. To assess the level of conflict between both
applications, the previously defined indicators were used todifferentiate three types of regions (hot spot, warning, and lowalert). A possible competition for the fresh OM could mostlikely be expected in BPUs which already have a high de-mand of biomass for energy production (CAP class ‘high’)and require a high increase of SOM reproduction due to cli-mate change (CDI class ‘high’). Therefore, BPUs having bothindicators classified as ‘high’, are hot spots. Combinations of’high’ in any category with ‘low’ or ‘medium’ in the second cat-egory are considered as warning level regions. Remainingareas are classified as low alert regions, as no ‘high’ matterdemand for any of the categories could be observed.
3 Results
3.1 Capacity Index
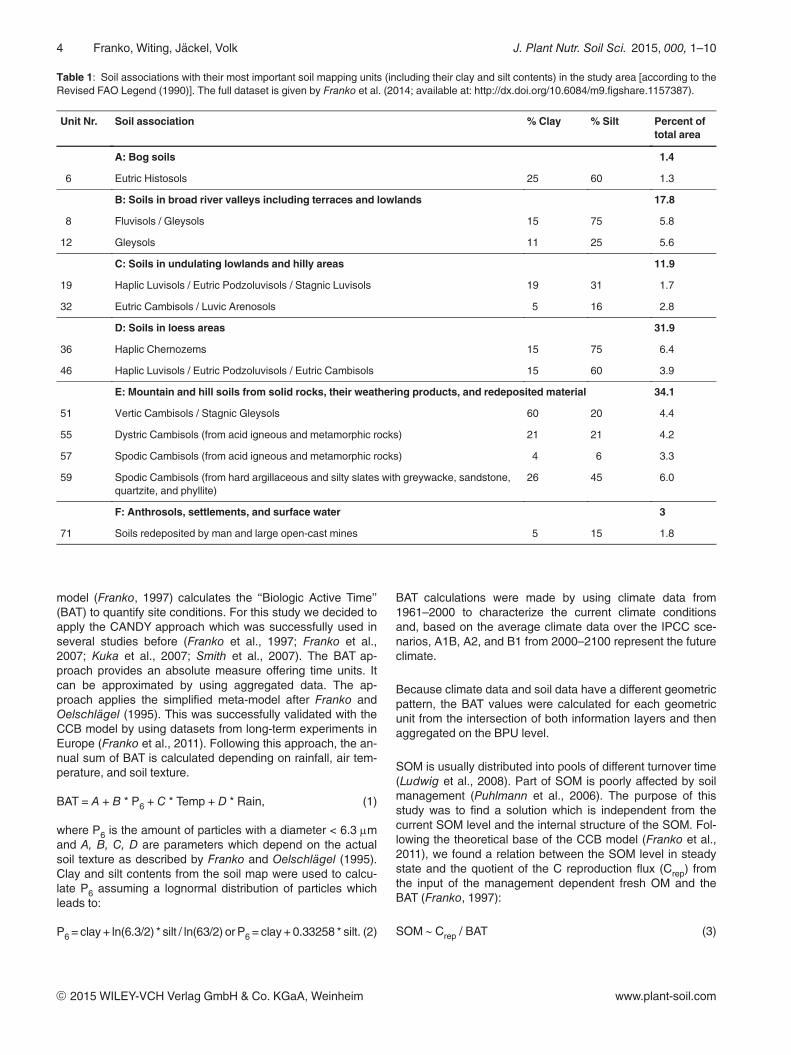
In total, CAP showed a wide range of values (from 0.0055 to2.5100) for the individual BPUs within the study region havinga rather equal distribution in the region and without significantcorrelation between IC and AA. An increase of CAP valuesmay basically be caused by growing installed capacities (IC)and/or reduced available agricultural areas (AA). After differ-entiating BPUs according to their IC into 5 classes of typicalbiogas plant sizes (< 150 kW, 150–300 kW, 301–500 kW,501–1000 kW, > 1000 kW), we found a constant increase ofCAP with growing IC (Fig. 2). To be more precise, higher ICsare not compensated by a larger area and increasingamounts of (co)substrates have to be provided from availableagricultural area for larger biogas plants.
3.2 Carbon Demand Index
The CDI values for different soil mapping units vary between1.04 and 1.46, which indicates that the C demand generallyincreases due to climate change (a value of 1 means that theC demand for SOM reproduction is not changing). The CDI
ª 2015 WILEY-VCH Verlag GmbH & Co. KGaA, Weinheim www.plant-soil.com
Agr
icul
tura
l are
a av
aila
ble
/ ha
Cap
acity
Inde
x (C
AP)
Installed capacities within a BPU / kW
Figure 2: Average values of capacity index (CAP) and available agri-cultural area represented in typical classes of installed capacitieswithin a bioenergy producing unit (BPU).
J. Plant Nutr. Soil Sci. 2015, 000, 1–10 Identification of soil carbon demand hot spots 5
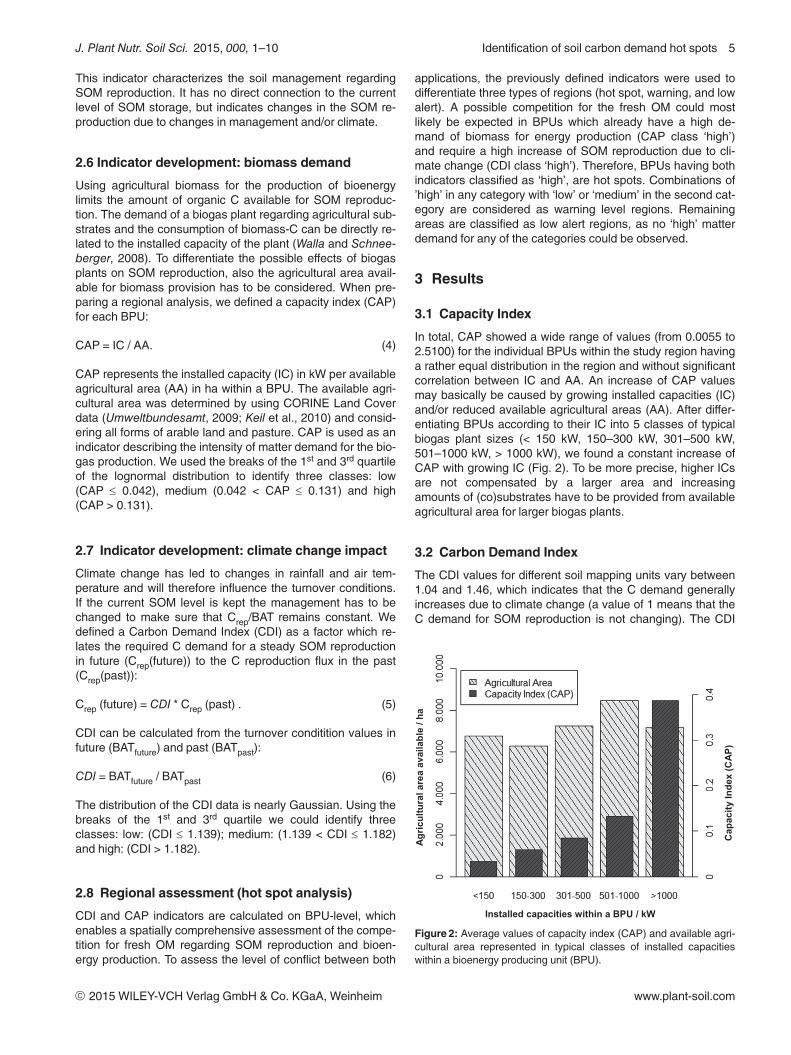
values show a pattern caused by the distribution and occur-rence of the soil mapping units which depend on the corre-sponding landscape and climate conditions (cf. Fig. 3 and 4).The lowest CDI values can be observed in the mainly light(sandy) soils of the soil associations ‘‘C’’, ‘‘E’’ and ‘‘F’’, withlow clay and silt contents [cf. Table 1 and complete datasetfrom Franko et al. (2014), available at: http://dx.doi.org/10.6084/m9.figshare.1157387].
These soils show a low variance of the CDI values. In con-trast, soil mapping units in bogs (soil association ‘‘A’’) and inriver valleys (‘‘B’’) and in loess areas (‘‘D’’) show medium to
high CDI values, but also indicate partly high variance de-pending on the mapping unit. For the selected soil mapping unitsdepicted in Fig. 3, the maximum CDI range is between 1.1 and1.4 in soil association ‘‘D’’ (Fig. 3). Looking at the results of all ex-isting soil mapping units, the variance is even higher (1.05 to1.45) in soil association ‘‘B’’ (Franko et al., 2014; available at:http://dx.doi.org/10.6084/m9.figshare.1157387). Furthermore,parts of the loess region belong to the driest areas in Ger-many, which favors medium CDI values. In contrast, the loessareas with currently higher precipitation amounts show highcarbon demand for SOM reproduction. The CDI values calcu-lated in the soil association of mountain and hill soils from sol-id rocks (‘‘E’’), their weathering products, and re-depositedmaterial have no clear pattern, the soils show both low andmedium CDI values. This can be explained by the great varie-ty of the parent material from different rock types and weath-ering products as well as by spatial differences in regional cli-mate change.
3.3 Regional assessment
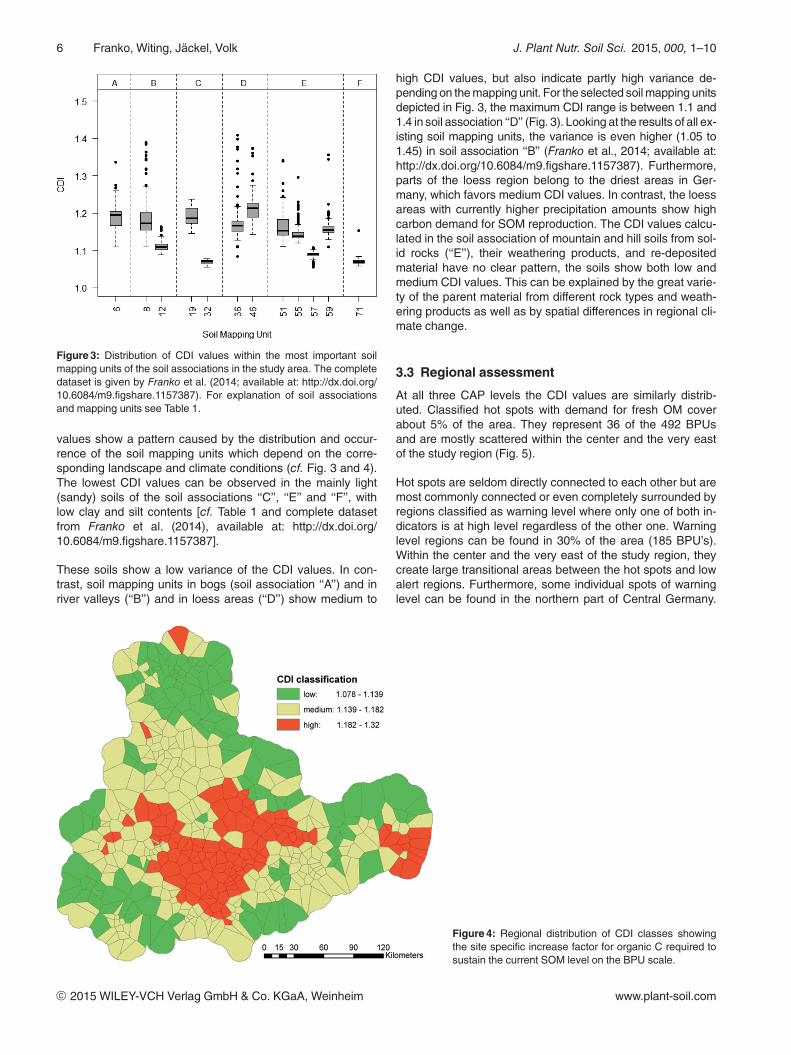
At all three CAP levels the CDI values are similarly distrib-uted. Classified hot spots with demand for fresh OM coverabout 5% of the area. They represent 36 of the 492 BPUsand are mostly scattered within the center and the very eastof the study region (Fig. 5).
Hot spots are seldom directly connected to each other but aremost commonly connected or even completely surrounded byregions classified as warning level where only one of both in-dicators is at high level regardless of the other one. Warninglevel regions can be found in 30% of the area (185 BPU’s).Within the center and the very east of the study region, theycreate large transitional areas between the hot spots and lowalert regions. Furthermore, some individual spots of warninglevel can be found in the northern part of Central Germany.
ª 2015 WILEY-VCH Verlag GmbH & Co. KGaA, Weinheim www.plant-soil.com
Figure 3: Distribution of CDI values within the most important soilmapping units of the soil associations in the study area. The completedataset is given by Franko et al. (2014; available at: http://dx.doi.org/10.6084/m9.figshare.1157387). For explanation of soil associationsand mapping units see Table 1.
Figure 4: Regional distribution of CDI classes showingthe site specific increase factor for organic C required tosustain the current SOM level on the BPU scale.
6 Franko, Witing, Jackel, Volk J. Plant Nutr. Soil Sci. 2015, 000, 1–10
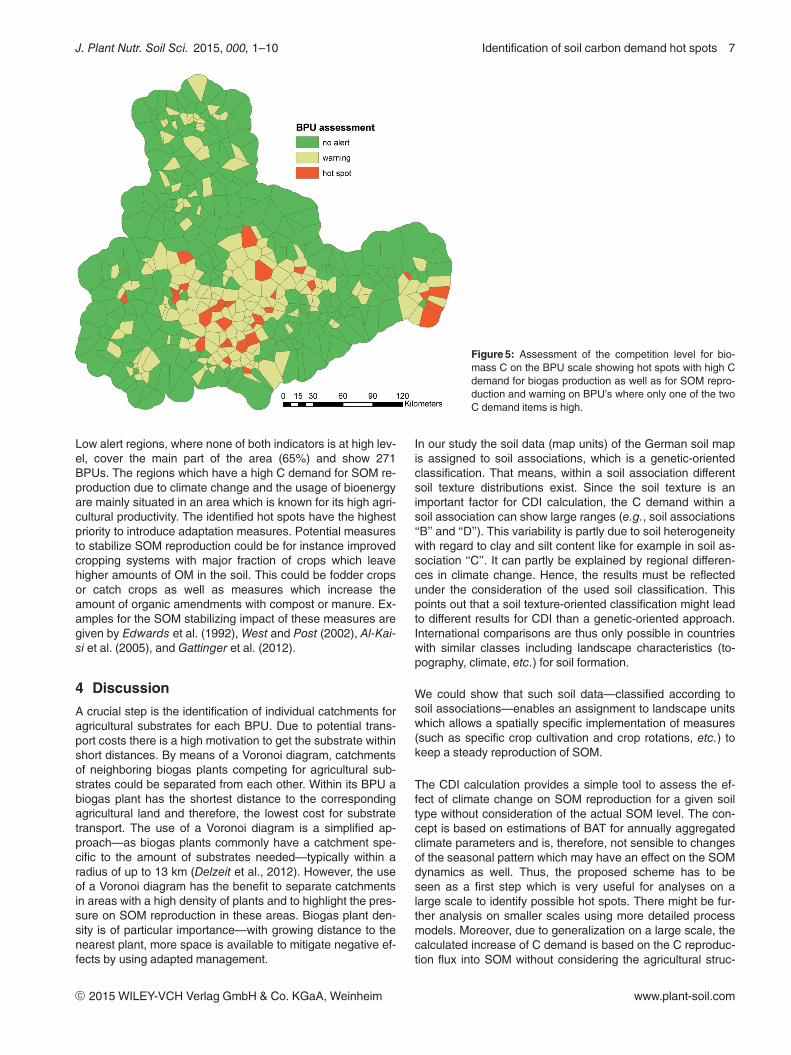
Low alert regions, where none of both indicators is at high lev-el, cover the main part of the area (65%) and show 271BPUs. The regions which have a high C demand for SOM re-production due to climate change and the usage of bioenergyare mainly situated in an area which is known for its high agri-cultural productivity. The identified hot spots have the highestpriority to introduce adaptation measures. Potential measuresto stabilize SOM reproduction could be for instance improvedcropping systems with major fraction of crops which leavehigher amounts of OM in the soil. This could be fodder cropsor catch crops as well as measures which increase theamount of organic amendments with compost or manure. Ex-amples for the SOM stabilizing impact of these measures aregiven by Edwards et al. (1992), West and Post (2002), Al-Kai-si et al. (2005), and Gattinger et al. (2012).
4 Discussion
A crucial step is the identification of individual catchments foragricultural substrates for each BPU. Due to potential trans-port costs there is a high motivation to get the substrate withinshort distances. By means of a Voronoi diagram, catchmentsof neighboring biogas plants competing for agricultural sub-strates could be separated from each other. Within its BPU abiogas plant has the shortest distance to the correspondingagricultural land and therefore, the lowest cost for substratetransport. The use of a Voronoi diagram is a simplified ap-proach—as biogas plants commonly have a catchment spe-cific to the amount of substrates needed—typically within aradius of up to 13 km (Delzeit et al., 2012). However, the useof a Voronoi diagram has the benefit to separate catchmentsin areas with a high density of plants and to highlight the pres-sure on SOM reproduction in these areas. Biogas plant den-sity is of particular importance—with growing distance to thenearest plant, more space is available to mitigate negative ef-fects by using adapted management.
In our study the soil data (map units) of the German soil mapis assigned to soil associations, which is a genetic-orientedclassification. That means, within a soil association differentsoil texture distributions exist. Since the soil texture is animportant factor for CDI calculation, the C demand within asoil association can show large ranges (e.g., soil associations‘‘B’’ and ‘‘D’’). This variability is partly due to soil heterogeneitywith regard to clay and silt content like for example in soil as-sociation ‘‘C’’. It can partly be explained by regional differen-ces in climate change. Hence, the results must be reflectedunder the consideration of the used soil classification. Thispoints out that a soil texture-oriented classification might leadto different results for CDI than a genetic-oriented approach.International comparisons are thus only possible in countrieswith similar classes including landscape characteristics (to-pography, climate, etc.) for soil formation.
We could show that such soil data—classified according tosoil associations—enables an assignment to landscape unitswhich allows a spatially specific implementation of measures(such as specific crop cultivation and crop rotations, etc.) tokeep a steady reproduction of SOM.
The CDI calculation provides a simple tool to assess the ef-fect of climate change on SOM reproduction for a given soiltype without consideration of the actual SOM level. The con-cept is based on estimations of BAT for annually aggregatedclimate parameters and is, therefore, not sensible to changesof the seasonal pattern which may have an effect on the SOMdynamics as well. Thus, the proposed scheme has to beseen as a first step which is very useful for analyses on alarge scale to identify possible hot spots. There might be fur-ther analysis on smaller scales using more detailed processmodels. Moreover, due to generalization on a large scale, thecalculated increase of C demand is based on the C reproduc-tion flux into SOM without considering the agricultural struc-
ª 2015 WILEY-VCH Verlag GmbH & Co. KGaA, Weinheim www.plant-soil.com
Figure 5: Assessment of the competition level for bio-mass C on the BPU scale showing hot spots with high Cdemand for biogas production as well as for SOM repro-duction and warning on BPU’s where only one of the twoC demand items is high.
J. Plant Nutr. Soil Sci. 2015, 000, 1–10 Identification of soil carbon demand hot spots 7

ture. This makes it far easier to come to first results on thelarge scale, but for practical considerations on a farm-scalelevel it will be necessary to take the specific quality of theavailable sources for SOM reproduction into account. Thesearch for potential solutions to increase the SOM reproduc-tion flux will require far more detailed information and canonly be performed with reasonable effort for previously identi-fied hot spots.
As the demand for agricultural substrates mainly depends onthe size of the individual biogas plants, it can also be charac-terized using the installed capacity of the plants [kW] (Wallaand Schneeberger, 2008). In this context, the form of agricul-tural biomass, which is used for the production of biogas suchas slurry, manure or any particular crop, is not necessarilyimportant. In all cases C is taken out of the agricultural systemand will not be added to the agricultural soils. With an increas-ing size and number of biogas plants within a region, moreagricultural biomass is required and the competition for freshOM between SOM reproduction and bioenergy production isgrowing—especially, if the available agricultural area is lim-ited. Here, the CAP indicator gives valuable information whichcan be used for the analysis and differentiation of matter de-mand for bioenergy production on a larger scale.
The combined assessment of CDI and CAP allows a BPUclassification in terms of a potential C competition. IndividualBPUs can subsequently be analyzed on a smaller scale usingregional-specific crop rotations and crop management as wellas the substrate and digestate management of the relevantbiogas plants.
The identified hot spots competing about the fresh OM (highCDI and high CAP) cover only about 5% of the area. There isa need for further analysis on a smaller scale using crop rota-tions, crop management as well as substrate and digestatemanagement of the relevant biogas plants.
To include ecological and spatial effects of biogas plants andenergy cropping into planning decisions, legal requirementsdifferent from those applied to traditional agricultural produc-tion have to be implemented into legislation. Within this con-text, regulations on water, soil, nature conservation, agricul-ture and regional planning could be adjusted as well as meas-ures for the promotion of renewable energies (Albrecht,2013a; 2013b). Current political developments are stronglylimiting a further increase of biogas production in Germany(EEG, 2014). Nevertheless, hot spots of C demand do alreadyexist. Other countries could evaluate and regulate futuredevelopments in the field of biogas production using a combi-nation of indicator based large scale approaches and ananalysis of local agricultural management systems from hotspots.
There are some other potential impacts which are worth con-sidering in a more detailed analysis:
(1) An inappropriate agricultural management or the usage ofspecific plants (like maize) can have an additional negativeimpact due to the use of large parts of the plant and less re-maining crop residues.
(2) The use of highly stabilized OM like biochar may solve theproblem of OM loss. However, it remains unclear if soil func-tions are supported by biochar in the same way like they areinfluenced by traditional substrates.
(3) Conservation tillage may also be a measure to save theSOC stocks, but the actual impact on a special system has tobe verified (Olson et al., 2014).
(4) Current afforestation programs aim at a proportion of 30%forests of the total area of Saxony until 2050 (SSUL, 2013)and at an improved distribution of forested land in Thuringia(TMLNU, 2006), as well as at a further increase of forests inSaxony-Anhalt (already 69,000 ha more forested land duringthe last 20 y). Furthermore, Hauck and Priess (2013) reporteda higher percentage of organic farming which usually includeshigher C reproduction fluxes into SOM. Both measures couldincrease the potential of C sinks of these areas and mitigatethe impact of biogas production and climate change.
(5) Continuing demographic changes and related decrease ofthe population in Central Germany can lead to a lower de-mand for agricultural products and energy enforcing the de-velopment as stated above (point 4).
5 Conclusions
Due to the current climate change projections for Central Ger-many there is a need for an adaptation of agricultural man-agement and production systems to sustain SOM. The pre-sented study developed two indicators (CDI and CAP) for alarge-scale identification of hot spots of high carbon demandfor SOM reproduction due to climate change and the produc-tion of bioenergy. One advantage of the method is its low datarequirements, which makes it widely applicable and transfer-able. The application of the indicators shows a general trendof an increasing C demand in the study area. Furthermore,the results reveal that the areas with the highest agriculturalproductivity overlap with regions of high C demand for SOMreproduction due to climate change and the usage of bioen-ergy—thus, it identifies hot spots with a need for adaptationmeasures. If there are changes in the pattern of bioenergyproduction, it might be worth to consider the potential conflictwith SOM reproduction and concentrate bioenergy productionwithin regions where the climate driven impact on SOM lossis lower. Further quantification of the actual C demand andspecific development of mitigation measures on a local tofarm scale would require high resolution data and an adapta-tion of indicators or models following a scale-specific proce-dure as suggested by Volk et al. (2008) and Volk et al. (2010).Such further development requires a close collaboration be-tween scientists, state authorities, and farmers who providethe necessary knowledge, experience, and data for the scale.
Acknowledgments
This study was partly supported by the Helmholtz Associationof German Research Centres within the project funding ‘‘Bio-mass and Bioenergy Systems’’ and Helmholtz Impulse andNetworking Fund of Helmholtz Interdisciplinary GraduateSchool for Environmental Research (HIGRADE). We would
ª 2015 WILEY-VCH Verlag GmbH & Co. KGaA, Weinheim www.plant-soil.com
8 Franko, Witing, Jackel, Volk J. Plant Nutr. Soil Sci. 2015, 000, 1–10
like to sincerely thank Dr. Subhashree Das (UFZ) for provid-ing data about biogas plants within Central Germany. Further-more, we especially thank Alena Roos (UFZ) for linguisticrevision of the manuscript.
References
Al-Kaisi, M. M., Yin, X., Licht, M. A. (2005): Soil carbon and nitrogenchanges as influenced by tillage and cropping systems in someIowa soils. Agr. Ecosyst. Environ. 105, 635–647.
Albrecht, J. (2013a): Planungsrechtliche Steuerung des Anbausnachwachsender Rohstoffe unter besonderer Berucksichtigungvon Natur und Landschaft. Teil 1: Raumliche Steuerung der Anbau-flachen. Natur Recht 35, 453–462.
Albrecht, J. (2013b): Planungsrechtliche Steuerung des Anbausnachwachsender Rohstoffe unter besonderer Berucksichtigungvon Natur und Landschaft. Teil 2: Indirekte raumliche Steuerungdurch planungsrechtliche Vorgaben fur Biomasseanlagen. NaturRecht 35, 529–537.
Bolinder, M. A., Andren, O., Katterer, T., de Jong, R., VandenBygaart,A. J., Angers, D. A., Parent, L. E., Gregorich, E. G. (2007): Soilcarbon dynamics in Canadian Agricultural Ecoregions: Quantifyingclimatic influence on soil biological activity. Agr. Ecosyst. Environ.122, 461–470.
Bolinder, M. A., Andren, O., Katterer, T., Parent, L. E. (2008): Soilorganic carbon sequestration potential for Canadian AgriculturalEcoregions calculated using the Introductory Carbon BalanceModel. Can. J. Soil Sci. 88, 451–460.
BMU—Bundesministerium fur Umwelt, Naturschutz und Reaktor-sicherheit (2013): Erneuerbare Energien in Zahlen: Nationale undInternationale Entwicklung.
Umweltbundesamt (2009): CORINE Land Cover (CLC2006) 100m—version 12/2009. Available at: http://www.eea.europa.eu/data-and-maps/data/corine-land-cover-2006-clc2006-100-m-version-12-2009.
Das, S., Eichhorn, M., Hopffgarten, M. V., Lang, E., Priess, J., Thran,D. (2012): Spatial analysis of the potential of district heating fromexisting bioenergy installations in Germany. Proceedings of the20th European Biomass Conference and Exhibition, Milan, Italy.
Delzeit, R., Britz, W., Holm-Muller, K. (2012): Modelling regional inputmarkets with numerous processing plants: The case of greenmaize for biogas production in Germany. Environ. Model. Softw.32, 74–84.
Eckelmann, W., Sponagel, H., Grottenthaler, W., Hartmann, K.-J.,Hartwich, R., Janetzko, P., Joisten, H., Kuhn, D., Sabel, K.-J.,Traidl, R. (2005): Bodenkundliche Kartieranleitung. 5. verbesserteund erweiterte Auflage, Schweizerbart’sche Verlagsbuchhandlung,Stuttgart, Germany.
Edwards, J. H., Wood, C. W., Thurlow, D. L., Ruf, M. E. (1992):Tillage and crop rotation effects on fertility status of a Hapludultsoil. Soil Sci. Soc. Am. J. 56, 1577–1582.
EEG—Erneuerbare Energien Gesetz (2014): Gesetz fur den Ausbauerneuerbarer Energien. Artikel 1 G. v. 21.07.2014 BGBl. I S. 1066;zuletzt geandert durch Artikel 4 G. v. 22.07.2014 BGBl. I S. 1218.
Franko, U., Oelschlagel, B. (1995): Einfluß von Klima und Textur aufdie biologische Aktivitat beim Umsatz der organischen Bodensub-stanz. Arch. Acker- Pfl. Boden 39, 155–163.
Franko, U., Crocker, G. J., Grace, P. R., Klir, J., Korschens, M.,Poulton, P. R., Richter, D. D. (1997): Simulating trends in soilorganic carbon in long-term experiments using the CANDY model.Geoderma 81, 109–120.
Franko, U. (1997): Modellierung des Umsatzes der organischenBodensubstanz. Arch. Acker- Pfl. Boden 41, 527–547.
Franko, U., Kuka, K., Romanenko, I. A., Romanenkov, V. A. (2007):Validation of the CANDY model with Russian long-term experi-ments. Reg. Environ. Change 7, 79–91.
Franko, U., Kolbe, H., Thiel, E., Ließ, E. (2011): Multi-site validation ofa soil organic matter model for arable fields based on generallyavailable input data. Geoderma 166, 119–134.
Franko, U., Witing, F., Volk, M. (2014): Soil associations and soilmapping units (including their clay and silt contents) in Thuringia,Saxony-Anhalt and Saxony (according to the revised FAO Legend(1990)). Available at: http://dx.doi.org/10.6084/m9.figshare.1157387.
Freibauer, A., Rounsevell, M. D. A., Smith, P., Verhagen, J. (2004):Carbon sequestration in the agricultural soils of Europe. Geoderma122, 1–23.
FvB—Fachverband Biogas e.V. (2013): Branchenzahlen—Prognose2013/2014. Available at: http://www.biogas.org/edcom/webfvb.nsf/id/DE_Branchenzahlen/$file/13–11–11_Biogas%20Branchen-zahlen_2013–2014.pdf.
Gattinger, A., Muller, A., Haeni, M., Skinner, C., Fliessbach, A.,Buchmann, N., Mader, P., Stolze, M., Smith, P., El-Hage Scia-labba, N., Niggli, U. (2012): Enhanced top soil carbon stocksunder organic farming. PNAS 109, 18226–18231.
Gebel, M., Halbfass, S., Burger, S., Lorz, C. (2013): Long-term simu-lation of effects of energy crop cultivation on nitrogen leaching andsurface water quality in Saxony/Germany. Reg. Environ. Change13, 249–261.
Hartwich, R., Behrens, J., Eckelmann, W., Haase, G., Richter, A.,Roeschmann, G., Schmidt, R. (1998): Bodenubersichtskarte derBundesrepublik Deutschland. Bundesanstalt fur Geologie undRohstoffe, Hannover, Germany.
Hauck, J., Priess, J. (2013): ‘‘The most likely future isn’t’’: Landnut-zungsszenarien fur Mitteldeutschland. Raumforsch. Raumord. 71,397–411.
Keil, M., Bock, M., Esch, T., Metz, A., Nieland, S., Pfitzner, A. (2010):CORINE Land Cover Aktualisierung 2006 fur Deutschland.Abschlussbericht zu den F+ E Vorhaben UBA FKZ 3707 12 200und FKZ 3708 12 200. Deutsches Zentrum Fur Luft-Und Raum-fahrt e.V., Deutsches Fernerkundungsdatenzentrum, Oberpfaffen-hofen, Germany.
Kuka, K., Franko, U., Ruhlmann, J. (2007): Modelling the impact ofpore space distribution on carbon turnover. Ecol. Modell. 208,295–306.
Ludwig, B., Kuka, K., Franko, U., von Lutzow, M. (2008):Comparison of two quantitative soil organic carbon models with aconceptual model using data from an agricultural long-termexperiment. J. Plant Nutr. Soil Sci. 171, 83–90.
Olson, K. R., Al-Kaisi, M. M., Lal, R., Lowery, B. (2014): Experimentalconsideration, treatments, and methods in determining soil organiccarbon sequestration rates. Soil Sci. Soc. Am. J. 78, 348–360.
Puhlmann, M., Kuka, K., Franko, U. (2006): Comparison of methodsfor the estimation of inert carbon suitable for initialisation of theCANDY model. Nutr. Cycl. Agroecosys. 74, 295–304.
Schimel, D. S., Braswell, B. H., Holland, E. A., McKeown, R., Ojima,D. S., Painter, T. H., Parton, W. J., Townsend, A. R. (1994):Climatic, edaphic, and biotic controls over storage and turnover ofcarbon in soils. Glob. Biogeochem. Cy. 8, 279–293.
Schmidt, M. W. I., Torn, M. S., Abiven, S., Dittmar, T., Guggenberger,G., Janssens, I. A., Kleber, M., Kogel-Knabner, I., Lehmann, J.,Manning, D. A. C., Nannipieri, P., Rasse, D. P., Weiner, S.,Trumbore, S. E. (2011): Persistence of soil organic matter as anecosystem property. Nature 478, 49–56.
ª 2015 WILEY-VCH Verlag GmbH & Co. KGaA, Weinheim www.plant-soil.com
J. Plant Nutr. Soil Sci. 2015, 000, 1–10 Identification of soil carbon demand hot spots 9
Smith, P., Smith, J. U., Franko, U., Kuka, K., Romanenkov, V. A.,Shevtsova, L. K., Wattenbach, M., Gottschalk, P., Sirotenko, O. D.,Rukhovich, D. I., Koroleva, P. V., Romanenko, I. A., Lisovoi, N. V.(2007): Changes in mineral soil organic carbon stocks in the crop-lands of European Russia and the Ukraine, 1990–2070;comparison of three models and implications for climate mitigation.Reg. Environ. Change 7, 105–119.
SSUL—Sachsisches Staatsministerium fur Umwelt und Landwirt-schaft (2013): Waldstrategie 2050 fur den Freistaat Sachsen.Available at: http://www.forsten.sachsen.de/wald/download/Doku-ment_Waldstrategie_2050.pdf.
Strauch, S., Krassowski, J. (2012): Overview of Biomethane Marketsand Regulations in Partner Countries. Fraunhofer UMSICHT, Ober-hausen, Germany.
TMLNU—Thuringer Ministerium fur Landwirtschaft, Naturschutz,und Umwelt (2006): Landeswaldprogramm des Freistaates Thurin-
gen. Available at: http://www.thueringen.de/de/publikationen/pic/pubdownload800.pdf.
Volk, M., Hirschfeld, J., Dehnhardt, A., Schmidt, G., Bohn, C.,Liersch, S., Gassman, P. W. (2008): Integrated ecological-economic modelling of water pollution abatement managementoptions in the Upper Ems River Basin. Ecol. Econ. 66, 66–76.
Volk, M., Moller, M., Wurbs, D. (2010): A pragmatic approach for soilerosion risk assessment within policy hierarchies. Land Use Policy27, 997–1009.
Walla, C., Schneeberger, W. (2008): The optimal size for biogasplants. Biomass Bioenerg. 32, 551–557.
Weiland, P. (2010): Biogas production: current state and perspec-tives. Appl. Microbiol. Biotechnol. 85, 849–860.
West, T. O., Post, W. M. (2002): Soil organic carbon sequestrationrates by tillage and crop rotation. Soil Sci. Soc. Am. J. 66, 1930–1946.
ª 2015 WILEY-VCH Verlag GmbH & Co. KGaA, Weinheim www.plant-soil.com
10 Franko, Witing, Jackel, Volk J. Plant Nutr. Soil Sci. 2015, 000, 1–10