Large-eddy simulation of a pseudo-shock system in a Laval nozzle
8
Large-eddy simulation of a pseudo-shock system in a Laval nozzle J.F. Quaatz ⇑ , M. Giglmaier, S. Hickel, N.A. Adams Institute of Aerodynamics and Fluid Mechanics, Technische Universität München, Boltzmannstraße 15, 85748 Garching b. München, Germany article info Article history: Available online xxxx Keywords: Pseudo-shock system Nozzle flow Large-eddy simulation Shock-wave–boundary-layer interaction abstract Well-resolved Large-Eddy Simulations (LES) of a pseudo-shock system in the divergent part of a Laval nozzle with rectangular cross section are conducted and compared with experimental results. The LES matches the parameter set of a reference experiment. Details of the experiment, such as planar side walls, are taken into account, all wall boundary layers are well-resolved and no wall model is used. The Adap- tive Local Deconvolution Method (ALDM) with shock sensor is employed for subgrid-scale turbulence modeling and shock capturing. The LES results are validated against experimental wall-pressure measurements and schlieren pictures. A detailed discussion of the complex flow phenomena of three- dimensional shock-wave–boundary-layer interaction, including corner vortices and recirculation zones, is presented. Limitations of RANS approaches are discussed with reference to the LES results. Ó 2014 Elsevier Inc. All rights reserved. 1. Introduction Depending on the applied back pressure, choked Laval nozzle flows develop a compression shock that decelerates the flow from supersonic to subsonic speed. Inviscid theory predicts an instanta- neous change of the flow variables through a single normal shock. Taking viscous effects into consideration, a so-called pseudo-shock system develops at sufficiently high pre-shock Mach numbers, which is generally a sequence of several oblique shocks and expan- sion waves interacting with the boundary layers at the nozzle walls and a subsequent mixing zone. Pseudo-shock systems affect the performance and the reliability of processes and facilities in many fields of engineering, see Matsuo et al. (1999) for a comprehensive overview. Although there are sev- eral previous experimental (e.g., Carroll and Dutton, 1990; Johnson and Papamoschou, 2010) and numerical (e.g., Xiao et al., 2007) studies, the mechanisms that govern the dynamic behavior of pseudo-shock systems are not yet sufficiently understood. Key mechanisms, such as the interaction between three-dimensional shocks and recirculation zones, are too complex to be analyzed and explained by experiments alone. For this flow configuration, previous numerical simulations solving the compressible Rey- nolds-averaged Navier–Stokes (RANS) equations show a high sen- sitivity of the results to details of the applied turbulence model (see Giglmaier et al., 2014). In particular, two-equation models based on the Boussinesq hypothesis give poor predictions of sec- ondary flow features and are not able to represent the anisotropy of turbulence. Results for Reynolds stress models that are based on the x-formulation generally are in much better agreement with experimental data. However, RANS simulations cannot recover highly unsteady small-scale phenomena. This motivates a numer- ical investigation with well-resolved Large-Eddy Simulation (LES). The paper is arranged as follows: Section 2 gives an overview of the investigated experiment and describes the numerical setup of the LES. The results are validated against the measurements in Section 3. Finally, the LES is compared to RANS simulations with several standard turbulence models applied in Section 4. 2. Experiment and numerical setup Geometry of the flow channel as well as operating conditions of this numerical investigation are adapted to a comprehensive exper- imental study conducted by Gawehn et al. (2010). The test rig is designed as double choked Laval nozzle system (refer to Fig. 1). The pseudo-shock system is located in the divergent part of the pri- mary nozzle. In contrast to (quasi) constant-area ducts (e.g., Carroll and Dutton, 1990; Morgan et al., 2014), in this experiment the mean shock position is well defined by the wall contour and the applied back pressure. Parallel side walls at the primary nozzle allow for schlieren imaging. The test rig is equipped with 47 pressure taps to record the wall pressure distribution. Assuming inviscid adiabatic flow, shock position and pre-shock Mach number are defined by the ratio of the stagnation pressures p 02 =p 01 at the exit and the entry of the primary nozzle, which is a function of the ratio of the critical cross section areas A 1 =A 2 . In the experiment, the secondary critical cross section area A 2 can be adjusted by a movable, slender cone to allow for different stagnation pressure ratios. http://dx.doi.org/10.1016/j.ijheatfluidflow.2014.05.006 0142-727X/Ó 2014 Elsevier Inc. All rights reserved. ⇑ Corresponding author. Tel.: +49 8928916393. E-mail address: [email protected] (J.F. Quaatz). International Journal of Heat and Fluid Flow xxx (2014) xxx–xxx Contents lists available at ScienceDirect International Journal of Heat and Fluid Flow journal homepage: www.elsevier.com/locate/ijhff Please cite this article in press as: Quaatz, J.F., et al. Large-eddy simulation of a pseudo-shock system in a Laval nozzle. Int. J. Heat Fluid Flow (2014), http:// dx.doi.org/10.1016/j.ijheatfluidflow.2014.05.006
Transcript of Large-eddy simulation of a pseudo-shock system in a Laval nozzle
International Journal of Heat and Fluid Flow xxx (2014) xxx–xxx
Contents lists available at ScienceDirect
International Journal of Heat and Fluid Flow
journal homepage: www.elsevier .com/ locate/ i jhf f
Large-eddy simulation of a pseudo-shock system in a Laval nozzle
http://dx.doi.org/10.1016/j.ijheatfluidflow.2014.05.0060142-727X/� 2014 Elsevier Inc. All rights reserved.
⇑ Corresponding author. Tel.: +49 8928916393.E-mail address: [email protected] (J.F. Quaatz).
Please cite this article in press as: Quaatz, J.F., et al. Large-eddy simulation of a pseudo-shock system in a Laval nozzle. Int. J. Heat Fluid Flow (2014)dx.doi.org/10.1016/j.ijheatfluidflow.2014.05.006
J.F. Quaatz ⇑, M. Giglmaier, S. Hickel, N.A. AdamsInstitute of Aerodynamics and Fluid Mechanics, Technische Universität München, Boltzmannstraße 15, 85748 Garching b. München, Germany
a r t i c l e i n f o a b s t r a c t
Article history:Available online xxxx
Keywords:Pseudo-shock systemNozzle flowLarge-eddy simulationShock-wave–boundary-layer interaction
Well-resolved Large-Eddy Simulations (LES) of a pseudo-shock system in the divergent part of a Lavalnozzle with rectangular cross section are conducted and compared with experimental results. The LESmatches the parameter set of a reference experiment. Details of the experiment, such as planar side walls,are taken into account, all wall boundary layers are well-resolved and no wall model is used. The Adap-tive Local Deconvolution Method (ALDM) with shock sensor is employed for subgrid-scale turbulencemodeling and shock capturing. The LES results are validated against experimental wall-pressuremeasurements and schlieren pictures. A detailed discussion of the complex flow phenomena of three-dimensional shock-wave–boundary-layer interaction, including corner vortices and recirculation zones,is presented. Limitations of RANS approaches are discussed with reference to the LES results.
� 2014 Elsevier Inc. All rights reserved.
1. Introduction
Depending on the applied back pressure, choked Laval nozzleflows develop a compression shock that decelerates the flow fromsupersonic to subsonic speed. Inviscid theory predicts an instanta-neous change of the flow variables through a single normal shock.Taking viscous effects into consideration, a so-called pseudo-shocksystem develops at sufficiently high pre-shock Mach numbers,which is generally a sequence of several oblique shocks and expan-sion waves interacting with the boundary layers at the nozzle wallsand a subsequent mixing zone.
Pseudo-shock systems affect the performance and the reliabilityof processes and facilities in many fields of engineering, see Matsuoet al. (1999) for a comprehensive overview. Although there are sev-eral previous experimental (e.g., Carroll and Dutton, 1990; Johnsonand Papamoschou, 2010) and numerical (e.g., Xiao et al., 2007)studies, the mechanisms that govern the dynamic behavior ofpseudo-shock systems are not yet sufficiently understood. Keymechanisms, such as the interaction between three-dimensionalshocks and recirculation zones, are too complex to be analyzedand explained by experiments alone. For this flow configuration,previous numerical simulations solving the compressible Rey-nolds-averaged Navier–Stokes (RANS) equations show a high sen-sitivity of the results to details of the applied turbulence model(see Giglmaier et al., 2014). In particular, two-equation modelsbased on the Boussinesq hypothesis give poor predictions of sec-ondary flow features and are not able to represent the anisotropy
of turbulence. Results for Reynolds stress models that are basedon the x-formulation generally are in much better agreement withexperimental data. However, RANS simulations cannot recoverhighly unsteady small-scale phenomena. This motivates a numer-ical investigation with well-resolved Large-Eddy Simulation (LES).
The paper is arranged as follows: Section 2 gives an overview ofthe investigated experiment and describes the numerical setup ofthe LES. The results are validated against the measurements inSection 3. Finally, the LES is compared to RANS simulations withseveral standard turbulence models applied in Section 4.
2. Experiment and numerical setup
Geometry of the flow channel as well as operating conditions ofthis numerical investigation are adapted to a comprehensive exper-imental study conducted by Gawehn et al. (2010). The test rig isdesigned as double choked Laval nozzle system (refer to Fig. 1).The pseudo-shock system is located in the divergent part of the pri-mary nozzle. In contrast to (quasi) constant-area ducts (e.g., Carrolland Dutton, 1990; Morgan et al., 2014), in this experiment the meanshock position is well defined by the wall contour and the appliedback pressure. Parallel side walls at the primary nozzle allow forschlieren imaging. The test rig is equipped with 47 pressure tapsto record the wall pressure distribution. Assuming inviscid adiabaticflow, shock position and pre-shock Mach number are defined by theratio of the stagnation pressures p02=p01 at the exit and the entry ofthe primary nozzle, which is a function of the ratio of the criticalcross section areas A�1=A�2. In the experiment, the secondary criticalcross section area A�2 can be adjusted by a movable, slender cone toallow for different stagnation pressure ratios.
, http://

Fig. 1. Overview of the LES setup. (a) Mach number distribution at the symmetry plane z ¼ 0 within the primary Laval nozzle predicted by a RANS simulation with the BSLEARSM turbulence model applied. The secondary Laval nozzle is not shown. The black box indicates the LES sub-domain. (b) Geometry and boundary conditions of the LES.Only one half is shown. (c) Sketch of the AMR block topology for the LES inlet plane.
2 J.F. Quaatz et al. / International Journal of Heat and Fluid Flow xxx (2014) xxx–xxx
The investigated operation point is characterized by a stagna-tion pressure of p01 ¼ 4:8 bar and a stagnation temperature ofT01 ¼ 300 K. The operating fluid is air. The stagnation pressureratio is set to p02=p01 ¼ 0:6, which results in the shock positionxs � 0:135 m measured from the primary critical cross section A�1.These conditions correspond to a pre-shock Mach number ofM � 1:91 and a Reynolds number of Red � 105 based on the bound-ary layer thickness d, which extends to approx. 36% of the channelhalf height. We emphasize, that all presented LES and RANS simu-lations are performed at the same parameter set – including theReynolds number – of this reference experiment. A sketch of theapparatus and the flow conditions is given in Fig. 1a, which showsthe Mach number distribution at the symmetry slice z ¼ 0.
Our computer code INCA is applied for conducting the LES. Thehyperbolic fluxes are discretized by the Adaptive Local Deconvolu-tion Method ALDM (Hickel et al., 2006; Hickel and Larsson, 2009).Built into this non-linear finite-volume discretization method is asubgrid-scale turbulence model that is consistent with turbulencetheory. Due to a shock sensor that triggers additional numerical vis-cosity over shocks, ALDM can capture shock waves while smoothpressure waves and turbulence are propagated without excessivenumerical dissipation. These features make ALDM applicable tothe full Mach number range of practical applications and particularlysuitable for LES of shock-turbulence interactions as demonstrated,e.g., by Grilli et al. (2012, 2013). Viscous and heat conduction termsare discretized by second-order centered differences, and an explicit3rd order Runge–Kutta method is used for time integration.
Unlike earlier work (e.g., Olson and Lele, 2011), we simulate thefull 3-D geometry of the rectangular nozzle duct including bothparallel side walls. Hence, effects of secondary flow features, suchas geometrically induced corner vortices and flow separation, aretaken into account, which is crucial for achieving agreement withexperiments. To facilitate such a large-scale simulation, the com-putational domain is restricted to the pseudo-shock system(0:1 m 6 x � 0:27 m). The LES sub-domain is indicated by the blackrectangle in Fig. 1a. The inflow boundary condition is locatedapprox. 25 boundary layer thicknesses d upstream of the primaryshock. The diverging upper and lower walls consist each of twosections with the respective opening semi angles a1 ¼ 1:5� anda2 ¼ 0:3�. The two sections are connected at x ¼ 0:195 m.
Please cite this article in press as: Quaatz, J.F., et al. Large-eddy simulation of a pdx.doi.org/10.1016/j.ijheatfluidflow.2014.05.006
INCA solves the compressible Navier–Stokes equations onCartesian multi-block grids. It also provides a built-in mesh gener-ator enabling adaptive mesh refinement (AMR) for efficientlyresolving the channel walls. The boundary layer refinement ofthe block topology normal to the mean flow direction x is illus-trated in Fig. 1c. The applied refinement ratio at block boundariesis set to 2. Different mesh resolutions allow for the generation ofhigh-quality initial conditions through grid-sequencing, whichstrongly reduces the computational effort necessary for reachingstatistically stationary flow conditions. The presented results areobtained on a grid of 387� 106 cells in 16484 blocks. While refinedgrids are used for resolving turbulent boundary layers, we do notspecifically refine grids at shocks in the core flow.
For representing the diverging upper and lower nozzle walls,we employ an immersed boundary method (for details see Meyeret al., 2010; Grilli et al., 2009) as shown in Fig. 1b. The parallel sidewalls at z ¼ �7:5� 10�3 m are represented by standard no-slipconditions at the regular cell faces. Performance is improved by alinear stretching of the cells normal to the side walls. Boundarylayer turbulence is resolved by the computational grid, and no wallmodel is applied. The non-dimensional wall-normal size of thewall cells is characterized by Dyþ � 2. All walls are assumed tobe adiabatic, which is reasonable for steady-state flow conditionsat ambient stagnation temperature.
For generating physical turbulent inflow conditions, we use arecycling-rescaling method (Petrache et al., 2011). Mean target val-ues for the LES inflow data at the inlet (xi ¼ 0:1 m) are extracted froma steady-state RANS simulation. It is performed with the commercialsolver ANSYS CFX Release 14.0 and an explicit algebraic Reynoldsstress model (EARSM – for details see Wallin and Johanson, 2000)in BSL formulation by Hellsten (2004). Giglmaier et al. (2014) givea rationale for choosing this particular RANS turbulence model. Tosuppress spurious periodic correlations, the recycled turbulence isadditionally mirrored at the center point of the test rig, y ¼ z ¼ 0.More specifically, the fluctuations occurring in the upper right halfof the channel are re-introduced into the lower left part and viceversa. The recycling length (see Fig. 1b) corresponds to approxi-mately nine times the incoming boundary layer thickness.
A static pressure of pexit ¼ 2:532 bar is prescribed at the end ofthe LES domain. This value is taken from RANS simulations and
seudo-shock system in a Laval nozzle. Int. J. Heat Fluid Flow (2014), http://
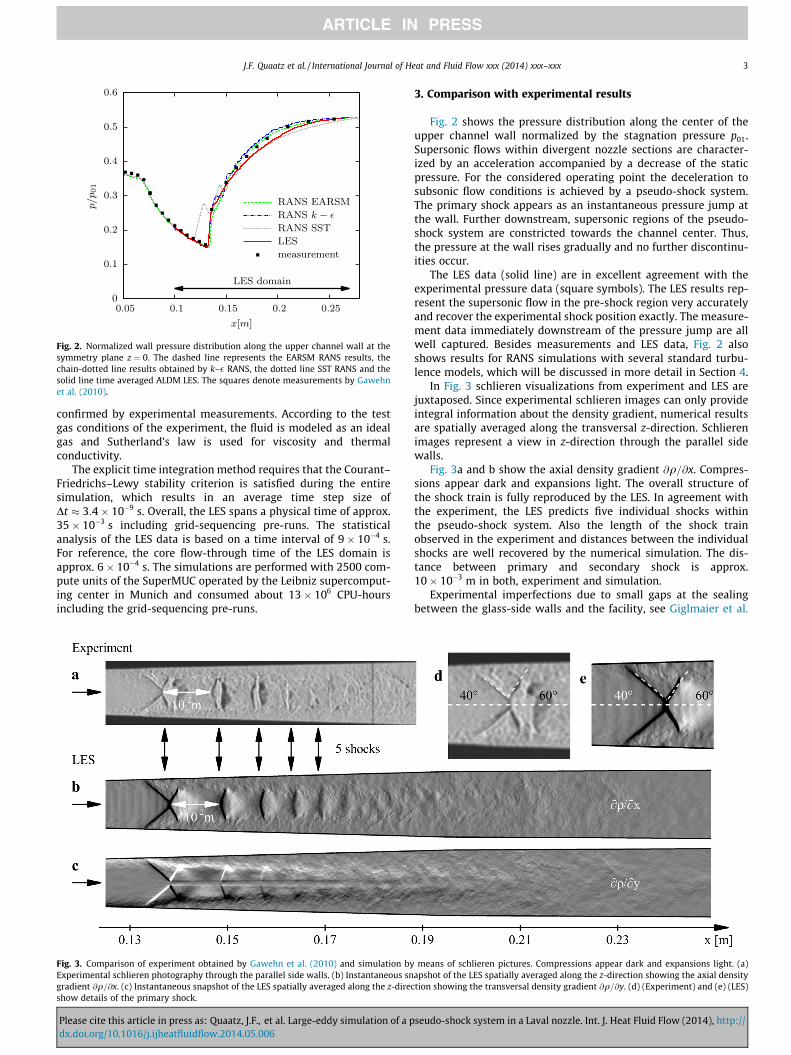
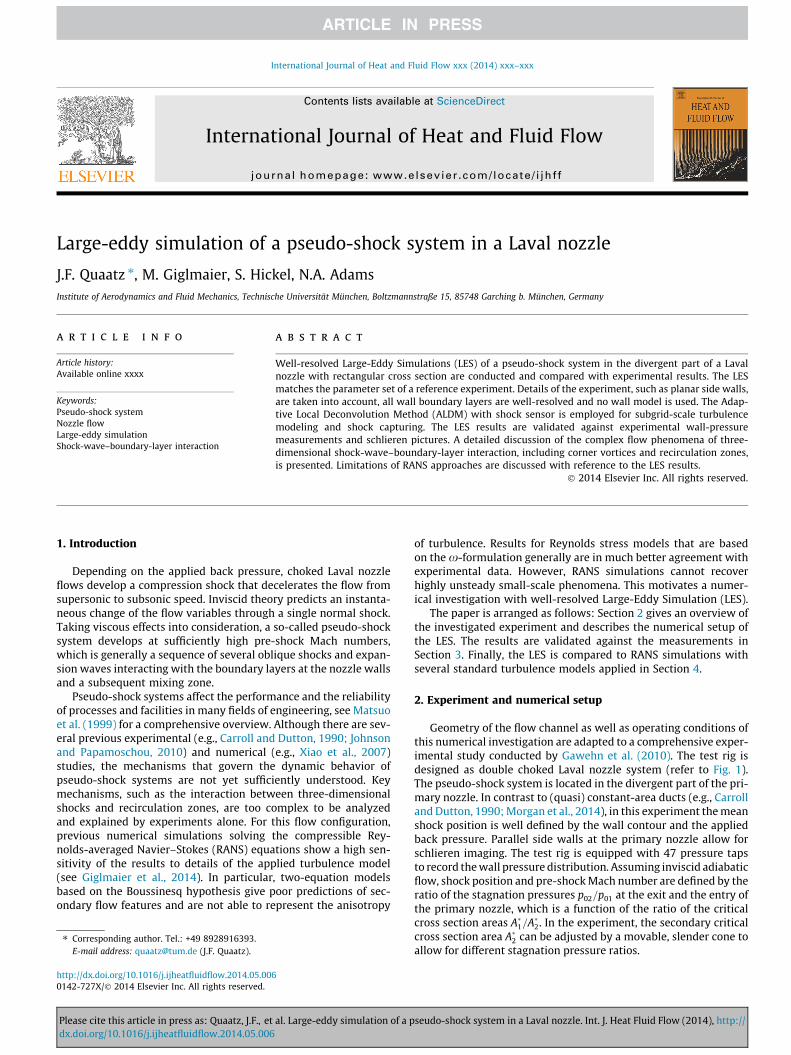
Fig. 2. Normalized wall pressure distribution along the upper channel wall at thesymmetry plane z ¼ 0. The dashed line represents the EARSM RANS results, thechain-dotted line results obtained by k–� RANS, the dotted line SST RANS and thesolid line time averaged ALDM LES. The squares denote measurements by Gawehnet al. (2010).
J.F. Quaatz et al. / International Journal of Heat and Fluid Flow xxx (2014) xxx–xxx 3
confirmed by experimental measurements. According to the testgas conditions of the experiment, the fluid is modeled as an idealgas and Sutherland’s law is used for viscosity and thermalconductivity.
The explicit time integration method requires that the Courant–Friedrichs–Lewy stability criterion is satisfied during the entiresimulation, which results in an average time step size ofDt � 3:4� 10�9 s. Overall, the LES spans a physical time of approx.35� 10�3 s including grid-sequencing pre-runs. The statisticalanalysis of the LES data is based on a time interval of 9� 10�4 s.For reference, the core flow-through time of the LES domain isapprox. 6� 10�4 s. The simulations are performed with 2500 com-pute units of the SuperMUC operated by the Leibniz supercomput-ing center in Munich and consumed about 13� 106 CPU-hoursincluding the grid-sequencing pre-runs.
Fig. 3. Comparison of experiment obtained by Gawehn et al. (2010) and simulation byExperimental schlieren photography through the parallel side walls. (b) Instantaneous sngradient @q=@x. (c) Instantaneous snapshot of the LES spatially averaged along the z-direcshow details of the primary shock.
Please cite this article in press as: Quaatz, J.F., et al. Large-eddy simulation of a pdx.doi.org/10.1016/j.ijheatfluidflow.2014.05.006
3. Comparison with experimental results
Fig. 2 shows the pressure distribution along the center of theupper channel wall normalized by the stagnation pressure p01.Supersonic flows within divergent nozzle sections are character-ized by an acceleration accompanied by a decrease of the staticpressure. For the considered operating point the deceleration tosubsonic flow conditions is achieved by a pseudo-shock system.The primary shock appears as an instantaneous pressure jump atthe wall. Further downstream, supersonic regions of the pseudo-shock system are constricted towards the channel center. Thus,the pressure at the wall rises gradually and no further discontinu-ities occur.
The LES data (solid line) are in excellent agreement with theexperimental pressure data (square symbols). The LES results rep-resent the supersonic flow in the pre-shock region very accuratelyand recover the experimental shock position exactly. The measure-ment data immediately downstream of the pressure jump are allwell captured. Besides measurements and LES data, Fig. 2 alsoshows results for RANS simulations with several standard turbu-lence models, which will be discussed in more detail in Section 4.
In Fig. 3 schlieren visualizations from experiment and LES arejuxtaposed. Since experimental schlieren images can only provideintegral information about the density gradient, numerical resultsare spatially averaged along the transversal z-direction. Schlierenimages represent a view in z-direction through the parallel sidewalls.
Fig. 3a and b show the axial density gradient @q=@x. Compres-sions appear dark and expansions light. The overall structure ofthe shock train is fully reproduced by the LES. In agreement withthe experiment, the LES predicts five individual shocks withinthe pseudo-shock system. Also the length of the shock trainobserved in the experiment and distances between the individualshocks are well recovered by the numerical simulation. The dis-tance between primary and secondary shock is approx.10� 10�3 m in both, experiment and simulation.
Experimental imperfections due to small gaps at the sealingbetween the glass-side walls and the facility, see Giglmaier et al.
means of schlieren pictures. Compressions appear dark and expansions light. (a)apshot of the LES spatially averaged along the z-direction showing the axial densitytion showing the transversal density gradient @q=@y. (d) (Experiment) and (e) (LES)
seudo-shock system in a Laval nozzle. Int. J. Heat Fluid Flow (2014), http://

4 J.F. Quaatz et al. / International Journal of Heat and Fluid Flow xxx (2014) xxx–xxx
(2014), and a slight translatory motion of the entire shock train areresponsible for a small streamwise shift of the pseudo-shock sys-tem, which is visible in the instantaneous schlieren pictures. Thepressure signal shown in Fig. 2 has been taken from another real-ization of the experiment with metal side walls, when the sealinggaps have been removed. As evident from Fig. 2, this gap-freeexperimental data are perfectly matched by the LES in terms ofthe streamwise location of the pseudo-shock system.
Fig. 3d and e allow for a detailed investigation of the primaryshock. In agreement with Matsuo et al. (1999) for comparably highpre-shock Mach numbers, the experiment shows a clearly devel-oped primary lambda-shock. At the centerline, the initial shockcreates a small Mach reflection. All details of the experiment(Fig. 3d) are accurately reproduced by the LES (Fig. 3e). The shockangles of the incoming and the reflected compressions at the Machreflection are in both cases 40� and 60�, respectively. The subse-
Fig. 4. Mean Mach number distribution hMi on the symmetry slice z ¼ 0. The blackrecirculation zones. The primary shock positions are marked by N. The RANS results areRANS simulation. (c) k–x RANS simulation. (d) k–� RANS simulation. (e) SST RANS simulareferred to the web version of this article.)
Please cite this article in press as: Quaatz, J.F., et al. Large-eddy simulation of a pdx.doi.org/10.1016/j.ijheatfluidflow.2014.05.006
quent shocks of the shock train are slightly curved, which is alsoobserved in the experiment.
The transversal density gradient @q=@y shown in Fig. 3c revealsthe shape of the shear layer between super- and subsonic flowregions. At the centerline the slip-line induced by the Mach reflec-tion of the primary shock is clearly visible and extends throughoutthe entire shock train.
Note that the flow structure is strongly inhomogeneous acrossthe transversal channel direction. The oblique parts of the primaryshock occupy approximately half of the channel depth. Althoughthe flow appears to be undisturbed at the center of the nozzle,the static pressure distribution is strongly affected by three-dimensional flow features. For this reason, simulations that neglectthe parallel side walls cannot provide reliable results for channelswith rectangular cross sections and a low aspect ratio. The numer-ical schlieren pictures show that the primary oblique shock is
lines correspond to hMi ¼ 1. Red lines indicate hui ¼ �10�3 m=s to visualize themirrored at the centerline of the channel (dash-dotted). (a) ALDM LES (b) EARSM
tion. (For interpretation of the references to color in this figure legend, the reader is
seudo-shock system in a Laval nozzle. Int. J. Heat Fluid Flow (2014), http://
J.F. Quaatz et al. / International Journal of Heat and Fluid Flow xxx (2014) xxx–xxx 5
located at approximately the same position xs at the side walls andthe diverging walls.
We conclude, that the reference experiment is very accuratelyreproduced by the LES, so that the LES results can serve as refer-ence for the evaluation of RANS simulations and the employed tur-bulence models.
4. Comparison of RANS and LES
In Fig. 4 we compare the time-averaged Mach number distribu-tion hMi at the channel-symmetry plane z ¼ 0, obtained from theLES (a) with the prediction of several standard RANS turbulencemodels (b–e). Black solid lines indicate sonic flow conditionshMi ¼ 1. Reverse-flow regions are enclosed by red contour lines.The computational domain of the RANS simulations contains onlyone quarter of the channel geometry. For presentation, the resultsare mirrored at the dash-dotted centerline. The RANS simulationsare performed with Ansys CFX 14.0. Default settings are appliedfor all turbulence models and all flow parameters are the sameas with LES and experiment.
The averaged results of the LES (Fig. 4a) show a pseudo-shocksystem that is clearly separated in two sections: (i) a shock trainwith distinct shocks, and (ii) a subsequent mixing region. Shock-free re-compression decelerates the supersonic core flow untilthe flow across the entire cross section is subsonic. The slightsmearing of the LES contours is a result of shock unsteadinessduring the averaging timespan of the LES. Stable separation zonesoccur at the diverging channel walls directly downstream of theprimary shock (red lines).
The first considered RANS turbulence model is the BSL-EARSM.The wall pressure distribution (dashed line in Fig. 2) is overall in
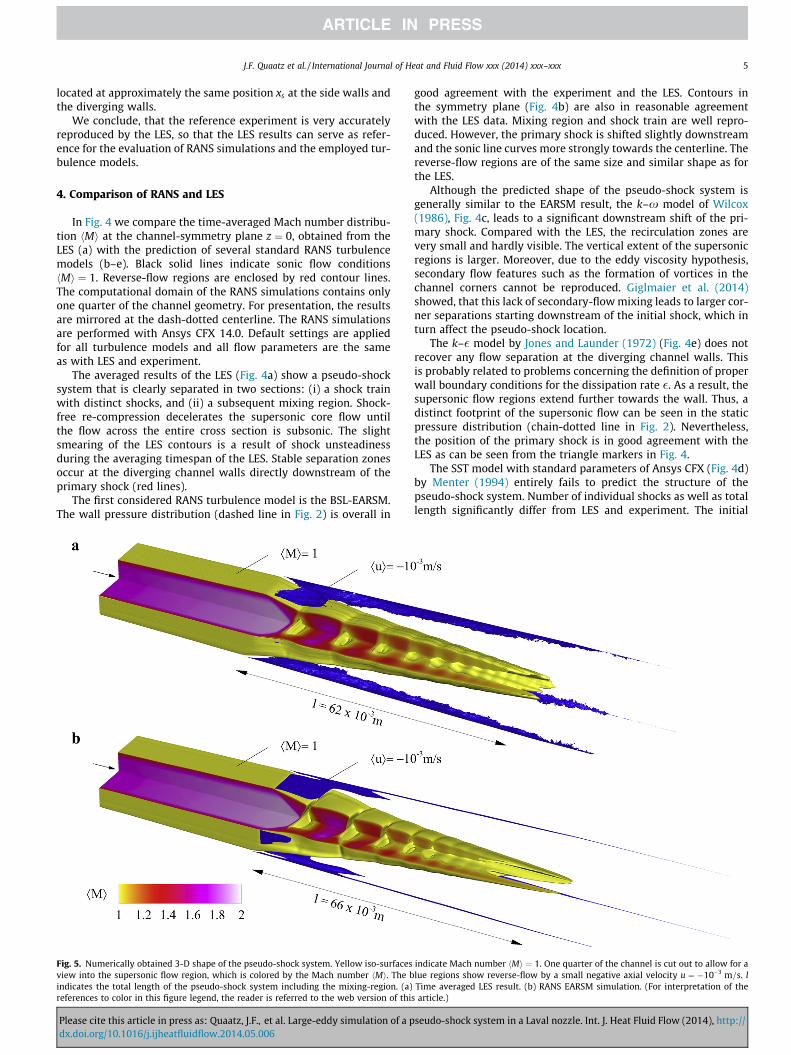
Fig. 5. Numerically obtained 3-D shape of the pseudo-shock system. Yellow iso-surfacesview into the supersonic flow region, which is colored by the Mach number hMi. The bindicates the total length of the pseudo-shock system including the mixing-region. (a)references to color in this figure legend, the reader is referred to the web version of thi
Please cite this article in press as: Quaatz, J.F., et al. Large-eddy simulation of a pdx.doi.org/10.1016/j.ijheatfluidflow.2014.05.006
good agreement with the experiment and the LES. Contours inthe symmetry plane (Fig. 4b) are also in reasonable agreementwith the LES data. Mixing region and shock train are well repro-duced. However, the primary shock is shifted slightly downstreamand the sonic line curves more strongly towards the centerline. Thereverse-flow regions are of the same size and similar shape as forthe LES.
Although the predicted shape of the pseudo-shock system isgenerally similar to the EARSM result, the k–x model of Wilcox(1986), Fig. 4c, leads to a significant downstream shift of the pri-mary shock. Compared with the LES, the recirculation zones arevery small and hardly visible. The vertical extent of the supersonicregions is larger. Moreover, due to the eddy viscosity hypothesis,secondary flow features such as the formation of vortices in thechannel corners cannot be reproduced. Giglmaier et al. (2014)showed, that this lack of secondary-flow mixing leads to larger cor-ner separations starting downstream of the initial shock, which inturn affect the pseudo-shock location.
The k–� model by Jones and Launder (1972) (Fig. 4e) does notrecover any flow separation at the diverging channel walls. Thisis probably related to problems concerning the definition of properwall boundary conditions for the dissipation rate �. As a result, thesupersonic flow regions extend further towards the wall. Thus, adistinct footprint of the supersonic flow can be seen in the staticpressure distribution (chain-dotted line in Fig. 2). Nevertheless,the position of the primary shock is in good agreement with theLES as can be seen from the triangle markers in Fig. 4.
The SST model with standard parameters of Ansys CFX (Fig. 4d)by Menter (1994) entirely fails to predict the structure of thepseudo-shock system. Number of individual shocks as well as totallength significantly differ from LES and experiment. The initial
indicate Mach number hMi ¼ 1. One quarter of the channel is cut out to allow for alue regions show reverse-flow by a small negative axial velocity u ¼ �10�3 m=s. lTime averaged LES result. (b) RANS EARSM simulation. (For interpretation of the
s article.)
seudo-shock system in a Laval nozzle. Int. J. Heat Fluid Flow (2014), http://

Fig. 6. Numerical schlieren pictures locally at the symmetry plane z ¼ 0. The axialdensity gradient @q=@x is shown. Compressions are dark and expansions light. (a)Instantaneous result of the LES. Primary shock angle is a ¼ 40� . (b) RANS simulationwith the EARSM turbulence model. Primary shock angle is a ¼ 38� .
6 J.F. Quaatz et al. / International Journal of Heat and Fluid Flow xxx (2014) xxx–xxx
oblique shock is very weak and initiates no subsonic regions. Thesonic line downstream of the primary shock extends down to thewall, which is, as with the k–�model, the reason for the corrugated
Fig. 8. Turbulent structures predicted by the LES. The axial slices through the full channelcuts through the vertical structures identified by the variable Q by Jeong and Hussain (199in one quarter (y; z < 0) of the LES domain confined to the shock region 0:125 m < x < 0:vector.
Fig. 7. Distribution of the turbulent kinetic energy k ¼ 12 hu0u0i þ hv 0v 0i þ hw0wð
Please cite this article in press as: Quaatz, J.F., et al. Large-eddy simulation of a pdx.doi.org/10.1016/j.ijheatfluidflow.2014.05.006
pressure distribution observed in Fig. 2 (dotted line). This isdirectly related to the absence of reverse regions at the divergingchannel walls. Considering that the SST model is a blend of thek–x and the k–� model, the poor performance is surprising. Fur-ther simulations with the Baseline model by Menter (1994) showbetter agreement with the k–� and the k–x model. Thus, recalibra-tion of the model coefficients as well as the limitation of the eddyviscosity may help to improve the SST results, the quality of EARSMresults, however, cannot be reached.
As the EARSM RANS shows best agreement with the LES, themean flow prediction of RANS and the corresponding differencesare compared with the LES and analyzed in detail for this particularturbulence model. Fig. 6 provides a comparison of numericalschlieren pictures between LES and RANS results. Data are evalu-ated locally at the symmetry plane of the channel z ¼ 0. Althoughthe shock position is reproduced well, the EARSM RANS results donot exhibit the Mach reflection at the centerline of the channel. Thepredicted shock angles differ from measurement and LES. The
domain are colored by the instantaneous Mach number M. The black lines represent5). The 3D-view shows an iso-surface of the variable Q colored by the Mach number
18 m. The shock train is indicated by an iso-surface of the divergence of the velocity
0iÞ on symmetry slice z ¼ 0. (a) ALDM LES. (b) EARSM RANS simulation.
seudo-shock system in a Laval nozzle. Int. J. Heat Fluid Flow (2014), http://

J.F. Quaatz et al. / International Journal of Heat and Fluid Flow xxx (2014) xxx–xxx 7
initial oblique shock extends down to the channel wall. The dis-tance between primary and secondary shock is under-predictedby about 10%.
Fig. 5 shows the complex shape of the hMi ¼ 1 iso-surface pre-dicted by the LES and the EARSM RANS simulation. One quarter ofthe channel is cut out, and the supersonic sections of the symmetryplanes are colored by the local Mach number to distinguishbetween super- and subsonic regions within the shock train. Blueiso-surfaces (hui ¼ �10�3 m=s) visualize the reverse-flow regionsin the domain.
The shock train predicted by the averaged LES data, Fig. 5a, con-sists of five shocks. Behind each shock, the sonic surfaces create athree-dimensional aerodynamic nozzle, which re-accelerates theflow to supersonic speed. The pseudo-shock system is terminatedby the mixing zone, where shock-free re-compression of the super-sonic core flow by turbulent momentum transport within the shearlayer between supersonic and subsonic regions occurs, until theentire cross section is subsonic. The total length of the pseudo-shock system from the foot of the primary shock to the end ofthe mixing zone is 62� 10�3 m. The mixing zone contributesapproximately one third of the length to the pseudo-shock system.
Analyzing the recirculation zones, two main phenomena can bedistinguished. First, the primary shock leads to flow separation anda recirculation zone that extends over the full channel depth at thediverging wall. In contrast, no backflow regions are found along theparallel side walls. Second, large corner separations develop alongthe channel edges downstream of the primary shock, which extendapproximately to the end of the pseudo-shock system.
The corresponding EARSM RANS simulation presented in Fig. 5bshows generally a similar behavior. Nevertheless, deviations fromthe LES data can be found. Although the overall length of thepseudo-shock system is 4� 10�3 m larger than predicted by LES,the shock train is shorter so that the mixing region is significantlylonger. In contrast to the LES, stable recirculation zones can befound at the parallel sidewalls. The separation in the channel cor-ners is distinctly smaller and very thin.
Fig. 7a and b show contour plots of the turbulent kinetic energyk ¼ 1
2 hu0u0i þ hv 0v 0i þ hw0w0ið Þ at the center slice of the channel forLES and RANS simulations. The distribution and the range of k pre-dicted by the EARSM RANS simulation and the LES are in goodagreement. In accordance to the extended pseudo-shock systemobserved in Fig. 5, the region of high turbulence intensity is largerfor the RANS simulation. The shock motion resolved by the LESaccounts for the higher values of k within the shock train. The pri-mary shock axially oscillates in a region of Dxs � 3:5� 10�3 m,which is in good agreement with the experimental results withDxs � 4:7� 10�3 m (see Gawehn et al., 2012). By definition, thiscannot be reproduced by the steady-state RANS simulations.
Fig. 8 gives an impression of the turbulent structures in the flowpredicted by the LES. The incoming boundary layer at the nozzlewalls is visualized by an iso-surface of the variable Q by Jeongand Hussain (1995) at the lower left quarter of the LES domain(y; z < 0). It is colored by the instantaneous Mach number. Theaxial slices show the Mach number distribution and a iso-line ofQ. At slice 1 at x ¼ 0:125 m turbulent vortical structures appearonly at the nozzle walls. When passing through the pseudo-shocksystem (slices 2–4), vortical structures rapidly spread towards thechannel center.
5. Conclusions and outlook
Well-resolved LES results of a pseudo-shock system in a Lavalnozzle at the same flow conditions match a reference experimentof Gawehn et al. (2010). The LES resolves wall turbulence at all fourside walls and recovers complex secondary flow structures accu-
Please cite this article in press as: Quaatz, J.F., et al. Large-eddy simulation of a pdx.doi.org/10.1016/j.ijheatfluidflow.2014.05.006
rately. The results are in excellent agreement with wall pressuremeasurements and experimental schlieren visualizations. The LESdata allow for a detailed analysis of RANS turbulence models forpseudo-shock systems in turbulent duct flows with respect tothe performance of several standard two-equation RANS modelsin this paper. Our results support the conclusions of Giglmaieret al. (2014) about the superior performance of explicit algebraicReynolds stress models. Eddy viscosity models consistently givepoor predictions of the mean flow. The extensive LES databaseallows for an detailed analysis of the unsteady behavior of thepseudo-shock system and the interaction of shock train and sepa-ration bubble, which is subject of future work.
Acknowledgments
Computing resources for the presented work are provided bythe Leibniz Rechenzentrum LRZ under grant PR45TU. The fruitfulcollaboration with Dr. Thomas Gawehn from the Institute of Aero-dynamics and Flow Technology at the German Aerospace CenterDLR is gratefully acknowledged. He provided all experimental dataused for this work. This work was partially supported by the Ger-man Research Foundation (DFG).
References
Carroll, B.F., Dutton, J.C., 1990. Characteristics of multiple shock wave/turbulentboundary-layer interactions in rectangular ducts. J. Propul. Power 6, 186–193.
Gawehn, T., Gülhan, A., Giglmaier, M., Al-Hasan, N.S., Quaatz, J.F., Adams, N.A., 2010.Analysis of pseudo-shock system structure and asymmetry in Laval nozzleswith parallel side walls. In: 19th International Shock Interaction Symposium,Moscow, Russia.
Gawehn, T., Gülhan, A., Giglmaier, M., Quaatz, J.F., Adams, N.A., 2012. Analysis of gapinfluence on pseudo-shock system asymmetry in rectangular Laval nozzles. In:20th International Shock Interaction Symposium, Stockholm, Sweden.
Giglmaier, M., Quaatz, J.F., Gawehn, T., Gülhan, A., Adams, N.A., 2014. Numerical andexperimental investigations of pseudo-shock systems in a planar nozzle:impact of bypass mass flow due to narrow gaps. Shock Waves 24, 139–156.http://dx.doi.org/10.1007/s00193-013-0475-2.
Grilli, M., Hickel, S., Adams, N.A., 2013. Large-eddy simulation of a supersonicturbulent boundary layer over a compressionexpansion ramp. Int. J. Heat FluidFlow 42, 79–93. http://dx.doi.org/10.1016/j.ijheatfluidflow.2012.12.006.
Grilli, M., Hickel, S., Hu, X., Adams, N.A., 2009. Conservative immersed boundarymethod for compressible flows. In: Proceedings of the Academy ColloquiumImmersed Boundary Methods: Current Status and Future Research Directions.Amsterdam, The Netherlands.
Grilli, M., Schmid, P.J., Hickel, S., Adams, N.A., 2012. Analysis of unsteady behaviourin shockwave turbulent boundary layer interaction. J. Fluid Mech. 700, 16–28.http://dx.doi.org/10.1017/jfm.2012.37.
Hellsten, A., 2004. New Advanced k–x Turbulence Model for High-LiftAerodynamics. AIAA Paper 2004-1120.
Hickel, S., Adams, N.A., Domaradzki, J.A., 2006. An adaptive local deconvolutionmethod for implicit LES. J. Comput. Phys. 213, 413–436. http://dx.doi.org/10.1016/j.jcp.2005.08.017.
Hickel, S., Larsson, J., 2009. On implicit turbulence modeling for les of compressibleflows. In: Eckhardt, B. (Ed.), Advances in Turbulence XII, Springer Proceedings inPhysics, vol. 132. Springer, Berlin Heidelberg, pp. 873–875. http://dx.doi.org/10.1007/978-3-642-03085-7_209.
Jeong, J., Hussain, F., 1995. On the identification of a vortex. J. Fluid Mech. 285, 69–94. http://dx.doi.org/10.1017/S0022112095000462.
Johnson, A.D., Papamoschou, D., 2010. Instability of shock-induced nozzle flowseparation. Phys. Fluids, 22. http://dx.doi.org/10.1063/1.3278523.
Jones, W., Launder, B., 1972. The prediction of laminarization with a two-equationmodel of turbulence. Int. J. Heat Mass Transfer 15, 301–314. http://dx.doi.org/10.1016/0017-9310(72)90076-2.
Matsuo, K., Miyazato, Y., Kim, H.D., 1999. Shock train and pseudo-shock phenomenain internal gas flows. Progr. Aerospace Sci. 35, 33–100. http://dx.doi.org/10.1016/S0376-0421(98)00011-6.
Menter, F.R., 1994. Two-equation eddy-viscosity turbulence models for engineeringapplications. AIAA J. 32, 1598–1605.
Meyer, M., Devesa, A., Hickel, S., Hu, X., Adams, N., 2010. A conservative immersedinterface method for large-eddy simulation of incompressible flows. J. Comput.Phys. 229, 6300–6317. http://dx.doi.org/10.1016/j.jcp.2010.04.040.
Morgan, B., Duraisamy, K., Lele, S.K., 2014. Large-eddy simulations of a normalshock train in a constant-area isolator. AIAA J. 52, 539–558. http://dx.doi.org/10.2514/1.J052348.
Olson, B.J., Lele, S.K., 2011. Large-Eddy Simulation of an Over-Expanded PlanarNozzle. AIAA Paper 2011-3908.
seudo-shock system in a Laval nozzle. Int. J. Heat Fluid Flow (2014), http://

8 J.F. Quaatz et al. / International Journal of Heat and Fluid Flow xxx (2014) xxx–xxx
Petrache, O., Hickel, S., Adams, N.A., 2011. Large Eddy Simulations of TurbulentEnhancement Due to Forced Shock Motion in Shock-Boundary LayerInteraction. AIAA Paper 2011-2216 .
Wallin, S., Johanson, A.V., 2000. An explicit algebraic Reynolds stress model forincompressible and compressible turbulent flows. J. Fluid Mech. 403, 89–132.http://dx.doi.org/10.1017/S0022112099007004.
Please cite this article in press as: Quaatz, J.F., et al. Large-eddy simulation of a pdx.doi.org/10.1016/j.ijheatfluidflow.2014.05.006
Wilcox, D., 1986. Multiscale model for turbulent flows. American Institute ofAeronautics and Astronautics. Aerospace Sciences Meetings. <http://dx.doi.org/10.2514/6.1986-29>.
Xiao, Q., Tsai, H.M., Papamoschou, D., 2007. Numerical investigation ofsupersonic nozzle flow separation. AIAA J. 45, 532–541. http://dx.doi.org/10.2514/1.20073.
seudo-shock system in a Laval nozzle. Int. J. Heat Fluid Flow (2014), http://