laporan akhir
91
-
Upload
khangminh22 -
Category
Documents
-
view
0 -
download
0
Transcript of laporan akhir


LAPORAN AKHIR PENELITIAN STRATEGIS NASIONAL
PENGEMBANGAN LISTRIK TENAGA BIOGAS SKALA KECIL MELALUI PROSES “DRY FERMENTATION” UNTUK MEMENUHI
KEBUTUHAN LISTRIK MASYARAKAT TERPENCIL
Ketua Tim Peneliti
Dr. Ir. Agus Haryanto, M.P. (NIDN.0027056503)
Anggota Tim Peneliti
Dr. Ir. Udin Hasanudin, M.T. (NIDN. 0006016403) Dr. Ir. Sugeng Triyono, M.Sc (NIDN. 0011126101)
Kontrak: 419/UN26/8/LPPM/2016
UNIVERSITAS LAMPUNG OKTOBER, 2016
Kode/nama rumpun ilmu: 163/Teknologi Pertanian Tema: Energi Baru dan Terbarukan (New and Renewable Energy)


iii
DAFTAR ISI
Halaman Judul ..................................................................................................... i
Halaman Pengesahan ........................................................................................... ii
DAFTAR ISI ......................................................................................................... iii
RINGKASAN ........................................................................................................ iv
BAB 1. PENDAHULUAN ................................................................................. 1
1.1. Latar Belakang ................................................................................ 1
1.2. Perumusan Masalah ......................................................................... 2
1.3. Tujuan Khusus ................................................................................ 2
1.4. Manfaat Khusus ................................................................................ 2
1.5. Urgensi (Keutamaan) Penelitian ..................................................... 2
1.6. Luaran ............................................................................................... 3
BAB 2. STUDI PUSTAKA ................................................................................ 4
2.1. Biogas sebagai sumber energi .......................................................... 4
2.2. Mekanisme Proses Biogas ................................................................ 5
2.3. Faktor-faktor Penting ........................................................................ 7
2.4. Bahan Baku (Feedstock) ................................................................... 10
2.5. Peta Jalan Penelitian ........................................................................ 14
BAB 3. METODE PENELITIAN ...................................................................... 17
3-1. Penelitian Tahun I (2016) ................................................................. 17
3.2. Penelitian Tahun I (2017) .................................................................. 19
3-3. Penelitian Tahun I (2018) ................................................................. 20
BAB 4. HASIL DAN PEMBAHASAN ................................................................ 21
4.1. Potensi Produksi Biogas Skala Rumah Tangga ................................ 21
4.2. Konsumsi Biogas Generator Skala Rumah Tangga .......................... 22
4.3. Pengaruh Laju Pembebanan ............................................................. 23
BAB 5. KESIMPULAN......................................................................................... 26
DAFTAR PUSTAKA .......................................................................................... 27
LAMPIRAN ......................................................................................................... 31
1. Makalah Seminar Internasional ISABE
2. Draft makalah Jurnal Internasional Renewable Energy
3. Acceptance Letter Seminar PERTETA Padang

iv
RINGKASAN
Biogas merupakan sumber energi terbarukan yang dapat menjadi solusi handal bagi pemenuhan listrik di daerah dan pulau-pulau terpencil. Biogas dapat diproduksi dari berbagai bahan organic baik melalui “fermentasi anaerobik basah” maupun “fermentasi anaerobik kering.” Setelah proses clean up, biogas dapat digunakan untuk menjalankan genset guna menghasilkan listrik.
Tujuan jangka panjang dari penelitian ini adalah untuk menghasilkan sistem pembangkitan listrik dengan bahan bakar biogas yang dihasilkan dari bahan organik padat melalui proses “fermentasi kering.” Target khusus yang ingin dicapai adalah memperoleh sistem pembangkit listrik tenaga biogas skala kecil yang dapat dioperasikan untuk memenuhi kebutuhan listrik rumah tangga di daerah atau pulau-pulau terpencil. Penelitian direncanakan selama tiga tahun dan dilakukan mulai dari laboratorium hingga skala aplikasi.
Pada tahun pertama telah dilakukan penelitian sebagai berikut:
1. Pengukuran potensi produksi biogas dari digester skala rumah tangga. Penelitian dilakukan menggunakan manometer air pipa U yang dipasang pada rangkaian pipa digester skala rumah tangga di Desa Pesawaran Indah.
2. Pengukuran konsumsi biogas untuk generator skala rumah tangga (kapasitas 750W). Penelitian dilakukan dengan menjalankan generator menggunakan 100% biogas pada berbagai pembebanan untuk mengetahui konsumsi biogas, daya yang dihasilkan dan efisiensi termal.
3. Produksi biogas dari campuran substrat kotoran sapi dan jerami atau rumput gajah. Penelitian dilakukan menggunakan digester drum berkapasitas 220 liter dan digester gallon kapasitas 36 L. Penelitian ini akan difokuskan pada upaya mengetahui kondisi yang optimum untuk menghasilkan biogas dari beberapa bahan organic segar dengan sumber bakteri dari kotoran sapi. Faktor-faktor penting yang mempengaruhi produksi biogas akan dikaji pada tahun ini seperti perbandingan substrate dengan inokulum (kotoran sapi), laju pembebanan, kandungan padatan total (TS), dan pengaruh pencampuran bahan (co-digestion). Parameter yang diamati meliputi produksi biogas, komposisi biogas, HRT, suhu, pH, kadar TS, kadar abu dan rasio C/N dari substrat. Substrat yang akan digunakan meliputi jerami padi dan rumput gajah.
Hasil yang sudah diperoleh dari 2 kegiatan di atas adalah:
(1) Digester skala rumah tangga dengan 5-6 ekor sapi menghasilkan biogas sebanyak 1582 L/hari atau 280 L/ekor/hari.
(2) Konsumsi biogas untuk generator kapasitas 750W adalah rata-rata 415 L/jam.
(3) Digester skala rumah tangga dengan 5-6 ekor sapi dapat melayani pengoperasian mesin generator kapasitas 750W selama 4 jam/hari.
(4) Hasil penelitian skala Lab menggunakan digester volume 36 L (volume kerja 25 L) dengan sistem pengumpanan semi mekanis menghasilkan produksi biogas sebesar 0,288 L/L substrat per hari. Jika volume kerja biogas 6 m3, maka produksinya adalah setara dengan 1.728 L/hari, sedikit lebih tinggi dari produksi biogas di lapangan.
Kata kunci: listrik, biogas, limbah pertanian, rumput gajah, generator.

1
BAB I. PENDAHULUAN
1.1 Latar Belakang
Menurut laporan PLN, pada akhir tahun 2012 rasio elektrifikasi di Indonesia telah mencapai
73,37% (PLN, 2013). Hal ini berarti masih ada sekitar 26% msyarakat Indonesia yang belum
memiliki akses terhadap listrik. Pada umumnya msyarakat ini tinggal di daerah terpencil dan
pulau-pulau kecil. Daerah seperti ini dicirikan oleh tidak adanya aktivitas industri, lemahnya
infrastruktur dan secara geografis tidak terjangkau oleh jaringan distribusi listrik PLN.
Beberapa kelompok masyarakat membangkitkan listrik secara swadaya menggunakan genset
berbahan bakar minyak. Tetapi pilihan ini tidak ramah lingkungan dan harga listrik menjadi
jauh lebih mahal.
Biogas bisa menjadi salah satu solusi yang handal untuk menghasilkan listrik di daerah
terpencil. Bahan baku biogas dapat dikembangkan secara lokal sehingga murah. Berdasarkan
analisis parametrik secara menyeluruh, Chandra et al. (2012) menyimpulkan bahwa produksi
metana (biogas) dari lignoselulosa biomassa limbah pertanian adalah lebih menguntungkan
secara ekonomis maupun lingkungan dan merupakan cara pemanfaatan biomassa secara
berkelanjutan untuk menghasilkan energi. Biogas merupakan salah sumber energi terbarukan
yang telah memainkan peranan penting di berbagai negara, baik negara maju maupun
berkembang (Abraham et al., 2007). Beberapa negara seperti Jerman (Federal Ministry of
Food and Agriculture, 2014), China (Feng et al., 2012; Li, 2014), dan India (Ministry of New
and Renewable Energy, 2014) telah memperoleh manfaat yang besar dari biogas. Tetapi,
aplikasi biogas di Indonesia masih sangat terbatas.
Pada umumnya proses produksi biogas di Indonesia dilakukan menggunakan “fermentasi
basah” (sistem konvensional) dengan substrat limbah cair agroindustri yang susah diperoleh
di daerah terpencil. Proses basah juga memiliki beberapa keterbatasan, di antaranya: ukuran
digester besar, feedstock terbatas pada bahan dengan kandungan padatan kering (TS) kurang
dari 10%, perlu banyak air, dan masalah yang berkaitan dengan pengelolaan digestat (slurry).
Proses kering dapat menggunakan bahan organik secara lebih luas karena TS bisa mencapai
25% sehingga bahan baku tidak perlu diencerkan.
Limbah organik padat hasil pertanian seperti jerami, batang jagung, bagase, kulit kopi, kulit
kakao, dan limbah halaman rumah berupa dedaunan serta limbah pakan dan kotoran ternak
merupakan bahan baku yang melimpah. Bahan-bahan ini dapat diproses melalui proses
fermentasi kering untuk menghasilkan biogas yang selanjutnya dapat dikonversi menjadi
listrik.

2
1.2 Perumusan Masalah
Biogas bisa menjadi salah satu solusi untuk menyediakan listrik bagi masyarakat di daerah
terpencil yang belum terjangkau jaringan PLN belum. Biogas dapat dihasilkan dari substrat
yang diproduksi secara lokal sehingga lebih sustainable. Oleh karena itu dikembangkan
sistem pembangkitan listrik skala kecil berbasis biogas yang dapat dioperasikan secara
mandiri.
1.3 Tujuan Khusus
Tujuan dari penelitian ini adalah untuk menghasilkan sistem pembangkitan listrik skala kecil
dari konversi biogas yang diproduksi melalui fermentasi anaerobik bahan organik padat
seperti limbah pertanian (jerami dan batang jagung), sampah dedaunan, limbah ternak dan
rumput.
1.4 Manfaat Khusus
Manfaat khusus dari penelitian ini adalah tersedianya teknologi sistem pembangkitan listrik
skala kecil berbahan baku lokal yang dapat memenuhi kebutuhan listrik masyarakat di daerah
dan pulau-pulau terpencil.
1.5 Urgensi (keutamaan) Penelitian
Listrik merupakan kebutuhan primer masyarakat. Sekitar 26% masyarakat Indonesia yang
tinggal di daerah dan pulau-pulau terpencil belum memperoleh akses listrik sehingga perlu
dikembangkan system pembangkitan listrik berbasis sumberdaya lokal yang ramah
lingkungan dan lestari (sustainable). Biogas merupakan suatu sistem yang lestari karena
dapat memanfaatkan bahan biologi yang dihasilkan dari proses fotosintesis. Generai listrik
skala kecil berbahan bakar biogas dapat mengatasi persoalan listrik bagi masyarakat di daerah
terpencil. Limbah organik padat yang diproses melalui fermentasi anaerobik “kering” juga
menghasilkan produk samping berupa kompos siap pakai. Pemanfaatan kompos digestat
sebagai pupuk organik berarti mengembalikan produk fotosintesis ke tanah sehingga akan
tercipta suatu siklus yang lestari. Secara teknis, kegiatan penelitian ini sangat sesuai karena
selaras dengan kebutuhan riil di lapangan.

3
1.6 Luaran
Luaran yang diharapkan dari penelitian selama 3 tahun ini secara singkat diberikan dalam
Tabel 1.
Tabel 1. Luaran penelitian selama 3 tahun
Luaran Tahun 1 Tahun 2 Tahun 3
Publikasi Nasional (Non Akreditasi) √√ √√ √√
Publikasi Nasional (Akreditasi) √ √ √
Publikasi Internasional √ √
Teknologi Tepat Guna √
Buku Ajar √
Produk yang dapat langsung dimanfaatkan adalah teknologi tepat guna berupa sistem
pembangkitan listrik skala kecil berbahan bakar biogas yang dihasilkan dari fermentasi
anaerobik bahan organik padat. Sistem ini dapat langsung diaplikasikan ke masyarakat.
Produk samping dari sistem ini adalah kompos yang dapat diaplikasikan oleh masyarakat
untuk mengganti atau mengurangi konsumsi pupuk kimia.

4
BAB II. STUDI PUSTAKA
2.1 Biogas sebagai Sumber Energi
Makin menipisnya cadangan energi fosil dan makin meningkatnya harga energi telah
menempatkan Indonesia berada pada kondisi krisis energi. Azahari (2012) melaporkan bahwa
cadangan energi fosil Indonesia hanya akan bertahan selama 11 tahun untuk minyak, 32
tahun untuk gas, dan 85 tahun untuk batubara. Oleh karena itu perlu dikembangan energi
alternatif yang dapat diperbaharui. Limbah pertanian dan peternakan merupakan sumber
biomassa yang melimpah yang dapat digunakan sebagai bahan baku untuk menghasilkan
biogas karena memiliki kandungan bahan organik yang tinggi.
Proses fermentasi anaerobik biogas merupakan alternatif bagi pengomposan konvensional
dan pengelolaan limbah organik lainnya, dan mengubah bahan organik oleh konsorsium
mikroba dalam kondisi tanpa oksigen menjadi dua kategori produk berharga, yaitu biogas dan
pupuk organik (Jingura dan Rutendo, 2009; Li et al., 2011; Lema dan Omil, 2001; Li dan
Liew, 2011). Biogas telah menjadi salah satu teknologi konversi energi biomasa yang telah
mapan dan terbukti dapat menyediakan energi listrik dan panas. Teknologi biogas dipercaya
dapat menjadi salah satu sumber energi yang lestari (sustainable). Beberapa negara telah
memperoleh keuntungan dari teknologi biogas, baik negara maju maupun berkembang, di
antaranya adalah China, India, Vietnam, Nepal, dan Jerman. Pada akhir tahun 2012, di China
terdapat 41,68 juta unit biogas skala rumah tangga, 24.000 unit biogas skala peternakan kecil,
80.500 unit biogas skala peternakan besar dan 3,691 unit biogas skala menengah-besar (Li,
2014). Di Jerman lebih dari 7000 unit biogas mampu menghasilkan listrik hingga 4000 MW
(Federal Ministry of Food and Agriculture, 2014). Hingga tahun 2011, lebih dari 4 juta
keluarga di India telah menggunakan biogas skala rumah tangga (Ministry of New and
Renewable Energy, 2014). Aplikasi biogas di Indonesia baru mulai dan masih sangat terbatas
jumlahnya. Salah satu alasan lambatnya perkembangan biogas di Indonesia adalah masih
melimpahnya bahan bakar kayu di wilayah perdesaan (Marchaim, 1992). Program BIRU
(Biogas Rumah), suatu program biogas rumah tangga Indonesia yang merupakan kerjasama
pemerintah Indonesia dan Belanda, hanya menargetkan 10.000 unit biogas skala rumah
tangga untuk periode 4 tahun (2009-2012) (SNV, 2012).
Saat ini mulai banyak industri yang memanfaatkan air limbah untuk produksi biogas, antara
lain industri kelapa sawit, tapioka, dan etanol. Sekitar 10 industri di Lampung telah
menginstal biogas untuk pembangkit listrik maupun panas. Hasanudin et al. (2011)

5
melaporkan, Lampung berpotensi menghasilkan biogas yang jika dimanfaatkan berpotensi
menurunkan emisi GHG antara 1,49 hingga 1,57 ton CO2 ekivalen per tahun.
2.2 Mekanisme Proses Biogas
Perombakan senyawa organik menjadi biogas dapat dianggap berlangsung dalam dua tahap.
Pertama, kelompok bakteri fakultatif dan bakteri anaerobik mengubah senyawa organik
kompleks menjadi material organik yang lebih sederhana (asam lemak volatil, CO2 dan H2).
Kedua, asam organik dan H2 dikonversi menjadi CH4 dan CO2. Proses produksi biogas dapat
dirinci lagi berdasarkan lintasan metabolik seperti disajikan pada Gambar 1. Terlihat bahwa
proses konversi substrat organik kompleks menjadi biogas melibatkan empat tahap, yaitu:
1. Hidrolisis polimer organik menjadi asam amino, gula, dan asam lemak (hidrolisis).
2. Fermentasi asam amino dan gula menjadi hidrogen, asetat dan asam lemak volatil rantai
pendek, serta alkohol (acidogenesis).
3. Oksidasi anaerobik produk intermediet seperti asam-asam volatil (kecuali asetat) menjadi
asam asetat (acetogenesis).
4. Konversi asetat menjadi metana oleh organism asetotrofik dan hidrogen menjadi metana
(reduksi CO2) oleh organism hidrogenotrofik (metanogenesis).
Hidrolisis
Acidogenesis
Acetogenesis Metanogenesis
Gambar 1. Tahap-tahap dalam proses penguraian anaerobik (Lingkaran kecil menunjukkan
jenis bakteri: 1. Bakteri hidrolisis (fermentatif), 2. Bakteri acetogenik, 3 dan 4. Bakteri metanogenik (Ahring, 2003).

6
Berdasarkan kandungan padatan kering (TS) dalam bahan baku, teknologi biogas dibedakan
menjadi fermentasi anaerobik “basah” dan “kering.” Li et al. (2011) menggunakan batas TS
kurang dari 15% untuk fermentasi basah dan lebih dari 15% untuk fermentasi kering.
Sementara itu, de Baere (2000) membatasi TS untuk fermentasi basah kurang dari 10% dan
fermentasi kering hingga 40%.
Meskipun proses fermentasi basah limbah organik untuk produksi biogas telah berkembang
baik dan banyak digunakan, masih ada beberapa masalah yang harus diperhatikan.
Fermentasi basah memiliki beberapa kekurangan yang akan memberikan pengaruh negatif
terhadap kelayakan ekonominya. Sistem ini memerlukan beberapa persyaratan, di antaranya
adalah: perlunya suplai dan pengelolaan air dalam jumlah besar; perlunya instalation digester
atau reaktor berukuran besar; efluen digester (digestat) dalam jumlah besar perlu pengeringan
dan penanganan; dan perlu energi besar untuk pemanasan digester, pemompaan slurry
umpan, dan penanganan digestat atau slurry (Jha et al., 2010; Radwan et al., 1993).
Untuk mengatasi kekurangan-kekurangan di atas, fermentasi kering dapat digunakan. Proses
fermentasi basah maupun kering bergantung pada prinsip dan proses yang sama untuk
menguraikan bahan organik. Tetapi, proses kering menawarkan keuntungan: di antaranya
dapat memanfaatkan limbah dalam bentuk apa adanya, tidak mensyaratkan sumber air, laju
beban organik yang tinggi, ukuran digester kecil, tidak menghasilkan limbah cair, tidak perlu
perlakuan untuk digestat (Pavan et al., 2000). Proses fermentasi kering menstabilkan limbah
padat organik tanpa pengenceran atau menggunakan air terbatas. Oleh karena itu, biogas
menggunakan fermentasi kering merupakan keuntungan bagi daerah-daerah dengan sumber
air yang sulit (Köttner, 2002). Fermentasi anaerobik kering lebih dipilih dari fermentasi basah
karena digestat dapat dengan mudah digunakan sebagai pupuk (Li dan Liew, 2011).
Selain itu, proses fermentasi kering mampu menghasilkan produksi biogas yang lebih tinggi
per satuan volume reaktor. Brown (2012) melaporkan bahwa produktivitas biogas volumetrik
dari fermentasi anaerobik kering sampah kertas adalah 70% hingga 88% lebih tinggi untuk
proses kering dibandingkan proses basah. Chen et al. (2014) juga melaporkan bahwa
produksi metana dari fermentasi anaerobik kering dengan kandungan TS 15–20% adalah
lebih tinggi dibandingkan hasil pada fermentasi basah pada kandungan yang sama.
Melalui sistem fermentasi anaerobik kering, metana dari sampah organik dapat digunakan
untuk energi sehingga fermentasi anaerobik kering menjadi alternatif bagi penumpukan
sampah di TPA (landfilling) dan pengomposan konvensional (Li dan Liew, 2011).

7
2.3 Faktor-faktor Penting
Parameter pengoperasian digester harus diontrol untuk meningkatkan aktivitas mikrobial
sehingga meningkatkan efisiensi degradasi sistem anaerobik. Beberapa faktor penting
meliputi komposisi bahan, C/N ratio, kandungan TS, suhu, pH, dan SRT.
2.3.1 Komposisi Substrat
Bahan kompleks untuk biogas bisa memiliki komposisi yang berbeda-beda yang akan
mempengaruhi produksi biogas dan kualitasnya, serta mempengaruhi kualitas kompos
(kandungan CH4 dalam biogas). Tabel 2 meringkaskan reaksi (stoikhiometri) dan komposisi
metana dari berbagai substrat. Terlihat bahwa, kandungan metana (70%) tertinggi diperoleh
dari substrat lemak.
Tabel 2. Komposisi teoritis metana dari beberapa jenis substrat (Harikishan, 2008)
Substrat Reaksi CH4 (%)
Karbohidrat (C6H10O5)n + nH2O → 3nCH4 + 3nCO2 50
Protein 4C11H24O5N4 + 58H2O → 33CH4 + 15CO2 + 19NH+4 + 16HCO−3 69
Lemak 4C15H90O6 + 98H2O → 139CH4 + 61CO2 70
Sludge primer C10H19O3N + 4,5H2O → 6,25CH4 + 3,75CO2 + NH3 62,5
Limbah-aktif C5H7O2N + 3H2O → 2,5CH4 + 2,5CO2 + NH3 50
2.3.2 Kandungan Padatan
Tchobanoglous (1993) membagi bahan baku untuk proses fermentasi anaerobik menjadi tiga
golongan berdasarkan kandungan padatannya, yaitu bahan dengan kandungan padatan rendah
(TS < 10%), medium (TS =15-20%), dan tinggi (TS = 22-40%). Makin tinggi kandungan TS
berimplikasi pada penurunan volume reaktor (digester).
Li et al. (2011b) meneliti pengaruh kandungan TS pada proses produksi biogas sistem kering
dari batang jagung pada suhu termofilik (55°C) dan mesofilik (37°C). Produksi biogas
tertinggi (403,7 L/kg VS) diperoleh pada 55°C dengan kandungan TS bahan 22%. Mereka
juga melaporkan bahwa peningkatan TS dari 22% menjadi 27% mengakibatkan penurunan
produksi biogas sebesar 29,8% pada suhu 55°C. Digester dengan TS lebih dari 35% memiliki
laju reaksi yang semakin lambat (Jewell et al., 1993). Menurut Chen et al. (2014), penurunan
produksi biogas akibat peningkatan TS mungkin disebabkan oleh beban organik yang
berlebihan dan kelebihan ammonia.
8
Pengoperasian digester pada kandungan TS hampir tiga kali lipat dari digester basah
mengakibatkan produksi gas per unit volume yang meningkat secara signifikan sehingga
meningkatkan efektivitas biaya. Secara hipotesis, pengoperasian digester kering dengan TS
30% akan meningkatkan tingkat produksi gas oleh tiga kali dibandingkan digester bash (TS
10%), dengan catatan semua variabel lainnya konstan dan bahwa densitas padatan bukanlah
faktor pembatas. Namun, peningkatan konsentrasi padatan secara proporsional akan
meningkatkan variabel lain (alkalinitas, konsentrasi amonia-N, dan massa mikroba). Sebagai
contoh, jika alkalinitas dalam digester basah adalah 8 g/L (sebagai CaCO), maka pada
digester kering nilai itu akan melebihi 20 g/L (Jewell, et al., 1993).
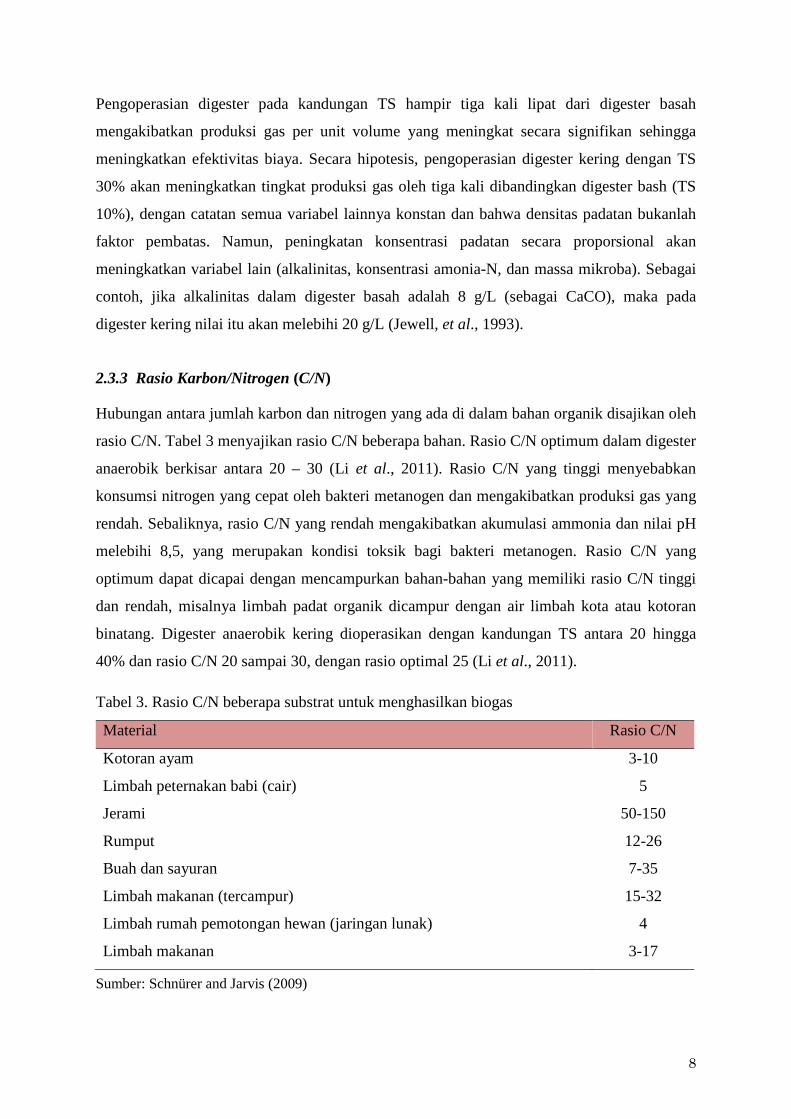
2.3.3 Rasio Karbon/Nitrogen (C/N)
Hubungan antara jumlah karbon dan nitrogen yang ada di dalam bahan organik disajikan oleh
rasio C/N. Tabel 3 menyajikan rasio C/N beberapa bahan. Rasio C/N optimum dalam digester
anaerobik berkisar antara 20 – 30 (Li et al., 2011). Rasio C/N yang tinggi menyebabkan
konsumsi nitrogen yang cepat oleh bakteri metanogen dan mengakibatkan produksi gas yang
rendah. Sebaliknya, rasio C/N yang rendah mengakibatkan akumulasi ammonia dan nilai pH
melebihi 8,5, yang merupakan kondisi toksik bagi bakteri metanogen. Rasio C/N yang
optimum dapat dicapai dengan mencampurkan bahan-bahan yang memiliki rasio C/N tinggi
dan rendah, misalnya limbah padat organik dicampur dengan air limbah kota atau kotoran
binatang. Digester anaerobik kering dioperasikan dengan kandungan TS antara 20 hingga
40% dan rasio C/N 20 sampai 30, dengan rasio optimal 25 (Li et al., 2011).
Tabel 3. Rasio C/N beberapa substrat untuk menghasilkan biogas
Material Rasio C/N
Kotoran ayam 3-10
Limbah peternakan babi (cair) 5
Jerami 50-150
Rumput 12-26
Buah dan sayuran 7-35
Limbah makanan (tercampur) 15-32
Limbah rumah pemotongan hewan (jaringan lunak) 4
Limbah makanan 3-17
Sumber: Schnürer and Jarvis (2009)

9
2.3.4 Derajat Keasaman (pH)
Nilai pH untuk fermentasi anaerobik biogas terletak di antara 6,0 dan 8,5. Di luar kisaran ini
akan terjadi ketidakseimbangan. Bakteri methanogen dan acetogen memiliki pH optimum
sekitar 7, sedangkan pH optimum untuk bakteri acidogen sekitar 6. Nilai pH yang rendah
akan menghambat acidogenesis dan pada pH kurang dari 6,4 dapat menjadi kondisi toksik
bagi bakteri pembentuk metana. Kisaran pH optimum bagi bakteri metanogenesis adalah
antara 6,6 hingga 7. Pada pH kurang dari 6,6 bakteri metanogen tumbuh sangat lambat.
Kisaran pH yang optimal bagi proses fermentasi anaerobik berada pada rentang yang sempit,
yaitu 6,4 hingga 7,2 (Monet, 2003).
2.3.5 Suhu
Suhu merupakan faktor lingkungan utama yang mempengaruhi pertumbuhan bakteri. Laju
pertumbuhan bakteri meningkat dengan naiknya temperatur hingga suatu batas tertentu, tetapi
pertumbuhan menurun tajam pada suhu mendekati batas atas di mana bakteri dapat bertahan.
Selain itu, suhu juga mempengaruhi parameter-parameter fisik seperti viskositas, tegangan
permukaan dan perpindahan masa. Berdasarkan suhu optimumnya, mikroorganisme dapat
dibagi menjadi empat kelompok (Warner et al., 1989), yaitu psychrophilic (15–18°C),
mesophilic (28–33°C), thermophilic (40–60°C), dan hipertermofilik (> 65°C).
Suhu memiliki efek positif pada laju dekomposisi bahan organik dan mengakibatkan volume
produksi metana yang lebih tinggi. Vindis et al. (2009) melaporkan bahwa produksi biogas
kumulatif dari batang jagung varietas NK PAKO mencapai 400 Nl/kg VS di hari ke-27 pada
kondisi mesofilik dan 600 Nl/kg VS di hari ke-25 dengan kondisi termofilik.
2.3.6 Waktu Tinggal (Retention Time)
Waktu retensi adalah waktu rata-rata bahan baku menghabiskan waktu di dalam digester;
untuk proses basah dinamakan waktu tinggal hidrolik atau HRT (hydraulic retention time)
dan untuk proses kering dinamakan waktu tinggal padatan atau SRT (solids retention time).
SRT adalah desain dasar dan parameter operasi untuk semua proses anaerobik. Tahap-tahap
dalam proses fermentasi anaerobik secara langsung berhubungan dengan waktu tinggal.
Penurunan waktu tinggal akan menurunkan tingkat reaksi, dan demikian sebaliknya.
Waktu tinggal bervariasi bergantung pada teknologi, suhu proses, dan komposisi bahan.
Waktu tinggal untuk limbah kota yang diolah pada digester mesofilik berkisar antara 10

10
hingga 40 hari. Waktu tinggal untuk digester dengan kotoran sapi adalah antara 20 hingga 30
hari. Digester termofilik memerlukan waktu tinggal lebih cepat.
Hubungan antara produksi gas dan waktu tinggal dalam reaktor (semi-) CSTR (Appels et al.,
2008) menunjukkan bahwa: (i) waktu retensi kurang dari 5 hari tidak mencukupi untuk
penguraian yang stabil karena konsentrasi VFA meningkat akibat bakteri metanogen tercuci,
(ii) konsentrasi VFA masih relatif tinggi untuk SRT 5-8 hari sehingga dekomposisi senyawa
belum sempurna, terutama lipid, (iii) penguraian yang stabil diperoleh setelah 8-10 hari:
konsentrasi VFA rendah, kerusakan lipid dimulai, dan (iv) kurva kerusakan stabil pada SRT
410 hari, semua senyawa lumpur berkurang secara signifikan.
2.4 Bahan Baku (Substrat)
Sebagaimana telah disampaikan sebelumnya, fermentasi anaerobik sistem kering dapat
menggunakan bahan organik apa pun dengan kandungan TS hingga 40%. Limbah agro-
industri, limbah rumah tangga, sampah halaman, dan tanaman energi merupakan bahan baku
yang potensial bagi proses biogas fermentasi kering. Pemanfaatan limbah agro-industri
sebagai substrat dalam proses anaerobik kering memberikan jalan alternatif dan nilai tambah
pada limbah tersebut (Pandey, 2003). Di antara bahan-bahan tersebut, jerami padi, batang
jagung, sampah halaman, dan rumput gajah perlu memperoleh perhatian.
2.4.1 Jerami Padi
Jerami padi sangat melimpah di negara kita sehingga layak dipertimbangkan potensinya
sebagai feedstock untuk menghasilkan biogas sistem kering. Sarnklong et al. (2010)
melaporkan bahwa jerami padi adalah 45% dari padi yang dihasilkan. Dengan luas panen
69,06 juta ton (BPS, 2013), potensi jerami Indonesia adalah 31,08 juta ton per tahun.
Jerami padi sangat potensial sebagai bahan baku biogas karena memiliki kandungan selulose
33,35% TS dan hemiselulose 31,42% TS. Shyam dan Sharma (1994) melaporkan fermentasi
anaerobik dari jerami padi dan bahan organik lain yang dicampur dengan kotoran ternak
dalam digester batch kecil, memberi hasil yang menggembirakan pada konsentrasi TS awal
16-19%. Produksi biogas bervariasi dari 202,2 hingga 499,3 liter/hari/m3 untuk waktu tinggal
7 minggu dan 196,2 hingga 407,7 liter/hari/m3 untuk waktu tinggal 10 minggu, lebih tinggi
dibandingkan dengan 204-372 liter/hari/m3 untuk kasus digester basah semi kontinyu
menggunakan kotoran ternak yang diencerkan pada konsentrasi TS 8-9 % dan waktu tinggal
7 minggu. Song et al. (2013) melaporkan produksi metana sebesar 225,3 L/kg VS dari jerami

11
padi dengan perlakuan alkali (9,81% Ca(OH)2, w/w TS) dan proporsi inokulum 45,12%.
Sementara itu, Teghammar et al. (2012) melaporkan bahwa produksi metana dari jerami padi
meningkat dari 22 Nml/g bahan (tanpa perlakuan) dengan waktu tinggal 6 minggu. Dengan
perlakuan NMMO atau N-methylmorpholine-N-oxide produksi metana meningkat tajam
menjadi 157 Nml/g bahan, setara dengan 328 Nml CH4/g karbohidrat yang berarti 79% dari
produksi teoritis 415 Nml CH4/g karbohidrat). Selain itu waktu tinggal dapat dipercepat
menjadi hanya 1,5 minggu.
2.4.2 Batang Jagung
Menurut Prasetyo dkk. (2002) limbah batang dan daun jagung kering adalah 3,46 ton/ha.
Dengan luas panen 3,9 juta ha (BPS, 2013) maka pada tahun 2013 limbah batang dan daun
jagung diperkirakan mencapai 13,5 juta ton. Batang jagung tua memiliki TS sekitar 80%
dengan TDN (Total Digestable Nutrient) 59 sampai 67%, sedangkan TS dan TDN untuk
batang jagung muda berturut-turut adalah 26% dan 65% (Umiyasih dan Wina, 2008).
Fermentasi anaerobik kering campuran batang jagung dan kotoran ternak pada 55 - 35°C
(Molnar and Bartha, 1989) dalam digester batch berisolasi termal juga telah dibuktikan
keberhasilannya. Produksi biogas yang efektif melalui fermentasi kering batang jagung baik
pada suhu mesofilik (37°C) maupun termofilik (55°C) juga dilaporkan Li et al. (2011b).
Produksi biogas tertinggi (403,7 L/kg VS) diperoleh pada suhu 55°C dengan kandungan TS
22% dan inokulum (kotoran ternak) 29% berat bahan. Olugbemide et al. (2012) melaporkan
produksi biogas dari campuran daun jagung dan daun rumput gajah menggunakan digester 2
L dengan volume isian setengahnya. Produksi biogas mencapai 520 ml untuk daun jagung
dan 870 ml untuk campuran 90% daun jagung dengan 10% daun rumput gajah. Amon et al.
(2007) mencoba mengoptimalkan pencernaan anaerobik jagung dan kotoran sapi perah.
Produksi metana diukur selama 60 hari dalam 1 l digester batch pada 38oC. Produksi metana
spesifik tertinggi 166,3 Nl CH4/kg VS. Produksi metana menurun ketika tanaman mendekati
kematangan penuh. Produksi metana berkisar antara 312 dan 365 Nl CH4/kg VS (matang
susu) dan 268-286 Nl CH4/kg VS (matang penuh). Produksi metana dari silase jagung
meningkat sekitar 25 % dibandingkan dengan jagung segar.
Zheng et al. (2009), melaporkan perlakuan sodium hidroksida (NaOH) pada proses anaerobik
basah menggunakan batang jagung dengan dosis NaOH 2% dan laju pembebanan 65 g/L
menghasilkan biogas secara optimal. Produksi biogas 72,9% lebih banyak dibandingkan
batang jagung tanpa perlakuan dengan produksi metana 73,4% lebih tinggi dan waktu tinggal
34,6% lebih pendek. Perlakuan NaOH basah memerlukan NaOH 66,7% lebih sedikit

12
dibandingkan proses kering. Perlakuan alkaline dengan dosis NaOH antara 1 hingga 7,5%
(w/w) juga dilaporkan oleh Zhu et al., (2010) pada proses fermentasi kering batang jagung
dengan inokulum efluen cair digester anaerobik. Degradasi lignin meningkat dari 9.1%
hingga 46.2% ketika dosis NaOH meningkat dari 1.0% menjadi 7.5%. Produksi biogas
tertinggi 372.4 L/kg VS diperoleh pada batang jagung dengan perlakuan NaOH 5%. Hasil ini
37,0% lebih tinggi dari batang jagung tanpa perlakuan. Dosis NaOH 7,5% mengakibatkan
produksi asam lebih volatil lebih cepat pada tahap hidrolisis dan acidogenesis, yang
menghambat metanogenesis. Zhong et al. (2011) menemukan bahwa dengan perlakuan awal,
komposisi jerami jagung seperti lignin, selulosa, dan hemiselulosa akan terdegradasi secara
signifikan, dan bahwa struktur fisik dari matriks lignoselulosa juga akan berubah.
Percobaannya menunjukkan bahwa produktivitas biogas meningkat oleh semua perlakuan
(pemberian Jamur Pleurotus florida, NaOH, amonia, dan urea); dan bahwa produksi biogas
setelah perlakuan NaOH 207,07% lebih tinggi dari jerami jagung tanpa perlakuan.
2.4.3 Rumput
Rumput gajah (Penisetum purpuerum) dalam beberapa tahun terakhir telah menarik perhatian
dan telah menjadi salah satu fokus dari riset bioenergi. Tanaman perennial ini memiliki
tampilan yang tinggi, dan daun lebar (3 cm) dengan panjang 30–90 cm (Duke, 1983).
Rumput ini telah dibudidayakan di Indonesia untuk keperluan pakan sapi. Pengamatan
lapangan di PT. Great Giant Livestock (GGL), Lampung Tengah menunjukkan bahwa
rumput ini mampu mengasilkan biomasa segar antara 40 hingga 80 ton per panen dengan
masa panen 70-80 hari. Rumput dapat diratoon 6-7 kali sebelum dibongkar. Rumput ini juga
lebih toleran di tanah yang sedikit masam (GGL, 2014). Komposisi kimia rumput ini (Tabel
4) menunjukkan bahwa rumput gajah berpotensi untuk dikembangkan sebagai bahan baku
produksi biogas melalui proses kering.
Tabel 4. Komposisi kimia rumput gajah (%)
Komposisi kimia Silase Segar
Kadar air - 77.8
Protein 5.8 1.0
Lemak 4.9 0.5
Karbohidrat total 73.4 17.6
Abu 15.9 3.1
Sumber: Duke (1983)

13
Pemanfaatan rumput sebagai bahan baku untuk menghasilkan biogas telah dimulai oleh
beberapa peneliti. Hidrolisis komponen dinding sel rumput gajah menghasilkan gula yang
siap dikonversi menjadi metana melaui fermentasi anaerobik. Jewell et al. (1993) meneliti
produksi biogas dari tanaman energi yang meliputi sorgum (Sorghum bicolor), rumput gajah
(Pennisetum purpureum), dan jagung (Zea maiz) dengan kandungan TS 25-30% dan
memperoleh tingkat produksi metana maksimal.
Ahn et al. (2010) meneliti kinerja fermentasi anaerobik kering rumput switchgrass yang
dicampur kotoran ternak yang berbeda (babi, unggas, dan sapi perah) pada TS 15% dan suhu
termofilik (55°C). Campuran dengan kotoran babi menghasilkan dekomposisi VS (volatile
solids) sebesar 52,9%, lebih tinggi dari campuran kotoran unggas (9,3%) dan kotoran sapi
perah (20,2%). Selama 62 hari waktu tinggal, campuran rumput dengan kotoran babi
menghasilkan metana tertinggi (0,337 L CH4/g VS), sedangkan campuran dengan kotoran
sapi perah dan kotoran unggas berturut-turut menghasilkan metana 0,028 L CH4/g VS dan
0,002 L CH4/g VS.
Ekpenyong et al. (1995) melaporkan produksi biogas dari fermentasi anaerobik batang
rumput gajah kering yang digiling mencapai sekitar 450 ml selama 5 hari dengan 4 g substrat.
Peningkatan produksi biogas sebanyak 40% diperoleh dengan penambahan 0,01 g urea.
2.4.4 Kotoran Sapi
Digester biogas dari kotoran sapi biasanya dilakukan dengan menambahkan air dengan
perbandingan 1:1. Selain memerlukan air dalam jumlah besar, hal ini akan memerlukan
volume digester yang besar juga. Lumpur digestat yang banyak memerlukan tempat yang
besar untuk pengeringan guna memudahkan pengangkutan ke lahan untuk digunakan sebagai
kompos. Masalah inilah yang membatasi instalasi biogas sistem basah di daerah yang
memiliki keterbatasan lahan dan air. Beberapa penelitian telah dilakukan untuk menghasilkan
biogas dari limbah sapi dengan konsentrasi TS yang tinggi.
Singh dan Anand (1994) melaporkan bahwa produksi biogas dari kotoran sapi pada digester
kering adalah 84% dari sistem konvensional (basah) dengan suhu ambient maksimum 40,2oC
dan minimum 24,9oC. Sementara itu Jha et al. (2013) melaporkan digester menggunakan
kotoran sapi pada suhu mesofilik (35oC) dengan fermentasi sistem basah dan sistem kering,
berturut-turut menghasilkan produksi CH4 spesifik 0,333 dan 0,345 LCH4/gVS, dekomposisi
VS 50,01% dan 56,33%, serta COD removal 54,99% dan 61,35%. Pada fermentasi termofilik
(55oC), produksi CH4 spesifik meningkat menjadi 0,351 dan 0,374 LCH4/gVS, dengan

14
dekomposisi VS 53,43% dan 60,52%, serta COD removal 58,37% dan 65,36%, berturut-turut
untuk sistem basah dan sistem kering. Meskipun penambahan air dapat membantu proses
start-up dan biodegradabilitas substrat, produksi metana melalui proses fermentasi anaerobik
kering cukup sebanding dengan proses basah. Selain itu, volume reaktor untuk proses kering
(15,18% TS) adalah separoh dari proses basah (7,68% TS) untuk bahan baku kotoran sapi.
Oleh karena itu, fermentasi kering lebih baik dalam hal rekoveri energi, penghematan sumber
daya, dan investasi teknik dibandingkan dengan proses fermentasi basah (Jha et al., 2013).
Produksi gas, secara umum, lebih tinggi untuk substrat yang terdiri dari campuran kotoran
ternak dan limbah pertanian dibandingkan kotoran ternak saja. Gu et al. (2014) menunjukkan
bahwa inokulum efluen dari digester dengan substrat kotoran sapi menghasilkan biogas
terbaik dibandingkan efluen digester dengan kotoran babi, kotoran ayam, dan air limbah kota.
2.5 Peta Jalan Penelitian
Dalam tiga tahun terakhir, pengusul telah melakukan penelitian terkait dengan biogas. Studi
pendahuluan mengenai produksi biogas dari bahan organik padat telah kami lakukan
menggunakan tandan kosong kelapa sawit (Haryanto dkk., 2014), rumput gajah (Ayub dkk.,
2015), dan kulit pisang (Fairuz dkk., 2015). Penggunaan jerami padi untuk menghasilkan
biogas saat ini sedang dalam proses. Penelitian-penelitian tersebut menunjukkan bahwa
bahan organic padat dapat menghasilkan biogas melalui proses fermentasi kering. Tetapi
hasilnya masih belum menggembirakan sehingga perlu dilakukan perbaikan proses.
Penelitian mengenai pemurnian biogas menggunakan biofilter juga sudah kami lakukan sejak
2012. Hasilnya sangat memuaskan karena biofileter dapat menurunkan kadar H2S menjadi <2
ppm (Indraningtyas dkk., 2012). Selanjutnya Fadli dkk. (2015) telah mengkaji kinerja genset
700 W menggunakan bahan bakar biogas yang dihasilkan dari limbah cair industri kelapa
sawit dalam digester berkapasitas 5 m3 substrat. Penelitian awal menunjukkan bahwa dengan
pretreatment sederhana biogas dapat digunakan langsung sebagai bahan bakar genset. Genset
berkapasitas puncak 700 W ini bekerja dengan baik hingga beban mendekati maksimum (600
W).
Secara ringkas, peta jalan (roadmap) penelitian produksi listrik skala kecil dari biogas adalah
seperti diberikan dalam Tabel 5 dan Gambar 2.

15
Tabel 5. Roadmap penelitian produksi listrik skala kecil dari biogas.
Yang sudah/akan dikerjakan Tahun
Peningkatan Kualitas Biogas Menggunakan Biofilter
(Indraningtyas, L., Hasanudin, U., Haryanto, A., Triyono, S., Waluyo, S. 2012. Studi Reduksi Kadar H2S pada Biogas Air Limbah Industri Tapioka Menggunakan Biofilter Kompos. Seminar Nasional Asosiasi Profesi Teknologi Agroindustri (APTA), Bali, 2-3 November 2012.)
2012
……… 2013
Produksi Biogas dari Tandan Kosong Kelapa Sawit
(Apria, N.E., Haryanto, A., Triyono, S. 2014. Produksi Biogas Dari Limbah Tandan Kosong Kelapa Sawit Melalui Proses Dry Fermentation. Seminar BKS PTN Wilayah Barat. UNILA 19-20 Agustus 2014.
2014
Produksi Biogas dari Rumput Gajah
(Ayub, Haryanto, A., Prabawa, S. 2015. Produksi Biogas Dari Rumput Gajah Melalui Fermentasi Kering. Unpublished)
2014
Produksi Biogas dari Campuran Kulit Pisang dan Ampas Kelapa
(Fairuz, A., Haryanto, A., Tusi, A. 2015. Produksi Biogas Dari Campuran Limbah Kulit Pisang dan Ampas Kelapa. Jurnal Teknik Pertanian Lampung 2015 accepted)
Kinerja Genset dengan Bahan Bakar Biogas
(Marotin, F., Haryanto, A., Kadir, M.Z. 2015. Studi Kinerja Genset Biogas Kapasitas 750 Watt Dengan Bahan Bakar Biogas Dari Limbah Kelapa Sawit. Jurnal Teknik Pertanian Lampung, submitted)
2015
Produksi Biogas dari Jerami Padi (on going) 2015
Penguatan dan Optimalisasi Produksi Biogas dari Bahan Organik Padat 2016
Desain Sistem Pembangkitan Listrik Skala Kecil Menggunakan Biogas 2017
Aplikasi Sistem PLT Biogas Skala Kecil untuk Pengoperasian Kandang Ternak Sapi
2018
PLT Biogas Skala Rumah Tangga …….
Catatan: 2016 dan seterusnya akan dikerjakan

16
Gambar 2. Diagram fish bone tahapan penelitian hingga tahun 2018.
PEMBANGKIT LISTRIK TENAGA BIOGAS SKALA
RUMAH TANGGA
MP3EI 2013: Biogas dari TKKS
STRANAS 2012: BioFilter Biogas
DIPA 2014: Biogas dari Rumput Gajah
DIPA 2015: Biogas dari Kulit Pisang
2016: Penguatan & Optimalisasi Biogas
2015: Biogas dari Jerami
Pretreatment
C/N ratio
+ Ragi
TS
HRT
TS Filter Kompos
H2S
TS
HRT Inokulan
TS
Indikator capaian: Jurnal Akreditasi
Indikator capaian: Jurnal Nasional
Substrat
2018: Aplikasi PLT Biogas
2017: Desain Sitem PLT Biogas
Pretreatment
Ekonomi
Load
Ketahanan
Indikator capaian: Jurnal Akreditasi
Indikator capaian: Jurnal Akreditasi

17
BAB 3. METODE PENELITIAN
Secara keseluruhan, penelitian ini dirancang selama 3 tahun (Gambar 3). Secara garis besar
fokus pada tiap-tiap tahun adalah sbb:
* Tahun I: Penguatan dan Optimalisasi proses produksi biogas dari bahan organic padat
dengan variable substrat, jenis (sumber) inokulant, perlakuan awal (pretreatment),
kandungan TS, dan C/N ratio.
* Tahun II: Desain Sistem Pembangkit Listrik Tenaga Biogas Skala Kecil dengan variable
kebutuhan bahan bakar, perlakuan awal biogas, kebutuhan dasar listrik rumah tangga.
* Aplikasi PLT Biogas skala kecil untuk mengoperasikan kandang sapi kapasitas 5 ekor.
Gambar 3. Diagram alir pelaksanaan penelitian selama 3 tahun (2016-2018)
3-1. Penelitian Tahun I (2016)
3.1.1. Bahan Baku
Bahan baku utama dalam penelitian ini terdiri dari:
* Limbah pertanian terpilih (jerami padi, jerami jagung) diperoleh dari kebun dan sawah
petani terdekat.
* Sampah dedaunan dikumpulkan dari sekitar kampus Unila.
* Rumput gajah diperoleh dari kebun Lab. Lapang Terpadu, Fakultas Pertanian, Unila
* Starter yang akan digunakan adalah kotoran sapi yang akan diambil dari kandang sapi
milik Jurusan Peternakan Fakultas Pertanian (UNILA) dan efluen dari digester pilot yang
terdapat pada Jurusan Teknologi Hasil Pertanian (UNILA).
Penguatan dan Optimalisasi produksi biogas dari bahan organic padat: substrat, inokulum, C/N rasio,
TS, pretreatment
Tahun 2 Desain Sistem PLT Biogas: Kebutuhan bahan bakar, Load, pemurnian & penyimpanan biogas
Luaran: Makalah seminar, jurnal nasional, jurnal
akreditasi
Luaran: PTL Biogas skala kecil, jurnal akreditasi,
jurnal internasional
Aplikasi PLT Biogas Luaran: TTG PLT Biogas,
jurnal akreditasi, jurnal internasional, buku ajar
Tahun 1
Tahun 3

18
Pertama-tama, bahan-bahan tersebut akan dikarakterisasi untuk memperoleh informasi yang
diperlukan, seperti kadar air, kandungan bahan kering (TS), kandungan bahan organik (VS),
kandungan Nitrogen total (N), karbon (C), dan rasio C-N. Kandungan TS, dan VS juga
diukur untuk effluent dan kotoran sapi segar.
3.1.2. Rangkaian Percobaan
Drum dari bahan fiber dengan volume 220 liter digunakan sebagai digester anaerobik
(Gambar 4). Di dalam drum diberi sarangan dari bahan plastik setinggi 10 cm dari dasar.
Drum ditutup menggunakan tutup yang kedap udara. Pada tutup dilengkapi dengan port
untuk mengeluarkan gas dan menyemprotkan air. Di bagian bawah toples dilengkapi dengan
port untuk mengeluarkan lindi.
Gambar 4. Sketsa unit eksperimen produksi biogas melalui fermentasi kering
3.1.3. Prosedur Eksperimen
(1) Bahan-bahan baku dihancurkan atau dicacah untuk mendapatkan ukuran panjang
maksimum 2 cm.
(2) Sampel bahan ditimbang sebelum dan sesudah proses.
(3) Kadar air setiap bahan (dan kandungan padatan kering, TS) dihitung dengan cara
pengeringan di dalam oven pada suhu 105°C selama 24 jam.
Saringan plastik
Kolektor gas
Digester Anaerobik
Campuran Substrat + Inokulum
Gelas Ukur
Daur Ulang Lindi
Penampung Lindi
spray

19
(4) Kandungan bahan organik (VS) dihitung dengan cara pembakaran di dalam tanur pada
suhu 550°C selama 30 menit.
(5) Kandungan C dan N substrat dianalisis menggunakan CN analyzer (Lab. Pengolahan
Limbah, Jurusan THP).
(7) Produksi biogas diukur setiap hari hingga berakhirnya fermentasi menggunakan gas flow
meter atau menggunakan metode pemindahan air.
(8) Biogas yang dihasilkan diukur menggunakan metode pemindahan air.
(9) Komposisi biogas diukur menggunakan GC (Simadzu GC 4514).
3.1.4. Potensi Produksi Biogas Skala Rumah Tangga
(1) Produksi biogas diukur dari digester skala rumah tangga berbentuk fixed dome di desa
Pesawaran Indah menggunakan manometer air sederhana berbentuk pipa U.
(2) Pengukuran dilakukan pada dua digester kapasitas 6 m3.
3.1.5. Kebutuhan Biogas Generator Skala Rumah Tangga
(1) Konsumsi biogas diukur dengan menguji mesin generator kapasitas 750W menggunakan
100% biogas.
(2) Pengukuran dilakukan pada beban 100 – 700 W.
(3) Parameter yang diukur: voltase, arus, daya output, konsumsi biogas
3-2. Penelitian Tahun II (2017)
Penelitian pada tahun II dilakukan dengan membuat desain pembangkit listrik tenaga biogas
(PLT Biogas) skala kecil yang memiliki komponen seperti diberikan dalam Gambar 5.
Pengujian dilakukan pada kebutuhan bahan bakar biogas, kualitas bahan bakar biogas yang
mampu diterima genset, serta daya output dari genset. Pada tahap ini, sistem pembangkit
listrik tenaga biogas juga akan diuji di lokasi Bapak Supar (Mitra) yang telah memiliki
instalasi biogas skala besar tetapi belum dikonversi menjadi listrik.

20
Gambar 5. Komponen desain PLT Biogas skala kecil
3-2. Penelitian Tahun III (2018)
Pada tahun III, PLT Biogas skala kecil akan diaplikasikan pada pengoperasian kandang sapi
kapasitas 5 ekor yang ada di Jurusan Peternakan (UNILA). Pengujian dilakukan pada aspek
ketercukupan biogas, ketahanan (durability), serta ekonomi.
Digester
Pengukuran
Drying Biofilter H2S
Storage Genset Beban

21
BAB 4. HASIL DAN PEMBAHASAN
4.1. Potensi Produksi Biogas Skala Rumah Tangga
Tabel 4-1 menunjukkan produksi biogas dari dua digester tipe fixed dome yang
diperkirakan menggunakan perbedaan tinggi air pada kolom manometer U. Digester
dengan 5 hingga 6 ekor sapi bisa menghasilkan biogas pada laju rata-rata 1582 L/hari atau
280 L/hari per ekor sapi. Hasil ini masih jauh dari produksi teoritis. Pathak et al. (2009)
menghitung bahwa digester skala rumah tangga dengan 4 ekor sapi dapat menghasilkan
biogas 2200 m3/tahun atau 6 m3/hari. Oleh karena itu, produksi biogas dari digester
rumah tangga masih bisa ditingkatkan melalui operasi dan manajemen yang lebih baik.
Table 4-1. Produksi biogas dari digester skala rumah tangga
Digester Jumlah sapi (ekor)
Produksi biogas (L/hari)
Produksi biogas (L/hari/ekor)
1 6 2164 360.7
2 5 1000 200.0
Rata-rata 1582 280.3
Komposisi biogas disajikan pada Tabel 4-2. Komposisi tersebut mengindikasikan
bahwa biogas memiliki kualitas yang cukup baik dan mudah dibakar. Menggunakan nilai
energi (low heating value, LHV) untuk metana sebesar 191.76 kcal/mole atau 35.82
MJ/Nm3 maka biogas (dengan kandungan metana 51.4%) memiliki nilai kalori 20.23
MJ/Nm3. Artinya, digester skala rumah tangga tipe fixed dome menghasilkan biogas
dengan nilai energi 29.14 MJ/hari. Dengan mengambil nilai LHV bensin 44 MJ/kg atau
32 MJ/l, maka biogas yang dihasilkan setara dengan bensin 0,91 L/hari.
Table 4-2. Komposisi biogas yang dihasilkan dari digester rumah tangga
Digester Komposisi
CH4 CO2 N2
1 54.14 34.90 10.95
2 48.71 32.72 18.56
Rata-rata 51.42 33.81 14.76

22
Potensi produksi biogas dari bahan campuran kotoran sapi dengan bahan organik lain
seperti rumput gajah dan jerami padi sedang dalam proses penelitian.
4.2. Konsumsi Biogas Generator Skala Rumah Tangga
Tabel 4-3 menunjukkan kinerja mesin generator menggunakan bahan bakar 100%
biogas. Hasil tersebut menunjukkan bahwa pada beban 100 hingga 700 W, konsumsi
biogas (BC) berkisar dari 400.8 hingga 434.4 L/jam dengan nilai rata-rata 415 L/jam.
Tabel 4-3. Kinerja mesin generator 750W dengan 100% biogas
Load
(W)
BC
(L/h)
Power out
(W)
SBC
(L/Wh)
ηth
(%)
100 400.8 80 5.05 6
200 413.6 177 2.35 14
300 386.4 207 1.98 17
400 407.6 286 1.42 23
500 426.8 284 1.50 21
600 437.6 408 1.07 30
700 434.4 379 1.15 28
Parameter lain adalah konsumsi biogas spesifik (SBC), yaitu laju aliran bahan bakar
yang digunakan per unit daya keluaran (power output). SBC merupakan ukuran seberapa
efisien suatu mesin mengkonversi bahan bakar untuk menghasilkan kerja yang berguna.
Hasil kami menunjukkan bahwa SBC menurun terhadap beban dan berkisar dari 5,05
L/Wh pada beban 100 W (13.3%) hingga 1,07 L/Wh pada beban 600 W (80%). Ini
menunjukkan bahwa mesin bekerja makin efisien pada beban mendekati spesifikasinya.
Efisiensi termal (ηTH) bervariasi terhadap beban dari 6% pada beban 100 W hingga
30% pada beban 600 W. Ini membuktikan bahwa mesin menghasilkan kinerja terbaiknya
pada beban mendekati kapasitas maksimum . Kami juga mengamati bahwa penggunaan
biogas sebagai bahan bakar mesin generator menunjukkan operasi yang baik, tanpa
kendala berarti, yang mencapai total waktu 210 menit.

23
Berdasarkan pada data produksi biogas skala rumah tangga sebelumnya, dapat kita
tunjukkan bahwa biogas yang dihasilkan dari digester rumah tangga dengan 5 sampai 6
ekor sapi dapat melayani generator kapasitas 750W sekitar 4 jam per hari (jam 18.00
hingga 22.00). Jika manajemen dan pengoperasian digester diperbaiki, maka produksi
biogas dapat ditingkatkan sehingga generator dapat dioperasikan dengan waktu lebih
lama lagi.
4.3. Pengaruh laju pembebanan
Penelitian skala lab dilakukan menggunakan digester semi kontinyu rancangan
sendiri. Digester terbuat dari dua gallon air minum yang disatukan di bagian pantatnya.
Volume digester adalah 36 L dengan volume kerja (working volume) 25 L, karena ruang
kosong harus disisakan untuk menampung biogas. Proses anaerobic digestion dilakukan
menggunakan kotoran sapi segar yang diperoleh dari Jurusan Peternakan, Universitas
Lampung. Karakteristik kotoran sapi diberikan pada Tabel 4-4.
Table 4-4. Karakteristik substrat kotoran sapi segar
Karakteristik Nilai rata-rata
Kadar Air (% wb) 80.12
Total solid, TS (% wb) 19.88
Abu (% TS) 30.58
Volatile solid, VS (% TS) 69.42
C 39.87
N 1.42
C/N ratio 28.1
Kotoran sapi diencerkan dengan air bersih pada perbandingan 1:1. Hal ini dilakukan
untuk menurunkan kandungan TS hingga sekitar 10% agar proses biogas dapat
berlangsung optimal (Ituen et al., 2007). Penelitian dilakukan untuk mengetahui efek laju
pembenanan terhadap kinerja biogas. Pengisian awal dilakukan dengan volume 25 L.
Selanjutnya, digester diisi setiap hari dengan volume pengisian bervariasi. Lima variasi
laju pembebanan beserta waktu tinggal hidrolik atau HRT (hydraulic retention time) yang
terkait diberikan pada Tabel 4-5.

24
Tabel 4-5. Variasi laju pembebanan dan HRT yang bersangkutan
Hasil penelitian diberikan dalam Gambar 4-1 dan 4-2. Gambar 4-2 memperlihatkan
produksi biogas rata-rata harian dengan metode moving average 10-harian. Terlihat
bahwa pada periode transisi produksi biogas meningkat dari rata-rata 0,6 L/hari menjadi
sekitar antara 5 hingga 7 L/hari tergantung pada laju pembebanan. Periode stabil dimulai
pada hari ke 44 yang ditandai dengan produksi biogas yang stabil.
Gambar 4-1. Produksi biogas harian dengan metode moving average 10-harian
Kualitas biogas diuji dengan membakar biogas yang dihasilkan. Biogas baru dapat
dibakar setelah memasuki minggu ke-4. Gambar 4-1 memperlihatkan bahwa perlakuan
laju pembebanan 0,5 L/hari menghasilkan produksi biogas terbaik, mencapai 7,2 L/hari.
Dengan volume kerja 25 L, maka hal ini sama dengan 0,288 L/hari per liter substrata tau
Volume Laju Pembebanan HRT
(ℓ) (ℓ/hari) (hari)
25 2,5 10,0
25 2,0 12,5
25 1,5 16,7
25 1,0 25,0
25 0,5 50,0

25
sekitar 1.728 L/hari untuk digester dengan volume kerja 6 m3. Hasil ini sedikit lebih
tinggi dari data yang diperoleh dari lapangan sebagaimana dibahas pada bagian
sebelumnya, yaitu rata-rata 1.582 L.
Gambar 4-1. Pengaruh laju pembebanan terhadap produksi biogas kumulatif. Angka yang mengikuti perlakuan menunjukkan hari dimana biogas dapat dibakar (misalnya P1, 22: Pada perlakuan P1, biogas dapat dibakar pada hari ke-22 )
Gambar 4-2 memperlihatkan hubungan antara laju pembebanan terhadap volume
produksi biogas kumulatif yang diamati selama 54 hari. Terlihat bahwa perlakuan
laju pembebanan 0,5 L/hari menghasilkan produksi biogas terbanyak mencapai hampir
200 L.

26
BAB 5. KESIMPULAN
(1) Konsumsi biogas untuk generator kapasitas 750W adalah rata-rata 415 L/jam.
(2) Digester skala rumah tangga dengan 5-6 ekor sapi menghasilkan biogas sebanyak
1582 L/hari atau 280 L/ekor/hari.
(3) Digester skala rumah tangga dengan 5-6 ekor sapi dapat melayani pengoperasian
mesin generator kapasitas 750W selama 4 jam/hari.
(4) Produksi biogas skala rumah tangga masih dapat ditingkatkan dengan mengatur laju
pembebanan yang tepat.

27
DAFTAR PUSTAKA
Abraham, E.R., Ramachandran, S. and Ramalingam, V. 2007. Biogas: Can it be an important source of energy? Env Sci Pollut Res 14(1): 67 – 71
Ahn, H.K., Smith, M.C., Kondrad, S.L. and White, J.W. 2010. Evaluation of biogas production potential by dry anaerobic digestion of switchgrass–animal manure mixtures. Appl Biochem Biotechnol 160: 965–975.
Ahring, B.K. 2003. Perspectives for anaerobic digestion. Advances in Biochemical Engineering/Biotechnology 81: 1-30.
Amon, T., Amon, B., Kryvoruchko, V., Zollitsch, W., Mayer, K., and Gruber, L. 2007. Biogas production from maize and dairy cattle manure—Influence of biomass composition on the methane yield. Agriculture, Ecosystems and Environment 118: 173–182.
Appels, L., Baeyens, J., Degrèvea, J., Dewil, R. 2008. Principles and potential of the anaerobic digestion of waste-activated sludge. Progress in Energy and Combustion Science 34: 755–781
Azahari, H.L. 2012. New and Renewable Energy Policies. Presentation at Conference and Exhibition EBTKE 2012. Jakarta, July 18th, 2012
BPS. 2013. Produksi Padi, Jagung, dan Kedelai (Angka Ramalan I Tahun 2013). Berita Resmi Statistik. No. 45/07/ Th. XVI, 1 Juli 2013. 10 hal.
Brown, D. 2012. Comparison of Solid-State to Liquid Phase Anaerobic Digestion of Lignocellulosic Biomass for Biogas Production. Master Thesis. Graduate Program in Food, Agricultural, and Biological Engineering. The Ohio State University.
Chandra, R., Takeuchib, H., and Hasegawa, T. 2012. Methane production from lignocellulosic agricultural crop wastes: A review in context to second generation of biofuel production. Renewable and Sustainable Energy Reviews 16: 1462–1476.
Chen, X., Yan, W., Sheng, K. and Sanati, M. 2014. Comparison of high-solids to liquid anaerobic co-digestion of food waste and green waste. Bioresource Technology 154: 215–221
de Baere, L., 2000. Anaerobic digestion of solid waste: state-of-the-art. Water Science and Technology. 41(3): 283–290. (CARI)
Duke, J.A. 1983. Handbook of Energy Crops. Diakses pada 06 March 2014 dari https://www.hort.purdue.edu/newcrop/duke_energy/Pennisetum_purpureum.html
Ekpenyong, K.I., Arawo, J.D.E., Melaiye, A., Ekwenchi, M.M. and Abdullahi, H.A. 1995. Biogas production potential of unextracted, nutrient-rich elephant-grass lignocelluloses. Fuel. 74(7): 108-1082.
Federal Ministry of Food and Agriculture. 2014. Bioenergy in Germany: Facts and Figures. http://international.fnr.de
Feng, Y., Guo, Y., Gaihe, Y., Qin, X., Song, Z. 2012. Household biogas development in rural China : On policy support and other macro conditions. Renewable and Sustainable Energy Review. 16: 5617 – 5624.
GGL (Great Giant Livestock). 2013. Komunikasi pribadi pada tanggal 8 Januari 2014.
Gu, Y., Chen, X., Liu, Z., Zhou, X., Zhang, Y. 2014. Effect of inoculum sources on the anaerobic digestion of rice straw. Bioresource Technology. 158: 149–155.

28
Harikishan S. 2008. Biogas processing and utilization as an energy source. In Anaerobic Biotechnology for Bioenergy Production: Principles and Applications (Samir Kumar Khanal, editor). Wiley-Blackwell, Iowa: 267–291.
Hasanudin, U., Haryanto, A., and Suroso, E. 2011. Mitigation of Green House Gases Emission in Cassava Mill: Case Study in Lampung, Indonesia. Proceedings International Conference and Exhibition on Sustainable Energy and Advanced Materials (ICE SEAM 2011). Jurusan Teknik Mesin, Fakultas Teknik, Universitas Sebelas Maret, Solo.
Ituen, E.E, John, N.M, and Bassey, B.E. 2007. Biogas production from organic waste in Akwa Ibom State of Nigeria. In Appropriate Technologies for Environmental Protection in the Developing World : Selected Papers from ERTEP 2007, July 17-19, Ghana. (Ernest K. Yanful, editor). Springer Science + Business Media B.V.
Jewell, W.J., Cummings, R.O., and Richards, B.K. 1993. Methane fermentation of energy crops: maximum conversion kinetics and inxw biogas purification. Biomass and Bioenergy 5(3-4): 261-278.
Jha, A.K., Li, J., Zhang, L., Ban, Q. and Jin, Y. 2013. Komparison between wet and dry anaerobic digestions of cow dung under mesophilic and thermophilic conditions. Advances in Water Resource and Protection 1(2): 28-38
Jingura, R.M. and Rutendo, M. 2009. Optimization of biogas production by anaerobic digestion for sustainable energy development in Zimbabwe. Renewable Sustainable Energy Reviews.13:1116e20.
Köttner, M. 2002. Dry fermentation – a new method for biological treatment in ecological sanitation systems (ECOSAN) for biogas and fertilizer production from stackable biomass suitable for semiarid climates. In Proc. 3rd International Conference on Environmental Management, pp 16. Johannesburg, South Africa 2002.
Lema, J.M. and Omil, F. 2001. Anaerobic Treatment: A Key Technology for a Sustainable Management of Wastes in Europe. Water Science and Technology. 44:133-140
Li, X. 2014. Biogas Production in China: current status and future development. http://www.epa.gov/agstar/documents/conf13 .….pdf (20 April 2014).
Li, Y. and Liew, L.N. 2011. Solid-state anaerobic digestion for energy production from organic waste. Fact Sheet. Agriculture and Natural Resources. The Ohio State University.
Li, Y., Park, S. Y., and Zhu, J. 2011a. Solid-state anaero-anaerobic digestion for methane production from organic waste. Renewable and Sustainable Energy Reviews (15): 821–826.
Li, Y., Zhu, J., Wan, C. and Park, S.Y. 2011b. Solid‐state anaerobic digestion of corn stover for biogas production. Transactions of the ASABE. 54(4): 1415-1421.
Marchaim, U. 1992. Biogas processes for sustainable development. Food and Agriculture Organization (FAO), Viale delle Terme di Caracalla, 00100 Rome, Italy.
Ministry of New and Renewable Energy. 2014. Family Type Biogas Plants Programme. http://mnre.gov.in/schemes/decentralized-systems/schems-2/ (April 21, 2014)
Monet, F. 2003. An introduction to anaerobic digestion of organic wastes. http://www.biogasmax.co.uk/media/introanaerobicdigestion__073323000_1011_24042007.pdf (20 April 2014)

29
Olugbemide, A.D., Imasuen, A.O., Oleghe, P.O. and Efosa, J.O. 2012. anaerobic co-digestion of fresh maize leaves with elephant grass. J. Appl. Sci. Environ. Manage. 16(1): 133–135.
Pandey, A. 2003. Solid-state fermentation. Biochemical Engineering Journal 13: 81–84
Pathak, H., N. Jain, A. Bhatia, S. Mohanty, N. Gupta. 2009. Global Warming Mitigation Potential of Biogas Plants in India. Environment Monitoring Assessment, 157: 407-418.
Pavan, P., Battistoni, P., Mata-Alvarez, J. and Cecchi, F. (2000). Performance of thermophilic semi-dry anaerobic digestion process changing the feed biodegradability. Wat. Sci. Technol., 41(3): 75–81.
PLN (Perusahaan Listrik Negara). 2013. PLN Statistics 2012. ISSN: 0852-8179
Prasetyo, T., Handoyo, J. dan Setiani, C. 2002. Karakteristik Sistem Usahatani Jagung-Ternak di Lahan Irigasi. Prosiding Seminar Nasional: Inovasi Teknologi Palawija, Buku 2- Hasil Penelitian dan Pengkajian. Pusat Penelitian dan Pengembangan Sosial Ekonomi Pertanian, Badan Litbang Pertanian: 581-605.
Radwan, A.M., Sebak, H.A., Mitry, N.R., El-Zanati, E.A. and Hamad, M.A. 1993. dry anaerobic fermentation of agricultural residues. Biomass and Bioenergy 5(6): 495-499.
Sarnklong, C., Cone, J.W., Pellikaan, W., Hendriks, W.H. 2010. utilization of rice straw and different treatments to improve its feed value for ruminants: A review. Asian-Aust. J. Anim. Sci. 23(5) : 680 – 692.
Schnürer, A. and Jarvis, Å. 2009. Microbiological Handbook for Biogas Plants. Swedish Waste Management, Malmö: 142 halaman.
Shyam, M. dan Sharma, P.K. 1994. Solid-state anaerobic digestion of cattle dung and agro-residues in small capacity field digesters. Bioresource Technology, 48(3): 203–207.
Singh, R. and Anand, R.C. 1994. Comparative performances of Indian small solid state and conventional anaerobic digesters. Bioresource Technology 47: 235-238.
SNV. 2012. Annual Report 2011: Indonesia Domestic Biogas Programme. http://www.snvworld.org/en/countries/indonesia/publications.
Song, Z., Yang, G., Han, X., Feng, Y., and Ren, G. 2013. optimization of the alkaline pretreatment of rice straw for enhanced methane yield. BioMed Research International. Vol. 2013: 9 pages.
Tchobanoglous, G., Theisen, H., and Vigil, S.1993. Intergrated Solid Waste Management. McGraw-Hill, New York.
Teghammar, A., Karimi, K., Horváth, I.S., Taherzadeh, M.J. 2012. Enhanced biogas production from rice straw, triticale straw and softwood spruce by NMMO pretreatment. Biomass and Bioenergy 36: 116-120.
Umiyasih, U. dan Wina, E. 2008. Pengolahan dan nilai nutrisi limbah tanaman jagung sebagai pakan ternak ruminansia. Wartazoa. 18(3): 127-136.
Vindis P, Mursec B, Janzekovic M, Cus F. 2009. The impact of mesophilic and thermophilic anaerobic digestion on biogas production. Journal of Achievements in Materials and Manufacturing Engineering 36(2): 192-198.

30
Warner U, Stöhr U, Hees N. 1989. Biogas plants in animal husbandry. Gesellschaft für Technische Zusammenarbeit (GTZ), Eschborn I, Federal Republic of Germany: 153 halaman.
Zheng, M., Li, X., Li, L., Yang, X., He, Y. 2009. Enhancing anaerobic biogasification of corn stover through wet state NaOH pretreatment. Bioresource Technology 100: 5140–5145.
Zhu, J., Wan, C., and Li, Y. 2010. Enhanced solid-state anaerobic digestion of corn stover by alkaline pretreatment. Bioresource Technology 101: 7523–7528.

LAMPIRAN:

ISBN : 978-602-14315-2-8

ISBN : 978-602-14315-2-8 Editor : Prof. Lilik Sutiarso Hanim Zuhrotul Amanah Reviewers: Prof. Dipl,-lng. Dr.nat.techn. Axel Mentler (Institute of Soil Research BOKU – Austria) Prof. Dr. Ir. Jan Pieters (Universitiet Ghen – Belgium) Ir. Patrick vanSchijndel (Eindhoven Univerity of Technology [TU/e – Netherlands) Assoc.Prof. Takashi Okayasu (Kyushu University – JAPAN) Dr. Ching-Nuo Chen (National Pingtung University of Science and Technology – Taiwan) Prof. Bambang Purwantana (Universitas Gadjah Mada – Indonesia) Prof. Lilik Sutiarso (Universitas Gadjah Mada – Indonesia) Dr. Sri Rahayoe (Universitas Gadjah Mada – Indonesia) Dr. Joko Nugroho (Universitas Gadjah Mada – Indonesia) Prof. Putu Sudira (Universitas Gadjah Mada – Indonesia) Dr. Eng. Sukmawaty (Universitas Mataram - Indonesia) Dr. Ansar (Universitas Mataram - Indonesia) Assoc. Prof. Dr. Rosnah Shamsudin (Malaysian Society of Agricultural Engineers/MSAE Prof. Azmi Dato' Yahya (Universiti Putra Malaysia, Malaysia)
Proceedings The 2nd International Symposium on Agricultural and Biosystem Engineering 2016 Theme : Recent Technology on Agricultural and Bio-system Engineering Published by : Departemen Teknik Pertanian Fakultas Teknologi Pertanian Universitas Gadjah Mada Jl. Flora No.1 Bulaksumur, Yogyakarta, Indonesia 55281 Telephone/fax : +62-274-563542 E-mail : [email protected] Copyright law protected Don’t to quote, reproduce and translate some or allof these books without the permission of the publisher Second Edition : 2016 ISBN : 978-602-14315-2-8

i
MESSAGE FROM THE CHAIRPERSON OF THE 2ND ISABE 2016 It is my honor to welcome you to the International Symposium on Agricultural and Biosystem Engineering 2016. Thank you all to be here today at the Jayakarta Lombok Beach Resort for attending this important meeting. The 2nd ISABE 2016 is held in August 9-11 organized by Department of Agricultural Engineering Faculty of Agricultural Technology Universitas Gadjah Mada, Department of Agricultural Engineering Faculty of Food Technology and Agro-Industry Mataram University and the Indonesian Society of Agricultural Engineer (PERTETA). The theme of the 2nd ISABE 2016 is “Recent
Technology on Agricultural and Bio-system Engineering. The objectives of the symposium are to disseminate knowledge, to promote research and development, to obtain the latest information, as well as to exchange technical information in agricultural and biosystem engineering innovation. Moreover, the symposium will provide opportunity to strengthen networking among Indonesia and international academia, government and industries. The meeting will feature a serie of keynote speech in plenary sessions, presentations in technical sessions, cultural night, as well as excursion. I am very pleased to welcome all the guest speakers: a. Prof. Sakae Shibusawa (TUAT, Japan), Prof. Chang-Hyun Choi (Korean Society of Agricultural Machinery, Korea), Prof. Ir. Dr. Azmi Dato' Yahya (Universiti Putra Malaysia, Malaysia), Prof. Mitsutoshi Nakajima (University of Tsukuba, Japan), Prof. Dipl.-Ing.Dr.nat.techn. Axel Mentler (Institute of Soil Research BOKU, Vienna), as well as Prof. Sigit Supadmo Arif (Universitas Gadjah Mada, Indonesia). And joining us to deliver a congratulatory speech Governor of West Nusa Tenggara Province. Thank you very much for all of you for your contribution in this symposium. I am also pleased to greet participants of 61 selected papers, among them are 6 papers from Korea, 1 from Japan, 1 from Taiwan, 1 from Thailand, 1 from Malaysia,1 from Bangladesh and the remaining 56 papers are from Indonesia. For delegates who do not present papers, thank you for your participation. I hope you can enjoy all the agenda. I would like to express my sincere gratitude to all colleagues, sponsors, organizing committee, steering committee for their support and cooperation for making this event succesfully performed. Finally, thank you again for your participation and welcome to the 2nd ISABE 2016 meeting. Chairperson of The 2nd ISABE 2016 Dr. Ngadisih

ii
LIST OF CONTENT
Foreword ................................................................................................................... i
List of Content ........................................................................................................... ii
SUB THEME: LAND AND WATER RESOURCES ENGINEERING
Irrigation Scheduling on Runoff Harvesting System For Dry Land Farming
Authors: Sophia Dwiratna NP 1 and Nurpilihan Bafdal
A01
Spatial and Temporal Variability of Baseflow in East Java Regions
Authors: Indarto Indarto, Sri Wahyuningsih, Elida Novita, Hamid Ahmad, Muhardjo
Pudjojono
A02
Spatial Variabilities of Soil Properties Based on Its Spectral Reflectance for Developing
Precision Farming System
Authors: Sari Virgawati and Muhjidin Mawardi
A03
Pitcher Fertigation System for Effective Fertilization and Irrigation
Authors: Muhjidin Mawardi and Fuad Asani
A04
Analysis of Rainfall Index for the Identification of Drought-Prone Areas in the Special
Regions of Yogyakarta
Authors: Putu Sudira, Bayu Dwi Apri Nugroho, Muhammad Naufal
A05
Development of Irrigation Automation Device based on Crop Growth Stage
Authors: I Putu Gede Budisanjaya, I Wayan Tika, Sumiyati
A06
Application of Bio-system Principles For the Development of Economic and Environmental
Integration Between Upper and Lower Mountainous Area
Author: Sahid Susanto
A07
Application of Bio-System Engineering Principles for the Development of Bio-Landscape
and Soil-Water Conservation Measures at Mountainous Areas
Author: Sahid Susanto
A08

iii
Stomatal Aperture and Potential of Carbon dioxide Absorbtion by Sansevieria trifasciata P.
as Related to Water Stress
Authors: Badi’atun Nihayah, Ngadisih and Muhjidin Mawardi
A09
SRI and Legowo Applications for Increasing Red Rice Productivity
Authors: I Wayan Tika , I Putu Gede Budisanjaya, Sumiyati
A10
Technology Aspect and Feasibility Analysis of Sugarcane Slash Management on dry land
sugarcane Plantation
Authors: Iqbal, Tineke Mandang, E. Namaken Sembiring, dan M.A. Chozin
A11
Pothole Application for Paddy Field on Discharge Simulation of SWAT Program
(Case of Upper Cimanuk Sub Watershed)
Authors: Asep Sapei , Yuli Suharnoto, Sutoyo and Agung Trinanda
A12
Estimating Flood Potential Using Scoring Model-Geographic Information System in a Small
Watershed
Authors: Sitti Nur Faridah, Mahmud Achmad dan Dewi Sartika
A13
Setting up of Knowledge Management Center to Develop Modernization of Irrigation in
Indonesia (Case Study: Bedegolan Irrigation System)
Authors: Rizki Maftukhah, Intan K. Wardani, Murtiningrum, and Sigit Supadmo Arif
A14
Water Stress and its Impact to Soil Thermal of Cocopeat Planting Media on Lidah Mertua
(Sansevieria Trifasciata P.)
Authors: Rahmawati and Ngadisih
A15
Developing knowledge map of irrigation (a case study: Bedegolan Irrigation System)
Authors: Intan K. Wardani, Rizki Maftukhah, Sigit S. Arif, and Murtiningrum
A16
Utilization of Unmanned Aerial Vehicles in Evaluating River Morphology
Authors: Samkele S. Tfwala, Ching-Nuo Chen and Yu-Min Wang
A17
Development of Information System for Planting Pattern Determination in Modernization of
Irrigation System in Indonesia
Authors: Murtiningrum, Edi Subiantoro, and Sigit Supadmo Arif
A18

iv
Implementation of Decision Support System for Monitoring and Evaluation of Performance
in District Cross-Boundary Irrigation System
Authors: Murtiningrum, Sudjarwadi, Rachmad Jayadi, and Putu Sudira
A19
Relationships between rice production and precipitable water from 1980 onwards in Maluku,
Indonesia
Author: Bayu Dwi Apri Nugroho
A20
Mulching and Shaping of Soil Surface Profile To Maintain Suitable Soil Moisture for Direct
Seeding of Rice
Authors: I Wayan Astika, Agatha Devi Phina, Gatot Pramuhadi
A21
System of Rice Intesification (SRI) in Individual Pot Scale and its Impact on Nitrate
Distribution
Authors: Ngadisih, Andra Tersiana Wati, Muhjidin Mawardi
A22
SUB THEME: ENERGY AND AGRICULTURE MACHINERY
Effect of Hand Tractor Speed Rate and Tilt Angle of Stubble Blade on Sugarcane Stubble
Cutting Quality
Authors: Syafriandi*,1, Susi Chairani2, Hendri Syah
B01
Design and Performance of Vacuum Type Seed Metering Device for Precision Soybean
Planter
Authors: Wawan Hermawan, Tineke Mandang, Agus Sutejo and Lenny Saulia
B02
Design of Control System at Drying Process based on Microcontroller
Authors: Guyup Mahardhian Dwi Putra, Diah Ajeng Setiawati
B03
Design Parameters Affecting Air/Liquid Ratio of Air Induction Nozzles
Authors: Sothea Ra, Foad Vashahi, Yong Choi and Jeekeun Lee
B04
Design of Flat-Fan Type Nozzle Tip and Its Spray Characteristics
Authors: Sothea Ra, Foad Vashahi, Yong Choi and Jeekeun Lee
B05

v
Selective Mechanization in Wet Season Rice Cultivation
Authors: AKM Saiful Islam, Youngjung Kim, Md Tariqul Islam, Md Shakilur Rahman, Md
Abdur Rahman
B06
Alternative Meat Slicing Knife Design to Reduce Operator Cutting Force
Authors: Makbul Hajad and Suchada Rianmora
B07
Design and Performance Test of Small Scale Semiautomatic Pineapple Peeling Machine
Authors: M. Muhaemin, T. Herwanto, A. Yusuf, M. Saukat, T. Sagala, N.F. Rahadian, RP
Dewaner
B08
Tribology Characteristic of SCM 440 Bearing Steel in Tractor Under Paraffin Oil and
Nitrogen Lubrication
Authors: Okka Adiyanto,Pandu Sandi Pratama, S.W.Chung,
S.H.Kwon,S.G.Kwon,J.M.Park,J.S.Kim, and Won-Sik Choi
B09
Separation Performance of Oil Palm Mesocarp and Kernel using Different Blade Orientation
Authors: C.J. Vincent1, R. Shamsudin, A.S. Baharuddin, and R. Yunus
B10
Developing Family-Size Biogas-Fueled Electric Generator
Authors: Agus Haryanto, Sugeng Triyono, and Udin Hasanudin
B11
SUB THEME: POSTHARVEST AND FOOD ENGINEERING
Determination of Oil Palm Fruit Rupture Point and Biological Yield Point at Various
Ripening Levels and Before Process Time Delay
Author: Andreas Wahyu Krisdiarto
C01
Freshness Maintainance of Rambutan (Naphelium lappaceum L.) by Combination of
Packaging Techniques with Aloe vera L. Based Coating
Authors: Emmy Darmawati, Sutrisno, Rusnaldi, Muhamad Wahyu A, Nelida
C02
vi
Evaluation for Sterilization of Rendang Packaged by Flexible Retort Pouch using Finite
Difference Method
Authors: Anggita Sari Praharasti, Joko Nugroho, Budi Rahardjo, Asep Nurhikmat
C03
Transportation Packaging Design for Papaya (Carica papaya L.) IPB 9
Authors: Mohammad Iqwal Tawakal , Emmy Darmawati and Sutrisno
C04
Engineeriing of Particle Expansion for Modifying the Particle Density of Cocoa Powders
Authors: S. Achadiyah, and B. Rahardjo
C05
Effects of Particle Density to Floating Distribution and Settlement Rate of Cacao Powder in
Liquid
Authors: S. Achadiyah, B. Rahardjo and G. Supriyanto
C06
Effects of Cold Storage on Quality and Sulfur of Minimally Processed Shallots (Allium
ascolanicum L.) Slices
Authors: Anni Nuraisyah and Yohanes Aris Purwanto, Emmy Darmawati
C07
Effect of Inlet Air Temperature and Velocity on The Agglomeration Process of Maltodextrin
Powder with Fluidized Bed Agglomerator
Authors: Hafiz Fajrin Aditama, Joko Nugroho W.K., and Nursigit Bintoro
C08
Potato Inventory Cost Optimization Based On Shelf Life (Case Study At CV. Bimandiri
Lembang As A Supplier Of Retail Stores)
Authors: Totok Pujianto, Sarifah Nurjanah, Nurrusly Syarip
C09
A Preliminary Study on the Technical Feasibility of the Industrial Production of Resistant
Starch From Cassava Starch in Indonesia
Authors: Andri Harbi Salim and Asaf Kleopas Sugih
C10
Effects of 1-Methylcyclopropene and Ethylene Treatment on Ripening Characteristics of the
‘Silver Bell’ Pears
Authors: Bayu Nugraha, Nursigit Bintoro, Joko Nugroho, Akihiro Itai, Hideki Murayama
C11

vii
Heat Transfer Analysis of Heat Exchanger for Additional Heating of the Rack Type Hybrid
Solar Dryer
Authors: Dyah Wulandani and Candra Viki Arnanda
C12
Effect of Discharge and Air Temperature to Physical Properties of Maltodekstrin-Mixed
Stevia Leave Extraction on Drying Process Using Spray Dryer
Authors: Qisthi Sharah and Joko Nugroho
C13
Moisture Sorption Characteristics of Okara Powders in Various Storage Conditions
Authors: Iwan Taruna and Edy Irmanto
C14
Odor mitigation approach for composting of leftover food using clinoptilolite
Authors: Bintang Madrini, Sakae Shibusawa , Yoichiro Kojima and Shun Hosaka
C15
Characteristics of Cassava (Manihot utilissima) Rice and its Rapid Detection of Aroma Using
E- Nose
Authors: Rudiati Evi Masithoh, Kuwat Triyana and Sabilla Avinda
C16
A Preliminary Study on the Synthesis of Resistant Starch Type III (RS – 3) from Banana
Flour
Authors: Asaf Kleopas Sugih*, Yohanes Irvan Prasethio, and Henky Muljana
C17
A Preliminary Study on the Synthesis of Phosphorylated Sweet Potato (Ipomoea batatas L.)
Starch
Authors: Asaf Kleopas Sugih, Amelia Dewi, Devina Yukano, and Henky Muljana
C18
Defect detection on Pontianak citrus using fluorescence spectroscopy
Authors: Usman Ahmad, Tika Hafzara Siregar, Y. Aris Purwanto, Sutrisno, and Akhiruddin
Maddu
C19
The Viability of Papaya Seeds (Carica papaya, L) Dried Using Hybrid Dryer
Authors: Lestari S. Simanjuntak, Lilik Sutiarso, Devi Yuni Susanti, Sri Rahayoe
C20

viii
Identification of Volatile Odor Compounds and Consumer Acceptance of Mixing Apple,
Pear and Omija Juice
Authors: Mi-Ja Kim, Pandu Sandi Pratama, Destiani Supeno, S.W.Chung,
S.H.Kwon,S.G.Kwon,J.M.Park,J.S.Kim, and Won-Sik Choi
C21
SUB THEME: AGRICULTURAL STRUCTURES AND ENVIRONMENTAL
ENGINEERING
Development of Kansei-based Temperature Control Model for Workstation of Agro-industry
Authors: Mirwan Ushada, Nafis Khuriyati, Tsuyoshi Okayama, Atris Suyantohadi
D01
Magnetic Water Treatment for Improving Eggplants (Solanum molongena-L) Crop Quality
Authors: Hye-Sil Kim, Destiani Supeno, Pandu Sandi Pratama, S.W.Chung, S.H.Kwon,
S.G.Kwon, J.M.Park, J.S.Kim, and Won-Sik Choi
D02
SUB THEME: OTHER TOPIC RELATED TO AGRICULTURE ENGINEERING
Quantification of 2D Lateral Leaf Motion on Mature Plants Foliage using Optical Flow to
Study the Circadian Rhythms
Authors: Andri Prima Nugroho, Takashi Okayasu, Rin-ichiro Taniguchi, Eiji Inoue,
Yasumaru Hirai, Muneshi Mitsuoka, and Lilik Sutiarso
E01
The Effect of Colchicine on Morphology and Number of Chromosome of Binahong Plant
(Anredera cordifolia Tenn. Steenis.)
Authors: Eva Sartini Bayu, Diana Sofia Hanafiah, Olivia Avriyanti Hanafiah, Rosida
Mahyuni
E02
Addition of silver nitrate solution at Pottery Filter to reduce the Content of Escherichia Coli
Bacteria
Authors: Reza Abel, Sophia Dwiratna, Dwi Rustam Kendarto, Chay Asdak
E03
Total Ergonomic Approach to Minimize Environmental Conditions and Work Load in the
Company Workshop
Author: I Nyoman Sucipta
E04

ix
Reducing Heavy Metal Cadmium (Cd) Concentration with Water Hyacinth Plant (Eichornia
Crassipes Solms) at a Continuous Flow
Author: Rusnam
E05

Haryanto, et al./ISABE Proceedings, 9 – 11 August 2016
B11 – 1
Developing Family-Size Biogas-Fueled Electric Generator
Agus Haryanto*,1, Sugeng Triyono1, and Udin Hasanudin2 1Department of Agricultural and Biosystem Engineering, Faculty of Agriculture
University of Lampung, Jl. Soemantri Brojonegoro No.1 Bandar Lampung 35145, Indonesia. 2Department of Agro-Industrial Technology, Faculty of Agriculture
University of Lampung, Jl. Soemantri Brojonegoro No.1 Bandar Lampung 35145, Indonesia. Email: [email protected]*
Abstract Recently, electrification ratio in Indonesia has reached 84%. This means that there are still 16% (around 40 million peoples or 8 to 10 million household) have no access to national electricity grid (PLN). Most of these peoples live in isolated areas and remote islands that have not been facilitated by power grid (off grid). Family size power generation fueled by biogas can be a suitable solution for these areas. This paper discusses potential to develop small scale electricity generation using biogas produced from anaerobic digestion of cowdung. Results show that a family size anaerobic biogas digester with 6 heads of cows is able to serve 750W power generator engine operating for 4 hours per day. Therefore this technology is attractive to be developed to powering isolated areas with no access to PLN grid. Keywords: biogas, cowdung, electricity, remote areas.
1. INTRODUCTION
Indonesia is covered by many small islands that are remote and out of national electric grid (PLN). By September 2014, electrification ratio in Indonesia has reached 84.3% in (PT. PLN, 2015). This number is still lower as compared to other ASEAN countries such as Malaysia (99.4%), Singapore (100%), Thailand (99.3%), the Philippines (89.7), or Vietnam (97.3%) (Power in Indonesia, 2015). The implication of this condition is that there are still around 16% of Indonesian people (about 40 million) who do not have access to the electricity. These people are living in remote and sparsely populated areas or small islands. Most of the unelectrified household (HH) live in and currently uneconomical to be reached by PLN.
Considering each unelectrified HH requires electricity supply of 450 VA at peak load (the lowest of existing power rate from PLN’s grid) and all power plants to supply
them operate at maximum 80% of their name plate capacity, then it will require approximately 5,6 MW new additional capacity to power up just the HHs in remote areas. The actual power capacity will be larger than just to cover the HH demand, likely reach 7–8 GW capacity due to increasing economic
activity and other infrastructures, such as: schools, telecommunications, health clinic, village administration and police station, as well as other rural economic and retail activities.
Some communities have generated their own electricity using small diesel- or gasoline-generators. However, this option is expensive. At non subsidy diesel fuel price of 9.400 IDR/L and gasoline 8.600 IDR/L, and engine efficiency of 30%, then the cost of electricity is around 3,100 IDR/kwh (for diesel generator) and 2,900 IDR/kwh (for gasoline generator) just to cover fuel consumption. This is much expensive as compared to current electricity price of 1,509.38 IDR/kwh for R1-TR connection type (www.pln.co.id). In more remote areas the electricity price using diesel generators will likely be much higher due to fuel transportation cost.
Remote and sparsely populated areas will be best powered up by locally available renewable energy using economically efficient and proven technology, such as: biomass and hydro power, or biogas plant. Biogas can be one of the reliable solutions to generate electricity in remote areas. Raw materials or substrates for biogas can be developed locally and cheaply such as cow dung and agricultural

Haryanto, et al./ISABE Proceedings, 9 – 11 August 2016
B11 - 2
wastes. In less developed countries, the biogas produced from renewable sources is the right option and could play a major role in meeting both energy and environmental problems (Kabir et al., 2013). Based on a thorough parametric analysis, Chandra et al. (2012) concluded that the production of methane (biogas) from lignocellulosic biomass agricultural waste is more economically and environmentally advantageous and is the utilization of biomass in a sustainable way to produce energy.
Application of family-sized biogas in Indonesia has a renewed attention since 2009 through a program popularly called BIRU (Biogas Rumah). By the end of 2014, the program a total of 14,110 domestic digesters (BIRU, 2015).
Small-scale electricity generation using biogas fuel can be one of the most suitable ways to overcome the electricity shortage problem for people in remote areas. Small generators (about 1 kW capacity) run on gasoline has been more and more applied in suburban areas by small shops, households or offices to cope up with the frequent power black outage. The generator can be operated completely using biogas to overcome electricity scarcity in remote areas. Vaghmashi et al. (2014) concluded that compressed biogas is having good potential to replace petrol. Ayade and Latey (2016) recently reported that blending biogas with petrol at a ratio of 60% petrol and 40% biogas (B40) resulted in the increase of thermal efficiency of the engine up to around 37% as compared to around 26% of engine with neat petrol. Ehsan and Naznin (2005) reported their work on power generation using small engine (1.5 kW) running with 100% biogas. Even though the brake specific fuel consumption (BSFC) using biogas was comparatively high but peak efficiency was comparable to that of engine using petrol.
Spark ignited gasoline engines may be converted to operate on biogas by changing the carburetor to one that operates on gaseous fuels. The conversion of SI engines to gas fuelling is a simple matter, requiring only the fitting of a simple gas-fuel adaptor and, possibly, hardened valves and valve seats (Jawurek et al., 1987). Recently, it was reported a simple conversion of gasoline-fueled single cylinder four stroke engines to
run the electric generator using biogas without changing the compression ratio of original spark ignition engine. The engine run stable and was able to generate electricity using 100% biogas (Surata et al., 2014). Biogas treatment, however, may be necessary depending on the type of engine used. Electric generation using ignition engine requires that biogas must be cleaned so that the hydrogen sulfide (H2S) content reaches less than 100 ppm (McKinsey-Zicari, 2003).
This paper discusses a prospect for developing family sized power generation using biogas, especially to electrify remote and sparsely populated areas.
2. MATERIALS AND METHOD
2.1. Biogas Consumption of Engine
Biogas consumed by power generator engine was evaluated by testing a 750W generator engine using pretreated biogas. The pretreatment was intended to reduce H2S content to a level accepted by the internal spark engine. Pretreatment was conducted using locally fabricated compost. After pretreatment, the biogas has CH4 content of 56.48% (calorific value of 20.23 MJ/N m3) and H2S content of 75 ppm. The engine testing was performed by varying the load from 100 to 700 W and was replicated 3 times for each load. Each experiment unit was run for 10 minutes. Parameter to be analyzed including biogas consumption, power production, and thermal efficiency. Power is equal to electric voltage (V) multiplied by electric current (I). Thermal efficiency (ηth) is calculated from:
ηth = V.I/(BC × HV) (1)
where BC is biogas consumption (L/s) and HV is heating value of biogas (MJ/L).
2.2. Biogas Production Potential
Biogas production potential from a family sized biogas digester was evaluated by measuring biogas yield of biogas digesters located in Pesawaran Indah village, District of Pesawaran, Lampung Province (Figure 1). The digesters were constructed in 2010 using concrete with fixed dome type and capacity of 6 m3. Biogas yield was calculated by pressure difference measured using simple U-tube water manometer for a given period. Biogas composition was analyzed using a gas

Haryanto, et al./ISABE Proceedings, 9 – 11 August 2016
B11 - 3
chromatograph (Shimadzu GC2014) with TCD detector and zinc carbon column.
Figure 1. Fixed dome biogas digester and
simple water manometer.
3. RESULTS AND DISCUSSION
3.1. Biogas Consumption
Table 1 showed power generator engine performance using 100% biogas. The results showed that at load of 100 to 700 W, biogas consumption (BC) ranged from 400.8 to 434.4 L/h with an average value of 415 L/h.
A more useful parameter is the specific biogas consumption (SBC) which is fuel flow rate per unit power output. It measures how efficiently an engine converts the fuel to produce useful work. Our results showed that SBC decreased with load and ranged from 5.05 L/Wh at a load of 100 W (13.3%) to 1.07 L/Wh at a load of 600 W (80%).
Table 1. Performance of 750W power generator engine using 100% biogas
Load (W)
BC (L/h)
Power out (W)
SBC (L/Wh)
ηth (%)
100 400.8 80 5.05 6
200 413.6 177 2.35 14
300 386.4 207 1.98 17
400 407.6 286 1.42 23
500 426.8 284 1.50 21
600 437.6 408 1.07 30
700 434.4 379 1.15 28
Thermal efficiency (ηTH) varied from, increased with the load. This meant that the engine produce the best performance at load
closes to the maximum capacity . At a load of 600 W, thermal efficiency was 30% with SBC
of 6.88 L/Wh. It was also noted that biogas utilization as
fuel for generator set showed a good performance during the test, which reached a total of 210 minutes.
3.2. Biogas Potential
Table 2 showed biogas yield of two biogas digester estimated by pressure difference of a U-tube manometer (indicated by difference of water column). Digesters with 5 to 6 heads of cow were capable of producing biogas at rate of 1582 L/day or 280 L/day per head of cow. Pathak et al. (2009) calculated that 2200 m3/year (6 m3/day) biogas can be produced from a family-sized digester with four cattle. Therefore, our result is much lower than the theoretical potential that can be improved through a better operation and management.
Table 2. Biogas yield of family size digester
Digester Number of cow (head)
Biogas yield
(L/day)
Biogas yield (L/head/day)
1 6 2164 360.7
2 5 1000 200.0
Average 1582 280.3
Biogas composition was presented in
Table 3. The composition indicated that biogas has a fairly good quality and easy to burn. Using low heating value of 191.76 kcal/mole or 35.82 MJ/Nm3 for methane (, the biogas has a calorific value of 20.23 MJ/N m3. With an average CH4 content of 51.4%, fixed dome family size digester produced biogas with energy value of 29.14 MJ/day. By taking low heating value (LHV) for gasoline as much as 44 MJ/kg or 32 MJ/l, the produced biogas is equivalent to 0.91 L of gasoline/day.
Table 2. Biogas composition
Digester Composition
CH4 CO2 N2
1 54.14 34.90 10.95
2 48.71 32.72 18.56
Average 51.42 33.81 14.76
Based on previous data on biogas
consumption, it can be showed that biogas

Haryanto, et al./ISABE Proceedings, 9 – 11 August 2016
B11 - 4
produced from a family digester with 5 to 6 heads of cow will be able to fuel 750W generator set for around 4 hours a day. Assuming that electricity consumption for lighting (a very basic need) of a simple family is 450W (the existing PLN grid connection for R1 type) for 4 hours a day (6:00 to 10:00 PM), it can be concluded that a family digester with 5-6 heads of cow is able to electrify a single family.
4. CONCLUSION
The power generator can be well operated using 100% biogas with methane content of 56.48%. Biogas consumption of 750W power generator engine ranged from 400.8 to 434.4 L/h. A family size anaerobic biogas digester with 5-6 heads of cow is able to serve 750W genset operating for 4 hour per day. More research is required to study the effect of biogas fuel on the engine performance as well as carbon deposit at the piston for much longer running time.
ACKNOWLEDGEMENT This work was supported by the DGHE
(Directorate General of Higher Education), Ministry of Research, Technology, and Higher Education. Contract: 419/UN26/8/LPPM/2016 (June, 2, 2016).
REFERENCES
Ayade, M., A.A. Latey. 2016. Performance and Emission Characteristics of Biogas–
Petrol Dual Fuel in SI Engine. International Journal of Mechanical Engineering and Technology (IJMET), 7: 45-54.
BIRU (Biogas Rumah). 2015. Annual Report Indonesia Domestic Biogas Programme January – December 2014.
Chandra, R., H. Takeuchi, T. Hasegawa. 2012. Methane Production From Lignocellulosic Agricultural Crop Wastes: A Review in Context to Second Generation of Biofuel Production. Renewable and Sustainable Energy Reviews, 16: 1462-1476.
Ehsan, M., N. Naznin. 2005. Performance of a Biogas Run Petrol Engine for Small Scale Power Generation. Journal of Energy & Environment, 4: 1-9.
Jawurek, H.H., N.W. Lane, C.J. Rallis. 1987. Biogas/Petrol Dual Fuelling of SI Engine for Rural Third World Use. Biomass, 13: 87-103
Kabir, H., R.N. Yegbemey, S. Bauer. 2013. Factors Determinant of Biogas Adoption in Bangladesh. Renewable and Sustainable Energy Reviews, 28: 881-889.
McKinsey-Zicari, S. 2003. Removal of Hydrogen Sulphyde Using Cow Manure Compost. Thesis. Department of Biological and Environmental Engineering, Cornel University.
Pathak, H., N. Jain, A. Bhatia, S. Mohanty, N. Gupta. 2009. Global Warming Mitigation Potential of Biogas Plants in India. Environment Monitoring Assessment, 157: 407-418.
Perry, R.H., C.H. Chilton. 1985. Chemical Engineer’s Handbook. 5th ed. McGraw Hill International.
Power in Indonesia. 2015. Investment and Taxation Guide. (www.pwc.com/id) Accessed on January 11, 2016.
PT. PLN (Persero). 2015. Statistic PLN 2014. Jakarta. Sekretariat PT. PLN (Persero). Jakarta. (in Bahasa Indonesia).
Surata, I.W., T.G.T. Nindhia, I.K.A. Atmika, D.N.K.P. Negara, I.W.E.P. Putra. 2014. Simple Conversion Method from Gasoline to Biogas Fueled Small Engine to Powered Electric Generator. Energy Procedia, 52: 626-632.
Vaghmashi, J.D., D.R. Shah, D.C. Gosai. 2014. An Experimental Study of Petrol Engine Using Compressed Biogas as a Fuel. International Journal for Scientific Research & Development, 2: 2321-0613.
www.pln.co.id. Electricity Tariff Adjustment of Desember 2015. (www.pln.co.id/wp-content/uploads/2015/11/TA-Desember-2015.pdf) Accessed on January 11, 2016.


PRELIMINARY RESULTS ON THE PERFORMANCE OF A FAMILY-1
SIZE BIOGAS-FUELED GENERATOR USING BIOGAS PRODUCED 2
FROM PALM OIL MILL WASTES 3
4
Agus Haryanto1,*, Fadli Marotin1, Sugeng Triyono1, Udin Hasanudin2, Koichi Fujie3. 5
1. Department of Agricultural Engineering, University of Lampung, Bandar Lampung, 35144, 6
INDONESIA. 7
2. Department of Agroindustrial Technology, University of Lampung, Bandar Lampung, 35144, 8
INDONESIA. 9
3. Graduate School of Environment and Information Sciences, Yokohama National University, 10
79-7 Tokiwadai, Hodogaya-ku, Yokohama 240-8501, JAPAN 11
*) Corresponding author: Agus Haryanto, Ph.D., research fields: biomass-based renewable 12
energy. E-mail: [email protected]. 13
14
Abstract 15
The purpose of this study was to evaluate biogas utilization to generate household electricity. 16
Research was conducted by testing a 750-W generator set (genset). Biogas was produced from a 17
wet digester (5-m3 capacity) combined with 4 dry digesters (220-L, each). Palm oil mill effluent 18
at a rate of 150 L/day was introduced into wet digester and its effluent was used as bacteria 19
source for dry digesters which were loaded with 20 kg of empty bunches pressed for each dry 20
digester. Biogas was filtered using bioscrubber and was analyzed using a gas chromatograph. 21
Hydrogen sulfide (H2S) level of biogas was measured using a H2S detector. Biogas consumed by 22
the genset was measured at different load from 100 to 700 W (13.3 to 93.3% of the rated power). 23

Three replications for each load experiment were taken. Results showed that the total biogas 24
yield was 2.02 m3/day with methane content of 56.48% by volume. Biofilter successfully 25
reduced H2S content in the biogas by 94% in average. Genset showed good performance during 26
the test. Biogas specific consumption decreased with load, whilst thermal efficiency increased 27
with load. At a load of 600 W, biogas consumption was 0.73 L/W/hour with a thermal efficiency 28
of 30%. 29
30
Keywords: biogas, palm oil mill effluent, empty bunch pressed, biogas-fueled genset, electricity. 31
32
Introduction 33
In 2014 the installed capacity of power plants in Indonesia was 43.46 GW, consisted of 33.5 GW 34
in the Java-Bali, 6.17 GW in Sumatera and 3.84 in East Indonesia. The number has already taken 35
into account the participation or contribution from Independent Power Producers (IPPs). With 36
this capacity, electrification ratio in Indonesia has reached 84.3%, increasing 2.6% from the 37
previous year [1, 2]. This number, however, is still lower as compared to other ASEAN countries 38
such as Malaysia (99.4%), Singapore (100%), Thailand (99.3%), the Philippines (89.7), or 39
Vietnam (97.3%) [3]. 40
The implication of this condition is that there are still around 16% of Indonesian people (about 41
40 million or around 10 million household) who do not have access to electricity grid. In general, 42
these people are living in remote and sparsely populated areas or small islands. Such areas are 43
characterized by the absence of industrial activity, poor infrastructure and are geographically not 44
covered by the electricity distribution network (off grid) from Government-owned Electricity 45
Company or PLN. This problem is accentuated by the fact that Indonesia consists of about 46

13,000 populated islands. Considering each unelectrified household requires electricity supply of 47
450 VA (the lowest of existing power rate from PLN’s grid), and all power plants to supply them 48
operate at a maximum 80% of their name plate capacity, then it will require approximately 5.6 49
GW new additional capacity to power up just households in remote areas. The Power Supply 50
Business Plan (RUPTL) 2015-2024 plans for PLN and IPPs to develop 70,7 GW for the next 10 51
years [1]. This means an average growth rate of 7 GW per annum. 52
Some communities (mostly in the remote areas and on Indonesia’s small islands) have generated 53
their own electricity using small diesel generators. This option, however, is not environmentally 54
friendly. Fossil fuels, especially oil, happen to more and more difficult and are not available in 55
remote areas. Electricity price using this option is much more expensive. At non subsidy diesel 56
fuel price of 9.400 IDR/L and engine efficiency of 30%, the cost of electricity is around 3,100 57
IDR/kWh just to cover fuel consumption. In more remote areas the electricity price using diesel 58
generators will be much more expensive as compared to current electricity price of 1,509.38 59
IDR/kWh for R1-TR connection type [4]. 60
Remote and sparsely populated areas in Indonesia will be best powered up by locally available 61
renewable energy using economically efficient and proven technology, such as: biomass, 62
microhydro power, or biogas plant. Small gasification combined with internal combustion engine 63
provides an efficient way of converting solid biomass into electricity because it uses renewable 64
energy source, and presents a local fuel alternative [5]. Marginal, or even nil, economic 65
profitability from small biomass gasifier plant, however, has resulted in difficulties of this plant 66
to be developed. In the mid of ninety, Indonesia applied some small biomass power plants using 67
gasification technology for heat and power generation. These power plants, however, collapsed 68
and were no longer active. The reason of this faulty was mainly caused by economy aspect 69

where most small gasifier projects are not economically profitable. In addition, some gasifiers, 70
especially those using rice husk, faced problems related to high tar content (10 to 40 times higher 71
than allowable) in the producer gas that corrosively damaged the gasifier [5]. 72
Biogas can be one of the reliable solutions to generate electricity in remote areas. Raw materials 73
or substrates for biogas can be developed locally and cheaply such as cow dung, agricultural 74
wastes or dedicated crops. Production of biogas from renewable feedstock, such as energy crops 75
and agro-industrial wastes through anaerobic digestion process could substitute fossil fuel-76
derived energy and reduce greenhouse gas emission [6]. Regarding the socio-economic features 77
of villagers in less developed countries, the biogas produced from renewable sources is the right 78
option and could play a major role in meeting both energy and environmental problems [7]. 79
Based on a thorough parametric analysis, Chandra et al. (2012) concluded that the production of 80
methane (biogas) from lignocellulosic biomass of agricultural waste is more economically and 81
environmentally advantageous and is a sustainable way to produce energy from biomass [8]. 82
Biogas produced from anaerobic digestion is competitive in term of costs and efficiencies as 83
compared to other biomass energy forms including heat, synthesis gases, and ethanol [6]. Biogas 84
has played an important role in many countries, both developed and developing countries [9]. 85
Some countries such as Germany [10], China [11], and India [12] have benefited greatly from 86
biogas. 87
Since 2009, Indonesia has received support from Netherlands Government to promote domestic 88
biogas through a program that popularly called BIRU (Biogas Rumah). As a result, application 89
of family-sized biogas is increasingly growing. In 2013, BIRU had successfully installed 11,249 90
domestic digesters [13] and by the end of 2014, BIRU had installed 2,861 more digesters [14], 91
making a total of 14,110 domestic digesters. The biogas was used mainly for cooking. Small-92

scale electricity generation using biogas fuel is one of the most suitable ways to overcome the 93
electricity shortage problem for people in remote areas. Using small scale independent generator 94
means that no grid is required. From ecological point of view, the engines fuelled by the biogas 95
emit much lower amount of CO2 and decreases the global warming potential on our earth due to 96
lower contents of the carbon in the fuel [15]. 97
Family-sized power generation using biogas can be completed with small ignition engines by 98
blending (dual mode) for diesel engines or completely (100%) running with biogas for gasoline 99
or petrol engines. The power can be used to run some appliances as refrigerator, compressor, 100
generator and irrigation pumps. Biogas can potentially be utilized in a dual fuel operation and 101
performed satisfactorily without any engine hardware modification under long term engine 102
operation. No significant problems were observed during the entire engine durability test [16]. 103
Small generators (about 1 kW capacity) run on gasoline has been more and more applied in 104
suburban areas by small shops, households or offices to cope up with the frequent power black 105
outage. The generator can be operated completely using biogas to overcome electricity scarcity 106
in remote areas. Vaghmashi et al. (2014) concluded that compressed biogas is having good 107
potential to replace petrol [17]. Ayade and Latey (2016) recently reported that blending biogas 108
with petrol at a ratio of 60% petrol and 40% biogas (B40) resulted in the increase of thermal 109
efficiency of the engine up to around 37% as compared to around 26% of engine with neat petrol 110
[18]. In addition, the B40 blending also decreased brake specific fuel consumption by 8% in 111
comparison with neat petrol. Ehsan and Naznin (2005) reported their work on power generation 112
using small engine (1.5 kW) running with 100% biogas. Even though the brake specific fuel 113
consumption (BSFC) using biogas was comparatively high but peak efficiency was comparable 114
to that of engine using petrol [19]. 115

Spark ignited gasoline engines may be converted to operate on biogas by changing the carburetor 116
to one that operates on gaseous fuels. The conversion of SI engines to gas fuelling is a simple 117
matter, requiring only the fitting of a simple gas-fuel adaptor and, possibly, hardened valves and 118
valve seats [20]. Recently, Surata et al., (2014) reported a simple conversion of gasoline-fueled 119
single cylinder four stroke engines to run the electric generator using biogas without changing 120
the compression ratio of original spark ignition engine. The engine run stable and was able to 121
generate electricity using 100% biogas [21]. Biogas treatment, however, may be necessary 122
depending on the type of engine used. Electric generation using ignition engine requires that 123
biogas must be cleaned so that the hydrogen sulfide (H2S) content reaches less than 100 ppm 124
[22]. The objective of this research was to evaluate biogas utilization to generate household 125
electricity through small generator set (genset) engine. 126
127
Materials and Method 128
Biogas Production 129
Biogas was produced from a combination of wet anaerobic digester and four dry anaerobic 130
digesters. Wet digester system was made from fiberglass with a capacity of 5 m3. About 4 m3 of 131
palm oil mill effluent (POME) was introduced into the digester as substrate. After stabilization 132
phase was achieved, POME was delivered at a rate of 150 L/day. Dry digesters were a batch 133
mode having a capacity of 220 L each. Dry digester used 20 kg of empty bunches pressed (EBP) 134
of oil palm as substrate and using wet digester effluent as inoculum. Both POME and EBP was 135
provided by Bekri palm oil mill of PTPN VII. Biogas produced from the digester system is 136
passed through a flowmeter (Itron ACD G1.6), then to a biofilter scrubber, and to a storage 137
pouch for generator set testing. Biogas piping was equipped with an expansion valve to dry the 138

biogas. Biogas composition was analyzed using a gas chromatograph (Shimadzu GC2014) with 139
TCD detector and zinc carbon column. The level of H2S before and after passing through the 140
biofilter was measured using a H2S detector (Gastech). Figure 1 showed tools and equipment 141
configuration used during the experiment. 142
143
Biogas Desulfurization 144
Prior to utilization as engine fuel biogas was purified using scrubber filled with biofilter made 145
from locally-produced compost, especially to remove H2S. Biogas was flowed into the bottom of 146
a vessel containing biofilter, flowing out through the top. While the biogas is flowing up through 147
the bed of biofilter, it is expected that chemotrophic bacteria separate the sulfur from the biogas. 148
In order to elucidate the biological role of biofilter scrubber in the declining of H2S content in 149
the biogas, we performed microbial quionone analysis in the biofilter scrubber. The analysis can 150
be used to effectively quantify microbial community structure. The detail procedure of quinone 151
analysis has been previously described [23]. 152
153
Engine Testing 154
The biogas-fueled genset was procured from PT. SWEN Bogor, Indonesia. It was a four stroke 155
spark ignition engine modified to using biogas fuel with a capacity of 750 W (Table 1). As 156
depicted in Figure 1, the biogas was stored in a pouch prior to using for the engine testing. 157
Genset testing was performed by varying the load from 100 to 700 W and was replicated 3 times 158
for each load. Several incandescent lamps and iron parallely arranged were used as variable 159
electric loads. 160
The engine parameters to be evaluated are brake power (Pb), specific fuel consumption (SFC), 161

and thermal efficiency (ηTH). All of these parameters are calculated as in the following [24]: 162
Pb = V × I (1) 163
SFC = FC/Pb (2) 164
ηTH = 1003600
×××LHVFC
Pb (3) 165
where V is the voltage developed by the generator (V), I is the current produced by the generator 166
(A), FC is the fuel (biogas) consumption rate (L/h), and LHV is the lower heating value of the 167
biogas (MJ/L). The voltage is measured using a multitester Sanwa YX360TRF) and electric 168
current is measured using a digital clamp meter (Kyoritsu 2007A). Biogas consumption rate was 169
measured using gas flow meter (Itron ACD G1.6). 170
171
Results and Discussion 172
Biogas production and purification 173
The results showed that combination of dry and wet anaerobic digestion system was capable to 174
produce biogas at a total of 2.02 m3/day consisting of 1.91 m3/day of wet digester and 0.11 175
m3/day of dry digester (Table 2). Biogas composition (Table 3) showed a relatively normal value 176
of methane (CH4), which is 56.48% by volume. This value indicated that biogas has a fairly 177
good quality and easy to burn. Using low heating value of 191.76 kcal/mole or 35.82 MJ/N m3 178
for methane [25], the biogas has a calorific value of 20.23 MJ/N m3. 179
The low biogas yield from dry digesters could be resulted from the substrate, that is EBP, 180
characteristic which is relatively dry as compared to unpressed one. Previously, we have 181
conducted an experiment of dry digestion using unpressed empty fruit bunches (EFB) and got 182
high biogas yield [26]. We assumed that oil remnant attached at fibers of the EFB played major 183

role in the biogas production. In EBP, a lot of liquid (water and oil) has been removed. As a 184
comparison, our observation noted that water content of EFB was 64.2% [26] and was 46.9% for 185
EBP used in this experiment. 186
Biogas produced from anaerobic digestion mainly constituted of methane and carbon dioxide. 187
Trace compounds in the biogas includes ammonia, water, nitrogen, and notably hydrogen sulfide 188
(H2S). Hydrogen sulfide is produced from the mineralization of organic compounds containing 189
sulfur, such as proteins, by sulfate reducing bacteria. Hydrogen sulfide is so corrosive to metal 190
parts in the engine that must be removed. In addition, combustion of biogas containing H2S 191
produces poisonous sulfur dioxide (SO2). When SO2 reacts with water vapor it produces sulfuric 192
acid that corrodes the engine and exhaust pipe. The SO2 also dissolves in engine oil causing the 193
oil to become acidic and lose its lubrication ability [27]. 194
Biogas produced in this experiment had high H2S content (400-800 ppm) which is harmful for 195
the engine (Table 2). In this case, dry anaerobic digestion process of EBP produced biogas with 196
higher H2S content than that of wet process. In this case, we equipped biofilter scrubber to 197
reduce H2S content. Kobayashi noted some biological desulfurization including biofilter 198
processes, the bioscrubber processes, and the process using headspace of the digesters 199
(headspace process) [28]. Our results showed that biofilter scrubber effectively reduced H2S 200
level by 94% in average (Table 2). McKinsey-Zicari (2003) used cow-mansure compost to 201
remove of hydrogen sulfide from biogas with H2S removal efficiencies over 80% [22]. Su et al. 202
(2013) reported an average H2S removal efficiency exceeding 93% in the livestock biogas using 203
farm-scale bio-filter desulfurization system [29]. 204
Desulfurization of H2S occur either physically through absorption by water or biologically by 205
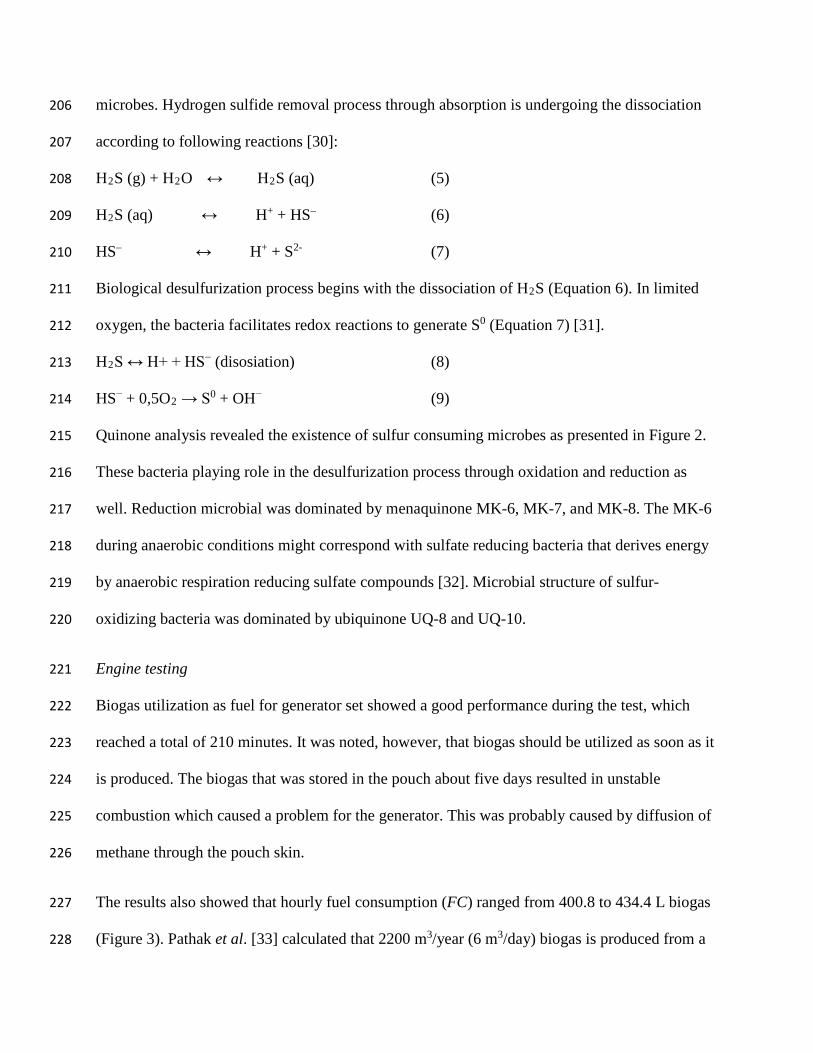
microbes. Hydrogen sulfide removal process through absorption is undergoing the dissociation 206
according to following reactions [30]: 207
H2S (g) + H2O ↔ H2S (aq) (5) 208
H2S (aq) ↔ H+ + HS– (6) 209
HS– ↔ H+ + S2- (7) 210
Biological desulfurization process begins with the dissociation of H2S (Equation 6). In limited 211
oxygen, the bacteria facilitates redox reactions to generate S0 (Equation 7) [31]. 212
H2S ↔ H+ + HS− (disosiation) (8) 213
HS− + 0,5O2 → S0 + OH− (9) 214
Quinone analysis revealed the existence of sulfur consuming microbes as presented in Figure 2. 215
These bacteria playing role in the desulfurization process through oxidation and reduction as 216
well. Reduction microbial was dominated by menaquinone MK-6, MK-7, and MK-8. The MK-6 217
during anaerobic conditions might correspond with sulfate reducing bacteria that derives energy 218
by anaerobic respiration reducing sulfate compounds [32]. Microbial structure of sulfur-219
oxidizing bacteria was dominated by ubiquinone UQ-8 and UQ-10. 220
Engine testing 221
Biogas utilization as fuel for generator set showed a good performance during the test, which 222
reached a total of 210 minutes. It was noted, however, that biogas should be utilized as soon as it 223
is produced. The biogas that was stored in the pouch about five days resulted in unstable 224
combustion which caused a problem for the generator. This was probably caused by diffusion of 225
methane through the pouch skin. 226
The results also showed that hourly fuel consumption (FC) ranged from 400.8 to 434.4 L biogas 227
(Figure 3). Pathak et al. [33] calculated that 2200 m3/year (6 m3/day) biogas is produced from a 228

family-sized digester with four cattle. Giving that digester efficiency is 70%, then every single 229
digester is able to serve a genset for about 10 hours duration, which is much more enough for 230
primary lighting the house during night time. Figure 3 also revealed that biogas consumption 231
slightly increased linearly with load. The relation between biogas consumption (BC) and load 232
(W) can be presented mathematically as: 233
BC = 0.067 W + 388.2 [R2 = 0.608] (10) 234
The linear relation of biogas consumption towards load was also reported by Ehsan and Naznin 235
[19]. Using 1.5 kW engine capacity, they reported the biogas consumption about 2.0 kg/h at a 236
load of 800 W. Using biogas density of 1.2 kg/m³ [34], the figure corresponded to around 1667 237
L/h. Biogas consumption of our result was significantly lower. The different of engine capacity 238
(750 W vs. 1500 W) might be the reason of this discrepancy. 239
A more useful parameter is the specific fuel consumption (SFC) the fuel flow rate per unit power 240
output. It measures how efficiently an engine is using the fuel supplied to produce useful work. 241
Our results (Figure 4) showed that SFC decreased with load and ranged from 30.3 L/Wh at a 242
load of 100 W (13.3%) to 6.9 L/Wh at a load od 700 W (93.3%). It can also be observed that the 243
magnitude of the electric load affected the SFC and can be presented mathematically as: 244
SFC = 914.8 W-0.76 [R2 = 0.959] (11) 245
Similar pattern of the relationship between SFC of the engine generator set and load applied to 246
the generator was found in the work reported by others [19, 24]. Ehsan and Naznin reported 247
specific fuel (biogas) consumption ranged from 4034 g/kWh (around 3362 L/kWh) at 370 W to 248
about 2413 g/kWh (2010 L/kWh) at 800 W load for biogas with 55% methane content [19]. In 249
general, increasing load close to the engine capacity resulted in the decreasing specific fuel 250
consumption. Under low load the SFC is high because the mechanical efficiency is low. At high 251

engine load (close to the rated power), the combustion is improved due to higher temperature 252
(inside the cylinder) after successive working of engine at high load which improves fuel 253
atomization and fuel-air mixing process as well. 254
Thermal efficiency (ηTH), on the contrary, increased with the load (Figure 5). This means that the 255
engine produce the best performance at loads close to the maximum capacity. At a load of 600 W 256
(80%), the hourly specific consumption of biogas was 0.73 L/W with an effective thermal 257
efficiency of 30%. Thermal efficiency and load relationship can be presented mathematically as: 258
ηTH = 0.036 W + 5.444 [R2 = 0.910] (12) 259
Himabindu and Ravikhrisna reported a prototype of small power generator running on entirely 260
biogas containing 65% methane. The prototype showed good performance in the power range of 261
around 1 kW with maximum overall efficiency of 19% and approximated brake thermal 262
efficiency between 25 to 37% [36]. 263
264
Conclusion 265
We have successfully run four stroke spark ignited electric generator using 100% biogas. The 266
generator run quite well using 100% biogas with methane content of 56.48%. Biogas 267
consumption ranged from 400.8 to 434.4 L/h and increased with load. Load also affected specific 268
fuel consumption and thermal efficiency. Specific fuel consumption was around 30 L/W/h at 269
load of 100 W. The highest thermal efficiency was 30.0% and occurred at a load of 600 watt 270
(80% load). More research is required to study the effect of biogas fuel on the engine 271
performance as well as carbon deposit at the piston for much longer running time. 272
273
Acknowledgment 274

This work was partially supported by DGHE (Directorate General of Higher Education), 275
Ministry of Research, Technology, and Higher Education. Contract number: 276
419/UN26/8/LPPM/2016. 277
References 278
[1] PT. PLN (Persero). 2015. Power Supply Business Plan PT PLN (Persero) 2015-2024 279
(Executive Summary). Sekretariat PT. PLN (Persero). Jakarta. 280
[2] PT. PLN (Persero). 2015. Statistic PLN 2014. Jakarta. Sekretariat PT. PLN (Persero). 281
Jakarta. (in Bahasa Indonesia). 282
[3] Power in Indonesia. 2015. Investment and taxation guide. 3rd edition. Available from 283
www.pwc.com/id (January 11, 2016) 284
[4] Electricity Tariff Adjustment of Desember 2015. www.pln.co.id/wp-285
content/uploads/2015/11/TA-Desember-2015.pdf (January 11, 2016) 286
[5] Stassen HE. Small-scale biomass gasifiers for heat and power: A global review. The World 287
Bank; 1995. 288
[6] Chynoweth DP, Owens JM, Legrand R. Renewable methane from anaerobic digestion of 289
biomass. Renewable Energy 2001; 22(3): 1-8. 290
[7] Kabir H, Yegbemey RN, Bauer S. Factors determinant of biogas adoption in Bangladesh. 291
Renewable and Sustainable Energy Reviews 2013; 28: 881-889. 292
[8] Chandra R, Takeuchi H, Hasegawa T. Methane production from lignocellulosic agricultural 293
crop wastes: a review in context to second generation of biofuel production. Renewable and 294
Sustainable Energy Reviews 2012; 16: 1462-1476. 295
[9] Abraham ER, Ramachandran S and Ramalingam V.. Biogas: Can it be An Important Source 296
of Energy? Env. Sci. Pollut. Res. 2007; 14(1): 67-71. 297
[10] Federal Ministry of Food and Agriculture. Bioenergy in Germany: Facts and Figures. 298
Accessed July 19, 2014. http://international.fnr.de 299
[11] Feng Y, Guo Y, Gaihe Y, Qin X, Song Z. Household biogas development in rural China : 300
On policy support and other macro conditions. Renewable and Sustainable Energy Review 301
2012; 16: 5617-5624. 302
[12] Ministry of New and Renewable Energy. Family Type Biogas Plants Programme. July 19, 303
2013. http://mnre.gov.in/schemes/decentralized-systems/schems-2/. 304
[13] BIRU (Biogas Rumah). 2014. Final Report Indonesia Domestic Biogas Programme May 305
2009 – December 2013. 306
[14] BIRU (Biogas Rumah). 2015. Annual Report Indonesia Domestic Biogas Programme 307
January – December 2014. 308
[15] Mitianiec W. Factors determing ignition and efficient combustion in modern engines 309
operating on gaseous fuels. Internal Combustion Engines (Lejda K and Woś P, editors). 310
InTech; 2012. 311
[16] Tippayawong N, Promwungkwa A, Rerkkriangkrai P. Durability of a small agricultural 312
engine on biogas/diesel dual fuel operation. Iranian Journal of Science & Technology, 313
Transaction B: Engineering 2010; 34(B2): 167-177. 314
[17] Vaghmashi JD, Shah DR, Gosai DC. An experimental study of petrol engine using 315
compressed biogas as a fuel. International Journal for Scientific Research & Development 316
2014; Vol. 2(04): 2321-0613. 317
[18] Ayade M, Latey AA. Performance and emission characteristics of biogas–petrol dual fuel in 318
SI engine. International Journal of Mechanical Engineering and Technology (IJMET) 2016; 319
7(2): 45-54. 320

[19] Ehsan M, Naznin N. Performance of a biogas run petrol engine for small scale power 321
generation. Journal of Energy & Environment 2005; 4: 1-9. 322
[20] Jawurek HH, Lane NW, Rallis CJ. Biogas/petrol dual fuelling of SI engine for rural third 323
world use. Biomass 1987; 13(2): 87-103 324
[21] Surata IW, Nindhia TGT, Atmika IKA, Negara DNKP, Putra IWEP. Simple conversion 325
method from gasoline to biogas fueled small engine to powered electric generator. Energy 326
Procedia 2014; 52: 626-632. 327
[22] McKinsey-Zicari S. Removal of hydrogen sulphyde using cow manure compost. Master 328
Thesis. Department of Biological and Environmental Engineering, Cornel University; 2003. 329
[23] Hasanudin, U., Fujita, M., Fujie, K., and Koibuchi Y. 2005. Dynamic changes in 330
environment condition and microbial community structure in trench and flat seabed 331
sediments of Tokyo bay, Japan. Journal of Water Science and Technology. 52(9): 332
[24] Reddy KS, Aravindhan S, Mallick TK. Investigation of performance and emission 333
characteristics of a biogas fuelled electric generator integrated with solar concentrated 334
photovoltaic system. Renewable Energy 2016; 92: 233-243. 335
[25] Perry RH, Chilton CH. Chemical Engineer’s Handbook. 5th edition. McGraw Hill 336
International; 1985. 337
[26] Haryanto A, Sugianti C, Triyono S, Apria NE. Biogas production from oil palm empty fruit 338
bunches through dry fermentation process: Preliminary results. PERTETA Seminar, 339
Yogyakarta, September 6, 2014. 340
[27] Cherosky PB. Anaerobic digestion of yard waste and biogas purification by removal of 341
hydrogen sulfide. Master Thesis. Graduate Program in Food, Agricultural and Biological 342
Engineering, The Ohio State University; 2012. 343
[28] Kobayashi T, Li Y-Y, Kubota K, Harada H, Maeda T, Yu H-Q. Characterization of sulfide-344
oxidizing microbial mats developed inside a full-scale anaerobic digester employing 345
biological desulfurization. Appl Microbiol Biotechnol 2012; 93:847–857 346
[29] Su J-J, Chang Y-C, Chen Y-J, Chang K-C, Lee S-Y. Hydrogen sulfide removal from 347
livestock biogas by a farm-scale bio-filter desulfurization system. Water Science & 348
Technology 2013; 67(6): 1288-1293. 349
[30] Horikawa MS, Rossi F, Gimenes ML, Costa CMM, da Silva MGC. Chemical Absorption of 350
H2S for Biogas Purification. Brazilian Journal of Chemical Engineering 2004; 21(03): 415 351
– 422. 352
[31] Abatzoglou N. A review of biogas purification processes. Biofuels, Bioproducts, Biorefining 353
2009; 3:42–71. 354
[32] Hasanudin U, Fujita M, Kunihiro T, Fujie K, Suzuki T. The effect of clams (Tapes 355
philippinarum) on changes in microbial community structure in tidal flat sediment 356
mesocosms, based on quinone profiles. Journal of Ecological Engineering 2004; 22(3): 185-357
196. 358
[33] Pathak H, Jain N, Bhatia A, Mohanty S, Gupta N. Global warming mitigation potential of 359
biogas plants in India. Environment Monitoring Assessment 2009; 157: 407-418 360
[34] Persson M, Wellinger A. Biogas upgrading and utilization - IEA Bioenergy. International 361
Energy Association, France; 2000; 32 p. 362
[35] Pulkrabek, W.W. 1997. Engineering fundamentals of the internal combustion engine. 363
Prentice Hall, Upper Saddle River, New Jersey: 411 pp. 364
[36] Himabindu M, Ravikhrisna RV. Performance assessment of a small biogas-fueled power 365
generator prototype. Journal of Scientific and Industrial Research 2014; 73: 781-785. 366

367
TABLES 368
369
Table 1. Biogas engine specification used in the experiment 370
Engine type air cooled, 4 stroke, single cylinder
Displacement 79.7 cm3
Rated power output 750 VA
Maximum power output 850 VA
Voltage output 220 V
Frequency 50 Hz
371
372
373

Table 1. Biogas yield and H2S content of biogas before and after biofiltration 374
Digester type Biogas Yield
(m3/day)
H2S content
before filtration
H2S content after
filtration
H2S removal
Wet 1.91 400 ppm 9 ppm 98 %
Dry 0.11 800 ppm 80 ppm 90 %
Average 94 %*
*) Average of H2S removal was calculated from: 375
Average H2S removal = BT
SHBDSHBW DW ][][ 22 ×+× (4) 376
where BW and BD are biogas amount produced from wet and dry digester, respectively; [H2S]W 377
and [H2S]D are H2S content of biogas produced from wet and dry digester, respectively; and BT 378
is total amount of biogas. 379
380
381

Table 2. Biogas Composition (in % Vol.) 382
Composition Value
Methane (CH4) 56,48
Nitrogen (N2) 3,33
Carbon Dioxide (CO2) 39,31
Others 0,88
383
384
385
386
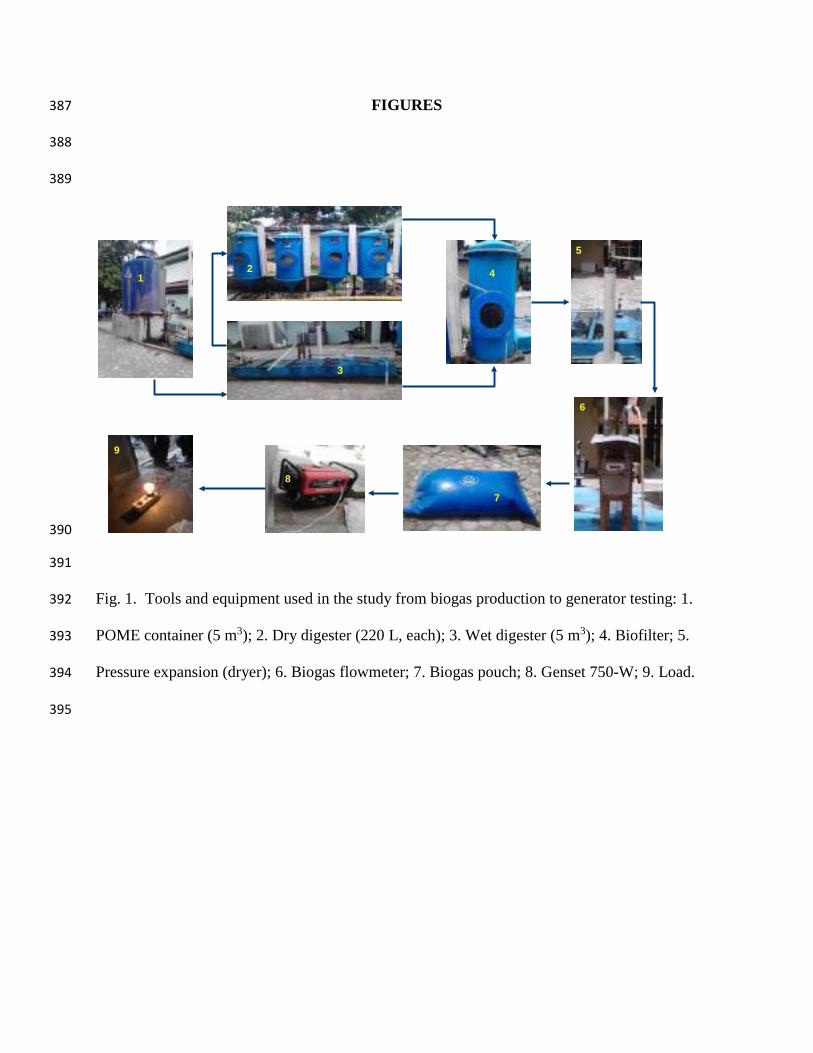
FIGURES 387
388
389
390
391
Fig. 1. Tools and equipment used in the study from biogas production to generator testing: 1. 392
POME container (5 m3); 2. Dry digester (220 L, each); 3. Wet digester (5 m3); 4. Biofilter; 5. 393
Pressure expansion (dryer); 6. Biogas flowmeter; 7. Biogas pouch; 8. Genset 750-W; 9. Load. 394
395
12
3
4
5
6
7
8
9

396
Figure 2. Microbial quinone distribution obtained from fresh biofilter scrubber. 397
398
399
0.0
2.0
4.0
6.0
8.0
10.0
12.0
14.0
16.0
18.0
UQ-7 UQ-8 UQ-9 UQ-10 UQ-
7(H2)
UQ-
7(H4)
UQ-
8(H4)
UQ-
9(H4)
MK-6 MK-7 MK-8 MK-9 MK-10 MK-
7(H2)
MK-
8(H2)
MK-
9(H2)
MK-
6(H4)
MK-
7(H4)
MK-
8(H4)
MK-
9(H4)
MK-
6(H6)
MK-
9(H6)
UQ-7 UQ-8 UQ-9
UQ-10 UQ-7(H2) UQ-7(H4)
UQ-8(H4) UQ-9(H4) MK-6
MK-7 MK-8 MK-9
MK-10 MK-7(H2) MK-8(H2)
MK-9(H2) MK-6(H4) MK-7(H4)
MK-8(H4) MK-9(H4) MK-6(H6)
MK-9(H6)

400
401
Fig. 3. Relation of load and biogas consumption. 402
403
404
BC = 0.067W + 388.2R² = 0.608
0
50
100
150
200
250
300
350
400
450
0 100 200 300 400 500 600 700 800
Biog
as C
onsu
mpt
ion
(L/h
our)
Load (watt)

405
406
Fig. 4. Effect of load on the spscific biogas consumption. 407
408
SFC = 196.9 W-0.76
R² = 0.959
0.0
5.0
10.0
15.0
20.0
25.0
30.0
35.0
0.0 20.0 40.0 60.0 80.0 100.0
SFC
(Lbi
ogas
/W.h
)
Load (% of Rated Power)

409
410
Fig. 5. Effect of load on the thermal efficiency. 411
ηTH = 0.036 W + 5.444R² = 0.910
0.0
5.0
10.0
15.0
20.0
25.0
30.0
35.0
0 100 200 300 400 500 600 700 800
Ther
mal
Effi
cienc
y (%
)
Load(W)
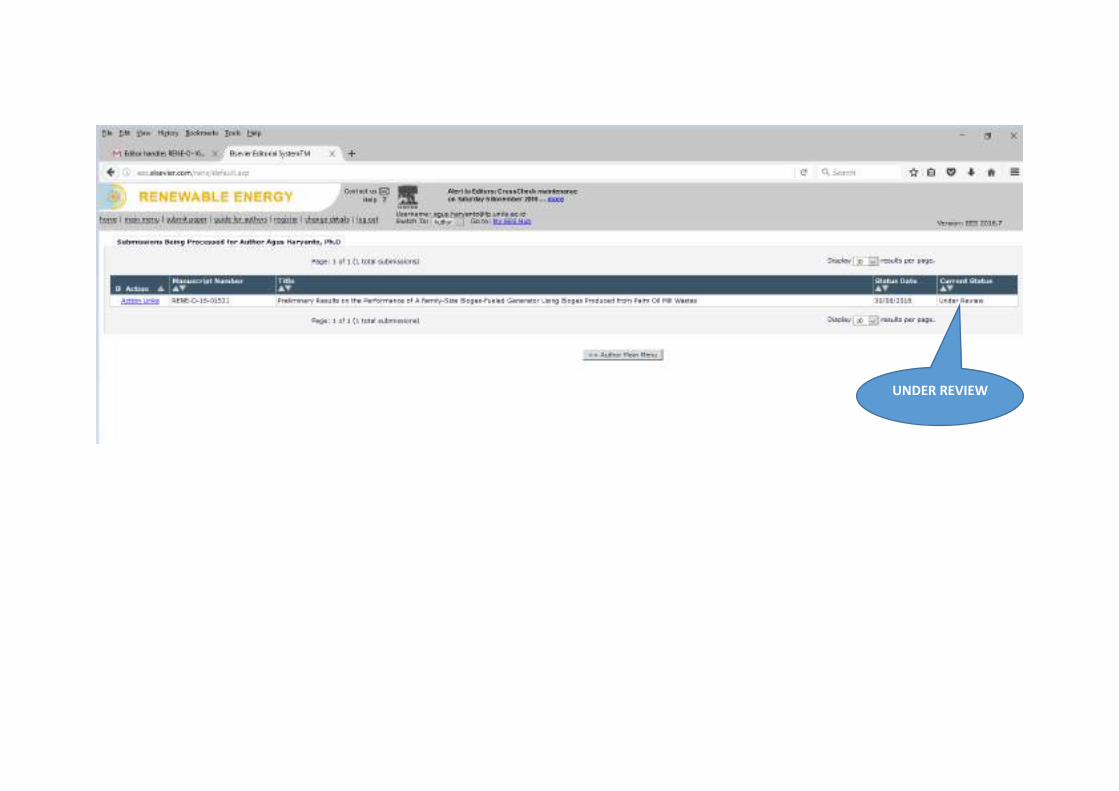
UNDER REVIEW

Sekretariat : Jurusan Teknik Pertanian Fakultas Teknologi Pertanian Universitas Andalas Email : [email protected]. Telp/Fax :0751-777413
LETTER OF ACCEPTANCE Dear Mr. Agus Haryanto Your abstract entitled” EFFECT OF LOADING RATE ON BIOGAS PRODUCTION FROM COW MANURE USING SEMI CONTINOUS ANAEROBIC DIGESTER” was accepted as oral presentation in The Seminar Nasional Perhimpunan Teknik Pertanian Indonesia that will be held on 4th and 5th of November 2016, in Convention Hall, Andalas University, Padang, Indonesia.
For futher updated information, please kindly visit our website :
http://www.perteta.or.id/en/perteta-cab-sumatera-barat/
Best regards, Indonesian Society of Agricultural Engineering (PERTETA)
Chairman of Organizing Commitee PERTETA,
Dr. Eng. M. Makky, S.TP, M.Si
NIP. 19791001 200604 1 002
Chairman of PERTETA Branch of West Sumatera,
Dr. Ir. Eri Gas Ekaputra, MS NIP. 19621205 199302 1 001


EFFECT OF LOADING RATE ON BIOGAS PRODUCTION FROM COW DUNG
USING SEMI CONTINUOUS ANAEROBIC DIGESTER
Agus Haryanto*, Sugeng Triyono, Nugroho Hargo Wicaksono Jurusan Teknik Pertanian, Fakuℓas Pertanian, Universitas Lampung
Jl. Soemantri Brojonegoro No. 1, Bandar Lampung 35145 *) Corresponding author: [email protected] (081379078674)
ABSTRACT The efficiency of biogas production on semi-continuous anaerobic digester is influenced by several factors, among other is loading rate. This research aimed to determine the effect of loading rate variation on the biogas productivity. Experiment was conducted using self-made anaerobic digester of 36-ℓ capacity with substrate of a mixture of fresh cow dung and water at a ratio of 1:1. Experiment was run with substrate initial amount of 25 ℓand five treatment variations of loading rate, namely3,33kg/hari/m3 (P1), 2,67kg/hari/m3 (P2), 1,90kg/hari/m3 (P3), 1,23kg/hari/m3 (P4) dan 0,65 kg/hari/m3 (P5).Digester performance including pH, temperature, and biogas yield was measured every day. After stable condition was achieved, biogas composition was analyzed using a gas chromatograph (GC). A 10-day moving average analysis of biogas production was performed to compare biogas yield of each treatment. Results showed that the best productivity was found in P5 treatment (loading rate 0.65 kg/hari/m3)with biogas yield of 7.23 ℓ/day. Biogas production showed a stable rate after the day of 44.
Keywords: biogas, yield, cow manure, loading rate, semi-continuous digester

Effect of Loading Rate on Biogas Production from Cow Dung Using Semi Continuous Anaerobic Digester
Agus Haryanto#, Sugeng Triyono#, Nugroho Hargo Wicaksono# # Department of Agricultural Engineering, University of Lampung, Jl. Soemantri Brojonegoro No. 1, Bandar Lampung, 35145, Indonesia
E-mail: [email protected]
E-mail: [email protected]
E-mail: [email protected]
Abstract— The efficiency of biogas production on semi-continuous anaerobic digester is influenced by several factors, among other is loading rate. This research aimed to determine the effect of loading rate variation on the biogas productivity. Experiment was conducted using lab scale self-designed anaerobic digester of 36-ℓ capacity with substrate of a mixture of fresh cow dung and water at a ratio of 1:1. Experiment was run with substrate initial amount of 25 ℓ and five treatment variations of organic loading rate, namely 1.31 kg/L/day (P1), 2.47 kg/L/day (P2), 3.82 kg/L/day (P3), 5.35 kg/L/day (P4) and 6.67 kg/L/day (P5). Digester performance including pH, temperature, and biogas yield was measured every day. After stable condition was achieved, biogas composition was analyzed using a gas chromatograph. A 10-day moving average analysis of biogas production was performed to compare biogas yield of each treatment. Results showed that digesters run quite well with pH of average 6.8-7.0 and average daily temperature 28.7-29.1. The biogas best productivity was found in P1 treatment (organic loading rate of 1.31 kg/L/day) with biogas yield of 7.23 ℓ/day. Biogas production showed a stable rate after the day of 44. Biogas contained methane at average of 53.88%. Keywords— biogas; yield; cow dung; loading rate; semi-continuous digester.
I. INTRODUCTION
Along with economic growth at 5:02% during 2014, the energy needs of Indonesia also increased. During period of 2000-2014, the final energy consumption in Indonesia grew from 556 million to 962 million of oil equivalent, meaning an average annual growth of 3.99%. The growth is projected to increase into 4,3% under base scenario or into 5,1% under high scenario. The energy consumption was dominated by fossil fuels with a total of 76% including oil (32%), coal (23%), gas (18%) and fossil-based electricity (11%) [1].
On the other side, Indonesia is bestowed with enormous sources of renewable energy such as biomass, hydro, solar, wind, and geothermal. Biomass resource has a potential of 32,654 MWe, but only 1,626 MW (off grid) snd 91.1 MW (on grid) have been developed so far. Important biomass sources include a great number of solid and liquid wastes from agricultural, agro-industry, and livestock activities. Livestock in Indonesia is increasingly growing and by 2015 the number was as follows: dairy cattle (518,650), beef cattle (15,419,720), buffalo (1,346,920), goat (19,012,790), sheep (17,024,680), pig (7,808,090), horse (430,400), duck (45,321,960), native chiken (285,304,310), layer chiken (155,007,390), and broiler chicken (1,528,329,180) [2]. The
waste produced from livestocks can be utilized to produce usable energy. Therefore, developing this potency in various ways is urgently required.
Biogas produced from anaerobic digestion is a promising way to convert agriculture waste and into energy especially in developing countries, including Indonesia. Biogas not only alleviates energy shortage in rural areas but also effectively reduces the environmental risk associated with agricultural waste management [3]. Various appliances can be fuelled by biogas, with stoves offering an application appropriate for deployment in developing countries. Other applications include the use of biogas as fuel heating, lighting or electricity generation. In addition, slurry digestate can be utilised as good compost. In fact, cow manure presents an important potential of renewable sources for energy and fertilizer. Regarding the socio-economic features of villagers in less developed countries, the biogas produced from renewable sources is the right option and could play a major role in meeting both energy and environmental problems [4].
Small scale biogas installations systems allow energy generation on site, thereby eliminating the need for energy intensive transport [5]. Small-scale biogas plants with no agitation and heating devices are most feasible because of convenience in management and maintenance [3]. In
Biarkan bagian kotak ini Kirim Makalah Secara online ke [email protected] dalam bentuk DOC file
Pastikan tidak ada kesalahan nama penulis maupun ejaan dalam makalah anda sebelum
dikirim

addition, the operation and maintenance of household bio-digesters are easier, and their environmental and economic performances are superior compared to those of medium and large scale. Household bio-digesters are suitable for undeveloped regions where the rural residents live far apart from each other [3]. Under correct and proper construction of the feeding process, small scale biogas digester is able to supply sufficient energy to the people but also provide digestate that can be used efficiently as fertilizer on tha farm, replacing chemical nitrogen and phosphorus [6]. Family size biogas technologies play a significant role to fulfil energy need in some countries such as China [7], India [8], Nepal [9], Bangladesh [10], and Vietnam [11].
Biogas digester performance is affected by many factors including microbial population, acidity (pH), carbon-to-nitrogen mass ratio (C/N ratio), operating temperature, substrate particle size, organic loading rate, hydraulic retention time, total solids content, reactor configuration (batch or continuous, single or two stage), oxidation-reduction potential, and the presence of inhibitory and toxic substances [5]. The process tends to fail if one or more of the environmental factors changes suddenly. Loading rate is a very important factor because it affects the stability of the anaerobic digestion and the biogas production rates. Because volatile solids represent the portion of organic-material solids that can be digested, then organic loading rate (OLR) indicates the amount of volatile solids to be fed into the digester each day [12]. Optimum organic loading rate is required to maximize biogas production; otherwise the productivity will be low. The purpose of this research was to investigate the effect of loading rate on the biogas yield produced from cow dung using semi continuous feeding anaerobic digester.
II. THE MATERIAL AND METHOD
Biogas production was carried out using lab scale self-designed 36-ℓ semi continuous anaerobic digester. Five digesters each of 25 litres working volume were set up for this experiment. The digester vessels were made of two 5-gallon transparent plastic drinking water containers as depicted in Figure 1. The two containers were cut at their bottom and then combined by using fiber resin and let to dry for 24 hours.
Fig. 1 Lab scale self-designed 36-L semi continuous anaerobic digester
Substrate used to produce biogas was fresh cow dung
collected from the Department of Animal Husbandry, University of Lampung. In order to have a maximum biogas yield, fresh cow dung was diluted with tap water at a ratio of 1:1 [13, 14]. The analysis of fresh cow dung include moisture content, total solid (TS), volatile solid (VS), ash,
carbon (C), and nitrogen (N) content. The moisture content of samples was obtained by sun drying followed by oven-drying (Memmert type UM 500) at 105oC for 24 hours. Volatile solid was determined using a muffle furnace (Barnstead International model FB1310M-33) at 550oC for at least two hours. Same sample was sent to Soil Science Lab. to determine the C and N content. Table 1 presented results of the analysis.
TABLE I CHARACTERISTIC OF FRESH COW DUNG
Characteristic Average Value Water content (% wb) 80.12 Total solid, TS (% wb) 19.88 Ash (%TS) 30.58 Volatile solid, VS (% TS) 69.42 C 39.87 N 1.42 C/N ratio 28.1
Initially, 25 ℓ of substrate was loaded into the digester.
The digester was refilled at five different loading rates. Table 2 presented five variations of loading rate application and the respected organic loading rate (OLR) and hydraulic residence time (HRT).
TABLE III LOADING RATE VARIATIONS AND THEIR CORRESPONDING OLR AND HRT
Treatment VS in (% TS)
Loading Rate (L/day)
OLR (kg/L/day)
HRT (day)
P1 71.38 0.5 1.31 50.0 P2 70.44 1.0 2.47 25.0 P3 69.07 1.5 3.82 16.7 P4 73.45 2.0 5.35 12.5 P5 72.53 2.5 6.67 10.0
Important processing parameters include pH, temperature
(digester and ambient), and biogas yield. The pH was measured daily for fresh inlet and spent substrate using portable digital pH-meter (PHMETER, PH_009(I)). Same analysis for TS and VS was also performed for spent slurry. Removed VS (VSremoval) was calculated using: VS removal = VS in – VSout (g) (1) or, %100removal ×
−=
in
outin
VS
VSVSVS (%) (2)
Ambient as well as digester temperatures were monitored daily using digital thermocouple (Digi Sense, Cole Parmer, model No. 93410-00) equipped with K-type wire. Biogas production was measured daily using water displacement methode. Data were recorded for 55 days, by which time the digestion process was expected to already stable and the digesters were operating in practically steady conditions. After stable condition was achieved, biogas composition was analyzed using gas chromatography (Shimadzu GC 2014) with thermal conductivity detector (TCD) and 4 meter length of shin-carbon column. Helium gas was used as carrier gas with flow rate 40 ml/min. Biogas productivity was calculated from biogas yield at stable condition by using:
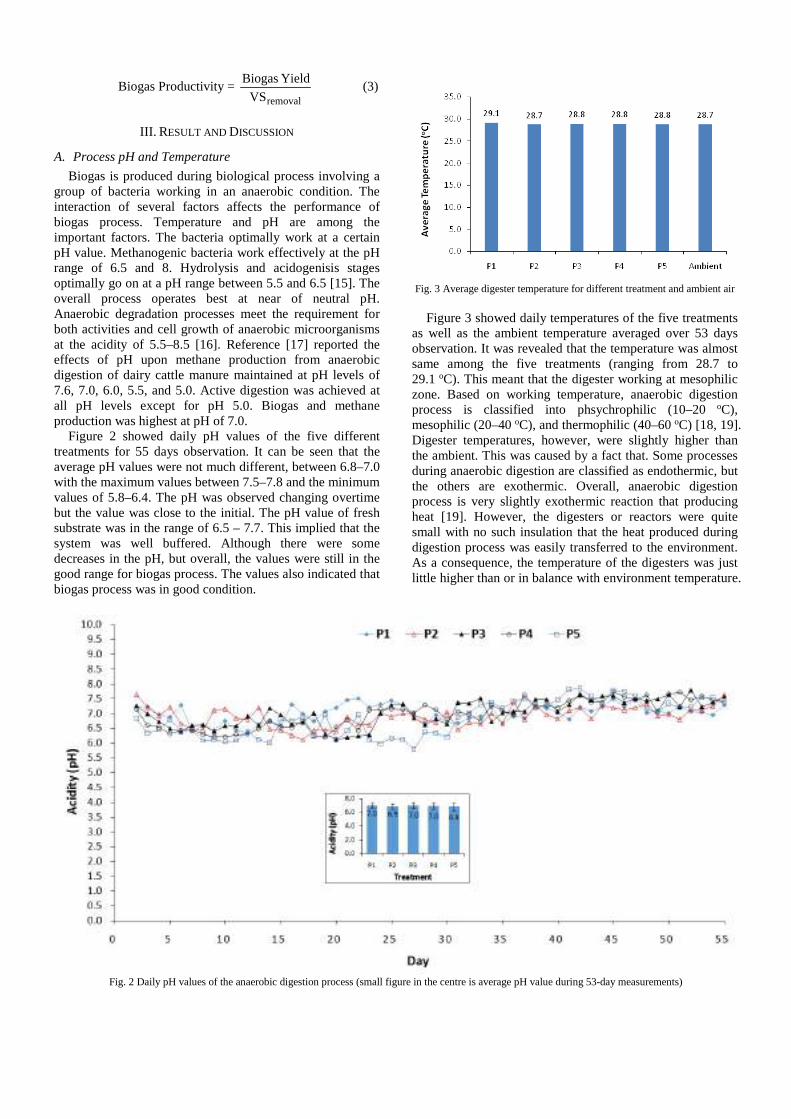
Biogas Productivity = removalVS
Yield Biogas (3)
III. RESULT AND DISCUSSION
A. Process pH and Temperature
Biogas is produced during biological process involving a group of bacteria working in an anaerobic condition. The interaction of several factors affects the performance of biogas process. Temperature and pH are among the important factors. The bacteria optimally work at a certain pH value. Methanogenic bacteria work effectively at the pH range of 6.5 and 8. Hydrolysis and acidogenisis stages optimally go on at a pH range between 5.5 and 6.5 [15]. The overall process operates best at near of neutral pH. Anaerobic degradation processes meet the requirement for both activities and cell growth of anaerobic microorganisms at the acidity of 5.5–8.5 [16]. Reference [17] reported the effects of pH upon methane production from anaerobic digestion of dairy cattle manure maintained at pH levels of 7.6, 7.0, 6.0, 5.5, and 5.0. Active digestion was achieved at all pH levels except for pH 5.0. Biogas and methane production was highest at pH of 7.0.
Figure 2 showed daily pH values of the five different treatments for 55 days observation. It can be seen that the average pH values were not much different, between 6.8–7.0 with the maximum values between 7.5–7.8 and the minimum values of 5.8–6.4. The pH was observed changing overtime but the value was close to the initial. The pH value of fresh substrate was in the range of 6.5 – 7.7. This implied that the system was well buffered. Although there were some decreases in the pH, but overall, the values were still in the good range for biogas process. The values also indicated that biogas process was in good condition.
Fig. 3 Average digester temperature for different treatment and ambient air
Figure 3 showed daily temperatures of the five treatments
as well as the ambient temperature averaged over 53 days observation. It was revealed that the temperature was almost same among the five treatments (ranging from 28.7 to 29.1 oC). This meant that the digester working at mesophilic zone. Based on working temperature, anaerobic digestion process is classified into phsychrophilic (10–20 oC), mesophilic (20–40 oC), and thermophilic (40–60 oC) [18, 19]. Digester temperatures, however, were slightly higher than the ambient. This was caused by a fact that. Some processes during anaerobic digestion are classified as endothermic, but the others are exothermic. Overall, anaerobic digestion process is very slightly exothermic reaction that producing heat [19]. However, the digesters or reactors were quite small with no such insulation that the heat produced during digestion process was easily transferred to the environment. As a consequence, the temperature of the digesters was just little higher than or in balance with environment temperature.
Fig. 2 Daily pH values of the anaerobic digestion process (small figure in the centre is average pH value during 53-day measurements)

B. VS removal
Anaerobic digestion process involves consortium of microorganisms that make use organic components within the substrate as building blocks. Therefore, efficiency of an anaerobic digestion system can be evaluated from the value of VS removal, which is a measure of anaerobic digestion system ability in decomposing organic material. For the purpose of evaluating the effect of loading rate on the process efficiency, VS reduction and biogas yield were both taken into account as the indicators to assess the reactor performance and efficiency of each loading rate.
0.0
20.0
40.0
60.0
80.0
100.0
120.0
0.0 1.0 2.0 3.0 4.0 5.0 6.0 7.0
VS re
mov
al
Organic Loading Rate (g VS/L.day)
VS removal (%) VS removal (g)
Fig. 4 Effect of loading rate on VS removal Figure 4 showed the relationship of loading rate and VS
removal. The digester efficiency (in term of VS removal) was in the range of 42.1% to 46.4%. It was revealed that elevating loading rate resulted in the increasing VS removal. But at an organic loading rate of 5.35 g VS/L/day, there was a tendency of VS removal to decrease. At an OLR range of 1.4-2.75, it was reported that VS removal decrease with increasing OLR [12]. On the other hand, Reference [21] reported an increase in the amount of organic matter biodegradation with increasing the OLR at a range of 3.4-5.0 g VS/L/day.
C. Biogas Yield
Figure 5 showed cumulative biogas production resulted from different treatments. The figure revealed that treatment P1 with loading rate of 0.5 L/day gave the highest cumulative biogas production, amounted to 194.4 L during 53 days consecutive measurement. In addition to biogas production measurement, the biogas was burnt to simply check if the biogas contains enough methane. It was observed that for the first three weeks the biogas could not be combusted, implying that the methane content was still low. In the figure we showed the day at which the biogas was able to be burnt and produce blue flame.
Biogas yield and biogas productivity were influenced by loading rate. Previously we showed that the increase in loading rate has resulted in the increase in VS removal (Figure 4). In contrast, Figure 6 showed that by increasing loading rate the biogas yield as well as biogas productivity decreased. This can be understood because the higher the loading rate (meaning the shorter HRT) the the process became uncomplete so that the biogas production was also low. This also implied that the decomposition process was not complete yet. Figure 6 also further strengthened the
conclusion that treatment P1 with organic loading rate of 1.31 g VSL/day was the best for biogas production with biogas productivity of 0.08 L/g VS removal. Reference [22], however, reported higher productivity, like 0.358 LCH4/gVS removal. This means that there is a challenge to improve the biogas productivity, for instance by apply agitation.
0
20
40
60
80
100
120
140
160
180
200
0 5 10 15 20 25 30 35 40 45 50 55
Biog
as P
rodu
ctio
n (li
ter)
Day
P1 P2 P3 P4 P5
Fig. 5 Cumulative biogas production (solid symbols with different size and colour represent the day where biogas can be burnt).
0.00
0.01
0.02
0.03
0.04
0.05
0.06
0.07
0.08
0.09
0
1
2
3
4
5
6
7
8
9
10
0.0 1.0 2.0 3.0 4.0 5.0 6.0 7.0
Biog
as P
rodu
ctiv
ity (L
/g V
Srem
oval
)
Biog
as Y
ield
(L/d
ay)
Organic Loading Rate (L/day)
Biogas Yield Biogas Productivity
Fig. 6 Effect of loading rate on daily biogas yield and biogas productivity
By using 10-day moving average, the daily biogas yield is presented in Figure 5. In the figure we can differentiate two regions or periods, namely transition and stable periods. The transition period finished at around day 44 at which the stable period starts. It was revealed that during transition period the biogas yield gradually increases from around 0.6-0.9 to around 5-7 L/day. After stable period was achieved, biogas yield was stable at around 6 to 7. Again, treatment P1 with OLR of 1.33 g VS/L/day showed the best and gave the highest biogas yield with average of 7.23 L/day.

0
1
2
3
4
5
6
7
8
10 15 20 25 30 35 40 45 50 55
Aver
age
Biog
as Y
ield
(lite
r)
Day
P5
P4
P3
P2
P1
Transition Period Stable Period
Fig. 5 The growth of daily biogas yield using 10-days moving average
D. Biogas Composition
Biogas is used as fuel. Therefore, its value is determined by combustible components. Good quality biogas mainly consists of methane (CH4) gas at around 55-70% followed by carbon dioxide (CO2) around 30-45%. Table III presented the composition of biogas collected from the best treatment (loading rate of 0.5 L/day). It was revealed that the biogas comprised of fairly high methane content (average 53.88 %) so that it was well burnt and can be used for fuel.
TABLE IIIII BIOGAS COMPOSITION
Composition Sample 1 Sample 2 Average CH4 32.91 31.13 32.02 CO2 50.53 57.23 53.88 N2 16.56 11.54 14.05
IV. CONCLUSIONS
Loading rate influenced biogas productivity and biogas yield of semi continuous digester. Increasing loading rate resulted in the decrease in both biogas yield and biogas productivity. Organic loading rate of 1.31 g VS/L/day gave the highest biogas yield (7.32 L/day) and biogas productivity (0.08 L/g VSremoval). The biogas produced from cow dung using semi continuous digester contained fairly good methane content (53.88%). Digester efficiency, in term of VS removal, was almost same for all treatments and was in the range of 42.1% and 46.4%.
ACKNOWLEDGMENT
The authors greatly acknowledge the Directorate General of Higher Education (DIKTI), Ministry of Research, Technology, and Higher Education that financially supported this work under STRANAS scheme with contract number: 419/UN26/8/LPPM/2016 (June 2, 2016). However, the views expressed in this document are solely those of the authors.
REFERENCES [1] A. Sugiyono, Anindhita, L. M. A. Wahid, and Adiarso (editors).
Indonesia Energy Outlook 2016. Jakarta: Agency for the Assessment and Application of Technology (BPPT), 2016.
[2] BPS (Badan Pusat Statistik). Statistical Yearbook Indonesia 2015. Jakarta: Badan Pusat Statistik, 2015.
[3] Z. Song, C. Zhang, G. Yang, Y. Feng, G. Ren, and X. Han. Comparison of biogas development from households and medium and large-scale biogas plants in rural China. Renewable and Sustainable Energy Reviews, vol. 33, pp. 204–213. 2014.
[4] H. Kabir, R. N. Yegbemey, and S. Bauer. Factors determinant of biogas adoption in Bangladesh. Renewable and Sustainable Energy Reviews, vol. 28, pp. 881–889. 2013.
[5] L. Naik, Z. Gebreegziabher, V. Tumwesige, B. B. Balana, J. Mwirigi, and G. Austin. Factors determining the stability and productivity of small scale anaerobic digesters. Biomass and Bioenergy, vol. 70, pp. 51–57. 2014.
[6] T. Luo, N. Zhu, F. Shen, E. Long, Y. Long, X. Chen, and Z. A. Mei. Case study assessment of the suitability of small-scale biogas plants to the dispersed agricultural structure of China. Waste and Biomass Valorization, vol. 7(5), pp. 1131–1139.
[7] Y. Chen, W. Hua, Y. Feng, and S. Sweeney. Status and prospects of rural biogas development in China. Renewable and Sustainable Energy Reviews, vol. 39, pp. 679–685. 2014.
[8] K. J. Singh and S. S. Sooch. Comparative study of economics of different models of family size biogas plants for state of Punjab, India. Energy Conversion & Management, vol. 45, pp. 1329–1341. 2004.
[9] S. Barnhart. From household decisions to global networks: biogas and the allure of carbon trading in Nepal. The Professional Geographer, vol. 66(3), pp. 345–353. 2014.
[10] U. K. Khan, B. Mainali, A. Martin, S. Silveira. Techno-economic analysis of small scale biogas based polygeneration systems: Bangladesh case study. Sustainable Energy Technologies and Assessments, vol. 7, pp. 68–78. 2014.
[11] V. C. N. Nguyen. Small-scale anaerobic digesters in Vietnam – Development and challenges. Journal of Vietnamese Environment, vol. 1(1), pp. 12-18. 2011.
[12] A. Babaee and J. Shayegan. Effect of organic loading rates (OLR) on production of methane from anaerobic digestion of vegetables waste. World Renewable Energy Congress 2011, Linköping, Sweden: 8–13 May 2011.
[13] B. S. U. I. Abubakar and N. Ismail. Anaerobic digestion of cow dung for biogas production. Journal of Engineering and Applied Sciences, vol. 7(2), pp. 169–172. 2012.
[14] E. E. Ituen, N. M. John, and B. E. Bassey. Biogas production from organic waste in Akwa Ibom State of Nigeria. In Appropriate Technologies for Environmental Protection in the Developing World: Selected Papers from ERTEP 2007, July 17-19, Ghana. (Ernest K. Yanful, editor). Germany: Springer Science + Business Media B.V. 2007.
[15] N. T. Sibiya, E. Muzenda, and H. B. Tesfagiorgis. Effect of temperature and pH on the anaerobic digestion of grass silage. 6th International Conference on Green Technology, Renewable Energy & Environmental Engineering (ICGTREEE). Cape Town, South Africa: Nov. 27-28, 2014
[16] T. S. Abbasi, M. Tauseef, and S. A. Abbasi. Biogas Energy. New York: Springer Briefs in Environmental Science. 2012.
[17] M. G. Stafford. The Effect of pH on Methane Production from Dairy Cattle Manure. Masters Thesis, University of Central Florida, USA: 1982.
[18] B. Salam, S. Biswas, and Md. S. Rabbi. Biogas from mesophilic anaerobic digestion of cow dung using silica gel as catalyst. Procedia Engineering, vol. 105, pp. 652–657. 2015
[19] T. Z. D. de Mes, A. J. M. Stams, J. H. Reith, and G. Zeeman. Methane production by anaerobic digestion of wastewater and solid wastes. In Bio-methane & Bio-hydrogen: Status and Perspectives of Biological Methane and Hydrogen Production (Edited by: J. H. Reith, R. H. Wijffels, and H. Barten). Dutch Biological Hydrogen Foundation, the Netherlands. 2003.
[20] U. Marchaim. Biogas Processes for Sustainable Development. Rome: FAO (Food and Agriculture Organization). 1992.
[21] E. F. Gomez. Effects of Organic Loading Rate on Reactor Performance and Archaeal Community Structure in Mesophilic Anaerobic Digesters Treating Municipal Sewage Sludge. M.Sc. Thesis, The Ohio State University, Ohio, USA. 2010.
[22] A. K. Jha, J. Li, Q. Ban, L. Zhang, and B. Zhao. Dry anaerobic digestion of cow dung for methane production: effect of mixing. Pakistan Journal of Biological Sciences, vol. 15, pp. 1111-1118. 2012.