Lanthanide and actinide speciation in molten fluorides: A structural approach by NMR and EXAFS...
6
Lanthanide and actinide speciation in molten fluorides: A structural approach by NMR and EXAFS spectroscopies Catherine Bessada * , Aydar Rakhmatullin, Anne-Laure Rollet, Didier Zanghi CNRS, Centre de Recherche sur les Mate ´riaux a ` Hautes Tempe ´ratures (CRMHT), 1D Avenue de la Recherche Scientifique, 45071 Orle ´ans cedex 2, France Abstract The objective of this paper is to describe the local structure in fluoride melts of nuclear interest. Our experimental approach combines NMR and EXAFS spectroscopies both sensitive to the microstructure of solid and liquid materials. These techniques allow identifying the complex formation in molten media. Thanks to the development of specific cells adapted to molten fluorides up to 1300 °C, we give some structural description of LiF–LnF 3 systems (Ln = Y, Lu, Ce) and discuss the evolution of 19 F spectra in terms of different fluorine configurations depending on the composition. This approach is further extended to the characterization of LiF–ThF 4 system by 19 F NMR in melts from 0 to 100 mol% ThF 4 at temperatures ranging from 600 to 1100 °C. We report also very first EXAFS spectra obtained in situ at high tempera- ture, at the Thorium LIII edge, in LiF–ThF 4 molten mixtures. Ó 2006 Elsevier B.V. All rights reserved. 1. Introduction The problems of energy management in terms of pollution and production lead to the renewal of the interest in nuclear energy, through the Generation IV initiative. Among the six selected GenIV con- cepts, the thorium based molten salts reactor (MSR) would provide a series of attractive advanta- ges on safety requirements, nuclear source extension and proliferation resistance [1,2]. The radiotoxicity of the inventory of these reactors could be consider- ably lower than that of uranium reactor with fast spectrum, with an efficient separation of minor actinides and fission products. The choice of the salt is of primary importance and will be based on neutronic, stability, reactivity criteria but also on the chemical reprocessing ability and the selective extraction of the different components in the spent fuel: uranium, thorium, minor actinides and lantha- nides. The knowledge of the different ionic species existing in these baths in terms of their distribu- tion, coordination and oxidation number is one of the unavoidable stages toward a better understand- ing of physical and chemical properties of the molten salts proposed for the MSR. In one of the scenario, the carrier salt would be a mixture of fluorides based on LiF, ThF 4 , possibly BeF 2 and 0022-3115/$ - see front matter Ó 2006 Elsevier B.V. All rights reserved. doi:10.1016/j.jnucmat.2006.08.012 * Corresponding author. Tel.: +33 2 38 25 55 09; fax: +33 2 38 63 81 03. E-mail address: [email protected] (C. Bessada). Journal of Nuclear Materials 360 (2007) 43–48 www.elsevier.com/locate/jnucmat
-
Upload
sorbonne-fr -
Category
Documents
-
view
1 -
download
0
Transcript of Lanthanide and actinide speciation in molten fluorides: A structural approach by NMR and EXAFS...

Journal of Nuclear Materials 360 (2007) 43–48
www.elsevier.com/locate/jnucmat
Lanthanide and actinide speciation in molten fluorides:A structural approach by NMR and EXAFS spectroscopies
Catherine Bessada *, Aydar Rakhmatullin, Anne-Laure Rollet, Didier Zanghi
CNRS, Centre de Recherche sur les Materiaux a Hautes Temperatures (CRMHT), 1D Avenue de la Recherche Scientifique,
45071 Orleans cedex 2, France
Abstract
The objective of this paper is to describe the local structure in fluoride melts of nuclear interest. Our experimentalapproach combines NMR and EXAFS spectroscopies both sensitive to the microstructure of solid and liquid materials.These techniques allow identifying the complex formation in molten media. Thanks to the development of specific cellsadapted to molten fluorides up to 1300 �C, we give some structural description of LiF–LnF3 systems (Ln = Y,Lu,Ce)and discuss the evolution of 19F spectra in terms of different fluorine configurations depending on the composition. Thisapproach is further extended to the characterization of LiF–ThF4 system by 19F NMR in melts from 0 to 100 mol% ThF4
at temperatures ranging from 600 to 1100 �C. We report also very first EXAFS spectra obtained in situ at high tempera-ture, at the Thorium LIII edge, in LiF–ThF4 molten mixtures.� 2006 Elsevier B.V. All rights reserved.
1. Introduction
The problems of energy management in terms ofpollution and production lead to the renewal of theinterest in nuclear energy, through the GenerationIV initiative. Among the six selected GenIV con-cepts, the thorium based molten salts reactor(MSR) would provide a series of attractive advanta-ges on safety requirements, nuclear source extensionand proliferation resistance [1,2]. The radiotoxicityof the inventory of these reactors could be consider-
0022-3115/$ - see front matter � 2006 Elsevier B.V. All rights reserved
doi:10.1016/j.jnucmat.2006.08.012
* Corresponding author. Tel.: +33 2 38 25 55 09; fax: +33 2 3863 81 03.
E-mail address: [email protected] (C. Bessada).
ably lower than that of uranium reactor with fastspectrum, with an efficient separation of minoractinides and fission products. The choice of the saltis of primary importance and will be based onneutronic, stability, reactivity criteria but also onthe chemical reprocessing ability and the selectiveextraction of the different components in the spentfuel: uranium, thorium, minor actinides and lantha-nides. The knowledge of the different ionic speciesexisting in these baths in terms of their distribu-tion, coordination and oxidation number is one ofthe unavoidable stages toward a better understand-ing of physical and chemical properties of themolten salts proposed for the MSR. In one of thescenario, the carrier salt would be a mixture offluorides based on LiF, ThF4, possibly BeF2 and
.

44 C. Bessada et al. / Journal of Nuclear Materials 360 (2007) 43–48
small additions of 233UF4 at temperatures up to800 �C.
Because of the strong reactivity of molten fluo-rides at high temperature towards a great numberof materials, and their sensitivity to moisture andoxygen, their experimental analysis is extremelydifficult and needs specific developments. Ourapproach is based on in situ characterization at hightemperature by two complementary spectroscopictechniques that we have adapted for high tempera-ture measurements in molten salts up to 1300 �C:nuclear magnetic resonance (NMR) and extendedX-ray absorption fine structure (EXAFS) [3–5].These two spectroscopies are both sensitive to thelocal structure around a selected element. NMR isbetter adapted for the structural description of thelightest elements, such as 19F, 17O, 27Al, 23Na,7Li, . . ., while EXAFS gives the description of theenvironment for the heaviest (lanthanides, tho-rium, . . .). More precisely, NMR spectroscopyprobes the local environment around a nucleus insolid or liquid materials, and can provide informa-tion about its coordination, the nature of the firstneighbours around the anions and cations of thesystem, and then the nature of the chemical com-plexes formed in the melt. A laser heated systemassociated with a tightly closed boron nitride cruci-ble was developed and adapted to the NMR spec-trometer, at the CRMHT laboratory few yearsago and has been successfully used in the study ofdifferent molten fluorides [5–7].
EXAFS analysis provides direct information onthe first shell of neighbours around the observed ele-ment by mean of its coordination number, and theinteratomic distances. We have built a new cell com-patible with molten fluorides and X-ray spectros-copy requirements that we have successfully testedon molten LiF–LaF3, YF3 and LuF3 binaries [3–5]. The spectra obtained are difficult to modelbecause of the disorder existing in the melt andthe rapid decrease of the EXAFS oscillations. Nev-ertheless, the data confirmed that the first shellremains unchanged with composition around thelanthanide in these melts and evidence a decreaseof the coordination between the solid and the liquidphase.
We describe in this paper our in situ approach ofthe LiF–LnF3mixtures at temperature ranging from850 to 1250 �C. We focus on the 19F NMR study ofLiF–YF3, CeF3 and ThF4 systems and present ourpreliminary EXAFS spectra at the Thorium LIIIedge on LiF–ThF4 mixtures.
2. Experimental
Samples have been prepared in a glove box underdried argon by mixing suitable proportions of LnF3,Ln = Y,Lu,Ce (Aldrich, 99.99%), ThF4 (CERAC)and LiF (Aldrich, 99.9%) without further purifica-tion. The composition range extends from 0 to100 mol% of LnF3 or ThF4.
The NMR experiments have been carried out ona Bruker DSX 400 NMR spectrometer with amagnetic field of 9.4 T, operating at frequencies of376.3 MHz for 19F. High temperature (HT) NMRexperiments were acquired using the previouslydescribed laser heated system developed atCRMHT (Orleans, France) [7]. Each sample wascontained in a high purity boron nitride (BNAX05 from Carborundum) crucible, tightly closedby a screwed BN cap and placed inside the RF coilin the centre of the cryomagnet.
The sample is heated by a CO2 laser(k = 10.6 lm) 10–20� above the melting temperatureof the corresponding composition. The NMR signalof the different nuclei in the molten state is sharpand Lorentzian shaped, corresponding to the aver-age signature of the different species present in themelt. The high temperature NMR conditions weretuned in order to obtain reliable signal to noiseratio: single pulse excitation, 20 ls, recycle delaysof 500 ms–15 s and up to 256 scans.
19F solid-state MAS NMR spectra have beenacquired at room temperature on pure compoundsYF3, CeF3 and ThF4 and on solidified compositionsafter high temperature measurements, to correlatethe experimental chemical shifts and the structuraldetails given by crystallographic data. The solidstate NMR data were collected with the same spec-trometer (9.4 T) using a 2.5 mm MAS probe and a35 kHz spinning rate with short pulse lengths(0.5 ls), and recycle times of 1–5 s. 19F chemicalshifts were referenced to 1 M CFCl3 solution atroom temperature.
The EXAFS spectra presented in this paper wereobtained at the Thorium LIII edge (16.3 keV) at theEuropean Synchrotron Radiation Facility (ESRF)in Grenoble (France), on the D2AM French CRGBeamline. The LiF–ThF4 compositions were chosenaround the eutectic composition: 22.5, 25 and28.5 mol% ThF4. The cell is made by two plates ofpyrolitic boron nitride maintained fixed by screwsand has been previously described elsewhere [3,4].The heating system has been optimized in order tofit with the limited space available on ESRF beam
-140-120-100-80-60-40-20020(ppm)
19F MAS NMR RT in solid YF3
2010
Mol%YF3
70504030
80
100
0
-200-160-120-80-40(ppm)
Pure YF3
Pure LiF
19F NMR HT in LiF-YF3 melts
-140-120-100-80-60-40-20020(ppm)
19F MAS NMR RT in solid YF3
-140-120-100-80-60-40-20020(ppm)
19F MAS NMR RT in solid YF3
2010
Mol%YF3
70504030
80
100
0
-200-160-120-80-40(ppm)
Pure YF3
Pure LiF
19F NMR HT in LiF-YF3 melts
2010
Mol%YF3
70504030
80
100
0
-200-160-120-80-40(ppm)
Pure YF3
Pure LiF
19F NMR HT in LiF-YF3 melts
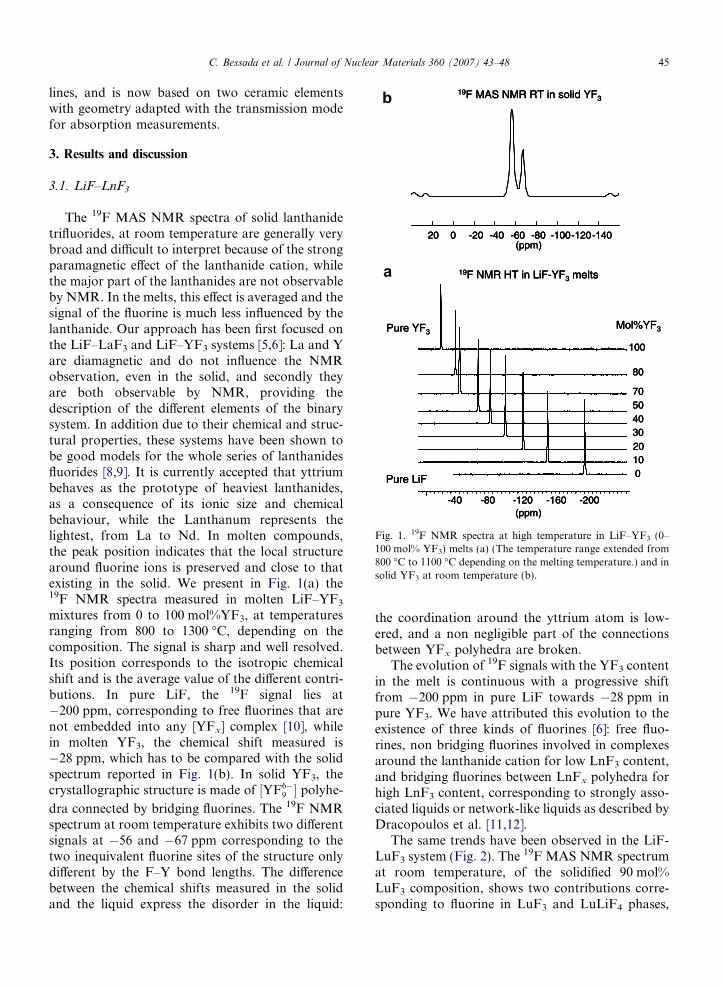
Fig. 1. 19F NMR spectra at high temperature in LiF–YF3 (0–100 mol% YF3) melts (a) (The temperature range extended from800 �C to 1100 �C depending on the melting temperature.) and insolid YF3 at room temperature (b).
C. Bessada et al. / Journal of Nuclear Materials 360 (2007) 43–48 45
lines, and is now based on two ceramic elementswith geometry adapted with the transmission modefor absorption measurements.
3. Results and discussion
3.1. LiF–LnF3
The 19F MAS NMR spectra of solid lanthanidetrifluorides, at room temperature are generally verybroad and difficult to interpret because of the strongparamagnetic effect of the lanthanide cation, whilethe major part of the lanthanides are not observableby NMR. In the melts, this effect is averaged and thesignal of the fluorine is much less influenced by thelanthanide. Our approach has been first focused onthe LiF–LaF3 and LiF–YF3 systems [5,6]: La and Yare diamagnetic and do not influence the NMRobservation, even in the solid, and secondly theyare both observable by NMR, providing thedescription of the different elements of the binarysystem. In addition due to their chemical and struc-tural properties, these systems have been shown tobe good models for the whole series of lanthanidesfluorides [8,9]. It is currently accepted that yttriumbehaves as the prototype of heaviest lanthanides,as a consequence of its ionic size and chemicalbehaviour, while the Lanthanum represents thelightest, from La to Nd. In molten compounds,the peak position indicates that the local structurearound fluorine ions is preserved and close to thatexisting in the solid. We present in Fig. 1(a) the19F NMR spectra measured in molten LiF–YF3
mixtures from 0 to 100 mol%YF3, at temperaturesranging from 800 to 1300 �C, depending on thecomposition. The signal is sharp and well resolved.Its position corresponds to the isotropic chemicalshift and is the average value of the different contri-butions. In pure LiF, the 19F signal lies at�200 ppm, corresponding to free fluorines that arenot embedded into any [YFx] complex [10], whilein molten YF3, the chemical shift measured is�28 ppm, which has to be compared with the solidspectrum reported in Fig. 1(b). In solid YF3, thecrystallographic structure is made of ½YF6�
9 � polyhe-
dra connected by bridging fluorines. The 19F NMRspectrum at room temperature exhibits two differentsignals at �56 and �67 ppm corresponding to thetwo inequivalent fluorine sites of the structure onlydifferent by the F–Y bond lengths. The differencebetween the chemical shifts measured in the solidand the liquid express the disorder in the liquid:
the coordination around the yttrium atom is low-ered, and a non negligible part of the connectionsbetween YFx polyhedra are broken.
The evolution of 19F signals with the YF3 contentin the melt is continuous with a progressive shiftfrom �200 ppm in pure LiF towards �28 ppm inpure YF3. We have attributed this evolution to theexistence of three kinds of fluorines [6]: free fluo-rines, non bridging fluorines involved in complexesaround the lanthanide cation for low LnF3 content,and bridging fluorines between LnFx polyhedra forhigh LnF3 content, corresponding to strongly asso-ciated liquids or network-like liquids as described byDracopoulos et al. [11,12].
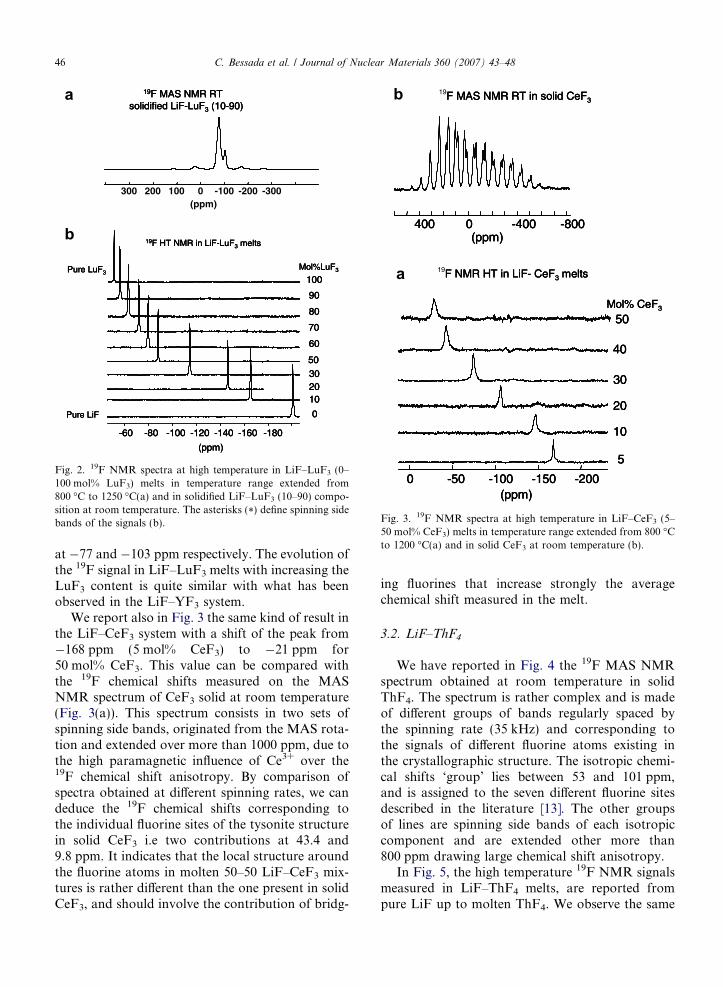
The same trends have been observed in the LiF-LuF3 system (Fig. 2). The 19F MAS NMR spectrumat room temperature, of the solidified 90 mol%LuF3 composition, shows two contributions corre-sponding to fluorine in LuF3 and LuLiF4 phases,
19F HT NMR in LiF-LuF3 melts
Mol%LuF3
-180-160-140-120-100-80-60
(ppm)
0
102030
60
70
90
80
100
50
Pure LuF3
Pure LiF
19F MAS NMR RTsolidified LiF-LuF3 (10-90)
19F HT NMR in LiF-LuF3 melts
Mol%LuF3
-180-160-140-120-100-80-60
(ppm)
0
102030
60
70
90
80
100
50
Pure LuF3
Pure LiF
19F HT NMR in LiF-LuF3 melts
Mol%LuF3
-180-160-140-120-100-80-60
(ppm)
0
102030
60
70
90
80
100
50
Pure LuF3
Pure LiF
19F MAS NMR RTsolidified LiF-LuF3 (10-90)
(ppm)-300-200-1000100200300
19F MAS NMR RTsolidified LiF-LuF3 (10-90)
Fig. 2. 19F NMR spectra at high temperature in LiF–LuF3 (0–100 mol% LuF3) melts in temperature range extended from800 �C to 1250 �C(a) and in solidified LiF–LuF3 (10–90) compo-sition at room temperature. The asterisks (*) define spinning sidebands of the signals (b).
19F MAS NMR RT in solid CeF3
(ppm)-800-4000400
(ppm)-200-150-100-500
5
10
20
30
40
50Mol% CeF3
19F NMR HT in LiF- CeF3 melts
F MAS NMR RT in solid CeF3
(ppm)-800-4000400
F MAS NMR RT in solid CeF3
(ppm)-800-4000400
(ppm)-200-150-100-500
5
10
20
30
40
50Mol% CeF3
F NMR HT in LiF- CeF3 melts
(ppm)-200-150-100-500
5
10
20
30
40
50Mol% CeF3
F NMR HT in LiF- CeF3 melts
Fig. 3. 19F NMR spectra at high temperature in LiF–CeF3 (5–50 mol% CeF3) melts in temperature range extended from 800 �Cto 1200 �C(a) and in solid CeF3 at room temperature (b).
46 C. Bessada et al. / Journal of Nuclear Materials 360 (2007) 43–48
at �77 and �103 ppm respectively. The evolution ofthe 19F signal in LiF–LuF3 melts with increasing theLuF3 content is quite similar with what has beenobserved in the LiF–YF3 system.
We report also in Fig. 3 the same kind of result inthe LiF–CeF3 system with a shift of the peak from�168 ppm (5 mol% CeF3) to �21 ppm for50 mol% CeF3. This value can be compared withthe 19F chemical shifts measured on the MASNMR spectrum of CeF3 solid at room temperature(Fig. 3(a)). This spectrum consists in two sets ofspinning side bands, originated from the MAS rota-tion and extended over more than 1000 ppm, due tothe high paramagnetic influence of Ce3+ over the19F chemical shift anisotropy. By comparison ofspectra obtained at different spinning rates, we candeduce the 19F chemical shifts corresponding tothe individual fluorine sites of the tysonite structurein solid CeF3 i.e two contributions at 43.4 and9.8 ppm. It indicates that the local structure aroundthe fluorine atoms in molten 50–50 LiF–CeF3 mix-tures is rather different than the one present in solidCeF3, and should involve the contribution of bridg-
ing fluorines that increase strongly the averagechemical shift measured in the melt.
3.2. LiF–ThF4
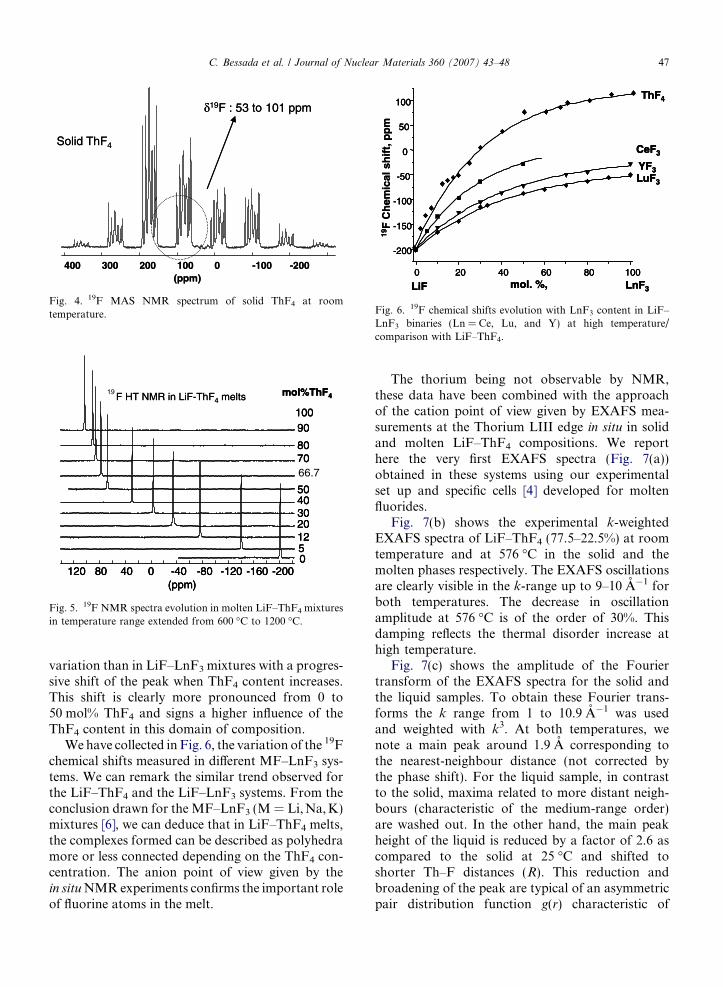
We have reported in Fig. 4 the 19F MAS NMRspectrum obtained at room temperature in solidThF4. The spectrum is rather complex and is madeof different groups of bands regularly spaced bythe spinning rate (35 kHz) and corresponding tothe signals of different fluorine atoms existing inthe crystallographic structure. The isotropic chemi-cal shifts ‘group’ lies between 53 and 101 ppm,and is assigned to the seven different fluorine sitesdescribed in the literature [13]. The other groupsof lines are spinning side bands of each isotropiccomponent and are extended other more than800 ppm drawing large chemical shift anisotropy.
In Fig. 5, the high temperature 19F NMR signalsmeasured in LiF–ThF4 melts, are reported frompure LiF up to molten ThF4. We observe the same
(ppm)-200-1000100200300400
Solid ThF4
δ19F : 53 to 101 ppm
(ppm)-200-1000100200300400
Solid ThF4
δ19F : 53 to 101 ppm
Fig. 4. 19F MAS NMR spectrum of solid ThF4 at roomtemperature.
mol%ThF4
(ppm)-200-160-120-80-4004080120
0
125
10090
8070
50
66.7
3040
20
19F HT NMR in LiF-ThF4 melts mol%ThF4
(ppm)-200-160-120-80-4004080120
0
125
10090
8070
50
3040
20
mol%ThF4
(ppm)-200-160-120-80-4004080120
0
125
10090
8070
50
3040
20
F HT NMR in LiF-ThF4 melts
Fig. 5. 19F NMR spectra evolution in molten LiF–ThF4 mixturesin temperature range extended from 600 �C to 1200 �C.
19F
Ch
emic
alsh
ift,
pp
m
0 20 40 60 80 100
-200
-150
-100
-50
0
50
100
LnF3LiF mol. %,
CeF3
LuF3
YF3
ThF4
19F
Ch
emic
alsh
ift,
pp
m
0 20 40 60 80 100
-200
-150
-100
-50
0
50
100
LnF3LiF mol. %,
CeF3
LuF3
YF3
ThF4
0 20 40 60 80 100
-200
-150
-100
-50
0
50
100
LnF3LiF mol. %,
CeF3
LuF3
YF3
ThF4
Fig. 6. 19F chemical shifts evolution with LnF3 content in LiF–LnF3 binaries (Ln = Ce, Lu, and Y) at high temperature/comparison with LiF–ThF4.
C. Bessada et al. / Journal of Nuclear Materials 360 (2007) 43–48 47
variation than in LiF–LnF3 mixtures with a progres-sive shift of the peak when ThF4 content increases.This shift is clearly more pronounced from 0 to50 mol% ThF4 and signs a higher influence of theThF4 content in this domain of composition.
We have collected in Fig. 6, the variation of the 19Fchemical shifts measured in different MF–LnF3 sys-tems. We can remark the similar trend observed forthe LiF–ThF4 and the LiF–LnF3 systems. From theconclusion drawn for the MF–LnF3 (M = Li, Na, K)mixtures [6], we can deduce that in LiF–ThF4 melts,the complexes formed can be described as polyhedramore or less connected depending on the ThF4 con-centration. The anion point of view given by thein situ NMR experiments confirms the important roleof fluorine atoms in the melt.
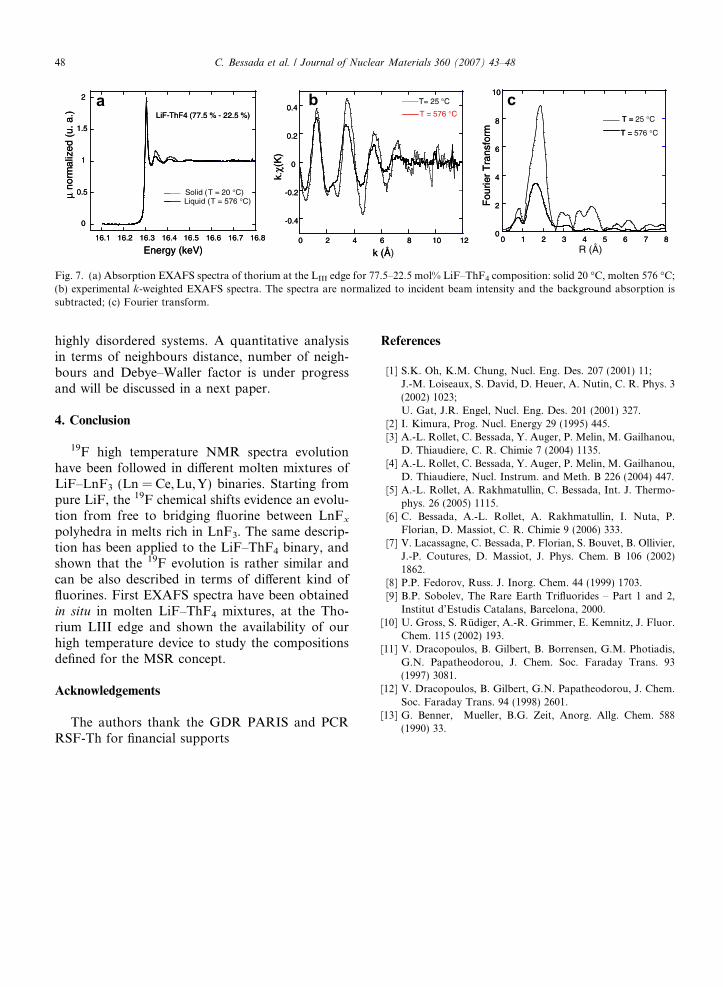
The thorium being not observable by NMR,these data have been combined with the approachof the cation point of view given by EXAFS mea-surements at the Thorium LIII edge in situ in solidand molten LiF–ThF4 compositions. We reporthere the very first EXAFS spectra (Fig. 7(a))obtained in these systems using our experimentalset up and specific cells [4] developed for moltenfluorides.
Fig. 7(b) shows the experimental k-weightedEXAFS spectra of LiF–ThF4 (77.5–22.5%) at roomtemperature and at 576 �C in the solid and themolten phases respectively. The EXAFS oscillationsare clearly visible in the k-range up to 9–10 A�1 forboth temperatures. The decrease in oscillationamplitude at 576 �C is of the order of 30%. Thisdamping reflects the thermal disorder increase athigh temperature.
Fig. 7(c) shows the amplitude of the Fouriertransform of the EXAFS spectra for the solid andthe liquid samples. To obtain these Fourier trans-forms the k range from 1 to 10.9 A�1 was usedand weighted with k3. At both temperatures, wenote a main peak around 1.9 A corresponding tothe nearest-neighbour distance (not corrected bythe phase shift). For the liquid sample, in contrastto the solid, maxima related to more distant neigh-bours (characteristic of the medium-range order)are washed out. In the other hand, the main peakheight of the liquid is reduced by a factor of 2.6 ascompared to the solid at 25 �C and shifted toshorter Th–F distances (R). This reduction andbroadening of the peak are typical of an asymmetricpair distribution function g(r) characteristic of
-0.4
-0.2
0
0.2
0.4
0 2 4 6 8 10 12
T= 25 ˚C
T =
k (Å
0
2
4
6
8
10
0 1 2 3 4 5 6 7 8
T =
T =
k.χ(
K)
0
0.5
1
1.5
2
16.1 16.2 16.3 16.4 16.5 16.6 16.7 16.8
LiF-ThF4 (77.5 % - 22.5 %)
Solid ( T = 20˚C)Liquid ( T = 576˚C
Energy (keV)
μno
rmal
ized
(u. a
.)
Fou
rier
Tra
nsfo
rm
-0.4
-0.2
0
0.2
0.4
0 2 4 6 8 10 12
T= 25 °CT = 576 °C
k (Å)
0
2
4
6
8
10
0 1 2 3 4 5 6 7 8
T = 25 °C
T = 576 °C
R (Å)
k.χ(
K)
0
0.5
1
1.5
2
16.1 16.2 16.3 16.4 16.5 16.6 16.7 16.8
LiF-ThF4 (77.5 % - 22.5 %)
Solid ( T = 20 °C)Liquid ( T = 576 °C)
Energy (keV)
μno
rmal
ized
(u. a
.)
Fou
rier
Tra
nsfo
rm
Fig. 7. (a) Absorption EXAFS spectra of thorium at the LIII edge for 77.5–22.5 mol% LiF–ThF4 composition: solid 20 �C, molten 576 �C;(b) experimental k-weighted EXAFS spectra. The spectra are normalized to incident beam intensity and the background absorption issubtracted; (c) Fourier transform.
48 C. Bessada et al. / Journal of Nuclear Materials 360 (2007) 43–48
highly disordered systems. A quantitative analysisin terms of neighbours distance, number of neigh-bours and Debye–Waller factor is under progressand will be discussed in a next paper.
4. Conclusion
19F high temperature NMR spectra evolutionhave been followed in different molten mixtures ofLiF–LnF3 (Ln = Ce,Lu,Y) binaries. Starting frompure LiF, the 19F chemical shifts evidence an evolu-tion from free to bridging fluorine between LnFx
polyhedra in melts rich in LnF3. The same descrip-tion has been applied to the LiF–ThF4 binary, andshown that the 19F evolution is rather similar andcan be also described in terms of different kind offluorines. First EXAFS spectra have been obtainedin situ in molten LiF–ThF4 mixtures, at the Tho-rium LIII edge and shown the availability of ourhigh temperature device to study the compositionsdefined for the MSR concept.
Acknowledgements
The authors thank the GDR PARIS and PCRRSF-Th for financial supports
References
[1] S.K. Oh, K.M. Chung, Nucl. Eng. Des. 207 (2001) 11;J.-M. Loiseaux, S. David, D. Heuer, A. Nutin, C. R. Phys. 3(2002) 1023;U. Gat, J.R. Engel, Nucl. Eng. Des. 201 (2001) 327.
[2] I. Kimura, Prog. Nucl. Energy 29 (1995) 445.[3] A.-L. Rollet, C. Bessada, Y. Auger, P. Melin, M. Gailhanou,
D. Thiaudiere, C. R. Chimie 7 (2004) 1135.[4] A.-L. Rollet, C. Bessada, Y. Auger, P. Melin, M. Gailhanou,
D. Thiaudiere, Nucl. Instrum. and Meth. B 226 (2004) 447.[5] A.-L. Rollet, A. Rakhmatullin, C. Bessada, Int. J. Thermo-
phys. 26 (2005) 1115.[6] C. Bessada, A.-L. Rollet, A. Rakhmatullin, I. Nuta, P.
Florian, D. Massiot, C. R. Chimie 9 (2006) 333.[7] V. Lacassagne, C. Bessada, P. Florian, S. Bouvet, B. Ollivier,
J.-P. Coutures, D. Massiot, J. Phys. Chem. B 106 (2002)1862.
[8] P.P. Fedorov, Russ. J. Inorg. Chem. 44 (1999) 1703.[9] B.P. Sobolev, The Rare Earth Trifluorides – Part 1 and 2,
Institut d’Estudis Catalans, Barcelona, 2000.[10] U. Gross, S. Rudiger, A.-R. Grimmer, E. Kemnitz, J. Fluor.
Chem. 115 (2002) 193.[11] V. Dracopoulos, B. Gilbert, B. Borrensen, G.M. Photiadis,
G.N. Papatheodorou, J. Chem. Soc. Faraday Trans. 93(1997) 3081.
[12] V. Dracopoulos, B. Gilbert, G.N. Papatheodorou, J. Chem.Soc. Faraday Trans. 94 (1998) 2601.
[13] G. Benner, Mueller, B.G. Zeit, Anorg. Allg. Chem. 588(1990) 33.