Phase Transitions at the Mn/ZnO (000-1) Interface Probed by High Energy X ray Spectroscopies
6
Published: November 18, 2011 r2011 American Chemical Society 665 dx.doi.org/10.1021/jp206705p | J. Phys. Chem. C 2012, 116, 665–670 ARTICLE pubs.acs.org/JPCC Phase Transitions at the Mn/ZnO (000 1) Interface Probed by High Energy X-ray Spectroscopies Mac C. Mugumaoderha,* ,† Robert Sporken, † Jacques Ghijsen, † Frank M.F. de Groot, ‡ and Jacques A. Dumont † † Research Centre in Physics of Matter and Radiation, University of Namur (FUNDP), Rue de Bruxelles 61, 5000 Namur, Belgium ‡ Department of Inorganic Chemistry and Catalysis, Utrecht University, Sorbonnelaan 16, 3584 CA Utrecht, The Netherlands 1. INTRODUCTION The state of a material with a given homogeneous composition at thermodynamical equilibrium depends on its temperature and pressure. At constant pressure, phase transitions will depend only on temperature for such material. When the composition of a material is not uniform as it is in the case for heterostructures, the situation may become more complicated. Indeed, as a result of diffusion processes, concentration gradients will appear near interfaces. Hence, at a given temperature and pressure, the phase observed at a given position in the material will be ruled by the local composition, which also depends on time and on the initial heterojunction stacking sequence. This situation is illustrated in the present article on a relatively simple system, namely, the Mn/ ZnO interface. The perfect control of the structure of ZnO-based ternary compounds is indeed very important for achieving the proper physical properties. As an example, a wide diversity of magnetic properties has been reported in the literature for (Zn, TM)O diluted magnetic semiconductors, indicating that the magnetization in such diluted magnetic oxides (DMOs) depends on the growth and doping conditions to a point that the experimental parameters and associated physical properties can hardly be reproduced by different groups. 13 The existing literature on the physical chemistry of the Mn/ZnO interface is rather scarce. Zou et al. 4 found that after annealing at high temperature (∼900 K) interfacial reactions lead to oxides where Mn is present as Mn 3+ or Mn 4+ . The investigations of Guziewicz et al. 5 provided information about the contribution of Mn 3d states to the valence band of ZnMnO. The phase diagram of the (Zn,Mn)O system is relatively well- known since the mid-60s. 6 For increasing temperatures (between 875 and 1775 K) and for decreasing Mn concentration, Mn appears in a cubic Zn y Mn 2y O 3 ,then in a tetragonal or cubic Zn y Mn 3y O 4 spinel, and finally in the zincite (wurtzite) Zn 1z Mn z O phase. Hence the Mn oxidation state progressively changes from 3+ to 2+ with decreasing concentration or increasing temperature. In the case of thermal diffusion of a thin Mn layer into ZnO, the Mn concentration decreases due to diffusion, while temperature increases. Therefore, the same phase evolution should be expected as for bulk Zn/Mn/O equilibria. Nevertheless, the situation may differ slightly because annealing is performed under ultrahigh vacuum (UHV). The oxygen supply to the Mn therefore requires ZnO decomposition. In a previous paper, we showed that mild annealing of Mn films results in the formation of a thin MnO film, which is unexpected from the phase diagram. 7 In the present work, we aim at elucidating the phase transition occurring at the interface between Mn and ZnO, especially in relation to the local Mn concentration that is determined by diffusion processes. To achieve this goal, we combined hard X-ray photoelectron spectroscopy (HAXPES) with X-ray ab- sorption near-edge spectroscopy (XANES). As shown in a recent publication by our group, 8 this is a powerful combination of hard X-ray-based techniques for investigating the electronic and structural properties of buried interfaces. In addition, because Mn oxidation can proceed either by the formation of separate oxide phases or by incorporation of Mn atoms at Zn sites, we performed charge transfer multiplet calculations of the Mn 2p X-ray photoelectron spectra to identify the local environment of Mn atoms. 2. EXPERIMENTAL METHODS The ZnO (000 1) single crystals produced by hydrothermal growth were polished by a mechanical and chemical method (NovaSiC). The samples were then cleaned ex situ in an acetone ultrasonic bath (10 min) and blown dry with nitrogen after the bath. Next, they were loaded into UHV (base pressure below 2 10 9 mbar) at the beamline BW2 at DESY. They were cleaned Received: July 14, 2011 Revised: November 14, 2011 ABSTRACT: Phase transitions occurring at the Mn/ZnO interface upon annealing are probed in situ by high-energy X-ray: photoelectron and absorption spectroscopies. A thin Mn film (∼1 nm) is grown on the (000 1) surface of a ZnO single crystal. Upon annealing to progressively higher temperature ranging from 575 to 800 K, various Mn phases form successively. At first, the Mn film oxidizes and a MnO layer forms on top of the surface. Then, while Mn atoms diffuse deeper into the bulk of ZnO, Zn y Mn 3y O 4 starts to form. Finally, at the highest annealing temperature, Mn appears to be substitutionally diluted at Zn sites within the ZnO lattice.
-
Upload
independent -
Category
Documents
-
view
1 -
download
0
Transcript of Phase Transitions at the Mn/ZnO (000-1) Interface Probed by High Energy X ray Spectroscopies

Published: November 18, 2011
r 2011 American Chemical Society 665 dx.doi.org/10.1021/jp206705p | J. Phys. Chem. C 2012, 116, 665–670
ARTICLE
pubs.acs.org/JPCC
Phase Transitions at the Mn/ZnO (0001) Interface Probed by HighEnergy X-ray SpectroscopiesMac C. Mugumaoderha,*,† Robert Sporken,† Jacques Ghijsen,† Frank M.F. de Groot,‡ andJacques A. Dumont†
†Research Centre in Physics of Matter and Radiation, University of Namur (FUNDP), Rue de Bruxelles 61, 5000 Namur, Belgium‡Department of Inorganic Chemistry and Catalysis, Utrecht University, Sorbonnelaan 16, 3584 CA Utrecht, The Netherlands
1. INTRODUCTION
The state of amaterial with a given homogeneous compositionat thermodynamical equilibrium depends on its temperature andpressure. At constant pressure, phase transitions will depend onlyon temperature for such material. When the composition of amaterial is not uniform as it is in the case for heterostructures, thesituation may become more complicated. Indeed, as a result ofdiffusion processes, concentration gradients will appear nearinterfaces. Hence, at a given temperature and pressure, the phaseobserved at a given position in the material will be ruled by thelocal composition, which also depends on time and on the initialheterojunction stacking sequence. This situation is illustrated inthe present article on a relatively simple system, namely, theMn/ZnO interface. The perfect control of the structure of ZnO-basedternary compounds is indeed very important for achieving theproper physical properties. As an example, a wide diversity ofmagnetic properties has been reported in the literature for (Zn,TM)O diluted magnetic semiconductors, indicating that themagnetization in such diluted magnetic oxides (DMOs) dependson the growth and doping conditions to a point that theexperimental parameters and associated physical properties canhardly be reproduced by different groups.1�3 The existingliterature on the physical chemistry of the Mn/ZnO interface israther scarce. Zou et al.4 found that after annealing at hightemperature (∼900 K) interfacial reactions lead to oxides whereMn is present as Mn3+ or Mn4+. The investigations of Guziewiczet al.5 provided information about the contribution of Mn 3dstates to the valence band of ZnMnO.
The phase diagram of the (Zn,Mn)O system is relatively well-known since the mid-60s.6 For increasing temperatures(between 875 and 1775 K) and for decreasingMn concentration,Mn appears in a cubic ZnyMn2�yO3,then in a tetragonal or cubicZnyMn3�yO4 spinel, and finally in the zincite (wurtzite)Zn1�zMnzO phase. Hence the Mn oxidation state progressivelychanges from 3+ to 2+ with decreasing concentration orincreasing temperature. In the case of thermal diffusion of a thin
Mn layer into ZnO, the Mn concentration decreases due todiffusion, while temperature increases. Therefore, the same phaseevolution should be expected as for bulk Zn/Mn/O equilibria.Nevertheless, the situation may differ slightly because annealingis performed under ultrahigh vacuum (UHV). The oxygen supplyto the Mn therefore requires ZnO decomposition. In a previouspaper, we showed that mild annealing of Mn films results in theformation of a thin MnO film, which is unexpected from thephase diagram.7
In the present work, we aim at elucidating the phase transitionoccurring at the interface between Mn and ZnO, especially inrelation to the local Mn concentration that is determined bydiffusion processes. To achieve this goal, we combined hardX-ray photoelectron spectroscopy (HAXPES) with X-ray ab-sorption near-edge spectroscopy (XANES). As shown in a recentpublication by our group,8 this is a powerful combination of hardX-ray-based techniques for investigating the electronic andstructural properties of buried interfaces. In addition, becauseMn oxidation can proceed either by the formation of separateoxide phases or by incorporation of Mn atoms at Zn sites, weperformed charge transfer multiplet calculations of the Mn 2pX-ray photoelectron spectra to identify the local environment ofMn atoms.
2. EXPERIMENTAL METHODS
The ZnO (0001) single crystals produced by hydrothermalgrowth were polished by a mechanical and chemical method(NovaSiC). The samples were then cleaned ex situ in an acetoneultrasonic bath (10 min) and blown dry with nitrogen afterthe bath.
Next, they were loaded into UHV (base pressure below 2 �10�9 mbar) at the beamline BW2 at DESY. They were cleaned
Received: July 14, 2011Revised: November 14, 2011
ABSTRACT: Phase transitions occurring at the Mn/ZnO interface uponannealing are probed in situ by high-energy X-ray: photoelectron and absorptionspectroscopies. A thin Mn film (∼1 nm) is grown on the (0001) surface of a ZnOsingle crystal. Upon annealing to progressively higher temperature ranging from575 to 800 K, various Mn phases form successively. At first, the Mn film oxidizesand a MnO layer forms on top of the surface. Then, while Mn atoms diffusedeeper into the bulk of ZnO, ZnyMn3�yO4 starts to form. Finally, at the highest annealing temperature, Mn appears to besubstitutionally diluted at Zn sites within the ZnO lattice.
666 dx.doi.org/10.1021/jp206705p |J. Phys. Chem. C 2012, 116, 665–670
The Journal of Physical Chemistry C ARTICLE
in situ by several Ar+ sputtering (1 keV, 5 min) and annealing(875 K, 30 min) cycles until no contaminants were seen byHAXPES and a sharp 1 � 1 LEED pattern was observed. Thesamples were heated by direct current flow across a glassy carbonsample in contact with the single crystal. The temperature wascalibrated using a type-K thermocouple in contact with the ZnOsurface before UHV cleaning and Mn deposition. Mn wassublimated from a resistively heated filament coiled around aMn pellet (99.999% purity), with the sample held at roomtemperature. The deposition rate measured using a quartzoscillator before each Mn deposit ranged between 0.125 and0.25 nm/min. Mn coverage is specified as equivalent thickness,that is, the thickness of a uniform layer of bulk Mn with the samemass. For HAXPES measurements, a photon energy of 3500 eVwas used. Photoelectrons were collected in the normal emissiongeometry, andAu 4f7/2 reference spectra were recorded before andafter each core level and valence band data set to take into accountpossible photon energy drifts during the experiments. The intensityof the Au 4f reference spectra was also used to normalize thespectra with respect to photon flux changes occurring during theexperiment. XANES measurements were performed by recordingthe total photon absorption yield (i.e., the drain current) tuningthe photon energy around the Mn K-edge (6560 eV).
3. THEORETICAL METHODS
For a correct interpretation of the features observed in the Mn2p spectrum from the annealed Mn/ZnO (0001) system, weneed a proper theoretical description of the photoemissionprocess accounting for interatomic and intra-atomic Coulomband exchange interactions. Calculations of the theoretical Mn 2pphotoelectron spectra from Mn2+ were performed using theCTM4XAS code (version 3.1).9,10 This program is based on theAnderson model of charge-transfer multiplets and providessimulations of X-ray absorption, photoelectron, and X-ray emis-sion spectra of transition-metal compounds. In such compounds,the photoemission of a core electron from the transition-metalatom is often accompanied by an electron transfer from theneighboring O atoms, thus improving the screening of thephotohole. Depending on the number of electrons transferredto the Mn atom, several final states may exist leading to the so-called charge-transfer multiplet structures. CTM4XAS includesboth the cd5 and cd6L configurations where c denotes the corehole, dn is the number n of electrons on the 3d shell, and L is thehole on the ligand 2p orbital after electron transfer. In thecalculations, different parameters are modified and adjusted forproper simulation of the experimental data. 10Dq, the crystalfield splitting, takes positive (respectively negative) values foroctahedral (respectively tetrahedral) symmetry. Δ is the charge-transfer parameter, Udd is the d-d Coulomb repulsion energy,Upd is the core hole potential, and Tσ (respectively Tπ) is thehybridization energy between the metal dxy, dyz, or dzx(respectively, d(3z2-r2) or d(x2-y2)) and the ligand p orbitals.Note that in tetrahedral symmetry calculation, the values of Tσ
and Tπ used for octahedral symmetry are exchanged. It is alsopossible to take into account the pd Slater�Condon (ref 9 andrefs therein) and 3d- and 2p-spin�orbit coupling parameters(respectively, noted as so3d and so2p). The calculated spectrawere convoluted with a 0.2 to 0.3 eV wide (fwhm) Lorentzianfunction to take into account the finite lifetime of the photoholeas well as with a 0.2 to 0.3 eV wide (fwhm) Gaussian function totake into account the limited resolution of the experimental
setup. The temperature at which the crystal is analyzed experi-mentally (∼300 K) is also included in the calculations through aBoltzmann distribution of the occupation of the initial states.
4. RESULTS AND DISCUSSION
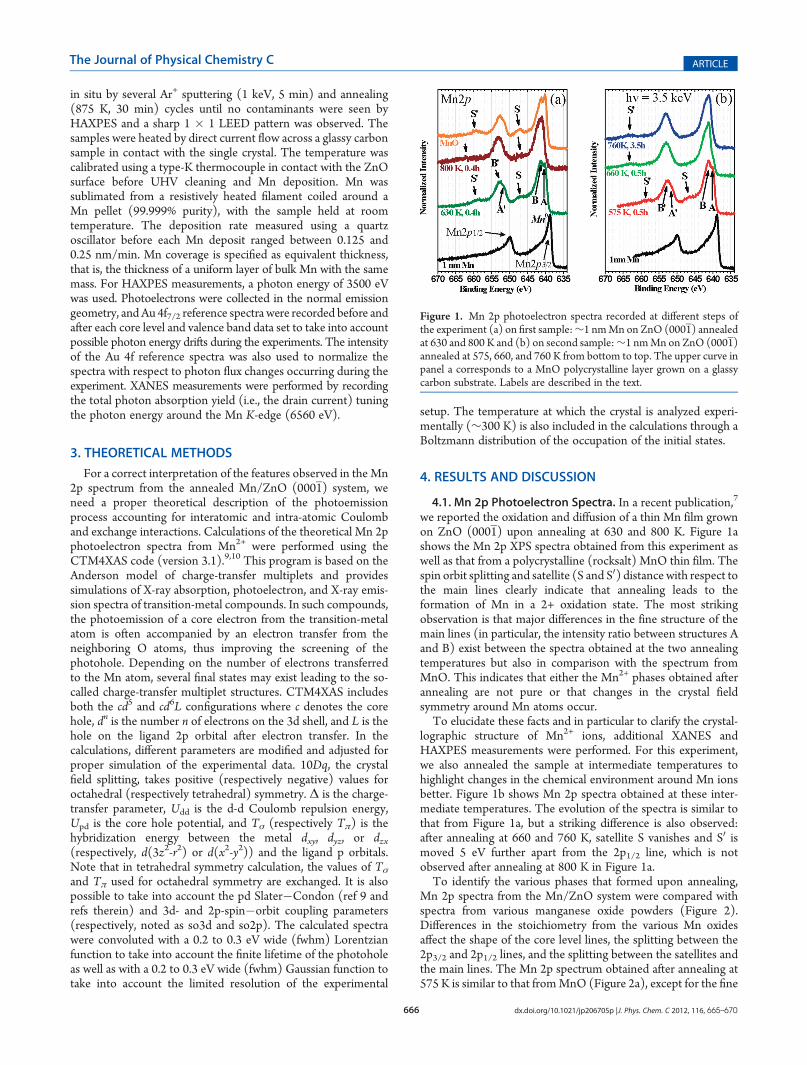
4.1. Mn 2p Photoelectron Spectra. In a recent publication,7
we reported the oxidation and diffusion of a thin Mn film grownon ZnO (0001) upon annealing at 630 and 800 K. Figure 1ashows the Mn 2p XPS spectra obtained from this experiment aswell as that from a polycrystalline (rocksalt) MnO thin film. Thespin orbit splitting and satellite (S and S0) distance with respect tothe main lines clearly indicate that annealing leads to theformation of Mn in a 2+ oxidation state. The most strikingobservation is that major differences in the fine structure of themain lines (in particular, the intensity ratio between structures Aand B) exist between the spectra obtained at the two annealingtemperatures but also in comparison with the spectrum fromMnO. This indicates that either the Mn2+ phases obtained afterannealing are not pure or that changes in the crystal fieldsymmetry around Mn atoms occur.To elucidate these facts and in particular to clarify the crystal-
lographic structure of Mn2+ ions, additional XANES andHAXPES measurements were performed. For this experiment,we also annealed the sample at intermediate temperatures tohighlight changes in the chemical environment around Mn ionsbetter. Figure 1b shows Mn 2p spectra obtained at these inter-mediate temperatures. The evolution of the spectra is similar tothat from Figure 1a, but a striking difference is also observed:after annealing at 660 and 760 K, satellite S vanishes and S0 ismoved 5 eV further apart from the 2p1/2 line, which is notobserved after annealing at 800 K in Figure 1a.To identify the various phases that formed upon annealing,
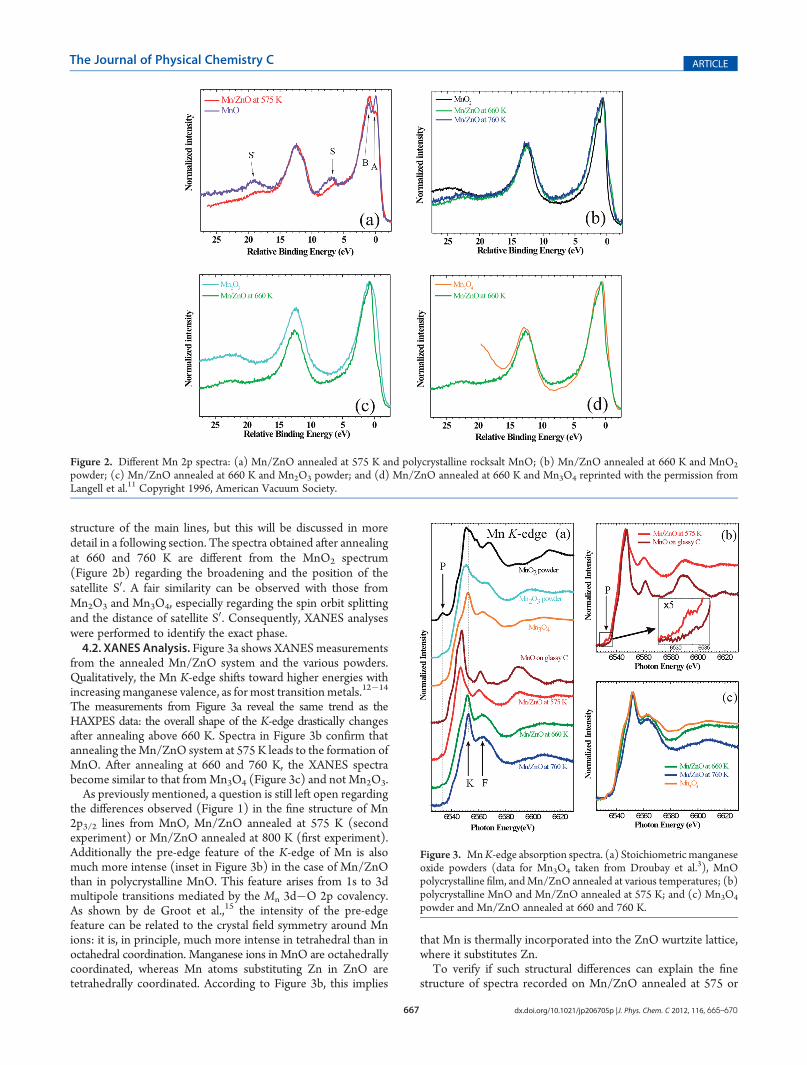
Mn 2p spectra from the Mn/ZnO system were compared withspectra from various manganese oxide powders (Figure 2).Differences in the stoichiometry from the various Mn oxidesaffect the shape of the core level lines, the splitting between the2p3/2 and 2p1/2 lines, and the splitting between the satellites andthe main lines. The Mn 2p spectrum obtained after annealing at575 K is similar to that fromMnO (Figure 2a), except for the fine
Figure 1. Mn 2p photoelectron spectra recorded at different steps ofthe experiment (a) on first sample:∼1 nmMn on ZnO (0001) annealedat 630 and 800 K and (b) on second sample:∼1 nmMn on ZnO (0001)annealed at 575, 660, and 760 K from bottom to top. The upper curve inpanel a corresponds to a MnO polycrystalline layer grown on a glassycarbon substrate. Labels are described in the text.
667 dx.doi.org/10.1021/jp206705p |J. Phys. Chem. C 2012, 116, 665–670
The Journal of Physical Chemistry C ARTICLE
structure of the main lines, but this will be discussed in moredetail in a following section. The spectra obtained after annealingat 660 and 760 K are different from the MnO2 spectrum(Figure 2b) regarding the broadening and the position of thesatellite S0. A fair similarity can be observed with those fromMn2O3 and Mn3O4, especially regarding the spin orbit splittingand the distance of satellite S0. Consequently, XANES analyseswere performed to identify the exact phase.4.2. XANES Analysis. Figure 3a shows XANES measurements
from the annealed Mn/ZnO system and the various powders.Qualitatively, the Mn K-edge shifts toward higher energies withincreasingmanganese valence, as for most transitionmetals.12�14
The measurements from Figure 3a reveal the same trend as theHAXPES data: the overall shape of the K-edge drastically changesafter annealing above 660 K. Spectra in Figure 3b confirm thatannealing theMn/ZnO system at 575 K leads to the formation ofMnO. After annealing at 660 and 760 K, the XANES spectrabecome similar to that fromMn3O4 (Figure 3c) and not Mn2O3.As previously mentioned, a question is still left open regarding
the differences observed (Figure 1) in the fine structure of Mn2p3/2 lines from MnO, Mn/ZnO annealed at 575 K (secondexperiment) or Mn/ZnO annealed at 800 K (first experiment).Additionally the pre-edge feature of the K-edge of Mn is alsomuch more intense (inset in Figure 3b) in the case of Mn/ZnOthan in polycrystalline MnO. This feature arises from 1s to 3dmultipole transitions mediated by the Mn 3d�O 2p covalency.As shown by de Groot et al.,15 the intensity of the pre-edgefeature can be related to the crystal field symmetry around Mnions: it is, in principle, much more intense in tetrahedral than inoctahedral coordination. Manganese ions in MnO are octahedrallycoordinated, whereas Mn atoms substituting Zn in ZnO aretetrahedrally coordinated. According to Figure 3b, this implies
that Mn is thermally incorporated into the ZnO wurtzite lattice,where it substitutes Zn.To verify if such structural differences can explain the fine
structure of spectra recorded on Mn/ZnO annealed at 575 or
Figure 2. Different Mn 2p spectra: (a) Mn/ZnO annealed at 575 K and polycrystalline rocksalt MnO; (b) Mn/ZnO annealed at 660 K and MnO2
powder; (c) Mn/ZnO annealed at 660 K and Mn2O3 powder; and (d) Mn/ZnO annealed at 660 K and Mn3O4 reprinted with the permission fromLangell et al.11 Copyright 1996, American Vacuum Society.
Figure 3. MnK-edge absorption spectra. (a) Stoichiometric manganeseoxide powders (data for Mn3O4 taken from Droubay et al.3), MnOpolycrystalline film, andMn/ZnO annealed at various temperatures; (b)polycrystalline MnO and Mn/ZnO annealed at 575 K; and (c) Mn3O4
powder and Mn/ZnO annealed at 660 and 760 K.

668 dx.doi.org/10.1021/jp206705p |J. Phys. Chem. C 2012, 116, 665–670
The Journal of Physical Chemistry C ARTICLE
800 K, we performed charge-transfer multiplet calculations forthe Mn 2p spectra from Mn2+ in both structures.4.3. Charge-Transfer Multiplet calculations. The XPS 2p
line shape of transition-metal atoms is by nature very complex. Thecoupling between the 2p core hole and the open 3d valence shellleads to multiplet splitting in photoemission spectra. In the case oftransition-metal oxides, multiplet structure may additionally ap-pear due to electron transfer from neighboring oxygen atoms.The origin of the fine structure observed in the Mn 2p spectra
from MnO was for long very controversial.16�19 The multipletsplitting and intra-atomic valence shell recoupling may play aminor role with respect to the interatomic screening (chargetransfer).10,20 Basically, the XPS 2p spectrum is describedassuming the 3d5 + 3d6L ground state. The main peak isdominated by 2p53d6L, and the satellite is dominated by2p53d5. Focusing on the 2p3/2 line, we find that satellite S ispresumably originating from 3d electrons recoupling in the sameway as expected for atomic Mn. In 2p-ionized Mn atoms, thecalculated satellite to the Mn 2p3/2 multiplet is assigned to 3drecoupled 2p53d5(4P,4D)4s2 states, which corresponds to a finalconfiguration where the spin of one 3d electron has flipped. Themultiplet structure (lines A and B in Figures 1 and 2a) in the main2p3/2 line can be described in the samemanner as in 2p-ionizedMnatom based on a jj coupling of the 2p3/2 hole to the valence shell inits Hund’s rule ground state 3d54s2(6S). Four multiplet compo-nents in the 2p3/2 peak emerge from this coupling with a totalangularmomentum J= 4, 3, 2, and 1, respectively. A corresponds toJ = 4 and B corresponds to J = 3. Components associated with J = 2and 1 are not resolved in the experimental spectrum.In conclusion, if charge transfer dominates, then crystal field
effects are not well-visible (as in 2p XPS). When atomic effectsdominate (2pXAS), crystal field effects are clearly visible.We shouldthus conclude that the differences observed in our Mn2+ spectra aremostly due to the coexistence of various phases. To check thishypothesis and definitively rule out any effect of the crystal fieldaround Mn2+ ions, we performed charge-transfer multiplet calcula-tions of the Mn 2p spectra for Mn2+ in octahedral (rocksalt MnO)and tetrahedral (wurtzite (Zn,Mn)O) configurations.
Table 1 gives parameters used for calculated spectra shown inFigure 4a,b using CTM4XAS code, which takes charge transfersplitting into account. To simulate our data properly and in lightof Bocquet and Fujimori’s work,21 we first tried tomatch both theintensity ratio and the energy splitting between the main 2p3/2line and its charge-transfer satellite by tuning Δ(5eΔe 7 eV).After this, we worked with fixed Udd/Upd = 0.83, 2p and 3dspin�orbit coupling at so2p = 1 (the core spin�orbit coupling isnever screened) and so3d = 0, according to values found in theliterature.9 Finally, we tuned the value of 10Dq (0 e 0Dq e 0.0eV) and T (0.53 e Tσ/Tπ e 0.67) for the best match betweenthe calculated and experimental spectra. All four components arereproducible by the calculation for 10Dq e 0.5 eV, althoughsome of them are not well-resolved for high values of theLorentzian and Gaussian broadening parameters. Values of10Dq above 0.5 eV induce other states in the main 2p3/2 line.Indeed, because of the crystal field the five 3d orbitals loose theirdegeneracy and become split energy levels: t2g with low energy(localized) and eg high energy (delocalized) in octahedralsymmetry, whereas for tetrahedral symmetry, e has low energyand t2 has high energy.As seen in Figure 4a, the experimental spectrum from a
polycrystalline (rocksalt) MnO film can be nicely comparedwith a calculation spectra of Mn2+ in an octahedral crystal field.Nevertheless, as shown in Figure 4b, a similar looking spectrumcan be obtained using a different parameter set and, moreimportantly, for a tetrahedral symmetry. In addition, this calcu-lated spectrum matches also quite well those recorded on theMn/ZnO system annealed at 630 K, which means that the crystalfield plays a minor role in the shape of the Mn2+ XPS spectra.Nonetheless, it is worth noticing that no calculation of Mn2+ ineither octahedral or tetrahedral symmetries allowed us to repro-duce the relative weights observed for peaks A and B in the Mn2p3/2 line of Mn/ZnO annealed at 630 K.4.4. Phase Transitions in the Mn/ZnO System. Two ques-
tions are now left open: (1)What is the origin of the difference inthe A/B intensity ratio observed for MnO and Mn/ZnOannealed up to 630 K? (2) What is the structure of Mn after
Table 1. Best Parameters for Mn 2p Calculation Using CTM4XAS 3.1 Codea
symmetry Δ eV Udd eV Upd eV Tσ eV Tπ eV so2p so3d 10Dq eV Figure
octahedral 6.5 6 7.2 1.9 1 1 1 0 Figure 4a
tetrahedral 5 5 6 1 1.5 1 1 �1 Figure 4ba Parameters used are described in Section 3.
Figure 4. Mn 2p spectra: (a)Mn/ZnO annealed at 630 K andMnO polycrystalline film, both recorded with a photon energy of 3500 eV, and calculatedspectrum in octahedral symmetry (using Bocquet’s parameter values); (b) MnO polycrystalline film and calculated spectrum assuming tetrahedralsymmetry.
669 dx.doi.org/10.1021/jp206705p |J. Phys. Chem. C 2012, 116, 665–670
The Journal of Physical Chemistry C ARTICLE
annealing at 800 K? The answer to both questions may lie in thepresence of an intermediate phase.As shown in Section 4.2 and above, a wurtzitic (Zn,Mn)O
phase is formed after annealing up to 630 K, but a phasetransition occurs at 660 K, leading to spectral signatures similarto Mn3O4. The usual structure of Mn3O4 is hausmannite,corresponding to a cubic oxide phase where one-third of theMn atoms are tetrahedrally coordinated and in a 2+ oxidationstate, and the remaining two-third are octahedrally coordinatedin a 3+ oxidation state. According to the literature, ZnyMn3�yO4
spinel can be formed in wurtzite ZnO, with Mn2+ ions substitut-ing Zn atoms and Mn3+ being located interstitially in theoctahedral cavities.22 The relative concentration of Mn in bothvalences is not fixed and, a priori, all phases from pure wurtziticZnxMn1�xO (tetrahedrally coordinated Mn2+ ions only) to purehetaerolite ZnMn2O4 (octahedrally coordinated Mn3+ ionsonly) are allowed.To a first approximation, photoemission or photoabsorption
spectra frommanganese inMn3O4 or ZnyMn3�yO4 spinel can beconsidered as a superposition from weighted MnO (Mn2+) andMn2O3 (Mn3+) spectra. After mild annealing (up to 630 K), theMn 2p photoelectron spectrum (Figures 1a and 2a) is similar tothe one from rocksalt MnO, except that the A/B intensity ratio islarger in the case of MnO. This difference may be explained as aresult from minute amounts of octahedrally coordinated Mn3+
interstitials.23�25 Annealing at 660 and 760 K further decreases
the intensity of feature A to a point where the spectrum becomessimilar to that from Mn3O4 (as highlighted in Figure 2d)Finally, annealing at 800 K leads to the presence of a weak
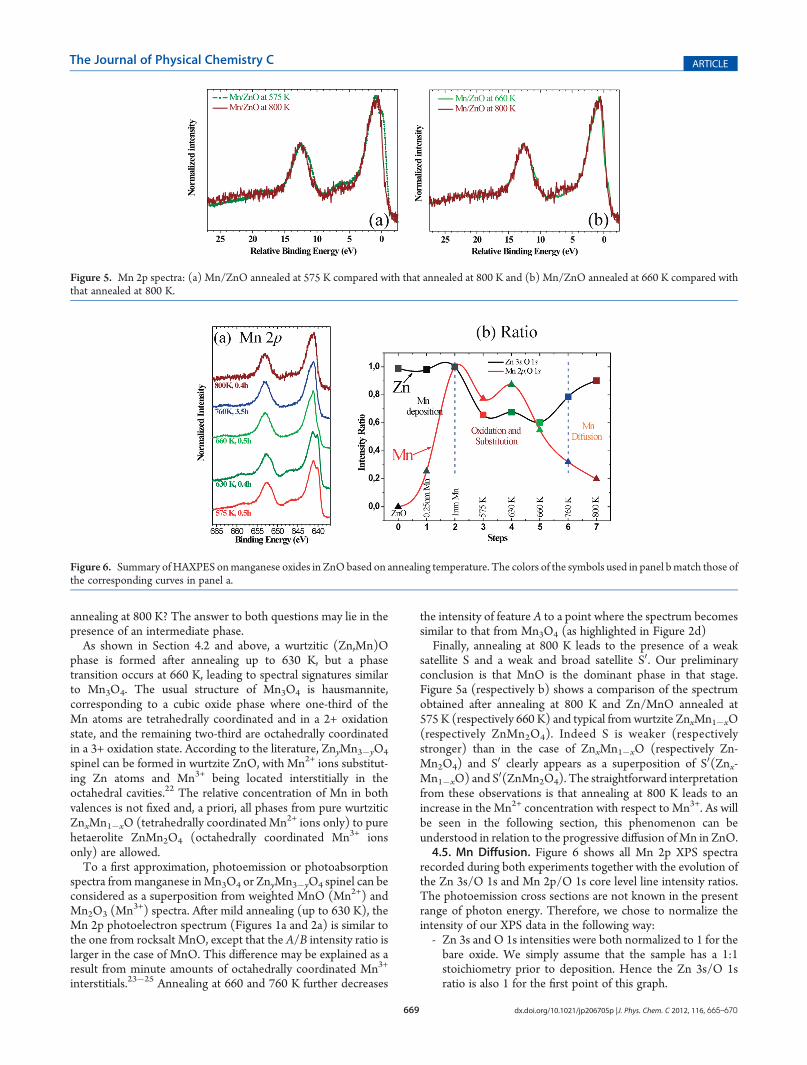
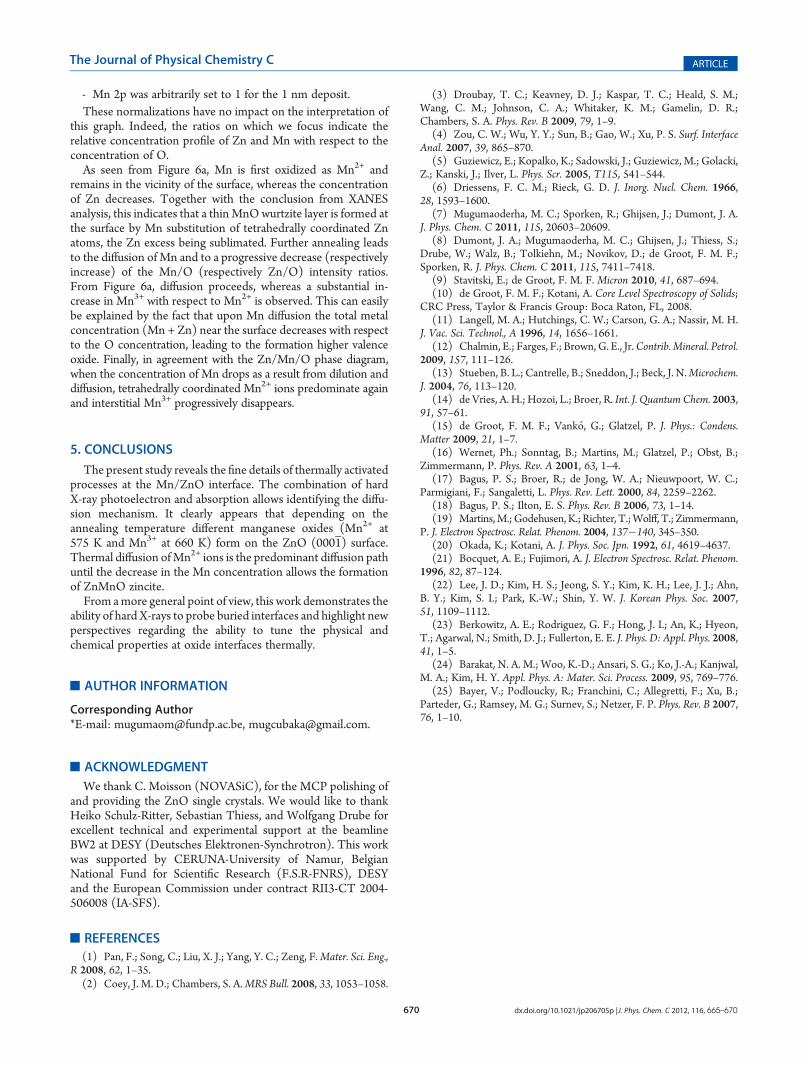
satellite S and a weak and broad satellite S0. Our preliminaryconclusion is that MnO is the dominant phase in that stage.Figure 5a (respectively b) shows a comparison of the spectrumobtained after annealing at 800 K and Zn/MnO annealed at575 K (respectively 660 K) and typical from wurtzite ZnxMn1�xO(respectively ZnMn2O4). Indeed S is weaker (respectivelystronger) than in the case of ZnxMn1�xO (respectively Zn-Mn2O4) and S0 clearly appears as a superposition of S0(Znx-Mn1�xO) and S0(ZnMn2O4). The straightforward interpretationfrom these observations is that annealing at 800 K leads to anincrease in the Mn2+ concentration with respect to Mn3+. As willbe seen in the following section, this phenomenon can beunderstood in relation to the progressive diffusion ofMn in ZnO.4.5. Mn Diffusion. Figure 6 shows all Mn 2p XPS spectra
recorded during both experiments together with the evolution ofthe Zn 3s/O 1s and Mn 2p/O 1s core level line intensity ratios.The photoemission cross sections are not known in the presentrange of photon energy. Therefore, we chose to normalize theintensity of our XPS data in the following way:- Zn 3s and O 1s intensities were both normalized to 1 for thebare oxide. We simply assume that the sample has a 1:1stoichiometry prior to deposition. Hence the Zn 3s/O 1sratio is also 1 for the first point of this graph.
Figure 5. Mn 2p spectra: (a) Mn/ZnO annealed at 575 K compared with that annealed at 800 K and (b) Mn/ZnO annealed at 660 K compared withthat annealed at 800 K.
Figure 6. Summary ofHAXPES onmanganese oxides in ZnObased on annealing temperature. The colors of the symbols used in panel bmatch those ofthe corresponding curves in panel a.
670 dx.doi.org/10.1021/jp206705p |J. Phys. Chem. C 2012, 116, 665–670
The Journal of Physical Chemistry C ARTICLE
- Mn 2p was arbitrarily set to 1 for the 1 nm deposit.These normalizations have no impact on the interpretation of
this graph. Indeed, the ratios on which we focus indicate therelative concentration profile of Zn and Mn with respect to theconcentration of O.As seen from Figure 6a, Mn is first oxidized as Mn2+ and
remains in the vicinity of the surface, whereas the concentrationof Zn decreases. Together with the conclusion from XANESanalysis, this indicates that a thinMnOwurtzite layer is formed atthe surface by Mn substitution of tetrahedrally coordinated Znatoms, the Zn excess being sublimated. Further annealing leadsto the diffusion of Mn and to a progressive decrease (respectivelyincrease) of the Mn/O (respectively Zn/O) intensity ratios.From Figure 6a, diffusion proceeds, whereas a substantial in-crease in Mn3+ with respect to Mn2+ is observed. This can easilybe explained by the fact that upon Mn diffusion the total metalconcentration (Mn + Zn) near the surface decreases with respectto the O concentration, leading to the formation higher valenceoxide. Finally, in agreement with the Zn/Mn/O phase diagram,when the concentration of Mn drops as a result from dilution anddiffusion, tetrahedrally coordinated Mn2+ ions predominate againand interstitial Mn3+ progressively disappears.
5. CONCLUSIONS
The present study reveals the fine details of thermally activatedprocesses at the Mn/ZnO interface. The combination of hardX-ray photoelectron and absorption allows identifying the diffu-sion mechanism. It clearly appears that depending on theannealing temperature different manganese oxides (Mn2+ at575 K and Mn3+ at 660 K) form on the ZnO (0001) surface.Thermal diffusion ofMn2+ ions is the predominant diffusion pathuntil the decrease in the Mn concentration allows the formationof ZnMnO zincite.
From amore general point of view, this work demonstrates theability of hard X-rays to probe buried interfaces and highlight newperspectives regarding the ability to tune the physical andchemical properties at oxide interfaces thermally.
’AUTHOR INFORMATION
Corresponding Author*E-mail: [email protected], [email protected].
’ACKNOWLEDGMENT
We thank C. Moisson (NOVASiC), for the MCP polishing ofand providing the ZnO single crystals. We would like to thankHeiko Schulz-Ritter, Sebastian Thiess, and Wolfgang Drube forexcellent technical and experimental support at the beamlineBW2 at DESY (Deutsches Elektronen-Synchrotron). This workwas supported by CERUNA-University of Namur, BelgianNational Fund for Scientific Research (F.S.R-FNRS), DESYand the European Commission under contract RII3-CT 2004-506008 (IA-SFS).
’REFERENCES
(1) Pan, F.; Song, C.; Liu, X. J.; Yang, Y. C.; Zeng, F.Mater. Sci. Eng.,R 2008, 62, 1–35.(2) Coey, J. M. D.; Chambers, S. A.MRS Bull. 2008, 33, 1053–1058.
(3) Droubay, T. C.; Keavney, D. J.; Kaspar, T. C.; Heald, S. M.;Wang, C. M.; Johnson, C. A.; Whitaker, K. M.; Gamelin, D. R.;Chambers, S. A. Phys. Rev. B 2009, 79, 1–9.
(4) Zou, C. W.; Wu, Y. Y.; Sun, B.; Gao, W.; Xu, P. S. Surf. InterfaceAnal. 2007, 39, 865–870.
(5) Guziewicz, E.; Kopalko, K.; Sadowski, J.; Guziewicz, M.; Golacki,Z.; Kanski, J.; Ilver, L. Phys. Scr. 2005, T115, 541–544.
(6) Driessens, F. C. M.; Rieck, G. D. J. Inorg. Nucl. Chem. 1966,28, 1593–1600.
(7) Mugumaoderha, M. C.; Sporken, R.; Ghijsen, J.; Dumont, J. A.J. Phys. Chem. C 2011, 115, 20603–20609.
(8) Dumont, J. A.; Mugumaoderha, M. C.; Ghijsen, J.; Thiess, S.;Drube, W.; Walz, B.; Tolkiehn, M.; Novikov, D.; de Groot, F. M. F.;Sporken, R. J. Phys. Chem. C 2011, 115, 7411–7418.
(9) Stavitski, E.; de Groot, F. M. F. Micron 2010, 41, 687–694.(10) de Groot, F. M. F.; Kotani, A. Core Level Spectroscopy of Solids;
CRC Press, Taylor & Francis Group: Boca Raton, FL, 2008.(11) Langell, M. A.; Hutchings, C. W.; Carson, G. A.; Nassir, M. H.
J. Vac. Sci. Technol., A 1996, 14, 1656–1661.(12) Chalmin, E.; Farges, F.; Brown, G. E., Jr.Contrib. Mineral. Petrol.
2009, 157, 111–126.(13) Stueben, B. L.; Cantrelle, B.; Sneddon, J.; Beck, J. N.Microchem.
J. 2004, 76, 113–120.(14) de Vries, A. H.; Hozoi, L.; Broer, R. Int. J. Quantum Chem. 2003,
91, 57–61.(15) de Groot, F. M. F.; Vank�o, G.; Glatzel, P. J. Phys.: Condens.
Matter 2009, 21, 1–7.(16) Wernet, Ph.; Sonntag, B.; Martins, M.; Glatzel, P.; Obst, B.;
Zimmermann, P. Phys. Rev. A 2001, 63, 1–4.(17) Bagus, P. S.; Broer, R.; de Jong, W. A.; Nieuwpoort, W. C.;
Parmigiani, F.; Sangaletti, L. Phys. Rev. Lett. 2000, 84, 2259–2262.(18) Bagus, P. S.; Ilton, E. S. Phys. Rev. B 2006, 73, 1–14.(19) Martins,M.;Godehusen, K.; Richter, T.;Wolff, T.; Zimmermann,
P. J. Electron Spectrosc. Relat. Phenom. 2004, 137�140, 345–350.(20) Okada, K.; Kotani, A. J. Phys. Soc. Jpn. 1992, 61, 4619–4637.(21) Bocquet, A. E.; Fujimori, A. J. Electron Spectrosc. Relat. Phenom.
1996, 82, 87–124.(22) Lee, J. D.; Kim, H. S.; Jeong, S. Y.; Kim, K. H.; Lee, J. J.; Ahn,
B. Y.; Kim, S. I.; Park, K.-W.; Shin, Y. W. J. Korean Phys. Soc. 2007,51, 1109–1112.
(23) Berkowitz, A. E.; Rodriguez, G. F.; Hong, J. I.; An, K.; Hyeon,T.; Agarwal, N.; Smith, D. J.; Fullerton, E. E. J. Phys. D: Appl. Phys. 2008,41, 1–5.
(24) Barakat, N. A. M.; Woo, K.-D.; Ansari, S. G.; Ko, J.-A.; Kanjwal,M. A.; Kim, H. Y. Appl. Phys. A: Mater. Sci. Process. 2009, 95, 769–776.
(25) Bayer, V.; Podloucky, R.; Franchini, C.; Allegretti, F.; Xu, B.;Parteder, G.; Ramsey, M. G.; Surnev, S.; Netzer, F. P. Phys. Rev. B 2007,76, 1–10.