000 Korice-SM2020-185x275.cdr
66
Vol. 25, No. 3 2020
-
Upload
khangminh22 -
Category
Documents
-
view
0 -
download
0
Transcript of 000 Korice-SM2020-185x275.cdr

Vol. 25, No. 3
2020

Strategic Management International Journal of Strategic Management and
Decision Support Systems in Strategic Management
www.smjournal.rsPublisher University of Novi Sad, Faculty of Economics in Subotica Segedinski put 9-11, 24000 Subotica, Serbia Tel: +381 24 628 000 Fax: +381 546 486 http://www.ef.uns.ac.rs
For Publisher Aleksandar Grubor, University of Novi Sad, Faculty of Economics in Subotica, Serbia
Editor-in-Chief Aleksandar Grubor, University of Novi Sad, Faculty of Economics in Subotica, Serbia International co-editor Jean Andrei, Petroleum-Gas University of Ploiesti, Faculty of Economic Sciences, Romania
National Editorial Board Jovica Đurković, University of Novi Sad, Faculty of Economics in Subotica, Serbia Dušan Bobera, University of Novi Sad, Faculty of Economics in Subotica, Serbia Otilija Sedlak, University of Novi Sad, Faculty of Economics in Subotica, Serbia
Dejan Jakšić, University of Novi Sad, Faculty of Economics in Subotica, Serbia Saša Veljković, University of Belgrade, Faculty of Economics Belgrade, Serbia
Nebojša Janićijević, University of Belgrade, Faculty of Economics Belgrade, Serbia Vesna Milićević, University of Belgrade, Faculty of Organizational Sciences, Serbia Aleksandar Živković, University of Belgrade, Faculty of Economics, Serbia
Dejan Petrović, University of Belgrade, Faculty of Organizational Sciences, Serbia Jonel Subić, Institute of Agricultural Economics in Belgrade, Serbia Zoran Simonović, Institute of Agricultural Economics in Belgrade, Serbia Slavomir Miletić, University of Priština, Faculty of Economy Kosovska Mitrovica, Serbia Nikola Ćurčić, Institute of Agricultural Economics, Belgrade, Serbia Drago Cvijanović, University of Kragujevac, Faculty of Hotel Management and Tourism Vrnjačka Banja, Serbia Ivana Simić, University of Niš, Faculty of Economics, Serbia Jovan Zubović, Institute of Economic Science Belgrade, Serbia Nikola Radivojević, Technical College at Applied Studies Kragujevac, Serbia Ivana Domazet, Institute of Economic Science Belgrade, Serbia
International Editorial Board Donatella Privitera, University of Catania, Italy Ignacio De Los Ríos Carmenado, Universidad Politécnica de Madrid, Spain Teodor Sedlarski, St Kliment Ohridski University of Sofia, Bulgaria Panagiotis Kaldis, University of West Attica, Greece Aristidis Papagrigoriou, University of West Attica, Greece Petros Kalantonis, University of West Attica, Greece Gheorghe Ileana, Petroleum-Gas University of Ploiesti, Romania Nica Elvira, Faculty of Administration and Public Management, Bucharest Academy of Economic Studies, Romania Andrei Jean Vasile, Petroleum-Gas University of Ploiesti, Romania Konstantin Kostin, Saint-Petersburg State University of Economics, Russia Ilona Bažantova, Charles University in Prague, Faculty of Law, Czech Republic André Boyer, University of Nice Sophia-Antipolis, France Ivan Brezina, University of Economics in Bratislava, Faculty of Economic Informatics, Bratislava, Slovakia Agnes Hofmeister, Corvinus University of Budapest, Faculty of Business Administration, Hungary Pedro Isaias, Open University Lisbon, Portugal Novak Kondić, University of Banja Luka, Faculty of Economics, Banja Luka, Bosnia and Herzegovina Mensura Kudumović, University of Sarajevo, Faculty of Medicine, Bosnia and Herzegovina Vujica Lazović, University of Montenegro, Faculty of Economics, Podgorica, Montenegro Pawel Lula, Cracow University of Economics, Poland Emilija Novak, West University of Timisoara, Timisoara, Romania Elias Pimenidis, University of East London, England Vladimir Polovinko, Omsk State University, Russia Ludovic Ragni, University of Nice Sophia-Antipolis, France Kosta Sotiroski, University „ST Kliment Ohridski“ Bitol, Faculty of Economics Prilep, Macedonia Ioan Talpos, West University of Timisoara, Faculty of Economics, Romania
Assistant Editors Marton Sakal, University of Novi Sad, Faculty of Economics in Subotica, Serbia Vuk Vuković, University of Novi Sad, Faculty of Economics in Subotica, Serbia Lazar Raković, University of Novi Sad, Faculty of Economics in Subotica, Serbia
Proofreading Željko Buljovčić
Prepress Aleksandar Vugdelija
Print Epoha d.o.o. Požega
Circulation 150
The Journal is published quarterly.

Strategic Management International Journal of Strategic Management and
Decision Support Systems in Strategic Management
ISSN 1821-3448, UDC 005.21 Strategic Management is a quarterly journal addressing issues concerned with all aspects of strategic man-agement. It is devoted to the improvement and further development of the theory and practice of strategic management and it is designed to appeal to both practicing managers and academics. Specially, Journal pub-lishes original refereed material in decision support systems in strategic management.
Thematic Fields Mission and Philosophy of the Organization
Culture and Climate of the Organization
Effectiveness and Efficiency of the Organization
Structure and Form of the Organization
Strategic Analysis
Aims and Strategies
Process of Strategic Management
Characteristics of Strategic Management in the New Economy
Contemporary Ontological, Epistemological and Axiological Suppositions on the Organization and its Environment
Analysis of the Organization and its Interaction with the Environment
Structure and Dynamics of the Organizational Environment
Uncertainty and Indistinctiveness of the Organizational Environment
Synchronic and Diachronic Analysis of the Organizational Environment
Analysis Techniques of the Organization
Business Processes, Learning and Development within the Context of Strategic Management
Evaluation and Measuring of the Potential and Realization of the Organization within the Context of Strategic Management
Strategic Control in Contemporary Management
Information Technologies in Strategic Management
Business Intelligence and Strategic Management
Decision Support Systems and Artificial Intelligence in Strategic Management
All scientific articles submitted for publication in Journal are double-blind reviewed by at least two academics appointed by the Editor's Board: one from the Editorial Board and one independent scientist of the language of origin - English. Reviewers stay anonymous. Authors will timely receive written notification of acceptance, re-marks, comments and evaluation of their articles.

Strategic Management International Journal of Strategic Management and
Decision Support Systems in Strategic Management www.smjournal.rs ISSN 1821-3448 UDC 005.21 2020, Vol. 25, No. 3
Contents Lovorka Galetić Reward strategy and practice as a tool to retain employees: case of Croatia 3-13 Katalin Balog The concept and competitiveness of agile organization in the fourth industrial revolution’s drift 14-27 Biljana Đorđević, Maja Ivanović-Đukić, Vinko Lepojević, Sandra Milanović The impact of employees' commitment on organizational performances 28-37 Shekhar Suman, Satyasiba Das Structured literature review on organizational innovation in family business context 38-44 Roland Schmuck Strategic management consulting in Hungary 45-53

STRATEGIC MANAGEMENT, Vol. 20 (2020), No. 3, pp. 003-013
doi: 10.5937/StraMan2003003G
Received: June 02, 2020
Accepted: August 19, 2020
Reward strategy and practice as a tool to retain employees: case of Croatia Lovorka Galetić University of Zagreb, Faculty of Economics & Business, Zagreb, Croatia
Abstract This paper explores the differences in reward strategy and practice between Croatia and EU countries. Rewardis one of the key tools for attracting, retaining and motivating employees. Croatian and European companieshave already started competing for the best human resources and the figures for 2016 reveal that Croatia iscurrently experiencing negative net migration rates (Croatian Bureau of Statistics, 2019). Since the trend isdiscouraging for Croatian companies, we find it necessary to examine the state of reward strategy and practicein Croatia. Our empirical research was conducted on a sample of 61 middle- and large-sized Croatian companies. Research results revealed that there is a very large gap between the annual earnings of Croatianemployees and average annual earnings in EU companies. However, the differences in incentive pay practices,benefits and non-monetary incentives between Croatia and other countries were not so great. Keywords reward strategy, reward management, Croatia, EU countries
Introduction Reward is a key element of the employment relationship and, in addition to being the single greatest operating cost for many organizations, it has been advocated as a tool for attracting, retaining and motivating employees. The high impact of reward management on overall organizational performance and competitiveness (Stajkovic & Luthans, 2001; Hansen, 1997, Jenkins et al. 1998) prompted us to research reward management in detail within Croatian companies. Furthermore, since Croatia entered the European Union (EU), Croatian companies are part of the larger EU labour market where mobility and free movement of persons is guaranteed. In such a context, reward management strategies and practices used by Croatian companies need to be competitive within the larger EU context. The basic EU principle of mobility and free movement implies that all countries and companies have access to candidates from the common labour market (European Commission, 2014). The competition for the best human resources among
Croatian and European companies has already started and the data for 2018 (Croatian Bureau of Statistics, 2019) testify to a negative net migration with other countries. This is discouraging for Croatian companies and the reasons for this worrying trend may be found in the state of strategy and practice of reward management in Croatia.
The purpose of this paper is to identify reward strategies that would allow Croatian companies to increase their relative competitiveness in the EU labour market and reduce excessive employee drain. To gain a better insight into the compensation strategies and practices used by Croatian companies we conducted an empirical research and obtained answers to the following research questions:
RQ1: What types of individual and group incentives as well as non-mandatory benefits are offered in Croatian enterprises, and does context matter?
RQ2: What is the difference between compensation strategy and practice in Croatian and EU enterprises?
RQ3: What improvements would make

4 Lovorka Galetić Reward strategy and practice as a tool to retain employees: case of Croatia
STRATEGIC MANAGEMENT, Vol. 25 (2020), No. 3, pp. 003-013
compensation strategy and practice of Croatian enterprises more attractive to young people who are leaving Croatia?
1. Theoretical background Employee performance and rewards should be managed in a strategic way, which means that organisations need to identify and apply reward principles, policies and practices that best support the strategic objectives of the organisation as a whole and human resource management specifically. Reward strategy can be defined as a declaration of intent which explains what an organization wants to do in the future to develop and implement reward policies, practices and processes which will further the achievement of its business goals and meet the needs of its stakeholders (Armstrong, 2012). Although it is often seen as nothing more than a process of defining broad plans for the future, reward strategy is very much concerned with the design of the reward system. Namely, if managers want to implement a reward strategy, they must design a reward system which will allow them to translate the strategy into action and choose the appropriate techniques to fit the strategy.
Milkovich et al. (2014) argue that all organizations that pay people have a reward strategy, only some of them may have written their reward strategy for all to see and understand while other organizations may not even realize that they have a reward strategy at all. In the latter case, managers make strategic reward decisions more chaotically, as ad hoc responses to pressures from the economic, socio-political and regulatory context in which their enterprises operate. It means that different organizations have different reward strategies. However, Armstrong and Stephens (2012) emphasize that strategies adopted by different organizations will include similar aspects of reward, but their treatment will vary as a result of the differences in business contexts, strategies and cultures.
These similar aspects of reward that are implemented differently in different organizations are the basis of the reward system. Managers are free to choose from multiple compensation policies to achieve the desired effects on employee behaviours and performance of their organizations. Various organizations typically use the following main reward components: base pay, individual variable pay or individual incentives, group incentives, employee benefits and non-financial rewards (Galetić, 2015).
Base pay is a fixed amount of money (salary or wage) paid to an employee in return for efforts and time spent on the job. Also defined as the rate for the job, base pay is the primary component of total remuneration, and can be defined as the part of an employee’s direct remuneration that is not performance-related (Shields, 2008). Base pay amounts for different jobs are usually determined according to the required level of skill, effort, responsibility and working conditions. These compensable factors influence pay level (Martocchio, 2004). Organisations conduct market rate analyses to identify base pay rates in the external market and to compare their salaries with those of competitors. Market rate analysis also enables organizations to decide on their preferred labour market position (Bashkir, 2013). Namely, different employers set different pay levels and choose to pay above or below what others are paying for the same work (Milkovich et al., 2014). Having at their disposal both the internal and external pay data, managers can design the pay structure that will attract and retain the right employees.
Individual variable pay or individual incentives can take a wide variety of forms. These may include additional amounts provided weekly, monthly, quarterly or annually as well as amounts granted upon the achievement of a certain result or occurrence of a certain event. Individual incentives range from premium and differential payments for employees who work in unusual situations to bonuses for individual innovation and creativity or to awards and bonuses for achieving all kinds of desired results (Henderson, 2006). It has been well-established in the literature that individual-based bonus schemes, such as individual-based pay for performance, merit pay, sales commission incentives and piece-rates, can have a positive effect on job satisfaction (Green & Heywood, 2008; Jovanović, 2019), productivity (Cadsby, Song & Tapon, 2007), and level of organizational performance (Dohmen & Falk, 2011). Furthermore, some forms of individual incentive pay reduce employee turnover (O’Halloran, 2011) and play an important role in motivating staff to achieve organizational goals (Schraeder & Becton, 2003).
The usual types of group incentives discussed in the literature are team pay, gain-sharing, profit-sharing, employee-shared ownership (mostly in the form of ESOP) and stock options. The literature recognizes a series of possibly beneficial effects of group incentives: increase in employees’
Lovorka Galetić Reward strategy and practice as a tool to retain employees: case of Croatia 5
STRATEGIC MANAGEMENT, Vol. 25 (2020), No. 3, pp. 003-013
commitment to the organization, higher task motivation, higher interest in the affairs of the organization, reduced absenteeism and turnover, increased identification with and understanding of the organization, development of cooperation and information sharing among employees, improvement of labour-management relations and reduced industrial conflicts (Shields, 2016; Armstrong, 2015). It seems that the future of group incentives is assured. Given that work is becoming increasingly interdependent, and that the need for cooperation grows, we may expect to see an increase in the number of incentive plans that foster group cohesion and collective effort (Shields, 2016).
Employee benefits are part of the tangible reward package offered by an employer to its employees (Renaud & Morrin, 2015). They are the costly part of the remuneration package because they can amount to a third or more of an organisation’s basic pay costs. Employee benefits provide for the personal needs of employees while increasing their commitment to the organization (Armstrong, 2015). In labour markets where key talents are in short supply, financial and non-financial benefits increasingly contribute to the ability of the reward management system to attract, retain and motivate high-potential and high-performing employees (Shields, 2016).
Non–financial rewards focus on the needs of employees for varying degrees of recognition, achievement, responsibility, autonomy, influence and personal growth. They can be extrinsic, such as recognition, or intrinsic, i.e. arising from the work itself and associated with job challenge and interest (Armstrong, 2015). Henderson (2006) argues that any activity that has an impact on the intellectual, emotional and physical well-being of the employee and is not specifically covered by the financial rewards is part of the non-financial reward system. Furthermore, over the last 50 years, behavioural scientists have been describing non-financial rewards as critical for improving workplace performance.
Top managers are required to provide guidelines on development and implementation of an attractive pay structure taking into consideration all of the above-mentioned aspects of compensation strategy. Not an easy task since reward policy decisions include a number of specific considerations: how much money needs to be reserved for the whole compensation package, should the structure of pay lead the market, what are the minimum and maximum levels of pay, how
should the general relationship among pay levels be defined, what portion of total compensation should go to base pay, variable pay, group incentives (if any) and benefits, what performance standards should be used at different organizational levels and so on. Only the right decisions can produce a comprehensive reward system which is able to attract, retain and motivate employees.
2. Research methodology Sample. The first step in designing our research was to select participants for our empirical research study. This research study is part of a larger project funded by the Croatian Science Foundation aiming to cover the entire population of Croatian companies and emphasis was placed on large and medium-sized companies since they are expected to generally have more sophisticated HRM practices (Kotey & Sheridan 2004), reward practices included. The population of Croatian companies (excluding banking and finance sector) that employ more than 100 staff was obtained through the Croatian Chamber of Commerce (CCC). As per this source, approximately 1700 companies in Croatia employ more than 100 staff, out of which 386 companies employ more than 250 staff (labelled as “large companies”).
Research instrument. A questionnaire that was designed for the purpose of conducting empirical research consisted of 46 questions in total. The majority of the questions were closed-ended and referred to different pay modalities as well as various attitudes, behaviour-based indicators or organizational outcomes that were of interest as potential independent variables. A certain number of variables were treated as dummy variables (e.g. whether certain pay element existed in organization or not), while the majority was of nominal and continuous character. The respondents were asked to make an assessment by using a Likert-type 5-point scale (1= not important at all, 5= of utmost importance). The majority of key questions about different reward management strategies were taken or adapted from different journal articles and the internal materials of the Chartered Institute for Personnel Development.
Data collection and analysis. After the
population was identified, a questionnaire was created using online resources and an e-mail with a cover letter from the Project leader was sent to HRM departments of all companies in the CCC database in April 2017. By the end of November 2017, we received 61 fulfilled questionnaires
6 Lovorka Galetić Reward strategy and practice as a tool to retain employees: case of Croatia
STRATEGIC MANAGEMENT, Vol. 25 (2020), No. 3, pp. 003-013
representing approximately 3.59% of the determined population size.
Company characteristics in the sample are given in a summary table below.
Table 1 Data distribution by sample characteristics
Company characteristic
Data distribution
Industry Manufacturing – 42.6% Services – 57.4%
Year of establishment
Before 1990 – 47.50% After 1990 – 52.50%
Number of employees
Less than 250 – 52.50% More than 250 – 47.50%
Ownership structure
Private domestic – 55.70% Private foreign – 32.80% State-owned and mixed – 11.50%
Legal form Joint stock company – 32.80% Limited liability company – 67.20%
Profitability in the last 5 years
Cannot assess – 1.3% Unprofitable or low profitability – 26.3% Profitable – 72.10%
Source: The author
As it can be seen from Table 1, our sample
included both manufacturing and service companies (N=26 and N=35, respectively), companies that employ less than 250 (52.5%) and more than 250 people (47.5%), as well those founded after (52.5%) and before the dissolution of the Yugoslavia (47.5%) in 1990. When it comes to ownership structure, more than half of the sample is comprised of private domestic companies, approximately one-third of the sample are privately-owned foreign companies, while state-owned and companies with mixed ownership are underrepresented in the sample (11.5% combined). Limited liability companies form the majority in the sample (67.20%) while the rest of the companies in the sample are joint stock companies (32.8%). When it comes to self-reported profitability in the last 5 years, 72.1% of the companies reported being profitable, approximately one quarter of them had low profitability or were unprofitable.
3. Research results In today's challenging business environment, the need to use pay strategically is more important than ever as organizations and their leaders look for ways to improve outcomes, performance, productivity, and teamwork (Gross & Friedman, 2004). Therefore, the first step in analysing the data was to explore the prevalence of formally designed reward strategies and reward policies in the sampled companies as well as their contribution to competitive advantage. The results are shown in Table 2. Table 2 Formally designed reward strategies and reward
policies and their contribution to competitive advantage Pay strategy element
Data distribution
Formally designed reward strategy
Does not exist – 20.00% Partially exists – 30.00% Formally exists - 50.00%
Formally designed reward policy
Does not exist – 8.17% Partially exists – 39.34% Formally exists - 52.46%
Contribution of reward system to competitive advantage
Does not contribute at all – 3.28% Contributes minimally – 21.31% Contributes partially – 34.43% Contributes in large part – 36.07% Contributes exceptionally – 4.91%
Source: The author
In one half of the sampled companies a reward
strategy exists on a formal level, while in the other half it either exists only partially, or not at all. As regards reward policies, the results are quite similar; however, formally designed policies are more prevalent than formally designed reward strategies. HR managers were asked to assess the extent to which the reward system contributes to the competitive advantage of the company and the analysis revealed that in almost 45% of cases the reward system contributed in large part or exceptionally, while in an additional one third of cases the contribution was partial. Next, we wanted to learn about the most important goals that the employers want to achieve by implementing a reward strategy. Consequently, the respondents were asked to make an assessment on a Likert-type 5-point scale (1= not important at all, 5= of utmost importance).
Lovorka Galetić Reward strategy and practice as a tool to retain employees: case of Croatia 7
STRATEGIC MANAGEMENT, Vol. 25 (2020), No. 3, pp. 003-013
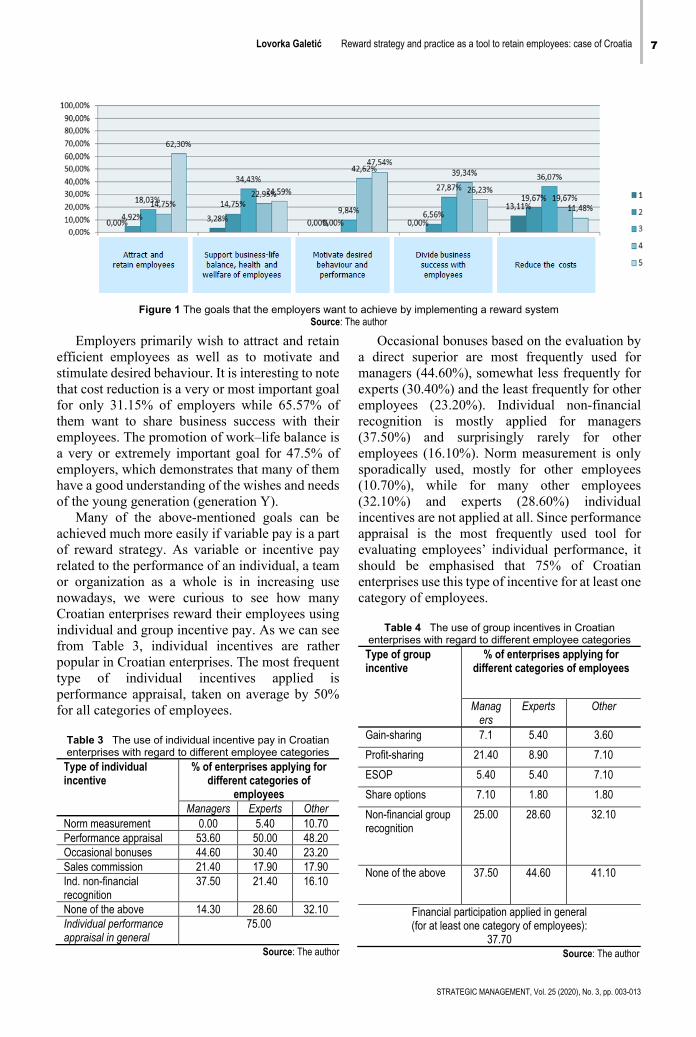
Figure 1 The goals that the employers want to achieve by implementing a reward system Source: The author
Employers primarily wish to attract and retain efficient employees as well as to motivate and stimulate desired behaviour. It is interesting to note that cost reduction is a very or most important goal for only 31.15% of employers while 65.57% of them want to share business success with their employees. The promotion of work–life balance is a very or extremely important goal for 47.5% of employers, which demonstrates that many of them have a good understanding of the wishes and needs of the young generation (generation Y).
Many of the above-mentioned goals can be achieved much more easily if variable pay is a part of reward strategy. As variable or incentive pay related to the performance of an individual, a team or organization as a whole is in increasing use nowadays, we were curious to see how many Croatian enterprises reward their employees using individual and group incentive pay. As we can see from Table 3, individual incentives are rather popular in Croatian enterprises. The most frequent type of individual incentives applied is performance appraisal, taken on average by 50% for all categories of employees.
Table 3 The use of individual incentive pay in Croatian enterprises with regard to different employee categories
Type of individual incentive
% of enterprises applying for different categories of
employees Managers Experts Other
Norm measurement 0.00 5.40 10.70 Performance appraisal 53.60 50.00 48.20 Occasional bonuses 44.60 30.40 23.20 Sales commission 21.40 17.90 17.90 Ind. non-financial recognition
37.50 21.40 16.10
None of the above 14.30 28.60 32.10 Individual performance appraisal in general
75.00
Source: The author
Occasional bonuses based on the evaluation by a direct superior are most frequently used for managers (44.60%), somewhat less frequently for experts (30.40%) and the least frequently for other employees (23.20%). Individual non-financial recognition is mostly applied for managers (37.50%) and surprisingly rarely for other employees (16.10%). Norm measurement is only sporadically used, mostly for other employees (10.70%), while for many other employees (32.10%) and experts (28.60%) individual incentives are not applied at all. Since performance appraisal is the most frequently used tool for evaluating employees’ individual performance, it should be emphasised that 75% of Croatian enterprises use this type of incentive for at least one category of employees.
Table 4 The use of group incentives in Croatian
enterprises with regard to different employee categories Type of group incentive
% of enterprises applying for different categories of employees
Managers
Experts Other
Gain-sharing 7.1 5.40 3.60
Profit-sharing 21.40 8.90 7.10
ESOP 5.40 5.40 7.10
Share options 7.10 1.80 1.80
Non-financial group recognition
25.00 28.60 32.10
None of the above 37.50 44.60 41.10
Financial participation applied in general (for at least one category of employees):
37.70 Source: The author
8 Lovorka Galetić Reward strategy and practice as a tool to retain employees: case of Croatia
STRATEGIC MANAGEMENT, Vol. 25 (2020), No. 3, pp. 003-013
Group incentives (Table 4) are not as popular in Croatian enterprises as individual incentives. The most frequently applied group incentive is profit-sharing, which is used in 21.4% enterprises for managers, 8.9% enterprises for experts and only in 7.1% enterprises for other employees. Other cash group incentives are applied less frequently than profit sharing or they are not applied at all. 44.6% of enterprises do not use any of the above group incentives for experts. 41.1% do not use them for other employees and, surprisingly, 37.5% of enterprises do not use any financial group incentives for managers. On the other hand, non-financial group recognition is very popular for all categories of employees and it is used in 25% of cases for managers, 28.6% of cases for experts and 32.1% for other employees.
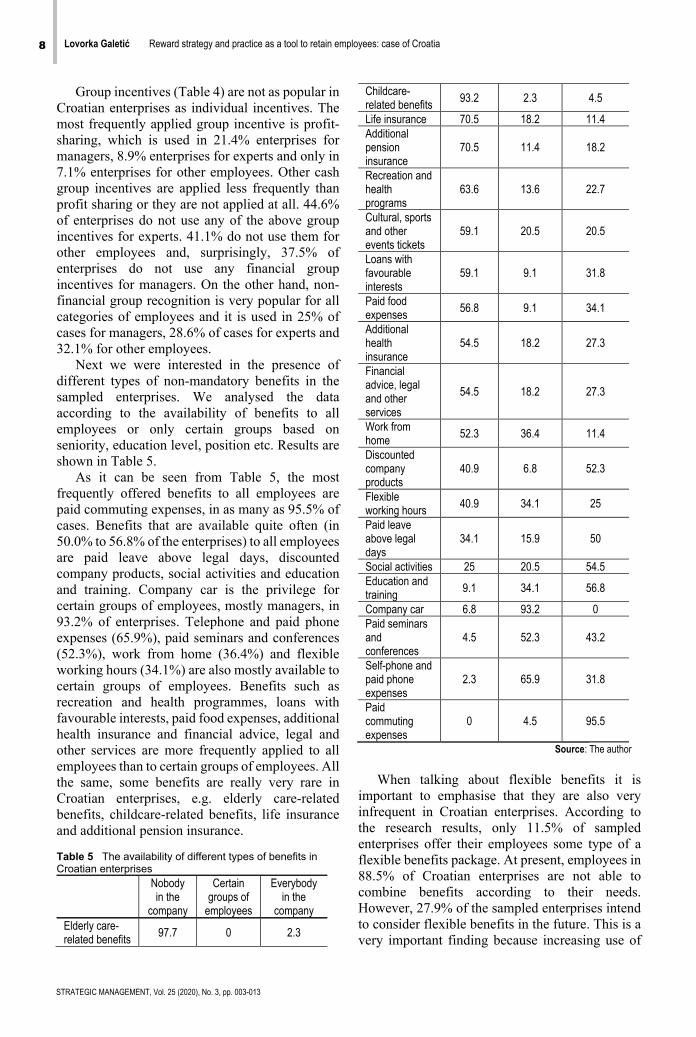
Next we were interested in the presence of different types of non-mandatory benefits in the sampled enterprises. We analysed the data according to the availability of benefits to all employees or only certain groups based on seniority, education level, position etc. Results are shown in Table 5.
As it can be seen from Table 5, the most frequently offered benefits to all employees are paid commuting expenses, in as many as 95.5% of cases. Benefits that are available quite often (in 50.0% to 56.8% of the enterprises) to all employees are paid leave above legal days, discounted company products, social activities and education and training. Company car is the privilege for certain groups of employees, mostly managers, in 93.2% of enterprises. Telephone and paid phone expenses (65.9%), paid seminars and conferences (52.3%), work from home (36.4%) and flexible working hours (34.1%) are also mostly available to certain groups of employees. Benefits such as recreation and health programmes, loans with favourable interests, paid food expenses, additional health insurance and financial advice, legal and other services are more frequently applied to all employees than to certain groups of employees. All the same, some benefits are really very rare in Croatian enterprises, e.g. elderly care-related benefits, childcare-related benefits, life insurance and additional pension insurance. Table 5 The availability of different types of benefits in Croatian enterprises
Nobody in the
company
Certain groups of
employees
Everybody in the
company Elderly care-related benefits
97.7 0 2.3
Childcare-related benefits
93.2 2.3 4.5
Life insurance 70.5 18.2 11.4 Additional pension insurance
70.5 11.4 18.2
Recreation and health programs
63.6 13.6 22.7
Cultural, sports and other events tickets
59.1 20.5 20.5
Loans with favourable interests
59.1 9.1 31.8
Paid food expenses
56.8 9.1 34.1
Additional health insurance
54.5 18.2 27.3
Financial advice, legal and other services
54.5 18.2 27.3
Work from home
52.3 36.4 11.4
Discounted company products
40.9 6.8 52.3
Flexible working hours
40.9 34.1 25
Paid leave above legal days
34.1 15.9 50
Social activities 25 20.5 54.5 Education and training
9.1 34.1 56.8
Company car 6.8 93.2 0 Paid seminars and conferences
4.5 52.3 43.2
Self-phone and paid phone expenses
2.3 65.9 31.8
Paid commuting expenses
0 4.5 95.5
Source: The author
When talking about flexible benefits it is
important to emphasise that they are also very infrequent in Croatian enterprises. According to the research results, only 11.5% of sampled enterprises offer their employees some type of a flexible benefits package. At present, employees in 88.5% of Croatian enterprises are not able to combine benefits according to their needs. However, 27.9% of the sampled enterprises intend to consider flexible benefits in the future. This is a very important finding because increasing use of
Lovorka Galetić Reward strategy and practice as a tool to retain employees: case of Croatia 9
STRATEGIC MANAGEMENT, Vol. 25 (2020), No. 3, pp. 003-013
flexible benefits represents a major trend in human resource management today.
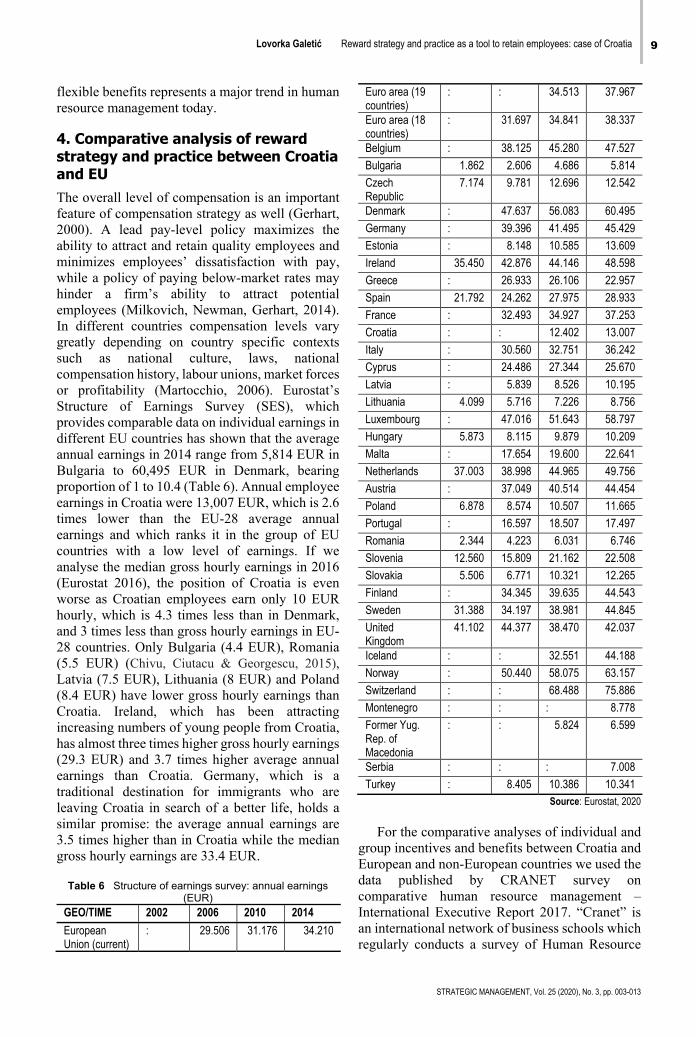
4. Comparative analysis of reward strategy and practice between Croatia and EU The overall level of compensation is an important feature of compensation strategy as well (Gerhart, 2000). A lead pay-level policy maximizes the ability to attract and retain quality employees and minimizes employees’ dissatisfaction with pay, while a policy of paying below-market rates may hinder a firm’s ability to attract potential employees (Milkovich, Newman, Gerhart, 2014). In different countries compensation levels vary greatly depending on country specific contexts such as national culture, laws, national compensation history, labour unions, market forces or profitability (Martocchio, 2006). Eurostat’s Structure of Earnings Survey (SES), which provides comparable data on individual earnings in different EU countries has shown that the average annual earnings in 2014 range from 5,814 EUR in Bulgaria to 60,495 EUR in Denmark, bearing proportion of 1 to 10.4 (Table 6). Annual employee earnings in Croatia were 13,007 EUR, which is 2.6 times lower than the EU-28 average annual earnings and which ranks it in the group of EU countries with a low level of earnings. If we analyse the median gross hourly earnings in 2016 (Eurostat 2016), the position of Croatia is even worse as Croatian employees earn only 10 EUR hourly, which is 4.3 times less than in Denmark, and 3 times less than gross hourly earnings in EU-28 countries. Only Bulgaria (4.4 EUR), Romania (5.5 EUR) (Chivu, Ciutacu & Georgescu, 2015), Latvia (7.5 EUR), Lithuania (8 EUR) and Poland (8.4 EUR) have lower gross hourly earnings than Croatia. Ireland, which has been attracting increasing numbers of young people from Croatia, has almost three times higher gross hourly earnings (29.3 EUR) and 3.7 times higher average annual earnings than Croatia. Germany, which is a traditional destination for immigrants who are leaving Croatia in search of a better life, holds a similar promise: the average annual earnings are 3.5 times higher than in Croatia while the median gross hourly earnings are 33.4 EUR.
Table 6 Structure of earnings survey: annual earnings (EUR)
GEO/TIME 2002 2006 2010 2014 European Union (current)
: 29.506 31.176 34.210
Euro area (19 countries)
: : 34.513 37.967
Euro area (18 countries)
: 31.697 34.841 38.337
Belgium : 38.125 45.280 47.527
Bulgaria 1.862 2.606 4.686 5.814
Czech Republic
7.174 9.781 12.696 12.542
Denmark : 47.637 56.083 60.495
Germany : 39.396 41.495 45.429
Estonia : 8.148 10.585 13.609
Ireland 35.450 42.876 44.146 48.598
Greece : 26.933 26.106 22.957
Spain 21.792 24.262 27.975 28.933
France : 32.493 34.927 37.253
Croatia : : 12.402 13.007
Italy : 30.560 32.751 36.242
Cyprus : 24.486 27.344 25.670
Latvia : 5.839 8.526 10.195
Lithuania 4.099 5.716 7.226 8.756
Luxembourg : 47.016 51.643 58.797
Hungary 5.873 8.115 9.879 10.209
Malta : 17.654 19.600 22.641
Netherlands 37.003 38.998 44.965 49.756
Austria : 37.049 40.514 44.454
Poland 6.878 8.574 10.507 11.665
Portugal : 16.597 18.507 17.497
Romania 2.344 4.223 6.031 6.746
Slovenia 12.560 15.809 21.162 22.508
Slovakia 5.506 6.771 10.321 12.265
Finland : 34.345 39.635 44.543
Sweden 31.388 34.197 38.981 44.845
United Kingdom
41.102 44.377 38.470 42.037
Iceland : : 32.551 44.188
Norway : 50.440 58.075 63.157
Switzerland : : 68.488 75.886
Montenegro : : : 8.778
Former Yug. Rep. of Macedonia
: : 5.824 6.599
Serbia : : : 7.008
Turkey : 8.405 10.386 10.341 Source: Eurostat, 2020
For the comparative analyses of individual and
group incentives and benefits between Croatia and European and non-European countries we used the data published by CRANET survey on comparative human resource management – International Executive Report 2017. “Cranet” is an international network of business schools which regularly conducts a survey of Human Resource
10 Lovorka Galetić Reward strategy and practice as a tool to retain employees: case of Croatia
STRATEGIC MANAGEMENT, Vol. 25 (2020), No. 3, pp. 003-013
management, enquiring into policies and practices in people management through a set of common questions. The survey is undertaken approximately every five years and this report for 2017 discusses the Cranet survey data collected between 2014 and 2016.
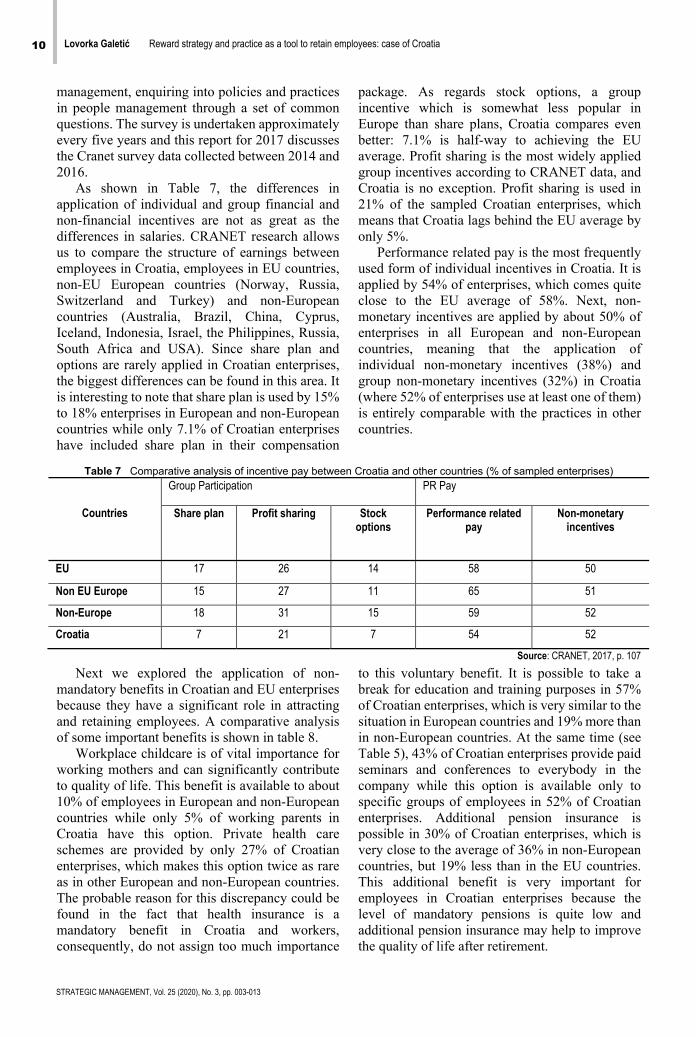
As shown in Table 7, the differences in application of individual and group financial and non-financial incentives are not as great as the differences in salaries. CRANET research allows us to compare the structure of earnings between employees in Croatia, employees in EU countries, non-EU European countries (Norway, Russia, Switzerland and Turkey) and non-European countries (Australia, Brazil, China, Cyprus, Iceland, Indonesia, Israel, the Philippines, Russia, South Africa and USA). Since share plan and options are rarely applied in Croatian enterprises, the biggest differences can be found in this area. It is interesting to note that share plan is used by 15% to 18% enterprises in European and non-European countries while only 7.1% of Croatian enterprises have included share plan in their compensation
package. As regards stock options, a group incentive which is somewhat less popular in Europe than share plans, Croatia compares even better: 7.1% is half-way to achieving the EU average. Profit sharing is the most widely applied group incentives according to CRANET data, and Croatia is no exception. Profit sharing is used in 21% of the sampled Croatian enterprises, which means that Croatia lags behind the EU average by only 5%.
Performance related pay is the most frequently used form of individual incentives in Croatia. It is applied by 54% of enterprises, which comes quite close to the EU average of 58%. Next, non-monetary incentives are applied by about 50% of enterprises in all European and non-European countries, meaning that the application of individual non-monetary incentives (38%) and group non-monetary incentives (32%) in Croatia (where 52% of enterprises use at least one of them) is entirely comparable with the practices in other countries.
Table 7 Comparative analysis of incentive pay between Croatia and other countries (% of sampled enterprises)
Countries
Group Participation PR Pay
Share plan Profit sharing Stock options
Performance related pay
Non-monetary incentives
EU 17 26 14 58 50
Non EU Europe 15 27 11 65 51
Non-Europe 18 31 15 59 52
Croatia 7 21 7 54 52
Source: CRANET, 2017, p. 107
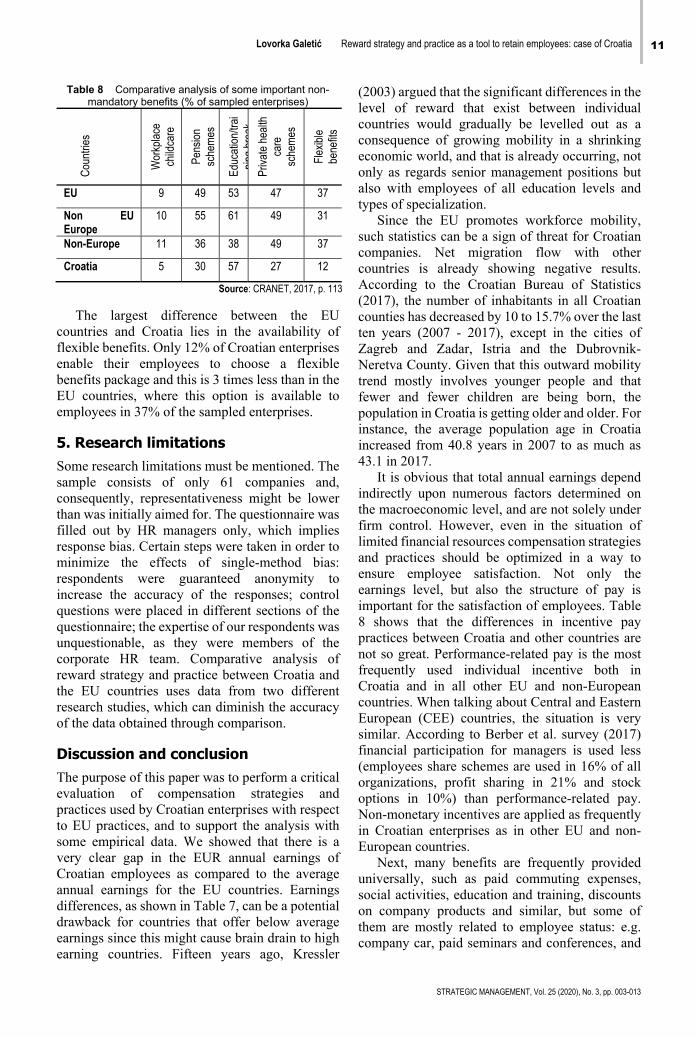
Next we explored the application of non-mandatory benefits in Croatian and EU enterprises because they have a significant role in attracting and retaining employees. A comparative analysis of some important benefits is shown in table 8.
Workplace childcare is of vital importance for working mothers and can significantly contribute to quality of life. This benefit is available to about 10% of employees in European and non-European countries while only 5% of working parents in Croatia have this option. Private health care schemes are provided by only 27% of Croatian enterprises, which makes this option twice as rare as in other European and non-European countries. The probable reason for this discrepancy could be found in the fact that health insurance is a mandatory benefit in Croatia and workers, consequently, do not assign too much importance
to this voluntary benefit. It is possible to take a break for education and training purposes in 57% of Croatian enterprises, which is very similar to the situation in European countries and 19% more than in non-European countries. At the same time (see Table 5), 43% of Croatian enterprises provide paid seminars and conferences to everybody in the company while this option is available only to specific groups of employees in 52% of Croatian enterprises. Additional pension insurance is possible in 30% of Croatian enterprises, which is very close to the average of 36% in non-European countries, but 19% less than in the EU countries. This additional benefit is very important for employees in Croatian enterprises because the level of mandatory pensions is quite low and additional pension insurance may help to improve the quality of life after retirement.
Lovorka Galetić Reward strategy and practice as a tool to retain employees: case of Croatia 11
STRATEGIC MANAGEMENT, Vol. 25 (2020), No. 3, pp. 003-013
Table 8 Comparative analysis of some important non-mandatory benefits (% of sampled enterprises)
Cou
ntrie
s
Wor
kpla
ce
child
care
Pens
ion
sche
mes
Educ
atio
n/tra
ini
ngbr
eak
Priv
ate
heal
th
care
sc
hem
es
Flex
ible
be
nefit
s
EU 9 49 53 47 37
Non EU Europe
10 55 61 49 31
Non-Europe 11 36 38 49 37
Croatia 5 30 57 27 12
Source: CRANET, 2017, p. 113 The largest difference between the EU
countries and Croatia lies in the availability of flexible benefits. Only 12% of Croatian enterprises enable their employees to choose a flexible benefits package and this is 3 times less than in the EU countries, where this option is available to employees in 37% of the sampled enterprises.
5. Research limitations Some research limitations must be mentioned. The sample consists of only 61 companies and, consequently, representativeness might be lower than was initially aimed for. The questionnaire was filled out by HR managers only, which implies response bias. Certain steps were taken in order to minimize the effects of single-method bias: respondents were guaranteed anonymity to increase the accuracy of the responses; control questions were placed in different sections of the questionnaire; the expertise of our respondents was unquestionable, as they were members of the corporate HR team. Comparative analysis of reward strategy and practice between Croatia and the EU countries uses data from two different research studies, which can diminish the accuracy of the data obtained through comparison.
Discussion and conclusion The purpose of this paper was to perform a critical evaluation of compensation strategies and practices used by Croatian enterprises with respect to EU practices, and to support the analysis with some empirical data. We showed that there is a very clear gap in the EUR annual earnings of Croatian employees as compared to the average annual earnings for the EU countries. Earnings differences, as shown in Table 7, can be a potential drawback for countries that offer below average earnings since this might cause brain drain to high earning countries. Fifteen years ago, Kressler
(2003) argued that the significant differences in the level of reward that exist between individual countries would gradually be levelled out as a consequence of growing mobility in a shrinking economic world, and that is already occurring, not only as regards senior management positions but also with employees of all education levels and types of specialization.
Since the EU promotes workforce mobility, such statistics can be a sign of threat for Croatian companies. Net migration flow with other countries is already showing negative results. According to the Croatian Bureau of Statistics (2017), the number of inhabitants in all Croatian counties has decreased by 10 to 15.7% over the last ten years (2007 - 2017), except in the cities of Zagreb and Zadar, Istria and the Dubrovnik-Neretva County. Given that this outward mobility trend mostly involves younger people and that fewer and fewer children are being born, the population in Croatia is getting older and older. For instance, the average population age in Croatia increased from 40.8 years in 2007 to as much as 43.1 in 2017.
It is obvious that total annual earnings depend indirectly upon numerous factors determined on the macroeconomic level, and are not solely under firm control. However, even in the situation of limited financial resources compensation strategies and practices should be optimized in a way to ensure employee satisfaction. Not only the earnings level, but also the structure of pay is important for the satisfaction of employees. Table 8 shows that the differences in incentive pay practices between Croatia and other countries are not so great. Performance-related pay is the most frequently used individual incentive both in Croatia and in all other EU and non-European countries. When talking about Central and Eastern European (CEE) countries, the situation is very similar. According to Berber et al. survey (2017) financial participation for managers is used less (employees share schemes are used in 16% of all organizations, profit sharing in 21% and stock options in 10%) than performance-related pay. Non-monetary incentives are applied as frequently in Croatian enterprises as in other EU and non-European countries.
Next, many benefits are frequently provided universally, such as paid commuting expenses, social activities, education and training, discounts on company products and similar, but some of them are mostly related to employee status: e.g. company car, paid seminars and conferences, and
12 Lovorka Galetić Reward strategy and practice as a tool to retain employees: case of Croatia
STRATEGIC MANAGEMENT, Vol. 25 (2020), No. 3, pp. 003-013
flexible working hours. Our comparative analysis of some important benefits between Croatia and European and non-European countries shows that workplace childcare, flexible benefits, private health care schemes and additional pension schemes are used rather more infrequently in Croatian enterprises than in other countries. This gap opens an opportunity for Croatian enterprises to increase the attractiveness of their compensation strategy and practice.
Consequently, what should be done to improve the compensation strategy and practice of Croatian enterprises and to make them more attractive for young people who are considering leaving Croatia? The large gap between the annual earnings in Croatia and the EU countries is the most serious problem and it is one of the most frequent reasons for emigration to countries with a higher standard of living. The only way to somehow counteract this trend and reduce emigration is to increase the low annual earnings level of Croatian employees and the state tax policy must support this process by lowering the taxes connected with employee earnings. The employers have a very important role in this process as well: they should try to pay their employees above market average because it is the only way to keep the best talents and specialists. Performance-related pay schemes should be applied by even more employers as they are a strong incentive for the best talent. This approach also includes bonuses based on individual and team goals as a very popular tool to increase employees’ engagement and efficiency. The usage of share plans and stock options could also be greatly enhanced, especially with respect to managers and specialists. Profit sharing encourages loyalty to the firm and should be applied to all employees in the enterprise. When talking about non-monetary benefits, workplace childcare is very important for young families and mothers because it enables them to concentrate on the work and makes their every-day life much easier. Flexible benefits are very popular in the EU and USA because they enable everybody to satisfy their personal needs and priorities. A greater use of flexible benefit packages can increase employee’s satisfaction and make the enterprise more attractive at the labour market. Finally, work-life balance is especially important for young people and employers should try to fulfil their expectations and invest more effort into learning about young people’s wishes through regular communication. As well they must know that the factors influencing job search are related to employer branding, employer's position and
employer attractiveness on labour market (Bejtkovský, 2018).
To introduce these changes it is necessary for the organizations to develop corporate cultures that promote openness and tendency for changes. According to Adamik, Nowicki & Szymanska (2018) “openness is an expression of an enterprise’s ability to adapt to changing environment conditions and its ability to cooperate with different types of partners. A given company’s openness shows its readiness for the creation of dynamics of many business processes“, including the creation of competitive compensation policy. To achieve this goal human resource managers and knowledge workers must have skills and understanding of the possible ways to navigate through and adapt to constant change (Tsui & Dragicevic, 2018).
Acknowledgement This paper has been sponsored by Croatian Science Foundation.SM
References Armstrong, M., Stephens T. (2005). Employee Reward
Management and Practice. London: Kogan Page https://doi.org/10.1177/103841119303100214
Armstrong, M. (2012). Armstrong’s Handbook of Reward Management Practice (4th ed.). London: Kogan Page. https://doi.org/10.1108/00197850910983965
Armstrong, M. (2015). Armstrong’s Handbook of Reward Management Practice. (5th ed.). London: Kogan Page. https://doi.org/10.1108/00197850910983965
Adamik, A., Nowicki, M., & Szymanska, K. (2018). Openness to co-creation as a method of reducing the complexity of the environment and dynamizing companies' competitive advantages. Management & Marketing – Challenges for the Knowledge Society, 13 (2), 880-896. https://doi.org/10.2478/mmcks-2018-0011
Bashker, D.B. (2013). Compensation and Benefit Design. USA: FT Press – Person Education LTD https://doi.org/10.1177/088636878501700206
Bejtkovský, J., (2018). Factors influencing the job search and job selection in students of Generation Y in the Czech Republic in the employer branding context. Management & Marketing - Challenges for the Knowledge Society, 13 (3), 1133-1149. https://doi.org/10.2478/mmcks-2018-0028
Berber, N., Morley, M. J., Slavić, A., & Poór, J. (2017). Management compensation systems in Central and Eastern Europe: a comparative analysis. The International Journal of Human Resource Management, 28 (12), 1661-1689. https://doi.org/10.1080/09585192.2016.1277364
Chivu, L., Ciutacu, C., & Georgescu, L. (2015). Household income in Romania. A challenge to economic and social cohesion. Procedia Economics and Finance, 22, 398-401. https://doi.org/10.1016/S2212-5671(15)00310-X

Lovorka Galetić Reward strategy and practice as a tool to retain employees: case of Croatia 13
STRATEGIC MANAGEMENT, Vol. 25 (2020), No. 3, pp. 003-013
CRANET (2017). Survey on comparative human resource management – International Executive Report.
Dohmen, T., Falk, A. (2011). Performance pay and multidimensional sorting: Productivity, preferences, and gender. American Economic Review, 101, 556-590. https://doi.org/10.1257/aer.101.2.556
Eurostat (2020). Structure of earnings survey: annual earnings. Retrieved January 15, 2020, from http://appsso.eurostat.ec.europa.eu/nui/show.do?dataset=earn_ses_annual&lang=en
Galetic, L. (2015). Kompenzacijski menadžment. Zagreb: Sinergija
Green, C., Heywood, J. (2008). Does Performance Pay Increase Job Satisfaction? Economica, 75, 710-728. https://doi.org/10.1111/j.1468-0335.2007.00649.x
Gross, S. E., Friedman, H. M. (2004). Creating an Effective Total Reward Strategy: Holistic Approach Better Supports Business Success. Benefits Quarterly, 20 (3), 7-12. https://doi.org/10.1142/9781783269938_0004
Hansen, D. G. (1997). Worker performance and group incentives: A case study. Industrial and Labor Relations Review, 51 (1), 37-49. https://doi.org/10.2307/2525033
Henderson, R.I. (2006). Compensation Management in a Knowledge-Based World (10th ed.). New Jersey: Pearson Education,Inc. https://doi.org/10.2139/ssrn.763325
Jenkins, D. G. et al. (1998). Are financial incentives related to performance? A meta analytic review of empirical research. Journal of Applied Psychology, 83 (5), 777-78. https://doi.org/10.1037/0021-9010.83.5.777
Jovanović, M. (2019). The political behavior of managers and employers as an instrument for advancing career - influence and factors on individual and organizational effectiveness. Ekonomika 65, (4), 87-105.
Kottey, B., Sheridan, A. (2004). Changing HRM practices with firm growth. Journal of Small Business and Enterprise Development, 11 (4), 474-486. https://doi.org/10.1108/14626000410567125
Kressler, H. W. (2003). Motivate and Reward. Palgrave Macmillan https://doi.org/10.1057/9781403937711
Martocchio, J. J. (2006). Strategic Compensation: A Human Resource Management Approach (4th ed.). New
Jersey: Prentice Hall https://doi.org/10.1016/s1053-4822(03)00014-7
Milkovich G., Newman J., Gerhart B. (2014). Compensation. New York: McGraw-Hill/Irwin
O'Halloran, P. L. (2012). Performance pay and employee turnover. Journal of Economic Studies, 39 (6), 653-674. https://doi.org/10.1108/01443581211274601
Renaud, S., Morrin, L. (2015.) Traditional VS innovative benefits: A longitudinal test of their differential impact on Canadian ICT workers’ turnover. Paper presented at the Reward Management Conference, Bruxelles, Belgium, EIASM https://doi.org/10.1027/1866-5888/a000180
Schraeder, M.,Becton, J.B. (2003). An Overview of Recent Trends on Incentive pay Program. The Coastal Business Journal, 2 (1), 18-27.
Shields J. (2008). Managing Employee Performance and Reward. Melbourne: Cambridge University Press https://doi.org/10.1017/cbo9781139168748.017
Shields J. (2016). Managing Employee Performance and Reward (2nd ed.). Melbourne: Cambridge University Press https://doi.org/10.1017/cbo9781139168748.015
Stajkovic, A. D., Luthans, F. (2001.) Differential effects of incentive motivators on work performance. Academy of Management Journal, 44 (3), 580-590 https://doi.org/10.5465/3069372
Tsui, E., & Dragicevic, N. (2018). Use of scenario development and personal learning environment and networks (PLE&N) to support curriculum co-creation. Management & Marketing – Challenges for the Knowledge Society, 13 (2), 848-858. https://doi.org/10.2478/mmcks-2018-0009
Correspondence
Lovorka Galetić
University of Zagreb, Faculty of Economics & Business, Zagreb, Croatia Trg John F. Kennedy 6, 10000, Zagreb, Croatia E-mail: [email protected]

STRATEGIC MANAGEMENT, Vol. 25 (2020), No. 3, pp. 014-027
doi: 10.5937/StraMan2003014B
Received: May 20, 2020
Accepted: August 19, 2020
The concept and competitiveness of agile organization in the fourth industrial revolution’s drift Katalin Balog Szent István University Gödöllő, Management and Business Administration Doctoral School, Hungary
Abstract Corporate competitiveness is constantly being shaped by the Fourth Industrial Revolution, the explosive development of technology, the globalization and the hyper-competition. The VUCA status has now become a permanent reality: volatility and complexity cannot be traced to traditional corporate operations. The Industry 4.0 projects a physical, a digital and a biological megatrend such as advanced robotics, artificial intelligence, new materials, personalized healing, self-driving cars. Through usage of the resources and knowledge sharing, the global economy is experiencing mutations such as the sharing economy, the peer to peer economy, the gig economy in the labor market and the Big Data in planning. Meanwhile, the disruptive innovations are transforming industries and gaining exponentially competitive advantage. The special business concepts were born and whom cannot be handled by models of classic macro and micro economics: the largest taxi company in the world does not own any taxicab (Uber), the largest accommodation company does not own any property (Airbnb), the largest telecommunication company has no infrastructure (Skype), the world's most valuable retailer has no inventory (Alibaba), the most popular media doesn't create its own content (Facebook), the world's largest cinema doesn't have its own movie (Netflix). In the meantime, those are treasuring huge profits, business influence and information capital. The competitiveness of their agile way of working can be proved. These call for changes not only in the market, but also in organizational and individual terms. An adaptive corporate structure and leadership, a self-organizing group, an agile working method hold companies in the direction of growing track and changes in the future. My research about discovering some aspects of agile way of working versus traditional organization work. My hypothesis is that employees are more motivated, effective and committed in an agile team than in a classic hierarchy or matrix. I added own business and project-based worker as their flexible, effective work is a must. My hypotheses are partially fulfilled. Keywords agile, Industry 4.0, VUCA, sharing economy, competitiveness
Introduction
The Industrial Revolution represents a comprehensive social, economic and technological change. In addition to the technological boom, the usage of social media platforms, we are living in the area of social networking, sharing and crowdsourcing time. My research interest is in discovering what organization can be competitive,
or, let us say survivor of the momentum we are. This study is one part of my series intended to research into agile organization characteristics. Agile teams seem to be faster, smarter, more effective, and more valuable with wider community compared to traditional hierarchies. Maybe this way of working or structure is the secret of the winner companies.

15
STRATEGIC MANAGEMENT, Vol. 25 (2020), No. 3, pp. 014-027
Katalin Balog The concept and competitiveness of agile organization in the fourth industrial revolution’s drift
1. The Fourth Industrial Revolution Today we are in the Fourth Industrial Revolution. The previous three have also brought significant changes, not only in production, manufacturing, in economy, but also in social functioning. The First Industrial Revolution (1760-1840), the invention of the steam engine, the construction of railways, and the production and use of engines radically transformed the economy and people’s lives (Mokyr, 1985). We can say that the human power was replaced by machines at their work environment. The Second Industrial Revolution (late 19th, early 20th century), the spread of usage of the electricity and the assembly line production allowed the mass production (Mokyr, 1998). In terms of manpower, the physical workforce was less affected, but the intellectual capital and knowledge were valorized. The Third Industrial Revolution (since 1960) is known as the computer or digitization revolution. The explosion of semiconductors, industrial and personal computing, and the use of the Internet soon resulted in another qualitative leap in work organization, efficiency and communication (Greenwood & Jovanovic, 1999). Software and network developments may project ahead all the economic and social phenomena we are now experiencing. The reasons for the Fourth Industrial Revolution were that production system’s unsustainability, the technological synergies that were created by new hardware and software and the aging society, which could not provide an adequate workforce in developed countries. Wang (2016) argues that Industry 4.0 makes factories even smarter, more adaptable, and even more resource efficient. The transparency and the interconnection of processes allow them to be optimized, to increase its efficiency and flexibility (Müller, 2017). The Fourth Industrial Revolution seems to be different from the previous ones. The multiple events and developmental leaps took place in the same time period. A significant social transformation has taken place in parallel with technological change. Today we are surrounded with learning algorithms, intelligent factories, self-driving cars and nanotechnology in the workplace. The idea of Science Fiction can now be called the Science Fact. Artificial intelligence, machine learning, automation, the Big-Data, quantum computers, robotics, the 5G, the IIOT (Industrialized Internet of Things), the Cyber Security, the Bitcoin, 3D printing and thousands of applications on smart devices were built to our everyday.
We can experience similar changes in human resources and organizations. Today HR is also digitized; resource planning, selection, onboarding, learning and development, career management, performance appraisal and payroll are all done by means of software. The HR software shows a real-time, instant data, extracted from multiple systems at once which helps decision making, rendering it faster and more realistic. The working methods have changed due to smartphones, constant and fast internet access and cloud technology. The organization of work, learning, information flow, and data usage has been taken to a new level. The smart devices have transformed the boundaries of work and private life, the space and time constraints of work and performance. Multilingualism, multicultural teams, cross-continental projects, new technological solutions and globalization result in challenges in the organization. Parallel it affects the organizational structure and the operation of the company and changes the responsibilities and the tasks of the managers. Schwab, the founding president of the World Economic Forum, said that the Fourth Industrial Revolution will not change the way we work, the way we do our activities, but us. It combines the physical, the biological and digital knowledge systems. In his book (The Fourth Industrial Revolution, 2016), he mentions that there are researchers and practitioners who see the phenomena now taking place around us as part of the Third Industrial Revolution. Debating this, Schwab highlighted three main differences:
▪ velocity: this development is exponential, non-linear pace. This is the result of living in a deeply interconnected, diverse world, and of the ability of new technology to create newer and better technology again and again
▪ breadth and depth: it combines the complex technologies based on the digital revolution that have led to a paradigm shift in the economy, the business and the society
▪ systems impact: it means the transformation of the whole system through and within the countries, the companies, the industries and the societies.
According to Schwab (2016), the following megatrends can be identified:
1. Physical manifestation: self-driving cars, new devices, 3D printing, advanced robotics, new raw materials

STRATEGIC MANAGEMENT, Vol. 25 (2020), No. 3, pp. 014-027
16 Katalin Balog The concept and competitiveness of agile organization in the fourth industrial revolution’s drift
2. Digital manifestation: IoT, collaboration with blockchain, the on-demand economy, the sharing economy
3. Biological manifestation: genetic sequencing, synthetic biology, personalized medical care, 3D print
The study covers cost reductions as well, as the
technical progress has led to a significant reduction in the labor force as a share of GDP. A half of this reduction is due to the relative decrease in the investment costs. The other half is that the progressive nature of innovation results in replacing labor with capital. The Industry 4.0 calls for a paradigm shift: it must be followed not only by technological change, but also by business processes and competency of education.
2. The VUCA business environment IBM gave a presentation on what kind of special business concepts have emerged in recent years (in Molnár, 2018): the world's largest taxi company does not own any taxis (Uber), the largest accommodation agency does not own a single property (Airbnb), the largest telephone company does not have a telecommunications infrastructure (Skype), the world's most valuable retailer has no inventory (Alibaba), the most popular media do not create their own content (Facebook), the fastest growing bank has no real money (SocietyOne), the world's largest cinema does not have its own film (Netflix).These are service companies that do not have their own investment, production capacities or fixed costs, but in return they accumulate a huge profit, a business influence and an information capital. The principles of classical economics are ignored by them. Boston Consulting Group (2018) has compiled a ranking of the Top 50 Innovative Companies. They are like Apple, Google, Microsoft, Amazon, Samsung, Tesla, Facebook, Alibaba, Airbnb, SpaceX, and Netflix. They connect the possibilities explored by technology with the collective needs of generations, ages and lifestyles. This is how they change our lifestyle, our way of working. They no longer think in terms of products, not in countries, but in exploiting the global market potential and the user experience. Now we never have to “need” anywhere to be able to do something.
Schumpeter (1980) distinguished five basic cases of innovation: the creation of a new product, the introduction of a new production process, the entry into a new market, the exploration of new raw materials and the formation of a new industrial
organization. Christensen (1997) introduced the concept of disruptive innovation and defined the following types of innovation strategy: sustaining: development does not affect
the established market evolutionary: the product evolves,
providing a new type of solution to a consumer need
revolutionary: new, unexpected, creates a new market, but does not affect the previous ones
disruptive: creates new value that transcends and shatters existing markets
In its study of Accenture (2018) points out that
63% of the companies have already been subjected to a disruptive “attack” by an innovative firm. The 68% of the executives feel it will happen again in the next 3 years. As a result of the disruptive companies, many markets have transformed in the last decade: automotive, travel and accommodation services, learning, education, job search, shopping, cinema, TV, entertainment. The adaptation cycles of innovation have also been shortened: the electricity reached 25% of the total population after 45 years, telephone after 35 years, the Internet in 5 years, and the smartphones in just 2 years. Why we are surrounded by disruptive innovation? Because the economic conditions are not stable, are always in motion. The VUCA business environment has becomes our base environment. The acronym VUCA was first used by the U.S. Army in the early 1990s. In Sullivan's (2012) formulation, this means: volatile - things that change rapidly that are unpredictable and may not be repetitive, uncertain- frequent changes that can be confusing, no predictability, no reliance on the past, no analysis, complex - many effects occur simultaneously, they are difficult to manage on their own, and in their complexity, they can also generate novel turns, ambiguous-untraceable cause, who did what, for what purpose, why, so it is difficult to develop good responses.
3. The labor market and changes in competencies. New business concepts, disruptive innovations and a VUCA environment are the business environment whereas the companies and the employees need to prevail in and gain a competitive edge. Keynes said in 1931 that there is a time lag between unemployment caused by the spread of technology (surplus labor saved through technology) and how to find a new role for this

17
STRATEGIC MANAGEMENT, Vol. 25 (2020), No. 3, pp. 014-027
Katalin Balog The concept and competitiveness of agile organization in the fourth industrial revolution’s drift
workforce. According to PwC’s analysis (2018), the development of technology and the artificial intelligence, the usage of robots, will create as many jobs as they trigger. The jobs will shift by sector, maybe will be generated more in the health, the science, the technology, and the education, while shrinking in the factories, the shipping, the warehousing, and the administration. Schwab (2016) highlights two competing effects on technology in terms of employment: one is downsizing caused by disruptive innovations and automation, which replaces human labor, causes unemployment, or requires the re-use of their skills. The second is that the downsizing effect is accompanied by a capitalization effect, the demand for new products and services increases, which results in the creation of new occupations and business lines. The question is whether the timing and extent of the capitalization effect overrides the destructive effect. Workforce replacement in jobs that consist of constantly repetitive tasks and require precise manual labor has already taken place. In the future, it will also happen for intellectual jobs such as lawyers, analysts, doctors, journalists, accountants. The outsourcing has long been used in companies to manage the workforce and the functions in an effective and flexible way. Along with the efficiency expectations, the service centers (SSC - Shared Service Center) have been established, in which companies outsource one function to one country, from where they serve other subsidiaries as well.
The combination of several factors’ presence influences labor market supply and demand. The 5 generations working at the same time, who are globally available and can be mobilized. The X and Y generations “got” the digital revolution, they had to learn and to live with it. The generation Z was born, and their approach to knowledge acquisition, work and community existence is different. Jobs are constantly being created and lost, which is difficult for the education to follow, and new competency structure is required at individual and corporate level. The 2018 report by The World Economic Forum analyzes the acceleration of labor transformation between 2018 and 2022. The conclusions were: Drivers of change that drive economic
growth: four major technological advances such as high-speed mobile internet, artificial intelligence, the spreading of big data analytics, and cloud technology. It supports the national economic growth trajectories, the
strengthening of education and the sustainable, green world economy.
Accelerating technology adaptation: 85% of managers want to make further improvements
Robotization: almost 30% of companies are planning this type of investment.
Changing production, distribution and value chain: 59% of the respondents stated that they would change their processes significantly. When choosing a production location, 74% of the employers prioritize by the competency structure of local talent and the available local workforce.
Changing forms of workforce employment: 50% of the companies expect that the automation will result in a reduction in the number of full-time employees which means the current job profiles. 38% believe they will expand their workforce with new, efficiency-enhancing positions and 25% will create new positions. In addition, they seek to expand the range of contractors (contract workers, service providers) requested for special tasks
Changing the boundaries between humans and robots in the existing jobs: 71% of the hours worked in connection with tasks will be done by human force in 2018, and 29% by machines. This rate will change by 2022 so that 58% will be done by humans and as much as 42% by machines. An algorithm or machine will work in 57% of the execution of tasks, clearly as an added value. 62% of organizations ’data use, the information retrieval and the transfer will be performed by machines instead of the current 46%. 20-30% of communication, organization, consulting and decision making will be automated.
Net positive employment prospects: the number of new jobs created compensates for the number of job losses. By 2022, the share of new occupations in the application will increase from 16% to 27%, which means an increase of 11%. In contrast, redundant jobs will be reduced from the current 31% to 21%, which is 10% overall. It is currently estimated that 0.98 million jobs will be lost, while 1.74 million will be created. With the exception of the agricultural sector, 75 million positions can be shared between the
STRATEGIC MANAGEMENT, Vol. 25 (2020), No. 3, pp. 014-027
18 Katalin Balog The concept and competitiveness of agile organization in the fourth industrial revolution’s drift
machines and the people, and a further 133 million between people, machines and algorithms. It means that two parallel and interconnected effect will transform the workforce: the first is a large reduction of few jobs that will be automatized or eliminated. The second is the creation of new jobs related to the growing demand of new products and services.
Emerging new jobs: by 2022, there will be a growing demand for jobs such as data analysts, data researchers, software and application developers, e-commerce and social media specialists. These are created by the usage of new technology. Furthermore, it is expected that tasks requiring strong soft skills will increase, such as customer service, salespeople, marketers, trainers, human and corporate culture developers, and innovation managers. The latest technological advances are creating new positions, such as Big Data analysts and process automation experts.
Increasing capability instability: new technologies and the disruptive business models, the shift between human and robot workforce are transforming job profiles and the skills set needed to fill them. The global average capability stability - which is the ratio of the core competencies to a job that does not change - will be 58% by 2022. It means that 42% of the required workforce skills will change.
Reskilling requirements: by 2022, 54% of employees will need reskilling. In addition, general skills such as analytical thinking, innovative approach, active learning and technological skills will be expected. Furthermore, the soft skills such as creativity, originality, initiative, critical thinking, persuasion and negotiation skills remain important. Also, attention to detail, resilience, flexibility, complex problem-solving, emotional intelligence, leadership, community influence, and service skills become more important.
The concept of lifelong learning is fundamentally changing the role of learning in our lives, thanks to compelling technical and IT advances and globalization. To change our professions up to 3-4 times in a lifetime, the
emergence of foreign language and computer skills as basic requirements, the rapidly accelerating development within certain disciplines and the compulsion to keep pace with them all encourage the workforce to learn partly in formal and non-formal education.
The Institute for the Future (2011) identified six drivers of change and then the future capabilities associated with them: The increasing life span changes the
nature of career and learning. By 2025, the proportion of the population over the age of 60 in US will reach 70%. This means that both companies and individuals need to rethink their careers, family life and education. The lifelong learning and the multiple career type become natural.
The smart systems and machines take over the boring, repetitive tasks, and later more tasks managed by humans. It is the time for a partnership of machines and people. We will use our competencies for more complex tasks.
In the computerized world, all machines are connected to each other and all interactions are recorded and transformed into data. It may reveal unprecedented connections and patterns which can increase productivity.
A new media ecology has emerged. Communication tools require new media literacy. The production of video, digital animations, augmented reality, and gamification resulted in a new form of messaging that will become more and more advanced. We had to develop a new mother tongue, a new communication method.
The super-structured organizations: the community of technologies created a new form of production and value creation. The organizations known today, whether training or corporate structure, are considered the products of the last century. Due to their foundations, they will disappear by a disruptive way. The new organizational generation and work skills will not come from the traditional management theories, but from areas such as the game theory, the neuroscience research, and the positive psychology founded by Seligman (2004).
In a globally interconnected world, the multicultural teams, the outsourced
19
STRATEGIC MANAGEMENT, Vol. 25 (2020), No. 3, pp. 014-027
Katalin Balog The concept and competitiveness of agile organization in the fourth industrial revolution’s drift
experts that can be deployed at any point of the globe, require a completely different work processes and working methods.
They stated the following of the workforce skills are considered to be decisive in the future: transdisciplinary social intelligence sense-making novel and adaptive thinking constructive thinking, approach (design
mindset) virtual collaboration cross cultural competency cognitive load management new media literacy computational thinking
Bersin’s (2019) published that we need the stop
the conversation about soft skills because power skills are much needed today. An important measure of his research is that 34% of company executives consider further training, reskilling and job crafting as top priority. The reason is that one of the three main barriers to corporate growth is an adequate employee skills structure. Companies usually group skills into two directions: hard skills and soft skills. Hard skills usually mean what is needed to complete the task (technical, learnable knowledge), soft skills mean what we are born with (e.g. cooperation and communication). As hard skills are easy to measure, the hiring managers are focusing on it during recruitment, career progress and promotion. According to Bersin, the right approach needs to be the other way around, because today in such a technological environment, hard knowledge is constantly changing and becoming obsolete, and it is easy to access and learn it anytime. In contrast, the soft skills are those that are difficult to acquire, change, retain, and these are critically important to the proper functioning of organizations. That is why he renamed soft skills to power skills. The concept of power skill needs to be explained. As Bersin formulates, the work abilities of the future are not technical but behavioral. Although the technological advances require the knowledge of engineers, developers, designers, but managers know that they can be purchased this competency relatively easily by outsourcing service. However, developing strength skills requires effort as any behavior change is lengthy and cumbersome or unless impossible. The power skills are the following: problem-solving, decision-making,
judgment, communication, self-management, collaboration and value clarification.
4. The competitiveness of agile organizations.
4.1. The concept of agility The concept of agility was the feature of software developers. In their work, it is not possible to plan the process, expectations and output in advance, as we are used to in the case of an average company. In addition, they need openness, creativity, and making mistakes to be able to achieve new results. One person is not sure, but a team can solve any problems. Development teams are not huge organizations, but rather members of a close, inspiring community. Such a team attracts talented, self-motivated, creative members who can increase their strength further. The agility in the economic sense means that a company is able to predict, perceive and respond to market volatility in a way that creates value. The consultant company Accenture Strategy (2015) describes agility as the sum of adaptability + quick response + great execution. According to Goldman (1995), agility is the ability to react quickly to fragmented world market situations full of constant and unexpected changes. Agility is not a new concept. The major milestones in its formation were the transport of Toyota's Lean, Kanban from 1943, and then NASA's iterative increment, from 1990 to the creation of Scrum until the Agile Manifesto. The Manifesto (2001) essence is the value creation for the client in a result-oriented, simple way, through daily collaboration, by building a team autonomy. The manifesto shifts the emphasis from previously accepted and well-functioning elements: evaluates the individual and personal communication more than methodologies, a working product versus a final documentation, customer engagement versus contractual negotiation, willingness to change versus strict adherence to plans. A significant step for HR and organizations is the HR Agile Manifesto (2015), in which organizational developers stated that collaboration and networking are more important than hierarchical structure, transparency, flexibility in regulations, involvement in management and internal ambition in external rewards. In a study of Gallup (2018) European business leaders were asked what agility means to them: the ability of employees to collect and share information about the environmental change and how quickly and appropriately they respond to it. Here I would turn again to the

STRATEGIC MANAGEMENT, Vol. 25 (2020), No. 3, pp. 014-027
20 Katalin Balog The concept and competitiveness of agile organization in the fourth industrial revolution’s drift
concept of BigData, coined by Mashey (1998). The BigData is a technology environment that enables the analysis and processing of diverse, large amounts of rapidly changing data. The relational database, the SQL programming language, the data warehousing, the binary data and the cloud systems are present at big companies. Using digitization and social media tools, companies get an astonishing amount of data from both business and private use. One of the secrets of agile operation is the correct analysis and usage of relevant data. It can find out the pattern of consumer behavior, which can be used to more precisely targeting markets and creating marketing messages. The president of the Association for Direct and Interactive Marketing said in 2016 that we can learn from traditional market research what people are saying about themselves. The Big Data shows what they are actually doing. Amazon, Spotify, Google, Apple examine its data with data analyst teams. This way, they can “see into the future” and can bring high experience factor solutions to market. Sondergaard (2012), a senior advisor at Gartner, put it this way: “Information is the oil of the 21st century and analysis is the explosive engine.” Gallup (2018) created a measure called the Agility Index. Looking at the 4 dominant European economies, the workers rated their employer from this point. It can be seen that half or more of colleagues think their company is not agile at all. Meanwhile, in the VUCA business environment, the start-ups with agile methods are constantly turning up stable markets and posing a potential threat. (See Figure 1).
Figure 1 Agile Index Source: Gallup, 2018
4.2 The agile organizational structure The agility can manifest itself in corporate structures in the following ways (determined by the company’s size, position, and the leader’s opinion about opportunities): founded to be agile, such as
Spotify or Netflix, transform the entire organization into an agile mode like Amazon or bimodal company (using a hybrid model, on the one hand, it works with its regulated, well-developed systems, on the other, with a separate development team.) There is another concept related to innovative operation, called holacracy. Koestler (1967) described how it operates. The word holacracy is based on holon, which means biological and social unit. Holacracy is the cooperation of holons. A holon is a unit itself, but also part of a larger organization. In the event when one holon group does not function properly, the others will take over its role, thus not compromising the functioning of the whole system. These units are autonomous and cooperative. They are structured, rules-based organizations: a complex system that can use its resources most efficiently, flexible and fast, and can maintain its stability in the event of any disruption. They solve the problem within their own circle, on their own. Regardless, the upper circles give instructions. The roles of the smallest unit, the individual, are clear, well defined. The task of the holon is to keep its hands on it in its own territory, to immediately notice the changes, opportunities, to perceive the problems. There is no hierarchy in the classical sense, no managers, no jobs, the control is in everyone’s own hands. (See Figure 2).
Figure 2 Holacracy circle Source: Robertson, 2015
Anchor cycle generally means the board of the company. GCC (general company cycle) is the executive leadership team. Sub-circles are dedicated to particular functions. Roles are the elements of the traditional jobs split by tasks. This type of operation supports innovation, open, fresh thinking, the exploitation and self-realization of individual abilities, responsibility. Meanwhile, it reduces the pressure on workers and managers.

21
STRATEGIC MANAGEMENT, Vol. 25 (2020), No. 3, pp. 014-027
Katalin Balog The concept and competitiveness of agile organization in the fourth industrial revolution’s drift
4.3 The characteristics of agile structures The goal of every company is value creation. According to Chican (2007), value creation is the conversion of a company's resources into consumer value. The question is what the value to the consumer is today. In the VUCA world, it is hard enough to articulate. What seems valuable today could be devalued in an instant: see the fate of discs and CDs, cameras and Mp3 players and smartphones came out. My observation is that classic companies, while seeing innovation as essential, still find it more important for them to meet today’s goal, this year’s annual budget. Understandably, as this gives them stability, that is why managers get their bonus. However, the question rightly arises whether they are able to think innovatively while being programmed to act as a market protector. The concept of value flow is known from the lean methodology (Ries, 2011). It refers to the actions that create value during the production of a product: production, logistics, marketing, sales and customer service. Everything else is necessary but not value-creating. In the hierarchical model, leaders are considered to be the most valuable, they are the ones who decide everything. They base their decisions on the numbers of the past. In contrast, the agile, lean operations require managers to serve their team: do their best to provide the most optimal conditions, and the employee feedback is critically important. In a hierarchical organization, colleagues work in silos, they do not see the whole value chain, there is no good communication flow and synergy. In contrast, the agile team members are informed about everything, they decide together, they think together, they pass on their knowledge. I compared the agile method to the traditional, waterfall model by the majority of companies operate (Casteren, 2017). The most important difference is that in a traditional, waterfall operation, when a project started the result will be achieved through strict, sequential steps. In case of suddenly changed environments, can’t step back. In an agile operation, one stage duration is 2-6-week intervals. At the end it is clear whether the direction is good, whether there has been a change. The section of this size can be restarted at any time. The following figure (3) shows a comparison of the value proposition represented by traditional (waterfall) and agile value-creating operations in developments (Ries, 2011).
Figure 3 Value creation
Source: Ries, 2011
Visibility-time axis In the traditional operation, they deliver a
product after a long time while not being able to handle changes.
In agile operations, the client is part of the project team from day one
Business value-time axis In Agile mode, delivery occurs at regular
intervals so that both parties sense the amount of value.
The waterfall model transfers the business value at the end of the project.
Adaptability-time axis In traditional development mode, it is
impossible to change the business scenario only if the project is restarted.
In agile mode, adaptation is consistently high.
Risk-time axis The risk is highest at the beginning of any
project. Those who work in the traditional way have to deal with a lot of unknown factors.
In the case of agile operation, the risk is significantly reduced, as the team's ability to adapt during short sprints is high.
One of the most important drivers of decisions
is the estimation, the mitigation and the exclusion of risks and the uncertainties. Berstein (1998) said that the boundary line between the modern age and the past is control over risk. There is no absolute certainty as not all information is available. The uncertainty is a constant feature of business and life. The agile operation reduces this risk. In 1921 Keynes had already ruled out the possibility of learning about objective reality, which means we can rely on subjective estimates only. The psychological state of individuals and their relevance to judgment are also decisive to evaluate
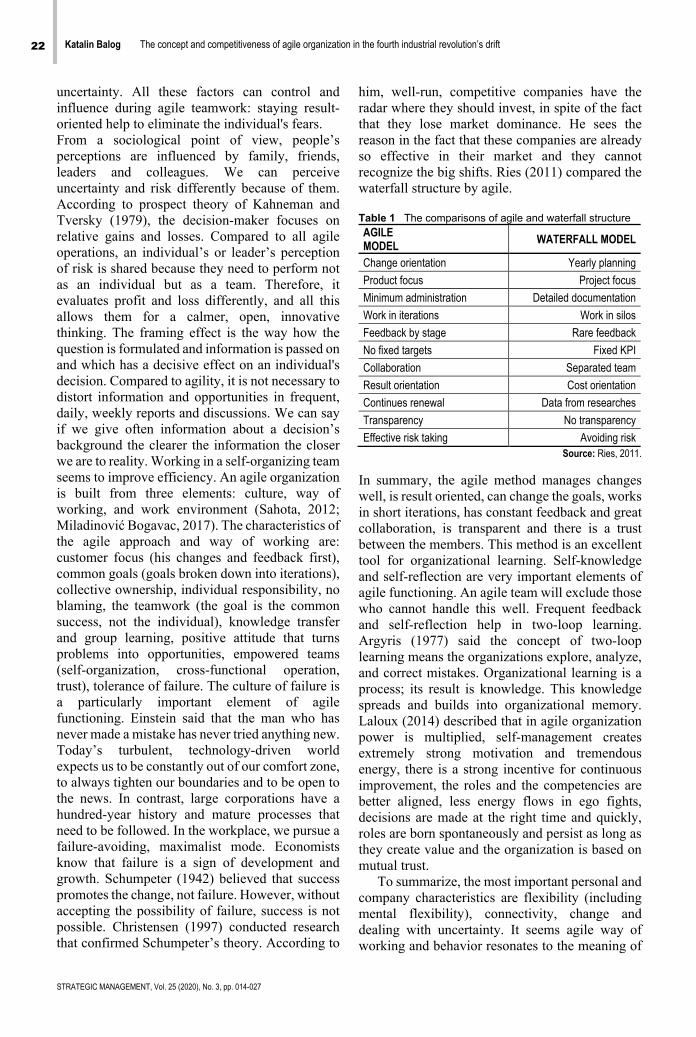
STRATEGIC MANAGEMENT, Vol. 25 (2020), No. 3, pp. 014-027
22 Katalin Balog The concept and competitiveness of agile organization in the fourth industrial revolution’s drift
uncertainty. All these factors can control and influence during agile teamwork: staying result-oriented help to eliminate the individual's fears. From a sociological point of view, people’s perceptions are influenced by family, friends, leaders and colleagues. We can perceive uncertainty and risk differently because of them. According to prospect theory of Kahneman and Tversky (1979), the decision-maker focuses on relative gains and losses. Compared to all agile operations, an individual’s or leader’s perception of risk is shared because they need to perform not as an individual but as a team. Therefore, it evaluates profit and loss differently, and all this allows them for a calmer, open, innovative thinking. The framing effect is the way how the question is formulated and information is passed on and which has a decisive effect on an individual's decision. Compared to agility, it is not necessary to distort information and opportunities in frequent, daily, weekly reports and discussions. We can say if we give often information about a decision’s background the clearer the information the closer we are to reality. Working in a self-organizing team seems to improve efficiency. An agile organization is built from three elements: culture, way of working, and work environment (Sahota, 2012; Miladinović Bogavac, 2017). The characteristics of the agile approach and way of working are: customer focus (his changes and feedback first), common goals (goals broken down into iterations), collective ownership, individual responsibility, no blaming, the teamwork (the goal is the common success, not the individual), knowledge transfer and group learning, positive attitude that turns problems into opportunities, empowered teams (self-organization, cross-functional operation, trust), tolerance of failure. The culture of failure is a particularly important element of agile functioning. Einstein said that the man who has never made a mistake has never tried anything new. Today’s turbulent, technology-driven world expects us to be constantly out of our comfort zone, to always tighten our boundaries and to be open to the news. In contrast, large corporations have a hundred-year history and mature processes that need to be followed. In the workplace, we pursue a failure-avoiding, maximalist mode. Economists know that failure is a sign of development and growth. Schumpeter (1942) believed that success promotes the change, not failure. However, without accepting the possibility of failure, success is not possible. Christensen (1997) conducted research that confirmed Schumpeter’s theory. According to
him, well-run, competitive companies have the radar where they should invest, in spite of the fact that they lose market dominance. He sees the reason in the fact that these companies are already so effective in their market and they cannot recognize the big shifts. Ries (2011) compared the waterfall structure by agile. Table 1 The comparisons of agile and waterfall structure
AGILE MODEL WATERFALL MODEL
Change orientation Yearly planning
Product focus Project focus
Minimum administration Detailed documentation
Work in iterations Work in silos
Feedback by stage Rare feedback
No fixed targets Fixed KPI
Collaboration Separated team
Result orientation Cost orientation
Continues renewal Data from researches
Transparency No transparency
Effective risk taking Avoiding risk Source: Ries, 2011.
In summary, the agile method manages changes well, is result oriented, can change the goals, works in short iterations, has constant feedback and great collaboration, is transparent and there is a trust between the members. This method is an excellent tool for organizational learning. Self-knowledge and self-reflection are very important elements of agile functioning. An agile team will exclude those who cannot handle this well. Frequent feedback and self-reflection help in two-loop learning. Argyris (1977) said the concept of two-loop learning means the organizations explore, analyze, and correct mistakes. Organizational learning is a process; its result is knowledge. This knowledge spreads and builds into organizational memory. Laloux (2014) described that in agile organization power is multiplied, self-management creates extremely strong motivation and tremendous energy, there is a strong incentive for continuous improvement, the roles and the competencies are better aligned, less energy flows in ego fights, decisions are made at the right time and quickly, roles are born spontaneously and persist as long as they create value and the organization is based on mutual trust.
To summarize, the most important personal and company characteristics are flexibility (including mental flexibility), connectivity, change and dealing with uncertainty. It seems agile way of working and behavior resonates to the meaning of
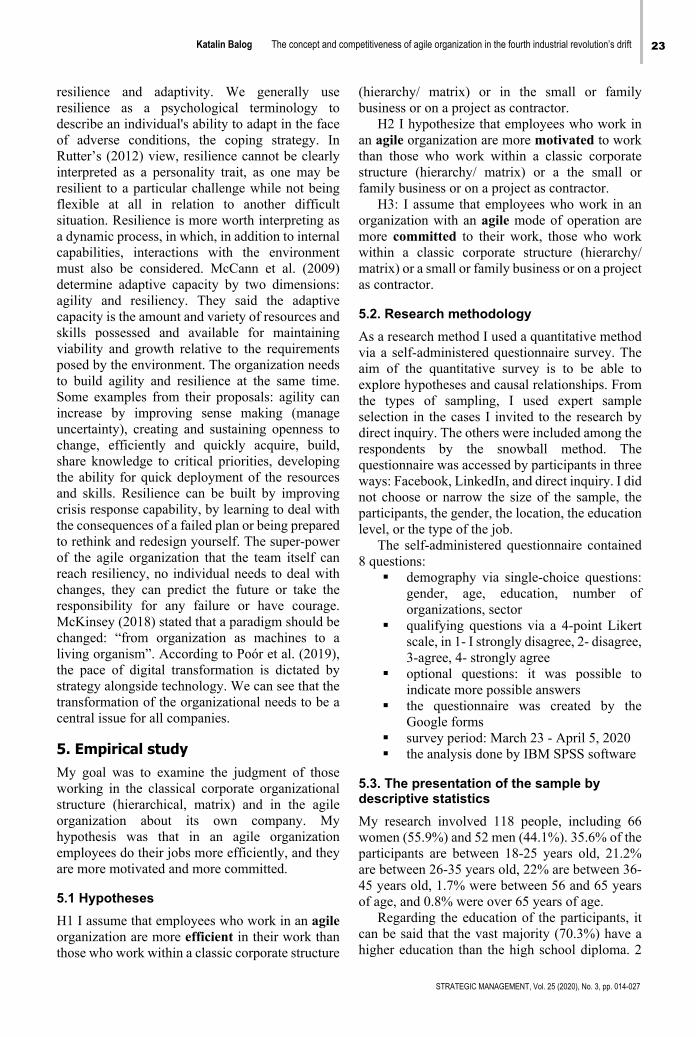
23
STRATEGIC MANAGEMENT, Vol. 25 (2020), No. 3, pp. 014-027
Katalin Balog The concept and competitiveness of agile organization in the fourth industrial revolution’s drift
resilience and adaptivity. We generally use resilience as a psychological terminology to describe an individual's ability to adapt in the face of adverse conditions, the coping strategy. In Rutter’s (2012) view, resilience cannot be clearly interpreted as a personality trait, as one may be resilient to a particular challenge while not being flexible at all in relation to another difficult situation. Resilience is more worth interpreting as a dynamic process, in which, in addition to internal capabilities, interactions with the environment must also be considered. McCann et al. (2009) determine adaptive capacity by two dimensions: agility and resiliency. They said the adaptive capacity is the amount and variety of resources and skills possessed and available for maintaining viability and growth relative to the requirements posed by the environment. The organization needs to build agility and resilience at the same time. Some examples from their proposals: agility can increase by improving sense making (manage uncertainty), creating and sustaining openness to change, efficiently and quickly acquire, build, share knowledge to critical priorities, developing the ability for quick deployment of the resources and skills. Resilience can be built by improving crisis response capability, by learning to deal with the consequences of a failed plan or being prepared to rethink and redesign yourself. The super-power of the agile organization that the team itself can reach resiliency, no individual needs to deal with changes, they can predict the future or take the responsibility for any failure or have courage. McKinsey (2018) stated that a paradigm should be changed: “from organization as machines to a living organism”. According to Poór et al. (2019), the pace of digital transformation is dictated by strategy alongside technology. We can see that the transformation of the organizational needs to be a central issue for all companies.
5. Empirical study My goal was to examine the judgment of those working in the classical corporate organizational structure (hierarchical, matrix) and in the agile organization about its own company. My hypothesis was that in an agile organization employees do their jobs more efficiently, and they are more motivated and more committed.
5.1 Hypotheses H1 I assume that employees who work in an agile organization are more efficient in their work than those who work within a classic corporate structure
(hierarchy/ matrix) or in the small or family business or on a project as contractor.
H2 I hypothesize that employees who work in an agile organization are more motivated to work than those who work within a classic corporate structure (hierarchy/ matrix) or a the small or family business or on a project as contractor.
H3: I assume that employees who work in an organization with an agile mode of operation are more committed to their work, those who work within a classic corporate structure (hierarchy/ matrix) or a small or family business or on a project as contractor.
5.2. Research methodology As a research method I used a quantitative method via a self-administered questionnaire survey. The aim of the quantitative survey is to be able to explore hypotheses and causal relationships. From the types of sampling, I used expert sample selection in the cases I invited to the research by direct inquiry. The others were included among the respondents by the snowball method. The questionnaire was accessed by participants in three ways: Facebook, LinkedIn, and direct inquiry. I did not choose or narrow the size of the sample, the participants, the gender, the location, the education level, or the type of the job.
The self-administered questionnaire contained 8 questions: demography via single-choice questions:
gender, age, education, number of organizations, sector
qualifying questions via a 4-point Likert scale, in 1- I strongly disagree, 2- disagree, 3-agree, 4- strongly agree
optional questions: it was possible to indicate more possible answers
the questionnaire was created by the Google forms
survey period: March 23 - April 5, 2020 the analysis done by IBM SPSS software
5.3. The presentation of the sample by descriptive statistics My research involved 118 people, including 66 women (55.9%) and 52 men (44.1%). 35.6% of the participants are between 18-25 years old, 21.2% are between 26-35 years old, 22% are between 36-45 years old, 1.7% were between 56 and 65 years of age, and 0.8% were over 65 years of age.
Regarding the education of the participants, it can be said that the vast majority (70.3%) have a higher education than the high school diploma. 2
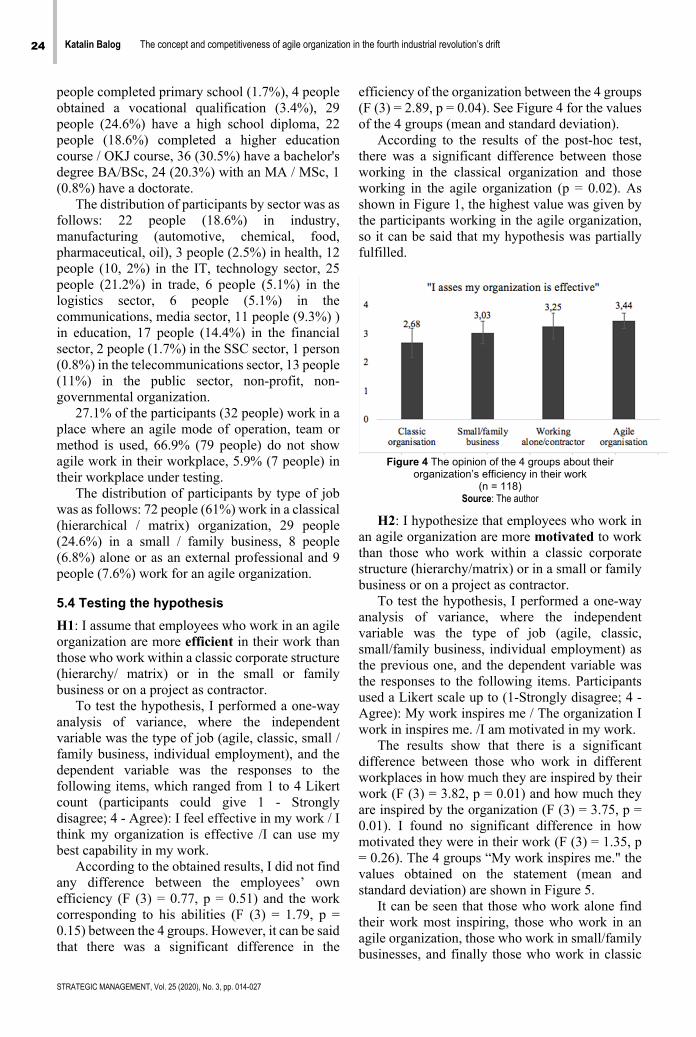
STRATEGIC MANAGEMENT, Vol. 25 (2020), No. 3, pp. 014-027
24 Katalin Balog The concept and competitiveness of agile organization in the fourth industrial revolution’s drift
people completed primary school (1.7%), 4 people obtained a vocational qualification (3.4%), 29 people (24.6%) have a high school diploma, 22 people (18.6%) completed a higher education course / OKJ course, 36 (30.5%) have a bachelor's degree BA/BSc, 24 (20.3%) with an MA / MSc, 1 (0.8%) have a doctorate.
The distribution of participants by sector was as follows: 22 people (18.6%) in industry, manufacturing (automotive, chemical, food, pharmaceutical, oil), 3 people (2.5%) in health, 12 people (10, 2%) in the IT, technology sector, 25 people (21.2%) in trade, 6 people (5.1%) in the logistics sector, 6 people (5.1%) in the communications, media sector, 11 people (9.3%) ) in education, 17 people (14.4%) in the financial sector, 2 people (1.7%) in the SSC sector, 1 person (0.8%) in the telecommunications sector, 13 people (11%) in the public sector, non-profit, non-governmental organization.
27.1% of the participants (32 people) work in a place where an agile mode of operation, team or method is used, 66.9% (79 people) do not show agile work in their workplace, 5.9% (7 people) in their workplace under testing.
The distribution of participants by type of job was as follows: 72 people (61%) work in a classical (hierarchical / matrix) organization, 29 people (24.6%) in a small / family business, 8 people (6.8%) alone or as an external professional and 9 people (7.6%) work for an agile organization.
5.4 Testing the hypothesis H1: I assume that employees who work in an agile organization are more efficient in their work than those who work within a classic corporate structure (hierarchy/ matrix) or in the small or family business or on a project as contractor.
To test the hypothesis, I performed a one-way analysis of variance, where the independent variable was the type of job (agile, classic, small / family business, individual employment), and the dependent variable was the responses to the following items, which ranged from 1 to 4 Likert count (participants could give 1 - Strongly disagree; 4 - Agree): I feel effective in my work / I think my organization is effective /I can use my best capability in my work.
According to the obtained results, I did not find any difference between the employees’ own efficiency (F (3) = 0.77, p = 0.51) and the work corresponding to his abilities (F (3) = 1.79, p = 0.15) between the 4 groups. However, it can be said that there was a significant difference in the
efficiency of the organization between the 4 groups (F (3) = 2.89, p = 0.04). See Figure 4 for the values of the 4 groups (mean and standard deviation).
According to the results of the post-hoc test, there was a significant difference between those working in the classical organization and those working in the agile organization (p = 0.02). As shown in Figure 1, the highest value was given by the participants working in the agile organization, so it can be said that my hypothesis was partially fulfilled.
Figure 4 The opinion of the 4 groups about their
organization’s efficiency in their work (n = 118)
Source: The author
H2: I hypothesize that employees who work in an agile organization are more motivated to work than those who work within a classic corporate structure (hierarchy/matrix) or in a small or family business or on a project as contractor.
To test the hypothesis, I performed a one-way analysis of variance, where the independent variable was the type of job (agile, classic, small/family business, individual employment) as the previous one, and the dependent variable was the responses to the following items. Participants used a Likert scale up to (1-Strongly disagree; 4 - Agree): My work inspires me / The organization I work in inspires me. /I am motivated in my work.
The results show that there is a significant difference between those who work in different workplaces in how much they are inspired by their work (F (3) = 3.82, p = 0.01) and how much they are inspired by the organization (F (3) = 3.75, p = 0.01). I found no significant difference in how motivated they were in their work (F (3) = 1.35, p = 0.26). The 4 groups “My work inspires me." the values obtained on the statement (mean and standard deviation) are shown in Figure 5.
It can be seen that those who work alone find their work most inspiring, those who work in an agile organization, those who work in small/family businesses, and finally those who work in classic
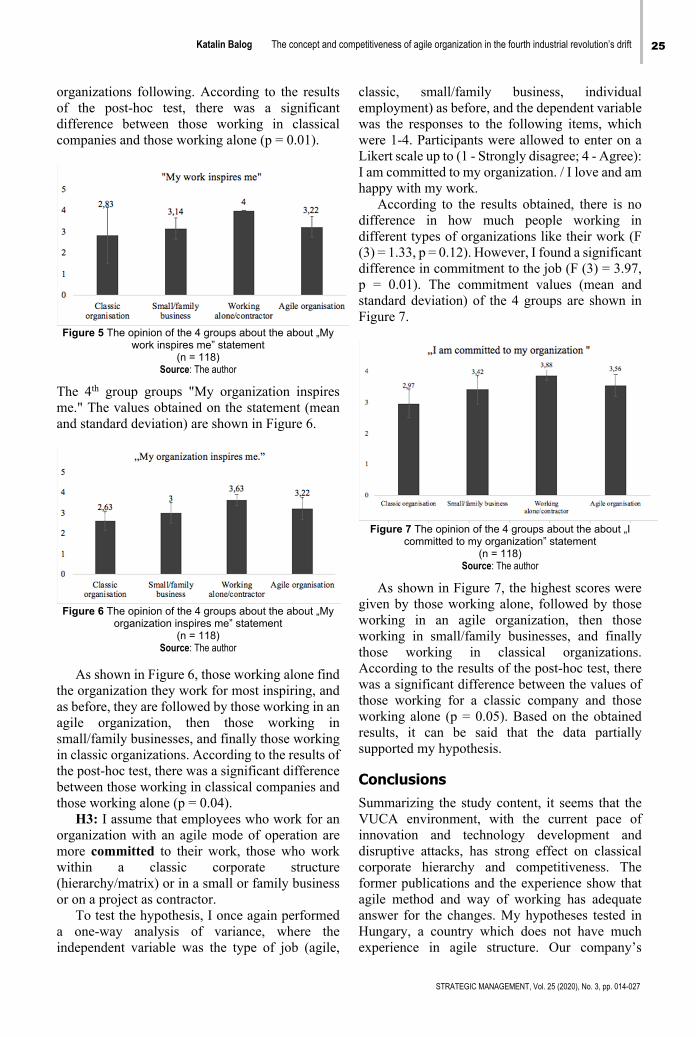
25
STRATEGIC MANAGEMENT, Vol. 25 (2020), No. 3, pp. 014-027
Katalin Balog The concept and competitiveness of agile organization in the fourth industrial revolution’s drift
organizations following. According to the results of the post-hoc test, there was a significant difference between those working in classical companies and those working alone (p = 0.01).
Figure 5 The opinion of the 4 groups about the about „My
work inspires me” statement (n = 118)
Source: The author
The 4th group groups "My organization inspires me." The values obtained on the statement (mean and standard deviation) are shown in Figure 6.
Figure 6 The opinion of the 4 groups about the about „My
organization inspires me” statement (n = 118)
Source: The author
As shown in Figure 6, those working alone find the organization they work for most inspiring, and as before, they are followed by those working in an agile organization, then those working in small/family businesses, and finally those working in classic organizations. According to the results of the post-hoc test, there was a significant difference between those working in classical companies and those working alone (p = 0.04).
H3: I assume that employees who work for an organization with an agile mode of operation are more committed to their work, those who work within a classic corporate structure (hierarchy/matrix) or in a small or family business or on a project as contractor.
To test the hypothesis, I once again performed a one-way analysis of variance, where the independent variable was the type of job (agile,
classic, small/family business, individual employment) as before, and the dependent variable was the responses to the following items, which were 1-4. Participants were allowed to enter on a Likert scale up to (1 - Strongly disagree; 4 - Agree): I am committed to my organization. / I love and am happy with my work.
According to the results obtained, there is no difference in how much people working in different types of organizations like their work (F (3) = 1.33, p = 0.12). However, I found a significant difference in commitment to the job (F (3) = 3.97, p = 0.01). The commitment values (mean and standard deviation) of the 4 groups are shown in Figure 7.
Figure 7 The opinion of the 4 groups about the about „I
committed to my organization” statement (n = 118)
Source: The author
As shown in Figure 7, the highest scores were given by those working alone, followed by those working in an agile organization, then those working in small/family businesses, and finally those working in classical organizations. According to the results of the post-hoc test, there was a significant difference between the values of those working for a classic company and those working alone (p = 0.05). Based on the obtained results, it can be said that the data partially supported my hypothesis.
Conclusions Summarizing the study content, it seems that the VUCA environment, with the current pace of innovation and technology development and disruptive attacks, has strong effect on classical corporate hierarchy and competitiveness. The former publications and the experience show that agile method and way of working has adequate answer for the changes. My hypotheses tested in Hungary, a country which does not have much experience in agile structure. Our company’s

STRATEGIC MANAGEMENT, Vol. 25 (2020), No. 3, pp. 014-027
26 Katalin Balog The concept and competitiveness of agile organization in the fourth industrial revolution’s drift
composition has two main direction: classic hierarchy and small, family business. Compare that the results show that agile way of working makes people efficient, committed and motivated. It was interesting to realize if I include the independent, contractor way of working it has same result as agile structure. My personal experience is that independent, provider form requires similar agile competencies like agile organization such as take responsibility, independency, feedback and communication.
My study is an exploratory case to clarify and narrow my research field in the measurement of agile method effectiveness into Hungarian organizations.SM
References Accenture Strategy (2015). HR drives the agile
organization. Retrieved February 25, 2020, from https://www.accenture.com/t20160913T220140__w__/usen/_acnmedia/Accenture/Conversion-Assets/DotCom/Documents/Global/PDF/Strategy_3/Accenture-Future-of-HR-Trends-Agile-Organizations.pdf
Accenture (18 May, 2018). The Age of Intelligence, The future of all industry is disruption – and that’s a good thing. Retrieved February 28, 2020, from https://www.wired.co.uk/article/the-future-of-all-industry-is-disruption-and-thats-a-good-thing
Agile Manisfesto (2001). Retrieved January 5, 2020, from http://agilemanifesto.org/iso/en/manifesto.html
Bernstein, E., Bucnh, J., Canner, N., & Lee, M. (2016). Beyond the Holacracy HYPE. Harvard Business Review. July-August. Retrieved January 20, 2020, from https://hbr.org/2016/07/beyond-the-holacracy-hype
Bersin, J. (2018, January 16.). Agile organization models will start to go mainstream, Deloitte Bersin report. Retrieved January 22, 2020, from https://blog.bersin.com/prediction-1-agile-organization-models-will-start-to-go-mainstream/
Bersin, J. (2019, October 31.). Let’s stop talking about soft skills. Retrieved January 19, 2020, from https://joshbersin.com/2019/10/lets-stop-talking-about-soft-skills-theyre-power-skills/
Boston Consulting Group (2018, January 17). The most innovative companies in 2018. Retrieved January 19, 2020, from https://www.bcg.com/publications/2018/most-innovative-companies-2018-innovation.aspx
Casteren, V. W. (2017, February). The Waterfall model and the Agile methodology: a comparison by project characteristics. Research Gate. Retrieved January 28, 2020, from https://www.researchgate.net/publication/313768756_The_Waterfall_Model_and_the_Agile_Methodologies_A_comparison_by_project_characteristics https://doi.org/10.13140/RG.2.2.36825.72805
Charterhouse (2018). Holacracy vs. Hierarchy. Retrieved February 2, 2020, from https://www.charterhouse.com.sg/blog/2018/10/holacracy-vs-hierarchy
Chikán A. & Gelei A. (2007). The combination of corporate competitiveness and customer value and capability-based approach. (in Hungarian). Vezetéstudomány, 38 (3).
Chikan, A., Gelei, A., Demeter K., & Dénes F. (2003). The management of the value creation processes (3rd ed.)
(in Hungarian). Budapest: Aula. Christensen, M. C. (1997). The Innovator's Dilemma:
When New Technologies Cause Great Firms to Fail. Brighton. Harvard Business Review Press.
Christensen, M. C., Raynor, E. M., & McDonald, R. (2015, December). What Is Disruptive Innovation? Retrieved February 10, 2020, from https://hbr.org/2015/12/what-is-disruptive-innovation
Gallup (2018). The real future of the work report. Retrieved December 14, 2019, from https://www.gallup.com/workplace/241295/future-work-agility-download.aspx
Gartner (2014, October 8.) Gartner Identifies the top 10 Strategic Technology Trends for 2015. Gartner Symposium/ITxpo. Retrieved January 5, 2020, from https://www.gartner.com/en/newsroom/press-releases/2014-10-08-gartner-identifies-the-top-10-strategic-technology-trends-for-2015
Goldman, S.L., Nagel, R.N., & Preiss, K. (1995). Agile Competitors and Virtual Organisations – Measuring Agility and Infrastructure for Agility. New York: Van Nostrand Reinhold.
Greenwood, J. & Jovanovic, B. (1999, February). The informatmion-Technology Revolution and the Stock Market. US:American Economic Review, 89 (2). https://doi.org/10.3386/w6931
HR Agile Manifesto (2015). Retrieved January 5, 2020, from https://www.agilehrmanifesto.org
Institute for the Future for the University of Phoenix Research Institute (2011). Future work skills 2020. Retrieved January 25, 2020, from https://www.iftf.org/uploads/media/SR-1382A_UPRI_future_work_skills_sm.pdf
Kahneman, D., & Tversky, A. (1982). The Psychology of Preferences. Scientific American, 246(1), 160–173. https://doi.org/10.1038/scientificamerican0182-160
Keynes, J. M. (1930). Economic possibilities for our grandchildren. London: Royal Economic Society.
Keynes, J. M (1921). A Treatise on Probability. London: Macmillan & Co.
Koestler, A. (1967). The Ghost in the Machine. New York: Macmillan.
Laloux, F. (2014). Reinventing organizations. Brussels: Nelson Parker. https://doi.org/10.15358/9783800649143
Mashey, J. R. (1999, June 6-11). Big Data ... and the Next Wave of InfraStress. Usenix Annual Technical Conference. Retrieved February 10, 2020, from https://www.usenix.org/conference/1999-usenix-annual-technical-conference/big-data-and-next-wave-infrastress-problems
McCann, J., Selsky, J., & Lee, J. (2009). Building Agility, Resilience and Performance in Turbulent Environments. People & Strategy, 32 (3).
McKinsey Global Institute (2013, May). Disruptive technologies. Retrieved February 18, 2020, from https://www.mckinsey.com/~/media/McKinsey/Busin
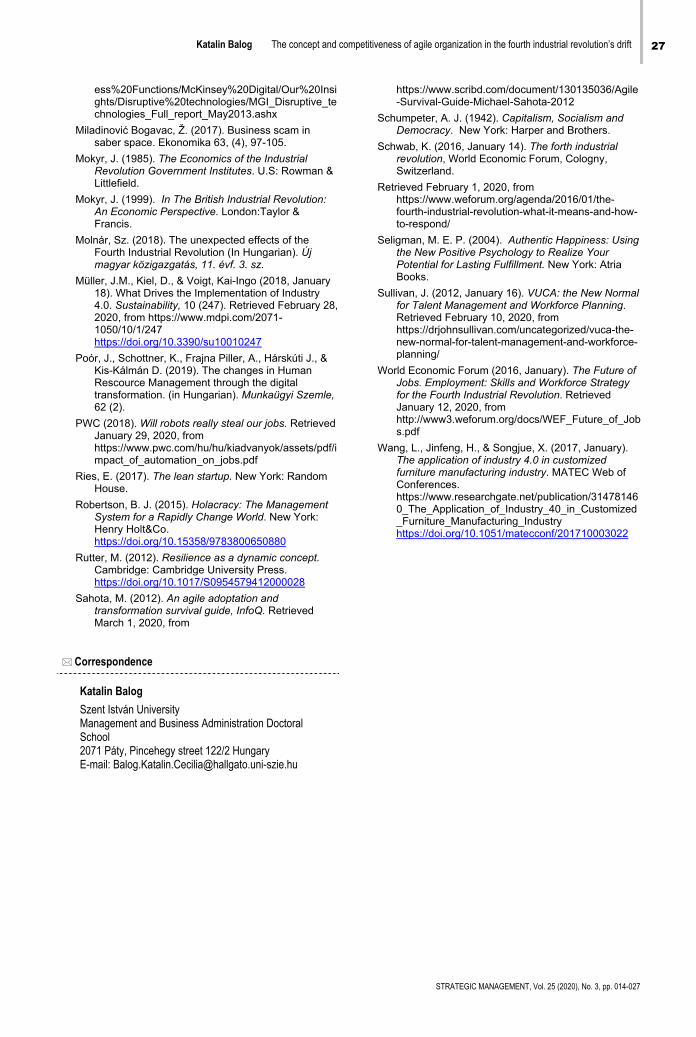
27
STRATEGIC MANAGEMENT, Vol. 25 (2020), No. 3, pp. 014-027
Katalin Balog The concept and competitiveness of agile organization in the fourth industrial revolution’s drift
ess%20Functions/McKinsey%20Digital/Our%20Insights/Disruptive%20technologies/MGI_Disruptive_technologies_Full_report_May2013.ashx
Miladinović Bogavac, Ž. (2017). Business scam in saber space. Ekonomika 63, (4), 97-105.
Mokyr, J. (1985). The Economics of the Industrial Revolution Government Institutes. U.S: Rowman & Littlefield.
Mokyr, J. (1999). In The British Industrial Revolution: An Economic Perspective. London:Taylor & Francis.
Molnár, Sz. (2018). The unexpected effects of the Fourth Industrial Revolution (In Hungarian). Új magyar közigazgatás, 11. évf. 3. sz.
Müller, J.M., Kiel, D., & Voigt, Kai-Ingo (2018, January 18). What Drives the Implementation of Industry 4.0. Sustainability, 10 (247). Retrieved February 28, 2020, from https://www.mdpi.com/2071-1050/10/1/247 https://doi.org/10.3390/su10010247
Poór, J., Schottner, K., Frajna Piller, A., Hárskúti J., & Kis-Kálmán D. (2019). The changes in Human Rescource Management through the digital transformation. (in Hungarian). Munkaügyi Szemle, 62 (2).
PWC (2018). Will robots really steal our jobs. Retrieved January 29, 2020, from https://www.pwc.com/hu/hu/kiadvanyok/assets/pdf/impact_of_automation_on_jobs.pdf
Ries, E. (2017). The lean startup. New York: Random House.
Robertson, B. J. (2015). Holacracy: The Management System for a Rapidly Change World. New York: Henry Holt&Co. https://doi.org/10.15358/9783800650880
Rutter, M. (2012). Resilience as a dynamic concept. Cambridge: Cambridge University Press. https://doi.org/10.1017/S0954579412000028
Sahota, M. (2012). An agile adoptation and transformation survival guide, InfoQ. Retrieved March 1, 2020, from
https://www.scribd.com/document/130135036/Agile-Survival-Guide-Michael-Sahota-2012
Schumpeter, A. J. (1942). Capitalism, Socialism and Democracy. New York: Harper and Brothers.
Schwab, K. (2016, January 14). The forth industrial revolution, World Economic Forum, Cologny, Switzerland.
Retrieved February 1, 2020, from https://www.weforum.org/agenda/2016/01/the-fourth-industrial-revolution-what-it-means-and-how-to-respond/
Seligman, M. E. P. (2004). Authentic Happiness: Using the New Positive Psychology to Realize Your Potential for Lasting Fulfillment. New York: Atria Books.
Sullivan, J. (2012, January 16). VUCA: the New Normal for Talent Management and Workforce Planning. Retrieved February 10, 2020, from https://drjohnsullivan.com/uncategorized/vuca-the-new-normal-for-talent-management-and-workforce-planning/
World Economic Forum (2016, January). The Future of Jobs. Employment: Skills and Workforce Strategy for the Fourth Industrial Revolution. Retrieved January 12, 2020, from http://www3.weforum.org/docs/WEF_Future_of_Jobs.pdf
Wang, L., Jinfeng, H., & Songjue, X. (2017, January). The application of industry 4.0 in customized furniture manufacturing industry. MATEC Web of Conferences. https://www.researchgate.net/publication/314781460_The_Application_of_Industry_40_in_Customized_Furniture_Manufacturing_Industry https://doi.org/10.1051/matecconf/201710003022
Correspondence
Katalin Balog
Szent István University Management and Business Administration Doctoral School 2071 Páty, Pincehegy street 122/2 Hungary E-mail: [email protected]

STRATEGIC MANAGEMENT, Vol. 25 (2020), No. 3, pp. 028-037
doi: 10.5937/StraMan2003028D
Received: April 02, 2020
Accepted: August 17, 2020
The impact of employees' commitment on organizational performances Biljana Đorđević Faculty of Economics, University of Niš, Niš, Serbia Maja Ivanović-Đukić Faculty of Economics, University of Niš, Niš, Serbia Vinko Lepojević Faculty of Economics, University of Niš, Niš, Serbia Sandra Milanović Innovation Center, University of Niš, Niš, Serbia
Abstract: This paper examines the impact of employees’ commitment on the productivity of organizations in the Republic of Serbia. Employees’ commitment represents the willingness of employees to make efforts for thebenefit of the organization and the desire to remain in them. It can be seen as: affective, continuous and normative commitment. Affective commitment reflects a belief in the goals of an organization and a willingness to actively participate in its development; normative commitment reflects a sense of obligation on employees toremain in the organization while continuing commitment is due to employees' assessment that leaving theorganization causes greater costs than benefits. Previous research shows that all types of commitment have a major impact on the performance of organizations. As the number of empirical studies on this topic in Serbia islimited, this paper examines the impact of each type of organizational commitment on the productivity of organizations in Serbia, as well as the impact of the overall commitment. The aim of the paper was to identify the types of organizational commitment that have the greatest impact on the performance of organizations in Serbia and to propose measures to HR managers whose implementation can improve the operations ofdomestic organizations. The starting point of the paper was that employees' commitment has a statistically significant effect on organizational performance. To verify the validity of this assumption, a primary survey wasconducted. 169 employees of 17 organizations in Serbia were surveyed. By applying correlation and regressionanalysis methods, it has been proven that overall organizational commitment, as well as its certain types, have a positive impact on the productivity of organizations in Serbia, with the impact of normative commitment onperformance greater than other types of commitment. At the same time, the contribution of continuous commitment to the performance of organizations in Serbia is negligible (statistically insignificant). In line withthe obtained results, recommendations for human resources managers in Serbia are proposed. The theoretical implications of the paper are reflected in filling the gap in the national literature in the field of organizationalcommitment, while the empirical implications are reflected in the mechanisms and measures that are proposed at the end of the paper. Keywords employees' commitment, management, organizational performance, Serbia.
Introduction Employees' commitment is a phenomenon that has been occupying the attention of the scientific and professional public for several decades. The reasons for this can be found in the fact that this
phenomenon has a strong impact on many significant phenomena and outcomes in the working environment, such as absenteeism, turnover, employee performance etc. (Irefin & Mechanic, 2014; Zia ud & Khan, 2010; Folorunso, Adewale, & Abodunde, 2014). Besides, some
Đorđević et al. The impact of employees' commitment on organizational performances 29
STRATEGIC MANAGEMENT, Vol. 25 (2020), No. 3, pp. 028-037
authors suggest that the competitive advantage of the organizations and their superior performance may be based precisely on the commitment of the employees that make up those organizations (Akintayo, 2010). In short, employees' commitment to the organizations has potentially serious consequences on the overall organizational performance (Irefin & Mechanic, 2014).
Employees' commitment, however, is not an unambiguous phenomenon. The significant body of literature in this area suggests that this is a complex category that can be viewed from different angles. Accordingly, we can talk about the employees' commitment to an organization, commitment to work, commitment to oneself, commitment to colleagues, commitment to customers, etc. In this paper, the authors will analyse employees' commitment to an organization for which we will use the term organizational commitment as a synonym.
Organizational commitment is a complex category that can be observed through three types of commitment: affective, continuous and normative commitments (Meyer & Allen, 1997). These types of commitment at the same time reflect the different reasons on which the commitment of employees to the organization is based on. Thus, some employees are committed to the organization because they strongly believe in the organizational values it stands for, the others are committed because of the high cost of leaving the organization, while some employees have a sense of moral obligation to the organization in which they are employed (Meyer & Allen, 1997).
Having in mind the importance of the organizational commitment for many phenomena in the working place, but, above all, for the performance the employees achieve, and thus for the organizational performance, the subject of this paper is to examine the impact of organizational commitment, both overall and its different types, on the performance that companies in Serbia achieve. This paper’s aims are to identify the types of organizational commitment that have the greatest impact on the performance of organizations in the Republic of Serbia and to propose measures for human resource managers whose implementation can improve the business of domestic companies.
The paper is structured as follows: first, the literature on the concept of organizational commitment is reviewed and the initial hypotheses are defined. Then, the research results and their discussion are presented while, at the end of the
paper, concluding remarks and implications for managers are given.
1. Literature review and hypothesis development
1.1. Organizational commitment Organizational commitment as a concept has been the subject of research for a long period. There are opinions that this concept, in addition to the concept of job satisfaction, is one of the most studied in management. The reason for that lies in the fact that it has been found that this phenomenon affects many outcomes and phenomena in the working place that directly or indirectly affect the overall results that organizations achieve, as well as the phenomena such as absenteeism, fluctuation and the like. Consequently, organizational commitment is recognized as an important component of the overall organizational success (Randall, Fedor & Longenecker, 1990).
When it comes to the conceptualization of this phenomenon, it is noticeable that there are many points of view in the literature. First of all, several theories explain the essence of this concept. These are behavioural theory, transactional theory, obligatory theory, attitudinal theory, and a multidimensional approach (Mercurio, 2015). According to behavioural theory, the commitment of employees occurs as a consequence of their actions, i.e. behaviour. Some theorists use the term "volition" to explain this mechanism and state that if employees are free to make decisions about an activity in which they will participate, then they will feel a greater obligation and responsibility to carry out these activities to the end, as well as consider the costs of non-participation in these activities (Salancik, 1997). The essence of the transactional theory is that commitment to an organization results from the perceived loss of certain investments that an individual has made in a given organization. These investments are reflected in the invested time, effort and money. In short, commitment to an organization according to transactional theory is based on employee economic decisions. This theory derives its name from Becker's (1960) side-bet theory (Mercurio, 2015). The obligatory theory sees the basis for commitment to an organization in the employee's sense of obligation to that organization. This internalized sense of obligation can be based on the reciprocal benefits that the individual sees in the relationship with the organization (Mercurio, 2015). Attitudinal commitment theory sees an
30 Đorđević et al. The impact of employees' commitment on organizational performances
STRATEGIC MANAGEMENT, Vol. 25 (2020), No. 3, pp. 028-037
explanation for commitment in identifying the individual with the organization and feeling cohesive with it (Kanter, 1968 in Mercurio, 2015). Finally, there is a multidimensional approach to commitment adopted by several authors (Angle & Perry, 1981; O'Reilly & Chatman, 1986; Jaros, Jermier, Koehler, & Sincich, 1993).
The most well-known multidimensional model of commitment is the one developed by Meyer and Allen (1991) according to which commitment is a three-dimensional concept. The mentioned authors believe that commitment is based on both behavioural theory and attitudinal theory. They also believe that these theories are not mutually exclusive. In support of this, they state that affective commitment can result from freely chosen behaviour of employees and over time grows into a true affective connection with the organization (Meyer & Allen, 1991).
In the paper, the authors will implement the multidimensional approach to commitment advocated by the above-mentioned authors. Accordingly, the types of organizational commitment identified by them (affective, continuous and normative commitment) will be explained in more detail below (Meyer & Allen, 1991).
When it comes to affective commitment, it is considered to be the most desirable manifestation of commitment, because it refers to the emotional connection and identification of employees with the organizations. Employees who have this type of commitment show a high degree of motivation, a strong belief in the goals of the organization, willingness to actively participate in its development etc. Meyer and Allen (1991) indicate that employees who develop this type of commitment stay in the organization because they want to.
As for continuous commitment, Meyer and Allen (1991) describe in the context of the costs associated with leaving an organization. In practice, this means that if employees estimate that the costs of leaving an organization will be high, they will be committed to that organization, not because they want to, but because they have to. The costs of leaving the organization include the costs of looking for a new job, but also the benefits that would be lost. Leaving the company can additionally cause intangible losses, such as broken social ties and contacts, loss of image resulting from work for a particular organization, etc. This type of commitment is often shown by employees who are at high positions on the hierarchical ladder
because they usually put a lot of energy and effort to reach those positions. Continuous commitment is also shown by those employees who would have limited opportunities for alternative employment. According to some authors, this type of commitment could be increased if the organization had a clear plan for employee promotion, a good reward system and a career development plan (Akhtar & Tan, 1994; Shouksmith, 1994).
Normative commitment, as the third type of commitment, reflects the feeling of obligation of employees to stay in the organization for certain reasons (scholarships, various types of help from the company, etc.). However, the factors that affect the normative commitment to the organization have a complex structure, because depending on the personality of the employee, they can have different effects. Seen from the perspective of the organization, this group of employees is important for the company because they can achieve high performance. However, over time, the level of normative commitment may weaken, which may have a negative impact on employees’ performance.
1.2. Employees' performance Employees' performance is commonly defined as the outcome of activities undertaken by employees that result from their efforts, abilities, and perceptions of the tasks delegated to them (Prasetya & Kato, 2011). They reflect the degree of achievement in each job and the fulfilment of organizational regulations, expectations or requirements arising from the task assigned to them (Folorunso et al., 2014). Performance is often defined in the context of the quantity, quality and contribution that employees make to the achievement of organizational goals. They are also viewed as an overall outcome of work including efficiency and effectiveness (Hsu, 2005).
Because employees are the ones who make up organizations, the performances they achieve in their workplaces are also reflected in the performances on the organizational level (Zheng, Sharan, & Wei, 2010). Starting from that fact, employers and managers need to know how they can get the best out of their employees. In this context, it is very useful to look at the results of research conducted in this area, because these results also suggest the directions in which the efforts of employers and managers to improve individual performance should go. Research in this area shows that the performances that employees achieve are influenced by a large number of
Đorđević et al. The impact of employees' commitment on organizational performances 31
STRATEGIC MANAGEMENT, Vol. 25 (2020), No. 3, pp. 028-037
factors, among which the most important are: leadership style, job satisfaction, salary satisfaction, the ability to participate in decision-making, etc.
1.3. Hypothesis development Research on the relationship between organizational commitment and the performance that employees achieve was the subject of many studies. Furthermore, the relationship between the overall organizational commitment and performance, as well as the relationship between certain types of organizational commitment and performance were investigated.
There is a large body of research proving that overall organizational commitment and its types have a positive impact on employee performance (Negin, Omid, & Ahmad, 2013; Chughtai & Zafar, 2006; Khan, Ziauddin, & Ramay, 2010). For example, Zefeiti and Mohamad (2017) examined the impact of employees' commitment on their productivity in public enterprises in Oman and proved that commitment has a positive and statistically significant impact on employees' productivity. Similarly, Zia ud and Kxan (2010) found that there is a positive relationship between overall organizational commitment and employees' performance and that all three types of organizational commitment have a positive and significant impact on employees' performance. A similar conclusion was reached by Folorunso and his associates (2014). They have proven that affective, normative, and continuous commitment together and independently exert a positive impact on employees' performance (Folorunso et al., 2014). Accordingly, our first hypothesis is:
H1: Organizational commitment of employees
(overall and different types) has a positive impact on organizational performance.
Some authors have noted that the impact of
certain types of organizational commitment does not have the same impact on organizational performance. Thus, for example, Khan et al. (2010) show that all types of organizational commitment have a positive and statistically significant impact on performance, but the contribution of the normative component of commitment to organizational performance is the greatest. Accordingly, our second hypothesis is:
H2: Normative commitment of employees has
the greatest impact on organizational performance.
Some studies show that the relationship
between all types of organizational commitment and performance can be both negative and positive, but statistically insignificant. For example, Clarke (2006) showed in his research that the relationship between continuous commitment and performance is negative, while overall commitment, as well as its affective and normative types, have a positive impact on company performance. Somers and Birnbaum (1998) found that commitment to an organization was positively correlated with employee performance and that relationship was statistically significant, whereas the relationship between continuous commitment and employee performance was not statistically significant. Accordingly, our next hypothesis is:
H3: The impact of continuous commitment of
employees on organizational performance is not statistically significant.
When it comes to affective commitment, it is
considered to be the most desirable manifestation of commitment, because employees who develop this type of commitment stay in the organization because they want to (Meyer & Allen, 1991). Their job satisfaction is at a relatively high level, which encourages greater engagement and better performance. For these reasons, the impact of affective commitment on organizational performance is mostly positive and statistically significant, as evidenced by numerous studies (Kumari & Afroz, 2013). Accordingly, our last hypothesis is:
H4: Affective commitment of employees has a
positive and statistically significant impact on organizational performance.
2. Research methodology To check the validity of the stated hypotheses, primary research was conducted. We examined which type of organizational commitment is present in employees in the organizations of the Republic of Serbia that were included in the research and whether there is a connection, both between certain types of organizational commitment and business performance and between overall organizational commitment and business performance. The research was conducted in the period from October 2017 to February 2018 by surveying employees in organizations in the Republic of Serbia. The questionnaire included
32 Đorđević et al. The impact of employees' commitment on organizational performances
STRATEGIC MANAGEMENT, Vol. 25 (2020), No. 3, pp. 028-037
two groups of questions. The first group consisted of general questions, related to gender, age and education of employees. The second group consisted of questions related to the types of organizational commitment. The questions were formulated according to a questionnaire created by Meyer and Allen (Meyer & Allen, 1991). Employees were asked to answer questions related to types of organizational commitment from 1 to 5 on the Likert scale (where 1 means "I do not agree at all" and 5 "I completely agree"). Organizational performance in the paper is examined through the productivity of the employee, measured as income per employee. This indicator was chosen because data related to the achieved performance is usually business secret and employees did not enter it when filling out the questionnaire. Therefore, we used the official data from the Serbian Business Registers Agency SBRA website on the performances of the organizations, whose employees were interviewed. The income per employee, as an indicator of productivity, was chosen because some organizations whose employees were surveyed did not report a profit in the observation year.
The sample included 200 employees in 17 organizations operating in the territory of the Republic of Serbia. The organizations covered by the survey according to the Regulation on Classification of Activities (Službeni glasnik, 2010) belong to the sector of agriculture, forestry and fishing, manufacturing, water supply, sewerage and waste management and remediation activities, wholesale and retail trade, transportation and storage, financial and insurance activities, as well as human health and social work activities. As many as 13 companies belong to the group of large legal entities, while only 4 belong to the group of medium-sized legal entities.
Table 1 Sample structure
Education Gender Total Male Female Primary Education 5.1% 1.4% 3.6% High school 63.3% 70.5% 66.2% Higher education 10.2% 8.5% 9.5% High education 21.5% 19.7% 20.7% Total 100.0% 100.0% 100.0% Age <25 8.2% 12.7% 10.1% 26 - 40 37.8% 47.9% 42.0% 41 - 55 44.9% 33.8% 40.2% 56 and more 9.2% 5.6% 7.7% Total 100.0% 100.0% 100.0%
Source: The authors’ calculations
Out of the total number of distributed questionnaires, 31 were rejected due to incomplete answers, and 169 were retained. The structure of the sample, in terms of gender, education and age of respondents, is shown in Table 1. In the sample structure, women participated with 42.0%, while there were slightly more men and they made up 58.0% of the respondents. Regarding the age structure, it was as follows: 10.1% were respondents under the age of 25, 42.0% were respondents between 26 and 40, 40.2% were respondents between 41 and 55, 7.7% of respondents were older than 55 years. Also, 3.6% have primary education, 66.2% of employees have a secondary school, 9.5% have higher education and 20.7% have high education. 3. Research results The measurement scale used in the research consisted of three items. Examining its reliability, it is concluded that Cronbach’s Alpha values of 0.828 indicate very good reliability and internal consistency of the scales in the sample. According to the data in Table 2, column Correlated Item-Total Correlation, there is a high degree of correlation of each item with the overall results. As all values in the Cronbach's Alpha if Item Deleted column are less than the final alpha value (0.828), we find that it is advisable to keep all items in the existing scale and that such a scale is comparable to research based on this scale. Also, the mean value of the correlation between items is 0.654, and the correlation of pairs of items is from 0.593 to 0.687, which indicates that the correlation between items is strong. Table 2 Measurement scale reliability
Item Corrected Item-Total
Correlation
Cronbach's Alpha if Item
Deleted Affective commitment .593 .806 Continuous commitment .687 .697 Normative commitment .682 .699 Cronbach’s Alpha .828 Sample size 169
Source: The authors’ calculations
To check the validity of the first hypothesis, a
simple correlation and regression analysis were performed. The dependent variable in the model was labour productivity, measured as income per employee, while the independent variable was the level of overall commitment. The results of the correlation and regression analysis for testing the first hypothesis are shown in Table 3.

Đorđević et al. The impact of employees' commitment on organizational performances 33
STRATEGIC MANAGEMENT, Vol. 25 (2020), No. 3, pp. 028-037
Table 3 Correlation and regression analysis (employee commitment and performance of organizations in the Republic of Serbia)
Coefficients Sig. (Constant) -1,413,998.068 .740 Organizational commitment 3,301,993.883 .016 Pearson Correlation .455 .008 R Square .034
Source: The authors’ calculations
As it can be seen from Table 3, there is a
moderate, direct and statistically significant relationship (0.455) between employees' commitment and the performance of organizations in the Republic of Serbia, as measured by labour productivity. In other words, with an increase in the degree of commitment, there is an increase in labour productivity and, conversely, a decrease in the level of commitment is accompanied by a decrease in labour productivity. Since this relationship is statistically significant, this conclusion can be generalized.
To examine the impact of employees' commitment on labour productivity more closely, a simple regression analysis was performed. The corresponding linear regression model that establishes the relationship between labour productivity as a dependent variable and organizational commitment (Table 3) has the following form:
Productivity 1,413,998.0683,301,993.883 organizational commitment
= − +×
(1)
The value of the regression coefficient is
3,301,993.883 (Table 3). This means that an increase in the level of commitment among employees in the Republic of Serbia by 1, on a scale from 1 to 5, leads to an increase in income per employee by 3,301,993.883 dinars per year. This coefficient is statistically significant at the level of 5% so that the conclusion can be generalized. This proves the first hypothesis of the paper.
Before testing the impact of certain forms of commitment on labour productivity, correlation analysis was applied to examine the relationship between productivity and types of organizational commitment (affective, continuous and normative). A direct and statistically significant relationship was found between productivity, on the one hand, and affective commitment (r = .450, p <.05, medium-strong relationship), continuous commitment (r = .435, p <.05, medium-strong relationship) and normative commitment (r = .463,
p <.05, medium-strong relationship), on the other hand.
Multiple regression was performed to check the impact of certain forms of commitment on labour productivity and to test hypotheses. The dependent variable in the model is labour productivity and the independent variables are an affective, continuous and normative commitment. The regression equation that represents the regression model is:
Productivity 1,738,179.6271,449,276.797 affective commitment522,080.021 continuous commitment1,480,939.639 normative commitment
= − +× +
× +×
(2)
The results are shown in Table 4.
Table 4 Influence of types of commitment on labour productivity in organizations in the Republic of Serbia
Beta Sig. Unstandardized Standardized (Constant) -1,738,179.627 .392 Affective commitment
1,449,276.797 .088 .045
Continuous commitment
522,080.021 .040 .125
Normative commitment
1,480,939.639 .103 .033
R .488 R Square .238 Adjusted R Square
.218
Dependent Variable: Productivity Source: The authors’ calculations
As it can be seen from Table 4, the normative
commitment has the greatest impact on labour productivity (St.B = 0.103), and this coefficient is statistically significant. This proves the second hypothesis. Slightly weaker influence, concerning normative commitment, has affective commitment (St.B = 0.088), where the influence is statistically significant. This proves the fourth hypothesis. The weakest impact is recorded by continuous commitment (St.B = 0.040), while this coefficient is not statistically significant. This proves the third hypothesis of the paper. The model explains 21.8% of the variability in labour productivity.
4. Discussion and implications for human resources managers Our research, based on a sample of 169 employees in 17 organizations in Serbia, showed that organizational commitment, both overall and different types (normative, affective and

34 Đorđević et al. The impact of employees' commitment on organizational performances
STRATEGIC MANAGEMENT, Vol. 25 (2020), No. 3, pp. 028-037
continuous), has a great impact on employees' behaviour and thus the overall performance of the organization. The commitment of employees in organizations in Serbia explains almost 22% of the variability in the productivity of the organization.
When it comes to the different types of commitment, our research has shown that the impact of all types of commitment on the performance of organizations is not the same. The normative commitment had the greatest impact on the performance of organizations in Serbia, which is similar to the results obtained by Khan et al. (Khan et al., 2010). This can be explained by the fact that many employees in Serbia base their employment in organizations on recommendations, scholarships, professional practice and the like. As a consequence of this fact, employees often feel a moral obligation to justify such a privilege with great dedication and good results.
Our research has shown that the contribution of affective commitment to the performance of organizations in the Republic of Serbia is also positive and statistically significant, which is in line with the results of previous research (Kumari & Afroz, 2013). However, the impact of affective commitment on productivity in organizations in the Republic of Serbia is smaller compared to the impact of normative commitment. This can be partly explained by the situation in the Republic of Serbia, which is characterized by organizations often behaving irresponsibly towards employees (often there are non-registration of workers, overtime longer than allowed by law, often unpaid, etc.) As a result, a relatively small number of employees in the Republic of Serbia develop affective commitment. Also, it is at such a level that there is no significant impact on performance. In addition, its impact is less than the impact of normative commitment.
Finally, our research showed that the impact of continuous commitment of employees to the performance of organizations in the Republic of Serbia is positive but statistically insignificant. These results are similar to the conclusions reached by Somers and Birnbaum (1998). This can be partly explained by the fact that an increasing number of employees in Serbia are thinking about leaving organizations and going abroad so that the "organizational co-dependency” that was present among the older generations is no longer present.
Having in mind the results of empirical research conducted on the territory of the Republic of Serbia, as well as what the relevant literature
suggests regarding ways to increase employees' commitment, the measures for increasing it in domestic companies could be proposed. Some of the most important measures are as follow: Establishing communication channels -
Establishing adequate communication channels has always been considered as a good way to build employees' commitment. These channels must be two-way for information to move from employees to management and vice versa (Zangaro, 2001). In addition to the usual ways of communication (conversation, phone, e-mail, meetings, etc.), communication can be improved by introducing the so-called "open doors", "open books", etc. Involving employees in the decision-making
process - Involving employees in the decision-making process is one of the best ways to increase the affective commitment of employees. The positive link between employees' involvement in the decision-making process and their commitment has also been confirmed in numerous empirical studies (Wainaina, Iravo & Waititu, 2014; Zin & Talet, 2016; Majeed, Ramaya, Mustamil, Nazri & Jamshed, 2017; Paunescu, Popescu, & Blid, 2018). However, in addition to the fact that the involvement of employees in the decision-making process has a positive impact on employees' commitment, it also has a positive impact on other phenomena related to employees, such as job satisfaction, empowerment, etc., which, on the other hand, are also closely related to the performance that employees achieve. Creating opportunities for inclusion in
training programs – Employee retention in a particular organization often depends on their involvement in training programs. The reason why this is so can be explained by the fact that employees who are involved in training programs understand that organizations see them as valuable members of that organization and that is worth investing in them. In this way, the proposed measure contributes to the building of both affective and normative commitment. The positive link between employees' involvement in training programs is also confirmed by numerous empirical studies (Al-Emadi & Marquardt, 2007; Aguinis & Kraiger, 2009; Dias & Silva, 2016; Foerster-Pastor & Golowko, 2018). Given the importance of training of employees for the competitiveness of the organization, some authors in the training even see a central area of human resource management along with activities such as recruitment, selection and rewarding (Bulut & Culha, 2010). Recruitment and selection of candidates
Đorđević et al. The impact of employees' commitment on organizational performances 35
STRATEGIC MANAGEMENT, Vol. 25 (2020), No. 3, pp. 028-037
whose values match the values of the organization - If candidates whose values match the values advocated by the organization are selected to fill job positions, such employees will likely be committed to that organization. Additionally, some authors suggest that it is very important for new employees (and useful for the organization) to feel like “insiders” very quickly, and in that sense recommend mentoring programs that can significantly contribute to this (Smith, 2000). Designing a reward system that recognizes
individual achievements - A reward system is a very convenient mechanism for building employees' commitment and motivation if employees can see a direct link between their contribution and the rewards they receive. This is evidenced by many empirical studies (Nawab & Bhatti, 2011; Rahaman, Mohani & Rahman, 2016), so this mechanism should be used to build employees' commitment, but also other positive outcomes and phenomena related to them, such as job satisfaction, performance, organizational citizenship behaviour, etc. (Barber, Dunham & Formisano, 1992; Chivu, Ciutacu & Georgescu, 2015). An introduction of family-friendly practices
- If organizations meet the needs of employees when it comes to their families (flexible working hours, part-time work, etc.), it is likely that this will positively affect the commitment of such employees. This is confirmed by empirical studies (Bae & Yang, 2017) as well, so this mechanism, when it is possible, should be used for increasing the employees' commitment.
Conclusion The paper dealt with the basic characteristics of the concept of organizational commitment, as well as the impact of this phenomenon on the performance that employees achieve. The paper points out that this is a frequently studied phenomenon, but at the same time, it is very important, which is evidenced in the great body of literature in this field. It is pointed out that organizational commitment is a multidimensional phenomenon that can be based on different bases, and in this regard, a distinction is made between the affective, continuous and normative commitment of employees.
In addition to reviewing and analysing the literature in the field of organizational commitment, the paper also presents the results of empirical research that focused on the relationship between employee commitment in organizations in the Republic of Serbia and the performance that
these organizations achieve in terms of productivity. The results showed that the overall organizational commitment, as well as its types, have a positive impact on the productivity of organizations in the Republic of Serbia, with the impact of normative commitment on performance greater than other forms of commitment. At the same time, the contribution of continuous commitment to organizational performance, although positive is negligible (statistically insignificant). Following the obtained results, some recommendations for human resource managers in the Republic of Serbia were proposed with the aim of improvement of the business results through increased organizational commitment.
Key limitations of the paper are related to theoretical implications and sample size. The first limitation is based on the fact that empirical research was conducted in the Republic of Serbia, which is a small underdeveloped country. Therefore, the question that arises here is for how many people in the world the results of the study will be worth to consider? However, through a comparative analysis with similar researches from other countries, especially developed, it is possible to identify some similarities and differences. Consequently, some contribution to filling the gap in the Serbian literature in the field of human resource management can be made. The second limitation is related to a sample that included only 17 organizations from one region of the Republic of Serbia. On the other hand, having in mind the fact that in the Republic of Serbia it is relatively difficult to obtain empirical data and conduct primary research, which is why scientific papers are often theoretical (or empirical but based on the use of secondary data), any empirical research based on primary data in this country can provide useful information and intrigue other scientists to continue a deeper analysis in this field.SM
References Aguinis, H., & Kraiger, K. (2009). Benefits of training and
development for individuals and teams, organizations, and society. Annual Review of Psychology, 60 (1), 451-474. https://doi.org/10.1146/annurev.psych.60.110707.163505
Akhtar, S., & Tan, D. (1994). Reassessing and reconceptualizing the multidimensional nature of organizational commitment. Psychological Reports, 75 (3), 1379-1390. https://doi.org/10.2466/pr0.1994.75.3.1379
Akintayo, D.I. (2010). Work-Family Role Conflict and Organizational Commitment Among Industrial Workers in Nigeria. Journal of Psychology and Counselling, 2 (1), 1-8.

36 Đorđević et al. The impact of employees' commitment on organizational performances
STRATEGIC MANAGEMENT, Vol. 25 (2020), No. 3, pp. 028-037
Al-Emadi, M. A. S. & Marquardt, M. J. (2007). Relationship between employees’ beliefs regarding training benefits and employees’ organizational commitment in a petroleum company in the state of Qatar. International Journal of Training and Development, 11 (1), 49-70. https://doi.org/10.1111/j.1468-2419.2007.00269.x
Angle, H. L., & Perry, J. L. (1981). An empirical assessment of organizational commitment and organizational effectiveness. Administrative Science Quarterly, 26 (1), 1-14. https://doi.org/10.2307/2392596
Bae, K. B., & Yang, G. (2017). The effects of family-friendly policies on job satisfaction and organizational commitment: A panel study conducted in South Korea. Public Personnel Management, 46 (1), 25–40. https://doi.org/10.1177/0091026016689669
Barber, A. E., Dunham, R. B., & Formisano, R. A. (1992). The impact of flexible benefits on employee satisfaction: A field study. Personnel Psychology, 45 (1), 55–75. https://doi.org/10.1111/j.1744-6570.1992.tb00844.x
Becker, H. S. (1960). Notes on the concept of commitment. American Journal of Sociology, 66, 32–40. https://doi.org/10.1086/222820
Bulut, C., & Culha, O. (2010). The effects of organizational training on organizational commitment. International Journal of Training and Development, 14 (4), 309-332. https://doi.org/10.1111/j.1468-2419.2010.00360.x
Chivu, L., Ciutacu, C., & Georgescu, L. (2015). Household income in Romania. A challenge to economic and social cohesion. Procedia Economics and Finance, 22, 398-401. https://doi.org/10.1016/S2212-5671(15)00310-X
Chughtai, A.A, & Zafar, S. (2006). Antecedents and consequences of Organizational Commitment Among Pakistani University Teachers. Applied H.R.M Research,11 (1), 39-64. http://dx.doi.org/10.4236/jhrss.2014.22009
Clarke. N (2006). The relationships between network commitment, its antecedents and network performance. Management Decision, 44 (9), 1183-1205. http://dx.doi.org/10.1108/00251740610707677
Dias, V. A., & Silva, R. (2016). Organizational training and organizational commitment: a literature review and conceptual development. International Journal of Inovative Science, Engineering & Technology, 3 (1), 387-399. https://doi.org/10.32535/ijabim.v3i1.86
Foerster-Pastor (Foerster-Metz), U. S., & Golowko, N. (2018). The need for digital and soft skills in the Romanian business service industry. Management & Marketing – Challenges for the Knowledge Society, 13 (1), 831-847. https://doi.org/10.2478/mmcks-2018-0008
Folorunso, O.O., Adewale, A.J., & Abodunde, S.M. (2014). Exploring the effect of organizational commitment dimensions on employees performance: An empirical evidence from Academic Staff of Oyo State Owned Tertiary Institutions, Nigeria. International Journal of Academic Research in Business and Social Sciences, 4 (8), 275-286. http://dx.doi.org/10.6007/IJARBSS/v4-i8/1096
Hsu, P. Y. (2005). The research of the influence of cross-cultural on the job performance: The case on Philippine & Thailand labor in high-tech industry (Unpublished master’s thesis, National Cheng Kung University, Taiwan). Retrieved from: http://etds.lib.ncku.edu.tw/etdservice/view_metadata?etdun=U0026-0812200911253515
Irefin, P., & Mechanic, M. (2014). Effect of commitment on organisational performance in Coca Cola Nigeria Limeited Maiduguri, Borno State. Journal of Humanities and Social Science, 19 (3), 33-41. https://doi.org/10.9790/0837-19313341
Jaros, S. J., Jermier, J. M., Koehler, J. W., & Sincich, T. (1993). Effects of continuance, affective, and moral commitment on the withdrawal process: An evaluation of eight structural equation models. Academy of Management Journal, 36 (5), 951-995. https://psycnet.apa.org/doi/10.2307/256642
Kanter, R. M. (1968). Commitment and social organization: A study of commitment mechanisms in utopian communities. American Sociological Review, 33 (4), 499-517. https://psycnet.apa.org/doi/10.2307/2092438
Khan, M.R., Ziauddin, Jam, F.A., & Ramay, M.I. (2010). The impacts of Organizational commitment on employee job performance. European Journal of Social Sciences, 15 (3), 292–298.
Kumari, N., & Afroz, N. (2013). The Impact of Affective Commitment in Employees Life Satisfaction. The Impact of Affective Commitment in Employees Life Satisfaction, 13 (7), 1-7.
Majeed, N., Ramaya, T., Mustamil, N., Nazri, M. & Jamshed, S. (2017). Transformational Leadership and Organizational Citizenship Behavior: Modeling Emotional Intelligence as Mediator. Management and Marketing. Challenges for the Knowledge Society, 12 (4), 571-590. https://dx.doi.org/10.1515/mmcks-2017-0034
Mercurio Z. A. (2015). Affective commitment as a core essence of organizational commitment: an integrative literature review. Human Resource Development Review, 14 (4), 389-414. https://doi.org/10.1177%2F1534484315603612
Meyer, J. P & Allen, N. J (1997). The measurement and antecedents of affective, continuance, and normative commitment to the organization. Journal of Occupational Psychology, 63 (1), 1-18. https://doi.org/10.1111/j.2044-8325.1990.tb00506.x
Meyer, J.P., & Allen, N.J. (1991). A three-component conceptualization of organizational commitment. Human Resource Management Review, 1 (1), 61-89. https://doi.org/10.1016/1053-4822(91)90011-Z
Nawab, S. & Bhatti, K. K. (2011). Influence of Employee Compensation on Organizational Commitment and Job Satisfaction: A Case Study of Educational Sector of Pakistan. International Journal of Business and Social Science, 2 (8), 25–32.
Negin, M., Omid, M., & Ahmad, B.M. (2013). The Impact of Organizational Commitment on Employees job performance: A study of Meli Bank. International Journal of Contemporary Research in Business, 5 (5), 164-171.
O’Reilly, C. A., & Chatman, J. (1986). Organizational commitment and psychological attachment: The effects of compliance, identification, and internalization on prosocial behavior. Journal of Applied Psychology, 71 (3), 492-499. https://psycnet.apa.org/doi/10.1037/0021-9010.71.3.492
Paunescu, C., Popescu, M. C. & Blid, L. (2018). Business impact analysis for business continuity: Evidence from Romanian enterprises on critical functions. Management & Marketing – Challenges for the Knowledge Society, 13 (3), 1035-1050.

Đorđević et al. The impact of employees' commitment on organizational performances 37
STRATEGIC MANAGEMENT, Vol. 25 (2020), No. 3, pp. 028-037
https://doi.org/10.2478/mmcks-2018-0021 Prasetya, A. & Kato, M. (2011). The Effect of Financial and
Non Financial Compensation to the Employee Performance. The 2nd International Research Symposium in Service Management. Yogyakarta, Indonesia.
Rahaman, S. M., A. Mohani & Rahman, M. M. (2016). Organizational Commitment: Do Employees’ Compensations and Benefits Matter? Journal of Business and Management, 18 (10), 135-141. https://doi.org/10.9790/487X-181005135141
Randall, D.M., Fedor, D.B., & Longenecker, C.O. (1990). The behavioral expression of organizational commitment. Journal of Vocational Behavior, 36 (2), 210-224. https://psycnet.apa.org/doi/10.1016/0001-8791(90)90028-Z
Salancik, G. R. (1977). Commitment and the control of organizational behavior and belief. In B. M. Staw & G. R. Salancik (Eds.). New directions in organizational behavior (pp. 1-54). Chicago: St. Clair-Press.
Shouksmith, G. (1994). Variables related to organizational commitment in health professionals. Psychological Reports, 74 (3), 707-711. https://doi.org/10.2466%2Fpr0.1994.74.3.707
Službeni glasnik RS br. 54/2010 (2010) Uredba o klasifikaciji delatnosti.
Smith, B. (2000). Managing generation X. USA Today Magazine, 129 (2666), 32-33.
Somers, M. J., & Birnbaum, A. D. (1998). Work-related commitment and job performance: it's also the nature of the performance that counts. Journal of Organizational Behavior, 19 (6), 621-634. https://psycnet.apa.org/doi/10.1002/(SICI)1099-1379(1998110)19:6%3C621::AID-JOB853%3E3.0.CO;2-B
Wainaina, L, Iravo, M. & Waititu, A. (2014). Effect of
employee participation in decision making on the organizational commitment amongst academic staff in the private and public Universities in Kenya. International Journal of Advanced Research in Management and Social Sciences, 3 (12), 131-142.
Zangaro, G. (2001). Organizational commitment: A concept analysis. Nursing Forum, 36 (2), 14-22. https://doi.org/10.1111/j.1744-6198.2001.tb01179.x
Zefeiti, S., & Mohamad, N. (2017). The Influence of Organizational Commitment on Omani Public Employees’ Work Performance. International Review of Management and Marketing, 7 (2), 151-160.
Zheng, W., Sharan, K.,& Wei, J. (2010). New Development of Organizational Commitment: A Critical Review (1960-2009). African Journal of Business Management, 4 (1), 12-20.
Zia ud, D., & Khan, M.R. (2010). The Impact of Organizational Commitment on Employees Job Performance: A Study of Oil and Gas Sector of Pakistan. Rochester: Social Science Research Network. https://dx.doi.org/10.2139/ssrn.1570544
Zin M. R. & Talet, N. A. (2016). The effects of participation in decision making on organizational commitment: some empirical evidences. 3rd Business & Management Conference, Lisbon.
Correspondence
Biljana Đorđević
University of Niš, Faculty of Economics Trg kralja Aleksandra Ujedinitelja 11, 18105 Niš, Serbia
E-mail: [email protected]

STRATEGIC MANAGEMENT, Vol. 25 (2020), No. 3, pp. 038-044
doi: 10.5937/StraMan2003038S
Received: February 13, 2020
Accepted: May 26, 2020
Structured literature review on organizational innovation in family business context
Shekhar Suman Indian Institute of Management (IIM) Raipur, India Satyasiba Das Indian Institute of Management (IIM) Raipur, India
Abstract Over the past decade, research on innovation in family firms has shown incremental growth. Several scholars and practitioners across the globe have shown interest in this field, which has also enriched the current body of literature. Despite the growth in studies related to innovation, research lacks a comprehensive review of the past and present achievements. In our study, we tried to fulfill this gap with a focus on family and firms' influence on organizational innovation. Based on a systematic review of 30 plus journal articles, it presents an integrative picture of family firm innovation. Major research avenues have been discussed based on which areas of future research can be determined. Keywords Family business, innovation, family factor, firm factor
Introduction The importance of innovation has already been realized in the business domain and in recent past, it has gained momentum in family businesses too. Innovation being the most important factor for economic prosperity and sustainable growth has become the need of the hour (Porter, 1979). The vision of continuity and transgenerational succession being vital characteristics of the family business has developed a need for innovation study in this domain (Chua, Chrisman, & Sharma, 1999). The majority of research compared family firms with their non-family counterparts, showing the former as less innovation than the latter. Authors show that family involvement and control in businesses are a few of the major factors to influence the innovation process. Duran, Kammerlander, Van Essen, & Zellweger (2016) shows that though family businesses invest less in innovation, they do it more efficiently. To understand the family firms' multi-staged
innovation activities better, it is necessary to study elements that differ from family firms to non-family firms (Duran et. al., 2016). Though many studies have been conducted, we still lack a comprehensive overview of innovation in family firms and this literature review is a try to fill this gap. We would review the effect of family and firm characteristics on innovation. The insights from this review can open doors to future research in the domain of family business innovation. Along with the researchers, practitioners can also benefit from this review by linking family business characteristics with innovation.
The article has been designed to cover the conceptual background of the topic, the methodology for selection of papers, the literature review on family factors and the firms' characteristics and their influence on the organizational innovation process, and conclusion that covers findings, limitations, and scope for future research. The article also presents a tabular form of journals of selected papers for this review.

Suman et al. Structured literature review on organizational innovation in family business context 39
STRATEGIC MANAGEMENT, Vol. 25 (2020), No. 3, pp. 038-044
1. Conceptual background
1.1. Innovation process The innovation process has been defined as the process of generating and adopting new or improved products, processes, policies, structures or administrative systems (Damanpour, 1991). De Massis, Frattini, & Lichtenthaler (2013) have explained the innovation process in three steps of input, activity, and output. The innovation input stage is concerned with investment in Research and Development (R&D) and in employees related to innovation. The innovation activity stage covers the aspects of resource allocation, organizational culture, learning process, and knowledge management. In the last stage, innovation output describes the radical or incremental innovation in product, process, administration or business model. Moreover, Lumpkin, Steier, & Wright (2011) write about contextual parameters of firms such as geographical location, size, family ownership, company structure, industry size, and governance. that can affect the firm's innovativeness.
1.2 Family business and innovation The role of the family system in a family business is the most important parameter to study any phenomena in the setting of the family business (Zachary, 2011). Family businesses have been looked upon as social systems that couple business families with the business i.e. the ability of the family to influence business premises via communicating their decisions that would affect the future of the firm; also known as Luhmann's new systems theory (Luhmann, 1995). Few other concepts like socioemotional wealth and familiness form a resource-based platform to study innovation in the family business. Popescu & Andrei (2011) has analyzed the impact of Common Agriculture Policy on promoting family farms in Romanian agrarian economy. Though the family farms would not succeed in providing good economic performance, but it can satisfy the consumption needs. The paper shows the importance of strong relationship among community members and socioemotional wealth over financial gain. Patel & Fiet (2011) have explained long-term orientation, tacit knowledge, strong family bonds and social network as few factors that influence family firm's ability to innovate. Even startups showed great prospects for growth and value creation to their customers through implementation of innovative digital
platforms (Ruggieri, Savastano, Scalingi, Bala, & D’Ascenzo, 2018). Our approach in this article is to study the holistic approach of ability, willingness and control of family over businesses and the approach towards innovation. Chrisman, Chua, De Massis, Frattini, & Wright (2015) has studied the importance of economic and non-economic goals across family firms over innovativeness and found that it depends upon various factors such as governance structure, resources, and idiosyncratic situational aspects. However, the family businesses that are involved in multi-levels of innovation enjoy sustainable growth and profit across generations (Sharma & Salvato, 2011).
2. Methodology for paper selection The goal of our systematic review is to identify ongoing themes in the family business innovation domain and to find out the significant research gaps. For a systematic review of the literature, the first step is to develop criteria for selecting research papers and articles. The next step of the literature review is keyword selection. Keyword searches were made over numerous databases such as EBSCO, Google Scholar, Pro-Quest, Science Direct, and Emerald. The timeframe of the search was majorly from 2011 to 2017 with few old seminal works. Keywords, as Family Firms, Innovation, Innovation Process, Family System were used for refining and narrowing the search criteria for classifying papers. The early databank was further refined to identify research papers that match the research questions and aims. Once the research papers and articles were identified, the references of the papers were used for identifying additional papers, an approach termed as 'snowball sampling'. Thirty-two articles/research papers were recognized based on predefined primary keywords using various search engines and databases combined. Table 1 shows the categorization of the journals based on the above classification and ranked by the number of papers used in this review.
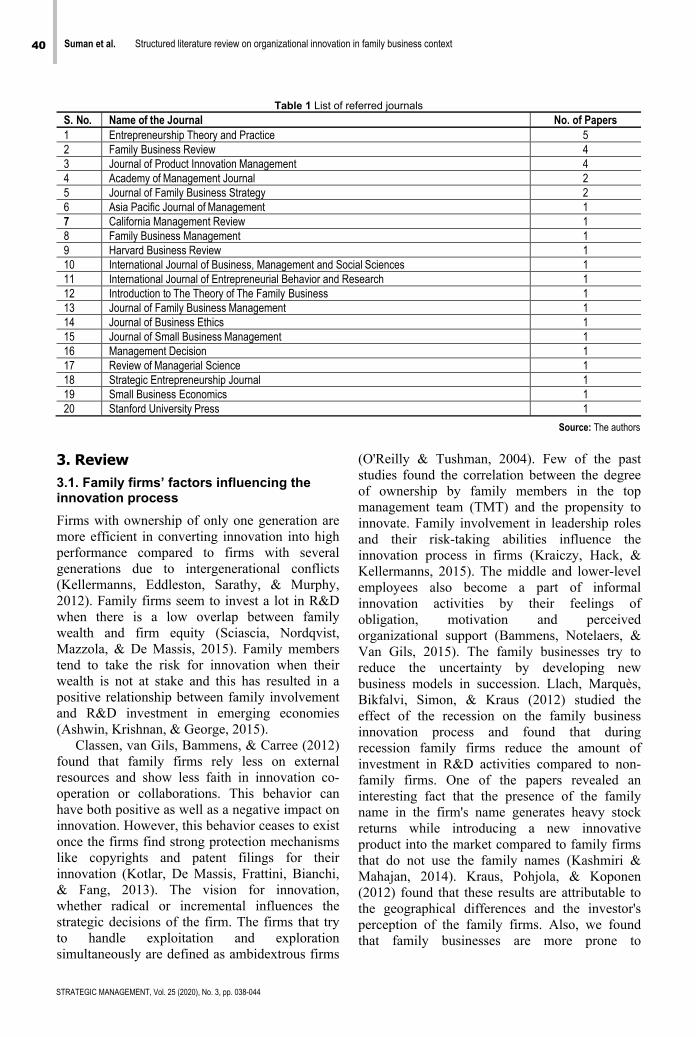
40 Suman et al. Structured literature review on organizational innovation in family business context
STRATEGIC MANAGEMENT, Vol. 25 (2020), No. 3, pp. 038-044
Table 1 List of referred journals
S. No. Name of the Journal No. of Papers 1 Entrepreneurship Theory and Practice 5 2 Family Business Review 4 3 Journal of Product Innovation Management 4 4 Academy of Management Journal 2 5 Journal of Family Business Strategy 2 6 Asia Pacific Journal of Management 1 7 California Management Review 1 8 Family Business Management 1 9 Harvard Business Review 1 10 International Journal of Business, Management and Social Sciences 1 11 International Journal of Entrepreneurial Behavior and Research 1 12 Introduction to The Theory of The Family Business 1 13 Journal of Family Business Management 1 14 Journal of Business Ethics 1 15 Journal of Small Business Management 1 16 Management Decision 1 17 Review of Managerial Science 1 18 Strategic Entrepreneurship Journal 1 19 Small Business Economics 1 20 Stanford University Press 1
Source: The authors
3. Review 3.1. Family firms’ factors influencing the innovation process Firms with ownership of only one generation are more efficient in converting innovation into high performance compared to firms with several generations due to intergenerational conflicts (Kellermanns, Eddleston, Sarathy, & Murphy, 2012). Family firms seem to invest a lot in R&D when there is a low overlap between family wealth and firm equity (Sciascia, Nordqvist, Mazzola, & De Massis, 2015). Family members tend to take the risk for innovation when their wealth is not at stake and this has resulted in a positive relationship between family involvement and R&D investment in emerging economies (Ashwin, Krishnan, & George, 2015).
Classen, van Gils, Bammens, & Carree (2012) found that family firms rely less on external resources and show less faith in innovation co-operation or collaborations. This behavior can have both positive as well as a negative impact on innovation. However, this behavior ceases to exist once the firms find strong protection mechanisms like copyrights and patent filings for their innovation (Kotlar, De Massis, Frattini, Bianchi, & Fang, 2013). The vision for innovation, whether radical or incremental influences the strategic decisions of the firm. The firms that try to handle exploitation and exploration simultaneously are defined as ambidextrous firms
(O'Reilly & Tushman, 2004). Few of the past studies found the correlation between the degree of ownership by family members in the top management team (TMT) and the propensity to innovate. Family involvement in leadership roles and their risk-taking abilities influence the innovation process in firms (Kraiczy, Hack, & Kellermanns, 2015). The middle and lower-level employees also become a part of informal innovation activities by their feelings of obligation, motivation and perceived organizational support (Bammens, Notelaers, & Van Gils, 2015). The family businesses try to reduce the uncertainty by developing new business models in succession. Llach, Marquès, Bikfalvi, Simon, & Kraus (2012) studied the effect of the recession on the family business innovation process and found that during recession family firms reduce the amount of investment in R&D activities compared to non-family firms. One of the papers revealed an interesting fact that the presence of the family name in the firm's name generates heavy stock returns while introducing a new innovative product into the market compared to family firms that do not use the family names (Kashmiri & Mahajan, 2014). Kraus, Pohjola, & Koponen (2012) found that these results are attributable to the geographical differences and the investor's perception of the family firms. Also, we found that family businesses are more prone to

Suman et al. Structured literature review on organizational innovation in family business context 41
STRATEGIC MANAGEMENT, Vol. 25 (2020), No. 3, pp. 038-044
incremental innovation, but it might be the consequences of the industry in which family firm operates and also the demand of the customers (Grundström, Öberg, & öhrwall Rönnbäck, 2012; Hiebl, 2015) 3.2. Family factors influencing the innovation process If the families have long-term orientation and ambition to forward entrepreneurial acumen through generations, then the firms will invest in innovation processes such as in R&D activities and hire innovative professionals. regardless of their success in product development and launch (Cassia, De Massis, & Pizzurno, 2011; 2012). The paper also reveals that the family's intention to protect the longevity of the business sometime might result in risk aversion and thus low investment in innovation activities. On the other hand, Litz & Kleysen (2001) found that incumbent family members in the businesses promote intergenerational innovation by permitting their successors to experiment on innovation and that results in the formation of relevant competencies in the succeeding generations. The impact of family's control over innovation activities reduces agency costs and support for better strategic moves but at times unquestioned and complete authority of the family might lead to lack of personnel with sufficient
qualification for innovational activities and biases in decision making (De Massis, Kotlar, Frattini, Chrisman, & Nordqvist, 2015). This leads to nepotism where all the crucial employee positions are filled by family members irrespective of their qualification and that results in a demotivated workforce (Miller, Wright, Le Breton-Miller, & Scholes, 2015). Shared family visions and goals in a family firm have a positive impact on innovation (Craig, Dibrell, & Garrett, 2014), i.e. family members that share the same values have a high level of communication and cohesiveness among them and that results in successful organizational innovation activities (Cassia De Massis, & Pizzurno, 2011). Whereas family conflicts show a negative impact on the organizational innovation process where family members are not in a condition to understand, recognize or exploit each other's knowledge related to innovation (Chirico & Salvato, 2016). The family values and vision lead to competitive advantage for the firms and that depends on the degree of influence family has on business through the implementation of business decisions and also the business's willingness to accept them (Frank, Kessler, Rusch, Suess-Reyes, & Weismeier-Sammer, 2017).
Figure 1 Conceptual framework of family’s and firm’s interaction with organizational innovation Source: Developed by the authors

42 Suman et al. Structured literature review on organizational innovation in family business context
STRATEGIC MANAGEMENT, Vol. 25 (2020), No. 3, pp. 038-044
Conclusion Drawing on to the perspective of new system theory, this literature review presents a holistic overview of the family business and innovation process. We tried to contribute by studying both the family and firms' factors and their influence on innovation. The interaction found from the existing literature has been shown in Figure 1. Through several articles discussed we found that familiness in businesses has both advantages and disadvantages for the adoption and implementation of the innovation process. Based on our personal observation, research literature on family business is very complex and that limits its scope for practical implications. Our article contributed to the family business research domain by summarizing the structures and findings of previous literature that are easy to understand and applicable in the practical sense. Family managers can benefit from the knowledge of family and firms' factors and their influence over the innovation process. Like other articles, this literature also has a few limitations. The innovation process discussed here does not clearly differentiate between innovation creation and adoption along with other innovation processes. The review also fails to include the perspective of family firm entrepreneurship in the innovation system.
The review has opened many areas for future research. It would be interesting to study factors such as skills of R&D personnel, human resources, capabilities, knowledge and their influence over the innovation process. Research on a different kind of innovation such as process, product, and administration. can be encouraged. Scant research is observed in family dynamics and how it interacts with innovation. The presence of spouses, siblings and parents in the family and their influence over organizational innovation by their direct or indirect involvement in business can be a good area for future research. The last, but one of the most interesting aspects that can be attended to in future research is the effect of gender on innovation in family firms.SM
References Ahrens, J. P., Landmann, A., & Woywode, M. (2015).
Gender preferences in the CEO successions of family firms: Family characteristics and human capital of the successor. Journal of Family Business Strategy, 6(2), 86–103. https://doi.org/10.1016/j.jfbs.2015.02.002
Ashwin, A. S., Krishnan, R. T., & George, R. (2015). Family firms in India: family involvement, innovation and agency and stewardship behaviors. Asia Pacific Journal of Management, 32(4), 869–900. https://doi.org/10.1007/s10490-015-9440-1
Bammens, Y., Notelaers, G., & Van Gils, A. (2015). Implications of Family Business Employment for Employees’ Innovative Work Involvement. Family Business Review, 28(2), 123–144. https://doi.org/10.1177/0894486513520615
Cassia, L., De Massis, A., & Pizzurno, E. (2011). An exploratory investigation on NPD in Small Family Businesses from Northern Italy. International Journal of Business, Management and Social Sciences, 2(2), 1–14.
Cassia, L., De Massis, A., & Pizzurno, E. (2012). Strategic innovation and new product development in family firms: An empirically grounded theoretical framework. International Journal of Entrepreneurial Behaviour and Research, 18(2), 198–232. https://doi.org/10.1108/13552551211204229
Chirico, F., & Salvato, C. (2016). Knowledge Internalization and Product Development in Family Firms: When Relational and Affective Factors Matter. Entrepreneurship: Theory and Practice, 40(1), 201–229. https://doi.org/10.1111/etap.12114
Chrisman, J. J., Chua, J. H., De Massis, A., Frattini, F., & Wright, M. (2015). The ability and willingness paradox in family firm innovation. Journal of Product Innovation Management, 32(3), 310–318. https://doi.org/10.1111/jpim.12207
Chua, J. H., Chrisman, J. J., & Sharma, P. (1999). Defining the Family Business by Behavior. Entrepreneurship Theory and Practice, 23(4), 19–39. https://doi.org/10.1177/104225879902300402
Classen, N., van Gils, A., Bammens, Y., & Carree, M. (2012). The Search Breadth of Family SMEs. Journal of Small Business Management, 50(2), 191–215. https://doi.org/10.1111/j.1540-627X.2012.00350.x
Craig, J. B., Dibrell, C., & Garrett, R. (2014). Examining relationships among family influence, family culture, flexible planning systems, innovativeness and firm performance. Journal of Family Business Strategy, 5(3), 229–238. https://doi.org/10.1016/j.jfbs.2013.09.002
Damanpour, F. (1991). Organizational Innovation : A Meta-Analysis of Effects of Determinants and Moderators Author ( s ): Fariborz Damanpour Source : The Academy of Management Journal , Vol . 34 , No . 3 ( Sep ., 1991 ), pp . 555-590 Published by : Academy of Management Stable. Academy of Management, 34(3), 555–590. https://doi.org/10.5465/256406
de Massis, A., Frattini, F., & Lichtenthaler, U. (2013). Research on Technological Innovation in Family Firms: Present Debates and Future Directions. Family Business Review, 26(1), 10–31. https://doi.org/10.1177/0894486512466258
De Massis, A., Kotlar, J., Frattini, F., Chrisman, J. J., & Nordqvist, M. (2015). Family Governance at Work: Organizing for New Product Development in Family SMEs. Family Business Review, 29(2), 189–213. https://doi.org/10.1177/0894486515622722
Suman et al. Structured literature review on organizational innovation in family business context 43
STRATEGIC MANAGEMENT, Vol. 25 (2020), No. 3, pp. 038-044
Duran, P., Kammerlander, N., Van Essen, M., & Zellweger, T. (2016). Doing more with less: Innovation input and output in family firms. Academy of Management Journal, 59(4), 1224–1264. https://doi.org/10.5465/amj.2014.0424
Frank, H., Kessler, A., Rusch, T., Suess-Reyes, J., & Weismeier-Sammer, D. (2017). Capturing the Familiness of Family Businesses: Development of the Family Influence Familiness Scale (FIFS). Entrepreneurship: Theory and Practice, 41(5), 709–742. https://doi.org/10.1111/etap.12229
Grundström, C., Öberg, C., & öhrwall Rönnbäck, A. (2012). Family-owned manufacturing SMEs and innovativeness: A comparison between within-family successions and external takeovers. Journal of Family Business Strategy, 3(3), 162–173. https://doi.org/10.1016/j.jfbs.2012.07.001
Hiebl, M. R. W. (2015). Family involvement and organizational ambidexterity in later-generation family businesses: A framework for further investigation. Management Decision, 53(5), 1061–1082. https://doi.org/10.1108/MD-04-2014-0191
Kashmiri, S., & Mahajan, V. (2014). A Rose by Any Other Name: Are Family Firms Named After Their Founding Families Rewarded More for Their New Product Introductions? Journal of Business Ethics, 124(1), 81–99. https://doi.org/10.1007/s10551-013-1861-5
Kellermanns, F. W., Eddleston, K. A., Sarathy, R., & Murphy, F. (2012). Innovativeness in family firms: A family influence perspective. Small Business Economics, 38(1), 85–101. https://doi.org/10.1007/s11187-010-9268-5
Kotlar, J., De Massis, A., Frattini, F., Bianchi, M., & Fang, H. (2013). Technology acquisition in family and nonfamily firms: A longitudinal analysis of spanish manufacturing firms. Journal of Product Innovation Management, 30(6), 1073–1088. https://doi.org/10.1111/jpim.12046
Kraiczy, N. D., Hack, A., & Kellermanns, F. W. (2015). What makes a family firm innovative? CEO risk-taking propensity and the organizational context of family firms. Journal of Product Innovation Management, 32(3), 334–348. https://doi.org/10.1111/jpim.12203
Kraus, S., Pohjola, M., & Koponen, A. (2012). Innovation in family firms: An empirical analysis linking organizational and managerial innovation to corporate success. Review of Managerial Science, 6(3), 265–286. https://doi.org/10.1007/s11846-011-0065-6
Litz, R. A., & Kleysen, R. F. (2001). Your Old Men Shall Dream Dreams, Your Young Men Shall See Visions: Toward a Theory of Family Firm Innovation with Help from the Brubeck Family. Family Business Review, 14(4), 335–351. https://doi.org/10.1111/j.1741-6248.2001.00335.x
Llach, J., Marquès, P., Bikfalvi, A., Simon, A., & Kraus, S. (2012). The innovativeness of family firms through the economic cycle. Journal of Family Business Management, 2(2), 96–109. https://doi.org/10.1108/20436231211261853
Luhmann, N. (1995). Social System. Series on Contemporary China. https://doi.org/10.1142/9789813206700_0009
Lumpkin, G. T., Steier, L., & Wright, M. (2011). in Family Business Business and Strategic. Strategic Entrepreneurship Journal, 306, 285–306. https://doi.org/10.1002/sej
Miller, D., Wright, M., Le Breton-Miller, I., & Scholes, L. (2015). Resources and innovation in family businesses: The Janus-face of socioemotional preferences. California Management Review, 58(1), 20–40. https://doi.org/10.1525/cmr.2015.58.1.20
Patel, P. C., & Fiet, J. O. (2011). Knowledge combination and the potential advantages of family firms in searching for opportunities. Entrepreneurship: Theory and Practice, 35(6), 1179–1197. https://doi.org/10.1111/j.1540-6520.2011.00497.x
Popescu, G., & Andrei, J. (2011). From industrial holdings to subsistence farms in the Romanian agriculture. Analyzing the subsistence components of the CAP. Agricultural Economics, 57(11), 555–564. https://doi.org/10.17221/72/2010-agricecon
Porter, M. E. (1979). How competitive forces shape strategy. Harvard Business Review, 137–135. https://doi.org/10.1097/00006534-199804050-00042
Ruggieri, R., Savastano, M., Scalingi, A., Bala, D., & D’Ascenzo, F. (2018). The impact of Digital Platforms on Business Models: An empirical investigation on innovative start-ups. Management and Marketing, 13(4), 1210–1225. https://doi.org/10.2478/mmcks-2018-0032
Sciascia, S., Nordqvist, M., Mazzola, P., & De Massis, A. (2015). Family ownership and R&D intensity in small- and medium-sized firms. Journal of Product Innovation Management, 32(3), 349–360. https://doi.org/10.1111/jpim.12204
Sharma, P., & Salvato, C. (2011). Commentary: Exploiting and exploring new opportunities over life cycle stages of family firms. Entrepreneurship: Theory and Practice, 35(6), 1199–1205. https://doi.org/10.1111/j.1540-6520.2011.00498.x
Zachary, R. K. (2011). The importance of the family system in family business. Journal of Family Business Management, 1(1), 26–36. https://doi.org/10.1108/20436231111122263

44 Suman et al. Structured literature review on organizational innovation in family business context
STRATEGIC MANAGEMENT, Vol. 25 (2020), No. 3, pp. 038-044
Correspondence
Shekhar Suman
PhD Scholar, Strategic Management Indian institute of Management (IIM) Raipur Atal Nagar (Naya Raipur), P. O. - Kurru (Abhanpur) Raipur, PIN - 493 661, State - Chhattisgarh, India Ph: +91 7024780949
E-mail:[email protected]

STRATEGIC MANAGEMENT, Vol. 25 (2020), No. 3, pp. 045-053
doi: 10.5937/StraMan2003045S
Received: February 11, 2020
Accepted: May 26, 2020
Strategic management consulting in Hungary
Roland Schmuck University of Pécs, Faculty of Business and Economics, Pécs, Hungary
Abstract Several Hungarian SMEs are facing problems using management methodologies. The goal of the research is to analyze the Hungarian management consulting market based on two previous Hungarian surveys. Strategic management consulting is one of the most important management consulting topics. The purpose of this research is to understand the Hungarian strategic management consulting market better. Two surveys are compared with each other and the size of the Hungarian strategic consulting market is calculated based on these secondary data. Trends and problems in the industry are also described briefly. The results of this research contribute to better understanding of the developments happening in this industry. Keywords strategy, management, consulting, Hungary
Introduction Most of Hungarian businesses are small and medium enterprises which were founded after the change of the regime in Hungary in 1989. The problem is that many of these companies grew in the last decades solely by the professional knowledge and personal connections of their founder and owner lacking the appropriate knowledge of management sciences. There is an urgent need for these companies to develop their management skills and use up-to-date strategic management methodologies to be able to develop further and increase their competitiveness. The use of strategic management consulting can help these companies to achieve their goals.
The purpose of this paper is to describe the Hungarian strategic management consulting market. Several Eastern European countries are in a similar economic situation, where small and medium enterprises are facing similar problems as in Hungary. This research gives an opportunity to better understand one of these markets: the Hungarian market.
The object of the research is to analyze the Hungarian strategic management consulting
industry after a brief introduction of strategic management consulting as a service. There is not much detailed information available on this market. The research estimates the market size and shows the market trends of the Hungarian strategic management consulting sector. The research questions are the following:
1. What is the market size of the Hungarian strategic management consulting market?
2. What are the main trends in the Hungarian strategic management consulting market?
The article shows up-to-date data by a comparison of previous surveys and gives an own estimation of the size of the Hungarian strategic management consulting market.
Tasks of the research is to describe strategic management and differentiate it from strategic planning. This literature review consists of publications in strategic management. The paper shows what strategic consultants are doing and which are the main problems they are facing. The main part of the research is to reanalyze previously published data. Two third-party researches are shown and analyzed according to strategic management consulting.

46 Roland Schmuck Strategic management consulting in Hungary
STRATEGIC MANAGEMENT, Vol. 25 (2020), No. 3, pp. 045-053
1. The importance of strategic management Traditional method of strategy development is strategic planning which is the planning of company goals under static or slowly changing corporate environmental conditions (Barakonyi, 1999). Strategy can be divided into functional strategies or geographical strategies (Bartek-Lesi et al., 2007). Strategic priorities are important issues (Chivu, 2019). There is a need for strategic planning to access or develop markets (Angeloska-Dichovska & Mirchevska, 2017). The external environment changes are happening so rapidly nowadays that the changes in the environment have to be taken into consideration as well. In modern, dynamic, environments, strategic management is becoming more vital for firms than ever before (Bao, 2015). This evolved strategic planning into strategic management (Barakonyi, 2000). Strategic management is an art and science of formulating, implementing and evaluating cross-functional decisions that enable an organization to achieve its objectives. Because of this, strategic management integrates management and other functional areas of the company (David & David, 2015). Strategic managers have to lead, communicate, encourage and influence to influence the expected outcomes (Rosenzweig, 2013).
Knowledge economy is reshaping businesses (Hadad, 2018, Bratianu, Prelipcean, & Bejinaru, 2020). A great strategy can be a good start for a business, but it does not mean that this strategy is easy to follow and the company will be competitive just by using appropriate planning techniques, such as the Interpretative Structural Modeling (Susilo, Ciptomulyono, Putra, Ahmadi, & Suharyo, 2019). Implementing is a very important issue but unfortunately most companies struggle with implementation (Neilson, Martin, Powers, 2008). Strategic management emphasizes long-term performance over short-term. There is a need of sustainable investments strategy (Popescu, Andrei, Nica, & Panait, 2019). Only 13 companies have survived so far from the original Forbes 100 companies listed in 1917. To be able to succeed in long-term companies have to adopt to new and changing market trends (Wheelen, Hunger, Hoffman, & Bamford, 2017) and satisfy critical success factors (Jelača & Boljević, 2016).
Most of the companies are unable to implement their strategies. The reasons can be the following:
• Awareness: 95% of the typical workforce does not understand the strategy.
• Financial resources: 60% of organizations do not link budgets to strategy.
• Governance: 44% of board directors cannot identify the key drivers of value in the companies they govern.
• Executive agenda: 85% of executive teams spend less than one hour per month discussing strategy.
• Incentives: 70% of organizations do not link middle management incentives to strategy.
• People: 55% of human resources (HR) organizations either interpret strategy or deal only with operational priorities (Renaissance & Business Intelligence, 1996).
A survey involving 354 company executives shows that the leaders of companies consider one of the most important business challenge is how to implement their strategy. Leaders noticed this issue and many of them started initiatives to better formalize and implement the company strategy (Provice, 2017). A vast majority, 70% of companies with formalized strategic implementation processes, have better performance than companies not using these management practices (Provice, 2017). An accurate perception of the environment is crucial for implementing strategies (Molina, del Pino, & Rodríguez, 2004, Pham, Phan, Tučková, Vo, & Nguyen, 2018). The key is to make sure companies can effectively execute the right things. As the proverb says: “The main thing is to keep the main thing the main thing.” (Covey, Merrill, & Merrill, 1994).
Strategic planners are those people in an organization who are specialized on ensuring the organization to develop and implement an appropriate strategy. Strategy is developed in consensus of the strategic planners and the management of the organization. After the strategic plan is ready it has to be widely communicated within the organization. (Arnold & Bernstein, 2006). There is a need to plan and implement a strategic communication to achieve the company’s mission and overall strategy (Mitrović, 2019). If the organization emphasizes the strategy consequently in its decisions the strategy will most probably be implemented. (Arnold & Bernstein, 2006).
2. The role of strategic management consulting The strategic orientation of the management of companies in accordance with the modern global trends is inevitable (Milićević, Backović,

Roland Schmuck Strategic management consulting in Hungary 47
STRATEGIC MANAGEMENT, Vol. 25 (2020), No. 3, pp. 045-053
Sofronijević, 2015). The “product” of consultant companies is the intellectual property of their consultants which is actually the accumulation of special skills and knowledge. Consulting is a service where consultants stimulate their clients to make changes. The future success is important, but the previous knowledge of consultants may give some “guarantee” on good ideas and proposals. Consultants should be ready to handle unexpected situations in strong cooperation with the organization. Consultant is a helper hand for the organization (Biswas & Twitchell, 2006).
Consultants who concern themselves with issues like basic goals or mission, business policy and strategy, planning, structuring and control of an organization are strategic or general management consultants. They are different than those consultants who consult in a specialized functional area like finance or marketing (Kubr, 2002). Organizations are facing potential hazardous events (Paunescu, Popescu, Blid, 2018), such as the current COVID-19 situation. Companies with deteriorating results, in crisis or near crisis may need the help of such consultants.
In these cases the top management may be out of ideas where the company is heading and what to do. In other cases the management may identify the goals well but they are unable to implement the strategies leading to them (Kubr, 2002). Furthermore, in a turbulent environment the strategic planning process is needed to be supplemented with a dynamic strategic issue management system (Perrott, 2011).
Strategic management consulting is part of management consulting, so the features of management consulting applies to this type of consulting as well: Management consulting should be done on
base of a contract. Consultants are independent of the
company which receives the consulting activity.
Consultants should not decide on their ideas and proposals.
Consultants should only cooperate in implementing their proposals if they are asked to do that (Hoványi 1997).
Table 1 Goal and functions of strategic planning Goal and function of strategic planning Description Proposal Informing the top management of the proposed strategic steps
with the help of analysis. Determinate course line Facilitate competitive short-, middle-, or long-term strategies with
the help of company ideas and analysis. It can be implemented through three methods: top-down, down-top or hybrid of the two.
Motivational paradigm shift Raising provocative business ideas and motivating managers to differ from ordinary strategies and tactics.
Analyze strategic business information Analyzing information to help the work of the top management. Encouragement and motivation Persuasion of the affected groups within the organization and
motivate them to use business ideas. Provide intellectual property to business decisions Creating of databases and make analysis to support
management decisions in mainly those cases which are important by a strategic view (e.g. company mergers and acquisitions).
“Think tank” or inexhaustible storehouse of ideas Creating of analysis and definition of statements to solve business problems.
Source: Arnold & Benstein 2006, p. 94.
Any consultant service includes changes in the organization – let it be strategic plan or business process reengineering (Maira, 2006). This causes that consultants need to use change management techniques. There is usually no guarantee that the proposals of the consultant will work. However, Biech suggests that consultants should offer 100% money-back guarantee for the work done (Biech, 2006).
Strategic consultants concentrate on the five main subjects of the strategic consulting process as shown in Figure 1.
Any consultant service includes changes in the organization – regardless of whether it is strategic plan or business process reengineering (Maira, 2006). Consultants need to apply change management methods, but even with proper usage of these methods there can be no guarantee that the proposals of the consultant will work. Biech suggests that consultants should offer 100% money-back guarantee for the work done (Biech, 2006). This is more risky for the consultant but reduces the risks of the customer.

48 Roland Schmuck Strategic management consulting in Hungary
STRATEGIC MANAGEMENT, Vol. 25 (2020), No. 3, pp. 045-053
Strategic management consulting concentrates on five main subjects that is illustrated in Figure 1.
Resources Results Systems Goals
Management Figure 1 Five main issues of strategic management consulting
Source: Hoványi 1997, p. 68.
Ordinary company resources are capital,
technology, human resources and natural resources. Using a modern view these resources can be extended by six further resources: (1) information, (2) innovation potential, (3) coordination, (4) intangible assets, (5) fit in the vertical value chain and (6) time (Hoványi, 1997).
Systems stand for the functional parts and their cooperation inside the company. Companies are built up of smaller subsystems which should be synchronized with each other.
Consultants should help to develop the company in measurable results. The quantified results can be considered the most important which may be included in the company balance sheet and income statement. Key Performance Indicators (KPIs) are monitoring the success and in modern companies they also proactively drive it (Schrage, 2019). Results are directly connected to the goals. Managers should have specified goals for the whole company and for the company subsystems as well. Goals may affect the environment of the company as well: some organizations have social goals to achieve next to their internal goals (Hoványi, 1997). Digital orientation undoubtedly became part of modern strategic management goals (Fosić, Trusić, & Šebalj, 2017). The digital transformation needs proactive leadership (Kontić & Vidicki, 2018).
Strategic consultants should help the company to develop competitive advantages. This can be based on company resources, systems, goals, results or leadership. The realized competitive
advantage always depends on the features of the company and the environment, the strong and weak points of the competitors. Competitive advantage should be built in permanent (sub)systems. The developing costs of the skills causing competitive advantages should be low compared to the positive outcome of these advantage (Hoványi, 1997).
3. The strategic management consulting market in Hungary Most of the information available is about the whole Hungarian consulting market. There is a lack of detailed information on the strategic management consulting market. To describe the state of the strategic management consulting in Hungary in this section, I compare two surveys (Poór 2014, 2015) and show the available information on the market size which makes it possible to estimate the size of the strategic management consulting market in Hungary.
The total market size of the management consulting market can only be estimated. An estimation based on the members of the Hungarian Association of the Management Consultants (called VTMSZ) is that the total consulting market is about 50.000.000.000 Hungarian Forints (which is about 160 million Euros calculated by the average 316.5 HUF/Euro rate in 2015). (MNB, 2015) From this value approximately 23.500.000.000 Hungarian Forints (about 74.2 million Euros) is the market of management consulting (Vicze, 2014).

Roland Schmuck Strategic management consulting in Hungary 49
STRATEGIC MANAGEMENT, Vol. 25 (2020), No. 3, pp. 045-053
Most of the VTMSZ member companies are small, with less than 10 employees. VTMSZ member companies cope with minimum three consulting topics (Vicze, 2014). Consulting companies coping exclusively with strategic management problems are very uncommon in Hungary.
In the following part two surveys are shown with the goal to reanalyze their data and show trends over time. The survey of Szent István University and the Consulting Roundtable shows the occurrence of different types of business consulting. There were 150 questionnaires answered by Hungarian companies in this survey. Each company could give up to three answers regarding its activities. The most common business
consulting activities are operation and organization (56.67%), project management (50%) and strategic management consulting (42%) (Poór, 2014). This survey indicates that the most common operations in Hungary after the financial crisis was to start new activities and the second most common activity was to redefine the strategy of the company (Poór, 2014). Participating companies in the survey were asked about which consultancy field is increasing or decreasing by their own estimations. The use of the consulting services show that strategic management and HR consulting activities declined mostly. This probably indicates that the market of these consulting services became saturated.
Figure 2 Most common business consulting activities in Hungary in 2014
Source: Poór 2014, p 10.
A similar survey was done in 2015. 130
companies participated in this survey. Hungarian companies could give up to three answers to the most common consulting activities used. The report of the research only gives relative numbers to each other which is not directly comparable to
the 2014 numbers. In this survey, the most frequent consulting services in Hungary are operations (20%), strategy (15%) and project management (15%). The order is similar to the survey of 2014 (Poór, 2015).
14%2.37%
4%4.67%
8%10.67%
14%20%
21.33%22.67%
42%50%
56.67%
0% 10% 20% 30% 40% 50% 60%
OthersCrisis Management
OutsourcingTeamcoaching
Knowledge ManagementCoaching
Systems development and integrationIT
Change ManagementHR
StrategyProject management
Operation and organization

50 Roland Schmuck Strategic management consulting in Hungary
STRATEGIC MANAGEMENT, Vol. 25 (2020), No. 3, pp. 045-053
Figure 3 Most common business consulting activities in Hungary in 2015
Source: Poór 2015, p. 8.
Based on the survey, strategic consulting
includes development of strategic planning, mergers, acquisitions, sales and marketing, so overall strategic management.
To answer the first research question we need to compare the 2014 and 2015 surveys. The surveys are not directly comparable, so I recalculated the 2014 survey results to relative values such as the data available from the 2015
survey. The results confirm the prediction of the 2014 survey: strategic management consulting is decreasing. It decreased about one percentage point from about 16% to 15%. The leading consultancy topics, such as operations consulting and project consulting also decreased. HR, change management and knowledge management increased the most.
Figure 4 Most common business consulting activities in 2014-2015 in Hungary
Source: Own calculations based on Poór, 2014, 2015
Based on the Hungarian market size estimation
by Vicze (2014), we can calculate the size of strategic management consulting market in Hungary. By calculating with 15% market share of
7%
1%
2%
5%
6%
7%
11%
11%
15%
15%
20%
0% 5% 10% 15% 20% 25%
Others
Crisis Management
Outsourcing
Systems development and integration
Knowledge Management
IT
HR
Change Management
Project management
Strategy
Operation and organization
0% 5% 10% 15% 20% 25%
Crisis Management
Outsourcing
Knowledge Management
Systems development and integration
IT
Change Management
HR
Strategy
Project management
Operation and organization
2015 2014

Roland Schmuck Strategic management consulting in Hungary 51
STRATEGIC MANAGEMENT, Vol. 25 (2020), No. 3, pp. 045-053
the total market, the size of the strategic consulting market is 7.500.000.000 Hungarian Forints (which is about 23.7 million Euros). This gives answer to the second research question.
Strategic management consulting is not only very popular among business consulting but it is offered by many consulting companies in Hungary as well, including multinational companies. The best known traditional consulting companies in Hungary are Synergon, Ernst & Young, KPMG, Deloitte (Mártonffy, 2009). There are small private companies and consulting entrepreneurs as well on the market. Gábor Kornai, the owner of AAM Consulting states that the hourly fees of consulting can be very different. Strategic management consulting has the highest hourly fees which can be around 300 Euros / hour (Mártonffy, 2009). Subsidiaries of the “big four” consultant companies can use even higher hourly fees. This allows the smaller-sized consulting companies and individual consultant entrepreneurs to gain market share. As there is no real guarantee on the proposals given by consultants, trust and previous experience is a major issue.
Conclusion The research had a goal to estimate the size of the Hungarian strategic management consulting market and show which are the main trends in this consulting sector.
There is a wide variety of companies offering management consulting in Hungary: entrepreneurs, small companies and the “big four” consulting companies are present on the market.
Most Hungarian consulting companies are offering several different services, typically at least in three different topics. Strategic management consulting is a relevant topic in management consulting services as the surveys of 2014-2015 indicate. Trends show that the market share of strategic management consulting decreased lightly from 15% to 14% in one year to 2015. This does not affect the fact that strategic management consulting still remains one of the leading consultant topics. In 2015 it is the second most used consulting service in Hungary after operation and organization consulting. The market size of strategic management consulting was estimated in this research. It is approximately 23.7 million Euros (equaling 7.500.000.000 HUF) in Hungary in 2015.
Researches show that strategic management consulting is one of the best paying consultant roles with the highest fees. The market share of big
multinational consulting companies is high, but the high fees create market demand for smaller sized consulting companies and individual consultants offering cheaper prices. As there is no guarantee for the success of the consulting services trust and previous experience is an important decision factor for customers.
In the next few years we can expect changes in the focus of the business consulting in Hungary. While several topics are expected to remain important, such as the operation and organization consulting and the project management consulting, some other consulting fields are expected to gain market share. With the wider spread of digitalization among companies the role of IT consulting is expected to increase. The use of new IT-based business models highlights the importance of strategic management consulting. The COVID-19 pandemic can bring the strengthening of crisis management consulting. Local production may become preferable increasing the consulting needs in outsourcing or insourcing topics. However, the increasing demand in several consulting topics can be easily overwritten by a worldwide crisis situation. The whole business consulting market may face a crisis situation because of the COVID-19 pandemic, similar to the situation that happened after the financial crisis began in 2008.SM
References Angeloska-Dichovska, M., & Mirchevska, T. P. (2017).
Challenges of the Company in the New Economy and Development of E-business Strategy. Strategic Management: International Journal of Strategic Management and Decision Systems in Strategic Management, 22 (2) 27-35.
Arnold, C., Bernstein, S. C. (2006). A stratégiatervezés mint belső tanácsadás. In Biswas,-Twitchell (editor): Menedzsment tanácsadás: Teljes körű útmutató az üzletághoz. Pécs: VHE.
Bartek-Lesi, M., Bartók, I., Czakó, E., Gáspár, J., Könczöl, E., & Pecze, K. (2007). Vállalati stratégia. Budapest: Alinea Kiadó.
Barakonyi, K. (1999). Stratégiaalkotás I. Stratégiai tervezés. Budapest: Nemzeti Tankönyvkiadó
Barakonyi, K. (2000). Stratégiaalkotás II. Stratégiai menedzsment. Budapest: Nemzeti Tankönyvkiadó.
Bao, G. (2015). What theories are needed for strategic management? Nankai Business Review International, 6 (4) 433-454. https://doi.org/10.1108/NBRI-05-2015-0012
Biech, E. (2006). A tanácsadás világa. Az alapoktól kezdve… Pécs: VHE.
Biswas, S., Twitchell, D. (2006). Menedzsment tanácsadás: Teljes körű útmutató az üzletághoz. Pécs: VHE.
Bratianu, C., Prelipcean, G., & Bejinaru, R. (2020). Exploring the latent variables which support SMEs to become learning organizations. Management &

52 Roland Schmuck Strategic management consulting in Hungary
STRATEGIC MANAGEMENT, Vol. 25 (2020), No. 3, pp. 045-053
Marketing. Challenges for the Knowledge Society, 15, 2, 154-171. https://www.doi.org/10.2478/mmcks-2020-0010
Chivu, L. (2019. Local entrepreneurship and social services in Romania. Territorial analysis. European Research on Management and Business Economics, 25, 2, 79-86. https://doi.org/10.1016/j.iedeen.2019.04.001
Covey, S. R., Merrill, A. R., & Merrill, R. R. (1994). First Things First. New York: Fireside.
David, F. R., & David F. R. (2015). Strategic Management. A Competitive Advantage Approach, Concepts & Cases. Fifteenth Edition. USA: Pearson Education.
Fosić, I., Trusić, A., & Šebalj, D. (2017). Digital Organizational Strategy – Ticket for Competitiveness on the International Market. Strategic Management: International Journal of Strategic Management and Decision Systems in Strategic Management, 22 (3) 3-10.
Hadad, S. (2018). The geographic distribution of Knowledge Economy (KE) within the European Union (EU). Management & Marketing. Challenges for the Knowledge Society, 13, 3, 1089-1107. https://www.doi.org/mmcks-2018-0025
Hoványi, G. (1997). Menedzsment tanácsadás. Pécs: Janus Pannonius Tudományegyetem Közgazdaságtudományi Kar.
Jelača, M. S., Boljević, A. (2016). Critical Success Factors and Negative Effects of Development – The Boeing 787 Dreamliner. Strategic Management: International Journal of Strategic Management and Decision Systems in Strategic Management, 21 (1) 30-39.
Kontić, L., Vidicki, Đ. (2018). Strategy for Digital Organization: Testing a Measurement Tool for Digital Transformation. Strategic Management: International Journal of Strategic Management and Decision Systems in Strategic Management, 23 (1) 29-35. https://doi.org/10.5937/StraMan1801029K
Kubr, M. (2002). Management Consulting: a Guide to the Profession. Forth Edition. Geneva: International Labour Office.
Maira, A. (2006). Tanácsadás a változásmenedzsment területén. In Biswas-Twitchell: Menedzsment tanácsadás: Teljes körű útmutató az üzletághoz. Pécs: VHE.
Mártonffy, A. (2009). A tanácsadó és a svindler. ITBusiness. Retrieved Мarch 7, 2020, from http://www.itbusiness.hu/Fooldal/main_flash_banner/A_tanacsado_es_a_svindler.html
Milićević, V., Backović, N., Sofronijević, A. (2015). Strategic Orientation of European Management in the Conditions of Globalisation. Strategic Management: International Journal of Strategic Management and Decision Systems in Strategic Management, 20 (2), 49-57.
Mitrović, M. (2019). Strategic communication concept implemented through the corporate political activities – suggested strategy modeling. Strategic Management: International Journal of Strategic Management and Decision Systems in Strategic Management, 24 (4), 13-20. http://doi.org/10.5937/StraMan1904013M
MNB (2015). MNB Középárfolyam Figyelő. http://www.mnbkozeparfolyam.hu/arfolyam-2015.html, accessed 7th March 2020
Molina, M. A., del Pino, I. B., & Rodríguez, A. C. (2004). Industry, Management Capabilities and Firms’ Competitiveness: An Empirical Contribution. Managerial and Decision Economics, 25: 265-281.
https://doi.org/10.1002/mde.1148 Neilson, G. L., Martin, K. L., Powers, E. (2008). The Secrets
to Successful Strategy Execution. Harvard Business Review: HBR’s Must Reads on Strategy.
Paunescu, C., Popescu, M. C., Blid, L. (2018). Business impact analysis for business continuity: Evidence from Romanian enterprises on critical functions. Management & Marketing – Challenges for the Knowledge Society, 13 (3), 1035-1050. https://doi.org/10.2478/mmcks-2018-0021
Perrott, B. E. (2011). Strategic issue management as change catalyst. Strategy & Leadership, 39 (5) 20-29. https://doi.org/10.1108/10878571111161499
Pham, N.T., Phan, Q.P.T., Tučková, Z., Vo, N. & Nguyen, L.H.L. (2018). Enhancing the organizational citizenship behavior for the environment: the roles of green training and organizational culture. Management & Marketing. Challenges for the Knowledge Society, 13, 4, 1174-1189. https://www.doi.org/10.2478/mmcks-2018-0030
Poór J. (2014). Menedzsment tanácsadás helyzete Magyarországon. Menedzsment és HR Kutató Központ, Szent István Egyetem, GTK TTI.
Poór, J. (2015). Menedzsment tanácsadás módszereinek változása Magyarországon. Menedzsment és HR Kutató Központ, Szent István Egyetem, GTK TTI.
Popescu, G. H., Andrei, J. V., Nica, E., Mieilă, M., & Panait, M. (2019). Analysis on the impact of investments, energy use and domestic material consumption in changing the Romanian economic paradigm. Technological and Economic Development of Economy, 25 (1), 59-81. https://doi.org/10.3846/tede.2019.7454
Provice (2017). Stratégia végrehajtási képességfejlesztés. Retrieved Мarch 13, 2017, from http://www.provice.hu/Strategia_Vegrehajtasi_Kepessegfejlesztes
Renaissance, CFO & Business Intelligence (1996). Translating Strategy into Action. Joint study by Renaissance Solutions Inc., CFO Magazine and Business Intelligence magazine, and Business Intelligence
Rosenzweig, P. (2013). What Makes Strategic Decisions Different. Harvard Business Review, 2013 November 89-93.
Schrage, M. (2019). Smart Strategies Require Smarter KPIs. MITSloan Management Review, September 16, 2019.
Susilo, A. K., Ciptomulyono, U., Putra, I. N., Ahmadi, & Suharyo, O. S. (2019). Navy Ability Development Strategy using SWOT Analysis-Interpretative Structural Modeling (ISM). Strategic Management: International Journal of Strategic Management and Decision Systems in Strategic Management, 24 (1), 30-40. https://doi.org/10.5937/StraMan1901030S
Vicze, G. (2014). Versenyképességi tényezők és kitörési lehetőségek a magyar szolgáltató szektorban – a vezetési tanácsadás esete. PhD dissertation. Veszprém: Pannon Egyetem, Gazdálkodás- és Szervezéstudományok Doktori Iskola.
Wheelen, T. L, Hunger, J. D., Hoffman, A. N., & Bamford, C. E. (2017). Concepts in Strategic Management and Business Policies.Globalization, Innovation and Sustainability. Fifteenth Edition. USA: Pearson Education.

Roland Schmuck Strategic management consulting in Hungary 53
STRATEGIC MANAGEMENT, Vol. 25 (2020), No. 3, pp. 045-053
Correspondence
Dr. Roland Schmuck
University of Pécs, Faculty of Business and Economics Rákóczi út 80, H-7622 Pécs, Hungary
E-mail: [email protected]

MANUSCRIPT REQUIREMENTS
The paper must be written in the template which can be found on the Submission of Papers page of the Strategic Management journal web site (http://www.smjournal.rs/submision.php) and to be sent, together with the Copyright and Use Agreement. Headings must be short, clearly defined and numbered, except for Introduction and Conclusions. Apply at most three levels of headings. All tables, graphs and diagrams are expected to back your research findings. They should be clearly referred to and numbered consecutively in Arabic numerals. They should be placed in the text at the appropriate paragraph (just after its reference). Tables should be centered. All tables must have captions. The title of your table should follow the table number. Tables should not be wider than the margins of the paper. Figures should be centered. All figures must have captions. The title of figures should appear immediately below the figure. The title of the figure should follow the figure number. Figures should not be wider than the margins of the paper. Figures will not be redrawn by the publisher. Figures should be high-quality gray-scale graphics (please, do not use colors): vector drawings (with text converted to curves) or 300 dpi bitmaps. Please do not supply any graphics copied from a website, as the resolution will be too low. In all figures taken or adapted from other sources, a brief note to that effect is obligatory, below the figure. One sentence at least referring to the illustration is obligatory. Mathematical expressions should be numbered on the right side, while all variables and parameters must be defined. PROOF
Authors are responsible for ensuring that all manuscripts (whether original or revised) are accurately typed before final submission. One set of proof will be sent to authors, if requested, before the final publication, which must be returned promptly. REFERENCING GUIDE
The references should specify the source (such as book, journal article or a web page) in sufficient detail to enable the readers to identify and consult it. The references are placed at the end of the work, with sources listed alphabetically (a) by authors’ surnames or (b) by the titles of the sources (if the author is unknown). Multiple entries by the same author(s) must be sequenced chronologically, starting from the earliest, e.g.:
Ljubojević, T.K. (1998). Ljubojević, T.K. (2000a). Ljubojević, T.K. (2000b). Ljubojević, T.K., & Dimitrijević, N.N. (1994).
Here is a list of the most common reference types: A. PERIODICALS
Authors must be listed by their last names, followed by initials. Publication year must be written in paren-theses, followed by a full stop. Title of the article must be in sentences case: only the first word and proper nouns in the title are capitalized. The periodical title must be in title case, followed by the volume number, which is also italicized:

Author, A. A., Author, B. B., & Author, C. C. (Year). Title of article. Title of Periodical, volume number(issue number), pages.
Journal article, one author, paginated by issue Journals paginated by issue begin with page 1 in every issue, so that the issue number is indicated in paren-theses after the volume. The parentheses and issue numbers are not italicized, e.g.
Tanasijević, V. (2007). A PHP project test-driven end to end. Management Information Systems, 5 (1), 26-35.
Journal article, one author, paginated by volume Journals paginated by volume begin with page 1 in issue 1, and continue page numbering in issue 2 where issue 1 ended, e.g.
Perić, O. (2006). Bridging the gap: Complex adaptive knowledge management. Strategic Management, 14, 654-668.
Journal article, two authors, paginated by issue
Strakić, F., & Mirković, D. (2006). The role of the user in the software development life cycle. Management Information Systems, 4 (2), 60-72.
Journal article, two authors, paginated by volume
Ljubojević, K., & Dimitrijević, M. (2007). Choosing your CRM strategy. Strategic Management, 15, 333-349.
Journal article, three to six authors, paginated by issue
Jovanov, N., Boškov, T., & Strakić, F. (2007). Data warehouse architecture. Management Information Systems, 5 (2), 41-49.
Journal article, three to six authors, paginated by volume
Boškov, T., Ljubojević, K., & Tanasijević, V. (2005). A new approach to CRM. Strategic Management, 13, 300-310.
Journal article, more than six authors, paginated by issue
Ljubojević, K., Dimitrijević, M., Mirković, D., Tanasijević, V., Perić, O., Jovanov, N., et al. (2005). Putting the user at the center of software testing activity. Management Information Systems, 3 (1), 99-106.
Journal article, more than six authors, paginated by volume
Strakić, F., Mirković, D., Boškov, T., Ljubojević, K., Tanasijević, V., Dimitrijević, M., et al. (2003). Metadata in data warehouse. Strategic Management, 11, 122-132.
Magazine article
Strakić, F. (2005, October 15). Remembering users with cookies. IT Review, 130, 20-21. Newsletter article with author
Dimitrijević, M. (2009, September). MySql server, writing library files. Computing News, 57, 10-12.

Newsletter article without author
VBScript with active server pages. (2009, September). Computing News,57, 21-22. B. BOOKS, BROCHURES, BOOK CHAPTERS, ENCYCLOPEDIA ENTRIES, AND BOOK REVIEWS Basic format for books
Author, A. A. (Year of publication). Title of work: Capital letter also for subtitle. Location: Publisher. Note: “Location" always refers to the town/city, but you should also include the state/country if the town/city could be mistaken for one in another country. Book, one author
Ljubojević, K. (2005). Prototyping the interface design. Subotica: Faculty of Economics. Book, one author, new edition
Dimitrijević, M. (2007). Customer relationship management (6th ed.). Subotica: Faculty of Economics. Book, two authors
Ljubojević, K., Dimitrijević, M. (2007). The enterprise knowledge portal and its architecture. Subotica: Faculty of Economics.
Book, three to six authors
Ljubojević, K., Dimitrijević, M., Mirković, D., Tanasijević, V., & Perić, O. (2006). Importance of software testing. Subotica: Faculty of Economics.
Book, more than six authors
Mirković, D., Tanasijević, V., Perić, O., Jovanov, N., Boškov, T., Strakić, F., et al. (2007). Supply chain management. Subotica: Faculty of Economics.
Book, no author or editor
Web user interface (10th ed.). (2003). Subotica: Faculty of Economics. Group, corporate, or government author
Statistical office of the Republic of Serbia. (1978). Statistical abstract of the Republic of Serbia. Belgrade: Ministry of community and social services.
Edited book
Dimitrijević, M., & Tanasijević, V. (Eds.). (2004). Data warehouse architecture. Subotica: Faculty of Eco-nomics.
Chapter in an edited book
Boškov, T., & Strakić. F. (2008). Bridging the gap: Complex adaptive knowledge management. In T. Boškov & V. Tanasijević (Eds.), The enterprise knowledge portal and its architecture (pp. 55-89). Su-botica: Faculty of Economics.
Encyclopedia entry
Mirković, D. (2006). History and the world of mathematicians. In The new mathematics encyclopedia (Vol. 56, pp. 23-45). Subotica: Faculty of Economics.
C. UNPUBLISHED WORKS Paper presented at a meeting or a conference
Ljubojević, K., Tanasijević, V., Dimitrijević, M. (2003). Designing a web form without tables. Paper pre-sented at the annual meeting of the Serbian computer alliance, Beograd.
Paper or manuscript
Boškov, T., Strakić, F., Ljubojević, K., Dimitrijević, M., & Perić, O. (2007. May). First steps in visual basic for applications. Unpublished paper, Faculty of Economics Subotica, Subotica.
Doctoral dissertation
Strakić, F. (2000). Managing network services: Managing DNS servers. Unpublished doctoral dissertation, Faculty of Economics Subotica, Subotica.
Master’s thesis
Dimitrijević, M. (2003). Structural modeling: Class and object diagrams. Unpublished master’s thesis, Faculty of Economics Subotica, Subotica.
D. ELECTRONIC MEDIA The same guidelines apply for online articles as for printed articles. All the information that the online host makes available must be listed, including an issue number in parentheses:
Author, A. A., & Author, B. B. (Publication date). Title of article. Title of Online Periodical, volume num-ber(issue number if available). Retrieved from http://www.anyaddress.com/full/url/
Article in an internet-only journal
Tanasijević, V. (2003, March). Putting the user at the center of software testing activity. Strategic Man-agement, 8 (4). Retrieved October 7, 2004, from www.ef.uns.ac.rs/sm2003
Document from an organization
Faculty of Economics. (2008, March 5). A new approach to CRM. Retrieved July 25, 2008, from http://www.ef.uns.ac.rs/papers/acrm.html

Article from an online periodical with DOI assigned
Jovanov, N., & Boškov, T. A PHP project test-driven end to end. Management Information Systems, 2 (2), 45-54. doi: 10.1108/06070565717821898.
Article from an online periodical without DOI assigned Online journal articles without a DOI require a URL.
Author, A. A., & Author, B. B. (Publication date). Title of article. Title of Journal, volume number. Re-trieved from http://www.anyaddress.com/full/url/
Jovanov, N., & Boškov, T. A PHP project test-driven end to end. Management Information Systems, 2 (2),
45-54. Retrieved from http://www.ef.uns.ac.rs/mis/TestDriven.html. REFERENCE QUOTATIONS IN THE TEXT Quotations If a work is directly quoted from, then the author, year of publication and the page reference (preceded by “p.”) must be included. The quotation is introduced with an introductory phrase including the author’s last name followed by publication date in parentheses.
According to Mirković (2001), “The use of data warehouses may be limited, especially if they contain confidential data” (p. 201). Mirković (2001), found that “the use of data warehouses may be limited” (p. 201). What unexpected impact does this have on the range of availability?
If the author is not named in the introductory phrase, the author's last name, publication year, and the page number in parentheses must be placed at the end of the quotation, e.g.
He stated, “The use of data warehouses may be limited,” but he did not fully explain the possible impact (Mirković, 2001, p. 201).
Summary or paraphrase
According to Mirković (1991), limitations on the use of databases can be external and software-based, or temporary and even discretion-based. (p.201)
Limitations on the use of databases can be external and software-based, or temporary and even dis-cretion-based (Mirković, 1991, p. 201).
One author
Boškov (2005) compared the access range… In an early study of access range (Boškov, 2005), it was found...
When there are two authors, both names are always cited:
Another study (Mirković & Boškov, 2006) concluded that… If there are three to five authors, all authors must be cited the first time. For subsequent references, the first author’s name will cited, followed by “et al.”.

(Jovanov, Boškov, Perić, Boškov, & Strakić, 2004).
In subsequent citations, only the first author’s name is used, followed by “et al.” in the introductory phrase or in parentheses:
According to Jovanov et al. (2004), further occurences of the phenomenon tend to receive a much wider media coverage. Further occurences of the phenomenon tend to receive a much wider media coverage (Jovanov et al., 2004).
In “et al.", “et” is not followed by a full stop. Six or more authors
The first author’s last name followed by "et al." is used in the introductory phrase or in parentheses:
Yossarian et al. (2004) argued that… … not relevant (Yossarian et al., 2001).
Unknown author
If the work does not have an author, the source is cited by its title in the introductory phrase, or the first 1-2 words are placed in the parentheses. Book and report titles must be italicized or underlined, while titles of articles and chapters are placed in quotation marks:
A similar survey was conducted on a number of organizations employing database managers ("Limit-ing database access", 2005).
If work (such as a newspaper editorial) has no author, the first few words of the title are cited, followed by the year:
(“The Objectives of Access Delegation,” 2007)
Note: In the rare cases when the word "Anonymous" is used for the author, it is treated as the author's name (Anonymous, 2008). The name Anonymous must then be used as the author in the reference list.
Organization as an Author
If the author is an organization or a government agency, the organization must be mentioned in the intro-ductory phrase or in the parenthetical citation the first time the source is cited:
According to the Statistical Office of the Republic of Serbia (1978), …
Also, the full name of corporate authors must be listed in the first reference, with an abbreviation in brackets. The abbreviated name will then be used for subsequent references:
The overview is limited to towns with 10,000 inhabitants and up (Statistical Office of the Republic of Serbia [SORS], 1978). The list does not include schools that were listed as closed down in the previous statistical overview (SORS, 1978).

When citing more than one reference from the same author:
(Bezjak, 1999, 2002) When several used works by the same author were published in the same year, they must be cited adding a, b, c, and so on, to the publication date:
(Griffith, 2002a, 2002b, 2004) Two or more works in the same parentheses When two or more works are cited parenthetically, they must be cited in the same order as they appear in the reference list, separated by a semicolon.
(Bezjak, 1999; Griffith, 2004) Two or more works by the same author in the same year If two or more sources used in the submission were published by the same author in the same year, the entries in the reference list must be ordered using lower-case letters (a, b, c…) with the year. Lower-case letters will also be used with the year in the in-text citation as well:
Survey results published in Theissen (2004a) show that… To credit an author for discovering a work, when you have not read the original:
Bergson’s research (as cited in Mirković & Boškov, 2006)… Here, Mirković & Boškov (2006) will appear in the reference list, while Bergson will not. When citing more than one author, the authors must be listed alphabetically:
(Britten, 2001; Sturlasson, 2002; Wasserwandt, 1997) When there is no publication date:
(Hessenberg, n.d.) Page numbers must always be given for quotations:
(Mirković & Boškov, 2006, p.12) Mirković & Boškov (2006, p. 12) propose the approach by which “the initial viewpoint…
Referring to a specific part of a work: (Theissen, 2004a, chap. 3) (Keaton, 1997, pp. 85-94)
Personal communications, including interviews, letters, memos, e-mails, and telephone conver-sations, are cited as below. (These are not included in the reference list.)
(K. Ljubojević, personal communication, May 5, 2008).
FOOTNOTES AND ENDNOTES
A few footnotes may be necessary when elaborating on an issue raised in the text, adding something that is in indirect connection, or providing supplementary technical information. Footnotes and endnotes are numbered with superscript Arabic numerals at the end of the sentence, like this.1 Endnotes begin on a sepa-rate page, after the end of the text. However, Strategic Management journal does not recommend the use of footnotes or endnotes. COPYRIGHT AND USE AGREEMENT
Articles submitted to the Journal should be authentic and original contributions and should have never been published before in full text, nor be under consideration for any other publication at the same time. Authors submitting articles for publication warrant that the work is not an infringement of any existing cop-yright and will indemnify the publisher against any breach of such warranty. Authors retain copyright of the published papers and grant to the publisher the non-exclusive right to publish the article, to be cited as its original publisher in case of reuse, and to distribute it in all forms and media.

CIP - Каталогизација у публикацији Библиотека Матице српске, Нови Сад 005.21 STRATEGIC managament : international journal of strategic managament and decision support systems in strategic managament / editor-in-chief Aleksandar Grubor. - Vol. 14, no. 1 (2009) - . - Subotica: University of Novi Sad, Faculty of Economics, 2009-. - 30 cm Tromesečno. - Nastavak publikacije: Strategijski menadžment = ISSN 0354-8414 ISSN 1821-3448 COBISS.SR-ID 244849927 Rešenjem Ministarstva za informisanje Republike Srbije, časopis "Strategijski menadžment" upisan je u regis-tar javnog informisanja pod brojem 2213, od 7. avgusta 1996. Rešenjem Ministarstva za nauku i tehnologiju Republike Srbije br. 413-00-435/1/96-01 časopis je oslobođen opšteg poreza na promet proizvoda kao publi-kacija od posebnog interesa za nauku.

9 771821 344000
ISSN 1821-3448