Lanka Tiles PLC | Integrated Annual Report 2021/22 - CSE
152
Lanka Tiles PLC | Integrated Annual Report 2021/22 Fine Living Redefined
-
Upload
khangminh22 -
Category
Documents
-
view
3 -
download
0
Transcript of Lanka Tiles PLC | Integrated Annual Report 2021/22 - CSE
Lanka Tiles PLC | Integrated Annual Report 2021/22
FineLivingRedefined

Contents
About Us 2
Values 2
About the Report 3
Our Product Portfolio 5
Our Group Structure 7
Organizational Structure 8
Financial Highlights 9
Non Financial Highlights 10
Executive Reviews
Chairman’s Statement 12
Managing Director’s Message 15
Board of Directors 18
Senior Management 22
Management Discussion & Analysis
Strategy 24
Materiality 26
Stakeholder Engagement 28
Strategic Value Creation 30
Principal Risks 32
Risk Overview 33
Operating Environment 35
Business Line Review 37
Capital Report 40
Financial Capital 41
Manufactured Capital 44
Human Capital 48
Social and Relationship Capital 51
Intellectual Capital 54
Natural Capital 56
Corporate Governance
Corporate Governance 60
Annual Report of the Board of Directors on the Affairs of the Company
71
Statement of Directors’ Responsibility 76
Chief Executive Officer’s and Chief Financial Officer’s Responsibility Statement
77
Related Party Transactions Review Committee Report
78
Remuneration Committee Report 79
Audit Committee Report 80
Financial Statements
Independent Auditor’s Report 82
Consolidated Statement of Financial Position
86
Consolidated Statement of profit or loss and other comprehensive income
87
Statement of Changes in Equity 88
Consolidated Statement of Cash Flow 89
Notes to the Financial Statements 90
Supplementary Information
Five Year Summary statement of Comprehensive Income
134
Five Year Summary statement of Financial Position 135
Shareholder Information 136
20 Major shareholders as at 31st march 2022 137
Statement of Value Added 139
GRI Index 140
Corporate Information 143
Notes 144
Notice of Meeting 146
Form of Proxy 147
We enhanced lifestyles with an innovative value proposition that promised elegance with unwavering quality. Today, we stand ready to re-define our concept of fine living, with a fresh brand outlook centred around the masterpiece that is your life. Our ability to evolve and be proactive in the face of change, has elevated us to become the leading tile manufacture in Sri Lanka.
Our strong fundamentals, thriving on our stringent values system, have given us momentum to cruise through any uncertainty with courage. In a bid to support our renewed brand strategy, we have aligned our growth efforts to seize untapped market opportunities, successfully leveraging on our portfolio of contemporary designs and formats. Today, we invite you to join our onward journey, as we Redefine Fine Living.

2 | Lanka Tiles PLC
About Us
VisionCreating a fine art of living
MissionCreating contemporary fashionable lifestyles for our customers while adding value to our stakeholders by excelling in everything we do with the strength of our inherited values.
ValuesQuality, Trust, Sense of Heritage, Long standing relationships
QualityEvery tile is manufactured to the highest quality standards and we can proudly claim that our products are second to none.
StyleOur portfolio features a wide range of tiles in a variety of colours, textures and sizes including special Mosaic tiles.
EleganceClassic style, innovative designs and simple elegance make all our products distinctive in local and international markets.
ValueOur stakeholders are diverse and demanding. Over the years we have delivered unmatched value to all of them.
Values
About Lanka Tiles PLCEstablished as a private Limited company in 1984,
Lanka Tiles PLC became a listed company in 1986.
Our main business activity is to manufacture and sale
of glazed ceramic and porcelain floor tiles.
Registered Name: Lanka Tiles PLC
Company Registration No: PQ 129
www.lankatiles.com
Annual Report 2021/22 | 3
About the Report
Lanka Tiles PLC has continuously invested in the best
materials, state of art technology, innovative thinking and
consumer confidence which has led us to become a leading tile
manufacturer in the country and to expand our business into
international markets.
This year, we present our 5th Integrated Annual Report for
the period ending 31 March 2022, which captures our strife,
triumphs and strategies in the year. This report details the
advancements made since our previous annual report released
in 2021.
The Report covers the operations of Lanka Tiles PLC (LTPLC)
and its subsidiary companies, Beyond Paradise Collection
Limited, LTL Development Limited and Lanka Tiles Private
Limited – India.
The financial Year 2021/22 Annual Report is organised as
follows:
AN OVERVIEW ABOUT US
AN INTRODUCTION
PERFORMANCE HIGHLIGHTS
CHAIRMAN’S MESSAGE
MANAGING DIRECTOR’S MESSAGE
MANAGEMENT DISCUSSION AND ANALYSIS CAPITALS REVIEW
Our focus on each capital to ensure that we add value to our
multiple stakeholders and business activities.
CORPORATE GOVERNANCE
Our compliance with governance and accountability standards
that shape and guide our business practice
FINANCIAL STATEMENTS AUDITED FINANCIAL STATEMENTS
SUPPLEMENTARY INFORMATION NOTICE OF ANNUAL GENERAL MEETING
PROXY FORM
CORPORATE INFORMATION
Towards regulatory compliance and corporate best practices
in our reporting, the following standards, frameworks, and
guidelines were followed in the preparation of the report.
REGULATORY REQUIREMENTS COMPANIES ACT NO.7 OF 2007
CONTINUED LISTING REQUIREMENTS OF THE COLOMBO
STOCK EXCHANGE
SRI LANKA ACCOUNTING & AUDITING STANDARDS ACT
NO.15 OF 1995
SRI LANKA ACCOUNTING STANDARDS
CODE OF BEST PRACTICE ON CORPORATE GOVERNANCE
2013
INTEGRATED REPORTING FRAMEWORK
GRI STANDARDS “IN ACCORDANCE” OPTION
The Annual report of Lanka Tiles PLC for the year ended
31st March 2022 has been prepared and reviewed by the
Management of the Company who have recommended the
same to the Group’s Audit Committee and Board for their
approval.
There were no re-statements of information and no changes to
our reporting period during the year.
The Board acknowledges its responsibility to ensure the
integrity of the Annual report which provides a balanced view
of the performance of the Group, addressing all material issues
that may have an impact on the Group’s capacity to create
value over the short term. The Board is of the opinion that the
Integrated Annual Report of Lanka Tiles PLC for the financial
year ending 31st March 2022 is presented in accordance
with the <IR> Framework 2022. The report was unanimously
approved by the Board on 31st May 2022 and is signed on its
behalf by:
Chairman Audit Committee Managing
Chairman Director
For any inquiries, please contact,
Mr. Tyrell Roche
General Manager (Finance)
Email: [email protected]
Telephone : 011 4526700
GRI 102-45, 102-46, 102-48, 102-50, 102-51, 102-52, 102-53, 102-54,

4 | Lanka Tiles PLC
Annual Report 2021/22 | 5
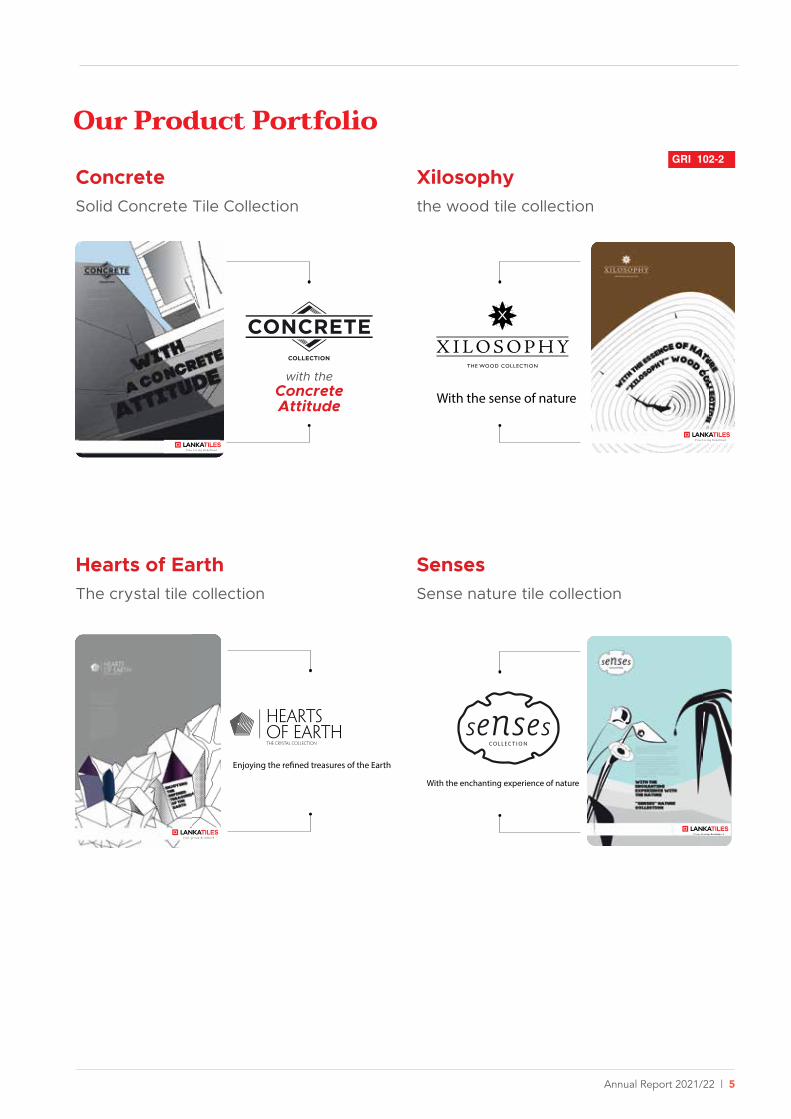
Our Product Portfolio
With the enchanting experience of nature
Enjoying the re�ned treasures of the Earth
ConcreteSolid Concrete Tile Collection
with theConcrete Attitude
Hearts of EarthThe crystal tile collection
Xilosophythe wood tile collection
SensesSense nature tile collection
With the sense of nature
With the enchanting experience of nature
GRI 102-2
6 | Lanka Tiles PLC
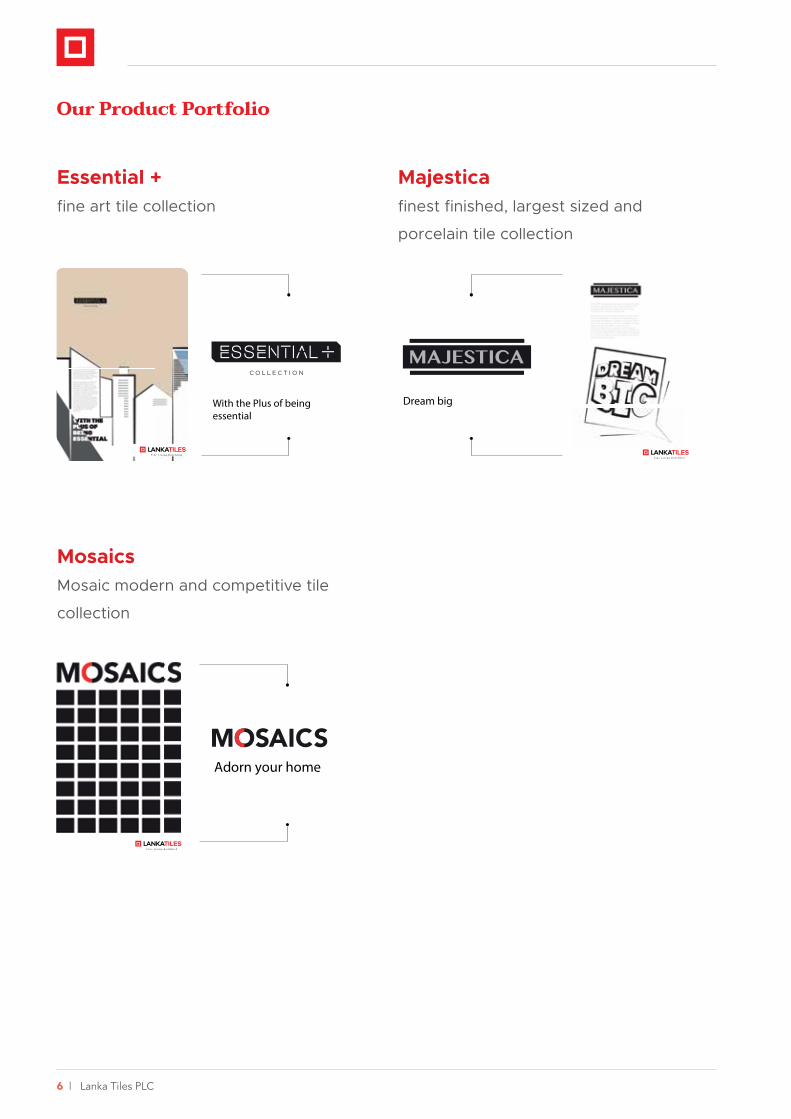
Our Product Portfolio
With the Plus of being essential
Adorn your home
Dream big
Essential + fine art tile collection
MosaicsMosaic modern and competitive tile
collection
Majesticafinest finished, largest sized and
porcelain tile collection
Dream bigWith the Plus of being essential
Adorn your home

Annual Report 2021/22 | 7
Our Group Structure
Lanka Tiles PLC
LTL Development Ltd.
100%
CP Holdings (Pvt) Ltd.
24.63%
Swisstek (Ceylon) PLC
47.80%
Lanka Tiles (Pvt) Ltd –
India 51%
Swisstek Aluminium Ltd
87.38%
Beyond Paradise
Collections Ltd 100%
Swisstek Development
Ltd. 100%
16.6
7%
16.67%
GRI 102-7

8 | Lanka Tiles PLC
Organisational Structure
Fac
tory
M
anag
er
Dire
ctor
- M
anuf
actu
ring
/
Ass
t. G
ener
al M
anag
er
(P/T
)
Gen
eral
Man
ager
(F
inan
ce)
Man
agin
g D
irect
or
Dire
ctor
-
Gro
up M
arke
ting
Eng
inee
ring
M
anag
erTP
MM
anag
erQ
ualit
y M
anag
erP
rod
uctio
n M
anag
ers
IMSH
RM
AM
AM
AM
AM
AM
ASM
MA
AC
CEx
por
t M
anag
erTr
aini
ng
Man
ager
Sale
s M
anag
er
M IT
Gro
up H
R
Man
ager
Gro
up
Com
mer
cial
M
anag
er
Gro
up
Stor
es
Man
ager
Gro
up
Bus
ines
s D
evel
opm
ent
Man
ager
Hea
d o
f IT
Gro
up
Fina
nce
Man
ager
Gro
upM
anag
er(S
ales
A
dm
inis
trat
ion)
Gro
up H
ead
ofM
arke
ting
IM
– Im
por
ts M
anag
erM
IT
– M
anag
er IT
SHR
M –
Sen
ior
HR
Man
ager
ASM
–
Ass
ista
nt S
tore
s M
anag
erM
A
– M
anag
emen
t A
ccou
ntan
tA
CC
–
Acc
ount
ant
AM
–
Ass
ista
nt M
anag
er
AM
AM
AM
AM
GRI 102-18

Annual Report 2021/22 | 9
Financial Highlights
Financial Performance Unit 2021/22 2020/21 %
Revenue Rs. ‘000 14,591,620 12,626,485 16
Gross Profits Rs. ‘000 6,608,922 4,746,103 39
Earnings Before Interest and Tax (EBIT) Rs. ‘000 4,545,765 2,775,596 64
Profit before tax Rs. ‘000 5,037,008 2,854,668 76
Profits after tax Rs. ‘000 4,110,316 2,450,894 68
Profits attributable to shareholders Rs. ‘000 4,110,139 2,450,773 68
Gross profit margin % 45.3 37.6 20
Net profit margin % 28.1 19.4 45
Return on assets (ROA) % 24.2 17.4 39
Return on equity (ROE) % 33.6 27.5 22
Interest cover No. of times 48.5 8.3 484
Financial Position Unit 2021/22 2020/21 %
Assets Rs. ‘000 16,926,973 14,248,047 19
Capital expenditure on PPE Rs. ‘000 609,748 433,121 41
Debt Rs. ‘000 1,467,812 1,292,933 14
Other liabilities Rs. ‘000 3,231,743 3,021,841 7
Shareholders’ equity Rs. ‘000 12,219,323 9,927,081 23
Gearing % 12.0 13.0 8
Net assets per share Rs./share 46.07 37.43 23
Current ratio No. of times 2.8 2.6 8
Quick assets ratio No. of times 2.0 1.6 25
Shareholder Information Unit 2021/22 2020/21 %
No of shares in issue No 265,252,050 265,252,050 -
Dividend per share Rs./share 7.00 3.23 117
Earnings per share Rs./share 15.50 9.24 68
Market capitalisation Rs. Mn 4,488 2,769 62
Dividend payout ratio % 45 35 29
Other Unit 2021/22 2020/21 %
Number of employees No 730 702 4
Average revenue per employee Rs ’000 19,989 17,404 15
Average profit per employee Rs ’000 5,645 3,378 67
Number of showrooms No 51 49 4
10 | Lanka Tiles PLC
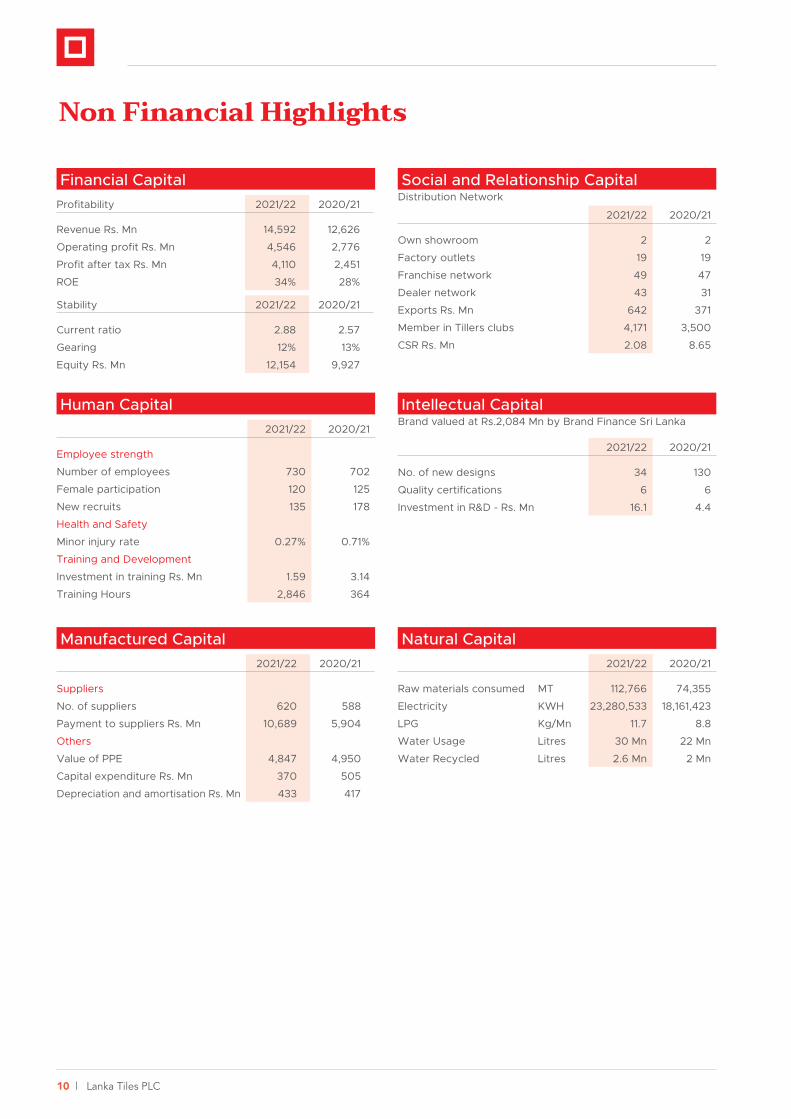
Non Financial Highlights
Human Capital 2021/22 2020/21
Employee strength
Number of employees 730 702
Female participation 120 125
New recruits 135 178
Health and Safety
Minor injury rate 0.27% 0.71%
Training and Development
Investment in training Rs. Mn 1.59 3.14
Training Hours 2,846 364
Manufactured Capital2021/22 2020/21
Suppliers
No. of suppliers 620 588
Payment to suppliers Rs. Mn 10,689 5,904
Others
Value of PPE 4,847 4,950
Capital expenditure Rs. Mn 370 505
Depreciation and amortisation Rs. Mn 433 417
Financial CapitalProfitability 2021/22 2020/21
Revenue Rs. Mn 14,592 12,626
Operating profit Rs. Mn 4,546 2,776
Profit after tax Rs. Mn 4,110 2,451
ROE 34% 28%
Stability 2021/22 2020/21
Current ratio 2.88 2.57
Gearing 12% 13%
Equity Rs. Mn 12,154 9,927
Social and Relationship CapitalDistribution Network
2021/22 2020/21
Own showroom 2 2
Factory outlets 19 19
Franchise network 49 47
Dealer network 43 31
Exports Rs. Mn 642 371
Member in Tillers clubs 4,171 3,500
CSR Rs. Mn 2.08 8.65
Intellectual CapitalBrand valued at Rs.2,084 Mn by Brand Finance Sri Lanka
2021/22 2020/21
No. of new designs 34 130
Quality certifications 6 6
Investment in R&D - Rs. Mn 16.1 4.4
Natural Capital2021/22 2020/21
Raw materials consumed MT 112,766 74,355
Electricity KWH 23,280,533 18,161,423
LPG Kg/Mn 11.7 8.8
Water Usage Litres 30 Mn 22 Mn
Water Recycled Litres 2.6 Mn 2 Mn
Annual Report 2021/22 | 11
EXECUTIVE REVIEWS
Devoted toExcellence
Chairman’s Statement 12
Managing Director’s Message 15
Board of Directors 18
Senior Management 22
12 | Lanka Tiles PLC
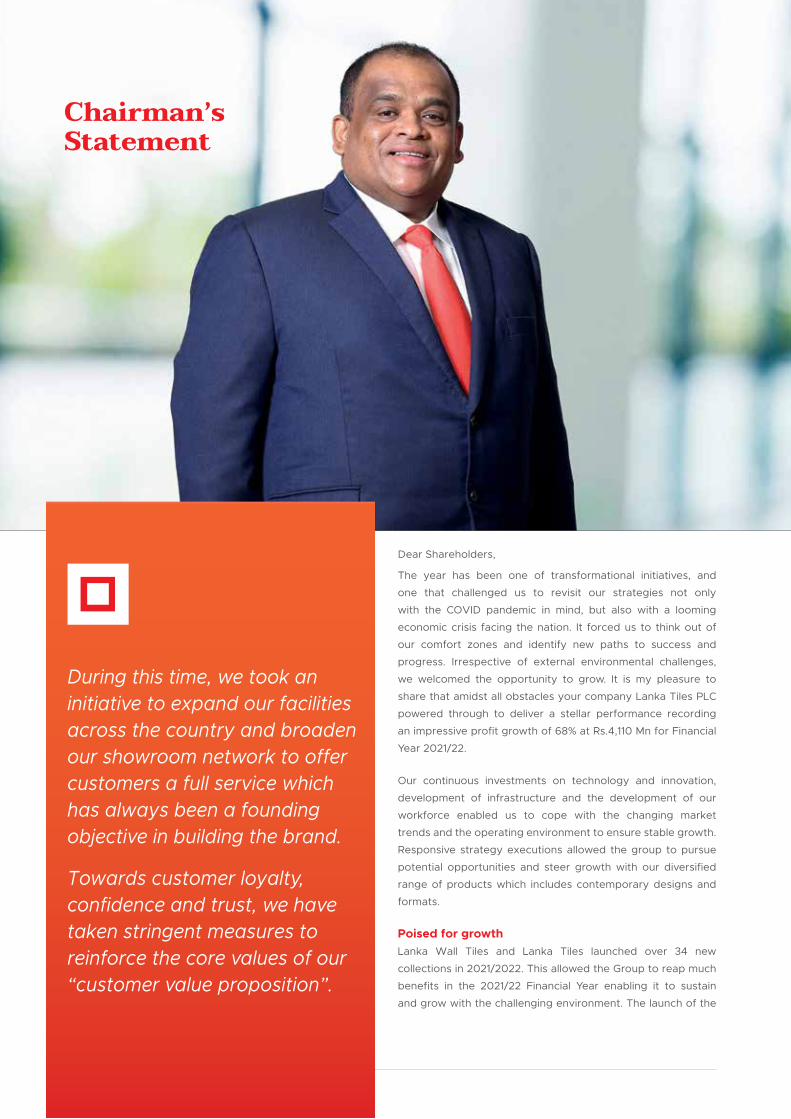
Chairman’sStatement
During this time, we took an initiative to expand our facilities across the country and broaden our showroom network to offer customers a full service which has always been a founding objective in building the brand.
Towards customer loyalty, confidence and trust, we have taken stringent measures to reinforce the core values of our “customer value proposition”.
Dear Shareholders,
The year has been one of transformational initiatives, and
one that challenged us to revisit our strategies not only
with the COVID pandemic in mind, but also with a looming
economic crisis facing the nation. It forced us to think out of
our comfort zones and identify new paths to success and
progress. Irrespective of external environmental challenges,
we welcomed the opportunity to grow. It is my pleasure to
share that amidst all obstacles your company Lanka Tiles PLC
powered through to deliver a stellar performance recording
an impressive profit growth of 68% at Rs.4,110 Mn for Financial
Year 2021/22.
Our continuous investments on technology and innovation,
development of infrastructure and the development of our
workforce enabled us to cope with the changing market
trends and the operating environment to ensure stable growth.
Responsive strategy executions allowed the group to pursue
potential opportunities and steer growth with our diversified
range of products which includes contemporary designs and
formats.
Poised for growth Lanka Wall Tiles and Lanka Tiles launched over 34 new
collections in 2021/2022. This allowed the Group to reap much
benefits in the 2021/22 Financial Year enabling it to sustain
and grow with the challenging environment. The launch of the
Annual Report 2021/22 | 13
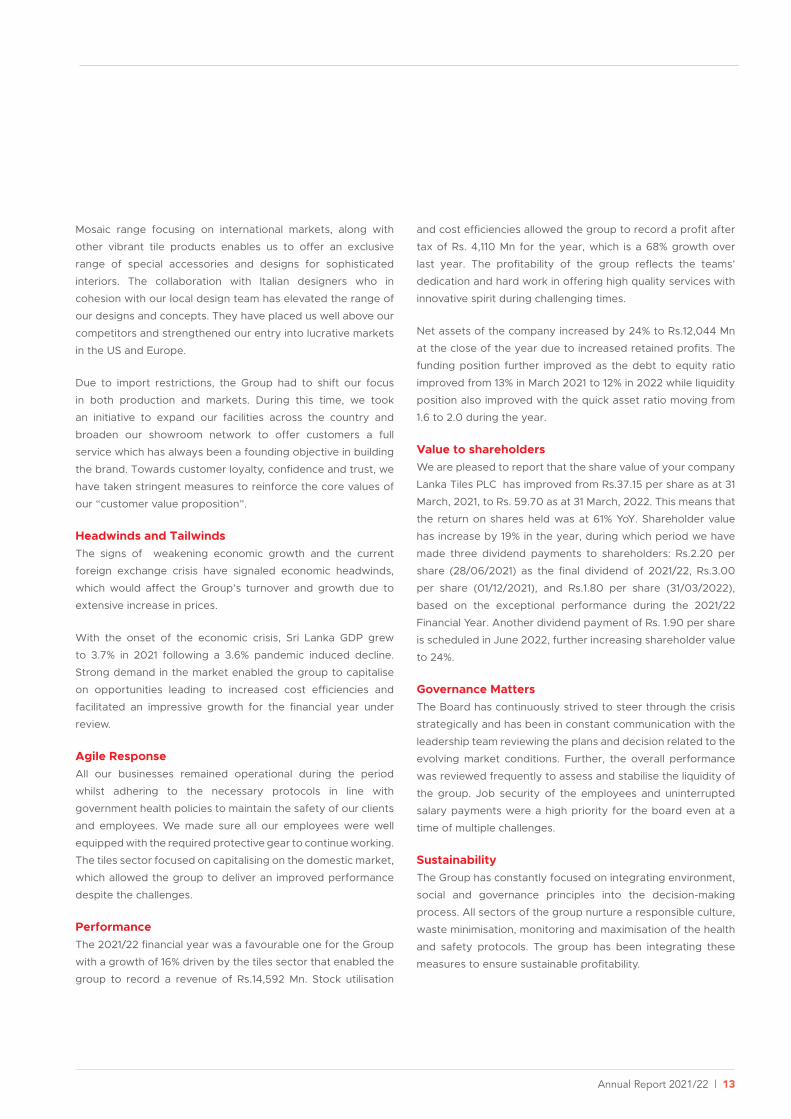
Mosaic range focusing on international markets, along with
other vibrant tile products enables us to offer an exclusive
range of special accessories and designs for sophisticated
interiors. The collaboration with Italian designers who in
cohesion with our local design team has elevated the range of
our designs and concepts. They have placed us well above our
competitors and strengthened our entry into lucrative markets
in the US and Europe.
Due to import restrictions, the Group had to shift our focus
in both production and markets. During this time, we took
an initiative to expand our facilities across the country and
broaden our showroom network to offer customers a full
service which has always been a founding objective in building
the brand. Towards customer loyalty, confidence and trust, we
have taken stringent measures to reinforce the core values of
our “customer value proposition”.
Headwinds and TailwindsThe signs of weakening economic growth and the current
foreign exchange crisis have signaled economic headwinds,
which would affect the Group’s turnover and growth due to
extensive increase in prices.
With the onset of the economic crisis, Sri Lanka GDP grew
to 3.7% in 2021 following a 3.6% pandemic induced decline.
Strong demand in the market enabled the group to capitalise
on opportunities leading to increased cost efficiencies and
facilitated an impressive growth for the financial year under
review.
Agile ResponseAll our businesses remained operational during the period
whilst adhering to the necessary protocols in line with
government health policies to maintain the safety of our clients
and employees. We made sure all our employees were well
equipped with the required protective gear to continue working.
The tiles sector focused on capitalising on the domestic market,
which allowed the group to deliver an improved performance
despite the challenges.
Performance The 2021/22 financial year was a favourable one for the Group
with a growth of 16% driven by the tiles sector that enabled the
group to record a revenue of Rs.14,592 Mn. Stock utilisation
and cost efficiencies allowed the group to record a profit after
tax of Rs. 4,110 Mn for the year, which is a 68% growth over
last year. The profitability of the group reflects the teams’
dedication and hard work in offering high quality services with
innovative spirit during challenging times.
Net assets of the company increased by 24% to Rs.12,044 Mn
at the close of the year due to increased retained profits. The
funding position further improved as the debt to equity ratio
improved from 13% in March 2021 to 12% in 2022 while liquidity
position also improved with the quick asset ratio moving from
1.6 to 2.0 during the year.
Value to shareholdersWe are pleased to report that the share value of your company
Lanka Tiles PLC has improved from Rs.37.15 per share as at 31
March, 2021, to Rs. 59.70 as at 31 March, 2022. This means that
the return on shares held was at 61% YoY. Shareholder value
has increase by 19% in the year, during which period we have
made three dividend payments to shareholders: Rs.2.20 per
share (28/06/2021) as the final dividend of 2021/22, Rs.3.00
per share (01/12/2021), and Rs.1.80 per share (31/03/2022),
based on the exceptional performance during the 2021/22
Financial Year. Another dividend payment of Rs. 1.90 per share
is scheduled in June 2022, further increasing shareholder value
to 24%.
Governance MattersThe Board has continuously strived to steer through the crisis
strategically and has been in constant communication with the
leadership team reviewing the plans and decision related to the
evolving market conditions. Further, the overall performance
was reviewed frequently to assess and stabilise the liquidity of
the group. Job security of the employees and uninterrupted
salary payments were a high priority for the board even at a
time of multiple challenges.
Sustainability The Group has constantly focused on integrating environment,
social and governance principles into the decision-making
process. All sectors of the group nurture a responsible culture,
waste minimisation, monitoring and maximisation of the health
and safety protocols. The group has been integrating these
measures to ensure sustainable profitability.

14 | Lanka Tiles PLC
Chairman’s Statement
OutlookAlthough the economic outlook remains to be seen with the
current crisis and disruptions to the economic activities in the
country, the board is initiating stringent measures to ensure
that inventories are monetised in an efficient manner while
growing existing markets and exploring potential new markets.
The country’s weakened economic condition raises constant
concerns with regard to exchange rates, interest rates and
sovereign debt payments. Lanka Tiles will continue to cater to
the domestic market through the diversified network and will
simultaneously pursue our expansion into new international
markets. The Group will revisit our strategic plans to make
calculated decisions in order to maintain a healthy funding and
liquidity position that enables the group to steer through the
uncertainty.
AppreciationI commend the leadership of Mr. Mahendra Jayasekara for
inspiring and guiding his team to achieve corporate goals and
growth during the unprecedented times. I thank the teams of
the Lanka Tiles group for their untiring efforts and commitment
during this year. I deeply appreciate our business partners,
board members and shareholders whose perspectives and
advice have been insightful and have helped to strengthen our
progress.
Mr. Dhammika PereraChairman
31st May 2022
Annual Report 2021/22 | 15
During the year, we focused on strategies which concentrated on exhausting our underperforming and low margin products.
We rationalised our product portfolio in order to sustain our total production, resulting in increased efficiency. Our retail products were sold at reasonable rates that were mindful of consumer purchasing power under difficult conditions.
Managing Director’s Message
Dear Shareholders,
I am happy to share with you the performance of your company
Lanka Tiles for the 2021/22 financial year. I am pleased to
report that the company has outperformed last year’s record
profits by 68% to report Rs.4.1 Bn for the current year, yet again
achieving the highest annual growth in the Group’s history.
I take this opportunity to commend the untiring efforts of the
Lanka Tiles team, our partners and distributors without whose
indomitable spirit to succeed, this phenomenal achievement
could not have been possible through the macro-economic and
policy challenges and in the peak of the COVID-19 pandemic.
I am equally pleased that this year, Lanka Tiles was recognised
as a ‘Great Place to Work’ by the Great Place to Work in Sri
Lanka Authority, which stands a testament to the value created
for our employees and partners in our journey of success.
Overcoming ChallengesThe 2021/22 financial year was full of surprises on all fronts.
The domestic economy was struggling to recover from the
economic impacts of the COVID-19 pandemic; the rising cost
of essential raw material and supplies imports; escalating
domestic inflation and falling Sri Lanka Rupee challenged most
industries including the tiles manufacturing sector. Contributing
to this were state policies on exchange rate controls such as
16 | Lanka Tiles PLC
Managing Director’s Message
pegging the exchange rate of LKR to USD which spiralled into a
foreign exchange crisis and the ensuing restriction on imports.
Towards the last quarter of the financial year, industries also
faced gas and fuel shortages for manufacturing and delivery
which continued at the time of developing this year’s annual
report.
While most of these affected Lanka Tiles as well as other
companies, our strategic approach to the challenges helped to
convert them into opportunities.
With import restrictions limiting tile imports to Sri Lanka, Lanka
Tiles had the opportunity to meet the demand previously met
by imported tile brands. We increased our capacities to meet
this demand and were able to operate profitably through
increased production and market share. The limited availability
of tiles in the local market helped the company to maintain its
prices without discounted offers. The dearth of tiles available
in the market also provided an opportunity to dispose of
previously accumulated inventory.
InvestmentsDespite challenges on the external front, Lanka Tiles took a
strategic decision to move forward with our investment and
expansion plans. Our manufacturing facilities were enhanced
and expanded to meet the demand increase for production,
while existing machinery, kiln and other infrastructure were
upgraded. In addition, new technology enabled the company
to develop market infrastructure and stabilise operations. Total
investments in facility enhancements totalled Rs.433 Mn during
the year.
PerformanceThe 2021/22 financial year, was a progressive year for the
Group. The Group reported a gross revenue of Rs.15.7 Bn Mn
during the year under review, a 16% growth over last year.
Accordingly, profit after tax also increased by 68% to Rs.4.1
Bn marking a record growth in the history of Lanka Tiles PLC.
Operating expenses were at Rs.7.98 Bn slightly higher due to
increased cost of production arising out of macro economic
conditions such as exchange rate fluctuations, rising inflation
and higher cost of fuel and gas for manufacturing. However,
an increase in production and the ability to dispose of existing
stock from previous years led to higher earnings offsetting the
challenges.
Our most profitable segment was the sale of Glazed Ceramic
Tiles accounting for 90% of total revenue at Rs.14.5 Bn. The
introduction of mosaic tiles increased our revenue by 6% during
the year. As a young product, the product is yet to achieve its
full potential and market demand.
StrategyDuring the year, we focused on strategies which concentrated
on exhausting our underperforming and low margin products.
We rationalised our product portfolio in order to sustain our
total production, resulting in increased efficiency. Our retail
products were sold at reasonable rates that were mindful of
consumer purchasing power under difficult conditions.
One of our key strategies was the introduction of our new
product line of Mosaic Tiles. We were able to innovate new
technology and business processes to manufacture mosaic
tiles in our local facility. This escalated our competitiveness in
the domestic as well as overseas markets.
Future Outlook While Lanka Tiles has performed exceptionally during the year
under review, planning for the coming year has been a tough
challenge. Our greatest concern is maintaining our supply chain
to support the manufacturing process. The country’s economic
conditions, which have impacted the availability of foreign
exchange needed for material imports, increasing inflation, and
led to unavailability of essential resources, will determine the
future of the company and the industry.
Inability to procure raw materials would directly affect our
production and our expansion plans would have to adopt a
‘watch and wait’ attitude under current country conditions.
In light of these, we are strategically exploring opportunities
in neighbouring nations such as India to expand operations in
the future.
Moving forward we would continue to be cost conscious and
implement cost management and cost efficiency improvement
strategies throughout the Group.
We are anticipating a severe decline in the purchasing power
of stakeholders which will in turn lower the demand for our
products in the market. Based on the current situation of the
country we are unable to forecast the performance for the
coming year.

Annual Report 2021/2022 | 17
However, we will continue to invest in the training and
development of our human resource and improve our
stakeholder relations whilst adding value to our numerous
stakeholders.
We fervently look forward to the strengthening of the country’s
economic situation for a sustainable and profitable growth.
Acknowledgment This year was about working together to overcome challenges;
a task to which our employees and partners rose, as a result of
which Lanka Tiles recorded a triumphant and profitable year.
I extend my sincere appreciation to the Board for their
visionary guidance and support during this tough time. I extend
my gratitude to the Lanka Tiles team for their commitment and
hard work and for their indomitable spirit.
The dedication and support of our partners and distributors
have been a strength during the year in managing our inventory
and strengthening our brand for which I thank all partners
and distributors. A sincere appreciation to our customers for
their continued trust and confidence in Lanka Tiles and for
patronising our products.
I wish to record my gratitude to our shareholders for their
patience and faith in the Board of Directors and our teams,
and I assure you we would continue to create value for your
investments in the coming years.
J A P M JayasekeraManaging Director
31st May 2022

18 | Lanka Tiles PLC
Board of Directors
Mr. Dhammika PereraChairman
Mr. A M WeerasingheDeputy Chairman
Mr. J A P M Jayasekera Managing Director
Dr. S Selliah Director
Mr. K D G GunaratneDirector
Mr. T G ThoradeniyaDirector

Annual Report 2021/22 | 19
Ms. A M L PageDirector
Mr. J A N R AdhihettyDirector
Mr. G A R D Prasanna Alternate Director
Mr. S M LiyanageDirector
Mr. S R Jayaweera Director
Mr. J R GunarathneDirector

20 | Lanka Tiles PLC
Board of Directors
Mr. Dhammika PereraChairman
Mr Dhammika Perera is a quintessential strategist and a business
leader with interests in a variety of key industries including
manufacturing, banking and finance, leisure, plantations, and
hydropower generation. He has over 30 years of experience
in building formidable businesses through unmatched strategic
foresight and extensive governance experience gained
through membership of the Boards of quoted and unquoted
companies.
Mr Perera is the Chairman of Vallibel One PLC, Royal Ceramics
Lanka PLC, Lanka Tiles PLC, Lanka Walltiles PLC, The Fortress
Resort PLC, Vallibel Power Erathna PLC, Greener Water Ltd,
Delmege Limited, and LB Microfinance Myanmar Company
Limited. He is the Co Chairman of Hayleys PLC, The Kingsbury
PLC and Singer (Sri Lanka) PLC. Executive Deputy Chairman of
L B Finance PLC, Deputy Chairman of Horana Plantations PLC.
He is also an Executive Director of Vallibel Finance PLC and
serves on the Boards of Hayleys Leisure PLC, Haycarb PLC,
Hayleys Fabric PLC and Dipped Products PLC. Also, a Director
of Dhammika and Priscilla Perera Foundation.
Mr. A M Weerasinghe Deputy Chairman
Founder of Royal Ceramics Lanka PLC in 1990. A Gem Merchant
by profession. Mr. Weerasinghe has been in the business field
for more than 37 years involved in Real Estate, Construction,
Transportation & Hospital Industry and has been a Landed
Proprietor. In addition to the above, he is the Chairman of
Singhe Hospitals PLC, Weerasinghe Property Development
(Pvt) Ltd., Trade Huts (Pvt) Ltd. and Weerasinghe Gems (Pvt)
Ltd, and the Deputy Chairman of Royal Ceramics Lanka PLC,
Lanka Tiles PLC., and Lanka Walltiles PLC. He also serves as
a Director of Swisstek (Ceylon) PLC and Swisstek Aluminum
Limited.
Mr. J A P M JayasekeraManaging Director
Mahendra Jayasekera is the Managing Director of Lanka
Walltiles PLC, Lanka Tiles PLC, Swisstek (Ceylon) PLC and
Swisstek Aluminium Limited. He is the Chairman of Sri Lanka
Cost and Management Accounting Standards Board. He
has an honours degree in Business Administration from the
University of Sri Jayewardenapura and is a fellow member of
the Institute of Chartered Accountants of Sri Lanka. He holds a
Post Graduate Diploma in Buddhist Studies (Distinction Pass)
from the Post Graduate Institute of Pali and Buddhist Studies,
University of Kelaniya. He has just completed Master of Arts in
Buddhist Studies from the Post Graduate Institute of Pali and
Buddhist Studies, University of Kelaniya and awaiting results.
He has served as both executive and non-executive director of
many other listed and unlisted Companies. He is the President
of Colombo Young Men’s Buddhist Association.
Dr. S Selliah (MBBS, M.Phil)
Director
Dr. Selliah holds an MBBS degree and a Master’s Degree
(M.Phil). He has over two decades of diverse experience in
varied fields including Manufacturing, Healthcare, Insurance,
Logistics, Packaging, Renewable Power , Plantation, Retail etc.
He serves on the Boards of many Public listed and Private
companies.
Dr. Selliah is currently the Deputy Chairman of Asiri Hospital
Holdings PLC, Asiri Surgical Hospital PLC, Central Hospitals
Private Ltd, and Chairman of JAT Holdings PLC. Some of the
other listed companies he currently serves as a Director are
: Commercial Bank of Ceylon PLC, Lanka Walltiles PLC, ACL
Cables PLC, HNB Assurance PLC, Lanka Tiles PLC, Softlogic
Holdings PLC, Odel PLC, Swisstek (Ceylon) PLC. He has
also served on many other Boards in the past. Currently, he
also serves as a Member or Chairman of many Board sub
committees such as : Human Resource and Remuneration
Committee, Related party Transaction Committee, Audit
Committee, Investment Committee, Strategic Planning
Committee, and Risk management Committee.
Dr. Selliah has served as a Senior Lecturer in the Faculty of
Medicine, University of Kelaniya for many years in the past and
served on several committees. He has also been Head of the
Department of Physiology for many years during this period at
the Faculty.
Mr. T G ThoradeniyaDirectorMr. Thoradeniya has over two decades of senior management experience in multi- industry scenarios. He is the Group Director Marketing and Business Development of Royal Ceramics Lanka PLC. He sits on the Boards of several public quoted and privately held companies, including Lanka Ceramics PLC, Lanka Walltiles PLC, Lanka Tiles PLC, Hayleys Fibre PLC, Delmege Ltd, Vallibel Plantation Management Ltd, Dipped Products (Thailand) Ltd, Unidil Packaging (Pvt) Ltd, Fentons Ltd and Swisstek Aluminium Ltd, among others. He has been credited as a proven business innovator across industries. A marketer by profession, he was in the pioneering batch of Chartered
Marketers of the Chartered Institute of Marketing (UK).
Annual Report 2021/22 | 21
Mr. K D G GunaratneDirectorMr. Gunaratne studied at St. Thomas’ College Mt. Lavinia and was a member of the Western Province Council during the period 1989 to 2009. He currently holds the position of Chairman Lanka Hotels & Residences (Pvt) Ltd and Urban Investments & Development Company (Pvt) Ltd.
He also serves as a Director of Lanka Tiles PLC, Lanka Walltiles PLC, Lanka Ceramic PLC, Dipped Products PLC, Swisstek (Ceylon) PLC, Singer Industries Ceylon PLC and Regnis Lanka PLC and as an Alternate Director at Horana Plantations PLC.
Ms. A M L PageDirectorMs. Anjalie Page holds a BSc (Hons) Psychology (First Class) from the University of Nottingham, United Kingdom and a MSc in Economics, Finance and Management (Distinction) from the University of Bristol, United Kingdom.
Ms. Page has been employed at several institutions in Sri Lanka and overseas.
Mr. J A N R AdhihettyDirectorMr. Amrith Adhihetty has full membership of CPA, Australia and holds a B Com degree from University of Macquarie, Sydney, Australia. After completing his studies has worked as a Financial Analyst at Hitachi Data Systems Australia Pty Ltd prior to returning to Sri Lanka.
Mr. Adhihetty has a wide range of experience in business development, financial reporting, business restructuring and marketing with a demonstrated ability to synthesize technical analysis into business insights.
Presently he is attached to Delmege Forsyth & Co. Ltd as a Director.
Mr. S M LiyanageDirectorMr. Liyanage is a respected professional with over 8 years’ experience and a record for exceptional performance. He has demonstrated transformational leadership in business transformation for the companies under the Vallibel One PLC Group. He has a degree in Bachelor of Science in Industrial Management and Statistics from the Wayamba University of Sri Lanka and Master of Business Administration from University of Kelaniya. He holds a Diploma in Information Technology from University of Colombo.
He currently serves as an Group Director- Continuous Improvement and Research at Vallibel One PLC, where he is responsible for business strategic planning, supply chain development, developing new business and coordinating manufacturing excellence projects at the Vallibel Group of Companies. He currently serves on the Board of Directors of Royal Ceramics Lanka PLC, Lanka Walltiles PLC, Lanka Ceramics PLC, Swisstek Aluminium Limited, Uni Dil Packaging Limited and Horana Plantation PLC. He was certified as a Lean Six Sigma Black Belt and has trained as a Lean Six Sigma Master Black Belt. He was also declared as a certified TPM practitioner and has a publication on the topic of Lean Six Sigma 4.0 at the OELSS conference in Colombo. Mr. Liyanage is a Member of the Alumina Association of SSMI Asia and Global. He has participated in International Business and Management at MSU, Malaysia.
Mr. S R JayaweeraDirectorMr. S R Jayaweera was appointed to the Board of Lanka Tiles PLC on 9th October 2020. Mr. Jayaweera counts over two decades of experience in working for top corporates including several John Keells Group of Companies listed on the Colombo Stock Exchange. He brings with him years of expertise in the fields of Financial Accounting, Management Accounting, Hotel Management, Manufacturing, Retail, Audit and Compliance. He is also serves as a Non Executives Director on the Board of Lanka Walltiles PLC, Royal Ceramics Lanka PLC and Delmage Ltd.
Mr J R GunarateDirectorMr. J R Gunaratne counts 40 years of experience in Strategic Planning, Production & Distribution, Industrial Relations and Change Management in the Food & Beverage, Plantations and Leisure Sectors. During his career at John Keells Holdings PLC, he has held Directorships in several listed and private companies of the John Keells Group. He has been a Member of the Food Advisory Council of the Ministry of Health and a Member of the Council for Hotel & Tourism of the Employer’s Federation of Ceylon. He was the Founder Chairman of the Beverage Association of Sri Lanka.
Mr. G A R D PrasannaAlternate DirectorMr. Dimuth Prasanna was appointed as an Alternate Director to the Lanka Tiles Board on 10th October 2014. He has wide experience in various businesses and also in business management. He is the Chairman of L B Finance PLC and former Chairman of Pan Asia Banking Corporation PLC. And also the Managing Director of Wise Property Solutions (Pvt) Ltd. Further, he serves as a Director on the Boards of La Fortresse Private (Pvt) Limited and Delmege Group of Companies and Wise Homes (Pvt) Ltd.

22 | Lanka Tiles PLC
Senior Management
Mahendra Jayasekera
Managing Director
Prabhath Pupulewatta
Factory Manager
Tyrell Roche
General Manager (Finance)
Sajeewani Amarasinghe
Group Finance Manager
Daminda Perera
Group Head of Marketing
Nandajith Somaratne
Director - Manufacturing
Patrick Piyasena
Assistant General Manager
(Plant and Technical)
Anura Ratnayake
Group Business Development
Manager
Shirley Mahendra
Director - Group Marketing
Prasad Keerthiratna
Head of IT
Mr. Kapila Ranatunga
Group Commercial Manager
B A M Thilakasiri
Group Stores Manager
Athula Hewapathirana
Group HR Manager
Kaushalya Sudasinghe
Group Manager - Sales
Administration

Annual Report 2021/22 | 23
MANAGEMENT DISCUSSION & ANALYSIS
Defined by Crafting
Strategy 24
Materiality 26
Stakeholder Engagement 28
Strategic Value Creation 30
Principal Risks 32
Risk Overview 33
Operating Environment 35
Business Line Review 37
Capital Report 40
Financial Capital 41
Manufactured Capital 44
Human Capital 48
Social and Relationship Capital 51
Intellectual Capital 54
Natural Capital 56

24 | Lanka Tiles PLC
Strategy
Lanka Tiles PLC believes in taking well calculated strategic
decisions to enhance business growth. Being an industry leader
enjoying a majority market share in the tile industry in Sri Lanka,
we are trend-setters and the benchmark that is often followed
by our competition. Last year, we envisioned new strategic
Strategic
View points
Modern &
Fashionable
designsTarget new
segments
with unique
products
Strategic
View points
Multiple
customer
touch points
Modernise
awareness
campaign
Stronger distribution
network locally and
internationally
Only local
exporting
company
decisions mindful of the challenges faced by the industry, our
consumers and the nation. At the same time, we focused on
opportunities that have arisen in the midst of these challenges
for growth and expansion.
Need financial information for show revenue/growth of the
company over the last 5 years
Growth Mindset Expansion into international markets
Identifying gaps in the local tile industry to cater to needs
Introducing additional product lines complementary to our
business
Financial Stability Managing financial leverage
Effective working capital management
Expansion of funding capacity
KPI’s 2021/22 2020/21
Capital employed 13,999,278 11,884,608
Interest Cover 48.5 8.3
Gearing Ratio 12% 13%
Efficiency Automation and workflow streamlining
Investment in technology
Increasing employee productivity
KPI’s 2021/22 2020/21
Cost to income ratio (%) 2.21 1.28
Gross Profit Margin (%) 45 38
Operating profit margin (%) 31 22
ROE (%) 33 28
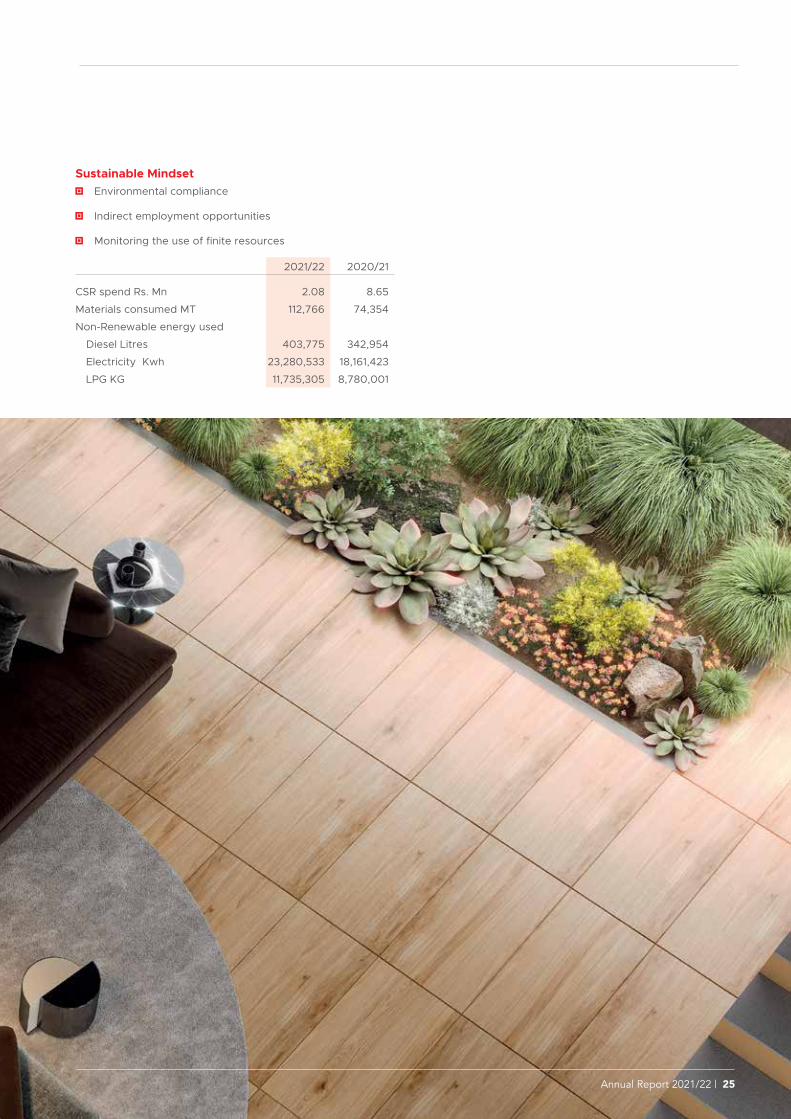
Sustainable Mindset Environmental compliance
Indirect employment opportunities
Monitoring the use of finite resources
2021/22 2020/21
CSR spend Rs. Mn 2.08 8.65
Materials consumed MT 112,766 74,354
Non-Renewable energy used
Diesel Litres 403,775 342,954
Electricity Kwh 23,280,533 18,161,423
LPG KG 11,735,305 8,780,001
Annual Report 2021/22 | 25

26 | Lanka Tiles PLC
Materiality
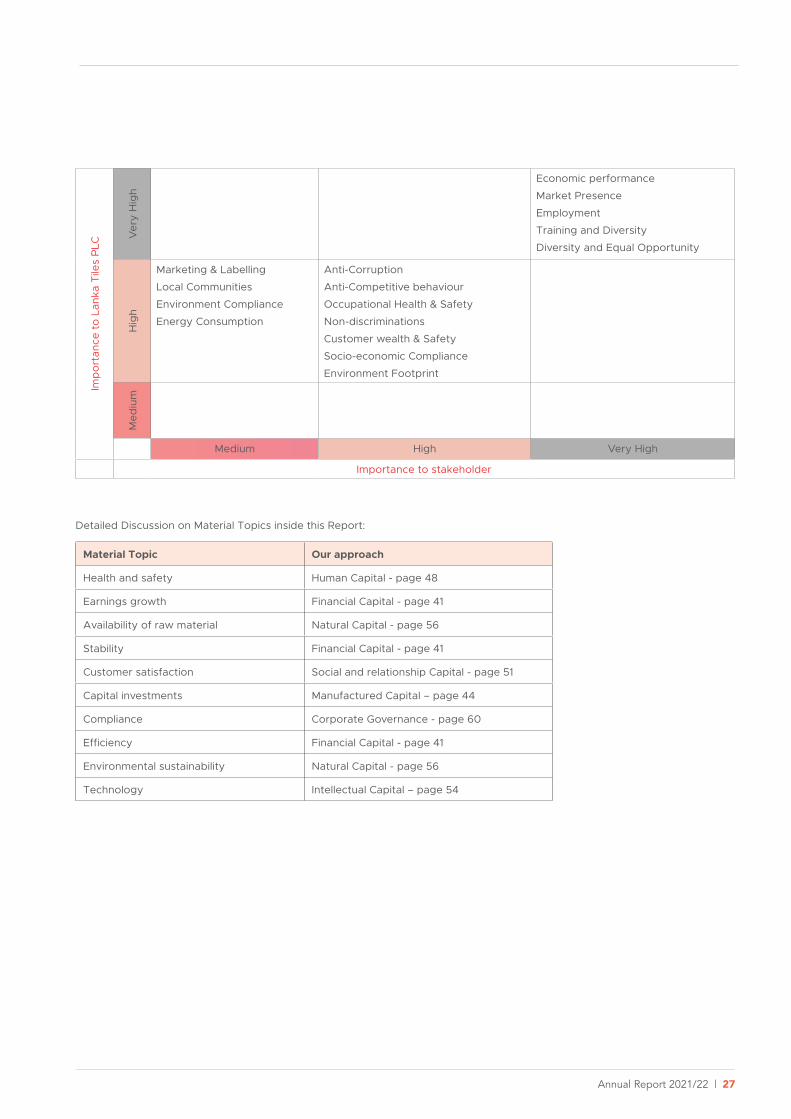
Lanka Tiles PLC materiality indicates how the company’s financial and non-financial factors contribute towards stakeholders as well
as their importance to Lanka Tiles. In this report, we indicate how well we have overcome material concerns through our strategies
and resource allocations.
To create economic, social and environment values Lanka Tiles has effectively engaged with the stakeholders in various ways
under ranging intensities as provided below:
Fina
ncia
l
Man
ufac
ture
d
Inte
llect
ual
Hum
an
Soci
al
Nat
ural
Importance to Lanka
Tiles
Importance to
Stakeholders
Economic
Economic performance Very High Very High
Market Presence Very High Very High
Anti-Corruption High High
Anti-Competitive behaviour High High
Social
Employment Very High Very High
Occupational Health & Safety High High
Training and Diversity Very High Very High
Diversity and Equal Opportunity Very High Very High
Non-discriminations High High
Customer Health and Safety High High
Marketing and Branding High Medium
Environment
Local Communities High Medium
Socio-economic Compliance High High
Energy consumption High Medium
Environment Footprint Medium Medium
Compliance with Environment High Medium
Annual Report 2021/22 | 27
Imp
ort
ance
to
Lan
ka T
iles
PLC
Ver
y H
igh
Economic performance
Market Presence
Employment
Training and Diversity
Diversity and Equal Opportunity
Hig
h
Marketing & Labelling
Local Communities
Environment Compliance
Energy Consumption
Anti-Corruption
Anti-Competitive behaviour
Occupational Health & Safety
Non-discriminations
Customer wealth & Safety
Socio-economic Compliance
Environment Footprint
Med
ium
Medium High Very High
Importance to stakeholder
Detailed Discussion on Material Topics inside this Report:
Material Topic Our approach
Health and safety Human Capital - page 48
Earnings growth Financial Capital - page 41
Availability of raw material Natural Capital - page 56
Stability Financial Capital - page 41
Customer satisfaction Social and relationship Capital - page 51
Capital investments Manufactured Capital – page 44
Compliance Corporate Governance - page 60
Efficiency Financial Capital - page 41
Environmental sustainability Natural Capital - page 56
Technology Intellectual Capital – page 54

28 | Lanka Tiles PLC
Stakeholder Engagement
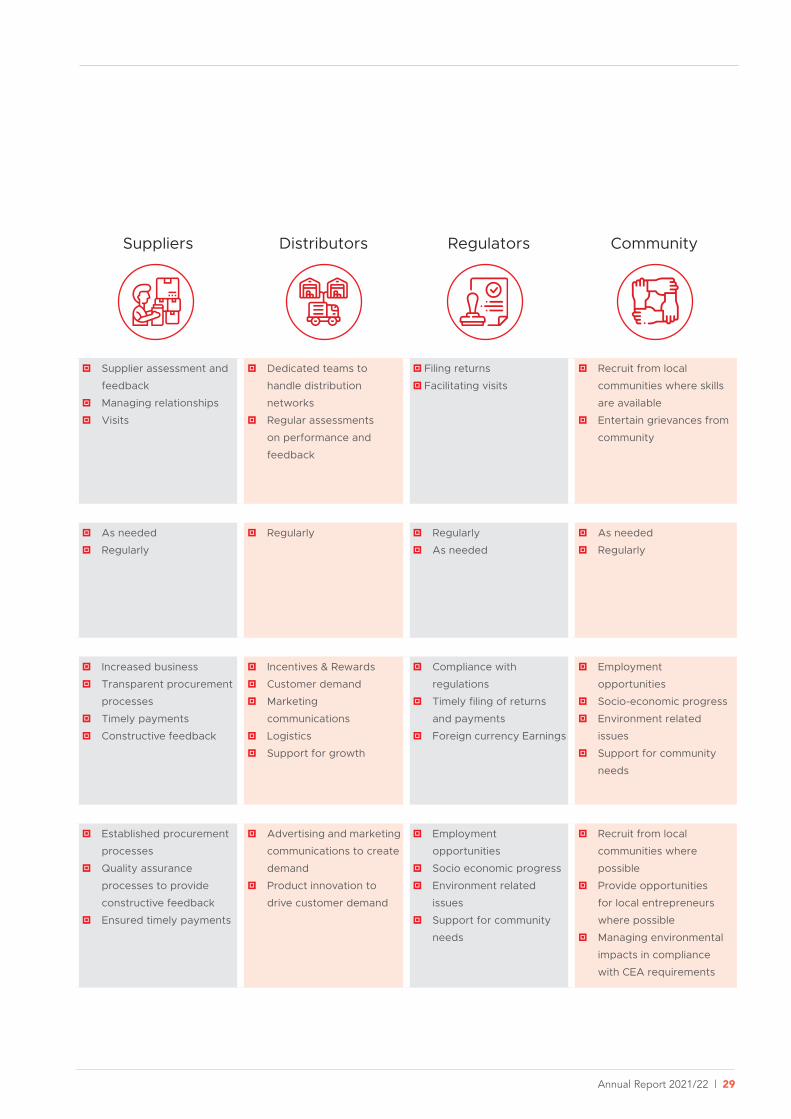
Lanka Tiles PLC believes that the success of our business relies on progressive stakeholder engagement. Our stakeholders are vital
in ensuring the seamless functioning of our business from sourcing to sales. We continuously communicate with our stakeholders
and consistently meet superior service excellence.
Method ofEngagement
Frequency of Engagement
Interest/Expectations
Managing concerns/
expectations
Direct interaction with
Senior Management
Formal performance
appraisals
Regular meetings with
unions
Communication of
company performance
Face to face interactions
at our own showrooms
Customer hotline
Trade Exhibitions
Customer feedback
Social media platforms
Call centre
Quarterly Financial
Statements
Press Releases
Annual Report
Annual General Meeting
CSE announcements
Supplier assessment and
feedback
Managing relationships
Visits
Dedicated teams to
handle distribution
networks
Regular assessments
on performance and
feedback
Filing returns
Facilitating visits
Recruit from local
communities where skills
are available
Entertain grievances from
community
Annually
As needed
Regular
Quarterly
Regular
24/7
Annually
As needed
Quarterly
As needed
Annually
As needed
Regularly
Regularly Regularly
As needed
As needed
Regularly
Fair remuneration
Employee benefits
Workplace health and
safety
Conducive workplace
Training & Development
Job security
Career progression
Value for money
Product quality
Choice of products
Availability and
accessibility
Earnings & Dividends
Growth prospects
Transparency
Environment & Social
impact
Governance
Share price and liquidity
Increased business
Transparent procurement
processes
Timely payments
Constructive feedback
Incentives & Rewards
Customer demand
Marketing
communications
Logistics
Support for growth
Compliance with
regulations
Timely filing of returns
and payments
Foreign currency Earnings
Employment
opportunities
Socio-economic progress
Environment related
issues
Support for community
needs
Benchmarked
remuneration packages in
line with the industry
Open door policy with
senior management
Fair and transparent
performance appraisal
system
Quality certifications
Product quality assurance
processes
Driving cost efficiencies
Managing price and
volume growth
Island-wide presence
Safeguarding our market
position
Improving manufacturing
capacity and efficiency
Corporate Governance
and Risk management
Established procurement
processes
Quality assurance
processes to provide
constructive feedback
Ensured timely payments
Advertising and marketing
communications to create
demand
Product innovation to
drive customer demand
Employment
opportunities
Socio economic progress
Environment related
issues
Support for community
needs
Recruit from local
communities where
possible
Provide opportunities
for local entrepreneurs
where possible
Managing environmental
impacts in compliance
with CEA requirements
Employees Customers Shareholders Suppliers Distributors Regulators Community
GRI 102-40, 102-41, 102-42, 102-43, 102-44
Annual Report 2021/22 | 29
Direct interaction with
Senior Management
Formal performance
appraisals
Regular meetings with
unions
Communication of
company performance
Face to face interactions
at our own showrooms
Customer hotline
Trade Exhibitions
Customer feedback
Social media platforms
Call centre
Quarterly Financial
Statements
Press Releases
Annual Report
Annual General Meeting
CSE announcements
Supplier assessment and
feedback
Managing relationships
Visits
Dedicated teams to
handle distribution
networks
Regular assessments
on performance and
feedback
Filing returns
Facilitating visits
Recruit from local
communities where skills
are available
Entertain grievances from
community
Annually
As needed
Regular
Quarterly
Regular
24/7
Annually
As needed
Quarterly
As needed
Annually
As needed
Regularly
Regularly Regularly
As needed
As needed
Regularly
Fair remuneration
Employee benefits
Workplace health and
safety
Conducive workplace
Training & Development
Job security
Career progression
Value for money
Product quality
Choice of products
Availability and
accessibility
Earnings & Dividends
Growth prospects
Transparency
Environment & Social
impact
Governance
Share price and liquidity
Increased business
Transparent procurement
processes
Timely payments
Constructive feedback
Incentives & Rewards
Customer demand
Marketing
communications
Logistics
Support for growth
Compliance with
regulations
Timely filing of returns
and payments
Foreign currency Earnings
Employment
opportunities
Socio-economic progress
Environment related
issues
Support for community
needs
Benchmarked
remuneration packages in
line with the industry
Open door policy with
senior management
Fair and transparent
performance appraisal
system
Quality certifications
Product quality assurance
processes
Driving cost efficiencies
Managing price and
volume growth
Island-wide presence
Safeguarding our market
position
Improving manufacturing
capacity and efficiency
Corporate Governance
and Risk management
Established procurement
processes
Quality assurance
processes to provide
constructive feedback
Ensured timely payments
Advertising and marketing
communications to create
demand
Product innovation to
drive customer demand
Employment
opportunities
Socio economic progress
Environment related
issues
Support for community
needs
Recruit from local
communities where
possible
Provide opportunities
for local entrepreneurs
where possible
Managing environmental
impacts in compliance
with CEA requirements
Employees Customers Shareholders Suppliers Distributors Regulators Community

30 | Lanka Tiles PLC
Strategic Value Creation
Our MissionCreating contemporary and fashionable lifestyles choices for our customers’ homes, while adding value to our stakeholders through
excellence is our success formula for strategic value creation. Relying on the strength of inherited values Lanka Tiles has ensured
that all stakeholders are beneficiaries and partners in our success.
Reliable
supply chain
and effective
engagement
State of art
manufacturing
facilities
Wide
distribution
network
Customer
engagement
Innovation in
production
portfolio and
operations
Portfolio to
reflect current
market trends
Economical FOREX of Rs. 642 Mn
Economic value added by the group was Rs. 7,415 Mn
Tax payments both direct and indirect amounted to Rs. 1,890 Mn
Environmental 36,205 TCO2 emissions
17,228 MT waste discharge
Non-renewable energy Electricity 23,280,533 KWH
LPG Kg 11,735,305 Diesel Litre 403,775
Society Community development projects 12,000 beneficiaries
Employment opportunities 730
Impacts

Annual Report 2021/22 | 31
Financial CapitalShareholder Funds Rs. 12,219 MnDebt Rs. 1,468 Mn
ShareholdersNet Assets per Share Rs. 46.07Earnings per Share Rs. 15.50
Manufactured CapitalOther Manufacturing Capital Rs 3 BnPlants and Machinery Rs. 2 Bn
EmployeesSalaries and wages Rs 1,316 MnCost of Health and safety at workplace
Rs. 13.2 Mn
Social & Relationship CapitalDistribution network of 803Suppliers 620
CustomersTiles manufactured 5.2 Mn Sq.mtNew designs 34
Human CapitalEmployees 730Training hours 2,846
SuppliersPayment to local
supplies Rs. 8,402 MnPayment to foreign
suppliers Rs. 2,287 Mn
Natural CapitalLand Value of Rs. 1.3 BnEnergy Consumed (Diesel)
403,775 Litres
GovernmentTaxes paid Rs. 1,890 MnForex income Rs. 642 Mn
Intellectual CapitalBrand Value of Rs 2,084 MnInvestments in
training Rs. 1,589 Mn
CommunityCSR spend Rs 2 MnJob opportunities 730
Input GRI 204 - 1Value Created to Stakeholders

32 | Lanka Tiles PLC
Risk GovernanceRisk governance plays a critical role
in helping to accomplish company
goals by controlling and making the
right decisions to manage risks.
The Board of Directors with the
assistance of the Board Audit
Committee governs and predicts
the risks that the company
may confront. The Company’s
Executive Committee reviews risk
frequently as part of their routine
agenda and provide the Audit
Committee and the Board with the
necessary papers. In terms of risk
management and risk reporting, we
follow the below structure.
Board of Directors
Audit Committee
Managing Director
Executive Committee
Operational Managers
Principal Risks
Risk is an inevitable factor in our business. Due to the nature
of our industry, we are reliant on goods and services for
manufacture and is influenced by external and internal
factors beyond our control. Lanka Tiles develop a three-year
strategic plan to overcome uncertainty and achieve our aims
and objectives in our business. During the year, we confronted
government policy changes, uncertainty in economic and
political conditions in Sri Lanka, rupee depreciation, government
restriction on some goods import, weather changes, labour-
related risks, and IT risks. We faced major risks due to unstable
economic and political environment. The major risks associated
with the Covid-19 pandemic remained throughout the year.
Our Enterprise Risk Management (ERM) strategy focuses on
reducing risk by improving performance and decision-making
through risk detection, evaluation, and management. Risks are
managed in four ways:
Identifying risks,
Evaluating risks,
Controlling and reporting risks,
Monitoring and reviewing risks.
Culture
Coverage
Risk Appetite
Governance & Policies
Measurement Evaluation and Communication
Risk Data and
Infrastructure
Control Environment
Response
Stress Testing
The Lanka Tiles risk management process can be explained by the three lines of
defense concept of risk management as given below.
First Line
Responsibility Day to day identification, assessment, management and reporting of all risks within control.
Ensuring risk exposures remain within limits.
Accountability Executives and supervisors
Second Line
Responsibility Transparent and well communicated risk policies together with an effective monitoring system.
Providing assurance that risks are being managed across the business.
Accountability Corporate management team
Third Line
Responsibility Independent assurance and oversight on the effectiveness of the risk management system and internal control.
Accountability The Board of Directors
Annual Report 2021/22 | 33
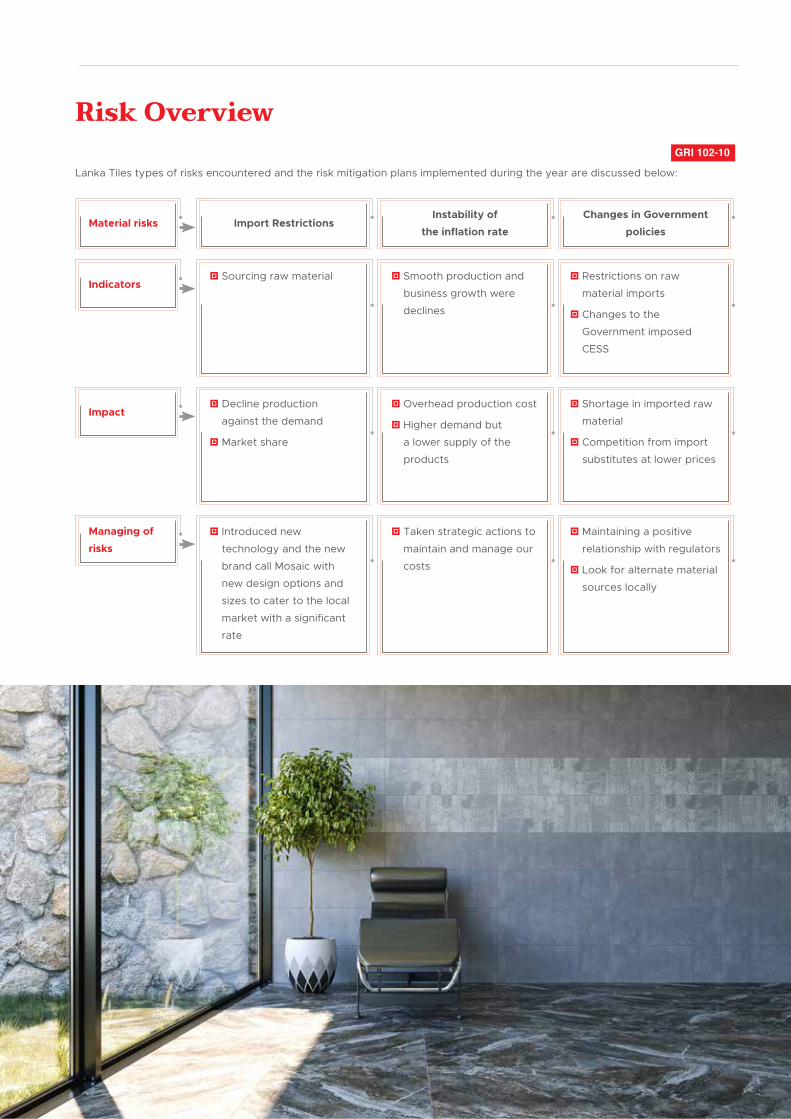
Risk Overview
Material risks Import Restrictions
Sourcing raw material
Decline production
against the demand
Market share
Introduced new
technology and the new
brand call Mosaic with
new design options and
sizes to cater to the local
market with a significant
rate
Instability of
the inflation rate
Smooth production and
business growth were
declines
Overhead production cost
Higher demand but
a lower supply of the
products
Taken strategic actions to
maintain and manage our
costs
Changes in Government
policies
Restrictions on raw
material imports
Changes to the
Government imposed
CESS
Shortage in imported raw
material
Competition from import
substitutes at lower prices
Maintaining a positive
relationship with regulators
Look for alternate material
sources locally
Indicators
Impact
Managing of
risks
Lanka Tiles types of risks encountered and the risk mitigation plans implemented during the year are discussed below:
GRI 102-10
34 | Lanka Tiles PLC
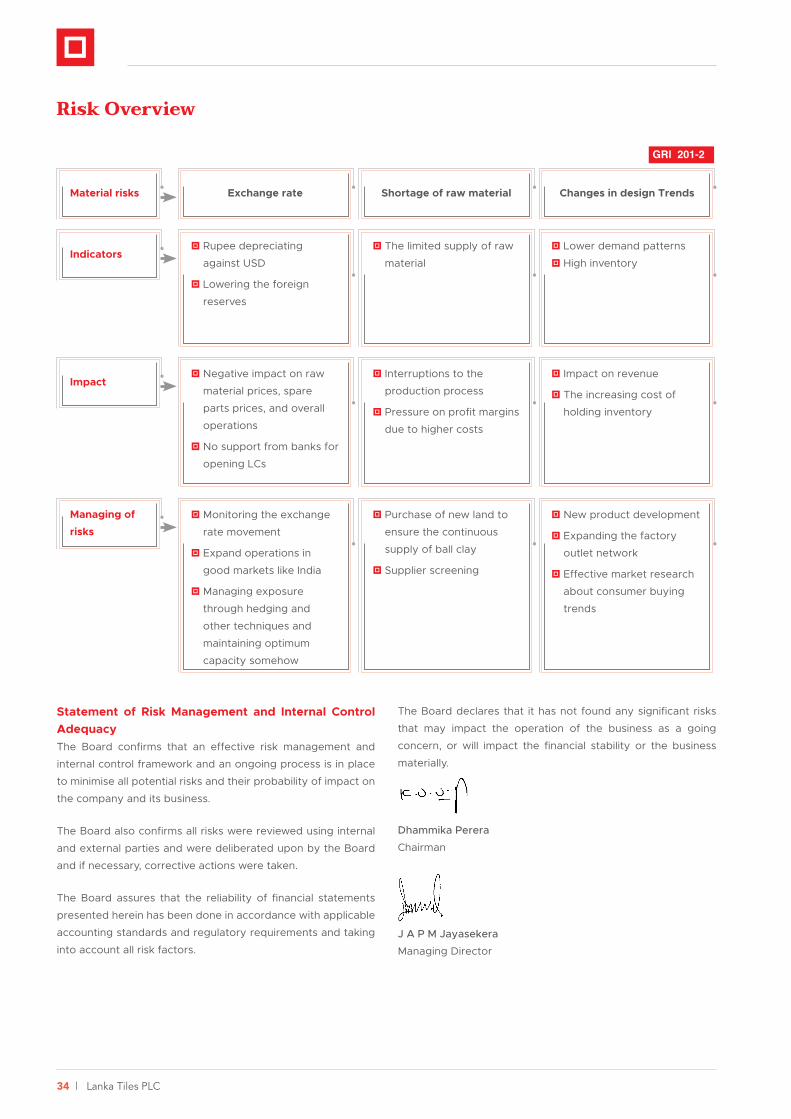
Risk Overview
Material risks Exchange rate
Rupee depreciating
against USD
Lowering the foreign
reserves
Negative impact on raw
material prices, spare
parts prices, and overall
operations
No support from banks for
opening LCs
Monitoring the exchange
rate movement
Expand operations in
good markets like India
Managing exposure
through hedging and
other techniques and
maintaining optimum
capacity somehow
Shortage of raw material
The limited supply of raw
material
Interruptions to the
production process
Pressure on profit margins
due to higher costs
Purchase of new land to
ensure the continuous
supply of ball clay
Supplier screening
Changes in design Trends
Lower demand patterns
High inventory
Impact on revenue
The increasing cost of
holding inventory
New product development
Expanding the factory
outlet network
Effective market research
about consumer buying
trends
Indicators
Impact
Managing of
risks
Statement of Risk Management and Internal Control Adequacy The Board confirms that an effective risk management and
internal control framework and an ongoing process is in place
to minimise all potential risks and their probability of impact on
the company and its business.
The Board also confirms all risks were reviewed using internal
and external parties and were deliberated upon by the Board
and if necessary, corrective actions were taken.
The Board assures that the reliability of financial statements
presented herein has been done in accordance with applicable
accounting standards and regulatory requirements and taking
into account all risk factors.
The Board declares that it has not found any significant risks
that may impact the operation of the business as a going
concern, or will impact the financial stability or the business
materially.
Dhammika Perera
Chairman
J A P M Jayasekera
Managing Director
GRI 201-2
Annual Report 2021/22 | 35
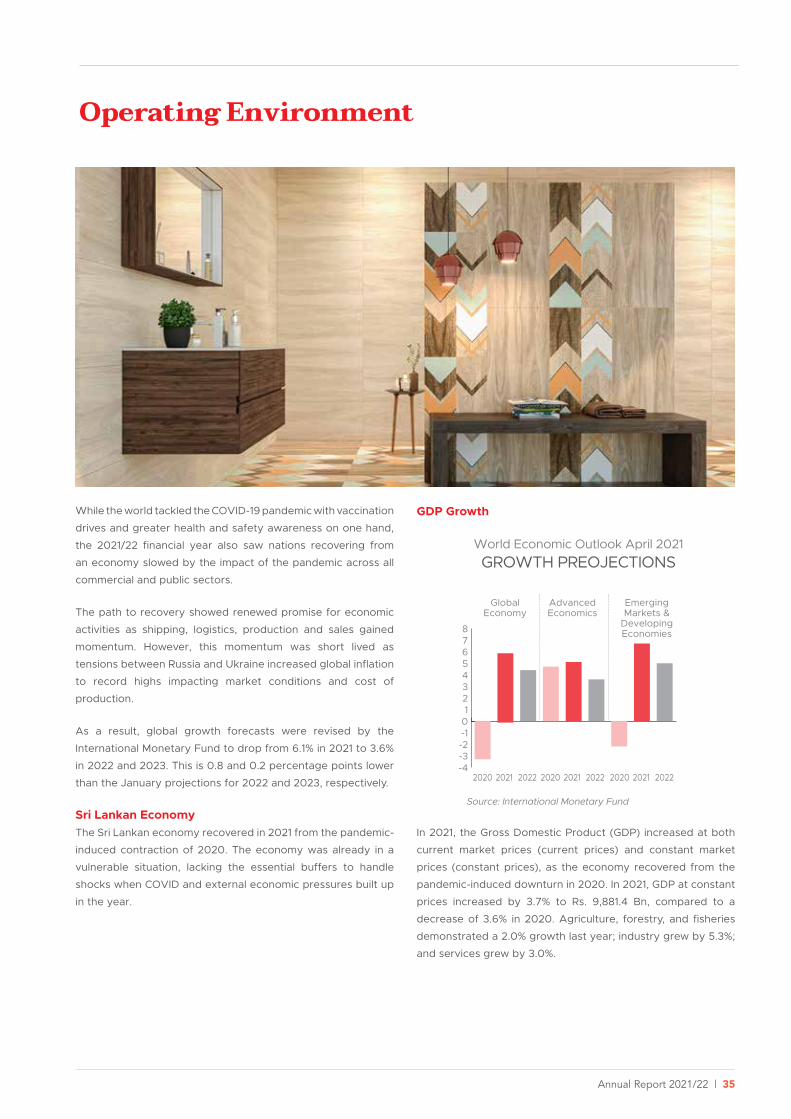
Operating Environment
While the world tackled the COVID-19 pandemic with vaccination
drives and greater health and safety awareness on one hand,
the 2021/22 financial year also saw nations recovering from
an economy slowed by the impact of the pandemic across all
commercial and public sectors.
The path to recovery showed renewed promise for economic
activities as shipping, logistics, production and sales gained
momentum. However, this momentum was short lived as
tensions between Russia and Ukraine increased global inflation
to record highs impacting market conditions and cost of
production.
As a result, global growth forecasts were revised by the
International Monetary Fund to drop from 6.1% in 2021 to 3.6%
in 2022 and 2023. This is 0.8 and 0.2 percentage points lower
than the January projections for 2022 and 2023, respectively.
Sri Lankan EconomyThe Sri Lankan economy recovered in 2021 from the pandemic-
induced contraction of 2020. The economy was already in a
vulnerable situation, lacking the essential buffers to handle
shocks when COVID and external economic pressures built up
in the year.
GDP Growth
-4-3-2-1012345678
2020 2021 2022 2020 2021 2022 2020 2021 2022
World Economic Outlook April 2021GROWTH PREOJECTIONS
GlobalEconomy
AdvancedEconomics
EmergingMarkets &
DevelopingEconomies
Source: International Monetary Fund
In 2021, the Gross Domestic Product (GDP) increased at both
current market prices (current prices) and constant market
prices (constant prices), as the economy recovered from the
pandemic-induced downturn in 2020. In 2021, GDP at constant
prices increased by 3.7% to Rs. 9,881.4 Bn, compared to a
decrease of 3.6% in 2020. Agriculture, forestry, and fisheries
demonstrated a 2.0% growth last year; industry grew by 5.3%;
and services grew by 3.0%.

36 | Lanka Tiles PLC
Operating Environment
InflationDue to global and domestic supply-side disruptions, headline inflation rose in 2021. The core inflation grew owing to a surge in global commodity prices, upward revisions in administered prices and strong monetary accommodation. The increase in headline inflation was due to both food and non-food inflation, as evidenced by the year-on-year change in the National Consumer Price Index (NCPI, 2013=100) and the Colombo Consumer Price Index (CCPI, 2013=100), although food inflation accounted for a higher share.
Exchange RateThe Sri Lanka Rupee’s yearly depreciation against the US dollar was limited to 7.0 % by the end of 2021, helping to offset the negative implications of excessive devaluation at a time when the economy was recuperating from the pandemic’s impact.
During 2021, the Sri Lanka Rupee appreciated against the Japanese Yen (3.8%) and the Euro (1.1%), but sank against the Pound Sterling (6.0%) and the Indian Rupee (5.5%), indicating cross currency exchange rate fluctuations.
The pressures on the exchange rate observed in 2021 and early 2022 as a result of poor liquidity in the domestic foreign exchange market required adjustment in the exchange rate as was implemented in early March 2022. However, significant liquidity pressures in the domestic foreign exchange market as well as market correction delays continued to depreciate the Sri Lanka Rupee (LKR) against the US Dollar (USD).
Construction SectorConstruction value-added increased by 1.9% in 2021, recovering from a drop of 13.2% in 2020, boosted by revived demand for real estate and housing and the resumption of projects.
However, a raw material shortage hampered the full recovery. In terms of construction-related metrics, total cement availability in the country decreased somewhat in 2021, while building material imports increased.
As at the end of December 2021, Licensed Commercial Banks (LCBs) boosted their lending to the private sector for construction projects, including personal housing construction, indicating a greater availability of cash for construction. However, the third wave of the pandemic, which lasted through the second and third quarters of the year and caused disruptions in global and local supply chains, had a negative impact on construction projects.
According to the Central Bank, supply-side disruptions, particularly shortages of essential raw materials such as cement, steel, and tiles, as well as quick price increases, hampered the industry’s full potential.
However, import restrictions and high cost of imported construction material such as tiles, bath-ware and sanitary ware
2017 2018 2019 2020 2021
3.63.3
2.3
-3.6
3.7
RealEconomic
GrowthRate
%
Source: CBSL Annual Report 2021
Agriculture6.9%
Taxes lessSubsidies
8.9%
Gross ValueAdded
91.1%
Industry25.9%
Services58.3%
Constant(2010) Prices
Source: CBSL Annual Report 2021
increased the demand for locally manufactured products. As a result, higher prices could be demanded on available local products while demand increased production as well.
OutlookWith uncertainly on economic, social and political fronts looming, the growth potential of the country is yet to be assessed. Increased international debt, widening balance of payments gap, rising exchange rate coupled with state policies to restrict imports, rationalise fuel and gas issued for domestic and industrial use are concerns to consider for the future.
Domestic manufacturing is also becoming a challenge due to lack of raw material arising from import restrictions and increasing cost of production under the high inflation scenario.
However, exports will remain the most promising area of growth for Lanka Tiles PLC. Expansions into overseas markets with new products is being aggressively promoted by the company while setting up production facilities overseas is under consideration.

Annual Report 2021/22 | 37
Business Line Review
Our CapabilitiesStarting out as an export-oriented venture, Lanka Tiles have achieved the industry leader position amongst local manufacturers
as the number one tile maker in the Sri Lanka. We have a wide range of designs, textures, and sizes that cater to the different
market segments we operate in. Lanka Tiles export sales revenue for the year was at Rs.642 Mn and domestic sales revenue was
at Rs.13,950 Mn.
Market ShareDomestic Market share
Floor Tiles 38%
International Markets
USA, Australia
Singapore, India, Canada, Maldives
Social and Relationship
CapitalNew Suppliers
Tax payments
RS.1,890 MnNew jobs - 135New Tilers - 67
Investment for CSR 2 MnNew franchise showrooms - 4
High Customer Satisfaction
Financial CapitalRevenue
Rs. 14,592 MnAsset Turnover
Rs. 86%ROA
Rs. 24%
Intellectual & Manufactured
CapitalPlant and Machinery - Rs. 2 Bn
New Designs - 34CapEx - Rs. 369 Mn
Brand Value - Rs 2 Bn
Human CapitalInvestment for Training &
Development
Rs. 1.59 Mn
Natural CapitalEnergy saving 550 KWH
Water recycling 2.6 Mn LitresCompliance and quality
Low Wastage
13,292 MT Recycled
Track Co2 emission consumption
36,205
ProcurementLanka Ceramic PLC and other
local and foreign suppliers
ManufacturingLankatiles PLC
Factories at Jalthara, Ranala
DistributionOwn showrooms
Franchise showroomFactory outletsDirect dealersDistributorsSub dealers
WarehousingBiyagamaGonawala
NarahenpitaNawala
GRI 102-9

38 | Lanka Tiles PLC
Business Line Review
To the economy To the environment To the community To the people
Rs.14,592 Mn revenue Rs.4,110 Mn PAT Rs.642 Mn export income Rs.1,890 Mn taxes paid by
the company
112,766 MT material consumed
Energy saved; Water 2,127,584 Litres Electricity Kwh 550
730 jobs created Rs. 2 Mn spent on CSR Infrastructure development
Rs.40 Mn value Direct and Indirect
employment opportunities
135 new recruits Rs. 13.2 Mn spent on
employee health and safety
Rs. 1,589 Mn spent on training and development
Future Outlook
OUTLOOK THREATS OPPORTUNITIES
Introducing new types of machinery to increase capacity and reduce waste of water
Focus on introducing new tile designs and expanding our business to new areas such as kitchen sink, aluminium, sheets kitchen sink, aluminium, and sheets
Collaborative agreements with suppliers to enhance our supply chain
Growing the exporting business (India, USA)
Consider alternative material sources locally
Health and safety implications Shortage of raw materials as a result
of the export limitations Depreciation of the LKR
Increased demand arising from restrictions on importing of tiles, steel etc in the local construction industry
Being the only local tile manufacturer who do exports
Selection of new raw material suppliers
Contribution to top line distribution network
Method Value
Own showrooms 2
Factory outlets 19
Franchise showrooms 49
Dealers 43
Distributors 30
Performance
Revenue
Rs. ‘000
Operating Profit
Rs. ‘000
Net Profit
Rs. ‘000
19/20 6,694,824 1,026,965 581,945
20/21 12,626,485 2,775,596 2,450,894
21/22 14,591,620 4,545,765 4,110,316
Profit Margins
GP OP NP
19/20 36% 15% 9%
20/21 36% 22% 19%
21/22 45% 31% 28%

Annual Report 2021/22 | 39
Despite the year being difficult, Lanka Tiles grew exponentially
both in terms of brand equity and profitability. Our reputation
as a credible local tile maker in Sri Lanka, increased our top
line by 16% over previous year’s Rs. 12,626 Mn. We peaked
our production capacity by reinforcing our manufacturing with
new machinery and strengthened our trust with stakeholders
through investment in relationships.
We improved our export revenues during the financial year with
our Mosaic range which targets the United States and Mexico,
and is marketed via our online partners Amazon and Wayfair.
Lanka Tiles export revenue increased by 73%, contributing
to the total revenue increase of 16 % to Rs. 14,591.62 Mn. We
sustained our operations without disruptions resulting in an
increase in gross profit margin of Rs. 1,863 Mn from Rs. 4,746
Mn last year.
Total Productive Maintenance (TPM) contributed to a significant
cost reduction of Rs.192 Mn. Operating profits increased by
64% to Rs.4,545 Mn, due to improved profit margins and top-
line growth.
Lanka Tiles Group total capital expenditure was recorded at
Rs.433 Mn, while total non-current assets improved to Rs.8,592
Mn. Total inventory at the end of the 2021/22 financial year
ending 31st March 2022 was Rs. 2,473.8 Mn up from Rs. 2,322.2
Mn last year.
40 | Lanka Tiles PLC
Capital Reports
Financial Capital
We use Financial Capital to create, grow and secure other capitals in order to deliver returns to our stakeholders
Our capitals are the input in our business process.
Optimal management of these capitals is key to managing stakeholder expectations.
Capitals can be consumed, enhanced, or modified in the process of value creation.
Our Capitals Report sets out a brief description of and description of how its utilised within our business journey. We recognise that managing one capital would have an impact on another and strive to manage the inter-dependencies in an optimal manner.
Manufactured Capital
Manufactured capital is the physical asset base through which value is created to fulfil stakeholder requirements.
Human Capital
We value our Human Capital and continuously invest in enhancing skills and capability of our team to ensure their personal and professional growth.
Social and Relationship Capital
Social and Relationship capital focuses on the relationships within and between communities, stakeholders and other networks and the ability to enhance individual and collective well-being
Intellectual Capital
Intellectual capital consists of our knowledge, skills and expertise, systems and processes and brand value, giving us the competitive edge over others.
Natural Capital
Our responsible approach to Natural capital has helped us in minimising impact to the environment while complying with all the statutory requirements.

Annual Report 2021/22 | 41
Financial Capital
Highlights Topline growth of
> Export Sales: Rs. 642 Mn
> Local Sales : Rs.13,950 Mn
Bottom line growth
> Improved profit margins by 68%
> Record highest profit of Rs. 4,110 Mn
Lanka Tiles PLC’s Financial Capital reflects the Company’s
financial position, profitability and performance during the
year, providing shareholders and the management with a
comprehensive understanding of the success rate of the
efforts and strategies implemented in the financial year under
review. It also serves as an indicator for future strategies and
financial planning.
Prudent financial management is vital for the existence of the
Company and the creation of shareholder wealth. Lanka Tiles
PLC has set in place a formal system of financial governance
and internal controls to handle possible financial risks that may
arise from external and internal circumstances.
Profitability 2021/22 2020/21 Change
Revenue Rs. Mn 14,592 12,626 15.56%
Operating profit Rs. Mn 4,546 2,776 63.78%
Profit after tax Rs. Mn 4,110 2,451 67.69%
ROE 34% 28% 21.43%
Efficiency 2021/22 2020/21 Change
GP margin 45% 38% 18.40%
Asset turnover 86% 89% (3.37%)
Working capital turnover 2.7 3.4 (20.59%)
Stability 2021/22 2020/21 Change
Current ratio 2.88 2.57 12.06%
Gearing 12% 13% 7.69%
Equity Rs. Mn 12,154 9,927 22.43%
Growth 2021/22 2020/21 Change
Total assets Rs. Mn 16,926 14,248 18.79%
CapEx Rs. Mn 610 433 40.88%
PPE Rs. Mn 6,471 6,374 1.52%
Financial Capital
42 | Lanka Tiles PLC
Revenue In the year under review, we reported a revenue of Rs. 14,592 Mn, a 16% increase compared with last year’s revenue of Rs. 12,626 Mn.
Export sales accounted for Rs. 642 Mn whilst domestic sales generated Rs. 13,950 Mn in sales revenue. Recently introduced range of mosaic tiles have attracted a healthy demand from export countries such as the United States which has led to the increased revenue from export market sales. This was a significant growth in export revenues of 73% in the year from Rs. 371 Mn reported last year.
On the domestic front, revenues increased on insufficient local supply for demand that helped Lanka Tiles PLC to reduce inventories and optimise market demand. The production units were operational throughout the year to support the high demand during the financial year. However, with import restrictions being imposed on all non-essential sectors and higher foreign exchange pressures in the economy, the Company has faced challenges towards the latter part of the year in sourcing production material and obtaining furnace fuels for manufacture.
Productivity and ProfitabilityThe Financial Year 2021/22 was the most productive and profitable year ever, the best year we have had in the last 20-30 years. Despite the COVID-19 situation prevailed in the country, our Company achieved production exceeding the operational capacity of the Company due to the enhancement of employee efficiency. This paved the way for higher sales which directly led to achieve better profits during the year. Thus, gross profit margin in Financial Year 2021/22 increased by 40% over last year reporting a gross profit of Rs. 6,609 Mn. Lanka Tiles PLC profit after tax grew by 68% in the year to report Rs. 4,110 Mn from Rs. 2,451 Mn last year.
As a result of the savings achieved through TPM and other initiatives, the operating profit increased by 64% from Rs.2,776 Mn to Rs.4,546 Mn.
Lanka Tiles PLC was able to settle long-term debt from higher topline, resulting in a significant reduction in interest expenses of 61%. This reduced finance expense from Rs. 224 Mn to Rs. 88 Mn during the year.
Asset Base and Funding ProfileTotal assets of the company increased by 19% to Rs.16,926 Mn. The Company made capital investments in property, plant, and equipment which increased asset value to Rs. 6,471 Mn.
Inventory increased by 7% over last year, indicating a 16.43% of growth in raw materials.
Due to strong topline growth, cash and cash equivalents increased to Rs.4,936 Mn, up from Rs.2,330 Mn last year.
Liabilities and EquityTotal liabilities were marked by Rs. 4,315 Mn to Rs.4,699 Mn, as a result of long-term borrowings which reduced by 28%. The increase of deferred tax liability is 17%.
The total equity increased by 23% to Rs. 12,219 Mn. Due to the decrease of borrowings and influx of more shareholder funds, the debt in equity ratio decreased to 12% from 13% in previous years.
Cash flow management Cash and cash equivalents indicated a growth of Rs.4,936 Mn from Rs. 2,330 Mn the previous year. Operating activities provided a high cash flow of Rs.4,782 Mn with a current ratio of 2.9, up from 2.6 in the previous year.
The capital expenditure incurred throughout the year resulted in a cash outflow of Rs. 700 Mn from investment activities. The payment of debt & dividend accounted for Rs.2,139 Mn in cash outflow from finance activities & dividend.
Profit before Tax (PBT) There was a growth in PBT from Rs.2,854 Mn to Rs.5,037 Mn in the financial year as a result of increased gross profit and finance income. The amount spent on distribution and administrative costs grew slightly. Financial costs for the year were Rs. 88 Mn, lower from Rs. 224 Mn in the last year. Net finance expenses had a 141% decrease because of the interest expenses on an overdraft, bank loans, and decreased finance charges on lease along with the increase in interest income.
Profit after Tax Profit after tax increased to Rs.4,110 Mn for the year even though income tax expenses increased this year from Rs. 404 Mn to Rs. 927 Mn.
Capital Structure The Group’s capital structure remain unchanged compared to previous year as the debt-to-equity ratio declined to 12%, up from 13% the previous year. During the year, shareholder equity increased by 23% to Rs.12,219 Mn due to growth in retained earnings. The Group’s reported capital remained constant.
Financial Capital

Annual Report 2021/22 | 43
Revenue GrowthYear Revenue –
Export SalesRevenue –
Local SalesRevenue -
Total
19/20 108,622 6,586,202 6,694,824
20/21 370,670 12,255,815 12,626,485
21/22 641,961 13,949,659 14,591,620
Interest-bearing borrowings Year Long term
BorrowingsShort term
Borrowings
19/20 1,270,881 2,342,350
20/21 971,206 321,727
21/22 705,420 762,392
Profitability Year Gross Profit Operating
ProfitNet Profit
19/20 2,416,027 1,026,965 581,945
20/21 4,746,103 2,775,596 2,450,894
21/22 6,608,922 4,545,765 4,110,316
Asset Composition Year PPE Investments in
AssociatesInventories Cash and
EquivalentsTrade and other
Receivables
19/20 5,974,804 1,005,793 4,780,594 76,741 1,003,662
20/21 6,373,888 1,339,684 2,322,116 2,329,621 1,026,460
21/22 6,471,179 1,563,428 2,473,794 4,936,501 910,523
Funding Profile Year Shareholders’
FundBorrowings
19/20 7,872,774 3,613,231
20/21 9,927,081 1,292,933
21/22 12,219,323 1,467,812

44 | Lanka Tiles PLC
Manufactured Capital
Highlights Investments in plant and machinery Rs.3 Bn
Value of current plant, machinery, vehicles Rs.5 Bn
Showroom, Branch network 803
Total Production capacity 5.1 Mn sq.m
Capacity utilisation 97.21%
Entering in to a Tier One ERP Solution for the Group with
SAP S4HANA
Our manufactured capital consists of the buildings, plant and
machinery, tools and equipment, showrooms in addition to fixed
and tangible assets that are essential in the manufacturing to
sales cycle. As a vital aspect of our business, we continuously
invest in upgrading and maintaining our manufactured capital,
whilst ensuring their contribution towards the value creation
processes. Ensuring our production plants and machinery are
in keeping with the latest technology and meeting the industry
and consumer demand needs and that our sales outlets are
inviting and demonstrative of the high quality of our products
is important in planning our manufactured capital.
Manufactured Capital (RS Mn)
2021/22 2020/21
Value of PPE 6,147 4,950
CAPEX 369 505
Manufacturing FacilityOur manufacturing facility in Ranala is equipped with the top
of the range machinery from Italy and consists of a total floor
area of 16,250 square meters. We have invested Rs.369 Mn
in upgrading and expanding our manufacturing facility during
the 2021/22 Financial Year Despite the pandemic, the facility
operated at a 97.21% capacity utilisation.
SAP S4HANA
ERP
Solution
Production
Capacity
5.1 Mn Sq.m
Capacity
Utilisation
97.21%
Machinery &
Equipment
Rs.2,972 Mn
Value of PPE
Rs. 6,147 Mn
Showroom,
Branch
Network
803
Manufactured Capital
Proposed expansions to the facility include expanding the
kiln to support the increase in tile production capacity and
increased design variety.
2021/22
Rs’000Additions Depreciation
Net Book Value
Buildings 13,032 36,482 1,409,123
Plants & Machinery 247,326 294,002 2,972,958
Furniture & Fittings 87,841 61,652 224,316
Electrical Distribution Scheme
11,847 27,724 180,684
Motor Vehicle - 6,109 13,715
Other 9,434 7,146 46,195
Total 369,480 433,115 4,846,991
Showroom and Branch NetworkOur outlets are situated across the country where our items are
easily accessible to our customers. Approximately 30%-40% of
our production is sold in the western province.
Export destinations over the worldWe have also expanded our business overseas where our brand
is welcomed and recognised. Our main export destination is
Australia with significant presence also in USA, Canada, Japan,
and some Asian nations.
Manufactured CapitalGRI 203-1

Annual Report 2021/22 | 45
50
LANKATILES Showrooms
LANKATILES Factory Outlets
19
48
1
49
12
27 28 31
28
23 29
28
6 24
8 9
28
10
28
35
28
41
28
33
28
22
28
39
28
17
28
18
28
15
28
37
28
5
28
32
28
14
28
13
28
2
3
4
7 11
45
16
20 25
21 26
30
34
36
38
40 42
43
44
46
28
47
1
2
28
4
28
3
5
16
28
8
28
9
28
10
11
12
13
15
6
14
50
7
6
51
19
18
17
Lankatiles Showrooms1. Nawala 2. Jawatta 3. Aluthgama 4. Ambalanthota 5. Ambalangoda 6. Ampara 7. Athurugiriya 8. Avissawella 9. Badulla 10. Balangoda 11. Bandarawela 12. Chilaw 13. Embilipitiya 14. Galle 15. Gampaha 16. Gampola 17. Horana 18. Ja ela 19. Jaffna 20. Kadawatha 21. Kaduwela 22. Kaluthara 23. Kandy 24. Kegalle 25. Kiribathgoda 26. Kottawa 27. Kuliyapitiya 28. Kurunegala 29. Mahiyanganaya 30. Malabe 31. Matale 32. Matara 33. Mathugama 34. Minuwangoda 35. Monaragala 36. Moratuwa 37. Negombo 38. Nittambuwa 39. Panadura 40. Peradeniya 41. Ratnapura 42. Warakapola 43. Wariyapola 44. Wattala 45. Welimada 46. Wellawaya 47. Wennappuwa 48. Vavuniya 49. Dambulla 50. Batticaloa 51. Anuradhapura
1. Ballummahara 2. Meetiyagoda 3. Eheliyagoga 4. Godagama 5. Kandy 6. Medawachchiya 7. Siyambalanduwa 8. Thissamaharamaya
9. Matara 10. Dambulla 11. Mahabage 12. Alawwa 13. Mirigama 14. Anamaduwa 15. Kilinochchi 16. Narahenpita 17. Nochchiyagama 18. Kalmunai 19. Thalawakele
Lankatiles Factory Outlets:
GRI 102-4
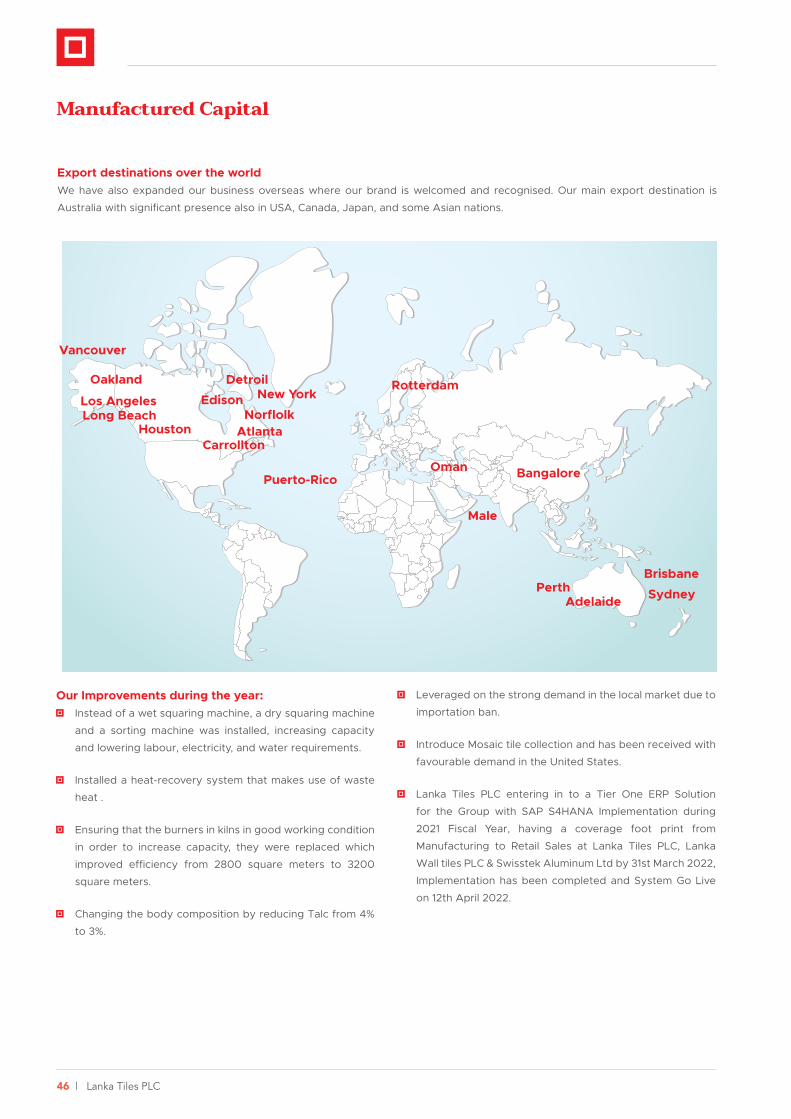
46 | Lanka Tiles PLC
Export destinations over the worldWe have also expanded our business overseas where our brand is welcomed and recognised. Our main export destination is
Australia with significant presence also in USA, Canada, Japan, and some Asian nations.
Rotterdam
Oman
Male
Bangalore
New YorkEdison
Detroil
Puerto-Rico
Vancouver
CarrolltonAtlanta
Norflolk
Oakland
Los AngelesLong Beach
Houston
PerthBrisbane
SydneyAdelaide
Our Improvements during the year: Instead of a wet squaring machine, a dry squaring machine
and a sorting machine was installed, increasing capacity
and lowering labour, electricity, and water requirements.
Installed a heat-recovery system that makes use of waste
heat .
Ensuring that the burners in kilns in good working condition
in order to increase capacity, they were replaced which
improved efficiency from 2800 square meters to 3200
square meters.
Changing the body composition by reducing Talc from 4%
to 3%.
Leveraged on the strong demand in the local market due to
importation ban.
Introduce Mosaic tile collection and has been received with
favourable demand in the United States.
Lanka Tiles PLC entering in to a Tier One ERP Solution
for the Group with SAP S4HANA Implementation during
2021 Fiscal Year, having a coverage foot print from
Manufacturing to Retail Sales at Lanka Tiles PLC, Lanka
Wall tiles PLC & Swisstek Aluminum Ltd by 31st March 2022,
Implementation has been completed and System Go Live
on 12th April 2022.
Manufactured Capital
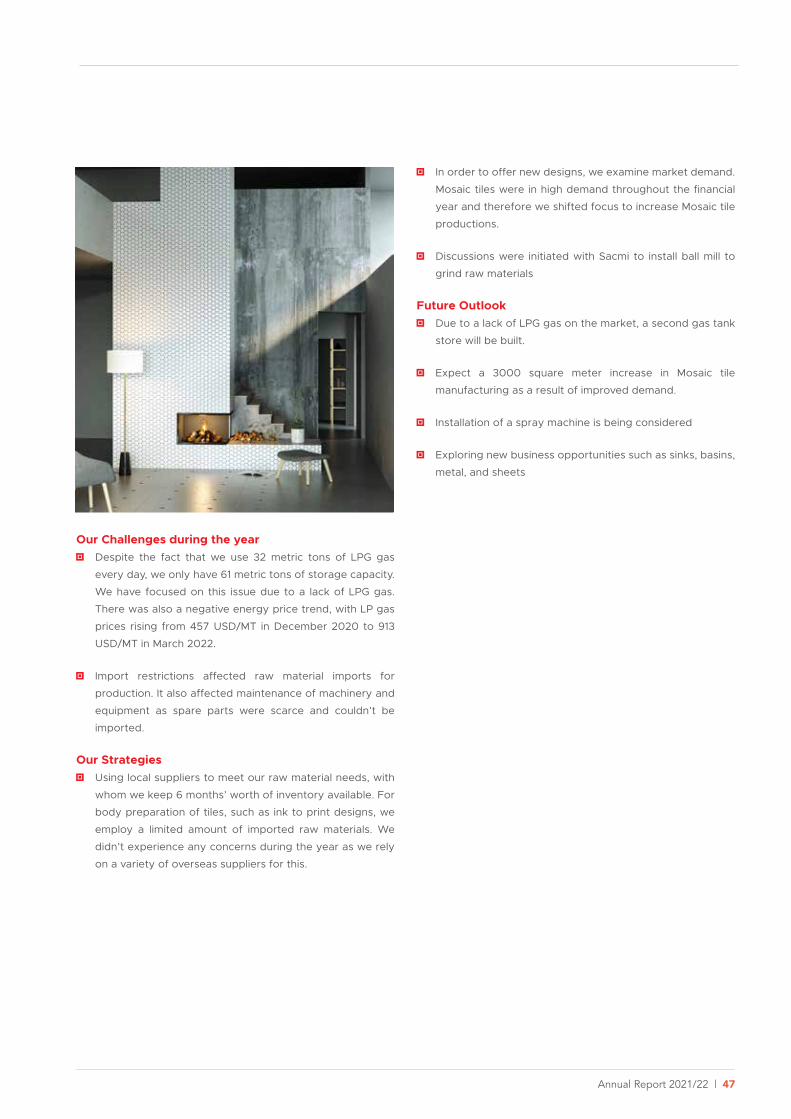
Annual Report 2021/22 | 47
Our Challenges during the year Despite the fact that we use 32 metric tons of LPG gas
every day, we only have 61 metric tons of storage capacity.
We have focused on this issue due to a lack of LPG gas.
There was also a negative energy price trend, with LP gas
prices rising from 457 USD/MT in December 2020 to 913
USD/MT in March 2022.
Import restrictions affected raw material imports for
production. It also affected maintenance of machinery and
equipment as spare parts were scarce and couldn’t be
imported.
Our Strategies Using local suppliers to meet our raw material needs, with
whom we keep 6 months’ worth of inventory available. For
body preparation of tiles, such as ink to print designs, we
employ a limited amount of imported raw materials. We
didn’t experience any concerns during the year as we rely
on a variety of overseas suppliers for this.
In order to offer new designs, we examine market demand.
Mosaic tiles were in high demand throughout the financial
year and therefore we shifted focus to increase Mosaic tile
productions.
Discussions were initiated with Sacmi to install ball mill to
grind raw materials
Future Outlook Due to a lack of LPG gas on the market, a second gas tank
store will be built.
Expect a 3000 square meter increase in Mosaic tile
manufacturing as a result of improved demand.
Installation of a spray machine is being considered
Exploring new business opportunities such as sinks, basins,
metal, and sheets
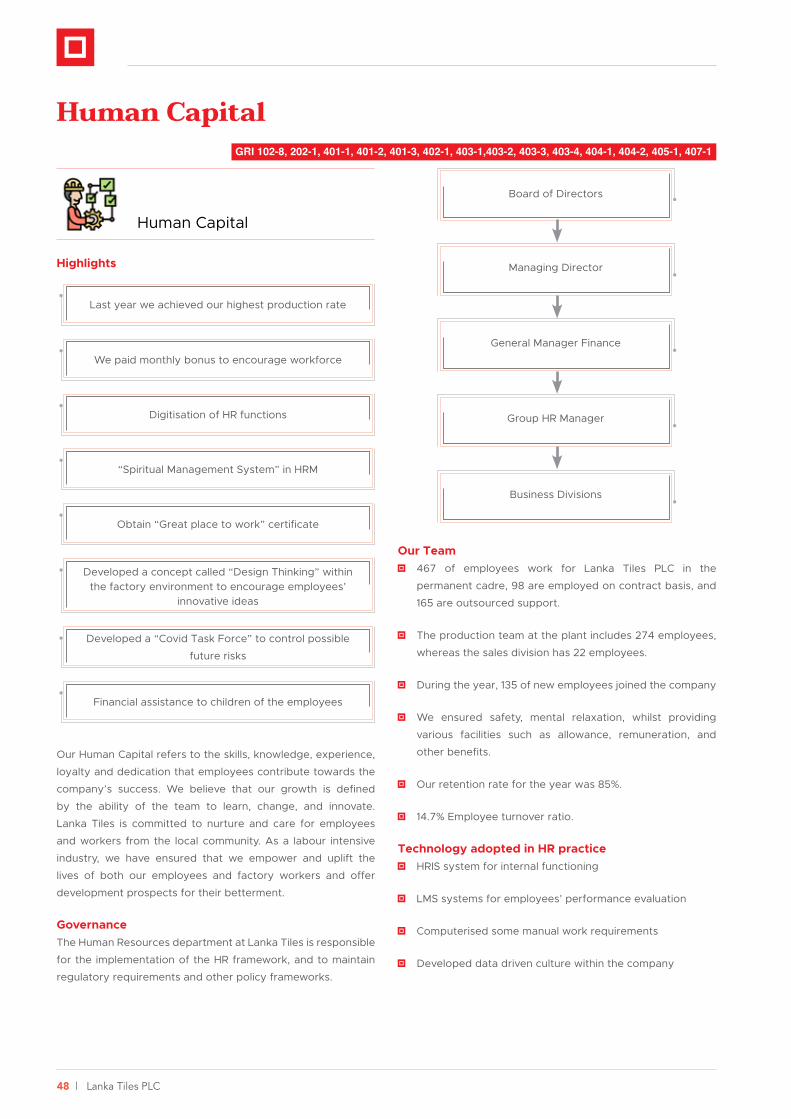
48 | Lanka Tiles PLC
Human Capital
Highlights
Last year we achieved our highest production rate
We paid monthly bonus to encourage workforce
“Spiritual Management System” in HRM
Developed a concept called “Design Thinking” within the factory environment to encourage employees’
innovative ideas
Digitisation of HR functions
Obtain “Great place to work” certificate
Developed a “Covid Task Force” to control possible
future risks
Financial assistance to children of the employees
Our Human Capital refers to the skills, knowledge, experience,
loyalty and dedication that employees contribute towards the
company’s success. We believe that our growth is defined
by the ability of the team to learn, change, and innovate.
Lanka Tiles is committed to nurture and care for employees
and workers from the local community. As a labour intensive
industry, we have ensured that we empower and uplift the
lives of both our employees and factory workers and offer
development prospects for their betterment.
GovernanceThe Human Resources department at Lanka Tiles is responsible
for the implementation of the HR framework, and to maintain
regulatory requirements and other policy frameworks.
Our Team 467 of employees work for Lanka Tiles PLC in the
permanent cadre, 98 are employed on contract basis, and
165 are outsourced support.
The production team at the plant includes 274 employees,
whereas the sales division has 22 employees.
During the year, 135 of new employees joined the company
We ensured safety, mental relaxation, whilst providing
various facilities such as allowance, remuneration, and
other benefits.
Our retention rate for the year was 85%.
14.7% Employee turnover ratio.
Technology adopted in HR practice HRIS system for internal functioning
LMS systems for employees’ performance evaluation
Computerised some manual work requirements
Developed data driven culture within the company
Board of Directors
General Manager Finance
Business Divisions
Managing Director
Group HR Manager
Human CapitalGRI 102-8, 202-1, 401-1, 401-2, 401-3, 402-1, 403-1,403-2, 403-3, 403-4, 404-1, 404-2, 405-1, 407-1

Annual Report 2021/22 | 49
Health and Safety During the COVID-19 pandemic, we looked after our
employees and set in place a dedicated team called the
‘Covid Task Force’ to look after affected employees and
their families. Even now, we follow health and safety
procedures such as hand washing, wearing masks,
and measuring body temperatures. The company also
encouraged our employees to be fully vaccinated.
We kept the production running uninterrupted ensuring
health and safety guidelines were followed
Our safety committee meets on a monthly basis to identify
areas for improvement. We confirm their safety in keeping
with our collective bargaining agreement which is reviewed
regularly.
We adhere to internationally recognised OHSAS 18001
safety standards in all our factory operations and there
have been no serious injuries as a result of our efforts to
maintain a safe work environment.
Employees are provided with the necessary protective
gear which is compulsory to be worn within the premises.
All machinery is examined before purchase and each
machine operator is held responsible for their maintenance
and security under TPM.
In the financial year 2021/22, we allocated Rs.13 Mn towards
employee health and safety.
Type of Accident 2021/22 2020/21
Minor Accidents 2 5
Training and Development Training programs are well attended by the employees
which provide an opportunity to learn or enhance new skills
and knowledge that are useful for employees. We arranged
2,846 hours of training programs during the year.
Our Performance Management System is designed to
identify gaps in knowledge and skill levels and to address
training needs.
Even during the pandemic, Lanka Tiles conducted training
programs through online platforms.
We conducted following programs during the year:
Recruitments
Compensation
Management
Performance
ManagementIndustrial
Relations
Employee
Services
Employee
Relations
Digitisation of HR Practices
Training &
Development
Category Male Female Total
By staff category
Senior management and
above
28 2 30
Executive 32 10 42
Staff 475 33 508
Operative 75 75 150
Total 610 120 730
By region
Central Province 21 - 21
Eastern Province 7 - 7
North Central Province 1 - 1
North Western Province 3 - 3
Northern Province 5 - 5
Sabaragamuwa province 43 - 43
Southern Province 19 - 19
Uva province 11 - 11
Western Province 500 120 620
Total 610 120 730

50 | Lanka Tiles PLC
Leadership development programs
5’S Training
Health awareness programs.
During the year, Rs.1.59 Mn of investment was allocated for
training and development.
Recognition and Career Progression To encourage our employees, and to enhance their
capabilities, we rely on a performance appraisal system that
is applied to all. Employees have the opportunity to grow
their careers since we offer current employees first priority
when filling vacant positions. When recruiting, we also
prioritise applicants based on knowledge and youthfulness
and provide opportunities for candidates from all parts of
the country.
Career counselling and professional development
workshops were held during the year.
We assess the performance of the employees and provide
clear succession plans.
We encourage employees to provide innovative ideas by
giving increments, gifts and certificates for encouragement.
Compensation and Benefits This part is guided by the company’s Remunerations
Committee and the remuneration policy is evaluated
regularly and altered according to market conditions.
We implement a fair and equal remuneration policy for men
and women with a 1:1 ratio of salary.
In compensations and benefits, we provide:
Health insurance
Reimbursement of medical costs,
Parental leave
Financial assistance for education qualifications
Overseas trips for top performing employees.
During the year, we did not face any penalties due to non-
compliance with labour laws.
With the positive contribution from the employees, we
were able to achieve higher production than the capacity.
During the year, following financial assistance for the
employee children.
Give Rs.7,500 cash benefit for who passed the grade 5
scholarship.
Give loan facility to buy laptop who passed O/L with 10A’s
& A/L with 3A’s take students.
With the collective agreement, we provide both salary and
welfare for our employees.
Staff Cost (Rs. Mn) 1,315 Mn
Defined benefit contribution schemes (Rs.Mn) 14.04 Mn
Gratuity (Rs.Mn) 13.8 Mn
Employee Engagement Rather than monitoring our employees’ performance and
problems, we physically meet them ensuring employees
that we are with them.
During the COVID-19 pandemic, our specially formed team
called ‘Covid Task Force’ had a meeting each month to
identify through discussions with the employees their
concerns.
Our ‘Spiritual Management’ program helps develop the
mind, body and the soul of the employee. Under this
initiative, we provide music therapy, meditation, OPD
programs within our organisation.
We have held OBT programs in Habarana and Wasgamuwa,
among other places in Sri Lanka.
Employee Grievance Mechanisms In order to handle employee grievances effectively we
have a structured solution process within our organisation
which is in line with OHSAS 18001. We give priority to all
employees equally in managing their issues confidentially,
promptly and fairly.
Freedom of Association We maintain a positive and engaging relationship with
trade unions where we have 33% of representation from
our permanent workforce. At Lanka Tiles, all unions belong
to the inter-employee union. There were no major trade
union actions during the year.
Human Capital
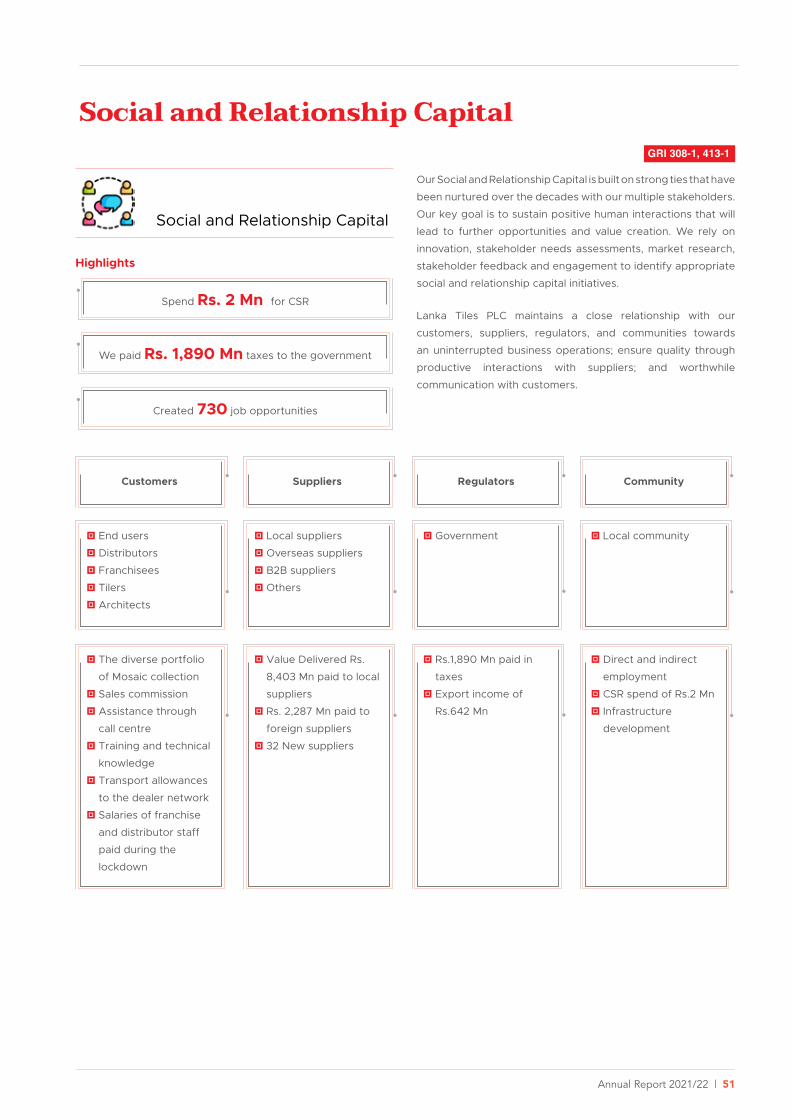
Annual Report 2021/22 | 51
Social and Relationship Capital
Social and Relationship Capital
Spend Rs. 2 Mn for CSR
Created 730 job opportunities
We paid Rs. 1,890 Mn taxes to the government
Customers
End users
Distributors
Franchisees
Tilers
Architects
The diverse portfolio
of Mosaic collection
Sales commission
Assistance through
call centre
Training and technical
knowledge
Transport allowances
to the dealer network
Salaries of franchise
and distributor staff
paid during the
lockdown
Regulators
Government
Rs.1,890 Mn paid in
taxes
Export income of
Rs.642 Mn
Suppliers
Local suppliers
Overseas suppliers
B2B suppliers
Others
Value Delivered Rs.
8,403 Mn paid to local
suppliers
Rs. 2,287 Mn paid to
foreign suppliers
32 New suppliers
Community
Local community
Direct and indirect
employment
CSR spend of Rs.2 Mn
Infrastructure
development
Highlights
Our Social and Relationship Capital is built on strong ties that have
been nurtured over the decades with our multiple stakeholders.
Our key goal is to sustain positive human interactions that will
lead to further opportunities and value creation. We rely on
innovation, stakeholder needs assessments, market research,
stakeholder feedback and engagement to identify appropriate
social and relationship capital initiatives.
Lanka Tiles PLC maintains a close relationship with our
customers, suppliers, regulators, and communities towards
an uninterrupted business operations; ensure quality through
productive interactions with suppliers; and worthwhile
communication with customers.
GRI 308-1, 413-1
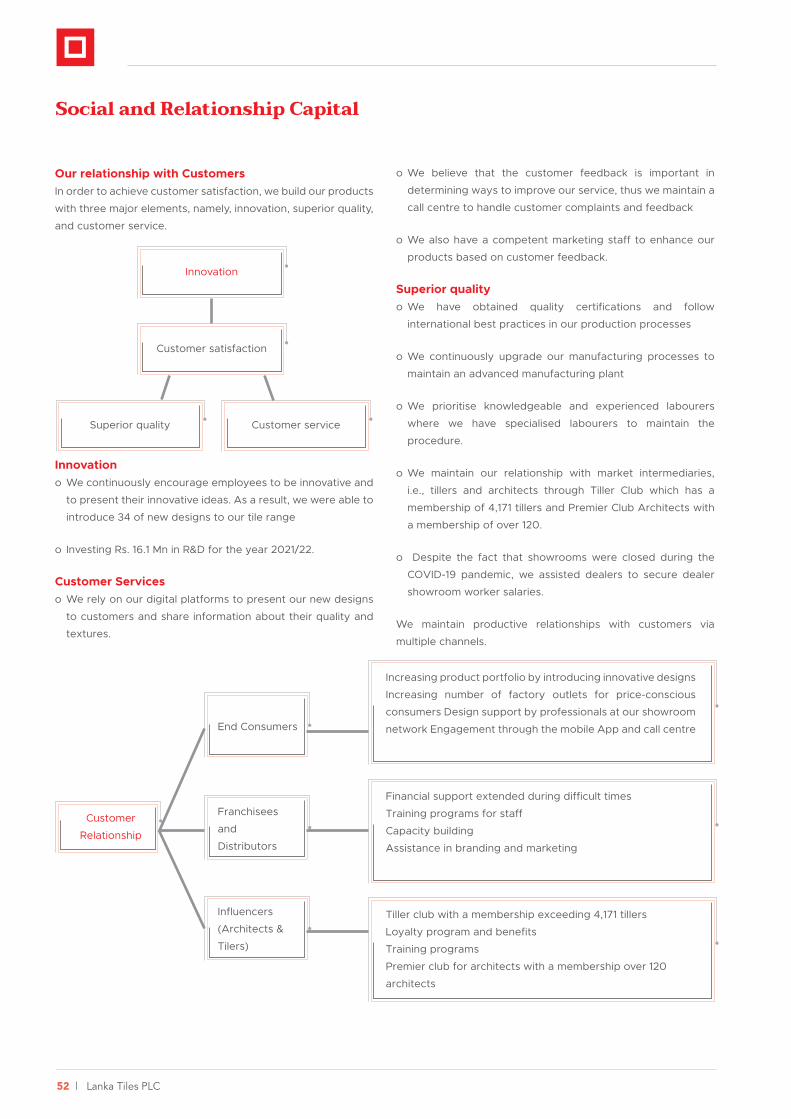
52 | Lanka Tiles PLC
Our relationship with CustomersIn order to achieve customer satisfaction, we build our products
with three major elements, namely, innovation, superior quality,
and customer service.
Innovation
Customer satisfaction
Superior quality Customer service
Innovationo We continuously encourage employees to be innovative and
to present their innovative ideas. As a result, we were able to
introduce 34 of new designs to our tile range
o Investing Rs. 16.1 Mn in R&D for the year 2021/22.
Customer Services o We rely on our digital platforms to present our new designs
to customers and share information about their quality and
textures.
o We believe that the customer feedback is important in
determining ways to improve our service, thus we maintain a
call centre to handle customer complaints and feedback
o We also have a competent marketing staff to enhance our
products based on customer feedback.
Superior qualityo We have obtained quality certifications and follow
international best practices in our production processes
o We continuously upgrade our manufacturing processes to
maintain an advanced manufacturing plant
o We prioritise knowledgeable and experienced labourers
where we have specialised labourers to maintain the
procedure.
o We maintain our relationship with market intermediaries,
i.e., tillers and architects through Tiller Club which has a
membership of 4,171 tillers and Premier Club Architects with
a membership of over 120.
o Despite the fact that showrooms were closed during the
COVID-19 pandemic, we assisted dealers to secure dealer
showroom worker salaries.
We maintain productive relationships with customers via
multiple channels.
End Consumers
Franchisees
and
Distributors
Influencers
(Architects &
Tilers)
Increasing product portfolio by introducing innovative designs
Increasing number of factory outlets for price-conscious
consumers Design support by professionals at our showroom
network Engagement through the mobile App and call centre
Financial support extended during difficult times
Training programs for staff
Capacity building
Assistance in branding and marketing
Tiller club with a membership exceeding 4,171 tillers
Loyalty program and benefits
Training programs
Premier club for architects with a membership over 120
architects
Customer
Relationship
Social and Relationship Capital
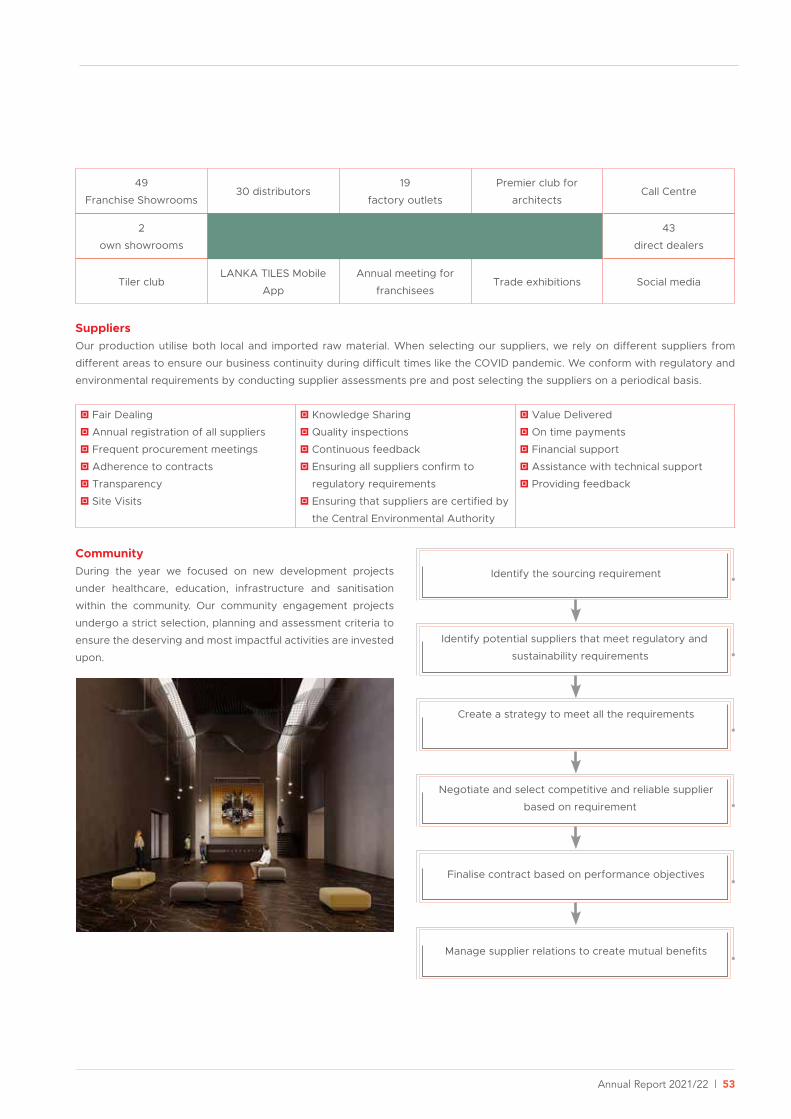
Annual Report 2021/22 | 53
49
Franchise Showrooms30 distributors
19
factory outlets
Premier club for
architectsCall Centre
2
own showroomsCustomer Touchpoints
43
direct dealers
Tiler clubLANKA TILES Mobile
App
Annual meeting for
franchiseesTrade exhibitions Social media
SuppliersOur production utilise both local and imported raw material. When selecting our suppliers, we rely on different suppliers from
different areas to ensure our business continuity during difficult times like the COVID pandemic. We conform with regulatory and
environmental requirements by conducting supplier assessments pre and post selecting the suppliers on a periodical basis.
Fair Dealing
Annual registration of all suppliers
Frequent procurement meetings
Adherence to contracts
Transparency
Site Visits
Knowledge Sharing
Quality inspections
Continuous feedback
Ensuring all suppliers confirm to
regulatory requirements
Ensuring that suppliers are certified by
the Central Environmental Authority
Value Delivered
On time payments
Financial support
Assistance with technical support
Providing feedback
CommunityDuring the year we focused on new development projects
under healthcare, education, infrastructure and sanitisation
within the community. Our community engagement projects
undergo a strict selection, planning and assessment criteria to
ensure the deserving and most impactful activities are invested
upon.
Identify the sourcing requirement
Create a strategy to meet all the requirements
Finalise contract based on performance objectives
Identify potential suppliers that meet regulatory and
sustainability requirements
Negotiate and select competitive and reliable supplier
based on requirement
Manage supplier relations to create mutual benefits
54 | Lanka Tiles PLC
Intellectual Capital
Highlights Lanka Tile brand valued at Rs.2,084 Mn by Brand Finance
Sri Lanka in 2022
More than 1.4% number of staff with over 20 years of
expertise/experience
SLS, CE (UK), OHSAS certified brand
ISO 14001 and 9001 certified systems and processes
Our Intellectual Capital has been a key strength for Lanka Tiles
in our growth over the last three decades. Having started as
a pioneer tile manufacturer in Sri Lanka, we have grown and
nurtured an abundance of knowledge and experience during
these years. Through this journey, our brand has evolved and
grown to be one of the most respected brands in Sri Lanka.
The Lanka Tiles brand name, skills, knowledge and expertise,
innovation, system and processes and operational excellence
constitute the intellectual capital of the company.
Our BrandThe Lanka Tiles brand is our most valuable intellectual property.
Built with years of trust and reliability, the Lanka Tiles brand
is a well known and sought after brand in Sri Lanka. Our
brand is resonant with advanced technology, expertise and
professionalism, innovation and superior quality of products.
We have maintained our competitive edge in the local market
while making steady progress as a leading tile exporter in the
global arena. In 2022, Lanka Tiles was valued at Rs. 2,084 Mn
by Brand Finance Sri Lanka, gaining the 48th place among the
100 Most Valuable Sri Lankan Brands.
Skills, Knowledge and ExpertiseFor years, we have mastered the art of tile manufacturing.
We have invested in developing the skills, knowledge and
expertise of our teams through continuous training, skills
development, and knowledge enhancement. Our recruitment
process and value proposition have attracted top performers.
In addition, our experienced employees and leadership team
serve as our valuable knowledge base. We believe educated
and experienced employees are the best investment for the
company. Towards this, we provide extensive learning, training
and skills development opportunities.
InnovationInnovation is a key differentiator that has given Lanka Tiles
an advantage over our competitors. We nurture a culture of
innovation. Our Research and Development team continuously
monitor market trends and consumer needs to identify potential
innovations. Lanka Tiles is proud to have added over 34 new
designs in our portfolio during the year. In addition to product
innovation, our R&D would also focus increasing the efficiency
and productivity of our processes while exploring ways of
minimising the environment impact from our manufacturing
process.
Operational ExcellenceWith the help of technology investments, Lanka Tiles has
continued to improve our operational excellence through
waste reduction and productivity improvement. We strive to
improve our quality, processes, products and customer service
in all our endeavours. We increased our production by 1.3 Mn
sq.ft for the year 2022. Our goal is to provide excellent service
while meeting the needs of our customers. During the financial
year, we implemented the following activities to reduce waste
while increasing the quality.
Automotive maintenance
Planned maintenance
Quality Integration
Focus Improvement
Early Equipment Management
Intellectual Capital
Annual Report 2021/22 | 55
Systems and Processes Ensuring seamless and efficient systems and processes are
crucial in operational efficacy and productivity. Technology
improvements to our systems and processes have been
implemented across all divisions. A three-year strategic plan
that prioritises health and safety, environmental impact, and
employee performance was also implemented. Some of the
systems we maintain include:
A production quality system: maintain the best practices
for workflows, health and safety environmental safety
Employee performance management system
Total Productive Maintenance (TPM): evaluate existing
production flows and procedures, identify modifications,
eliminate repetitive activities and duplications
Certifications SLS ISO 14001:2015 - Certificate of the Environmental
Management System by the Sri Lanka Standards Institution
SLS ISO 9001 :2015 - Quality Managements system
certification from Sri Lanka Standards Institution
CE Mark Certificate - Certificate for Ceramic Tiles by QSA
International, UK
OHSAS 18001:2007 - Occupational Health and Safety
Management System certification from SLSI
SLS 1181:2013 - Product Certification Mark (SLS Mark)
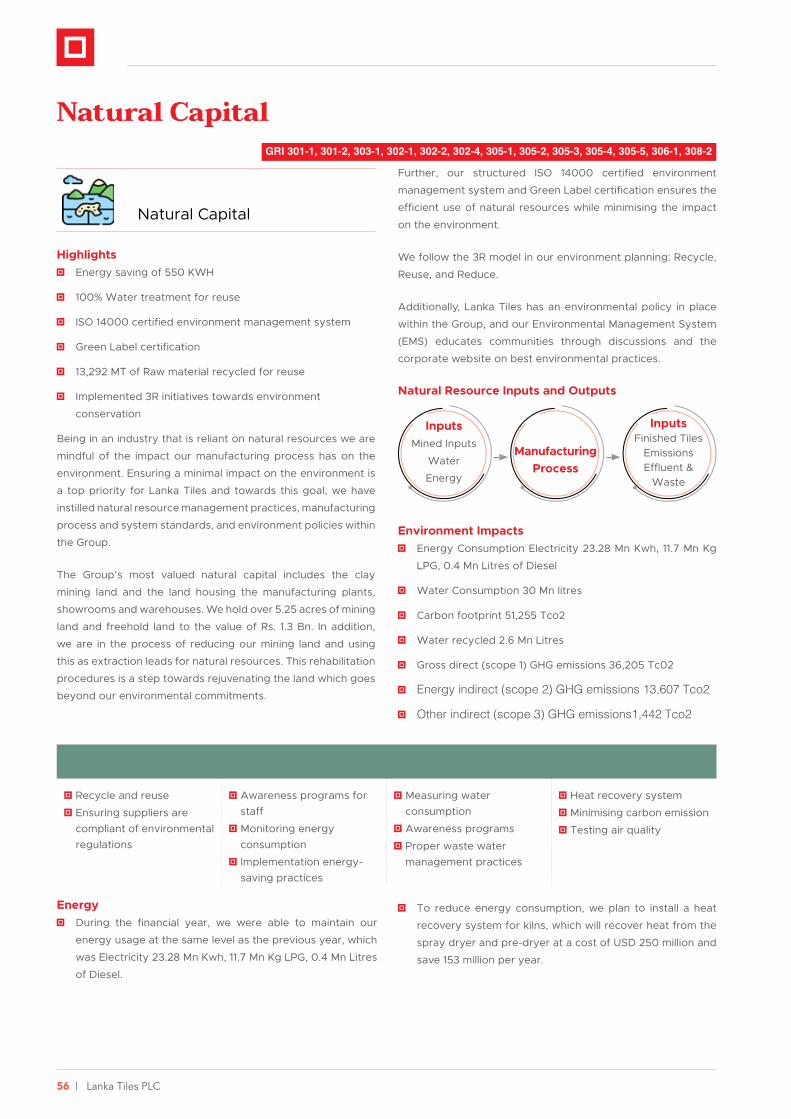
56 | Lanka Tiles PLC
Natural Capital
Natural Capital
Highlights Energy saving of 550 KWH
100% Water treatment for reuse
ISO 14000 certified environment management system
Green Label certification
13,292 MT of Raw material recycled for reuse
Implemented 3R initiatives towards environment
conservation
Being in an industry that is reliant on natural resources we are
mindful of the impact our manufacturing process has on the
environment. Ensuring a minimal impact on the environment is
a top priority for Lanka Tiles and towards this goal, we have
instilled natural resource management practices, manufacturing
process and system standards, and environment policies within
the Group.
The Group’s most valued natural capital includes the clay
mining land and the land housing the manufacturing plants,
showrooms and warehouses. We hold over 5.25 acres of mining
land and freehold land to the value of Rs. 1.3 Bn. In addition,
we are in the process of reducing our mining land and using
this as extraction leads for natural resources. This rehabilitation
procedures is a step towards rejuvenating the land which goes
beyond our environmental commitments.
Further, our structured ISO 14000 certified environment
management system and Green Label certification ensures the
efficient use of natural resources while minimising the impact
on the environment.
We follow the 3R model in our environment planning: Recycle,
Reuse, and Reduce.
Additionally, Lanka Tiles has an environmental policy in place
within the Group, and our Environmental Management System
(EMS) educates communities through discussions and the
corporate website on best environmental practices.
Natural Resource Inputs and Outputs
InputsMined Inputs
Water
Energy
InputsFinished Tiles
EmissionsEffluent &
Waste
Manufacturing Process
Environment Impacts Energy Consumption Electricity 23.28 Mn Kwh, 11.7 Mn Kg
LPG, 0.4 Mn Litres of Diesel
Water Consumption 30 Mn litres
Carbon footprint 51,255 Tco2
Water recycled 2.6 Mn Litres
Gross direct (scope 1) GHG emissions 36,205 Tc02
Energy indirect (scope 2) GHG emissions 13,607 Tco2
Other indirect (scope 3) GHG emissions1,442 Tco2
Raw material and waste management
Energy Consumption Managing Water Consumption
Controlling Emissions
Recycle and reuse
Ensuring suppliers are compliant of environmental regulations
Awareness programs for staff
Monitoring energy consumption
Implementation energy-saving practices
Measuring water consumption
Awareness programs
Proper waste water management practices
Heat recovery system
Minimising carbon emission
Testing air quality
Energy During the financial year, we were able to maintain our
energy usage at the same level as the previous year, which
was Electricity 23.28 Mn Kwh, 11.7 Mn Kg LPG, 0.4 Mn Litres
of Diesel.
To reduce energy consumption, we plan to install a heat
recovery system for kilns, which will recover heat from the
spray dryer and pre-dryer at a cost of USD 250 million and
save 153 million per year.
GRI 301-1, 301-2, 303-1, 302-1, 302-2, 302-4, 305-1, 305-2, 305-3, 305-4, 305-5, 306-1, 308-2
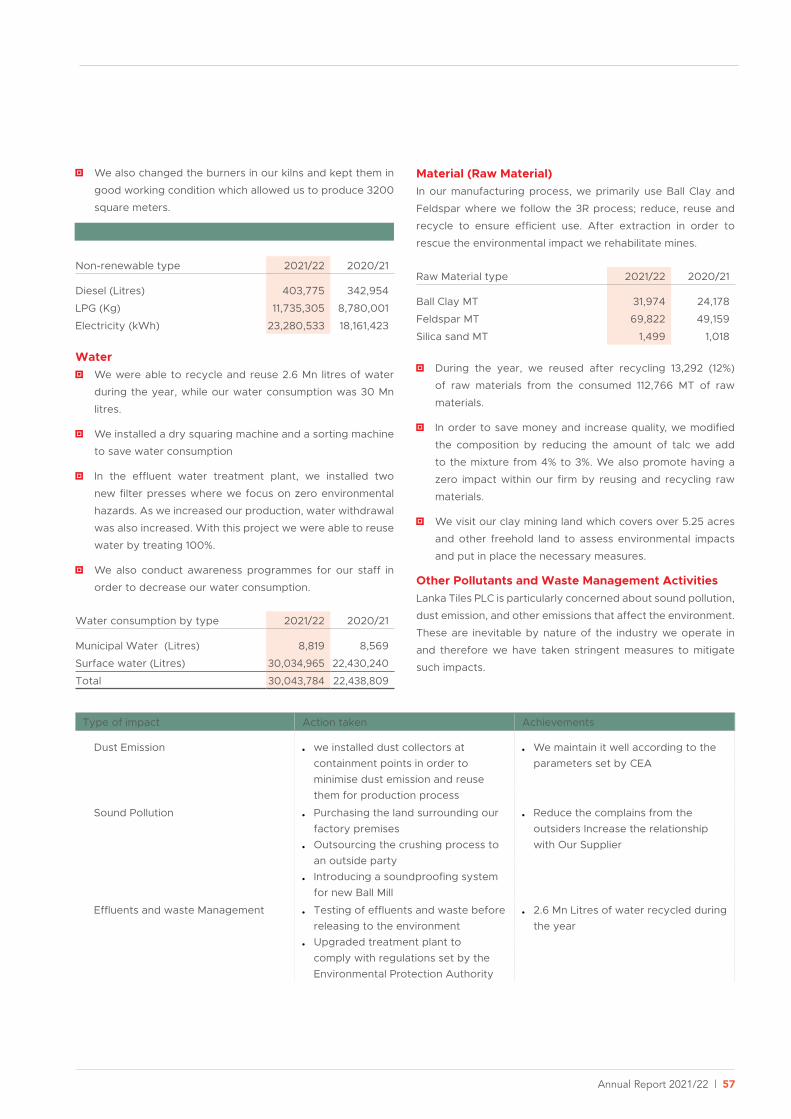
Annual Report 2021/22 | 57
We also changed the burners in our kilns and kept them in
good working condition which allowed us to produce 3200
square meters.
Energy Consumption by type
Non-renewable type 2021/22 2020/21
Diesel (Litres) 403,775 342,954
LPG (Kg) 11,735,305 8,780,001
Electricity (kWh) 23,280,533 18,161,423
Water We were able to recycle and reuse 2.6 Mn litres of water
during the year, while our water consumption was 30 Mn
litres.
We installed a dry squaring machine and a sorting machine
to save water consumption
In the effluent water treatment plant, we installed two
new filter presses where we focus on zero environmental
hazards. As we increased our production, water withdrawal
was also increased. With this project we were able to reuse
water by treating 100%.
We also conduct awareness programmes for our staff in
order to decrease our water consumption.
Water consumption by type 2021/22 2020/21
Municipal Water (Litres) 8,819 8,569
Surface water (Litres) 30,034,965 22,430,240
Total 30,043,784 22,438,809
Material (Raw Material)In our manufacturing process, we primarily use Ball Clay and
Feldspar where we follow the 3R process; reduce, reuse and
recycle to ensure efficient use. After extraction in order to
rescue the environmental impact we rehabilitate mines.
Raw Material type 2021/22 2020/21
Ball Clay MT 31,974 24,178
Feldspar MT 69,822 49,159
Silica sand MT 1,499 1,018
During the year, we reused after recycling 13,292 (12%)
of raw materials from the consumed 112,766 MT of raw
materials.
In order to save money and increase quality, we modified
the composition by reducing the amount of talc we add
to the mixture from 4% to 3%. We also promote having a
zero impact within our firm by reusing and recycling raw
materials.
We visit our clay mining land which covers over 5.25 acres
and other freehold land to assess environmental impacts
and put in place the necessary measures.
Other Pollutants and Waste Management ActivitiesLanka Tiles PLC is particularly concerned about sound pollution,
dust emission, and other emissions that affect the environment.
These are inevitable by nature of the industry we operate in
and therefore we have taken stringent measures to mitigate
such impacts.
Type of impact Action taken Achievements
Dust Emission we installed dust collectors at containment points in order to minimise dust emission and reuse them for production process
We maintain it well according to the parameters set by CEA
Sound Pollution Purchasing the land surrounding our factory premises
Outsourcing the crushing process to an outside party
Introducing a soundproofing system for new Ball Mill
Reduce the complains from the outsiders Increase the relationship with Our Supplier
Effluents and waste Management Testing of effluents and waste before releasing to the environment
Upgraded treatment plant to comply with regulations set by the Environmental Protection Authority
2.6 Mn Litres of water recycled during the year

58 | Lanka Tiles PLC
Natural Capital
Future Outlook Expansion of solar power generation in our manufacturing
plants.
With the completion of Phase 1 of the solar panel installations,
we plan to expand this initiative to our manufacturing
plants to minimise our dependency on conventional energy
sources.
Reduce waste
In line with our 3R policy, we hope to increase our resource
wastage through increase employee participation and use
of technology to ensure as much waste is recycled, reused
or reduced.
Annual Report 2021/22 | 59
CORPORATE GOVERNANCE
Designed ForLivingCorporate Governance 60
Annual Report of the Board of Directors on the Affairs of the Company
71
Statement of Directors’ Responsibility 76
Chief Executive Officer’s and Chief Financial Officer’s Responsibility Statement
77
Related Party Transactions Review Committee Report
78
Remuneration Committee Report 79
Audit Committee Report 80

60 | Lanka Tiles PLC
Corporate GovernanceThe Lanka Tiles Group is a reputed business entity in Sri Lanka, spearheading the tiling industry and setting the benchmark
on multiple areas. Recognised as a best corporate citizen of Sri Lanka in many occasions and certified as a governance and
accountability champion, the Group is committed to ensure an effective governance framework and risk management is in force
within the group. This framework has over the years, guided the Group’s strategic way forward and helped overcome obstacles
and unstable situations in achieving our corporate goals.
Board CompositionThe Board comprises of 11 members as illustrated below
Board Composition
The Board comprises of 11 members as illustrated below,
Compliance Framework
Please refer page 63 About this Report for the list of
mandatory and voluntary frameworks we comply with.
Composition by Gender
101
MaleFemale
Composition by Age
3 3 5
30-45 61-7046-60
Composition by Expertise
3 2 2 22
Engineering Law
AccountancyBanking
Entrepreneurship
Composition
1 4 6
Executive Non-Executive Independent
Non-Executive
The Board of directors of Lanka Tiles
PLC
Audit Committee
Managing Director
Management Committee
Remuneration Committee
Related Party Transaction
Review Committee
Internal and Procedures
Articles of Association
HR Policy
Health and Safety Policy

Annual Report 2021/22 | 61
Governance in 2021/22The 2021/22 financial year was difficult and uncertain due
to global economic disruption caused by Covid 19, rupee
depreciation, and the Russian-Ukraine conflict. The Board of
Directors of Lanka Tiles played a critical role in risk management
and supply chain maintenance, as well as assisting the company
in seizing opportunities.
Lanka Tiles PLC held its Annual General Meeting virtual/physical
with the participation of shareholders and the Chairman of the
Board and the Board Committees were present and responded
to the questions raised.
The Board disclosed the impact of the Covid 19 pandemic on
the Group as mandated by the Colombo Stock Exchange.
Shareholders
As of 31st March 2022, shares of Lanka Tiles PLC were held
among 4,632 shareholders with our parent Company, Lanka
Walltiles PLC holding 68.217%. The total number of shares in
issue to 265,252,050 shares.
Communication with shareholdersThe Company maintains an effective communication with its
shareholders via various channels.
Com
mun
icat
ion
chan
nels
Annual General Meeting
Interim Financial Statements
Press Releases and announcements to the Colombo Stock Exchange
Annual Report
Company website
Social media platforms
The Board understands its obligation to offer a balanced and
fair assessment of the Group’s financial condition, performance,
and prospects, and is committed to full disclosure, with a focus
on accuracy, timeliness, and relevance.
Role of the Chairman and Managing DirectorThe clear distinction between the Chairman’s and Managing
Director’s tasks and responsibilities is recognised and respected
by our organisation. This maintains a balance of authority,
ensuring that no single person exercises unconstrained control
over decision-making and implementation.
Appointment of DirectorsThe Company notifies the Colombo Stock Exchange when
it appoints a new Director to the Board, along with a brief
resume of the Director that includes the nature of his/ her
expertise in relevant functional areas, other directorships held,
memberships on Board Committees, and the nature of the
appointment.
Re- election of DirectorsExcept for individuals above 70 years of age, Directors are
appointed by the Board and are available for re-election by the
shareholders at the next Annual General Meeting.
Independence of Non-executive DirectorsThe Board determines the Directors’ independence based
on annual statements given by Non-Executive Directors in
compliance with the Colombo Stock Exchange’s Listing Rules.
Directors are allowed to make independent decisions since
they are not involved in day-to-day management and have no
business dealings with the company.
Dr. S. Selliah, Mr. K. D. G. Gunaratne, Ms. A. M. L. Page, Mr. J.
A. R. N. Adihetty, Mr. S R Jayaweera, and Mr. J R Gunaratne
meet the independence criteria set forth in Rule 7.10.4 of the
Listing Rules, and the Board has determined that they are
Independent Directors based on declarations submitted by the
said Directors.
Board CommitteesThe Audit Committee, Related Party Transactions Review
Committee, and Remuneration Committee are the three
primary Board committees formed by the Board to aid in
the effective and efficient discharge of the Board’s functions
and responsibilities. The committees are given all necessary
resources to enable them to carry out their responsibilities
effectively. The Company Secretary serves as the committee
secretary, and the minutes of each committee meeting are
forwarded to all directors once they are completed.
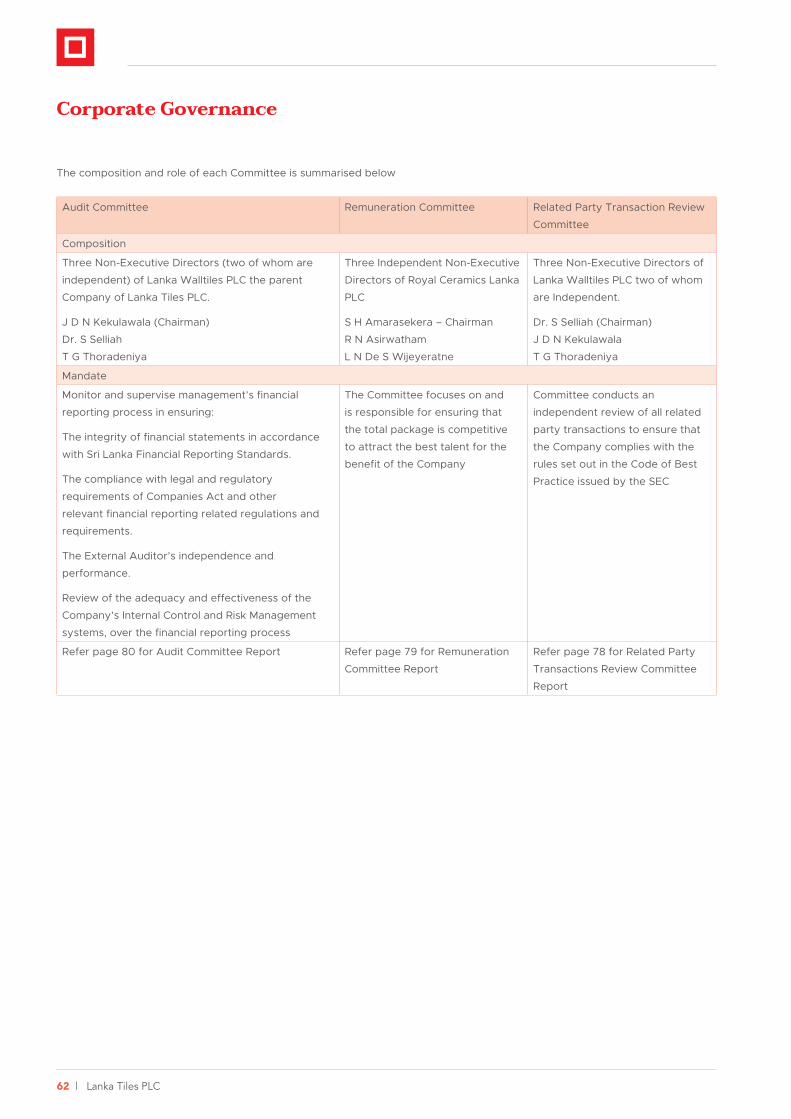
62 | Lanka Tiles PLC
Corporate Governance
The composition and role of each Committee is summarised below
Audit Committee Remuneration Committee Related Party Transaction Review
Committee
Composition
Three Non-Executive Directors (two of whom are
independent) of Lanka Walltiles PLC the parent
Company of Lanka Tiles PLC.
J D N Kekulawala (Chairman)
Dr. S Selliah
T G Thoradeniya
Three Independent Non-Executive
Directors of Royal Ceramics Lanka
PLC
S H Amarasekera – Chairman
R N Asirwatham
L N De S Wijeyeratne
Three Non-Executive Directors of
Lanka Walltiles PLC two of whom
are Independent.
Dr. S Selliah (Chairman)
J D N Kekulawala
T G Thoradeniya
Mandate
Monitor and supervise management’s financial
reporting process in ensuring:
The integrity of financial statements in accordance
with Sri Lanka Financial Reporting Standards.
The compliance with legal and regulatory
requirements of Companies Act and other
relevant financial reporting related regulations and
requirements.
The External Auditor’s independence and
performance.
Review of the adequacy and effectiveness of the
Company’s Internal Control and Risk Management
systems, over the financial reporting process
The Committee focuses on and
is responsible for ensuring that
the total package is competitive
to attract the best talent for the
benefit of the Company
Committee conducts an
independent review of all related
party transactions to ensure that
the Company complies with the
rules set out in the Code of Best
Practice issued by the SEC
Refer page 80 for Audit Committee Report Refer page 79 for Remuneration
Committee Report
Refer page 78 for Related Party
Transactions Review Committee
Report
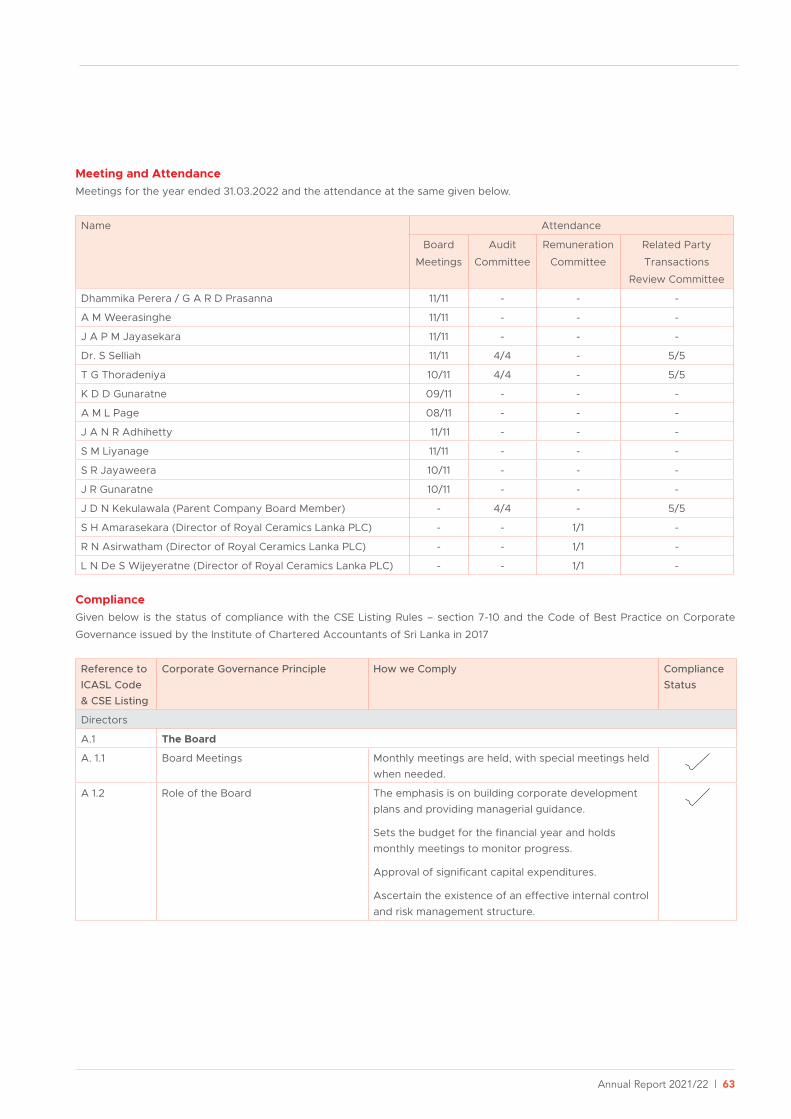
Annual Report 2021/22 | 63
Meeting and AttendanceMeetings for the year ended 31.03.2022 and the attendance at the same given below.
Name Attendance
Board
Meetings
Audit
Committee
Remuneration
Committee
Related Party
Transactions
Review Committee
Dhammika Perera / G A R D Prasanna 11/11 - - -
A M Weerasinghe 11/11 - - -
J A P M Jayasekara 11/11 - - -
Dr. S Selliah 11/11 4/4 - 5/5
T G Thoradeniya 10/11 4/4 - 5/5
K D D Gunaratne 09/11 - - -
A M L Page 08/11 - - -
J A N R Adhihetty 11/11 - - -
S M Liyanage 11/11 - - -
S R Jayaweera 10/11 - - -
J R Gunaratne 10/11 - - -
J D N Kekulawala (Parent Company Board Member) - 4/4 - 5/5
S H Amarasekara (Director of Royal Ceramics Lanka PLC) - - 1/1 -
R N Asirwatham (Director of Royal Ceramics Lanka PLC) - - 1/1 -
L N De S Wijeyeratne (Director of Royal Ceramics Lanka PLC) - - 1/1 -
ComplianceGiven below is the status of compliance with the CSE Listing Rules – section 7-10 and the Code of Best Practice on Corporate
Governance issued by the Institute of Chartered Accountants of Sri Lanka in 2017
Reference to ICASL Code & CSE Listing
Corporate Governance Principle How we Comply Compliance Status
Directors
A.1 The Board
A. 1.1 Board Meetings Monthly meetings are held, with special meetings held when needed.
A 1.2 Role of the Board The emphasis is on building corporate development plans and providing managerial guidance.
Sets the budget for the financial year and holds monthly meetings to monitor progress.
Approval of significant capital expenditures.
Ascertain the existence of an effective internal control and risk management structure.

64 | Lanka Tiles PLC
Corporate Governance
Reference to ICASL Code & CSE Listing
Corporate Governance Principle How we Comply Compliance Status
A 1.3 Compliance with laws and access to independent professional advice
The Board seeks independent professional advice when deemed necessary, particularly before making any decisions which could have a significant impact on the Company. Further, the Board is always mindful of the new laws/ regulations which are implemented and ensures compliance with same
When it is judged appropriate, the Board obtains independent professional assistance, particularly before making any decisions that could have a substantial impact on the Company. Furthermore, the Board is continually aware of new laws/regulations that are enacted and ensures that they are followed.
Further, the Board is always mindful of the new laws/ regulations which are implemented and ensures compliance with same.
A 1.4 Access to advice from the Company Secretary Indemnifying the Board, Directors and key management personnel
All Directors have access to the advice of the Company Secretary.
The services and advice of the Company Secretary M/s. PW Corporate Secretarial (Pvt.) Ltd. is made available to Directors as necessary.
A 1.5 Independent judgment of the Directors Board comprises mainly of independent professionals who in turn exercise independent judgment in discharging their duties.
A 1.6 Dedicating adequate time and effort Regular Board meetings and sub-committee meetings are scheduled well in advance and Board papers circulated one week prior to the meetings, giving adequate time to prepare.
A 1.7 Calls for resolutions Resolutions are passed for all Board approvals and minutes are recorded.
A 1.8 Induction & Training of Directors At the time a Director is appointed, a letter confirming such appointment together with details on the duties of a Director in terms of the Act and Listing Rules are forwarded to them.
All Directors have considerable experience in the industry.
Relevant local and foreign training opportunities are made available.
A 2 Segregation of Roles of Chairman & CEO
Please refer Chairman and Managing Director pages 12 and 15.
A 3 Chairman’s Role The Chairman ensures that meetings are conducted in an orderly manner and that each Board Member and Member of staff is given an opportunity to present his views/concerns on matters.
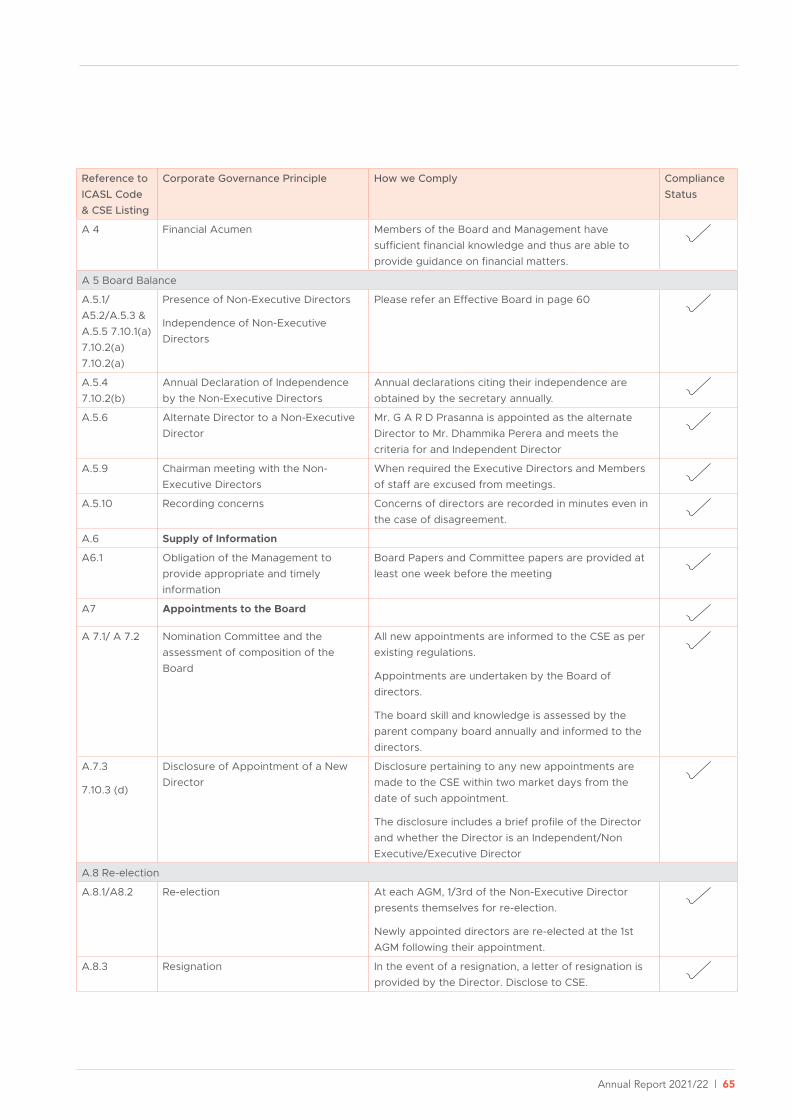
Annual Report 2021/22 | 65
Reference to ICASL Code & CSE Listing
Corporate Governance Principle How we Comply Compliance Status
A 4 Financial Acumen Members of the Board and Management have sufficient financial knowledge and thus are able to provide guidance on financial matters.
A 5 Board Balance
A.5.1/A5.2/A.5.3 & A.5.5 7.10.1(a) 7.10.2(a) 7.10.2(a)
Presence of Non-Executive Directors
Independence of Non-Executive Directors
Please refer an Effective Board in page 60
A.5.4 7.10.2(b)
Annual Declaration of Independence by the Non-Executive Directors
Annual declarations citing their independence are obtained by the secretary annually.
A.5.6 Alternate Director to a Non-Executive Director
Mr. G A R D Prasanna is appointed as the alternate Director to Mr. Dhammika Perera and meets the criteria for and Independent Director
A.5.9 Chairman meeting with the Non-Executive Directors
When required the Executive Directors and Members of staff are excused from meetings.
A.5.10 Recording concerns Concerns of directors are recorded in minutes even in the case of disagreement.
A.6 Supply of Information
A6.1 Obligation of the Management to provide appropriate and timely information
Board Papers and Committee papers are provided at least one week before the meeting
A7 Appointments to the Board
A 7.1/ A 7.2 Nomination Committee and the assessment of composition of the Board
All new appointments are informed to the CSE as per existing regulations.
Appointments are undertaken by the Board of directors.
The board skill and knowledge is assessed by the parent company board annually and informed to the directors.
A.7.3
7.10.3 (d)
Disclosure of Appointment of a New Director
Disclosure pertaining to any new appointments are made to the CSE within two market days from the date of such appointment.
The disclosure includes a brief profile of the Director and whether the Director is an Independent/Non Executive/Executive Director
A.8 Re-election
A.8.1/A8.2 Re-election At each AGM, 1/3rd of the Non-Executive Director presents themselves for re-election.
Newly appointed directors are re-elected at the 1st AGM following their appointment.
A.8.3 Resignation In the event of a resignation, a letter of resignation is provided by the Director. Disclose to CSE.
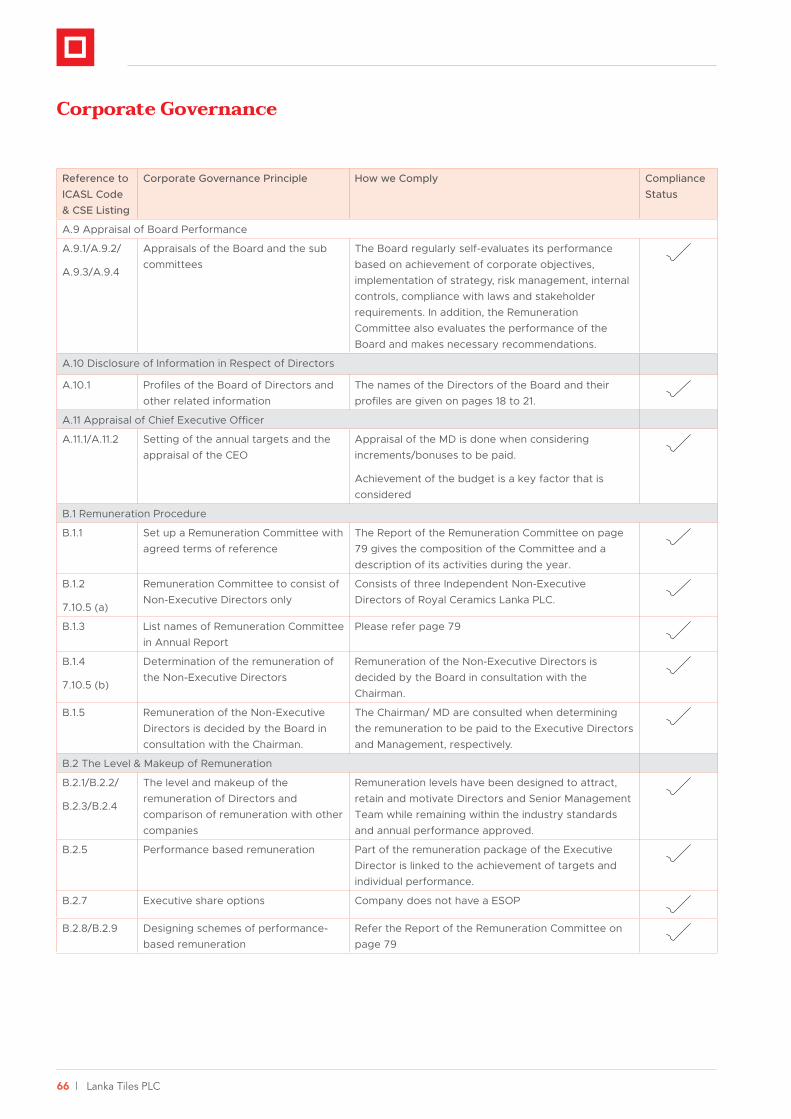
66 | Lanka Tiles PLC
Corporate Governance
Reference to ICASL Code & CSE Listing
Corporate Governance Principle How we Comply Compliance Status
A.9 Appraisal of Board Performance
A.9.1/A.9.2/
A.9.3/A.9.4
Appraisals of the Board and the sub committees
The Board regularly self-evaluates its performance based on achievement of corporate objectives, implementation of strategy, risk management, internal controls, compliance with laws and stakeholder requirements. In addition, the Remuneration Committee also evaluates the performance of the Board and makes necessary recommendations.
A.10 Disclosure of Information in Respect of Directors
A.10.1 Profiles of the Board of Directors and other related information
The names of the Directors of the Board and their profiles are given on pages 18 to 21.
A.11 Appraisal of Chief Executive Officer
A.11.1/A.11.2 Setting of the annual targets and the appraisal of the CEO
Appraisal of the MD is done when considering increments/bonuses to be paid.
Achievement of the budget is a key factor that is considered
B.1 Remuneration Procedure
B.1.1 Set up a Remuneration Committee with agreed terms of reference
The Report of the Remuneration Committee on page 79 gives the composition of the Committee and a description of its activities during the year.
B.1.2
7.10.5 (a)
Remuneration Committee to consist of Non-Executive Directors only
Consists of three Independent Non-Executive Directors of Royal Ceramics Lanka PLC.
B.1.3 List names of Remuneration Committee in Annual Report
Please refer page 79
B.1.4
7.10.5 (b)
Determination of the remuneration of the Non-Executive Directors
Remuneration of the Non-Executive Directors is decided by the Board in consultation with the Chairman.
B.1.5 Remuneration of the Non-Executive Directors is decided by the Board in consultation with the Chairman.
The Chairman/ MD are consulted when determining the remuneration to be paid to the Executive Directors and Management, respectively.
B.2 The Level & Makeup of Remuneration
B.2.1/B.2.2/
B.2.3/B.2.4
The level and makeup of the remuneration of Directors and comparison of remuneration with other companies
Remuneration levels have been designed to attract, retain and motivate Directors and Senior Management Team while remaining within the industry standards and annual performance approved.
B.2.5 Performance based remuneration Part of the remuneration package of the Executive Director is linked to the achievement of targets and individual performance.
B.2.7 Executive share options Company does not have a ESOP
B.2.8/B.2.9 Designing schemes of performance-based remuneration
Refer the Report of the Remuneration Committee on page 79

Annual Report 2021/22 | 67
Reference to ICASL Code & CSE Listing
Corporate Governance Principle How we Comply Compliance Status
B.3 Disclosure of Remuneration
B.3.1
7.10.5 (c)
Disclosure of Remuneration Report of the Remuneration Committee on page 79
Notes 27.3 in the financial statements on 128.
Relations with Shareholders
C.1 Constructive use of AGM and Conduct of Meetings
C.1.1 Dispatch of Notice of AGM and related papers to shareholders
Notice of Meeting, the Agenda for the Annual General Meeting and the Annual Report are circulated to shareholders prior to 15 days as required by the Articles of Association and the Code.
C.1.2 Separate resolution for substantially separate issues
Separate resolutions are passed for each matter taken up at the AGM
C.1.3 Accurate recording and counting valid proxy appointments received for general meeting
Valid proxies are listed together with the number of shares held by the shareholder appointing the proxy.
C.1.4 Availability of Chairman of Board Committees at the Annual General Meeting
The Chairman of the Board Committees are present to answer any queries of the shareholders directed to them by the Chairman of the Company
C.1.5 Summary of Notice of General Meetings and procedures governing voting at General Meetings
A summary of the procedure on voting is given in the Notice of Meeting.
C.2 Communications with shareholders
C.2.1. to C.2.7 Communications with Shareholders The AGM and EGM (if any) are used as the method for communicating with the shareholders.
All quarterly and annual financial information and other important matters as required for by the Act and the Listing Rules are shared by way of disclosures through the CSE.
The Company Secretaries/Registrars are the main contact people for the shareholders.
All major concerns of the shareholders are brought to the notice of the Board at the AGM and at Board/ Subcommittee meetings.
All queries of shareholders are answered at the AGM and all shareholders are given the opportunity to express their views/concerns.
C.3 Major & Material Transactions
C.3.1 & C.3.2 Disclosure of Major Transactions There were no transactions during the period under review which are considered as material/ Major as per the companies Act.
The report of the Related Party Transactions Review Committee is on the page 78.
D Accountability & Audit
D.1.1 Annual Report Refer Accountability & Audit on page 76 & 77
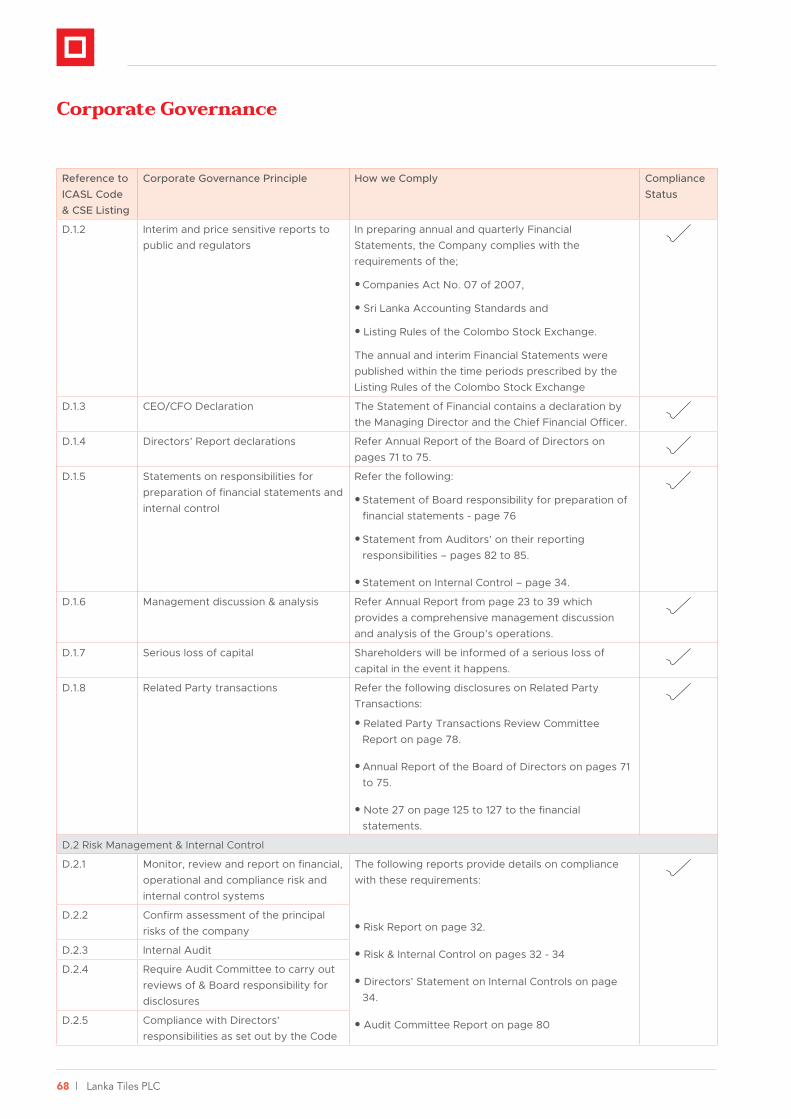
68 | Lanka Tiles PLC
Corporate Governance
Reference to ICASL Code & CSE Listing
Corporate Governance Principle How we Comply Compliance Status
D.1.2 Interim and price sensitive reports to public and regulators
In preparing annual and quarterly Financial Statements, the Company complies with the requirements of the;
• Companies Act No. 07 of 2007,
• Sri Lanka Accounting Standards and
• Listing Rules of the Colombo Stock Exchange.
The annual and interim Financial Statements were published within the time periods prescribed by the Listing Rules of the Colombo Stock Exchange
D.1.3 CEO/CFO Declaration The Statement of Financial contains a declaration by the Managing Director and the Chief Financial Officer.
D.1.4 Directors’ Report declarations Refer Annual Report of the Board of Directors on pages 71 to 75.
D.1.5 Statements on responsibilities for preparation of financial statements and internal control
Refer the following:
• Statement of Board responsibility for preparation of financial statements - page 76
• Statement from Auditors’ on their reporting responsibilities – pages 82 to 85.
• Statement on Internal Control – page 34.
D.1.6 Management discussion & analysis Refer Annual Report from page 23 to 39 which provides a comprehensive management discussion and analysis of the Group’s operations.
D.1.7 Serious loss of capital Shareholders will be informed of a serious loss of capital in the event it happens.
D.1.8 Related Party transactions Refer the following disclosures on Related Party Transactions:
• Related Party Transactions Review Committee Report on page 78.
• Annual Report of the Board of Directors on pages 71 to 75.
• Note 27 on page 125 to 127 to the financial statements.
D.2 Risk Management & Internal Control
D.2.1 Monitor, review and report on financial, operational and compliance risk and internal control systems
The following reports provide details on compliance with these requirements:
• Risk Report on page 32.
• Risk & Internal Control on pages 32 - 34
• Directors’ Statement on Internal Controls on page 34.
• Audit Committee Report on page 80
D.2.2 Confirm assessment of the principal risks of the company
D.2.3 Internal Audit
D.2.4 Require Audit Committee to carry out reviews of & Board responsibility for disclosures
D.2.5 Compliance with Directors’ responsibilities as set out by the Code

Annual Report 2021/22 | 69
Reference to ICASL Code & CSE Listing
Corporate Governance Principle How we Comply Compliance Status
D.3 Audit Committee
D.3.1
7.10.6 (a)
Establish an Audit Committee comprising wholly of Non-Executive Directors of which at least 2 must be independent
Audit Committee comprises 03 non-executive directors of whom 02 are independent.
Refer Audit Committee on page 80
D.3.2.
7.10.6(b)
Written Terms of Reference for Audit Committee
The Audit Committee has a written Terms of Reference summarised in the Audit Committee Report on page 80.
D.3.3.
7.10.6(c)
Disclosures The Audit Committee Report with required disclosures are given on page 80.
D.4 Related Party Transactions Review Committee
D.4.1/D.4.2/
D.4.3
9.3.2
Related Party Transactions Review Committee
Refer report of the Related Party Transactions Review Committee on page 78
D.5 Code of Business Conduct & Ethics
D.5.1. Board declaration for compliance with Code
Refer Code of Ethics on page 70
D.5.2 Price sensitive information Material and price sensitive information is promptly disclosed to the CSE by the Company Secretaries.
D.5.3 Monitor Share purchase by Directors/ KMPs
Refer the Related Party Transactions Committee Report on page 78
D.5.4 Chairman’s statement Refer the Chairman’s Message on Corporate Governance on 70 and The Board of Directors’ Statement on Internal Controls on page 34
D.6 Corporate Governance disclosures The Corporate Governance Report on page 60 - 70 together with its Annexes comply with this requirement.
E Institutional Investors
E.1.1 Institutional investors The proxies of the major institutional investors, such as the major shareholder are obtained.
E.2 Evaluation of Governance Disclosures Information required for evaluation of governance structures is provided in the Annual Report.
F Other Investors
F.1 Investing and divesting decision We seek to provide sufficient information to investors through the annual report, quarterly financial statements and announcements to the CSE to assist investors with their investment and divestment decision.
F.2 Encouraging shareholder participation Refer Shareholder Relations on page 146. The Company encourages individual shareholders to participate in general meetings and exercise their voting rights.
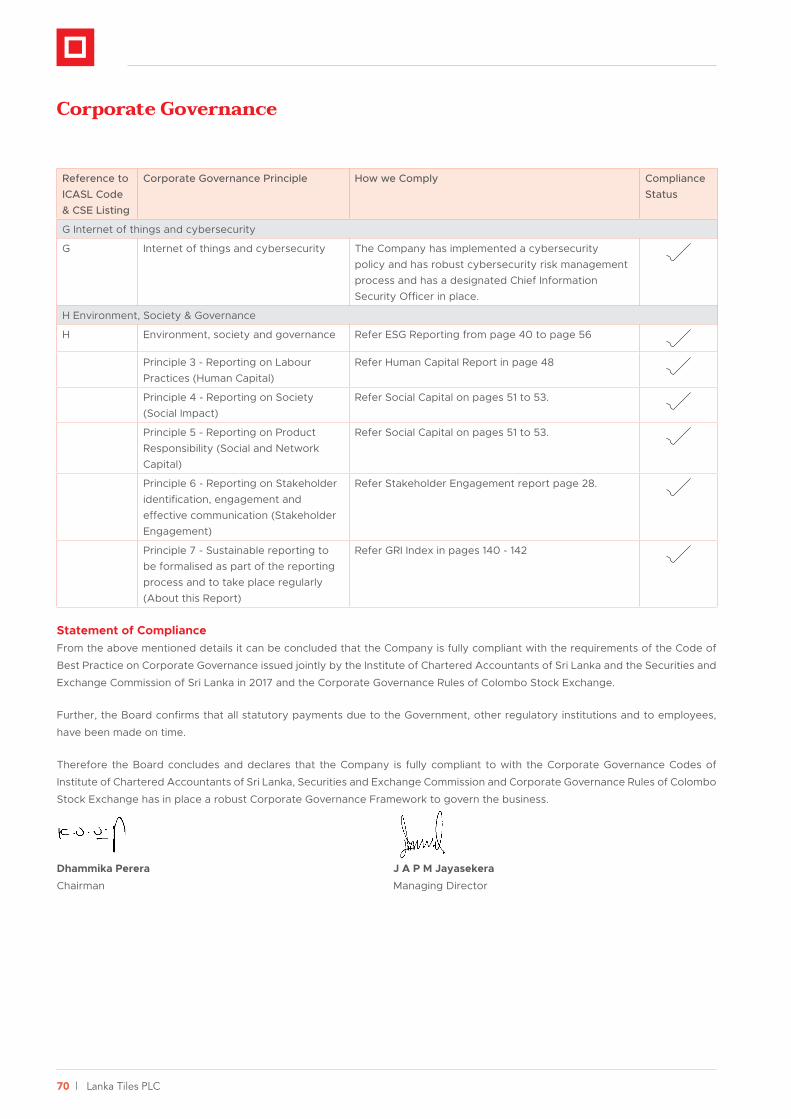
70 | Lanka Tiles PLC
Corporate Governance
Reference to ICASL Code & CSE Listing
Corporate Governance Principle How we Comply Compliance Status
G Internet of things and cybersecurity
G Internet of things and cybersecurity The Company has implemented a cybersecurity policy and has robust cybersecurity risk management process and has a designated Chief Information Security Officer in place.
H Environment, Society & Governance
H Environment, society and governance Refer ESG Reporting from page 40 to page 56
Principle 3 - Reporting on Labour Practices (Human Capital)
Refer Human Capital Report in page 48
Principle 4 - Reporting on Society (Social Impact)
Refer Social Capital on pages 51 to 53.
Principle 5 - Reporting on Product Responsibility (Social and Network Capital)
Refer Social Capital on pages 51 to 53.
Principle 6 - Reporting on Stakeholder identification, engagement and effective communication (Stakeholder Engagement)
Refer Stakeholder Engagement report page 28.
Principle 7 - Sustainable reporting to be formalised as part of the reporting process and to take place regularly (About this Report)
Refer GRI Index in pages 140 - 142
Statement of Compliance From the above mentioned details it can be concluded that the Company is fully compliant with the requirements of the Code of
Best Practice on Corporate Governance issued jointly by the Institute of Chartered Accountants of Sri Lanka and the Securities and
Exchange Commission of Sri Lanka in 2017 and the Corporate Governance Rules of Colombo Stock Exchange.
Further, the Board confirms that all statutory payments due to the Government, other regulatory institutions and to employees,
have been made on time.
Therefore the Board concludes and declares that the Company is fully compliant to with the Corporate Governance Codes of
Institute of Chartered Accountants of Sri Lanka, Securities and Exchange Commission and Corporate Governance Rules of Colombo
Stock Exchange has in place a robust Corporate Governance Framework to govern the business.
Dhammika Perera J A P M Jayasekera
Chairman Managing Director

Annual Report 2021/22 | 71
Annual Report of the Board of Directors on the Affairs of the CompanyThe Board of Directors of Lanka Tiles
PLC is pleased to present herewith the
Annual Report together with the audited
consolidated financial statements of the
Company and its subsidiary (collectively
referred to as ‘the Group’) for the year
ended 31st March 2022 as set out on
page 86 To 132
This Annual Report of the Board on
the affairs of the Company contains
the information required in terms of
the Companies Act No. 07 of 2007,
the Listing Rules of the Colombo
Stock Exchange and is guided by
recommended best practices.
Formation
The Company is a public limited liability
company incorporated and domiciled in
Sri Lanka and is listed on the Colombo
Stock Exchange. The registered office
and the principle place of business of the
Company is located at No.215, Nawala
Road, Narahenpita, Colombo 05.
The Company was incorporated in
Sri Lanka on 30 March 1984 under the
Companies Act No. 17 of 1982 as a
private limited liability Company bearing
the name Lanka Tiles (Private) Limited.
On 7th August 1984, Lanka Tiles Limited
was listed on the Colombo Stock
Exchange as a Public Limited Liability
Company.
Pursuant to the requirements of the
new Companies Act No. 7 of 2007,
the Company was re-registered on
19th March 2008 and was accordingly
renamed as Lanka Tiles PLC and bears
registration number PQ129.
Principal activities of the Company and
review of performance during the year
The main activity of the Company, which
remains unchanged since the previous
year, is the manufacture and sale of
glazed ceramic floor tiles.
This Report together with the Financial Statements, reflect the state of affairs of the
Company.
Financial Statements
The Financial Statements of the Company duly signed by two Directors on behalf of
the Board and the Auditors are given on pages 82 to 132.
Summarised financial results
Year ended 31st March 2022 2021Rs.’000 Rs.’000
Revenue 14,591,620 12,626,485
Total comprehensive
Income for the year 4,150,908 2,911,494
Independent Auditors’ Report
The Report of the Independent Auditors
on the Financial Statements of the
Company is given on page 82
Accounting Policies
The financial statements of the
Company and the Group have been
prepared in accordance with the Sri
Lanka Accounting Standards, which
comprise Sri Lanka Financial Reporting
Standards (SLFRSs), Sri Lanka Financial
Reporting Standards (LKASs) relevant
interpretations of the Standing
Interpretations Committee (SIC) and
International Financial Reporting
Interpretations Committee (IFRIC). The
significant accounting policies adopted
in the preparation of financial statements
are given on pages 90 to 99.
Directors
The names of the Directors who held
office as at the end of the accounting
period are given below and their brief
profiles appear on pages 18 to 21.
Executive Directors
Mr. J A P M Jayaskera - Managing Director
Non - Executive Directors
Mr. Dhammika Perera - Chairman
(Alternate Director Mr. G A R D Prasanna)
Mr. A M Weerasinghe - Deputy Chairman
Mr. T G Thoradeniya - Director
Mr. S M Liyanage - Director
Independent Non - Executive Directors
Dr. S Selliah - Director
Mr. K D G Gunaratne - Director
Ms. A M L Page - Director
Mr. J A N R Adhihetty - Director
Mr. S R Jayaweera - Director
Mr. J R Gunaratne - Director
Mr. Dhammika Perera, Mr. K D G
Gunarante and Mr. S M Liyanage retire by
rotation at the conclusion of the Annual
General Meeting in terms of Articles 103
and 104 of the Articles of Association
and being eligible are recommended by
the Directors for re-election.
Directors of the subsidiary Company
Beyond Paradise Collection Ltd
Mr. M H Jamaldeen
Mr. K D H Perera
Mr. J A P M Jayasekera
Lankatiles (Private) Limited
Mr. A.M Weerasinghe
Mr. J A P M Jayasekera
Mr. Fatheraj Singhvi
Mr. Praveen Kumar Singhvi
LTL Development (Pvt) Ltd
Mr. K.D.A Perera
Mr. J.A.P.M Jayasekara
Mr. A M Weerasinghe
Interests Register
The Company maintains an Interests
Register in terms of the Companies Act,
No. 7 of 2007, which is deemed to form
part and parcel of this Annual Report and
available for inspection upon request.
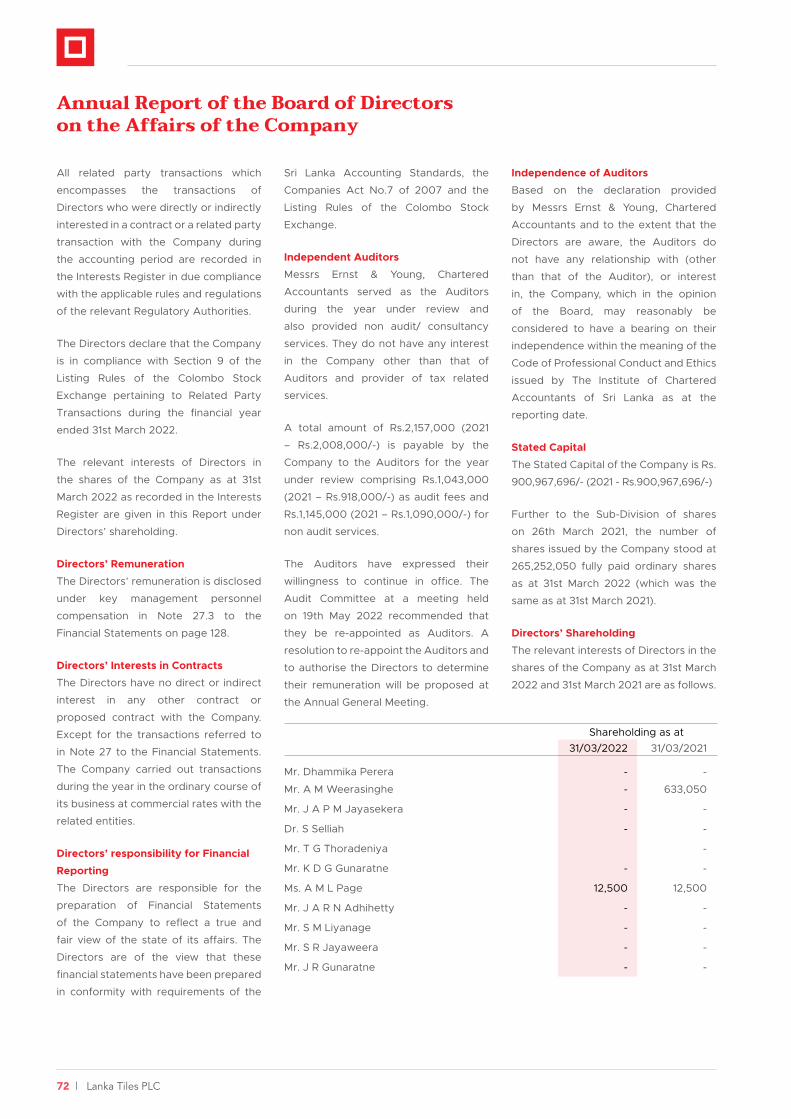
72 | Lanka Tiles PLC
Annual Report of the Board of Directors on the Affairs of the Company
All related party transactions which
encompasses the transactions of
Directors who were directly or indirectly
interested in a contract or a related party
transaction with the Company during
the accounting period are recorded in
the Interests Register in due compliance
with the applicable rules and regulations
of the relevant Regulatory Authorities.
The Directors declare that the Company
is in compliance with Section 9 of the
Listing Rules of the Colombo Stock
Exchange pertaining to Related Party
Transactions during the financial year
ended 31st March 2022.
The relevant interests of Directors in
the shares of the Company as at 31st
March 2022 as recorded in the Interests
Register are given in this Report under
Directors’ shareholding.
Directors’ Remuneration
The Directors’ remuneration is disclosed
under key management personnel
compensation in Note 27.3 to the
Financial Statements on page 128.
Directors’ Interests in Contracts
The Directors have no direct or indirect
interest in any other contract or
proposed contract with the Company.
Except for the transactions referred to
in Note 27 to the Financial Statements.
The Company carried out transactions
during the year in the ordinary course of
its business at commercial rates with the
related entities.
Directors’ responsibility for Financial
Reporting
The Directors are responsible for the
preparation of Financial Statements
of the Company to reflect a true and
fair view of the state of its affairs. The
Directors are of the view that these
financial statements have been prepared
in conformity with requirements of the
Sri Lanka Accounting Standards, the
Companies Act No.7 of 2007 and the
Listing Rules of the Colombo Stock
Exchange.
Independent Auditors
Messrs Ernst & Young, Chartered
Accountants served as the Auditors
during the year under review and
also provided non audit/ consultancy
services. They do not have any interest
in the Company other than that of
Auditors and provider of tax related
services.
A total amount of Rs.2,157,000 (2021
– Rs.2,008,000/-) is payable by the
Company to the Auditors for the year
under review comprising Rs.1,043,000
(2021 – Rs.918,000/-) as audit fees and
Rs.1,145,000 (2021 – Rs.1,090,000/-) for
non audit services.
The Auditors have expressed their
willingness to continue in office. The
Audit Committee at a meeting held
on 19th May 2022 recommended that
they be re-appointed as Auditors. A
resolution to re-appoint the Auditors and
to authorise the Directors to determine
their remuneration will be proposed at
the Annual General Meeting.
Independence of Auditors
Based on the declaration provided
by Messrs Ernst & Young, Chartered
Accountants and to the extent that the
Directors are aware, the Auditors do
not have any relationship with (other
than that of the Auditor), or interest
in, the Company, which in the opinion
of the Board, may reasonably be
considered to have a bearing on their
independence within the meaning of the
Code of Professional Conduct and Ethics
issued by The Institute of Chartered
Accountants of Sri Lanka as at the
reporting date.
Stated Capital
The Stated Capital of the Company is Rs.
900,967,696/- (2021 - Rs.900,967,696/-)
Further to the Sub-Division of shares
on 26th March 2021, the number of
shares issued by the Company stood at
265,252,050 fully paid ordinary shares
as at 31st March 2022 (which was the
same as at 31st March 2021).
Directors’ Shareholding
The relevant interests of Directors in the
shares of the Company as at 31st March
2022 and 31st March 2021 are as follows.
Shareholding as at31/03/2022 31/03/2021
Mr. Dhammika Perera - -
Mr. A M Weerasinghe - 633,050
Mr. J A P M Jayasekera - -
Dr. S Selliah - -
Mr. T G Thoradeniya -
Mr. K D G Gunaratne - -
Ms. A M L Page 12,500 12,500
Mr. J A R N Adhihetty - -
Mr. S M Liyanage - -
Mr. S R Jayaweera - -
Mr. J R Gunaratne - -

Annual Report 2021/22 | 73
Shareholders
There were 4,632 shareholders
registered as at 31st March 2022 (3,327
shareholders as at 31st March 2021). The
details of distribution are given on page
136 of this Report.
Major Shareholders, Distribution
Schedule and other information
Information on the distribution of
shareholding, analysis of shareholders,
market values per share, earnings,
dividends, net assets per share, twenty
largest shareholders of the Company,
percentage of shares held by the public
as per the Listing Rules of the Colombo
Stock Exchange are given on pages 136
to 137 under Share Information.
Employment Policy
The Company’s employment policy
is totally non-discriminatory which
respects individuals and provides carrier
opportunities irrespective of the gender,
race or religion.
As at 31st March 2022, 730 persons
were in employment (702 persons as at
31st March 2021).
Reserves
The reserves of the Company with the
movements during the year are given in
Note 11 to the Financial Statements on
page 112.
Capital Expenditure
The total capital expenditure during
the year amounted to Rs. 700 Mn on
property, plant and equipment compared
to Rs.434 Mn incurred in the previous
year. Details of movement in property,
plant and equipment and capital work-
in-progress are given under Note 03 to
the financial statements. Additions of
intangible assets of the Company and
Group during the year amounted to Rs.
2.1 Mn And all other related movements
are disclosed in Note 04 to the Financial
Statements.
Land holdings
The book value of property, plant and
equipment as at the balance sheet
date amounted to Rs.6,471 Mn (2021 –
Rs.6,374 Mn)
The extents, locations, valuations and the
number of buildings of the Company’s
land holdings are given below:
Location No. of
Buildings
Lands in extent Valuation/Cost
2022
(Rs. ‘000)
2021
(Rs. ‘000)
Factory at Jaltara, Ranala 42 28A-02R-32.69P 1,708,900 1,708,900
Land adjacent to the factory 17 08A-02R-08.56P 252,100 252,100
Warehouse at Biyagama 5 02A-00R-15.93P 528,400 528,400
Ball Clay land at Kalutara - 5A-01R-0.83P 53 53
Nawala Land - 00A-00R-32.03P 240,200 240,200
Land at Madampe - 13A-00R-02P - 42,900
Total 2,729,653 2,772,553
The movement of fixed assets during the
year is given in Note 03 to the financial
statements.
Dividends
An interim dividend of Rs. 3/- per share
for the year ending 31st March 2022
was declared on 28th October 2021. A
second interim dividend of Rs.1/80 per
share for the year ending 31st March
2022 was declared on 25th February
2022.
A third interim dividend of Rs. 1.90 per
share for the year ended 31st March
2022 was declared on 26th May 2022.
Substantial Shareholdings
The Company is controlled by Lanka
Walltiles PLC which holds 68.2% of the
issued share capital of the Company.
Lanka Walltiles PLC itself is a subsidiary
of Royal Ceramics Lanka PLC of which
the ultimate parent Company is Vallibel
One PLC.
Investments
Details of the Company’s quoted and
unquoted investments as at 31st March
2022 are given in Notes and 05 to the
Financial Statements on pages 106 to
109.
Public Holding
28.342% (2021 - 28.014% ) of the issued
shares of the Company are widely held
by the public
74 | Lanka Tiles PLC
Donations
The Company made donations
amounting to Rs.4,823,846 in total,
during the year under review. (For 2021
-Rs.8,650,000)
Risk Management
An ongoing process is in place to
identify and manage the risks that
are associated with the business
and operations of the Company.
The Directors review this process
through the Audit Committee.
Specific steps taken by the Company in
managing the risks are detailed in the
section on Risk Management on pages
32 to 34.
Statutory Payments
The Directors confirm that to the best
of their knowledge, all taxes, duties
and levies payable by the Company,
all contributions, levies and taxes
payable on behalf of, and in respect
of employees of the Company and all
other known statutory dues as were
due and payable by the Company as at
the Balance Sheet date have been paid
or, where relevant provided for, except
for certain assessments where appeals
have been lodged.
Contingent Liabilities
Except as disclosed in Note 28 to the
Financial Statements on page 128 there
were no material Contingent Liabilities
as at the Balance Sheet date.
Events after the Reporting Period
As disclosed in Note 29 to the financial
statements there are no material
events as at the date of the auditor’s
report which require adjustment to or
disclosure in the financial statements.
Corporate Governance
The Board of Directors confirm that the
Company is compliant with section 7.10
of the Listing Rules of the CSE.
An Audit Committee, Remuneration
Committee and a Related Party
Transaction Review Committee function
as Board sub committees, with Directors
who possess the requisite qualifications
and experience. The composition of the
said committees is as follows.
Audit Committee
Mr. J D N Kekulawala - Chairman
Dr. S Selliah
Mr. T G Thoradeniya
Remuneration Committee
Mr. S H Amarasekera - Chairman
Mr. R N Asiriwatham
Mr. L N de S Wijeyeratne
Related Party Transaction Review
Committee
Dr. S Selliah - Chairman
Mr. J D N Kekulawala
Mr. T G Thoradeniya
The Directors declare that the Company
is in compliance with Rule 9 of the Listing
Rules of the Colombo Stock Exchange
pertaining to Related Party Transactions
during the Financial Year ended 31st
March 2022
The Corporate Governance of the
Company is reflected in its strong belief
in protecting and enhancing stakeholder
value in a sustainable manner, supported
by a sound system of policies and
practices. Prudent internal controls
ensure professionalism, integrity and
commitment of the Board of Directors,
Management and employees.
The Corporate Governance Statement
on pages 62 to 70 explains the measures
adopted by the Company during the
year.
Corporate Social Responsibility
The Company continued its Corporate
Social Responsibility Programme,
Environmental Protection
After making adequate enquiries from
the management, the Directors are
satisfied that the Company operates in
a manner that minimises the detrimental
effects on the environment and provides
products and services that have a
beneficial effect on the customers
and the communities within which the
Company operates.
Going Concern
In determining the basis of preparing the
financial statements for the year ended
31st March 2022, based on available
information, the management has
assessed the existing and anticipated
effects of COVID 19 on the Group
Companies and the appropriateness of
the use of the going concern basis.
Having presented the outlook for each
industry group to the Lanka Tiles PLC
Board and after due consideration of
the range and likelihood of outcomes,
the Directors are satisfied that
the Company, its subsidiaries and
associates have adequate resources
to continue in operational existence for
the foreseeable future and continue
to adopt the going concern basis in
preparing and presenting these financial
statements.
Annual Report of the Board of Directors on the Affairs of the Company

Annual Report 2021/22 | 75
The financial statements are prepared
on going concern principles. After
making adequate enquires from the
management, the Directors are satisfied
that the Company has adequate
resources to continue its operations in
the foreseeable future.
Annual General Meeting
The Notice of the Thirty Eighth (38th)
Annual General Meeting appears on
page 146.
This Annual Report is signed for and on
behalf of the Board of Directors by
Dhammika Perera
Chairman
J A P M Jayasekera
Managing Director
P W Corporate Secretarial (Pvt) Ltd
Secretaries
31st May 2022
76 | Lanka Tiles PLC
Statement of Directors’ Responsibility
The Directors are required by the
Companies Act, No. 7 of 2007 to
prepare financial statements for each
financial year, which give a true and fair
view of the statement of affairs of the
Company as at the end of the financial
year and the income and expenditure of
the Company for the financial year.
The Directors are also responsible to
ensure that the financial statements
comply with any regulations made under
the Companies Act which specifies the
form and content of financial statements
and any other requirements which apply
to the Company’s financial statements
under any other law.
The Directors consider that the
financial statements presented in this
Annual Report have been prepared
using appropriate accounting policies,
consistently applied and supported
by reasonable and prudent judgments
and estimates and is in compliance with
the Sri Lanka Accounting Standards,
Companies Act, No. 7 of 2007, Sri Lanka
Accounting and Auditing Standards Act
No. 15 of 1995.
The Directors are responsible for
ensuring that the Company keeps
sufficient accounting records, which
disclose the financial position of the
Company with reasonable accuracy
and enable them to ensure that
the financial statements have been
prepared and presented as aforesaid.
They are also responsible for taking
measures to safeguard the assets of the
Company and in that context, to have
proper regard to the establishment of
appropriate systems of internal control
with a view to prevention and detection
of fraud and other irregularities.
The Directors continue to adopt the
going concern basis in preparing the
financial statements. The Directors,
after making inquiries and review of
the Company’s Business Plan for the
financial year 2021/22, including cash
flows and borrowing facilities, consider
that the Company has adequate
resources to continue in operation.
By Order of the Board
LANKA TILES PLC
P W Corporate Secretarial (Pvt) Ltd
Secretaries
31st May 2022

Annual Report 2021/22 | 77
Chief Executive Officer’s and Chief Financial Officer’s Responsibility StatementThe financial statements are prepared
in compliance with the Sri Lanka
Accounting Standards issued by the
Institute of Chartered Accountants of
Sri Lanka and the requirements of the
Companies Act No. 7 of 2007 and any
other applicable statues to the extent
applicable to the Company. There are
no departures from the prescribed
accounting standards in their adoption.
The accounting policies used in the
preparation of the financial statements
are appropriate and are consistently
applied, except where otherwise stated
in the notes accompanying the financial
statements.
The Board of Directors and the
management of your Company accept
responsibility for the integrity and
objectivity of these financial statements.
The estimates and judgments relating
to the financial statements were made
on a prudent and reasonable basis,
in order that the financial statements
reflect in a true and fair manner, the
form and substance of transactions,
and reasonably presents the Company’s
state of affairs. To ensure this, the
Company has taken proper and
sufficient care in installing a system
of internal control and accounting
records, for safeguarding assets, and for
preventing and detecting frauds as well
as other irregularities, which is reviewed,
evaluated and updated on an ongoing
basis.
Our internal auditor have conducted
periodic audits to provide reasonable
assurance that the established policies
and procedures of the Company were
consistently followed. However, there
are inherent limitations that should be
recognised in weighing the assurance
provided by any system of internal
controls and accounting.
The financial statements were
audited by Ernst & Young, Chartered
Accountants, the Independent Auditors.
The independence of the external
auditor has been assessed by the Audit
Committee and the Board and have
been determined as independent.
The Audit Committee of your Company
meets periodically with the internal
auditors and the external auditors to
review the manner in which these auditors
are performing their responsibilities, and
to discuss auditing, internal control and
financial reporting issues. To ensure
complete independence, the external
auditors and the internal auditors have
full and free access to the members
of the Audit Committee to discuss any
matter of substance.
It is also declared and confirmed that
the Company has complied with and
ensured compliance by the auditors
with the guidelines for the audit of Listed
Companies.
It is also confirmed that the Company is
compliant with the Code of Best Practice
in Corporate Governance issued by the
Institute of Chartered Accountants of Sri
Lanka and the Code of Best Practice on
Related Party Transactions issued by the
Securities and Exchange Commission of
Sri Lanka.
B T T Roche
General Manager - Finance
J A P M Jayasekera
Managing Director
31st May 2022

78 | Lanka Tiles PLC
Related Party Transactions Review Committee ReportThe Related Party Transactions Review Committee (RPTRC) of the Company was formed by the Board in January 2016 in accordance with Section 9 of the Listing Rules of the Colombo Stock Exchange to ensure compliance with those Rules facilitating independent review, approval and oversight of Related Party Transactions of the Company.
Purpose of the CommitteeThe purpose of the RPTRC of the Company is to conduct an independent review approval and oversight of all related party transactions of Lanka Tiles PLC and to ensure that the Company complies with the rules set out in the Listing Rules. The primary objectives of the said rules are to ensure that the interests of the shareholders as a whole are taken into account when entering into related party transactions, and to prevent Directors, key management personnel or substantial shareholders from taking advantage of their positions. To exercise this purpose the Committee has adopted the related party transaction Policy which contains the Company’s Policy governing the review, approval and oversight of related party transactions.
Responsibilities of the Related Party Transactions Review CommitteeThe following are key responsibilities have been set out in the Charter for RPTRC;
a) Ensure that the Company complies with the rules set out in the Listing Rules
b) Subject to the exceptions given in the Listing Rules, review, in advance all proposed related party transactions
c) Perform other activities related to the Charter as requested by the Board
d) Have meetings every fiscal quarter and report to the Board on the Committee’s activities
e) Share information with the Audit Committee as necessary and appropriate, to permit the Audit Committee to carry out its statutory, regulatory and other responsibilities with regard to related party transactions.
f) Review the Charter and Policy at least annually and recommend amendments to the Charter and Policy to the Board as and when determined to be appropriate by the Committee.
Composition of the CommitteeThe Related Party Transactions Review Committee comprises of the following three Non-Executive Directors of Lanka Walltiles PLC which is the parent company of LTPLC.1. Dr. S Selliah – Chairman2. Mr. J D N Kekulawala3. Mr. T G Thoradeniya
The Managing Director and the General Manager - Finance attend meetings by invitation and the Company Secretary functions as the Secretary to the Committee.
The Committee members possess vast experience in business management and financial expertise to perform the duty of the Committee successfully.
MeetingsThe Committee held five meetings during the year.
The attendance of the members at the meeting is as follows.Mr. J D N Kekulawala - 5/5Dr. S Selliah - 5/5Mr. T G Thoradeniya - 5/5
The minutes of the Committee meeting were tabled at Board meeting, for the review of the Board.
Procedures for Reporting RPT’sThe Managing Director (MD) is responsible for reporting to the Committee, for its review and approval the information set out under Rule 30 of the Code at the minimum, in respect of each related party transaction proposed to be entered into other than the exceptions given in Rule 27 of the code. Moreover, on a quarterly basis, the MD is required to report to the Committee on the approved related party transactions actually entered into by the Company.
The Committee has approved the Related Party Transactions Declaration Form required to be filled by the Directors and key management personnel of the Company. The Company uses this form to capture the related party transactions at the end of every quarter.
Review of Related Party TransactionsThe Committee reviewed all related party transactions of the Company for the financial year 2021/22 and has communicated the comments and observation to the Board of Directors. In terms of Rule 9.3.2 of the Listing Rules of the Colombo Stock Exchange on related party transactions, there were no none-recurrent related party transactions entered into during the course of the financial year aggregative value of which exceeded the lower of 10% of the equity or 5% of the assets. There were no recurrent related party transactions carried out during the financial year ended 31st March 2022, the aggregate value of which exceeded 10% of the revenue.
In the opinion of the Committee, the terms of these transactions were not more favourable to the related parties than those generally available to the public. The details of related party transactions entered into during the year are given in Note 27 to the Financial Statements, on pages 125 to 128 of this Annual Report.
DeclarationA declaration by the Board of Directors on compliance with the rules pertaining to Related Party Transactions appears on the report of the Board of Directors on page 71 of this Annual Report.
Dr. S SelliahChairman - Related Party Transactions Review Committee31st May 2022

Annual Report 2021/22 | 79
Remuneration Committee Report
Role of the Remuneration Committee
The Remuneration Committee is a sub -
committee of Royal Ceramics Lanka PLC
Board, to which it is accountable. The
Committee evaluates the performance
of the respective Group Company
Boards, its Chief Executive Officers, Key
Management Personal and executive
staff against the set objectives and
goals, and determines the remuneration
policy of the Group Company for all
levels of employees. The Committee
supports and advises the Board on
remuneration and remuneration related
matters and makes decisions under
delegated authority with a view to
aligning the interests of employees and
shareholders.
Composition of the Remuneration
Committee
The Remuneration Committee comprises
of the following three independent non-
executive Directors of Royal Ceramics
Lanka PLC.
Mr. S H Amarasekera - Chairman
Mr. R N Asirwatham
Mr. L N De S Wijeyeratne
The Managing Director attends the
Committee meeting by invitation. The
Company Secretary is the Secretary of
the Remuneration Committee.
The above Committee members
possess vast experience in the fields
of Business Management, Human
Resources Management, Labour
Relations and Labour Law. Hence the
Committee has adequate expertise
in remuneration policy and business
management to deliberate and propose
necessary changes and improvements
to meet the roles and responsibility of
the Committee.
Meetings
The Remuneration Committee met once
for the year. The attendance of the
members at the meeting is as follows.
Mr. S H Amarasekera - 1/1
Mr. R N Asirwatham - 1/1
Mr. L N De S Wijeyeratne - 1/1
Functions performed by the
Remuneration Committee
a. Evaluating and recommending
the remuneration payable to the
Board, Managing Director and the
Key Management Personal of the
Company to the Board to make the
final determination. Based on that,
the aggregate remuneration paid to
Executive and Non Executive Directors
for last financial year is given on Page
136 of the Annual Report under key
management remuneration.
b. Ensuring that the Board complies
with the Companies Act in relation to
Directors remunerations, especially
the requirements of section 216. It
also ensures that employees are
adequately compensated based on
their performance and contribution
for the period under review and future
potential.
c. Constructing a specific remuneration
policy and remuneration framework
that enables the Company to
attract and retain a high quality and
representative staff in its operations
and do this inter alia with reference
to appropriate market rates where
these are relevant, and benchmarking
specific categories where required.
d. Ensuring internal equity and fairness
in and between the various pay
categories and building incentives
in the cost of employment structure
to encourage and reward excellent
performance, on objectively defined
criteria.
e. Ensuring that staff costs are within
the budget set by the Board, and are
sustainable over time.
Conclusion
The Committee is satisfied that it has
performed the responsibilities that were
delegated to it by the Board for the
year under review and the necessary
objectives were achieved for the year
under review.
S H Amarasekera
Chairman of the Remuneration
Committee
31st May 2022
80 | Lanka Tiles PLC
Audit Committee Report
Role of the Audit CommitteeThe Audit Committee is a Sub Committee of the Board, to which it is accountable. The function of the Audit Committee is defined in the Audit Committee Charter. Primarily it is to assist the Board in its oversight of the integrity of the Financial Statements of the Company, to assess the adequacy of the risk management framework of the Company, assess the independence and the performance of the Company’s external audit function and internal audit functions, and review compliance of the Company with legal and regulatory requirements.
Composition of the Audit CommitteeThe Audit Committee comprised of the following three Directors.
Mr. J D N KekulawalaChairman, Independent Non – Executive DirectorDr. S SelliahCommittee Member - Independent Non – Executive DirectorMr. T G ThoradeniyaCommittee Member- Non – Executive Director
The Managing Director and the General Manager – Finance attend the meetings at the invitation of the Audit Committee.
The Company Secretary functions as the Secretary to the Audit Committee. Representatives of the Company, external auditors and internal auditors also attend Audit Committee meetings by invitation.
The Audit Committee has the required expertise in finance, law and business management to deliberate Audit Committee matters and recommend necessary action to be taken.
MeetingsThe Audit Committee met 04 times during the year. The attendance of the members at the meeting is as follows.Mr. J D N Kekulawala - 4/4Dr. S Selliah - 4/4Mr. T G Thoradeniya - 4/4
Functions performed by the Audit Committee a. The Committee reviewed the
provisional financial statements that were published for financial year 2021/22 and the audited financial statements of financial year 2021/22. It reviewed the preparation, presentation and adequacy of disclosures in the financial statements of the Company, in accordance with Sri Lanka Accounting Standards. It also reviewed the Company’s compliance with financial reporting requirements, information requirements of the Companies Act and other relevant financial reporting related regulations and requirements.
b. The Committee reviewed the quarterly internal audit reports. The internal audit function is carried out by M/s. BDO Partners. The Internal audits are done on a process based audit framework to improve process performance and control.
c. The Committee reviewed the external auditor’s report and management letter for the last year. All recommendations proposed by the external auditors were discussed with the senior partner and recommendations proposed were duly carried out by the management. In addition the Audit Committee reviewed external auditors and the engagement partner’s relationships with the Company, and assessed that the external auditors are independent.
d. The Audit Committee in conjunction with the Managing Director of the Company reviewed the Company’s disclosure controls and procedures and internal control over financial reporting.
e. The Audit Committee reviewed the Company’s framework and practices with respect to risk assessment and risk management, including discussing with management the Company’s major financial risk exposures and the steps that have
been taken to monitor and control such exposures.
f. The Audit Committee reviewed the company’s arrangement for the confidential receipt, retention and treatment of complaints alleging fraud, received from any sources and pertaining to accounting, internal controls or other such matters and assured the confidentiality to whistle-blowing employees. It also reviewed the company’s procedures for detecting and preventing fraud and bribery and receiving reports on non-compliance and reviewed the procedure for receiving and dealing with “Non-Compliance with Laws and Regulations (NOCLAR) referred by Professional Accountants.
g. Performed other activities related to this charter as requested by the Board of Directors. Oversaw special investigations as needed. Reviewed and assessed the adequacy of the committee charter annually and requested Board approval for proposed changes, and ensured appropriate disclosure as may be required by law or regulations.
ConclusionThe Audit Committee is satisfied that the Company’s accounting policies, independence of the auditors and risk management policies are adequate for its operations. The Audit Committee has also accomplished responsibilities and functions that are delegated to it by the Board and outlined in the Charter.
J D N KekulawalaChairman – Audit Committee31st May 2022
Annual Report 2021/22 | 81
FINANCIAL STATEMENTS
DeliverLastingValue
Independent Auditor’s Report 82
Consolidated Statement of Financial Position
86
Consolidated Statement of profit or loss and other comprehensive income
87
Statement of Changes in Equity 88
Consolidated Statement of Cash Flow 89
Notes to the Financial Statements 90
82 | Lanka Tiles PLC
Independent Auditor’s Report
TO THE SHAREHOLDERS OF LANKA
TILES PLC
Report on the audit of the Consolidated
Financial Statements
Opinion
We have audited the financial statements
of Lanka Tiles PLC (“the Company”) and
the consolidated financial statements of
the Company and its subsidiaries (“the
Group”), which comprise the statement
of financial position as at 31 March 2022,
and the statement of comprehensive
income, statement of changes in equity
and Statement of cash flows for the year
then ended, and notes to the financial
statements, including a summary of
significant accounting policies.
In our opinion, the accompanying
financial statements of the Company
and the Group give a true and fair view
of the financial position of the Company
and the Group as at 31 March 2022,
and of their financial performance and
cash flows for the year then ended in
accordance with Sri Lanka Accounting
Standards.
Basis for opinion
We conducted our audit in accordance
with Sri Lanka Auditing Standards
(SLAuSs). Our responsibilities under
those standards are further described
in the Auditor’s responsibilities for the
audit of the financial statements section
of our report. We are independent of
the Group in accordance with the Code
of Ethics issued by CA Sri Lanka (Code
of Ethics) and we have fulfilled our other
ethical responsibilities in accordance
with the Code of Ethics. We believe that
the audit evidence we have obtained is
sufficient and appropriate to provide a
basis for our opinion.
Key audit matters
Key audit matters are those matters
that, in our professional judgement,
were of most significance in our audit of
the financial statements of the current
period. These matters were addressed
in the context of our audit of the financial
statements as a whole, and in forming
the auditor’s opinion thereon, and we do
not provide a separate opinion on these
matters. For each matter below, our
description of how our audit addressed
the matter is provided in that context.
We have fulfilled the responsibilities
described in the Auditor’s responsibilities
for the audit of the financial statements
section of our report, including in relation
to these matters. Accordingly, our audit
included the performance of procedures
designed to respond to our assessment
of the risks of material misstatement
of the financial statements. The results
of our audit procedures, including the
procedures performed to address the
matters below, provide the basis for
our audit opinion on the accompanying
financial statements.
Annual Report 2021/22 | 83
Key audit matter How our audit addressed the Key Audit Matter
Recognition of Revenue
The Group’s Revenue for the year ended 31 March 2022,
amounting to Rs. 14.59Bn is derived from sales of glazed
ceramic and porcelain floor tiles as disclosed in note 17 to
the financial statements.
Revenue was a key audit matter due to:
the significance of the amount
high volume of transactions and significant increase
recorded during the current year
We identified sales of glazed ceramic and porcelain floor tiles as
significant revenues and our audit procedures amongst others
included the following;
Assessed the appropriateness of the Group’s revenue
recognition accounting policy,
Evaluated the design of internal controls and tested the
operating effectiveness of relevant controls relating to revenue
recognition
Performed analytical procedures to understand and assess the
reasonableness of the reported revenues
Tested the general IT control environment and the key IT
application controls relating to the most significant IT systems
relevant to revenue recognition
Tested the appropriateness of revenue recognised by
reviewing the relevant sales contracts and other supporting
documents; and
Assessed the adequacy of the disclosures in respect of
revenue in Note 17 to the financial statements
Valuation of Land and Buildings
Property, Plant and Equipment and Investment Property
include land and buildings carried at fair value in
accordance with its accounting policies disclosed in notes
2.3.7 and 2.3.10. The fair values of land and buildings were
determined by an external valuer engaged by the Group.
This was a key audit matter due to the:
materiality of the reported Land & Buildings within
Property, Plant and Equipment and Investment
Property which amounted to Rs. 6.47Bn and Rs. 483Mn
respectively as of reporting date
degree of assumptions, judgements and estimation
uncertainties associated with the fair valuation of Land
and Buildings such as reliance on comparable market
transactions and consideration of current market
conditions
Key areas of significant judgments, estimates and
assumptions used in the valuation of the land and buildings
as disclosed in notes 3.3.1 and 3.6.1:
Estimate of per perch value of the land
Estimate of the per square foot value of the buildings
Our audit procedures were focused on the valuations performed
by the external valuer engaged by the Group, and included the
following;
We assessed the competency, capability and objectivity of the
external valuer engaged by the Group
We read the external valuer’s report and understood the
key estimates made and the approach taken by the valuer in
determining the valuation of each property
We assessed the reasonableness of the significant judgements
made by the valuer and valuation techniques used, per perch
price and value per square foot used by the valuer in the
valuation of each property
We have also assessed the adequacy of the disclosures made in
notes 2.3.7, 2.3.10, 3.3 and 3.6.1 in the financial statements
84 | Lanka Tiles PLC
Other information included in the
Group’s 2022 Annual Report
Other information consists of the
information included in the Annual
Report, other than the financial
statements and our auditor’s report
thereon. Management is responsible for
the other information.
Our opinion on the financial statements
does not cover the other information
and we do not express any form of
assurance conclusion thereon.
In connection with our audit of the
financial statements, our responsibility
is to read the other information and, in
doing so, consider whether the other
information is materially inconsistent
with the financial statements or our
knowledge obtained in the audit or
otherwise appears to be materially
misstated. If, based on the work we
have performed, we conclude that there
is a material misstatement of this other
information, we are required to report
that fact. We have nothing to report in
this regard
Responsibilities of management and
those charged with governance for the
financial statements
Management is responsible for the
preparation of financial statements that
give a true and fair view in accordance
with Sri Lanka Accounting Standards,
and for such internal control as
management determines is necessary
to enable the preparation of financial
statements that are free from material
misstatement, whether due to fraud or
error.
In preparing the financial statements,
management is responsible for
assessing the Group’s ability to continue
as a going concern, disclosing, as
applicable, matters related to going
concern and using the going concern
basis of accounting unless management
either intends to liquidate the Group or
to cease operations, or has no realistic
alternative but to do so.
Those charged with governance
are responsible for overseeing the
Company’s and the Group’s financial
reporting process.
Auditor’s responsibilities for the audit
of the financial statements
Our objectives are to obtain reasonable
assurance about whether the financial
statements as a whole are free from
material misstatement, whether due to
fraud or error, and to issue an auditor’s
report that includes our opinion.
Reasonable assurance is a high level
of assurance, but is not a guarantee
that an audit conducted in accordance
with SLAuSs will always detect a
material misstatement when it exists.
Misstatements can arise from fraud
or error and are considered material
if, individually or in the aggregate,
they could reasonably be expected
to influence the economic decisions
of users taken on the basis of these
financial statements.
As part of an audit in accordance with
SLAuSs, we exercise professional
judgement and maintain professional
skepticism throughout the audit. We
also:
Identify and assess the risks of
material misstatement of the financial
statements, whether due to fraud
or error, design and perform audit
procedures responsive to those risks,
and obtain audit evidence that is
sufficient and appropriate to provide
a basis for our opinion. The risk of not
detecting a material misstatement
resulting from fraud is higher than for
one resulting from error, as fraud may
involve collusion, forgery, intentional
omissions, misrepresentations, or the
override of internal control.
Obtain an understanding of internal
control relevant to the audit in order
to design audit procedures that are
appropriate in the circumstances, but
not for the purpose of expressing an
opinion on the effectiveness of the
internal controls of the Company and
the Group.
Evaluate the appropriateness of
accounting policies used and the
reasonableness of accounting
estimates and related disclosures
made by management.
Conclude on the appropriateness
of management’s use of the going
concern basis of accounting and,
based on the audit evidence obtained,
whether a material uncertainty exists
related to events or conditions that
may cast significant doubt on the
Group’s ability to continue as a going
concern. If we conclude that a material
uncertainty exists, we are required
to draw attention in our auditor’s
report to the related disclosures in
the financial statements or, if such
disclosures are inadequate, to modify
Independent Auditor’s Report
Annual Report 2021/22 | 85
our opinion. Our conclusions are
based on the audit evidence obtained
up to the date of our auditor’s report.
However, future events or conditions
may cause the Group to cease to
continue as a going concern.
Evaluate the overall presentation,
structure and content of the financial
statements, including the disclosures,
and whether the financial statements
represent the underlying transactions
and events in a manner that achieves
fair presentation.
Obtain sufficient appropriate audit
evidence regarding the financial
information of the entities or business
activities within the Group to express
an opinion on the consolidated financial
statements. We are responsible
for the direction, supervision and
performance of the group audit. We
remain solely responsible for our audit
opinion.
We communicate with those charged
with governance regarding, among
other matters, the planned scope
and timing of the audit and significant
audit findings, including any significant
deficiencies in internal control that we
identify during our audit.
We also provide those charged
with governance with a statement
that we have complied with ethical
requirements in accordance with the
Code of Ethics regarding independence,
and to communicate with them all
relationships and other matters that may
reasonably be thought to bear on our
independence, and where applicable,
related safeguards.
From the matters communicated with
those charged with governance, we
determine those matters that were of
most significance in the audit of the
financial statements of the current
period and are therefore the key audit
matters. We describe these matters
in our auditor’s report unless law or
regulation precludes public disclosure
about the matter or when, in extremely
rare circumstances, we determine that
a matter should not be communicated
in our report because the adverse
consequences of doing so would
reasonably be expected to outweigh
the public interest benefits of such
communication.
Report on Other Legal and Regulatory
Requirements
As required by section 163 (2) of the
Companies Act No. 07 of 2007, we
have obtained all the information and
explanations that were required for the
audit and, as far as appears from our
examination, proper accounting records
have been kept by the Company.
CA Sri Lanka membership number of
the engagement partner responsible
for signing this independent auditor’s
report is 2471.
31st May 2022
Colombo
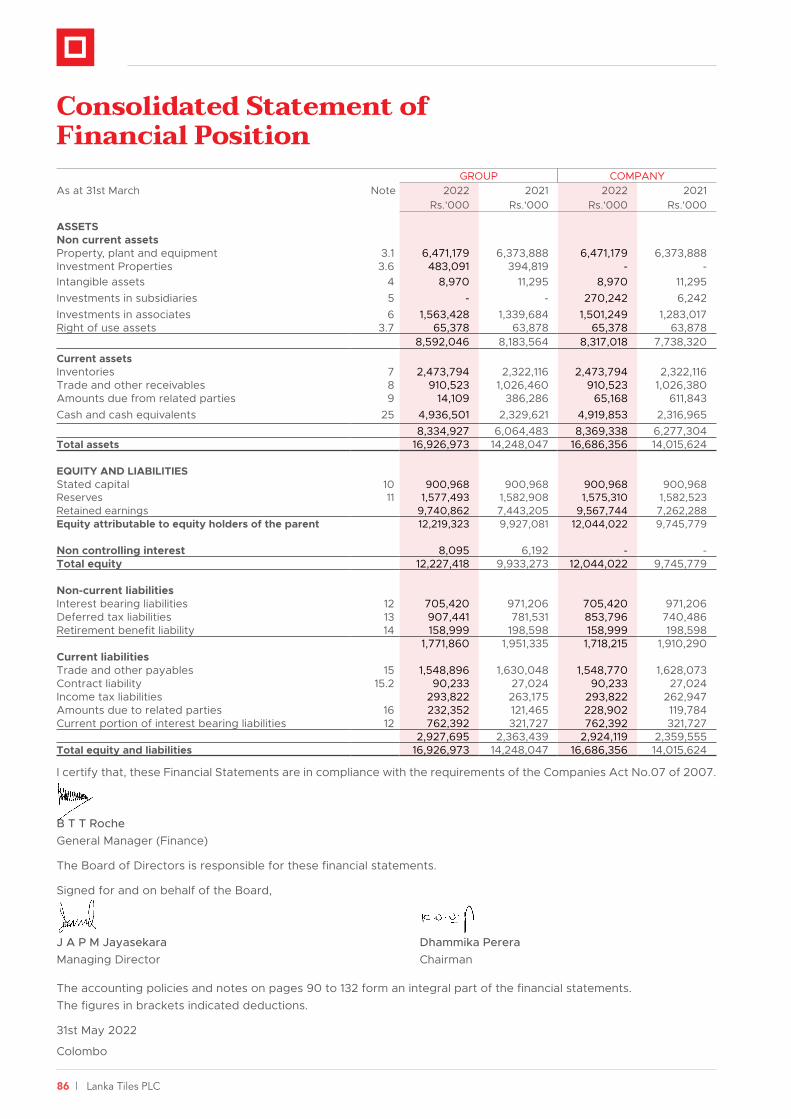
86 | Lanka Tiles PLC
GROUP COMPANYAs at 31st March Note 2022 2021 2022 2021
Rs.'000 Rs.'000 Rs.'000 Rs.'000
ASSETSNon current assetsProperty, plant and equipment 3.1 6,471,179 6,373,888 6,471,179 6,373,888 Investment Properties 3.6 483,091 394,819 - - Intangible assets 4 8,970 11,295 8,970 11,295 Investments in subsidiaries 5 - - 270,242 6,242 Investments in associates 6 1,563,428 1,339,684 1,501,249 1,283,017 Right of use assets 3.7 65,378 63,878 65,378 63,878
8,592,046 8,183,564 8,317,018 7,738,320 Current assetsInventories 7 2,473,794 2,322,116 2,473,794 2,322,116 Trade and other receivables 8 910,523 1,026,460 910,523 1,026,380 Amounts due from related parties 9 14,109 386,286 65,168 611,843 Cash and cash equivalents 25 4,936,501 2,329,621 4,919,853 2,316,965
8,334,927 6,064,483 8,369,338 6,277,304 Total assets 16,926,973 14,248,047 16,686,356 14,015,624
EQUITY AND LIABILITIESStated capital 10 900,968 900,968 900,968 900,968 Reserves 11 1,577,493 1,582,908 1,575,310 1,582,523 Retained earnings 9,740,862 7,443,205 9,567,744 7,262,288 Equity attributable to equity holders of the parent 12,219,323 9,927,081 12,044,022 9,745,779
Non controlling interest 8,095 6,192 - - Total equity 12,227,418 9,933,273 12,044,022 9,745,779
Non-current liabilitiesInterest bearing liabilities 12 705,420 971,206 705,420 971,206 Deferred tax liabilities 13 907,441 781,531 853,796 740,486 Retirement benefit liability 14 158,999 198,598 158,999 198,598
1,771,860 1,951,335 1,718,215 1,910,290 Current liabilitiesTrade and other payables 15 1,548,896 1,630,048 1,548,770 1,628,073 Contract liability 15.2 90,233 27,024 90,233 27,024 Income tax liabilities 293,822 263,175 293,822 262,947 Amounts due to related parties 16 232,352 121,465 228,902 119,784 Current portion of interest bearing liabilities 12 762,392 321,727 762,392 321,727
2,927,695 2,363,439 2,924,119 2,359,555 Total equity and liabilities 16,926,973 14,248,047 16,686,356 14,015,624
I certify that, these Financial Statements are in compliance with the requirements of the Companies Act No.07 of 2007.
B T T RocheGeneral Manager (Finance)
The Board of Directors is responsible for these financial statements.
Signed for and on behalf of the Board,
J A P M Jayasekara Dhammika PereraManaging Director Chairman
The accounting policies and notes on pages 90 to 132 form an integral part of the financial statements. The figures in brackets indicated deductions.
31st May 2022
Colombo
Consolidated Statement of Financial Position
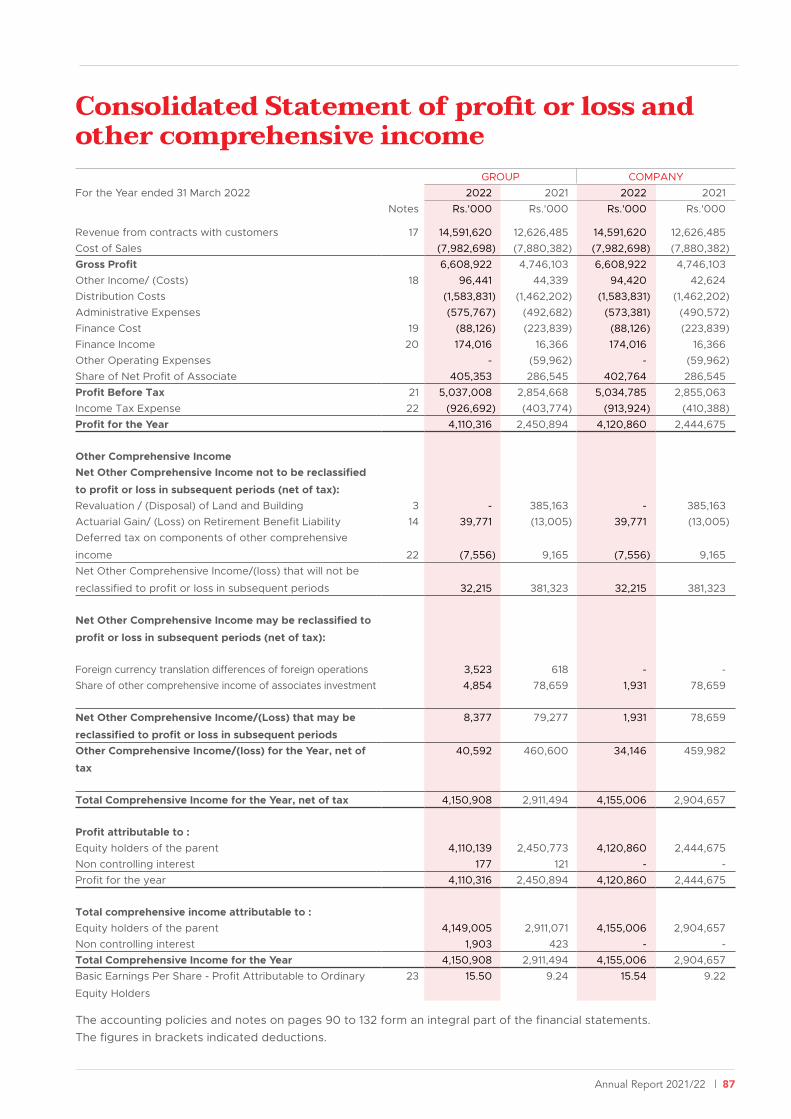
Annual Report 2021/22 | 87
GROUP COMPANYFor the Year ended 31 March 2022 2022 2021 2022 2021
Notes Rs.'000 Rs.'000 Rs.'000 Rs.'000
Revenue from contracts with customers 17 14,591,620 12,626,485 14,591,620 12,626,485 Cost of Sales (7,982,698) (7,880,382) (7,982,698) (7,880,382)Gross Profit 6,608,922 4,746,103 6,608,922 4,746,103 Other Income/ (Costs) 18 96,441 44,339 94,420 42,624 Distribution Costs (1,583,831) (1,462,202) (1,583,831) (1,462,202)Administrative Expenses (575,767) (492,682) (573,381) (490,572)Finance Cost 19 (88,126) (223,839) (88,126) (223,839)Finance Income 20 174,016 16,366 174,016 16,366 Other Operating Expenses - (59,962) - (59,962)Share of Net Profit of Associate 405,353 286,545 402,764 286,545 Profit Before Tax 21 5,037,008 2,854,668 5,034,785 2,855,063 Income Tax Expense 22 (926,692) (403,774) (913,924) (410,388)Profit for the Year 4,110,316 2,450,894 4,120,860 2,444,675
Other Comprehensive Income Net Other Comprehensive Income not to be reclassified
to profit or loss in subsequent periods (net of tax):Revaluation / (Disposal) of Land and Building 3 - 385,163 - 385,163 Actuarial Gain/ (Loss) on Retirement Benefit Liability 14 39,771 (13,005) 39,771 (13,005)Deferred tax on components of other comprehensive
income 22 (7,556) 9,165 (7,556) 9,165 Net Other Comprehensive Income/(loss) that will not be
reclassified to profit or loss in subsequent periods 32,215 381,323 32,215 381,323
Net Other Comprehensive Income may be reclassified to
profit or loss in subsequent periods (net of tax):
Foreign currency translation differences of foreign operations 3,523 618 - - Share of other comprehensive income of associates investment 4,854 78,659 1,931 78,659
Net Other Comprehensive Income/(Loss) that may be
reclassified to profit or loss in subsequent periods
8,377 79,277 1,931 78,659
Other Comprehensive Income/(loss) for the Year, net of
tax
40,592 460,600 34,146 459,982
Total Comprehensive Income for the Year, net of tax 4,150,908 2,911,494 4,155,006 2,904,657
Profit attributable to :Equity holders of the parent 4,110,139 2,450,773 4,120,860 2,444,675 Non controlling interest 177 121 - - Profit for the year 4,110,316 2,450,894 4,120,860 2,444,675
Total comprehensive income attributable to :Equity holders of the parent 4,149,005 2,911,071 4,155,006 2,904,657 Non controlling interest 1,903 423 - - Total Comprehensive Income for the Year 4,150,908 2,911,494 4,155,006 2,904,657 Basic Earnings Per Share - Profit Attributable to Ordinary
Equity Holders
23 15.50 9.24 15.54 9.22
The accounting policies and notes on pages 90 to 132 form an integral part of the financial statements. The figures in brackets indicated deductions.
Consolidated Statement of profit or loss and other comprehensive income

88 | Lanka Tiles PLC
As at 31 March Stated
capital
Revaluation
reserve
Amalgamation
reserve
Retained
earnings
Exchange
translation
reserve
Non
controlling
interest
Total
Rs.’000 Rs.’000 Rs.’000 Rs.’000 Rs.’000 Rs.’000 Rs.’000
GROUPBalance as at 1st April 2020 900,968 730,515 460,151 5,781,070 70 5,769 7,878,543
Profit for the Year - - - 2,450,773 - 121 2,450,894 Other Comprehensive Income - - - 68,125 316 302 68,743 Revaluation gain 391,857 391,857 Total Comprehensive Income 391,857 - 2,518,898 316 423 2,911,494 Dividends 1st Interim 2020/21
(Rs. 3.85 per share)
- - - (204,244) - - (204,244)
2nd Interim 2020/21
(Rs. 12.30 per share)
- - - (652,520) - - (652,520)
- - - (856,764) - - (856,764)Balance as at 1st April 2021 900,968 1,122,372 460,151 7,443,204 386 6,192 9,933,273
Profit for the Year - - - 4,110,139 - 177 4,110,316
Other Comprehensive Income - - - 37,069 1,797 1,726 40,592
Transfer from revaluation
reserve on disposal of land
- (7,213) - 7,213 - - -
Total Comprehensive Income - (7,213) - 4,154,421 1,797 1,903 4,150,908
Dividends Final 2020/21
(Rs. 2.20 per share)
- - - (583,554) - - (583,554)
1st Interim 2021/22
(Rs. 3.00 per share)
- - - (795,756) - - (795,756)
2nd Interim 2021/22
(Rs. 1.80 per share)
- - - (477,453) - - (477,453)
- - - (1,856,763) - - (1,856,763)Balance as at 31 March 2022 900,968 1,115,159 460,151 9,740,862 2,183 8,095 12,227,418
Stated
capital
Revaluation
reserve
Amalgamation
reserve
Retained
Earnings
Total
Rs.’000 Rs.’000 Rs.’000 Rs.’000 Rs.’000
COMPANYBalance as at 1st April 2020 900,968 730,515 460,151 5,606,252 7,697,886 Profit for the Year - - - 2,444,675 2,444,675
Other Comprehensive Income - - - 68,125 68,125 Revaluation gain - 391,857 - - 391,857 Total Comprehensive Income - 391,857 - 2,512,800 2,904,657 Dividends 1st Interim 2020/21 (Rs. 3.85 per share) - - - (204,244) (204,244)2nd Interim 2020/21 (Rs. 12.30 per share) - - - (652,520) (652,520)
- - - (856,764) (856,764)Balance as at 1st April 2021 900,968 1,122,372 460,151 7,262,288 9,745,779 Profit for the Year - - - 4,120,860 4,120,860 Other Comprehensive Income - - - 34,146 34,146 Transfer from revaluation reserve on disposal of land - (7,213) - 7,213 - Total Comprehensive Income - (7,213) - 4,162,219 4,155,006 Dividends Final 2020/21 (Rs. 2.20 per share) - - - (583,554) (583,554)1st Interim 2021/22 (Rs. 3.00 per share) - - - (795,756) (795,756)2nd Interim 2021/22 (Rs. 1.80 per share) (477,453) (477,453)
- - - (1,856,763) (1,856,763)Balance as at 31 March 2022 900,968 1,115,159 460,151 9,567,744 12,044,022
The accounting policies and notes on pages 90 to 132 form an integral part of the financial statements. The figures in brackets indicated deductions.
Statement of Changes in Equity
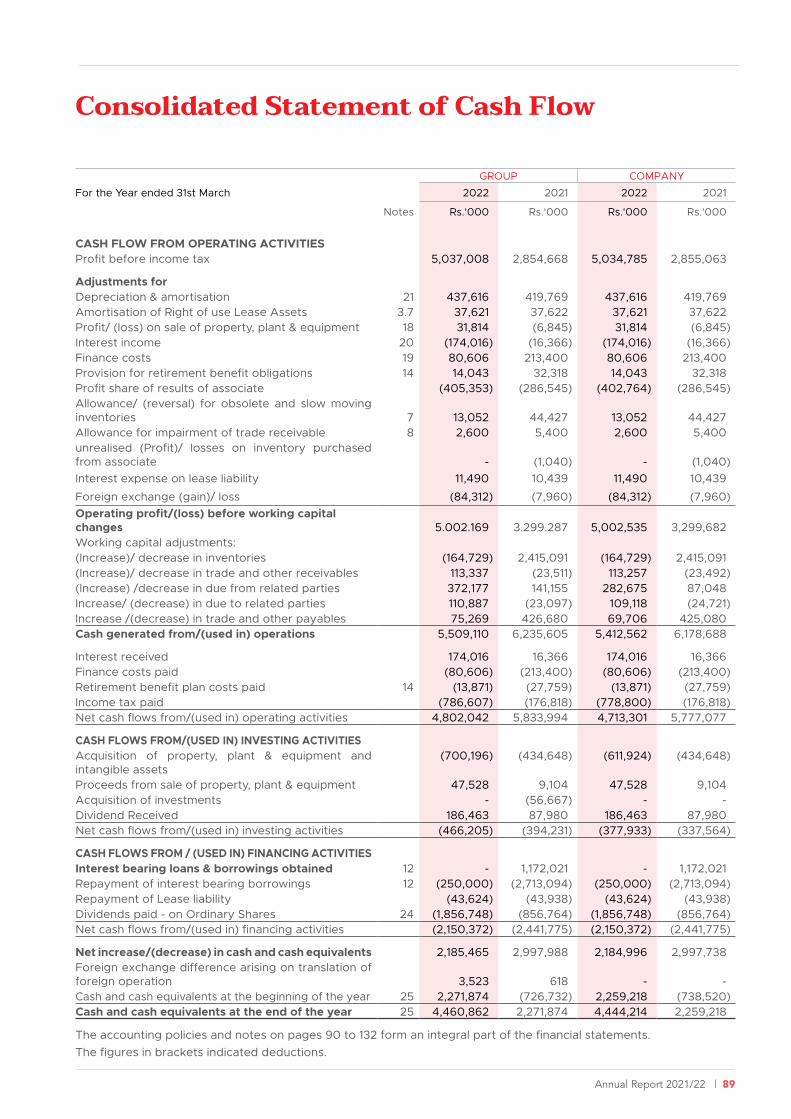
Annual Report 2021/22 | 89
GROUP COMPANY
For the Year ended 31st March 2022 2021 2022 2021
Notes Rs.'000 Rs.'000 Rs.'000 Rs.'000
CASH FLOW FROM OPERATING ACTIVITIESProfit before income tax 5,037,008 2,854,668 5,034,785 2,855,063
Adjustments forDepreciation & amortisation 21 437,616 419,769 437,616 419,769 Amortisation of Right of use Lease Assets 3.7 37,621 37,622 37,621 37,622 Profit/ (loss) on sale of property, plant & equipment 18 31,814 (6,845) 31,814 (6,845)Interest income 20 (174,016) (16,366) (174,016) (16,366)Finance costs 19 80,606 213,400 80,606 213,400 Provision for retirement benefit obligations 14 14,043 32,318 14,043 32,318 Profit share of results of associate (405,353) (286,545) (402,764) (286,545)Allowance/ (reversal) for obsolete and slow moving inventories 7 13,052 44,427 13,052 44,427 Allowance for impairment of trade receivable 8 2,600 5,400 2,600 5,400 unrealised (Profit)/ losses on inventory purchased from associate - (1,040) - (1,040)Interest expense on lease liability 11,490 10,439 11,490 10,439
Foreign exchange (gain)/ loss (84,312) (7,960) (84,312) (7,960)Operating profit/(loss) before working capital changes 5.002.169 3.299.287 5,002,535 3,299,682Working capital adjustments:(Increase)/ decrease in inventories (164,729) 2,415,091 (164,729) 2,415,091 (Increase)/ decrease in trade and other receivables 113,337 (23,511) 113,257 (23,492)(Increase) /decrease in due from related parties 372,177 141,155 282,675 87,048 Increase/ (decrease) in due to related parties 110,887 (23,097) 109,118 (24,721)Increase /(decrease) in trade and other payables 75,269 426,680 69,706 425,080 Cash generated from/(used in) operations 5,509,110 6,235,605 5,412,562 6,178,688
Interest received 174,016 16,366 174,016 16,366 Finance costs paid (80,606) (213,400) (80,606) (213,400)Retirement benefit plan costs paid 14 (13,871) (27,759) (13,871) (27,759)Income tax paid (786,607) (176,818) (778,800) (176,818)Net cash flows from/(used in) operating activities 4,802,042 5,833,994 4,713,301 5,777,077
CASH FLOWS FROM/(USED IN) INVESTING ACTIVITIESAcquisition of property, plant & equipment and intangible assets
(700,196) (434,648) (611,924) (434,648)
Proceeds from sale of property, plant & equipment 47,528 9,104 47,528 9,104 Acquisition of investments - (56,667) - - Dividend Received 186,463 87,980 186,463 87,980 Net cash flows from/(used in) investing activities (466,205) (394,231) (377,933) (337,564)
CASH FLOWS FROM / (USED IN) FINANCING ACTIVITIESInterest bearing loans & borrowings obtained 12 - 1,172,021 - 1,172,021 Repayment of interest bearing borrowings 12 (250,000) (2,713,094) (250,000) (2,713,094)Repayment of Lease liability (43,624) (43,938) (43,624) (43,938)Dividends paid - on Ordinary Shares 24 (1,856,748) (856,764) (1,856,748) (856,764)Net cash flows from/(used in) financing activities (2,150,372) (2,441,775) (2,150,372) (2,441,775)
Net increase/(decrease) in cash and cash equivalents 2,185,465 2,997,988 2,184,996 2,997,738 Foreign exchange difference arising on translation of foreign operation 3,523 618 - - Cash and cash equivalents at the beginning of the year 25 2,271,874 (726,732) 2,259,218 (738,520)Cash and cash equivalents at the end of the year 25 4,460,862 2,271,874 4,444,214 2,259,218
The accounting policies and notes on pages 90 to 132 form an integral part of the financial statements. The figures in brackets indicated deductions.
Consolidated Statement of Cash Flow
90 | Lanka Tiles PLC
Notes to the Financial Statements
1. CORPORATE INFORMATION
1.1 Reporting Entity
Lanka Tiles PLC (“Company”) which is a
limited liability company incorporated and
domiciled in Sri Lanka and listed on the
Colombo Stock Exchange. The registered
office and the principal place of business
of the Company is located at No. 215,
Nawala Road, Narahenpita, Colombo 05.
1.2 Principal activities and nature of
operations
During the year principal activities of the
company were the manufacture and sales
of glazed ceramic and porcelain floor tiles
for export and local markets and holding
investments.
The principal activities of the other
company of the Group are disclosed
in Note 5.1 and 6.1 to the Financial
Statements.
1.3 Parent enterprise and ultimate
parent enterprise
The Company’s parent entity is Lanka
Walltiles PLC. In the opinion of the
Directors, the Company’s ultimate parent
undertaking and controlling party is
Vallibel One PLC, which is incorporated in
Sri Lanka.
The Group’s ultimate controlling party is
Mr. K.D.D. Perera.
1.4 Date of authorisation for issue
The Financial Statement of Lanka Tiles
PLC and its Subsidiaries for year ended
31 March 2022 was authorised for issue
in accordance with a resolution of the
Board of Directors on 31 May 2022.
2. SUMMARY OF SIGNIFICANT
ACCOUNTING POLICIES
2.1 Basis of Preparation
The financial statements of the Company
and the Group have been prepared in
accordance with Sri Lanka Accounting
Standards comprising SLFRS and LKAS
(hereafter “SLFRS”) as issued by the
Institute of Chartered Accountants of Sri
Lanka.
2.1.1 Basis of measurement
The financial statements of the Company
and the Group have been prepared on
a historical cost basis, other than for
following assets measured at fair value.
1. Property, Plant and Equipment – Land
and Buildings .
2. Investment properties
The financial statements are presented
in Sri Lankan Rupees (LKR), except when
otherwise indicated.
2.1.2 Statement of Compliance
The financial statements of the Company
and consolidated financial statements
of the Group have been prepared in
accordance with Sri Lanka Accounting
Standards (“SLFRS”) as issued by
Institute of Chartered Accountants of Sri
Lanka.
The preparation and presentation
of these financial statements is in
compliance with the requirements of the
Companies Act No.07 of 2007.
2.1.3 Going concern
When preparing financial statements,
management has made assessments
of the ability of the constituents of the
Group to continue as going concern,
taking into account all available
information about the future, including
intentions of curtailment of business, as
decided by Board.
2.1.4 Comparative information
The accounting policies have been
consistently applied by the Company
and they are consistent with those
used in the previous years. Previous
year’s figures and phrases have been
re-arranged whenever necessary to
conform to current presentation.
2.1.5 Basis of Consolidation
The consolidated financial statements
comprise the financial statements of the
Group and its subsidiaries as at 31 March
2022.
Subsidiaries and equity accounted
investees are disclosed in Note 05 to 06
the Financial Statements.
Subsidiaries are those entities controlled
by the Group. Control is achieved when
the Group is exposed, or has rights, to
variable returns from its involvement
with the investee and has the ability to
affect those returns through its power
over the investee. Specifically, the Group
controls an investee if, and only if, the
Group has:
1. Power over the investee (i.e., existing
rights that give it the current ability
to direct the relevant activities of the
investee)
2. Exposure, or rights, to variable returns
from its involvement with the investee
3. The ability to use its power over the
investee to affect its returns
Generally, there is a presumption that a
majority of voting rights result in control.
To support this presumption and when
the Group has less than a majority of the
voting or similar rights of an investee,
the Group considers all relevant facts
and circumstances in assessing whether
it has power over an investee, including:
1. The contractual arrangement with the
other vote holders of the investee
2. Rights arising from other contractual
arrangements
3. The Group’s voting rights and
potential voting rights
The Group re-assesses whether or
not it controls an investee if facts and
circumstances indicate that there are
changes to one or more of the three
elements of control. Consolidation of
a subsidiary begins when the Group
obtains control over the subsidiary and
ceases when the Group loses control of
the subsidiary. Assets, liabilities, income
and expenses of a subsidiary acquired
Annual Report 2021/22 | 91
or disposed of during the year are
included in the consolidated financial
statements from the date the Group
gains control until the date the Group
ceases to control the subsidiary.
Profit or loss and each component of
other comprehensive income (OCI) are
attributed to the equity holders of the
parent of the Group and to the non-
controlling interests, even if this results
in the non-controlling interests having
a deficit balance. When necessary,
adjustments are made to the financial
statements of subsidiaries to bring
their accounting policies into line
with the Group’s accounting policies.
All intra-group assets and liabilities,
equity, income, expenses and cash
flows relating to transactions between
members of the Group are eliminated in
full on consolidation.
A change in the ownership interest of a
subsidiary, without a loss of control, is
accounted for as an equity transaction.
If the Group loses control over a
subsidiary, it derecognises the related
assets (including goodwill), liabilities,
non-controlling interest and other
components of equity while any
resultant gain or loss is recognised in
profit or loss. Any investment retained is
recognised at fair value.
Companies in the Group, the Group
holdings in its subsidiary are given in
Note 5.1 to the financial statements.
2.1.6 Equity accounted investees
(Investment in associates)
The Group’s investment in its associate is
accounted for using the equity method.
An associate is an entity in which the
group has significant influence. Under
the associate is carried in the statement
of Financial Position cost plus post
acquisition changes in the Group’ share
of net assets of the associate. Goodwill
relating to the associate is included in
the carrying amount of the investment
and is neither amortised nor individually
tested for impairment. The Statement
of profit or loss of income reflects the
share of the results of operations the
associate. Where there has been a
change recognised directly in the equity
of the associates, the Group recognises
its share of any changes and discloses
this, when applicable, in the Statement
of changes in Equity. Unrealised gains
and losses resulting from transactions
between the group and the associate
are eliminated to the extent of the
interest in the associate.
The share of profit of an associate is
shown on the face of the Statement of
profit or loss. This s profit attributable
to equity holders of the associate and
therefore is profit after tax and non-
controlling interests in the subsidiaries of
the associate. The Financial Statement
of the associate are prepared for the
same reporting period as the Group.
After application of the equity method,
the Group determines whether it is
necessary to recognise an additional
impairment loss on the Group’s
investment in its associate. The Group
determines at each reporting date
whether there is any objective evidence
that the investment in the associate is
impaired. If this is the case, the Group
calculates the amount of impairment
as the difference between recoverable
amount of the associate and its carrying
value and recognises the amount in the
‘share of profit or loss . The investment
in the separate financial statements.
2.2 Significant accounting judgments,
estimates and assumptions
2.2.1 Judgements
In the process of applying the Group
accounting policies, management has
made the following judgements, apart
from those involving estimations, which
has the most significant effect on the
amounts recognised in the financial
statements.
a) Useful life-time of the Property,
Plant and equipment
The Group reviews the useful lives
and methods of depreciation of assets
at each reporting date. Judgement
of the management is exercised in
the estimation of these values, rates,
methods and hence they are subject to
uncertainty (Note 3).
2.2.2 Estimates and Assumptions
The key assumptions concerning
the future and other key sources of
estimation uncertainty at the reporting
date, that have a significant risk of
causing a material adjustment to
the carrying amounts of assets and
liabilities within the next financial year
are discussed below. The respective
carrying amounts of assets and liabilities
are given in related notes to the financial
statements.
a) Defined benefit plans
The cost of defined benefit plan- gratuity
is determined using actuarial valuations.
The actuarial valuation involves making
assumptions about discount rates,
future salary increases, mortality rates
and future pension increases. Due to
the long term nature of these plans,
such estimates are subject to significant
uncertainty. Retirement benefit liability
of the Group is disclosed in Note 14 for
the assumptions used and the sensitivity
thereon.
b) Provision for Slow moving
inventories
A provision for slow moving inventories is
recognised based on the best estimates
available to management on their
future usability/sale. As management
uses historical information as the basis
to determine the future usability and
recoverability, actual future losses on
inventories could vary from the provision
made in these financial statements
(Note 7.1).

92 | Lanka Tiles PLC
Notes to the Financial Statements
c) Fair value of Freehold Land and
Buildings and Land classified as
Investment properties
The Group measures freehold land and
buildings as well as Land classified as
Investment properties at fair value with
changes in fair value being recognised
in other comprehensive income and
statement of profit and loss respectively.
Land and buildings were valued by
reference to market-based evidence,
using comparable prices adjusted for
specific market factors such as nature,
location and condition of the property.
Fair value related disclosures for assets
measured at fair value are summarised
in the Note 3.3.1 and 3.6.1 to the financial
statements.
d) Impairment of debtors
The Group uses a provision matrix to
calculate ECLs for trade receivables and
contract assets. The provision rates are
based on days past due for groupings
of various customer segments that have
similar loss patterns
(i.e., by geography, product type,
customer type and rating, and coverage
by letters of credit and other forms of
credit insurance).
The provision matrix is initially based
on the Group’s historical observed
default rates. The Group will calibrate
the matrix to adjust the historical credit
loss experience with forward-looking
information. For instance, if forecast
economic conditions (i.e., gross domestic
product) are expected to deteriorate
over the next year which can lead to
an increased number of defaults in the
manufacturing sector, the historical
default rates are adjusted. At every
reporting date, the historical observed
default rates are updated and changes
in the forward-looking estimates are
analysed.
The assessment of the correlation
between historical observed default
rates, forecast economic conditions
and ECLs is a significant estimate. The
amount of ECLs is sensitive to changes in
circumstances and of forecast economic
conditions. The Group’s historical
credit loss experience and forecast of
economic conditions may also not be
representative of customer’s actual
default in the future. (Note 8.1)
d) Impairment of Non-Financial Assets
The Group assesses whether there
are any indicators of impairment
for all non-financial assets at each
reporting date. Non-financial assets are
tested for impairment when there are
indicators that the carrying amounts
may not be recoverable. When values
in use calculations are undertaken,
management must estimate the
expected future cash flows from the
assets or cash generating unit and
choose a suitable discount rate in order
to calculate the present value of those
cash flows.
2.3 SUMMARY OF SIGNIFICANT
ACCOUNTING POLICIES
2.3.1 Foreign currency translation
The financial statements are presented
in Sri Lanka Rupees, which is the
Group’s functional and presentation
currency. Transactions in foreign
currencies are initially recorded at
the functional currency rate ruling at
the date of the transaction. Monetary
assets and liabilities denominated in
foreign currencies are retranslated
at the functional currency rate of
exchange ruling at the reporting date.
All differences are taken to profit or
loss. Non monetary items that are
measured in terms of historical cost in
a foreign currency are translated using
the exchange rates as at the dates of
the initial transactions. Non monetary
items measured at fair value in a foreign
currency are translated using the
exchange rates at the date when the fair
value was determined.
2.3.2 Fair Value Measurement
Fair value related disclosures for assets
measured at fair value or financial
instruments that are not measured
at fair value, for which fair values are
disclosed, are summarised in the 12.4 to
the financial statements.
The fair value of an asset or a liability is
measured using the assumptions that
market participants would use when
pricing the asset or liability, assuming
that market participants act in their
economic best interest.
The Group uses valuation techniques that
are appropriate in the circumstances and
for which sufficient data are available
to measure fair value, maximising the
use of relevant observable inputs and
minimising the use of unobservable
inputs.
All assets and liabilities for which fair
value is measured or disclosed in the
Financial Statements are categorised
within the fair value hierarchy, described
as follows,
Level 1 - Quoted (unadjusted) market
prices in active markets for identical
assets or liabilities
Level 2 - Valuation techniques for which
the lowest level input that is significant
to the fair value measurement is directly
or indirectly observable
Level 3 - Valuation techniques for which
the lowest level input that is significant
to the fair value measurement is
unobservable
For assets and liabilities that are
recognised in the Financial Statements
on a recurring basis, the Group
determines whether transfers have
occurred between levels in the
hierarchy by re-assessing categorisation
(based on the lowest level input that is
significant to the fair value measurement
as a whole) at the end of each reporting
period.
Annual Report 2021/22 | 93
The management determines the
policies and procedures for both
recurring fair value measurement and
for non- recurring measurement.
For the purpose of fair value disclosures,
the Group has determined classes of
assets and liabilities on the basis of the
nature, characteristics and risks of the
asset or liability and the level of the fair
value hierarchy as explained above.
2.3.3 Taxation
Current taxes
Current income tax assets and liabilities
for the current and prior periods are
measured at the amount expected
to be recovered from or paid to the
taxation authorities. The tax rates and
tax laws used to compute the amount is
those that are enacted or substantively
enacted by the reporting date.
The provision for income tax is based on
the elements of income and expenditure
as reported in the financial statements
and computed in accordance with the
provisions of the relevant tax legislations.
Current income tax relating to items
recognised directly in equity statement
is recognised in equity and not in the
statement of comprehensive income.
Deferred taxation
Deferred income tax is provided, using
the liability method, on temporary
differences at the reporting date
between the tax bases of assets and
liabilities and their carrying amounts for
financial reporting purposes.
Deferred income tax liabilities are
recognised for all taxable temporary
differences except where the deferred
income tax liability arises from the
initial recognition of an asset or
liability in a transaction that is not a
business combination and, at the time
of the transaction, affects neither the
accounting profit nor taxable profit or
loss.
Deferred income tax assets are
recognised for all deductible temporary
differences, carry-forward of unused
tax assets and unused tax losses, to the
extent that it is probable that taxable
profit will be available against which
the deductible temporary differences,
and the carry-forward of unused tax
assets and unused tax losses can be
utilised except where the deferred
income tax asset relating to the
deductible temporary difference arises
from the initial recognition of an asset
or liability in a transaction that is not a
business combination and, at the time
of the transaction, affects neither the
accounting profit nor taxable profit
or loss; and the carrying amount of
deferred income tax assets is reviewed
at each reporting date and reduced to
the extent that it is no longer probable
that sufficient taxable profit will be
available to allow all or part of the
deferred income tax asset to be utilised.
Deferred income tax assets and liabilities
are measured at the tax rates that are
expected to apply to the year when the
asset is realised or the liability is settled,
based on tax rates (and tax laws) that
have been enacted or substantively
enacted at the reporting date.
Deferred income tax relating to items
recognised directly in equity statement is
recognised in equity statement and not
in the statement of total comprehensive
income.
Sales tax
Revenue, expenses and assets are
recognised net of the amount of sales
tax except where the sales tax incurred
on a purchase of assets or services
is not recoverable from the taxation
authorities in which case the sales tax is
recognised as a part of the cost of the
asset or part of the expense items as
applicable and receivable and payable
are stated with the amount of sales
tax included. The amount of sales tax
recoverable and payable in respect of
taxation authorities is included as a part
of other receivables and other payables
in the Statement of Financial Position.
2.3.4 Borrowing costs
Borrowing costs are recognised as an
expense in the period in which they
are incurred, except to the extent
where borrowing costs that are
directly attributable to the acquisition,
construction, or production of an asset
that takes a substantial period of time
to get ready for its intended use or sale,
are capitalised as part of that asset.
Borrowing costs that are not directly
attributable to the acquisition,
construction or production of a
qualifying asset are recognised in
statement of comprehensive income
using the effective interest method.
The amounts of borrowing costs
which are eligible for capitalisation are
determined in accordance with LKAS 23
– “Borrowing Costs”.
2.3.5 Inventories
Inventories are valued at the lower
of cost and net realisable value, after
making due allowances for obsolete and
slow moving items. Net realisable value
is the price at which inventories can be
sold in the ordinary course of business
less the estimated cost of completion
and the estimated cost necessary to
make the sale.
The cost incurred in bringing inventories
to its present location and condition
is accounted using the following cost
formulae:-
Manufacturing goods
At the cost of direct materials, direct
labour and an appropriate proportion
of fixed production overheads based on
normal operating capacity, but excluding
borrowing cost.

94 | Lanka Tiles PLC
Notes to the Financial Statements
work-in-progress
At actual cost
Trading goods
At purchase cost on first in first out basis
Consumable and spares
At actual cost on weighted average
basis
Goods in transit
At actual cost
Raw materials
At purchase cost on weighted average
cost basis.
2.3.6 Financial Instruments
Financial Assets
Initial Recognition and Measurement
Financial assets within the scope
of SLFRS 9, are classified, at initial
recognition, as subsequently measured
at amortised cost, fair value through
other comprehensive income (OCI), and
fair value through profit or loss.
In order for a financial asset to be
classified and measured at amortised
cost or fair value through OCI, it
needs to give rise to cash flows that
are ‘solely payments of principal and
interest (SPPI)’ on the principal amount
outstanding. This assessment is referred
to as the SPPI test and is performed at
an instrument level.
The Group’s business model for
managing financial assets refers to how
it manages its financial assets in order
to generate cash flows. The business
model determines whether cash flows
will result from collecting contractual
cash flows, selling the financial assets,
or both.
The classification of financial assets
at initial recognition depends on the
financial asset’s contractual cash flow
characteristics and the Group’s business
model for managing them. With the
exception of trade receivables that
do not contain a significant financing
component or for which the Group has
applied the practical expedient, the
Group initially measures a financial asset
at its fair value plus, in the case of a
financial asset not at fair value through
profit or loss, transaction costs.
Subsequent Measurement
The Group classifies all of these financial
assets in the measurement category of
financial assets at amortised cost.
a) Financial assets at amortised cost
This category is the most relevant to the
Group. The Group measures financial
assets at amortised cost if both of the
following conditions are met:
The financial asset is held within a
business model with the objective to
hold financial assets in order to collect
contractual cash flows and
The contractual terms of the financial
asset give rise on specified dates to
cash flows that are solely payments of
principal and interest on the principal
amount outstanding
Financial assets at amortised cost are
subsequently measured using the
effective interest (EIR) method and are
subject to impairment. Gains and losses
are recognised in profit or loss when
the asset is derecognised, modified or
impaired.
The Group’s financial assets at
amortised cost includes trade and other
receivables, amounts due from related
parties, short term investments, long
term receivables and cash and cash
equivalents.
Derecognition
A financial asset (or, where applicable
a part of a financial asset or part of
a Group of similar financial assets) is
derecognised when:
The rights to receive cash flows from
the asset have expired
The Group has transferred its rights to
receive cash flows from the asset or
has assumed an obligation to pay the
received cash flows in full.
Impairment of Financial Assets
The Group recognises an allowance for
expected credit losses (ECLs) for all
debt instruments not held at fair value
through profit or loss. ECLs are based on
the difference between the contractual
cash flows due in accordance with the
contract and all the cash flows that the
Group expects to receive, discounted
at an approximation of the original
effective interest rate. The expected
cash flows will include cash flows from
the sale of collateral held or other credit
enhancements that are integral to the
contractual terms.
ECLs are recognised in two stages. For
credit exposures for which there has
not been a significant increase in credit
risk since initial recognition, ECLs are
provided for credit losses that result from
default events that are possible within
the next 12-months (a 12-month ECL).
For those credit exposures for which
there has been a significant increase in
credit risk since initial recognition, a loss
allowance is required for credit losses
expected over the remaining life of the
exposure, irrespective of the timing of
the default (a lifetime ECL).
For trade receivables and contract
assets, the Company applies a simplified
approach in calculating ECLs. Therefore,
the Company does not track changes
in credit risk, but instead recognises a
loss allowance based on lifetime ECLs
at each reporting date. The Company
has established a provision matrix
that is based on its historical credit
loss experience, adjusted for forward-
looking factors specific to the debtors
and the economic environment.

Annual Report 2021/22 | 95
Financial Liabilities
Initial Recognition and Measurement
Financial liabilities within the scope
of SLFRS 9 are classified as financial
liabilities at fair value through profit or
loss, loans and borrowings, payables or
as derivatives designated as hedging
instruments in an effective hedge, as
appropriate. The Group determines the
classification of its financial liabilities at
initial recognition.
All financial liabilities are recognised
initially at fair value and, in the case
of loans and borrowings, carried at
amortised cost. This includes directly
attributable transaction costs.
The Group’s financial liabilities include
trade and other payables, bank
overdrafts and loans and borrowings.
Accordingly Group financial liabilities
have been classified as and loans and
borrowings.
Subsequent Measurement
The measurement of financial liabilities
depends on their classification as
follows:
a) Loans and Borrowings
After initial recognition, interest bearing
loans and borrowings are subsequently
measured at amortised cost using
the effective interest rate method.
Gains and losses are recognised in the
statement of comprehensive income
when the liabilities are derecognised
as well as through the effective interest
rate method (EIR) amortisation process.
Amortised cost is calculated by
considering any discount or premium
on acquisition and fees or costs those
are an integral part of the EIR. The EIR
amortisation is included in finance costs
in the statement of comprehensive
income.
Derecognition
A financial liability is derecognised
when the obligation under the liability is
discharged or cancelled or expires.
2.3.7 Property, plant and equipment
Property, plant and equipment is
stated at cost or valuation, excluding
the costs of day to day servicing,
less accumulated depreciation and
accumulated impairment in value. Such
cost includes the cost of replacing part
of the plant and equipment when that
cost is incurred, if the recognition criteria
are met. When each major inspection
is performed, its cost is recognised in
the carrying amount of the plant and
equipment as a replacement if the
recognition criteria are satisfied.
An item of property, plant and equipment
is derecognised upon disposal or
when no future economic benefits are
expected from its use or disposal. Any
gain or loss arising on de-recognition of
the asset (calculated as the difference
between the net disposal proceeds and
the carrying amount of the asset) is
included in the income statement in the
year the asset is derecognised.
Depreciation is calculated on a straight
line basis over the useful life of the
assets. The asset’s residual values, useful
lives and methods of depreciation are
reviewed, and adjusted if appropriate, at
each financial year end.
Capital expenditure incurred in relation
to fixed assets which are not completed
as at the reporting date are shown as
capital work-in-progress and is stated at
cost. On completion, the related assets
are transferred to property, plant and
equipment. Depreciation on capital
work-in-progress commences when the
assets are ready for their intended use.
Free hold land and building is
subsequently measured at fair value.
Valuations are performed every 3-5
years (or frequently enough) to ensure
that the fair value of a revalued asset
does not differ materially from it carrying
amount.
A revaluation surplus is recognised
in other comprehensive income and
credited to the revaluation surplus in
equity. However, to the extent that it
reverses a revaluation deficit of the
same asset previously recognised
in the income statement, in which
case the increase is recognised in the
income statement. A revaluation deficit
is recognised in profit or loss, except
to the extent that it offsets an existing
surplus on the same asset recognised
in the asset revaluation reserve. Upon
disposal, any revaluation reserve
relating to the particular asset being
sold is transferred to retained earnings.
2.3.8 Intangible assets
Basis of recognition
An intangible asset is recognised if it is
probable that future economic benefits
associated with the asset will flow to the
company and the cost of the asset can
be reliably measured.
Basis of measurement
Intangible assets acquired separately are
measured on initial recognition at cost.
The cost of intangible assets acquired in
a business combination is their fair value
as at the date of acquisition. Following
initial recognition, intangible assets are
carried at cost less any accumulated
amortisation and accumulated
impairment losses. internally generated
intangibles, excluding capitalised
development costs, are not capitalised
and related expenditure is reflected in
the Statement of profit or loss in the
year in which expenditure is incurred.
Useful economics lives, amortisation
and impairment
The useful lives of intangible assets are
assessed as either finite or indefinite

96 | Lanka Tiles PLC
Notes to the Financial Statements
lives. Intangible assets with finite lives
are amortised over the useful economic
life and assessed for impairment
whenever there is an indication that the
intangible asset may be impaired. The
amortisation method for an intangible
asset with a finite useful life is reviewed
at least at each financial year-end and
such changes are treated as accounting
estimates. The amortisation expense
on intangible assets with finite lives is
recognised in the income statement.
The estimated useful life of assets are as
follows:
Accounting Software 05 Years
2.3.9 Leases
The Group assesses at contract
inception whether a contract is, or
contains, a lease. That is, if the contract
conveys the right to control the use of
an identified asset for consideration.
To assess whether a contract conveys
the right control the use of an identified
asset, the Group consider whether;
* The contracts involves the use of an
identified asset. This may be specified
explicitly or implicitly and should
be physically distinct or represent
substantially all of the capacity of a
physically distinct asset. If the supplier
has a substantive substation right,
then the asset in not identified
* The group has the right to obtain
substantially all of the economic
benefits of assets throughout the
period of use.
* The group has right to direct the use
of the asset. The group has the right
when it has decision making rights
that are most relevant to changing
how and for what purpose the asset is
used. In rare cases where the decision
about how and what purpose the
asset is used is predetermined, the
group has the right to direct the use
of the asset if either;
* The group has right to operate the
asset; or
* The group designated the asset in a
way that predetermines how and for
what purpose it will . be used.
a) Group as the Lessee
The group applies a single recognition
and measurement approach for all
leases, except for short-term leases
and leases of low-value assets. The
company recognises lease liabilities to
make lease payments and right of use
assets representing the right of use the
underlying assets.
b) Group as the Lessor
Leases in which the Group does not
transfer substantially all the risks and
rewards of ownership of an asset is
classified as operating leases. Initial
direct costs incurred in negotiating and
arranging an operating lease added to
the carrying amount of the leased asset
and recognised over the lease term on
the same basis rental income. Contingent
rents are recognised as revenue in the
period in which they are earned.
(i) Right-of-use assets
The Company recognises right-of-use
assets at the commencement date of
the lease (i.e., the date the underlying
asset is available for use). Right-of-
use assets are measured at cost, less
any accumulated depreciation and
impairment losses, and adjusted for any
remeasurement of lease liabilities. The
cost of right-of-use assets includes the
amount of lease liabilities recognised,
initial direct costs incurred, and lease
payments made at or before the
commencement date less any lease
incentives received. The right-of-use
assets are subsequently depreciated
using the straight-line method from the
commencement date to the lease term.
The estimated useful lives of right-of-
use assets are determined on the same
basis as those of property, plant and
equipment and are in the range of 1 to
5 years.
If ownership of the leased asset transfers
to the Group at the end of the lease
term or the cost reflects the exercise
of a purchase option, depreciation is
calculated using the estimated useful
life of the asset. The right-of-use assets
are also subject to impairment. Refer to
the accounting policies in section 2.2.2-
Impairment of non-financial assets.
(ii) Lease liabilities
At the commencement date of the lease,
the Group recognises lease liabilities
measured at the present value of lease
payments to be made over the lease
term. The lease payments include fixed
payments (including in-substance fixed
payments) less any lease incentives
receivable, variable lease payments
that depend on an index or a rate, and
amounts expected to be paid under
residual value guarantees. The lease
payments also include the exercise price
of a purchase option reasonably certain
to be exercised by the Group and
payments of penalties for terminating
the lease, if the lease term reflects
the Group exercising the option to
terminate. Variable lease payments that
do not depend on an index or a rate are
recognised as expenses (unless they are
incurred to produce inventories) in the
period in which the event or condition
that triggers the payment occurs.
In calculating the present value of
lease payments, the Group uses its
incremental borrowing rate at the
lease commencement date because
the interest rate implicit in the lease
is not readily determinable. After the
commencement date, the amount of
lease liabilities is increased to reflect the
accretion of interest and reduced for
the lease payments made. In addition,
the carrying amount of lease liabilities is
remeasured if there is a modification, a
change in the lease term, a change in the

Annual Report 2021/22 | 97
lease payments (e.g., changes to future
payments resulting from a change in an
index or rate used to determine such
lease payments) or a change in the
assessment of an option to purchase the
underlying asset. (refer Note 3.7).
(c) Short-term leases and leases of
low-value assets
The Company applies the short-term
lease recognition exemption to its short-
term leases (i.e., those leases that have a
lease term of 12 months or less from the
commencement date and do not contain
a purchase option). It also applies the
lease of low-value assets recognition
exemption to leases that are considered
to be low value. Lease payments on
short-term leases and leases of low-
value assets are recognised as expense
on a straight-line basis over the lease
term.
The accounting policies applicable to
the Group as a lessor in the comparative
period were not difference from SLFRS
16.
2.3.10 Investment properties
Properties held for capital appreciation
and properties held to earn rental income
have been classified as Investment
Property. Investment Property is
recognised if it is probable that future
economic benefits that are associated
with the Investment Property will flow
to the Group and cost of the Investment
Property can be reliably measured.
Initial measurement
An Investment Property is measured
initially at its cost. The cost of a purchased
Investment Property comprises of
its purchase price and any directly
attributable expenditure. The cost of a
self-constructed investment is its cost
at the date when the construction or
development is complete.
Subsequent measurement
The Group applies the Fair Value Model
for Investment Properties in accordance
with Sri Lanka Accounting Standard 40
(LKAS 40), - “Investment Property”.
Accordingly, land and buildings classified
as Investment Properties are stated at
Fair Value.
Investment properties are derecognised
when either they have been disposed
of or when the investment property is
permanently withdrawn from use and no
future economic benefit is expected from
its disposal. The difference between the
net disposal proceeds and the carrying
amount of the asset is recognised in the
statement of comprehensive income in
the period of derecognition. Transfers
are made to or from investment property
only when there is a change in use. For
a transfer from investment property to
owner-occupied property, the deemed
cost for subsequent accounting is
the fair value at the date of change. If
owner-occupied property becomes an
investment property, the Group accounts
for such property in accordance with the
policy stated under property, plant and
equipment up to the date of change.
2.3.11 Provisions
Provisions are recognised when the
Group has a present obligation (legal or
constructive) as a result of past events, it
is probable that an outflow of resources
embodying economic benefits will be
required to settle the obligation, and
a reliable estimate can be made of the
amount of the obligation. When the
Group expects some or all of a provision
to be reimbursed, the reimbursement
is recognised as a separate asset but
only when the reimbursement is virtually
certain. The expense relating to any
provision is presented in the statement
of total comprehensive income net of
any reimbursement.
2.3.12 Retirement benefit obligations
(a) Defined Benefit Plan – Gratuity
A defined benefit plan is a post-
employment benefit plan other than a
defined contribution plan. The defined
benefit is calculated by independent
actuaries using Projected Unit Credit
(PUC) method as recommended by
LKAS 19 – “Employee benefits”. The
present value of the defined benefit
obligation is determined by discounting
the estimated future cash outflows using
interest rates that are denominated in
the currency in which the benefits will
be paid, and that have terms to maturity
approximating to the terms of the
related liability.
The present value of the defined
benefit obligations depends on a
number of factors that are determined
on an actuarial basis using a number
of assumptions about discount rate,
expected rates of return on assets,
future salary increases and mortality
rates. Due to the long-term nature of
these plans, such estimates are subject
to significant uncertainty. All assumptions
are reviewed at each reporting date.
Interest expense and the current service
cost related to the liability is recognised
in profit or loss and actuarial gain or loss
is recognised in other comprehensive
income.
Accordingly, the employee benefit
liability is based on the actuarial
valuation as of 31 March 2022.
Funding Arrangements
The Gratuity liability is not externally
funded.
(b) Defined Contribution Plans-
Employees’ Provident Fund and
Employees’ Trust Fund
Employees are eligible for Employees’
Provident Fund Contributions and
Employees’ Trust Fund Contributions
in line with respective statutes and
98 | Lanka Tiles PLC
Notes to the Financial Statements
regulations. These are recognised as an
expense in the statement of income as
incurred.
The Group contributes 12% and 3% of
gross emoluments of the employees
to Employees’ Provident Fund and
Employees’ Trust Fund respectively.
2.3.13 Impairment of non-financial
assets
The Group assesses at each reporting
date whether there is an indication that
an asset may be impaired. If any such
indication exists, the Group makes an
estimate of the asset’s recoverable
amount. An asset’s recoverable amount
is the higher of an asset’s or cash-
generating unit’s fair value less costs to
sell and its value in use and is determined
for an individual asset, unless the asset
does not generate cash inflows that are
largely independent of those from other
assets or groups of assets. Where the
carrying amount of an asset exceeds
its recoverable amount an asset is
considered impaired and is written down
to its recoverable amount.
2.3.14 Revenue recognition
Revenue from contracts with customers
The Group is primarily involved in
manufacturing and marketing of tiles
and associated items in Sri Lanka
and overseas as detailed in Note. 17.
Revenue from contracts with customers
is recognised when control of the goods
are transferred to the customer at an
amount that reflects the consideration
to which the Group expects to be
entitled in exchange for those goods.
The Group/Company is the principal in
its revenue arrangements, as it typically
controls the goods before transferring
them to the customer.
Sale of goods - tiles and associated
items
Revenue from sales of goods is
recognised at the point in time when
control of the goods is transferred to the
customer, generally on delivery of the
goods which include one performance
obligation. Control transition point to
recognise the revenue on export sales
is determined based on the international
commercial terms applicable for the
respective transactions. In determining
the transaction price for the sale of
goods, the Group considers the effects
of variable consideration, which is not
materially affect on the recognition of
revenue.
Significant financing component
Generally, the Group receives short-
term advances from its customers.
Using the practical expedient in SLFRS
15, the Group does not adjust the
promised amount of consideration for
the effects of a significant financing
component if it expects, at contract
inception, that the period between
the transfer of the promised good
or service to the customer and when
the customer pays for that good or
service will be one year or less.
Contact assets
A contract asset is the right to
consideration in exchange for
goods or services transferred to the
customers. If the group performs by
transferring goods or services to a
customer before the customer pays
consideration or before payment is
due, a contract asset is recognised
for the earned consideration that is
additional.
Trade receivables
A receivable represents the Company’s
right to an amount of consideration
that is unconditional (i.e., only the
passage of time is required before
payment of the consideration is due).
Refer to accounting policies of financial
instruments – initial recognition and
subsequent measurement.
Contract liabilities
A contact liability is the obligation
to transfer goods to a customer for
which the company has received
consideration from the customer. If a
customer pays consideration before
the company transfers goods to
the customers, a contract liability is
recognised when the payment is due.
Contract liabilities are recognised as
revenue when the company performs
under the contracts.
Other Sources of Revenue
(a) Interest
For all financial instruments measured
at amortised cost and interest bearing
financial assets, interest income or
expense is recorded using the effective
interest rate (EIR), which is the rate that
exactly discounts the estimated future
cash payments or receipts through the
expected life of the financial instrument
or a shorter period, where appropriate,
to the net carrying amount of the
financial asset or liability.
Interest income is included in finance
income in the statement of total
comprehensive income.
(b) Dividends
Dividend income is recognised when the
shareholders’ right to receive payment
is established.
(c) Rental income
Rental income receivable under
operating leases is recognised on a
straight-line basis over the term of the
lease.
(d) Other income
Other income is recognised on an
accrual basis.
Net gains and losses of a revenue
nature on the disposal of property, plant
& equipment and other non- current
assets including investments have
been accounted for in the statement
of total comprehensive income, having
deducted from proceeds on disposal,
the carrying amount of the assets and
related selling expenses. On disposal of
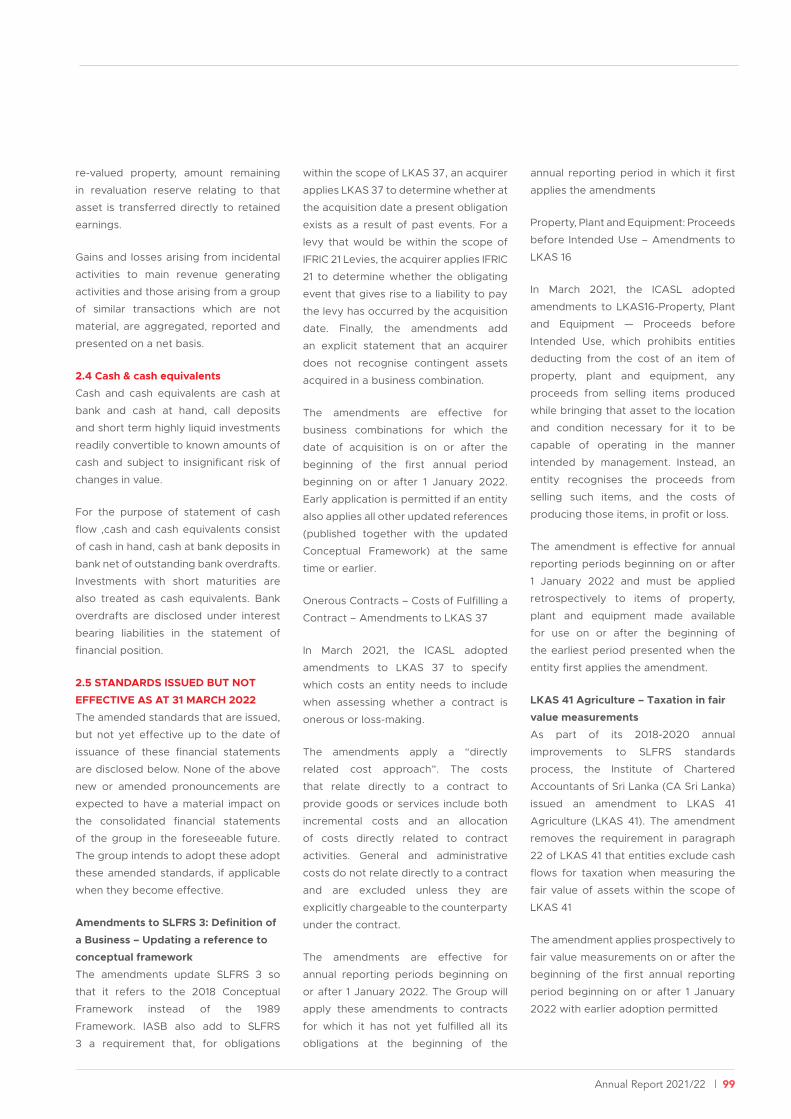
Annual Report 2021/22 | 99
re-valued property, amount remaining
in revaluation reserve relating to that
asset is transferred directly to retained
earnings.
Gains and losses arising from incidental
activities to main revenue generating
activities and those arising from a group
of similar transactions which are not
material, are aggregated, reported and
presented on a net basis.
2.4 Cash & cash equivalents
Cash and cash equivalents are cash at
bank and cash at hand, call deposits
and short term highly liquid investments
readily convertible to known amounts of
cash and subject to insignificant risk of
changes in value.
For the purpose of statement of cash
flow ,cash and cash equivalents consist
of cash in hand, cash at bank deposits in
bank net of outstanding bank overdrafts.
Investments with short maturities are
also treated as cash equivalents. Bank
overdrafts are disclosed under interest
bearing liabilities in the statement of
financial position.
2.5 STANDARDS ISSUED BUT NOT
EFFECTIVE AS AT 31 MARCH 2022
The amended standards that are issued,
but not yet effective up to the date of
issuance of these financial statements
are disclosed below. None of the above
new or amended pronouncements are
expected to have a material impact on
the consolidated financial statements
of the group in the foreseeable future.
The group intends to adopt these adopt
these amended standards, if applicable
when they become effective.
Amendments to SLFRS 3: Definition of
a Business – Updating a reference to
conceptual framework
The amendments update SLFRS 3 so
that it refers to the 2018 Conceptual
Framework instead of the 1989
Framework. IASB also add to SLFRS
3 a requirement that, for obligations
within the scope of LKAS 37, an acquirer
applies LKAS 37 to determine whether at
the acquisition date a present obligation
exists as a result of past events. For a
levy that would be within the scope of
IFRIC 21 Levies, the acquirer applies IFRIC
21 to determine whether the obligating
event that gives rise to a liability to pay
the levy has occurred by the acquisition
date. Finally, the amendments add
an explicit statement that an acquirer
does not recognise contingent assets
acquired in a business combination.
The amendments are effective for
business combinations for which the
date of acquisition is on or after the
beginning of the first annual period
beginning on or after 1 January 2022.
Early application is permitted if an entity
also applies all other updated references
(published together with the updated
Conceptual Framework) at the same
time or earlier.
Onerous Contracts – Costs of Fulfilling a
Contract – Amendments to LKAS 37
In March 2021, the ICASL adopted
amendments to LKAS 37 to specify
which costs an entity needs to include
when assessing whether a contract is
onerous or loss-making.
The amendments apply a “directly
related cost approach”. The costs
that relate directly to a contract to
provide goods or services include both
incremental costs and an allocation
of costs directly related to contract
activities. General and administrative
costs do not relate directly to a contract
and are excluded unless they are
explicitly chargeable to the counterparty
under the contract.
The amendments are effective for
annual reporting periods beginning on
or after 1 January 2022. The Group will
apply these amendments to contracts
for which it has not yet fulfilled all its
obligations at the beginning of the
annual reporting period in which it first
applies the amendments
Property, Plant and Equipment: Proceeds
before Intended Use – Amendments to
LKAS 16
In March 2021, the ICASL adopted
amendments to LKAS16-Property, Plant
and Equipment — Proceeds before
Intended Use, which prohibits entities
deducting from the cost of an item of
property, plant and equipment, any
proceeds from selling items produced
while bringing that asset to the location
and condition necessary for it to be
capable of operating in the manner
intended by management. Instead, an
entity recognises the proceeds from
selling such items, and the costs of
producing those items, in profit or loss.
The amendment is effective for annual
reporting periods beginning on or after
1 January 2022 and must be applied
retrospectively to items of property,
plant and equipment made available
for use on or after the beginning of
the earliest period presented when the
entity first applies the amendment.
LKAS 41 Agriculture – Taxation in fair
value measurements
As part of its 2018-2020 annual
improvements to SLFRS standards
process, the Institute of Chartered
Accountants of Sri Lanka (CA Sri Lanka)
issued an amendment to LKAS 41
Agriculture (LKAS 41). The amendment
removes the requirement in paragraph
22 of LKAS 41 that entities exclude cash
flows for taxation when measuring the
fair value of assets within the scope of
LKAS 41
The amendment applies prospectively to
fair value measurements on or after the
beginning of the first annual reporting
period beginning on or after 1 January
2022 with earlier adoption permitted
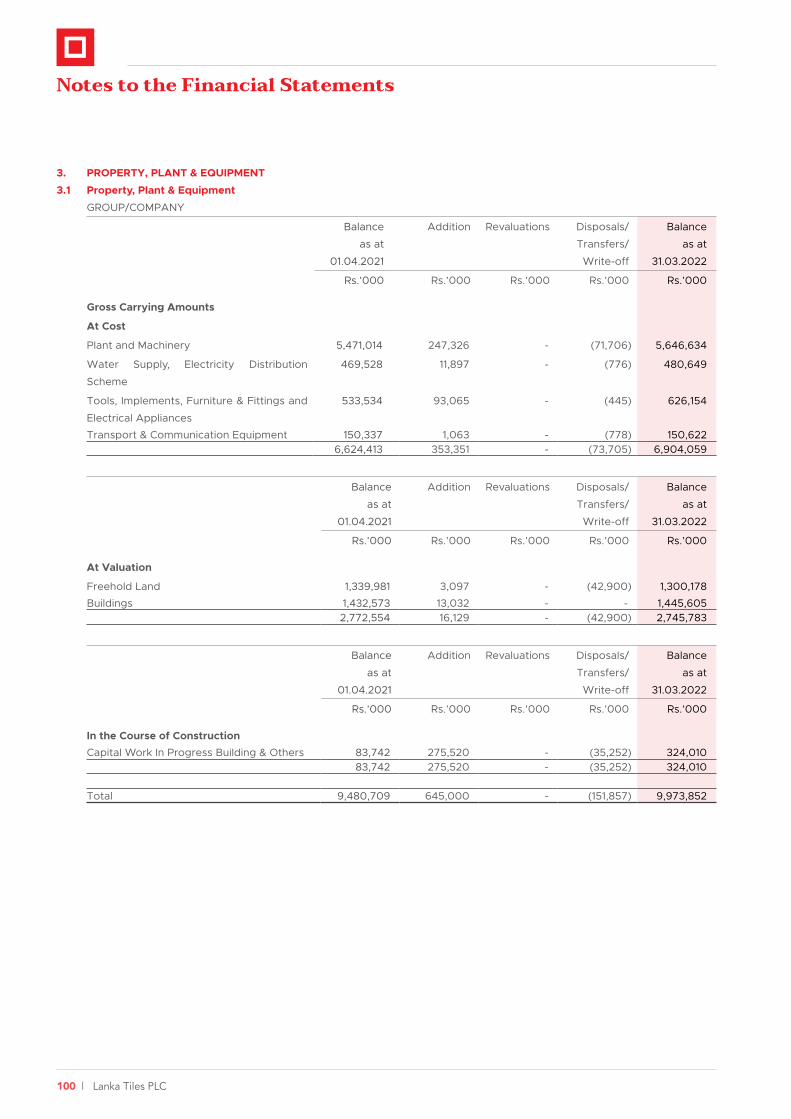
100 | Lanka Tiles PLC
3. PROPERTY, PLANT & EQUIPMENT
3.1 Property, Plant & Equipment
GROUP/COMPANY
Balance
as at
01.04.2021
Addition Revaluations Disposals/
Transfers/
Write-off
Balance
as at
31.03.2022
Rs.’000 Rs.’000 Rs.’000 Rs.’000 Rs.’000
Gross Carrying Amounts
At Cost
Plant and Machinery 5,471,014 247,326 - (71,706) 5,646,634
Water Supply, Electricity Distribution
Scheme
469,528 11,897 - (776) 480,649
Tools, Implements, Furniture & Fittings and
Electrical Appliances
533,534 93,065 - (445) 626,154
Transport & Communication Equipment 150,337 1,063 - (778) 150,622 6,624,413 353,351 - (73,705) 6,904,059
Balance
as at
01.04.2021
Addition Revaluations Disposals/
Transfers/
Write-off
Balance
as at
31.03.2022
Rs.’000 Rs.’000 Rs.’000 Rs.’000 Rs.’000
At Valuation
Freehold Land 1,339,981 3,097 - (42,900) 1,300,178
Buildings 1,432,573 13,032 - - 1,445,605 2,772,554 16,129 - (42,900) 2,745,783
Balance
as at
01.04.2021
Addition Revaluations Disposals/
Transfers/
Write-off
Balance
as at
31.03.2022
Rs.’000 Rs.’000 Rs.’000 Rs.’000 Rs.’000
In the Course of ConstructionCapital Work In Progress Building & Others 83,742 275,520 - (35,252) 324,010
83,742 275,520 - (35,252) 324,010
Total 9,480,709 645,000 - (151,857) 9,973,852
Notes to the Financial Statements
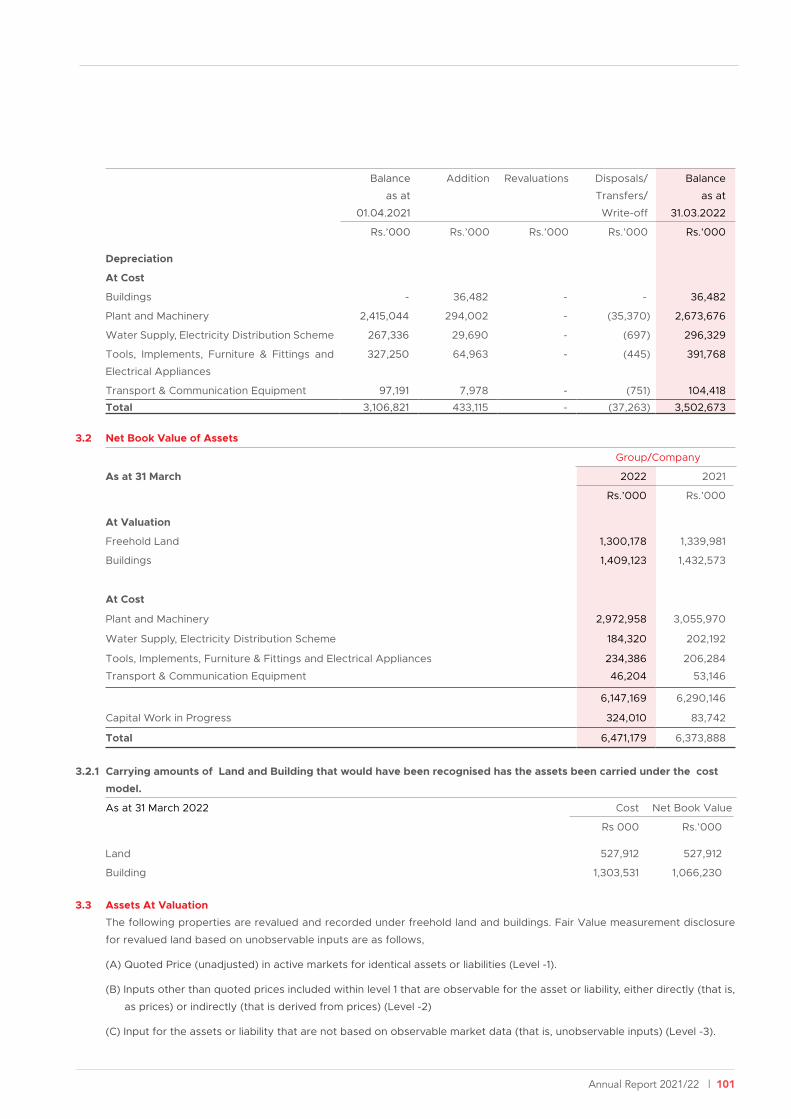
Annual Report 2021/22 | 101
Balance
as at
01.04.2021
Addition Revaluations Disposals/
Transfers/
Write-off
Balance
as at
31.03.2022
Rs.’000 Rs.’000 Rs.’000 Rs.’000 Rs.’000
Depreciation
At Cost
Buildings - 36,482 - - 36,482
Plant and Machinery 2,415,044 294,002 - (35,370) 2,673,676
Water Supply, Electricity Distribution Scheme 267,336 29,690 - (697) 296,329
Tools, Implements, Furniture & Fittings and
Electrical Appliances
327,250 64,963 - (445) 391,768
Transport & Communication Equipment 97,191 7,978 - (751) 104,418
Total 3,106,821 433,115 - (37,263) 3,502,673
3.2 Net Book Value of Assets
Group/Company
As at 31 March 2022 2021
Rs.’000 Rs.’000
At Valuation
Freehold Land 1,300,178 1,339,981
Buildings 1,409,123 1,432,573
At Cost
Plant and Machinery 2,972,958 3,055,970
Water Supply, Electricity Distribution Scheme 184,320 202,192
Tools, Implements, Furniture & Fittings and Electrical Appliances 234,386 206,284
Transport & Communication Equipment 46,204 53,146
6,147,169 6,290,146
Capital Work in Progress 324,010 83,742
Total 6,471,179 6,373,888
3.2.1 Carrying amounts of Land and Building that would have been recognised has the assets been carried under the cost
model.
As at 31 March 2022 Cost Net Book Value
Rs 000 Rs.’000
Land 527,912 527,912
Building 1,303,531 1,066,230
3.3 Assets At Valuation
The following properties are revalued and recorded under freehold land and buildings. Fair Value measurement disclosure
for revalued land based on unobservable inputs are as follows,
(A) Quoted Price (unadjusted) in active markets for identical assets or liabilities (Level -1).
(B) Inputs other than quoted prices included within level 1 that are observable for the asset or liability, either directly (that is,
as prices) or indirectly (that is derived from prices) (Level -2)
(C) Input for the assets or liability that are not based on observable market data (that is, unobservable inputs) (Level -3).
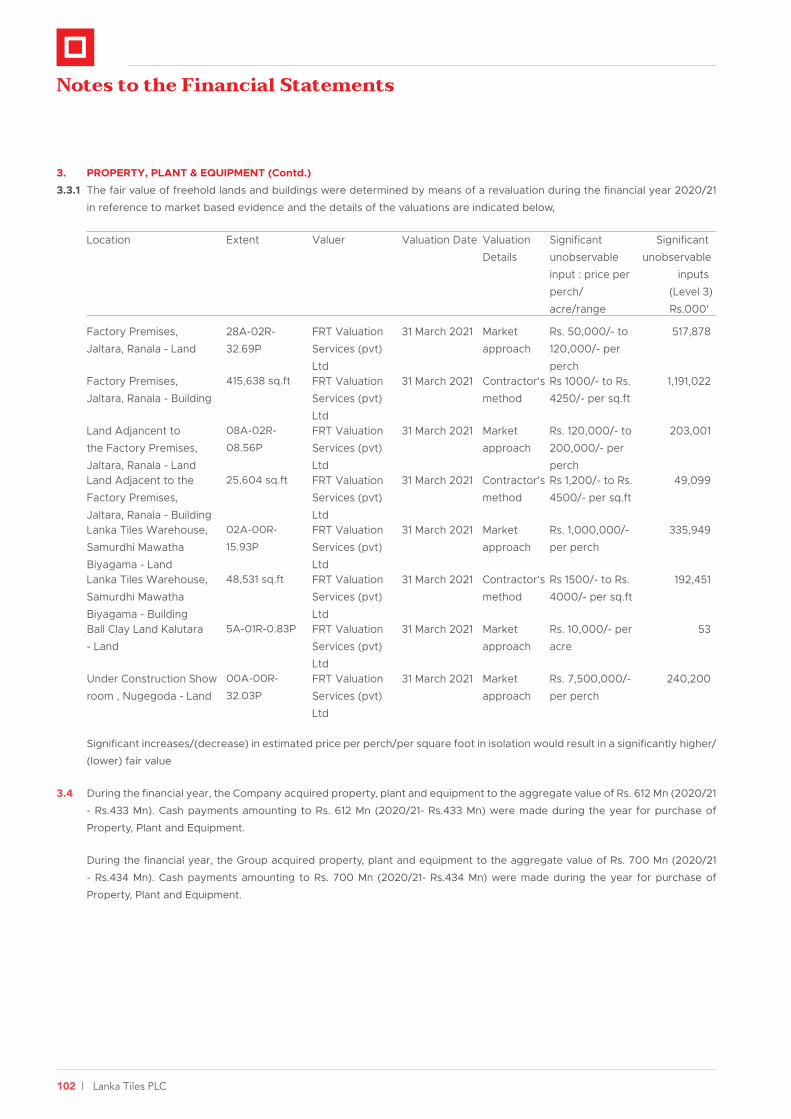
102 | Lanka Tiles PLC
3. PROPERTY, PLANT & EQUIPMENT (Contd.)
3.3.1 The fair value of freehold lands and buildings were determined by means of a revaluation during the financial year 2020/21
in reference to market based evidence and the details of the valuations are indicated below,
Location Extent Valuer Valuation Date Valuation Details
Significant unobservable input : price per perch/ acre/range
Significant unobservable
inputs(Level 3)Rs.000'
Factory Premises, Jaltara, Ranala - Land
28A-02R-32.69P
FRT Valuation Services (pvt) Ltd
31 March 2021 Market approach
Rs. 50,000/- to 120,000/- per perch
517,878
Factory Premises, Jaltara, Ranala - Building
415,638 sq.ft FRT Valuation Services (pvt) Ltd
31 March 2021 Contractor's method
Rs 1000/- to Rs. 4250/- per sq.ft
1,191,022
Land Adjancent to the Factory Premises, Jaltara, Ranala - Land
08A-02R-
08.56P
FRT Valuation Services (pvt) Ltd
31 March 2021 Market approach
Rs. 120,000/- to 200,000/- per perch
203,001
Land Adjacent to the Factory Premises, Jaltara, Ranala - Building
25,604 sq.ft FRT Valuation Services (pvt) Ltd
31 March 2021 Contractor's method
Rs 1,200/- to Rs. 4500/- per sq.ft
49,099
Lanka Tiles Warehouse, Samurdhi Mawatha Biyagama - Land
02A-00R-
15.93P
FRT Valuation Services (pvt) Ltd
31 March 2021 Market approach
Rs. 1,000,000/- per perch
335,949
Lanka Tiles Warehouse, Samurdhi Mawatha Biyagama - Building
48,531 sq.ft FRT Valuation Services (pvt) Ltd
31 March 2021 Contractor's method
Rs 1500/- to Rs. 4000/- per sq.ft
192,451
Ball Clay Land Kalutara - Land
5A-01R-0.83P FRT Valuation Services (pvt) Ltd
31 March 2021 Market approach
Rs. 10,000/- per acre
53
Under Construction Show room , Nugegoda - Land
00A-00R-
32.03P
FRT Valuation Services (pvt) Ltd
31 March 2021 Market approach
Rs. 7,500,000/- per perch
240,200
Significant increases/(decrease) in estimated price per perch/per square foot in isolation would result in a significantly higher/
(lower) fair value
3.4 During the financial year, the Company acquired property, plant and equipment to the aggregate value of Rs. 612 Mn (2020/21
- Rs.433 Mn). Cash payments amounting to Rs. 612 Mn (2020/21- Rs.433 Mn) were made during the year for purchase of
Property, Plant and Equipment.
During the financial year, the Group acquired property, plant and equipment to the aggregate value of Rs. 700 Mn (2020/21
- Rs.434 Mn). Cash payments amounting to Rs. 700 Mn (2020/21- Rs.434 Mn) were made during the year for purchase of
Property, Plant and Equipment.
Notes to the Financial Statements
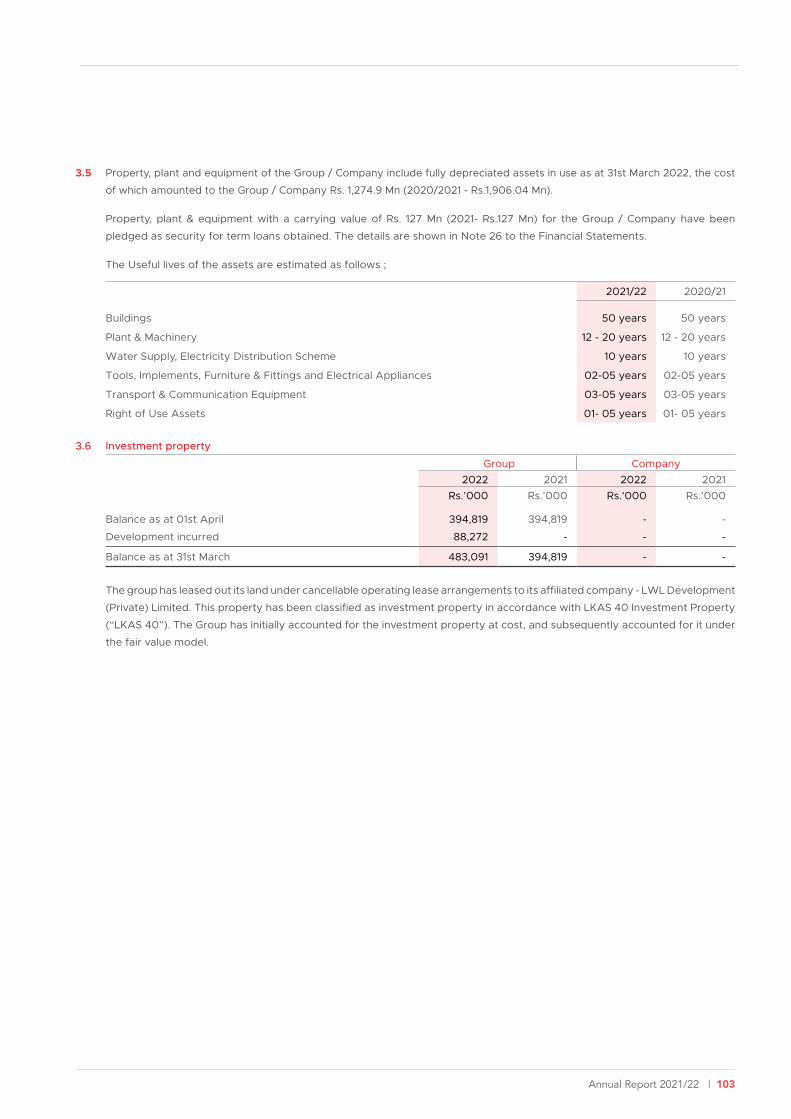
Annual Report 2021/22 | 103
3.5 Property, plant and equipment of the Group / Company include fully depreciated assets in use as at 31st March 2022, the cost
of which amounted to the Group / Company Rs. 1,274.9 Mn (2020/2021 - Rs.1,906.04 Mn).
Property, plant & equipment with a carrying value of Rs. 127 Mn (2021- Rs.127 Mn) for the Group / Company have been
pledged as security for term loans obtained. The details are shown in Note 26 to the Financial Statements.
The Useful lives of the assets are estimated as follows ;
2021/22 2020/21
Buildings 50 years 50 years
Plant & Machinery 12 - 20 years 12 - 20 years
Water Supply, Electricity Distribution Scheme 10 years 10 years
Tools, Implements, Furniture & Fittings and Electrical Appliances 02-05 years 02-05 years
Transport & Communication Equipment 03-05 years 03-05 years
Right of Use Assets 01- 05 years 01- 05 years
3.6 Investment property
Group Company2022 2021 2022 2021
Rs.’000 Rs.’000 Rs.’000 Rs.’000
Balance as at 01st April 394,819 394,819 - -
Development incurred 88,272 - - -
Balance as at 31st March 483,091 394,819 - -
The group has leased out its land under cancellable operating lease arrangements to its affiliated company - LWL Development
(Private) Limited. This property has been classified as investment property in accordance with LKAS 40 Investment Property
(“LKAS 40”). The Group has initially accounted for the investment property at cost, and subsequently accounted for it under
the fair value model.
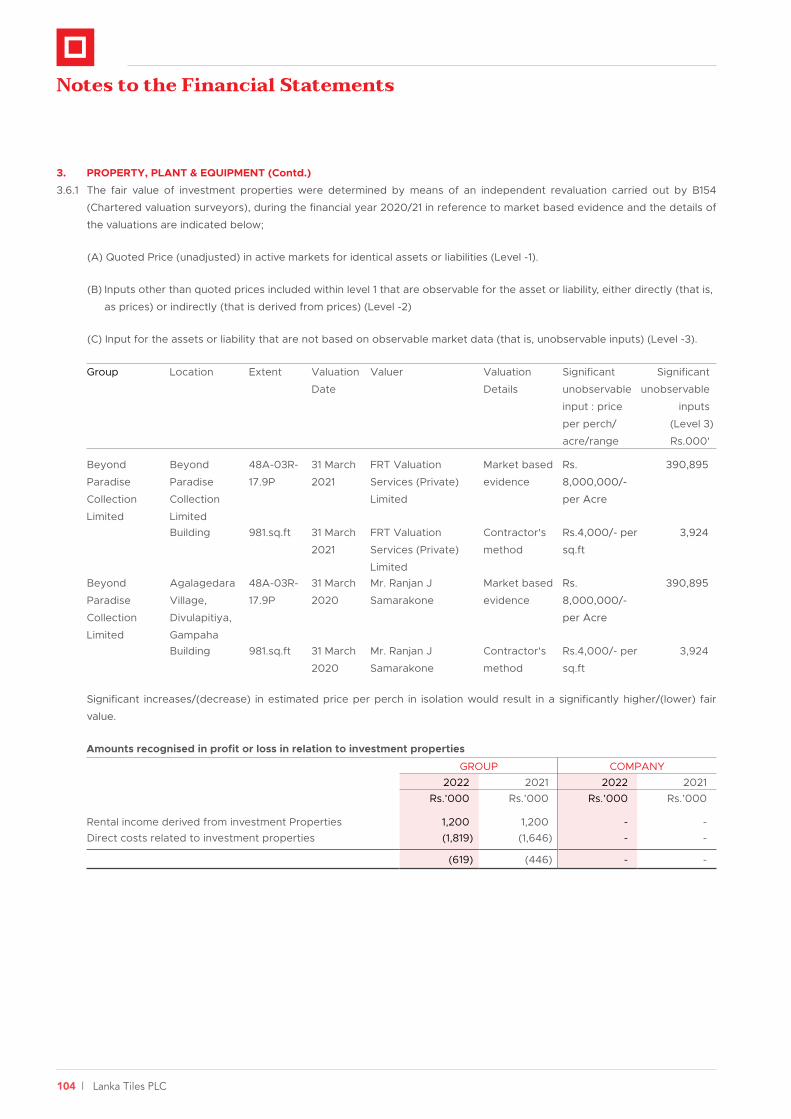
104 | Lanka Tiles PLC
3. PROPERTY, PLANT & EQUIPMENT (Contd.)
3.6.1 The fair value of investment properties were determined by means of an independent revaluation carried out by B154
(Chartered valuation surveyors), during the financial year 2020/21 in reference to market based evidence and the details of
the valuations are indicated below;
(A) Quoted Price (unadjusted) in active markets for identical assets or liabilities (Level -1).
(B) Inputs other than quoted prices included within level 1 that are observable for the asset or liability, either directly (that is,
as prices) or indirectly (that is derived from prices) (Level -2)
(C) Input for the assets or liability that are not based on observable market data (that is, unobservable inputs) (Level -3).
Group Location Extent Valuation
Date
Valuer Valuation
Details
Significant
unobservable
input : price
per perch/
acre/range
Significant
unobservable
inputs
(Level 3)
Rs.000'
Beyond
Paradise
Collection
Limited
Beyond
Paradise
Collection
Limited
48A-03R-
17.9P
31 March
2021
FRT Valuation
Services (Private)
Limited
Market based
evidence
Rs.
8,000,000/-
per Acre
390,895
Building 981.sq.ft 31 March
2021
FRT Valuation
Services (Private)
Limited
Contractor's
method
Rs.4,000/- per
sq.ft
3,924
Beyond
Paradise
Collection
Limited
Agalagedara
Village,
Divulapitiya,
Gampaha
48A-03R-
17.9P
31 March
2020
Mr. Ranjan J
Samarakone
Market based
evidence
Rs.
8,000,000/-
per Acre
390,895
Building 981.sq.ft 31 March
2020
Mr. Ranjan J
Samarakone
Contractor's
method
Rs.4,000/- per
sq.ft
3,924
Significant increases/(decrease) in estimated price per perch in isolation would result in a significantly higher/(lower) fair
value.
Amounts recognised in profit or loss in relation to investment properties
GROUP COMPANY2022 2021 2022 2021
Rs.’000 Rs.’000 Rs.’000 Rs.’000
Rental income derived from investment Properties 1,200 1,200 - - Direct costs related to investment properties (1,819) (1,646) - -
(619) (446) - -
Notes to the Financial Statements

Annual Report 2021/22 | 105
3.7 Right of use Assets
Right of Use Assets/Lease Liabilities
Set below, are the carrying amounts of the Group/Company’s right of use assets and liabilities and the movements during the
period.
Group/Company
Building Total
Rs.’000 Rs.’000
Right of Use Asset
As at 1 April 2021 63,878 63,878 Additions 39,121 39,121
Less: Depreciation Expense (37,621) (37,621)
As at 31 March 2022 65,378 65,378
Lease Liability
As at 1 April 2021 68,519 68,519
Additions 39,121 39,121
Interest Expense 11,490 11,490
Less: Payments (43,624) (43,624)
As at 31 March 2022 75,506 75,506
The following are the amounts recognised in profit or loss:
Group/Company
2022 2021
Rs.’000 Rs.’000
Amortisation expense of right-of-use assets 37,621 37,622
Interest expense on lease liabilities 11,490 10,439
Expense relating to short-term leases (included in selling & distribution expenses) 31,467 24,624
Total amount recognised in profit or loss 80,578 72,685
Group/Company
2022 2021
Rs.’000 Rs.’000
Payable as follows :
Payable within One Year 36,753 13,980
Payable within One to Five Years 38,753 54,539
Lease Liabilities as at 31st March 75,506 68,519

106 | Lanka Tiles PLC
4. Intangible Assets
Software Group/Company
2022 2021
Rs.’000 Rs.’000
Balance as at 1 April 11,295 12,594
Additions 2,176 1,527
Amortisation charge (4,501) (2,826)
Balance as at 31 March 8,970 11,295
As at 31 March
Cost 17,376 15,200
Accumulated amortisation (8,406) (3,905)
Balance as at 31 March 8,970 11,295
5. INVESTMENTS IN SUBSIDIARIES
COMPANY
a) Non-quoted Holding % Cost Market
Value/
Directors’
Valuation*
Cost Market
Value/
Directors’
Valuation*
2022 2021 2022 2022 2021 2021
LTL Development Limited 100.00 100.00 0.01 0.01 0.01 0.01
Beyond Paradise Collection
Limited
100.00 100.00 264,000 0.01 0.01 0.01
Lankatiles (Pvt) Ltd
(Foreign Subsidiary)
51.00 51.00 6,242 6,242 6,242 6,242
Total Non-quoted Investments in
Subsidiaries
270,242 6,242 6,242 6,242
Non quoted investments of the Company has been valued by the directors based on the cost of investments.
Notes to the Financial Statements
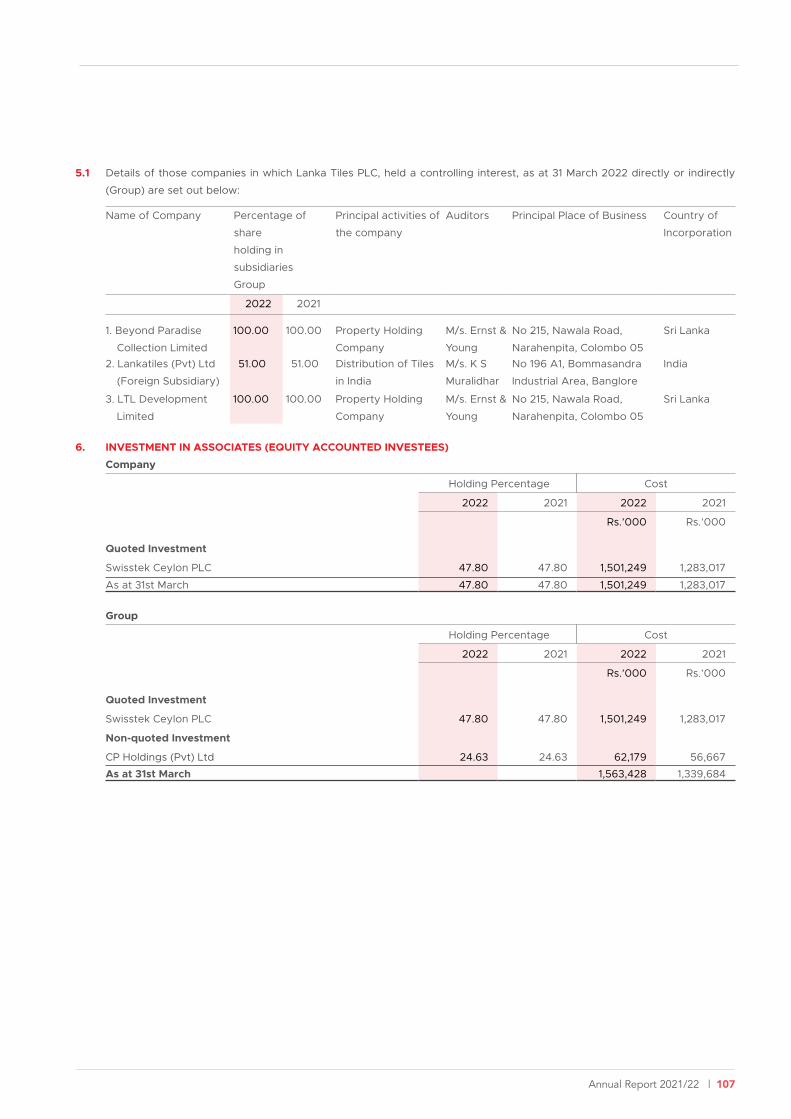
Annual Report 2021/22 | 107
5.1 Details of those companies in which Lanka Tiles PLC, held a controlling interest, as at 31 March 2022 directly or indirectly
(Group) are set out below:
Name of Company Percentage of
share
holding in
subsidiaries
Group
Principal activities of
the company
Auditors Principal Place of Business Country of
Incorporation
2022 2021
1. Beyond Paradise
Collection Limited
100.00 100.00 Property Holding
Company
M/s. Ernst &
Young
No 215, Nawala Road,
Narahenpita, Colombo 05
Sri Lanka
2. Lankatiles (Pvt) Ltd
(Foreign Subsidiary)
51.00 51.00 Distribution of Tiles
in India
M/s. K S
Muralidhar
No 196 A1, Bommasandra
Industrial Area, Banglore
India
3. LTL Development
Limited
100.00 100.00 Property Holding
Company
M/s. Ernst &
Young
No 215, Nawala Road,
Narahenpita, Colombo 05
Sri Lanka
6. INVESTMENT IN ASSOCIATES (EQUITY ACCOUNTED INVESTEES)
Company
Holding Percentage Cost
2022 2021 2022 2021
Rs.’000 Rs.’000
Quoted Investment
Swisstek Ceylon PLC 47.80 47.80 1,501,249 1,283,017
As at 31st March 47.80 47.80 1,501,249 1,283,017
Group
Holding Percentage Cost
2022 2021 2022 2021
Rs.’000 Rs.’000
Quoted Investment
Swisstek Ceylon PLC 47.80 47.80 1,501,249 1,283,017
Non-quoted Investment
CP Holdings (Pvt) Ltd 24.63 24.63 62,179 56,667
As at 31st March 1,563,428 1,339,684
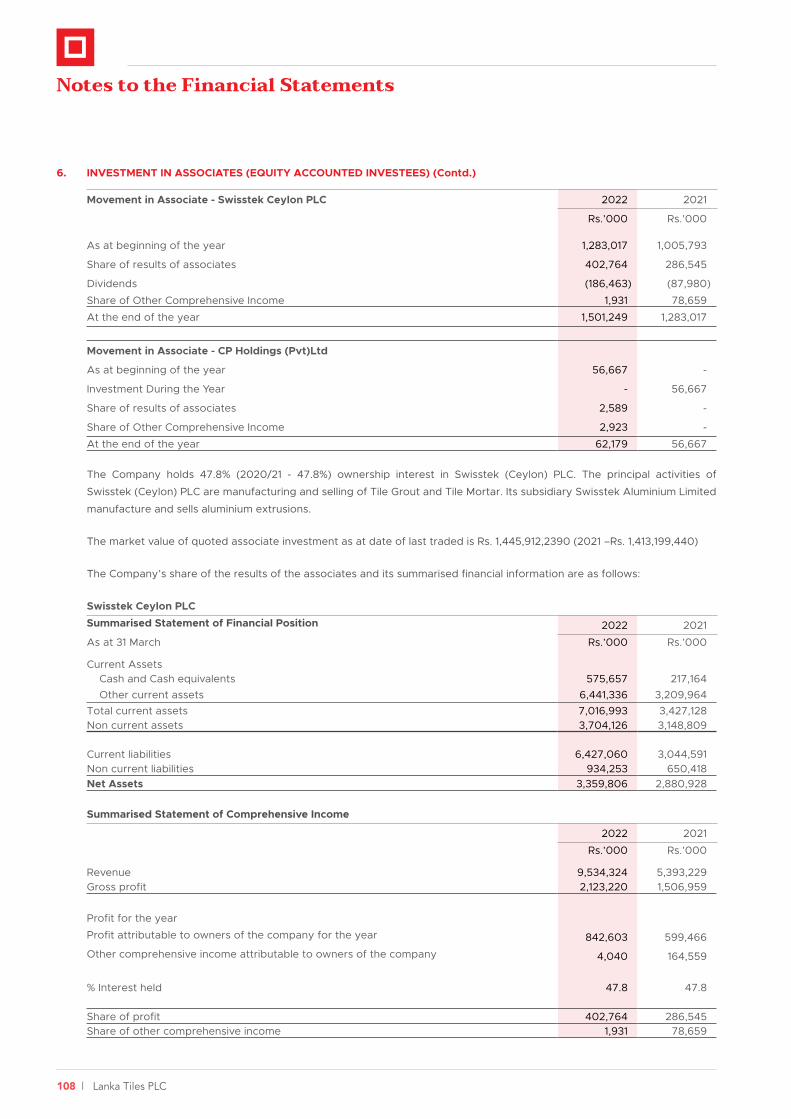
108 | Lanka Tiles PLC
Notes to the Financial Statements
6. INVESTMENT IN ASSOCIATES (EQUITY ACCOUNTED INVESTEES) (Contd.)
Movement in Associate - Swisstek Ceylon PLC 2022 2021
Rs.’000 Rs.’000
As at beginning of the year 1,283,017 1,005,793
Share of results of associates 402,764 286,545
Dividends (186,463) (87,980)
Share of Other Comprehensive Income 1,931 78,659
At the end of the year 1,501,249 1,283,017
Movement in Associate - CP Holdings (Pvt)Ltd
As at beginning of the year 56,667 -
Investment During the Year - 56,667
Share of results of associates 2,589 -
Share of Other Comprehensive Income 2,923 -
At the end of the year 62,179 56,667
The Company holds 47.8% (2020/21 - 47.8%) ownership interest in Swisstek (Ceylon) PLC. The principal activities of
Swisstek (Ceylon) PLC are manufacturing and selling of Tile Grout and Tile Mortar. Its subsidiary Swisstek Aluminium Limited
manufacture and sells aluminium extrusions.
The market value of quoted associate investment as at date of last traded is Rs. 1,445,912,2390 (2021 –Rs. 1,413,199,440)
The Company’s share of the results of the associates and its summarised financial information are as follows:
Swisstek Ceylon PLC
Summarised Statement of Financial Position 2022 2021
As at 31 March Rs.’000 Rs.’000
Current AssetsCash and Cash equivalents 575,657 217,164 Other current assets 6,441,336 3,209,964
Total current assets 7,016,993 3,427,128 Non current assets 3,704,126 3,148,809
Current liabilities 6,427,060 3,044,591 Non current liabilities 934,253 650,418 Net Assets 3,359,806 2,880,928
Summarised Statement of Comprehensive Income
2022 2021
Rs.’000 Rs.’000
Revenue 9,534,324 5,393,229 Gross profit 2,123,220 1,506,959
Profit for the year
Profit attributable to owners of the company for the year 842,603 599,466
Other comprehensive income attributable to owners of the company 4,040 164,559
% Interest held 47.8 47.8
Share of profit 402,764 286,545 Share of other comprehensive income 1,931 78,659

Annual Report 2021/22 | 109
CP Holdings (pvt) Ltd
Summarised Statement of financial position 2022 2021
As at 31 March Rs.’000 Rs.’000
Current assets 15,742 22,216Non current assets 352,079 326,966
Current liabilities 1,282 9,323 Non current liabilities 4,302 - Net Assets 362,237 339,859
Summarised Statement of comprehensive income 2022 2021
Rs.’000 Rs.’000
Revenue - - Gross profit - -
Profit for the yearProfit attributable to owners of the company for the year 10,512 - Other comprehensive income attributable to owners of the company 11,867 -
% Interest held 24.6 -
Share of profit 2,589 - Share of other comprehensive income 2,923 -
6.1 Details of those companies in which Lanka Tiles PLC, held as Associates as at 31 March 2022 directly or indirectly (Group)
are set out below:
Name of Company Principal activities
of the company
Auditors Principal Place of Business Country of
Incorporation
1. Swisstek Ceylon PLC Manufacture and
sale of tile grout
and tile mortar.
M/s. KPMG No 215, Nawala Road,
Narahenpita, Colombo 05
Sri Lanka
2. CP Holdings Private Limited Property Holding
Company
M/s. Ernst & Young No 23, Nawala Road,
Narahenpita, Colombo 05
Sri Lanka

110 | Lanka Tiles PLC
7. INVENTORIES
GROUP/COMPANY
2022 2021
Rs.’000 Rs.’000
Raw materials 2,000,595 1,718,245
Work in progress 75,741 48,016
Finished goods 315,385 414,894
Trading Stocks 237,324 283,160
Provision for obsolete and slow moving stocks (155,251) (142,199)
Total 2,473,794 2,322,116
7.1 Provision for obsolete and slow moving stocks
GROUP/COMPANY
2022 2021
Rs.’000 Rs.’000
Provision as at 01 April 142,199 97,772
Charge during the year 13,052 44,427
Provision as at 31 March 155,251 142,199
8. TRADE AND OTHER RECEIVABLES
GROUP COMPANY
2022 2021 2022 2021
Rs.’000 Rs.’000 Rs.’000 Rs.’000
Trade debtors 595,338 686,546 595,338 686,546
Less: Allowances for doubtful debts (23,308) (20,708) (23,308) (20,708)
572,030 665,838 572,030 665,838
Advance and prepayments 309,066 246,896 309,066 246,896
Other debtors 29,427 113,726 29,427 113,646
Total 910,523 1,026,460 910,523 1,026,380
GROUP/COMPANY
2022 2021
Rs.’000 Rs.’000
Allowances for doubtful debts
Balance as at 1 April 20,708 15,308
Provided during the year 2,600 5,400
Balance as at 31 March 23,308 20,708
Notes to the Financial Statements
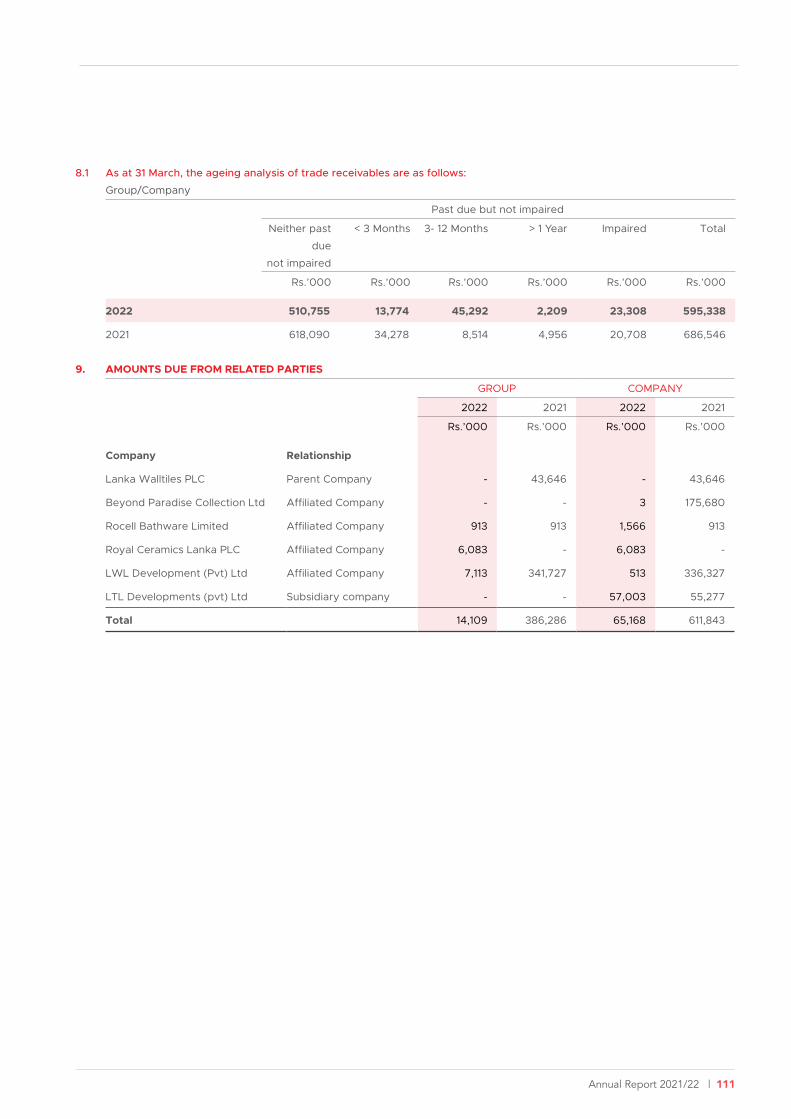
Annual Report 2021/22 | 111
8.1 As at 31 March, the ageing analysis of trade receivables are as follows:
Group/Company
Past due but not impaired
Neither past
due
not impaired
< 3 Months 3- 12 Months > 1 Year Impaired Total
Rs.’000 Rs.’000 Rs.’000 Rs.’000 Rs.’000 Rs.’000
2022 510,755 13,774 45,292 2,209 23,308 595,338
2021 618,090 34,278 8,514 4,956 20,708 686,546
9. AMOUNTS DUE FROM RELATED PARTIES
GROUP COMPANY
2022 2021 2022 2021
Rs.’000 Rs.’000 Rs.’000 Rs.’000
Company Relationship
Lanka Walltiles PLC Parent Company - 43,646 - 43,646
Beyond Paradise Collection Ltd Affiliated Company - - 3 175,680
Rocell Bathware Limited Affiliated Company 913 913 1,566 913
Royal Ceramics Lanka PLC Affiliated Company 6,083 - 6,083 -
LWL Development (Pvt) Ltd Affiliated Company 7,113 341,727 513 336,327
LTL Developments (pvt) Ltd Subsidiary company - - 57,003 55,277
Total 14,109 386,286 65,168 611,843

112 | Lanka Tiles PLC
10. STATED CAPITAL - GROUP/COMPANY
10.1 Issued & fully paid
2022 2021
Number Rs.'000 Number Rs.'000
Balance as at 01st April 265,252,050 900,968 53,050,410 900,968
Share Split - - 212,201,640 -
Balance as at 31st March 265,252,050 900,968 265,252,050 900,968
10.2 On 26 March 2021, the Company effected the sub-division of Ordinary Shares on the basis of a sub-division of
every one (01) Ordinary Shares into five (05) Ordinary Shares, thus increasing the existing 53,050,410 issued
Ordinary Shares of the Company to 265,252,050 Ordinary Shares.
10.3 The holders of ordinary shares confer their right to receive dividends as declared from time to time and are entitled to one
vote per share at a meeting of the Company. All shares rank equally with regard to the Company’s residual assets.
11. RESERVES
GROUP COMPANY
2022 2021 2022 2021
Rs.’000 Rs.’000 Rs.’000 Rs.’000
Revaluation reserve (11.1) 1,115,159 1,122,372 1,115,159 1,122,372
Amalgamation reserve 460,151 460,151 460,151 460,151
Exchange translation reserve 2,183 385 - -
Total 1,577,493 1,582,908 1,575,310 1,582,523
11.1 Revaluation reserve
GROUP/COMPANY
2022 2021
Rs.’000 Rs.’000
On: Property Plant & Equipment
As at 01 April 1,122,372 730,515
Revaluation of freehold land and building net of deferred tax (7,213) 391,857
As at 31 March 1,115,159 1,122,372
Amalgamation reserve resulted from amalgamation of two fully owned subsidiaries Lanka Tiles Trading (Private) Limited and
Ceradec (Private) Limited on 19 December 2011 in terms of Section 242(1) of the Companies Act No 07 of 2007.
Notes to the Financial Statements
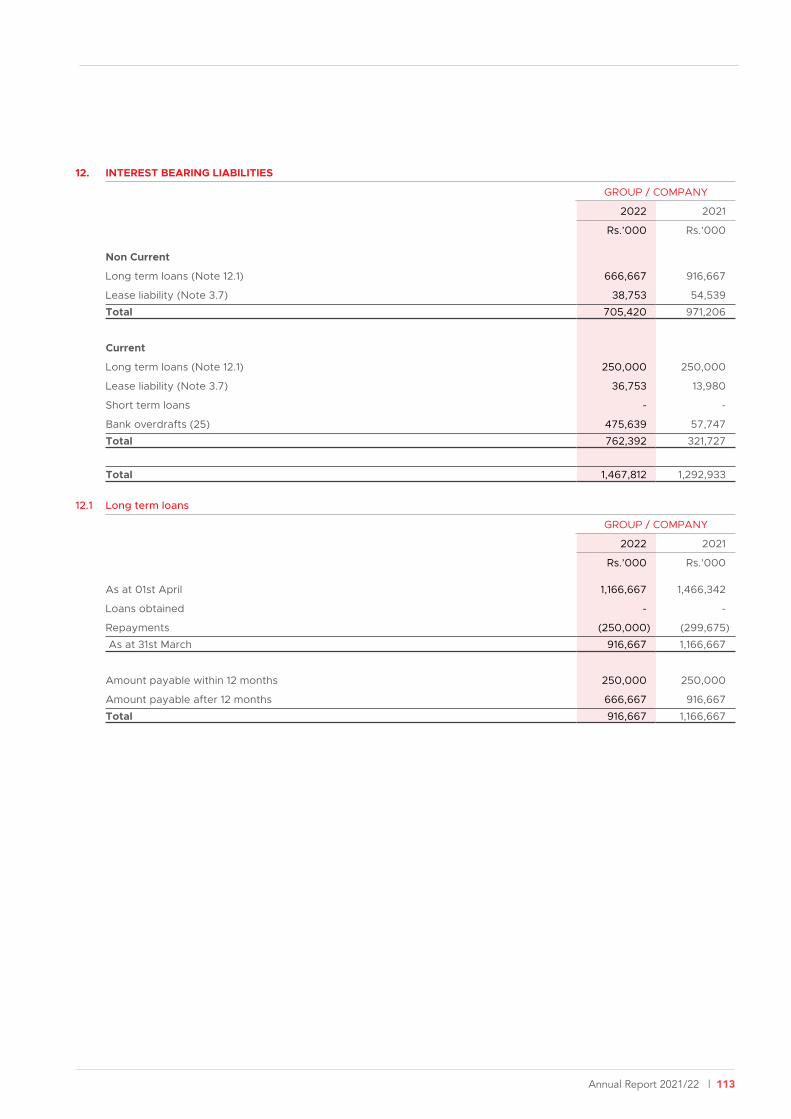
Annual Report 2021/22 | 113
12. INTEREST BEARING LIABILITIES
GROUP / COMPANY
2022 2021
Rs.’000 Rs.’000
Non Current
Long term loans (Note 12.1) 666,667 916,667
Lease liability (Note 3.7) 38,753 54,539
Total 705,420 971,206
Current
Long term loans (Note 12.1) 250,000 250,000
Lease liability (Note 3.7) 36,753 13,980
Short term loans - -
Bank overdrafts (25) 475,639 57,747
Total 762,392 321,727
Total 1,467,812 1,292,933
12.1 Long term loans
GROUP / COMPANY
2022 2021
Rs.’000 Rs.’000
As at 01st April 1,166,667 1,466,342
Loans obtained - -
Repayments (250,000) (299,675)
As at 31st March 916,667 1,166,667
Amount payable within 12 months 250,000 250,000
Amount payable after 12 months 666,667 916,667
Total 916,667 1,166,667

114 | Lanka Tiles PLC
12. INTEREST BEARING LIABILITIES (Contd.)
12.2 Short term loans
GROUP / COMPANY
2022 2021
Rs.’000 Rs.’000
As at 01st April - 1,241,398
Loans obtained - 1,172,021
Repayments - (2,413,419)
As at 31st March - -
12.3 Details of long term loans of the Group / Company
Financial
Institution
Repayment
terms
Principal Interest rate
per annum
Security Annual
repayment
Balance
as at
31.03.2022
Balance
as at
31.03.2021
Rs.’000 Rs.’000 Rs.’000 Rs.’000
Lanka Tiles PLC
DFCC Bank 72 monthly
instalment
(12 month Grace
period)
1,500,000 AWPLR+0.75% A primary
mortgage over
land, buildings
and plant and
machinery
located at Ranala
amounting to
Rs.1,500 Mn
250,000 916,667 1,166,667
Company Total 916,667 1,166,667
Notes to the Financial Statements
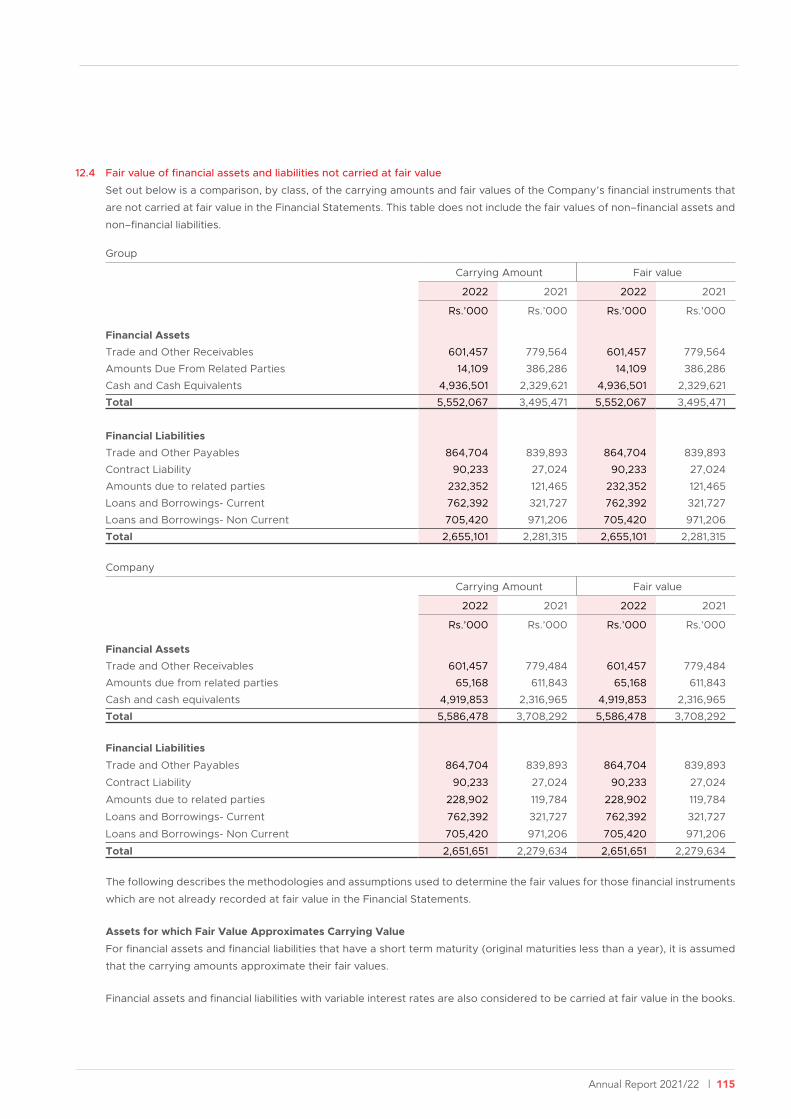
Annual Report 2021/22 | 115
12.4 Fair value of financial assets and liabilities not carried at fair value
Set out below is a comparison, by class, of the carrying amounts and fair values of the Company’s financial instruments that
are not carried at fair value in the Financial Statements. This table does not include the fair values of non–financial assets and
non–financial liabilities.
Group
Carrying Amount Fair value
2022 2021 2022 2021
Rs.’000 Rs.’000 Rs.’000 Rs.’000
Financial AssetsTrade and Other Receivables 601,457 779,564 601,457 779,564
Amounts Due From Related Parties 14,109 386,286 14,109 386,286
Cash and Cash Equivalents 4,936,501 2,329,621 4,936,501 2,329,621
Total 5,552,067 3,495,471 5,552,067 3,495,471
Financial LiabilitiesTrade and Other Payables 864,704 839,893 864,704 839,893
Contract Liability 90,233 27,024 90,233 27,024
Amounts due to related parties 232,352 121,465 232,352 121,465
Loans and Borrowings- Current 762,392 321,727 762,392 321,727
Loans and Borrowings- Non Current 705,420 971,206 705,420 971,206
Total 2,655,101 2,281,315 2,655,101 2,281,315
Company
Carrying Amount Fair value
2022 2021 2022 2021
Rs.’000 Rs.’000 Rs.’000 Rs.’000
Financial AssetsTrade and Other Receivables 601,457 779,484 601,457 779,484
Amounts due from related parties 65,168 611,843 65,168 611,843
Cash and cash equivalents 4,919,853 2,316,965 4,919,853 2,316,965
Total 5,586,478 3,708,292 5,586,478 3,708,292
Financial Liabilities
Trade and Other Payables 864,704 839,893 864,704 839,893
Contract Liability 90,233 27,024 90,233 27,024
Amounts due to related parties 228,902 119,784 228,902 119,784
Loans and Borrowings- Current 762,392 321,727 762,392 321,727
Loans and Borrowings- Non Current 705,420 971,206 705,420 971,206
Total 2,651,651 2,279,634 2,651,651 2,279,634
The following describes the methodologies and assumptions used to determine the fair values for those financial instruments
which are not already recorded at fair value in the Financial Statements.
Assets for which Fair Value Approximates Carrying Value
For financial assets and financial liabilities that have a short term maturity (original maturities less than a year), it is assumed
that the carrying amounts approximate their fair values.
Financial assets and financial liabilities with variable interest rates are also considered to be carried at fair value in the books.
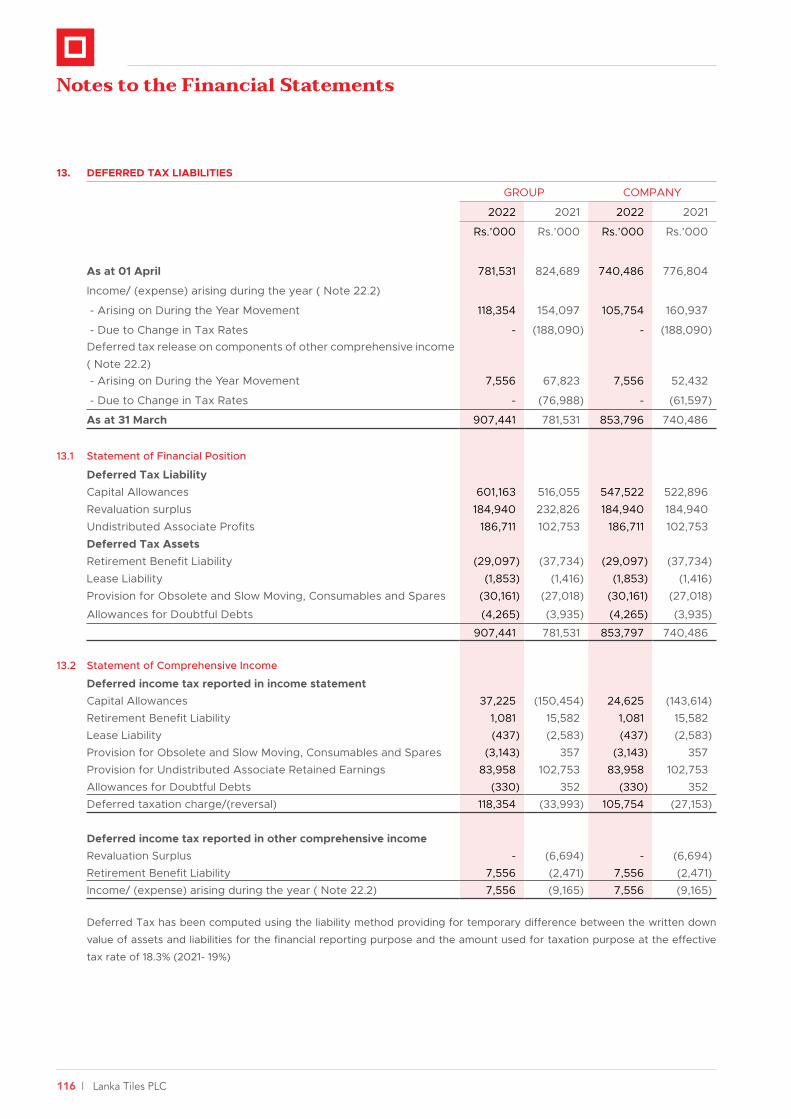
116 | Lanka Tiles PLC
13. DEFERRED TAX LIABILITIES
GROUP COMPANY
2022 2021 2022 2021
Rs.’000 Rs.’000 Rs.’000 Rs.’000
As at 01 April 781,531 824,689 740,486 776,804
Income/ (expense) arising during the year ( Note 22.2)
- Arising on During the Year Movement 118,354 154,097 105,754 160,937
- Due to Change in Tax Rates - (188,090) - (188,090)Deferred tax release on components of other comprehensive income ( Note 22.2) - Arising on During the Year Movement 7,556 67,823 7,556 52,432
- Due to Change in Tax Rates - (76,988) - (61,597)
As at 31 March 907,441 781,531 853,796 740,486
13.1 Statement of Financial Position
Deferred Tax LiabilityCapital Allowances 601,163 516,055 547,522 522,896 Revaluation surplus 184,940 232,826 184,940 184,940 Undistributed Associate Profits 186,711 102,753 186,711 102,753 Deferred Tax Assets Retirement Benefit Liability (29,097) (37,734) (29,097) (37,734)Lease Liability (1,853) (1,416) (1,853) (1,416)Provision for Obsolete and Slow Moving, Consumables and Spares (30,161) (27,018) (30,161) (27,018)
Allowances for Doubtful Debts (4,265) (3,935) (4,265) (3,935)
907,441 781,531 853,797 740,486
13.2 Statement of Comprehensive Income
Deferred income tax reported in income statementCapital Allowances 37,225 (150,454) 24,625 (143,614)Retirement Benefit Liability 1,081 15,582 1,081 15,582 Lease Liability (437) (2,583) (437) (2,583)Provision for Obsolete and Slow Moving, Consumables and Spares (3,143) 357 (3,143) 357 Provision for Undistributed Associate Retained Earnings 83,958 102,753 83,958 102,753 Allowances for Doubtful Debts (330) 352 (330) 352 Deferred taxation charge/(reversal) 118,354 (33,993) 105,754 (27,153)
Deferred income tax reported in other comprehensive incomeRevaluation Surplus - (6,694) - (6,694)Retirement Benefit Liability 7,556 (2,471) 7,556 (2,471)Income/ (expense) arising during the year ( Note 22.2) 7,556 (9,165) 7,556 (9,165)
Deferred Tax has been computed using the liability method providing for temporary difference between the written down
value of assets and liabilities for the financial reporting purpose and the amount used for taxation purpose at the effective
tax rate of 18.3% (2021- 19%)
Notes to the Financial Statements
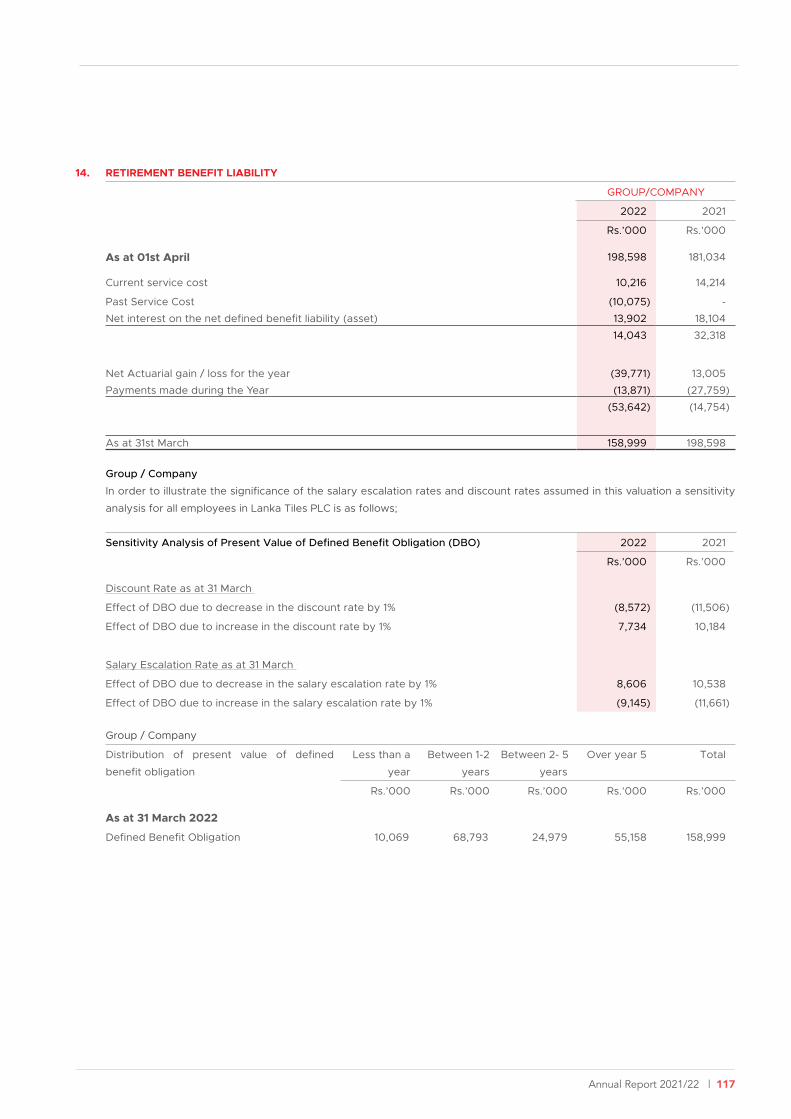
Annual Report 2021/22 | 117
14. RETIREMENT BENEFIT LIABILITY
GROUP/COMPANY
2022 2021
Rs.’000 Rs.’000
As at 01st April 198,598 181,034
Current service cost 10,216 14,214
Past Service Cost (10,075) -
Net interest on the net defined benefit liability (asset) 13,902 18,104
14,043 32,318
Net Actuarial gain / loss for the year (39,771) 13,005
Payments made during the Year (13,871) (27,759)
(53,642) (14,754)
As at 31st March 158,999 198,598
Group / Company
In order to illustrate the significance of the salary escalation rates and discount rates assumed in this valuation a sensitivity
analysis for all employees in Lanka Tiles PLC is as follows;
Sensitivity Analysis of Present Value of Defined Benefit Obligation (DBO) 2022 2021
Rs.’000 Rs.’000
Discount Rate as at 31 March
Effect of DBO due to decrease in the discount rate by 1% (8,572) (11,506)
Effect of DBO due to increase in the discount rate by 1% 7,734 10,184
Salary Escalation Rate as at 31 March
Effect of DBO due to decrease in the salary escalation rate by 1% 8,606 10,538
Effect of DBO due to increase in the salary escalation rate by 1% (9,145) (11,661)
Group / Company
Distribution of present value of defined
benefit obligation
Less than a
year
Between 1-2
years
Between 2- 5
years
Over year 5 Total
Rs.’000 Rs.’000 Rs.’000 Rs.’000 Rs.’000
As at 31 March 2022
Defined Benefit Obligation 10,069 68,793 24,979 55,158 158,999

118 | Lanka Tiles PLC
14. RETIREMENT BENEFIT LIABILITY (Contd.)
Lanka Tiles PLC the Group and the Company the defined benefit liability as of 31 March 2022 was actuarially valued by
Messrs. Actuarial and Management Consultants (Pvt) Ltd. qualified actuary.
The principal assumptions underlying the valuation are as follows;
2022 2021
Discount rate (per annum) 15.40% 7.00%
Salary scale (per annum) - Executives 14.00% 8.60%
- Non Executives 10.00% 10.00%
Retirement Age 60 Years 55 Years
Staff Turnover ratio 7% up to
54 years,
thereafter 0%
8% up to
49 years,
thereafter 0%
Weighted Average duration of defined benefit obligation (Years) 5.85 5.76
15. TRADE AND OTHER PAYABLES
GROUP COMPANY
2022 2021 2022 2021
Rs.’000 Rs.’000 Rs.’000 Rs.’000
Trade creditors - other 585,852 678,523 585,852 678,523
- related parties [15.1] 278,852 161,370 278,852 161,370
864,704 839,893 864,704 839,893
Sundry creditors including accrued expenses 684,192 790,155 684,066 788,180
Total 1,548,896 1,630,048 1,548,770 1,628,073
15.1 Trade creditors - related parties
GROUP COMPANY
2022 2021 2022 2021
Company Relationship Rs.’000 Rs.’000 Rs.’000 Rs.’000
Swisstek Ceylon PLC Associate Company 278,852 161,370 278,852 161,370
278,852 161,370 278,852 161,370
Notes to the Financial Statements
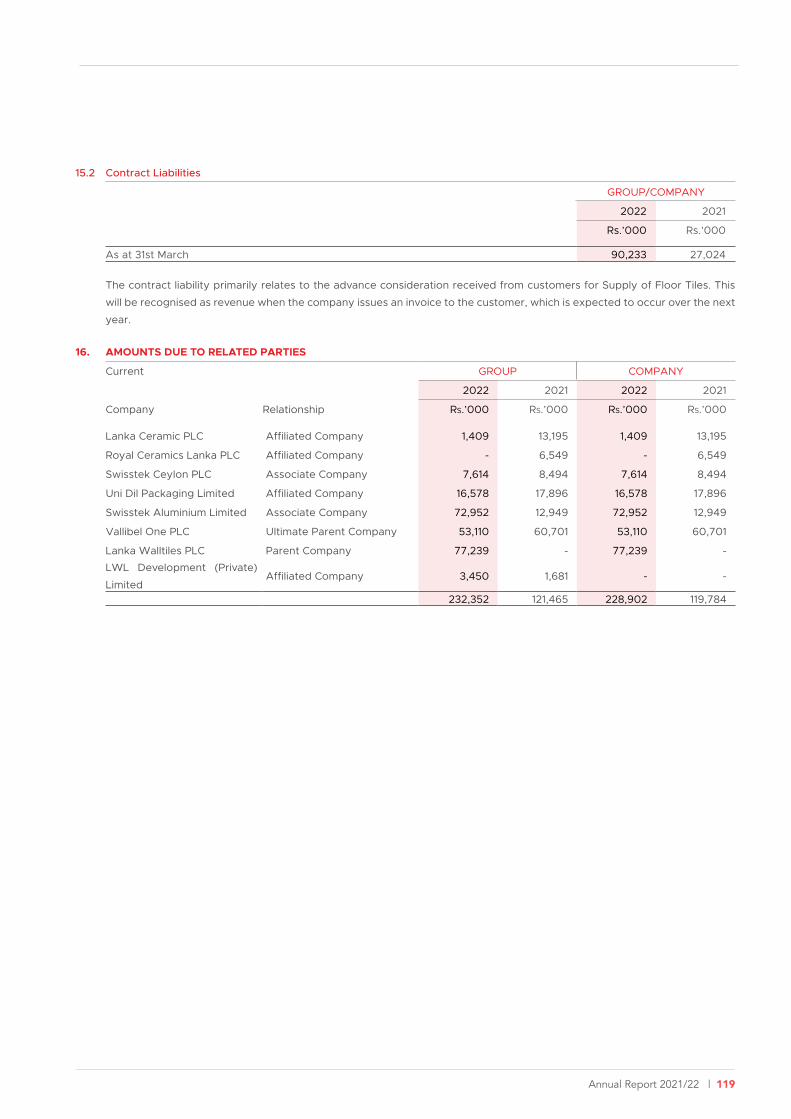
Annual Report 2021/22 | 119
15.2 Contract Liabilities
GROUP/COMPANY
2022 2021
Rs.’000 Rs.’000
As at 31st March 90,233 27,024
The contract liability primarily relates to the advance consideration received from customers for Supply of Floor Tiles. This
will be recognised as revenue when the company issues an invoice to the customer, which is expected to occur over the next
year.
16. AMOUNTS DUE TO RELATED PARTIES
Current GROUP COMPANY
2022 2021 2022 2021
Company Relationship Rs.’000 Rs.’000 Rs.’000 Rs.’000
Lanka Ceramic PLC Affiliated Company 1,409 13,195 1,409 13,195
Royal Ceramics Lanka PLC Affiliated Company - 6,549 - 6,549
Swisstek Ceylon PLC Associate Company 7,614 8,494 7,614 8,494
Uni Dil Packaging Limited Affiliated Company 16,578 17,896 16,578 17,896
Swisstek Aluminium Limited Associate Company 72,952 12,949 72,952 12,949
Vallibel One PLC Ultimate Parent Company 53,110 60,701 53,110 60,701
Lanka Walltiles PLC Parent Company 77,239 - 77,239 -
LWL Development (Private)
Limited Affiliated Company 3,450 1,681 - -
232,352 121,465 228,902 119,784

120 | Lanka Tiles PLC
17. REVENUE FROM CONTRACTS WITH CUSTOMERS
GROUP/COMPANY
Year ended 31st March 2022 2021
Rs.’000 Rs.’000
Sale of tiles & associated items
Export sales 641,961 370,670
Local sales 13,949,659 12,255,815 14,591,620 12,626,485
Turnover net of tax 14,591,620 12,626,485
17.1 Contract Balances
GROUP COMPANY
2022 2021 2022 2021
Rs.’000 Rs.’000 Rs.’000 Rs.’000
Trade receivables (Note 08) 910,523 1,026,460 910,523 1,026,380
Contract liability (Note 17.2) 90,233 27,024 90,233 27,024
1,000,756 1,053,484 1,000,756 1,053,404
17.2 Contract Liability
GROUP/COMPANY
2022 2021
Rs.’000 Rs.’000
As at 31st March 90,233 27,024
The contract liability primarily relates to the advance consideration received from customers for Supply of Porcelain and
Ceramic Floor tiles . This will be recognised as revenue when the company issues an invoice to the customer, which is
expected to occur over the next year.
18. OTHER INCOME / (EXPENSES)
GROUP COMPANY
2022 2021 2022 2021
Rs.’000 Rs.’000 Rs.’000 Rs.’000
Disposal Gain/(Loss) on property, plant and equipment (31,814) 6,845 (31,814) 6,845
Sundry income 43,943 29,534 41,922 27,819
Exchange gain 84,312 7,960 84,312 7,960
96,441 44,339 94,420 42,624
Notes to the Financial Statements
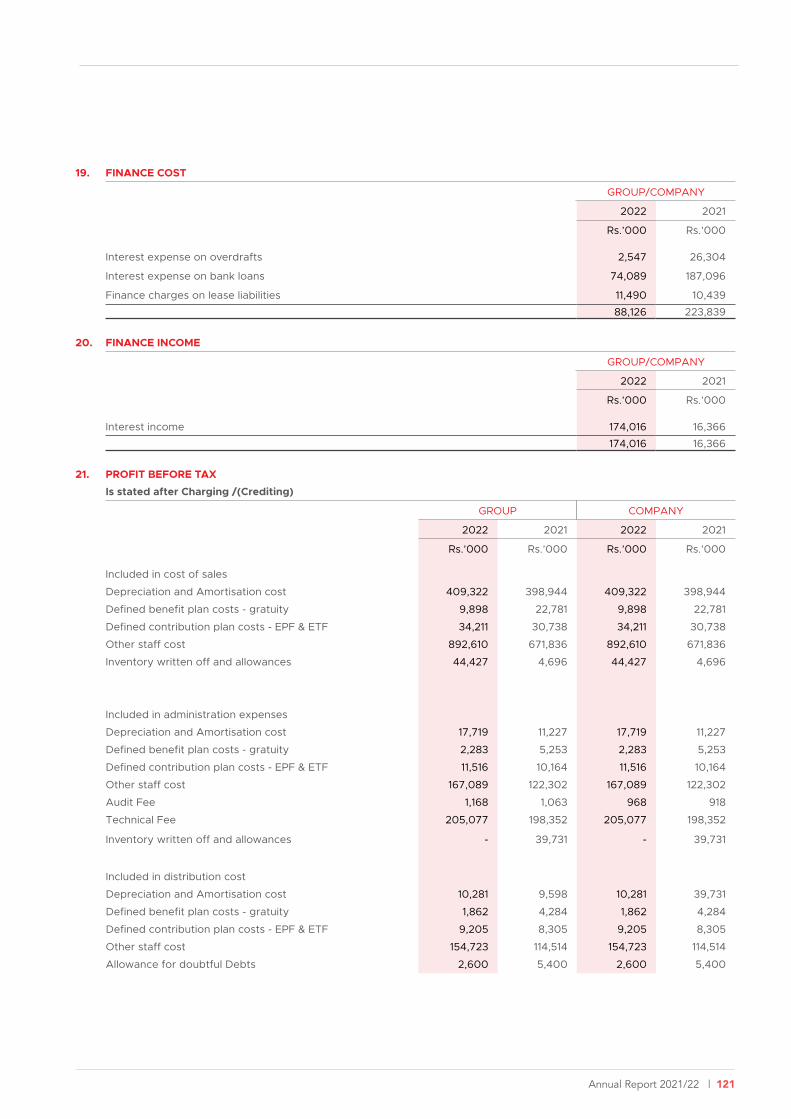
Annual Report 2021/22 | 121
19. FINANCE COST
GROUP/COMPANY
2022 2021
Rs.’000 Rs.’000
Interest expense on overdrafts 2,547 26,304
Interest expense on bank loans 74,089 187,096
Finance charges on lease liabilities 11,490 10,439
88,126 223,839
20. FINANCE INCOME
GROUP/COMPANY
2022 2021
Rs.’000 Rs.’000
Interest income 174,016 16,366
174,016 16,366
21. PROFIT BEFORE TAX
Is stated after Charging /(Crediting)
GROUP COMPANY
2022 2021 2022 2021
Rs.’000 Rs.’000 Rs.’000 Rs.’000
Included in cost of sales
Depreciation and Amortisation cost 409,322 398,944 409,322 398,944
Defined benefit plan costs - gratuity 9,898 22,781 9,898 22,781
Defined contribution plan costs - EPF & ETF 34,211 30,738 34,211 30,738
Other staff cost 892,610 671,836 892,610 671,836
Inventory written off and allowances 44,427 4,696 44,427 4,696
Included in administration expenses
Depreciation and Amortisation cost 17,719 11,227 17,719 11,227
Defined benefit plan costs - gratuity 2,283 5,253 2,283 5,253
Defined contribution plan costs - EPF & ETF 11,516 10,164 11,516 10,164
Other staff cost 167,089 122,302 167,089 122,302
Audit Fee 1,168 1,063 968 918
Technical Fee 205,077 198,352 205,077 198,352
Inventory written off and allowances - 39,731 - 39,731
Included in distribution cost
Depreciation and Amortisation cost 10,281 9,598 10,281 39,731
Defined benefit plan costs - gratuity 1,862 4,284 1,862 4,284
Defined contribution plan costs - EPF & ETF 9,205 8,305 9,205 8,305
Other staff cost 154,723 114,514 154,723 114,514
Allowance for doubtful Debts 2,600 5,400 2,600 5,400

122 | Lanka Tiles PLC
22. INCOME TAX EXPENSES
22.1 The major components of income tax expense are as follows;
GROUP COMPANY
Year ended 31st March 2022 2021 2022 2021
Rs.’000 Rs.’000 Rs.’000 Rs.’000
(a) Current income tax
Current income tax charge 796,105 435,888 795,937 435,662
Under/(over) provision of current taxes in respect of
prior years
- (6,966) - (6,966)
Tax effect on Inter company Dividends 12,233 8,845 12,233 8,845
808,338 437,767 808,170 437,541
(b) Deferred income tax
Deferred taxation charge/(reversal) 118,354 (33,993) 105,754 (27,153)
Income tax expense reported in the Income
statement926,692 403,774 913,924 410,388
22.2 Reconciliation between current tax expense and the product of accounting profit.
GROUP COMPANY
Year ended 31st March 2022 2021 2022 2021
Rs.’000 Rs.’000 Rs.’000 Rs.’000
Accounting profit before income tax 5,037,008 2,854,668 5,034,784 2,855,063
Non deductible expenses 546,300 569,327 546,300 569,327 Deductible expenses (1,059,993) (1,063,116) (1,059,993) (1,063,116)Total Statutory Income 4,523,315 2,360,879 4,521,091 2,361,274 Net Taxable profit 4,523,315 2,360,879 4,521,091 2,361,274
Taxable Profit 4,523,315 2,360,879 4,521,091 2,361,274
Net Taxable profit 4,523,315 2,360,879 4,521,091 2,361,274
Current income tax expense
Taxation -14% 22,314 9,665 22,314 9,665
Taxation -18% 767,793 365,674 767,625 365,448
Taxation -24% 5,998 60,549 5,998 60,549
796,105 435,888 795,937 435,662
Notes to the Financial Statements
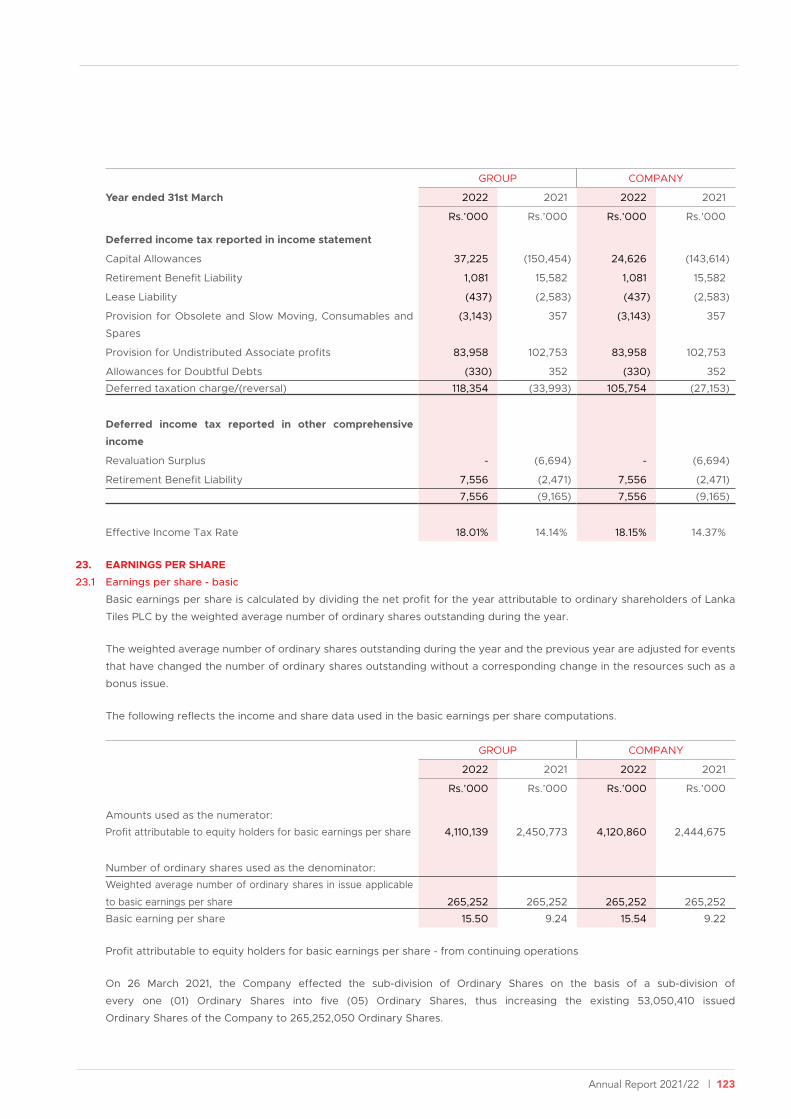
Annual Report 2021/22 | 123
GROUP COMPANY
Year ended 31st March 2022 2021 2022 2021
Rs.’000 Rs.’000 Rs.’000 Rs.’000
Deferred income tax reported in income statement
Capital Allowances 37,225 (150,454) 24,626 (143,614)
Retirement Benefit Liability 1,081 15,582 1,081 15,582
Lease Liability (437) (2,583) (437) (2,583)
Provision for Obsolete and Slow Moving, Consumables and
Spares
(3,143) 357 (3,143) 357
Provision for Undistributed Associate profits 83,958 102,753 83,958 102,753
Allowances for Doubtful Debts (330) 352 (330) 352
Deferred taxation charge/(reversal) 118,354 (33,993) 105,754 (27,153)
Deferred income tax reported in other comprehensive
income
Revaluation Surplus - (6,694) - (6,694)
Retirement Benefit Liability 7,556 (2,471) 7,556 (2,471)
7,556 (9,165) 7,556 (9,165)
Effective Income Tax Rate 18.01% 14.14% 18.15% 14.37%
23. EARNINGS PER SHARE
23.1 Earnings per share - basic
Basic earnings per share is calculated by dividing the net profit for the year attributable to ordinary shareholders of Lanka
Tiles PLC by the weighted average number of ordinary shares outstanding during the year.
The weighted average number of ordinary shares outstanding during the year and the previous year are adjusted for events
that have changed the number of ordinary shares outstanding without a corresponding change in the resources such as a
bonus issue.
The following reflects the income and share data used in the basic earnings per share computations.
GROUP COMPANY
2022 2021 2022 2021
Rs.’000 Rs.’000 Rs.’000 Rs.’000
Amounts used as the numerator:
Profit attributable to equity holders for basic earnings per share 4,110,139 2,450,773 4,120,860 2,444,675
Number of ordinary shares used as the denominator:
Weighted average number of ordinary shares in issue applicable
to basic earnings per share 265,252 265,252 265,252 265,252
Basic earning per share 15.50 9.24 15.54 9.22
Profit attributable to equity holders for basic earnings per share - from continuing operations
On 26 March 2021, the Company effected the sub-division of Ordinary Shares on the basis of a sub-division of
every one (01) Ordinary Shares into five (05) Ordinary Shares, thus increasing the existing 53,050,410 issued
Ordinary Shares of the Company to 265,252,050 Ordinary Shares.

124 | Lanka Tiles PLC
24. DIVIDENDS PAID
GROUP /COMPANY
2022 2021
Rs.’000 Rs.’000
Declared and paid during the year
Equity dividends on ordinary shares :
Final 2020/21 (Rs. 2.20 per share) 583,554 204,244
1st Interim 2021/22 (Rs. 3.00 per share) 795,756 652,520
2nd Interim 2021/22 (Rs. 1.80 per share) 477,453 -
1,856,763 856,764
Dividend Payout Ratio(%) 45% 35%
25. CASH AND CASH EQUIVALENTS
Components of cash and cash equivalents
Favourable cash & cash equivalents balance GROUP COMPANY
2022 2021 2022 2021
Rs.’000 Rs.’000 Rs.’000 Rs.’000
Cash & bank balances 4,936,501 2,329,621 4,919,853 2,316,965
Unfavourable cash & cash equivalent balances
Bank overdrafts (Note 12) (475,639) (57,747) (475,639) (57,747)
Total cash and cash equivalents for the purpose of Statement
of Cash Flows
4,460,862 2,271,874 4,444,214 2,259,218
26. ASSETS PLEDGED
Following Assets have been pledged as security for liabilities, in addition to the items disclosed in Note 12.3 to these financial
statements.
Lanka Tiles PLC
Bank overdrafts and Short term loans are secured primarily on inventories.
Import Loans / Short term Loans - Commercial Bank PLC Immovable Properties Rs. 100,000,000
Import Loans / Short term Loans - Hatton National Bank PLC Immovable Properties Rs. 27,000,000
Notes to the Financial Statements
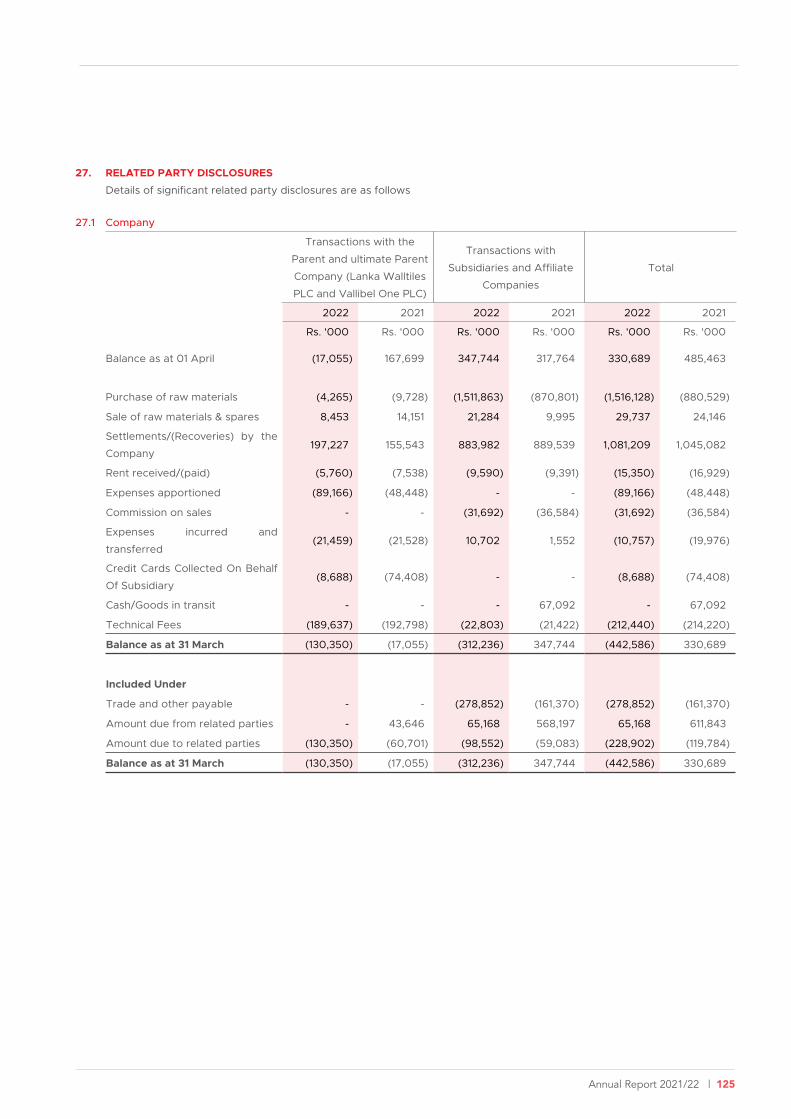
Annual Report 2021/22 | 125
27. RELATED PARTY DISCLOSURES
Details of significant related party disclosures are as follows
27.1 Company
Transactions with the
Parent and ultimate Parent
Company (Lanka Walltiles
PLC and Vallibel One PLC)
Transactions with
Subsidiaries and Affiliate
Companies
Total
2022 2021 2022 2021 2022 2021
Rs. '000 Rs. '000 Rs. '000 Rs. '000 Rs. '000 Rs. '000
Balance as at 01 April (17,055) 167,699 347,744 317,764 330,689 485,463
Purchase of raw materials (4,265) (9,728) (1,511,863) (870,801) (1,516,128) (880,529)
Sale of raw materials & spares 8,453 14,151 21,284 9,995 29,737 24,146
Settlements/(Recoveries) by the
Company 197,227 155,543 883,982 889,539 1,081,209 1,045,082
Rent received/(paid) (5,760) (7,538) (9,590) (9,391) (15,350) (16,929)
Expenses apportioned (89,166) (48,448) - - (89,166) (48,448)
Commission on sales - - (31,692) (36,584) (31,692) (36,584)
Expenses incurred and
transferred (21,459) (21,528) 10,702 1,552 (10,757) (19,976)
Credit Cards Collected On Behalf
Of Subsidiary (8,688) (74,408) - - (8,688) (74,408)
Cash/Goods in transit - - - 67,092 - 67,092
Technical Fees (189,637) (192,798) (22,803) (21,422) (212,440) (214,220)
Balance as at 31 March (130,350) (17,055) (312,236) 347,744 (442,586) 330,689
Included Under
Trade and other payable - - (278,852) (161,370) (278,852) (161,370)
Amount due from related parties - 43,646 65,168 568,197 65,168 611,843
Amount due to related parties (130,350) (60,701) (98,552) (59,083) (228,902) (119,784)
Balance as at 31 March (130,350) (17,055) (312,236) 347,744 (442,586) 330,689
126 | Lanka Tiles PLC
27. RELATED PARTY DISCLOSURES (Contd.)
The above subsidiaries and affiliates include following companies;
Company
- Royal Ceramics Lanka PLC
- Unidil Packaging (Private) Limited
- Swisstek Aluminum Limited
- Swisstek (Ceylon) PLC
- Rocell Bathware Limited
- LWL Development ( Private) Limited
- Beyond Paradise Collection Limited
- Lankatiles (Private) Limited
- LTL Development (Private) Limited
- Lanka Ceramics PLC
- Hayleys Travels & Tours (Private) limited
- Hayleys Agriculture Holding Limited
- Hayleys Electronic Lighting (Private) Limited
- Hayleys Industrial Solutions (Private) Limited
- Delmage Freight Services (Private) Limited
Terms and conditions with related parties
The ‘Sales to’ and ‘Purchases from’ related parties are made on commercial terms agreed with respective parties.
Outstanding balances as at the year end are unsecured, interest free and settlement occur in cash.
Technical fees paid to Royal Ceramic Lanka PLC and Vallibel One PLC are for services rendered in providing technical advises
to improve manufacturing process of Lanka Tiles PLC.
Notes to the Financial Statements

Annual Report 2021/22 | 127
27.2 Group - Related Party Transactions
27.2.1 Lanka Tiles PLC
Name of the company Relationship Nature of the transaction 2022 2021Rs. '000 Rs. '000
(a) Sale of goods /services toLanka Walltiles PLC Parent Raw materials 8,453 14,151 Rocell Bathware Ltd Affiliated Company Raw materials 1,938 534
Spares - - Royal Ceramics Lanka PLC Affiliated Company Raw materials 4,589 8,875
Spares 3,957 586 Packaging 10,800 -
(b) Purchase of goods/Services from:Lanka Walltiles PLC Parent Raw materials 2,678 616
Consumables 1,588 9,113 Services - -
Lanka Ceramic PLC Affiliated Company Raw materials 110,152 76,406 Swisstek Aluminum Ltd Affiliated Company Trading Items 209,012 76,446 Swisstek (Ceylon) PLC Affiliated Company Trading Items 962,995 586,400
Sales Commission 31,692 36,584Reimbursement of
Operational
5,994 5,495
ExpensesUni-Dil Packing (Pvt) Ltd Affiliated Company Packing Material 228,625 122,235Royal Ceramics Lanka PLC Affiliated Company Raw materials 941 130
Spares 17 107 Consumables 121 7,695 Technical fees 22,803 19,834
Vallibel One PLC Affiliated Company Technical fees 189,637 178,509Heyleys Travels & Tours (Private) limited Affiliated Company Services 4,107 124 Heyleys Agriculture Holding Limited Affiliated Company Services - 40 Heyleys Electronic Lighting (Private)
Limited
Affiliated Company Services 202 405
(c) Receipts of funds from:Lanka Walltiles PLC Parent Expenses Reimbursement :
Settlement
109,934 95,768
Raw Material Sale-
Settlement
433 4,119
(d) Transfer of funds to: Lanka Walltiles PLC Parent Expenses Reimbursement :
Settlement
129,468 144,504
Raw Material
Sale- Settlement
1,684 9,343
Swisstek (Ceylon) PLC Affiliated Company Settlement of Trading
Items
845,513 493,954
LWL Development Ltd Affiliated Company Fund Transfer 20,438 3,483LTL Development (Private) Limited Subsidiary Company Fund Transfer 55,110(e) Expenses incurred and transferred to/(from)Lanka Walltiles PLC Parent - Administration expenses 34,423 84,988
- Distribution expenses 109,562 129,596Swisstek (Ceylon) PLC Affiliated Company - Administration expenses 14,389 8,229Swisstek Alumimium Ltd Affiliated Company - Administration expenses 15,263 1,705Beyond Paradise Collection Limited Subsidiary Company - Administration expenses 152 196LTL Development (Private) Limited Subsidiary Company - Administration expenses 1,727 -LWL Development (Private) Limited Affiliated Company - Administration expenses 1,696 1,129
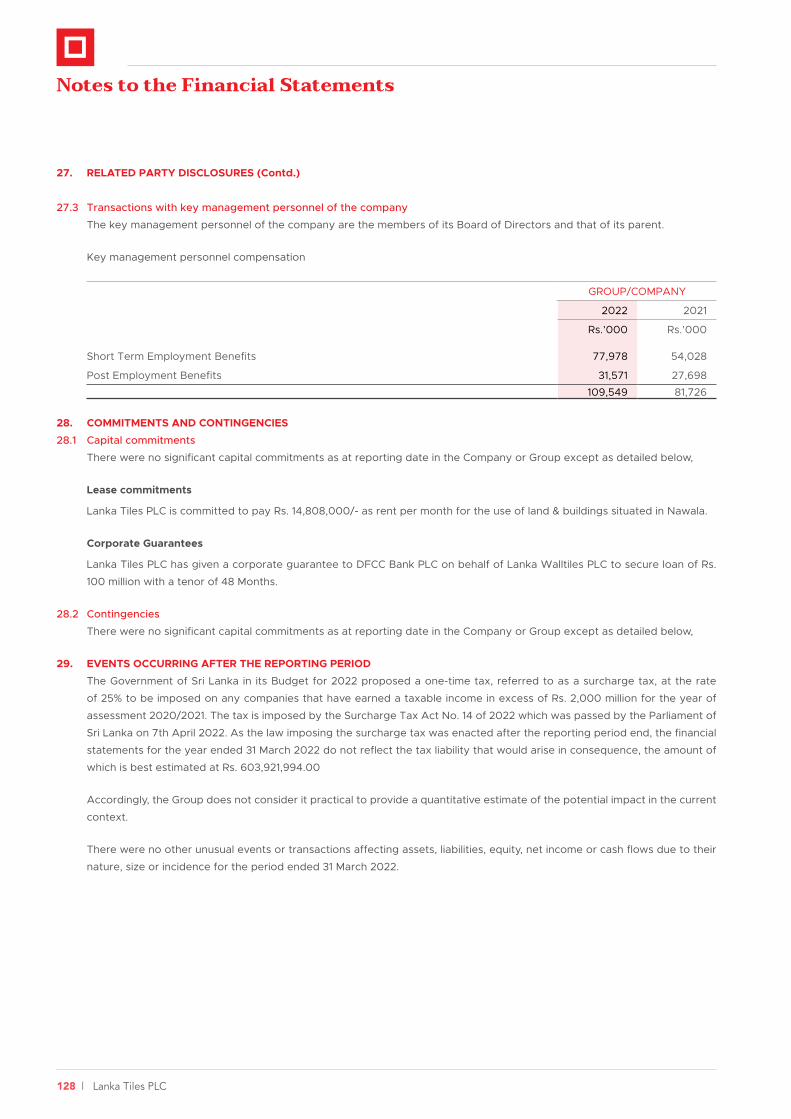
128 | Lanka Tiles PLC
27. RELATED PARTY DISCLOSURES (Contd.)
27.3 Transactions with key management personnel of the company
The key management personnel of the company are the members of its Board of Directors and that of its parent.
Key management personnel compensation
GROUP/COMPANY
2022 2021
Rs.’000 Rs.’000
Short Term Employment Benefits 77,978 54,028
Post Employment Benefits 31,571 27,698
109,549 81,726
28. COMMITMENTS AND CONTINGENCIES
28.1 Capital commitments
There were no significant capital commitments as at reporting date in the Company or Group except as detailed below,
Lease commitments
Lanka Tiles PLC is committed to pay Rs. 14,808,000/- as rent per month for the use of land & buildings situated in Nawala.
Corporate Guarantees
Lanka Tiles PLC has given a corporate guarantee to DFCC Bank PLC on behalf of Lanka Walltiles PLC to secure loan of Rs.
100 million with a tenor of 48 Months.
28.2 Contingencies
There were no significant capital commitments as at reporting date in the Company or Group except as detailed below,
29. EVENTS OCCURRING AFTER THE REPORTING PERIOD
The Government of Sri Lanka in its Budget for 2022 proposed a one-time tax, referred to as a surcharge tax, at the rate
of 25% to be imposed on any companies that have earned a taxable income in excess of Rs. 2,000 million for the year of
assessment 2020/2021. The tax is imposed by the Surcharge Tax Act No. 14 of 2022 which was passed by the Parliament of
Sri Lanka on 7th April 2022. As the law imposing the surcharge tax was enacted after the reporting period end, the financial
statements for the year ended 31 March 2022 do not reflect the tax liability that would arise in consequence, the amount of
which is best estimated at Rs. 603,921,994.00
Accordingly, the Group does not consider it practical to provide a quantitative estimate of the potential impact in the current
context.
There were no other unusual events or transactions affecting assets, liabilities, equity, net income or cash flows due to their
nature, size or incidence for the period ended 31 March 2022.
Notes to the Financial Statements
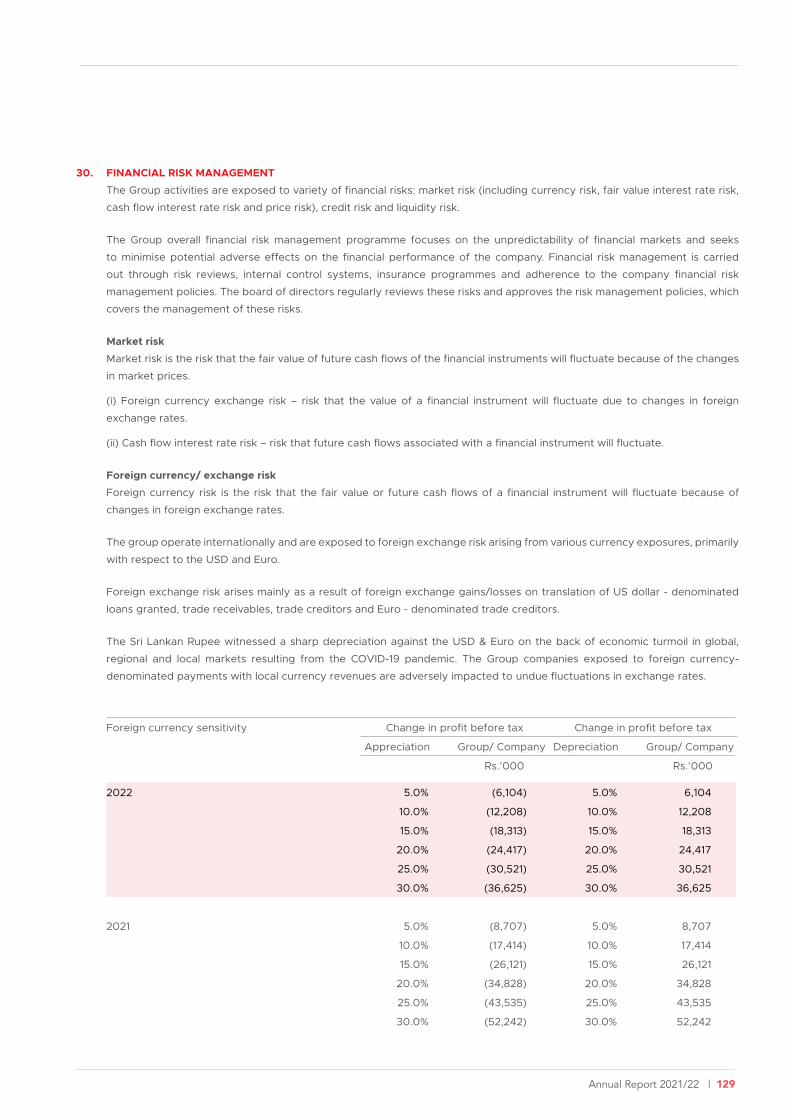
Annual Report 2021/22 | 129
30. FINANCIAL RISK MANAGEMENT
The Group activities are exposed to variety of financial risks: market risk (including currency risk, fair value interest rate risk,
cash flow interest rate risk and price risk), credit risk and liquidity risk.
The Group overall financial risk management programme focuses on the unpredictability of financial markets and seeks
to minimise potential adverse effects on the financial performance of the company. Financial risk management is carried
out through risk reviews, internal control systems, insurance programmes and adherence to the company financial risk
management policies. The board of directors regularly reviews these risks and approves the risk management policies, which
covers the management of these risks.
Market risk
Market risk is the risk that the fair value of future cash flows of the financial instruments will fluctuate because of the changes
in market prices.
(i) Foreign currency exchange risk – risk that the value of a financial instrument will fluctuate due to changes in foreign
exchange rates.
(ii) Cash flow interest rate risk – risk that future cash flows associated with a financial instrument will fluctuate.
Foreign currency/ exchange risk
Foreign currency risk is the risk that the fair value or future cash flows of a financial instrument will fluctuate because of
changes in foreign exchange rates.
The group operate internationally and are exposed to foreign exchange risk arising from various currency exposures, primarily
with respect to the USD and Euro.
Foreign exchange risk arises mainly as a result of foreign exchange gains/losses on translation of US dollar - denominated
loans granted, trade receivables, trade creditors and Euro - denominated trade creditors.
The Sri Lankan Rupee witnessed a sharp depreciation against the USD & Euro on the back of economic turmoil in global,
regional and local markets resulting from the COVID-19 pandemic. The Group companies exposed to foreign currency-
denominated payments with local currency revenues are adversely impacted to undue fluctuations in exchange rates.
Foreign currency sensitivity Change in profit before tax Change in profit before tax
Appreciation Group/ Company Depreciation Group/ Company
Rs.’000 Rs.’000
2022 5.0% (6,104) 5.0% 6,104
10.0% (12,208) 10.0% 12,208
15.0% (18,313) 15.0% 18,313
20.0% (24,417) 20.0% 24,417
25.0% (30,521) 25.0% 30,521
30.0% (36,625) 30.0% 36,625
2021 5.0% (8,707) 5.0% 8,707
10.0% (17,414) 10.0% 17,414
15.0% (26,121) 15.0% 26,121
20.0% (34,828) 20.0% 34,828
25.0% (43,535) 25.0% 43,535
30.0% (52,242) 30.0% 52,242
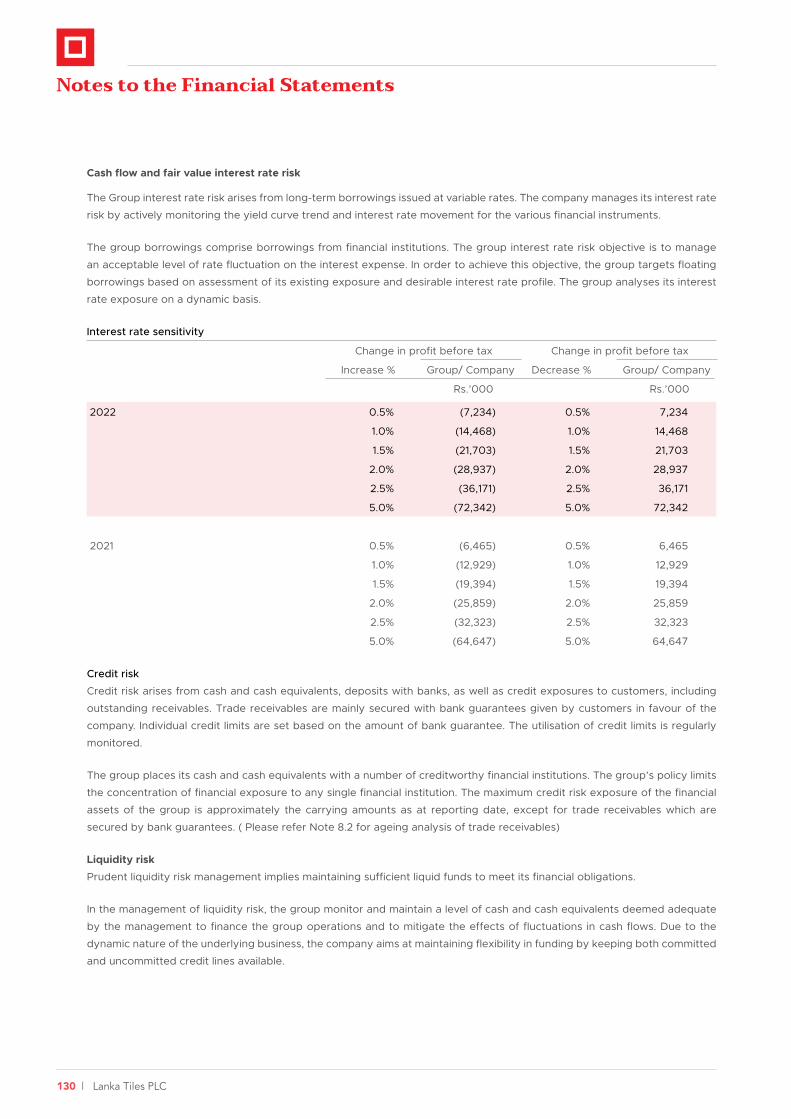
130 | Lanka Tiles PLC
Notes to the Financial Statements
Cash flow and fair value interest rate risk
The Group interest rate risk arises from long-term borrowings issued at variable rates. The company manages its interest rate
risk by actively monitoring the yield curve trend and interest rate movement for the various financial instruments.
The group borrowings comprise borrowings from financial institutions. The group interest rate risk objective is to manage
an acceptable level of rate fluctuation on the interest expense. In order to achieve this objective, the group targets floating
borrowings based on assessment of its existing exposure and desirable interest rate profile. The group analyses its interest
rate exposure on a dynamic basis.
Interest rate sensitivity
Change in profit before tax Change in profit before tax
Increase % Group/ Company Decrease % Group/ Company
Rs.’000 Rs.’000
2022 0.5% (7,234) 0.5% 7,234
1.0% (14,468) 1.0% 14,468
1.5% (21,703) 1.5% 21,703
2.0% (28,937) 2.0% 28,937
2.5% (36,171) 2.5% 36,171
5.0% (72,342) 5.0% 72,342
2021 0.5% (6,465) 0.5% 6,465
1.0% (12,929) 1.0% 12,929
1.5% (19,394) 1.5% 19,394
2.0% (25,859) 2.0% 25,859
2.5% (32,323) 2.5% 32,323
5.0% (64,647) 5.0% 64,647
Credit risk
Credit risk arises from cash and cash equivalents, deposits with banks, as well as credit exposures to customers, including
outstanding receivables. Trade receivables are mainly secured with bank guarantees given by customers in favour of the
company. Individual credit limits are set based on the amount of bank guarantee. The utilisation of credit limits is regularly
monitored.
The group places its cash and cash equivalents with a number of creditworthy financial institutions. The group’s policy limits
the concentration of financial exposure to any single financial institution. The maximum credit risk exposure of the financial
assets of the group is approximately the carrying amounts as at reporting date, except for trade receivables which are
secured by bank guarantees. ( Please refer Note 8.2 for ageing analysis of trade receivables)
Liquidity risk
Prudent liquidity risk management implies maintaining sufficient liquid funds to meet its financial obligations.
In the management of liquidity risk, the group monitor and maintain a level of cash and cash equivalents deemed adequate
by the management to finance the group operations and to mitigate the effects of fluctuations in cash flows. Due to the
dynamic nature of the underlying business, the company aims at maintaining flexibility in funding by keeping both committed
and uncommitted credit lines available.

Annual Report 2021/22 | 131
30. FINANCIAL RISK MANAGEMENT (Contd.)
The table below analyses the group’s non-derivative financial liabilities into relevant maturity groupings based on the
remaining period at the statement of financial position date to the contractual maturity date.
The Board together with the Management is focused on minimising the Liquidity risk and ensuring long term business
continuity by critically analysing cash flow management in order to preserving and increasing liquidity.
Group
At 31 March 2022 Less than
3 months
Between
3 months
and 1 year
Between
year 1 and
2 year
Between
year 2 and
year 5
Over
5 years
Rs. ('000)
Interest Bearing Loans and Borrowings 544,274 217,163 298,806 565,104 -
Lease Liability on Right of Use Assets 4,540 15,304 23,281 20,813 -
Trade and other payables 1,639,129 - - - -
Amounts due to related parties 232,352 - - - -
At 31 March 2021 Less than
3 months
Between
3 months
and 1 year
Between
year 1 and
2 year
Between
year 2 and
year 5
Over
5 years
Rs. ('000)
Interest Bearing Loans and Borrowings 124,351 208,218 286,287 840,749 -
Lease Liability on Right of Use Assets 3,128 11,927 20,662 49,084 -
Trade and other payables 1,657,072 - - - -
Amounts due to related parties 121,465 - - - -
Company
At 31 March 2022 Less than
3 months
Between
3 months
and 1 year
Between
year 1 and
2 year
Between
year 2 and
year 5
Over
5 years
Rs. ('000)
Interest Bearing Loans and Borrowings 544,274 217,163 298,806 565,104 -
Lease Liability on Right of Use Assets 4,540 15,304 23,281 20,813 -
Trade and other payables 1,639,003 - - - -
Amounts due to related parties 228,902 - - - -

132 | Lanka Tiles PLC
Notes to the Financial Statements
At 31 March 2022 Less than
3 months
Between
3 months
and 1 year
Between
year 1 and
2 year
Between
year 2 and
year 5
Over
5 years
Rs. ('000)
Interest Bearing Loans and Borrowings 124,351 208,218 286,287 840,749 -
Lease Liability on Right of Use Assets 3,128 11,927 20,662 49,084 -
Trade and other payables 1,657,097 - - - -
Amounts due to related parties 119,784 - - - -
Capital management risk
The primary objective of the Group’s capital management is to ensure that it maintains a strong credit rating and healthy
capital ratios in order to support its business and maximise shareholder value.
The Group manages its capital structure and makes adjustments to it in light of changes in economic conditions. To maintain
or adjust the capital structure, the group may or may not make dividend payments to shareholders, return capital to
shareholders or issue new shares or other instruments.
Consistent with others in the industry, the Group monitors capital on the basis of the gearing ratio. This ratio is calculated as
total borrowings by total equity. Total borrowings including non-current and current borrowings as shown in the statements
of financial position. Total equity is calculated as ‘Total equity’ in the statements of financial position.
The gearing ratio as at 31 March is as follows:
GROUP COMPANY
2022 2021 2022 2021
Rs.’000 Rs.’000 Rs.’000 Rs.’000
Borrowings 1,467,812 1,292,933 1,467,812 1,292,933
Total equity 12,227,418 9,933,274 12,044,022 9,745,779
Gearing ratio; Debt to Equity 12% 13% 12% 13%
Annual Report 2021/22 | 133
SUPPLEMENTARY INFORMATION
Dedicated ToDistinction
Five Year Summary statement of ComprehensiveIncome
134
Five Year Summary statement of Financial Position 135
Shareholder Information 136
Major shareholders as at 31st march 2022 20 137
Statement of Value Added 139
GRI Index 140
Corporate Information 143
Notes 144
Notice of Meeting 146
Form of Proxy 147
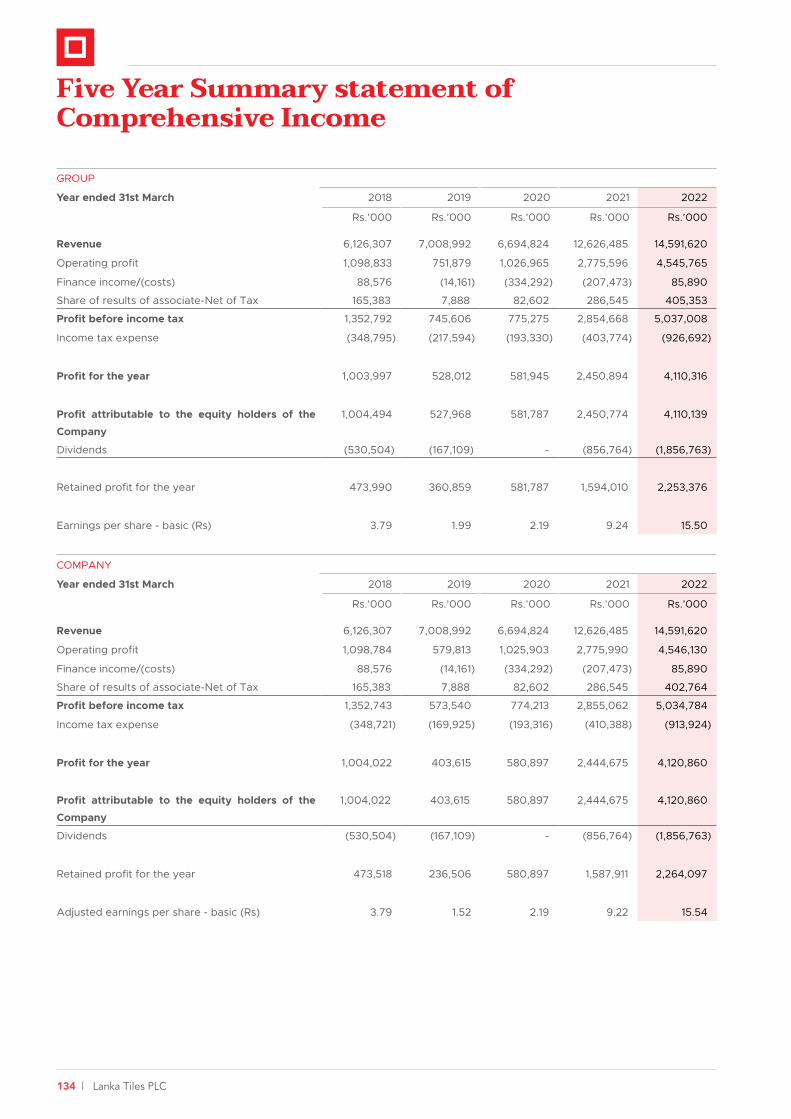
134 | Lanka Tiles PLC
Five Year Summary statement of Comprehensive Income
GROUP
Year ended 31st March 2018 2019 2020 2021 2022
Rs.’000 Rs.’000 Rs.’000 Rs.’000 Rs.’000
Revenue 6,126,307 7,008,992 6,694,824 12,626,485 14,591,620
Operating profit 1,098,833 751,879 1,026,965 2,775,596 4,545,765
Finance income/(costs) 88,576 (14,161) (334,292) (207,473) 85,890
Share of results of associate-Net of Tax 165,383 7,888 82,602 286,545 405,353
Profit before income tax 1,352,792 745,606 775,275 2,854,668 5,037,008
Income tax expense (348,795) (217,594) (193,330) (403,774) (926,692)
Profit for the year 1,003,997 528,012 581,945 2,450,894 4,110,316
Profit attributable to the equity holders of the
Company
1,004,494 527,968 581,787 2,450,774 4,110,139
Dividends (530,504) (167,109) - (856,764) (1,856,763)
Retained profit for the year 473,990 360,859 581,787 1,594,010 2,253,376
Earnings per share - basic (Rs) 3.79 1.99 2.19 9.24 15.50
COMPANY
Year ended 31st March 2018 2019 2020 2021 2022
Rs.’000 Rs.’000 Rs.’000 Rs.’000 Rs.’000
Revenue 6,126,307 7,008,992 6,694,824 12,626,485 14,591,620
Operating profit 1,098,784 579,813 1,025,903 2,775,990 4,546,130
Finance income/(costs) 88,576 (14,161) (334,292) (207,473) 85,890
Share of results of associate-Net of Tax 165,383 7,888 82,602 286,545 402,764
Profit before income tax 1,352,743 573,540 774,213 2,855,062 5,034,784
Income tax expense (348,721) (169,925) (193,316) (410,388) (913,924)
Profit for the year 1,004,022 403,615 580,897 2,444,675 4,120,860
Profit attributable to the equity holders of the
Company
1,004,022 403,615 580,897 2,444,675 4,120,860
Dividends (530,504) (167,109) - (856,764) (1,856,763)
Retained profit for the year 473,518 236,506 580,897 1,587,911 2,264,097
Adjusted earnings per share - basic (Rs) 3.79 1.52 2.19 9.22 15.54
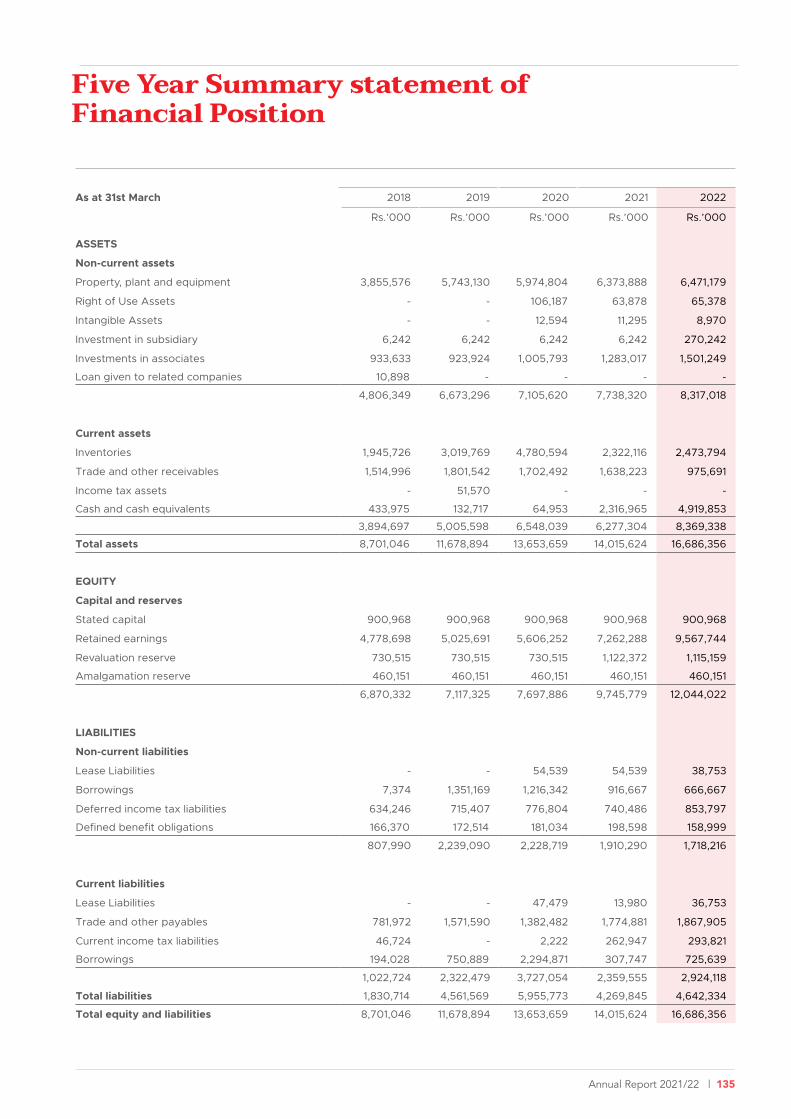
Annual Report 2021/22 | 135
Five Year Summary statement of Financial Position
As at 31st March 2018 2019 2020 2021 2022
Rs.’000 Rs.’000 Rs.’000 Rs.’000 Rs.’000
ASSETS
Non-current assets
Property, plant and equipment 3,855,576 5,743,130 5,974,804 6,373,888 6,471,179
Right of Use Assets - - 106,187 63,878 65,378
Intangible Assets - - 12,594 11,295 8,970
Investment in subsidiary 6,242 6,242 6,242 6,242 270,242
Investments in associates 933,633 923,924 1,005,793 1,283,017 1,501,249
Loan given to related companies 10,898 - - - -
4,806,349 6,673,296 7,105,620 7,738,320 8,317,018
Current assets
Inventories 1,945,726 3,019,769 4,780,594 2,322,116 2,473,794
Trade and other receivables 1,514,996 1,801,542 1,702,492 1,638,223 975,691
Income tax assets - 51,570 - - -
Cash and cash equivalents 433,975 132,717 64,953 2,316,965 4,919,853
3,894,697 5,005,598 6,548,039 6,277,304 8,369,338
Total assets 8,701,046 11,678,894 13,653,659 14,015,624 16,686,356
EQUITY
Capital and reserves
Stated capital 900,968 900,968 900,968 900,968 900,968
Retained earnings 4,778,698 5,025,691 5,606,252 7,262,288 9,567,744
Revaluation reserve 730,515 730,515 730,515 1,122,372 1,115,159
Amalgamation reserve 460,151 460,151 460,151 460,151 460,151
6,870,332 7,117,325 7,697,886 9,745,779 12,044,022
LIABILITIES
Non-current liabilities
Lease Liabilities - - 54,539 54,539 38,753
Borrowings 7,374 1,351,169 1,216,342 916,667 666,667
Deferred income tax liabilities 634,246 715,407 776,804 740,486 853,797
Defined benefit obligations 166,370 172,514 181,034 198,598 158,999
807,990 2,239,090 2,228,719 1,910,290 1,718,216
Current liabilities
Lease Liabilities - - 47,479 13,980 36,753
Trade and other payables 781,972 1,571,590 1,382,482 1,774,881 1,867,905
Current income tax liabilities 46,724 - 2,222 262,947 293,821
Borrowings 194,028 750,889 2,294,871 307,747 725,639
1,022,724 2,322,479 3,727,054 2,359,555 2,924,118
Total liabilities 1,830,714 4,561,569 5,955,773 4,269,845 4,642,334
Total equity and liabilities 8,701,046 11,678,894 13,653,659 14,015,624 16,686,356
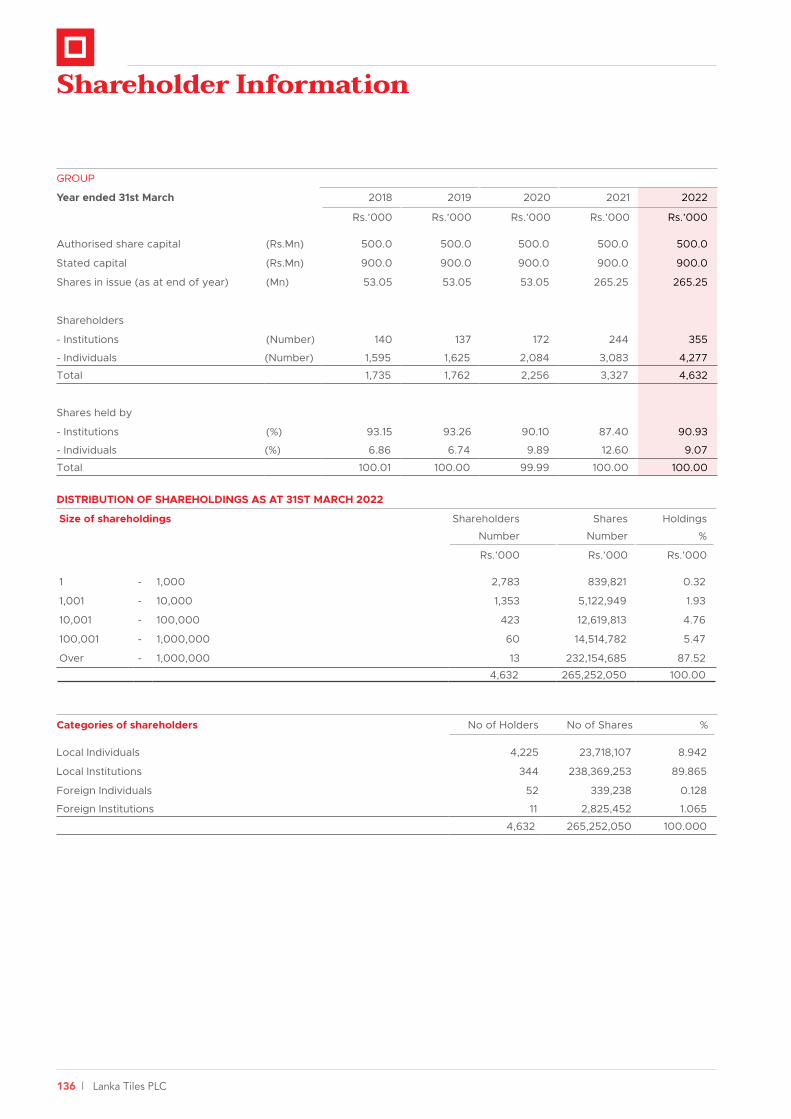
136 | Lanka Tiles PLC
Shareholder Information
GROUP
Year ended 31st March 2018 2019 2020 2021 2022
Rs.’000 Rs.’000 Rs.’000 Rs.’000 Rs.’000
Authorised share capital (Rs.Mn) 500.0 500.0 500.0 500.0 500.0
Stated capital (Rs.Mn) 900.0 900.0 900.0 900.0 900.0
Shares in issue (as at end of year) (Mn) 53.05 53.05 53.05 265.25 265.25
Shareholders
- Institutions (Number) 140 137 172 244 355
- Individuals (Number) 1,595 1,625 2,084 3,083 4,277
Total 1,735 1,762 2,256 3,327 4,632
Shares held by
- Institutions (%) 93.15 93.26 90.10 87.40 90.93
- Individuals (%) 6.86 6.74 9.89 12.60 9.07
Total 100.01 100.00 99.99 100.00 100.00
DISTRIBUTION OF SHAREHOLDINGS AS AT 31ST MARCH 2022
Size of shareholdings Shareholders
Number
Shares
Number
Holdings
%
Rs.’000 Rs.’000 Rs.’000
1 - 1,000 2,783 839,821 0.32
1,001 - 10,000 1,353 5,122,949 1.93
10,001 - 100,000 423 12,619,813 4.76
100,001 - 1,000,000 60 14,514,782 5.47
Over - 1,000,000 13 232,154,685 87.52
4,632 265,252,050 100.00
Categories of shareholders No of Holders No of Shares %
Local Individuals 4,225 23,718,107 8.942
Local Institutions 344 238,369,253 89.865
Foreign Individuals 52 339,238 0.128
Foreign Institutions 11 2,825,452 1.065
4,632 265,252,050 100.000
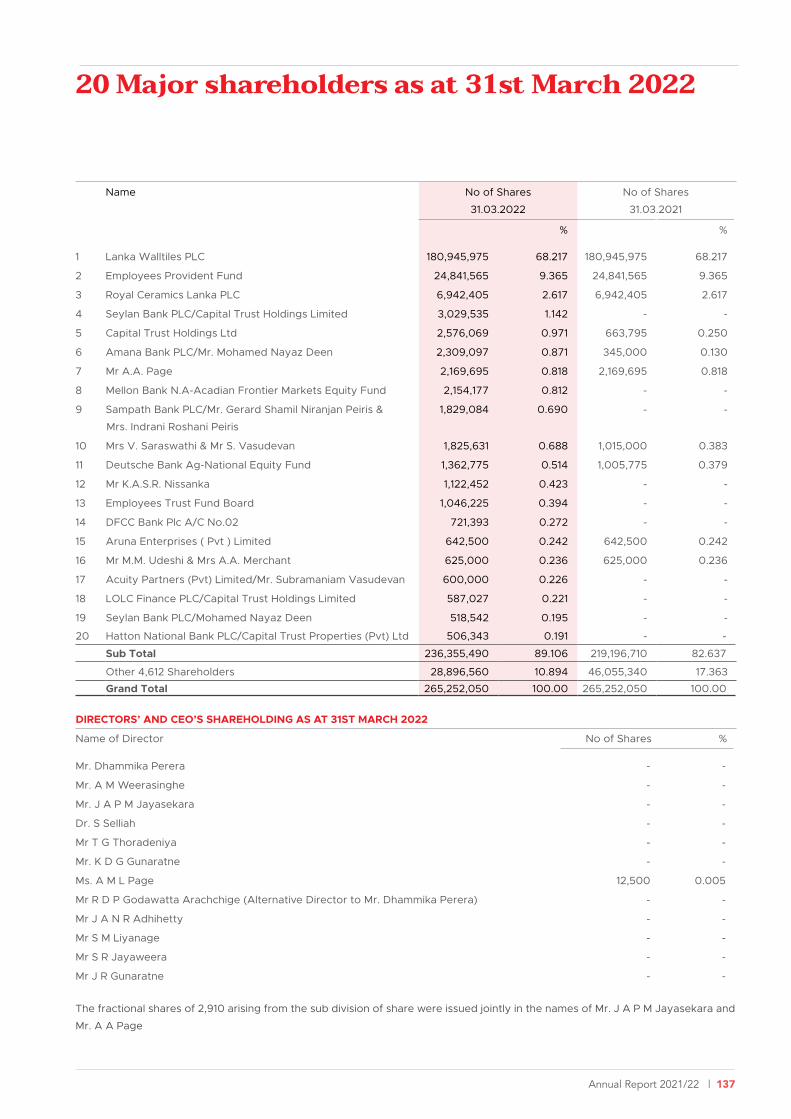
Annual Report 2021/22 | 137
20 Major shareholders as at 31st March 2022
Name No of Shares
31.03.2022
No of Shares
31.03.2021
% %
1 Lanka Walltiles PLC 180,945,975 68.217 180,945,975 68.217
2 Employees Provident Fund 24,841,565 9.365 24,841,565 9.365
3 Royal Ceramics Lanka PLC 6,942,405 2.617 6,942,405 2.617
4 Seylan Bank PLC/Capital Trust Holdings Limited 3,029,535 1.142 - -
5 Capital Trust Holdings Ltd 2,576,069 0.971 663,795 0.250
6 Amana Bank PLC/Mr. Mohamed Nayaz Deen 2,309,097 0.871 345,000 0.130
7 Mr A.A. Page 2,169,695 0.818 2,169,695 0.818
8 Mellon Bank N.A-Acadian Frontier Markets Equity Fund 2,154,177 0.812 - -
9 Sampath Bank PLC/Mr. Gerard Shamil Niranjan Peiris &
Mrs. Indrani Roshani Peiris
1,829,084 0.690 - -
10 Mrs V. Saraswathi & Mr S. Vasudevan 1,825,631 0.688 1,015,000 0.383
11 Deutsche Bank Ag-National Equity Fund 1,362,775 0.514 1,005,775 0.379
12 Mr K.A.S.R. Nissanka 1,122,452 0.423 - -
13 Employees Trust Fund Board 1,046,225 0.394 - -
14 DFCC Bank Plc A/C No.02 721,393 0.272 - -
15 Aruna Enterprises ( Pvt ) Limited 642,500 0.242 642,500 0.242
16 Mr M.M. Udeshi & Mrs A.A. Merchant 625,000 0.236 625,000 0.236
17 Acuity Partners (Pvt) Limited/Mr. Subramaniam Vasudevan 600,000 0.226 - -
18 LOLC Finance PLC/Capital Trust Holdings Limited 587,027 0.221 - -
19 Seylan Bank PLC/Mohamed Nayaz Deen 518,542 0.195 - -
20 Hatton National Bank PLC/Capital Trust Properties (Pvt) Ltd 506,343 0.191 - -
Sub Total 236,355,490 89.106 219,196,710 82.637
Other 4,612 Shareholders 28,896,560 10.894 46,055,340 17.363
Grand Total 265,252,050 100.00 265,252,050 100.00
DIRECTORS’ AND CEO’S SHAREHOLDING AS AT 31ST MARCH 2022
Name of Director No of Shares %
Mr. Dhammika Perera - -
Mr. A M Weerasinghe - -
Mr. J A P M Jayasekara - -
Dr. S Selliah - -
Mr T G Thoradeniya - -
Mr. K D G Gunaratne - -
Ms. A M L Page 12,500 0.005
Mr R D P Godawatta Arachchige (Alternative Director to Mr. Dhammika Perera) - -
Mr J A N R Adhihetty - -
Mr S M Liyanage - -
Mr S R Jayaweera - -
Mr J R Gunaratne - -
The fractional shares of 2,910 arising from the sub division of share were issued jointly in the names of Mr. J A P M Jayasekara and
Mr. A A Page
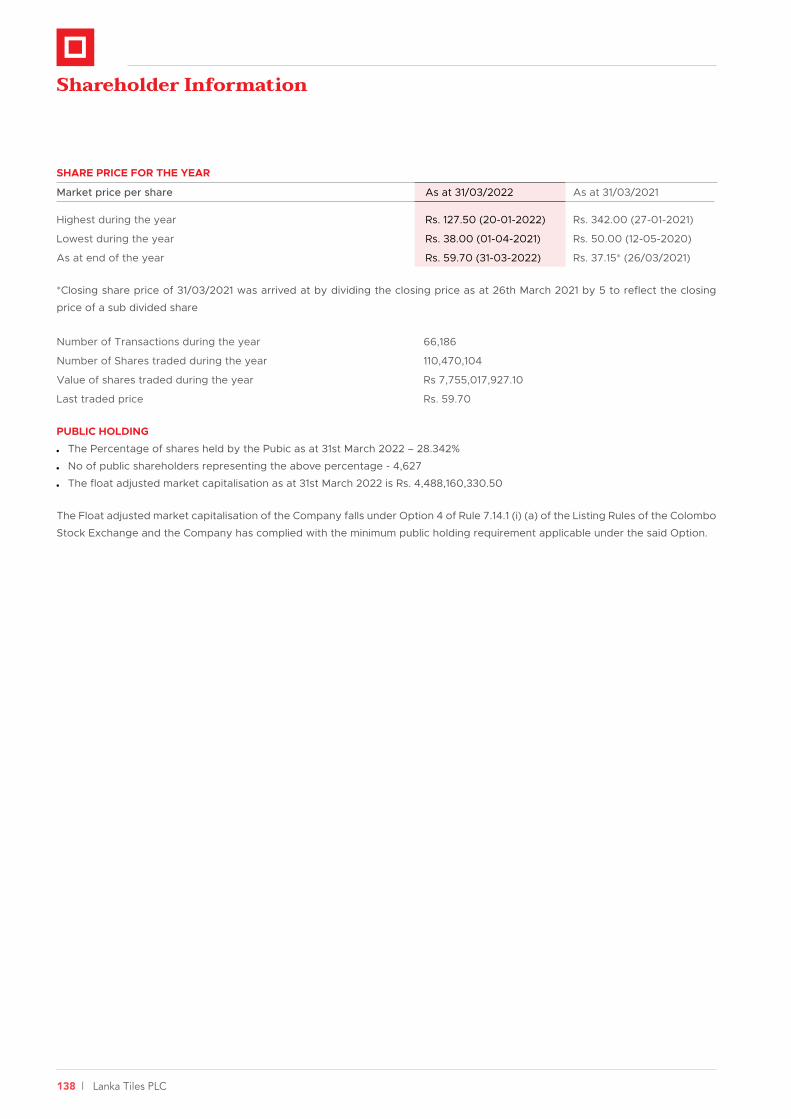
138 | Lanka Tiles PLC
Shareholder Information
SHARE PRICE FOR THE YEAR
Market price per share As at 31/03/2022 As at 31/03/2021
Highest during the year Rs. 127.50 (20-01-2022) Rs. 342.00 (27-01-2021)
Lowest during the year Rs. 38.00 (01-04-2021) Rs. 50.00 (12-05-2020)
As at end of the year Rs. 59.70 (31-03-2022) Rs. 37.15* (26/03/2021)
*Closing share price of 31/03/2021 was arrived at by dividing the closing price as at 26th March 2021 by 5 to reflect the closing
price of a sub divided share
Number of Transactions during the year 66,186
Number of Shares traded during the year 110,470,104
Value of shares traded during the year Rs 7,755,017,927.10
Last traded price Rs. 59.70
PUBLIC HOLDING
The Percentage of shares held by the Pubic as at 31st March 2022 – 28.342%
No of public shareholders representing the above percentage - 4,627
The float adjusted market capitalisation as at 31st March 2022 is Rs. 4,488,160,330.50
The Float adjusted market capitalisation of the Company falls under Option 4 of Rule 7.14.1 (i) (a) of the Listing Rules of the Colombo
Stock Exchange and the Company has complied with the minimum public holding requirement applicable under the said Option.
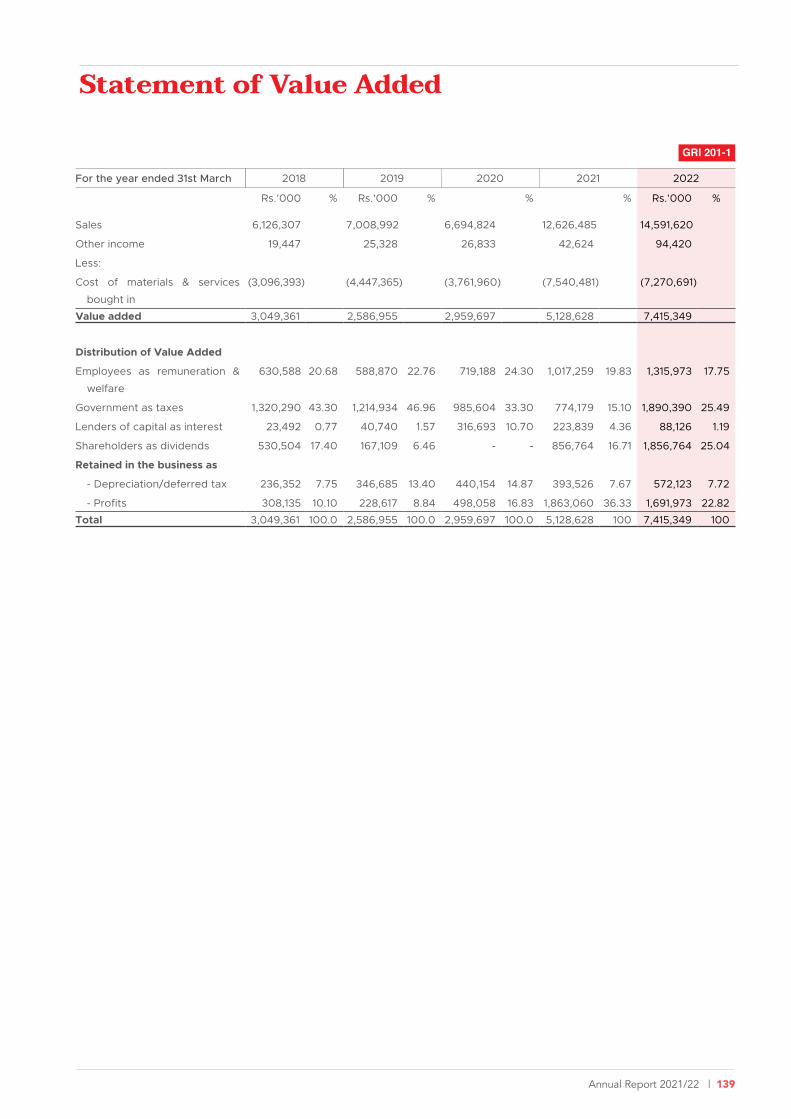
Annual Report 2021/22 | 139
Statement of Value Added
For the year ended 31st March 2018 2019 2020 2021 2022
Rs.’000 % Rs.’000 % % % Rs.’000 %
Sales 6,126,307 7,008,992 6,694,824 12,626,485 14,591,620
Other income 19,447 25,328 26,833 42,624 94,420
Less:
Cost of materials & services
bought in
(3,096,393) (4,447,365) (3,761,960) (7,540,481) (7,270,691)
Value added 3,049,361 2,586,955 2,959,697 5,128,628 7,415,349
Distribution of Value Added
Employees as remuneration &
welfare
630,588 20.68 588,870 22.76 719,188 24.30 1,017,259 19.83 1,315,973 17.75
Government as taxes 1,320,290 43.30 1,214,934 46.96 985,604 33.30 774,179 15.10 1,890,390 25.49
Lenders of capital as interest 23,492 0.77 40,740 1.57 316,693 10.70 223,839 4.36 88,126 1.19
Shareholders as dividends 530,504 17.40 167,109 6.46 - - 856,764 16.71 1,856,764 25.04
Retained in the business as
- Depreciation/deferred tax 236,352 7.75 346,685 13.40 440,154 14.87 393,526 7.67 572,123 7.72
- Profits 308,135 10.10 228,617 8.84 498,058 16.83 1,863,060 36.33 1,691,973 22.82
Total 3,049,361 100.0 2,586,955 100.0 2,959,697 100.0 5,128,628 100 7,415,349 100
GRI 201-1
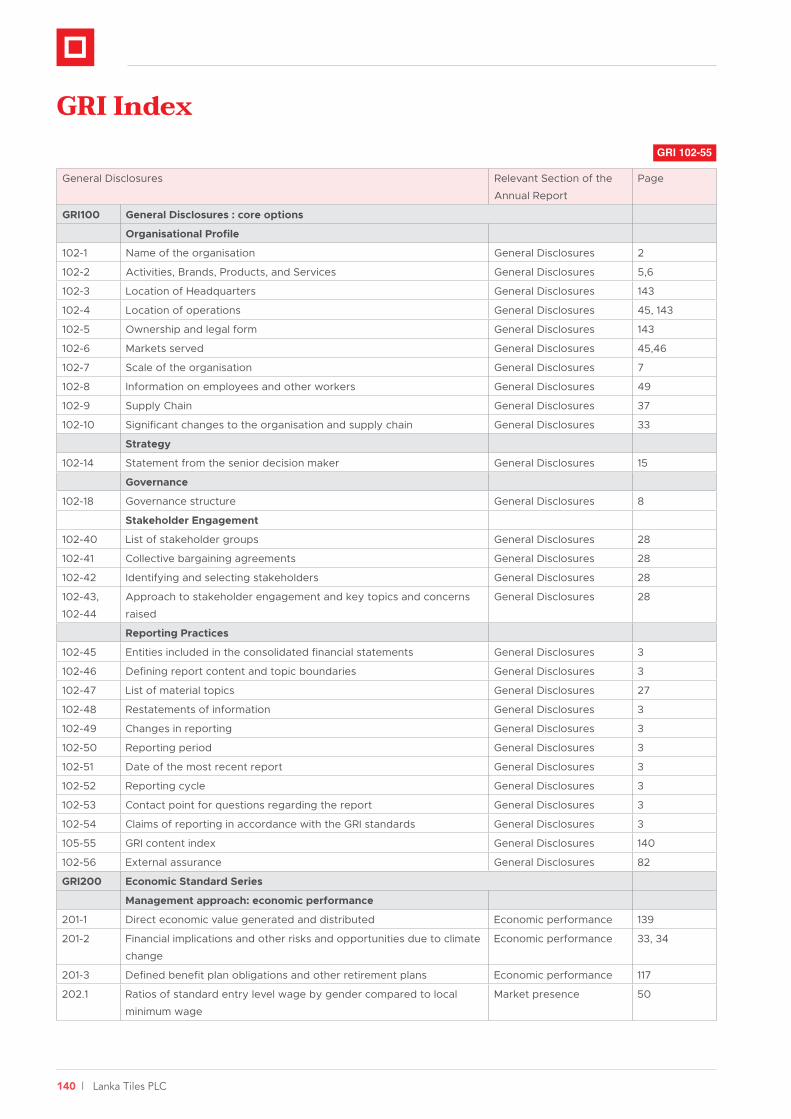
140 | Lanka Tiles PLC
GRI Index
General Disclosures Relevant Section of the
Annual Report
Page
GRI100 General Disclosures : core options
Organisational Profile
102-1 Name of the organisation General Disclosures 2
102-2 Activities, Brands, Products, and Services General Disclosures 5,6
102-3 Location of Headquarters General Disclosures 143
102-4 Location of operations General Disclosures 45, 143
102-5 Ownership and legal form General Disclosures 143
102-6 Markets served General Disclosures 45,46
102-7 Scale of the organisation General Disclosures 7
102-8 Information on employees and other workers General Disclosures 49
102-9 Supply Chain General Disclosures 37
102-10 Significant changes to the organisation and supply chain General Disclosures 33
Strategy
102-14 Statement from the senior decision maker General Disclosures 15
Governance
102-18 Governance structure General Disclosures 8
Stakeholder Engagement
102-40 List of stakeholder groups General Disclosures 28
102-41 Collective bargaining agreements General Disclosures 28
102-42 Identifying and selecting stakeholders General Disclosures 28
102-43,
102-44
Approach to stakeholder engagement and key topics and concerns
raised
General Disclosures 28
Reporting Practices
102-45 Entities included in the consolidated financial statements General Disclosures 3
102-46 Defining report content and topic boundaries General Disclosures 3
102-47 List of material topics General Disclosures 27
102-48 Restatements of information General Disclosures 3
102-49 Changes in reporting General Disclosures 3
102-50 Reporting period General Disclosures 3
102-51 Date of the most recent report General Disclosures 3
102-52 Reporting cycle General Disclosures 3
102-53 Contact point for questions regarding the report General Disclosures 3
102-54 Claims of reporting in accordance with the GRI standards General Disclosures 3
105-55 GRI content index General Disclosures 140
102-56 External assurance General Disclosures 82
GRI200 Economic Standard Series
Management approach: economic performance
201-1 Direct economic value generated and distributed Economic performance 139
201-2 Financial implications and other risks and opportunities due to climate
change
Economic performance 33, 34
201-3 Defined benefit plan obligations and other retirement plans Economic performance 117
202.1 Ratios of standard entry level wage by gender compared to local
minimum wage
Market presence 50
GRI 102-55

Annual Report 2021/22 | 141
General Disclosures Relevant Section of the
Annual Report
Page
Management approach: economic impacts
203-1 Infrastructure investments and services supported Indirect Economic
Impacts
44
204-1 Proportion of spending on local suppliers Procurement practices 31
GRI300 Environmental Disclosures – Environmental Standards Series
Environmental
301-1 Material used by weight or volume Materials 57
301-2 Percentage of recycled input materials Materials 57
Management approach: energy
302-1 Energy consumption within the organisation Energy 57
302-2 Energy consumption outside of the organisation Energy 57
302-3 Energy intensity ratio for the organisation Energy 56
302-4 Reduction of energy consumption Energy 56
Management approach: water security
303-1 Water withdrawal by source Water 57
303-2 Water sources significantly affected by withdrawal of water Water 57
303-3 Water recycled and reused Water 57
Management approach: carbon emissions
305-1 Gross direct (scope 1) GHG emissions Emission 57
305-2 Energy indirect (scope 2) GHG emissions Emission 57
305-3 Other indirect (scope 3) GHG emissions Emission 57
305-4 GHG emissions intensity Emission 57
305-5 Reduction in GHG emissions Emission 57
Management approach: waste
306-1 Water discharge by quality and destination Effluent and Waste 57
Management approach: supplier assessment
308-1 New suppliers that were screened using environmental criteria Supplier environmental
assessment
51
308-2 Negative environmental impacts in the supply chain and actions taken Supplier environmental
assessment
56, 57
GRI400 Management approach: Social Standards Series
Management approach: human resources
401-1 Employee hires and employee turnover Employment 48
401-2 Benefits provided to full-time employees that are not provided to
temporary or part-time employees
Employment 50
401-3 Parental leave Employment 50
Management approach: Labour Relations
402-1 Minimum notice periods regarding operational changes Labour Management/
Relations
50
Management approach: health and safety
403-1 Minimum notice periods regarding operational changes Occupational Health and
Safety
50
403-2 Types of injury and rates of injury, occupational diseases, lost days,
and absenteeism, and number of work-related fatalities
Occupational Health and
Safety
49
403-3 Workers with high incidence or high risk of diseases related to their
occupation
Occupational Health and
Safety
49

142 | Lanka Tiles PLC
General Disclosures Relevant Section of the
Annual Report
Page
403-4 Health and safety topics covered in formal agreements with trade
unions
Occupational Health and
Safety
49
Management approach: staff learning
404-1 Average hours of training per year per employee Training and Education 49
404-2 Health and safety topics covered in formal agreements with trade
unions
Training and Education 49
404-3 Percentage of employees receiving regular performance and career
development review
Training and Education 50
Management approach: diversity and inclusion
405-1 Diversity of governance bodies and employees Diversity and Equal
Opportunity
49
Management approach: Association and collective bargaining
407-1 Health and safety topics covered in formal agreements with trade
unions
Freedom of Association
and collective bargaining
49
Local Communities
413-1 Percentage with local community engagement, impact assessments,
and development programs
Local Communities 51
Customer Health and Safety
416-1 Assessment of the health and safety impacts of product and service
categories
Customer Health and
Safety
50
GRI Index

Annual Report 2021/22 | 143
Corporate Information
NAME OF THE COMPANY
Lanka Tiles PLC
LEGAL FORM
Public Limited Liability Company listed on the Colombo Stock
Exchange. (Incorporated as a Private Limited Liability Company
on 30th March 1984 under the Companies Act No. 17 of 1982
and converted to a Public Limited Liability Company on 07th
August 1984.) The Company was re-registered under the
New Companies Act No. 07 of 2007 on 19th March 2008.
(Registration No. PQ 129)
DIRECTORS
Mr. Dhammika Perera (Chairman)
Mr. A M Weerasinghe (Deputy Chairman)
Mr. J A P M Jayasekera (Managing Director)
Dr. S Selliah
Mr. T G Thoradeniya
Mr. K D G Gunaratne
Ms. A M L Page
Mr. J A N R Adhihetty
Mr. S M Liyanage
Mr. S R Jayaweera
Mr. J R Gunarathna
Mr. G A R D Prasanna
(Alternate Director to Mr. Dhammika Perera)
SECRETARIES
P W Corporate Secretarial (Pvt) Ltd
No. 3/17, Kynsey Road
Colombo 08
Telephone : + 94 -11 - 4640360-3
Facsimile : + 94 -11 - 4740588
E-mail : [email protected]
REGISTERED OFFICE
215, Nawala Road, Narahenpita, Colombo 05
Telephone : + 94 -11 - 2808050 / 2808001-3
Facsimile : + 94 -11 - 2806232
E-mail : [email protected]
Website : www.lankatiles.com
FACTORY
St. James Estate, Jaltara, Ranala
Telephone : + 94 - 11 - 2141055, 2141057, 2141819
Facsimile : + 94 - 11 - 2141045
E-mail : [email protected]
BANKERS
Commercial Bank of Ceylon PLC
DFCC Bank
Bank of Ceylon
Hongkong & Shanghai Banking Corp. Limited
Hatton National Bank PLC
Sampath Bank PLC
Seylan Bank PLC
AUDITORS
Ernst & Young
Chartered Accountants
201 , De Saram Place
Colombo 10
GRI 102-3, 102-5

144 | Lanka Tiles PLC
Notes

Annual Report 2021/22 | 145

146 | Lanka Tiles PLC
Notice of Meeting
NOTICE IS HEREBY GIVEN that the Thirty Eighth (38th) Annual General Meeting of Lanka Tiles PLC will be held by way of electronic
means on the 29th day of June 2022 at 9.30 a.m centered at the Board Room of Royal Ceramic Lanka PLC, No.20, R A de Mel
Mawatha, Colombo 03 for the following purposes:
1. To receive and consider the Annual Report of the Board of Directors on the affairs of the Company and the Statement of
Accounts for the year ended 31st March 2022 and the Report of the Auditors thereon.
2. To re-elect Mr. K D G Gunaratne, who retires by rotation in terms of Articles 103 and 104 of the Articles of Association, as a
Director of the Company
3. To re-elect Mr. Dhammika Perera, who retires by rotation in terms of Articles 103 and 104 of the Articles of Association, as a
Director of the Company.
4. To re-elect Mr. S M Liyanage, who retires by rotation in terms of Articles 103 and 104 of the Articles of Association, as a Director
of the Company.
5. To re-appoint Messrs Ernst & Young, Chartered Accountants, the retiring Auditors and to authorise the Directors to determine
their remuneration.
6. To authorise the Directors to determine Donations for the ensuing year.
By Order of the Board
LANKA TILES PLC
P W Corporate Secretarial (Pvt) Ltd
Director / Secretaries
At Colombo
31st May 2022
Notes:
1) A shareholder entitled to attend or attend and vote at the Meeting is entitled to appoint a Proxy who need not be a
shareholder, to attend and vote instead of him/her. A Proxy need not be a member of the Company. A Form of Proxy is
enclosed for this purpose.
2) A Form of Proxy is enclosed in this Report.
3) The completed Form of Proxy should be deposited at the Registered Office of the Company, No. 215, Nawala Road, Narahenpita,
Colombo 05, not less than forty-eight (48) hours before the time fixed for the commencement of the Meeting.

Annual Report 2021/22 | 147
Form of Proxy
*I/We ....................................................................................................................................................................................................................................of
......................................................................................................................................................................................................................................being a
*Shareholder /Shareholders of Lanka Tiles PLC, do hereby appoint ................................................................................................................ of
.................................................................................................................................................................................................................. or failing him/her
Mr. Dhammika Perera of Colombo or failing him *
Mr. Amarakone Mudiyanselage Weerasinghe of Colombo or failing him*
Mr. Jayasekera Arachchige Panduka Mahendra Jayasekera of Colombo or failing him*
Dr. Sivakumar Selliah of Colombo or failing him*
Mr. Tharana Gangul Thoradeniya of Colombo or failing him*
Mr. Kalupathiranalage Don Gamini Gunaratne of Colombo or failing him*
Ms. Anjalie Maryanne Letitia Page of Colombo or failing her*
Mr. John Amrith Nishan Ratnatunga Adhihetty of Colombo or failing him*
Mr. Sameera Madushanka Liyanage of Colombo or failing him*
Mr. Sanjeewa Renuka Jayaweera of Colombo or failing him*
Mr. Jithendra Romesh Gunaratne of Colombo or failing him*
as *my/our proxy to represent me/us to speak and vote for me/us on my/our behalf at the Annual General Meeting of the Company
to be held on 29th June 2022 at 9.30 a.m and any adjournment thereof and at every poll which may be taken in consequence
thereof.
FOR AGAINST
1 To re-elect Mr. K D G Gunaratne, who retires by rotation in terms of Article 103 and 104 of the
Articles of Association as a Director of the Company.
2 To re-elect Mr. Dhammika Perera who retires by rotation in terms of Article 103 and 104 of the
Articles of Association as a Director of the Company.
3 To re-elect Mr. S M Liyanage who retires by rotation in terms of Article 103 and 104 of the Articles
of Association as a Director of the Company.
4 To re-appoint M/s Ernst & Young as Auditors of the Company for the ensuing year and to authorise
the Directors to determine their remuneration.
5 To authorise the Directors to determine donations for the ensuing year
Signed this .............................. day of .............................. Two Thousand and Twenty Two.
..............................
Signature
1) *Please delete the inappropriate words.
2) Instructions as to completion are noted on the reverse thereof.

148 | Lanka Tiles PLC
INSTRUCTIONS AS TO COMPLETION
1. The full name, National Identity Card number and the registered address of the
shareholder appointing the Proxy and the relevant details of the Proxy should be
legibly entered in the Form of Proxy which should be duly signed and dated.
2. The Proxy shall –
(a) In the case of an individual be signed by the shareholder or by his/her attorney,
and if signed by an Attorney, a notarially certified copy of the Power of Attorney
should be attached to the completed Proxy if it has not already been registered
with the Company.
(b) In the case of a company or corporate / statutory body either be under its
Common Seal or signed by its Attorney or by an Officer on behalf of the company
or corporate / statutory body in accordance with its Articles of Association or the
Constitution or the Statute (as applicable).
3. Please indicate with a ‘X’ how the Proxy should vote on each resolution. If no
indication is given, the Proxy in his/her discretion will vote as he/she thinks fit.
4. To be valid, the completed Form of Proxy must be deposited with the Company
Secretaries, P W Corporate Secretarial (Pvt) Ltd at No. 3/17, Kynsey Road, Colombo
08, Sri Lanka or must be emailed to [email protected] 48 hours before the time
fixed for the meeting.

Designed & produced by
Digital plates and printing by Gunaratne Offset (Pvt) Ltd

# 215, Nawala Road, Narahenpita, Colombo 05, Sri Lanka.