Landscape Level Vegetation Characterization of Lidder Valley Using Geoinformatics
14
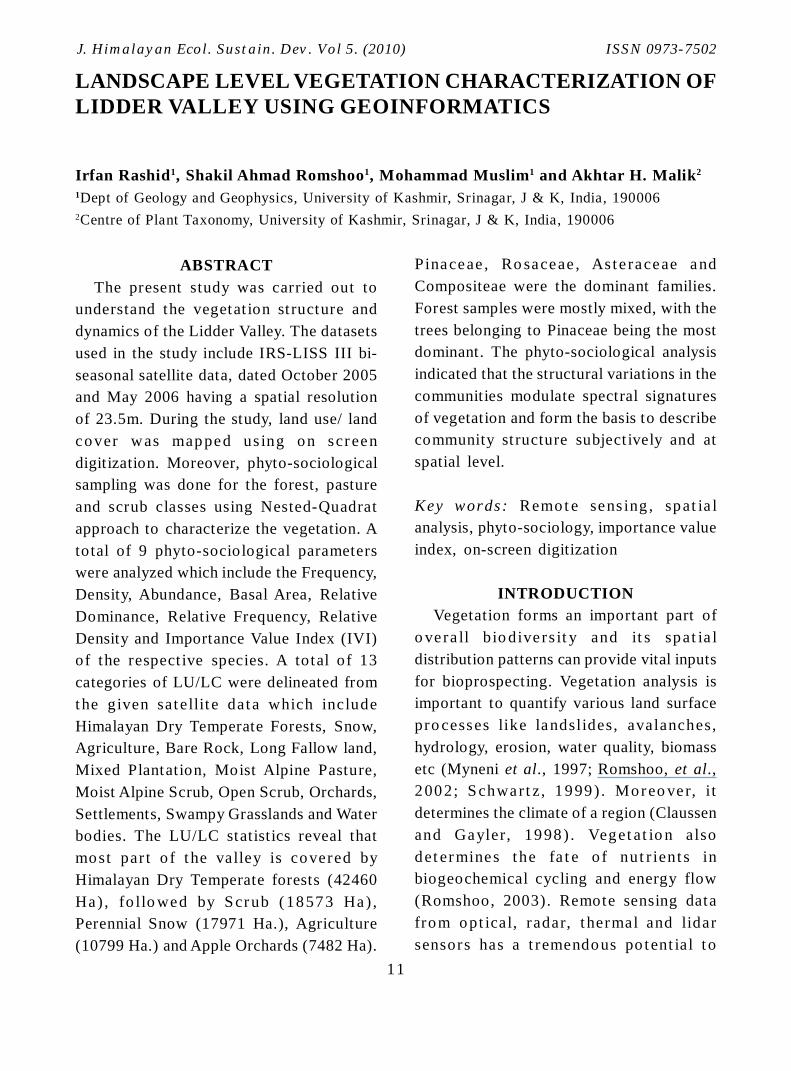
11 J. Himalayan Ecol. Sustain. Dev. Vol 5. (2010) ISSN 0973-7502 LANDSCAPE LEVEL VEGETATION CHARACTERIZATION OF LIDDER VALLEY USING GEOINFORMATICS Irfan Rashid 1 , Shakil Ahmad Romshoo 1 , Mohammad Muslim 1 and Akhtar H. Malik 2 1 Dept of Geology and Geophysics, University of Kashmir, Srinagar, J & K, India, 190006 2 Centre of Plant Taxonomy, University of Kashmir, Srinagar, J & K, India, 190006 ABSTRACT The present study was carried out to understand the vegetation structure and dynamics of the Lidder Valley. The datasets used in the study include IRS-LISS III bi- seasonal satellite data, dated October 2005 and May 2006 having a spatial resolution of 23.5m. During the study, land use/ land cover was mapped using on screen digitization. Moreover, phyto-sociological sampling was done for the forest, pasture and scrub classes using Nested-Quadrat approach to characterize the vegetation. A total of 9 phyto-sociological parameters were analyzed which include the Frequency, Density, Abundance, Basal Area, Relative Dominance, Relative Frequency, Relative Density and Importance Value Index (IVI) of the respective species. A total of 13 categories of LU/LC were delineated from the given satellite data which include Himalayan Dry Temperate Forests, Snow, Agriculture, Bare Rock, Long Fallow land, Mixed Plantation, Moist Alpine Pasture, Moist Alpine Scrub, Open Scrub, Orchards, Settlements, Swampy Grasslands and Water bodies. The LU/LC statistics reveal that most part of the valley is covered by Himalayan Dry Temperate forests (42460 Ha), followed by Scrub (18573 Ha), Perennial Snow (17971 Ha.), Agriculture (10799 Ha.) and Apple Orchards (7482 Ha). Pinaceae, Rosaceae, Asteraceae and Compositeae were the dominant families. Forest samples were mostly mixed, with the trees belonging to Pinaceae being the most dominant. The phyto-sociological analysis indicated that the structural variations in the communities modulate spectral signatures of vegetation and form the basis to describe community structure subjectively and at spatial level. Key words: Remote sensing, spatial analysis, phyto-sociology, importance value index, on-screen digitization INTRODUCTION Vegetation forms an important part of overall biodiversity and its spatial distribution patterns can provide vital inputs for bioprospecting. Vegetation analysis is important to quantify various land surface processes like landslides, avalanches, hydrology, erosion, water quality, biomass etc (Myneni et al ., 1997; Romshoo, et al ., 2002; Schwartz, 1999). Moreover, it determines the climate of a region (Claussen and Gayler, 1998). Vegetation also determines the fate of nutrients in biogeochemical cycling and energy flow (Romshoo, 2003). Remote sensing data from optical, radar, thermal and lidar sensors has a tremendous potential to
-
Upload
independent -
Category
Documents
-
view
4 -
download
0
Transcript of Landscape Level Vegetation Characterization of Lidder Valley Using Geoinformatics
11
J. Himalayan Ecol. Sustain. Dev. Vol 5. (2010) ISSN 0973-7502
LANDSCAPE LEVEL VEGETATION CHARACTERIZATION OFLIDDER VALLEY USING GEOINFORMATICS
Irfan Rashid1, Shakil Ahmad Romshoo1, Mohammad Muslim1 and Akhtar H. Malik2
1Dept of Geology and Geophysics, University of Kashmir, Srinagar, J & K, India, 1900062Centre of Plant Taxonomy, University of Kashmir, Srinagar, J & K, India, 190006
ABSTRACT
The present study was carried out to
understand the vegetat ion st ructure and
dynamics of the Lidder Valley. The datasets
used in the study include IRS-LISS III bi-
seasonal satellite data, dated October 2005
and May 2006 having a spatial resolution
of 23.5m. During the study, land use/ land
cover was mapped us ing on scr een
digitization. Moreover, phyto-sociological
sampling was done for the forest, pasture
and scrub classes using Nested-Quadrat
approach to characterize the vegetation. A
total of 9 phyto-sociological parameters
were analyzed which include the Frequency,
Density, Abundance, Basal Area, Relative
Dominance, Relative Frequency, Relative
Density and Importance Value Index (IVI)
of the respect ive species. A total of 13
categories of LU/LC were delineated from
the given sat ellit e dat a which include
Himalayan Dry Temperate Forests, Snow,
Agriculture, Bare Rock, Long Fallow land,
Mixed Plantation, Moist Alpine Pasture,
Moist Alpine Scrub, Open Scrub, Orchards,
Settlements, Swampy Grasslands and Water
bodies. The LU/LC statistics reveal that
most par t o f t he valley is covered by
Himalayan Dry Temperate forests (42460
Ha) , fo llo wed by Scr ub ( 18573 Ha) ,
Perennial Snow (17971 Ha.), Agriculture
(10799 Ha.) and Apple Orchards (7482 Ha).
Pinaceae , Ro saceae , As t e raceae and
Compositeae were the dominant families.
Forest samples were mostly mixed, with the
trees belonging to Pinaceae being the most
dominant. The phyto-sociological analysis
indicated that the structural variations in the
communities modulate spectral signatures
of vegetation and form the basis to describe
community st ructure subject ively and at
spatial level.
Key words: Remot e sens ing , spat ia l
analysis, phyto-sociology, importance value
index, on-screen digitization
INTRODUCTION
Vegetation forms an important part of
o vera ll bio dive rs it y and it s spat ia l
distribution patterns can provide vital inputs
for bioprospecting. Vegetation analysis is
important to quantify various land surface
pro cesses like landslides, avalanches,
hydrology, erosion, water quality, biomass
etc (Myneni et al., 1997; Romshoo, et al.,
2002; Schwar t z, 1999) . Mor eo ver, it
determines the climate of a region (Claussen
and Gayler, 1998) . Veget at io n also
det er mines t he fa t e o f nut r ient s in
biogeochemical cycling and energy flow
(Romshoo, 2003). Remote sensing data
from opt ical, radar, t hermal and lidar
sensors has a t remendous po tent ial t o
Generated by Foxit PDF Creator © Foxit Softwarehttp://www.foxitsoftware.com For evaluation only.
12
J. Himalayan Ecol. Sustain. Dev. Vol 5. (2010) ISSN 0973-7502
measure vegetat ion at t ributes and land
sur face p ro per t ie s t hat cou ld a id in
modeling and assessment of the carbon
cycle with better accuracies (Hoekman and
Quinones, 2000; Romshoo, 2004). Remote
Sensing t echno logy has been used fo r
generating spatial data on forest vegetation
and land use using var io us d ig it al
classification techniques (Joshi et al., 2005;
Kellndorfer et al., 1998; Kokaly et al.,
2003; Tsai and Philpot, 1998; Zhang et al.,
2003). Spatial database on vegetation types
and status in a GIS domain has applications
for landscape and habitat analysis (Pauli et
al., 2003; Saran et al., 2003). The spatial,
non-spatial data and other ancillary data
sources are combined to generate habitat
maps fo r eva luat ing enviro nmenta l
influences in various ecosystems (Marcot,
2006; Wilson et al . , 2003). Geospat ial
presentation of habitat status has become a
key issue fo r p lanning co nser va t ion.
Vegetation characterization of the habitat
provides the basis of prioritizing the sites
for biodiversity conservation effort (Roy
and Tomar, 2000) . Defo r es t a t ion,
commercial logging and overexploitation of
fo r es t re so ur ces has resu lt ed in
fragmentation of the landscape (Roy and
Tomar, 2000). The application of remote
sensing dat a in linking r eg io na l and
landscape scales for assessing biodiversity
and identifying the causes of depletion has
been studied in several studies (Nagendra,
2001a, b; Nagendra and Gadgil, 1998).
Geoinformatics plays a significant role in
analyzing and understanding the dynamics
of the landscapes and its relation with other
components. The various parameters (viz.,
patch shape, patch size, number of patches,
porosity, fragmentation and juxtaposition)
have been analyzed on a land cover map to
spatially present the disturbance regimes
(Roy et al., 2000). Geospatial models are
being used to delineate the spatial pattern
of biological richness (Lindenmayer et al.,
2002). Disturbance is widely believed to be
one of the main factors influencing variations
in species diversity (Connel, 1978; Huston,
1979, 1994; Noss, 1996). The geospatial
analyses has been used to assess t he
anthropogenic impacts on biodiversity at the
landscape in Western Himalayan region.
Relatively more biological rich area was
observed where the magnitude of disturbance
was less (Chandrasekhar et al. , 2003,
Chandrasekhar et al., 2001). Forest type maps
were analyzed in conjunction with climate and
topography in Geographic Information System
(GIS) to categorize habitats a priori and then
determined the relationship between remotely
sensed habitat categories and species
distribution patterns (Debinski et al., 1999;
Roy et al., 2001; Porwal et al., 2003; Ramesh
et al., 1997; Giriraj et al., 2003). New frontiers
in understanding the biodiversity richness,
distribution, impact of causative factors for
loss and conservation have been opened up in
Geoinformatics where patch characteristics are
analyzed to determine the impact of the human
dimensions to establish disturbance regimes
(Roy et al., 2000).
The main objectives of the present study
were to analyze the Vegetation using remote
sensing data. Moreover, vegetat ion was
characterized using phyto-sociological data.
Landscape analysis of the study area performed
by using SPLAM model and two important
landscape parameters, interspersion and
fragmentation are discussed in this paper.
Generated by Foxit PDF Creator © Foxit Softwarehttp://www.foxitsoftware.com For evaluation only.
13
J. Himalayan Ecol. Sustain. Dev. Vol 5. (2010) ISSN 0973-7502
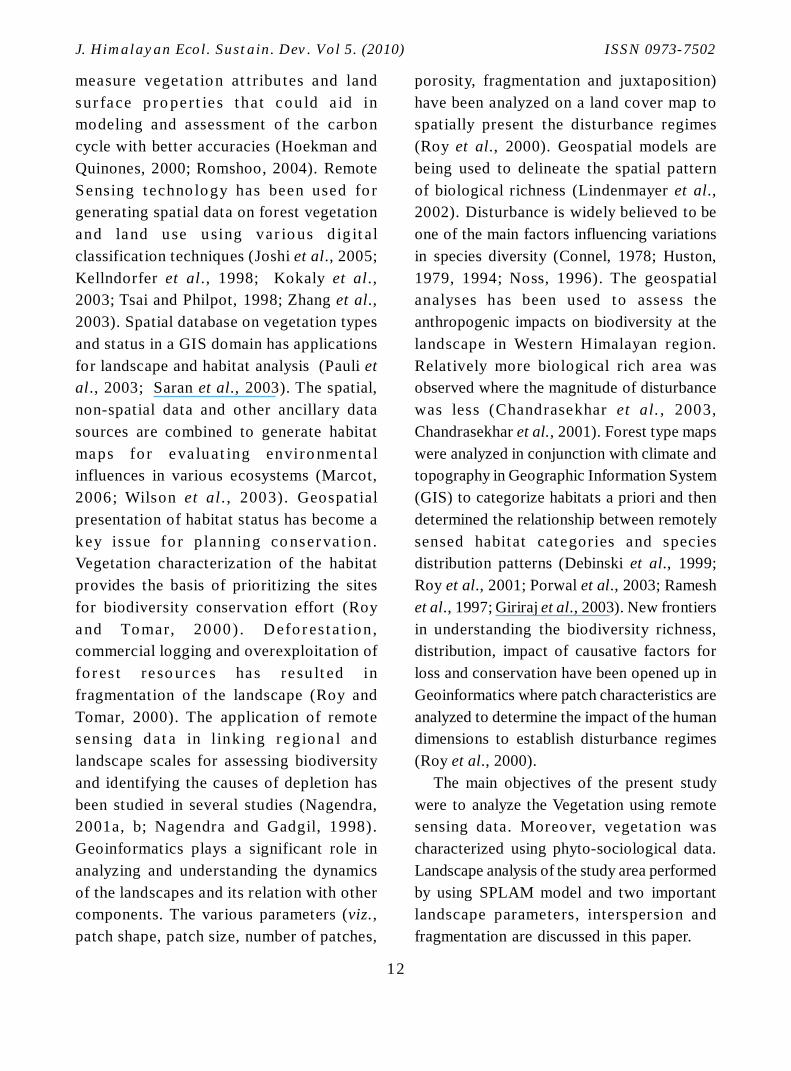
STUDY AREA
The study area in the present research is
Lidder valley (Fig 1). Lidder Valley which
is one of the dozen major valleys of Kashmir
lies between the geographical coordinates
of 33o4’N-34o15’N latitude and 75o5'-75o32'
E longitude with an area o f 1250 km2
approximately. The valley is nearly 50 km long
and has a varied topography and exhibits
altitudinal extremes of 1600m to 5200m. Its
relief is diverse, comprising of steep slopes,
alpine meadows and alluvial fans. The climate
of the area is sub-humid temperat e,
experiencing maximum rainfall from March
to May, while as heavy snowfall is received
during December to February. The lower part
of the valley is very fertile, hence, ideal for
agriculture, whereas, the upper portion
comprises of dense pine forests and lush green
alpine pastures. The valley possesses a number
of tourist resorts. Of them particular mention
may be made of Pahalgam, Aru, Chandanwari,
Baisaran, Kolahoi and Holy Amarnath Cave.
DATA SETS USED
The datasets used in the present study
were satellite data and field data. IRS P6
LISS III Bi-Seasonal (October 2005 and
May 2006) satellite data with a spat ial
reso lut ion o f 23.5m was used to map
vegetation types. Moreover ground truth
data pertaining to various land covers was
also inco rporated in t he study. Phyto -
sociological data was also collected to
characterize vegetation. Besides, remote
sensing and GIS softwares used in the study
were Arc GIS 9.0, Arc View 3.2(a) and
ERDAS IMAGINE 9.
MATERIAL AND METHODS
Champion and Seth classification (1968)
was employed fo r classifying different
vegetation types of Lidder valley. In order
to map vegetation, multispectral bi-seasonal
satellite data (IRS P6 LISS III) of October
2005 and May 2006 was visually interpreted
using on-screen digitization technique at
1:50,000 scale. Bi-seasonal satellite data
was used so as to discriminate deciduous
and evergr een vege t a t ion. This was
followed by extensive ground validation in
o rder t o obt a in a final and accur at e
Fig. 1. IRS P6 LISS III satellite image of Lidder Valley
Generated by Foxit PDF Creator © Foxit Softwarehttp://www.foxitsoftware.com For evaluation only.
14
J. Himalayan Ecol. Sustain. Dev. Vol 5. (2010) ISSN 0973-7502
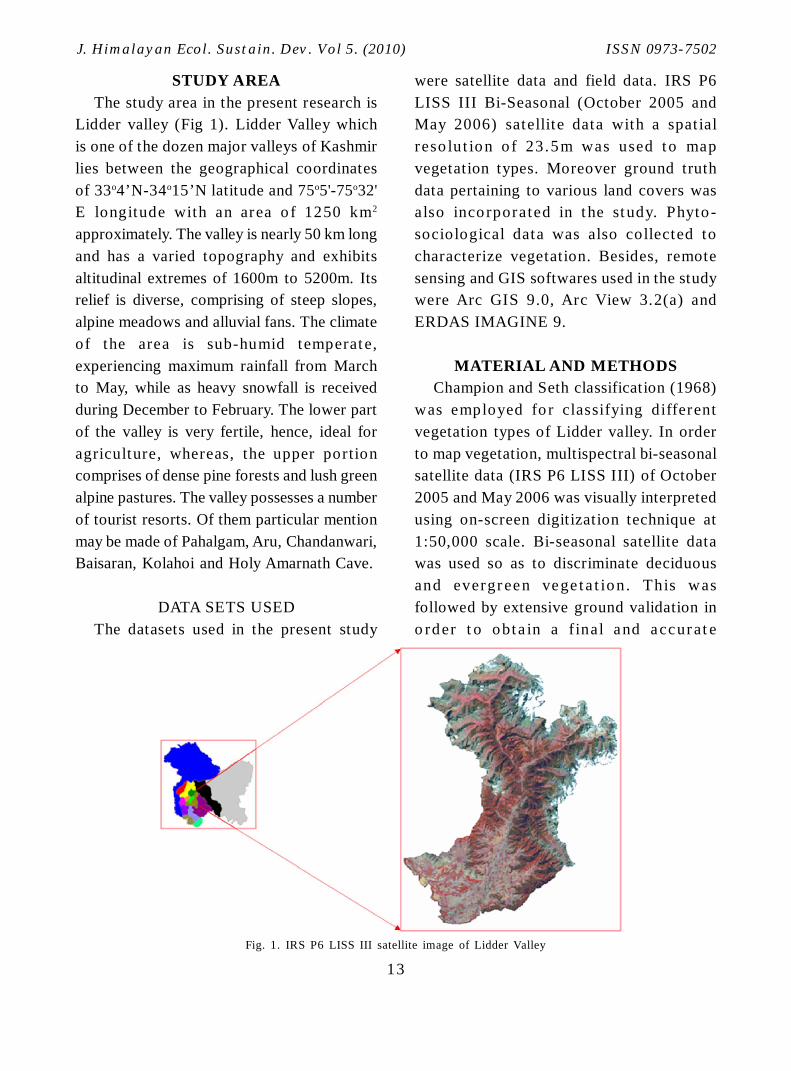
Fig 2. Nested Quadrat
vegetation type map. For acquiring phyto- sociological dat a pertaining to various
vegetation types stratified random sampling
technique was employed. Nested Quadrat
(Fig 2) approach was used for carrying out
phyto-sociological analysis. The principle of
the sampling is to collect field data based on
vegetation type strata to bring out vegetation
type specific and macro habitat specific
relat ive species abundance informat ion
along with other ecologically important
variables. Hence, sampling addresses the
bas ic issues re la t ed t o compo sit ion,
structure and function through appropriate
distribution and intensity across spatial and
temporal gradients. Remote sensing based
vegetation type strata in conjunction with
topography and climate serve as spat ial
framework to optimize for low sampling
int ensity and enhance the efficiency of
distribution across the variability. Keeping
in view of the available resources, time and
var iability of t he study area, 0.001%-
0.002% of the forest area of a given study
region was sampled. Moreover, secondary
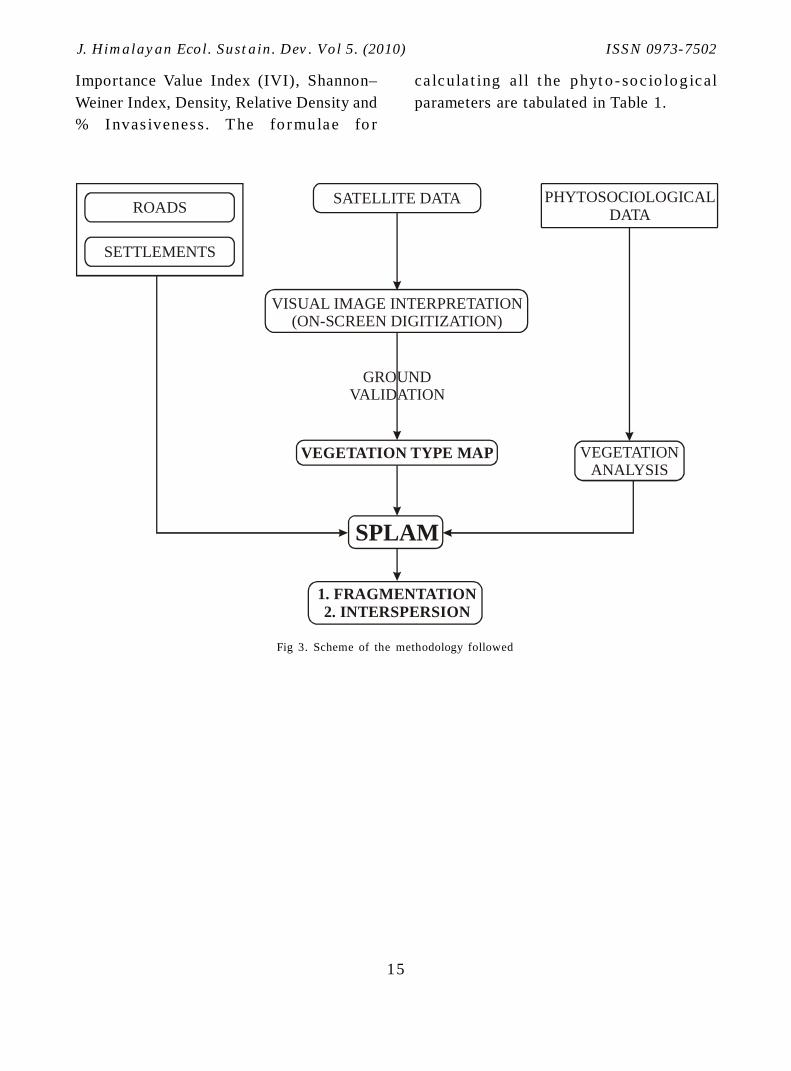
layers - settlement and road themes were
generated in GIS environment . Another
aspect in the present study was the use of
Spa t ial Landscape Ana lysis Mo de l
(SPLAM). The input dat a used to run
SPLAM are Vegetation Type Map, Phyto-
Sociological Data, Secondary layers in the
form of Settlement and Roads. Preliminary
results pertaining to fragmentat ion and
interspersion were obtained from SPLAM.
SPLAM generates a 3x3 pixel window and
sweeps it over ent ire data layer. While
calcu la t ing fragmenta t ion, t he mo de l
computes the number of forest and non-
forest patches per unit area. In interspersion,
the model counts the number of dissimilar
pixels with respect to a central pixel. The
overall methodology adopted for the current
study is shown in Fig 3. Moreover, 11 phyto-
sociological parameters were evaluated in
the current study so as to characterize
vegetation which include circumference at
br east height (cbh) fo r t r ee species ,
Frequency, Relative Frequency, Abundance,
Relat ive Do minance, Basal Cover,
Generated by Foxit PDF Creator © Foxit Softwarehttp://www.foxitsoftware.com For evaluation only.
15
J. Himalayan Ecol. Sustain. Dev. Vol 5. (2010) ISSN 0973-7502
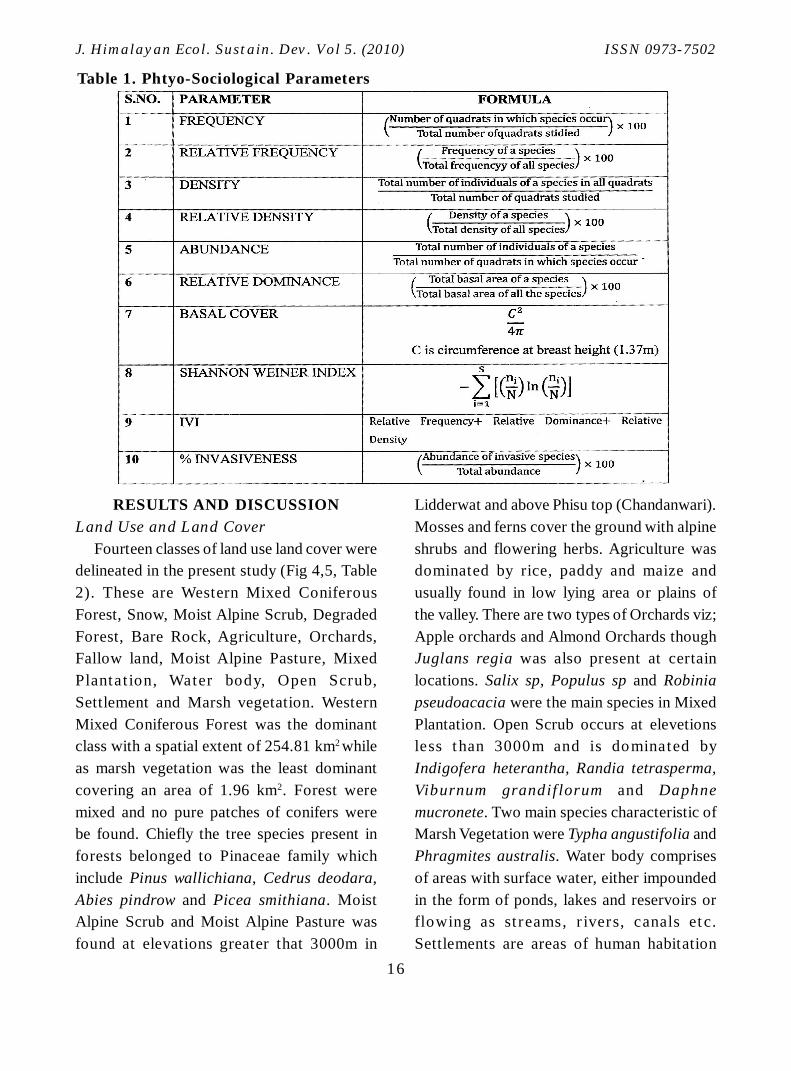
ca lcula t ing all t he phyt o - soc io log ical
parameters are tabulated in Table 1.
SATELLITE DATAROADS
SETTLEMENTS
PHYTOSOCIOLOGICALDATA
VISUAL IMAGE INTERPRETATION(ON-SCREEN DIGITIZATION)
GROUNDVALIDATION
VEGETATION TYPE MAP VEGETATIONANALYSIS
SPLAM
1. FRAGMENTATION2. INTERSPERSION
Fig 3. Scheme of the methodology followed
Importance Value Index (IVI), Shannon–
Weiner Index, Density, Relative Density and
% I nvas iveness. T he fo r mulae fo r
Generated by Foxit PDF Creator © Foxit Softwarehttp://www.foxitsoftware.com For evaluation only.
16
J. Himalayan Ecol. Sustain. Dev. Vol 5. (2010) ISSN 0973-7502
RESULTS AND DISCUSSION
Land Use and Land Cover
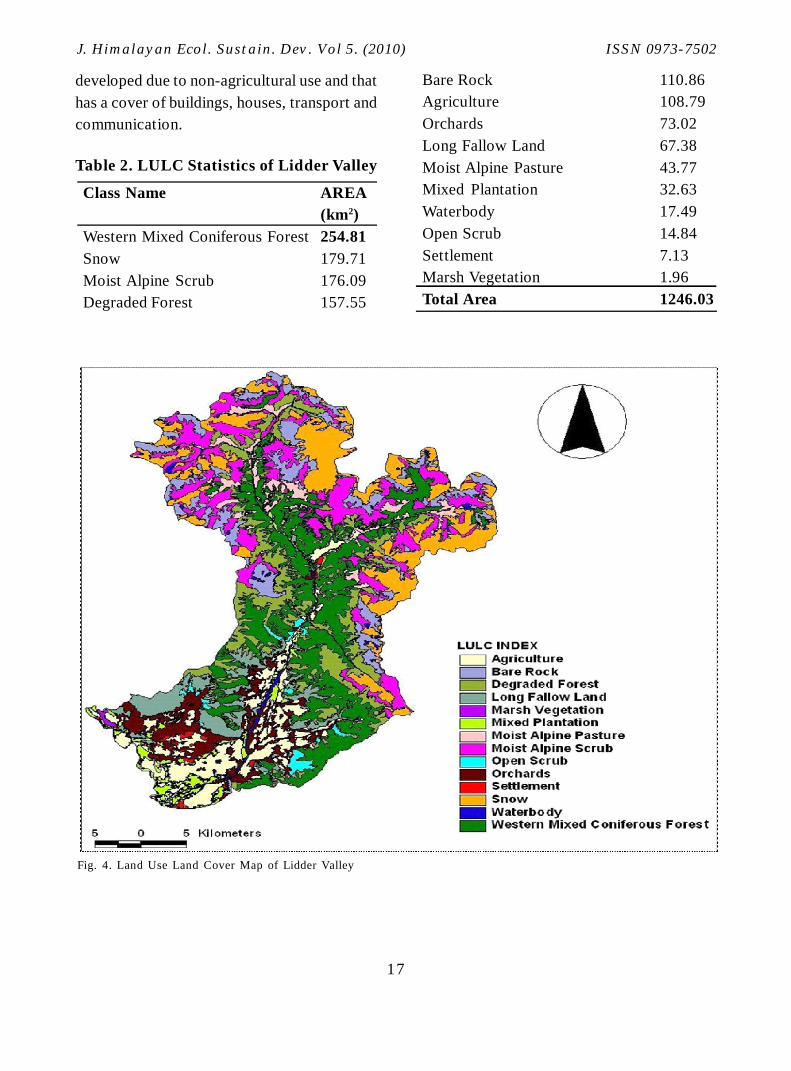
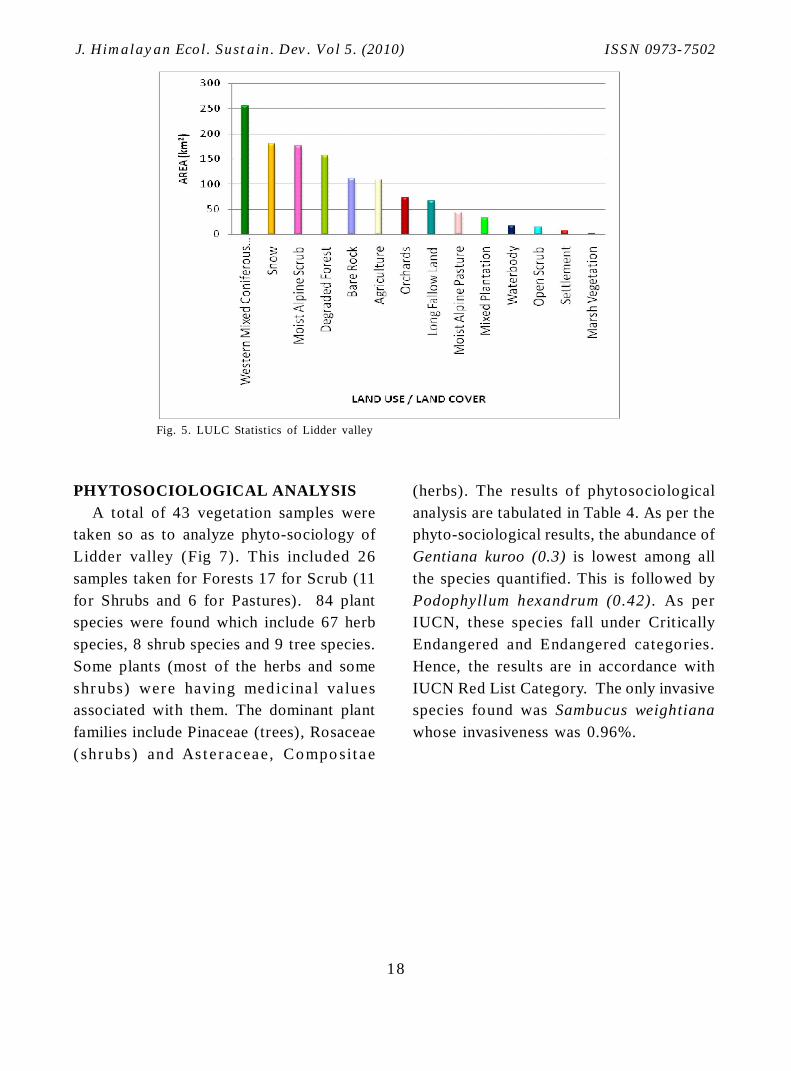
Fourteen classes of land use land cover were
delineated in the present study (Fig 4,5, Table
2). These are Western Mixed Coniferous
Forest, Snow, Moist Alpine Scrub, Degraded
Forest, Bare Rock, Agriculture, Orchards,
Fallow land, Moist Alpine Pasture, Mixed
Plantat ion, Water body, Open Scrub,
Settlement and Marsh vegetation. Western
Mixed Coniferous Forest was the dominant
class with a spatial extent of 254.81 km2 while
as marsh vegetation was the least dominant
covering an area of 1.96 km2. Forest were
mixed and no pure patches of conifers were
be found. Chiefly the tree species present in
forests belonged to Pinaceae family which
include Pinus wallichiana, Cedrus deodara,
Abies pindrow and Picea smithiana. Moist
Alpine Scrub and Moist Alpine Pasture was
found at elevations greater that 3000m in
Lidderwat and above Phisu top (Chandanwari).
Mosses and ferns cover the ground with alpine
shrubs and flowering herbs. Agriculture was
dominated by rice, paddy and maize and
usually found in low lying area or plains of
the valley. There are two types of Orchards viz;
Apple orchards and Almond Orchards though
Juglans regia was also present at certain
locations. Salix sp, Populus sp and Robinia
pseudoacacia were the main species in Mixed
Plantation. Open Scrub occurs at elevetions
less t han 3000m and is dominated by
Indigofera heterantha, Randia tetrasperma,
Viburnum grandif lorum and Daphne
mucronete. Two main species characteristic of
Marsh Vegetation were Typha angustifolia and
Phragmites australis. Water body comprises
of areas with surface water, either impounded
in the form of ponds, lakes and reservoirs or
flowing as st reams, r ivers, canals et c.
Settlements are areas of human habitation
Table 1. Phtyo-Sociological Parameters
Generated by Foxit PDF Creator © Foxit Softwarehttp://www.foxitsoftware.com For evaluation only.
17
J. Himalayan Ecol. Sustain. Dev. Vol 5. (2010) ISSN 0973-7502
developed due to non-agricultural use and that
has a cover of buildings, houses, transport and
communication.
Table 2. LULC Statistics of Lidder Valley
Class Name AREA
(km2)
Western Mixed Coniferous Forest 254.81
Snow 179.71
Moist Alpine Scrub 176.09
Degraded Forest 157.55
Bare Rock 110.86
Agriculture 108.79
Orchards 73.02
Long Fallow Land 67.38
Moist Alpine Pasture 43.77
Mixed Plantation 32.63
Waterbody 17.49
Open Scrub 14.84
Settlement 7.13
Marsh Vegetation 1.96
Total Area 1246.03
Fig. 4. Land Use Land Cover Map of Lidder Valley
Generated by Foxit PDF Creator © Foxit Softwarehttp://www.foxitsoftware.com For evaluation only.
18
J. Himalayan Ecol. Sustain. Dev. Vol 5. (2010) ISSN 0973-7502
PHYTOSOCIOLOGICAL ANALYSIS
A total of 43 vegetation samples were
taken so as to analyze phyto-sociology of
Lidder valley (Fig 7). This included 26
samples taken for Forests 17 for Scrub (11
for Shrubs and 6 for Pastures). 84 plant
species were found which include 67 herb
species, 8 shrub species and 9 tree species.
Some plants (most of the herbs and some
shr ubs) were having med icina l values
associated with them. The dominant plant
families include Pinaceae (trees), Rosaceae
( shrubs) and Aste r aceae, Compo sit ae
(herbs). The results of phytosociological
analysis are tabulated in Table 4. As per the
phyto-sociological results, the abundance of
Gentiana kuroo (0.3) is lowest among all
the species quantified. This is followed by
Podophyllum hexandrum (0.42). As per
IUCN, these species fall under Critically
Endangered and Endangered categories.
Hence, the results are in accordance with
IUCN Red List Category. The only invasive
species found was Sambucus weightiana
whose invasiveness was 0.96%.
Fig. 5. LULC Statistics of Lidder valley
Generated by Foxit PDF Creator © Foxit Softwarehttp://www.foxitsoftware.com For evaluation only.

19
J. Himalayan Ecol. Sustain. Dev. Vol 5. (2010) ISSN 0973-7502
(a)Pinus wallichiana
Fig 6(a-h). Common plant species of Lidder valley
(b)Abies pindrow (c)Cedrus deodara (d)Verbascum thapsus
(e)Hypericum perforatum (f)Viola odorata (g) Ajuga bracteosa (h)Berberis lycium
Fig 7. Location of phyto-sociological samples
Generated by Foxit PDF Creator © Foxit Softwarehttp://www.foxitsoftware.com For evaluation only.
20
J. Himalayan Ecol. Sustain. Dev. Vol 5. (2010) ISSN 0973-7502
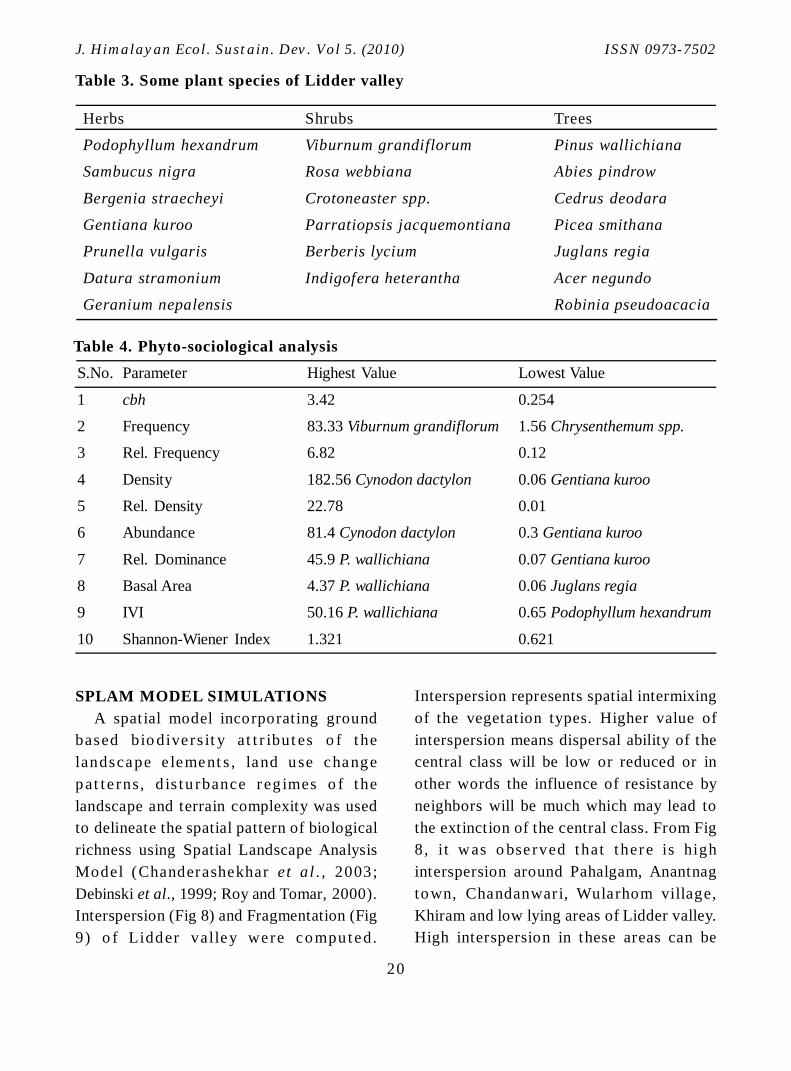
Table 4. Phyto-sociological analysis
S.No. Parameter Highest Value Lowest Value
1 cbh 3.42 0.254
2 Frequency 83.33 Viburnum grandiflorum 1.56 Chrysenthemum spp.
3 Rel. Frequency 6.82 0.12
4 Density 182.56 Cynodon dactylon 0.06 Gentiana kuroo
5 Rel. Density 22.78 0.01
6 Abundance 81.4 Cynodon dactylon 0.3 Gentiana kuroo
7 Rel. Dominance 45.9 P. wallichiana 0.07 Gentiana kuroo
8 Basal Area 4.37 P. wallichiana 0.06 Juglans regia
9 IVI 50.16 P. wallichiana 0.65 Podophyllum hexandrum
10 Shannon-Wiener Index 1.321 0.621
Table 3. Some plant species of Lidder valley
Herbs Shrubs Trees
Podophyllum hexandrum Viburnum grandiflorum Pinus wallichiana
Sambucus nigra Rosa webbiana Abies pindrow
Bergenia straecheyi Crotoneaster spp. Cedrus deodara
Gentiana kuroo Parratiopsis jacquemontiana Picea smithana
Prunella vulgaris Berberis lycium Juglans regia
Datura stramonium Indigofera heterantha Acer negundo
Geranium nepalensis Robinia pseudoacacia
SPLAM MODEL SIMULATIONS
A spat ial model incorporating ground
based bio dive rs it y at t r ibut es o f t he
landscape e lement s , land use change
pat t e rns, d is tu rbance r eg imes o f t he
landscape and terrain complexity was used
to delineate the spatial pattern of biological
richness using Spatial Landscape Analysis
Model (Chanderashekhar et al . , 2003;
Debinski et al., 1999; Roy and Tomar, 2000).
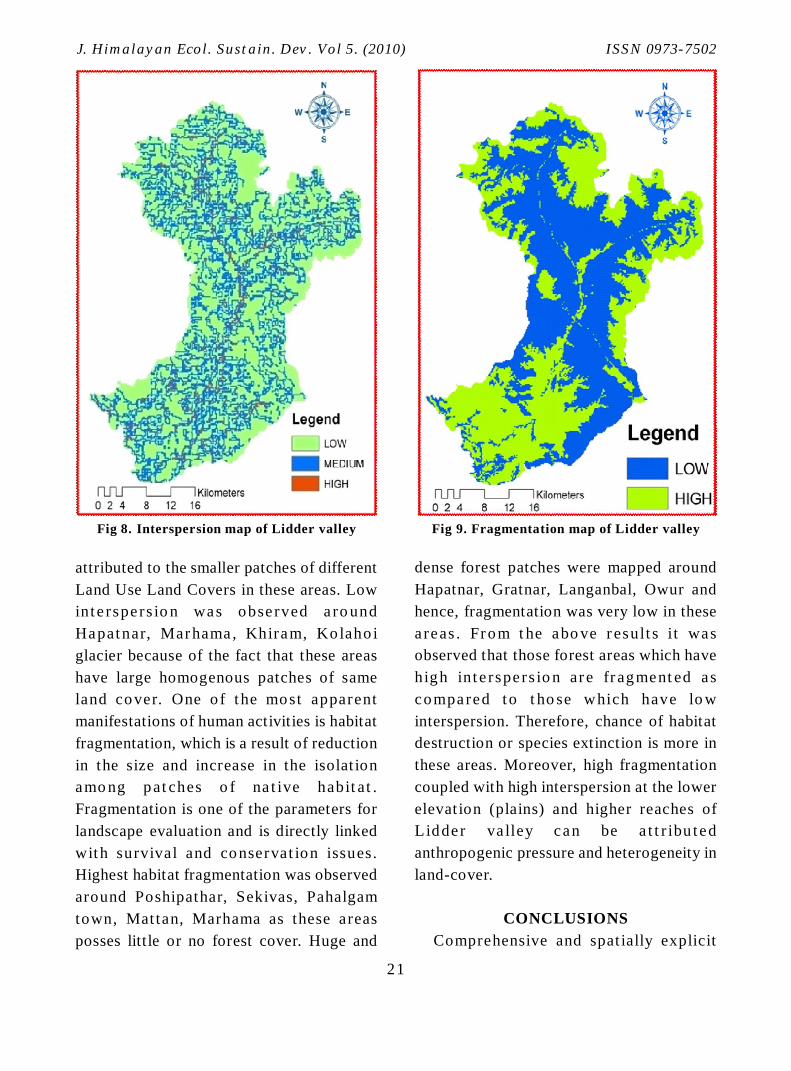
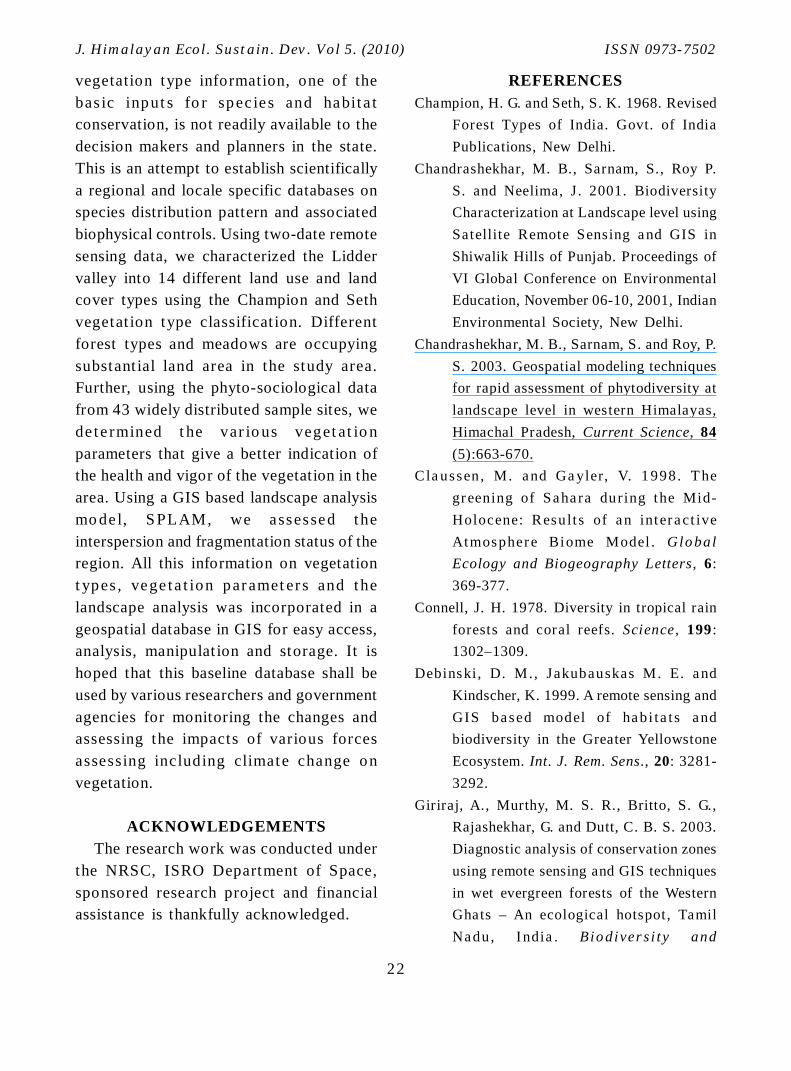
Interspersion (Fig 8) and Fragmentation (Fig
9) o f Lidder valley were computed.
Interspersion represents spatial intermixing
of the vegetation types. Higher value of
interspersion means dispersal ability of the
central class will be low or reduced or in
other words the influence of resistance by
neighbors will be much which may lead to
the extinction of the central class. From Fig
8, it was o bse rved that t her e is high
interspersion around Pahalgam, Anantnag
town, Chandanwar i, Wularhom village,
Khiram and low lying areas of Lidder valley.
High interspersion in these areas can be
Generated by Foxit PDF Creator © Foxit Softwarehttp://www.foxitsoftware.com For evaluation only.
21
J. Himalayan Ecol. Sustain. Dev. Vol 5. (2010) ISSN 0973-7502
attributed to the smaller patches of different
Land Use Land Covers in these areas. Low
inte rspers io n was obse rved a ro und
Hapatnar, Mar hama, Khiram, Ko laho i
glacier because of the fact that these areas
have large homogenous patches of same
land cover. One o f t he most apparent
manifestations of human activities is habitat
fragmentation, which is a result of reduction
in the size and increase in the isolat ion
amo ng pat ches o f na t ive habit at .
Fragmentation is one of the parameters for
landscape evaluation and is directly linked
with survival and conservat ion issues.
Highest habitat fragmentation was observed
around Poshipathar, Sekivas, Pahalgam
town, Mat tan, Marhama as these areas
posses little or no forest cover. Huge and
dense forest patches were mapped around
Hapatnar, Gratnar, Langanbal, Owur and
hence, fragmentation was very low in these
a reas . Fr om t he abo ve r esult s it was
observed that those forest areas which have
high int e rspers io n ar e fr agment ed as
compared to t ho se which have lo w
interspersion. Therefore, chance of habitat
destruction or species extinction is more in
these areas. Moreover, high fragmentation
coupled with high interspersion at the lower
elevat ion (plains) and higher reaches of
Lidder va lley can be a t t r ibu t ed
anthropogenic pressure and heterogeneity in
land-cover.
CONCLUSIONS
Comprehensive and spat ially explicit
Fig 8. Interspersion map of Lidder valley Fig 9. Fragmentation map of Lidder valley
Generated by Foxit PDF Creator © Foxit Softwarehttp://www.foxitsoftware.com For evaluation only.
22
J. Himalayan Ecol. Sustain. Dev. Vol 5. (2010) ISSN 0973-7502
vegetation type information, one of the
bas ic input s fo r spec ies and habit a t
conservation, is not readily available to the
decision makers and planners in the state.
This is an attempt to establish scientifically
a regional and locale specific databases on
species distribution pattern and associated
biophysical controls. Using two-date remote
sensing data, we characterized the Lidder
valley into 14 different land use and land
cover types using the Champion and Seth
vegetat ion type classificat ion. Different
forest types and meadows are occupying
substant ial land area in the study area.
Further, using the phyto-sociological data
from 43 widely distributed sample sites, we
de te rmined t he var io us veget at io n
parameters that give a better indication of
the health and vigor of the vegetation in the
area. Using a GIS based landscape analysis
mo de l, SPLAM, we assessed the
interspersion and fragmentation status of the
region. All this information on vegetation
t ypes , vege t a t ion par amet er s and the
landscape analysis was incorporated in a
geospatial database in GIS for easy access,
analysis, manipulat ion and storage. It is
hoped that this baseline database shall be
used by various researchers and government
agencies for monitoring the changes and
assessing the impacts of various forces
assessing including climate change on
vegetation.
ACKNOWLEDGEMENTS
The research work was conducted under
the NRSC, ISRO Department of Space,
sponsored research project and financial
assistance is thankfully acknowledged.
REFERENCES
Champion, H. G. and Seth, S. K. 1968. Revised
Forest Types of India. Govt. of India
Publications, New Delhi.
Chandrashekhar, M. B., Sarnam, S., Roy P.
S. and Neelima, J. 2001. Biodiversity
Characterization at Landscape level using
Satellite Remote Sensing and GIS in
Shiwalik Hills of Punjab. Proceedings of
VI Global Conference on Environmental
Education, November 06-10, 2001, Indian
Environmental Society, New Delhi.
Chandrashekhar, M. B., Sarnam, S. and Roy, P.
S. 2003. Geospatial modeling techniques
for rapid assessment of phytodiversity at
landscape level in western Himalayas,
Himachal Pradesh, Current Science, 84
(5):663-670.
Cla ussen , M. and Ga yler, V. 1 998. T he
greening of Saha ra dur ing the Mid-
Holocene: Result s of an inter act ive
Atmosphere Biome Model . Glo bal
Ecology and Biogeography Letters, 6:
369-377.
Connell, J. H. 1978. Diversity in tropical rain
forests and coral reefs. Science, 199 :
1302–1309.
Debinski, D. M., Jakubauskas M. E. and
Kindscher, K. 1999. A remote sensing and
GIS based model of habi ta t s and
biodiversity in the Greater Yellowstone
Ecosystem. Int. J. Rem. Sens., 20: 3281-
3292.
Giriraj, A., Murthy, M. S. R., Britto, S. G.,
Rajashekhar, G. and Dutt, C. B. S. 2003.
Diagnostic analysis of conservation zones
using remote sensing and GIS techniques
in wet evergreen forests of the Western
Ghats – An ecological hotspot, Tamil
Nadu, I ndia . Bio diver s i t y and
Generated by Foxit PDF Creator © Foxit Softwarehttp://www.foxitsoftware.com For evaluation only.
23
J. Himalayan Ecol. Sustain. Dev. Vol 5. (2010) ISSN 0973-7502
Conservation.
Hoekman, D. H. and Quinones, J. M. 2000.
Land cover typ e and b iomass
class ification using AirSAR data for
evaluation of monitor ing scenar ios in
Colombian Amazon. IEEE Transactions
on Geoscience and Remote Sensing ,
38(2): 685-696.
Huston, M. A. 1979. A general hypothesis of
species diversity. American Naturalist
113:81–101.
Huston, M. A. 1994. Biological diversity: the
coexis tence of sp ecies on changing
landscapes. Cambridge University Press,
Cambridge, UK.
Joshi, P. K., Rawat, G. S., Padaliya, H. and Roy,
P. S. 2005. Land use and land cover
identification in alpine and arid region
(Nubra valley, Ladakh) using satellite
remote sensing. Journal of Indian Society
of Remote Sensing, 33(3): 371-380.
Kellndorfer, J. M., Pierce, L. E., Dobson, M.
C. and Ulaby, F. T. 1998 . Toward
cons is tent r egiona l- to-glob a l sca le
vegetation characterization using orbital
SAR Sys tem. IEEE Transact ions on
Geosciece and Remote Sensing, 36(5):
1396-1411.
Kokaly, R. F., Despain, D. G., Clark, R. N.,
Livo, K. E. 2003. Mapping vegetation in
Yellowstone National park using spectral
feature analysis of AVIRIS data: Remote
Sensing of Environment, 84: 437-456.
Lindenmayer, D. B. , Cunningham, R . B. ,
Donnelly, C. F. and Lesslie, R. 2002. On
the use of l andscape s ur roga tes a s
ecologica l indica tor s in f r agmented
forests. Forest Ecology and Management,
159: 203-216.
Marcot, B. G. 2006. Habitat modeling for
biodiversity conservation. Northwestern
Naturalist, 87: 56-65.
Myneni, R. B., Keeling, C. D., Tucker, C. J.,
Asra r, G. and Nemani, R . R . 1997.
Increased plant growth in the northern
latitudes from 1981-1991. Nature, 386:
698-702.
Nagendra, H. & Gadgil, M. 1998. Linking
regiona l and landscap e sca les for
assessing biodiversity: A case study from
Western Ghats. Curr. Sci. 75: 264.271.
Nagendra, H. 2001a. Incorporating landscape
transformation into local conservation
prioritization: a case study in the Western
Ghats, India. Biod. and Cons., 10: 353–
365.
Nagendra, H. 2001b. Using remote sensing to
assess biodiversity: a review article. Int.
Jr. of Rem. Sens., 22: 2377–2400.
Noss, R. S. 1996. Conservation of biodiversity
at the landscape scale. pp. 574–589 In:
Biodivers ity in managed landscapes:
theory and practice. R. C. Szaro and D.
W. Johnston (eds.). Oxford, New York,
USA.
Pauli, H., Gottfried, Dirnbock, T., Dullinger, S.
& Grabheer, G. 2003. Assessing the long
term dynamics of endemic p lant s a t
summit habitats. Ecological Studies, 167:
195-2006.
Porwal, M. C., Sharma, L. & Roy, P. S. 2003.
Stratification and mapping of Ephedra
gerardiana Wall. in Poh (Lahul and Spiti)
using remote sensing and GIS. Curr. Sci.,
84: 208.212.
Ramesh, B. R., Menon, S. & Bawa, K. S. 1997.
A vegeta t ion based app roach to
biodiver s ity gap ana lys i s in the
Agastyamalai region, Western Ghats,
India . Royal S wedis h Aca demy o f
Generated by Foxit PDF Creator © Foxit Softwarehttp://www.foxitsoftware.com For evaluation only.
24
J. Himalayan Ecol. Sustain. Dev. Vol 5. (2010) ISSN 0973-7502
Sciences, 529- 536.
Romshoo, S. A. 2004. Estimation of Forest
Biomass in Tempera te Fores t s of
Nor thern Jap an Us ing Airborne
Mult if requency Pola r imet r ic Pi-SAR
Data. Asian Journal of Geoinformatics,
4(2): 71-84.
Romshoo, S. A. 2003. Radar Remote Sensing
for Monitoring of Dynamic Processes
Related to Biogeochemical Exchanges in
the Trop ica l Pea t lands . Vis ual
Geosciences, 8: 63-82. [DOI: 10.1007/s
10069-003-0015-9].
Romshoo, S. A., Shimada, M. and Igarshi, T.
2002. SAR Sensit ivity for Vegetation
Biomass and Ecosystem Dynamics from
Tropical Forests of Southeast Asia. Asian
Journal of Geo-informatics, 3(1): 3-17.
Roy, P. S. and Tomar, S. 2000. Biodiversity
Characterization at Landscape level using
Geospa t ia l Modell ing Technique.
Biological Conservation, 95(1): 95-109.
Roy, P. S., Sarnam, S. and Hegde, V. S. 2000.
Biodiversity characterization at landscape
level using satellite remote sensing and
geographic Information System. p. 18-47.
In: P.S. Roy, Sarnam Singh and A.G.
Tox opeu s (eds . ) . Pro ceed ings o f
International Workshop on Biodiversity
and Environment – Remote sensing and
Geo graph ic In form at ion Sys tem
Perspectives, Dehradun.
Roy, P. S., Talukdar, G. and Joshi, P. K. 2001.
Landscape Ecology Approach for Spatial
Biodiver s ity Chrac ter is a t ion . The
Botanica, 51: 1-17.
Saran, S., Gosh, S., Srivastava, G., Roy, P.S.,
Talukdar, G. and Prasad, N. 2003. Spatial
decision support system for biodiversity
conservation prioritization: Web based
app roach . Asi an Jo urnal o f
Geoinformatics, 4: 21-30.
Schwartz , M. D. 1999. Advancing to fu ll
bloom: Planning phonological research
for the 21st century. International Journal
of Biometeorology, 42: 113-118.
Tsai, F. and Philpot, W. 1998. Derivative
analysis of hyperspectral data. Remote
Sensing of Environment, 66: 41-51.
Wilson, J. S., Clay M., Martin E., Stuckey, D
and Vidder-Risch, K. 2003. Evaluating
environmental influences of zoning in
urban ecosystems with remote sensing.
Remote Sensing of Envioronment, 86 :
303-321.
Zhang, X. , Fr iedl , M. A. , Schaa f, C . B. ,
Strahler, A. H., Hodges, J. C. F., Gao, F.,
Reed, B. C . a nd Hu ete, A. 20 03.
Monitoring vegetation phenology using
MODIS. Remote Sensing of Environment,
84: 471-475.
Generated by Foxit PDF Creator © Foxit Softwarehttp://www.foxitsoftware.com For evaluation only.