Champlain Valley School District
108
Federal Compliance Audit Champlain Valley School District June 30, 2019
-
Upload
khangminh22 -
Category
Documents
-
view
3 -
download
0
Transcript of Champlain Valley School District

Federal Compliance Audit
Champlain Valley School District
June 30, 2019

CHAMPLAIN VALLEY SCHOOL DISTRICT
CONTENTS
JUNE 30, 2019 PAGE INDEPENDENT AUDITORS' REPORT 1 - 3 MANAGEMENT’S DISCUSSION AND ANALYSIS 4 - 12
BASIC FINANCIAL STATEMENTS
GOVERNMENT-WIDE FINANCIAL STATEMENTS STATEMENT A - STATEMENT OF NET POSITION 13 STATEMENT B - STATEMENT OF ACTIVITIES 14 - 15
FUND FINANCIAL STATEMENTS STATEMENT C - BALANCE SHEET - GOVERNMENTAL FUNDS 16 STATEMENT D - RECONCILIATION OF THE GOVERNMENTAL FUNDS BALANCE SHEET TO THE STATEMENT OF NET POSITION 17 STATEMENT E - STATEMENT OF REVENUES, EXPENDITURES AND CHANGES IN FUND BALANCES - GOVERNMENTAL FUNDS 18 STATEMENT F - RECONCILIATION OF THE STATEMENT OF REVENUES,
EXPENDITURES AND CHANGES IN FUND BALANCES OF GOVERNMENTAL FUNDS TO THE STATEMENT OF ACTIVITIES 19
STATEMENT G - STATEMENT OF NET POSITION - PROPRIETARY FUNDS 20 STATEMENT H - STATEMENT OF REVENUES, EXPENSES AND CHANGES IN NET POSITION - PROPRIETARY FUNDS 21 STATEMENT I - STATEMENT OF CASH FLOWS - PROPRIETARY FUNDS 22 STATEMENT J - STATEMENT OF NET POSITION - FIDUCIARY FUNDS 23 STATEMENT K - STATEMENT OF CHANGES IN NET POSITION - FIDUCIARY FUNDS 24

NOTES TO FINANCIAL STATEMENTS 25 - 65
REQUIRED SUPPLEMENTARY INFORMATION REQUIRED SUPPLEMENTARY INFORMATION DESCRIPTION 66 SCHEDULE 1 - BUDGETARY COMPARISON SCHEDULE - BUDGETARY
BASIS - BUDGET AND ACTUAL - GENERAL FUND 67 SCHEDULE 2 - SCHEDULE OF PROPORTIONATE SHARE OF THE NET
PENSION LIABILITY 68
SCHEDULE 3 - SCHEDULE OF CONTRIBUTIONS - PENSIONS 69 SCHEDULE 4 - SCHEDULE OF PROPORTIONATE SHARE OF THE NET
OPEB LIABILITY 70
SCHEDULE 5 - SCHEDULE OF CONTRIBUTIONS - OPEB 71 NOTES TO REQUIRED SUPPLEMENTARY INFORMATION 72
OTHER SUPPLEMENTARY INFORMATION
OTHER SUPPLEMENTARY INFORMATION DESCRIPTION 73 SCHEDULE A - BUDGETARY COMPARISON SCHEDULE - BUDGETARY BASIS BUDGET AND ACTUAL - GENERAL FUND REVENUES 74
SCHEDULE B - SCHEDULE OF DEPARTMENTAL OPERATIONS - GENERAL
FUND 75
SCHEDULE C - COMBINING BALANCE SHEET - NONMAJOR GOVERNMENTAL FUNDS 76
SCHEDULE D - COMBINING SCHEDULE OF REVENUES, EXPENDITURES AND CHANGES IN FUND BALANCES - NONMAJOR
GOVERNMENTAL FUNDS 77 SPECIAL REVENUE FUNDS DESCRIPTION 78 SCHEDULE E - COMBINING BALANCE SHEET - NONMAJOR SPECIAL REVENUE
FUNDS 79 - 84 SCHEDULE F - COMBINING SCHEDULE OF REVENUES, EXPENDITURES AND CHANGES IN FUND BALANCES - NONMAJOR SPECIAL
REVENUE FUNDS 85 - 90

CAPITAL PROJECTS FUND DESCRIPTION 91 SCHEDULE G - COMBINING BALANCE SHEET - NONMAJOR CAPITAL
PROJECTS FUND 92 SCHEDULE H - COMBINING SCHEDULE OF REVENUES, EXPENDITURES
AND CHANGES IN FUND BALANCES - NONMAJOR CAPITAL PROJECTS FUND 93
FIDUCIARY FUNDS DESCRIPTION 94 SCHEDULE I - COMBINING SCHEDULE OF NET POSITION - FIDUCIARY
FUNDS - PRIVATE - PURPOSE FUNDS 95 SCHEDULE J - COMBINING SCHEDULE OF CHANGES IN NET POSITION
FIDUCIARY FUNDS - PRIVATE - PURPOSE FUNDS 96
FEDERAL COMPLIANCE SCHEDULE OF EXPENDITURES OF FEDERAL AWARDS 97 NOTES TO SCHEDULE OF EXPENDITURES OF FEDERAL AWARDS 98 INDEPENDENT AUDITORS’ REPORT ON INTERNAL CONTROL OVER
FINANCIAL REPORTING AND ON COMPLIANCE AND OTHER MATTERS BASED ON AN AUDIT OF FINANCIAL STATEMENTS PERFORMED IN ACCORDANCE WITH GOVERNMENT AUDITING STANDARDS 99 - 100
INDEPENDENT AUDITORS’ REPORT ON COMPLIANCE FOR EACH MAJOR
PROGRAM AND ON INTERNAL CONTROL OVER COMPLIANCE REQUIRED BY THE UNIFORM GUIDANCE 101 - 103
SCHEDULE OF FINDINGS AND QUESTIONED COSTS 104

1
INDEPENDENT AUDITORS’ REPORT Board of Directors Champlain Valley School District Shelburne, Vermont Report on the Financial Statements We have audited the accompanying financial statements of the governmental activities, business-type activities, each major fund and the aggregate remaining fund information of Champlain Valley School District as of and for the year ended June 30, 2019 and the related notes to the financial statements, which collectively comprise the Champlain Valley School District’s basic financial statements as listed in the table of contents. Management’s Responsibility for the Financial Statements
Management is responsible for the preparation and fair presentation of these financial statements in accordance with accounting principles generally accepted in the United States of America; this includes the design, implementation and maintenance of internal control relevant to the preparation and fair presentation of financial statements that are free from material misstatement, whether due to fraud or error. Auditors’ Responsibility Our responsibility is to express opinions on these financial statements based on our audit. We conducted our audit in accordance with auditing standards generally accepted in the United States of America and the standards applicable to financial audits contained in Government Auditing Standards, issued by the Comptroller General of the United States. Those standards require that we plan and perform the audit to obtain reasonable assurance about whether the financial statements are free of material misstatement.
An audit involves performing procedures to obtain audit evidence about the amounts and disclosures in the financial statements. The procedures selected depend on the auditor’s judgment, including the assessment of the risks of material misstatement of the financial statements, whether due to fraud or error. In making those risk assessments, the auditor considers internal control relevant to the entity’s preparation and fair presentation of the financial statements in order to design audit procedures that are appropriate in the circumstances, but not for the purpose of expressing an opinion on the effectiveness of the entity’s internal control. Accordingly, we express no such opinion. An audit also includes evaluating the appropriateness of accounting policies used and the reasonableness of significant accounting estimates
3 Old Orchard Road, Buxton, Maine 04093
Tel: (800) 300-7708 (207) 929-4606 Fax: (207) 929-4609 www.rhrsmith.com

2
made by management, as well as evaluating the overall presentation of the financial statements.
We believe that the audit evidence we have obtained is sufficient and appropriate to provide a basis for our audit opinions. Opinions
In our opinion, the financial statements referred to above present fairly, in all material respects, the respective financial position of the governmental activities, business-type activities, each major fund and the aggregate remaining fund information of Champlain Valley School District as of June 30, 2019 and the respective changes in financial position and, where applicable, cash flows thereof for the year then ended in accordance with accounting principles generally accepted in the United States of America. Other Matters Required Supplementary Information
Accounting principles generally accepted in the United States of America require that the management’s discussion and analysis, budgetary comparison information, pension and OPEB information on pages 4 through 12 and 67 through 72 be presented to supplement the basic financial statements. Such information, although not a part of the basic financial statements, is required by the Governmental Accounting Standards Board, who considers it to be an essential part of financial reporting for placing the basic financial statements in an appropriate operational, economic, or historical context. We have applied certain limited procedures to the required supplementary information in accordance with auditing standards generally accepted in the United States of America, which consisted of inquiries of management about the methods of preparing the information and comparing the information for consistency with management’s responses to our inquiries, the basic financial statements and other knowledge we obtained during our audit of the basic financial statements. We do not express an opinion or provide any assurance on the information because the limited procedures do not provide us with sufficient evidence to express an opinion or provide any assurance. Other Information
Our audit was conducted for the purpose of forming opinions on the financial statements that collectively comprise Champlain Valley School District’s basic financial statements. The Budgetary Comparison Schedule - Budgetary Basis - Budget and Actual - General Fund - Revenues, Schedule of Departmental Operations - General Fund and combining and individual nonmajor fund financial statements are presented for purposes of additional analysis and are not a required part of the basic financial statements. The schedule of expenditures of federal awards is presented for purposes of additional analysis as required by Title 2 U.S. Code of Federal Regulations (CFR) Part 200, Uniform Administrative Requirements, Cost Principles and Audit

3
Requirements for Federal Awards and is also not a required part of the basic financial statements.
The Budgetary Comparison Schedule - Budgetary Basis - Budget and Actual -
General Fund Revenues, Schedule of Departmental Operations - General Fund, combining and individual nonmajor fund financial statements and the schedule of expenditures of federal awards are the responsibility of management and were derived from and related directly to the underlying accounting and other records used to prepare the basic financial statements. Such information has been subjected to the auditing procedures applied in the audit of the basic financial statements and certain additional procedures, including comparing and reconciling such information directly to the underlying accounting and other records used to prepare the basic financial statements or to the basic financial statements themselves and other additional procedures in accordance with auditing standards generally accepted in the United States of America. In our opinion, the Schedule of Departmental Operations - General Fund, combining and individual nonmajor fund financial statements and the schedule of expenditures of federal awards are fairly stated in all material respects in relation to the basic financial statements as a whole.
Other Reporting Required by Government Auditing Standards In accordance with Government Auditing Standards, we have also issued our report dated February 12, 2020 on our consideration of Champlain Valley School District’s internal control over financial reporting and on our tests of its compliance with certain provisions of laws, regulations, contracts and grant agreements and other matters. The purpose of that report is to describe the scope of our testing of internal control over financial reporting and compliance and the results of that testing and not to provide an opinion on the internal control over financial reporting or on compliance. That report is an integral part of an audit performed in accordance with Government Auditing Standards in considering Champlain Valley School District’s internal control over financial reporting and compliance.
Buxton, Maine Vermont Registration No. 092.0000697 February 12, 2020

4
REQUIRED SUPPLEMENTARY INFORMATION MANAGEMENT'S DISCUSSION AND ANALYSIS
JUNE 30, 2019
(UNAUDITED) The following management’s discussion and analysis of the Champlain Valley School District's financial performance provides an overview of the School District's financial activities for the fiscal year ended June 30, 2019. Please read it in conjunction with the School District's financial statements.
Financial Statement Overview The School District’s basic financial statements include the following components: 1) government-wide financial statements, 2) fund financial statements and 3) notes to the financial statements. This report also includes required supplementary information which consists of the general fund budgetary comparison schedule, pension and OPEB information and other supplementary information which includes combining and other schedules.
Basic Financial Statements The basic financial statements include financial information in two differing views: the government-wide financial statements and the fund financial statements. These basic financial statements also include the notes to financial statements that explain in more detail certain information in the financial statements and also provide the user with the accounting policies used in the preparation of the financial statements.
Government-Wide Financial Statements The government-wide financial statements provide a broad view of the School District’s operations in a manner that is similar to private businesses. These statements provide both short-term as well as long-term information in regard to the School District’s financial position. These financial statements are prepared using the accrual basis of accounting. This measurement focus takes into account all revenues and expenses associated with the fiscal year regardless of when cash is received or paid. The government-wide financial statements include the following two statements:
The Statement of Net Position - this statement presents all of the government’s assets, deferred outflows of resources, liabilities and deferred inflows of resources with the difference being reported as net position.
The Statement of Activities - this statement presents information that shows how the government’s net position changed during the period. All changes in net position are reported as soon as the underlying event giving rise to the change occurs, regardless of the timing of the related cash flows.

5
Both of the above-mentioned financial statements have separate columns for the two different types of School District activities. The types of activities presented for the School District are:
● Governmental activities - The activities in this section are mostly supported by intergovernmental revenues (federal and state grants) and charges for services. Most of the School District's basic services are reported in governmental activities, which instructional programs, instructional support, administrative/other support, building operations and maintenance, fiscal services, transportation, prior year and program expenses.
● Business-type activities - These activities are normally intended to recover all or a significant portion of their costs through user fees and/or charges to external users for goods and/or services. These activities for the School District include the Food Service Program and the After School Program. The After School program was separated from the School District at the end of fiscal year 2018. The expenses in FY19 represent the net write-off of this program.
Fund Financial Statements
A fund is a grouping of related accounts that is used to maintain control over
resources that have been segregated for specific activities or objectives. The School District, like other local governments uses fund accounting to ensure and demonstrate compliance with financial related legal requirements. All of the funds of the School District can be classified into three categories: governmental funds, proprietary funds and fiduciary funds.
Governmental funds: All of the basic services provided by the School District are
financed through governmental funds. Governmental funds are used to account for essentially the same functions reported in governmental activities in the government-wide financial statements. However, unlike the government-wide financial statements, the governmental fund financial statements focus on near-term inflows and outflows of spendable resources. They also focus on the balance of spendable resources available at the end of the fiscal year. Such information will be useful in evaluating the government’s near-term financing requirements. This approach is known as the current financial resources measurement focus and the modified accrual basis of accounting. Under this approach, revenues are recorded when cash is received or when susceptible to accrual. Expenditures are recorded when liabilities are incurred and due. These statements provide a detailed short-term view of the School District’s finances to assist in determining whether there will be adequate financial resources available to meet the current needs of the School District. Because the focus of governmental funds is narrower than that of government-wide financial statements, it is useful to compare the information presented for governmental funds with similar information presented for governmental activities in the government-wide financial statements. By doing so, readers may better understand the long-term

6
impact of the government’s near-term financing decisions. Both the governmental funds balance sheet and the governmental funds statement of revenues, expenditures and changes in fund balances provide a reconciliation to facilitate this comparison between governmental funds and governmental activities. These reconciliations are presented on the page immediately following each governmental fund financial statement. The School District presents five columns in the governmental funds balance sheet and the governmental funds statement of revenues, expenditures and changes in fund balances. The School District’s four major funds are the general fund, Medicaid MAC, the debt service fund and the construction fund. All other funds are shown as nonmajor and are combined in the “Other Governmental Funds” column on these statements. The general fund is the only fund for which the School District legally adopted a budget. The Budgetary Comparison Schedule - Budgetary Basis - Budget and Actual - General Fund provides a comparison of the original and final budget and the actual expenditures for the current year. Proprietary Funds: The School District maintains two proprietary funds, the food service program and the after school program. These funds are used to show activities that operate more like those of commercial enterprises. Proprietary funds provide the same type of information as the government-wide financial statements, only in more detail. Like the government-wide financial statements, proprietary fund financial statements use the accrual basis of accounting. No reconciliation is needed between the government-wide financial statements for business-type activities and the proprietary fund financial statements.
Fiduciary Funds: These funds are used to account for resources held for the
benefit of parties outside the School District. These funds are not reflected in the government-wide financial statements because the resources of these funds are not available to support the School District’s own programs. The accounting used for fiduciary funds are much like that of proprietary funds. They use the accrual basis of accounting.
Notes to the Financial Statements
The notes provide additional information that is essential to a full understanding of the data provided in the Government-Wide and the Fund Financial Statements. The Notes to Financial Statements can be found following the Statement of Changes in Net Position - Fiduciary Funds.

7
Required Supplementary Information The basic financial statements are followed by a section of required supplementary information, which includes a Budgetary Comparison Schedule - Budgetary Basis - Budget and Actual - General Fund, a Schedule of Proportionate Share of the Net Pension Liability, a Schedule of Contributions - Pensions, a Schedule of Proportionate Share of the Net OPEB Liability, a Schedule of Contributions - OPEB and Notes to Required Supplementary Information.
Other Supplementary Information Other supplementary information follows the required supplementary information. These combining and other schedules provide information in regard to nonmajor funds, capital asset activity and other detailed budgetary information for the general fund.
Government-Wide Financial Analysis
Our analysis below focuses on the net position and changes in net position of the School District's governmental and business-type activities. The School District's total net position for governmental activities increased by $2,651,849 from $39,997,258 to a balance of $42,649,107. The School District’s total net position for business-type activities decreased by $63,488 from $67,535 to a balance of $4,047.
Unrestricted net position - the part of net position that can be used to finance day-to-day operations without constraints established by debt covenants, enabling legislation, or other legal requirements - increased for governmental activities to a balance of $2,759,287 at the end of this year. Unrestricted net position for business-type activities decreased to a balance of $0.

8
2018 2018
2019 (Restated) 2019 (Restated)
Assets:
Current Assets 12,067,191$ 17,283,180$ 95,195$ 133,867$
Noncurrent Assets 75,236,341 72,838,826 4,047 19,115
Total Assets 87,303,532$ 90,122,006$ 99,242$ 152,982$
Deferred Outflows of Resources:
Deferred Outflows Related to Pensions 4,904,575$ 2,838,608$ -$ -$
Total Deferred Outflows of Resources 4,904,575$ 2,838,608$ -$ -$
Liabilities:
Current Liabilities 5,480,250$ 6,992,025$ 95,195$ 85,447$
Noncurrent Liabilities 42,330,820 43,842,415 - -
Total Liabilities 47,811,070$ 50,834,440$ 95,195$ 85,447$
Deferred Inflows of Resources:
Deferred Revenues 1,659,361$ 1,616,970$ -$ -$
Deferred Inflows Related to Pensions 88,569 511,946 - -
Total Deferred Inflows of Resources 1,747,930$ 2,128,916$ -$ -$
Net Position:
Net Investment in Capital Assets 36,179,796$ 31,525,355$ 4,047$ 19,115$
Restricted 3,710,024 7,435,528 - -
Unrestricted 2,759,287 1,036,375 - 48,420
Total Net Position 42,649,107$ 39,997,258$ 4,047$ 67,535$
Governmental Activities Business-type Activities
Table 1
Champlain Valley School District
Net Position
June 30,
Revenues and Expenses
Revenues for the School District’s governmental activities increased by 32.18% from the prior year while expenses increased by 29.27%. The largest increase in revenues was in operating grants and contributions. The largest increase in expenses was in on-behalf payments. The increase in revenues and expenses are primarily attributable to VSTRS pension and OPEB expense paid by the State of Vermont on-behalf of the School District.

9
Revenues for the School District’s business-type activities decreased by 6.78% from the prior year while expenses decreased by 1.45% primarily due to the divestment of the After School Program.
2019 2018 2019 2018
Revenues
Program Revenues:
Charges for services 377,370$ 229,893$ 1,471,036$ 1,634,128$
Operating grants and contributions 49,671,875 23,959,908 464,985 479,899
General Revenues:
Grants and contributions not restricted to
specific programs 67,346,061 64,448,263 - -
Miscellaneous 1,383,832 1,221,366 88,232 57,480
Total Revenues 118,779,138 89,859,430 2,024,253 2,171,507
Expenses
Instructional programs 43,404,077 44,204,755 - -
Instructional support 8,906,273 8,792,293 - -
Administrative/other support 8,132,454 7,710,575 - -
Building operations and maintenance 4,833,162 3,636,386 - -
Fiscal services 1,050,496 1,034,882
Transportation 3,596,488 3,072,251 - -
Prior year 114,918 10,308 - -
On-behalf payments 40,415,351 14,990,567 - -
Program expenses 2,680,305 2,981,704 2,403,494 2,438,889
Interest on long-term debt 1,016,204 1,057,637 - -
Capital outlay (747,713) - - -
Unallocated depreciation (Note 4) 2,409,521 2,096,349
Total Expenses 115,811,536 89,587,707 2,403,494 2,438,889
Transfers (315,753) (188,334) 315,753 188,334
Change in Net Position 2,651,849 83,389 (63,488) (79,048)
Net Position - July 1, Restated 39,997,258 39,913,869 67,535 146,583
Net Position - June 30 42,649,107$ 39,997,258$ 4,047$ 67,535$
Table 2
Champlain Valley School District
Changes in Net Position
For the Years Ended June 30,
Governmental
Activities
Business-type
Activities

10
Financial Analysis of the School District’s Fund Statements
Governmental funds: The financial reporting focus of the School District’s governmental funds is to provide information on near-term inflows, outflows and balances of spendable resources. Such information may be useful in assessing the School District’s financial requirements. In particular, unassigned fund balance may serve as a useful measure of a government’s financial position at the end of the year and the net resources available for spending.
2019 2018
Major Funds:
General Fund:
Nonspendable 136,418$ 92,783$
Committed 1,000,000 -
Assigned 2,323,698 4,109,060
Unassigned 676,709 -
Total General Fund 4,136,825$ 4,201,843$
Debt Service Fund:
Restricted 2,733,120$ 2,289,434$
Total Debt Service Fund 2,733,120$ 2,289,434$
Construction Fund:
Restricted 453,652$ 4,742,631$
Total Construction Fund 453,652$ 4,742,631$
Nonmajor Funds:
Special Revenue Funds:
Restricted -$ 2,720$
Capital Projects Funds:
Restricted 386,834 307,960
Total Nonmajor Funds 386,834$ 310,680$
June 30,
Fund Balances - Governmental Funds
Champlain Valley School District
Table 3
The general fund total fund balance decreased by $65,018 from the prior fiscal year
primarily due to interfund transfers. The debt service fund increased by $443,686 from the prior fiscal year primarily due to transfers from other funds. The capital projects fund total fund balance decreased by $4,288,979 from the prior fiscal year primarily due to capital outlay. The nonmajor funds total fund balance increased by $76,154 from the prior fiscal year primarily due to activity in the nonmajor capital projects funds.

11
Proprietary funds: The School District’s proprietary funds provide the same type of information found in the government-wide financial statements, but in more detail.
The food service program had a decrease in net position of $37,292 for the year
ended June 30, 2019. The after school program had a decrease of $26,196 for the year ended June 30, 2019.
Budgetary Highlights
The general fund produced a deficit of $65,018 for the year ended June 30, 2019.
Actual expenditures exceeded actual revenues by that amount primarily due to intergovernmental revenues being receipted less than budgeted amounts, primarily offset by instructional programs, instructional support and administrative/other support being expended under budgeted amounts.
Capital Asset and Long-Term Debt Activity
Capital Assets
As of June 30, 2019, the School District capital assets increased by $2,382,447. This increase was due to current year additions of $5,199,080 less net disposals of $392,044 and depreciation expense of $2,424,589. Refer to Note 4 of Notes to Financial Statements for detailed information.
2019 2018
Land 375,000$ 375,000$
Construction in progress 29,209,402 25,153,561
Buildings and building improvements 43,094,705 44,717,251
Machinery, equipment and vehicles 2,561,281 2,612,129
Total 75,240,388$ 72,857,941$
Table 4
Champlain Valley School District
Capital Assets (Net of Depreciation)
June 30,
Debt
At June 30, 2019, the School District had $39,056,545 in bonds and notes from direct borrowings payable versus $41,313,471 in the prior fiscal year. Refer to Note 6 of the Notes to Financial Statements for detailed information.

12
Currently Known Facts, Decisions or Conditions
Economic Factors and Next Year's Budgets and Rates
The 2020 - 2021 financial performance could be impacted by the ongoing staff compensation negotiations and the as-yet-undetermined cost of the recently settled state-wide health insurance agreement.
Contacting the School District's Financial Management
This financial report is designed to provide our citizens, taxpayers, customers and
creditors with a general overview of the School District's finances and to show the School District's accountability for the money it receives. If you have questions about this report or need additional financial information, contact the School District at 5420 Shelburne Road, Suite 300, Shelburne, Vermont 05482.

STATEMENT A CHAMPLAIN VALLEY SCHOOL DISTRICT
STATEMENT OF NET POSITION
JUNE 30, 2019
See accompanying independent auditors' report and notes to financial statements.
13
Governmental Business-type
Activities Activities Total
ASSETS
Current assets:
Cash and cash equivalents 7,525,181$ -$ 7,525,181$
Investments 2,719,259 - 2,719,259
Accounts receivable (net of allowance for uncollectibles) 67,305 25,543 92,848
Due from other governments 1,619,034 16,615 1,635,649
Inventory 61,848 53,031 114,879
Prepaid items 74,570 - 74,570
Internal balances (6) 6 -
Total current assets 12,067,191 95,195 12,162,386
Noncurrent assets:
Capital assets:
Land and other assets not being depreciated 29,584,402 - 29,584,402
Buildings, building improvements and other assets,
net of accumulated depreciation 45,651,939 4,047 45,655,986
Total noncurrent assets 75,236,341 4,047 75,240,388
TOTAL ASSETS 87,303,532 99,242 87,402,774
DEFERRED OUTFLOWS OF RESOURCES
Deferred outflows related to pensions 4,904,575 - 4,904,575
TOTAL DEFERRED OUTFLOWS OF RESOURCES 4,904,575 - 4,904,575
TOTAL ASSETS AND DEFERRED OUTFLOWS OF RESOURCES 92,208,107$ 99,242$ 92,307,349$
LIABILITIES
Current liabilities:
Accounts payable 1,540,720$ 95,195$ 1,635,915$
Accrued payroll 166,132 - 166,132
Accrued expenses 244,242 - 244,242
Due to other governments 746,305 - 746,305
Current portion of long-term obligations 2,782,851 - 2,782,851
Total current liabilities 5,480,250 95,195 5,575,445
Noncurrent liabilities:
Noncurrent portion of long-term obligations:
Bonds payable 35,121,902 - 35,121,902
Notes from direct borrowings payable 1,218,275 - 1,218,275
Accrued compenated absences 436,681 - 436,681
Accrued severance payable 15,000 - 15,000
Net pension liability 5,538,962 - 5,538,962
Total noncurrent liabilities 42,330,820 - 42,330,820
TOTAL LIABILITIES 47,811,070 95,195 47,906,265
DEFERRED INFLOWS OF RESOURCES
Deferred revenue 1,659,361 - 1,659,361
Deferred inflows related to pensions 88,569 - 88,569
TOTAL DEFERRED INFLOWS OF RESOURCES 1,747,930 - 1,747,930
NET POSITION
Net investment in capital assets 36,179,796 4,047 36,183,843
Restricted 3,710,024 - 3,710,024
Unrestricted 2,759,287 - 2,759,287
TOTAL NET POSITION 42,649,107 4,047 42,653,154
TOTAL LIABILITIES, DEFERRED INFLOWS OF RESOURCES
AND NET POSITION 92,208,107$ 99,242$ 92,307,349$

STATEMENT B CHAMPLAIN VALLEY SCHOOL DISTRICT
STATEMENT OF ACTIVITIES
FOR THE YEAR ENDED JUNE 30, 2019
14
Business -
Charges for Operating Grants Capital Grants Governmental type
Functions/Programs Expenses Services and Contributions and Contributions Activities Activities Total
Governmental activities:
Instructional programs 43,404,077$ 97,531$ 7,994,473$ -$ (35,312,073)$ -$ (35,312,073)$
Instructional support 8,906,273 - - - (8,906,273) - (8,906,273)
Administrative/Other support 8,132,454 - - - (8,132,454) - (8,132,454)
Building operations and maintenance 4,833,162 - - - (4,833,162) - (4,833,162)
Fiscal services 1,050,496 - - - (1,050,496) - (1,050,496)
Transportation 3,596,488 - 1,262,051 - (2,334,437) - (2,334,437)
Prior year 114,918 - - - (114,918) - (114,918)
Program expenses 2,680,305 279,839 - - (2,400,466) - (2,400,466)
On-behalf payments 40,415,351 - 40,415,351 - - - -
Interest on long-term debt 1,016,204 - - - (1,016,204) - (1,016,204)
Capital outlay (747,713) - - - 747,713 - 747,713
Unallocated depreciation (Note 4)* 2,409,521 - - - (2,409,521) - (2,409,521)
Total governmental activities 115,811,536 377,370 49,671,875 - (65,762,291) - (65,762,291)
Business-type activities:
Food service 2,377,298 1,471,036 464,985 - - (441,277) (441,277)
After school program 26,196 - - - - (26,196) (26,196)
Total business-type activities 2,403,494 1,471,036 464,985 - - (467,473) (467,473)
Total government 118,215,030$ 1,848,406$ 50,136,860$ -$ (65,762,291) (467,473) (66,229,764)
*This amount excludes the depreciation that is included in the direct expenses of the various programs.
Program Revenues in Net Position
Net (Expense) Revenue and Changes

STATEMENT B (CONTINUED) CHAMPLAIN VALLEY SCHOOL DISTRICT
STATEMENT OF ACTIVITIES
FOR THE YEAR ENDED JUNE 30, 2019
See accompanying independent auditors' report and notes to financial statements. 15
Governmental Business-type
Activities Activities Total
Changes in net position:
Net (expense) revenue (65,762,291) (467,473) (66,229,764)
General revenues:
Grants and contributions not restricted
to specific programs 67,346,061 - 67,346,061
Miscellaneous 1,383,832 88,232 1,472,064
Total general revenues 68,729,893 88,232 68,818,125
Transfers (315,753) 315,753 -
Change in net position 2,651,849 (63,488) 2,588,361
NET POSITION - JULY 1, RESTATED 39,997,258 67,535 40,064,793
NET POSITION - JUNE 30 42,649,107$ 4,047$ 42,653,154$

STATEMENT C CHAMPLAIN VALLEY SCHOOL DISTRICT
BALANCE SHEET - GOVERNMENTAL FUNDS
JUNE 30, 2019
See accompanying independent auditors' report and notes to financial statements. 16
Debt Other Total
General Medicaid Service Construction Governmental Governmental
Fund MAC Fund Fund Funds Funds
ASSETS
Cash and cash equivalents 7,217,263$ -$ 13,861$ 294,057$ -$ 7,525,181$
Investments - - 2,719,259 - - 2,719,259
Accounts receivable (net of allowance for
uncollectibles) 67,305 - - - - 67,305
Due from other governments 5,484 31,589 - - 1,581,961 1,619,034
Inventory 61,848 - - - - 61,848
Prepaid items 74,570 - - - - 74,570
Due from other funds 1,377,459 1,135,850 - 220,943 626,351 3,360,603
TOTAL ASSETS 8,803,929$ 1,167,439$ 2,733,120$ 515,000$ 2,208,312$ 15,427,800$
LIABILITIES
Accounts payable 1,434,181$ 1,339$ -$ 61,348$ 43,852$ 1,540,720$
Accrued payroll 166,132 - - - - 166,132
Accrued expenses 244,242 - - - - 244,242
Due to other governments 746,305 - - - - 746,305
Due to other funds 1,983,150 - - - 1,377,459 3,360,609
TOTAL LIABILITIES 4,574,010 1,339 - 61,348 1,421,311 6,058,008
DEFERRED INFLOWS OF RESOURCES
Deferred revenues 93,094 1,166,100 - - 400,167 1,659,361
TOTAL DEFERRED INFLOWS OF
RESOURCES 93,094 1,166,100 - - 400,167 1,659,361
FUND BALANCES
Nonspendable - inventory & prepaid items 136,418 - - - - 136,418
Restricted - - 2,733,120 453,652 386,834 3,573,606
Committed 1,000,000 - - - - 1,000,000
Assigned 2,323,698 - - - - 2,323,698
Unassigned 676,709 - - - - 676,709
TOTAL FUND BALANCES 4,136,825 - 2,733,120 453,652 386,834 7,710,431
TOTAL LIABILITIES AND FUND
BALANCES 8,803,929$ 1,167,439$ 2,733,120$ 515,000$ 2,208,312$ 15,427,800$

STATEMENT D CHAMPLAIN VALLEY SCHOOL DISTRICT
RECONCILIATION OF THE GOVERNMENTAL FUNDS BALANCE SHEET
TO THE STATEMENT OF NET POSITION JUNE 30, 2019
See accompanying independent auditors' report and notes to financial statements. 17
Total
Governmental
Funds
Total Fund Balances 7,710,431$
Amounts reported for governmental activities in the Statement of Net Position are
different because:
Capital assets used in governmental activities are not financial resources and
therefore are not reported in the funds, net of accumulated depreciation 75,236,341
Deferred outflows of resources related to pensions are not financial resources
and therefore are not reported in the funds 4,904,575
Long-term obligations shown below are not due and payable in the current period
and therefore are not reported in the funds shown above:
Bonds payable (37,349,355)
Notes from direct borrowings payable (1,707,190)
Accrued compensated absences (459,664)
Accrued severance payable (58,500)
Net pension liability (5,538,962)
Deferred inflows of resources related to pensions are not financial resources
and therefore are not reported in the funds (88,569)
Net position of governmental activities 42,649,107$

STATEMENT E CHAMPLAIN VALLEY SCHOOL DISTRICT
STATEMENT OF REVENUES, EXPENDITURES AND CHANGES IN FUND BALANCES
GOVERNMENTAL FUNDS FOR THE YEAR ENDED JUNE 30, 2019
See accompanying independent auditors' report and notes to financial statements. 18
Debt Other Total
General Medicaid Service Construction Governmental Governmental
Fund MAC Fund Fund Funds Funds
REVENUES
Intergovernmental revenues 79,261,468$ 449,696$ -$ -$ 2,051,857$ 81,763,021$
Tuition 97,531 - - - - 97,531
Charges for services - - - - 279,839 279,839
Interest income 453,012 - 54,740 31,780 423 539,955
Unrealized gains/(losses), net of activity - - 125,983 - - 125,983
Miscellaneous revenues 571,990 - - 35,044 110,860 717,894
TOTAL REVENUES 80,384,001 449,696 180,723 66,824 2,442,979 83,524,223
EXPENDITURES
Current:
Instructional programs 45,235,641 - - - - 45,235,641
Instructional support 8,906,273 - - - - 8,906,273
Administrative/Other support 8,132,454 - - - - 8,132,454
Building operations and maintenance 4,441,118 - - - - 4,441,118
Fiscal services 1,050,496 - 1,050,496
Transportation 3,596,488 - - - - 3,596,488
On-behalf payments 5,160,436 - - - - 5,160,436
Prior year 114,918 114,918
Program expenses - 449,696 12,037 5,229 2,213,343 2,680,305
Debt service:
Principal 2,726,927 - - - - 2,726,927
Interest 1,016,204 - - - - 1,016,204
Capital outlay - - - 4,451,367 - 4,451,367
TOTAL EXPENDITURES 80,380,955 449,696 12,037 4,456,596 2,213,343 87,512,627
EXCESS OF REVENUES OVER
(UNDER) EXPENDITURES 3,046 - 168,686 (4,389,772) 229,636 (3,988,404)
OTHER FINANCING SOURCES (USES)
Debt proceeds 470,000 - - - - 470,000
Transfers in 200,000 - 275,000 110,000 46,518 631,518
Transfers (out) (738,064) - - (9,207) (200,000) (947,271)
TOTAL OTHER FINANCING SOURCES
(USES) (68,064) - 275,000 100,793 (153,482) 154,247
NET CHANGE IN FUND BALANCES (65,018) - 443,686 (4,288,979) 76,154 (3,834,157)
FUND BALANCES - JULY 1 4,201,843 - 2,289,434 4,742,631 310,680 11,544,588
FUND BALANCES - JUNE 30 4,136,825$ -$ 2,733,120$ 453,652$ 386,834$ 7,710,431$

STATEMENT F CHAMPLAIN VALLEY SCHOOL DISTRICT
RECONCILIATION OF THE STATEMENT OF REVENUES, EXPENDITURES AND
CHANGES IN FUND BALANCES OF GOVERNMENTAL FUNDS TO THE STATEMENT OF ACTIVITIES
FOR THE YEAR ENDED JUNE 30, 2019
See accompanying independent auditors' report and notes to financial statements. 19
Net change in fund balances - total governmental funds (Statement E) (3,834,157)$
Amounts reported for governmental activities in the Statement of Activities
(Statement B) are different because:
Governmental funds report capital outlays as expenditures while governmental activities
report depreciation expense allocated to those expenditures over the life of the assets:
Capital asset acquisitions 5,199,080
Capital asset disposals (392,044)
Depreciation expense (2,409,521)
2,397,515
Deferred outflows of resources are a consumption of net position by the
government that are applicable to a future reporting period and therefore are
not reported in the funds 2,065,967
Debt proceeds provide current financial resources to governmental funds, but
issuing debt increases long-term obligations in the Statement of Net Position (470,000)
Repayment of long-term debt principal is an expenditure in the governmental
funds, but the repayment reduces long-term obligations in the Statement of
Net Position 2,726,926
Deferred inflows of resources are an acquisition of net position by the
government that are applicable to a future reporting period and therefore are
not reported in the funds 423,377
Some expenses reported in the Statement of Activities do not require the use
of current financial resources and therefore are not reported as expenditures in
governmental funds:
Accrued compensated absences (26,494)
Accrued severance payable 28,250
Net pension liability (659,535)
(657,779)
Change in net position of governmental activities (Statement B) 2,651,849$

STATEMENT G CHAMPLAIN VALLEY SCHOOL DISTRICT
STATEMENT OF NET POSITION - PROPRIETARY FUNDS
JUNE 30, 2019
See accompanying independent auditors' report and notes to financial statements. 20
Food After School
Service Programs Total
ASSETS
Current assets:
Accounts receivable (net of allowance for uncollectibles) 25,543$ -$ 25,543$
Due from other governments 16,615 - 16,615
Inventory 53,031 - 53,031
Due from other funds 6 - 6
Total current assets 95,195 - 95,195
Noncurrent assets:
Capital assets:
Building improvements 13,894 - 13,894
Furniture and equipment 188,643 - 188,643
Less: accumulated depreciation (198,490) - (198,490)
Total noncurrent assets 4,047 - 4,047
TOTAL ASSETS 99,242$ -$ 99,242$
LIABILITIES
Current liabilities:
Accounts payable 95,195$ -$ 95,195$
Total current liabilities 95,195 - 95,195
TOTAL LIABILITIES 95,195 - 95,195
NET POSITION
Net investment in capital assets 4,047 - 4,047
TOTAL NET POSITION 4,047 - 4,047
TOTAL LIABILITIES AND NET POSITION 99,242$ -$ 99,242$
Enterprise Funds

STATEMENT H CHAMPLAIN VALLEY SCHOOL DISTRICT
STATEMENT OF REVENUES, EXPENSES AND CHANGES IN NET POSITION
PROPRIETARY FUNDS FOR THE YEAR ENDED JUNE 30, 2019
See accompanying independent auditors' report and notes to financial statements. 21
Food After School
Service Program Total
OPERATING REVENUES
Intergovernmental 464,985$ -$ 464,985$
Charges for services 1,471,036 - 1,471,036
Miscellaneous 88,232 - 88,232
TOTAL OPERATING REVENUES 2,024,253 - 2,024,253
OPERATING EXPENSES
Salaries 959,836 - 959,836
Benefits 448,649 - 448,649
Repairs and maintenance 15,818 - 15,818
Supplies and food 916,457 - 916,457
Travel 624 - 624
Software 4,524 - 4,524
Equipment and maintenance 6,059 - 6,059
Depreciation 15,068 - 15,068
Other 10,263 26,196 36,459
TOTAL OPERATING EXPENSES 2,377,298 26,196 2,403,494
OPERATING INCOME (LOSS) (353,045) (26,196) (379,241)
NONOPERATING REVENUES (EXPENSES)
Transfers in 315,753 - 315,753
TOTAL NONOPERATING REVENUES (EXPENSES) 315,753 - 315,753
CHANGES IN NET POSITION (37,292) (26,196) (63,488)
NET POSITION - JULY 1, RESTATED 41,339 26,196 67,535
NET POSITION - JUNE 30 4,047$ -$ 4,047$
Enterprise Funds

STATEMENT I CHAMPLAIN VALLEY SCHOOL DISTRICT
STATEMENT OF CASH FLOWS - PROPRIETARY FUNDS
FOR THE YEAR ENDED JUNE 30, 2019
See accompanying independent auditors' report and notes to financial statements. 22
Food After School
Service Programs Total
CASH FLOWS FROM OPERATING ACTIVITIES
Receipts from customers 1,567,730$ -$ 1,567,730$
Intergovernmental receipts 1,511,795 - 1,511,795
Internal activity - receipts (payments) from/to other funds (1,040,177) 26,196 (1,013,981)
Payments to suppliers (2,355,101) (26,196) (2,381,297)
NET CASH PROVIDED (USED) BY OPERATING ACTIVITIES (315,753) - (315,753)
CASH FLOWS FROM NONCAPITAL FINANCING ACTIVITIES
Transfers in (out) 315,753 - 315,753
NET CASH PROVIDED (USED) BY NONCAPITAL FINANCING ACTIVITIES 315,753 - 315,753
NET INCREASE (DECREASE) IN CASH AND CASH EQUIVALENTS - - -
CASH AND CASH EQUIVALENTS - JULY 1 - - -
CASH AND CASH EQUIVALENTS - JUNE 30 -$ -$ -$
RECONCILIATION OF OPERATING INCOME (LOSS) TO NET
CASH PROVIDED (USED) BY OPERATING ACTIVITIES:
Operating income (loss) (353,045)$ (26,196)$ (379,241)$
Adjustments to reconcile operating income to net cash provided
(used) by operating activties:
Depreciation expense 15,068 - 15,068
Changes in operating assets, liabilities and deferred inflows of resources:
(Increase) decrease in accounts receivable 8,462 - 8,462
(Increase) decrease in due from other governments 1,046,810 - 1,046,810
(Increase) decrease in inventory (2,619) - (2,619)
(Increase) decrease in due from other funds (6) 26,196 26,190
(Decrease) increase in accounts payable 9,748 - 9,748
(Decrease) increase in due to other funds (1,040,171) - (1,040,171)
NET CASH PROVIDED (USED) BY OPERATING ACTIVITIES (315,753)$ -$ (315,753)$
Enterprise Funds
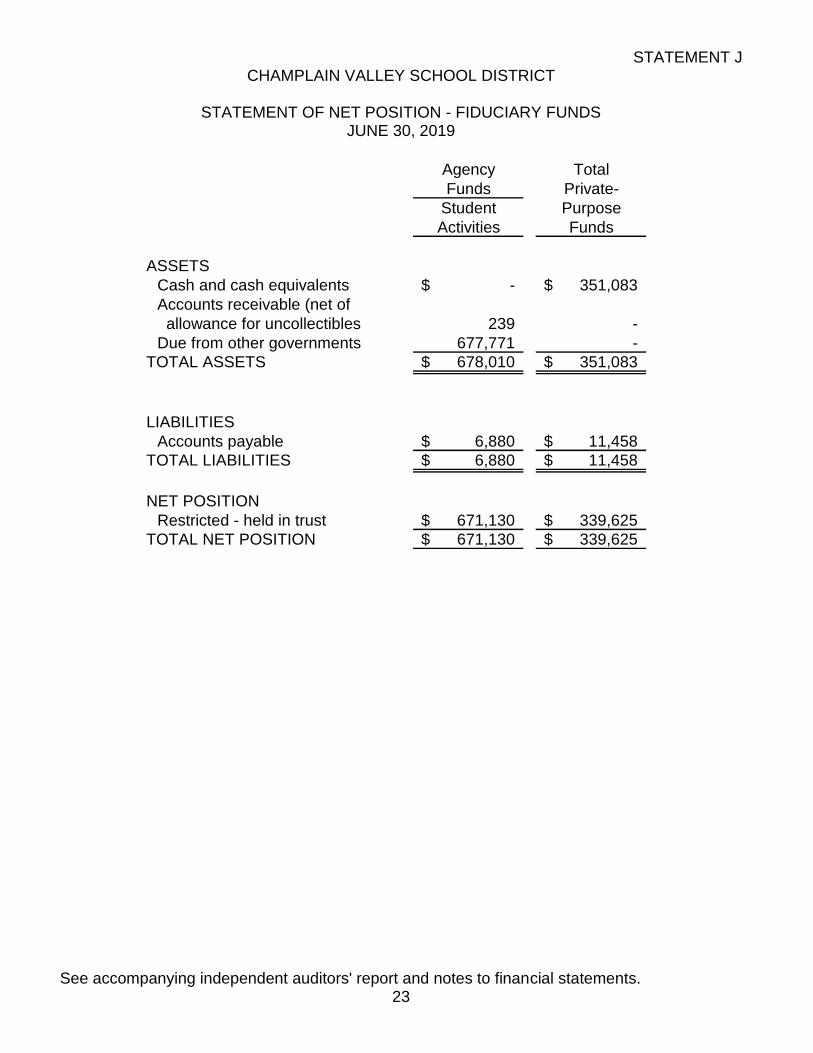
STATEMENT J CHAMPLAIN VALLEY SCHOOL DISTRICT
STATEMENT OF NET POSITION - FIDUCIARY FUNDS
JUNE 30, 2019
See accompanying independent auditors' report and notes to financial statements. 23
Agency Total
Funds Private-
Student Purpose
Activities Funds
ASSETS
Cash and cash equivalents -$ 351,083$
Accounts receivable (net of
allowance for uncollectibles 239 -
Due from other governments 677,771 -
TOTAL ASSETS 678,010$ 351,083$
LIABILITIES
Accounts payable 6,880$ 11,458$
TOTAL LIABILITIES 6,880$ 11,458$
NET POSITION
Restricted - held in trust 671,130$ 339,625$
TOTAL NET POSITION 671,130$ 339,625$

STATEMENT K CHAMPLAIN VALLEY SCHOOL DISTRICT
STATEMENT OF CHANGES IN NET POSITION - FIDUCIARY FUNDS
FOR THE YEAR ENDED JUNE 30, 2019
See accompanying independent auditors' report and notes to financial statements. 24
Total
Private-
Purpose
Funds
ADDITIONS
Contributions
Donations 45,266$
Total contributions 45,266
Investment earnings:
Income earned 533
Total investment earnings, net 533
Total additions 45,799
DEDUCTIONS
Scholarship awards 9,093
Transfer to other account 11,458
Administrative expenses 56,957
Total deductions 77,508
CHANGE IN NET POSITION (31,709)
NET POSITION - JULY 1 371,334
NET POSITION - JUNE 30 339,625$

CHAMPLAIN VALLEY SCHOOL DISTRICT
NOTES TO FINANCIAL STATEMENTS JUNE 30, 2019
25
NOTE 1 - SUMMARY OF SIGNIFICANT ACCOUNTING POLICIES
Reporting Entity
The School District operates under the authority of the Vermont education laws.
The School District provides services to Champlain Valley Union High School and the towns of St George, Williston, Shelburne, Hinesburg and Charlotte. The School District’s financial statements are prepared in accordance with generally accepted accounting principles (GAAP). The Governmental Accounting Standards Board (GASB) is responsible for establishing GAAP for state and local governments through its pronouncements (Statements and Interpretations).
The School District’s combined financial statements include all accounts and all operations of the School District. We have determined that the School District has no component units as described in GASB Statement No. 14 and amended by GASB Statements No. 39 and No. 61.
Implementation of New Accounting Standards
During the year ended June 30, 2019, the following statements of financial
accounting standards issued by the Governmental Accounting Standards Board became effective:
Statement No. 83 “Certain Asset Retirement Obligations.” This Statement establishes criteria for determining the timing and pattern of recognition of a liability and a corresponding deferred outflow of resources for AROs. This Statement requires that recognition occur when the liability is both incurred and reasonably estimable. The determination of when the liability is incurred should be based on the occurrence of external laws, regulations, contracts, or court judgments, together with the occurrence of an internal event that obligates a government to perform asset retirement activities. Laws and regulations may require governments to take specific actions to retire certain tangible capital assets at the end of the useful lives of those capital assets, such as decommissioning nuclear reactors and dismantling and removing sewage treatment plants. Other obligations to retire tangible capital assets may arise from contracts or court judgments. Internal obligating events include the occurrence of contamination, placing into operation a tangible capital asset that is required to be retired, abandoning a tangible capital asset before it is placed into operation, or acquiring a tangible capital asset that has an existing ARO. This Statement also requires disclosure of information about the nature of a government’s AROs, the methods and assumptions used for the estimates of the liabilities, and the estimated remaining useful life of the associated tangible capital assets. If an ARO (or portions thereof) has been incurred by a government but is not yet recognized because it is not reasonably estimable, the government is required to disclose that fact and the reasons therefor. This Statement

CHAMPLAIN VALLEY SCHOOL DISTRICT
NOTES TO FINANCIAL STATEMENTS JUNE 30, 2019
26
NOTE 1 - SUMMARY OF SIGNIFICANT ACCOUNTING POLICIES (CONTINUED) requires similar disclosures for a government’s minority shares of AROs. Management has determined the impact of this Statement is not material to the financial statements.
Statement No. 88 “Certain Disclosures Related to Debt, Including Direct Borrowings and Direct Placements.” This Statement defines debt for purposes of disclosure in notes to financial statements as a liability that arises from a contractual obligation to pay cash (or other assets that may be used in lieu of cash) in one or more payments to settle an amount that is fixed at the date the contractual obligation is established. This Statement requires that additional essential information related to debt be disclosed in notes to financial statements, including unused lines of credit; assets pledged as collateral for the debt; and terms specified in debt agreements related to significant events of default with finance-related consequences, significant termination events with finance-related consequences, and significant subjective acceleration clauses. Management has determined the impact of this Statement is not material to the financial statements.
Government-Wide and Fund Financial Statements The School District’s basic financial statements include both government-wide (reporting the School District as a whole) and fund financial statements (reporting the School District’s major funds). Both the government-wide and fund financial statements categorize primary activities as governmental or business-type. The School District’s food service and after school programs are categorized as business-type activities. All other activities of the School District are categorized as governmental. In the government-wide Statement of Net Position, both the governmental and business-type activities columns are (a) presented on a consolidated basis by column and (b) are reported on a full accrual, economic resources basis, which recognizes all long-term assets and receivables as well as long-term debt and obligations. The School District's net position is reported in three parts - net investment in capital assets;restricted net position; and unrestricted net position. The School District first utilizes restricted resources to finance qualifying activities.
The government-wide Statement of Activities reports both the gross and net cost of each of the School District's functions (instruction, administration, etc.) excluding fiduciary activities. The functions are also supported by general government revenues (certain intergovernmental revenues, charges for services, miscellaneous revenues, etc.). The Statement of Activities reduces gross expenses by related program revenues, operating and capital grants. Program revenues must be directly associated with the function or a business-type activity. Operating grants include operating-specific

CHAMPLAIN VALLEY SCHOOL DISTRICT
NOTES TO FINANCIAL STATEMENTS JUNE 30, 2019
27
NOTE 1 - SUMMARY OF SIGNIFICANT ACCOUNTING POLICIES (CONTINUED) and discretionary (either operating or capital) grants while the capital grants column reflects capital-specific grants. For the most part, the interfund activity has been eliminated from these government-wide financial statements. The net costs (by function) are normally covered by general revenue (assessments, certain intergovernmental revenues and interest income, etc.). The School District does not allocate indirect costs. All costs are charged directly to the corresponding departments.
The government-wide focus is more on the sustainability of the School District as
an entity and the change in the School District’s net position resulting from the current year’s activities.
Measurement Focus - Basic Financial Statements & Fund Financial Statements The financial transactions of the School District are reported in the individual funds in the fund financial statements. Each fund is accounted for by providing a separate set of self-balancing accounts that comprise its assets, deferred outflows of resources, liabilities, deferred inflows of resources, fund balances, revenues and expenditures/expenses. The various funds are reported by generic classification within the financial statements. The following fund types are used by the School District: 1. Governmental Funds: The focus of the governmental funds' measurement (in the fund statements) is upon determination of financial position (sources, uses and balances of financial resources) rather than upon net income. The following is a description of the governmental funds of the School District: Major Funds
a. The General Fund is the general operating fund of the School District. It is used to account for all financial resources except those required to be accounted for in another fund.
b. Medicaid MAC Fund is used to account for the proceeds of Medicaid
sources that are legally restricted to expenditures for specified purposes. c. The Debt Service Fund is used to account for debt proceeds related to
capital asset purchases.

CHAMPLAIN VALLEY SCHOOL DISTRICT
NOTES TO FINANCIAL STATEMENTS JUNE 30, 2019
28
NOTE 1 - SUMMARY OF SIGNIFICANT ACCOUNTING POLICIES (CONTINUED)
d. The Construction Fund is used to account for the acquisition or
construction of major capital facilities. Nonmajor Funds
e. Special Revenue Funds are used to account for the proceeds of specific revenue sources that are legally restricted to expenditures for specified purposes.
f. The Capital Projects Fund is used to account for the acquisition or construction of major capital facilities.
2. Proprietary Funds The focus of proprietary fund measurement is upon determination of operating income, changes in net position, financial position and cash flows. The generally accepted accounting principles applicable are those similar to businesses in the private sector. Operating revenues include charges for services, intergovernmental reimbursements and other miscellaneous fees which are a direct result of the proprietary activity. Nonoperating revenues are any revenues which are generated outside of the general proprietary activity, i.e. interest income. The following is a description of the proprietary funds of the School District:
a. Enterprise Funds are required to be used to account for operations for which a fee is charged to external users for goods or services and the activity (a) is financed with debt that is solely secured by a pledge of net revenues, (b) has third party requirements that the cost of providing. services, including capital costs, be recovered with fees and charges or (c) established fees and charges based on a pricing policy designed to recover similar costs.
3. Fiduciary Funds:
Fiduciary funds are used to report assets held in a trustee or agency capacity for others and therefore are not available to support the School District’s programs. The reporting focus is on net position and changes in net position and is reported using accounting principles similar to proprietary funds. Component units that are fiduciary in nature have been excluded from these financial statements.
The School District’s fiduciary funds are presented in the fiduciary fund financial statements by type (agency and private-purpose). Since by definition these assets are being held for the benefit of a third party (other local governments, private parties, etc.)

CHAMPLAIN VALLEY SCHOOL DISTRICT
NOTES TO FINANCIAL STATEMENTS JUNE 30, 2019
29
NOTE 1 - SUMMARY OF SIGNIFICANT ACCOUNTING POLICIES (CONTINUED) and cannot be used to address activities or obligations of the government, these funds are not incorporated into the government-wide financial statements.
The emphasis in fund financial statements is on the major funds in the
governmental activity category. Nonmajor funds by category are summarized into a single column. GASB Statement No. 34 sets forth minimum criteria (percentage of the assets, deferred outflows of resources, liabilities, deferred inflows of resources, revenues, or expenses of either the fund category or the governmental and enterprise combined) for the determination of major funds. The nonmajor funds are combined in a column in the fund financial statements.
Basis of Accounting Basis of accounting refers to when revenues and expenditures or expenses are recognized in the accounts and reported in the financial statements. Basis of accounting relates to the timing of the measurements made, regardless of the measurement focus applied. 1. Accrual Governmental activities in the government-wide financial statements and fiduciary fund financial statements are presented on the accrual basis of accounting. Revenues are recognized when earned and expenses are recognized when incurred. 2. Modified Accrual The governmental fund financial statements are presented on the modified accrual basis of accounting. Under the modified accrual basis of accounting, revenues are recorded when susceptible to accrual; i.e., both measurable and available. "Available" means collectible within the current period or soon enough thereafter to be used to pay liabilities of the current period. Expenditures are generally recognizedunder the modified accrual basis of accounting when the related liability is incurred. The exception to this general rule is that principal and interest on general obligation long-term debt, if any, is recognized when due.
Budget
The School District’s policy is to adopt an annual budget for operations. The budget is presented on the modified accrual basis of accounting which is consistent with generally accepted accounting principles.
CHAMPLAIN VALLEY SCHOOL DISTRICT
NOTES TO FINANCIAL STATEMENTS JUNE 30, 2019
30
NOTE 1 - SUMMARY OF SIGNIFICANT ACCOUNTING POLICIES (CONTINUED)
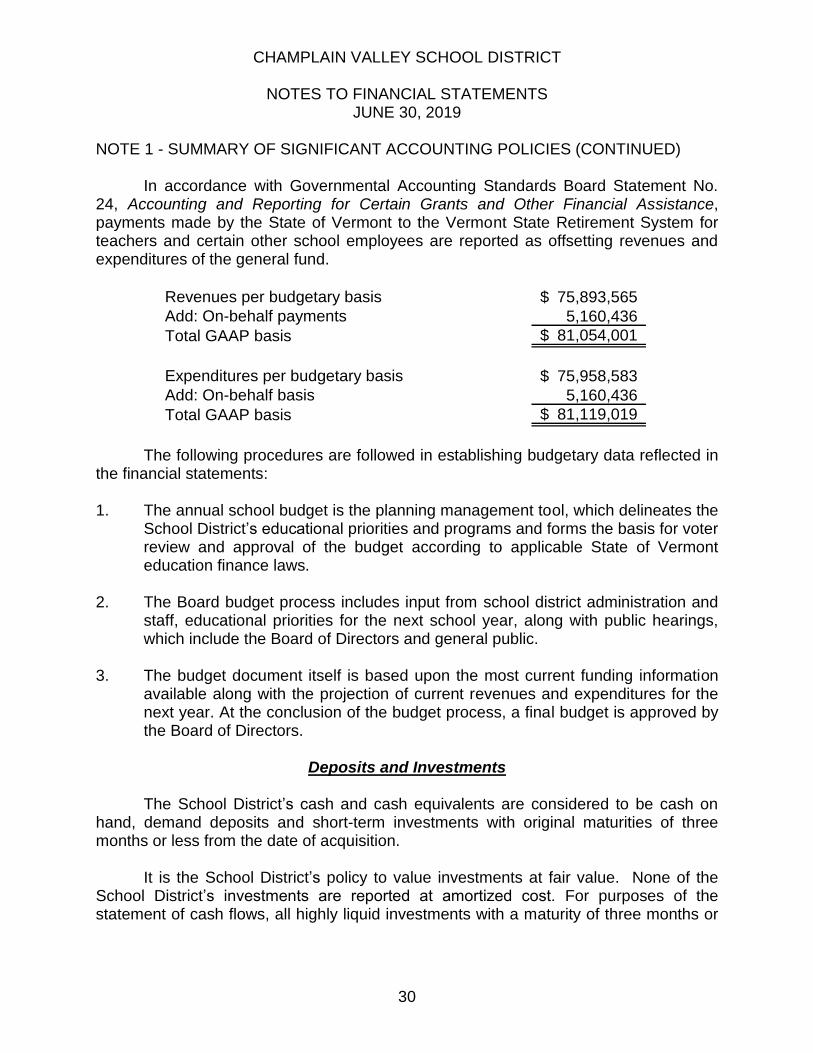
In accordance with Governmental Accounting Standards Board Statement No.
24, Accounting and Reporting for Certain Grants and Other Financial Assistance, payments made by the State of Vermont to the Vermont State Retirement System for teachers and certain other school employees are reported as offsetting revenues and expenditures of the general fund.
Revenues per budgetary basis 75,893,565$
Add: On-behalf payments 5,160,436
Total GAAP basis 81,054,001$
Expenditures per budgetary basis 75,958,583$
Add: On-behalf basis 5,160,436
Total GAAP basis 81,119,019$
The following procedures are followed in establishing budgetary data reflected in the financial statements: 1. The annual school budget is the planning management tool, which delineates the
School District’s educational priorities and programs and forms the basis for voter review and approval of the budget according to applicable State of Vermont education finance laws.
2. The Board budget process includes input from school district administration and
staff, educational priorities for the next school year, along with public hearings, which include the Board of Directors and general public.
3. The budget document itself is based upon the most current funding information
available along with the projection of current revenues and expenditures for the next year. At the conclusion of the budget process, a final budget is approved by the Board of Directors.
Deposits and Investments
The School District’s cash and cash equivalents are considered to be cash on hand, demand deposits and short-term investments with original maturities of three months or less from the date of acquisition. It is the School District’s policy to value investments at fair value. None of the School District’s investments are reported at amortized cost. For purposes of the statement of cash flows, all highly liquid investments with a maturity of three months or

CHAMPLAIN VALLEY SCHOOL DISTRICT
NOTES TO FINANCIAL STATEMENTS JUNE 30, 2019
31
NOTE 1 - SUMMARY OF SIGNIFICANT ACCOUNTING POLICIES (CONTINUED) less when purchased are considered to be a cash equivalent. The School District Treasurer is authorized by State Statutes to invest all excess funds in the following:
- Obligations of the U.S. Government, its agencies and instrumentalities - Certificates of deposits and other evidences of deposits at banks, savings and
loan associations and credit unions - Repurchase agreements - Money market mutual funds The Champlain Valley School District has no formal investment policy but instead
follows the State of Vermont Statutes.
Receivables
Receivables include amounts due from governmental agencies and local businesses. All receivables are current and therefore due within one year. Receivables are reported net of an allowance for uncollectible accounts and revenues net of uncollectibles. Allowances are reported when accounts are proven to be uncollectible. Allowances for uncollectible accounts netted with accounts receivable were $1,728,497 for the year ended June 30, 2019. The allowance for uncollectible accounts is estimated to be $0 as of June 30, 2019.
Inventories and Prepaid Items Inventories consist of expendable supplies held for consumption and are valued
at cost which approximates market, using the first-in/first-out (FIFO) method. The costs of inventories are recorded as expenditures when used (consumption method). Inventory of the food service fund consists of supplies and food.
Certain payments to vendors reflect costs applicable to future accounting periods
and are recorded as prepaid items.
Interfund Receivables and Payables
Transactions between funds that are representative of lending/borrowing
arrangements outstanding at the end of the fiscal year are referred to as “due to/from other funds”. While these balances are reported in fund financial statements, certaineliminations are made in the preparation of the government-wide financial statements. Any residual balances outstanding between governmental activities and business-type activities are reported in the governmental-wide financial statements as “internal balances”.

CHAMPLAIN VALLEY SCHOOL DISTRICT
NOTES TO FINANCIAL STATEMENTS JUNE 30, 2019
32
NOTE 1 - SUMMARY OF SIGNIFICANT ACCOUNTING POLICIES (CONTINUED)
Transactions Between Funds Legally authorized transfers are treated as interfund transfers and are included in
the results of operations of both Governmental and Proprietary Funds.
Capital Assets Capital assets purchased or acquired with an original cost of $5,000 or more are
reported at historical cost or estimated historical cost. Contributed assets are reported at fair market value as of the date received. Additions, improvements and other capital outlays that significantly extend the useful life of an asset are capitalized. Other costs incurred for repairs and maintenance are expensed as incurred. Depreciation on all assets is provided on the straight-line basis over the estimated useful lives.
The assets are valued at historical cost when available and estimated historical
cost where actual invoices or budgetary data was unavailable. Donated fixed assets are valued at their estimated fair market value on the date received. All retirements have been recorded by eliminating the net carrying values.
Estimated useful lives are as follows: Buildings & improvements 20 - 50 years Machinery and equipment 3 - 50 years Vehicles 3 - 25 years
Long-term Obligations The accounting treatment of long-term obligations depends on whether the
assets are used in governmental fund operations or proprietary fund operations and whether they are reported in the government-wide or fund financial statements.
All long-term obligations to be repaid from governmental and business-type resources is reported as liabilities in government-wide statements. The long-term obligations consist primarily of bonds payable, notes from direct borrowings payable, accrued compensated absences, accrued severance payable and net pension liability.
Long-term debt for governmental funds is not reported as liabilities in the fund financial statements. The debt proceeds are reported as other financing sources and payment of principal and interest reported as expenditures. The accounting for the proprietary funds is the same in the fund statements as it is in the government-wide statements.

CHAMPLAIN VALLEY SCHOOL DISTRICT
NOTES TO FINANCIAL STATEMENTS JUNE 30, 2019
33
NOTE 1 - SUMMARY OF SIGNIFICANT ACCOUNTING POLICIES (CONTINUED)
Pensions
For purposes of measuring the net pension liability, deferred outflows of resources and deferred inflows of resources related to pensions and pension expense, information about the fiduciary net position of the Vermont State Teachers’ Retirement System (VSTRS) and the Vermont Municipal Employees’ Retirement System (VMERS) Plans and additions to/deductions from the VSTRS and VMERS Plans’ fiduciary net position have been determined on the same basis as they are reported by the VSTRS and VMERS Plans. For this purpose, benefit payments (including refunds of employee contributions) are recognized when due and payable in accordance with the benefit terms. Investments are reported at fair value.
OPEB For purposes of measuring the net OPEB liability, deferred outflows of resources and deferred inflows of resources related to OPEB, information about the fiduciary net position of the Vermont State Teachers’ Retirement System (VSTRS) and additions to/deductions from the VSTRS OPEB Plan’s fiduciary net position have been determined on the same basis as they are reported by VSTRS. For this purpose,benefit payments (including refunds of employee contributions) are recognized when due and payable in accordance with the benefit terms.
Net Position Net position represents the difference between all other elements in a statement
of financial position. Net investment in capital assets consists of capital assets, net of accumulated depreciation, reduced by the outstanding balances of any borrowing used for those assets and adding back unspent proceeds. Net position is reported as restricted when there are limitations imposed on its use either through enabling legislations adopted by the School District or through external restrictions imposed by creditors, grantors or laws or regulations of other governments. Unrestricted net position is the net amount of the assets, deferred outflows of resources, liabilities and deferred inflows of resources that are not included in the determination of net investment in capital assets or restricted net position.
Fund Balance
In the fund financial statements, fund balance for governmental funds is reported in classifications that comprise a hierarchy based primarily on the extent to which the School District is bound to honor constraints on the specific purpose for which amounts in the funds can be spent. Fund balance is reported in five components - nonspendable, restricted, committed, assigned and unassigned.

CHAMPLAIN VALLEY SCHOOL DISTRICT
NOTES TO FINANCIAL STATEMENTS JUNE 30, 2019
34
NOTE 1 - SUMMARY OF SIGNIFICANT ACCOUNTING POLICIES (CONTINUED)
Nonspendable - This includes amounts that cannot be spent either because they are not in spendable form or because they are legally or contractually required to be maintained intact.
Restricted - This includes amounts that can be spent only for specific purposes
because of constitutional provisions or enabling legislation or because of constraints that are externally imposed by creditors, grantors, contributors, or the laws or regulations of other governments.
Committed - This includes amounts that can be used only for specific purposes determined by a formal action of the inhabitants of the School District. The inhabitants of the School District through School Board meetings are the highest level of decision-making authority of the School District. Commitments may be established, modified, or rescinded only through a School District meeting vote.
Assigned - This includes amounts that do not meet the criteria to be classified as
restricted or committed but that are intended to be used for specific purposes. The authority for assigning fund balance is expressed by the School Board.
Unassigned - This includes all other spendable amounts. The general fund is the only fund that reports a positive unassigned fund balance amount. Other governmental funds besides the general fund can only report a negative unassigned fund balance amount.
When an expenditure is incurred for purposes for which both restricted and
unrestricted fund balances are available, the School District considers restricted funds to have been spent first. When an expenditure is incurred for which committed, assigned, or unassigned fund balances are available, the School District considers amounts to have been spent first out of committed funds, then assigned funds and finally unassigned funds, as needed, unless the School Board meeting vote has provided otherwise in its commitment or assignment actions.
Deferred Outflows and Inflows of Resources In addition to assets, the statement of financial position and/or balance sheet will
at times report a separate section for deferred outflows of resources. This separate financial statement element, deferred outflows of resources, represents a consumption of net position that applies to a future period(s) and so will not be recognized as an outflow of resources (expense/expenditure) until then. The School District currently has one type of item, deferred outflows related to pensions. This item is reported in the statement of net position.

CHAMPLAIN VALLEY SCHOOL DISTRICT
NOTES TO FINANCIAL STATEMENTS JUNE 30, 2019
35
NOTE 1 - SUMMARY OF SIGNIFICANT ACCOUNTING POLICIES (CONTINUED)
In addition to liabilities, the statement of financial position and or balance sheet
will at times report a separate section for deferred inflows of resources. This separate financial statement element, deferred inflows of resources, represents an acquisition of net position that applies to a future period(s) and so will not be recognized as an inflow of resources (revenue) until that time. Deferred revenues qualify for reporting in this category. This item is reported in both the statements of net position and governmental funds balance sheet. Deferred inflows related to pensions also qualifies for reporting in this category as well. This item is reported only in the statement of net position. All items in this category are deferred and recognized as inflows of resources in the period that the amounts become available.
Program Revenues Program revenues include all directly related income items applicable to a
particular program (charges to customers or applicants for goods, services, or privileges provided; operating or capital grants and contributions, including special assessments).
Operating/Nonoperating Proprietary Fund Revenues Operating revenues consist mainly of direct revenue sources and/or charges for
services applicable to that fund’s ongoing operations. All revenue and expenses not meeting this definition are reported as nonoperating revenues and expenses.
Encumbrance Accounting
Encumbrances are not liabilities and, therefore, are not recorded as expenditures until receipt of material or service. For budgetary purposes, appropriations lapse at fiscal year-end. The School District does not utilize encumbrance accounting for its general fund.
Use of Estimates During the preparation of the School District’s financial statements, management
is required to make estimates and assumptions that affect the reported amounts of assets, liabilities and disclosure of contingent items as of the date of the financial statements and the reported amounts of revenues and expenses/expenditures during the reporting period. Actual results may differ from these estimates.

CHAMPLAIN VALLEY SCHOOL DISTRICT
NOTES TO FINANCIAL STATEMENTS JUNE 30, 2019
36
NOTE 2 - DEPOSITS AND INVESTMENTS Deposits:
The School District’s investment policies, which follow state statutes, authorize the School District to invest in obligations of the U.S. Treasury, agencies and instrumentalities, other states and Canada, provided such securities are rated within the three highest grades by an approved rating service of the State of Vermont, corporate stocks and bonds within statutory limits, financial institutions, mutual funds and repurchase agreements. These investment policies apply to all School District funds. Custodial credit risk for deposits is the risk that, in the event of a failure of a depository financial institution, the School District will not be able to recover its deposits or will not be able to recover collateral securities that are in possession of an outside party. The School District does not have a policy covering custodial credit risk. At June 30, 2019, the School District’s cash balance of $7,876,264 was comprised of bank deposits of $14,576,356. The variance between the bank balances presented and the cash balances are reconciling items (i.e. deposits in transit, uncleared checks, etc.). In this instance, there is an outstanding check in the amount of $6,333,089 in the sweep account that occurred on June 28, 2019 that still remains in transit for banking purposes as of June 30, 2019. This entire amount was either fully insured by federal depository insurance or Securities Investor Protection Corporation (SIPC) and consequently was not exposed to custodial credit risk or was collateralized with securities held by the financial institution in the School District’s name or by debt issued in the School District’s name.
Bank
Account Type Balance
Checking accounts 2,193,145$
Sweep account 12,060,163
Money market fund 294,057
Cash and cash equivalents 28,991
14,576,356$
Investments: Custodial credit risk for investments is that, in the event of failure of the
counterparty, the School District will not be able to recover the value of its investments or collateral securities that are in possession of an outside party. Currently, the School District does not have a policy for custodial credit risk for investments.

CHAMPLAIN VALLEY SCHOOL DISTRICT
NOTES TO FINANCIAL STATEMENTS JUNE 30, 2019
37
NOTE 2 - DEPOSITS AND INVESTMENTS (CONTINUED)
At June 30, 2019, the School District had the following investments and
maturities:
Not Less than Over
Investment Type Fair Value Applicable 1 Year 1 - 5 Years 5 Years
Debt securities:
US agency securities 2,719,259$ -$ -$ 1,371,713$ 1,347,546$
Of the School District’s investments of $2,719,259, $486,138 was covered by the Securities Investor Protection Corporation (SIPC). The remaining investments of $2,233,121 were uncollateralized and uninsured. Fair Value Hierarchy The School District categorizes its fair value measurements within the fair value hierarchy established by generally accepted accounting principles. The School District has the following recurring fair value measurements as June 30, 2019:
Quoted Prices in Significant
Active Markets Other Significant
for Identical Observable Unobservable
June 30, 2018 Assets Inputs Inputs
Total (Level I) (Level II) (Level III)
Investments by fair value level
Debt securities:
US agency securities 2,719,259$ -$ 2,719,259$ -$
Total investments by fair value level 2,719,259 - 2,719,259 -
Cash equivalents measured at the net asset value (NAV)
Money market mutual funds 28,991
Total cash equivalents measured at the NAV 28,991$
Total investments and cash equivalents measured
at fair value 2,748,250$
Fair Value Measurements Using
Debt securities classified in Level 2 of the fair value hierarchy are valued from publicly reliable sources or using a matrix pricing technique. Matrix pricing is used to value securities based on the securities' relationship to benchmark quoted prices. The School District has no Level 1 or 3 investments. The fair value of money market mutual

CHAMPLAIN VALLEY SCHOOL DISTRICT
NOTES TO FINANCIAL STATEMENTS JUNE 30, 2019
38
NOTE 2 - DEPOSITS AND INVESTMENTS (CONTINUED) funds that are measured at NAV per share (or its equivalent) is calculated as of June 30, 2019 in a manner consistent with the Financial Accounting Standards Board’s measurement principles for investment companies.
Credit risk - Statutes for the State of Vermont authorize the School District to invest in obligations of the U.S. Treasury, agencies and instrumentalities, other states and Canada, provided such securities are rated within the three highest grades by an approved rating service of the State of Vermont, corporate stocks and bonds within statutory limits, financial institutions, mutual funds and repurchase agreements. The School District does not have an investment policy on credit risk. Generally, the School District invests excess funds in savings accounts and various insured certificates of deposit.
Interest rate risk - is the risk that changes in interest rates will adversely affect the fair value of an investment. The School District does not have a formal investment policy that limits investment maturities as a means of managing its exposure to fair value losses arising from fluctuations in interest rates. NOTE 3 - INTERFUND RECEIVABLES AND PAYABLES
Interfund balances at June 30, 2019 consisted of the following individual fund receivables and payables:
Receivables Payables
(Due from) (Due to)
General Fund 1,377,459$ 1,983,150$
Medicaid Mac Fund 1,135,850 -
Capital Project Funds 220,943 -
Nonmajor Governmental Funds 626,351 1,377,459
Enterprise Funds 6 -
3,360,609$ 3,360,609$
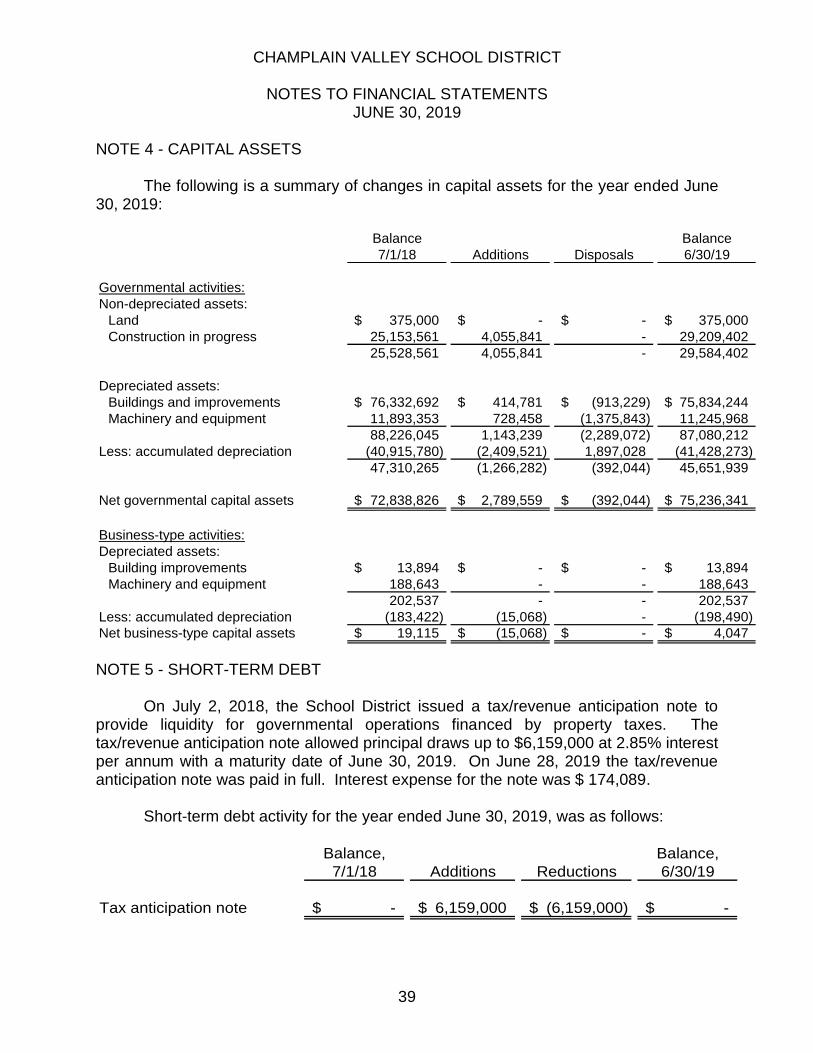
CHAMPLAIN VALLEY SCHOOL DISTRICT
NOTES TO FINANCIAL STATEMENTS JUNE 30, 2019
39
NOTE 4 - CAPITAL ASSETS
The following is a summary of changes in capital assets for the year ended June 30, 2019:
Balance Balance
7/1/18 Additions Disposals 6/30/19
Governmental activities:
Non-depreciated assets:
Land 375,000$ -$ -$ 375,000$
Construction in progress 25,153,561 4,055,841 - 29,209,402
25,528,561 4,055,841 - 29,584,402
Depreciated assets:
Buildings and improvements 76,332,692$ 414,781$ (913,229)$ 75,834,244$
Machinery and equipment 11,893,353 728,458 (1,375,843) 11,245,968
88,226,045 1,143,239 (2,289,072) 87,080,212
Less: accumulated depreciation (40,915,780) (2,409,521) 1,897,028 (41,428,273)
47,310,265 (1,266,282) (392,044) 45,651,939
Net governmental capital assets 72,838,826$ 2,789,559$ (392,044)$ 75,236,341$
Business-type activities:
Depreciated assets:
Building improvements 13,894$ -$ -$ 13,894$
Machinery and equipment 188,643 - - 188,643
202,537 - - 202,537
Less: accumulated depreciation (183,422) (15,068) - (198,490)
Net business-type capital assets 19,115$ (15,068)$ -$ 4,047$
NOTE 5 - SHORT-TERM DEBT On July 2, 2018, the School District issued a tax/revenue anticipation note to provide liquidity for governmental operations financed by property taxes. The tax/revenue anticipation note allowed principal draws up to $6,159,000 at 2.85% interest per annum with a maturity date of June 30, 2019. On June 28, 2019 the tax/revenue anticipation note was paid in full. Interest expense for the note was $ 174,089.
Short-term debt activity for the year ended June 30, 2019, was as follows:
Balance, Balance,
7/1/18 Additions Reductions 6/30/19
Tax anticipation note -$ 6,159,000$ (6,159,000)$ -$

CHAMPLAIN VALLEY SCHOOL DISTRICT
NOTES TO FINANCIAL STATEMENTS JUNE 30, 2019
40
NOTE 6 - LONG-TERM DEBT
A summary of long-term debt for the year ended June 30, 2019 is as follows:
Balance,
7/1/18 Balance, Current Year
(Restated) Additions Deletions 6/30/19 Portion
Bonds payable 39,576,808$ -$ (2,227,453)$ 37,349,355$ 2,227,453$
Notes from direct borrowings
payable 1,736,663 470,000 (499,473) 1,707,190 488,915
Total 41,313,471$ 470,000$ (2,726,926)$ 39,056,545$ 2,716,368$
The following is a description of the outstanding bonds and notes and direct borrowings payable:
Bonds payable:
$14,220,000, 2004 General Obligation bond due to Vermont Municipal
Bond Bank in annual principal installments of $640,000 to $780,000
through 2024. The fixed interest rate ranges from 1.87% to 5.09% per
annum. 3,850,000$
$249,000, 2013 General Obligation bond due to Vermont Municipal
Bond Bank in annual principal installments of $25,000 with a final
principal installment of $24,000 in 2023. The fixed interest rate ranges
from 0.804% to 3.634% per annum. 124,000
$540,000, 2016 General Obligation bond due to Vermont Municipal
Bond Bank in annual preincipal installments of $36,000 November of
2031. The fixed interest rate ranges from 1.491% to 2.861% per
annum. 468,000
$2,800,000, 2010 General Obligation bond due to Community Bank in
full on March 1, 2027. The School District makes annual payments to
a sinking fund in the amount of $145,000. No interest is charged on
this bond. 2,800,000
$2,500,000, 2010 General Obligation bond due to Community Bank in
full on March 1, 2027. The School District makes annual payments to
a sinking fund in the amount of $130,000. No interest is charged on
this bond. 2,500,000

CHAMPLAIN VALLEY SCHOOL DISTRICT
NOTES TO FINANCIAL STATEMENTS JUNE 30, 2019
41
NOTE 6 - LONG-TERM DEBT (CONTINUED)
$9,250,000, 2017 General Obligation bond due to Vermont Municipal
Bond Bank in annual principal installments of $462,500 through
November 2036. The fixed interest rate charged is 2.732% per
annum. 8,325,000
$480,000, 2008 General Obligation bond due to Vermont Municipal
Bond Bank in annual principal installments of $30,000 to $35,000
through November of 2023. The fixed interest rate ranges from 1.9%
to 4.41% per annum. 150,000
$365,000, 2011 General Obligation bond due to Vermont Municipal
Bond Bank in semi-annual installments of $11,227 through December
2027. The fixed interest rate charged is 0.179% per annum. 190,855
$140,000, 2014 General Obligation bond due to Vermont Municipal
Bond Bank in annual principal installments of $14,000 through
November of 2024. The fixed interest rate ranges from 0.513% to
3.223% per annum. 84,000
$19,850,000, 2017 General Obligation bond due to Vermont Municipal
Bond Bank in annual principal installments of $992,500 through
November of 2037. The fixed interest rate ranges from 1.55% to
3.82% per annum. 18,857,500
Total bonds payable 37,349,355$
Notes from direct borrowings payable:
Bus note payable to Community National Bank in annual principal
installments of $94,000 through July 2023. Interest is charged at a
fixed rate of 2.75% per annum. 470,000$
Bus note payable to Community Bank, interest is charged at a fixed
rate of 1.60%, principal and interest due July 15, 2021. 119,819
Bus note payable to Community National Bank, interest is charged at
a fixed rate of 1.50% per annum, principal and interest due July 15,
2020. 66,800
Bus note payable to Peoples United Bank, interest is charged at a
fixed rate of 1.95% per annum, principal and interest due July 15,
2019. 33,894
$370,000, Capital improvement note payable to Community Bank in
annual principal installments of $24,667 through July 2030. Interest is
a fixed rate of 2.45% per annum. 296,000

CHAMPLAIN VALLEY SCHOOL DISTRICT
NOTES TO FINANCIAL STATEMENTS JUNE 30, 2019
42
NOTE 6 - LONG-TERM DEBT (CONTINUED)
Bus note payable to Peoples United Bank, interest is charged at a
fixed rate of 1.95% per annum, annual principal payments of $19,783
and interest due July 15, 2019. 19,783
Bus note payable to Community National Bank, interest is charged at
a fixed rate of 1.50% per annum, annual principal payments of
$20,200 and interest due July 15, 2020. 40,400
Bus note payable to Community Bank, interest is charged at a fixed
rate of 1.60% per annum, annual principal payments of $39,940 and
interest due July 15, 2021. 119,819
Bus note payable to Peoples United Bank, interest is charged at a
fixed rate of 1.95% per annum, annual principal payments of $19,783
and interest due July 15, 2019. 19,783
Bus note payable to Community National Bank, interest is charged at
a fixed rate of 1.50% per annum, annual principal payments of
$20,200 and interest due July 15, 2020. 40,400
Bus note payable to Merchants Bank, interest is charged at a fixed
rate of 1.60% per annum, annual principal payments of $39,940 and
interest due July 15, 2021. 119,820
$260,000, Financial/HR system note payable to Community National
Bank in annual principal installments of $52,000 through November of
2021. Interest is charged as a fixed rate of 1.50% per annum. 156,000
$255,840, Bus note payable to Community National Bank in annual
principal installments of $51,168 through July of 2022. Interest is
charged as a fixed rate of 2.25% per annum. 204,672
Total notes from direct borrowings payable 1,707,190$

CHAMPLAIN VALLEY SCHOOL DISTRICT
NOTES TO FINANCIAL STATEMENTS JUNE 30, 2019
43
NOTE 6 - LONG-TERM DEBT (CONTINUED) The following is a summary of outstanding bond and notes from direct borrowings payable principal and interest requirements for the fiscal years ending June 30:
Year Ending
June 30, Principal Interest Principal Interest
2020 2,227,453$ 976,716$ 488,915$ 37,018$
2021 2,227,453 917,085 415,453 26,797
2022 2,222,453 854,447 341,653 19,510
2023 2,222,453 788,639 169,835 11,560
2024 2,221,453 719,214 118,667 7,207
2025-2029 13,487,590 2,633,308 123,333 13,879
2030-2034 7,383,000 1,638,064 49,334 1,228
2035-2039 5,357,500 413,975 - -
37,349,355$ 8,941,448$ 1,707,190$ 117,199$
Governmental Activities
Bonds Payable Payable
Notes from Direct Borrowings
NOTE 7 - OTHER LONG-TERM OBLIGATIONS A summary of other long-term obligations for the year ended June 30, 2019 is as follows:
Balance, Balance, Current Year
7/1/18 Additions Deletions 6/30/19 Portion
Accrued compensated
absences 433,170$ 26,494$ -$ 459,664$ 22,983$
Accrued severance payable 86,750 30,000 (58,250) 58,500 43,500
Net pension liability 4,879,427 2,160,069 (1,500,534) 5,538,962 -
5,399,347$ 2,216,563$ (1,558,784)$ 6,057,126$ 66,483$
Refer to Notes 8, 9 and 14 for more detailed information regarding other long-term obligations. NOTE 8 - ACCRUED COMPENSATED ABSENCES The School District’s policies regarding vacation and sick time do permit employees to accumulate earned but unused vacation and sick leave. The liability for these compensated absences is recorded as long-term obligations in the government-wide financial statements. In the fund financial statements, governmental funds report only the compensated absence liability payable from expendable available financial resources, while the proprietary funds report the liability as it is incurred. As of June 30, 2019, the School District’s liability for compensated absences is $459,664.

CHAMPLAIN VALLEY SCHOOL DISTRICT
NOTES TO FINANCIAL STATEMENTS JUNE 30, 2019
44
NOTE 9 - ACCRUED SEVERANCE PAYABLE Teachers that have taught a minimum of ten consecutive years and that are on the 14th step of the salary schedule are eligible for severance pay. The liability for accrued severance payable is recorded as long-term obligations in the government-wide financial statements. In the fund financial statements, governmental funds report only the severance liability payable from expendable available financial resources, while the proprietary funds report the liability as it is incurred. As of June 30, 2019, the School District’s liability for severance payable is $58,500. NOTE 10 - NONSPENDABLE FUND BALANCES At June 30, 2019, the School District had the following nonspendable fund balances:
General fund:
Inventory 61,848$
Prepaid items 74,570
136,418$
NOTE 11 - RESTRICTED FUND BALANCES At June 30, 2019, the School District had the following restricted fund balances:
Debt service fund 2,733,120$
Capital projects fund 453,652
Nonmajor capital projects funds (Schedule G) 386,834
3,573,606$
NOTE 12 - COMMITTED FUND BALANCE At June 30, 2019, the School District had the following committed fund balance:
Capital projects fund 1,000,000$

CHAMPLAIN VALLEY SCHOOL DISTRICT
NOTES TO FINANCIAL STATEMENTS JUNE 30, 2019
45
NOTE 13 - ASSIGNED FUND BALANCES
At June 30, 2019, the School District had the following assigned fund balances:
General fund:
FY 2020 budget 500,000$
Revenue for future budgets 1,823,698
2,323,698$
NOTE 14 - DEFINED BENEFIT PENSION PLANS
VERMONT STATE TEACHERS’ RETIREMENT SYSTEM
Plan Description
All of the teachers employed by the School District participate in the Vermont State Teachers’ Retirement System (“VSTRS”), a cost-sharing multiple-employer defined benefit pension plan with a special funding situation, covering nearly all public day school and nonsectarian private Union teachers and administrators as well as teachers in schools and teacher training institutions within and supported by the State of Vermont that are controlled by the State Board of Education. Membership in the system for those covered classes is a condition of employment. During the year ended June 30, 2017 (the most recent period available), the retirement system consisted of 22,193 participating members.
The plan was established effective July 1, 1947 and is governed by Title 16, V.S.A. Chapter 55. Subsequent Vermont state legislation, Act 74, which became effective on July 1, 2010, contained numerous changes to the plan benefits available to current and future members, as well as a change in access to health care coverage after retirement, resulting from a multi-party agreement to provide sustainability of quality pension and retiree health benefits for Vermont teachers.
The general administration and responsibility for formulating administrative policy and procedures of the retirement System for its members and their beneficiaries is vested in the Board of Trustees consisting of six members. They are the Secretary of Education (ex-officio); the State Treasurer (ex-officio), the Commissioner of Financial Regulation (ex-officio); two members and one alternate elected by active members of the System under rules adopted by the Board; and one retired member and one alternate elected by the board of directors of Association of Retired Teachers of Vermont. The Chair is elected by the Board and acts as executive officer of the Board.
All assets are held in a single trust and are available to pay retirement benefits to all members. Benefits available to each group are based on average final compensation (AFC) and years of creditable service. The Vermont State Agency of

CHAMPLAIN VALLEY SCHOOL DISTRICT
NOTES TO FINANCIAL STATEMENTS JUNE 30, 2019
46
NOTE 14 - DEFINED BENEFIT PENSION PLANS (CONTINUED) Administration issues a publicly available Comprehensive Annual Financial Report (CAFR) that includes financial statements and required supplementary information for the VSTRS. That report may be viewed on the State’s Department of Finance & Management website at: http://finance.vermont.gov/reports_and_publications/cafr.
Benefits Provided
The VSTRS provides retirement and disability benefits, annual cost-of-living adjustments, health care and death benefits to plan members and beneficiaries. There are two levels of contributions and benefits in the System: Group A - for public school teachers employed within the State of Vermont prior to July 1, 1981 and elected to remain in Group A; and Group C - for public school teachers employed within the State of Vermont on or after July 1, 1990. Group C also includes those teachers hired prior to July 1, 1990 and were in Group B on July 1, 1990. When Act 74 became effective on June 30, 2010, Group C was further bifurcated into Groups #1 and #2. Group #1 contains members who were at least 57 years of age or had at least 25 years of service and Group #2 contains members who were less than 57 years of age and had less than 25 years of service.
Benefits available to each group are based on average final compensation (AFC) and years of creditable service and are summarized below:
VSTRS Group A Group C – Group # 1
Group C – Group # 2
Normal service retirement eligibility (no reduction)
Age 60 or 30 years of service
Age 62 or with 30 years of service
Age 65 or when the sum of age and service equals 90
Average Final Compensation (AFC)
Highest 3 consecutive years, including unused annual leave, sick leave and bonus/incentives
Highest 3 consecutive years, excluding all payments for anything other than service actually performed
Highest 3 consecutive years, excluding all payments for anything other than service actually performed
Benefit formula – normal service retirement
1.67% x creditable service x AFC
1.25% x service prior to 6/30/90 x AFC + 1.67% x service after 7/1/90 x AFC
1.25% x service prior to 6/30/90 x AFC + 1.67% x service after 7/1/90 x AFC, 2.0% after attaining 20 years
Maximum Benefit Payable
100% of AFC 53.34% of AFC 60% of AFC

CHAMPLAIN VALLEY SCHOOL DISTRICT
NOTES TO FINANCIAL STATEMENTS JUNE 30, 2019
47
NOTE 14 - DEFINED BENEFIT PENSION PLANS (CONTINUED)
VSTRS Group A Group C – Group # 1
Group C – Group # 2
Post-Retirement COLA
Full CPI, up to a maximum of 5% after 12 months of retirement; minimum of 1%
50% CPI, up to a maximum of 5% after 12 months of retirement or with 30 years; minimum of 1%
50% CPI, up to a maximum of 5%, minimum of 1% after 12 months of normal retirement or age 65
Early Retirement Eligibility
Age 55 with 5 years of service
Age 55 with 5 years of service
Age 55 with 5 years of service
Early Retirement Reduction
Actuarial reduction 6% per year from age 62
Actuarial reduction
Other post-employment benefits are available to all plan members include the
following:
VSTRS Group A Group C – Group # 1
Group C – Group # 2
Medical Benefits Health subsidy based on member’s service credit
Health subsidy based on member’s service credit
Health subsidy based on member’s service credit
Dental Members pay full premium
Members pay full premium
Members pay full premium
Contributions
VSTRS is a cost-sharing public employee retirement system with one exception:
all risks and costs are not shared by the School District but are the liability of the State of Vermont. VSTRS is funded through State and employee contributions and trust fund investment earnings; and the School District has no legal obligation for paying benefits. Required contributions to the System are made by the State of Vermont based upon a valuation report prepared by the System’s actuary, which varies by plan group. The Vermont State Teachers Retirement System estimates the contributions on behalf of the School District’s employees included in the teacher’s retirement plan which approximates $5,160,436 or 15.75% of total payroll for employees covered under the plan. Beginning in 2016, School Districts that pay for teachers with federal dollars are required to include costs of pensions in the federal grant, lowering the liability for the State. Federally funded pension costs reimbursed to the State by the School District for the fiscal year ending June 30, 2019 were $123,138. The School District’s total payroll for all federal funded employees covered under this plan was $781,834 for the year ended June 30, 2019.

CHAMPLAIN VALLEY SCHOOL DISTRICT
NOTES TO FINANCIAL STATEMENTS JUNE 30, 2019
48
NOTE 14 - DEFINED BENEFIT PENSION PLANS (CONTINUED)
Employee contribution rates by plan group follow:
VSTRS Group A Group C – Group # 1
Group C – Group # 2
Employee Contributions
5.5% of gross salary 5.0% of gross salary with 5 or more years of service as of 7/1/14; 6.0% of gross salary if less than 5 years of service as of 7/1/14
5.0% of gross salary with 5 or more years of service as of 7/1/14; 6.0% of gross salary if less than 5 years of service as of 7/1/14
Employee contributions totaled $1,715,338 during the year and were paid by the
School District to the State of Vermont. The School District has no other liability under the plan. The School District’s total payroll for all employees covered under this plan was $32,764,674 for the year ended June 30, 2019.
VERMONT MUNICIPAL EMPLOYEES’ RETIREMENT SYSTEM
Plan Description
The Vermont Municipal Employees’ Retirement System (VMERS) is a cost-sharing, multiple-employer defined benefit pension plan that is administered by the State Treasurer and its Board of Trustees. The plan was established effective July 1, 1975 and is governed by Title 24, V.S.A. Chapter 125. It is designed for school districts and other municipal employees that work on a regular basis and also includes employees of museums and libraries if at least half of that institution’s operating expenses are met by municipal funds. An employee of any employer that becomes affiliated with the system may join at that time or at any time thereafter. Any employee hired subsequent to the effective participation date of their employer who meets the minimum hourly requirements is required to join the system. Employees of the School other than Teachers are eligible to participate in the VMERS providing they work on a regular basis for not less than 30 hours a week and for not less than 1,040 hours for the school year. For the year ended June 30, 2017 (the most recent data available), the retirement system consisted of 13,262 participating members.
The general administration and responsibility for formulating administrative policy and procedures of the Retirement System for its members and their beneficiaries is vested in the Board of Trustees consisting of five members. They are the State Treasurer, two employee representatives elected by the membership of the system and

CHAMPLAIN VALLEY SCHOOL DISTRICT
NOTES TO FINANCIAL STATEMENTS JUNE 30, 2019
49
NOTE 14 - DEFINED BENEFIT PENSION PLANS (CONTINUED) two employer representatives-one elected by the governing bodies of participating employers of the system and one selected by the Governor from a list of four nominees. The list of four nominees is jointly submitted by the Vermont League of Cities and Schools and the Vermont School Boards Association.
All assets are held in a single trust and are available to pay retirement benefits to all members. Benefits available to each group are based on average final compensation (AFC) and years of creditable service. VMERS does not issue stand-alone financial reports, but instead are included as part of the State of Vermont’s Comprehensive Annual Financial Report (CAFR). The CAFR may be viewed on the State’s Department of Finance and Management website at:
http://finance.vermont.gov/reports_and_publications/cafr. Benefits Provided
The pension plan is divided into four membership groups:
• Group A – general employees whose legislative bodies have not elected to become a member of Group B or Group C
• Groups B & C – general employees whose legislative bodies have elected to become members of Group B or Group C
• Group D – sworn police officers, firefighters and emergency medical personnel
The School District participates in Groups A, B and C. Benefits available to each
group are based on average final compensation (AFC) and years of creditable service and are summarized below:
VMERS Group A Group B Group C Group D
Normal service retirement eligibility
Age 65 with 5 years of service, or age 55 with 35 years of service
Age 62 with 5 years of service, or age 55 with 30 years of service
Age 55 with 5 years of service
Age 55 with 5 years of service
Average Final Compensation (AFC)
Highest 5 consecutive years
Highest 3 consecutive years
Highest 3 consecutive years
Highest 2 consecutive years

CHAMPLAIN VALLEY SCHOOL DISTRICT
NOTES TO FINANCIAL STATEMENTS JUNE 30, 2019
50
NOTE 14 - DEFINED BENEFIT PENSION PLANS (CONTINUED)
VMERS Group A Group B Group C Group D
Benefit formula – normal service Retirement (no reduction)
1.4% x creditable service x AFC
1.7% x creditable service x AFC + previous service; 1.4% x Group A service x AFC
2.5% x creditable service x AFC + previous service; 1.4% x Group A service x AFC; 1.7% x Group B x AFC
2.5% x creditable service x AFC + previous service; 1.4% x Group A service x AFC; 1.7% x Group B x AFC; 2.5% x Group C service x AFC
Maximum Benefit Payable
60% of AFC 60% of AFC 50% of AFC 50% of AFC
Post-Retirement COLA
50% of CPI, up to 2% per year
50% of CPI, up to 3% per year
50% of CPI, up to 3% per year
50% of CPI, up to 3% per year
Early Retirement Eligibility
Age 55 with 5 years of service
Age 55 with 5 years of service
N/A Age 50 with 20 years of service
Early Retirement Reduction
6% per year from age 65 **
6% per year from age 62 **
N/A No reduction
** - A special early retirement factor of 3% per year only for municipal police officers who have attained age 60
Members of all groups may qualify for vested deferred allowance, disability allowances and death benefit allowance subject to meeting various eligibility requirements. Benefits are based on AFC and service.
Contributions
Title 24 VSA Chapter 125 of Vermont Statutes grants the authority to the Retirement Board to annually review the amount of municipalities’ contributions as recommended by the actuary of the retirement system in order to achieve and preserve the financial integrity of the fund and to certify the rates of contributions payable by employers. The Board of Trustees also certifies the rates of contribution payable by employees. Contribution rates for each group are as follows:

CHAMPLAIN VALLEY SCHOOL DISTRICT
NOTES TO FINANCIAL STATEMENTS JUNE 30, 2019
51
NOTE 14 - DEFINED BENEFIT PENSION PLANS (CONTINUED)
VMERS Group A Group B Group C Group D
Employee Contributions
2.625% of gross salary
5.0% of gross salary
10.125% of gross salary
11.475% of gross salary
Employer Contributions
4.125% of gross salary
5.625% of gross salary
7.375% of gross salary
9.975% of gross salary
Employee contributions are withheld pre-income tax by the School District and
are remitted to the State of Vermont. Such withholdings for the year ended June 30, 2019 totaled $809,370. The School District contributed $747,451 for the year ended June 30, 2019. The School District’s total payroll for the year ended June 30, 2019 for all employees covered under this plan was $12,266,618.
Pension Liabilities
VSTRS Plan
The State is a nonemployer contributor and is required by statute to make all actuarially determined employer contributions on behalf of member employers.
Therefore, these employers are considered to be in a special funding situation as defined in GASB No. 68 and the State is treated as a nonemployer to VSTRS. Since the School District does not contribute directly to VSTRS, no net pension liability was recorded at June 30, 2019. The State’s portion of the collective net pension liability that was associated with the School District was as follows:
School District's proportionate share of the net
pension liability -$
State's proportionate share of the net pension
liability associated with the School District 32,207,307
Total 32,207,307$
The State of Vermont’s proportionate share of the net pension liability associated with the School District is equal to the collective net pension liability, actuarially measured as of June 30, 2018, multiplied by the School District’s proportionate share percentage. The School District’s proportionate share percentage was based on its reported salaries to the total reported salaries for all participating employers. At June 30, 2018, the School District’s proportion was 4.76415% which was an increase of 0.0238% from its proportion measured as of June 30, 2017.

CHAMPLAIN VALLEY SCHOOL DISTRICT
NOTES TO FINANCIAL STATEMENTS JUNE 30, 2019
52
NOTE 14 - DEFINED BENEFIT PENSION PLANS (CONTINUED) VMERS Plan
At June 30, 2019, the School District reported a liability of $5,538,962 for its proportionate share of the net pension liabilities for each plan. The net pension liabilities were measured as of June 30, 2018 and the total pension liabilities used to calculate the net pension liabilities was determined by an actuarial valuation as of that date. The School District’s proportion of the net pension liabilities were based on a projection of the School District’s long-term share of contributions to each pension plan relative to the projected contributions of all participating towns, actuarially determined.
At June 30, 2018, the School District’s proportion was 3.9374% for VMERS,
which was a decrease of 0.0900% from its proportion measured as of June 30, 2017 for VMERS.
Pension Expense and Deferred Outflows of Resources and Deferred Inflows of Resources Related to Pensions
For the year ended June 30, 2019, the School District recognized total pension expense of $24,542,761 and revenue of $24,542,761 for support provided by the State of Vermont for the VSTRS plan. In the same period, the School District recognized pension revenue of $1,829,809 for the VMERS plan. At June 30, 2019, the School District reported deferred outflows of resources and deferred inflows of resources related to pensions from the following sources:
Deferred Outflows Deferred Inflows Deferred Outflows Deferred Inflows
of Resources of Resources of Resources of Resources
Differences between expected and actual
experience -$ -$ 481,118$ 88,569$
Changes of assumptions - - 613,370 -
Net difference between projected and actual
earnings on pension plan investments - - 641,946 -
Changes in proportion and differences between
contributions and proportionate share of
contributions - - 2,420,690 -
Contributions subsequent to the measurement
date - - 747,451 -
Total -$ -$ 4,904,575$ 88,569$
VSTRS VMERS

CHAMPLAIN VALLEY SCHOOL DISTRICT
NOTES TO FINANCIAL STATEMENTS JUNE 30, 2019
53
NOTE 14 - DEFINED BENEFIT PENSION PLANS (CONTINUED) $747,451 reported as deferred outflows of resources related to pensions resulting from School District contributions subsequent to the measurement date will be recognized as a reduction of the net pension liability in the year ended June 30, 2020. Other amounts reported as deferred outflows of resources and deferred inflows of resources related to pensions will be recognized in pension expense as follows:
VSTRS VMERS
Plan Plan
Plan year ended June 30:
2019 -$ 1,644,789$
2020 - 984,447
2021 - 700,956
2022 - 738,362
2023 - -
Thereafter - -
Significant Actuarial Assumptions and Methods
The total pension liability for the June 30, 2018 measurement date was determined by an actuarial valuation as of June 30, 2017 rolled forward to June 30, 2018 using the actuarial assumptions outlined below.
Investment Rate of Return: For both plans, 7.50%, net of pension plan investment expenses, including inflation.
Inflation: For both plans, 2.50%. Salary Increases: For the VSTRS plan, increases ranging from 3.75% to 9.09%.
For the VMERS plan, increases are 5.00% per year.
Deaths After Retirement: The VSTRS plan used 98% of the RP-2006 White Collar Employee with generational projection using Scale SSA-2017 for pre-retirement, 98% of the RP-2006 White Collar Annuitant with generational projection using Scale SSA-2017 for healthy retirees, and the RP-2006 Disabled Mortality Table with generational projection using Scale SSA-2017 for disabled retirees.
Mortality rates for pre-retirement, healthy retirees and disabled retirees in the
VMERS plan for Groups A, B, C and D were based on variations of RP-2006 Tables with generational improvement using Scale SSA-2017 as follows:

CHAMPLAIN VALLEY SCHOOL DISTRICT
NOTES TO FINANCIAL STATEMENTS JUNE 30, 2019
54
NOTE 14 - DEFINED BENEFIT PENSION PLANS (CONTINUED)
Pre-retirement - Groups A, B, and C blended with a 60% Blue Collar Employee
and 40% Healthy Employee, and Group D with a Blue Collar Annuitant Table
Healthy Retiree - Groups A, B and C with a 60% Blue Collar Annuitant and 40% Healthy Annuitant, and Group D with a Blue Collar Annuitant Table
Disabled Retiree - All Groups with a RP-2006 Disabled Mortality Table Inactive Members: Valuation liability for the VSTRS plan equals 250.0% of
accumulated contributions and 200% for the VMERS plan. Future Administrative Expenses: No provisions were made for the VSTRS plan
as Systems expenses are paid for by the State. For the VMERS plan, an expense adjustment based on actual expenses for the previous year is reflected in the development of recommended employer contribution levels.
Unknown Data for Participants: For both plans, they are the same as those
exhibited by participants with similar known characteristics. If not specified, participants are assumed to be male.
Percent Married: For both plans, 85% of male members are assumed to be
married. 35% of female members for the VSTRS plan and 50% of female members for the VMERS plan are assumed to be married.
Spouse’s Age: For both plans, husbands are assumed to be three years older
than their wives. Cost-of-Living Adjustments: Adjustments for both plans are assumed to occur on
January 1 following one year of retirement. For the VSTRS plan this occurs at the rate of 2.55% per annum for Group A members and 1.40% per annum for Group C members (beginning at age 62 for Group C members who elect reduced early retirement). The January 1, 2019 COLA is assumed to be 2.60% for Group A and 1.30% for Group C. For the VMERS plan, this occurs at the rate of 1.15% per annum for Group A members and 1.30% per annum for Groups B, C and D members (beginning Normal Retirement eligibility age for members who elect reduced early retirement, at age 62 for Group A, B and D members who receive a disability retirement benefit and at age 55 for members of Group C who receive a disability retirement benefit). The January 1, 2019 COLA is 1.30% for all groups.
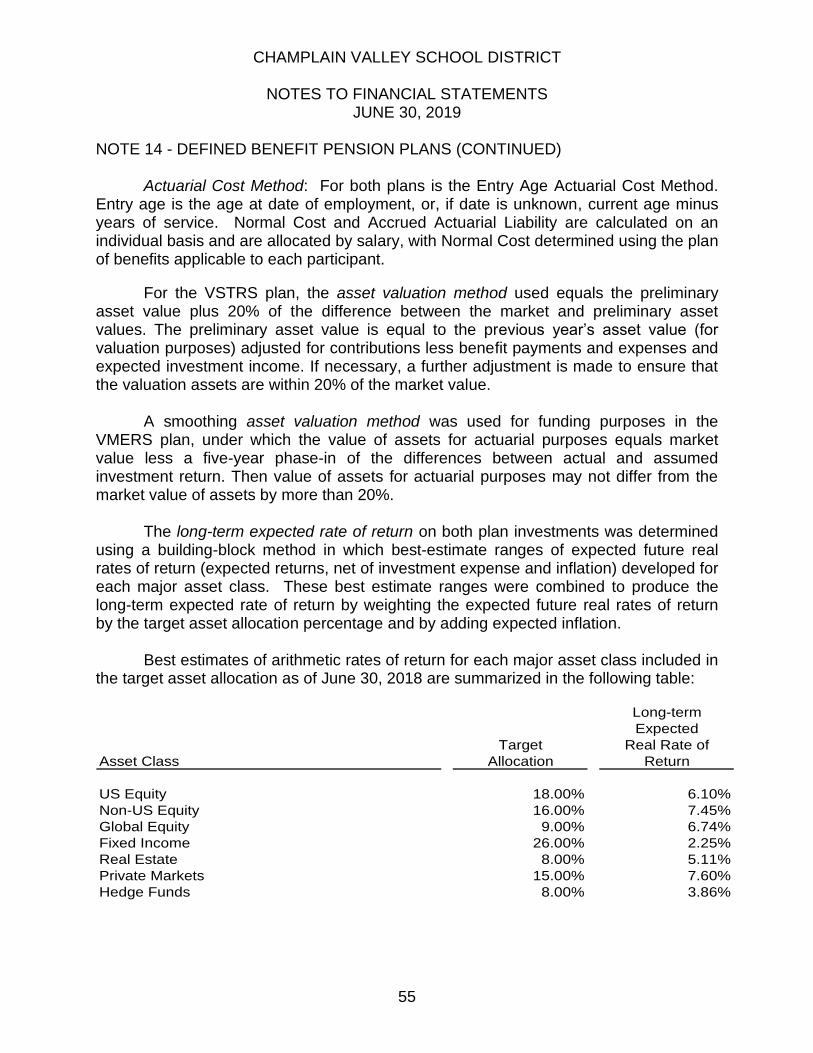
CHAMPLAIN VALLEY SCHOOL DISTRICT
NOTES TO FINANCIAL STATEMENTS JUNE 30, 2019
55
NOTE 14 - DEFINED BENEFIT PENSION PLANS (CONTINUED)
Actuarial Cost Method: For both plans is the Entry Age Actuarial Cost Method.
Entry age is the age at date of employment, or, if date is unknown, current age minus years of service. Normal Cost and Accrued Actuarial Liability are calculated on an individual basis and are allocated by salary, with Normal Cost determined using the plan of benefits applicable to each participant.
For the VSTRS plan, the asset valuation method used equals the preliminary asset value plus 20% of the difference between the market and preliminary asset values. The preliminary asset value is equal to the previous year’s asset value (for valuation purposes) adjusted for contributions less benefit payments and expenses and expected investment income. If necessary, a further adjustment is made to ensure that the valuation assets are within 20% of the market value.
A smoothing asset valuation method was used for funding purposes in the VMERS plan, under which the value of assets for actuarial purposes equals market value less a five-year phase-in of the differences between actual and assumed investment return. Then value of assets for actuarial purposes may not differ from the market value of assets by more than 20%.
The long-term expected rate of return on both plan investments was determined
using a building-block method in which best-estimate ranges of expected future real rates of return (expected returns, net of investment expense and inflation) developed for each major asset class. These best estimate ranges were combined to produce the long-term expected rate of return by weighting the expected future real rates of return by the target asset allocation percentage and by adding expected inflation.
Best estimates of arithmetic rates of return for each major asset class included in
the target asset allocation as of June 30, 2018 are summarized in the following table:
Long-term
Expected
Target Real Rate of
Asset Class Allocation Return
US Equity 18.00% 6.10%
Non-US Equity 16.00% 7.45%
Global Equity 9.00% 6.74%
Fixed Income 26.00% 2.25%
Real Estate 8.00% 5.11%
Private Markets 15.00% 7.60%
Hedge Funds 8.00% 3.86%

CHAMPLAIN VALLEY SCHOOL DISTRICT
NOTES TO FINANCIAL STATEMENTS JUNE 30, 2019
56
NOTE 14 - DEFINED BENEFIT PENSION PLANS (CONTINUED) Discount Rate
The discount rate used to measure the total pension liability was 7.50% for the VSTRS plan and the VMERS plan. The projection of cash flows used to determine the discount rate assumed that contributions will continue to be made in accordance with the current funding policy which exceeds the actuarially determined contribution rate. Based on these assumptions, the fiduciary net position was projected to be available to make all projected future benefit payments to current System members. The assumed discount rate has been determined in accordance with the method prescribed by GASB 68.
Sensitivity of the School District’s Proportionate Share of the Net Pension Liability to Changes in the Discount Rate
The following presents the School District’s proportionate share of the net pension liability calculated using the discount rate of 7.50% for both the VSTRS and VMERS plans, as well as what the School District’s proportionate share of the net pension liability would be if it were calculated using a discount rate that is 1 percentage point lower (6.50%) or 1 percentage point higher (8.50%) than the current rate:
1% Discount 1%
Decrease Rate Increase
VSTRS:
Discount rate 6.50% 7.50% 8.50%
School District's proportionate share of
the net pension liability -$ -$ -$
VMERS:
Discount rate 6.50% 7.50% 8.50%
School District's proportionate share of
the net pension liability 9,381,753$ 5,538,962$ 4,157,124$
Pension Plan Fiduciary Net Position
The schedule of employer allocations and schedule of pension amounts by employer are prepared on the accrual basis of accounting in accordance with U.S. generally accepted accounting principles. The schedules present amounts that are elements of the financial statements of the VSTRS and VMERS or their participating employers. VSTRS and VMERS do not issue stand-alone financial reports, but instead are included as part of the State of Vermont’s Comprehensive Annual Financial Report (CAFR). The CAFR can be viewed on the State’s Department of Finance and Management website at: http://finance.vermont.gov/reports_and_publications/cafr

CHAMPLAIN VALLEY SCHOOL DISTRICT
NOTES TO FINANCIAL STATEMENTS JUNE 30, 2019
57
NOTE 15 - OTHER POST EMPLOYMENT BENEFIT (OPEB) PLAN
VERMONT STATE TEACHERS’ RETIREMENT SYSTEM
Plan Description
The Vermont State Teachers’ Retirement System provides postemployment
benefits to eligible VSTRS employees who retire from the System through a cost-sharing, multiple-employer postemployment benefit (OPEB) plan (the Plan).
The plan covers nearly all public day school and nonsectarian private high school
teachers and administrators as well as teachers in schools and teacher training institutions within and supported by the State that are controlled by the State Board of Education. Membership in the system for those covered classes is a condition of employment. During the year ended June 30, 2018 (the most recent period available), the plan consisted of 4,878 retired members or beneficiaries currently receiving benefits and 8,941 active members.
Vermont Statute Title 16 Chapter 55 assigns the authority to VSTRS to establish
and amend the benefits provisions of the Plan and to establish maximum obligations of the Plan members to contribute to the Plan. Management of the Plan is vested in the Vermont State Teachers’ Retirement System Board of Trustees, which consists of the Secretary of Education (ex-officio); the State Treasurer (ex-officio); the Commissioner of Financial Regulation (ex-officio); two trustees and one alternate who are members of the system (each elected by the system under rules adopted by the Board) and one trustee and one alternate who are retired members of the system receiving retirement benefits (who are elected by the Association of Retired Teachers of Vermont).
All assets of the Plan are held in a single trust and are available to pay OPEB
benefits to all members. The Vermont State Agency of Administration issues a publicly available Comprehensive Annual Financial Report (CAFR) that includes financial statements and required supplementary information for the VSTRS. That report may be viewed on the State’s Department of Finance and Management website at: http://finance.vermont.gov/reports_and_publications/cafr.
Benefits Provided
VSTRS retirees and their spouses are eligible for medical, prescription drug and dental benefits on a lifetime basis if the retiree is eligible for pension benefits, as described in the Notes to Financial Statements for Defined Benefit Plan(s).

CHAMPLAIN VALLEY SCHOOL DISTRICT
NOTES TO FINANCIAL STATEMENTS JUNE 30, 2019
58
NOTE 15 - OTHER POST EMPLOYMENT BENEFIT (OPEB) PLAN (CONTINUED)
Contributions
Varying levels of contributions are required from retirees and spouses for medical
and prescription drug coverage at the following premium subsidy rates:
Retiree Subsidy Spouse Subsidy*
Retired before June 30, 2010
At least ten years of service-80% of premium Less than ten years of service-0% of premium
0% of premium
Retired after June 30, 2010
10 years or more of service at June 30, 2010-80% of premium
Years of service at June 30, 2010-80%
of premium: Less than 10 years of service at June 30, 2010:
Less than 15 years at retirement
Less than 15 years at retirement
Less than 10 years 25 years at retirement
15-19.99 years at retirement
15-19.99 years at retirement
10-14.99 years 25 years at retirement
20-24.99 years at retirement
20-24.99 years at retirement
15-24.99 years 10 additional years from June 30, 2010
25 years or more at retirement
25 years or more at retirement
25-29.99 years 35 years at retirement
30 or more years 5 additional years from June 30, 2010
* Spouses of retirees who do not meet the requirements for an 80% subsidy can
receive unsubsidized coverage Premium Reduction Option: Participants retiring on or after January 1, 2007 with
a VSTRS premium subsidy have a one-time option to reduce the VSTRS subsidy percentage during the retiree’s life so that a surviving spouse may continue to receive the same VSTRS subsidy for the spouse’s lifetime. If the retiree elects the joint and survivor pension option but not the Premium Reduction Option, spouses are covered for the spouse’s lifetime but pay 100% of the plan premium after the retiree’s death.

CHAMPLAIN VALLEY SCHOOL DISTRICT
NOTES TO FINANCIAL STATEMENTS JUNE 30, 2019
59
NOTE 15 - OTHER POST EMPLOYMENT BENEFIT (OPEB) PLAN (CONTINUED)
OPEB Liabilities The State is a nonemployer contributor and is required by statute to make all
actuarially determined employer contributions on behalf of member employers. Therefore, these employers are considered to be in a special funding situation as defined in GASB No. 75 and the State is treated as a nonemployer to VSTRS. Since the School District does not contribute directly to VSTRS, no net OPEB liability warecorded at June 30, 2019. The State’s portion of the collective net OPEB liability that was associated with the School District was as follows:
School District's proportionate share of the
net OPEB liability -$
State's proportionate share of the net OPEB
liability associated with the School District 37,546,495
Total 37,546,495$
The State of Vermont’s proportionate share of the net OPEB liability associated with the School District is equal to the collective net OPEB liability, actuarially measured as of June 30, 2018, multiplied by the School District’s proportionate share percentage. The School District’s proportionate share percentage was based on its reported salaries to the total reported salaries for all participating employers. At June 30, 2018, the School District’s proportion was 3.93451% which was an increase of 0.09838% from its proportion measured as of June 30, 2017.
OPEB Expense and Deferred Outflows of Resources and Deferred Inflows of Resources Related to OPEB
For the year ended June 30, 2019, the School District recognized total OPEB expense of $10,712,154 and revenue of $10,712,154 for support provided by the State of Vermont for the Plan. At June 30, 2019, the School District reported deferred outflows of resources and deferred inflows of resources related to OPEB from the following sources:

CHAMPLAIN VALLEY SCHOOL DISTRICT
NOTES TO FINANCIAL STATEMENTS JUNE 30, 2019
60
NOTE 15 - OTHER POST EMPLOYMENT BENEFIT (OPEB) PLAN (CONTINUED)
Deferred Outflows Deferred Inflows
of Resources of Resources
Differences between expected and actual
experience -$ -$
Changes of assumptions - -
Net difference between projected and actual
earnings on pension plan investments - -
Changes in proportion and differences between
contributions and proportionate share of
contributions - -
Contributions subsequent to the
measurement date - -
Total -$ -$
VSTRS OPEB Plan
Other amounts reported as deferred outflows of resources and deferred inflows of resources related to OPEB will be recognized in pension expense as follows:
VSTRS OPEB Plan
Plan year ended June 30:
2019 -$
2020 -
2021 -
2022 -
2023 -
Thereafter -
Discount Rate The discount rate is the single rate of return, that when applied to all projected benefit payments, results in an actuarial present value that is the sum of the actuarial present value of projected benefit payments projected to be funded by plan assets using a long term rate of return and the actuarial present value of projected benefit payments that are not included in (1) using a yield or index rate for 20-year tax exempt general obligation municipal bonds with an average rating of AA/Aa or higher. The sensitivity of net OPEB liability to changes in discount rate are as follows:

CHAMPLAIN VALLEY SCHOOL DISTRICT
NOTES TO FINANCIAL STATEMENTS JUNE 30, 2019
61
NOTE 15 - OTHER POST EMPLOYMENT BENEFIT (OPEB) PLAN (CONTINUED)
1% Discount 1%
Decrease Rate Increase
VSTRS OPEB Plan:
Discount rate 2.87% 3.87% 4.87%
School District's proportionate share of
the net OPEB liability -$ -$ -$
Healthcare Trend Rate Health care trend measures the anticipated overall rate at which health plan costs are expected to increase in future years. The trend rate assumptions were developed using Segal’s internal guidelines, which are established each year using data sources such as the 2019 Segal Health Trend Survey, internal client results, trends from other published surveys prepared by the S&P Dow Jones Indices, consulting firms and brokers and CPI statistics published by the Bureau of Labor Statistics. The sensitivity of net OPEB liability to changes in healthcare trend rates are as follows:
1% Healthcare 1%
Decrease Trend Rates Increase
School District's proportionate share of
the net OPEB liability -$ -$ -$
Actuarial Methods and Assumptions The total OPEB liability for the Plan was determined by an actuarial valuation as
of June 30, 2018, using the following methods and assumptions applied to all periods included in the measurement:
Actuarial Cost Method
The Entry Age Normal Actuarial Cost Method is used to determine costs. Under this funding method, a normal cost rate is determined as a level percent of pay for each active Plan member and then summed to produce the total normal cost for this Plan. The unfunded actuarial liability is the difference between the actuarial liability and the actuarial value of assets.
Amortization
The total OPEB liability of this Plan is amortized on an open 30-year period. The amortization method is a level dollar amortization method.

CHAMPLAIN VALLEY SCHOOL DISTRICT
NOTES TO FINANCIAL STATEMENTS JUNE 30, 2019
62
NOTE 15 - OTHER POST EMPLOYMENT BENEFIT (OPEB) PLAN (CONTINUED)
Asset Valuation Method The Asset Valuation Method used equals the preliminary asset value plus 20% of
the difference between the market and preliminary asset values. The preliminary asset value is equal to the previous year’s asset value (for valuation purposes) adjusted for contributions less benefit payments and expenses and expected investment income. If necessary, a further adjustment is made to ensure that the valuation assets are within 20% of the market value.
The long-term expected rate of return on both plan investments was determined using a building-block method in which best-estimate ranges of expected future real rates of return (expected returns, net of investment expense and inflation) developed for each major asset class. These best estimate ranges were combined to produce the long-term expected rate of return by weighting the expected future real rates of return by the target asset allocation percentage and by adding expected inflation.
Best estimates of arithmetic rates of return for each major asset class included in the target asset allocation as of June 30, 2018 are summarized in the following table:
Long-term
Expected
Target Real Rate of
Asset Class Allocation Return
Large cap equity 20.00% 7.50%
International equity 15.00% 7.75%
Emerging international equity 5.00% 9.25%
Core bonds 60.00% 3.75%
Inflation 2.75%
Total 100.00%
Assumptions The actuarial assumptions used to calculate the actuarially determined contribution rates can be found in the Report on the Actuarial Valuation of Post-Retirement Benefits of the Vermont State Teachers’ Retirement System Prepared as of June 30, 2016 completed by Buck Consulting. As of June 30, 2017, they are as follows:

CHAMPLAIN VALLEY SCHOOL DISTRICT
NOTES TO FINANCIAL STATEMENTS JUNE 30, 2019
63
NOTE 15 - OTHER POST EMPLOYMENT BENEFIT (OPEB) PLAN (CONTINUED) Discount Rate 3.87% Salary Increase Rate Varies by age Non-Medicare 7.15% graded to 4.50% over 12 years Medicare 7.30% graded to 4.50% over 11 years Retiree Contributions Equal to health trend Pre-retirement Mortality 98% of RP-2014 White Collar Employee with
generational projection using Scale SSA-2017. Post-retirement Mortality 98% of RP-2014 White Collar Annuitant with
generational projection using Scale SSA-2017. Changes in Net OPEB Liability
Changes in net OPEB liability are recognized in OPEB expense for the year ended June 30, 2019 with the following exceptions:
Changes in Assumptions Differences due to changes in assumptions about future economic, demographic
or claim and expense factors or other inputs are recognized in OPEB expense using a straight-line amortization method over a closed period equal to the average expected remaining service lives of active and inactive members in each plan. The first year isrecognized as OPEB expense and the remaining years are shown as either deferred outflows of resources or deferred inflows of resources. The amortization period was six years for June 30, 2018. For the fiscal year ended June 30, 2018, the discount rate was increased from 3.58% to 3.87%.
OPEB Plan Fiduciary Net Position
The schedule of employer allocations and schedule of OPEB amounts by employer are prepared on the accrual basis of accounting in accordance with U.S. generally accepted accounting principles. The schedules present amounts that are elements of the financial statements of VSTRS or their participating employers. VSTRS does not issue stand-alone financial reports, but instead are included as part of the State of Vermont’s Comprehensive Annual Financial Report (CAFR). The CAFR can be viewed on the State’s Department of Finance & Management website at: http://finance.vermont.gov/reports_and_publications/cafr
NOTE 16 - RISK MANAGEMENT The School District is exposed to various risks of loss related to torts, thefts of, damage to and destruction of assets; errors and omissions; and injuries to employees. The School District maintains commercial insurance coverage covering each of those

CHAMPLAIN VALLEY SCHOOL DISTRICT
NOTES TO FINANCIAL STATEMENTS JUNE 30, 2019
64
NOTE 16 - RISK MANAGEMENT (CONTINUED) risks of loss. Management believes such coverage is sufficient to preclude any significant uninsured losses to the School District. Settled claims have not exceeded this commercial coverage in any of the past three fiscal years. In addition, the School District is a member of the Vermont Education Health Initiative (VEHI). VEHI is a nonprofit corporation formed to provide insurance and risk management programs for Vermont School Districts and is owned by the participating districts. To provide health insurance coverage, VEHI has established a self-funded fully insured program in conjunction with Blue Cross and Blue Shield. A portion of member contributions is used to purchase reinsurance and to fund a reserve required by the reinsurance. The pooling agreement does not permit the pool to make additional assessments to its members.
NOTE 17 - CONTINGENCIES With regard to pending legal claims or any unasserted claims, it is not feasible at this time to predict or determine their outcome. Management believes, however, that settlement amounts, if any, will not have a material adverse effect on the School District’s financial position. The School District participates in various intergovernmental grant programs which may be subject to future program compliance audits by the grantors or their representatives. Accordingly, the School District’s compliance with applicable grant requirement may be established at some future date. The amount, if any, of any liabilities arising from the disallowance of expenditures or ineligibility of grant revenues cannot be determined at this time.
The School District participates in a medical insurance plan negotiated through VEHI. This plan is a high-deductible plan with an HRA (Health Reimbursement Arrangement) funded by the School District. The organization contracted to coordinate the processing of claims on behalf of the School District with HRA funds has not processed all claims as of June 30, 2019 and through the date of this report. Additionally, they were unable to provide management with the outstanding amount to be expensed by the School District through June 30, 2019. Therefore, the amount, if any, of any liabilities arising from the unprocessed claims cannot be determined at this time.

CHAMPLAIN VALLEY SCHOOL DISTRICT
NOTES TO FINANCIAL STATEMENTS JUNE 30, 2019
65
NOTE 19 - COMPARATIVE DATA/RECLASSIFICATIONS
Comparative total data for the prior year have been presented in selected sections of the accompanying financial statements in order to provide an understanding of the changes in the School District’s financial position and operations. Also, certain amounts presented in the prior year’s data have been reclassified to be consistent with the current year’s presentation.
NOTE 20 - RESTATEMENTS In 2019, the School District recognized that certain transactions were recorded incorrectly or omitted. Therefore, a restatement to the July 1, 2018 balances were necessary. The notes from direct borrowings payable balance was decreased by $2,934 from $1,739,597 to $1,736,663. The net position for governmental activities was increased by $2,934 from $39,994,324 to $39,997,258. The net position for business-type activities was restated by an increase of $69,077 from a deficit balance of $1,542 to a balance of $67,535 to correct the accounts receivable and deferred revenue balances.
NOTE 21 - SUBSEQUENT EVENTS On July 1, 2019, the School District issued a tax/revenue anticipation note in anticipation of tax revenues to meet its operating obligations during the fiscal year. The note allows principal draws up to $6,874,000 at a fixed interest rate of 2.85% and a maturity date of June 30, 2020.
On July 15, 2019, the School District issued a capital equipment note with People United Bank, National Association to purchase five school buses. The note is in the amount of $485,000 with a fixed interest rate of 2.40% and a maturity date of July 15, 2024.

Required Supplementary Information
66
Required supplementary information includes financial information and disclosures that are required by the Government Accounting Standards Board but are not considered a part of the basic financial statements. Such information includes:
● Budgetary Comparison Schedule - Budgetary Basis - Budget and Actual - General Fund
● Schedule of Proportionate Share of the Net Pension Liability
● Schedule of Contributions - Pensions
● Schedule of Proportionate Share of the Net OPEB Liability
● Schedule of Contributions - OPEB ● Notes to Required Supplementary Information

SCHEDULE 1 CHAMPLAIN VALLEY SCHOOL DISTRICT
BUDGETARY COMPARISON SCHEDULE - BUDGETARY BASIS
BUDGET AND ACTUAL - GENERAL FUND FOR THE YEAR ENDED JUNE 30, 2019
See accompanying independent auditors' report and notes to financial statements. 67
Variance
Actual Positive
Original Final Amounts (Negative)
Budgetary Fund Balance, July 1 4,201,843$ 4,201,843$ 4,201,843$ -$
Resources (Inflows):
Intergovernmental:
State/Town support 64,990,232 64,990,232 64,717,786 (272,446)
Other 10,481,429 10,481,429 9,383,246 (1,098,183)
Tuition 72,035 72,035 97,531 25,496
Interest income 190,000 190,000 453,012 263,012
Miscellaneous 254,345 254,345 571,990 317,645
Bond proceeds - - 470,000 470,000
Transfers from other funds 100,000 100,000 200,000 100,000
Amounts Available for Appropriation 80,289,884 80,289,884 80,095,408 (194,476)
Charges to Appropriations (Outflows):
Instructional programs 46,257,318 46,257,318 45,235,641 1,021,677
Instructional support 9,444,802 9,444,802 8,906,273 538,529
Administrative/Other support 8,488,122 8,488,122 8,132,454 355,668
Building operations and maintenance 4,415,617 4,415,617 4,441,118 (25,501)
Fiscal services 1,094,450 1,094,450 1,050,496 43,954
Transportation 2,893,500 2,893,500 3,596,488 (702,988)
Debt service:
Principal 2,726,927 2,726,927 2,726,927 -
Interest 1,023,971 1,023,971 1,016,204 7,767
Prior year - - 114,918 (114,918)
Transfers to other funds 493,334 493,334 738,064 (244,730)
Total Charges to Appropriations 76,838,041 76,838,041 75,958,583 879,458
Budgetary Fund Balance, June 30 3,451,843$ 3,451,843$ 4,136,825$ 684,982$
Utilization of assigned fund balance 750,000$ 750,000$ -$ (750,000)$
Budgeted Amounts

SCHEDULE 2 CHAMPLAIN VALLEY SCHOOL DISTRICT
SCHEDULE OF PROPORTIONATE SHARE OF THE NET PENSION LIABILITY
LAST 10 FISCAL YEARS*
See accompanying independent auditors' report and notes to financial statements. 68
2019 2018 2017 2016 2015 2014
VSTRS:
Proportion of the net pension liability 4.76% 4.74% 4.69% 4.93% 5.00% 4.78%
School District's proportionate share of the net
pension liability -$ -$ -$ -$ -$ -$
State's proportionate share of the net pension
liability associated with the School District 32,207,307 70,271,804 61,384,462 58,376,467 47,951,519 48,407,770$
Total 32,207,307$ 70,271,804$ 61,384,462$ 58,376,467$ 47,951,519$ 48,407,770$
Covered-employee payroll 32,278,448$ 31,262,756$ 29,715,990$ 29,016,707$ 29,209,810$ 28,080,639$
Proportionate share of the net pension
liability as a percentage of its covered-
employee payroll 0.00% 0.00% 0.00% 0.00% 0.00% 0.00%
Plan fiduciary net position as a percentage of the
total pension liability 54.81% 53.98% 55.31% 58.22% 64.02% 60.59%
VMERS:
Proportion of the net pension liability 3.94% 4.03% 4.32% 4.24% 4.08% 4.17%
Proportionate share of the net pension
liability 5,538,962$ 4,879,427$ 5,563,450$ 3,271,737$ 391,067$ 1,600,481$
Covered-employee payroll 11,585,010$ 11,694,713$ 11,784,678 10,986,178 10,788,041 10,583,704
Proportionate share of the net pension
liability as a percentage of its covered-
employee payroll 47.81% 41.72% 47.21% 29.78% 3.63% 15.12%
Plan fiduciary net position as a percentage of the
total pension liability 82.60% 83.64% 80.95% 87.42% 98.32% 92.71%
* The amounts presented for each fiscal year were determined as of June 30 and are for those years for which information is available.

SCHEDULE 3 CHAMPLAIN VALLEY SCHOOL DISTRICT
SCHEDULE OF CONTRIBUTIONS - PENSIONS
LAST 10 FISCAL YEARS*
See accompanying independent auditors' report and notes to financial statements. 69
2019 2018 2017 2016 2015 2014
VSTRS:
Contractually required contribution -$ -$ -$ -$ -$ -$
Contributions in relation to the contractually
required contribution - - - - - -
Contribution deficiency (excess) -$ -$ -$ -$ -$ -$
Covered-employee payroll 32,764,674$ 32,278,448$ 31,262,756$ 29,715,990$ 29,016,707$ 29,209,810$
Contributions as a percentage of covered-
employee payroll 0.00% 0.00% 0.00% 0.00% 0.00% 0.00%
VMERS:
Contractually required contribution 747,451$ 689,398$ 657,709$ 657,019$ 593,208$ 552,832$
Contributions in relation to the contractually
required contribution (747,451) (689,398) (657,709) (657,019) (593,208) (552,832)
Contribution deficiency (excess) -$ -$ -$ -$ -$ -$
Covered-employee payroll 12,266,618$ 11,585,010$ 11,694,713$ 11,784,678$ 10,986,178$ 10,788,041$
Contributions as a percentage of covered-
employee payroll 6.09% 5.95% 5.62% 5.58% 5.40% 5.12%
* The amounts presented for each fiscal year are for those years for which information is available.

SCHEDULE 4 CHAMPLAIN VALLEY SCHOOL DISTRICT
SCHEDULE OF PROPORTIONATE SHARE OF THE NET OPEB LIABILITY
LAST 10 FISCAL YEARS*
See accompanying independent auditors' report and notes to financial statements. 70
2019 2018
VSTRS OPEB Plan:
Proportion of the net OPEB liability 3.93% 3.84%
School District's proportionate share of the
net OPEB liability -$ -$
State's proportionate share of the net OPEB
liability associated with the School District 37,546,495 35,763,784
Total 37,546,495$ 35,763,784$
Covered-employee payroll 32,278,448$ 31,262,756$
Proportionate share of the net OPEB liability
as a percentage of its covered-employee
payroll 0.00% 0.00%
Plan fiduciary net position as a percentage of the
total OPEB liability 1.76% 1.52%
* The amounts presented for each fiscal year were determined as of June 30 and are for
those years for which information is available.
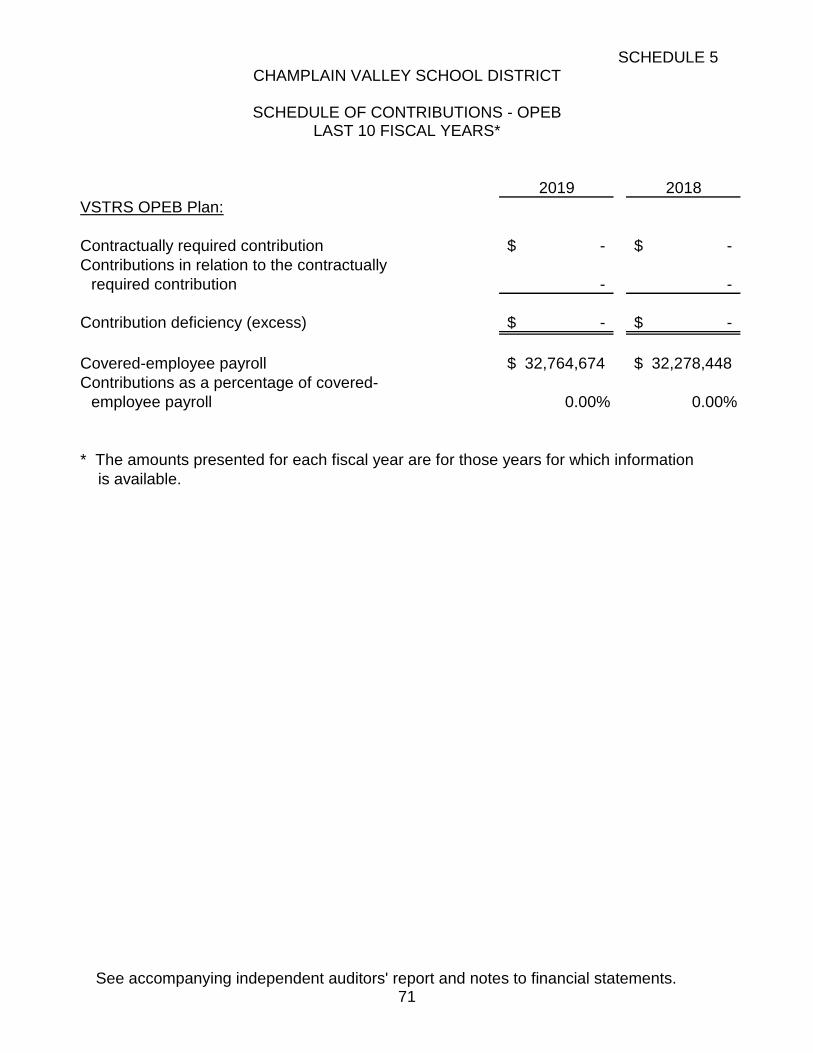
SCHEDULE 5 CHAMPLAIN VALLEY SCHOOL DISTRICT
SCHEDULE OF CONTRIBUTIONS - OPEB
LAST 10 FISCAL YEARS*
See accompanying independent auditors' report and notes to financial statements. 71
2019 2018
VSTRS OPEB Plan:
Contractually required contribution -$ -$
Contributions in relation to the contractually
required contribution - -
Contribution deficiency (excess) -$ -$
Covered-employee payroll 32,764,674$ 32,278,448$
Contributions as a percentage of covered-
employee payroll 0.00% 0.00%
* The amounts presented for each fiscal year are for those years for which information
is available.

CHAMPLAIN VALLEY SCHOOL DISTRICT
NOTES TO REQUIRED SUPPLEMENTARY INFORMATION FOR THE YEAR ENDED JUNE 30, 2019
See accompanying independent auditors' report and notes to financial statements. 72
Changes of Assumptions
For the VSTRS Pension Plan, the valuation liability for inactive members as reported by the System was lowered from 332.5% of accumulated contributions to 250.0% of accumulated contributions.
The discount rate increased from 3.58% to 3.87% for the VSTRS OPEB liability. The percentage of non-DC Plan current retirees assumed to have life insurance coverage was increased from 65% to 75%. Future male retirees were assumed to be two years older than their spouses, decreased from three years. Future female retirees were assumed to be one year younger than their spouses, decreased from three years. The percentage of future retirees assumed to have a spouse electing coverage was increased from 60% to 70% for male retirees and from 50% to 60% for female retirees. The claims cost development methodology was modified for non-Medicare participants. The per capita valuation-year claims and retiree contribution rates were updated. The assumed health trend rates were modified.

Other Supplementary Information
73
Other supplementary information includes financial statements and schedules not required by the Government Accounting Standards Board, nor a part of the basic financial statements, but are presented for purposes of additional analysis.
● Budgetary Comparison Schedule - Budgetary Basis - Budget and
Actual - General Fund Revenues ● Schedule of Departmental Operations - General Fund ● Combining Balance Sheet - Nonmajor Governmental Funds ● Combining Schedule of Revenues, Expenditures and Changes in
Fund Balances - Nonmajor Governmental Funds ● Combining Balance Sheet - Nonmajor Special Revenue Funds ● Combining Schedule of Revenues, Expenditures and Changes in
Fund Balances - Nonmajor Special Revenue Funds ● Combining Balance Sheet - Major Capital Projects Funds ● Combining Schedule of Revenues, Expenditures and Changes in
Fund Balances - Major Capital Projects Funds ● Combining Schedule of Net Position - Fiduciary Funds - Private -
Purpose Funds ● Combining Schedule of Changes in Net Position - Fiduciary Funds -
Private - Purpose Funds

SCHEDULE A CHAMPLAIN VALLEY SCHOOL DISTRICT
BUDGETARY COMPARISON SCHEDULE - BUDGETARY BASIS
BUDGET AND ACTUAL - GENERAL FUND REVENUES FOR THE YEAR ENDED JUNE 30, 2019
See accompanying independent auditors' report and notes to financial statements. 74
Variance
Original Final Actual Positive
Budget Budget Amounts (Negative)
Resources (Inflows):
Intergovernmental revenues:
Education spending grant 64,990,232$ 64,990,232$ 64,365,682$ (624,550)$
Supplemental assistance grant - - 352,104 352,104
State aid transportation 1,110,861 1,110,861 1,262,051 151,190
Driver education reimbursement 7,000 7,000 12,750 5,750
High school completion reimbursement 22,000 22,000 24,235 2,235
Medicaid EDPSDT 468,078 468,078 - (468,078)
Special education reimbursement 5,474,838 5,474,838 5,313,911 (160,927)
Mainstream block grant 1,469,963 1,469,963 1,469,963 -
Extraordinary reimbursement 569,873 569,873 679,684 109,811
State-placed special education 50,000 50,000 229,364 179,364
IDEA-B 782,529 782,529 - (782,529)
Special education EEE 301,551 301,551 301,551 -
Program grants 187,736 187,736 - (187,736)
Vocational transportation 37,000 37,000 76,440 39,440
Unenrolled resident reimbursement - - 13,297 13,297
Charges for services:
Tuition 72,035 72,035 97,531 25,496
Interest income 190,000 190,000 453,012 263,012
Miscellaneous:
Prior year adjustments/other 1,500 1,500 35,324 33,824
Community service - - 287,155 287,155
Rentals 252,845 252,845 246,554 (6,291)
Gain/loss on sale of fixed assets - - 2,957 2,957
Bond proceeds - - 470,000 470,000
Transfers in 100,000 100,000 200,000 100,000
Amounts Available for Appropriation 76,088,041$ 76,088,041$ 75,893,565$ (194,476)$

SCHEDULE B CHAMPLAIN VALLEY SCHOOL DISTRICT
SCHEDULE OF DEPARTMENTAL OPERATIONS - GENERAL FUND
FOR THE YEAR ENDED JUNE 30, 2019
See accompanying independent auditors' report and notes to financial statements. 75
Variance
Original Final Positive
Budget Budget Actual (Negative)
Instructional programs -
Instructional programs 31,946,947$ 31,946,947$ 31,201,173$ 745,774$
Special education
Instructional programs 11,484,165 11,484,165 11,267,570 216,595
Summer 265,014 265,014 195,950 69,064
504 242,979 242,979 363,643 (120,664)
Vocational/tech ed 868,119 868,119 715,422 152,697
Athletics 824,725 824,725 1,259,867 (435,142)
Cocurriculars 625,369 625,369 107,713 517,656
Summer school - - 124,303 (124,303)
46,257,318 46,257,318 45,235,641 1,021,677
Instructional support -
Guidance 3,035,512 3,035,512 2,500,556 534,956
Health 690,921 690,921 709,587 (18,666)
Psychology 472,261 472,261 471,052 1,209
Speech and language 1,435,440 1,435,440 1,395,513 39,927
Occupational therapy 219,782 219,782 232,990 (13,208)
Physical therapy 154,518 154,518 160,665 (6,147)
Other student support services - - 255,393 (255,393)
Instructional and curricular development 1,165,758 1,165,758 1,051,263 114,495
Instructional staff training 840,288 840,288 816,081 24,207
Library/Media 1,095,566 1,095,566 1,030,051 65,515
Instructional technology 334,756 334,756 283,122 51,634
9,444,802 9,444,802 8,906,273 538,529
Administrative/Other support -
School board 145,467 145,467 180,663 (35,196)
Executive administration 1,128,804 1,128,804 1,006,255 122,549
Other executive administration 328,272 328,272 335,861 (7,589)
Campus administration 3,134,258 3,134,258 3,140,194 (5,936)
Special education administration 1,067,693 1,067,693 858,134 209,559
Other administrative support services 266,146 266,146 234,515 31,631
Personnel services 646,073 646,073 642,547 3,526
Technology services 1,771,409 1,771,409 1,734,285 37,124
8,488,122 8,488,122 8,132,454 355,668
Building operations and maintenance 4,415,617 4,415,617 4,441,118 (25,501)
Fiscal service 1,094,450 1,094,450 1,050,496 43,954
Transportation 2,893,500 2,893,500 3,596,488 (702,988)
Debt service
Principal 2,726,927 2,726,927 2,726,927 -
Interest 1,023,971 1,023,971 1,016,204 7,767
3,750,898 3,750,898 3,743,131 7,767
Prior year - - 114,918 (114,918)
Transfer to other funds
Debt service fund 275,000 275,000 275,000 -
Capital projects funds 110,000 110,000 110,000 -
Special revenue funds - - 37,311 (37,311)
Food service fund 108,334 108,334 315,753 (207,419)
493,334 493,334 738,064 (244,730)
TOTAL DEPARTMENTAL OPERATIONS 76,838,041$ 76,838,041$ 75,958,583$ 879,458$

SCHEDULE C CHAMPLAIN VALLEY SCHOOL DISTRICT
COMBINING BALANCE SHEET - NONMAJOR GOVERNMENTAL FUNDS
JUNE 30, 2019
See accompanying independent auditors' report and notes to financial statements. 76
Special Capital Total Nonmajor
Revenue Projects Governmental
Funds Funds Funds
ASSETS
Due from other governments 1,406,459$ 175,502$ 1,581,961$
Due from other funds 395,089 231,262 626,351
TOTAL ASSETS 1,801,548$ 406,764$ 2,208,312$
LIABILITIES
Accounts payable 37,165$ 6,687$ 43,852$
Due to other funds 1,364,216 13,243 1,377,459
TOTAL LIABILITIES 1,401,381 19,930 1,421,311
DEFERRED INFLOWS OF RESOURCES
Deferred revenues 400,167 - 400,167
TOTAL DEFERRED INFLOWS OF
RESOURCES 400,167 - 400,167
FUND BALANCES
Nonspendable - - -
Restricted - 386,834 386,834
Committed - - -
Assigned - - -
Unassigned - - -
TOTAL FUND BALANCES - 386,834 386,834
TOTAL LIABILITIES, DEFERRED INFLOWS
OF RESOURCES AND FUND BALANCES 1,801,548$ 406,764$ 2,208,312$

SCHEDULE D CHAMPLAIN VALLEY SCHOOL DISTRICT
COMBINING SCHEDULE OF REVENUES, EXPENDITURES AND CHANGES IN
FUND BALANCES - NONMAJOR GOVERNMENTAL FUNDS FOR THE YEAR ENDED JUNE 30, 2019
See accompanying independent auditors' report and notes to financial statements. 77
Special Capital Total Nonmajor
Revenue Projects Governmental
Funds Funds Funds
REVENUES
Intergovernmental 2,051,857$ -$ 2,051,857$
Interest income - 423 423
Charges for services/fees - 279,839 279,839
Other 28,988 81,872 110,860
TOTAL REVENUES 2,080,845 362,134 2,442,979
EXPENDITURES
Other 2,083,565 129,778 2,213,343
TOTAL EXPENDITURES 2,083,565 129,778 2,213,343
EXCESS OF REVENUES OVER
(UNDER) EXPENDITURES (2,720) 232,356 229,636
OTHER FINANCING SOURCES (USES)
Transfers in - 46,518 46,518
Transfers (out) - (200,000) (200,000)
TOTAL OTHER FINANCING
SOURCES (USES) - (153,482) (153,482)
NET CHANGE IN FUND BALANCES (2,720) 78,874 76,154
FUND BALANCES - JULY 1 2,720 307,960 310,680
FUND BALANCES - JUNE 30 -$ 386,834$ 386,834$

Special Revenue Funds
78
Special revenue funds are established to account for the proceeds of specific revenue sources (other than expendable trusts or for major capital projects) that are legally restricted to expenditures for specific purposes.

SCHEDULE E CHAMPLAIN VALLEY SCHOOL DISTRICT
COMBINING BALANCE SHEET - NONMAJOR SPECIAL REVENUE FUNDS
JUNE 30, 2019
79
Friends of
Families Nellie Mae Ed Rowland CVU
Will/StG Foundation Foundation Misc Grants
ASSETS
Due from other governments -$ -$ -$ -$
Due from other funds 3,752 4,041 - 36,958
TOTAL ASSETS 3,752$ 4,041$ -$ 36,958$
LIABILITIES
Accounts payable -$ -$ -$ -$
Due to other funds - - - -
TOTAL LIABILITIES - - - -
DEFERRED INFLOWS OF RESOURCES
Deferred revenues 3,752 4,041 - 36,958
TOTAL DEFERRED INFLOWS OF
RESOURCES 3,752 4,041 - 36,958
FUND BALANCES
Nonspendable - - - -
Restricted - - - -
Committed - - - -
Assigned - - - -
Unassigned - - - -
TOTAL FUND BALANCES - - - -
TOTAL LIABILITIES, DEFERRED INFLOWS
OF RESOURCES AND FUND BALANCES 3,752$ 4,041$ -$ 36,958$

SCHEDULE E (CONTINUED) CHAMPLAIN VALLEY SCHOOL DISTRICT
COMBINING BALANCE SHEET - NONMAJOR SPECIAL REVENUE FUNDS
JUNE 30, 2019
80
Vermont Mobius VT
Hinesburg Charlotte CVSD VEHI Children's Mentors
Misc Grants Misc Grants Misc Grants VP3 Program Trust Grant
ASSETS
Due from other governments 11,458$ -$ -$ -$ -$ -$
Due from other funds - 4,264 74 12,449 - 162
TOTAL ASSETS 11,458$ 4,264$ 74$ 12,449$ -$ 162$
LIABILITIES
Accounts payable -$ -$ -$ -$ -$ 162$
Due to other funds 6,316 - - - - -
TOTAL LIABILITIES 6,316 - - - - 162
DEFERRED INFLOWS OF RESOURCES
Deferred revenues 5,142 4,264 74 12,449 - -
TOTAL DEFERRED INFLOWS OF
RESOURCES 5,142 4,264 74 12,449 - -
FUND BALANCES
Nonspendable - - - - - -
Restricted - - - - - -
Committed - - - - - -
Assigned - - - - - -
Unassigned - - - - - -
TOTAL FUND BALANCES - - - - - -
TOTAL LIABILITIES, DEFERRED INFLOWS
OF RESOURCES AND FUND BALANCES 11,458$ 4,264$ 74$ 12,449$ -$ 162$

SCHEDULE E (CONTINUED) CHAMPLAIN VALLEY SCHOOL DISTRICT
COMBINING BALANCE SHEET - NONMAJOR SPECIAL REVENUE FUNDS
JUNE 30, 2019
81
Northwest VT Joint Champlain DOH
Reading Collective Wellness Valley Rev Prev
Recovery Bargaining Initiative Sup Assoc Stars Partnerships
ASSETS
Due from other governments -$ -$ -$ -$ -$ 4,270$
Due from other funds 33,279 29,586 1,037 473 4,398 -
TOTAL ASSETS 33,279$ 29,586$ 1,037$ 473$ 4,398$ 4,270$
LIABILITIES
Accounts payable 50$ -$ -$ -$ -$ -$
Due to other funds - - - - - 4,270
TOTAL LIABILITIES 50 - - - - 4,270
DEFERRED INFLOWS OF RESOURCES
Deferred revenues 33,229 29,586 1,037 473 4,398 -
TOTAL DEFERRED INFLOWS OF
RESOURCES 33,229 29,586 1,037 473 4,398 -
FUND BALANCES
Nonspendable - - - - - -
Restricted - - - - - -
Committed - - - - - -
Assigned - - - - - -
Unassigned - - - - - -
TOTAL FUND BALANCES - - - - - -
TOTAL LIABILITIES, DEFERRED INFLOWS
OF RESOURCES AND FUND BALANCES 33,279$ 29,586$ 1,037$ 473$ 4,398$ 4,270$

SCHEDULE E (CONTINUED) CHAMPLAIN VALLEY SCHOOL DISTRICT
COMBINING BALANCE SHEET - NONMAJOR SPECIAL REVENUE FUNDS
JUNE 30, 2019
82
Whole School
Standards Community
Board Grant BEST EPSDT SBSAS Child
ASSETS
Due from other governments 291$ 11,665$ -$ -$ -$
Due from other funds 1,768 - 258,941 - 3,907
TOTAL ASSETS 2,059$ 11,665$ 258,941$ -$ 3,907$
LIABILITIES
Accounts payable -$ 6,500$ 143$ -$ -$
Due to other funds - 5,165 - - -
TOTAL LIABILITIES - 11,665 143 - -
DEFERRED INFLOWS OF RESOURCES
Deferred revenues 2,059 - 258,798 - 3,907
TOTAL DEFERRED INFLOWS OF
RESOURCES 2,059 - 258,798 - 3,907
FUND BALANCES
Nonspendable - - - - -
Restricted - - - - -
Committed - - - - -
Assigned - - - - -
Unassigned - - - - -
TOTAL FUND BALANCES - - - - -
TOTAL LIABILITIES, DEFERRED INFLOWS
OF RESOURCES AND FUND BALANCES 2,059$ 11,665$ 258,941$ -$ 3,907$

SCHEDULE E (CONTINUED) CHAMPLAIN VALLEY SCHOOL DISTRICT
COMBINING BALANCE SHEET - NONMAJOR SPECIAL REVENUE FUNDS
JUNE 30, 2019
83
Sober IDEA Title I
Truth on Formula IDEA IDEA School
Prevention Preschool Preschool Formula Improvement
ASSETS
Due from other governments 94,290$ 30,879$ 7,018$ 721,471$ -$
Due from other funds - - - - -
TOTAL ASSETS 94,290$ 30,879$ 7,018$ 721,471$ -$
LIABILITIES
Accounts payable -$ -$ -$ 26$ -$
Due to other funds 94,290 30,879 7,018 721,445 -
TOTAL LIABILITIES 94,290 30,879 7,018 721,471 -
DEFERRED INFLOWS OF RESOURCES
Deferred revenues - - - - -
TOTAL DEFERRED INFLOWS OF
RESOURCES - - - - -
FUND BALANCES
Nonspendable - - - - -
Restricted - - - - -
Committed - - - - -
Assigned - - - - -
Unassigned - - - - -
TOTAL FUND BALANCES - - - - -
TOTAL LIABILITIES, DEFERRED INFLOWS
OF RESOURCES AND FUND BALANCES 94,290$ 30,879$ 7,018$ 721,471$ -$

SCHEDULE E (CONTINUED) CHAMPLAIN VALLEY SCHOOL DISTRICT
COMBINING BALANCE SHEET - NONMAJOR SPECIAL REVENUE FUNDS
JUNE 30, 2019
See accompanying independent auditors' report and notes to financial statements. 84
Drug Free
Schools
Title IV Title III Title II Title I Project Total
ASSETS
Due from other governments 44,794$ 1,747$ 129,929$ 348,647$ -$ 1,406,459$
Due from other funds - - - - - 395,089
TOTAL ASSETS 44,794$ 1,747$ 129,929$ 348,647$ -$ 1,801,548$
LIABILITIES
Accounts payable 7,150$ 178$ 22,500$ 456$ -$ 37,165$
Due to other funds 37,644 1,569 107,429 348,191 - 1,364,216
TOTAL LIABILITIES 44,794 1,747 129,929 348,647 - 1,401,381
DEFERRED INFLOWS OF RESOURCES
Deferred revenues - - - - - 400,167
TOTAL DEFERRED INFLOWS OF
RESOURCES - - - - - 400,167
FUND BALANCES
Nonspendable - - - - - -
Restricted - - - - - -
Committed - - - - - -
Assigned - - - - - -
Unassigned - - - - - -
TOTAL FUND BALANCES - - - - - -
TOTAL LIABILITIES, DEFERRED INFLOWS
OF RESOURCES AND FUND BALANCES 44,794$ 1,747$ 129,929$ 348,647$ -$ 1,801,548$

SCHEDULE F CHAMPLAIN VALLEY SCHOOL DISTRICT
COMBINING SCHEDULE OF REVENUES, EXPENDITURES AND CHANGES IN FUND BALANCES
NONMAJOR SPECIAL REVENUE FUNDS FOR THE YEAR ENDED JUNE 30, 2019
85
Friends of
Families Nellie Mae Ed Rowland CVU
Will/StG Foundation Foundation Misc Grants
REVENUES
Intergovernmental -$ 4,975$ 4,102$ 17,868$
Other - - - -
TOTAL REVENUES - 4,975 4,102 17,868
EXPENDITURES
Other - 4,975 4,102 17,868
TOTAL EXPENDITURES - 4,975 4,102 17,868
EXCESS OF REVENUES OVER
(UNDER) EXPENDITURES - - - -
OTHER FINANCING SOURCES (USES)
Transfers in - - - -
Transfers (out) - - - -
TOTAL OTHER FINANCING SOURCES (USES) - - - -
NET CHANGE IN FUND BALANCES - - - -
FUND BALANCES - JULY 1 - - - -
FUND BALANCES - JUNE 30 -$ -$ -$ -$

SCHEDULE F (CONTINUED) CHAMPLAIN VALLEY SCHOOL DISTRICT
COMBINING SCHEDULE OF REVENUES, EXPENDITURES AND CHANGES IN FUND BALANCES
NONMAJOR SPECIAL REVENUE FUNDS FOR THE YEAR ENDED JUNE 30, 2019
86
Vermont Mobius VT
Hinesburg Charlotte CVSD VEHI Children's Mentors
Misc Grants Misc Grants Misc Grants VP3 Program Trust Grant
REVENUES
Intergovernmental 7,937$ -$ -$ -$ 12,481$ 28,575$
Other 11,458 - - 5,614 - -
TOTAL REVENUES 19,395 - - 5,614 12,481 28,575
EXPENDITURES
Other 19,395 - - 5,614 12,481 28,575
TOTAL EXPENDITURES 19,395 - - 5,614 12,481 28,575
EXCESS OF REVENUES OVER
(UNDER) EXPENDITURES - - - - - -
OTHER FINANCING SOURCES (USES)
Transfers in - - - - - -
Transfers (out) - - - - - -
TOTAL OTHER FINANCING SOURCES (USES) - - - - - -
NET CHANGE IN FUND BALANCES - - - - - -
FUND BALANCES - JULY 1 - - - - - -
FUND BALANCES - JUNE 30 -$ -$ -$ -$ -$ -$

SCHEDULE F (CONTINUED) CHAMPLAIN VALLEY SCHOOL DISTRICT
COMBINING SCHEDULE OF REVENUES, EXPENDITURES AND CHANGES IN FUND BALANCES
NONMAJOR SPECIAL REVENUE FUNDS FOR THE YEAR ENDED JUNE 30, 2019
87
Northwest VT Joint Champlain DOH
Reading Collective Wellness Valley Rev Prev
Recovery Bargaining Initiative Sup Assoc Stars Partnerships
REVENUES
Intergovernmental 63,684$ -$ -$ -$ 2,104$ 17,149$
Other - - - - - -
TOTAL REVENUES 63,684 - - - 2,104 17,149
EXPENDITURES
Other 63,684 - - - 2,104 17,149
TOTAL EXPENDITURES 63,684 - - - 2,104 17,149
EXCESS OF REVENUES OVER
(UNDER) EXPENDITURES - - - - - -
OTHER FINANCING SOURCES (USES)
Transfers in - - - - - -
Transfers (out) - - - - - -
TOTAL OTHER FINANCING SOURCES (USES) - - - - - -
NET CHANGE IN FUND BALANCES - - - - - -
FUND BALANCES - JULY 1 - - - - - -
FUND BALANCES - JUNE 30 -$ -$ -$ -$ -$ -$
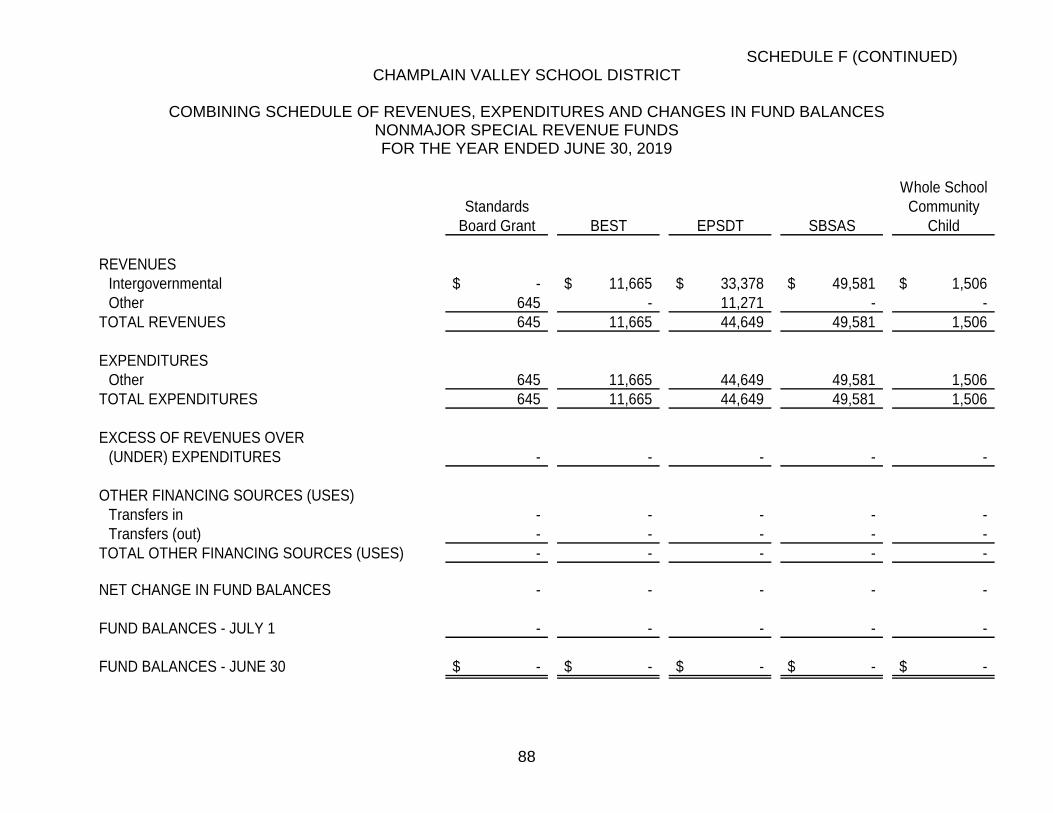
SCHEDULE F (CONTINUED) CHAMPLAIN VALLEY SCHOOL DISTRICT
COMBINING SCHEDULE OF REVENUES, EXPENDITURES AND CHANGES IN FUND BALANCES
NONMAJOR SPECIAL REVENUE FUNDS FOR THE YEAR ENDED JUNE 30, 2019
88
Whole School
Standards Community
Board Grant BEST EPSDT SBSAS Child
REVENUES
Intergovernmental -$ 11,665$ 33,378$ 49,581$ 1,506$
Other 645 - 11,271 - -
TOTAL REVENUES 645 11,665 44,649 49,581 1,506
EXPENDITURES
Other 645 11,665 44,649 49,581 1,506
TOTAL EXPENDITURES 645 11,665 44,649 49,581 1,506
EXCESS OF REVENUES OVER
(UNDER) EXPENDITURES - - - - -
OTHER FINANCING SOURCES (USES)
Transfers in - - - - -
Transfers (out) - - - - -
TOTAL OTHER FINANCING SOURCES (USES) - - - - -
NET CHANGE IN FUND BALANCES - - - - -
FUND BALANCES - JULY 1 - - - - -
FUND BALANCES - JUNE 30 -$ -$ -$ -$ -$

SCHEDULE F (CONTINUED) CHAMPLAIN VALLEY SCHOOL DISTRICT
COMBINING SCHEDULE OF REVENUES, EXPENDITURES AND CHANGES IN FUND BALANCES
NONMAJOR SPECIAL REVENUE FUNDS FOR THE YEAR ENDED JUNE 30, 2019
89
Sober IDEA Title I
Truth on Formula IDEA IDEA School
Prevention Preschool Preschool Formula Improvement
REVENUES
Intergovernmental 38,007$ 31,854$ 12,428$ 873,181$ 13,440$
Other - - - - -
TOTAL REVENUES 38,007 31,854 12,428 873,181 13,440
EXPENDITURES
Other 38,007 31,854 12,428 873,181 13,440
TOTAL EXPENDITURES 38,007 31,854 12,428 873,181 13,440
EXCESS OF REVENUES OVER
(UNDER) EXPENDITURES - - - - -
OTHER FINANCING SOURCES (USES)
Transfers in - - - - -
Transfers (out) - - - - -
TOTAL OTHER FINANCING SOURCES (USES) - - - - -
NET CHANGE IN FUND BALANCES - - - - -
FUND BALANCES - JULY 1 - - - - -
FUND BALANCES - JUNE 30 -$ -$ -$ -$ -$

SCHEDULE F (CONTINUED) CHAMPLAIN VALLEY SCHOOL DISTRICT
COMBINING SCHEDULE OF REVENUES, EXPENDITURES AND CHANGES IN FUND BALANCES
NONMAJOR SPECIAL REVENUE FUNDS FOR THE YEAR ENDED JUNE 30, 2019
See accompanying independent auditors' report and notes to financial statements. 90
Drug Free
Schools
Title IV Title III Title II Title I Project Total
REVENUES
Intergovernmental 64,795$ 16,654$ 186,920$ 559,573$ -$ 2,051,857$
Other - - - - - 28,988
TOTAL REVENUES 64,795 16,654 186,920 559,573 - 2,080,845
EXPENDITURES
Other 64,795 16,654 186,920 559,573 2,720 2,083,565
TOTAL EXPENDITURES 64,795 16,654 186,920 559,573 2,720 2,083,565
EXCESS OF REVENUES OVER
(UNDER) EXPENDITURES - - - - (2,720) (2,720)
OTHER FINANCING SOURCES (USES)
Transfers in - - - - - -
Transfers (out) - - - - - -
TOTAL OTHER FINANCING SOURCES (USES) - - - - - -
NET CHANGE IN FUND BALANCES - - - - (2,720) (2,720)
FUND BALANCES - JULY 1 - - - - 2,720 2,720
FUND BALANCES - JUNE 30 -$ -$ -$ -$ -$ -$

Capital Projects Fund
91
The capital projects funds are used to account for the financial resources to be
used for the acquisition or construction of major capital facilities.

SCHEDULE G CHAMPLAIN VALLEY SCHOOL DISTRICT
COMBINING BALANCE SHEET - NONMAJOR CAPITAL PROJECTS FUND
JUNE 30, 2019
See accompanying independent auditors' report and notes to financial statements. 92
Williston
Impact Fees
Fund Technology Total
ASSETS
Due from other governments 155,572$ 19,930$ 175,502$
Due from other funds 231,262 - 231,262
TOTAL ASSETS 386,834$ 19,930$ 406,764$
LIABILITIES
Accounts payable -$ 6,687$ 6,687$
Due to other funds - 13,243 13,243
TOTAL LIABILITIES - 19,930 19,930
FUND BALANCES
Nonspendable - - -
Restricted 386,834 - 386,834
Committed - - -
Assigned - - -
Unassigned - - -
TOTAL FUND BALANCES 386,834 - 386,834
TOTAL LIABILITIES AND FUND
BALANCES 386,834$ 19,930$ 406,764$

SCHEDULE H CHAMPLAIN VALLEY SCHOOL DISTRICT
COMBINING SCHEDULE OF REVENUES, EXPENDITURES AND CHANGES IN
FUND BALANCES - NONMAJOR CAPITAL PROJECTS FUND FOR THE YEAR ENDED JUNE 30, 2019
See accompanying independent auditors' report and notes to financial statements. 93
Williston
Impact Fees
Fund Technology Total
REVENUES
Interest income 423$ - 423$
Charges for services/fees 279,839 - 279,839
Other - 81,872 81,872
TOTAL REVENUES 280,262 81,872 362,134
EXPENDITURES
Other 1,388 128,390 129,778
TOTAL EXPENDITURES 1,388 128,390 129,778
EXCESS OF REVENUES OVER
(UNDER) EXPENDITURES 278,874 (46,518) 232,356
OTHER FINANCING SOURCES (USES)
Transfers in - 46,518 46,518
Transfers (out) (200,000) - (200,000)
TOTAL OTHER FINANCING SOURCES (USES) (200,000) 46,518 (153,482)
NET CHANGE IN FUND BALANCES 78,874 - 78,874
FUND BALANCES - JULY 1 307,960 - 307,960
FUND BALANCES - JUNE 30 386,834$ -$ 386,834$

Fiduciary Funds
94
Fiduciary funds are used to report assets held in a trustee or agency capacity for others and therefore are not available to support the School District’s programs.
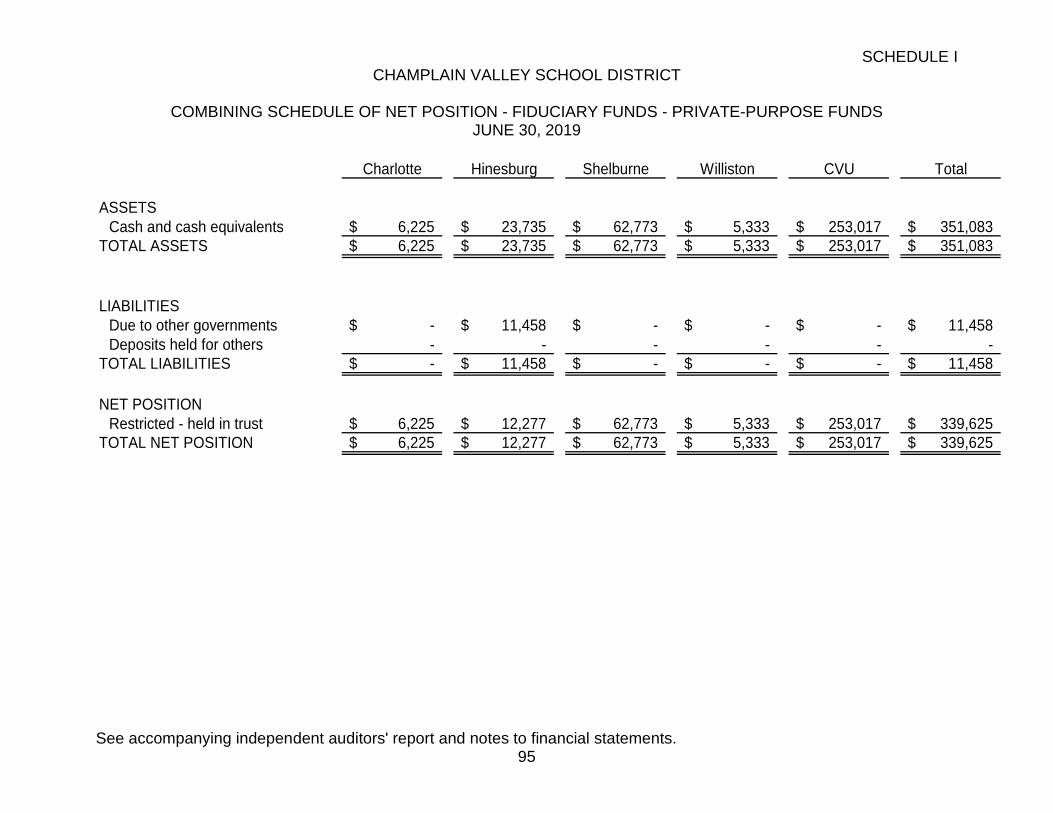
SCHEDULE I CHAMPLAIN VALLEY SCHOOL DISTRICT
COMBINING SCHEDULE OF NET POSITION - FIDUCIARY FUNDS - PRIVATE-PURPOSE FUNDS
JUNE 30, 2019
See accompanying independent auditors' report and notes to financial statements. 95
Charlotte Hinesburg Shelburne Williston CVU Total
ASSETS
Cash and cash equivalents 6,225$ 23,735$ 62,773$ 5,333$ 253,017$ 351,083$
TOTAL ASSETS 6,225$ 23,735$ 62,773$ 5,333$ 253,017$ 351,083$
LIABILITIES
Due to other governments -$ 11,458$ -$ -$ -$ 11,458$
Deposits held for others - - - - - -
TOTAL LIABILITIES -$ 11,458$ -$ -$ -$ 11,458$
NET POSITION
Restricted - held in trust 6,225$ 12,277$ 62,773$ 5,333$ 253,017$ 339,625$
TOTAL NET POSITION 6,225$ 12,277$ 62,773$ 5,333$ 253,017$ 339,625$

SCHEDULE J CHAMPLAIN VALLEY SCHOOL DISTRICT
COMBINING SCHEDULE OF CHANGES IN NET POSITION - FIDUCIARY FUNDS
PRIVATE-PURPOSE FUNDS JUNE 30, 2019
See accompanying independent auditors' report and notes to financial statements. 96
Charlotte Hinesburg Shelburne Williston CVU Total
ADDITIONS
Contributions
Donations -$ 37,353$ 1,000$ -$ 6,913$ 45,266$
Total contributions - 37,353 1,000 - 6,913 45,266
Investment earnings:
Income earned 10 8 122 9 384 533
Total investment earnings, net 10 8 122 9 384 533
Total additions 10 37,361 1,122 9 7,297 45,799
DEDUCTIONS
Scholarship awards - - - - 9,093 9,093
Transfer to other account - 11,458 - - - 11,458
Administrative expenses 200 28,000 28,507 250 - 56,957
Total deductions 200 39,458 28,507 250 9,093 77,508
CHANGE IN NET POSITION (190) (2,097) (27,385) (241) (1,796) (31,709)
NET POSITION - JULY 1 6,415 14,374 90,158 5,574 254,813 371,334
NET POSITION - JUNE 30 6,225$ 12,277$ 62,773$ 5,333$ 253,017$ 339,625$

CHAMPLAIN VALLEY SCHOOL DISTRICT
SCHEDULE OF EXPENDITURES OF FEDERAL AWARDS FOR THE YEAR ENDED JUNE 30, 2019
97
Federal Pass-through
CFDA Grantor Expenditures to Federal
Number Number Subrecipients Expenditures
U.S. Department of Agriculture
Pass-through State of Vermont Agency of Education:
Child Nutrition Cluster:
School Breakfast Program 10.553 4452U056190 -$ 68,464$
National School Lunch Program 10.555 4450U056190 - 281,661
National School Lunch Program - Food Distribution 10.555 4456U056190 - 92,622
Subtotal Child Nutrition Cluster - 442,747
Total U.S. Department of Agriculture - 442,747
U.S. Department of Education
Pass-through State of Vermont Agency of Education:
Title I Grants to Local Educational Agencies 84.010 4250U0561901 - 559,573
Title I Grants to Local Educational Agencies 84.010 4255U0561901 - 13,440
Special Education Cluster:
Special Education-Grants to States (IDEA, Part B) 84.027 4226U05618901 - 873,181
Special Education-Grants to States (IDEA, Part B) 84.027 4223U0561901 - 31,854
Special Education-Preschool Grants (IDEA Preschool) 84.173 4228U0561901 - 12,428
Subtotal Special Education Cluster - 917,463
English Language Acquisition State Grants 84.365 4375U0561901 - 16,654
Supporting Effective Instruction State Grants 84.367 4651U0561901 - 186,920
Race to the Top - Early Learning Challenge 84.412 4504U0561901 - -
Student Support and Academic Enrichment Program 84.424 4570U0561901 - 64,795
Total U.S. Department of Education - 1,758,845
Direct Program:
93.243 SP023004-02 - 38,007
Pass-through State of Vermont Agency of Health and Human Services:
93.243 03420-A19011S/RPP_CY2019 - 17,149
93.758 03420-6872S - 1,506
93.959 03420-A18044S - 49,581
for Disease Control and Prevention - 106,243
TOTAL FEDERAL ASSISTANCE -$ 2,307,835$
Total U.S. Department of Health and Human Services Centers
Federal Grantor
Pass-through Grantor
Program or Cluster Title
U.S. Department of Health and Human Services Centers for Disease Control and
Prevention
Preventive Health and Health Services Block Grant funded solely with Prevention
and Public Health Funds (PPHF)
Substance Abuse and Mental Health Services-Projects of Regional and National
Significance
Substance Abuse and Mental Health Services-Projects of Regional and National
Significance
Block Grants for Prevention and Treatment of Substance Abuse

CHAMPLAIN VALLEY SCHOOL DISTRICT
NOTES TO SCHEDULE OF EXPENDITURES OF FEDERAL AWARDS FOR THE YEAR ENDED JUNE 30, 2019
98
1. Basis of Presentation
The accompanying schedule of expenditures of federal awards (the Schedule) includes the federal award activity of the Champlain Valley School District under programs of the federal government for the year ended June 30, 2019. The information in this Schedule is presented in accordance with the requirements of Title 2 U.S. Code of Federal Regulations Part 200, Uniform Administrative Requirements, Cost Principles and Audit Requirements for Federal Awards (Uniform Guidance). Because the Schedule presents only a selected portion of the operations of the Champlain Valley School District, it is not intended to and does not present the financial position, changes in net position, or cash flows of the Champlain Valley School District. 2. Summary of Significant Accounting Policies
a. Expenditures reported on the Schedule are reported on the accrual basis of accounting. Such expenditures are recognized following the cost principles contained in the Uniform Guidance and/or OMB Circular A-87, Cost Principles for State, Local and Indian Tribal Governments, wherein certain types of expenditures are not allowable or are limited as to reimbursement.
b. The U.S. Department of Education (USED) has delegated to the State of
Vermont Agency of Education the authority to issue indirect cost rates to all Local Education Agencies (LEAs) based on a plan approved by the USED. Therefore, the Champlain Valley School District does not use the 10% de minimus indirect cost rate as allowed under the Uniform Guidance.

99
INDEPENDENT AUDITORS’ REPORT ON INTERNAL CONTROL OVER FINANCIAL
REPORTING AND ON COMPLIANCE AND OTHER MATTERS BASED ON AN AUDIT OF FINANCIAL STATEMENTS PERFORMED IN ACCORDANCE WITH
GOVERNMENT AUDITING STANDARDS Board of School Directors Champlain Valley School District Shelburne, Vermont
We have audited, in accordance with the auditing standards generally accepted in the United States of America and the standards applicable to financial audits contained in Government Auditing Standards, issued by the Comptroller General of the United States, the financial statements of the governmental activities, business-type activities, each major fund and the aggregate remaining fund information of Champlain Valley School District, as of and for the year ended June 30, 2019 and the related notes to the financial statements, which collectively comprise Champlain Valley School District’s basic financial statements, and have issued our report thereon dated February 12, 2020. Internal Control Over Financial Reporting
In planning and performing our audit of the financial statements, we considered Champlain Valley School District’s internal control over financial reporting (internal control) to determine the audit procedures that are appropriate in the circumstances for the purpose of expressing our opinion on the financial statements, but not for the purpose of expressing an opinion on the effectiveness of Champlain Valley School District’s internal control. Accordingly, we do not express an opinion on the effectiveness of the Champlain Valley School District’s internal control.
A deficiency in internal control exists when the design or operation of a control does not allow management or employees, in the normal course of performing their assigned functions, to prevent or detect and correct misstatements on a timely basis. A material weakness is a deficiency, or combination of deficiencies, in internal control such that there is a reasonable possibility that a material misstatement of the entity’s financial statements will not be prevented or detected and corrected on a timely basis. A significant deficiency is a deficiency, or a combination of deficiencies, in internal control that is less severe than a material weakness, yet important enough to merit attention by those charged with governance.
3 Old Orchard Road, Buxton, Maine 04093 Tel: (800) 300-7708 (207) 929-4606 Fax: (207) 929-4609
www.rhrsmith.com

100
Our consideration of internal control was for the limited purpose described in the first paragraph of this section and was not designed to identify all deficiencies in internal control that might be material weaknesses or significant deficiencies. Given theselimitations, during our audit we did not identify any deficiencies in internal control that we consider to be material weaknesses. However, material weaknesses may exist that have not been identified. Compliance and Other Matters
As part of obtaining reasonable assurance about whether Champlain Valley School District’s financial statements are free of material misstatement, we performed tests of its compliance with certain provisions of laws, regulations, contracts and grant agreements, noncompliance with which could have a direct and material effect on the determination of financial statement amounts. However, providing an opinion on compliance with those provisions was not an objective of our audit and, accordingly, we do not express such an opinion. The results of our tests disclosed no instances of noncompliance or other matters that are required to be reported under Government Auditing Standards. We noted certain other matters that we reported to management of the Champlain Valley School District in a separate letter dated December 20, 2019. Purpose of this Report
The purpose of this report is solely to describe the scope of our testing of internal control and compliance and the results of that testing and not to provide an opinion on the effectiveness of the organization’s internal control or compliance. This report is an integral part of an audit performed in accordance with Government Auditing Standards in considering the organization’s internal control and compliance. Accordingly, this communication is not suitable for any other purpose.
Buxton, Maine Vermont Registration No. 092.0000697 February 12, 2020

101
INDEPENDENT AUDITORS’ REPORT ON COMPLIANCE FOR EACH MAJOR PROGRAM AND INTERNAL CONTROL OVER COMPLIANCE IN ACCORDANCE
REQUIRED BY THE UNIFORM GUIDANCE
Board of School Directors Champlain Valley School District Shelburne, Vermont Report on Compliance for Each Major Federal Program
We have audited Champlain Valley School District’s compliance with the types of compliance requirements described in the OMB Compliance Supplement that could have a direct and material effect on each of Champlain Valley School District’s major federal programs for the year ended June 30, 2019. Champlain Valley School District’s major federal programs are identified in the summary of auditor’s results section of the accompanying schedule of findings and questioned costs. Management’s Responsibility
Management is responsible for compliance with the federal statutes, regulations and the terms and conditions of its federal awards applicable to its federal programs. Auditors’ Responsibility
Our responsibility is to express an opinion on compliance for each of Champlain Valley School District’s major federal programs based on our audit of the type of compliance requirements referred to above. We conducted our audit of compliance in accordance with auditing standards generally accepted in the United States of America; the standards applicable to financial audits contained in Government Auditing Standards, issued by the Comptroller General of the United States; and the audit requirements of Title 2 U.S. Code of Federal Regulations Part 200, Uniform Administrative Requirements, Cost Principles and Audit Requirements for Federal Awards (Uniform Guidance). Those standards and the Uniform Guidance require that we plan and perform the audit to obtain reasonable assurance about whether noncompliance with the types of compliance requirements referred to above that could have a direct and material effect on a major federal program occurred. An audit includes examining, on a test basis, evidence about Champlain Valley School District’s compliance with those requirements and performing such other procedures as we considered necessary in the circumstances.
3 Old Orchard Road, Buxton, Maine 04093
Tel: (800) 300-7708 (207) 929-4606 Fax: (207) 929-4609 www.rhrsmith.com

102
We believe that our audit provides a reasonable basis for our opinion on compliance for each major federal program. However, our audit does not provide a legal determination on Champlain Valley School District’s compliance. Opinion on Each Major Federal Program
In our opinion, Champlain Valley School District, complied in all material respects, with the type of compliance requirements referred to above that could have a direct and material effect on each of its major federal programs for the year ended June 30, 2019. Report on Internal Control Over Compliance
Management of Champlain Valley School District is responsible for establishing and maintaining effective internal control over compliance with the type of compliance requirements referred to above. In planning and performing our audit of compliance, we considered Champlain Valley School District internal control over compliance with the types of requirements that could have a direct and material effect on a major federal program in order to determine our auditing procedures that are appropriate in the circumstances for the purpose of expressing our opinion on compliance for each major federal program and to test and report on internal control over compliance in accordance with the Uniform Guidance, but not for the purpose of expressing an opinion on the effectiveness of internal control over compliance. Accordingly, we do not express an opinion on the effectiveness of Champlain Valley School District’s internal control over compliance.
A deficiency in internal control over compliance exists when the design or operation of a control over compliance does not allow management or employees, in the normal course of performing their assigned functions, to prevent, or detect and correct, noncompliance with a type of compliance requirement of a federal program on a timely basis. A material weakness in internal control over compliance is a deficiency, or combination of deficiencies, in internal control over compliance requirements of a federal program will not be prevented or detected and corrected on a timely basis. A significant deficiency in internal control over compliance is a deficiency, or a combination of deficiencies, in internal control over compliance with a type of compliance requirement of a federal program that is less severe than a material weakness in internal control over compliance, yet important enough to merit attention by those charged with governance.
Our consideration of internal control over compliance was for the limited purpose described in the first paragraph of this section and was not designed to identify all deficiencies in internal control over compliance that might be material weaknesses or significant deficiencies. We did not identify any deficiencies in internal control over compliance that we consider to be material weaknesses. However, material weaknesses may exist that have not been identified.

103
This purpose of this report on internal control over compliance is solely to describe the scope of our testing of internal control over compliance and the results of that testing based on the requirements of the Uniform Guidance. Accordingly, this report is not suitable for any other purpose.
Buxton, Maine Vermont Registration No. 092.0000697 February 12, 2020

CHAMPLAIN VALLEY SCHOOL DISTRICT
SCHEDULE OF FINDINGS AND QUESTIONED COSTS FOR THE YEAR ENDED JUNE 30, 2019
104
Section I - Summary of Auditor’s Results Financial Statements Type of auditor’s report issued: Unmodified Internal control over financial reporting:
• Material weakness(es) identified? yes X no
• Significant deficiency(ies) identified? yes X no
• Noncompliance material to financial statements noted? yes X no
Federal Awards Internal control over major programs:
• Material weakness(es) identified? yes X no
• Significant deficiency(ies) identified? yes X no Type of auditor’s report issued on compliance for major programs: Unmodified Any audit findings disclosed that are required to be reported In accordance with 2 CFR 200.516(a)? yes X no Identification of major programs: CFDA Numbers Name of Federal Program or Cluster 84.010 Title I Grants to Local Educational Agencies 84.367 Supporting Effective Instruction State Grants 84.424 Student Support and Academic Enrichment Program Dollar threshold used to distinguish between type A and B: $750,000 Auditee qualified as low-risk auditee? X yes no
Section II - Financial Statement Findings
None
Section III - Federal Awards Findings and Questioned Costs
None