DRAFT 07/20/2021 - Indian Wells Valley Water District
572
INDIAN WELLS VALLEY WATER DISTRICT POST OFFICE BOX 1329 RIDGECREST, CA 93556-1329 (760) 375-5086 DRAFT 07/20/2021 INDIAN WELLS VALLEY WATER DISTRICT 2020 WATER SHORTAGE CONTINGENCY PLAN JULY 2021 Adopted by Ordinance No. ___ on August 9, 2021 Prepared by (951) 684-6900 Office: 3602 University Ave, Riverside, CA 92501 Mail/Ship: 3890 Orange St #1509, Riverside, CA 92502 178-64.6 VEM/DFS/nr/blt 178-64P6-UWMP-2020
-
Upload
khangminh22 -
Category
Documents
-
view
0 -
download
0
Transcript of DRAFT 07/20/2021 - Indian Wells Valley Water District

INDIAN WELLS VALLEY WATER DISTRICT POST OFFICE BOX 1329 RIDGECREST, CA 93556-1329 (760) 375-5086
DRAFT 07/20/2021
INDIAN WELLS VALLEY WATER DISTRICT 2020 WATER SHORTAGE CONTINGENCY PLAN
JULY 2021
Adopted by Ordinance No. ___ on August 9, 2021
Prepared by
(951) 684-6900 Office: 3602 University Ave, Riverside, CA 92501
Mail/Ship: 3890 Orange St #1509, Riverside, CA 92502
178-64.6 VEM/DFS/nr/blt
178-64P6-UWMP-2020

TABLE OF CONTENTS

2020 Water Shortage Contingency Plan Table of Contents
Table of Contents-i
TABLE OF CONTENTS SECTION PAGE 1. Introduction ................................................................................................................................. 1-1
1.1 Purpose of WSCP ............................................................................................................ 1-1 1.2 Background ...................................................................................................................... 1-1 1.3 Definitions ....................................................................................................................... 1-2 2. Water Supply Reliability Analysis ............................................................................................ 2-1
Table 2-1 Projected Normal Year Supply and Demand Comparison Table 2-2 Projected Single Dry Year Supply and Demand Comparison Table 2-3 Projected Multiple Dry Years Supply and Demand Comparison Table 2-4 Supply Source Production Capability 3. Annual Water Supply and Demand Assessment Procedures ................................................. 3-1
3.1 Decision-Making Process ................................................................................................ 3-2 3.2 Data and Methodologies .................................................................................................. 3-2 3.3 Communication Protocols ................................................................................................ 3-3 4. Water Shortage Levels and Shortage Response Actions ......................................................... 4-1
4.1 Water Shortage Levels ..................................................................................................... 4-1 4.2 Shortage Response Actions .............................................................................................. 4-3 4.3 Drought State of Emergency ............................................................................................ 4-6 4.4 Emergency Response Actions During a
Catastrophic Interruption of Water Supplies ................................................................... 4-7 4.5 Water Allotments During a Catastrophic Interruption of Water Supplies ....................... 4-9 4.6 Shortage Response Action Effectiveness ....................................................................... 4-14 Table 4-1 Water Shortage Contingency Plan Levels (From DWR Submittal Table 8-1) Table 4-2 Water Shortage Levels and Reduction Goals Table 4-3 Use Allotment Per Tier in Hundred Cubic Feet Per Ordinance No. 104
Water Sales and Service Policy Manual Table 4-4 Existing Storage Facilities Table 4-5 Demand Reduction Actions (From DWR Submittal Table 8-2) Table 4-6 Supply Augmentation and Other Actions (From DWR Submittal Table 8-3) 5. Seismic Risk Assessment and Mitigation Plan ......................................................................... 5-1 6. Prohibitions, Penalties, and Appeals ......................................................................................... 6-1
6.1 Ordinance No. 93 ............................................................................................................. 6-1 6.2 Ordinance No. 100 ........................................................................................................... 6-7 6.3 Ordinance No. 103 ......................................................................................................... 6-12 6.4 Fines and Penalties for Exceeding Allotments .............................................................. 6-14 6.5 Appeals Process ............................................................................................................. 6-16 7. Legal Authority ........................................................................................................................... 7-1
7.1 Statutory Authority .......................................................................................................... 7-1 7.2 Ordinances ....................................................................................................................... 7-2

2020 Water Shortage Contingency Plan Table of Contents
Table of Contents-ii
TABLE OF CONTENTS SECTION PAGE 8. Financial Consequences of WSCP Activation .......................................................................... 8-1
8.1 Potential Revenue Reductions and Mitigation Actions ................................................... 8-1 8.2 Cost of Compliance with Chapter 3.3 .............................................................................. 8-2 Table 8-1 Actions and Conditions that Impact Revenues Table 8-2 Actions and Conditions that Impact Expenditures Table 8-3 Proposed Measures to Overcome Revenue Impacts Table 8-4 Proposed Measures to Overcome Expenditure Impacts 9. Monitoring and Reporting ......................................................................................................... 9-1
9.1 Monitoring During Normal or Level 1 Water Shortage Conditions ................................ 9-1 9.2 Monitoring During a Level 2 or 3 Water Shortage Condition ......................................... 9-2 9.3 Monitoring During a Level 4, 5, or 6 Water Shortage Condition .................................... 9-2 9.4 Catastrophic Interruption of Water Supplies ................................................................... 9-2 10. WSCP Refinement Procedures ................................................................................................ 10-1 11. Special Water Feature Distinction........................................................................................... 11-1 12. Plan Adoption, Submittal, and Availability ............................................................................ 12-1 APPENDICES Appendix 1: Ordinance No. ___ Adopting the 2020 Water Shortage Contingency Plan Appendix 2: Relevant Sections of the California Water Code Appendix 3: Water Sales & Service Policy Manual (Ordinance No. 104) Appendix 4: Ordinance Nos. 93, 98, 99, 100, and 103 Appendix 5: County of Kern Multi-Jurisdiction 2020 Hazard Mitigation Plan

SECTION 1
INTRODUCTION

2020 Water Shortage Contingency Plan Introduction
Page 1-1
SECTION 1 INTRODUCTION
1.1 Purpose of the WSCP
The primary purpose of the Water Shortage Contingency Plan (WSCP) is to comply with the
requirements of the California Water Code (CWC) sections, which are described in additional detail
in Section 1.2 below. Importantly, the District has a civic and legal responsibility to provide for
the water-related health and safety needs of the community. During a water shortage or a
catastrophic interruption of water supplies, the District will take the actions described herein to
minimize the interruption in water service to its customers to the extent possible, until normal
service can be resumed. The WSCP includes an analysis of the contingency plan and sets forth
actions, prohibitions, and penalties to be implemented during the various levels of a water shortage
or a catastrophic interruption of water supplies to help ensure that the District can provide
continuous service to its customers during a severe or extended water shortage in which the District
has access to less than 50% of its normal water supply.
1.2 Background
Indian Wells Valley Water District (the District) prepared its initial Water Shortage Contingency
Plan in 1992 (1992 WSCP) and adopted same by Resolution No. 92-08 on April 27, 1992. The
1992 WSCP was prepared in response to the adoption of California Assembly Bill 11X (AB 11X)
relating to drought contingency in California. AB 11X added Section 10656 to the CWC and
amended CWC Sections 10620, 10631, and 10652.
The District later prepared a revised WSCP, the 2017 Water Shortage Contingency Plan (2017
WSCP), and adopted same by Ordinance No. 101 on July 10, 2017. The 2017 WSCP was prepared
in response to the addition of CWC Sections 365 through 367. Sections 365 through 367 were
Water Code
10632(a) Every urban water supplier shall prepare and adopt a water shortage contingency plan as part of its urban water management plan…

2020 Water Shortage Contingency Plan Introduction
Page 1-2
added to the CWC by Senate Bill 814 on August 29, 2016 and relate to excessive residential water
use during drought.
Since adoption of the 2017 WSCP, several revisions and additions to the CWC have taken effect.
In 2015, Senate Bill 664 added Section 10632.5 to the CWC. CWC Section 10632.5 requires that
a WSCP, beginning January 1, 2020, include a seismic risk assessment and mitigation plan to assess
the vulnerability of each of the various facilities of a water system and mitigate those
vulnerabilities. Section 10632.5 additionally requires that an urban water supplier update the
seismic risk assessment and mitigation plan when updating its urban water management plan. In
2018, Senate Bill 606 (SB 606) modified CWC Section 10632 and added Sections 10632.2 and
10632.3, which pertain to the contents of a WSCP, the usage of a WSCP during a drought or other
shortage conditions, and the requirement that a WSCP be included as part of an urban water
supplier's urban water management plan. In 2019, Assembly Bill 1414 amended CWC Section
10632.1, requiring an urban water supplier to conduct an annual water supply and demand
assessment and to submit an annual water shortage assessment report to the Department of Water
Resources (DWR). The WSCP must include the procedures for conducting the annual water supply
and demand assessment.
This current WSCP supersedes the 2017 WSCP and has been adopted pursuant to Ordinance
No. _____, a copy of which is included in Appendix 1 herein. This WSCP has been made available
to the public prior to adoption, and the final, adopted version will be made available to the public,
and provided to the City of Ridgecrest, County of Kern, and County of San Diego, within 30 days
after adoption.
This WSCP has been prepared to coordinate the elements and analysis required pursuant to the
CWC sections described above and is intended to create a standard and uniform response to a water
shortage or a catastrophic interruption of water supplies. Copies of the relevant CWC sections are
included in Appendix 2 herein.
1.3 Definitions
"Allotment" means the quantity of water allocated (including increased allotments) to a
District customer under mandatory rationing during a Water Supply Shortage, a Catastrophic

2020 Water Shortage Contingency Plan Introduction
Page 1-3
Interruption of Water Supplies, a Drought State of Emergency, or a Local Water Supply
Shortage.
"California Water Code" or "CWC" means the California Water Code adopted by the State
of California and available at http://leginfo.legislature.ca.gov/faces/codes.xhtml.
"Catastrophic Interruption of Water Supplies" means a significant interruption of water
supplies resulting from a disaster, such as earthquake, fire, or flood, or from any other sudden,
unexpected event.
"Commercial Customer" means a business or individual who provides a service or sells
products for profit.
"Decorative Water Feature" means a man-made fountain, pond, waterfall, or other water-
using feature that is provided solely for aesthetic or beautification purposes.
"District" means the Indian Wells Valley Water District.
"Drought State of Emergency" means either:
a. A period for which the Governor has issued a proclamation of a state of emergency
under the California Emergency Services Act (Chapter 7 (commencing with
Section 8550) of Division 1 of Title 2 of the Government Code) based on statewide
drought conditions to an urban retail water supplier that has moved to a level of action
in response to a local water supply shortage condition under the District's contingency
plan pursuant to CWC Section 10632(a) that requires mandatory water use reductions;
or
b. A period for which the Governor has issued a proclamation of a state of emergency
under the California Emergency Services Act (Chapter 7 (commencing with
Section 8550) of Division 1 of Title 2 of the Government Code) based on local
drought conditions.
"Excessive Water Use" means usage in excess of Tier 2 of the District's rate structure; i.e.
usage in Tiers 3 and 4, which are defined below.
"Hundred Cubic Feet" or "HCF", means 748 gallons.

2020 Water Shortage Contingency Plan Introduction
Page 1-4
"Local Water Supply Shortage" under CWC Section 367(a)(2) means a period in which the
District has moved to a level of action in response to a local water supply shortage condition
under the District's contingency plan pursuant to CWC Section 10632(a)(1) that requires
mandatory water use reductions.
"Residential Customer" means a single-family residence or a customer in a multi-unit
housing complex in which each unit is metered individually.
"Swimming Pool" means any structure intended for swimming or recreational bathing that
contains water over 18 inches deep. "Swimming Pool" includes in-ground and aboveground
structures and includes, but is not limited to, hot tubs, spas, portable spas, and nonportable
wading pools.
"Tier 2" is the customer usage criterion that is described in the District's Water Sales & Service
Policy Manual, adopted December 10, 2018 by Ordinance No. 104 (refer to Appendix 3
herein).
"Tier 3" is the customer usage criterion that is described in the District's Water Sales & Service
Policy Manual, adopted December 10, 2018 by Ordinance No. 104 (refer to Appendix 3
herein).
"Tier 4" is the customer usage criterion that is described in the District's Water Sales & Service
Policy Manual, adopted December 10, 2018 by Ordinance No. 104 (refer to Appendix 3
herein).
"Urban Retail Water Supplier" means a water supplier, either publicly or privately owned,
that provides water either directly or indirectly to more than 3,000 end users or that supplies
more than 3,000 acre-feet of water annually for municipal purposes. The District is an Urban
Retail Water Supplier.
"Water Shortage Response Team" consists of representatives of various District
departments, as determined and appointed by the General Manager.
"Water Supply Shortage" means a period in which the District has moved to a level of action
in response to a water supply shortage under the District's contingency plan pursuant to CWC
Section 10632(a)(1).

SECTION 2
WATER SUPPLY RELIABILITY ANALYSIS

2020 Water Shortage Contingency Plan Water Supply Reliability Analysis
Page 2-1
SECTION 2 WATER SUPPLY RELIABILITY ANALYSIS
The District's sole source of potable water supply water supply consists of groundwater pumped from the
Indian Wells Valley Groundwater Basin (IWVGB). Although California had experienced severe drought
conditions extending from 2012 through 2017, the IWVWD did not experience any actual supply
deficiencies due to its reliance on local groundwater sources.
The IWVGB is one of 21 basins in the state that the DWR determined is in "critical overdraft," meaning
that the Basin suffers from chronic overuse of water supplies beyond the natural recharge of the Basin. The
region has created a Groundwater Sustainability Agency (the Indian Wells Valley Groundwater Authority
or IWVGA) to take policy steps that address the long-term sustainability of the IWVGB. IWVGA is a
joint-powers authority consisting of the City of Ridgecrest, County of Kern, County of Inyo, County of San
Bernardino, and the Indian Wells Valley Water District. IWVGA is in the process of implementing a
Groundwater Sustainability Plan (GSP) to reverse the effects of overdraft while maintaining the water needs
of area residents and business, which include the Indian Wells Valley Water District. The GSP was
submitted to the DWR on January 31, 2020 and is currently in review. While the plan is in review, the
IWVGA is implementing a series of projects and procedures to slow the groundwater overdraft and bring
the basin back into long-term sustainability.
Water Code
10632(a) Every urban water supplier shall prepare and adopt a water shortage contingency plan as part of its urban water management plan that consists of the following elements:
(1) The analysis of water supply reliability conducted pursuant to Section 10635.
10635 Every urban water supplier shall include, as part of its urban water management plan, an assessment of the reliability of its water service to its customers during normal, dry, and multiple dry water years. This water supply and demand assessment shall compare the total water supply sources available to the water supplier with the long-term total projected water use over the next 20 years, in five-year increments, for a normal water year, a single dry water year, and a drought lasting five consecutive water years. The water service reliability assessment shall be based upon the information compiled pursuant to Section 10631, including available data from state, regional, or local agency population projections within the service area of the urban water supplier.

2020 Water Shortage Contingency Plan Water Supply Reliability Analysis
Page 2-2
The GSP includes alternatives for implementation of a recycled water program, alternatives for purchasing
and importing water to the IWVGB, and a program to facilitate fallowing of active farmland, among other
projects and programs.
IWVWD does not have an immediate concern with short-term water supply reliability, and because the
District's water supply is groundwater, the District is not subject to short-term water shortages resulting
from temporary dry weather conditions. As described in the District's 2020 Urban Water Management Plan
(2020 UWMP), the District and other groundwater users in the Indian Wells Valley have been
implementing ongoing groundwater management practices to extend the useful life of the groundwater
resource to meet current and future demands.
The District's goal is to provide its customers with adequate and reliable supplies of high-quality water,
which meet present and future needs in an environmentally and economically responsible manner. The
District's projected water supply reliability under normal conditions, during a single dry water year, and
during a drought lasting up to five consecutive years, is shown in Tables 2-1 through 2-3 below.
TABLE 2-1 PROJECTED NORMAL YEAR SUPPLY AND DEMAND COMPARISON
2025 2030 2035 2040 2045 Supply totals (acre-feet per year (AF/yr)) 20,000 20,000 20,000 20,000 20,000 Demand totals (AF/yr) 6,930 7,130 7,690 7,830 8,050 Difference (supply minus demand, in AF/yr) 13,070 12,870 12,310 12,170 11,950 Difference as % of Supply 65% 64% 62% 61% 60% Difference as % of Demand 189% 181% 160% 155% 148%
TABLE 2-2 PROJECTED SINGLE DRY YEAR SUPPLY AND DEMAND COMPARISON
2025 2030 2035 2040 2045 Supply totals (AF/yr) 20,000 20,000 20,000 20,000 20,000 Demand totals (AF/yr) 6,930 7,130 7,690 7,830 8,050 Difference (supply minus demand, in AF/yr) 13,070 12,870 12,310 12,170 11,950 Difference as % of Supply 65% 64% 62% 61% 60% Difference as % of Demand 189% 181% 160% 155% 148%

2020 Water Shortage Contingency Plan Water Supply Reliability Analysis
Page 2-3
TABLE 2-3 PROJECTED MULTIPLE(1) DRY YEARS SUPPLY AND DEMAND COMPARISON
2025 2030 2035 2040 2045 Supply totals (AF/yr) 20,000 20,000 20,000 20,000 20,000 Demand totals (AF/yr) 6,930 7,130 7,690 7,830 8,050 Difference (supply minus demand, in AF/yr) 13,070 12,870 12,310 12,170 11,950 Difference as % of Supply 65% 64% 62% 61% 60% Difference as % of Demand 189% 181% 160% 155% 148%
(1) Based on a drought lasting five consecutive years and ending in the year specified in each column.
The estimated groundwater supply of 20,000 acre-feet per year (AF/yr) is based on the maximum quantity
of water that the District is capable of producing if all existing wells operate continuously for 24 hours per
day (20,856 AF/yr rounded down). The District has not experienced an actual supply deficiency during
dry years. The District is located in an arid high desert region; therefore, supply and demand remain
relatively unchanged in the District's service area during dry years, and the District does not expect a
decrease in supply based on drought conditions (including a drought lasting up to five years) or climate
change.
Since the District relies exclusively on groundwater as its source of supply, and is therefore not subject to
short-term shortages caused by periodic drought, the analysis herein focuses on equipment failure and
disaster. Table 2-4 below shows the nominal production capability for each of the District's production
wells.
TABLE 2-4 SUPPLY SOURCE PRODUCTION CAPABILITY
Well No. Nominal Production Capacity
(gallons per minute(gpm)) 9A 1,000 10 1,100 11 1,200 13 1,200 17 1,200 18 1,200 30 1,400 31 1,200 33 1,200 34 2,000
Total 12,700

2020 Water Shortage Contingency Plan Water Supply Reliability Analysis
Page 2-4
The District's current pumping plant capacity is capable of providing for the current maximum day demand
of 11,050 gallons per minute (gpm), with a reserve capacity of 1,650 gpm.
The District has an emergency water system interconnection with the China Lake Naval Air Weapons
Station (China Lake NAWS) which permits either entity to deliver water to the other as needed to meet
water supply requirements during emergencies. If, during a period of peak demand, one pumping plant
was out of service, the District may rely upon water supplied from the emergency interconnection with the
China Lake NAWS to make up the pumping shortfall (there is some emergency supply in storage). The
District also has an emergency interconnection with Searles Valley Minerals (SVM); however, the District
cannot accept water from the SVM interconnection because SVM water is not chlorinated until further
downstream.
Additionally, the District recently approved a modified version of its Water Supply Improvement Project,
which is designed to increase the District's water production capacity and maintain a 20% redundancy factor
above the estimated maximum day demand to accommodate scheduled and unscheduled maintenance and
repairs. As part of the project, Well 35 has been constructed and is expected to be placed into service in
the latter half of 2021, which will increase the District's production capacity by an estimated 1,200 gpm.
The District plans to increase Well 35's capacity to 2,200 in the future.
The District's Emergency Response Plan for the Indian Wells Valley Water District, dated October 2019
(referred to as the Emergency Response Plan) outlines the actions to be taken in the event of a major
catastrophe. The Emergency Response Plan is reviewed regularly and updated as needed. The District's
Emergency Response Plan is incorporated herein by reference and is kept on file at the District's office.
The District does not anticipate any inconsistency in supply due to legal, environmental, water quality, or
climate factors. Factors that can cause water supply shortages or supply interruptions for the District are
earthquakes, equipment failure, chemical spills, and energy outages at treatment and pumping facilities.
The actions the District will take in the event of a water supply shortage or supply interruption are described
in Section 4 herein.

SECTION 3
ANNUAL WATER SUPPLY AND DEMAND ASSESSMENT PROCEDURES

Annual Water Supply and 2020 Water Shortage Contingency Plan Demand Assessment Procedures
Page 3-1
SECTION 3 ANNUAL WATER SUPPLY AND DEMAND ASSESSMENT PROCEDURES
In accordance with CWC Section 10632.1, the District is required to prepare and submit an annual water
supply and demand assessment (referred to herein as the Annual Assessment) to the DWR each year by
July 1, beginning in 2022. The Annual Assessment will be conducted based on the procedures described
in this section of the WSCP.
Water Code
10632(a) Every urban water supplier shall prepare and adopt a water shortage contingency plan as part of its urban water management plan that consists of the following elements:
(2) The procedures used in conducting an annual water supply and demand assessment that include, at a minimum, both of the following:
(A) The written decision-making process that an urban water supplier will use each year to determine its water supply reliability.
(B) The key data inputs and assessment methodology used to evaluate the urban water supplier's water supply reliability for the current year and one dry year, including all of the following:
(i) Current year unconstrained demand, considering weather, growth, and other influencing factors, such as policies to manage current supplies to meet demand objectives in future years, as applicable.
(ii) Current year available supply, considering hydrological and regulatory conditions in the current year and one dry year. The annual supply and demand assessment may consider more than one dry year solely at the discretion of the urban water supplier.
(iii) Existing infrastructure capabilities and plausible constraints.
(iv) A defined set of locally applicable evaluation criteria that are consistently relied upon for each annual water supply and demand assessment.
(v) A description and quantification of each source of water supply. 10632.1 An urban water supplier shall conduct an annual water supply and demand
assessment pursuant to subdivision (a) of Section 10632 and, on or before July 1 of each year, submit an annual water shortage assessment report to the department with information for anticipated shortage, triggered shortage response actions, compliance and enforcement actions, and communication actions consistent with the supplier's water shortage contingency plan. An urban water supplier that relies on imported water from the State Water Project or the Bureau of Reclamation shall submit its annual water supply and demand assessment within 14 days of receiving its final allocations, or by July 1 of each year, whichever is later.

Annual Water Supply and 2020 Water Shortage Contingency Plan Demand Assessment Procedures
Page 3-2
3.1 Decision-Making Process
The process and anticipated timeline that the District will follow in conducting its Annual
Assessment is below.
January
Convene Water Shortage Response Team (WSRT), as defined in Section 1.3 herein. WSRT will
assess supplies and demands based on monitoring data and current conditions.
February
WSRT will develop preliminary report and present to Board of Directors.
March
WSRT will prepare an updated Annual Assessment report based on current supply and demand
data. If a shortage is anticipated, District staff will use the WSCP to determine shortage level and
appropriate actions, including triggered shortage response actions, compliance and enforcement
actions, and communication actions.
April
WSRT will present Annual Assessment report and accompanying ordinance or resolution to Board
of Directors for consideration and approval. If revisions to the Annual Assessment report or
accompanying ordinance or resolution are needed after Board review, District staff will make the
necessary revisions and present the final versions to the Board for review and approval prior to
submission to DWR.
June
District will submit final Annual Assessment Report to DWR. The report is due on or before July
1 each year, with the first report due on or before July 1, 2022.
3.2 Data and Methodologies
This section includes a description of the key data inputs and methodology used to evaluate the
District's water system reliability in preparation of the Annual Assessment.

Annual Water Supply and 2020 Water Shortage Contingency Plan Demand Assessment Procedures
Page 3-3
Key Data Inputs:
Prior year water demand
Estimated water demand for the following year
Capacity and current condition of all existing wells
Capacity and current condition of all existing storage tanks
Status of current and proposed water system facilities projects
District staff will evaluate all available data to determine any supply or facilities constraints or
deficiencies. If shortages are anticipated, the District will use this WSCP to determine the
anticipated shortage level and appropriate actions.
3.3. Communication Protocols
The District maintains a website, www.iwvwd.com, with public notices, announcements,
mandatory and voluntary water conservation measures, conservation tips, adopted ordinances, and
other information. The District will prominently display on its website notice of any current or
predicted water shortages or any shortage response actions triggered or anticipated to be triggered
by the annual water supply and demand assessment or by the District's routine monitoring activities.
The District will also communicate a current or anticipated Water Supply Shortage, Drought State
of Emergency, or Local Water Supply Shortage, defined in Section 1.3 herein, by mail, various
social media outlets, and email.
Water Code
10632(a) Every urban water supplier shall prepare and adopt a water shortage contingency plan as part of its urban water management plan that consists of each of the following elements:
(5) Communication protocols and procedures to inform customers, the public, interested parties, and local, regional, and state governments, regarding, at a minimum, all of the following:
(A) Any current or predicted shortages as determined by the annual water supply and demand assessment described pursuant to Section 10632.1.
(B) Any shortage response actions triggered or anticipated to be triggered by the annual water supply and demand assessment described pursuant to Section 10632.1.
(C) Any other relevant communications.

SECTION 4
WATER SHORTAGE LEVELS AND SHORTAGE RESPONSE ACTIONS

Water Shortage Levels and 2020 Water Shortage Contingency Plan Shortage Response Actions
Page 4-1
SECTION 4 WATER SHORTAGE LEVELS AND SHORTAGE RESPONSE ACTIONS
4.1 Water Shortage Levels
CWC Section 10632(a)(3)(A) sets forth six standard water shortage levels that correspond to
progressive ranges of shortage, up to and including a shortage of greater than 50 percent. The
District's shortage response actions are summarized in Table 4-1 below, which is based on DWR
Submittal Table 8-1, a table that is required by DWR for submission with 2020 WSCPs. The
District's shortage response actions are described in additional detail in Sections 4.2 through 4.5.
Water Code
10632(a) Every urban water supplier shall prepare and adopt a water shortage contingency plan as part of its urban water management plan that consists of each of the following elements:
(3) (A) Six standard water shortage levels corresponding to progressive ranges of up to 10, 20, 30, 40, and 50 percent shortages and greater than 50 percent shortage. Urban water suppliers shall define these shortage levels based on the suppliers' water supply conditions, including percentage reductions in water supply, changes in groundwater supply levels, changes in surface elevation or level of subsidence, or other changes in hydrological or other conditions indicative of the water supply available for use. Shortage levels shall also apply to catastrophic interruption of water supplies, including, but not limited to, a regional power outage, an earthquake, and other potential emergency events.
(B) An urban water supplier with an existing water shortage contingency plan that uses different water shortage levels may comply with the requirement in subparagraph (A) by developing and including a cross-reference relating its existing categories to the six standard water shortage levels.
(4) Shortage response actions that align with the defined shortage levels and include, at a minimum, all of the following:
(A) Locally appropriate supply augmentation actions.
(B) Locally appropriate demand reduction actions to adequately respond to shortages.
(C) Locally appropriate operational changes.
(D) Additional, mandatory prohibitions against specific water use practices that are in addition to state-mandated prohibitions and appropriate to the local conditions.
(E) For each action, an estimate of the extent to which the gap between supplies and demand will be reduced by implementation of the action.

Water Shortage Levels and 2020 Water Shortage Contingency Plan Shortage Response Actions
Page 4-2
TABLE 4-1 WATER SHORTAGE CONTINGENCY PLAN LEVELS
(FROM DWR SUBMITTAL TABLE 8-1)
Shortage Level
Percent Shortage
Range Shortage Response Actions
(Narrative description)
1 Up to 10%
The District routinely provides water conservation information to customers. Because the District has adequate capacity to provide regular service to customers at this shortage level, no additional actions will be taken by the District in response to a shortage level of 10% or less.
2 Up to 20%
The District will notify customers via customer portal and will provide conservation information to customers, explaining importance of water use reductions. The District will provide technical information to customers regarding methods of improving water use efficiency. The District will conduct a media campaign to remind customers of the need to save water.
3 Up to 30%
The District will notify customers via customer portal and will provide conservation information to customers, explaining importance of water use reductions. The District will provide technical information to customers regarding methods of improving water use efficiency. The District will conduct a media campaign to remind customers of the need to save water.
4 Up to 40%
Residential and commercial water use in excess of Tier 2 will be considered Excessive Water Use and will be assessed a fine of $100 for the initial HCF of usage in Tier 3 and an additional $10 for each HCF over the initial Tier 3 HCF. Fines will be increased for each consecutive billing cycle in which a customer exceeds Tier 2 water use. In severe situations, water rationing may be implemented.
5 Up to 50%
Residential and commercial water use in excess of Tier 2 will be considered Excessive Water Use and will be assessed a fine of $100 for the initial HCF of usage in Tier 3 and an additional $10 for each HCF over the initial Tier 3 HCF. Fines will be increased for each consecutive billing cycle in which a customer exceeds Tier 2 water use. In severe situations, water rationing may be implemented.
6 >50%
Residential and commercial water use in excess of Tier 2 will be considered Excessive Water Use and will be assessed a fine of $100 for the initial HCF of usage in Tier 3 and an additional $10 for each HCF over the initial Tier 3 HCF. Fines will be increased for each consecutive billing cycle in which a customer exceeds Tier 2 water use. In severe situations, water rationing may be implemented.

Water Shortage Levels and 2020 Water Shortage Contingency Plan Shortage Response Actions
Page 4-3
4.2 Shortage Response Actions
The District has developed a rationing plan (refer to Table 4-2) to implement during a Water Supply
Shortage which coincides with the actions to be taken during a Drought State of Emergency or a
Local Water Supply Shortage.
The District's rationing plan includes voluntary and mandatory rationing, which will be
implemented based on factors, including but not limited to, the cause, severity, and anticipated
duration of the Water Supply Shortage. Voluntary rationing occurs when a Level 2 or 3 (up to 30%
shortage) exists or a Drought State of Emergency, that contains mandatory water usage restrictions,
has been declared by the Governor. Mandatory rationing will be implemented when a Level 4
shortage condition (>30% shortage) exists or a Local Water Supply Shortage has been declared by
the District.
A Water Supply Shortage may be triggered by a shortage in aquifer supply, equipment failure,
catastrophe (such as earthquake or power outage), or other event that results in a Water Supply
Shortage. Once a Water Supply Shortage is triggered, depending on the shortage condition, either
voluntary or mandatory rationing will be implemented as described in Table 4-2 below.
TABLE 4-2 WATER SHORTAGE LEVELS AND REDUCTION GOALS
Shortage Level Shortage Condition
Customer Reduction
Goal
Type of Rationing Program
1 ≤10% -- Voluntary* 2 ≤20% 25% Voluntary* 3 ≤30% 25% Voluntary* 4 ≤40% 30% Mandatory 5 ≤50% 35% Mandatory 6 >50% 40% Mandatory
* In the event the State of California issues mandatory water conservation requirements, whether or not such requirements are accompanied by a Governor-declared Drought State of Emergency, the District will adopt an ordinance setting forth mandatory measures to comply with such mandatory water conservation requirements.

Water Shortage Levels and 2020 Water Shortage Contingency Plan Shortage Response Actions
Page 4-4
4.2.1 Voluntary Rationing Program
In the event of a Level 2 or 3 shortage condition, the District will implement the voluntary
measures outlined in Items (1) through (4) below. These voluntary measures, will also
be implemented in the event of a Level 4, 5, or 6 water shortage condition, a Local Water
Supply Shortage, or a Drought State of Emergency, that include mandatory water usage
restrictions. Note that during any shortage condition level, the requirements of District
Ordinance No. 103 and the penalties applicable to violations thereof remain in effect.
District Ordinance No. 103 is described in Section 6.3 herein, and a copy of said ordinance
is included in Appendix 4.
1) The District will notify customers of the water shortage by customer portal, mail,
the District's website, various social media outlets, and email. Conservation
information will be mailed to every customer, which will explain the importance
of significant water use reductions.
2) Technical information will be provided to the District's customers regarding
methods for improving water use efficiency.
3) The District will conduct a media campaign to remind consumers of the need to
save water.
4.2.2 Mandatory Rationing Program
In the event of a Level 4, Level 5, or Level 6 shortage condition or a Local Water Supply
Shortage, water use in excess of Tier 2 water use is considered Excessive Water Use and
is subject to the penalties described below. The District's tiered usage Allotment, listed in
Table 4-3 below, is based on the District's tiered rate structure, which is set forth in the
Indian Wells Valley Water District Water Sales & Service Policy Manual (Ordinance
No. 104), a copy of which is included in Appendix 3 herein. The rate structure is organized
into usage tiers based on quantity, meter size, and connection type.
The quantities of water designated in Table 4-3 and Ordinance No. 104 are given in units
of hundred cubic feet (HCF), which is the standard measurement for all District water

Water Shortage Levels and 2020 Water Shortage Contingency Plan Shortage Response Actions
Page 4-5
deliveries and is indicated on the District's water bills and water meters. One HCF is
equivalent to 748 gallons of water.
TABLE 4-3 USE ALLOTMENT PER TIER IN HUNDRED CUBIC FEET (HCF)
PER ORDINANCE NO. 104 - WATER SALES AND SERVICE POLICY MANUAL
RESIDENTIAL: Tier All Meter Sizes
Tier 1 0 - 9 Tier 2 9.01 - 24 Tier 3 24.01 - 45 Tier 4 45.01 and Over
COMMERCIAL: Tier 3/4" Meter 1" Meter 1-1/2" Meter 2" Meter
Tier 1 0 - 9 0 - 15 0 - 30 0 - 48 Tier 2 9.01 - 24 15.01 - 40 30.01 - 80 48.01 - 128 Tier 3 24.01 - 45 40.01 - 75 80.01 - 150 128.01 - 240 Tier 4 45.01 and Over 75.01 and Over 150.01 and Over 240.01 and Over
COMMERCIAL: Tier 3" Meter 4" Meter 6" Meter 8" Meter
Tier 1 0 - 96 0 - 150 0 - 300 0 - 690 Tier 2 96.01 - 256 150.01 - 400 300.01 - 800 690.01 - 1280 Tier 3 256.01 - 480 400.01 - 750 800.01 - 1500 1280.01 - 2400 Tier 4 480.01 and Over 750.01 and Over 1500.01 and Over 2400.01 and Over
During a Level 4, 5, or 6 shortage condition or a Local Water Supply Shortage, the
following will apply, in addition to the actions applicable during a Level 2 or 3 shortage
condition:
1) Residential and Commercial water use in excess of Tier 2 of the District's rate
structure in a single billing cycle shall be considered Excessive Water Use.
2) A Residential Customer or Commercial Customer exceeding Tier 2 usage in a
single billing cycle shall be assessed a fine of $100 for the initial HCF of usage in
Tier 3. An additional fine of $10 for each HCF of usage over the initial Tier 3
HCF of usage shall be assessed in addition to the base rate.
3) For each consecutive billing cycle that a Residential Customer's or Commercial
Customer's usage exceeds Tier 2 usage, the previous fine shall be increased by

Water Shortage Levels and 2020 Water Shortage Contingency Plan Shortage Response Actions
Page 4-6
$100 for the initial HCF of usage in Tier 3. The additional $10 fine for each HCF
of usage over the initial Tier 3 HCF of usage shall similarly increase $10 in
addition to the base rate. For example, a second consecutive billing cycle will
result in an Excessive Water Use fine of $200 for the initial HCF of Tier 3 usage.
For each additional HCF of Tier 3 and 4 usage, a penalty of $20 shall be assessed
in addition to the base rate. A third consecutive billing cycle will result in an
Excessive Water Use fine of $300 for the initial HCF of Tier 3 usage. For each
additional HCF of Tier 3 and 4 usage, a penalty of $30 shall be assessed in addition
to the base rate. The fines shall increase in increments of $100 and $10,
respectively, up to a maximum of $500 for the initial HCF of Tier 3 usage and $50
for each additional HCF over the initial HCF of Tier 3 usage in addition to the base
rate.
4) Any fine resulting from violation of this WSCP will be added to the customer's
water bill and is due and payable with that water bill.
5) Non-payment of a fine shall be addressed with due process in mind.
4.3 Drought State of Emergency
During a period for which the Governor has issued a proclamation of a Drought State of
Emergency, water use in excess of Tier 2 water use is considered Excessive Water Use and the
following will apply:
1) Residential and Commercial water use in excess of Tier 2 of the District's rate structure in
a single billing cycle shall be considered Excessive Water Use.
2) Residential and Commercial water use in excess of Tier 2 of the District's rate structure in
a single billing cycle will be assessed a fine of 1% of the total Tier 3 and Tier 4 use during
that billing cycle until the Drought State of Emergency is declared over by proclamation
of the Governor or like action.

Water Shortage Levels and 2020 Water Shortage Contingency Plan Shortage Response Actions
Page 4-7
3) Any fine resulting from violation of this Ordinance will be added to the customer’s water
bill and is due and payable with that water bill.
4) Non-payment of a fine shall be addressed with due process in mind.
4.4 Emergency Response Actions During a Catastrophic Interruption of Water Supplies
The water shortage contingency analysis includes the possibility of a catastrophic interruption of
water supplies impacting the District's ability to deliver water. Events that can cause catastrophic
outages include earthquakes, chemical spills, and power outages at treatment plants and pumping
facilities. The Emergency Response Plan for the Indian Wells Valley Water District, dated October
2019, referred to as the Emergency Response Plan, describes the actions to be taken in the event of
a catastrophic interruption of water supplies. The Emergency Response Plan is reviewed regularly
and updated as needed. The District's Emergency Response Plan is incorporated herein by
reference and is kept on file at the District's office.
The Emergency Response Plan is coordinated with other emergency services, including police, fire,
medical services, other utilities, as well as county, state, and federal agencies. The Emergency
Response Plan includes procedures for reportable emergency incidents, notifications, boil water
orders, unsafe water alerts, and emergency chlorination.
The following steps comprise the District's procedure for emergency situation response and
evaluation of a catastrophic interruption of water supplies.
STEP 1: The priority response to any degree of disaster, prior to plant evaluation, is to shut and
lock off the inlet and outlet valves of the Bowman #2 service-level storage tank on
West Bowman Road. This tank is one of the three service-level storage tanks in the
A-Zone, which can supply water to the District's main distribution grid. The isolation
of this tank will have minimal effect on the hydraulics of the system and can be left
off, pending evaluation of the distribution mains.
STEP 2: Evaluate the integrity of the District's remaining service-level storage tanks and the
quantities of water still contained therein.

Water Shortage Levels and 2020 Water Shortage Contingency Plan Shortage Response Actions
Page 4-8
STEP 3: Coordinate the personnel available for use in the emergency and establish District
communication. Next, establish communication with other local governmental and
law enforcement agencies.
STEP 4: Evaluate the damage done to the rest of the District's facilities, including wells and
distribution mains.
**** Damaged mains will be assumed contaminated, and therefore will not be put back into
service until the District determines that they comply with all applicable federal and state
laws and regulations. ****
If system evaluation shows a loss of capacity, then depending on the amount of capacity lost, it
might be necessary to valve off additional service-level storage tanks to protect the system from
loss of stored water. District staff maintains the ability to take any necessary action to maintain the
integrity of all District facilities.
The general priorities for valving off additional service-level storage are:
1. R/C Heights Tank 3,000,000 gallons
2. Springer Tank 2,000,000 gallons
3. C-Zone Tanks 1,400,000 gallons
4. Gateway Tank 550,000 gallons
And in a drastic situation:
5. Salisbury Tanks 500,000 gallons
6. Kendall Tank 2,000,000 gallons
7. College Tank 600,000 gallons
As soon as the evaluation is complete, the District will communicate necessary information to other
emergency services and to the public. If plant integrity is found to be good, any storage tanks that
have been valved off can be put back online as determined by the District. The District's storage
facilities are listed in Table 4-4.

Water Shortage Levels and 2020 Water Shortage Contingency Plan Shortage Response Actions
Page 4-9
TABLE 4-4 EXISTING STORAGE FACILITIES
No. Total Volume
(gallons) Number of
Storage Tanks Name Zone Location 1 2,000,000 1 Bowman # 1 A West Bowman Road 2 5,000,000 1 Bowman # 2 A West Bowman Road 3 2,000,000 1 Kendall A Kendall Street 4 3,000,000 1 R/C Heights B Kendall & Brady 5 2,000,000 1 Springer B Springer Street 6 550,000 1 Gateway B Gateway & Javis 7 1,400,000 2 C-Zone C Sunland, South of Javis 8 500,000 2 Salisbury D Belle Vista & Richmond 9 600,000 1 College E East of Cerro Coso College
The District maintains spare motors and pumping equipment for use at any of its pumping plants
and has typically been able to return pumping plants to service within two weeks after minor
damage. Further, the District has adequate backup power (generators) to provide emergency water
service (indoor domestic use only) to its customers in the event of a catastrophic interruption of
water supplies. Refer to the water Allotments described in Section 4.5 below.
The District has interconnection agreements with the China Lake Naval Air Weapons Station
(China Lake NAWS) and Searles Valley Minerals (SVM). The District's interconnection with
China Lake NAWS includes facilities that can transfer approximately 1,300 gpm from China Lake
NAWS to the District and approximately 2,000 gpm from the District to China Lake NAWS under
emergency conditions. The District's interconnection with SVM consists of a single tie-in located
in the northern half of the District's service area, and allows SVM to take up to approximately 750
gpm from the District under emergency conditions. Since SVM does not perform well-head
disinfection, the District cannot currently accept water from SVM.
4.5 Water Allotments During a Catastrophic Interruption of Water Supplies
In the event of a catastrophic interruption of water supplies, the District will establish mandatory
monthly Allotments for each connection. The water Allotment for a residential customer is based
on the minimum quantity that is required for health and safety needs (e.g. drinking, personal
hygiene). The District has established said minimum quantity as 68 gallons per capita per day
(gpcd), as described below. The water Allotment for commercial, industrial, and landscape

Water Shortage Levels and 2020 Water Shortage Contingency Plan Shortage Response Actions
Page 4-10
connections will be based on average use during a three-year base period that will supplement the
voluntary measures outlined in Section 4.2.1. Said base period will be selected by the District's
Water Shortage Response Team, which is defined in Section 1.3 herein.
a. Allotments by Customer Type
1) Single-Family Residential Connections
Each single-family residential connection will receive an Allotment, calculated as
described below.
The Allotment for Single-Family Residential Connections is determined by the
following equation:
68 Gallons per Capita per Day (gpcd) x 3.1 Persons
per Household x Number of Days in the Billing Month
Each single-family residential connection will receive no more than 103 HCF per
year (68 gpcd minimum water requirement x 3.1 persons per household x 365 days
= 76,942 gallons ÷ 748 = 103 HCF) per dwelling unit plus 20% of the Allotment.
The 103 HCF per year equates to 0.2822 HCF per day. This daily figure will be
used to calculate the monthly Allotments based on the number of days in the
relevant month(s).
2) Multi-Family Residential Connections
Each multi-family residential connection will receive an Allotment, calculated as
described below.
The Allotment for Multi-Family Residential Connections is determined by the
following equation:
68 Gallons per Capita per Day (gpcd)
x 2.3 Persons per Household
x Number of Days in the Billing Month

Water Shortage Levels and 2020 Water Shortage Contingency Plan Shortage Response Actions
Page 4-11
Each multi-family residential connection will receive no more than 76 HCF per
year (68 gpcd minimum water requirement x 2.3 persons per dwelling unit x 365
days = 57,086 gallons ÷ 748 = 76 HCF) per dwelling unit plus 20% of the
Allotment. The 76 HCF per year equates to 0.2082 HCF per day. This daily figure
will be used to calculate the monthly Allotments based on the number of days in
the relevant month(s).
3) The Allotment for each commercial and industrial connection will be no more than
60% of average usage for said account for the same billing month over the selected
three-year base period.
4) Each account that has been identified as a landscape connection will receive an
Allotment consisting of 20% of the average water use of said account for the same
billing month over the selected three-year base period, unless the specific account
has been determined by District staff to meet the District's landscape guidelines for
xeriscape design, irrigation, and maintenance, in which case it will receive 70% of
the average water usage for said account for the billing month over the selected
three-year base period.
5) No meters will be installed for new accounts during a Water Supply Shortage or a
Drought State of Emergency.
b. Increased Customer Allotments
Increased Allotments may be approved for the following:
1) Substantial Medical Requirements: Increased Allotments to a residential customer
may be established and approved when the residential customer has established to
the satisfaction of the District that the Allotment would be dangerous to the health
of the residential customer or a full-time resident of the residential customer's
household. Certification from a licensed physician, public health nurse, or a social
worker may be required by the District.

Water Shortage Levels and 2020 Water Shortage Contingency Plan Shortage Response Actions
Page 4-12
2) Residential Connections with Four or More Residents in a Single-Family
Household or Three or More Residents per Unit in a Multi-Family Residence:
These connections may, at the discretion of the District, receive additional
Allotments based upon the same calculations used for Allotments. A census may
be conducted to determine the actual number of residents per dwelling unit.
Increased Allotments will be approved for permanent residents only. Permanent
residents are defined as people who live in the specific residence a minimum of
five days per week, nine months per year.
3) Commercial Customers for which Water Supply Reductions Will Result in
Unemployment or Decreased Production: A District water auditor must first
confirm that the Commercial Customer has implemented all applicable water
efficiency improvements.
4) Non-commercial customers can appeal for additional or increased Allotments for
a horse, cow, or other large non-domestic animal, and for each efficiently irrigated
mature fruit tree.
5) Government agencies may have separate Allotments.
c. Appeals Procedure for Customer Allotments
Customers may appeal their Allotment in accordance with the procedure described below.
1) Any person who wishes to appeal their customer classification or Allotment must
do so in writing, using forms and procedures to be provided by the District.
2) Appeals will be handled and decided by the Water Shortage Response Team. Site
visits will be scheduled as determined by the Water Shortage Response Team.
3) One of the conditions of approval will be that all applicable plumbing fixtures or
irrigation systems be replaced or modified to provide maximum water
conservation.
4) The Water Shortage Response Team may enlist the services of a qualified
consultant to assist in making the final decision of any appeal.

Water Shortage Levels and 2020 Water Shortage Contingency Plan Shortage Response Actions
Page 4-13
5) The Water Shortage Response Team will approve or deny all appeals.
6) If the applicant disagrees with the decision of the Water Shortage Response Team,
the applicant may further appeal the decision which will then be heard by the
District's Board of Directors, who will make the final determination.
7) The decision on all appeals will be reported monthly to the District's Board of
Directors as a part of the District's Water Supply Report.

Water Shortage Levels and 2020 Water Shortage Contingency Plan Shortage Response Actions
Page 4-14
4.6 Shortage Response Action Effectiveness
TABLE 4-5 DEMAND REDUCTION ACTIONS
(FROM DWR SUBMITTAL TABLE 8-2)
Shortage Level
Demand Reduction Actions Drop down list
These are the only categories that will be accepted by the WUEdata online submittal tool. Select those
that apply.
How much is this going to reduce the
shortage gap? Include units used
(volume type or percentage)
Additional Explanation or
Reference (optional)
Penalty, Charge, or Other
Enforcement? For Retail
Suppliers Only Drop Down List
2 Expand Public Information Campaign See Notes No
2 Increase Frequency of Meter Reading See Notes No
2 Offer Water Use Surveys See Notes No
2 Provide Rebates on Plumbing Fixtures and Devices See Notes No
2 Landscape - Restrict or prohibit runoff from landscape irrigation See Notes No
2 Landscape - Limit landscape irrigation to specific times See Notes No
2 Landscape - Limit landscape irrigation to specific days See Notes No
2 CII - Lodging establishment must offer opt out of linen service See Notes No
2 CII - Restaurants may only serve water upon request See Notes No
2 Water Features - Restrict water use for decorative water features, such as fountains
See Notes No
2 Pools and Spas - Require covers for pools and spas See Notes No
2 Other - Customers must repair leaks, breaks, and malfunctions in a timely manner
See Notes No
2 Other - Prohibit use of potable water for washing hard surfaces See Notes No
2 Other - Prohibit vehicle washing except at facilities using recycled or recirculating water
See Notes No
4, 5, 6 Implement or Modify Drought Rate Structure or Surcharge Minimal See Notes Yes
4, 5, 6 Moratorium or Net Zero Demand Increase on New Connections Minimal See Notes No
NOTES: Actions implemented for each Shortage Level will also be implemented for all higher shortage levels. Most of the actions listed for Level 2 are already in place by ordinance. Because of existing conservation measures already in place, including many of those listed above, substantial water use reduction is not expected during Level 2. Actions implemented for Levels 4-6 are expected to result in an unknown reduction in any shortage gap, but any reduction is expected to be minimal.

Water Shortage Levels and 2020 Water Shortage Contingency Plan Shortage Response Actions
Page 4-15
TABLE 4-6 SUPPLY AUGMENTATION AND OTHER ACTIONS
(FROM DWR SUBMITTAL TABLE 8-3)
Shortage Level
Supply Augmentation Methods and Other Actions by Water
Supplier Drop down list
These are the only categories that will be accepted by the WUEdata
online submittal tool
How much is this going to reduce the shortage
gap? Include units used (volume type or
percentage)
Additional Explanation or Reference
(optional) 4 Stored Emergency Supply Existing storage in reservoirs
4 Transfers 1,300 gpm Emergency interconnection with China Lake NAWS
NOTES: Supply augmentation methods will be implemented as deemed necessary by the District's Board of Directors and are not limited to any particular shortage level.
SECTION 5
SEISMIC RISK ASSESSMENT AND MITIGATION PLAN

Seismic Risk Assessment & 2020 Water Shortage Contingency Plan Mitigation Plan
Page 5-1
SECTION 5 SEISMIC RISK ASSESSMENT AND MITIGATION PLAN
To comply with CWC Section 10632.5, this WSCP includes a copy of the most recent hazard mitigation
plan adopted for Kern County, County of Kern Multi-Jurisdiction 2020 Hazard Mitigation Plan, which was
adopted by Kern County on February 11, 2021 and approved by the Federal Emergency Management
Agency (FEMA) on April 9, 2021. The plan includes a seismic risk assessment for the county, and a copy
of said plan is included in Appendix 5 herein.
Measures that the District will take in the event of a seismic event will depend upon the resultant water
shortage level or whether a catastrophic water supply interruption results from the seismic event, and are
described in Section 4 herein.
Water Code
10632.5 (a) In addition to the requirements of paragraph (3) of subdivision (a) of Section 10632, beginning January 1, 2020, the plan shall include a seismic risk assessment and mitigation plan to assess the vulnerability of each of the various facilities of a water system and mitigate those vulnerabilities.
(b) An urban water supplier shall update the seismic risk assessment and mitigation plan when updating its urban water management plan as required by Section 10621.
(c) An urban water supplier may comply with this section by submitting, pursuant to Section 10644, a copy of the most recent adopted local hazard mitigation plan or multihazard mitigation plan under the federal Disaster Mitigation Act of 2000 (Public Law 106-390) if the local hazard mitigation plan or multihazard mitigation plan addresses seismic risk.

SECTION 6
PROHIBITIONS, PENALTIES, AND APPEALS

2020 Water Shortage Contingency Plan Prohibitions, Penalties, and Appeals
Page 6-1
SECTION 6 PROHIBITIONS, PENALTIES, AND APPEALS
The District currently has multiple ordinances in effect that prohibit or restrict specific water use practices.
Ordinance No. 98 requires a water efficient landscape as a condition of receiving new water service, and
Ordinance No. 99 requires water efficient landscape as a condition of receiving new multi-family dwellings,
commercial, and/or institutional water service. Ordinance No. 103, adopted September 11, 2017 imposes
water use prohibitions and restrictions, as well as penalties for noncompliance. It is important to note that,
as of the adoption of the WSCP, Ordinance No. 93 is currently superseded by Ordinance No. 100, and
Ordinance No. 100 is currently superseded by Ordinance No. 103; however, Ordinance No. 100 will be put
back into effect if Ordinance No. 103 is rescinded by the District. Likewise, Ordinance No. 93 will be put
back into effect if Ordinance No. 100 is rescinded by the District. Ordinance Nos. 93, 100, and 103 are
described below, and copies of these ordinances are included Appendix 4 herein.
6.1 Ordinance No. 93
a. Summary
The District adopted Ordinance No. 93 Ordinance of the Board of Directors of the Indian
Wells Valley Water District, Kern and San Bernardino Counties, California, Rescinding
Ordinance No. 72 in its Entirety; and Adopting Voluntary and Mandatory Conservation
Measures and Recommending and/or Requiring Certain Water Conservation Measures,
effective as of May 10, 2010, also referred to as the Water Efficient Landscape Ordinance.
Ordinance No. 93 sets forth landscape procedures for new development (including
residential, commercial, industrial, and institutional development), including water
features and new swimming pools. Additionally, Ordinance No. 93 includes certain
mandatory water restrictions for all District customers.
Water Code
10632(a)(6) For an urban retail water supplier, customer compliance, enforcement, appeal, and exemption procedures for triggered shortage response actions as determined pursuant to Section 10632.2.

2020 Water Shortage Contingency Plan Prohibitions, Penalties, and Appeals
Page 6-2
Ordinance No. 93 is currently superseded by Ordinance No. 100, until such time that
Ordinance No. 100 is rescinded by the District's Board of Directors. As noted in
Section 6.2, Ordinance No. 103 supersedes Ordinance No. 100. The water use
restrictions, the associated penalties, and the appeal process pursuant to Ordinance No. 93
are described in Items b through d below.
b. Water Use Restrictions Pursuant to Ordinance No. 93
The following water use restrictions will be in effect in accordance with Ordinance No. 93,
upon rescission of Ordinance No. 100:
1) All new single-family residential landscape projects are subject to District
Ordinance No. 98, which imposes mandatory restrictions on landscaping and
rescinded Ordinance No. 90. All existing single-family residential landscape
projects which are not subject to Ordinance No. 98 are encouraged to abide by
these recommendations. Existing landscape areas larger than one acre may be
audited so recommendations can be made for water savings.
2) Item (4) below cites the Approved Plant List. The Approved Plant List is the list
formulated by District Staff and approved and/or modified by the District's Board
of Directors. The Approved Plant List is a requirement for new development
subject to District Ordinance Nos. 98 and 99. The Approved Plant List is a
recommendation for existing single-family and multi-family dwellings,
commercial, and/or institutional development.
3) The following is recommended for all single-family homes:
a) Turf landscaping should not exceed 2,000 square feet of single-family
residential lots 10,000 square feet or smaller.
b) Turf landscaping should not exceed 3,000 square feet of single family
residential lots 10,001 square feet or larger.

2020 Water Shortage Contingency Plan Prohibitions, Penalties, and Appeals
Page 6-3
c) Irrigation and Landscape Design. Homebuilders, developers, and/or
landscape contractors should provide the residential customer with an
irrigation design and landscape design that would, if installed, demonstrate
compliance with Ordinance No. 93. Low volume irrigation systems will
be demonstrated along with low water use plant material.
d) The irrigation design needs to show proper drainage to eliminate water
waste.
e) Irrigation Drainage. All irrigation water is to remain on property during
normal water run cycle, such that there is minimal or limited runoff from
the area being irrigated, specifically onto sidewalks and streets.
4) All new landscape projects for multi-family residential, commercial, industrial, or
institutional customers are subject to District Ordinance No. 99, which imposes
mandatory restrictions on:
a) Turf and/or any plants not on the Approved Plant List (defined in
Ordinance No. 93 in Appendix 4 herein) are limited to up to 50% of the
landscape area.
b) Only the plants from the Approved Plant List, on file and maintained by
the District, shall be used within the remaining landscape area.
c) The irrigation system in the remaining landscape area must be a Low
Volume Irrigation System, as defined in Ordinance No. 93.
d) All of the landscape area shall be designed to eliminate any runoff.
e) An irrigation and landscape plan shall be submitted to the City of
Ridgecrest Planning Department, containing low volume irrigation
systems and low water use plants. The irrigation plan shall demonstrate
drainage to eliminate water waste. The plan must provide adequate water
supply such that all of the water needed can be delivered every other day

2020 Water Shortage Contingency Plan Prohibitions, Penalties, and Appeals
Page 6-4
within the water window of 8:00 PM - 8:00 AM during the months of May,
June, July, August, September, and October.
f) Irrigation Drainage. All irrigation water is to remain on property during
normal water run cycle, such that there is no runoff from the area being
irrigated, specifically onto sidewalks and streets.
5) Public and private swimming pools and water bodies over 300 square feet shall
adhere to the goal of water efficiency, as follows:
a) New swimming pools shall have a swimming pool cover.
b) New swimming pools shall have a drainage plan.
c) Water features, including swimming pools, must have recycling or
recirculation features.
6) No water user shall waste water, as described in the following Items (a) through
(d).
a) Landscape irrigation to an extent which allows water to runoff the area
being irrigated, specifically onto sidewalks and streets creating an undue,
continuous flow of water.
b) Washing down hard or paved surfaces, including but not limited to
sidewalks, walkways, driveways, parking areas, tennis courts, patios, or
alleys, is prohibited except when necessary to alleviate safety or sanitary
hazards, and then only by use of hand-held bucket or similar container, a
hand-held hose equipped with a positive self-closing water shut-off device
or a low-volume water broom, high-pressure cleaning machine equipped
to recycle any water used. General maintenance cleaning shall be
performed by other means, such as by using a broom.

2020 Water Shortage Contingency Plan Prohibitions, Penalties, and Appeals
Page 6-5
c) Knowingly allowing water to leak through water connections, hoses,
faucets, pipes, outlets, or plumbing fixtures.
d) Limits on washing vehicles: Using water to wash or clean a vehicle,
including but not limited to any automobile, truck, van, bus, motorcycle,
boat, motor home, or trailer, whether motorized or not is prohibited, except
by use of a hand-held bucket or similar container or a hand-held hose
equipped with a positive self-closing water shut-off nozzle or device. This
subsection does not apply to any commercial car washing facility that
recycles water.
7) Landscape shall not be irrigated on the surface, except for hand watering and/or
the use of a drip irrigation system, between the hours of 8:00 AM - 8:00 PM during
the months of May, June, July, August, September, and October, unless a special
permit is issued to accommodate newly planted material.
8) No water shall be provided to any structure hereafter constructed or remodeled
unless the plumbing fixtures to be installed conform to requirements of law as to
flow capacity.
c. Notice and Penalties for Violation of Water Use Restrictions Pursuant to Ordinance No. 93
1) Upon confirmation by the District of any violation of Ordinance No. 93, if in effect,
the District shall provide written notice, along with educational materials to the
owner of record and/or occupant. The notice shall be dated and shall specify the
address, the nature of the violation, list the steps that must be taken to comply with
Ordinance No. 93 and the name and telephone number of a District staff person
from whom additional information can be obtained. In addition, the notice shall
advise the owner/occupant that termination of water service will result from
continued non-compliance. These provisions are for a first violation within any
consecutive twelve month period.
2) If the owner/occupant fails to comply with the requirements of the notice pursuant
to Item (c)(1) above, within a reasonable amount of time, a second violation shall

2020 Water Shortage Contingency Plan Prohibitions, Penalties, and Appeals
Page 6-6
occur and a second notice containing the information specified in Item (c)(1) shall
be issued. The second violation shall impose a fine in an amount not to exceed
fifty dollars ($50) and will be charged to and billed on the water user's account. If,
under the discretion of the District, satisfactory progress is being made on steps to
correct the violation, a second notice will not be issued.
3) If the owner/occupant fails to comply with the requirements of the notice pursuant
to Item (c)(2) above, within a reasonable amount of time, a third violation shall
occur and a third notice containing the information specified in Item (c)(1)shall be
issued. The third violation shall impose a fine in an amount not to exceed two
hundred dollars ($200) and will be charged to and billed on the water user's
account.
The third notice shall also notify the owner/occupant that water service will be
terminated within thirty (30) calendar days unless the owner/occupant is in
compliance with the provisions of Ordinance No. 93. If the owner/occupant fails
to comply with the provisions of Ordinance No. 93, the final notice of service
termination shall be posted at the entrance to the dwelling/property, which
indicates that water service shall be terminated in forty-eight (48) hours.
The District's General Manager shall have the authority to extend any deadlines by a period
of time not to exceed an additional 30 days as set forth in Ordinance No. 93.
d. Appeal Process Under Ordinance No. 93
Should a property owner/occupant determined to be in violation of the provisions of
Ordinance No. 93 dispute the findings of staff or if said property owner/occupant believes
they have sufficient justification for said violation, said property owner/occupant may
request a hearing with an appropriate committee of the Board of Directors. The hearing
shall be scheduled within thirty (30) calendar days of the request. The hearing shall be
attended by the District's General Manager or a designated representative of the General
Manager.

2020 Water Shortage Contingency Plan Prohibitions, Penalties, and Appeals
Page 6-7
The District's General Manager or a designated representative of the General Manager shall
mail the property owner/occupant a written decision within ten (10) calendar days of the
hearing. If the property owner/occupant is dissatisfied with the outcome of the hearing,
the property owner/occupant may request the matter be placed on the agenda of the
District's regularly scheduled Board Meeting. The property owner/occupant may then
make his or her petition to the Board of Directors. The Board's determination shall be final.
6.2 Ordinance No. 100
a. Summary
On January 11, 2016, the District adopted Ordinance No. 100 Ordinance of the Board of
Directors of the Indian Wells Valley Water District, Kern and San Bernardino Counties,
California, Rescinding Ordinance Number 97 in its Entirety and Adopting Emergency
Water Conservation Mandatory Restrictions, a copy of which is included in Appendix 4
herein. Ordinance No. 100 includes provisions for compliance with the mandatory
restrictions imposed by the SWRCB's emergency water conservation regulations.
Ordinance No. 100 supersedes Ordinance No. 93 until such time that Ordinance No. 100
is rescinded by the District's Board. Ordinance No. 100 is currently superseded by
Ordinance No. 103, until such time that Ordinance No. 103 is rescinded by the
District's Board of Directors.
The water use restrictions set forth in Ordinance No. 100 are described below.
b. Water Use Restrictions Pursuant to Ordinance No. 100
The following water use restrictions are in effect in accordance with Ordinance No. 100
(until rescinded by the District's Board of Directors):
1) No water user shall waste water. For the purposes of this section, "waste" includes
the following and is prohibited:

2020 Water Shortage Contingency Plan Prohibitions, Penalties, and Appeals
Page 6-8
a) Landscape irrigation to an extent which allows water to runoff the
landscape area being irrigated, specifically onto sidewalks and streets
creating an undue, continuous flow of water.
b) Washing down hard or paved surfaces, including but not limited to
sidewalks, walkways, driveways, parking areas, tennis courts, patios or
alleys, is prohibited except when necessary to alleviate safety or sanitary
hazards, and then only by use of handheld bucket or similar container, a
handheld hose equipped with a positive self-closing water shut-off device
or a low-volume water broom, high-pressure cleaning machine equipped
to recycle any water used. General maintenance cleaning shall be
performed by other means, such as by using a broom.
c) Knowingly allowing water to leak through water connections, hoses,
faucets, pipes, outlets, or plumbing fixtures.
d) Limits on washing vehicles: Using water to wash or clean a vehicle,
including but not limited to any automobile, truck, van, bus, motorcycle,
boat, motor home, or trailer, whether motorized or not is prohibited, except
by use of a handheld bucket or similar container or a handheld hose
equipped with a positive self-closing water shut-off nozzle or device. This
subsection does not apply to any commercial car washing facility that
recycles water.
2) During the months of April, May, June, July, August, September, and October, all
customers of the District (including residential, commercial, public, and industrial)
with even-numbered addresses may only operate irrigation systems on Tuesday,
Thursday, and Saturday, and odd-numbered addresses may only operate irrigation
systems on Wednesday, Friday, and Sunday. Irrigation systems may not be
operated on Mondays. Landscape Areas shall not be irrigated on the surface,
except for hand watering and/or the use of a drip irrigation system, between the
hours of 8:00 AM - 8:00 PM, unless a special permit is issued to accommodate
newly planted material.

2020 Water Shortage Contingency Plan Prohibitions, Penalties, and Appeals
Page 6-9
During the months of November, December, January, and February, all customers
of the District (including residential, commercial, public, and industrial) with even-
numbered addresses may only operate irrigation systems on Saturday and odd-
numbered addresses may only operate irrigation systems on Sunday. Irrigation
systems may not be operated on Mondays, Tuesdays, Wednesdays, Thursdays, or
Fridays. There will be no daytime watering restrictions during these months.
3) Turf or ornamental landscapes shall not be irrigated during the 48 hours following
measurable precipitation.
4) Restaurants and other food service establishments shall only serve water to
customers upon request by customer.
5) Operators of hotels and motels shall provide guests with the option of choosing not
to have towels and linens laundered daily and prominently display notice of this
option.
6) Operating a fountain or Decorative Water Feature is prohibited, unless the water
is part of a recirculating system.
7) No water service shall be provided to any structure hereafter constructed or
remodeled unless the plumbing fixtures to be installed conform to the requirements
of law as to flow capacity.
8) The District's General Manager or designee may provide health and safety
exceptions with regards to mandatory measures on a case by case basis.
c. Notice and Penalties for Violation of Water Use Restrictions Pursuant to Ordinance
No. 100
Upon confirmation by the District of any violation of Ordinance No. 100, the District shall
provide written notice (warning) to the owner of record, and/or occupant, and/or property
manager (owner/occupant/manager). The notice shall be dated and shall specify the

2020 Water Shortage Contingency Plan Prohibitions, Penalties, and Appeals
Page 6-10
address, the nature of the violation, list the steps that must be taken to comply with the
water use restrictions, and the name and telephone number of a District staff person from
whom additional information can be obtained. In addition, the notice shall advise the
owner/occupant/manager that termination of water service may result from continued non-
compliance. These provisions are for a first violation of the water use restrictions.
Once a warning has been issued to any owner/occupant/manager, they shall be considered
duly informed of the District's mandatory restrictions pursuant to Ordinance 100, and any
future violations shall be subject to the provisions in Items (1) through (4) below.
1) If the owner/occupant/manager fails to comply with the requirements of the written
notice described above, within a reasonable amount of time but not less than two
weeks, a second violation shall occur and the District shall provide a second
written notice to the owner/occupant/manager. The notice shall be dated and shall
specify the address, the nature of the violation, list the steps that must be taken to
comply with the water use restrictions, how to obtain educational water
conservation materials electronically, and the name and telephone number of a
District staff person that can provide additional information including hard copies
of educational water conservation materials. In addition, the notice shall advise
the owner/occupant/manager that a monetary fine in the amount of fifty dollars
($50) shall be imposed for a third violation of the water use restrictions and that
termination of water service may result from continued non-compliance.
2) If the owner/occupant/manager fails to comply with the requirements of the notice
given pursuant to Item (1) above, within a reasonable amount of time but not less
than two weeks, a third violation shall occur and a third notice containing the date,
the address, the nature of the violation, and the steps that must be taken to comply
with the water use restrictions shall be issued. The third notice shall further advise
the owner/occupant/manager that a fine in the amount of two hundred dollars
($200) shall be imposed for a fourth violation of the water use restrictions. The
third violation shall impose a fifty dollar ($50) fine charged to and billed on the
water user's account. This fine shall be subject to the District's delinquent charges
section, as described in the current Water Sales and Service Policy Manual (refer
to Appendix 3 herein). If, in the sole discretion of the District, satisfactory

2020 Water Shortage Contingency Plan Prohibitions, Penalties, and Appeals
Page 6-11
progress is being made on steps to correct the violation, a third notice will not be
issued.
3) If the owner/occupant/manager fails to comply with the requirements of the notice
given pursuant to Item (2) above, within a reasonable amount of time but not less
than two weeks, a fourth violation shall occur and a fourth notice containing the
date, the address, the nature of the violation, and the steps that must be taken to
comply with the water use restrictions shall be issued. The fourth violation shall
impose a two hundred dollar ($200) fine charged to and billed on the water user's
account on a monthly basis until the violation(s) ceases. This fine shall be subject
to the District's delinquent charges section as described in the current Water Sales
and Service Policy Manual (refer to Appendix 3 herein).
4) If the owner/occupant/manager fails to comply with the requirements of the notice
given pursuant to Item (3) above, resulting in repeated and significant water loss
as determined by the District, the District may terminate water service within ten
(10) calendar days unless the owner/occupant/manager is in compliance with the
water use restrictions. If the owner/occupant/manager fails to comply with the
water use restrictions, then the final notice of service termination, subject to the
District's current 48-hour notice of termination charge, shall be posted at the
entrance to the dwelling/property stating that water service shall be terminated in
forty-eight (48) hours.
Service may only be restored if the violation has been corrected.
Owner/occupant/manager will be required to pay all fines and penalties previously
assessed, plus a service reinstatement charge per the Customer Service Charges
section of the current Water Sales and Service Policy Manual (refer to Appendix 3
herein).
d. Appeal Process Under Ordinance No. 100
Should an owner/occupant/manager determined to be in violation of the water use
restrictions set forth in Ordinance No. 100 dispute the findings of staff or if said
owner/occupant/manager believes they have sufficient justification for said violation, said
owner/occupant/manager may request a hearing with an appropriate committee of the

2020 Water Shortage Contingency Plan Prohibitions, Penalties, and Appeals
Page 6-12
Board of Directors. The hearing shall be scheduled within thirty (30) calendar days of the
request. The hearing shall be attended by the District's General Manager or a designated
representative of the General Manager.
The District's General Manager or a designated representative of the General Manager shall
mail the owner/occupant/manager a written decision within ten (10) calendar days of the
hearing. If the owner/occupant/manager is dissatisfied with the outcome of the hearing,
the owner/occupant/manager may request the matter be placed on the agenda of the
District's regularly scheduled Board Meeting. The owner/occupant/manager may then
make his or her petition to the Board of Directors. The Board's determination shall be final.
e. Administrative Exceptions Under Ordinance No. 100
The General Manager of the District or District's designee may provide administrative
exceptions to the landscape and irrigation plan requirements of Ordinance No. 100 on a
case by case basis.
The General Manager of the District or designee will notify the City Manager of any
administrative exemption granted pursuant to Ordinance No. 100 prior to the date the
exception becomes effective.
The City Manager or designee after consultation with and approval from the General
Manager of Indian Wells Valley Water District may grant an administrative exception.
6.3 Ordinance No. 103
a. Summary
On September 11, 2017, the District adopted Ordinance No. 103 Ordinance of the Board
of Directors of the Indian Wells Valley Water District, Kern and San Bernardino Counties,
California, Rescinding Ordinance Number 100 in its Entirety and Adopting Emergency
Water Conservation Mandatory Restrictions, a copy of which is included in Appendix 4
herein. Ordinance No. 103 includes provisions for compliance with the mandatory
restrictions imposed by the SWRCB's emergency water conservation regulations.
Ordinance No. 103 supersedes Ordinance No. 100 until such time that Ordinance No. 103

2020 Water Shortage Contingency Plan Prohibitions, Penalties, and Appeals
Page 6-13
is rescinded by the District's Board. Ordinance No. 100 is currently superseded by
Ordinance No. 103, until such time that Ordinance No. 103 is rescinded by the
District's Board of Directors.
The water use restrictions set forth in Ordinance No. 103 are identical to those described
in Ordinance No. 100, except with regard to landscape irrigation restrictions during the
months of November through February. Ordinance No. 103 allows for landscape irrigation
on three days per week (alternating days for even- and odd-numbered addresses), while
Ordinance No. 100 allowed for landscape irrigation only one day per week (on different
days for even- and odd-numbered addresses).
Ordinance No. 103 states the following with regard to irrigation during the months of
November through February:
"During the months of November, December, January, and February, all customers of the
District (residential/commercial/public/industrial) with even-numbered addresses may
only operate irrigation systems on Tuesday, Thursday and Saturday and odd numbered
addresses may only operate irrigation systems on Wednesday, Friday and Sunday.
Irrigation systems may not be operated on Mondays. Landscape Areas may be irrigated
by hand watering and/or the use of a drip irrigation system at any time. There will be no
daytime watering restriction during these months."
For comparison, Ordinance No. 100, currently rescinded, states the following with regard
to irrigation during the months of November through February: "During the months of
November, December, January, and February, all customers of the District (including
residential, commercial, public, and industrial) with even-numbered addresses may only
operate irrigation systems on Saturday and odd-numbered addresses may only operate
irrigation systems on Sunday. Irrigation systems may not be operated on Mondays,
Tuesdays, Wednesdays, Thursdays, or Fridays. There will be no daytime watering
restrictions during these months."

2020 Water Shortage Contingency Plan Prohibitions, Penalties, and Appeals
Page 6-14
6.4 Fines and Penalties for Exceeding Allotments
The District has established fines and penalties for water use in excess of Tier 2 of the District's
rate structure. If a Level 4, 5, or 6 shortage condition exists, the Governor declares a Drought State
of Emergency, or a Local Water Supply Shortage has been declared by the District, the fines and
penalties described below will be implemented.
Level 4, 5, or 6 Shortage Condition or Local Water Supply Shortage
During a Level 4, Level 5, or Level 6 shortage condition or a Local Water Supply Shortage, the
following will apply:
1. Residential and Commercial water use in excess of Tier 2 of the District's rate structure in
a single billing cycle shall be considered Excessive Water Use.
2. A Residential Customer or Commercial Customer exceeding Tier 2 usage in a single billing
cycle shall be assessed a fine of $100 for the initial HCF of usage in Tier 3. An additional
fine of $10 for each HCF of usage over the initial Tier 3 HCF of usage shall be assessed in
addition to the base rate.
3. For each consecutive billing cycle that a Residential Customer's or Commercial Customer's
usage exceeds Tier 2 usage, the previous fine shall be increased by $100 for the initial HCF
Water Code
366(b)(C) (i) A violation of an excessive use ordinance, rule, or tariff condition established pursuant to subparagraph (A) shall result in an infraction or administrative civil penalty. The penalty for a violation may be based on conditions identified by the urban retail water supplier and may include, but is not limited to, a fine of up to five hundred dollars ($500) for each hundred cubic feet of water, or 748 gallons, used above the excessive water use threshold established by the urban retail water supplier in a billing cycle.
(ii) Any fine imposed pursuant to this subparagraph shall be added to the customer's water bill and is due and payable with that water bill.
(iii) Each urban retail water supplier shall have a process for nonpayment of the fine, which shall be consistent with due process and reasonably similar to the water supplier's existing process for nonpayment of a water bill.

2020 Water Shortage Contingency Plan Prohibitions, Penalties, and Appeals
Page 6-15
of usage in Tier 3. The additional $10 fine for each HCF of usage over the initial Tier 3
HCF of usage shall similarly increase $10 in addition to the base rate. For example, a
second consecutive billing cycle will result in an Excessive Water Use fine of $200 for the
initial HCF of Tier 3 usage. For each additional HCF of Tier 3 and 4 usage, a penalty of
$20 shall be assessed in addition to the base rate. A third consecutive billing cycle will
result in an Excessive Water Use fine of $300 for the initial HCF of Tier 3 usage. For each
additional HCF of Tier 3 and 4 usage, a penalty of $30 shall be assessed in addition to the
base rate. The fines shall increase in increments of $100 and $10, respectively, up to a
maximum of $500 for the initial HCF of Tier 3 usage and $50 for each additional HCF
over the initial HCF of Tier 3 usage in addition to the base rate.
4. Any fine resulting from violation of this WSCP will be added to the customer's water bill
and is due and payable with that water bill.
5. Non-payment of a fine shall be addressed with due process in mind.
Drought State of Emergency
During a period for which the Governor has issued a proclamation of a Drought State of
Emergency, that includes mandatory water usage restrictions, the following will apply:
1. Residential and Commercial water use in excess of Tier 2 of the District's rate structure in
a single billing cycle shall be considered Excessive Water Use.
2. Residential and Commercial water use in excess of Tier 2 of the District's rate structure in
a single billing cycle will be assessed a fine of 1% of the total Tier 3 and Tier 4 use during
that billing cycle until the Drought State of Emergency is declared over by proclamation
of the Governor or like action.
3. Any fine resulting from violation of this WSCP will be added to the customer's water bill
and is due and payable with that water bill.
4. Non-payment of a fine shall be addressed with due process in mind.

2020 Water Shortage Contingency Plan Prohibitions, Penalties, and Appeals
Page 6-16
6.5. Appeals Process
A Residential Customer or Commercial Customer determined to have Excessive Water Use may
appeal the imposition of the fine for same either by submitting a written appeal or by requesting a
hearing with the Administrative and Executive Committee of the Board of Directors, within thirty
(30) days of receipt of the billing statement on which the fine was first imposed. The hearing shall
be scheduled within thirty (30) calendar days of the request. The hearing shall be attended by the
District's General Manager and/or a designated representative of the General Manager.
The Residential Customer or Commercial Customer shall be provided with an opportunity to
provide evidence that there was no excessive use of water or of a bona fide reason for the excessive
use, as determined by the District. The District will provide the Residential Customer or
Commercial Customer with documentation demonstrating the excessive water use.
The District's General Manager or a designated representative of the General Manager shall mail
the Residential Customer or Commercial Customer a written decision within ten (10) calendar days
of the hearing. If the Residential Customer or Commercial Customer is dissatisfied with the
outcome of the hearing, the Residential Customer or Commercial Customer may request the matter
be placed on the agenda of the District's regularly scheduled Board meeting, by submitting such
request in writing within fifteen (15) days of the date of the decision. The Residential Customer or
Commercial Customer may then present his or her position to the Board of Directors. The Board
of Director's Determination shall be final.
Water Code
366(b)(D) (i) Consistent with due process, an urban retail water supplier shall establish a process and conditions for the appeal of a fine imposed pursuant to subparagraph (C) whereby the customer may contest the imposition of the fine for excessive water use.
(ii) As part of the appeal process, the customer shall be provided with an opportunity to provide evidence that there was no excessive water use or of a bona fide reason for the excessive water use, including evidence of a water leak, a medical reason, or any other reasonable justification for the water use, as determined by the urban retail water supplier.
(iii) As part of the appeal process, the urban retail water supplier shall provide documentation demonstrating the excessive water use.

SECTION 7
LEGAL AUTHORITY

2020 Water Shortage Contingency Plan Legal Authority
Page 7-1
SECTION 7 LEGAL AUTHORITY
7.1 Statutory Authority
Indian Wells Valley Water District (the District) is a County Water District, formed and operating
under and pursuant to California Water District Law (CWC Sections 30000 et seq), and pursuant
to said law, the District is authorized to perform all acts necessary to fully carry out its functions
(CWC Section 31001).
Additionally, pursuant to CWC Section 31026, the District is authorized to restrict the use of district
water during any emergency caused by drought, or other threatened or existing water shortage, and
to prohibit the wastage of district water or the use of district water during such periods, for any
purpose other than household uses or such other restricted uses as may be determined to be
necessary by the District and may prohibit use of such water during such periods for specific uses
which the District may from time to time find to be nonessential.
In accordance with CWC Section 350, the District will declare a water shortage emergency
condition to prevail within the District's service area when its Board of Directors determines that
Water Code
10632(a)(7) (A) A description of the legal authorities that empower the urban water supplier to implement and enforce its shortage responses actions specified in paragraph (4) that may include, but are not limited to statutory authorities, ordinances, resolutions, and contract provisions.
(B) A statement that an urban water supplier shall declare a water shortage emergency in accordance with Chapter 3 (commencing with Section 350) of Division 1.
(C) A statement that an urban water supplier shall coordinate with any city or county within which it provides water supply services for the possible proclamation of a local emergency, as defined in Section 8558 of the Government Code.
350 The governing body of a distributor of a public water supply, whether publicly or privately owned and including a mutual water company, shall declare a water shortage emergency condition to prevail within the area served by such distributor whenever it finds and determines that the ordinary demands and requirements of water consumers cannot be satisfied without depleting the water supply of the distributor to the extent that there would be insufficient water for human consumption, sanitation, and fire protection.

2020 Water Shortage Contingency Plan Legal Authority
Page 7-2
the ordinary demands and requirements if its customers cannot be satisfied without depleting the
District's water supply to the extent that there would be insufficient water for human consumption,
sanitation, and fire protection.
Further, the District will coordinate with the City of Ridgecrest, County of Kern, and County of
San Bernardino for a possible proclamation of a local emergency under the California Emergency
Services Act (California Government Code Section 8558).
7.2 Ordinances
Consistent with its statutory authority, the District has adopted the following ordinances pertaining
to water conservation and the District's response to water shortage conditions:
Ordinance No. 93: Ordinance of the Board of Directors of the Indian Wells Valley Water
District, Kern and San Bernardino Counties, California, rescinding Ordinance No. 72 in its
entirety; and adopting voluntary and mandatory conservation measures and recommending
and/or requiring certain water conserving measures, adopted May 10, 2010.
Ordinance No. 98: Ordinance of the Board of Directors of the Indian Wells Valley Water
District, Kern and San Bernardino Counties, California, rescinding Ordinance No. 90 in its
entirety; and requiring water efficient landscape as a condition of receiving new single family
dwelling water service, adopted December 14, 2015.
Ordinance No. 99: Ordinance of the Board of Directors of The Indian Wells Valley Water
District, Kern and San Bernardino Counties, California, rescinding Ordinance No. 91 in its
entirety; and requiring water efficient landscape as a condition of receiving new multi-family
dwellings, commercial and/or institutional water service, adopted December 14, 2015.
Ordinance No. 100: Ordinance of the Board of Directors of the Indian Wells Valley Water
District, Kern and San Bernardino Counties, California, rescinding Ordinance No. 97 in its
entirety and adopting emergency water conservation mandatory restrictions, adopted
January 11, 2016.

2020 Water Shortage Contingency Plan Legal Authority
Page 7-3
Ordinance No. 103: Ordinance of the Board of Directors of the Indian Wells Valley Water
District, Kern and San Bernardino Counties, California, rescinding Ordinance No. 100 in
its entirety and adopting emergency water conservation mandatory restrictions, adopted
September 11, 2017.
Copies of Ordinance Nos. 93, 98, 99, 100, and 103 are included in Appendix 4 herein.

SECTION 8
FINANCIAL CONSEQUENCES OF WSCP ACTIVATION

Financial Consequences of 2020 Water Shortage Contingency Plan WSCP Activation
Page 8-1
SECTION 8 FINANCIAL CONSEQUENCES OF WSCP ACTIVATION
8.1 Potential Revenue Reductions and Mitigation Actions
Surplus revenues from water sales are placed in the District's reserve, which is used to fund
emergency repairs, water system capital improvements, conservation, alternative water supply and
other needs. The District maintains a financial reserve that is adequate to address the costs of
multiple plant repairs. The District does not project a substantial impact on water revenues due to
a Water Supply Shortage and is adequately funded to respond to emergencies. Tables 8-1 through
8-4 below summarize actions and conditions that impact revenues and expenditures, as well as
proposed measures to overcome the impacts of such actions and conditions.
TABLE 8-1 ACTIONS AND CONDITIONS THAT IMPACT REVENUES
Type Anticipated Revenue Reduction Natural Disaster Dependent on severity Plant Failure Minimum revenue reduction Contamination Dependent on severity
Water Code
10632(a) Every urban water supplier shall prepare and adopt a water shortage contingency plan as part of it urban water management plan that consists of each of the following elements:
(8) A description of the financial consequences of, and responses for, drought conditions, including, but not limited to, all of the following:
(A) A description of potential revenue reductions and expense increases associated with activated shortage response actions described in paragraph (4).
(B) A description of mitigation actions needed to address revenue reductions and expense increases associated with activated shortage response actions described in paragraph (4).
(C) A description of the cost of compliance with Chapter 3.3 (commencing with Section 365) of Division 1.

Financial Consequences of 2020 Water Shortage Contingency Plan WSCP Activation
Page 8-2
TABLE 8-2 ACTIONS AND CONDITIONS THAT IMPACT EXPENDITURES
Category Anticipated Cost Natural Disaster Increased staff costs; facility repair costs Plant Failure Facility repair costs Water Supply Contamination Increased costs of supply and treatment
TABLE 8-3 PROPOSED MEASURES TO OVERCOME REVENUE IMPACTS
Names of Measures Summary of Effects Rate adjustment or assessment Increased revenue Development of reserves IWVWD has a reserve fund FEMA/Cal OES (1) Funding assistance during a disaster
(1) United States Department of Homeland Security Federal Emergency Management Agency/California Office of Emergency Services
TABLE 8-4 PROPOSED MEASURES TO OVERCOME EXPENDITURE IMPACTS
Names of Measures Summary of Effects Rate adjustment or assessment Increased revenue Maintain reserve fund IWVWD currently maintains a reserve fund FEMA/Cal OES (1) Funding assistance during a disaster
(1) United States Department of Homeland Security Federal Emergency Management Agency/California Office of Emergency Services
In the event of a short-term Water Supply Shortage lasting six months or less, the District has
established an emergency reserve equal to six months of operating expenses less depreciation. The
use of this reserve is intended to guard the District from the temporary effects of reduced revenues
and increased expenses. Should the Water Supply Shortage be expected to extend past six months,
a change to the regular rate structure, or similar measure, would be considered to responsibly budget
for the District's continued operations during the Water Supply Shortage.
8.2 Cost of Compliance with Chapter 3.3
CWC Section 10632(a)(8)(C) requires that the WSCP include a description of the cost of
compliance with Chapter 3.3 (commencing with Section 365) of Division 1 of the CWC. Chapter
3.3 consists of CWC Sections 365-367.

Financial Consequences of 2020 Water Shortage Contingency Plan WSCP Activation
Page 8-3
To comply with CWC Sections 365-367, the District prepared and adopted its 2017 WSCP, and
developed and adopted Ordinance Nos. 100 and 103, which cost the District a combined total of
approximately $37,330.

SECTION 9
MONITORING AND REPORTING

2020 Water Shortage Contingency Plan Monitoring and Reporting
Page 9-1
SECTION 9 MONITORING AND REPORTING
Through its Supervisory Control and Data Acquisition System (SCADA) the District routinely tracks the
groundwater extracted from each well on a monthly basis, metered water usage utilizing Automated
Metering Infrastructure (AMI) for each customer type (single-family residential, multi-family residential,
commercial/industrial/institutional, and landscape irrigation. The District also conducts an annual water
loss audit to estimate annual water losses. This data is routinely provided to the District's General Manager
and Board of Directors.
All of the District's service connections are metered, and metered data is used to monitor quantities of water
used. The monitoring data will be used to determine actual reductions in water use pursuant to this WSCP.
Monthly reports will be provided to the District's Board of Directors, to the Customer Accounts Department,
and to the District's Water Shortage Response Team. If reduction goals are not met, the Water Shortage
Response Team will examine individual customer usages, and corrective action will be taken.
Monitoring and reporting of water use within the District varies depending on the current water supply
conditions. Water supply shortage levels are described in Table 4-1 herein. Monitoring and reporting for
each shortage level is described in the following paragraphs.
9.1. Monitoring During Normal or Level 1 Water Shortage Conditions
In normal and Level 1 water supply conditions, production figures are recorded daily in the
District's computerized database. Total production and consumption by all categories of customers
are reported monthly to District management and incorporated into a monthly water supply report.
The monthly water supply report is presented to the Board of Directors at regularly scheduled Board
meetings. Tank levels and pumping plants are monitored on a continuous basis by telemetry at the
District's headquarters, with alarms for abnormal conditions.
Water Code
10632(a)(9) For an urban retail water supplier, monitoring and reporting requirements and procedures that ensure appropriate data is collected, tracked, and analyzed for purposes of monitoring customer compliance and to meet state reporting requirements.

2020 Water Shortage Contingency Plan Monitoring and Reporting
Page 9-2
9.2 Monitoring During a Level 2 or 3 Water Shortage Condition
During a Level 2 or 3 water shortage condition, daily production figures will be reported to the
Operations Manager, who will compare the weekly production to the target weekly production to
verify that the reduction goal is being met. Weekly reports will be forwarded to the District's
General Manager.
9.3 Monitoring During a Level 4, 5, or 6 Water Shortage Condition
During a Level 4, 5, or 6 water shortage condition, the same procedure for a Level 2 or 3 water
shortage will be followed, with the addition of a daily production report to the District's General
Manager.
9.4 Catastrophic Interruption of Water Supplies
During a catastrophic interruption of water supplies, production figures will be reported to the
Operations Manager hourly, and to the General Manager and the Water Shortage Response Team
daily. Reports will also be provided to the City of Ridgecrest Emergency Services Committee.

SECTION 10
WSCP REFINEMENT PROCEDURES

2020 Water Shortage Contingency Plan WSCP Refinement Procedures
Page 10-1
SECTION 10 WSCP REFINEMENT PROCEDURES
Following implementation of the WSCP, District staff will consider the experience and make any
recommendations for how to improve the WSCP. It is the intent of the District that the WSCP will be
periodically reevaluated to ensure that its shortage risk tolerance is adequate and that its shortage response
actions are effective.
Comments and recommendations from District staff, customers, and other interested parties will be
considered in reevaluating and improving the WSCP. If certain procedural refinements or new actions are
identified by District staff or suggested by customers or other interested parties, the District will evaluate
their effectiveness and will incorporate them into the WSCP, as appropriate.
At a minimum, the District will reevaluate its WSCP every five years during preparation of its Urban Water
Management Plan.
Water Code
10632(a)(10) Reevaluation and improvement procedures for systematically monitoring and evaluating the functionality of the water shortage contingency plan in order to ensure shortage risk tolerance is adequate and appropriate water shortage mitigation strategies are implemented as needed.

SECTION 11
SPECIAL WATER FEATURE DISTINCTION

2020 Water Shortage Contingency Plan Special Water Feature Distinction
Page 11-1
SECTION 11 SPECIAL WATER FEATURE DISTINCTION
Swimming pools and spas are defined and analyzed by the District separately from other water features that
are artificially supplied with water, including ponds, lakes, waterfalls, and fountains. Said features are
defined in the definitions "Swimming Pool" and "Decorative Water Feature" below and as set forth in
Section 1.3 herein.
"Swimming Pool" means any structure intended for swimming or recreational bathing that contains
water over 18 inches deep. "Swimming Pool" includes in-ground and aboveground structures and
includes, but is not limited to, hot tubs, spas, portable spas, and nonportable wading pools.
"Decorative Water Feature" means a man-made fountain, pond, waterfall, or other water-using
feature that is provided solely for aesthetic or beautification purposes.
Pursuant to District Ordinance No. 103, "Operating a fountain or other decorative water feature is
prohibited, unless the water is part of a recirculating system." A copy of Ordinance 103 is included in
Appendix 4 herein.
Water Code
10632(b) For purposes of developing the water shortage contingency plan pursuant to subdivision (a), an urban water supplier shall analyze and define water features that are artificially supplied with water, including ponds, lakes, waterfalls, and fountains, separately from swimming pools and spas, as defined in subdivision (a) of Section 115921 of the Health and Safety Code.
Health and Safety Code
115921(a) "Swimming pool" or "pool" means any structure intended for swimming or recreational bathing that contains water over 18 inches deep. "Swimming pool" includes in-ground and aboveground structures and includes, but is not limited to, hot tubs, spas, portable spas, and nonportable wading pools.

SECTION 12
PLAN ADOPTION, SUBMITTAL, AND AVAILABILITY

2020 Water Shortage Contingency Plan Plan Adoption, Submittal, and Availability
Page 12-1
SECTION 12 PLAN ADOPTION, SUBMITTAL, AND AVAILABILITY
This WSCP has been prepared in accordance with all applicable sections of the CWC as summarized in
Section 1.2 herein. In accordance with CWC Section 10632(a), this WSCP is included in the District's
2020 UWMP. The WSCP was adopted by the District's Board of Directors on ________ by Ordinance
No. ____.
Prior to adoption of the WSCP, the District provided notice of the availability of the draft 2020 WSCP and
notice of the public hearing to consider adoption of the WSCP. The public review draft was posted on the
District's website, and copies of the draft were also made available for inspection at the District's office.
The WSCP, along with the 2020 UWMP, has been provided to City of Ridgecrest, County of Kern, County
of San Bernardino, and is also available to the public on the District's website at www.iwvwd.com/public-
documents/public-reports/ and at the District's office located at 500 W. Ridgecrest Boulevard, Ridgecrest,
California 93556-1329.
Water Code
10632(c) The urban water supplier shall make available the water shortage contingency plan prepared pursuant to this article to its customers and any city or county within which it provides water supplies no later than 30 days after adoption of the water shortage contingency plan.

APPENDIX 1
ORDINANCE NO. _______ ADOPTING THE 2020 WATER SHORTAGE CONTINGENCY PLAN

To be added after adoption

APPENDIX 2
RELEVANT SECTIONS OF THE CALIFORNIA WATER CODE

4/22/2021 Codes Display Text
https://leginfo.legislature.ca.gov/faces/codes_displayText.xhtml?lawCode=WAT&division=1.&title=&part=&chapter=3.3.&article= 1/2
Code: Select Code Section: 1 or 2 or 1001 Search
365.
366.
Up^ Add To My FavoritesWATER CODE - WAT
DIVISION 1. GENERAL STATE POWERS OVER WATER [100 - 540] ( Division 1 enacted by Stats. 1943, Ch. 368. )
CHAPTER 3.3. Excessive Residential Water Use During Drought [365 - 367] ( Chapter 3.3 added by Stats. 2016, Ch.230, Sec. 1. )
(a) The Legislature finds and declares that this chapter furthers important state policies of encouraging waterconservation and protecting water resources in the interest of the people and for the public welfare.
(b) For the purposes of this chapter, “urban retail water supplier” has the same meaning as provided in Section10608.12.
(Added by Stats. 2016, Ch. 230, Sec. 1. (SB 814) Effective January 1, 2017.)
(a) During periods described in subdivision (a) of Section 367, excessive water use is prohibited by aresidential customer in a single-family residence or by a customer in a multiunit housing complex in which each unitis individually metered or submetered by the urban retail water supplier.
(b) Each urban retail water supplier shall establish a method to identify and discourage excessive water use,through one of the following options:
(1) Establishing a rate structure, subject to applicable constitutional and statutory limitations, that includes blocktiers, water budgets, or rate surcharges over and above base rates for excessive water use by a residential watercustomer.
(2) (A) Establishing an excessive water use ordinance, rule, or tariff condition, or amending an existing ordinance,rule, or tariff condition, that includes a definition of or a procedure to identify and address excessive water use bymetered single-family residential customers and customers in multiunit housing complexes in which each unit isindividually metered or submetered and may include a process to issue written warnings to a customer and performa site audit of customer water usage prior to deeming the customer in violation.
(B) For the purposes of subparagraph (A), excessive water use shall be measured in terms of either gallons orhundreds of cubic feet of water used during the urban retail water supplier’s regular billing cycle. In establishing thedefinition of excessive use, the urban retail water supplier may consider factors that include, but are not limited to,all of the following:
(i) Average daily use.
(ii) Full-time occupancy of households.
(iii) Amount of landscaped land on a property.
(iv) Rate of evapotranspiration.
(v) Seasonal weather changes.
(C) (i) A violation of an excessive use ordinance, rule, or tariff condition established pursuant to subparagraph (A)shall result in an infraction or administrative civil penalty. The penalty for a violation may be based on conditionsidentified by the urban retail water supplier and may include, but is not limited to, a fine of up to five hundreddollars ($500) for each hundred cubic feet of water, or 748 gallons, used above the excessive water use thresholdestablished by the urban retail water supplier in a billing cycle.
(ii) Any fine imposed pursuant to this subparagraph shall be added to the customer’s water bill and is due andpayable with that water bill.
(iii) Each urban retail water supplier shall have a process for nonpayment of the fine, which shall be consistent withdue process and reasonably similar to the water supplier’s existing process for nonpayment of a water bill.
Home Bill Information California Law Publications Other Resources My Subscriptions My Favorites

4/22/2021 Codes Display Text
https://leginfo.legislature.ca.gov/faces/codes_displayText.xhtml?lawCode=WAT&division=1.&title=&part=&chapter=3.3.&article= 2/2
367.
(D) (i) Consistent with due process, an urban retail water supplier shall establish a process and conditions for theappeal of a fine imposed pursuant to subparagraph (C) whereby the customer may contest the imposition of thefine for excessive water use.
(ii) As part of the appeal process, the customer shall be provided with an opportunity to provide evidence that therewas no excessive water use or of a bona fide reason for the excessive water use, including evidence of a waterleak, a medical reason, or any other reasonable justification for the water use, as determined by the urban retailwater supplier.
(iii) As part of the appeal process, the urban retail water supplier shall provide documentation demonstrating theexcessive water use.
(c) (1) The provisions of subdivision (b) do not apply to an urban retail water supplier that is not fully metered inaccordance with Section 527. An urban retail water supplier shall comply with the provisions of subdivision (b)when all of the water supplier’s residential water service connections are being billed based on metered waterusage.
(2) An urban retail water supplier that is not fully metered shall prohibit water use practices by an ordinance,resolution, rule, or tariff condition that imposes penalties for prohibited uses of water supplied by the watersupplier. The urban retail water supplier may include a process to issue written warnings prior to imposing penaltiesas well as increased penalty amounts for successive violations.
(Amended by Stats. 2017, Ch. 561, Sec. 260. (AB 1516) Effective January 1, 2018.)
(a) This chapter applies only as follows:
(1) During a period for which the Governor has issued a proclamation of a state of emergency under the CaliforniaEmergency Services Act (Chapter 7 (commencing with Section 8550) of Division 1 of Title 2 of the GovernmentCode) based on statewide drought conditions to an urban retail water supplier that has moved to a stage of actionin response to a local water supply shortage condition under the water supplier’s contingency plan pursuant toparagraph (1) of subdivision (a) of Section 10632 that requires mandatory water use reductions.
(2) To an urban retail water supplier during a period in which the water supplier has moved to a stage of action inresponse to a local water supply shortage condition under the water supplier’s contingency plan pursuant toparagraph (1) of subdivision (a) of Section 10632 that requires mandatory water use reductions.
(3) To an urban retail water supplier affected during a period for which the Governor has issued a proclamation of astate of emergency under the California Emergency Services Act (Chapter 7 (commencing with Section 8550) ofDivision 1 of Title 2 of the Government Code) based on local drought conditions.
(b) The provisions of this chapter are in addition to, and do not supersede or limit, any other measures or remediesimplemented by an urban retail water supplier.
(Added by Stats. 2016, Ch. 230, Sec. 1. (SB 814) Effective January 1, 2017.)

4/22/2021 Law section
https://leginfo.legislature.ca.gov/faces/codes_displaySection.xhtml?lawCode=WAT§ionNum=10632. 1/2
Code: Select Code Section: 1 or 2 or 1001 Search
DIVISION 6. CONSERVATION, DEVELOPMENT, AND UTILIZATION OF STATE WATER RESOURCES [10000 - 12999] (Heading of Division 6 amended by Stats. 1957, Ch. 1932. )
PART 2.6. URBAN WATER MANAGEMENT PLANNING [10610 - 10657] ( Part 2.6 added by Stats. 1983, Ch. 1009, Sec.1. )
CHAPTER 3. Urban Water Management Plans [10620 - 10645] ( Chapter 3 added by Stats. 1983, Ch. 1009, Sec. 1. )
10632.
Up^ << Previous Next >> cross-reference chaptered bills PDF | Add To My FavoritesSearch Phrase: Highlight
WATER CODE - WAT
ARTICLE 2. Contents of Plans [10630 - 10634] ( Article 2 added by Stats. 1983, Ch. 1009, Sec. 1. )
(a) Every urban water supplier shall prepare and adopt a water shortage contingency plan as part of itsurban water management plan that consists of each of the following elements:
(1) The analysis of water supply reliability conducted pursuant to Section 10635.
(2) The procedures used in conducting an annual water supply and demand assessment that include, at aminimum, both of the following:
(A) The written decisionmaking process that an urban water supplier will use each year to determine its watersupply reliability.
(B) The key data inputs and assessment methodology used to evaluate the urban water supplier’s water supplyreliability for the current year and one dry year, including all of the following:
(i) Current year unconstrained demand, considering weather, growth, and other influencing factors, such as policiesto manage current supplies to meet demand objectives in future years, as applicable.
(ii) Current year available supply, considering hydrological and regulatory conditions in the current year and one dryyear. The annual supply and demand assessment may consider more than one dry year solely at the discretion ofthe urban water supplier.
(iii) Existing infrastructure capabilities and plausible constraints.
(iv) A defined set of locally applicable evaluation criteria that are consistently relied upon for each annual watersupply and demand assessment.
(v) A description and quantification of each source of water supply.
(3) (A) Six standard water shortage levels corresponding to progressive ranges of up to 10, 20, 30, 40, and 50percent shortages and greater than 50 percent shortage. Urban water suppliers shall define these shortage levelsbased on the suppliers’ water supply conditions, including percentage reductions in water supply, changes ingroundwater levels, changes in surface elevation or level of subsidence, or other changes in hydrological or otherlocal conditions indicative of the water supply available for use. Shortage levels shall also apply to catastrophicinterruption of water supplies, including, but not limited to, a regional power outage, an earthquake, and otherpotential emergency events.
(B) An urban water supplier with an existing water shortage contingency plan that uses different water shortagelevels may comply with the requirement in subparagraph (A) by developing and including a cross-reference relatingits existing categories to the six standard water shortage levels.
(4) Shortage response actions that align with the defined shortage levels and include, at a minimum, all of thefollowing:
(A) Locally appropriate supply augmentation actions.
Home Bill Information California Law Publications Other Resources My Subscriptions My Favorites

4/22/2021 Law section
https://leginfo.legislature.ca.gov/faces/codes_displaySection.xhtml?lawCode=WAT§ionNum=10632. 2/2
(B) Locally appropriate demand reduction actions to adequately respond to shortages.
(C) Locally appropriate operational changes.
(D) Additional, mandatory prohibitions against specific water use practices that are in addition to state-mandatedprohibitions and appropriate to the local conditions.
(E) For each action, an estimate of the extent to which the gap between supplies and demand will be reduced byimplementation of the action.
(5) Communication protocols and procedures to inform customers, the public, interested parties, and local,regional, and state governments, regarding, at a minimum, all of the following:
(A) Any current or predicted shortages as determined by the annual water supply and demand assessmentdescribed pursuant to Section 10632.1.
(B) Any shortage response actions triggered or anticipated to be triggered by the annual water supply and demandassessment described pursuant to Section 10632.1.
(C) Any other relevant communications.
(6) For an urban retail water supplier, customer compliance, enforcement, appeal, and exemption procedures fortriggered shortage response actions as determined pursuant to Section 10632.2.
(7) (A) A description of the legal authorities that empower the urban water supplier to implement and enforce itsshortage response actions specified in paragraph (4) that may include, but are not limited to, statutory authorities,ordinances, resolutions, and contract provisions.
(B) A statement that an urban water supplier shall declare a water shortage emergency in accordance with Chapter3 (commencing with Section 350) of Division 1.
(C) A statement that an urban water supplier shall coordinate with any city or county within which it provides watersupply services for the possible proclamation of a local emergency, as defined in Section 8558 of the GovernmentCode.
(8) A description of the financial consequences of, and responses for, drought conditions, including, but not limitedto, all of the following:
(A) A description of potential revenue reductions and expense increases associated with activated shortageresponse actions described in paragraph (4).
(B) A description of mitigation actions needed to address revenue reductions and expense increases associated withactivated shortage response actions described in paragraph (4).
(C) A description of the cost of compliance with Chapter 3.3 (commencing with Section 365) of Division 1.
(9) For an urban retail water supplier, monitoring and reporting requirements and procedures that ensureappropriate data is collected, tracked, and analyzed for purposes of monitoring customer compliance and to meetstate reporting requirements.
(10) Reevaluation and improvement procedures for systematically monitoring and evaluating the functionality ofthe water shortage contingency plan in order to ensure shortage risk tolerance is adequate and appropriate watershortage mitigation strategies are implemented as needed.
(b) For purposes of developing the water shortage contingency plan pursuant to subdivision (a), an urban watersupplier shall analyze and define water features that are artificially supplied with water, including ponds, lakes,waterfalls, and fountains, separately from swimming pools and spas, as defined in subdivision (a) of Section115921 of the Health and Safety Code.
(c) The urban water supplier shall make available the water shortage contingency plan prepared pursuant to thisarticle to its customers and any city or county within which it provides water supplies no later than 30 days afteradoption of the water shortage contingency plan.
(Repealed and added by Stats. 2018, Ch. 14, Sec. 32. (SB 606) Effective January 1, 2019.)

4/22/2021 Codes Display Text
https://leginfo.legislature.ca.gov/faces/codes_displayText.xhtml?lawCode=WAT&division=6.&title=&part=2.6.&chapter=3.&article=2. 1/1
10632.1.
10632.2.
10632.3.
10632.5.
An urban water supplier shall conduct an annual water supply and demand assessmentpursuant to subdivision (a) of Section 10632 and, on or before July 1 of each year, submit anannual water shortage assessment report to the department with information for anticipatedshortage, triggered shortage response actions, compliance and enforcement actions, andcommunication actions consistent with the supplier’s water shortage contingency plan. An urbanwater supplier that relies on imported water from the State Water Project or the Bureau ofReclamation shall submit its annual water supply and demand assessment within 14 days ofreceiving its final allocations, or by July 1 of each year, whichever is later.(Amended by Stats. 2019, Ch. 239, Sec. 9. (AB 1414) Effective January 1, 2020.)
An urban water supplier shall follow, where feasible and appropriate, the prescribedprocedures and implement determined shortage response actions in its water shortagecontingency plan, as identified in subdivision (a) of Section 10632, or reasonable alternativeactions, provided that descriptions of the alternative actions are submitted with the annual watershortage assessment report pursuant to Section 10632.1. Nothing in this section prohibits anurban water supplier from taking actions not specified in its water shortage contingency plan, ifneeded, without having to formally amend its urban water management plan or water shortagecontingency plan.(Added by Stats. 2018, Ch. 14, Sec. 34. (SB 606) Effective January 1, 2019.)
It is the intent of the Legislature that, upon proclamation by the Governor of a state ofemergency under the California Emergency Services Act (Chapter 7 (commencing with Section8550) of Division 1 of Title 2 of the Government Code) based on drought conditions, the boarddefer to implementation of locally adopted water shortage contingency plans to the extentpracticable.(Added by Stats. 2018, Ch. 14, Sec. 35. (SB 606) Effective January 1, 2019.)
(a) In addition to the requirements of paragraph (3) of subdivision (a) of Section 10632,beginning January 1, 2020, the plan shall include a seismic risk assessment and mitigation planto assess the vulnerability of each of the various facilities of a water system and mitigate thosevulnerabilities.
(b) An urban water supplier shall update the seismic risk assessment and mitigation plan whenupdating its urban water management plan as required by Section 10621.
(c) An urban water supplier may comply with this section by submitting, pursuant to Section10644, a copy of the most recent adopted local hazard mitigation plan or multihazard mitigationplan under the federal Disaster Mitigation Act of 2000 (Public Law 106-390) if the local hazardmitigation plan or multihazard mitigation plan addresses seismic risk.(Added by Stats. 2015, Ch. 681, Sec. 1. (SB 664) Effective January 1, 2016.)

APPENDIX 3
WATER SALES & SERVICE POLICY MANUAL (ORDINANCE NO. 104)
Indian Wells Valley Water District
WATER SALES & SERVICE POLICY
MANUAL
Adopted: December 10, 2018 By Ordinance No. 104 Effective Date: January 1, 2019

ii
TABLE OF CONTENTS Page General Provisions - Conditions of Service 1
Metered and Flat Rates and Charges - General 3
Monthly Account Charge 4
Monthly Ready-to-Serve Charges 4
Monthly Arsenic Compliance Charges 4
Zone Charge 5
Metered Monthly Quantity Rates Based Upon Meter Size – Single Family Residence 5
Metered Monthly Quantity Rates Based Upon Meter Size – Non-Single Family Residence 6
Construction Meter Charges, Rates & Provisions 9
Bulk Water Station Charges, Rates & Provisions 11
Private Fire Protection Service Charges, Rates & Provisions 12
Delinquent Charges 13
Backflow Prevention Device Test 14
Returned Payment Charges 14
Disputed Bills 14
Customer Deposits 15
Customer Service Charges 16
Water Theft 16
Customer Complaints 17
Meter Exchanges 17
Continuity of Service Agreement 18
Capital Facility Fee 18
Distribution System Fee 20
Master Meters 22
Service Installation Charges 23
Concept/Plan Checking Fees/Inspection Deposits 24
Will-Serve Letters 25
Refund Agreements 26
Continuity/Special Conditions/Severability 27

1
GENERAL PROVISIONS - CONDITIONS OF SERVICE For conditions of service applicable to new connections to the District's system, see the various fee and charge provisions included within this manual and the District's Standard Construction Specifications, which is under separate cover. New service is when an applicant 1) would like to start service with the District but does not have an active account, 2) has an active account and would like to open another active account at a new address, or 3) would like to close the active account and start service at a new address. Before new service is started, applicants shall pay the refundable deposit and service charge. Before new service is started, applicants and/or others in the residence or business benefitting from the new water service who have existing delinquent accounts shall pay the balance in full including interest. Lease agreements listing all tenants may be required before starting new service. The District will at all times attempt to deliver to its customers a continuous and sufficient supply of water at adequate pressure at the meter to meet reasonable service demands. However, the District is not and will not be liable for any loss, damage, or inconvenience to any person by reason of shortage, insufficiency, suspension, or discontinuance of water service, or for increases or decreases in water pressure. Additionally, partial or total interruptions in service are sometimes necessary for the repair, maintenance, alteration, or extension of the District's facilities and the District shall not be liable or responsible for such interruptions. The District reserves the right at any and all times to shut off water delivery for the purpose of maintenance or for making repairs and alterations to its system. Whenever possible, advance notice of interruption of service will be given to all affected water users; however, the District cannot guarantee complete freedom from service interruption at all times. The District will endeavor to provide potable water (water meeting the applicable water quality requirements of the California State Water Resources Control Board) to its customers. The District does not and shall not accept liability or responsibility for water that meets such applicable standards at the meter but reacts or interacts with non-District owned facilities causing damage or harm. All water sold or dispensed by the District shall be metered or measured. By applying for and/or receiving water service from the District, each consumer irrevocably licenses the District and its authorized employees and agents to enter upon the consumer's property at reasonable times for the purpose of reading, inspecting, testing, checking, repairing, maintaining, or replacing the District's meters, customer's backflow prevention devices, and other facilities. Meters and service laterals shall be located in dedicated easements that allow entry for reading, repair and other necessary District activity by District personnel, without limitation. When the meter and service lateral are not located in a dedicated easement, the same irrevocable license provisions shall apply.

2
If a meter cannot be accessed due to a customer-caused obstruction or situation that prevents the reading of a meter and said obstruction/situation cannot be easily remedied by the District, the customer will be notified to correct the obstruction/situation in a timely manner. If the obstruction/situation prevents the meter from being read, the usage will be estimated for billing purposes until the meter can be properly read by District personnel. At the District’s sole discretion, the customer may be billed for expenses incurred by the District to remedy the obstruction/situation, including time and materials plus an overhead and administrative charge of 15%. District service facilities including meters, boxes and service laterals from the District's water main to and through the meter and customer service valve shall belong to and be maintained by the District. It is the customer's responsibility for installation and maintenance of the customer service line, including all service piping, valves and appurtenances on the discharge side of the meter after the customer service valve. A customer service valve shall be installed on the discharge side of a new meter by the District to allow the customer to turn on/off the supply of water to his/her service line. In the event the customer service valve has been removed from an existing meter, the District may install the valve for the cost of time and materials plus an overhead and administrative charge of 15%. The meter valve (angle stop) on the street side of the meter shall be operated by District personnel only. If a meter valve (angle stop) is damaged by non-District personnel, the customer will be responsible for all repair charges including the cost of time and materials plus an overhead and administrative charge of 15%. If an angle stop has been locked by the District and the lock is damaged or broken, the customer shall be charged $100. Title to water furnished by the District, the risk of loss thereof, and full responsibility for the carriage, handling, storage, disposal and use thereof, shall pass from the District to the water user at the outlet of the District meter, the control valve of a fire hydrant, or the control valve for a fire service. For liability reasons, the District shall not repair leaks nor loan equipment or material for repairs on the customer's side of the meter, unless the installation was done by District personnel, such as in the case of a District installed change over, and then only within one year of installation. A meter shall not be used to service any parcel or unit other than as assigned by the District. A service line may not cross a parcel or lot to reach another parcel or lot for service. Customers shall not serve water to neighboring properties via a garden hose, similar device or any other method. Water that has been sold by the District shall not be resold, unless the customer is a local purveyor or water system, and then only in case of an emergency water shortage, and only with written consent of the Board of Directors of the District or General Manager. In accordance with State Code, a customer's water service may be discontinued for nonpayment of a bill for water service. The District may also discontinue service to any customer for violation of its rules and regulations, or where safety of the water supply is endangered. If an unsafe or hazardous condition is found or is reasonably likely to exist on the customer's premises, or if the use of water thereon by apparatus, appliances, equipment, or otherwise is found and is reasonably suspected to be detrimental or damaging to the District or to its customer, the service may be shut off without notice.

3
In the event of unusual or other circumstances deemed appropriate by the District’s Board of Directors, any of the rules, regulations, rates, fees, or charges, contained herein, are subject to review and or modification as the Board of Director’s may determine, in its sole and absolute discretion, on a case by case basis.
METERED AND FLAT RATES AND CHARGES - GENERAL
Flat rate bulk water accounts and flat rate private fire protection accounts shall be billed on a monthly basis. All other categories of rates shall be read and billed on a monthly basis. Since it is not always possible to read meters at exactly the same intervals every month, the period between reading dates may vary slightly. Meters will be read as nearly as possible on the same day of each month. Special readings will be made on commencement and termination of service for purposes of pro-rating opening and closing bills. If a meter fails to register correctly or cannot be read due to a malfunction, the usage may be estimated at 75% of the customer's historical consumption for the same period of time for the previous year, if available, or estimated by taking into consideration seasonal water demand, or any other factors that are material and significant to arriving at fair usage, or the District may use any other reasonable usage deemed appropriate after consultation with the customer. The District will endeavor to correct in a timely manner those situations that prevent a meter from being read so that the meter reading will not have to be estimated for a second consecutive billing period. If a meter is not registering water usage, through no fault of the customer, the non-working meter will be repaired or replaced by the District by the next scheduled meter reading date, or the customer will be billed the minimum rate only until such time as repairs are made except in circumstances where prompt repair or replacement may be impossible, including circumstances such as natural disasters. Meter boxes will be scheduled for cleanout or meters will be replaced, as circumstances dictate, in a prompt manner. To increase the operating efficiency of the District and provide better service to customers, the 3/4-inch meter is the standard size meter for the District’s smallest sized water service. All new single family residential services will use the 3/4-inch meter. The following rates and charges are listed for a monthly billing schedule. All meter connections, excepting Private Fire Protection Service, will be charged the monthly Ready-to-Serve charge, the Arsenic Compliance charge plus metered monthly quantity rates and a zone charge if applicable. Landscape meter usage shall be billed at the Non-Single Family Residence rates.

4
MONTHLY ACCOUNT CHARGE The Monthly Account Charge is generally intended to cover the District’s cost of managing the customer’s account.
Effective 01/01/2019
Effective 07/01/2019
Effective 07/01/2020
Effective 07/01/2021
Effective 07/01/2022
$4.47 $4.60 $4.74 $4.88 $5.03
MONTHLY READY-TO-SERVE CHARGES The Monthly Ready-to-Serve Charge is generally intended to cover the fixed expenses of the District, excluding interest expense.
Meter Size
Effective 01/01/2019
Effective 07/01/2019
Effective 07/01/2020
Effective 07/01/2021
Effective 07/01/2022
3/4” $23.22 $23.92 $24.64 $25.38 $26.14 1” $38.78 $39.94 $41.14 $42.37 $43.64 1-1/2” $77.32 $79.64 $82.03 $84.49 $87.02 2” $123.76 $127.47 $131.29 $135.23 $139.29 3” $247.76 $255.19 $262.85 $270.74 $278.86 4” $387.08 $398.69 $410.65 $422.97 $435.66 6” $773.92 $797.14 $821.05 $845.68 $871.05 8” $1,238.32 $1,275.47 $1,313.73 $1,353.14 $1,393.73 10” $1,780.15 $1,833.55 $1,888.56 $1,945.22 $2,003.58
MONTHLY ARSENIC COMPLIANCE CHARGES
The Monthly Arsenic Compliance Charge is intended to cover the District’s total arsenic compliance costs, including both debt principal and operations expenses.
Meter Size
Effective 01/01/2019
Effective 07/01/2019
Effective 07/01/2020
Effective 07/01/2021
Effective 07/01/2022
3/4” $10.39 $10.70 $11.02 $11.35 $11.69 1” $17.35 $17.87 $18.41 $18.96 $19.53 1-1/2” $34.60 $35.64 $36.71 $37.81 $38.94 2” $55.38 $57.04 $58.75 $60.51 $62.33 3” $110.86 $114.19 $117.62 $121.15 $124.78 4” $173.20 $178.40 $183.75 $189.26 $194.94 6” $346.30 $356.69 $367.39 $378.41 $389.76 8” $554.10 $570.72 $587.84 $605.48 $623.64 10” $796.54 $820.44 $845.05 $870.40 $896.51

5
ZONE CHARGE The Zone Charge is intended to recover from customers all the variable direct costs of power to supply water to the higher zones. Other variable direct costs could be charged to these customers when there is a reasonable way to identify and quantify them. The Zone Charge is assessed as a multiple of the customer’s zone against their usage. Each zone represents a difference of approximately 100 feet in elevation. The zones are designated A (lowest), B, C, D, and E (highest). Zone Charges are applied to customers in zones B, C, D, and E. The zone charges are, per 100 cubic feet: Effective
01/01/2019 Effective 07/01/2019
Effective 07/01/2020
Effective 07/01/2021
Effective 07/01/2022
B-Zone $0.21 $0.22 $0.23 $0.24 $0.25 C-Zone $0.42 $0.43 $0.44 $0.45 $0.46 D-Zone $0.63 $0.65 $0.67 $0.69 $0.71 E-Zone $0.84 $0.87 $0.90 $0.93 $0.96
METERED MONTHLY QUANTITY RATES BASED UPON METER SIZE
SINGLE FAMILY RESIDENCE RATES
All Meter Sizes Rate per Hundred Cubic Feet (HCF)
Hundred Cubic
Feet (HCF) Effective
01/01/2019 Effective
07/01/2019 Effective
07/01/2020 Effective
07/01/2021 Effective
07/01/2022
Tier 1 0 - 9 $0.74 $0.76 $0.78 $0.80 $0.82
Tier 2 9.01 - 24 $1.24 $1.28 $1.32 $1.36 $1.40
Tier 3 24.01 - 45 $2.39 $2.46 $2.53 $2.61 $2.69
Tier 4 45.01 and Over $4.92 $5.07 $5.22 $5.38 $5.54 + zone charge

6
METERED MONTHLY QUANTITY RATES BASED UPON METER SIZE
NON-SINGLE FAMILY RESIDENCE RATES Rate per Hundred Cubic Feet (HCF)
3/4" Meter
Rate per HCF
Hundred Cubic Feet (HCF)
Effective 01/01/2019
Effective 07/01/2019
Effective 07/01/2020
Effective 07/01/2021
Effective 07/01/2022
Tier 1 0 - 9 $0.74 $0.76 $0.78 $0.80 $0.82
Tier 2 9.01 - 24 $1.24 $1.28 $1.32 $1.36 $1.40
Tier 3 24.01 - 45 $2.39 $2.46 $2.53 $2.61 $2.69
Tier 4 45.01 and Over $4.92 $5.07 $5.22 $5.38 $5.54 + zone charge
1" Meter
Rate per HCF
Hundred Cubic Feet (HCF)
Effective 01/01/2019
Effective 07/01/2019
Effective 07/01/2020
Effective 07/01/2021
Effective 07/01/2022
Tier 1 0 - 15 $0.74 $0.76 $0.78 $0.80 $0.82
Tier 2 15.01 - 40 $1.24 $1.28 $1.32 $1.36 $1.40
Tier 3 40.01 - 75 $2.39 $2.46 $2.53 $2.61 $2.69
Tier 4 75.01 and Over $4.92 $5.07 $5.22 $5.38 $5.54 + zone charge
1-1/2" Meter Rate per HCF
Hundred Cubic
Feet (HCF) Effective
01/01/2019 Effective
07/01/2019 Effective
07/01/2020 Effective
07/01/2021 Effective
07/01/2022
Tier 1 0 - 30 $0.74 $0.76 $0.78 $0.80 $0.82
Tier 2 30.01 - 80 $1.24 $1.28 $1.32 $1.36 $1.40
Tier 3 80.01 - 150 $2.39 $2.46 $2.53 $2.61 $2.69
Tier 4 150.01 and Over $4.92 $5.07 $5.22 $5.38 $5.54 + zone charge

7
2" Meter
Rate per HCF
Hundred Cubic Feet (HCF)
Effective 01/01/2019
Effective 07/01/2019
Effective 07/01/2020
Effective 07/01/2021
Effective 07/01/2022
Tier 1 0 - 48 $0.74 $0.76 $0.78 $0.80 $0.82
Tier 2 48.01 - 128 $1.24 $1.28 $1.32 $1.36 $1.40
Tier 3 128.01 - 240 $2.39 $2.46 $2.53 $2.61 $2.69
Tier 4 240.01 and Over $4.92 $5.07 $5.22 $5.38 $5.54 + zone charge
3" Meter
Rate per HCF
Hundred Cubic Feet (HCF)
Effective 01/01/2019
Effective 07/01/2019
Effective 07/01/2020
Effective 07/01/2021
Effective 07/01/2022
Tier 1 0 - 96 $0.74 $0.76 $0.78 $0.80 $0.82
Tier 2 96.01 - 256 $1.24 $1.28 $1.32 $1.36 $1.40
Tier 3 256.01 - 480 $2.39 $2.46 $2.53 $2.61 $2.69
Tier 4 480.01 and Over $4.92 $5.07 $5.22 $5.38 $5.54 + zone charge
4" Meter
Rate per HCF
Hundred Cubic Feet (HCF)
Effective 01/01/2019
Effective 07/01/2019
Effective 07/01/2020
Effective 07/01/2021
Effective 07/01/2022
Tier 1 0 - 150 $0.74 $0.76 $0.78 $0.80 $0.82
Tier 2 150.01 - 400 $1.24 $1.28 $1.32 $1.36 $1.40
Tier 3 400.01 - 750 $2.39 $2.46 $2.53 $2.61 $2.69
Tier 4 750.01 and Over $4.92 $5.07 $5.22 $5.38 $5.54 + zone charge

8
6" Meter Rate per HCF
Hundred Cubic
Feet (HCF) Effective
01/01/2019 Effective
07/01/2019 Effective
07/01/2020 Effective
07/01/2021 Effective
07/01/2022
Tier 1 0 - 300 $0.74 $0.76 $0.78 $0.80 $0.82
Tier 2 300.01 - 800 $1.24 $1.28 $1.32 $1.36 $1.40
Tier 3 800.01 - 1500 $2.39 $2.46 $2.53 $2.61 $2.69
Tier 4 1500.01 and Over $4.92 $5.07 $5.22 $5.38 $5.54 + zone charge
8" Meter
Rate per HCF
Hundred Cubic Feet (HCF)
Effective 01/01/2019
Effective 07/01/2019
Effective 07/01/2020
Effective 07/01/2021
Effective 07/01/2022
Tier 1 0 - 480 $0.74 $0.76 $0.78 $0.80 $0.82
Tier 2 480.01 - 1280 $1.24 $1.28 $1.32 $1.36 $1.40
Tier 3 1280.01 - 2400 $2.39 $2.46 $2.53 $2.61 $2.69
Tier 4 2400.01 and Over $4.92 $5.07 $5.22 $5.38 $5.54 + zone charge
10" Meter
Rate per HCF
Hundred Cubic Feet (HCF)
Effective 01/01/2019
Effective 07/01/2019
Effective 07/01/2020
Effective 07/01/2021
Effective 07/01/2022
Tier 1 0 - 690 $0.74 $0.76 $0.78 $0.80 $0.82
Tier 2 690.01 - 1840 $1.24 $1.28 $1.32 $1.36 $1.40
Tier 3 1840.01 - 3450 $2.39 $2.46 $2.53 $2.61 $2.69
Tier 4 3450.01 and Over $4.92 $5.07 $5.22 $5.38 $5.54 + zone charge

9
CONSTRUCTION METER CHARGES, RATES & PROVISIONS
ACCOUNT SETUP CHARGES A $20.00 processing charge will be applied each time a construction meter permit, including permit extensions, is approved. The construction meter applicant shall submit a deposit in the amount of $1,550.00. This deposit amount represents the value of replacing a construction meter. The deposit is refundable provided the meter is returned in working condition determined by a District inspection before the account is closed and the meter is returned to service. The inspection results will be documented on the Temporary Construction Meter Use Permit. The final bill, which includes Monthly Service Charge, Metered Monthly Usage Rates, and any cost to repair damages to the construction meter, shall be deducted from the deposit. The District may hold a deposit for up to five days for immediate return to the permittee if the meter is returned within the designated timeframe and passes a District inspection.
MONTHLY SERVICE CHARGE Construction meters will be charged a monthly service charge and metered monthly usage rates.
$183.61 effective January 1, 2019
$189.12 effective July 1, 2019 $194.79 effective July 1, 2020 $200.63 effective July 1, 2021 $206.65 effective July 1, 2022
METERED MONTHLY USAGE RATES
(Rate per HCF) (All Usage)
$4.19 effective January 1, 2019
$4.31 effective July 1, 2019 $4.44 effective July 1, 2020 $4.57 effective July 1, 2021 $4.71 effective July 1, 2022
+ zone charge
GENERAL PROVISIONS - CONDITIONS OF SERVICE Construction Meter Water Service means service provided through a temporary construction water meter that is installed on a fire hydrant generally for construction and other legitimate non-potable water use as determined by the General Manager. Fire hydrants are for use by Water District personnel or by organized fire protection agencies, pursuant to contract with the Water District. Other parties desiring to use fire hydrants for any

10
purpose must first obtain a permit from the District prior to the use and shall operate said fire hydrants according to the regulations set forth herein and as otherwise directed by the Water District. The permittee must furnish said permit for inspection if requested to do so by a District employee or by a law enforcement officer. Unauthorized use of fire hydrants shall be prosecuted according to law. Construction meters may only be connected to District facilities. Construction meters may be portable or locked onto a fire hydrant by the District. Each permit will allow for temporary metered water usage from a specific hydrant for up to 90 consecutive days. Permits may be extended up to 270 additional consecutive days at no less than 30-day increments at the discretion of the District. Meters may be returned prior to the permit expiration date. The permittee must use a wrench specifically designed for opening and closing fire hydrant valves and said opening and closing shall be done slowly to prevent damage to the valve and distribution system. Pipe wrenches or crescent wrenches shall not be used, as these will damage valve stems. The District will furnish a proper fire hydrant wrench for use by the customer and may charge a deposit or a fee for its use. The permittee shall be responsible and solely liable for any damage to said fire hydrant, the wrench, valves or the system for failing to exercise proper care in the opening and closing of any fire hydrant valve. The permittee is responsible for closing the hydrant and removing any portable construction meter at the completion of each day. If there is water loss over night or over a weekend from a hydrant that was recently opened for construction meter use, the permittee shall be charged the estimated usage at the current construction meter monthly metered usage rates if the loss is due to the permittee’s action or inaction as determined by the District. If a meter becomes damaged or fails to record the water usage properly, it must be returned immediately to the Water District for repair and/or replacement. The permittee is responsible for any and all labor and material costs associated with repair or replacement of a lost or damaged construction meter. If the calibration vane, calibration screen, register pin and/or seal pin is missing from the meter or there is other evidence the meter has been tampered with, damaged or removed from the hydrant for the purpose of receiving water without paying the full lawful charge, the permittee shall be charged for estimated usage at the current construction meter monthly metered usage rates plus any and all labor and material costs associated with repair or replacement of the damaged construction meter. These costs are subject to an overhead and administrative charge of 15%. No further service will be allowed until all fees and charges are paid in full. All construction meters must be read by District personnel at approximately 30 day intervals for billing purposes. Locked-on meters will routinely be read in the field by District personnel. Permittees with portable construction meters shall return portable construction meters to District Headquarters for a reading by the due date set by the District. Permittees of portable construction meters who do not bring in the meter by the due date will be charged a minimum of $73.00 for all

11
costs associated with dispatching District personnel to locate and read a portable construction meter, including the cost of time and materials plus an overhead and administrative charge of 15%. Failure of the permittee to make the meter available for reading on a monthly basis or failure to pay charges when due may result in cancellation of said permit in which case the meter will be subject to immediate confiscation. At the expiration date of the permit or upon completion of use, if sooner, the permittee shall return the permit, and if applicable, the portable meter to the Water District for inspection and final billing. Monthly service charges will not be pro-rated for meters returned prior to the billing due date. The deposit, minus any charges for water use and applicable meter repair, will be returned to the permittee by mail, or the permittee may be billed for any applicable charges exceeding the deposit. If the permit and/or the portable meter is not returned as set forth herein, or within ten days after District provides written or telephone communication to do so, the permit shall be deemed revoked, however the construction meter shall still be deemed property of the District subject to immediate return. Smaller angle-stop construction meters are prohibited. When permanent service is paid for in advance, construction water may be taken from the permanent meter and service connection intended to serve the parcel. District facilities damaged during construction will be repaired by the District and charged to the developer on a time and material basis plus an overhead and administrative charge of 15%. Additional terms and conditions of the construction meter agreement are listed in the permit agreement. The District reserves the right to amend the permit agreement. Consult Ordinance Number 87 and successor agreements for the backflow prevention requirements for construction meters.
BULK WATER STATION CHARGES, RATES & PROVISIONS
FLAT MONTHLY SERVICE RATE
$47.11 effective January 1, 2019 $48.52 effective July 1, 2019 $49.98 effective July 1, 2020 $51.48 effective July 1, 2021 $53.02 effective July 1, 2022
The Bulk Water Station is not currently equipped with metering technology, therefore the District is presently unable to charge a metered rate. The District intends to install metering technology and a card reader at the Bulk Water Station that will enable the District to charge metered rates for bulk water service. Once the metering technology is operational, a fixed monthly charge and a uniform rate with will be charged to customers in place of the Flat Monthly Service Rate listed above. The fixed monthly charge and uniform rate to take effect once the metering technology is operational is as follows:

12
METERED RATES
Effective 01/01/2019
Effective 07/01/2019
Effective 07/01/2020
Effective 07/01/2021
Effective 07/01/2022
Monthly Fixed $28.68 $29.55 $30.44 $31.35 $32.29 Volumetric Per
HCF $2.63 $2.71 $2.79 $2.87 $2.96
Bulk water is water obtained by the customer from the District's bulk water station facility. Bulk water customers shall submit a security deposit as specified under the Customer Deposits section. Bulk water accounts shall pay an additional $10.00 deposit for each key to the bulk water facility. If the bulk water account holder does not haul their own water, the name, address and phone number of the account holder's designated agent must be on file with the District. From time to time it is necessary for the District to change the locks and issue new keys for the bulk water stations due to nonpayment by some bulk water station customers. Those Bulk Water Station customers at that time who are 90 days or more delinquent must pay the cost to re-key the bulk water station (in total or in part) on a time and material basis plus an overhead and administrative charge of 15% in addition to all past due amounts, late charges, and required deposits before they are issued new keys. It is the responsibility of any applicant who proposes to utilize hauled water as the source of domestic supply to satisfy the requirements of the Indian Wells Valley Water District. Applicants are advised that there may be California State Water Resources Control Board regulations that applicant may need to comply with as well.
PRIVATE FIRE PROTECTION SERVICE CHARGES, RATES & PROVISIONS
FLAT MONTHLY SERVICE RATE
Connection Size
Effective 01/01/2019
Effective 07/01/2019
Effective 07/01/2020
Effective 07/01/2021
Effective 07/01/2022
1” $1.55 $1.60 $1.64 $1.70 $1.75 2" $9.62 $9.91 $10.21 $10.52 $10.84 3" $27.96 $28.80 $29.66 $30.55 $31.47 4" $59.57 $61.36 $63.20 $65.10 $67.05 6" $173.05 $178.24 $183.59 $189.10 $194.77 8" $368.78 $379.84 $391.2 $402.98 $415.07
10” $663.20 $683.10 $703.59 $724.70 $746.44

13
A Private Fire Protection Service consists of facilities serving building sprinkler systems, hydrants, hose reels and other facilities installed on private property for fire protection purposes. The applicant for private fire protection service shall pay the actual cost of installation of the service from the distribution main to the customer's premises, including the cost of a detector check meter or other suitable and equivalent device, valve, and meter box. The District may also require a check valve of a type approved by the National Board of Fire Underwriters or similar organization, and the District may also require that said check valve be equipped with a bypass meter, at the expense of the property owner. The District may agree to install the connection and meter on a time and material basis plus an overhead and administrative charge of 15%. There shall be no connections between a fire protection service or system and any other water distribution system on the premises except when the service or system requires a remote fixture connection. There shall be no water used through a non-remote fixture connection fire protection service except to extinguish fires and for testing firefighting equipment. A fire protection service with a remote fixture connection may use up to one hundred cubic feet of water per month at the current metered monthly quantity rate based on meter type and size. If water consumption exceeds one hundred cubic feet in a month or if any consumption is recorded on a non-remote fixture connection meter, the private fire protection service customer shall be charged double the regular flat monthly service rates, except that no charge shall be made for water used to extinguish fires where such fires were reported to the fire department. If the District does not require a meter and if water is used through a fire service connection for any other purpose than extinguishing of fires, the District shall have the right to place a meter on the fire service connection at the owner's expense. If water is used from a private fire service in violation of these regulations, the District may, at its option, discontinue the service. The District assumes no responsibility for loss or damage due to lack of water or pressure, and merely agrees to endeavor to furnish such water quantities and pressures that are available at the time of use. The service is subject to shutdowns and variations required by the operation of the system.
DELINQUENT CHARGES
WATER SALES
All charges for water furnished are due and payable when billed. A late charge of $2.00 plus five percent (5%) will be assessed on unpaid amounts outstanding at the time of the next billing (typically 30 days). Those customers who have entered into payment arrangements prior to the next billing will not be assessed a delinquent fee on amounts subsequently paid according to the arrangement terms. Other exceptions deemed worthy and appropriate may be granted on a case by case basis by the General Manager or the General Manager’s designate. Whenever an account becomes delinquent, prior to termination of water service:
• The District shall issue a 10-Day Notice of Termination letter to the customer. • The District shall issue a 10-Day Notice of Termination letter to the actual user prior to the
date of termination of service. The notice shall further inform the actual users that under certain circumstances they have the right to become customers of the District without being required to pay the amount due on the delinquent account.

14
• The District shall issue a 48-Hour Notice of Termination to the premises. Upon failure to remit payment within the specified time per a 48-hour notice, service shall be terminated until payment in full is made, which includes payment of Notice of Termination charges, Service Reinstatement charge, and payment of a security deposit, if one is not already on file. Other outstanding account charges may also be collected. Delinquent charges are as follows:
10-Day Notice of Termination $ 6.00 per letter to customer or actual user 48-Hour Notice of Termination $ 13.00 per meter Service Reinstatement Charge Damaged or Broken Lock
$ 38.00 per meter/$195.00 per meter after hours $100.00
(Reference: Government Code Section 60370 through 60375) If an account becomes uncollectible as determined by the District, the total balance will be turned over to a Collection Agency. The customer must pay the total balance, plus interest, before service is resumed.
BACKFLOW PREVENTION DEVICE TEST
All backflow prevention devices, which are required by the District, must be tested on an annual basis according to District Ordinance 87 or succeeding ordinances. An additional fee of $6.00 will be charged when a 10-Day Notice of Termination letter is issued and a fee of $13.00 will be charged when a 48-hour notice is issued to the customer's premises. Upon failure to provide successful test results within the time specified in a final notice, service shall be discontinued until the device is tested and passes, and a $38.00 Service Reinstatement charge is paid.
RETURNED PAYMENT CHARGES
If a check, credit card transaction or automatic payment service is used for payment of District fees, rates or charges and the payment is declined by the bank upon which it is drawn, for whatever reason, the customer will be charged the amount payable to cover the returned check, credit card transaction or automatic payment; the actual Non-Sufficient Funds (NSF) bank fees assessed to the District; and a Returned Payment Charge of $20.00. Payment to cover these charges must be made in cash or with certified funds. Customers having more than two returned payment transactions within six months may be required to pay future bills in cash or with certified funds and may be removed from Auto-Pay at the discretion of the District.
DISPUTED BILLS
In the event of a disputed reading, the meter shall be reread. If the accuracy of the meter is questioned by a customer, the customer shall be given the option of placing a $75.00 deposit with the District for a meter registration accuracy test. The District recommends that the customer be present to watch the meter being removed from the meter box and to record the serial number. The meter will then be shipped to a third party tester.

15
If the results of the test show the meter is greater than 101.5% accurate, the meter is over-reading usage, the meter will be replaced, a pro-rated adjustment will be made on previous bills up to a maximum of six months and the $75.00 deposit will be returned to the customer. If the meter is less than 98.5% accurate, the meter is under-reading usage, the meter will be replaced, the $75.00 deposit will be forfeited and no further action will be taken. If the results of the test show that the meter is at least 98.5% to 101.5% accurate, the customer shall forfeit the $75.00 deposit to cover the District's expense to perform the meter accuracy test.
CUSTOMER DEPOSITS Applicants for metered and bulk rate water service shall deposit with the District, an amount equal to the estimated average monthly water bill, fixed as follows: METER SIZE DEPOSIT 3/4" & Bulk Customers ……………………………………...………………........ $70.00 1" …………………………………………………………………………….…... $90.00 1-1/2" ………………………………………………………....……………….…... $160.00 2" …………………………………………………………………........................ $230.00 3" …………………………………………………………………………….…... $460.00 4" ……………………………………………………………………….…….….. $570.00 6" ……………………………………………………………………….…….….. $805.00 8" ……………………………………………………………………………..….. $1,145.00 10” ……………………………………………………………………………..….. $2,290.00
Security deposits are required of all applicants for water service. Any service discontinued for nonpayment shall require a security deposit, if said deposit is not already on file, in addition to payment of all other applicable fees and charges, before water service is resumed. The amount of the security deposit for reinstatement of discontinued service will be the estimated average monthly water bill, but in no case less than the fixed deposit schedule stated above. Any account having three or more delinquencies within the past twelve months will be required to pay and maintain a deposit according to the schedule stated above, even though water service may not have actually been disconnected, if said deposit is not already on file. A security deposit will be refunded on any account that has remained in good standing for twelve consecutive months. Accounts will be reviewed for potential refund on an annual anniversary basis. Any security deposits on file when service is discontinued will be applied towards the final billing. Developers/Customers may be required to provide the District with a deposit when applying for a new service. The amount will be determined on a case by case basis. The deposit will be returned upon final approval by the District’s Field Service Department of the meter, meter box installation and all other connection facilities. In the event the meter, meter box and other connection facilities

16
do not meet the time and/or other requirements of the District, the deposit will be used to pay for District labor, materials and/or outside contracts to remedy the situation plus an overhead and administrative charge of 15%.
CUSTOMER SERVICE CHARGES New Account Charge (Regular hours turn-on) $20.00 New Account Charge (After hours turn-on) $195.00 Service Reinstatement Charge (Regular hours) $38.00 Service Reinstatement Charge (After hours) $195.00 In addition to the above, other customer service visits may include, but are not limited to, emergency turn-offs, turn-ons and meter re-readings and may be subject to a $38.00 charge during regular working hours or a $195.00 charge during non-working hours. Other applicable fees, charges and security deposits may also be required for customer service visit requests. These Customer Service Charges are not applicable to Continuity of Service Agreements to accounts that are in good standing.
WATER THEFT
California law, including but not limited to Penal codes 498, 624 and 625, defines various methods of water theft. In the event that a suspected water theft is discovered, District personnel will contact law enforcement personnel. Water theft can result in the District pressing charges. To prevent further water delivery from occurring, the District may remove or lock the meter or confiscate the equipment or materials that allow the unauthorized connection. The customer/ individual will be charged all costs incurred by the District associated with reporting the incident including but not limited to labor, materials and equipment used to report the incident and all costs incurred by the District to replace or repair any District facilities or other items that were tampered with, damaged or removed for the purpose of receiving water without paying the full lawful charge. These costs are subject to an overhead and administrative charge of 15%. No further service will be allowed at the address until all fees and charges are paid in full. When the District has discovered that a customer has obtained water service by fraudulent means, or has diverted the water service for unauthorized use, the service to that customer may be discontinued without notice. The District shall not restore service until the customer has complied with all rules and requirements of the District and the District has been reimbursed for the full amount of the actual cost to the District incurred by reason of the said fraudulent use. For additional information on the District's unauthorized service policy, refer to Ordinance No. 82 adopted August 23, 1993, and any successor ordinances. Tampering, altering, modifying, reconnecting, bypassing, or any otherwise unauthorized or fraudulent control of water meters and appurtenances are violations of the California Penal Code. Breaking or obstructing water pipes or meters, diverting flow or drawing water from any stopcock or faucet by which the flow of water is controlled, after the service has been closed or shut off for a

17
specific cause, is also a violation of the California Penal Code and will be addressed according to the “Procedure for Suspected Water Theft” adopted on June 12, 2006. Any violation that causes the District to repair, restore, replace, or relocate a District-owned facility will be billed on a time and material basis plus an overhead and administrative charge of 15%. Nonpayment of such amounts may result in termination of service or collection action.
CUSTOMER COMPLAINTS
Should Customer Accounts staff be unable to satisfy a customer's billing complaint, the customer may file a complaint with the Chief Financial Officer. Should the Chief Financial Officer be unable to satisfy the customer's complaint, the customer may file a complaint with the General Manager. Should the General Manager be unable to satisfy the customer’s complaint, the customer may file a complaint with the Board of Directors by submitting the complaint in writing. The decision of the Board of Directors shall be final.
METER EXCHANGES
A customer, upon request, may exchange an existing meter for a meter of lesser or greater size, subject to District approval. Installation of the new meter and service lateral, if required, for a 2” or smaller service, will be billed on a time and material basis plus an overhead and administrative charge of 15%. New meters, 3” or larger, or compound meters, shall be purchased and installed at the sole cost of the applicant and shall be subject to Engineering Dept. specifications, review and inspection. Once installed, the meter and service connection become the property and maintenance responsibility of the District; however, the applicant must warrant the installation for a period of two years. Customers shall only be allowed to exchange meters with the approval of the District, and the meter and installation charge shall be computed on an individual basis. Inasmuch as Capital Facility Fees are based solely upon meter size, any customer/developer who requests a larger meter, whether domestic or landscape, will be responsible for payment of the Capital Facility Fee (aka Basic Facility Fee) differential between the current meter size originally paid and the larger meter Capital Facility Fee in existence at the time of the exchange, in addition to payment of time and material costs plus an overhead and administrative charge of 15% associated with the actual meter and service installation change. In the event that a customer requests a meter exchange for the purpose of downsizing his/her service, the District will not refund the Capital Facility Fees differential between the current meter size originally paid and the smaller meter Capital Facility Fee. The District will issue a letter to the customer that can be remitted anytime within ten years to permit the service to be restored to the original size without having to pay an additional Capital Facilities Fee. This letter is transferrable to a future property owner. Single family residential customers will not generally be permitted to exchange an existing meter for a meter size greater than 3/4-inch, since such request shall constitute a significant change in

18
water demand and service. If the District requests the change in meter size, charges, if any, will be determined on an individual basis.
CONTINUITY OF SERVICE AGREEMENT In order to accommodate interim water service for "clean and show" purposes, an owner or agent may have water service for specific water meter(s) automatically placed in the owner's or agent's name at the time a tenant requests discontinuance of service, if the owner or agent applies for and executes an Application for Continuity of Service Agreement. Please note that the District reserves the right to disconnect water service to a tenant for nonpayment of water bills, regardless of whether or not a Continuity of Service Agreement is on file. The District will not require that the owner or agent pay the standard Customer Service Charges and/or deposits for establishing a new account for any meter for which there is a Continuity of Service Agreement on file and if the account is in good standing. When responsibility for a meter reverts to an owner or agent under a Continuity of Service Agreement, the meter must remain on until a new tenant or a new owner applies for the water service or until the Continuity of Service Agreement is canceled with ten days' written notice.
CAPITAL FACILITY FEE
Connection fees are composed of Capital Facility Fees and Distribution System Fees.
Meter Size Capital Facility Fee 3/4" $ 5,068.00 1" $ 8,463.00
1-1/2" $ 16,875.00 2" $ 27,011.00 3" $ 54,072.00 4" $ 84,478.00 6" $ 168,905.00 8" $ 270,258.00
10” $ 388,537.00 Capital Facility Fees and all other Rates, Charges and Fees associated with new service can only be accepted on behalf of a parcel that has an adjacent District water main that extends completely across one or more sides of the parcel to be served, and only if said main is of adequate size, age and service pressure to serve the development proposed, and for which a meter will be installed within 90 days, or as otherwise allowed or required by the District’s Board of Directors in unusual circumstances. Payment of all other Rates, Charges and Fees applicable to the proposed parcel must accompany the payment of Capital Facility Fees. If an applicant or developer desires to serve a parcel or lot that has had no previous authorized service from the District, and said parcel or lot is not adjacent to an existing water main of a size, condition, and service pressure deemed necessary by the District to serve the proposed development or property, the applicant or developer shall be required to construct all necessary water system

19
facilities, including a water main line extension to and across the entire frontage of the parcel(s) to be served, at the applicant or developer’s sole expense, in accordance with District specifications, rules, and regulations. In such case, the applicant or developer shall bear the entire cost of all design, construction, and inspection. The applicant or developer must contact the Engineering Department for more information about District specifications, rules and regulations regarding the construction of water system facilities and to be issued a permit for construction. An applicant for service from a main through which the static water pressure will be lower than the normal minimum operating pressure of forty (40) pounds per square inch (psi) must apply for a Low Water Pressure Agreement, in recordable form, and if granted, shall be responsible for installation and maintenance of privately owned pressure equipment, including a District approved backflow device or other devices, as required. An applicant for service from a main through which the static water pressure will be higher than the normal operating limit of 90 psi must apply for a High Water Pressure Agreement, in recordable form, and if granted, shall be responsible for installation and maintenance of privately owned pressure equipment, including a pressure regulator on applicant’s side of the meter or other devices as required to mitigate the potential problems/damages from high water service pressure. Customer may elect to have the District provide and install said pressure regulator on Customer’s side of the meter on the service line to the Customer’s Property. District will warranty the installation of the pressure regulator only for one year at which time the pressure regulator will become the sole responsibility of Customer to be maintained by Customer in accordance with District Regulations. In a parcel split situation, only one division of the original parcel will be given credit for the residential service originally paid for. The remaining newly-formed parcels shall be subject to payment of all applicable Water District rates currently in effect for obtaining water service. In addition, in order to receive water service, the newly-created parcels must be completely fronted on at least one side by a Water District pipeline of a size and pressure adequate to service the newly-created parcels. If additional distribution pipelines are required to reach remote parcel locations, the labor and materials to install such pipelines, to District specifications, will be at the owner’s or developer’s sole expense. All residential, commercial, public, industrial and agricultural connections shall be levied a Capital Facility Fee based upon their meter size. Capital Facility Fees are a one-time charge and are used to finance the upgrading and/or rehabilitation or replacement of existing water supply, storage, and transmission facilities as well as the construction of new water supply, water treatment, storage, and transmission facilities in order to service the demand caused by the new development, and must be paid in advance of any service connection to the benefited parcel. It is a charge for facilities in existence at the time a charge is imposed or charges for new facilities to be constructed in the future that are of benefit to the person or property being charged. It is appropriate and necessary to provide for system facilities that have not been constructed, or that have been constructed, but for which new development has not contributed its fair share of the cost. The Capital Facility Fees collected shall be used to cover the cost of the source of supply, storage, major transmission and distribution lines, and any additional related facilities as required to service the demand load caused by the new development. The Fee shall be solely used to pay (1) for public facilities constructed or to be constructed by the District, (2) for reimbursing the District for the development's fair share of those capital

20
improvements already constructed by the District and/or (3) to reimburse other developers who have constructed basic facilities, where those facilities were beyond those needed for the other developer's project(s). Certain properties may not be subject to Capital Facility Fees due to an agreement or memorandum of understanding covering the tract or property. When a customer desires to individually meter a multiple unit building (residential or commercial) that is master metered and where the Capital Facility Fee or Basic Facility Fee was paid for the master metered service, and where individual meters would not constitute a material increase in capacity or demand, as determined by the District, no additional Capital Facility Fee will be charged. The District reserves the right to determine the appropriate meter size for the development or proposed development from information provided by the applicant and as investigated by the District. Applicants for water service shall have the right to appeal to the Board of Directors a determination made by staff. The decision of the Board of Directors shall be final and binding. A customer must notify the District of any new construction or placement of new living structures upon a parcel with existing water service. Any new construction/structures will be evaluated by the District to determine whether a larger meter, additional meter or other system modifications would be required to accommodate increased capacity or demand needs caused by new or additional improvements. If the District determines that an additional capacity or demand need will be placed upon the District’s water production, transmission, and storage facilities as a result of the new construction, the District reserves the right to charge and collect from the customer an additional Capital Facility Fee to be determined on a case by case basis. Except in unusual circumstances, as determined by the District, Private Fire Service shall be exempt from the payment of Connection Fees (Capital Facility Fees and Distribution System Fees). Landscape-only meters may be exempt from Connection Fees (Capital Facility Fees and Distribution Fees), at the sole discretion of the District, provided the landscape-only meter serves no facility whatsoever and is no larger than the meter used to monitor domestic water for which appropriate connection fees have been paid, or for which no structure whatsoever is involved, such as a meter for street island landscaping. All landscape-only meters are subject to engineering analysis by the District.
DISTRIBUTION SYSTEM FEE
The Distribution System Fee is a charge for the water distribution system typically located between transmission lines and service laterals. The applicant shall pay the following Distribution System Fee where a water main abuts applicant's benefited parcel, provided, however, that the applicant shall be exempted from such Distribution System Fee whenever water service is provided from a water main constructed and installed at the sole cost of said applicant or the applicant’s predecessor-in-interest:
Meter Size Distribution System Fee 3/4" $ 3,724.00

21
1" $ 6,206.00 1-1/2" $ 12,412.00
2" $ 19,860.00 3" $ 39,719.00 4" $ 62,061.00 6" $ 124,122.00 8" $ 198,595.00
10” $ 285,480.00 An additional fee may also be imposed to include the estimated cost of modifications or additions to infrastructure that may become necessary to bring existing infrastructure up to current District standards or due to unusual or exceptional circumstances related to a customer’s application for service.
An applicant shall not be required to pay any Distribution System Fee if the applicant can prove to the satisfaction of the District that the same or a similar charge was imposed upon applicant's predecessor-in-interest and was paid within twenty years of the date of applicant's request for water service from a steel main, or within thirty years of the date of applicant's request for water service from an asbestos cement or polyvinyl chloride pipe main. A predecessor-in-interest shall be deemed to exist where the subject lot is within a subdivision of land in which the developer has installed and dedicated to the District a distribution system which provides service to the lot. A predecessor-in-interest shall be deemed to exist where the property to be served is within Assessment District No. 14 (a city assessment district), 82-1, 87-1, 91-1, or within the Bradley Tract No. 2460. If an applicant or developer desires to serve a parcel or lot that has had no previous service from the District, and is not adjacent to an existing water main of a size, condition, and service pressure deemed necessary by the District to serve the proposed development or property, the applicant or developer shall be required to construct all necessary water system facilities including a water main line extension to and across the entire frontage of the parcel(s) to be served, at the applicant or developer's sole expense, in accordance with District Specifications, Rules, Regulations and General Plan. The applicant or developer shall bear the entire cost of all design, construction and inspection. Please also see REFUND AGREEMENTS. As with Capital Facility Fees, Distribution System Fees must be paid in advance of any service connection to the benefited parcel. Distribution System Fees may also be required from an applicant not otherwise covered by the above, if in the discretion of the District, such charge is reasonably necessary to ensure the applicant pays an equitable fee or charge associated with the District’s distribution system.

22
MASTER METERS Generally, all residential units must be individually metered, and multiple meters are encouraged for conservation purposes; however, master metering may, at the sole discretion of the District, be allowed with respect to residential developments, under the following circumstances: 1. The property served is a single parcel, owned by a single person, entity, or organization and
consisting of more than three residential units. 2. All master meters permitted shall be in the owner's name and all bills shall be the primary
responsibility of and shall be paid by said owner. Any agent of the owner shall have their name on file with the District.
3. The master meter shall be located at the property line adjacent to the street or easement. 4. The District reserves the right to require additional meters or to impose conditions in special
or unusual circumstances, such as for heavy landscaping or for widely separated buildings on large parcels.
5. An approved backflow prevention device(s) will be required for all master meters, installed
and maintained by the owner, at the owner's expense. The meter size, as required for any particular development, may be determined by the District, at the District's sole discretion, based upon information provided by the applicant and investigation by the District. In the case of more than one service to the same development, the total charge shall be the sum of the appropriate individual charges. The District reserves the right to require an increase in meter size at any time. The owner-applicant must, at that time, pay any additional fees due, including but not limited to Capital Facility Fees. Generally, all commercial, public, industrial, and agricultural units must be individually metered, and multiple meters are encouraged for conservation and safety purposes; however, master metering may, at the sole discretion of the District, be allowed with respect to commercial, public, industrial, and agricultural developments in circumstances where separate meters would be impractical, such as hotels and motels or facilities of common use such as common bathrooms or washrooms. If master metering is allowed, an approved backflow prevention device(s) must be installed and maintained by the owner, at the owner's expense. There shall be at least one separate meter for each separate sewer lateral. There shall be a separate meter to each customer for which a backflow prevention device is required. There shall be a separate meter for each culinary establishment, each commercial/industrial establishment which uses water as a part of its commercial or industrial business or process, each medical and dental office, each veterinary clinic and animal grooming or boarding or sales establishment, each grocery and food handling or sales establishment, and as otherwise required by the District in its sole discretion; whether or not such establishments are in separate freestanding buildings and whether or not such establishments require backflow prevention devices. There shall also be a separate meter for all commercial and industrial establishments which contains fifty or more fixture units per Uniform Plumbing Code.

23
SERVICE INSTALLATION CHARGES Service Installation Charges cover the cost of a water service lateral (from the water main to the customer's meter location) and the installation of a water meter, meter box, valves, and other appurtenances up to the discharge side of the customer valve. Service Installation Charges are collected at the time application for service is made. Where the premises to which water is to be furnished does not have a meter for use on said premises, the applicant shall pay an installation charge based on all costs of installation, including meters, appurtenances, and appurtenant work and shall make a deposit of the estimated amount. Said charge shall be paid in advance of water service. Once installed, the water service lateral, water meter, meter box, valves, and appurtenances become the property of the District. Payment for meter installation, in addition to all other usual and regular charges of the District, is as follows: Meter Size Amount 3/4" $ 382.00 1" $ 506.00 1-1/2" $ 920.00 2" $ 1,056.00 For most meter installations, the above amounts are payment in full. However, when District costs exceed the deposit amount due to special circumstances (such as a non-plastic meter box and lid) the customer shall be billed the additional costs on a time and materials basis plus an overhead and administrative charge of 15%. When it is also necessary for the District to install the service lateral from the main to the meter location, an additional charge of $757.00 for 3/4” and 1” meters (1” lateral) or $1,013.00 for 1-1/2” and 2” meters (2” lateral) must be paid by the customer. This charge does not include excavation, backfill and street repair, which must be performed by the developer/customer and inspected by the District to ensure the District’s installation specifications are met. Meter and service connections must be installed by the District; however, a service connection may be installed by a California licensed contractor, with the District's prior approval, and in such event, the applicant must warrant the installation for a period of two years. At the discretion of the District, prior to installation, the developer must provide the final grade and curb stake information placed by a California licensed Surveyor or California licensed Professional Civil Engineer. Meter and service connections larger than two-inches in size, or any size compound meter, shall be installed by a California licensed contractor at the sole cost of the applicant. Once installed, the meter and service connection become the property and maintenance responsibility of the District; however, the applicant must warrant the installation for a period of two years. Upon receipt of an application, a deserted or inactive service may be activated, provided the applicant pays actual time and materials costs plus an overhead and administrative charge of 15% required to locate the service, restore it, and/or upgrade it to current District standards. If the service cannot be located, it will be classified as abandoned. Abandoned services may be considered as new services for purposes of collection of some or all rates, charges and fees for obtaining service.

24
An existing service connection may be relocated on the same property, or upgraded, with the approval of the District; however, it may not be moved to a new property. All work by the District will be done on a time and material basis plus an overhead and administrative charge of 15%. If the meter and service installation requires a backflow prevention device, the costs associated with the installation and maintenance of the backflow prevention device are the sole responsibility of the applicant. (Refer to Ordinance No. 87 and any other successor ordinances.)
CONCEPT/PLAN CHECK FEES/INSPECTION DEPOSITS
An applicant/developer must first submit an application for water system improvements with the Engineering Department. The Engineer will then review the requirements and process for obtaining a permit to install new water system improvements with the applicant/developer. A permit will not be issued until the concept plan and construction plans have been approved in writing and the appropriate fees paid. In addition, the construction inspection deposit must be paid and construction submittals approved before a permit will be issued. The fees for Concept Plan Approval, Plan Check and Construction Inspection are listed below. Once a water system improvements permit is issued, it is valid for two (2) years from the date of approval. If the construction of water system improvements has not been completed and those improvements dedicated to the District within said two years, the applicant/developer will be subject to any new standards and construction specifications that have been adopted by the District, AWWA, or State of California since the permit was issued. An applicant/developer will be required to provide waterworks plans designed by a California licensed Professional Engineer and to adhere to the District’s Standard Construction Specifications and Drawings, which are provided under separate cover and available through the District’s Engineering Department. Please refer to the Standard Construction Specifications and Drawings for details on requirements for project bonding, insurance, environmental impact reports, and easements. 1. Concept Plan Approval: Applicant must make an advance payment of a Concept Plan Fee in
the amount of $100.00 to cover facility design requirements review and approval. When required, the applicant must also pay all costs for the District engineering staff, District engineering consultant and/or legal counsel related to the applicant’s request plus an overhead and administrative charge of 15%. Any Concept Plan Approval granted is valid for a period of one year from the date of said approval. If construction plans are not submitted to the District during such 12 months, the applicant must resubmit a new concept plan and pay an additional Concept Plan Fee. A Concept Plan Fee is also required for those variance requests where a conceptual plan or drawing needs to be reviewed by District engineering staff.
2. Plan Check: Applicant must pay a fee, as follows, in advance, to cover engineering review and approval of construction plans and specifications submitted for each proposed water system improvement project:

25
Engineer’s Cost Estimate Fee $0 - $200,000 2% (minimum $500) > $200,000 1% (minimum $4,000)
Applicant must also pay (if applicable) actual costs incurred by the District for engineering consultant and/or legal counsel review plus an overhead and administrative charge of 15%.
Any plan approval is good for a period of one year from the date of said approval. If actual construction work is not initiated during such one year, the applicant must revert back to the Concept Plan or Plan Check approval stage for the proposed project, whichever is determined to be appropriate by the District. At that time, additional Concept Plan and/or Plan Checking fees may be required.
3. Construction Inspection: Applicant must pay a deposit before construction begins to cover the
cost of District inspection of water system improvements. The applicant must deposit 3% of the actual construction cost of the water system improvement work ($180.00 minimum). Inspections or tests shall be charged on an actual time basis, calculated at $120.00 per hour with a minimum one hour charge for each official inspection. All construction work necessitating the District Inspector to appear at the construction site before or after normal working hours (8:00 am – 5:00 pm M-F excluding District holidays) may require the applicant to pay an after hour rate of $155.00 per hour subject to a minimum charge of $265.00 per after-hours inspection. Any after-hours inspection must be pre-paid and pre-arranged with the District Inspector. Any refund of the unused portion of the 3% deposit will not be granted until all water system improvements have been completed and dedicated to the District with approval by the Board of Directors.
WILL-SERVE LETTERS
The City of Ridgecrest, the Counties of Kern and San Bernardino, as well as other public and governmental agencies, financial entities and private individuals frequently require developers to obtain "Will-Serve" letters from the Water District to establish that the District water service is available for a proposed project. If deemed necessary by the District, the developer will be required to submit a tentative project map or site plan for review. The fee for a requested "Will-Serve" letter is $25.00. The District may require submittal and/or approval of a concept/plan prior to issuance of a will-serve letter. The District will review the proposed project to determine if the project lies within the District's boundaries and the extent of the expected impacts on District facilities and/or District customers. For projects requiring extensive review and consultation, the developer will pay all costs for District engineering staff, District engineering consultant and or legal/counsel plus an overhead and administrative charge of 15% exceeding $25.00 related to the developer’s request for a “Will-Serve” letter.

26
If appropriate, as determined in its sole discretion and upon terms and conditions it deems appropriate, the District will send the requesting agency a "Will-Serve" letter on behalf of the developer's proposed project. Generally this letter will state that the District can provide service, upon demand, to any location within its boundaries, subject to all District Ordinances, Rules and Policies, and upon construction by the developer of any water system facility extensions; relocation of any existing water lines and/or existing fire hydrants; and/or additional improvements or requirements which may be found necessary, and the deposit of applicable charges and fees for obtaining water service. All such offers of service shall be valid for a period of one year.
REFUND AGREEMENTS
Developers may be required, at their sole expense, to install or replace or upgrade existing water system facilities, including, but not limited to, water mains, valves, fire hydrants, backflow prevention devices and service connections, as a condition to receiving water service. If required, developers must furnish all labor and materials necessary to install or replace the water system facilities, in accordance with District-approved plans and specifications. If the District requires the installation or replacement of a water main to service an applicant's benefited parcel as a condition to receiving water service, and said water main, once installed, may provide water service to neighboring parcels other than those benefiting the applicant, the applicant may be entitled to receive partial reimbursement for eligible costs of improvements. Developers may request such a reimbursement by applying for a Refund Agreement, at or prior to the time of dedication. The District may, under the terms and conditions elsewhere described, impose a Distribution System Fee to be paid by new connections where the property owner requesting service or predecessor-in-interest has not participated in the costs of the water main abutting said property. During the term of the Refund Agreement, the District shall credit the developer with 100% of said Distribution System Fees collected on said eligible water line. The Refund Agreement shall expire ten years from the date of said agreement, or when the developer has been repaid 100% of the eligible costs of said improvements, whichever occurs first. Eligible costs include, but are not limited to, construction, engineering and surveying. Refund Agreements must be approved by the Board of Directors. Developers may also be eligible for partial reimbursement if required to install water lines larger than would normally be needed for their proposed development alone, and larger than 12" in diameter. Each District requirement for such an "oversized" line will be negotiated with the developer on an individual basis.
CONTINUITY/SPECIAL CONDITIONS/SEVERABILITY
Continuity – Adoption of these rules shall not be construed as a waiver of any right or obligation under any prior agreement, contract or commitment. Special Conditions – In the event that conditions arise which are not specifically covered by these rules, the Board may take whatever action which, in its sole discretion, is warranted.

27
Severability – If any section, subsection, subdivision, paragraph, sentence, clause, or phrase of this regulation, or any part thereof, is for any reason held to be invalid, such decision shall not affect the validity of the remaining portions of this regulation, or any part thereof. The Board hereby declares that it would have passed each section, subsection, subdivision, paragraph, sentence, clause, or phrase thereof, irrespective of the fact that any one or more sections, subsections, subdivisions, paragraphs, sentences, clauses, or phrases be declared invalid.

APPENDIX 4
ORDINANCE NOS. 93, 98, 99, 100, AND 103

ORDINANCE NO. 93
ORDINANCE OF THE BOARD OF DIRECTORS OF THE INDIAN WELLS VALLEY WATER DISTRICT, KERN AND SAN BERNARDINO COUNTIES, CALIFORNIA, RESCINDING ORDINANCE NO. 72 IN ITS ENTIRETY; AND ADOPTING VOLUNTARY AND MANDATORY CONSERVATION MEASURES AND RECOMMENDING AND/OR REQUIRING CERTAIN WATER CONSERVING MEASURES
WHEREAS, the Indian Wells Valley Water District (District) is a County Water District formed and operating under and pursuant to California Water District Law (California Water Code §§ 30000 et seq.); and
WHEREAS, pursuant to Water Code § 31001, the District is authorized to perform all acts necessary to fully carry out its functions; and
WHEREAS, pursuant to Water Code § 31035, the District may undertake a water conservation program to reduce water use and may require as a condition of new service that reasonable watersaving devices and water reclamation devices be installed to reduce water use; and
WHEREAS, the Board of Directors of the District find that the water sources available to the District and all the other water users in the Indian Wells Valley is a limited resource and must be conserved to the fullest extent possible.
WHEREAS, a Memorandum of Understanding was made and entered into by and between the District and the City of Ridgecrest (City) for the mutual goal of conserving groundwater and adopting a water efficient landscape ordinance.
NOW THEREFORE, BE IT ORDAINED by the Board of Directors of the Indian Wells Valley Water District, as follows:
SECTION 1. TITLE
This Section shall be known and may be cited as the Water Efficient Landscape Ordinance.
1

SECTION 2. PURPOSE AND INTENT
A. Promote the values and benefits of landscaping while recognizing the need to utilize water and other resources as efficiently as possible;
B. establish a water conservation plan to reduce water consumption in the residential and commercial landscape environment by encouraging single-family residential water conservation, and, in multi-family, commercial and manufacturing zone districts, limiting the use of turf and requiring the utilization of low water use plant materials in new projects;
c. establish provisions for water management practices and water waste prevention for new development;
D. establish a plan for designing, installing and maintaining water efficient landscapes in new projects; and
E. implement a more efficient use of water through swimming pool and water body design by the use of efficient water body management and proper recirculation of water.
SECTION 3. DEFINITIONS
Approved Plant List shall mean the list formulated by District staff and approved and/or modified by the District Board of Directors.
Drainage system shall mean a landscape or irrigation system design to drain the water to be reused on the property or to channel the water off the property.
Drip Irrigation System shall mean the use of a drip emitter system that permits no more than 5 gallons of water per hour from each emitter.
Emitter shall mean a drip irrigation component that dispenses water to plants at a predictable rate, measured in gallons or liters per hour.
Hand Watering shall mean the actual watering of landscape by a person who remains present and holds onto and directs the watering device.
Irrigation Systems shall mean appropriately designed system that utilizes water sprinklers, emitters and bubblers.
2

Landscape area shall mean all permeable area located on the property and land set aside exclusively for shrubs, flowers, trees, water features and other landscape material to enhance the natural beauty of an area.
Low volume irrigation systems shall mean appropriately designed irrigation systems that utilize low volume sprinklers appropriate to the climatic and site factors. Such heads include low volume sprinkler heads, drip emitters and bubbler emitters.
Low water use plants shall mean trees, shrubs and ground covers that survive with a limited amount of supplemental water as recommended by the Approved Plant List or as identified in the booklet "Landscape Plants for the California High Desert" published by the Indian Wells Valley Water District, Rosamond Community Services District, Palmdale Water District, City of Palmdale, Kern County Water Agency and Naval Air Weapons Station China Lake. A copy of the Approved Plant List and booklet shall be on file and available for inspection in the City Planning Department and Indian Wells Valley Water District Offices. Other plant material that is believed to be low water use may be added to the Approved Plant List by special application to the Indian Wells Valley Water District or City Planning Commission.
Recirculation shall mean the reuse of water in a pool or pond in such a way that the water would enter from one point and be reused in another portion in such a way that the water is not wasted or lost by reuse in the pool or pond.
Recycling shall mean the reuse of water in a pool or pond through a series of pumps and filters.
Runoff shall mean water which is not absorbed by the soil or landscape to which it is applied and flows from the landscape area. For example, runoff may result from water that is applied at too great a rate (application rate exceeds infiltration rate) or when there is a slope.
Turf shall mean a surface layer of earth containing mowed or un-mowed grass with its roots.
3

SECTION 4: APPLICABILITY
All new developer, homeowner and/or commercial installed landscape projects within the boundaries of the District shall be subject to this Ordinance as well as Ordinances No. 90 and/or 91 adopted by the District Board of Directors on December 14,2009. All water users within the boundaries of the District shall be subject to Section 9 of this Ordinance
SECTION 5: SINGLE-FAMILY RESIDENTIAL LANDSCAPE PROCEDURE
A. All new single-family residential landscape projects are subject to District Ordinance No. 90 which imposes mandatory restrictions on landscaping. All existing single-family residential landscape projects which are not subject to Ordinance No. 90 are encouraged to abide by these recommendations. Existing landscape areas larger than one acre may be audited so recommendations can be made for water savings.
B. The following is recommended for all single-family residential homes:
1. Turf landscaping should not exceed 2,000 square feet of single-family residential lots 10,000 square feet or smaller.
2. Turf landscaping should not exceed 3,000 square feet of single-family residential lots 10,001 square feet or larger.
3. Irrigation and Landscape Design. Homebuilders, developers and/or landscape contractors should provide the residential customer an irrigation design and landscape design that would, if installed, demonstrate compliance with this Ordinance. Low volume irrigation systems will be demonstrated along with low water use plant material.
4. The irrigation design needs to show proper drainage to eliminate water waste.
5. Irrigation Drainage. All irrigation water is to remain on property during normal water run cycle, such that there is minimal or limited runoff from the area being irrigated, specifically onto sidewalks and streets.
4

SECTION 6. MULTI-FAMILY RESIDENTIAL, COMMERCIAL, INDUSTRIAL OR INSTITUTIONAL LANDSCAPE PROCEDURE
A. All new landscape projects for multi-family residential, commercial, industrial or institutional are subject to District Ordinance No. 91.
B. The following limitations apply:
1. Turf and/or any plants not on the Approved Plant List are limited up to 50% of the landscape area.
2. Only the plants from the Approved Plant List, on file and maintained by the District, shall be used within the remaining Landscape Area.
3. The irrigation system in the remaining Landscape Area must be a Low Volume Irrigation System.
4. All of the Landscape Area shall be designed to eliminate any runoff.
5. An irrigation and landscape plan shall be submitted to the City of Ridgecrest Planning Department, containing low volume irrigation systems and low water use plants. The
irrigation plan shall demonstrate drainage to eliminate water waste. The plan must provide adequate water supply such that all of the water needed can be delivered every other day within the water window of 8:00 PM - 8:00 AM during the months of May, June, Ju1y, August, September and October.
6. Irrigation Drainage. All irrigation water is to remain on property during normal water run cycle, such that there is no runoff from the area being irrigated, specifically onto sidewalks and streets.
SECTION 7. SWIMMING POOLS AND WATER BODIES
A. Public and private swimming pools and water bodies over 300 square feet shall adhere to
the goal of water efficiency as set forth in this Section.
1. New swimming pools shall have a swimming pool cover.
2. New swimming pools shall have a drainage plan.
5

3. Water features including swunmmg pools must have recycling or recirculation features.
SECTION 8. APPROVED PLANT LIST
The Approved Plant List is a recommendation for existing single-family and multi-family dwellings, commercial and/or institutional development. The Approved Plant List is a requirement for new development subject to District Ordinances No. 90 and 91.
SECTION 9. MANDATORY MEASURES
The General Manager of the Indian Wells Valley Water District or designee may provide health and safety exceptions with regards to mandatory measures on a case by case basis.
A. No water user shall waste water. For the purposes of this section enforcement shall be to that degree necessary to prevent the waste of water. "Waste" means the following:
1. Landscape irrigation to an extent which allows water to runoff the area being irrigated, specifically onto sidewalks and streets creating an undue, continuous flow of water.
2. Washing down hard or paved surfaces, including but not limited to sidewalks, walkways, driveways, parking areas, tennis courts, patios or alleys, is prohibited except when necessary to alleviate safety or sanitary hazards, and then only by use of hand-held bucket or similar container, a hand-held hose equipped with a positive selfclosing water shut-off device or a low-volume water broom, high-pressure cleaning machine equipped to recycle any water used. General maintenance cleaning shall be performed by other means such as by using a broom.
3. Knowingly allowing water to leak through water connections, hoses, faucets, pipes, outlets or plumbing fixtures.
4. Limits on washing vehicles: Using water to wash or clean a vehicle, including but not limited to any automobile, truck, van, bus, motorcycle, boat, motor home, or trailer, whether motorized or not is prohibited, except by use of a hand-held bucket or similar container or a hand-held hose equipped with a positive self-closing water shut-off nozzle or device. This subsection does not apply to any commercial car washing facility that recycles water.
6

B. Landscape shall not be irrigated on the surface, except for hand watering and/or the use of a drip irrigation system, between the hours of 8:00 AM - 8:00 PM during the months of May, June, July, August, September and October unless a special pennit is issued to accommodate newly planted material.
c. No water shall be provided to any structure hereafter constructed or remodeled unless the plumbing fixtures to be installed confonn to requirements of law as to flow capacity.
SECTION 10. NOTICE AND PENAL TIES
A. Upon confinnation by the District of any violation of this Ordinance, the District shall provide written notice along with educational materials to the owner of record and/or occupant. The notice shall be dated and shall specify the address, the nature of the violation, list the steps that must be taken to comply with this Ordinance and the name and telephone number of a District staff person whom additional infonnation can be obtained. In addition, the notice shall advise the owner/occupant that tennination of water service will result from continued non-compliance. These provisions are for a first violation within any consecutive twelve month period.
B. If the owner/occupant fails to comply with the requirements of the notice pursuant to Section 10.A above, within a reasonable amount of time, a second violation shall occur and a second notice containing the infonnation specified in Section 10.A above shall be issued. The second violation shall impose a fine in an amount not to exceed Fifty Dollars ($50.00) and will be charged to and billed on the water user's account.
If under the discretion of the District, satisfactory progress is being made on steps to correct the violation, a second notice will not be issued.
c. If the owner/occupant fails to comply with the requirements of the notice pursuant to Section 10.B above, within a reasonable amount of time, a third violation shall occur and a third notice containing the infonnation specified in Section 10.A shall be issued. The third violation shall impose a fine in an amount not to exceed Two Hundred Dollars ($200.00) and will be charged to and billed on the water user's account.
The third notice shall also notify the owner/occupant that water service will be tenninated within thirty (30) calendar days unless the owner/occupant is in compliance with the provisions of this Ordinance. If the owner/occupant fails to comply with the provisions of this Ordinance, the final notice of service tennination shall be posted at the entrance to the dwelling/property which indicates that water service shall be tenninated in forty-eight (48) hours.
7

SECTION 11. EXTENSION
The General Manager shall have the authority to extend any deadlines by a period of time not to exceed an additional 30 days as set forth in this Ordinance.
SECTION 12. APPEAL
1. Should a property owner/occupant determined to be in violation of this Ordinance dispute the findings of staff or if said property owner/occupant believes they have sufficient justification for said violation, said property owner/occupant may request a hearing with an appropriate committee of the Board of Directors. The hearing shall be scheduled within thirty (30) calendar days of the request. The hearing shall be attended by the District's General Manager or a designated representative of the General Manager.
2. The District's General Manager or a designated representative of the General Manager shall mail the property owner/occupant a written decision within ten (10) calendar days of the hearing. If the property owner/occupant is dissatisfied with the outcome of the hearing, the property owner/occupant may request the matter be placed on the agenda of the District's Regularly Scheduled Board Meeting. The property owner/occupant may then make his or her petition to the Board of Directors. The Board's determination shall be final.
SECTION 11. ADMINISTRATIVE EXCEPTIONS
The General Manager of the District or designee may provide administrative exceptions to the landscape and irrigation plan requirements of this Ordinance on a case by case basis.
The General Manager of the District or designee will notify the City Manager of any administrative exemption granted pursuant to this Section prior to the date the exception becomes effective.
The City Manager or designee after consultation with the General Manager of Indian Wells Valley Water District may grant an administrative exception.
SECTION 12. EFFECTIVE DATE
1. The foregoing Ordinance shall become effective upon adoption of same by the Board of Directors of the Indian Wells Valley Water District.
8

SECTION 13. PUBLICATION
1. The Secretary is hereby directed to cause this Ordinance to be published once in full in a newspaper of general circulation, printed, published and circulated within the District.
ADOPTED this 10th day of May, 2010.
ATTEST
Secretary of the Indian Wells Valley Water District Board of Directors
(SEAL)
Vice-President of the Indian Wells Valley Water District Board of Directors
9
ORDINANCE NO. 98
ORDINANCE OF THE BOARD OF DIRECTORS OF THE INDIAN WELLS VALLEY WATER DISTRICT, KERN AND SAN BERNARDINO COUNTIES, CALIFORNIA, RESCINDING ORDINANCE NUMBER 90 IN ITS ENTIRETY; AND REQUIRING WATER EFFICIENT LANDSCAPE AS A CONDITION OF RECEIVING NEW SINGLE FAMILY DWELLING WATER SERVICE.
WHEREAS, the Indian Wells Valley Water District (District) is a County Water District formed and operating under and pursuant to California Water District Law (California Water Code§§ 30000, et seq.); and
WHEREAS, pursuant to Water Code § 31001, the District is authorized to perform all acts necessary to fully carry out its functions; and
WHEREAS, pursuant to Water Code § 31035, the District may undertake a water conservation program to reduce water use and may require as a condition of new service that reasonable water saving devices and water reclamation devices be installed to reduce water use; and
WHEREAS, the Board of Directors of the District find that the water sources available to the District and all the other water users in the Indian Wells Valley is a limited resource and must be conserved to the fullest extent possible.
NOW THEREFORE, BE IT ORDAINED by the Board of Directors of the Indian Wells Valley Water District, as follows:
SECTION 1. PURPOSE
The purpose of this Ordinance is to conserve water by requiring all Front Yards of Single Family Dwellings to at all times comply with the provisions herein as a condition of receiving District water service.
SECTION 2. REPEAL, RESCISION AND AMENDMENT.
Ordinance No. 90 is hereby rescinded in its entirety.
SECTION 3. DEFINITIONS
A. "Approved Plant List" means the list formulated by staff and approved and/or modified by the District Board of Directors.
1

B. "Front Yard" means the Landscape Area that is between the Single Family Dwelling and any street or road, including any Landscape Area between the sidewalk and the street/road that is the responsibility of the property owner.
C. "Landscape Area" means all non-hardscape or non-building area located on the Front Yard.
D. "Low Volume Irrigation System" means appropriately designed irrigation systems that utilize low volume watering devices appropriate to the climatic and site factors including microsprinkler heads, drip emitters, and bubbler emitters.
E. "Master Shutoff Valve" is an automatic valve installed at the irrigation supply point which controls water flow into the irrigation system.
F. "Runoff' means water from irrigation that leaves the Landscape Area and flows onto sidewalks, streets, or roads.
G. "Single Family Dwelling" means a newly constructed single family residential dwelling or existing single family residential dwelling whose owner/occupant is making application to the District for new water service on a property where District water service did not previously exist.
H. "Turf'' means a surface layer of earth containing mowed or unmowed living grass with its roots.
SECTION 4. RESTRICTIONS ON LANDSCAPE
A. There shall be no Turf allowed in the Landscape Area of the Front Yard.
B. Only the plants from the Approved Plant List, on file and maintained by the District, shall be used within the Landscape Area of the Front Yard.
C. The irrigation system in the Landscape Area of the Front Yard must be a Low Volume Irrigation System.
D. All irrigation devices must use high efficiency sprinkler heads.
E. All irrigation systems must have pressure regulators and master shut-off valves.
F. The Landscape Area shall be designed to eliminate any runoff.
2

SECTION 5. NOTICE
A. District shall record a Covenant of Landscape Restrictions on each Single Family Dwelling that is subject to this Ordinance with the Kem County Recorder as notice to each and every owner of said Single Family Dwelling of the provisions of this Ordinance.
B. Upon confirmation by the District of any violation of this Ordinance, the District shall provide written notice along with educational materials to the owner of record of the Single Family Dwelling and the occupant of the Single Family Dwelling. The notice shall be dated and shall specify the address of the Single Family Dwelling, the nature of the violation, list the steps that must be taken to comply with this Ordinance and the name and telephone number of a District staff person from whom additional information can be obtained. In addition, the notice shall advise the owner/occupant that termination of water service will result from continued noncompliance. These provisions are for a first violation within any consecutive twelve month period.
C. If the owner/occupant fails to comply with the requirements of the notice pursuant to Section 5(A) above, within thirty (30) calendar days, a second violation shall occur and a second notice containing the information specified in Section 5(B) above shall be issued. The second violation shall impose a fine in an amount not to exceed Fifty Dollars ($50.00) and will be charged to and billed on the water user's account.
If, under the discretion of the District, satisfactory progress is being made on steps to correct the violation, a second notice will not be issued.
D. If the owner/occupant fails to comply with the requirements of the notice pursuant to Section 5(C) above, within thirty (30) calendar days, a third violation shall occur and a third notice containing the information specified in Section 5(B) above shall be issued. The third violation shall impose a fine in an amount not to exceed Two Hundred Dollars ($200.00) and will be charged to and billed on the water user's account.
The third notice shall also notify the owner/occupant that water service will be terminated in thirty (30) calendar days unless the Single Family Dwelling is in compliance with the provisions of this Ordinance. If the owner/occupant fails to comply with the provisions of this Ordinance, the final notice of service termination shall be posted at the entrance to the Single Family Dwelling which indicates that water service shall be terminated in forty-eight ( 48) hours.
SECTION 6. EXTENSION
A. The General Manager shall have the authority to extend any deadlines by a period of time not to exceed an additional 30 days as set forth in this Ordinance.
3

SECTION 7. APPEAL
A. Should a property owner/occupant of a Single Family Dwelling determined to be in violation of this Ordinance dispute the findings of staff, said property owner/occupant may request a hearing with an appropriate committee of the Board of Directors. The hearing shall be scheduled within thirty (30) calendar days of the request. The hearing shall be attended by the District's General Manager or a designated representative of the General Manager.
B. The District's General Manager or a designated representative of the General Manager shall mail the property owner/occupant a written decision within ten (10) calendar days of the hearing. If the property owner/occupant is dissatisfied with the outcome of the hearing, the property owner/occupant may request the matter be placed on the agenda of the District's Regularly Scheduled Board Meeting. The property owner may then make his or her petition to the Board of Directors. The Board's determination shall be final.
SECTION 8. EFFECTIVE DATE
A. The foregoing Ordinance shall become effective on December 1, 2015 upon adoption of same by the Board of Directors of the District.
SECTION 9. PUBLICATION
A. The Secretary is hereby directed to cause this Ordinance to be published once in full in a newspaper of general circulation, printed, published and circulated within the District.
ADOPTED this 14th day of December, 2015.
ATTEST
Secretary of the Indi Water district Board
(SEAL)
4
President' of the Indian Wells Valley Water District Board of Directors

ORDINANCE NO. 99
ORDINANCE OF THE BOARD OF DIRECTORS OF THE INDIAN WELLS VALLEY WATER DISTRICT, KERN AND SAN BERNARDINO COUNTIES, CALIFORNIA, RESCINDING ORDINANCE NUMBER 91 IN ITS ENTIRETY; AND REQUIRING WATER EFFICIENT LANDSCAPE AS A CONDITION OF RECEIVING NEW MULTIFAMILY DWELLINGS, COMMERCIAL AND/OR INSTITUTIONAL WATER SERVICE.
WHEREAS, the Indian Wells Valley Water District (District) is a County Water District formed and operating under and pursuant to California Water District Law (California Water Code §§ 30000, et seq.); and
WHEREAS, pursuant to Water Code § 31001, the District is authorized to perform all acts necessary to fully carry out its functions; and
WHEREAS, pursuant to Water Code § 31035, the District may undertake a water conservation program to reduce water use and may require as a condition of new service that reasonable water saving devices and water reclamation devices be installed to reduce water use; and
WHEREAS, the Board of Directors of the District find that the water sources available to the District and all the other water users in the Indian Wells Valley is a limited resource and must be conserved to the fullest extent possible.
NOW THEREFORE, BE IT ORDAINED by the Board of Directors of the Indian Wells Valley Water District, as follows:
SECTION 1. PURPOSE
The purpose of this Ordinance is to conserve water by requiring all Landscape Areas of Multi-Family Dwellings, Commercial and/or Institutional buildings/facilities to at all times comply with the provisions herein as a condition of receiving District water service.
SECTION 2. REPEAL, RESCISION AND AMENDMENT.
Ordinance No. 91 is hereby rescinded in its entirety.
SECTION 3. DEFINITIONS
A. "Approved Plant List" means the list formulated by staff and approved and/or modified by the District Board of Directors.
1

B. "Landscape Area" means all non-hardscape or non-building area.
C. "Low Volume Irrigation System" means appropriately designed irrigation systems that utilize low volume watering devices appropriate to the climatic and site factors including microsprinkler heads, drip emitters, and bubbler emitters.
D. "Master Shut-off Valve" is an automatic valve installed at the irrigation supply point which controls water flow into the irrigation system. When this valve is closed water will not be supplied to the irrigation system.
E. "Multi-Family Dwellings, Commercial and/or Institutional" means a newly constructed or existing multi-family residential dwelling, commercial and/or institutional building/facility whose owner/occupant is making application to the District for new water service on a property where District water service did not previously exist (collectively referred to herein as "Multi-Family Dwelling").
F. "Plant Factor" or "plant water use factor" is a factor, when multiplied by evapotranspiration (ETo), estimates the amount of water needed by plants.
G. "Runoff' means water from irrigation that leaves the Landscape Area and flows onto sidewalks, streets, or roads.
F. "Turf" means a surface layer of earth containing mowed or unmowed living grass with its roots.
SECTION 4. RESTRICTIONS ON LANDSCAPE
A. Turf and/or any plants not on the Approved List are limited up to 50% of the Landscape Area.
B. High water use plants, characterized by a plant factor of 0.7 to 1.0, are prohibited in street medians.
C. Only the plants from the Approved Plant List, on file and maintained by the District, shall be used within the remaining Landscape Area.
D. The irrigation system in the remaining Landscape Area must be a Low Volume Irrigation System.
E. All irrigation devices must use high efficiency sprinkler heads.
F. All irrigation systems must have pressure regulators and master shut-off valves.
G. All of the Landscape Area shall be designed to eliminate any runoff.
2

H. Areas less than 10 feet wide must be irrigated with subsurface drip or other technology that produces no over spray or runoff.
SECTION 5. NOTICE
A. District shall record a Covenant of Landscape Restrictions on each Multi-Family Dwelling that is subject to this Ordinance with the Kem County Recorder as notice to each and every owner of said Multi-Family Dwelling of the provisions of this Ordinance.
B. Upon confirmation by the District of any violation of this Ordinance, the District shall provide written notice along with educational materials to the owner of record of the MultiFamily Dwelling and the occupant of the Multi-Family Dwelling. The notice shall be dated and shall specify the address of the Multi-Family Dwelling, the nature of the violation, list the steps that must be taken to comply with this Ordinance and the name and telephone number of a District staff person from whom additional information can be obtained. In addition, the notice shall advise the owner/occupant that termination of water service will result from continued noncompliance. These provisions are for a first violation within any consecutive twelve month period.
C. If the owner/occupant fails to comply with the requirements of the notice pursuant to Section 5(A) above, within thirty (30) calendar days, a second violation shall occur and a second notice containing the information specified in Section 5(B) above shall be issued. The second violation shall impose a fine in an amount not to exceed Fifty Dollars ($50.00) and will be charged to and billed on the water user's account.
If, under the discretion of the District, satisfactory progress is being made on steps to correct the violation, a second notice will not be issued.
D. If the owner/occupant fails to comply with the requirements of the notice pursuant to Section 5(C) above, within thirty (30) calendar days, a third violation shall occur and a third notice containing the information specified in Section 5(B) above shall be issued. The third violation shall impose a fine in an amount not to exceed Two Hundred Dollars ($200.00) and will be charged to and billed on the water user's account.
The third notice shall also notify the owner/occupant that water service will be terminated in thirty (30) calendar days unless the Multi-Family Dwelling is in compliance with the provisions of this Ordinance. If the owner/occupant fails to comply with the provisions of this Ordinance, the final notice of service termination shall be posted at the entrance to the Multi-Family Dwelling which indicates that water service shall be terminated in forty-eight ( 48) hours.
3

j
SECTION 6. EXTENSION
A. The General Manager shall have the authority to extend any deadlines by a period of time not to exceed an additional 30 days as set forth in this Ordinance.
SECTION 7. APPEAL
A. Should a property owner/occupant of a Multi-Family Dwelling determined to be in violation of this Ordinance dispute the findings of staff, said property owner/occupant may request a hearing with an appropriate committee of the Board of Directors. The hearing shall be scheduled within thirty (30) calendar days of the request. The hearing shall be attended by the District's General Manager or a designated representative of the General Manager.
B. The District's General Manager or a designated representative of the General Manager shall mail the property owner/occupant a written decision within ten (10) calendar days of the hearing. If the property owner/occupant is dissatisfied with the outcome of the hearing, the property owner/occupant may request the matter be placed on the agenda of the District's Regularly Scheduled Board Meeting. The property owner may then make his or her petition to the Board of Directors. The Board's determination shall be final.
SECTION 8. EFFECTIVE DATE
A. The foregoing Ordinance shall become effective on December 1, 2015 upon adoption of same by the Board of Directors of the District.
SECTION 9. PUBLICATION
A. The Secretary is hereby directed to cause this Ordinance to be published once in full in a newspaper of general circulation, printed, published and circulated within the District.
ADOPTED this 14th day of December, 2015.
ATTEST
(SEAL)
4
Presid~µt'bf the Indian Wells Valley Water District Board of Directors

ORDINANCE NO. 100
ORDINANCE OF THE BOARD OF DIRECTORS OF THE INDIAN WELLS VALLEY WATER DISTRICT, KERN AND SAN BERNARDINO COUNTIES, CALIFORNIA, RESCINDING ORDINANCE NUMBER 97 IN ITS ENTIRETY AND ADOPTING EMERGENCY WATER CONSERVATION MANDATORY RESTRICTIONS
WHEREAS, the Indian Wells Valley Water District (District) is a County Water District formed and operating under and pursuant to California Water District Law (California Water Code§§ 30000 et seq.); and
WHEREAS, pursuant to Water Code § 31001, the District is authorized to perform all acts necessary to fully carry out its functions; and
WHEREAS, pursuant to Water Code § 31026, the District may restrict the use of district water during any emergency caused by drought, or other threatened or existing water shortage, and to prohibit the wastage of district water or the use of district water during such periods, for any purpose other than household uses or such other restricted uses as may be determined to be necessary by the district and may prohibit use of such water during such periods for specific uses which the district may from time to time find to be nonessential;
WHEREAS, the Board of Directors of the District find that the water sources available to the District and all the other water users in the Indian Wells Valley is a limited resource and must be conserved to the fullest extent possible;
WHEREAS, the State Water Resources Control Board adopted emergency regulations to safeguard the state's remaining water supplies by imposing mandatory water restrictions more stringent than those of the District's Ordinance No. 93;
WHEREAS, this Ordinance will supersede Ordinance No. 93 until rescinded by the District's Board of Directors.
NOW THEREFORE, BE IT ORDAINED by the Board of Directors of the Indian Wells Valley Water District, as follows:
SECTION 1. TITLE
This Section shall be known and may be cited as the Emergency Water Conservation Regulation.
1

SECTION 2. PURPOSE AND INTENT
A. Establish a drought water conservation plan to reduce water consumption in residential, commercial, public and industrial landscape, and the hotel/motel, and restaurant industry; and
B. implement a more efficient use of water.
SECTION 3. REPEAL, RECISSION AND AMENDMENT
Ordinance 97 is hereby rescinded in its entirety.
SECTION 4. DEFINITIONS
Drip Irrigation System shall mean the use of a drip emitter system that permits no more than 5 gallons of water per hour from each emitter.
Hand Watering shall mean the actual watering of landscape by a person who remains present and holds onto and directs the watering device.
Irrigation System shall mean an irrigation system that utilizes water sprinklers, emitters and/or bubblers.
Recirculation shall mean the reuse of water in a pool or pond in such a way that the water would enter from one point and be reused in another portion in such a way that the water is not wasted or lost by reuse in the pool or pond.
Runoff shall mean water which is not absorbed by the soil or landscape to which it is applied and flows from the landscape area. For example, runoff may result from water that is applied at too great a rate (application rate exceeds infiltration rate) or when there is a slope.
Landscape Area means all non-hardscape or non-building area on the property.
Turf shall mean a surface layer of earth containing mowed or un-mowed grass with its roots.
2

SECTION 5. MANDATORY RESTRICTIONS
A. No water user shall waste water. For the purposes of this section "waste" includes the following and is prohibited:
1. Landscape irrigation to an extent which allows water to runoff the Landscape Area being irrigated, specifically onto sidewalks and streets creating an undue, continuous flow of water.
2. Washing down hard or paved surfaces, including but not limited to sidewalks, walkways, driveways, parking areas, tennis courts, patios or alleys, is prohibited except when necessary to alleviate safety or sanitary hazards, and then only by use of hand~held bucket or similar container, a hand-held hose equipped with a positive selfclosing water shut-off device or a low-volume water broom, high-pressure cleaning machine equipped to recycle any water used. General maintenance cleaning shall be performed by other means such as by using a broom.
3. Knowingly allowing water to leak through water connections, hoses, faucets, pipes, outlets or plumbing fixtures.
4. Limits on washing vehicles: Using water to wash or clean a vehicle, including but not limited to any automobile, truck, van, bus, motorcycle, boat, motor home, or trailer, whether motorized or not is prohibited, except by use of a hand-held bucket or similar container or a hand-held hose equipped with a positive self-closing water shut-off nozzle or device. This subsection does not apply to any commercial car washing facility that recycles water.
B. During the months of April, May, June, July, August, September and October, all customers of the District (residential/commercial/public/industrial) with even-numbered addresses may only operate irrigation systems on Tuesday, Thursday and Saturday and odd numbered addresses may only operate irrigation systems on Wednesday, Friday and Sunday. Irrigation systems may not be operated on Mondays. Landscape Areas shall not be irrigated on the surface, except for hand watering and/or the use of a drip irrigation system, between the hours of 8:00 AM - 8:00 PM, unless a special permit is issued to accommodate newly planted material.
During the months of November, December, January and February, all customers of the District (residential/commercial/public/industrial) with even-numbered addresses may only operate irrigation systems on Saturday and odd numbered addresses may only operate irrigation systems on Sunday. Irrigation systems may not be operated on
3

Mondays, Tuesdays, Wednesdays, Thursdays or Fridays. There will be no daytime
watering restriction during these months.
C. Turf or ornamental landscapes shall not be irrigated during the 48 hours following
measurable precipitation.
D. Restaurants and other food service establishments shall only serve water to customers on
their request.
E. Operators of hotels and motels shall provide guests with the option of choosing not to have towels and linens laundered daily and prominently display notice ofthis option.
F. Operating a fountain or decorative water feature is prohibited, unless the water is part of a
recirculating system.
G. No water service shall be provided to any structure hereafter constructed or remodeled
unless the plumbing fixtures to be installed conform to requirements of law as to flow
capacity.
The General Manager of the Indian Wells Valley Water District or designee may provide health and safety exceptions with regards to mandatory measures on a case by case basis.
SECTION 6. NOTICE AND PENAL TIES
A. Upon confirmation by the District of any violation of this Ordinance, the District shall provide written notice (warning) to the owner of record, and/or occupant and/or property manager (owner/occupant/manager). The notice shall be dated and shall specify the address, the nature of the violation, list the steps that must be taken to comply with this Ordinance and the name and telephone number of a District staff person from whom
additional information can be obtained. In addition, the notice shall advise the owner/occupant/manager that termination of water service may result from continued non-compliance. These provisions are for a first violation of the provisions of this
Ordinance 100 by the owner/occupant/manager.
1. Once a warning has been issued to any owner/occupant/manager, they shall be considered duly informed of the District's Mandatory Restrictions pursuant to this
Ordinance 100 and any future violations shall be subject to Sections 6.B through E below.
4

B. If the owner/occupant/manager fails to comply with the requirements of the notice given pursuant to Section 6.A above, within a reasonable amount of time but not less than two weeks, a second violation shall occur and the District shall provide a second written notice to the owner/occupant/manager. The notice shall be dated and shall specify the address, the nature of the violation, list the steps that must be taken to comply with this Ordinance, how to obtain educational water conservation materials electronically, and the name and telephone number of a District staff person that can provide additional information including hard copies of educational water conservation materials. In addition, the notice shall advise the owner/occupant/manager that a monetary fine in the amount of Fifty Dollars ($50.00) shall be imposed for a third violation of this Ordinance and that termination of water service may result from continued non-compliance.
C. If the owner/occupant/manager fails to comply with the requirements of the notice given pursuant to Section 6.B above, within a reasonable amount of time but not less than two weeks, a third violation shall occur and a third notice containing the date, the address, the nature of the violation and the steps that must be taken to comply with this Ordinance shall be issued. The third notice shall further advise the owner/occupant/manager that a fine in the amount of Two Hundred Dollars ($200.00) shall be imposed for fourth violation of this Ordinance and that termination of water service may result from continued non-compliance. The third violation shall impose a Fifty Dollar ($50.00) fine charged to and billed on the water user's account. This fine shall be subject to the District's Delinquent Charges section as described in the current Water Sales and Service Policy Manual.
If, in the sole discretion of the District, satisfactory progress is being made on steps to correct the violation, a third notice will not be issued.
D. If the owner/occupant/manager fails to comply with the requirements of the notice given pursuant to Section 6.C above, within a reasonable amount of time but not less than two weeks, a fourth violation shall occur and a fourth notice containing the date, the address, the nature of the violation and the steps that must be taken to comply with this Ordinance shall be issued. The fourth violation shall impose a Two Hundred Dollar ($200.00) fine charged to and billed on the water user's account on a monthly basis until the violation(s) ceases. This fine shall be subject to the District's Delinquent Charges section as described in the current Water Sales and Service Policy Manual.
E. If the owner/occupant/manager fails to comply with the requirements of the notice given pursuant to Section 6.D above resulting in repeated and significant water loss as determined by the District, the District may terminate water service within ten (10) calendar days unless the owner/occupant/manager is in compliance with the provisions of
5

this Ordinance. If the owner/occupant/manager fails to comply with the provisions of this Ordinance, the final notice of service termination, subject to the District's current 48-Hour Notice of Termination charge, shall be posted at the entrance to the dwelling/property stating that water service shall be terminated in forty-eight ( 48) hours
Service may only be restored if the violation has been corrected. Owner/occupant/manager will be required to pay all fines and penalties previously assessed pursuant to this Ordinance plus a Service Reinstatement Charge per the Customer Service Charges section as described in the current Water Sales and Service Policy Manual.
SECTION 7. EXTENSION
The General Manager shall have the authority to extend any deadlines by a period of time not to exceed an additional 30 days as set forth in this Ordinance.
SECTION 8. APPEAL
1. Should an owner/occupant/manager determined to be in violation of this Ordinance dispute the findings of staff or if said owner/occupant/manager believes they have sufficient justification for said violation, said owner/occupant/manager may request a hearing with an appropriate committee of the Board of Directors. The hearing shall be scheduled within thirty (30) calendar days of the request. The hearing shall be attended by the District's General Manager or a designated representative of the General Manager.
2. The District's General Manager or a designated representative of the General Manager shall mail the owner/occupant/manager a written decision within ten (10) calendar days of the hearing. If the owner/occupant/manager is dissatisfied with the outcome of the hearing, the owner/occupant/manager may request the matter be placed on the agenda of the District's Regularly Scheduled Board Meeting. The owner/occupant/manager may then make his or her petition to the Board of Directors. The Board's determination shall be final.
SECTION 9. ADMINISTRATIVE EXCEPTIONS
The General Manager of the District or designee may provide administrative exceptions to the landscape and irrigation plan requirements of this Ordinance on a case by case basis.
6

The General Manager of the District or designee will notify the City Manager of any administrative exemption granted pursuant to this Section prior to the date the exception becomes effective.
The City Manager or designee after consultation with and approval from the General Manager of Indian Wells Valley Water District may grant an administrative exception.
SECTION 10. EFFECTIVE DATE
1. The foregoing Ordinance shall become effective upon adoption of same by the Board of Directors of the Indian Wells Valley Water District.
SECTION 11. PUBLICATION
1. The Secretary is hereby directed to cause this Ordinance to be published once in full in a newspaper of general circulation, printed, published and circulated within the District within ten (10) days after adoption.
All the foregoing being on the motion of Vice-President Brown seconded by Director Corlett, and authorized by the following vote, namely:
AYES:
NOES:
ABSENT:
ABSTAIN:
President Cortichiato Vice-President Brown Director Cordell Director Corlett
Director Griffin
None.
None.
I HEREBY CERTIFY that all the foregoing ordinance is the ordinance of the Indian Wells Valley Water District as duly passed and adopted by said Board of Directors at a legally convened meeting held on the 11th day of January, 2016.
7

WITNESS my hand and the official seal of said Board of Directors this 11th day of January, 2016.
~~ f the Indian Wells Valley Water District
ATIEST j iWJlQ
(SEAL)
8

ORDINANCE NO. 103
ORDINANCE OF THE BOARD OF DIRECTORS OF THE INDIAN WELLS VALLEY WATER DISTRICT, KERN AND SAN BERNARDINO COUNTIES, CALIFORNIA, RESCINDING ORDINANCE NUMBER 100 IN ITS ENTIRETY AND ADOPTING EMERGENCY WATER CONSERVATION MANDATORY RESTRICTIONS
WHEREAS, the Indian Wells Valley Water District (District) is a County Water District formed and operating under and pursuant to California Water District Law (California Water Code§§ 30000 et seq.); and
WHEREAS, pursuant to Water Code § 31001, the District is authorized to perform all acts necessary to fully carry out its functions; and
WHEREAS, pursuant to Water Code § 31026, the District may restrict the use of district water during any emergency caused by drought, or other threatened or existing water shortage, and to prohibit the wastage of district water or the use of district water during such periods, for any purpose other than household uses or such other restricted uses as may be determined to be necessary by the district and may prohibit use of such water during such periods for specific uses which the district may from time to time find to be nonessential;
WHEREAS, the Board of Directors of the District find that the water sources available to the District and all the other water users in the Indian Wells Valley is a limited resource and must be conserved to the fullest extent possible;
WHEREAS, the State Water Resources Control Board adopted emergency regulations to safeguard the state's remaining water supplies by imposing mandatory water restrictions more stringent than those of the District's then current Ordinance No. 93 and required the Board of Directors of the District to adopt Ordinance No. 100 on January 11, 2016;
WHEREAS, the Board of Directors of the District have determined that restricting landscape irrigation to one day a week can be detrimental to not only turf, trees and shrubs, but also the aesthetic qualify of the Ridgecrest community; and
WHEREAS, this Ordinance will supersede Ordinance No. 100 until rescinded by the District's Board of Directors.
1

NOW THEREFORE, BE IT ORDAINED by the Board of Directors of the Indian
Wells Valley Water District, as follows:
SECTION 1. TITLE
This Section shall be known and may be cited as the Emergency Water Conservation Regulation.
SECTION 2. PURPOSE AND INTENT
A. Establish a drought water conservation plan to reduce water consumption in residential, commercial, public and industrial landscape, and the hotel/motel, and restaurant industry;
and
B. implement a more efficient use of water.
SECTION 3. REPEAL, RECISSION AND AMENDMENT
Ordinance No. 100 is hereby rescinded in its entirety.
SECTION 4. DEFINITIONS
Drip Irrigation System shall mean the use of a drip emitter system that permits no more
than 5 gallons of water per hour from each emitter.
Hand Watering shall mean the actual watering of landscape by a person who remains
present and holds onto and directs the watering device.
Irrigation System shall mean an irrigation system that utilizes water sprinklers, emitters
and/or bubblers.
Recirculation shall mean the reuse of water in a pool or pond in such a way that the water
would enter from one point and be reused in another portion in such a way that the water is not wasted or lost by reuse in the pool or pond.
Runoff shall mean water which is not absorbed by the soil or landscape to which it is applied and flows from the landscape area. For example, runoff may result from water
that is applied at too great a rate (application rate exceeds infiltration rate) or when there
is a slope.
Landscape Area means all non-hardscape or non-building area on the property. 2

I
l .
Turf shall mean a surface layer of earth containing mowed or un-mowed grass with its roots.
SECTION 5. MANDATORY RESTRICTIONS
A. No water user shall waste water. For the purposes of this section "waste" includes the following and is prohibited:
1. Landscape irrigation to an extent which allows water to runoff the Landscape Area being irrigated, specifically onto sidewalks and streets creating an undue, continuous flow of water.
2. Washing down hard or paved surfaces, including but not limited to sidewalks, walkways, driveways, parking areas, tennis courts, patios or alleys, is prohibited except when necessary to alleviate safety or sanitary hazards, and then only by use of hand-held bucket or similar container, a hand-held hose equipped with a positive selfclosing water shut-off device or a low-volume water broom, high-pressure cleaning machine equipped to recycle any water used. General maintenance cleaning shall be performed by other means such as by using a broom.
3. Knowingly allowing water to leak through water connections, hoses, faucets, pipes, outlets or plumbing fixtures.
4. Limits on washing vehicles: Using water to wash or clean a vehicle, including but not limited to any automobile, truck, van, bus, motorcycle, boat, motor home, or trailer, whether motorized or not is prohibited, except by use of a hand-held bucket or similar container or a hand-held hose equipped with a positive self-closing water shut-off nozzle or device. This subsection does not apply to any commercial car washing facility that recycles water.
B. During the months of April, May, June, July, August, September and October, all customers of the District (residential/commercial/public/industrial) with even-numbered addresses may only operate irrigation systems on Tuesday, Thursday and Saturday and odd numbered addresses may only operate irrigation systems on Wednesday, Friday and Sunday. Irrigation systems may not be operated on Mondays. Landscape Areas shall not be irrigated on the surface, except for hand watering and/or the use of a drip irrigation system, between the hours of 8:00 AM - 8:00 PM, unless a special permit is issued to accommodate newly planted material.
3

During the months of November, December, January and February, all customers of the District (residential/commercial/public/industrial) with even-numbered addresses may only operate irrigation systems on Tuesday, Thursday and Saturday and odd numbered addresses may only operate irrigation systems on Wednesday, Friday and Sunday. Irrigation systems may not be operated on Mondays. Landscape Areas may be irrigated by hand watering and/or the use of a drip irrigation system at any time. There will be no daytime watering restriction during these months.
C. Turf or ornamental landscapes shall not be irrigated during the 48 hours following measurable precipitation.
D. Restaurants and other food service establishments shall only serve water to customers on their request.
E. Operators of hotels and motels shall provide guests with the option of choosing not to have towels and linens laundered daily and prominently display notice of this option.
F. Operating a fountain or decorative water feature is prohibited, unless the water is part of a recirculating system.
G. No water service shall be provided to any structure hereafter constructed or remodeled unless the plumbing fixtures to be installed conform to requirements of law as to flow capacity.
The General Manager of the Indian Wells Valley Water District or designee may provide health and safety exceptions with regards to mandatory measures on a case by case basis.
SECTION 6. NOTICE AND PENAL TIES
A. Upon confirmation by the District of any violation of this Ordinance, the District shall provide written notice (warning) to the owner of record, and/or occupant and/or property manager (owner/occupant/manager). The notice shall be dated and shall specify the address, the nature of the violation, list the steps that must be taken to comply with this Ordinance and the name and telephone number of a District staff person from whom additional information can be obtained. In addition, the notice shall advise the owner/occupant/manager that termination of water service may result from continued non-compliance. These provisions are for a first violation of the provisions of this Ordinance No. 103 by the owner/occupant/manager.
4

1. Once a warning has been issued to any owner/occupant/manager, they shall be considered duly informed of the District's Mandatory Restrictions pursuant to this Ordinance No. 103 and any future violations shall be subject to Sections 6.B through E below.
B. If the owner/occupant/manager fails to comply with the requirements of the notice given pursuant to Section 6.A above, within a reasonable amount of time but not less than two weeks, a second violation shall occur and the District shall provide a second written notice to the owner/occupant/manager. The notice shall be dated and shall specify the address, the nature of the violation, list the steps that must be taken to comply with this Ordinance, how to obtain educational water conservation materials electronically, and the name and telephone number of a District staff person that can provide additional information including hard copies of educational water conservation materials. In addition, the notice shall advise the owner/occupant/manager that a monetary fine in the amount of Fifty Dollars ($50.00) shall be imposed for a third violation of this Ordinance and that termination of water service may result from continued non-compliance.
C. If the owner/occupant/manager fails to comply with the requirements of the notice given pursuant to Section 6.B above, within a reasonable amount of time but not less than two weeks, a third violation shall occur and a third notice containing the date, the address, the nature of the violation and the steps that must be taken to comply with this Ordinance shall be issued. The third notice shall further advise the owner/occupant/manager that a fine in the amount of Two Hundred Dollars ($200.00) shall be imposed for fourth violation of this Ordinance and that termination of water service may result from continued non-compliance. The third violation shall impose a Fifty Dollar ($50.00) fine charged to and billed on the water user's account. This fine shall be subject to the District's Delinquent Charges section as described in the current Water Sales and Service Policy Manual.
If, in the sole discretion of the District, satisfactory progress is being made on steps to correct the violation, a third notice will not be issued.
D. If the owner/occupant/manager fails to comply with the requirements of the notice given pursuant to Section 6.C above, within a reasonable amount of time but not less than two weeks, a fourth violation shall occur and a fourth notice containing the date, the address, the nature of the violation and the steps that must be taken to comply with this Ordinance shall be issued. The fourth violation shall impose a Two Hundred Dollar ($200.00) fine charged to and billed on the water user's account on a monthly basis until the violation(s) ceases. This fine shall be subject to the District's Delinquent Charges section as described in the current Water Sales and Service Policy Manual.
5

E. If the owner/occupant/manager fails to comply with the requirements of the notice given pursuant to Section 6.D above resulting in repeated and significant water loss as determined by the District, the District may terminate water service within ten (10) calendar days unless the owner/occupant/manager is in compliance with the provisions of this Ordinance. If the owner/occupant/manager fails to comply with the provisions of this Ordinance, the final notice of service termination, subject to the District's current 48-Hour Notice of Termination charge, shall be posted at the entrance to the dwelling/property stating that water service shall be terminated in forty-eight ( 48) hours
Service may only be restored if the violation has been corrected. Owner/occupant/manager will be required to pay all fines and penalties previously assessed pursuant to this Ordinance plus a Service Reinstatement Charge per the Customer Service Charges section as described in the current Water Sales and Service Policy Manual.
SECTION 7. EXTENSION
The General Manager shall have the authority to extend any deadlines by a period of time not to exceed an additional 30 days as set forth in this Ordinance.
SECTION 8. APPEAL
1. Should an owner/occupant/manager determined to be in violation of this Ordinance dispute the findings of staff or if said owner/occupant/manager believes they have sufficient justification for said violation, said owner/occupant/manager may request a hearing with an appropriate committee of the Board of Directors. The hearing shall be scheduled within thirty (30) calendar days of the request. The hearing shall be attended by the District's General Manager or a designated representative of the General Manager.
2. The District's General Manager or a designated representative of the General Manager shall mail the owner/occupant/manager a written decision within ten (10) calendar days of the hearing. If the owner/occupant/manager is dissatisfied with the outcome of the hearing, the owner/occupant/manager may request the matter be placed on the agenda of the District's Regularly Scheduled Board Meeting. The owner/occupant/manager may then make his or her petition to the Board of Directors. The Board's determination shall be final.
6

SECTION 9. ADMINISTRATIVE EXCEPTIONS
The General Manager of the District or designee may provide administrative exceptions to the landscape and irrigation plan requirements of this Ordinance on a case by case basis.
The General Manager of the District or designee will notify the City Manager of any administrative exemption granted pursuant to this Section prior to the date the exception becomes effective.
The City Manager or designee after consultation with and approval from the General Manager of Indian Wells Valley Water District may grant an administrative exception.
SECTION 10. EFFECTIVE DATE
1. The foregoing Ordinance shall become effective upon adoption of same by the Board of Directors of the Indian Wells Valley Water District.
SECTION 11. PUBLICATION
1. The Secretary is hereby directed to cause this Ordinance to be published once in full in a newspaper of general circulation, printed, published and circulated within the District within ten (10) days after adoption.
All the foregoing being on the motion of Director Kicinski seconded by Director Cortichiato, and authorized by the following vote, namely:
AYES:
NOES:
ABSENT:
ABSTAIN:
President Brown Vice-President Cordell Director Cortichiato Director Kicinski
Director Griffin
None.
None.
I HEREBY CERTIFY that all the foregoing ordinance is the ordinance of the Indian Wells Valley Water District as duly passed and adopted by said Board of Directors at a legally convened meeting held on the 11th day of September, 2017.
7

WITNESS my hand and the official seal of said Board of Directors this 11th day of September, 2017.
ATTEST
District Board of Dire
President of the Indian Wells Valley Water District Board of Directors
(SEAL)
8
STATE OF CALIFORNIA ) COUNTIES OF KERN ) AND SAN BERNARDINO)
I, DONALD M. ZDEBA, Secretary of the Board of Directors of the Indian Wells Valley Water District, DO HEREBY CERTIFY, as follows:
The foregoing Ordinance is a full, true and correct copy of Ordinance No. 103, duly adopted at a Regular Meeting of the Board of Directors of said District, duly and held at the regular meeting place of the Board on the 11th day of September, 2017, for which all of the members of said Board of Directors had due notice and at which a majority of the Board of Directors were present. All the foregoing being on the motion of Director Kicinski seconded by Director Cortichiato, and authorized by the following vote, namely:
AYES:
NOES:
ABSENT:
ABSTAIN:
President Brown Vice-President Cordell Director Cortichiato Director Kicinski
Director Griffin
None.
None.
I have carefully compared the foregoing with the original Minutes of said meeting on file and of record in my office, and the foregoing is a full, true and correct copy of the original ordinance adopted at said Hearing and entered into said Minutes.
Ordinance No. 103 has not been amended, modified or rescinded since the date of its adoption on September 11, 2017, and the same is now in full force and effect.
WITNESS my hand and the official seal of said Board of Directors this 11th day of September, 2017.
'resident of the Indian Wells Valley Water District and of the Board of Directors thereof.
Secretary of the Indi and of the Board of D
9
(SEAL)

APPENDIX 5
COUNTY OF KERN MULTI-JURISDICTION 2020 HAZARD MITIGATION PLAN

U.S. Department of Homeland Security FEMA Region IX 1111 Broadway, Suite 1200 Oakland, CA 94607-4052
www.fema.gov
April 9, 2021
Wendy Benson Administrative Coordinator Kern County Fire Department Office of Emergency Services 2601 Panorama Drive, Building B Bakersfield, CA 93306 Dear Ms. Benson: The County of Kern Multi-Jurisdictional Hazard Mitigation Plan 2020 Update was officially adopted by Kern County on February 11, 2021 and submitted for review and approved to the U.S. Department of Homeland Security’s Federal Emergency Management Agency (FEMA). The review is complete, and FEMA finds the plan to be in conformance with the Code of Federal Regulations, Title 44, Part 201, Section 6 (44 C.F.R. 201.6). A list of the status of participating jurisdictions is enclosed with this letter. This plan approval ensures Kern County’s continued eligibility for funding under FEMA’s Hazard Mitigation Assistance programs, including the Hazard Mitigation Grant Program (HMGP), the Building Resilient Infrastructure and Communities program (BRIC), and the Flood Mitigation Assistance (FMA) program. All requests for funding are evaluated individually according to eligibility and other program requirements. Approved hazard mitigation plans may also be eligible for points under the National Flood Insurance Program’s Community Rating System (CRS). FEMA’s approval is for a period of five years, effective the date of this letter. Prior to April 9, 2026, Kern County and all participating jurisdictions must review, revise, and submit their plan to FEMA for approval to maintain eligibility for grant funding. The enclosed plan review tool provides additional recommendations to incorporate into future plan updates. If you have any questions regarding the planning or review processes, please contact the FEMA Region IX Hazard Mitigation Planning Team at [email protected].
Sincerely,
Kathryn Lipiecki Director, Mitigation Division FEMA Region IX

Kern County Hazard Mitigation Plan Approval Letter April 9, 2021 Page 2 of 3
www.fema.gov
Enclosures (2)
Status of Participating Jurisdictions Kern County Final Plan Review Tool, dated April 9, 2021
cc: Victoria LaMar-Haas, Hazard Mitigation Planning Chief, California Governor’s Office of
Emergency Services Jennifer Hogan, State Hazard Mitigation Officer, California Governor’s Office of Emergency Services

Kern County Hazard Mitigation Plan Approval Letter April 9, 2021 Page 3 of 3
www.fema.gov
Status of Participating Jurisdictions as of April 9, 2021
Jurisdictions – Adopted and Approved
# Jurisdiction Date of Adoption 1 Kern County February 11, 2021
Jurisdictions – Approvable Pending Adoption
# Jurisdiction 1 Tehachapi, City of 2 Wasco, City of 3 Arvin-Edison Water Storage District 4 East Niles Community Services District 5 Kern County Water Agency 6 Kern High School District 7 Lost Hills Union School District 8 Mojave Air and Space Port 9 Stallion Springs Community Services District 10 Tehachapi Unified School District 11 Tehachapi Valley Recreation and Park District


Kern Multi-Jurisdiction 2020 MJHMP UpdateCOUNTY OF KERN
i
FEMA/Cal OES Submission Draft 10-27-2020

Kern Multi-Jurisdiction 2020 MJHMP UpdateCOUNTY OF KERN
ii
INTENTIONAL BLANK PAGE
FEMA/Cal OES Submission Draft 10-27-2020

Kern Multi-Jurisdiction 2020 MJHMP UpdateCOUNTY OF KERN
iii
Kern County Multi-Jurisdiction Hazard Mitigation Plan
Volume 1 Planning-Area-Wide Elements
Executive Summary ................................................................................................................................ xi
What is a hazard mitigation plan? .................................................................................................................................................. xii
Why have a hazard mitigation plan? ............................................................................................................................................. xii
Why is the plan updated so often? ................................................................................................................................................ xiii
Participating Jurisdictions .............................................................................................................................................................. xiii
Plan Development and Update Methods .................................................................................................................................... xiv
Risk Assessment .................................................................................................................................................................................... xv
Hazard Exposure and Damage Estimation ............................................................................................................................... xvi
Population and Asset Exposure ............................................................................................................................................... xvi
Damage Assessments ................................................................................................................................................................. xvii
Summary of Vulnerable Assets: People, Property Value, and Infrastructure ............................................................ xviii
Mitigation Goals ................................................................................................................................................................................. xxiii
Mitigation Strategy ............................................................................................................................................................................ xxiii
County Wide Priority Mitigation Actions ................................................................................................................................. xxiv
Mitigation Action Implementation ............................................................................................................................................. xxiv
Adoption Records (To be included) .............................................................................................. xxvii
Volume 1 .................................................................................................................................................... 1-1
Section 1. Introduction ......................................................................................................................... 1-2
1.1 Purpose ................................................................................................................................................................................................ 1-2
1.2 Background and Scope ................................................................................................................................................................. 1-2
1.3 Participating Jurisdictions ......................................................................................................................................................... 1-3
1.4 Why Update This Plan? ................................................................................................................................................................ 1-3
1.4.1 Purposes for Planning ......................................................................................................................................................... 1-4
1.5 Who Will Benefit from This Plan? ............................................................................................................................................ 1-5
1.6 How to Use This Plan .................................................................................................................................................................... 1-5
Section 2. What’s New .......................................................................................................................... 2-1
FEMA/Cal OES Submission Draft 10-27-2020

Kern Multi-Jurisdiction 2020 MJHMP UpdateCOUNTY OF KERN
iv
2.1 Participating Jurisdictions in the 2014 HMP vs MJHMP Update ............................................................................... 2-1
2.2 Mitigation Actions ........................................................................................................................................................................ 2-3
2.3 New Analysis and Risk Assessment Methodology ......................................................................................................... 2-4
2.4 Successful Mitigation Activities ............................................................................................................................................. 2-5
2.5 Incorporation into other Planning Mechanisms .............................................................................................................. 2-9
Section 3. Planning Process ................................................................................................................ 3-1
STEP 1: Organize Resources ............................................................................................................................................................. 3-3
Building the Planning Team ...................................................................................................................................................... 3-3
Steering Committee ...................................................................................................................................................................... 3-3
Planning Committee ..................................................................................................................................................................... 3-4
Planning Committee Meetings .............................................................................................................................................. 3-18
Public Involvement and Outreach ........................................................................................................................................ 3-19
STEP 2: Assess the Risk .................................................................................................................................................................. 3-20
Identify/Profile Hazards ........................................................................................................................................................... 3-20
Assess Vulnerabilities ............................................................................................................................................................... 3-20
Web Based Risk Assessment Mapping and Analysis ................................................................................................... 3-21
STEP 3: Develop a Mitigation Strategy .......................................................................................................................................3-22
Identify Goals .................................................................................................................................................................................3-22
Develop Capabilities Assessment .........................................................................................................................................3-22
Identify Hazard Problem Statements .................................................................................................................................. 3-23
Identify Mitigation Actions ...................................................................................................................................................... 3-23
Mitigation Action Support Tool (MAST) .............................................................................................................................. 3-23
County Planning Processes Library .................................................................................................................................... 3-24
Multi-Jurisdiction Planning Process .................................................................................................................................. 3-24
STEP 4: Adopt and Implement the Plan .................................................................................................................................... 3-25
Plan Review and Revision ........................................................................................................................................................ 3-25
Plan Adoption and Submittal .................................................................................................................................................. 3-25
Implement, Evaluate, and Revise the Plan ........................................................................................................................ 3-25
Plan Maintenance ........................................................................................................................................................................3-26
Section 4. Risk Assessment ................................................................................................................ 4-1
4.1 Hazard Identification and Screening ..................................................................................................................................... 4-1
4.1.1 Hazard Screening ................................................................................................................................................................. 4-2
FEMA/Cal OES Submission Draft 10-27-2020

Kern Multi-Jurisdiction 2020 MJHMP UpdateCOUNTY OF KERN
v
4.1.2 Past Major Hazard Events ................................................................................................................................................ 4-5
4.2 Hazard Prioritization ................................................................................................................................................................... 4-7
4.3 Kern County Geographic and Demographic Profile ....................................................................................................... 4-9
4.3.1 Geography ............................................................................................................................................................................... 4-9
4.3.2 Climate .................................................................................................................................................................................. 4-10
4.3.3 Demographics and Vulnerable Populations ........................................................................................................... 4-10
4.3.4 Economy ............................................................................................................................................................................... 4-19
4.3.5 Past and Future Trends in Development ................................................................................................................. 4-20
4.4 Vulnerability Assessment Methods .................................................................................................................................... 4-23
4.4.1 Population and Asset Inventory .................................................................................................................................. 4-23
4.4.2 Hazard Exposure and Damage Estimation ............................................................................................................. 4-27
4.5 Vulnerability to Specific Hazards ......................................................................................................................................... 4-29
4.5.1 Severe Weather Hazard Profile .................................................................................................................................... 4-30
4.5.2 Flood Hazard Profile ......................................................................................................................................................... 4-45
4.5.3 Dam Failure Hazard Profile ........................................................................................................................................... 4-77
4.5.4 Earthquake Hazard Profile ............................................................................................................................................ 4-94
4.5.5 Wildfire Hazard Profile .................................................................................................................................................. 4-126
4.5.6 Drought Hazard Profile ................................................................................................................................................. 4-146
4.5.7 Slope Failure Hazard Profile ....................................................................................................................................... 4-156
4.5.8 Soil Stability Hazard Profile ........................................................................................................................................ 4-168
Section 5. Mitigation Strategy ............................................................................................................ 5-1
5.1 Mitigation Alternatives ................................................................................................................................................................ 5-1
5.2 Identifying the Problem .............................................................................................................................................................. 5-6
5.3 Capabilities Assessment ............................................................................................................................................................ 5-6
5.3.1 Planning and Regulatory Mitigation Capabilities................................................................................................... 5-7
5.3.2 Financial Capabilities ........................................................................................................................................................ 5-9
5.3.3 Education and Outreach .................................................................................................................................................. 5-10
5.3.4 Administrative and Technical Capabilities ............................................................................................................. 5-11
5.3.5 Federal and State Funding Opportunities ................................................................................................................ 5-12
5.4 Mitigation Goals ........................................................................................................................................................................... 5-16
5.5 County Wide Mitigation Actions ............................................................................................................................................ 5-17
5.5.1 Prioritization of Mitigation Actions ............................................................................................................................. 5-18
FEMA/Cal OES Submission Draft 10-27-2020

Kern Multi-Jurisdiction 2020 MJHMP UpdateCOUNTY OF KERN
vi
5.5.2 Mitigation Action Plan .................................................................................................................................................... 5-20
Section 6. Plan Implementation and Maintenance ..................................................................... 6-1
6.1 Plan Adoption .................................................................................................................................................................................. 6-1
6.2 Plan Implementation ................................................................................................................................................................... 6-1
6.2.1 Steering Committee ............................................................................................................................................................ 6-1
6.3 Monitoring, Evaluating and Updating the MJHMP ......................................................................................................... 6-2
6.3.1 Schedule ................................................................................................................................................................................... 6-2
6.3.2 Mitigation Action Support Tool (MAST) Updates ................................................................................................... 6-2
6.3.3 Process ..................................................................................................................................................................................... 6-3
6.3.4 Continuing Public Involvement ..................................................................................................................................... 6-4
6.3.5 HMA Monitoring ................................................................................................................................................................... 6-5
6.3.6 Incorporation into Other Planning Mechanisms ................................................................................................... 6-7
6.3.7 Planning Integration Processes ..................................................................................................................................... 6-8
Section 7. Works Cited .......................................................................................................................... 7-1
Appendix A. Analysis Methodology ........................................................................................... A-1
A.1. Natural Hazard Exposure ................................................................................................................................................... A-2
Damage Estimation with Hazus ............................................................................................................................ A-2
Distinguishing Results – Natural Hazard Exposure Analysis vs Hazus Results .............................. A-4
A.2. Analysis Data .......................................................................................................................................................................... A-4
Assets, Value, and Population ................................................................................................................................ A-4
Natural Hazard Data ................................................................................................................................................... A-5
Methodology Overview ............................................................................................................................................. A-7
Data Dictionary ............................................................................................................................................................ A-8
Insured Assets Roll ................................................................................................................................................... A-10
Appendix B. Process Documentation ........................................................................................ B-1
List of Figures
Figure ES 1 Risk Assessment Methodology Summary ........................................................................................................ xvi Figure ES 2 Exposure explanation graphic .............................................................................................................................. xvii Figure ES 3 Hazus Damage Estimation Example .................................................................................................................. xvii Figure ES 4 Wildfire and Flood Snapshots ................................................................................................................................ xix
Figure ES 5 Dam Inundation and Earthquake Snapshot ...................................................................................................... xx
FEMA/Cal OES Submission Draft 10-27-2020

Kern Multi-Jurisdiction 2020 MJHMP UpdateCOUNTY OF KERN
vii
Figure ES 6 Awareness Zone and Landslide Snapshot ....................................................................................................... xxi Figure ES 7 Subsidence and Earthquake Snapshot ............................................................................................................. xxii Figure 1-1: Participating Jurisdictions Map ................................................................................................................................ 1-4
Figure 2-1: Caliente Creek Feasibility Study Area ................................................................................................................... 2-6
Figure 2-2: U.S. Forest Service Worker Removing Branches from Dead Tree ............................................................. 2-7
Figure 2-3: Bena Bridges During Construction ........................................................................................................................ 2-8
Figure 3-1: Kern County MHJHMP Planning Process ........................................................................................................... 3-2
Figure 3-2 Snapshot of community survey results from English-speaking survey. Results are captured fully in Appendix B. ........................................................................................................................................................................................... 3-19
Figure 3-3: RAMP Facilities Map Access at mitigatehazards.com ................................................................................. 3-21
Figure 3-4: RAMP showing the population of Bakersfield overlaid with FEMA Flood Hazard .......................... 3-22
Figure 3-5. Categories of issues addressed in problem statements .............................................................................. 3-23
Figure 3-6 MAST elements and Cal OES Grant Applications........................................................................................... 3-26
Figure 4-1 Prioritized Hazard Assessment Matrix for Kern County ............................................................................... 4-8
Figure 4-2 Kern County Geographic Overview ...................................................................................................................... 4-10
Figure 4-3: Median Household Income Distribution ........................................................................................................... 4-14
Figure 4-4: Population Under Age 18 ........................................................................................................................................... 4-15
Figure 4-5: Population Over Age 65 ............................................................................................................................................ 4-16
Figure 4-6: Kern County Race Distribution in 2017 .............................................................................................................. 4-17
Figure 4-7: Data Source and Method .......................................................................................................................................... 4-23
Figure 4-8: Critical Facilities in Kern County ......................................................................................................................... 4-26
Figure 4-9: Hazard Exposure Explanation Graphic .............................................................................................................. 4-27
Figure 4-10: Hazus Damage Estimation Example ................................................................................................................. 4-28
Figure 4-11 Historical & Projected Annual Average Maximum Temp Increase ....................................................... 4-33
Figure 4-12 Kern County - Average Annual Precipitation ................................................................................................. 4-36
Figure 4-13: 30-YR Normal Maximum Temperature for July........................................................................................... 4-37
Figure 4-14: 30-YR Normal Minimum Temperature for January ................................................................................... 4-38
Figure 4-15: Annual Average Wind Speed (Power Class) ................................................................................................... 4-39
Figure 4-16 Watershed Map ........................................................................................................................................................... 4-54
Figure 4-17: FEMA Flood Zone Exposure Map ........................................................................................................................ 4-55
Figure 4-18 DWR Awareness Zones ............................................................................................................................................ 4-57
Figure 4-19 Population Exposure to Flood (Unincorporated County) ........................................................................... 4-62
Figure 4-20: FEMA Flood Zone Exposure and Snapshot Map .......................................................................................... 4-63
Figure 4-21 100-YR Flood Damage Estimation by Occupancy ........................................................................................ 4-69
Figure 4-22 500 YR Flood Damage Estimation by Occupancy Type ............................................................................. 4-71
Figure 4-23. Oroville Dam Spillway after 2017 failure. ........................................................................................................ 4-80
Figure 4-24: Dam Inundation Exposure .................................................................................................................................... 4-83
Figure 4-25 Kern County Levee System ................................................................................................................................... 4-84
Figure 4-26: Dam Failure Vulnerability Snapshot Map ...................................................................................................... 4-88
Figure 4-27 Population Exposure to Dam Inundation by Zone ....................................................................................... 4-89
Figure 4-28: Earthquake Faulting ................................................................................................................................................ 4-94
FEMA/Cal OES Submission Draft 10-27-2020

Kern Multi-Jurisdiction 2020 MJHMP UpdateCOUNTY OF KERN
viii
Figure 4-29: Zones of Required Investigation ........................................................................................................................ 4-98
Figure 4-30 Fault Probability Map for Kern County .......................................................................................................... 4-102
Figure 4-31: Earthquake Shaking Potential ........................................................................................................................... 4-104
Figure 4-32. Earthquake Scenario, S. San Andreas Mojave N. ....................................................................................... 4-105
Figure 4-33 S. San Andreas Mojave N. Exposure and Snapshot Map ........................................................................ 4-108
Figure 4-34: Population Exposure to S. San Andreas Mojave N. Scenario (Unincorporated County) ........... 4-109
Figure 4-35: 2016 Erskine Fire .....................................................................................................................................................4-130
Figure 4-36: Historic Fire Occurrence Map (Fires Greater than 2,000 acres, 2000-2018) .................................... 4-131
Figure 4-37: Wildfire Return Intervals ...................................................................................................................................... 4-135
Figure 4-38: Wildfire Severity Zones ........................................................................................................................................ 4-136
Figure 4-39 Population Exposed to Wildfire Risk ................................................................................................................ 4-138
Figure 4-40: Exposure Wildfire Vulnerability and Snapshot Map ................................................................................ 4-139
Figure 4-41. Drought-lowered Lake Isabella in 2015. Photo by Don Barrett, USC News ...................................... 4-148
Figure 4-42 Kern County Drought Severity Timeline 2000-2021 .................................................................................. 4-150
Figure 4-43. Mudflow near Tehachapi Mountains ............................................................................................................. 4-158
Figure 4-44: Landslide Susceptibility ...................................................................................................................................... 4-160
Figure 4-45: Landslide Vulnerability Snapshot .................................................................................................................... 4-163
Figure 4-46. Illustration of various stages of erosion. .......................................................................................................4-169
Figure 4-47 Subsidence Areas .................................................................................................................................................... 4-173
Figure 4-48. Subsidence example in San Joaquin Valley. .............................................................................................. 4-174
Figure 5-1: Mitigation Action Application ................................................................................................................................ 5-17
Figure 5-2: Mitigation Action Number Key ............................................................................................................................. 5-20
Figure 6-1 Diagram of MAST viewing details ............................................................................................................................ 6-3
Figure 6-2: MAST and Cal OES Grant Applications ................................................................................................................ 6-6
Figure 6-3: HMGP Timeline .............................................................................................................................................................. 6-7
Figure 7-1: Hazard Exposure ................................................................................................................................................................ 2
Figure 7-2: Flood Depth and Damage Curves ................................................................................................................................ 3
Figure 7-3: Hazus Damage Estimations .......................................................................................................................................... 3
Figure 7-4: Data Analysis Methodology .......................................................................................................................................... 7
List of Tables
Table 2-1: Participating Jurisdiction Tracker ............................................................................................................................ 2-1
Table 2-2. Cancelled Mitigation Actions from 2014 ................................................................................................................ 2-4
Table 2-3. Completed Mitigation Actions Since 2014 MJHMP ........................................................................................... 2-5
Table 3-1: MJHMP Steering Committee ....................................................................................................................................... 3-3
Table 3-2: MJHMP Planning Committee ..................................................................................................................................... 3-5
Table 3-3: MJHMP Update Consultant Team .......................................................................................................................... 3-17
Table 3-4: Meeting Summary ......................................................................................................................................................... 3-18
Table 3-5 Kern County Links to HMP Resources .................................................................................................................. 3-24
Table 4-1: Document Review Crosswalk ..................................................................................................................................... 4-2
Table 4-2. Hazard prioritization ...................................................................................................................................................... 4-3
Table 4-3: Disaster Declarations in Kern County 1995- present ........................................................................................ 4-6
FEMA/Cal OES Submission Draft 10-27-2020

Kern Multi-Jurisdiction 2020 MJHMP UpdateCOUNTY OF KERN
ix
Table 4-4: Disability Status of Non-Institutionalized Population in Kern County in 2017 ................................... 4-19
Table 4-5: Top 10 Jobs by Occupation in Kern County1 in May 2018 ............................................................................. 4-20
Table 4-6: Parcel Counts and Value ............................................................................................................................................ 4-25
Table 4-7: Severe Weather Damage Summary by Year 2000-2019 ................................................................................ 4-34
Table 4-8: Classes of Wind Power Density at 10 m and 50 ma .......................................................................................... 4-40
Table 4-9 Severe Weather Problem Statements .................................................................................................................... 4-44
Table 4-10: Flood Insurance Statistics for Kern County ..................................................................................................... 4-49
Table 4-11: Kern County Flood Events Since 2000 ................................................................................................................ 4-50
Table 4-12: Summary of Discharges in Kern County ........................................................................................................... 4-58
Table 4-13: Summary Population Exposure to Flood (Unincorporated County) ....................................................... 4-62
Table 4-14: Parcels Exposed to NFIP Flood Zones (Unincorporated County) ............................................................ 4-64
Table 4-15: Critical Facility Points in the Floodplain ........................................................................................................... 4-64
Table 4-16: Lifelines in the Floodplain (Unincorporated County) .................................................................................. 4-66
Table 4-17: 100 YR Flood Damage Estimation by Occupancy Type ............................................................................... 4-68
Table 4-18 100 YR Flood Damage Estimation of County Insured Assets ..................................................................... 4-69
Table 4-19: Damage Estimation Summary for 500 yr. Floodplain .................................................................................. 4-70
Table 4-20 500-YR Flood Damage Estimation of County Facilities .............................................................................. 4-72
Table 4-21 Flood Problem Statements ....................................................................................................................................... 4-73
Table 4-22: FEMA & DSOD Hazard Potential Classification .............................................................................................. 4-81
Table 4-23: Dams in Kern County ................................................................................................................................................ 4-81
Table 4-24: Population Exposure to Dam Failure (Unincorporated County).............................................................. 4-89
Table 4-25: Parcel Values at Risk from Dam Inundation (Unincorporated County) ............................................... 4-90
Table 4-26: Critical Infrastructure Points in Dam Inundation Zones (Unincorporated County) ....................... 4-90
Table 4-27: Miles of Critical Infrastructure (Linear) in Dam Inundation Zones (Unincorporated County) ... 4-92
Table 4-28 Dam Failure Problem Statements ......................................................................................................................... 4-93
Table 4-29: Moment Magnitude Scale ....................................................................................................................................... 4-95
Table 4-30: Modified Mercalli intensity level descriptions ............................................................................................... 4-96
Table 4-31: Modified Mercalli Scale and Peak Ground Acceleration ............................................................................. 4-97
Table 4-32: Earthquakes in Kern County 4.5 Magnitude or Greater Since 2000 ..................................................... 4-100
Table 4-33: Population Exposure to S. San Andreas Mojave N. Scenario (Unincorporated County) ............. 4-109
Table 4-34: Seismic Benchmark Years .................................................................................................................................... 4-110
Table 4-35: Definitions of FEMA Building Types .................................................................................................................. 4-111
Table 4-36: Age of Structures in Kern County ....................................................................................................................... 4-112
Table 4-37: Parcel Exposure to S. San Andreas Mojave N. Scenario (Unincorporated County) ........................ 4-113
Table 4-38: Critical Facility Exposure to S. San Andreas Mojave N. Scenario (Unincorporated County) .....4-114
Table 4-39: Lifeline Exposure S. San Andreas Mojave N. Scenario (Unincorporated County) .......................... 4-115
Table 4-40: Hazus Building Damage Descriptions ............................................................................................................. 4-120
Table 4-41: Loss Estimations for S. San Andreas Mojave N. Scenario ......................................................................... 4-121
Table 4-42: Loss Estimations for S. San Andreas Mojave N. Scenario ....................................................................... 4-122
Table 4-43 Earthquake Problem Statements ........................................................................................................................ 4-124
Table 4-44: Wildfire Events in Kern County 2000 Acres or Greater 2000-2018 ....................................................... 4-129
Table 4-45 Populations Exposed to Wildfire Risk (Unincorporated County) ........................................................... 4-138
FEMA/Cal OES Submission Draft 10-27-2020

Kern Multi-Jurisdiction 2020 MJHMP UpdateCOUNTY OF KERN
x
Table 4-46: Residential Buildings and Content within Wildfire Severity Zones (Unincorporated County) 4-140
Table 4-47: Critical Facility Exposure to Wildfire Severity Zones (Unincorporated County) ............................ 4-141
Table 4-48: Lifelines in Wildfire Severity Zones (Unincorporated County) ............................................................. 4-142
Table 4-49 Wildfire Problem Statements ............................................................................................................................... 4-143
Table 4-50. Drought Classifications and Impacts for California .................................................................................. 4-149
Table 4-51 Drought Problem Statements ................................................................................................................................ 4-155
Table 4-52: Slope Failure Events in Kern County Since 2000 ......................................................................................... 4-158
Table 4-53: Population Exposure to Landslide Susceptibility ........................................................................................ 4-162
Table 4-54: Property Value Exposed to Landslides. ........................................................................................................... 4-164
Table 4-55: Critical Facility Points with Slope Failure Hazard Risk (Unincorporated County) ....................... 4-164
Table 4-56: Critical Facilities (Linear) with Slope Failure Hazard Risk (Unincorporated County) .................. 4-165
Table 4-57 Slope Failure Problem Statements ..................................................................................................................... 4-167
Table 4-58 Dust Storm Events 2000-2019 ............................................................................................................................... 4-171
Table 4-59 Soil Stability Hazard Problem Statements ...................................................................................................... 4-178
Table 5-1: Kern County Planning and Regulatory Mitigation Capabilities .................................................................... 5-7
Table 5-2: Kern County Fiscal Capabilities Summary ........................................................................................................... 5-9
Table 5-3: Kern County Education/ Outreach Capabilities Summary ........................................................................... 5-10
Table 5-4: Kern County Administrative and Technical Capabilities .............................................................................. 5-11
Table 5-5: Federal and State Funding Opportunities ........................................................................................................... 5-12
Table 5-6: County Wide Mitigation Action Tracker .............................................................................................................. 5-21
Table 7-1 Wildfire Hazard Severity Classification ....................................................................................................................... 6
Table 7-2: Data Dictionary ..................................................................................................................................................................... 8
Table 7-3 Insured Assets Roll ............................................................................................................................................................ 10
FEMA/Cal OES Submission Draft 10-27-2020

Kern Multi-Jurisdiction 2020 MJHMP UpdateCOUNTY OF KERN
xi
Executive Summary
FEMA/Cal OES Submission Draft 10-27-2020

Kern Multi-Jurisdiction 2020 MJHMP UpdateCOUNTY OF KERN
xii
Kern County prepared this Hazard Mitigation Plan to guide County and City Officials, Special District Managers, School District Administrators, and Water and Wastewater District Managers in protecting the people and property within the County from the effects of natural disasters and hazard events. This plan demonstrates Kern County’s commitment to reducing risk from natural hazards through mitigation and serves as a tool to direct County resources to achieve optimum results with available administrative, technical, and financial resources.
The term “hazard mitigation” refers to actions or strategies that can reduce or eliminate long-term risks caused by natural disasters. Mitigation activities can be developed, planned, and implemented before or after a disaster occurs. After disasters, repairs and reconstruction often are completed in such a way as to simply restore damaged property to pre-disaster conditions. These efforts may return property and infrastructure to “the norm”, but the replication of pre-disaster conditions may result in a repetitive cycle of damage and reconstruction. Hazard mitigation planning in Kern County can break this repetitive cycle by reducing vulnerability to hazards through smart construction and proper planning of future development and critical infrastructure. Hazard mitigation activities can be conducted through a wide variety of mitigation strategies, such as construction of regional flood control projects or implementing fuel reduction activities around buildings within high wildfire risk areas.
What is a hazard mitigation plan?
This Hazard Mitigation Plan provides an explanation of prevalent hazards within the County and how hazards may affect the County and participating cities and special districts differently based upon proximities to natural hazards. This plan also identifies risks to vulnerable assets, both people and property. Most importantly, the mitigation strategy presented in this plan responds to the identified vulnerabilities within each community and provides prescriptions or actions to achieve the greatest risk reduction based upon available resources. The County and participating jurisdictions intend to save lives, reduce injuries, reduce property damage, and protect natural resources for future generations through mitigation activities.
Why have a hazard mitigation plan?
The passage of the Disaster Mitigation Act in 2000 (DMA 2000) requires proactive pre-disaster planning as a condition of receiving certain federal financial assistance under the Robert T. Stafford Act. DMA 2000 encourages state and local authorities to work together on pre-disaster planning to assist local governments to accurately assess mitigation needs, resulting in faster allocation of funding and more cost-effective risk reduction projects under FEMA’s Hazard Mitigation Assistance program. The purpose of this Multi-jurisdiction Hazard Mitigation Plan (MJHMP) is twofold. First, it provides the County and participating jurisdictions continued access to grant funding from FEMA to conduct hazard mitigation activities for participating jurisdictions. Secondly, it provides resources for residents wishing to conduct
FEMA/Cal OES Submission Draft 10-27-2020

Kern Multi-Jurisdiction 2020 MJHMP UpdateCOUNTY OF KERN
xiii
hazard mitigation efforts by identifying areas of extreme risk and providing financial and technical mitigation resources based upon current gaps.
Why is the plan updated so often?
As a DMA 2000 requirement, the plan must be updated every five years to remain in compliance with federal mitigation grant conditions. Federal regulations require hazard mitigation plans to include a plan for monitoring, evaluating, and updating the hazard mitigation plan. An update process provides an opportunity to reevaluate recommendations, monitor the impacts of actions that have been accomplished, and determine if there is a need to change the focus of mitigation strategies over time. Grant compliance is contingent on meeting the plan update requirements that are contained in the Code of Federal Regulations (CFRs). Jurisdictions that allow a plan to expire are not able to pursue funding under the Robert T. Stafford Act.
Participating Jurisdictions
The Kern County MJHMP has multiple participating jurisdictions and geographically covers the entire area within Kern County (hereinafter referred to as the “planning area”). A planning partnership was formed to develop and steer content in this Plan. This partnership consists of Kern County stakeholders and participating jurisdictions who have worked together to create the goals, objectives, mitigation strategies, and implementation methods to reduce risk. Any local government or non-profit agency with the ability to regulate building or infrastructure development or maintenance may participate in the planning process. However, to obtain FEMA approval, each of the local jurisdictions must meet all FEMA planning requirements outlined in federal regulations at 44 CFR § 201.6 et seq. A list of jurisdictions that have elected to participate in this MJHMP can be found in Table 2-1.
FEMA/Cal OES Submission Draft 10-27-2020

Kern Multi-Jurisdiction 2020 MJHMP UpdateCOUNTY OF KERN
xiv
Plan Development and Update Methods
Hazard mitigation planning is the process through which hazards are identified, likely impacts determined, mitigation goals set, and appropriate mitigation strategies identified. This plan documents the hazard mitigation planning process the County and participating jurisdictions used to increase natural hazard resiliency in the community. Kern County and all participating jurisdictions followed the recommended FEMA four-step process to develop this 2020 updated Plan. This update included a reorganization of planning partners to provide clear delineation of jurisdiction information, development of a new risk assessment, revaluation of goals and objectives, development of new mitigation actions, new enhancements for implementing mitigation actions, updates to all sections of the 2014 plan, and a new website for stakeholder involvement and public information.
FEMA/Cal OES Submission Draft 10-27-2020

Kern Multi-Jurisdiction 2020 MJHMP UpdateCOUNTY OF KERN
xv
Risk Assessment
The risk assessment measures the potential loss of life, personal injury, economic injury, and property or infrastructure damage resulting from natural hazards in order to determine vulnerability. For this update, the risk assessment utilized new data and technologies that have become available since 2014. The County and participating jurisdictions used risk assessment information to rank risks and to gauge the potential impacts of each hazard of concern in the Operational Area. The risk assessment included:
• Hazard identification and profiling, • Assessment of the impact of hazards on physical, social, and economic assets, • Identification of particular areas of vulnerability, • Additional impacts of each hazard due to climate change, and • Estimates of the cost of potential damage.
The following natural hazard threats were identified and profiled as County priority hazards:
Severe Weather
SECTION 4.5.1 Flood
SECTION 4.5.2
Dam Failure
SECTION 4.5.3
Earthquake
SECTION 0 Wildfire
SECTION 4.5.5 Drought
SECTION 4.5.6
Slope Failure
SECTION 4.5.7 Soil Stability
SECTION 4.5.8
Participating jurisdictions also individually assessed risks applicable to their jurisdiction. Many participating jurisdictions identified fewer than the County-identified hazards. Those jurisdiction-specific profiles are included in Volume 2 of this MJHMP.
FEMA/Cal OES Submission Draft 10-27-2020

Kern Multi-Jurisdiction 2020 MJHMP UpdateCOUNTY OF KERN
xvi
Hazard Exposure and Damage Estimation
In Kern County, earthquakes, flooding, slope failure, dam failure, and wildfire have known geographic extents and corresponding spatial information, which make exposure and damage estimation possible. In order to describe vulnerability for each hazard, it is important to understand the total population and total assets at risk. This provides the estimated damage and losses expected during a “worst case scenario” event for each hazard.
Figure ES 1 Risk Assessment Methodology Summary
Population and Asset Exposure
The total counts of parcels, people, facilities, assets and the sum of values within the planning area which could be exposed to a hazard event is referred to as the “exposure” in this plan. A natural hazards overlay was developed to reflect the combination of many known natural hazard spatial footprints. The spatial overlay method enables summarization of building values, parcel counts, population exposure, and critical facility exposure within a hazard’s geographic extents (see Figure ES 2 exposure example). This method has been used to evaluate exposure for earthquakes, landslides, flooding, dam inundation, and wildfire. For a more detailed explanation on Risk Assessment Methods, see Section 4.4 and Appendix A at A 1-2.
FEMA/Cal OES Submission Draft 10-27-2020

Kern Multi-Jurisdiction 2020 MJHMP UpdateCOUNTY OF KERN
xvii
Figure ES 2 Exposure explanation graphic
Damage Assessments
FEMA’s Hazus software was used to conduct a detailed loss estimation for flood and earthquake. Hazus is a nationally-applicable, standardized methodology that contains models for estimating potential losses from earthquakes, floods, and hurricanes. Hazus uses Geographic Information Systems (GIS) technology to estimate physical, economic, and social impacts of disasters. For this planning effort, Hazus was used to generate damage estimations due to possible earthquakes and flooding. The estimated damage and losses provided by the Hazus Software is a “worst case scenario” event and provides the ability to understand possible widescale damage to buildings and facilities.
In the hypothetical map in Figure ES 3, even though both structures are exposed to flooding, it is predicted that the structure with a first floor height below the depth of flooding will receive significantly more damage than the structure with a first floor height above the expected water depth. For a more detailed explanation on Risk Assessment Methods, see Section 4.4 and Appendix A at A 1-2.
Figure ES 3 Hazus Damage Estimation Example
FEMA/Cal OES Submission Draft 10-27-2020

Kern Multi-Jurisdiction 2020 MJHMP UpdateCOUNTY OF KERN
xviii
Summary of Vulnerable Assets: People, Property Value, and Infrastructure
Hazards with spatial boundaries can be evaluated to demonstrate the amount of population, critical infrastructure, and parcels within each hazard’s footprint. At-risk populations, critical infrastructure, improved parcels, and loss results for each hazard category are provided in bar chart summary tables throughout this plan to evaluate the percentage of assets exposed to different types of hazards. The side-by-side comparison allows officials to evaluate the impacts of potential hazards to determine what hazards to direct energy and financial resources for mitigation activities. For detailed vulnerabilities assessment information, see the individual hazard-specific sections presented in Section 4.5. This Executive Summary provides map summaries for the profiled hazards in Figure ES 4 through Figure ES 7.
FEMA/Cal OES Submission Draft 10-27-2020

Kern Multi-Jurisdiction 2020 MJHMP UpdateCOUNTY OF KERN
xix
Figure ES 4 Wildfire and Flood Snapshots
FEMA/Cal OES Submission Draft 10-27-2020

Kern Multi-Jurisdiction 2020 MJHMP UpdateCOUNTY OF KERN
xx
Figure ES 5 Dam Inundation and Earthquake Snapshot
FEMA/Cal OES Submission Draft 10-27-2020

Kern Multi-Jurisdiction 2020 MJHMP UpdateCOUNTY OF KERN
xxi
Figure ES 6 Awareness Zone and Landslide Snapshot
FEMA/Cal OES Submission Draft 10-27-2020

Kern Multi-Jurisdiction 2020 MJHMP UpdateCOUNTY OF KERN
xxii
Figure ES 7 Subsidence and Earthquake Snapshot
FEMA/Cal OES Submission Draft 10-27-2020

Kern Multi-Jurisdiction 2020 MJHMP UpdateCOUNTY OF KERN
xxiii
Mitigation Goals
The Steering Committee reviewed and updated the goals from the 2014 Kern County Hazard Mitigation Plan and confirmed a set of objectives. The following guiding principles aided the Steering Committee and planning partners in selecting actions contained in this plan Update:
Goal 1: Enable residents to mitigate the impacts of hazards
and disasters.
Goal 2: Reduce hazard impacts to existing and future
development and the natural environment.
Goal 3: Reduce hazard impacts to existing and future critical
facilities, infrastructure, and high potential loss
facilities.
Goal 4: Improve multi-jurisdiction coordination to reduce risk
through mitigation planning and hazard analysis on a
continual basis.
Mitigation Strategy
The mitigation strategies and activities designed to reduce or eliminate losses resulting from natural hazards are the centerpiece of the mitigation planning process. Through the mitigation actions, participating jurisdictions will become more resilient to disasters. Actions identified in this plan may or may not be geared toward grant funding under HMA. Rather, the focus was the initiatives’ effectiveness in achieving the goals of the plan within each jurisdiction’s capabilities.
Participating jurisdictions individually selected a range of appropriate mitigation actions to work toward achieving the MJHMP’s goals, compiled in Volume 2 and the jurisdiction Annex HMPs. In addition, the Steering Committee and participating jurisdictions identified countywide actions benefiting the whole partnership, as listed in Volume 1. These initiatives also are summarized in the following tables.
FEMA/Cal OES Submission Draft 10-27-2020

Kern Multi-Jurisdiction 2020 MJHMP UpdateCOUNTY OF KERN
xxiv
County Wide Priority Mitigation Actions
Mitigation No. Hazard Type Year Title/Description
ma-AH-KC-201 All Hazard 2005 Hazard Public Education
ma-AH-KC-104 All Hazard 2005 Remote Automated Weather Station System
ma-DF-KC-384 Dam Failure 2020 Design and implement County-wide warning system program, with all other HMP participating jurisdictions as secondary participants, to warn everyone within a dam inundation zone of impending dam failure
ma-DR-KC-290 Drought 2020 Develop a public education campaign to encourage water conservation during drought.
ma-DR-KC-291 Drought 2020 Install remote monitoring devices on well flow meters on County owned wells
ma-DR-KC-293 Drought 2020 Amend land use codes to incorporate regulations that encourage and incentive water savings for development
ma-DR-KC-294 Drought 2020 Replace existing turf grass and water intensive landscaping with drought resistant landscaping
ma-DR-KC-384 Drought 2020 Expand Willow Springs Water Bank to reduce drought and increase water supply flexibility and sustainability
ma-EQ-KC-297 Earthquake 2020 Encourage privately owned critical facilities (e.g. churches, hotels, other gathering facilities) to evaluate the ability of the buildings to withstand earthquakes and to address any deficiencies identified.
ma-AH-KC-111 Earthquake 2005 Mobile Home Foundation Earthquake Retrofitting
ma-EQ-KC-102 Earthquake 2005 Formation of Kern County Unreinforced Masonry Task Force
ma-EQ-KC-305 Earthquake 2020 Participate in seismic studies and needed seismic retrofits on County bridges that are located in high risk areas for earthquake scenarios included in this HMP
ma-EQ-KC-306 Earthquake 2020 Evaluate soil liquefaction potential around County assets in areas with shallow groundwater
ma-EQ-KC-307 Earthquake 2020 Install seismic gas shut-off valves on County buildings to prevent the flow of gas into buildings during a seismic event
ma-EQ-KC-295 Earthquake 2020 Retrofit / Harden County-owned critical facilities and buildings and their ability to withstand earthquakes.
ma-EQ-KC-296 Earthquake 2020 Retrofit non-compliant suspended ceilings in County buildings. This includes Non-Structural Suspended Gypsum Dry-Wall & Cement Plaster Ceilings built 1950-1974.
ma-EW-KC-301 Extreme Weather
2020 Outreach and Education to developers before and during the development process about best management practices to mitigate the effects of the urban heat island effect and stormwater runoff resulting from increased impervious surface
FEMA/Cal OES Submission Draft 10-27-2020

Kern Multi-Jurisdiction 2020 MJHMP UpdateCOUNTY OF KERN
xxv
ma-EW-KC-435 Extreme Weather
2020 Develop outreach to educate the public, via County communication channels, on preparedness for driving in winter weather including preparing your vehicle, driving techniques, and what to do if caught in a winter weather event while driving.
ma-FL-KC-202 Flood 2005 Kern Lake CRMP Master Plan Mitigation Projects
ma-FL-KC-283 Flood 2020 Adopt higher regulatory standards (including but not limited to freeboard, comp storage, lower substantial damage thresholds, setback and fill restrictions) as means to reduce future flood risk and support a no-adverse-impact (NAI) philosophy to floodplain management
ma-FL-KC-284 Flood 2020 Routinely inspect storm water channels for vegetation build up or encroachment, trash and debris, silt and gravel build up, and erosion or bank failure
ma-FL-KC-285 Flood 2020 Elevate and retrofit bridges and culverts to allow proper stormwater / 100-YR flows
ma-AH-KC-153 Flood 2005 Caliente Creek Habitat Mitigation Project
ma-AH-KC-158 Flood 2005 Cuddy Creek Restoration Project
ma-FL-KC-110 Flood 2005 Flood Mitigation Plan
ma-FL-KC-99 Flood 2014 Streambed Mitigation in Kern River South Fork at Sierra Hwy (north of SR 178)
ma-FL-KC-70 Flood 2014 Continue to Implement Sound Floodplain Management Practices through Participation in the National Flood Insurance Program
ma-FL-KC-97 Flood 2014 Lake Isabella Blvd Box Culvert at Erskine Creek (near Elizabeth Norris Rd)
ma-FL-KC-82 Flood 2014 Bridge on Famoso Road at Poso Creek (approx 1/3 mile east of State Hwy 99)
ma-FL-KC-98 Flood 2014 Construct a Box Culvert across Redrock Randsburg Road at Redrock Canyon Wash (just east of Hwy 14)
ma-FL-KC-302 Flood 2020 Kern Storm Water Resource Plan Mitigation Projects
ma-FL-KC-303 Flood 2020 Kern County Flood Hazard Mitigation Plan - Projects
ma-FL-KC-304 Flood 2020 County of Kern Caliente Creek - Conceptual Plan for Mitigation
ma-SF-KC-292 Slope Failure 2020 Establish a priority list of slope failure locations and implement slope stabilization projects in the highest risk areas.
ma-AH-KC-245 Soil Stability 2005 Lebec Landfill and Transfer Station Drainage Improvements and Erosion Control
ma-AH-KC-63 Soil Stability 2014 Kern Valley Landfill and Transfer Station Drainage Improvements and Erosion Control
ma-SS-KC-299 Soil Stability 2020 Implement wind breaks to prevent wind erosion leading to buildup of soil on County roads and bridges. Wind break erosion mitigation examples include solid fences, porous fences, straw bales, soil surface modification, berms, and landscaping
ma-SS-KC-300 Soil Stability 2020 Conduct subsidence investigations on County bridges located in high subsidence areas
ma-SH-KC-298 Soil Stability 2020 Outreach and educational programming to property owners and agricultural growers about wind erosion and mitigation techniques such as introducing cover crops, eliminating tillage, and avoiding over grazing
ma-AH-KC-179 Wildfire 2005 Hazard Tree Removal, County Park Lands
FEMA/Cal OES Submission Draft 10-27-2020

Kern Multi-Jurisdiction 2020 MJHMP UpdateCOUNTY OF KERN
xxvi
ma-WF-KC-231 Wildfire 2005 Roadside Disc Breaks
ma-WF-KC-183 Wildfire 2005 Defensible Space, Public Education
ma-WF-KC-184 Wildfire 2005 Education, Fire Department Personnel
ma-WF-KC-180 Wildfire 2005 Greater Tehachapi Area Community Wildfire Protection Plan (was Hazardous Wildland Fuels Mitigation, Greater Tehachapi Area)
ma-WF-KC-181 Wildfire 2005 Mount Pinos Community Wildfire Protection Plan (was Hazardous Wildland Fuels Mitigation, Frazier Mtn Area)
ma-WF-KC-182 Wildfire 2005 Kern River Valley Community Wildfire Protection Plan (formerly Hazardous Wildland Fuels Mitigation, Kern River Valley)
ma-WF-KC-286 Wildfire 2020 Retrofit care facilities (adult care, child care, schools) with fire-resistant materials and or create defensible space around structures.
ma-WF-KC-287 Wildfire 2020 The Alta Sierra CWPP details mitigation needed to protect 7 structure protection groups throughout the WUI in Alta Sierra Community.
ma-WF-KC-288 Wildfire 2020 Myers Canyon CWPP Mitigation Projects
ma-WF-KC-289 Wildfire 2020 Make high visibility address markers available to all residents within the WUI
Mitigation Action Implementation
Despite County efforts, no amount of planning or mitigation can prevent disasters from occurring or eliminate the risk and impacts of such events. Hazard events will continue to occur, and the County and participating jurisdictions will take actions to reduce the risks these hazards pose to life, property, and the economy. While this MJHMP identifies opportunities for reasonable mitigation actions, each individual has a responsibility to be aware of the potential hazards where they live and to minimize their own household’s vulnerability.
The County’s ability to carry out mitigation is limited to those facilities over which it has authority. The County does not have direct authority over schools, water and sanitation districts, private gas, electric and communication utilities, state and federal highways and facilities, private hospitals, or neighboring cities and tribes. The County will focus on actions within its authority to do while seeking to cooperatively work with other entities to address mutual areas of vulnerability and interdependence.
Full implementation of the Plan’s recommendations will take time and resources. The measure of the Plan’s success will be the coordination and pooling of resources within the participating jurisdictions and maintaining these successes over time. Teaming together to seek financial assistance at the state and federal level will be a priority to initiate projects that are dependent on alternative funding sources. This plan was built upon the effective leadership of a multi-disciplined steering committee and a process that relied heavily on public input and support. The plan will succeed for the same reasons.
FEMA/Cal OES Submission Draft 10-27-2020

Kern Multi-Jurisdiction 2020 MJHMP UpdateCOUNTY OF KERN
xxvii
Adoption Records (To be included)
To comply with DMA 2000, the County Board of Supervisors officially adopt this Kern County Multi-Jurisdiction Hazard Mitigation Plan Volume 1 and Volume 2 upon plan approval from Cal OES and FEMA. The adoption of the MJHMP in its entirety recognizes the County’s commitment to reducing the impacts of natural hazards within the Cities and County. See below record of Adoption.
FEMA/Cal OES Submission Draft 10-27-2020

Kern Multi-Jurisdiction 2020 MJHMP UpdateCOUNTY OF KERN
xxviii
INTENTIONAL BLANK PAGE
FEMA/Cal OES Submission Draft 10-27-2020

Kern Multi-Jurisdiction 2020 MJHMP UpdateCOUNTY OF KERN
1-1
Volume 1
FEMA/Cal OES Submission Draft 10-27-2020

Kern Multi-Jurisdiction 2020 MJHMP UpdateCOUNTY OF KERN
1-2
Section 1. Introduction
1.1 Purpose
Kern County and many other participating jurisdictions prepared this Multi-Jurisdiction Hazard Mitigation Plan (MJHMP), originally approved by the Federal Emergency Management Agency (FEMA) in 2006. The plan in its current form reflects a comprehensive update in 2019-2020. The purpose of this plan is to guide hazard mitigation planning to better protect the people and property of the County from the effects of hazard events. This plan demonstrates the commitment of each participating jurisdiction to reducing risks from hazards and serves as a tool to help decision makers direct mitigation activities and resources. This plan was also developed to ensure Kern County and participating jurisdictions’ continued eligibility for certain federal disaster assistance, specifically the FEMA Hazard Mitigation Assistance (HMA) grants, including the Hazard Mitigation Grant Program (HMGP), Building Resilient Infrastructure and Communities (BRIC), and Flood Mitigation Assistance Program (FMA). The plan is also important for maintaining and improving the standing of the County in the National Flood Insurance Program’s Community Rating System (CRS) which provides for lower flood insurance premiums to the residents in the unincorporated areas.
The Master Goal/Mission Statement of the Kern County Multi-Jurisdiction Hazard Mitigation Plan is “to develop sustainable communities to preserve life, protect property, the environment, and the economy from natural hazards.”
1.2 Background and Scope
Each year in the United States, natural disasters take the lives of hundreds of people and injure thousands more. Nationwide, taxpayers pay billions of dollars annually to help communities, organizations, businesses, and individuals recover from disasters. These monies only partially reflect the true cost of disasters, because additional expenses incurred by insurance companies and nongovernmental organizations are not reimbursed by tax dollars. Many natural disasters are predictable, and much of the damage caused by these events can be reduced or even eliminated. Hazard mitigation is defined by FEMA as “any sustained action taken to reduce or eliminate long-term risk to human life and property from a hazard event.” The results of a three-year, congressionally mandated independent study to assess future savings from mitigation activities demonstrates that mitigation activities are highly cost-effective. On average, each dollar spent on mitigation saves society an average of $6 in avoided future losses in addition to saving lives and preventing injuries. (National Institute of Building Sciences, 2017)
FEMA/Cal OES Submission Draft 10-27-2020

Kern Multi-Jurisdiction 2020 MJHMP UpdateCOUNTY OF KERN
1-3
1.3 Participating Jurisdictions
The Kern County Hazard Mitigation Plan is a multi-jurisdiction plan that geographically covers the entire area within Kern County’s jurisdictional boundaries (hereinafter referred to as the “planning area”). A planning partnership was formed to develop and steer content in this plan. This partnership consists of Kern County and local government planning partners who worked together to create the goals, objectives, mitigation strategies, and implementation methods to reduce natural hazard risk within the planning area. Any jurisdiction or organization may participate in the planning process. However, to obtain Federal Emergency Management Agency (FEMA) approval, each local jurisdiction must meet all requirements of hazard mitigation planning outlined in 44 C.F.R. § 201.6. Participating jurisdictions are listed in Table 2-1 and are shown in Figure 1-1.
1.4 Why Update This Plan?
Hazard mitigation is a way to reduce or alleviate the loss of life, personal injury, and property damage that can result from a disaster through long and short-term strategies. It involves strategies such as planning, policy changes, programs, projects, and other activities that can mitigate the impacts of hazards. The responsibility for hazard mitigation lies with many, including private property owners, business and industry, and local, state and federal government.
The Federal Disaster Mitigation Act of 2000 (DMA 2000) required state and local governments to develop hazard mitigation plans as a condition of federal disaster grant assistance. (Pub. L. No. 106-390; 42 U.S.C. § 5121 et seq.) Prior to 2000, federal disaster funding focused on disaster relief and recovery, with limited funding for hazard mitigation planning. DMA 2000 increased the emphasis on planning for disasters before they occur.
DMA 2000 encourages state and local authorities to work together on pre-disaster planning and promotes sustainability. Sustainable hazard mitigation includes the sound management of natural resources and the recognition that hazards and mitigation must be understood in the broadest possible social and economic context. The enhanced planning network called for by DMA 2000 helps local governments articulate accurate mitigation needs, resulting in faster allocation of funding and more cost-effective risk reduction projects.
FEMA/Cal OES Submission Draft 10-27-2020

Kern Multi-Jurisdiction 2020 MJHMP UpdateCOUNTY OF KERN
1-4
Figure 1-1: Participating Jurisdictions Map
1.4.1 Purposes for Planning
This Hazard Mitigation Plan identifies resources, information, and strategies for reducing risk from natural hazards. Kern County and the local jurisdictions that participated as planning partners (collectively “the planning partners”) initiated this planning effort in part because:
▪ the Kern County area has significant exposure to numerous natural hazards that have caused millions of dollars in past damage;
▪ the planning partners want to be proactive in preparing for the probable impacts of natural hazards; and
▪ limited local resources make it difficult to implement proactive risk-reduction measures. Federal and State financial assistance is paramount to successful hazard mitigation in the area.
Elements and strategies in the plan were selected because they best meet the needs of the planning partners and their citizens. The plan was developed to meet the following objectives:
▪ Meet or exceed requirements of the DMA 2000 and the 2015 California legislation requiring the incorporation of climate adaptation strategies into hazard mitigation planning (SB 379).
▪ Enable all planning partners to continue using federal grant funding to reduce risk through mitigation.
▪ Meet the needs of each planning partner as well as state and federal requirements.
FEMA/Cal OES Submission Draft 10-27-2020

Kern Multi-Jurisdiction 2020 MJHMP UpdateCOUNTY OF KERN
1-5
▪ Create a risk assessment that focuses on Kern County hazards of concern. ▪ Create a single planning document that integrates all planning partners into a framework that
supports partnerships within the County and puts all partners on the same planning cycle for future updates.
▪ Coordinate existing plans and programs so that high-priority initiatives and projects to mitigate possible disaster impacts are funded and implemented.
1.5 Who Will Benefit from This Plan?
One benefit of multi-jurisdiction planning is the ability to pool resources and eliminate redundant activities within a planning area with fairly uniform risk exposure and vulnerabilities. FEMA encourages multi-jurisdiction planning under its guidance for the DMA 2000. The plan will help guide and coordinate mitigation activities throughout Kern County.
All citizens and businesses of Kern County are the ultimate beneficiaries of this MJHMP. The plan reduces risk for those who live in, work in, and visit the County. It provides a viable planning framework for all foreseeable natural hazards that may impact the County. County stakeholder participation helped ensure that plan outcomes will be mutually beneficial. The resources and background information in the plan are applicable countywide, and the Plan’s goals and recommendations can lay groundwork for the development and implementation of local mitigation activities and partnerships.
1.6 How to Use This Plan
This plan has been set up in two volumes to separate jurisdiction-specific elements (Volume 2) from those that apply to the whole planning area (Volume 1):
▪ Volume 1—Volume 1 includes all federally-required elements of a hazard mitigation plan that apply to the entire planning area. This includes the description of the planning process, public involvement strategy, goals and objectives, countywide hazard risk assessment, countywide mitigation initiatives, and a plan maintenance strategy. Vol. 1 includes the following appendices:
▪ Appendix A—Annex Methodology ▪ Appendix B—Planning Process Documentation
▪ Volume 2—Volume 2 includes a crosswalk that directs readers to all federally-required, jurisdiction-specific elements for each participating jurisdiction, which are in turn available as standalone Annex HMPs. Vol. 2 describes the categorization of jurisdictions into municipalities, special districts, school districts, and water and wastewater districts. All planning partners have adopted Volume 1 in its entirety and each partner’s jurisdiction-specific Annex HMP.
FEMA/Cal OES Submission Draft 10-27-2020

Kern Multi-Jurisdiction 2020 MJHMP UpdateCOUNTY OF KERN
1-6
INTENTIONAL BLANK PAGE
FEMA/Cal OES Submission Draft 10-27-2020

Kern Multi-Jurisdiction 2020 MJHMP UpdateCOUNTY OF KERN
2-1
Section 2. What’s New This section of the plan includes background information on the 2014 MJHMP and this MJHMP Update. The 2014 Mitigation Actions were reviewed and have been changed, updated, and revised to reflect new priorities in this MJHMP. Only the information and data still valid from the 2014 Plan was carried forward as applicable into this MJHMP update. The sections below describe the planning process for this update.
2.1 Participating Jurisdictions in the 2014 HMP vs MJHMP Update
In September of 2014, the County met all approval requirements from the DMA and officially adopted an update to the 2006 HMP. Eligibility status of the planning partnership was monitored by the Kern County Point of Contact (POC) over the five-year update process. A partner was deemed to be meeting participation requirements based on:
▪ Progress reports being submitted annually by the specified time frames, ▪ Partners notifying the POC of changes in designated points of contact, ▪ Partners supporting the Steering Committee by attending designated meetings or responding
to needs identified by the Committee, and ▪ Partners continuing to be supportive as specified in the planning partner expectations package
provided to them at the beginning of the process.
Table 2-1 tracks 2014 and 2020 Participating Jurisdictions. Table 2-1: Participating Jurisdiction Tracker
Jurisdiction Name
2014 Participating
Jurisdiction
2020 Participating
Jurisdiction
Airport Districts
Indian Wells Valley Airport District Y N Mojave Air and Space Port Y Y
Community Service Districts
Arvin CSD Y Y Bear Valley CSD Y Y East Niles CSD Y Y Golden Hills CSD Y Y Rosamond CSD Y Y Stallion Springs CSD Y Y
Mosquito Abatement Districts
South Fork Mosquito Abatement District Y N
FEMA/Cal OES Submission Draft 10-27-2020

Kern Multi-Jurisdiction 2020 MJHMP UpdateCOUNTY OF KERN
2-2
Jurisdiction Name
2014 Participating
Jurisdiction
2020 Participating
Jurisdiction
Municipalities
City of Arvin Y Y City of Bakersfield Y Y City of California City Y Y City of Delano Y Y City of Maricopa Y Y City of McFarland Y N** City of Ridgecrest Y Y City of Shafter Y Y City of Taft Y Y City of Tehachapi Y Y City of Wasco Y Y
Recreation and Park Districts
Buttonwillow RPD Y N* North of River RPD Y Y Shafter RPD Y Y Tehachapi Valley RPD Y Y Wasco RPD Y N West Side RPD Y Y
School Districts
Bakersfield City School District Y Y Buttonwillow Union School District Y Y Delano Joint Union High School District Y N* Edison Elementary School District Y N* Elk Hills School District Y N* Fairfax School District Y N* Kern Community College District Y Y Kern High School District Y Y Kernville Union School District Y N* Lost Hills Union School District Y Y Mojave Unified School District Y Y Panama-Buena Vista School District Y N Pond Union School District Y N* Richland School District Y Y Sierra Sands Unified School District Y Y Taft City School District Y Y
FEMA/Cal OES Submission Draft 10-27-2020

Kern Multi-Jurisdiction 2020 MJHMP UpdateCOUNTY OF KERN
2-3
Jurisdiction Name
2014 Participating
Jurisdiction
2020 Participating
Jurisdiction
Tehachapi Unified School District Y Y Vineland School District Y Y
Sanitation Districts
Ford City-Taft Heights Sanitation District Y Y Kern Sanitation Authority Y Y North of the River Sanitary District Y Y
Water Districts
Arvin-Edison Water Storage District Y Y Berrenda Mesa Water District Y Y Buena Vista Water Storage District Y N Buttonwillow County Water District Y Y Cawelo Water District Y Y Greenfield County Water District Y Y Kern County Water Agency Y Y Kern Delta Water District Y Y Kern-Tulare Water District Y Y Lost Hills Water District Y Y North of the River Municipal Water District Y Y Semitropic Water Storage District Y Y Tehachapi-Cummings County Water District Y Y West Kern Water District Y Y Wheeler Ridge-Maricopa Water Storage District Y Y
* Indicates a jurisdiction that did not participate in the HMP formulation process, although never formally withdrew participation. ** The City of McFarland has its own active Hazard Mitigation Plan that explores vulnerabilities and mitigation separate from this MJHMP.
2.2 Mitigation Actions
During this MJHMP update process, each of the 2014 County-wide mitigation actions were examined for relevancy and the potential for future implementation and then evaluated for potential follow-up. Some mitigation actions developed during the 2014 HMP effort are an inherent part of the HMP update process or were not detailed enough for implementation at a local jurisdiction level, and thus were not included in this update. The County has made significant changes to other 2014 Mitigation Actions because of the updated risk assessment and implementation strategy, to include more detail, or to update based on current mitigation practices.
FEMA/Cal OES Submission Draft 10-27-2020

Kern Multi-Jurisdiction 2020 MJHMP UpdateCOUNTY OF KERN
2-4
Table 2-2 provides a record of cancelled County-wide Mitigation Actions and an explanation for why the mitigation action was cancelled. Ongoing or pending mitigations actions from previous HMPs are included within the Mitigation Action Plan in Table 5-6. Completed previous Mitigation Actions for the County are detailed in Table 2-3.
Table 2-2. Cancelled Mitigation Actions from 2014
Mitigation No.
Hazard Type Status Year
Primary Agency Title/Description Responsible Party Reason Cancelled
ma-AH-KC-64
All Hazard
Cancelled 2014 County of Kern
Mosquito Vector Control in Kern County for Communities without Mosquito Control Districts
Kern County Department of Public Health
Some progress has been made over the years; marked as deleted in 2014.
ma-FL-KC-62
Flood Cancelled 2014 County of Kern
Bridge on Redrock Randsburg Road at Redrock Canyon Wash
Kern County Roads Department
This project has been replaced with an alternative project to construct a box culvert.
2.3 New Analysis and Risk Assessment Methodology
The County strengthened this plan by using new research methods and information systems. Geographic Information Systems (GIS) mapping provided the County with the tools to develop more comprehensive data sets than those in the 2014 MJHMP.
This MJHMP focuses on natural hazards. New MJHMP mitigation actions focus on four different classifications, including:
▪ Local Plans and Regulations – intended to reduce the County’s vulnerability to future hazard events through the implementation of codes and regulations.
▪ Structure and Infrastructure Projects – intended to protect existing structures by retrofitting, relocating, or modifying the structure to withstand a hazard event.
▪ Natural Systems – to reduce the effects of hazards on the natural resources within a region by preserving and/or restoring natural areas along with their mitigation functions.
▪ Public Information and Awareness – to advise residents, potential buyers, and visitors about hazards, potentially hazardous areas, and mitigation techniques.
FEMA/Cal OES Submission Draft 10-27-2020

Kern Multi-Jurisdiction 2020 MJHMP UpdateCOUNTY OF KERN
2-5
2.4 Successful Mitigation Activities
The 2014 Kern County HMP guiding principles, goals, objectives, and mitigation actions have been implemented through various on-going projects, plans and programs. With respect to the mitigation actions and strategies developed in 2014, Kern County has made improvements toward reducing natural hazard risks to life and property within the County. Significant risk reduction efforts have been made for floodplain management, flood damage prevention, and fire hazard abatement. Table 2-3 summarizes the completed mitigation actions since 2014. These and many other successful policies, programs, and projects are summarized below.
Table 2-3. Completed Mitigation Actions Since 2014 MJHMP
Mitigation No.
Hazard Type
Status Year Primary Agency Title/Description Responsible Party
ma-AH-KC-39
Soil Stability
Completed 2014 County of Kern Bena Landfill Drainage Improvements and Erosion Control
County of Kern Waste Management Department
ma-FL-KC-100
Flood Completed 2014 County of Kern Replace Tehachapi Blvd Bridge at Cache Creek with Reinforced Concrete Box Culvert
Kern County Roads Department
ma-FL-KC-69
Flood Completed 2014 County of Kern Bena Road Bridge Replacements at Caliente Creek and Walker Basin Creek
Kern County Roads Department
ma-FL-KC-94
Flood Completed 2014 County of Kern Emergency Bridge on Pasadena Lane (across Borel Canal)
Kern County Roads Department
ma-FL-KC-95
Flood Completed 2014 County of Kern Cuddy Creek Streambed Restoration at Frazier Mtn Park Rd Bridge
Kern County Roads Department
ma-WF-KC-3
Wildfire Completed 2014 County of Kern Fire Safe Council Development Kern County FD
ma-HM-KC-109
Hazmat Completed 2005 County of Kern Pesticide Accident Response Gap Alleviation Kern County Office of Emergency Services
FEMA/Cal OES Submission Draft 10-27-2020

Kern Multi-Jurisdiction 2020 MJHMP UpdateCOUNTY OF KERN
2-6
Caliente Creek Flood Mitigation Study
Kern County Public Works published the Caliente Creek Habitat Mitigation and Groundwater Recharge Feasibility Study (Feasibility Study) in June 2017, and a counterpart, the Caliente Creek Conceptual Plan in May 2019, as initial steps in flood mitigation for Caliente Creek. The Feasibility Study includes two alternative scenarios for floodplain management. In the first scenario, 267 acres would remain in farming production while the remaining 233 acres would be restored to native vegetation. In the second scenario the entire 500-acre floodplain would be restored to native vegetation with no farming. The Caliente Creek Conceptual Plan includes permitting
requirements and estimated costs for each alternative scenario.
Backup Emergency Generators Installed in the City of Bakersfield
The City of Bakersfield received funding from FEMA’s Hazard Mitigation Grant Program (HMGP) to purchase and install emergency backup generators at Beach Park Storm Lift Station and Pistol Range Storm Lift Station. During rain events, storm runoff drains to the two pump stations, where it is pumped over levees into the river channel. Installing two new backup generators will aid in ensuring that the lift stations remain functional during any storms which might impair access to power, vital to flood protection for the City. The City utilized (HMGP) funds for 75% of the associated costs, matched by local funding.
Removal of Wildfire Prone Dead and Dying Trees throughout Kern County
The combined effects of drought and insect infestation have caused massive tree die-offs both regionally and in Kern County in recent years. Approximately 150 million trees have died from the California drought, which began in 2011. (Smithsonian Magazine, 2019) These trees pose a fire hazard to public facilities owned and operated by the County. The Kern County Fire Department conducted a series of tree removal projects during 2019. Two projects on Sawmill Road and Poso Creek involved the selection and removal of 2,223 dead or dying trees to reduce wildfire hazard in those areas. The County also completed removal projects for Tehachapi Mountain Park, Rancheria Road, Breckenridge Road, the Piute Mountains, Icehouse Road, and Old State Road.
Figure 2-1: Caliente Creek Feasibility Study Area Photo: AECOM (Patch, May 2019)
FEMA/Cal OES Submission Draft 10-27-2020

Kern Multi-Jurisdiction 2020 MJHMP UpdateCOUNTY OF KERN
2-7
The County has also taken administrative steps to mitigate the fire risk of tree die-offs. The County established a Kern County Tree Mortality Task Force which was assembled in order to create a response plan for removing dead and dying hazard trees in addition to serving as a forum for information sharing between local, state, federal, private, and non-profit agencies. One of the principal goals of the Task Force is to collaborate with local, private, and public partners to identify and remove these trees. The Task Force meets on a monthly basis. It has so far been associated with a number of ongoing efforts to remove fire prone trees around Kern County. These include securing state responsibility area fire prevention fund grants, and working with Cal Trans, private landowners, and utility companies to remove trees. (Kern County Fire Department, n.d.)
Kern County Fire Department’s Maintenance of Fire Roads and Fuel Breaks
Kern County Fire Department Road Crews have maintained more than 1,000 miles of fire roads and fuel breaks between 2019 and 2020. Maintaining routes for firefighting is an indispensable mitigation measure to prepare for and lessen the risk of wildland fires on both public and private lands. Maintaining defensible space around key structures or infrastructure is also one of the most cost-effective ways of protecting property from highly combustible material such as grass, brush, and timber.
Walker Basin Creek, Caliente Creek, and Tehachapi Boulevard Bridge Replacements
Two bridges were constructed in 1933 to cross Walker Basin Creek and Caliente Creek. The original construction of these bridges used wood pile and frame with concrete decking. The wooden supports of the construction were severely damaged from flooding activity in 2011, which effectively undermined the supporting framework of the construction. County Engineers inspected the bridge and determined that it was not practical to retrofit or rehabilitate the bridges. They also determined that the bridges were no longer safe for motorists and could collapse under heavy weight. After deciding on an emergency replacement, the County selected a protected box culvert conveyance design. Additionally, the roadway surroundings were modified to provide extensive erosion mitigation in order to protect the roadway and downstream properties from any damage resulting from the culvert capacity being exceeded.
Figure 2-2: U.S. Forest Service Worker Removing Branches from Dead Tree Photo: U.S. Forest Service (Patch, April 2016)
FEMA/Cal OES Submission Draft 10-27-2020

Kern Multi-Jurisdiction 2020 MJHMP UpdateCOUNTY OF KERN
2-8
The Tehachapi bridge replacement resulted from the need to construct an emergency replacement bridge due to the Piute Fire which burned the structural supports of the bridge on July 17, 2012. A new bridge was constructed in 2012 which featured a design of triple box culverts.
Cuddy Creek Bridge and Channel Protection
The Cuddy Creek bridge project consisted of placing concreted-rock channel protection downstream from the bridge in order to prevent further degradation to the bridge, to prevent the channel from an immediate danger of being washed out from potential flooding, and to provide for the general safety of travelers using the bridge. Construction of the project began in October of 2008 and it was completed on November of the same year. There were an additional number of protective measures that were taken during and after construction. These included a Water Diversion Plan, biological monitoring, and post-construction surveys. The County was careful to protect fish and wildlife resources in and around Cuddy Creek. Vehicle access corridors and staging areas were marked with highly visible flags to ensure that environmentally sensitive areas were not disturbed. Excess construction materials were also removed from the project site in order to restore the channel bed and banks to their condition prior to construction.
County-Wide Community Wildfire Protection Plan Update In-Development
Since the 2014 HMP, the County took proactive role in developing Community Wildfire Protection Plans (CWPPs) for the Mount Pinos, Greater Tehachapi, and Kern River Valley areas. The purpose of CWPPs is to reduce wildfire risk through a collaborative process of planning, prioritizing, and implementing hazardous fuels reduction projects. CWPPs are community plans and thus require the involvement of various stakeholders from throughout the County. These were in addition to the development of Fire Safe Councils. Fire Safe Councils are grassroots community-based organizations which share the objective of making California’s communities less vulnerable to catastrophic wildfire.
Figure 2-3: Bena Bridges During Construction Photo: Kern County California (Patch, October 2012)
FEMA/Cal OES Submission Draft 10-27-2020

Kern Multi-Jurisdiction 2020 MJHMP UpdateCOUNTY OF KERN
2-9
The County is currently developing its first county-wide CWPP which encompasses over two million acres and could potentially affect over 70,000 habitable structures. The work is being done by a consultant and is being funded by a Calfire Greenhouse Gas Reduction Fund (GGRF) grant for $93,333. The CWPP will be completed by September 2021.
The CWPP will be broken into three geographic regions:
▪ The Kern River Valley area, which includes the communities of Kernville, Lake Isabella, Bodfish, Alta Sierra, and Glenville.
▪ The Frazier Park area, which includes the communities of Pine Mt. Club, Pinion Pines, and Lake of the Woods.
▪ The greater Tehachapi area, which includes the communities of Keene, Hart Flat, and Bear Valley Springs.
Along with providing important regional wildfire data, it is hoped that involving community members in the CWPP planning process will bring out a new group of potential fire planning leaders.
2.5 Incorporation into other Planning Mechanisms
Over the past 5 years, the 2014 HMP was incorporated into other planning mechanisms as a demonstration of progress in local hazard mitigation effort. This newly-updated HMP will be referenced in the 2020-2021 Kern County Emergency Operations Plan and the 2021 County-Wide CWPP. This update also will be incorporated into planning documents such as the County Flood Mitigation Plan, Groundwater Management Plan, Groundwater Sustainability Plan, General Plan, Wildfire Protection Plan and the Kern County Integrated Regional Water Management (IRWM) Plan in the future.
FEMA/Cal OES Submission Draft 10-27-2020

Kern Multi-Jurisdiction 2020 MJHMP UpdateCOUNTY OF KERN
2-10
INTENTIONAL BLANK PAGE
.
FEMA/Cal OES Submission Draft 10-27-2020

Kern Multi-Jurisdiction 2020 MJHMP UpdateCOUNTY OF KERN
3-1
Section 3. Planning Process This section describes each stage of the planning process used to develop the MJHMP. The planning process provides a framework for document development and follows the FEMA recommended steps as enumerated in federal regulation and outlined herein. This MJHMP is a community-driven, living document. The planning process itself is as important as the resulting plan because it encourages communities to integrate mitigation with day-to-day decision making. This section describes each stage of the planning process.
The Robert T. Stafford Disaster Relief and Emergency Assistance Act, as amended by the Disaster Mitigation Act of 2000 (DMA 2000, 42 U.S.C. § 5165), is intended to “reduce the loss of life and property, human suffering, economic disruption, and disaster assistance costs resulting from natural disasters.” Under this legislation, state, tribal, and local governments must develop a hazard mitigation plan as a condition for receiving certain types of non-emergency disaster assistance through FEMA Hazard Mitigation Assistance. FEMA regulations implementing the DMA 2000 are located at 44 C.F.R. § 201.6 et seq.
FEMA prescribes four major planning steps:
• Step 1: Organize Resources • Step 2: Assess Risk • Step 3: Develop a Mitigation Strategy • Step 4: Adopt and Implement the plan
Each jurisdiction that participated in the MJHMP independently followed the FEMA four step process. Figure 3-1 provides a detailed, phased breakdown of the planning process that each participating jurisdiction completed. These four steps are integrated with a ten step planning process which FEMA’s Community Rating System uses to establish floodplain management credit in addition to Flood Mitigation Assistance programs.
FEMA/Cal OES Submission Draft 10-27-2020

Kern Multi-Jurisdiction 2020 MJHMP UpdateCOUNTY OF KERN
3-2
Figure 3-1: Kern County MHJHMP Planning Process
FEMA/Cal OES Submission Draft 10-27-2020

Kern Multi-Jurisdiction 2020 MJHMP UpdateCOUNTY OF KERN
3-3
STEP 1: Organize Resources
The first step of the MJHMP planning process was organizing resources, consisting of developing the planning team and reviewing relevant existing documents.
Building the Planning Team
The Planning Team was comprised of participants from all participating jurisdictions who worked together to develop the MJHMP. The Planning Team consisted of a Steering Committee, Planning Committee, a broader group of residents and regional stakeholders, and an HMP consultant used for plan development and facilitation.
Steering Committee
The Steering Committee was at the core of the MJHMP planning process and was integral to ensuring the success of the planning process, its implementation, and future maintenance. Members of the Steering Committee, listed in Table 3-1 below, represented each participating jurisdiction and were also a part of the MJHMP Planning Committee, discussed below and in the individual annexes in Volume 2.
Table 3-1: MJHMP Steering Committee
Name Title Department County of Kern
Alexa Kolosky Planner III Public Works Department Andrew Freeborn Public Information Officer Fire Department Brad Aragon Loss Prevention Specialist Kern County Counsel/Risk
Management Brandon Smith Battalion Chief Fire Department Chris Huot Assistant City Manager City of Bakersfield David Witt Fire Chief/Director of
Emergency Services Fire Department
Dennis McNamara Division Chief Planning and Natural Resources Department
Greg Van Mullem Systems Analyst II Assessor-Recorder Jeff Fariss EMS Program Manager Public Health Services
Department
PLANNING TEAM
Stakeholders
Planning Committee
Steering Committe
FEMA/Cal OES Submission Draft 10-27-2020

Kern Multi-Jurisdiction 2020 MJHMP UpdateCOUNTY OF KERN
3-4
Name Title Department Jeffrey Utter GIS Manager Information and Technology
Services Jon Lifquist Assessor-Recorder Assessor-Recorder Jose De Leon GIS Specialist Fire Department Kevin Hamilton Floodplain Manager Public Works Department Lorelei Oviatt Director Planning and Natural
Resources Department Megan Person Director of Countywide
Communications Board of Trade/KGOV
Michael Dillenbeck Public Works Manager Public Works Department Nik Turner GIS Specialist Public Works Department Robert Voyles Public Works Operations
Manager City of Bakersfield
Wendy Benson Administrative Coordinator Fire Department Zachary Wells Battalion Chief Fire Department
Planning Committee
The MJHMP Planning Committee consisted of multiple key decisionmakers with specific expertise to contribute to the planning process from each participating jurisdiction. The Planning Committee served as liaisons to the greater community. Each Planning Committee member was responsible for communicating the direction and status of the planning effort to respective departments and constituents of each jurisdiction and were expected to represent the perspectives of the participating jurisdiction to the Committee.
The Planning Committee was involved in various planning processes, including:
▪ Structured coordination and meetings ▪ Collection of valuable local information and other requested data ▪ Decision making on plan process and content ▪ Development of mitigation actions ▪ Review and comment on plan drafts ▪ Coordination of the public input process
All Planning Committee members did not necessarily attend stakeholder group meetings. Some participated by reviewing draft documents, assisting in individual jurisdictional vulnerability assessments, with public outreach, or at other stages of the process. Table 3-2 provides a list of the Planning Committee Members. Documentation of Planning Committee invitations are provided in Appendix B.
FEMA/Cal OES Submission Draft 10-27-2020

Kern Multi-Jurisdiction 2020 MJHMP UpdateCOUNTY OF KERN
3-5
Table 3-2: MJHMP Planning Committee
Name Title Department County of Kern
Adrianna Kessler Senior Human Resources Manager Department of Human Services
Alexa Kolosky Planner II Public Works Department
Andrew Freeborn Public Information Officer Fire Department
Brandon Smith Battalion Chief Fire Department
Brian Marsh County Director/Farm Advisor Farm and Home Advisor
Carl Brewer Senior CAO Manager, Construction Services County Administrative Office/General Services Division
Carlos Rojas Planner III Planning and Natural Resources Department
Darin Heard Deputy Agricultural Commissioner/Sealer Agricultural and Measurement Standards Department
David Witt Interim Fire Chief/Director of Emergency Services
Fire Department
Dennis McNamara Division Chief Planning and Natural Resources Department
Ed Greynolds
Department of Agriculture
Greg Van Mullem Systems Analyst II Assessor-Recorder
Jared Bradford Planner I Planning and Natural Resources Department
Jeff Fariss EMS Program Manager Public Health Services Department
Jeffrey Utter GIS Manager Information and Technology Services
Jeremy Oliver Program Director Aging & Adult Services Department
John George Supervising Planner Planning and Natural Resources Department
Jose De Leon GIS Specialist Fire Department
Kaler Ayala Fiscal and Policy Analyst III County Administrative Office
Kevin Hamilton Floodplain Manager Public Works Department
Kevin Kimmel
Sheriff's Department
Kimberly Fleming, B.S., M.P.A. Special Projects Manager County Administrative Office/General Services Division
Mark Lewis Business Manager Library
Michael Dillenbeck Waste Management Supervisor Public Works Department
Michael Mata Assistant Probation Division Director Probation Department
Nick Cullen Director Animal Services Department
Nik Turner GIS Specialist Public Works Department
Shane Denton Supervising Park Ranger Kern County Administrative Office/General Services Division
Steve Williams Lieutenant Sheriff's Department
FEMA/Cal OES Submission Draft 10-27-2020

Kern Multi-Jurisdiction 2020 MJHMP UpdateCOUNTY OF KERN
3-6
Name Title Department Zachary Wells Battalion Chief Fire Department
Zack Bittle Sergeant Sheriff's Department
City of Arvin
Cecilia Vela City Clerk City of Arvin
Christine Viterelli Grant Writer City of Arvin
Jerry Breckinridge City Manager City of Arvin
Olan Armstrong Lieutenant Arvin Police Department
Pawan Gill Director of HR and Administrative Services City of Arvin
City of Bakersfield
Brianna Carrier Administrative Analyst III City Manager's Office
Chris Huot Assistant City Manager City of Bakersfield
John Frando Deputy Fire Chief Bakersfield Fire
Kevin Albertson Fire Marshal/Training Officer Bakersfield Fire Department
Robert Voyles Operations Manager City of Bakersfield Public Works Department
Stuart Patteson, P.E. Assistant Public Works Director City of Bakersfield Public Works Department
William Ballard Deputy Fire Chief Bakersfield Fire Department
City of California City
Anna Linn Acting City Manager City of California City
David Orr Firefighter/Paramedic California City Fire Department
Jeremy Kosick Fire Chief / Fire Marshal California City Fire Department
Riuss Jensma Administrator/EOC Coordinator California City Fire Department
City of Delano
Joe Rojas Associate Engineer/Water Coordinator City of Delano
Pattie Castellanos Department Assistant City of Delano Engineering Department
Roman Dowling, P.E. City Engineer / Public Works Director City of Delano Public Works Department
City of Maricopa
Eric Ziegler City Administrator City of Maricopa
Laura Robison Deputy City Clerk City of Maricopa
City of McFarland
Alexander Lee City Planner City of McFarland
Claudia Ceja City Clerk City of McFarland
Diana Garcia Grant Administrator City of McFarland
Maria Lara, M.A. Community Development Director City of McFarland Community Development Department
FEMA/Cal OES Submission Draft 10-27-2020

Kern Multi-Jurisdiction 2020 MJHMP UpdateCOUNTY OF KERN
3-7
Name Title Department City of Ridgecrest
Bard Lower Public Works Director City of Ridgecrest Public Works Department
Heather Spurlock Administrative Secretary City of Ridgecrest Planning Department
Joshua Villa Code Enforcement Officer Ridgecrest Police Department
Ronald Strand City Manager City of Ridgecrest
City of Shafter
Diana Burnett Captain Shafter Police Department
Jeff Bell Captain Shafter Police Department
Kevin Zimmermann Chief Shafter Police Department
Suzanne Forrest Senior Planner City of Shafter Planning Department
Wayne Clausen Planning Director City of Shafter Planning Department
City of Taft
Craig Jones City Manager City of Taft
Damon McMinn Chief Taft Police Department
Lonn Boyer Director of Human Resources/Assistant City Manager
City of Taft
Mark Staples Director of Planning and Development Services
Planning and Development Services
Michelle Kincaid Administrative Assistant to the City Manager
City of Taft
City of Tehachapi
Ashley Whitmore Administrative Manager/Deputy City Clerk City of Tehachapi
Corey Costelloe Assistant to the City Manager City of Tehachapi
Greg Garrett City Manager City of Tehachapi
Kent Kroeger Chief Tehachapi Police Department
Key Budge Community Relations Specialist City of Tehachapi
City of Wasco
Biridiana Bishop Public Works Director City of Wasco Public Works Department
Daniel Ortiz-Hernandez City Manager City of Wasco
Jeff Tackett Water Superintendent City of Wasco
Keri Cobb Senior Planner City of Wasco
Maria Martinez Executive Assistant City of Wasco
Wayne Jackson Facilities Supervisor City of Wasco
Bakersfield City School District
Kristabel Garcia-Diaz Office Manager Bakersfield City School District
Marcos Rodriguez Director, Facilities Bakersfield City School District
FEMA/Cal OES Submission Draft 10-27-2020

Kern Multi-Jurisdiction 2020 MJHMP UpdateCOUNTY OF KERN
3-8
Name Title Department Buttonwillow Union School District
Dana Baugh Administrative Assistant Buttonwillow Union School District
Steven Santillan Lead Bus Driver/Custodian Buttonwillow Union School District
Stuart Packard Superintendent Buttonwillow Union School District
Delano Joint Union High School District
Adrian Maduena Chief Financial Officer Delano Joint Union High School District
Matt Carter Director of MOT Delano Joint Union High School District
Norma Gomez Facilities Technician Delano Joint Union High School District
Edison School District
Todd Noble MOT Director Edison School District
Elk Hills School District
Lenetta Cloud Administrative Assistant to the Superintendent
Elk Hills School District
Ricardo Esquivel Interim Superintendent Elk Hills School District
Fairfax School District
Michael Coleman District Superintendent Fairfax School District
Kern Community College District
Christopher Counts Director, Public Safety Bakersfield College
Joseph Grubbs Executive Director, Risk Assessment and Management
Kern Community College District
Sheila Shearer Coordinator, Risk Management and Safety Kern Community College District
Kern High School District
Benny Wofford Emergency Preparedness & Safety Manager Kern High School District
Brian Mendiburu Director of Student Behavior & Supports Kern High School District
Jenny Hannah Director of Facilities Kern High School District
Kenny Seals, Ed.D. Director of Business Administration Kern High School District
Patrick Blake Emergency Preparedness & Safety Administrator
Kern High School District
Dr. Kenny Seals Director of Business Administration Kern High School District
Ed Komin Chief of Police Kern High School District
Kernville Union School District
Alex Brundage M and O Manager Woodrow Wallace Elementary School
Jennifer Bartlett Secretary Woodrow Wallace Elementary School
Nikolle Evans Director of Maintenance and Operations Kernville Union School District
FEMA/Cal OES Submission Draft 10-27-2020

Kern Multi-Jurisdiction 2020 MJHMP UpdateCOUNTY OF KERN
3-9
Name Title Department Lost Hills Union School District
Harrison Favereaux Chief Administrative Officer Lost Hills Union School District
Jackie Villa
Lost Hills Union School District
Mojave Unified School District
Aaron Haughton, Ed.D. Superintendent Mojave Unified School District
Cassie Hogan Supervisor of Accounting & Categorical Programs
Mojave Unified School District
Keith Gainey Assistant Superintendent - Business Services
Mojave Unified School District
Paula Dickerson Administrative Assistant to the Superintendent
Mojave Unified School District
Panama-Buena Vista Union School District
Glenn Imke Assistant Superintendent of Business Services
Panama-Buena Vista Union School District
Kay Lackey HSRM Coordinator Panama-Buena Vista Union School District
Kevin Silberberg, Ed.D. Superintendent Panama-Buena Vista Union School District
Sandie Taylor Administrative Secretary Panama-Buena Vista Union School District
Pond Union School District
Alex Lopez Superintendent Pond Union School District
Humberto Vargas Director of Transportation Pond Union School District
Kim Howard Administrative Assistant Pond Union School District
Richland School District
Martin Rodriguez Chief Business Officer Richland School District
Yuriana Torres Facilities Planning & Operations Secretary Richland School District
Sierra Sands Unified School District
Bryan Auld Assistant Superintendent, Human Resources Sierra Sands Unified School District
Carol Brewster Human Resource Technician, Human Resources
Sierra Sands Unified School District
Dave Ostash Superintendent Sierra Sands Unified School District
Diane Naslund Administrative Secretary to the Superintendent
Sierra Sands Unified School District
Taft City School District
Janice Dillingham Executive Assistant Taft City School District
Tommy Aguilera MOT Director Taft City School District Tehachapi Unified School District
Julianna Schill Secretary to the Business Services Chief Administrator
Tehachapi Unified School District
FEMA/Cal OES Submission Draft 10-27-2020

Kern Multi-Jurisdiction 2020 MJHMP UpdateCOUNTY OF KERN
3-10
Name Title Department Kelly Patterson Secretary to the Director of Maintenance and
Operations Tehachapi Unified School District
Kirk Gilbert Director of Maintenance and Operations Tehachapi Unified School District
Hojat Entezari Business Services Chief Administrator Tehachapi Unified School District
Stacey Larson-Everson Superintendent Tehachapi Unified School District
Vineland School District
Anabel Rubio Administrative Assistant/Human Resources Vineland School District
Cindy Castro Superintendent Vineland School District
Ivan Mendieta Supervisor, MOT Vineland School District
Special Districts
Bear Valley CSD
Kristy McEwen Secretary of the Board Bear Valley Community Services District
Tim Melanson Chief of Police Bear Valley Community Services District
William Malinen General Manager Bear Valley Community Services District
Buttonwillow RPD
Megan Lucas Office Manager/Program Director Buttonwillow Recreation and Park District
East Niles CSD
Larry White Senior Treatment Operator East Niles Community Services District
Timothy Ruiz, P.E. General Manager East Niles Community Services District
Tony Johnson Superintendent East Niles Community Services District
Indian Wells Valley Airport District
Demi Mace Assistant Manager Indian Wells Valley Airport District
Scott Seymour Manager Indian Wells Valley Airport District
Mojave Air and Space Port
Brandon Welton Deputy Fire Chief Mojave Air and Space Port
Floyd VanWey Facilities Manager Mojave Air and Space Port
Joe Hughes Fire Chief Assistant Mojave Air and Space Port
John Himes Director of Operations Mojave Air and Space Port
North of the River RPD
Joe West CTSA Transportation Supervisor North of the River Recreation and Park District
Monya Jameson General Manager North of the River Recreation and Park District
Paul Anderson Superintendent of Parks North of the River Recreation and Park District
FEMA/Cal OES Submission Draft 10-27-2020

Kern Multi-Jurisdiction 2020 MJHMP UpdateCOUNTY OF KERN
3-11
Name Title Department Rosamond CSD
Brach Smith Director of Public Works Rosamond Community Services District
John Houghton Assistant General Manager/Superintendent Rosamond Community Services District
Lizette Guerrero Director of Administration/Board Secretary Rosamond Community Services District
Shafter RPD
Armando Gonzalez
Shafter Recreation and Park District
Phillip Jimenez District Manager Shafter Recreation and Park District
South Fork MAD
Genel Hodges Clerk of the Board of Trustees South Fork Mosquito Abatement District
Paul Coburn Manager/Technician South Fork Mosquito Abatement District
Stallion Springs CSD
Brad Burris
Stallion Springs Community Services District
David Aranda General Manager Stallion Springs Community Services District
Ed Gordon President, Board of Directors Stallion Springs Community Services District
Tehachapi Valley RPD
Carrie Champlin Business Manager/Clerk of the Board Tehachapi Valley Recreation and Parks District
Corey Torres Interim District Manager Tehachapi Valley Recreation and Park District
Wasco RPD
Vickie Hight District Manager Wasco Recreation and Parks District
West Side RPD
Brad White Maintenance Supervisor West Side Recreation and Park District
Christy Cloud Business Services Supervisor West Side Recreation and Park District
Terra O'Neill Administrative Assistant West Side Recreation and Park District
Arvin CSD Alexis Gaona Chief Operator Arvin Community Services District
Raul Barraza, Jr. General Manager Arvin Community Services District
Arvin-Edison Water Storage District
Chris Krauter General Superintendent Arvin-Edison Water Storage District
Fernando Ceja Engineering Technician Arvin-Edison Water Storage District
FEMA/Cal OES Submission Draft 10-27-2020

Kern Multi-Jurisdiction 2020 MJHMP UpdateCOUNTY OF KERN
3-12
Name Title Department Jeevan Muhar Engineer-Manager Arvin-Edison Water Storage District
Mark Dawson, P.E. Engineer Arvin-Edison Water Storage District
Micah Clark Engineering Technician Arvin-Edison Water Storage District
Sherry Jauch Executive Secretary Arvin-Edison Water Storage District
Berrenda Mesa Water District
Kris Lawrence Regulatory Coordinator Berrenda Mesa Water District / Lost Hills Water District
Phillip Nixon Co-Manager Berrenda Mesa Water District
Steve Bottoms Operations and Maintenance Superintendent
Berrenda Mesa Water District
Buena Vista Water Storage District
Angie Thompson Executive Assistant Buena Vista Water Storage District
Tim Ashlock Engineer-Manager Buena Vista Water Storage District
Buttonwillow County Water District
Regina Houchin Board Secretary Buttonwillow County Water District
Cawelo Water District
David Ansolabehere General Manager Cawelo Water District
Ford City-Taft Heights Sanitation District
Adrian Nava Engineer III-C Ford City-Taft Heights Sanitation District
Jason Nordine Wastewater Specialist II Ford City-Taft Heights Sanitation District
Kyle Perez Engineer II Ford City-Taft Heights Sanitation District and Kern Sanitation Authority
Leslie Edwards Engineer III-C Ford City-Taft Heights Sanitation District and Kern Sanitation Authority
Rositza Lopez Administrative Coordinator Ford City-Taft Heights Sanitation District
Golden Hills CSD
Debbie Lee Administrative Assistant Golden Hills Community Services District
Susan Wells General Manager Golden Hills Community Services District
Greenfield County Water District
Mel Johnson General Manager Greenfield County Water District
Nick Cooper Operations Manager Greenfield County Water District
Windy Rojas Office Manager Greenfield County Water District
Kern County Water Agency
Monica Tennant Water Resources Planner Kern County Water Agency
FEMA/Cal OES Submission Draft 10-27-2020

Kern Multi-Jurisdiction 2020 MJHMP UpdateCOUNTY OF KERN
3-13
Name Title Department Kern Delta Water District
Jana Marquez Groundwater Manager Kern Delta Water District
Steven Teglia General Manager Kern Delta Water District
Kern Sanitation Authority
Adrian Nava Engineer III-C Kern Sanitation Authority
Jason Nordine Wastewater Specialist II Kern Sanitation Authority
Leslie Edwards Engineer III-C Ford City-Taft Heights Sanitation District and Kern Sanitation Authority
Rositza Lopez Administrative Coordinator Kern Sanitation Authority
Kern-Tulare Water District
Skye Grass Resources Manager Kern-Tulare Water District
Steven Dalke General Manager Kern-Tulare Water District
Vanessa Yap Staff Engineer Kern-Tulare Water District
Lost Hills Water District
Kris Lawrence Regulatory Coordinator Berrenda Mesa Water District/Lost Hills Water District
North of River Sanitary District No. 1
Megan Lee Office Administrator North of River Sanitary District No. 1
Patrick Ostly District Manager North of River Sanitary District No. 1
North of the River Municipal Water District
Carol Havens Office Manager / Controller North of the River Municipal Water District
Doug Nunneley General Manager/Secretary-Treasurer North of the River Municipal Water District
Ryan Nunneley
North of the River Municipal Water District
Semitropic Water Storage District
Isela Medina Staff Engineer, Water Resources Semitropic Water Storage District
John Luna Engineering Technician Semitropic Water Storage District
Marsha Payne Executive Secretary Semitropic Water Storage District
Tehachapi-Cummings County Water District
Cat Adams Executive Assistant and Board Secretary Tehachapi-Cummings County Water District
Curtis Hilliker Operations Assistant Tehachapi-Cummings County Water District
Tom Neisler General Manager Tehachapi-Cummings County Water District
Troy DePriest Operations Manager Tehachapi-Cummings County Water District
FEMA/Cal OES Submission Draft 10-27-2020

Kern Multi-Jurisdiction 2020 MJHMP UpdateCOUNTY OF KERN
3-14
Name Title Department West Kern Water District
Andrea Crabb Technical Analyst West Kern Water District
Deann Crabtree General Manager West Kern Water District
Greg Hammett General Manager West Kern Water District
Tami Sivils Human Resource Administrator West Kern Water District
Wheeler Ridge-Maricopa Water Storage District
Eric McDaris Contract Administrator Wheeler Ridge-Maricopa Water Storage District
Thomas Suggs, P.E., P.G., H.G. Staff Engineer Wheeler Ridge-Maricopa Water Storage District
Stakeholders
Aaron Bock Chief Planner Tulare County RMA - Planning
Amanda Verhaege Emergency Services Coordinator Kings County Fire Department
Amy Rocha District Conservationist Natural Resources Conservation Service
Andrew Lockman Emergency Services Manager Tulare County Office of Emergency Services
Antelope Valley Conservancy
Ariana Joven Executive Director Kern County Farm Bureau
Ben Raymond Regional Planner Kern Council of Governments
Bernice Romo Assistant Team Manager, Sand Canyon Greater Tehachapi Valley CERT
Bob Belcher Assistant Coordinator Bakersfield CERT
Brad Aragon Loss Prevention Specialist Kern County Counsel/Risk Management
Brandon Bates Acting Area Conservationist, New Mexico - South Area
Natural Resources Conservation Service
Brenda Dawson Coordinator Indian Wells Valley CERT
Brian Hockett District Manager North West Kern Resource Conservation District
Brian Thoburn Governmental Relations Manager Southern California Edison
Brian Uhl Emergency Services Manager Santa Barbara County Office of Emergency Management
Cal Rossi Government Relations Manager Southern California Edison
Cathreen Richards Director Inyo County Planning Department
Chris Hickernell General Superintendent Friant Water Authority
Christian Buenrostro Mechanical Engineer, Operations Division, South-Central California Area Office
U. S. Bureau of Reclamation
Colt Esenwein Director County of San Luis Obispo Public Works Department
David Brinsfield CenCal ADFMO Bureau of Land Management
David Burt Assistant Coordinator Stallion Springs CERT
FEMA/Cal OES Submission Draft 10-27-2020

Kern Multi-Jurisdiction 2020 MJHMP UpdateCOUNTY OF KERN
3-15
Name Title Department David Davis Emergency Services Officer San Bernardino County Office of
Emergency Services David Reiner Assistant Coordinator Mountain Communities CERT
David Romo Team Manager, Sand Canyon Greater Tehachapi Valley CERT
David Shaw Coordinator / Team Manager, Golden Hills/Tehachapi
Greater Tehachapi Valley CERT
Dayne Yancey Pine Mountain Club CERT
Dean Ott Assistant Coordinator Kern River Valley CERT
Douglas DeFitch Chief Operating Officer Friant Water Authority
Dylan Van Dyne Project Manager U. S. Army Corps of Engineers
Ed Gordon President, Board of Directors Stallion Springs Community Services District
Ed Rieth Pine Mountain Club POA
Emily Montanez Senior Program Manager, Chief Executive Office
Los Angeles County Office of Emergency Management
Emmanuel Gonzalez Hinojosa Soil Conservationist Natural Resources Conservation Service
Frank Trotta Superintendent, Kern River Valley California Water Service Company
Gary Crowell Interim Chief Stallion Springs Police Department
Gary Darcy Coordinator Rosamond CERT
Geoff Fulks District Manager, Bakersfield District California Water Service Company
Gerald Simon VP, Chief Safety, Sec & EPO California Water Service Company
Gina Darcy Assistant Coordinator Rosamond CERT
Greg Gatzka Community Development Director Kings County Community Development Agency
Helen Chavez Assistant Director Los Angeles County Office of Emergency Management
Hunter Merritt Water Resources Planner, Public Involvement Specialist
U.S. Army Corps of Engineers, Sacramento District
J. D. Saucedo Emergency Manager Santa Barbara County Office of Emergency Management
James Nelson Team Manager, Bear Valley Springs Greater Tehachapi Valley CERT
Jeannie Taylor Kern County CERT Coordinator Kern County Fire Department
Jeannine Giuffre President Tehachapi Resource Conservation District
Jeffrey Kestly Senior Public Safety Specialist PG&E
Jim Mason Coordinator Mountain Communities CERT
Joe Guzzardi Emergency Services Manager San Luis Obispo County Office of Emergency Services
Jon Yasin Local Manager, Kern River Valley District California Water Service Company
Jose Pena Superintendent California Water Service Company
Justin Gagnon Los Padres National Forest
FEMA/Cal OES Submission Draft 10-27-2020

Kern Multi-Jurisdiction 2020 MJHMP UpdateCOUNTY OF KERN
3-16
Name Title Department Karin Shulman General Manager Pine Mountain Club POA
Kathy Gibson Emergency Manager Ventura County Office of Emergency Services
Katie Allen Marketing and Communications PG&E
Kelley Williams Emergency Services Manager County of Inyo
Kern River Valley Heritage Foundation
Kim Lary District Conservationist Natural Resources Conservation Service
Kristen Doud Government Relations Representative, Corporate Affairs
PG&E
Leif Mathiesen Bakersfield Zone Fire Management Officer Bureau of Land Management
Lynn Greer Outreach Program Specialist / Public Involvement
U. S. Army Corps of Engineers
Marty Pepito Superintendent California Water Service Company
Matt Gutierrez Risk Manager Risk Management Division
Michael Dyer Technical Specialist Santa Barbara County Office of Emergency Management
Michael Heimer Regional Planner III Kern Council of Governments
Michael Washam Associate Director Tulare County Resource Management Agency
Mike Martinez Assistant DFMO Suppression United States Forest Service
Miles Wagner Emergency Services Officer San Bernardino County OES
Monica Williams Hazard Mitigation Grants Specialist Governor's Office of Emergency Services
Nancy Gooch Administrative Assistant Eastern Kern County Resource Conservation District
Nick Lesourd Natural Disaster Program Manager EOC
Pat Wood Senior Civil Engineer Los Angeles County Public Works Department
Peggy Hoyt-Voelker Pine Mountain Club POA
Phillip Dixon District Conservationist Natural Resources Conservation Service
Phyllis Throckmorton Pine Mountain Club POA
Rafael Molina California Water Service Company
Reed Schenke Director Tulare County Resource Management Agency
Rob Dixon Team Manager, Old West Ranch Greater Tehachapi Valley CERT
Ross Miller Chief Engineer Tulare County Resource Management Agency
Sally Thoun Team Manager, Alpine Forest Greater Tehachapi Valley CERT
Sandy Young Coordinator Stallion Springs CERT
FEMA/Cal OES Submission Draft 10-27-2020

Kern Multi-Jurisdiction 2020 MJHMP UpdateCOUNTY OF KERN
3-17
Name Title Department Sarah Rose Assistant Team Manager, Golden
Hills/Tehachapi Greater Tehachapi Valley CERT
Scott Milner Emergency Services Coordinator San Luis Obispo County Office of Emergency Services
Sergio Vargas Deputy Director, Watershed Planning & Permits Division
Ventura County Watershed Protection District
Seth Mitchell District Fire Management Officer (Detailed) United States Forest Service
Shane Santos Assistant District Fire Manager United States Forest Service
Stephanie Stephens Hazard Mitigation Grants Specialist Governor's Office of Emergency Services
Steve Doe, Ph.D., P.E. Chief, Special Investigations Branch, South Central Region Office
California Department of Water Resources
Steven Larson Chief, Pre-Disaster and Flood Mitigation Division
Governor's Office of Emergency Services
Terri Mejorado Emergency Services Coordinator Governor's Office of Emergency Services
Terry Butler Assistant Coordinator Pine Mountain Club CERT
Thomas Klein Coordinator Kern River Valley CERT
Thomas Yancey Coordinator Pine Mountain Club CERT
Wendy Wang Water Resources Engineer, Central Valley Flood Planning Office
California Department of Water Resources
The County enlisted Dynamic Planning + Science (DP+S or Planning Consultant Team) due to its expertise in assisting public sector entities with developing hazard mitigation plans. DP+S staff facilitated the planning process, collected, and analyzed data, produced meeting materials, and produced drafts of the MJHMP for review. The MJHMP Consultant Team, as shown in Table 3-3, consisted of a variety of hazard mitigation and certified urban planning professionals.
Table 3-3: MJHMP Update Consultant Team
HMP Update Project Team HMP Update Project Team Role
Ethan Mobley, AICP Project Manager / Hazard Mitigation Planner Brian Greer GIS Specialist/Spatial Analyst Torie Jarvis Assistant Project Manager Ty Johnson Hazard Mitigation Planner Daniel Spivak Hazard Mitigation Planner Alex Krebs GIS Associate
FEMA/Cal OES Submission Draft 10-27-2020

Kern Multi-Jurisdiction 2020 MJHMP UpdateCOUNTY OF KERN
3-18
Planning Committee Meetings
The Planning Committee met throughout the development of the updated MJHMP. Table 3-4 charts those meetings, including date, type, and topics discussed. Meeting documentation, including agendas, hazard maps, PowerPoint presentations, minutes, sign-in sheets, and other relevant handouts, are provided in Appendix B.
Table 3-4: Meeting Summary
Date Meeting Type Topics
April 12th, 2019
Planning Committee Kickoff Meeting
▪ Welcome and Introductions ▪ Statement of Work Review ▪ Expectations from Participating Jurisdictions ▪ DMA 2000 Requirements ▪ Project Schedule ▪ Data Calls/Data Review ▪ Next Steps
May 23rd, 2019
Planning Committee Meeting #1
▪ Welcome and Introductions ▪ Mitigation Planning Defined ▪ Expectations from Participating Jurisdictions ▪ Planning Process Review ▪ Project Schedule ▪ Website Review ▪ FEMA Hazard Mitigation Program ▪ 2012 Mitigation plan Review ▪ What has Changed? ▪ Outreach ▪ Next Steps
July 18th, 2019
Planning Committee Meeting #2
▪ Welcome and Introductions ▪ Meeting #1 Recap ▪ Planning Team Development ▪ Risk Assessment Data Review ▪ RAMP Tool Review ▪ RAMP Tool Exercises ▪ Next Steps
September 19th, 2019
Planning Committee Meeting #3
▪ Welcome and Introductions ▪ Planning Process Recap ▪ Pinpointing Your Vulnerabilities ▪ Developing a Nexus to HMA Funding ▪ Closeout
November 14th, 2019
Planning Committee Meeting #4
▪ Welcome and Introductions ▪ Planning Process Recap ▪ Mitigation Alternatives ▪ Hazard Areas of Concern ▪ Goals & Objectives Review (previous plan) ▪ Updating the Mitigation Strategy
FEMA/Cal OES Submission Draft 10-27-2020

Kern Multi-Jurisdiction 2020 MJHMP UpdateCOUNTY OF KERN
3-19
Public Involvement and Outreach
Public involvement is an important and requisite component of any HMP update. The public outreach strategy for this update maximized public involvement throughout the planning process and utilized websites, local media, and community face-to-face efforts.
As required by FEMA, the general public was given an opportunity to be involved in the planning process while developing the HMP Update through surveys, a project website, and public review periods. Each is described below.
Surveys
An 8-question community survey was distributed via the County Nixle Account and website, Facebook page, and e-mail blasts. A total of 1,173survey responses were collected, including 4 Spanish-speaking survey responses. The results of the survey were used to ensure that the priorities of the County and participating jurisdictions match those of the residents/community members. For example, community members were asked if they believe their property was at risk from a natural hazard disaster; 77.9% said “yes.” An example result is displayed in Figure 3-2, while full survey results are discussed in Section 5.5.1.2. The full survey results can be found in Appendix B.
Figure 3-2 Snapshot of community survey results from English-speaking survey. Results are captured fully in Appendix B.
FEMA/Cal OES Submission Draft 10-27-2020

Kern Multi-Jurisdiction 2020 MJHMP UpdateCOUNTY OF KERN
3-20
HMP Update Website
For this MJHMP, a project portal at http://mitigatehazards.com/county-of-kern/ served and will continue to serve as a centralized project information and file-sharing platform. This website provides a tool for project management, collaborative content, and one-stop-shop for mitigation planning resources.
In addition to internal coordination, the project portal played a critical role in public involvement throughout the planning process and documenting public involvement including the community survey, meetings, and working sessions. Resources such as the Risk Assessment Mapping Platform (RAMP) and links to all meeting summaries are available to the public via the website. Project participants and stakeholders used the website as a project resource for the duration of the planning process and will continue to have access during the 5-year update cycle and beyond. Public Review of Draft HMP
The public reviewed the draft HMP during July of 2020. The County and several other jurisdictions announced the available public draft via their websites, and the drafts were available at http://mitigatehazards.com/county-of-kern/. The public was able to provide comment via a collaborative PDF, an online submission form, or an email. The notice and response to comments received are available in Appendix B.
STEP 2: Assess the Risk
In accordance with FEMA requirements, the Planning Committee identified and prioritized the natural hazards affecting both Kern County as a whole and each participating jurisdiction individually. It also assessed the vulnerability from those identified hazards. Results from this risk assessment aided subsequent identification of appropriate mitigation actions. While the process is described below, the substance of this risk assessment is detailed in Section 4.
Identify/Profile Hazards
Based on a review of past hazard events, existing plans, reports, and other technical studies, data, and information, the Planning Committee determined if regional hazards could affect the planning area. The Planning Committee completed screening and prioritization processes to determine priority hazards to be assessed. A risk assessment finalized the prioritization process by ranking hazards according to the impact and threat to the County in Vol. 1 and to each participating jurisdiction in Annex HMPs.
Assess Vulnerabilities
Assessing vulnerabilities exposes the unique characteristics of individual hazards and begins the process of narrowing down which areas within Kern County are vulnerable to specific hazard events. The vulnerability assessment included field visits and a GIS overlaying method for examining such
FEMA/Cal OES Submission Draft 10-27-2020

Kern Multi-Jurisdiction 2020 MJHMP UpdateCOUNTY OF KERN
3-21
vulnerabilities more in depth. Participating jurisdictions completed this exercise both singly and jointly with the County, and the identified hazards varied widely depending on the geographic make-up of, priorities of, and services provided by the participating jurisdiction. Using these methods, participating jurisdictions estimated vulnerable populations, infrastructure, and potential losses from hazards.
Updated content for each hazard profile for the County, including vulnerability, is provided in Section 4.5. Participating jurisdictions are profiled individually in Volume 2 of this plan as Annex HMPs.
Web Based Risk Assessment Mapping and Analysis The web based and interactive Risk Assessment Mapping Platform (RAMP), accessed via the project website at www.mitigatehazards.com, allows interactive discovery of robust risk, vulnerability, and exposure data developed especially for Kern County. RAMP is a mapping platform built specifically for mitigation planning. It displays County facilities and buildings overlaid with natural hazards layers to bring interactivity and individual discovery to the GIS analysis performed for the MJHMP. Figure 3-3 shows the location of RAMP on the project website.
Figure 3-3: RAMP Facilities Map Access at mitigatehazards.com
The Planning Team used RAMP in meetings and as needed to understand vulnerabilities to the County and participating jurisdiction facilities. Users interactively filter facilities and buildings by natural hazard zones and/or construction characteristics.
RAMP’s robust data filtering and summation calculations allow the user to understand and visualize vulnerabilities at the facility level with detailed information on the number of structures exposed to various natural hazards. RAMP enables Kern County to pinpoint vulnerabilities and reinforces problem statements in the mitigation strategy. Figure 3-4 demonstrates the RAMP web-based interface.
FEMA/Cal OES Submission Draft 10-27-2020

Kern Multi-Jurisdiction 2020 MJHMP UpdateCOUNTY OF KERN
3-22
Figure 3-4: RAMP showing the population of Bakersfield overlaid with FEMA Flood Hazard
STEP 3: Develop a Mitigation Strategy
The MJHMP was prepared in accordance with requirements from DMA 2000 and the California Office of Planning and Research (OPR) and FEMA’s HMP guidance. This document provides an explicit strategy and blueprint for reducing potential losses identified in the risk assessment based on existing authorities, policies, programs and resources, and participating jurisdictions’ abilities to expand on and improve these existing tools. MJHMP development included identifying goals, assessing existing capabilities, reviewing the 2013 HMP goals, and identifying new mitigation actions. The process is described below; the substance of the mitigation strategy is detailed in Section 5 for the County and within Annex HMPs for other participating jurisdictions.
Identify Goals
The Planning Committee reviewed the 2014 HMP goals and determined their current validity, consistent with FEMA requirements. The goals and objectives were updated to meet the current hazard environments and to be consistent with the changing policies and goals of participating organizations. The Goals and Objectives are presented in Section 5.3.4.1.
Develop Capabilities Assessment
A capabilities assessment is a comprehensive review of participating jurisdictions’ capabilities and tools to implement the mitigation actions in the MJHMP. The Planning Committee identified technical, financial, and administrative capabilities to implement mitigation actions, as detailed in Section 5.3 and in Annex HMPs.
FEMA/Cal OES Submission Draft 10-27-2020

Kern Multi-Jurisdiction 2020 MJHMP UpdateCOUNTY OF KERN
3-23
Identify Hazard Problem Statements
The Planning Committee developed mitigation actions, as both planning activities and projects, to address problems that could originate from hazards identified in the risk assessment, in line with identified capability of each jurisdiction. Mitigation actions were created first by developing problem statements for prioritized hazards. As a rule of thumb, each hazard problem statement should be mitigated with a combination of short-term and long-range planning activities, either through operational and or physical projects. Hazard Problem Statements are located at the conclusion of each hazard profile in table format and are also uploaded in an interactive web-based Mitigation Action Support Tool (MAST), described below. Hazard problem statements for the County and other participating jurisdictions are categorized as impact-related, victim-related, or threat-related, as described in Figure 3-5.
Figure 3-5. Categories of issues addressed in problem statements
Identify Mitigation Actions
As part of the MJHMP planning process, the Planning Committee reviewed and analyzed the status of the mitigation actions identified in the 2014 HMP. The Consultant Team and Planning Committee then worked together to identify and develop new mitigation actions with implementation elements. The Planning Committee prioritized and further detailed the implementation strategies during Planning Committee Meeting #3. Additional detail on these mitigation actions is provided in Section 5.3.
Mitigation Action Support Tool (MAST)
Hazard problem statements and mitigation activities are presented and will be updated through a web interface application developed specifically for participating jurisdictions, truly creating a living document
IMPACTCasualties
Property Damage
Business Interruption
Financial Loss
Environmental Contamination
VICTIM
School Children in Hazard High
Hazard Areas
Care Facilities in High Hazard
Area
Vulnerable Population Exposed to
hazards
THREAT
Increased Fuels due to drought
Hotter, drier climates
More Intense Storms
Impervious surfaces = greater
runoff
Increases of Invasive Species
FEMA/Cal OES Submission Draft 10-27-2020

Kern Multi-Jurisdiction 2020 MJHMP UpdateCOUNTY OF KERN
3-24
that can continue to be a valuable resource into the future. The Mitigation Action Support Tool (MAST) is accessible through www.mitigatehazards.com
MAST is a web-based interactive tool that enables multiple users to search, view, enter, and update mitigation actions, ideas or projects, and other information. MAST provides participating jurisdictions and plan reviewers (California Office of Emergency Services (Cal OES) and FEMA) access to valuable mitigation information that can be leveraged by future planning or other risk reduction efforts within the County. Participating jurisdictions can update the status of their mitigation projects throughout the planning lifecycle, and this web-based tool will improve participating jurisdiction’s ability to apply for FEMA’s Hazard Mitigation Assistance (HMA) grant programs including initial grant application processes through Cal OES.
County Planning Processes Library
Kern County assessed hazards, explored hazard vulnerability, developed mitigation strategies, and followed the planning process as described in this section. Table 3-5 provides planning library links for Kern County to each individual vulnerability task that was completed throughout the planning process.
Table 3-5 Kern County Links to HMP Resources
Jurisdiction Planning Library Links
Kern County Risk Assessment – View Maps / Download maps Hazard Prioritization – View Risk Matrix Areas of Concern – View Problem Statements Capability Assessments – View Capability Assessment
Multi-Jurisdiction Planning Process
Multi-jurisdiction hazard mitigation planning offers many benefits, such as increased coordination and efficiency in planning and implementation efforts. At the same time, each jurisdiction has specific hazards and specific mitigation actions that must be addressed individually. The MJHMP balances the benefits of a comprehensive, coordinated approach to hazard mitigation with the specific realities of individual participating jurisdictions. Multi-jurisdiction plans are contemplated under FEMA regulations at 44 C.F.R. § 201.6(4).
Volume 2 of this MJHMP documents each jurisdiction’s HMP resources. Each participating jurisdiction individually assessed hazards, explored hazard vulnerability, developed mitigation strategies, and followed the same planning process as Kern County to create the annexes. Volume 2 provides links to each participating jurisdiction’s stand-alone annex and its vulnerability assessment tasks completed. This ensures each jurisdiction can quickly and easily access its annex, making it a more usable document than a large, unwieldly combined document.
FEMA/Cal OES Submission Draft 10-27-2020

Kern Multi-Jurisdiction 2020 MJHMP UpdateCOUNTY OF KERN
3-25
STEP 4: Adopt and Implement the Plan
Once the risk assessment and mitigation strategy were completed, information, data, and associated narratives were compiled into the MJHMP. Section 2 provides detailed information on new and updated elements of the MJHMP.
Plan Review and Revision
Once the Draft MJHMP Update was completed, a public and government review period was established for official review and revision. Public comments were accepted, reviewed, and incorporated into this update. Applicable comments from the public have been received and addressed prior to the “authorization to submit” to FEMA and Cal OES. Notice of the public comment period is included in Appendix B.
Plan Adoption and Submittal
This plan has been submitted and approved by FEMA and adopted by the County. Copies of the resolutions are provided in forward of this document. NOTE: adoption proceedings will be completed after approval by Cal OES and FEMA.
Implement, Evaluate, and Revise the Plan
The true worth of any mitigation plan is its implementation and success under FEMA’s grant programs. This MJHMP has been assembled to reduce the risk of natural hazards, and also to meet the requirements of the DMA 2000 and maintain eligibility under FEMA’s Hazard Mitigation Assistance (HMA) grant programs.
FEMA administers three programs that provide funding for local agencies with approved mitigation plans:
▪ Hazard Mitigation Grant Program (HMGP), which assists in implementing long-term hazard mitigation planning and projects following a Presidential major disaster declaration.
▪ Building Resilient Infrastructure and Communities (BRIC), which provides funds for hazard mitigation planning and projects on an annual basis.
▪ Flood Mitigation Assistance (FMA), which provides funds for planning and projects to reduce or eliminate risk of flood damage to buildings that are insured under the National Flood Insurance Program (NFIP) on an annual basis.
For more information about FEMA HMA, visit: https://www.fema.gov/hazard-mitigation-assistance.
FEMA/Cal OES Submission Draft 10-27-2020

Kern Multi-Jurisdiction 2020 MJHMP UpdateCOUNTY OF KERN
3-26
Plan Maintenance
The County will update and monitor this plan in accordance with all FEMA requirements in order maintain eligibility for FEMA HMA. Evaluation and revision procedures for this plan are detailed in Section 6.
Section 6 includes the measures Kern County and participating jurisdictions will take to ensure the MJHMP’s continuous long‐term implementation, including MJHMP monitoring, reporting, evaluation, maintenance, and updating. Most of this implementation and maintenance will be done through MAST. Figure 3-6 demonstrates how MAST information will translate into Cal OES NOIs and grant sub application requests. Section 6 also contains specifics on integrating mitigation with day-to-day decision making.
Figure 3-6 MAST elements and Cal OES Grant Applications
FEMA/Cal OES Submission Draft 10-27-2020

Kern Multi-Jurisdiction 2020 MJHMP UpdateCOUNTY OF KERN
4-1
Section 4. Risk Assessment The risk assessment measures the potential impact to life, property, and the economy resulting from natural hazards. The intent of the Risk Assessment is to identify the qualitative and quantitative vulnerabilities of a community to the greatest extent possible given available data. The risk assessment increases understanding of natural hazard impacts to the community and provides a foundation to develop and prioritize mitigation actions. In turn, mitigation actions reduce damage from natural disasters through increased preparedness and focus resources to areas of greatest vulnerability.
This risk assessment section evaluates potential loss from a hazard event by assessing the vulnerability of buildings, infrastructure, and people. It identifies the characteristics and potential consequences of hazards, explores how much of the County could be affected by a hazard, and assesses the impact on County assets. The risk assessment approach consists of three (3) components:
▪ HAZARD IDENTIFICATION AND SCREENING
Identification and screening of hazards (Section 4.1)
▪ HAZARD PRIORITIZATION
Identifying “priority hazards” for each participating jurisdiction to be profiled in more detail (Section 4.2)
▪ VULNERABILITY ASSESSMENT
Determination of potential losses or impacts to buildings, infrastructure and population
This section contains HAZARD PROFILES for individual priority hazards (Section 4.5)
4.1 Hazard Identification and Screening
Per FEMA Guidance, the first step in developing the Risk Assessment is identifying the hazards. This step includes two parts. First, the MJHMP Planning Team considered and screened a broad set of hazards presented in relevant local, regional, and statewide hazard planning documents. The crosswalk of documents reviewed and the results of screening the relevant hazards to be reviewed are outlined in Section 4.1.1. Second, the MJHMP considered past hazard events in Kern County to help prioritize hazards to be evaluated in this document, as outlined in Section 0.
FEMA/Cal OES Submission Draft 10-27-2020

Kern Multi-Jurisdiction 2020 MJHMP UpdateCOUNTY OF KERN
4-2
4.1.1 Hazard Screening
The County’s MJHMP Planning Team first reviewed previously-prepared hazard mitigation plans and other relevant documents to determine the realm of natural hazards that have the potential to affect the County and the nearby region. Table 4-1 provides a crosswalk of hazards identified in the 2014 Kern County MJHMP, 2009 Kern County General Plan, and the 2018 California State Hazard Mitigation Plan. Eighteen different hazards were identified based on a thorough document review. The crosswalk was used to develop a preliminary hazards list, providing a framework for MJHMP Planning Team members to evaluate which hazards were truly relevant to participating jurisdictions and which ones were not. For example, volcanoes were considered to have no relevance to the County, while earthquake, flood, dam failure, landslide, and wildfire were indicated in every hazard document.
Table 4-1: Document Review Crosswalk
Hazards
2014 Kern County
MJHMP
2009 Kern County
General Plan
2018 California State
HMP
Agricultural Pests ■ Climate Change ■ ■ Dam Failure ■ ■ ■ Drought ■ ■ Earthquake ■ ■ ■ Flood ■ ■ ■ Insect Hazards ■ Landslide ■ ■ ■ Levee Failure ■ ■ Manmade Hazards ■ ■ Pandemic Disease ■ ■ Sea Level Rise ■ Severe Weather ■ ■ Soil Hazards ■ ■ Terrorism & Tech Hazards ■ Tsunami ■ Volcano ■ ■ Wildfire ■ ■ ■
The crosswalk provided the basis for prioritizing hazards to be profiled, displayed in Table 4-2. The prioritized hazards have detailed hazard profiles in Section 4.5, the Vulnerability Assessment.
FEMA/Cal OES Submission Draft 10-27-2020

Kern Multi-Jurisdiction 2020 MJHMP UpdateCOUNTY OF KERN
4-3
Table 4-2. Hazard prioritization
Hazard Type Explanation
Climate Change High priority county-wide, profiled as part of Flood, Wildfire, and Severe Weather hazard.
Dam failure High priority county-wide, profiled hazard.
Drought High priority county-wide, profiled hazard
Dust Storms High priority county-wide; profiled as part of Severe Weather Earthquake/ Geologic Hazards High priority county-wide, profiled hazard Extreme Heat Profiled as part of Severe Weather hazard
Extreme Cold Extreme cold is rare in Kern County and not profiled in this plan
Flood High priority county-wide, profiled hazard Hail Hail events are rare in Kern County and not profiled in this plan
Fog While fog events do occur within Kern County, they are rare and are not considered a priority
Hazardous Material While hazardous materials can release and impact the County, there are better avenues to address this hazard outside this plan.
High Winds/ Straight Line Winds High priority county-wide, profiled as part of Severe Weather
Insect Hazards While insects including Africanized honeybee and pine bark beetle exist in Kern County, this was not considered a priority and pests are not profiled in this plan
Levee Failure High priority county-wide, profiled as part of Dam Failure
Lightning Lightning was not identified as a priority for this plan.
Pandemic Disease While pandemic disease can impact the County, there are better avenues to address this hazard outside this plan. See Note after table for additional info.
Radon This hazard was not identified as a priority
Severe Thunderstorm Severe thunderstorms are rare in Kern County and not profiled in this plan.
Slope Failure High priority county-wide, profiled hazard
Soil Hazards High priority county-wide, profiled hazard
Terrorism/Human Caused Threats While terrorism is certainly a threat to the County and participating jurisdictions, it is best addressed in other plans as this HMP does not address human caused threats.
Tornado Impacts to the County from tornados are extremely unlikely, if any.
Volcanic Activity Due to distance from volcanoes and the limited chance of an eruption, this hazard was not identified as a priority.
Wildfire High priority county-wide, profiled hazard
Winter Storm / Freeze Events Profiled as part of Severe Weather hazard
FEMA/Cal OES Submission Draft 10-27-2020

Kern Multi-Jurisdiction 2020 MJHMP UpdateCOUNTY OF KERN
4-4
Note regarding pandemic: The County’s pandemic planning efforts go back to at least 2006, when a working group prepared a pandemic influenza continuity of operations report that was presented to the Kern Operational Area Emergency Council. At the time, the Emergency Council approved moving forward with the working group’s recommendations. Several months later, the report was distributed to the managers of the incorporated cities so they could work on their own pandemic response planning.
The region has continued to move forward implementing recommendations, including the Kern County Board of Supervisors approving labor relations guidelines that would be activated in the event of a pandemic disaster or other disaster that affected employees’ availability at their worksites. The guidelines were put into practice during the COVID-19 pandemic in Spring 2020.
In 2012, the need to plan continuity of operations from a perspective broader than solely pandemic influenza was identified. Subsequently, pandemic influenza continuity of operations planning evolved into all-hazards continuity of operations planning.
All-hazards continuity of operations planning continued as an in-County effort until late 2012, when efforts began to hire a consultant to review the County-produced documents, identify inconsistencies, and deliver a Countywide Continuity of Operations Plan (COOP). In 2014, the Board of Supervisors hired a consultant.
COOP development continues. Staff from the responsible County department continues to work with departments to reconcile any conflicting information included in the COOP, such as multiple departments that inadvertently plan to use the same continuity facility. The COOP will eventually be integrated into the overall County EOP, which is in the process of being updated.
FEMA/Cal OES Submission Draft 10-27-2020

Kern Multi-Jurisdiction 2020 MJHMP UpdateCOUNTY OF KERN
4-5
4.1.2 Past Major Hazard Events
One important consideration in identifying and prioritizing hazards is past major hazard events, especially those that triggered federal or state disaster declarations. The MJHMP Planning Team reviewed and considered past major hazard events in Kern County as part of the screening and identification process. During this Plan update process, the Planning Team concluded its review of past major hazard events and identified the hazards that would be profiled in the updated MJHMP in July 2019, approximately six months before the COVID-19 pandemic began.
Most available information on major past hazard events comes from federal or state disaster declarations. These declarations may be granted when the severity and magnitude of an event surpasses the ability of the local government to respond and recover. Additional federal or state disaster funding (or both) is generally available in response to a disaster declaration. State funding assistance is provided when a local government’s capacity to respond to the disaster is exceeded. Should the disaster be so severe that both the local and state governments’ capacities are exceeded, a federal emergency or disaster declaration may be issued allowing for the provision of federal assistance.
The federal government may issue a disaster declaration through FEMA, the U.S. Department of Agriculture (USDA), and the Small Business Administration (SBA). FEMA also issues emergency declarations, which are more limited in scope and do not include the long-term federal recovery programs that accompany major disaster declarations. Quantity and types of damage are the determining factors.
Kern County has received 32 federal disaster declarations1 since 1953, some of which were statewide, including:
9 Wildfires 2 Earthquakes
11 Severe Weather
1 Drought
5 Floods
Severe weather and flooding events are most likely to occur in the winter months, with twenty-five of the 54 federally-declared disasters occurring in January and February. Wildfires have typically occurred in the late summer and fall, with 170 wildfire declarations from July through October. Table 4-3 lists federal disaster declarations in Kern County since 1995.
1 Officially, 33 disasters have been declared, as California was declared as part of Hurricane Katrina evacuation; however, no disaster occurred in California.
FEMA/Cal OES Submission Draft 10-27-2020

Kern Multi-Jurisdiction 2020 MJHMP UpdateCOUNTY OF KERN
4-6
Table 4-3: Disaster Declarations in Kern County 1995- present
Year Date Declared Incident Description Disaster Number
2019 07/19 Earthquake EM-3415 2017 03/17 Severe Winter Storms, Flooding, & Mudslides DR-4305 2016 08/16 California Cedar Fire FM-5150 2016 06/16 California Erskine Fire FM-5131 2011 09/11 California Canyon Fire FM-2961 2011 09/11 California Comanche Fire Complex FM-2971 2011 09/11 California Keene Fire Complex FM-2970 2011 01/11 Winter Storms, Flooding, & Debris & Mudflow DR-1952 2010 07/10 California Bull Fire FM-2849 2010 09/10 California Canyon Fire FM-2858 2010 08/10 California Post Fire FM-2852 2010 07/10 California West Fire FM-2850 2008 06/08 California Wildfires EM-3287 2007 03/07 Severe Freeze DR-1689 2005 09/05 Hurricane Katrina Evacuation EM-3248 2005 02/05 Severe Storms, Flooding, Debris Flow, & Mudslides DR-1577 2005 04/05 Severe Storms, Flooding, Landslides, & Mud/Debris Flow DR-1585 2003 06/03 California Sawmill Fire FM-2473 2003 06/03 California Tejon Fire FM-2474 2002 07/02 California Deer Fire FSA-2450 1999 02/99 Severe Storms, Tornadoes, High Winds, and Flooding DR1267 1998 02/98 Severe Winter Storms and Flooding DR-1203 1995 03/95 Severe Winter Storms, Flooding, Landslides, Mud Flows DR-1046 1995 01/95 Severe Winter Storms, Flooding, Landslides, Mud Flows DR-1044
Source: FEMA Disaster Database via http://mitigatehazards.com/hazard-mapping/ , accessed 03/04/2020.
Drought declarations may also occur through the United States Department of Agriculture (USDA), as agricultural areas such as Kern County can be particularly impacted from drought. A USDA disaster declaration certifies that the affected county has suffered at least a 30-percent loss in one or more crop or livestock areas and provides affected producers with access to low-interest loans and other programs to help mitigate the impact of the drought. Importantly, all counties neighboring those receiving disaster declarations are eligible for the same assistance. Since 1995, Kern County qualified for USDA drought assistance in 2006 and 2009.
FEMA/Cal OES Submission Draft 10-27-2020
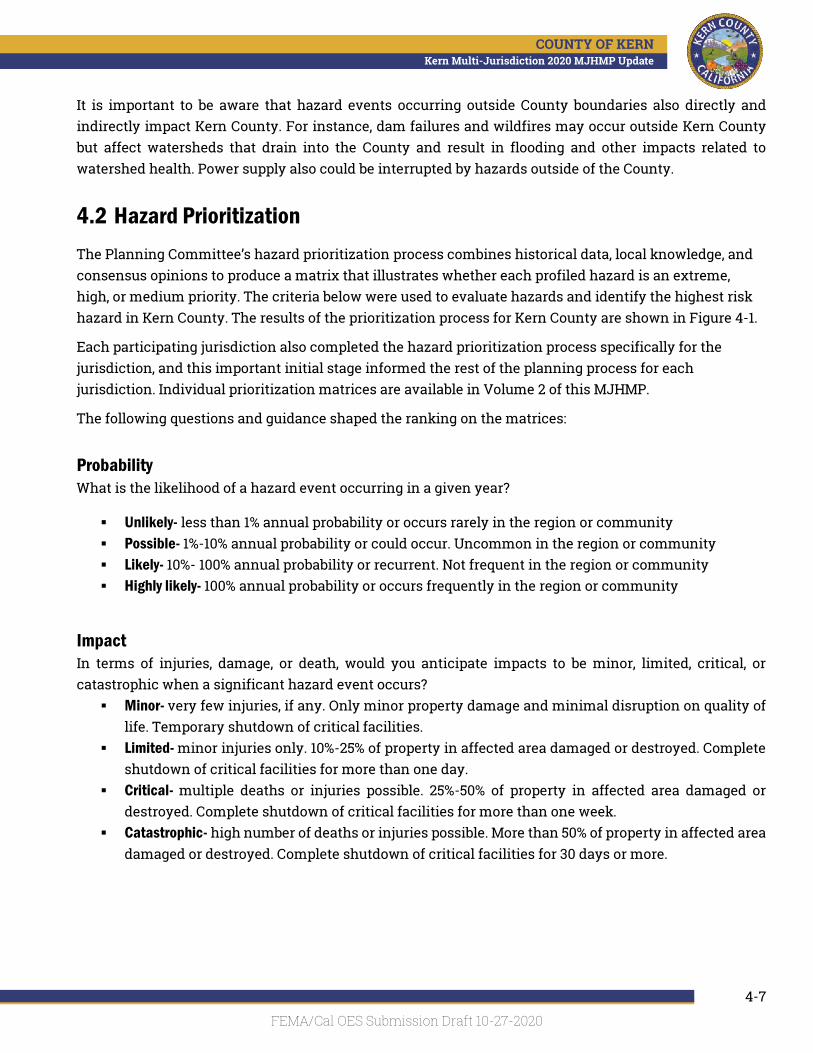
Kern Multi-Jurisdiction 2020 MJHMP UpdateCOUNTY OF KERN
4-7
It is important to be aware that hazard events occurring outside County boundaries also directly and indirectly impact Kern County. For instance, dam failures and wildfires may occur outside Kern County but affect watersheds that drain into the County and result in flooding and other impacts related to watershed health. Power supply also could be interrupted by hazards outside of the County.
4.2 Hazard Prioritization
The Planning Committee’s hazard prioritization process combines historical data, local knowledge, and consensus opinions to produce a matrix that illustrates whether each profiled hazard is an extreme, high, or medium priority. The criteria below were used to evaluate hazards and identify the highest risk hazard in Kern County. The results of the prioritization process for Kern County are shown in Figure 4-1.
Each participating jurisdiction also completed the hazard prioritization process specifically for the jurisdiction, and this important initial stage informed the rest of the planning process for each jurisdiction. Individual prioritization matrices are available in Volume 2 of this MJHMP.
The following questions and guidance shaped the ranking on the matrices:
Probability What is the likelihood of a hazard event occurring in a given year?
▪ Unlikely- less than 1% annual probability or occurs rarely in the region or community ▪ Possible- 1%-10% annual probability or could occur. Uncommon in the region or community ▪ Likely- 10%- 100% annual probability or recurrent. Not frequent in the region or community ▪ Highly likely- 100% annual probability or occurs frequently in the region or community
Impact In terms of injuries, damage, or death, would you anticipate impacts to be minor, limited, critical, or catastrophic when a significant hazard event occurs?
▪ Minor- very few injuries, if any. Only minor property damage and minimal disruption on quality of life. Temporary shutdown of critical facilities.
▪ Limited- minor injuries only. 10%-25% of property in affected area damaged or destroyed. Complete shutdown of critical facilities for more than one day.
▪ Critical- multiple deaths or injuries possible. 25%-50% of property in affected area damaged or destroyed. Complete shutdown of critical facilities for more than one week.
▪ Catastrophic- high number of deaths or injuries possible. More than 50% of property in affected area damaged or destroyed. Complete shutdown of critical facilities for 30 days or more.
FEMA/Cal OES Submission Draft 10-27-2020

Kern Multi-Jurisdiction 2020 MJHMP UpdateCOUNTY OF KERN
4-8
Figure 4-1 Prioritized Hazard Assessment Matrix for Kern County
FEMA/Cal OES Submission Draft 10-27-2020

Kern Multi-Jurisdiction 2020 MJHMP UpdateCOUNTY OF KERN
4-9
4.3 Kern County Geographic and Demographic Profile
The geographic and demographic profile for Kern County and participating jurisdictions sets the stage for the vulnerability assessment. Paired with the vulnerability assessment, the regional profile can help guide jurisdictions’ resources to key populations and geographic areas.
4.3.1 Geography
Kern County is located in southern California, at the southern end of California’s San Joaquin Valley. Kern County is California’s third-largest county in land area, and at 8,172 square miles, is larger than the land area of Massachusetts, New Jersey, or Hawaii. It is also larger than the areas of Delaware, Rhode Island, and Connecticut combined (California State Association of Counties, 2014). Elevations range from a low of 206' above sea level along the northern border of the county to a high of 8824' in southwest Kern County, just north of the summit of Mt. Pinos (the summit is in Ventura County). The County is bordered by Los Angeles and Ventura Counties on the south, San Bernardino County on the east, Inyo, Tulare and Kings Counties on the north, and San Luis Obispo and Santa Barbara Counties on the west.
Kern County is as diverse as it is large. Terrain varies dramatically within the County, from the fertile lowlands of the San Joaquin Valley, rugged mountain peaks of the southern Sierra Nevada and Tehachapi mountains, to the sweeping panoramas of the Mojave Desert. The County contains the San Joaquin Valley, the Mojave Desert, and interspersed mountain regions. The San Joaquin Valley floor comprises most of the western third of the County and is the population and agricultural center. Mountain ranges include the Sierra Nevada Range, the Tehachapi Range, Temblor Range, El Tejon Mountains, and Tecuya Ridge. The Mojave Desert covers roughly the eastern quarter of the County. Many of the hazards experienced throughout Kern County are more prevalent in one region or another. For example, the mountain region is more susceptible to wildfires while the valley region may be more impacted by drought.
Kern’s main water sources are snowmelt from the Sierras that feed into the Kern River from other tributaries and groundwater resources of the San Joaquin Valley and Mojave Desert. The Lake Isabella Dam on the Kern River is the major surface water impoundment in the County. Another important man-made body of water is the Gov. Edmund Brown Aqueduct (also called the California Aqueduct), which carries up to 2 million gallons of water per minute south from the Sacramento River Delta, through Kern County, and into metropolitan Los Angeles. The single largest water user is the Kern County Water Agency, who receives as much as 1 million acre-feet per year for its member districts who hold agricultural and municipal and industrial water supply contracts with the Agency. The aqueduct is visible along portions of Interstate 5, as are powerful pumping stations that help carry its flow over the Tehachapi Mountains towards Los Angeles. (Water Education Foundation, 2020)
Figure 4-2 displays a geographic overview of Kern County.
FEMA/Cal OES Submission Draft 10-27-2020

Kern Multi-Jurisdiction 2020 MJHMP UpdateCOUNTY OF KERN
4-10
Figure 4-2 Kern County Geographic Overview
4.3.2 Climate
Due to a highly varied geography, Kern County has a diverse range of climates, determined largely by elevation and precipitation. Temperatures are marked by extremes, with summertime highs topping 100 degrees in the San Joaquin Valley and Mojave Desert, while winter temperatures dip into the teens during snowfalls in the higher mountains. Generally, the County is classified as desert or semi-arid, with hot, dry summers and mild, humid winters. In most areas, 90 percent of the precipitation occurs between November and April. The Valley averages 3 to 7 inches of precipitation annually. The western side of the Tehachapi and Sierra Nevada Ranges receive as much as 40 inches of precipitation a year. The desert averages 3 to 6 inches of precipitation a year but is extremely variable. Snowfall is rare in the desert and valley regions but may range from 1 to 4 inches. (Kern County Flood Insurance Study, 2008)
4.3.3 Demographics and Vulnerable Populations
Population information directly relates to the impact of hazards and to other community needs such as housing, industry, stores, public facilities and services, and transportation. Knowledge of the composition of the population, how it has changed, and how it may change in the future helps with future decision making. The United States Census Bureau estimated Kern County’s population to be 896,764 in 2018, an estimated 7% increase since 2010. ( United States Census Bureau, 2018) This is in contrast to an estimated 6% population increase in California in the same period. (Id.)
FEMA/Cal OES Submission Draft 10-27-2020

Kern Multi-Jurisdiction 2020 MJHMP UpdateCOUNTY OF KERN
4-11
Importantly, demographics help identify which populations may be particularly vulnerable to hazard events. Some populations are at greater risk because of age, resources, physical abilities, or other factors. Vulnerability in the face of a hazard event is not a fixed characteristic; the same person may be at risk for some hazards but not at risk for others. For example, a low-income family without a car may be at risk for a wildfire or flood if a quick evaluation is necessary but prepared in the event of an earthquake. Some individuals are highly and permanently vulnerable to many hazards, such as the frail elderly; people living with chronic sensory, mobility, or cognitive impairments; and individuals dependent upon assistive devices or complex medical regimens in order to survive. (National Center for Disaster Preparedness, 2020) Vulnerable populations also may be living in hazard-prone areas, compounding their risk.
In the context of all-hazards preparedness and response planning, at-risk individuals (often used interchangeably with “vulnerable populations”) are defined federally as “children, pregnant women, senior citizens, and other individuals who have access or functional needs in the event of a public health emergency.” (42 U.S.C. § 2802(b)(4)(B)(2019)) Examples of these populations may include, but are not limited to, individuals with disabilities, individuals who live in institutional settings, individuals from diverse cultures, individuals who have limited English proficiency or are non-English speaking, individuals who are transportation-disadvantaged, individuals experiencing homelessness, individuals who have chronic medical disorders, and individuals who have pharmacological dependency.
Natural resource managers may be able to reduce vulnerability of certain populations by increasing the adaptive capacity of affected communities. Examples include cost-sharing to reduce fuels, stabilize structures, or implement flood-reducing measures or educational programs offered in English and Spanish and targeted to specific populations. Specifically planning for vulnerable populations in hazard mitigation can help prioritize resources where they will be the most effective.
This section explores the various demographic and economic circumstances surrounding common vulnerable populations.
FEMA/Cal OES Submission Draft 10-27-2020

Kern Multi-Jurisdiction 2020 MJHMP UpdateCOUNTY OF KERN
4-12
4.3.3.1 Income & Housing
Income or wealth is one of the most important factors in natural hazard vulnerability. First, lower income populations are less able to afford housing and other infrastructure that can withstand extreme events. The poor typically occupy more poorly-built and inadequately-maintained housing. For example, mobile or modular homes are more susceptible to damage in earthquakes and floods than other types of housing. In urban areas, the poor often live in older houses and apartment complexes which are more likely to be made of un-reinforced masonry, a building type that is particularly susceptible to damage during earthquakes.
Second, low income populations are less able to purchase resources needed for disaster response. In the United States, individual households are expected to use private resources to prepare for, respond to, and recover from disasters, to a large extent. This means that households living in poverty and minorities are disadvantaged when confronting hazards. The more affluent are able to relocate to safer areas or rebuild following a hazard event. Moreover, individuals who do not own cars or who cannot afford gas for their cars will likely decide not to evacuate. (Krause & Reeves, 2017)
Furthermore, residents below the poverty level are less likely to have insurance to compensate for losses incurred from natural disasters. This means that residents below the poverty level have a great deal to lose during an event and are the least prepared to deal with potential losses. Hurricane events such as Harvey, Irma, and Katrina demonstrate that low-income and minority communities are more vulnerable to hazard events, and they struggle to recover the most. (Id.)
Figure 4-3 shows the median household income distribution for Kern County. The “median” is the value that divides the distribution of household income into two equal parts (e.g., the middle). The median household income in Kern County in 2015 (in 2015 dollars) was estimated to be $55,775, compared to $56,516 across the U.S. (United States Census Bureau, 2015)
FEMA/Cal OES Submission Draft 10-27-2020

Kern Multi-Jurisdiction 2020 MJHMP UpdateCOUNTY OF KERN
4-13
4.3.3.2 Age
Children and the elderly may be more vulnerable during an extreme hazard event.
Specific planning attention for the elderly is an important consideration, especially given the current aging of the American population. Elderly vulnerability can vary significantly based on health, age, and economic security. However, as a group, the elderly more often lack the physical and economic resources necessary for response to hazard events and are more likely to suffer health-related consequences that make recovery slower. They are more likely to be vision, hearing, or mobility impaired and more likely to experience mental impairment or dementia.
Additionally, elderly persons are more likely to live in assisted-living facilities where emergency preparedness occurs at the discretion of facility operators. These facilities are typically identified as “critical facilities” by emergency managers because they require extra notice to implement evacuation. Elderly residents living in their own homes may have more difficulty evacuating their homes and could be stranded in dangerous situations.
Lower-income elderly populations are less likely to have access to medical care due to financial hardship and are more likely to need special medical attention which may not be readily available during natural disasters.
In many cases, both children and the elderly depend on others to care for them during day-to-day life. Very young children and the elderly may be vulnerable to injury or sickness; this vulnerability can be worsened during a natural disaster because they may not understand the measures that need to be taken to protect themselves from hazards. They also may be weaker and less able to survive a hazard event.
Finally, both children and the elderly have fewer financial resources and are frequently dependent on others for survival. For these populations to remain resilient before and after a natural hazard event, it may be necessary to assist residents with resources provided by the County, Cities, State and Federal emergency management agencies and organizations.
Based on the 2015 American Community Survey, 14% of Kern County’s population is 65 or older. The overall age distribution for Kern County is illustrated in Figure 4-4 for population under 18 and Figure 4-5 for population over 65. Figure 4-5 shows that the highest concentrations of people over the age of 65 are east of Arvin. (United States Census Bureau, 2015)
FEMA/Cal OES Submission Draft 10-27-2020

Kern Multi-Jurisdiction 2020 MJHMP UpdateCOUNTY OF KERN
4-14
Figure 4-3: Median Household Income Distribution
FEMA/Cal OES Submission Draft 10-27-2020

Kern Multi-Jurisdiction 2020 MJHMP UpdateCOUNTY OF KERN
4-15
Figure 4-4: Population Under Age 18
FEMA/Cal OES Submission Draft 10-27-2020

Kern Multi-Jurisdiction 2020 MJHMP UpdateCOUNTY OF KERN
4-16
Figure 4-5: Population Over Age 65
FEMA/Cal OES Submission Draft 10-27-2020

Kern Multi-Jurisdiction 2020 MJHMP UpdateCOUNTY OF KERN
4-17
4.3.3.3 Race, Ethnicity and Language
Non-English or limited-English speakers may have difficulty understanding emergency information as a result of language and literacy barriers. Non-white communities in fire-prone areas appear from research to be less able to adapt to a wildfire event. (Levin, Phil; Davies, Ian, 2019) Another study found that communities of color lose up to $29,000 on average in personal wealth following events like hurricanes and wildfires. (Mandel, How Natural Disasters Widen the Wealth Gap Between Mintority and White Communities, 2018) Since higher proportions of ethnic minorities live below the poverty line than the majority white population, poverty can compound vulnerability. Farm workers may be particularly vulnerable during a hazard event, especially those non-English speaking and those living in temporary worker housing. (California Employment Development Department, 2019) . (U.S. Dep't of Ag, 2017)
According to the 2017 American Community Survey estimates, Kern County is predominately white, at 75.1% of the total population. The largest minority population is Hispanic or Latino, at 52% of the total county population. This percentage includes other applicable race categories. See Figure 4-6 for the racial distribution within Kern County and a source note explaining the percentage estimates.
Figure 4-6: Kern County Race Distribution in 2017
Source: 2017 American Community Survey Note: Hispanics may be of any race, so are included in applicable race categories. This has the effect of influencing total population percentage. (a) Includes persons reporting only one race. (b) Hispanics may be of any race, so also are included in applicable race categories
75%
52%
5%
1%
5%
0.2%
3%
0% 10% 20% 30% 40% 50% 60% 70% 80%
White
Hispanic (b)
Black or AfricanAmerican (a)
American Indian &Alaska Native (a)
Asian (a)
Native Hawaiian &Other Pacific Islander (a)
Two or More Races
FEMA/Cal OES Submission Draft 10-27-2020

Kern Multi-Jurisdiction 2020 MJHMP UpdateCOUNTY OF KERN
4-18
4.3.3.4 At-risk Individuals with Access and Functional Needs
Another vulnerable population is individuals with access and functional needs that may interfere with their ability to access or receive medical care before, during, or after a disaster or emergency. Irrespective of specific diagnosis, status, or label, the term “access and functional needs” refers to a broad set of cross-cutting access and function-based needs, generally distinguished into access-based or function-based needs according to the following:
▪ Access-based needs require that resources are accessible to all individuals, such as social services, accommodations, information, transportation, and medications to maintain health.
▪ Function-based needs refer to restrictions or limitations an individual may have that requires assistance before, during, and after a disaster or public health emergency.
At-risk individuals may have additional needs that must be considered in planning for, responding to, and recovering from a disaster or emergency. A recommended approach for integrating the access and functional needs of these individuals is to consider elements based on the CMIST (defined below) Framework:
▪ Communication – Individuals who may have limitations that interfere with the receipt of and response to information require information be provided in an appropriate and accessible format. This can include individuals who are deaf or hard of hearing, individuals who speak American Sign Language, individuals who have limited or no English proficiency, individuals who are blind or have low vision, and individuals who have cognitive or physiological limitations.
▪ Maintaining Health – Individuals who may require Personal Assistance Services (or personal care assistance) in maintaining their activities of daily living such as eating, dressing, grooming, transferring, and toileting. Independence – Includes individuals who function independently if they have their assistive devices, such as consumable medical supplies (diapers, formula, bandages, ostomy supplies, etc.), durable medical equipment (wheelchairs, walkers, scooters, etc.), and/or service animals.
▪ Services and Support – Includes support for individuals with behavioral health needs, those who have psychiatric conditions (such as dementia, Alzheimer's disease, Schizophrenia, severe mental illness), pregnant women, nursing mothers, infants, and children.
▪ Transportation – Includes individuals with transportation needs because of age, disability, temporary injury, poverty, addiction, legal restriction, or those who do not have access to a vehicle. This requires coordination to ensure access to mass transit and accessible vehicles such as para-transit. (Services, 2016)
While most individuals with access and functional needs do not have acute medical needs requiring the support of trained medical professionals, many will require assistance to maintain health and minimize preventable medical conditions. These individuals may require more time and assistance during an evacuation. It is estimated that over 38% of people over age 65 have some form of disability, as shown in
FEMA/Cal OES Submission Draft 10-27-2020

Kern Multi-Jurisdiction 2020 MJHMP UpdateCOUNTY OF KERN
4-19
Table 4-4. (United States Census Bureau, 2018) These numbers warrant special attention from planners and emergency managers.
Table 4-4: Disability Status of Non-Institutionalized Population in Kern County in 2017
Age Persons with a Disability Percent of Age Group
Under 18 years 9,279 4
18 to 64 years 52,065 10
Age 65 years and over 34,097 40
Source: 2017 American Community Survey
4.3.4 Economy
Agriculture has been Kern County's number one industry for many years. Kern County ranks in the top four California counties in agricultural production. Kern County became the leading county with an agricultural production value of $7.19 billion in 2016. (California Department of Food and Agriculture, 2017) Leading export commodities include almonds, apples, carrots, cotton, garlic, grapes, onions, oranges, pistachios, plums, and roses. These commodities are exported to over 85 foreign countries. The Pacific Rim, including China, Hong Kong, Japan, Republic of Korea, Australia, Canada, India, Vietnam, and the Philippines, receive most of the exported commodities. (2017 Kern County Agricultural Crop Report, 2017)
Kern County had the most farm workers in California in 2016, totaling 150,300, defined by an individual having at least one farm job. In Kern County, the number of farmworkers rose 25% in 2015. (University of California, 2019) The leading sectors of farm employment in Kern County include farm labor contractors (97,900), tree nut farming (11,800), grape vineyards (11,300), other vegetables and melon farming (3,100), and other non-citrus fruit farming (3,000).
A high percentage of farmworkers in Kern County are estimated to be migrant workers. Some of these farm workers may not have proper documentation to be working in the U.S. and may be more hesitant to seek aid or ask questions to properly prepare for a hazard event because of their immigration status. Farmworkers in Kern County are paid an average wage significantly below the national average. In 2014, the average annual wage in the Kern County food system was $24,182, compared to $43,737 for all industries. (Sustainable Agriculture Research and Education Program, 2017)
Kern ranks as the largest oil-producing county in the state, with most of the 30,000 working oil wells studding the hills along the western edge of the County. In the desert to the east, the military plays an important role as the home to Edwards Air Force Base and the China Lake Naval Weapons Center. Edwards Air Force Base ranks among the best-known military installations in the country, being the site of many space shuttle landings, and the place where Air Force test pilots push the limits of aircraft under development.
The population centers of Kern County generally correlate with the economic bases for the regions.
FEMA/Cal OES Submission Draft 10-27-2020

Kern Multi-Jurisdiction 2020 MJHMP UpdateCOUNTY OF KERN
4-20
Bakersfield, the county seat, is home to over one-third of the County's residents and has seen continued economic growth. Ridgecrest, Tehachapi, and Mojave in the east are aligned with military installations that provide employment. Eastern Kern County is known as a space industry employer. Rosamond provides reasonably priced homes to Los Angeles commuters. Taft and other smaller communities in the southern area of Kern are contiguous to large petroleum fields that have been in operation since the early 1900's. Lamont, Arvin, Delano, Shafter, and Lost Hills provide services and homes to the workers who labor in the fields of the large farms and ranches in the county.
The Kern economy can fluctuate more than other counties because of the cyclical nature of the agricultural, military support, and petroleum industries that comprise the largest segments of the Kern economy. Kern County, CA, had the largest percentage decrease in GDP (-0.7 percent). The mining, quarrying, and oil and gas extraction industry (primarily oil and gas extraction) was the leading contributor to the decrease. (United States Bureau of Economic Analysis, 2018) 2017 unemployment in the County was at 11%. (US Census Bureau, 2017) According to the Bureau of Labor Statistics, in Dec 2019 there were 357,700 jobs in all industries in Kern County. Table 4-5 shows the number of jobs by sector in the County of the top ten occupations in 2018. The top sectors farming, fishing, and forestry related, office and administrative support occupations related, and sales and related occupations.
Table 4-5: Top 10 Jobs by Occupation in Kern County1 in May 2018
Occupation
Percent of total
employment (in %)
Mean hourly
wage (in $)
Farming, Fishing, and Forestry 13.3 11.77 Office and Administrative Support Occupations 11.7 18.43 Sales and Related Occupations 8.1 17.96 Food Preparation and Serving Related 7.8 12.95 Education, Training, and Library Occupations 7.5 31.65 Transportation and Material Moving 7.0 18.69 Construction and Extraction 5.4 25.72 Healthcare Practitioners and Technical Occupations 4.8 40.66 Installation, Maintenance, and Repair 4.3 24.75 Production Occupations 3.8 18.84 Management Occupations 3.7 54.56
1 The Bureau of Labor Statistics refers to Kern County as the “Bakersfield, California Metropolitan Statistical Area.”
Source: Bureau of Labor Statistics, May 2018, https://www.bls.gov/regions/west/news-release/occupationalemploymentandwages_bakersfield.htm.
4.3.5 Past and Future Trends in Development
Kern County has long been on the forefront of planning for the preservation of agricultural lands and intends to remain leaders in planning for a sustainable future. Kern County has retained its prime agricultural lands in production, even while vast tracts of farmland in other parts of the state have been
FEMA/Cal OES Submission Draft 10-27-2020

Kern Multi-Jurisdiction 2020 MJHMP UpdateCOUNTY OF KERN
4-21
urbanized. Looking to the future, there are a number of demographic and land use trends relating to housing, population, and employment issues.
Past development that most increased the risk of hazards in the County happened many decades and even more than a century ago. The County and other participating jurisdictions are well aware of areas of increased hazard risk through older development.
More recently, development in the last few decades has occurred with minimized hazard risk because of existing overlay of federal, state, and local regulation. First, the County and its municipal planning partners all adopt general plans (GPs) which serve as blueprints for establishing long-range development policies, as directed with California’s General Planning Law. A GP provides a basis for private development proposals and public projects to remain consistent with existing city, regional and state policies. The GP is designed to help the County and participating jurisdictions address issues related to land use, circulation (traffic), housing, open space, conservation, noise, and safety. The Land Use portion of the plan helps guide the County and participating jurisdictions in determining the location of future development(s), to include possible future annexations for municipal jurisdictions. The Safety Element of the GP serves to decrease risk of impact from natural hazards through multiple required elements and subsection most importunately through the health and safety as required by the California Sate Law.
All planning partners reviewed their general plans under the capability assessments undertaken for this hazard mitigation plan. Deficiencies revealed by these reviews are identified as mitigation actions to decrease risks to move beyond past trends.
Moreover, while past development has occurred in hazard areas to some degree, increasing hazard risks, development standards and performance measures, often times incorporated into specific plans, policy plans, and master plans, are employed to reduce risk. These development standards are continually improving and will continue to strengthen into the future.
The total housing units forecast for Kern County includes occupied and vacant housing units. Current methodologies utilized for estimating housing trend predictions include projections based on jobs-to-housing ratios. These models indicate that the region’s housing stock will increase by about 1.2 percent per year, but multifamily housing will grow faster, by about 2.3 percent per year, compared to 0.9 percent per year for single family housing. Population forecasts indicate that the County’s household population (those living in households) will increase annually by about 1.8% whereas its group quarters population (those living in institutional settings, primarily correctional facilities, college dormitories, and nursing homes) will increase by about 1.1% annually between 2015 and 2050. (Kern Council of Governments, 2015)
Current employment forecasts predict a lower level of growth in the farming sector over the next 35 years. This reflects the potential impact of water supply constraints and the potential conversion of farmland to other uses such as habitat conservation, water recharge, solar, and urban development. The forecast does show an increase in the mining, logging, and oil and gas exploration and extraction sector. Employment in this sector is almost exclusively in oil and gas. Employment in this sector could vary based on the
FEMA/Cal OES Submission Draft 10-27-2020

Kern Multi-Jurisdiction 2020 MJHMP UpdateCOUNTY OF KERN
4-22
consistency of oil prices. Total employment forecasts predict an upward trend in growth. (Kern Council of Governments, 2015)
General trends in development indicate a growth pattern which began in 2010 and was reaffirmed in 2013 by a more robust housing market. Wise public policies and social trends explain the healthier trend. For instance, there was federal intervention in the mortgage market and rising incomes. The federal government changed housing finance patterns which consequently influenced how housing was built, bought, and sold in the United States. Additionally, migration patterns help to explain demographic forecasts in the San Joaquin Valley. These trends explain development patterns among many of the Counties in the Valley, including Kern County. (Kern Council of Governments, 2015)
Participating jurisdictions have gone to great lengths to ensure future development within hazard areas is minimized and mitigated to the greatest extent possible. Section 5.3 (Capabilities Assessment) of Volume 1 for the County and each jurisdiction’s capabilities assessment of Volume 2 of this MJHMP explain those proactive steps in greater detail. Buildings are increasingly more resilient to hazards through California’s building codes, some of the strongest in the country. Nationally, building codes have continually improved disaster resilience, and since 1990 those great improvements have only added about 1% to construction costs. (National Institute of Building Sciences, 2019)
FEMA/Cal OES Submission Draft 10-27-2020

Kern Multi-Jurisdiction 2020 MJHMP UpdateCOUNTY OF KERN
4-23
4.4 Vulnerability Assessment Methods
This section provides an overview of the methods used in the vulnerability assessments in Section 4.5. Vulnerabilities to each hazard are assessed in a two-step process, as outlined in this section. First, population, critical facilities, and county parcels are inventoried to develop a “lay of the land.” Second, the inventories are used to calculate estimated exposure and damage from hazards at various levels of severity. A more detailed explanation of the methodology is included in Appendix A.
The vulnerability assessment utilizes geospatial data along with local knowledge of past events. Geospatial data is essential in determining population and assets exposed to hazards identified in this plan. Geospatial analysis can be conducted if a natural hazard has a spatial footprint that can be analyzed against the locations of people and assets. In Kern County, dam failure, earthquake, flooding, landslide, soil subsidence, and wildfire have identifiable geographic extents and corresponding spatial information about each hazard.
Figure 4-7 illustrates the data inputs and outputs used to create the vulnerability analyses for each hazard in Section 4.5.
Figure 4-7: Data Source and Method
4.4.1 Population and Asset Inventory
In order to describe vulnerability for each hazard, it is important to first understand the total population and total assets at risk. The population and asset inventories provide a baseline to measure the significance or vulnerability to people and assets for natural hazard events. The asset inventories can also be used to estimate damages and losses expected during a “worst case scenario” event for each hazard. The following sections provide a description of the total population, critical facilities, and parcel inventory inputs.
FEMA/Cal OES Submission Draft 10-27-2020

Kern Multi-Jurisdiction 2020 MJHMP UpdateCOUNTY OF KERN
4-24
4.4.1.1 Population
An initial step in producing the hazard-specific vulnerability assessments is to determine the population near each natural hazard. Each natural hazard scenario affects the County residents differently depending on the location of the hazard and the population density of where the hazard event could occur. For hazards that potentially affect the whole county such as earthquake or drought, the vulnerability assessment assumes 896,764 persons or 100% of the County’s population is exposed. 2 Vulnerability assessments presented in Section 4.5 summarize the population exposure for each natural hazard if available.
4.4.1.2 Critical Facilities Inventory
Critical facilities are of particular concern when planning to mitigate hazards. A critical facility is a structure or other improvement that, because of its function, size, service area, or uniqueness, has the potential to cause disruption of vital socioeconomic activities if it is destroyed, damaged, or functionally impaired.
Critical facilities inventory data was developed from a variety of sources, including County, City, District, State, Federal, and private industry datasets. A critical infrastructure spatial database was developed to translate critical facilities information into georeferenced3 points and lifelines.
Critical facility points include police stations, fire stations, hospitals, elder care facilities, day care facilities, buildings containing hazardous materials (HAZMAT), schools, transportation infrastructure, utilities, and government buildings. Lifelines include communication, electric power, liquid fuel, natural gas, and transportation routes. A current representation of the critical facility points and lifelines are provided in Figure 4-8. Some critical facility information has been omitted from this document due to national security purposes.
Critical facilities and transportation and lifeline data came from a collection of sources, including but not limited to Kern County GIS, Kern County and local jurisdiction insurance data, California Department of Social Services (CDSS), California Energy Commission (CEC), Federal Communications Commission (FCC), Hazus, U.S. Army Corps of Engineers (USACE), FEMA, and National Park Service (NPS). All data sources have a level of accuracy acceptable for planning purposes. Due to the sensitivity of this information, a detailed list of facilities is not provided. The list is on file with each planning partner. The risk assessment for each hazard qualitatively discusses critical facilities with regard to that hazard.
2 Population estimates were derived from 2018 Census American Community Survey (ACS) information. 3 To georeference something means to define its existence in physical space. That is, establishing its location in terms of map projections or coordinate systems. The term is used both when establishing the relation between raster or vector images and coordinates, and when determining the spatial location of other geographical features.
FEMA/Cal OES Submission Draft 10-27-2020

Kern Multi-Jurisdiction 2020 MJHMP UpdateCOUNTY OF KERN
4-25
4.4.1.3 Parcel Value Inventory
The Kern County Assessor’s data is essential to developing parcel values exposed to each hazard and includes current fair market value of at-risk assets. Kern County Parcel Value Inventory is summarized in Table 4-6. This table only includes parcels that are located in unincorporated Kern County. The Parcel Value Inventory includes market value,4 content replacement value, and total assessed value (“total value”), and each hazard profile outlines predicted impacts to this inventory for each hazard’s geographic extent. These elements are called out in the table because, in the event of a disaster, the value of the infrastructure or improvements to the land is usually the focus of concern. Generally, the land is not a total loss, and structures can be rebuilt or contents replaced.
“Total market value” as presented in this plan reflect Kern County Assessor data including fair market value where available. If no fair market value was available for a given property, the value reflects the assessed improvement value.
“Total content value” was calculated based on assessor's use codes, translated to occupancy-based multipliers. Each occupancy class prescribes a specific content cost multiplier used to calculate the content cost values shown in the summary and in the hazard profiles in Section 4.5. Occupancy-based content cost multipliers used in this plan reflect those found in the FEMA Hazus 4.2 technical manuals.
Table 4-6: Parcel Counts and Value
Total Parcels Total Market Value ($) Total Content Value ($) Total Value ($)
Unincorporated County 91,455 $ 10,906,675 $ 5,453,338 $16,360,013 Currency in Thousands. Total market value as provided by County Assessor's Office. Content value calculated using content multipliers per Hazus occupancy classes per county land use designation. Total value is the sum of total market value and total content value.
4 Market Value Includes a long-term asset which indicates the cost of the constructed improvements to land, such as buildings, driveways, walkways, lighting, and parking lots.
FEMA/Cal OES Submission Draft 10-27-2020

Kern Multi-Jurisdiction 2020 MJHMP UpdateCOUNTY OF KERN
4-26
Figure 4-8: Critical Facilities in Kern County
FEMA/Cal OES Submission Draft 10-27-2020

Kern Multi-Jurisdiction 2020 MJHMP UpdateCOUNTY OF KERN
4-27
4.4.2 Hazard Exposure and Damage Estimation
The population and inventory information are used to generate specific exposure and damage estimations based on the severity of specific hazard events. The hazards in Kern County which have known geographic extents and corresponding spatial information, and thus have exposure and damage estimations, are:
▪ earthquake, ▪ flooding, ▪ slope failure, ▪ soil subsidence, ▪ dam failure, and ▪ wildfire.
Population and Asset Exposure
“Exposure” of assets and population refers to the total counts of parcels, people, facilities, and assets within the planning area in which a hazard event may occur. A natural hazards overlay was developed to reflect the combination of many known natural hazard spatial footprints. The spatial overlay method enables summarization of building values, parcel counts, population exposure, and critical facility exposure within a hazard’s geographic extents. Figure 4-9 illustrates hypothetical flooding exposure. Exposure numbers were generated using Kern County Assessor, address point, and parcel data for replacement and content cost estimates.
Figure 4-9: Hazard Exposure Explanation Graphic
Damage Estimation
For flood and earthquake, detailed damage estimations were conducted through FEMA’s Hazus software. Hazus is a nationally applicable, standardized methodology that contains models for estimating potential losses from earthquakes, floods, and hurricanes. Hazus uses Geographic Information Systems (GIS) technology to estimate physical, economic, and social impacts of disasters. The estimated damage and losses provided by the Hazus Software is a based upon chosen severity of events and provides the ability to understand possible widescale damage to buildings and facilities.
FEMA/Cal OES Submission Draft 10-27-2020

Kern Multi-Jurisdiction 2020 MJHMP UpdateCOUNTY OF KERN
4-28
In the hypothetical geography shown in Figure 4-10, even though both structures are exposed to flooding, it is expected that the structure with a first floor height below the depth of flooding will receive significantly more damage than the structure with a first floor height above the expected water depth. For a more detailed explanation on risk assessment methods, see Appendix A.
At-risk populations, critical infrastructure, improved parcels, and loss results for each hazard category are provided in bar chart summary tables in Section 4.5 to evaluate the percentage of assets exposed to different types of hazards. The side-by-side comparison allows participating jurisdictions to evaluate impacts of potential hazards to prioritize hazard mitigation energy and resources.
Figure 4-10: Hazus Damage Estimation Example
FEMA/Cal OES Submission Draft 10-27-2020

Kern Multi-Jurisdiction 2020 MJHMP UpdateCOUNTY OF KERN
4-29
4.5 Vulnerability to Specific Hazards
This section introduces prevalent hazards within the unincorporated portions of Kern County and analyzes how each may affect populations, property, and critical facilities within the County’s jurisdiction. Importantly, the hazard mitigation strategy presented in Section 5 is informed by, and responds to, the particular vulnerabilities outlined in this section. The mitigation strategy provides prescriptions or actions to achieve the greatest reduction of vulnerability based on this section, which results in saved lives, reduced injuries, reduced property damage, and protection for the environment in the event of a natural hazard. Methods for calculating exposure and loss estimates are described in Section 4.4 and Appendix A.
This section provides quantifiable exposures to people and property and also contains damage and loss estimates for the unincorporated portions of the County. Participating Jurisdiction Annexes in Vol. 2 of this plan contain specific vulnerabilities to hazards. This section provides information for the following hazards that were prioritized by the MJHMP Planning Committee:
Severe Weather
SECTION 4.5.1 Flood
SECTION 4.5.2
Dam Failure
SECTION 4.5.3
Earthquake
SECTION 4.5.4 Wildfire
SECTION 4.5.5 Drought
SECTION 4.5.6
Slope Failure
SECTION 4.5.7 Soil Stability
SECTION 4.5.8
FEMA/Cal OES Submission Draft 10-27-2020

Kern Multi-Jurisdiction 2020 MJHMP UpdateCOUNTY OF KERN
4-30
4.5.1 Severe Weather Hazard Profile
Severe weather refers to any dangerous meteorological phenomena with the potential to cause damage, serious social disruption, or loss of human life.
Severe weather events can be categorized into two groups: those that form over wide geographic areas are classified as general severe weather; those with a more limited geographic area are classified as localized severe weather. Severe weather, technically, is not the same as extreme weather, which refers to unusual weather events at the extremes of the historical distribution for a given area. (Crop Insurance Solutions, n.d.)
The MJHMP Planning Committee identified three types of severe weather events that typically impact Kern County: high wind, winter weather, and high heat. Thunderstorms are not highlighted as a severe weather hazard on their own, as the primary impact of thunderstorms is the potential spread of wildfire, which is described in detail in Section 4.5.5.
The following are characteristics of severe weather events that can occur in Kern County.
High Wind
Damaging winds are classified as those exceeding 60 mph. Damage from such wind accounts for half of all severe weather reports in the lower 48 states and is more common than damage from tornadoes. Wind speeds can reach up to 100 mph and can produce a damage path extending for hundreds of miles. There are seven types of damaging winds:
▪ Straight-line winds—Any thunderstorm wind that is not associated with rotation; this term is used primarily to differentiate from tornado winds. Most thunderstorms produce some straight-line winds as a result of outflow generated by the thunderstorm downdraft.
▪ Downdrafts—A small-scale column of air that rapidly sinks toward the ground. ▪ Downbursts—A strong downdraft with horizontal dimensions larger than 2.5 miles resulting in an
outward burst or damaging winds on or near the ground. Downburst winds may begin as a microburst and spread out over a wider area, sometimes producing damage similar to a strong tornado. Although usually associated with thunderstorms, downbursts can occur with showers too weak to produce thunder.
▪ Microbursts—A small concentrated downburst that produces an outward burst of damaging winds at the surface. Microbursts are generally less than 2.5 miles across and short-lived, lasting only 5 to 10 minutes, with maximum wind speeds up to 168 mph. There are both wet and dry microbursts. A wet microburst is accompanied by heavy precipitation. Dry microbursts, common in places like the high plains and the intermountain west, occur with little or no precipitation reaching the ground.
FEMA/Cal OES Submission Draft 10-27-2020

Kern Multi-Jurisdiction 2020 MJHMP UpdateCOUNTY OF KERN
4-31
▪ Gust front—A gust front is the leading edge of rain-cooled air that clashes with warmer thunderstorm inflow. Gust fronts are characterized by a wind shift, temperature drop, and gusty winds out ahead of a thunderstorm. Sometimes winds push up air above them, forming a shelf cloud or detached roll cloud.
▪ Derecho—A derecho is a widespread thunderstorm wind caused when new thunderstorms form along the leading edge of the boundary formed by horizontal spreading of thunderstorm-cooled air. The word “derecho” is of Spanish origin and means “straight ahead.” Thunderstorms feed on the boundary and continue to reproduce. Derechos typically occur in summer when complexes of thunderstorms form over plains, producing heavy rain and severe wind. The damaging winds can last a long time and cover a large area.
▪ Bow Echo—A bow echo is a linear wind front bent outward in a bow shape. Damaging straight-line winds often occur near the center of a bow echo. Bow echoes can be 200 miles long, last for several hours, and produce extensive wind damage at the ground. (The National Severe Storms Laboratory, n.d.)
Extreme Cold / Freeze Events
Extreme cold and freeze events are most likely to occur in Kern County during the months of November-February. Prolonged exposure to the cold can cause frostbite or hypothermia, with infants and the elderly being the most susceptible. Extreme cold can freeze and burst pipes and impair communication facilities. Late or early freeze events can have a devastating effect on agriculture and the economy of the region. Freeze events in Kern County usually occur in the Central Valley and are becoming less exceptional as extreme weather conditions become more common due to climate change.
Hail
Hail occurs when updrafts in thunderstorms carry raindrops upward into extremely cold areas of the atmosphere where they freeze into ice. Super-cooled water may accumulate on frozen particles near the backside of a storm as they are pushed forward across and above the updraft by the prevailing winds near the top of the storm. Eventually, the hailstones encounter downdraft air and fall to the ground.
Hailstones grow two ways: by wet growth or dry growth. In wet growth, a tiny piece of ice is in an area where the air temperature is below freezing, but not super cold. When the tiny piece of ice collides with a super-cooled drop, the water does not freeze on the ice immediately. Instead, liquid water spreads across tumbling hailstones and slowly freezes. Since the process is slow, air bubbles can escape, resulting in a layer of clear ice. Dry-growth hailstones grow when the air temperature is well below freezing, and the water droplet freezes immediately as it collides with the ice particle. The air bubbles are “frozen” in place, leaving cloudy ice.
Hailstones can have layers like an onion if they travel up and down in an updraft, or they can have few or no layers if they are “balanced” in an updraft. One can tell how many times a hailstone traveled to the top of the storm by counting its layers. Hailstones can begin to melt and then re-freeze together, forming large, irregularly-shaped, damaging hail.
FEMA/Cal OES Submission Draft 10-27-2020

Kern Multi-Jurisdiction 2020 MJHMP UpdateCOUNTY OF KERN
4-32
High Heat / Heat Waves
Heat waves are periods of abnormally hot weather lasting days to weeks. The number of heat waves has been increasing in recent years across the Country and locally. Figure 4-11 displays historical and projected annual average maximum temperature increase in California from 1950 to 2099. Climate change will continue to cause extreme heat events more often. Studies show that by the end of this century, the number of days with temperatures reaching 100°F or more is projected to increase dramatically across the United States as a result of climate change. What the public now considers to be an exceptional event could become routine across much of the country. As temperatures rise and extreme heat events become longer, more severe, and more frequent, experts expect to see more health problems and deaths caused by heat (Center for Disease Control).
According to information provided by FEMA, extreme heat is defined as temperatures that hover 10 degrees or more above the average high temperature for the region and last for several weeks. Heat kills by taxing the human body beyond its abilities. In a normal year, about 175 Americans succumb to the demands of summer heat. According to the National Weather Service (NWS), among natural hazards, only the cold of winter—not lightning, hurricanes, tornados, floods, or earthquakes—takes a greater toll. (National Weather Service, 2020) In the 40-year period from 1936 through 1975, nearly 20,000 people were killed in the United States by the effects of heat and solar radiation. In the heat wave of 1980, more than 1,250 people died. (Disasters Are Us, n.d.)
Heat disorders generally have to do with a reduction or collapse of the body’s ability to shed heat by circulatory changes and sweating or a chemical (salt) imbalance caused by too much sweating. When heat gain exceeds the level the body can remove, or when the body cannot compensate for fluids and salt lost through perspiration, the temperature of the body’s inner core begins to rise and heat-related illness may develop. Elderly persons, small children, chronic invalids, those on certain medications or drugs, and persons with weight and alcohol problems are particularly susceptible to heat reactions, especially during heat waves in areas where moderate climate usually prevails. (Canadian Centre for Occupational Health and Safety, 2020)
Heat emergencies are often slower to develop, taking several days of continuous, oppressive heat before a significant or quantifiable impact is seen. Heat waves do not strike victims immediately, but rather their cumulative effects slowly take the lives of vulnerable populations. Heat waves do not cause damage or elicit the immediate response of floods, fires, earthquakes, or other more “typical” disaster scenarios. While heat waves are obviously less dramatic, they are potentially more deadly. The worst single heat wave event in California occurred in Southern California in 1955, when an eight-day heat wave resulted in 946 deaths. (California Office of Emergency Services, 2008)
FEMA/Cal OES Submission Draft 10-27-2020

Kern Multi-Jurisdiction 2020 MJHMP UpdateCOUNTY OF KERN
4-33
Figure 4-11 Historical & Projected Annual Average Maximum Temp Increase Source: Cal-Adapt
FEMA/Cal OES Submission Draft 10-27-2020

Kern Multi-Jurisdiction 2020 MJHMP UpdateCOUNTY OF KERN
4-34
Climate Change
The effects of climate change are varied and include warmer and more varied weather patterns, such as melting ice caps and poor air quality. As a result, climate change will likely worsen a number of natural hazards including severe weather. The effects of climate change on severe weather are most likely to create more frequent and prolonged periods of extreme heat. However, climate change will result in unpredictable temperature fluctuations that could lead to freeze events during the warmer months of the year which could have a devastating effect on agriculture. (United States Environmental Protection Agency, 2016)
4.5.1.1 Plans, Policies, and Regulatory Environment
There are very few formal regulations that pertain directly to severe weather events. The California Building Code, 5 adopted by Kern County and the participating jurisdictions, is generally adequate to properly address development impacts from severe weather events.
Faulty Weather Protection in Kern County Code, § 1001.7
Kern County Code includes provision for severe weather preparedness having to do with substandard building conditions. Defective housing materials and general conditions demonstrating a lack of weather protection and requiring maintenance or repair include crumbling or loose plaster, ineffective waterproofing of exterior walls, roof or floors, and broken windows.
4.5.1.2 Past Events
Strong wind events and frost or freeze events have been the only type of severe weather events to occur in Kern County since the year 2000 (not high heat). Table 4-7 summarizes extreme weather events in Kern County since 2000, as recorded by the National Oceanic and Atmospheric Administration (NOAA). Strong wind events are most common, resulting in property damage every year since 2000.
Table 4-7: Severe Weather Damage Summary by Year 2000-2019
Year
Total Property Damage
Value ($)
Total Crop Damage
Value ($)
Strong Wind Events 2002 12,000 0
2003 277,000 0
2004 218,000 0
2005 137,000 0
2006 376,000 112,500
2007 113,500 0
2008 106,900 9,000
5 Available at https://www.dgs.ca.gov/BSC/Codes.
FEMA/Cal OES Submission Draft 10-27-2020

Kern Multi-Jurisdiction 2020 MJHMP UpdateCOUNTY OF KERN
4-35
Year
Total Property Damage
Value ($)
Total Crop Damage
Value ($)
2009 12,800 0
2010 708,000 0
2011 9,000 0
2012 147,000 0
2013 61,000 0
2014 31,000 0
2017 100,000 0
2018 6,000 0
2019 381,000 0
Total 2,696,200 121,500
Frost/Freeze Events 2001 0 1,100,000
2006 0 5,420,000
2007 150,000 568,600,000
Total 150,000 575,120,000
Source: NOAA Storm Events Database
4.5.1.3 Location
Severe weather events have the potential to happen anywhere in the planning area. Communities in the Central Valley are more susceptible to extreme weather and freeze events. Wind events are most damaging to areas that are heavily wooded. The following figures show average weather conditions for Kern County, including:
▪ Figure 4-12: Average Annual Precipitation, ▪ Figure 4-13: Normal Maximum Temperatures for July, ▪ Figure 4-14: Normal Minimum Temperatures for January, and ▪ Figure 4-15: Annual Average Wind Speed.
Table 4-8 explains further the classes of wind power density shown in Figure 4-15.
FEMA/Cal OES Submission Draft 10-27-2020

Kern Multi-Jurisdiction 2020 MJHMP UpdateCOUNTY OF KERN
4-36
Figure 4-12 Kern County - Average Annual Precipitation
FEMA/Cal OES Submission Draft 10-27-2020

Kern Multi-Jurisdiction 2020 MJHMP UpdateCOUNTY OF KERN
4-37
Figure 4-13: 30-YR Normal Maximum Temperature for July
FEMA/Cal OES Submission Draft 10-27-2020

Kern Multi-Jurisdiction 2020 MJHMP UpdateCOUNTY OF KERN
4-38
Figure 4-14: 30-YR Normal Minimum Temperature for January
FEMA/Cal OES Submission Draft 10-27-2020

Kern Multi-Jurisdiction 2020 MJHMP UpdateCOUNTY OF KERN
4-39
Figure 4-15: Annual Average Wind Speed (Power Class)
FEMA/Cal OES Submission Draft 10-27-2020

Kern Multi-Jurisdiction 2020 MJHMP UpdateCOUNTY OF KERN
4-40
Table 4-8: Classes of Wind Power Density at 10 m and 50 ma
Wind Power Class
10 m (33 ft) 50 m (164 ft)
Wind Power Density
(W/m2) Speedb m/s (mph)
Wind Power Density
(W/m2) Speedb m/s (mph)
1 0 0 0
100 4.4 (9.8) 200 5.6 (12.5)
2 150 5.1 (11.5) 300 6.4 (14.3)
3 200 5.6 (12.5) 400 7.0 (15.7)
4 250 6.0 (13.4) 500 7.5 (16.8)
5 300 6.4 (14.3) 600 8.0 (17.9)
6 400 7.0 (15.7) 800 8.8 (19.7)
7 1000 9.4 (21.1) 2000 11.9 (26.6)
a Vertical extrapolation of wind speed based on the 1/7 power law. b Mean wind speed is based on Rayleigh speed distribution of equivalent mean wind power density. Wind speed is for standard sea-level conditions. To maintain the same power density, speed increases 3%/1000 m (5%/5000 ft) elevation.
NOTE: Each wind power class should span two power densities. For example, Wind Power Class = 3 represents the Wind Power Density range between 150 W/m2 and 200 W/m2. The offset cells in the first column attempt to illustrate this concept.
4.5.1.4 Frequency/ Probability of Future Events
Severe weather events for Kern County since the year 2000, as shown in Table 4-7, have all been related to either wind or freeze events. Strong wind events since the year 2000 have caused a total of $2.6 million worth of property damage in Kern County. Figure 4-15 displays average annual wind speeds by power class in Kern County and Table 4-8 describes wind power classes.
4.5.1.5 Severity and Extent
The most common problems associated with severe storms are immobility and loss of utilities. Fatalities are uncommon but can occur. Roads may become impassable due to flooding, downed trees, ice or snow, or a landslide. Crops can be damaged by below-freezing temperatures. Power lines may be downed due to high winds or ice accumulation, and services such as water or phone may not be able to operate without power. Utility companies will shutoff power (also known as, Public Safety Power Shutoffs) as a fire prevention measure in hot and dry periods.
FEMA/Cal OES Submission Draft 10-27-2020

Kern Multi-Jurisdiction 2020 MJHMP UpdateCOUNTY OF KERN
4-41
Windstorms can be a problem in the planning area and could cause damage to utilities. It is important to note that the predicted wind speed given in wind warnings issued by the National Weather Service is for a one-minute average; gusts may be 25 to 30 percent higher.
Hail events can occur in Kern County. Events have occurred in the greater County and in the City of Taft with hail size ranging from .25 to .75 inches.
High heat events can occur throughout Kern County, and are projected to worsen with climate change. In 2018, the southern portion of California’s central valley, and, in particular, the region including Los Angeles broke an all-time record of 111 degrees, surpassing the previous record of 109 degrees, set in 1939. (Washington Post, 2018)
4.5.1.6 Warning Time
Meteorologists can often predict the likelihood of a severe storm. This can give several days of warning time. However, meteorologists cannot predict the exact time of onset or severity of the storm. Some storms may come on more quickly and have only a few hours of warning time.
4.5.1.7 Secondary Hazards
The most significant secondary hazards associated with severe local storms are floods, falling and downed trees, landslides, downed power lines, and wildfire. Heavy rain can overwhelm both natural and man-made drainage systems, causing overflow and property destruction. Landslides occur when the soil on slopes becomes oversaturated and fails. Landslides are further outlined as slope failure in Section 4.5.7, while flooding is analyzed in Section 4.5.2.
4.5.1.8 Severe Weather Vulnerability Analysis
4.5.1.8.1 Population
It can be assumed that the entire planning area is exposed to some extent to severe weather events. Certain areas are more exposed due to geographic location and local weather patterns. Populations living at higher elevations with large stands of trees or power lines may be more susceptible to wind damage and black out.
Vulnerable populations such as the elderly, low income or linguistically isolated populations, people with life-threatening illnesses, and residents living in areas may become isolated from major roads in severe weather events. Power outages can be life threatening to those dependent on electricity for life support. These populations face isolation and exposure during severe weather events and could suffer more secondary effects of the hazard, and therefore vulnerable populations are of particular concern.
FEMA/Cal OES Submission Draft 10-27-2020

Kern Multi-Jurisdiction 2020 MJHMP UpdateCOUNTY OF KERN
4-42
4.5.1.8.2 Property
All property is vulnerable during severe weather events, but properties in poor condition or in particularly vulnerable locations may risk the most damage. Those in higher elevations and on ridges may be more prone to wind damage. Those that are located under or near overhead lines or near large trees may be vulnerable to falling ice or may be damaged in the event of a collapse. Crops may be damaged by frost, especially if a frost event occurs after the growing season has already begun.
4.5.1.8.3 Critical Facilities and Infrastructure
All critical facilities exposed to flooding are also likely exposed to severe weather. Additional facilities on higher ground may also be exposed to wind damage or damage from falling trees. The most common problems associated with severe weather are loss of utilities. Downed power lines can cause blackouts, leaving large areas isolated. Phone, water, and sewer systems may not function. Roads may become impassable due to ice or snow or from secondary hazards such as landslides.
4.5.1.8.4 Lifelines
Loss of roads or power and communication lines are the primary lifeline failures resulting from severe weather and are mostly due to secondary hazards such as floods, falling and downed trees, landslides, and wildfire. Landslides caused by heavy prolonged rains can block roads. High winds can cause significant damage to trees and power lines, blocking roads with debris, incapacitating transportation, isolating population, and disrupting ingress and egress. Snowstorms in higher elevations can significantly impact the transportation system and the availability of public safety services. Of particular concern are roads providing access to isolated areas and vulnerable populations.
Prolonged obstruction of major routes due to landslides, snow, debris, or floodwaters can disrupt the shipment of goods and other commerce. Large, prolonged storms can have negative economic impacts for an entire region.
Severe windstorms, downed trees, and ice can create serious impacts on power and above-ground communication lines. Freezing of power and communication lines can cause them to break, disrupting electricity and communication. Loss of electricity and phone connection would leave certain populations isolated because residents would be unable to call for assistance.
FEMA/Cal OES Submission Draft 10-27-2020

Kern Multi-Jurisdiction 2020 MJHMP UpdateCOUNTY OF KERN
4-43
4.5.1.8.5 Future Trends in Development
All future development will be affected by severe storms. The ability to withstand impacts lies in sound land use practices and consistent enforcement of codes and regulations for new construction. Participating jurisdictions have adopted the California Building Code, which corresponds to the International Building Code, to meet California mandates. This code is equipped to deal with the impacts of severe weather events. Land use policies identified in general plans within the planning area also address many of the secondary impacts, such as flood and landslide, of the severe weather hazard. With these tools, the participating jurisdictions are well equipped to deal with future growth and the associated impacts of severe weather.
4.5.1.8.6 Severe Weather Hazard Problem Statements
As part of the mitigation action identification process, the Planning Committee for the County and for each jurisdiction identified issues and weaknesses, also called problem statements, for their respective facilities based on the risk assessment and vulnerability analysis, utilizing the RAMP mapping tool and flood data. Severe weather problem statements for Kern County are listed in Table 4-9; problem statements for all other participating jurisdictions are accessed in Volume 2 of this plan.
Identifying these common issues and weaknesses assists the Planning Committee in understanding the realm of resources needed for mitigation. The goal is to have at least one mitigation action for every problem statement. See Table 5-6 for a full list of mitigation actions and the corresponding problem statements that they address. Each problem statement is coded with a problem number for cross-referencing between Table 4-9 and Table 5-6.
FEMA/Cal OES Submission Draft 10-27-2020

Kern Multi-Jurisdiction 2020 MJHMP UpdateCOUNTY OF KERN
4-44
Table 4-9 Severe Weather Problem Statements
Problem No.
Hazard Area of Concern
Mitigation Alternatives
Primary Agency
Problem Description Related MA
ps-EW-KC-227
Extreme Weather
Impact PPRO - Property Protection , NRP - Natural Resource Protection , ES - Emergency Services , SP - Structural Projects
County of Kern
Heavy rains could create localized flooding issues around County infrastructure including buildings and roads, posing a threat to buildings and creating hazardous travel conditions The following culverts have been identified as undersized by Kern County and frequently create flooding issues after heavy rain events: LAKE ISABELLA BLVD, 200' S OF ELIZABETH NORRIS RD, LAKE ISABELLA ; FRAZIER MTN PARK RD, 2,200' E OF MT PINOS WY E, FRAZIER PARK; CALIENTE CREEK RD, BETWEEN MILLERSVILLE AND TWIN OAKS; COPUS RD, 3,000' W OF I-5 FWY
ma-FL-KC-98
ps-EW-KC-228
Extreme Weather
Threat PE&A - Public Education & Awareness , NRP - Natural Resource Protection
County of Kern
Strong winds can blow over trees and utility lines, posing a hazard to traffic and pedestrians
ma-AH-KC-179
ps-EW-KC-229
Extreme Weather
Threat PRV - Prevention
County of Kern
Increased impervious surfaces can lead to the urban heat island effect and increased runoff during heavy rains events that may overwhelm storm drain facilities that have received insufficient storm water maintenance
ma-EW-KC-301
ps-EW-KC-338
Extreme Weather
Threat PE&A - Public Education & Awareness
County of Kern
Winter weather events can interrupt travel on County roads leading to hazardous driving conditions and road closures
ma-EW-KC-435
FEMA/Cal OES Submission Draft 10-27-2020

Kern Multi-Jurisdiction 2020 MJHMP UpdateCOUNTY OF KERN
4-45
4.5.2 Flood Hazard Profile
Flooding is one of the three primary hazards in California, along with earthquake and wildfire, and represents the second most destructive source of hazard, vulnerability, and risk statewide. (California Office of Emergency Services, 2018) Flooding is a priority hazard for Kern County as well.
Connections between a river and its floodplain are most apparent during and after major flood events. A floodplain is the area adjacent to a river, creek, or lake that becomes inundated during a flood. Floodplains may be broad, as when a river crosses an extensive flat landscape, or narrow, as when a river is confined in a canyon. These areas form a complex physical and biological system that supports a variety of natural resources and provides natural flood and erosion control. When a river is separated from its floodplain with levees and other flood control facilities, its natural, built-in benefits can be lost, altered, or significantly reduced. (Federal Emergency Management Agency)
There are four types of flood events in the Kern County area: riverine, flash, urban stormwater, alluvial fan, and dam failure. Regardless of the type, the cause is primarily the result of severe weather and excessive rainfall, either in the flood area or upstream reach. (The National Severe Storms Laboratory, n.d.)
Riverine flooding occurs when a watercourse exceeds its ‘bank-full’ capacity and is the most common type of flood event. Riverine flooding occurs as a result of prolonged rainfall that is combined with saturated soils from previous rain events, or combined with snowmelt, and is characterized by high peak flows of moderate duration and by a large volume of runoff. Riverine flooding occurs in river systems whose tributaries drain large geographic areas and can include many watersheds and sub-watersheds. The duration of riverine floods varies from a few hours to many days. Factors that directly affect the amount of flood runoff include precipitation amount, intensity and distribution, soil moisture content, channel capacity, seasonal variation in vegetation, snow depth, and water-resistance of the surface due to urbanization. (Id)
In Kern County, riverine flooding can occur anytime during the period from November through April. Flooding is more severe when antecedent rainfall has resulted in saturated ground conditions
The term “flash flood” describes localized floods of great volume and short duration, generally in less than four hours. In contrast to riverine flooding, this type of flood usually results from a heavy rainfall in a relatively small drainage area. Precipitation of this sort usually occurs in the spring and summer. (Kern County MJHMP, 2014)
Urbanization may increase peak flow runoff as well as the total volume of stormwater runoff from a site. The increase is dependent upon the type of soil and its topography in relation to the proposed development. Comparison of the peak flow and volume impacts to the watershed should be analyzed whenever development is proposed to ensure that any increases are accommodated. (United States Geological Survey, 2016)
FEMA/Cal OES Submission Draft 10-27-2020

Kern Multi-Jurisdiction 2020 MJHMP UpdateCOUNTY OF KERN
4-46
Flooding may result as a secondary impact from an earthquake, and may cause failure of dams, canal banks, or areas where landslides block drainage channels, streams, and/or rivers. See Section 0 for the Earthquake Hazard Profile.
Dam failures also often result in flash flooding. However, dam failures are discussed separately in this plan. See Section 4.5.3.
Floodplain Definitions
100-YR Floodplain The boundaries of the 100 year (100-YR) floodplain coincide with an annual risk of 1% and are a FEMA study product consisting of both floodway and flood fringe. 500-YR Floodplain
The boundaries of the floodplain coincide with an annual risk of 0.2% and are a FEMA study product. The 500-YR floodplain includes the 100-YR.
Floodway
This includes the channel of the tributary and the land adjacent to it. This zone needs to remain free from obstruction so the 100-YR floodplain can be conveyed downstream.
Flood Fringe
This is the remaining portion of the 100-YR floodplain, excluding the floodway. This zone can be obstructed or developed if criteria are met.
Special Flood Hazard Area (SFHA)
An area having special flood, mudflow, or flood-related erosion hazards and shown on a Flood Insurance Rate Map (FIRM). The SFHA is the area where the National Flood Insurance Program’s (NFIP) floodplain management regulations must be enforced.
Floodplain Ecosystems
Floodplains can support ecosystems that are rich in quantity and diversity of plant and animal species. A floodplain can contain 100 or even 1,000 times as many species as a river. Wetting of the floodplain soil releases an immediate surge of nutrients left over from the last flood and resulting from the rapid decomposition of organic matter that had accumulated. Microscopic organisms thrive, and larger species enter a rapid breeding cycle. Opportunistic feeders, particularly birds, move in to take advantage. The production of nutrients peaks and falls away quickly; however, the surge of new growth endures for some time. This makes floodplains particularly valuable for agriculture. Species growing in floodplains are markedly different from those that grow outside floodplains. For instance, trees in floodplains and riparian areas tend to be very tolerant of root disturbance and very quick-growing compared to non-riparian trees.
Floodplains that are undisturbed or have been restored to a natural state provide many benefits to both human and natural systems. In their natural vegetative state, undisturbed floodplains provide the following benefits:
FEMA/Cal OES Submission Draft 10-27-2020

Kern Multi-Jurisdiction 2020 MJHMP UpdateCOUNTY OF KERN
4-47
▪ Slow the rate at which incoming surface runoff reaches the main body of water, slowing down the impact of flood events.
▪ Maintain water quality by allowing surface runoff to drop sediment into the natural soil, preventing it from depositing in streams and rivers.
▪ Recharge groundwater. The slowing of runoff allows additional time for the runoff to recharge existing groundwater aquifers.
▪ Provide habitat for large and diverse populations of plants and animals.
Floodplains are often compromised by human development. Because they border water bodies, floodplains have historically been popular sites to establish settlements. Human activities tend to concentrate in floodplains because water is readily available, land is fertile and suitable for farming, transportation by water is easily accessible, and land is flatter and easier to develop. But human activity in floodplains frequently interferes with the natural function of floodplains. It can affect the distribution and timing of drainage, thereby increasing flood problems. Human development can create local flooding problems by altering or confining drainage channels. This increases flood potential in two ways: it reduces the stream’s capacity to contain flows, and it increases flow rates or velocities downstream during all stages of a flood event. Human activities can interface effectively with a floodplain as long as steps are taken to mitigate the activities’ adverse impacts on floodplain functions.
4.5.2.1 Plans, Policies, and Regulatory Environment
National Flood Insurance Program (NFIP)
The NFIP makes federally-backed flood insurance available to homeowners, renters, and business owners in participating communities. Kern County and the cities of Arvin, Bakersfield, California City, Delano, Maricopa, McFarland, Shafter, Taft, Tehachapi, and Wasco all participate in NFIP.
For most participating communities, FEMA has prepared a detailed Flood Insurance Study (FIS). The study presents water surface elevations for floods of various magnitudes, including the 1-percent annual chance flood (the 100-year flood) and the 0.2-percent annual chance flood (the 500-year flood).
Base-flood elevations and the boundaries of the 100- and 500-year floodplains are shown on Flood Insurance Rate Maps (FIRMs), which are the principal tool for identifying the extent and location of the flood hazard. FIRMs also designate and display the floodway which is the channel of the river or stream and adjacent land that must remain free from obstruction so that the 100-year flood can be conveyed downstream. FIRMs are the most detailed and consistent data source available, and for many communities they represent the minimum area of oversight under their floodplain management program. The most recent countywide FIRM was completed September 26th, 2008 and is a digital flood insurance rate map (DFIRM).
FEMA/Cal OES Submission Draft 10-27-2020

Kern Multi-Jurisdiction 2020 MJHMP UpdateCOUNTY OF KERN
4-48
Participants in the NFIP must, at a minimum, regulate development in floodplain areas in accordance with NFIP criteria. Before issuing a permit to build in a floodplain, participating jurisdictions must ensure that three criteria are met:
▪ New buildings and those undergoing substantial improvements must, at a minimum, be elevated to protect against damage by the 100-YR flood;
▪ New floodplain development must not aggravate existing flood problems or increase damage to other properties; and
▪ New floodplain development must exercise a reasonable and prudent effort to reduce its adverse impacts on threatened salmonid species.
Structures permitted or built in the County before December 31, 1974, are called “pre-FIRM” structures, and structures built afterwards are called “post-FIRM.” Post-FIRM properties are eligible for reduced flood insurance rates. Such structures are less vulnerable to flooding since they were constructed after regulations and codes were adopted to decrease vulnerability. Pre-FIRM properties are more vulnerable to flooding because they do not meet code or are located in hazardous areas. The insurance rate is different for the two types of structures.
Compliance is monitored by FEMA regional staff and by the California Department of Water Resources under a contract with FEMA. Maintaining compliance under the NFIP is an important component of flood risk reduction. All planning partners that participate in the NFIP have identified initiatives to maintain their compliance and good standing.
Community Rating System (CRS)
The CRS is a voluntary program within the NFIP that encourages floodplain management activities that exceed the minimum NFIP requirements. Flood insurance premiums are discounted to reflect the reduced flood risk resulting from community actions that meet the three goals of the CRS: 1) reduce flood losses, 2) facilitate accurate insurance rating, and 3) promote awareness of flood insurance.
For participating communities, flood insurance premium rates are discounted in increments of 5 percent according to the community’s classification. For example, a Class 1 community would receive a 45 percent premium discount, and a Class 9 community would receive a 5 percent discount. Class 10 communities are those that do not participate in the CRS; they receive no discount. The CRS classes for local communities are based on 18 creditable activities related to public information, mapping and regulations, flood damage reduction, and flood preparedness.
CRS activities can help to save lives and reduce property damage. Communities participating in the CRS represent a significant portion of the nation’s flood risk; over 66 percent of the NFIP’s policy base are communities in the CRS. Communities receiving premium discounts through the CRS range from small to large and represent a broad mixture of flood risks, including both coastal and riverine flood risks. Table 4-10 lists NFIP and CRS statistics for the County.
FEMA/Cal OES Submission Draft 10-27-2020

Kern Multi-Jurisdiction 2020 MJHMP UpdateCOUNTY OF KERN
4-49
Table 4-10: Flood Insurance Statistics for Kern County
NFIP and CRS Status & Information
County of Kern NFIP Status Participating since 09/29/86
CRS Class 9 Policies in Force 3,168 Policies in SFHA 2,678 Policies in non-SFHA 490 Total Claims Paid 128 Paid Losses $791,697 Repetitive Loss Properties 0 Severe Repetitive Loss Properties 0 Repetitive Loss Payment by NFIP on Building N/A Repetitive Loss Payment by NFIP on Contents N/A
Note: The Privacy Act of 1974 (5 U.S.C. 522a) restricts the release of certain types of data to the public. Flood insurance policy and claims data are included in the list of restricted information. FEMA can only release such data to state and local governments, and only if the data are used for floodplain management, mitigation, or research purposes. Therefore, this plan does not identify the repetitive loss properties or include claims data for any individual property.
Cobey-Alquist Floodplain Management Act
The Cobey-Alquist Floodplain Management Act of 1965 provided state-level guidance and review of floodplain management, including the review of floodplain management plans, establishment of floodplain management regulations, and the use of designated floodways. The California Department of Water Resources (DWR) adopts regulations, maintains a statewide flood management data collection and planning program, manages a statewide grant program, and helps coordinate emergency flood response operations.
State Plan of Flood Control (SPFC) in the Central Valley
The SPFC describes authorized project levees and related facilities for which the State of California has accepted responsibility for maintenance. The Plan further describes the existing flood control works of the State-federal flood protection system in California’s central valley, in addition to the lands, modes of operations and maintenance necessary for the system to function, conditions, and programs and plans for the system. (Department of Water Resources, 2010) (Legislative Analyst's Office, 2019)
FEMA/Cal OES Submission Draft 10-27-2020

Kern Multi-Jurisdiction 2020 MJHMP UpdateCOUNTY OF KERN
4-50
Kern County General Plan
The 2004 Kern County General Plan includes many policies, implementation measures, and goals in the Land Use and Safety Elements that limit development occurring in floodplains and mitigate impacts from such development.
Policies around flooding include limited development in floodplains, generally forbidding structures that impede flow in floodplains, and preserving important flood channels and water courses from development more broadly. The Kern County General Plan is currently being updated and will consider this MJHMP Update as it continues to shape policies around flood mitigation and protection.
Floodplain Management Ordinance in Kern County Code, § 17.48
The Kern County Code addresses mitigation options for reducing flood losses through restricting or prohibiting development that may be dangerous due to flooding and erosion. These methods and provisions additionally stipulate that vulnerable uses be protected against flood damage during construction; the management of natural floodplains and stream channels in order to accommodate flood waters; the management of any development which might increase flood damage; and the management of flood barrier construction, which might increase flood hazards in other areas.
The County’s regulations also prohibit the encroachment of new development that would increase any flood levels within the severe flood hazard area. Contingent on this first provision being satisfied, all new construction and other proposed development shall comply with all other applicable flood hazard reduction provisions of this chapter.
4.5.2.2 Major Flood Events
Table 4-11 shows the flood events that took place in Kern County since the year 2000 that caused either property or crop damage. (NOAA, 2019)
Table 4-11: Kern County Flood Events Since 2000
Date
Flood Type Property Damage
Value ($)
Crop Damage
Value ($)
1/8/2002 Flood 25,000 0
11/8/2002 Flood 23,000 0
2/12/2003 Flood 50,000 0
7/31/2003 Flash Flood 5,000 0
12/25/2003 Flood 30,000 0
2/22/2004 Flood 5,000 0
10/26/2004 Flood 5,000 0
10/26/2004 Flood 5,000 0
1/9/2005 Flood 2,000,000 0
1/10/2005 Flood 500,000 0
1/10/2005 Flood 250,000 0
FEMA/Cal OES Submission Draft 10-27-2020

Kern Multi-Jurisdiction 2020 MJHMP UpdateCOUNTY OF KERN
4-51
Date
Flood Type Property Damage
Value ($)
Crop Damage
Value ($)
2/21/2005 Flood 0 300,000
2/22/2005 Flood 5,000 0
8/15/2005 Flash Flood 198,500 0
10/17/2005 Flash Flood 75,000 0
10/17/2005 Flash Flood 25,000 0
10/29/2007 Flash Flood 10,000 0
1/27/2008 Flash Flood 25,000 0
1/27/2008 Flood 5,000 0
1/27/2008 Flood 1,000 0
7/12/2008 Flash Flood 1,500,000 0
7/13/2008 Flash Flood 50,000 0
7/13/2008 Flash Flood 25,000 0
7/14/2008 Flash Flood 100,000 0
7/15/2008 Flash Flood 20,000 0
7/16/2008 Flash Flood 1,000 0
7/20/2008 Flash Flood 30,000 0
12/10/2009 Flood 25,000 0
1/18/2010 Flood 100,000 0
1/18/2010 Flash Flood 10,000 0
1/19/2010 Flood 35,000 0
10/1/2010 Flood 5,000 0
10/2/2010 Flash Flood 10,000 0
10/2/2010 Flood 5,000 0
10/6/2010 Flash Flood 100,000 0
10/6/2010 Flood 10,000 0
10/17/2010 Flood 5,000 0
12/19/2010 Flood 5,000,000 0
12/19/2010 Flood 50,000 0
12/20/2010 Flash Flood 5,000 0
12/22/2010 Flood 350,000 0
12/29/2010 Flood 1,000,000 0
1/2/2011 Flood 12,700,000 0
1/2/2011 Flood 800,000 0
2/26/2011 Flood 5,000 0
2/26/2011 Flood 2,500 0
3/20/2011 Flood 5,000 0
3/23/2011 Flood 2,000 0
3/23/2011 Flood 2,000 0
7/4/2011 Flash Flood 5,000 0
7/5/2011 Flash Flood 2,500 0
7/30/2011 Flash Flood 5,000 0
FEMA/Cal OES Submission Draft 10-27-2020

Kern Multi-Jurisdiction 2020 MJHMP UpdateCOUNTY OF KERN
4-52
Date
Flood Type Property Damage
Value ($)
Crop Damage
Value ($)
8/1/2011 Flash Flood 25,000 0
8/27/2011 Flash Flood 25,000 0
9/11/2011 Flood 25,000 0
3/17/2012 Flood 12,000 0
3/17/2012 Flood 6,000 0
4/13/2012 Flood 15,000 0
8/22/2012 Flash Flood 60,000 0
10/11/2012 Flood 25,000 0
3/8/2013 Flood 5,000 0
7/22/2013 Flash Flood 50,000 0
8/18/2013 Flash Flood 50,000 0
8/19/2013 Flash Flood 100,000 0
8/19/2013 Flash Flood 100,000 0
2/28/2014 Flood 20,000 0
12/31/2016 Flash Flood 10,000 0
1/5/2017 Flood 36,000 0
1/5/2017 Flood 15,000 0
1/5/2017 Flood 6,000 0
1/22/2017 Flood 150,000 0
3/6/2019 Flash Flood 50,000 0
3/6/2019 Flash Flood 20,000 0
3/6/2019 Flash Flood 10,000 0
Source: NOAA Storm Events Database
FEMA/Cal OES Submission Draft 10-27-2020

Kern Multi-Jurisdiction 2020 MJHMP UpdateCOUNTY OF KERN
4-53
4.5.2.3 Location
Kern County, due to its large extent and varied geography, has several hundred potential flood sources. Figure 4-17 displays FEMA flood zones within Kern County. More detailed views of FEMA flood zones are available for participating jurisdictions through the Risk Assessment Mapping Platform (RAMP) on mitigatehazards.com. The types of floodplains within the County are diverse and include riverine floodplains (fast moving channelized flow), distributary flow floodplains (broad, slow moving, shallow flow), and alluvial fan floodplains (heavily sediment-laden, broad, shifting, and rapid moving flow).
Kern County’s watersheds are effectively a closed basin system, with all drainage discharging to one of the following lake basins in the County: Tulare Lake, Kern Lake, Lake Isabella (manmade), Koehn Lake, Rogers Lake, Buena Vista Lake, Castac (Tejon) Lake, China Lake, and Rosamond Lake. These lakes temporarily enlarge during flood events. Rogers Lake, China Lake, and Rosamond Lake are “dry lakes,” meaning that only under certain conditions do they fill with water. Figure 4-16 displays the watersheds in Kern County.
Most of the major streams are fed by melting snow from high in the Sierra Nevada. The Kern River is the major river in the County and has an average annual runoff of 700,000 acre feet. The Kern River flows from the Sierras northeast of Bakersfield, is dammed at Lake Isabella, and continues approximately 30 miles through the steep Kern River Canyon to the Valley, where it flows through Bakersfield. The river enters the Buena Vista lakebed twenty-one miles downstream of Bakersfield or flows to Tulare Lake via the Kern River Flood Canal. Flows can also be diverted into the California Aqueduct via the Kern River-California Aqueduct Intertie, built in 1977. (Kern County MJHMP, 2014)
FEMA/Cal OES Submission Draft 10-27-2020

Kern Multi-Jurisdiction 2020 MJHMP UpdateCOUNTY OF KERN
4-54
Figure 4-16 Watershed Map
Valley Flood Sources
The Kern River is the source of flooding for the Central Valley in Kern County. Many small streams also cause flooding in the Valley where they discharge from steep canyons. While confined in the upland areas, the streams tend to spread onto alluvial fans with poorly defined drainages on the valley floor. Flow is further disrupted by cultivation and urbanization. This type of flooding occurs at the Little Poso Creek, Caliente Creek, Walker Basin Creek, Sycamore Canyon, Little Sycamore Canyon, Comanche Creek, Tejon Creek, El Paso Creek, Grapevine and Tecuya Creek, and in the vicinity of Taft.
Flooding is typically broad and shallow, two feet deep or less. All surface water originating in or passing through Central and Western Kern County infiltrates into the San Joaquin Valley aquifer or drains into Tulare and Buena Vista Lakes. Man-made drainages that could potentially lead to flooding include several diversion canals that siphon water from the Kern River that flow through the City of Bakersfield, as well as the California Aqueduct and Kern Water Bank Canal. Some of these canals have above-grade sections that can result in local flooding when the canals fail, much like a levee failure flood.
Poso Creek is a major water course that flows north westerly through Kern County. The watershed covers more than 250,000 acres. Precipitation on this watershed ranges from six to thirty inches annually. In years of high rainfall extensive flooding occurs along a 25 mile reach from Zerker Road to the Kern National Wildlife Refuge. For the flood years of 1969 and 1978 flood waters broke out of the Poso Creek Channel and inundated an area of 17,280 acres. Improvements were made under the Emergency Watershed Protection Act for repairs implemented in 1978 and 1979. The channel now is designed to carry 1,050 cfs. More flooding occurred in 1997 and 1998. A major project was undertaken to repair the levees with assistance from the NRCS through an Emergency Watershed Protection grant in 1997. However, the 1998 flooding was curtailed with assistance from two of the local water districts. (FEMA, 2008, p. 21)
Desert Flood Sources
The desert zone lies in the eastern portion of Kern County and has flood problems similar to the Valley, where intermittent streams shift across alluvial fans. Streets, roads, and railroads often divert flows and may increase flood problems. Most flood sources that affect the desert areas originate in local drainages in the eastern portion of Kern County; only Jawbone Canyon Wash originates in the Sierra Nevada range. (FEMA, 2008, p. 21)
Mountain Flood Sources
Floods in the Mountain region typically have flood flows that peak quickly and have high velocities. Floods can occur on streams that include Cuddy Creek, Upper Sycamore Creek, Antelope Creek, Blackburn Creek, Caliente Creek, Erskine and Kelso Creeks. Flows typically are more confined to narrow valleys, but alluvial fan flooding can occur in the vicinity of Lake Isabella. Life safety is a concern in this region due to the flash floods that could potentially impact travelers and those participating in outdoor recreation in the mountain valleys. (FEMA, 2008, p. 21)
FEMA/Cal OES Submission Draft 10-27-2020

Kern Multi-Jurisdiction 2020 MJHMP UpdateCOUNTY OF KERN
4-55
Figure 4-17: FEMA Flood Zone Exposure Map
FEMA/Cal OES Submission Draft 10-27-2020

Kern Multi-Jurisdiction 2020 MJHMP UpdateCOUNTY OF KERN
4-56
4.5.2.3.1 Flood Awareness Zones
Flood Awareness Zones have been developed by California DWR to map areas of additional flood threat throughout the state. The intent of the Awareness Floodplain Mapping project is to identify all pertinent flood hazard areas for areas that are not mapped under the Federal Agency Management Agency's (FEMA) National Flood Insurance Program (NFIP) and to provide the community and residents an additional tool in understanding potential flood hazards currently not mapped as a regulated floodplain. The awareness maps identify the 100-YR flood hazard areas using approximate assessment procedures. These floodplains are shown simply as flood prone areas without specific depths and other flood hazard data. Flood awareness zones for Kern County are shown in Figure 4-18.
4.5.2.4 Measuring Frequency and Severity
The frequency and severity of flooding are measured using a discharge probability, a statistical tool which defines the probability that a certain river discharge or flow level will be equaled or exceeded within a given year. Flood studies use historical records to determine the probability of occurrence for the different discharge levels. The flood frequency equals 100 divided by the discharge probability. For example, the 100-YR discharge has a 1-percent chance of being equaled or exceeded in any given year. The “annual flood” is the greatest flood event expected to occur in a typical year. These measurements reflect statistical averages only; it is possible for two or more floods with a 100-YR or higher recurrence interval to occur in a short time period. The same flood can have different recurrence intervals at different points on a river.
The extent of flooding associated with a 1-percent annual probability of occurrence (the base flood or 100-YR flood) is used as the regulatory boundary by many agencies. Also referred to as the special flood hazard area (SFHA), this boundary is a convenient tool for assessing vulnerability and risk in flood-prone communities. Many communities have maps that show the extent and likely depth of flooding for the base flood. Corresponding water-surface elevations describe the elevation of water that will result from a given discharge level, which is one of the most important factors used in estimating flood damage.
FEMA/Cal OES Submission Draft 10-27-2020

Kern Multi-Jurisdiction 2020 MJHMP UpdateCOUNTY OF KERN
4-57
Figure 4-18 DWR Awareness Zones
FEMA/Cal OES Submission Draft 10-27-2020

Kern Multi-Jurisdiction 2020 MJHMP UpdateCOUNTY OF KERN
4-58
4.5.2.5 Frequency/ Probability of Future Occurrences
Kern County will experience flooding in the future, with the probability of flooding in Kern County between 10 and 100% annually. The majority of the floods in Kern County have occurred from winter-through-spring rainfall, but several have been the result of heavy rain events during the months of July, August, and September. Flooding in Southern California is often associated with the El Nino weather phenomenon. El Nino is a term originally used to describe the appearance of warm (surface) water from time to time in the eastern equatorial Pacific region along the coasts of Peru and Ecuador. This ocean warming can strongly affect weather patterns all over the world. El Nino events are often associated with above normal precipitation in the southwestern United States. El Niños often occur during the Christmas season. La Niña is the opposite or “cold phase” of the El Niño cycle. It was once suggested that minor El Niño events occurred about every two to three years and major ones about every 8 to 11 years. Today, scientists note that El Niño has a return period of four to five years. When an El Niño event occurs, it often lasts from 12 to 18 months. (National Oceanic and Atmospheric Administration , 2020)
4.5.2.6 Severity and Extent
The main factors affecting flood damage are water depth and velocity. Deeper and faster flood flows can cause more damage. Shallow flooding with high velocities can cause as much damage as deep flooding with slow velocity. This is especially true when a channel migrates over a broad floodplain, redirecting high velocity flows and transporting debris and sediment. Flood severity is often evaluated by examining peak discharges; Table 4-12 lists peak flows used by FEMA to map Kern County floodplains.
Table 4-12: Summary of Discharges in Kern County
Drainage sq.
Miles
Peak Discharge (cubic feet/second)
Flooding Source/Location 10% Annual
Chance 2% Annual
Chance 1% Annual
Chance 0.2% Annual
Chance
Antelope Creek
At Tehachapi Western Corporate Limit 25.4 2,730 6,970 9,090 18,000
At Western Corporate Limits 4.8 650 1,150 1,380 1,900
Blackburn Creek At Tehachapi Boulevard and Dennison Road
10.1 2,410 5,780 7,450 11,850
At Western Corporate Limits 16.2 2,730 6,970 9,090 18,000 Downstream of Tehachapi Boulevard 28.2 3,310 8,250 12,030 23,000 Near Highline Road 4.5 * * 5,290 *
Caliente Creek Above Bealville Road Bridge 186.1 1,800 7,550 19,800 56,000 At State Highway 58 467.8 3,600 16,000 27,000 87,500
Caliente Creek Near Loraine
Upstream of Confluence of Weaver Creek 20.0 325 1,800 3,350 12,300
FEMA/Cal OES Submission Draft 10-27-2020

Kern Multi-Jurisdiction 2020 MJHMP UpdateCOUNTY OF KERN
4-59
Drainage sq.
Miles
Peak Discharge (cubic feet/second)
Flooding Source/Location 10% Annual
Chance 2% Annual
Chance 1% Annual
Chance 0.2% Annual
Chance
Downstream of Indian Creek Confluence 124.0 1,650 9,050 16,900 61,000
Upstream of Sand Canyon Confluence 51.0 800 4,000 7,650 26,000
Upstream of Unnamed Tributary Confluence
47.0 770 3,800 7,100 24,000
Cuddy Creek
At Lebec Road 46.4 850 3,900 7,750 25,000
El Paso Wash
At North Downs St. & Ridgecrest-Inyoken Rd.
12.7 240 1,670 3,000 7,050
Erskine Creek
At State Highway 178 37.7 850 2,300 7,700 25,000
Grapevine Canyon Creek 11.0 520 4,330 9,200 42,000
Grapevine Canyon Creek 11.0 520 4,330 9,200 42,000
Kelso Creek
At State Highway 178 159.5 2,850 11,000 22,700 68,000
Kern River
At Gaging Station 5.8 Miles NE of Bakersfield Post Office
2,407.0 2,800 7,000 10,200 28,700
At Kernville Gaging Stations 2,407.0 2,800 7,000 10,200 28,700
At Stockdale Highway * 2,800 7,000 10,200 28,700
Poso Creek
At State Highway 58 368.0 2,900 11,500 19,000 52,000
Upper Sycamore
At Lower End of Valley Rd. 14.9 260 990 2,900 10,000 * Data not available
Source: Table 5 Summary of Discharges from FEMA FIS Text, 2008
4.5.2.7 Warning Time
The type and rate of flooding experienced in Kern County varies. In general, warning times for floods can be between 24 and 48 hours to prepare communities to reduce flood damages Seasonal notification for flooding can enhance awareness for citizens at risk, and, when communicated effectively, advance notification can reach target audiences on a large scale.
FEMA/Cal OES Submission Draft 10-27-2020

Kern Multi-Jurisdiction 2020 MJHMP UpdateCOUNTY OF KERN
4-60
4.5.2.7.1 DWR Awareness Zones Notification
The Flood Risk Notification Program (FRN Program) is part of DWR’s FloodSAFE California Initiative. The program’s key goal is to increase flood risk awareness by effectively communicating that risk to individual property owners, the public, and local, state, and federal agencies. This includes encouraging people to understand the levee system that protects them; be prepared and aware of their flood risk; and take appropriate actions before, during, and after flooding to protect themselves, minimize damage to their property or personal possessions, and facilitate recovery.
To achieve this goal, the FRN Program:
▪ sends out an annual notice to property owners whose property is at risk of flooding, ▪ maintains accurate Levee Flood Protection Zone (LFPZ) maps 6 and an associated parcel
information database, ▪ provides people with useful ways to assess risk and reduce flood loss, ▪ establishes outreach and educational projects with public involvement, ▪ expands its interactive Flood Risk Notification website, and ▪ collaborates with federal agencies, local agencies, and communities.
In September of 2010, DWR provided the first annual written notice of flood risks to each landowner whose property is protected by State Plan of Flood Control (SPFC) levees and is within an LFPZ. The notice informs recipients of their property’s potential flood risks and potential sources of flooding and offers flood emergency planning and preparedness tips. It encourages recipients to take preventative actions such as purchasing flood insurance, elevating or “floodproofing” their buildings, and preventing blockage of channels, drains, and ditches.
4.5.2.8 Secondary Hazards
The most problematic secondary hazard for flooding is bank erosion, which in some cases can be more harmful than actual flooding. Flooding is also responsible for landslides when high flows over-saturate soils on steep slopes and cause them to fail. Hazardous materials spills are a secondary hazard of flooding if storage tanks rupture and spill into streams or storm sewers. (Department of Environmental Conservation, 2020)
Wildland fires within a watershed can exacerbate the flood hazard by virtue of increased rate and volume of runoff and attendant erosion and sediment discharge. (United States Geological Survey, 2020)
4.5.2.9 Climate Change Impacts
The effects of climate change are varied and include warmer and more varied weather patterns, melting ice caps, and poor air quality, for example. As a result, climate change will likely worsen a number of natural hazards including flooding. Climate change will shift rainfall patterns, making heavy rains more
6 These maps are different from Federal Emergency Management Agency regulatory maps.
FEMA/Cal OES Submission Draft 10-27-2020

Kern Multi-Jurisdiction 2020 MJHMP UpdateCOUNTY OF KERN
4-61
frequent in many areas. An increase in heavy rain events will lead to more flooding including flash floods that happen suddenly as a result of heavy rain and localized flooding which involves pooling of water in low-lying areas. Heavy rain events can inundate and overwhelm stormwater drainage systems resulting in localized flooding where pooling of water can cause significant damage to buildings. Overwhelmed stormwater drainage facilities also create hazardous conditions on roadways where water pools in low lying areas creating dangerous driving conditions. (United States Environmental Protection Agency, 2020)
4.5.2.10 Flood Vulnerability Analysis
Both an exposure analysis and Hazus loss estimation analysis were conducted to develop the flood vulnerability analysis for Kern County. Flood exposure numbers were generated using the inventories outlined in 4.5.2.10.1 County inventories were overlaid with FEMA delineated flood plains to determine exposure. These risk assessment exposure analysis values do not include Hazus-generated results.
Hazus flood vulnerability data was generated using a Level 2 Hazus-MH 4.2 analysis. Hazus is a FEMA software product that uses a GIS to analyze 100-year depth grids derived from FEMA 100-year “A” zones with Base Flood Elevations (BFE) to estimate loss. Parcel data defined in 4.5.2.10.1 was imported into Hazus as User Defined Facilities (UDF) and serves as the basis for replacement and content cost estimations as well as associated loss. Where flood vulnerability is mentioned absent of Hazus, exposure analysis figures are used. Figure 4-20 displays a snapshot of flood exposure and damage estimation in Unincorporated Kern County.
4.5.2.10.1 Flood Exposure
The tables and graphs in this section detail population, property, and infrastructure that are exposed to flooding in Unincorporated Kern County. Flood exposure is categorized by exposure to different flood hazard zones including the floodway, flood fringe, 100-year floodplain, and 500-year floodplain. The tables and graphs also include a category of 100-year total which is a combined total of floodway, flood fringe, and 100-year floodplain categories. The 500-year sans 100-year category includes only the 500-year floodplain, and the 500-year total includes all of the categories combined. Refer to section 4.5.2 for floodplain definitions to better understand these flood hazard areas.
Population
Population counts of those living in the floodplain were generated by analyzing County assessor and parcel data that intersect with the 100-YR and 500-year floodplains identified on FIRMs. Using GIS, U.S. Census Bureau information was used to intersect the floodplain and an estimate of population was calculated by weighting the population within each census block and track with the percentage of flood risk area. Using this approach, Table 4-13 and displays the results of this analysis showing how much of the population of Unincorporated Kern County is exposed to flood hazard zones.
FEMA/Cal OES Submission Draft 10-27-2020

Kern Multi-Jurisdiction 2020 MJHMP UpdateCOUNTY OF KERN
4-62
Figure 4-19 Population Exposure to Flood (Unincorporated County)
Table 4-13: Summary Population Exposure to Flood (Unincorporated County)
Total Population
Unincorporated County 299,935
Flood Hazard Zone Population Count % of Total
Flood Fringe 34,925 11.64%
Floodway 439 0.15%
100-YR Total 35,364 11.79%
500-YR sans 100-YR 15,857 5.29%
500-YR Total 51,221 17.08%
34,925
439
35,364
15,857
51,221
-
10,000
20,000
30,000
40,000
50,000
60,000
Flood Fringe Floodway 100-YR Total 500-YR sans 100-YR 500-YR Total
Population Exposure Population Count in the 100-Year and 500-YR Floodplains
FEMA/Cal OES Submission Draft 10-27-2020

Kern Multi-Jurisdiction 2020 MJHMP UpdateCOUNTY OF KERN
4-63
Figure 4-20: FEMA Flood Zone Exposure and Snapshot Map
FEMA/Cal OES Submission Draft 10-27-2020

Kern Multi-Jurisdiction 2020 MJHMP UpdateCOUNTY OF KERN
4-64
Structures and Parcel Value Table 4-14 summarizes parcels in Unincorporated Kern County that are exposed to flood hazard areas. The beginning of Section 4.5.2 includes definitions of the various flood hazard areas.
Table 4-14: Parcels Exposed to NFIP Flood Zones (Unincorporated County)
Total Parcels
Total Market
Value ($)
Total Content
Value ($) Total Value ($)
Unincorporated County 91,455 $10,906,675 $ 5,453,338 $ 16,360,013
Flood Hazard Zone Parcel Count % of Total Market Value
Exposure ($)
Content Value
Exposure ($) Total Exposure ($) % of Total
Flood Fringe 7,823 8.6% $678,412 $ 339,206 $ 1,017,618 6.2%
Floodway 143 0.2% $ 11,380 $ 5,690 $ 17,070 0.1%
100-YR Total 7,966 8.7% $ 689,792 $ 344,896 $ 1,034,688 6.3% 500-YR sans 100-YR 7,002 7.7% $ 807,307 $ 403,653 $ 1,210,960 7.4%
500-YR Total 14,968 16.4% $ 1,497,099 $ 748,549 $2,245,648 13.7% Currency in Thousands
Note: The table above does not display loss estimation results; the table exhibits total value at risk based upon the hazard overlay and Kern County Assessor data.
Critical Facilities and Infrastructure Table 4-15 summarizes the critical facilities and infrastructure located in the flood fringe, floodway, and 100-year and 500-year floodplains of Kern County.
Table 4-15: Critical Facility Points in the Floodplain
Infrastructure Type Flood Fringe Floodway 100-YR Total 500-YR sans
100-YR 500-YR Total
Essential Facility 6 - 6 5 11
EOC - - - - -
Fire Station 6 - 6 2 8
Hospital - - - - -
Police Station - - - - -
Sheriff Station - - - 3 3
High Potential Loss 79 - 79 60 139
Adult Residential facility 2 - 2 1 3
Child Care Center 11 - 11 9 20
Dam 5 - 5 - 5
Family Child Care Home 9 - 9 9 18
Foster Family Agency - - - - -
Historic Building - - - 1 1
Home Care Organization - - - - -
FEMA/Cal OES Submission Draft 10-27-2020

Kern Multi-Jurisdiction 2020 MJHMP UpdateCOUNTY OF KERN
4-65
Infrastructure Type Flood Fringe Floodway 100-YR Total 500-YR sans
100-YR 500-YR Total
Library 6 - 6 2 8
Residential Child Care 1 - 1 - 1
Residential Elder Care - - - 1 1
School 14 - 14 14 28
County Insured Asset* 20 - 20 13 33
Cooling Center - - - 1 1
Healthcare Facility 2 - 2 2 4
Special Needs Facility 9 - 9 7 16
City Hall - - - - -
Historic Site - - - - -
Transportation and Lifeline 968 14 982 122 1,104
Airport - - - 2 2
Bridge 129 12 141 12 153
Power Plant 22 1 23 1 24
Substation 17 1 18 7 25
Transmission Line Tower 741 - 741 98 839
NG Facility 13 - 13 2 15
Wind Turbine 42 - 42 - 42
Bus Facility 1 - 1 - 1
Potable Water Facility 1 - 1 - 1
Waste Water Facility 1 - 1 - 1
Oil Facility 1 - 1 - 1
Railroad Facility - - - - -
Grand Total 1,053 14 1,067 187 1,254 *These insured assets may include critical infrastructure already represented in other Infrastructure Types. For more information on these insured assets, see the Damage Estimation at Section 4.5.2.10.2.
Linear Utilities
It is important to determine who may be at risk if infrastructure is damaged by flooding. Roads or railroads that are blocked or damaged can isolate residents and can prevent access throughout the county, including for emergency service providers needing to get to vulnerable populations or to make repairs. Bridges washed out or blocked by floods or debris also can cause isolation. Water and sewer systems can be flooded or backed up, causing health problems. Underground utilities can be damaged. Levees can fail or be overtopped, inundating the land that they protect. Table 4-16 shows critical facilities (linear) in the floodplain.
FEMA/Cal OES Submission Draft 10-27-2020

Kern Multi-Jurisdiction 2020 MJHMP UpdateCOUNTY OF KERN
4-66
Table 4-16: Lifelines in the Floodplain (Unincorporated County)
Lifelines (miles) - Flood Risk Exposure
Infrastructure Type (linear) Flood Fringe Floodway 100-YR Total 500-YR sans
100-YR 500-YR Total
Levee 304.90 - 304.90 4.01 308.91
NG Pipeline 158.28 0.39 158.67 11.30 169.97
Railroad 79.34 0.89 80.23 15.34 95.57
Street 1600.74 22.18 1622.92 334.39 1957.31
4WD trail 7.58 - 7.58 0.14 7.72
4WD trail, major - - - 0.08 0.08
Alley 0.94 - 0.94 0.55 1.49
Cul-de-sac 0.46 - 0.46 0.13 0.59
Driveway 17.62 0.35 17.97 3.10 21.06
Interstate 43.27 2.02 45.29 10.24 55.53
Local road 636.93 11.63 648.57 124.06 772.63
Local road, major 574.65 3.12 577.77 124.84 702.60
Primary highway 41.93 0.04 41.97 8.84 50.81
Ramp 8.11 0.59 8.70 3.60 12.30
Road, parking area 3.37 - 3.37 - 3.37
Service road 0.53 - 0.53 2.17 2.70
State/county highway 231.44 4.30 235.74 54.57 290.31
State/county highway, major - - - - -
Thoroughfare, major 33.83 0.13 33.96 1.82 35.79
Walkway 0.08 - 0.08 0.23 0.31
Transmission Line 387.13 5.78 392.91 37.08 429.99
Grand Total 2530.39 29.25 2559.64 402.12 2961.76
Roads
Kern County Public Works (KCPW) maintains a list of roads throughout the County to avoid during a flood event. That list can be viewed by contacting the Kern County Public Works directly. It is also available on the Kern County Public Works website. KCPW also has real-time closure notifications provided at https://kernpublicworks.com/transportation/road-status-closures
Water and Sewer Infrastructure
Water and sewer systems can be affected by flooding. Floodwaters can back up drainage systems, causing localized flooding. Culverts can be blocked by debris from flood events, also causing localized urban flooding. Floodwaters can get into drinking water supplies, causing contamination. Sewer systems can be backed up, causing wastewater to spill into homes, neighborhoods, rivers, and streams.
FEMA/Cal OES Submission Draft 10-27-2020

Kern Multi-Jurisdiction 2020 MJHMP UpdateCOUNTY OF KERN
4-67
4.5.2.10.2 Flood Damage Estimation
This section provides estimations of damages to County insured assets and residential buildings in the 100-year and 500-year flood zones. This section first looks at overall damages for County insured assets and residential buildings in the 100-year flood zone, then looks specifically at potential damage to various County insured assets according to type (e.g., administrative buildings, equipment and services, or recreation). This section then repeats this information for the 500-year flood zone.
Damage estimations, as calculated by Hazus, estimate losses to structures from flooding by analyzing the depth of flooding and type of structure. Using historical flood insurance claim data, Hazus estimates the percentage of damage to structures and their contents by applying established damage functions to an inventory. For this analysis, all non-vacant parcels with current market values were used instead of the default inventory data provided with Hazus. Table 4-17 and Figure 4-21 show the 100-year flood loss estimation (based on depth) in NFIP flood zones by occupancy type. Figure 4-22 and Table 4-19 shows the 500-year flood loss estimation (based on depth) in NFIP flood zones by occupancy type.
The County’s insurance data was obtained and formatted for use in Hazus for a detailed damage estimation of County-owned insured assets. This combined government dataset has additional information including number of floors, building value, content value, and construction type that greatly enhances Hazus results. Table 4-18 displays damage estimation for County insured assets located in the 100-year flood zone, and Table 4-20 displays the same in the 500-year flood zone.
FEMA/Cal OES Submission Draft 10-27-2020

Kern Multi-Jurisdiction 2020 MJHMP UpdateCOUNTY OF KERN
4-68
Damage Estimation for 100 yr. Floodplain Table 4-17 and Figure 4-21 display damage estimation summaries for the 100-year floodplain in Unincorporated Kern County by occupancy type.
Table 4-17: 100 YR Flood Damage Estimation by Occupancy Type
Building Type Building Damage ($)
Building
Damage
(% of total
loss)
Content
Damage ($)
Content
Damage
(% of total
loss)
Total Damage
($)
Proportion
of Loss (%)
County Insured Assets
Government Service† $ 117,332 0.1% $ 69,557 0.0% $ 186,888 0.1%
Emergency Response†† $ - 0.0% $ - 0.0% $ - 0.0%
Residential
Single Family $ 138,281,371 72.2% $ 41,169,002 21.5% $179,450,373 93.7%
Mobile Home $ 2,659,571 1.4% $ 876,594 0.5% $3,536,165 1.8%
Multi Family Duplex $ 4,249,036 2.2% $ 2,584,794 1.3% $ 6,833,830 3.6%
Multi Family 3-4 Units $ 901,543 0.5% $ 550,297 0.3% $ 1,451,840 0.8%
Multi Family 5-9 Units $ 33,282 0.0% $13,313 0.0% $ 46,595 0.0%
Multi Family 10-19 Units $ - 0.0% $ - 0.0% $ - 0.0%
Multi Family 20-49 Units $ - 0.0% $ - 0.0% $ - 0.0%
Total $ 146,242,134 76.4% $ 45,263,557 23.6% $191,505,691 †Government Services includes: admin, airport, animal, building, bus, correctional, equipment, golf course, health, leased, library, misc, museum, office, park, recreation, relay, shop, storage, vacant, veterans, warehouse, water, yard †† Emergency Response includes Sherriff Offices and Fire Departments
Note: Total Inventory Values 1 - Building Replacement Costs = $11,868,231,028.60 2 - Content Replacement Costs = $5,673,439,613.70
3 - Total Value = $17,541,670,642.30
FEMA/Cal OES Submission Draft 10-27-2020

Kern Multi-Jurisdiction 2020 MJHMP UpdateCOUNTY OF KERN
4-69
Figure 4-21 100-YR Flood Damage Estimation by Occupancy
Table 4-18 displays damage estimation for County insured assets located in the 100-year flood zone.
Table 4-18 100 YR Flood Damage Estimation of County Insured Assets
Asset Type Bldg.
Count
Bldg. Cost
USD
Content
Cost USD
Bldg.
Dmg. %.
Content
Dmg. %
Bldg.
Loss %
Content
Loss %
Total
Value
Loss USD
Total Loss
as % of
Values
Administrative & Office 2 $2,265,678 $2,000 0.0% 0.0% $0 $0 $0 0.0%
Admin 2 $2,265,678 $2,000 0.0% 0.0% $0 $0 $0 0.0% Equipment & Storage 2 $796,212 $12,274 0.0% 0.0% $0 $0 $0 0.0%
Yard 2 $796,212 $12,274 0.0% 0.0% $0 $0 $0 0.0%
Other Assets 3 $1,396,511 $620,194 2.8% 20.1% $117,332 $69,557 $186,888 9.3%
Leased 3 $1,396,511 $620,194 2.8% 20.1% $117,332 $69,557 $186,888 9.3%
Recreation 3 $1,227,733 $18,257 0.0% 0.0% $0 $0 $0 0.0%
Park 1 $135,359 $1,000 0.0% 0.0% $0 $0 $0 0.0%
Recreation 2 $1,092,374 $17,257 0.0% 0.0% $0 $0 $0 0.0%
Services 8 $5,612,671 $418,183 0.0% 0.0% $0 $0 $0 0.0%
$- $20,000,000 $40,000,000 $60,000,000 $80,000,000 $100,000,000 $120,000,000 $140,000,000 $160,000,000
GovernmentService
EmergencyResponse
Single Family
Mobile Home
Multi FamilyDuplex
Multi Family3-4 Units
Multi Family5-9 Units
Multi Family10-19 Units
Multi Family20-49 Units
Building Damage ($) Content Damage ($)
FEMA/Cal OES Submission Draft 10-27-2020

Kern Multi-Jurisdiction 2020 MJHMP UpdateCOUNTY OF KERN
4-70
Asset Type Bldg.
Count
Bldg. Cost
USD
Content
Cost USD
Bldg.
Dmg. %.
Content
Dmg. %
Bldg.
Loss %
Content
Loss %
Total
Value
Loss USD
Total Loss
as % of
Values
Fire 4 $2,893,100 $306,260 0.0% 0.0% $0 $0 $0 0.0%
Library 2 $2,620,412 $2,000 0.0% 0.0% $0 $0 $0 0.0%
Sheriff 2 $99,159 $109,923 0.0% 0.0% $0 $0 $0 0.0%
Grand Total 18 $11,298,805 $1,070,908 0.5% 3.3% $117,332 $69,557 $186,888 1.5%
Damage Estimation for 500 yr. Floodplain Table 4-19 and Figure 4-22 display the damage estimation summaries for the 500 yr. floodplain in Unincorporated Kern County by occupancy type.
Table 4-19: Damage Estimation Summary for 500 yr. Floodplain
Building Type
Building
Damage ($)
Building
Damage
(% of total
lossl)
Content
Damage ($)
Content
Damage
(% of total
loss)
Total Damage
($)
Proportion
of Loss
(%)
County Insured Assets
Government Service† $ 460,297 0.1% $ 56,267 0.0% $ 516,563 0.3%
Emergency Response†† $ 33,985 0.0% $8,682 0.0% $ 42,667 0.0%
Residential
Single Family $251,352,817 75.7% $ 68,051,451 35.5% $
319,404,268 166.8%
Mobile Home $ 2,613,035 0.8% $1,116,376 0.6% $
3,729,412 1.9%
Multi Family Duplex $ 3,570,518 1.1% $ 2,041,086 1.1% $
5,611,604 2.9%
Multi Family 3-4 Units $ 1,825,942 0.5% $ 1,037,288 0.5% $
2,863,229 1.5%
Multi Family 5-9 Units $ 822 0.0% $ 329 0.0% $ 1,151 0.0%
Multi Family 10-19 Units $ 38,416 0.0% $ 26,380 0.0% $ 64,796 0.0%
Multi Family 20-49 Units $ - 0.0% $ - 0.0% $ - 0.0%
Total $
259,895,832 78.2% $ 72,337,858 21.8% $
332,233,690 †Government Services includes: admin, airport, animal, building, bus, correctional, equipment, golf course, health, leased, library, misc, museum, office, park, recreation, relay, shop, storage, vacant, veterans, warehouse, water, yard †† Emergency Response includes Sherriff Offices and Fire Departments
Note: Total Inventory Values 1 - Building Replacement Costs = $11,868,231,028.60 2 - Content Replacement Costs = $5,673,439,613.70
3 - Total Value = $17,541,670,642.30
FEMA/Cal OES Submission Draft 10-27-2020

Kern Multi-Jurisdiction 2020 MJHMP UpdateCOUNTY OF KERN
4-71
Figure 4-22 500 YR Flood Damage Estimation by Occupancy Type
$- $50,000,000 $100,000,000 $150,000,000 $200,000,000 $250,000,000 $300,000,000
GovernmentService
EmergencyResponse
Single Family
Mobile Home
Multi FamilyDuplex
Multi Family3-4 Units
Multi Family5-9 Units
Multi Family10-19 Units
Multi Family20-49 Units
Building Damage ($) Content Damage ($)
FEMA/Cal OES Submission Draft 10-27-2020

Kern Multi-Jurisdiction 2020 MJHMP UpdateCOUNTY OF KERN
4-72
Table 4-20 displays damage estimation for County facilities located in the 500-year flood zone.
Table 4-20 500-YR Flood Damage Estimation of County Facilities
Row Labels
Bldg.
Count
Bldg. Cost
USD
Content
Cost USD
Bldg.
Dmg.
%
Conten
t Dmg.
%
Bldg.
Loss %
Content
Loss %
Total Value
Loss USD
Total Loss
as % of
Values
Equipment & Storage 1 $579,319 $36,616 4.9% 29.3% $28,285 $10,726 $39,011 6.3%
Storage 1 $579,319 $36,616 4.9% 29.3% $28,285 $10,726 $39,011 6.3% Other Assets 2 $2,000 $480,268 0.0% 0.0% $0 $0 $0 0.0%
Leased 2 $2,000 $480,268 0.0% 0.0% $0 $0 $0 0.0%
Recreation 3 $3,414,586 $49,963 8.7% 58.3% $289,83
7 $45,333 $335,170 9.7% Recreatio
n 3 $3,414,586 $49,963 8.7% 58.3% $289,83
7 $45,333 $335,170 9.7%
Services 4 $5,634,901 $207,245 3.1% 8.9% $176,16
0 $8,889 $185,049 3.2%
Fire 3 $1,513,954 $206,245 2.9% 5.0% $33,985 $8,682 $42,667 2.5%
Library 1 $4,120,947 $1,000 3.5% 20.7% $142,17
5 $207 $142,382 3.5%
Grand Total 10 $9,630,806 $774,092 4.3% 24.0% $494,28
1 $64,949 $559,230 5.4%
4.5.2.11 Future Trends in Development
Levees in Kern County provide the community with some degree of protection from flooding. Kern County has a comprehensive floodplain management ordinance (Kern County Code § 17.48) to restrict and mitigate impacts from future development occurring within floodplains and floodways. The County has also undertaken several studies on reducing flood risk and converted those follow up projects into mitigation actions. For example, see Caliente Creek Feasibility Study and Conceptual Plan.
The Kern County Water Agency (KCWA) has limited flood control responsibilities through Improvement District No. 1 in the Rosedale area of Bakersfield and Improvement District No. 3 to provide flood protection to Weldon Valley residents east of Isabella Reservoir. (KCWA, 2018)
The County and its planning partners are equipped to handle future growth within flood hazard areas. The County and all other municipal planning partners have General Plans that address frequently flooded areas in their Safety Elements. All partners have committed to linking their General Plans to this MJHMP. This will create an opportunity for wise land use decisions as future growth impacts flood hazard areas.
FEMA/Cal OES Submission Draft 10-27-2020

Kern Multi-Jurisdiction 2020 MJHMP UpdateCOUNTY OF KERN
4-73
4.5.2.12 Flood Hazard Problem Statements
As part of the mitigation action identification process, the Planning Committee for the County and for each jurisdiction identified issues and weaknesses, also called problem statements, for their respective facilities based on the risk assessment and vulnerability analysis, utilizing the RAMP mapping tool and flood data. Flood problem statements for the County are listed in Table 4-21; problem statements for all other participating jurisdictions are accessed in Volume 2 of this plan.
Identifying these common issues and weaknesses assists the Planning Committee in understanding the realm of resources needed for mitigation. The goal is to have at least one mitigation action for every problem statement. See Table 5-6 for a full list of mitigation actions and the corresponding problem statements that they address. Each problem statement is coded with a problem number for cross-referencing between Table 4-21 and Table 5-6.
Table 4-21 Flood Problem Statements
Problem No. Hazard
Area of Concern
Mitigation Alternatives
Primary Agency Problem Description
Related MA
ps-FL-KC-173
Flood Impact PRV - Prevention , PPRO - Property Protection , PE&A - Public Education & Awareness
County of Kern
Floods and their impacts will vary by community, and will likely only affect certain areas of the County during specific timeframes.
ma-FL-KC-110, ma-FL-KC-70
ps-FL-KC-174
Flood Impact PPRO - Property Protection , NRP - Natural Resource Protection
County of Kern
While many of the floods are shallow sheet flow events, they have resulted in property damage, road washouts, and transportation disruptions.
ma-FL-KC-284
ps-FL-KC-175
Flood Impact PPRO - Property Protection , SP - Structural Projects
County of Kern
County bridges are affected by scouring during flooding. Reference the County Poor Health Bridges Report for bridges of poor quality that require attention- https://www.dropbox.com/s/kkb4c685iwlefsd/Poor%20Health%20Bridges%20Report.pdf?dl=1
ma-FL-KC-285
ps-FL-KC-176
Flood Victim PRV - Prevention
County of Kern
Problems still occur in areas that have no mapped floodplain or where floodplain maps are inaccurate.
ma-FL-KC-110, ma-FL-KC-70
ps-FL-KC-177
Flood Victim PRV - Prevention , PE&A - Public Education & Awareness , NRP - Natural Resource Protection , SP - Structural Projects
County of Kern
Approx . 35k residents live within or near the 100 YR Floodplain. Approx. 400 live within proximity to floodway.
ma-FL-KC-70, ma-FL-KC-110, ma-FL-KC-283
FEMA/Cal OES Submission Draft 10-27-2020

Kern Multi-Jurisdiction 2020 MJHMP UpdateCOUNTY OF KERN
4-74
Problem No. Hazard
Area of Concern
Mitigation Alternatives
Primary Agency Problem Description
Related MA
ps-FL-KC-178
Flood Victim PPRO - Property Protection , NRP - Natural Resource Protection , SP - Structural Projects
County of Kern
High Potential Loss Facilities within 100-YR Flood Zone: 11 - Child Care Centers 9 – In-Home Child Care Facilities 9 – Special Needs Facilities
ma-FL-KC-110, ma-FL-KC-70
ps-FL-KC-179
Flood Threat PPRO - Property Protection , NRP - Natural Resource Protection , SP - Structural Projects
County of Kern
Based on input from the Golden Hills Community Service District, 2,100-7,500 persons could be impacted by floods in this area. Certain areas of the District’s water system and roads in two road maintenance districts could be affected. Areas could be isolated from emergency services and experience loss of power service, power, and natural gas.
ma-FL-KC-110, ma-FL-KC-70, ma-FL-KC-284
ps-FL-KC-180
Flood Threat PPRO - Property Protection , SP - Structural Projects
County of Kern
South Lake – The area along the southeast shore of Lake Isabella has several residential developments constructed on active alluvial fans.
ma-FL-KC-70, ma-FL-KC-283, ma-FL-KC-110
ps-FL-KC-181
Flood Threat PPRO - Property Protection , SP - Structural Projects
County of Kern
Lynch Canyon/Mountain Mesa – This residential and commercial area, along the south shore of Lake Isabella, is constructed on an active alluvial fan.
ma-FL-KC-283, ma-FL-KC-70, ma-FL-KC-110
ps-FL-KC-182
Flood Threat PPRO - Property Protection , NRP - Natural Resource Protection , SP - Structural Projects
County of Kern
Cache Creek – Pg. 4 of Kern Co. Flood Hazard Mitigation Plan details issues w/ this waterway. https://www.dropbox.com/s/544jltdk9vf6sy4/Kern%20County%20Flood%20Hazard%20Mitigation%20Plan%20%281998%29.pdf?dl=1
ma-FL-KC-303
ps-FL-KC-183
Flood Threat PPRO - Property Protection , NRP - Natural Resource Protection , SP - Structural Projects
County of Kern
Little Dixie Wash – Pg. 4 of Kern Co. Flood Hazard Mitigation Plan details issues w/ this waterway. https://www.dropbox.com/s/544jltdk9vf6sy4/Kern%20County%20Flood%20Hazard%20Mitigation%20Plan%20%281998%29.pdf?dl=1
ma-FL-KC-303
ps-FL-KC-184
Flood Threat PPRO - Property Protection , NRP - Natural Resource Protection , SP - Structural Projects
County of Kern
Ridgecrest Washes – Pg. 4 of Kern Co. Flood Hazard Mitigation Plan details issues w/ this waterway. https://www.dropbox.com/s/544jltdk9vf6sy4/Kern%20County%20Flood%20Hazard%20Mitigation%20Plan%20%281998%29.pdf?dl=1
ma-FL-KC-303
FEMA/Cal OES Submission Draft 10-27-2020

Kern Multi-Jurisdiction 2020 MJHMP UpdateCOUNTY OF KERN
4-75
Problem No. Hazard
Area of Concern
Mitigation Alternatives
Primary Agency Problem Description
Related MA
ps-FL-KC-185
Flood Threat PPRO - Property Protection , NRP - Natural Resource Protection , SP - Structural Projects
County of Kern
According to the Wheeler Ridge-Maricopa Water Storage District and Kern County Roads Department the following public roads have flood problems, some of which could use improvements to prevent recurrent damage: David Rd at Grapevine Creek and El Paso Creek Sebastion Rd at Grapevine Creek and El Paso Creek Laval Rd at Grapevine Creek Red Rock Randsburg Rd near Red Rock Canyon State Park Copus and Valpredo Rds near the junction of Highway 99 and Interstate 5 Wheeler Ridge Road and Rancho Road near El Paso and Tejon Creek Frazier Mtn Park Rd and bridges along Cuddy Creek has erosion concerns
ma-FL-KC-99
ps-FL-KC-204
Flood Threat PPRO - Property Protection , NRP - Natural Resource Protection , SP - Structural Projects
County of Kern
Sandy Creek (Taft/Ford City area) –Pg. 3 of Kern Co. Flood Hazard Mitigation Plan details issues w/ this waterway. https://www.dropbox.com/s/544jltdk9vf6sy4/Kern%20County%20Flood%20Hazard%20Mitigation%20Plan%20%281998%29.pdf?dl=1
ma-FL-KC-284, ma-FL-KC-285
ps-FL-KC-206
Flood Threat PPRO - Property Protection , NRP - Natural Resource Protection , SP - Structural Projects
County of Kern
The Southern Stream Group – Pg. 3 of Kern Co. Flood Hazard Mitigation Plan details issues w/ this waterway. https://www.dropbox.com/s/544jltdk9vf6sy4/Kern%20County%20Flood%20Hazard%20Mitigation%20Plan%20%281998%29.pdf?dl=1
ma-FL-KC-99, ma-FL-KC-202
ps-FL-KC-207
Flood Threat PPRO - Property Protection , NRP - Natural Resource Protection , SP - Structural Projects
County of Kern
Poso Creek – Pg. 3 of Kern Co. Flood Hazard Mitigation Plan details issues w/ this waterway. https://www.dropbox.com/s/544jltdk9vf6sy4/Kern%20County%20Flood%20Hazard%20Mitigation%20Plan%20%281998%29.pdf?dl=1 Also has potential to break across HWY 99 and create backwater flooding issues as a result of debris and flow impediment.
ma-FL-KC-82, ma-FL-KC-244
ps-FL-KC-208
Flood Threat PPRO - Property Protection , NRP - Natural Resource Protection , SP - Structural Projects
County of Kern
Caliente Creek – Pg. 3 of Kern Co. Flood Hazard Mitigation Plan details issues w/ this waterway. https://www.dropbox.com/s/544jltdk9vf6sy4/Kern%20County%20Flood%20Hazard%20Mitigation%20Plan%20%281998%29.pdf?dl=1
ma-FL-KC-99, ma-FL-KC-202, ma-FL-KC-304
FEMA/Cal OES Submission Draft 10-27-2020

Kern Multi-Jurisdiction 2020 MJHMP UpdateCOUNTY OF KERN
4-76
Problem No. Hazard
Area of Concern
Mitigation Alternatives
Primary Agency Problem Description
Related MA
ps-FL-KC-209
Flood Threat PPRO - Property Protection , NRP - Natural Resource Protection , SP - Structural Projects
County of Kern
Upper Caliente Creek – Pg. 3 of Kern Co. Flood Hazard Mitigation Plan details issues w/ this waterway. https://www.dropbox.com/s/544jltdk9vf6sy4/Kern%20County%20Flood%20Hazard%20Mitigation%20Plan%20%281998%29.pdf?dl=1
ma-AH-KC-153, ma-FL-KC-304
ps-FL-KC-210
Flood Threat PPRO - Property Protection , NRP - Natural Resource Protection , SP - Structural Projects
County of Kern
North Fork of the Kern River (Kernville) – Pg. 3 of Kern Co. Flood Hazard Mitigation Plan details issues w/ this waterway. https://www.dropbox.com/s/544jltdk9vf6sy4/Kern%20County%20Flood%20Hazard%20Mitigation%20Plan%20%281998%29.pdf?dl=1
ma-FL-KC-303
ps-FL-KC-211
Flood Threat PPRO - Property Protection , NRP - Natural Resource Protection , SP - Structural Projects
County of Kern
Lower Kern River/Buena Vista Lake – Pg. 3 of Kern Co. Flood Hazard Mitigation Plan details issues w/ this waterway. https://www.dropbox.com/s/544jltdk9vf6sy4/Kern%20County%20Flood%20Hazard%20Mitigation%20Plan%20%281998%29.pdf?dl=1
ma-FL-KC-303
ps-FL-KC-212
Flood Threat PPRO - Property Protection , NRP - Natural Resource Protection , SP - Structural Projects
County of Kern
Onyx – Pg. 4 of Kern Co. Flood Hazard Mitigation Plan, details issues w/ this waterway. Kelso Creek also has a role in this problem area. https://www.dropbox.com/s/544jltdk9vf6sy4/Kern%20County%20Flood%20Hazard%20Mitigation%20Plan%20%281998%29.pdf?dl=1
ma-FL-KC-303
ps-FL-KC-213
Flood Threat PPRO - Property Protection , NRP - Natural Resource Protection , SP - Structural Projects
County of Kern
Kelso Creek – Pg. 4 of the Kern Co. Flood Hazard Mitigation Plan, details issues w/ this waterway. https://www.dropbox.com/s/544jltdk9vf6sy4/Kern%20County%20Flood%20Hazard%20Mitigation%20Plan%20%281998%29.pdf?dl=1
ma-FL-KC-303
ps-FL-KC-214
Flood Impact PRV - Prevention , PE&A - Public Education & Awareness , NRP - Natural Resource Protection , SP - Structural Projects
County of Kern
Properties in the area of Kelso Creek have a total value of approx. $7.5 million, and many properties are not floodproofed to the County’s standards. Flooding could affect more than 200 residents in the area. Portions of Kelso Creek Road are at risk with an average cost of repairs of approximately $80,000 each time it floods.
ma-FL-KC-70, ma-FL-KC-283
FEMA/Cal OES Submission Draft 10-27-2020

Kern Multi-Jurisdiction 2020 MJHMP UpdateCOUNTY OF KERN
4-77
4.5.3 Dam Failure Hazard Profile
Dam failures in the United States typically occur in one of four ways:
• Overtopping of the primary dam structure, which accounts for 34 percent of all dam failures, can occur due to inadequate spillway design, settlement of the dam crest, blockage of spillways, and other factors.
• Foundation defects due to differential settlement, slides, slope instability, uplift pressures, and foundation seepage can also cause dam failure. These account for 30 percent of all dam failures.
• Failure due to piping and seepage accounts for 20 percent of all failures. These are caused by internal erosion due to piping and seepage, erosion along hydraulic structures such as spillways, erosion due to animal burrows, and cracks in the dam structure.
• Failure due to problems with conduits and valves, typically caused by the piping of embankment material into conduits through joints or cracks, constitutes 10 percent of all failures. (Federal Emergency Management Agency, 2019)
Many dam failures in the United States have been secondary results of other disasters, such as earthquakes, landslides, extreme storms, massive snowmelt, equipment malfunction, structural damage, foundation failures, and sabotage. Poor construction, lack of maintenance and repair, and deficient operational procedures are preventable or correctable by a program of regular inspections. Terrorism and vandalism are serious concerns that all operators of public facilities must plan for; these threats are under continuous review by public safety agencies. (Id.) Dam inundation zones are shown in Figure 4-24.
Levees
Levees are a common form of flood protection throughout the Kern County. Figure 4-25 displays the levee system in Kern County. A levee is built parallel to a body of water in order to protect life and property on the other side by channeling the water away during flooding.
Levees do not provide full protection from flooding. They are designed to provide a specific level of flood protection and large flood events can cause levees to be overtopped or fail. Levee failure is most likely during large flood events where a large surge of water leads to erosion of the soil that constitutes the levee itself.
4.5.3.1 Plans, Policies, and Regulatory Environment
1972 National Dam Safety Act
The potential for catastrophic flooding due to dam failures led to passage of the 1972 National Dam Safety Act, Pub. Law No. 92-367. The National Dam Safety Program requires a periodic engineering analysis of every major dam in the country. The goal of this FEMA-monitored effort is to identify and mitigate the risk of dam failure so as to protect the public lives and property.
FEMA/Cal OES Submission Draft 10-27-2020

Kern Multi-Jurisdiction 2020 MJHMP UpdateCOUNTY OF KERN
4-78
FERC Dam Safety Program
The Federal Energy Regulatory Commission (FERC) has the largest dam safety program in the United States. FERC cooperates with a large number of federal and state agencies to ensure and promote dam safety and, more recently, homeland security. There are 3,036 dams that are part of regulated hydroelectric projects in the FERC program. Two-thirds of these are more than 50 years old. (Federal Energy Regulatory Commission, 2011) As dams age, concern about their safety and integrity grows, so oversight and regular inspection are important. FERC staff inspects hydroelectric projects on an unscheduled basis to investigate the following:
▪ Potential dam safety problems ▪ Complaints about constructing and operating a project ▪ Safety concerns related to natural disasters ▪ Issues concerning compliance with the terms and conditions of a license.
Every five years, an independent consulting engineer, approved by the FERC, must inspect and evaluate projects with dams higher than 10 meters (32.8 feet), or with a total storage capacity of more than 2,000 acre-feet. (Id.)
FERC staff monitors and evaluates seismic research in geographic areas where there are concerns about seismic activity. This information is applied in investigating and performing structural analyses of hydroelectric projects in these areas. FERC staff also evaluates the effects of potential and actual large floods on the safety of dams. During and following floods, FERC staff visits dams and licensed projects, determines the extent of damage, if any, and directs any necessary studies or remedial measures the licensee must undertake. The FERC publication Engineering Guidelines for the Evaluation of Hydropower Projects guides the FERC engineering staff and licensees in evaluating dam safety. The publication is frequently revised to reflect current information and methodologies.
The FERC requires licensees to prepare emergency action plans and conducts training sessions on how to develop and test these plans. The plans outline an early warning system if there is an actual or potential sudden release of water from a dam due to failure. The plans include operational procedures that may be used, such as reducing reservoir levels and reducing downstream flows, as well as procedures for notifying affected residents and agencies responsible for emergency management. These plans are frequently updated and tested to ensure that everyone knows what to do in emergency situations. (Id.)
U.S. Army Corps of Engineers Dam Safety Program
The U.S. Army Corps of Engineers (“Corps”) is responsible for safety inspections of some federal and non-federal dams in the United States that meet the size and storage limitations specified in the National Dam Safety Act. The Corps has inventoried such dams and surveyed each state and federal agency’s capabilities, practices, and regulations regarding design, construction, operation, and maintenance of the dams. The Corps develops guidelines for inspection and evaluation of dam safety.
FEMA/Cal OES Submission Draft 10-27-2020

Kern Multi-Jurisdiction 2020 MJHMP UpdateCOUNTY OF KERN
4-79
California Division of Safety of Dams
California’s Division of Safety of Dams, a division of the Department of Water Resources, monitors the dam safety program at the state level. When a new dam is proposed, Division staff inspects the site. The Division reviews dam applications and building plans to ensure that the dam is designed to meet minimum requirements and that the design is appropriate for known geologic conditions. It also inspects construction to ensure that the work is done in accordance with the approved plans. The Division inspects constructed dams on an annual basis to ensure that it is performing as intended and is not developing problems. Roughly a third of these inspections include in-depth instrumentation reviews. The Division periodically reviews the stability of dams and their major appurtenances in light of improved design approaches and requirements, as well as new findings regarding earthquake hazards and hydrologic estimates in California. (Cal. Dep't of Water Resources, 2019)
Senate Bill 92: Dam Safety
Senate Bill 92 was signed into law on June 27th, 2017 and it provides new requirements focused on dam safety. Specifically, it requires dam owners to submit inundation maps to the Department of Water Resources. After they have been approved, the dam owner must then submit an emergency action plan (EAP) to Cal OES. These need to be approved by Cal OES, and resubmitted every 10 years. (California Office of Emergency Services, 2020)
Kern County General Plan
The 2004 Kern County General Plan includes many policies, implementation measures, and goals in the Land Use and Safety Elements that limit development occurring in inundation zones and mitigate impacts from such development.
Policies around dam failure include limited development in inundation zones, generally forbidding structures to be built without emergency response and evacuation plans or without inundation mitigation capabilities. The Kern County General Plan is currently being updated and will consider this MJHMP Update as it continues to shape policies around dam failure mitigation and protection.
FEMA/Cal OES Submission Draft 10-27-2020

Kern Multi-Jurisdiction 2020 MJHMP UpdateCOUNTY OF KERN
4-80
4.5.3.2 Past Events
No dams have failed in Kern County to date. As the risk assessment for Kern County illustrates, the chances of a dam failure area low, but the consequences of such are quite severe.
The most recent concerning dam failure in California was the 2017 collapse of a spillway on the Oroville Dam in Butte County, California. Oroville Dam is the largest facility within the State Water Project in California; the dam stores 3.5 million acre-feet of water, and serves as important flood control for the Feather River. In 2017, after substantial runoff from the Sierra Nevadas, Lake Oroville was full, and the spillway was opened to release extra water downstream.
“Spillways” are dam safety features that allow water to overtop the dam if the reservoir fills too quickly. Spillway overflow events, often referred to as “design failures,” result in increased discharges downstream and increased flooding potential.
The force of the release gouged a large crater in the concrete spillway and required the California Department of Water Resources (DWR) to halt water releases via that conduit. The high lake level then created fear that erosion would compromise the integrity of the auxiliary spillway and flood the city of Oroville and surrounding communities. Thousands were evacuated, and eventually runoff receded without further issue. Ultimately, an independent analysis concluded that poor design and construction and inadequate state oversight contributed to the collapse of the concrete spillway. (Water Education Foundation, 2020)
The Oroville Dam spillway failure triggered inspection of 93 dam spillways across California through the new Spillway Re-evaluation Program. (Cal. Dep't of Water Resources, 2019)
Figure 4-23. Oroville Dam Spillway after 2017 failure.
Source: https://www.watereducation.org/aquapedia/oroville-dam
FEMA/Cal OES Submission Draft 10-27-2020

Kern Multi-Jurisdiction 2020 MJHMP UpdateCOUNTY OF KERN
4-81
4.5.3.3 Location
According to California Department of Water Resources Division of Dam Safety and USACE National Inventory of Dams (NID), there are 25 dams in Kern County, shown in Table 4-23. These dams are rated for hazard potential according to the descriptors in Table 4-22. FEMA developed the classification system shown in for potential dam failures. California DWR Division of Safety of Dams (DSOD) includes a fourth category “Extremely High”. This hazard potential classification system categorizes dams based on the probable loss of human life and the impacts on economic, environmental, and lifeline interests. Improbable loss of life exists where persons are only temporarily in the potential inundation area.
Figure 4-24 shows inundation zones for select dams in Kern County. Areas of the County most threatened by dam inundation are those within the Central Valley.
Figure 4-25 displays the levee system in Kern County. During large flood events, a levee failure could impact populations, properties, and infrastructure within levee inundation zones.
Table 4-22: FEMA & DSOD Hazard Potential Classification
Hazard Potential Classification Loss of Human Life Economic, Environmental, Lifeline Losses
Low None expected Low and generally limited to owner
Significant None expected Yes
High Probable. One or more expected Yes (but not necessary for this classification)
Extremely High One or more and inundating an area of 1,000+ population
Inundation of facilities/infrastructure, posing significant threat to public safety determined case-by-case by DSOD
Source: Federal Guidelines for Dam Safety- Hazard Potential Classification Systems for Dams, April 2004, DSOD Jurisdictional Dams
Table 4-23: Dams in Kern County
DWR ID NID ID Dam Name Owner Year Built Hazard
No. 1083-2 CA01213 Antelope Tehachapi Cummings County Water District 1987 H+
No. 738-6 CA01498 Bap Pond 5 Rio Tinto 2008 L No. 738-7 CA01552 Bap Pond 6 Rio Tinto 2012 L No. 738-8 CA10410 Bap Pond 7 Rio Tinto Unknown L No. 738-5 CA01430 Bap Ponds 1, 2, 3, 4 Rio Tinto 2003 L
No. 1051-0 CA00884 Berrenda Mesa Berrenda Mesa Water District 1967 S
No. 737-0 CA00722 Big Four Ranch Kern-Tulare Water District 1970 S
No. 1083-3 CA01310 Blackburn Tehachapi Cummings County Water District 1991 H
No. 738-4 CA01190 Borax Solar Evaporation Ponds Rio Tinto 1984 L
FEMA/Cal OES Submission Draft 10-27-2020

Kern Multi-Jurisdiction 2020 MJHMP UpdateCOUNTY OF KERN
4-82
DWR ID NID ID Dam Name Owner Year Built Hazard
No. 738-0 CA01099 Boron Tails Pond Rio Tinto 1975 L No. 738-3 CA01178 Boron Tails Pond 6 Rio Tinto 1980 L
No. 732-0 CA00717 Buena Vista J.G. Boswell Company & Tenneco West 1890 S
No. 735-2 CA00721 Buena Vista Kern County Parks and Recreation 1973 S
No. 104-2 CA00429 Diversion No. 1 Southern California Edison 1906 H
CA01558 Fresh Water Impoundment Oil-Dri Corporation of America Unknown H
CA01559 Fresh Water Pond CALMAT Unknown H No. 2011-2 CA01181 Irrigation Reservoir City of Bakersfield 1980 H CA10106 Isabella Dam CESPK 1953 H
No. 1083-0 CA00587 J.C. Jacobsen Tehachapi Cummings County Water District 1973 H
No. 735-0 CA00720 Kern River County Park Kern County Parks and Recreation 1959 H
CA01614 Kern River No. 1 Forebay Southern California Edison Unknown S CA01595 Rio Bravo Canal Olcese Water District 1988 S CA01595 Rio Bravo Diversion Olcese Water District 1989 L No. 734-0 CA00718 Tejon Storage 1 Tejon Ranch Company 1946 L No. 734-2 CA00729 Tejon Storage 2 Tejon Ranch Company 1956 L Note: Hazard Definitions: L – Low; S – Significant; H – High; H+ – Extremely High
Source: DWR Jurisdictional Dams & USACE National Inventory of Dams
FEMA/Cal OES Submission Draft 10-27-2020

Kern Multi-Jurisdiction 2020 MJHMP UpdateCOUNTY OF KERN
4-83
Figure 4-24: Dam Inundation Exposure
FEMA/Cal OES Submission Draft 10-27-2020

Kern Multi-Jurisdiction 2020 MJHMP UpdateCOUNTY OF KERN
4-84
Figure 4-25 Kern County Levee System
FEMA/Cal OES Submission Draft 10-27-2020

Kern Multi-Jurisdiction 2020 MJHMP UpdateCOUNTY OF KERN
4-85
4.5.3.4 Severity and Extent
Dam failure can be catastrophic to all life and property downstream. The potential loss of life and property is difficult to qualtify. For example, the FEMA hazard potential classification system in Table 4-22 does not contemplate the improbable loss of life of the occasional recreational user of the river and downstream lands, passer-by, or non-overnight outdoor user of downstream lands. In any classification system, all possibilities cannot be defined. High usage areas of any type should be considered appropriately. Judgment and common sense must ultimately be a part of any decision on classification. Further, no allowances for evacuation or other emergency actions by the population should be considered because emergency procedures should not be a substitute for appropriate design, construction, and maintenance of dam structures.
4.5.3.5 Frequency/ Probability of Future Occurrences
The probability of any type of dam failure is low in today’s regulatory and dam safety oversight environment. Dam failure events usually coincide with events such as earthquakes, landslides, and excessive rainfall and snowmelt.
4.5.3.6 Warning Time
Warning time for dam failure depends on the cause of failure. In an event of extreme precipitation or massive snowmelt, evacuations can be planned with sufficient time. In the event of a structural failure due to earthquake, there may be no warning time. A dam’s structural type also affects warning time. Earthen dams do not tend to fail instantaneously. Once a breach is initiated, discharging water erodes the breach until the reservoir water is depleted, or the breach resists further erosion. Concrete gravity dams also tend to have an initial partial breach. The time of breach formation ranges from a few minutes to a few hours. Several participating jurisdictions have established protocols in their emergency operations plans for warning and response to imminent dam failure within the flood warning. These protocols are tied to emergency action plans created by the dam owner.
Developing Emergency Action Plans (EAPs) for all high and significant hazard potential dams for Kern County is critical to reducing the risks of loss of life and property damage from dam failures. The EAP contains procedures and information to assist the dam owner in issuing early warning and notification messages to emergency management authorities. The EAP also contains inundation maps to identify the areas subject to flooding in the unlikely event of dam failure.
FEMA/Cal OES Submission Draft 10-27-2020

Kern Multi-Jurisdiction 2020 MJHMP UpdateCOUNTY OF KERN
4-86
EAPs are critical in identifying areas downstream from dams requiring warning and evacuation in the event of dam failure. Documented cases have demonstrated that warning and evacuation time for EAPs can dramatically influence the loss of life. Loss of life can vary from 0.02 percent of the persons-at-risk when the warning time is 90 minutes to 50 percent when less than 15 minutes, (Graham, Assessing the Threat to Life from Dam Failure, 1988) One USGS report states that the average number of fatalities per dam failure is 19 times greater when there is little to no warning. (U.S. Geological Survey, 1985) Dam breach inundation studies usually assume one of two failure scenarios:
• Flows from a dam failure during “fair weather” or “sunny day” conditions with the reservoir at the normal pool level and receiving normal inflow (usually insignificant). A fair weather failure is generally considered to have the most potential for loss of human life, primarily due to the element of surprise.
• Flows from a dam failure during flood conditions or the inflow design flood. Failure during flood conditions is considered to show the upper limit of inundation and to have less potential for loss of human life because the downstream population is “on alert.” The flood conditions scenario is more expensive to analyze due to the additional cost for the necessary watershed and spillway studies.
Inundation mapping shows a continuous “line of inundation” identifying the area potentially at risk in event of dam failure. It starts at the dam and continues downstream to a point where the breach flood no longer poses a risk to life and property damage, such as a large river or reservoir with the capacity of storing the flood waters. The need to consider the “domino effect” should be made on a case-by-case basis if the assumed failure of a dam would cause the failure of any downstream dams.
FEMA/Cal OES Submission Draft 10-27-2020

Kern Multi-Jurisdiction 2020 MJHMP UpdateCOUNTY OF KERN
4-87
4.5.3.7 Secondary Hazards
Dam failure can cause severe downstream flooding, depending on the magnitude of the failure. Other potential secondary hazards of dam failure are landslides around the reservoir perimeter, bank erosion on the rivers, and destruction of downstream habitat.
4.5.3.8 Dam Failure Vulnerability Assessment
The primary danger associated with dam failure is high velocity flooding downstream of the dam and limited warning times for evacuation. Vulnerability varies by community and depends on the particular dam profile and the nature and extent of the failure. Vulnerable populations are present directly below the dam and may include those who are incapable of escaping the area within the allowable time frame. This population includes the elderly and young who may be unable to self-evacuate from the inundation area. Vulnerable populations also include those who would not have adequate warning from a television or radio emergency warning system. Dam inundation zones created by Cal OES were used in conjunction with the inventory listed in Table 4-23 to develop at risk populations and loss estimations for dam failure.
4.5.3.8.1 Exposure Analysis
4.5.3.8.2 Population
Vulnerable populations are all populations downstream from dam failures that are incapable of escaping the area within the allowable time frame. This population includes the elderly and young who may be unable to get themselves out of the inundation area. The vulnerable population also includes those who would not have adequate warning from a television, radio emergency warning system, have not registered with reverse 911, or do not have cell phones that can receive amber alerts. The potential for loss of life is affected by the capacity and number of evacuation routes available to populations living in areas of potential inundation. The entire population in a dam failure inundation zone is exposed to the risk of a dam failure. The estimated population exposed to dam inundation is summarized in Figure 4-26 and Table 4-24.
FEMA/Cal OES Submission Draft 10-27-2020

Kern Multi-Jurisdiction 2020 MJHMP UpdateCOUNTY OF KERN
4-88
Figure 4-26: Dam Failure Vulnerability Snapshot Map
FEMA/Cal OES Submission Draft 10-27-2020

Kern Multi-Jurisdiction 2020 MJHMP UpdateCOUNTY OF KERN
4-89
Table 4-24: Population Exposure to Dam Failure (Unincorporated County)
Total Population
Unincorporated County 299,935
Dam Inundation Zone Population Count % of Total
Antelope Kern 1,101 0.37% Berrenda Mesa - 0.00% Blackburn 1,393 0.46% South Haiwee 184 0.06% Isabella 98,408 32.81% JC Jacobsen 62 0.02%
Total* 100,621 33.55% *Total population is not equal to sum of all dam inundation zones due to dissolved overlapping inundation areas.
Figure 4-27 Population Exposure to Dam Inundation by Zone
4.5.3.8.3 Property
Vulnerable properties are those closest to the dam inundation area. These properties would experience the largest, most destructive surge of water. Low-lying areas where water would collect are also vulnerable. Transportation routes, discussed below, are also vulnerable to dam inundation and have the potential to be eliminated or compromised, creating isolation issues. Vulnerable populations may not be able to withstand a large water surge. Utilities such as overhead power, cable, and phone lines could also be vulnerable. Loss of these utilities could create additional isolation issues for the inundation areas. Table 4-25 below displays parcel values exposed to dam inundation.
1,101 - 1,393 184
98,408
62 -
20,000
40,000
60,000
80,000
100,000
120,000
Antelope Kern Berranda Mesa Blackburn South Haiwee Isabella JC Jacobson
FEMA/Cal OES Submission Draft 10-27-2020

Kern Multi-Jurisdiction 2020 MJHMP UpdateCOUNTY OF KERN
4-90
Table 4-25: Parcel Values at Risk from Dam Inundation (Unincorporated County)
Total
Parcels
Total Market Value
($)
Total Content
Value ($) Total Value ($)
Unincorporated County 91,455 $ 10,906,675 $ 5,453,338 $ 16,360,013
Dam Inundation Zone Parcel
Count % of Total
Market Value
Exposure ($)
Content Value
Exposure ($) Total Exposure ($) % of Total
Antelope Kern 22 0.0% $5,407.08 $ 2,703.54 $ 8,110.61 0.05%
Berrenda Mesa 1 0.0% $ - $- $ - 0.00%
Blackburn 19 0.0% $ 2,173.95 $ 1,086.97 $ 3,260.92 0.02%
South Haiwee - 0.0% $ - $- $ - 0.00%
Isabella 24,363 26.6% $ 3,347,387.22 $ 1,673,693.61 $5,021,080.83 30.69%
JC Jacobsen 9 0.0% $ 1,547.71 $ 773.85 $ 2,321.56 0.01%
Dam Inundation Area* 24,411 26.7% $ 3,356,366 $ 1,678,183 $ 5,034,549 30.8% Currency in Thousands *Totals are not equal to sum of all dam inundation zones due to dissolved overlapping inundation areas.
4.5.3.8.4 Critical Facilities & Lifelines
Low-lying areas are vulnerable to dam inundation, especially transportation routes. This includes all roads, railroads, and bridges in the flow path of water, which could be eliminated or compromised in a dam inundation event. The most vulnerable critical facilities are those in poor condition that would have difficulty withstanding a large surge of water. Utilities such as overhead power lines and communication lines could also be vulnerable. Loss of these utilities could create additional compounding issues for emergency management officials attempting to conduct evacuation and response actions. Table 4-26 and Table 4-27 summarizes critical infrastructure exposed to dam failure in Kern County.
Table 4-26: Critical Infrastructure Points in Dam Inundation Zones (Unincorporated County)
Infrastructure Type
TOTA
L FE
ATU
RE
CO
UN
T
An
telo
pe
Ker
n
Ber
ren
da
Mes
a
Bla
ckb
urn
So
uth
Ha
iwee
Isa
bel
la
JC J
aco
bse
n
Essential Facility 10 - - - - 10 -
EOC - - - - - - -
Fire Station 8 - - - - 8 -
Hospital 1 - - - - 1 -
Police Station - - - - - - -
Sheriff Station 1 - - - - 1 -
High Potential Loss 1 - - - - 1 -
Adult Residential facility 21 - - - - 21 -
Child Care Center 33 - - - - 33 -
FEMA/Cal OES Submission Draft 10-27-2020

Kern Multi-Jurisdiction 2020 MJHMP UpdateCOUNTY OF KERN
4-91
Infrastructure Type
TOTA
L FE
ATU
RE
CO
UN
T
An
telo
pe
Ker
n
Ber
ren
da
Mes
a
Bla
ckb
urn
So
uth
Ha
iwee
Isa
bel
la
JC J
aco
bse
n
Dam 5 - - - - 5 -
Family Child Care Home - - - - - - -
Foster Family Agency - - - - - - -
Historic Building - - - - - - -
Home Care Organization - - - - - - -
Library 3 - - - - 3 -
Residential Child Care - - - - - - -
Residential Elder Care 12 - - - - 12 -
School 40 - - - - 40 -
County Insured Asset* 28 - - - - 28 -
Cooling Center 2 - - - - 2 -
Healthcare Facility 11 - - - - 11 -
Special Needs Facility 52 - - - - 52 -
City Hall - - - - - - -
Historic Site - - - - - - -
Transportation and Lifeline - - - - - - -
Airport - - - - - - -
Bridge 107 - - 4 - 103 -
Power Plant 19 - - - - 19 -
Substation 23 - - - - 23 -
Transmission Line Tower 1070 - - - 13 1055 2
NG Facility 29 - - - - 29 -
Wind Turbine - - - - - - -
Bus Facility - - - - - - -
Potable Water Facility - - - - - - -
Waste Water Facility - - - - - - -
Oil Facility 9 - - - - 9 -
Railroad Facility 1 - - - - 1 -
Grand Total 1475 - - 4 13 1456 2 * These insured assets may include critical infrastructure already represented in other Infrastructure Types.
FEMA/Cal OES Submission Draft 10-27-2020

Kern Multi-Jurisdiction 2020 MJHMP UpdateCOUNTY OF KERN
4-92
Table 4-27: Miles of Critical Infrastructure (Linear) in Dam Inundation Zones (Unincorporated County)
Infrastructure Type
(linear) TO
TAL
DA
M
EXP
OS
UR
E
An
telo
pe
Ker
n
Ber
ran
da
Mes
a
Bla
ckb
urn
So
uth
Ha
iwee
Isa
bel
la
JC J
aco
bso
n
Levee 267.96 - - - - 268.0 -
NG Pipeline 242.46 - - - - 241.1 1.4
Railroad 54.22 2.6 - 0.0 - 51.6 -
Street 1613.76 6.9 - 17.8 127.9 1457.6 5.0
4WD trail 2.39 - - - 2.3 0.0 -
4WD trail, major - - - - - - -
Alley 0.64 - - - - 0.6 -
Cul-de-sac 1.15 - - - 0.4 0.8 -
Driveway 21.97 - - - - 22.0 -
Interstate 123.44 3.0 - 4.5 - 115.9 -
Local road 513.79 1.3 - 5.3 26.5 479.2 2.0
Local road, major 424.38 1.3 - 5.1 18.2 397.8 2.8
Primary highway 12.07 - - - - 12.1 -
Ramp 21.66 - - - 0.0 21.6 -
Road, parking area 0.35 - - - - 0.3 -
Service road 1.41 - - - - 1.4 -
State/county highway 311.81 1.3 - 2.8 - 307.6 0.2
State/county highway, major 0.02 - - - - 0.0 -
Thoroughfare, major 177.96 - - - 80.5 97.5 -
Walkway 0.69 - - - - 0.7 -
Transmission Line 426.55 0.9 - 4.4 5.2 415.8 0.5
Grand Total 3792.15 10.3 - 22.1 133.1 2434.0 6.8
4.5.3.8.5 Future Trends in Development
Flooding due to a dam failure event is likely to exceed the special flood hazard areas regulated through local floodplain ordinances. The County and participating jurisdictions should consider the dam failure hazard when permitting development in mapped dam inundation zones and downstream of high hazard and significant hazard dams in the County. Low hazard dams could become significant or high hazard dams if development occurs below them.
FEMA/Cal OES Submission Draft 10-27-2020

Kern Multi-Jurisdiction 2020 MJHMP UpdateCOUNTY OF KERN
4-93
4.5.3.9 Dam Failure Hazard Problem Statements
As part of the mitigation action identification process, the Planning Committee for the County and for each jurisdiction identified issues and weaknesses, also called problem statements, for their respective facilities based on the risk assessment and vulnerability analysis, utilizing the RAMP mapping tool and flood data. Dam failure hazard problem statements are listed in Table 4-28; problem statements for all other participating jurisdictions are accessed in Volume 2 of this plan.
Identifying these common issues and weaknesses assists the Planning Committee in understanding the realm of resources needed for mitigation. The goal is to have at least one mitigation action for every problem statement. Projects or actions have been developed to mitigate each problem identified. See Table 5-6 for a full list of mitigation actions and corresponding problem statements that they address. Each problem statement is coded with a problem number for cross-referencing between Table 4-28 and Table 5-6.
Table 4-28 Dam Failure Problem Statements
Problem No.
Hazard Area of Concern
Mitigation Alternatives
Primary Agency
Problem Description Related MA
ps-DF-KC-252
Dam Failure
Victim PRV - Prevention , PPRO - Property Protection , PE&A - Public Education & Awareness , ES - Emergency Services , SP - Structural Projects
County of Kern
There are approx. 100,000 people and 24,000 parcels within the dam inundation zone in the unincorporated county
ma-DF-KC-384
ps-DF-KC-253
Dam Failure
Impact PPRO - Property Protection , PE&A - Public Education & Awareness , ES - Emergency Services , SP - Structural Projects
County of Kern
There are approx. 213 critical infrastructure facilities and 2.5 miles of transportation and lifelines within the dam inundation zone in the unincorporated county
ma-DF-KC-384
ps-DF-KC-254
Dam Failure
Victim PPRO - Property Protection , PE&A - Public Education & Awareness , ES - Emergency Services , SP - Structural Projects
County of Kern
Cascading effects of dam inundation could include loss of power and blocked access for evacuation routes
ma-DF-KC-384
FEMA/Cal OES Submission Draft 10-27-2020

Kern Multi-Jurisdiction 2020 MJHMP UpdateCOUNTY OF KERN
4-94
4.5.4 Earthquake Hazard Profile
Earthquake is the sudden shaking of the ground caused by the passage of seismic waves through Earth’s rocks. Seismic waves are produced when some form of energy stored in Earth’s crust is suddenly released, usually when masses of rock straining against one another suddenly fracture and “slip.” Earthquakes associated with this type of energy release are called tectonic earthquakes. The energy also can be released by elastic strain, gravity, chemical reactions, or even the motion of massive bodies. Earthquakes occur most often along geologic faults, narrow zones where rock masses move in relation to one another. (United States Geological Survey, n.d.)
Earthquakes have different properties depending on the type of fault that causes them. See Figure 4-28. The usual fault model has a “strike” (that is, the direction from north taken by a horizontal line in the fault plane) and a “dip” (the angle from the horizontal shown by the steepest slope in the fault). The lower wall of an inclined fault is called the footwall. Lying over the footwall is the hanging wall. When rock masses slip past each other parallel to the strike, the movement is known as strike-slip faulting. Movement parallel to the dip is called dip-slip faulting. In dip-slip faults, if the hanging-wall block moves downward relative to the footwall block, it is called “normal” faulting; the opposite motion, with the hanging wall moving upward relative to the footwall, produces reverse or thrust faulting. (Id)
As a fault rupture progresses along or up the fault, rock masses are flung in opposite directions and thus spring back to a position where there is less strain. (Id)
Soil Liquefaction Soil liquefaction is a phenomenon in which the strength and stiffness of a soil is reduced by earthquake shaking or other rapid loading. Soil liquefaction and related phenomena have been responsible for tremendous amounts of damage in historical earthquakes around the world. Soil liquefaction occurs when material that is ordinarily a solid behaves like a liquid. Saturated or partially-saturated soil substantially loses strength and stiffness in response to an applied stress such as shaking during an earthquake or other sudden change in stress condition. The phenomenon is most often observed in saturated, loose, low-density or uncompacted, sandy soils. Loose sand tends to compress when a load is applied. Dense sands, by contrast, tend to expand in volume or 'dilate'. If the soil is saturated by water, which often occurs when
Figure 4-28: Earthquake Faulting
FEMA/Cal OES Submission Draft 10-27-2020

Kern Multi-Jurisdiction 2020 MJHMP UpdateCOUNTY OF KERN
4-95
soil is below the water table or sea level, then water fills the pore spaces between soil grains. (United States Geological Survey, n.d.)
Artificial Induction Earthquakes are sometimes caused by human activities, including the injection of fluids into deep wells, pumping of ground water, the excavation of mines, and the filling of large reservoirs. In fluid injection, the slip is thought to be induced by premature release of elastic strain, as in the case of tectonic earthquakes, after fault surfaces are lubricated by the liquid. (Encyclopedia Britannica, 2020)
Earthquake Classifications Earthquakes are typically classified in one of two ways: by the amount of energy released, measured as magnitude; or by the impact on people and structures, measured as intensity. (United States Geological Survey, n.d.)
Magnitude
The most common method for measuring earthquakes is magnitude, which measures the strength of earthquakes. While majority of scientists currently use either the Mw Scale or Modified Mercalli Intensity (MMI) Scale to measure an earthquake, the Richter scale is the most well-known measurement for earthquake magnitude. The magnitude of an earthquake is related to the total area of the fault that ruptured, as well as the amount of offset (displacement) across the fault. As shown in Table 4-29, there are seven earthquake magnitude classes, ranging from great to micro. A magnitude class of great can cause tremendous damage to infrastructure, compared to a micro class, which results in minor damage to infrastructure. (Id)
Table 4-29: Moment Magnitude Scale
Earthquake Magnitude Classes
Magnitude Class Magnitude Range (M =
Magnitude)
Description
Great M > 8 Tremendous damage Major 7 <= M < 7.9 Widespread heavy damage Strong 6 <= M < 6.9 Severe damage
Moderate 5 <= M < 5.9 Considerable damage Light 4 <= M < 4.9 Moderate damage Minor 3 <= M < 3.9 Rarely causes damage. Micro M < 3 Minor damage
FEMA/Cal OES Submission Draft 10-27-2020

Kern Multi-Jurisdiction 2020 MJHMP UpdateCOUNTY OF KERN
4-96
Intensity
The effects of an earthquake in a particular location are measured by intensity. Earthquake intensity decreases with increasing distance from the epicenter of the earthquake. The Modified Mercalli Intensity value assigned to a specific site after an earthquake has a more meaningful measure of severity to the nonscientist than the magnitude because intensity refers to the effects experienced at that place. (United States Geological Survey)
The lower numbers of the intensity scale generally deal with the manner in which the earthquake is felt by people. The higher numbers of the scale are based on observed structural damage. Structural engineers usually contribute information for assigning intensity values of VIII or above. Table 4-30 is an abbreviated description of the levels of Modified Mercalli intensity. (Id)
Table 4-30: Modified Mercalli intensity level descriptions
Intensity Shaking Description/Damage
I Not felt Not felt except by a very few under especially favorable conditions. II Weak Felt only by a few persons at rest, especially on upper floors of buildings. III Weak Felt quite noticeably by persons indoors, especially on upper floors of buildings.
Many people do not recognize it as an earthquake. Standing motor cars may rock slightly. Vibrations similar to the passing of a truck. Duration estimated.
IV Light Felt indoors by many, outdoors by few during the day. At night, some awakened. Dishes, windows, doors disturbed; walls make cracking sound. Sensation like heavy truck striking building. Standing motor cars rocked noticeably.
V Moderate Felt by nearly everyone; many awakened. Some dishes, windows broken. Unstable objects overturned. Pendulum clocks may stop.
VI Strong Felt by all, many frightened. Some heavy furniture moved; a few instances of fallen plaster. Damage slight.
VII Very strong
Damage negligible in buildings of good design and construction; slight to moderate in well-built ordinary structures; considerable damage in poorly built or badly designed structures; some chimneys broken.
VIII Severe Damage slight in specially designed structures; considerable damage in ordinary substantial buildings with partial collapse. Damage great in poorly built structures. Fall of chimneys, factory stacks, columns, monuments, walls. Heavy furniture overturned.
IX Violent Damage considerable in specially designed structures; well-designed frame structures thrown out of plumb. Damage great in substantial buildings, with partial collapse. Buildings shifted off foundations.
X Extreme Some well-built wooden structures destroyed; most masonry and frame structures destroyed with foundations. Rails bent.
Source: USGS, Abridged from The Severity of an Earthquake, USGS General Interest Publication 1989-288-913
FEMA/Cal OES Submission Draft 10-27-2020

Kern Multi-Jurisdiction 2020 MJHMP UpdateCOUNTY OF KERN
4-97
Ground Motion
Earthquake hazard assessment is also based on expected ground motion. This involves determining the annual probability that certain ground motion accelerations will be exceeded, then summing the annual probabilities over the time period of interest. The most commonly-mapped ground motion parameters are the horizontal and vertical peak ground accelerations (PGA) for a given soil or rock type. Instruments called accelerographs record levels of ground motion due to earthquakes at stations throughout a region. These readings are recorded by state and federal agencies that monitor and predict seismic activity. (Pacific Northwest Seismic Network)
Maps of PGA values form the basis of seismic zone maps that are included in building codes such as the International Building Code. Building codes that include seismic provisions specify the horizontal force due to lateral acceleration that a building should be able to withstand during an earthquake. PGA values are directly related to these lateral forces that could damage “short period structures” such as single-family dwellings. Longer-period response components determine the lateral forces that damage larger structures with longer natural periods such as apartment buildings, factories, high-rises, bridges. Table 4-31 lists damage potential and perceived shaking by PGA factors, compared to the Mercalli scale. (USGS)
Table 4-31: Modified Mercalli Scale and Peak Ground Acceleration
Potential Structure Damage Estimated PGA
Modified Mercalli Scale Perceived Shaking Resistant Buildings Vulnerable Buildings (%g)
I Not Felt None None <0.17% II-III Weak None None 0.17% - 1.4% IV Light None None 1.4% - 3.9% V Moderate Very Light Light 3.9% - 9.2% VI Strong Light Moderate 9.2% - 18% VII Very Strong Moderate Moderate/Heavy 18% - 34% VIII Severe Moderate/Heavy Heavy 34% - 65% IX Violent Heavy Very Heavy 65% - 124% X - XII Extreme Very Heavy Very Heavy >124%
Note: PGA measured in percent of g, where g is the acceleration of gravity
Sources: USGS, 2008; USGS, 2010
FEMA/Cal OES Submission Draft 10-27-2020

Kern Multi-Jurisdiction 2020 MJHMP UpdateCOUNTY OF KERN
4-98
Figure 4-29: Zones of Required Investigation
Quaternary faults are those active faults that have been recognized at the surface and which have evidence of movement in the past 1.6 million years - the duration of the Quaternary Period.
FEMA/Cal OES Submission Draft 10-27-2020

Kern Multi-Jurisdiction 2020 MJHMP UpdateCOUNTY OF KERN
4-99
4.5.4.1 Plans, Policies, and Regulatory Environment
Alquist‐Priolo Earthquake Fault Zoning Act and Seismic Hazards Mapping Act (1972)
The 1971 San Fernando Earthquake resulted in the destruction of numerous structures built across its path. This led to passage of the Alquist‐Priolo Earthquake Fault Zoning Act in 1972. This Act prohibits the construction of buildings for human occupancy across active faults in the State of California. Similarly, extensive damage caused by ground failures during the 1989 Loma Prieta Earthquake focused attention on decreasing the impacts of landslides and liquefaction. This led to the creation of the Seismic Hazards Mapping Act, which increases construction standards at locations where ground failures are probable during earthquakes. Figure 4-29 displays these zones of required investigation in Kern County.
2019 California Building Standards Code
The 2019 California Building Code, adopted by Kern County in January 2020, includes materials requirements, construction methods, and maintenance standards for earthquake protection and resiliency.
Kern County General Plan
The 2004 Kern County General Plan includes many policies, implementation measures, and goals in the Safety Element that limit development occurring in earthquake fault lines and mitigate impacts from such development.
Policies around earthquakes include limited development near earthquake fault lines, generally forbidding structures for human occupancy that are located near active fault lines and determining the liquefaction potential of different sites more broadly. The Kern County General Plan is currently being updated and will consider this MJHMP Update as it continues to shape policies around earthquake mitigation and protection.
FEMA/Cal OES Submission Draft 10-27-2020

Kern Multi-Jurisdiction 2020 MJHMP UpdateCOUNTY OF KERN
4-100
4.5.4.2 Past Events
Numerous earthquakes have occurred in and near Kern County over the last twenty years. See Table 4-32 for earthquake events 4.5 magnitude or greater since 2000. Ridgecrest experienced 6.4 and 7.1 magnitude earthquakes on July 4th and 5th of 2019 which was the largest earthquake in southern California since 1999 The July 2019 earthquake resulted in significant damage to homes in the Ridgecrest area where some homes were ripped off foundations. No deaths or major building damage resulted from the July 2019 earthquake. (KSBY News, 2019)
Table 4-32: Earthquakes in Kern County 4.5 Magnitude or Greater Since 2000
Date Location Magnitude
1/25/2003 20km NE of Arvin 4.9
9/29/2004 25km SSW of Bodfish 5.0
4/16/2005 20km ESE of Maricopa 4.6
9/22/2005 14km NW of Grapevine 4.7
2/24/2016 6km SSW of Wasco 4.9
7/4/2019 200km NE of Los Angeles near Ridgecrest 6.4
7/5/2019 11 km from 7/4/2019 earthquake (in San Bernardino County) 7.1
Source: USGS
4.5.4.3 Location
The Alquist-Priolo Act established earthquake fault zones in California. These Alquist-Priolo Earthquake Fault Zones encompass surface traces of active faults that have a potential for future surface fault rupture and are mapped across California. These zones have been established by the State Geologist and indicate an active fault within the zone. The fault may pose a risk to existing or future structures from a surface fault rupture. The major faults include the San Andreas fault system running north and south on the western portion of the County, several smaller faults of the Sierra Nevadas to the west of the San Andreas fault, and the Garlock and Ridgecrest faults to the east. Figure 4-29 shows the location of fault zones as well as the underlying quaternary faults near the County.
FEMA/Cal OES Submission Draft 10-27-2020

Kern Multi-Jurisdiction 2020 MJHMP UpdateCOUNTY OF KERN
4-101
4.5.4.4 Frequency/ Probability of Future Occurrences
This plan utilizes two mapping tools for understanding the frequency and probability of an earthquake occurring at different faults in and around Kern County: 1) the Uniform California Earthquake Rupture Forecast, Version 3 (UCERF3)(see Figure 4-30) and 2) the Earthquake Shaking Potential based on the USGS National Seismic Hazard Model (see Figure 4-31). Both mapping tools are described in more detail below.
Importantly, these probabilistic maps were used to determine the earthquake scenario used for the vulnerability analysis. While the Risk Assessment Mapping Platform (RAMP) contains exposure and damage estimations around the 7.2 M White Wolf scenario, this plan focuses on the South San Andreas Mojave North scenario, because it is the scenario with the highest likelihood of severe shaking and of producing a magnitude 6.7 earthquake within 30 years. See Figure 4-32 for an overview map of the scenario and Section 4.5.4.4.3 for further explanation on why this scenario was chosen.
According the California State Hazard Mitigation Plan, earthquakes large enough to cause moderate damage to structures—those of 5.5 Magnitude (M.) or larger—occur three to four times a year statewide. Strong earthquakes of 6 to 6.9 M. strike on an average of once every two to three years. Major earthquakes of 7 to 7.9 M. occur in California about once every 10 years.
4.5.4.4.1 30-Year Earthquake Probability (UCERF3)
Probability of earthquake events is based on the approximate location of earthquake faults within and outside the Kern County region. The Uniform California Earthquake Rupture Forecast, Version 3 (UCERF3)7 is a comprehensive model of earthquake occurrence for California. It represents the best available science for authoritative estimates of the magnitude, location, and likelihood of potentially damaging earthquakes in California. According to UCERF3 and as shown in Figure 4-30, the San Andreas fault as a 10% to 100% probability of occurrence within 30 years, the highest probability affecting the County. A study by the USGS indicates that the Big Bend section of the San Andreas fault near Tejon Pass is overdue for a strong or major earthquake. (Scharer, 2017) On average, an earthquake occurs in this area every 100 years, with the most recent 7.9 Fort Tejon earthquake occurring in 1857. (Id.) The Garlock Central and West faults have close to a 5% chance of an occurrence within thirty years, with many other faults having less than a 1% chance of annual occurrence.
7 Quaternary faults are those active faults that have been recognized at the surface and which have evidence of movement in the past 1.6 million years - the duration of the Quaternary Period.
FEMA/Cal OES Submission Draft 10-27-2020

Kern Multi-Jurisdiction 2020 MJHMP UpdateCOUNTY OF KERN
4-102
Figure 4-30 Fault Probability Map for Kern County
4.5.4.4.2 Earthquake Shaking Potential
The Earthquake Shaking Potential Map, Figure 4-31, shows potential seismic shaking from anticipated future earthquakes. It is probabilistic in the sense that the analysis takes into consideration the uncertainties in the size and location of earthquakes and the resulting ground motions that can affect a particular site. (CGS, 2020) It is also useful in understanding the probability of severe shaking in different locations throughout the County, as discussed in Section 4.5.4.5.
The map is expressed in terms of probability of exceeding a certain ground motion. The map shows a 2% probability of exceeding one second of ground motion in 50 years. Earthquake shaking potential in California is calculated based on the USGS National Seismic Hazard Model and in partnership with California Geological Survey (CGS). Earthquake shaking potential also considers historic earthquakes, slip rates on major faults, deformation throughout the region, and the potential for amplification of seismic waves by near-surface geologic materials. (CGS, 2020)
FEMA/Cal OES Submission Draft 10-27-2020

Kern Multi-Jurisdiction 2020 MJHMP UpdateCOUNTY OF KERN
4-103
The map depicts a range of lower hazard to higher hazard probability, where higher hazard areas are those regions near major, active faults that will on average experience stronger earthquake shaking more frequently. This intense shaking can damage even strong, modern buildings. Lower hazard areas are those regions that are distant from known, active faults that will experience lower levels of shaking less frequently. In most earthquakes, only weaker, masonry buildings would be damaged. However, very infrequent earthquakes could still cause strong shaking in those locations. (D. Branum, 2016)
The shaking potential is calculated as the level of ground motion that has a 2% chance of being exceeded in 50 years, which is the same as the level of ground-shaking with about a 2500-year average repeat time. Relatively long-period (1.0 second) earthquake shaking is shown. Long-period shaking affects tall, relatively flexible buildings, but also correlates well with overall earthquake damage. Although the greatest hazard is in areas of highest intensity as shown in Figure 4-31, no region is immune from potential earthquake damage. (Id.)
The potential for earthquake ground shaking, as defined by the U.S. National Seismic Hazard Model, is used by engineers to design buildings for larger ground motions than what we think will occur during a 50-year interval, which will make buildings safer than if they were only designed for the ground motions that we expect to occur in the next 50 years. (USGS, 2018 United States (Lower 48) Seismic Hazard Long-term Model, 2020)
4.5.4.4.3 S. San Andreas Mojave N. Earthquake Scenario
The South San Andreas Mojave North earthquake scenario was chosen from a range of regional, scenario-based shakemaps available from USGS for the vulnerability analysis. The shakemap data consist of peak ground velocity, peak ground acceleration, peak spectral accelerations in an earthquake scenario. The San Andreas fault has the highest probability of an earthquake greater than 6.7 M. within Kern County, with a greater than 10% annual probability. See Figure 4-30. Likewise, the most significant shaking potential depicted in the ShakeMap in Figure 4-31 centers around the San Andreas fault system
The RAMP mapping tool also displays the 7.2 M White Wolf scenario which would occur along the white wolf fault line, displayed in Figure 4-30. The White Wolf scenario was one of the scenarios included in the 2014 MJHMP and also matches the 7.7 M Bakersfield earthquake of 1952. (United States Geological Survey, 1984) This plan chose to highlight the South San Andreas Mojave scenario in the vulnerability analysis over the White Wolf scenario because it has a higher probability of occurring and has a higher shaking potential, as displayed in Figure 4-30 and Figure 4-31.
Section 4.5.4.8.1 analyzes the County’s exposure to this scenario and Section 4.5.4.8.2 details damage estimation to residential properties and County facilities for this scenario.
FEMA/Cal OES Submission Draft 10-27-2020

Kern Multi-Jurisdiction 2020 MJHMP UpdateCOUNTY OF KERN
4-104
Figure 4-31: Earthquake Shaking Potential
FEMA/Cal OES Submission Draft 10-27-2020

Kern Multi-Jurisdiction 2020 MJHMP UpdateCOUNTY OF KERN
4-105
Figure 4-32. Earthquake Scenario, S. San Andreas Mojave N.
FEMA/Cal OES Submission Draft 10-27-2020

Kern Multi-Jurisdiction 2020 MJHMP UpdateCOUNTY OF KERN
4-106
4.5.4.5 Severity and Extent
As we know from past events, even a “moderate” earthquake occurring in or near the Kern County region could result in deaths, casualties, property and environmental damage, and disruption of normal services and activities. The severity of the event could be aggravated by collateral emergencies such as fires, hazardous material spills, utility disruptions, landslides, transportation emergencies, and the possible failure of the Kern County dams.
Neither the occurrence of an earthquake nor the severity can be predicted. Instead, scientists can only calculate the probability that a significant earthquake will occur in a specific area within a certain number of years.
The probabilistic Earthquake Shake Potential Map, Figure 4-31, illustrates the areas of the County most likely to experience an earthquake exceeding one second of ground motion in 50 years, which aids in understanding locations in Kern County with the greatest probability of experiencing a severe earthquake. The greatest probability of a severe earthquake focuses around the San Andreas fault. This is merely a probability, as the same map also illustrates that most of the County is susceptible to moderate-to-severe earthquakes depending on the location, intensity, and magnitude of the earthquake.
4.5.4.6 Warning Time
There is currently no reliable way to predict the day or month that an earthquake will occur at any given location. Research is being done with warning systems that use the low energy waves that precede major earthquakes. Seconds and minutes of advance warning can allow people and systems to take actions to protect life and property from destructive shaking. Even a few seconds of warning can enable protective actions specific to various sectors of the population, such as:
▪ Public: Citizens, including schoolchildren, drop, cover, and hold on; turn off stoves, safely stop vehicles.
▪ Businesses: Personnel move to safe locations, automated systems ensure elevator doors open, production lines are shut down, sensitive equipment is placed in a safe mode.
▪ Medical services: Surgeons, dentists, and others stop delicate procedures. ▪ Emergency responders: Open firehouse doors, personnel prepare and prioritize response decisions. ▪ Power infrastructure: Protect power stations and grid facilities from strong shaking.
4.5.4.7 Secondary Hazards
Earthquakes can create the secondary hazards of soil liquefaction and tsunamis. Tsunamis are not applicable to Kern County. Other hazards can also occur from earthquakes and are profiled in other parts of this plan, such as dam failure or wildfires. Soil Liquefaction
Soil liquefaction occurs when seismic waves pass through saturated granular soil, distorting its granular structure, and causing some of the pore spaces between granules to collapse. Pore-water pressure may also increase sufficiently to cause the soil to behave like a fluid for a brief period and cause deformations.
FEMA/Cal OES Submission Draft 10-27-2020

Kern Multi-Jurisdiction 2020 MJHMP UpdateCOUNTY OF KERN
4-107
Soil liquefaction can cause severe damage to property, including damaging pipes, compromising building foundations, and bucking roads and airport runways. Soil liquefaction problems could be present in areas built on unconsolidated river soils.
4.5.4.8 Earthquake Vulnerability Analysis
Earthquakes are a considerable threat to life and property in Kern County. A moderate to severe seismic incident on any fault zones in close proximity to the County is expected to cause:
▪ Extensive property damage, particularly to pre-1930’s unreinforced masonry structures, ▪ Possible fatalities and injuries, ▪ Damage to water and sewage systems, ▪ Disruption of communications systems, ▪ Broken gas mains and petroleum pipelines, ▪ Disruption of transportation arteries, and ▪ Competing requests for regional aid resources.
Community needs would quickly exceed the response capability of the County's emergency management organization, requiring mutual assistance from volunteer and private agencies, the Governor's Office of Emergency Services, and the Federal Emergency Support Functions.
In any earthquake, the primary consideration is saving lives. Time and effort must also be given to providing for people's mental health by reuniting families, providing shelter to the displaced persons, and restoring basic needs and services. A major effort will be needed to remove debris and clear roadways, demolish unsafe structures, assist in reestablishing public services and utilities, and provide continuing care and temporary housing for affected citizens.
After any earthquake there will be a loss of income both in private and public sectors. Individuals can lose wages due to businesses inability to function because of damaged goods or facilities. Due to business losses, Kern County and the cities in the planning area will lose revenue. Economic recovery from even a minor earthquake is critical.
4.5.4.8.1 Earthquake Exposure
The exposure analysis for Kern County centers on an earthquake scenario produced from the South San Andreas Mojave North Faultline. As discussed in Section 4.5.4.4, this scenario is the highest probability for a severe earthquake and severe shaking in Kern County.
An exposure analysis was conducted to develop earthquake vulnerability data throughout Kern County using the methods outlined in Section 4.4. To develop earthquake exposure data for the County, asset inventories for people, property, and critical facilities were superimposed with earthquake shaking intensity data from the USGS.
FEMA/Cal OES Submission Draft 10-27-2020

Kern Multi-Jurisdiction 2020 MJHMP UpdateCOUNTY OF KERN
4-108
Figure 4-33 S. San Andreas Mojave N. Exposure and Snapshot Map
FEMA/Cal OES Submission Draft 10-27-2020

Kern Multi-Jurisdiction 2020 MJHMP UpdateCOUNTY OF KERN
4-109
Population Figure 4-34 and Table 4-33 summarize population exposure results for the S. San Andreas Mojave N. scenario. The entire population of Kern County is potentially exposed to direct and indirect impacts from earthquakes. The degree of exposure depends on many factors, including the age and construction type of dwellings, the soil types on which their homes are constructed, and proximity to fault location. Whether directly or indirectly impacted, the entire population will have to deal with the consequences of earthquakes to some degree. Business interruption could keep people from working, road closures could isolate populations, and loss of functions of utilities could impact populations that suffered no direct damage from an event itself. (United States Geological Survey, 1981)
Figure 4-34: Population Exposure to S. San Andreas Mojave N. Scenario (Unincorporated County)
Table 4-33: Population Exposure to S. San Andreas Mojave N. Scenario (Unincorporated County)
Total Population
Unincorporated County 299,935
Shake Severity Zone Population Count % of Total
IX - Violent 77 0.03%
VIII - Severe 1,971 0.66%
VII - Very Strong 22,917 7.64%
Total 24,965 8.32%
Population Exposure Population Count by Exposure
to USGS 50-YR Shake Intensities
(Unincorporated County)
77 1,971
22,917
-
5,000
10,000
15,000
20,000
25,000
IX - Violent VIII - Severe VII - Very Strong
FEMA/Cal OES Submission Draft 10-27-2020

Kern Multi-Jurisdiction 2020 MJHMP UpdateCOUNTY OF KERN
4-110
Property An earthquake vulnerability assessment depends on determining two important factors:
(1) the year in which seismic codes were initially adopted and enforced by the jurisdiction having authority, and
(2) the year in which seismic codes were improved and enforced.
These are known as benchmark years. (Federal Emergency Management Agency, 2020) The County adheres to the 2019 California Building Code. Table 4-34 provides a listing of code improvements. Benchmark years are indicated in bold. For reference, Table 4-35 provides the definitions of building types.
Table 4-34: Seismic Benchmark Years
Code Edition Effective Date Building Type
(2019 CBC) January 1, 2020 (2016 CBC) January 1, 2017 (2013 CBC) January 1, 2014 N/A (2012 IBC) (2010 CBC) January 1, 2011 N/A (2009 IBC) (2007 CBC) January 1, 2008 N/A (2006 IBC) (2001 CBC) November 1, 2002 N/A (1997 UBC) (1998 CBC) July 1, 1999 W1a, S2, S2a, RM1, PC1, PC1a (1997 UBC) (1994 UBC) January 7, 1996 S1, S1a, C1, C2, C2a, RM2 (1991 UBC) November 29, 1992 URM (1988 UBC) April 29, 1990 S2 & S2a (1985 UBC) November 8, 1987 N/A (1982 UBC) December 9, 1984 N/A (1979 UBC) June 21, 1981 N/A (1976 UBC) November 1, 1977 W1 and W2 (1973 UBC) April 13, 1975 N/A (1970 UBC) August 29, 1971 N/A (1967 UBC) July 12, 1968 N/A (1964 UBC) July 1, 1965 N/A (1961 UBC) August 17, 1962 N/A (1958 UBC) October 1, 1958 N/A (1955 UBC) January 1, 1956 N/A (1955 UBC) January 1, 1956 N/A (1946 UBC) June 18, 1948 N/A (1943 UBC) July 13, 1944 N/A
FEMA/Cal OES Submission Draft 10-27-2020

Kern Multi-Jurisdiction 2020 MJHMP UpdateCOUNTY OF KERN
4-111
Code Edition Effective Date Building Type
(1940 UBC) April 4, 1941 N/A (1937 UBC) September 10, 1937 N/A (1930 UBC) March 20, 1933 N/A
Source: ASCE 41-13. County Building Dept.
Table 4-35: Definitions of FEMA Building Types
FEMA Building Type Definition
W1 Wood Light Frame W1A Wood Light Frame (multi-unit residence) W2 Wood Frame (commercial and industrial) S1 Steel Moment Frames S2 Steel-braced Frames S3 Steel Light Frames S4 Steel Frames with concrete shear walls S5 Steel Frames with infill masonry walls C1 Concrete Moment Frames C3 Concrete Frames with infill masonry shear walls C2 Concrete Shear Walls PC1 Tilt-Up Concrete shear walls PC2 Precast Concrete Frames with shear walls RM1 Reinforced Masonry Walls with flexible diaphragms RM2 Reinforced Masonry Walls with stiff diaphragms URM Unreinforced Masonry Bearing Walls
Building Ages
The California State Building Code Council incorporates significant milestones in building and seismic code requirements that directly affect the structural integrity of development in California. Using these seismic benchmark years, the Steering Committee used county-provided assessor’s data to identify the number of parcels by date of construction or improvement. Table 4-36 shows the results of this analysis. The number of parcels does not reflect the number of total housing units, as many multi-family units and attached housing units are reported on one parcel.
FEMA/Cal OES Submission Draft 10-27-2020

Kern Multi-Jurisdiction 2020 MJHMP UpdateCOUNTY OF KERN
4-112
Table 4-36: Age of Structures in Kern County
Time Period
No. of County Parcels
with Improvements in
Period
Significance of Time Frame
Pre-1933 3,915
Before 1933, there were no explicit earthquake requirements in building codes. State law did not require local governments to have building officials or issue building permits.
1933-1940 5,869 Before the first strong motion recording was made in 1940.
1941-1960 22,488 Prior to when the Structural Engineers Association of California published guidelines on earthquake construction in 1960.
1961-1975 12,790 Prior significant improvements to lateral force requirements in 1975.
1976-1994 27,043 Prior to the Uniform Building Code being amended to include provisions for seismic safety in 1994.
1995 - present 18,058 Seismic code is currently enforced.
Source: Kern County Assessor
Soft-Story Buildings
A soft-story building is a multi-story building with one or more floors that are “soft” due to structural design. If a building has a floor that is 70-percent less stiff than the floor above it, it is considered a soft-story building. These floors can be especially dangerous in earthquakes, because they cannot cope with the lateral forces caused by the swaying of the building during a quake. As a result, the soft story may fail, causing what is known as a soft story collapse. Soft stories are typically associated with retail spaces and parking garages, often on the lower stories of a building. A soft story collapse can cause the rest of the building to collapse as well, causing serious structural damage that may render the structure totally unusable.
Soft-story collapse is one of the leading causes of earthquake damage to private residences. The level of vulnerability due to this type of construction within the planning area is not currently known. This type of data should be generated to support future earthquake risk assessments.
Property Value Exposure
An inventory of current market values and content value was completed using County Assessor’s parcel data. GIS was used to create centroids, or points, to represent the center of each parcel polygon, assumed to be the location of the structure for analysis purposes. The centroids were then superimposed with the USGS probabilistic shaking severity zones to determine the at-risk structures. Table 4-37 shows the count of at-risk parcels and their associated building and content exposure values to the S. San Andreas Mojave N. earthquake scenario.
FEMA/Cal OES Submission Draft 10-27-2020

Kern Multi-Jurisdiction 2020 MJHMP UpdateCOUNTY OF KERN
4-113
Table 4-37: Parcel Exposure to S. San Andreas Mojave N. Scenario (Unincorporated County)
Total
Parcels
Total Market Value ($)
(000)
Total Content Value ($)
(000)
Total Value ($)
(000)
Unincorporated County 91,455 $ 10,906,675 $ 5,453,338 $ 16,360,013
Shake Severity Zone
Improved
Res.
Parcel
Count
% of Total
Market Value Exposure
($)
(000)
Content Value Exposure
($)
(000)
Total Exposure ($)
(100) % of Total
IX - Violent 84 0.1% $ 12,206 $ 6,103 $ 18,309 0.1%
VIII - Severe 1,884 2.1% $ 177,763 $ 88,881 $266,644 1.6%
VII - Very Strong 9,144 10.0% $ 1,305,581 $ 652,790 $ 1,958,371 12.0%
Total 11,112 12.2% $1,495,549 $ 747,775 $ 2,243,324 13.7%
*Currency in Thousands
Critical Facilities and Infrastructure
Earthquakes pose numerous risks to critical facilities and infrastructure. Seismic risks, or losses, that are likely to result from exposure to seismic hazards include:
▪ Utility outages. ▪ Economic losses for repair and replacement of critical facilities, roads, buildings, etc. ▪ Indirect economic losses such as income lost during downtime resulting from damaged public
infrastructure. ▪ Roads or railroads that are blocked or damaged can prevent access throughout the area and can
isolate residents and emergency service providers needing to reach vulnerable populations or to make repairs.
Linear utilities and transportation routes are vulnerable to rupture and damage during and after a significant earthquake event. The cascading impact of a single failure can have affects across multiple systems and utility sectors. Degrading infrastructure systems and future large earthquakes with epicenters near critical regional infrastructure could result in system outages that last weeks for the most reliable systems, and multiple months for others.
All critical facilities in Kern County are exposed to the earthquake hazard. Table 4-38 lists the number of each type of facility in the Violent, Severe, and Very Severe MMI severity zones within the County, described in Table 4-30.
FEMA/Cal OES Submission Draft 10-27-2020

Kern Multi-Jurisdiction 2020 MJHMP UpdateCOUNTY OF KERN
4-114
Table 4-38: Critical Facility Exposure to S. San Andreas Mojave N. Scenario (Unincorporated County)
Critical Infrastructure - S. San Andreas Mojave N. Scenario
Infrastructure Type IX - Violent VIII - Severe VII - Very Strong
Essential Facility - 2 5 EOC - - -
Fire Station - 1 4
Hospital - - -
Police - - -
Sheriff - 1 1
High Potential Loss 1 15 42 Adult Residential facility - - 2
Child Care Center - 2 4
Dam - - 4
Family Child Care Home - - 10
Foster Family Agency - - -
Historic Building - - -
Home Care Organization - - -
Library - 1 1
Residential Child Care - - -
Residential Elder Care - - -
School - 6 8
County Insured Asset* - 4 8
Cooling Center - 1 1
Healthcare Facility 1 - -
Special Needs Facility - 1 4
City Hall - - -
Historic Site - - -
Transportation and Lifeline 16 89 1536 Airport - - 1
Bridge 2 9 44
Power Plant - 5 31
Substation - 3 30
Transmission Line Tower 14 70 1342
NG Facility - 2 18
Wind Turbine - - 70
Bus Facility - - -
Potable Water Facility - - -
Waste Water Facility - - -
Oil Facility - - -
Railroad Facility - - -
Grand Total 17 106 1583 * These insured assets may include critical infrastructure already represented in other Infrastructure Types. For more information on these insured assets, see the Damage Estimation at Section 4.5.4.8.2.
FEMA/Cal OES Submission Draft 10-27-2020

Kern Multi-Jurisdiction 2020 MJHMP UpdateCOUNTY OF KERN
4-115
HazMat Fixed Facilities
Earthquakes can produce hazardous materials (HazMat) threats at very high levels. Depending on the year of build and construction of each facility containing HazMat, the earthquake-initiated hazardous material release (EIHR) potential will vary. HazMat contained within masonry or concrete structures built before certain benchmark years may be particularly vulnerability.
Utilities
Linear utilities and transportation infrastructure would likely suffer considerable damage in the event of an earthquake. Due to the amount of infrastructure and sensitivity of utility data, linear utilities are difficult to analyze without further investigating individual system components. Table 4-39 provides best available linear utility data; it should be assumed that these systems are exposed to breakage and failure.
Table 4-39: Lifeline Exposure S. San Andreas Mojave N. Scenario (Unincorporated County)
Lifelines (miles) – S. San Andreas Mojave N. Scenario
Infrastructure Type (Linear) IX - Violent VIII - Severe VII - Very Strong
Levee - 5.09 92.39
NG Pipeline 0.79 5.73 217.67
Railroad - - 19.77
Street 21.12 207.60 1846.22
4WD trail 1.84 5.25 20.78
4WD trail, major - 0.18 -
Alley - 2.64 0.59
Cul-de-sac - 0.54 0.20
Driveway 0.62 1.03 5.24
Interstate 1.75 11.04 92.67
Local road 10.97 121.03 791.37
Local road, major 2.42 53.98 594.14
Primary highway - - -
Ramp 0.75 1.87 15.63
Road, parking area - - 2.73
Service road - 2.42 1.15
State/county highway 2.07 7.46 200.12
State/county highway, major - - -
Thoroughfare, major 0.70 0.15 121.61
Walkway - - -
Transmission Line 5.70 25.85 515.63
Grand Total 27.62 244.28 2691.67
FEMA/Cal OES Submission Draft 10-27-2020

Kern Multi-Jurisdiction 2020 MJHMP UpdateCOUNTY OF KERN
4-116
Water Supply Utilities
Kern County’s water supply is mostly dependent on snowmelt runoff in the mountains, some of which is captured in reservoirs, and groundwater resources in the Valley and Desert regions. Kern County receives water from external sources that include the State Water Project and Central Valley Project. (Kern County MJHMP, 2014)
The Kern River provides most of the water to Kern County via Lake Isabella. Lake Isabella is on solid ground and expected to be usable after a major earthquake, but any disruption to water deliver infrastructure from an earthquake will affect the ability of Lake Isabella to supply water to populations of Kern County.
Natural Gas Utilities
Several common characteristics of earthquakes and their impacts on natural gas safety are:
• Earthquake ground shaking will generally lead to substantially more instances of building damage than fire ignitions.
• Ground motions that are sufficient enough to damage buildings are the most likely to impact utility and customer gas systems and create a potential for gas-related fire ignitions.
• The number of post-earthquake fire ignitions related to natural gas can be expected to be 20% to 50% of the total post-earthquake fire ignitions.
• The consequences of post-earthquake fire ignitions for residential gas customers are largely financial. A fire ignition only becomes a life safety concern when inhabitants are unable to exit the building following earthquakes. Experience in past earthquakes indicates that egress from earthquake damaged single-family homes is generally possible because of the limited structure height, low numbers of occupants, and multiple direct escape paths through doors and windows. (Earthquake Country Alliance, 2020)
• The potential life safety dangers from post-earthquake fires are considerably more serious in seismically vulnerable apartment or condominium buildings since they provide a greater chance for damaging the structure and trapping the occupants. (United States Geological Survey, 2020)
SoCal Gas and Pacific Gas & Electric, Kern County’s natural gas utility providers, are responsible for designing, constructing, maintaining, and operating the natural gas system safely and efficiently. This includes all the facilities used in the delivery of gas to any customer up to and including the point of delivery to the customers’ gas piping system. (SoCalGas, 2020) (City of Taft, n.d.)
Gas customers and Kern County residents are responsible for using gas safely on their property and within their buildings and other facilities. Customers meet this responsibility by maintaining their gas appliances in good working condition, assuring that only qualified individuals are engaged to modify or
FEMA/Cal OES Submission Draft 10-27-2020

Kern Multi-Jurisdiction 2020 MJHMP UpdateCOUNTY OF KERN
4-117
maintain their gas service and facility piping, and knowing what to do before and after earthquakes to maintain the safe operation of their natural gas service.
The following conditions, when combined, pose the greatest risk for post-earthquake fire damage:
1. Buildings are unoccupied and individuals are not present to mitigate damage to gas systems or control small fires.
2. High building density or dense, fire-prone vegetation.
3. High wind and low humidity weather conditions.
4. Damage to water systems that severely limits firefighting capabilities.
5. Reduced responsiveness of firefighting resulting from impaired communications, numerous requests for assistance, direct damage to fire stations, restricted access because of traffic congestion and damaged roadways, and delays in mutual aid from neighboring fire districts. (Science Daily, 2013)
Telecommunication
Telecommunication systems will be affected by system failure, overloads, loss of electrical power and possible failure of some alternate power systems. Immediately following an event, numerous failures will occur, compounded by system use overloads. This will likely disable up to 80% of the telephone system for one day. County UHF/VHF and microwave radio systems are expected to operate at 40% effectiveness the first 12 hours following an earthquake, increase to 50% for the second 12 hours then begin to slowly decline to approximately 40% within 36 hours.
Microwaves systems will likely be 30% or less effective following a major earthquake. Damage to natural gas facilities serving the Kern County communities will consist primarily of isolated breaks in major transmission lines. Breaks in mains and individual service connections within the distribution system will be significant, particularly near the fault zones. These many leaks pose a fire threat in these susceptible areas of intense ground shaking and/or poor ground near the shoreline. Breaks in the system will affect large portions of the County and restoration of natural gas service could be significantly delayed. (International Telecommunication Union, 2013)
Public Schools
The Field Act was enacted on April 10, 1933, one month after the Long Beach Earthquake in which many schools were destroyed or suffered major damage. Public school construction has been governed by the Field Act since 1933 and enforced by the Division of the State Architect. In any community, public schools constructed under the Field Act after 1978 are likely to be among the safest buildings in which to experience a major earthquake. The Field Act requires:
FEMA/Cal OES Submission Draft 10-27-2020

Kern Multi-Jurisdiction 2020 MJHMP UpdateCOUNTY OF KERN
4-118
▪ School building construction plans to be prepared by qualified California licensed structural engineers and architects.
▪ Designs and plans to be checked by the Division of the State Architect (DSA) for compliance with the Field Act before a contract for construction can be awarded.
▪ Qualified inspectors, independent of the contractors and hired by the school districts, to continuously inspect construction and verify full compliance with plans.
▪ The responsible architects and/or structural engineers to observe the construction periodically and prepare changes to plans (if needed) subject to approval by DSA.
▪ Architects, engineers, inspectors and contractors to file reports, under penalty of perjury, to verify compliance of the construction with the approved plans emphasizing the importance of testing and inspections to achieve seismically safe construction. Any person who violates the provisions or makes any false statement in any verification report or affidavit required pursuant to the Act, is guilty of a felony.
Private schools are not subject to the Field Act and fall solely under the jurisdiction of the local building departments and their requirements. Private schools are covered under the Private Schools Building Act of 1986, with the legislative intent that children attending private schools be afforded life safety protection similar to that of children attending public schools.
In the late 1960s regulations were put in place to have pre-Field Act (1933) buildings retrofitted, removed from school use or demolished. (Cal. Edu. Code § 15516, Appendix X, 1968) The Field Act also prohibits use of unreinforced masonry buildings as school buildings. Seismic building standards in general were greatly strengthened after significant damage to buildings was observed, especially in the 1971 San Fernando earthquake. The Field Act regulations in place since 1978 are considered adequate for most public school buildings in most cases. (GeoScienceWorld, 2003)
Transportation
Earthquake events can significantly impact bridges and overpasses which often provide the only access to some neighborhoods. Since soft soil regions generally follow floodplain boundaries, bridges that cross water courses are considered vulnerable.
Interstate 5 (I-5) is a major north–south route of the Interstate Highway System in the U.S. state of California. It begins at the Mexico–United States border at the San Ysidro crossing, goes north across the length of California and crosses into Oregon south of the Medford-Ashland metropolitan area. It is the more important and most used of the two major north south routes on the Pacific Coast. I-5 provides vital connectivity for Kern County to other cities and supply hubs in California. I-5 could become impassable after an earthquake event which could isolate the County until road crews are able to complete road restoration. Table 4-39 shows transportation infrastructure exposed to shake severity zones in the event of the S San Andreas Mojave N. earthquake scenario.
FEMA/Cal OES Submission Draft 10-27-2020

Kern Multi-Jurisdiction 2020 MJHMP UpdateCOUNTY OF KERN
4-119
4.5.4.8.2 Earthquake Damage Estimation
This section provides estimations of damages to County insured assets and residential buildings in S San Andreas Mojave N. earthquake scenario. This section first looks at overall damages for County insured assets and residential buildings, then looks specifically at potential damage to various County insured assets according to type (e.g., administrative buildings, equipment and services, or recreation).
Hazus Earthquake damage data was generated using a Level 2 Hazus 4.2 analysis. Hazus is a FEMA software product that uses a GIS to analyze multiple factors influencing earthquake damage estimates including peak ground velocity (PGV), peak ground acceleration (PGA) and soil of a given scenario and geographic area. Once the location and size of a hypothetical earthquake is identified, Hazus software estimates the intensity of the ground shaking, the number of buildings damaged, the number of casualties, the damage to transportation systems and utilities, the number of people displaced from their homes, and the estimated cost of repair and clean up.
The parcel data defined in Section 4.4.2 was imported into Hazus as User Defined Facilities (UDF) serving as the basis for replacement and content cost as well as associated damage estimation and loss. The scenarios used for the Kern County Hazus analysis was the S. San Andreas Mojave North.
To understand building damage, damage outputs from Hazus are categorized into slight, moderate, and extensive damage. Ranges of damage are used to provide the user with an understanding of the building’s physical condition. Table 4-40 provides a physical description of each damage state.
County assessor data does not include detailed information for tax exempt structures, such as federal and local government buildings. These data were added through the development of GIS data by utilizing insurance schedule tables for each municipality’s insured assets.
While there are several limitations to the FEMA Hazus earthquake models, it does allow for potential loss estimation for each building construction category. County wide loss estimation results are summarized by building category type in Table 4-42 for the S San Andreas Mojave North 7.7 magnitude earthquake scenario. It is important to understand that the Hazus loss estimation values for earthquake are categorized in exceedance values. From reviewing Table 4-42, one can infer the probability of structures exceeding extensive damage is relatively low. However, if damage were to occur, the economic loss is averaged and summarized for each building type defined in the software.
Important to note: Loss estimation is worst case scenario. Loss estimation does not include damage to transportation routes, infrastructure, and other public and private utilities located throughout the County. An important concept in loss data is the “probability” of damage to exceed a certain degree. It is unlikely that buildings in County would receive “extensive” damage from earthquake shaking.
FEMA/Cal OES Submission Draft 10-27-2020

Kern Multi-Jurisdiction 2020 MJHMP UpdateCOUNTY OF KERN
4-120
Table 4-40: Hazus Building Damage Descriptions
Damage State Damage Description
Slight Small plaster cracks at corners of door and window openings and wall/ceiling intersections; small cracks in masonry chimneys and masonry veneers. Small cracks are assumed to be visible with a maximum width of less than 1/8 inch (cracks wider than 1/8 inch are referred to as “large” cracks).
Moderate Large plaster or gypsum-board cracks at corners of door and window openings; small diagonal cracks across shear wall panels exhibited by small cracks in stucco and gypsum wall panels; large cracks in brick chimneys; toppling of tall masonry chimneys.
Extensive Large diagonal cracks across shear wall panels or large cracks at plywood joints; permanent lateral movement of floors and roof; toppling of most brick chimneys; cracks in foundations; splitting of wood sill plates and/or slippage of structure over foundations.
Complete Structure may have large permanent lateral displacement or be in imminent danger of collapse due to cripple wall failure or failure of the lateral load resisting system; some structures may slip and fall off the foundation; large foundation cracks. Three percent of the total area of buildings with Complete damage is expected to be collapsed, on average.
FEMA/Cal OES Submission Draft 10-27-2020

Kern Multi-Jurisdiction 2020 MJHMP UpdateCOUNTY OF KERN
4-121
Damage Estimation Hazus 4.2 was used to estimate the loss potential to residential properties and Government service facilities exposed to S San Andreas Mojave N. earthquake scenario. Hazus reports the damage potential and loss potential from a given earthquake scenario in four categories: slight damage, moderate damage, extensive damage, and economic loss. Economic loss consists of estimations on the cost of repair and replacement to damaged or destroyed buildings and contents, relocation expenses, capital-related income, wage losses, and rental income losses. The results shown in Table 4-41 summarizes residential property loss with county insurance holding data.
Table 4-41: Loss Estimations for S. San Andreas Mojave N. Scenario
Building Type
Average of
Potential
Damage to
Exceed
“Slight”
Average of
Potential
Damage to
Exceed
“Moderate”
Average of
Potential
Damage to
Exceed
“Extensive”
Average
Economic Loss
for Each
Building
Category
Sum of
Economic Loss
Proportion
of Loss (%)
County Insured Assets
Government Service† 12.6% 4.7% 1.0% $ 59,161 $ 19,700,776 14.1%
Emergency Response†† 10.5% 4.2% 1.3% $ 10,058 $ 663,816 0.5%
Residential
Single Family 9.0% 1.3% 0.1% $ 1,394 $ 108,691,550 77.8%
Mobile Home 9.5% 1.1% 0.1% $ 898 $ 1,705,888 1.2%
Multi Family Duplex 9.9% 1.7% 0.2% $ 872 $ 7,034,332 5.0%
Multi Family 3-4 Units 9.4% 1.5% 0.1% $ 1,033 $ 1,840,423 1.3%
Multi Family 5-9 Units 11.9% 2.8% 0.2% $ 610 $ 14,638 0.0%
Multi Family 10-19 Units 4.1% 0.3% 0.0% $ 826 $ 1,652 0.0%
Multi Family 20-49 Units 3.5% 0.3% 0.0% $ 5,658 $ 28,291 0.0%
Total $ 139,681,366 †Government Services includes: admin, airport, animal, building, bus, correctional, equipment, golf course, health, leased, library, misc, museum, office, park, recreation, relay, shop, storage, vacant, veterans, warehouse, water, yard †† Emergency Response includes Sherriff Offices and Fire Departments
Note: Total Inventory Values 1 - Building Replacement Costs = $11,868,231,028.60 2 - Content Replacement Costs = $5,673,439,613.70
3 - Total Value = $17,541,670,642.30
FEMA/Cal OES Submission Draft 10-27-2020

Kern Multi-Jurisdiction 2020 MJHMP UpdateCOUNTY OF KERN
4-122
Damage Estimation for County Owned Property Hazus 4.2 was used to estimate the loss potential to county facilities exposed to the S. San Andreas Mojave N. earthquake scenario. Hazus reports the damage potential and loss potential from a given earthquake scenario in four categories: slight damage, moderate damage, extensive damage, and economic loss. Economic loss consists of estimations on the cost of repair and replacement to damaged or destroyed buildings and contents, relocation expenses, capital-related income, wage losses, and rental income losses.
County insurance data was obtained and formatted for use in Hazus for a detailed damage estimation. This dataset has additional information including number of floors, building value, content value, and construction type that greatly enhances results from default Hazus database.
The results shown in Table 4-42 summarizes essential facility and high potential loss facilities with county insurance holding data.
Table 4-42: Loss Estimations for S. San Andreas Mojave N. Scenario
Row Labels
Bldg
Count
Bldg
Cost Content Cost Total Value
PD Ex.
Slight
PD Ex.
Moderate
PD Ex.
Extensive
Economic
Loss
Loss
%
Administrative & Office 68
$359,226,983 $118,496,490 $477,723,473 11.6% 4.0% 0.6% $10,931,124 2.3%
Admin 26 $281,03
6,365 $2,180,986 $283,217,351 9.2% 2.2% 0.2% $9,318,203 3.3%
Building 12 $22,885,
686 $1,192,850 $24,078,536 10.7% 4.5% 0.9% $632,278 2.6%
Office 30 $55,304,
932 $115,122,654 $170,427,586 14.1% 5.4% 0.9% $980,644 0.6% Equipment & Storage 51
$57,237,326 $5,149,231 $62,386,557 19.0% 9.7% 2.9% $3,617,495 5.8%
Equipment 5 $127,97
7 $3,302,171 $3,430,148 52.1% 30.2% 7.1% $3,389 0.1%
Shop 11 $41,016,
235 $837,660 $41,853,895 14.2% 7.6% 2.0% $2,515,277 6.0%
Storage 20 $6,039,3
90 $446,971 $6,486,361 12.1% 4.8% 0.9% $663,345 10.2
%
Warehouse 6 $6,387,0
91 $526,728 $6,913,819 15.6% 4.1% 0.3% $195,036 2.8%
Yard 9 $3,666,6
33 $35,701 $3,702,334 23.7% 15.4% 7.8% $240,448 6.5%
Other Assets 42 $6,182,0
00 $26,036,768 $32,218,768 8.4% 2.5% 0.5% $175,017 0.5%
Leased 31 $2,397,8
83 $20,982,229 $23,380,112 7.1% 1.2% 0.1% $45,609 0.2%
Misc 3 $203,62
2 $4,770,874 $4,974,496 27.5% 16.2% 5.5% $1,427 0.0%
Relay 4 $154,57
6 $21,384 $175,960 1.1% 0.1% 0.0% $207 0.1%
Vacant 4 $3,425,9
19 $262,281 $3,688,200 11.1% 4.7% 0.5% $127,775 3.5%
FEMA/Cal OES Submission Draft 10-27-2020

Kern Multi-Jurisdiction 2020 MJHMP UpdateCOUNTY OF KERN
4-123
Row Labels
Bldg
Count
Bldg
Cost Content Cost Total Value
PD Ex.
Slight
PD Ex.
Moderate
PD Ex.
Extensive
Economic
Loss
Loss
%
Recreation 107 $48,550,
442 $8,536,674 $57,087,116 14.6% 4.9% 0.8% $1,056,087 1.8%
Golf Course 3 $2,927,2
48 $3,000 $2,930,248 8.7% 0.8% 0.0% $32,601 1.1%
Museum 76 $19,615,
343 $6,634,355 $26,249,698 16.7% 5.8% 1.0% $521,824 2.0%
Park 9 $10,016,
887 $1,409,407 $11,426,294 5.6% 1.0% 0.1% $116,025 1.0%
Recreation 19 $15,990,
964 $489,912 $16,480,876 11.8% 3.5% 0.4% $385,637 2.3%
Services 121 $438,02
3,808 $56,317,933 $494,341,741 8.7% 3.1% 0.8% $3,582,045 0.7%
Animal 1 $528,59
1 $1,000 $529,591 16.3% 7.7% 1.2% $23,216 4.4%
Correctional 27 $288,26
5,742 $193,074 $288,458,816 3.7% 1.0% 0.1% $1,191,262 0.4%
Fire 47 $40,345,
749 $4,818,942 $45,164,691 11.6% 4.6% 1.5% $577,059 1.3%
Health 5 $23,063,
560 $3,690,348 $26,753,908 10.4% 2.1% 0.1% $627,690 2.3%
Library 18 $57,750,
901 $46,750,699 $104,501,600 8.5% 2.0% 0.2% $680,012 0.7%
Sheriff 19 $14,114,
343 $351,792 $14,466,135 7.7% 3.3% 0.9% $86,757 0.6%
Veterans 1 $672,86
8 $184,792 $857,660 4.5% 0.7% 0.0% $4,495 0.5%
Warehouse 1 $1,038,4
72 $50,193 $1,088,665 17.7% 4.1% 0.3% $32,328 3.0%
Water 2 $12,243,
582 $277,093 $12,520,675 11.6% 5.0% 0.7% $359,227 2.9%
Transportation 10 $52,335,
358 $5,564,962 $57,900,320 15.5% 7.4% 2.0% $1,002,824 1.7%
Airport 9 $52,334,
358 $5,563,962 $57,898,320 10.3% 3.2% 0.4% $1,002,561 1.7%
Bus 1 $1,000 $1,000 $2,000 62.4% 44.7% 16.2% $263 13.2
%
Grand Total 399 $961,55
5,917 $220,102,058 $1,181,657,975 12.2% 4.6% 1.0% $20,364,59
2 1.7%
4.5.4.9 Future Trends in Development
Land use in the planning area will be directed by general plans adopted under California’s General Planning Law. The safety elements of the general plans establish standards and plans for the protection of the community from hazards. The information in this plan provides the participating partners a tool to ensure that there is no increase in exposure in areas of high seismic risk. Development in the planning area will be regulated through building standards and performance measures so that the degree of risk will be reduced. The geologic hazard portions of the planning area are heavily regulated under California’s General Planning Law. The International Building Code establishes provisions to address seismic risk.
FEMA/Cal OES Submission Draft 10-27-2020

Kern Multi-Jurisdiction 2020 MJHMP UpdateCOUNTY OF KERN
4-124
4.5.4.10 Earthquake Hazard Problem Statements:
As part of the mitigation action identification process, the Planning Committee for the County and for each jurisdiction identified issues and weaknesses, also called problem statements, for their respective facilities based on the risk assessment and vulnerability analysis, utilizing the RAMP mapping tool and flood data. Earthquake problem statements for all participating jurisdictions are listed in Table 4-43; problem statements for all other participating jurisdictions are accessed in Volume 2 of this plan.
Identifying these common issues and weaknesses assists the Planning Committee in understanding the realm of resources needed for mitigation. The goal is to have at least one mitigation action for every problem statement. See Table 5-6 for a full list of mitigation actions and the corresponding problem statements that they address. Each problem statement is coded with a problem number for cross-referencing between Table 4-43 and Table 5-6.
Table 4-43 Earthquake Problem Statements
Problem No. Hazard Area of Concern
Mitigation Alternatives Primary Agency Problem Description Related MA
ps-EQ-KC-242 Earthquake Impact PPRO - Property Protection , SP - Structural Projects
County of Kern Older construction and particularly unreinforced masonry (URM) buildings within the County will pose hazards during earthquakes.
ma-EQ-KC-102, ma-EQ-KC-295, ma-AH-KC-111
ps-EQ-KC-243 Earthquake Impact PPRO - Property Protection , SP - Structural Projects
County of Kern Historic buildings can be more susceptible to ground shaking since many of these buildings have weakened with age and were built before the use of building codes.
ma-EQ-KC-295, ma-EQ-KC-296, ma-EQ-KC-297, ma-EQ-KC-307
ps-EQ-KC-244 Earthquake Impact PPRO - Property Protection , PE&A - Public Education & Awareness , SP - Structural Projects
County of Kern The following County assets are located in severe or violent shakes zone for the S. San Andreas Mojave N. EQ scenario: Pine Mtn Fire Station, Kern Co. Fire Station 55, Frazier Park Branch Kern Co. Library, Frazier Park Rec Bldg, Frazier Park Fire Station, Wanda Kirk Branch Kern Co. Library, Hummel Hall Community Center, Rosamond Fire Station, Rosamond Rec Center, Search and Rescue Desert Unit, and Lebec Maintenance Yard. Table 4-42 in Vol. 1 also lists damage estimation of County facilities for this EQ scenario
ma-EQ-KC-295, ma-EQ-KC-296, ma-EQ-KC-307
FEMA/Cal OES Submission Draft 10-27-2020

Kern Multi-Jurisdiction 2020 MJHMP UpdateCOUNTY OF KERN
4-125
Problem No. Hazard Area of Concern
Mitigation Alternatives Primary Agency Problem Description Related MA
ps-EQ-KC-245 Earthquake Impact PPRO - Property Protection , PE&A - Public Education & Awareness , SP - Structural Projects
County of Kern The following County assets are located in severe shake zones for the 7.2 white wolf EQ scenario: Kern Co. Fire Station 55, Tejon Fire Station, Park Home (KCAC) special needs facility, DAI Break residential facility, Bear Valley Fire Station, Kern Co. Fire Station 16, Keene Fire Station, Kern Co. Fire Station 11, Book Mobile 1 Library.
ma-EQ-KC-295, ma-EQ-KC-296, ma-EQ-KC-307
ps-EQ-KC-246 Earthquake Impact PPRO - Property Protection , SP - Structural Projects
County of Kern The following County bridges have been identified as poor quality by the County and could be severely damaged by an earthquake: East of Harbor Rd. (#50C0261) .5 Mi N/O Rnd Mtn Rd. (#50C0085) 2.9 Mi E State HWY 43 (#50C0118) .6 Mi N of RTE 178 (#50C0195) E of Buena Vista Dr. (#50C0018)
ma-EQ-KC-305
ps-EQ-KC-247 Earthquake Victim PPRO - Property Protection , PE&A - Public Education & Awareness , NRP - Natural Resource Protection
County of Kern Shallow ground water near planned development areas in south Bakersfield should be evaluated for liquefaction potential.
ma-EQ-KC-306
ps-EQ-KC-248 Earthquake Impact PPRO - Property Protection , SP - Structural Projects
County of Kern Tenant improvements and building remodels, including non-structural retrofits, may not have included seismic upgrades
ma-EQ-KC-296
FEMA/Cal OES Submission Draft 10-27-2020

Kern Multi-Jurisdiction 2020 MJHMP UpdateCOUNTY OF KERN
4-126
4.5.5 Wildfire Hazard Profile
A wildfire is any uncontrolled fire occurring on undeveloped land that requires fire suppression. Wildfires can be ignited by lightning or by human activity such as smoking, campfires, equipment use, and arson. The 2018 California State Hazard Mitigation Plan provides the following definition of wildfires:
any free-burning vegetative fire that initiates from an unplanned ignition, whether natural (e.g., lightning) or human-caused (e.g., powerlines, mechanical equipment, escaped prescribed fires), where the management objective is full suppression. (CalOES, 2018, p. 507)
Wildfires are costly, putting lives and property at risk and compromising rivers and watersheds, open space, timber, range, recreational opportunities, wildlife habitats, endangered species, historic and cultural assets, scenic assets, and local economies. Vulnerability to flooding increases due to the destruction of forest and ground cover within watersheds. The potential for significant damage to life and property increases in areas where development is adjacent to densely vegetated areas, known as wildland urban interface (WUI) areas. (Federal Emergency Management Agency, 2020)
While some fires are allowed to burn naturally in order to maintain or restore the health of forest lands, out of control wildfires need to be prevented through cooperative, community, and land management planning. (United States Forest Service, n.d.)
4.5.5.1 Local Conditions Relating to Wildfire
Kern County spans the southern extent of the Central Valley floor. The County is flanked by the southern slope of the coastal mountain ranges to the west and the southern slope of the eastern Sierra Nevada to the east, both mountain ranges are surrounded by and intermingled with steep, hilly, grassy, wooded terrain—areas highly susceptible to wildfires. Such fires expose residential and other development within the County to an increased risk of conflagration, or extensive fire which destroys a great deal of land or property. The hilly/mountainous terrain on the east and west side of the Central Valley strongly influences both wildland fire behavior and fire suppression capabilities.
Wind is also a significant factor in the spread of fire, as fires spread faster, and burning embers are carried with the wind to adjacent exposed areas. In densely-populated areas, flying ember production is the principal driver of wildfire. A related concern in built-out areas is the relative density of vegetative fuels that can serve as sites for new spot fires within the urban core and spread to adjacent structures.
FEMA/Cal OES Submission Draft 10-27-2020

Kern Multi-Jurisdiction 2020 MJHMP UpdateCOUNTY OF KERN
4-127
4.5.5.2 Plans, Policies, and Regulatory Environment
Wildfire Protection Responsibility in California
Local, state, tribal, and federal organizations all have legal and financial responsibility for wildfire protection. In many instances, two fire organizations have dual primary responsibility on the same parcel of land—one for wildfire protection and the other for structural fire protection. To address wildfire jurisdiction responsibilities, in 1981 the California State Legislature outlined various wildfire responsibilities, described below, in Cal. Pub. Res. Code § 4291.5 and Cal. Health & Safety Code § 13108.5:
▪ Federal Responsibility Areas (FRAs)—FRAs are fire-prone wildland areas that are owned or managed by a federal agency such as the U.S. Forest Service, National Park Service, Bureau of Land Management, U.S. Fish and Wildlife Service, or U.S. Department of Defense. Primary financial and rule-making jurisdiction authority rests with the federal land agency. In many instances, FRAs are interspersed with private land ownership or leases. Fire protection for developed private property is usually the responsibility of the relevant local government agency, not the federal land management agency.
▪ State Responsibility Areas (SRAs)—SRAs are lands in California where the California Department of Forestry and Fire Protection (CAL FIRE) has legal and financial responsibility for wildfire protection. CAL FIRE administers fire hazard classifications and building standard regulations in these areas. SRAs are defined as lands that:
o are in the unincorporated county areas, o are not federally-owned, o have wildland vegetation cover rather than agricultural or ornamental plants, o have row crops or seasonal crops, or o have watershed, range, or forage values.
CAL FIRE adopts SRA boundaries and updates them every 5 years. Where SRAs contain structures or development, the relevant local government agencies have fire protection responsibility for those improvements.
▪ Local Responsibility Areas (LRAs)—LRAs include land in cities, cultivated agriculture lands, unincorporated non-flammable areas, and lands that do not meet the criteria for SRA or FRA. LRA fire protection is typically provided by city or county fire departments, fire protection districts, or by CAL FIRE under contract to local governments. LRAs may still include areas of flammable vegetation and WUI.
In 2012, as part of local General Plan requirements, California began requiring local governments in State Responsibility Areas (SRAs) and Very High Fire Hazard Severity Zones (VHFHSZ) to:
▪ Update their general plan safety elements to recognize specific wildfire risks in such areas, ▪ Adopt special findings when approving subdivisions in such areas, and
FEMA/Cal OES Submission Draft 10-27-2020

Kern Multi-Jurisdiction 2020 MJHMP UpdateCOUNTY OF KERN
4-128
▪ Use wildfire safety guidelines and California Environmental Quality Act (CEQA) initial study wildfire hazards checklist updates issued by the Governor’s Office of Planning and Research (OPR) when those become available. Cal. Gov. Code § 65040.20 and § 65302.5.
For further information on the details and implications of these Safety Element requirements, see Progress Summaries 3.F and 8.A of the 2018 California State Hazard Mitigation Plan.
Healthy Forests Restoration Act (2003)
The federal Healthy Forests Restoration Act (HFRA) appropriates funding to address five main sub-categories of the National Fire Plan (NFP): preparedness, suppression, reduction of hazardous fuels, burned-area rehabilitation, and state and local assistance to firefighters. Kern County Community CWPPs have integrated these sub-categories through the following four best practices:
1. identifying and prioritizing fuels reduction opportunities across the landscape, 2. addressing structural ignitability, 3. assessing community fire suppression capabilities, and 4. collaborating with stakeholders.
California Fire Code (2016)
Kern County has adopted the 2016 Edition of the California Fire Code to safeguard the public health, safety, and general welfare from the hazards of fire, explosion, or dangerous conditions in new and existing buildings, structures, and premises, and to provide safety and assistance to fire fighters and emergency responders during emergency operations. Section (§17.32) of the Kern County Fire Code applies the 2016 California Fire Code which describes what is required for a Fire Protection Plan, applicable to all new development within the Wildland-Urban Interface Fire Area. It stipulates that such a plan address water supply, access, fire resistance of buildings, fire protection systems and equipment, defensible space and vegetation management.
California Building Standards Code (2019)
The 2019 California Building Code, adopted by the County in 2020, includes materials and construction methods for exterior wildfire exposure and standards of quality for fire-resistant buildings. See Cal. Building Codes, Chapter 7a (2019).
Hazardous Environmental Conditions in Kern County Code, §17.32
The Kern County Code aids in enforcing wildfire prevention strategies via its regulation of potentially hazardous environmental conditions (§17.32). When the Fire Chief determines that hazardous environmental conditions necessitate restricted use of open flame or other ignition sources, the Fire Chief is authorized to prohibit the use or ignition of any such materials.
FEMA/Cal OES Submission Draft 10-27-2020

Kern Multi-Jurisdiction 2020 MJHMP UpdateCOUNTY OF KERN
4-129
Required Operational Permits in Kern County Code, §17.32
An operational permit is required to ignite or cause to be ignited tumbleweeds, agricultural waste, or other combustible material. This is stipulated in the Rules and Regulations of the Air Pollution Control District with jurisdiction.
4.5.5.3 Past Events
There are four major factors that contribute to historic wildfire events:
1. Extreme vegetation diversity 2. Diverse fire weather and fire behavior 3. Dynamic fire history 4. Complex land use patterns
From 2010-2018 there were 22 wildfires burning over 2,000 acres in Kern County. These events are listed in Table 4-44 and displayed in Figure 4-36.
Table 4-44: Wildfire Events in Kern County 2000 Acres or Greater 2000-2018
Date Name Size in Acres Cause
8/3/2018 Tarina Fire 3,516 Tarina Fire
7/7/2017 Hawk Fire 2,940 Hawk Fire
8/16/2016 Cedar Fire 29,101 Cedar Fire
6/23/2016 Erskine Fire 48,008 Erskine Fire
8/18/2014 Way Fire 3,882 Way Fire
6/13/2014 Shirley Fire 2,546 Shirley Fire
5/16/2013 Grand Fire 4,345 Grand Fire
8/10/2012 Jawbone Complex Fire 12,015 Jawbone Complex Fire
9/23/2011 65 Fire 2,003 65 Fire
9/11/2011 Cattle Fire 2,130 Cattle Fire
9/10/2011 Black Fire 2,578 Black Fire
9/10/2011 Knob Fire 2,710 Knob Fire
9/10/2011 Indian Fire 3,069 Indian Fire
9/10/2011 North Fire 3,439 North Fire
9/10/2011 Reed Fire 5,900 Reed Fire
9/10/2011 Breckenridge Complex Fire 25,223 Breckenridge Complex Fire
9/10/2011 Comanche Fire 25,939 Comanche Fire
9/4/2011 Canyon Fire 14,585 Canyon Fire
6/21/2011 Quinn Fire 3,139 Quinn Fire
6/19/2011 Antelope Fire 5,069 Antelope Fire
9/12/2010 Canyon Fire 9,336 Canyon Fire
7/25/2010 Bull Fire 16,448 Bull Fire
6/28/2008 Piute Fire 37,346 Piute Fire
FEMA/Cal OES Submission Draft 10-27-2020

Kern Multi-Jurisdiction 2020 MJHMP UpdateCOUNTY OF KERN
4-130
Date Name Size in Acres Cause
6/24/2007 White Fire 12,432 White Fire
12/7/2006 Westside Fire 4,025 Westside Fire
8/13/2006 Quail Fire Fire 4,770 Quail Fire Fire
8/7/2006 Cottonwood Fire 2,344 Cottonwood Fire
7/22/2006 Ridge Fire 2,417 Ridge Fire
9/3/2005 Gorman Fire 2,516 Gorman Fire
6/15/2002 Borel Fire 3,418 Borel Fire
8/1/2000 King Fire 5,106 King Fire
Recent Large Wildfire Events
Erskine Fire (2016) The Erskine fire occurred near Lake Isabella in 2016. An investigation revealed that the fire began as a result of a private power line that wore down as it repeatedly rubbed against a tree. Ultimately, the Erskine Fire consumed approximately 48,008 acres and destroyed more than 280 residences. It was the most devastating fire in Kern County history and was California’s second largest wildfire in 2016. (Kotowski, 2016)
Comanche Fire Complex (2011) The Comanche Fire Complex consisted of four fires that burned in the Tehachapi Mountains just five miles southeast of Arvin in September, 2011. The fires started from lightning strikes and grew to 29,000 acres as wind fueled the growth. Evacuations were ordered for nearby residents while crews worked to control the fire.
Bull Fire (2010) The Bull Fire was a human caused fire that occurred in a remote area at the bottom of Bull Run Creek Canyon in July, 2010. The Bull Fire threatened the communities of Riverkern and Kernville as the fire spread down the Bull Run Creek drainage and across the Kern River Canyon. The fire grew to over 16,000 acres, destroyed 16 structures, and was the largest wildfire of the 2010 California wildfire season. (CalFire, 2010)
See Figure 4-36 for locations of these historic fires.
Figure 4-35: 2016 Erskine Fire Photo: Michael Cuffe (Patch, June, 2016)
FEMA/Cal OES Submission Draft 10-27-2020

Kern Multi-Jurisdiction 2020 MJHMP UpdateCOUNTY OF KERN
4-131
Figure 4-36: Historic Fire Occurrence Map (Fires Greater than 2,000 acres, 2000-2018)
FEMA/Cal OES Submission Draft 10-27-2020

Kern Multi-Jurisdiction 2020 MJHMP UpdateCOUNTY OF KERN
4-132
4.5.5.4 Fire Hazard Severity Zones (FHSZs)
The County's hilly areas contain the major wildland fire hazard risks for residential structures and other development, characterized by steep slopes, poor fire suppression delivery access, inadequate water supply and highly flammable vegetation.
To help better refine areas of wildfire concern, CAL FIRE establishes and maps Fire Hazard Severity Zones (FHSZ), or areas of significant fire hazards based on factors such as fuel, weather, terrain, and the number of days of moderate, high and extreme fire hazard. These zones define the application of various mitigation strategies to reduce risk associated with wildfires.
The FHSV model inputs frequency of fire weather, ignition patterns, expected rate-of-spread, and past fire history. It also accounts for flying ember production based on the area of influence where embers are likely to land and cause ignitions. The FHSZ model also is built from existing data and hazard constructs, and thus does not necessarily take into consideration significant land use and structural resiliency. The geography, weather patterns and vegetation in the planning area provide ideal conditions for recurring wildfires. See Figure 4-37 and Figure 4-38 for wildfire return intervals and fire severity zones. These maps are the basis for this wildfire risk assessment.
4.5.5.5 Frequency/ Probability of Future Occurrences
Generally, Kern County faces a wildland fire threat each and every year. Fire conditions arise from a combination of hot weather, an accumulation of vegetation, and low moisture content in the air. These conditions, when combined with high winds and years of drought, increase the potential for a wildfire to occur. Urban wildfires often occur in those areas where development has expanded into the rural areas. A fire along this wildland urban interface (WUI) can result in major losses of property and structures. Generally, there are three major factors that sustain wildfires and allow for predictions of a given area’s potential to burn: fuel, topography, and weather.
Fuel is the material that feeds a fire and is a key factor in wildfire behavior. Fuel is generally classified by type and volume. Fuel sources are diverse and include everything from dead tree needles and leaves, twigs, and branches to dead standing trees, live trees, brush, and cured grasses. Man-made structures and other associated combustibles may be considered fuel sources. The type of prevalent fuel directly influences the behavior of wildfire. Light fuels such as grasses burn quickly and serve as a catalyst for fire spread. The volume of available fuel is described in terms of Fuel Loading. Certain areas in and surrounding Kern County are extremely vulnerable to fires as a result of dense grassy vegetation combined with a growing number of structures being built near and within wildland areas.
An area’s topography affects its susceptibility to wildfire spread. Fire intensities and rates of spread increase as slope increases due to the tendency of heat from a fire to rise via convection. The natural arrangement of vegetation throughout a hillside can also contribute to increased fire activity on slopes.
FEMA/Cal OES Submission Draft 10-27-2020

Kern Multi-Jurisdiction 2020 MJHMP UpdateCOUNTY OF KERN
4-133
Weather components such as temperature, relative humidity, wind, and lightning also affect the potential for wildfire. High temperatures and low relative humidity dry out the fuels that feed the wildfire creating a situation where fuel will more readily ignite and burn more intensely.
Wind is the most treacherous weather factor. The greater a wind, the faster a fire will spread, and the more intense it will be. Winds can be significant in Kern County. However, it should be noted that the winds generally occur during the winter storm season, not during the summer fire season. In addition to high winds, wind shifts can occur suddenly due to temperature changes or the interaction of wind with topographical features such as slopes or steep hillsides.
Recent drought conditions also have increased the threat of wildfire. (Kern County MJHMP, 2014) The majority of past wildfire events in Kern County were in the late summer months (typically July through September). Frequency of wildfire events may increase because of increasingly drier conditions caused by climate change. Fire risk will also continue to grow as more people build in WUI areas, which increases fuel loads and the risk of human-caused fires.
As seen in Figure 4-36, fire occurrences are the most common in mountainous areas in the central and eastern portion of Kern County. The probability of a wildfire occurring in Kern County is highly likely (100% annual chance).
4.5.5.6 Severity and Extent
The severity of the wildland fire hazard is determined by the relationship between three factors: fuel classification, topographic slope, and critical fire weather frequency. Critical fire weather conditions occur in periods of relative low humidity, high heat and high winds. Smoke and air pollution from wildfires can be a health hazard, especially for sensitive populations including children, the elderly and those with respiratory and cardiovascular diseases. Wildfire may also threaten the health and safety of those fighting the fires. First responders are exposed to the dangers from the initial incident and after-effects from smoke inhalation and heat stroke. In addition, wildfire can lead to ancillary impacts such as landslides in steep ravine areas and flooding due to the impacts of silt in local watersheds.
4.5.5.7 Warning Time
Regardless of the circumstances around the start of a wildfire, response time can be rapid and warning time short. Wildfires are often caused by humans, intentionally or accidentally. There is no way to predict when one might break out.
The Fourth of July can be a time of heightened concern and outreach around wildfires, since fireworks can cause fires and usage is high. Dry seasons and droughts greatly increase fire likelihood. Dry lightning may trigger wildfires. Severe weather can be predicted, so special attention can be paid during weather events that may include lightning or wind events. Reliable National Weather Service lightning warnings are available on average 24 to 48 hours prior to a significant electrical storm. (California Fire, 2019)
FEMA/Cal OES Submission Draft 10-27-2020

Kern Multi-Jurisdiction 2020 MJHMP UpdateCOUNTY OF KERN
4-134
If a fire does break out and spread rapidly, residents may need to evacuate within days or hours. A fire’s peak burning period generally is between 1 p.m. and 6 p.m. Once a fire has started, fire alerting is reasonably rapid in most cases. The rapid spread of cellular and two-way radio communications in recent years has contributed to a significant improvement in warning time. (Id)
4.5.5.8 Secondary Hazards
Wildfires can generate a range of secondary effects, which in some cases may cause more widespread and prolonged damage than the fire itself. Fires can cause direct economic losses in the reduction of harvestable timber and indirect economic losses in reduced tourism and commerce. Wildfires cause the contamination of reservoirs, destroy transmission lines, and contribute to flooding. They strip slopes of vegetation, exposing them to greater amounts of runoff, weakening soils, and causing slope failures. Major landslides can occur several years after a wildfire. Most wildfires burn hot and for long durations that can bake soils, especially those high in clay content, thus creating hydrophobic soils that repel water. When it rains in burned areas, more soil washes off the hills and into roads, ditches, and streams and increases flooding. (Id)
4.5.5.9 Climate Change Impacts
Fire in western ecosystems is determined by climate variability, local topography, and human intervention. Climate change has the potential to affect multiple elements of the wildfire system: fire behavior, ignitions, fire management, and vegetation fuels. Hot, dry spells create the highest fire risk. Drought and increased temperatures intensify wildfire danger by warming and drying out vegetation. Climate change also may increase winds that spread fires. Faster fires are harder to contain, and thus are more likely to expand into residential neighborhoods.
A changing climate is expected to subject forests to increased stress due to drought, disease, invasive species, and insect pests. These stressors are likely to make forests more vulnerable to catastrophic fire. While periodic fires are natural processes and fulfill an important ecological function, catastrophic fire events that cannot be contained or managed can cause serious threats to homes and infrastructure, especially for properties located at the wildland-urban interface. Moreover, rain events are predicted to become more severe in our changing climate, and post-fire flooding could worsen as well.
It is predicted that Kern County will see higher daily temperatures, more heatwaves, increased wildfires, and a diminished snowpack within this century, as a result of climate change. The eastern edge of Kern County is projected to experience an increase in wildfire risk of 4 to 6 times current fire season averages by the year 2050. (Advancement Project California, 2019)
FEMA/Cal OES Submission Draft 10-27-2020

Kern Multi-Jurisdiction 2020 MJHMP UpdateCOUNTY OF KERN
4-135
Figure 4-37: Wildfire Return Intervals
FEMA/Cal OES Submission Draft 10-27-2020

Kern Multi-Jurisdiction 2020 MJHMP UpdateCOUNTY OF KERN
4-136
Figure 4-38: Wildfire Severity Zones
FEMA/Cal OES Submission Draft 10-27-2020

Kern Multi-Jurisdiction 2020 MJHMP UpdateCOUNTY OF KERN
4-137
4.5.5.10 Wildfire Vulnerability Analysis
This section describes vulnerabilities to wildfire in terms of population, property, and infrastructure. Wildfire population, parcel value, critical facilities and lifeline exposure numbers were generated by overlaying the inventory outlined in Section 4.4 with CalFire Wildfire Hazard Severity Zones. Figure 4-40 shows a snapshot of wildfire vulnerability in Kern County. All data sources have a level of accuracy acceptable for planning purposes. Details for each snapshot can be found in this section.
4.5.5.10.1 Population
Smoke and air pollution from wildfires can be a severe health hazard, especially for sensitive populations including children, the elderly, and those with respiratory and cardiovascular diseases. Smoke generated by wildfire contain visible and invisible emissions that contain particulate matter such as soot, tar, water vapor, and minerals; gases such as carbon monoxide, carbon dioxide, and nitrogen oxides; and toxics such as formaldehyde, benzene. Emissions from wildfires depend on the type of fuel, the moisture content of the fuel, the efficiency or temperature of combustion, and the weather. Public health impacts associated with wildfire include difficulty in breathing, odor, and reduction in visibility. First responders likewise are exposed to the dangers from the initial incident and after-effects from smoke inhalation and heat stroke. (EPA)
Wildfire is of greatest concern to populations residing in the moderate, high and very high fire hazard severity zones. U.S. Census Bureau block data was used to estimate populations within the CAL FIRE identified hazard zones. See Figure 4-40, Figure 4-39, and Table 4-45 for detail on populations residing in wildfire risk areas.
FEMA/Cal OES Submission Draft 10-27-2020

Kern Multi-Jurisdiction 2020 MJHMP UpdateCOUNTY OF KERN
4-138
Table 4-45 Populations Exposed to Wildfire Risk (Unincorporated County)
Total Population
Unincorporated County 299,935
Wildfire Severity Zone Population Count % of Total
Very High Intensity 19,903 6.64%
High Intensity 11,453 3.82%
Moderate Intensity 40,614 13.54%
Total 71,970 24.00%
Figure 4-39 Population Exposed to Wildfire Risk
19,903
11,453
40,614
0
5,000
10,000
15,000
20,000
25,000
30,000
35,000
40,000
45,000
Very High Intensity High Intensity Moderate Intensity
FEMA/Cal OES Submission Draft 10-27-2020
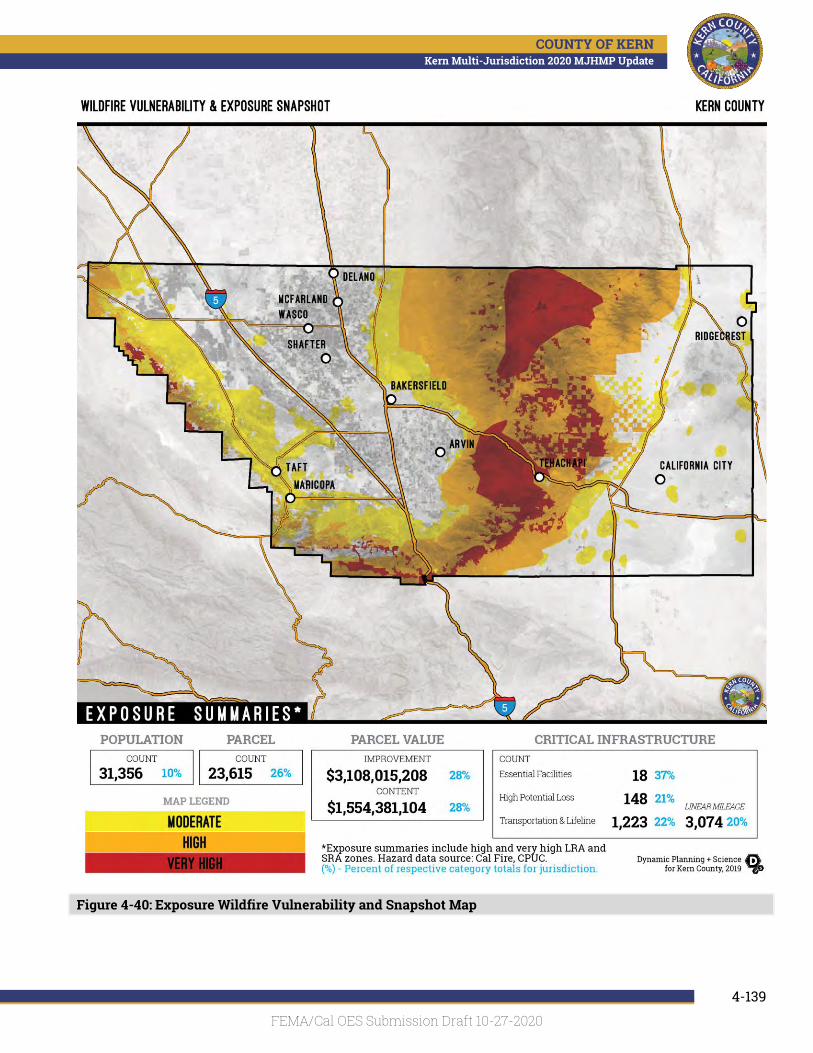
Kern Multi-Jurisdiction 2020 MJHMP UpdateCOUNTY OF KERN
4-139
Figure 4-40: Exposure Wildfire Vulnerability and Snapshot Map
FEMA/Cal OES Submission Draft 10-27-2020

Kern Multi-Jurisdiction 2020 MJHMP UpdateCOUNTY OF KERN
4-140
4.5.5.10.2 Property
This Section calculates the considerable assets at risk of wildfire in those severity zones. See Table 4-46, which utilizes County parcel information to calculate exposure. In some cases, a parcel will be within in multiple fire threat zones, and for this exercise every parcel with a square footage value greater than zero was developed in some way. Only improved parcels were analyzed.
Table 4-46: Residential Buildings and Content within Wildfire Severity Zones (Unincorporated County)
Total Parcels
Total Market Value
($)
Total Content
Value ($) Total Value ($)
Unincorporated County 91,455 $ 10,906,675 $5,453,338 $ 16,360,013
Fire Hazard Severity Zone Parcel Count % of Total Market Value
Exposure ($)
Content Value
Exposure ($) Total Exposure ($) % of Total
Very High 21,750 23.8% $ 1,459,089 $21,750 $1,480,839 9.1% High 1,865 2.0% $ 94,545 $ 1,865 $96,410 0.6% Moderate 14,434 15.8% $874,469 $14,434 $ 888,903 5.4%
Total 38,049 42% $ 2,428,103 $ 38,049 $ 2,466,152 15.1%
Currency in Thousands
4.5.5.10.3 Critical Facilities and Infrastructure
Critical facilities of wood frame construction are especially vulnerable during wildfire events; power lines are also at risk from wildfire because some poles are made of wood and are susceptible to burning.
In most cases, roads and railroads are not susceptible to damage from wildfire but create response issues if affected. Fires can create conditions that block or prevent access and can isolate residents and emergency service providers. Wildfire typically does not have a major direct impact on bridges, but it can create conditions in which bridges are obstructed. Many bridges in areas of high to moderate fire risk are important because they provide the only ingress and egress to large areas and in some cases to isolated neighborhoods.
Critical facilities data were overlaid with fire hazard severity zone data to determine the type and number of facilities within each risk classification. Table 4-47 lists the critical facilities in wildfire hazard severity zones for Kern County, and Table 4-48 similarly lists critical infrastructure.
FEMA/Cal OES Submission Draft 10-27-2020

Kern Multi-Jurisdiction 2020 MJHMP UpdateCOUNTY OF KERN
4-141
Table 4-47: Critical Facility Exposure to Wildfire Severity Zones (Unincorporated County)
Critical Infrastructure - Wildfire Severity Zone
Infrastructure Type Very High High Moderate
Essential Facility 12 6 10
EOC - - -
Fire Station 8 4 7
Hospital 1 - -
Police Station 1 - 1
Sheriff Station 2 2 2 High Potential Loss 119 29 121
Adult Residential facility 3 - 7
Child Care Center 14 - 7
Dam 2 5 6
Family Child Care Home 2 - -
Foster Family Agency 1 - -
Historic Building - - -
Home Care Organization - - -
Library 9 3 2
Residential Child Care - - -
Residential Elder Care 8 - 5
School 14 13 17
County Insured Asset* 42 7 57
Cooling Center 2 - -
Healthcare Facility 7 - 4
Special Needs Facility 15 1 16
City Hall - - -
Historic Site - - - Transportation and Lifeline 163 1060 1474
Airport - - 1 Bridge 45 36 85 Power Plant 4 37 67 Substation 11 29 83
Transmission Line Tower 99 914 1163 NG Facility 2 8 57 Wind Turbine - 34 15 Bus Facility - - - Potable Water Facility 1 1 -
Waste Water Facility 1 1 - Oil Facility - - 3 Railroad Facility - - -
Grand Total 294 1095 1605 * These insured assets may include critical infrastructure already represented in other Infrastructure Types.
FEMA/Cal OES Submission Draft 10-27-2020

Kern Multi-Jurisdiction 2020 MJHMP UpdateCOUNTY OF KERN
4-142
Table 4-48: Lifelines in Wildfire Severity Zones (Unincorporated County)
Lifelines (miles) - Wildfire Severity Zone
Infrastructure Type (Linear) Very High High Moderate
Levee 1.50 4.23 123.97
NG Pipeline 55.01 90.02 420.74
Railroad 28.64 16.77 47.12
Street 1262.59 1172.69 1720.92
4WD trail 16.87 66.15 29.75
4WD trail, major 0.18 0.03 0.04
Alley 1.08 2.68 0.50
Cul-de-sac 0.38 0.51 0.88
Driveway 6.36 2.37 14.52
Interstate 32.04 41.76 69.46
Local road 701.45 456.30 528.57
Local road, major 290.16 359.01 568.40
Primary highway 2.88 6.81 135.59
Ramp 6.09 3.99 15.00
Road, parking area 0.52 - 0.60
Service road 0.35 2.10 1.88
State/county highway 196.69 220.79 240.02
State/county highway, major - - 0.42
Thoroughfare, major 6.95 6.93 114.60
Walkway 0.57 3.26 0.69
Transmission Line 127.12 315.15 643.23
Grand Total 1474.87 1598.86 2955.97
4.5.5.11 Changes in Development and Future Trends
Fuel reduction projects are ongoing on federal, state, and private lands in Kern County. Such projects include vegetation management, broadcast burning, pre-commercial thinning, and the removal of dead, dying, and diseased trees. The Kern County Fire Hazard Reduction Program (FHRP) is a joint effort between the Kern County Fire Department, Cal Fire, Kern County Code Enforcement, and property owners to ensure fire safe communities within the County. The goal of the program is to provide sufficient defensible space around homes and other structures to improve the safety of the public and emergency personnel, as well as increase the chance of a home’s survival in the event of fires. Having heavy accumulations of fuel, and/or dry fuel poses a significant risk to a specific property, neighboring properties, and fire personnel. While inspections are typically done once a year, after June 1 in preparation for fire season, a property can receive an inspection at any time if it is deemed to be a hazard. (Kern County Fire Department, n.d.)
FEMA/Cal OES Submission Draft 10-27-2020

Kern Multi-Jurisdiction 2020 MJHMP UpdateCOUNTY OF KERN
4-143
4.5.5.12 Wildfire Problem Statements
As part of the mitigation action identification process, the Planning Committee for the County and for each jurisdiction identified issues and weaknesses, also called problem statements, for their respective facilities. The problem statements were based on the risk assessment and vulnerability analysis which utilizes the RAMP mapping tool and flood data. Wildfire problem statements for all participating jurisdictions are listed in Table 4-49; problem statements for all other participating jurisdictions are accessed in Volume 2 of this plan.
Identifying these common issues and weaknesses assists the Planning Committee in understanding the realm of resources needed for mitigation. The goal is to have at least one mitigation action for every problem statement. See Table 5-6 for a full list of mitigation actions and the corresponding problem statements that they address. Each problem statement is coded with a problem number for cross-referencing between Table 4-49 and Table 5-6.
Table 4-49 Wildfire Problem Statements
Problem No. Hazard
Area of Concern
Mitigation Alternatives
Primary Agency Problem Description
Related MA
ps-WF-KC-232
Wildfire Impact PPRO - Property Protection , PE&A - Public Education & Awareness , NRP - Natural Resource Protection
County of Kern
The Alta Sierra CWPP (link below) details fire hazards requiring mitigation for the continued protection of the WUI throughout the area: https://www.dropbox.com/s/nfk6320d3j5vg2l/Alta%20Sierra%20CWPP%201204.pdf?dl=1
ma-WF-KC-183, ma-WF-KC-184, ma-WF-KC-287
ps-WF-KC-233
Wildfire Impact PPRO - Property Protection , PE&A - Public Education & Awareness , NRP - Natural Resource Protection
County of Kern
The Kern Valley CWPP (link below) details fire hazards requiring mitigation for the continued protection of the WUI throughout the area: https://www.dropbox.com/s/5ia29n0nt0by10e/Community%20Wildfire%20Protection%20Plan-February%202012%20Update1.pdf?dl=1
ma-WF-KC-182, ma-WF-KC-183, ma-WF-KC-184
ps-WF-KC-234
Wildfire Impact PPRO - Property Protection , PE&A - Public Education & Awareness , NRP - Natural Resource Protection
County of Kern
The Mt. Pinos CWPP (link below) details fire hazards requiring mitigation for the continued protection of the WUI throughout the area: https://www.dropbox.com/s/3vel3cdnk791acm/107658_FSPLT3_4276170.pdf?dl=1
ma-WF-KC-181, ma-WF-KC-183, ma-WF-KC-184
FEMA/Cal OES Submission Draft 10-27-2020

Kern Multi-Jurisdiction 2020 MJHMP UpdateCOUNTY OF KERN
4-144
Problem No. Hazard
Area of Concern
Mitigation Alternatives
Primary Agency Problem Description
Related MA
ps-WF-KC-235
Wildfire Impact PPRO - Property Protection , PE&A - Public Education & Awareness , NRP - Natural Resource Protection
County of Kern
The Myers Canyon CWPP (link below) details fire hazards requiring mitigation for the continued protection of the WUI throughout the area: https://www.dropbox.com/s/l93a92wpj5om8sx/Myers%20CWPP%20081605.pdf?dl=1
ma-WF-KC-288, ma-WF-KC-183, ma-WF-KC-184
ps-WF-KC-236
Wildfire Impact PPRO - Property Protection , PE&A - Public Education & Awareness , NRP - Natural Resource Protection
County of Kern
The Greater Tehachapi Area CWPP (link below) details fire hazards requiring mitigation for the continued protection of the WUI throughout the area: https://www.wildfirelessons.net/HigherLogic/System/DownloadDocumentFile.ashx?DocumentFileKey=48eaad9b-b2ab-4abc-841e-79dd5320d8dd&forceDialog=1
ma-WF-KC-180, ma-WF-KC-183, ma-WF-KC-184
ps-WF-KC-237
Wildfire Impact PPRO - Property Protection , PE&A - Public Education & Awareness , ES - Emergency Services
County of Kern
Not all address markers are compliant. Reflective number signs are needed on all homes and at the road.
ma-WF-KC-289
ps-WF-KC-238
Wildfire Victim PRV - Prevention , PPRO - Property Protection , PE&A - Public Education & Awareness
County of Kern
There are approx. 11 Adult Care Facilities, 15 special needs facilities, and 11 Health Care facilities in Very High Wildfire Severity Zones in mountain communities.
ma-WF-KC-286, ma-AH-KC-104
ps-WF-KC-239
Wildfire Victim PRV - Prevention , PPRO - Property Protection , PE&A - Public Education & Awareness
County of Kern
There are approx. 10 Schools in Very High Wildfire Severity Zones in mountain communities.
ma-WF-KC-286, ma-AH-KC-104
ps-WF-KC-240
Wildfire Victim PRV - Prevention , PPRO - Property Protection , PE&A - Public Education & Awareness
County of Kern
There are approx. 20,000 people living in the very high wildfire intensity zone. Approx. 10,000 in Tehachapi Area. Approx. 7,000 in Lake Isabella Area.
ma-WF-KC-184, ma-WF-KC-183, ma-AH-KC-201
FEMA/Cal OES Submission Draft 10-27-2020

Kern Multi-Jurisdiction 2020 MJHMP UpdateCOUNTY OF KERN
4-145
Problem No. Hazard
Area of Concern
Mitigation Alternatives
Primary Agency Problem Description
Related MA
ps-WF-KC-241
Wildfire Threat PPRO - Property Protection , NRP - Natural Resource Protection
County of Kern
Ongoing fuel mitigation is needed throughout the County. The County has identified the following fuel project priorities: Battalion 1: Bear Valley (Skyline), Water Canyon, Old West Ranch, Alpine, Golden Hills Battalion 5: Pinion Pines, South Frazier, Lake of the Woods, Camp Condor with emphasis on Peak to Peak Charter School, PMC Green Belts Battalion 7: Alta Sierra, Kernville (includes Frontier, Grandview and Burma fuel breaks), Bodfish Phase 1,2, and 3, Pala Ranches, Squirrel Valley
ma-AH-KC-179, ma-WF-KC-231
FEMA/Cal OES Submission Draft 10-27-2020
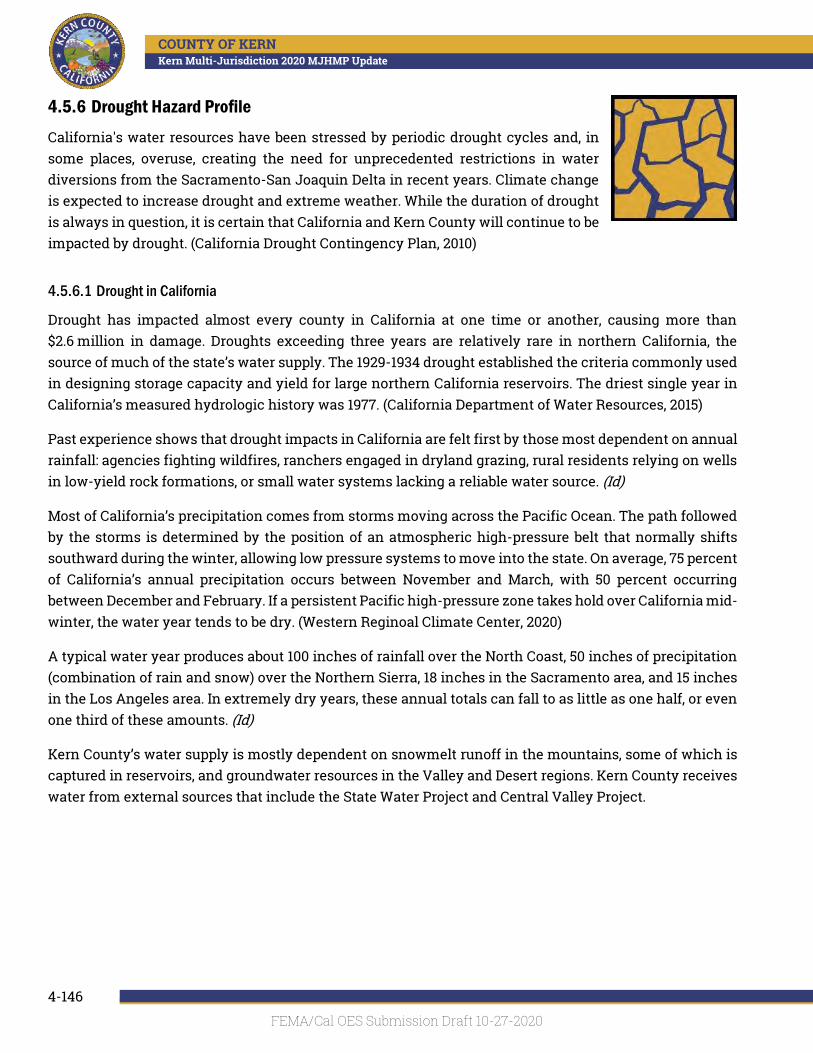
Kern Multi-Jurisdiction 2020 MJHMP UpdateCOUNTY OF KERN
4-146
4.5.6 Drought Hazard Profile
California's water resources have been stressed by periodic drought cycles and, in some places, overuse, creating the need for unprecedented restrictions in water diversions from the Sacramento-San Joaquin Delta in recent years. Climate change is expected to increase drought and extreme weather. While the duration of drought is always in question, it is certain that California and Kern County will continue to be impacted by drought. (California Drought Contingency Plan, 2010)
4.5.6.1 Drought in California
Drought has impacted almost every county in California at one time or another, causing more than $2.6 million in damage. Droughts exceeding three years are relatively rare in northern California, the source of much of the state’s water supply. The 1929-1934 drought established the criteria commonly used in designing storage capacity and yield for large northern California reservoirs. The driest single year in California’s measured hydrologic history was 1977. (California Department of Water Resources, 2015)
Past experience shows that drought impacts in California are felt first by those most dependent on annual rainfall: agencies fighting wildfires, ranchers engaged in dryland grazing, rural residents relying on wells in low-yield rock formations, or small water systems lacking a reliable water source. (Id)
Most of California’s precipitation comes from storms moving across the Pacific Ocean. The path followed by the storms is determined by the position of an atmospheric high-pressure belt that normally shifts southward during the winter, allowing low pressure systems to move into the state. On average, 75 percent of California’s annual precipitation occurs between November and March, with 50 percent occurring between December and February. If a persistent Pacific high-pressure zone takes hold over California mid-winter, the water year tends to be dry. (Western Reginoal Climate Center, 2020)
A typical water year produces about 100 inches of rainfall over the North Coast, 50 inches of precipitation (combination of rain and snow) over the Northern Sierra, 18 inches in the Sacramento area, and 15 inches in the Los Angeles area. In extremely dry years, these annual totals can fall to as little as one half, or even one third of these amounts. (Id)
Kern County’s water supply is mostly dependent on snowmelt runoff in the mountains, some of which is captured in reservoirs, and groundwater resources in the Valley and Desert regions. Kern County receives water from external sources that include the State Water Project and Central Valley Project.
FEMA/Cal OES Submission Draft 10-27-2020

Kern Multi-Jurisdiction 2020 MJHMP UpdateCOUNTY OF KERN
4-147
4.5.6.2 Plans, Policies, and Regulatory Environment
California Sustainable Groundwater Management Act
On September 16, 2014, Governor Brown signed into law a package of bills (SB1168, AB1739 and SB1319) collectively called the Sustainable Groundwater Management Act (SGMA). SGMA requires governments and water agencies of high and medium priority basins to halt overdraft and bring groundwater basins into balanced levels of pumping and recharge. Kern County currently has one basin, the Kern River Valley Basin, which is categorized as high-medium priority. Under SGMA, these basins should reach sustainability within 20 years of implementing their sustainability plans. For critically over-drafted basins, that date will be 2040. For the remaining high and medium priority basins, 2042 is the deadline.
Statewide Emergency Water Conservation Regulations
In 2016, the State Water Resources Control Board (Water Board) adjusted emergency water conservation regulations in recognition of the differing water supply conditions and ongoing drought across the state to comply with an Executive Order from the California Governor declaring a drought emergency. Executive Order B-37-16 Making Water Conservation a California Way of Life updates temporary emergency water restrictions and transitions to permanent, long-term improvements in water use by:
▪ providing for wiser water use ▪ Eliminating water waste ▪ Strengthening local drought resilience ▪ Improving agricultural water use efficiency and drought planning
In April of 2017, a new Executive Order lifted the drought emergency but retained many of the conservation requirements. Most regulations are still in effect with the exception of water supply “stress test” requirements and conservation standards for urban water suppliers. The temporary restrictions established a baseline of the types of benefits that are possible from water conservation requirements. The Executive Orders are found at: https://www.waterboards.ca.gov/water_issues/programs/conservation_portal/executive_orders.html California Water Plan
The California Water Plan presents strategic plan elements including a vision, mission, goals, guiding principles, and recommendations for current water conditions, challenges, and activities. The plan includes future uncertainties and climate change impacts, scenarios for 2050, and a roadmap for improving data and analytical tools needed for integrated water management and sustainability. The California Water Plan was updated most recently in 2018. See: https://water.ca.gov/Programs/California-Water-Plan.
FEMA/Cal OES Submission Draft 10-27-2020

Kern Multi-Jurisdiction 2020 MJHMP UpdateCOUNTY OF KERN
4-148
4.5.6.3 Past Events
California experienced massive changes over the course of the twentieth century as evidenced by dramatic population increases and land use conversion. (Cal. Dep't of Water Resources, 2015) The California Department of Water Resources has state hydrologic data back to the early 1900s. The hydrologic data show multi-year droughts from 1912 to 1913, 1918 to 1920, 1922 to 1924, 2007-2009, and 2014 to 2017.
The most recent major drought in California spanned 2014-2017. With California facing water shortfalls in the driest year in recorded state history, California State Governor Jerry Brown declared a drought state of emergency on January 17, 2014. In the State of Emergency declaration, Governor Brown directed state officials to assist farmers and communities that are economically impacted by dry conditions and to ensure the state can respond if Californians face drinking water shortages. The Governor also directed state agencies to use less water and hire more firefighters and initiated a greatly expanded water conservation public awareness campaign. Figure 4-41 shows drought-impacted Lake Isabella in 2015. On April 17, 2017, Brown issued Executive Order B-40-17, officially ending the drought state of emergency in all California counties except Fresno, Kings, Tulare, and Tuolumne.
The National Drought Monitor provides drought data and maps nationally and on a localized, watershed scale. The National Drought Monitor is the product of eleven agencies, from the NDMC, NOAA and USDA, and is available at http://droughtmonitor.unl.edu/. The National Drought Monitor categorizes the level of drought from D0 through D4, with D4 being the highest “exceptional drought.” Table 4-50 depicts drought classifications and impacts from the level of drought occurrence in California.
Figure 4-42 shows a time series of the level of drought in Kern County from 2000 to 2020 according to the National Drought Monitor as well as the watersheds in Kern County. The National Drought Monitor also classifies drought on a watershed scale (according to hydrologic units established by the US Geological Survey). The participating jurisdiction annexes for those jurisdictions that prioritized drought hazards depict the past twenty years of droughts within applicable watersheds.
Figure 4-41. Drought-lowered Lake Isabella in 2015. Photo by Don Barrett, USC News
FEMA/Cal OES Submission Draft 10-27-2020

Kern Multi-Jurisdiction 2020 MJHMP UpdateCOUNTY OF KERN
4-149
Table 4-50. Drought Classifications and Impacts for California
Category Description Possible Impacts
D0 Abnormally
Dry
▪ Soil is dry; irrigation deliver begins early ▪ Dryland crop germination is stunted ▪ Active fire season begins ▪ Winter resort visitation is low; snowpack is minimal
D1 Moderate Drought
▪ Dryland pasture growth is stunted; producers give supplemental feed to cattle ▪ Landscaping and gardens need irrigation earlier; wildlife patters begin to change ▪ Stock ponds and creeks are lower than usual
D2 Severe
Drought
▪ Producers increase water efficiency methods and drought-resistant crops; ▪ Grazing land inadequate ▪ Fire season is longer, with high burn intensity, dry fuels, and large fire spatial
extent; more fire crews on staff ▪ Lake- and river-based tourism declines; boat ramps close ▪ Trees are stressed; plants increase reproductive mechanisms; wildlife diseases
increase ▪ Water temperatures increase; programs to divert water to protect fish begin ▪ River flows decrease; reservoir levels are low and banks are exposed
D3 Extreme Drought
▪ Livestock need expensive supplemental feed, cattle and horses are sold; little pasture remains
▪ Fruit trees bud early; producers begin irrigating in winter ▪ Federal water not adequate to meet irrigation contracts, extracting supplemental
groundwater is expensive ▪ Dairy operations close ▪ Fire season lasts year-round; fires occur in typically wet parts of the state; burn
bans are implemented ▪ Ski and rafting business is low, mountain communities suffer ▪ Orchard removal and will drilling company business increase; panning for gold
increases ▪ Low water levels impede fish migration and cause lower survival rates ▪ Wildlife encroach on developed areas; little native food and water is available for
bears, which hibernate less ▪ Water sanitation is a concern, reservoir levels drop significantly, surface water is
nearly dry, flows are very low; water theft occurs ▪ Well and aquifer levels decrease; homeowners drill new wells
D4 Exceptional
Drought
▪ Fields are left fallow; orchards are removed; vegetable yields are low; honey harvest is small; agricultural unemployment is high, food aid is needed
▪ Fire season is very costly; number of fires and areas burned are extensive ▪ Many recreational activities are affected ▪ Fish rescue and relocation begins; pine beetle infestation occurs; forest mortality
is high; wetlands dry up; survival of native plants and animals is low; fewer wildflowers bloom; wildlife death is widespread; algae blooms appear
▪ Poor air quality affects health; greenhouse gas emissions increase as hydropower production decreases; West Nile outbreaks rise
▪ Water shortages are widespread; surface water is depleted; federal irrigation water deliveries are curtailed; water prices are extremely high; wells are dry, more and deeper wells are drilled; water quality is poor
Adapted from U.S. Drought Monitor Drought Classifications and Impacts. https://droughtmonitor.unl.edu/Data/StateImpacts.aspx
FEMA/Cal OES Submission Draft 10-27-2020

Kern Multi-Jurisdiction 2020 MJHMP UpdateCOUNTY OF KERN
4-150
Figure 4-42 Kern County Drought Severity Timeline 2000-2021
Drought is one of the few hazards with the potential to impact the entire population of Kern County directly or indirectly, be it from water restrictions, higher water and food prices, reduced air or water quality, or restricted access to recreational areas. No portion of the County is immune from drought conditions. Lack of winter snowfall in the mountains can eventually lead to agricultural impacts due to decreased stream flows. Droughts of just a few weeks during critical periods of plant development can have disastrous effects on agriculture production. Reduced reservoir storage from decreased runoff in the mountains can lead to water shortages. Droughts that occur in populated areas may not have direct effects to the residents but may increase the threat of wildfire in the wildland urban interface areas.
FEMA/Cal OES Submission Draft 10-27-2020

Kern Multi-Jurisdiction 2020 MJHMP UpdateCOUNTY OF KERN
4-151
4.5.6.4 Frequency/Probability of Future Occurrences
Currently there is no data on the probability of drought akin to data for predicting earthquakes or flood probability. Empirical studies conducted over the past century have shown that meteorological drought is never the result of a single cause. It is the result of many causes, often synergistic in nature; these include global weather patterns that produce persistent, upper-level high-pressure systems along the West Coast with warm, dry air resulting in less precipitation.
According to the results of the risk factor exercises for the participating jurisdictions, the probability of drought occurring in Kern County is highly likely (100% annual probability). Figure 4-42 provides a time series from the National Drought Monitor that shows Kern County has been in some form of drought for well over half of the period from 2000 to 2020.
4.5.6.5 Severity and Extent
The severity of a drought depends on the degree of moisture deficiency, the duration, and the size and location of the affected area. The longer the duration of the drought and the larger the area impacted, the more severe the potential impacts. Droughts are not usually associated with direct impacts on people or property, but they can have significant impacts on agriculture, which can impact people indirectly.
The agricultural sector clearly demonstrates the site-specific nature of drought impacts. Agricultural drought impacts are normally felt earliest by those relying on unmanaged water supplies: entities carrying out dryland grazing and non-irrigated crop production, usually grain crops. Impacts to irrigated agriculture depend on the source and nature of the irrigation water supply, whether it be local groundwater, local surface water, or imported surface water, and any water rights or contractual provisions that may be associated with the source. The extent to which producers may mitigate water shortage impacts depends on multiple factors but is heavily influenced by economic considerations. Factors involved in making decisions about mitigating irrigation water shortages include availability and costs of pumping groundwater, price of alternative surface water sources, capital investments associated with maintaining permanent plantings, and status of international crop markets. (California Drought Contingency Plan, 2010)
Unlike most disasters, droughts normally occur slowly but last a long time. On average, the nationwide annual impacts of drought are greater than the impacts of any other natural hazard. They are estimated to be between $6 billion and $8 billion annually in the United States and occur primarily in the agriculture, transportation, recreation and tourism, forestry, and energy sectors. Social and environmental impacts are also significant, although it is difficult to put a precise cost on these impacts.
Drought eventually affects groundwater sources but generally not as quickly as surface water supplies; groundwater supplies generally take longer to recover. Reduced precipitation during a drought means that groundwater supplies are not replenished at a normal rate. This can lead to a reduction in groundwater levels and problems such as reduced pumping capacity or wells going dry. Shallow wells are more susceptible than deep wells. Reduced replenishment of groundwater affects streams. Much of the flow in
FEMA/Cal OES Submission Draft 10-27-2020

Kern Multi-Jurisdiction 2020 MJHMP UpdateCOUNTY OF KERN
4-152
streams comes from groundwater, especially during the summer when there is less precipitation and after snowmelt ends. Reduced groundwater levels mean that even less water will enter streams when steam flows are lowest.
A drought directly or indirectly impacts all people in affected areas. A drought can result in farmers not being able to plant crops or the failure of planted crops. This results in loss of work for farm workers and those in food processing and wine making jobs. Other water-dependent industries are commonly forced to shut down all or a portion of their facilities, resulting in further layoffs. A drought can harm recreational companies that use water (e.g., swimming pools, water parks, and river rafting companies) as well as landscape and nursery businesses because people will not invest in new plants if water is not available to sustain them.
Table 4-50 described impacts of the various severity levels of drought in California according to the National Drought Monitor classifications.
4.5.6.6 Warning Time
Droughts are climatic patterns that occur over long periods of time. Only generalized warning can take place due to the numerous variables that scientists have not pieced together well enough to make accurate and precise predictions .Predicting drought depends on the ability to forecast precipitation and temperature. Anomalies of precipitation and temperature may last from several months to several decades. How long they last depends on interactions between the atmosphere and the oceans, soil moisture and land surface processes, topography, internal dynamics, and the accumulated influence of weather systems on the global scale. (National Institute of Water and Atmospheric Research, 2016)
4.5.6.7 Secondary Hazards
The secondary hazard most associated with drought is wildfire. A prolonged lack of precipitation dries out vegetation, which becomes increasingly susceptible to ignition as the duration of the drought extends.
4.5.6.8 Drought Vulnerability Analysis
All people, property, and environments in the County planning area would be exposed to the impacts of moderate to extreme drought conditions to some degree.
Drought produces a complex web of impacts that spans many sectors of the economy and reaches well beyond the area experiencing physical drought. This complexity exists because water is integral to the ability to produce goods and provide services. Drought vulnerability of an activity usually depends on its water demand, how the demand is met, and what water supplies are available to meet the demand. California’s 2018 Water Plan indicates that water demand in the state will continue to increase.
FEMA/Cal OES Submission Draft 10-27-2020

Kern Multi-Jurisdiction 2020 MJHMP UpdateCOUNTY OF KERN
4-153
4.5.6.8.1 Population
The residents of the county rely on healthy watersheds to provide adequate water for domestic and agricultural purposes. Kern County has experienced population growth and is projected to continue grow, with Bakersfield being one of the fastest growing cities in the state. No significant life or health impacts are anticipated as a result of drought within the planning area.
4.5.6.8.2 Property
During drought years, property owners with shallow wells can be impacted by drought with increased demand on groundwater resources. Surface water supplies are often lower, which can reduce available supplies and increase cost. This sometimes encourages growers who historically used surface water to switch to groundwater, which has a permanent impact on the amount of users using groundwater.
No structures will be directly affected by drought conditions, though some structures may become vulnerable to wildfires, which are more likely following years of drought. Droughts can also have significant impacts on landscapes, which could cause a financial burden to property owners. However, these impacts are not considered critical in planning for impacts from the drought hazard.
4.5.6.8.3 Critical Facilities
Critical facilities, as defined for this plan, will continue to be operational during a drought. Critical facility elements such as landscaping may not be maintained due to limited resources, but the risk to the planning area’s critical facilities inventory will be largely aesthetic. For example, when water conservation measures are in place, landscaped areas will not be watered and may die. These aesthetic impacts are not considered significant.
4.5.6.9 Future Trends in Development
The County will face challenges in providing sufficient water supplies in the future due to climate change effects, coupled with an increasing population (i.e., mostly in the incorporated areas) and increasing water demand. While the County has already taken steps towards achieving long-term groundwater sustainability, there is still a possibility that water supply availability may change in the future and will need to be further addressed.
A new program is being developed to address drought and future development. It involves Kern County and the expansion of the Willow Springs Water Bank (WSWB). Kern County is the lead for a 2018 FEMA grant of $15 M. The grant is part of the Hazard Grant Mitigation Program funds allocated to California. It will pay for facilities to pre-deliver water owned by Kern County from Lake Isabella to WSWB. Pre-delivery creates empty space in the reservoir. The empty volume created in Isabella can (1) provide new yield that can be used to mitigate drought, and (2) reduce the water level in Lake Isabella, reducing dam failure risk. WSWB can provide county-wide benefits to address future droughts.
FEMA/Cal OES Submission Draft 10-27-2020

Kern Multi-Jurisdiction 2020 MJHMP UpdateCOUNTY OF KERN
4-154
Education is also important to ensure sustainable future trends in development. The Water Association of Kern County exists to inform and educate the public and water community about water issues in Kern County. They are a resource for information on water issues in Kern County and provide tips for water conservation.
Finally, each participating municipality has an established General Plan that includes policies directing land use and dealing with issues of water supply and the protection of water resources. These plans provide the capability at the local level to protect future development from the impacts of drought. All participating municipalities reviewed their general plans as part of their hazard mitigation capability assessments. Deficiencies identified by these reviews can be identified as mitigation actions to increase the capability to deal with future trends in development.
4.5.6.10 Climate Change Impacts
The long-term effects of climate change on regional water resources are unknown, but global water resources are already experiencing the following stresses without climate change:
▪ Growing populations ▪ Increased competition for available water ▪ Poor water quality ▪ Environmental claims ▪ Uncertain reserved water rights ▪ Groundwater overdraft ▪ Aging urban water infrastructure
With a warmer climate, droughts could increase in severity, frequency, and duration. According to the UC Davis Center for Watershed Sciences, water shortages in 2016 were projected to cost the agricultural industry a total of $550 million in direct costs and 1,815 in lost jobs. More frequent extreme events such as droughts could end up being more cause for concern than the long-term change in temperature and precipitation averages. (University of California, Davis Center for Watershed Sciences, 2020)
4.5.6.11 Drought Hazard Problem Statements
As part of the mitigation action identification process, the Planning Committee for the County and for each jurisdiction identified issues and weaknesses, also called problem statements, for their respective facilities based on the risk assessment and vulnerability analysis, utilizing the RAMP mapping tool and flood data. Drought hazard problem statements for the County are listed in Table 4-51; problem statements for all other participating jurisdictions are accessed in Volume 2 of this plan.
Identifying these common issues and weaknesses assists the Planning Committee in understand the realm of resources needed for mitigation. The goal is to have at least one mitigation action for every problem statement. Projects or actions have been developed to mitigate each problem identified. See Table 5-6 for a full list of mitigation actions and corresponding problem statements that they address.
FEMA/Cal OES Submission Draft 10-27-2020

Kern Multi-Jurisdiction 2020 MJHMP UpdateCOUNTY OF KERN
4-155
Each problem statement is coded with a problem number for cross-referencing between Table 4-51 and Table 5-6.
Table 4-51 Drought Problem Statements
Problem No. Hazard Area of Concern
Mitigation Alternatives Primary Agency Problem Description
Related MA
ps-DR-KC-215 Drought Impact PE&A - Public Education & Awareness
County of Kern Public education and programming is needed to support the water conservation efforts by WAKC and GSA’s
ma-DR-KC-290
ps-DR-KC-216 Drought Victim PRV - Prevention , PE&A - Public Education & Awareness , SP - Structural Projects
County of Kern Groundwater pumping for private wells during drought years has created water quality issues in existing aquifers
ma-DR-KC-291
ps-DR-KC-217 Drought Victim PRV - Prevention , PE&A - Public Education & Awareness , SP - Structural Projects
County of Kern Private wells are at risk of going dry during drought years
ma-DR-KC-291
ps-DR-KC-218 Drought Threat PRV - Prevention , NRP - Natural Resource Protection
County of Kern County buildings and facilities have irrigated landscaping including turf grass
ma-DR-KC-294
ps-DR-KC-219 Drought Threat PRV - Prevention , PE&A - Public Education & Awareness
County of Kern Existing land use/building code does not require or incentivize water conservation measures including requiring the use of low-flow toilets and showerheads
ma-DR-KC-293
ps-DR-KC-220 Drought Threat PRV - Prevention
County of Kern There is an opportunity for the County land use code to include more incentives for developers to implement drought-tolerant landscaping that provides shade and lowers the urban heat island effect
ma-DR-KC-293
FEMA/Cal OES Submission Draft 10-27-2020

Kern Multi-Jurisdiction 2020 MJHMP UpdateCOUNTY OF KERN
4-156
4.5.7 Slope Failure Hazard Profile
Landslides, mudflow, debris flow, and rockfall, collectively known as slope failure, may cause damage across the County. They rarely present a threat to human life, but often result in a disruption of everyday services, including emergency response capabilities. Landslides can block transportation routes, dam creeks and drainages, and contaminate water supplies. When these hazards affect transportation routes, they are frequently expensive to clean-up and can have significant economic impacts to the County. (United States Geological Survey, 2004)
For this MJHMP update, three types of slope failure (Landslide, Debris Flow, and Rockfall) were identified as concerns to the County and are briefly described below.
Landslide The many types of landslides are categorized based on form and type of movement. They range from slow moving rotational slumps and earth flows, which can slowly distress structures but are less threatening to personal safety, to fast-moving rock avalanches and debris flows that are a serious threat to structures and have been responsible for most fatalities during landslide events. Many large landslides are complex and a combination of more than one landslide type. (Bakersfield.com, 2008, p. 341)
Mudflow/Debris Flow When slope material becomes saturated with water, a debris flow may develop. According to NOAA, debris flow is the most common type of slope failure in Kern County. From a geologic perspective, there are generally two types of debris flows: debris flows related to shallow landslides and post-wildfire debris flows. (United States Geological Survey, 2005)
Debris flows related to shallow landslides occur on hillslope due to soil failure in which soil liquefies and runs downhill. This type of debris flow generally results from a shallow landslide (less than 10 to 15 feet deep) and has a discrete initiation zone depositional area. Shallow landslides tend to occur in winter but are most likely after prolonged periods of heavy rainfall when soil materials are saturated. Debris flows are typically more dangerous because they are fast moving, causing both property damage and loss of life. (Id)
Post-wildfire debris flows are a result of post-fire conditions, where burned soil surfaces enhance rainfall runoff that concentrates in a channel and picks up debris as it moves. The post-fire debris flow has a less discrete initiation zone but is similar to a debris flow derived from hillslopes in that it may result in inundation and a detrimental impact on lives and property within its zone of runout and deposition. It can result in downstream flooding. (Id)
FEMA/Cal OES Submission Draft 10-27-2020

Kern Multi-Jurisdiction 2020 MJHMP UpdateCOUNTY OF KERN
4-157
An example of a catastrophic post-fire debris flow is the event that occurred in Kern County on July 12, 2008, when, significant thunderstorm activity in the mountains above Lake Isabella, tons of water were deposited through the Erskine Creek watershed. See Figure 4-43 for debris flow in the Tehachapi area. (Bakersfield.com, 2008)
Rockfall Rockfall is the falling of a newly detached mass of rock from a cliff or rock outcrop or a loose rock that erodes out of unconsolidated debris on a hillside and rolls or falls down a very steep slope. Over-steepened slopes such as at roadcuts or in glaciated terrain are susceptible to rockfall due to the steep slopes that are not highly vegetated or benched, which can help attenuate rockfall. Rock outcrops that are highly fractured and/or undercut by weaker rock layers are also susceptible to rockfall. (Colorado Geological Survey, 2020)
Alluvial Fan Alluvial fans consist of sediment deposits leftover from a flood event. The sediment is carried by a flood and distributed in a fan-like shape. Alluvial fans represent a high risk of natural hazards in the form of debris flow as the deposited soil remains unstable after the flood event.
4.5.7.1 Plans, Policies, and Regulatory Environment
Kern County General Plan
The 2004 Kern County General Plan includes policies and implementation measures in the Land Use and Safety Elements that ensure adequate slope stability for development in areas prone to slope failure and impacts from the potential of slope failure are mitigated.
Policies and implantation measures around slope failure include ensuring effective slope stability for development and developing spatial referents for geologic hazards more generally. The Kern County General Plan is currently being updated and will consider this MJHMP Update as it continues to shape policies around slope failure mitigation and protection.
Regulation of Cut Surfaces in Kern County Code, § 17.28
The Kern County Code discusses the regulation of slope via its Grading Code, § 17.28. It stipulates that the slope of cut surfaces shall be no steeper than is safe for the intended use and shall be no steeper than two (2) units horizontal to one (1) unit vertical, the exception being if the applicant furnishes a soils engineering or an engineering geology report, or both, stating that the site has been investigated and giving an opinion that a cut at a steeper slope will be stable and not create a hazard to public or private property.
FEMA/Cal OES Submission Draft 10-27-2020

Kern Multi-Jurisdiction 2020 MJHMP UpdateCOUNTY OF KERN
4-158
4.5.7.2 Past Events
According to NOAA, the most common type of slope failure in Kern County is debris flow, which typically occurs during winter months. Table 4-52 lists the slope failure events that took place in the County since the year 2000.
Table 4-52: Slope Failure Events in Kern County Since 2000
Date Type of Event Property Damage Value ($) Crop Damage
12/7/2003 Debris Flow 5,000 None reported
2/21/2005 Debris Flow 3,000 None reported
4/24/2005 Debris Flow 3,000 None reported
12/16/2016 Debris Flow 1,000 None reported
9/3/2017 Debris Flow 50,000 None reported
10/3/2018 Debris Flow 1,000 None reported
12/26/2019 Debris Flow 100,000 None reported
Source: NOAA Storm Events Database
Figure 4-43. Mudflow near Tehachapi Mountains
Photo by The Watchers, https://watchers.news/2015/10/19/massive-mudslide-engulfs-highway-58-near-the-tehachapi-mountains-california/
FEMA/Cal OES Submission Draft 10-27-2020

Kern Multi-Jurisdiction 2020 MJHMP UpdateCOUNTY OF KERN
4-159
4.5.7.3 Location
The best available predictor of where movement of slides and earth flows might occur is the location of past movements. Past landslides can be recognized by their distinctive topographic shapes, which can remain in place for thousands of years. Most landslides recognizable in this fashion range from a few acres to several square miles. Most show no evidence of recent movement and are not currently active. A small proportion of them may become active in any given year, with movements concentrated within all or part of the landslide masses or around their edges.
Recognizing ancient dormant mass movement sites is important to identify current areas susceptible to flows and slides, because they can be reactivated by earthquakes or by exceptionally wet weather. Those ancient scars also consist of broken materials, frequently involve disruption of groundwater flow, and are vulnerable to construction-triggered sliding.
Kern County does have a history of landslide events that have impacted transportation, access to more remote residences in the unincorporated county, and caused property damage. Figure 4-43 shows a 2015 mudflow adjacent to the Tehachapi Mountains that caused traffic backups on Highway 58.
Figure 4-44 shows low, moderate, and high landslide susceptibility in Kern County. Most of the high susceptibility areas are in the hilly regions bordering the Central Valley. This map should be used with caution, however, as site-specific conditions can make some locations in low to moderate instability areas highly unstable and some high instability locations more stable.
FEMA/Cal OES Submission Draft 10-27-2020

Kern Multi-Jurisdiction 2020 MJHMP UpdateCOUNTY OF KERN
4-160
Figure 4-44: Landslide Susceptibility
FEMA/Cal OES Submission Draft 10-27-2020

Kern Multi-Jurisdiction 2020 MJHMP UpdateCOUNTY OF KERN
4-161
4.5.7.4 Frequency/ Probability of Future Occurrences
Slope failures are most frequently triggered in periods of high rainfall. The hazard is greatest in steeply-sloped areas, although slides may occur on slopes of 15 percent or less if the conditions are right. Slope steepness and underlying soils are the most important factors affecting the landslide hazard. However, surface and subsurface drainage patterns also affect the landslide hazard, and vegetation removal can increase the likelihood of a landslide. (United States Geological Survey, 2004)
Slope failures are often triggered by other natural hazards such as earthquakes, heavy rain, floods, or wildfires, so landslide frequency is often related to the frequency of these other hazards. The probability of slope failure occurring in Kern County is likely (between 10 and 100% annual probability).
4.5.7.5 Severity and Extent
The severity of landslide problems depends upon the local bedrock and soil conditions, including moisture content, slope, and vegetation. Small landslides are common in the County’s mountain areas as loose material moves naturally down slope or fires have caused loss of soil-stabilizing vegetative cover. In addition, many human activities tend to make the earth materials less stable and, thus, increase the chance of ground failure. Some of the natural nonseismic causes of ground instability are steam and lakeshore erosion, heavy rainfall, and poor quality natural materials. Human activities contribute to soil instability through grading of steep slopes or overloading them with artificial fill, by extensive irrigation, construction of impermeable surfaces, excessive groundwater withdrawal, and removal of stabilizing vegetation (Kern County General Plan, 2009)
4.5.7.6 Warning Time
Some geologic hazards occur slowly but can have significant property or health consequences, like erosion and some forms of slope movement or land sliding. The identification of those hazards generally takes site-specific analysis to determine if the site soils and geology are susceptible to these hazards and what mitigation is most relevant and prudent for a site. For these types of hazards, warning time is long.
For other hazards, such as debris flows, rockfall, and landslides, warning time is often very short and may not occur at all. Identifying areas where these events are known have occurred, or which have ideal characteristics for these hazards to occur, could help with hazard preparedness when triggering-type events like intense rainfall occur. This identification won’t reduce the warning time, but it will make proactive response to potential triggering events more effective. (AGU Publications, 2016)
FEMA/Cal OES Submission Draft 10-27-2020

Kern Multi-Jurisdiction 2020 MJHMP UpdateCOUNTY OF KERN
4-162
4.5.7.7 Secondary Hazards
There are some hazards that can trigger or exacerbate slope failure. Flooding, for example, can undercut the toe of a slope which can remove the support for the slope and cause a landslide or rockfall. Wildfires create an immediate hazard of their own and create long-term impacts by altering the soil structure, impeding its ability to absorb moisture, and destroying vegetation that binds the soil with roots and absorbs rainfall and runoff with foliage. Post-wildfire, even small rainfall events can create devastating mudflows, debris flows, and landslides. Areas that are mapped currently as low to moderate risk of these hazards may have high risk after a wildfire.
4.5.7.8 Slope Failure Vulnerability Assessment
Figure 4-45 displays landslide susceptibility for population and infrastructure in Kern County. This section discusses exposure to this vulnerability.
4.5.7.8.1 Population
An estimated 5,769 persons, or 1.92% of the County population, are exposed to slope failure areas, as shown in Table 4-53 below. Population estimates within slope failure areas were generated by analyzing County assessor and parcel data that intersect with landslide hazard areas identified by California Geological Survey. Using GIS, U.S. Census Bureau information was used to intersect slope failure hazards an estimate of population was calculated by weighting the population within each census block and track with the percentage of slope hazard areas.
Table 4-53: Population Exposure to Landslide Susceptibility
Total Population
Unincorporated County 299,935
Landslide Susceptibility Population Count % of Total
High 5,769 1.92% Total 5,769 1.92%
FEMA/Cal OES Submission Draft 10-27-2020

Kern Multi-Jurisdiction 2020 MJHMP UpdateCOUNTY OF KERN
4-163
Figure 4-45: Landslide Vulnerability Snapshot
FEMA/Cal OES Submission Draft 10-27-2020

Kern Multi-Jurisdiction 2020 MJHMP UpdateCOUNTY OF KERN
4-164
4.5.7.8.2 Property
Table 4-54 shows the number of parcels, market value exposure and content value exposure in the steep-slope risk areas. The predominant zoning classes in cities are single-family, vacant and manufactured homes.
Table 4-54: Property Value Exposed to Landslides.
Total Parcels
Total Market
Value ($)
Total Content
Value ($) Total Value ($)
Unincorporated County 91,455 $ 10,906,675 $ 5,453,338 $ 16,360,013
Landslide Susceptibility Parcel Count % of
Total
Market Value
Exposure ($)
Content Value
Exposure ($) Total Exposure ($)
% of
Total
High 1,942 2.1% $ 275,953 $ 137,976 $ 413,929 2.5% Total 1,942 2% $ 275,953 $ 137,976 $ 413,929 2.5%
Currency in Thousands
4.5.7.8.3 Critical Facilities and Infrastructure
Several types of infrastructure are exposed to mass movements, including transportation, water, sewer, and power infrastructure. At this time, all infrastructure and transportation corridors identified as exposed to the landslide hazard are considered vulnerable until more information becomes available. Table 4-55 and Table 4-56 summarize the critical facilities exposed to the slope failure hazard.
Table 4-55: Critical Facility Points with Slope Failure Hazard Risk (Unincorporated County)
Critical Infrastructure - Landslide Susceptibility
Infrastructure Type High
Essential Facility -
EOC -
Fire Station -
Hospital -
Police Station -
Sheriff Station -
High Potential Loss 4
Adult Residential facility -
Child Care Center -
Dam 2
Family Child Care Home 1
Foster Family Agency -
Historic Building -
Home Care Organization -
FEMA/Cal OES Submission Draft 10-27-2020

Kern Multi-Jurisdiction 2020 MJHMP UpdateCOUNTY OF KERN
4-165
Critical Infrastructure - Landslide Susceptibility
Infrastructure Type High
Library -
Residential Child Care -
Residential Elder Care -
School -
County Insured Asset* 1
Cooling Center -
Healthcare Facility -
Special Needs Facility -
City Hall -
Historic Site -
Transportation and Lifeline 342
Airport -
Bridge 9
Power Plant 8
Substation 6
Transmission Line Tower 318
NG Facility 1
Wind Turbine -
Bus Facility -
Potable Water Facility -
Waste Water Facility -
Oil Facility -
Railroad Facility -
Grand Total 346 * These insured assets may include critical infrastructure already represented in other Infrastructure Types.
Table 4-56: Critical Facilities (Linear) with Slope Failure Hazard Risk (Unincorporated County)
Lifelines (miles) - Landslide Susceptibility
Infrastructure Type (Linear) High
Levee 0.85
NG Pipeline 28.49
Railroad 7.26
Street 172.44
4WD trail 12.54
4WD trail, major -
Alley 0.05
FEMA/Cal OES Submission Draft 10-27-2020

Kern Multi-Jurisdiction 2020 MJHMP UpdateCOUNTY OF KERN
4-166
Lifelines (miles) - Landslide Susceptibility
Infrastructure Type (Linear) High
Cul-de-sac -
Driveway 0.98
Interstate 4.79
Local road 69.07
Local road, major 41.92
Primary highway 3.10
Ramp 0.45
Road, parking area -
Service road -
State/county highway 35.82
State/county highway, major -
Thoroughfare, major 3.74
Walkway -
Transmission Line 122.05
Grand Total 331.09
4.5.7.8.4 Lifelines
A significant amount of linear infrastructure (or lifelines) can be exposed to mass movements:
▪ Roads—Access to major roads is crucial to life-safety, response, and recovery operations after a disaster event. Landslides can block egress and ingress on roads, causing isolation for neighborhoods, traffic problems, and delays for public and private transportation. This can result in economic losses for businesses.
▪ Bridges—Landslides can significantly impact bridges, by knocking out bridge abutments or significantly weaken the soil supporting them.
▪ Power Lines—Power lines are generally elevated above steep slopes, but the towers supporting them can be subject to landslides. A landslide could trigger failure of the soil underneath a tower, causing it to collapse and rip down the lines. Power and communication failures due to landslides can create problems for vulnerable populations and businesses.
4.5.7.9 Future Trends in Development
Kern County is equipped to handle future growth within landslide hazard areas. The 2009 Kern County General Plan addresses development in areas susceptible to slope failure.
FEMA/Cal OES Submission Draft 10-27-2020

Kern Multi-Jurisdiction 2020 MJHMP UpdateCOUNTY OF KERN
4-167
4.5.7.10 Slope Failure Hazard Problem Statements
As part of the mitigation action identification process, the Planning Committee for the County and for each jurisdiction identified issues and weaknesses, also called problem statements, for their respective facilities based on the risk assessment and vulnerability analysis, utilizing the RAMP mapping tool and flood data. Slope failure hazard problem statements are listed in Table 4-57; problem statements for all other participating jurisdictions are accessed in Volume 2 of this plan.
Identifying these common issues and weaknesses assists the Planning Committee in understand the realm of resources needed for mitigation. The goal is to have at least one mitigation action for every problem statement. Projects or actions have been developed to mitigate each problem identified. See Table 5-6 for a full list of mitigation actions and corresponding problem statements that they address. Each problem statement is coded with a problem number for cross-referencing between Table 4-57 and Table 5-6.
Table 4-57 Slope Failure Problem Statements
Problem No. Hazard
Area of Concern
Mitigation Alternatives
Primary Agency Problem Description
Related MA
ps-SF-KC-230
Slope Failure
Impact PPRO - Property Protection , PE&A - Public Education & Awareness
County of Kern
County transportation routes may be located near high danger landslide areas, which could result in blocked roads and dangerous driving conditions in the event of a landslide. The following County roads pass through high landslide risk areas: Bakersfield-Glennville Rd.; Round Mountain Rd.; Granite Rd.; and Caliente Bodfish Rd
ma-SF-KC-292
ps-SF-KC-231
Slope Failure
Impact PPRO - Property Protection , PE&A - Public Education & Awareness
County of Kern
The following County bridges are located in high landslide risk areas: Cottonwood Creek (50 0047); Hillside (50 0137); Hillside (50 0140); Hillside (50 0182)
ma-SF-KC-292
FEMA/Cal OES Submission Draft 10-27-2020

Kern Multi-Jurisdiction 2020 MJHMP UpdateCOUNTY OF KERN
4-168
4.5.8 Soil Stability Hazard Profile
Hazards associated with soils in Kern County include land subsidence and wind erosion.
Land Subsidence Land subsidence is a gradual settling or sudden sinking of the Earth's surface due to subsurface movement of earth materials. The main cause of subsidence in California is groundwater pumping. The effects of subsidence include damage to buildings and infrastructure, increased flood risk in low-lying areas, and lasting damage to groundwater aquifers and aquatic ecosystems. Subsidence in Kern County is most often caused by the withdrawal of large volumes of fluids from underground reservoirs, but it can also occur by the addition of surface water to certain types of soils, called hydrocompaction. Subsidence from any cause accelerates maintenance problems on roads, lined and unlined canals, and underground utilities. Subsidence has and will continue to cause gradient changes in canals, causing the need for canal banks to be raised and bridges elevated at significant expense. (USGS, Land Subsidence in California, n.d.)
There are four types of subsidence occurring in Kern County.
▪ Tectonic subsidence, a long-term, very slow sinking of the valley, which is significant only over a geologic time period.
▪ Subsidence caused by the extraction of oil and gas. This type of subsidence is still too small to be of serious concern. The State Division of Oil, Gas, and Geothermal Resources monitors subsidence in oil and gas fields and regulates oil and gas withdrawal and repressurizing of the fields.
▪ Subsidence caused by withdrawal of groundwater in quantities much larger than replacement can occur, causing a decline of the water level. This type of subsidence is of major concern and should be regulated and reduced, especially in urbanizing areas. This practice has lowered the ground level over a large area south of Bakersfield and in other areas of the County.
▪ Subsidence caused by hydrocompaction of moisture – deficient alluvial deposits. This is a one time densification from collapse of the soil structure in near-surface strata where the rainfall or other moisture has not penetrated during a long period of time. Parts of the California Aqueduct were constructed through and over hydrocompaction deposit after compaction has occurred through ponding. The areas where hydrocompaction exists and suspect areas should be mapped, studied, and evaluated. Any development on these areas of damaging subsidence requires corrective measures. (Kern County General Plan, 2009)
Wind Erosion Erosion is the general process whereby the materials of the earth’s crust are worn down, removed by weathering, and deposited in other places by water or air. Lakeshore erosion is a special problem involving wave action and can be practically eliminated by proper engineering, construction, and soil stabilization through vegetative cover. Alluvial fans that form at the base of mountain foothills are a product of erosion in the watershed above depositing debris on the gentler valley floors, often associated with debris flows. Development in these areas can be subject to inundation from mud to boulder sized particles. Within
FEMA/Cal OES Submission Draft 10-27-2020

Kern Multi-Jurisdiction 2020 MJHMP UpdateCOUNTY OF KERN
4-169
urbanized areas, the major problem of erosion is from the continued need to remove sediment from drainage systems and basins. Sedimentation within these systems decreases the volume of flood flows that the system can handle. (Kern County MJHMP, 2014)
Agricultural areas are particularly susceptible to wind erosion between crops, during periods of fallow, when grazed by sheep, or when taken completely out of production. Any process that reduces vegetative cover creates dust control issues. For growers, blowing dust comes from two sources, land you own or lease and the land upwind of it. Sand blowing from upwind may cause your previously stable ground to begin to erode, as high winds pick up loose sand particles and bounce them along the ground. This saltation of sand and other coarse particles sandblasts the soil surface, eroding the stable crust, dislodging additional particles, and causing further erosion. Saltating particles can kill vegetation, scour stable land, and cause dust to be lofted into the air. See Figure 4-46. Wind rarely lifts sand higher than about 3 feet above ground. However, fine dust rises much higher, which eliminates any practical means of capture.
Growers may choose to implement procedures that control dust, in order to improve visibility, reduce wind erosion and loss of topsoil, minimize damage to roads and structures, and limit health impacts due to poor air quality. Effective dust control methods conserve your topsoil, protect your downwind cropped acreage, and support compliance with air quality regulations. Soils remain viable for production only when soil loss is held below about 5 tons per acre per year. Dust regulations require submittal of a Best Management Practice Plan that includes selection of Practices for Agricultural Operations specifically developed for control of fugitive dust in the Mojave Desert. (Antelope Valley Dustbusters, 2010)
Figure 4-46. Illustration of various stages of erosion.
From Antelope Valley Dustbuster’s Agricultural Guide to Controlling Windblown Sand and Dust, 2010, http://www.kernair.org/Documents/Dust_Buster/Dustbusters%20Agricultural%20Guide%2010-25-10.pdf
FEMA/Cal OES Submission Draft 10-27-2020

Kern Multi-Jurisdiction 2020 MJHMP UpdateCOUNTY OF KERN
4-170
High winds can create hazardous dust storms in Kern County. Dust storms can damage agricultural crops, property, and create hazardous driving conditions. Dust storms are also a health hazard to residents that are forced to breathe particulates in the air. Dust storms in Kern County are most likely to occur in valley and desert areas.
4.5.8.1 Plans, Policies, and Regulatory Environment
Healthy Soils Action Plan
The California Healthy Soils Action Plan was created by a collaboration of state agencies and departments which are referred to as the Healthy Soils Initiative. They are headed by the California Department of Food and Agriculture. The California Healthy Soils Action Plan is meant to promote the development of healthy soils on California’s farm and ranchlands. The benefits of healthy soil include increased plant health and yields, water retention, greenhouse gas sequestration, and reduced sediment erosion and dust. There are five primary actions which the Healthy Soils Initiative promotes:
▪ the protection and restoration of soil organic matter in California’s soils. ▪ the identification of sustainable and integrated financing opportunities to facilitate healthy soils. ▪ the provision for research, education, and technical support to facilitate healthy soils. ▪ increased governmental efficiencies to enhance soil health on public and private lands. ▪ the promotion of interagency coordination and collaboration to support soils and related state
goals.
Kern County General Plan
The 2004 Kern County General Plan includes several policies and implementation measures in the Land Use and Safety Elements that maintain soil stability in development areas and mitigate impacts from such development.
Policies around soil stability include minimizing alteration of the landscape in order maintain soil stability. The Kern County General Plan is currently being updated and will consider this MJHMP Update as it continues to shape policies around soil stability mitigation and protection.
Soil Stabilization: Maintenance of Disturbed Lands in Kern County Code, § 19.80
The Kern County Code includes a provision for the Eastern Kern Desert Region, which regulates any development that results in any surface disturbance. Best management practices are to be used for the minimization of soil erosion by onsite activities, rainfall, flowing water, or wind.
4.5.8.2 Past Events
Land subsidence in the San Joaquin Valley was first noted in 1935 near Delano. Accelerated ground water pumping of the deep aquifer system during the 1950’s and 1960’s caused about 75 percent of the total volume of land subsidence. The southern end of the Valley has seen the most subsidence, up to 4 to 8 feet in some areas. Some of the direct damages associated with subsidence in the Valley have included
FEMA/Cal OES Submission Draft 10-27-2020

Kern Multi-Jurisdiction 2020 MJHMP UpdateCOUNTY OF KERN
4-171
decreased aquifer storage, partial or complete submergence of canals and associated bridges and pipe crossings, collapse of well casings, and disruption of collector drains and irrigation ditches.
Land subsidence in the vicinity of Edwards Air Force Base has been associated with declining ground water levels and the presence of subsurface fine-grained material that is subject to compaction. Groundwater pumping in this area has been extensive to satisfy water demands at the base as well as agricultural needs. Subsidence in this area was first reported in 1926 and by 1992 about 200 square miles of the Antelope Valley, which includes the Base, were affected by as much as 4 feet of subsidence. The average rate of subsidence between 1961 and 1989 has been about a tenth of a foot a year.
Land-use problems at Edwards AFB due to subsidence have included: ▪ Failure of well casings during compaction of the aquifer, ▪ Damage to fluid transport systems such as underground water, sewer, and petroleum lines, ▪ Erosion of drainage channels and formation of new drainage channels on the lakebed, ▪ Increase in areas subject to flooding as a result of subsidence, ▪ Development of cracks, fissures, soft spots and depressions that affect the use of runways, ▪ Rapid drainage of water on the lakebed into fissures and sink-like depressions. (Kern County
MJHMP, 2014)
Erosion over time can be difficult to track as a past “event.” This HMP examines dust storms as past events that can be a catalyst for more rapid erosion in the County. Dust storms in Kern County have caused property damage, injuries, and deaths. Table 4-58 summarizes dust storm events in Kern County since 2000, as recorded by the National Oceanic and Atmospheric Administration (NOAA).
Table 4-58 Dust Storm Events 2000-2019
Dust Storm Events
Date Deaths Injuries Property Damage Value ($)
10/16/2007 0 0 500,000
10/13/2009 3 0 100,000
6/4/2012 0 0 25,000
6/4/2012 0 0 25,000
7/31/2012 0 0 5,000
1/23/2014 0 1 100,000
1/23/2014 0 0 3,000
3/26/2014 0 0 100,000
6/15/2014 0 0 60,000
11/2/2015 0 15 0
4/13/2017 0 0 100,000
9/3/2017 0 0 10,000
9/3/2017 0 0 10,000
9/3/2017 0 0 10,000
FEMA/Cal OES Submission Draft 10-27-2020

Kern Multi-Jurisdiction 2020 MJHMP UpdateCOUNTY OF KERN
4-172
Dust Storm Events
Date Deaths Injuries Property Damage Value ($)
9/3/2017 0 0 10,000
9/3/2017 0 0 1,000
9/3/2017 0 0 1,000
9/3/2017 0 0 1,000
9/3/2017 0 0 1,000
9/3/2017 0 0 1,000
Total 3 16 1,062,000
4.5.8.3 Location
Subsidence from groundwater withdrawal affects the San Joaquin Valley, particularly the southwest end of the Valley in the vicinity of the Buena Vista Lakebed. Edwards Air Force Base in the Desert Region has also experienced subsidence problems in the vicinity of the Rogers Dry Lakebed. (Kern County MJHMP, 2014) Figure 4-47 shows subsidence areas in Kern County.
Erosion can occur throughout the County. The San Juaquin Valley and the Mojave Desert region have more rapid erosion events such as dust storms more often.
4.5.8.4 Frequency/ Probability of Future Occurrences
Subsidence is occurring in the Valley and Desert regions of Kern County. Now that the hazard is recognized and understood, subsidence from ground water withdrawal has generally slowed since the 1970’s in the San Joaquin Valley due to reductions in ground water pumping. Long term subsidence is expected to continue, but at a slower rate than before. Studies indicate that subsidence in the Edwards AFB area will be between 0.5-1.7 feet in the next 25 years, depending on groundwater levels. Even though water levels have stabilized in the past 20 years, subsidence continues due to past stresses on the aquifer system. Continued population growth, water demands, and uncertain water supplies will likely continue the trend of groundwater withdrawal and continued subsidence. (Kern County MJHMP, 2014)
Erosion occurs slowly over time and is expected to continue occurring throughout the County to varying degrees. As drought intensifies and continues intensifying due to climate change, additional dust in the air will increase the probability and frequency of erosion. Dust storms are projected to increase as well.
FEMA/Cal OES Submission Draft 10-27-2020
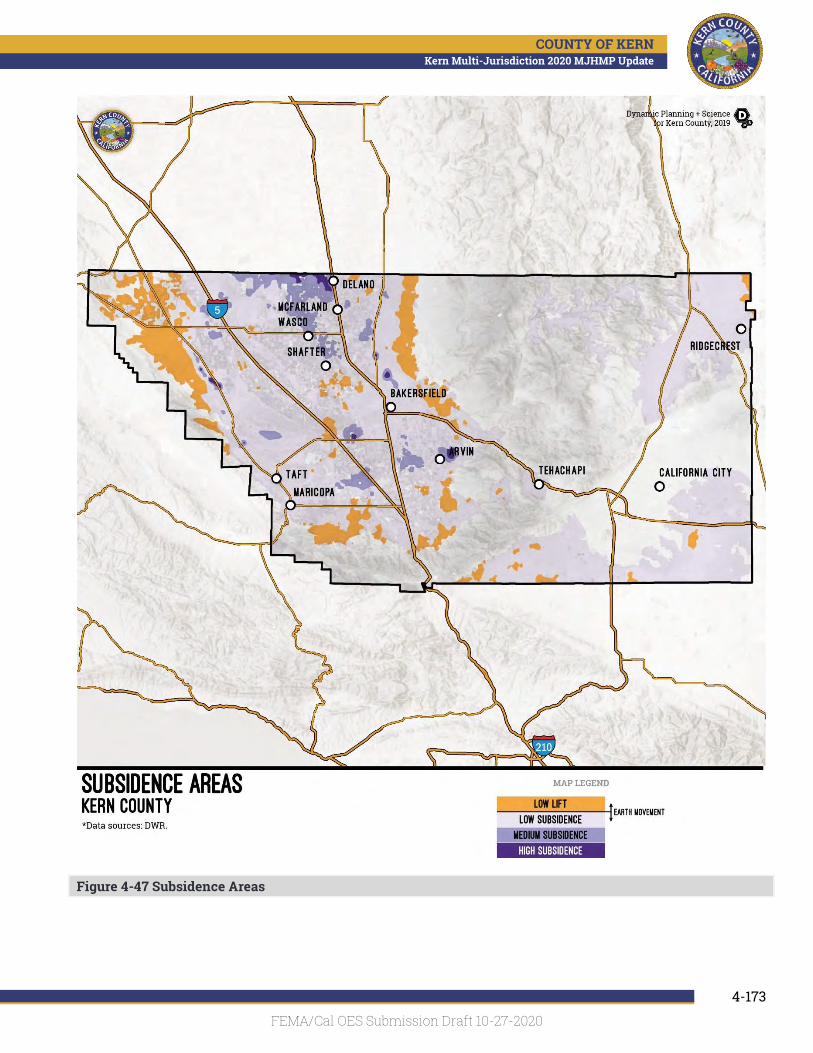
Kern Multi-Jurisdiction 2020 MJHMP UpdateCOUNTY OF KERN
4-173
Figure 4-47 Subsidence Areas
FEMA/Cal OES Submission Draft 10-27-2020

Kern Multi-Jurisdiction 2020 MJHMP UpdateCOUNTY OF KERN
4-174
4.5.8.5 Severity
Subsidence from any cause accelerates maintenance problems on roads, lined and unlined canals, and underground utilities. All new installations in areas suspected of subsidence should be engineered to withstand such subsidence. The usual remedial action is that of raising the water table by injecting water or by reducing groundwater pumping. This increases the fluid pressure in the aquifer and, in most instances, subsidence decreases or stops after a period of time. Figure 4-48 displays exposure of property and population in Kern County to land subsidence.
Erosion occurs slowly over time and is expected to continue occurring throughout the County to varying degrees. As drought intensifies and continues intensifying due to climate change, additional dust in the air will increase the severity of erosion and dust storms.
4.5.8.6 Warning Time
Subsidence is a long-term hazard with a slow onset. Subsidence can occur years after groundwater pumping has stopped due to the long-term effects it has on the aquifer. Detailed studies and modeling can predict future subsidence based on past groundwater pumping. Erosion likewise occurs slowly over time with the exception of dust storms, which can accelerate erosion and cause damage as an extreme weather event.
4.5.8.7 Secondary Hazards
There are no significant secondary hazards associated with land subsidence. However, land subsidence has the possibility to alter floodplains makings some areas more prone to flooding. Erosion can create secondary slope failure hazards such as landslides and mudflows. See Section 4.5.7 for more information on these secondary hazards.
Figure 4-48. Subsidence example in San Joaquin Valley.
Source: Matt Ball, Nov. 19, 2013 in Informed Infrastructure Magazine, https://informedinfrastructure.com/6816/land-subsidence-poses-risk-to-water-infrastructure-in-californias-san-joaquin-valley/
FEMA/Cal OES Submission Draft 10-27-2020

Kern Multi-Jurisdiction 2020 MJHMP UpdateCOUNTY OF KERN
4-175
4.5.8.8 Soil Stability Vulnerability Assessment
4.5.8.8.1 Population
Land subsidence poses a threat to the population of Kern County. Subsidence occurring near residential areas threatens homes and the populations that live in those areas. Figure 4-49 displays the number and percentage of the population which are in areas of the County that are vulnerable to land subsidence.
Wind erosion effects the population of Kern County because it can cause dust clouds. Dust clouds are a source of poor air quality. They have the effect of causing respiratory health problems. Wind erosion can also damage crop production and it can limit visibility, triggering roadway accidents. (Antelope Valley Dustbusters, 2010)
4.5.8.8.2 Critical Facilities
Critical facilities can be affected by land subsidence. Land subsidence creates maintenance problems on roads, lined and unlined canals, and underground utilities that can impact the County as a whole. Figure 4-49 displays the number and percentage of critical infrastructure which is in areas of the County which are vulnerable to land subsidence.
Wind erosion can negatively impact drainage infrastructure, especially in urban and agricultural areas. Erosion causes a continued need to remove sediment from drainage systems and basins. Sedimentation within these systems decreases the volume of flood flows that the system can handle. (Kern County MJHMP, 2014)
FEMA/Cal OES Submission Draft 10-27-2020

Kern Multi-Jurisdiction 2020 MJHMP UpdateCOUNTY OF KERN
4-176
Figure 4-49 Subsidence Vulnerability & Exposure Snapshot
FEMA/Cal OES Submission Draft 10-27-2020

Kern Multi-Jurisdiction 2020 MJHMP UpdateCOUNTY OF KERN
4-177
4.5.8.9 Future Trends in Development
Future development has the potential to increase subsidence issues in Kern County. Private water well drilling during drought years can contribute to subsidence issues as it depletes the aquifer, increasing the amount of areas that are susceptible to subsidence. Kern County Department of Public Health issues permits to construct, reconstruct, and destroy water wells and evaluates the construction and water quality of existing wells. The Kern County General Plan acknowledges subsidence issues throughout Kern County and the County is capable of managing growth and development to avoid high risk subsidence areas. Geologic studies and mapping will enhance the County’s understanding of high-risk subsidence areas and trends and help the County manage growth and development to avoid high risk areas.
Increased development in arid areas creates additional dust that can exacerbate erosion. (Robbins, 2017) As farming and other development spreads into arid regions, vegetation is destroyed and the soil is exposed to wind erosion. Expected future increase in droughts compound this issue. (Id.) This could affect Kern County in some key areas that may experience growth in already-arid exurban areas.
4.5.8.10 Soil Stability Hazard Problem Statements
As part of the mitigation action identification process, the Planning Committee for the County and for each jurisdiction identified issues and weaknesses, also called problem statements, for their respective facilities based on the risk assessment and vulnerability analysis, utilizing the RAMP mapping tool and flood data. Agricultural disaster hazard problem statements are listed in Table 4-59; problem statements for all other participating jurisdictions are accessed in Volume 2 of this plan.
Identifying these common issues and weaknesses assists the Planning Committee in understanding the realm of resources needed for mitigation. The goal is to have at least one mitigation action for every problem statement. Projects or actions have been developed to mitigate each problem identified. See Table 5-6 for a full list of mitigation actions and corresponding problem statements that they address. Each problem statement is coded with a problem number for cross-referencing between Table 4-59 and Table 5-6.
FEMA/Cal OES Submission Draft 10-27-2020

Kern Multi-Jurisdiction 2020 MJHMP UpdateCOUNTY OF KERN
4-178
Table 4-59 Soil Stability Hazard Problem Statements
Problem No. Hazard Area of Concern
Mitigation Alternatives Primary Agency Problem Description
Related MA
ps-SS-KC-221 Soil Stability Impact PRV - Prevention , PE&A - Public Education & Awareness , NRP - Natural Resource Protection
County of Kern Increased groundwater pumping for private wells can contribute to land subsidence problems.
ma-DR-KC-291
ps-SS-KC-222 Soil Stability Impact PPRO - Property Protection , SP - Structural Projects
County of Kern Bridge at Rock Pile Rd. and Arvin Edison Canal is located in a high risk subsidence area and may need further investigation
ma-SS-KC-300
ps-SS-KC-223 Soil Stability Impact PPRO - Property Protection , SP - Structural Projects
County of Kern There are 13 bridges in Unincorporated Kern County located in medium subsidence area which may require further investigation
ma-SS-KC-300
ps-SS-KC-224 Soil Stability Impact PE&A - Public Education & Awareness , NRP - Natural Resource Protection
County of Kern Wind erosion could lead to soil accumulation on county roadways, creating hazardous driving conditions
ma-SH-KC-298, ma-SS-KC-299
ps-SS-KC-225 Soil Stability Threat PE&A - Public Education & Awareness , NRP - Natural Resource Protection
County of Kern The presence of fallow agricultural fields and ag fields without cover crops contribute to wind erosion
ma-SH-KC-298
ps-SS-KC-226 Soil Stability Threat NRP - Natural Resource Protection
County of Kern A lack of erosion control in areas around steep hillsides will increase the risk of landslide/mudflow/rockslide
ma-AH-KC-158
ps-SF-KC-249 Soil Stability Impact PPRO - Property Protection
County of Kern The Lebec Landfill and Transfer Station site is located at the bottom of a canyon which is surrounded by high steep hills. Runoff from adjacent properties is eroding deep gullies into the hillsides.
Ma-AH-KC-245
ps-SS-KC-250 Soil Stability Impact PPRO - Property Protection
County of Kern Bena Landfill could see future damage caused by precipitation. The following requires mitigation: high water velocity flows in earth ditches, steep grades and limited vegetation on surface slopes.
Ma-AH-KC-39
ps-SS-KC-251 Soil Stability Impact PPRO - Property Protection
County of Kern Kern Valley Landfill and Transfer Station is at risk of erosion from high precipitation
Ma-AH-KC-63
FEMA/Cal OES Submission Draft 10-27-2020

Kern Multi-Jurisdiction 2020 MJHMP UpdateCOUNTY OF KERN
5-1
Section 5. Mitigation Strategy The mitigation strategy is the guidebook to future hazard mitigation administration for the County and all other participating jurisdictions, capturing the key outcomes of the MJHMP planning process. The mitigation strategy is intended to reduce vulnerabilities outlined in the previous section with a prescription of policies and physical projects. These mitigation actions should be compatible with existing planning mechanisms and should outline specific roles and resources for implementation success. The Planning Committee conducted the hazard mitigation planning process through typical problem-solving, as did the Steering Committees for each participating jurisdiction. Those steps included:
▪ Estimate the impacts (See Vulnerability Assessment); ▪ Describe the problem (See Problem Statements); ▪ Assess what resources exist to lessen impacts and problem (See Capability Assessment,); ▪ Develop Goals and Objectives to address the problems (See Goals and Objectives); and ▪ Determine what can be done and develop actions that are appropriate for the community (See
Mitigation Action Matrix).
5.1 Mitigation Alternatives
During Planning Committee Meeting #4 on November 14th, 2019 the MJHMP Planning Committee developed and reviewed mitigation actions with a wide range of alternatives, using FEMA’s six broad categories of mitigation alternatives described below. The MJHMP Planning Committee considered many mitigation alternatives for implementation under each mitigation category, both county-wide and for individual participating jurisdictions.
PREVENTION (PRV):
Preventative activities keep hazard problems from getting worse and typically are administered through government programs or regulations addressing building and land development. Preventative actions are particularly effective in reducing a community’s future vulnerability in areas where development has not occurred, or capital improvements have not yet been substantial. Examples of preventative activities include:
▪ Planning and zoning ordinances; ▪ Building codes; ▪ Open space preservation; ▪ Floodplain regulations; ▪ Stormwater management regulations; ▪ Drainage system maintenance; ▪ Capital improvements programming; and ▪ Riverine or fault zone setbacks.
FEMA/Cal OES Submission Draft 10-27-2020

Kern Multi-Jurisdiction 2020 MJHMP UpdateCOUNTY OF KERN
5-2
PRV ALTERNATIVES:
▪ Establish ingress/ egress standards for future development. ▪ Enhance the County’s GIS database and capabilities related to hazards information. ▪ Assist dam owners in updating their Emergency Action Plans. ▪ Maintain detention basins. ▪ Conduct detailed study and mapping of floodplains for Kern River and its tributaries, targeting
problematic floodplains. ▪ Update and distribute wildfire risk mapping for Kern County. ▪ Restrict new development in dam inundation zones. ▪ Amend or revise water conservation regulations for landscape design for commercial and
residential development with the goal of limiting outdoor watering.
PROPERTY PROTECTION (PPRO):
Property protection measures involve the modification of existing buildings and structures to help them better withstand the forces of a hazard, or removal of the structures from hazardous locations. Examples include:
▪ Building elevation; ▪ Critical facilities protection; ▪ Retrofitting (e.g., seismic design techniques, etc.); ▪ Safe rooms, shutters, shatter resistant glass; and ▪ Insurance.
PPRO ALTERNATIVES:
1. Continue to work with the County of Kern local Fire Safe Councils to conduct mitigation projects with homeowners. Provide homeowners easily accessible resources for mitigating the risk of wildfire around their homes.
2. Implement additional fuel reduction projects. 3. Remove existing structures from flood areas whenever and to the greatest extent possible; Relocate
farm work centers from flood risk areas. 4. Encourage privately owned critical facilities (e.g. Churches, Hotels, other gathering facilities) to
evaluate the ability of the buildings to withstand earthquakes and to address any deficiencies identified.
5. Identify and harden critical lifeline systems (i.e., critical public services such as utilities and roads) to meet “Seismic Design Guidelines and Standards for Lifelines” or equivalent standards such as American Lifelines Alliance (ALA) guidance.
6. Increase participation in NFIP. 7. Review construction plans for all bridges to determine their susceptibility to collapse and
retrofitting problem bridges. 8. Use flexible piping when extending water, sewer, or natural gas service.
FEMA/Cal OES Submission Draft 10-27-2020

Kern Multi-Jurisdiction 2020 MJHMP UpdateCOUNTY OF KERN
5-3
9. Strengthening and retrofitting non-reinforced masonry buildings and non-ductile concrete facilities that are particularly vulnerable to ground shaking
10. Install shutoff valves and emergency connector hoses where water mains cross fault lines. 11. Continue to incentivize drought-tolerant landscape design.
PUBLIC EDUCATION AND AWARENESS (PE&A):
Public education and awareness activities advise students, staff, parents, nearby residents, and elected officials about hazards, hazardous areas, and mitigation techniques they can use to protect themselves and their property. Measures to educate and inform the public include:
▪ Outreach projects including neighborhood and community outreach; ▪ Speaker series / demonstration events; ▪ Hazard mapping; ▪ Real estate disclosures; ▪ Materials library; ▪ School children educational programs; and ▪ Hazard expositions.
PE&A ALTERNATIVES:
1. Continue to work with the County of Kern local Fire Safe Councils educating homeowners on reducing the risk of wildfire on their property, including understanding their wildfire risk, and free site visits.
2. Distribute public education materials relating to natural hazards as well as emergency notifications in both English and Spanish.
3. Partner with Water Association of Kern County, Eastern Kern County Resource Conservation District, Kern Valley Resource Conservation District, North West Kern Resource Conservation District, and/or Tehachapi Resource Conservation District, and the Kern Valley River Council in their public education and conservation campaigns (in English and Spanish).
4. Encourage businesses to build financial reserves as part of economic development. 5. Improve floodplain management, earthquake preparedness, wildfire mitigation and preparedness,
and other information on participating jurisdiction’s websites. 6. Distribute National Flood Insurance Program and floodplain development information in County
libraries for access by the public 7. Focus a public education program around neighborhoods with egress/ingress issues and narrow
roads. 8. Improve interactive hazard mapping resources available to public. 9. Develop a public information campaign on 72-hour kits. 10. Develop a "Natural Hazard Awareness Week" campaign and conduct corresponding outreach to the
community and all interested parties.
FEMA/Cal OES Submission Draft 10-27-2020

Kern Multi-Jurisdiction 2020 MJHMP UpdateCOUNTY OF KERN
5-4
11. Conduct outreach to builders, architects, engineers, and inspectors about building susceptibility to earthquakes and proper design and building requirements.
12. Educate on the importance of drought-tolerant landscaping, low flow indoor fixtures, and other water savings techniques to better withstand periods of drought.
13. Partner with local organizations such as the Kern River Watershed Coalition Authority and Water Association of Kern County to educate farmers on soil and water conservation practices.
14. Offer agricultural disaster training and networking opportunities for farmers and ag regulatory agencies.
NATURAL RESOURCE PROTECTION (NRP):
Natural resource protection activities reduce the impact of natural hazards by preserving or restoring natural areas and their protective functions. Such areas include floodplains, wetlands, steep slopes, and sand dunes. Parks, recreation, or conservation agencies and organizations often implement these protective measures. Examples include:
▪ Floodplain protection ▪ Watershed management; ▪ Vegetation management (e.g., fire resistant landscaping, fuel breaks, etc.); ▪ Erosion and sediment control; ▪ Wetland and habitat preservation and restoration;
NRP ALTERNATIVES:
1. Continue to implement the Kern County Flood Hazard Mitigation Plan. 2. Protect and restore wetlands, riparian areas, and natural buffers to sea level rise, in particular
continuing to implement restoration of Kern County rivers. 3. Continue to implement the County of Kern Storm Water Management Plan. 4. Complete vegetation management projects as prescribed in Community Wildfire Protection Plans. 5. Encourage and incentivize drought-tolerant landscape design. 6. Establish a priority list of slope failure locations and implement slope stabilization projects in the
highest risk areas. EMERGENCY SERVICES (ES):
Although not typically considered a “mitigation” technique, emergency service measures do minimize the impact of a hazard event on people and property. These commonly are actions taken immediately prior to, during, or in response to a hazard event. Examples include:
▪ Warning systems; ▪ Construction of evacuation routes; ▪ Sandbag staging for flood protection; and
FEMA/Cal OES Submission Draft 10-27-2020

Kern Multi-Jurisdiction 2020 MJHMP UpdateCOUNTY OF KERN
5-5
▪ Installing temporary shutters on buildings for wind protection.
ES ALTERNATIVES:
1. Construct/Install back up power generators for fire stations, pump houses, emergency shelters and cooling centers.
2. Utilize website “Smart911,” for vulnerable populations to register information such as where the individual in question lives, medications, restrictions, etc. Also, map registrants or tie information to Nixle alert system
3. Focus capital improvements on evacuation or emergency access routes needing attention. 4. Increase the capacity of existing hospitals through retrofits or upgrades such as isolation wings. 5. Construct or improve egress for wildfire emergencies in wilderness-urban interface (WUI) areas.
STRUCTURAL PROJECTS (SP):
Structural mitigation projects are intended to lessen the impact of a hazard by modifying the environmental natural progression of the hazard event through construction. They are usually designed by engineers and managed or maintained by public works staff. Examples include:
▪ Stormwater diversions / detention / retention infrastructure; ▪ Utility Upgrades ▪ Seismic Retrofits
SP ALTERNATIVES:
1. Continue Kern River restoration projects. 2. Improve water supply and delivery systems to be more resilient during times of drought. 3. Construct and develop alternative water supplies to augment single sources of water delivery. 4. Construct rainwater catchment systems to recharge groundwater in government ROWs. 5. Install water monitoring devices and drought-tolerant landscaping on government-owned
facilities. 6. Improve stormwater drainage capacity; construct / improve stormwater basins County-wide to
accomplish 100-YR protection. 7. Conduct regular maintenance for drainage systems and flood control structures. 8. Construct, install and maintain warning gauges on local dams as the opportunity or need arises. 9. Create an inventory and establish a priority list for culvert replacement that takes into account
fish passage, flood depth reduction and future losses avoided. 10. Retrofit critical care facilities with enhanced HVAC and isolation areas.
FEMA/Cal OES Submission Draft 10-27-2020

Kern Multi-Jurisdiction 2020 MJHMP UpdateCOUNTY OF KERN
5-6
5.2 Identifying the Problem
As part of the mitigation action identification process, the MJHMP Planning Committee identified the areas of concern and potential impacts of each of the identified hazards on the community. Developing these “problem statements” for areas of concern, which describe the nature of the consequences or effects of a hazard occurrence on the community and its assets, ensures the identified mitigation actions are tailored to the specific problems created by various hazard scenarios and are specific to each participating jurisdiction. Each jurisdiction’s problem statements are available as part of the Mitigation Action Support Tool (MAST), which is summarized in Section 3, Step STEP 3: Develop a Mitigation Strategy, available on mitigatehazards.com, and summarized in individual participating jurisdictions in Volume 2 of this plan.
See Section 5.5 for related Countywide mitigation actions, or related mitigation actions for each participating jurisdiction in Volume 2 of this plan.
5.3 Capabilities Assessment
This section examines the County’s planning and regulatory, administrative, technical, financial, educational, and outreach capabilities to augment known issues and weaknesses from identified natural hazards. Volume 2 of this HMP includes a capabilities assessment for each participating jurisdiction as part of their annexes.
The tables in this section explore various local planning mechanisms, administrative capacity, financial capabilities, and education and outreach initiatives. The columns in each table represent deeper dives into the following questions:
▪ Is the existing planning or regulatory mechanism used currently? (Column 1, Status) ▪ Has the HMP been integrated into the planning mechanism currently so that the named
mechanism is currently used in HMP planning? (Column 2, Current Mitigation Use) ▪ Is there a future opportunity to expand, improve upon, and incorporate this 2020 HMP Update into
the planning or regulatory mechanism? (Column 3, Future Opportunity)
The capabilities and evaluation is easily-digestible and based on color coding to indicate which policies and plans are adequate, need improvement or in which the HMP could be integrated. Each table includes a legend that explain how each one of these questions are being answered according to the color indicated: green, yellow, and orange.
FEMA/Cal OES Submission Draft 10-27-2020

Kern Multi-Jurisdiction 2020 MJHMP UpdateCOUNTY OF KERN
5-7
5.3.1 Planning and Regulatory Mitigation Capabilities
The information in Table 5-1 is used to align mitigation actions with existing planning and regulatory capabilities of the County. Planning and regulatory tools typically used by local jurisdictions to implement hazard mitigation activities are building codes, zoning regulations, floodplain management policies, and other municipal planning documents.
Table 5-1: Kern County Planning and Regulatory Mitigation Capabilities
CAPABILITY ASSESSMENT LEGEND
Status Current Mitigation Use Future Opportunity
Currently in use or present. Used widely for mitigation. Opportunity to expand and integrate.
(Sort of) Seldomly used or limited presence. Limited use in mitigation planning. Limited opportunity to expand and integrate.
(No) Not present or available. Not used in mitigation planning. No opportunity to expand or integrate.
HMP Integration
Notes / Additional Detail Resource Status
Current Mitigation
Use Future
Opportunity
Planning and Regulatory Capabilities
Construction and Future Development Regulations
Building Codes Green Yellow Green
BCEGS Rating Orange Orange Green
Public Protection (ISO Class) Green Orange Green
Hazard Related Development Standards Green Yellow Green
Zoning Ordinance Green Yellow Green Title 17, Buildings and Construction.
Hazard-Specific Ordinance Green Yellow Green
Growth Management Ordinance Orange Orange Green
Hazard Reduction Programs (Annually Conducted)
Capital Improvements Program (CIP) or Plan Green Yellow Green
Erosion/Sediment Control Program Green Yellow Green
Hazard-Related Public Outreach Program Orange Orange Green See Education and Outreach Resource Capabilities.
Stormwater Management Program (Annual Inspections) Green Yellow Green
Seismic Safety Program (Non-structural) Orange Orange Green
Earthquake Modernization Plan (Building Safety) Orange Orange Green
FEMA/Cal OES Submission Draft 10-27-2020

Kern Multi-Jurisdiction 2020 MJHMP UpdateCOUNTY OF KERN
5-8
HMP Integration
Notes / Additional Detail Resource Status
Current Mitigation
Use Future
Opportunity
Planning and Regulatory Capabilities
Hazard Plans
General Plan Safety Element Green Yellow Green
Community Wildfire Protection Plan (CWPP) Yellow Green Green Countywide CWPP expected 2021.
Floodplain Management Plan Green Yellow Green
Stormwater Management Plan Green Yellow Green
Emergency Operations Plan Green Yellow Green
Climate Action Plan Yellow Orange Green
Ground Water Management Planning / Plans Green Orange Green
Groundwater authorities with plans in Kern include the Kern Groundwater Authority for valley region and Mojave Water Agency
National Flood Protection Program (NFIP)
Floodplain Management Regulations Green Yellow Green
Flood Insurance Education and Technical Assist. Green Yellow Green
Flood Hazard Mapping / Re-Mapping Green Orange Green
Community Rating System (CRS) Green Yellow Green CRS Class 7
FEMA/Cal OES Submission Draft 10-27-2020

Kern Multi-Jurisdiction 2020 MJHMP UpdateCOUNTY OF KERN
5-9
5.3.2 Financial Capabilities
Table 5-2 identifies the financial tools or resources that the County has used to fund mitigation activities.
Table 5-2: Kern County Fiscal Capabilities Summary
CAPABILITY ASSESSMENT LEGEND
Status Current Mitigation Use Future Opportunity
Currently in use or present. Used widely for mitigation. Opportunity to expand and integrate.
(Sort of) Seldomly used or limited presence.
Limited use in mitigation planning. Limited opportunity to expand and integrate.
(No) Not present or available. Not used in mitigation planning. No opportunity to expand or integrate.
HMP Integration
Notes / Additional Detail Resource Status
Current Mitigation
Use Future
Opportunity
Fiscal Capabilities
Financial Resources for Hazard Mitigation Levy for Specific Purposes with Voter Approval Green Yellow Green
Utilities Fees Orange Orange Green
Benefit assessments Orange Orange Green
System Development Fee Orange Orange Green
General Obligation Bonds to Incur Debt Green Yellow Green
Special Tax Bonds to Incur Debt Orange Orange Green
Withheld Spending in Hazard-Prone Areas Orange Orange Green
Stormwater Service Fees Orange Orange Green
Capital Improvement Project Funding Green Yellow Green
FEMA/Cal OES Submission Draft 10-27-2020

Kern Multi-Jurisdiction 2020 MJHMP UpdateCOUNTY OF KERN
5-10
5.3.3 Education and Outreach
Table 5-3 lists the local citizen groups that communicate hazard risks.
Table 5-3: Kern County Education/ Outreach Capabilities Summary
CAPABILITY ASSESSMENT LEGEND
Status Current Mitigation Use Future Opportunity
Currently in use or present. Used widely for mitigation. Opportunity to expand and integrate.
(Sort of) Seldomly used or limited presence.
Limited use in mitigation planning. Limited opportunity to expand and integrate.
(No) Not present or available. Not used in mitigation planning. No opportunity to expand or integrate.
HMP Integration
Notes / Additional Detail Resource Status
Current Mitigation
Use Future
Opportunity
Education / Outreach Capabilities
Education/Outreach Resources Website Dedicated to Hazard Topics Yellow Orange Green
https://www.kerncountyfire.org/en/emergency-preparedness-info/emergency-preparedness-links.html
Dedicated Social Media Orange Orange Green
Hazard Info. Avail. at Library/ Planning Desk Green Yellow Green
Annual Public Safety Events Yellow Orange Green
Law enforcement "National Night Out", Emergency Preparedness Fair, and September National Preparedness Month
Ability to Field Public Tech. Assistance Requests Green Yellow Green
Public Safety Newsletters or Printed Outreach Green Yellow Green
Fire Safe Councils Green Yellow Green The umbrella organization is the Kern Fire Safe
Council.
Resource Conservation Districts Green Yellow Green
Other N/A N/A N/A
FEMA/Cal OES Submission Draft 10-27-2020

Kern Multi-Jurisdiction 2020 MJHMP UpdateCOUNTY OF KERN
5-11
5.3.4 Administrative and Technical Capabilities
Table 5-4 shows the administrative and technical capabilities of Kern County.
Table 5-4: Kern County Administrative and Technical Capabilities
CAPABILITY ASSESSMENT LEGEND
Status Current Mitigation Use Future Opportunity
Currently in use or present. Used widely for mitigation. Opportunity to expand and integrate.
(Sort of) Seldomly used or limited presence.
Limited use in mitigation planning. Limited opportunity to expand and integrate.
(No) Not present or available. Not used in mitigation planning. No opportunity to expand or integrate.
HMP Integration
Notes / Additional Detail Resource Status
Current Mitigation
Use Future
Opportunity
Administrative and Technical
Community Planning and Development Services Community Planner Green Yellow Green
Civil Engineer Green Yellow Green
Building Code Official (Full time or Augmented) Orange Orange Green
Floodplain Administrator Green Yellow Green
Fire Marshal Green Yellow Green
Dedicated Public Outreach Personnel Green Yellow Green
GIS Specialist and Capability Green Yellow Green
Emergency Manager Green Yellow Green
Full-Time Building Official Green Yellow Green
Grant Manager, Writer, or Specialist Green Yellow Green
Other N/A N/A N/A
Warning Systems/Services
General Green Yellow Green
Flood Green Yellow Green
Wildfire Orange Orange Green
Geological Hazards Orange Orange Green
FEMA/Cal OES Submission Draft 10-27-2020

Kern Multi-Jurisdiction 2020 MJHMP UpdateCOUNTY OF KERN
5-12
5.3.4.1 Expanding and Improving Existing Policies and Programs
The capabilities assessment presents an opportunity for the County to examine what capabilities it does not currently have and where it makes the most sense to expand and improve upon those capabilities in the future. This assessment effort shaped mitigation actions for all hazards and for specific hazards that focus on expanding and improving existing policies and programs. See mitigation actions in Table 5-6 that relate to policy and program improvements identified by the County.
5.3.5 Federal and State Funding Opportunities
Table 5-5 is a list of available funding sources from state and federal agencies. This includes the FEMA Hazard Mitigation Assistance grant program, which is described in more detail in Section 6.3.5. This list serves as a resource and is not exclusive.
Table 5-5: Federal and State Funding Opportunities
Agency /
Grant Name Potential Programs/Grants
FEMA Hazard Mitigation Assistance Grants
See Section 6 for FEMA/ HMA grant details. For more information on current grants visit https://www.fema.gov/hazard-mitigation-assistance
▪ Hazard Mitigation Grant Program (HMGP): https://www.fema.gov/hazard-mitigation-grant-program
▪ Building Resilient Infrastructure and Communities (BRIC): https://www.fema.gov/grants/mitigation/building-resilient-infrastructure-communities
▪ Flood Mitigation Assistance Grant Program (FMA): https://www.fema.gov/flood-mitigation-assistance-grant-program
FEMA other grant programs Including: ▪ Assistance to Firefighters Grant Program. Assistance to Firefighters Grants,
Fire Prevention & Safety, and Staffing for Adequate Fire and Emergency Response. https://www.fema.gov/welcome-assistance-firefighters-grant-program
▪ Emergency Management Performance Grants (EMPG). Good for Equipment, Back Up Generators, Etc. https://www.fema.gov/emergency-management-performance-grant-program
▪ Regional Catastrophic Preparedness Grant Program (RCPGP). Housing and Logistics and Supply Chain Management, encouraging innovative regional solutions to issues related to catastrophic incidents, and building on existing regional efforts. https://www.fema.gov/regional-catastrophic-preparedness-grant-program
U.S. Dept. of Energy / Energy Efficiency and Conservation Block Grant Program
Provides funding for weatherization of structures and development of building codes/ordinances to ensure energy efficiency and restoration of older homes.
https://www.energy.gov/eere/wipo/energy-efficiency-and-conservation-block-grant-program
FEMA/Cal OES Submission Draft 10-27-2020

Kern Multi-Jurisdiction 2020 MJHMP UpdateCOUNTY OF KERN
5-13
Agency /
Grant Name Potential Programs/Grants
State and County Community Development Dept. Block Grants (CDBG)
Through Cal. Dept. of Housing and Community Development Dept. (HCD) Programs Include: ▪ Community Development (CD) ▪ Economic Development (ED) ▪ Disaster Recovery Initiative (DRI) ▪ Neighborhood Stabilization Program (NSP)
https://www.hcd.ca.gov/grants-funding/active-funding/cdbg.shtml
Cal OES
Proposition 1B Grants Programs
The Highway Safety, Traffic Reduction, Air Quality and Port Security Bond Act of 2006, approved by the voters as Proposition 1B at the November 7, 2006 general election, authorizes the issuance of nineteen billion nine hundred twenty five million dollars ($19,925,000,000) in general obligation bonds for specified purposes, including grants for transit system safety, security, and disaster response projects.
http://www.caloes.ca.gov/cal-oes-divisions/grants-management/homeland-security-prop-1b-grant-programs/proposition-1b-grant
California Proposition 1: the Water Bond (AB 1471)
Authorize $7.545 billion in general obligation bonds for state water supply infrastructure projects, such as public water system improvements, surface and groundwater storage, drinking water protection, water recycling and advanced water treatment technology, water supply management and conveyance, wastewater treatment, drought relief, emergency water supplies, and ecosystem and watershed protection and restoration.
The State Water Resources Control Board (State Water Board) will administer Proposition 1 funds for five programs. The estimated implementation schedule for each is outlined in Five Categories:
▪ Small Community Wastewater ▪ Water Recycling ▪ Drinking Water ▪ Stormwater ▪ Groundwater Sustainability
http://www.waterboards.ca.gov/water_issues/programs/grants_loans/proposition1.shtml
Assistance to Firefighters Grant Program (AFG); Fire Prevention and Safety (FP&S)
The primary goal of the FP&S Grants is to enhance the safety of the public and firefighters with respect to fire and fire-related hazards. The Grant Programs Directorate administers the FP&S Grants as part of the AFG Program. FP&S Grants are offered to support projects in two activity areas:
1). Fire Prevention and Safety (FP&S) Activity Activities designed to reach high-risk target groups and mitigate the incidence of death and injuries caused by fire and fire-related hazards.
2). Research and Development (R&D) Activity To learn more about how to prepare to apply for a project under this activity, please see the FP&S Research and Development Grant Application Get Ready Guide.
FEMA/Cal OES Submission Draft 10-27-2020

Kern Multi-Jurisdiction 2020 MJHMP UpdateCOUNTY OF KERN
5-14
Agency /
Grant Name Potential Programs/Grants
https://www.fema.gov/fire-prevention-safety-grants
California Housing and Community Development (HCD) Emergency Solutions Grant (ESG) Program
To fund projects that serve homeless individuals and families with supportive services, emergency shelter/transitional housing, assisting persons at risk of becoming homeless with homelessness prevention assistance, and providing permanent housing to the homeless population. The Homeless Emergency Assistance and Rapid Transition to Housing (HEARTH) Act of 2009 places new emphasis on assisting people to quickly regain stability in permanent housing after experiencing a housing crisis and/or homelessness.
http://www.hcd.ca.gov/fa/esg/index.html
CalTrans Division of Local Assistance / Safe Routes to School Program
California Dept. of Transportation. Federal funding administered via Caltrans. Local 10% match is the minimum requirement. http://www.dot.ca.gov/hq/LocalPrograms/saferoutes/saferoutes.htm
Active transportation grant program. Creating mobility and connectivity. Prioritize projects, and preparation of PED for active transportation projects.
Property Assessed Clean Energy (PACE) Programs
PACE financing allows property owners to fund energy efficiency, water efficiency and renewable energy projects with little or no up-front costs. With PACE, residential and commercial property owners living within a participating district can finance up to 100% of their project and pay it back over time as a voluntary property tax assessment through their existing property tax bill.
HazMat Emergency Preparedness Grant
The purpose of this grant program is to increase effectiveness in safely and efficiently handling hazardous materials accidents and incidents; enhance implementation of the Emergency Planning and Community Right-to-Know Act of 1986 (EPCRA); and encourage a comprehensive approach to emergency training and planning by incorporating the unique challenges of responses to transportation situations.
http://www.caloes.ca.gov/cal-oes-divisions/fire-rescue/hazardous-materials/hazmat-emergency-preparedness-grant
CERT Program Manager Course
The purpose of this Community Emergency Response Team (CERT) Program Manager course is to prepare CERT Program Managers for the tasks required to establish and sustain an active local CERT program.
http://www.californiavolunteers.org/index.php/CERT/PM/
California Residential Mitigation Program
The California Residential Mitigation Program (CRMP) was established to carry out mitigation programs to assist California homeowners who wish to seismically retrofit their houses.
http://www.californiaresidentialmitigationprogram.com/
FEMA/Cal OES Submission Draft 10-27-2020

Kern Multi-Jurisdiction 2020 MJHMP UpdateCOUNTY OF KERN
5-15
Agency /
Grant Name Potential Programs/Grants
Earthquake Brace + Bolt (EBB)
EBB, part of the California Residential Mitigation Program, was developed to help homeowners lessen the potential for damage to their houses during an earthquake by offering eligible homeowners up to a $3,000 incentive to seismically retrofit their homes.
https://www.earthquakebracebolt.com/
California Air Resources Board Air Pollution Incentives, Grants and Credit Programs
These programs have hundreds of millions of dollars in grants available over the next several years to reduce emissions from on- and off-road vehicles and equipment.
https://www.arb.ca.gov/ba/fininfo.htm
California Department of Water Resources Grants and Loans
https://water.ca.gov/Work-With-Us/Grants-And-Loans
Agency offers a variety of grants and loans related to integrated regional water management, flood mitigation, water conservation and efficiency, environmental restoration, groundwater, water quality, and water supply.
US Bureau of Reclamation WaterSMART Grants
Annual funding available for:
▪ Water Reclamation and Reuse funding ▪ Drought Resiliency Project funding ▪ Water and Energy Efficiency Grant funding
https://www.usbr.gov/watersmart/
FEMA/Cal OES Submission Draft 10-27-2020

Kern Multi-Jurisdiction 2020 MJHMP UpdateCOUNTY OF KERN
5-16
5.4 Mitigation Goals
Hazard mitigation plans must identify goals for reducing long-term vulnerabilities to identified hazards (44 C.F.R. § 201.6(c)(3)(i)). The Steering Committee established a set of goals for this plan, based on data from the preliminary risk assessment and the results of the public involvement strategy.
Goals discussed in this section describe what actions should occur. Specific, measurable mitigation actions explain how to accomplish the goals. The goals and actions form the basis for the development of the Mitigation Action Strategy and specific mitigation projects. The process consists of 1) setting goals, 2) considering mitigation alternatives, 3) identifying strategies or “actions”, and 4) developing a prioritized action plan resulting in a mitigation strategy.
The goals, objectives, and mitigation actions in this plan all support each other. Objectives were selected that met multiple goals. Actions were prioritized based on their ability to achieve multiple objectives. A mitigation strategy is considered effective based on how well the goals of the strategy are achieved. The following are the goals for this plan:
Goal 1: Enable residents to mitigate the impacts of hazards
and disasters.
Goal 2: Reduce hazard impacts to existing and future
development and the natural environment.
Goal 3: Reduce hazard impacts to existing and future critical
facilities, infrastructure, and high potential loss
facilities.
Goal 4: Improve multi-jurisdiction coordination to reduce risk
through mitigation planning and hazard analysis on a
continual basis.
FEMA/Cal OES Submission Draft 10-27-2020

Kern Multi-Jurisdiction 2020 MJHMP UpdateCOUNTY OF KERN
5-17
5.5 County Wide Mitigation Actions
Mitigation actions were developed based upon planning committee priorities, risk assessment results, and mitigation alternatives. Most importantly, the newly-developed mitigation actions acknowledge updated risk assessment information outlined in the Executive Summary under Risk Assessment.
Mitigation actions are available on MAST linked through mitigatehazards.com; the format allows for regular updating and easy sorting by jurisdiction and hazard. Figure 5-1 illustrates the mitigation actions entered through MAST.
Table 5-6 establishes mitigation actions for the County and Participating Jurisdictions. Each participating jurisdiction developed mitigation actions specifically tailored to their vulnerabilities and capabilities. Those mitigation actions are available as part of the planning process library, which is summarized for Kern County in Table 3-5, available on the Mitigation Action Application, and available for each individual participating jurisdiction in Volume 2 of this plan.
Some mitigation actions support ongoing activities of participating jurisdictions, while other actions are intended to be completed when funding is available. All mitigation actions will be reviewed annually.
Figure 5-1: Mitigation Action Application
FEMA/Cal OES Submission Draft 10-27-2020
Kern Multi-Jurisdiction 2020 MJHMP UpdateCOUNTY OF KERN
5-18
5.5.1 Prioritization of Mitigation Actions
Implementing the identified mitigation can be overwhelming for any local jurisdiction or district, especially with limited staffing and fiscal resources; prioritizing the identified mitigation actions can help greatly with this. To ensure this MJHMP realistically reflects available resources, mitigation actions are prioritized by considering benefit cost review, public input, and MJHMP Planning Committee agreement.
5.5.1.1 Cost/ Benefit Review
The action plan must be prioritized according to a benefit/cost analysis of the proposed projects and their associated costs (44 C.F.R. §201.6(c)(3)(iii)). The benefits of proposed projects were weighed against estimated costs as part of the project prioritization process. This review does not meet FEMA Hazard Mitigation Grant Program (HMGP) and Building Resilient Infrastructure and Communities (BRIC) grant program requirements. A less formal, less costly approach was used because some projects may not be implemented for up to 10 years, and associated costs and benefits could change dramatically in that time. Parameters were established for assigning subjective ratings (high, medium, and low) to the costs and benefits of these projects. Cost ratings were defined as follows:
▪ High—Existing funding will not cover the cost of the project; implementation would require new revenue through an alternative source (for example, bonds, grants, and fee increases).
▪ Medium—The project could be implemented with existing funding but would require a re-apportionment of the budget or a budget amendment, or the cost of the project would have to be spread over multiple years.
▪ Low—The project could be funded under the existing budget. The project is part of or can be part of an ongoing existing program.
Benefit ratings were defined as follows:
▪ High—Project will provide an immediate reduction of risk exposure for life and property. ▪ Medium—Project will have a long-term impact on the reduction of risk exposure for life and
property, or project will not provide an immediate reduction in the risk exposure for property. ▪ Low—Long-term benefits of the project are difficult to quantify in the short term.
Using this approach, projects with positive benefit versus cost ratios (such as high over high, high over medium, medium over low, etc.) are considered cost-beneficial and are prioritized accordingly. For many of the strategies identified in this action plan, the partners may seek financial assistance under the HMGP or BRIC programs, both of which require detailed benefit/cost analyses. These analyses will be performed on projects at the time of application using the FEMA benefit-cost model. For projects not seeking financial assistance from grant programs that require detailed analysis, the partners reserve the right to define “benefits” according to parameters that meet the goals and objectives of this HMP.
FEMA/Cal OES Submission Draft 10-27-2020

Kern Multi-Jurisdiction 2020 MJHMP UpdateCOUNTY OF KERN
5-19
5.5.1.2 Public Input
An 8-question community survey was distributed to the public, yielding 1,156 survey responses and useful insight into the community’s perception of natural hazards affecting Kern County. Specific question responses heavily influenced the prioritization of mitigation actions, including:
▪ 77.9% of participants believe their property is at risk from a natural hazard disaster. ▪ 66.8% of respondents have experienced earthquakes, 24.9% experienced wildfire, and 38.4%
experienced drought. Only 12.9% of respondents (or someone in their household) had not experienced a natural hazard.
▪ 60.2% of participants considered the risk of naturally occurring hazards when choosing their home. ▪ 59.6% of respondents felt they were well-informed about the dangers of natural hazards, while 31.1%
felt somewhat informed and 9.4% felt not informed. ▪ When asked what incentives would encourage additional home protection from possible natural
hazards, the top responses were insurance premium discounts (67.4%), rebate programs or reimbursement of upfront costs (66.8%), and home improvement cost-share grants (40%).
▪ Respondents indicated top mitigation projects that local government agencies should focus on:
o Retrofit and strengthen essential facilities (59.7%) o Replace inadequate or vulnerable bridges and roadways (55.8%) o Retrofit or upgrade drainage systems (45.9%) o Work on improving damage resistance of utilities (68.2%) o Ensure emergency shelters, the Emergency Operations Center, and communication towers
have backup power generators (57.5%)
The complete survey results can be found in Appendix B.
FEMA/Cal OES Submission Draft 10-27-2020

Kern Multi-Jurisdiction 2020 MJHMP UpdateCOUNTY OF KERN
5-20
5.5.2 Mitigation Action Plan
Table 5-6 lists each mitigation action for the unincorporated County. Each participating jurisdiction developed unique mitigation actions as well, targeted at their own unique priorities and vulnerabilities; these are available on MAST and in Vol. 2 of this MJHMP. Each mitigation action identifies the responsible party, time frame, potential funding source, implementation steps and resources needed to implement these priority mitigation actions. As a living document, hazard problem statements and mitigation activities will be updated through MAST.
The detail provided in MAST and captured in Table 5-6 meets the regulatory requirements of FEMA and DMA 2000.
The actions detailed in Table 5-6 and MAST contain both new action items developed for this plan Update as well as old actions that were yet to be completed from the 2012 Plan. The action numbers indicate whether the action is new or from the 2012 plan. A sample of the action number nomenclature is presented in Figure 5-2.
Section 2, What’s New, illustrates progress towards new and previous mitigation action and indicates how many actions have been completed, deleted, or are ongoing or pending.
Important to note: The Planning Committee realizes that new needs and priorities may arise as a result of a disaster or other circumstances and reserves the right to support new actions and edit existing actions as necessary as long as they conform to the overall goals of the plan
.
Figure 5-2: Mitigation Action Number Key
FEMA/Cal OES Submission Draft 10-27-2020

Kern Multi-Jurisdiction 2020 MJHMP UpdateCOUNTY OF KERN
5-21
Table 5-6: County Wide Mitigation Action Tracker
Mitigation No. Hazard Type
Mitigation Type
Status Year Primary Agency
Title/Description Responsible Party
Estimated Cost Estimated Benefit Time Frame
HMA Activity Type
Potential Grant Source
Priority Related Problem Statements
ma-AH-KC-201 All Hazard PE&A - Public Education & Awareness
Ongoing 2005 County of Kern
Hazard Public Education Kern County Office of Emergency Services
Low - The project could be funded under the existing budget. The project is part of or can be part of an ongoing existing program.
Low - Long-term benefits of the project are difficult to quantify in the short term.
Ongoing 5% EMPG Low ps-WF-KC-240
ma-AH-KC-104 All Hazard ES - Emergency Services
Pending 2005 County of Kern
Remote Automated Weather Station System
Kern FD High - Existing funding will not cover the cost of the project; implementation would require new revenue through an alternative source (for example, bonds, grants, and fee increases).
High - Project will provide an immediate reduction of risk exposure for life and property.
Ongoing Project HMGP / BRIC Medium ps-WF-KC-238, ps-WF-KC-239
ma-DF-KC-384 Dam Failure
ES - Emergency Services
Pending 2020 County of Kern
Design and implement County-wide warning system program, with all other HMP participating jurisdictions as secondary participants, to warn everyone within a dam inundation zone of impending dam failure
Kern County Medium - The project could be implemented with existing funding but would require a re-apportionment of the budget or a budget amendment, or the cost of the project would have to be spread over multiple years.
High - Project will provide an immediate reduction of risk exposure for life and property.
3-5 Years Project FMA Medium ps-DF-KC-252, ps-DF-KC-253, ps-DF-KC-254
ma-DR-KC-290 Drought PE&A - Public Education & Awareness
Ongoing 2020 County of Kern
Develop a public education campaign to encourage water conservation during drought.
Public Works, Planning, Building
Low - The project could be funded under the existing budget. The project is part of or can be part of an ongoing existing program.
High - Project will provide an immediate reduction of risk exposure for life and property.
Ongoing 5% HMGP / BRIC Medium ps-DR-KC-215
ma-DR-KC-291 Drought NRP - Natural Resource Protection
Pending 2020 County of Kern
Install remote monitoring devices on well flow meters on County owned wells
Public Health Services
Medium - The project could be implemented with existing funding but would require a re-apportionment of the budget or a budget amendment, or the cost of the project would have to be spread over multiple years.
High - Project will provide an immediate reduction of risk exposure for life and property.
3-5 Years
HMGP / BRIC High ps-SS-KC-221, ps-DR-KC-216, ps-DR-KC-217
ma-DR-KC-293 Drought NRP - Natural Resource Protection
Pending 2020 County of Kern
Amend land use codes to incorporate regulations that encourage and incentive water savings for development
Planning and Natural Resources
Low - The project could be funded under the existing budget. The project is part of or can be part of an ongoing existing program.
Medium - Project will have a long-term impact on the reduction of risk exposure for life and property, or project will not provide an immediate reduction in the risk exposure for property.
1-3 Years Planning HMGP / BRIC Medium ps-DR-KC-219, ps-DR-KC-220
ma-DR-KC-294 Drought NRP - Natural Resource Protection
Pending 2020 County of Kern
Replace existing turf grass and water intensive landscaping with drought resistant landscaping
General Services
Medium - The project could be implemented with existing funding but would require a re-apportionment of the budget or a budget amendment, or the cost of the project would have to be spread over multiple years.
High - Project will provide an immediate reduction of risk exposure for life and property.
3-5 Years Planning HMGP / BRIC Medium ps-DR-KC-218
FEMA/Cal OES Submission Draft 10-27-2020

Kern Multi-Jurisdiction 2020 MJHMP UpdateCOUNTY OF KERN
5-22
Mitigation No. Hazard Type
Mitigation Type
Status Year Primary Agency
Title/Description Responsible Party
Estimated Cost Estimated Benefit Time Frame
HMA Activity Type
Potential Grant Source
Priority Related Problem Statements
ma-DR-KC-384 Drought NRP - Natural Resource Protection
Pending 2020 County of Kern
Expand Willow Springs Water Bank to reduce drought and increase water supply flexibility and sustainability
Executive Office
High - Existing funding will not cover the cost of the project; implementation would require new revenue through an alternative source (for example, bonds, grants, and fee increases).
High - Project will provide an immediate reduction of risk exposure for life and property.
3-5 Years Project HMGP / BRIC High ps-DR-KC-216, ps-DR-KC-217
ma-EQ-KC-297 Earthquake PE&A - Public Education & Awareness
Ongoing 2020 County of Kern
Encourage privately owned critical facilities (e.g. churches, hotels, other gathering facilities) to evaluate the ability of the buildings to withstand earthquakes and to address any deficiencies identified.
Kern County Low - The project could be funded under the existing budget. The project is part of or can be part of an ongoing existing program.
High - Project will provide an immediate reduction of risk exposure for life and property.
Ongoing 5% HMGP / BRIC High ps-EQ-KC-243
ma-AH-KC-111 Earthquake PPRO - Property Protection
Pending 2005 County of Kern
Mobile Home Foundation Earthquake Retrofitting
Kern County Office of Emergency Services
Medium - The project could be implemented with existing funding but would require a re-apportionment of the budget or a budget amendment, or the cost of the project would have to be spread over multiple years.
High - Project will provide an immediate reduction of risk exposure for life and property.
Funding Dependent
Project HMGP / BRIC Medium ps-EQ-KC-242
ma-EQ-KC-102 Earthquake PPRO - Property Protection
Pending 2005 County of Kern
Formation of Kern County Unreinforced Masonry Task Force
Since 10 communities will be potentially involved, the topic of who facilitates and coordinates the work will have to be decided. Initially options include a committee representing all of the candidate jurisdictions, County OES, or the Kern County Council of Governments.
High - Existing funding will not cover the cost of the project; implementation would require new revenue through an alternative source (for example, bonds, grants, and fee increases).
Medium - Project will have a long-term impact on the reduction of risk exposure for life and property, or project will not provide an immediate reduction in the risk exposure for property.
Ongoing Planning HMGP / BRIC , CDBG DRI
High ps-EQ-KC-242
FEMA/Cal OES Submission Draft 10-27-2020

Kern Multi-Jurisdiction 2020 MJHMP UpdateCOUNTY OF KERN
5-23
Mitigation No. Hazard Type
Mitigation Type
Status Year Primary Agency
Title/Description Responsible Party
Estimated Cost Estimated Benefit Time Frame
HMA Activity Type
Potential Grant Source
Priority Related Problem Statements
ma-EQ-KC-305 Earthquake PPRO - Property Protection
Pending 2020 County of Kern
Participate in seismic studies and needed seismic retrofits on County bridges that are located in high risk areas for earthquake scenarios included in this HMP
Public Works High - Existing funding will not cover the cost of the project; implementation would require new revenue through an alternative source (for example, bonds, grants, and fee increases).
High - Project will provide an immediate reduction of risk exposure for life and property.
5-10 Years Project HMGP / BRIC High ps-EQ-KC-246, ps-AH-ENCSD-10
ma-EQ-KC-306 Earthquake PPRO - Property Protection
Pending 2020 County of Kern
Evaluate soil liquefaction potential around County assets in areas with shallow groundwater
Public Works High - Existing funding will not cover the cost of the project; implementation would require new revenue through an alternative source (for example, bonds, grants, and fee increases).
High - Project will provide an immediate reduction of risk exposure for life and property.
3-5 Years Project HMGP / BRIC Medium ps-EQ-KC-247
ma-EQ-KC-307 Earthquake PPRO - Property Protection
Pending 2020 County of Kern
Install seismic gas shut-off valves on County buildings to prevent the flow of gas into buildings during a seismic event
General Services
Medium - The project could be implemented with existing funding but would require a re-apportionment of the budget or a budget amendment, or the cost of the project would have to be spread over multiple years.
High - Project will provide an immediate reduction of risk exposure for life and property.
1-3 Years Project HMGP / BRIC High ps-EQ-KC-243, ps-EQ-KC-244, ps-EQ-KC-245
ma-EQ-KC-295 Earthquake SP - Structural Projects
Pending 2020 County of Kern
Retrofit / Harden County-owned critical facilities and buildings and their ability to withstand earthquakes.
General Services
High - Existing funding will not cover the cost of the project; implementation would require new revenue through an alternative source (for example, bonds, grants, and fee increases).
High - Project will provide an immediate reduction of risk exposure for life and property.
5-10 Years Project HMGP / BRIC High ps-EQ-KC-242, ps-EQ-KC-243, ps-EQ-KC-244, ps-EQ-KC-245
ma-EQ-KC-296 Earthquake SP - Structural Projects
Pending 2020 County of Kern
Retrofit non-compliant suspended ceilings in County buildings. This includes Non-Structural Suspended Gypsum Dry-Wall & Cement Plaster Ceilings built 1950-1974.
Public Works - Building
High - Existing funding will not cover the cost of the project; implementation would require new revenue through an alternative source (for example, bonds, grants, and fee increases).
High - Project will provide an immediate reduction of risk exposure for life and property.
3-5 Years Project HMGP / BRIC High ps-EQ-KC-243, ps-EQ-KC-244, ps-EQ-KC-245, ps-EQ-KC-248
ma-EW-KC-301 Extreme Weather
PE&A - Public Education & Awareness
Ongoing 2020 County of Kern
Outreach and Education to developers before and during the development process about best management practices to mitigate the effects of the urban heat island effect and stormwater runoff resulting from increased impervious surface
Planning and Natural Resources
Low - The project could be funded under the existing budget. The project is part of or can be part of an ongoing existing program.
High - Project will provide an immediate reduction of risk exposure for life and property.
Ongoing 5% HMGP / BRIC Medium ps-EW-KC-229
FEMA/Cal OES Submission Draft 10-27-2020
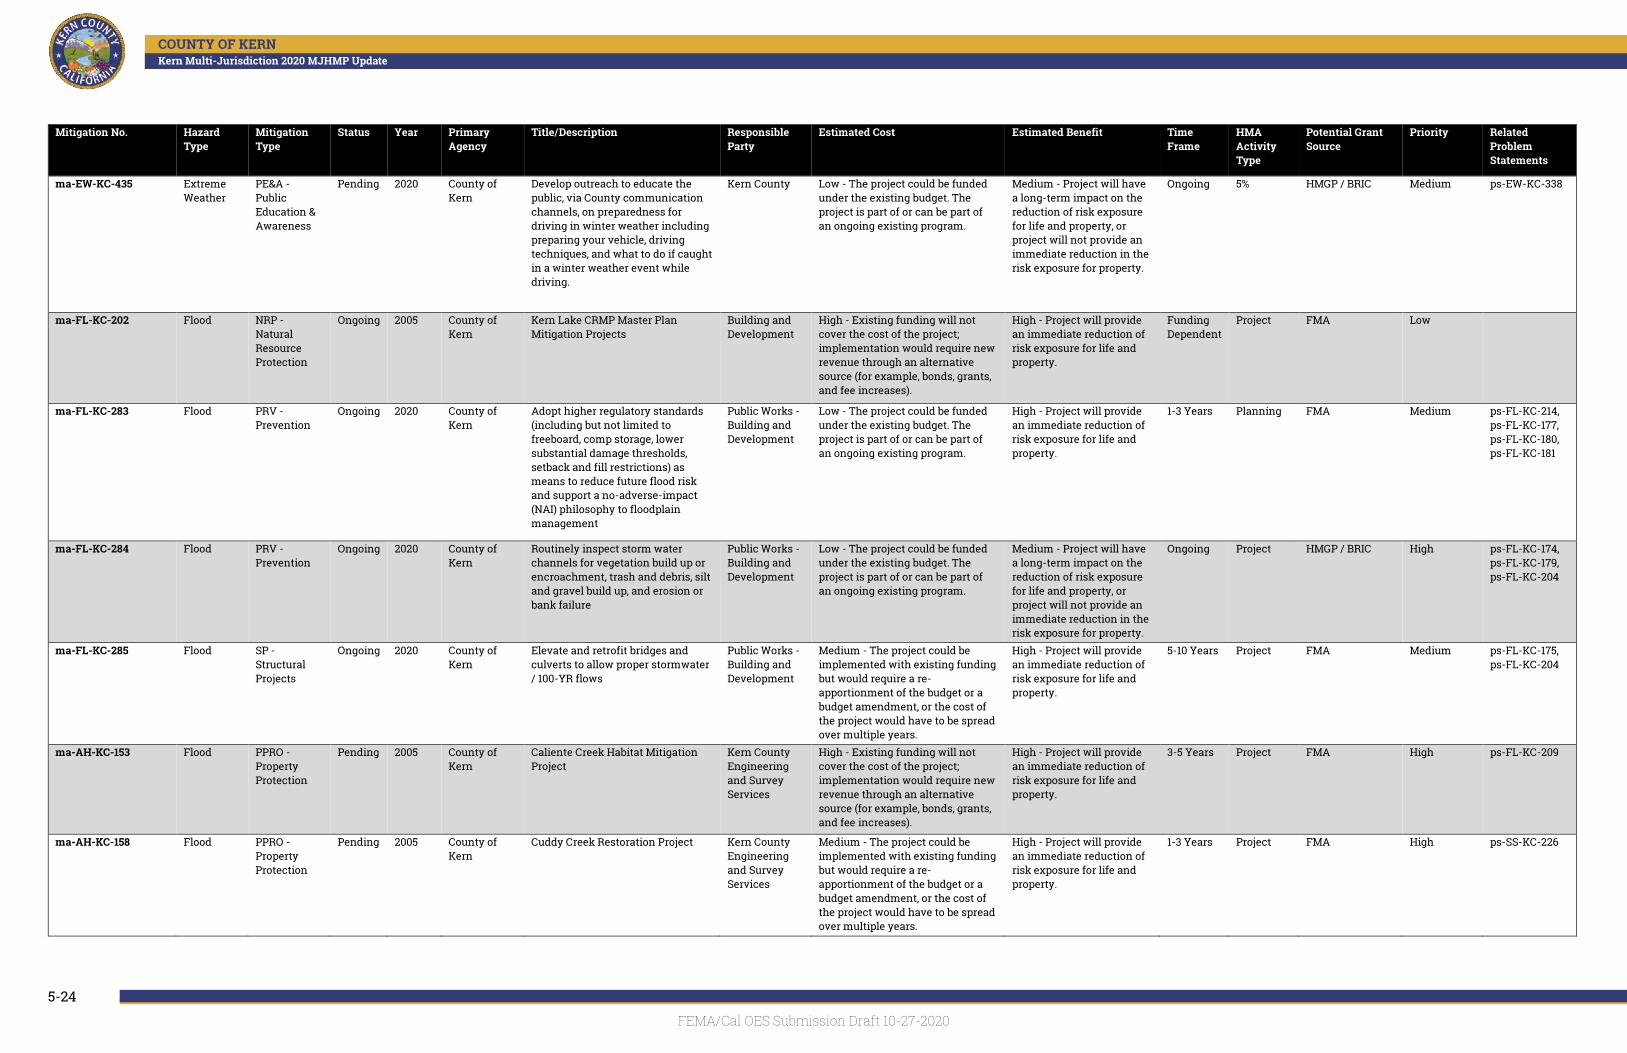
Kern Multi-Jurisdiction 2020 MJHMP UpdateCOUNTY OF KERN
5-24
Mitigation No. Hazard Type
Mitigation Type
Status Year Primary Agency
Title/Description Responsible Party
Estimated Cost Estimated Benefit Time Frame
HMA Activity Type
Potential Grant Source
Priority Related Problem Statements
ma-EW-KC-435 Extreme Weather
PE&A - Public Education & Awareness
Pending 2020 County of Kern
Develop outreach to educate the public, via County communication channels, on preparedness for driving in winter weather including preparing your vehicle, driving techniques, and what to do if caught in a winter weather event while driving.
Kern County Low - The project could be funded under the existing budget. The project is part of or can be part of an ongoing existing program.
Medium - Project will have a long-term impact on the reduction of risk exposure for life and property, or project will not provide an immediate reduction in the risk exposure for property.
Ongoing 5% HMGP / BRIC Medium ps-EW-KC-338
ma-FL-KC-202 Flood NRP - Natural Resource Protection
Ongoing 2005 County of Kern
Kern Lake CRMP Master Plan Mitigation Projects
Building and Development
High - Existing funding will not cover the cost of the project; implementation would require new revenue through an alternative source (for example, bonds, grants, and fee increases).
High - Project will provide an immediate reduction of risk exposure for life and property.
Funding Dependent
Project FMA Low
ma-FL-KC-283 Flood PRV - Prevention
Ongoing 2020 County of Kern
Adopt higher regulatory standards (including but not limited to freeboard, comp storage, lower substantial damage thresholds, setback and fill restrictions) as means to reduce future flood risk and support a no-adverse-impact (NAI) philosophy to floodplain management
Public Works - Building and Development
Low - The project could be funded under the existing budget. The project is part of or can be part of an ongoing existing program.
High - Project will provide an immediate reduction of risk exposure for life and property.
1-3 Years Planning FMA Medium ps-FL-KC-214, ps-FL-KC-177, ps-FL-KC-180, ps-FL-KC-181
ma-FL-KC-284 Flood PRV - Prevention
Ongoing 2020 County of Kern
Routinely inspect storm water channels for vegetation build up or encroachment, trash and debris, silt and gravel build up, and erosion or bank failure
Public Works - Building and Development
Low - The project could be funded under the existing budget. The project is part of or can be part of an ongoing existing program.
Medium - Project will have a long-term impact on the reduction of risk exposure for life and property, or project will not provide an immediate reduction in the risk exposure for property.
Ongoing Project HMGP / BRIC High ps-FL-KC-174, ps-FL-KC-179, ps-FL-KC-204
ma-FL-KC-285 Flood SP - Structural Projects
Ongoing 2020 County of Kern
Elevate and retrofit bridges and culverts to allow proper stormwater / 100-YR flows
Public Works - Building and Development
Medium - The project could be implemented with existing funding but would require a re-apportionment of the budget or a budget amendment, or the cost of the project would have to be spread over multiple years.
High - Project will provide an immediate reduction of risk exposure for life and property.
5-10 Years Project FMA Medium ps-FL-KC-175, ps-FL-KC-204
ma-AH-KC-153 Flood PPRO - Property Protection
Pending 2005 County of Kern
Caliente Creek Habitat Mitigation Project
Kern County Engineering and Survey Services
High - Existing funding will not cover the cost of the project; implementation would require new revenue through an alternative source (for example, bonds, grants, and fee increases).
High - Project will provide an immediate reduction of risk exposure for life and property.
3-5 Years Project FMA High ps-FL-KC-209
ma-AH-KC-158 Flood PPRO - Property Protection
Pending 2005 County of Kern
Cuddy Creek Restoration Project Kern County Engineering and Survey Services
Medium - The project could be implemented with existing funding but would require a re-apportionment of the budget or a budget amendment, or the cost of the project would have to be spread over multiple years.
High - Project will provide an immediate reduction of risk exposure for life and property.
1-3 Years Project FMA High ps-SS-KC-226
FEMA/Cal OES Submission Draft 10-27-2020

Kern Multi-Jurisdiction 2020 MJHMP UpdateCOUNTY OF KERN
5-25
Mitigation No. Hazard Type
Mitigation Type
Status Year Primary Agency
Title/Description Responsible Party
Estimated Cost Estimated Benefit Time Frame
HMA Activity Type
Potential Grant Source
Priority Related Problem Statements
ma-FL-KC-110 Flood PPRO - Property Protection
Pending 2005 County of Kern
Flood Mitigation Plan Public Works - Building and Development
Medium - The project could be implemented with existing funding but would require a re-apportionment of the budget or a budget amendment, or the cost of the project would have to be spread over multiple years.
High - Project will provide an immediate reduction of risk exposure for life and property.
Funding Dependent
Planning FMA High ps-FL-KC-173, ps-FL-KC-176, ps-FL-KC-177, ps-FL-KC-178, ps-FL-KC-179, ps-FL-KC-180, ps-FL-KC-181
ma-FL-KC-99 Flood NRP - Natural Resource Protection
Pending 2014 County of Kern
Streambed Mitigation in Kern River South Fork at Sierra Hwy (north of SR 178)
Kern County Engineering & Surveying Services (Flood Plain Management) and Kern County Roads Department
Medium - The project could be implemented with existing funding but would require a re-apportionment of the budget or a budget amendment, or the cost of the project would have to be spread over multiple years.
High - Project will provide an immediate reduction of risk exposure for life and property.
3-5 Years Project FMA Medium ps-FL-KC-185
ma-FL-KC-70 Flood PPRO - Property Protection
Pending 2014 County of Kern
Continue to Implement Sound Floodplain Management Practices through Participation in the National Flood Insurance Program
Engineering, Surveying and Permit Services Department
Low - The project could be funded under the existing budget. The project is part of or can be part of an ongoing existing program.
High - Project will provide an immediate reduction of risk exposure for life and property.
Ongoing Planning HMGP / BRIC Medium ps-FL-KC-214, ps-FL-KC-173, ps-FL-KC-176, ps-FL-KC-177, ps-FL-KC-178, ps-FL-KC-179, ps-FL-KC-180, ps-FL-KC-181
ma-FL-KC-97 Flood PPRO - Property Protection
Pending 2014 County of Kern
Lake Isabella Blvd Box Culvert at Erskine Creek (near Elizabeth Norris Rd)
Kern County Roads Department
Medium - The project could be implemented with existing funding but would require a re-apportionment of the budget or a budget amendment, or the cost of the project would have to be spread over multiple years.
High - Project will provide an immediate reduction of risk exposure for life and property.
5-10 Years Project HMGP / BRIC Medium
ma-FL-KC-82 Flood SP - Structural Projects
Pending 2014 County of Kern
Bridge on Famoso Road at Poso Creek (approx 1/3 mile east of State Hwy 99)
Kern County Roads Department
High - Existing funding will not cover the cost of the project; implementation would require new revenue through an alternative source (for example, bonds, grants, and fee increases).
High - Project will provide an immediate reduction of risk exposure for life and property.
Funding Dependent
Project FMA Medium ps-FL-KC-207
ma-FL-KC-98 Flood SP - Structural Projects
Pending 2014 County of Kern
Construct a Box Culvert across Redrock Randsburg Road at Redrock Canyon Wash (just east of Hwy 14)
Public Works- Building and Development
High - Existing funding will not cover the cost of the project; implementation would require new revenue through an alternative source (for example, bonds, grants, and fee increases).
High - Project will provide an immediate reduction of risk exposure for life and property.
5-10 Years Project FMA High ps-EW-KC-227
ma-FL-KC-302 Flood PPRO - Property Protection
Pending 2020 County of Kern
Kern Storm Water Resource Plan Mitigation Projects
Public Works High - Existing funding will not cover the cost of the project; implementation would require new revenue through an alternative source (for example, bonds, grants, and fee increases).
High - Project will provide an immediate reduction of risk exposure for life and property.
Ongoing Project FMA High
FEMA/Cal OES Submission Draft 10-27-2020

Kern Multi-Jurisdiction 2020 MJHMP UpdateCOUNTY OF KERN
5-26
Mitigation No. Hazard Type
Mitigation Type
Status Year Primary Agency
Title/Description Responsible Party
Estimated Cost Estimated Benefit Time Frame
HMA Activity Type
Potential Grant Source
Priority Related Problem Statements
ma-FL-KC-303 Flood PPRO - Property Protection
Pending 2020 County of Kern
Kern County Flood Hazard Mitigation Plan - Projects
Public Works High - Existing funding will not cover the cost of the project; implementation would require new revenue through an alternative source (for example, bonds, grants, and fee increases).
High - Project will provide an immediate reduction of risk exposure for life and property.
5-10 Years Project FMA High ps-FL-KC-210, ps-FL-KC-211, ps-FL-KC-212, ps-FL-KC-213, ps-FL-KC-182, ps-FL-KC-183, ps-FL-KC-184
ma-FL-KC-304 Flood PPRO - Property Protection
Pending 2020 County of Kern
County of Kern Caliente Creek - Conceptual Plan for Mitigation
Public Works High - Existing funding will not cover the cost of the project; implementation would require new revenue through an alternative source (for example, bonds, grants, and fee increases).
High - Project will provide an immediate reduction of risk exposure for life and property.
3-5 Years Project FMA High ps-FL-KC-208, ps-FL-KC-209
ma-SF-KC-292 Slope Failure
PPRO - Property Protection
Pending 2020 County of Kern
Establish a priority list of slope failure locations and implement slope stabilization projects in the highest risk areas.
Public Works Medium - The project could be implemented with existing funding but would require a re-apportionment of the budget or a budget amendment, or the cost of the project would have to be spread over multiple years.
Low - Long-term benefits of the project are difficult to quantify in the short term.
5-10 Years Project HMGP / BRIC Low ps-SF-KC-230, ps-SF-KC-231
ma-AH-KC-245 Soil Stability
PPRO - Property Protection
Ongoing 2005 County of Kern
Lebec Landfill and Transfer Station Drainage Improvements and Erosion Control
Kern County Waste Management Department
Medium - The project could be implemented with existing funding but would require a re-apportionment of the budget or a budget amendment, or the cost of the project would have to be spread over multiple years.
Medium - Project will have a long-term impact on the reduction of risk exposure for life and property, or project will not provide an immediate reduction in the risk exposure for property.
1-3 Years Project
High ps-SF-KC-249
ma-AH-KC-63 Soil Stability
PPRO - Property Protection
Pending 2014 County of Kern
Kern Valley Landfill and Transfer Station Drainage Improvements and Erosion Control
County of Kern Waste Management Department
Medium - The project could be implemented with existing funding but would require a re-apportionment of the budget or a budget amendment, or the cost of the project would have to be spread over multiple years.
Medium - Project will have a long-term impact on the reduction of risk exposure for life and property, or project will not provide an immediate reduction in the risk exposure for property.
1-3 Years Project HMGP / BRIC High ps-SS-KC-251
ma-SS-KC-299 Soil Stability
NRP - Natural Resource Protection
Pending 2020 County of Kern
Implement wind breaks to prevent wind erosion leading to buildup of soil on County roads and bridges. Wind break erosion mitigation examples include solid fences, porous fences, straw bales, soil surface modification, berms, and landscaping
Public Works Low - The project could be funded under the existing budget. The project is part of or can be part of an ongoing existing program.
High - Project will provide an immediate reduction of risk exposure for life and property.
1-3 Years Project HMGP / BRIC Medium ps-SS-KC-224
FEMA/Cal OES Submission Draft 10-27-2020

Kern Multi-Jurisdiction 2020 MJHMP UpdateCOUNTY OF KERN
5-27
Mitigation No. Hazard Type
Mitigation Type
Status Year Primary Agency
Title/Description Responsible Party
Estimated Cost Estimated Benefit Time Frame
HMA Activity Type
Potential Grant Source
Priority Related Problem Statements
ma-SS-KC-300 Soil Stability
NRP - Natural Resource Protection
Pending 2020 County of Kern
Conduct subsidence investigations on County bridges located in high subsidence areas
Public Works and Engineering
High - Existing funding will not cover the cost of the project; implementation would require new revenue through an alternative source (for example, bonds, grants, and fee increases).
High - Project will provide an immediate reduction of risk exposure for life and property.
5-10 Years Project HMGP / BRIC Medium ps-SS-KC-222, ps-SS-KC-223
ma-SH-KC-298 Soil Stability
PE&A - Public Education & Awareness
Pending 2020 County of Kern
Outreach and educational programming to property owners and agricultural growers about wind erosion and mitigation techniques such as introducing cover crops, eliminating tillage, and avoiding over grazing
Agriculture & Administration
Low - The project could be funded under the existing budget. The project is part of or can be part of an ongoing existing program.
Medium - Project will have a long-term impact on the reduction of risk exposure for life and property, or project will not provide an immediate reduction in the risk exposure for property.
Ongoing Project HMGP / BRIC Medium ps-SS-KC-224, ps-SS-KC-225
ma-AH-KC-179 Wildfire NRP - Natural Resource Protection
Ongoing 2005 County of Kern
Hazard Tree Removal, County Park Lands
Kern County FD, KC Parks
Low - The project could be funded under the existing budget. The project is part of or can be part of an ongoing existing program.
Medium - Project will have a long-term impact on the reduction of risk exposure for life and property, or project will not provide an immediate reduction in the risk exposure for property.
Ongoing Project HMGP / BRIC High ps-WF-KC-241, ps-EW-KC-228
ma-WF-KC-231 Wildfire NRP - Natural Resource Protection
Ongoing 2005 County of Kern
Roadside Disc Breaks KCFD Low - The project could be funded under the existing budget. The project is part of or can be part of an ongoing existing program.
Medium - Project will have a long-term impact on the reduction of risk exposure for life and property, or project will not provide an immediate reduction in the risk exposure for property.
Annually Project HMGP / BRIC High ps-WF-KC-241
ma-WF-KC-183 Wildfire PE&A - Public Education & Awareness
Ongoing 2005 County of Kern
Defensible Space, Public Education Kern County FD
Low - The project could be funded under the existing budget. The project is part of or can be part of an ongoing existing program.
High - Project will provide an immediate reduction of risk exposure for life and property.
Ongoing 5% HMGP / BRIC , FP&S
High ps-WF-KC-232, ps-WF-KC-233, ps-WF-KC-234, ps-WF-KC-235, ps-WF-KC-236, ps-WF-KC-240
ma-WF-KC-184 Wildfire PE&A - Public Education & Awareness
Ongoing 2005 County of Kern
Education, Fire Department Personnel
KCFD Low - The project could be funded under the existing budget. The project is part of or can be part of an ongoing existing program.
Medium - Project will have a long-term impact on the reduction of risk exposure for life and property, or project will not provide an immediate reduction in the risk exposure for property.
Ongoing 5% FP&S Medium ps-WF-KC-232, ps-WF-KC-233, ps-WF-KC-234, ps-WF-KC-235, ps-WF-KC-236, ps-WF-KC-240
ma-WF-KC-180 Wildfire PPRO - Property Protection
Ongoing 2005 County of Kern
Greater Tehachapi Area Community Wildfire Protection Plan (was Hazardous Wildland Fuels Mitigation, Greater Tehachapi Area)
KCFD Medium - The project could be implemented with existing funding but would require a re-apportionment of the budget or a budget amendment, or the cost of the project would have to be spread over multiple years.
High - Project will provide an immediate reduction of risk exposure for life and property.
Ongoing Project HMGP / BRIC High ps-WF-KC-236
FEMA/Cal OES Submission Draft 10-27-2020

Kern Multi-Jurisdiction 2020 MJHMP UpdateCOUNTY OF KERN
5-28
Mitigation No. Hazard Type
Mitigation Type
Status Year Primary Agency
Title/Description Responsible Party
Estimated Cost Estimated Benefit Time Frame
HMA Activity Type
Potential Grant Source
Priority Related Problem Statements
ma-WF-KC-181 Wildfire PPRO - Property Protection
Ongoing 2005 County of Kern
Mount Pinos Community Wildfire Protection Plan (was Hazardous Wildland Fuels Mitigation, Frazier Mtn Area)
KCFD Medium - The project could be implemented with existing funding but would require a re-apportionment of the budget or a budget amendment, or the cost of the project would have to be spread over multiple years.
High - Project will provide an immediate reduction of risk exposure for life and property.
Ongoing Project HMGP / BRIC , FMA
High ps-WF-KC-234
ma-WF-KC-182 Wildfire PPRO - Property Protection
Ongoing 2005 County of Kern
Kern River Valley Community Wildfire Protection Plan (formerly Hazardous Wildland Fuels Mitigation, Kern River Valley)
KCFD Medium - The project could be implemented with existing funding but would require a re-apportionment of the budget or a budget amendment, or the cost of the project would have to be spread over multiple years.
High - Project will provide an immediate reduction of risk exposure for life and property.
Ongoing Project FP&S High ps-WF-KC-233
ma-WF-KC-286 Wildfire PPRO - Property Protection
Ongoing 2020 County of Kern
Retrofit care facilities (adult care, child care, schools) with fire-resistant materials and or create defensible space around structures.
Kern County Fire
Medium - The project could be implemented with existing funding but would require a re-apportionment of the budget or a budget amendment, or the cost of the project would have to be spread over multiple years.
High - Project will provide an immediate reduction of risk exposure for life and property.
3-5 Years Project FP&S High ps-WF-KC-238, ps-WF-KC-239
ma-WF-KC-287 Wildfire PPRO - Property Protection
Ongoing 2020 County of Kern
The Alta Sierra CWPP details mitigation needed to protect 7 structure protection groups throughout the WUI in Alta Sierra Community.
Kern County Fire
Medium - The project could be implemented with existing funding but would require a re-apportionment of the budget or a budget amendment, or the cost of the project would have to be spread over multiple years.
High - Project will provide an immediate reduction of risk exposure for life and property.
Ongoing Project FP&S High ps-WF-KC-232
ma-WF-KC-288 Wildfire PPRO - Property Protection
Ongoing 2020 County of Kern
Myers Canyon CWPP Mitigation Projects
Kern County Fire
Medium - The project could be implemented with existing funding but would require a re-apportionment of the budget or a budget amendment, or the cost of the project would have to be spread over multiple years.
High - Project will provide an immediate reduction of risk exposure for life and property.
Ongoing Project FP&S High ps-WF-KC-235
ma-WF-KC-289 Wildfire PPRO - Property Protection
Ongoing 2020 County of Kern
Make high visibility address markers available to all residents within the WUI
Kern County Fire
Low - The project could be funded under the existing budget. The project is part of or can be part of an ongoing existing program.
High - Project will provide an immediate reduction of risk exposure for life and property.
1-3 Years Project FP&S High ps-WF-KC-237
Note: As a living document, project descriptions and actions in the tables above will be modified to reflect current conditions over time in MAST.
FEMA/Cal OES Submission Draft 10-27-2020

Kern Multi-Jurisdiction 2020 MJHMP UpdateCOUNTY OF KERN
6-1
Section 6. Plan Implementation and Maintenance It is important that this plan becomes a usable, used tool for all participating jurisdictions to ensure reductions in possible damage from a natural hazard event. This section discusses adopting, implementing, monitoring, evaluating, and updating the MJHMP, which should help ensure that the MJHMP remains relevant. This section describes incorporation of the MJHMP into existing planning mechanisms, and how the jurisdictions will continue to engage the public.
6.1 Plan Adoption
To comply with DMA 2000, the Kern County Board of Supervisors has officially adopted the Kern County Multi-Jurisdiction Hazard Mitigation Plan. The adoption of the MJHMP recognizes the County’s commitment to reducing the impacts of natural hazards within the County. A copy of the MJHMP adoption resolution is included immediately following the Executive Summary.
6.2 Plan Implementation
Over time, implementation strategies for mitigation actions will become more detailed. MAST will be extremely useful to plan for updates to this MJHMP and to update individual mitigation actions as implemented or revised. In conjunction with the progress report processes, implementation strategy worksheets will be extremely useful as a plan of record tool for updates. Each implementation strategy worksheet provides individual steps and resources need to complete each priority mitigation action. The following are considerations for developing future implementation strategies:
▪ Use processes that already exist. Take advantage of tools and procedures identified in the capability assessment in Section 5.3. Using planning mechanisms already in use and familiar to participating jurisdictions will give the planning implementation phase a strong initial boost.
▪ Updated work plans, policies, or procedure. Incorporating hazard mitigation concepts and activities can help integrate the HMP into daily operations. These changes can include how major development projects and subdivision reviews are addressed in hazard prone areas or ensure that hazard mitigation concerns are considered in the approval of major capital improvement projects.
▪ Job descriptions. Working with department or agency heads to revise job descriptions of government staff to include mitigation-related duties, including designating a “mitigation lead” within a department, can further institutionalize hazard mitigation with little financial expenditure or programmatic overhaul.
6.2.1 Steering Committee
The Steering Committee oversaw the development of the plan and made recommendations on key elements of the plan, including the maintenance strategy. The Steering Committee recommended that an
FEMA/Cal OES Submission Draft 10-27-2020

Kern Multi-Jurisdiction 2020 MJHMP UpdateCOUNTY OF KERN
6-2
oversight committee, referred to herein as the MJHMP Steering Committee, should have an active role in the plan maintenance strategy. Therefore, it is recommended that the MJHMP Steering Committee become involved in key elements of the plan maintenance strategy. The new MJHMP Steering Committee should strive to include representation from the planning partners, as well as other stakeholders in the planning area.
The new MJHMP Steering Committee will review the annual progress report and provide input to Kern County on possible improvements or action steps to be considered at the next update. Keeping this new MJHMP Steering Committee intact will also jump start future updates. Completion of a progress report is the responsibility of each participating jurisdiction, not the responsibility of the steering committee. It will simply be the MJHMP Steering Committee’s role to review the progress report in an effort to identify issues needing to be addressed by future plans.
6.3 Monitoring, Evaluating and Updating the MJHMP
This section describes the schedule and process for monitoring, evaluating, and updating the MJHMP.
6.3.1 Schedule
Monitoring the progress of the mitigation actions will be ongoing throughout the five-year period between the adoption of the MJHMP and the next update effort. The newly-formed MJHMP Steering Committee will meet biannually to monitor the implementation of mitigation actions and develop updates as necessary.
The MJHMP will be updated every five years, as required by DMA 2000. The update process will begin at least one year prior to the expiration of the MJHMP. However, should a significant disaster occur within the County, the MJHMP Steering Committee will reconvene within 30 days of the disaster to review and update the MJHMP as appropriate. The Board of Supervisors will adopt written updates to the MJHMP as a DMA 2000 requirement.
6.3.2 Mitigation Action Support Tool (MAST) Updates
Hazard problem statements and mitigation activities will be updated through a web interface application developed specifically for Kern County, available on project website, (http://mitigatehazards.com/county-of-kern/), to ensure this MJHMP stays a living document.
MAST is a web-based interactive tool that enables multiple users to search, view, enter, and update mitigation actions, ideas or projects, and other information. MAST provides participating jurisdiction staff and plan reviewers (Cal OES/FEMA) access to valuable mitigation information that can be leveraged by future planning or other risk reduction efforts. Users can update the status of their mitigation projects throughout the planning lifecycle and this web-based tool will improve participating jurisdiction’s ability to apply for FEMA’s Hazard Mitigation Assistance (HMA) grant programs including the initial grant application processes through Cal OES.
FEMA/Cal OES Submission Draft 10-27-2020

Kern Multi-Jurisdiction 2020 MJHMP UpdateCOUNTY OF KERN
6-3
6.3.3 Process
The MJHMP Steering Committee will coordinate with responsible agencies/organizations identified for each mitigation action. These responsible agencies/organizations will monitor and evaluate the progress made on the implementation of mitigation actions and report to the MJHMP Steering Committee on an annual basis. These responsible departments will assess the effectiveness of the mitigation actions and modify them as appropriate. MAST will assist mitigation project managers in reporting on the status and assessing the effectiveness of the mitigation actions. Most updates to the HMP will occur easily through MAST. Figure 6-1 displays MAST viewing details for problem statements and mitigation actions.
Figure 6-1 Diagram of MAST viewing details
FEMA/Cal OES Submission Draft 10-27-2020

Kern Multi-Jurisdiction 2020 MJHMP UpdateCOUNTY OF KERN
6-4
Information from the mitigation leads within responsible departments will be used to monitor mitigation actions and annual evaluation of the MJHMP. The following questions will be considered in evaluating MJHMP effectiveness:
▪ Has the nature or magnitude of hazards affecting the County and other jurisdictions changed? ▪ Are there new hazards that have the potential to impact the County and other jurisdictions? ▪ Do the identified goals and actions address current and expected conditions? ▪ Have mitigation actions been implemented or completed? ▪ Has the implementation of identified mitigation actions resulted in expected outcomes? ▪ Are current resources adequate to implement the MJHMP? ▪ Should additional local resources be committed to address identified hazards?
Future updates to the MJHMP will account for any new hazard vulnerabilities, special circumstances, or new information that becomes available. Issues that arise or updates made during monitoring and evaluating the MJHMP will be incorporated into the next update of the MJHMP in 2024. The questions identified above would remain valid during the preparation of the 2025 update.
6.3.4 Continuing Public Involvement
During the five-year update cycle, County staff will involve the public through public workshops and meetings. Information on upcoming public events related to the MJHMP or solicitation for comments will be announced via newspapers, mailings, and on the County MJHMP website (http://mitigatehazards.com/county-of-kern/). An electronic copy of the current MJHMP document will be accessible through the County website. Hard copies will be placed in each of the open Kern County branch libraries. The MJHMP Planning Committee will, as much as practicable, incorporate the following concepts into its public outreach strategy to ensure continued public involvement in the MJHMP planning process:
▪ Work with public service clubs, i.e., the Bakersfield Breakfast Lions. ▪ Collaborate with faith-based organizations, i.e., Kern River Valley Christian Church, Discovery
Church, Unitarian Universalist Fellowship of Kern County, Temple Beth El, etc. ▪ Create story ideas for media outlets, such as newspapers, local radio, and TV ▪ Distribute emails and postcards/mailers to County/ City/ Town residents about hazard mitigation
updates ▪ Post meeting announcements at City Halls, community centers, coffee houses, grocery stores, etc. ▪ Educate and collaborate with insurance companies. ▪ Participate in other existing local community meeting places, i.e., Haggin Oaks Farmers’ Market,
Valley Farmers’ Market, Brimhall Farmers’ Market, etc. ▪ Distribute information through K-12 schools ▪ Continue to use the County website as a distribution point of hazard mitigation information
FEMA/Cal OES Submission Draft 10-27-2020
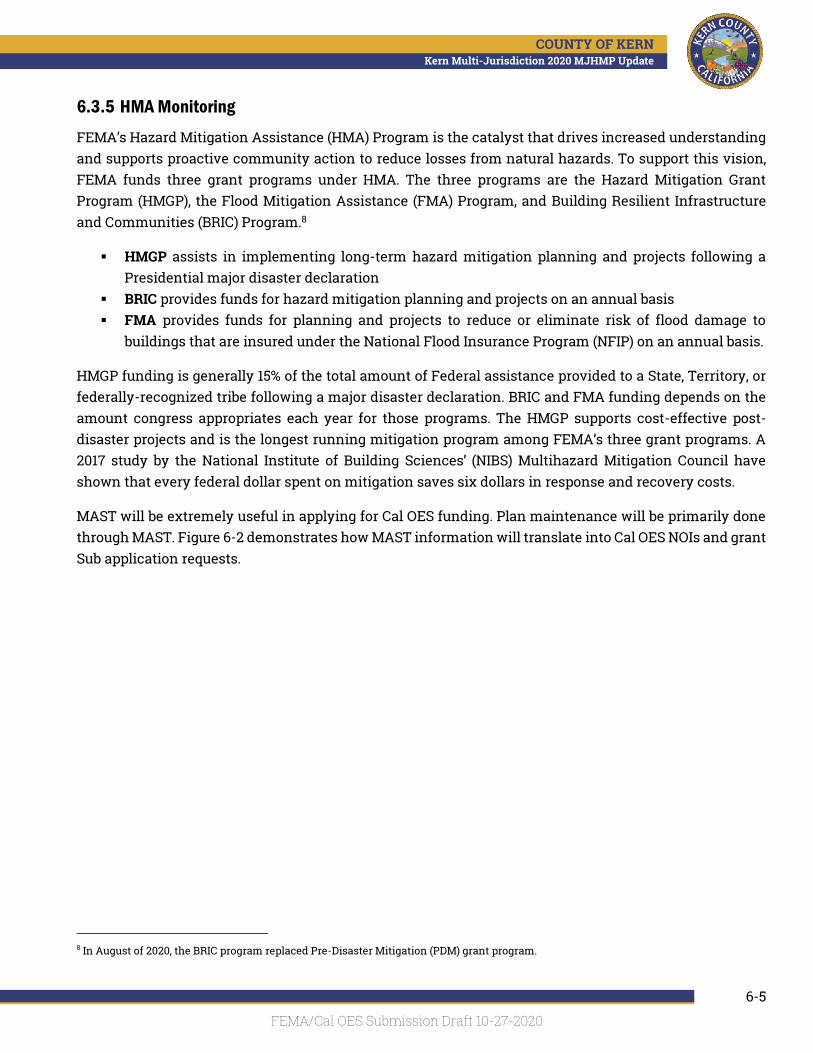
Kern Multi-Jurisdiction 2020 MJHMP UpdateCOUNTY OF KERN
6-5
6.3.5 HMA Monitoring
FEMA’s Hazard Mitigation Assistance (HMA) Program is the catalyst that drives increased understanding and supports proactive community action to reduce losses from natural hazards. To support this vision, FEMA funds three grant programs under HMA. The three programs are the Hazard Mitigation Grant Program (HMGP), the Flood Mitigation Assistance (FMA) Program, and Building Resilient Infrastructure and Communities (BRIC) Program.8
▪ HMGP assists in implementing long-term hazard mitigation planning and projects following a Presidential major disaster declaration
▪ BRIC provides funds for hazard mitigation planning and projects on an annual basis ▪ FMA provides funds for planning and projects to reduce or eliminate risk of flood damage to
buildings that are insured under the National Flood Insurance Program (NFIP) on an annual basis.
HMGP funding is generally 15% of the total amount of Federal assistance provided to a State, Territory, or federally-recognized tribe following a major disaster declaration. BRIC and FMA funding depends on the amount congress appropriates each year for those programs. The HMGP supports cost-effective post-disaster projects and is the longest running mitigation program among FEMA’s three grant programs. A 2017 study by the National Institute of Building Sciences’ (NIBS) Multihazard Mitigation Council have shown that every federal dollar spent on mitigation saves six dollars in response and recovery costs.
MAST will be extremely useful in applying for Cal OES funding. Plan maintenance will be primarily done through MAST. Figure 6-2 demonstrates how MAST information will translate into Cal OES NOIs and grant Sub application requests.
8 In August of 2020, the BRIC program replaced Pre-Disaster Mitigation (PDM) grant program.
FEMA/Cal OES Submission Draft 10-27-2020

Kern Multi-Jurisdiction 2020 MJHMP UpdateCOUNTY OF KERN
6-6
Figure 6-2: MAST and Cal OES Grant Applications
Following a disaster, California Office of Emergency Services (Cal OES) and local Kern County officials, in a joint effort with FEMA, will perform Preliminary Damage Assessments (PDA) of the areas that sustained damage. Cal OES submits, through the FEMA Regional Office, the information collected along with a damage estimate to request a declaration from the President. A Presidential Major Disaster Declaration provides for the availability of HMGP funds at the request of a state’s Governor in eligible communities within a state, tribe, or territory. Figure 6-3 depicts this.
Figure 6-3 shows a timeline of how projects should be developed and administered by local government and FEMA under the HMGP program. HMGP grant recipients will have 36 months from the close of the application period to complete projects.
FEMA/Cal OES Submission Draft 10-27-2020

Kern Multi-Jurisdiction 2020 MJHMP UpdateCOUNTY OF KERN
6-7
Figure 6-3: HMGP Timeline
For More information on HMGP project development process visit: www.fema.gov/hazard-mitigation-grant-program-guide-state/local-governments
6.3.6 Incorporation into Other Planning Mechanisms
For the HMP to be successful, the recommendations and underlying principles of the MJHMP should be incorporated into community planning and development such as capital improvement budgeting, building and zoning codes, general plans and regional plans. Integration into a variety of departments at the County and participating jurisdiction level provides an opportunity to network, identify, and highlight mitigation activities and opportunities at all levels of government. It is also important to monitor funding opportunities which can be leveraged to implement the mitigation actions.
The Capabilities Assessment in Section 5.3 includes an evaluation of which planning processes might incorporate the HMP in the future. For example, the information from this MJHMP can be incorporated into:
▪ Kern County and Municipal General Plans: The MJHMP will provide information that can be incorporated into the Safety, Land Use, and Conservation Elements of General Plans for municipalities and the County as they are updated. Many jurisdictions will update the Safety Element of the General Plan to incorporate the MJHMP in compliance with AB 2140. Specific risk and vulnerability information from the Kern County MJHMP will assist to identify areas where development may be at risk to potential hazards, which in turn can be incorporated into General Plans. For example, jurisdictions may consider instituting a hazard overlay zone that requires additional scrutiny because of close proximity to certain hazards..
▪ Building / Development Codes and Zoning Ordinances: The MJHMP provides information to enable the County and municipalities to make decisions on appropriate building/development codes and ordinances. Appropriate building codes and ordinances can increase resilience against natural disasters. Some County and municipal mitigation actions directly recommend updates or new regulations as mitigation for hazard risks; those mitigation actions indicate priorities for regulatory updates in participating jurisdictions.
FEMA/Cal OES Submission Draft 10-27-2020

Kern Multi-Jurisdiction 2020 MJHMP UpdateCOUNTY OF KERN
6-8
▪ Community Wildfire Protection Plans (CWPP): The MJHMP will provide information that can be incorporated into CWPPs and Strategic Fire Plan updates for areas within the County. The MJHMP likewise captured mitigation actions derived from CWPPs.
▪ Water/ Flood Management Plans: The MJHMP will provide information that can be included in updates of the Kern County Groundwater Monitoring Plan, Stormwater Management Plan, the Kern River Flood Management Plan, and other water/ flood management plans. While the process for updating these types of plans will vary by jurisdiction, the flood data developed for the MJHMP can be used in other mechanisms along with exposure and damage estimation information.
▪ Planning Mechanisms for Special Districts. Special districts and other participating jurisdictions likely have specific planning documents that will incorporate elements of the MJHMP as well. These will vary by jurisdiction and are explored more specifically in each Annex Capability Assessment. These include capital improvement plans, maintenance plans, emergency response or operations plans, and other relevant planning documents. Mitigation actions prioritize what plans may need to be updated to reflect this MJHMP information. Valuable information includes exposure and damage estimation and granular spatial footprint information from RAMP.
6.3.7 Planning Integration Processes
With adoption of this plan, Kern County and participating jurisdictions will be responsible for the plan implementation and maintenance. The County and the MJHMP Steering Committee will continue to:
▪ Act as a forum for hazard mitigation issues; ▪ Disseminate hazard mitigation ideas and activities to Kern County communities; ▪ Ensure hazard mitigation risk assessments and maps remain a consideration for safety
decisionmakers; ▪ Report on plan progress and recommended changes; and ▪ Inform and solicit input from the public.
FEMA/Cal OES Submission Draft 10-27-2020

Kern Multi-Jurisdiction 2020 MJHMP UpdateCOUNTY OF KERN
7-1
Section 7. Works Cited United States Census Bureau. (2018). Population Estimates.
(2014). Retrieved from National Climate Assessment: https://nca2014.globalchange.gov/
2017 Kern County Agricultural Crop Report. (2017). Retrieved from http://www.kernag.com/caap/crop-reports/crop10_19/crop2017.pdf
(2019). Retrieved from Napa County Mosquito Abatement District: http://napamosquito.org/vectors-and-pests/ticks/tick-borne-diseases/
(2013). Addressing Climate Change Adaptation in Regional Transportation Plans .
Administration, N. O. (2017). National Centers for Environmental Information. Retrieved from Storm Events Database: https://www.ncdc.noaa.gov/stormevents/eventdetails.jsp?id=550055
Advancement Project California. (2019, April). Kern County's Future in the Face of Climate Change. Retrieved 05 14, 2020, from https://www.advancementprojectca.org/wp-content/uploads/2019/05/AP-Kern-Climate-Adaptation-May-2019-8.5-x-11-single-page.pdf
Affairs, C. D. (n.d.). County and Municipal Population Timeseries.
Agency, U. S. (n.d.). Climate Change Indicators: Heavy Precipitation. Retrieved from Climate Change Indicators: https://www.epa.gov/climate-indicators/climate-change-indicators-heavy-precipitation
AGU Publications. (2016). Real-time detection, location, and characterization of Rockslides using broadband regional seismic networks. Retrieved from https://agupubs.onlinelibrary.wiley.com/doi/pdf/10.1002/2016GL069572
Antelope Valley Dustbusters. (2010, October). Agricultural Guide to Controlling Windblown Sand and Dust. Retrieved from http://www.kernair.org/Documents/Dust_Buster/Dustbusters%20Agricultural%20Guide%2010-25-10.pdf
Antelope Valley Dustbusters. (2010). Agricultural Guide to Controlling Windblown Sand and Dust. Retrieved from http://www.kernair.org/Documents/Dust_Buster/Dustbusters%20Agricultural%20Guide%2010-25-10.pdf
Ass'n of Bay Area Governments. (2011). Regional Hazard Mitigation Plan for the San Francisco Bay Area. Retrieved from http://resilience.abag.ca.gov/2011mitigation/
FEMA/Cal OES Submission Draft 10-27-2020

Kern Multi-Jurisdiction 2020 MJHMP UpdateCOUNTY OF KERN
7-2
Association of Bay Area Governments. (2014, July 21). Napa County Earthquake Hazard. Retrieved from Association of Bay Area Governments Resilience Program: http://resilience.abag.ca.gov/earthquakes/napa/
Association of Bay Area Governments. (2018, July 15). Landslide Maps and Information. Retrieved from Association of Bay Area Governments Resilience Program: http://resilience.abag.ca.gov/landslides/
Bakersfield.com. (2008). Floodwaters hit Isabella area. Retrieved 06 1, 2020, from https://www.bakersfield.com/news/floodwaters-hit-isabella-area/article_5e15f7fb-d434-5486-9170-0acea48604d1.html
Beacon Economics. (2018). Sonoma County Complex FIres: Housing and Fiscal Impact Report. Santa Rosa, Cali.: Sonoma County Economic Development Board. Retrieved 0126 2020, from file:///C:/Users/Swing-Laptop/Downloads/Sonoma%20County%20Complex%20Fires%20Housing%20and%20Fiscal%20Impact%20Report%202018.pdf
Bureau, U. C. (n.d.). 2010 Census.
Bureau, U. C. (2017). QuickFacts. US Census Bureau.
Bureau, U. S. (2015). American Community Survey.
CA.gov. (2014, January 17). Retrieved from GOVERNOR BROWN DECLARES DROUGHT STATE OF EMERGENCY: https://www.gov.ca.gov/news.php?id=18368
Cal Fire. (2018, September 3). Incident Information. Retrieved from Cal Fire: http://cdfdata.fire.ca.gov/incidents/incidents_cur_search_results?search=napa&submit=Search
Cal. Air Resources Board. (2020). Protecting Yourself from Wildfire Smoke. CARB. Retrieved 04 07, 2020, from https://ww2.arb.ca.gov/protecting-yourself-wildfire-smoke
Cal. Dep't of Water Resources. (2015). California's Most Significant Droughts: Comparing Historical and Recent Conditions.
Cal. Dep't of Water Resources. (2019). Division of Safety of Dams. Retrieved Jan. 30, 2020, from https://water.ca.gov/Programs/All-Programs/Division-of-Safety-of-Dams
Cal-Adapt. (2018). Annual Averages. Retrieved from cal-adapt: https://cal-adapt.org/tools/annual-averages/#climatevar=tasmax&scenario=rcp45&lat=38.24&lng=-121.35&boundary=climregions&units=fahrenheit
CalFire. (2010). Retrieved from https://www.fire.ca.gov/
(n.d.). California Adaptation Planning Guide: Understanding Regional Characteristics.
FEMA/Cal OES Submission Draft 10-27-2020

Kern Multi-Jurisdiction 2020 MJHMP UpdateCOUNTY OF KERN
7-3
California Department of Food and Agriculture. (2017). Statistics Review. Retrieved from https://www.cdfa.ca.gov/Statistics/PDFs/2016-17AgReport.pdf
California Department of Water Resources. (2015). California's Most Significant Droughts. Retrieved May 15, 2020, from https://water.ca.gov/LegacyFiles/waterconditions/docs/California_Signficant_Droughts_2015_small.pdf
(2010). California Drought Contingency Plan. California Department of Water Resources. Retrieved 05 14, 2020, from https://water.ca.gov/LegacyFiles/waterplan/docs/cwpu2013/Final/vol4/drought/01California_Drought_Contigency_Plan.pdf
(2013). California Drought Contingency Plan.
California Employment Development Department. (2019). Agricultural Employment in California. Retrieved 01 26, 2020, from Occupational Employment Statistics and Wages (OES) Employment and Wages: https://www.labormarketinfo.edd.ca.gov/data/oes-employment-and-wages.html
California Fire. (2019). Fireworks Safety. Retrieved from https://www.readyforwildfire.org/more/fireworks-safety/
California Office of Emergency Services. (2008). Contingency Plan for Excessive Heat Emergencies. Retrieved from https://ww3.arb.ca.gov/cc/ab32publichealth/meetings/042010/contintency_plan.pdf
California Office of Emergency Services. (2018). State of California Hazard Mitigation Plan. Retrieved from https://www.caloes.ca.gov/HazardMitigationSite/Documents/002-2018%20SHMP_FINAL_ENTIRE%20PLAN.pdf#search=404
California Office of Emergency Services. (2020). Dam Safety Planning Division. Retrieved from Cal OES: https://www.caloes.ca.gov/cal-oes-divisions/hazard-mitigation/dam-safety-planning-division
California State Association of Counties. (2014). Square Mileage by County. Retrieved 04 02, 2020, from https://www.counties.org/pod/square-mileage-county
CalOES. (2018). California State Hazard Mitigation Plan.
CalTrans. (July 2017). Structure Maintenance and Investigations Log of Bridges on State Highways.
Canadian Centre for Occupational Health and Safety. (2020). Hot Environments - Health Effects and First Aid.
Center for Disease Control. (n.d.). Climate Change and Extreme Heat Events. Retrieved 05 06, 2020, from https://www.cdc.gov/climateandhealth/pubs/climatechangeandextremeheatevents.pdf
FEMA/Cal OES Submission Draft 10-27-2020

Kern Multi-Jurisdiction 2020 MJHMP UpdateCOUNTY OF KERN
7-4
CGS. (2020). Seismic Shaking Hazard Assessment. Retrieved from https://www.conservation.ca.gov/cgs/Pages/PSHA/shaking-assessment.aspx
City of Taft. (n.d.). Local. Retrieved June 1, 2020, from Municipal Web Site: https://www.cityoftaft.org/pview.aspx?id=5398&catid=563
Climate Adaption Strategy. (2009). Retrieved from https://ww2.energy.ca.gov/2009publications/CNRA-1000-2009-027/CNRA-1000-2009-027-D.PDF
Colorado Geological Survey. (2020). Rockfall. Retrieved from https://coloradogeologicalsurvey.org/hazards/rockfall/
County, L. A. (2016). Municipal Service Review and Sphere of Influence Update Checklist for Napa County Flood Control and Water Conservation District.
County, T. (2006). Tehama County Flood Mitigation Plan.
Courtney, K. (2019, June 12). Napa breaks heat record that had lasted 115 years. Retrieved 07 08, 2020, from Napa Valley Register: https://napavalleyregister.com/news/local/napa-broke-heat-record-that-had-lasted-years/article_3fba82a1-0d13-5f9f-8bc9-0a13c448f2ef.html
Crop Insurance Solutions. (n.d.). Severe Weather Spotlight. Retrieved May 15, 2020, from http://cropinsurancesolutions.com/severe-weather-spotlight/
D. Branum, R. C. (2016). Earthquake Shaking Potential for California. CGS. Retrieved 04 07, 2020, from https://ssc.ca.gov/forms_pubs/shaking_18x23.pdf
Department of Environmental Conservation. (2020). State of Vermont. Retrieved from https://dec.vermont.gov/waste-management/spills
Department of Water Resources. (2010). State Plan of Flood Control. Retrieved from https://water.ca.gov/LegacyFiles/cvfmp/docs/DRAFT_SPFC_Descriptive_Doc_20100115.pdf
Disasters Are Us. (n.d.). Heat Wave. Retrieved 05 08, 2020, from http://www.disastersrus.org/emtools/Heatwave/heatwave.htm
District, T. C. (2003). Water Inventory and Analysis.
Earthquake Country Alliance. (2020). Gas Safety. Retrieved from https://www.earthquakecountry.org/step1/gassafety/
Encyclopedia Britannica. (2020). Artificial induction. Retrieved from https://www.britannica.com/science/artificial-induction
EPA. (n.d.). Health Effects Attributed to WIldfire Smoke. Retrieved 2020, from https://www.epa.gov/wildfire-smoke-course/health-effects-attributed-wildfire-smoke
FEMA/Cal OES Submission Draft 10-27-2020

Kern Multi-Jurisdiction 2020 MJHMP UpdateCOUNTY OF KERN
7-5
Federal Emergency Management Agency. (2019). Why Dams Fail. Retrieved from https://www.fema.gov/why-dams-fail
Federal Emergency Management Agency. (2020, May 14). Benchmark Year. Retrieved from https://training.fema.gov/emiweb/earthquake/neh0103030.htm
Federal Emergency Management Agency. (2020). Wildland urban interface (WUI). Retrieved from https://www.usfa.fema.gov/wui/
Federal Emergency Management Agency. (n.d.). Types of Floods and Floodplains. Retrieved May 15, 2020, from https://training.fema.gov/hiedu/docs/fmc/chapter%202%20-%20types%20of%20floods%20and%20floodplains.pdf
Federal Energy Regulatory Commission. (2011). Dam Safety Program. Retrieved from https://www.ferc.gov/industries/hydropower/gen-info/regulation/dam-safety.asp
Federation, N. W. (2002, 08 01). National Wildlife Federation. Retrieved from Seeking an End to a Flood of Claims.
FEMA. (2008). Flood Insurance Study Kern County and Incorporated Areas, Vol. 1. Retrieved from https://kernpublicworks.com/building-and-development/floodplain-management/
FEMA. (2016). Flood Insurance Study for Napa County and Incorporated Areas.
FEMA. (2017). FEMA. Retrieved from National Flood Insurance Program: Frequently Asked Questions.
FIRE, C. (n.d.). CAL FIRE Jurisdiction Fires, Acres, Dollar Damage, and Structures Destroyed.
GeoScienceWorld. (2003). The Filed Act: History and Issues for California Schools. Retrieved from https://pubs.geoscienceworld.org/ssa/srl/article-abstract/74/1/27/142797/The-Field-Act-History-and-Issues-for-California?redirectedFrom=fulltext
Governments, A. o. (2014, July 21). Napa County Earthquake Hazard. Retrieved from Association of Bay Area Governments Resilience Program: http://resilience.abag.ca.gov/earthquakes/napa/
Graham, B. a. (1988). Assessing the Threat to Life from Dam Failure. Water Resources Bulletin, 24(6).
Graham, B. a. (1988). Assessing the Threat to Life from Dam Failure. Water Resources Bulletin, vol. 24, no. 6.
(2010). Grand Terrace General Plan.
International Telecommunication Union. (2013). Technical Rerpot on Telecommunications and Disaster Mitigation. Retrieved from https://www.itu.int/en/ITU-T/focusgroups/drnrr/Documents/Technical_report-2013-06.pdf
FEMA/Cal OES Submission Draft 10-27-2020

Kern Multi-Jurisdiction 2020 MJHMP UpdateCOUNTY OF KERN
7-6
KCWA. (2018). Agency Functions. Retrieved from https://www.kcwa.com/agencyfunction/
Kern Council of Governments. (2015). 2015–2050 Growth Forecast Update. Retrieved from http://www.kerncog.org/wp-content/uploads/2009/10/Growth_Forecast_20180807.pdf
Kern County Fire Department. (n.d.). Retrieved from https://www.kerncountyfire.org/hazard-info/hazard-info/tree-mortality.html
Kern County Fire Department. (n.d.). Kern County Fire Department. Retrieved from Fire Hazard Reduction Program Frequently Asked Questions: https://www.kerncountyfire.org/hazard-info/fire-hazard-reduction-program-frequently-asked-questions.html
(2008). Kern County Flood Insurance Study. Retrieved 04 02, 2020, from https://kernpublicworks.com/building-and-development/floodplain-management/
(2009). Kern County General Plan. Retrieved 05 14, 2020, from https://kernplanning.com/planning/planning-documents/general-plans-elements/
Kern County MJHMP. (2014). Multi-Jurisdiction Hazard Mitigation Plan. Retrieved from http://mitigatehazards.com/county-of-kern/documents/
Kotowski, J. (2016, December 22). Erskine Fire caused by power line, officials say. Bakersfield Californian, p. 1. Retrieved from https://www.bakersfield.com/news/erskine-fire-caused-by-power-line-fire-officials-say/article_bd1f7a02-bbc6-59e2-a47f-30fc7a99b744.html
Krause, E., & Reeves, R. (2017, Sept. 18). Hurricans hit the poor the hardest. Retrieved Jan. 30, 2020, from Brookings Institute: https://www.brookings.edu/blog/social-mobility-memos/2017/09/18/hurricanes-hit-the-poor-the-hardest/
KSBY News. (2019, July 5). Retrieved 4 9, 2020, from https://www.ksby.com/news/2019/07/05/usgs-7-1m-earthquake-reported-near-ridgecrest
Legislative Analyst's Office. (2019). Overview of Flood Management in California. Retrieved from https://lao.ca.gov/handouts/resources/2019/Flood-Management-050919.pdf
Lenhard, M. (2019, Nov. 26). How the California Wildfires are Impacting Tourism. Skift.com. Retrieved Jan. 26, 2020, from https://skift.com/2019/11/26/how-the-california-wildfires-are-impacting-tourism/
Levin, P., & Davies, I. (2019, Nov. 6). Racial and Ethnic Minorities are More Vulnerable to Wildfires. Retrieved Jan. 30, 2020, from The Conversation: http://theconversation.com/racial-and-ethnic-minorities-are-more-vulnerable-to-wildfires-106290
Levin, Phil; Davies, Ian. (2019, Nov. 6). Racial and Ethnic Minorities are More Vulnerable to Wildfires. Retrieved Jan. 30, 2020, from The Conversation: http://theconversation.com/racial-and-ethnic-minorities-are-more-vulnerable-to-wildfires-106290
FEMA/Cal OES Submission Draft 10-27-2020

Kern Multi-Jurisdiction 2020 MJHMP UpdateCOUNTY OF KERN
7-7
(2007). Los Molinos Drainage Study, Existing Condition Flood Hydrology. Tehama County.
Lutz, H. (2018, February 21). Napa grapegrowers brace for extended frost season, with little rain. Retrieved from Napa Valley Register: https://napavalleyregister.com/news/local/napa-grapegrowers-brace-for-extended-frost-season-with-little-rain/article_74a4eca7-b723-5ebd-abdf-61a2ba7e4958.html
Mandel, K. (2018, Aug. 21). How Natural Disasters Widen the Wealth Gap Between Minority and White Communities. Retrieved Jan. 30, 2020, from ThinkProgress.org: https://thinkprogress.org/wealth-gap-between-minority-and-white-communities-widens-after-natural-disasters-5108851f6b27/
Mandel, K. (2018, Aug. 21). How Natural Disasters Widen the Wealth Gap Between Mintority and White Communities. Retrieved Jan. 30, 2020, from ThinkProgress.org: https://thinkprogress.org/wealth-gap-between-minority-and-white-communities-widens-after-natural-disasters-5108851f6b27/
(2018). Napa County Climate Action Plan.
(2018). Napa County Climate Action Plan. Retrieved from https://www.countyofnapa.org/DocumentCenter/View/9247/Revised-Draft-CAP-PDF
(2008). Napa County General Plan.
(2013). Napa County Operational Area Hazard Mitigation Plan 2013 Update.
Napa Dep't of Ag./ Sealer of Weights & Measures. (2017). Napa County Agricultural Crop Report. Retrieved from https://www.countyofnapa.org/DocumentCenter/View/13105/2017-Crop-Report-English
Napa Valley Vinters. (2020). Commitment to Farmworkers. Retrieved 01 26, 2020, from Napa Valley Vintners: https://napavintners.com/community/farmworkers.asp
Napa Valley Vintners. (n.d.). Napa Valley Fast Facts. Retrieved Jan. 30, 2020, from https://napavintners.com/press/docs/napa_valley_fast_facts.pdf
National Center for Disaster Preparedness. (2020). Vulnerable Populations. Retrieved 01 24, 2020, from https://ncdp.columbia.edu/research/vulnerable-populations/
National Institute of Building Sciences. (2017). Publications. Retrieved from https://www.fema.gov/media-library-data/1516812817859-9f866330bd6a1a93f54cdc61088f310a/MS2_2017InterimReport.pdf
National Institute of Building Sciences. (2019). Natural Hazard Mitigation Saves: 2019 Report. Retrieved 07 16, 2020, from https://www.nibs.org/page/mitigationsaves
National Institute of Water and Atmospheric Research. (2016). Drought. Retrieved from https://niwa.co.nz/education-and-training/schools/students/drought
FEMA/Cal OES Submission Draft 10-27-2020

Kern Multi-Jurisdiction 2020 MJHMP UpdateCOUNTY OF KERN
7-8
National Oceanic and Atmospheric Administration . (2020). What are El Niño and La Niña? Retrieved from National Ocean Service: https://oceanservice.noaa.gov/facts/ninonina.html
National Weather Service. (2020). Education. Retrieved from https://www.weather.gov/
Nix, J. (2017, Oct. 25). 42 Dead, 8,400 Structures Burned, More Than $1 Billion in Damage: the Devastating Toll of California’s Wildfires. Retrieved from Mother Jones: https://www.motherjones.com/environment/2017/10/california-fires-damage-total/
NOAA. (2019). Storm Events Database. Retrieved Jan. 30, 2020, from National Centers for Environmental Information: https://www.ncdc.noaa.gov/stormevents/eventdetails.jsp?id=5486532
NOAA. (n.d.). Heavy Snow- NOAA's National Weather Service- Glossary. Retrieved from https://forecast.weather.gov/glossary.php?word=heavy%20snow
Pacific Northwest Seismic Network. (n.d.). Ground Motion. Retrieved May 15, 2020, from https://pnsn.org/outreach/earthquakehazards/ground-motion
Pests & Diseases. (n.d.). Retrieved from Napa County: https://www.countyofnapa.org/1270/Pests-Diseases
Prevention, C. f. (n.d.). Climate Change and Extrememe Heat Events.
Program, U. G. (n.d.). Global Change. Retrieved from National Climate Assessment: globalchange.gov
Resources, D. o. (2017). Jurisdictional Dams.
(2010). Riverside Highland Water Company Urban Water Management Plan.
Robbins, J. (2017, Nov. 30). Climate Connection: Unraveling the Surprising Ecology of Dust. Yale Environment 260. Retrieved from https://e360.yale.edu/features/climate-connection-unraveling-the-surprising-ecology-of-dust
San Francisco Department of Emergency Management. (2019). Communicable Diseases. Retrieved from SF72: https://www.sf72.org/hazard/communicable-diseases
Scharer, K. a. (2017). Ground-rupturing earthquakes on the northern Big Ben of the San Andreas Fault, California, 800 A.D. to present. US Geological Survey. American Geophysical Union. Retrieved 04 06, 2020, from https://agupubs.onlinelibrary.wiley.com/doi/abs/10.1002/2016JB013606
Science Daily. (2013). How earthquake damage can impact building fire safety performance. Retrieved from https://www.sciencedaily.com/releases/2013/03/130311151247.htm
(2012). Sea-Level Rise for the Coasts of California, Oregon, and Washington.
FEMA/Cal OES Submission Draft 10-27-2020

Kern Multi-Jurisdiction 2020 MJHMP UpdateCOUNTY OF KERN
7-9
Service, N. W. (n.d.). What causes bands of heavy snowfall? Retrieved from National Weather Service National Oceanic and Atmospheric Administration: https://www.weather.gov/fsd/news_bandedsnowfall_20151121
Services, U. D. (2016). Public Health Emergency. Retrieved from https://www.phe.gov/Preparedness/planning/abc/Pages/afn-guidance.aspx
Smithsonian Magazine. (2019). California's Drought Killed Almost 150 Million Trees. Retrieved from https://www.smithsonianmag.com/smart-news/why-californias-drought-killed-almost-150-million-trees-180972591/
SoCalGas. (2020). Bringing Natural Gas to California City. Retrieved from https://www.socalgas.com/save-money-and-energy/assistance-programs/california-city-project
SoCalGas Gas Transmission and High Pressure Distribution Pipeline Interactive Map. (n.d.). Retrieved from https://www.socalgas.com/stay-safe/pipeline-and-storage-safety/natural-gas-pipeline-map/san-bernardino
Society, N. C. (2015). Napa County History. Retrieved from Napa County Historical Society: http://wordpress.napahistory.org/wordpress/local-history/napa-county-history/
(1967). Soil Survey- Tehama County California. United States Department of Agriculture Soil Conservation Service and Forest Service.
Stonebridge Research Group. (2017, Dec.). The Economic Impact of Napa County's Wine and Grapes, 2016. St. Helena, Cali. Retrieved from https://napavintners.com/community/docs/Economic_Impact_Report_2017.pdf
(2017). Strategic Fire Plan Sonoma-Lake-Napa Unit.
Survey, U. S. (2017).
Sustainable Agriculture Research and Education Program. (2017). Kern County Food System Assessment. Retrieved 04 02, 2020, from https://asi.ucdavis.edu/sites/g/files/dgvnsk5751/files/inline-files/KCFSA_report_full-1.pdf
Tehama County. (2012). Tehama County Hazard Mitigation Plan. Red Bluff, CA: Tehema County.
(2011). Tehama County Flood Insurance Study.
The National Flood Insurance Program. (n.d.). Retrieved from https://www.fema.gov/national-flood-insurance-program
The National Severe Storms Laboratory. (n.d.). SEVERE WEATHER 101. Retrieved May 17, 2020, from https://www.nssl.noaa.gov/education/svrwx101/floods/types/
FEMA/Cal OES Submission Draft 10-27-2020

Kern Multi-Jurisdiction 2020 MJHMP UpdateCOUNTY OF KERN
7-10
The National Severe Storms Laboratory. (n.d.). Severe Weather 101 - Damaging Winds. Retrieved May 17, 2020, from https://www.nssl.noaa.gov/education/svrwx101/wind/types/
The Vane. (2014, 12 13). Retrieved from Maps: Tornadoes in California Aren't as Rare as You Might Think: http://thevane.gawker.com/maps-tornadoes-in-california-arent-as-rare-as-you-migh-1670728375
U.S. Census Bureau. (2019). Napa County, California. Retrieved 01 24, 2020, from QuickFacts: https://www.census.gov/quickfacts/fact/table/napacountycalifornia,CA/PST045219
U.S. Climate Data. (2020). Climate Napa-California. Retrieved Jan. 24, 2020, from https://www.usclimatedata.com/climate/napa/california/united-states/usca2061
U.S. Dep't of Ag. (2017). Hired Farm Labor, Workers and Payroll. Retrieved 01 26, 2020, from USDA National Agricultural Statistics Service: https://www.nass.usda.gov/Quick_Stats/CDQT/chapter/2/table/7/state/CA/county/055/year/2017
U.S. Geological Survey. (1985). Floods from Dam Failures. U.S. Geological Survey Open-File Report. Retrieved 05 08, 2020, from https://pubs.usgs.gov/of/1985/0560/report.pdf
U.S. Geological Survey. (1985). Floods from Dam Failures. U.S. Geological Survey Open-File Report.
(2016). Unit Strategic Fire Plan Tehama-Glenn Unit.
United States Bureau of Economic Analysis. (2018). Local Area Gross Domestic Product. Retrieved 04 02, 2020, from https://www.bea.gov/news/2019/local-area-gross-domestic-product-2018
United States Census Bureau. (2015). American Community Survey. Retrieved 04 02, 2020, from https://data.census.gov/cedsci/table?q=acs&hidePreview=false&tid=ACSSE2015.K200101&vintage=2015
United States Census Bureau. (2015). Median Household Income. Retrieved 04 02, 2020, from https://data.census.gov/cedsci/table?q=kern%20median%20household%20income&tid=ACSST1Y2015.S1901&t=Income%20%28Households,%20Families,%20Individuals%29%3AHousehold%20and%20Family
United States Census Bureau. (2018). Selected Social Characteristics in the United States. Retrieved 04 02, 2020, from https://data.census.gov/cedsci/table?d=ACS%205-Year%20Estimates%20Data%20Profiles&table=DP02&tid=ACSDP5Y2018.DP02&y=2018&g=0400000US06_0500000US06029&hidePreview=true
United States Environmental Protection Agency. (2016). Climate Impacts on Agriculture and Food Supply. Retrieved from https://19january2017snapshot.epa.gov/climate-impacts/climate-impacts-agriculture-and-food-supply_.html
FEMA/Cal OES Submission Draft 10-27-2020

Kern Multi-Jurisdiction 2020 MJHMP UpdateCOUNTY OF KERN
7-11
United States Environmental Protection Agency. (2020). Green Infrastructure. Retrieved from https://www.epa.gov/green-infrastructure/manage-flood-risk
United States Forest Service. (n.d.). Prescribed Fire. Retrieved May 15, 2020, from https://www.fs.usda.gov/managing-land/prescribed-fire
United States Geological Survey. (1981). What are the effects of Earthquakes. Retrieved from https://www.usgs.gov/natural-hazards/earthquake-hazards/science/what-are-effects-earthquakes?qt-science_center_objects=0#qt-science_center_objects
United States Geological Survey. (1984). United States Earthquakes, 1952. Retrieved June 1, 2020, from https://pubs.usgs.gov/of/1984/0952/report.pdf
United States Geological Survey. (2004). Landslide Types and Processes. Retrieved from https://pubs.usgs.gov/fs/2004/3072/fs-2004-3072.html
United States Geological Survey. (2004). Landslide Types and Processes. Retrieved from https://pubs.usgs.gov/fs/2004/3072/fs-2004-3072.html
United States Geological Survey. (2005). NOAA-USGS Debris-Flow Warning System-Final Report. Retrieved from https://pubs.usgs.gov/circ/2005/1283/pdf/Circular1283.pdf
United States Geological Survey. (2016). Effects of Urban Development on Floods. Retrieved from USGS Science for a Changing World: https://pubs.usgs.gov/fs/fs07603/
United States Geological Survey. (2020, May 14). How do Earthquakes Affect Buildings. Retrieved from https://www.usgs.gov/faqs/how-do-earthquakes-affect-buildings?qt-news_science_products=0#qt-news_science_products
United States Geological Survey. (2020). Increases in Wildfire-Caused Erosion Could Impact Water Supply and Quality in the West. Retrieved from https://www.usgs.gov/news/increases-wildfire-caused-erosion-could-impact-water-supply-and-quality-west-2
United States Geological Survey. (n.d.). Earthquake Gloassary. Retrieved May 15, 2020, from Earthquake Hazards Program: https://earthquake.usgs.gov/learn/glossary/?term=magnitude
United States Geological Survey. (n.d.). The Modified Mercalli Intensity Scale. Retrieved May 15, 2020, from https://www.usgs.gov/natural-hazards/earthquake-hazards/science/modified-mercalli-intensity-scale?qt-science_center_objects=0#qt-science_center_objects
United States Geological Survey. (n.d.). The Science of Earthquakes. Retrieved May 15, 2020, from USGS Science for a Changing World: https://www.usgs.gov/natural-hazards/earthquake-hazards/science/science-earthquakes?qt-science_center_objects=0#qt-science_center_objects
FEMA/Cal OES Submission Draft 10-27-2020

Kern Multi-Jurisdiction 2020 MJHMP UpdateCOUNTY OF KERN
7-12
United States Geological Survey. (n.d.). What is liquefaction? Retrieved May 15, 2020, from USGS Science for a Changing World: https://www.usgs.gov/faqs/what-liquefaction?qt-news_science_products=0#qt-news_science_products
University of California, A. a. (2019). Ratio of farmworkers to farm jobs in California increased to 2.3 in 2016. Retrieved from http://calag.ucanr.edu/archive/?article=ca.2019a0002
University of California, Davis Center for Watershed Sciences. (2020). Projects and Research Programs. Retrieved from https://watershed.ucdavis.edu/
(2015). Upper Santa Ana Integrated Resources Water Management Plan.
US Census Bureau. (2017). QuickFacts. US Census Bureau. Retrieved from https://www.census.gov/quickfacts/fact/table/kerncountycalifornia/PST045219#
US Census Bureau Factfinder. (n.d.). Retrieved from http://factfinder.census.gov/faces/tableservices/jsf/pages/productview.xhtml?src=CF
USGS. (2020). 2018 United States (Lower 48) Seismic Hazard Long-term Model. Retrieved from https://www.usgs.gov/natural-hazards/earthquake-hazards/science/2018-united-states-lower-48-seismic-hazard-long-term?qt-science_center_objects=0#qt-science_center_objects
USGS. (n.d.). Earthquake Hazards 201 - Technical Q&A. Retrieved May 15, 2020, from US Geological Survey, Science for a Changing World: https://137.227.224.120/hazards/learn/technical.php#accel
USGS. (n.d.). Land Subsidence in California. Retrieved 4 3, 2020, from https://www.usgs.gov/centers/ca-water-ls
USGS. (n.d.). Land Subsidence in California. Retrieved 4 3, 2020, from https://www.usgs.gov/centers/ca-water-ls
USGS. (n.d.). Lassen Volcanic Center Hazards. Retrieved from https://volcanoes.usgs.gov/volcanoes/lassen_volcanic_center/hazard_summary.html
Vintners, N. V. (n.d.). Napa Valley Fast Facts.
Washington Post. (2018). All-time High Temperature Records Set Throughout Southern California, including Los Angeles. Retrieved from https://www.washingtonpost.com/news/capital-weather-gang/wp/2018/07/06/monster-heat-dome-threatens-all-time-high-temperature-records-in-southern-california-friday/
Water Education Foundation. (2020). California Aqueduct Aquapedia. Retrieved March 13, 2020, from https://www.watereducation.org/aquapedia/california-aqueduct
Water Education Foundation. (2020). Oroville Dam: Aquapedia Background. Retrieved Jan. 30, 2020, from Aquapedia: https://www.watereducation.org/aquapedia/oroville-dam
FEMA/Cal OES Submission Draft 10-27-2020

Kern Multi-Jurisdiction 2020 MJHMP UpdateCOUNTY OF KERN
7-13
Western Reginoal Climate Center. (2020). Climate of California. Retrieved from https://wrcc.dri.edu/Climate/narrative_ca.php
What is Known About Groundwater. (n.d.). Retrieved from Napa County California: https://www.countyofnapa.org/1237/What-is-Known-About-Groundwater
Yune, H. (2017, Aug. 2). After Oroville crisis, state orders inspection of 3 Napa County dam spillways. Napa Valley Register. Retrieved Jan. 30, 2020, from https://napavalleyregister.com/news/local/after-oroville-crisis-state-orders-inspection-of-napa-county-dam/article_c72d5ee9-67ce-5db2-8c9a-b65c3142d826.html
FEMA/Cal OES Submission Draft 10-27-2020

Kern Multi-Jurisdiction 2020 MJHMP UpdateCOUNTY OF KERN
7-14
INTENTIONAL BLANK PAGE
FEMA/Cal OES Submission Draft 10-27-2020

Kern Multi-Jurisdiction 2020 MJHMP UpdateCOUNTY OF KERN
A-1
A
Appendix A. Analysis Methodology
FEMA/Cal OES Submission Draft 10-27-2020

Kern Multi-Jurisdiction 2020 MJHMP UpdateCOUNTY OF KERN
A-2
A GIS-based vulnerability assessment was conducted for each of the priority hazards identified by the Planning Committee. Several sources of data are necessary to conduct a vulnerability analysis. This appendix presents an outline of the data inputs, processing steps, and outputs used to create the vulnerability analysis results presented in the Hazard Mitigation Plan. The analysis methodology is presented first, followed by an overview of the analysis data.
A.1. Natural Hazard Exposure
The natural hazard exposure analysis (see C. Natural Hazard Exposure in Figure 7-4) is an inventory of population, parcels, critical facilities, and other assets within each natural hazard area. As shown in Figure 7-1, the presence of a structure inside a natural hazard area (the flood zone in this example) qualifies that structure as exposed to the natural hazard.
Figure 7-1: Hazard Exposure
The total counts of parcels, people, facilities, assets and the sum of values within the planning area which could be exposed to a hazard event is referred to as the “exposure” in this plan. A natural hazards overlay was developed to reflect the combination of many known natural hazard spatial footprints. The spatial overlay method enables summarization of building values, parcel counts, population exposure, and critical facility exposure within a hazard’s geographic extents (see C. Natural Hazard Exposure in Figure 7-4). The input data is used to evaluate exposure for earthquakes, landslides, flooding, dam inundation, wildfire, and subsidence.
Damage Estimation with Hazus
FEMA’s Hazus software was implemented to conduct a detailed loss estimation for flood and earthquake. Hazus is a nationally applicable standardized methodology that contains models for estimating potential losses from earthquakes, floods, and hurricanes. Hazus uses Geographic Information Systems (GIS) technology to estimate physical, economic, and social impacts of disasters. For purposes of this planning effort, Hazus was used to generate damage estimations due to possible earthquakes and flooding. The
FEMA/Cal OES Submission Draft 10-27-2020

Kern Multi-Jurisdiction 2020 MJHMP UpdateCOUNTY OF KERN
A-3
estimated damage and losses provided by the Hazus Software provides the ability to understand possible widescale damage to buildings and facilities (see D. Hazus Damage Estimations in Figure 7-4).
In the hypothetical geography shown in Figure 7-3, even though both structures are exposed to flooding, it is expected that the structure with a first floor height below the depth of flooding will receive significantly more damage than the structure with a first floor height above the expected water depth. Note that not all building data contains first floor height and first floor height is an example of the type of field utilized by Hazus in calculating damage estimates.
Figure 7-2: Flood Depth and Damage Curves
Figure 7-3: Hazus Damage Estimations
Hazus is a FEMA product with highly detailed documentation provided on the analysis steps and algorithms performed against the input data and associated scenarios in the process of obtaining loss estimates. The explanation in this appendix section is simplified. Refer to the full documentation and technical manuals from FEMA for greater explanation on Hazus specifics.
FEMA/Cal OES Submission Draft 10-27-2020

Kern Multi-Jurisdiction 2020 MJHMP UpdateCOUNTY OF KERN
A-4
Distinguishing Results – Natural Hazard Exposure Analysis vs Hazus Results
Table and chart references throughout the hazard mitigation plan are explicitly called out for Hazus results as “Damage Estimates”. There are expected differences in the results between estimations of Natural Hazard overlays and detailed Hazus results. Snapshot tables and Natural Hazard Exposure sections do not contain Hazus estimates.
A.2. Analysis Data
Assets, Value, and Population
A.2.1.1. Parcels
County provided parcel geometry was joined with county assessor data. In some cases, there were multiple building attributed to a single parcel. Centroids were created to represent parcels at a single location. Where multiple building values were represented in the parcel roll, multiple overlapping centroids were created. In situations where building values were duplicated among overlapping points, the points were weighted for equal and accurate representation of the parcel totals. Building type, year built, number of stories, use code, area, and valuation data were all fields that were input into the analyses. Earthquake building design level attribution was based on year built and building code adaptation chronology. Improved residential parcels were chosen for the parcels dataset by a query of improvement value presence and residential construction type codes. The parcel inputs were supplemented with point geometries from the Asset Insurance Schedule.
A.2.1.2. Asset Insurance Schedules
County assessor data does not include detailed information for tax exempt structures, such as federal and local government buildings. This data was added to the GIS utilizing insurance schedule tables for the county. The Insurance Schedule data was consolidated with the county parcel dataset.
A.2.1.3. Population
Population estimates were derived from 2015 5-year Census American Community Survey (ACS) numbers as applied to census block groups and then processed through GIS modeling to break down the proportional population for smaller units of area.
A.2.1.4. Critical Infrastructure
Critical facilities and transportation/lifeline typically include hospitals, fire stations, police stations, storage of critical records, and similar facilities. These data came from a collection of sources including but not limited to: County GIS, County and local jurisdiction insurance data, CDSS, CEC, FCC, Hazus, USACE,
FEMA/Cal OES Submission Draft 10-27-2020

Kern Multi-Jurisdiction 2020 MJHMP UpdateCOUNTY OF KERN
A-5
FEMA, and NPS. All data sources have a level of accuracy acceptable for planning purposes. See Table 7-2 for a list of Critical Infrastructure data used in the analysis.
A.2.1.5. Hazus Inputs
Hazus data inputs can be customized in several different ways including hazard scenario data and detailed building data. The GIS team conducted a Level 2 analysis utilizing user-defined buildings with refined building characteristic parameters as inputs for the damage estimation calculations (See A.2.1.1 andA.2.1.2). Both countywide building data and government assets were used as inputs in this level 2 analysis. The customized user defined building dataset allows for more accurate results for damage estimation based upon detailed building characteristics.
Note: FEMA’s Hazus software utilizes different user defined building information inputs to develop loss estimates depending on the hazard module. The Hazus flood and earthquake modules use fragility curves based upon the user’s definition of building characteristics including but not limited to:
• Area • Year Built • Construction Type • Number of Stories • EQ Design Level • Occupancy Type (Residential, Government, etc) • Building Values
A default set of field values is utilized in leu of missing values where required by Hazus.
Natural Hazard Data
A.2.2.1. Dam Inundation Zones
Dam inundation zone GIS data were provided by the County. These represent the estimated flood extent in the event of dam failure for individual dams.
A.2.2.2. Earthquake Shaking
The CGS 2 percent chance – 50-yr probability map was used as a qualitative guide in selecting an earthquake epicenter based shakemap scenario for analyses. The South San Andreas Mojave North M7.7 Scenario was chosen for use in Hazus for damage estimations.
A.2.2.3. Subsidence
Obtained from DWR vertical movement subsidence dataset. Classified from low-lift to high-subsidence.
FEMA/Cal OES Submission Draft 10-27-2020

Kern Multi-Jurisdiction 2020 MJHMP UpdateCOUNTY OF KERN
A-6
A.2.2.4. Flood Zones
The input parameters for Hazus analysis of Flood exposure included depth grids created with the FEMA Flood Zone data mentioned in section A.2.2.4. 100-YR, 500-YR, and Areas Protected by Levee were all scenarios that were used to analyze the exposure to Hazus inputs as depicted in Figure 7-4.
A.2.2.5. Landslide Susceptibility
GIS layer with geographic boundaries defining the likelihood of deep-seated landslides. Underlying geology and slope angle are used in the creation of this layer by the California Geological Society. High landslide classes were chosen as summary classes for this plan.
A.2.2.6. Wildfire Hazard Severity
A proprietary DP+S composite layer derived from Wildland Urban Interfaces, California Public Utilities Commission fire threat areas and Fire Hazard Severity Zones. See Table 7-1.
Table 7-1 Wildfire Hazard Severity Classification
Hazard Native Class Description
Moderate
Tier 1 HHZs are zones in direct proximity to communities, roads, and utility lines, and are a direct threat to public safety.
1 WUI is the potential treatment zone in which projects could be conducted to reduce wildland fire threats to people.
1 / Moderate See Cal Fire FHSZ (State Responsibility Area [SRA] & Local Responsibility Area [LRA])
High Tier 2
Tier 2 fire-threat areas depict areas where there is an elevated risk (including likelihood and potential impacts on people and property) from utility associated wildfires.
High See Cal Fire FHSZ (State Responsibility Area [SRA] & Local Responsibility Area [LRA])
Very High
Tier 3 Tier 3 fire-threat areas depict areas where there is an extreme risk (including likelihood and potential impacts on people and property) from utility associated wildfires.
Very High
Classification of a zone as moderate, high or very high fire hazard is based on a combination of how a fire will behave and the probability of flames and embers threatening buildings. Each area of the map gets a score for flame length, embers, and the likelihood of the area burning. Scores are then averaged over the zone areas. Final zone class (moderate, high and very high) is based on the averaged scores for the zone.
Source: Moderate - Cal Fire Tree Mortality, WUI, FHSZ; High - CPUC Utility Threat, Cal Fire FHSZ; Very High - High - CPUC Utility Threat, Cal Fire FHSZ (SRA & LRA)
FEMA/Cal OES Submission Draft 10-27-2020
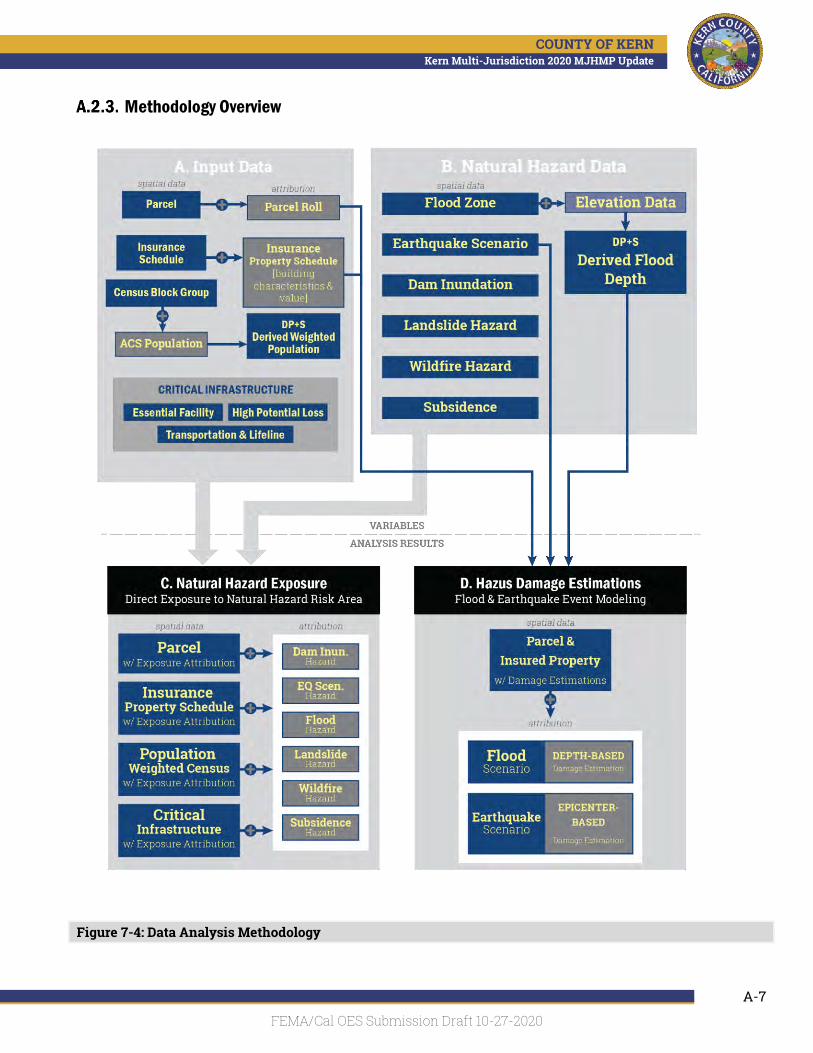
Kern Multi-Jurisdiction 2020 MJHMP UpdateCOUNTY OF KERN
A-7
Methodology Overview
Figure 7-4: Data Analysis Methodology
FEMA/Cal OES Submission Draft 10-27-2020

Kern Multi-Jurisdiction 2020 MJHMP UpdateCOUNTY OF KERN
A-8
Data Dictionary
Table 7-2: Data Dictionary
Dataset Data Steward Notes Airport Districts Local Jurisdiction Received from local jurisdiction
Community Service Districts Local Jurisdiction Received from local jurisdiction
County Census, Esri County boundary and planning area extent
Incorporated Cities Census, Local Jurisdiction Received from local jurisdiction
Mosquito Abatement District Local Jurisdiction Received from local jurisdiction
Recreation And Park Districts Local Jurisdiction Received from local jurisdiction
Sanitation Districts Local Jurisdiction Received from local jurisdiction
School Districts Local Jurisdiction Received from local jurisdiction, consolidated with CDE School Ownership
Water Districts USBR, Local Jurisdiction Received from local jurisdiction
DEM NED 1/3 Arc Second
Place Census TIGER dataset
Stream Esri, NHD Multiple stream basemap layers for various cartographic products
Water Esri Downloaded from Esri dataset
GNIS USGS Downloaded from USGS
Parcel Geometry Local Assessors Received from local jurisdiction
Parcel Roll Local Assessors Received from local assessor office
Building Roll Local Assessors Received from local assessor office
Emergency Operations Center Local Jurisdiction Geocoded from notes
Fire Local Jurisdiction Received from local jurisdiction
Hospital Local Jurisdiction Received from local jurisdiction
Police Hazus, Local Jurisdiction Reconciled police and sheriff with Hazus and Local data
Sheriff Local Jurisdiction Reconciled police and sheriff with Hazus and Local data
Adult Res Facility CA Department of Social Services Geocoded with ESRI streetfile
Child Care Center CA Department of Social Services Geocoded with ESRI streetfile
Family Child Care Home CA Department of Social Services Geocoded with ESRI streetfile
Foster Family Agency CA Department of Social Services Geocoded with ESRI streetfile
Home Care Organization CA Department of Social Services Geocoded with ESRI streetfile
Res Child Care CA Department of Social Services Geocoded with ESRI streetfile
Res Elder Care Facility CA Department of Social Services Geocoded with ESRI streetfile
Library Local Jurisdiction Received from local jurisdiction
Healthcare Facility Local Jurisdiction Received from local jurisdiction
Cooling Center Local Jurisdiction Received from local jurisdiction
FEMA/Cal OES Submission Draft 10-27-2020

Kern Multi-Jurisdiction 2020 MJHMP UpdateCOUNTY OF KERN
A-9
Dataset Data Steward Notes City Hall Local Jurisdiction Received from local jurisdiction
Dam USACE NID Have dam locations as provided in NID
Historic Building NPS National Park Service Data
Historic Site NPS National Park Service Data
Special Needs Facility Local Jurisdiction Received from local jurisdiction
School Local Jurisdiction, CDE Received from local jurisdiction, reconciled with CDE data
Potable Water Facility Hazus Hazus data is limited
Waste Water Facility Hazus Hazus data is limited
Airport Hazus Hazus data compared to other sources
Bridge NBI National Bridge Inventory data
Bus Facility HAZUS Hazus data was most complete for this asset
Levee FEMA From NFHL
Levee Flood Wall USACE NLD From NLD WFS
Levee Levee Centerline USACE NLD Do not appear to be any (Also the new WFS does not contain centerlines)
NG Facility Local Jurisdiction Open Data
NG Pipeline Local Jurisdiction Open Data
Oil Facility Hazus Hazus limited
Power Plant Local Jurisdiction Open Data
Railroad Esri From Esri dataset
Railroad Facility Hazus Hauz limited
Street Esri Esri for classifications Substation Local Jurisdiction Open Data Transmission Line Local Jurisdiction Open Data
Transmission Line Tower CEC have statewide dataset
Wind Turbine Local Jurisdiction Open Data County Insured Assets (Insurance Schedule) Insurance Provider Reconcile with CI
Census Block US Census Bureau TIGER dataset
Census Block Group US Census Bureau TIGER dataset - appended pops
Census Tract US Census Bureau TIGER dataset
Awareness Zones DWR have statewide dataset
Dam Inundation Cal OES Dam inundation from Cal OES zones
EQ Probabilistic MI USGS, CISN Used to determine scenarios
EQ Scenarios 1-2 USGS, CISN Scenarios as determined by Probabilistic composition
Flood Hazard FEMA NFHL
Subsidence DWR Classified from Low-Lift to High - Subsidence
Landslide Susceptibility CGS High class 8-10 from raw data
Wildfire Hazard Severity Zone Cal Fire / CPUC Proprietary composite layer for DPS including Cal Fire / CPUC data
200 Year Usace USACE NLD From National levee Dataset
FEMA/Cal OES Submission Draft 10-27-2020

Kern Multi-Jurisdiction 2020 MJHMP UpdateCOUNTY OF KERN
A-10
Dataset Data Steward Notes EQ Fault Zones CGS Used for overview, global source
Fire Perimeter Calfire Cal Fire Used for overview, global source
Fire Regime MFRI USGS Used for overview, global source
Qfaults USGS Used for overview, global source
Insured Assets Roll
Table 7-3 Insured Assets Roll
Asset Building Count Building Cost Content Cost Total Value Administrative & Office 68 $359,226,983 $118,496,490 $477,723,473
Admin 26 $281,036,365 $2,180,986 $283,217,351
Building 12 $22,885,686 $1,192,850 $24,078,536
Office 30 $55,304,932 $115,122,654 $170,427,586
Equipment & Storage 51 $57,237,326 $5,149,231 $62,386,557
Equipment 5 $127,977 $3,302,171 $3,430,148
Shop 11 $41,016,235 $837,660 $41,853,895
Storage 20 $6,039,390 $446,971 $6,486,361
Warehouse 6 $6,387,091 $526,728 $6,913,819
Yard 9 $3,666,633 $35,701 $3,702,334
Other Assets 42 $6,182,000 $26,036,768 $32,218,768
Leased 31 $2,397,883 $20,982,229 $23,380,112
Misc 3 $203,622 $4,770,874 $4,974,496
Relay 4 $154,576 $21,384 $175,960
Vacant 4 $3,425,919 $262,281 $3,688,200
Recreation 107 $48,550,442 $8,536,674 $57,087,116
Golf Course 3 $2,927,248 $3,000 $2,930,248
Museum 76 $19,615,343 $6,634,355 $26,249,698
Park 9 $10,016,887 $1,409,407 $11,426,294
Recreation 19 $15,990,964 $489,912 $16,480,876
Services 121 $438,023,808 $56,317,933 $494,341,741
Animal 1 $528,591 $1,000 $529,591
Correctional 27 $288,265,742 $193,074 $288,458,816
Fire 47 $40,345,749 $4,818,942 $45,164,691
Health 5 $23,063,560 $3,690,348 $26,753,908
Library 18 $57,750,901 $46,750,699 $104,501,600
Sheriff 19 $14,114,343 $351,792 $14,466,135
Veterans 1 $672,868 $184,792 $857,660
Warehouse 1 $1,038,472 $50,193 $1,088,665
FEMA/Cal OES Submission Draft 10-27-2020

Kern Multi-Jurisdiction 2020 MJHMP UpdateCOUNTY OF KERN
A-11
Asset Building Count Building Cost Content Cost Total Value Water 2 $12,243,582 $277,093 $12,520,675
Transportation 10 $52,335,358 $5,564,962 $57,900,320
Airport 9 $52,334,358 $5,563,962 $57,898,320
Bus 1 $1,000 $1,000 $2,000
Grand Total 399 $961,555,917 $220,102,058 $1,181,657,975
FEMA/Cal OES Submission Draft 10-27-2020

Kern Multi-Jurisdiction 2020 MJHMP UpdateCOUNTY OF KERN
A-12
INTENTIONAL BLANK PAGE
FEMA/Cal OES Submission Draft 10-27-2020

Kern Multi-Jurisdiction 2020 MJHMP UpdateCOUNTY OF KERN
B-1
B
Appendix B. Process Documentation
FEMA/Cal OES Submission Draft 10-27-2020

Kern Multi-Jurisdiction 2020 MJHMP UpdateCOUNTY OF KERN
B-2
INTENTIONAL BLANK PAGE
FEMA/Cal OES Submission Draft 10-27-2020

Kern Multi-Jurisdiction 2020 MJHMP UpdateCOUNTY OF KERN
Appendix BTable of Contents
Planning Committee Meeting Documentation..................................................B1
Public Notice & Press Release Documentation ................................................ B2
Survey & Results Documentation ........................................................................ B3
Mitigation Strategy Prioritization Process Documentation .......................... B4
Website Documentation ........................................................................................ B5
FEMA/Cal OES Submission Draft 10-27-2020

Kern Multi-Jurisdiction 2020 MJHMP UpdateCOUNTY OF KERN
PAGE INTENTIONALLY BLANK
FEMA/Cal OES Submission Draft 10-27-2020

Kern Multi-Jurisdiction 2020 MJHMP UpdateCOUNTY OF KERN
Planning Committee Meeting Documentation
Appendix B.1
FEMA/Cal OES Submission Draft 10-27-2020

Kern Multi-Jurisdiction 2020 MJHMP UpdateCOUNTY OF KERN
PAGE INTENTIONALLY BLANK
FEMA/Cal OES Submission Draft 10-27-2020
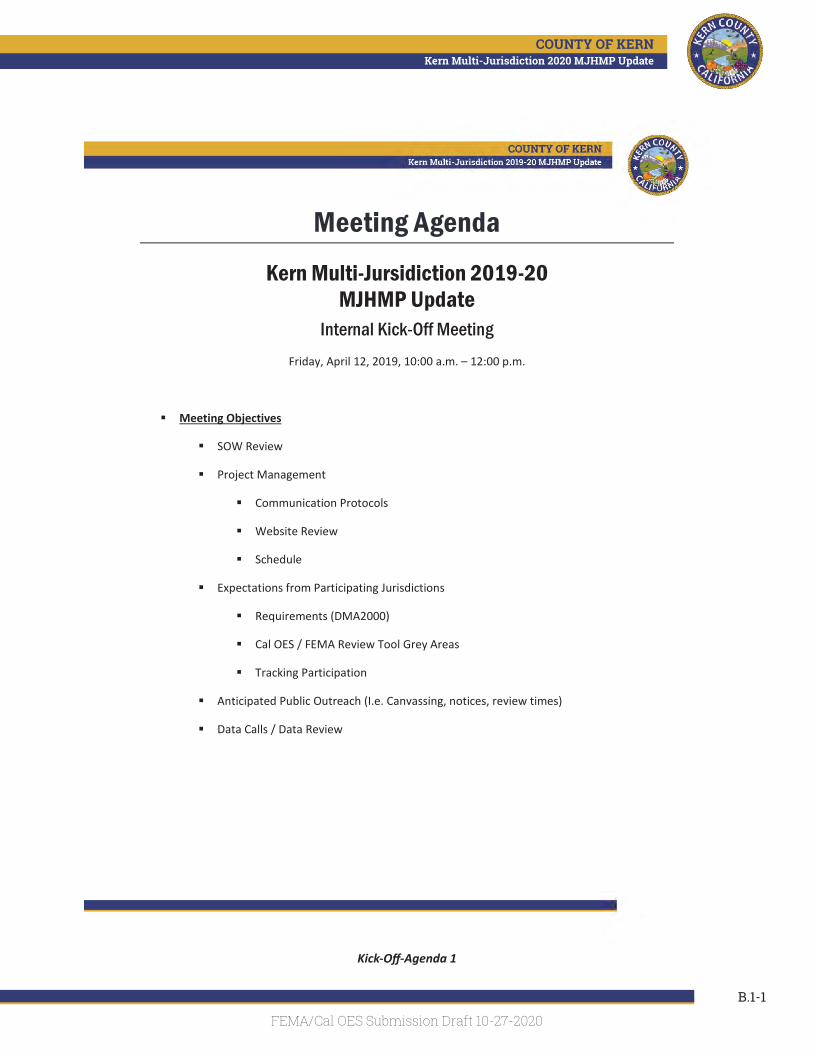
Kern Multi-Jurisdiction 2020 MJHMP UpdateCOUNTY OF KERN
B.1-1
Meeting Agenda
Kern Multi-Jursidiction 2019-20 MJHMP Update
Internal Kick-Off Meeting Friday, April 12, 2019, 10:00 a.m. – 12:00 p.m.
Meeting Objectives
SOW Review
Project Management
Communication Protocols
Website Review
Schedule
Expectations from Participating Jurisdictions
Requirements (DMA2000)
Cal OES / FEMA Review Tool Grey Areas
Tracking Participation
Anticipated Public Outreach (I.e. Canvassing, notices, review times)
Data Calls / Data Review
Kick-Off-Agenda 1
FEMA/Cal OES Submission Draft 10-27-2020

Kern Multi-Jurisdiction 2020 MJHMP UpdateCOUNTY OF KERN
B.1-2
Kick-Off Sign-In Sheets 1
FEMA/Cal OES Submission Draft 10-27-2020

Kern Multi-Jurisdiction 2020 MJHMP UpdateCOUNTY OF KERN
B.1-3
Kick-Off Sign-In Sheets 2
FEMA/Cal OES Submission Draft 10-27-2020

Kern Multi-Jurisdiction 2020 MJHMP UpdateCOUNTY OF KERN
B.1-4
Kick-Off Sign-In Sheets 3
FEMA/Cal OES Submission Draft 10-27-2020

Kern Multi-Jurisdiction 2020 MJHMP UpdateCOUNTY OF KERN
B.1-5
Kick-Off Sign-In Sheets 4
FEMA/Cal OES Submission Draft 10-27-2020

Kern Multi-Jurisdiction 2020 MJHMP UpdateCOUNTY OF KERN
B.1-6
Kick-Off Photo
FEMA/Cal OES Submission Draft 10-27-2020

Kern Multi-Jurisdiction 2020 MJHMP UpdateCOUNTY OF KERN
B.1-7
Meeting 1 MailChimp Notification
FEMA/Cal OES Submission Draft 10-27-2020

Kern Multi-Jurisdiction 2020 MJHMP UpdateCOUNTY OF KERN
B.1-8
1
Meeting Agenda:
Kern County Multi-Jurisdiction Hazard Mitigation Plan 2019-20 Update
Planning Committee Meeting #1
Thursday, May 23rd, 2019, 9:00 a.m. – 12:00 p.m.
Meeting Objectives
• Welcome and Introductions
• Mitigation Planning Defined
• Expectations from Participating Jurisdictions
• Planning Process Review
• Project Schedule
• Website Review
• FEMA Hazard Mitigation Program
• 2012 Mitigation Plan Review
• What has Changed?
• Outreach
• Next Steps
Project Website: mitigatehazards.com
Project Webpage: http://mitigatehazards.com/county-of-kern/
Website Password: Kern2020
Polling Website for Smartphone: www.pollev.com/dynamicplanning
PC Meeting 1 Agenda
FEMA/Cal OES Submission Draft 10-27-2020

Kern Multi-Jurisdiction 2020 MJHMP UpdateCOUNTY OF KERN
B.1-9
PC Meeting1 Sign In 1
FEMA/Cal OES Submission Draft 10-27-2020
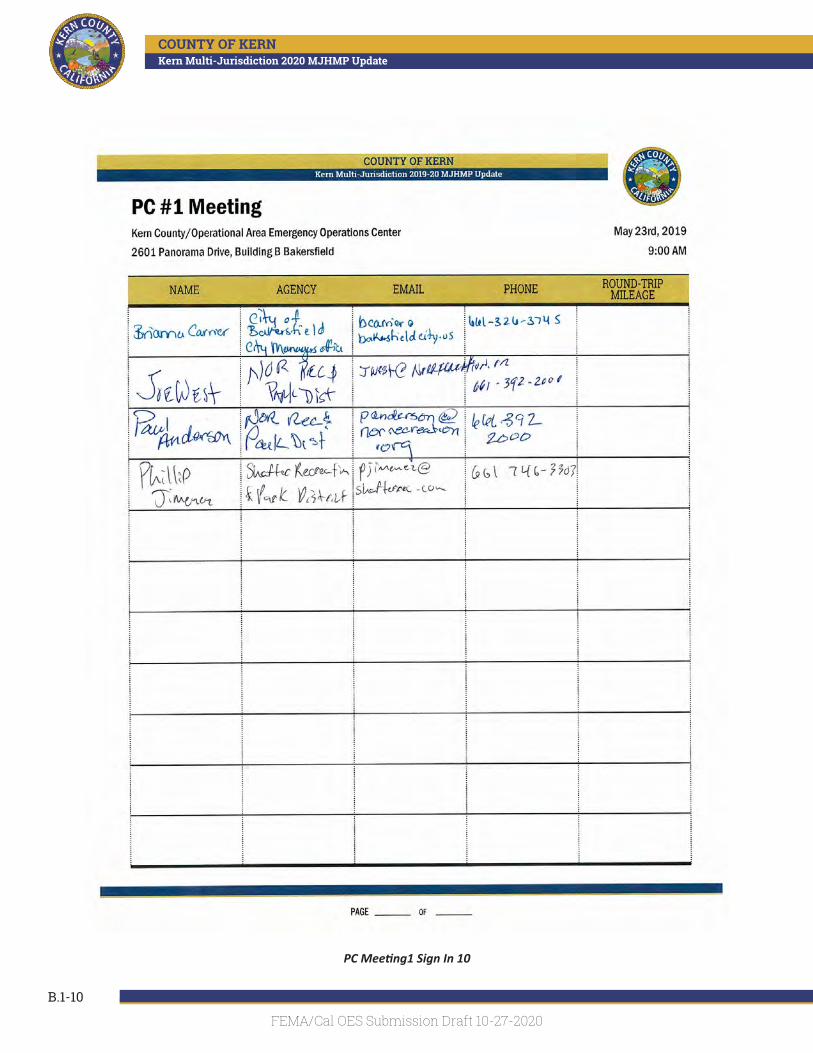
Kern Multi-Jurisdiction 2020 MJHMP UpdateCOUNTY OF KERN
B.1-10
PC Meeting1 Sign In 10
FEMA/Cal OES Submission Draft 10-27-2020

Kern Multi-Jurisdiction 2020 MJHMP UpdateCOUNTY OF KERN
B.1-11
PC Meeting1 Sign In 11
FEMA/Cal OES Submission Draft 10-27-2020

Kern Multi-Jurisdiction 2020 MJHMP UpdateCOUNTY OF KERN
B.1-12
PC Meeting1 Sign In 12
FEMA/Cal OES Submission Draft 10-27-2020

Kern Multi-Jurisdiction 2020 MJHMP UpdateCOUNTY OF KERN
B.1-13
PC Meeting1 Sign In 13
FEMA/Cal OES Submission Draft 10-27-2020

Kern Multi-Jurisdiction 2020 MJHMP UpdateCOUNTY OF KERN
B.1-14
PC Meeting1 Sign In 2
FEMA/Cal OES Submission Draft 10-27-2020

Kern Multi-Jurisdiction 2020 MJHMP UpdateCOUNTY OF KERN
B.1-15
PC Meeting1 Sign In 3
FEMA/Cal OES Submission Draft 10-27-2020

Kern Multi-Jurisdiction 2020 MJHMP UpdateCOUNTY OF KERN
B.1-16
PC Meeting1 Sign In 4
FEMA/Cal OES Submission Draft 10-27-2020

Kern Multi-Jurisdiction 2020 MJHMP UpdateCOUNTY OF KERN
B.1-17
PC Meeting1 Sign In 5
FEMA/Cal OES Submission Draft 10-27-2020

Kern Multi-Jurisdiction 2020 MJHMP UpdateCOUNTY OF KERN
B.1-18
PC Meeting1 Sign In 6
FEMA/Cal OES Submission Draft 10-27-2020

Kern Multi-Jurisdiction 2020 MJHMP UpdateCOUNTY OF KERN
B.1-19
PC Meeting1 Sign In 7
FEMA/Cal OES Submission Draft 10-27-2020

Kern Multi-Jurisdiction 2020 MJHMP UpdateCOUNTY OF KERN
B.1-20
PC Meeting1 Sign In 8
FEMA/Cal OES Submission Draft 10-27-2020
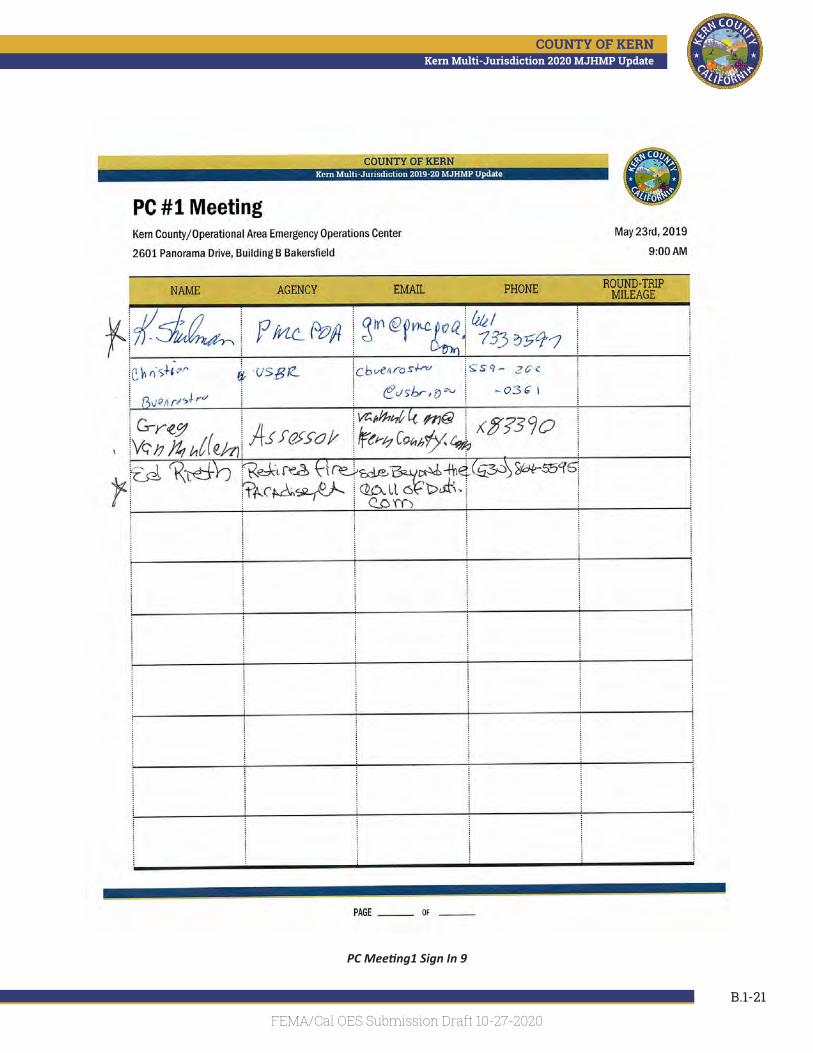
Kern Multi-Jurisdiction 2020 MJHMP UpdateCOUNTY OF KERN
B.1-21
PC Meeting1 Sign In 9
FEMA/Cal OES Submission Draft 10-27-2020
Kern Multi-Jurisdiction 2020 MJHMP UpdateCOUNTY OF KERN
B.1-22
PC Meeting 1 Photo 1
FEMA/Cal OES Submission Draft 10-27-2020

Kern Multi-Jurisdiction 2020 MJHMP UpdateCOUNTY OF KERN
B.1-23
PC Meeting 1 Photo 2
FEMA/Cal OES Submission Draft 10-27-2020

Kern Multi-Jurisdiction 2020 MJHMP UpdateCOUNTY OF KERN
B.1-24
PC Meeting 1 Photo 3
FEMA/Cal OES Submission Draft 10-27-2020

Kern Multi-Jurisdiction 2020 MJHMP UpdateCOUNTY OF KERN
B.1-25
Meeting 2 MailChimp Notification
FEMA/Cal OES Submission Draft 10-27-2020

Kern Multi-Jurisdiction 2020 MJHMP UpdateCOUNTY OF KERN
B.1-26
1
Meeting Agenda Kern County Multi-Jurisdiction Hazard Mitigation Plan 2019-20 Update
Planning Committee Meeting #2
Thursday, July 18th, 2019, 9:00 a.m. – 12:00 p.m.
Meeting Objectives • Welcome and Introductions
• Meeting #1 Recap
• Planning Team Development
• Risk Assessment Data Review
• IRAMP Tool Review
• IRAMP Exercises
• Next Steps
Project Website: mitigatehazards.com
Project Webpage: http://mitigatehazards.com/county-of-kern/
Website Password: Kern2020
Polling Website for Smartphone: www.pollev.com/dynamicplanning
NOTES:
PC Meeting 2 Agenda 1
FEMA/Cal OES Submission Draft 10-27-2020

Kern Multi-Jurisdiction 2020 MJHMP UpdateCOUNTY OF KERN
B.1-27
2
Kern County Hazard Risk Assessment Criteria Planning Committee Meeting #2, July 18th, 2019
Probability
What is the likelihood of a hazard event occurring in a given year?
Unlikely - less than 1% annual probability
Possible - between 1 & 10% annual probability
Likely - between 10 &100% annual probability
Highly likely - 100% annual probability
Impact
In terms of injuries, damage, or death, would you anticipate impacts to be minor, limited, critical, or catastrophic when a significant hazard event occurs?
Minor - very few injuries, if any. Only minor property damage & minimal disruption on quality of life. Temporary shutdown of critical facilities.
Limited - minor injuries only. More than 10% of property in affected area damaged or destroyed. Complete shutdown of critical facilities for more than one day.
Critical - multiple deaths/injuries possible. More than 25% of property in affected area damaged or destroyed. Complete shutdown of critical facilities for more than one week.
Catastrophic - high number of deaths/injuries possible. More than 50% of property in affected area damaged or destroyed. Complete shutdown of critical facilities for 30 days or more.
PC Meeting 2 Agenda 2
FEMA/Cal OES Submission Draft 10-27-2020

Kern Multi-Jurisdiction 2020 MJHMP UpdateCOUNTY OF KERN
B.1-28
PC Meeting 2 Sign In 1
FEMA/Cal OES Submission Draft 10-27-2020

Kern Multi-Jurisdiction 2020 MJHMP UpdateCOUNTY OF KERN
B.1-29
PC Meeting 2 Sign In 10
FEMA/Cal OES Submission Draft 10-27-2020
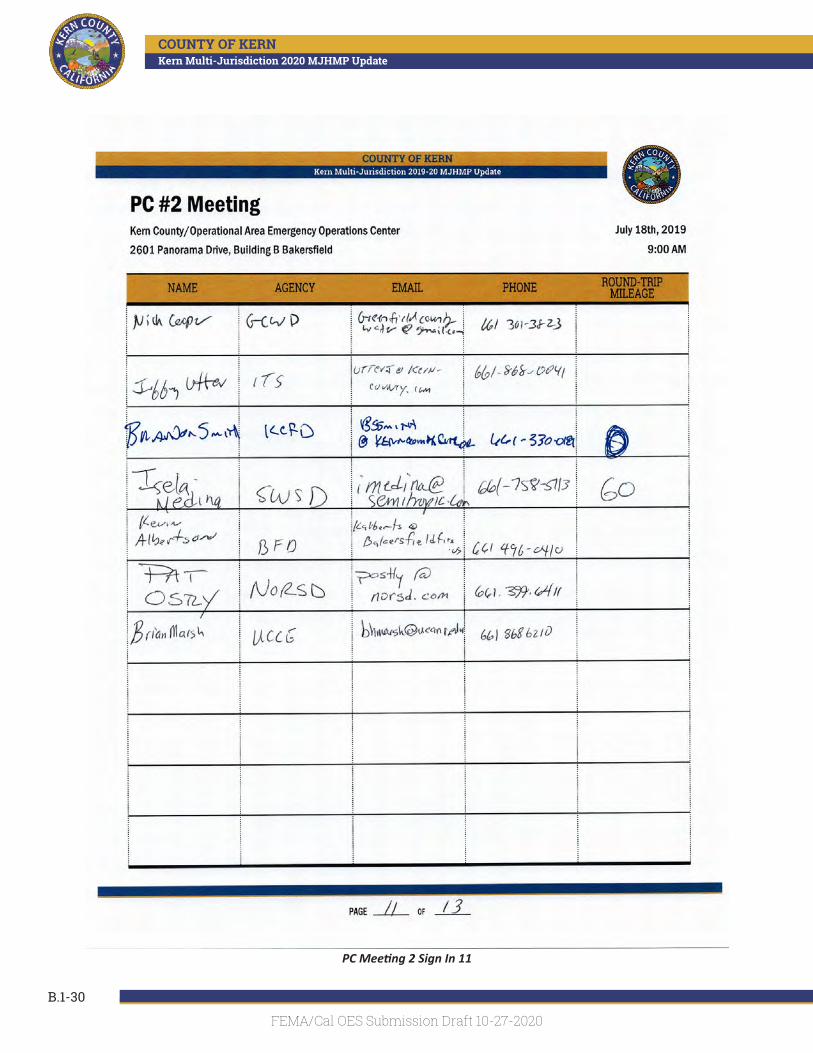
Kern Multi-Jurisdiction 2020 MJHMP UpdateCOUNTY OF KERN
B.1-30
PC Meeting 2 Sign In 11
FEMA/Cal OES Submission Draft 10-27-2020

Kern Multi-Jurisdiction 2020 MJHMP UpdateCOUNTY OF KERN
B.1-31
PC Meeting 2 Sign In 12
FEMA/Cal OES Submission Draft 10-27-2020

Kern Multi-Jurisdiction 2020 MJHMP UpdateCOUNTY OF KERN
B.1-32
PC Meeting 2 Sign In 13
FEMA/Cal OES Submission Draft 10-27-2020

Kern Multi-Jurisdiction 2020 MJHMP UpdateCOUNTY OF KERN
B.1-33
PC Meeting 2 Sign In 2
FEMA/Cal OES Submission Draft 10-27-2020

Kern Multi-Jurisdiction 2020 MJHMP UpdateCOUNTY OF KERN
B.1-34
PC Meeting 2 Sign In 3
FEMA/Cal OES Submission Draft 10-27-2020
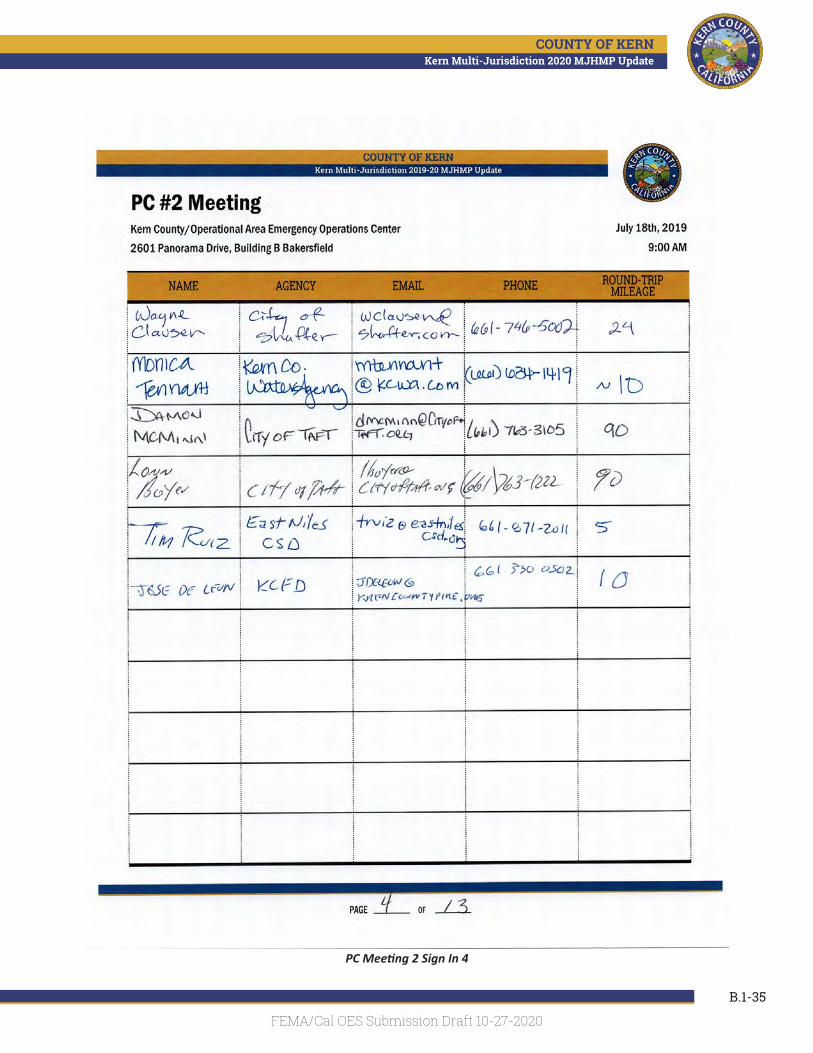
Kern Multi-Jurisdiction 2020 MJHMP UpdateCOUNTY OF KERN
B.1-35
PC Meeting 2 Sign In 4
FEMA/Cal OES Submission Draft 10-27-2020

Kern Multi-Jurisdiction 2020 MJHMP UpdateCOUNTY OF KERN
B.1-36
PC Meeting 2 Sign In 5
FEMA/Cal OES Submission Draft 10-27-2020

Kern Multi-Jurisdiction 2020 MJHMP UpdateCOUNTY OF KERN
B.1-37
PC Meeting 2 Sign In 6
FEMA/Cal OES Submission Draft 10-27-2020

Kern Multi-Jurisdiction 2020 MJHMP UpdateCOUNTY OF KERN
B.1-38
PC Meeting 2 Sign In 7
FEMA/Cal OES Submission Draft 10-27-2020

Kern Multi-Jurisdiction 2020 MJHMP UpdateCOUNTY OF KERN
B.1-39
PC Meeting 2 Sign In 8
FEMA/Cal OES Submission Draft 10-27-2020

Kern Multi-Jurisdiction 2020 MJHMP UpdateCOUNTY OF KERN
B.1-40
PC Meeting 2 Sign In 9
FEMA/Cal OES Submission Draft 10-27-2020

Kern Multi-Jurisdiction 2020 MJHMP UpdateCOUNTY OF KERN
B.1-41
PC Meeting 2 Photo 1
FEMA/Cal OES Submission Draft 10-27-2020

Kern Multi-Jurisdiction 2020 MJHMP UpdateCOUNTY OF KERN
B.1-42
PC Meeting 2 Photo 2
FEMA/Cal OES Submission Draft 10-27-2020

Kern Multi-Jurisdiction 2020 MJHMP UpdateCOUNTY OF KERN
B.1-43
Meeting 3 MailChimp Notification
FEMA/Cal OES Submission Draft 10-27-2020

Kern Multi-Jurisdiction 2020 MJHMP UpdateCOUNTY OF KERN
B.1-44
1
Meeting Agenda Kern County Multi-Jurisdiction Hazard Mitigation Plan 2019-20 Update
Planning Committee Meeting #3
Thursday, September 19th, 2019, 9:00 a.m. – 12:00 p.m.
Meeting Objectives:
• Welcome and Introductions
• Planning Process Recap
• Pinpointing your Vulnerabilities
• Developing a Nexus to HMA Funding
• Next Steps
Project Website: mitigatehazards.com
Project Webpage: mitigatehazards.com/county-of-kern/
Website Password: Kern2020
Polling Website for Smartphone: pollev.com/dynamicplanning
NOTES:
PC Meeting 3 Agenda
FEMA/Cal OES Submission Draft 10-27-2020

Kern Multi-Jurisdiction 2020 MJHMP UpdateCOUNTY OF KERN
B.1-45
PC Meeting 3 Sign In 1
FEMA/Cal OES Submission Draft 10-27-2020

Kern Multi-Jurisdiction 2020 MJHMP UpdateCOUNTY OF KERN
B.1-46
PC Meeting 3 Sign In 10
FEMA/Cal OES Submission Draft 10-27-2020

Kern Multi-Jurisdiction 2020 MJHMP UpdateCOUNTY OF KERN
B.1-47
PC Meeting 3 Sign In 11
FEMA/Cal OES Submission Draft 10-27-2020

Kern Multi-Jurisdiction 2020 MJHMP UpdateCOUNTY OF KERN
B.1-48
PC Meeting 3 Sign In 12
FEMA/Cal OES Submission Draft 10-27-2020

Kern Multi-Jurisdiction 2020 MJHMP UpdateCOUNTY OF KERN
B.1-49
PC Meeting 3 Sign In 13
FEMA/Cal OES Submission Draft 10-27-2020

Kern Multi-Jurisdiction 2020 MJHMP UpdateCOUNTY OF KERN
B.1-50
PC Meeting 3 Sign In 2
FEMA/Cal OES Submission Draft 10-27-2020

Kern Multi-Jurisdiction 2020 MJHMP UpdateCOUNTY OF KERN
B.1-51
PC Meeting 3 Sign In 3
FEMA/Cal OES Submission Draft 10-27-2020

Kern Multi-Jurisdiction 2020 MJHMP UpdateCOUNTY OF KERN
B.1-52
PC Meeting 3 Sign In 4
FEMA/Cal OES Submission Draft 10-27-2020

Kern Multi-Jurisdiction 2020 MJHMP UpdateCOUNTY OF KERN
B.1-53
PC Meeting 3 Sign In 5
FEMA/Cal OES Submission Draft 10-27-2020

Kern Multi-Jurisdiction 2020 MJHMP UpdateCOUNTY OF KERN
B.1-54
PC Meeting 3 Sign In 6
FEMA/Cal OES Submission Draft 10-27-2020

Kern Multi-Jurisdiction 2020 MJHMP UpdateCOUNTY OF KERN
B.1-55
PC Meeting 3 Sign In 7
FEMA/Cal OES Submission Draft 10-27-2020

Kern Multi-Jurisdiction 2020 MJHMP UpdateCOUNTY OF KERN
B.1-56
PC Meeting 3 Sign In 8
FEMA/Cal OES Submission Draft 10-27-2020

Kern Multi-Jurisdiction 2020 MJHMP UpdateCOUNTY OF KERN
B.1-57
PC Meeting 3 Sign In 9
FEMA/Cal OES Submission Draft 10-27-2020

Kern Multi-Jurisdiction 2020 MJHMP UpdateCOUNTY OF KERN
B.1-58
PC Meeting 3 Photo 1
FEMA/Cal OES Submission Draft 10-27-2020

Kern Multi-Jurisdiction 2020 MJHMP UpdateCOUNTY OF KERN
B.1-59
PC Meeting 3 Photo 2
FEMA/Cal OES Submission Draft 10-27-2020

Kern Multi-Jurisdiction 2020 MJHMP UpdateCOUNTY OF KERN
B.1-60
PC Meeting 3 Photo 3
FEMA/Cal OES Submission Draft 10-27-2020

Kern Multi-Jurisdiction 2020 MJHMP UpdateCOUNTY OF KERN
B.1-61
Meeting 4 MailChimp Notification
FEMA/Cal OES Submission Draft 10-27-2020

Kern Multi-Jurisdiction 2020 MJHMP UpdateCOUNTY OF KERN
B.1-62
1
Meeting Agenda Kern County Multi-Jurisdiction Hazard Mitigation Plan 2019-20 Update
Planning Committee Meeting #4
Thursday, November 14th, 2019, 9:00 a.m. – 12:00 p.m.
Meeting Objectives:
• Welcome and Introductions
• Planning Process Recap
• Mitigation Alternatives
• Hazard Areas of Concern
• Goals & Objectives Review (previous plan)
• Updating the mitigation strategy
Project Website: mitigatehazards.com
Project Webpage: mitigatehazards.com/county-of-kern/
Website Password: Kern2020
Polling Website for Smartphone: pollev.com/dynamicplanning
NOTES:
PC Meeting 4 Agenda 1
FEMA/Cal OES Submission Draft 10-27-2020

Kern Multi-Jurisdiction 2020 MJHMP UpdateCOUNTY OF KERN
B.1-63
PC Meeting 4 Sign in 1
FEMA/Cal OES Submission Draft 10-27-2020

Kern Multi-Jurisdiction 2020 MJHMP UpdateCOUNTY OF KERN
B.1-64
PC Meeting 4 Sign in 10
FEMA/Cal OES Submission Draft 10-27-2020

Kern Multi-Jurisdiction 2020 MJHMP UpdateCOUNTY OF KERN
B.1-65
PC Meeting 4 Sign in 2
FEMA/Cal OES Submission Draft 10-27-2020

Kern Multi-Jurisdiction 2020 MJHMP UpdateCOUNTY OF KERN
B.1-66
PC Meeting 4 Sign in 3
FEMA/Cal OES Submission Draft 10-27-2020

Kern Multi-Jurisdiction 2020 MJHMP UpdateCOUNTY OF KERN
B.1-67
PC Meeting 4 Sign in 4
FEMA/Cal OES Submission Draft 10-27-2020

Kern Multi-Jurisdiction 2020 MJHMP UpdateCOUNTY OF KERN
B.1-68
PC Meeting 4 Sign in 5
FEMA/Cal OES Submission Draft 10-27-2020

Kern Multi-Jurisdiction 2020 MJHMP UpdateCOUNTY OF KERN
B.1-69
PC Meeting 4 Sign in 6
FEMA/Cal OES Submission Draft 10-27-2020

Kern Multi-Jurisdiction 2020 MJHMP UpdateCOUNTY OF KERN
B.1-70
PC Meeting 4 Sign in 7
FEMA/Cal OES Submission Draft 10-27-2020

Kern Multi-Jurisdiction 2020 MJHMP UpdateCOUNTY OF KERN
B.1-71
PC Meeting 4 Sign in 8
FEMA/Cal OES Submission Draft 10-27-2020

Kern Multi-Jurisdiction 2020 MJHMP UpdateCOUNTY OF KERN
B.1-72
PC Meeting 4 Sign in 9
FEMA/Cal OES Submission Draft 10-27-2020

Kern Multi-Jurisdiction 2020 MJHMP UpdateCOUNTY OF KERN
B.1-73
PC Meeting 4 Photo 1
FEMA/Cal OES Submission Draft 10-27-2020

Kern Multi-Jurisdiction 2020 MJHMP UpdateCOUNTY OF KERN
B.1-74
PC Meeting 4 Photo 2
FEMA/Cal OES Submission Draft 10-27-2020
Kern Multi-Jurisdiction 2020 MJHMP UpdateCOUNTY OF KERN
B.1-75
PC Meeting 4 Photo 3
FEMA/Cal OES Submission Draft 10-27-2020

Kern Multi-Jurisdiction 2020 MJHMP UpdateCOUNTY OF KERN
B.1-76
PAGE INTENTIONALLY BLANK
FEMA/Cal OES Submission Draft 10-27-2020

Kern Multi-Jurisdiction 2020 MJHMP UpdateCOUNTY OF KERN
Public Notice & Press Release Documentation
Appendix B.2
FEMA/Cal OES Submission Draft 10-27-2020

Kern Multi-Jurisdiction 2020 MJHMP UpdateCOUNTY OF KERN
PAGE INTENTIONALLY BLANK
FEMA/Cal OES Submission Draft 10-27-2020

Kern Multi-Jurisdiction 2020 MJHMP UpdateCOUNTY OF KERN
B.2-1
survey graphic
FEMA/Cal OES Submission Draft 10-27-2020

Kern Multi-Jurisdiction 2020 MJHMP UpdateCOUNTY OF KERN
B.2-2
PAGE INTENTIONALLY BLANK
FEMA/Cal OES Submission Draft 10-27-2020

Kern Multi-Jurisdiction 2020 MJHMP UpdateCOUNTY OF KERN
Survey & Results Documentation
Appendix B.3
FEMA/Cal OES Submission Draft 10-27-2020

Kern Multi-Jurisdiction 2020 MJHMP UpdateCOUNTY OF KERN
PAGE INTENTIONALLY BLANK
FEMA/Cal OES Submission Draft 10-27-2020

Kern Multi-Jurisdiction 2020 MJHMP UpdateCOUNTY OF KERN
B.3-1
1,046 responses
1,169 responses
ArvinBakersfieldCalifornia CityDelanoMaricopaMcFarlandRidgecrestShafter
1/11
16.4%
14.8%
42%
Welcome to the Kern Hazard Mitigation Plan Survey!!! https://docs.google.com/forms/d/1ZPs776C9XG2ut262KQiUeICjPOQX...
2 of 20 8/19/2020, 4:01 PM
Kern Survey Results Summary
1,169 responses
1,169 responses
YesNoDid not have an optionCan't remember
28.4%
60.3%
YesNo
22.1%
77.9%
Welcome to the Kern Hazard Mitigation Plan Survey!!! https://docs.google.com/forms/d/1ZPs776C9XG2ut262KQiUeICjPOQX...
3 of 20 8/19/2020, 4:01 PM
FEMA/Cal OES Submission Draft 10-27-2020

Kern Multi-Jurisdiction 2020 MJHMP UpdateCOUNTY OF KERN
B.3-2
1,162 responses
0 200 400 600 800
Flooding (includingfrom a river, local…
WildfireDam Failure
Drought (agriculturalor domestic)
Severe Weather –Winter (extremely low
…
None of the above.WindWind
Power loss
Power outageTree fell on my home
Dust stormsHigh winds (winter)
Heavy WindsCRIME
Trees falling from highwinds
no water, no power
Alkaline leachingTerror activities
earthquakeDismantling of Ham
radio repeaters. I b…Power Outages
DUSTCedar Fire
Power outages
Power OutagesTransfers
Toxic waste dumpLack of public safety
PSPS EventPower Shut Downs
Tree branch died andfell thru my house…
119 (10.2%)777 (66.9%)
289 (24.9%)60 (5.2%)
14 (1.2%)447 (38.5%)
56 (4.8%)574 (49.4%)
312 (26.9%)18 (1.5%)
45 (3.9%)149 (12.8%)
2 (0.2%)2 (0.2%)1 (0.1%)1 (0.1%)1 (0.1%)1 (0.1%)1 (0.1%)1 (0.1%)1 (0.1%)1 (0.1%)1 (0.1%)1 (0.1%)1 (0.1%)1 (0.1%)1 (0.1%)1 (0.1%)1 (0.1%)1 (0.1%)1 (0.1%)1 (0.1%)1 (0.1%)1 (0.1%)1 (0.1%)1 (0.1%)1 (0.1%)1 (0.1%)1 (0.1%)1 (0.1%)1 (0.1%)1 (0.1%)1 (0.1%)1 (0.1%)1 (0.1%)1 (0.1%)1 (0.1%)1 (0.1%)1 (0.1%)
Welcome to the Kern Hazard Mitigation Plan Survey!!! https://docs.google.com/forms/d/1ZPs776C9XG2ut262KQiUeICjPOQX...
4 of 20 8/19/2020, 4:01 PMKern Survey Results Summary
1,169 responses
YesNoSomewhat31.1%9.5%
59.5%
Welcome to the Kern Hazard Mitigation Plan Survey!!! https://docs.google.com/forms/d/1ZPs776C9XG2ut262KQiUeICjPOQX...
5 of 20 8/19/2020, 4:01 PM
FEMA/Cal OES Submission Draft 10-27-2020

Kern Multi-Jurisdiction 2020 MJHMP UpdateCOUNTY OF KERN
B.3-3
1,144 responses
homeowners /renters insuranc…Installed alternate
power supply;gener…
Installed basementflood proofing
measu…purchased
earthquakeinsurance
Own multiple Feetof Fire Hose
Doing
Purchased a fireextinguisher,
created …
no lawnRemove hazardous
treesfire extinguishers
Getting informationon how to prepare
f…
renter
Trim trees
Weed abatement
ManufactureHome, installed tie
downs i…
Keep weed growth
984 (86%)633 (55.3%)624 (54.5%)
441 (38.5%)353 (30.9%)
250 (21.9%)191 (16.7%)
36 (3.1%)16 (1.4%)5 (0.4%)3 (0.3%)2 (0.2%)2 (0.2%)1 (0.1%)1 (0.1%)1 (0.1%)1 (0.1%)1 (0.1%)1 (0.1%)1 (0.1%)1 (0.1%)1 (0.1%)1 (0.1%)1 (0.1%)1 (0.1%)1 (0.1%)1 (0.1%)1 (0.1%)1 (0.1%)1 (0.1%)1 (0.1%)1 (0.1%)1 (0.1%)1 (0.1%)1 (0.1%)1 (0.1%)1 (0.1%)1 (0.1%)1 (0.1%)1 (0.1%)1 (0.1%)1 (0.1%)1 (0.1%)1 (0.1%)1 (0.1%)1 (0.1%)1 (0.1%)1 (0.1%)1 (0.1%)
Welcome to the Kern Hazard Mitigation Plan Survey!!! https://docs.google.com/forms/d/1ZPs776C9XG2ut262KQiUeICjPOQX...
6 of 20 8/19/2020, 4:01 PMKern Survey Results Summary
FEMA/Cal OES Submission Draft 10-27-2020

Kern Multi-Jurisdiction 2020 MJHMP UpdateCOUNTY OF KERN
B.3-4
1,169 responses
0 200 400 600 800
Low Interest homeimprovement loans
Insurance premiumdiscounts
Building Permit FeeWaiver
NoneLower property tax
None of aboveN/A
Money free vouchersfrom kern county fo…
We are rentersI would love to see aprogram modelled …
Nothinghouse paid off
I don't knowRebates for artificial
turfGive us back our
insurance. We arebei…
InformationProperty tax relief for
improvements th…Small Grants to
individuals, rebates,h…
Help for low incomeperson to fix/corre…
Tax rebatesnone of the above
Property TaxDeductions
no cost climateadaptation planning
gui…
456 (39%)467 (39.9%)
780 (66.7%)788 (67.4%)
340 (29.1%)426 (36.4%)
455 (38.9%)5 (0.4%)4 (0.3%)2 (0.2%)1 (0.1%)1 (0.1%)1 (0.1%)1 (0.1%)1 (0.1%)1 (0.1%)1 (0.1%)1 (0.1%)1 (0.1%)1 (0.1%)1 (0.1%)1 (0.1%)1 (0.1%)1 (0.1%)1 (0.1%)1 (0.1%)1 (0.1%)1 (0.1%)1 (0.1%)1 (0.1%)1 (0.1%)1 (0.1%)1 (0.1%)1 (0.1%)1 (0.1%)1 (0.1%)1 (0.1%)1 (0.1%)1 (0.1%)1 (0.1%)1 (0.1%)1 (0.1%)1 (0.1%)1 (0.1%)1 (0.1%)1 (0.1%)1 (0.1%)1 (0.1%)1 (0.1%)
Welcome to the Kern Hazard Mitigation Plan Survey!!! https://docs.google.com/forms/d/1ZPs776C9XG2ut262KQiUeICjPOQX...
9 of 20 8/19/2020, 4:01 PMKern Survey Results Summary
FEMA/Cal OES Submission Draft 10-27-2020

Kern Multi-Jurisdiction 2020 MJHMP UpdateCOUNTY OF KERN
B.3-5
1,169 responses
strengthenessential facil…
Ensure thatemergency
shelters, the Em…Assist vulnerableproperty owners
with …Education and
assistance whereneeded i…
Assist Small LocalRural Communities
wi…Add additional fuel
breaks nearvulnera…
More controlledburns to clear
brush, d…Financially assist
low-incomehomeowner…
Lowet taxes soproperty owners
can affo…Abandoned
properties thathave overgrow…
closely monotorEdison's "effort" to
mi…Assistance for
small waterdistricts to…
Other
696 (59.5%)651 (55.7%)
538 (46%)802 (68.6%)
671 (57.4%)295 (25.2%)
483 (41.3%)634 (54.2%)
539 (46.1%)569 (48.7%)
18 (1.5%)2 (0.2%)1 (0.1%)1 (0.1%)1 (0.1%)1 (0.1%)1 (0.1%)1 (0.1%)1 (0.1%)1 (0.1%)1 (0.1%)1 (0.1%)1 (0.1%)1 (0.1%)1 (0.1%)1 (0.1%)1 (0.1%)1 (0.1%)1 (0.1%)1 (0.1%)1 (0.1%)1 (0.1%)1 (0.1%)1 (0.1%)1 (0.1%)1 (0.1%)1 (0.1%)1 (0.1%)1 (0.1%)1 (0.1%)1 (0.1%)1 (0.1%)1 (0.1%)1 (0.1%)1 (0.1%)1 (0.1%)1 (0.1%)1 (0.1%)1 (0.1%)
Welcome to the Kern Hazard Mitigation Plan Survey!!! https://docs.google.com/forms/d/1ZPs776C9XG2ut262KQiUeICjPOQX...
11 of 20 8/19/2020, 4:01 PMKern Survey Results Summary
FEMA/Cal OES Submission Draft 10-27-2020

Kern Multi-Jurisdiction 2020 MJHMP UpdateCOUNTY OF KERN
B.3-6
PAGE INTENTIONALLY BLANK
FEMA/Cal OES Submission Draft 10-27-2020

Kern Multi-Jurisdiction 2020 MJHMP UpdateCOUNTY OF KERN
Mitigation Strategy Prioritization Process Documentation
Appendix B.4
FEMA/Cal OES Submission Draft 10-27-2020

Kern Multi-Jurisdiction 2020 MJHMP UpdateCOUNTY OF KERN
PAGE INTENTIONALLY BLANK
FEMA/Cal OES Submission Draft 10-27-2020
Kern Multi-Jurisdiction 2020 MJHMP UpdateCOUNTY OF KERN
B.4-1
MAST Priority Field
FEMA/Cal OES Submission Draft 10-27-2020

Kern Multi-Jurisdiction 2020 MJHMP UpdateCOUNTY OF KERN
B.4-2
PAGE INTENTIONALLY BLANK
FEMA/Cal OES Submission Draft 10-27-2020

Kern Multi-Jurisdiction 2020 MJHMP UpdateCOUNTY OF KERN
Website Documentation
Appendix B.5
FEMA/Cal OES Submission Draft 10-27-2020

Kern Multi-Jurisdiction 2020 MJHMP UpdateCOUNTY OF KERN
PAGE INTENTIONALLY BLANK
FEMA/Cal OES Submission Draft 10-27-2020

Kern Multi-Jurisdiction 2020 MJHMP UpdateCOUNTY OF KERN
B.5-1
Executive Summary
FEMA/Cal OES Submission Draft 10-27-2020

Kern Multi-Jurisdiction 2020 MJHMP UpdateCOUNTY OF KERN
B.5-2
Mitigation at Home
FEMA/Cal OES Submission Draft 10-27-2020
Kern Multi-Jurisdiction 2020 MJHMP UpdateCOUNTY OF KERN
B.5-3
Other Planning Documents
FEMA/Cal OES Submission Draft 10-27-2020

Kern Multi-Jurisdiction 2020 MJHMP UpdateCOUNTY OF KERN
B.5-4
Get Involved
FEMA/Cal OES Submission Draft 10-27-2020

Kern Multi-Jurisdiction 2020 MJHMP UpdateCOUNTY OF KERN
B.5-5
Learn More
FEMA/Cal OES Submission Draft 10-27-2020
Kern Multi-Jurisdiction 2020 MJHMP UpdateCOUNTY OF KERN
B.5-6
Documents
FEMA/Cal OES Submission Draft 10-27-2020

Kern Multi-Jurisdiction 2020 MJHMP UpdateCOUNTY OF KERN
B.5-7
RAMP
FEMA/Cal OES Submission Draft 10-27-2020

Kern Multi-Jurisdiction 2020 MJHMP UpdateCOUNTY OF KERN
B.5-8
Planning Library
FEMA/Cal OES Submission Draft 10-27-2020

Kern Multi-Jurisdiction 2020 MJHMP UpdateCOUNTY OF KERN
B.5-9
Meetings
FEMA/Cal OES Submission Draft 10-27-2020

Kern Multi-Jurisdiction 2020 MJHMP UpdateCOUNTY OF KERN
B.5-10
Documents
FEMA/Cal OES Submission Draft 10-27-2020

Kern Multi-Jurisdiction 2020 MJHMP UpdateCOUNTY OF KERN
B.5-11
Project Management Team
FEMA/Cal OES Submission Draft 10-27-2020

Kern Multi-Jurisdiction 2020 MJHMP UpdateCOUNTY OF KERN
B.5-12
PAGE INTENTIONALLY BLANK
FEMA/Cal OES Submission Draft 10-27-2020