Land Cover/Use Spatial Change Detection and Analysis for Landfill Determination using Geospatial...
9
IOSR Journal of Environmental Science, Toxicology and Food Technology (IOSR-JESTFT) e-ISSN: 2319-2402,p- ISSN: 2319-2399.Volume 8, Issue 12 Ver. III (Dec. 2014), PP 24-32 www.iosrjournals.org www.iosrjournals.org 24 | Page Land Cover/Use Spatial Change Detection and Analysis for Landfill Determination using Geospatial Technology Approach for Bauchi, Bauchi State, Nigeria 1 Shuaibu, A. M., 2 Musa, A. A. & 3 Idowu, T. O. 1 Dept. of Surveying & Geoinformatics, Abubakar Tafawa Balewa University, Bauchi, Nigeria 2 Dept. of Surveying & Geoinformatics, Modibbo Adama University of Technology,Yola,Nigeria 3 Dept. of Surveying & Geoinformatics, Federal University of Technology, Akure, Nigeria Abstract: The major spatial challenge in landfill determination is the classical identification of spaces available for its location in an area. Researches recently have indicated that spatial change detection and analysis could be carried out easily, very fast and accurately to provide specific spatial information needed on land cover/use using geospatial technology approach. The acquisition of spatial data for all geographic spaces at different epochs through remote sensing has become powerful technology for generating spatial data about geographical features. This study used satellite imagery and GIS techniques to assess spatial changes in land cover/use in Bauchi over a period of two decades. The study made use of Landsat images of 1994 and 2014 as basic data for change detection in the area. Color composite of the images were made and then classified using the Maximum Likelihood classification techniques with the aid of Integrated Land and Water Information System (ILWIS) Software. IDRISI 32 software was used for post-classification comparisons, while HP 620 laptop computer and handhelt GPS were used as the hardware for data capture and input. Paired t-test and cross tabulation analyses were carried out and the results indicated that land cover changes occurred in bare surface (-1.12%), built-up area (+1.27%), farmland (+41.31%), rock outcrop (+0.44%) and vegetation (- 55.86%) in the study area between the periods. The study highlights the importance of spatial change detection in uncovering land cover situation in Bauchi. Two factors were discovered to have caused the change; population and increased in income of the inhabitants. Aforestation to control deforestation and landfill to be located on farmland were among other recommendations made towards achieving an efficient refuse disposal and sustainable management in Bauchi metropolis. Key words: Geospatial Technology, land cover/use, spatial change analysis, landfill I. Introduction Current information about land cover/use are sacrosanct in spatial site selection planning especially for landfill determination. This information, as stipulated in the ethical documents of good practices in geomatics, is required as reconnaissance information to enable realistic spatial planning work. To obtain current information about land cover/use of a given area, is to compare spatially at different epochs what occurred in the area using spatial change detection technique. Spatial change detection is a process of identifying differences in the state of a phenomenon by observation at different epoch (Singh, 1989 and Orisakwe, 2008). There are many methods available to spatial change detection such as field survey, photogrammetry, graphic, remote sensing etc. Remote sensing together with GIS is now widely prepared over classical methods for faster and more accurate spatial change detection (Orisakwe 2008; Olaleye, Abiodun and Igbokwe 2009; Shuaibu and Sulaiman, 2012). As reported in Orisakwe (2008), many researchers such as Pender and Mills (1999), Adeniyi and Omojola (1999) used satellite images and GIS techniques in land cover/use change detection in Zimbabwe and Nigeria respectively for mapping and generation of land cover/use map and statistics. The explaination given by Ezeigbo (1989) and Ndukwe (2001) to remote sensing as remote gathering of information at interval of time without physical contact on a phenomenon makes sense in the usage of its data for change detection work. Likewise GIS as described by Uluaocha (2007) to be a collection of hardware and software with geodata and procedures to manipulate data for spatial analysis indicate its relevance for adoption in spatial change detection analysis. Moreover, Shuaibu and Sulaiman (2012) observed that while remote sensing data provide reliable, timely, accurate, and periodic data, GIS provides various methods of integrating many data or information to create or model different planning scenarios for sound decision making. These concepts were applied that revealed the situation of land cover/use trends and other information provided from the spatial change detection and analysis in the study area. This information could help for the location of landfill in the study area.
-
Upload
independent -
Category
Documents
-
view
5 -
download
0
Transcript of Land Cover/Use Spatial Change Detection and Analysis for Landfill Determination using Geospatial...
IOSR Journal of Environmental Science, Toxicology and Food Technology (IOSR-JESTFT)
e-ISSN: 2319-2402,p- ISSN: 2319-2399.Volume 8, Issue 12 Ver. III (Dec. 2014), PP 24-32 www.iosrjournals.org
www.iosrjournals.org 24 | Page
Land Cover/Use Spatial Change Detection and Analysis for
Landfill Determination using Geospatial Technology Approach
for Bauchi, Bauchi State, Nigeria
1Shuaibu, A. M.,
2Musa, A. A. &
3Idowu, T. O.
1Dept. of Surveying & Geoinformatics, Abubakar Tafawa Balewa University, Bauchi, Nigeria 2Dept. of
Surveying & Geoinformatics, Modibbo Adama University of Technology,Yola,Nigeria 3Dept. of Surveying & Geoinformatics, Federal University of Technology, Akure, Nigeria
Abstract: The major spatial challenge in landfill determination is the classical identification of spaces
available for its location in an area. Researches recently have indicated that spatial change detection and
analysis could be carried out easily, very fast and accurately to provide specific spatial information needed on
land cover/use using geospatial technology approach. The acquisition of spatial data for all geographic spaces
at different epochs through remote sensing has become powerful technology for generating spatial data about
geographical features. This study used satellite imagery and GIS techniques to assess spatial changes in land cover/use in Bauchi over a period of two decades. The study made use of Landsat images of 1994 and 2014 as
basic data for change detection in the area. Color composite of the images were made and then classified using
the Maximum Likelihood classification techniques with the aid of Integrated Land and Water Information
System (ILWIS) Software. IDRISI 32 software was used for post-classification comparisons, while HP 620
laptop computer and handhelt GPS were used as the hardware for data capture and input. Paired t-test and
cross tabulation analyses were carried out and the results indicated that land cover changes occurred in bare
surface (-1.12%), built-up area (+1.27%), farmland (+41.31%), rock outcrop (+0.44%) and vegetation (-
55.86%) in the study area between the periods. The study highlights the importance of spatial change detection
in uncovering land cover situation in Bauchi. Two factors were discovered to have caused the change;
population and increased in income of the inhabitants. Aforestation to control deforestation and landfill to be
located on farmland were among other recommendations made towards achieving an efficient refuse disposal
and sustainable management in Bauchi metropolis.
Key words: Geospatial Technology, land cover/use, spatial change analysis, landfill
I. Introduction Current information about land cover/use are sacrosanct in spatial site selection planning especially for
landfill determination. This information, as stipulated in the ethical documents of good practices in geomatics,
is required as reconnaissance information to enable realistic spatial planning work. To obtain current
information about land cover/use of a given area, is to compare spatially at different epochs what occurred in the
area using spatial change detection technique. Spatial change detection is a process of identifying differences in
the state of a phenomenon by observation at different epoch (Singh, 1989 and Orisakwe, 2008).
There are many methods available to spatial change detection such as field survey, photogrammetry,
graphic, remote sensing etc. Remote sensing together with GIS is now widely prepared over classical methods
for faster and more accurate spatial change detection (Orisakwe 2008; Olaleye, Abiodun and Igbokwe 2009; Shuaibu and Sulaiman, 2012). As reported in Orisakwe (2008), many researchers such as Pender and Mills
(1999), Adeniyi and Omojola (1999) used satellite images and GIS techniques in land cover/use change
detection in Zimbabwe and Nigeria respectively for mapping and generation of land cover/use map and
statistics.
The explaination given by Ezeigbo (1989) and Ndukwe (2001) to remote sensing as remote gathering
of information at interval of time without physical contact on a phenomenon makes sense in the usage of its data
for change detection work. Likewise GIS as described by Uluaocha (2007) to be a collection of hardware and
software with geodata and procedures to manipulate data for spatial analysis indicate its relevance for adoption
in spatial change detection analysis. Moreover, Shuaibu and Sulaiman (2012) observed that while remote
sensing data provide reliable, timely, accurate, and periodic data, GIS provides various methods of integrating
many data or information to create or model different planning scenarios for sound decision making. These concepts were applied that revealed the situation of land cover/use trends and other information provided from
the spatial change detection and analysis in the study area. This information could help for the location of
landfill in the study area.
Land Cover/Use Spatial Change Detection and Analysis for Landfill Determination using Geospatial
www.iosrjournals.org 25 | Page
1.1 Statement of the Problem
The disposal of refuse (solid waste) has continued to cause a lot of quandaries especially in developing
cities. Various techniques were proposed for refuse disposal management such as; reduce, reuse and recycle, etc. But the final un-use refuse (residue) which is plentiful had to be taken to incinerators or disposed in landfill.
Incineration due to its high cost, is mostly used in countries with land scarcity and for energy generation like in
Japan, South Africa and Lagos in Nigeria (Shuaibu, 2014). However, the incineration technique could not be
sustained in Nigeria due to the high final implications and hence the landfill choice. While landfill involves the
burring of the refuse, e.g., in abandoned quarries, mining voids, borrow pits or specially made ones. This
method has remained a common practice and most economical for refuse end destination globally. However, it
is the determination of landfill that has become a big problem, because of the total lack of current spatial
information on land cover/use in developing cities (Shuaibu, 2014).
In Bauchi metropolis, spatial information on land cover/use has became obsolete. The one available
was produced before the creation of the state in 1968 which was to be updated after every twenty years
(Orisakwe, 2008). This situation may not be unconnected with the trobles of time consuming, conbusome activities and high financial requirements that are associated with classical methods of spatial change detection
couple with inaccuracy of analysis. Therefore, a faster and more accurate means of getting this information is
hihly diserable. Hence, the research attempted the use of geospatial technology for the detection and analysis of
land cover/use in the study area.
1.2 Aim and Objectives
The aim of the research is to applygeospatial technology in the detection and analysis of land cover/use
for the provision of spatial information for landfill determination in Bauchi metropolis. This was achieved using
the following objectives:
1) To acquire satellite images of the study area with atleast twenty years interval inbetween.
2) To identify land cover/use classes in the study area for change detection work.
3) To obtain spatial information on land cover/use classes for image training site technique. 4) To carry out spatial change detection and analyzes land cover/use in the study area.
5) To highlight relevant spatial information needed for landfill determination to aid in refuse disposal
management.
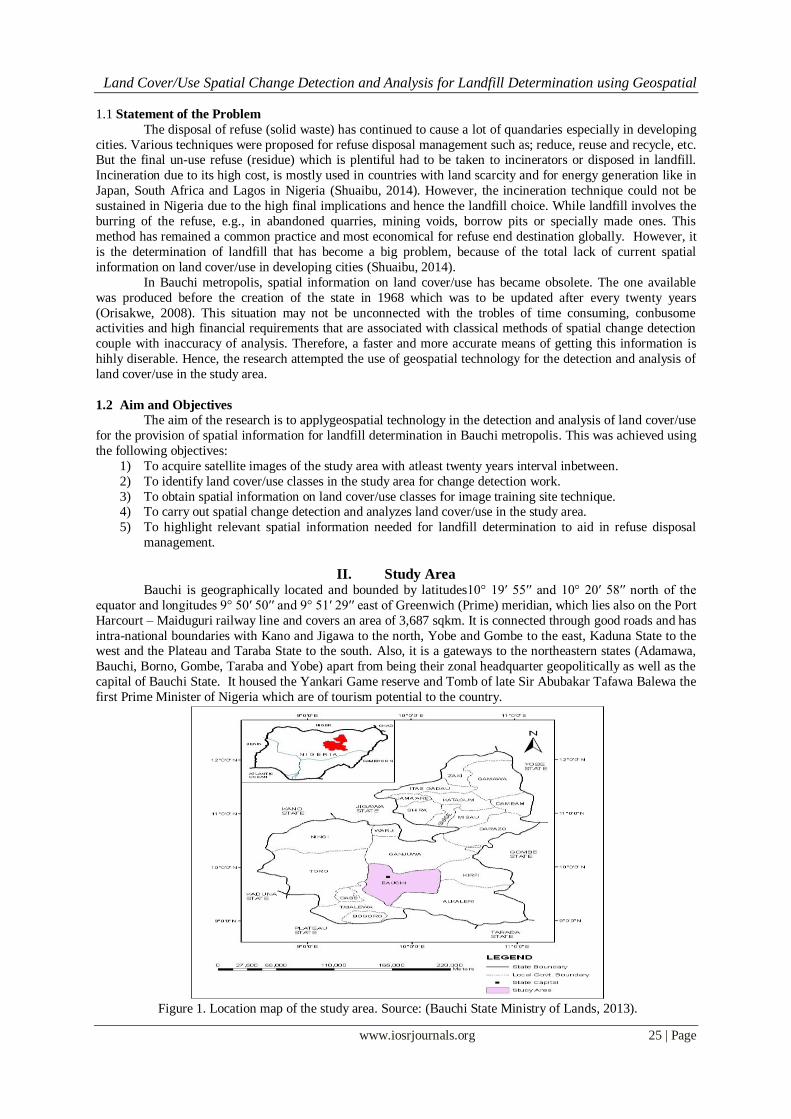
II. Study Area Bauchi is geographically located and bounded by latitudes10° 19′ 55′′ and 10° 20′ 58′′ north of the
equator and longitudes 9° 50′ 50′′ and 9° 51′ 29′′ east of Greenwich (Prime) meridian, which lies also on the Port
Harcourt – Maiduguri railway line and covers an area of 3,687 sqkm. It is connected through good roads and has
intra-national boundaries with Kano and Jigawa to the north, Yobe and Gombe to the east, Kaduna State to the west and the Plateau and Taraba State to the south. Also, it is a gateways to the northeastern states (Adamawa,
Bauchi, Borno, Gombe, Taraba and Yobe) apart from being their zonal headquarter geopolitically as well as the
capital of Bauchi State. It housed the Yankari Game reserve and Tomb of late Sir Abubakar Tafawa Balewa the
first Prime Minister of Nigeria which are of tourism potential to the country.
Figure 1. Location map of the study area. Source: (Bauchi State Ministry of Lands, 2013).
Land Cover/Use Spatial Change Detection and Analysis for Landfill Determination using Geospatial
www.iosrjournals.org 26 | Page
The population of the study area, according to the 2006 population census, the result stood at four
hundred and ninety-three thousand eight hundred and ten (493,810) persons. Agricultural practices for
production of both food and cash crops have captured the life of the inhabitants of the city. The climatic condition of the study area is very hot in the months of April and May while December
and January are the coldest months. Mean daily temperature ranges from 28.2°C in August to 36.6°C in April
maximum while from about 13.3°C in December to about 22.1°C in April and May minimum (Climate-data.org,
2013).There are two major seasons in Bauchi i.e. rainy and dry seasons. The rainy season months are May to
September, when humidity ranges from about 37% to 68%. The onset of the rains has been often in March and
they end virtually of October while the dry season starts from November to May (Weather-bug, 2013).
The topography of Bauchi metropolis is littly mountainous that lies in the crystalline uplands of
Northern Nigeria and they rose over 600m to 650m above sea level (OnlineNigeria. Com, 2013). Although, the
area is situated within the belt of open Sudan savannah characterized by sparse trees of up to 20ft or more. The
vegetation is less uniform and grasses are shorter than what grows due to considerable human interference
through cultivation, grazing and burning. This may not be unconnected with the vast fertile soil in the area as an advantage for cattle rearing and other agricultural activities for the production of products such as guinea corn,
rice, millet, groundnut and maize (BASG, 2012).
III. Methodology In this section, a detail description of equipment used, data acquired, software applied and various methods
adopted in this research are stated.
3.1 Data
The data requirements of this study were acquired to include primary and secondary data as follows:
Primary Data:
Spatial data for georeference, ground truth of the satellite images and coordinates known land
cover/use classes from Global Positioning System (GPS).
Attribute information from the field survey
Secondary Data:
Satellite images (Landsat TM and +ETM) of 1994 and 2014 for Bauchi metropolis from National
Remote Sensing Center, Jos was obtained.
3.2 Equipment and Software
3.2.1 Hardware
The facilities available for this research are: HP 620 laptop series, Pentium (R) Dual Core UPU, 700gb HDD, 4GB RAM, 4.40GHz microprocessor
speed, Web camp and Keyboard
Handheld GPS (GARMIN 76)
HP Desk Jet 2050A 3 in one Printer
HP Photo Smart (C5500 Series) printer, scanner and photocopier
External Drive 500GB
3.2.2 Software
The software includes the following:
Integrated Land and Water Information System (ILWIS) 3.3 Software
IDRISI 32 for windows
MATLAB R2010a Programming Language
Google Earth Pro 4.2
Microsoft word
Land Cover/Use Spatial Change Detection and Analysis for Landfill Determination using Geospatial
www.iosrjournals.org 27 | Page
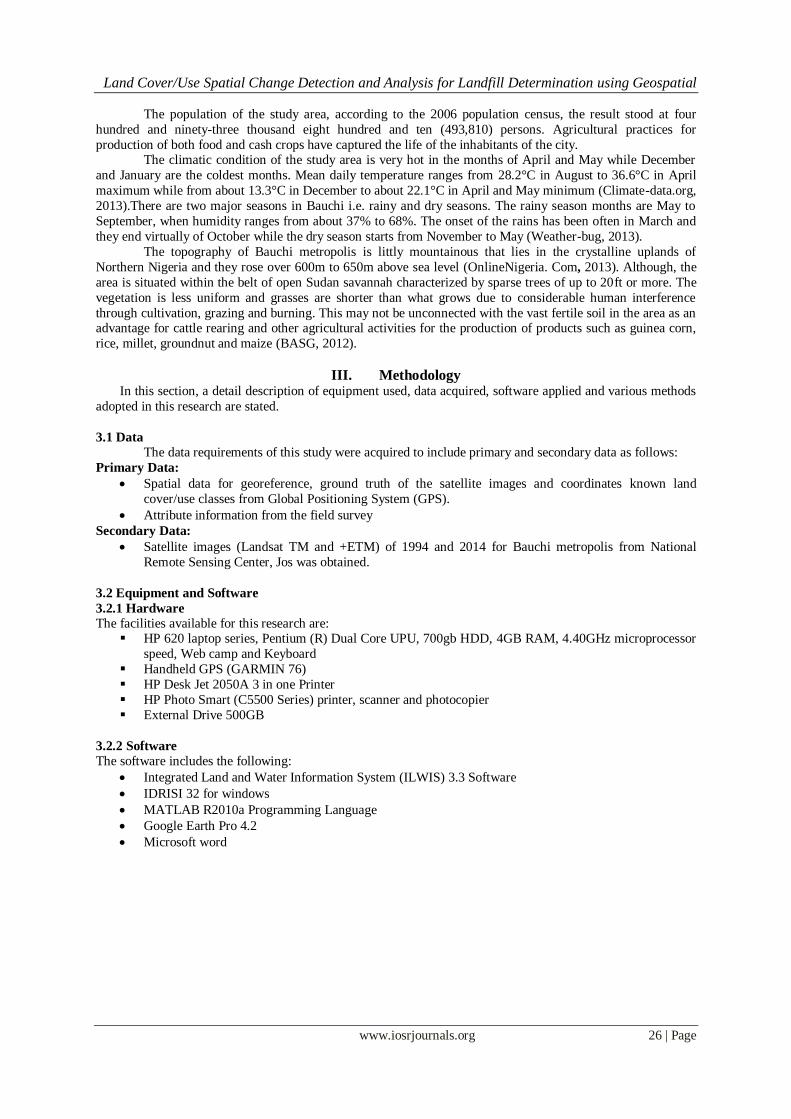
Figure 2. 1994-2014 bands 2_3_4 of the landsat images imported.
3.3 Importation of Satellite images
The images are imported from the file folder in the computer hard disk C to ILWIS environment
through import via geogateway. Each band 2, 3 and 4 for all the years were selected and imported as single
image. The images were then given tiff as the file format and save in the appropriate folder (see Figure 2). This
process was repeated until all the bands were imported.
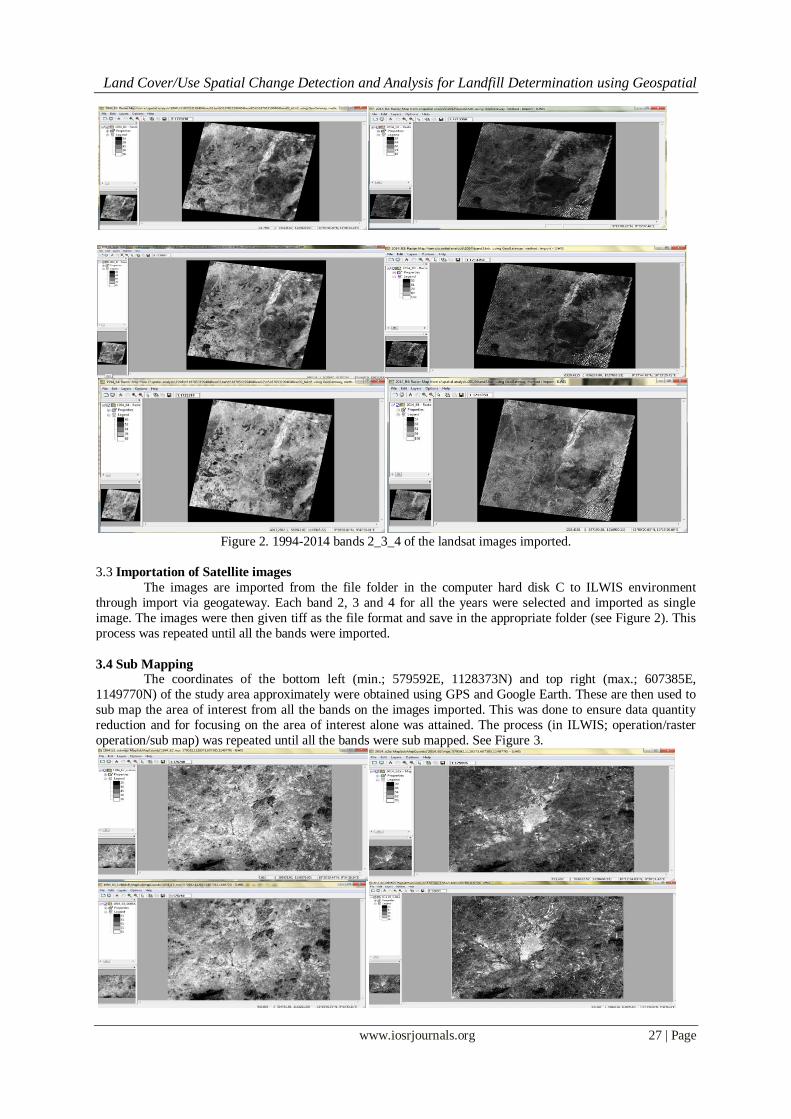
3.4 Sub Mapping The coordinates of the bottom left (min.; 579592E, 1128373N) and top right (max.; 607385E,
1149770N) of the study area approximately were obtained using GPS and Google Earth. These are then used to
sub map the area of interest from all the bands on the images imported. This was done to ensure data quantity
reduction and for focusing on the area of interest alone was attained. The process (in ILWIS; operation/raster
operation/sub map) was repeated until all the bands were sub mapped. See Figure 3.
Land Cover/Use Spatial Change Detection and Analysis for Landfill Determination using Geospatial
www.iosrjournals.org 28 | Page
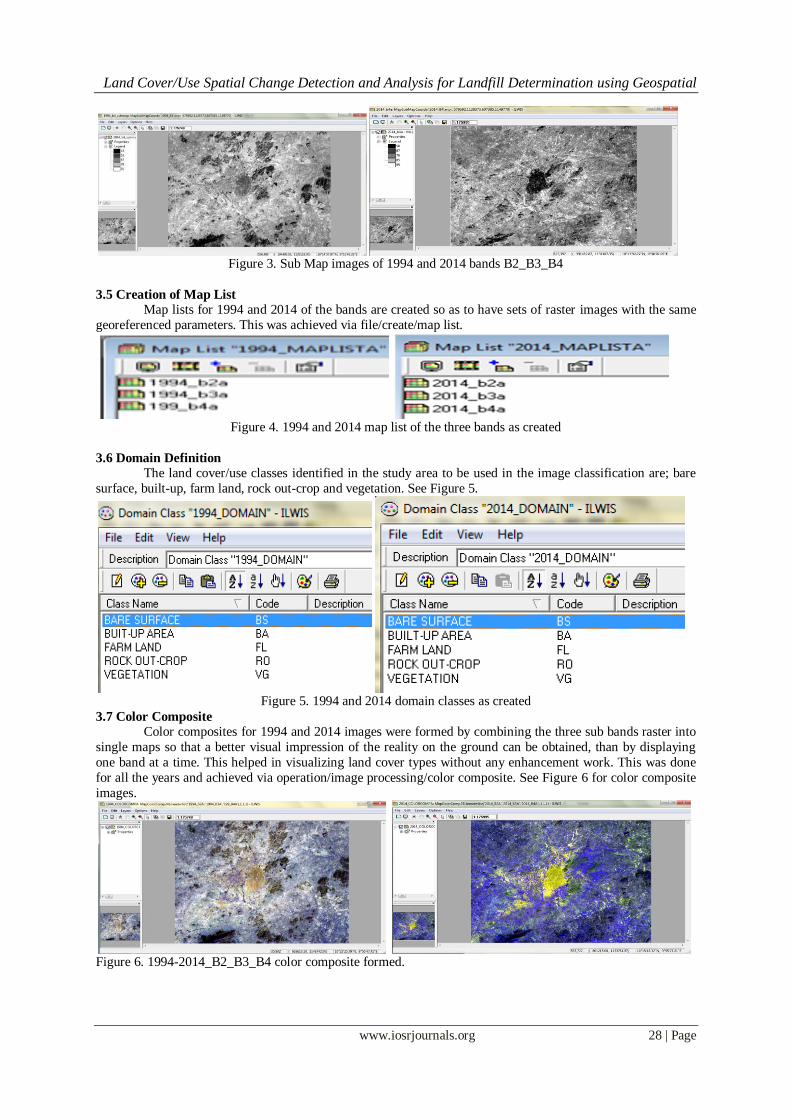
Figure 3. Sub Map images of 1994 and 2014 bands B2_B3_B4
3.5 Creation of Map List
Map lists for 1994 and 2014 of the bands are created so as to have sets of raster images with the same
georeferenced parameters. This was achieved via file/create/map list.
Figure 4. 1994 and 2014 map list of the three bands as created
3.6 Domain Definition
The land cover/use classes identified in the study area to be used in the image classification are; bare
surface, built-up, farm land, rock out-crop and vegetation. See Figure 5.
Figure 5. 1994 and 2014 domain classes as created
3.7 Color Composite
Color composites for 1994 and 2014 images were formed by combining the three sub bands raster into
single maps so that a better visual impression of the reality on the ground can be obtained, than by displaying
one band at a time. This helped in visualizing land cover types without any enhancement work. This was done
for all the years and achieved via operation/image processing/color composite. See Figure 6 for color composite
images.
Figure 6. 1994-2014_B2_B3_B4 color composite formed.
Land Cover/Use Spatial Change Detection and Analysis for Landfill Determination using Geospatial
www.iosrjournals.org 29 | Page
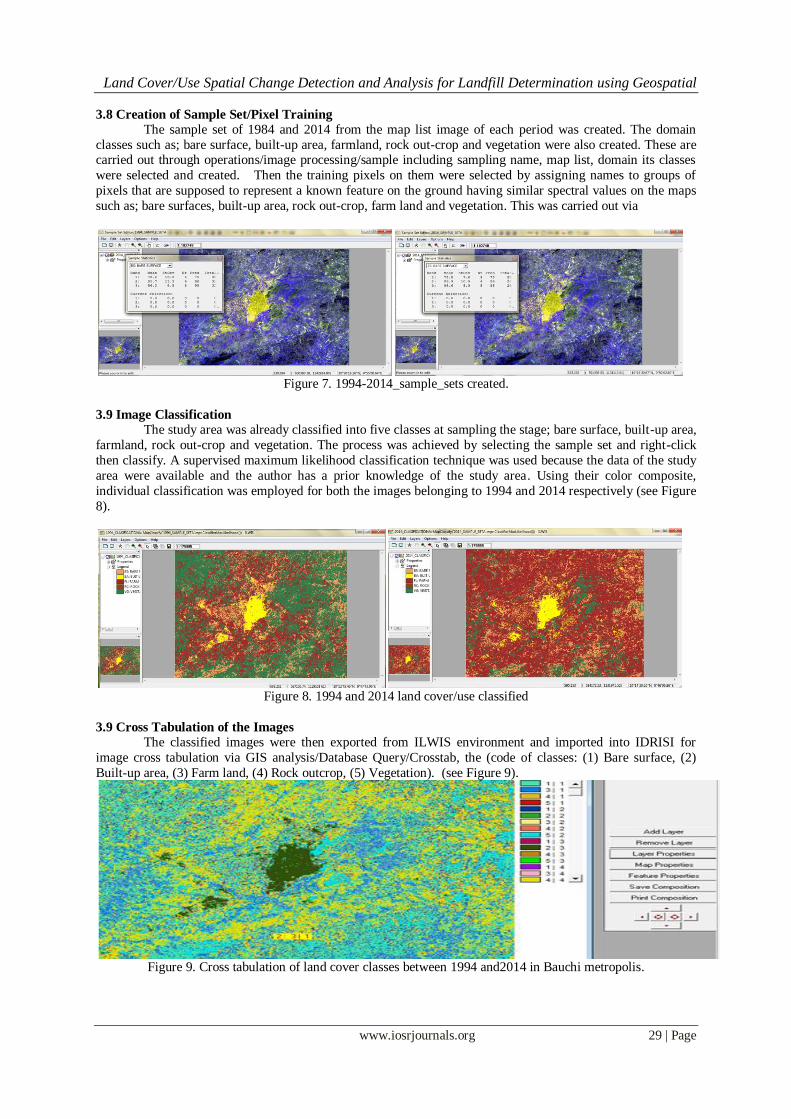
3.8 Creation of Sample Set/Pixel Training The sample set of 1984 and 2014 from the map list image of each period was created. The domain
classes such as; bare surface, built-up area, farmland, rock out-crop and vegetation were also created. These are carried out through operations/image processing/sample including sampling name, map list, domain its classes
were selected and created. Then the training pixels on them were selected by assigning names to groups of
pixels that are supposed to represent a known feature on the ground having similar spectral values on the maps
such as; bare surfaces, built-up area, rock out-crop, farm land and vegetation. This was carried out via
Figure 7. 1994-2014_sample_sets created.
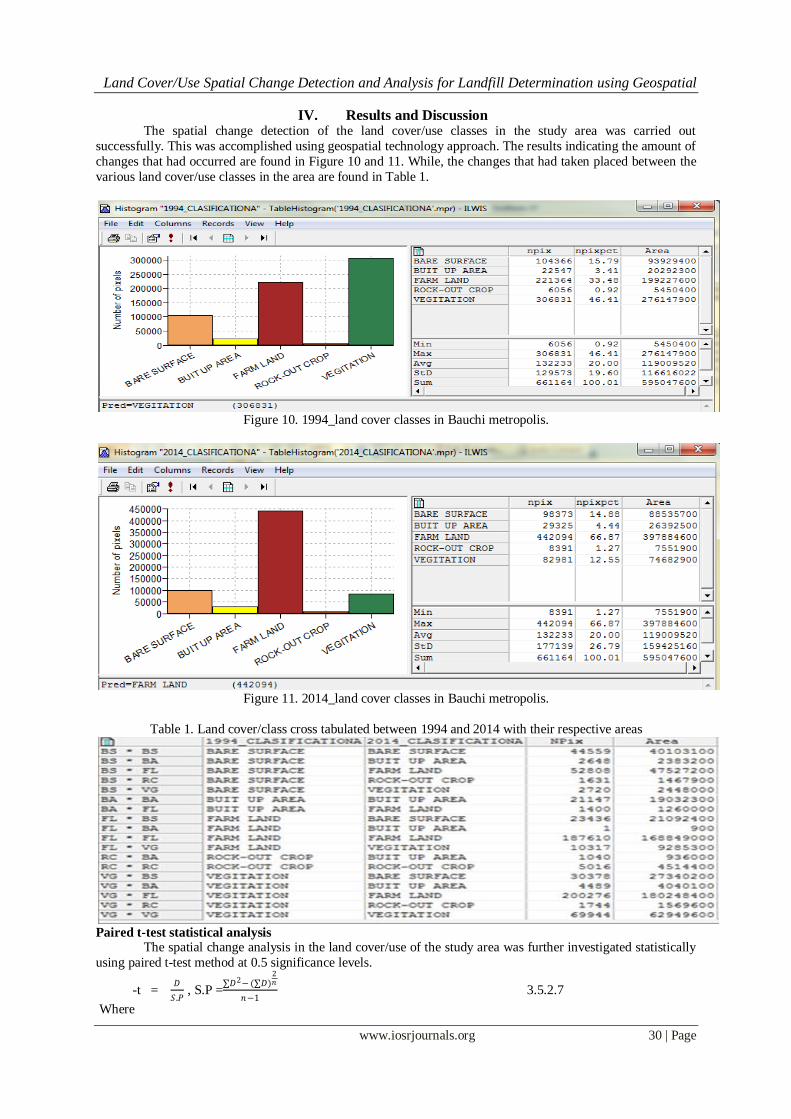
3.9 Image Classification
The study area was already classified into five classes at sampling the stage; bare surface, built-up area,
farmland, rock out-crop and vegetation. The process was achieved by selecting the sample set and right-click
then classify. A supervised maximum likelihood classification technique was used because the data of the study
area were available and the author has a prior knowledge of the study area. Using their color composite,
individual classification was employed for both the images belonging to 1994 and 2014 respectively (see Figure
8).
Figure 8. 1994 and 2014 land cover/use classified
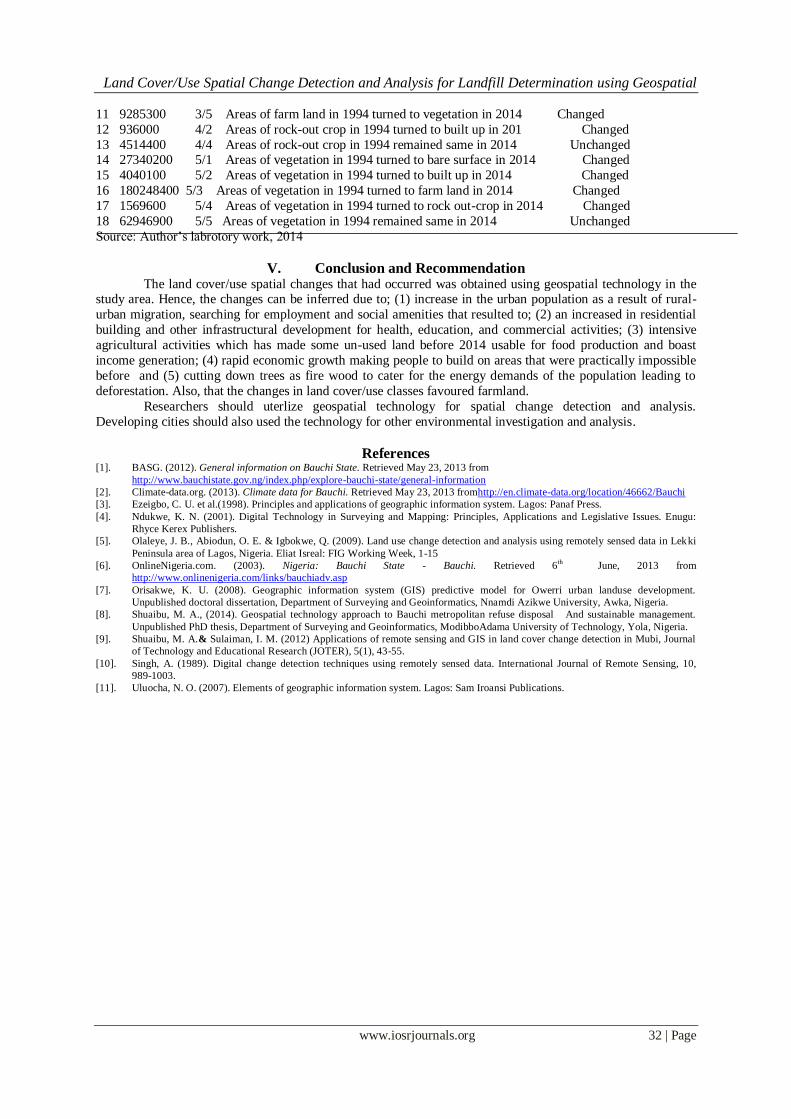
3.9 Cross Tabulation of the Images
The classified images were then exported from ILWIS environment and imported into IDRISI for
image cross tabulation via GIS analysis/Database Query/Crosstab, the (code of classes: (1) Bare surface, (2)
Built-up area, (3) Farm land, (4) Rock outcrop, (5) Vegetation). (see Figure 9).
Figure 9. Cross tabulation of land cover classes between 1994 and2014 in Bauchi metropolis.
Land Cover/Use Spatial Change Detection and Analysis for Landfill Determination using Geospatial
www.iosrjournals.org 30 | Page
IV. Results and Discussion The spatial change detection of the land cover/use classes in the study area was carried out
successfully. This was accomplished using geospatial technology approach. The results indicating the amount of
changes that had occurred are found in Figure 10 and 11. While, the changes that had taken placed between the
various land cover/use classes in the area are found in Table 1.
Figure 10. 1994_land cover classes in Bauchi metropolis.
Figure 11. 2014_land cover classes in Bauchi metropolis.
Table 1. Land cover/class cross tabulated between 1994 and 2014 with their respective areas
Paired t-test statistical analysis
The spatial change analysis in the land cover/use of the study area was further investigated statistically
using paired t-test method at 0.5 significance levels.
-t = 𝐷
𝑆.𝑃 , S.P =
∑𝐷2− (∑𝐷)2𝑛
𝑛−1 3.5.2.7
Where

Land Cover/Use Spatial Change Detection and Analysis for Landfill Determination using Geospatial
www.iosrjournals.org 31 | Page
t = critical point
D = Difference between the two sets of data
S.P = Variance of the sum of the difference n = Number of observations
Table 2 shows the computed summation of the differences (∑D) and the summation of the square of the
differences (∑D2) in land cover/use classes between 1994 and 2014 which were used to compute the value of t
(critical point).
From able 2, it also shows that;
n = 2d
∑D = 0.00
∑D2= 76433924140000000
Therefore,
S.P = ∑𝐷2− (∑𝐷)
2𝑛
𝑛−1 =
76433924140000000 −(0.00)2/2
2−1 =
76433924140000000 −(0.00)1
2−1
= 76433924140000000 −0.00
2−1 =
76433924140000000
1
= 76433924140000000
-t = 𝐷
𝑆.𝑃 =
0.00
76433924140000000 . = 0.00,
Hence, the computed value of t = 0.00
Degree of freedom (DF) = n-k = 2-1 = 1 (where the k = number of variables = 1)
Using 5% significance level,
5
100
2=
0.05
2 = 0.025
Table 2. Areas of land cover/use classes in 1994 and 2014 for Bauchi metropolis
Land cover Area covered Area covered Diff. % Remarks
class in 1994 (m2) in 2014 (m2) D D2 Changed
Bare surface 93929400 88535700 5393700 29091999690000 01.12 decreased
Buit-up area 20292300 26392500 -6100200 37212440040000 01.27 increased Farm land 199227600 397884600 -198657000 3.946460365*1015 41.31 increased
Rock-out crop 5450400 7551900 -2101500 4416302250000 00.44 increased
Vegetation 276147900 74682900 268679000 7.218840504*1016 55.86 decreased
Total 595047600 595047600 00 7.643392414*1016 100.0
Source: field survey, 2014
Spatial land cover/use changed between 1994 and 2014 of the study area
Figure 10, 11 and Table 2 show areas in square meters and percentages of the land cover classes that
changed between 1994 and 2014 in Bauchi metrpolis. The codes of the classes are: (1) bare surface, (2) built-up
area, (3) farm land, (4) rock outcrop, (5) vegetation.
The land cover/use classification was carried as follows: bare surface has changed from 93929400m2 in
1994 to 88535700m2 in 2014 with 1.12% decrement; built-up area from 20292300m2 in 1994 to 26392500m2 2014 with 1.27% increment; farm land from 199227600m2 in 1994 to 397884600m2 in 2014 with 41.31%
increment; rock outcrop from 5450400m2 in 1994 to 7551900m2 in 2014 with 0.44% decrement; vegetation
from 276147900m2 in 1994 to 74682900m2 in 2014 with 55.86% decrement.
Since the computed value of t (0.00) is less than the table value (12.71) from the t-test, it then
suggested that there was no significant spatial change in land cover/use between 1994 and 2014 in the Bauchi
metropolis for landfill siting.
Table 3: The cross tabulation analysis of spatial changes in Bauchi from 1994 to 2014.
S/ Area Result Interpretation of results Remark
N (m2)
1 40103100 1/1 Areas that are bare surface in 1994 remained same in 2014 unchanged 2 2383200 1/2 Areas that are bare surface in 1994 turned to built up in 2014 Changed
3 47527200 1/3 Areas that are bare surface in 1994 turned to farmland in 2014 Changed
4 1467900 1/4 Areas of bare surface in 1994 turned to rock outcrop in 2014 Changed
5 2448000 1/5 Areas of bare surface in 1994 turned to vegetation in 2014 Changed
6 19032300 2/2 Areas that are built up in 1994 remained same in 2014 Unchanged
7 1260000 2/3 Areas of built up in 1994 turned to farm land in 2014 Changed
8 21092400 3/1 Areas of farn land in 1994 turned to bare surface in 2014 Changed
9 900 3/2 Areas of farm land in 1994 turned to built up in 2014 Changed
10 168849000 3/3 Areas of farm land in 1994 remained same in 2014 Unchanged
Land Cover/Use Spatial Change Detection and Analysis for Landfill Determination using Geospatial
www.iosrjournals.org 32 | Page
11 9285300 3/5 Areas of farm land in 1994 turned to vegetation in 2014 Changed
12 936000 4/2 Areas of rock-out crop in 1994 turned to built up in 201 Changed
13 4514400 4/4 Areas of rock-out crop in 1994 remained same in 2014 Unchanged 14 27340200 5/1 Areas of vegetation in 1994 turned to bare surface in 2014 Changed
15 4040100 5/2 Areas of vegetation in 1994 turned to built up in 2014 Changed
16 180248400 5/3 Areas of vegetation in 1994 turned to farm land in 2014 Changed
17 1569600 5/4 Areas of vegetation in 1994 turned to rock out-crop in 2014 Changed
18 62946900 5/5 Areas of vegetation in 1994 remained same in 2014 Unchanged
Source: Author’s labrotory work, 2014
V. Conclusion and Recommendation The land cover/use spatial changes that had occurred was obtained using geospatial technology in the
study area. Hence, the changes can be inferred due to; (1) increase in the urban population as a result of rural-
urban migration, searching for employment and social amenities that resulted to; (2) an increased in residential
building and other infrastructural development for health, education, and commercial activities; (3) intensive
agricultural activities which has made some un-used land before 2014 usable for food production and boast
income generation; (4) rapid economic growth making people to build on areas that were practically impossible
before and (5) cutting down trees as fire wood to cater for the energy demands of the population leading to
deforestation. Also, that the changes in land cover/use classes favoured farmland.
Researchers should uterlize geospatial technology for spatial change detection and analysis.
Developing cities should also used the technology for other environmental investigation and analysis.
References [1]. BASG. (2012). General information on Bauchi State. Retrieved May 23, 2013 from
http://www.bauchistate.gov.ng/index.php/explore-bauchi-state/general-information
[2]. Climate-data.org. (2013). Climate data for Bauchi. Retrieved May 23, 2013 fromhttp://en.climate-data.org/location/46662/Bauchi
[3]. Ezeigbo, C. U. et al.(1998). Principles and applications of geographic information system. Lagos: Panaf Press.
[4]. Ndukwe, K. N. (2001). Digital Technology in Surveying and Mapping: Principles, Applications and Legislative Issues. Enugu:
Rhyce Kerex Publishers.
[5]. Olaleye, J. B., Abiodun, O. E. & Igbokwe, Q. (2009). Land use change detection and analysis using remotely sensed data in Lekki
Peninsula area of Lagos, Nigeria. Eliat Isreal: FIG Working Week, 1-15
[6]. OnlineNigeria.com. (2003). Nigeria: Bauchi State - Bauchi. Retrieved 6th June, 2013 from
http://www.onlinenigeria.com/links/bauchiadv.asp
[7]. Orisakwe, K. U. (2008). Geographic information system (GIS) predictive model for Owerri urban landuse development.
Unpublished doctoral dissertation, Department of Surveying and Geoinformatics, Nnamdi Azikwe University, Awka, Nigeria.
[8]. Shuaibu, M. A., (2014). Geospatial technology approach to Bauchi metropolitan refuse disposal And sustainable management.
Unpublished PhD thesis, Department of Surveying and Geoinformatics, ModibboAdama University of Technology, Yola, Nigeria.
[9]. Shuaibu, M. A.& Sulaiman, I. M. (2012) Applications of remote sensing and GIS in land cover change detection in Mubi, Journal
of Technology and Educational Research (JOTER), 5(1), 43-55.
[10]. Singh, A. (1989). Digital change detection techniques using remotely sensed data. International Journal of Remote Sensing, 10,
989-1003.
[11]. Uluocha, N. O. (2007). Elements of geographic information system. Lagos: Sam Iroansi Publications.