Assessment of Land Use/Land Cover Using Geospatial Techniques in a Semi-arid Region of Madhya...
12
10 Assessment of Land Use/Land Cover Using Geospatial Techniques in a Semi-arid Region of Madhya Pradesh, India Prafull Singh, Jay Krishna Thakur 1 , Suyash Kumar 2 and U.C. Singh 3 Dept. of Civil Engineering, SAMCET, Bhopal, Madhya Pradesh, India 1 Dept. Hydrogeology and Environmental Geology, Institute of Geosciences, Martin Luther University, Halle, Germany 2 Department of Geology, Govt. PG Science College, Gwalior, India 3 School of Studies in Earth Science, Jiwaji University, Gwalior, India Introduction The Earth’s land cover characteristics and its use are key variables in global change. The society today is already in the mainstream of another revolution – the information revolution. This brings enormous changes to life and living, providing new approaches: how to advance the frontiers of previous revolutions particularly those of earth resources mapping and monitoring. Over the last few decades, there has been a significant change on land use and land cover (LULC) across the globe due to the climatic changes and over demand of the growing inhabitants. Semi-arid regions are undergoing severe stresses due to the combined effects of growing population and climate change (Mukherjee et al., 2009). In the last three decades, the technologies and methods of remote sensing have progressed significantly. Now a days remote sensing data, along with increased resolution from satellite platforms, makes these technology appear poised to make better impact on land resource management initiatives involved in monitoring LULC mapping and change detection at varying spatial ranges (Singh et al., 2010; Thakur, 2010). Remote sensing technology offers collection and analysis of data from ground-based, space and Earth-orbiting platforms, with linkages to Global Positioning System (GPS) and geographic DOI 10.1007/978-94-007-1858-6_10, © Capital Publishing Company 2012 152 e , J.K. Thakur et al. (eds.), G ospatial Techniques for Managing Environmental Resources
Transcript of Assessment of Land Use/Land Cover Using Geospatial Techniques in a Semi-arid Region of Madhya...

152 Prafull Singh et al.
10Assessment of Land Use/Land Cover
Using Geospatial Techniquesin a Semi-arid Region of
Madhya Pradesh, India
Prafull Singh, Jay Krishna Thakur1,Suyash Kumar2 and U.C. Singh3
Dept. of Civil Engineering, SAMCET, Bhopal, Madhya Pradesh, India1Dept. Hydrogeology and Environmental Geology, Institute of
Geosciences, Martin Luther University, Halle, Germany2Department of Geology, Govt. PG Science College, Gwalior, India
3School of Studies in Earth Science, Jiwaji University, Gwalior, India
Introduction
The Earth’s land cover characteristics and its use are key variables in globalchange. The society today is already in the mainstream of another revolution– the information revolution. This brings enormous changes to life and living,providing new approaches: how to advance the frontiers of previous revolutionsparticularly those of earth resources mapping and monitoring. Over the lastfew decades, there has been a significant change on land use and land cover(LULC) across the globe due to the climatic changes and over demand of thegrowing inhabitants. Semi-arid regions are undergoing severe stresses due tothe combined effects of growing population and climate change (Mukherjeeet al., 2009). In the last three decades, the technologies and methods of remotesensing have progressed significantly. Now a days remote sensing data, alongwith increased resolution from satellite platforms, makes these technologyappear poised to make better impact on land resource management initiativesinvolved in monitoring LULC mapping and change detection at varying spatialranges (Singh et al., 2010; Thakur, 2010). Remote sensing technology offerscollection and analysis of data from ground-based, space and Earth-orbitingplatforms, with linkages to Global Positioning System (GPS) and geographic
DOI 10.1007/978-94-007-1858-6_10, © Capital Publishing Company 2012
152e ,J.K. Thakur et al. (eds.), G ospatial Techniques for Managing Environmental Resources

Assessment of Land Use/Land Cover Using Geospatial Techniques 153
information system (GIS) data with promising modelling capabilities (Franklin,2001; Thakur et al., 2010). This has made remote sensing valuable for landcover and land use information.
As the demand for quantity and quality of information and technologycontinues to improve, remote sensing is becoming more significant for thefuture. Therefore, the chapter focuses on the issues and challenges associatedwith monitoring LULC mapping in semi-arid region. For example, at therural-urban fringe, large tracts of undeveloped rural land are rapidly convertedto urban land use. To maintain up-to-date land-cover and land use information,where typical updating processes are on an interval scale of five years, isdifficult task for planners (Chen et al., 2002). The full potential of geospatialtechnology for change detection applications still has to be realized for plannersat local, regional, and international levels. In the near future, the field ofremote sensing will change dramatically with the projected increase in numberof satellites of all types (Glackin, 1998). In order to have better understandingof the rapid advancements in geospatial technology, we provide a brief historyof the advances in geospatial technology.
In developing countries like India, efforts are being made for the sustainableland resource planning and management with reliable and updatedgeoinformation, which is pre-requisite for land use planning. Such informationcould only be obtained through the modern techniques and equipment forresearch and mapping. Since land use and land cover changes are activefeatures over space and time, it is difficult to obtain real time informationthrough conventional resources and these methods are time consuming,laborious, high cost and work force oriented. Spatial variation of LULC createsdoubt about the point data collected by conventional methods. In moderntimes, satellite based remote sensing technology has been developed, whichare of immense value for preparing LULC map and their monitoring at regularperiodic intervals of time (Kumar et al., 2004).
As such, spatial repetitive and synoptic coverage from satellites collectedover a wide range of electromagnetic spectrum admirably suit the requirementof LULC mapping and monitoring. These spatial data indicates the distributionof various LULC categories in an area. Due to the availability of repetitivedata, it is possible to update existing database for various land use planningand design making. Therefore, with the use of geospatial technology (remotesensing, GIS, GPS and computational techniques) it is evident that thesecould be used effectively to prepare LULC mapping (Tejaswini, 2005; Rao etal., 1996, Mukherjee et al., 2009; Srivastava et al., 2010). Geospatial technologyguarantees the availability and quick access of real time data, geospatialinformation for resource mapping.
LULC relates to the observable earth surface expressions, such asvegetation, geology, water resources and anthropogenic features whichdescribes the Earth’s physical condition in terms of the natural environmentwith man-made structures.

154 Prafull Singh et al.
In India, spatial accounting and monitoring have been carried out at anational level on 1:250,000 scale, using multi-temporal Indian Remote Sensing(IRS) satellites to address the spatial and temporal variability in landuse patterns(NRSA, 1989). In the absence of basic information about the current land usepattern, it would be difficult to determine future improvements and theirdeterioration. Therefore, it is necessary to provide up-to-date informationabout earth resources that helps planners in decision-making for sustainabledevelopment and utilization of the earth resources. The use of geospatialinformation establishes a discussion between science, and national developmentstrategies.
Background
The relative evaluation of land for various uses is an urgent issue in the semi-arid regions. Industrial and recreational park, and nature preserves versusdiverse agricultural and pastoral uses of the land should be evaluated. Optionsfor gathering the problems, though limited, are based on the ecology of thespecific local area or region (Dhinva et al., 1992).
Application of remote sensing technology for LULC change analysis hasbeen carried out in semi-arid region of Madhya Pradesh and found that the useof remote sensing along with Survey of India toposheets could be usedappropriately for LULC mapping of semi-arid area (Jaiswal et al., 1999).
The semi-arid regions are characterized by erratic rainfall and high rate ofvegetation dynamics. The dynamics of plant species over time is mainly dueto continuous and complex interactions of the plant communities with theirenvironment. The human interferences and climatic variations are commondriving forces in bringing changes to the environment (Shetty et al., 2005).The increasing biotic pressure together with increasing human demands exertspressure on the available land resources all over the region. Therefore, inorder to have best possible use of land, it is not only necessary to have theinformation on the existing LULC, but also to monitor the dynamic land useresulting because of increasing demands aroused from the growing population(Raghavswamy et al., 2005). Continuous overexploitation of natural resourceslike land, water, and forest has caused serious threat to the local population ofthe semi-arid region (Rao et al., 2006). This causes problems like little scopefor soil moisture storage, high rate of soil erosion, declining groundwaterlevel and shortage of drinking water. In a semi-arid area, there will be lessvegetation so the diverse classes of vegetation will not be clearly recognized;and are the major problem of LULC mapping (Chaudhary et al., 2008).
It has extreme importance to the planners and decision makers forformulating the long-term plans for land resources development andmanagement to improve the quality of habitat in semi-arid regions. In general,the study area has limited rainfall and, subject to prolonged droughts as well
Assessment of Land Use/Land Cover Using Geospatial Techniques 155
as anthropogenic activities, reduces the natural vegetal cover and soil loss dueto high erosion and environmental degradation (Singh, 2009). As per theregional status of the area some work has been reported such as LULC mappingof Kanera watershed of Madhya Pradesh is carried out through the use ofremote sensing data for groundwater exploration purpose and observed thatsatellite data are very useful for land evaluation of semi-arid region (Akarmet al., 2009; Singh et al., 2011).
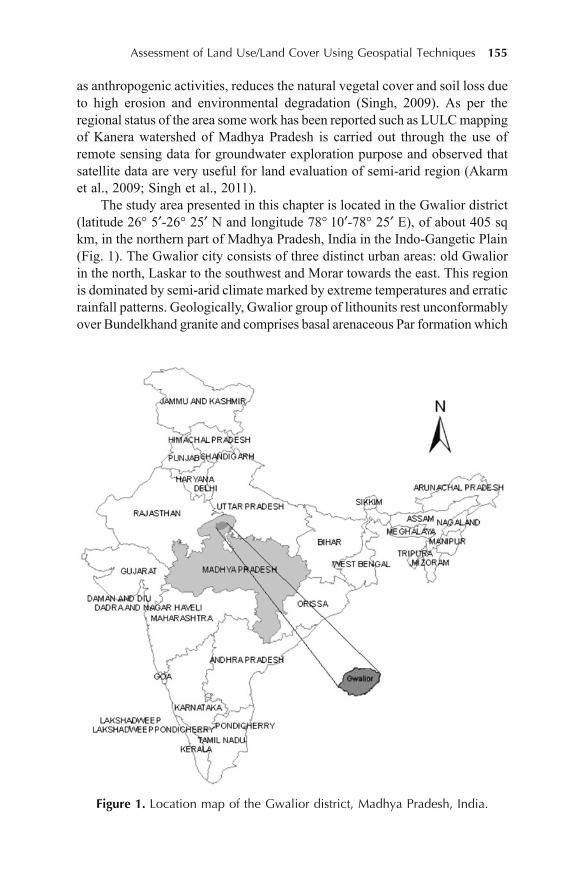
The study area presented in this chapter is located in the Gwalior district(latitude 26° 5 -26° 25 N and longitude 78° 10 -78° 25 E), of about 405 sqkm, in the northern part of Madhya Pradesh, India in the Indo-Gangetic Plain(Fig. 1). The Gwalior city consists of three distinct urban areas: old Gwaliorin the north, Laskar to the southwest and Morar towards the east. This regionis dominated by semi-arid climate marked by extreme temperatures and erraticrainfall patterns. Geologically, Gwalior group of lithounits rest unconformablyover Bundelkhand granite and comprises basal arenaceous Par formation which
Figure 1. Location map of the Gwalior district, Madhya Pradesh, India.

156 Prafull Singh et al.
are overlain by volcano-sedimentary sequences of Morar formation consistingof ferruginous shale with bands of chert-jasper.
The main objective of this chapter is to explore the role of geospatialtechnologies for land use mapping of one of the drought prone city of MadhyaPradesh, India and to examine the present status of LULC within the basinusing satellite data for sustainable utilization of resources and theirdevelopment.
Data Used and Methodology
National LULC classification system using remote sensing data for mappinghas been attempted by National Remote Sensing Agency (NRSA, 1995) of thecountry to understand and manage country’s natural resources. Thereafterfurther efforts to map on 1:50,000 scales followed certain standards that requiredmodifications in the current day’s context. To this extent, an exhaustive LULCclassification was evolved to facilitate an in-depth assessment of all the LULCcategories (NRSA, 2005). The benefits of adopting a classification are tendingto persuade for evolving a standard classification system that is guided bypractical experience and continuous observation over the past many years andabove all that meet the user requirements. The remotely sensed data, thematicmaps and ground truth data used are in Table 1.
Table 1: Remote sensing and other data used in the study
S.No. Data Sources
1. IRS ID LISS III image and PAN image National Remote Sensing Agency(NRSA), Hyderabad, India
2. Survey of India Topographic Map Survey of India(Sheet numbers 54 J/3, J/4, J/7 and J/8on 1:50,000 scale)
3. Field data on land use/land cover Ground truth collection duringfield survey and district revenuedepartment
Image interpretation has been carried out in two most popular ways e.g.digital analysis and visual interpretation. In the digital classification process,training areas for different classes were defined for the satellite imagery onspectral response pattern in different spectral bands generated. Based on thesetraining areas, satellite imagery was classified into different classes usingparametric or non-parametric classifiers (Lu et al., 2007). Following imageprocessing steps were involved in image classification starting from processingof IRS LISS III Image to correct for atmospheric errors, registration of LISSIII and Pan images with reference to toposheets from Survey of India (SOI),generation of other secondary data, image classification and accuracyassessment. The information provided by the satellites in combination withother sources to quantify the various parameters for efficient mapping of land

Assessment of Land Use/Land Cover Using Geospatial Techniques 157
use of the basin was evaluated by applying various image processing stepsusing ERDAS Imagine and ArcGIS 9.3.
Preprocessing
Accurate registrations of satellite images are essential for analyzing LULCconditions of a particular geographic position. The atmospheric scattering iscommon in remote sensing images, which are more pronounced in the shorterwavelength regions, and they cause some additional contribution to spectralreflectance. In the present study, satellite data was geometrically corrected forthe distortions and degradations caused by the errors due to variation in altitude,velocity of the sensor platform, earth curvature and relief displacement.
The images of IRS ID and PAN (Path 97 and Row 53) were geometricallycorrected and geocoded to the Universal Transverse Mercator (UTM)coordinate system by using a reference image of SOI toposheets. A minimumof 45 regularly distributed ground control points were selected from the images.The registration was performed using first order polynominal transformation,resampling using a nearest neighbour algorithm. The transformation with aRoot Mean Square (RMS) error is 0.643. Image enhancement, contraststretching and false colour composites were worked out.
Image Classification
Supervised classification was performed to produce land cover map from theIRS satellite data. Defining of the training sites, extraction of signatures fromthe image and then classification of the image was done. Training data extractionwas a critical step in supervised classification; these must be selected from theregions representative of the land cover classes under consideration. Thus,data were collected from relatively homogeneous areas consisting of thoseclasses. The collection of training data was time consuming and tedious process,as it involved laborious field surveys and accumulation of reference data fromvarious sources. The features of training sites were digitized. Three trainingsites were selected for this purpose. This procedure assures both the accuracyof classification and the true interpretation of the results. After the training siteareas digitization, the statistical characterizations of the information werecreated. These were called signatures. Finally, the classification methods wereapplied. All the classification techniques like the maximum likelihoodclassification (MLC), parallelepiped and minimum distance to meanclassification were applied for the images and the best classification techniquewas then chosen. It was observed that Maximum Likelihood Classification(MLC) gave good results as compared to the other two techniques. To determinethe accuracy of classification, a simple testing pixel was selected on theground trothed reference data. In thematic mapping from remotely senseddata, the accuracy, and the degree of ‘correctness’ of a map or classificationwas calculated.

158 Prafull Singh et al.
Result and Discussions
Land is one of the most important natural resources. The landuse pattern andits spatial distribution are the prime requisites for the preparation of an effectivelanduse policy needed for the proper planning and management of any area.The land use map prepared using above methodology has been shown inFig. 2 and their spatial distributions are given in Table 2. The various LULCclasses delineated from the available data include built-up, agriculture,
Figure 2. Land Use/Land Cover map of the Morar River BasinMadhya Pradesh, India.

Assessment of Land Use/Land Cover Using Geospatial Techniques 159
wasteland, forest and water bodies. Three types of built-up lands weredelineated: urban settlement, rural settlement and industrial complex. Onsatellite images these structures look as block-like appearance and show bluishtone on the image and on the PAN data they look typically blocky appearancewith light tone.
The urban settlements are widely spread in central part of the basin. Itcovers an area of about 31.87 sq km. About 20 villages are identified fromsatellite image, covering an area of about 5.82 sq km. Within the basin, one ofthe important industrial complexes is named as Malanpur Industrial Complexcovering an area of about 20.95 sq km. The total area covered by settlementsin the basin constitutes 58.64 sq km (16.23%) respectively.
Forest is discerned by their red to dark red tone and varying in sizes. Theyshow irregular shape and smooth texture. These forest areas are found onlower side of the basin. Based on the tonal and textual variations, the forestsof the basin are divided into three categories as dense, open and forest blank.Dense forests are found in lower and central side of the area at uplandtopography. Approximately such dense forests cover an area of about 50.76 sqkm. Open forests cover an area of about 11.74 sq km. Forest blank appears inlight yellow to light brown tone generally small and most of these forests arefound on hilltops and slopes. Forest blanks account very small having an areaof about 1.85 sq km. These forests cover an area of about 19.05%. Agriculturalland is shown in pink colour with smooth appearance on pan data and darkpatches with step-like arrangement and agricultural land without crops isshown in bluish/greenish grey with smooth texture. In the present study, suchcropped areas were found mostly in the northeastern portion and some amountin southwestern portion. Such cropped areas cover approximately 61.51 sqkm (16.71%). Fallow lands were identified by their dark greenish tone, smallersize, regular shape and medium texture. Such fallow lands are found welldistributed in the central and northeastern portion of the basin, which occupies110.53 sq km (29.33%).
Due to non-availability of satellite data of Kharif season, some agriculturalland is marked as fallow land in the basin as they were verified during fieldsurvey. Three categories of wasteland are identified such as land with scrub,land without scrub and gullied/ravenous land from satellite image and theycover approximately 83.34 sq km (20.61%). Land without scrub is in thelower part of the basin. Gullies are formed because of localized surface run-off affecting the unconsolidated material resulting in the formation ofperceptible channels causing undulating terrain. They are mostly associatedwith stream courses and sloping grounds with good rainfall and entrencheddrainage. Number of surface water bodies such as ponds, one reservoir namedRamaua with one perennial and one seasonal river are delineated from thesatellite image and they cover 9.10 sq km (2.48%).

160 Prafull Singh et al.
Table 2: Areas under different classes of Land Use/Land Cover
S.No. Land use/Land cover Area (in sq km) Area (in %)
1 Urban settlement 31.87 8.872 Rural settlement 5.82 1.443 Industrial complex 20.95 5.924 Dense forest 50.76 14.045 Open forest 11.74 2.906 Forest blank 1.85 2.117 Agricultural land 61.51 16.718 Fallow land 110.53 29.339 Land with scrub 31.25 7.73
10 Land without scrub 46.04 11.3911 Gullied/ravenous land 5.05 1.4912 Reservoir 1.40 0.3413 River 6.08 1.5014 Ponds 1.62 0.64
Conclusion and Recommendation
The present research work demonstrates the capability of geospatial techniquesto capture the land use categories in a semi-arid region of Madhya Pradesh,India, which are necessary for optimum and sustainable utilization of landresources and prevention of further undesirable deterioration in land use.Analysis shows the agricultural area mostly found in the northern portionwhereas southern portion of the basin is occupied by the forest cover over thedenudational hills. The observation also shows major portion of the basinaffected by severe soil erosion due to the occurrence of shales and steep slope.Therefore, the present work suggested that area urgently needs to minimizesoil erosion by applying various techniques of soil conservation and large-scale aforestation.
Wastelands must be converted into cultivable land through massiveprogrammes of afforestation, plantation or pasture development to increasefood, fodder and fuel production. Land with and without scrub can be utilizedfor growing plants, which need soil cover. These plants are a source of fuelwood whereas some of them are of medicinal and economic importance.Check bunds should be constructed with waste-weirs wherever necessary tocontrol soil erosion in the gullied/ravenous land. These bunds allow retentionof water and soil whereby lands can be reclaimed and brought under cultivation.
To ensure planned development and monitor the land utilization pattern,preparation of LULC maps is necessary in the area. Scientists should usegeospatial as reliable mapping and monitoring tool for new research andplanning applications. It is expected that this trend will have dramaticimplications in the field of geoinformatics for the natural resource mapping,monitoring and modelling over the next decade.

Assessment of Land Use/Land Cover Using Geospatial Techniques 161
References
Balak, Ram and Kolarkar, A.S. (1993). Remote sensing application in monitoring landuse changes in arid region of Rajasthan. International Journal of Remote Sensing,14(17), 3191–3200.
Chaudhary, B.S., Saroha, G.P. and Yadav, Manoj (2008). Human induced land use/land cover changes in Northern part of Gurgaon district, Haryana, India. Journalof Human Ecology, 23(3), 243–252.
Chaurasia, R. and Sharma, P.K. (1999). Land Use/Land Cover Mapping and ChangeDetection using Satellite Data—A Case Study of Dehlon Block, District Ludhiana,Punjab. Journal of Indian Society of Remote Sensing, 27(2), 115–121.
Chen, D. and Stow, D. (2002). The effect of training strategies on supervisedclassification at different spatial resolutions. Photogrammetric Engineering andRemote Sensing, 68, 1155–1161.
Cihlar (2000). Land cover mapping of large areas from satellites: status and researchpriorities. International Journal of Remote Sensing, 21(6&7), 1093–1114.
Dhinwa, P.S., Pathak, S.K., Sastry, S.V.C., Rao, M., Majumdar, K.L., Chotani, M.L.,Singh, P.J. and Sinha, R.L.P. (1992). Land use change analysis of Bharatpur Districtusing GIS. Journal of the Indian Society of Remote Sensing, 20(4), 237–250.
Diouf, A. and Lambin, E.F. (2001). Monitoring land-cover changes in semi-arid regions:remote sensing data and field observations in the Ferlo, Senegal. Journal of AridEnvironments, 48(2), 129–148.
Foody, M.G. (2002). Status of land cover classification accuracy assessment. RemoteSensing of Environment, 8, 185–201.
Franklin, S.E. (2001). Remote Sensing for Sustainable Forest Management. LewisPublishers, Boca Raton, FL.
Gautam, N.C. and Channiah, C.H. (1985). Land use and land cover mapping andchange detection in Tripura using satellite Landsat data. Journal of the IndianSociety of Remote Sensing, 6(3&4), 517–528.
Glackin, D.L. (1998). International space-based remote sensing overview: 1980–2007.Canadian Journal of Remote Sensing, 24, 307–314.
Jaiswal, R.K., Saxena, R. and Mukherjee, S. (1999). Application of remote sensingtechnology for landuse/landcover change analysis. Journal of the Indian Society ofRemote Sensing, 27, 123–128.
Javed, Akram, Khanday, M.Y. and Ahmed, Rizwan (2009). Prioritization of sub-watersheds based on morphometric and land use analysis using remote sensing andGIS techniques. Journal of the Indian Society of Remote Sensing, 37(2), 261–274.
Jensen, J.R. (1996). Introductory Digital Image Processing, Second Edition. Prentice-hall Press, New Jersey.
Jensen, J.R. and Cowen, D.J. (1999). Remote sensing of urban/suburban infrastructureand socio-economic attributes. Photogrammetric Engineering and Remote Sensing,65, 611–622.
Kumar, Vijay, Rai, S.P. and Rathore, D.S. (2004). Land use mapping of Kandi Beltsof Jammu Region. Journal of Indian Society of Remote, 32(4), 323–328.
Kunwar, P., Kachhwaha, T.S., Kumar, Anil, Agrawal, A.K., Singh, A.N. and Mendiratta,Nisha (2010). Use of high-resolution IKONOS data and GIS technique fortransformation of landuse/landcover for sustainable development. Current Science,98(2), 204–212.

162 Prafull Singh et al.
Lillesand, T.M., Kiefer, R.W. and Chipman, J.W. (2008). Remote sensing and imageinterpretation. John Wiley & Sons, Inc., New York.
Lu, D. and Weng, Q. (2007). A survey of image classification methods and techniquesfor improving classification performance. International Journal of Remote Sensing,28(5), 823–870.
Merem, E.C. and Twumasi, Y.A. (2008). Using Geospatial Information Technology inNatural Resources Management: The Case of Urban Land Management in WestAfrica. Sensors, 8, 607–619.
Mukherjee, S., Shashtri, S., Singh, C., Srivastava, P. and Gupta, M. (2009). Effect ofcanal on land use/land cover using remote sensing and GIS. Journal of the IndianSociety of Remote Sensing, 37(3), 527–537.
National Remote Sensing Agency (1989). Manual of Nation wide Land use/Landcover Mapping using satellite imagery, Part I. NRSA, Hyderabad.
National Remote Sensing Agency (1995). IMSD Technical Guidelines. National RemoteSensing.
NRSA (2005). Integrated Mission for Sustainable Development. Technical Guidelines,Hyderabad.
Palaniswami, C., Upadhyay, A.K. and Maheswarappa, H.P. (2006). Spectral MixtureAnalysis for sub pixel classification of coconut. Current Science, 91(12), 1706–1711.
Raghavswamy, V., Pathan, S.K., Ram, Mohan, P., Bhanderi, R.J., Padma, Priya (2005).IRS-IC applications for urban planning and development. Current Science, 70,582–588.
Ranjeet, J., Jiquan, Chen, Nan, Lu, Ke, Guo, Cunzhu, Liang, Yafen, Wei et al. (2008).Predicting plant diversity based on remote sensing products in the semi-arid regionof Inner Mongolia. Remote Sensing of Environment, 112(5), 2018–2032.
Rao, D.P., Gautam, N.C., Nagaraja, R. and Ram, M.P. (1996). IRS-1C applications inland use mapping and planning. Current Science. 70(7), 575–581.
Rao, K.N. and Narendra, K. (2006). Mapping and evaluation of urban sprawling in theMehadrigedda watershed in Visakhapatnam metropolitan region using remotesensing and GIS. Current Science, 91(11), 1552 –1557.
Rogana, John and Chen, D.M. (2004). Remote sensing technology for mapping andmonitoring land-cover and land-use change. Progress in Planning, 61, 301–325.
Saha, A.K., Arora, M.K., Csaplovics, E. and Gupta, P.K. (2005). Land coverclassification using IRS LISS III image and DEM in a rugged terrain: A case studyin Himalayas. Geocarto International, 20(2), 33–40.
Shetty, Amba, Lakshman, N., Sangeeta, T. and Rajesh, M.V.S. (2005). Land use-landcover mapping using satellite data for a forested watershed, Udipi district, Karnatakastate, India. J. Indian Soc. Remote Sensing, 33, 233–238.
Singh, Praful, Kumar Suyash and Singh, U.C. (2011). Groundwater resource evaluationin the Gwalior area, India, using satellite data: an integrated geomorphological andgeophysical approach. Hydrogeology Journal, (DOI:10.1007/s10040.011-0758-6).
Singh, P.K. (2009). Remote sensing and GIS based hydrogeological study of MorarWatershed, District Gwalior (M.P) India. Unpublished Ph.D. thesis, Faculty ofScience, Jiwaji University, Gwalior, M.P., India.
Singh, A. (1989). Digital change detection technique using remote sensing data.International Journal of Remote Sensing, 26, 1–6.

Assessment of Land Use/Land Cover Using Geospatial Techniques 163
Singh, P.K. and Singh, U.C. (2009). Water resource evaluation and management forMorar River basin, Gwalior District, Madhya Pradesh, using GIS. E-journal ofEarth Science India, 2(3), 174–186.
Singh, S.K., Thakur, J.K. and Singh, U.K. (2010). Environmental monitoring of landcover/land use changes in Siwalik Hills, Rupnagar district of Punjab, India usingremote sensing and ancillary data. Paper presented at the International Conferenceon Global Climate Change.
Srivastava, P., Mukherjee, S. and Gupta, M. (2010). Impact of Urbanization on LandUse/Land Cover Change using Remote Sensing and GIS: A Case Study. Journal ofEcological Economics and Statistics, 18, 106–117.
Tapiador, F. and Casanova, J.L. (2003). Land use mapping methodology using remotesensing for the regional planning directives in Segovia, Spain.
Tejaswini, N.B. (2005). Land use/Land cover mapping in the coastal area of NorthKarnataka using remote sensing data. Journal of the Indian Society of RemoteSensing, 33(2), 253–257.
Thakur, J.K. (2010). Eco-hydrological wetland monitoring in a semi-arid region (Acase study of Konya Closed Basin, Turkey). Faculty of International Institute forGeo-Information Science and Earth Observation (ITC), Universiteit Twente,Enschede, the Netherlands.
Thakur, J.K. and Singh, S.K. (2010). Eco-hydrological monitoring of wetlands in asemi-arid region using remote sensing, GIS, GPS and various data sets: A casestudy of Konya closed basin, Turkey. Paper presented at the IAH 2010.