Lafarge 2013 annual report - Holcim
290
REGISTRATION DOCUMENT LAFARGE 2013 ANNUAL REPORT
-
Upload
khangminh22 -
Category
Documents
-
view
0 -
download
0
Transcript of Lafarge 2013 annual report - Holcim

REGISTRATION DOCUMENTLAFARGE 2013
ANNUAL REPORT
GROUP PRESENTATION
1.1 Lafarge presentation ............................................. 101.2 Strategy ................................................................... 121.3 Overview of operations ........................................... 28
11
RISKS AND CONTROL5.1 Risks factor ........................................................... 1465.2 Internal control procedures ................................. 1585.3 Auditing matters ................................................... 162
55
SHAREHOLDERS, SHARE CAPITAL AND ADDITIONAL INFORMATION
6.1 Shareholders......................................................... 1666.2 Share capital and additional information ............ 172
66
FINANCIAL STATEMENTS ........................F3
FF
CROSS-REFERENCE TABLES ...............281GLOSSARY ............................................285
CERTIFICATION ....................................181
2.1 Overview .................................................................. 442.2 Accounting policies and defi nitions ....................... 452.3 Results of operations for the years ended
December 31, 2013 and 2012 ................................. 492.4 Liquidity and capital resources .............................. 57
OPERATING AND FINANCIAL REVIEW AND PROSPECTS
22
CORPORATE GOVERNANCE AND COMPENSATION
3.1 Board of Directors - Corporate Offi cers ................. 623.2 Board and Committees rules and practices .......... 883.3 Executive Offi cers ................................................... 963.4 Compensation and benefi ts .................................... 983.5 Long-term incentives
(stock options and performance share plans)..... 1093.6 Share Ownership ................................................... 1153.7 Implementation of the principle
“Comply or Explain” of the Afep-Medef Code ...... 116
33
SOCIAL AND ENVIRONMENTAL RESPONSIBILITY
4.1 Introduction .......................................................... 1204.2 Building communities ........................................... 1214.3 Building sustainably .............................................. 1284.4 Building the circular economy ............................. 1304.5 Key Performance Indicators ................................ 136
44
This Registration Document was fi led in the French language with the Autorité des marchés financiers on
April 2 , 2014 in accordance with article 212-13 of its General Regulations. It may be used to support a fi nancial
transaction if accompanied by an information memorandum (note d’opération) approved by the AMF. It has
been prepared by the issuer and is the responsibility of the person whose signature appears herein.
This document is a translation of the original French document and is provided for information purposes only. In all matters
of interpretation of information, views or opinions expressed therein, the original French version takes precedence over this
translation.
LAFARGE PROFILE

EDITORIAL BY BRUNO LAFONT
• Chairman and Chief Executive Offi cer •
1,636production sites
2013 ended on a more positive note than it began.
Our annual operating results improved signifi cantly at the end of the year.
We met our targets on innovation and cost reduction, delivering 670 million euros of additional Ebitda.
We also reduced our net debt by 1 billion euros.
Following a rise of approximately 80% in 2012, our share price achieved a solid performance in 2013.
Looking beyond these results, we have pressed ahead with our dynamic of change as we move closer to our markets and to our customers, with an increasingly innovative offer of products and solutions designed for building better cities. It is our ambition to support the phenomenon of urbanization across the planet.
We have made three key undertakings for 2014:
d We will reduce our net debt to below 9 billion euros by the end of 2014 and return to an investment grade profile.
d We will deliver our 2012-2015 plan by the end of 2014, with at least 600 million euros of Ebitda achieved through cost reductions and innovation.
d We will continue to grow with project in North America and on emerging markets, especially in Sub-Saharan Africa, where we plan to invest in 10 million tonnes of additional cement capacity over the next four years.
In terms of the macroeconomic environ-ment, 2014 appears to be more favo-rable than previous years. Growth in our markets is based on major construction needs in emerging countries, but also on the gradual recovery of developed economies, particularly North America.
We are very strongly placed to take full advantage of this positive outlook and to move into 2014 with confi dence.
15,198revenue in million euros
64,000employees
countries62
Lafarge - Registration Document 2013 • 01

Back , from left to right : Christian Herrault, Jean-Jacques Gauthier, Peter Hoddinott, Thomas Farrell, Eric Olsen.
Front , from left to right : Gérard Kuperfarb, Sonia Artinian, Bruno Lafont , Alexandra Rocca,
Jean Desazars de Montgailhard, Guillaume Roux.
Back , from left to right : Juan Gallardo, Paul Desmarais, Jr., Philippe Charrier, Baudouin Prot,
Oscar Fanjul (Vice-chairman of the Board of Directors), Michel Rollier, Jérôme Guiraud.
Front , from left to right : Gérard Lamarche, Hélène Ploix, Philippe Dauman, Colette Lewiner,
Bruno Lafont (Chairman and Chief Executive Offi cer), Ian Gallienne, Véronique Weill, Nassef Sawiris.
BOARD OF DIRECTORS
EXE CUTIVE COMMITEE
GOVERNANCE
• Lafarge - Registration Document 2013 02
LAFARGE PROFILE

LAFARGE WORLDWIDE (D ecember 31, 2013)
KEY FIGURES BY GE OGRAPHIC AREA (D ecember 31, 2013)
World map of L afarge’s presence as of De cember 31, 2013 (plants an d sales offi ces).
North America Asia Western Europe Central and Eastern Europe Middle East and Africa Latin America
%EMPLOYEES
1. Western Europe 22.7%
12.2%
9.6%3. Central and Eastern Europe2. North America
29.8%4. Middle East and Africa
1
2
3
4
5
6
3.6%5. Latin America 22.1%6. Asia
%REVENUE
1. Western Europe 21.4%
20.6%
7.5%3. Central and Eastern Europe2. North America
26.9%4. Middle East and Africa
1
2
3
4
5
6
5.7%5. Latin America 17.9%6. Asia
Lafarge - Registration Document 2013 • 03
LAFARGE PROFILE

KEY FIGURES BY ACTIVITIES
%REVENUE
1. Cement 63.5%
35.9%
0.6%3. Other2. Aggregates and concrete
1
2
3
%EMPLOYEES
1. Cement 59.6%
39.3%
1.1%3. Other2. Aggregates and concrete
1
2
3
A WORLD LEADER IN CEMENT (December 31, 2013)
AGGREGATES AND CONCRETENo.2 AND No.4 WORLDWIDE (December 31, 2013)
9,657revenue million euros
38,000employees
56countries
155production sites
5,451revenue million euros
25,000employees
37countries
1,481production sites
• Lafarge - Registration Document 2013 04
LAFARGE PROFILE

LAFARGE KEY FIGURES
REVENUE (in M€)
2013 15,198
2012 15,816
2011 15,284
EBITDA (2) (in M€)
2013 3,102
2012 3,423(3)
2011 3,217(4)
OPERATING INCOME BEFORE CAPITAL GAINS, IMPAIRMENTS, RESTRUCTURING AND OTHERS (in M€)
2013 2,075
2012 2,413(3)
2011 2,179(4)
FREE CASH-FLOW (2) (in M€)
2013 864
2012 884
2011 1,208
GROUP NET DEBT (2) (in M€)
2013 10,330
2012 11,317
2011 11,974
NET INCOME GROUP SHARE (in M€)
2013 601
2012 365(3)
2011 593(4)
NET EARNING PER SHARE (in €)
2013 2.09
2012 1. 27(3)
2011 2.07(4)
DIVIDEND PER SHARE (in €)
2013 1.00
2012 1.00
2011 0.50
(1) Like for like variations are calculated excluding the impact of scope, exchange rates, carbon credit sales and one-time gains (39 million euros in 2012 and 20 million euros in 2013).
(2) See Section 2.2 (Accounting policies and defi nitions).
(3) 2012 fi gures have been restated following the application of IAS 19 amended.
(4) Data published in 2012 for 2011 and not restated for the amendments of IAS 19.
Revenue was impacted by a negative effect of the foreign exchange variations. At constant scope and exchange rates, sales grew 2%, supported by growth in all regions but Europe.
Resilient Group Ebitda margin, at 20.4%, supported by 670 million euros of additional Ebitda from cost savings and innovation measures for the year. Significant negative impact of variations in scope and exchange rates.
Current Operating Income was up 3% like-for-like(1) for the year. Improving trends in the second half of the year, with a visible operating leverage in North America and a robust performance in Middle East and Africa.
Significant reduction of Group net debt by 1 billion euros. Lafarge has the objective to reduce its net debt below 9 billion euros in 2014.
Strong improvement of the net income, notably helped by significant gains on disposals.
The Group pursued its actions to maximize the free cash flow, with notable improvements in the level of the working capital requirements.
Dividend of 1.00 euro per share, proposed at the General M eeting of Shareholders on May 7, 2014.
Net earnings per share increased 65%.
Lafarge - Registration Document 2013 • 05
LAFARGE PROFILE

SELECTED FINANCIAL DATA
Following European Regulation no. 1606/2002 issued on July 19, 2002, the Group has prepared consolidated fi nancial statements for the year ending December 31, 2013 in accordance with International Financial Reporting Standards (IFRS) adopted by the European Union on December 31, 2013.
The tables below show selected consolidated fi nancial data under IFRS for the years ending December 31, 2013, 2012, and 2011. The selected fi nancial information is derived from our consolidated fi nancial statements, which were audited by Deloitte & Associés and Ernst & Young et Autres. The audited consolidated fi nancial statements for the years ending December 31, 2013 and 2012 appear in part F at the end of this Registration Document .
KEY FIGURES FOR THE GROUP
(million euros, unless otherwise indicated) 2013 2012(1) 2011(2)
CONSOLIDATED STATEMENT OF INCOME
Revenue 15,198 15,816 15,284
Ebitda (3) 3,102 3,423 3,217
Operating income before capital gains, impairment, restructuring and other 2,075 2,413 2,179
Operating income 2,020 1,920 1,683
Net income 782 554 736
Out of which:
Net Income from continuing operations 736 538 244
Net income from discontinued operations 46 16 492
Out of which part attribuable to:
Owners of the parent of the Group 601 365 593
Non-controlling interests (minority interests) 181 189 143
Earnings per share – attributable to the owners of the parent company:
Basic earnings per share (euros) 2.09 1.27 2.07
Diluted earnings per share (euros) 2.08 1.27 2.06
Earnings per share of continuing operations
Basic earnings of continuing operations per share (euros) 1.93 1.21 0.36
Diluted earnings of continuing operations per share (euros) 1.92 1.21 0.35
Basic average number of shares outstanding (thousands) 287,268 287,079 286,514
(1) 2012 figures have been restated following the application of IAS 19 amended.
(2) Data published in 2012 for 2011 and not restated for the amendments of IAS 19.
(3) See Section 2.2.4 (Reconciliation of non-GAAP financial measures) for the definition of this indicator.
• Lafarge - Registration Document 2013 06
LAFARGE PROFILE Selected fi nancial data

(million euros) 2013 2012(1) 2011(2)
CONSOLIDATED STATEMENT OF FINANCIAL POSITION
ASSETS
Non-current assets 29,358 30,180 31,172
Current assets 7,717 9,284 9,547
Out of which assets held for sale - 2,280 2,195
TOTAL ASSETS 37,075 39,464 40,719
EQUITY AND LIABILITIES
Equity attributable to the owners of the parent company 14,555 15,666 16,004
Non-controlling interests (minority interests) 1,951 2,082 2,197
Non-current liabilities 13,620 14,451 15,260
Current liabilities 6,949 7,265 7,258
Out of which liabilities associated with assets held for sale - 388 364
TOTAL EQUITY AND LIABILITIES 37,075 39,464 40,719
(1) 2012 figures have been restated following the application of IAS 19 a mended.
(2) Data published in 2012 for 2011 and not restated for the amendments of IAS 19.
(million euros) 2013 2012(1) 2011(2)
CONSOLIDATED STATEMENT OF CASH FLOWS
Net cash provided by operating activities 1,256 1,298 1,619
Net operating cash generated by continuing operations 1,255 1,276 1,597
Net operating cash generated by discontinued operations 1 22 22
Net cash provided by/(used in) investing activities 37 (327) 843
Net cash provided by/(used in) investing activities from continuing operations 39 (323) 891
Net cash provided by/(used in) investing activities from discontinued operations (2) (4) (48)
Net cash provided by/(used in) financing activities (460) (1,348) (2,529)
Net cash provided by/(used in) financing activities from continuing operations (460) (1,348) (2,455)
Net cash provided by/(used in) financing activities from discontinued operations - - (74)
Increase (decrease) in cash and cash equivalents 833 (377) (67)
(1) 2012 figures have been restated following the application of IAS 19 a mended.
(2) Data published in 2012 for 2011 and not restated for the amendments of IAS 19.
(million euros, unless otherwise indicated) 2013 2012(2) 2011(3)
ADDITIONAL FINANCIAL INDICATORS (1)
Free Cash-Flow 864 884 1,208
Return on capital employed (4) (%) 7.2 7.8 6.8
Net Debt 10,330 11,317 11,974
(1) See Section 2.2.4 (Reconciliation of non-GAAP financial measures) for the definition of these indicators.
(2) 2012 figures have been restated following the application of IAS 19 a mended.
(3) Data published in 2012 for 2011 and not restated for the amendments of IAS 19.
(4) Before tax.
(euros, unless otherwise indicated) 2013 2012 (1) 2011
DIVIDENDS
Total dividend (million euros) 289 (3) 289 145
Basic dividend per share 1.00 (1) 1.00 0.50
Loyalty dividend per share (2) 1.10 (1) 1.10 0.55
(1) Proposed dividend.
(2) See Section 6.2.5 (Articles of Association (Statuts) – Rights, preferences and restrictions attached to shares) for an explanation of our “Loyalty dividend”.
(3) Based on an estimation of 287,347,462 shares eligible for dividends.
Lafarge - Registration Document 2013 • 07
LAFARGE PROFILE Selected fi nancial data

• Lafarge - Registration Document 2013 08
LAFARGE PROFILE

1
Lafarge - Registration Document 2013 • 09
GROUP PRESENTATION
11.1 Lafarge presentation ........................... 101.1.1 Profi le ............................................................................ 101.1.2 History and development .............................................. 10
1.2 Strategy ........................................... 121.2.1 Our ambition: building better cities .............................. 121.2.2 A solid foundation: a balanced geographical
portfolio focused on emerging markets and on Lafarge’s core business lines ........................................ 14
1.2.3 Innovating to build better cities .................................... 151.2.4 Becoming yet more competitive through performance .. 201.2.5 Men and women, at the heart of Lafarge
transformation.............................................................. 231.2.6 A fi rm commitment to sustainable development .......... 251.2.7 Intellectual Property ...................................................... 261.2.8 Recent acquisitions, partnerships and divestitures ..... 27
1.3 Overview of operations ......................... 281.3.1 Cement ......................................................................... 31
Cement trading activities ................................................351.3.2 Aggregates and Concrete .............................................. 37
Aggregates ......................................................................37Ready-mix concrete .........................................................37Asphalt ............................................................................37Breakdown by region ........................................................38
1.3.3 Other products: Gypsum ............................................... 391.3.4 Mineral reserves and quarries ....................................... 391.3.5 Expenditures in 2013 and 2012 .................................... 411.3.6 Capital expenditures planned for 2014 ......................... 41

• Lafarge - Registration Document 201310
GROUP PRESENTATION11 1.1 Lafarge presentation
Founded in France in 1833, Lafarge has become a world leader in building materials.
1.1.1 PROFILE
Lafarge primarily produces and sells cement, aggregates and ready-mix concrete worldwide, mostly under the “Lafarge” brand name. Its building products and solutions are used to construct and renovate homes, buildings and infrastructures.
Based on its revenues and on internal and external analysis, Lafarge is a world leader in building materials and in the cement market. It is the second largest producer of aggregates and the fourth largest producer of ready-mix concrete.
In the 2013 fi nancial year, Lafarge generated sales of 15,198 million euros, with Ebitda (1) of 3,102 million euros and net income, group share of 601 million euros. At year-end, its assets totaled 37,075 million euros and the Group employed approximately 64,000 people in 62 countries.
Lafarge S.A. is a Limited Liability Company (Société Anonyme) incorporated in France under French law, registered on the Paris Corporate and Trade Register under
number 542 105 572. The Company’s corporate term is due to expire on December 31, 2066 and may be extended pursuant to its by-laws. The registered offi ce is located at 61 rue des Belles Feuilles, 75116 Paris, France. The Group reporting currency is the euro (€).
Lafarge shares have been traded on the Paris Stock Exchange (NYSE Euronext Paris) since 1923. Lafarge shares have belonged to the CAC 40 since the creation of this index.
1.1.2 HISTORY AND DEVELOPMENT
In 1833, Joseph-Auguste Pavin de Lafarge sets up a lime operation in Le Teil (Ardèche, France), on the right bank of the Rhône river. Through sustained growth and numerous acquisitions, the Company becomes France’s largest cement producer by the late 30’s.
Lafarge’s fi rst step to international expansion takes place in 1864 with the export of lime for the construction of the Suez Canal. Its expansion then continues, first in the Mediterranean basin (particularly Algeria), then in Canada and Brazil in the 1950s. The acquisition of General Portland Inc. in 1981 allows it to become one of the largest concrete manufacturers in North America, while the purchase of the Swiss group Cementia in 1989 enables it to take up new positions, particularly
in Europe and East Africa. The 1990s see the Group’s fi rst sites appear in Eastern Europe and Asia, primarily China and India.
In the meantime, Lafarge develops it aggregates and ready-mix concrete activity. In 1997, the acquisition of the British company Redland allows Lafarge to expand in this sector. .
With the purchase of the British manufacturer Blue Circle in 2001, Lafarge further increases its presence on emerging markets and becomes the world’s leading cement producer. In January 2008, Lafarge acquires the cement activity of the Egyptian Orascom group (Orascom Building Materials Holding S.A.E.), which makes it the market leader in the Middle East and Africa.
Lafarge decided to refocus on its core business lines of cement and aggregates and concrete, which show very high growth potential, by disposing in 2011 and 2013 most of its gypsum assets, having done the same with its roofi ng business in 2007.
Defi nitions
“Lafarge S.A.” refers to the Group listed parent company.
“Lafarge” refers to the whole Lafarge Group.
(1) See Section 2.2.4 (Reconciliation of non-GAAP fi nancial measures) for the defi nition of this indicator.
1.1LAFARGE PRESENTATION
KEY DATES
1833
February2007
Beginning
of operations
in France
1956 1981Acquisition of General
Portland, making
Lafarge one of the largest
cement manufacturers
in North America
1994Lafarge enters
the Chinese market
Sale of
the Roofing Division
1864Lafarge delivers
110,000 tonnes of lime
for the construction
of the Suez Canal
1959First operations in Brazil
1989Acquisition
of Cementia
1997Acquisition of Redland plc,
one of the principal
manufacturers
of aggregates
and concrete worldwide
2001Acquisition
of Blue Circle
Industries plc.
2011Sale of
our Gypsum
operations
2006Lafarge owns 100%
of Lafarge North
America Inc.
January 2008Acquisition
of Orascom
Cement
Lafarge builds
its 1 cement plant
in Richmond, Canada
st
1998First operations
in India

Lafarge - Registration Document 2013 • 11
GROUP PRESENTATION
1
1.1 Lafarge presentation
WHAT MAKES US DIFFERENT
Strategic levers Our strengths The evidence
A strong ambition:
"Build better cities"
A new positioning in line with the challenges of a growing
urbanization
The contribution of Lafarge to build cities with more
housing, more compact, more durable, more beautiful and
better connected.
Geographical
portfolio to
capture growth
Strong and diversified presence in emerging countries Z 71% of our revenue outside Europe;
Z 58% of our revenue in emerging countries;
Z No single emerging country represents more than 5%
of sales.
Staying ahead
through innovation
Innovation, a growth driver 220 million euros of incremental Ebitda generated in 2013 .
R&D focused on market needs Z The world’s largest R&D center in the building materials
sectors, established in 1887.
Z A budget of 122 million euros.
Z 116 new patent applications in 2013.
Z D evelopment laboratories in Lyon , Mumbai, Chongquing
and Algiers . Project 2014 : Brazil .
Innovative products and solutions:
Z Cements and concretes
Z Special concretes to meet construction challenge
Z More than 140 launches of cement and concrete
products
by countries in 2013.
Z Special concrete products accounted for 36 %
of concrete sales volume in 2013: Hydromédia™
permeable concrete, Agilia® self-compacting concrete,
Artevia® decorative concrete, Thermedia® thermal
concrete and Ductal® ultra-high-strength concrete.
A growing number of services to support projects
and distribution
Some examples:
Z the “placing and finishing” service for concrete
launched in 21 countries;
Z creation of innovative distribution circuits in Morocco,
Tanzania, Algeria, Nigeria.
Development of specification and consultancy services for
architects and decision-makers
More than 6 0 positions for construction specialists and
international key account managers.
Continuous
improvement
in performance
to boost our
competitiveness
Cost reduction 450 million euros of cost reduction in 2013, through
various levers.
Z For example, non-fossil fuels constitute more than
17 % of the consumption of our cement plants ;
Z A sourcing platform in Beijing to supply plants
with equipments and spare parts at the best value.
Increase productivity of the plants Z 13 to 15 million additional cement tonnes have been
identified during 2012-2015;
Z reliability rate of 94.9% in 2013;
Z continuous improvement of the cement/clinker ratio
during the past ten years;
Z business models in each business.
Men and women at
the heart of the Group
transformation
Health and Safety: Our first priority Lost Time Incident Frequency rate strongly improved from
2012 (0.62%) to 0.49 % in 2013.
Increase sales efficiency 1, 400 sales people trained on new methods and sales tools.
Promote diversity Creation of the inclusion index.
Training 1.6 million hours of training in 2013.
A continuing
commitment
to sustainable
Development
Contribute to the needs of communities Z 37 % of countries implemented a job creation plan or
an educatio nal program;
Z 57,000 hours of voluntary services by staff.
Contribute to sustainable construction Development of new products to reduce our carbon
footprint: Aether®, Thermedia 0.3®, deployment of
Hydromedia® in 20 countries.
Contribute to the circular economy Z Volume of recycled aggregates increased by 88%;
Z C02 emission per tonne reduced by 26% since 1990.

• Lafarge - Registration Document 201312
GROUP PRESENTATION11 1.2 Strategy
1.2STRATEGY
1.2.1 OUR AMBITION: BUILDING BETTER CITIES
Over the next few decades, growth in the world population will occur almost exclusively in urban environments. One of the key challenges of the 21st century consists in making a success of human, economic and ecological urbanization.
a) The phenomenon of urbanizationGrowth of the urban population will continue during the coming decades, setting challenges that will call for imagination and innovation.
Z WORLD POPULATION GROWTH
The planet population surpassed 7 billion in 2011. According to United Nations forecasts, it should pass the 8 billion mark in 2025, and 9 billion around 2050. In less than 40 years, an extra 2 billion (1) people will need to be housed, mostly in cities. Urbanization, which rose with the demographic explosion of the twentieth century, will become even more spectacular. Since 2007, the majority of the world population has lived in towns and cities, compared to 30% in 1950. The rate is expected to be close to 70% by 2050, as the cities absorb all the population growth (2).
Z A NEW URBAN LANDSCAPE
Growth in towns and cities will occur in all countries. The phenomenon will be less marked – but nonetheless real – in regions that are already highly urbanized (Europe, North America, South America), but it will be considerable in emerging countries, including in Africa.
Two phenomena will characterize the urban landscape of the future:
Z a larger number of average-size cities of between 100,000 and 500,000 inhabitants, which will contain around half of the total urban population;
Z a growing proportion of megalopolises (metropolitan areas with more than 10 million inhabitants), which will increase in number from 23 today to around 40 in 2025, with many located in Asia.
Z CHALLENGES TO BE MET
Urbanization generates enormous needs at the same time as many challenges: better management of population density and fl uidity of movement, providing access for all to decent housing, signifi cantly improving the quality of the housing stock, building collective infrastructures for the production and distribution of energy (water, electricity), sewage systems, public transport networks and educational, cultural and sports facilities.
In this context, it is critical to avoid increasing waste of natural resources, pollution and greenhouse gas emissions, and even to reduce them.
The construction market is naturally positioned at the heart of the challenges of urbanization. It has the twofold mission of meeting major needs, particular in emerging countries, and proposing innovative solutions that will contribute to improving the quality of life.
b) The construction marketThe construction market is divided into two segments: building (residential and non-residential) and infrastructure. At the global level, these segments are distributed as follows : 32 % for infrastructure, 34 % for residential and 34 % for non- residential ( Oxford Economics 2013). The expertise acquired by Lafarge in each of its markets allows the Group to continuously innovate by anticipating the needs of its customers.
Z THE MARKET FOR RESIDENTIAL BUILDING (HOUSING)
Housing demand is growing strongly as two factors combine : population growth and rising per capita income. For housing construction continues to accelerate , it is necessary to ensure that the price of building materials is affordable and that the distribution range. In developed countries, new energy effi ciency requirements have emerged. To meet these new environmental standards , the materials used must evolve and become more effi cient .
Z THE MARKET FOR NON-RESIDENTIAL BUILDING
Strong commercial construction in each country depends on GDP growth and corporate health. While making the strongest and most durable commercial buildings, Lafarge contributed to limit urban sprawl to preserve farmland and offer more mobility within the urban compact cities .
Z THE INFRASTRUCTURE MARKET
Investment in infrastructure is critical to future economic growth , because the productivity of an economy depends largely on the quality of its infrastructure networks. Even in the case of developped countries , large sources of growth could emerge if the infrastructure were upgraded . The McKinsey Global Institute showed that in the United States , a GDP permanent gain 2 points of growth if infrastructure investments increased a percentage point of GDP.
Keeping pace with trends on these
markets to meet new needsAs a world leader in building materials, Lafarge has a crucial part to play in the changes occurring in the urban landscape. In 2013, it defi ned a new positioning which will enable it to meet both the quantitative and qualitative needs of the construction market, with the ambition of contributing to building better cities.
(1) http://www.un.org/en/globalissues/humansettlements/
(2) http://www.who.int/gho/urban_health/situation_trends//en/

Lafarge - Registration Document 2013 • 13
GROUP PRESENTATION
1
1.2 Strategy
c) For b etter citiesDeeply committed to the construction of better cities, Lafarge has defi ned fi ve key priorities: providing cities with more housing and making cities more compact, more durable, more beautiful, and better connected.
Z CITIES WITH MORE HOUSING
To provide decent housing for all city-dwellers, especially newcomers, whatever their income level, construction industry players are working out solutions to build quality housing at affordable prices.
In Bègles, France, Lafarge, is taking part in an innovative project in partnership with the town council, architect Christophe Hutin and property developer Domofrance. It consists of stacked decks divided into units of between 100 and 120 square meters including 50% living space and 50% garden, half of which can be converted into additional living space, if required.
Facilitating access to housingThrough its Sustainability Ambitions 2020, launched in June 2012, Lafarge has undertaken to facilitate access to affordable and sustainable housing for two million people around the world.
In Mumbai, India, Lafarge has devised a simple solution: concrete in buckets that can be delivered by three wheels motorcycles in very narrow alleyways to allow the construction of high-quality two story houses for improving the quality of life in the city slums.
In several countries (the Philippines, Nigeria, Morocco, Zambia, Bangladesh, Sri Lanka, Indonesia), Lafarge has created or set up microcredit programs intended to help families with low purchasing power to build, improve or enlarge their homes.
Z MORE COMPACT CITIES
Cities will not be able to accommodate their growing populations simply by expanding outward, since sprawl poses complex, costly problems related to transportation, ineffi cient use of energy and disappearance of farmland. Instead, cities will have to become more dense .
Building upwardDensification will entail building upward, whether by adding one or more additional stories to one-story buildings or by building high-rise developments, depending on the size of the city and the geography.
To help make these projects possible, Lafarge offers numerous types of concrete: very high strength concrete for the foundations and the lower parts, lightweight concrete for the upper parts, insulation, etc.
The Group contributed to building the Lodha World One tower in Mumbai, one of the world tallest residential skyscrapers. With the help of state-of the-art technology, Lafarge designed a concrete that combines properties of extreme solidity and durability.
Reimagining and renewing citiesAs cities become denser, efforts must also be made to increase their attractiveness and to improve their residents’ well-being through a balanced approach to urban planning. In Marseille, for instance, this has taken the form of the renovation of the former industrial neighborhood of Arenc, the redevelopment of the Vieux-Port and the regeneration of the Porte d’Aix neighborhood.
Z MORE DURABLE CITIES
More durable cities are more solid and more environmentally friendly. Thanks to its numerous properties, concrete is a material particularly well adapted to meeting these requirements.
Withstanding earthquakesConcrete is the building material that offers the best resistance against natural disasters. It is good at withstanding earthquakes, deformation and fi re. In sensitive regions, Lafarge’s range includes special concretes with enhanced resistance to earthquakes and hurricanes. The facades of the new Pérez Art Museum in Miami incorporate ultra-high-performance fi ber-reinforced Ductal® concrete because it meets the anti-hurricane standards in force in Florida.
THE MUCEM CAPTIVATES MARSEILLE
The Museum of Civilizations from Europe
and the Mediterranean (MuCEM),
inaugurated in June 2013, has already
proved to be a success.
Located at the entrance to Marseille
Vieux-Port and connected to the Fort
Saint-Jean by a stunning footbridge, this
“vertical casbah” features a latticework
sun-break like a gigantic mashrabiya,
entirely produced with ultra-high
performance fi ber-reinforced Ductal®
concrete, which is one of the favorite
materials of the building’s designer,
architect Rudy Riccioti.
He also used Ductal® for the outer shell of
the stands of the new Jean Bouin stadium,
the home ground of the Paris rugby team,
Stade Français.

• Lafarge - Registration Document 201314
GROUP PRESENTATION11 1.2 Strategy
Improving thermal effi ciencyProviding buildings with better insulation to reduce both energy costs and CO
2 emissions
has become a high priority for property developers, owners and tenants.
In response to this ambition, Lafarge offers simple and effective solutions, such as Thermedia® concrete, which gives three times better insulation that standard concrete, and a thermal break based on Ductal® and rockwool.
In partnership with the French house builder Cécile Robin Construction, Lafarge has designed a townhouse with positive energy (i.e. it produces more energy than it consumes). Named “House of the Year” in its category by the Union des Maisons Françaises in 2012, it combines traditional techniques and innovative materials.
Reducing the environmental footprint of
constructionIn its Sustainability Ambitions 2020, Lafarge set itself targets of reducing its CO
2 emissions
per tonne of cement produced by 33% compared to 1990 levels, using 50% of non-fossil fuels in its cement plants (including 30% biomass), manufacturing 15 million tonnes of aggregates from reused or recycled materials and incorporating these aggregates in 20% of its concrete production.
Actions are already under way to address all these points. They include development of the new Aether® cement, constant improvement to the cement/clinker ratio, an agreement signed in October 2013 with a young American company, Solidia Technologies, for the industrial development of an innovative technique that will reduce the CO
2 footprint of
precast concrete; implementation of sourcing programs for alternative fuels; and the removal of demolition waste which is transformed and marketed as aggregates under the Aggneo™ brand name.
Z MORE BEAUTIFUL CITIES
The beauty and attractiveness of buildings is a key factor in the quality of life of city-dwellers. It is no coincidence that concrete inspires so many architects: its technical performance combines with its great fl exibility to make possible every audacious architectural achievement to make cities more beautiful.
High-performance concrete with
an esthetic edgeConcretes developed by Lafarge enable architects to design buildings that are as audacious as well as robust.
The facade of a retirement home in Paris, dating back to 1935, was restructured and
set behind a latticework screen in Ductal® designed to resemble enormous bamboo stems blowing in the wind.
The Hepworth Gallery in Wakefield, near Leeds (United Kingdom), was built using Agilia® self-placing concrete enhanced with a purple-gray pigment. A specific casting technique was needed in order to obtain a uniform color throughout the structure.
Decorative artThe Artevia® range of decorative concretes is particularly well-suited to the embellishment of buildings and public spaces. When combined with other types of concrete, it is possible to create an aesthetically-pleasing, environmentally-friendly result.
For the Plaza del Milenio in Valladolid, Spain, Lafarge teams devised tailored solutions to create an environmentally exemplary space. The paving was carried out in green and grey Artevia® while the cycle track employs a pervious concrete that optimizes the drainage of rainwater, which is recovered for the purpose of watering the green spaces.
Artevia® was also chosen to create an 80-meter facade at the Cambridge University Botanic Garden in the United Kingdom, with joints that are barely visible.
Artevia® is often used in private homes to create or restore a polished concrete patio, to create garden paths or colored swimming pools sides, or to use stamped concrete to simulate the warm appearance of a wooden patio.
Z BETTER CONNECTED CITIES
The mobility of city-dwellers is essential for their quality of life and for economic activity in the city. Lafarge draws on its expertise, its cutting-edge products and services and its international resources to offer construction solutions for infrastructures that link people together and allows them access to energy resources.
Lafarge has been involved in the construction of the 200 meter tall telecommunications tower in Belgrade; tunnels and bridges, including the Port Mann Bridge in Canada, the world widest bridge; and transport infrastructures such as the tramway in Casablanca, Morocco, and an expressway which crosses Poland from West to East. In this example, Lafarge is the only supplier capable of offering a complete range including concrete for bridges and roads, aggregates for stabilization, cement and associated services.
Improving energy supply to citiesWorking toward the harmonious development of cities entails taking part in constructing the infrastructure networks that supply them with energy, and require particularly strong and reliable materials.
Lafarge was chosen to supply three layers of different types of concrete for the foundations of wind turbines in the largest European wind farm, in Romania (1,100 hectares, 240 turbines). The foundations of a future hydroelectric power plant in Roanne, France, laid in the bed of the Loire river, nine meters below the water, required 7,000 cubic meters of Agilia® concrete, which was selected for its self-leveling properties and its compactness. Following a number of tests, Ductal® was chosen for the renovation of the Caderousse dam on the Rhône river in France, because of its exceptional resistance to shocks and abrasion.
1.2.2 A SOLID FOUNDATION: A BALANCED GEOGRAPHICAL PORTFOLIO FOCUSED ON EMERGING MARKETS AND ON LAFARGE’S CORE BUSINESS LINES
With a balanced geographic portfolio oriented towards emerging markets and a presence in 62 countries, Lafarge - having refocused on its core business lines and with a more effi cient organizational structure since 2012 - has the strengths required for its development and to consolidate its position in the world building materials market.
a) A balanced international groupThanks to its long-standing international expansion strategy, Lafarge has now achieved a geographic balance that offers a unique growth potential with strong positions in both developed and emerging markets and with limited risk: no single emerging country accounts for more than 5% of its sales. Sales in emerging markets in Central and Eastern Europe, Middle East and Africa, Latin America and Asia, grew from 32% in 2005 to 58 % of sales in 2013. Lafarge is therefore in a strong position to seize all opportunities for worldwide growth and will continue to develop its leading positions through selective organic investments, notably in Subsaharan Africa and in North America.

Lafarge - Registration Document 2013 • 15
GROUP PRESENTATION
1
1.2 Strategy
b) A group refocused on its core businessIn 2011, Lafarge decided to refocus on its core business lines of cement and aggregates and concrete, which show very high growth potential, by disposing most of its Gypsum assets in 2011 and 2013, having done likewise with its Roofi ng business in 2007.
c) A country-based organizational structureEarly in 2012, a new organizational structure - more agile, more reactive and more focused on markets and customers - was implemented with a view to enhancing Lafarge’s effi ciency and accelerating its growth. The business-based structure was replaced by a country-based organization. Each country unit is headed by a general manager responsible for all cement and aggregates and concrete activities in the country, drawing on shared local support functions as well as Lafarge’s support functions.
The organizational structure and the responsibilities of the Executive Committee were also redistributed with the creation of Innovation and Performance functions.
This new structure is the natural continuation of both Lafarge’s geographic expansion phase and its refocusing on its core business. Its aim is to increase Lafarge’s differentiation through the development of higher added value products and solutions for construction, linking all cement and aggregates and concrete skills in each country, thus reinforcing Lafarge’s position as a key player in construction.
1.2.3 INNOVATING TO BUILD BETTER CITIES
Innovation has always been one of the pillars of Lafarge’s strategy. Today, this approach is not limited to the creation of new products through cutting-edge R&D. It also incorporates marketing policy with a focus on the end-user, including a needs analysis for each market in every country, to ensure the development of innovative offers that will deliver added value to customers and ensure the growth of Group businesses. Innovation is a key growth driver, with 450 million euros of additional Ebitda expected for the period 2012-2014, and a new objective of 500 million euros expected in 2015-2016.
a) As close as possible to our marketsDetermined to strengthen its customer focus, Lafarge is now organized in a way that enables it to promote its products, solutions and services to its markets. Lafarge also makes its offer available through the development
of licenses and franchises for the industry and by increasing the professionalism of its distribution network.
Z BUILDING
The building market is key for Lafarge. It consists of two segments: residential (housing) and non-residential (commercial, offices, industrial).
In 2012, Lafarge began a process in each country of identifying markets with strong growth potential and developing specifi c offers corresponding to them. These can combine products, solutions for applications (walls, fl oors, roof terraces, etc.) and services and, in some cases, they may involve partners.
For example, in China, a lightweight insulating concrete was developed early in 2013 to meet the construction requirement of very tall apartment buildings (30 storeys). The fi rst contract with Longfor, one of the leading Chinese developers, covers the delivery of 17,000 m³, which will allow the construction of 500,000 m2 of slabs.
In France, an offer for low-consumption houses was launched on the market. One of the objectives is to promote concrete blocks over bricks. Four major regional manufacturers have set up a grouping called GIE France Blocs to work on this issue. As a partner in this project, Lafarge developed a lightweight block based on pumice stone (12 kg instead of 18 kg) with high thermal performance. It is used for the construction of Pro-Eco low-consumption houses designed by Lafarge and sold by regional developers.
Construction systems: solutions
for specifi ersLaunched in 2012, construction systems are innovative solutions for the production of structural components (walls, floors, facades, etc.) with stand-out characteristics in one or more areas (cost, durability, strength, insulation, aesthetics, ease of application, etc.). The catalog includes more than 50 solutions for developing appropriate offers for each market.
Promoting affordable housingThere is a great need for housing construction in emerging countries for the middle classes, but especially for the most underprivileged populations. It is essential to offer solutions for building decent, solid housing at affordable prices.
In India, Lafarge has developed an innovative distribution system in the heart of the slums, where trucks cannot pass along the narrow alleyways: bags of concrete and mortar are delivered by motorized rickshaws. Launched in Mumbai, this offer could be extended to several other cities . Replication of the offer in other countries, such as Brazil, is under consideration.
To help families with low purchasing power to build, improve or extend their homes, Lafarge has also introduced microcredit programs, in partnership with banks or specialized fi nance institutions and distributors.
Following Indonesia, the Philippines and Zambia, the program was extended to Nigeria this year, with the expertise and fi nancial support of the French Development Agency. Others are being set up in Morocco, Bangladesh and Sri Lanka. The programs
A WINNING PARTNERSHIP IN THE PHILIPPINES
The Philippines provide an interesting
example of partnership. The concept
consists in a complete green roof on
very tall offi ce towers which enables
property developers to increase their
LEED (Leadership in Energy and
Environmental Design) rating. The project
involves two perfectly complementary
partners: Sika, a manufacturer of roofi ng
membranes, which also has a good network
of installers, and Lafarge, which provides
the design solutions and offers custom
mix soil and pumice aggregates specially
selected for their lightness and drainage
properties. Thanks to Sika's and Lafarge's
collaboration , the solution has been made
available to sustainability-conscious
developers .

• Lafarge - Registration Document 201316
GROUP PRESENTATION11 1.2 Strategy
devised by Lafarge are not restricted to granting loans for the purchase of building materials. They offer complete solutions, with design, products, training and services covering the entire construction chain.
Z INFRASTRUCTURES
Transports, energy and mining, roads, telecommunications, water, public facilities, ... infrastructures are keys to the development of cities and countries, and represent a business sector in which materials play a signifi cant role because of unique requirements in terms of technological challenges and longevity. One of the keys to success is to contribute value starting from the project design phase. For infrastructures, the majority of decisions – broad strategic choices and options of techniques and materials – are taken a long way upstream. It is therefore at this decisive time that it is important to be present.
Products, solutions, logisticsMajor infrastructure projects constitute challenges in terms of design and technical application, of meeting commitments on schedules and budgets, of guaranteeing longevity and public acceptability. In all these areas, Lafarge is able to make major contributions.
For major projects such as the extension of the Madrid airport and the Casablanca tramway, Lafarge convinced the decision-makers as much by the quality and the innovative nature of its products (self-compacting Agilia® concrete, decorative Artevia® concrete, etc.) as by its capacity to supply large quantities on a continuous basis. For the Koralpe tunnel, in Austria, the Lafarge Research Center devised a customized cement adapted to the chemical composition of the rocks. For the Le Havre stadium, a positive energy building, Lafarge supplied cement with very low carbon content, which enabled the construction site to achieve a 22% reduction in CO
2 emissions.
Apart from their technical and environmental performance, Lafarge solutions also meet the esthetic challenges that are central to the public acceptability of urban infrastructures. The choice of fiber-reinforced ultra-high performance Ductal® concrete for the MuCEM in Marseille, for example, in spite of being more expensive than ordinary concrete, made it possible to construct a building at a competitive cost compared to that of other European museums built with other materials, while offering innovative architecture to the public.
Z A SPECIAL CEMENT FOR THE OIL AND GAS INDUSTRY
In 2012, the Oil Well Cement market was established as a Lafarge market in its own right. The oil drilling sector, which continues to expand to keep pace with the growth in world energy demand, calls for specifi c products and requires a specifi c commercial approach.
Very stringent standardsBoth onshore and offshore wells, which can exceed 2,000 meters in depth for a diameter of only one meter, are composed of a metal casing surrounded by a special cement slurry mix known as oil well cement that fi lls the space between the outer face of the tubing and the wall formation of the hole and ensures the consolidation and insulation of the geographical layers crossed.
Given the complexity of the application and the extreme conditions of temperature and pressure to which they are exposed, oil well cements must be carefully designed to meet the most stringent requirements such as predictable set time and thickening time, high sulfate resistance, adjustable density and viscosity, fluid loss control, low free fluid, strength, a perfect seal, etc. These requirements correspond to a standard stipulated by the American Petroleum Institute (API), and the plants manufacturing this cement must be certifi ed for conformity.
A global ambitionAs a producer of oil well cement at its Le Havre plant in France and in plants in the United States and Canada, the aim for Lafarge is to become one of the benchmark players on the world market.
Lafarge’s presence in many countries gives it another competitive edge. Although many contracts with drilling companies are signed at an international level, proximity is a benefi t when it comes to logistics. In Algeria, for example, Lafarge is capable of delivering cement to the oil wells in the south of the country. As a result of this expertise, Lafarge signed new contracts in 2013 in Algeria, Iraq and Egypt.
Z TWO MAJOR CHANNELS FOR PROMOTING THE LAFARGE OFFER
Developing licenses and franchises for the industrial market. This includes all customers who process materials industrially: ready-mix concrete, precast concrete products, asphalt mixes and mortars.
Industrial customers generally purchase bulk cement and aggregates. They sell their products to the construction and infrastructure markets. The cost of raw materials accounts for between 50% and 70% of their cost price.
Lafarge has extensive operational and commercial experience in the concrete industry (both ready-mix and precast
CEMENT AND EARTH, A SUCCESSFUL COMBINATION
IN MALAWI
In Malawi, the construction of brick houses
results in heavy consumption of wood used
for fi ring the clay. Anxious to put a stop to
deforestation, the country authorities now
discourage this technique. Lafarge has
devised an alternative solution, a product
called Durabric. Designed in conjunction
with the Group’s Research Center, this new
cement binder is mixed with earth and/
or sand to produce stabilized blocks of
earth without fi ring. The solution is reliable,
affordable and environmentally friendly.
Lafarge supports its product offer with a range
of services including analysis of the earth used
to optimize formulation, renting of machines
and training. This solution could easily be
replicated in other countries: two billion people
around the world live in earth houses.

Lafarge - Registration Document 2013 • 17
GROUP PRESENTATION
1
1.2 Strategy
concrete). The aim of this new offer for Lafarge is to become an indispensable industrial partner for its customers. It goes much farther than merely supplying materials; it also enables the Group to share its know-how through licensing or franchise contracts.
In a highly competitive open market, this type of contract makes it possible for customers to benefi t from the full value of the Lafarge brand and its innovative products, to improve their operational and marketing approach, and to have the support of a recognized partner.
Following the United States, Romania and France, new projects are underway in Germany, Poland and Algeria.
More professional distribution networksThe distribution market covers sales to intermediaries – wholesalers and retailers – that resell the products without modifying them.
In emerging countries, the largest part of sales is made up of bagged cement, distribution mostly entailing a chain of intermediaries of varying length. In developed countries, retail sales account for less than 30% of the cement volumes sold on all distribution circuits. To a large extent, particularly in France, it is concentrated by networks of specialist retailers and do-it-yourself stores.
However, a constant on practically all markets has been a growing demand for specialty products, ready-to-use products for specifi c utilizations and specifi c forms of packaging (aggregates in bags, small quantities of cement in plastic bags, masonry cements, mortars in buckets, etc.). This trend is linked to the development of self-build observed in the residential building sector.
On this substantial market, the Group has multiplied the initiatives in 2013, in practically
every country in order to fi nd – or create – the most suitable circuits for making its products available under the best conditions.
In developped countries, this strategy mostly entails the creation of special partnerships with leading retailers (including in-store promotions and events, training of sales personnel, etc.), to ensure that Lafarge products are more present and to raise the Group’s profi le.
In Nigeria and China, strategic distributors have been identifi ed and selected to improve coverage of the country or of markets. This principle of close partnership will develop over the next few years.
In Tanzania and Zambia, a network of containers has been put in place to enable the development of cement distribution in rural regions.
Lafarge’s targets are not only professional distributors but also end-users: small contractors, craftsmen and even the public. This entails building up the most complete possible range of products and developing strong brands, such as in India, Brazil and the Philippines, creating service offerings going as far as fi nance and microcredit arrangements or making grants to match bank loans, as is done in Serbia (see page 15 ).
b) An innovative offer of products and solutionsThe development of offers that meet market needs is based on Lafarge’s products, construction solutions and services, whether traditional or more innovative. They are vital to the performance of these offers. Sometimes created by a particular country to respond to a specifi c situation, they are then added to the Group’s catalog and are available for
application in other countries and in other situations.
Z SPECIAL CONCRETES
Lafarge’s range of special concretes constitute one of the strengths of its offer. Available in 25 countries, this range represented 36% of concrete sales in terms of volume in 2013, an increase of 12.4 % over the previous year on a like-for-like basis.
Increasing the proportion of special concretes in the Lafarge offer will remain an objective for the Group in 2014.
Innovative projectsHydromedia™ pervious concrete was available in 20 countries in 2013, against 10 in 2010. After a project in Greece in 2012, it was used in 2013 to surface a supermarket car park in Vietnam, a fi rst in this country, and in China it was used for the plaza of the Yuelai international exhibition center in Chongqing.
Agilia® self-compacting and self-leveling concrete, available in different formulations according to the application (foundations, horizontal, vertical, etc.), quick to apply and offering an outstanding fi nish, was used in a number of prestigious sites, including Madrid airport, the Islamic Arts wing at the Louvre in Paris, the Olympic diving boards in London and the Absolute Towers (also known as the Marilyn Towers) in Mississauga, Toronto, Canada, etc.
Decorative Artevia® concrete is as suitable for the swimming pool surrounds and pathways of private houses as for public areas, such as the paving for the Casablanca tramway in Morocco, the Plaza del Milenio in Valladolid, Spain, and the Place de la République in Paris, where Hydromedia™ was also employed.
THE FIRST SALES OUTLET IN ALGERIA
In Algeria, the fi rst Batistore branch
opened its doors in July 2013. Directly
managed by Lafarge, this is the pilot for
a future chain of stores intended to expand
mostly through franchising: roughly one
hundred outlets are planned by 2016.
The initiative is inspired by the Mawadis
chain of stores in Morocco, launched by
Lafarge, two years ago.

• Lafarge - Registration Document 201318
GROUP PRESENTATION11 1.2 Strategy
Chronolia®, as fl exible to use as traditional concrete, quickly develops very high mechanical strength. This speed is particularly appreciated in bridge construction, a recent case in point being the 2,300 elements constituting the deck of the Port Mann Bridge in Canada.
The Thermedia® range of insulating concrete is the basis of numerous solutions for reducing energy bills ranging from the slabs of residential tower blocks in China to the facades of an occupational health care center in Perpignan, France.
Placing and Finishing services
boost salesLaunched in 2005 in Spain, the “placing and fi nishing” turnkey service is currently provided in 21 countries, including Egypt, South Africa and Malaysia. The principle is simple: Lafarge is responsible for both supplying value-added concrete solutions and installing them, subcontracting to approved installers. Originally launched for just Artevia® and Agilia®, the offer is now also available for Hydromedia™. This has proved to be an effective way of offering an additional service, especially to small contractors.
Z INNOVATION IN CEMENTS AND AGGREGATES
Concrete is not the only area in which Lafarge is developing innovative products. Cements and aggregates are also evolving to meet new market expectations.
Tailor-made cementsBy using blended cements, based on separate grinding of clinker and additives, it is possible to meet the needs of different markets.
In Canada, in response to the growing demand for sustainable construction, Lafarge has launched Contempra™, a limestone cement that delivers lower greenhouse gas emissions and has helped change the image of concrete in the eyes of the authorities.
In each country, the aim is to launch cell-designed, well-formulated products adapted to local needs. An excellent example is MohtarifTM, a blast furnace slag cement specifi cally designed for the infrastructure market in Algeria.
New-generation aggregatesIn the aggregates sector, the highlight of 2013 was the development of Aggneo™, a range of new-generation high-quality recycled aggregates. It can be used for road sub-bases as well as in concrete production. It meets many needs for sustainable construction in civil engineering as well as for residential and commercial construction, and is an example of the circular economy, where waste become a quality resource.
Lafarge also markets manufactured sand, produced from crushing rocks, graded and “worn down” according to the needs of each market to ensure optimum quality. This solution is both more economical and more ecological in many countries where natural sand deposits are rare and collection is subject to strict regulations.
c) Research & Development, keys to innovationThe innovation strategy is supported by the Group’s Research Center, whose work is continued at local level by the Construction Development Labs.
Z GLOBAL EXPERTISE FOR LOCAL MARKETS
See also page 23 Section 1.2.5 (Men and wormen, at the heart of Lafarge transformation).
Innovation is only possible thanks to substantial efforts in research and development. This strategy has always been one of the strengths of Lafarge: its very fi rst research center was created in 1887. On today site in l’Isle d’Abeau, near Lyon, France, some 240 engineers and technicians from a variety of scientifi c backgrounds and a dozen or so nationalities work at the Lafarge Research Center (LCR).
In 2013, the principal areas of research, which corresponded to requests from the countries, focused on energy efficiency, renovation – particularly in developped countries – and affordable housing, as well as binders, recycled asphalt mix and aggregates for roads, special concretes for wind turbines, etc.
Work also continued on reducing greenhouse gas emissions, in both manufacture and product usage, and the efficiency of production processes.
THE KEY ACCOUNTS APPROACH REWARDS
WITH ALSTOM
As a partner of Alstom Transport on the
construction of the Casablanca tramway,
Lafarge dedicated a key account director to
the constructor. In addition to a thorough
understanding of his client, expectations
and market, his mission is to work
upstream with Alstom technical managers
and project directors to specify Lafarge
solutions according to their needs, and then
to provide coordination with the Lafarge
teams in the country where the project
is situated. This approach has already
borne fruit: the Group has been selected
for three other tramway projects, in Dubai
(United Arab Emirates), Nottingham
(United Kingdom) and Gisors (France), and
two other projects are currently under study
(the underground of Riyadh in Saudi Arabia
and of Baghdad in Iraq).

Lafarge - Registration Document 2013 • 19
GROUP PRESENTATION
1
1.2 Strategy
Z DEVELOPMENT AT COUNTRY LEVEL
Lafarge launched the fi rst of its Construction Development Labs in 2011. They are tasked with adapting Lafarge’s solutions to the needs, restrictions, characteristics and opportunities of its local markets, in close partnership with customers and specifi ers (architects, industrial operators, distributors, consulting engineers, etc.).
In 2013, the three existing laboratories – in l’Isle d’Abeau (France), Mumbai (India) and Chongqing (China) – expanded their portfolios. On November 18, 2013, a fourth one, near Algiers, was added to the network, with the aim of supporting Lafarge growth in Algeria. By the end of 2015, the Group expects to be operating ten of these innovation tools intended to boost development in the countries.
Z INTERNATIONAL PARTNERSHIPS
As an internationally-renowned benchmark, Lafarge’s Research Center takes part in scientifi c networks and forms partnerships with the most important research institutions, top-ranking higher education establishments and universities worldwide.
d) Selling differently, selling betterSelling innovations means being commercially innovative. The countries have put in place sales and marketing strategies based on new skills and on the best sales practices to implement.
Z SPECIALISTS SPEAK TO SPECIFIERS
In order to be present as far upstream as possible with architects and decision-makers, Lafarge has created high-level specialized sales functions: construction specialists
A PARTNERSHIP TO REDUCE THE ENVIRONMENTAL FOOTPRINT OF PRECAST CONCRETE
Apart from collaborations with universities and research centers, the Lafarge Research Center forms partnerships with companies offering
breakthrough solutions. The most recent agreement of this kind was signed with Solidia Technologies, an American start-up that has developed an
innovative process that can reduce the carbon footprint of precast concrete by 70% by manufacturing low-carbon cement in a traditional rotary kiln
using the same raw materials as normal cement and using CO2 capture in the manufacture of precast concrete using this cement.
R&DAT LAFARGE
- A budget of 122 millions euros in 2013.
- 240 engineers and technicians at Lafarge Research Center in L'Isle D'Abeau site (Lyons).
- 116 new patent applications were fi led in 2013 .

• Lafarge - Registration Document 201320
GROUP PRESENTATION11 1.2 Strategy
operating in the countries and key account managers. Their role consists in analyzing needs and offering them tailored solutions, chiefl y employing products and innovative solutions. Thanks to their professional skills and Lafarge’s global expertise, they are a source of ideas and advice.
It was construction specialists, for instance, who devised the solution of using Chronolia® in repair work to the foundations of a building on the aerospace exploration site in Madrid, of a system of pre-stressed concrete panels for a library in Louisville, Kentucky, the choice of pervious Hydromedia™ concrete for the plaza of the Yuelai international exhibition center in Chongqing, China, and Agilia® and Artevia® for the plaza of Bucharest U niversity, in Romania.
Z A PROGRAM TO ACHIEVE A TRANSFORMATION IN SALES
See page 23 Section 1.2.5 (Men and Women, at the heart of Lafarge transformation).
1.2.4 BECOMING YET MORE COMPETITIVE THROUGH PERFORMANCE
Along with innovation, performance is the Group’s other key growth driver. In order to permanently improve its competitiveness, Lafarge is acting to increase the value of its products and services, reduce its costs, optimize its supply chain and increase the productivity of its plants.
a) Cutting costsIn 2013, Lafarge reduced its costs by 450 million euros, added to the 1.5 billion euros of savings already generated between 2006 and 2012. The 2012-2015 plan intended to generate an additional 1.3 billion euros of cost reductions will be completed by
the end of 2014. Encouraged by the success, the Group announced in November 2013 a new objective of 600 million euros cost reduction over the period 2015-2016.
Z REDUCING THE COST OF ENERGY
Energy accounts for one third of the cost of cement production (before distribution and administrative costs). Lowering the energy bill and protecting the Group against price increases are therefore priorities. By improving purchasing management, reducing specifi c cases of energy consumption and using alternative fuels, the Group is able to achieve considerable progress. In Nigeria, Benin, Jordan and Uganda, equipment has been modifi ed to take ground coal or petcoke instead of other fuels with unreliable supply or too high a cost. Also a new Purchasing legal entity called "Lafarge Energy Solutions" has been created in order to enhance the global Lafarge presence on the coal and petcoke market and therefore optimize its sourcing performance.
DUCTAL®, THE ULTRA-HIGH PERFORMANCE CONCRETE
Fiber-reinforced ultra-high performance Ductal® concrete, one of the most prestigious products in the Lafarge range, has been in the spotlight in
recent years in the projects of several leading architects, including Rudy Ricciotti’s MuCEM in Marseille and Jean Bouin stadium in Paris, Frank
Gehry’s Louis Vuitton Foundation for Creation in Paris . Thanks to its exceptional properties, it is also used to strengthen dams, to build bridges, wind
turbine masts and lightweight insulated facades...

Lafarge - Registration Document 2013 • 21
GROUP PRESENTATION
1
1.2 Strategy
Optimizing electricity supplyThe strategy for optimizing electricity bills, which has been directed for several years by a dedicated team, depends on the type of market: use of preferential rates in countries where prices are regulated; hedging of volatility on liberalized markets; negotiations with different operators in countries with a mixed or transitional system. In every case, a detailed analysis and accurate forecast of needs can make substantial savings possible.
In several countries, Lafarge has created its own power plants, either to ensure secure and reliable supply at low cost or to improve its energy effi ciency thanks to heat recovery equipment fi tted with the cement process, feeding the electricity generators. In addition, whenever possible, Lafarge can adapt its consumption or production of electricity in order to obtain additional remuneration and play its part in ensuring the security of public electricity networks.
Developing alternative fuelsLafarge is also seeking ways to increase the proportion of alternative fuels in its plants: tires and waste industrial oils, household, industrial
and agricultural waste, etc. In 2013, these fuels accounted for more than 17% of cement plant consumption, against less than 15% in 2012. The goal is to approach 30% by the end of 2015 and 50% in 2020.
Considerable progress was made in 2013, particular in sub-Saharan African countries (South Africa, Benin, Cameroon, Zambia, Zimbabwe, Uganda), and projects are under way in the majority of countries where Lafarge operates, including Morocco, Kenya, China, the Philippines, Pakistan, Algeria, Brazil and Canada.
This year, the Group introduced complete solutions for processing household waste, thanks to an innovative bio-drying technology, in Romania and developed a system for roasting biomass in Benin. These solutions will increase the use of alternative fuels in cement plants.
The Saint-Pierre-La-Cour cement plant in France has installed a new mill for shredding non-toxic and non-polluting waste sourced from local businesses (plastics, paper, cardboard, textiles, bulky objects) to supplement the shredded tires that have been used as fuel for many years. As a result,
it has been possible to achieve a rate of 50% of non-fossil fuels, with a subsequent target of 75% becoming feasible.
Z OPTIMIZING THE SUPPLY CHAIN
Supply chain management consists in planning and supervising supplies to the plant and delivery to customers. It is a fundamental aspect of performance. Transport and logistics constitute a high proportion of costs. Optimizing internal and external fl ows and delivery rotations, avoiding empty return trips, avoiding waits during loading and breaks in supply caused by a lack of trucks, improving the management of transport providers by incorporating performance clauses into their contracts, ensuring that road safety standards are respected: each one of these actions creates value for the Group and for its customers. By assuring the regularity and punctuality of deliveries and unloading, and possibly onsite stock management and other value-added services, supply chain excellence can be responsible for a decisive competitive advantage in all markets.
OPERATING MODELS BASED ON EXPERIENCE
To improve its performance, Lafarge developed
operating models for each of its business
areas. Based on best practices, both industrial
and commercial, observed in the Group, they
have been modifi ed over time to keep pace
with markets changes and with priorities in the
countries. They have also been pared down to
make them still more operational.
Following TOP for concrete – which will be
updated in 2014 – and ROCK for aggregates,
CEM’UP, launched in 2012, combines the
Cement business’ industrial model (POM
2.0, reworked in the second half of 2013)
and a commercial model built on four
pillars: price management, brand defi nition,
product defi nition, and sales and distribution
strategies. Added to these is MOVE, developed
in 2013, for the supply chain (see below ).
The aim is to connect the different aspects of
the business – production, logistics, marketing
and sales – to improve plant performance
continuously and sustainably and provide
better service to customers.

• Lafarge - Registration Document 201322
GROUP PRESENTATION11 1.2 Strategy
This is why in 2013 Lafarge tasked a dedicated team with organizing and directing the supply chain function, with the aim of making it more professional and designing a business model, including the introduction of transport planning and management software and performance indicators. These will come into operation early in 2014.
Z A PROGRESS PLAN FOR QUARRIES
All the raw materials in Lafarge’s businesses are extracted from quarries. The Group operates more than 500 quarries, from which 400 million tonnes of rock are extracted every year. As such, Lafarge has much in common with a mining group. This is the culture that it is striving to acquire in its efforts to improve safety, productivity, costs and environmental management. The “basics” of mining culture include the following:
Z safe operation based on the rigorous implementation of a mining plan which defines operating sequences over the entire lifecycle of the quarry;
Z more rational management of the removal and storage of overburden;
Z expertise in drilling and blasting at the rock face to optimize fragmentation for the primary crushing plants
Z optimization of transport within the quarry from rock faces to site installations to ensure continuous feeding of primary crushing plants.
These are the aims of the Mining Acceleration project, launched in 2013, which focuses on
the implementation of the “basics” of mining at quarry level as well as on sustainable savings. Twelve sites in fi ve countries (Algeria, Western Canada , Iraq, Nigeria, Russia) have been chosen to act as pilots. By the end of 2014, the project will have been rolled out on 70 sites in 26 countries.
Z SEEKING THE BEST SOURCES OF SUPPLY
To optimize costs, Lafarge has set up a global sourcing and procurement community of more than 1,000 people, consisting of a focused central team, responsible for sourcing a limited number of critical inputs, notably energy and cementitious products, and disseminating best practices, completed by a worldwide network at country level, with a strong local expertise.
The objective is to select the best suppliers, committed to safety and sustainability, offering the lowest total cost of ownership, innovative solutions, overall performance including quality and transactional effi ciency.
The decision to leverage a purchasing category at a specifi c level (global or country) is based on a combination of factors including the supplier market structure, the ability to standardize our requirements, the ability to maximize our value creation, the ability for our suppliers to service our sites.
Based on its experience acquired during the construction of new cement plants in China, Lafarge has expanded its sourcing platform in Beijing with a new team (International Sourcing Development Team) responsible
for supplying its plants with equipment and replacement parts at the lowest possible prices, while performing controls throughout the production process to ensure that the components are of the highest quality.
b) Increasing productivityLafarge has identifi ed 13 to 15 million tonnes additional cement production capacity to be made available between 2012 and 2015, with minimal investment, while bringing new products to market to meet customers’ needs and while maintaining product quality.
Z CONTINUING TO IMPROVE THE CEMENT/CLINKER RATIO
The production of clinker, the base component of cement, is the operation with the highest energy-consumption. However, it is possible to replace clinker by other components: slag (a by-product of steel production), fl y ash (produced by the combustion of coal in thermal power plants) and pozzolan (volcanic rock). This method enhances a facility production capacities – thereby limiting investment costs – while cutting energy bills and CO
2 emissions. Moreover, the use of these
components gives cement special properties that can be advantageous in certain contexts, such as better resistance to chemical stresses (improved durability in environments with high levels of sulfur or chlorine) and low hydration heat (reduced cracking in large structures).
Progress is measured by changes in the cement/clinker ratio. At Lafarge, this has been constantly rising for the past ten years.
A WELL-MANAGED CONSTRUCTION SITE
IN RAJASTHAN
To construct a plant in Rajasthan, India,
with a capacity of 5,000 tonnes of clinker
per day, an ad hoc project team was put
in place in 2011. The construction project
required more than 15 million man-hours
of work and saw up to 4,500 people on
the site at certain times. Construction was
accident-free, and the plant was delivered
on time and under budget.

Lafarge - Registration Document 2013 • 23
GROUP PRESENTATION
1
1.2 Strategy
Z OPTIMIZING EXPERTISE OF PRODUCTION FACILITIES
Lafarge is working on optimizing its expertise of its production facilities and manufacturing processes in its cement plants, quarries and concrete plants to improve their reliability, and thus their productivity. This improvement is achieved by applying operating models that have proved their effectiveness.
A well-managed cement plant also achieves better safety results and 20% lower maintenance costs. Energy consumption is also 5% lower on average.
Lafarge is constantly improving its operational mastery: the plant reliability rate rose slightly compared to the previous year to a new record level of 94.9%. Beyond this record, this mastery has made it possible to improve the quality and regularity of products and increase the speed and reliability with which new products are brought to market.
Lafarge launched in 2011 the Boost project. This project aims to work with sites’ teams to improve rapidly the performance level in a sustainable way. The “boosters” provide assistance and share their knowledge and experience. Ready to be mobilized at any time, they may remain on assignment from 3 to 9 months.
Z MORE EFFICIENT ENGINEERING
The Group is trying to reduce the cost of building new facilities, particularly by shortening the time taken for construction and the build-up to full production capacity, through a reorganization of the governance and fi nancial control of projects. In summary, each project is managed as a business in its own right.
The construction of a cement plant in Rajasthan, India, which was fully operational only three months after start-up operations began, is a good example of success, achieved thanks to excellent collaboration between local teams and the engineering Division (see below).
The formation of start-up teams to support the operating teams for the time needed to achieve full capacity is another key to success. This joint work is vital for the start-up phase to run smoothly, and the cost is cheap compared to the cost of loss of production .
Eliminating bottlenecksThe engineering Division has also analyzed plant operations to detect potential for increasing production with a minimum investment, through the elimination of bottlenecks. The debottlenecking plan, which should help meet the target of raising capacity by 13 to 15 million tonnes, has been rolled out in some twelve countries.
1.2.5 MEN AND WOMEN, AT THE HEART OF LAFARGE TRANSFORMATION
A key element in the success of the strategy, human resources have supported the Group’s commercial transformation more specifi cally, particularly with regard to hiring and training.
Lafarge’s human resources policy continues to promote diversity, professional development for everyone through training and career management, health, safety and well-being at the workplace.
a) Attracting talents, developing skillsTo be truly effective, the new Group organization, focused on markets and customers, is backed up by hiring, training and career management policies that are in line with performance and innovation targets.
Z BRINGING R&D AND MARKETING CLOSER
The strategy towards customers materializes in Research and Development .
In 2013, the Research Center at L’Isle d’Abeau (LCR) was reorganized according to our market priorities. A team tasked with helping with technology transfers and bringing new products to market in the countries was also set up. New profi les (such as engineers, architects, etc.) combining knowledge of techniques and experience of markets were recruited for the Construction Development Labs, which report to Marketing departments in the countries. Interaction between R&D and marketing is encouraged.
Z A PROGRAM TO ACHIEVE A TRANSFORMATION IN SALES
Since 2011, Lafarge has been operating a commercial transformation program. It proposes a method and a set of tools that will enhance the activity management of its sales teams. By the end of 2013, the half of sales force has been trained in the new methods and the best practices were shared widely.
In 2014, this program should be accelerated and benefi t to the entire sales force.
SPEEDING UP DEVELOPMENT PATHS
Launched late in 2013 by Lafarge University,
“Make It Yours” is an initiative that aims to
accelerate individuals’ progress through skills
development programs, whether technical
or behavioral, for employees in contact with
customers. So this does not only involve
sales teams, but also production teams in the
Group’s three product lines: cement, concrete
and aggregates. The aim is to learn to offer
innovative solutions, sell them effectively and
produce them at a competitive cost. After each
participant’s skills are evaluated, an individual
development plan is drawn up, which specifi es
training programs, learning activities in the
fi eld, e-learning and coaching. A qualifi cation
is awarded to recognize the skill acquired
when the program is completed.

• Lafarge - Registration Document 201324
GROUP PRESENTATION11 1.2 Strategy
Z TRAINING TO BOOST PERFORMANCE
Enhancing its employees’ skill sets is central to Lafarge’s business models. A well-managed production unit, with well-trained teams and individuals, will have a high level of reliability, which will make it more competitive. The Group therefore organizes a range of training programs for managers and other key operational employees . These programs, which have been running for several years, are recognized by certifi cation, and will eventually involve 1,300 employees.
b) Promoting diversityAs an international g roup, Lafarge is convinced that diversity speeds up change and is a source of performance, creativity and innovation. The Sustainability Ambitions 2020 emphasize a desire to increase the number of women holding senior management posts with a target of 35% and to promote inclusivity in order to allow people of differing backgrounds (nationality, socio-professional category, etc.) to contribute value to the Group in their own right.
In 2013, an Inclusivity index was developed. This makes it possible to assess to what extent employees feel able to succeed and to contribute value. This has enabled the countries to identify areas of development and to devise a progress plan. Moreover, a Diversity and Inclusion evaluation grid was deployed in 2013. The Group is aiming for 75% of countries to be in category A or B on the “Diversity and Inclusivity” evaluation grid and to have a minimum of 20 countries recognized as an “employer of choice”.
c) A high quality of industrial relationsLafarge seeks to benefi t from the involvement of employee representatives, especially in a rapidly changing economic environment. It therefore values high-quality social dialogue at country, European and international level.
Z WELL-BEING AT THE WORKPLACE
Lafarge considers that well-being at the workplace is an essential factor in employee motivation, and in turn for the entire Group performance. A year after a joint declaration on safety, hygiene and health protection, the trade unions signed a declaration on well-being at the workplace in 2013. The Group European works council is paying close attention to action plans adopted following surveys of well-being at the workplace carried out in France, Germany and Austria between 2009 and 2013.
Z AN INTERNATIONAL AGREEMENT
In 2013, Lafarge continued to strive to develop high-quality industrial relations. It is
worth pointing out that each year, the annual meeting of the European works council is chaired by the Chairman and Chief Executive Offi cer of Lafarge, while representatives of the international trade unions and the European works council take part in meetings of the stakeholder panel.
Lafarge signed an international agreement in 2013 with the European Federation of Building and Wood Workers and the IndustriALL Global Union covering the Group social responsibility and international industrial relations.
d) The absolute priority of Health and SafetyImproving Health and Safety remains the fi rst priority of the Group. To consolidate the progress it has achieved, Lafarge is committed to a strategy based on a constant analysis of Health and Safety risks and regular revision of the corrective actions needed to reduce them.
Z MANAGING HEALTH AND SAFETY RISKS
Lafarge’s objective in the context of its Sustainability Ambitions 2020 is to achieve zero fatal accidents and to prevent lost-time incidents for both employees and contractors. The Group wishes to be acknowledged as a world leader in Health and Safety by all its stakeholders.
In 2013, the lost-time incident frequency rate (number of accidents/million hours worked) was 0.49, a distinct improvement over 2012, which was 0.62. This excellent performance results from a strong re-engagement with the subject of Safety by teams in every country in line with a strategy which gives countries freedom to manage and rank risks according to local conditions, and effective sharing of experience and best practice.
Although the number of fatal accidents has fallen, it remains a major concern. The majority of these accidents relate to road transport. All countries are working relentlessly on the implementation of Group standards on transport in order to make further progress.
Z CHANGING BEHAVIOR
To improve behavior with regard to risks, Lafarge rolled out a vast program of audits (30 sites audited in 2013) based on the 10 key elements of the Health and Safety Management System, to identify strengths and areas requiring progress. The aim for each of the countries is to share the best practices to implement, to carry out regular monitoring of the actions that are required, and to involve employees at every level. It is hoped that all Group sites will be audited over the next three years.
HEALTH AND SAFETY PRIORITY N° 1
In 2013, the lost-time incident frequency rate (number of accidents/million hours worked) was 0.49, a distinct improvement over 2012, which was 0.62.
INITIATIVES IN FAVOR OF DIVERSITY
In 2013, actions have been set up in order to promote diversity. As examples, the recruitment of several people with hearing impairments to work in supply chain posts in Malaysia and the exemplary way in which they were integrated into the company, and a partnership set up with Women Building Futures in Alberta, Canada, resulting in 18 women being hired and trained as concrete truck drivers.

Lafarge - Registration Document 2013 • 25
GROUP PRESENTATION
1
1.2 Strategy
Thanks to this effective system and action plan, the countries have access to all the tools they need in order to bring about a lasting change to behavior in regard to Safety. The Group supports this culture change by celebrating every year the Health and Safety Month. The theme for 2013, “at home, at work – make the link”, attracted involvement from 100% of the countries. Another example is the Health and Safety Excellence Club, which has introduced a level of recognition for the most mature countries. Four countries were given this award in 2013.
e) SecurityWhile safety focuses on unintentional incidents (occupational accidents and diseases), security relates to incidents resulting from malevolent acts (terrorism, crime, etc.) or natural catastrophes.
Ensuring the protection of its employees and its property is a major responsibility for Lafarge. This was why the Group defi ned a Security policy in 2009. Its expansion has taken it to some particularly exposed parts of the world. Based on analyzing and evaluating risks and on anticipation, the policy makes use of protection plans and tried and tested procedures.
The commitment to Security and the rules to apply are part of Lafarge’s principles of action: by example behavior, integrity, respect for others. Beyond the managers and teams specialized in this function, Security is a shared concern for everyone in the Group, at every level.
1.2.6 A FIRM COMMITMENT TO SUSTAINABLE DEVELOPMENT
Lafarge’s commitment to sustainable development is not recent. Nor are its motivations philanthropic: the Group is convinced that its performance and its competitiveness are inextricably linked to the social and economic living conditions of the communities in which it operates, and that there can be no sustainable economic development without preserving our living environment and our planet.
Back in 2001, Lafarge set the target of a 20% reduction in its CO
2 emissions per tonne
of cement produced by 2010. It reached its goal a year ahead of schedule. In 2007, the Group’s fi rst complete program, Ambitions 2012, was set up, and all its commitments were met. Encouraged by these successes, the Group has now set itself new targets.
a) Major strides in 2013The Group initiatives are geared to contributions to three specific areas: the development of communities, sustainable construction and the circular economy.
Z CONTRIBUTING TO THE DEVELOPMENT OF COMMUNITIES
Lafarge’s areas of focus divide into two key areas: health and safety, and local economic and social development. It engages in a constructive and transparent dialogue with stakeholders to take stock of their needs and help them resolve their local issues. Here are a few examples.
The Beocin cement plant, in Serbia, has partnered with the city council in creating a business park, occupied so far by four companies with the creation of 350 jobs.
In India, the Group has provided IT education programs in areas surrounding its cement plants in remote regions. 12,000 children have already taken part.
In Bangladesh, working with a local NGO, Lafarge has made it possible for 25,000 people living in 40 villages close to its plant in the north of the country to have access to health services. Training in the installation of solar panels has also been organized in the same region, leading to the creation of jobs.
In addition to these local initiatives, the Group has launched two global programs to preserve water resources and to promote voluntary work.
Preserving water resourcesWater is a key issue in a number of countries in which Lafarge is present, which is why the Group has been working for several years to reduce its water footprint. 70% of its industrial sites are already equipped with wastewater recycling and/or rainwater recovery systems. Since 2012, the Group has gone farther: it now evaluates the water risks of its 155 plants of the cement activity and 475 aggregates quarries, and, alongside other stakeholders, makes a commitment to organize more sustainable water management, particularly in the ten water basins where the situation has been identifi ed as being the most critical.
Promoting voluntary workLafarge has introduced a program for employees who would like to contribute their expertise to local communities, in the spirit of the Group values. A very ambitious target has been set of providing a million hours of voluntary work each year devoted to locally selected projects in the areas of biodiversity, preservation of water resources, training, affordable housing, health and the creation of jobs.
CHOOSING RESPONSIBLE SUPPLIERS
Lafarge’s commitment to sustainable development plays a part in its procurement policy. It chooses suppliers that also respect fundamental human rights and workers’ rights.
In 2013, the Group launched a vast program to assess its suppliers’ performance in the areas of the environment, working conditions, human rights, ethics, and sustainable purchasing practices.
When necessary, the Group Purchasing teams are working alongside suppliers to develop corrective action plans.

• Lafarge - Registration Document 201326
GROUP PRESENTATION11 1.2 Strategy
Z CONTRIBUTING TO SUSTAINABLE CONSTRUCTION
The Group has developed many innovations in the fi eld of sustainable construction that meet the needs of its markets and comply with the principles of sustainable development.
In 2013, R&D and marketing teams worked on the fi rst concrete-based applications for Aether®, the new-generation Lafarge cement with a carbon footprint reduced 25% to 30% by comparison with a traditional Portland cement. The Thermedia® insulating concrete range has expanded with the launch of Thermedia® 0.3, specially designed for facade walls and offering six times more insulation than conventional concrete. The Group also continues to roll out Hydromedia™, its new pervious concrete, which is now available in around twenty countries.
New solutions have also been developed for affordable housing (see the chapter “Innovating to build better cities” page 15 ).
Z CONTRIBUTING TO THE CIRCULAR ECONOMY
The circular economy is one of the keys to responsible industrial development. It is based on maximizing the re-use of materials considered as waste. A pioneer in industrial ecology, Lafarge is working to reduce its ecological impact on natural environments by way of two major focuses: reducing its consumption of fossil energies and its CO
2
emissions and preserving biodiversity.
Increasing the use of non-fossil fuelsThe replacement of fossil fuels by alternative fuels is one of the Group objectives. In 2013, they represented more than 17% of consumption by cement plants, compared to
less than 15% in 2012. The aim is to approach an average of 30% in 2015 and 50% in 2020.
This change has the double interest of reducing energy costs and converting waste (used tires, plastics, biomass, etc.). Both initiatives undertaken in Uganda for the use of coffee husks, which accounted for 50% of the Lafarge cement plant energy mix in 2013, and an agreement signed in November with the regional authorities in Iraq to provide a complete and innovative solution for converting household waste are also beneficial for the communities: they provide an alternative to landfi lls and help create jobs (see the chapter “Becoming yet more competitive” page 20 ).
Reduced environmental impact is also a consequence of the constant improvement in the cement/clinker ratio (see the chapter “Becoming yet more competitive” page 20 ).
Preserving biodiversityIn 2013, Lafarge also pressed ahead with programs to rehabilitate its quarries, with rehabilitation projects covering more than 1,600 hectares out of a total of more than 39,400 hectares of land being quarried. An analysis of over 700 of the Group quarries to identify sensitive areas for biodiversity at an international level has identifi ed 22 % of sites as being at risk. By the end of 2013, all these sites had implemented a biodiversity management plan.
d) Ambitions 2020 to take Lafarge fartherSustainability Ambitions 2020, introduced by Lafarge in 2012, is the most comprehensive and the most ambitious program in the sector. It covers all the dimensions of sustainable
development, social, economic and environmental, considered as a whole.
The Ambitions incorporate quantifi ed targets and constitute the Group roadmap for making a net positive contribution to society and to nature. The aim is to minimize the environmental footprint while maximizing the value created for all stakeholders.
1.2.7 INTELLECTUAL PROPERTY
Lafarge has a substantial portfolio of Intellectual Property rights including patents, trademarks, domain names and registered designs, which are used as a strategic tool in the protection of its business activities.
Lafarge aims to enhance the value of Intellectual Property by coordinating, centralizing and establishing its rights through patents, trademarks, copyright and other relevant laws and conventions and by using legal and regulatory recourse in the event of infringement of the rights by a third party.
The Group Intellectual Property department is in charge of protecting the Group trade name, and trademark portfolios in more than 120 countries, and implementing the necessary legal recourse against third party unauthorized use of the Lafarge name. Action against illegal use of the Lafarge name and logo against local counterfeiters in China as well as in France,continued during 2013, with criminal lawsuits resulting in severe sentences .
The Group Intellectual Property department is also strongly involved in new information and communication technologies issues by protecting and defending Lafarge domain names as well as securing the presence of Lafarge on the internet and new digital medias
COMMITMENT AT THE TOP LEVEL
The success of the Lafarge sustainable development policy owes
much to a commitment displayed by the Group Chairman and Chief
Executive Offi cer, Bruno Lafont, at the highest level of the national,
European and worldwide organizations.
Co-chair of the Energy Effi ciency in Building (EEB) initiative run
by the World Business Council for Sustainable Development (WBCSD)
since 2006, he was appointed a member of the WBCSD Executive
Committee in November 2013. He also chairs the Energy and Climate
Change working group of the European Round Table of Industrialists
(ERT), a forum of fi fty chief executives and chairmen of major
European companies in industry and technology.
In France, he has been elected president of the Sustainable
Development Commission of the Medef, the French employers’
federation. He took up this position in January 2014.

Lafarge - Registration Document 2013 • 27
GROUP PRESENTATION
1
1.2 Strategy
including social networking, s martphone applications etc.
The use of, and access to, Lafarge Intellectual Property rights are governed by the terms of license agreements granted by Lafarge S.A. to its subsidiaries as well as to third parties.
Such agreements, granted by Lafarge S.A. to its subsidiaries, include a series of licenses permitting the use of the intangible assets by the Group (such as know-how, trademark, trade name, patents, software and best practices ).
The global process to revise all agreements, launched in 2011, is now close to b eing completed .
The portfolio of patents continues to grow, with 116 new patent applications submitted in 2013. The number of patent fl ilings refl ects Lafarge’s continued commitment to innovation. A significant part of the applications relates to sustainable construction and sustainable development, in line with the 2020 ambitions of Lafarge.
1.2.8 RECENT ACQUISITIONS, PARTNERSHIPS AND DIVESTITURES
Z SIGNIFICANT RECENT ACQUISITIONS
In 2013 and 2012, the Group made a limited number of small to medium-sized acquisitions.
Acquisitions during the last two years had an overall positive effect on revenue of 187 million euros in 2013 compared to 2012.
Z SIGNIFICANT RECENT PARTNERSHIPS
See Notes 3 (Signifi cant events of the period) and 20 (Equity) to the consolidated fi nancial statements for more information on these partnerships.
United Kingdom. On January 7, 2013, creation of Lafarge Tarmac, 50/50 joint venture between Lafarge and Anglo American. This joint venture combines the cement, aggregates, ready-mix concrete, asphalt and asphalt surfacing, maintenance services, and waste services businesses in the United Kingdom.
Mexico. On July 31, 2013, Lafarge and Elementia completed the creation of an entity combining their cement assets in Mexico. The Group brought to the new entity its two plants of Vito and Tula for a total capacity close to one million tonnes , while Elementia contributed the new one million tonnes plant in central Mexico. The new entity formed is held at 47% by the Group and 53% by Elementia and is recorded under equity method in the Group consolidated fi nancial statements.
Z SIGNIFICANT RECENT DIVESTITURES
See Notes 3 (Signifi cant events of the period), 5 (Net gains (losses) on disposals) and 32 (Supplemental cash fl ow disclosures) to the consolidated fi nancial statements for more information on these divestitures .
Honduras. On November 27, 2013, the Group disposed of its cement asset in Honduras to the group Argos. Sold assets comprise an integrated cement plant with a capacity of 1 million tonnes and a grinding station with a 0.3 million tonnes capacity.
Ukraine. On September 25, 2013, Lafarge disposed of its cement asset in Ukraine to the CRH group. Lafarge remains present in Ukraine through three aggregate quarries serving the Ukrainian as well as the Russian and Polish markets.
The United States:
On November 30, 2012, Lafarge sold its cement and concrete and aggregates assets in Missouri and Oklahoma to Eagle Materials Inc. The assets sold include cement plants in Kansas City (Missouri), and Tulsa (Oklahoma) having a total cement capacity of 1.6 million tonnes , along with associated cement terminals. Lafarge also sold its Aggregates and ready-mix Concrete operations in Kansas City.
During the first quarter 2013, Lafarge disposed of six aggregates quarries in Georgia.
On August 30, 2013, Lafarge disposed of its Gypsum operations in North America to an affi liate of Lone Star investment fund. Since September 2011, Gypsum operations (activities in Middle East and Africa excluded) were presented as discontinued operations in the Group consolidated fi nancial statements.
In addition, during 2013 and 2012, Lafarge carried out several small-to-medium sized divestments.
In total, divestitures during the last two years reduced the Group revenue by 277 million euros in 2013 compared to 2012.
Z POST CLOSING DIVESTITURES
See Note 34 (Subsequent events) to the consolidated fi nancial statements for more information on these divestitures.
Europe and South America. On December 26, 2013, Lafarge announced the sale of its 20% minority stake in European and South American Gypsum operations to Etex. T his transaction was closed on February 12, 2014.
The United States. On January 10, 2014, Lafarge announces the sale of fi ve aggregates quarries and related assets in Maryland (USA) to Bluegrass Materials. After the relevant regulatory approvals have been received, the transaction was closed on February 12, 2014.

• Lafarge - Registration Document 201328
GROUP PRESENTATION11 1.3 Overview of operations
1.3OVERVIEW OF OPERATIONS
The breakdown of Lafarge revenue by geographic area and activity is as follows:
SALES BY GEOGRAPHIC AREA (1)
2013 (million euros) (%)
2012 (million euros) (%)
Western Europe 3,256 21 3,181 20
North America 3,137 21 3,375 21
Central and Eastern Europe 1,145 7 1,270 8
Middle East & Africa 4,067 27 4,283 27
Latin America 869 6 961 6
Asia 2,724 18 2,746 18
TOTAL 15,198 100 15,816 100
(1) After elimination of sales between geographic areas.
SALES BY ACTIVITY (1)
2013 (million euros) (%)
2012 (million euros) (%)
Cement 9,657 63 10,373 66
Aggregates and concrete 5,451 36 5,353 33
Other products 90 1 90 1
TOTAL 15,198 100 15,816 100
(1) After elimination of sales between activities.
EBITDA (1) BY GEOGRAPHIC AREA
2013 (million euros) (%)
2012 (million euros) (%)
Western Europe 354 11 507 16
North America 560 18 558 16
Central and Eastern Europe 201 7 256 7
Middle East & Africa 1,153 37 1,242 36
Latin America 240 8 296 9
Asia 594 19 564 16
TOTAL 3,102 100 3,423 100
(1) As defined in Section 2.2.4 (Reconciliation of non-GAAP Financial measures).

Lafarge - Registration Document 2013 • 29
GROUP PRESENTATION
1
1.3 Overview of operations
EBITDA (1) BY ACTIVITY
2013 (million euros) (%)
2012 (million euros) (%)
Cement 2,665 86 2,983 87
Aggregates and concrete 464 15 479 14
Other products (27) (1) (39) (1)
TOTAL 3,102 100 3,423 100
(1) As defined in Section 2.2.4 (Reconciliation of non-GAAP Financial measures).
In the following pages of this Section 1.3:
Z sales figures are presented “by origin” country. They include all the amounts both produced and sold in the market, as well as any quantities exported to other markets. They are presented before elimination of inter-activities sales and calculated following applicable consolidation rules;
Z data regarding the number of sites and production capacity include 100% of all its subsidiaries’ facilities and production capacity, whether fully or proportionately consolidated;
Z the percentage of sales for each region is computed in relation to the total sales of the relevant activity, before elimination of inter-activity sales.
During its operations, Lafarge may face risks that are presented in Section 5.1 (Risk Factors).
Detailed comments per geographic area and per country can be found in Section 2.3 (Results of operations for the years ended December 31, 2013 and 2012).

• Lafarge - Registration Document 201330
GROUP PRESENTATION11 1.3 Overview of operations
4
1
Blasting
3
Crusher
Preheating
Cooler 5Kiln
Cl inker storage
Storage Silos
Grinder
Truck
Rail
7
Boat
Grinder 6
Additives
2Quarry
CEMENT
9,657revenue million euros
38,000employees
56countries
155production sites
A WORLD
LEADER(December 31, 2013)
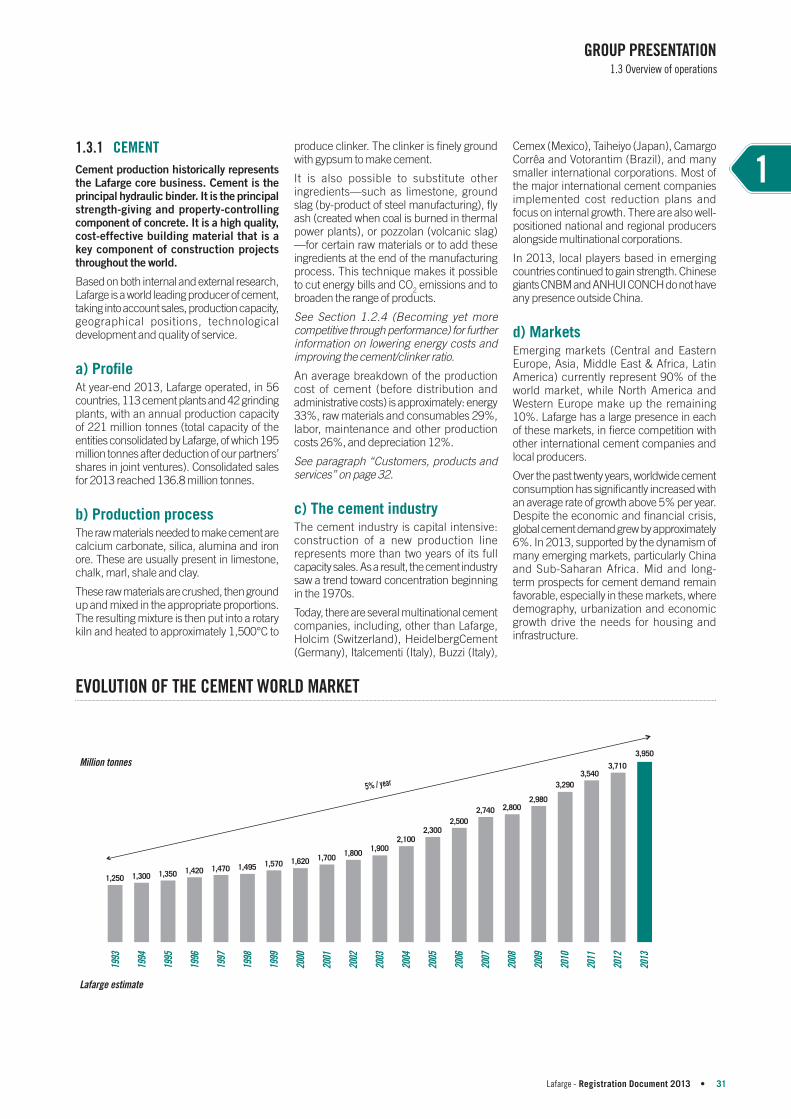
Lafarge - Registration Document 2013 • 31
GROUP PRESENTATION
1
1.3 Overview of operations
1.3.1 CEMENT
Cement production historically represents the Lafarge core business. Cement is the principal hydraulic binder. It is the principal strength-giving and property-controlling component of concrete. It is a high quality, cost-effective building material that is a key component of construction projects throughout the world.
Based on both internal and external research, Lafarge is a world leading producer of cement, taking into account sales, production capacity, geographical positions, technological development and quality of service.
a) Profi leAt year-end 2013, Lafarge operated, in 56 countries, 113 cement plants and 42 grinding plants, with an annual production capacity of 221 million tonnes (total capacity of the entities consolidated by Lafarge, of which 195 million tonnes after deduction of our partners’ shares in joint ventures). Consolidated sales for 2013 reached 136.8 million tonnes.
b) Production processThe raw materials needed to make cement are calcium carbonate, silica, alumina and iron ore. These are usually present in limestone, chalk, marl, shale and clay.
These raw materials are crushed, then ground up and mixed in the appropriate proportions. The resulting mixture is then put into a rotary kiln and heated to approximately 1,500°C to
produce clinker. The clinker is fi nely ground with gypsum to make cement.
It is also possible to substitute other ingredients—such as limestone, ground slag (by-product of steel manufacturing), fl y ash (created when coal is burned in thermal power plants), or pozzolan (volcanic slag) —for certain raw materials or to add these ingredients at the end of the manufacturing process. This technique makes it possible to cut energy bills and CO
2 emissions and to
broaden the range of products.
See Section 1.2.4 (Becoming yet more competitive through p erformance) for further information on lowering energy costs and improving the cement/clinker ratio.
An average breakdown of the production cost of cement (before distribution and administrative costs) is approximately: energy 33%, raw materials and consumables 29%, labor, maintenance and other production costs 26%, and depreciation 12%.
See paragraph “Customers, products and services” on page 32 .
c) The cement industryThe cement industry is capital intensive: construction of a new production line represents more than two years of its full capacity sales. As a result, the cement industry saw a trend toward concentration beginning in the 1970s.
Today, there are several multinational cement companies, including, other than Lafarge, Holcim (Switzerland), HeidelbergCement (Germany), Italcementi (Italy), Buzzi (Italy),
Cemex (Mexico), Taiheiyo (Japan), Camargo Corrêa and Votorantim (Brazil), and many smaller international corporations. Most of the major international cement companies implemented cost reduction plans and focus on internal growth. There are also well-positioned national and regional producers alongside multinational corporations.
In 2013, local players based in emerging countries continued to gain strength. Chinese giants CNBM and ANHUI CONCH do not have any presence outside China.
d) MarketsEmerging markets (Central and Eastern Europe, Asia, Middle East & Africa, Latin America) currently represent 90% of the world market, while North America and Western Europe make up the remaining 10%. Lafarge has a large presence in each of these markets, in fi erce competition with other international cement companies and local producers.
Over the past twenty years, worldwide cement consumption has signifi cantly increased with an average rate of growth above 5% per year. Despite the economic and fi nancial crisis, global cement demand grew by approximately 6 % . I n 2013, supported by the dynamism of many emerging markets, particularly China and Sub-Saharan Africa. Mid and long-term prospects for cement demand remain favo rable, especially in these markets, where demography, urbanization and economic growth drive the needs for housing and infrastructure.
EVOLUTION OF THE CEMENT WORLD MARKET
1993
1994
1995
1996
1997
1998
1999
2000
2001
2002
2003
2004
2005
2006
2007
2008
2010
2009
2011
2012
2013
1,250 1,300 1,350 1,420 1,470 1,495 1,570 1,620 1,7001,800
1,9002,100
2,3002,500
2,740 2,8002,980
3,290
3,5403,710
3,950
Million tonnes
Lafarge estimate
5% / year

• Lafarge - Registration Document 201332
GROUP PRESENTATION11 1.3 Overview of operations
e) Location of our cement plants and marketsCement is a product that is costly to transport over land. Consequently, the radius within which a typical cement plant is competitive extends for no more than 300 kilometers for the most common types of cement. However, cement can be shipped more economically by sea and inland waterway over great distances. The location of a cement plant and the cement transportation cost produced through our distribution network signifi cantly affect the plant’s competitiveness. Lafarge establishes its plants to the extent possible near its clients.
f) Customers, products, and servicesLafarge produces an extensive line of cements and hydraulic binders, ranging from Portland cements and classic masonry cements to
specialized products for different types of environments (e.g., environments exposed to seawater, sulfates and other harsh natural conditions, in which case cements with high slag or pozzolan content provide greater durability) and products intended for specifi c applications (e.g. white cement, oil-well cements, road surfacing binders, etc.).
These products are designed for all segments of the construction and public works industries: construction/public works companies, manufacturers (producers of ready-mix concrete and prefabricated products), and the general public, via retailers.
These products go hand-in-hand with certain complementary services, such as technical support, order and delivery logistics, documentation, and demonstrations and training related to the characteristics and proper use of cement.
The quality and consistency of the products, as well as the reliability of a producer’s deliveries and related services represent major competitive advantages. Lafarge makes every effort to meet its customers’ expectations in these areas.
g) Breakdown by regionsLafarge produces and sells cement in the regions and countries listed in the tables below.
The following presentation shows, for each region, the percentage contribution to 2013 cement sales in euros, as well as the number of plants operated, cement production capacity, and approximate market share in each country over the year ending December 31, 2013.
SALES CEMENT ACTIVITY 2013
1
2
3
4
5
6
SALES CEMENTACTIVITY 2013
14%
12%
9%
34%
7%
24%
1. Western Europe 2. North America3. Central and Eastern Europe4. Middle East and Africa5. Latin America 6. Asia
In the following section, stated production capacities are reported on the basis of 100% of operating plants controlled by Lafarge in the indicated countries, disregarding the percentage of ownership. Volumes sold are reported on a stand alone basis before elimination of intra-group sales.
The approximate market share has been calculated per country based on information contained in the Industrial Building Materials Sector report published by Jefferies in August 2012 (the “Jefferies Report”) and internal estimates.
Comparable information for the year 2012 is available in the 2012 Registration Document.

Lafarge - Registration Document 2013 • 33
GROUP PRESENTATION
1
1.3 Overview of operations
WESTERN EUROPE (14% OF THE CEMENT ACTIVITY 2013 SALES)
NUMBER OF
Country Cement plants Grinding plants
Cement production capacity
(million tonnes)
Approximate market share
(%)
France 9 5 10.0 34
Greece 2 - 6.8 50
Spain 3 2 6.8 10
United Kingdom 5 - 4.6 40
Germany 2 1 3.4 10
French West Indies/Guyana - 3 1.0 100
TOTAL WESTERN EUROPE 21 11 32.6
The Lafarge Tarmac 50/50 joint venture in the United Kingdom was completed on January 7, 2013 and has a total capacity of 4.6 million tonnes, considering the contribution of one Tarmac plant and the disposal of one Lafarge plant .
NORTH AMERICA (12% OF THE CEMENT ACTIVITY 2013 SALES)
NUMBER OF
Country Cement plants Grinding plants
Cement production capacity
(million tonnes)
Approximate market share
(%)
United States 6 3 10.7 12
Canada 6 2 5.8 33
TOTAL NORTH AMERICA 12 5 16.5
CENTRAL AND EASTERN EUROPE (9% OF THE CEMENT ACTIVITY 2013 SALES)
NUMBER OF
Country Cement plants Grinding plants
Cement production capacity
(million tonnes)
Approximate market share
(%)
Poland 3 - 5.7 20
Romania 2 1 4.9 31
Russia 2 - 4.1 7
Austria 2 - 2.0 32
Serbia 1 - 2.0 45
Moldova 1 - 1.4 62
Czech Republic 1 - 1.2 9
Hungary 1 - 1.0 20
Slovenia 1 - 0.6 38
TOTAL CENTRAL
AND EASTERN EUROPE 14 1 22.9
Lafarge sold its wet process cement plant in Ukraine to CRH in the third quarter of 2013.

• Lafarge - Registration Document 201334
GROUP PRESENTATION11 1.3 Overview of operations
MIDDLE EAST AND AFRICA (34% OF THE CEMENT ACTIVITY 2013 SALES)
NUMBER OF
Country Cement plants Grinding plants
Cement production capacity
(million tonnes)
Approximate market share
(%)
Egypt 1 - 10.0 15
Algeria 2 - 9.4 36
Morocco 3 1 6.8 43
Iraq 3 - 5.8 24
Nigeria 3 - 5.7 32
Jordan 2 - 4.8 33
South Africa 1 2 3.6 17
United Arab Emirates 1 - 3.0 6
Syria 1 - 2.6 23
Kenya 1 1 2.0 48
Cameroon 1 1 1.7 92
Zambia 2 - 1.3 75
Uganda 1 - 0.8 62
Benin 1 - 0.7 37
Zimbabwe 1 - 0.5 38
Tanzania 1 - 0.3 22
Malawi - 1 0.2 76
TOTAL MIDDLE EAST AND AFRICA 25 6 59.2
Lafarge develops its cement business through joint ventures in Morocco (50%), the United Arab Emirates (50%), Benin (50%).
Lafarge also has two participations consolidated by the equity method:
- In Nigeria, in Unicem (2.5 million euros tonnes capacity plant).
- In Saudi Arabia, a 25% stake in Al Safwa Cement, which operates a 2 million tonnes capacity plant.
LATIN AMERICA (7% OF THE CEMENT ACTIVITY 2013 SALES)
NUMBER OF
Country Cement plants Grinding plants
Cement production capacity
(million tonnes)
Approximate market share
(%)
Brazil 5 3 7.1 11-12
Ecuador 1 - 1.4 20
TOTAL LATIN AMERICA 6 3 8.5
Lafarge sold its cement operations in Honduras to Cementos Argos (including one cement plant of one million tonnes capacity and a grinding station of 0.3 m illion tonne capacity).
Lafarge created in 2013 a joint venture in Mexico with Elementia that combines the cement assets of both entities: Lafarge contributed its two plants of Vito and Tula for a total capacity close to 1 million tonnes, while Elementia contributed its new 1 million tonnes
plant located in central Mexico. The new joint venture, which is held 47% by Lafarge and 53% by Elementia, has been incorporated by Lafarge as an equity affi liate since August 2013.

Lafarge - Registration Document 2013 • 35
GROUP PRESENTATION
1
1.3 Overview of operations
ASIA (24% OF THE CEMENT ACTIVITY 2013 SALES)
NUMBER OF
Country Cement plants Grinding plants
Cement production capacity
(million tonnes)
Approximate market share
(%)
China 20 9 35.9 6-22 (1)
Malaysia 3 1 12.5 37
South Korea 1 2 9.6 13
India 3 2 11.0 20 (2)
Philippines 5 1 6.5 33
Pakistan 1 - 2.1 6
Indonesia 1 - 1.6 4
Bangladesh 1 - 1.6 7
Vietnam - 1 0.5 1
TOTAL ASIA 35 16 81.3
(1) Depending on region where Lafarge is operating.
(2) For our relevant markets.
Lafarge commissioned in 2013 a new integrated cement plant with 2.6 million tonnes capacity in Rajasthan (northern India).
In China, Lafarge operates through a joint venture with Hong Kong based company Shui On. This joint venture is currently the market leader in Southwest China (Sichuan, Chongqing, Guizhou and Yunnan).
The cement business in Bangladesh is held through a joint venture with Cementos Molins (Spain).
CEMENT TRADING ACTIVITIES
Lafarge also manages worldwide cement trading activities, which helps meeting fl uctuations in demand in certain countries without building plants that may result in
excess capacity. Lafarge conducts these activities primarily through its subsidiary Cementia Trading AG. In addition, another subsidiary Marine Cement AG/Ltd. acts mainly as an importer and distributor of cement in the Indian Ocean and the Red Sea countries.

• Lafarge - Registration Document 201336
GROUP PRESENTATION11 1.3 Overview of operations
5,451revenue million euros
25,000employees
37countries
1,481production sites
N°2 AND 4worldwide(December 31, 2013)
AGGREGATESAND CONCRETE

Lafarge - Registration Document 2013 • 37
GROUP PRESENTATION
1
1.3 Overview of operations
1.3.2 AGGREGATES AND CONCRETE
AGGREGATES
Aggregates are used as raw materials for concrete, masonry, asphalt, and other industrial processes, and as base materials for roads, landfi lls, and building.
According to internal and external analysis, Lafarge is the world’s second largest producer of aggregates, thanks in large part to its mineral reserves in key markets. These reserves are an undeniable advantage given the growing environmental pressures that make it increasingly diffi cult to obtain extraction permits.The Group’s responsible environmental management and quarry restoration contribute to the ability to obtain these permits.
a) Profi leOn December 31, 2013, Lafarge had 475 production facilities for aggregates (each including one or more quarries) in 23 countries. Consolidated sales reached approximately 192.8 million tonnes.
b) Production processAggregates are typically produced by blasting hard rock from quarries and then extracting it and crushing it. Aggregates production also involves the extraction of sand and gravel from both land and marine locations, which generally requires less crushing. In both cases, the aggregates are then screened to obtain various sizes to meet different needs.
c) Industry and marketsThe production of aggregates requires heavy equipment including crushing and screening systems and mobile equipment like wheel loaders and dumpers, etc. The cost of the processing systems and mobile equipment can range from a few million euros for a small quarry to several tens of million euros for a very large quarry. Furthermore, the law in many countries restricts the development of new sites. Consequently, the aggregates industry is in the early stages of consolidation, mainly in mature markets. Competitors include a few multinational groups (Lafarge, Cemex, CRH, HeidelbergCement, Holcim), national producers like Martin Marietta Materials and Vulcan Materials in the US, and a large number of independent operators.
Because of the high weight of aggregates and the cost to ship them, markets are very local in nature. Although it does business worldwide, Lafarge still remains mainly present in Western Europe and North America.
d) Customers, products, and servicesThe customers of the aggregates activity number in the tens of thousands. Major customers include concrete and asphalt producers, manufacturers of prefabricated products and construction and public works contractors of all sizes.
Aggregates differ in terms of their physical characteristics such as hardness, geological nature (limestone, granite, etc.), their granularity (ranging from sand to riprap used in seawalls), their shape, their color and their granular distribution. These characteristics have a large impact on the quality of the applications in which they are used, especially for concrete. The work of the Lafarge Research Center has made it possible to redefi ne its offer to products with greater added value. Lafarge also markets high-quality recycled aggregates made from crushed concrete and asphalt issued from deconstruction.
READY-MIX CONCRETE
Ready-mix concrete is one of the largest markets for the cement and aggregate industries.
As the fourth largest producer of ready-mix concrete, according to internal and external analyses, Lafarge is known for its innovation with sophisticated, high value added concretes.
a) Profi leOn December 31, 2013, Lafarge had 1,006 concrete plants in 34 countries. Consolidated sales reached approximately 30.7 million cubic meters.
b) Production processIndispensable to most construction projects around the world, concrete is produced by mixing aggregates, cement, chemical admixtures and water in varying proportions depending on the type of concrete to be produced. Ready-mix concrete is prepared at concrete production plants. The mixture is loaded into concrete trucks so that it can be mixed until consistent and delivered to the
customer within a very specifi c timeframe. Concrete plants are usually fi xed permanent sites, but there are also portable facilities that may be set up at major construction sites or at sites that are too far removed from any permanent plants.
c) Industry and marketsThe ready-mix concrete industry is less capital intensive than the cement industry. It is also highly decentralized, since concrete is a heavy product that must be delivered quickly, thus requiring that production facilities be near to wherever the concrete is going to be used. Because of this, only very large integrated corporations that produce both cement and aggregates, including Lafarge and its main competitors - Cemex, CRH, HeidelbergCement, Holcim and Italcementi—have succeeded in establishing an international presence in this market. The competition consists mainly of independent, local operators.
Lafarge’s ready-mix concrete production facilities are still located primarily in Western Europe and North America. However, its operations are rapidly expanding in North Africa, the Middle East, latin America and Asia.
d) Customers, products, and servicesBuyers of ready-mix concrete are typically construction and public works contractors, ranging from major multinational corporations to small-scale customers. In this highly competitive market, Lafarge works to set itself apart based on the quality and consistency of its products, the breadth of its product line and, especially, the innovative products by its Research Center. These products include ultra-high performance fiber reinforced concrete, self-filling and self-levelling concrete, decorative concrete, insulating concrete, pervious concrete, etc.
ASPHALT
In North America and the United Kingdom, we produce asphalt which we sell either as a stand-alone product, or in conjunction with contracted paving. Asphalt consists of 90-95% dried aggregates mixed with 5-10% heated liquid bitumen, a by-product of oil refi ning that acts as a binder.
We obtain much of the aggregates needed to produce asphalt from internal sources and purchase the bitumen from third

• Lafarge - Registration Document 201338
GROUP PRESENTATION11 1.3 Overview of operations
party suppliers. Bitumen is a by-product of petroleum refi ning, the price of which is tied to oil prices. Asphalt is produced at plants consisting of raw material storage facilities and equipment for combining raw materials in the proper proportions at a high temperature. Our asphalt plants range in output from 5,000 to 500,000 tonnes per year.
Like concrete, asphalt must be delivered quickly by specialized vehicles after it is produced. Thus, asphalt markets tend to be very local. Generally speaking, asphalt is sold directly by the asphalt producer to the customer, with only very limited use of intermediate distributors or agents since prompt and reliable delivery is essential.
BREAKDOWN BY REGION
Lafarge produces and sells Aggregates and Concrete in the regions and countries of the world listed in the table below. The table shows the number of industrial sites operated on December 31, 2013 and the volume of Aggregates and Concrete sold by the consolidated operations in 2013.
NUMBER OF INDUSTRIAL SITES VOLUMES SOLD (2)
Region/country Aggregates (1) Ready-mix concreteAggregates
(million tonnes)Ready-mix concrete
(million cubic meters)
WESTERN EUROPE
France 105 260 33.2 6.7
United Kingdom 124 94 23.6 1.4
Spain 8 42 1.4 0.6
Greece 9 20 1.2 0.4
Other - 2 - 0.1
NORTH AMERICA
Canada 115 143 54.7 5.0
United States 35 37 37.6 1.2
CENTRAL AND EASTERN EUROPE
Poland 13 36 10.3 1.1
Romania 16 16 2.6 0.4
Russia 3 - 2.7 -
Ukraine 3 - 4.7 -
Serbia - 4 - 0. 1
Hungary 1 - 0.5 -
MIDDLE EAST AND AFRICA
South Africa 19 54 5.2 1.4
Reunion/Mauritius 3 9 1.0 0.3
Egypt 3 19 1.8 1.1
Algeria 2 21 0.4 0.8
Morocco 3 27 0.4 0.4
Nigeria - 5 - 0.1
Qatar 1 10 - 0.6
Iraq 1 17 - 0.7
Oman - 9 - 0.3
Jordan - 7 - 0.8
Saudi Arabia - 3 - 0.1
United Arab Emirates - 4 - 0.2
Kuwait - 4 - 0.1
OTHER
Malaysia/Singapore 6 29 3.4 2.2
Philippines 1 - 3.4 -
Brazil 3 54 2.8 1.2
India 1 66 1.4 3.0
Other - 14 0.5 0.4
TOTAL 475 1, 006 192.8 30.7
(1) Industrial sites for the production of aggregates from one or more quarries.
(2) Volumes sold take into account 100% of volumes from fully consolidated subsidiaries and the consolidated percentage of volumes for proportionately consolidated
subsidiaries.
In 2013, Lafarge’s asphalt operations produced and sold a total of 6.2 million tonnes in the United States, Canada and the United Kingdom.

Lafarge - Registration Document 2013 • 39
GROUP PRESENTATION
1
1.3 Overview of operations
1.3.3 OTHER PRODUCTS: GYPSUM
Nearly all of the Group Gypsum activities were disposed of in Asia, Europe, South America, Australia and United States in 2011 and 2013. Lafarge retained operations only in a few countries in the Middle East and Africa.
1.3.4 MINERAL RESERVES AND QUARRIES
In an effort to secure the availability of raw materials necessary to produce our products, Lafarge is implementing internal procedures to manage mineral resources by managing land control and permits as well as by monitoring the reserves of its quarries.
a) ObjectivesLafarge’s businesses activities are involved in heavy industry, and as such, are built to last. Therefore, they must own or have control over substantial reserves of raw materials. These reserves represent a major competitive asset in terms of their location, quantity and quality.
All business units must follow the Group policy concerning the acquisition and preservation of its reserves (limestone, marl, clay, sand, etc.), within the constraints of local regulation.
In particular they must ensure they have adequate reserves for:
Z plants currently in operation;
Z plants projected for the relatively near future;
Z long-term projects intended to assure growth, restructuring or strategic positioning.
The exploration for deposits must be based on rigorous geological studies .
b) RequirementsIn order to comply with international standards, Lafarge has reclassifi ed, in 2013, its reserves following in the 4 categories: “proven”, “probable”, “possible” and “potential”. This new classifi cation allows the split in reserves sensu stricto (proven and probable) and mineral resources (possible and potential).
Z Each entity has to define its reserves in terms of years of production of aggregates or clinker production (for cement). The target in cement is to maintain fifty years of proven and probable reserves except where justified for exemple by constraints due to local regulations.
Z For each deposit, entities must establish a long term plan for obtaining or extending mining rights, and for managing landholding and operating permits. For all areas involved in long-term operations, including buffer zones, this plan must contain the following information:
Z property limits,
Z expiry dates of mining permits,
Z tonnage and quality of reserves,
Z characteristics of the deposits and their environmental constraints,
Z action plans and budget necessary until restoration.
c) Defi nitionsThe raw material deposits are considered as reserves when the technical and economical operability is confirmed. Reserves of raw materials are validated by the Industrial Performance Centres and classifi ed as follows:
Z PROVEN AND PROBABLE RESERVES
Reserves are defi ned as proven when Lafarge has full control over them through the following parameters:
Z the mining rights and necessary administrative permits for mining operations are obtained;
Z the full control of the land for which we have the mining rights is achieved;
Z the reserve evaluation is validated based on representative core drilling or equivalent and reliable geochemical analyses.
Reserves are defined as probable if the mining permit or the land control are subject to renewal.
Z POSSIBLE AND POTENTIAL RESOURCES
Resources are defi ned as possible if only one of the above parameters is not fully achieved, such as:
Z some necessary administrative permits for mining operations could be incomplete;
Z the control of the land for which Lafarge has mining rights could be incomplete;
Z the necessary geological investigations have not been finalized.
Resources are considered as potential if they are in a land which is not fully controlled, but recognized as potentially mine able after obtaining the necessary permits. The
necessary geological investigations are not fully carried out.
d) Remarks on the impact of local regulations for granting permits
Z In some countries, permits are given for a limited period of time. Reserves are therefore proven for the duration of the permits and probable for the remaining time. Local regulations may therefore impact proven reserves. In France for example, the mining right duration is not more than 30 years; in the most favorable case, the reserves can only be proven for 30 years. In other countries the mining rights could be obtained for a very long period of time but the surface rights are limited to five years. In this case, reserves are proven for five years and probable for the remaining duration of the mining rights. For this reason, proven and probable reserves are reported together.
Z The mining rights procedures in each country may also influence the land control strategy that is implemented locally. For example, a limited duration of mining rights provides less visibility on the future. Surface rights will be granted until expiry of this period but not necessarily beyond. The capital expenditure is thus spread out over a long period of time. In that hypothesis, the corresponding reserves are only potential. Land management is therefore specific to each situation.
e) Yearly reportingA senior geologist in the Industrial Performance team must approve the reserve reporting for cement production in his area. For aggregates, the calculation of reserves is approved by the land director of each entity.
Ownership titles, mining permits and others legal issues (environment, parks, historical monuments, etc.) must be validated by a Lafarge legal manager.
The reserves are expressed in years of production (of clinker or of aggregates) as compared to average production of the three previous years.
Every year the reserves table is updated in the yearly internal reporting. The numbers are worked out between the geologists and the quarry managers according to the reserves calculated with the latest quarry model using the plant raw materials consumption.

• Lafarge - Registration Document 201340
GROUP PRESENTATION11 1.3 Overview of operations
Z The raw material expert obtains the tonnage mined during the previous year from the quarry manager.
Z The reserve calculation is done by the raw material expert for cement and by the geologist for aggregates:
Z simple yearly calculation by subtracting quarry production from the last reserve estimation;
Z full reserves reconciliation using accurate topographic survey, deposit block model and production figures (each three-five years).
Z For cement, the result is validated through an exchange between the plant quarry manager, the country raw material
manager and the raw material expert from the Industrial Performance team. For aggregates, the calculation is validated by the quarry manager, the geologist and the land director.
For purposes of external reporting of the cement plants’ reserves, only the limestone reserves are considered critical for the plant’s life. Additives such as clay, sand, iron and alumina represent a small percentage of the ingredients making up the raw mix. The supply of these additives is controlled either through ownership of quarries, like for limestone, or through supply agreements. Control of these materials is not as critical as control of limestone resources, since they may be purchased from outside sources and
transported long distances. Nevertheless, internal teams monitor the sourcing of these materials since this could potentially impact production costs.
In the tables below, the reserves are consolidated region by region with the total tonnage of raw material reserves available divided by the total production of the plants in each region. As explained above, the production taken as a reference is the average production of the past three years. Mothballed plants are included in this computation. All the plants technically managed by Lafarge at the end of December 2013 are fully taken into account, even if Lafarge is not the majority shareholder.
CEMENT
Average Production
2011 - 2013 (MT Clinker)
Proven and probable reserves
(years)
Possible and potential
resources (years)
Number of clinker
production sites
Western Europe 13.7 64 66 21
North America 8.9 146 57 12
Central and Eastern Europe 9.1 145 114 14
Middle East and Africa 33.8 67 36 25
Latin America 4.2 78 199 6
Asia 42.9 33 48 35
TOTAL 112.6 67 58 113
AGGREGATES
Average Production
2011 - 2013 (MT Aggregates )
Proven and probable reserves
(years)
Possible and potential
resources (years)
Number of quarries
Western Europe 75.5 75 18 246
North America 79.8 70 41 150
Central and Eastern Europe 23.6 25 63 36
Middle East and Africa 10.5 47 24 32
Latin America 2.6 38 87 3
Asia 6.2 16 2 8
TOTAL 198.2 49 33 475
The changes in reserves refl ect the divestments and coming on stream of new sites in various countries.

Lafarge - Registration Document 2013 • 41
GROUP PRESENTATION
1
1.3 Overview of operations
1.3.5 EXPENDITURES IN 2013 AND 2012
The following table presents the Group’s capital expenditures for each of the two
years ending December 31, 2013 and 2012. Sustaining expenditures serve to maintain or replace equipment, while internal development expenditures are intended to enhance productivity, increase capacity,
or build new production lines. External development expenditures are devoted to the acquisition of production assets and equity interests in companies.
SUSTAINING AND INTERNAL DEVELOPMENT EXPENDITURES
EXTERNAL DEVELOPMENT EXPENDITURES
(million euros) 2013 2012 2013 2012
Western Europe 171 154 13 (32) (1)
North America 119 109 (2) 4
Central and Eastern Europe 285 114 (1) 11
Middle East and Africa 164 137 7 15
Latin America 61 72 1 1
Asia 246 170 3 3
TOTAL 1,046 756 21 2
(1) Including the indemnity received pursuant the settlement agreement with Orascom Construction Industries S.A.E. (s ee Note 28 (Off-blalance sheet commitments)
to the consolidated financial statements).
See Section 2.4 (Liquidity and Capital Resources) for more information on 2013 investments.
Lafarge generally owns its plants and equipments. The legal status of the quarries and lands depends on the activity:
Z in the cement activity, Lafarge owns its quarries or holds long-term operating rights;
Z in the aggregates activity, mineral lease contracts are favored in order to minimize the capital employed.
See also Section 1.3.4 (Mineral reserves and quarries) for more information.
1.3.6 CAPITAL EXPENDITURES PLANNED FOR 2014
Capital expenditures for 2014 will be limited initially to 1.1 billion euros in 2014.
These capital expenditures will be fi nanced notably by the cash provided by operating activities, the cash provided by the issuance of debt, and establishment of short and medium term credit lines.

• Lafarge - Registration Document 201342
GROUP PRESENTATION11

43
2.1 Overview .......................................... 442.1.1 2013 Highlights ............................................................ 442.1.2 2014 perspectives ........................................................ 44
2.2 Accounting policies and defi nitions ........... 452.2.1 Signifi cant accounting policies .................................... 452.2.2 Effects on reported results of changes in the scope
of operations and currency fl uctuations ........................ 462.2.3 Defi nition of operating income before capital gains,
impairment, restructuring and other ............................ 472.2.4 Reconciliation of non-GAAP fi nancial measures ........... 47
2.3 Results of operations for the years ended December 31, 2013 and 2012 .................. 49Volumes, sales, Ebitda and current operating income by geographical area ...........................................50Consolidated operating income and consolidated net income ...........................................55
2.4 Liquidity and capital resources ................ 572.4.1 Group funding policies .................................................. 572.4.2 Cash fl ows .................................................................... 572.4.3 Level of debt and fi nancial ratios .................................. 592.4.4 Rating ........................................................................... 60
22OPERATING
AND FINANCIAL REVIEW
AND PROSPECTS
Lafarge - Registration Document 2013 • 43

2.1OVERVIEW
2.1.1 2013 HIGHLIGHTS
After a fi rst semester marked by a low volume environment, notably due to adverse weather, the second half of the year 2013 experienced more positive trends versus last year in most countries, benefi tting from continuing recovery in the residential market in the United States, sustained growth in Middle East and Africa and in Asia and stabilizing volumes in Europe.
Sales and Ebitda were impacted by the unfavorable impact of changes in scope and foreign exchange rates. However, the underlying operational performance was solid, with sales and Ebitda up like for like (1) .
Sales, at 15.2 billion euros, contracted 4% versus 2012, impacted by unfavorable currency variations. At constant scope and exchange rates, sales grew 2%, supported by pricing gains to address cost infl ation across all product lines, while volumes sold were overall stable.
Ebitda was also affected by the adverse effect of foreign exchange fl uctuations, as well as lower carbon credit sales. Like-for-like(1), Ebitda improved 2% versus 2012, thanks to the combined effect of our performance and innovation measures and price increases that more than offset cost infl ation and adverse impact of a reduction of our inventories.
Net income Group share (2) was 601 million euros in 2013 compared to 365 million euros in 2012, benefi tting from the net gain on the divestment of our operations in Honduras (172 million euros after tax), and considering the 200 million euros impairment charge on Greek assets recorded in 2012.
The Group successfully implemented targeted actions to promote innovation and reduce costs and debt:
d With a total of 670 million euros generated (450 million euros from cost savings and 220 million euros from innovation measures), the Group has reached its 2013 objective .
d The net consolidated debt was reduced by a further 1 billion euros reflecting the forceful deleveraging actions taken throughout the year. Net debt stood at 10,330 million euros at year-end. Adjusted for the 380 million euros (total enterprise value) of secured divestments announced around the year end and closed mid February 2014, the year-end Group net debt would stand below 10 billion euros.
2.1.2 2014 PERSPECTIVES
Overall, Lafarge sees cement growth in its markets of between 2 to 5 percent in 2014 versus 2013. Markets shall increasingly benefi t from the recovery in the United States and the continuing growth in emerging markets as Europe overall stabilizes.
Cost infl ation should continue at a similar pace as in 2013, which should result in higher prices overall.
The Group targets to deliver additional Ebitda of above 600 million euros in 2014 through its cost reduction and innovation measures (above 400 million euros from cost savings and more than 200 million euros from innovation). Beyond 2014, in 2015-2016, it plans to generate at least 1.1 billion euros of additional Ebitda from its actions of which 600 million euros from cost reductions and 500 million euros from innovation. This represents a minimum objective of 550 million euros per annum.
The Group is also aiming to reduce net debt below 9 billion euros in 2014 and will continue to apply the utmost discipline in capital allocation and our aim is to return to an investment grade profi le this year.
Such forward-looking statements do not constitute forecasts regarding results or any other performance indicator, but rather trends or targets, as the case may be, including with respect to plans, initiatives, events, products, solutions and services, their development and potential. Although Lafarge believes that the expectations refl ected in such forward-looking statements are based on reasonable assumptions as at the time of publishing this document, investors are cautioned that these statements are not guarantees of future performance. Actual results may differ materially from the forward-looking statements as a result of a number of risks and uncertainties, many of which are diffi cult to predict and generally beyond the control of Lafarge, including but not limited to the risks described in the Section 5.1 (Risk Factors) and uncertainties related to the market conditions and the implementation of our plans. Accordingly, we caution you against relying on forward looking statements. Lafarge does not undertake to provide updates of these forward-looking statements.
(1) At constant scope and exchange rates, and excluding carbon credit sales (14 million euros in 2013 versus 99 million euros in 2012) and one-time gains (20 million euros in 2013 and 39 million euros in 2012).
(2) Net income/loss attributable to the owners of the parent company.
• Lafarge - Registration Document 201344
OPERATING AND FINANCIAL REVIEW AND PROSPECTS22 2.1 Overview

2
2.2ACCOUNTING POLICIES AND DEFINITIONS
2.2.1 SIGNIFICANT ACCOUNTING POLICIES
See Note 2 (Summary of significant accounting policies) to the consolidated fi nancial statements for more information.
Impairment of goodwillIn accordance with IAS 36 – Impairment of Assets, goodwill is tested for impairment, whose purpose is to take into consideration events or changes that could have affected the recoverable amount of these assets, at least annually and quarterly when there are some indications that an impairment loss may have been identifi ed. The annual impairment test is performed during the last quarter of the year, in relation with the budget process. The recoverable amount is defi ned as the higher of the fair value less costs to sell and the value in use.
For the purposes of the goodwill impairment test, net assets are allocated to Cash Generating Units (CGUs) or groups of CGUs. A CGU is the smallest identifi able group of assets generating cash infl ows independently and represents the level used by the Group to organize and present its activities and results in its internal reporting. CGUs generally represent one of the two activities of the Group (Cement or Aggregates and Concrete) in a particular country. When it is not possible to allocate goodwill on a non-arbitrary basis to individual CGUs, goodwill can be allocated to a group of CGUs at a level not higher than the operating segment, as defi ned in Note 4 (Operating segment information) to the consolidated fi nancial statements.
Impairment tests are carried out in two steps:
d first step: the Group compares the carrying amount of CGUs or groups of CGUs with an Ebitda multiple (the industry-specific multiples used is determinate every year on the basis of a sample of companies in our industry). Ebitda is defined as the operating income before capital gains, impairment, restructuring and other, before depreciation and amortization on tangible and intangible assets;
d second step: for CGUs or groups of CGUs presenting an impairment risk according to this first step approach, the Group determines the recoverable amount of the CGU or group of CGUs as its fair value less costs to sell or its value in use.
Fair value is the best estimate of the amount obtainable from the sale in an arm’s length transaction between knowledgeable, willing parties. This estimate is based either on market information available, such as market multiple, on discounted expected market cash fl ows, or any other relevant valuation method.
Value in use is estimated based on discounted cash fl ows expected over a 10-year period. This period refl ects the characteristics of our activities where operating assets have a high lifespan and where technologies evolve very slowly.
If the recoverable amount of the CGU or group of CGUs is less than its carrying value, the Group records an impairment loss, fi rst to reduce the carrying amount of any goodwill allocated to the CGU or group of CGUs, then to reduce the carrying amount of the other assets of the CGU or group of CGUs.
Goodwill impairment losses cannot be reversed.
See Note 10 (Goodwill) to the consolidated fi nancial statements for more information.
Pension plans, termination benefi ts and other post-employment benefi tsAccounting rules for pension plans and other post-employment benefi ts require us to make certain assumptions that have a signifi cant impact on the expenses and liabilities recorded for pension plans, termination benefi ts, and other post-employment benefi ts.
From January 1, 2013, the Group applies “Amendments to IAS 19” – Employee benefi ts. These amendments impact mainly the fi nancial component of the net periodic pension cost recorded in the consolidated statement of income. It is now calculated by applying the discount rate to the defi cit at the beginning of the period, taking into account any variation during the period from contributions and benefi t payments. The difference with the actual return of plan assets will be recorded in the other comprehensive income. As a result, this will impact neither the total amount of the obligation nor the equity. It will only change the split of the fi nancial component of the net periodic pension cost between net income and other comprehensive income. Furthermore, following the adoption o these amendments, the fi nancial component of the net periodic pension cost which is now presented in “Financial expense” the consolidated statement of income.
See Note 2.1 (Accounting principles) to the consolidated fi nancial statements for more information on the impacts of the fi rst application of the amendments to IAS 19.
The United Kingdom and North America (the United States and Canada) represent as of December 31, 2013, 60% and 25%, respectively, of the Group’s total obligations in respect of pension plans, termination benefi ts and other post-employment benefi ts.
See Note 23 (Pension plans, termination benefi ts and other post-employment benefi ts) to the consolidated fi nancial statements for more information on the primary assumptions made to account for pension plans, termination benefi ts and other post-employment benefi ts.
Pension and other post-employment benefi t obligations are impacted by the 2013 discount rates, which refl ect the rate of long-term high-grade corporate bonds. An increase of the discount rate assumption by 0.5 percentage point at December 31, 2013 would have led to a decrease in the valuation of the obligations of the main benefi t plans located in the United Kingdom and North America by approximately 335 million euros.
Lafarge - Registration Document 2013 • 45
OPERATING AND FINANCIAL REVIEW AND PROSPECTS2.2 Accounting policies and defi nitions

Provision for environmental risksCosts incurred to mitigate or prevent future environmental contamination and costs incurred that result in future economic benefi ts, such as extending useful lives, increasing capacity or safety, are capitalized. When the Group determines that a legal or constructive obligation exists and that its resolution will result in an outfl ow of resources, an estimate of the future remediation cost is recorded as a provision without contingent insurance recoveries being offset (only quasi-certain insurance recoveries are recognized as an asset). When the Group does not have a reliable reversal time schedule or when the effect of the passage of time is not signifi cant, the provision is calculated based on undiscounted cash fl ows.
Environmental costs, which are not included above, are expensed as incurred.
See Note 24 (Provisions) to the consolidated fi nancial statements for more information.
Provision for site restorationWhere the Group is legally, contractually or implicitly required to restore a quarry site, the estimated costs of site restoration are accrued and recognized under cost of sales on the basis of production levels and depletion rates of the quarry. The estimated future costs for known restoration requirements are determined on a site-by-site basis and are calculated based on the present value of estimated future costs.
See Note 24 (Provisions) to the consolidated fi nancial statements for more information.
Income taxIn accordance with IAS 12 – Income tax, deferred taxes are accounted for by applying the liability method to temporary differences between the tax basis of assets and liabilities and their carrying amounts (including tax loss and capital loss available for carry forward). Deferred tax asset is recognized to the extent that it is probable that future taxable profi ts will be available on which these tax advantage will be used.
The Group offsets deferred tax assets and liabilities if the entity has a legally enforceable right to offset current tax assets against current tax
liabilities, and the deferred tax assets and deferred tax liabilities relate to income taxes levied by the same taxing authority.
The Group calculates the income tax expense in accordance with the prevailing tax legislation in the countries where the income is earned.
See Note 22 (Income tax) to the consolidated fi nancial statements for more information.
2.2.2 EFFECTS ON REPORTED RESULTS OF CHANGES IN THE SCOPE OF OPERATIONS AND CURRENCY FLUCTUATIONS
Changes in the scope of our operations, such as acquisitions and divestitures, changes in consolidation method for an entity, such as a change from proportionate to full consolidation, or changes in exchange rates used for the conversion of accounts of foreign subsidiaries to euro, may increase or decrease our consolidated sales, Ebitda and operating income before capital gains, impairment, restructuring and other in comparison to a prior year and thus make it diffi cult to determine trends in the underlying performance of our operations.
Changes in the scope of our operationsIn order to provide a meaningful analysis between any two years (referred to below as the “current” year and the “prior” year), sales, Ebitda and operating income before capital gains, impairment, restructuring and other are adjusted to compare the two years at constant scope. With respect to businesses entering the scope of consolidation at any time during the two years under comparison, current year sales, Ebitda and operating income before capital gains, impairment, restructuring and other are adjusted to take into account the contribution made by these businesses during the current year only for a period of time identical to the period of their consolidation in the prior year. With respect to businesses leaving the scope of consolidation at any time during the two years under comparison, prior-year sales, Ebitda and operating income before capital gains, impairment, restructuring and other are adjusted to take into account the contribution of these businesses during the prior year only for a period of time identical to the period of their consolidation in the current year.
• Lafarge - Registration Document 201346
OPERATING AND FINANCIAL REVIEW AND PROSPECTS22 2.2 Accounting policies and defi nitions

2
Currency fl uctuationsSimilarly, as a global business operating in numerous currencies, changes in exchange rates against our reporting currency, the euro, may result in an increase or a decrease in the sales, Ebitda and operating income before capital gains, impairment, restructuring and other reported in euros not linked to trends in underlying performance. Unless stated otherwise, the impact of currency fluctuations is calculated as the difference between the prior year’s fi gures as reported (adjusted if necessary for the effects of businesses leaving the scope of consolidation) and the result of translating the prior year’s fi gures (adjusted if necessary for the effects of businesses leaving the scope of consolidation) using the current year’s exchange rates.
2.2.3 DEFINITION OF OPERATING INCOME BEFORE CAPITAL GAINS, IMPAIRMENT, RESTRUCTURING AND OTHER
The Group has included the “Operating income before capital gains, impairment, restructuring and other” sub-total (which is commonly referred to as “current operating income” hereinafter) on the face of consolidated statement of income. This measure excludes aspects of our operating performance that are by nature unpredictable in their amount and/or in their frequency, such as capital gains, asset impairment charges and restructuring costs. While these amounts have been incurred in recent years and may recur in the future, historical amounts may not be indicative of the nature or amount of these charges, if any, in future periods. The Group believes that the “Operating income before capital gains, impairment, restructuring and other” sub-total allows to better identify the current operating performance and provides to the users of fi nancial statements a useful information for a predictive approach of the results.
In addition, operating income before capital gains, impairment, restructuring and other is a major component of the Group’s key profi tability measure, “return on capital employed” (ROCE).
The Group’s sub-total shown under operating income may not be comparable to similarly titled measures used by other groups. Furthermore, this measure should not be considered as an alternative for operating income as the effects of capital gains, impairment, restructuring and other amounts excluded from this measure ultimately affect our operating performance and cash fl ows. Accordingly, the Group also presents “operating income” on the consolidated statement of income, which encompasses all the amounts affecting the Group’s operating performance and cash fl ows.
2.2.4 RECONCILIATION OF NON-GAAP FINANCIAL MEASURES
Net debt and cash fl ow from operationsTo assess the Group’s fi nancial strength, various indicators, in particular the net debt-to-equity ratio and the cash fl ow from operations to net debt ratio are used. These ratios are useful to investors as they provide a view of the Group-wide level of debt in comparison with its total equity and its cash fl ow from operations.
See Section 2.4.3 (Level of debt and fi nancial ratios) for the value of these ratios in 2013 and 2012.
As shown in the table below, the net debt is defi ned as the sum of long-term debt, short-term debt (including current portion of long-term debt), non current and current derivative instruments liabilities less cash and cash equivalents, current and non current derivative instruments assets.
Lafarge - Registration Document 2013 • 47
OPERATING AND FINANCIAL REVIEW AND PROSPECTS2.2 Accounting policies and defi nitions

(million euros) 2013 2012
Long-term debt 10,805 11,261
Short-term debt (including current portion of long-term debt) 2,891 2,823
Non current derivative instruments liabilities 1 8
Current derivative instruments liabilities 15 53
Cash and cash equivalents (3,346) (2,733)
Non current derivative instruments assets (12) (27)
Current derivative instruments assets (24) (68)
NET DEBT 10,330 11,317
The net debt-to-equity ratio is calculated by dividing the amount of the net debt, as computed above, by the total equity as shown on the consolidated statement of fi nancial position.
The cash flow from continuing operations to net debt ratio is calculated by dividing cash fl ow from continuing operations by the net
debt as computed above. Cash fl ow from continuing operations (after interest and income tax paid) is the net cash provided by operating activities from operations, before changes in operating working capital items, before fi nancial expenses and income taxes, see table below:
(million euros) 2013 2012
Net operating cash generated by continuing operations 1,255 1,276
Changes in operating working capital items, excluding income tax and financial expenses 36 304
CASH FLOW FROM CONTINUING OPERATIONS 1,291 1,580
Free cash fl owFree cash fl ow corresponds to net operating cash fl ows generated by operations less sustaining capital expenditures.
EbitdaEbitda is defi ned as the current operating income before depreciation and amortization on tangible and intangible assets. The Ebitda margin is calculated as the ratio Ebitda on revenue.
Return on capital employedOne of the key profi tability measures used by Lafarge is the “return on capital employed” (1). This non-GAAP measure is calculated by dividing the sum of “Operating income before capital gains, impairment,
restructuring and other” and share of net income (loss) of associates by the average of “capital employed” at the end of the current and prior year. This measure is used by Lafarge internally to manage and assess the results of its operations and those of its operating segments, make decisions with respect to investments and resource allocations and assess the performance of the management. However, because this measure has limitations, Lafarge restricts the use of this measure to these purposes only.
See Note 4 (Operating segment information) to the consolidated fi nancial statements for more information on current operating income and capital employed by operating segment.
Return on capital employed before tax was 7.2% in 2013 vs 7.8% (2)
in 2012.
(1) Before tax.
(2) Adjusted following the application of IAS 19 amended.
• Lafarge - Registration Document 201348
OPERATING AND FINANCIAL REVIEW AND PROSPECTS22 2.2 Accounting policies and defi nitions

2
2.3RESULTS OF OPERATIONS FOR THE YEARS ENDED
DECEMBER 31, 2013 AND 2012
All data regarding sales, sales volumes, Ebitda and COI include the proportional contributions of our proportionately consolidated subsidiaries.
When we analyze volumes and sales trends per country, and unless specified, we comment on the domestic volumes and sales both originating and completed within the relevant geographic market, and thus exclude export sales and volumes.
Demand for cement and aggregates and concrete products is seasonal and tends to be lower in the winter months in temperate countries and in the rainy season in tropical countries. Lafarge usually experiences a reduction in sales on a consolidated basis in the first quarter during the winter season in its principal markets in Western Europe and North America, and an increase in sales in the second and third quarters, reflecting the summer construction season.
CONSOLIDATED SALES AND EBITDA
SALES BY GEOGRAPHICAL AREA AND ACTIVITY
(million euros)
12 months
Variation
Scope variations
effectForeign
e xchange e ffect
Varation at constant scope and exchange
rates2013 2012
By geographical area
North America 3,137 3,375 -7% -7% -5% 5%
Western Europe 3,256 3,181 2% 5% - -3%
Central and Eastern Europe 1,145 1,270 -10% -1% -1% -8%
Middle East and Africa 4,067 4,283 -5% - -7% 2%
Latin America 869 961 -10% -4% -11% 5%
Asia 2,724 2,746 -1% - -6% 5%
By activity
Cement 9,657 10,373 -7% -3% -5% 1%
Aggregates and Concrete 5,451 5,353 2% 4% -5% 3%
Holding and others 90 90
TOTAL 15,198 15,816 -3.9% -0.4% -5.1% 1.6%
Consolidated sales, at 15,198 million euros in 2013 were down 4% versus last year.
Currency impacts were unfavorable (-5.1% or -756 million euros in 2013), overshadowing the organic growth experienced in many countries. They were mainly due to the depreciation of the Canadian and US dollars, the South African rand, the Egyptian pound, the Brazilian real and the Indian rupee versus the euro. Net changes in the scope of consolidation had a slightly negative impact on sales (-0.4% or -90 million euros on the full year sales). The combined effect of the divestment of two plants located in Missouri and Oklahoma (United States), the deconsolidation of our Mexican cement operations now
combined with Elementia assets from August 2013 and the disposal of our Ukrainian and Honduras cement activities (completed end of September 2013 and November 2013, respectively) was partly offset by the net impact of the consolidation of the joint-venture with Tarmac in the United Kingdom.
At constant scope and exchange rates, consolidated sales were up 2% in the year, supported by improved prices across all of our product lines to address cost infl ation. The volume progression experienced in the second half of the year offset the impact of the volume decrease in the fi rst semester. Sales were up in all regions but Europe.
Lafarge - Registration Document 2013 • 49
OPERATING AND FINANCIAL REVIEW AND PROSPECTS2.3 Results of operations for the years ended December 31, 2013 and 2012

EBITDA BY GEOGRAPHICAL AREA AND ACTIVITY
(million euros)
12 Months
Variation Scope
Foreign e xchange
e ffectCO
2 and one-
time effectsVariation
like-for-like (2)2013 2012
By geographical area
North America 560 558 - -10% -7% -1% 18%
Western Europe (1) 354 507 -30% -4% - -10% -16%
Central & Eastern Europe (1) 201 256 -21% - - -7% -14%
Middle East and Africa 1,153 1,242 -7% - -7% - -
Latin America 240 296 -19% -4% -9% -5% -1%
Asia 594 564 5% - -8% - 13%
By activity
Cement (1) 2,665 2,983 -11% 2%
Aggregates and Concrete 464 479 -3% 1%
Holding and others (27) (39) - -
TOTAL (1) 3,102 3,423 -9% -2% -6% -3% 2%
(1) Impacted by 85 million euros lower sales of carbon credits for the year:
- Western Europe: 62 million euros lower proceeds (11 million euros sold in 2013 versus 73 million euros sold in 2012).
- Central and Eastern Europe: 23 million euros lower proceeds (3 million euros sold in 2013 versus 26 million euros sold in 2012).
(2) Like-for-like variations are calculated excluding the carbon credit sales and one-time gains (20 million euros in 2013 and 39 million euros in 2012),
and at constant scope and exchange rates .
Ebitda declined in the year, impacted by an adverse impact of foreign currency variations (-6% for the year), a negative effect of the changes in scope (-2% in the year) and the unfavourable evolution of one-time gains and CO
2 proceeds .
Like for like, Ebitda improved 2% in 2013, thanks to the combined effect of our performance and innovation measures and price increases that more than offset cost infl ation and the adverse 56 million euros
impact of a reduction of our inventories. The Group continued to actively increase prices although the impact on Ebitda for the year was limited by price adjustments in a few number of countries and adverse mix effects. The Group generated 450 million euros of Ebitda through cost reduction measures and 220 million euros through innovation initiatives in 2013, achieving its 2013 objective.
VOLUMES, SALES, EBITDA AND CURRENT OPERATING INCOME BY GEOGRAPHICAL AREA
NORTH AMERICA - VISIBLE OPERATING LEVERAGE IN THE SECOND HALF OF THE YEAR AND STRONG COST REDUCTIONS
12 Months
VariationVariation
like-for-like (1)2013 2012
Volumes
- Cement (MT) 11.3 12.8 -12% -3%
- Pure aggregates (MT) 92.3 97.2 -5% 1%
- Ready-mix concrete (Mm3) 6.2 6.5 -4% 2%
Sales (million euros) 3,137 3,375 -7% 5%
Ebitda (million euros) 560 558 - 18%
Ebitda Margin (% of sales) 17.9% 16.5% 140bps 190bps
COI (million euros) 405 360 13% 32%
(1) Variations like-for-like are calculated at constant scope and exchange rates, and excluding the one-time gains recorded for pensions (24 million euros in 2012 and
20 million euros in 2013).
Overall, market trends are solid in the region, on the back of the recovery in the residential sector in the United States and the well-oriented economy in Western Canada. The second half of the year was marked
by volume growth across all product lines, after a fi rst semester 2013 affected by adverse weather in our relevant regions in the United States, as well as fl oods across Canada.
• Lafarge - Registration Document 201350
OPERATING AND FINANCIAL REVIEW AND PROSPECTS22 2.3 Results of operations for the years ended December 31, 2013 and 2012

2
The region was impacted by targeted divestments achieved in line with the Group’s strategy of focusing on the most promising geographic areas in the United States and by the depreciation of the Canadian dollar. Changes in scope had a negative impact on 2013 sales of -7%, or -227 million euros, refl ecting the divestment of two plants located in Missouri and in Oklahoma (United States) at the end of November 2012, together with other smaller disposals of aggregates quarries. Foreign exchange variations also lowered sales with the depreciation of the Canadian and US dollar against the euro (negative impact of -5%, or -159 million euros, on 2013 sales).
At constant scope and exchange rates, sales were up 5% compared to last year, with solid price gains across all product lines and volumes back to positive territory in the second half of the year.
d In the United States, housing starts continued to improve, exceeding 900,000 units in 2013, while constrained public spending continued to weigh on civil engineering. In this context, volumes grew solidly in the second half of the year, supported by the
recovery in the residential segment and partly catching up after a first semester impacted by adverse weather in the Northeast region. Like-for-like annual cement and ready-mix sales volumes decreased 3% and 2%, respectively, while yearly aggregates sales volumes were slightly up 1%. Prices remained firmly up in all product lines, driving sales up for the year.
d In Canada, sales increased in the year, under the combined effect of price gains and solid growth in Western Canada more than offsetting a soft market in Quebec. Like-for-like annual cement sales volumes decreased 2%, while 2013 aggregates and ready-mix sales volumes improved 2% and 3%, respectively, supported by several projects in Western Canada.
Ebitda increased 18% versus last year like-for-like (24 million euros in 2012 and 20 million euros in 2013) , benefi ting from operating leverage as volumes recovered as well as solid pricing and a continuous focus on cost-saving and innovation measures, and despite a negative impact of stock movements (26 million euros in 2013).
WESTERN EUROPE - COST-CUTTING IN A CHALLENGING ENVIRONMENT ; STABILIZATION AT A LOW LEVEL IN THE SECOND HALF OF THE YEAR
12 Months
VariationVariation like-for-
like (2)2013 2012
Volumes
- Cement (million tonnes ) 14.0 16.4 -14% -3%
- Pure aggregates (million tonnes ) 59.4 50.9 17% -3%
- Ready-mix concrete (million cubic meters ) 9.1 9.8 -7% -5%
Sales (million euros) 3,256 3,181 2% -3%
Ebitda(1) (million euros) 354 507 -30% -16%
Ebitda Margin(1) (% of sales) 10.9% 15.9% -500bps -170bps
COI (million euros)(1) (3) 87 316 -72% -34%
(1) Impacted by lower carbon credit sales : 62 million euros versus the year 2012.
(2) Variations like-for-like are calculated excluding the carbon credit sales, and at constant scope and exchange rates .
(3) The COI was impacted by the restarting of the depreciation of the assets in the UK: 80 million euros of additional depreciation in 2013 versus 2012, included in the
scope impacts .
In Western Europe, the market trends were contrasting within the region, with an overall stabilization at low levels in the second half of the year.
Changes in the scope of consolidation had a net positive impact on sales, refl ecting the impact of the completion of the Lafarge Tarmac joint venture in the United Kingdom in January 2013. The effects of the divestments of some assets required by the competition authorities (notably a 1.4 million tonnes cement capacity plant and some ready-mix plants) and the deconsolidation of 50% of the remaining assets of Lafarge were more than offset by the impact of the integration of 50% of the assets brought by Tarmac into the joint-venture. The impact of foreign exchange rates was negligible.
At constant scope and exchange rates, sales were down 3% versus last year, mainly driven by volume trends.
d In France, the construction market was quite resilient, supported by several infrastructure projects and investments ahead of local elections expected in 2014. The level of activity for the residential sector remains quite low, with housing starts at 332,000 units in 2013, down 4% versus last year. Annual cement, aggregates and ready-mix volumes were down 3%, 3% and 4% versus last year, respectively, showing a stabilization from the second quarter.
d In the UK, the construction market was down in the first quarter of the year, but progressively improved from the second quarter, supported by the housing segment. The joint venture Lafarge
Lafarge - Registration Document 2013 • 51
OPERATING AND FINANCIAL REVIEW AND PROSPECTS2.3 Results of operations for the years ended December 31, 2013 and 2012

Tarmac started in January 2013. Overall, our sales went up in the year, reflecting a higher proportion of aggregates and asphalt and paving sales from the assets contributed to the joint venture by Tarmac.
d Activity in Spain and Greece remained affected by the economic environment. In Spain, both the residential and the infrastructure sectors continued to be hampered by severe cuts in spending made to address the public deficit, but our cement sales volumes were flat, helped by lower margin sales of clinker. In Greece, cement volumes were down 8% versus last year; in the second half of the year though, our volumes benefited from an upswing, with GDP
contraction beginning to slow down and construction activity slightly increasing from low levels. In a challenging environment, mitigating actions, such as cost-saving, adapting our industrial network and focusing on innovation and the development of exports continue to be deployed in these two countries.
Ebitda was affected by lower carbon credit sales versus 2012 (impact of -62 million euros for the full year) and by the scope impact on the UK (negative impact of 42 million euros on 2013). Excluding these impacts, and at constant foreign exchange rates, Ebitda was down 16% versus last year, with robust cost-cutting initiatives partly offsetting the lower sales.
CENTRAL AND EASTERN EUROPE - LIMITED INFRASTRUCTURE SPENDING WEIGHED ON VOLUMES IN THE FIRST HALF OF THE YEAR
12 Months
VariationVariation like-for-
like (2)2013 2012
Volumes
- Cement (MT) 12.5 13.2 -6% -5%
- Pure aggregates (MT) 20.7 22.3 -7% -8%
- Ready-mix concrete (Mm3) 1.6 1.5 6% 6%
Sales (million euros) 1,145 1,270 -10% -8%
Ebitda(1) (million euros) 201 256 -21% -14%
Ebitda Margin(1) (% of sales) 17.6% 20.2% -260bps -120bps
COI (million euros)(1) 112 175 -36% -27%
(1) Impacted by the lower carbon credit sales: 23 million euros versus the year 2012.
(2) Variations like-for-like are calculated excluding carbon credit sales, and at constant scope and exchange rates.
The region has been impacted by limited infrastructure spending as a result of lower EU funds available in Poland and Romania.
In this context, sales were down 10% versus last year, with an easing decline in the third quarter and a stabilization in the fourth quarter, thanks to normalized comparables and improved market trends in Poland. The foreign exchange variations had a slightly negative effect on sales (-1% in the year), while the divestment of our cement Ukrainian operations negatively impacted our sales by 1% versus 2012.
At constant scope and exchange rates, sales were down 8% versus 2012.
d In Poland, building activity showed some softness in the first part of the year, after having been bolstered by the European Cup Games of June 2012 and EU funding. Cement sales volumes decreased 5% in 2013, but improved in the second part of the year, under the combined effect of a normalized comparison base and the increasing contribution from our innovation actions. Aggregates
sales also experienced an improvement quarter after quarter, but decreased versus last year. Average cement prices were lower than the 2012 levels, mostly due to price erosion during the second half of 2012.
d In Romania, cement sales were down 16% versus last year, impacted by lower infrastructure spending and a competitive environment.
d In Russia, market trends were positive, although our sales were affected by the competitive environment and by production limitations. Cement sales volumes were down 6% in the year.
In 2013, Ebitda decreased, hampered by a volume decline in the cement and aggregates product lines, lower average prices in Poland, 23 million euros lower carbon credit sales versus last year and a negative impact of stock movements (6 million euros) which more than offset the cost reduction and innovation achievements.
• Lafarge - Registration Document 201352
OPERATING AND FINANCIAL REVIEW AND PROSPECTS22 2.3 Results of operations for the years ended December 31, 2013 and 2012

2
MIDDLE EAST AND AFRICA - HIGHER PRICING IN RESPONSE TO COST INFLATION AND SELF -HELP MEASURES - ROBUST PERFORMANCE
IN THE SECOND HALF OF THE YEAR
12 Months
VariationVariation
like-for-like (1)2013 2012
Volumes
- Cement (MT) 44.4 45.2 -2% -4%(2)
- Pure aggregates (MT) 8.9 8.6 4% 6%
- Ready-mix concrete (Mm3) 6.9 7.0 -1% -1%
Sales (million euros) 4,067 4,283 -5% 2%
Ebitda (million euros) 1,153 1,242 -7% -
Ebitda Margin (% of sales) 28.4% 29.0% -60bps -50bps
COI (million euros) 847 913 -7% -
(1) At constant scope and exchange rates.
(2) Domestic only.
The region benefi tted from well-oriented markets in most countries, supported by signifi cant needs for housing and infrastructure.
Overall, cement volumes trends improved quarter after quarter, as actions to limit the effect of gas shortages in Egypt progressively showed their impacts, and volumes were back in positive territory for this region in the second half of the year.
Sales were impacted by a significant adverse impact of foreign exchange rate variations (-7%, or -309 million euros, reduction of 2013 sales).
At constant scope and exchange rates, sales were up 2% versus 2012, benefi ting from price hikes in response to signifi cant cost infl ation, while volumes experienced contrasting trends.
d Nigeria benefited from strong market trends. Cement sales increased 10% year-to-date, with a double-digit volume growth largely offsetting the price adjustment implemented in the first quarter.
d Algeria’s underlying market demand was strong throughout the year, and our cement sales increased 9% versus 2012, supported by the development of the sales of new cement products. Volumes were up 1% compared with 2012, impacted by a 10-day work stoppage in the first quarter. A new grinder, started recently, will allow us to further capture market growth.
d In Egypt, our cement sales volumes were affected by gas shortages. This impact has eased throughout the year as we progressively replaced gas by other fuels; after a first semester experiencing volumes down 30%, volumes contracted 19% in the third quarter and only 7% in the fourth quarter. Prices were raised in response to high cost inflation.
d In Morocco, cement volumes were down 6% compared to 2012, but stabilized from the second quarter with an easing comparison base. Sales improved, supported by an increasing proportion of value-added products and with the development of a strong distribution network through franchises.
d In Iraq, where cement demand remains strong, our sales were impacted by Iranian imports.
d South Africa benefited from positive market trends. Cement and aggregates sales volumes grew 1% and 7% compared with 2012, respectively, while ready-mix concrete sales volumes soared 14% compared to 2012, supported by road projects and renewable energy projects.
d In Kenya, construction market growth was dampened as elections were held in March 2013. Kenya experienced a 5% cement volume decline over last year, after a 12% cement volume growth in 2012.
d Syria continued to be impacted by the current environment.
At constant scope and exchange rates, Ebitda was stable compared with last year, as the good performance in many countries was offset by the effect of the production limitations in Egypt. Prices moved higher in many markets in response to signifi cant cost infl ation. Ebitda experienced double-digit growth both in the third and fourth quarters, with a positive contribution from the vast majority of the countries. The Ebitda resilience and its strong improvement in the second half of the year was achieved through improving volume trends in the second semester, signifi cant cost-saving and innovation measures combined with pricing gains in many countries in response to cost infl ation, and despite an adverse destocking effect (-18 million euros for the year).
Lafarge - Registration Document 2013 • 53
OPERATING AND FINANCIAL REVIEW AND PROSPECTS2.3 Results of operations for the years ended December 31, 2013 and 2012

LATIN AMERICA - MODERATE MARKET GROWTH IN A STRONG INFLATION ENVIRONMENT
12 Months
VariationVariation
like-for-like (1)2013 2012
Volumes
- Cement (MT) 8.8 9.2 -4% 1%
- Pure aggregates (MT) 2.8 2.7 2% 2%
- Ready-mix concrete (Mm3) 1.2 1.1 10% 10%
Sales (million euros) 869 961 -10% 5%
Ebitda (million euros) 240 296 -19% -1%
Ebitda Margin (% of sales) 27.6% 30.8% -320bps -170bps
COI (million euros) 202 256 -21% -3%
(1) Variations like-for-like are calculated at constant scope and exchange rates, and excluding the 15 million euros one-time gain recorded in Q4 2012.
In Latin America, market trends were positive overall. Sales were affected by a signifi cant adverse impact of currency fl uctuations (-11% year-to-date, or -94 million euros), primarily due to the depreciation of the Brazilian real versus the euro. Additionally, the deconsolidation of our Mexican cement operations now combined with Elementia assets from August 2013 and the divestment of our Honduras cement activities completed mid-November 2013 reduced annual sales by 4%.
At constant scope and exchange rates, sales grew 5% like-for-like in the year, with higher prices and volumes.
d In Brazil, the construction market experienced subdued growth. The impact of the development of infrastructures ahead of the sports events coming in 2014 and 2016 was mitigated by the economic
backdrop characterized by cost inflation and significant exchange rate fluctuations. Year-to-date domestic cement sales were up 3%, with some pricing gains in response to significant cost inflation, while volumes were somewhat hindered by some production limitations in the last quarter.
d In Ecuador, construction market trends were solid throughout the year, supported by higher demand in the infrastructure segment. Cement sales were up 12% versus 2012, with higher prices and volumes.
At constant scope and exchange rates, and excluding the one-time gain of 15 million euros recorded in the fourth quarter 2012, Ebitda was down 1% year-to-date, refl ecting the infl ationary environment and some production limitations in Brazil.
ASIA - POSITIVE MARKET TRENDS - EARNINGS GROWTH IN 2013 DESPITE NEGATIVE IMPACT OF THE CURRENCY FLUCTUATIONS
12 Months
VariationVariation like-for-
like (1)2013 2012
Volumes
- Cement (MT) 45.8 44.3 3% 3%
- Pure aggregates (MT) 8.7 6.6 32% 30%
- Ready-mix concrete (Mm3) 5.7 5.9 -4% -1%
Sales (million euros) 2,724 2,746 -1% 5%
Ebitda (million euros) 594 564 5% 13%
Ebitda Margin (% of sales) 21.8% 20.5% 130bps 140 bps
COI (million euros) 422 393 7% 16%
(1) At constant scope and exchange rates.
In Asia, market trends were positive in most countries in which we operate, but our sales were impacted by the effect of foreign exchange fl uctuations that lowered sales by 6% or 161 million euros for the year.
At constant scope and exchange rates, sales grew 5% year-to-date, with higher volumes and pricing gains in response to cost infl ation.
d The Philippines benefited from buoyant market trends and the start-up of a new grinding facility in the second quarter, bolstering cement volumes, up 9% year-to-date, while prices rose solidly to offset cost inflation. However, the construction market was temporarily hit by the Yolanda typhoon in the fourth quarter.
• Lafarge - Registration Document 201354
OPERATING AND FINANCIAL REVIEW AND PROSPECTS22 2.3 Results of operations for the years ended December 31, 2013 and 2012

2
d In Malaysia, sales were up 1% in the year. Cement sales volumes slightly increased by 1%. Average cement prices were lower than the price levels of last year, mostly reflecting price erosion during the second half of 2012, but improved in the second semester of 2013.
d In India, our regions were resilient despite a slowdown in the economy ahead of the 2014 elections, impacting the construction sector in the last part of the year. Our cement sales volumes increased 2% year-to-date while prices improved to mitigate the impact of cost inflation. Our ready-mix sales volumes were down 11% versus 2012, but we were able to raise prices in response to cost inflation. Our new 2.6 million tonnnes cement plant located in Rajasthan successfully started in the fourth quarter 2013 and should help us to continue to benefit from market growth in the coming years.
d In China, cement sales volumes were up 3% over the year. Average price levels were slightly below last year’s levels, with contrasting trends by region
d In South Korea, improved market trends supported an acceleration of the pace of the volume growth quarter after quarter. Domestic cement volumes were up 5% versus last year.
The devaluation of several currencies of the region against the euro reduced Ebitda by 8% over the year. At constant scope and exchange rates, Ebitda increased 13% versus 2012, supported by volume growth, pricing gains to face overall cost infl ation, the visible impact of cost cutting and innovation measures and the effect of lower coal prices in China.
CONSOLIDATED OPERATING INCOME AND CONSOLIDATED NET INCOME
The table below shows our operating income and net income for the period ended December 31, 2013 and 2012:
(million euros)
12 Months
Variation %2013 2012
Ebitda 3,102 3,423 -9%
Depreciation (1,027) (1,010) 2%
Current Operating Income 2,075 2,413 -14%
Net gains on disposals 295 53
Other operating income (expenses) (350) (546)
Operating Income 2,020 1,920 5%
Net financial (costs) (1,041) (1,095) -5%
Of which:
Financial expenses (1,177) (1,255) -6%
Financial income 136 160 -15%
Share of net income (loss) of associates 19 5
Income before Income Tax 998 830 20%
Income tax (262) (292) -10%
Net Income from continuing operations 736 538 37%
Net income from discontinued operations 46 16
Net income 782 554 41%
of which part attributable to:
Owners of the parent company 601 365 65%
Non-controlling interests 181 189 -4%
Depreciation was 1,027 million euros in 2013 versus 1,010 million euros in 2012, with the restarting of the depreciation in the United Kingdom (80 million euros of additional depreciation in 2013 versus 2012), partly offset by the impact of the divestment of some US operations and the effect of the changes in foreign exchange rates.
Net gains on disposals were 295 million euros in 2013 versus 53 million euros in 2012, and mainly comprise the gain of the divestment of our Honduras operations and the positive effect of the creation of a joint-venture with Elementia in Mexico.
Other operating expenses primarily refl ect the impact of impairments and restructuring. They amounted to 350 million euros in 2013 versus 546 million euros in 2012. In 2013, the Group recorded 157 million euros of restructuring charges as part of executing its cost-cutting program, and 125 million euros of impairment on various assets, mostly located in Europe. In 2012, the Group recorded 204 million euros of restructuring costs in the context of the implementation of its new country-based organization, and 200 million euros of impairment of goodwill and other assets given the economic conditions in Greece.
Lafarge - Registration Document 2013 • 55
OPERATING AND FINANCIAL REVIEW AND PROSPECTS2.3 Results of operations for the years ended December 31, 2013 and 2012

Operating income improved 5% to 2,020 million euros, as the lower restructuring and impairment charges recorded over 2013 and higher gains on disposals versus last year more than offset the impact of the lower current operating income.
Net financial costs, comprised of fi nancial expenses on net debt, foreign exchange, and other financial income and expenses, at 1,041 million euros in 2013 versus 1,095 million euros in 2012, decreased 5%.
The fi nancial expenses on net debt decreased to 834 million euros from 889 million euros, refl ecting the effect of a lower average net debt as we successfully implemented our deleveraging action plan. The average interest rate on our gross debt, at 6.2%, was stable versus 2012 and benefi tted from the temporary drawing of short term debt during the year, as proceeds from divestments were mostly received in the second half of the year. It is worth noticing that the spot average rate on gross debt at December 31, 2013 stands at 6.5%.
Foreign exchange resulted in a loss of 52 million euros in 2013 compared with a loss of 23 million euros in 2012, primarily relating to debt placed by certain countries in a currency different from the local currency, and for which no hedging market is available.
Other fi nancial costs were reduced to 155 million euros in 2013 versus 183 million euros in 2012, and mainly comprise bank commissions, the amortization of debt issuance costs, and the net interest cost related to pensions.
The contribution from our associates represented a net gain of 19 million euros in 2013, versus 5 million euros in 2012, thanks to a strong improvement of results generated by Unicem in Nigeria, while the contribution of the 20% ownership in Siniat (Gypsum operations
in Europe and Latin America) was impacted by a non-recurring depreciation charge recorded in the fi rst quarter of 2013.
Income tax was 262 million euros in 2013, corresponding to an effective tax rate of 27% notably benefi tting from the one-time effect of the divestment of our Honduras activities. In 2012, the effective tax rate was 35%, impacted by a non-deductible impairment charge on goodwill.
Net income from continuing operations increased by 37%, from 538 million euros to 736 million euros, as the lower impairment and restructuring charges and higher gains on disposals more than compensated the decrease in Ebitda.
Net income from discontinued operations was a gain of 46 million euros in 2013, versus a gain of 16 million euros last year, notably refl ecting the net gain achieved on the divestment of our Gypsum operations in North America completed at the end of August 2013.
Net income Group share(1) was 601 million euros in 2013 compared to 365 million euros in 2012, benefi tting from the net gain on the divestment of our operations in Honduras (172 million euros after tax), and considering the 200 million euros impairment charge on Greek assets recorded in 2012.
Non-controlling interests slightly decreased to 181 million euros versus 189 million euros in 2012, mostly refl ecting the effect of lower volumes in Egypt.
Basic earnings per share was 2.09 euros in 2013, compared to 1.27 euros in 2012, refl ecting the strong improvement in net income attributable to the owners of the parent company over the year, while the average number of shares was relatively stable.
(1) Net income/loss attributable to the owners of the parent company.
• Lafarge - Registration Document 201356
OPERATING AND FINANCIAL REVIEW AND PROSPECTS22 2.3 Results of operations for the years ended December 31, 2013 and 2012

2
2.4LIQUIDITY AND CAPITAL RESOURCES
2.4.1 GROUP FUNDING POLICIES
The Group fi nancial policies are defi ned by the Group Executive committee. They are aiming at ensuring a strong fi nancial structure and the Group ability to face its obligations. These policies deal particularly with the targeted Group fi nancial structure and fi nancial ratios, the average maturity of the Group debt, the Group exposure to interest rates and the level of committed credit facilities. These elements are monitored on a regular basis. In accordance with these policies, an important part of the indebtedness is long term. Committed and unused medium term credit lines are constantly maintained.
Lafarge is subject to foreign exchange risks as a result of either its ownership of companies which operate in geographies where the functional currency is different from the ultimate Group functional currency (the euro), or as a result of transactions being conducted by Group companies in a currency which is different from their functional currency.
The Group policy is for group companies to borrow, to the extent possible, in the same currency that the currency of their cash fl ows.
However, for companies that have excess cash balances in emerging market currencies, the Group policy is to make sure, to the extent possible, that these excess cash balances be translated in either US dollars or euros to protect these assets against any possible devaluation.
Regarding foreign exchange risks linked to the Group transactions, the Group policy is, as much as possible and as early as possible, to hedge these risks by using mostly forward sales or purchases of currencies.
2.4.2 CASH FLOWS
During the periods presented, the main sources of liquidity were:
d cash provided by operating activities;
d cash provided by the divestment of assets;
d cash provided by the issuance of bonds and commercial paper, of share capital, and set up of short and medium term credit lines.
COMPONENTS OF CASH FLOW
(million euros) 2013 2012
CASH FLOW FROM CONTINUING OPERATIONS 1,291 1,580
Changes in operating working capital items excluding financial expenses and income taxes (36) (304)
Net operating cash generated/(used) by continuing operations 1,255 1,276
Net operating cash generated/(used) by discontinued operations 1 22
Net operating cash generated/(used) by operations 1,256 1,298
Net cash provided by/(used in) investing activities from continuing operations 39 (323)
Net cash provided by/(used in) investing activities from discontinued operations (2) (4)
Net cash provided by/(used in) investing activities 37 (327)
Net cash provided by/(used in) financing activities from continuing operations (460) (1,348)
Net cash provided by/(used in) financing activities from discontinued operations - -
Net cash provided by/(used in) financing activities (460) (1,348)
INCREASE/(DECREASE) IN CASH AND CASH EQUIVALENTS 833 (377)
Lafarge - Registration Document 2013 • 57
OPERATING AND FINANCIAL REVIEW AND PROSPECTS2.4 Liquidity and capital resources

a) Net cash provided by operating activitiesNet operating cash generated by continuing operations was 1,255 million euros in 2013 (versus 1,276 million euros in 2012).
Net operating cash generated by continuing operations was almost stable, as the solid improvement of working capital(1) performance offset the decrease in Ebitda.
The Group pursued its efforts on this topic in 2013, with a particular focus on stock management optimization and a more effective negotiation to extend payment times to our suppliers. These efforts entailed close internal collaboration at every level of the Group between all the teams involved (commercial, industrial, purchasing, fi nance, etc.). Compared to the end of December 2012, strict working capital expressed as a number of days of sales was reduced by 3 days.
See Section 2.2.4 (Reconciliation of non-GAAP fi nancial measures) for more information on cash fl ow from operations.
b) Net cash provided by (used in) investing activitiesNet cash provided by investing activities from continuing operations was 39 million euros (compared with 323 million euros of net cash used in 2012).
Sustaining capital expenditures were maintained stable versus 2012, representing a total of 391 million euros spent in 2013.
Capital expenditures for productivity projects and for the building of new capacity amounted to 655 million euros, refl ecting a strict discipline in capital expenditures. They mostly comprise investments in on-going new cement plants projects in Russia and India and in the plants of Exshaw and Ravena in North America, as well as fast-return new grinding capacities in the Philippines, Algeria and Brazil.
Net of net debt disposed of, and including the proceeds of the disposals of ownership interests with no loss of control, the divestment operations have reduced, net of selling costs, the Group’s fi nancial net debt by 1,283 million euros in 2013. They mainly comprise 0.5 billion euros of proceeds received from the sale of US Gypsum assets, a 0.2 billion euros capital injection of the new partner in India, the divestment of a few aggregates quarries in the United States, the sale of cement operations in Ukraine and Honduras and the proceeds related to the disposal of some UK assets.
See Section 1.2.8 (Recent acquisitions, partnerships and divestitures) for more information.
c) Net cash used in fi nancing activitiesAt December 31, 2013, total net debt amounted to 10,330 million euros ( 11,317 million euros at the end of December 2012).
The net consolidated debt was reduced by a further 1 billion euros refl ecting the forceful deleveraging actions taken throughout the year.
Net debt stood at 10,330 million euros at year-end. Adjusted for the 380 million euros (total enterprise value) of secured divestments announced around the year end and closed mid February 2014 (disposal of the 20% remaining stake in gypsum operations in Europe and Latin America for 145 million euros announced in December 2013 and sale of some aggregates assets in Maryland for an enterprise value of
320 million dollars announced in January 2014), the year-end Group net debt would stand below 10 billion euros.
See Note 25 (Financial debt) to the consolidated fi nancial statements for more information on our fi nancing.
d LONG AND MEDIUM TERM DEBT
In general, medium and long-term fi nancing needs are met through bond issuances, in particular in the framework of its Euro Medium Term Notes (EMTN) program and also through bank borrowings . Under the EMTN program, Lafarge has a maximum available amount of 12,000 million euros of which 9,702 million euros is used at December 31, 2013.
Long and medium-term debt securities issuances in 2013
and 2012During 2013 and 2012, the principal fi nancing transactions have been the following:
Under the EMTN Program
d on September 30 , 2013, issue of a 750 million euros bond, bearing a fixed interest rate of 4.75% with a 7-year maturity;
d on March 15, 2012, issue of a 50 million euros private placement, bearing a fixed interest rate of 5.25% with a 5-year maturity;
d on June 19, 2012, issue of a 40 million euros private placement, bearing a fixed interest rate of 5.375% with a 5-year maturity. This debt comes in addition to the 500 million euros bond issued on June 26, 2007;
d on July 9, 2012, issue of a 500 million euros bond, bearing a fixed interest rate of 5.875% with a 7-year maturity;
d on July 10, 2012, issue of a 175 million euros private placement, bearing a fixed interest rate of 5% with a 5-year-and-a-half maturity;
Outside the EMTN Program
d on October 12, 2012, issue of a private placement for 50 million euros with a 7-year maturity, bearing a floating interest rate of Euribor 3M + 2% at December 31, 2013.
Lafarge S.A. has not issued any bond or other related security in 2013 outside the EMTN program.
Bank loans
d on June 28, 2013, a 120 million euros bank loan was signed, bearing a floating interest rate of Euribor 6M + 1.9% with a 3-year maturity;
d on July 24, 2013, a 300 million euros bank loan was signed, bearing a floating interest rate of Euribor 6M + 2.85% with a 7-year maturity;
d on December 10, 2013, a 100 million euros bank loan was signed, bearing a floating interest rate of Euribor 3M + 2.0%, with a 5-year maturity. This loan was not drawn on December 31, 2013 and may be drawn in May 2014 ;
d on December 17, 2013, a 150 million euros bank loan was signed, bearing a floating interest rate of Euribor 3M + 2.05% with a 4-year maturity. This loan was not drawn on December 31, 2013 and may be drawn in May 2014.
(1) Strict working capital: requirements trade receivables plus inventories less trade payables.
• Lafarge - Registration Document 201358
OPERATING AND FINANCIAL REVIEW AND PROSPECTS22 2.4 Liquidity and capital resources
2
Principal debt repayments in 2013
d on June 28, 2013, Lafarge S.A. repaid a 165 million euros bank loan;
d on October 15, 2013, Lafarge S.A. repaid an installement of a Schuldschein borrowing for 64 million euros;
d on December 4, 2013, Lafarge S.A. repaid a 500 million euros bond.
d SHORT-TERM DEBT
Short-term needs are met mainly through the use of bank loans, the use of bank credit lines, the issuance of commercial paper, as well as the use of our securitization programs.
Lafarge currently has a euro-denominated commercial paper program, with a maximum available amount of 3,000 million euros. At December 31, 2013, 7 million euros in commercial paper were outstanding under this program.
Lafarge also currently has securitization programs, for which detailed information is given in Note 17 (Trade receivables) to the consolidated fi nancial statements.
d COMMITTED CREDIT LINES
The group maintains committed credit lines with various banks (mainly at Lafarge S.A. level) to ensure the availability of funding on an as-needed basis.
The syndicated credit facility signed in 2004 for a 5-year term and an initial amount of 1,850 million euros, has been amended several times successfully. Through the last amendment of March 19, 2012, the amount was reduced to 1,235 million euros and the maturity extended to July 28, 2015 for 1,200 million euros. This syndicated credit facility contains an optional exit mechanism, on an individual basis for each participating bank, if the consolidated net debt to Ebitda ratio is higher than 4.75. Such an event would not be considered an event of default and would have no impact on the status of the Group’s other fi nancing arrangements.
In addition , eleven bilateral committed credit lines initially maturing in 2014, 2015 and 2016 for a total amount of 1,750 million euros have been renegotiated in 2013, with an updated maturity of 2016 for 350 million euros, 2017 for 700 million euros and 2018 for 700 million euros. Additionally a new 50 million euros committed credit line has been implemented.
At December 31, 2013, committed credit lines amounted to 3,435 million euros (compared with 3,435 million euros at December 31, 2012), fully available on December 31, 2012 (also fully available at December 31, 2012). The average maturity of these credit facilities was approximately 2.8 years at the end of 2013 versus 2.5 years at the end of 2012.
In addition, we have a 450 million euros undrawn financing at December 31, 2013 maturing on June 22, 2020. This specific financing set-up in 2012, and the utilization of which would be considered as a private placement outside the EMTN program, is not considered in the committed credit lines amount disclosed above.
d CASH AND CASH EQUIVALENTS
Cash and cash equivalents amounted to 3,346 million euros at year-end 2013, with 39% of this amount denominated in euros and the remainder in a large number of other currencies.
d CASH MANAGEMENT
In order to ensure that cash surpluses are used effi ciently, cash pooling structures on a country-by-country basis were adopted in a number
of cases. A centralized cash management process was established for most of the euro-zone countries, and the centralization of cash management was also extended to signifi cant non-euro countries (such as Hungary, Poland, Romania, Switzerland, the United Kingdom and the United States). Local cash pools have also been set up in other parts of the Group.
Owing to legal or regulatory constraints or national regulations, Lafarge does not operate a fully global centralized cash management program. However, the policies set by senior management tend to maximize cash recycling within the Group. Where cash cannot be recycled internally, cash surpluses are invested in liquid, short-term instruments.
d SHARE CAPITAL
See Section 6.2.1 (Share capital), Note 15 (Other fi nancial assets ) to the statutory accounts and Note 20 (Equity) to the consolidated fi nancial statements for information on the share capital of Lafarge S.A.
2.4.3 LEVEL OF DEBT AND FINANCIAL RATIOS
See Note 25 (Debt) to the consolidated fi nancial statements for more information on debt.
a) Total debtOn December 31, 2013, total debt amounted to 13,662 million euros (compared with 14,035 million euros in 2012) excluding put options on shares of subsidiaries and the impact of derivative instruments. At the end of 2013, 7 million euros of short-term debt were reclassifi ed to long-term debt on the basis of the Group's ability to refi nance this obligation using the available funding provided by medium and long-term committed credit lines.
Long-term debt totalled 10,782 million euros at year-end 2013 compared with 11,212 million euros at year-end 2012. Approximately 32% of the 2013 long-term debt is due to mature after 2018. Long-term debt mainly comprises fi xed-rate debt (after taking into account interest rate swaps). Most of this debt is denominated in euros and US dollars.
At December 31, 2013, short-term debt (including the current portion of long-term debt) amounted to 2,880 million euros (compared with 2,823 million euros in 2012).
At December 31, 2013, the average spot interest rate on total debt after swaps was 6.5%, compared to 6.4% at December 31, 2012. The average annual interest rate on debt after swaps was 6.2% in 2013 as in 2012 . (see Section 2.4.4 - Rating).
See Section 5.1.1 (b) (Financial and market risks) and Notes 25 (Debt) and 26 (Financial instruments) to the consolidated fi nancial statements for more information.
b) Net debt and net debt ratiosThe net debt, which includes put options on shares of subsidiaries and derivative instruments, totalled 10,330 million euros at December 31, 2013 (compared with 11,317 million euros at December 31, 2012).
The net debt-to-equity ratio stood at 63% at December 31, 2013 (compared with 64% at December 31, 2012).
The cash fl ow from operations to net debt ratio stood at 13% at December 31, 2013 (compared with 14% at December 31, 2012).
See Section 2.2.4 (Reconciliation of non-GAAP fi nancial measures) for more information on these ratios.
Lafarge - Registration Document 2013 • 59
OPERATING AND FINANCIAL REVIEW AND PROSPECTS2.4 Liquidity and capital resources

c) Loan agreementsSome of the loan agreements contain restrictions on the ability of subsidiaries to transfer funds to the parent company in certain specifi c situations. The nature of these restrictions can be either regulatory, when the transfers of funds are subject to approval by local authorities, or contractual, when the loan agreements include restrictive provisions, such as negative covenants on the payment of dividends. However, we do not believe that any of these covenants or restrictions, which relate to just a few loans, will have any material impact on our ability to meet our obligations.
See Section 5.1.1 (b) (Financial and market risks).
At December 31, 2013, the fi nancing contracts of Lafarge S.A. do not contain any fi nancial covenants. A few subsidiaries’ loan agreements include such provisions. These subsidiaries are located in the following countries: Bangladesh, Ecuador, India, Pakistan, Qatar and United Arab Emirates. Debt with such financial covenants represents approximately 2% of the total Group debt excluding put options on shares of subsidiaries at December 31, 2013. For most of them, these fi nancial covenants have a low probability of being triggered. Given the split of these contracts on various subsidiaries and the quality of the Group’s liquidity through its access to committed credit lines, the existence of such clauses cannot materially affect the Group’s fi nancial situation.
See Note 25 (e) (Debt) to the consolidated fi nancial statements.
2.4.4 RATING
Because external sources are used to fi nance a signifi cant portion of the Group capital requirements, access to global sources of fi nancing is important. The cost and availability of unsecured fi nancing are generally dependent on short-term and long-term credit ratings. Factors that are signifi cant in the determination of credit ratings or that otherwise could affect the ability to raise short-term and long-term fi nancing include: the level and volatility of earnings, the relative positions in the markets in which Lafarge operates, the global and product diversifi cation, the risk management policies and the fi nancial ratios, such as net debt to total equity and cash fl ow from operations to net debt. Credit rating agencies are expected to focus, in particular, on the ability to generate suffi cient operating cash fl ows to cover the repayment of debt. Deterioration in any of the previously stated factors or a combination of these factors may lead rating agencies to downgrade credit ratings, thereby increasing the cost of obtaining unsecured fi nancing. Conversely, an improvement in these factors may prompt rating agencies to upgrade credit ratings.
Since the fi ling of the previous Registration Document, the credit ratings for Lafarge's short and long-term debt evolved as follows:
03/17/2011 08/05/2011 03/13/2012 08/12/2013 11/12/2013
Standard
&Poor's
Short-term
rating
B
Long-term
rating
BB+
(stable outlook)
BB+
(negative outlook)
BB+
(stable outlook)
Moody’s Short-term
rating
Long-term
rating
Ba1
(stable outlook)
Ba1
(negative outlook)
See Section 5.1.1 (b) (Financial and market risks - indebtedness and credit ratings) for information on the fi nancial impact of changes to Lafarge's credit ratings.
• Lafarge - Registration Document 201360
OPERATING AND FINANCIAL REVIEW AND PROSPECTS22 2.4 Liquidity and capital resources

61
3.1 Board of Directors - Corporate Offi cers ...... 623.1.1 Form of organization of governance –
Board of Directors – Chairman and Chief Executive Offi cer – Vice-Chairman .............................................. 63
3.1.2 Powers of the Chairman and Chief Executive Offi cer ..... 643.1.3 Information on Directors ............................................... 663.1.4 Independent Directors – Parity and diversity
within the Board ............................................................ 843.1.5 Director’s charter .......................................................... 86
3.2 Board and Committees rules and practices . 883.2.1 Board of Directors ......................................................... 883.2.2 Board of Directors’ Committees .................................... 893.2.3 Self-assessment of the Board, its Committees
and of the Chairman and Chief Executive Offi cer .......... 943.2.4 Summary table on the attendance at Board
and Committee meetings.............................................. 95
3.3 Executive Offi cers ............................... 96
3.4 Compensation and benefi ts .................... 983.4.1 Compensation paid to Directors – Directors’ fees ......... 983.4.2 General principles on the compensation of the
Chairman and Chief Executive Offi cer .......................... 993.4.3 Total compensation and benefi ts of the Chairman
and Chief Executive Offi cer ......................................... 1003.4.4 Compensation elements due or granted in 2013
to the Chairman and Chief Executive Offi cer submitted for notice to shareholders at the General Meeting on may 7, 2014 (“say on pay”) ....................... 106
3.4.5 Compensation of the executive offi cers ....................... 108
3.5 Long-term incentives (stock options and performance share plans) .............. 109
3.5.1 Grant policy – performance conditions and holding rule .......................................................... 109
3.5.2 Stock option plans....................................................... 1113.5.3 Performance share plans ............................................ 1133.5.4 Multi-year variable compensation .............................. 114
3.6 Share Ownership ............................... 1153.6.1 Directors, Chairman and Chief Executive Offi cer
and Executive Offi cers share ownership ...................... 1153.6.2 Trading in Lafarge shares by Directors, Chairman
and Chief Executive Offi cer and Executive Offi cers ..... 115
3.7 Implementation of the principle “Comply or Explain” of the Afep-Medef Code....................... 116
CORPORATE GOVERNANCE AND COMPENSATION
33
61Lafarge - Registration Document 2013 •

DECLARATION IN TERMS OF CORPORATE GOVERNANCE – GOVERNANCE CODE OF REFERENCE
The Code of Corporate Governance which the Company refers to is the “Code of the Corporate Governance of Listed Corporations” published by the Afep (Association française des entreprises privées) and the Medef (Mouvement des entreprises de France), named the “Afep-Medef Code”.
This Code, which is available online on www.medef.com or www.afep.com, consolidates the various corporate governance principles and recommendations of the Afep and the Medef in its June 2013 version.
The Lafarge S.A. Board of Directors considers that these recommendations are in line with the corporate governance principles of the Company.
In accordance with this Code and French law, companies that refer to this Code must state in their Registration Document how these recommendations have been implemented and explain, if need be, the reasons why they have not been fully complied with . Explanations regarding compliance by Lafarge S.A. will be mentioned in this Chapter 3.
See Section 3.7 (Implementation of the principle “Comply or Explain” of the Afep-Medef Code) for a consolidated presentation of the provisions of the Code which are not applied by the Company.
LEGAL FRAMEWORK:
French listed companies are required to publish a statement of corporate governance specifying which Code they are voluntarily referring to
and indicating, where appropriate, the provisions of this Code of corporate governance that have not been applied and the reasons for which
they have not been implemented (Article L. 225-37 of the French Commercial Code).
3.1BOARD OF DIRECTORS - CORPORATE OFFICERS
LEGAL FRAMEWORK:
Under French law, the Chairman and Chief Executive Offi cer as well
as the members of the Board of Directors are considered
as the "Corporate Offi cers" (mandataires sociaux) of Lafarge S.A.
At present, the Board of Directors of Lafarge S.A. consists of 15 members with largely international backgrounds that bring to the Board of Directors diverse complementary expertise and experience.
The Board’s composition was modifi ed during the 2013 fi nancial year as a result of the following events:
d Mr Michel Bon did not ask for the renewal of his office as Director upon expiration of his term of office at the end of the General Meeting held on May 7, 2013;
d Shareholders at the General Meeting held on May 7, 2013 re-appointed Mrs Hélène Ploix as well as Messrs Bruno Lafont (Chairman and Chief Executive Officer), Oscar Fanjul (Vice-Chairman of the Board), Philippe Charrier and Juan Gallardo as Directors.
In addition, the Board of Directors held following the General Meeting of May 7, 2013 renewed Mr Bruno Lafont as Chairman and Chief Executive Offi cer. Mr Bruno Lafont is the only Board member exercising executive functions within the Group.
These changes to the Board are set out in the table in Section 3.1.3, which also summarizes various other information relating to the Board’s composition.
• Lafarge - Registration Document 201362
CORPORATE GOVERNANCE AND COMPENSATION33 3.1 Declaration in terms of corporate governance – Governance code of reference

3
GENERAL INFORMATION ON DIRECTORSHIPS AT LAFARGE
Several Board members have professional dealings with the Group and therefore have a good understanding of the Group’s activities. Other Directors are not as close to our business and bring to the table other experience, a global understanding of business matters and the ability to benchmark the Group’s activities against practices and standards in other industries.
In accordance with the Director’s Charter, each Board member must carry out his duties with full freedom of judgment . Proposals for the election of a new Director when their nomination is on the agenda, are made by the Corporate Governance and Nominations Committee.
The Company’s current Articles of Association provide that:
d Directors are appointed for a 4-year office term;
d Directors must not be over 70 years old; and
d each Director must hold a minimum of 1,143 shares of the Company in registered form.
A proposal to amend the age limit set out in the A rticles of A ssociation for Directors will be put to the vote at the next General Meeting convened on May 7, 2014. The current provisions of the A rticles of A ssociation (which provide that no Director may be over 70 years of age) are more restrictive than the fallback provisions proposed by the French Code of Commerce and according to which, in the absence of specifi c provisions in the articles of association, “the number of directors having reached 70 years of age may not exceed one third of the directors in offi ce”.
The Company’s current provisions in the A rticles of A ssociation are also more restrictive than most provisions adopted by other CAC 40 companies and no longer seem appropriate in light of the current evolution of society given the extension of the average working life of executive offi cers which in turn delays their availability for directorships. A measured relaxation of these provisions in line with the fallback position of the French Code of Commerce would in future enable the Company to keep benefi ting from the experience and expertise of high quality directors, when appointing or renewing their terms of offi ce.
Consequently, the following amendments to the A rticles of A ssociation will be put to the vote of the shareholders at the General Meeting called on May 7, 2014 :
d no director to be over 73 years of age; and
d the number of directors having reached 70 years of age may not exceed one third of the directors in office.
These amendments would have immediate effect and the first consequence would be that the terms of offi ce of Mrs Hélène Ploix and Mr Michel Rollier would no longer expire by anticipation following the General Meeting of May 7, 2014.
REPRESENTATION OF EMPLOYEES ON THE BOARD OF DIRECTORS
LEGAL FRAMEWORK:
Boards of Directors of entities that meet the criteria set out by French
law must include Directors representing employees. When more than
12 Directors sit on the Board, the number of Directors representing
employees must at least correspond to 2 (article L. 225-27-1
of the French Commercial Code).
Two representatives of the Works council attend Board meetings.
There is no Director representing either employee shareholders or employees as of the date of publication of this Registration Document.
Further to the entry into force of the new law on representation of employees on Boards of Directors described above, amendments to the A rticles of A ssociation of the Company will be put to the vote of the next General Meeting of Lafarge S.A. in order to lay down the procedure for nominating two Directors representing employees on the Board of Directors. These two Directors will have to be nominated within six months following the General Meeting, before November 7, 2014.
The draft resolution approved by the Board of Directors which will be put to the vote of the General Meeting provides that the fi rst Director representing the employees will be appointed by the Works Council of Lafarge S.A., and the second one by the European Works Council, provided that and for as long as the Board of Directors comprises more than 12 members elected by the general shareholders’ assembly.
This combined appointment method is considered the most suitable for a global group such as Lafarge. Lafarge S.A.’s Works Council is - as a matter of fact - the body receiving the most comprehensive and regular information on the issues affecting the Group, and will be the body solicited on the parent company’ s strategic approach. Lafarge S.A.’ s Works Council is the most relevant body representing the employees for the appointment of the fi rst Director who will represent the workforce. The appointment of the second of such Directors by the European Works Council - the Group’ s most international body representing staff, comprising representatives of the operating companies located in different European countries - aims to take into account this international dimension and to encourage European representation of the employees in the Board of Directors.
Having been consulted pursuant to the applicable legislation, Lafarge S.A.’s Works Council has expressed a favorable opinion in relation to the proposed appointment procedures .
See Section 6.2.5 (Articles of Association (statuts)) for more information on the rules governing the Board of Directors.
3.1.1 FORM OF ORGANIZATION OF GOVERNANCE – BOARD OF DIRECTORS – CHAIRMAN AND CHIEF EXECUTIVE OFFICER – VICE-CHAIRMAN
a) Chairman of the Board and Chief Executive Offi cer
LEGAL FRAMEWORK:
The governance structure of a French public limited liability
company (i.e.: a one-tier Board of Directors or a two-tier Board with
a Management Board and a separate Supervisory Board) is chosen
by the shareholders in General Meeting. For companies with a one-
tier Board, it is up to the Board of Directors to decide whether or not
the functions of Chairman and Chief Executive Offi cer need to be
separate. For these types of companies, general management can be
assumed by the Chairman of the Board (in this case the functions of
Chairman and CEO are unifi ed). It can also be transferred to a person
other than the Chairman, the Chief Executive Offi cer (separation of
functions) (Article L. 225-51-1 of the French Commercial Code).
On May 28, 2002, the General Meeting of Lafarge S.A. resolved to amend the Articles of Association of the Company, providing that the Company would be managed through a one-tier Board structure.
Lafarge - Registration Document 2013 • 63
CORPORATE GOVERNANCE AND COMPENSATION3.1 Board of Directors - Corporate Offi cers

At its May 3, 2007 meeting, and further to the recommendations of the Nominations Committee, the Lafarge Board of Directors resolved that it was in the best interest of the Company to unify the functions of Chairman of the Board and Chief Executive Offi cer. On the same date, it decided to confer these functions to Mr Bruno Lafont.
This type of governance is very common in French issuing companies with a Board of Directors. It is deemed appropriate given the organization and operating mode of Lafarge, offering a reactive and effi cient decision making process which maintains and reinforces alignment within the organization. This type of governance structure is exercised in compliance with the specifi c powers of each governing body (General Meetings, Board of Directors, Executive Offi cers), particularly in terms of control over management of the Group’s activity.
The presence of a majority of independent Directors on the Board together with the framework set by the Board’s internal regulations which in particular provide for the election of an independent Vice-Chairman of the Board (Lead Independent Director) with specifi c powers, ensure compliance with corporate governance best practices . It was noted by the Board of Directors during its self-assessment conducted at the beginning of 2013 that the governance structure of the Company allowed for a balanced functioning of the Board, in compliance with corporate governance best practices.
See Section 3.1.2 (Powers of the Chairman and Chief Executive Offi cer) for further information regarding the powers of the Chairman and Chief Executive Offi cer and their limitations, as well as the paragraph below for information on the missions of the Vice-Chairman of the Board (Lead Independent Director).
b) Vice-Chairman of the Board (Lead Independent Director)This offi ce is currently held by Mr Oscar Fanjul.
In accordance with its internal regulations, the Board elects a Vice-Chairman of the Board (Lead Independent Director) from amongst the Directors who are classifi ed as independent for a one-year renewable term of offi ce upon recommendation by the Corporate Governance and Nominations Committee.
He is elected at the Board of Directors meeting following the annual Shareholders’ Meeting of the Company.
The Vice-Chairman of the Board is a member of the Corporate Governance and Nominations Committee and of the Remunerations Committee.
He chairs meetings of the Board in the absence of the Chairman and Chief Executive Offi cer and, in particular, chairs the Board of Directors’ discussions at least once per year to assess the performance and set the remuneration of the Chairman and Chief Executive Offi cer, such discussions taking place in the absence of the latter.
Likewise, should he consider it necessary, the Vice-Chairman may arrange, in advance of the meeting of the Board of Directors during which the assessment of the Board is scheduled to take place, a separate meeting of the independent Directors to consult on, coordinate and facilitate the communication of any recommendations by these Directors.
More generally, as provided for in the Articles of Association (Article 16), a meeting of the Board may be convened and then chaired by the Vice-Chairman if the Chairman and Chief Executive Offi cer is unavailable.
Since the agenda of Board meetings is prepared in conjunction with the Vice-Chairman, the Chairman and Chief Executive Offi cer will send him a draft version before convening the meeting. Where appropriate after consulting with the other Committee Chairmen, the Vice-Chairman may propose adding further points to this agenda. The Vice-Chairman may also propose convening an unscheduled meeting of the Board of Directors to the Chairman and Chief Executive Offi cer to consider a particular issue, the importance or urgent nature of which would justify holding such an exceptional meeting.
Such requests may not be dismissed without good reason.
On an annual basis, the Vice-Chairman draws up and presents to the Board an activity report helping it to assess the performance of his role and duties, particularly with regard to monitoring all the corporate governance-related issues in conjunction with the Chairman and Chief Executive Offi cer, and the use of his specifi c powers.
As part of this role of monitoring corporate governance-related issues, the Vice-Chairman’s duties include coordinating within the Corporate Governance and Nominations Committee the proper implementation of procedures to identify, analyze and provide information about situations that could possibly fall within the scope of the management of confl icts of interest within the Board of Directors.
See Section 3.2.3 (Self-assessment by the Board, Committees, Chairman and Chief Executive Offi cer – Activity report of the Vice-Chairman) for the principal fi ndings of the Vice-Chairman’s activity report for 2013.
c) Secretary of the BoardThe Board of Directors appoints a Secretary of the Board, who may be selected from beyond the membership of the Board of Directors. The Secretary of the Board may also be appointed as secretary to the Committees of the Board.
The Secretary of the Board’s broad responsibility is to assist the Chairman and Chief Executive Offi cer in ensuring Board effectiveness and in organizing the work of the Board and of its Committees.
The Secretary of the Board is Ms Bi Yong Chungunco, Group General Counsel and Corporate Secretary.
3.1.2 POWERS OF THE CHAIRMAN AND CHIEF EXECUTIVE OFFICER
a) General description of the Chairman and CEO’s powersThe Chairman and Chief Executive Offi cer represents the Company in its relations with third parties. He has broad powers to act on behalf of our Company in all circumstances (Article L. 225-56 of the French Commercial Code).
He exercises these powers within the limits of the Company’s corporate purpose and subject to the powers expressly granted by law to Shareholders' Meetings and to the Board of Directors.
He represents the Company in its dealings with third parties. The Company is bound by the Chief Executive Offi cer’s acts which are outside the Company’s corporate purpose unless the Company can prove that the third party knew that such act fell outside the scope of the Company’s corporate purpose or could not have ignored it given the circumstances, it being clarifi ed that publication of the articles of association in itself does not constitute suffi cient proof.
Provisions of the articles of association and decisions of the Board of Directors limiting the powers of the Chief Executive Offi cer are unenforceable against third parties.
In addition, as Chairman of the Board, the Chairman and Chief Executive Offi cer represents the Board of Directors. In accordance with the provisions of the law and of the Board’s internal regulations, the Chairman and Chief Executive Offi cer chairs meetings of the Board of Directors and prepares and coordinates its work and that of its Committees. In this regard and with the support of the Company Secretary, he will:
d call meetings of the Board of Directors according to the timetable laid down, and decide whether to call meetings of the Board at any other time as needed ;
• Lafarge - Registration Document 201364
CORPORATE GOVERNANCE AND COMPENSATION33 3.1 Board of Directors - Corporate Offi cers

3
d prepare the agenda in collaboration with the Vice-Chairman, supervise the preparation of papers for the Board of Directors and ensure that the information contained therein is complete;
d call meetings of the Committees in collaboration with the Chairmen of Committees;
d ensure that certain subjects are discussed by the Committees in preparation for meetings of the Board, and satisfy himself that their proposals carry weight with the Board;
d ensure that the Directors observe the provisions of the internal regulations of the Board and of the Committees;
d ensure that the decisions of the Board are followed up;
d prepare and organize the Board’s work of periodic assessment, in collaboration with the Corporate Governance and Nominations Committee; and
d preside over the Board’s discussions.
The Chairman and Chief Executive Offi cer will act as a liaison between the Board of Directors and shareholders at specifi c meetings or at meetings with the members of the shareholders’ consultative Committee.
The Company’s strategic priorities are proposed by the Chairman and Chief Executive Offi cer and are discussed by the Board of Directors and the Strategy, Investment and Sustainable Development Committee. Specifi c strategic presentations may be submitted to the Board of Directors as often as necessary. The Company’s strategic priorities are approved by the Board of Directors.
Limitations of the Chairman and Chief Executive Offi cer’s powers are contained in the Board’s internal regulations and concern investment and divestment decisions, as well as certain fi nancial transactions.
b) Prior approval and information of the Board (limitations)
d INVESTMENTS AND DIVESTMENTS
The Board’s internal regulations provide that investment and divestment decisions must be submitted to the Board of Directors as follows:
d as regards transactions which are in line with strategy previously approved by the Board:
d submission post transaction for information purposes: for transactions below 200 million euros,
d submission for prior information of the principle of the transaction, either during a Board meeting or in writing, enabling Directors to comment on the proposed transaction or request a Board decision: for transactions between 200 and 600 million euros,
d submission for prior approval of the transaction and its terms: for transactions in excess of 600 million euros;
d as regards transactions that do not fall within the scope of the Company’s strategy as previously defined by the Board: submission for prior approval of transactions exceeding 100 million euros.
The above amounts refer to the Company’s total commitment including assumed debt and deferred commitments.
d FINANCIAL TRANSACTIONS
The Board’s internal regulations provide that transactions relating to the arrangement of debt, fi nancing and liquidity that can be decided by Chief Executive Offi cers by law, or pursuant to a delegation by the Board of Directors and the General Meeting, are subject to the following rules:
d financing transactions carried out through bilateral or syndicated credit facilities for an amount below 2,000 million euros are submitted to the Board of Directors by the Chairman and Chief Executive Officer for information purposes post transaction. Those transactions exceeding 2,000 million euros are submitted to the Board for prior approval;
d bond issues, which may be decided by the Chairman and Chief Executive Officer pursuant to a Board delegation, must be submitted to the Board as follows:
d for information purposes following the closing of the issue: for bond issues below 300 million euros,
d for information purposes prior to the launch of the issue: for bond issues between 300 million and 1,000 million euros, the Chairman and Chief Executive Officer is in charge of defining the terms and conditions of the issue,
d for prior approval of the issue and its terms: for bond issues in excess of 1,000 million euros,
d for prior approval of the issue and its terms for bond issues convertible or exchangeable into shares.
SUMMARY OF THE PRIOR APPROVAL AND INFORMATION RULES CONTAINED IN THE BOARD’S INTERNAL REGULATIONS
Type of transactionAmount of transaction (in million euros) Board consultation
INVESTMENTS AND DIVESTMENTS
In line with strategy previously approved by the Board <200 Post Information
≥200 ≤600 Prior Information
>600 Prior Approval
That do not fall within the scope of the Company’s strategy
as previously defined by the Board >100 Prior Approval
FINANCIAL TRANSACTIONS
Credit facilities
<2,000 Post Information
≥2,000 Prior Approval
Bond issues <300 Post Information
≥300 ≤1,000 Prior Information
>1,000 Prior Approval
Bond issues convertible or exchangeable into shares From 1st euro Prior Approval
Lafarge - Registration Document 2013 • 65
CORPORATE GOVERNANCE AND COMPENSATION3.1 Board of Directors - Corporate Offi cers

3.1.3 INFORMATION ON DIRECTORS
The Board of Directors of Lafarge S.A. is composed of 15 members with largely international profi les. Their respective management experience and expertise, presented below, bring together diverse and complementary skills to the Board of Directors.
CHANGES DURING 2013
Directors Appointment Renewal End of office Nationality Age (1) GenderDate of initial appointment
Years of service on the Board (1)
DIRECTORS CURRENTLY IN OFFICE
Bruno LAFONT
Chairman of the Board and
Chief Executive Officer
_ General Meeting held
on May 7, 2013
_ French 57 M 05/25/ 2005 8
Oscar FANJUL
Vice-Chairman of the Board
Lead Independent Director
_ General Meeting held
on May 7, 2013
_ Spanish 64 M 05/25/ 2005 8
Philippe CHARRIER _ General Meeting held
on May 7, 2013
_ French 59 M 05/25/ 2005 8
Philippe DAUMAN _ _ _ American 60 M 05/03/ 2007 6
Paul DESMARAIS, Jr. _ _ _ Canadian 59 M 01/18/ 2008 6
Juan GALLARDO _ General Meeting held
on May 7, 2013
_ Mexican 66 M 09/03/ 2003
(cooptation)
10
Ian GALLIENNE _ _ _ French 43 M 11/03/ 2011
(cooptation)
2
Jérôme GUIRAUD _ _ _ French 53 M 05/07/ 2008 5
Gérard LAMARCHE _ _ _ Belgian 52 M 05/15/ 2012 1
Colette LEWINER _ _ _ French 68 F 05/06/ 2010 3
Hélène PLOIX _ General Meeting held
on May 7, 2013
French 69 F 05/27/ 1999 14
Baudouin PROT _ _ _ French 62 M 05/12/ 2011 2
Michel ROLLIER _ _ _ French 69 M 05/07/ 2008 5
Nassef SAWIRIS _ _ _ Egyptian 53 M 01/18/ 2008 6
Véronique WEIL _ _ _ French 54 F 05/06/ 2010 3
DIRECTORS WHOSE TERM OF OFFICE HAS EXPIRED IN 2013
Michel BON _ _ At the end of the
General Meeting held
on May 7, 2013
_ _ _ _ _
(1) On the date of publication of the Registration Document.
(2) Conditional upon approval of the amendments to the articles of association to be put to the vote of the General Meeting called on May 7, 2014.
(3) For further information on the classification of Directors as independent, please refer to Section 3.1.4 (Independent Directors).
(4) As at 12/31 /2013. For the attendance rate at Committee meetings, please refer to Section 3.2.4 (Summary Table on the attendance at Board and Committee meetings).
(5) Audit=Audit Committee, GN= Corporate Governance and Nominations Committee, Rem=Remunerations Commitee, SDD=Strategy, Investment and Sustainable Development Commitee, C=Chairman of the Committee.
(6) Including the Lafarge S.A. directorship and in accordance with the Afep-Medef Code recommendations.
(7) Directorships in listed companies held as representative of companies in which a Director holds an executive office and whose main activity is to acquire and manage holdings do not count towards the number of directorships
held, pursuant to the Afep-Medef Code. As a result, the number of directorships in listed companies held by Mr Desmarais Jr. is in line with the limitations recommended by the Afep-Medef Code.
(8) Directorships in listed companies held as representative of companies in which a Director holds an executive office and whose main activity is to acquire and manage holdings do not count towards the number of directorships
held, pursuant to the Afep-Medef Code. As a result, the number of directorships in listed companies held by Mrs Ploix is in line with the limitations recommended by the Afep-Medef Code.
• Lafarge - Registration Document 201366
CORPORATE GOVERNANCE AND COMPENSATION33 3.1 Board of Directors - Corporate Offi cers
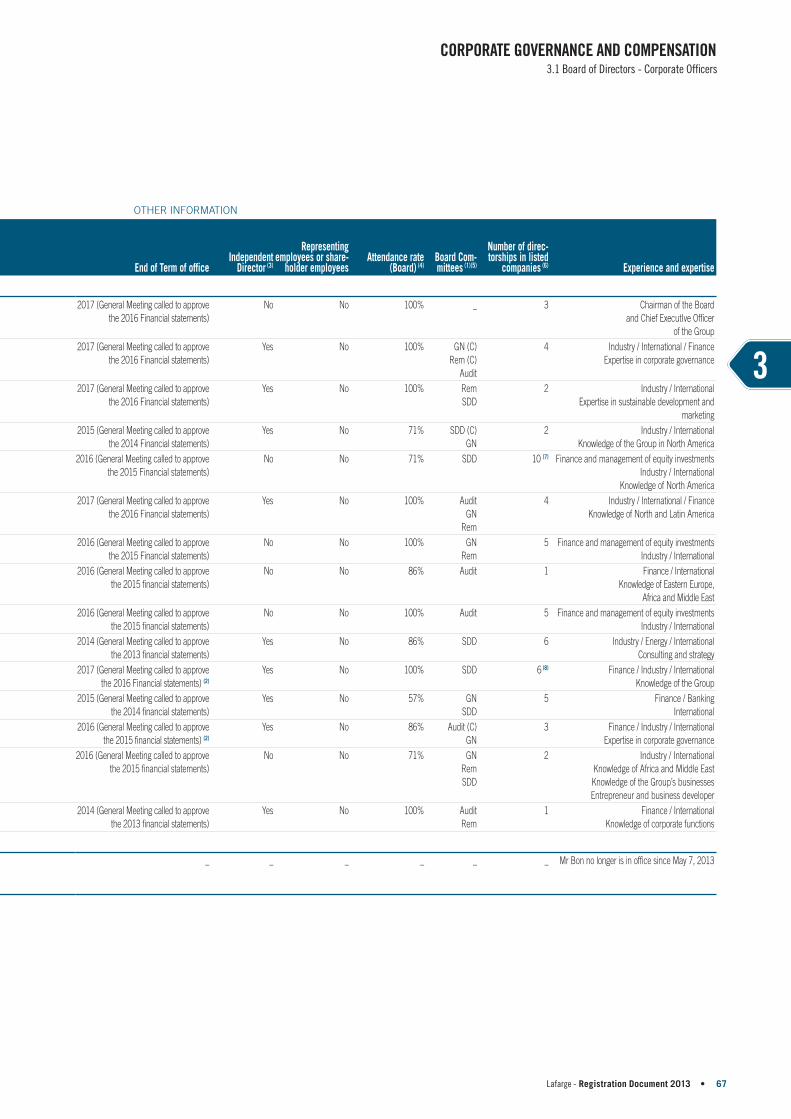
3
OTHER INF ORMATION
End of Term of officeIndependent
Director (3)
Representing employees or share-
holder employeesAttendance rate
(Board) (4)Board Com-mittees (1)(5)
Number of direc-torships in listed
companies (6) Experience and expertise
2017 (General Meeting called to approve
the 2016 Financial statements)
No No 100% _ 3 Chairman of the Board
and Chief ExecutIve Officer
of the Group
2017 (General Meeting called to approve
the 2016 Financial statements)
Yes No 100% GN (C)
Rem (C)
Audit
4 Industry / International / Finance
Expertise in corporate governance
2017 (General Meeting called to approve
the 2016 Financial statements)
Yes No 100% Rem
SDD
2 Industry / International
Expertise in sustainable development and
marketing
2015 (General Meeting called to approve
the 2014 Financial statements)
Yes No 71% SDD (C)
GN
2 Industry / International
Knowledge of the Group in North America
2016 (General Meeting called to approve
the 2015 Financial statements)
No No 71% SDD 10 (7) Finance and management of equity investments
Industry / International
Knowledge of North America
2017 (General Meeting called to approve
the 2016 Financial statements)
Yes No 100% Audit
GN
Rem
4 Industry / International / Finance
Knowledge of North and Latin America
2016 (General Meeting called to approve
the 2015 Financial statements)
No No 100% GN
Rem
5 Finance and management of equity investments
Industry / International
2016 (General Meeting called to approve
the 2015 financial statements)
No No 86% Audit 1 Finance / International
Knowledge of Eastern Europe,
Africa and Middle East
2016 (General Meeting called to approve
the 2015 financial statements)
No No 100% Audit 5 Finance and management of equity investments
Industry / International
2014 (General Meeting called to approve
the 2013 financial statements)
Yes No 86% SDD 6 Industry / Energy / International
Consulting and strategy
2017 (General Meeting called to approve
the 2016 Financial statements) (2)
Yes No 100% SDD 6 (8) Finance / Industry / International
Knowledge of the Group
2015 (General Meeting called to approve
the 2014 financial statements)
Yes No 57% GN
SDD
5 Finance / Banking
International
2016 (General Meeting called to approve
the 2015 financial statements) (2)
Yes No 86% Audit (C)
GN
3 Finance / Industry / International
Expertise in corporate governance
2016 (General Meeting called to approve
the 2015 financial statements)
No No 71% GN
Rem
SDD
2 Industry / International
Knowledge of Africa and Middle East
Knowledge of the Group’s businesses
Entrepreneur and business developer
2014 (General Meeting called to approve
the 2013 financial statements)
Yes No 100% Audit
Rem
1 Finance / International
Knowledge of corporate functions
_ _ _ _ _ _ Mr Bon no longer is in office since May 7, 2013
Lafarge - Registration Document 2013 • 67
CORPORATE GOVERNANCE AND COMPENSATION3.1 Board of Directors - Corporate Offi cers

a) Presentation of the Directors – Expertise and experience
BRUNO LAFONT - born on June 8, 1956 - French citizen
61, rue des Belles Feuilles, 75116 Paris, France
Number of Lafarge shares held: 27,506
Experience and expertise
Chairman of the Board of Directors and Chief Executive Offi cerBruno Lafont was appointed as Chairman of the Board of Directors in May 2007. He has held the offi ce of Director since May 2005 and Chief Executive Offi cer since January 1, 2006. He graduated from the Hautes Études Commerciales business school (HEC 1977, Paris) and the École Nationale d’Administration (ENA 1982, Paris). He began his career at Lafarge in 1983 and held various positions in fi nance and international operations. In 1995, Mr Lafont was appointed Group Executive Vice-President, Finance, then Executive Vice-President of the Gypsum Division in 1998. Mr Lafont joined the Group’s General Management as Chief Operating Offi cer between May 2003 and December 2005. He also acts as Director for EDF and ArcelorMittal (Luxembourg).Bruno Lafont is a member of the Executive Committee of the World Business Council for Sustainable Development (WBCSD) where he co-chairs the Energy Effi ciency in Buildings project, he presently chairs the Energy & Climate Change Working Group of the European Round Table of Industrialists and the Sustainable Development Commission of the Medef (Mouvement des Entreprises de France, the French employers association). Mr Lafont is a special adviso r to the Mayor of Chongqing (China).
Position (appointment/renewal/expiry of term of offi ce)
Appointment as Director of Lafarge in 2005. Expiry of his term of offi ce after the General Meeting called to approve the 2016 fi nancial statements. Chief Executive Offi cer since January 2006. Chairman and Chief Executive Offi cer since May 2007.
Positions held in France and abroad over the last fi ve years
Current positions:
In France:Director, Chairman and Chief Executive Offi cer of Lafarge (listed company)Director of EDF (listed company)
Abroad:Director of ArcelorMittal (Luxembourg) (listed company)Director of Lafarge Shui On Cement Limited (China) (a Group company)
Over the last fi ve years that have ended, in France and abroad :
Abroad:Positions in various subsidiaries of the Group
• Lafarge - Registration Document 201368
CORPORATE GOVERNANCE AND COMPENSATION33 3.1 Board of Directors - Corporate Offi cers

3
OSCAR FANJUL - born on May 20, 1949 - Spanish citizen
Paseo de la Castellana, 28-5°, ES-28046 Madrid, Spain
Number of Lafarge shares held: 6,193
Experience and expertise
Vice-Chairman of the Board and Director, Chairman of the Corporate Governance and Nominations Committee, Chairman of the Remunerations Committee, member of the Audit CommitteeOscar Fanjul was appointed to the Lafarge Board of Directors in 2005 and has been Vice-Chairman of the Board since August 1, 2007. He began his career in 1972 working for the Industrial Holding I.N.I. (Spain), then acted as Chairman Founder and Chief Executive Offi cer of Repsol (Spain).He currently acts as Chairman of the Board of Deoleo, S.A. (Spain) and Vice-Chairman of Omega Capital, SL (Spain). Oscar Fanjul also is a Director of Marsh & McLennan Companies (United States) and Acerinox (Spain).Independent Director, Oscar Fanjul in particular brings to the Board his experience as an executive offi cer and Director of international industrial groups as well as his expertise in fi nance and corporate governance. In addition to his specifi c duties as Vice-Chairman of the Board, Oscar Fanjul ensures coordination and coverage of work and topics to be addressed by the Corporate Governance and Nomination Committee and the Remunerations Committee, which he chairs.
Position (appointment/renewal/expiry of term of offi ce)
Appointment as Director of Lafarge in 2005. Expiry of his term of offi ce after the General Meeting called to approve the 2016 fi nancial statements.
Positions held in France and abroad over the last fi ve years
Current positions:
In France:Director and Vice-Chairman of the Board of Lafarge (listed company)
Abroad:Vice-Chairman of Omega Capital (Spain)Director of Marsh & McLennan Companies (USA) (listed company)Director of Acerinox (Spain) (listed company)Chairman of Deoleo, S.A. (Spain) (listed company)
Over the last fi ve years that have ended, in France and abroad :
In France:Director of Areva (listed company) until 2011
Abroad:Director of the London Stock Exchange (United Kingdom) (listed company) until 2010
Lafarge - Registration Document 2013 • 69
CORPORATE GOVERNANCE AND COMPENSATION3.1 Board of Directors - Corporate Offi cers

PHILIPPE CHARRIER - born on August 2, 1954 - French citizen
60-62, rue d’Hauteville, 75010 Paris, France
Number of Lafarge shares held: 6,118
Experience and expertise
Director, member of the Remunerations Committee, member of the Strategy, Investment and Sustainable Development CommitteePhilippe Charrier was appointed to the Lafarge Board of Directors in 2005. He acts as Chief Executive Offi cer of Labco, Chairman of the Board of Directors of Alphident and Dental Emco S.A. He is also a Founding member of the Club Entreprise et Handicap and a Director of Rallye. He is President of the Cap’Cités association established in 2010 and President of the Clubhouse France association established in 2011. He is President and Director of the association Unafam.He was Vice-President, Chief Executive Offi cer and Director of Œnobiol from 2006 to 2010 and Chairman and Chief Executive Offi cer of Procter & Gamble France from 1999 to 2006. He joined Procter & Gamble in 1978 and held various fi nancial positions before serving as Chief Financial Offi cer from 1988 to 1994, Marketing Director in France from 1994 to 1996, and Chief Operating Offi cer of Procter & Gamble Morocco from 1996 to 1998.Independent Director, Philippe Charrier in particular brings to the Board his experience as an executive offi cer and Director of international industrial groups as well as his expertise in the fi eld of sustainable development and marketing.
Position (appointment/renewal/expiry of term of offi ce)
Appointment as Director of Lafarge in 2005. Expiry of his term of offi ce after the General Meeting called to approve the 2016 fi nancial statements.
Positions held in France and abroad over the last fi ve years
Current positions:
In France:Director of Lafarge (listed company)Chief Executive Offi cer of LabcoChairman of the Board of Directors of Alphident and Dental Emco S.A. (subsidiary of Alphident)Director of Rallye (listed company)Director and President of the Unafam (association)President of Clubhouse France (association)
Over the last fi ve years that have ended, in France and abroad :
In France:Vice-President, Chief Executive Offi cer and Director of Œnobiol from 2006 to 2010Chairman of the Supervisory Board of Spotless group until 2010Chairman of Entreprise et Progrès until 2009
• Lafarge - Registration Document 201370
CORPORATE GOVERNANCE AND COMPENSATION33 3.1 Board of Directors - Corporate Offi cers

3
PHILIPPE DAUMAN - born on March 1, 1954 - American citizen
1515 Broadway, New York, NY 10036, USA
Number of Lafarge shares held: 1,143
Experience and expertise
Director, Chairman of the Strategy, Investment and Sustainable Development Committee, member of the Corporate Governance and Nominations CommitteePhilippe Dauman was appointed to the Lafarge Board of Directors in May 2007. He has been President and Chief Executive Offi cer of Viacom Inc. (US) since September 2006. He was previously Joint Chairman of the Board and Chief Executive Offi cer of DND Capital Partners LLC (US) from May 2000. Before creating DND Capital Partners, Philippe Dauman was Deputy Chairman of the Board of Viacom from 1996 to May 2000, Executive Vice-President from 1995 to May 2000, and General Counsel and Secretary of the Board from 1993 to 1998. Prior to that, he was a partner in New York law fi rm Shearman & Sterling. He served as Director of Lafarge North America Inc. from 1997 to 2006. He is currently a Director of Viacom Inc. and National Amusements Inc. (US), a member of the Dean’s Council for the University of Columbia Law School, a member of the Business Roundtable (US), a member of the Board of the National Cable & Telecommunications Association (US) and Co-Chairman of the Partnership for New York (US). He is also a member of The Paley Center for Media’s Board (US), a member of the Board of Kipp Foundation (US), and a member of the Executive Committee of the Board of Lenox Hill Hospital (US).Independent Director, Philippe Dauman in particular brings to the Board his knowledge of the Group, in particular in North America, as well as his experience as an executive offi cer and Director of international industrial groups.
Position (appointment/renewal/expiry of term of offi ce)
Appointment as Director of Lafarge in 2007. Expiry of his term of offi ce after the General Meeting called to approve the 2014 fi nancial statements.
Positions held in France and abroad over the last fi ve years
Current positions:
In France:Director of Lafarge (listed company)
Abroad:Director, President and Chief Executive Offi cer of Viacom Inc. (USA) (listed company)Director of National Amusements Inc. (USA)
Over the last fi ve years that have ended, in France and abroad :Nil
Lafarge - Registration Document 2013 • 71
CORPORATE GOVERNANCE AND COMPENSATION3.1 Board of Directors - Corporate Offi cers

PAUL DESMARAIS, JR. - born on July 3, 1954 - Canadian citizen
751, Square Victoria, Montreal, Quebec H2Y 2J3, Canada
Number of Lafarge shares held: 6,715
Experience and expertise
Director, member of the Strategy, Investment and Sustainable Development CommitteePaul Desmarais, Jr. was appointed to the Lafarge Board of Directors in January 2008. He has been Chairman and Co-Chief Executive Offi cer of Power Corporation of Canada (PCC or Power) since 1996 and Co-Chairman of the Board of Power Financial Corporation (PFC). Prior to joining PCC in 1981, he was at SG Warburg & Co. in London and Standard Brands Incorporated in New York. He was President and Chief Operating Offi cer of PFC from 1986 to 1989, Vice-Chairman of the Board of PFC from 1989 to 1990 and Chairman of PFC from 1990 to 2005. He is a Director and member of the Executive Committee of many Power group companies in North America. He is also Executive Director and Chairman of the Board of Pargesa Holding S.A. (Switzerland), Vice-Chairman of the Board and Director of Groupe Bruxelles Lambert (Belgium) and a Director of Total S.A., GDF-Suez and SGS S.A. (Switzerland).Paul Desmarais, Jr. is Chairman of the Board of Governors of the International Economic Forum of the Americas (Canada), Founder and member of the International Advisory Committee of the É cole des Hautes Études Commerciales (HEC) in Montreal and honorary member for life of the Desautels Faculty Advisory Board and member of the Principal’s International Advisory Board of McGill University (Canada). He is a member of the Advisory Council of the INSEAD (France), and one of the trustees and Vice-Presidents of the International Advisory Council of the Brookings Institution (Washington, US). Paul Desmarais, Jr. is a member of the Economic Consultative Council directed by minister Flaherty (Canada), Chairman of the Board and member of the Executive Committee of the CCCE (Conseil canadien des chefs d’entreprise). He is also member of the Global Board of Advisers of the Council on Foreign Relations, member of the Global Advisory Council of Harvard University (United States). Paul Desmarais, Jr. studied at McGill University where he obtained a Bachelor’s degree in Commerce. He then graduated from the European Institute of Business Administration (INSEAD) in Fontainebleau, France, with an MBA.Paul Desmarais, Jr. in particular brings to the Board his expertise in fi nance and management of equity investments as well as his experience as a Director of international industrial groups and his knowledge of North America.
Position (appointment/renewal/expiry of term of offi ce)
Appointment as Director of Lafarge in 2008. Expiry of his term of offi ce after the General Meeting called to approve the 2015 fi nancial statements.
• Lafarge - Registration Document 201372
CORPORATE GOVERNANCE AND COMPENSATION33 3.1 Board of Directors - Corporate Offi cers

3
Positions held in France and abroad over the last fi ve years
Current positions:
In France:Director of Lafarge (listed company)(1)
Director of Total S.A. (listed company)(1)
Director of GDF-Suez (listed company)(1)
Abroad:Chairman of the Board and Co-Chief Executive Offi cer of Power Corporation of Canada (Canada) (listed company)(1)
The following positions are held as representative of Power Corporation of Canada:Co-Chief Executive Offi cer and Director of Power Financial Corporation (Canada) (listed company)(1)
Chairman of the Board of Directors and Deputy Managing Director of Pargesa Holding (Switzerland) (listed company)(1)
Director and member of the Executive Committee of Great-West, Compagnie d’assurance-vie (Canada)Director and member of the Executive Committee of Great-West Life & Annuity Insurance Company (USA)Director and member of the Executive Committee of Great-West Lifeco Inc. (Canada) (listed company)(1)
Vice-Chairman of the Board, Director and member of the Executive Committee of Groupe Bruxelles Lambert S.A. (Belgium) (listed company)(1)
Director and member of the Executive Committee of group Investors Inc. (Canada)Director and member of the Executive Committee of London Insurance group Inc. (Canada)Director and member of the Executive Committee of London Life Compagnie d’assurance-vie (Canada)Director and member of the Executive Committee of Mackenzie Inc. (Canada)Director and member of the Executive Committee of Canada Life Assurance Company (Canada)Director and member of the Executive Committee of Canada Life Financial Corporation (Canada)Director and member of the Executive Committee of Canada Life Capital Corporation (Canada)Director and Chairman of the Board of Power Corporation International (Canada)Director and Vice-President of the Board of Square Victoria Communications group Inc. (Canada)Director and member of the Executive Committee of IGM Financial Inc. (Canada) (listed company)(1)
Member of the Supervisory Board of Parjointco N.V. (Netherlands)Director and Vice-President of the Board of Gesca Ltée (Canada)Director and Vice-President of the Board of La Presse Ltée (Canada)Director of Power Communications Inc. (Canada)Director and member of the Executive Committee of Putnam Investments LLC (USA)Director of Great-West Financial (Canada) Inc. (Canada)Director and Chairman of 171263 Canada Inc. (Canada)Director of 152245 Canada Inc. (Canada)Director of GWL&A Financial Inc. (United States)Director of Great-West Financial (Nova Scotia) Co. (Canada)Director of Great-West Life & Annuity Insurance Company of New York (United States)Member of the Supervisory Board of Power Financial Europe B.V. (Netherlands)Director and Member of the Management Board of The Canada Life Insurance Company of Canada (Canada)Director of SGS S.A. (Switzerland) (listed company)(1)
Over the last fi ve years that have ended, in France and abroad :
Abroad:Director and member of the Executive Committee of Crown Life Insurance Company (Canada) until 2012Vice-Chairman of the Board of 3819787 Canada Inc. (Canada) until 2010Director of Canada Life Insurance Company of America (United States) until 2009
(1) Directorships in listed companies held as representative of companies in which a Director holds an executive office and whose main activity is to acquire and
manage holdings do not count towards the number of directorships held, pursuant to the Afep Medef Code. As a result, the number of directorships in listed
companies held by Mr Desmarais Jr. is in line with the limitations recommended by the Afep Medef Code.
Lafarge - Registration Document 2013 • 73
CORPORATE GOVERNANCE AND COMPENSATION3.1 Board of Directors - Corporate Offi cers

JUAN GALLARDO - born on July 28, 1947 - Mexican citizen
Monte Caucaso 915 - 4 piso, Col. Lomas de Chapultepec C.P., MX 11000 Mexico, Mexico
Number of Lafarge shares held: 1,500
Experience and expertise
Director, member of the Audit Committee, member of the Corporate Governance and Nominations Committee, member of the Remunerations CommitteeJuan Gallardo was co-opted to the Lafarge Board of Directors in 2003. He has been Chairman of Organizacion Cultiba SAB de CV (Holding Grupo GEPP and Grupo Azucarero Mexico) (Mexico) since 1985. He is also a Director of IDEA S.A., Caterpillar Inc. (USA) and Banco Santander (Mexico). Juan Gallardo coordinated the private sector efforts in the Alena negotiations as well as for the free-trade agreement between Mexico and the European Union. He is a member of the Mexican Business Roundtable. He was previously a member of the International Advisory Council of Lafarge, the Chairman of the Fondo Mexico, Vice-President of Home Mart Mexico and Director of Grupo Mexico S.A. de C.V. (Mexico).Independent Director, Juan Gallardo in particular brings to the Board his experience as a Director of international industrial groups, his expertise in fi nance as well as his knowledge of North and Latin America.
Position (appointment/renewal/expiry of term of offi ce)
Co-optation as Director of Lafarge in 2003. Expiry of his term of offi ce after the General Meeting called to approve the 2016 fi nancial statements.
Positions held in France and abroad over the last fi ve years
Current positions:
In France:Director of Lafarge (listed company)
Abroad:Chairman of the Board of Organizacion Cultiba SAB de CV (Mexico) (listed company)Director of IDEA S.A. (Mexico)Director of Caterpillar Inc. (USA) (listed company)Director of Banco Santander (Mexico) (listed company)
Over the last fi ve years that have ended, in France and abroad :
Abroad:Director of Mexicana de Aviacion (Mexico) until 2010Director of Grupo Mexico S.A. de C.V. (Mexico) (listed company) until 2009Member of the International Advisory Board of Textron Inc. (United States) (listed company) until 2009
• Lafarge - Registration Document 201374
CORPORATE GOVERNANCE AND COMPENSATION33 3.1 Board of Directors - Corporate Offi cers

3
IAN GALLIENNE - born on January 23, 1971 - French citizen
Avenue Marnix 24, 1000 Bruxelles, Belgium
Number of Lafarge shares held: 1,143
Experience and expertise
Director, member of the Corporate Governance and Nominations Committee, member of the Remunerations CommitteeIan Gallienne was co-opted to the Lafarge Board of Directors in 2011. Ian Gallienne has been Managing Director of Groupe Bruxelles Lambert (Belgium) since January 1, 2012. He has a degree in Management and Administration, with a specialization in Finance, from the E.S.D.E. in Paris and an MBA from Insead in Fontainebleau. He began his career in Spain, in 1992, as co-founder of a commercial company. From 1995 to 1997, he was a member of management of a consulting fi rm specializ ed in the reorganization of ailing companies in France. From 1998 to 2005, he was manager of the private equity funds Rhône Capital LLC in New York and London. From 2005 to 2012, he founded and served as Managing Director of the private equity funds Ergon Capital Partners, Ergon Capital Partners II and Ergon Capital Partners III in Brussels. He has been a Director of Groupe Bruxelles Lambert (Belgium) since 2009, of Imerys (France) since 2010, of Pernod Ricard (France) since 2012 and SGS (Switzerland) since 2013.Ian Gallienne in particular brings to the Board his expertise in fi nance and management of equity investments as well as his experience as a Director of international industrial groups.
Position (appointment/renewal/expiry of term of offi ce)
Co-optation as a Director of Lafarge in 2011. Expiry of his term of offi ce after the General Meeting called to approve the 2015 fi nancial statements.
Positions held in France and abroad over the last fi ve years
Current positions:
In France:Director of Lafarge (listed company)Director of Imerys (listed company)Director of Pernod Ricard (listed company)
Abroad:Managing Director of Groupe Bruxelles Lambert S.A. (Belgium) (listed company)The following positions are held as representative of Groupe Bruxelles Lambert S.A.:Director of SGS (Switzerland) (listed company)Managing Director of Ergon Capital Partners S.A. (Belgium), Ergon Capital Partners II S.A. (Belgium) and Ergon Capital Partners III S.A. (Belgium)Director of Ergon Capital S.A. (Belgium)Director of Steel Partners N.V. (Belgium)Director of Gruppo Banca Leonardo S.P.A. (Italy)Managing Director of Ergon Capital II Sàrl (Luxembourg)Managing Director of Sienna Capital Sàrl (Luxembourg)Managing Director of Serena Sàrl (Luxembourg)Member of the Supervisory Board of Kartesia GP (Luxembourg)
Over the last fi ve years that have ended, in France and abroad :
In France:Director of Central Parc Villepinte S.A. (until July 31, 2011)Director of EliTech group S.A.S. (until December 31, 2011)Director of the “Fonds de dotations du Palais”Director of PLU Holding S.A.S (until April 26, 2012)
Abroad:Director of Arno Glass S.A. (Luxembourg) until June 1, 2009Director of La Gardenia Beauty S.P.A. (Italy) until December 31, 2011Director of Seves S.P.A. (Italy) until December 31, 2011Director of group De Boeck S.A. (Belgium) until December 31, 2011Managing Director of Egerton Sàrl (Luxembourg) until October 3, 2013
Lafarge - Registration Document 2013 • 75
CORPORATE GOVERNANCE AND COMPENSATION3.1 Board of Directors - Corporate Offi cers

JÉRÔME GUIRAUD - born on January 7, 1961 - French citizen
4 Cork street, London W1S 3LG, United Kingdom
Number of Lafarge shares held: 3,948
Experience and expertise
Director, member of the Audit CommitteeJérôme Guiraud was appointed to the Lafarge Board of Directors in 2008. He graduated from École des Hautes Études Commerciales (HEC 1984 –Paris). Jérôme Guiraud started his career at the French Embassy in Zagreb (Croatia) in 1985 as Deputy to the Commercial Attaché. He joined the Société Générale group at the Inspection Générale department in 1986. From 1993 he has held various managing positions abroad, in Europe and in emerging countries on capital markets, then as Country manager and Director of the Société Générale group’s listed subsidiaries. He joined the NNS group in 2008. He is currently Chief Executive Offi cer of NNS Capital, Director of NNS Holding and member of the Audit Committee of Orascom Construction Industries S.A.E. (signifi cant construction and in fertilizer company, listed on the Cairo stock exchange).Jérôme Guiraud in particular brings to the Board his expertise in fi nance, his experience as an executive offi cer and Director of international groups as well as his knowledge of Eastern Europe, Africa and the Middle East.
Position (appointment/renewal/expiry of term of offi ce)
Appointment as Director of Lafarge in 2008. Expiry of his term of offi ce after the General Meeting called to approve the 2015 fi nancial statements.
Positions held in France and abroad over the last fi ve years
Current positions:
In France:Director of Lafarge (listed company)
Abroad:Director Chief Executive Officer of NNS Capital (United Kingdom)Director of NNS Holding Sàrl (Luxembourg)Member of the Audit Committee of Orascom Construction Industries S.A.E. (Egypt) (listed company)
Over the last fi ve years that have ended, in France and abroad :
Abroad:Director of Orascom Construction Industries S.A.E. (Egypt) (listed company) from 2008 to 2013
• Lafarge - Registration Document 201376
CORPORATE GOVERNANCE AND COMPENSATION33 3.1 Board of Directors - Corporate Offi cers

3
GÉRARD LAMARCHE - born on July 15, 1961 - Belgian citizen
Avenue Marnix 24, 1000 Bruxelles, Belgium
Number of Lafarge shares held: 1,143
Experience and expertise
Director, member of the Audit CommitteeGérard Lamarche was appointed to the Lafarge Board of Directors in 2012. He graduated from the University of Louvain-la-Neuve with a Bachelor’s degree in Economics . He also completed the Advanced Management Program for Suez group Executives at the Insead Business School and took part in the 1998-99 Wharton International Forum (Global Leadership Series). He began his professional career in 1983 with Deloitte Haskins & Sells in Belgium, and became M&A Consultant in the Netherlands in 1987. In 1988, he joined the Venture Capital department of Société Générale de Belgique as Investment manager. He was promoted to Controller in 1989, and in 1992 was appointed Advisor to the Director of Strategic Planning. He became Special Projects Advisor to the President and Secretary of the Suez Board of Directors (1995-1997) and was later appointed the new group’s Senior Vice-President in charge of Planning, Control and Accounts Management. In 2000, Mr Gérard Lamarche joined NALCO (American subsidiary of the Suez group and world leader in industrial water treatment) as Director, Senior Executive Vice-President and CFO. He was appointed CFO of the Suez group in March 2004.Gérard Lamarche was appointed Director of Groupe Bruxelles Lambert (GBL) (Belgium) in April 2011, of which he is also Managing Director since January 1, 2012. Gérard Lamarche is also a Director of Legrand, Total and SGS (Switzerland) as well as censor of GDF Suez.Gérard Lamarche in particular brings to the Board his expertise in fi nance and management of equity investments as well as his experience as an executive offi cer and Director of international industrial groups.
Position (appointment/renewal/expiry of term of offi ce)
Appointment as Director of Lafarge in 2012. Expiry of his term of offi ce after the General Meeting called to approve the 2015 fi nancial statements.
Positions held in France and abroad over the last fi ve years
Current positions:
In France:Director of Lafarge (listed company)Director of Legrand (listed company)Director of Total S.A. (listed company)Censor of GDF Suez (appointed in April 2012)
Abroad:Managing Director of Groupe Bruxelles Lambert S.A. (Belgium) (listed company)Director of SGS (Switzerland) (listed company)
Over the last fi ve years that have ended, in France and abroad :
In France:Director of Suez Environnement Company (from May 19, 2011 until December 21, 2011)Director of GDF Suez Energy Services (from September 15, 2005 until June 16, 2011)Director of Suez Environnement (from April 20, 2004 until October 28, 2010)
Abroad:Director of Electrabel (Belgium) until December 31, 2011Director of International Power plc (United Kingdom) (listed company) until December 8, 2011Director of Europalia (Belgium) until October 12, 2011Director of GDF Suez Belgium until October 1, 2011Director of Sociedad General de Aguas de Barcelona (Agbar - Spain) until June 28, 2011Director of Suez-Tractebel S.A. (Belgium) until January 25, 2011Director of Fortis Banque S.A. (Belgium) until July 2, 2010 Director of Suez Environnement North America (United States) until December 31, 2009Director of Leo Holding Company (United States) until May 15, 2009
Lafarge - Registration Document 2013 • 77
CORPORATE GOVERNANCE AND COMPENSATION3.1 Board of Directors - Corporate Offi cers

COLETTE LEWINER - born on September 19, 1945 - French citizen
Tour Europlaza-La Défense 4, 20 avenue André Prothin, 92927 Paris-La Défense, France
Number of Lafarge shares held: 1,653
Experience and expertise
Director, member of the Strategy, Investment and Sustainable Development CommitteeColette Lewiner was appointed to the Lafarge Board of Directors in 2010. Since July 2012, she has been energy advisor of the Chairman of Capgemini after having led since 1998 (the year she joined Capgemini ) the “Energy, Utilities & Chemicals” sector. She is also non executive Chairman of TDF. She is also Director of Bouygues, Colas (group Bouygues), Eurotunnel, Nexans, TGS Nopec (Norway) and Crompton Greaves (India). From 1992 to 1998, she was Chairman and CEO of SGN-Réseau Eurisys, a subsidiary of Cogema (Areva group). From 1979 to 1992, Colette Lewiner held various positions within the EDF group, at the Research & Development department, and then at the fuel procurement department that she managed in 1987. In 1989, she created the Development and Commercial Strategy Division and became the fi rst woman Executive Vice-President at EDF. Colette Lewiner is also a member of the French Academy of Technologies and of the Strategic Research Committee chaired by the French Prime Minister. After entering the École normale supérieure and graduating as a Doctor in Physics (PhD), she started her career as an Associate Professor and Researcher at the Denis Diderot University in Paris.Independent Director, Colette Lewiner in particular brings to the Board her recognized expertise in the fi eld of energy, her experience in consulting and strategy as well as her experience as an executive offi cer and Director of international industrial groups.
Position (appointment/renewal/expiry of term of offi ce)
Appointment as Director of Lafarge in 2010. Expiry of her term of offi ce after the General Meeting called to approve the 2013 fi nancial statements.
Positions held in France and abroad over the last fi ve years
Current positions:
In France:Director of Lafarge (listed company)Director of Nexans (listed company)Director of Bouygues (listed company)Director of Colas (group Bouygues)Director of Eurotunnel (listed company)Chairman of the Board of Directors of TDF (SAS)
Abroad:Director of TGS-Nopec (Norway) (listed company)Director of Crompton Greaves (India) (listed company)
Over the last fi ve years that have ended, in France and abroad :
In France:Director of La Poste until May 2011
• Lafarge - Registration Document 201378
CORPORATE GOVERNANCE AND COMPENSATION33 3.1 Board of Directors - Corporate Offi cers

3
HÉLÈNE PLOIX - born on September 25, 1944 - French citizen
162, rue du Faubourg-Saint-Honoré, 75008 Paris, France
Number of Lafarge shares held: 2,883
Experience and expertise
Director, Chairman of the Audit Committee (until February 18, 2014), member of the Strategy, Investment and Sustainable Development CommitteeHélène Ploix was appointed to the Lafarge Board of Directors in 1999. Hélène Ploix is Chairman of Pechel Industries SAS and Pechel Industries Partenaires SAS. She is also Chairman of FSH SAS. She was previously Deputy Chief Executive Offi cer of Caisse des Dépôts et Consignations (CDC ) and Chairman and Chief Executive Offi cer of CDC Participations from 1989 to 1995, Chairman of the Caisse Autonome de Refi nancement and Chairman of the Supervisory Board of CDC Gestion. She previously served as Special Counsel for the single currency at KPMG Peat Marwick from 1995 to 1996 and as Director of Alliance Boots plc (United Kingdom ) from 2000 to July 2007. She is a member of the Supervisory Board of Publicis groupe, a non-executive Director of BNP Paribas, Sofi na (Belgium), Genesis Emerging Markets Fund Limited (Guernesey) and, as Pechel Industries Partenaires’ permanent representative, she is also a Director of SES (Store Electronic System).Independent Director, Hélène Ploix in particular brings to the Board her recognized expertise in fi nance and her experience as an executive offi cer and Director of international industrial groups. The Board also benefi ts from her extensive knowledge of the Group, which she accompanies since 1999.
Position (appointment/renewal/expiry of term of offi ce)
Appointment as Director of Lafarge in 1999. Expiry of her term of offi ce after the General Meeting called to approve the 2016 fi nancial statements (subject to approval by the shareholders of the amendments to the articles of association to be put to the General Meeting convened on May 7, 2014).
Positions held in France and abroad over the last fi ve years
Current positions:
In France:Director of Lafarge (listed company)(1)
Director of BNP Paribas (listed company)(1) Member of the Supervisory Board of Publicis group (listed company)(1)
Director of SES (Store Electronic Systems) (representing Pechel Industries Partenaires) (listed company)(1)
Chairman of Pechel Industries SASChairman of Pechel Industries Partenaires SASChairman of FSH SASManager of Hélène Ploix SARLManager of HMJ (Hélène Marie Joseph) SARLManager of Sorepe Société Civile
Abroad:Director of Ferring S.A. (Switzerland)Director of Sofi na (Belgium) (listed company)(1)
Managing Director of Goëmar Holding (Luxembourg) –representing Pechel Industries PartenairesDirector of Genesis Emerging Markets Fund Limited (Guernesey) (listed company)(1)
Over the last fi ve years that have ended, in France and abroad :
In France:Director of Ypso Holding S.A. (as legal representative of Pechel Industries Partenaires) until October 2013Member of the Supervisory Board of Goëmar Développement (as permanent representive of Pechel Industries Partenaires SAS) until 2013Member of the Supervisory Board of Laboratoires Goëmar (as permanent representive of Pechel Industries Partenaires SAS) until 2013
Abroad:Director of Completel NV (Netherlands) (end of the term of offi ce December 31, 2010)
(1) Directorships in listed companies held as representative of companies in which a Director holds an executive office and whose main activity is to acquire and
manage holdings do not count towards the number of directorships held, pursuant to the Afep-Medef Code. As a result, the number of directorships in listed
companies held by Mrs Ploix is in line with the limitations recommended by the Afep-Medef Code.
Lafarge - Registration Document 2013 • 79
CORPORATE GOVERNANCE AND COMPENSATION3.1 Board of Directors - Corporate Offi cers

BAUDOUIN PROT - born on May 24, 1951 - French citizen
3 rue d’Antin, 75002 Paris, France
Number of Lafarge shares held: 1,250
Experience and expertise
Director, member of the Corporate Governance and Nominations Committee, member of the Strategy, Investment and Sustainable Development Committee Baudouin Prot was appointed to the Lafarge Board of Directors in 2011. He is Chairman of BNP Paribas since December 2011. After graduating from the French business school HEC in 1972 and from ENA in 1976, Baudouin Prot joined the French Ministry of Finance where he stayed for four years. He then became Deputy Director of Energy and Raw Materials at the French Ministry of Industry for three years. He joined BNP in 1983 as Deputy Director of the intercontinental branch of Banque Nationale de Paris and became Director for Europe in 1985. In 1987, he joined the Central Networks department, was promoted to Central Director in 1990, and became Executive Vice-President of BNP in charge of networks in 1992. Baudouin Prot was appointed Chief Executive Offi cer of BNP in 1996 and Chief Operating Offi cer (Directeur général délégué) of BNP Paribas in 1999. In May 2000, he was appointed Director and Chief Operating Offi cer (Directeur général délégué) of BNP Paribas, and became Director and Chief Executive Offi cer of the bank in May 2003. Baudouin Prot is also a Director of Kering, Veolia Environnement and Pargesa Holding S.A. (Switzerland).Independent Director, Baudouin Prot in particular brings to the Board his expertise in fi nance and banking and his experience as an executive offi cer and Director of international groups.
Position (appointment/renewal/expiry of term of offi ce)
Appointment as Director of Lafarge in 2011. Expiry of his term of offi ce after the General Meeting called to approve the 2014 fi nancial statements.
Positions held in France and abroad over the last fi ve years
Current positions:
In France:Director of Lafarge (listed company)Chairman of BNP Paribas (listed company)Director of Kering (listed company)Director of Veolia Environnement (listed company)
Abroad:Director of Pargesa Holding S.A. (Switzerland) (listed company)
Over the last fi ve years that have ended, in France and abroad :
In France:Director of Accor (from June 1992 to February 2009) (listed company)Chairman of the “Fédération Bancaire Française” (from September 2009 to August 2010)
Abroad:Director of Erbé S.A. (Belgium) until December 2013
• Lafarge - Registration Document 201380
CORPORATE GOVERNANCE AND COMPENSATION33 3.1 Board of Directors - Corporate Offi cers

3
MICHEL ROLLIER - born on September 19, 1944 - French citizen
27, cours de l'Ile Seguin, 92100 Boulogne-Bilancourt, France
Number of Lafarge shares held: 1,758
Experience and expertise
Director, Chairman of the Audit Committee (since February 18, 2014), member of the Corporate Governance and Nominations CommitteeMichel Rollier was appointed to the Lafarge Board of Directors in 2008. Since May 2012, he has been Chairman of Plateforme de la Filière Automobile (PFA). He is also Chairman of the Supervisory Board of Michelin, Chairman of the Supervisory Board of Somfy S.A. and Chairman of the Supervisory Board of Siparex Associés.Michel Rollier graduated from the Institut d’études politiques (1967) and the Université de Droit of Paris (1968). He previously held several positions with Aussedat-Rey (International Paper group) starting in 1971, including controller until 1982, Unit Operational manager from 1982 to 1987, Chief Financial Offi cer between 1987 and 1994 and Deputy Managing Director from 1994 to 1996. Michel Rollier joined Michelin in 1996 as Chief Legal Offi cer and Head of Financial Operations. He was appointed member of the Michelin group Executive Council and Chief Financial and Legal Offi cer in 1999 before being appointed as Managing Partner of the Compagnie Générale des Établissements Michelin in May 2005 until May 2012.Michel Rollier is also a member of the High Committee of Corporate Governance set up in October 2013 following the latest amendments to the Afep-Medef Code.Independent Director, Michel Rollier in particular brings to the Board his expertise in fi nance and corporate governance, as well as his experience as an executive offi cer and Director of international industrial groups.
Position (appointment/renewal/expiry of term of offi ce)
Appointment as Director of Lafarge in 2008. Expiry of his term of offi ce after the General Meeting called to approve the 2015 fi nancial statements (subject to approval by the shareholders of the amendments to the articles of association to be put to the General Meeting convened on May 7, 2014).
Positions held in France and abroad over the last fi ve years
Current positions:
In France:Director of Lafarge (listed company)Chairman of the Supervisory Board of MichelinChairman of the Supervisory Board of Somfy S.A. (listed company)Chairman of the Supervisory Board of Siparex AssociésChairman of Plateforme de la Filière Automobile (PFA)
Over the last fi ve years that have ended, in France and abroad :
In France:Managing Partner of the Compagnie Générale des Établissements Michelin (listed company) (until May 2012)Director of Moria (until September 2011)
Abroad:Managing Partner of la Compagnie Financière Michelin (Switzerland) (until May 2012)
Lafarge - Registration Document 2013 • 81
CORPORATE GOVERNANCE AND COMPENSATION3.1 Board of Directors - Corporate Offi cers

NASSEF SAWIRIS - born on January 19, 1961 - Egyptian citizen
61, rue des Belles Feuilles, 75116 Paris, France
Number of Lafarge shares held: 1,671 (this fi gure does not take into account the shares owned by NNS Holding Sàrl)
See Section 6 – (Major shareholders)
Experience and expertise
Director, member of the Corporate Governance and Nominations Committee, member of the Remunerations Committee, member of the Strategy, Investment and Sustainable Development CommitteeNassef Sawiris was appointed to the Lafarge Board of Directors in January 2008.Nassef Sawiris is the major shareholder and the Chief Executive Offi cer of OCI N.V. (the Netherlands). He joined the Orascom Group in 1992, became the Chief Executive Offi cer of OCI N.V.’s predecessor, Orascom Construction Industries (OCI S.A.E.) (Egypt), in 1998 and was also appointed Chairman of OCI S.A.E. in 1999. Mr Sawiris is also a Director of the BESIX group (Belgium). Mr Sawiris served on the Board of Directors of the Cairo & Alexandria Stock Exchanges (Egypt) from 2004-2007 and was also a Director of the Nasdaq DIFX (Dubai). Nassef Sawiris holds a BA in Economics from the University of Chicago, USA.Nassef Sawiris in particular brings to the Board his expertise as an entrepreneur and business developer as well as his experience as an executive offi cer and Director of international industrial groups. The Board also benefi ts from his extensive knowledge of Africa and the Middle East and of the Group’s businesses.
Position (appointment/renewal/expiry of term of offi ce)
Appointment as Director of Lafarge in 2008. Expiry of his term of offi ce after the General Meeting called to approve the 2015 fi nancial statements.
Positions held in France and abroad over the last fi ve years
Current positions:
In France:Director of Lafarge (listed company)
Abroad:Director and Chief Executive Offi cer of OCI N.V. (The Netherlands) (listed company)Director of BESIX (Belgium)
Over the last fi ve years that have ended, in France and abroad :
Abroad:Chairman and Chief Executive Offi cer of Orascom Construction Industries S.A.E. (OCI) (Egypt) (listed company) until 2013Director of NNS Holding S à r l (Luxembourg) until 2013Director of Nasdaq DIFX (Dubai International Stock Exchange) (United Arab Emirates) until 2011Chairman of Lafarge Cement Egypt S.A.E. (Egypt) and positions in various subsidiaries of the Group until 2012Director and General manager of several subsidiaries of OCI Group (Egypt)
• Lafarge - Registration Document 201382
CORPORATE GOVERNANCE AND COMPENSATION33 3.1 Board of Directors - Corporate Offi cers

3
VÉRONIQUE WEILL - born on September 16, 1959 - French citizen
25, avenue Matignon, 75008 Paris, France
Number of Lafarge shares held: 1,200
Experience and expertise
Director, member of the Audit Committee, member of the Remunerations CommitteeVéronique Weill was appointed to the Lafarge Board of Directors in 2010.Véronique Weill is a graduate of the Institut d'études politiques de Paris and of the Université la Sorbonne (Licence de Lettres). She spent more than 20 years at J.P. Morgan and has notably served as Group head of Operations for Investment Banking and global head of IT & Operations for Asset Management and Private Clients. Véronique Weill joined AXA in June 2006 as a Chief Executive Offi cer of AXA Business Services and Group Executive Vice-President of Operational Excellence. In January 2008, she was appointed Executive Vice-President IT and Operational Excellence of the Group. Since January 1, 2009, Véronique Weil is a member of the Executive Committee of the AXA Group and since December 2009, she has been Chief Operating Offi cer of AXA. She is now in charge of Group Marketing, Distribution, IT, Operational Excellence, Procurement and GIE AXA (headquarters' shared services). Véronique Weill is a member of the AXA Research Fund Scientifi c Committee. As from January 1, 2013, Véronique Weill is a member of the Management Committee of the AXA Group.Independent Director, Véronique Weill in particular brings to the Board her expertise in fi nance, her knowledge of corporate functions and her experience as an executive offi cer of an international group.
Position (appointment/renewal/expiry of term of offi ce)
Appointment as Director of Lafarge in 2010. Expiry of her term of offi ce after the General Meeting called to approve the 2013 fi nancial statements. The renewal of her term of offi ce will be proposed at the Shareholders Meeting to be held on May 7, 2014.
Positions held in France and abroad over the last fi ve years
Current positions:
In France:Director of Lafarge (listed company)Director of AXA Assistance S.A.Member of the Executive Committee of AXA Group Solutions (SAS)Chairman of the Supervisory Board of GIE AXAMember of the Supervisory Board of GIE AXA Group SolutionsChairman and member of the Executive Committee, AXA Technology Services (SAS)Permanent representative of Vamopar on the Board of FamilyProtectPermanent representative of AXA on the Board of AXA France IARD and AXA France Vie
Abroad:Director of AXA Business Services Private Ltd. (India)
Over the last fi ve years that have ended, in France and abroad :Nil
Lafarge - Registration Document 2013 • 83
CORPORATE GOVERNANCE AND COMPENSATION3.1 Board of Directors - Corporate Offi cers

SUMMARY OF EXPIRY OF TERM OF OFFICE OF LAFARGE DIRECTORS
Directors
2014(General Meeting called to approve the 2013 financial statements)
2015(General Meeting called to approve the 2014 financial statements)
2016(General Meeting called to approve the 2015 financial statements)
2017(General Meeting called to approve the 2016 financial statements)
Bruno Lafont Z
Oscar Fanjul Z
Philippe Charrier Z
Philippe Dauman Z
Paul Desmarais, Jr. Z
Juan Gallardo Z
Ian Gallienne Z
Jérôme Guiraud Z
Gérard Lamarche Z
Colette Lewiner Z
Hélène Ploix (1) Z
Baudouin Prot Z
Michel Rollier (1) Z
Nassef Sawiris Z
Véronique Weill Z
(1) Subject to approval by the General Meeting called on May 7, 2014 of the amendments to the articles of association relating to the age limit of Directors.
b) Number of directorshipsThe Afep-Medef Code recommends that non-executive Directors should not hold more than fi ve directorships in listed companies in total, including foreign entities. This recommendation applies at the time of appointment or on the next renewal of the term of offi ce of a Director.
Directorships in listed companies held as representative of companies in which a Director holds an executive offi ce and whose main activity is to acquire and manage holdings do not count towards the number of directorships held, pursuant to the Afep-Medef Code. As a result, the number of directorships in listed companies held by Mrs Ploix and Mr Desmarais, Jr. is in line with the limitations recommended by the Afep-Medef Code.
For further information on the number of directorships in listed companies held by each Director, please refer to the overview table in Section 3.1 (Board of Directors – Corporate Offi cers).
c) Sanctions applicable to the DirectorsTo the Company’s knowledge, no Director was, over the previous fi ve years, convicted of fraud, involved in a bankruptcy, receivership or liquidation, subject to offi cial public incrimination and/or sanctions, or disqualifi ed by a court from acting as Director or in management or conducting the affairs of any issuer.
3.1.4 INDEPENDENT DIRECTORS – PARITY AND DIVERSITY WITHIN THE BOARD
a) Independence
Directors qualified as independent
Philippe Charrier Hélène Ploix
Philippe Dauman Baudouin Prot
Oscar Fanjul Michel Rollier
Juan Gallardo Véronique Weill
Colette Lewiner
Percentage of independent Directors: 60%
• Lafarge - Registration Document 201384
CORPORATE GOVERNANCE AND COMPENSATION33 3.1 Board of Directors - Corporate Offi cers

3
Directors non-qualified as independent/justification
Bruno Lafont Corporate officer of Lafarge S.A. – Chairman and Chief Executive Officer.
Paul Desmarais, Jr.
Ian Gallienne
Gérard Lamarche
Connected to Groupe Bruxelles Lambert, a shareholder holding more
than 10% of the capital and voting rights of the Company.
Jérôme Guiraud
Nassef Sawiris
Connected to NNS Holding Sàrl, a shareholder holding more than 10%
of the capital and voting rights of the Company.
In accordance with the recommendations of the Afep-Medef Code and the Board’s internal regulations, the Board regularly reviews the situation of the Directors in light of the independence criteria.
The Board of Directors, after an individual assessment of each Director’s situation in light of the independence criteria applicable to the Company, considers that nine Directors, out of the fi fteen members of the Board, are independent, corresponding to 60% of the Board being independent Directors.
In accordance with the recommendations of the Afep-Medef Code, the Board’s internal regulations provide that a majority of the members of the Board, the Corporate Governance and Nominations Committee and the Remunerations Committee must qualify as “independent”, and that at least two-thirds of the members of the Audit Committee must qualify as “independent”.
The Board of Directors considers that the composition of the Board and its Committees is compliant with its internal regulations.
The formal non-qualification as “independent Director” in no way challenges the professionalism or freedom of judgement that characterize all Directors.
See Section 3.2.2 (Board of Directors’ Committees) for more information on the involvement of independent Directors in the Committees.
b) Independence criteriaThe Board of Directors has applied the following recommendations of the Afep-Medef Code in its assessment of independent Directors:
d not to be an employee or Corporate Officer of the Company, or an employee or Director of its parent or a company that it consolidates and not having been in such a position over the previous five years;
d not to be a Corporate Officer of a company in which the Company holds a directorship, directly or indirectly, or in which an employee appointed as such or a Corporate Officer of the Company (currently in office or having held such office going back five years) is a Director;
d not to be a customer, supplier, investment banker or commercial banker:
d that is material for the Company or its group,
d or for a significant part of whose business the Company or its group accounts;
d not to be related by close family ties to a Corporate Officer;
d not to have been an auditor of the Company over the previous five years;
d not to have been a Director of the Company for more than twelve years;
d finally, with respect to Board members representing shareholders holding 10% or more of the capital or voting rights of the Company, the Afep-Medef Code provides that the Board should systematically examine their qualifications as independent Directors. The Directors
of Lafarge linked to the Company’s two major shareholders (Groupe Bruxelles Lambert and NNS Holding) are not classified as independent Directors.
The Board of Directors did not apply the recommended 12-year limitation on length of service as Director. The Board considers that in a long-term business such as ours, where management is stable, serving as Director for a long period of time can bring more experience and authority, increasing the Directors’ independence. To date Mrs Hélène Ploix has been a director of Lafarge S.A. for over 12 years. The Board however considers that, particularly in light of the effective contribution of the Mrs Ploix to the work of the Board, of her extremely rigorous approach and great professionalism in particular demonstrated as Chairman of the Audit Committee, Mrs Ploix classifi es as an independent Director. It is specifi ed that in addition to Mrs Ploix the Board of Directors is composed of 8 independent Directors out of 15 members and that the Board of Directors remains composed of a majority of independent Directors whatever the position on the 12-year length of service criteria. In addition, Mrs Ploix no longer chairs the Audit Committee since the Board of February 18, 2014.
c) Materiality tests on business relationships between the Company and its DirectorsDuring the annual review of the classification of Directors as independent, the Corporate Governance and Nominations Committee as well as the Board of Directors, during their meetings on February 18, 2014, conducted materiality tests on business relationships between the Company and some of its Directors. These tests consist in verifying that the value of transactions between the Company and one of its Directors or a company with which such Director is associated (as customer, supplier, investment banker or commercial banker) does not exceed specifi c thresholds, which have been set in advance, of the Group’s revenues, equity, assets or debt.
In particular, the Board reviewed the relationship between Lafarge and BNP Paribas, one of the Group’s corporate and investment banks, of which Baudouin Prot is Chairman. Lafarge can rely on a pool of competitive banks preventing the likelihood of a relationship of dependency on BNP Paribas. Likewise, the fees that BNP Paribas receives from the Group account for an infi nitesimal percentage of the bank’s revenues and do not create a relationship of dependency for Lafarge. In addition, the results of the materiality test show that the value of the committed credit facilities of BNP Paribas towards the Group represents less than 5% of the Group’s gross debt, while the value of the transactions between the Company and BNP Paribas is less than 1% of the revenues, less than 10% of the equity and less than 5% total assets of both the Group and BNP Paribas.
In light of these factors, and given the independent thinking that Baudouin Prot has shown in his capacity as Director, the Board considers him to be an independent Director.
The Board of Directors also conducted materiality tests on the business relationships existing between the Company and AXA, of which Véronique Weill is a member of the Group Executive Committee. The results of these tests showed that the value of the transactions between
Lafarge - Registration Document 2013 • 85
CORPORATE GOVERNANCE AND COMPENSATION3.1 Board of Directors - Corporate Offi cers

the Company and AXA is less than 1% of the revenues, less than 10% of the equity and less than 5% of the total assets of the Group and AXA. The Board of Directors therefore resolved to classify Véronique Weill as independent Director.
d) Management of confl icts of interests
LEGAL FRAMEWORK:
Agreements entered into between a public limited liability
company and its corporate offi cers are subject to dual control: prior
approval of the Board, followed by a vote by the General Meeting
following the reading of a special report of the statutory auditors
(article L. 225-38 et seq. of the French Commercial Code).
The French regulatory authority, the AMF, recommends that related-
party agreements which have a continuing effect should be reviewed
by the Board on an annual basis.
As provided in the Lafarge S.A. Director’s Charter, a Director is required to inform the Board of any situation involving a confl ict of interests, even one of a potential nature, and must refrain from taking part in any vote on any resolution of the Board where he fi nds himself in any such situation.
The Charter also provides that Directors are required to inform the Chairman promptly of any relations that may exist between the companies in which they have a direct interest and the Company. The Directors must also, in particular, notify the Chairman of any agreement covered by article L.225-38 et seq. of the French Commercial Code that either they themselves, or any company of which they are Directors or in which they either directly or indirectly hold a signifi cant number of shares, have entered into with the Company or any of its subsidiaries (related-party agreements). These provisions do not apply to agreements made in the ordinary course of business.
During its meeting on February 18, 2014, the Board of Directors conducted a review of related-party agreements approved in prior years that had a continuing effect in 2013, no new related-party agreement or commitment not previously approved by the shareholders were authorised in 2013.
See the special report of the statutory auditors on related-party agreements and commitments on page F96 .
See Section 3.1.5 (Director’s charter).
The internal regulations of the Board of Directors specify that the Vice-Chairman’s duties include, as part of his role of monitoring corporate governance-related issues, coordinating within the Corporate Governance and Nominations Committee the proper implementation of procedures to identify, analyse and provide information about situations that could possibly fall within the scope of the management of confl icts of interest within the Board.
On the number of corporate offi ces held by Directors, the internal regulations of the Board of Directors provide that the Corporate Governance and Nominations Committee and the Board of Directors must give their prior approval before the Chief Executive Offi cer accepts a corporate offi ce of a listed company that does not belong to the Group.
In addition, all Directors certify on an annual basis the existence, or absence, of specifi c items and indicate that there are no potential confl icts of interests between their duties as a Director and their private interests or other duties.
To the best of Lafarge’s knowledge, there are no confl icts between the duties of the Group Board members and their private interests and other duties.
Lafarge has not entered into service contracts providing for the granting of future benefi ts.
e) Parity and diversity – Selection processThe Board of Directors of Lafarge S.A. is composed of members with largely international profi les, resulting from their professional experience.
Over a third of Directors are non-French nationals. Each Director brings to the Board of Directors diverse expertise and experiences which contribute to the diversity of the Board.
See Section 3.1.3 (Information on Directors) for a detailed presentation of the respective management experience and expertise of the Directors.
During its self-assessment conducted at the beginning of 2013, the Board of Directors considered that its composition was adapted to the situation of the Group, noting the good diversity of its membership while achieving the necessary balance between Directors qualifi ed as independent and representative of signifi cant shareholders.
In addition, and with the support of the Corporate Governance and Nominations Committee, the Board of Directors is aiming at increasing the number of women on the Board.
To sustain this diversity while accelerating gender parity on the Board in light of the directorships coming up for renewal, the Corporate Governance and Nominations Committee has put in place a selection process to identify and select candidates for board membership.
The proportion of women elected to the Board currently stands at 20%, with three women out of the 15 members composing the Board of Directors.
If the proposed resolutions put to the General Meeting convened on May 7, 2014 are passed, the composition of the Board will go to 16 members, of which 25 % are women.
LEGAL FRAMEWORK:
The law provides, under the balanced representation of women
and men on Boards of Directors, that Boards of Directors of listed
companies should comprise at least 20% women in 2014 and 40%
in 2017 (article L. 225-18-1 of the French Commercial Code).
The Afep-Medef Code recommends attaining the same percentages
one year earlier.
3.1.5 DIRECTOR’S CHARTER
The full text of the Lafarge S.A. Director’s Charter is set out below. It is also available on-line at www.lafarge.com.
PreambleIn accordance with the principles of corporate governance, a Director carries out his duties in good faith, in such a manner as, in his opinion, best advances the interests of the Company, applying the care and attention expected of a normally prudent person in the exercise of such offi ce.
• Lafarge - Registration Document 201386
CORPORATE GOVERNANCE AND COMPENSATION33 3.1 Board of Directors - Corporate Offi cers

3
d COMPETENCE
Before accepting offi ce, a Director must ascertain that he is acquainted with the general and specifi c obligations assigned to him. He must, in particular, acquaint himself with legal and statutory requirements, the Company articles of association (statuts), current internal rules and any supplementary information that may be provided to him by the Board.
d DEFENDING CORPORATE INTEREST
A Director must be an individual shareholder and hold the number of Company shares required by the articles of association (statuts), i.e., a number representing in total a nominal value of at least 4,572 euros which amounts to 1,143 shares, recorded in the share register in nominal form.
Every Director represents the body of shareholders and must in all circumstances act in their interest and in that of the Company.
d CONFLICTS OF INTEREST
A Director is required to inform the Board of any situation involving a confl ict of interests, even one of a potential nature, and must refrain from taking part in any vote on any resolution of the Board where he fi nds himself in any such situation.
d DILIGENCE
A Director must dedicate the necessary time and attention to his offi ce, while respecting the legal requirements governing the accumulation of several appointments. He must be diligent and take part, unless impeded from doing so for any serious reason, in all meetings of the Board and, where necessary, in any Committee to which he may belong.
d INFORMATION – CONFIDENTIALITY
A Director is bound by obligation to keep himself informed to be able to contribute in a useful manner to the issues under discussion on the Board agenda.
With regard to information outside of the public domain and which he has acquired while in offi ce, a Director must consider himself bound by a duty of confi dentiality, which goes beyond the simple obligation to maintain discretion as provided for by law.
d TRAINING
Every Director may, in particular at the time of his election to the Board and where he deems it necessary, take advantage of training on specifi c aspects of the Company and the Group, its business activities, fi eld of activity, organization and particular fi nancial circumstances.
d LOYALTY
A Director is bound by an obligation of loyalty. He must not, under any circumstances, do anything liable to damage the interests of the Company or those of any of the other companies in the Group. He may not personally take on any responsibilities, within any undertakings or businesses having any activity competing with those of Lafarge without fi rst notifying the Board of Directors thereof.
d PRIVILEGED INFORMATION – TRADING IN SHARES
A Director must not carry out any transactions involving Company shares except within the framework of the rules determined by the Company. He must make a statement to Lafarge concerning any transactions involving Lafarge shares carried out by him within fi ve days of any such transaction.
d INDEPENDENCE
A Director undertakes, in all circumstances, to maintain his independence of thought, judgement, decision and action and will resist all pressure, whatever the nature or origin.
A Director undertakes to refrain from seeking or accepting from the Company, or any other company linked to it, either directly or indirectly, any personal benefi ts likely to be deemed to be of such a nature as might compromise his freedom of judgement.
d AGREEMENTS IN WHICH DIRECTORS HAVE AN INTEREST
The Directors are required to inform the Chairman promptly of any relations that may exist between the companies in which they have a direct interest and the Company. The Directors must also, in particular, notify the Chairman of any agreement covered by article L. 225-38 et seq. of the French Commercial Code that either they themselves, or any company of which they are Directors or in which they either directly or indirectly hold a signifi cant number of shares, have entered into with the Company or any of its subsidiaries. These provisions do not apply to agreements made in the ordinary course of business.
d INFORMATION OF DIRECTORS
The Chairman ensures that the Directors receive in a timely manner, the information and documents needed to perform the full extent of their duties. Similarly, the Chairman of each of the said Committees ensures that every member of his Committee has the information needed to perform his duties.
Prior to every meeting of the Board (or of every Committee), the Directors must thus receive in a timely manner a fi le setting out all the items on the agenda. Any Director who was unable to vote because he was not fully apprised of the issue has to inform the Board and insist on receiving the critical information. Generally, every Director receives all the information necessary to perform his duties and may arrange to have all the relevant documents delivered to him by the Chairman. Similarly, the Committee Chairmen must supply the members of the Board, in a timely manner, with the reports they have prepared within the scope of their duties.
The Chairman ensures that members of the Board are apprised of all the principal relevant items of information, including any criticism concerning the Company, in particular, any articles of press or fi nancial research reports.
Meetings, during which any Director may make presentations and discuss with the Directors his fi eld of activity, are held on a regular basis by the Chairman during or outside Board meetings.
Every Director is entitled to request from the Chairman the possibility of special meetings with Group management in the fi elds of interest to them, without his presence.
Lafarge - Registration Document 2013 • 87
CORPORATE GOVERNANCE AND COMPENSATION3.1 Board of Directors - Corporate Offi cers
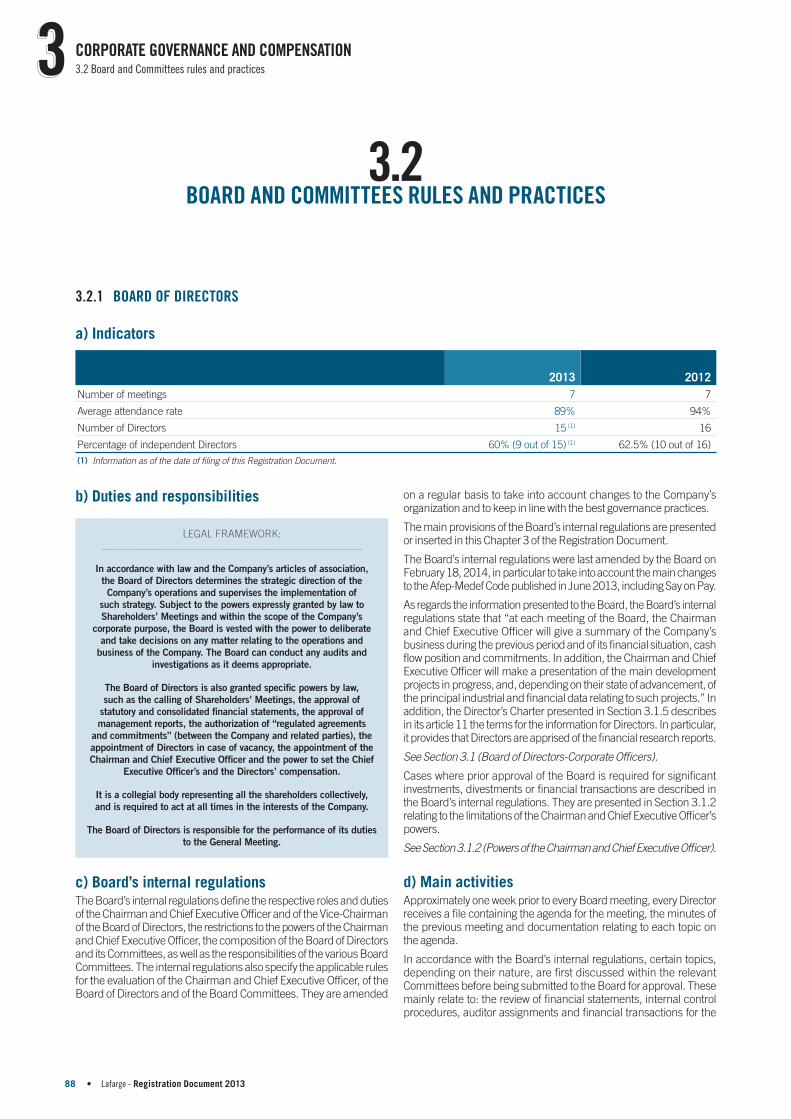
3.2BOARD AND COMMITTEES RULES AND PRACTICES
3.2.1 BOARD OF DIRECTORS
a) Indicators
2013 2012
Number of meetings 7 7
Average attendance rate 89% 94%
Number of Directors 15 (1) 16
Percentage of independent Directors 60% (9 out of 15) (1) 62.5% (10 out of 16)
(1) Information as of the date of filing of this Registration Document.
b) Duties and responsibilities
LEGAL FRAMEWORK:
In accordance with law and the Company’s articles of association,
the Board of Directors determines the strategic direction of the
Company’s operations and supervises the implementation of
such strategy. Subject to the powers expressly granted by law to
Shareholders’ Meetings and within the scope of the Company’s
corporate purpose, the Board is vested with the power to deliberate
and take decisions on any matter relating to the operations and
business of the Company. The Board can conduct any audits and
investigations as it deems appropriate.
The Board of Directors is also granted specifi c powers by law,
such as the calling of Shareholders’ Meetings, the approval of
statutory and consolidated fi nancial statements, the approval of
management reports, the authorization of “regulated agreements
and commitments” (between the Company and related parties), the
appointment of Directors in case of vacancy, the appointment of the
Chairman and Chief Executive Offi cer and the power to set the Chief
Executive Offi cer’s and the Directors’ compensation.
It is a collegial body representing all the shareholders collectively,
and is required to act at all times in the interests of the Company.
The Board of Directors is responsible for the performance of its duties
to the General Meeting.
c) Board’s internal regulationsThe Board’s internal regulations defi ne the respective roles and duties of the Chairman and Chief Executive Offi cer and of the Vice-Chairman of the Board of Directors, the restrictions to the powers of the Chairman and Chief Executive Offi cer, the composition of the Board of Directors and its Committees, as well as the responsibilities of the various Board Committees. The internal regulations also specify the applicable rules for the evaluation of the Chairman and Chief Executive Offi cer, of the Board of Directors and of the Board Committees. They are amended
on a regular basis to take into account changes to the Company’s organization and to keep in line with the best governance practices.
The main provisions of the Board’s internal regulations are presented or inserted in this Chapter 3 of the Registration Document.
The Board’s internal regulations were last amended by the Board on February 18, 2014, in particular to take into account the main changes to the Afep-Medef Code published in June 2013, including Say on Pay.
As regards the information presented to the Board, the Board’s internal regulations state that “at each meeting of the Board, the Chairman and Chief Executive Offi cer will give a summary of the Company’s business during the previous period and of its fi nancial situation, cash fl ow position and commitments. In addition, the Chairman and Chief Executive Offi cer will make a presentation of the main development projects in progress, and, depending on their state of advancement, of the principal industrial and fi nancial data relating to such projects.” In addition, the Director’s Charter presented in Section 3.1.5 describes in its article 11 the terms for the information for Directors. In particular, it provides that Directors are apprised of the fi nancial research reports.
See Section 3.1 (Board of Directors-Corporate Offi cers).
Cases where prior approval of the Board is required for signifi cant investments, divestments or fi nancial transactions are described in the Board’s internal regulations. They are presented in Section 3.1.2 relating to the limitations of the Chairman and Chief Executive Offi cer’s powers.
See Section 3.1.2 (Powers of the Chairman and Chief Executive Offi cer).
d) Main activitiesApproximately one week prior to every Board meeting, every Director receives a fi le containing the agenda for the meeting, the minutes of the previous meeting and documentation relating to each topic on the agenda.
In accordance with the Board’s internal regulations, certain topics, depending on their nature, are fi rst discussed within the relevant Committees before being submitted to the Board for approval. These mainly relate to: the review of fi nancial statements, internal control procedures, auditor assignments and fi nancial transactions for the
• Lafarge - Registration Document 201388
CORPORATE GOVERNANCE AND COMPENSATION33 3.2 Board and Committees rules and practices

3
Audit Committee; the election of new Directors, the appointment of senior managers and the composition of the Committees as regards the Corporate Governance and Nominations Committee; Directors and senior managers’ compensation as regards the Remunerations Committee and general strategic priorities of the Company and the Group for the Strategy, Investment and Sustainable Development Committee. The Committees carry out their duties under the supervision of the Board of Directors.
In 2013, in addition to the approval of the quarterly, interim and annual fi nancial statements, the composition of the Board and its Committees, the assessment of the independence of the Directors, the preparation of the General Meeting, determination of the fi xed and variable compensation of the Chairman and Chief Executive and of the Directors' fees and other decisions in the ordinary course of business, the Board notably worked on the following:
d follow up of developments and divestments and of the Group’s financial situation;
d follow up of the Group’s strategic plan;
d self-assessment of the Board and of its Committees;
d grants of performance shares and multi-annual variable compensation; reappointment of Mr Bruno Lafont as Chairman and Chief Executive Officer;
d review of the provisions of the articles of association relating to the age limit of Directors;
d review and analysis of various laws and reports on corporate governance topics, including representation of employees on the Board; and
d review of insider dealing rules applicable to Lafarge shares.
For further information on developments and divestments, please refer to Section 1.2.8 (Recent acquisitions, partnerships and divestures).
The compensation and benefi ts of the Chairman and Chief Executive Offi cer is described in Section 3.4.3 (Compensation and benefi ts paid to the Chairman and Chief Executive Offi cer).
Grants of performance shares in 2013 are described in Section 3.4.3 (Compensation and benefi ts paid to the Chairman and Chief Executive Offi cer) and in Section 3.5 (Long-term incentives).
Internal insider dealing rules applicable to Lafarge shares are described in Section 3.6 (Share ownership). Proposed amendments to the articles of association may be found in Section 3.1 on page 63 .
3.2.2 BOARD OF DIRECTORS’ COMMITTEES
LEGAL FRAMEWORK:
The Board of Directors may set up specialized Committees as
it sees fi t and appoint its members. These Committees have no
decision-making power but make recommendations to prepare Board
decisions. Only the setting up of an Audit Committee is compulsory
for listed companies.
The Board of Directors of Lafarge S.A. has defi ned, in its internal regulations, the duties and responsibilities of its various Standing Committees, which are:
d the Audit Committee;
d the Corporate Governance and Nominations Committee;
d the Remunerations Committee;
d the Strategy, Investment and Sustainable Development Committee.
The Committees are composed of a minimum of three members and a maximum of ten members nominated by the Board of Directors from among its Directors.
The term of offi ce of the Committee members is aligned with their Director offi ce. These positions can be renewed simultaneously.
The Committees are convened by their Chairmen or at the request of the Chairman and Chief Executive Offi cer by any means possible, including orally. The Committees may meet anywhere and using whatever means, including videoconference or teleconference. A quorum consists of at least one-half of members being present. At least two meetings are held per year.
The agenda for Committee meetings is drawn up by its Chairman. Minutes of the Committee meetings are drafted after each meeting.
For the purpose of their work, the Committees may interview members of Executive Offi cers of the Group or any other Group manager. The Committees may also engage any expert and interview him about his report.
The Committees report on their work to the next meeting of the Board, by way of verbal statement, opinion, proposals, recommendations or written reports.
The Committees may not handle on their own initiative any issue outside of their terms of reference, as defi ned below. They have no decision-making powers, but only the power to make recommendations to the Board of Directors.
a) Audit Committee
d INDICATORS
2013 2012
Number of meetings 5 5
Average attendance rate 91% 97%
Number of members 7 (1) 7
Percentage of independent Directors 71% (5 out of 7) (1) 71% (5 out of 7)
(1) Information as of the date of filing of this Registration Document.
Lafarge - Registration Document 2013 • 89
CORPORATE GOVERNANCE AND COMPENSATION3.2 Board and Committees rules and practices

d COMPOSITION
The Audit Committee was chaired by Mrs Hélène Ploix until February 18, 2014 (included). It has been chaired by Mr Michel Rollier since that date. It is composed of the following members:
d Michel Rollier, Chairman (independent Director);
d Oscar Fanjul (independent Director);
d Juan Gallardo (independent Director);
d Jérôme Guiraud;
d Gérard Lamarche;
d Véronique Weill (independent Director).
Mr Michel Bon was a member of the Audit Committee until the term of his offi ce, which ended at the General Meeting of May 7, 2013.
Mr Oscar Fanjul became a member of the Audit Committee further to his appointment by the Board of Directors on May 7, 2013.
In accordance with the Board’s internal regulations, the Audit Committee must be composed of a least two thirds of Directors qualifying as independent and must not include any executive Director. In addition, the Chairman of the Audit Committee, who must be an independent Director, is appointed by the Board on a recommendation from the Corporate Governance and Nominations Committee.
LEGAL FRAMEWORK:
Boards of Directors of listed company must set up a specialized
Committee monitoring issues relating to the preparation and control
of accounting and fi nancial information. The Board of Directors must
qualify at least one member of the Committee as having special
expertise in fi nance or accounting and being independent (Article
L. 823-19 of the French Commercial Code).
The Board’s internal regulations provide that all Audit Committee members must be competent in fi nance or accounting. Upon the Audit Committee’s proposal, the Board of Directors resolved on February 18, 2014, in line with its previous resolutions, that each member of the Audit Committee had the required level of expertise in fi nance or accounting with regards to their education and professional experience, as described in the biographies set out in Section 3.1.3 (Information on Directors).
d DUTIES AND RESPONSIBILITIES
The Audit Committee has the following duties:
Financial statements
d to ensure that the statutory auditors assess the relevance and consistency of accounting methods adopted for the preparation of the consolidated or statutory financial statements, as well as appropriate treatment of the major transactions at Group level;
d when the financial statements are prepared, to carry out a preliminary review and give an opinion on the draft statutory and consolidated financial statements, including quarterly, semi-annual and annual statements prepared by management, prior to their presentation to the Board; for those purposes, the draft financial statements and all other useful documents and information must be provided to the Audit Committee at least three days before the review of the financial statements by the Board. In addition, the review of the financial statements by the Audit Committee must be accompanied by (i) a memorandum from the statutory auditors highlighting the key points resulting from the audit and the accounting options adopted; and (ii) a memorandum from
the Finance Director describing the Company’s exposure to risk and the major off-balance sheet commitments. The Audit Committee interviews the statutory auditors, the Chairman and Chief Executive Officer and financial management, in particular concerning depreciation, reserves, the treatment of goodwill and consolidation principles;
d to review the draft interim financial statements, the draft half-year report and the draft report on results of operations prior to publication, together with all the accounts prepared for specific transactions (asset purchases, mergers, market operations, prepayments of dividends, etc.);
d to review, where necessary, the reasons given by the Chairman and Chief Executive Officer for not consolidating certain companies;
d to review the risks and the major off-balance sheet commitments.
d INTERNAL CONTROL AND INTERNAL AUDIT
d to be informed by the Chairman and Chief Executive Officer of the definition of internal procedures for the gathering and monitoring of financial information, ensuring the reliability of such information;
d to be informed of procedures and action plans in place in terms of internal control over financial reporting, to interview the persons in charge of internal control every half-year and at the end of each financial year, to examine the terms of engagement of the statutory auditors and to hear from the statutory auditors concerning internal control significant matters;
d to examine the Group’s internal audit plan and interview the persons in charge of internal audit for the purposes of taking note of their programs of work and to receive the internal audit reports of the Company and Group or an outline of those reports, and provided the Chairman and Chief Executive Officer has been informed in advance, these hearings may take place, if necessary, without the Chairman and Chief Executive Officer being in attendance.
d STATUTORY AUDITORS
d to listen regularly to the statutory auditors’ reports on their work, the methods used to carry out their work and their conclusions;
d to propose to the Board, where necessary, a decision on the points of disagreement between the statutory auditors and the Chairman and Chief Executive Officer, likely to arise when the work in question is performed, or because of its contents;
d to assist the Board in ensuring that the rules, principles and recommendations safeguarding the independence of the statutory auditors are applied and, for such purposes, the members of the Committee have, by way of delegation by the Board of Directors, the following duties:
d supervising the selection or renewal procedure (by invitation to tender) of statutory auditors, while taking care to select the “best bidder” as opposed to the “lowest bidder”, formulating an opinion on the amount of the fees sought for carrying out the statutory audit assignments, formulating an opinion stating the reasons for the selection of statutory auditors and notifying the Board of its recommendation in this respect,
d supervising the questions concerning the independence, fees and duties of the statutory auditors.
d FINANCIAL POLICY
d to be informed by the Chairman and Chief Executive Officer of the financial standing of the Group, the methods and techniques used to lay down financial policy, and to be regularly informed of the Group’s financial strategy guidelines in particular with regard to debt and the hedging of currency risks;
• Lafarge - Registration Document 201390
CORPORATE GOVERNANCE AND COMPENSATION33 3.2 Board and Committees rules and practices

3
d to be informed of the contents of official financial statements prior to their release;
d to be informed in advance of the conditions of the financial transactions performed by the Group; if a meeting of the Committee cannot be held owing to an emergency, the Audit Committee is informed of such reasons;
d to review any financial or accounting issue submitted to it by the Board, the Chairman and Chief Executive Officer or the statutory auditors;
d to be informed by the Chairman and Chief Executive Officer of all third party complaints and of any internal information criticizing accounting documents or the Company’s internal control procedures, as well as of procedures put in place for this purpose, and of the remedies for such complaints and criticism.
d FRAUD
d to ensure that procedures are put in place for the receipt, retention and treatment of accounting and financial related complaints received by the Company;
d to be informed of possible cases of fraud involving management or employees who have a significant role in internal controls concerning financial reporting.
d RISK MANAGEMENT
d to ensure that appropriate means and measures are put in place by, or at the initiative of, the general management to enable identification, analysis and continuous improvement in the management of risks to which the Group may be exposed as a result of its operations;
d to review risks and the material off-balance sheet commitments, assess the importance of any deficiencies or weaknesses which are communicated to it and, if necessary, inform the Board;
d every year, to dedicate one of its meetings to Internal Control, Internal Audit and risk management.
For practical reasons, in particular as a majority of Audit Committee members reside abroad, Audit Committee meetings usually take place on the day preceding the Board meeting. Taking into account this constraint and to enable the Audit Committee to carry out the full extent of its duties, the Board’s internal rules state that all pertinent documents and information must be provided to it by the Chairman and Chief Executive Offi cer on a timely basis. Committee papers are therefore sent to Audit Committee members suffi ciently ahead of Board and Committee meetings and at least three days before such meetings, giving them suffi cient time to review the accounts before meetings.
The Audit Committee is given the opportunity to listen to the statutory auditors as well as members of the fi nancial management (control,
consolidation and treasury). The Committee always has the possibility to listen to the statutory auditors without the Chairman and Chief Executive Offi cer or members of the management being in attendance.
d MAIN ACTIVITIES
In 2013, the Audit Committee focused mainly on:
d a preliminary review of the 2012 statutory and consolidated annual financial statements, the statutory interim financial statements and of the quarterly financial consolidated statements for the first three quarters of 2013;
d a review of the press releases and analyst slides concerning the publication of these financial statements;
d the auditors’ budget for 2013;
d the Group’s financing, liquidity and debt situation, with a specific focus on the Company’s credit ratings;
d the review of particular accounting and financial aspects of some of the Group’s strategic projects;
d supervision of the Group’s internal control, risk management and internal audit. In particular, the Audit Committee reviewed the management’s update of the Group’s risk mapping and followed up on the different action plans relating to the Group’s priority risks;
d regular updates on fraud, the Group’s fraud prevention program and the annual certification process;
d the qualification of its members as experts in finance;
d an assessment of its practices, as further described in Section 3.2.3 (Self-assessment by the Board, Committees, Chairman and Chief Executive Officer).
As part of its preliminary review of the 2013 statutory and consolidated financial statements in February 2014, and on the basis of presentations made by fi nance management and external auditors, the Audit Committee reviewed the principal items of the closing, with a special focus on other operating income and expense, fi nance costs, tax, goodwill impairment tests, as well as major off-balance sheet commitments and exposure to risks. It also reviewed the management’s assessment on internal controls over fi nancial reporting which are described in detail in the Chairman’s report on internal control procedures and considered the description of the Group’s risk factors in the Registration Document. It also examined the auditors’ assessment on accounting options selected at closing, fairness of our fi nancial statements and on our internal control over fi nancial reporting. Finally, the Audit Committee reviewed the draft dividend payout plan for 2013 and issued recommendations to the Board.
See Section 5.2 (Internal controls procedures).
b) Corporate Governance and Nominations Committee
d INDICATORS
2013 2012
Number of meetings 4 4
Average attendance rate 96% 96%
Number of members 7 (1) 7
Percentage of independent Directors 71% (5 out of 7) (1) 71% (5 out of 7)
(1) Information as of the date of filing of this Registration Document.
Lafarge - Registration Document 2013 • 91
CORPORATE GOVERNANCE AND COMPENSATION3.2 Board and Committees rules and practices

d COMPOSITION
The Corporate Governance and Nominations Committee is chaired by Mr Oscar Fanjul. It is composed of the following members:
d Oscar Fanjul, Chairman (Vice-Chairman – independent Director);
d Philippe Dauman (independent Director);
d Juan Gallardo (independent Director);
d Ian Gallienne;
d Baudouin Prot (independent Director);
d Michel Rollier (independent Director);
d Nassef Sawiris.
There was no change to the Committee’s composition during the 2013 fi nancial year.
In accordance with the Board’s internal regulations, the Corporate Governance and Nominations Committee must be composed of a majority of Directors qualifying as independent. In addition, the Chairman of the Corporate Governance and Nominations Committee, who must be an independent Director, is appointed by the Board on a recommendation from the Chairman and Chief Executive Offi cer.
d DUTIES AND RESPONSIBILITIES
The Corporate Governance and Nominations Committee is responsible, in cooperation with the Chairman and Chief Executive Offi cer, for ensuring compliance with the Company’s corporate governance rules. In particular, it is responsible for:
d monitoring governance practices in the market, submitting to the Board the corporate governance rules applicable by the Company and ensuring that the Company’s governance rules remain among the best in the market;
d reviewing proposals to amend the internal regulations or the Director’s Charter to be submitted to the Board;
d submitting to the Board the criteria to be applied to assess the independence of its Directors;
d submitting to the Board, every year before publication of the Registration Document, a list of Directors qualifying as independent;
d preparing assessment of the work of the Board provided for by the Board’s Internal Regulations;
d preparing changes in the composition of the Company’s management;
d giving its prior approval before the Corporate Executive Officer accepts a corporate office of a listed company that does not belong to the Group.
The Committee has special responsibility for examining the succession plans for senior management members and the selection of new Directors. It also makes recommendations to the Board for the appointment of the Vice-Chairman and the Chairmen of other Standing Committees.
The choices made by the Corporate Governance and Nominations Committee on the appointments of the candidates to the offi ce of Director are guided by the interests of the Company and all its shareholders. They take into account the balance of the Board’s composition, in accordance with the relevant rules laid down in its internal regulations. They ensure that each Director possesses the necessary qualities and availability, and that the Directors represent a range of experience and competence, thereby enabling the Board to perform its duties effectively, while maintaining the requisite objectivity and independence with regard to the Chairman and Chief Executive Offi cer and any shareholder or any particular group of shareholders.
d MAIN ACTIVITIES
In 2013, the Corporate Governance and Nominations Committee focused mainly on:
d composition of the Board and its Committees;
d assessment of the independence of the Directors and materiality tests;
d evaluation of the Chairman and Chief Executive Officer’s performance;
d reappointment of Mr Bruno Lafont as Chairman and Chief Executive Officer;
d reappointment of the Vice-Chairman of the Board;
d amendments to the internal rules on insider dealing relating to Lafarge shares;
d review of the provisions of the articles of association relating to the age of Directors;
d review of the Group’s succession plan for general management;
d review of related-party agreements and commitments;
d assessment of the Board and of its Committees (2013 and beginning of 2014);
d review of the Corporate Governance section in the 2013 Registration Document (beginning of 2014); and
d review and analysis of various laws and reports on topics falling within the scope of its duties (new Afep-Medef Code, law providing for the representation of employees on the Board, AMF report on corporate governance and compensation of corporate officers etc.).
c) Remunerations Committee
d INDICATORS
2013 2012
Number of meetings 5 3
Average attendance rate 97% 89%
Number of members 6 (1) 6
Percentage of independent Directors 67% (4 out of 6) (1) 67% (4 out of 6)
(1) Information as of the date of filing of this Registration Document.
• Lafarge - Registration Document 201392
CORPORATE GOVERNANCE AND COMPENSATION33 3.2 Board and Committees rules and practices

3
d) Strategy, Investment and Sustainable Development Committee
d INDICATORS
2013 2012
Number of meetings 5 7
Average attendance rate 94% 94%
Number of members 7 (1) 7
Percentage of independent Directors 71% (5 out of 7) (1) 71% (5 out of 7)
(1) Information as of the date of filing of this Registration Document.
d COMPOSITION
The Remunerations Committee is chaired by Mr Oscar Fanjul. It is composed of the following members:
d Oscar Fanjul, Chairman (Vice-Chairman – independent Director);
d Philippe Charrier (independent Director);
d Juan Gallardo (independent Director);
d Ian Gallienne;
d Nassef Sawiris;
d Véronique Weill (independent Director).
There was no change to the Committee’s composition during the 2013 fi nancial year.
In accordance with the Board’s internal regulations, the Remunerations Committee must not include any executive Director and must be composed of a majority of Directors qualifying as independent. In addition, the Chairman of the Remunerations Committee, who must be an independent Director, is appointed by the Board on a recommendation from the Corporate Governance and Nominations Committee.
There is no Director representing either employee shareholders or employees on the Board of Directors (nor consequently on the Remunerations Committee) as of the date of publication of this Registration Document.
d DUTIES AND RESPONSIBILITIES
The Remunerations Committee is responsible for examining the compensation and benefi ts paid to Directors and members of senior management, and providing the Board with comparisons and benchmarking with market practices, in particular:
d to review and make proposals in relation to the remuneration of senior management members, with regard to (i) the fixed portion and the variable portion of said annual remuneration and all benefits in kind, (ii) all long-term incentives (“LTI” = stock options, performance shares and other long-term multi-annual compensation), (iii) exceptional compensation, (iv) provisions relating to their retirements, (v) signing bonuses and severance pay and (vi) and all other benefits of whatever kind;
d to define and implement the rules for the determination of the variable portion while taking care to ensure these rules are compatible with the annual evaluation of the Company officers’ performances and with the medium-term strategy of the Company and the Group;
d to deliver to the Board an opinion on the general allocation policy for LTIs and on the different plans set up by the Chairman and Chief Executive Officer, and to propose to the Board what awards should be made;
d to be informed of the remuneration policy concerning the principal management personnel (aside from senior management) of the Company and other Group companies and to examine the coherence of this policy;
d to suggest to the Board the total amount of Directors’ fees for proposal to the Company’s shareholders’ meeting;
d to make proposals to the Board on the allocation rules for Directors’ fees and the individual payments to be made to the Directors, taking into account the attendance rate of the Directors at Board and Committee meetings and making sure that the variable portion is the greater in the allocation of directors’ fees;
d to examine every matter submitted to it by the Chairman and Chief Executive Officer, relating to the above questions, as well as plans for increases in the number of shares outstanding owing to the implementation of employee stock ownership;
d to approve the information disclosed to shareholders in the Registration Report on the remuneration of senior management members and the principles and methods determining the remuneration of said persons, as well as that presented to the Annual General Meeting for consultation of the shareholders (“Say on Pay”). To make recommendations to the Board in the event of negative opinion expressed by the shareholders.
d MAIN ACTIVITIES
During the course of 2013, the work of the Remunerations Committee was primarily focused on:
d a review of the Group’s long term incentives policy;
d performance shares and multi-annual variable compensation (2013 grants);
d validation of the achievement of the performance conditions applicable to the 2010, 2011 and 2012 stock option and performance shares grants;
d a review of the Directors’ fees budget and distribution for 2013;
d the Chairman and Chief Executive Officer’s annual compensation (fixed compensation and the criteria for the variable part of his compensation);
d a review of related-party commitments in favor of Mr Bruno Lafont put to the vote of the Shareholders’ Meeting of May 7, 2013;
d a review of the Group’s pension plans;
d an assessment of its practices; and
d the review of the Compensation and benefits section in the 2013 Registration Document (beginning of 2014).
Lafarge - Registration Document 2013 • 93
CORPORATE GOVERNANCE AND COMPENSATION3.2 Board and Committees rules and practices

d COMPOSITION
The Strategy, Investment and Sustainable Development Committee is chaired by Mr Philippe Dauman. It is composed of the following members:
d Philippe Dauman, Chairman (independent Director);
d Philippe Charrier (independent Director);
d Paul Desmarais, Jr;
d Colette Lewiner (independent Director);
d Hélène Ploix (independent Director);
d Baudouin Prot (independent Director);
d Nassef Sawiris.
Mr Michel Bon chaired the Strategy, Investment and Sustainable Development Committee until the term of his offi ce, which ended at the General Meeting of May 7, 2013.
Mr Philippe Dauman was appointed as Chairman of the Strategy, Investment and Sustainable Development Committee by the Board of Directors on May 7, 2013.
Mrs Hélène Ploix became a member of the Audit Committee further to her appointment by the Board of Directors on May 7, 2013.
In accordance with the Board’s internal regulations, the Chairman of the Strategy, Investment and Sustainable Development Committee is appointed by the Board on a recommendation from the Corporate Governance and Nominations Committee.
d DUTIES AND RESPONSIBILITIES
The Strategy, Investment and Sustainable Development Committee is responsible for:
d advising the Board on the main strategic priorities of the Company and Group and on the investment policy and important strategic issues put before the Board;
d reviewing in detail and giving the Board its opinion on the issues submitted to it relating to major investments, the creation and upgrading of equipment, external growth, or divestments and asset or share sales;
d ensuring that sustainable development and societal responsibility are a component of Lafarge’s long-term strategy and constitute one of the aspects of its economic development.
d MAIN ACTIVITIES
Since 2004, the Strategy, Investment and Sustainable Development Committee has been open to all Directors wishing to attend its meetings.
In 2013, the Strategy, Investment and Sustainable Development Committee focused on the following:
d results already achieved and objectives to be set in relation to action plans relating to innovation, commercial development as well as sustainable development, in line with the Group's 2020 Ambitions;
d mid term evolution of the Group's portfolio of assets and various scenarios for extracting the full value of those assets for the benefit of the Group’s shareholders . Lafarge decided to exit from certain geographies by divesting assets in these countries (Ukraine and Honduras in particular), to reposition its network of assets in North America and to accelerate its development on growing markets (Africa and Asia);
d short term to mid term financial objectives relating to reduction of the debt, financial flexibility, earnings per share and return on capital employed.
3.2.3 SELF-ASSESSMENT OF THE BOARD, ITS COMMITTEES AND OF THE CHAIRMAN AND CHIEF EXECUTIVE OFFICER
a) Self-assessment of the Board, its Committees and of the Chairman and Chief Executive Offi cerThe Board’s internal regulations provide that the Board is to hold a discussion at least once a year about its practices with a view to assessing and improving their effi ciency and to proceed with the evaluation of the Chairman and Chief Executive Offi cer. A formal assessment of its operations, the verifi cation that important issues are properly prepared and debated within the Board, and the effective participation and involvement of each Director in the deliberation, is to take place at least every two years using a questionnaire approved by the Board.
In 2013, the Board initiated a formal debate on its organization and practices in accordance with its internal regulations. This debate was led by the Vice-Chairman of the Board, fi rst within the Corporate Governance and Nominations Committee and then within the Board of Directors, following interviews with each of the Directors. This review also included an assessment of each of the Committees.
The outcome of the comments and discussions resulting from this assessment was that the Directors considered that the organization and practices of the Board and its Committees were globally very satisfactory. The principal fi ndings and recommendations for potential optimization were as follows:
d the Directors confirmed the sufficient diversity of background of the different members of the Board and how the necessary balance between Directors qualifying as independent and shareholder representatives had been successfully achieved;
d the Directors noted their appreciation of the organization of the Board and of how discussions were chaired by the Chairman and Chief Executive Officer, both regarding the direction of debates as well as the quality of his contributions. The Directors also noted that the governance structure of the Company allowed for a balanced functioning of the Board in compliance with corporate governance best practices, in particular as a result of the Vice-Chairman’s (Lead Independent Director) specific role and powers;
d the operation of the Board was considered very satisfactory and the Directors noted the relevance of the topics covered and the efficient allocation of work between the Board and its Committees. The quality of the work of the Board of Directors was perceived as very satisfactory, in particular in relation to financial management, budgeting and results;
d in terms of perspective, an interest was shown to continue the focus on strategy by the Board and for additional discussions on the Group's risks;
d in relation to the findings resulting from the previous formal assessment of the Board in 2010, the Board noted that the role of the Strategy, Investment and Sustainable Development Committee had since been reinforced in defining and following-up the Group’s strategy. In addition, in line with the recommendations for potential optimization resulting from the 2010 assessment, the Directors also noted a reduction in the overall number of Directors and an improved representation of women on the Board.
Based on a formal presentation of the Board’s and Committees’ activities as well as on the attendance rate of Directors, a discussion on the Board’s practices and on the effective contribution of its members during the year 2013 took place during the Board of Directors meeting held on February 18, 2014, led by the Vice-Chairman of the Board.The
• Lafarge - Registration Document 201394
CORPORATE GOVERNANCE AND COMPENSATION33 3.2 Board and Committees rules and practices
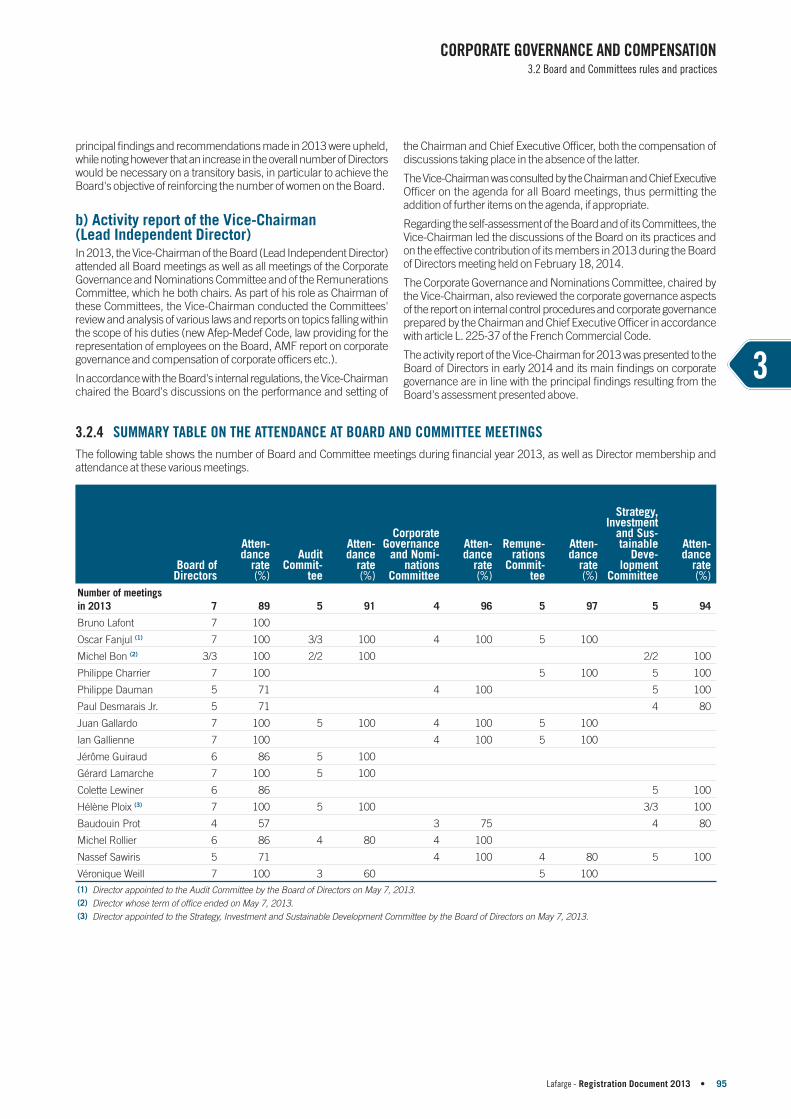
3
principal fi ndings and recommendations made in 2013 were upheld, while noting however that an increase in the overall number of Directors would be necessary on a transitory basis, in particular to achieve the Board's objective of reinforcing the number of women on the Board.
b) Activity report of the Vice-Chairman (Lead Independent Director)In 2013, the Vice-Chairman of the Board (Lead Independent Director) attended all Board meetings as well as all meetings of the Corporate Governance and Nominations Committee and of the Remunerations Committee, which he both chairs. As part of his role as Chairman of these Committees, the Vice-Chairman conducted the Committees' review and analysis of various laws and reports on topics falling within the scope of his duties (new Afep-Medef Code, law providing for the representation of employees on the Board, AMF report on corporate governance and compensation of corporate offi cers etc.).
In accordance with the Board's internal regulations, the Vice-Chairman chaired the Board's discussions on the performance and setting of
the Chairman and Chief Executive Offi cer, both the compensation of discussions taking place in the absence of the latter.
The Vice-Chairman was consulted by the Chairman and Chief Executive Offi cer on the agenda for all Board meetings, thus permitting the addition of further items on the agenda, if appropriate.
Regarding the self-assessment of the Board and of its Committees, the Vice-Chairman led the discussions of the Board on its practices and on the effective contribution of its members in 2013 during the Board of Directors meeting held on February 18, 2014.
The Corporate Governance and Nominations Committee, chaired by the Vice-Chairman, also reviewed the corporate governance aspects of the report on internal control procedures and corporate governance prepared by the Chairman and Chief Executive Offi cer in accordance with article L. 225-37 of the French Commercial Code.
The activity report of the Vice-Chairman for 2013 was presented to the Board of Directors in early 2014 and its main fi ndings on corporate governance are in line with the principal fi ndings resulting from the Board's assessment presented above.
3.2.4 SUMMARY TABLE ON THE ATTENDANCE AT BOARD AND COMMITTEE MEETINGS
The following table shows the number of Board and Committee meetings during fi nancial year 2013, as well as Director membership and attendance at these various meetings.
Board of Directors
Atten-dance
rate(%)
Audit Commit-
tee
Atten-dance
rate(%)
Corporate Governance
and Nomi-nations
Committee
Atten-dance
rate(%)
Remune-rations
Commit-tee
Atten-dance
rate(%)
Strategy, Investment
and Sus-tainable
Deve-lopment
Committee
Atten-dance
rate(%)
Number of meetings
in 2013 7 89 5 91 4 96 5 97 5 94
Bruno Lafont 7 100
Oscar Fanjul (1) 7 100 3/3 100 4 100 5 100
Michel Bon (2) 3/3 100 2/2 100 2/2 100
Philippe Charrier 7 100 5 100 5 100
Philippe Dauman 5 71 4 100 5 100
Paul Desmarais Jr. 5 71 4 80
Juan Gallardo 7 100 5 100 4 100 5 100
Ian Gallienne 7 100 4 100 5 100
Jérôme Guiraud 6 86 5 100
Gérard Lamarche 7 100 5 100
Colette Lewiner 6 86 5 100
Hélène Ploix (3) 7 100 5 100 3/3 100
Baudouin Prot 4 57 3 75 4 80
Michel Rollier 6 86 4 80 4 100
Nassef Sawiris 5 71 4 100 4 80 5 100
Véronique Weill 7 100 3 60 5 100
(1) Director appointed to the Audit Committee by the Board of Directors on May 7, 2013.
(2) Director whose term of office ended on May 7, 2013.
(3) Director appointed to the Strategy, Investment and Sustainable Development Committee by the Board of Directors on May 7, 2013.
Lafarge - Registration Document 2013 • 95
CORPORATE GOVERNANCE AND COMPENSATION3.2 Board and Committees rules and practices
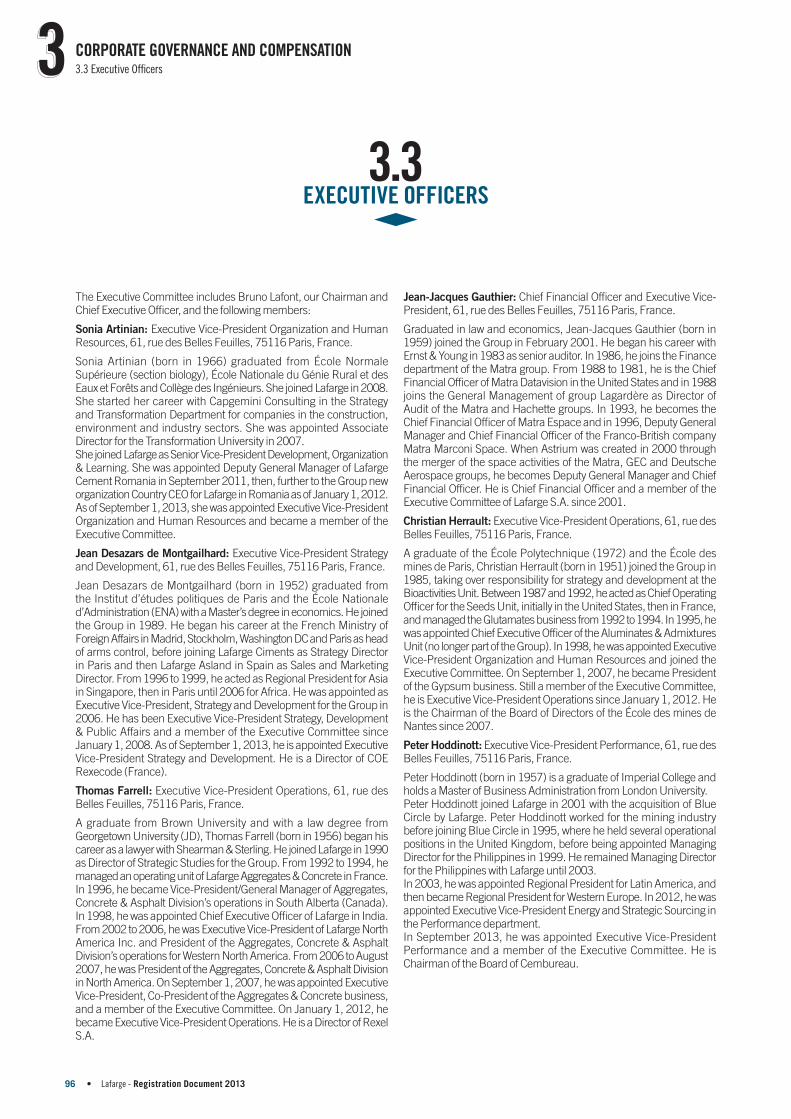
3.3EXECUTIVE OFFICERS
The Executive Committee includes Bruno Lafont, our Chairman and Chief Executive Offi cer, and the following members:
Sonia Artinian: Executive Vice-President Organization and Human Resources, 61, rue des Belles Feuilles, 75116 Paris, France.
Sonia Artinian (born in 1966) graduated from É cole Normale Supérieure (section biology), É cole Nationale du Génie Rural et des Eaux et Forêts and Collège des Ingénieurs. She joined Lafarge in 2008.She started her career with Capgemini Consulting in the Strategy and Transformation Department for companies in the construction, environment and industry sectors. She was appointed Associate Director for the Transformation University in 2007.She joined Lafarge as Senior Vice-President Development, Organization & Learning. She was appointed Deputy General Manager of Lafarge Cement Romania in September 2011, then, further to the Group new organization Country CEO for Lafarge in Romania as of January 1, 2012. As of September 1, 2013, she was appointed Executive Vice-President Organization and Human Resources and became a member of the Executive Committee.
Jean Desazars de Montgailhard: Executive Vice-President Strategy and Development, 61, rue des Belles Feuilles, 75116 Paris, France.
Jean Desazars de Montgailhard (born in 1952) graduated from the Institut d’études politiques de Paris and the École Nationale d’Administration (ENA) with a Master’s degree in economics. He joined the Group in 1989. He began his career at the French Ministry of Foreign Affairs in Madrid, Stockholm, Washington DC and Paris as head of arms control, before joining Lafarge Ciments as Strategy Director in Paris and then Lafarge Asland in Spain as Sales and Marketing Director. From 1996 to 1999, he acted as Regional President for Asia in Singapore, then in Paris until 2006 for Africa. He was appointed as Executive Vice-President, Strategy and Development for the Group in 2006. He has been Executive Vice-President Strategy, Development & Public Affairs and a member of the Executive Committee since January 1, 2008. As of September 1, 2013, he is appointed Executive Vice-President Strategy and Development. He is a Director of COE Rexecode (France).
Thomas Farrell: Executive Vice-President Operations, 61, rue des Belles Feuilles, 75116 Paris, France.
A graduate from Brown University and with a law degree from Georgetown University (JD), Thomas Farrell (born in 1956) began his career as a lawyer with Shearman & Sterling. He joined Lafarge in 1990 as Director of Strategic Studies for the Group. From 1992 to 1994, he managed an operating unit of Lafarge Aggregates & Concrete in France. In 1996, he became Vice-President/General Manager of Aggregates, Concrete & Asphalt Division’s operations in South Alberta (Canada). In 1998, he was appointed Chief Executive Offi cer of Lafarge in India. From 2002 to 2006, he was Executive Vice-President of Lafarge North America Inc. and President of the Aggregates, Concrete & Asphalt Division’s operations for Western North America. From 2006 to August 2007, he was President of the Aggregates, Concrete & Asphalt Division in North America. On September 1, 2007, he was appointed Executive Vice-President, Co-President of the Aggregates & Concrete business, and a member of the Executive Committee. On January 1, 2012, he became Executive Vice-President Operations. He is a Director of Rexel S.A.
Jean-Jacques Gauthier: Chief Financial Offi cer and Executive Vice-President, 61, rue des Belles Feuilles, 75116 Paris, France.
Graduated in law and economics, Jean-Jacques Gauthier (born in 1959) joined the Group in February 2001. He began his career with Ernst & Young in 1983 as senior auditor. In 1986, he joins the Finance department of the Matra group. From 1988 to 1981, he is the Chief Financial Offi cer of Matra Datavision in the United States and in 1988 joins the General Management of group Lagardère as Director of Audit of the Matra and Hachette groups. In 1993, he becomes the Chief Financial Offi cer of Matra Espace and in 1996, Deputy General Manager and Chief Financial Offi cer of the Franco-British company Matra Marconi Space. When Astrium was created in 2000 through the merger of the space activities of the Matra, GEC and Deutsche Aerospace groups, he becomes Deputy General Manager and Chief Financial Offi cer. He is Chief Financial Offi cer and a member of the Executive Committee of Lafarge S.A. since 2001.
Christian Herrault: Executive Vice-President Operations, 61, rue des Belles Feuilles, 75116 Paris, France.
A graduate of the École Polytechnique (1972) and the École des mines de Paris, Christian Herrault (born in 1951) joined the Group in 1985, taking over responsibility for strategy and development at the Bioactivities Unit. Between 1987 and 1992, he acted as Chief Operating Offi cer for the Seeds Unit, initially in the United States, then in France, and managed the Glutamates business from 1992 to 1994. In 1995, he was appointed Chief Executive Offi cer of the Aluminates & Admixtures Unit (no longer part of the Group). In 1998, he was appointed Executive Vice-President Organization and Human Resources and joined the Executive Committee. On September 1, 2007, he became President of the Gypsum business. Still a member of the Executive Committee, he is Executive Vice-President Operations since January 1, 2012. He is the Chairman of the Board of Directors of the École des mines de Nantes since 2007.
Peter Hoddinott: Executive Vice-President Performance, 61, rue des Belles Feuilles, 75116 Paris, France.
Peter Hoddinott (born in 1957) is a graduate of Imperial College and holds a Master of Business Administration from London University.Peter Hoddinott joined Lafarge in 2001 with the acquisition of Blue Circle by Lafarge. Peter Hoddinott worked for the mining industry before joining Blue Circle in 1995, where he held several operational positions in the United Kingdom, before being appointed Managing Director for the Philippines in 1999. He remained Managing Director for the Philippines with Lafarge until 2003. In 2003, he was appointed Regional President for Latin America, and then became Regional President for Western Europe. In 2012, he was appointed Executive Vice-President Energy and Strategic Sourcing in the Performance department.In September 2013, he was appointed Executive Vice-President Performance and a member of the Executive Committee. He is Chairman of the Board of Cembureau.
• Lafarge - Registration Document 201396
CORPORATE GOVERNANCE AND COMPENSATION33 3.3 Executive Offi cers

3
Gérard Kuperfarb: Executive Vice-President in charge of the Innovation function, 61 rue des Belles Feuilles, 75116 Paris, France.
Gérard Kuperfarb (born in 1961) graduated from the École des M ines de Nancy (France). He also holds a Master’s degree in Materials Science from the École des M ines de Paris and a MBA from the É cole des Hautes Études Commerciales (HEC). He has been with the Group since 1992. He began his career in 1983 as an engineer at the Centre de M ise en F orme des M atériaux (CEMEF) of the École des M ines de Paris, before joining the Composite materials Division at Ciba group in 1986, where he held sales and marketing functions. In 1989, he joined a strategy consulting fi rm in Brussels and Paris. He joined Lafarge in 1992 as Marketing Director for the Refractories business then became Vice-President for strategy at Lafarge Specialty Materials. In 1996, he became Vice-President Ready-mix concrete strategy in Paris. In 1998, he was appointed Vice-President/General manager for the Aggregates & Concrete business in Southwest Ontario (Canada) before heading the Performance group at Lafarge Construction Materials in North America in 2001. He joined the Aggregates & Concrete Division in Paris as Senior Vice-President Performance in 2002. From 2005 to August 2007, he was President of the Aggregates & Concrete business for Eastern Canada. On September 1, 2007, he became Executive Vice-President, Co-President of the Aggregates & Concrete business and a member of the Executive Committee. Since January 1, 2012, he is Executive Vice-President Innovation .
Eric Olsen: Executive Vice-President Operations, 61, rue des Belles Feuilles, 75116 Paris, France.
Eric Olsen (born in 1964) is a graduate in fi nance and accounting from University of Colorado and holds a Master’s of Business administration degree awarded by the école des Hautes Études Commerciales (HEC). He has been with the Group since 1999. He began his career as a Senior Accountant with Deloitte & Touche in New York. From 1992, he worked as senior associate at Paribas bank in Paris and then was partner at the consulting fi rm Trinity Associates in Greenwich, Connecticut, from 1993 to 1999. He joined Lafarge North America Inc. in 1999 as Senior Vice-President Strategy and Development. In 2001, he was appointed President of the Cement Division for the Northeast Region of North America and Senior Vice-President Purchasing for Lafarge North America Inc. He was appointed Chief Finance Offi cer of Lafarge North America Inc. in 2004. He was appointed Executive Vice-President for Organization and Human Resources and became a member of the Executive Committee on September 1, 2007. As of September 1, 2013, he was appointed Executive Vice-President Operations. He is a Member of the Supervisory Board of Vistaprint N.V. (The Netherlands), Chairman of the board of the American School of Paris and Board Member of the French-American Chamber of Commerce in France.
Alexandra Rocca: Executive Vice-President Communications, Public Affairs and Sustainable Development of Lafarge, 61, rue des Belles Feuilles, 75116 Paris, France.
Alexandra Rocca (born in 1962) is a graduate of the É cole des Hautes Études Commerciales (HEC), the Institut d’études politiques in Paris and has a degree in French language and literature. She began her career with the Printemps group from 1986 to 1990, and then joined Air Liquide where, from 1990 to 2001, she was notably in charge of client communications and international brand management, before being appointed Deputy Communications Director of the group. Alexandra Rocca was then Communications Director for Galeries Lafayette from 2001 to 2005. She then joined the Crédit Agricole S.A. group in 2005 to work as Communications Director for LCL (formerly Crédit Lyonnais) before being appointed Head of Communications for the Crédit Agricole S.A. group.Alexandra Rocca has been appointed as Senior Vice-President, Communications of Lafarge, in September 2010. She joined the Executive Committee on January 1, 2012. As of September 1, 2013, she is appointed Executive Vice-President Communications, Public Affairs and Sustainable Development. She is a Director of Groupe Etam.
Guillaume Roux: Executive Vice-President Operations, 61, rue des Belles Feuilles, 75116 Paris, France.
A graduate of the Institut d’études politiques in Paris, Guillaume Roux (born in 1959) joined the Group in 1980 as an internal auditor with Lafarge Ciment, France. He was Chief Financial Offi cer of the Biochemicals Unit in the United States from 1989 to 1992, before returning to Lafarge headquarters as Project Manager for the Finance department. In 1996, he returned to the United States as Vice-President of Marketing for Lafarge North America Inc. In 1999, he was appointed Chief Executive Offi cer of Lafarge’s operations in Turkey and then in 2001, Executive Vice-President of the Cement Division’s operations in South-East Asia. Guillaume Roux joined the Executive Committee when he was appointed Executive Vice-President, Co-President of the Cement business in January 2006. On January 1, 2012, he became Executive Vice-President, in charge of the Performance function. As of September 1, 2013, he is appointed Executive Vice-President Operations.
For information, Jean-Carlos Angulo was a member of the Executive committee until August 31, 2013.
There are no confl icts of interest affecting members of the Executive Committee between any duties owed to us and their private interests.
To our knowledge, during the previous fi ve years, no member of the Executive Committee has been convicted of fraudulent offences, involved in a bankruptcy, receivership or liquidation, subject to offi cial public incrimination and/or sanctions or disqualifi ed by a court from acting as a Director or from acting in the management or conduct of the affairs of any issuer.
Lafarge - Registration Document 2013 • 97
CORPORATE GOVERNANCE AND COMPENSATION3.3 Executive Offi cers

3.4COMPENSATION AND BENEFITS
3.4.1 COMPENSATION PAID TO DIRECTORS – DIRECTORS’ FEES
The only compensation paid to Directors in 2013 corresponded to Directors’ fees (with the exception of the Chairman and Chief Executive Offi cer).
a) Maximum amountThe General Meeting held on May 6, 2010 set the maximum aggregate amount of Directors’ fees at 700,000 euros.
b) Allocation rules 2013In addition, the Board of Directors adopted on March 24, 2010 allocation rules, which remain applicable to the allocation of Directors’ fees for the 2013 fi scal year. These rules are the following:
d each Director is currently entitled to receive a fixed fee of 17,000 euros per year (increased by 5,000 euros for the Committee Chairmen and by 15,000 for the Vice-Chairman). A Director who is appointed or whose office ends during the course of the year is entitled to 50% of the fixed fee;
d a variable fee of 1,200 euros is payable to each Director for every Board of Directors or Committees Meeting attended. Some Directors who must travel from distant locations are eligible for a double variable fee. In 2013, Philippe Dauman, Paul Desmarais Jr., Juan Gallardo and Nassef Sawiris received double variable fees for this reason.
c) 2013 Directors’ FeesThe total amount of Directors’ fees paid in 2014 (with respect to the 2013 fi nancial year) was 633,300 euros. In 2013 (with respect to the 2012 fi nancial year) it amounted to 671,900 euros, while the total amount paid in 2012 (with respect to the 2011 fi nancial year) was 656,500 euros.
Directors
Directors' fees for 2013paid in 2014
(euros)
Directors’ fees for 2012 paid in 2013
(euros)
Directors’ fees for 2011 paid in 2012
(euros)
Bruno Lafont 25,400 25,400 25,400
Oscar Fanjul 64,800 58,800 62,400
Michel Bon (1) 19,400 44,800 36,300
Philippe Charrier 37,400 37,400 33,800
Philippe Dauman 53,100 55,400 48,200
Paul Desmarais, Jr. 38,600 43,400 33,800
Juan Gallardo 67,400 62,600 62,600
Ian Gallienne (2) 36,200 31,400 -
Jérôme Guiraud 30,200 31,400 31,400
Gérard Lamarche (3) 31,400 14,500 -
Colette Lewiner 30,200 31,400 27,800
Hélène Ploix 40,000 36,400 35,200
Baudouin Prot 30,200 37,400 14,500
Michel Rollier 33,800 35,000 32,600
Nassef Sawiris 60,200 62,600 55,400
Véronique Weill 35,000 32,600 30,200
TOTAL 633,300 671,900 656,500 (4)
(1) Directors whose term of office expired on May 7, 2013.
(2) Director co-opted by the Board of Directors on November 3, 2011.
(3) Director appointed on May 15, 2012.
(4) Including fees paid to Directors whose term of office expired before 2013.
• Lafarge - Registration Document 201398
CORPORATE GOVERNANCE AND COMPENSATION33 3.4 Compensation and benefi ts

3
In accordance with the Group’s policy, no Directors’ fees have been paid with respect to the 2013 fi nancial year either to Lafarge S.A. Senior Offi cers or to Group Executive members for offi ces they may hold in any Group subsidiary.
d) 2014 new allocation rules for Directors’ f eesThe allocation rules for Directors' fees were amended by the Board of Directors on February 18, 2014 to ensure that the variable portion of fees is greater than the fi xed part, in line with the new recommendations of the Afep-Medef Code of June 2013. These new rules will apply starting in 2014, as follows:
d each Director is entitled to receive a fixed fee of 10,000 euros per year. This is capped at 50% for any Director appointed, or whose office ends, during the course of the year;
d a variable fee of 2,500 euros is payable to each Director for every Board of Directors meeting attended, increased to 5,000 euros for the Vice-Chairman of the Board;
d a variable fee of 1 250 euros is payable to each Director for every Committee meeting attended, increased to 2,500 euros for the Committee Chairmen;
d Directors who must travel from distant locations are eligible for a supplemental variable fee of 1,250 euros per meeting physically attended.
3.4.2 GENERAL PRINCIPLES ON THE COMPENSATION OF THE CHAIRMAN AND CHIEF EXECUTIVE OFFICER
As a world leader in its industry, Lafarge gives great recognition to performance.
Lafarge’s remuneration principles are:
d to attract, motivate and retain talented and qualified people;
d to be competitive against the comparable market;
d to be fair, transparent and performance-related;
d to be aligned with shareholders’ interest; and
d consistently applicable throughout the Group.
The remuneration is benchmarked annually against the practice of other global companies using data of consulting fi rms to ensure fairness and competitiveness.
The Remunerations Committee reviews on behalf of and recommends to the Board of Directors the principles of the remuneration policy applicable to Corporate Officers. The Board determines the remuneration policy applicable to the Chairman and Chief Executive
Offi cer taking into account the principles of comprehensiveness, balance, benchmarking, consistency, readability and measurement as recommended by the Afep-Medef Code of Corporate Governance. These Board of Directors decisions are taken with the Chairman and Chief Executive Offi cer not attending the discussion. This policy is based on the relevance and stability of performance criteria, in order to develop a long-term vision securing the best interests of the Group and of the shareholders.
The compensation paid to the Chairman and Chief Executive Offi cer comprises a fi xed portion and a variable short-term and long-term performance-related portion:
d a fixed portion: the annual base salary is driven by the reward market value of the position and is systematically compared with the market practices;
d a variable short-term performance-related portion which rewards annual performance based on achievement of the Group business and financial objectives set every year (such as Earning per share (EPS) variation, Free Cash-Flow (FCF), ROCE, Group performance compared to competitors, etc.) as well as individual performance compared to pre-defined objectives. The general policy of the Company is to set the performance-related portion at a maximum of 160% of fixed compensation, except in exceptional circumstances. The Board of Directors, upon recommendation of the Remunerations Committee may, in exceptional circumstances, grant an additional variable short-term performance-related portion;
d a long-term variable reward comprising Long-term Incentive plans (such as stock options, performance shares or any other long term incentives) which reward the achievement of long-term operational profit measured through cumulative internal and external performance criteria.
Furthermore, Mr Bruno Lafont, in his capacity as Chairman and Chief Executive Offi cer, benefi ts from a supplementary defi ned benefi ts pension plan through two collective plans applicable to Senior Management. In principle, a person is eligible for this plan only if he is still working in the Company upon his retirement date or if he ends his career in the Company after age 55 on the initiative of the Company . In February 2009, the Board of Directors, following the recommendations of the Afep-Medef Code, decided that the estimated pension amount paid to the Chairman and Chief Executive Offi cer related to these two plans would not exceed 40% of his last total cash compensation (fi xed and variable compensation of the reference period). This cap will be applied as the rule adopted by the Board of Directors for any future Corporate Offi cer.
In accordance with the aforementioned Code, the remuneration components of the Chief Executive Offi cer are made public after the Board’s meeting during which they are approved.
Lafarge - Registration Document 2013 • 99
CORPORATE GOVERNANCE AND COMPENSATION3.4 Compensation and benefi ts

Compensation elements Main drivers Performance criteria
Base compensation Annual base salary Position, experience,
sustained performance
Market practices, individual
performance
Variable compensation Annual Achievement of Group business
and financial yearly objectives
and reward of individual performance
(except exceptional circumstances)
Financial part (62.5% of Target
short-term annual incentive):
achievement of criteria such as EPS,
FCF, Ebitda, ROCE , change in Lafarge’s
performance compared to competitors.
Individual bonus (37.5% of Target
short-term annual incentive):
achievement of annual individual
objectives
Multi-annual A) Financial external conditions
measured by comparing Lafarge’s
annual improvement relative to a
peer group of companies or based
on a criteria linked to the Lafarge
S.A. share price, and
B) Internal financial conditions
Achievement of external and internal
conditions over several years
3.4.3 TOTAL COMPENSATION AND BENEFITS OF THE CHAIRMAN AND CHIEF EXECUTIVE OFFICER
TABLE SUMMARIZ ING THE COMPENSATION, OPTIONS AND SHARES AWARDED TO THE CHAIRMAN AND CHIEF EXECUTIVE OFFICER
(thousands of euros) 2013 2012
Compensation due in respect of the financial year (detailed in the table below) 1,890 2,948
Valuation of the multi-annual variable compensation due for the financial year
(detailed in Section 3.4.3 D.1) (1)
368 -
Valuation of the stock options awarded during the financial year (detailed in Section 3.4.3 H.2) (1) - 412
Valuation of the performance shares awarded during the financial year (detailed Section 3.4.3 I.2) (1) 952 361
TOTAL 3,210 3,721
(1) The Company considers that these items must not be aggregated with the compensation detailed in the table below because the amount of multi-annual
compensation , stock options and performance shares’ valuation at fair value at the grant date is not a compensation paid to the beneficiary.
TABLE SUMMARIZ ING THE COMPENSATION AWARDED TO THE CHAIRMAN AND CHIEF EXECUTIVE OFFICER
2013 2012
(thousands of euros )Amounts
earnedAmounts
paidAmounts
earnedAmounts
paid
Base compensation 975 975 950 950
Annual variable compensation 887 1,168 1,168 648
Multi-annual variable compensation N/A N/A N/A N/A
Exceptional compensation N/A 800 800 N/A
Director’s fees 25 25 25 25
Fringe benefits 3 3 5 5
TOTAL 1,890 2,971 2,948 1,628
• Lafarge - Registration Document 2013100
CORPORATE GOVERNANCE AND COMPENSATION33 3.4 Compensation and benefi ts

3
a) Fixed compensation paid to the Chairman and Chief Executive Offi cer in 2013In 2013, fi xed annual compensation paid to the Chairman and Chief Executive Offi cer was fi xed at 975,000 euros, which represents an increase of 2.6% compared to his previous fi xed remuneration which had not evolved since 2010 (Decision of the Board of Directors of February 19, 2013, upon the recommendation of the Remunerations Committee).
b) 2013 Variable part of the compensation (to be paid in 2014)The policy of the Company is to fi x the annual variable part of the Chairman and Chief Executive Officer, except if exceptional circumstances exist, to a maximum of 160% of the fi xed remuneration. It is determined based on the achievement of fi nancial objectives for 62.5% and on the realization of qualitative objectives for 37.5%.
The Board of Directors decided the amount of the 2013 annual variable part for the Chairman and Chief Executive Offi cer at 887,250 euros, which represents 57% of his maximum bonus.
The 2013 fi nancial objectives set for the variable part related to:
d evolution in earnings per share;
d free cash flow generation;
d Ebitda level;
d ROCE (return on capital employed);
d Change in Lafarge’s performance compared to competitors.
The level of realization of these fi nancial objectives was validated by the Remuneration Committee and the Board of Directors. They are not made public because of the confi dentiality linked to the strategy of the Group .
The 2013 individual objectives related to the following areas:
d health and safety and sustainable development action plan for 2020;
d balance sheet optimization; and financial performance;
d Strategic plan for the Group;
d financial communication;
d the development of the management team.
c) De ferred variable compensationThe principle of a deferred variable compensation is not planned to date.
d) Multi-annual variable compensation
d D.1) VALUE ENHANCEMENT BONUS:
2013 GRANT TO THE CHAIRMAN AND CHIEF EXECUTIVE OFFICER
2013 grant (number) Valuation (euros) (1)
Bruno Lafont 50,000 368,000 euros
(1) Value Enhancement Bonus fair value is calculated at grant date using the Black & Scholes model. See Note 21 (Share-based payments) to the consolidated
financial statements
During the m eeting held on March 13, 2013, the Board of Directors instituted a long-term incentive program in the form of the allocation of a Value Enhancement Bonus designed to recognize strong growth in Lafarge’s share price over the long term. The Board of Directors has decided to grant 50,000 Value Enhancement Bonus units to Mr Bruno Lafont.
At the end of a four-year period (2013 to 2017), and only if 100% of the internal and external performance conditions attached to the program have been achieved, this program allows for the payment of a Value Enhancement Bonus. This will be calculated on the basis of the difference between Lafarge’s share price at the end of the program (2 ) and a stock price target set at 70 euros (which represents an increase of over 40% compared to the stock price on December 31, 2012); this difference will be multiplied by the number of bonus units granted.
This program is subject to the achievement of the following performance conditions:
d The external performance condition is achieved if the share price target set at 70 euros is reached, which represents an increase of over 40% compared to the stock price on December 31, 2012;
d The internal performance condition requires that the average return on capital employed for 2013 to 2016 is greater than or equal to a predetermined target level; (3 )
d The program also provides:
d a continued presence condition, with a pro rata adjustment for length of service in case of disability, death, retirement or loss of rights in other circumstances;
d a commitment to reinvest a significant proportion of the amounts received in Lafarge shares;
d a payment in 2017.
At date of grant, the valuation of this multi- annual variable remuneration is 368,000 euros. It is reassessed every year.
In 2013, no amount is due related to this multi-annual variable remuneration.
d D.2) 2009 LONG-TERM INCENTIVE BASED ON THE COMPANY’S PERFORMANCE
Presentation of the planOn November 5, 2009, the Board of Directors decided to grant a long-term incentive to the Chairman and Chief Executive Offi cer Bruno Lafont, based on the Company’s performance over a period of three to seven years.
Such compensation will be due and payable between 2012 and 2016 insofar as the Company’s performance as benchmarked against a group of peer companies in the sector remains in the top half (external performance condition).
(2 ) Average fi rst quoted prices of Lafarge shares during the twenty trading days preceding March 13, 2017.
(3 ) The level of ROCE over the period 2013 to 2016 has been precisely determined. It is not published for reasons of confi dentiality.
Lafarge - Registration Document 2013 • 101
CORPORATE GOVERNANCE AND COMPENSATION3.4 Compensation and benefi ts

Provided this external performance condition is met, the amount of the long-term incentive will depend on the achievement of free cash fl ow and return on capital employed (ROCE) pre-defi ned objectives over a given period and such objectives correspond to the Company’s strategic objectives as set by the Board and already used in relation to the Group’s senior management (internal performance conditions). The amount of the long-term incentive will be reduced by a quarter for each internal performance condition which remains unsatisfi ed. Each performance condition (external and internal) will be tested every two years over the period until it is declared as being fulfi lled.
If all performance conditions are satisfi ed, the long-term incentive will amount to 1,500,000 euros as positively or negatively adjusted based on the evolution of the total shareholder return since the beginning of 2010 (Total Shareholder Return, percentage calculated by taking into account dividend and share price evolution).
In 2013, no amount is due related to this multi-annual variable remuneration for which the payment is planned in 2016 and 2017.
Performance testsOn March 15, 2012, the Board of Directors stated the achievement of the external performance condition only based on the results of the fi rst test. Consequently, 50% of this 2009 long-term remuneration is defi nitively vested.
On March 11, 2014, the Board of Directors made a second test on the internal performance conditions (based on the adjusted objectives of free cash-fl ow and ROCE). The result of this test shows that these conditions were not achieved. A last test is planned in 2016.
A provision of 750,000 euros is recorded in the accounts for this multi-annual variable remuneration. It is reassessed every year.
e) Exceptional compensationNo exceptional compensation was granted to Mr Bruno Lafont for the fi nancial year 2013.
f) Directors’ feesDirectos’ fees paid to Mr Bruno Lafont in 2014 (with respect to the 2013 fi nancial year) amounted to 25,400 euros.
The rules applicable to the allocation of Directors’ fees adopted on March 24, 2010 by the Board of Directors and used for the calculation of this total are detailed in the above Section 3.4.1 b).
g) Fringe benefi tsMr Bruno Lafont benefi ts from a company car.
h) Stock Option Plans
d H.1) 2013 STOCK OPTIONS GRANT
In 2013, no stock options were granted to Mr Bruno Lafont.
d H.2) SUMMARY TABLES ON THE STOCK OPTIONS GRANTED TO THE CHAIRMAN AND CHIEF EXECUTIVE OFFICER
The tables below set forth the following information related to Mr Bruno Lafont, Chairman and Chief Executive Offi cer:
d options granted by Lafarge S.A. and Group subsidiaries in 2013;
d options exercised in 2013;
d total number of options outstanding at December 31, 2013.
OPTIONS GRANTED IN 2013 TO THE CHAIRMAN AND CHIEF EXECUTIVE OFFICER
Plan No. and date of grant
Type of options
Valuation of options per accounting treatment used
in the consolidated accounts (euros)
Total number of options
Exercise price
(euros)Exercise
period
Bruno Lafont No grant in 2013
OPTIONS EXERCISED BY THE CHAIRMAN AND CHIEF EXECUTIVE OFFICER
Plan No. and date of grant Total number of options exercised Exercise price (euros)
Bruno Lafont The Chairman and Chief Executive Officer did not exercise any option in 2013
OPTIONS GRANTED TO THE CHAIRMAN AND CHIEF EXECUTIVE OFFICER OUTSTANDING AT DECEMBER 31, 2013
Options exercisable at December 31, 2013
Options not exercisable at December 31, 2013 Total
Bruno Lafont 381,797 190,000 (1) 571,797 (1)
(1) Including options, exercisability of which is conditional upon performance conditions.
d H.3) GENERAL INFORMATION ON THE PRIOR GRANTS TO THE CHAIRMAN AND CHIEF EXECUTIVE OFFICER
Information on grant policy, prior grants and performance conditions related to these grants including to the Chairman and Chief Executive Offi cer are detailed in Sections 3.5.1 and 3.5.2.
• Lafarge - Registration Document 2013102
CORPORATE GOVERNANCE AND COMPENSATION33 3.4 Compensation and benefi ts

3
PROPORTION OF STOCK OPTIONS SUBJECT TO PERFORMANCE CONDITIONS (HISTORY)
In line with the Afep-Medef Code, the Group’s policy is that all stock options granted to the Chairman and Chief Executive Offi cer must be conditional upon performance requirements.
2003 and 2004
2005 to 2008 2009 2010 2011 2012 2013
Bruno Lafont 43% 50% No grant 100% 100% 100% No grant
As the case with other benefi ciaries, in case of retirement, of death or of disability, Mr Bruno Lafont will keep his current or future rights related to the grants of stock options. In case of death, the heirs of Mr Bruno Lafont will keep the benefi t of his rights. The shareholders agreed on this subject during the General Meeting of May 7, 2013 (Resolution 5).
d H.4) HOLDING RULE – HEDGING INSTRUMENTS APPLICABLE TO THE CHAIRMAN AND CHIEF EXECUTIVE OFFICER FOR THE STOCK OPTIONS
The Chairman and Chief Executive Offi cer is required to hold 50% of shares resulting from the exercise of stock options for each allocation until the shares held by the Chairman and Chief Executive Offi cer (whatever their origin) represent an aggregate amount equivalent to 3 years of his la st fi xed pay (based on a calculation taking in to account the share price at the time of each exercise of stock options). This rule is applicable to all exercises of options carried out for options awarded that have not yet been exercised until the end of the Chairman and Chief Executive Offi cer’s mandate.
The Chairman and Chief Executive Offi cer must not use hedging instruments in relation to options granted.
i) Performance share plans
d I.1) 2013 PERFORMANCE SHARES GRANT
At its meeting on March 13, 2013, the Board of Directors decided to grant 33,500 Performance Shares to Mr Bruno Lafont, Chairman and Chief Executive Offi cer, which represents less than 10% of the total grant and 0.01% of issued capital.
The total amount (100%) of Performance Shares granted to Bruno Lafont is subject to the achievement of external and internal performance conditions. The number of shares to be delivered at the end of a three-year period will depend on the level of achievement of these conditions over the period 2013-2015.
d The external performance condition is based on Lafarge’s relative performance in terms of Total Shareholder Returns (TSR) and level of Return on Capital Employed (ROCE) compared to a panel of reference companies including Lafarge’s main competitors for the period from 2013 to 2015. 75% of the grant will be subject to this performance condition, with each of the two criteria (TSR and ROCE) accounting for half of this percentage. The number of Performance Shares to be delivered will be determined depending on Lafarge’s ranking in this panel.
d The internal performance condition is based on growth in the Group’s Ebitda resulting from innovation and performance actions. Target levels have been defined both for the 2013 financial year and for the period from 2013 to 2014. The level of achievement of these targets will determine the number of Performance Shares to be delivered under this part, up to a maximum of 25% of the grant.
The book value at grant date of that award of performance shares was 952,497 euros.
This grant was decided on the basis of Resolution 17 (“authorization to the Board of Directors to grant free existing shares or shares to be issued”) passed at the General Meeting of May 12, 2011.
d I.2) SUMMARY TABLES ON THE PERFORMANCE SHARES GRANTED TO THE CHAIRMAN AND CHIEF EXECUTIVE OFFICER
The tables below set forth the following information related to Mr Bruno Lafont, Chairman and Chief Executive Offi cer:
d Performance shares granted by Lafarge S.A. and Group subsidiaries in 2013;
d Performance shares definitively allotted in 2013;
d Total number of Performance shares granted at December 31, 2013.
PERFORMANCE SHARES GRANTED IN 2013 TO THE CHAIRMAN AND CHIEF EXECUTIVE OFFICER
Plan N° and date of grant
Number of shares granted
Valuation of shares per accounting treatment used in the consolidated accounts (1) (euros)
Date of definitive allotment
Date performance shares can be transferred Performance conditions
Bruno Lafont AGA 2013 of
03/13/2013
33,500 952,497 03/15/2016 03/16/2018 100% of the shares
granted are subject
to the performance
conditions, as described
in Section i.1 above
(1) Performance shares fair value is calculated at grant date using the Black & Scholes model. See Note 21 (Share-based payments) to the consolidated statements.
Lafarge - Registration Document 2013 • 103
CORPORATE GOVERNANCE AND COMPENSATION3.4 Compensation and benefi ts
PERFORMANCE SHARES DEFINITIVELY ALLOTTED IN 2013 TO THE CHAIRMAN AND CHIEF EXECUTIVE OFFICER
Plan N° and date of grant Total number of performance shares definitively alloted
Bruno Lafont No performance shares were definitively allotted to the Chairman and Chief Executive Officer in 2013
TOTAL NUMBER OF PERFORMANCE SHARES GRANTED TO THE CHAIRMAN AND CHIEF EXECUTIVE OFFICER SINCE 2011
Total
Bruno Lafont 73,500 (1)
(1) 100% of the performance shares allotment is conditional upon performance conditions.
d I.3) GENERAL INFORMATION ON THE PRIOR GRANTS TO THE CHAIRMAN AND CHIEF EXECUTIVE OFFICER
Performance shares was granted for the fi rst time to the Chairman and Chief Executive Offi cer in 2011.
Information on grant policy, prior grants and performance conditions related to these grants including to the Chairman and Chief Executive Offi cer is detailed in Sections 3.5.1 and 3.5.3.
PROPORTION OF PERFORMANCE SHARES SUBJECT TO PERFORMANCE CONDITIONS (HISTORY)
In line with the Afep-Medef Code, the Group’s policy is that all performance shares granted to the Chairman and Chief Executive Offi cer must be conditional upon performance requirements.
2011 2012 2013
Bruno Lafont 100% 100% 100%
As is the case for the other benefi ciaries, in case of retirement, of death or of disability, Mr Bruno Lafont will keep his current or future rights related to the grants of performance shares. In case of death, the heirs of Mr Bruno Lafont will keep the benefi t of his rights. The shareholders passed a resolution on this subject during the General Meeting of May 7, 2013 (resolution 5).
d I.4) HOLDING RULE – HEDGING INSTRUMENTS APPLICABLE TO THE CHAIRMAN AND CHIEF EXECUTIVE OFFICER FOR THE PERFORMANCE SHARES
The Chairman and Chief Executive Offi cer is required to hold 50% of shares resulting from the exercise of performance shares for each allocation and 50% of performance shares acquired at the end of the holding period for each allocation, until the shares held by the Chairman and Chief Executive Offi cer (whatever their origin) represent an aggregate amount equivalent to three years of his last fi xed pay (based on a calculation taking into account the share price at the time of each exercise of stock options or at the end of the holding period for performance shares). This rule is applicable to all exercises of performance shares carried out for performance shares granted but not allotted and to all performance shares granted yet to be acquired, until the end of the Chairman and Chief Executive Offi cer’s mandate.
The Afep-Medef Code recommends that Executive offi cers must buy a defi ned quantity of shares when the shares granted become available. The Board of Directors of Lafarge S.A. considers that the holding rule outlined above achieves the same objective as recommended by the Afep-Medef Code, making it unnecessary to impose a further obligation on corporate offi cers regarding the purchase of a defi ned quantity of shares upon defi nitive allotment of performance shares. This is particularly the case for Mr Bruno Lafont given the number of shares already held by the Chairman and Chief Executive Offi cer further to past acquisitions and amounting to 27,506 shares as at December 31, 2013.
The Chairman and Chief Executive Offi cer must not use hedging instruments in relation to performance shares granted.
j) Employment contract and Severance arrangements for the Chairman and Chief Executive Offi cer
d J.1) EMPLOYMENT CONTRACT OF MR BRUNO LAFONT
At their Meeting on July 27, 2011, further to a recommendation by the Corporate Governance and Nominations Committee, the Board of Directors decided to maintain Mr Bruno Lafont’s suspended employment contract and amend said employment contract in order to remove Mr Bruno Lafont’s commitment not to leave the Company before June 30, 2011 in consideration for which the dismissal notice period may run up until this date.
The Board considers that its decision to maintain Mr Bruno Lafont’s employment contract initially entered into on January 1, 1983 is warranted:
d in view of his 31 years’ service with the Group (and 24 years’ performance of his employment contract until it was suspended in 2006 when he was appointed Chief Executive Officer);
d as it encourages an internal promotion policy allowing for the appointment of Corporate Officers (mandataires sociaux) from among experienced senior executives (cadres dirigeants) with in-depth knowledge of the industry and markets on which Lafarge operates and for whom the loss of rights deriving from their employment contracts and length of service (e.g., severance compensation under the collective bargaining agreement) would act as a drawback.
This amendment to the employment contract was approved by the Company’s General Meeting of May 15, 2012.
• Lafarge - Registration Document 2013104
CORPORATE GOVERNANCE AND COMPENSATION33 3.4 Compensation and benefi ts

3
These decisions have not changed Mr Bruno Lafont’s position in particular with regard to his pension plan or severance compensation entitlement.
d J.2) SEVERANCE COMPENSATION RELATED TO MR BRUNO LAFONT SUSPENDED EMPLOYMENT CONTRACT
In compliance with the procedure on related-party agreements and commitments, the shareholders have voted on this subject at the Combined General Meeting of May 7, 2013 (Resolution 5) for the last time.
The employment agreement of Mr Bruno Lafont was suspended upon his appointment to serve as a corporate offi cer in 2006. That agreement includes contractual severance compensation payable subject to certain conditions, including a performance condition.
Following the automatic resumption of his employment agreement in the event Mr Bruno Lafont were to cease serving in his corporate offi ces (Chairman and Chief Executive Offi cer), the contractual severance compensation in case of dismissal (other than for gross negligence or serious misconduct) would only be owed to Mr Bruno Lafont if a series of conditions are met:
d Condition related to the event triggering the right to contractual severance compensation: The dismissal must take place after a change of control (meaning (i) a change in the Company’s capital characterized by the holding by Groupe Bruxelles Lambert and NNS Holding Sàrl, not acting in concert, of more than 50% in total of the Company’s voting rights or (ii) the fact that another shareholder or several shareholders acting in concert hold more than 50% of the Company’s voting rights) or after a change in the Company’s strategy;
d Performance condition: This condition will be satisfied and the contractual severance compensation would be paid if two of the following three criteria are satisfied. If only one criterion out of the three is satisfied, the condition will only be partially satisfied and only one half of the contractual severance compensation would be paid. If none of the criteria are satisfied, the condition would not be satisfied and no contractual severance compensation would be paid. The three criteria to be satisfied, over the last three fiscal years preceding the employment contract’s termination, are as follows:
d on average, over the last three fiscal years: the after-tax return on invested capital is greater than the Average Weighted Cost of the Capital. Here, the term Average Weighted Cost of the Capital means the sum of the cost of debt multiplied by the total debt divided by the total of the capital and cost of equity multiplied by the equity and divided by the total of capital (Group figures),
d on average, over the last three fiscal years: the ratio Ebitda/Turnover is strictly greater than 18% (Group figures),
d on average, over the last three fiscal years: the average percentage of given bonuses under the Employment Contract or the Term of Office is greater than 60% of the maximum bonus.
The maximum amount of this contractual severance compensation would be equal to two years of total gross compensation received by Mr Bruno Lafont for the most favorable of the three years preceding the date of his dismissal notice. This calculation basis is the same as for the dismissal compensation under the Collective Bargaining Agreement. In addition, so as to ensure that the total amount of the compensation due to Mr Bruno Lafont in case of departure remains within this limit, such contractual severance compensation would be reduced by the amount of the dismissal compensation due to Mr Bruno
Lafont pursuant to and in compliance with the terms of the Collective Bargaining Agreement applicable to engineers and executives in the cement production industry, which apply to his employment agreement in view of his length of service within the Group (31 years). In application of mandatory French labor laws, the dismissal compensation is subject to the conditions set forth under the Collective Bargaining Agreement.
A job elimination or decrease in level of responsibilities would also constitute a case of dismissal providing entitlement to such compensations.
k) Non- compete clause paymentsThere is non non-compete clause.
l) Supplementary Pensions Schemes In compliance with the procedure on related-party agreements and commitments, the shareholders have voted on this subject at the General Meetings of May 24, 2006 (Resolution 4) and May 6, 2009 (Resolution 4).
According to the Company’s general principles of compensation, Bruno Lafont is eligible for a supplementary defi ned benefi ts plan defi ned through two group plans applicable, under certain conditions, to certain senior executives. There is no specifi c pension plan for Corporate Offi cers.
Due to his 31 years of service within the Group, this plan would provide him with a pension equal to 26% of his reference salary(1) in excess of 8 times the annual French social security cap to which an additional 13% would be added in excess of 16 times the annual French social security cap.
As an example, if the calculation was made on the basis of the last three years (2011-2013), the annual pension paid to Mr Bruno Lafont would represent approximately 33% of his annual fi xed and variable compensation due for the reference period (versus 45% maximum recommended).
The two plans of this pension scheme remain open and potentially benefi t, under certain conditions, for one plan to all executives of Lafarge and its French subsidiaries, and for the other plan to all the members of the Group Executive Committee.
The other key features of this scheme and of the two collective plans composing it are as follows :
d This scheme applies only if, at the time of payment of the pension, the beneficiary is still employed by the Company or if he ended his career at the initiative of the Company after the age 55.
d These plans, among other conditions, respectively include a condition of a minimum seniority of 5 and 3 years in various positions within the Group in order to benefit from these plans (versus 2 years recommended). These conditions are met for Mr Bruno Lafont.
d The calculation of the amounts to be paid according to these plans is capped at respectively 20 and 10 years of service in various positions within the Group. These ceilings are reached concerning Mr Bruno Lafont.
d As recommended, the possible cumulative annual growth of the potential benefits under these two plans is less than 5 % of the reference salary.
(1) Reference salary is the average of the last three annual fi xed and variable compensation (excluding multi-annual compensation).
Lafarge - Registration Document 2013 • 105
CORPORATE GOVERNANCE AND COMPENSATION3.4 Compensation and benefi ts
SUMMARY
Corporate officer EMPLOYMENT CONTRACTSUPPLEMENTARY PENSION PLAN
SEVERANCE ARRANGEMENTS PAID OR
TO BE PAID IN CASE OF TERMINATION OR CHANGE
OF POSITIONNON- COMPETE
CLAUSE PAYMENTS
Yes No Yes No Yes No Yes No
Bruno Lafont (1)
Chairman and Chief
Executive Officer
d
(see Section
j.1)
d
(see Section l)d
(see Section
j.2)
d
(see Section k)
(1) Bruno Lafont was appointed as Director on May 25, 2005, Chief Executive Officer on January 1, 2006 and Chairman and Chief Executive Officer on May 3, 2007.
3.4.4 COMPENSATION ELEMENTS DUE OR GRANTED IN 2013 TO THE CHAIRMAN AND CHIEF EXECUTIVE OFFICER SUBMITTED FOR NOTICE TO SHAREHOLDERS AT THE GENERAL MEETING ON MAY 7, 2014 (“SAY ON PAY”)
Compensation elements due or granted during the financial year
Amounts or book value submitted to vote Presentation
Fixed compensation 975,000 euros
(amount paid)
Increase of 2.6% compared to his 2012 fixed remuneration – first evolution since 2010.
Annual variable
compensation
887,250 euros
(amount due, to
be paid in 2014)
The 2013 annual variable part represents 57 % of the maximum bonus.
The 2013 financial objectives set for the variable part related to: the evolution in earnings per share, the
free cash flow generation, the level of Ebitda , the ROCE (return on capital employed) and the change in
Lafarge’s performance compared to competitors.
The level of realization of these financial objectives were validated by the Remunerations Committee and
the Board of Directors.
The 2013 qualitative objectives were related to the following areas: health and safety and sustainable
development action plan for 2020, balance sheet optimization and financial performance, strategic plan
for the Group, financial communications and the development of the management team.
The policy of the Company is to set the annual variable part of the Chairman and Chief Executive Officer,
except if exceptional circuvmstances, to a maximum of 160 % of the fixed remuneration. It is determined
based on the achievement of financial objectives for 62,5% and on the realization of qualitative objectives
for 37,5 %.
De ferred variable
compensation
NA The principle of a deferred variable compensation is not planned.
Multi-annual
variable
compensation
0 euro
No amount
is due
2013 Value Enhancement Bonus :
d Grant of 50,000 Value Enhancement Bonus units (Board of Directors of March 13, 2013).
d At the end of a four-year period (2013 to 2017), and only if 100% of the internal and external
performance conditions attached to the program have been achieved, payment of a bonus amounting
to the number of units granted (50,000) multiplied by the difference between (i) Lafarge’s share price
at the end of the program* and (ii) a stock price target set at € 70.
d Performance conditions:
– The external performance condition is achieved if the share price target set at € 70 is reached;
– The internal performance condition: average return on capital employed for 2013 to 2016 being
greater than or equal to a predetermined target level.
d The program provides a payment in 2017. No amount is due related to this compensation for 2013.
At the date of grant, the valuation of this multi-annual variable remuneration is estimated at 368,000
euros. It is reassessed every year.
*Average first quoted prices of Lafarge shares during the twenty trading days preceding March 13, 2017.
Exceptional
compensation
NA No exceptional compensation was granted to the Chairman and Chief Executive Officer for the 2013
financial year.
• Lafarge - Registration Document 2013106
CORPORATE GOVERNANCE AND COMPENSATION33 3.4 Compensation and benefi ts

3
Compensation elements due or granted during the financial year
Amounts or book value submitted to vote Presentation
Stock options,
performance shares
Performance
shares =
952,497 euros
(book value)
2013 Performance shares grant:
d Grant of 33,500 performance shares, representing less than 10 % of the total of performance shares
granted and 0,01 % of the current share capital of the Company.
d 100 % of the grant is subject to the achievement of external and internal performance conditions.
The number of shares to be delivered at the end of a three-year period will depend on the level of
achievement of these conditions over the period 2013-2015.
– external performance condition (related to 75% of the grant): Lafarge’s relative performance in terms
of (i) Total Shareholder Returns (TSR) and (ii) level of Return on Capital Employed (ROCE), compared
to a panel of reference companies including Lafarge’s main competitors for the period from 2013 to
2015. The number of performance shares to be delivered will be determined depending on Lafarge’s
ranking in this panel.
– internal performance condition (related to 25% of the grant): growth in the Group’s Ebitda resulting
from innovation and performance actions (target levels have been defined both for the 2013 financial
year and for the period from 2013 to 2014).
d This grant was decided by the Board of Directors on March 13, 2013 on the basis of Resolution 17
(“Authorization to the Board of Directors to grant free existing shares or shares to be issued”) passed
at the General Meeting of May 12, 2011.
Stock Options
= NA
No grant of stock options
Directors’ fees 25,400 euros
(amount due, to
be paid in 2014)
Computation of Directors fees paid to Bruno Lafont in application of the allocation rules adopted
by the Board of Directors on March 24, 2010 (25,400€ = 17,000 € (fixed fee) + 8,400€
(variable fee : 7 meetings x 1,200 euros for every Board of Directors)).
Valuation of the
fringe benefits
3,428 euros
(book value)
Mr Bruno Lafont benefits from a company car.
Compensation elements due or granted in 2013 submitted to the vote of the General meeting according to the procedure on related-party agreements and commitments
Amounts submitted to the vote Presentation
Severance compensation 0 euro
No amount is due
Severance compensation related to the suspended employment contract of
Bruno Lafont:
In compliance with the procedure on related-party agreements and commitments,
the shareholders have voted on this subject at the Combined General Meeting of
May 7, 2013 (Resolution 5) for the last time.
The description of the severance compensation related to the suspended
employment agreement of Mr Bruno Lafont is detailed in Section 3.4.3-j.2
(page 105) of the present Registration Document.
Non-compete clause payments N/A There is no non-compete clause.
Supplementary Pensions Schemes 0 euro
No amount is due
Supplementary Benefits Plan:
In compliance with the procedure on related-party agreements and commitments,
the shareholders have voted on this subject at the General Meetings of May 24,
2006 (Resolution 4) and May 6, 2009 (Resolution 4).
The description of the supplementary defined pensions benefits under the two
collective plan applicable to Mr Bruno Lafont are detailed in Section 3.4.3-l
(page 105 ) of the present Registration Document.
Lafarge - Registration Document 2013 • 107
CORPORATE GOVERNANCE AND COMPENSATION3.4 Compensation and benefi ts

3.4.5 COMPENSATION OF THE EXECUTIVE OFFICERS
a) General information on compensation of the Executive Offi cers and retirement benefi tsThe Executive Offi cers include Mr Bruno Lafont, Chairman and Chief Executive Offi cer, and the members of the Executive Committee.
2013 Financial year
2012 Financial year
Average number of persons (1) 10.3 10.0
Amount paid (million euros) (2) 12.0 8.1
Pension commitment (million euros) (3) 47.5 46.6
(1) All those who were Executive Officers for the period of the year during which they were Executive Officers (for the evolution of the number of members of the Group
Executive Committee, please see Section 3.3).
(2) This amount includes:
– the fixed compensation of Executive Officers for the related year;
– a qualitative performance component, a financial performance component and a collective performance component as the variable portion paid for the preceding
year (and if applicable the exceptional variable compensation);
– Directors’ fees paid by Lafarge S.A. to Mr Bruno Lafont;
– if applicable, the amounts related to the multi-annual variable compensation.
(3) The evolution of the global commitment between 2012 and 2013 is explained essentially as a result of changes in the composition of the Executive Committee.
b) Stock options granted to the Executive Offi cersThe Chairman and Chief Executive Offi cer and the Executives offi cers of the Company as detailed in Section 3.3 (Executive Offi cers) hold 22.26% of unexercised options on December 31, 2013, with 8.17% held by the Chairman and Chief Executive Offi cer .
Information on the grant policy, prior grants and performance criteria attached to these grants is mentioned in Sections 3.5.1 and 3.5.2.
c) Performance shares granted to the Executive Offi cersThe Chairman and Chief Executive Offi cer and the Executives offi cers of the Company as detailed in Section 3.3 (Executive Offi cers) hold 12.65% of the performance shares (not defi nitively acquired) on December 31, 2013, with 5.15% held by the Chairman and Chief Executive Offi cer .
Information on the grant policy, prior grants and performance criteria attached to these grants is mentioned in Sections 3.5.1 and 3.5.3.
d) Holding rule – hedging instruments applicable to Executive Offi cers for the stock options and performance sharesEach member of the Executive Committee has (i) the obligation to reinvest in Lafarge S.A. shares one third of the potential gain (net of tax) realized upon the exercise of stock options or purchase and (ii) has the obligation to keep at the end of the retention period one third of the performance shares awarded at each grant, and hold Lafarge S.A. shares of a value up to the equivalent of its total fi xed annual remuneration until his termination as a member of the Group Executive Committee.
They must not use hedging instruments in relation to stock options and performance shares granted
The specifi c rules for the Chairman and Chief Executive Offi cer are stated in Sections 3.4.3 H.4 and 3.4.3 I.4.
• Lafarge - Registration Document 2013108
CORPORATE GOVERNANCE AND COMPENSATION33 3.4 Compensation and benefi ts

3
3.5LONG-TERM INCENTIVES
(STOCK OPTIONS AND PERFORMANCE SHARE PLANS)
3.5.1 GRANT POLICY – PERFORMANCE CONDITIONS AND HOLDING RULE
a) Grant policyThe objective of the Group’s remuneration policy is to reward and retain key talent while providing managers and employees with an opportunity to share in the success of the Group’s business including through the grant of stock options and performance shares (free allotment of shares), which are connected to the Group’s long-term strategy. Stock options and/or performance shares are granted to the Chairman and Chief Executive Offi cer, senior management, middle management and some key performers in recognition of their commitment and achievements for the Group.
Stock options and performance shares are granted by the Board of Directors upon a recommendation of the Remunerations Committee. Grants are made annually, usually during a Board of Directors meeting held in March.
Regarding stock options, the Group’s practice since 2002 is to allocate share subscription options. No discount is applied to the exercise price.
Following the Afep-Medef Code recommendations, the Board of Directors decided to limit the number of stock options or performance shares attributable to Corporate Offi cers. Under this rule, the proportion of options and performance shares attributable to Corporate Offi cers may not exceed respectively 10% of the total amount of options and 10% of the total amount of performance shares granted during any given fi nancial year.
b) Performance conditions applicable to the grants of stock options and performance shares
d PROPORTION OF OPTIONS OR PERFORMANCE SHARES SUBJECT TO PERFORMANCE CONDITIONS
Corporate Offi cers and Group’s Executive Committee MembersIn line with the Afep-Medef Code, the current Group’s policy is that all stock options and performance shares granted to the Chairman and Chief Executive Offi cer and the Group’s Executive Committee Members must be conditional upon performance requirements.
A history of the proportion of the grants subject to performance condition and applicable to the Chairman and Chief Executive Offi cer and Executive Committee Members is set out below.
2003 and 2004
2005 to 2007 2008 2009 2010 2011 2012 2013
Bruno Lafont 43% 50% 50% No grant 100% 100% 100% 100%
Executive Committee members 30% 50% 63% 70% 70% 80% 100% 100%
Other employees
Stock options and performance shares granted to other employees are also fully conditional upon performance requirements since 2013.
d APPLICABLE PERFORMANCE CONDITIONS
Since 2011, stock options and performance shares granted are conditional upon several performance criteria which have been set in advance, and this applies to all benefi ciaries.
2013 GrantThe performance criteria applicable to the 2013 grant are based on external and internal conditions. External conditions must be met over a period of three years. The level of achievement of external conditions will be evaluated by averaging the results obtained at the end of each year. Internal conditions must be met over a period of two years.
Regarding the Executive Committee Members and the Chairman and Chief Executive Offi cer:
d The achievement of the external condition determines the acquisition of 75% of the award subject to performance conditions. The external condition is based on Lafarge relative performance compared to its main competitors for each of the following two criteria: return on capital employed (ROCE ) and total shareholder return (TSR). Five levels of achievement have been identified for these objectives, in line with the Group’s strategic plan. These levels of achievement define the percentage of acquisition. For both external conditions, these thresholds are: 30% if the first level is reached, 45% if the second level is reached, 52.5% if the third level is reached, 60% if the fourth level is reached and 75% if the fifth level is reached.
Lafarge - Registration Document 2013 • 109
CORPORATE GOVERNANCE AND COMPENSATION3.5 Long-term incentives (stock options and performance share plans)

d The achievement of the internal conditions determines the acquisition of 25% of the award subject to performance conditions. The internal conditions are based on the increase in Ebitda related to action plans aiming at costs reduction, innovation and performance in 2013 and 2014. Three levels of achievement have been identified for these objectives in line with the Group’s strategic plan. These levels of achievement define the percentage of acquisition. For internal conditions, these thresholds are as follows: 6.25% if the first level is reached, 9.37% if the second level is reached and 12.5% if the third level is reached.
The level set to achieve 100% of internal performance conditions is ambitious and can represent up to 150% of the annual objectives of the Group’s strategic plan.
Regarding the other benefi ciaries, all grants are subject to performance conditions although for most of them, only internal performance conditions are applicable. Internal performance targets also vary depending on to the level of responsibility of the benefi ciaries.
SUMMARY OF THE PERFORMANCE CONDITIONS APPLICABLE TO THE GRANTS OF THE CORPORATE OFFICERS AND MEMBERS
OF THE EXECUTIVE COMMITTEE
Corporate Officers Executive Committee Members
2007 and 2008 Internal Conditions “Excellence 2008” cost reduction targets
2009 External Condition No grant Lafarge’s relative performance compared to peers
(2009, 2010 and 2011 average).
If the external condition is not met in 2012, a new test will be
implemented in 2013 and 2015.
Internal Conditions FCF and ROCE targets (2009, 2010 and 2011 average).
2010 External Condition Lafarge’s relative performance compared to peers (2010, 2011 and 2012 average).
Internal Conditions FCF and ROCE targets (2010, 2011 and 2012 average).
2011 External Condition Lafarge’s relative performance compared to peers (2011, 2012 and 2013 average).
Internal Conditions FCF and ROCE targets (2011, 2012 and 2013 average).
The vested portion depends on the level of performance achievement (there are 3 levels of performance
conditions for each of the FCF and ROCE targets).
2012 External Condition Lafarge’s relative performance compared to peers (2012, 2013 and 2014 average).
Internal Conditions FCF and ROCE targets (2012, 2013 and 2014 average).
The vested portion depends on the level of performance achievement (there are 3 levels of performance
conditions for each of the FCF and ROCE targets).
For members of the Executive Committee part of the internal performance condition is linked to 2012
cost reduction targets.
2013 External Condition Lafarge’s relative performance compared to peers (2013, 2014 and 2015 average).
Internal Conditions Ebitda growth resulting from cost reduction, innovation and performance targets for 2013 and 2014.
2014 External Condition Lafarge’s relative performance compared to peers (2014, 2015, 2016 average).
Internal Conditions Ebitda growth resulting from cost reduction and innovation targets for 2014 and 2015.
2011 and 2012 grantsThe performance conditions for 2011 and 2012 grants are both external and internal. These conditions must be met over a three year period. The level of achievement of each condition is to be measured at the end of each year and achievement is calculated as an average of these three years.
The external condition is based on the Group’s relative performance compared to its competitors in relation to the following: return on capital employed (ROCE ), total shareholder return (TSR) and free cash fl ow (FCF). The Group’s relative performance on these three criteria must be within the top tier of the benchmark for the performance condition to be met. If not, entitlement to half of the grant submitted to performance conditions is cancelled.
The internal performance conditions, which apply to the other half of the grant subject to performance conditions, are based on free cash fl ow (FCF) and return on capital employed (ROCE ) targets. Three levels have been set for each of these two targets, in line with the Group’s strategic plan. The percentage of entitlement to the grant which is subject to performance conditions depends on the level of achievement of each target. The percentages are as follows, for each target: 12.5% if the fi rst level is achieved, 18.75% if the second level is achieved and 25% if the third level is achieved.
The levels set to achieve 100% of the internal performance conditions are ambitious and may represent up to 150% of annual objectives set in the Group’s strategic plan.
The proportion of performance shares and stock options subject to these performance criteria depends on the level of responsibility of the eligible population.
Part of the performance conditions applicable to the 2011 grants were not met and the corresponding stock options and performance shares were cancelled.
2012 additional performance shares planBased on cost reduction targets at Group level, additional performance shares have been granted to Senior and Middle management of the Group. Cost reduction performance applies to 100% of this additional grant and to all benefi ciaries.
The performance condition is based on the Group cost reduction results. The vested portion depends on the level of achievement of the target. Three levels have been set: 50% if the fi rst level is achieved, 75% if the second level is achieved and 100% if the third level is achieved. The third level of this performance condition has been achieved for 2012.
• Lafarge - Registration Document 2013110
CORPORATE GOVERNANCE AND COMPENSATION33 3.5 Long-term incentives (stock options and performance share plans)

3
The Chairman and Chief Executive Offi cer was not eligible to this additional grant.
Prior grantsIn 2009 and 2010, stock options granted to members of the Executive Committee and some senior executives were also conditional upon several performance criteria, which were external based on the Group’s performance compared to competitors and internal based on free cash fl ow, return on capital employed, Ebitda or cost reduction targets. These criteria were alternate or combined in part, depending on the grant year and on the level of responsibility of the eligible population. These criteria also applied to stock options granted to the Chairman and Chief Executive Offi cer in 2010 (as the Chairman and Chief Executive Offi cer did not receive any stock options in 2009). Part of the performance conditions applicable to the grants made in 2009
and 2010 were not met and the corresponding stock options have been cancelled.
In 2007 and 2008, stock options granted to the Chairman and Chief Executive Offi cer, members of the Executive Committee and some senior executives had for sole performance condition cost reduction targets as part of the Excellence 2008 program.
From 2007 until 2010, the performance condition applicable to stock options and performance shares granted to employees (other than members of the Executive Committee and some senior executives) was the achievement of cost reduction targets as part of the Excellence 2008 program (for 2007 and 2008 grants) and the Excellence 2010 program (for 2009 and 2010 grants).
All performance conditions based on the cost reduction targets set out in the Excellence programs have been met.
SUMMARY OF THE ACHIEVEMENT OF THE PERFORMANCE CONDITIONS APPLICABLE TO THE GRANTS OF THE CORPORATE OFFICERS
AND MEMBERS OF THE EXECUTIVE COMMITTEE
Corporate Officers Executive Committee Members Performance conditions achievement
2007 and 2008 “Excellence 2008” cost reduction targets Conditions achieved
2009 No grant Lafarge’s relative performance compared to peers
(2009, 2010 and 2011 average).
If the external condition is not met in 2012,
a new test will be implemented in 2013 and 2015.
External condition achieved.
Internal conditions not achieved.
FCF and ROCE targets
(2009, 2010 and 2011 average).
2010 Lafarge’s relative performance compared to peers
(2010, 2011 and 2012 average).
External condition achieved.
Internal conditions not achieved.
FCF and ROCE targets (2010, 2011 and 2012 average).
2011 Lafarge’s relative performance compared to peers
(2011, 2012 and 2013 average).
FCF and ROCE targets (2011, 2012 and 2013 average).
External condition achieved.
Internal conditions not achieved.
2012 Lafarge’s relative performance compared to peers
(2012, 2013 and 2014 average).
FCF and ROCE targets (2012, 2013 and 2014 average).
Conditions’ achievement to be evaluated in 2014
2013 Lafarge’s relative performance compared to peers
(2013, 2014 and 2015 average).
Ebitda growth resulting from cost reduction, innovation and performance
targets for 2013 and 2014.
Conditions’ achievement to be evaluated in 2014
and 2015
c) Holding rule – hedging instrumentsThe holding rules and hedging instruments relative to:
d the Chairman and Chief Executive Officer are available in Sections 3.4.3 H.4 and 3.4.3 I.4.
d the Members of the Executive Committee are available in Section 3.4.5 D.
d) Insider dealing rules relating to the sale of shares resulting from stock option and performance share plansSpecifi c insider dealing rules apply to the sale of performance shares and to the sale of shares obtained through the exercise of stock options, when the sale and the exercise are simultaneous. In these cases, Group Executives (including Directors and members of the Executive Committee) are prohibited from trading in the Company’s securities during non authorized periods.
These periods start thirty days prior to the date of publication of quarterly, half-yearly or annual results and end ten trading days after
such publication for sales of performance shares or for the sale of shares obtained through the exercise of stock options, when the sale and the exercise are simultaneous.
3.5.2 STOCK OPTION PLANS
Total stock options outstanding at the end of December 2013 were 7,000,955 representing approximately 2.44% of our outstanding shares on that date.
a) Main terms of the stock options plans
d STOCK OPTION TERMS
All stock options are valid for a period of 10 years.
The exercise price of options is set as the average of the share price during the twenty trading days preceding the date of grant by the Board of Directors. No discount is applied to the exercise price.
Lafarge - Registration Document 2013 • 111
CORPORATE GOVERNANCE AND COMPENSATION3.5 Long-term incentives (stock options and performance share plans)

d TERMS OF EXERCISE
Since December 2001, the stock options granted are subject to a four-year vesting period.
For stock options granted since 2007, this restriction on availability of the stock options will automatically cease to apply if, within this 4 year period, there is a public offering for Lafarge S.A.’s shares or Lafarge S.A. merges with or is absorbed by another company.
d CANCELLATION OF OPTIONS
Stock options not exercised within 10 years of their date of grant are cancelled.
Since 2007, stock options are also cancelled in specifi c circumstances, such as resignation or termination of employment. The right to stock options may be maintained if the benefi ciary’s employing company is sold outside the Group.
b) Financial year 2013: information on grants and exerciseNo stock options were granted during the fi nancial year 2013.
TOTAL OF THE TEN LARGEST OPTION GRANTS MADE TO THE GROUP’S EMPLOYEES OTHER THAN THE CHAIRMAN AND CHIEF EXECUTIVE
OFFICER, AND THE TOTAL OF THE TEN LARGEST OPTION EXERCISES
Total number of options granted/shares subscribed or purchased
Exercise price (euros) Plan No.
Options granted during the 2013 financial year by the issuer and its consolidated subsidiaries for stock option grant purposes to the ten employees
of the issuer and its subsidiaries having received the largest grants (global information)
Lafarge S.A. No stock options were granted during the financial year 2013
Shares (1) subscribed or purchased during the 2013 financial year as a result of the exercise of stock options of the issuer and its consolidated
subsidiaries for stock option grant purposes, by the ten employees of the issuer and its subsidiaries having subscribed or purchased the largest
number of shares (global information)
Lafarge S.A. 47,765 30.74 OSA 2009 –
25/03/2009
(1) One share per option.
c) Information on outstanding stock options outstanding in 2013The total number of shares that could be subscribed or purchased upon exercise of the options, and the exercise price set forth in the
following tables have been readjusted since the date of grant to refl ect transactions that have affected option value, such as certain increases in the share capital or the issue of performance shares to existing shareholders, to maintain a constant total option value for each benefi ciary as provided by law.
OPTIONS TO SUBSCRIBE FOR SHARES GRANTED FROM DECEMBER 10, 2003 TO MAY 24, 2006
OSA 2003 12/10/2003
OSA 2004 12/14/2004
OSA 2005 12/16/2005
OSA 2006-1 05/24/2006
Allotment authorized by the Shareholders’ Meeting of 05/20/2003 05/20/2003 05/25/2005 05/25/2005
Date of allotment by the Board of Directors 12/10/2003 12/14/2004 12/16/2005 05/24/2006
Type of options subscription subscription subscription subscription
The total number of shares that could be subscribed upon exercise
of the options 1,427,604 791,575 1,466,294 768,626
Of which by Directors and Chairman and Chief Executive Officer
Bruno Lafont 28,925 34,709 69,418 69,418
Bertrand Collomb 92,556 46,279 46,278 -
Initial beneficiaries (total) 1,732 479 1,916 536
Available for exercise from 12/10/2007 12/14/2008 12/16/2009 05/24/2010
Option exercise period lapses 12/10/2013 12/14/2014 12/16/2015 05/24/2016
Exercise price (euros) 57.00 61.19 62.78 84.42
Total number of options subscribed as at December 31, 2013 263,473 9,134 45,975 3,050
Total number of options cancelled or that have lapsed (1) 1,164,131 40,900 106,062 44,425
OPTIONS OUTSTANDING AT DECEMBER 31, 2013 0 741,541 1,314,257 721,151
(1) In accordance with the terms of the plan.
• Lafarge - Registration Document 2013112
CORPORATE GOVERNANCE AND COMPENSATION33 3.5 Long-term incentives (stock options and performance share plans)

3
OPTIONS TO SUBSCRIBE FOR SHARES GRANTED FROM MAY 24, 2006 TO MARCH 15, 2012
OSA 2006-2 05/24/2006
OSA 2007 06/15/2007
OSA 2008 03/26/2008
OSA 2009 03/25/2009
OSA 2010 03/24/2010
OSA 2011 03/15/2011
OSA 2012 03/15/2012
Allotment authorized by
the Shareholders’ Meeting of 05/25/2005 05/03/2007 05/03/2007 05/03/2007 05/06/2009 05/06/2009 05/12/2011
Date of allotment by the Board
of Directors 05/24/2006 06/15/2007 03/26/2008 03/25/2009 03/24/2010 03/15/2011 03/15/2012
Type of options subscription subscription subscription subscription subscription subscription subscription
The total number of shares
that could be subscribed upon
exercise of the options 171,980 621,865 819,487 744,045 1,203,500 781,980 789,920
Of which by Directors and the
Chairman and Chief Executive
Officer
Bruno Lafont - 69,418 138,834 - 100,000 70,000 70,000
Bertrand Collomb - - - - - - -
Initial beneficiaries (total) 33 169 184 197 596 206 214
Available for exercise from 05/24/2010 06/15/2011 03/26/2012 03/25/2013 03/24/2014 03/15/2015 03/15/2016
Option exercise period lapses 05/24/2016 06/15/2017 03/26/2018 03/25/2019 03/24/2020 03/15/2021 03/15/2022
Exercise price (euros) 84.42 110.77 96.18 30.74 51.30 44.50 36.00
Total number of options subscribed
as at December 31, 2013 0 0 0 117,879 0 0 0
Total number of options cancelled
or that have lapsed (1) 15,785 65,705 68,246 51,498 511,713 47,645 30,300
OPTIONS OUTSTANDING
AT DECEMBER 31, 2013 156,195 556,160 751,241 574,668 691,787 734,335 759,620
(1) In accordance with the terms of the plan.
d) Financial year 2014: Information on grantsOn the date of this Registration Document, no options to subscribe for or acquire shares had been granted in fi scal year 2014.
3.5.3 PERFORMANCE SHARE PLANS
The total number of outstanding performance shares at the end of December 2013 was 1,427,847, representing approximately 0.50% of the Company’s share capital on December 31, 2013.
a) Main terms of the performance shares plans
d PERFORMANCE SHARE TERMS
Performance shares are defi nitively allotted to benefi ciaries upon expiry of a two-year or three-year vesting period for French tax residents or upon expiry of a four-year vesting period for non-French tax residents. In addition, French tax residents must also hold the performance shares for a further period of 2 years following defi nitive allotment.
d LOSS OF RIGHTS TO THE PERFORMANCE SHARES
Under certain circumstances, such as resignation or termination of employment, the right to performance shares will be lost during the vesting period.
The right to performance shares may be maintained if the benefi ciary’s employer company is sold outside the Group.
b) Financial year 2013: Information about performance shares grantedAt its Meeting on March 13, 2013, the Board of Directors decided to grant 636,920 performance shares, including 33,500 to the Chairman and Chief Executive and 70,200 to the ten largest grants made to the Group’s employees other than the Chairman and Chief Executive Offi cer.
The detail of the Chairman and Chief Executive Offi cer’s grant is available in Section 3.4.3 i.
The applicable performance conditions are presented in Section 3.5.1 b.
Lafarge - Registration Document 2013 • 113
CORPORATE GOVERNANCE AND COMPENSATION3.5 Long-term incentives (stock options and performance share plans)

c) Information on 2013 outstanding plans
PERFORMANCE SHARES GRANTED FROM MARCH 25, 2009 TO MARCH 13, 2013
AGA 2009 03/25/2009
AGA 2010 03/24/2010
AGA 2011 03/15/2011
AGA 2011 05/12/2011
AGA 2012 03/15/2012
AGA 2013 03/13/2013
Allotment authorized by the Shareholders’
Meeting of 05/03/2007 05/06/2009 05/06/2009 05/12/2011 05/12/2011 05/12/2011
Date of allotment by the Board of Directors 03/25/2009 03/24/2010 03/15/2011 05/12/2011 03/15/2012 03/13/2013
Performance shares initially granted (total) 230,758 169,605 328,755 20,000 483,967 636,920
Of which to Directors and Chairman and Chief
Executive Officer
Bruno Lafont - - - 20,000 20,000 33,500
Initial beneficiaries (total) 2,461 2,032 2,257 1 1,950 1,733
French tax residents 693 547 516 1 630 454
Non-French tax residents 1,768 1,485 1,741 0 1,320 1,279
Date of definitive allotment
French tax residents 03/25/2011 03/24/2012 03/15/2014 05/12/2014 03/17/2015 03/15/2016
Non-French tax residents 03/25/2013 03/24/2014 03/15/2015 N/A 03/15/2016 03/14/2017
Date performance shares can be transferred
French tax residents 03/25/2013 03/24/2014 03/15/2016 05/12/2016 03/17/2017 03/16/2018
Non-French tax residents 03/25/2013 03/24/2014 03/15/2015 N/A 03/15/2016 03/14/2017
Performance shares cancelled (1) 31,756 32,345 44,995 0 43,594 44,150
Performance shares definitively allotted
at December 31, 2013 (1) 199,002 45,170 955 0 191 0
PERFORMANCE SHARES OUTSTANDING
AT DECEMBER 31, 2013 0 92,090 282,805 20,000 440,182 592,770
(1) According to the plan rules.
d) Financial year 2014: Performance shares grantOn March 11, 2014, the Board of Directors granted 331,745 performance shares, of which 23,000 were granted to the Chairman and Chief Executive Offi cer.
3.5.4 MULTI-YEAR VARIABLE COMPENSATION
In March 2013, the Board of Directors instituted a long-term incentive program in the form of the allocation of a “Value Enhancement Bonus” designed to recognize strong growth in Lafarge’s share price over the long term.
Information on the terms of the “Value Enhancement Bonus” granted to the Chairman and Chief Executive Offi cer is available in Section 3.4.1 paragraph d.1.
TOTAL OF THE TEN LARGEST PERFORMANCE SHARES GRANTS MADE TO THE GROUP’S EMPLOYEES OTHER THAN THE CHAIRMAN AND CHIEF
EXECUTIVE OFFICER
Total number of performance shares granted Plan
Performance shares granted during the 2013 financial year to the ten Group’s employees having received the largest grants (global information)
Lafarge S.A. 70,200 AGA 2013-13/03/2013
• Lafarge - Registration Document 2013114
CORPORATE GOVERNANCE AND COMPENSATION33 3.5 Long-term incentives (stock options and performance share plans)

3
3.6SHARE OWNERSHIP
3.6.1 DIRECTORS, CHAIRMAN AND CHIEF EXECUTIVE OFFICER AND EXECUTIVE OFFICERS SHARE OWNERSHIP
Based on our knowledge, the Directors, Chairman and Chief Executive Offi cer and Executive Offi cers listed in Section 3.3 (Executive offi cers) held together 0.03% of our share capital and 0.04% of voting rights at December 31, 2013.
3.6.2 TRADING IN LAFARGE SHARES BY DIRECTORS, CHAIRMAN AND CHIEF EXECUTIVE OFFICER AND EXECUTIVE OFFICERS
The following transactions in Lafarge shares were carried out by our Directors, Chairman and Chief Executive Offi cer and Executive Offi cers in 2013:
NameNature
of transactionUnit price
(euros)
Total amount of transaction
(euros)
Type of financial instrument
Place of transaction
Date of transaction
Thomas Farrell Acquisition USD70.20 USD84,240.00 Lafarge shares Euronext Paris March 21, 2013
Bruno Lafont Acquisition 53.8809 188,583.15 Lafarge shares Euronext Paris May 17, 2013
Jean-Carlos Angulo Acquisition 53.65 9,657.00 Lafarge shares Euronext Paris May 17, 2013
Jean-Jacques Gauthier Souscription 30.74 160,063.18 Lafarge shares Euronext Paris May 22, 2013
Jean-Jacques Gauthier Sale 54.32 255,684.24 Lafarge shares Euronext Paris May 22, 2013
Jean-Carlos Angulo Acquisition 53.35 9,869.75 Lafarge shares Euronext Paris June 10, 2013
Guillaume Roux Acquisition 48.305 24,152.50 Lafarge shares Euronext Paris June 25, 2013
Jean-Carlos Angulo Souscription 30.74 186,714.76 Lafarge shares Euronext Paris September 13, 2013
Jean-Carlos Angulo Sale 51 309,774.00 Lafarge shares Euronext Paris September 13, 2013
Group Executives (including Directors and members of the Executive Committee) are prohibited from trading in the Company’s securities during non-authorized periods according to internal insider dealing rules.
These periods start thirty days prior to the date of publication of quarterly, half-yearly or annual results and end the day following publication (or ten trading days after such publication for sales of performance shares or the sale of shares obtained through the exercise of stock options, when the sale and the exercise are simultaneous).
Lafarge - Registration Document 2013 • 115
CORPORATE GOVERNANCE AND COMPENSATION3.6 Share Ownership
3.7IMPLEMENTATION OF THE PRINCIPLE “COMPLY OR EXPLAIN”
OF THE AFEP-MEDEF CODE
The summary table below lists the exceptions to implementation of the recommendations of the Afep-Medef Code.
Afep – Medef recommendationswhich are not applied
Lafarge’s Position – Explanation Reference
Independence criteria of the Directors
Article 9.4 of the Code: “The criteria to be
reviewed by the Committee and the Board in
order for a Director to qualify as independent
[…] are the following: […] not to have been
a Director of the corporation for more than
12 years”.
The Board of Directors did not apply the recommended 12-year
limitation on length of service.
The Board considers that in a long-term business, where
management is stable, serving as Director for a long period of
time can bring more experience and authority, increasing the
Directors’ independence.
To date Mrs Hélène Ploix has been a director of Lafarge S.A. for
over 12 years. The Board however considers that, particularly
in light of the effective contribution of Mrs Ploix to the work
of the Board, of her extremely rigorous approach and great
professionalism in particular demonstrated as Chairman of the
Audit Committee, Mrs Ploix classifies as an independent Director.
It is specified that in addition to Mrs Ploix the Board of Directors
is composed of 8 independent Directors out of 15 members
and that the Board of Directors remains composed of a majority
of independent Directors whatever the position on the 12-year
lenght of service criteria. In addition, Mrs Ploix no longer chairs
the Audit Committee since the Board of February 18, 2014.
Section 3.1.4 – paragraph
“Independence Criteria”
Audit Committee
Article 16.2.1 of the Code: “The time available
for reviewing the accounts should be sufficient
(no less than two days before review by the
Board).”
Audit Committee meetings are held on the day preceding Board
meetings
For practical reasons, in particular as a majority of Audit
Committee members reside abroad, Audit Committee meetings
usually take place on the day preceding the Board meeting.
Taking into account this constraint and to enable the Audit
Committee to carry out the full extent of its duties, the Board’s
internal rules state that all pertinent documents and information
must be provided to it by the Chairman and Chief Executive Officer
on a timely basis. Committee papers are therefore sent to Audit
Committee members sufficiently ahead of Board and Committee
meetings and at least three days before such meetings, giving
them sufficient time to review the accounts before meetings.
Section 3.2.2 – paragraph
“Audit Committee”
• Lafarge - Registration Document 2013116
CORPORATE GOVERNANCE AND COMPENSATION33 3.7 Implementation of the principle “Comply or Explain” of the Afep-Medef Code

3
Afep – Medef recommendationswhich are not applied
Lafarge’s Position – Explanation Reference
Employment contract of the Executive Director
Article 22 of the Code: “When an employee
is appointed as executive Director, it is
recommended to terminate his or her
employment contract with the company or
with a company affiliated to the group, whether
through contractual termination or resignation.”
The employment contract of the CEO is maintained given his length
of service
The Board considers that its decision to maintain Bruno Lafont’s
employment contract initially entered into on January 1, 1983 is
warranted:
d in view of his 31 years’ service with the Group (and 24 years’
performance of his employment contract until it was suspended
in 2006 when he was appointed Chief Executive Officer);
d as it encourages an internal promotion policy allowing for the
appointment of Corporate Officers (mandataires sociaux) from
among experienced senior executives (cadres dirigeants) with
in-depth knowledge of the industry and markets on which
Lafarge operates and for whom the loss of rights deriving
from their employment contracts and length of service (e.g.,
contractual severance compensation under the collective
bargaining agreement) would act as a drawback.
Section 3.4.3 – paragraph j
“Employment contract
and Severance arrangements
for the Chairman and Chief
Executive Officer”
Reinvestment of performance shares in shares
upon allotment
Article 23.2.4 of the Code: “Furthermore, it is
necessary to ensure that: […] in accordance
with terms determined by the Board and
announced upon the award, the performance
shares awarded to executive Directors are
conditional upon the acquisition of a defined
quantity of shares once the awarded shares
are available.”
There is an alternate obligation to hold 50% of the performance
shares
The Chairman and Chief Executive Officer is required to hold 50%
of shares resulting from the exercise of stock options for each
allocation and 50% of performance shares acquired at the end
of the holding period for each allocation, until the shares held by
the Chairman and Chief Executive Officer (whatever their origin)
represent an aggregate amount equivalent to three years of their
last fixed pay (based on a calculation taking into account the
share price (i) at the time of each exercise of stock options or (ii)
at the end of the holding period for performance shares). This
rule is applicable to all exercises of options carried out for options
awarded that have not yet been exercised and to all performance
shares granted yet to be acquired, until the end of the Chairman
and Chief Executive Officer’s mandate.
The Board of Directors of Lafarge S.A. considers that the
demanding holding rule described above achieves the same
objective as the recommendation of the Afep-Medef Code,
making it unnecessary to impose a further obligation on
Corporate Officers regarding the purchase of a defined quantity
of shares upon definitive allotment of performance shares. This
is particularly the case for Mr Bruno Lafont given the number of
shares already held by the Chairman and Chief Executive Officer
further to past acquisitions and amounting to 27,506 shares as at
December 31, 2013.
Section 3.4.3 I.4 – paragraph
“Holding rule – hedging
instruments”
Lafarge - Registration Document 2013 • 117
CORPORATE GOVERNANCE AND COMPENSATION3.7 Implementation of the principle “Comply or Explain” of the Afep-Medef Code

• Lafarge - Registration Document 2013118
CORPORATE GOVERNANCE AND COMPENSATION33

119
44.1 Introduction .................................... 120
4.2 Building communities ......................... 1214.2.1 Health and safety: our fi rst priority .............................. 1214.2.2 Employment, employee diversity and skills ................. 1224.2.3 Community development and outreach ...................... 1264.2.4 Sustainable supply chain ........................................... 127
4.3 Building sustainably ........................... 1284.3.1 Sustainable construction and cities ........................... 1284.3.2 Access to housing ....................................................... 129
4.4 Building the circular economy ............... 1304.4.1 C0
2 and air emissions ................................................. 130
4.4.2 Natural resources – biodiversity and water ................. 1324.4.3 Energy consumption and resource management ........ 134
4.5 Key Performance Indicators ................. 1364.5.1 Table of Key Performance Indicators ........................... 1364.5.2 Reporting methodology ............................................... 1414.5.3 Verifi cation report on the sincerity of the
information relative to the requirements of transparency of companies on the disclosure of environmental and social topics ................................. 142
4SOCIAL AND
ENVIRONMENTAL RESPONSIBILITY
Lafarge - Registration Document 2013 • 119
4.1INTRODUCTION
This year we present for the third time our material sustainable development indicators together with our financial results. This type of integrated reporting refl ects the inseparability of sustainable development and business. Lafarge will continue to publish a separate Sustainability Report to address the specifi c needs of all its stakeholders, especially communities and extra-fi nancial rating agencies.
Lafarge is committed to transparent reporting and disclosure for the benefi t of all its stakeholders. Lafarge reports publicly on over 100 indicators related to the environment, employees, society and socio-economic development. These indicators cover both the positive contribution and negative impacts of our business on sustainability issues and the means used to manage their related outcomes. Consistent with its GRI 4-checked reporting practices, Lafarge’s reporting focuses on material issues. Material issues are those issues that are important both to the success of our business and to our stakeholders (employees, local communities, clients, architects, investors, etc.). Material issues are assessed yearly by Group senior executives and informed through input from our Stakeholder Panel.
Based on this materiality assessment, we have defined three main priorities at Group level, where Lafarge aims for world-class performance: health & safety, climate change and ethics & governance. In addition, we have developed a methodology to allow country units’ management teams to yearly perform their own materiality assessment to guide the development of their strategic plan. This ensures the integration and coherence of sustainable development issues into business strategy and the relevance of our sustainability actions locally.
The health and safety of our employees and contractors is our number one priority. In 2013 we made progress on embedding health & safety into our operations and by 2020 we want to attain world-class performance: zero fatalities and virtually no lost time incidents for our employees and contractors. We recorded a strong reduction in our lost-time injury frequency rate (LTIFR) in 2013, from 0.62 in 2012 to 0.49 . We have increased our efforts toward road safety, although the results of these actions are not yet apparent (19 fatalities occurred on roads in 2013), and occupational health, putting systems in place to establish the medical fi tness of our employees and contractors to perform their jobs and to ensure that the environment they work in is healthy.
Lafarge continued to reduce its CO2 emissions in 2013, with a 26%
reduction per tonne of cement compared to 1990. This result was achieved thanks to intensifi ed performance efforts to improve kiln energy effi ciency, increase the use of alternative fuels and develop new blended cements for a range of applications, using carbon-neutral additives. In particular, we made signifi cant progress in replacing fossil fuel with alternative fuels such as municipal waste and biomass. In 2013 non-traditional fuels represented 17.2% of our overall fuel mix, 39% of which was carbon neutral biomass.
In terms of ethics and governance, Lafarge respects the major frameworks on business ethics formulated by the United Nations: the Universal Declaration on Human Rights, the Declaration on the Rights of Indigenous People and the Guiding Principles on Business and Human Rights (also known as the ‘Ruggie principles’). In 2013 Lafarge became a Lead member of the UN Global Compact. The Group also launched an assessment of all its critical suppliers on their sustainability practices, working with EcoVadis, a company specialized in supplier assessment. Three hundred critical suppliers were assessed in 2013 and the Group’s objective is to evaluate 80% of its total spend by 2020.
2013 saw the first year of implementation of our Sustainability Ambitions 2020, an ambitious program of objectives organized around three main pillars: Building Communities, Building Sustainably and Building the Circular Economy. Under the Building Communities pillar, we made progress towards achieving our objective of having 35% of senior management positions held by women by 2020, reaching 18.6% by year-end. We launched our volunteering program, registering over 57,000 volunteering hours at more than 250 operational sites, with programs in areas such as affordable housing, education and nature conservation. We also recorded local job creation plans and education programs in 37% of our countries. With regard to our objectives under the Building Sustainably Pillar, we continued to expand our Affordable Housing Program, enabling over 120,000 people to access decent housing in 2013. Our sales of sustainable products and services represented a total of 1.8 billion euros. Under the third pillar, Building the Circular Economy, we made signifi cant progress towards our objectives for CO
2 reduction and the use of alternative fuels,
as detailed above. Finally, in terms of recycling, for which we have set very ambitious targets, we increased our sales of recycled aggregates by 88% year-on-year. We also launched our concrete recycling project, carrying out our fi rst client pours and starting commercialization of our new Stabilia™ low-strength recycled concrete.
In 2013 Lafarge was recognized as a sustainability leader by Robeco SAM and was included in the Carbon Disclosure Leadership Index France, with a score of 96/100. Lafarge Chairman and Chief Executive Offi cer Mr Bruno Lafont currently chairs the Energy & Climate Change Working Group of the European Round Table of Industrialists and the Sustainable Development Commission of the Medef (Mouvement des entreprises de France). He has also joined the Executive Committee of the World Business Council for Sustainable Development (WBCSD), where he co-chairs the Energy Effi ciency in Buildings project.
• Lafarge - Registration Document 2013120
SOCIAL AND ENVIRONMENTAL RESPONSIBILITY44 4.1 Introduction

4.2BUILDING COMMUNITIES
4.2.1 HEALTH AND SAFETY: OUR FIRST PRIORITY
We are strongly committed to promoting health and safety among our employees and contractors. Our overall safety performance has improved signifi cantly over the last ten years as we have put into place more comprehensive policies and standards. However, we still need to do more to strengthen our health and safety culture and fully embed it into our business.
We recorded a strong reduction in our Lost-Time Injury Frequency rate (LTIFR) , from 0.62 in 2012 to 0.49 in 2013. We saw improvements in on-site safety compared to previous years. However, the overall number of fatalities in 2013 did not decrease, with 26 in total.
Lost time injuries and fatalities 2013 2012 2011
Number of lost time injuries among Lafarge employees 72 105 93
Number of lost time injuries among contractors employees - on site 51 51 63
Lafarge employee fatalities – on site 2 4 8
Lafarge employee fatalities – transport 1 1 -
Lafarge employee fatalities – customer job sites - - -
Contractors employee fatalities – on site 3 5 5
Contractors employee fatalities – transport 8 6 10
Contractors employee fatalities – customer job sites - - -
Contractors employee fatalities – project sites - 1 2
Third-Parties fatalities (customer job sites, transport) 12 8 9
Lost-Time Injury Frequency rate (including fatalities) employees and contractors (number of incidents per million hours worked) 0.49 0.62 0.61
a) Our priorities: road safety and occupational healthRoad safety remains the biggest health and safety issue in the Group: 19 fatalities occurred on roads in 2013, largely among contract transporters delivering product. As part of our Sustainability Ambitions 2020, we are committed to improving transport safety, with a 60% reduction in the number of road accidents per million km against a 2012 baseline. In 2013 we started rolling out road safety workshops in our countries, involving all relevant stakeholders: Country CEO and senior management, Country Supply Chain managers and road contractors. These workshops are aimed at engaging all key players and creating solid action plans to address this topic. Other specialized programs are running in our countries. For example, our business in Greece developed the People Transport Development Program, targeting Lafarge employees and their families, with the objective of creating a safe driving culture throughout the company. 53 sessions were held in 2013, covering employees of all Lafarge sites in the country.
In terms of health, we focused in 2013 on occupational health: putting systems in place to establish the medical fi tness of our employees and contractors to perform their jobs and to ensure that the environment they work in is healthy. We are focusing on three specifi c areas of risk: noise, dust and ergonomics, setting objectives in these areas as part of
our Sustainability Ambitions 2020. In 2013 health assessment systems were developed in 60% of our countries. Going forward we will follow up on the assessments performed.
b) Progressing towards a world-class H&S cultureWe are convinced that our performance in health and safety is linked to better operational effi ciency: a safe plant is a more effi cient plant and a healthy employee is a more productive employee. This is why we are seeking to embed health and safety more strongly into our business, ensuring, for example that it is fully integrated into POM 2.0, the new operating model for our cement business, designed to improve plant mastery and competitiveness. We also maintain a database concerning the safety of our products and communicate this information to customers through "material safety data sheets."
Our commitment to health and safety must be renewed every day by each one of our employees, starting from the highest level of responsibility. Indeed, health and safety is fi rst and foremost a leadership issue and this is why part of our Group Bonus Plan depends on our managers’ individual performance and results in health and safety. Each country has decided on a targeted program to fi t their safety maturity. For example, our business in the Philippines decided
Lafarge - Registration Document 2013 • 121
SOCIAL AND ENVIRONMENTAL RESPONSIBILITY
4
4.2 Building communities

to bolster the country’s health and safety culture by engaging a US Occupational Safety and Health (OSHA) outreach trainer to provide advanced industry safety training to more than 40 members of its leadership team.
4.2.2 EMPLOYMENT, EMPLOYEE DIVERSITY AND SKILLS
a) Overview of our workforce
d HEADCOUNT
At the end of 2013, the Group had 63,687 employees, representing a net decrease of 650 employees (or 1.0 %) compared to December 2012.
This evolution takes into account the integration of the employees from the Lafarge - Tarmac joint venture in the United Kingdom (3,701 employees) and divestments in the United States, Ukraine and Honduras (concerning 1,762 employees) .
Like for like, there is a net decrease of 2,072 employees (3.2%) due to reorganizations in many countries (e.g. China and Canada) (-4.4 %), partially offset by increased workforce in emerging markets (+1.2 %) such as Brazil, India and the Philippines.
The tables below present the changes in employee headcount in 2013, 2012 and 2011 by geographical area and by activity. Figures include 100% of the headcounts of our fully and proportionately consolidated subsidiaries.
EMPLOYEES BY GEOGRAPHICAL AREA
2013 2012 2011
Headcount % 13 vs 12 Headcount % 12 vs 11 Headcount %
Western Europe 14,431 22.7% 26.1% 11,448 17.8% (6.2%) 12,202 18.0%
North America 7,752 12.2% (12.1%) 8,821 13.7% (8.2%) 9,604 14.1%
Central and Eastern
Europe 6,086 9.6% (13.6%) 7,041 10.9% (5.7%) 7,464 11.0%
Middle East and Africa 19,055 29.8% (3.0%) 19,644 30.5% (3.6%) 20,376 30.0%
Latin America 2,269 3.6% (13.1%) 2,609 4.1% 2.9% 2,535 3.7%
Asia 14,094 22.1% (4.6%) 14,774 23.0% (6.1%) 15,742 23.2%
TOTAL 63,687 100% (1.0%) 64,337 100% (5.3%) 67,923 100%
EMPLOYEES BY ACTIVITY
2013 2012 2011
Headcount % 13 vs 12 Headcount % 12 vs 11 Headcount %
Cement 37,948 59.6% (8.0%) 41,249 64.1% (4.9%) 43,392 63.9%
Aggregates & Concrete 25,009 39.3% 14.8% 21,780 33.9% (6.3%) 23,242 34.2%
Others 730 1.1% (44.2%) 1,308 2.0% 1.4% 1,289 1.9%
TOTAL 63,687 100% (1.0%) 64,337 100% (5.3%) 67,923 100%
d EMPLOYMENT
Our employment policy aims to develop our people and improve our effi ciency. Job reduction is the option of last resort. The principles of our employment policy include:
d Stakeholder dialogue: involving employees, employee and union representatives, local and national public authorities;
d Solidarity and support to facilitate internal mobility, adapted measures for departing employees, internal job placement and outplacement;
d Support to entrepreneurship and vocational training outside the Group. Our objective is to have 75% of Lafarge operations implementing a local job creation & education plan by 2020.
EMPLOYMENT
2013 2012 2011
Percentage of full-time employees 99% 99% 99%
Percentage of part-time employees 1% 1% 1%
Percentage of permanent employees 97% 96% 97%
Percentage of fixed-term contract employees 3% 4% 3%
• Lafarge - Registration Document 2013122
SOCIAL AND ENVIRONMENTAL RESPONSIBILITY44 4.2 Building communities

JOB EVOLUTION
2013 2012 2011
Number of hirings 6,991 5,544 7,400
Number of resignations 3,354 2,996 3,770
Number of retirements 993 910 776
Number of redundancies 2,025 3,298 4,308
Number of deaths 114 98 125
MEASURES TO MITIGATE JOB CHANGES
2013 2012 2011
Percentage of country units having implemented significant headcount
reduction impacting more than 5% of workforce 21% 26% 20%
Of which % of country units having set up an employment channel
for employees 65% 71% 38%
Of which % of country units having set up a local economic development
channel for local communities 29% 21% 14%
Number of Lafarge employees re-employed outside the Group (in another
company or in their own business) 1,562 851 305
d LABOR ORGANIZATION
In 2013 Lafarge worked with 32,571 out-sourced contractors (3.1% more than 2012), accounting for some 34% of the workforce (as in 2012). These fi gures do not take into account subcontractors from the Lafarge - Tarmac joint venture.
Lafarge extended its health & safety practices to contractors, contributing to a reduction in occupational accidents. Furthermore,
several pilot actions were conducted in emerging countries. They aim at:
d Improving working conditions for contractor employees;
d Professionalizing business relationships with contracting parties;
d Increasing Lafarge efficiency.
OUTSOURCING BY FIELD OF ACTIVITY
(%) 2013 2012 2011
Production 36% 36% 36%
Maintenance and cleaning 26% 27% 27%
Transport 21% 18% 20%
Security and guarding 9% 9% 11%
Others (IT, accounting, etc.) 8% 10% 6%
WORKING HOURS
2013 2012 2011
% of employees working on (3) 8h shifts 14.1% 15.9% 15.0%
% of employees working on (2) 8h shifts 8.7% 8.2% 9.4%
Lafarge - Registration Document 2013 • 123
SOCIAL AND ENVIRONMENTAL RESPONSIBILITY
4
4.2 Building communities

d COMPENSATION & BENEFITS
Our compensation and benefi ts system is predominantly handled directly in each country where the Group operates. However, some core principles apply everywhere. These include a pay package consisting of a fi xed portion and a variable portion dependent on the completion of objectives (which include health and safety). Furthermore, employees are associated with the Group’s performance through the various profi t-sharing mechanisms which exist in countries where we operate.
For instance, in France, profi t-sharing agreements cover 98% of the employees. Employees can choose to make payments into the various existing company saving and retirement plans, with an employer matching contribution as the case may be. These savings benefi t from a preferential tax regime in consideration for a fi ve year holding period, save for early unblocking events as defi ned in the plans.
In 2013, under the Profi t-sharing Bonus French Law which applied for the fi rst time to Lafarge, a specifi c additional bonus of 200 euros was paid in almost all companies in France to employees present in 2012.
(For further information, see also Sections 3.5 on Long Term Incentives and 6.1.4 on Employee Share Ownership).
b) Leading business acceleration
d SKILLS DEVELOPMENT
Developing our people is a vital investment and an important lever to ensure continued growth for Lafarge. As part of our Sustainability Ambitions 2020, we have set objectives to have 75% of our key positions covered by certification programs and for 75% of our employees to complete the program for their position.
AVERAGE NUMBER OF HOURS OF TRAINING (HOURS PER PERSON)
37 3639
33
41
29
2011 2012 2013
Cadres Non cadres
Sustainability issues, including social, environmental and societal issues are included in our training programs and in a dedicated e-learning.
Our strategic orientation towards performance and innovation relies on our people to lead business acceleration. In 2013 the Group launched skill development initiatives targeted at specifi c groups spearheading our performance, innovation and commercial efforts. For example, 2013 saw the launch of our new Plant Operating Model “POM 2.0” designed to improve the mastery of the basics at our plants and make them more productive and competitive. By the end of 2014 all our plant managers throughout the world will have been trained on POM 2.0.
To support the commercial orientation of the Group, the Sales Force Effectiveness program was specifi cally designed for marketing and sales teams in Lafarge countries. In 2013, 1,400 marketing managers were trained throughout the world. Benefi ts of improved sales force effectiveness have been estimated at 105 million euros additional Ebitda in 2015 compared to 2011.
In addition, in order to evaluate each employee's own success, annual performance is assessed annually for non-managers and managers alike. This is part of tailored career development plans for each of our employees. In 2013, 92% of managers and 75% of non-managers had an annual performance review, representing a slight improvement from 2012 fi gures.
STAFF PERFORMANCE ASSESSMENT
2013 2012 2011
Percentage of managerial staff having an annual performance review
91.9% (M) / 92.4%
(F) (1) 88% 91%
Percentage of non-managerial staff having an annual performance review
73.7% (M) / 80.4%
(F) (1) 63% 62%
(1) M: Male / F: Female
• Lafarge - Registration Document 2013124
SOCIAL AND ENVIRONMENTAL RESPONSIBILITY44 4.2 Building communities

d DIVERSITY AND INCLUSION
Through diversity and inclusion, we aim to create an organization where our employees feel involved, respected and connected, so that more people with a wider range of backgrounds succeed. This will make our decision-making more effective, stimulate creativity and generate new business, contributing to our Group for years to come. The strong commitment to increasing Group performance and innovation thanks to diversity and inclusion is refl ected in our Sustainability Ambitions
2020 objectives of having 35% of senior management positions held by women and 75% of our countries with a high level of diversity and an inclusive work environment. In order to progress on our ambitions, we designed and implemented in all countries in 2013 the Diversity & Inclusion Maturity Level, which assesses the following criteria: gender diversity at senior management level; diversity of pipeline for senior management positions and the extent to which work environments are inclusive.
INCREASING NUMBER OF WOMEN IN SENIOR MANAGEMENT
2013 2012 2011
Boards of Directors 20.0% 18.8% 17.6%
Senior executives and managers (Lafarge grades 18+) (1) 18.6% 16.4% 15.8%
Senior executives (Lafarge grades 23+) 12.1% 11.2% 10.8%
Senior managers (Lafarge grades 18-22) (1) 19.1% 16.7% 16.2%
Managers (all categories) 20.3% 19.7% 18.8%
Non-managers employees 14.7% 14.9% 15.0%
(1) Employees from the joint venture Lafarge -Tarmac in the United Kingdom are not accounted for due to a difference in categories for seniority levels.
COUNTRY MATURITY LEVEL ON DIVERSITY AND INCLUSION
1
2
3
4
5
7.5%
45.0%
17.5%
5.0%
25.0%
1.Excellent (A)2.Good (B)3.Average (C)4.Below average (D)5.No answer
COUNTRYMATURITY LEVELS
ON DIVERSITY& INCLUSION
c) People engagementWell-being at work is an essential factor for employee motivation and in turn for Group performance, through for instance a reduction in employee turnover.
d LAFARGE EMPLOYER OF CHOICE
As part of its Sustainability Ambitions 2020 Lafarge aims to be recognized as an “Employer of choice” in at least 20 countries. In 2013 our businesses in Morocco, Brazil and France were recognized as Employer of choice. Moreover 18 countries, including Poland, India, and Nigeria, implemented surveys dedicated to well-being at work or employee satisfaction. While the 2013 global turnover resulting from all Company departures (including divestments, redundancies, retirements, etc.) was 16.1%, Lafarge continues to attract and retain talents, since the employee turnover rate for those employees choosing to leave the Group (also included in the global turnover) was only 5.3%.
d SOCIAL DIALOGUE FOR A GLOBAL AND SHARED STRATEGY
Lafarge values the involvement of employee representatives, especially in a rapidly changing business environment. In May 2013, Lafarge signed with the Building and Wood Workers’International (BWI) and IndustriALL Global Union a new Global Framework Agreement on corporate social responsibility and international industrial relations. This agreement was signed in the presence of the ILO Director General.
At country level, employees and management have regular exchanges on Group strategy. In 2013, 82.8% of countries informed their employees on business and strategy. In addition, health & safety and well-being at work remain the most discussed topics as part of our social dialogue. At the European level, Lafarge signed a declaration in May 2013 with its European Works Council and the EFBWW on well-being at work which aims to enshrine key principles and promote Group best practices. Today 97.5% of our employees benefi t from a Health & Safety Committee, allowing us to improve our safety results (see Section 4.2.1 of the report).
Lafarge - Registration Document 2013 • 125
SOCIAL AND ENVIRONMENTAL RESPONSIBILITY
4
4.2 Building communities

EMPLOYEES COVERED BY COLLECTIVE AGREEMENTS
2013 2012 2011
Health and safety 62% 62% 59%
Restructuring 58% 58% 57%
Compensation and benefits 64% 62% 58%
Others 36% 28% 35%
Staff employees represented by staff representatives or trade union
organizations 64% 70% 70%
Entities with collective agreements 75% 78% 74%
Entities having informed their employees on strategy 83 %
4.2.3 COMMUNITY DEVELOPMENT AND OUTREACH
We are a local business. Our products and solutions - manufactured and sold locally - are essential to the economic growth of the regions in which we operate. In turn, our development is closely linked to that of the communities around our sites: for Lafarge to thrive over the long term so must our communities. We have therefore set ourselves ambitious objectives to promote local socio-economic development, covering volunteering, local job creation and structuring engagement with stakeholders. In 2013 we focused on putting the organization into place to help our countries achieve these ambitions, in line with the Groups' integrated approach.
a) Integrated approach to stakeholder engagementStakeholder engagement facilitates the delivery of our business objectives and supports the achievement of our Sustainability Ambitions 2020. This is why we believe that we must have an integrated approach to this topic. Whether we are promoting more sustainable water management, introducing a new alternative fuel or working with our transport contractors on road safety, there is an impact on the communities around our sites. Therefore, it is necessary to dialog and
involve our stakeholders as part of the project. Our engagement with communities is guided by our recently updated Group methodology and toolkit, which help sites structure their engagement and evaluate their actions.
Hence, in 2013 52% of sites met regularly with stakeholders. Over 3,300 meetings took place (a 30% increase over 2012). 28% of these meetings were formal settings, with the remainder in more informal settings. Around 1,900 community programs were undertaken. 25% of these programs concentrated on promoting education and skills development, 16% focused on health issues and 14% were dedicated to job creation. This increased level of engagement can be contrasted with a reduced number of managers having participated in training on the topic (46% in total) and the reduced number of sites with action plans in place (29%).
The benefi t of increased engagement can perhaps be seen in the reduction of site managers experiencing difficult relations with stakeholders (38%, down from 45% in 2012). Of those experiencing diffi culties, 59% classifi ed the issue as minor, with the remainder seeing them as more serious issues impacting on the site’s image or business. Examples of sites where diffi cult relations are evident can be found on the Lafarge website.
Total CementAggregates
and Concrete
Sites managers mapping their stakeholders 54% 69% 39%
Sites managers developing action plans 30% 48% 10%
Sites managers meeting regularly with their local stakeholders/representatives of local communities 63% 86% 40%
Sites managers running corporate social responsibility actions 70% 83% 57%
b) Launching our Group volunteering programThe community-related objectives that we set as part of our Sustainability Ambitions 2020 program are bold. Volunteering is a relatively new initiative at Group level and in 2013 we worked on implementing the necessary infrastructure to support its roll-out, identifying sponsors in each country and preparing tools to assist with deployment. In 2013 a total of over 57,000 hours were recorded, with volunteering schemes in place at over 250 operational sites and programs in areas such as affordable housing, education and nature conservation. Our operations in the United States recorded 15,000
volunteering hours, for example, working with Wildlife Habitat Council on education initiatives close to our operations. In Ecuador, employees are encouraged to propose community-based volunteering activities, ensuring strong mobilization and more effective, targeted actions.
c) Managing our socio-economic footprintIn 2013 we continued to deploy the tool developed in partnership with CARE France to measure the socio-economic footprint of our operational sites, running key missions at Arasmeta plant in India and Kanthan plant in Malaysia. Quantitative and qualitative data collected
• Lafarge - Registration Document 2013126
SOCIAL AND ENVIRONMENTAL RESPONSIBILITY44 4.2 Building communities

in Malaysia, for example, provided useful input for the plant’s local stakeholder action plan. The plant today supports over 12,000 people in the surrounding area and runs over 30 community programs, focusing mainly on education initiatives. The plant is using this information and feedback from face to face interviews to strengthen its stakeholder engagement. This is particularly important at the current time, in the face of some local concerns about the site's quarry development program.
An area in which we can clearly contribute to local socio-economic development is in programs to support local employment, provide vocational training or basic education. 37 % of our countries had such a plan in place by the end of 2013; our aim is to increase this to 75% by 2020. In Algeria, for example, we set up the Hirfati (‘My profession’ in arabic) program to train local unemployed builders in masonry fi nishing skills, also helping them to fi nd employment with local customers after their training is completed. Our cement business in Bangladesh organized free training courses in solar panel installation and mobile servicing, areas identifi ed as offering signifi cant job opportunities in the region. More than 120 trainees completed the courses in the fi rst two years, all of whom subsequently found employment. Finally, the Beoçin Business Park project initiated by our team in Serbia in 2012 continued to thrive, with the arrival of a fourth investor in 2013, bringing the total number of jobs created since the start of the project up to 350.
4.2.4 SUSTAINABLE SUPPLY CHAIN
The United Nations Principles on Human Rights and business (also known as the Ruggie principles) state that as part of their responsibility to respect Human Rights, companies must carry out due diligence to ensure that their commercial partners also respect these rights. Over the past four years, Lafarge has worked towards the integration of sustainability assessment into the sourcing process. Ensuring the sustainability of our supply chain contributes to our operational performance and helps us deliver on other key business objectives such as the use of 50% of alternative fuels, which requires reliable and sustainable strategic sourcing.
a) Ensuring respect of United Nations Global Compact principles As part of our Sustainability Ambitions 2020, we have set an objective for all purchase orders to include a requirement to adhere to the United Nations Global Compact (UNGC) principles. Third party assessment must also be carried out for critical suppliers. In 2013 we focused mostly on the fi rst objective, which resulted in 99% of our purchase orders including the requirement to adhere to UNGC principles. This result is in line with the objective announced in our 2012 Sustainability Report.
b) Evaluating our Suppliers' sustainability practices We also continued our efforts to assess critical suppliers based on their sustainability practices. We engaged EcoVadis, a company that specializes in supplier assessments, to carry out a category risk mapping of our suppliers to assess their sustainability risk. As part of this assessment, we are evaluating suppliers on potential risks linked to social, environmental and ethical practices. In 2013, 300 critical suppliers were assessed by a third party in the United States, Canada, France, Algeria, Germany, Greece, Pakistan, India, Bangladesh, China, Malaysia, Philippines, Morocco, and South Africa. Because this is a new fi eld of endeavor for Lafarge, we chose to start implementing this ambition in very diverse countries in terms of Human Rights risks, quality of suppliers’ base and size of our business.
In 2014 we aim to extend the roll-out of this objective to all countries. We have also revised our initial target upwards, with the aim of assessing another 300+ critical suppliers in 2014 and 80% of our total spend by 2020.
In 2013 to help our suppliers go through the assessment process, we held several webinars to train our in-country purchasing teams and we developed a brochure translated into the Group’s main languages. We also identifi ed key success factors for implementation, including inclusion of this ambition in purchasing teams’ annual objectives, awareness raising and capacity building for both purchasing teams and suppliers.
c) Contributing to raising the bar in sustainability practices Once suppliers have been evaluated, this information will provide the country purchasing teams with an accurate mapping of their suppliers’ practices and will be used to establish corrective action plans when required. The benefi t for the suppliers is that they will receive feedback on their practices, which will allow them to work with Lafarge on improving performance. They will also be able to use a successful assessment with other potential clients to grow their business.
In 2013 we decided to include sustainability criteria in our tender processes. This commitment has been emphasized in the new Code Of Business Conduct that Lafarge requires its suppliers to endorse before doing business with them. This action will be implemented in 2014.
Finally, Lafarge is active through the World Business Council for Sustainable Development Cement Sustainability Initiative (CSI) working group devoted to supply chain sustainability. In 2013 the CSI agreed on key principles referring to United Nations Global Compact principles to include in supplier's due diligence processes.
Lafarge - Registration Document 2013 • 127
SOCIAL AND ENVIRONMENTAL RESPONSIBILITY
4
4.2 Building communities

4.3BUILDING SUSTAINABLY
4.3.1 SUSTAINABLE CONSTRUCTION AND CITIES
Increasing urbanization brings many social and environmental challenges. The construction sector as a whole must develop solutions to meet the needs of the world’s populations in terms of decent housing and infrastructure, contributing to an improvement in the quality of life in towns and cities, while ensuring that this is not to the detriment of the natural environment. With this in mind, we are harnessing our innovation to contribute to building better cities and climate change adaptation, developing high value-added products and solutions and devising new building systems in partnership with players all along the construction chain.
a) Innovating throughout the value chainWith our new Innovation organization in place, we focused in 2013 on helping our countries to develop segmented offers to meet the specifi c needs of their local markets. In Morocco, for example, we developed an offer for the mid-range collective housing segment, preparing nine construction solutions such as insulating roofs, fast-placing screed and a lost-framework solution to allow more effi cient, faster construction. In the Philippines, we developed a complete solution for green roof construction in partnership with Sika, a manufacturer of waterproofi ng membranes, using Lafarge lightweight aggregates. Aesthetically pleasing, green roofs can also contribute to more effi cient water management, help reduce the ‘heat island effect’ in towns and cities and improve energy effi ciency. In France, we went a step further, licensing the ABCD+ positive-energy house concept developed in partnership with French home builder Cécile Robin to other individual home builders across the country. This concrete detached house combines traditional techniques with innovative materials such as pumice-stone concrete blocks for optimal energy effi ciency.
b) Developing specialized in-house expertiseOur innovation strategy is supported by our research center near Lyon, France. The world’s leading building materials research facility, its research projects are closely aligned with the needs of our businesses. For example, our research teams are working on solutions
for energy effi ciency, renovation – particularly in developed countries – and affordable housing; but also binders, recycled asphalt and aggregates. They work in close partnership with our global network of local development laboratories. A fourth laboratory was inaugurated in Algeria in November 2013, adding to existing facilities in France, India and China. Further laboratories are planned in Brazil and Malaysia in the short term and by 2015, the Group should boast around ten of these facilities, allowing us to adapt our solutions to meet local needs, constraints and market opportunities.
Our dedicated team of in-house specialists continued to develop the Effi cient Building™ catalog of cement-based construction systems, now numbering over 50. This catalog includes information on technical and environmental performance, aesthetics, cost, along with commercialization guides, calculation tools and guides for local adaptation. An example of a construction system from the Effi cient Building™ catalog is the double-skin concrete wall, developed by Lafarge experts working in partnership with French construction company GBE Innovation. Consisting of a high-performance insulating panel placed between two layers of concrete, this system eliminates thermal bridges, a major case of energy loss in buildings. Furthermore, since interior walls can be left exposed, the thermal inertia of concrete can be used to regulate interior temperature.
c) Partnering with other players in the construction chainIn 2013 we continued to reinforce our high-level specialized sales functions: Construction Specialists, deployed in each country, and International Key Account Managers. Liaising with specifi ers and decision-makers at a very early stage in construction projects, their role is to analyze particular needs and offer appropriate products and solutions. We also continued to develop partnerships with other players in the construction chain in 2013 through global programs such as WBCSD’s Energy Effi ciency in Building (EEB 2.0) initiative and at country level. In Morocco, for example, we developed a partnership with Reichen & Robert and Novec, respectively the urban planning agency and engineering design fi rm in charge of the Zenata new ‘eco-city’ project.
• Lafarge - Registration Document 2013128
SOCIAL AND ENVIRONMENTAL RESPONSIBILITY44 4.3 Building sustainably

4.3.2 ACCESS TO HOUSING
We have developed our affordable housing project to help meet the enormous challenge of providing the world’s population with decent, sustainable housing. Over the past two years we have developed a unique portfolio of affordable housing projects across a range of geographies, including Northern and Sub-Saharan Africa, Asia and Eastern Europe. By the end of 2013, projects had been launched in 15 countries, benefi ting over 120,000 people. While contributing considerable social benefi ts, this is not an exercise in philanthropy: fi ve projects were already profi table in 2013 and all are expected to deliver additional Ebitda in 2014.
a) Structuring our offerOur affordable housing offer is organized around four specifi c market segments:
d Microfinance, to help people in emerging markets to fund the construction, renovation or extension of their homes
d Earth and cement solutions, to improve the durability of traditional earthen homes today used by an estimated 2 billion people
d Bagged concrete for slum rehabilitation
d Social housing in emerging markets, as well as developed countries.
b) Scaling up our microfi nance projectBy the end of 2013 microfi nance projects for affordable housing were in place and profi table in Indonesia, Serbia, the Philippines and Zambia. Other projects were also in the pipeline in Morocco, Sri Lanka and Bangladesh. In order to achieve our ambitious objectives in this area, we are working in partnership with local microfi nance institutions (MFIs), banks and retailers. In the Philippines, for example, our affordable
housing solutions are today available in over 200 outlets: either banks proposing microfi nance loans bundled with building materials – with over 1,000 credit offi cers trained so far - or retailers proposing materials bundled with microfi nance. In addition to products and access to fi nance, our microfi nance offer includes technical support from architects and developers throughout construction projects.
Following the launch of a partnership with the French Development Agency (AFD), we announced in October 2013 the AFD’s contribution of 5 million euros to the LAPO (Lift Above Poverty Organization) microfi nance institution, our partner in Nigeria. This will enable low-income families to fi nance the construction, expansion and renovation of their homes, helping to improve their living conditions.
c) Construction solutions tailored to local market needsIn 2013 we continued to roll out our innovative solution to deliver ready-mix concrete in bags to slums in Mumbai, helping to improve the quality and durability of housing in these informal settlements. We also developed solutions adapted to the rural market, with the launch of DuraBric in Malawi. This new cement binder can be mixed with soil to manufacture soil stabilized blocks for individual home building. Adapted to local construction methods, these blocks do not need to be burnt on wood fi res, leading to less deforestation and soil erosion. They are also more durable and water resistant than traditional burnt earth bricks.
Our affordable housing offer is not limited to emerging markets. In 2013 we continued to develop construction solutions for the social housing segment in developed markets, optimizing the use of the modular properties of concrete to develop projects such as Les Hauts Plateaux, the vertical housing estate in Bègles, France that was inaugurated in October 2013.
Lafarge - Registration Document 2013 • 129
SOCIAL AND ENVIRONMENTAL RESPONSIBILITY
4
4.3 Building sustainably

4.4BUILDING THE CIRCULAR ECONOMY
4.4.1 C02 AND AIR EMISSIONS
As part of our Sustainability Ambitions 2020, we have set an aggressive target to reduce our net CO
2 emissions per tonne of cement by 33%
in 2020 compared to 1990 levels. We are also committed to further reductions in our NOx, SO
2, dust and mercury emissions, focusing on
those plants where emissions are highest. Finally, in order to reduce potential negative impacts for the communities living around our sites, we have set objectives to improve the visual impact of our operations and reduce night-time noise.
a) Continuing to reduce our carbon footprintAt the end of 2013 we recorded a 26% reduction in CO
2 emissions
per tonne of cement, representing a 202kg reduction in CO2 emitted
per tonne of cement compared to 1990 (Kyoto reference year) and around 31.3 million tonnes of carbon emissions avoided in 2013. In 2013 our emissions from electricity consumption (Scope 2) were stable compared to 2012 levels, at 8.4 million tonnes, and emissions induced by our activities (Scope 3) amounted to 2.4 million tonnes. This is the fi rst year that we are reporting on these Scope 3 emissions, focusing specifi cally on emissions related to the transportation of our products, where the impact is highest and where we can also ensure maximum accuracy of our reporting. Our Carbon Disclosure Project score for carbon disclosure in 2013 was 96/100 and we are included in the Carbon Disclosure Leadership Index for France.
The further improvement in our CO2 performance was achieved thanks
to:
d B etter kiln energy efficiency;
d A n increase in our use of alternative fuels, including carbon-neutral biomass ;
d The continuing reduction in the clinker intensity of our cements, as we develop blended cements for a range of different applications. Our clinker factor was 71.9% in 2013, compared to 72.6% in 2012 and 84.5% in 1990 .
In addition to the ongoing industrial performance programs that have been driving these changes, our R&D teams continued to develop our new generation lower carbon Aether® cements in 2013, working on formulations for different ready-mix and precast applications.
We also signed a partnership with the US start-up Solidia Technologies® to industrialize an innovative technology involving CO
2 capture to
produce pre-cast concrete. Finally, we continued to develop new products and solutions to improve building energy effi ciency, such as our Thermedia™ range of structural insulating concrete, or our Effi cient BuildingTM construction systems.
GROSS CO2 EMISSIONS (kg per tonne of cement)
1990
2006
2007
2008
2009
2010
2011
2012
2013
783
670 660 645 627 620 610 603 597
In 2013 our gross emissions per tonne were 23.9% lower than 1990 levels.
NET CO2 EMITTED (kg per tonne of cement)
1990
2006
2007
2008
2009
2010
2011
2012
2013
777
658 646 630 612 604 592 585 577
In 2013 our net emissions per tonne were 26.0% lower than 1990 levels.
• Lafarge - Registration Document 2013130
SOCIAL AND ENVIRONMENTAL RESPONSIBILITY44 4.4 Building the circular economy

CARBON EFFICIENCY IN OPERATIONS
1990
2006
2007
2008
2009
2010
2011
2012
2013
100
150
161164
154 156
167169
167
100
127
134 133
121 121127 127
123
Net CO2
Tons Cement Produced
In 2013 we produced 67 % more cement than in 1990 but our CO2
emissions increased by only 23% over the same period.
GROSS CO2 EMISSIONS (million tonnes)
1990
2006
2007
2008
2009
2010
2011
2012
2013
49 44 46 42 30 30 30 30 26
25 51 55 59 62 61 66 67 66
Developed Countries Emerging markets
In 2013 our gross emissions decreased 3.6 % vs. 2012 while our production decreased 2.4 %.
NET CO2 EMISSIONS (million tonnes)
19
90
2006
2007
2008
2009
2010
2011
2012
2013
49 43 44 40 28 28 28 28 24
25 51 55 58 61 61 65 66 65
Developed Countries Emerging markets
In 2013 our net emissions decreased by 4.2 % compared to 2012 while our production decreased 2.4 %.
CLINKER FACTOR (percentage)
1990
2006
2007
2008
2009
2010
2011
2012
2013
85%
78% 77% 76% 75% 74% 73% 73% 72%
Clinker, the component of cement whose production is associated with CO
2 emissions has decreased 14.9% since 1990.
Lafarge - Registration Document 2013 • 131
SOCIAL AND ENVIRONMENTAL RESPONSIBILITY
4
4.4 Building the circular economy

b) Managing our air emissionsOur Sustainability Ambitions 2020 program includes demanding new targets for reductions in our NOx, SO
2 and dust emissions, set against a
new baseline year of 2010. In 2013 we achieved signifi cant reductions in all emissions: -26% for dust, -6% for SO
2 and -17% for NOx. These
improvements were achieved through a program focusing on those plants where emissions were highest. We installed new bag fi lters to reduce dust emissions at plants in Romania, Moldova, Russia, Uganda, and Tanzania, and introduced NOx and/or SO
2 abatement technologies
at two of our plants in the USA. There are also nine ongoing projects to reduce NOx emissions at plants in China.
As part of our Sustainability Ambitions 2020, we also aim to reduce mercury emissions per ton of clinker by 30% compared to 2010 levels. This year we are reporting on these emissions for the fi rst time, recording a slight reduction of 1%. In 2013 we focused on identifying the sources of mercury at those plants where emissions are highest.
NOX EMISSIONS (g/t clinker)
2005
2006
2007
2008
2009
2010
2011
2012
2013
2,4612,354
2,272
2,123
1,961
1,807
1,635 1,6121,495
There has been a 17% reduction in NOx emissions since 2010.
SO2 EMISSIONS (g/t clinker)
2005
2006
2007
2008
2009
2010
2011
2012
2013
906863
762
550
459426 423
352400
There has been a 6% reduction in SO2 emissions since 2010.
DUST EMISSIONS (g/t clinker)
2005
2006
2007
2008
2009
2010
2011
2012
2013
239
210 208 178 167 159 147 134 118
There has been a 26% reduction in dust emissions since 2010.
4.4.2 NATURAL RESOURCES – BIODIVERSITY AND WATER
a) BiodiversityManaging biodiversity and restoration over the long term is benefi cial both for the environment and for Lafarge. Quarry restoration is essential to our license to operate. The most cost-effective way of carrying out quarry restoration at our sites is to work closely with local wildlife NGOs, universities and other local stakeholders to identify the most suitable local species. These species will have a much higher survival rate and will also help to enhance local biodiversity, for the benefi t of our local communities.
• Lafarge - Registration Document 2013132
SOCIAL AND ENVIRONMENTAL RESPONSIBILITY44 4.4 Building the circular economy

d OUR SUSTAINABILITY AMBITIONS OBJECTIVES
As part of our Sustainability Ambitions 2020, we have set an objective for 100% of our aggregate quarries and cement plants to implement Biodiversity Management Plans in line with Group standards. By the beginning of 2013 these were already in place at all our sites located in or near an international biodiversity sensitive area. During 2013 we identifi ed those quarries situated in areas of local biodiversity sensitivity, using a methodology developed during our partnership with WWF International and through consultation with site personnel. In total, 22 % of our quarries are situated in areas of local biodiversity sensitivity. 33% of these have already developed a Biodiversity Management Plan and our objective is for these plans to be in place at all locally sensitive quarries by the end of 2015. Our number of quarries with rehabilitation plans at the end of 2013 stayed level at 85%. Gains in some areas were offset by changes due to mergers, acquisitions and divestments. We aim to accelerate the development of rehabilitation plans in 2014.
PROGRESS TOWARDS GROUP AMBITIONS FOR REHABILITATION AND BIODIVERSITY
201320122011
97.2% 100% 100%
86.4% 84.6% 85.1%
49.2%
99.2% 100%
Active quarries screened international biodiversity sensitivity
Active quarries with a rehabilitation plan
Active quarries with high biodiversity which have a BMP
PROGRESS WITH AMBITIONS FOR REHABILITATION AND BIODIVERSITY
Sample of 726 quarries 2013
% of Quarries with rehabilitation plans (target 100% by 2015) 85.1%
% of Quarries screened for international biodiversity sensitivity using IBAT data (1) 100%
Quarries which operate within or adjacent to an internationally protected area (2) 21.7%
Quarries which operate within or adjacent to an international protected area with site biodiversity programs 100%
Quarries which operate within or adjacent to a locally protected area (3) 19.6%
Quarries which operate within or adjacent to a locally protected area with site biodiversity programs
(target 100% by 2015) 36.6%
% of total Quarries with a biodiversity program (target 100% by 2020) 40.0%
(1) IBAT: a world database of protected areas developed by IUCN, Birdlife, UNEP, Conservation International and WCMC
(2) Quarries within 0.5 km of IUCN I – VI, Ramsar, IBA, Natura 2000 , I ncrease due to mergers and acquisitions
(3) Quarries within 0.5 km of local biodiversity sensitive area, quarries with protected habitats or species and quarries with naturally occurring caves.
d ACKNOWLEDGMENT FOR OUR ACHIEVEMENTS IN BIODIVERSITY
During 2013 Lafarge won several awards for biodiversity and quarry restoration. These included Sepolno Gravel Pit in Poland which won the European Aggregates Association (UEPG) award for restoration, for the development of a new restoration technique and Racos Quarry in Romania which won the UEPG special award for biodiversity for an outstanding biodiversity initiative involving sensitive landscaping and dialogue with stakeholders.
d CONTINUING TO RAISE THE BAR IN BIODIVERSITY MANAGEMENT
During 2013 we developed a Group strategy for biodiversity, in close consultation with our International Biodiversity Panel. This strategy includes commitments related to opening new quarries in protected areas, as well as the development of a methodology to demonstrate net positive impact through quarry rehabilitation. This strategy will be published later in 2014.
In 2014 we will focus our efforts on driving the implementation of Biodiversity Management plans in locally sensitive areas. These
should involve projects between our operations and local stakeholders, including local environmental NGOs and universities, for example, to build strong relationships between our sites and local biodiversity experts.
b) WaterAs 20% of our cement production is located in areas of water scarcity, we have both a social obligation and a business interest in managing our water impact in a responsible way. As climate change and demographic growth put increasing pressure on this essential resource in certain parts of the world, our water use and discharge and relationship with our local communities on this issue matter more than ever before.
Our efforts to improve water effi ciency have allowed us to reduce water consumption per tonne of cement by 10% since 2012.
We have been measuring and reporting the water footprint of our industrial sites for several years and continue to promote the reduction of water consumption through best practices such as rainwater harvesting, reuse of waste water and water recycling.
Lafarge - Registration Document 2013 • 133
SOCIAL AND ENVIRONMENTAL RESPONSIBILITY
4
4.4 Building the circular economy

d PREPARING THE GROUND FOR STAKEHOLDER ENGAGEMENT
In 2013 we focused our efforts on our cement operations in high-risk water basins, situated mainly in Northern and Sub-Saharan Africa, the Middle East, India and Pakistan. As part of our Sustainability Ambitions 2020 we are committed to continuing to reduce the water footprint of our operations in these zones, but also to promoting more responsible water stewardship in the wider water basin, working with the local stakeholders around our production sites. Understanding the water challenges within the basin and mapping existing stakeholders is the fi rst step towards initiating any stakeholder engagement on water-related issues. In 2013 we therefore prepared a detailed “ Basin ID” for each plant to analyze the basin in which it operates: physical characteristics, regulatory framework, current users and concerned parties, as well as any existing water initiatives. This work was carried out by our in-house environmental teams, working in partnership with local experts and NGOs. Based on this preparatory work, we will start working in 2014 on the development of partnerships in these priority basins, defi ning the appropriate type and level of local engagement for each water basin.
d STRUCTURING OUR APPROACH TO MAXIMIZE SHARED VALUE
We have identifi ed fi ve potential areas in which we could contribute to more sustainable water management. These are as follows:
d facilitating access to water for local communities;
d helping to improve water quality;
d protecting and promoting biodiversity;
d helping to reduce the risk of flooding;
d raising awareness on water-related issues through local volunteering actions and communication campaigns.
Thus, in Algeria, pipes and water points installed by our M’sila cement plant in a very arid region of the country have helped to provide the local community with easy access to water for domestic and farming purposes. Another example is in Greece, where we have set up a partnership with a local drinks company near our Volos cement plant to reuse their waste water in our industrial process. This partnership has allowed us both to reduce freshwater consumption at Volos and eliminate discharge of wastewater into the sea by the drinks company. Going forward, the Water Steering Committee set up in 2013 will provide advice and support to countries as they develop appropriate local initiatives around their sites in 2014 and beyond.
4.4.3 ENERGY CONSUMPTION AND RESOURCE MANAGEMENT
As part of our Sustainability Ambitions 2020, we aim to use 50% non-fossil fuels in our cement plants by 2020, 30% of which should be biomass. In order to achieve these very ambitious objectives, we are increasing our direct sourcing of alternative fuel, in particular municipal and agricultural waste, where we can develop shared value projects that benefit Lafarge operations, the environment and the wider community. In 2013 we continued to increase our use of alternative fuel, achieving an average fuel substitution rate of 15.8% (17.2% on an equity consolidated basis, consistent with the reference for our Sustainability Ambitions 2020 target) over the year and more than 30% in 14 countries. 64 major capital projects to improve alternative fuel usage, plus many smaller ones, were initiated in 2013. We therefore expect further improvements in our fuel substitution rate going forward.
FUEL MIX IN THE CEMENT BUSINESS
(% of total) 1990 2011 2012 2013
Coal 55.1% 46.0% 38.9% 36.7%
Coke 8.4% 17.3% 21.1% 22.6%
Oil 15.7% 7.1% 7.7% 8.6%
Gas 18.1% 16.7% 18.4% 16.3%
Waste 2.0% 9.6% 10.0% 11.5%
Biomass (pure) 0.7% 3.3% 3.9% 4.3%
TOTAL 100 .0% 100 .0% 100 .0% 100 .0%
• Lafarge - Registration Document 2013134
SOCIAL AND ENVIRONMENTAL RESPONSIBILITY44 4.4 Building the circular economy

Scaling up our municipal waste and biomass projectsMunicipal waste is a major issue in towns and cities in many emerging markets, where waste treatment facilities are either insuffi cient or non-existent. In 2013 we continued to develop our municipal waste treatment offer in a number of countries, such as Pakistan and Romania.
We also worked on scaling up our biomass projects, focusing in particular on Sub-Saharan Africa, where local farming activities generate significant amounts of agricultural waste. In 2013 our operations in Sub-Saharan Africa more than doubled their use of biomass as alternative fuel. Our cement business in Benin achieved a particularly strong increase in the use of biomass, reaching 25% in 2013 compared to 8% in 2012, complementing cotton waste – only available on a seasonable basis – with palm kernel shells.
Securing supply through strategic partnershipsGoing forward, we will continue to focus on strengthening our municipal waste offer as well as securing our supplies of biomass. In this regard, we are looking to develop agroforestry projects in a number of countries. Developed with local communities, these allow the production of high value products, crops for the local population plus biomass residues for our plants. This could therefore help us to ensure the security of our energy supply, while generating signifi cant social and environmental benefi ts for the communities around our plants. In 2013 we signed a Memorandum of Understanding with the Moringa Fund, sponsored by ONF International, to explore potential agroforestry projects in Nigeria, Kenya, Tanzania and Brazil. Pre-feasibility studies were carried out in Tanzania, Kenya and Nigeria at the end of 2013 and beginning of 2014.
Developing our recycled products offerAs part of our ongoing efforts to optimize the use of non-renewable resources, we continued to develop our sales of recycled aggregates in 2013, increasing these by 88% compared to 2012. 18% of these sales were of our A ggneo™ brand of high-quality recycled aggregates, developed for a range of higher-value applications such as road base, road shoulders and drainage systems, and which are now available in France and Canada.
We also launched our concrete recycling project as part of our Sustainability Ambitions 2020, working fi rst on the business case for ‘upcycling’ concrete, or Recycled Concrete Aggregate (RCA), into new concrete. At this stage, we are focusing mainly on non-structural applications, which represent around 65% of the overall world market. In 2013 in Canada we launched Stabilia™ low-strength recycled concrete that can be used as a base for paving stones or in utility trenches. Following laboratory trials and in-house pilots, we successfully carried out our fi rst recycled concrete pour at a client site in September, using Aggneo™ Pro RCA, for a sidewalk in the City of Mississauga in Ontario, Canada.
Commercialization of our fi rst recycled concrete products will continue in 2014, in countries such as the USA, the UK, Canada, Brazil and Qatar. We will pursue our research to allow us to incorporate all grades of recycled aggregate into concrete, including fi nes, looking at optimizing mix design and developing suitable admixtures to reduce water demand and shrinkage. Our researchers are also evaluating other recycled materials that could be incorporated into concrete, such as rice husks, plastics from inside computers or wood.
BREAKDOWN OF ALTERNATIVE FUELS
2011
2012
2013 38.2% 15.1% 27.4% 19.3%
33.9% 18.0% 28.0% 20.1%
32.6% 21.6% 25.5% 20.2%
Solid waste
Liquid waste
Pure biomass
Tyres
Lafarge - Registration Document 2013 • 135
SOCIAL AND ENVIRONMENTAL RESPONSIBILITY
4
4.4 Building the circular economy
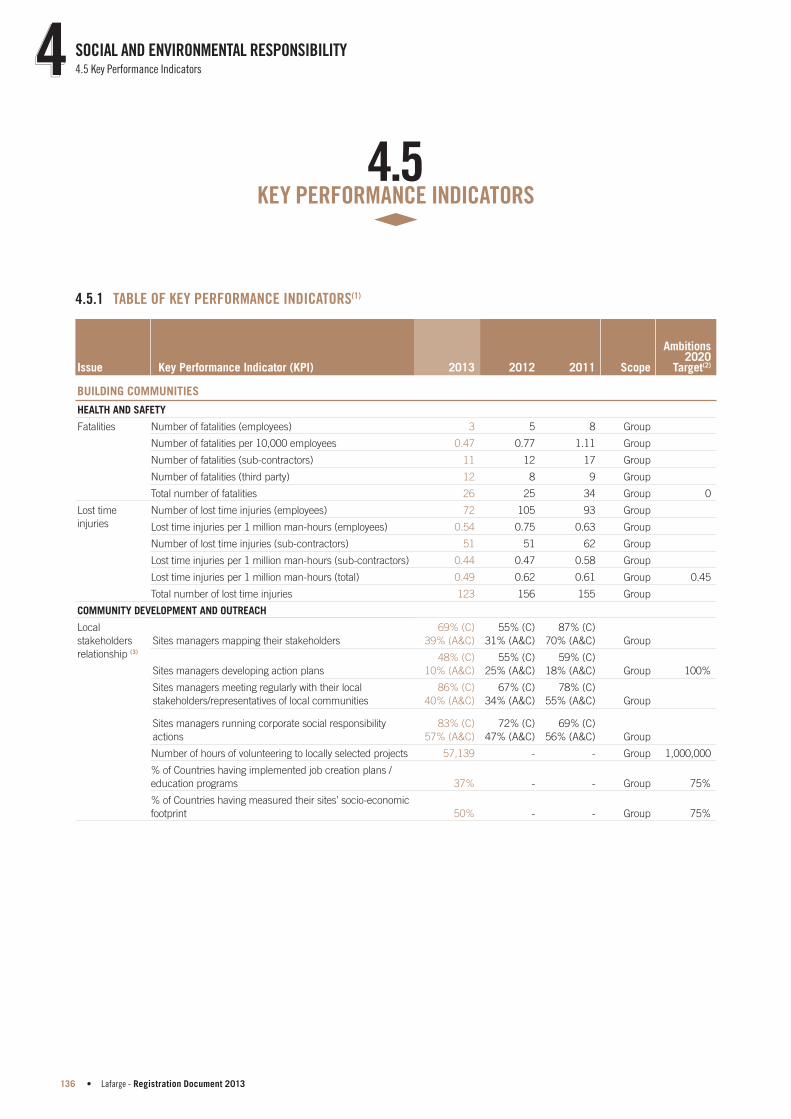
4.5KEY PERFORMANCE INDICATORS
4.5.1 TABLE OF KEY PERFORMANCE INDICATORS(1)
Issue Key Performance Indicator (KPI) 2013 2012 2011 Scope
Ambitions 2020
Target(2)
BUILDING COMMUNITIES
HEALTH AND SAFETY
Fatalities Number of fatalities (employees) 3 5 8 Group
Number of fatalities per 10,000 employees 0.47 0.77 1.11 Group
Number of fatalities (sub-contractors) 11 12 17 Group
Number of fatalities (third party) 12 8 9 Group
Total number of fatalities 26 25 34 Group 0
Lost time
injuries
Number of lost time injuries (employees) 72 105 93 Group
Lost time injuries per 1 million man-hours (employees) 0.54 0.75 0.63 Group
Number of lost time injuries (sub-contractors) 51 51 62 Group
Lost time injuries per 1 million man-hours (sub-contractors) 0.44 0.47 0.58 Group
Lost time injuries per 1 million man-hours (total) 0.49 0.62 0.61 Group 0.45
Total number of lost time injuries 123 156 155 Group
COMMUNITY DEVELOPMENT AND OUTREACH
Local
stakeholders
relationship (3)
Sites managers mapping their stakeholders
69% (C)
39% (A&C)
55% (C)
31% (A&C)
87% (C)
70% (A&C) Group
Sites managers developing action plans
48 % (C)
10% (A&C)
55% (C)
25% (A&C)
59% (C)
18% (A&C) Group 100%
Sites managers meeting regularly with their local
stakeholders/representatives of local communities
86% (C)
40% (A&C)
67% (C)
34% (A&C)
78% (C)
55% (A&C) Group
Sites managers running corporate social responsibility
actions
83% (C)
57% (A&C)
72% (C)
47% (A&C)
69 % (C)
56% (A&C) Group
Number of hours of volunteering to locally selected projects 57,139 - - Group 1,000,000
% of Countries having implemented job creation plans /
education programs 37% - - Group 75%
% of Countries having measured their sites’ socio-economic
footprint 50% - - Group 75%
• Lafarge - Registration Document 2013136
SOCIAL AND ENVIRONMENTAL RESPONSIBILITY44 4.5 Key Performance Indicators

Issue Key Performance Indicator (KPI) 2013 2012 2011 Scope
Ambitions 2020
Target(2)
EMPLOYMENT, EMPLOYEE DIVERSITY AND SKILLS
Workforce Total headcount 63,687 64,337 67,923 Group
Percentage of full-time employees 98.7% 99.1% 99.0% Group
Percentage of part-time employees 1.3% 0.9% 1.0% Group
Percentage of permanent employees 97% 96.4% 97.0% Group
Percentage of fixed-term contract employees 3% 3.6% 3.0% Group
Percentage of employees under the age of 30 14.5% 15.0% 16.1% Group
Percentage of employees between 30 and 50 63.5% 63.6% 63.0% Group
Percentage of employees above 50 22% 21.4% 20.9% Group
Turnover Employee turnover rate 16.1% 14.2% N/A Group
Voluntary employee turnover rate 5.3% 4.6% N/A Group
Number of hirings 6,991 5,544 7,400 Group
Number of resignations 3,354 2,996 3,770 Group
Number of retirements 993 910 776 Group
Number of redundancies 2,025 3,298 4,308 Group
Number of deaths 114 98 125 Group
Total number of male/female fatalities 24M/2 F 24M/1F 33M/1F Group
Employees by
business
Number of employees in cement 37,948 41,249 43,392 Group
Number of employees in aggregate and concrete 25,009 21,780 23,242 Group
Number of employees in other businesses 730 1,308 1,289 Group
Employees by
region
Number of employees in Western Europe 14,431 11,448 12,202 Group
Number of employees in North America 7,752 8,821 9,604 Group
Number of employees in Central and Eastern Europe 6,086 7,041 7,464 Group
Number of employees in the Middle East and Africa 19,055 19,644 20,376 Group
Number of employees in Latin America 2,269 2,609 2,535 Group
Number of employees in Asia 14,094 14,774 15,742 Group
Employer of
choice
Number of countries where Lafarge is recognized as
“Employer of choice” 3 - - Group 20
Training
and skills
development
Number of hours of training 1,557,717 1,577,585 1,611,339 Group
Average number of hours of training for management staff 37 39 41 Group
Average number of hours of training for non-management
staff 36 33 29 Group
Percentage of management staff having an annual
performance review (M/F)
91.9%/
92.4% 88.0% 91.0% Group
Percentage of non-management staff having an annual
performance review (M/F)
73.7%/
80.4% 63.0% 62.0% Group
% of our key positions covered by certification programs 25% - - Cement
75%
(Group)
For job families with certification programs, % of employees
with a completed program for their position 35% - - Cement
75%
(Group)
Lafarge - Registration Document 2013 • 137
SOCIAL AND ENVIRONMENTAL RESPONSIBILITY
4
4.5 Key Performance Indicators

Issue Key Performance Indicator (KPI) 2013 2012 2011 Scope
Ambitions 2020
Target(2)
Diversity % of women in senior management positions 18.6% 16.4% 15.8% Group 35%
% of entities with a recruitment and/or career development
plan aimed for a specific population. 37% 45% 31% Group
Of which, % of entities with a specific program for women 70% 76% 75% Group
Of which, % of entities with a specific program for disabled
workers 3 7% 33% 25% Group
% of countries rated at level A or B according to Lafarge
diversity maturity categorization criteria 52.5% - - Group 75%
Working hours % of employees working on (3) 8h shifts 14.1% 16% 15% Group
% of employees working on (2) 8h shifts 8.7% 8.2% 9.4% Group
Social dialogue Number of entities having had strike actions 6 4 9 Group
Percentage of business units where employees are covered
by collective agreements 75.3% 78% 74% Group
Percentage of total workforce covered by Health & Safety
Committees 97.5% 99% 98% Group
GOVERNANCE
% of countries that have implemented the Competition
Compliance Program 100% 100% 96% Group
% of purchases from suppliers who have agreed to respect
communities and workers’human rights 99% - - Group 100%
Number of suppliers assessed by third party on ESG issues 311 - - Group
BUILDING SUSTAINABLY
Sales of new sustainable solutions, products and services 1.8 2.2 2.3 Group
3 billion per
year
BUILDING THE CIRCULAR ECONOMY(4)
CO2 AND AIR EMISSIONS
Carbon
emissions
Total CO2 emissions - gross (million tonnes) 92.5 96.7 96.5 Cement
Total CO2 emissions - net (million tonnes) 89.4 93.8 93.7 Cement
Specific CO2 emissions - gross (kg/tonne cementitious material) 597 603 610 Cement
-33% vs
1990
Specific CO2 emissions - net (kg/tonne cementitious material) 577 585 592 Cement
GHG emissions from energy purchased and consumed
(scope 2) 8.72 8.91 9.003 Group
GHG emissions from transportation (scope 3) (5) 2.4 - - Group
• Lafarge - Registration Document 2013138
SOCIAL AND ENVIRONMENTAL RESPONSIBILITY44 4.5 Key Performance Indicators

Issue Key Performance Indicator (KPI) 2013 2012 2011 Scope
Ambitions 2020
Target(2)
Air emissions Total NOx emissions (tonne /year) 166,562 187,554 188,828 Cement
Specific NOx emissions (g/tonne clinker) 1,495 1,611 1,636 Cement
-25% vs
2010
Total SO2 emissions (tonne /year) 44,622 41,076 49,404 Cement
Specific SO2 emissions (g/tonne clinker) 400 353 428 Cement
-30% vs
2010
Total dust emissions (tonne /year) 13,121 15,463 16,842 Cement
Specific dust emissions (g/tonne clinker) 118 133 146 Cement
-50% vs
2010
Mercury emissions - t/year 3.5 3.8 3.8 Cement
Mercury emissions mg/tonne clinker 31.7 32.7 33.0 Cement
-30% vs
2010
Dioxin/furans emissions - g TEQ/year 3.1 3.3 4.7 Cement
Dioxin/furans emissions pg/tonne clinker 27.4 28.1 40.4 Cement
VOC emissions - kt/year 3.8 3.8 4.5 Cement
VOC emissions g/tonne clinker 34.0 32.8 39.0 Cement
Heavy Metals Emissions (6) ("HM1"): Cd + TI (1) (tonne /year) 3.93 4.26 4.06 Cement
Heavy Metals Emissions ("HM2 "): Cd + TI (1) (mg/ tonne
clinker) 35.3 36.6 35.2 Cement
Heavy Metals Emissions ("HM2"): Pb + As + Co + Ni + Sb
+ Cr + Cu + Mn + V (2) (tonne/year) 110.3 115.3 124.15 Cement
Heavy Metals Emissions ("HM2"): Pb + As + Co + Ni + Sb
+ Cr + Cu + Mn + V (2) (mg/ tonne clinker) 989 991 1,075 Cement
Clinker produced with monitoring of "HM1" emissions (%) 57% 56% 44% Cement
Clinker produced with monitoring of "HM2 " emissions (%) 58% 58% 45% Cement
% Clinker produced with monitoring of dust, SO2 and NO
x
emissions 99% 97% 94% Cement
% Clinker produced with continuous monitoring of dust,
SO2 and NO
x emissions 74% 71% 66% Cement
ENERGY CONSUMPTION AND RESOURCE MANAGEMENT
Energy
efficiency
Total energy consumption (PJ) 472.1 485.9 485.4 Group
Direct energy consumption by primary energy source
(million Teo) 9.99 10.32 10.27 Group
Electricity purchased (GWh) 14,926 13,686 11,538 Group
Specific heat consumption of clinker production (MJ/tonne
clinker) 3,625 3,652 3,659 Cement
Clinker intensity factor (%) 71.9% 72.6% 73.0% Cement
Alternative
fuels
Alternative fuel rate (%) 15.8% 13.9% 12.8% Cement
Biomass fuel fate (%) 6.3% 5.5% 4.7% Cement
Materials Quantity of quarried material (million tonnes) 429.1 375.1 373.9 Group
Alternative raw materials rate (%) 8.36% 8.78% 8.24% Group
Consumption of material (million tonnes) 468.2 420.9 415.3 Group
Waste Dust disposed on-site (kton) 479 557 556 Cement
Non hazardous waste recovered (kton) 356.3 352.9 221.4 Group
Non hazardous waste disposed (kton) 402.7 367.3 314.7 Group
Hazardous waste recovered (kton) 11.4 6.0 8.1 Group
Hazardous waste disposed (kton) 2.5 2.0 2.1 Group
Lafarge - Registration Document 2013 • 139
SOCIAL AND ENVIRONMENTAL RESPONSIBILITY
4
4.5 Key Performance Indicators
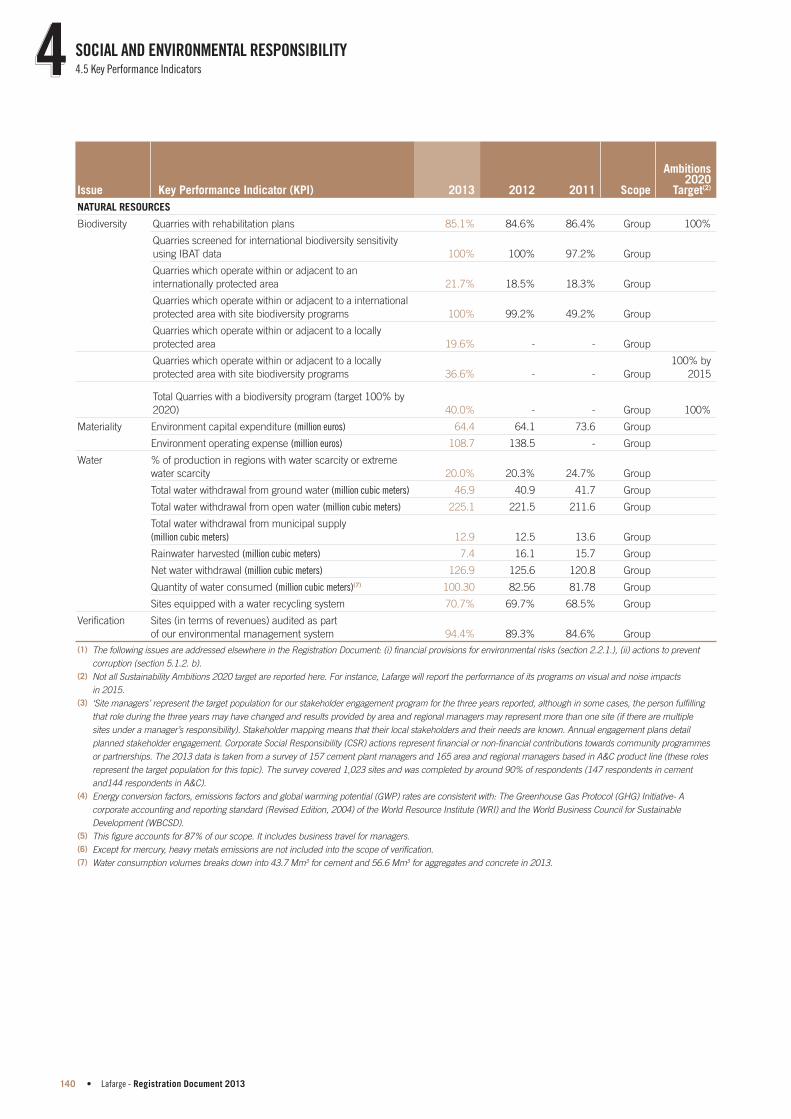
Issue Key Performance Indicator (KPI) 2013 2012 2011 Scope
Ambitions 2020
Target(2)
NATURAL RESOURCES
Biodiversity Quarries with rehabilitation plans 85.1% 84.6% 86.4% Group 100%
Quarries screened for international biodiversity sensitivity
using IBAT data 100% 100% 97.2% Group
Quarries which operate within or adjacent to an
internationally protected area 21.7% 18.5% 18.3% Group
Quarries which operate within or adjacent to a international
protected area with site biodiversity programs 100% 99.2% 49.2% Group
Quarries which operate within or adjacent to a locally
protected area 19.6% - - Group
Quarries which operate within or adjacent to a locally
protected area with site biodiversity programs 36.6% - - Group
100% by
2015
T otal Quarries with a biodiversity program (target 100% by
2020) 40.0% - - Group 100%
Materiality Environment capital expenditure (million euros) 64.4 64.1 73.6 Group
Environment operating expense (million euros) 108.7 138.5 - Group
Water % of production in regions with water scarcity or extreme
water scarcity 20.0% 20.3% 24.7% Group
Total water withdrawal from ground water (million cubic meters) 46.9 40.9 41.7 Group
Total water withdrawal from open water (million cubic meters) 225.1 221.5 211.6 Group
Total water withdrawal from municipal supply
(million cubic meters) 12.9 12.5 13.6 Group
Rainwater harvested (million cubic meters) 7.4 16.1 15.7 Group
Net water withdrawal (million cubic meters) 126.9 125.6 120.8 Group
Quantity of water consumed (million cubic meters)(7) 100.30 82.56 81.78 Group
S ites equipped with a water recycling system 70.7% 69.7% 68.5% Group
Verification S ites (in terms of revenues) audited as part
of our environmental management system 94.4% 89.3% 84.6% Group
(1) The following issues are addressed elsewhere in the Re gistration D ocument: (i) financial provisions for environmental risks (section 2.2.1.), (ii) actions to prevent
corruption (section 5.1.2. b).
(2) Not all Sustainability Ambitions 2020 target are reported here. For instance, Lafarge will report the performance of its programs on visual and noise impacts
in 2015.
(3) ‘Site managers’ represent the target population for our stakeholder engagement program for the three years reported, although in some cases, the person fulfilling
that role during the three years may have changed and results provided by area and regional managers may represent more than one site (if there are multiple
sites under a manager’s responsibility). Stakeholder mapping means that their local stakeholders and their needs are known. Annual engagement plans detail
planned stakeholder engagement. Corporate Social Responsibility (CSR) actions represent financial or non-financial contributions towards community programmes
or partnerships. The 2013 data is taken from a survey of 157 cement plant managers and 165 area and regional managers based in A&C product line (these roles
represent the target population for this topic). The survey covered 1,023 sites and was completed by around 90% of respondents (147 respondents in cement
and144 respondents in A&C).
(4) Energy conversion factors, emissions factors and global warming potential (GWP) rates are consistent with: The Greenhouse Gas Protocol (GHG) Initiative- A
corporate accounting and reporting standard (Revised Edition, 2004) of the World Resource Institute (WRI) and the World Business Council for Sustainable
Development (WBCSD).
(5) This figure accounts for 87% of our scope. It includes business travel for managers.
(6) Except for mercury, heavy metals emissions are not included into the scope of verification.
(7) Water consumption volumes breaks down into 43.7 Mm3 for cement and 56.6 Mm3 for aggregates and concrete in 2013.
• Lafarge - Registration Document 2013140
SOCIAL AND ENVIRONMENTAL RESPONSIBILITY44 4.5 Key Performance Indicators

4.5.2 REPORTING METHODOLOGY
a) Reporting standardsThe rules for computing the KPIs are consistent with the GRI (Global Reporting Initiative) G4 reporting standard. Where detailed defi nitions of KPIs are defi ned by WBCSD - CSI (World Business Council for Sustainable Development - Cement Sustainability Initiative), the recommended CSI methodology is used for the calculation of the KPI. All elements for calculating KPIs are documented in a glossary specifi c to the Cement, or Aggregates and Concrete businesses. Compliance with GRI G4, details on materiality assessment and a summary of reporting standards used is documented online at http:// www. lafarge. com.
Health and safety data is collected separately, taking into account our internal guidelines and external best practice. The Group’s Social Policies department conducts a separate survey on social data. The KPI related to the training on stakeholder relationship is also tracked and verifi ed. Local stakeholder relationship management training is organized around plant managers (in cement) and area/regional managers in aggregates and concrete.
b) Scope of consolidation and reporting methodologiesThe reporting covers all business units and their industrial production sites under the Group’s management control throughout the world.
When a new site is acquired by Lafarge, procedures and defi nitions for sustainability data are not necessarily in line with Lafarge standards. Accordingly we give new sites a maximum of four years to meet our standards but performance and emissions reporting are included from the start up date. This period is necessary to implement the appropriate management systems. When a plant is sold, we cease to include its performance data and we remove its data from the baseline data used for our Sustainability Ambitions, whether the reference year is 1990 or 2010. For plants divested during the year, social data is excluded for the entire year; for environmental and health and safety, data is included up until the time of divestiture.
We use the CSI Protocol V3 to calculate CO2 emissions between the
1990 baseline and the reporting year.
In 2011 we changed our methodology for calculating air emissions to be in accordance with the March 2012 CSI guidelines for emissions monitoring and reporting in the Cement Industry (wbcsdcement.org).
Previously, gas factors based on the type of kiln process were utilized whereas we now use gas factors based on the energy consumption of the specifi c kiln; prior years data and our baseline (2010) is restated using the this methodology for comparison.
For dust, SO2 and NOx emissions, we use standard emission
concentrations based on the site’s kiln process when no measurements are available. In 2013 the standard emission concentration was applied to 1.2% of clinker production for dust emissions, 0.9% for SO
2 emissions and 1.6% for NOx emissions.
For water, dewatering of quarries and non-contact cooling water taken from surface water and returned to the same catchment is not included in net withdrawal.
For the calculation of safety KPIs that include contractors, contractor off-site hours are not included in the divisor and therefore these indicators may slightly overstate the frequency rates.
Social data and health and safety data are collected by business units and consolidated at Group level. Social data for 2013 in this report is derived from a social survey covering 89 entities representing 100% of the total Group workforce and includes majority owned entities and managed assets. Headcount data is compiled by an external consultant supervised by Corporate and Country fi nance departments. Absenteeism data is not consolidated due to the various national defi nitions under which this data is captured. We are currently working on a methodology to address this issue.
c) Control and assuranceEnvironmental data is collected by business line and consolidated at Group level. For cement, environmental experts in the regional technical centers (Beijing, Cairo, Montréal, Kuala Lumpur and Vienna) review and validate the performance data for the plants within their regions.
Bureau Veritas provides independent verifi cation for sustainability data. A selection of key quantitative indicators (lost time injury frequency rate and fatality rate; total headcount, hours of training, workforce hirings, resignations, retirements, redundancies and death; women in senior and executive management; sites environmentally audited, quarries with rehabilitation plans and quarries screened for biodiversity and those having biodiversity management plans; consumption of energy, fuels used, CO
2, dust, NOx, SO
2, Mercury, VOC and Dioxins/Furans
emissions, water withdrawals by sources and consumption quarried and alternative raw materials consumption) were reviewed to issue a limited assurance report.
Lafarge - Registration Document 2013 • 141
SOCIAL AND ENVIRONMENTAL RESPONSIBILITY
4
4.5 Key Performance Indicators

4.5.3 VERIFICATION REPORT ON THE SINCERITY OF THE INFORMATION RELATIVE TO THE REQUIREMENTS OF TRANSPARENCY OF COMPANIES ON THE DISCLOSURE OF ENVIRONMENTAL AND SOCIAL TOPICS
The reviewed social, environmental and societal information are relative to year ended December 31, 2013
Request, Responsibilities and Independence At the request of the Lafarge Group, and in accordance with the requirements of article L.225-102-1 of the French C ommercial C ode (C ode de commerce), we performed, as independent third party, an independent verifi cation of the social, environmental and societal information contained within the section 4 “social and environmental responsibility” of the 2013 Lafarge registration document.
The preparation and presentation of the qualitative and quantitative information for the publication required by the article R.225-105-1 of the French C ommercial C ode (C ode de commerce) is the sole responsibility of Lafarge. The collection and management of this information has been coordinated by the Technical Director for Environment of the Lafarge in accordance with:
d the reporting procedure Group « group environmental standard » version V3.7.4;
d the group specific instructions and procedures, a summary of which is provided in Section 4.5.2 .
This is further named « the reporting methodology », available at Lafarge’s Head Offi ce, and a summary of which is included under the form of a methodological note in the registration document section 4.2.5, which will be available on Lafarge‘s website.
It is our role, in accordance with the requirements of the article R.225-105-2 of the French C ommercial C ode (C ode de commerce), to conduct the verifi cation pursuant to the issuing of this verifi cation report.
The conclusions of this report include:
d an attestation of completeness of the social, environmental and societal information required by the article R.225-105-1 of the French C ommercial C ode (C ode de commerce);
d a reasoned opinion on the sincerity of the published information as well as a limited assurance opinion of the quantitative information, and if any a reasoned opinion on the explanation given in case of the omission of certain consolidated information.
This opinion is independently stated, and without partiality. Our work has been conducted according to the professional practice. Bureau Veritas has implemented its Code of Ethics which is applied by its staff.
Nature and scope of our work During the period from October 2013 to February 2014, a team of verifi ers competent in social responsibility conducted the work; they are experienced on social, environmental and societal issues.
We verifi ed that the information covers the consolidated perimeter as defi ned in the articles L.233-1 and L.233-3 of the French C ommercial C ode (C ode de commerce). The perimeter’s adjustments for the social and environmental information are clarifi ed in the methodological note of the registration document
For the attestation of completeness of the information we undertook the following work:
d taking note of the Group policy relative to sustainable development, according to its social and environmental impacts and its societal commitments;
d comparison of the information presented in the registration document with the list as provided for in Article R.225-105-1 of the French C ommercial C ode (C ode de commerce);
d verification of the explanation in case of omission of consolidated information.
For the reasoned opinion on the sincerity of the information, we conducted our work in accordance with the legal order published on the 13th May 2013 determining the methodology according to which the independent third party conducts its mission.
We conducted the following procedures in order to provide limited assurance that nothing has come to our attention that causes us to believe that the produced Information contains any material misstatements likely to call into question its sincerity, in all material aspects according to the “reporting methodology”:
d review of the « reporting methodology » with regard to relevance, reliability, completeness, neutrality, understandability of information, relating to good practice within the sector ;
d identification of the persons, within the Group, in charge of the collection, and if any, those who are responsible for the procedures of internal control and risk management;
d verification of the implementation of a process for the collection, treatment, compilation, internal control of the Information to guarantee their completeness and consistency;
d examination of the internal control and risks management procedures relative to the preparation of the Information ;
d discussions with persons in charge of the social, environmental and societal reporting;
• Lafarge - Registration Document 2013142
SOCIAL AND ENVIRONMENTAL RESPONSIBILITY44 4.5 Key Performance Indicators
d selection of consolidated information to be tested(1) and definition of the nature and the scope of the tests, taking into consideration their importance with regard to the social and environmental consequences related to the Group activities as well as to its societal commitments;
d regarding the quantitative information we recognized as to be the most important we have:
d performed an analytical review of the information and check for a sample of information the calculations and the compilation of the information at the corporate level and the controlled entities,
d selected a sample of sites(2) based on their activities, their contribution to the consolidated information, their localization, the results of the previous verification exercises and a risks analysis,
d regarding each selected entity we performed the following work,
d interview to check that the « the reporting methodology » is correctly implemented,
d performance of detailed tests, checking, based on sampling, the calculation applied and reconciling the Information with supporting evidences.
The sample of the selected sites represents around 20% of the reported data for the environmental and social information, and around 50% of the clinker production.
d Regarding the qualitative information, for the information we believe to be the most important, we have conducted interviews, examined source documents and, if any, public information.
d Regarding the explanations relative to the missing/omitted information, we assessed their relevance.
Comments on the « reporting methodology » and on the information The procedures and process for the reporting of the group leads us to make the following comment:
d the additional verification of Technical Center is required for the information relative to water consumption in order to ensure the reliability of the data. In the aggregates quarries , the water consumption is most commonly estimated, it is necessary to strengthen the implementation of the internal reporting method of reporting and control;
d the method to account for subcontractor employee headcount differs between sites; however, at the global level the data is seen to be consistent on a year to year basis;
d although no major anomaly was detected on safety indicators, the collection of hours worked of subcontractors should be strengthened. Reinforcement to personnel of the definitions used to calculate safety indicators would increase the efficiency of the reporting process of these data.
Attestation of completeness of the information Based on our work, and within the limit of the perimeter defi ned by the Group, we attest to the completeness of all the required information
Sincerity opinion and limited assurance Based on our work nothing has come to our attention to suggest that the social, environmental and societal Information, communicated by Lafarge Group in its 2013 registration document, is not fairly presented in all material aspects in accordance with the reporting methodology.
The explanation in case of omission of consolidated information appears to be acceptable.
Puteaux, March 3, 2014
Bureau Veritas
Jacques Matillon
Agency Director
(1) Information with limited assurance
Social Information: total headcount breakdown by gender, age, kind of contract of employment, status; workforce hiring; retirements; resignations; redundancies, death ; women in senior and executive management ; hours of training.
Environmental and Health & safety Information: sites environmentally audited; dust; NOx; SO2; Mercury; VOC, Dioxins /Furans emissions, water withdrawals by
sources; consumption of energy, fuels used, consumption of quarried and alternative raw materials consumption, quarries with rehabilitation plans and quarries screened for biodiversity and those having biodiversity management plans, CO
2 emissions, lost time injury frequency rate and fatality rate.
(2) For social information the contributor entities in the following countries: China, France, India, Malaysia and United States of America.
For environmental and health & safety information: the cement and aggregates & concrete business units in China, France, India, Malaysia and United States of America, 2 regional technical centers (IPEA and China), 4 cement plants on site, 1 cement quarry, 2 aggregate quarries, 3 aggregates/concrete/asphalt centers located in the 5 countries above, moreover 7 cement plants have been verifi ed off site.
Lafarge - Registration Document 2013 • 143
SOCIAL AND ENVIRONMENTAL RESPONSIBILITY
4
4.5 Key Performance Indicators

• Lafarge - Registration Document 2013144

145
55.1 Risk factor ...................................... 1465.1.1 Presentation of the principal risks .............................. 1465.1.2 Risk management....................................................... 1545.1.3 Insurance and risk coverage ....................................... 157
5.2 Internal control procedures ................. 1585.2.1 Report of the Chairman of the Board of Directors
on internal control procedures and on corporate governance (article L. 225-37 of the French Commercial Code) ...................................................... 158
5.2.2 Statutory Auditors’ Report, prepared in accordance with Article L. 225-235 of the French Commercial Code (Code de Commerce), on the report prepared by the Chairman of the Board of Directors of Lafarge on the internal control and risk management procedures relating to the preparation and processing of fi nancial and accounting information .............................................. 161
5.3 Auditing matters ............................... 1625.3.1 Auditors ...................................................................... 1625.3.2 Auditors’ fees and services ......................................... 1625.3.3 Auditors’ reports ......................................................... 163
5RISKS AND CONTROL
Lafarge - Registration Document 2013 • 145

5.1RISK FACTOR
5.1.1 PRESENTATION OF THE PRINCIPAL RISKS
Lafarge operates in a constantly evolving environment, which exposes the Group to risk factors and uncertainties in addition to the risk factors related to its operations.
The materialization of the risks described below could have a material adverse effect on the operations, fi nancial condition, results, and prospects of Lafarge and on the Lafarge S.A. share price on the stock exchange.
There may be other risks that have not been identifi ed yet or whose occurrence is not considered likely to have such material adverse effect as of the date of this Registration Document.
The information given below is based on certain assumptions and hypotheses, which could, by their nature, prove to be inaccurate.
a) Risks related to the business
d RISKS RELATED TO WORLDWIDE PRESENCE
Operations and cyclicalityLafarge’s products are used mainly in the construction sector (buildings and civil works). Demand for Lafarge’s products in the different markets in which it operates depends on the level of activity in the construction sector. The construction sector tends to be cyclical and depends on various factors such as the level of infrastructure spending, the level of residential and commercial construction activity, interest rates, and, more generally, the level of economic activity in a given market. The cyclicality of the construction sector together with its dependence on economic activity could have a negative impact on the fi nancial results and the profi tability of the operations of Lafarge.
Lafarge manages this risk by operating in geographically diverse markets, with a portfolio of operations both in developed markets and in emerging countries, thereby minimizing its exposure to risk in a given country, although it might be signifi cantly affected by global downturns or in individual signifi cant markets.
See Risks relating to the global economic conditions on page 147 .
See Section 2.3 (Results of operations for the years ended December 31, 2013 and 2012) on page 49 for the review of operations per geographical area.
Emerging marketsApproximately 58% of Lafarge’s 2013 revenues are derived from emerging markets, defi ned as countries outside Western Europe and North America. Most of the Group's new production capacity projects are located in emerging markets.
Increased presence in emerging markets exposes Lafarge to risks such as gross domestic product (GDP) volatility, signifi cant currency fl uctuations, political, fi nancial and social uncertainties and turmoil, terrorism, civil war and unrest, high infl ation rates, exchange control
systems, less certainty concerning legal rights and their enforcement and the possible nationalization or expropriation of privately-held assets, any of which could damage or disrupt operations in a given market.
For example, in 2013, in Syria, the activity continued to be impacted by the current environment.
See Section 5.1.2 (b) (Risk management systems – Management of the Group’s assets portfolio) page 155 .
While Lafarge has spread its emerging markets operations across a large number of countries, diversifi cation efforts will not enable Lafarge to avoid risks that affect multiple emerging markets at the same time. No individual emerging country represents over 5% of its sales.
If such risks were to materialize in the future in a signifi cant and lasting manner, this could have a negative impact on the recoverable value of a signifi cant portion of the Group's assets.
See Risk on Acquisition-related accounting issues on page 150 and Note 10 (Goodwill) to the consolidated fi nancial statements on page F31 for further information on main goodwill and the analysis on the sensitivity of recoverable amounts and on impairment losses.
See Section 2.3 (Results of operations for the years ended December 31, 2013 and 2012) on page 49 for the review of operations per geographical area.
Climate and natural disastersBeing present in a large number of countries increases Lafarge’s exposure to meteorological and geological risks such as natural disasters, climate hazards, or earthquakes which could damage Lafarge’s property or result in business interruptions, or increase the risk of litigation, and which could have a material adverse effect on the Group's operations.
The natural events modeling process put in place within the Group in the last years was updated in 2013 to take into account the latest improvements of the insurance market tools. It covers earthquake and windstorm risks.
At the same time, the program launched in 2011 to assess site by site the same natural disasters risks was continued. This program aims at classifying sites according to their risk exposure and identifying potential losses depending on their fi nancial impact by event, country or fi nancial year as well as the probability of occurrence.
The current outcome of the modelling process and of the assessment program is that 21 % of the insured assets are classifi ed in “signifi cantly or highly exposed” classes for earthquake and windstorm risks.
In the future, other assets may prove to be exposed to meteorological and geological risks.
See Section 5.1.2 (b) (Risk management systems) on page 155 and Section 5.1.3 (Insurance and risk coverage) on page 157 for more information on risk management by the Group.
• Lafarge - Registration Document 2013146
RISKS AND CONTROL55 5.1 Risk factor

5
Seasonality and weatherConstruction activity, and thus demand for Lafarge’s products, decreases during periods of very cold weather, snow, or sustained rainfall. Consequently, demand for Lafarge’s products is lower during the winter in temperate countries and during the rainy season in tropical countries. Sales in Europe, North America and other markets generally increase during the second and third quarters due to better weather conditions. However, high levels of rainfall or low temperatures can adversely affect operations during these periods as well. Such adverse weather conditions can materially affect operational results and profi tability if they occur with unusual intensity, during abnormal periods, or last longer than usual in Lafarge’s major markets, especially during peak construction periods.
See Section 2.3 Results of operations for the years ended December 31, 2013 and 2012 on page 49 for the review of operations per geographical area.
d RISKS RELATED TO GLOBAL ECONOMIC CONDITIONS
Lafarge's results depend mainly on residential, commercial, and infrastructure construction activity, and spending levels.
The global economic and financial crisis that began during the second half of 2008 and the ongoing Eurozone sovereign debt crisis signifi cantly impact the construction business in developed markets.
To varying degrees depending on the market, this has had, and may continue to have, a negative impact on product demand as well as Lafarge’s business and operational results.
For example, operations in Greece and Spain have suffered from tougher economic conditions since 2009, resulting in particular from governmental austerity measures in the context of the sovereign debt crisis in the Eurozone. Together, both countries represent together approximately 2% of Lafarge’s sales in 2013.
Lafarge has prepared internal analysis of potential worldwide demand for Lafarge’s products for purposes of internal planning and resource allocation. Lafarge’s analysis of worldwide demand for cement is described in Sections 1.3 .1 (d) (Markets) on page 31 and 2.1.2 ( 2014 perspectives) on page 44 .
Lafarge estimates that cement demand in its markets will grow between 2% and 5% in 2014 versus 2013 with an overall stabilization of Europe at low levels, a progressive recovery in North America, and continuous growth in most emerging markets.
Cost infl ation should continue at a similar pace as in 2013, which should result in higher prices overall.
Lafarge pursues its strategy to extract the full value of its existing assets, notably through programs to reduce costs and increase the industrial performance, while continuing to reduce its debt level. While we believe that these actions, combined with a well-balanced geographic spread of high quality assets, should enable Lafarge to accelerate its organic growth, in particular through the development of innovative systems and solutions for its clients, tougher fi nancial conditions could continue to negatively affect the Group’s business operations and fi nancial results .
Were the foregoing risks to materialize in the future in a signifi cant and lasting manner, they could have a negative impact on the recoverable value of some of Lafarge’s assets.
See Risk on Acquisition-related accounting issues on page 150 and Note 10 (Goodwill) to the consolidated fi nancial statements on page F31 for further information on goodwill and on the analysis on the sensitivity of recoverable amounts and impairment losses.
See Section 2.3 page 49 for more information by geographical area.
d ENERGY COSTS AND AVAILABILITY
Lafarge’s operations consume signifi cant amounts of energy (electricity, coal, petcoke, natural gas and fuel), the cost of which can fl uctuate signifi cantly, largely as a result of market conditions and other factors beyond Lafarge’s control. Namely, energy prices are regulated in some countries where Lafarge operates. In addition, the availabilty of certain types of energy may change within some countries.
Energy cost infl ation has been a key factor of margin erosion over the past few years, in particular in emerging markets, which have structural fi xed cost infl ation refl ecting rapid increases in wages, production and logistics costs.
The markets in which Lafarge operates are competitive and in such environments the evolution of selling prices depends largely on supply and demand fl uctuations.
In this context, Lafarge pays particular attention to the impact of energy price variations on the selling price of its products, although situations can vary greatly from one country to another or even within the same country, as markets are local and heavy products cannot easily be transported. It is therefore diffi cult to provide meaningful data on the impact of energy price variations on selling prices. Energy markets may be regulated in some of the countries in which Lafarge operates and the evolution of prices could have an adverse impact on the profi tability of the operations of Lafarge’s subsidiaries.
While Lafarge takes a number of steps to manage energy cost risk, it cannot be sure that they will be fully effective. For example:
d Lafarge occasionally enters into medium-term supply contracts. In addition, the centralized purchasing organization at Group level also gives more leverage with suppliers, enabling Lafarge to obtain the most competitive terms and conditions. Nonetheless, if supply contracts contain indexation clauses, they will not always protect Lafarge from fluctuations in energy prices. Similarly, fixed price contracts signed when prices are high prevent the purchaser from benefitting from possible subsequent price decreases;
d Lafarge also uses derivative instruments, mainly swaps and options, on organized markets or on the over-the-counter (OTC) market, to manage its exposure to risk related to energy cost fluctuations; and
d Lafarge diversifies its fuel sources, including alternative fuels such as biomass, used oil, recycled tires and other recycled materials or industrial by-products, which has resulted in less vulnerability to fossil fuel price increases and permits a reduction energy costs.
Although these measures aim to reduce negative effects, they may not be suffi cient to protect Lafarge from its exposure to the volatility of energy prices or availabilty of energy. As an example, in 2013, in Egypt, cement sales volumes were affected by gas shortages.
As a result, material increases or changes in energy and fuel costs have affected, and may continue to affect, fi nancial results.
See Sections 5.1.1 (b) (Financial and market risks) on page 150 below and Section 1.3 .1 (b) (Production process) on page 31 for further information on the content and production of cement.
See also Section 2.3 Results of operations for the years ended December 31, 2013 and 2012 on page 49 for the review of operations by geographical area.
Lafarge - Registration Document 2013 • 147
RISKS AND CONTROL5.1 Risk factor

d RISKS RELATED TO SOURCING AND ACCESS TO RAW MATERIALS
Quarries, permits and reservesAccess to the raw materials necessary for operations (limestone, gypsum, aggregates and other raw materials) is essential for sustainability and profi tability of the Group's operations and is a key consideration in the investments.
Failure to obtain, maintain or renew these land and mining rights as well as any other permits, licenses, rights and titles necessary to carry out its operations or expropriation as a result of local legislative, regulatory or political action could have a negative impact on the Group's results or on the development of its activities.
Lafarge actively manages the quarries and production plants that it operates or expects to operate, and the related permits, licences, rights and titles, in order to secure its operations in the long-term.
Lafarge usually owns or holds long-term land and mining rights on the quarries of limestone, gypsum, aggregate and other raw materials essential to its operations. This factor is taken into account at the time of the investments.
See Section 1.3.4 (Mineral reserves and quarries) on page 39 for further information.
Other raw materialsIn addition, Lafarge increasingly uses certain by-products of industrial processes, such as synthetic gypsum, slag and fl y ash, produced by third parties as raw materials.
In general, Lafarge is not dependent on its raw materials suppliers and tries to secure the supply of the required materials through long-term renewable contracts and framework agreements, which ensure better management of supplies. Short-term contracts may however be entered into in certain countries.
Should existing suppliers cease operations or reduce or eliminate production of these by-products, sourcing costs for these materials could increase signifi cantly or require Lafarge to fi nd alternative sources for these materials.
For further information on quarries, see Sections 1.3 .1 (b) (Production process) on page 31 and 1.3.4 (Mineral reserves and quarries) on page 39 .
See Section 5.1.2 (b) (Risk management systems) on page 155 for more information on how Lafarge manages this risk.
d RISKS RELATED TO COMPETITION AND COMPETITION LAW INVESTIGATIONS
Competition is strong in the markets in which Lafarge operates. Competition, whether from established market participants or new entrants could cause Lafarge to lose market shares, increase expenditures or reduce pricing, any one of which could have a material adverse effect on business, fi nancial condition, results of operations or prospects.
This risk is partially compensated by certain characteristics of Lafarge’s markets which are not limited to trade-off between price and volume.
The cement industry is characterized by its high capital intensity, limiting the number of potential players likely to operate i n these
markets due to the signifi cant fi nancial investments required. A greenfi eld cement plant represents an average investment of several hundred million euros.
Regulatory constraints for obtaining licenses to operate in some of the countries where Lafarge is present is another specifi city of our markets. Marketing and innovation actions enable Lafarge to develop new products, services and solutions which are also differentiating factors.
Finally, the signifi cant impact of transport costs, and the low technical obsolescence of industrial equipment, lead Lafarge to establish market positions which are both close to the customers and sustainable for the long term.
Given Lafarge’s worldwide presence and the fact that it sometimes operates in markets in which the concentration of market participants is regarded as high by certain authorities, Lafarge is currently, and could be in the future, subject to investigations and civil or criminal proceedings by competition authorities for alleged infringement of antitrust laws or enjoying excess market power even without any fi nding of competition laws infringement. These investigations and proceedings can result in fi nes, civil or criminal liability, or forced divestments, which may have a material adverse effect on the image, fi nancial condition and results of operations of some of the Group’s entities, particularly given the level of fi nes imposed by European authorities in recent cases.
In November 2008, the major European cement companies, including Lafarge, were placed under investigation by the European Commission for alleged anti-competitive practices. In December 2010, the European Commission launched an offi cial investigation, while indicating that this only meant that the Commission intends to pursue this as a matter of priority but does not imply that the Commission has conclusive evidence of any infringement. At this stage, given the fact-intensive nature of the issues involved and the inherent uncertainty of such litigation and investigation, Lafarge is still not in a position to evaluate the possible outcome of this pending and long-lasting investigation.
In the UK, the Competition C ommission imposed on Lafarge-Tarmac Holdings (LT) a forced divestment of a cement plant (and some associated ready-mixed plants) in January, 2014, presumably due to oligopolistic market structure and related conduct, without any fi nding of infringement of competition law. LT lodged an appeal with the Competition Appeal Tribunal (CAT) on March 13, 2014 against the Competition Commission’s, Final Report and its proposed remedies. The CAT decision is expected to be released by the end of 2014.
Lafarge is committed to the preservation of vigorous, healthy and fair competition as well as complying with relevant antitrust laws in countries in which it operates.
In line with this objective, Lafarge has established a competition policy and a competition compliance program (CCP) described in Section 5.1.2 (b) (Risk management systems) intended to provide the Country managements with appropriate guidance to ensure complaince with the Group CCP and the applicable competition laws. Nonetheless, these procedures cannot provide absolute assurance against the risks relating to these issues.
See Section 1.3 (Overview of operations) on page 28 for a description of competitors in each of Lafarge’s markets.
See Note 29 (Legal and arbitration proceedings) to the consolidated fi nancial statements on page F66 for further information on material legal and arbitration proceedings.
• Lafarge - Registration Document 2013148
RISKS AND CONTROL55 5.1 Risk factor

5
See also Section 5.1.2 (b) (Risk management systems) on page 155 for more information on the competition policy of Lafarge and management of this risk.
d INDUSTRIAL RISKS RELATED TO SAFETY AND THE ENVIRONMENT
Although Lafarge’s industrial processes are very well-known and are dedicated to the production of cement, Aggregates & Concrete, which are not usually considered to be hazardous materials, its operations are subject to environmental and safety laws and regulations, as interpreted by relevant agencies and courts, which impose increasingly stringent obligations, restrictions and protective measures regarding, among other things, land and product use, remediation, air emissions, noise, waste and water, health and safety.
The costs of complying with these laws and regulations could increase in some jurisdictions, particularly as a result of new or more stringent regulations or changes in their interpretation or implementation.
In addition, non-compliance with these regulations could result in sanctions, including monetary fi nes, against Lafarge.
The risks faced by Lafarge regarding the environment can be illustrated by the following example related to its operations in Germany. This country recently enacted legislation, effective 2018, that will require NOx emissions from the cement industry to be reduced to very low levels which typically cannot be achieved without the installation capital intensive specialized air pollution control equipment.
Another example, which is typical of the global trend to reduce anthroprogenic emissions, is the recently concluded multi-lateral Minimata Convention, a legally binding agreement to reduce releases of mercury to the environment. This agreement, negotiated under the aus pic es of the United Nations Environment Programme, governs the emissions of mercury and the impact of industry on the environment.
Although Lafarge is active in developing solutions in anticipation of such changes, at this stage, it is still diffi cult to foresee the impact of such potential changes on its results.
Lafarge has implemented internal standards at Group level whereby environmental risks are taken into account in the management cycle and have developed a unifi ed and consistent reporting system in each Division to measure and control environmental performances. Nonetheless, these procedures cannot provide absolute assurance against risks relating to these issues.
See Section 4.4 (Building the circular economy) on page 130 for more information on the impact of environmental matters on operations, environmental policy and various environmental initiatives.
In terms of security risks, Lafarge's main objective is to reduce lost time injuries and fatalities and is implementing a risk mitigation strategy, which is further described in Section 4.2.1 (Health and Safety: our fi rst priority) on page 121 and Section 5.1.2 (b) (Risk management systems) on page 155 .
For all industrial risks, see Section 5.1.2 (b) (Risk management systems) on page 155 for more information on how the Group manages these risks.
See also Note 2.3 (Use of estimates and judgment) on page F14 and Note 24 (Provisions) to the consolidated fi nancial statements on page F53 .
d RISKS RELATED TO LITIGATION
Lafarge has worldwide operations, and subsidiaries are required to comply with applicable national and local laws and regulations, which vary from one country to another. As part of its operations, Lafarge is, or could be in the future, involved in various claims, as well as legal, administrative and arbitration proceedings and class action suits. New proceedings may be initiated against the Group’s entities in the future.
In connection with acquisitions made in past years, Lafarge or its subsidiaries are or may be faced with various demands or complaints, including those from minority shareholders.
In connection with disposals made in the past years, Lafarge and its subsidiaries provided customary warranties notably related to accounting, tax, employees, product quality, litigation, competition, and environmental matters.
Lafarge and its subsidiaries received, or may receive in the future, notice of claims arising from said warranties.
For example, an arbitration was ongoing between Lafarge’s subsidiaries and the buyer of one of our businesses which was claiming a total of 59 million US dollars. By a fi nal and binding decision delivered in August 2013, the arbitration tribunal accepted part of the plaintiffs’ claims, ordering our subsidiaries to pay 16.6 million US dollars in damages (plus 2 million US dollars in costs) and rejecting the remaining claims in the amount of 43 million US dollars.
See Note 29 (Legal and arbitration proceedings) to the consolidated fi nancial statements on page F66 for more information on Lafarge’s material legal and arbitration proceedings.
d RISKS RELATED TO THE GROUP STRUCTURE
Financial and tax issuesLafarge S.A. is a holding company with no signifi cant assets other than direct and indirect interests in its numerous subsidiaries.
A number of subsidiaries are located in countries that may impose regulations restricting the payment of dividends outside the country through exchange control regulations.
To the best of our knowledge, aside from North Korea, there are currently no countries in which Lafarge operates that prohibit the payment of dividends.
Furthermore, the transfer of dividends and other income from the Group subsidiaries may be limited by various credit or other contractual arrangements and/or tax constraints, which could make such payments diffi cult or costly.
Should such regulations, arrangements and constraints restricting the payment of dividends be signifi cantly increased in the future simultaneously in a large number of countries where Lafarge operates, it might impair its ability to make shareholder distributions.
Lafarge - Registration Document 2013 • 149
RISKS AND CONTROL5.1 Risk factor

In addition, Lafarge’s subsidiaries are subject to tax audits by the tax authorities in the respective jurisdictions in which they are located.
Various tax authorities have proposed or levied assessments for additional taxes for prior years.
Although we believe that the settlement of any or all of these assessments would not have a material adverse effect on its results or fi nancial position, Lafarge is not in a position to evaluate the possible outcome of these proceedings.
See Section 5.1.2 (b) (Risk management systems) on page 155 for more information on how the Group manages these risks and Note 22 E (Tax audits) to the consolidated fi nancial statements on page F47 .
Risks related to acquisition-related accounting issuesAs a result of signifi cant acquisitions, many of its tangible and intangible assets are recorded in the consolidated statement of fi nancial position of Lafarge at amounts based on their fair value as of the acquisition date. Lafarge has also recorded signifi cant goodwill of 11.6 billion euros on the consolidated statement of fi nancial position as of December 31, 2013.
In accordance with IFRS, Lafarge tests non-current assets, including goodwill, for impairment, as described in Notes 2.12 (Impairment of non-current assets) on page F18 and Note 10 (Goodwill) to the consolidated financial statements on page F31 for goodwill. In particular, a goodwill impairment test is performed at least annually and a specifi c analysis is performed at the end of each quarter in case of impairment indications.
The key assumptions used to perform impairment tests take into consideration the market level and forecasts on the evolution of prices and costs. These assumptions, which are further described in Note 10 (Goodwill) on page F31 to the consolidated fi nancial statements, refl ect the specifi c environments in each country of operation.
These assumptions do not, however, anticipate any major disruption in the economical or geopolitical environment.
If these assumptions prove incorrect, or must be revised to refl ect worsening conditions, this could have a material adverse effect on Lafarge’s results or fi nancial position.
Depending on the evolution of the recoverable value of cash generating units (CGUs) or groups of CGUs, which is mostly related to future market conditions, further impairment charges might be necessary and could have a signifi cant impact on results.
For example, the strong decrease in demand in Greece following tougher economic conditions resulted in the Group recording an impairment loss of 160 million euros for the CGU Cement Greece in 2012.
See Note 10 (Goodwill) to the consolidated fi nancial statements on page F31 for further information on impairment losses recorded and the analysis on the sensitivity of recoverable amounts of signifi cant assets.
Minority shareholders and partnersLafarge conducts its business through subsidiaries. In some instances, third-party shareholders hold minority interests in these subsidiaries. While this is generally considered positive as it may result in partnership or investment agreements, various disadvantages may result from the participation of minority shareholders whose interests may not always be aligned with the interests of Lafarge.
Some of these disadvantages may, among others, result in the diffi culty or inability to implement organizational effi ciencies and transfer cash and assets from one subsidiary to another in order to allocate assets most effectively.
See Section 6.2.8 (Intra-Group Relation ) on page 180 for further information on the relationship with minority shareholders within subsidiaries and Section 5.1.2 (b) (Risk management systems) on page 155 for more information on how Lafarge manages these risks.
b) Financial and market risks
d FINANCIAL RISKS
Indebtedness and credit ratingsLafarge is exposed to different market risks, which could have a material adverse effect on its fi nancial condition or on its ability to meet its fi nancial commitments. In particular, the access of Lafarge to global sources of fi nancing to cover our fi nancing needs or repayment of our debt could be impaired by the deterioration of fi nancial markets or downgrading of our credit rating. On December 31, 2013, the net debt (which includes put options on shares of subsidiaries and derivative instruments) amounted to 10,330 million euros, and the gross debt amounted to 13,712 million euros. 2,906 million euros of the gross debt as of December 31, 2013 was due in one year or less. As part of strict fi nancial policies, Lafarge continues to implement actions to improve its fi nancial structure.However, no assurance can be given that Lafarge will be able to implement these measures effectively or that further measures will not be required in the future.
The fi nancing contracts of Lafarge S.A. and its subsidiaries contain various commitments.
Some of Lafarge's subsidiaries are required to comply with certain fi nancial covenants and ratios. At the end of 2013, these agreements represented approximately 2% of the total Group gross debt excluding put options on shares of subsidaries. The main covenants are described in Note 25 (e) (Particular clauses in financing contracts) to the consolidated fi nancial statements on page F56 .
The Lafarge S.A. agreements and those of its subsidiaries also include cross-acceleration clauses. If Lafarge S.A., or under certain conditions, its material subsidiaries, fail to comply with their covenants, then the lenders could declare default and accelerate repayment of a signifi cant part of the debt.
If the construction sector deteriorates further economically, the reduction of the operating cash fl ows could make it necessary to obtain additional fi nancing. Changing conditions in the credit markets and the level of the outstanding debt of Lafarge could impair its ability to obtain additional fi nancing for working capital, capital expenditures, acquisitions, general corporate purposes or other purposes, or make access to this fi nancing more expensive than anticipated. This could result in greater vulnerability, in particular by limiting its fl exibility to adjust to changing market conditions or withstand competitive pressures.
The fi nancial costs and the ability to raise new fi nancing could be signifi cantly impacted by the level of the credit ratings. The rating agencies could downgrade the ratings either due to factors specifi c to the Group, or due to a prolonged cyclical downturn in the construction sector. On the fi ling date of this Registration Document, the Lafarge long-term corporate credit rating is BB+ (stable outlook) according
• Lafarge - Registration Document 2013150
RISKS AND CONTROL55 5.1 Risk factor
5
to Standard & Poor’s Rating Services, further to a downgrading on March 17, 2011 and the evolution of outlook from negative to stable on November 12, 2013. It is Ba1 (negative outlook) according to the rating agency Moody’s, further to a downgrading on August 5, 2011 and evolution of outlook from stable to negative on August 12, 2013. Such downgrading leads to additional net interest expense of approximately 65 million euros in 2013, mainly due to the “step up” clause included in bonds issued by Lafarge between 2009 and 2011.
Any new decline in our ratings could have a negative impact on the fi nancial condition, the results, and the ability of Lafarge to refi nance the existing debt.
See Section 2.4 (Liquidity and Capital Resources) on page 57 , Notes 8 (Financial (expenses) income) on page F30 and Note 25 (Debt) on page F53 to the consolidated fi nancial statements for more information.
Liquidity riskLafarge is exposed to a risk of insufficient financial resources, which could impact its ability to continue its operations. The Group implements policies to limit its exposure to liquidity risk. As a result of these policies, a signifi cant portion of its debt has a medium or long-term maturity. Lafarge also maintains committed credit lines with various banks, which are primarily used as a back-up for the debt maturing within one year as well as for the Group’s short-term fi nancing, and which contribute to the Group’s liquidity. Based on our current fi nancial outlook, we believe that we have suffi cient resources for our ongoing operations in both the short term and the long-term. Inability to maintain suffi cient liquidity could have a material adverse impact on its business, fi nancial condition, results of operations or prospects.
See Section 2.4 (Liquidity and Capital Resources) on page 57 and Notes 25 (b) (Analysis of debt excluding put options on shares of subsidiaries by maturity) on page F54 and 26 (g) (Liquidity risk) on page F63 to the consolidated fi nancial statements for more information on liquidity risk and such risk management.
Pension plansLafarge has obligations under defi ned benefi t pension plans, mainly in the United Kingdom and North America. Lafarge's funding obligations depend upon future asset performance, the level of interest rates used to measure future liabilities, actuarial assumptions and experience, benefi t plan changes, and government regulations. Due to the large number of variables that determine pension funding requirements, which are diffi cult to predict, as well as any legislative action, future cash funding requirements for our pension plans and other post-employment benefi t plans could be signifi cantly higher than the amounts estimated as at December 31, 2013. If so, these funding requirements could have a material adverse effect on the Group's fi nancial situation or results.
See Section 2.2 (Accounting policies and defi nitions) on page 45 and Note 23 (Pension plans, end of service benefi ts and other post employment benefi ts) to the consolidated fi nancial statements on page F92 for more information on pension plans.
See Section 5.1.2 (b) (Risk management systems) on page 155 for more information on how Lafarge manages these risks.
d MARKET RISKS
In this Section, debt fi gures are presented excluding put options on shares of subsidiaries granted to non-controlling interests.
Currency exchange risks and exchange rate sensitivity
Currency exchange riskLafarge and its subsidiaries are subject to foreign exchange risk as a result of the purchase and sale transactions in currencies other than their functional currencies.
With regard to transaction-based foreign currency exposures, the Group policy is to hedge all material foreign currency exposures through derivative instruments no later than when a fi rm commitment is entered into or becomes known. These derivative instruments are generally limited to forward contracts and standard foreign currency options, with terms of generally less than one year. From time to time, Lafarge also hedges future cash fl ows in foreign currencies when such fl ows become highly probable. Lafarge does not enter into foreign currency exchange contracts other than for hedging purposes.
Each subsidiary is responsible for managing the foreign exchange positions arising as a result of commercial and fi nancial transactions performed in currencies other than its domestic currency, with the support of the corporate Treasury department. Exposures are centralized and hedged with the corporate Treasury department using foreign currency derivative instruments when local regulations allow it. Otherwise, exposures are hedged with local banks. Lafarge S.A. attempts to reduce the overall exposure by netting purchases and sales in each currency on a global basis, where feasible and then covers its net position in the market.
As far as fi nancing is concerned, the Group’s general policy is for subsidiaries to borrow and invest excess cash in the same currency as their functional currency when possible, except for subsidiaries operating in emerging markets, where “structural” cash surpluses are invested, wherever possible, in US dollars or in euros. A portion of Lafarge's fi nancing is in US dollars and British pounds, in particular as a result of its operations located in these countries. Part of this debt was initially raised in euros at the parent company level then converted into foreign currencies through currency swaps.
Lafarge holds assets, earns income and incurs expenses and liabilities directly and through its subsidiaries in a variety of currencies. Consolidated fi nancial statements are presented in euros, therefore, the assets, liabilities, income and expenses in other currencies are translated into euros at the closing exchange rates.
See Note 25 (Debt) on page F53 and Note 26 (Financial instruments) on page F57 to the consolidated financial statements for more information on debt and fi nancial instruments. Additional information on the Group policies in place to mitigate this risk can be found in Section 5.1.2 (Risk management) on page 154 .
Exchange rate sensitivityIf the euro increases in value against a currency, the value in euros of assets, liabilities, income and expenses originally recorded in the other currency will decrease. Conversely, if the euro decreases in value against a currency, the value in euros of assets, liabilities, income, and expenses originally recorded in that other currency will increase. Consequently, increases and decreases in the value of the euro may affect the value in euros of Lafarge's non-euro assets, liabilities, income, and expenses, even though the value of these items has not changed in their original currency.
In 2013, Lafarge generated approximately 85% of its sales in currencies other than the euro, with approximately 25% denominated in US or Canadian dollars. As a result, a 10% change in the US dollar/euro exchange rate and in the Canadian dollar/euro exchange rate would have an impact on Lafarge's sales of approximately 358 million euros.
Lafarge - Registration Document 2013 • 151
RISKS AND CONTROL5.1 Risk factor

In addition, on December 31, 2013, before currency swaps, 15% of total debt was denominated in US dollars and 5% in British pounds. After taking into account the swaps, the US dollar denominated debt amounted to 9% of total debt, while debt denominated in British pounds represented 5% of the total. A +/-5% fl uctuation in the US dollar/euro and in the British pound/euro exchange rate would have an estimated maximum impact of -/+87 million euros on Lafarge's net debt exposed to these two foreign currencies as of December 31, 2013.
The table below provides information about Lafarge's debt and foreign exchange derivative fi nancial instruments that are sensitive to exchange rates.
d The table shows: for debt obligations, the principal cash flows in foreign currencies by expected maturity dates and before swaps;
d for foreign exchange forward agreements, the notional amounts by contractual maturity dates. These notional amounts are generally used to calculate the contractual payments to be exchanged under the contract.
MATURITIES OF NOTIONAL CONTRACT VALUES ON DECEMBER 31, 2013
(million euros) 2014 2015 2016 2017 2018 > 5 years Total Fair value
DEBT IN FOREIGN
CURRENCIES (1)
US dollar 224 469 651 13 41 666 2,064 2,264
British pound 5 - - 660 - - 665 766
Other currencies 718 190 130 36 8 20 1,102 1,090
TOTAL 947 659 781 709 49 686 3,831 4,120
FOREIGN EXCHANGE
DERIVATIVES (2)
Forward contract purchases
and currency swaps
US dollar 1,111 - - - - - 1,111 (9)
British pound 130 - - - - - 130 -
Other currencies 75 - - - - - 75 1
TOTAL 1,316 - - - - - 1,316 (8)
Forward contract sales
and currency swaps
US dollar 324 - - - - - 324 3
British pound 46 - - - - - 46 -
Other currencies 689 - - - - - 689 7
TOTAL 1,059 - - - - - 1,059 10
(1) The fair value of long-term debt was determined by estimating future cash flows on a borrowing-by-borrowing basis, and discounting these future cash flows using
an interest rate that takes into account the Group’s incremental borrowing rate at year-end for similar types of debt arrangements. Market price is used to determine
the fair value of publicly traded instruments.
(2) The fair value of foreign currency derivative instruments has been calculated using market prices that the Group would pay or receive to settle the related
agreements.
Based on outstanding hedging instruments on December 31, 2013, a +/-5% shift in exchange rates would have an estimated maximum impact of respectively +/-2 million euros on equity in respect of foreign currency derivatives designated as hedging instruments in a cash fl ow hedge relationship. The net income statement impact of the same exchange rate fl uctuations on the Group’s foreign exchange derivative instruments is -/+4 million euros. Fair values are calculated with internal models that rely on market observable data (currency spot rate, forward rate, currency rate curves, etc.).
Interest rate risks and sensitivity
Interest rate risksLafarge is exposed to interest-rate risk through debt and cash. Its interest rate exposure can be sub-divided among the following risks:
d price risk for fixed-rate financial assets and liabilities
By contracting a fixed-rate liability, for example, Lafarge is exposed to an opportunity cost in the event of a fall in interest rates. Changes in interest rates impact the market value of fixed-rate assets and liabilities, leaving the associated financial income or expense unchanged;
d cash flow risk for floating-rate assets and liabilities
Changes in interest rates have little impact on the market value of floating-rate assets and liabilities, but directly influence the future income or expense flows of the Group.
In accordance with its policy, Lafarge seeks to manage these two types of risks, including the use of interest-rate swaps and forward rate agreements. The Corporate Treasury department manages Lafarge’s financing and interest rate risk exposure in accordance with the defined rules in order to keep a balance between fixed rate and floating rate exposure.
• Lafarge - Registration Document 2013152
RISKS AND CONTROL55 5.1 Risk factor

5
Although interest rate exposure is managed as described above, it cannot immunize fully Lafarge from interest rate risks.
See Note 25 (Debt) on page F53 and Note 26 (Financial instruments) on page F57 to the consolidated financial statements for more information. Additional information on the Group policies in place to mitigate this risk can be found in Section 5.1.2 (Risk management) on page 154 .
Interest rate sensitivityBefore taking into account interest rate swaps, on December 31, 2013, 86% of the Group total debt carried a fi xed rate. After taking into account these swaps, the portion of fi xed-rate debt amounted to 72%.
A +/-1% change in short-term interest rates calculated on the net fl oating rate debt, taking into account derivative instruments would
have a maximum impact on the 2013 consolidated income before tax of -/+5 million euros.
The table below provides information about interest-rate derivative instruments and debt obligations that are sensitive to changes in interest rates and presents:
d for debt obligations, the principal cash flows by expected maturity dates and related weighted average interest rates before swaps;
d for interest-rate derivative instruments, notional amounts by contractual maturity dates and related weighted average interest rates. Notional amounts are used to calculate the contractual payments to be exchanged under the contract. Weighted average floating rates are based on effective rates at year-end.
MATURITIES OF NOTIONAL CONTRACT VALUES ON DECEMBER 31, 2013
(million euros)Average rate (%)
2014 H1
2014 H2 2015 2016 2017 2018
> 5 years Total
Fair value
DEBT (1)
Long-term debt (2) 6.4 1,085 907 1,494 2,346 1,695 1,829 3,419 12,775 13,951
Fixed-rate portion 6.7 1,011 785 1,434 1,941 1,657 1,702 3,158 11,688 12,855
Floating-rate portion 3.5 74 122 60 405 38 127 261 1,087 1,096
Short-term debt 5.2 692 195 887 887
INTEREST-RATE
DERIVATIVES (3)
Pay fixed
Euro 4.6 - 42 - - - - - 42 (1)
Other currencies 8.6 74 - - - 54 - - 128 16
Pay floating
Euro 0.3 - - - 500 1,000 500 - 2,000 2
Other currencies - - - - - - - - - -
Other interest-rate derivatives
Euro - - - - - - - - - -
Other currencies - - - - - - - - - -
(1) The fair value of long-term debt was determined by estimating future cash flows on a borrowing-by-borrowing basis, and discounting these future cash flows using
an interest rate that takes into account the Group’s incremental borrowing rate at year-end for similar types of debt arrangements.
(2) Including the current portion of long-term debt.
(3) The fair value of foreign interest rate derivative instruments has been calculated using market prices that the Group would pay or receive to settle the related
agreements.
Based on outstanding hedging instruments on December 31, 2013, a +/-100 basis point shift in yield curves would have a non signifi cant estimated impact on equity in respect of interest-rate derivatives designated as hedging instruments in a cash fl ow hedging relationship.
The impact on the income statement related to interest-rate derivative instruments designated as hedging instruments in a fair value hedging relationship is netted off by the revaluation of the underlying debt.
Furthermore, the income statement impact of the same yield curve fl uctuations on interest-rate derivative instruments, not designated as hedges for accounting purposes, would have a non signifi cant impact in income. Fair values are calculated with internal models that rely on observable market data (interest rates curves, “zero coupon” curves, etc.).
Commodity price fl uctuation risk and sensitivityLafarge is also subject to commodity price fl uctuation risk mainly in the power, natural gas, petcoke, coal, fuel and also maritime freight markets.
Exposure to fl uctuations in commodity prices is limited by increased use of alternative fuels and renewable energies.
From time to time, and if a market exists, commodity exposures are hedged through derivative instruments at the latest when a fi rm commitment is entered into or known, or where future cash fl ows are highly probable. These derivative instruments are generally limited to swaps and options, with maturities and terms adaptable on a case by case basis.
Lafarge - Registration Document 2013 • 153
RISKS AND CONTROL5.1 Risk factor

No derivative instrument is entered into other than for hedging purposes.
Based on outstanding hedging instruments on December 31, 2013, a +/-20% change in the commodity indexes against which Lafarge is hedged, i.e. mainly power, fuel (Platts), gas oil (IPE) and coal (Newcastle FOB), would have an estimated maximum impact of respectively -/+9 million euros on equity in respect of commodity derivative instruments designated as hedging instruments in a cash fl ow hedging relationship. The net income statement impact of the same commodity index fl uctuations on the Group’s commodity derivative instruments is not material. Fair values are calculated with internal models that rely on observable market data (raw materials spot and forward rates, etc.).
See Note 26 (e) (Commodity risk) to the consolidated financial statements on page F62 for more information on fi nancial instruments and commodity risk.
Counterparty risk for fi nancial operationsLafarge is exposed to credit risk in the event of default by a counterparty (mainly banks and other fi nancial institutions). The exposure to counterparty risks is limited by rigorously selecting its counterparties, by regularly monitoring the ratings assigned by credit rating agencies, and by taking into account the nature and maturity of its exposed transactions, according to internal Group policies.
Counterparty limits are defi ned and regularly reviewed. We believe our counterparty management risk is cautious and in line with market practices but this may not prevent us from being signifi cantly impacted in case of systemic crisis.
For further information on exposure to credit and counterparty risks and management thereof, see Note 26 (Financial instruments) to consolidated fi nancial statements on page F57 as well as Section 5.1.3 (Insurance and risk coverage) on page 157 .
Listed shares risk
Quoted equityLafarge does not hold any non-consolidated investments in listed companies which could have a signifi cant impact on the profi t or fi nancial situation of the Group.
The Group’s principal defi ned benefi ts pension plans, which are situated in the United Kingdom and in North America, are managed by pension funds that invest the main part of their assets in listed securities. The fair value of these assets as well the split of the investments between stock, bonds and others can be found in Note 23 (Pensions plans, end of service benefi ts and other post-employment benefi ts ) to consolidated fi nancial statements on page F48 .
In the United Kingdom, the pension assets are principally administered through a pension fund, governed by an independent Board of Trustees.
See Pension Plans risk on page 151 .
Treasury sharesOn December 31, 2013 Lafarge held 17,935 treasury shares. These shares are assigned to cover stock option or performance share grants. Lafarge considers the risk exposure with respect to treasury shares to be non signifi cant.
5.1.2 RISK MANAGEMENT
In order to ensure the sustainability of its business development and to meet its targets, the Group makes ongoing efforts to prevent and control the risks to which it is exposed.
Risk monitoring requires the establishment of standard procedures to identify and analyze the main risks to which the Group is exposed and continually deploying and managing risk management systems designed to eliminate or reduce the probability that risks will arise and to limit their impact.
a) Risk identifi cation and analysisRisk identification and analysis are structured around several coordinated approaches conducted within the Group under the responsibility of the Group Executive Committee.
A detailed Group risk mapping coordinated by Group Internal Audit and Group Internal Control departments is regularly performed. The main areas identifi ed are subjected to in-depth analysis and the development of actions plans which are progressively implemented. An update of these action plans was presented to the Group Audit Committee in June 2013. The next Group risk mapping update will be performed in 2014 and the results will be presented to the Group Audit Committee.
As part of the Group’s new management cycle, strategic reviews of all Group countries are conducted periodically by the heads of the countries and the Group in the context of the Country ambition plans. These strategic reviews include an analysis of the main risks to which the countries are exposed.
The Country CEOs and CFOs, the Group Executive Vice-Presidents in charge of operations and the heads of Corporate functions are also formally reporting a list of risks and uncertainties that could have a potential impact on the fi nancial statements. This is part of the annual “certifi cation” process. The certifi cation letters are consolidated by the Group Internal Control department and a summary is validated by the Chairman and Chief Executive Offi cer and the Executive Vice-President Finance, and presented to the Group Audit Committee.
Every year, an analysis of risks related to the reliability of fi nancial information, asset protection, and fraud detection and prevention is performed at the Group level by the Internal Control department, in conjunction with the relevant functional departments. This analysis serves as a basis for updating the Group’s internal control standards (1), which are deployed across the Group’s countries and within the Group’s functional departments (see Section 5.2.1 (b) (Procedures related to “internal control over financial reporting”) for more information).
The annual audit plan drawn up by the Group Internal Audit department takes into account the various analyses described above. In preparing this plan, Group Internal Audit also conducts a large number of interviews and corroborates or supplements these analyses. Implementation of this plan and the summary of work presented to the Group Executive Committee and Audit Committee lead to more in-depth analyses in certain areas and contribute to the ongoing risk identifi cation process.
(1) Group “Internal Control Standards” is the set of key controls covering main risks pertaining to processes in place for the preparation of fi nancial reporting.
• Lafarge - Registration Document 2013154
RISKS AND CONTROL55 5.1 Risk factor

5
b) Risk management systemsAn active risk management plan based on the risk identifi cation and analysis work described above has been in place within the Group for several years. It is continually adjusted in response to new issues and risks to which the Group is exposed.
d GENERAL RISK MANAGEMENT FRAMEWORK AND CODE OF BUSINESS CONDUCT
Responsibility and principles underlying risk managementGenerally speaking, the heads of the Countries and Group functional departments are responsible for defi ning and/or applying the measures required to reduce the Group’s risk exposure.
Risk management is based primarily on certain defi ning principles, such as:
d the Principles of Action, which define the Group’s commitments to customers, employees, shareholders, and other stakeholders, and define what the “Lafarge Way” is, i.e. the Group’s management philosophy;
d the principles of organization, which define responsibilities at all levels within the organization and the various components of the management cycle.
These principles are communicated on an ongoing basis and are a major component of the Group’s preventive management of main risks by defi ning the Group’s fundamental values and clearly identifying responsibilities.
In addition, the Group and each functional department have defi ned a set of complementary policies and rules. The functional managers, their staff, and the Country managers are in charge of disseminating and applying these policies and rules to ensure that practices are consistent at each level of the organization. All these rules have been gradually assembled to facilitate their implementation.
Lafarge Code of Business ConductAs a core part of its policies, the Group adopted a Code of Business Conduct that sets out the principles of conduct that each individual is to adopt in business situations. The Code of Business Conduct is essential in preventing the main risks faced by the Group, by setting out the issues, recommendations, and prohibitions pertaining primarily to the following: compliance with laws and regulations, abiding by competition rules, corruption and fraud prevention, insider trading rules, confl icts of interest, participation in political activities, health and safety, discrimination and harassment prevention, respect for the environment, protection of assets, reliability of information, importance of internal control and application of sanctions in case of violations.
The action to strengthen the dissemination of the Code of Business Conduct and its appropriation by all Group employees is a continuing process. A comprehensive training program, based on concrete case studies drawn from business examples, was reviewed by Transparency International and the International Chamber of Commerce in 2008, and disseminated in all countries where Lafarge operates. The Group continued in 2013 the active promotion of this program and interactive training tools, accessible through the Group intranet in all countries where the Group operates.
Asset protectionFor many years, the Group has been defi ning policies and practices implemented for the purpose of protecting its assets, both tangible (property, plant and equipment, inventories, accounts receivable, fi nancial assets, etc.) and intangible (brand, information, know-how, patents, etc.). The application of these policies has been strengthened by establishing internal control standards in the Group’s countries and functional departments, with one main objective being the safeguarding of assets.
Fraud prevention programThe Group has a program designed to prevent, deter, and detect fraud. This program has been gradually reinforced over the years and encompasses:
d the Code of Business Conduct, which provides a general framework in this area;
d a procedure that was defined and deployed for reporting and monitoring cases of fraud and other breaches of the Code of Business Conduct, which requires that each case be reported to the Group through the various channels set out in this procedure and defines the role of the different parties involved (Country heads, Group Legal, Human Resources, Internal Audit, and Internal Control departments), the various types of fraud and the course to be followed in case of suspected fraud;
d an ethics line set up to enable employees, anywhere in the world to anonymously exercise their whistleblowing rights, to report any breach of the rules set forth in the Code of Business Conduct and, more specifically, to report fraud cases. The guidelines issued by the Cnil (the French national data protection and privacy agency) were followed to set up this system, to ensure strict adherence to specific rules implemented in France regarding reporting mechanisms;
d the Group’s internal control standards, which cover many key controls that directly and indirectly target the risk of fraud and have been widely deployed; and
d more generally, the body of rules, procedures, and controls applied within the Group’s organizations.
d SYSTEMS FOR MANAGING SPECIFIC RISKS
In particular, risk management systems have been developed and applied in the following areas:
d management of the Group’s asset portfolio;
d actions to secure access to raw materials;
d environmental risk management and safety program;
d antitrust compliance program; and
d financial and market risks management.
These systems are defi ned by precise objectives, which are approved by the Group’s governing bodies, the use of dedicated tools and resources to achieve these objectives, and a set of oversight and monitoring actions to ensure that they are properly implemented.
Lafarge - Registration Document 2013 • 155
RISKS AND CONTROL5.1 Risk factor

Management of the Group’s asset portfolioManagement of the Group’s asset portfolio mainly entails:
d actively monitoring country risks, particularly those arising from the economic, political and social climate;
d a process for geographically modelling natural disaster risks;
d a structured decision-making process for investments and divestments; and
d a system to optimize the flows of funds into the Group.
The Group Strategy department has defined a methodology for measuring and monitoring country risk trends over time. This analysis is conducted annually and is taken into account when defi ning the Group’s asset management strategy. With the support of these analyses, we continue to diversify our portfolio geographically and exercise care to manage the respective weight of each country for the Group.
The Group’s Risks and Insurance department has developed a process for modelling natural event risks with the primary aim of setting up insurance programs to secure optimum coverage for such risks.
Acquisitions and disposals are subject to review and approval at various levels as a function of their materiality, upon completion of each phase - economic opportunity study, feasibility study and detailed study. The Risk and Portfolio Committee reviews the risks and rewards of each acquisition or disposal project submitted thereto, based on an assessment report that covers the strategic, business and fi nancial, legal, tax, human resources, and technical aspects (status of assets and mineral reserves, energy access conditions), as well as aspects related to sustainable development. A risk and opportunity analysis is performed in each of these areas.
Lastly, a Dividends Committee, in which the Group’s Tax, Legal, Control and Consolidation and Financing and Treasury departments are represented, determines how to optimize returns of cash to the Group.
Actions to secure access to certain raw materialsManaging the risk associated with access to raw materials is organized upstream in the Group’s development process, primarily through actions to secure long-term access to resources via acquisitions and development projects and ongoing management of land resources and other supply sources.
See Section 1.3.4 (Mineral reserves and quarries) on page 39 for further information.
Management of environmental, health and safety risksThe Group takes many measures to manage the environmental impact of its business operations. The Group’s Environmental and Public Affairs department monitors the application of its environmental policy throughout all Group entities. This policy covers managing production facilities in compliance with the law, minimizing quantities of non-renewable resources used, minimizing waste production, and implementing quarry rehabilitation plans. Audits and performance controls are carried out to ascertain that standards and performance targets are met.
The Group is engaged in an ambitious program to improve its performance in terms of the health and safety of persons who work on its sites. This is being accomplished by defi ning a risk management standard, deploying specifi c operational rules and standards, as well as through systematic analyses of the causes of serious incidents, and by disseminating information on experiences and good practices throughout the sites. All Group business units have been mobilized to implement these standards, which are gradually reducing accident risks. The Health and Safety Management System (HSMS) has the main following governance Standards: Incident Reporting and Investigation, Contractor Safety Management, Risk Management. On top of these, the HSMS has the following operational standards: Work at Height, Personal Protective Equipment, Energy Isolation, Transport of People and L oads and Workin Confi ned Space. This list is not exhaustive.
Competition compliance programThe Group's competition compliance program (Compliance Program), implemented since 2007, aims at ensuring that all Group employees abide by competition laws and regulations. It is applicable in all countries where Lafarge has operations and covers all of its activities, including those conducted jointly with third parties in the context of joint ventures. The Compliance Program is cascaded worldwide through a number of awareness tools and training actions, as well as verifi cations that the rules of the Compliance Program are being followed at Country level and information reporting through a dedicated network of competition correspondents based in every country where the Group operates.
In the event of allegations of breach of compliance with competition laws made against the Group or one of its subsidiaries, the Group’s policy is to cooperate with the local antitrust authorities.
In 2013, the Group Competition Team and local lawyers continued the promotion of this Program through various training sessions performed worldwide (including e-learning) and compliance verifi cations. In addition to the foregoing, various Group guidelines are available to increase the awareness of Group employees and to provide them with appropriate competition law guidance on the applicability of the Compliance Program in various types of situations.
Financial and market risk managementManagement of fi nancial and market risks (currency and interest rate risk, liquidity risk, equity risk and risk of price volatility for energy sources used in the production cycle) is centralized by the Group Finance department, which works jointly with the Group Purchasing department for energy source issues. A set of strict policies and procedures is determined at Group level to cover these risks and defi ne the responsibilities of the different parties involved.
Approval must be obtained from the Group Finance department for all operations or transactions involving setting up fi nancing and guarantees for a term of more than one year or above a certain amount, the use of some hedging instruments or derivatives, and the distribution of dividends.
• Lafarge - Registration Document 2013156
RISKS AND CONTROL55 5.1 Risk factor

5
Lafarge policies do not allow for any speculative positions on the market. Lafarge has instituted management rules based on the segregation of duties, fi nancial and administrative control and risk measurement. Lafarge has also introduced an integrated system for its operations managed at corporate level that permits real-time monitoring of hedging strategies.
Lafarge policy is to use derivative instruments to hedge our exposure to exchange rate and interest rate risks. We also use derivative instruments from time to time to manage our exposure to commodity risks.
Lafarge uses fi nancial instruments only to hedge existing or anticipated fi nancial and commercial exposures. This hedging is undertaken in the over-the-counter market with a limited number of highly rated counterparties. The positions in derivative fi nancial instruments are monitored using various techniques, including the fair value approach.
To reduce Lafarge's exposure to currency risks and interest rate fluctuations, the exposure is managed both on a central basis through the Group Treasury department and in conjunction with some of Lafarge's subsidiaries. Various standard derivative fi nancial instruments, such as forward exchange contracts, interest rate, currency swaps, and forward rate agreements, are used to hedge currency and interest rate fl uctuations on assets, liabilities and future commitments, in accordance with guidelines established by senior management.
Lafarge is also subject to commodity risk with respect to price changes principally in the energy and maritime freight markets and uses from time to time derivative fi nancial instruments to manage the exposure to these risks.
A follow-up review of risks related to fi nancial instruments is regularly carried out based on indicators provided to the management team through internal reporting.
Lafarge participates in the selection and monitoring of fi nancial assets covering pension benefi t obligations in conjunction with the entities that manage these funds.
5.1.3 INSURANCE AND RISK COVERAGE
Lafarge’s general insurance policy is based on the following key principles:
d implement prevention and protection actions in order to mitigate risks;
d retain exposure to frequency risks through Group captives;
d transfer only severity risks, above the self-retention threshold, to the leading insurers and reinsurers. Special attention is given to the financial strength of market participants;
d cover subsidiaries in which we own a majority shareholding under Group-wide insurance policies, subject to local regulatory constraints and specific geographical exclusions.
On this last point, the Group continues its actions. In this context, in 2013 the total cost of the Group’s insurance programs, including the risks self-insured via the captives, amounted to about 4.6% per thousand of the revenues of the insured perimeter.
a) Property damage and business interruption insuranceThese insurance programs cover property losses resulting from fi re, explosion, natural disasters, machinery breakdown, etc. and related business interruption, if any. These programs provide worldwide coverage. Group assets are insured at their actual cash value. Total insured values amount to 25,364 million euros.
Potential fi re loss scenarios for the largest sites are regularly evaluated with specialized engineers from an external consulting fi rm. The highest “Maximum Foreseeable Loss” for fi re per site is lower than 200 million euros.
In line with the modelization process of risks linked to natural disasters, established by Lafarge in the past few years, a pluri-annual plan permits classifi cation of the cement plants according to their vulnerability and to determine the potential scenarios and amounts involved.
The Group “Property Damage and Business Interruption” program limit remains at 200 million euros per claim, with the usual sub-limits set by insurance companies.
The number and diverse geographical locations of the Group’s industrial sites all over the world help mitigate the risk of high business interruption exposure.
In accordance with this plan, fire risk protection standards are progressively implemented in all cement plants with the support of prevention engineers from an external consulting fi rm.
b) Liability insurancePublic liability, product liability and environmental impairment liability policies are the main liability-type policies within the Group. They cover amounts commensurate with the nature of Lafarge’s business activities, the relevant countries, loss experience and available capacity in the insurance and reinsurance markets.
c) Captive insuranceLafarge has one insurance and one reinsurance captive insurance companies located in Europe to manage the frequency risk of the Group’s subsidiaries. The amount of liability retained by these captives stands at a maximum of 2 million euros per casualty claim and 5 million euros per property damage claim.
In North America, the Group has two captive insurance companies covering workers compensation, automobile liability and general liability . The maximum liability retained by these captives ranges from 2 million dollars to 5 million dollars per loss, depending on the type of coverage.
Lafarge - Registration Document 2013 • 157
RISKS AND CONTROL5.1 Risk factor

5.2INTERNAL CONTROL PROCEDURES
5.2.1 REPORT OF THE CHAIRMAN OF THE BOARD OF DIRECTORS ON INTERNAL CONTROL PROCEDURES AND ON CORPORATE GOVERNANCE (ARTICLE L. 225-37 OF THE FRENCH COMMERCIAL CODE)
This report on internal control procedures and corporate governance was prepared under the responsibility of the Chairman of the Board pursuant to article L. 225-37 of the French Commercial Code.
It was drafted with the support of the Group Internal Control department and the Group Audit department.
It was examined by the Audit Committee in its meeting of February 17, 2014, reviewed by the Corporate Governance and Nominations Committee, chaired by the Vice-Chairman of the Board (Lead Independent Director) on the governance aspects and approved by the Board of Directors in its meeting of February 18, 2014.
The information of this report is organized as follows:
d general organization of internal control and risk management;
d internal control procedures related to the preparation of accounting and financial information.
The introduction of Chapter 3 (Declaration in terms of corporate governance - Governance Code of Reference) and Sections 5.1.2 (Risk Management), 3.1 (Board of Directors-Corporate Offi cers), 3.2 (Board and Committees rules and practices), 3.4 (Compensation and benefits), 3.7 (Implementation of the principle “Comply or Explain” of the Afep-Medef Code), and 6.2.5 (e) (Convocation and admission to Shareholders’ General Meetings) of the Registration Document (Document de référence) are part of this report. Moreover the Registration Document includes the information pursuant to article L. 225-100-3 of the French Commercial Code in 6.2.6 (Change of control).
Internal control related to the preparation of fi nancial and accounting information is designated below as “internal control over fi nancial reporting”.
a) General organization of internal control and risk management
d INTERNAL CONTROL FRAMEWORK CHOSEN BY THE GROUP
In conformity with the defi nition of the COSO report (1), which is the framework chosen by the Group, the internal control process consists of implementing and permanently adapting appropriate management systems, aiming at giving the Directors and management reasonable assurance concerning the reliability of fi nancial reporting, compliance with laws and internal regulations, and the effectiveness and effi ciency
of major Company processes. One of the objectives of internal control is to prevent and monitor the risks of errors and fraud. Like all control systems, because of its inherent limitations, the internal control process cannot guarantee that all risks of errors or fraud are fully eliminated or controlled.
d GROUP INTERNAL CONTROL ENVIRONMENT
Lafarge aims to have effective Internal Control systems in place at each level of responsibility supported by commitment of management and a culture of internal control.
The Group’s internal control environment is based on key documents such as the Group Principles of Action, Principles of Organization and Code of Business Conduct, which have to be strictly applied by Group employees:
d the Principles of Actions present Group commitments towards customers, employees, shareholders and other Group stakeholders, and define what the “Lafarge Way” is, being its management philosophy;
d the Principles of Organization define responsibilities at all levels within the organization (countries and Group), the various components of the management cycle as well as the key principles driving performance improvement;
d the Code of Business Conduct defines rules of conduct and is structured as follows: compliance with laws and regulations, prevention of conflicts of interest, respect for people and the environment, safeguarding of the Group’s assets, financial disclosure, importance of internal control, implementation of behavioral rules and appropriate sanctions.
In addition, Group Approval Rules setting the approving authority for commitments and decisions involving Lafarge S.A. and any of its subsidiaries have been revised to align to the Group Country based organization progressively implemented in 2012 and 2013.
Those documents are complemented by rules and policies established by the Group defi ning priorities for each of the Group’s principal functions. Among other things, these rules state that implementing a robust internal control process is one of the primary responsibilities of the Executive Management of each legal or operational entity.
An annual assessment of the internal control environment is organized in the Group on the basis of self-assessment questionnaires completed at the Country and Group level and signed by relevant managers.
d RISK IDENTIFICATION AND ANALYSIS
The approach implemented by the Group, relating to the identifi cation and analysis of risks, is described in Section 5.1.2 (a) (Risk identifi cation and analysis) of the Registration Document.
(1) COSO: Committee of Sponsoring Organization of the Treadway Commission. September 1992.
• Lafarge - Registration Document 2013158
RISKS AND CONTROL55 5.2 Internal control procedures

5
d RISK MANAGEMENT SYSTEMS
A presentation of the general framework of risk management and of major risks management systems is also included in Section 5.1.2 (b) (Risk management systems) of the Registration Document.
d CONTROL ACTIVITIES
Control activities are implemented at every level in the Group, in conformity with rules and policies described above.
Internal control activities over major processes impacting the reliability of the Group’s fi nancial reporting are defi ned in the Group “Internal Control Standards” (1) and are documented and tested as described in Section 5.2.1 (b) below.
d INFORMATION AND COMMUNICATION
The Group’s key documents are available on the Group’s intranet. Function leaders are responsible for disseminating the rules, policies and procedures applicable Group-wide.
Controls and procedures over key processes affecting the Group’s fi nancial reporting are subject to formal documentation and test procedures described in Section 5.2.1 (b) below.
d INTERNAL CONTROL MONITORING ACROSS THE GROUP
Internal control is monitored at all levels of the Group. The roles of major stakeholders are described below.
Board of Directors and Board CommitteesThe Board of Directors and its specialized Committees, and in particular the Audit Committee, ensure the implementation of the Group’s internal control policy.
See Sections 3.1 (Board of Directors-Corporate Officers), 3.2 (Board and Committees rules and practices) and 3.4 (Compensation and benefits).
Group Executive CommitteeThe Executive Committee steers the effective implementation of the Group’s internal control policy, through:
d the monitoring and follow-up of internal control procedures performed throughout the Group, and in particular the follow-up of identified action plans. Periodic presentations on internal control are submitted to the Executive Committee. Specifically, the Country Chief Executive Officers of countries considered as priorities are required to present the internal control risks in their countries to Executive Vice President Operations ;
d the review of the annual summary of the Group’s internal audit reports.
Group functionsWith regard to processes affecting the preparation of fi nancial reporting, Group function leaders, including in particular managers of the Group Finance function, have been designated at Group level as “business process owners”, with the responsibility of:
d documenting their processes at Group level including product line specifics and verifying that the “Internal Control Standards” for such processes are effectively implemented;
d defining and updating the standards of internal control applicable to countries.
CountriesIn application of the Group internal control policy, internal control is under the direct responsibility of the Executive Committee of countries.
In each of the Group’s countries, “Internal Control Managers” are appointed. Their role consists mainly in supporting the identifi cation of risks by the management, the implementation of the Group’s “Internal Control Standards” and ensuring procedures related to “internal control over fi nancial reporting” in their country are implemented. Their activities are coordinated by the Group Internal Control department presented below.
Group Internal AuditThe Group Internal Audit department (around 30 persons) is responsible for performing an independent assessment of the quality of internal control at all levels in the organization, following the annual audit plan approved by the Chairman and Chief Executive Offi cer and Audit Committee.
Reports are issued to countries and to senior managers upon completion of the fi eldwork. An annual summary of such reports is presented to the Chairman and Chief Executive Offi cer and to the Audit Committee, who also receives comments from the Group’s external auditors on internal control.
Furthermore, follow-up assignments are organized to verify that internal audit recommendations have been put in place.
Group Internal Control departmentThe Group Internal Control department (7 persons) is part of the Group Finance function. This department is in charge of overseeing internal control and monitoring all procedures related to “internal control over fi nancial reporting”.
This department oversees the defi nition of “Internal Control Standards” mentioned above and coordinates the network of Internal Control Managers within countries. It supports countries and the heads of Group functions in the implementation of such standards as well as the documentation and tests of controls over fi nancial reporting presented in Section 5.2.1 (b) below.
The Internal Control Committee chaired by the Group Chief Financial Offi cer and encompassing the key fi nance managers at Group level, the Group audit Director, the Group information systems Director, the Group energy and strategic sourcing Director, and the Group legal counsel oversees the work performed on “internal control over fi nancial reporting”.
b) Procedures related to “internal control over fi nancial reporting”
d KEY PROCESSES WITH AN IMPACT ON THE RELIABILITY OF GROUP FINANCIAL REPORTING
Processes with a direct impact on the production of fi nancial reporting, for which key controls were defi ned as part of the analysis presented above, relate to the following areas: fi nance (closing process including monitoring of off-balance sheets commitments, consolidation process, legal and tax management, treasury management), purchasing (from the bidding process to recording and payment of invoices), sales (from orders receipt to revenue recognition and collection), IT (security management, among others), payroll and management of various employee benefi ts, management of tangible and intangible assets and management of inventories (physical count, valuation, etc.).
(1) Group “Internal Control Standards” is the set of key controls covering main risks pertaining to processes participating in the preparation of fi nancial reporting.
Lafarge - Registration Document 2013 • 159
RISKS AND CONTROL5.2 Internal control procedures

d DOCUMENTATION AND TESTING OF “CONTROLS OVER FINANCIAL REPORTING”
The Group is committed to maintain high standards of internal control. It implements detailed work related to documentation and testing of “internal control over fi nancial reporting” to support its assessment. All documentation is kept in a dedicated internal control tool which is maintained by Group Internal Control department.
This work is implemented by Countries and at Group level, on key controls contributing to the reliability of financial reporting and encompasses:
d a description of key processes affecting the reliability of the Group’s financial reporting, as presented above;
d a detailed description of key controls defined in the “Internal Control Standards” presented above;
d tests of controls to check the operational effectiveness of such controls; the scope of such tests being defined based on the materiality and risk level of each entity;
d an annual internal “certification” process to review the principal action plans in progress and to confirm management responsibility at Countries and Group level on the quality of both internal control and financial reporting. This process is also supporting the risk identification described in Section 5.1.2 (a) (Risk identification and analysis) of the Registration Document.
This work is part of the process of continuous improvement in internal control and includes the preparation of specifi c action plans, identifi ed through the activities described above, as well as through internal and external audits. The implementation of action plans is followed up by
relevant senior management. The outcome of such procedures is presented to the Audit Committee.
d PREPARATION OF PUBLISHED FINANCIAL REPORTING
Specifi c procedures are put in place to ensure the reliability of published fi nancial reporting, as follows:
d a consolidation and financial reporting system is used to prepare Group financial reporting;
d a formal reporting, analysis and control process for other published information included in the Group’s Registration Document (Document de Référence) is implemented.
This process is monitored by the Disclosure Committee, composed of the main heads of Group functions, who verify the content of fi nancial disclosures and reports before they are submitted to the Audit Committee and to the Board of Directors.
Paris, February 19, 2014
French original signed by
Bruno Lafont
Chairman of the Board of Directors
• Lafarge - Registration Document 2013160
RISKS AND CONTROL55 5.2 Internal control procedures

5
5.2.2 STATUTORY AUDITORS’ REPORT, PREPARED IN ACCORDANCE WITH ARTICLE L. 225-235 OF THE FRENCH COMMERCIAL CODE (CODE DE COMMERCE), ON THE REPORT PREPARED BY THE CHAIRMAN OF THE BOARD OF DIRECTORS OF LAFARGE ON THE INTERNAL CONTROL AND RISK MANAGEMENT PROCEDURES RELATING TO THE PREPARATION AND PROCESSING OF FINANCIAL AND ACCOUNTING INFORMATION
YEAR ENDED DECEMBER 31, 2013
This is a free translation into English of a report issued in the French language and is provided solely for the convenience of English-speaking users. This report should be read in conjunction with, and construed in accordance with, French Law and professional auditing standards applicable in France.
To the Shareholders,
In our capacity as statutory auditors of LAFARGE (the “Company”), and in accordance with Article L. 225- 235 of the French Commercial Code (Code de commerce), we hereby report to you on the report prepared by the Chairman of your Company in accordance with Article L. 225-37 of the French Commercial Code for the year ended December 31, 2013.
It is the Chairman’s responsibility to prepare, and submit to the Board of Directors for approval, a report on the internal control and risk management procedures implemented by the Company and containing the other disclosures required by Article L.225-37 of the French Commercial Code , particularly in terms of corporate governance.
It is our responsibility to:
d report to you on the information set out in the Chairman’s report in respect of the internal control and risk management procedures relating to the preparation and processing of the accounting and financial information;
d attest that this report contains the other disclosures required by Article L. 225- 37 of the French Commercial Code , it being specified that we are not responsible for verifying the fairness of these disclosures.
We conducted our work in accordance with professional standards applicable in France.
INFORMATION ON THE INTERNAL CONTROL AND RISK MANAGEMENT PROCEDURES RELATING TO THE PREPARATION AND PROCESSING OF ACCOUNTING AND FINANCIAL INFORMATION
The professional standards require that we perform the necessary procedures to assess the fairness of the information provided in the Chairman's report in respect of the internal control and risk management procedures relating to the preparation and processing of accounting and fi nancial information. These procedures consisted mainly in:
d obtaining an understanding of the internal control and risk management procedures relating to the preparation and processing of accounting and financial information on which the information presented in the Chairman's report is based and the existing documentation;
d obtaining an understanding of the work involved in the preparation of this information, and the existing documentation;
d determining if any material weaknesses in the internal control procedures relating to the preparation and processing of the accounting and financial information that we would have detected in the course of our engagement are properly disclosed in the Chairman’s report.
On the basis of these procedures, we have nothing to report on the information in respect of the Company’s internal control and risk management procedures relating to the preparation and processing of accounting and fi nancial information contained in the report prepared by the Chairman of the Board of Directors in accordance with Article L. 225-37 of the French Commercial Code .
OTHER DISCLOSURES
We hereby attest that the Chairman’s report contains the other information required by Article L. 225- 37 of the French Commercial Code .
Neuilly-sur-Seine and Paris-La Défense, February 28, 2014
The Statutory Auditors
DELOITTE & ASSOCIÉS
French original signed by
ERNST & YOUNG et Autres
French original signed by
Arnaud de Planta Frédéric Gourd Alain Perroux Nicolas Macé
Lafarge - Registration Document 2013 • 161
RISKS AND CONTROL5.2 Internal control procedures

5.3AUDITING MATTERS
5.3.1 AUDITORS
Auditors
DELOITTE & ASSOCIÉS ERNST & YOUNG ET AUTRES
Amount (excl. tax) % Amount (excl. tax) %
(million euros) 2013 2012 2013 2012 2013 2012 2013 2012
AUDIT FEES
Audit, attestation and review of individual
and consolidated financial statements 6.3 6.3 92% 84% 5.7 5.8 85% 84%
Lafarge S.A. 1.6 1.5 23% 20% 1.4 1.4 21% 20%
Subsidiaries fully and proportionately
consolidated 4.7 4.8 69% 64% 4.3 4.4 64% 64%
Audit-related Fees (1) 0.4 1.1 6% 15% 0.8 0.9 12% 13%
Lafarge S.A. 0.2 0.7 4% 10% 0.2 0.1 3% 1%
Subsidiaries fully and proportionately
consolidated 0.2 0.4 2% 5% 0.6 0.8 9% 12%
SUB-TOTAL 6.7 7.4 98% 99% 6.5 6.7 97% 97%
OTHER FEES
Tax fees (2) 0.1 0.1 2% 1% 0.2 0.2 3% 3%
Legal and Employment fees - - - - - - - -
Information technology - - - - - - - -
Others - - - - - - - -
SUB-TOTAL OTHER FEES 0.1 0.1 2% 1% 0.2 0.2 3% 3%
TOTAL FEES 6.8 7.5 100% 100% 6.7 6.9 100% 100%
(1) Audit-related fees are generally fees billed for services that are closely related to the performance of the audit or review of financial statements. These include due
diligence services related to acquisitions, consultations concerning financial accounting and reporting standards, attestation services not required by statute or
regulation, information system reviews.
(2) Tax fees are fees for services related to international and domestic tax compliance, including the review of tax returns and tax services regarding statutory,
regulatory or administrative developments and expatriate tax assistance and compliance.
d STATUTORY AUDITORS
DELOITTE & ASSOCIÉS185, avenue Charles-de-Gaulle, 92200 Neuilly-sur-Seine, represented by Arnaud de Planta and Frédéric Gourd, re-appointed in its functions on May 15 , 2012 for a period of six fi nancial years expiring at the end of the Shareholders’ Meeting called to approve the fi nancial statements for fi nancial year 2017.
ERNST & YOUNG ET AUTRESTour First, 1-2, place des Saisons, Paris La Défense 1, 92400 Courbevoie, represented by Alain Perroux and Nicolas Macé, appointed in its functions on May 15, 2012 for a period of six fi nancial years expiring at the end of the Shareholders’ Meeting called to approve the fi nancial statements for fi nancial year 2017 (replacing Ernst & Young Audit).
d ALTERNATE AUDITORS
BEAS195, avenue Charles-de-Gaulle, 92200 Neuilly-sur-Seine, re-appointed in its functions on May 15, 2012 for a period of six fi nancial years expiring at the end of the Shareholders’ Meeting called to approve the fi nancial statements for fi nancial year 2017.
AUDITEX1-2, place des Saisons, Paris La Défense 1, 92400 Courbevoie, re-appointed in its functions on May 15, 2012 for a period of six fi nancial years expiring at the end of the Shareholders’ Meeting called to approve the fi nancial statements for fi nancial year 2017.
5.3.2 AUDITORS ’ FEE S AND SERVICES
• Lafarge - Registration Document 2013162
RISKS AND CONTROL55 5.3 Auditing matters

5
5.3.3 AUDITORS’ REPORTS
The table below indicates where to fi nd in this Registration Document the different reports issued by the auditors.
Report Page
Report on the consolidated financial statements F 3
Report on the statutory accounts F 74
Special report on related-party agreements and commitments F 96
Report on the report prepared by the Chairman of the Board of Directors on internal control and risk management 161
In addition, Bureau Veritas C ertifi cation's report on sustainable development indicators can be found on page 142 of this Registration Document.
Lafarge - Registration Document 2013 • 163
RISKS AND CONTROL5.3 Auditing matters

• Lafarge - Registration Document 2013164
RISKS AND CONTROL55

165
66.1 Shareholders ................................... 1666.1.1 Major shareholders and share capital distribution ..... 1666.1.2 Shareholders’ agreement ............................................ 1676.1.3 Threshold notifi cations imposed by law
and declarations of intent ........................................... 1686.1.4 Employee share ownership.......................................... 1696.1.5 Listing ......................................................................... 170
6.2 Share capital and additional information .. 1726.2.1 Share capital .............................................................. 1726.2.2 Shares owned by the Company .................................... 1736.2.3 Securities non representative of share capital –
bonds .......................................................................... 1746.2.4 Authorizations delegated to the Board of Directors ..... 1756.2.5 Articles of Association (statuts) .................................. 1776.2.6 Change of control ........................................................ 1796.2.7 Material contracts ...................................................... 1796.2.8 Intra-group relations .................................................. 1806.2.9 Documents on display ................................................. 180
6SHAREHOLDERS, SHARE
CAPITAL AND ADDITIONAL INFORMATION
Lafarge - Registration Document 2013 • 165
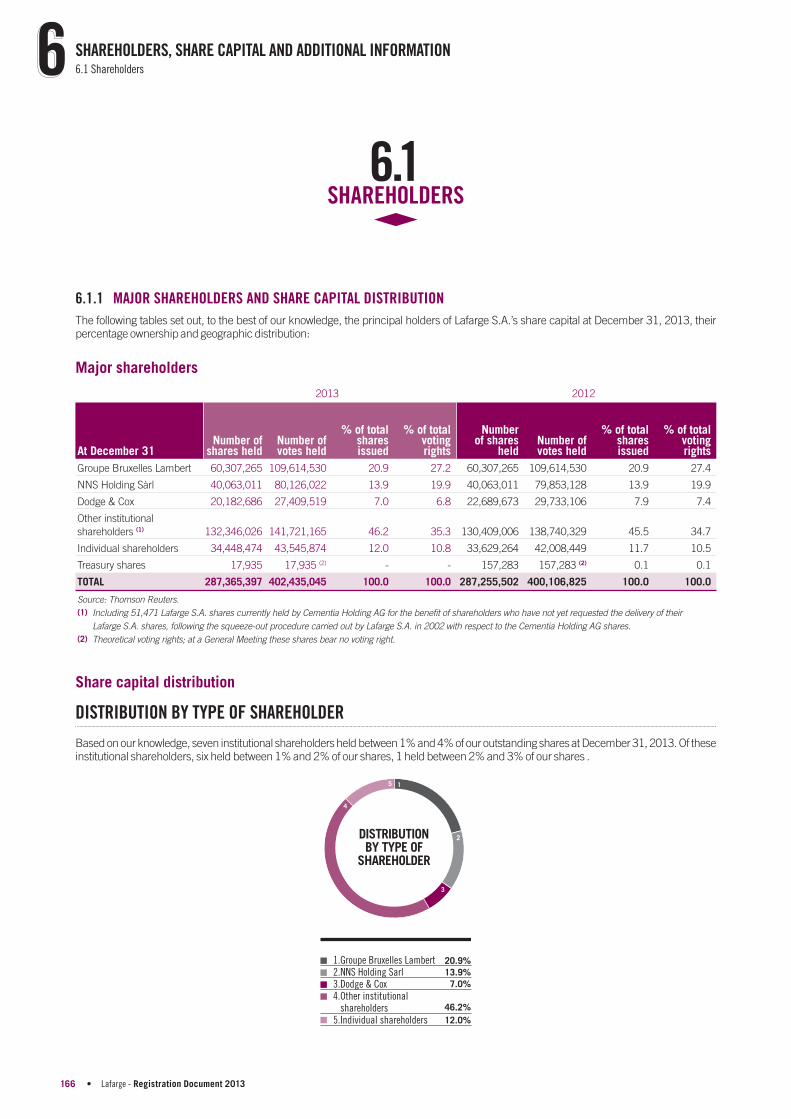
6.1SHAREHOLDERS
6.1.1 MAJOR SHAREHOLDERS AND SHARE CAPITAL DISTRIBUTION
The following tables set out, to the best of our knowledge, the principal holders of Lafarge S.A.’s share capital at December 31, 2013, their percentage ownership and geographic distribution:
Major shareholders
2013 2012
At December 31Number of
shares heldNumber of votes held
% of total shares issued
% of total voting rights
Number of shares
heldNumber of votes held
% of total shares issued
% of total voting rights
Groupe Bruxelles Lambert 60,307,265 109,614,530 20.9 27.2 60,307,265 109,614,530 20.9 27.4
NNS Holding Sàrl 40,063,011 80,126,022 13.9 19.9 40,063,011 79,853,128 13.9 19.9
Dodge & Cox 20,182,686 27,409,519 7.0 6.8 22,689,673 29,733,106 7.9 7.4
Other institutional
shareholders (1) 132,346,026 141,721,165 46.2 35.3 130,409,006 138,740,329 45.5 34.7
Individual shareholders 34,448,474 43,545,874 12.0 10.8 33,629,264 42,008,449 11.7 10.5
Treasury shares 17,935 17,935 (2) - - 157,283 157,283 (2) 0.1 0.1
TOTAL 287,365,397 402,435,045 100.0 100.0 287,255,502 400,106,825 100.0 100.0
Source: Thomson Reuters.
(1) Including 51,471 Lafarge S.A. shares currently held by Cementia Holding AG for the benefit of shareholders who have not yet requested the delivery of their
Lafarge S.A. shares, following the squeeze-out procedure carried out by Lafarge S.A. in 2002 with respect to the Cementia Holding AG shares.
(2) Theoretical voting rights; at a General Meeting these shares bear no voting right.
Share capital distribution
DISTRIBUTION BY TYPE OF SHAREHOLDER
Based on our knowledge, seven institutional shareholders held between 1% and 4% of our outstanding shares at December 31, 2013. Of these institutional shareholders, six held between 1% and 2% of our shares, 1 held between 2% and 3% of our shares .
DISTRIBUTIONBY TYPE OF
SHAREHOLDER
1
2
3
4
5
20.9%
13.9%
7.0%
46.2%
12.0%
1.Groupe Bruxelles Lambert2.NNS Holding Sarl3.Dodge & Cox4.Other institutional shareholders5.Individual shareholders
• Lafarge - Registration Document 2013166
SHAREHOLDERS, SHARE CAPITAL AND ADDITIONAL INFORMATION66 6.1 Shareholders

6
GEOGRAPHICAL DISTRIBUTION
2013 2012
At December 31Number of
shares held% of total
shares issuedNumber of
shares held% of total
shares issued
France 71,888,339 25.0 70,763,039 24.6
Belgium (1) 62,448,794 21.7 62,628,919 21.8
United States 54,049,287 18.8 55,532,729 19.3
Luxembourg (2) 40,727,373 14.2 40,309,519 14.0
United Kingdom 19,700,487 6.9 21,458,240 7.5
Rest of the World 38,551,117 13.4 36,563,056 12.8
TOTAL 287,365,397 100.0 287,255,502 100.0
Source: Thomson Reuters.
(1) Including shares held by Groupe Bruxelles Lambert.
(2) Including shares held by NNS Holding Sàrl.
GEOGRAPHICAL DISTRIBUTION
GEOGRAPHICALDISTRIBUTION
1
2
3
4
5
6
25.0%
21.7%
18.8%
14.2%
6.9%
13.4%
1.France2.Belgium3.United States4.Luxembourg5.United Kingdom6.Rest of the World
Pledge of our shares21,536,048 of our shares held in registered form were pledged at December 31, 2013, representing 7.49% of our share capital and 8.77% of our voting rights. 99.82% of these pledged shares were held by NNS Holding Sàrl.
6.1.2 SHAREHOLDERS’ AGREEMENT
Shareholders’ agreement with the Sawiris family and NNS Holding SàrlA 10-year shareholders’ agreement was entered into with certain members of the Sawiris family and NNS Holding Sàrl on December 9, 2007, following the acquisition of the Cement activities of the Orascom Group (Orascom Construction Industries S.A.E., acquired by the Group on January 23, 2008). This agreement contains certain commitments regarding the shares issued for their benefi t as a result of the reserved capital increase of 2008.
In particular, the shareholders’ agreement contained (i) a lock-up commitment of four years (with limited exceptions) followed by a three-year period for phased disposals; (ii) a standstill commitment for a four-year period not to acquire more than 8.5% of the share capital in addition to their current shareholding, such holding in any case not to exceed a total of 20% of the share capital or any other higher level of shareholding that would come to be held by another shareholder acting alone or in concert; and (iii) a commitment not to act in concert with a third party in relation to Lafarge S.A. shares for a 10-year period.
In consideration of these commitments, the Company has undertaken to make its best efforts to ensure that NNS Holding Sàrl is entitled to nominate two of its representatives as members of the Board of Directors as long as NNS Holding Sàrl and the Sawiris family together hold more than 10% of the share capital of the Company and comply with all their obligations under this agreement.
Since March 27, 2012, the shares held by NNS Holding Sàrl and certain members of the Sawiris family are no longer subject to the lock-up commitment and acquisitions of Lafarge S.A. shares are unrestricted. The only remaining covenants are information covenants as well as the commitment not to act in concert with a third party.
Lafarge - Registration Document 2013 • 167
SHAREHOLDERS, SHARE CAPITAL AND ADDITIONAL INFORMATION6.1 Shareholders

6.1.3 THRESHOLD NOTIFICATIONS IMPOSED BY LAW AND DECLARATIONS OF INTENT
Groupe Bruxelles LambertGroupe Bruxelles Lambert did not notify any threshold crossing or make any declaration of intent during 2013 and 2012.
In 2011, Groupe Bruxelles Lambert declared having exceeded the threshold of 25% of Lafarge S.A. voting rights on April 28, 2011 and holding 60,307,265 Lafarge S.A. shares representing 109,614,530 voting rights (corresponding to 21.05% of the share capital and 28.46% of the voting rights), as a result of the allotment of double voting rights.
It was specifi ed that there was no fi nancing or securities borrowing associated with this threshold crossing as it resulted from the allotment of double voting rights and Groupe Bruxelles Lambert confi rmed that it was not party to any agreement for the temporary transfer of its Lafarge S.A. shares or voting rights.
As part of this notifi cation, Groupe Bruxelles Lambert declared that it was acting in concert with those controlling Groupe Bruxelles Lambert (legal presumption) but not with any other third party, that it was not contemplating further acquisitions (without excluding the possibility of arbitrage) and that it had no intention of taking control of Lafarge S.A.
Groupe Bruxelles Lambert also confi rmed supporting the strategy of the Board of Directors of Lafarge S.A., that it had no intention of either soliciting the appointment of additional Directors other than its existing three representatives to the Lafarge Board of Directors or implementing the transactions listed in paragraph 6 of article 223-17 of the general regulations of the AMF, i.e. any of the following:
d merger, restructuring, liquidation or transfer of a substantial part of the Company’s assets, or of any controlled person as defined by article L. 233-3 of the French Commercial Code;
d change to the Company’s business;
d change to the Company’s articles of association;
d delisting of a category of securities issued by the Company;
d issue of Lafarge S.A. securities.
NNS Holding Sàrl and Mr Nassef SawirisMr Nassef Sawiris and NNS Holding Sàrl did not notify any threshold crossing or make any declaration of intent during 2013.
In 2012, Mr Nassef Sawiris declared having exceeded the threshold of 15% of Lafarge S.A.' share capital on October 1, 2012, acting in concert with NNS Holding Sàrl (the Sawiris family holding company) and NNS Holding (Cayman) (a company controlled by a trust constituted by Mr Nassef Sawiris) and holding in concert 48,120,866 Lafarge S.A. shares representing 87,912,654 voting rights (corresponding to 16.75% of the share capital and 22.04% of the voting rights).
This threshold crossing results from the assimilation of 6,000,000 Lafarge S.A. shares by NNS Holding (Cayman) following the entry into force of new legislation providing that shares underlying cash-settled share forward transactions must be assimilated to shares and voting rights held (article L. 233-9 I 4°bis of the French Commercial Code).
NNS Holding (Cayman) has entered into a cash-settled share forward transaction. This forward transaction does not give NNS Holding (Cayman) any right to Lafarge S.A. shares nor voting rights in the Company. NNS Holding (Cayman)'s economic exposure corresponds to an underlying number of 6,000,000 Lafarge S.A. shares. This forward transaction is due to settle on May 19, 2014 but can be settled earlier in all or in part.
It was also specifi ed that part of the shares declared by NNS Holding Sàrl (i.e.: 2,056,184 Lafarge S.A. shares representing 2,056,184 voting rights) correspond to two purchase options, to be cash or stock settled at NNS Holding Sàrl's initiative: one option relating to 1,022,247 Lafarge S.A. shares to be settled on January 17, 2013 and a further option relating to 1,033,937 Lafarge S.A. shares to be settled on January 31, 2013.
Mr Nassef Sawiris, NNS Holding Sàrl and NNS Holding (Cayman) declared acting in concert, it being specifi ed that as a result of the shareholders' agreement of December 9, 2007 entered into between Lafarge S.A. and NNS Holding Sàrl, they had undertaken not to act in concert with any third party (with the exception of members of Mr Nassef Sawiris’ family and related companies) for the duration of the shareholders agreement (10 years).
NNS Holding Sàrl and Mr Nassef Sawiris also declared envisaging to proceed to further acquisitions depending on opportunities and on the market (it being specifi ed that the limits set by the shareholders agreement of December 9, 2007, described further in Section 6.1.2 (Shareholders' agreement with the Sawiris family and NNS Holding Sàrl), are no longer applicable).
Mr Nassef Sawiris, NNS Holding Sàrl and NNS Holding (Cayman) declared having no intention of taking control of Lafarge S.A. and renewing their support to the management of the Company.
Mr Nassef Sawiris, NNS Holding Sàrl and NNS Holding (Cayman) declared that they were not party to any agreement for the temporary transfer of Lafarge S.A. shares or voting rights and had no project for any:
d merger, restructuring, liquidation or transfer of a substantial part of the Company’s assets;
d change to the Company’s articles of association or business;
d delisting of a category of securities issued by the Company;
d issue of Lafarge S.A. securities;
d request for the appointment of further Board members.
NNS Holding (Cayman) further declared having no intention to amend the cash-settled share forward transaction described above into a transaction which can be settled in Lafarge S.A. shares.
In 2011, Mr Nassef Sawiris declared having exceeded the threshold of 20% of the voting rights in Lafarge S.A. on April 28, 2011, acting in concert with NNS Holding Sàrl (the Sawiris family holding company) and holding in concert 40,297,995 Lafarge S.A. shares representing 80,126,943 voting rights (corresponding to 14.07% of the share capital and 21.14% of the voting rights), as a result of the allotment of double voting rights.
It was specifi ed that since the threshold was crossed as the result of the allotment of double voting rights, as opposed to the acquisition of shares, there was no fi nancing or securities borrowing associated to this threshold crossing.
• Lafarge - Registration Document 2013168
SHAREHOLDERS, SHARE CAPITAL AND ADDITIONAL INFORMATION66 6.1 Shareholders

6
As part of this notifi cation, NNS Holding Sàrl and Mr Nassef Sawiris made declarations of intent similar to the ones made in 2012 as set out above.
Dodge & CoxDodge & Cox did not notify any threshold crossing or make any declaration of intent during 2013 and 2012.
In 2011, Dodge & Cox, acting for client accounts, declared having exceeded the 5% threshold of the share capital of Lafarge S.A. on August 30, 2011 and holding for the accounts of the above mentioned clients 14,375,379 shares representing 21,135,004 voting rights, corresponding to 5.04% of the share capital and 5.33% of the voting rights of Lafarge S.A..This threshold crossing results from the acquisition of Lafarge S.A. shares on the market.
Southeastern Asset Management, Inc.Southeastern Asset Management, Inc. did not notify any threshold crossing or make any declaration of intent during 2013.
In 2012, Southeastern Asset Management, Inc., acting for client accounts, declared having fallen below the 5% threshold of the share capital of Lafarge S.A. on August 16, 2012 and holding for the accounts of the above mentioned clients 14,297,439 shares representing 14,297,439 voting rights, corresponding to 4.98% of the share capital and 3.58% of the voting rights of Lafarge S.A. This threshold crossing results from the sale of Lafarge S.A. shares off market.
In 2011, Southeastern Asset Management, Inc., acting for client accounts, declared having exceeded the 5% threshold of the share capital of Lafarge S.A. on November 24, 2011 and holding for the accounts of the above mentioned clients 14,846,018 shares representing 14,846,018 voting rights, corresponding to 5.17% of the share capital and 3.75% of the voting rights of Lafarge S.A. This threshold crossing results from the acquisition of Lafarge S.A. shares on the market and off market.
OthersTo our knowledge, there is no shareholder holding more than 5% of our share capital or voting rights other than those mentioned above.
6.1.4 EMPLOYEE SHARE OWNERSHIP
As at December 31, 2013, Lafarge employees held 1. 69% of the share capital and 2. 36% of voting rights. 1. 15% of the share capital was held by employees in direct ownership (registered account) and the balance, representing 0. 54% of the share capital, by the employee savings fund Lafarge 2000.
Employee Stock Ownership PolicySince 1961, date of the fi rst share offering reserved for employees, Lafarge has developed an active employee share ownership program.
The Group is convinced that being both an employee and a shareholder strengthens the tie with the Company and wishes to provide this opportunity on a regular basis to the largest possible number of employees on a worldwide basis.
All employee stock ownerships programs launched since 1995 have been direct stock ownership programs, enabling employees to be registered directly as shareholders and to vote individually at shareholders meetings. Direct ownership of employees in the share capital of Lafarge S.A. as at December 31, 2013 represented 1. 15%.
Lafarge launched six employee stock ownership programs called “Lafarge en action” (LEA) since 1995, enabling employees participating in these plans to subscribe to Lafarge S.A. shares, with a discount and an employer matching contribution. The amount of the employer contribution, applied to the fi rst shares purchased, depends on the gross domestic product of the relevant country. The shares are subject to a fi ve year holding period save for defi ned early unblocking events.
The plans launched in 1995 and 2002 gave employees the additional right to receive one option for every share purchased beginning with the eleventh share.
Lafarge also set up an employee savings fund in 1990 for its French employees, part of the Group Savings Plan, called Lafarge 2000, and under which participating employees can contribute to a savings plan linked to the value of the Lafarge S.A. shares and benefi t from an employer contribution. Voting rights of employees participating in Lafarge 2000 (which represent 0. 54% of the share capital of Lafarge S.A. as at December 31, 2013) are exercised collectively by the Supervisory Board of the savings plan fund, which is composed of an equal number of employee and employer representatives.
Latest share capital increase for employees: LEA 2011On May 12, 2011, the Board of Directors, acting by virtue of a delegation of the Annual Shareholders Meeting of May 12, 2011, decided on the terms of the LEA 2011 scheme. The goal of this employee stock ownership plan was to reach all employees of Lafarge, meaning that it was offered in all countries where it was legally feasible. The subscription price for the shares was set at 36.98 euros, corresponding to 80% of the reference price calculated on the basis of the average opening share price on Euronext Paris S.A. over the twenty trading days preceding May 12, 2011. With LEA 2011, each employee was offered the possibility to subscribe for Lafarge S.A. shares while benefi ting from a matching contribution from their employer on the fi rst 15 shares purchased. The share capital increase reserved to eligible employees was realized on July 29, 2011; the total amount of the share capital increase was 3,174,956 euros, corresponding to the issuance of 793,739 shares. The subscription rate was 44%.
W here it was not possible to offer the LEA 2011 program in a country, employees could subscribe to an alternative plan providing the same economical benefi ts.
Previous stock ownership programs in 2005 and 2009 were structured with offers essentially equivalent to that of the 2011 program.
Lafarge - Registration Document 2013 • 169
SHAREHOLDERS, SHARE CAPITAL AND ADDITIONAL INFORMATION6.1 Shareholders

SUMMARY TABLE
The following table sets out the main terms of employee stock ownership plans:
LEA 2011 LEA 2009 LEA 2005 LEA 2002 LEA 1999 LEA 1995
Number of countries covered 58 55 46 47 33 21
Number of eligible employees 57,588 70,085 51,150 53,818 40,570 20,113
Subscription rate 44.0% 53.0% 48.8% 53.3% 51.6% 74.6%
Total number of shares subscribed 793,739 1,101,834 576,125 708,718 493,954 482,582
Maximum number of shares offered to
each employee Unlimited (1) Unlimited (1) 110 110 110 110
Subscription price (euros) 36.98 48.80 57.31 81.84 73.17 39.94
Associated stock option grant No No No Yes No Yes
TOTAL NUMBER OF STOCK OPTIONS GRANTED N/A N/A N/A 437,373 (3) N/A 331,060 (2)
(1) Except for local regulations.
(2) These stock options may no longer be exercised.
(3) These stock options may no longer be exercised as of May 28, 2012.
6.1.5 LISTING
Listing on NYSE Euronext (Paris)The Company’s shares are listed on NYSE Euronext (Paris), under Code ISIN FR0000120537 and symbol “LG”.
Lafarge S.A.’s shares have been traded on the Paris stock exchange since 1923 and have been part of the French CAC 40 index since its creation on December 31, 1987.
All Lafarge S.A. shares are subject to the same voting right conditions, except for (i) our treasury shares, which at General Meetings bear no voting rights, and (ii) shares held in registered form for over two years, which carry double voting rights.
See Section 6.2.5 (Articles of Association (Statuts)).
Transactions and market capitalizationThe market capitalization of Lafarge S.A. totalled 15.7 billion euros at December 31, 2013.
The following tables show the volume and high and low closing price of Lafarge S.A. shares, as reported by NYSE Euronext (Paris).
FIVE MOST RECENT FINANCIAL YEARS
Average daily volume (in thousands of shares)
High intraday (in euros)
Low intraday (in euros)
1.509 1.4671.596
1.218
22.2826.06
48.7648.45
26.07
66.59
35.57
6356.48
43.81
789
2009 2010 2011 2012 2013
Source: NYSE Euronext (Paris).
• Lafarge - Registration Document 2013170
SHAREHOLDERS, SHARE CAPITAL AND ADDITIONAL INFORMATION66 6.1 Shareholders

6
THE LAST SIX MONTHS
Sept. 13 Oct. 13 Nov. 13 Dec. 13 Jan. 14 Feb. 14
Average daily volume (in thousands of shares)
High intraday (in euros)
Low intraday (in euros)
752713 683
567
745813
45.60 47.70 50.42 49.22 52.55 50.55
53.89 52.61 52.20 54.94 57.50 55.29
Source: NYSE Euronext (Paris).
American Depository Receipts (ADRs) ProgramSince October 8, 2007, Lafarge no longer is listed on the New York stock exchange and is deregistered from the Securities and Exchange Commission.
In addition, Lafarge voluntarily delisted its American Depository Receipts (ADRs) from the New York Stock Exchange on September 13, 2007. The delisting became effective on September 24, 2007. Since its delisting, the Lafarge ADR program has been maintained and ADRs continue to be traded over the counter (level one program).
Each ADR represents a quarter of a share. As of December 31, 2013, 4,152,053 ADRs existed.
Lafarge - Registration Document 2013 • 171
SHAREHOLDERS, SHARE CAPITAL AND ADDITIONAL INFORMATION6.1 Shareholders

6.2SHARE CAPITAL AND ADDITIONAL INFORMATION
6.2.1 SHARE CAPITAL
As at December 31, 2013, Lafarge S.A.’s share capital amounted to 1,149,461,588 euros divided into 287,365,397 fully paid-up shares, each with a nominal value of 4 euros.
Considering that double voting rights accrue to 115,069,648 shares held in registered form for at least 2 years, the total number of voting rights attached to the shares for the purpose of computing notifi cation thresholds amounted to 402,435,045 at December 31, 2013.
a) Changes in the share capital during the fi scal year ended December 31, 2013Lafarge S.A.’s share capital at December 31, 2012 amounted to 1,149,022,008 euros divided into 287,255,502 shares, each with a nominal value of 4 euros.
Since December 31, 2012, the share capital has increased by a total of 109,895 shares as a result of exercises of stock subscription options:
SUBSCRIPTION AMOUNT
(euros)Number of shares
issued CapitalShare
premium Total
Exercises of stock subscription options 109,895 439,580.00 2,938,592.30 3,378,172.30
b) Potential share capital at December 31, 2013The number of shares of the Company as at December 31, 2013 could be increased by a maximum of 7,000,955 shares in the hypothetical scenario that stock options granted to employees existing on that date were exercised. 4,815,213 out of these existing 7,000,955 stock options could have been exercised at December 31, 2013. The remaining 2,185,742 stock options can only be exercised upon expiry of a period of four years after their grant and subject to the performance conditions attached to some of these stock options being fulfi lled.
At December 31, 2013, there is no other type of security giving any right, directly or indirectly, to the Company’s share capital.
Our Board of Directors has received from our General Meeting held on May 7, 2013, the right to carry out share capital increases through the issue of shares or other equity securities with or without preferential subscription rights for shareholders, the capitalization of reserves, the issue of employee stock subscription options or performance shares, and through the issue of shares reserved for our employees.
See Section 6.2.4 (Authorizations delegated to the Board of Directors) for further information on fi nancial authorizations delegated to Board of Directors.
• Lafarge - Registration Document 2013172
SHAREHOLDERS, SHARE CAPITAL AND ADDITIONAL INFORMATION66 6.2 Share capital and additional information

6
c) Changes in our share capital over the past two fi nancial years
2013 2012
Share capital at the beginning of the financial year (number of shares) 287,255,502 287,247,518
Number of shares issued during the period from January 1 to December 31 as a result of 109,895 7,984
payment of the dividend in shares - -
exercise of stock subscription options 109,895 7,984
exercise of stock subscription warrants - -
increase in share capital reserved for employees - -
issue of new shares - -
Number of shares cancelled during the period from January 1 to December 31 - -
Maximum number of shares to be issued in the future as a result of 7,000,955 8,455,389
exercise of stock subscription options 7,000,955 8,455,389
exercise of stock subscription warrants - -
conversion of bonds - -
Share capital at the end of the financial year
a- euros 1,149,461,588 1,149,022,008
b- number of shares 287,365,397 287,255,502
6.2.2 SHARES OWNED BY THE COMPANY
a) Information on transactions completed during the fi nancial year ending December 31, 2013The Company held 17,935 shares with a nominal value of 4 euros, as of December 31, 2013, representing 0.01% of its capital stock. The value based on the purchase price of those shares is 1,294,268.80 euros.
All of the 17,935 shares held by the Company at December 31, 2013 are assigned to cover stock options or performance share grants.
In 2013, 139,348 shares were used to cover the delivery of performance shares. None of the shares held by the Company have been reassigned to cover different objectives.
The Company has not entered into any liquidity agreement with an investment service provider.
In 2013, the Company carried out the following transactions on its treasury shares:
PURCHASES SALES
Number of shares
purchasedAverage price
(in euros)Amounts (in euros)
Number of shares sold
Average price (in euros)
Amounts (in euros)
2013 financial year - - - 139,348 (1) - -
(1) Delivered to employees as part of performance share plans.
b) Information on the share buyback program approved on May 7, 2013The share buyback program approved by the Shareholders’ Meeting on May 7, 2013 has the following features:
Securities Shares
Maximum percentage of capital that may be authorized 5%
Maximum number of shares that may be acquired 14,362,775 (1)
Maximum total amount of the program 500 million euros
Maximum unit purchase price 100 euros
(1) Which is 5% of the capital as of December 31, 2012, subject to adjustment on the date the purchases are made.
Program objectives:
d the implementation of any Company stock option plan under the terms of articles L. 225-177 et seq. of the French Commercial Code or any similar plan;
d the allotment or sale of shares to employees under the French statutory profit-sharing scheme or the implementation of any employee savings plan under applicable legal conditions, in particular articles L. 3332-1 et seq. of the Labor Code;
Lafarge - Registration Document 2013 • 173
SHAREHOLDERS, SHARE CAPITAL AND ADDITIONAL INFORMATION6.2 Share capital and additional information

d the allotment of consideration free shares pursuant to the terms of articles L. 225-197-1 et seq. of the French Commercial Code;
d generally, to fulfill obligations linked with stock option programs or other share allotment schemes in favor of employees or executive officers of the Company or related entities;
d the delivery of shares on the exercise of rights attached to securities giving rights to the capital by redemption, conversion, exchange, presentation of a warrant or any other means;
d the cancellation of some or all of the shares purchased, pursuant to the 20th resolution approved by the Combined General Meeting on May 7, 2013 and according to the terms there of;
d the delivery of shares (in exchange, as payment, or otherwise) in connection with acquisitions, mergers, demergers or asset-for-share exchanges; or
d market-making in the secondary market or maintenance of the liquidity of Lafarge shares by an investment services provider under a liquidity contract that complies with the ethical code recognized by the Autorité des marchés financiers.
Period: 18 months, until November 7, 2014.
As indicated in the table in Section 6.2.2 (Information on transactions completed during the fi scal year ending December 31, 2013) above, the Company has not purchased any of its own shares within the share buyback program in 2013. In addition, the Company proceeded to buy back 250,000 shares from the beginning of the fi nancial year to cover the delivery of performance shares.
c) Information on the share buyback program to be approved on May 7, 2014 The Shareholders’ Meeting convened on May 7, 2014 should be presented with the following share buyback program for approval:
Securities Shares
Maximum percentage of capital that may be authorized 5%
Maximum number of shares that may be acquired 14,368,269 (1)
Maximum total amount of the program 500 million euros
Maximum unit purchase price 100 euros
(1) Which is 5% of the capital as of December 31, 2013, subject to adjustment on the date purchases are made .
Program objectives:
d the implementation of any Company stock option plan under the terms of articles L. 225-177 et seq. of the French Commercial Code or any similar plan;
d the allotment or sale of shares to employees under the French statutory profit-sharing scheme or the implementation of any employee savings plan under applicable legal conditions, in particular articles L. 3332-1 et seq. of the Labor Code;
d the allotment of consideration free shares pursuant to the terms of articles L. 225-197-1 et seq. of the French Commercial Code;
d generally, to fulfill obligations linked with stock option programs or other share allotment schemes in favor of employees or executive officers of the Company or related entities;
d the delivery of shares on the exercise of rights attached to securities giving rights to the capital by redemption, conversion, exchange, presentation of a warrant or any other means;
d the cancellation of some or all of the shares purchased, pursuant to the 20th resolution approved by the Combined General Meeting on May 7, 2013 and according to the terms there of;
d the delivery of shares (in exchange, as payment, or otherwise) in connection with acquisitions, mergers, demergers or asset-for-share exchanges; or
d market-making in the secondary market or maintenance of the liquidity of Lafarge shares by an investment services provider under a liquidity contract that complies with the ethical code recognized by the Autorité des marchés financiers.
Period: 18 months, until November 7, 2015.
As at February 28, 2014, the Company held 150,935 shares with a nominal value of 4 euros representing 0,05 % of its capital stock, all of which are assigned to cover performance share grants.
The Company has no open purchase or sale positions in relation to its share buyback program approved on May 7, 2013 on the date of publication of this Registration Document .
6.2.3 SECURITIES NON REPRESENTATIVE OF SHARE CAPITAL – BONDS
To meet the Group’s medium and long-term fi nancing needs and to optimize the maturity profi le of the Group’s debt, Lafarge issues bonds and other related securities on a regular basis, in particular under its Euro Medium Term Notes program (EMTN).
During the course of 2013, the Company has made one bond issue under the EMTN program.
The maximal nominal outstanding amount under our EMTN program is currently 12,000 million euros. At December 31, 2013, the Company’s total nominal outstanding amount of bond issues under the EMTN program is 9,702 million euros. The available balance for new bond issues was therefore 2,298 million euros at December 31, 2013.
At December 31, 2013, the total nominal outstanding amount of the Company resulting from bonds issues, including bonds issues made under the EMTN program, is 11,118 million euros.
Our General Meeting held on May 7, 2013 authorized our Board of Directors to issue up to 8,000 million euros of bonds and other related securities for a period of 26 months. At December 31, 2013, an outstanding amount of 7,250 million euros was available for new bonds, as the Company has issued bonds of an amount of 750 million euros since the authorization granted by the General Meeting held on May 7, 2013.
See Section 2.4.2. (c) (Net cash used in fi nancing activities) and Note 25 (Debt) to the consolidated fi nancial statements for more information on bond issues.
See Section 6.2.4 (Authorizations delegated to the Board of Directors) for further information on fi nancial authorizations delegated to our Board of Directors.
• Lafarge - Registration Document 2013174
SHAREHOLDERS, SHARE CAPITAL AND ADDITIONAL INFORMATION66 6.2 Share capital and additional information

6
6.2.4 AUTHORIZATIONS DELEGATED TO THE B OARD OF D IRECTORS
a) Authorizations delegated to the Board of Directors by the General MeetingAt March 11, 2014, the Board of Directors of Lafarge S.A. benefi ted from the following authorizations upon delegation by the General Meeting held on May 7, 2013:
Type of authorization to be voted upon Maximum amounts Expiration date
Maximum authorized amount available at March 11, 2014(euros)
Buy and sell its own shares
(11th resolution)
Up to 5% of the share
capital
Up to 500 million euros
Unitary Purchase price
up to 100 euros
November 7, 2014 14,118,269
Issue of bonds and other related securities (simple and complex bonds)
(12th and 13th resolutions)
8 billion euros (nominal
value) (common ceiling)
July 7, 2015 7.250 billion euros
Issue of shares or other equity securities with preferential subscription
rights
(14th resolution)
560 million euros
(nominal value) (1)
July 7, 2015 560 million euros
Issue of shares or other equity securities without preferential subscription
rights
(15th resolution)
112 million euros
(nominal value) (2)
July 7, 2015 112 million euros
Issue of shares in an offer as set forth in article L. 411-2 of the French
Monetary and Financial Code
(16th resolution)
112 million euros
(nominal value) (2) (3)
July 7, 2015 112 million euros
Issue of shares or other equity securities as payment for contributions in
kind
(17th resolution)
112 million euros
(nominal value) (2) (3)
July 7, 2015 112 million euros
Increase in the number of shares to be issued in case of a capital
increase with or without preferential subscription rights
(18th resolution)
Up to the amount
applicable to the initial
issue and to be applied
against the cap set forth
in the 15th and/or the
14th resolution
July 7, 2015 N/A
Capital increase through incorporation of premiums, reserves, profits or
other items
(19th resolution)
100 million euros
(nominal value) (2)
July 7, 2015 100 million euros
Reduction of share capital through cancellation of treasury shares
(20th resolution)
Up to 10% of the share
capital for a 24-month
period
July 7, 2015 10% of the share
capital
Allotment of free existing or new shares
(21st resolution)
1.5% of the share
capital (on grant date)
July 7, 2015 1.38 % of the share
capital
Grant of options to subscribe for and/or purchase shares
(22nd resolution)
1.5% of the share
capital (on grant date)
July 7, 2015 1.5 % of the share
capital
Issue of shares or other equity securities reserved for Group employees
(23rd resolution)
50 million euros
(nominal value)
July 7, 2015 50 million euros
Capital increase reserved for a category of beneficiaries as part of a
transaction reserved for employees (24th resolution)
50 million euros
(nominal value) (4)
November 7, 2014 50 million euros
(1) Global cap for the 14th, 15th, 16th, 17th, 18th and 19th resolutions.
(2) To be applied against the global cap set forth in the 14th resolution.
(3) To be applied against the cap set forth in the 15th resolution.
(4) To be applied against the cap set forth in the 23rd resolution.
Lafarge - Registration Document 2013 • 175
SHAREHOLDERS, SHARE CAPITAL AND ADDITIONAL INFORMATION6.2 Share capital and additional information

d USE OF EXISTING FINANCIAL AUTHORIZATIONS IN 2013
The Board of Directors made use of the authorization granted in the 17th resolution of the General Meeting held on May 12, 2011 during its meeting on March 13, 2013 by granting 636,920 performance shares.
In addition, the authorization to issue bonds and other related securities granted in the 12th resolution of the General Meeting held on May 7, 2013 was used on one occasion during the course of 2013 for a bond issuance of 750 million euros.
See Section 2.4.2 (c) (Net cash provided used in fi nancing activities) and Note 25 (Debt) to the consolidated fi nancial statements for more information on bond issues.
d USE OF EXISTING FINANCIAL AUTHORIZATIONS IN 2014
The Board of Directors made use of the authorization granted in the 21st resolution of the General Meeting held on May 7, 2013 during its meeting on March 11, 2014 by granting 331,745 performance shares.
In addition, the Company proceeded to buy back 250,000 shares to cover the delivery of performance shares by making use of the authorization granted in the 11th resolution of the General Meeting held on May 7, 2013.
b) Authorizations to be delegated to the Board of Directors by the General Meeting to be held on May 7, 2014
The General Meeting to be held on May 7, 2014 should vote upon the following delegations:
Type of authorization to be voted upon Maximum amounts Expiration date
Buy and sell its own shares
( 9 th resolution)
Up to 5% of the share capital
Up to 500 million euros
Unitary Purchase price up to 100 euros
November 7, 2015
• Lafarge - Registration Document 2013176
SHAREHOLDERS, SHARE CAPITAL AND ADDITIONAL INFORMATION66 6.2 Share capital and additional information

6
6.2.5 ARTICLES OF A SSOCIATION (STATUTS)
The main provisions of A rticles of A ssociation of Lafarge S.A. are summarized below.
a) Corporate purposeThe Company’s purpose, in France or abroad, is:
d The acquisition and management of all industrial and financial holdings, including, without limitation:
d industries relating to cement and other hydraulic binders, construction materials and products or equipment used in homes;
d refractory product industries;
d industrial plant engineering and construction;
d bio-industries and agri-business;
d Research and provision of services in any of the above-mentioned fields and in any other field where the skills of the Company and its subsidiaries may be relevant.
d All associations or undertakings, all acquisitions of securities, and all industrial, commercial, financial, agricultural, real and movable property transactions relating directly or indirectly to any of the above-mentioned purposes or such as ensure the development of Company assets.
b) Board of DirectorsThe Board of Directors must have a minimum of 3 members and a maximum of 18 members. The Directors are appointed by shareholders at a General Meeting, and their term of offi ce is for four years.
According to provisions of the current A rticles of A ssociation, Directors must not be over 70 years of age and must each hold at least 1,143 of the Company’s shares. Each Director’s term of offi ce expires at the end of the ordinary Shareholders’ Meeting called to approve the previous year’s fi nancial statements and held in the year during which the Director’s term of offi ce normally expires or during which the Director reaches the age limit of 70 years.
The General Meeting convened on May 7, 2014 will vote on a proposal to amend the provisions of the A rticles of A ssociation relating to the age limit applicable to Directors and to insert new provisions setting out the procedure for the appointment of two Directors representing employees on the Board of Directors.
For further information on the proposed resolutions that will be put to the vote of the shareholders at the 2014 General Meeting, please refer to Section 3.1 (Board of Directors – Corporate Offi cers).
The Board of Directors elects a Chairman from among its members. The Chairman of the Board must not be over 65 years of age. The Chairman automatically ceases to perform his duties on December 31 of the year in which he reaches the age of 65 unless the Board of Directors decides as an exceptional measure to extend the term of offi ce of the Chairman beyond the above-mentioned age limit for successive one-year periods provided that his term of offi ce as Director continues for such periods. In this case, the term of offi ce of the Chairman of the Board expires defi nitively on December 31 of the year in which he reaches the age of 67.
See Section 3.1 (Board of Directors-Corporate Offi cers) for more information on our Board of Directors.
d RELATED-PARTY TRANSACTIONS
Agreements between the Company and any member of the Board of Directors are subject to prior approval of the Board unless these agreements are entered into at arms’ length in the ordinary course of business. The Director who has an interest in the agreement to be approved by the Board cannot take part in the vote of the Board of
Directors. The same applies to agreements to be entered into between the Company and the Chief Executive Offi cer, a Chief Operating Offi cer, a shareholder holding more than 10% of the voting rights in the Company or, if such shareholder is a legal entity, a company controlling that shareholder.
d DIRECTORS’ COMPENSATION
The Shareholders’ Meeting can award a fi xed annual amount as compensation for the members of the Board of Directors. The Board can then distribute this amount between its members as it sees fi t.
See Section 3.4 (Compensation and benefi ts) for more information on the amount of compensation awarded to the Directors by the Shareholders’ Meeting.
The Board of Directors can authorize the reimbursement of travel expenses and expenses incurred by Directors in the interests of Lafarge. The Board may also award exceptional remuneration to Directors who are members of Committees formed from among its members or who are entrusted with specifi c tasks or duties.
c) Rights, preferences and restrictions attached to shares
d ALLOCATION AND APPROPRIATION OF EARNINGS
The net results of each fi nancial year after deduction of overhead and other Company expenses, including any depreciation and provisions, constitute the Company’s profi t or loss for that fi nancial year.
The Company contributes 5% of this profi t, as reduced by any loss carried forward from previous years, to a legal reserve fund; this contribution is no longer required if the legal reserve fund equals 10% of the Company’s issued share capital and becomes compulsory again if the legal reserve fund falls below this percentage of the share capital.
A contribution is also made to other reserve funds in accordance with French law.
The profi ts remaining after these contributions constitute the profi ts available for distribution, as increased by any profi t carried forward from the previous years, out of which an initial dividend equal to 5% of the nominal value of shares fully paid-up and not redeemed is paid to the shareholders. Such dividends cannot be carried forward from one year to another.
The profi ts available for distribution remaining after payment of the initial dividend can be allocated to optional reserve funds or carried forward. Any profi ts remaining are distributed to shareholders as a super dividend.
The Shareholders’ General Meeting may also decide to distribute part of the Company’s distributable reserves. In such cases, the decision of the shareholders must specify expressly from which reserves the distribution is to be made. In any event, dividends are to be paid fi rst from the fi nancial year’s distributable profi ts.
If the Company has incurred losses, such losses are recorded, after approval of the accounts by the shareholders, in a special balance sheet account and can be carried forward against profi ts in subsequent years until extinguished.
d PAYMENT OF DIVIDENDS
Our A rticles of A ssociation provide that the General Meeting may offer shareholders a choice, with respect to all or part of any dividend to be distributed, between payment in cash and payment in new Company shares pursuant to applicable law. Shareholders may be offered the same choice with regard to the payment of interim dividends.
Unclaimed dividends within fi ve years from the date of payment are forfeited and must be paid to the French State, in accordance with French law.
Lafarge - Registration Document 2013 • 177
SHAREHOLDERS, SHARE CAPITAL AND ADDITIONAL INFORMATION6.2 Share capital and additional information

d LOYALTY DIVIDEND
Any shareholder who, at the end of the financial year, has held registered shares for at least two years and still holds them at the date of payment of the dividend in respect of the year, will receive in respect of such shares a bonus equal to 10% of the dividend (fi rst and super dividend) paid to other shareholders, including any dividend which is paid in shares. Where applicable, the increased dividend will be rounded down to the nearest centime. Entitlement to the increased dividend is lost upon conversion of the registered shares into bearer form or upon transfer of the registered shares.
Similarly, any shareholder who, at the end of the fi nancial year, has held such registered shares for at least two years and still holds them at the date of an issue by way of capitalization of reserves, retained earnings or issue premiums of bonus shares, will receive additional shares equal to 10% of the number distributed, rounded down to the nearest whole number. The number of shares giving entitlement to such increases held by any one shareholder may not exceed 0.5% of total share capital at the relevant fi nancial year end.
In the event of a share dividend or bonus issue any additional stock will rank pari passu with the stock previously held by the shareholder for the purpose of determining any increased dividend or distribution of bonus shares. However, in the event of fractions:
d where the shareholder opts for payment of dividends in shares, the shareholder may pay a balancing amount in cash to receive an additional share provided he meets the applicable legal requirements;
d in the event of a bonus issue, the rights to any fractions of a share arising from the increase will not be negotiable and the corresponding shares will be sold and the proceeds distributed to the holders of such rights no later than thirty days after the registration in the share account of the whole number of shares allocated to them.
d VOTING RIGHTS
Each holder of shares is entitled to one vote per share at any Shareholders’ General Meeting. Voting rights attached to shares may be exercised by the holder of the usufruct except where the holder of the usufruct and the benefi cial owner agree otherwise and jointly notify the Company at least fi ve days before the date of the meeting.
Double voting rightsDouble voting rights are attached to fully paid-up shares registered for at least 2 years in the name of the same shareholder. In accordance with French law, entitlement to double voting rights is lost upon conversion of the registered shares into bearer form or upon transfer of the registered shares (this does not apply to transfers resulting from inheritance or gifts). Double voting rights were introduced in the Company's A rticles of A ssociation over 60 years ago and are exercisable within the limitations set out below.
Adjustment of voting rightsThere are no restrictions on the number of voting rights held by each of our shareholders if those rights do not exceed 5% of the rights attached to all the shares comprising the Company’s share capital. Above this threshold, the number of voting rights is adjusted on the basis of the percentage of the capital represented at the General Meeting rounded off to the nearest whole unit. This prevents over-representation of a shareholder when participation at a General Meeting is low, while ensuring that each of our shareholders obtains a percentage of voting rights at least equal to his stake in the Company’s share capital.
Where applicable, the voting rights held directly or indirectly by a shareholder are added to the voting rights belonging to any third party, with whom such shareholder is acting in concert, as defi ned by law.
This adjustment mechanism does not apply when the quorum at the General Meeting is greater than two-thirds of the total number of voting rights.
d) Changes to shareholders’ rightsShareholders’ rights can only be modifi ed if a resolution to amend our Articles of Association is passed at an Extraordinary General Meeting of the shareholders by a two-thirds majority. Unanimity is, however, required to increase shareholders’ obligations. In addition to a vote at the Shareholders’ Extraordinary General Meeting, elimination of double voting rights requires ratifi cation by a two-thirds majority at a special meeting of the shareholders benefi ting from such rights.
e) Convocation and admission to Shareholders’ General Meetings
d CONVOCATION OF GENERAL MEETINGS
Shareholders’ General Meetings can be called by the Board of Directors or, failing which, by the auditors and any other person legally authorized for such purpose.
The form of notice calling such meeting, which may be transmitted electronically, and the time limits for sending out this notice are regulated by law. The notice must specify the place of the meeting, which may be held at the registered offi ce or any other place, and the agenda of the meeting.
d ATTENDANCE AND VOTING AT GENERAL MEETINGS
Shareholders’ General Meetings may be attended by all shareholders regardless of the number of shares they hold, provided that all calls of capital contributions due or past due with respect to such shares have been paid in full.
Access to the General Meeting is open to such shareholders, as well as to their proxies and registered intermediaries who have provided evidence of their entitlement to attend no later than midnight (Paris time) three business days before the date of the General Meeting, including certifi cation that their shares are registered in an account. It is not necessary to block shares in order to attend General Meetings. The Board of Directors may, where appropriate, present shareholders with personal admission cards and request production of the cards.
At all General Meetings, shareholders are deemed present for quorum and majority purposes if participating in the General Meeting by videoconference or by any electronic communication means, including internet, that permits them to be identifi ed. The Board of Directors organizes, in accordance with applicable laws and regulations, the participation and voting by such shareholders at the meeting by creating a dedicated site, and verifi es the effi cacy of the methods adopted to permit shareholder identifi cation and to guarantee their effective participation in the General Meeting.
Shareholders not domiciled in French territory may be represented by an intermediary registered in accordance with applicable laws.
Any shareholder may be represented by proxy, even if the proxy holder is not a shareholder. Shareholders may also vote by mail in accordance with the conditions set out by law.
• Lafarge - Registration Document 2013178
SHAREHOLDERS, SHARE CAPITAL AND ADDITIONAL INFORMATION66 6.2 Share capital and additional information

6
Shareholders may, pursuant to applicable law and regulations, submit their proxy or mail voting forms in respect of any General Meeting, either in paper form or by a method of electronic communications, provided that such method is approved by the Board of Directors and published in the notices of meeting, no later than 3: 00 p.m. (Paris time) the day before the date of the General Meeting. The Board of Directors is authorized to reduce the time limit for the receipt of such forms.
Any shareholder fulfi lling the required conditions set out above may attend the General Meeting and take part in the vote, and any previously submitted correspondence vote or previously granted proxy is deemed invalid.
d QUORUM
In Ordinary and Extraordinary General Shareholders’ Meetings, the calculation of the quorum is based on the total number of shares with voting rights.
Ordinary General Meetings: the quorum for Ordinary General Meetings called pursuant to the fi rst notice of the meeting is only met if the shareholders present, deemed present or represented, hold 20% of the shares with voting rights. No quorum is required for a meeting called pursuant to a second notice.
Extraordinary Meetings: a quorum for Extraordinary Meetings is met only if the shareholders present, deemed present or represented at a meeting called pursuant to the fi rst notice, hold 25% of the shares with voting rights, or hold 20% of the shares with voting rights at a meeting called on second notice. If the quorum is not met pursuant to the second notice, the meeting is to be postponed to a date no later than 2 months after the date for which it had been called.
d MAJORITY REQUIRED
Resolutions at an Ordinary General Meeting of shareholders are passed by a simple majority of the votes cast by the shareholders present, deemed present or represented.
Resolutions at an Extraordinary General Shareholders’ Meeting are passed by a two-thirds majority of the votes cast by the shareholders present, deemed present or represented.
In the event of a capital increase by capitalization of reserves, profi ts or issue premiums, resolutions are passed in accordance with the voting requirements for Ordinary General Shareholders’ Meetings.
f) Disclosure of holdings exceeding certain thresholdsIn addition to the legal requirement to disclose holdings exceeding certain thresholds, our Articles of Association provide that any person acting alone or in concert who becomes, directly or indirectly, the owner of 2% or more of our share capital must notify the Company therein. This notifi cation requirement is governed by the same provisions that apply to the legal requirement. The Company must be notifi ed, within the time limits provided by law, by registered mail with return receipt requested or by fax or telex, of the number of shares held, indicating whether these are held directly or indirectly and whether the shareholder is acting alone or in concert. The same notifi cation requirement applies to each subsequent increase in ownership of 1%.
Notifi cations must be made within the same time limits and in the same format for subsequent decreases below the above mentioned thresholds whatever the reason. Notifi cations must also specify the date on which the threshold was crossed (which corresponds to the date on which the transaction resulting in the crossing of the threshold took place) and the number of shares held giving access to the share capital.
If a person does not comply with this notifi cation requirement, the provisions of the law providing for loss of voting rights apply. If this sanction is not applied automatically, one or more shareholders
holding 1% or more of our share capital or voting rights may require a Shareholders’ General Meeting to strip the shares in excess of the relevant threshold of voting rights at all General Meetings for 2 years following the date on which the owner complies with the notifi cation requirements. This penalty is irrespective of any legal sanction that may be issued by a court upon the request of the Chairman, a shareholder or the Autorité des marchés financiers (AMF).
The Company may at any time request, under the terms and conditions set forth by applicable law, the entity in charge of settlement of securities transactions to identify the holders of securities conferring immediate or future entitlement to voting rights at General Meetings and to state the number of securities held by each holder and any restrictions on such securities.
See Section 6.1.3 (Threshold notifications imposed by law and declarations of intent) for information on threshold notifi cations made in the last two fi nancial years.
6.2.6 CHANGE OF CONTROL
Within the framework of the provisions of article L. 225-100-3 of the French Commercial Code, the Company states that it has no specifi c provisions which may have an incidence in the event of a call for tenders. The change of control provisions of the Company’s principal fi nancing agreements, including those presented in Section 6.2.7 (Material contracts), detail the early reimbursement of the loans in case of a change of control. The EMTN program of the Company includes in its terms and conditions the situation of a change of control accompanied by a lowered fi nancial rating for the Company which could bring about, at the choice of bonds holders and subject to certain conditions, the early reimbursement of bonds. In addition, for informational purposes:
d the structure of the Company’s capital, the information on the thresholds notifications and declaration of intent are set forth in Section 6.1 (Shareholders) and certain provisions of the Articles of Association, including those regarding voting rights, are set forth in Section 6.2.5 (Articles of Association – Statuts);
d to the Company’s knowledge, there are no agreements between shareholders which may give rise to restrictions to the transfer of shares and the exercise of the Company’s voting rights, and the Company has not been informed of agreement clauses pursuant to article L. 233-11 of the French Commercial Code;
d the severance arrangements which may be due to the Chairman and Chief Executive Officer following a change of control is set forth in Section 3.4.3 (Compensation and benefits paid to the Chairman and Chief Executive Officer).
6.2.7 MATERIAL CONTRACTS
We are a party to a syndicated credit facility entered into on October 29, 2004, and amended successively on July 28, 2005, July 27, 2010 and March 19, 2012.
This facility originally provided a revolving credit line in the amount of 1,850 million euros, with a maturity of fi ve years. Through the last amendment of March 19, 2012, we have reduced the amount to 1,235 million euros and extended the maturity to July 28, 2015 for 1,200 million euros. This syndicated credit facility contains an optional exit mechanism, on an individual basis, if the consolidated net debt to Ebitda ratio is higher than 4.75. Such an event would not be considered an event of default and would have no impact on the status of the Group’s other fi nancing arrangements.
We also have a signifi cant number of contracts relating to outstanding bond issues.
Lafarge - Registration Document 2013 • 179
SHAREHOLDERS, SHARE CAPITAL AND ADDITIONAL INFORMATION6.2 Share capital and additional information

See Section 2.4 (Liquidity and capital resources) and Note 25 (Debt) to the consolidated fi nancial statements for further information.
In addition, we have entered into several agreements in relation to the signifi cant sales and acquisitions mentioned in Section 1.2.8 (Recent acquisitions, partnerships and divestitures). The Company also has entered into a shareholders’ agreement with the Sawiris family and NNS Holing SARL, further described in Section 6.1.2 (Shareholders’ agreement).
6.2.8 INTRA-GROUP RELATIONS
See Note 35 (List of significant subsidiaries, joint ventures and investments in associates at December 31, 2013 ) to the consolidated fi nancial statements for more information on signifi cant subsidiaries.
Lafarge S.A. is a holding company. We conduct our operations through over 1,000 subsidiaries, out of which 80 % are consolidated. We have a large number of operating companies because we previously conducted our operations through several Divisions, our businesses are local in nature, and we have facilities in 62 countries.
a) Relations between Lafarge S.A. and its subsidiariesLafarge S.A.’s relationship with its subsidiaries is that of an industrial holding company and includes a financial component and an assistance component.
The financial component covers the fi nancing by Lafarge S.A. of most subsidiaries’ operations and the transfer of dividends from subsidiaries.
On December 31, 2013, Lafarge S.A. held approximately 86 % of the Group’s debt excluding put options on shares of subsidiaries. Lafarge S.A. is subject to a quotation by Standard & Poor’s and by Moody’s. The Company has access to short-term and long-term fi nancial markets and large banking networks, and provides fi nancing to its subsidiaries through inter-company loans. To fund such loans, Lafarge S.A. draws primarily on its Euro Medium Term Notes program for medium to long-term fi nancing and the related Commercial Paper program for short-term fi nancing.
Nevertheless, this general fi nancing rule has some exceptions. As an example, if Lafarge S.A. cannot obtain fi nancing through these programs in a subsidiary’s local currency, it secures local funding to ensure the subsidiary’s operations are fi nanced in the relevant local currency. Furthermore, certain of Lafarge’s consolidated subsidiaries, which have minority shareholders, can access the fi nancial markets on their own and, thus, obtain and carry their own fi nancing.
For those subsidiaries for which it is possible (most subsidiaries located in the euro-zone, as well as the United States, Hungary, Poland, Romania, Switzerland and the United Kingdom for operations not transferred to the joint venture with Anglo American), Lafarge S.A. uses a cash pooling program, through which cash generated by such subsidiaries is consolidated and managed by Lafarge S.A. in connection with the fi nancing of the subsidiaries’ operations.
See Section 2.4 for more information on Liquidity and capital resources.
The assistance component relates to the supply by Lafarge S.A. of administrative and technical support to its subsidiaries. Lafarge S.A. also grants rights to use its brands, patents, and industrial know-how to its various subsidiaries.
The Research & Development activities are managed by the Lafarge's Research Center located in Lyon (L’Isle-d’Abeau), France. In addition, since 2011 several laboratories dedicated to construction development have been opened in Lyon, Chongqing, Mumbai and Alger and work in close cooperation with the Research Center in Lyon.
In the Cement Division, technical support services are provided by Lafarge’s various Technical Centers located in Lyon, Vienna, Montreal, Atlanta, Beijing, Kuala Lumpur and Cairo.
Subsidiaries are charged for these various services and licenses under patent license, support or brand licensing contracts.
See Section 1.2.2 (c) (Research & Development, keys to innovation) for more information.
b) Lafarge’s relationship with its subsidiaries’ minority shareholdersIn addition to Lafarge’s listed subsidiaries that have a broad base of minority shareholders, certain other controlled subsidiaries may have industrial or fi nancial partners, government entities, prior employees or prior owners as minority shareholders. In some cases, such minority shareholdings are required by local law or regulations (e.g. in the case of a partial privatization, mergers, local regulations, listing on capital markets). In other instances, we have partnered with them to share our business risk. In many cases, we have entered into shareholders' agreements with such minority shareholders providing for Board membership or other similar provisions, shareholders’ information rights and control provisions. We have not recently experienced any diffi culties in managing these subsidiaries with our partners, which could present a risk to our fi nancial structure.
A limited number of these shareholders' agreements contain exit provisions for our minority shareholders that may be exercised at any time, at certain fi xed times, or under specifi c circumstances, such as a continuing disagreement between Lafarge S.A. and the shareholder or a change in control of the relevant subsidiary or Lafarge S.A. In particular and by way of example, our shareholders' agreement relating to Lafarge’s Cement operations in Morocco contains provisions that enable our partners to buy back our shareholding in this business in the event of a change in control of Lafarge S.A. Similarly, the shareholders' agreements signed in the context of joint ventures with our partners Strabag for our Cement operations in Eastern Europe (Austria, Hungary, Czech Republic, Slovenia and Slovakia) and Anglo American for our operations in the United Kingdom allow our respective partners to acquire our stake should we lose the control of our subsidiary carrying the interest in the relevant joint venture.
See Note 25 (f) to the consolidated fi nancial statements for more information on put options on shares of subsidiaries.
6.2.9 DOCUMENTS ON DISPLAY
The Articles of Association of the Company, minutes of General Meetings as well as reports from the Board of Directors to the General Meeting, auditors’ reports, fi nancial statements of the Company for the last three fi nancial years, and any other document sent to or available for our shareholders in accordance with the law, are available for consultation during the validity period of this Registration Document at our registered offi ce, 61, rue des Belles Feuilles, 75116 Paris.
In addition, historical fi nancial information and regulated information relating to the Group as well as information relating to the Company’s General Meetings is available on-line at www.lafarge.com.
• Lafarge - Registration Document 2013180
SHAREHOLDERS, SHARE CAPITAL AND ADDITIONAL INFORMATION66 6.2 Share capital and additional information

CERTIFICATION
We hereby certify that, having taken all reasonable care to ensure that this is the case, the information set out in this Document de Référence is, to the best of our knowledge, true and accurate and that no information has been omitted that would be likely to impair the meaning thereof.
We certify that, to the best of our knowledge, the fi nancial statements have been prepared in accordance with applicable accounting standards and give a true and fair view of the assets and liabilities, and of the fi nancial position and results of the Company and of its consolidated subsidiaries, and that the management report of the Annual Financial Report defi ned on page 284 provides a true and fair view of the evolution of the business, results and fi nancial condition of the Company and of its consolidated subsidiaries, and a description of the main risks and uncertainties the Company and its consolidated subsidiaries are subject to.
We have obtained from our statutory auditors, Deloitte & Associés and Ernst & Young et Autres, a letter asserting that they have reviewed the information regarding the fi nancial condition and the fi nancial statements included in this Document de Référence and that they have read the whole Document de Référence.
Our statutory auditors have established a report on the fi nancial statements presented in this Document de Référence, set out on pages F3 and F74, as well as the 2012 and 2011 historical fi nancial data incorporated by reference. The statutory auditors’ report on the 2013 consolidated fi nancial statements presented on page F3 contains a technical observation.
Paris, April 2 , 2014
French original signed by
Jean-Jacques Gauthier Bruno Lafont
Chief Financial Offi cer Chairman and Chief Executive Offi cer
Lafarge - Registration Document 2013 • 181
CERTIFICATION

• Lafarge - Registration Document 2013182

FINANCIAL STATEMENTS F3
Statutory auditors’ report on the consolidated fi nancial statements F3
Consolidated statement of income F5
Consolidated statement of comprehensive income F6
Consolidated statement of fi nancial position F7
Consolidated statement of cash fl ows F8
Consolidated statement of changes in equity F10
NOTES TO THE CONSOLIDATED FINANCIAL STATEMENTS F11
Note 1 Business description F11Note 2 Summary of signifi cant accounting policies F11Note 3 Signifi cant events of the period F24Note 4 Operating segment information F25Note 5 Net gains (losses) on disposals F28Note 6 Other operating income (expenses) F29Note 7 Emission rights F29Note 8 Financial (expenses) income F30Note 9 Earnings per share F30Note 10 Goodwill F31Note 11 Intangible assets F34Note 12 Property, plant and equipment F35Note 13 Investments in associates F36Note 14 Joint ventures F37Note 15 Other fi nancial assets F38Note 16 Inventories F39Note 17 Trade receivables F39Note 18 Other receivables F40Note 19 Cash and cash equivalents F40Note 20 Equity F41Note 21 Share based payments F42Note 22 Income tax F45Note 23 Pension plans, end of service benefi ts
and other post-employment benefi ts F48Note 24 Provisions F53Note 25 Financial Debt F53Note 26 Financial instruments F57Note 27 Other payables F64Note 28 Off Balance Sheet Commitments F65Note 29 Legal and arbitration proceedings F66Note 30 Related parties F67Note 31 Employee costs and compensation to Directors
and executive offi cers for services F68Note 32 Supplemental cash fl ow disclosures F69Note 33 Auditors’ fees and services F70Note 34 Subsequent events F70Note 35 List of signifi cant subsidiaries, joint
ventures and investments in associates at December 31, 2013 F71
FINANCIAL STATEMENTS
FF
F1Lafarge - Registration Document 2013

STATUTORY ACCOUNTS F74
Statutory auditors’ report on the annual fi nancial statements F74
Comments on Income and fi nancial position statements F75
Appropriation of earnings F75
Statement of income F76
Balance sheet F77
Statement of cash fl ows F78
NOTES TO THE PARENT COMPANY FINANCIAL STATEMENTS F79
Note 1 Signifi cant events of the period F79Note 2 Accounting policies F79Note 3 Depreciation and amortization, operating
provision (allowance) reversal F80Note 4 Financial income from investments F81Note 5 Interest and similar income F81Note 6 Financial provision (allowance) reversal F81Note 7 Interest and similar expenses F82Note 8 Exceptional income (loss) F82Note 9 Income tax F82Note 10 Intangible assets and property, plant & equipment F83Note 11 Financial assets F83Note 12 Marketable securities F83Note 13 Lafarge S.A. treasury shares F84Note 14 Translation adjustments and bond
redemption premiums F84Note 15 Net equity F85Note 16 Provisions for losses and contingencies F86Note 17 Pension benefi t obligations F86Note 18 Financial debt F87Note 19 Derivatives F89Note 20 Financial commitments F90Note 21 Maturity of receivables and liabilities
at the balance sheets date F91Note 22 Information regarding Related parties F92Note 23 Compensation of the Board of Directors
and Executive Management F92Note 24 Average number of employees during the year F92Note 25 Individual rights to training F92Note 26 Deferred tax position – tax base
(holding company only) F93Note 27 Subsequent events F93Note 28 Investments F94
Change in the fi nancial income of the Company during the last fi ve years(articles R. 225-81, R. 225-83, R. 225-102 of the French Commercial Code) F95
Statutory Auditors’ special report on regulated agreements and commitments with third parties F96
Lafarge - Registration Document 2013F2
CONSOLIDATED FINANCIAL STATEMENTSSTATUTORY AUDITORS’ REPORT
ON THE CONSOLIDATED FINANCIAL STATEMENTS
FOR THE YEAR ENDED DECEMBER 31, 2013
To the Shareholders,
In compliance with the assignment entrusted to us by your Annual General Meeting, we hereby report to you, for the year ended December 31, 2013, on:
d the audit of the accompanying consolidated financial statements of Lafarge ;
d the justification of our assessments;
d the specific verification required by law.
These consolidated fi nancial statements have been approved by the Board of Directors. Our role is to express an opinion on these consolidated fi nancial statements based on our audit.
I. OPINION ON THE CONSOLIDATED FINANCIAL STATEMENTS
We conducted our audit in accordance with professional standards applicable in France; those standards require that we plan and perform the audit to obtain reasonable assurance about whether the consolidated fi nancial statements are free of material misstatement. An audit involves performing procedures, using sampling techniques or other methods of selection, to obtain audit evidence about the amounts and disclosures in the consolidated fi nancial statements. An audit also includes evaluating the appropriateness of accounting policies used and the reasonableness of accounting estimates made, as well as the overall presentation of the consolidated fi nancial statements. We believe that the audit evidence we have obtained is suffi cient and appropriate to provide a basis for our audit opinion.
In our opinion, the consolidated fi nancial statements give a true and fair view of the assets and liabilities and of the fi nancial position of the Group as at December 31, 2013 and of the results of its operations for the year then ended in accordance with International Financial Reporting Standards (IFRSs) as adopted by the European Union.
Without qualifying our conclusion, we draw your attention to Note 2.1 “Standards and interpretations applicable from January 1, 2013” to the consolidated fi nancial statements which describes the impacts related to the application of the amendments to IAS 19 – Employee Benefits- from January 1, 2013.
II. JUSTIFICATION OF OUR ASSESSMENTS
In accordance with the requirements of Article L. 823-9 of the French Commercial Code (Code de commerce) relating to the justifi cation of our assessments, we bring to your attention the following matters:
d Goodwill, property, plant and equipment, and intangible assets have been tested for impairment in accordance with the Group's accounting policies as described in Note 2.12 “Impairment of non-current assets” to the consolidated financial statements. The estimates used have been prepared based on currently available information at the time of the preparation of the consolidated financial statements and take into consideration the current economic crisis or political instability affecting some of the Group’s markets, as described in Note 2.3 “Use of estimates and judgment” to the consolidated financial statements. Therefore, as set out in Note 10 “Goodwill” to the consolidated financial statements, for European countries affected by the economic crisis and for Syria and Egypt, the operating assumptions and discount rates used in future discounted cash flows have been determined based on the specific country environment, for these countries, without taking into consideration any possible major disruption of the economic or geopolitical environment. In addition, the Group performed sensitivity tests on the recoverable amounts to a reasonable possible change of key assumptions (notably sensitivity to a one-point change in the discount rate or the perpetual growth rate) for the main goodwill items.
Our procedures consisted in reviewing available documents and the implementation of impairment testing, assessing the reasonableness of adopted valuations and the appropriateness of the information disclosed in the notes to the consolidated financial statements.
d Notes 2.3 “Use of estimates and judgment”, 2.23 and 22 “Income tax” to the consolidated financial statements specify that the recoverability of the deferred tax assets recognized as at December 31, 2013, notably those arising from the tax losses of the French tax consolidation which can be indefinitely carried forward, has been assessed by the Group on the basis of forecasts of future taxable profits. Our procedures consisted in reviewing the analysis performed on the recoverability of these assets, assessing the assumptions on which the used forecast data are based and verifying that the information disclosed in Notes 2.23 and 22 is appropriate.
This is a free translation into English of the statutory auditors’ report on the consolidated financial statements issued in the French language and is provided solely for the convenience of English speaking users.The statutory auditors’ report includes information specifically required by French law in such reports, whether
modified or not. This information is presented below the opinion on the consolidated financial statements and includes explanatory paragraphs discussing the auditors’ assessments of certain significant accounting and auditing matters. These assessments were made for the purpose of issuing an audit opinion on the consolidated financial statements taken as a whole and not to provide separate assurance on individual account captions or on information taken outside of the consolidated financial statements. This report also includes information relating to the specific verification of information given in the management report.
This report should be read in conjunction with, and is construed in accordance with, French law and professional auditing standards applicable in France.
Lafarge - Registration Document 2013 • F3
FINANCIAL STATEMENTS
F
Statutory auditors’ report on the consolidated fi nancial statements
As mentioned in the fi rst part of the report, note 2.1 ” Standards and interpretations applicable from January 1, 2013” to the consolidated fi nancial statements describes the effects of the application as from January 1, 2013 of the amendments to IAS 19 - Employee benefits. According to IAS 8, the comparative information disclosed in the consolidated fi nancial statements was restated retrospectively to refl ect this change in method. As a result, the comparative information is different from the consolidated fi nancial statements published with respect to the previous fi scal year ended December 31, 2012. As part of our assessment of the accounting policies adopted by your Group, we reviewed the comparative data and the information disclosed in Note 2.1 to the consolidated fi nancial statements.
These assessments were made as part of our audit of the consolidated fi nancial statements taken as a whole, and therefore contributed to the opinion we formed which is expressed in the fi rst part of this report.
III. SPECIFIC VERIFICATION
As required by law, we have also verifi ed in accordance with professional standards applicable in France the information presented in the Group’s management report.
We have no matters to report as to its fair presentation and its consistency with the consolidated fi nancial statements.
Neuilly-sur-Seine and Paris-La Défense, February 28, 2014
The Statutory Auditors
DELOITTE & A SSOCIÉS
French original signed by
ERNST & YOUNG et Autres
French original signed by
Arnaud de Planta Frédéric Gourd Alain Perroux Nicolas Macé
• Lafarge - Registration Document 2013F4
CONSOLIDATED FINANCIAL STATEMENTSFF Statutory auditors’ report on the consolidated fi nancial statements

CONSOLIDATED STATEMENT OF INCOME
YEARS ENDED DECEMBER 31,
(million euros, unless otherwise stated) NOTES 2013 2012 (1)
REVENUE (4) 15,198 15,816
Cost of sales (11,740) (11,934)
Selling and administrative expenses (1,383) (1,469)
OPERATING INCOME BEFORE CAPITAL GAINS, IMPAIRMENT, RESTRUCTURING AND OTHER (4) 2,075 2,413
Net gains (losses) on disposals (5) 295 53
Other operating income (expenses) (6) (350) (546)
OPERATING INCOME 2,020 1,920
Financial expenses (8) (1,177) (1,255)
Financial income (8) 136 160
Share of net income (loss) of associates (13) 19 5
INCOME BEFORE INCOME TAX 998 830
Income tax (22) (262) (292)
NET INCOME FROM CONTINUING OPERATIONS 736 538
Net income (loss) from discontinued operations (3) 46 16
NET INCOME 782 554
Of which attributable to:
Owners of the parent company 601 365
Non-controlling interests (minority interests) 181 189
EARNINGS PER SHARE (euros)
ATTRIBUTABLE TO THE OWNERS OF THE PARENT COMPANY
Basic earnings per share (9) 2.09 1.27
Diluted earnings per share (9) 2.08 1.27
From continuing operations
Basic earnings per share (9) 1.93 1.21
Diluted earnings per share (9) 1.92 1.21
BASIC AVERAGE NUMBER OF SHARES OUTSTANDING (in thousands) (9) 287,268 287,079
(1) Figures have been restated as mentioned in Note 2 “Summary of significant accounting policies” following the application of IAS 19 Amended (See Note 2.1).
The accompanying notes are an integral part of these consolidated financial statements.
Lafarge - Registration Document 2013 • F5
CONSOLIDATED FINANCIAL STATEMENTS
F
Consolidated statement of income

CONSOLIDATED STATEMENT OF COMPREHENSIVE INCOME
YEARS ENDED DECEMBER 31,
(million euros) 2013 2012 (1)
NET INCOME 782 554
Items that will not be reclassified subsequently to profit or loss
Actuarial gains/(losses) 119 (240)
Income tax on items that will not be reclassified to profit or loss (74) 64
Total items that will not be reclassified to profit or loss 45 (176)
Items that may be reclassified subsequently to profit or loss
Available-for-sale financial assets (14) -
Cash-flow hedging instruments 8 4
Foreign currency translation adjustments (1,699) (492)
Income tax on items that may be reclassified to profit or loss (1) (2)
Total items that may be reclassified to profit or loss (1,706) (490)
OTHER COMPREHENSIVE INCOME, NET OF INCOME TAX (1,661) (666)
TOTAL COMPREHENSIVE INCOME (879) (112)
Of which attributable to :
Owners of the parent company (928) (248)
Non-controlling interests (minority interests) 49 136
(1) Figures have been adjusted as mentioned in Note 2 “Summary of significant accounting policies” following the application of IAS 19 Amended (See Note 2.1).
The accompanying notes are an integral part of these consolidated financial statements.
• Lafarge - Registration Document 2013F6
CONSOLIDATED FINANCIAL STATEMENTSFF Consolidated statement of comprehensive income

CONSOLIDATED STATEMENT OF FINANCIAL POSITION
AT DECEMBER 31,
(million euros) NOTES 2013 2012 (1)
ASSETS
NON- CURRENT ASSETS 29,358 30,180
Goodwill (10) 11,612 12,184
Intangible assets (11) 574 620
Property, plant and equipment (12) 14,752 14,992
Investments in associates (13) 643 470
Other financial assets (15) 656 698
Derivative instruments (26) 12 27
Deferred tax assets (22) 1,082 1,149
Other receivables (18) 27 40
CURRENT ASSETS 7,717 9,284
Inventories (16) 1,621 1,662
Trade receivables (17) 1,929 1,762
Other receivables (18) 797 779
Derivative instruments (26) 24 68
Cash and cash equivalents (19) 3,346 2,733
Assets held for sale (3) - 2,280
TOTAL ASSETS (4) 37,075 39,464
EQUITY AND LIABILITIES
Common stock (20) 1,149 1,149
Additional paid-in capital (20) 9,712 9,695
Treasury shares (20) (1) (11)
Retained earnings 6,868 6,477
Other reserves (20) (885) (925)
Foreign currency translation adjustments (20) (2,288) (719)
EQUITY ATTRIBUTABLE TO OWNERS OF THE PARENT COMPANY 14,555 15,666
Non-controlling interests (minority interests) (20) 1,951 2,082
EQUITY 16,506 17,748
NON- CURRENT LIABILITIES 13,620 14,451
Deferred tax liabilities (22) 915 973
Pension & other employee benefits (23) 1,234 1,492
Provisions (24) 591 637
Financial debt (25) 10,805 11,261
Derivative instruments (26) 1 8
Other payables (27) 74 80
CURRENT LIABILITIES 6,949 7,265
Pension & other employee benefits (23) 123 102
Provisions (24) 124 127
Trade payables 2,224 1,985
Other payables (27) 1,447 1,567
Current tax payables 125 220
Financial debt (including current portion of long-term debt) (25) 2,891 2,823
Derivative instruments (26) 15 53
Liabilities associated with assets held for sale (3) - 388
TOTAL EQUITY AND LIABILITIES (4) 37,075 39,464
(1) Figures have been restated as mentioned in Note 2 “Summary of significant accounting policies” following the application of IAS 19 Amended (See Note 2.1).
The accompanying notes are an integral part of these consolidated financial statements.
Lafarge - Registration Document 2013 • F7
CONSOLIDATED FINANCIAL STATEMENTS
F
Consolidated statement of fi nancial position

CONSOLIDATED STATEMENT OF CASH FLOWS
YEARS ENDED DECEMBER 31,
(million euros) NOTES 2013 2012 (1)
NET CASH PROVIDED BY (USED IN) OPERATING ACTIVITIES
NET INCOME 782 554
NET INCOME FROM DISCONTINUED OPERATIONS 46 16
NET INCOME FROM CONTINUING OPERATIONS 736 538
Adjustments for income and expenses which are non cash or not related to operating
activities, financial expenses or income tax:
Depreciation and amortization of assets (4) 1,027 1,010
Impairment losses (6) 125 212
Share of net (income) loss of associates (13) (19) (5)
Net (gains) losses on disposals (5) (295) (53)
Financial (income) expenses (8) 1,041 1,095
Income tax (22) 262 292
Others, net (including dividends received from equity-accounted investments ) (168) (68)
Change in working capital items, excluding financial expenses and income tax
(see analysis below) (36) (304)
NET OPERATING CASH GENERATED BY CONTINUING OPERATIONS BEFORE IMPACT OF FINANCIAL
EXPENSES AND INCOME TAX 2,673 2,717
Interests (paid) received (893) (954)
Cash payments for income tax (525) (487)
NET OPERATING CASH GENERATED BY CONTINUING OPERATIONS 1,255 1,276
NET OPERATING CASH GENERATED BY DISCONTINUED OPERATIONS 1 22
NET CASH GENERATED BY OPERATING ACTIVITIES 1,256 1,298
NET CASH PROVIDED BY (USED IN) INVESTING ACTIVITIES
Capital expenditures (4) (1,051) (775)
Investment in subsidiaries and joint ventures(* ) (15) 21
Investment in associates (13) - (3)
Acquisition of available-for-sale financial assets (1) (1)
Disposals(** ) (3)/(32) 1,105 413
Net (increase) decrease in long-term receivables 1 22
NET CASH PROVIDED BY (USED IN) INVESTING ACTIVITIES FROM CONTINUING OPERATIONS 39 (323)
NET CASH PROVIDED BY (USED IN) INVESTING ACTIVITIES FROM DISCONTINUED OPERATIONS (2) (4)
NET CASH PROVIDED BY (USED IN) INVESTING ACTIVITIES 37 (327)
(1) Figures have been restated as mentioned in Note 2 “Summary of significant accounting policies” following the application of IAS 19 Amended (See Note 2.1).
The accompanying notes are an integral part of these consolidated financial statements.
• Lafarge - Registration Document 2013F8
CONSOLIDATED FINANCIAL STATEMENTSFF Consolidated statement of cash fl ows
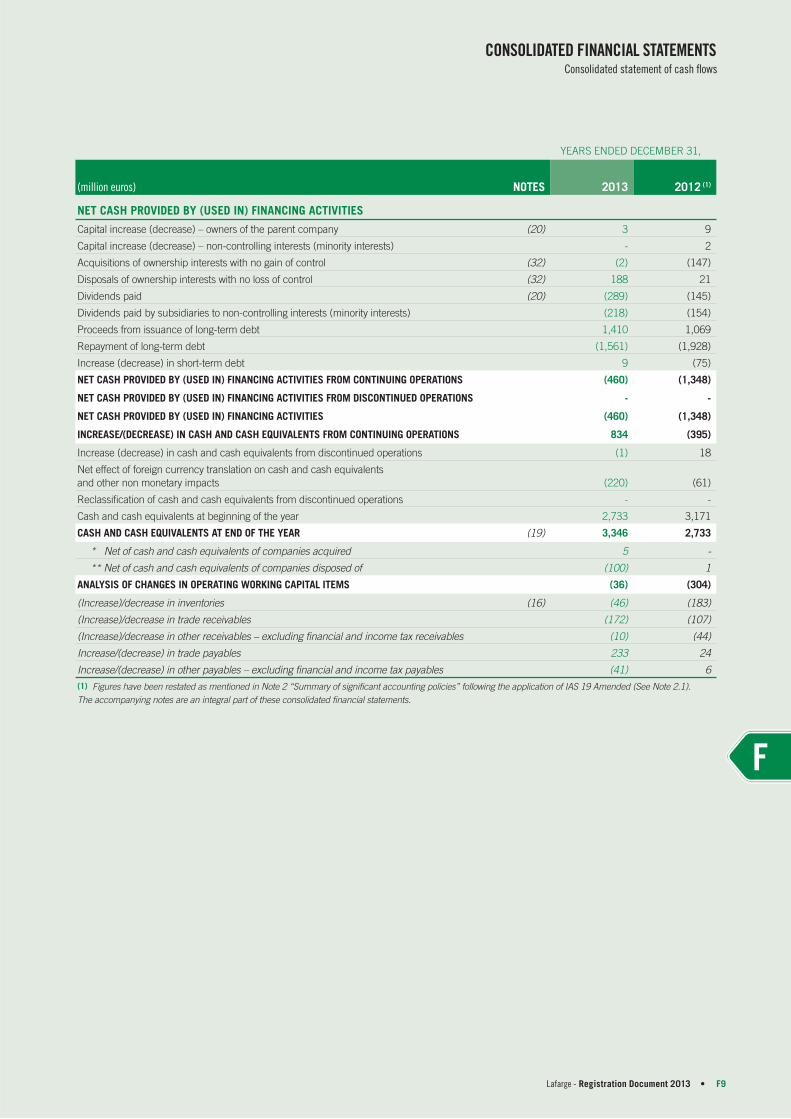
YEARS ENDED DECEMBER 31,
(million euros) NOTES 2013 2012 (1)
NET CASH PROVIDED BY (USED IN) FINANCING ACTIVITIES
Capital increase (decrease) – owners of the parent company (20) 3 9
Capital increase (decrease) – non- controlling interests (minority interests) - 2
Acquisitions of ownership interests with no gain of control (32) (2) (147)
Disposals of ownership interests with no loss of control (32) 188 21
Dividends paid (20) (289) (145)
Dividends paid by subsidiaries to non- controlling interests (minority interests) (218) (154)
Proceeds from issuance of long-term debt 1,410 1,069
Repayment of long-term debt (1,561) (1,928)
Increase (decrease) in short-term debt 9 (75)
NET CASH PROVIDED BY (USED IN) FINANCING ACTIVITIES FROM CONTINUING OPERATIONS (460) (1,348)
NET CASH PROVIDED BY (USED IN) FINANCING ACTIVITIES FROM DISCONTINUED OPERATIONS - -
NET CASH PROVIDED BY (USED IN) FINANCING ACTIVITIES (460) (1,348)
INCREASE/(DECREASE) IN CASH AND CASH EQUIVALENTS FROM CONTINUING OPERATIONS 834 (395)
Increase (decrease) in cash and cash equivalents from discontinued operations (1) 18
Net effect of foreign currency translation on cash and cash equivalents
and other non monetary impacts (220) (61)
Reclassification of cash and cash equivalents from discontinued operations - -
Cash and cash equivalents at beginning of the year 2,733 3,171
CASH AND CASH EQUIVALENTS AT END OF THE YEAR (19) 3,346 2,733
* Net of cash and cash equivalents of companies acquired 5 -
** Net of cash and cash equivalents of companies disposed of (100) 1
ANALYSIS OF CHANGES IN OPERATING WORKING CAPITAL ITEMS (36) (304)
(Increase)/decrease in inventories (16) (46) (183)
(Increase)/decrease in trade receivables (172) (107)
(Increase)/decrease in other receivables – excluding financial and income tax receivables (10) (44)
Increase/(decrease) in trade payables 233 24
Increase/(decrease) in other payables – excluding financial and income tax payables (41) 6
(1) Figures have been restated as mentioned in Note 2 “Summary of significant accounting policies” following the application of IAS 19 Amended (See Note 2.1).
The accompanying notes are an integral part of these consolidated financial statements.
Lafarge - Registration Document 2013 • F9
CONSOLIDATED FINANCIAL STATEMENTS
F
Consolidated statement of cash fl ows
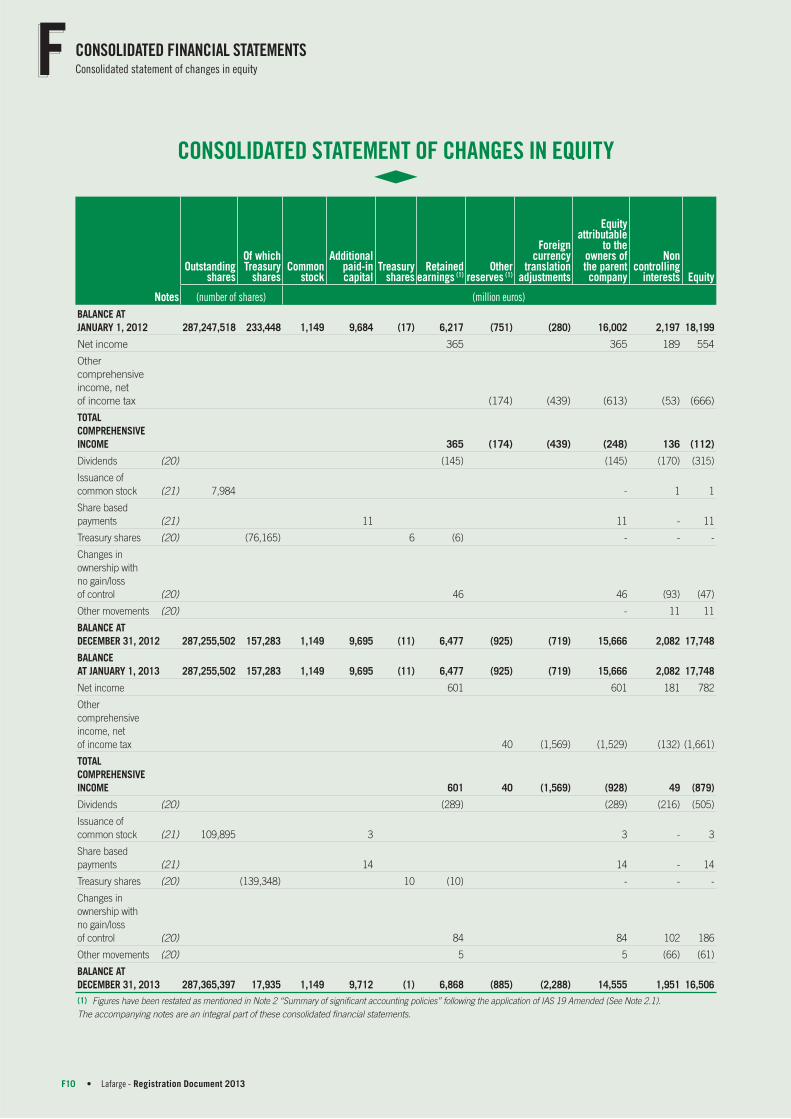
CONSOLIDATED STATEMENT OF CHANGES IN EQUITY
Notes
Outstanding shares
Of which Treasury
sharesCommon
stock
Additional paid-in capital
Treasury shares
Retained earnings (1)
Other reserves (1)
Foreign currency
translation adjustments
Equity attributable
to the owners of the parent company
Non controlling
interests Equity
(number of shares) (million euros)
BALANCE AT
JANUARY 1, 2012 287,247,518 233,448 1,149 9,684 (17) 6,217 (751) (280) 16,002 2,197 18,199
Net income 365 365 189 554
Other
comprehensive
income, net
of income tax (174) (439) (613) (53) (666)
TOTAL
COMPREHENSIVE
INCOME 365 (174) (439) (248) 136 (112)
Dividends (20) (145) (145) (170) (315)
Issuance of
common stock (21) 7,984 - 1 1
Share based
payments (21) 11 11 - 11
Treasury shares (20) (76,165) 6 (6) - - -
Changes in
ownership with
no gain/loss
of control (20) 46 46 (93) (47)
Other movements (20) - 11 11
BALANCE AT
DECEMBER 31, 2012 287,255,502 157,283 1,149 9,695 (11) 6,477 (925) (719) 15,666 2,082 17,748
BALANCE
AT JANUARY 1, 2013 287,255,502 157,283 1,149 9,695 (11) 6,477 (925) (719) 15,666 2,082 17,748
Net income 601 601 181 782
Other
comprehensive
income, net
of income tax 40 (1,569) (1,529) (132) (1,661)
TOTAL
COMPREHENSIVE
INCOME 601 40 (1,569) (928) 49 (879)
Dividends (20) (289) (289) (216) (505)
Issuance of
common stock (21) 109,895 3 3 - 3
Share based
payments (21) 14 14 - 14
Treasury shares (20) (139,348) 10 (10) - - -
Changes in
ownership with
no gain/loss
of control (20) 84 84 102 186
Other movements (20) 5 5 (66) (61)
BALANCE AT
DECEMBER 31, 2013 287,365,397 17,935 1,149 9,712 (1) 6,868 (885) (2,288) 14,555 1,951 16,506
(1) Figures have been restated as mentioned in Note 2 “Summary of significant accounting policies” following the application of IAS 19 Amended (See Note 2.1).
The accompanying notes are an integral part of these consolidated financial statements.
• Lafarge - Registration Document 2013F10
CONSOLIDATED FINANCIAL STATEMENTSFF Consolidated statement of changes in equity

NOTES TO THE CONSOLIDATED FINANCIAL STATEMENTS
NOTE 1 BUSINESS DESCRIPTION
Lafarge S.A. is a French limited liability company (société anonyme) governed by French law. The commercial name is “Lafarge”. The Company was incorporated in 1884 under the name “J. et A. Pavin de Lafarge”. Currently, the by-laws of the Company state its duration until December 31, 2066, unless further extension. The registered offi ce is located at 61 rue des Belles Feuilles, BP 40, 75782 Paris Cedex 16, France. The Company is registered in the Registrar of the Paris Commercial Court (Tribunal de Commerce de Paris) under the number 542105572 RCS Paris.
The Group has a country-based organization (see Note 4).
The Group’s shares have been traded on the Paris stock exchange since 1923 and have been a component of the French CAC 40 market index since its creation, and also included in the SBF 250 index.
As used herein, the terms “Lafarge S.A.” or the “parent company” refer to Lafarge a société anonyme organized under French law (excluding its consolidated subsidiaries). The terms the “Group” or “Lafarge” refer to Lafarge S.A. together with companies included in the scope of consolidation.
As at February 18, 2014, the Board of Directors prepared and authorized for issue these consolidated fi nancial statements for the year ended December 31, 2013. They will be submitted for approval by the shareholders during the Annual General Meeting to be held on May 7, 2014.
NOTE 2 SUMMARY OF SIGNIFICANT ACCOUNTING POLICIES
2.1 ACCOUNTING PRINCIPLES
1) Consolidated fi nancial statements preparation basis
The consolidated fi nancial statements of the Group are prepared in accordance with the International Financial Reporting Standards (“IFRS”) as endorsed by the European Union as of December 31, 2013 and available on the site http://ec.europa.eu/internal_market/accounting/ias/index_fr.htm, which do not differ, for the Group, from the effective IFRS as published by International Accounting Standard Board (“IASB”).
The consolidated financial statements have been prepared in accordance with the historical cost basis, except for the following, which are measured at fair value:
d derivative financial instruments;
d financial instruments at fair value through statement of income;
d available-for-sale financial assets;
d liabilities for cash-settled share based payment arrangements.
The consolidated fi nancial statements are presented in euros rounded to the nearest million, unless otherwise indicated.
As a fi rst time adopter of IFRS at January 1, 2004, the Group has followed the specifi c prescriptions of IFRS 1 which govern the fi rst-time adoption. The options selected for the purpose of the transition to IFRS are described in the following Notes.
2) Standards and interpretations applicable from January 1, 2013
The new IFRS and interpretations effective from January 1, 2013 had no material impact on the Group consolidated fi nancial statements at December 31, 2013 except for the amendments to IAS 19 that have been applied retrospectively as at January 1 , 2012.
d NEW STANDARDS AND INTERPRETATIONS WITH NO MATERIAL IMPACT ON THE GROUP CONSOLIDATED FINANCIAL STATEMENTS
d IFRS 13 – Fair value measurement, issued by the IASB in May 2011. IFRS 13 requires, in particular, to take account of counterparty risk in the fair value of derivative instruments. The valuation of counterparty risk is not material for the Group.
d Amendments to IFRS 1 – Government loans, issued by the IASB in March 2012.
d Amendments to IFRS 7 – Disclosures – Offsetting financial assets and financial liabilities, issued by the IASB in December 2011.
d Amendments to IAS 1 – Presentation of financial statements – Presentation of items of other comprehensive income, issued by the IASB in June 2011.
d Amendments to IAS 12 – Deferred tax – Recovery of underlying assets, issued by IASB in December 2010.
d Annual improvements to IFRS 2009-2011, issued by the IASB in May 2012.
d IFRIC 20 – Stripping costs in the production phase of a surface mine, issued by the IASB in October 2011.
Lafarge - Registration Document 2013 • F11
NOTES TO THE CONSOLIDATED FINANCIAL STATEMENTS
F
Note 2 Summary of signifi cant accounting policies

d FIRST APPLICATION OF THE AMENDMENTS TO IAS 19
The Group already applied the option offered by IAS 19 to recognize in other comprehensive income the actuarial gains or losses in the period in which they arise. As a result, these amendments impact mainly the fi nancial component of the net periodic pension cost recorded in the consolidated statement of income and the recognition of non-vested past service costs:
d the financial component of the net periodic pension cost is recorded as a financial expense. The financial gain on plan assets included in the financial component is calculated by multiplying the fair value of plan assets by the discount rate instead of the expected return rate of plan assets. The difference with the actual return of plan assets is recorded in the other comprehensive income. As a result, this impacts neither the total amount of the obligation nor the equity. It only changes the split of the financial component of the net periodic pension cost between net income and other comprehensive income ;
d non-vested past service costs from plan amendments are immediately recognized as an expense, and are no longer amortized over the remaining services lives of related employees. The unrecognized past service costs have been recorded in the provision for pension (non current) in counterpart of consolidated reserves for their total amount net of income tax as at January 1, 2012 (2 million euros).
Following the adoption of these amendments, the fi nancial component of the net periodic pension cost which was previously recorded in “Operating income before gains, impairment, restructuring and other”, is now presented in “Financial expenses” in the consolidated statement of income.
The following tables present the impact of this change of method on the statement of income and the statement of comprehensive income:
DECEMBER 31, 2012
Statement of income(million euros, except per share data) P ublished
IAS 19 R impact R estated
REVENUE 15,816 - 15,816
Cost of sales (11,945) 11 (11,934)
Selling and administrative expenses (1,431) (38) (1,469)
OPERATING INCOME BEFORE CAPITAL GAINS, IMPAIRMENT, RESTRUCTURING AND OTHER 2,440 (27) 2,413
Net gains (losses) on disposals 53 - 53
Other operating income (expenses) (546) - (546)
OPERATING INCOME 1,947 (27) 1,920
Financial expenses (1,191) (64) (1,255)
Financial income 160 - 160
Share of net income (loss) of associates 5 - 5
INCOME BEFORE INCOME TAX 921 (91) 830
Income tax (316) 24 (292)
NET INCOME FROM CONTINUING OPERATIONS 605 (67) 538
Net income from discontinued operations 16 - 16
NET INCOME 621 (67) 554
Of which attributable to:
Owners of the parent company 432 (67) 365
Non-controlling interests(minority interests) 189 - 189
EARNINGS PER SHARE (euros)
ATTRIBUTABLE TO THE OWNERS OF THE PARENT COMPANY
Basic earnings per share 1.50 (0.23) 1.27
Diluted earnings per share 1.50 (0.23) 1.27
From continuing operations
Basic earnings per share 1.44 (0.23) 1.21
Diluted earnings per share 1.44 (0.23) 1.21
• Lafarge - Registration Document 2013F12
NOTES TO THE CONSOLIDATED FINANCIAL STATEMENTSFF Note 2 Summary of signifi cant accounting policies

DECEMBER 31, 2012
Statement of comprehensive income(million euros) P ublished
IAS 19 R impact R estated
NET INCOME 621 (67) 554
Items that will not be reclassified subsequently to profit or loss
Actuarial gains/(losses) (331) 91 (240)
Income tax on items that will not be reclassified to profit or loss 88 (24) 64
Total items that will not be reclassified to profit or loss (243) 67 (176)
Total items that may be reclassified to profit or loss (490) (490)
OTHER COMPREHENSIVE INCOME FOR THE PERIOD, NET OF INCOME TAX (733) 67 (666)
TOTAL COMPREHENSIVE INCOME (112) - (112)
Of which attributable to:
Owners of the parent company (248) - (248)
Non-controlling interests (minority interests) 136 - 136
This change of method has no impact on the statement of cash fl ows except for the lines directly linked to the statement of income (net income, fi nancial (income) expenses, income tax and others).
d EARLY APPLICATION OF STANDARDS AND INTERPRETATIONS
Standards and Interpretations to existing standards that are not effective at January 1, 2013 have not been early adopted by the Group (see Note 2.27), except for the amendments to IAS 36 – Recoverable amount disclosures for non-fi nancial assets, issued by the IASB in May 2013 with a limited impact on the Group’s fi nancial statements.
2.2 PRINCIPLES OF CONSOLIDATION
SubsidiariesInvestments over which the Group exercises control are fully consolidated. Control exists when the Group has the power, directly or indirectly, to govern the fi nancial and operating policies of an enterprise so as to obtain benefi ts from its activities. In assessing control, potential voting rights that are currently exercisable are taken into account. The fi nancial statements of subsidiaries are included in the consolidated fi nancial statements from the date that control begins until the date that control ceases. The net income attributable to third parties is presented on the line “Non-controlling interests” in the statement of fi nancial position, even if it can create negative non-controlling interests.
Special Purpose Entities (SPE) are consolidated if, based on an evaluation of the substance of its relationship with the Group and the SPE’s risks and rewards, the Group concludes that it controls the SPE.
Joint venturesInvestments in companies in which the Group and a third party investor have agreed to exercise joint control are consolidated by the proportionate consolidation method. The Group’s share of the joint ventures’ results of operations, assets and liabilities is recorded in the consolidated fi nancial statements. Such entities are referred to as “joint ventures” throughout the consolidated fi nancial statements.
From January 1, 2014, joint ventures will be accounted for under the equity method according to IFRS 11 – Joint arrangements, issued by the IASB in May 2011 and applicable for annual periods beginning on or after January 1, 2014 (see Note 2.27).
AssociatesInvestments over which the Group exercises signifi cant infl uence on the fi nancial and operating policies, but not control, are accounted for under the equity method. Such investees are referred to as “associates” throughout the consolidated fi nancial statements. Signifi cant infl uence is presumed to exist when the Group holds at least 20% of the voting rights of associates. Associates are initially recognized at cost except if the Group previously controlled the investee. The consolidated fi nancial statements include the Group’s share of the income and expenses recorded by the associates, after taking into account adjustments for compliance of accounting policies with those of the Group, from the date on which the signifi cant infl uence begins until the date that signifi cant infl uence ceases. When the Group’s share of losses exceeds its interest in an equity accounted investee, the carrying amount of that interest (including any long term investments) is reduced to zero and the recognition of further losses is discontinued except to the extent that the Group has an obligation to contribute to losses or to make payments on behalf of the investee.
Transactions eliminated on consolidationAll intercompany balances and transactions have been eliminated in consolidation for fully consolidated companies and within the limits of the percentage of interests held for entities consolidated under the proportionate consolidation method.
Gains arising from transactions with equity accounted investees are eliminated against the investment to the extent of the Group’s interest in the investee. Losses are eliminated in the same way, but only to the extent that there is no evidence of impairment.
Lafarge - Registration Document 2013 • F13
NOTES TO THE CONSOLIDATED FINANCIAL STATEMENTS
F
Note 2 Summary of signifi cant accounting policies

2.3 USE OF ESTIMATES AND JUDGMENT
The preparation of consolidated fi nancial statements requires the Group’s management to exercise judgment, to make estimates and to use assumptions that affect the reported amounts of assets, liabilities, revenues or expenses and disclosures.
The management of the Group revises its estimates and assumptions on a regular basis to ensure that they are relevant regarding the past experience and the current environment. Such estimates are prepared on the assumption of going concern, are established based on currently available information and are in keeping with the current economic crisis or political instability affecting some of the Group’s markets. These forecasts do not refl ect any major disruption of the economical or geopolitical environment. Estimates may be revised in case of changes in circumstances used for the estimate or new information. Actual amounts could differ from the estimates.
The main estimates and judgments made by the management for the preparation of the fi nancial statements concern the following items:
d impairment tests of non-current assets (see Note 2.12 and Note 10 c ): the determination of recoverable amounts of the CGUs/groups of CGUs assessed in the impairment test requires an estimate of their fair value less costs to sell or of their value in use. The assessment of the recoverable value requires assumptions to be made with respect to the operating cash flows of the CGUs/groups of CGUs as well as the discount rates and perpetual growth rate;
d deferred tax (see Note 2.23 and Note 22): the recognition of deferred tax assets requires assessment of future taxable profit;
d pension plans, termination benefits and other post-employment benefits (see Note 2.20 and Note 23): the actuarial techniques used to assess the value of the defined benefit plan involve financial assumptions (discount rate, pension indexation rate , medical costs trend rate) and demographic assumptions (life expectancy , employee’s turnover rate…). The Group uses the assistance of an external independent actuary in the assessment of these assumptions;
d provisions for environmental risks and site restoration (see Note 2.21 and Note 24): provisions for environmental risks and site restoration require setting assumptions in terms of phasing and discount rate;
d provisions for litigation (see Note 24 and Note 29): the litigation and claims to which the Group is exposed are assessed by the Legal department. In certain situation, the Legal department may use the assistance of external specialised lawyers. Disclosures related to these provisions also require judgment;
d financial instruments (see Note 2.19, Note 25 and Note 26): the fair value of financial instruments is estimated on the basis of their market quotations, on valuation techniques relying on market observable data or by estimating the present value of future cash flows. The use of different valuations, methodologies and assumptions may have a material effect on the estimated fair value amounts. For financial liabilities recorded at amortized cost, the Group assesses events/circumstances of the period that may lead to revise the future payments and estimates the most probable scenario to determine if the carrying value of the financial liability shall be adjusted accordingly to IAS 39 principles.
2.4 FOREIGN CURRENCIES TRANSLATION
1) Foreign currency transactions
Transactions in foreign currencies are recorded in the respective
functional currencies of the entities of the Group by applying the
exchange rate at the date of the transactions.
At each reporting date, monetary assets and liabilities denominated in
foreign currencies recorded at historical cost are translated using the
functional currency closing rate, whereas those measured at fair value
are translated using the exchange rates at the date at which the fair
value was determined. Non-monetary assets and liabilities in a foreign
currency that are measured at historical cost are translated using the
exchange rates at the date of the transaction.
All exchange differences arising from those translations are recorded
in profi t and loss of the period, with the exception of differences on
monetary items that are designated as part of the hedge of the Group’s
net investment in a foreign entity. These are refl ected directly in other
comprehensive income, until the disposal of the net investment.
2) Foreign operations
The assets and liabilities, including goodwill and any fair value
adjustments arising on the acquisition of a foreign operation whose
functional currency is not the euro, are translated by using the closing
rate.
Income and expenses of a foreign entity, whose functional currency
is not the currency of a hyperinfl ationary economy, are translated by
using the average currency rate for the period unless exchange rates
fl uctuate signifi cantly.
The exchange differences arising on the translation are recorded in
other comprehensive income under “Foreign currency translation”.
On the partial or total disposal of a foreign entity with a loss of control,
the related share in the cumulative translation differences recorded
in equity is recognized in the statement of income.
In accordance with IFRS 1, the Group elected to “reset to zero” as
at January 1, 2004, cumulative translation differences arising from
the translation into euros of foreign subsidiaries’ fi nancial statements
denominated in foreign currencies. As a consequence, they will not
be included when calculating gains or losses arising from the future
disposal.
For companies that operate in hyperinfl ationary countries, amounts
in the statement of fi nancial position not yet expressed in terms of the
current measuring unit at the reporting date are restated by applying
the most relevant general price index. Revenues and expenses in local
currency are also restated on a monthly basis. Differences between
original values and reassessed values are included in statement of
income. In defi ning hyperinfl ation, the Group employs criteria which
include characteristics of the economic environment, such as infl ation
and foreign currency exchange rate fl uctuations.
• Lafarge - Registration Document 2013F14
NOTES TO THE CONSOLIDATED FINANCIAL STATEMENTSFF Note 2 Summary of signifi cant accounting policies

The schedule below presents foreign exchange rates for the main currencies used within the Group:
Rates(euros)
2013 2012
Average rate Year-end rate Average rate Year-end rate
US dollar (USD) 1.3281 1.3791 1.2857 1.3194
Canadian dollar (CAD) 1.3683 1.4671 1.2848 1.3137
British pound (GBP) 0.8492 0.8337 0.8111 0.8161
Brazilian real (BRL) 2.8671 3.2576 2.5101 2.7036
Chinese yuan (CNY) 8.1648 8.3491 8.1099 8.2207
Algerian dinar (DZD) 105.4004 106.8920 102.1376 102.8719
Egyptian pound (EGP) 9.1299 9.5675 7.8204 8.3454
Indian rupee (INR) 77.8675 85.3660 68.6448 72.5600
Indonesian rupiah (IDR) 13,858.5416 16,764.7800 12,053.2302 12,713.9700
Iraqi dinar (IQD) 1,635.2417 1,682.5020 1,583.5163 1,612.3068
Jordanian dinar (JOD) 0.9451 0.9807 0.9156 0.9396
Kenyan shilling (KES) 114.5385 119.3287 108.8581 113.6906
Korean won (KRW) 1,453.6235 1,450.9300 1,448.1967 1,406.2300
Moroccan dirham (MAD) 11.1889 11.2640 11.1239 11.1810
Malaysian ringgit (MYR) 4.1855 4.5221 3.9690 4.0347
Nigerian naira (NGN) 206.9221 214.4145 200.5315 205.2893
Philippine peso (PHP) 56.4115 61.2890 54.2747 54.1070
Polish zloty (PLN) 4.1972 4.1543 4.1840 4.0740
Romanian leu (RON) 4.4192 4.4710 4.4580 4.4445
Russian rouble (RUB) 42.3237 45.3246 39.9215 40.3295
South african rand (ZAR) 12.8313 14.5660 10.5556 11.1727
Syrian pound (SYP) 145.3404 196.2700 83.3661 102.6100
Zambian kwacha (ZMW) 7.1738 7.5994 6.6262 6.7820
2.5 BUSINESS COMBINATIONS, ACQUISITION OF ADDITIONAL INTERESTS AND DISPOSAL OF INTERESTS
1) Business combinationsBusiness combinations are accounted for in accordance with the acquisition method. The acquiree’s identifi able assets, liabilities and contingent liabilities are recognized at their fair value at the acquisition date, except for non-current assets held for sale which are recognized and measured at fair value less costs to sell in accordance with IFRS 5.
When goodwill is determined provisionally by the end of the reporting period in which the acquisition is completed, the Group recognizes any adjustments to those provisional values within one year of the acquisition date to refl ect new information obtained about facts and circumstances that existed as of the acquisition date. If the adjustments to provisional values would have materially affected the presentation of the consolidated fi nancial statements, comparative information which was presented for the periods before the fi nal accounting of fair values is corrected as if the initial accounting had been completed as of the acquisition date.
At the acquisition date, the goodwill is measured as the difference between:
d the fair value of the consideration transferred to take control over the entity, including contingent consideration, plus the amount of any non-controlling interests in the acquiree, and in a business
combination achieved in stages, the fair value at acquisition date of the previously held equity interest in the acquiree, accordingly revaluated through the statement of income; and
d the fair value of the identifiable assets acquired and the liabilities assumed on the acquisition date.
Any contingent consideration payable in a business combination is accordingly measured at fair value at the acquisition date. After the acquisition date, the contingent consideration is revalued at fair value at each reporting date. Subsequent changes to the fair value of the contingent consideration beyond one year from the acquisition date will be recognized in the statement of income if the contingent consideration is a fi nancial liability.
A negative goodwill is recognized immediately in the statement of income.
Acquisition costs directly attributable to the business combination, excluding costs to issue debt and equity securities, are expensed as incurred and are presented in the consolidated statement of income on the line “Other operating income (expenses)”.
When a business combination is entered into with an interest ownership below 100%, IFRS 3 revised standard allows, on a transaction-by-transaction basis, to account for goodwill either on a 100% basis or on the acquired interest ownership percentage (without any subsequent change in case of additional purchase of non-controlling interests). The non-controlling interests are accordingly measured either at fair value or at the non-controlling interests’ proportionate share in the acquiree’s net identifi able assets.
Lafarge - Registration Document 2013 • F15
NOTES TO THE CONSOLIDATED FINANCIAL STATEMENTS
F
Note 2 Summary of signifi cant accounting policies

d SPECIFIC TREATMENT RELATED TO FIRST-TIME ADOPTION OF IFRS (BUSINESS COMBINATIONS BEFORE JANUARY 1, 2004)
As permitted by IFRS 1, the Group has not restated the business combinations which predate the transition date (January 1, 2004).
In addition, under French accounting principles, before January 1, 2004, non-amortizable intangible assets such as market share, have been recognized through the purchase price allocation. These assets are not considered as a separately identifi able intangible asset under IAS 38, “Intangible Assets”. They have been reclassifi ed to goodwill as at January 1, 2004.
2) Acquisition of additional interests after control is obtained
Since there is no change on the control exercised over this entity, the difference between the acquisition price and the carrying amount of the non-controlling interests acquired is recognised directly in equity and attributed to the owners of the parent company with no change in the consolidated carrying amount of the subsidiary’s net assets and liabilities including goodwill. The cash consideration paid, net of acquisition costs, is refl ected as cash fl ows from fi nancing activities in the consolidated statement of cash fl ows.
3) Disposal of interests after control is obtained
d DISPOSAL OF INTERESTS WITHOUT LOSS OF CONTROL
Since there is no change on the control exercised over this entity, the difference between the fair value of the consideration received and the carrying amount of the interests disposed of at transaction date is recognised directly in equity and attributed to the owners of the parent company with no change in the consolidated carrying amount of the subsidiary’s net assets and liabilities . The cash consideration received, net of sale costs and tax paid, is refl ected as cash fl ows from fi nancing activities in the consolidated statement of cash fl ows.
d DISPOSAL OF INTERESTS WITH LOSS OF CONTROL
The loss of control triggers the recognition of a gain (loss) on disposal determined on both shares sold and retained at the transaction date. Any investment retained is accordingly measured at its fair value through the statement of income upon the date the control is lost. The cash part of the consideration received net of associated disposal costs, tax paid and cash and cash equivalents disposed of, is refl ected as investing activities cash fl ows on the line “Disposals” of the consolidated statement of cash fl ows.
2.6 REVENUE RECOGNITION
Revenue represents the value, before sales tax, of products and services sold by consolidated entities as part of their ordinary activities, after elimination of intra-Group sales.
Revenue is recorded when the Group has transferred the signifi cant risks and rewards of ownership (generally at the date ownership is transferred) and recovery of the consideration is probable.
Revenue is measured at the fair value of the consideration received or receivable net of return, taking into account the amount of any trade discounts and volume rebates.
Amounts billed to a customer in a sales transaction related to shipping and handling are included in “Revenue”. Costs incurred for shipping and handling are classifi ed as “Cost of sales”.
2.7 OPERATING INCOME BEFORE CAPITAL GAINS, IMPAIRMENT, RESTRUCTURING AND OTHER
The Group presents the subtotal “Operating income before capital gains, impairment, restructuring and other” in the consolidated statement of income. This measure excludes those elements of our operating income that are by nature unpredictable in their amount and/or in their frequency, such as capital gains, asset impairments and restructuring costs. While these amounts have been incurred in past years and may recur in the future, historical amounts are not indicative of the nature and/or amount of these expenses, if any, in the future. The Group believes that the subtotal “Operating income before capital gains, impairment, restructuring and other” allows to better identify the current operating performance, and provides to the users of fi nancial statements a useful information for a predictive approach of the results.
In addition, “Operating income before capital gains, impairment, restructuring and other” is a major component of the Group’s key profi tability measure: return on capital employed. This ratio is calculated by dividing the sum of “Operating income before capital gains, impairment, restructuring and other” and the share of net income (loss) of associates by the average of capital employed. This measure is used by the Group internally to: a) manage and assess the results of its operations and those of its business segments, b) make decisions with respect to investments and allocation of resources, and c) assess the performance of management personnel. However, because this measure has limitations as outlined below, the Group restricts its use to these purposes.
This subtotal within operating income may not be comparable to similarly titled measures used by other groups. Further, this measure should not be considered as an alternative for operating income as the effects of capital gains, impairment, restructuring and other amounts excluded from this measure do ultimately affect our operating results and cash fl ows. Accordingly, the Group also presents “Operating income” within the consolidated statement of income which encompasses all amounts which affect the Group’s operating results and cash fl ows.
2.8 FINANCIAL EXPENSES AND INCOME
Financial expenses and income comprise:
d interest charges and income relating to debenture loans, the liability component of compound instruments, other borrowings including lease-financing liabilities, and cash and cash equivalents;
d other expenses paid to financial institutions for financing operations;
d dividends received from non-consolidated investments;
d impact of discounting provisions and long-term receivables;
d financial component of the net pension costs;
d financial foreign currency exchange gains and losses;
d gains on the disposal of available-for-sale financial assets;
• Lafarge - Registration Document 2013F16
NOTES TO THE CONSOLIDATED FINANCIAL STATEMENTSFF Note 2 Summary of signifi cant accounting policies

d impairment losses recognised on available-for-sale financial assets;
d gains and losses associated with certain derivative instruments (except for the effective portion of derivative instruments qualified as cash flow hedge or net investment hedge);
d change in value of derivative instruments held for trading.
2.9 EARNINGS PER SHARE
Basic earnings per share are computed by dividing the net income attributable to the owners of the parent company by the weighted average number of common shares outstanding during the year.
Diluted earnings per share are computed by dividing adjusted net income attributable to the owners of the parent company by the weighted average number of common shares outstanding during the year adjusted to include any potential dilutive common shares.
Potential dilutive common shares result from stock options and performance shares issued by the Group.
2.10 INTANGIBLE ASSETS
Intangible assets primarily include depreciable items such as software, mineral rights, and real estate development rights, as well as certain development costs that meet the IAS 38 criteria.
Intangible assets are amortized using the straight-line method over their useful lives ranging from three to seven years, except for mineral rights, which are amortized based upon tonnes extracted, and real estate development rights, which are amortized over the estimated life of the program.
Depreciation expense is recorded in “Cost of sales” and “Selling and administrative expenses”, based on the function of the underlying assets.
Research & Development costsThe Group is committed to improving its manufacturing process, maintaining product quality and meeting existing and future customer needs. These objectives are pursued through various Research & Development programs. Within their framework, expenditure on research activities undertaken with the prospect of gaining new scientifi c or technical knowledge and understanding are recognised as expenses when incurred. Development costs (which have direct applications on the product offer) are capitalised, and amortized on a straight-line basis over fi ve years, only if the following criteria are demonstrated :
d the intention and the technical and financial resources to complete the development;
d the probability of future economic benefits for the Group;
d the reliable measurement of expenditures directly attributable to this asset.
Other development costs are recognised as expenses as incurred.
Intangible assets considered to have fi nite useful life are carried at their costs less accumulated amortization and accumulated impairment losses.
2.11 PROPERTY, PLANT AND EQUIPMENT
Property, plant and equipment are measured at cost less accumulated depreciation and accumulated impairment losses.
The cost of assets is allocated to its different components, each component having its specifi c useful life.
The cost of replacing part of an item of property, plant and equipment is recognized in the carrying amount of the item if it is probable that the future economic benefi ts embodied within the part will fl ow to the Group and its cost can be measured reliably. The costs of the day-to-day servicing of property, plant and equipment are recognized in the statement of income as incurred.
Investment subsidies are deducted from the cost of property, plant and equipment.
The residual values are reviewed, and adjusted if appropriate, at each reporting date.
LeasesLease contracts, or contracts which contain a lease according to IFRIC 4 criteria, which transfer to the Group the risks and rewards of ownership of the asset (fi nance lease contract) are capitalized in property, plant and equipment, with a corresponding fi nancial debt in liabilities.
Upon initial recognition the leased asset is measured at an amount equal to the lower of its fair value and the present value of the minimum lease payments. The leased asset is depreciated using the same criteria as for assets owned by the Group or the lease term if shorter.
Other leases are operating leases. The leased assets are not recognis ed in the Group’s consolidated statement of fi nancial position.
Borrowing costsInterest on borrowings related to the financing of significant investments, which is incurred during the construction phase, is capitalized in acquisition costs. The interest rate used to determine the amount of capitalized interest cost is the actual interest rate when there is a specifi c borrowing, or the Group’s debt average interest rate.
DepreciationDepreciation on property, plant and equipment is calculated as follows:
d mineral reserves are depleted by reference to the ratio of tonnes extracted during the year to the estimated total extraction capacity of the reserve over its useful life;
d land is not depreciated;
d buildings are depreciated using the straight-line method over estimated useful lives varying from 20 years to 50 years for office properties;
d machinery, equipment and installations are depreciated using the straight-line method over their estimated useful lives, ranging from 8 to 30 years.
Useful lives are reviewed on a regular basis and changes in estimates are accounted for on a prospective basis.
Depreciation expense is recorded in “Cost of sales” and “Selling and administrative expenses”, based on the function of the underlying assets.
Lafarge - Registration Document 2013 • F17
NOTES TO THE CONSOLIDATED FINANCIAL STATEMENTS
F
Note 2 Summary of signifi cant accounting policies

2.12 IMPAIRMENT OF NON-CURRENT ASSETS
1) GoodwillIn accordance with IAS 36 – Impairment of Assets, goodwill is tested for impairment, whose purpose is to take into consideration events that could have affected the recoverable amount of these assets, at least annually and quarterly when there are some indications that impairment may have been identifi ed. The annual impairment test is performed during the last quarter of the year, in relation with the budget process. The recoverable amount is defi ned as the higher of the fair value less costs to sell and the value in use.
For the purposes of the impairment test, the Group’s net assets are allocated to Cash Generating Units (“CGUs”) or groups of CGUs. A CGU is the smallest identifi able group of assets generating cash infl ows independently and represents the level used by the Group to organize and present its activities and results in its internal reporting. CGUs generally represent one of our two activities (Cement or Aggregates & Concrete) in a particular country. When it is not possible to allocate goodwill on a non-arbitrary basis to individual CGUs, goodwill can be allocated to a group of CGUs at a level not higher than the operating segment, as defi ned in Note 4.
Impairment tests are carried out in two steps:
d First step: the Group compares the net carrying value of CGUs or groups of CGUs with an Ebitda multiple (the industry-specified multiple used is determined every year on the basis of a sample of companies in our industry). Ebitda is defined as the operating income before capital gains, impairment, restructuring and other, before depreciation and amortization of property, plant and equipment and intangible assets;
d Second step: for CGUs or groups of CGUs presenting an impairment risk according to this first step approach, the Group determines the recoverable amount of the CGU or group of CGUs as its fair value less costs of sale or its value in use.
Fair value is the best estimate of the amount obtainable from the sale in an arm’s length transaction between knowledgeable, willing parties. This estimate is based either on market information available, such as market multiples, on discounted expected market cash fl ows, or any other relevant valuation method.
Value in use is estimated based on discounted cash fl ows expected over a 10-year period. This period refl ects the characteristics of our activities where operating assets have a high lifespan and where technologies evolve very slowly.
If the recoverable amount of the CGU or group of CGUs is less than its net carrying value, the Group records an impairment loss, fi rst to reduce the carrying amount of any goodwill allocated to the CGU or group of CGUs, then to reduce the carrying amount of the other assets of the CGU or group of CGUs. The impairment loss is recorded in “Other operating expenses” (see Note 6).
In accordance with IAS 36, impairment losses recognized for goodwill are never reversed.
2) Property, plant & equipment and depreciable intangible assets
Whenever events or new circumstances indicate that the carrying amount of an asset may not be recoverable, an impairment test is
performed. The purpose of this test is to compare the carrying value of the asset with its recoverable value. Recoverable amount is determined for an individual asset, unless the asset does not generate cash infl ows that are largely independent of those from other assets or groups of assets. In that case, the recoverable amount is determined for the cash-generating unit to which the asset belongs.
The recoverable amount is the higher of the fair value less costs to sell and the value in use, which is the present value of the future cash fl ows expected to be derived from the use of the asset or its disposal. When the carrying amount of an asset exceeds its recoverable amount, an impairment loss is recognized in “Other operating income and expenses”.
When an impairment loss is recognized for a cash-generating unit, the loss is allocated fi rst to reduce the carrying amount of the goodwill allocated to the cash-generating unit; and, then, to the other assets of the unit pro rata on the basis of the carrying amount of each asset in the unit.
After the impairment loss, the new carrying value of the asset is depreciated prospectively over its remaining life.
Assets other than goodwill that suffered impairment are reviewed for possible reversal of the impairment at each year-end. The carrying value of the assets, revised due to the increase of the recoverable value, cannot exceed the carrying amount (net of depreciation) that would have been determined had no impairment loss been recognized in prior periods. Such reversal is recognized in the statement of income.
2.13 OTHER FINANCIAL ASSETS
Other fi nancial assets mainly consist of shares held in non- consolidated companies, long-term loans and receivables, and cash balances that are restricted from use.
Other fi nancial assets are classifi ed in four categories: trading (assets that are bought and held principally for the purpose of selling them in the near term), held-to-maturity (assets with fi xed or determinable payments and fi xed maturity that the Group has a positive intent and ability to hold to maturity), long-term loans and receivables (assets with fi xed or determinable payments that are not quoted in an active market) and, available-for-sale (all other assets). The classifi cation depends on the purpose for which the fi nancial assets were acquired. The classifi cation is determined at initial recognition.
All fi nancial assets are reviewed for impairment on an annual basis to assess whether there is any indication that the asset may be impaired.
Purchases and sales of all fi nancial assets are accounted for at trade date.
Financial assets held for tradingFinancial assets held for trading are measured at fair value with unrealized gains and losses recorded as fi nancial income or expense. Assets in this category are classifi ed as current assets.
Financial assets held-to-maturityFinancial assets that are designated as held-to-maturity are initially measured at fair value and then at amortized cost, in accordance with the effective interest rate method.
• Lafarge - Registration Document 2013F18
NOTES TO THE CONSOLIDATED FINANCIAL STATEMENTSFF Note 2 Summary of signifi cant accounting policies

Long-term loans and receivablesLong-term loans and receivables are initially measured at fair value and then accounted for at amortized cost measured in accordance with the effective interest rate method.
Available-for-sale fi nancial assetsEquity interests in non-consolidated companies are classifi ed as available-for-sale fi nancial assets and are initially recognized and subsequently measured at fair value.
For equity securities listed on an active market, the fair value is quoted price.
In the absence of an active market, fair value is generally determined according to the most appropriate fi nancial criteria in each case (comparable transactions, multiples for comparable companies, present value of future cash fl ows, estimated selling price). If such fair value cannot be reliably measured, equity securities are accounted for at cost.
Gains and losses arising from changes in their fair value are recognized directly in other comprehensive income (“Other Reserves”). When the security is disposed of, the cumulative unrealized gain or loss is included in the statement of income for the period (“Financial income” – “Financial expenses”).
The Group assesses at the end of each reporting period whether there is any objective evidence that these fi nancial assets are impaired which would lead, if this were to be the case, to recognise in the statement of income the loss previously recognized in equity. Such impairment cannot subsequently be reversed.
Factors considered by the Group to assess the objective evidence of impairment of its investments and accordingly enabling the Group to determine whether the cost of its fi nancial assets can be or not recovered, are notably:
d the occurrence of significant financial difficulties;
d the analysis of the national/local economic conditions in relation with its assets;
d the analysis of significant adverse changes in the technological, economic or legal environment;
d the existence of a significant or prolonged decline in fair value of the investment below its acquisition cost.
2.14 DERECOGNITION OF FINANCIAL ASSETS
Financial assets can only be derecognized when no further cash fl ow is expected to fl ow to the Group from the asset and if substantially all risks and rewards attached to the assets have been transferred.
For trade receivables, programs for selling receivables with recourse against the seller in the event of default in payment (either in the form of a subordinated retained interest or a direct recourse) do not qualify for derecognition.
2.15 INVENTORIES
Inventories are stated at the lower of cost and net realizable value.The cost of inventories is determined using the weighted-average method and includes expenditure incurred in acquiring the inventories. In the case of manufactured inventories and work in progress, cost includes an appropriate share of production overhead based on normal operating capacity.
Net realizable value is the estimated selling price in the ordinary course of business, less the estimated costs of completion and selling expenses.
2.16 TRADE RECEIVABLES
Trade receivables are initially measured at fair value, and subsequently carried at amortized cost using the effective interest method less provision for impairment.
A depreciation for trade receivables is established when there is objective evidence that the Group will not be able to collect all amounts due according to the original terms of the receivables.
The amount of the depreciation is the difference between the asset’s carrying amount and the present value of estimated future cash fl ow, discounted at the original effective interest rate. Impairment loss is recorded in the statement of income.
2.17 CASH AND CASH EQUIVALENTS
Cash and cash equivalents consist of current account bank balances, cash, highly liquid investments and cash equivalents which are not subject to signifi cant changes in value and with an original maturity date of generally less than three months from the time of purchase. Investments, classifi ed as cash equivalents, with a maturity date greater than three months have:
d exit options exercisable with no penalty at any time or maximum every three months, planned at the initiation of the contract;
d no risk related to the minimum return acquired.
Cash balances that are restricted from use restrictions other than legal restrictions in force in some countries (exchange controls, etc.) are excluded from cash presented in the consolidated statement of fi nancial position and in the statement of cash fl ows and are classifi ed in non-current assets on the line “Other fi nancial assets”.
2.18 EQUITY
1) Ordinary sharesIncremental costs directly attributable to the issue of ordinary shares and share options are recognized as a deduction from equity, net of any tax effects.
2) Treasury sharesTreasury shares (own equity instruments held by Lafarge S.A.) are accounted for as a reduction of equity at acquisition cost and no further recognition is made for changes in fair value. When shares are sold out of treasury shares, the resulting profi t or loss is recognized in equity, net of tax.
2.19 FINANCIAL LIABILITIES AND DERIVATIVE INSTRUMENTS
1) Recognition and measurement of fi nancial liabilities
Financial liabilities are measured at amortized cost calculated based on the effective interest rate method.
Lafarge - Registration Document 2013 • F19
NOTES TO THE CONSOLIDATED FINANCIAL STATEMENTS
F
Note 2 Summary of signifi cant accounting policies

Accrued interests are presented within “Other payables” in the consolidated statement of fi nancial position.
Financial liabilities hedged by an interest rate swap that qualifi es for fair value hedge accounting are measured in the consolidated statement of fi nancial position at fair value for the part attributable to the hedged risk (risk related to changes in interest rates). The changes in fair value are recognized in earnings for the period of change and are offset by the portion of the loss or gain recognized on the hedging item that relates to the effective portion.
2) Compound instrumentsSome fi nancial instruments contain components with characteristics of both liability and equity items (e.g. bonds convertible into common shares). The different component parts are recorded in equity and in fi nancial liability for their respective part.
The component classifi ed as a fi nancial liability is valued at issuance at the present value (taking into account the credit risk at issuance date) of the future cash fl ows (including interest and repayment of the nominal value) of a bond with the same characteristics (maturity, cash fl ows) but without any option to be converted into or repaid in common shares.
The equity component corresponds to the residual carrying amount after deducting from the instrument as a whole the amount separately determined for the liability component.
3) Measurement and recognition of derivative instruments
The Group enters into fi nancial derivative instruments only in order to reduce its exposure to changes in interest rates, foreign currency exchange rates and commodities prices on fi rm or highly probable commitments.
Forward exchange contracts and foreign currency swaps are used to hedge foreign currency exchange rate exposures.
The Group enters also into interest rate swaps and options to manage its interest rate exposure. These swaps aim at converting fi nancial instruments either from fi xed rate to fl oating rate or from fl oating rate to fi xed rate.
The Group uses derivatives such as swaps and options in order to manage its exposure to commodity risks.
Derivative instruments are recorded in the consolidated statement of fi nancial position at their fair value. The accounting for changes in fair value of a derivative depends on the intended use of the derivative and the resulting designation. The Group designates its derivatives based on the criteria established by IAS 39.
In case of a fair value hedge relationship, changes in fair value on the hedging item are recognized in the consolidated statement of income of the period. The part corresponding to the effi cient portion of the hedge is offset by the unrealized loss or gain recognized on the hedged item.
In case of a cash fl ow hedge relationship, changes in fair value on the hedging are recognized directly in other comprehensive income for the effective portion and in fi nancial income (expense) for the ineffective portion. The gain or loss recognized in equity is subsequently reclassifi ed to the consolidated statement of income when the hedged exposure affects the latter.
Embedded derivatives not closely related to host contracts are recorded at fair value in the consolidated statement of fi nancial position. Their change in fair value is recorded in the statement of income of the period.
4) Put options on shares of subsidiaries (commitment to purchase non-controlling interests)
Put options granted to non-controlling interests of subsidiaries are considered fi nancial debt. The value of the debt is estimated using the contract formulas or prices. When utilizing formulas based upon multiples of earnings minus debt, we use the actual profi t or loss of the period and the debt of the subsidiary at the closing date of the estimation.
d PUT OPTIONS GRANTED TO NON-CONTROLLING INTERESTS BEFORE JANUARY 1, 2010
The Group recorded the put options granted to non-controlling interests as a fi nancial debt at present value of the put exercise price and as a reduction in non-controlling interests in equity. When the put exercise price exceeded the carrying amount of the non-controlling interest, the Group recorded this difference as goodwill.
The changes in the fair value of the debt related to put options granted to non-controlling interests before January 1, 2010, are recorded against non-controlling interests and against the goodwill initially recorded if the debt exceeds the carrying amount of the non-controlling interests. There is no impact on the consolidated statements of income nor on the equity attributable to the owners of the parent company.
d PUT OPTIONS GRANTED TO NON-CONTROLLING INTERESTS AFTER JANUARY 1, 2010
The Group recorded the put options granted to non-controlling interests as a fi nancial debt at present value of the put exercise price and as a reduction in non-controlling interests in equity. When such present value of the put exercise price exceeded the carrying amount of the non-controlling interest, the Group recorded this difference as a reduction in equity attributable to the owners of the parent company.
The changes in the fair value of the debt related to put options granted to non controlling interests after January 1, 2010, are recorded against non-controlling interests and against equity attributable to the owners of the parent company if the debt exceeds the carrying amount of the non-controlling interests.
2.20 PENSIONS, TERMINATION BENEFITS AND OTHER POST-EMPLOYMENT BENEFITS
The Group recorded all its liabilities related to pensions, termination benefi ts, medical coverage and other post-employment benefi ts according to the requirements of IAS 19 revised.
1) Defi ned contribution plansThe Group accounts for pension costs related to defi ned contribution pension plans as they are incurred (in “Cost of sales” or “Selling and administrative expenses” based on the benefi ciaries of the plan).
2) Defi ned benefi t plansEstimates of the Group’s pension and termination benefi t obligations are calculated annually, in accordance with the provisions of IAS 19 – Employee Benefi ts, with the assistance of independent actuaries, using the projected unit credit method. This method considers actuarial assumptions including the probable future length of the employees’ service, the employees’ fi nal pay, the expected average life span and probable turn-over of benefi ciaries.
• Lafarge - Registration Document 2013F20
NOTES TO THE CONSOLIDATED FINANCIAL STATEMENTSFF Note 2 Summary of signifi cant accounting policies

The obligations are discounted by country based upon appropriate discount rates. The obligations are recognized based upon the proportion of benefi ts earned by employees as services are rendered.
Assets held by external entities to fund future benefi t payments are valued at fair value at the closing date.
Actuarial gains and losses arise from changes in actuarial assumptions used in the valuation of obligations and plan assets and from market conditions effectively noticed regarding these assumptions, and experience effects. These gains or losses are recorded in other comprehensive income in the period in which they arise.
In the consolidated statement of income, costs related to defi ned benefi ts plans are refl ected as follows:
d the current period pension cost, which reflects the increase in the obligation resulting from the additional benefits earned by employees in the period is recorded in “Operating income before capital gains, impairment, restructuring and other” (in “Cost of sales” or “Selling and administrative expenses” based on the beneficiaries of the plan);
d the net financial expense of the period is recorded in “financial expenses”. It is determined by applying the discount rate to the amount recognized in the statement of financial position at the beginning of the period, taking into account any variation during the period resulting from contributions and benefit payments.
Pension plan amendments and curtailments effects on the obligations of the Group’s entities are recognized immediately in the consolidated statements of income.
In the event of overfunding of a plan’s liabilities by its dedicated assets, the Group applies the limitations applicable under IAS 19 and IFRIC 14.
3) Other post-employment benefi tsCertain subsidiaries grant their employees and dependants post-employment medical coverage or other types of post-employment benefi ts. The costs of these benefi ts are calculated based upon actuarial determinations and are recorded through the consolidated statement of income over the expected average remaining service lives of the employees (in “Cost of sales” or “Selling and administrative expenses” based on the benefi ciaries of the plan).
2.21 PROVISIONS
The Group recognizes provisions when it has a legal or constructive obligation resulting from past events, the resolution of which would result in an outfl ow of resources.
1) RestructuringA provision for restructuring costs is recorded when the restructuring plans have been fi nalized and approved by the management, and when the Group has raised a valid expectation in those affected that it will carry out the plan either by starting to implement the plan or announcing its main features. The provision only includes direct expenditures arising from the restructuring, notably severance payments, early retirement costs, costs for notice periods not worked and other costs directly linked with the closure of the facilities.
2) Site restorationWhen the Group is legally, contractually or constructively required to restore a quarry site, a provision for site restoration is recorded in cost of sales. This provision is recorded over the operating life of the quarry on the basis of production levels and depletion rates. The estimated future costs for known restoration requirements are determined on a site-by-site basis and are calculated based on the present value of estimated future costs.
3) Environmental costsCosts incurred to mitigate or prevent future environmental contamination and that result in future economic benefi ts, such as extending useful lives, increased capacity or safety, and those, are capitalized. When the Group determines that a legal or constructive obligation exists and that its resolution will result in an outfl ow of resources, an estimate of the future remediation is recorded as a provision without the offset of contingent insurance recoveries (only virtually certain insurance recoveries are recorded as an asset). When the effect of the passage of time is not signifi cant, the provision is calculated based on undiscounted cash fl ows.
Environmental costs, which are not included above, are expensed as incurred.
2.22 TRADE PAYABLES
Trade payables are recognized initially at fair value and subsequently measured at amortized cost using the effective interest method.
2.23 INCOME TAXES
Income tax expense or benefi t comprises current and deferred tax. Income tax is recognised in the consolidated statement of income except to the extent that it relates to items recognised directly in equity, in which case it is recognised in equity.
Current tax is (i) the expected tax payable on the taxable income for the year, using tax rates enacted or substantively enacted at the reporting date, and (ii) any adjustment to tax payable in respect of previous years.
Deferred tax is recognized using the balance sheet method, providing for temporary differences between the carrying amounts of assets and liabilities and the amounts used for taxation purposes. Deferred tax is not recognized for the following temporary differences: (i) the initial recognition of goodwill, (ii) the initial recognition of assets or liabilities in a transaction that is not a business combination and that affects neither accounting nor taxable profi t, and (iii) differences relating to investments in subsidiaries and jointly controlled entities to the extent that it is probable that they will not reverse in the foreseeable future.
Deferred tax is measured at the tax rates that are expected to be applied to the temporary differences when they reverse, based on the laws that have been enacted or substantively enacted by the reporting date. Deferred tax assets and liabilities are offset if there is a legally enforceable right to offset current tax liabilities and assets, and they relate to income taxes levied by the same tax authority either on the same taxable entity or on different tax entities, but they intend to settle current tax liabilities and assets on a net basis or their tax assets and liabilities will be realized simultaneously.
Lafarge - Registration Document 2013 • F21
NOTES TO THE CONSOLIDATED FINANCIAL STATEMENTS
F
Note 2 Summary of signifi cant accounting policies

A deferred tax asset is recognized to the extent that it is probable that future taxable profi ts will be available against which the temporary difference can be utilized. Deferred tax assets are reviewed at each reporting date and are reduced to the extent that it is no longer probable that the related tax benefi t will be realized.
A deferred tax liability is recognized for all taxable temporary differences associated with investments in subsidiaries, joint ventures and associates except to the extent that both of the following conditions are satisfi ed:
d the Group is able to control the timing of the reversal of the temporary difference (e.g. the payment of dividends); and
d it is probable that the temporary difference will not reverse in the foreseeable future.
Accordingly, for fully consolidated companies, a deferred tax liability is only recognized in the amount of taxes payable on planned dividend distributions by these companies.
2.24 SHARE BASED PAYMENTS
On a regular basis, the Group grants to its employees purchase or subscription stock options at a set price, performance stock plans and offers employee share purchase plans.
In accordance with the prescriptions of IFRS 2 – Share Based Payments, the Group records compensation expense for all share-based compensation granted to its employees.
1) Share options granted to employees, performance stock plans and cash settled plans
Share options and performance stock fair value are calculated at grant date using the Black & Scholes model. However, depending on whether the equity instruments granted are equity-settled through the issuance of Group shares or cash settled, the accounting treatment differs.
If the equity instrument is settled through the issuance of Lafarge’ shares, the fair value of the equity instruments granted is estimated and fi xed at the grant date and recorded in the consolidated statement of income over the vesting period (based on the characteristics of the equity instruments) with a counterpart in equity.
If the equity instrument is settled in cash (applicable for SAR “Stock Appreciation Rights”), the fair value of the equity instruments granted is estimated at the grant date and is re-estimated at each reporting date and the expense is adjusted pro rata taking into account the vested rights at the relevant reporting date. The expense is amortized over the vesting period (based on the characteristics of the equity instruments) with a counterpart in non-current provisions.
In accordance with IFRS 1 and IFRS 2, only plans granted after November 7, 2002 and not fully vested at January 1, 2004 have been measured and accounted for as employee costs.
2) Employee share purchase plansWhen the Group performs capital increases reserved for employees, and when the conditions offered are signifi cantly different from market conditions, the Group records a compensation cost.
This cost is measured at the grant date, defi ned as the date on which the Group and employees share a common understanding of the characteristics and conditions of the offer.
The measurement of the cost takes into account the Group’s contribution to the plan, the potential discount granted on the share price and the effect of post-vesting transfer restrictions (deducted from the discount granted).
The compensation cost calculated is expensed in the period of the operation (considered as compensation for past services) if no vesting condition is attached to the shares.
2.25 EMISSION RIGHTS
The Group receives CO2 emission rights free of charge under the
emissions trading scheme established in the European Union since 2005. The Emissions Trading Directive applies to all the cement plants of the Group in the 11 out of the 28 Member States of the European Union.
For the third period, covering the years 2013 to 2020, allowances are calculated according to a new methodology based on the historical production level for each plant (expressed in tonnes of clinker) and a reference value common to the European sector (expressed in tonnes of CO
2 per tonne of clinker). These allocations are free for the
European cement industry in 2013 and 2014; these allocations will remain free after 2015 if the cement industry is recognised as exposed to a signifi cant risk of international competition (“carbon leakage”).
The Group follows the emission rights on an annual basis but also on the entire reference period (currently 2013-2020). Actual emissions are consolidated on a monthly basis. The forecast of yearly position is updated regularly during the reporting period.
Until the IASB issues a position on the appropriate accounting treatment of tradeable emission quota under plans to reduce emissions of green house gases, the Group accounts for the effects of such scheme as follows:
d emission rights granted by governments are not recorded in the consolidated statement of financial position, as they have a cost equal to zero;
d proceeds from the sale of emission rights are recorded as a reduction to “Cost of sales”;
d purchases of emission rights on the market are recorded in “Cost of sales” when they cover actual emissions of the period. They are recorded as intangible assets if they cover actual emissions to be made in future periods;
d provisions are recorded (in “cost of sales”) when actual emissions exceed the number of emission rights (granted or purchased).
No other impact is recorded in the statement of income or in the consolidated statement of fi nancial position.
2.26 NON-CURRENT ASSETS HELD FOR SALE AND DISCONTINUED ACTIVITIES
A fi xed asset or a group of assets and liabilities is classifi ed as held for sale when its carrying amount will be recovered principally through a sale transaction rather than through continuing use. For this to be the case, the asset must be available for immediate sale and its sale must be highly probable. Such assets or group of assets are presented separately in the consolidated statement of fi nancial position, in the line “Assets held for sale” when they are material. These assets or group of assets are measured at the lower of their carrying value or the fair value less costs to sell. The liabilities directly linked to the assets or
• Lafarge - Registration Document 2013F22
NOTES TO THE CONSOLIDATED FINANCIAL STATEMENTSFF Note 2 Summary of signifi cant accounting policies

group of assets held for sale are presented in the line “Liabilities directly associated with assets held for sale” in the consolidated statement of fi nancial position.
A discontinued operation is a component of an entity that either has been disposed of or is classifi ed as held for sale, and:
d represents a separate major line of business or geographical area of operations for the Group;
d is part of a single coordinated plan to dispose of a separate major line of business or geographical area of operations for the Group; or
d is a significant subsidiary acquired exclusively with a view to resale.
Amounts included in the statement of income and the statement of cash fl ows related to these discontinued operations are presented separately for all prior periods presented in the fi nancial statements. Assets and liabilities related to discontinued operations are shown on separate lines with no restatement for prior years.
2.27 ACCOUNTING PRONOUNCEMENTS AT THE CLOSING DATE NOT YET EFFECTIVE
Standards and interpretations adopted by the European Union at the closing date
d PRONOUNCEMENTS WITH A POTENTIAL IMPACT ON CONSOLIDATED FINANCIAL STATEMENTS
d IFRS 11 – Joint arrangements, issued by the IASB in May 2011 and applicable for annual periods beginning on or after January 1, 2014: main impacts will arise from the application of the equity method of accounting for interests in joint ventures, currently consolidated under the proportionate consolidation method. For the financial year 2013, the application of IFRS11 would have the following impacts :
d decrease by 2,107 million euros of revenue;
d decrease by 308 million euros of Ebitda(1);
d decrease by 138 million euros of “Operating incomes before capital gains, impairment, restructuring and other”;
d decrease by 484 million euros of net debt(2);
d investments in joint ventures and associates: 1,550 million euros as at January 1st, 2013 and 3,174 million euros as at December 31, 2013 especially following the creation of the joint venture Lafarge Tarmac in the United Kingdom on January 7, 2013.
d IFRS 12 – Disclosures of interests in other entities, issued by the IASB in May 2011 and applicable for annual periods beginning on or after January 1, 2014: the analysis of disclosures is not yet complete.
d PRONOUNCEMENTS WITH LIMITED IMPACT EXPECTED ON CONSOLIDATED FINANCIAL STATEMENTS
d IFRS 10 – Consolidated financial statement, issued by the IASB in May 2011 and applicable for annual periods beginning on or after January 1, 2014.
d IAS 27 revised – Separate financial statements, issued by the IASB in May 2011 and applicable for annual periods beginning on or after January 1, 2014.
d IAS 28 revised – Investments in associates and joint ventures, issued by the IASB in May 2011 and applicable for annual periods beginning on or after January 1, 2014.
d Amendments to IFRS 10, IFRS 12 and IAS 27 – Investment Entities, issued by the IASB in October 2012 and applicable for annual periods beginning on or after January 1, 2014.
d Amendments to IFRS 10, IFRS 11 and IFRS 12 – Transition Guidance, issued by the IASB in June 2012 and applicable, consistent with IFRS 10, IFRS 11 and IFRS 12, for annual periods beginning on or after January 1, 2014.
d Amendments to IAS 32 – Financial instruments: Presentation – Offsetting financial assets and financial liabilities, issued by the IASB in December 2011 and applicable for annual periods beginning on or after January 1, 2014.
d Amendments to IAS 39 – Novation of derivatives and continuation of hedge accounting, issued by the IASB in June 2013 and applicable for annual periods beginning on or after January 1, 2014.
Standards and Interpretations issued but not yet adopted by the European Union at the closing date
d PRONOUNCEMENTS WITH A POTENTIAL IMPACT ON CONSOLIDATED FINANCIAL STATEMENTS
d IFRS 9 – Financial instruments and subsequent amendments, issued by the IASB in November 2009, October 2010 and in December 2011 and applicable for annual periods beginning on or after January 1, 2015.
d PRONOUNCEMENTS WITH LIMITED IMPACT EXPECTED ON CONSOLIDATED FINANCIAL STATEMENTS
d Amendments to IAS 19 – Employee contributions, issued by the IASB in November 2013 and applicable for annual periods beginning on or after July 1, 2014.
d Annual improvements to IFRS 2010-2012 cycle, issued by the IASB in December 2013 and applicable for annuals periods beginning on or after July 1, 2014.
d Annual improvements to IFRS 2011-2013 cycle, issued by the IASB in December 2013 and applicable for annuals periods beginning on or after July 1, 2014.
d IFRIC 21 – Levies, issued by the IASB in May 2013 and applicable for annual periods beginning on or after January 1, 2014.
(1) Ebitda (Earning before interests, taxes, depreciation and amortization) : operating income before capital gains, impairment losses, restructuring and others, before depreciation and amortization of property, plant and equipment and intangible assets.
(2) Net debt: sum of the long-term debt, short-term debt (including current portion of long-term debt), non current and current derivative instruments liabilities less the cash and cash equivalents, current and non current derivative instruments assets.
Lafarge - Registration Document 2013 • F23
NOTES TO THE CONSOLIDATED FINANCIAL STATEMENTS
F
Note 2 Summary of signifi cant accounting policies

NOTE 3 SIGNIFICANT EVENTS OF THE PERIOD
3.1 CREATION OF THE JOINT VENTURE LAFARGE TARMAC
Context of the operationThe Competition Commission in May 2012 approved the proposed joint venture between Lafarge UK and Tarmac Quarry Materials subject to the sale of a portfolio of Tarmac and Lafarge construction materials operations in the United Kingdom.
Those disposals and the completion of the joint venture Lafarge Tarmac occurred on January 7, 2013. This joint venture combines their cement, aggregates, ready-mix concrete, asphalt and asphalt surfacing, maintenance services, and waste services businesses in the United Kingdom.
The creation of the new entity was achieved without exchanging cash.
Accounting treatment of the joint venture creationAs of December 31, 2012, in compliance with IFRS 5, assets and liabilities of Lafarge UK were grouped on the lines “Assets held for sale” and “Liabilities directly associated to assets held for sale” respectively in the consolidated statement of fi nancial position (see Note 3 (Significant events of the period) to the consolidated financial statements as of December 31, 2012).
As of January 7, 2013, in accordance with IAS 27 approach further to the loss of control of Lafarge UK, the accounting treatment of the joint venture creation is as follows:
d disposal of all of Group’s interest previously held in UK Lafarge entities and recognition of the disposal impact in the statement of income;
d acquisition of 50% of Lafarge Tarmac for an amount equal to the fair value of the joint venture Lafarge Tarmac (50%). This joint takeover induces the recognition of a goodwill;
d Lafarge Tarmac whose 50% of voting rights are held by the Group, is consolidated using the proportionate method starting its creation.
Presentation of provisional impactsThe net impact of the joint venture creation and of the disposal of a business portfolio as required by the Competition Commission is a gain of 42 million euros in the consolidated statement of income on the line “Net gains (losses) on disposals”.
Details of the fair value of the net assets of Lafarge UK contributed, provisional net assets acquired (50% of Lafarge Tarmac) and provisional residual goodwill are as follows:
(million euros)
Fair value of the joint venture Lafarge Tarmac (50%) 1,515
Provisional fair value of net assets acquired (50%) 1,156
Provisional goodwill 359
The goodwill is mainly attributable to the market shares and to the expected synergies through improvement of the operational logistical and purchasing effi ciencies and the introduction of value-added products across a wider geographic area, which can’t be separately
recognized. Goodwill will be fi nalized in the fi rst quarter of 2014, immediately after completion of the valuation of cement plants.
The provisional fair value of assets and liabilities arising from the acquisition are as follows at the acquisition date:
(million euros) Fair Value
Intangible assets -
Property, plant and equipment 1,276
Inventories 69
Trade receivables 128
Other assets 81
Cash and cash equivalents 70
Provisions (172)
Debt -
Trade payables (127)
Other liabilities (169)
Non-controlling interests (Minority interests) -
TOTAL NET ASSETS ACQUIRED 1,156
For the year 2013, Lafarge Tarmac contributed revenues of 1,015 million euros, operating income before capital gains, impairment, restructuring and other of -10 million euros and net income (Group share) of -19 million euros to the Group.
The net impact of disposals of business portfolio and of the creation of the joint venture is 112 million euros, net of cash disposed of in the consolidated cash fl ows on the line “Disposals”.
3.2 DISPOSALS
3.2.1 Disposal of Gypsum division operations The Group has presented since September 2011 its Gypsum operations (activities in Middle East and Africa excluded) as discontinued operations as described in the Note 3.2.1 to the notes of the Group consolidated fi nancial statements of the 2012 Registration Document (page F 24). The completion of the divestments occurred in August 2011 for Australia and during the last quarter 2011 for Western Europe, Central and Eastern Europe, Latin America and Asia.
Until the disposal date, in compliance with IFRS 5:
d assets and liabilities of Gypsum operations in North America were respectively grouped on the lines “Assets held for sale” and “Liabilities directly associated to assets held for sale” in the consolidated statement of financial position;
d the depreciation charge on depreciable assets ceased (13 million euros impact for the eight months 2013 and 20 million euros for the year 2012).
On June 24, 2013, the Group signed a contract for the sale of its Gypsum operations in North America to an affi liate of Lone Star investment fund at an enterprise value of 700 million US dollar. This transaction was closed on August 30, 2013.
• Lafarge - Registration Document 2013F24
NOTES TO THE CONSOLIDATED FINANCIAL STATEMENTSFF Note 3 Signifi cant events of the period

The impact of this disposal on the Group’s fi nancial statements is as follows:
d consolidated cash flows on the line “Disposals” : 498 million euros, net of cash disposed;
d consolidated statement of income on the line “Net income from discontinued operations”: 25 million euros for the net gain on disposals after tax.
3.2.2 Disposal of aggregates assets in Georgia (United States)
In February and March 2013, the Group disposed of six aggregates quarries in Georgia (United States). The net impact of this disposal is 115 million euros, net of cash disposed of in the consolidated cash fl ows on the line “Disposals” and 4 million euros for the gain on disposals before tax on the consolidated statement of income on the line “Net gains (losses) on disposals”.
3.2.3 Disposal of Cement operations in UkraineIn September 2013, the Group disposed of its cement assets in Ukraine to the group CRH. The net impact of this disposal is 83 million euros, net of cash disposed of in the consolidated cash fl ows on the line “Disposals” and -21 million euros for the loss on disposals before tax on the consolidated statement of income on the line “Net gains (losses) on disposals”.
3.2.4 Disposal of Cement operations in Honduras
In November 2013, the Group disposed of its cement assets in Honduras to the group Argos. The net impact of this disposal is 144 million euros, net of cash disposed of in the consolidated cash fl ows on the line “Disposals” and 182 million euros for the gain on
disposals before tax on the consolidated statement of income on the line “Net gains (losses) on disposals”.
3.3 CREATION OF A NEW ENTITY IN MEXICO
In July 2013, the Group and Elementia created an entity combining their cement assets in Mexico. The Group brought to the new entity its two plants of Vito and Tula for a total capacity close to one million tonnes, while Elementia contributed the new one million tonnes plant that it is currently building in central Mexico.
The new entity formed is held at 47% by the Group and 53% by Elementia and is recorded under equity method in the Group’s consolidated fi nancial statements. Further to the loss of control, the disposal result is a gain before tax of 106 million euros in the consolidated statement of income on the line “Net gains (losses) on disposals”. The value of the equity investment, which represents 47% of the fair value, amounts to 207 million euros at the date of the creation of the entity.
3.4 CAPITAL INCREASE IN LAFARGE INDIA PRIVATE LIMITED
On July 15, 2013, the Group completed the capital increase of 14 billion Indian Rupees (around 180 million euros) subscribed by Baring Private Equity Asia, and representing a 14% minority stake in its Indian subsidiary, Lafarge India Private Limited. The net impact in equity attributable to owners of the parent company of the Group is 93 million euros.
3.5 ISSUANCE OF BONDS
In September 2013, the Group issued a 750 million euro bond with a seven year maturity and fi xed annual coupon of 4.75% to institutional investors.
NOTE 4 OPERATING SEGMENT INFORMATION
The Group is organized by countries. Countries or group of countries are the Group’s operating segments. For purposes of presentation, six regions corresponding to the aggregation of countries or group of countries are reported (except for North America which is an operating segment):
d Western Europe;
d North America;
d Central and Eastern Europe;
d Middle East and Africa;
d Latin America;
d Asia.
The information presented hereafter by reportable segment is in line with that reported to the Chief Executive Offi cer(1) for the purposes of making decisions about allocating resources to the segment and assessing its performance.
Each operating segment derives its revenues from the following products:
d a wide range of cement and hydraulic binders adapted to the needs of the construction industry;
d aggregates & concrete;
d other products: mainly gypsum.
Group management internally follows the performance of the business based upon:
d revenues by origin of production;
d earning before interests, taxes, depreciation and amortization (Ebitda), defined as the total of operating income before capital gains, impairment losses, restructuring and others, before depreciation and amortization of property, plant and equipment and intangible assets;
d operating income before capital gains, impairment losses, restructuring and others; and
d capital employed, defined as the total of goodwill, intangible assets and property, plant and equipment, investments in associates and working capital.
Group fi nancing, notably treasury process (including fi nancial income and expenses), and income taxes are managed at Group level and are not allocated to segments.
The accounting policies used for segment information indicators comply with those applied for the consolidated fi nancial statements (as described in Note 2).
The Group accounts for intersegment sales and transfers at market prices.
(1) Chief Operating Decision Maker.
Lafarge - Registration Document 2013 • F25
NOTES TO THE CONSOLIDATED FINANCIAL STATEMENTS
F
Note 4 Operating segment information

A) SEGMENT INFORMATION
DECEMBER 31, 2013
(million euros)Western Europe
North America
Central and Eastern Europe
Middle East and
AfricaLatin
America Asia Total
STATEMENT OF INCOME
Gross revenue 3,373 3,137 1,154 4,199 869 2,803
Less: intersegment (117) - (9) (132) - (79)
EXTERNAL REVENUE 3,256 3,137 1,145 4,067 869 2,724 15,198
EBITDA 354 560 201 1,153 240 594 3,102
Depreciation and amortization (267) (155) (89) (306) (38) (172) (1,027)
OPERATING INCOME BEFORE CAPITAL GAINS,
IMPAIRMENT, RESTRUCTURING AND OTHER 87 405 112 847 202 422 2,075
Net gains (losses) on disposals 46 (1) (21) (5) 269 7 295
Other operating income (expenses) (217) (28) (49) (36) 8 (28) (350)
Including impairment on assets
and goodwill (68) (10) (36) - - (11) (125)
OPERATING INCOME (84) 376 42 806 479 401 2,020
OTHER INFORMATION
Capital expenditures 172 119 284 167 61 248 1,051
Capital employed 5,548 4,552 2,660 10,501 1,213 3,611 28,085
STATEMENT OF FINANCIAL POSITION
Segment assets 6,945 5,063 2,863 11,665 1,394 4,681 32,611
Of which investments in associates 141 13 42 209 231 7 643
Unallocated assets (1) 4,464
TOTAL ASSETS 37,075
Segment liabilities 2,273 1,272 250 1,141 180 826 5,942
Unallocated liabilities and equity (2) 31,133
TOTAL EQUITY AND LIABILITIES 37,075
(1) Cash and cash equivalents, deferred tax assets and derivative instruments.
(2) Deferred tax liability, financial debt, derivative instruments and equity.
• Lafarge - Registration Document 2013F26
NOTES TO THE CONSOLIDATED FINANCIAL STATEMENTSFF Note 4 Operating segment information

DECEMBER 31, 2012
(million euros)Western Europe
North America
Central and Eastern Europe
Middle East and
AfricaLatin
America Asia Total
STATEMENT OF INCOME
Gross revenue 3,271 3,375 1,293 4,423 961 2,832
Less: intersegment (90) - (23) (140) - (86)
EXTERNAL REVENUE 3,181 3,375 1,270 4,283 961 2,746 15,816
EBITDA 507 558 256 1,242 296 564 3,423
Depreciation and amortization (191) (198) (81) (329) (40) (171) (1,010)
OPERATING INCOME BEFORE CAPITAL GAINS,
IMPAIRMENT, RESTRUCTURING AND OTHER 316 360 175 913 256 393 2,413
Net gains (losses) on disposals - 10 - 1 - 42 53
Other operating income (expenses) (357) (65) (36) (71) (4) (13) (546)
Including impairment on assets
and goodwill (178) (7) (19) (5) - (3) (212)
OPERATING INCOME (41) 305 139 843 252 422 1,920
OTHER INFORMATION
Capital expenditures 156 112 121 142 72 172 775
Capital employed 4,081 5,060 2,686 11,560 1,332 3,938 28,657
STATEMENT OF FINANCIAL POSITION
Segment assets 5,244 5,632 3,007 12,701 1,550 5,073 33,207
Of which investments in associates 156 20 42 204 40 8 470
Assets held for sale 1,849 431 - - - - 2,280
Unallocated assets (1) 3,977
TOTAL ASSETS 39,464
Segment liabilities 1,956 1,675 359 1,110 217 893 6,210
Liabilities associated with assets held
for sale 348 40 - - - - 388
Unallocated liabilities and equity (2) 32,866
TOTAL EQUITY AND LIABILITIES 39,464
(1) Cash and cash equivalents, deferred tax assets and derivative instruments.
(2) Deferred tax liability, financial debt, derivative instruments and equity.
B) INFORMATION BY PRODUCT LINE
(million euros)
External revenue Gross revenue
December 31, 2013 December 31, 2012 December 31, 2013 December 31, 2012
Cement 9,657 10,373 10,333 11,085
Aggregates & concrete 5,451 5,353 5,469 5,367
Other products 90 90 90 90
Eliminations (694) (726)
TOTAL 15,198 15,816 15,198 15,816
Lafarge - Registration Document 2013 • F27
NOTES TO THE CONSOLIDATED FINANCIAL STATEMENTS
F
Note 4 Operating segment information

C) GEOGRAPHIC AREA INFORMATION
DECEMBER 31, 2013 DECEMBER 31, 2012
(million euros) External revenueNon-current
segment assets (1) External revenueNon-current
segment assets (1)
WESTERN EUROPE 3,256 5,705 3,181 4,231
Of which:
France 1,794 2,322 1,855 2,344
United Kingdom (3) 1,015 1,624 822 -
NORTH AMERICA 3,137 4,196 3,375 4,700
Of which:
United States (2) 1,079 1,149 1,307 1,368
Canada (2) 2,058 796 2,068 894
CENTRAL AND EASTERN EUROPE 1,145 2,547 1,270 2,642
MIDDLE EAST AND AFRICA 4,067 10,384 4,283 11,444
Of which:
Egypt 368 2,137 459 2,491
Algeria 629 3,003 584 3,133
Nigeria 598 1,272 572 1,319
LATIN AMERICA 869 1,188 961 1,310
Of which:
Brazil 608 772 666 905
ASIA 2,724 3,561 2,746 3,939
TOTAL 15,198 27,581 15,816 28,266
(1) Non-current segment assets include goodwill, intangible assets, property, plant and equipment and investments in associates.
(2) Non-current segment assets excluding goodwill.
(3) Increase of non-current segment assets due to the creation of the Lafarge Tarmac joint venture (see Note 3.1).
D) MAJOR CUSTOMERS
The Group has no reliance on any of its customers.
NOTE 5 NET GAINS (LOSSES) ON DISPOSALS
2013
Net gains on disposals amount to 295 million euros and are notably composed of a 182 million euros gain on the sale of the Group’s Cement operations in Honduras, 106 million euros gain further to the loss of control resulting from the contribution of the Group’s Mexican cement assets to the new entity formed with Elementia and 42 million gain upon completion of the Lafarge Tarmac joint venture (see Note 3).
2012
Net gains on disposals amount to 53 million euros and are notably composed of a 40 million euros gain on the sale of most of the Group’s minority position in Lafarge Aso Cement in Japan and 8 million euros on the disposal of cement, Aggregates & Concrete assets in Missouri and in Oklahoma in the United States.
The effect of capital gains and losses on the tax rate is mentioned in the Note 22 (a).
• Lafarge - Registration Document 2013F28
NOTES TO THE CONSOLIDATED FINANCIAL STATEMENTSFF Note 5 Net gains (losses) on disposals

NOTE 6 OTHER OPERATING INCOME (EXPENSES)
Components of other operating income (expenses) are as follows:
YEARS ENDED DECEMBER 31,
(million euros) 2013 2012
Impairment losses on goodwill - (162)
Impairment losses on intangible assets and property, plant and equipment (125) (50)
IMPAIRMENT LOSSES (125) (212)
Restructuring costs (157) (204)
Litigation (6) (5)
Other income 26 14
Other expenses (88) (139)
OTHER OPERATING INCOME (EXPENSES) (350) (546)
2013
Other operating income (expenses) mainly comprises restructuring costs and impairment losses on assets in Western and Eastern Europe for an amount of 282 million euros. Restructuring costs include basically employees’ termination benefi ts and are notably due to the Group’s costs reduction plan in Western Europe. During the period, cash out amounted to 174 million euros.
2012
Other operating income (expenses) mainly comprises impairment losses on goodwill in Greece, depreciation of some assets in Europe and restructuring costs for 204 million euros in various locations. Restructuring costs include mostly employees’ termination benefi ts. They are mainly due to the Group’s costs reduction plans in France and in North America. During the period, cash out amounted to 183 million euros.
NOTE 7 EMISSION RIGHTS
The Group records emission rights of CO2 according to principles
described in Note 2.25.
In 2013, allowances that were allocated to the Group cement plants in the European Union are equivalent to about 17.6 million tonnes of CO
2 emissions.
In 2013, the low level of activity in the European markets combined with our improved performance in kg of CO
2 per tonne of cement has
led to a surplus of allowances. During 2013, the Group sold excess rights over actual emissions for an amount of 14.4 million euros (99 million euros in 2012).
For the year 2014, based on our estimate of allowances to be received and based on our current production forecasts, which may evolve in case of market trends different from those expected as at today, the allowances granted should exceed the needs of the Group on a consolidated basis.
Lafarge - Registration Document 2013 • F29
NOTES TO THE CONSOLIDATED FINANCIAL STATEMENTS
F
Note 7 Emission rights

NOTE 8 FINANCIAL (EXPENSES) INCOME
Components of fi nancial (expenses) income are as follows:
YEARS ENDED DECEMBER 31,
(million euros) 2013 2012
Interest expense (929) (1,000)
Net interest pension costs (63) (64)
Foreign currency exchange losses (88) (67)
Other financial expenses (97) (124)
FINANCIAL EXPENSES (1,177) (1,255)
Interest income 95 111
Dividends received from investments 2 2
Foreign currency exchange gains 36 44
Other financial income 3 3
FINANCIAL INCOME 136 160
NET FINANCIAL INCOME (EXPENSES) (1,041) (1,095)
Interest expense net of interest income and capitalized interest costs, amounts to 834 million euros as at December 31, 2013 (889 million euros as at December 31, 2012), which represents a decrease of 6%. This variation is mainly explained by:
d a decrease in average net indebtedness of 863 million euros in 2013 compared to 2012;
d an average interest rate on our gross debt of 6.2% in 2013, as compared to 6.2% in 2012 (7.4% in 2013 and 7.2% in 2012 on our net debt);
d capitalized interest costs for construction projects of 25 million euros in 2013 compared to 9 million euros for 2012.
The amount of foreign currency exchange gains and losses depends on the exchange risk exposure of loans and debts denominated in currencies different from the functional currencies of the c ompany that carries this loan and/or this debt. These exchange differences mainly relate to amounts denominated in US dollars.
NOTE 9 EARNINGS PER SHARE
The computation and reconciliation of basic and diluted earnings per share for the years ended December 31, 2013 and 2012 are as follows:
YEARS ENDED DECEMBER 31,
2013 2012
NUMERATOR (million euros)
NET INCOME – ATTRIBUTABLE TO THE OWNERS OF THE PARENT COMPANY 601 365
Out of which net income from continuing operations 555 349
DENOMINATOR (in thousands of shares)
WEIGHTED AVERAGE NUMBER OF SHARES OUTSTANDING 287,268 287,079
Total potential dilutive shares 1,964 1,183
Weighted average number of shares outstanding – fully diluted 289,232 288,262
BASIC EARNINGS PER SHARE (euros) 2.09 1.27
DILUTED EARNINGS PER SHARE (euros) 2.08 1.27
BASIC EARNINGS PER SHARE FROM CONTINUING OPERATIONS (euros) 1.93 1.21
DILUTED EARNINGS PER SHARE FROM CONTINUING OPERATIONS (euros) 1.92 1.21
For purposes of computing diluted earnings per share, stock options which would have an antidilutive effect on the calculation of the diluted earnings per share are excluded from the calculation.
In 2013, 4.9 million stock options were excluded from the diluted earnings per share calculation (7.0 million in 2012).
• Lafarge - Registration Document 2013F30
NOTES TO THE CONSOLIDATED FINANCIAL STATEMENTSFF Note 8 Financial (expenses) income

NOTE 10 GOODWILL
A) CHANGES IN GOODWILL
The following table displays the changes in the carrying amount of goodwill by operating segment:
(million euros)Western Europe
North America
Central and Eastern Europe
Middle East and
AfricaLatin
America Asia Total
GOODWILL AT DECEMBER 31, 2011 1,886 2,557 847 5,815 643 953 12,701
Gross amount 2,093 2,557 847 5,923 643 1,017 13,080
Accumulated impairment (207) - - (108) - (64) (379)
NET CARRYING AMOUNT AT JANUARY 1, 2012 1,886 2,557 847 5,815 643 953 12,701
Additions 5 9 - 3 - - 17
Disposals - (86) - - - - (86)
Impairment losses (160) - (2) - - - (162)
Change in goodwill related to put options
on shares of subsidiaries and other 1 - 5 - - (3) 3
Translation adjustments - (41) 4 (170) (60) 4 (263)
Other movements 4 (2) (38) 9 - 1 (26)
GOODWILL AT DECEMBER 31, 2012 1,736 2,437 816 5,657 583 955 12,184
Gross amount 2,104 2,437 818 5,763 583 1,022 12,727
Accumulated impairment (368) - (2) (106) - (67) (543)
NET CARRYING AMOUNT AT JANUARY 1, 2013 1,736 2,437 816 5,657 583 955 12,184
Additions 361 - - 5 - - 366
Disposals - (72) (42) - (30) - (144)
Translation adjustments (11) (114) (17) (445) (89) (118) (794)
GOODWILL AT DECEMBER 31, 2013 2,086 2,251 757 5,217 464 837 11,612
Gross amount 2,454 2,251 759 5,323 464 904 12,155
Accumulated impairment (368) - (2) (106) - (67) (543)
NET CARRYING AMOUNT AT DECEMBER 31, 2013 2,086 2,251 757 5,217 464 837 11,612
B) ACQUISITIONS AND DISPOSALS
2013
Acquisitions
d CREATION OF THE JOINT VENTURE LAFARGE TARMAC
The creation of the joint venture Lafarge Tarmac occurred on January 7, 2013. A provisional allocation of the share of the fair value (50%) was completed and will be fi nalized during the fi rst quarter of 2014 (see Note 3):
d the provisional fair value of net assets acquired (50%) amounts to 1,156 million euros;
d the provisional residual goodwill arising from this operation amounts to 359 million euros.
DisposalsChanges in goodwill related to disposals made in 2013 (see Note 3) mainly concern:
d the share of goodwill allocated to the CGU a ggregates & c oncrete North America affected by the disposal of aggregates assets in Georgia in the United States;
d the goodwill of cement CGUs in Ukraine, Mexico and Honduras.
2012
AcquisitionsNo signifi cant acquisition occurred in 2012.
DisposalsChanges in goodwill related to disposals made in 2012 are mainly related to the share of goodwill allocated to CGUs of the cement and a ggregates & c oncrete assets affected by the disposal of our operations in the Missouri and Oklahoma (United States).
C) IMPAIRMENT TEST FOR GOODWILL
The Group’s methodology to test its goodwill for impairment is described in Note 2.12.
Lafarge - Registration Document 2013 • F31
NOTES TO THE CONSOLIDATED FINANCIAL STATEMENTS
F
Note 10 Goodwill

Key assumptionsThe evolution of the economic and fi nancial, political and competitive context in the different countries may have an impact on the evaluation of recoverable amounts. Especially, key assumptions are the following:
d the market size, driven by expenditures in the residential and commercial construction sectors and for infrastructure in each country;
d the evolution of the products portfolio in association with the Group’s innovation program;
d the market share of the Group and the level of prices based especially on supply – demand balance on the market;
d the costs evolution factors and mainly the evolution of energy costs;
d the country specific discount rate based on the weighted average cost of capital;
d the country specific perpetual growth rate.
These parameters are based on:
d a 10-year period plan established during the last quarter of the year in line with the budget exercise and approved by the heads
of operating and functional matters, which details operating assumptions described above, based on the last trends known. Cash flows for the stabilized year are equal to or lower than the cash flows of the 10th year of the business plan;
d a country specific discount rate, which includes a country risk premium factoring political and economical risks of the country and takes into account if needed specific situations such as in some countries in Europe or the Middle East;
d a perpetual growth rate reflecting the long-term market trends in the construction segment in which the Group operates.
For Syria and Egypt, or Euro zone countries hit by the economic crisis such as Greece and Spain, the operating assumptions and discount rates used have been determined based on the specifi c country environment. These forecasts do not refl ect any major disruption of the economical or geopolitical environment.
As described in Note 2.12, in performing the fi rst step of the impairment test, the Group uses a multiple of Ebitda from 8.0 to 12.6 (7.6 to 12.5 in 2012) according to the corresponding activity.
When the Group determines the value in use of CGUs or groups of CGUs based on estimated discounted cash-fl ows (second step of the impairment test as described in Note 2.12), the discount rates and perpetual growth rates are included in the following segments as follow for the main regions where the Group operates:
Discount rate Perpetual growth rate
2013 2012 2013 2012
Western Europe [8.0%-10.0%] [7.0%-11.0%] 2.0% 2.0%
Central and Eastern Europe [7.4%-9.0%] 8.0% 2.0% 2.0%
North America 7.2% 7.3% 1.4% 1.4%
Middle East and Africa [8.0%-14.0%] [8.6%-14.0%] 3.0% 3.0%
Asia 8.5% [8.1%-12.4%] 3.0% [2.0%-3.0%]
D iscount rates are post-tax rates that are applied to post-tax cash fl ows. The use of these rates results in recoverable values that are identical to the ones that would have been obtained by using pre-tax rates applied to pre-tax cash fl ows.
The discount rates and perpetual growth rates are based on infl ation assumptions in Euro-Zone or US Dollar-zone (“hard currency”). Therefore, the cash fl ows used for the calculation of the value in use are performed in local currency and then, are translated in “hard currency” taking into account the devaluation all along the business plan’s length equal to the differential of infl ation between local currency and “hard currency”.
• Lafarge - Registration Document 2013F32
NOTES TO THE CONSOLIDATED FINANCIAL STATEMENTSFF Note 10 Goodwill

Main goodwillCGUs generally correspond to one of the two activities in a country. The key assumptions used for the valuation of the main CGUs or groups of CGUs, covering about 50% of total Group goodwill together with the carrying amount of corresponding goodwill are detailed as follows:
Main CGUs
AT DECEMBER 31,
2013 2012
Cash Generating Units
Carrying value of goodwill
(million euros) Discount ratePerpetual
growth rate
Carrying value of goodwill
(million euros) Discount ratePerpetual
growth rate
Cement Algeria 1,455 8.5% 3.0% 1,507 8.6% 3.0%
Cement North America 1,355 7.2% 1.4% 1,421 7.3% 1.4%
Cement Egypt 1,109 11.5% (1) 3.0 % 1,271 10.4% 3.0%
Aggregates & concrete North America 895 (2) n/a 1,016 (2) n/a
Cement Iraq 731 9.6% 3.0% 763 9.6% 3.0%
(1) Equivalent to 14.5% in local currency.
(2) In 2013 and 2012, the a ggregates & c oncrete North America CGU was estimated based on an Ebitda multiple of 12.6 and 12.5 respectively.
In 2012, following the new country-based organization implemented, the goodwill of the Middle East and Africa region (1,130 million euros as at December 31, 2011) has been reallocated to the CGUs/groups of CGUs of this region as at January 1, 2012 mainly: Cement Nigeria (500 million euros), Cement Morocco (130 million euros), Cement Algeria (100 million euros), Cement Iraq (100 million euros) and 180 million euros to the CGUs Cement of Kenya, Uganda and Tanzania.
The other CGUs or groups of CGUs do not represent amounts which individually don’t exceed more than 5% of total Group goodwill.
Sensitivity of recoverable amountsThe Group analyzed the sensitivities of the recoverable amounts to a reasonable possible change of a key assumption (notably to a change of one point in the discount rate and the perpetual growth rate). These analyses did not show a situation in which the carrying value of the main CGUs would exceed their recoverable amount, with the exception of the six CGUs referred to below.
For these six CGUs, the sensitivity of the recoverable amount to an independent change of one point in either the discount rate or the perpetual growth rate was as follows as at December 31, 2013:
Cash Generating Units(million euros)
Excess of estimated recoverable amount over carrying value
Group’s share
Sensitivity of the recoverable amount to one point increase/decrease in the
Discount rate Perpetual growth rate
+1 PT -1 PT +1 PT -1 PT
Cement Egypt 85 (180) 226 109 (87)
Cement Spain 86 (139) 193 112 (80)
Cement Greece 61 (93) 120 62 (49)
Cement Iraq 84 (161) 218 125 (93)
Cement Jordan 20 (25) 33 19 (14)
Cement Syria 23 (23) 27 9 (7)
For these six CGUs, the sensitivity estimated by the Group of the recoverable amount to reasonable changes of key assumptions included in 10-year period plans is refl ected by the sensitivity to the discount rate presented above, especially:
d assumptions related to the market size and the date and rhythm of recovery notably in Euro zone countries;
d assumptions for prices evolution and costs reductions.
Impairment losses
d 2013
No impairment loss occurred in 2013.
d 2012
In 2012, the Group recorded an impairment loss of 160 million euros for the goodwill of the CGU Cement Greece, based on the value in use of this CGU which takes into account the deterioration of the economic environment in Greece leading to a drop in demand. After this impairment loss the residual goodwill of the CGU Cement Greece amounts to 312 million euros.
Lafarge - Registration Document 2013 • F33
NOTES TO THE CONSOLIDATED FINANCIAL STATEMENTS
F
Note 10 Goodwill

NOTE 11 INTANGIBLE ASSETS
(million euros) 2013 2012
CARRYING AMOUNT AT JANUARY 1, 620 652
Additions 72 51
Disposals - (4)
Amortization (82) (81)
Impairment losses (16) -
Changes in scope and other changes 10 2
Translation adjustments (30) -
CARRYING AMOUNT AT DECEMBER 31, 574 620
For the years presented, no reversal of impairment charges has been recorded.
The following table presents details of intangible assets:
AT DECEMBER 31,
2013 2012
(million euros) Cost
Accumulated amortization and
impairment Carrying value Cost
Accumulated amortization and
impairment Carrying value
Software 511 391 120 492 365 127
Real estate development rights 44 30 14 89 61 28
Mineral rights 132 27 105 183 47 136
Other intangible assets 532 197 335 430 101 329
TOTAL INTANGIBLE ASSETS 1,219 645 574 1,194 574 620
For the years presented, “Other intangible assets” include only assets with fi nite useful lives.
In 2013, the overall Group’s expenditure for products innovation and industrial process improvement were 114 million euros, compared to 116 million euros in 2012. The portion of this expenditure that was expensed as incurred was 77 million euros in 2013 (103 million euros in 2012).
• Lafarge - Registration Document 2013F34
NOTES TO THE CONSOLIDATED FINANCIAL STATEMENTSFF Note 11 Intangible assets

NOTE 12 PROPERTY, PLANT AND EQUIPMENT
A) CHANGES IN PROPERTY, PLANT AND EQUIPMENT
(million euros)
Mineral reserves and land Buildings
Machinery, equipment,
fixtures and fittings
Construction in progress
Investment subsidies Total
Gross value 1,835 3,877 18,197 1,582 (61) 25,429
Accumulated depreciation (409) (1,708) (7,761) (10) (9,887)
CARRYING AMOUNT AT JANUARY 1, 2012 1,426 2,169 10,436 1,572 (61) 15,542
Additions 24 11 91 746 (7) 865
Disposals (6) - (16) (24) 1 (45)
Other changes in scope 35 (12) (194) 25 - (146)
Depreciation (28) (159) (745) (1) 4 (929)
Impairment losses (5) (3) (42) - - (50)
Other changes 27 10 800 (846) - (9)
Translation adjustments (5) (18) (199) (14) - (236)
CARRYING AMOUNT AT DECEMBER 31, 2012 1,468 1,998 10,131 1,458 (63) 14,992
Gross value 1,904 3,788 18,130 1,467 (63) 25,226
Accumulated depreciation (436) (1,790) (7,999) (9) (10,234)
CARRYING AMOUNT AT JANUARY 1, 2013 1,468 1,998 10,131 1,458 (63) 14,992
Additions 31 12 83 736 (7) 855
Disposals (27) (6) (119) (2) 1 (153)
Other changes in scope 389 (41) 757 16 - 1,121
Depreciation (50) (144) (754) - 3 (945)
Impairment losses (21) (27) (40) (21) - (109)
Other changes 58 113 400 (568) - 3
Translation adjustments (87) (114) (695) (118) 2 (1,012)
CARRYING AMOUNT AT DECEMBER 31, 2013 1,761 1,791 9,763 1,501 (64) 14,752
Gross value 2,287 3,626 17,990 1,532 (64) 25,371
Accumulated depreciation (526) (1,835) (8,227) (31) (10,619)
2013“Other changes in scope” primarily include the opening balance sheet of the Lafarge Tarmac joint venture (United Kingdom) set up on January 7, 2013.
2012“Other changes in scope” are mainly related to the disposal of the cement and Aggregates & Concrete assets in the Missouri and Oklahoma (United States).
B) FINANCE LEASE
The cost of property, plant and equipment includes 100 million euros and 115 million euros of assets under finance leases at December 31, 2013, and 2012, respectively. The remaining obligations on such assets amount to 33 million euros and 38 million euros at December 31, 2013, and 2012, respectively.
Lafarge - Registration Document 2013 • F35
NOTES TO THE CONSOLIDATED FINANCIAL STATEMENTS
F
Note 12 Property, plant and equipment

NOTE 13 INVESTMENTS IN ASSOCIATES
Investments in associates (see Note 35), presented below, are not listed on a stock exchange and therefore do not have a public quote. Their reporting date is in line with that of the Group.
A) CHANGES IN INVESTMENT IN ASSOCIATES
(million euros) 2013 2012
AT JANUARY 1, 470 604
Share of net income (loss) of associates 19 5
Dividends received from associates (10) (10)
Acquisitions or share capital increases 207 3
Disposals and reduction in ownership percentage (1) - (129)
Other changes (43) (3)
AT DECEMBER 31, 643 470
(1) In 2012 mainly corresponds to the disposal of our participation in Japan and to the decrease of our ownership percentage in Al Safwa (Saudi Arabia) .
Main events
d MEXICO
In July 2013, the Group and Elementia have created an entity combining their cement assets in Mexico. The new entity formed is held at 47% by the Group and is recorded under equity method in the Group’s consolidated fi nancial statements. The value of the equity investment, which represents 47% of the fair value, amounts to 207 million euros at the date of the creation of the entity.
d SINIAT GROUP
Following the disposal to Etex Group of the European and South American Gypsum operations, the Group retains a 20% interest in the partnerships, which combines the European and South American Gypsum activities of both groups and is accounted under equity method for 145 million euros as of December 31, 2013 and 163 million euros as of December 31, 2012 (see Note 34).
d AL SAFWA CEMENT COMPANY
In Saudi Arabia, the Group exercises a signifi cant infl uence over the Al Safwa Cement Company in 2011, which is accounted under equity method for 110 million euros as of December 31, 2013 and 2012 further to the entrance of two new Saudi fi nancial partners leading to a decrease in percentage owned from 50% to 25% in February 2012.
Information relating to the statement of incomeThe following table details the Group’s share of the operations of associates:
YEARS ENDED DECEMBER 31,
(million euros) 2013 2012
Operating income before capital gains, impairment, restructuring and other 48 38
Net gain (losses) on disposals - (1)
Other operating income (expenses), net (9) -
Financial income (expenses) (18) (26)
Income tax (2) (6)
SHARE OF NET INCOME (LOSS) FROM ASSOCIATES 19 5
• Lafarge - Registration Document 2013F36
NOTES TO THE CONSOLIDATED FINANCIAL STATEMENTSFF Note 13 Investments in associates

B) SUMMARIZED COMBINED STATEMENT OF FINANCIAL POSITION AND STATEMENT OF INCOME INFORMATION OF ASSOCIATES
Combined statement of fi nancial position information at 100%
AT DECEMBER 31,
(million euros) 2013 2012
Non-current assets 2,927 2,555
Current assets 798 672
TOTAL ASSETS 3,725 3,227
Total equity 1,620 1,274
Non-current liabilities 1,473 1,371
Current liabilities 632 582
TOTAL EQUITY AND LIABILITIES 3,725 3,227
Combined statement of income information at 100%
YEARS ENDED DECEMBER 31,
(million euros) 2013 2012
Revenue 1,564 1,605
Operating income before capital gains, impairment, restructuring and other 163 136
Operating income 121 134
Net income 52 29
NOTE 14 JOINT VENTURES
The Group has several interests in joint ventures (see Note 35).
As of December 31, 2013, the joint ventures mainly relate to:
d Lafarge Tarmac Holdings Ltd., the joint venture between Lafarge UK and Tarmac Quarry Materials created on January 7, 2013, in which the Group has a 50% share (see Note 3);
d Lafarge Emirates Cement LLC, owned at 50% in the United Arab Emirates;
d several joint ventures in Morocco for the c ement and a ggregates & c oncrete activities, owned at 35%;
d several joint ventures in China;
d other joint ventures in the Middle East for the a ggregates & c oncrete activity and in Bangladesh for the c ement activity.
Lafarge Shui On China is 55% owned by Lafarge. It comprises the Chinese operations mainly in the Provinces of Sichuan, Yunnan, Guizhou and Chongqing. In 2013, Lafarge exercised its right to terminate the exit plan that was previously granted to our partner Shui On pursuant to an agreement signed on December 31, 2012. The Group still exercises a joint control on Lafarge Shui On China, which is accounted under the proportionate consolidation method as of December 31, 2013.
The following amounts are included in the Group’s fi nancial statements as a result of the proportionate consolidation of joint ventures:
IMPACT ON THE CONSOLIDATED STATEMENT OF FINANCIAL POSITION
AT DECEMBER 31,
(million euros) 2013 2012
Non-current assets 2,933 2,081
Current assets 943 557
Non-current liabilities 398 345
Current liabilities 1,193 919
Lafarge - Registration Document 2013 • F37
NOTES TO THE CONSOLIDATED FINANCIAL STATEMENTS
F
Note 14 Joint ventures
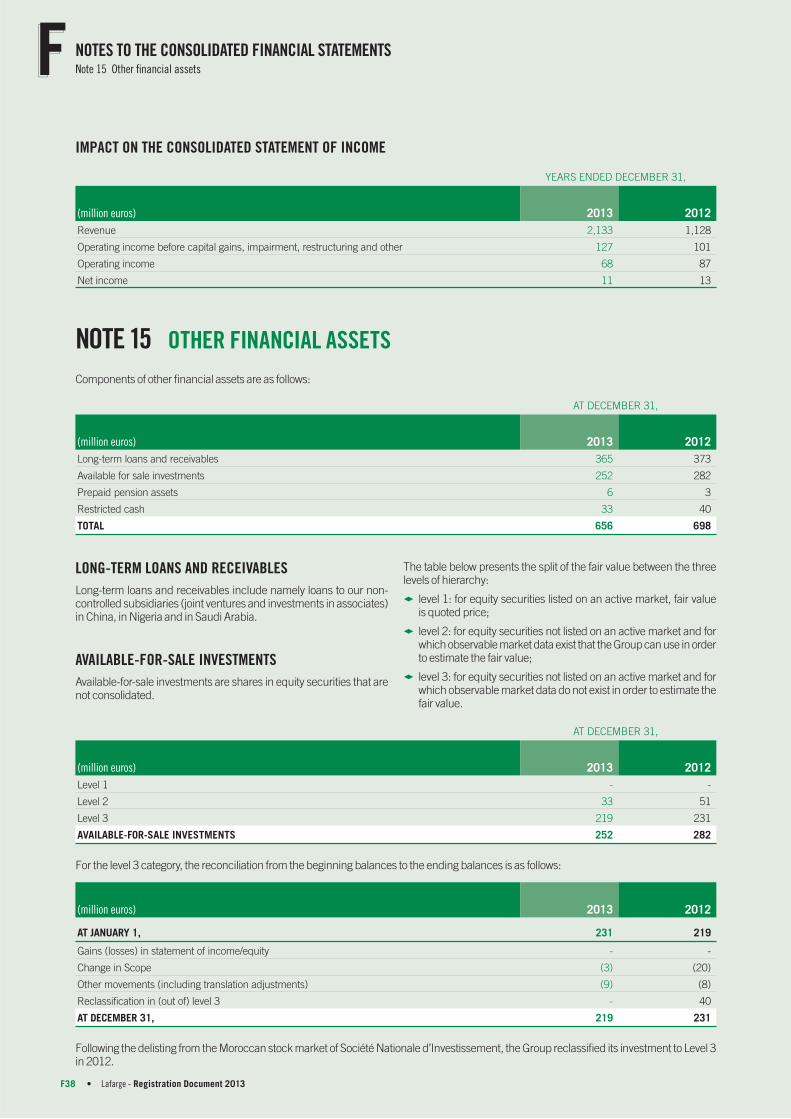
IMPACT ON THE CONSOLIDATED STATEMENT OF INCOME
YEARS ENDED DECEMBER 31,
(million euros) 2013 2012
Revenue 2,133 1,128
Operating income before capital gains, impairment, restructuring and other 127 101
Operating income 68 87
Net income 11 13
NOTE 15 OTHER FINANCIAL ASSETS
Components of other fi nancial assets are as follows:
AT DECEMBER 31,
(million euros) 2013 2012
Long-term loans and receivables 365 373
Available for sale investments 252 282
Prepaid pension assets 6 3
Restricted cash 33 40
TOTAL 656 698
LONG-TERM LOANS AND RECEIVABLES
Long-term loans and receivables include namely loans to our non-controlled subsidiaries (joint ventures and investments in associates) in China, in Nigeria and in Saudi Arabia.
AVAILABLE-FOR-SALE INVESTMENTS
Available-for-sale investments are shares in equity securities that are not consolidated.
The table below presents the split of the fair value between the three levels of hierarchy:
d level 1: for equity securities listed on an active market, fair value is quoted price;
d level 2: for equity securities not listed on an active market and for which observable market data exist that the Group can use in order to estimate the fair value;
d level 3: for equity securities not listed on an active market and for which observable market data do not exist in order to estimate the fair value.
AT DECEMBER 31,
(million euros) 2013 2012
Level 1 - -
Level 2 33 51
Level 3 219 231
AVAILABLE-FOR-SALE INVESTMENTS 252 282
For the level 3 category, the reconciliation from the beginning balances to the ending balances is as follows:
(million euros) 2013 2012
AT JANUARY 1, 231 219
Gains (losses) in statement of income/equity - -
Change in Scope (3) (20)
Other movements (including translation adjustments) (9) (8)
Reclassification in (out of) level 3 - 40
AT DECEMBER 31, 219 231
Following the delisting from the Moroccan stock market of Société Nationale d’Investissement, the Group reclassifi ed its investment to Level 3 in 2012.
• Lafarge - Registration Document 2013F38
NOTES TO THE CONSOLIDATED FINANCIAL STATEMENTSFF Note 15 Other fi nancial assets

NOTE 16 INVENTORIES
Components of inventories are as follows:
AT DECEMBER 31,
(million euros) 2013 2012
Raw materials 444 449
Work-in-progress 14 8
Finished and semi-finished goods 721 739
Maintenance and operating supplies 606 640
INVENTORIES GROSS VALUE 1,785 1,836
Depreciation (164) (174)
INVENTORIES 1,621 1,662
The depreciation primarily relates to maintenance and operating supplies for 112 million euros and 111 million euros at December 31, 2013 and 2012, respectively.
The change in the inventories is as follows:
(million euros) 2013 2012
AT JANUARY 1, 1,662 1,531
Movement of the year 46 183
Scope effects and other changes 27 (24)
Translation adjustments (114) (28)
AT DECEMBER 31, 1,621 1,662
NOTE 17 TRADE RECEIVABLES
Components of trade receivables are as follows:
AT DECEMBER 31,
(million euros) 2013 2012
Gross trade receivables and advances on trade payables 2,213 2,042
Valuation allowance (284) (280)
TRADE RECEIVABLES 1,929 1,762
The change in the valuation allowance for doubtful receivables is as follows:
(million euros) 2013 2012
AT JANUARY 1, (280) (233)
Current year addition (1) (33) (84)
Current year release 10 27
Cancellation 16 10
Scope and other changes (5) -
Translation adjustments 8 -
AT DECEMBER 31, (284) (280)
(1) Out of which 42 million euros related to receivables in Greece in 2012.
Lafarge - Registration Document 2013 • F39
NOTES TO THE CONSOLIDATED FINANCIAL STATEMENTS
F
Note 17 Trade receivables

SECURITIZATION PROGRAMS
The Group entered into multi-year securitization agreements, with
respect to trade receivables:
d the first one implemented in France in January 2000 for c ement
activity, renewed twice, has been extended to a ggregates & c oncrete
activity since September 2009. This is a five-year program from
June 2010;
d the second one implemented in September 2009 in North America
(United States and Canada) for a three-year period; this program
was renewed in 2012 for a two-year period;
d the last one implemented in March 2010 both in Spain and the
United Kingdom, also for a 5-year period, for some of the c ement,
a ggregates & c oncrete activities of these two countries. This program
was terminated and repaid early in December 2012.
Under these programs, some of the French and North American
subsidiaries agree to sell, on a revolving basis, some of their accounts
receivables. Under the terms of the arrangements, the subsidiaries
involved in these programs do not maintain control over the assets sold and there is neither entitlement nor obligation to repurchase the sold receivables. In these agreements, the purchaser of the receivables, in order to secure his risk, only fi nances a part of the acquired receivables as it is usually the case for similar commercial transactions. As risks and benefi ts cannot be considered as being all transferred, these programs do not qualify for derecognition of receivables, and are therefore accounted for as secured fi nancing.
Trade receivables therefore include sold receivables totalling 358 million euros and 371 million euros at December 31, 2013 and 2012, respectively.
The current portion of debt related to these programs includes 282 million euros and 300 million euros at December 31, 2013 and 2012, respectively.
The French securitization agreement is guaranteed by subordinated deposits and units totalling 76 million euros at December 31, 2013 (71 million euros at December 31, 2012).
NOTE 18 OTHER RECEIVABLES
Components of other receivables are as follows:
AT DECEMBER 31,
(million euros) 2013 2012
Taxes 285 314
Prepaid expenses 131 131
Interest receivables 18 27
Other current receivables 390 347
OTHER RECEIVABLES 824 819
Current portion 797 779
Non current portion 27 40
In 2013, “Other current receivables” mainly include:
d the receivables on disposals of assets and advances paid to suppliers for an amount of 29 million euros (50 million euros at December 31, 2012);
d the receivables from the employees for 15 million euros (15 million euros at December 31, 2012).
NOTE 19 CASH AND CASH EQUIVALENTS
Cash and cash equivalents, amounting to 3,346 million euros at December 31, 2013 (2,733 million euros at December 31, 2012), include cash equivalents totalling 1,389 million euros at
December 31, 2013 (670 million euros at December 31, 2012) which are mainly time deposits.
• Lafarge - Registration Document 2013F40
NOTES TO THE CONSOLIDATED FINANCIAL STATEMENTSFF Note 18 Other receivables

NOTE 20 EQUITY
A) COMMON STOCK
At December 31, 2013, Lafarge common stock consisted of 287,365,397 shares with a nominal value of 4 euros per share.
At December 31, 2013, the total number of theoretical voting rights attributable to the shares is 402,435,045 after inclusion of the double voting rights attached to registered shares held for at least two years in the name of the same shareholders.
B) CAPITAL INCREASE AND DECREASE
In 2013, the capital increase amounting to 3 million euros resulted from the exercise of stock options (see Note 21). There was no capital decrease.
In 2012, except for the exercise of stock options there was no capital increase, and there was no capital decrease.
C) DIVIDENDS
The following table indicates the dividend amount per share that the Group paid for the year 2012 as well as the dividend amount per share for 2013 proposed by our Board of Directors for approval at the Annual General Meeting of Shareholders to be held on May 7, 2014. Dividends on fully paid-up shares that have been held by the same shareholders in registered form for at least two years are increased by 10% over dividends paid on other shares. The number of shares eligible for this increased dividend for a shareholder is limited to 0.5% of all outstanding shares at the end of the fi nancial year for which the dividend is paid.
(euros, unless otherwise indicated) 2013 2012
Total dividend (million) 289 (3) 289
Base dividend per share 1. 00 (1) 1.00
Increased dividend per share (2) 1. 10 (1) 1.10
(1) Proposed dividend. As this dividend is subject to approval by shareholders at the Annual General Meeting, it has not been included as a liability in these financial
statements as of December 31, 2013.
(2) See Section 6.2.5 (Articles of Association (Statuts) – Rights, preferences and restrictions attached to shares) for an explanation of our “Loyalty dividend”.
(3) Based on an estimation of the number of shares eligible for dividends of 287,347,462 shares.
D) TRANSACTIONS ON TREASURY SHARES
In 2013, the treasury shares decreased by 139,348 shares related to the performance stock plans which were vested and delivered to the employees (vs 76,165 shares in 2012).
E) OTHER COMPREHENSIVE INCOME NET OF INCOME TAX – PART ATTRIBUTABLE TO THE OWNERS OF THE PARENT COMPANY
The roll forward of other comprehensive income, net of income tax, for the part attributable to the owners of the parent company, is as follows:
January 1, 2012
Gains/(losses) arising
during the year
Recycling to income statement
December 31, 2012
Gains/(losses) arising
during the year
Recycling to income statement
December 31, 2013
Available-for-sale financial assets 21 - - 21 (14) - 7
Gross value 31 - - 31 (14) - 17
Deferred taxes (10) - - (10) - - (10)
Cash flow hedge instruments (29) - 2 (27) 3 4 (20)
Gross value (41) - 4 (37) 3 5 (29)
Deferred taxes 12 - (2) 10 - (1) 9
Actuarial gains/(losses) (743) (176) - (919) 47 - (872)
Gross value (1,070) (240) - (1,310) 121 - (1,189)
Deferred taxes 327 64 - 391 (74) - 317
TOTAL OTHER RESERVES (751) (176) 2 (925) 36 4 (885)
TOTAL FOREIGN CURRENCY
TRANSLATION ADJUSTMENTS (280) (430) (9) (719) (1,623) 54 (2,288)
TOTAL OTHER COMPREHENSIVE
INCOME (LOSS), NET OF INCOME TAX (1,031) (606) (7) (1,644) (1,587) 58 (3,173)
Lafarge - Registration Document 2013 • F41
NOTES TO THE CONSOLIDATED FINANCIAL STATEMENTS
F
Note 20 Equity
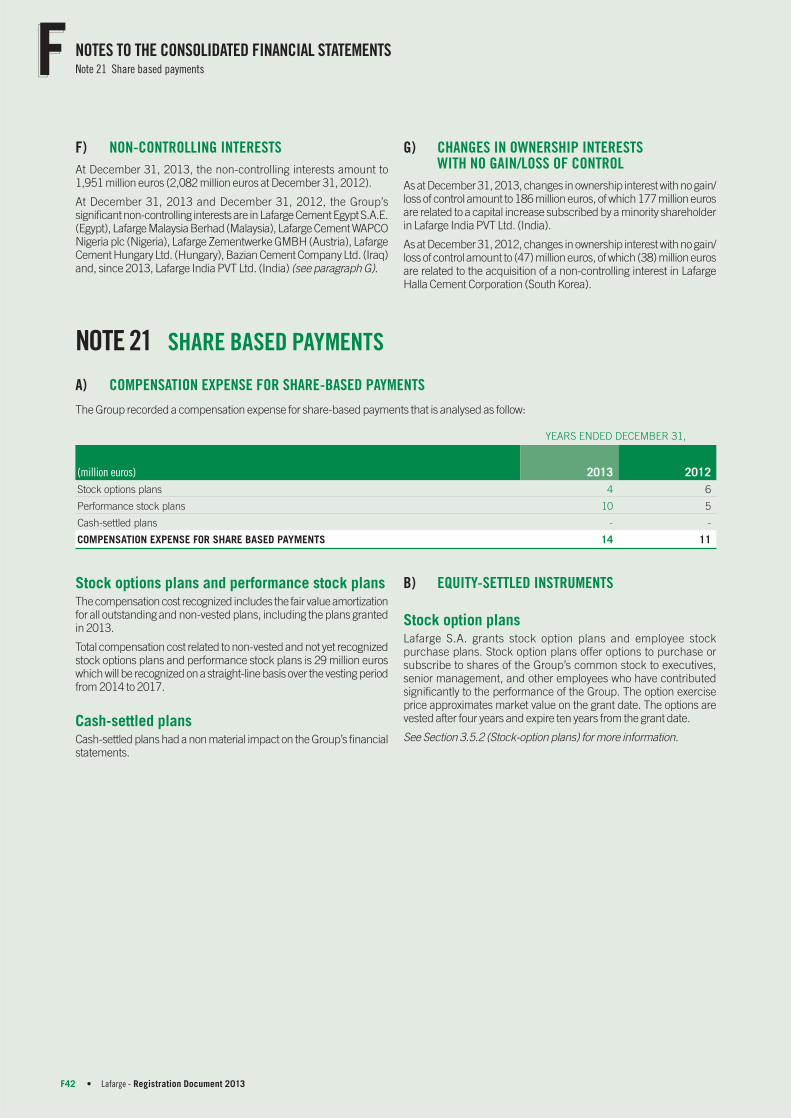
F) NON-CONTROLLING INTERESTS
At December 31, 2013, the non-controlling interests amount to 1,951 million euros (2,082 million euros at December 31, 2012).
At December 31, 2013 and December 31, 2012, the Group’s signifi cant non-controlling interests are in Lafarge Cement Egypt S.A.E. (Egypt), Lafarge Malaysia Berhad (Malaysia), Lafarge Cement WAPCO Nigeria plc (Nigeria), Lafarge Zementwerke GMBH (Austria), Lafarge Cement Hungary Ltd. (Hungary), Bazian Cement Company Ltd. (Iraq) and, since 2013, Lafarge India PVT Ltd. (India) (see paragraph G).
G) CHANGES IN OWNERSHIP INTERESTS WITH NO GAIN/LOSS OF CONTROL
As at December 31, 2013, changes in ownership interest with no gain/loss of control amount to 186 million euros, of which 177 million euros are related to a capital increase subscribed by a minority shareholder in Lafarge India PVT Ltd. (India).
As at December 31, 2012, changes in ownership interest with no gain/loss of control amount to ( 47) million euros, of which ( 38) million euros are related to the acquisition of a non-controlling interest in Lafarge Halla Cement Corporation (South Korea).
NOTE 21 SHARE BASED PAYMENTS
A) COMPENSATION EXPENSE FOR SHARE-BASED PAYMENTS
The Group recorded a compensation expense for share -based payments that is analysed as follow:
YEARS ENDED DECEMBER 31,
(million euros) 2013 2012
S tock options plans 4 6
Performance stock plans 10 5
Cash-settled plans - -
COMPENSATION EXPENSE FOR SHARE BASED PAYMENTS 14 11
S tock options plans and performance stock plansThe compensation cost recognized includes the fair value amortization for all outstanding and non-vested plans, including the plans granted in 2013.
Total compensation cost related to non-vested and not yet recognized stock options plans and performance stock plans is 29 million euros which will be recognized on a straight-line basis over the vesting period from 2014 to 2017.
Cash-settled plansCash-settled plans had a non material impact on the Group’s fi nancial statements.
B) EQUITY-SETTLED INSTRUMENTS
Stock option plansLafarge S.A. grants stock option plans and employee stock purchase plans. Stock option plans offer options to purchase or subscribe to shares of the Group’s common stock to executives, senior management, and other employees who have contributed signifi cantly to the performance of the Group. The option exercise price approximates market value on the grant date. The options are vested after four years and expire ten years from the grant date.
See Section 3.5.2 (Stock-option plans) for more information.
• Lafarge - Registration Document 2013F42
NOTES TO THE CONSOLIDATED FINANCIAL STATEMENTSFF Note 21 Share based payments

Information relating to the Lafarge S.A. stock options granted is summarized as follows:
2013 2012
Options
Weighted average
exercise price(euros) Options
Weighted average
exercise price (euros)
OPTIONS OUTSTANDING AT JANUARY 1, 8,455,389 59.09 8,511,063 66.25
Options granted 789,920 36.00
Options exercised (109,895) 30.74 (7,984) 30.74
Options cancelled and expired (1,344,539) 56.32 (837,610) 76.34
OPTIONS OUTSTANDING AT DECEMBER 31, 7,000,955 64.13 8,455,389 59.09
OPTIONS EXERCISABLE AT DECEMBER 31, 4,815,213 73.41 5,391,588 74.60
Weighted average share price for options exercised during the year 49.57 31.78
Weighted average share price at option grant date
(for options granted during the year) 36.39
Weighted average fair value of options granted during the year 7.12
Information relating to the Lafarge S.A. stock options outstanding at December 31, 2013 is summarized as follows:
Exercise price (euro)Number of options
outstandingWeighted average
remaining life (months)Number of options
exercisable
61.19 741,541 23 741,541
62.78 1,314,257 35 1,314,257
84.42 877,346 41 877,346
110.77 556,160 53 556,160
96.18 751,241 63 751,241
30.74 574,668 76 574,668
51.30 691,787 87 -
44.50 734,335 99 -
36.00 759,620 111 -
TOTAL 7,000,955 4,815,213
d FAIR VALUE OF OPTIONS GRANTED
The Group estimated the fair value of the options granted based on the following assumptions:
LAFARGE S.A. OPTIONS
Years ended December 31, 2012
Expected dividend yield 2.5%
Expected volatility of stock 30.2%
Risk-free interest rate 2.6%
Expected life of the option (years) 7.0
The expected dividend yield assumption in 2012 was based on a prospective approach, according to market expectations by 2013.
The expected volatility assumption was determined based on the observation of historical volatility over periods corresponding to the expected average maturity of the options granted, partially adjusted to eliminate extreme deviations and better refl ect long-term trends.
The Group assumes that the equivalent risk-free interest rate is the closing market rate, on the last trading day of the year, for treasury bills with maturity similar to the expected life of the options.
The Lafarge S.A. stock incentive plans were introduced on November 29, 1989. The Group assumes the estimated life of the outstanding option agreements based upon the number, of options historically exercised and cancelled since the plan’s inception.
Lafarge - Registration Document 2013 • F43
NOTES TO THE CONSOLIDATED FINANCIAL STATEMENTS
F
Note 21 Share based payments

Performance stock plansLafarge set up a performance stock plan. The shares are granted to executives, senior management and other employees for their contribution to the continuing success of the business. For French resident employees, these shares will be issued following a three-year
vesting period after the grant date (two years for 2010), but will remain unavailable for an additional two-year period. For non-French resident employees, the shares will be vested after four years.
See Section 3.5.3 (Performance share plans) for more information.
Information relating to the Lafarge S.A. performance stock plans outstanding at each December 31, is summarized as follows:
(million euros) 2013 2012
SHARES OUTSTANDING AT JANUARY 1, 1,055,587 679,510
Shares granted 636,920 483,967
Shares cancelled (125,312) (31,725)
Shares definitely alloted (139,348) (76,165)
SHARES OUTSTANDING AT DECEMBER 31, 1,427,847 1,055,587
Weighted average share price at option grant date 53.72 36.39
The Group estimated the fair value of the shares granted in 2013 and 2012 based on the following assumptions:
YEARS ENDED DECEMBER 31,
2013 2012
Expected dividend yield 2.5% 2.5%
Post vesting transfer restriction discount 3.7% 4.0%
The expected dividend yield assumption is based on a prospective approach, according to market expectations by 2014.
A discount for post vesting transfer restrictions has been applied on shares granted to French resident employees for the three years following the vesting date.
C) CASH-SETTLED INSTRUMENTS
Stock Appreciation Rights (SAR)In 2007 and 2008, Lafarge granted certain US employees equity instruments exclusively settled in cash, called Stock Appreciation Rights (SAR). T he cash payment based on Lafarge's share price, is equal to the increase in the value of the Lafarge share from the time of the grant until the date of exercise.
The SAR strike price approximates market value on the grant date. SAR are granted for ten years. Grant rights vest at a rate of 25% each year starting on the fi rst anniversary of the grant and are fully vested since 2012.
As at December 31, 2013, the number of exercisable SAR amounts to 567,545, and the average exercise price is 102.44 euros. The impact of this plan is not signifi cant on the Group’s fi nancial statements.
Value Enhancement BonusIn 2013, the Group granted to Executive Committee’s members a long-term incentive program in the form of the allocation of a “Value Enhancement Bonus” designed to recognize strong growth in Lafarge’s share price over the long term. This plan will be settled exclusively in cash.
At the end of a four-year period (2013 to 2017), and only if 100% of the internal and external performance conditions attached to the program have been achieved, this program allows for the payment of a Value Enhancement Bonus. This will be calculated on the basis of the difference between Lafarge’s share price at the end of the program and a stock price target set at 70 euros; this difference will be multiplied by the number of bonus units granted.
As at December 31, 2013, the number of outstanding rights amounts to 140, 000, and the exercise price is 70 euros. The impact of this plan is not signifi cant on the Group’s fi nancial statements.
• Lafarge - Registration Document 2013F44
NOTES TO THE CONSOLIDATED FINANCIAL STATEMENTSFF Note 21 Share based payments

NOTE 22 INCOME TAX
A) INCOME TAX
The components of the income tax expense for the reporting periods are as follows:
YEARS ENDED DECEMBER 31,
(million euros) 2013 2012
CURRENT INCOME TAX (482) (498)
Corporate income tax for the period (490) (450)
Adjustment of current tax of prior periods 13 (2)
Withholding tax on dividends (57) (31)
Other 52 (15)
DEFERRED INCOME TAX 220 206
Deferred taxes on origination or reversal of temporary differences & other movements 164 138
Reassessment of deferred tax assets 16 73
Adjustment of deferred tax of prior periods - (5)
Effect of changes in tax rates 40 -
INCOME TAX (262) (292)
The current corporate income tax expense in 2013 is slightly lower as compared to 2012: the increase in corporate income tax for the period (Canada notably) and withholding tax on dividends (exceptional distributions of dividends) is offset by the reversal of provisions, included in the line “Other” following the positive outcome of some litigation with tax authorities.
An analysis of the deferred tax (expense) income in respect of each temporary difference is presented in paragraph (c) “Change in deferred tax assets and liabilities”. The deferred income tax in 2013 is slightly higher as compared to 2012 due to:
d the recognition of deferred tax assets on some non-recurring expenses;
d the positive effect on deferred tax of changes in tax rates in the United Kingdom and Greece.
B) EFFECTIVE TAX RATE
The Group’s effective tax rate is based on income before income tax, excluding the share of net income (loss) of associates, namely 979 million euros for 2013 and 825 million euros for 2012.
For the years ended December 31, 2013 and 2012, the Group’s effective tax rate is reconciled to the same tax rate of 34.43%. This rate elected by the Group does not take into account the additional contribution of 10.7% as enacted in France by the Loi de Finances for 2014, based on the following grounds: i) this contribution is a temporary measure; ii) the French tax group is not a tax payer in 2013; iii) the impact of the reassessment of deferred taxes that will be reversed in 2014 is deemed not to have a material impact on the Group’s consolidated fi nancial statements.
The reconciliation is as follows:
YEARS ENDED DECEMBER 31,
(%) 2013 2012
Statutory tax rate 34.4 34.4
Effect of foreign tax rate differentials (9.1) (15.6)
Withholding taxes and other costs on dividends and service & royalties fees 8.7 8.1
Changes in enacted tax rates (4.1) -
Capital gains taxed at a different rate (7.9) 2.9
Impact of impairment loss on goodwill and other assets 1.7 7.6
Nonrecognition of deferred tax assets and provisions for tax exposure 2.1 (7.6)
Other effects 1.0 5.6
EFFECTIVE TAX RATE 26.8 35.4
Lafarge - Registration Document 2013 • F45
NOTES TO THE CONSOLIDATED FINANCIAL STATEMENTS
F
Note 22 Income tax

Effect of foreign tax rate differentialsThe effect of foreign tax rate differentials has a lower favourable impact on the effective tax rate due to the increase of the relative weight of results in high tax rate jurisdictions and to a lower contribution of some lower tax rate jurisdictions. The main contributors to tax rate differentials are Algeria, Canada and Malaysia.
Changes in enacted tax ratesThe amount of deferred tax assets in Greece has been reassessed following the increase in tax rate from 20% to 26%. In the United Kingdom, deferred tax liabilities have been reassessed following the decrease of tax rate from 23% to 20%. Those two changes decreased the effective tax rate by 4.1%.
Capital gains taxed at a different rateIn 2013, Group disposals, notably in Honduras, the loss of control in Mexico and the implementation of the joint venture Lafarge Tarmac in the United Kingdom generated low-taxed gains which decreased the effective tax rate by 9.9%. Conversely, asset disposals in the United States generated a higher taxable result than the accounting result which was offset against the recognized tax losses of the US tax group, thus increasing the effective tax rate by 2.0%.
In 2012, asset disposals in the United States generated a higher taxable result than the accounting result which had been offset against the recognized tax losses of the US tax group, thus increasing the effective tax rate by 4.4%. This caption also comprised the effect of the sale of the Group’s interests in Lafarge Aso Cement in Japan which had generated a low-taxed capital gain.
Impact of impairment loss on goodwill and other assetsThe impairment loss on other assets, which was partially not tax deductible, increased the effective tax rate by 1.7% in 2013 compared to 0.8% in 2012. In 2012, the goodwill impairment loss amounting to 162 million euros was not tax deductible and had increased the effective tax rate by 6.8%.
Non-recognition of deferred tax assets and provisions for tax exposureThe Group has re-estimated some of its deferred tax assets on tax loss carry forwards and on taxable temporary differences following the reassessment of the recoverability of these assets and the outcome of some litigation with tax authorities. Such re-evaluation increased the effective tax rate by 2.1%.
Other effectsOther effects include notably the impact of the new measure enacted by the Loi de Finances for 2012 in France, which limits the tax deduction of interest charges to 85% of their net amount. Such effect increased the effective tax rate by 3.6% as at December 31, 2013 compared to 4.8% as at December 31, 2012.
In 2013, other effects include also the positive impact for 3.5% of the five- year tax holiday obtained in Nigeria, retroactively from December 2011.
C) CHANGE IN DEFERRED TAX ASSETS AND LIABILITIES
The movements in net deferred tax assets from 176 million euros as at December 31, 2012 to 167 million euros as at December 31, 2013 as presented in the consolidated statement of fi nancial position are as follows:
(million euros)January 1,
2013(Expense)
income
Recorded in other
comprehensive income
Scope effects
Other changes
Translation adjustments
December 31, 2013
Pensions and other post-employment
benefits 494 (7) (74) - - (20) 393
Property, plant and equipment (1,486) 76 - (140) - 101 (1,449)
Net operating loss and tax credit carry
forwards 1,610 117 - (77) - (23) 1,627
Net capital loss carry forwards 239 (23) - 18 - (4) 230
Valuation allowance (757) 45 - (19) - 12 (719)
Provisions, current liabilities & others, net 76 12 (1) - - (2) 85
NET DEFERRED TAXES POSITIONS – ASSET
(LIABILITY) 176 220 (75) (218) - 64 167
• Lafarge - Registration Document 2013F46
NOTES TO THE CONSOLIDATED FINANCIAL STATEMENTSFF Note 22 Income tax

(million euros)January 1,
2012(Expense)
income
Recorded in other
comprehensive income
Scope effects
Other changes
Translation adjustments
December 31, 2012
Pensions and other post-employment
benefits 457 (25) 64 - 1 (3) 494
Property, plant and equipment (1,560) (2) - 34 20 22 (1,486)
Net operating loss and tax credit carry
forwards 1,448 193 - (1) (21) (9) 1,610
Net capital loss carry forwards 257 (24) - (1) 1 6 239
Valuation allowance (832) 68 - 1 11 (5) (757)
Provisions, current liabilities & others, net 101 (4) (2) 1 (19) (1) 76
NET DEFERRED TAXES POSITIONS – ASSET
(LIABILITY) (129) 206 62 34 (7) 10 176
In 2013, in addition to the deferred tax income accounted for in the consolidated statement of income, a net deferred tax expense of 75 million euros has been recorded mainly related to actuarial gains in other comprehensive income.
Scope effects are mostly composed of the implementation of the joint venture Lafarge Tarmac in the United Kingdom and the asset disposals in the United States.
D) TAX LOSS AND CAPITAL LOSS CARRY FORWARDS
At December 31, 2013, the Group has net operating loss (NOL) and tax credit carry forwards of approximately 5, 131 million euros, and capital loss carry forwards of 1, 144 million euros, which will expire as follows:
(million euros)NOL and tax credits
carry forwardsLong term capital loss
carry forwards Total
2013 122 - 122
2014 50 - 50
2015 72 - 72
2016 102 - 102
2017 and thereafter 4,785 1,144 5,929
TOTAL 5,131 1,144 6,275
Deferred tax assets have been recognized on all tax losses and a valuation allowance has been recorded when it is not probable that such deferred tax assets will be recoverable in a foreseeable future or when tax losses are uncertain to be used due to risks of diverse interpretations with regard to the application of tax legislation.
The analyses performed based on the most recent forecasts approved by the management conclude that it is probable that such assets will be recoverable in a foreseeable future, notably in France, United States and Spain where these net assets amounted to 888 million euros as at December 31, 2013. As at December 31, 2013, based on the most reasonable estimate of taxable results, net deferred tax assets of the French tax group amount to 549 million euros and should be recoverable within 12 years.
In France, since 2011, given the action plans implemented to reduce the level of indebtedness at Group level and the fi nancial expenses of the French tax group, the deferred tax assets on the tax loss carry forwards, along with tax assets relating to taxable temporary differences, have been recognized.
In the United States, the deferred tax assets on the tax loss carry forwards, along with tax assets relating to taxable temporary differences recognized for an amount of 223 million euros should be recoverable within 3 years.
In Spain, since 2012, the deferred tax assets generated each year by the tax group have been depreciated.
E) TAX AUDITS
The fi nancial year ended December 31, 2013 and prior years are open to tax audits by the respective tax authorities in the jurisdictions in which the Group has or had operations. Various tax authorities have proposed or levied adjustments for additional tax in respect of prior years.
In jurisdictions where notices of adjustments have been received, the Group has challenged almost all of the proposed assessments and is proceeding with discussions with relevant tax authorities.
As at December 31, 2013 the Group has covered its most reasonable estimate of the charge which may ultimately result from such on-going tax audits considering notably the technical merits of its positions towards tax authorities, possible settlements in certain countries and disputes that the Group could initiate.
The Group regularly reviews the assessment of such risk taking into account the evolution of audits and disputes.
Lafarge - Registration Document 2013 • F47
NOTES TO THE CONSOLIDATED FINANCIAL STATEMENTS
F
Note 22 Income tax

NOTE 23 PENSION PLANS, END OF SERVICE BENEFITS AND OTHER POST-EMPLOYMENT BENEFITS
The Group’s post-employment benefi ts vary in accordance with local legal requirements and each specifi c subsidiary benefi t policies. They are composed of both defi ned contribution and defi ned benefi ts plans.
For defi ned contribution plans, the Group’s obligations are limited to periodic payments to third party organizations, which are responsible for the fi nancial and administrative management of the funds. The pension costs recognized for these plans correspond to the contributions paid during the period. The total contribution paid in 2013 and 2012 (excluding mandatory social security plans organized at state level) for continuing operations is 35 million euros and 43 million euros, respectively.
Only defi ned benefi t plans create future obligations for the Group. Defi ned benefi t pension plans and end of service benefi ts constitute 95% of the Group’s post-retirement obligations. The balance relates mainly to post-employment medical plans. These obligations are estimated on a regular basis by independent actuaries using assumptions, which may vary over time.
The following tables present the valuation of defi ned benefi ts plans, for both funded and unfunded plans.
Funded plans are mainly pension plans located in the United Kingdom and in North America. These obligations are funded through Group’s and employees’ contributions to external funds which are third party legal entities, which investments are subject to fl uctuations in the fi nancial markets.
Unfunded plans are mainly retirement indemnities schemes or end of service benefi ts, as well as post-employment medical plans, which benefi ts are vested only if the employee is in the Group at the retirement date. A provision is recognized, with no funding obligation. For active employees, the payment of benefi ts remains uncertain and the provision is 536 million euros at the end of 2013. For retirees under post-employment medical plans, the provision is 314 million euros at the end of 2013.
AT DECEMBER 31,
Funded Plans Unfunded Plans Total
(million euros) 2013 2012 2013 2012 2013 2012
COMPONENTS OF NET PERIODIC PENSION COST
Net service cost 33 37 24 38 57 75
Plan amendment, curtailment and settlement (15) (20) (12) 1 (27) (19)
Administrative expenses and taxes 5 4 - - 5 4
Net operating expense 23 21 12 39 35 60
Net financial expense 28 25 35 39 63 64
NET PERIODIC PENSION COST 51 46 47 78 98 124
CHANGE IN DEFINED BENEFIT OBLIGATION
PRESENT VALUE OF DEFINED BENEFIT OBLIGATION AT JANUARY 1, 4,713 4,407 950 905 5,663 5,312
Net service cost 33 37 24 38 57 75
Interest cost 189 207 35 39 224 246
Employees contributions - - - - - -
Plan amendments(1) (3) - (18) - (21) -
Curtailments(2) (20) (10) (7) (23) (27) (33)
Settlements(3) (1) (79) 2 - 1 (79)
Special termination benefits 13 16 11 24 24 40
Business combinations/Divestitures - - (2) - (2) -
Benefits paid (228) (239) (77) (95) (305) (334)
Actuarial (gains)/losses related to change in demographic assumptions 66 - 3 - 69 -
Actuarial (gains)/losses related to change in financial assumptions 50 257 (29) 85 21 342
Actuarial (gains)/losses related to experience effects 12 63 (5) (17) 7 46
Foreign currency translations (173) 54 (37) (6) (210) 48
PRESENT VALUE OF DEFINED BENEFIT OBLIGATION AT DECEMBER 31, 4,651 4,713 850 950 5,501 5,663
(1) Including in 2013, the plan amendment of post-retirement healthcare coverage in the United States.
(2) Including in 2013, the frozen of main pension plans decided in the United States from December 31st, 2018.
(3) Corresponding in 2012 to the buy-out of pension rights in the United States: a decrease of the obligation by 79 million euros generating a gain of 26 million euros.
See Note 23 (a).
• Lafarge - Registration Document 2013F48
NOTES TO THE CONSOLIDATED FINANCIAL STATEMENTSFF Note 23 Pension plans, end of service benefi ts and other post-employment benefi ts
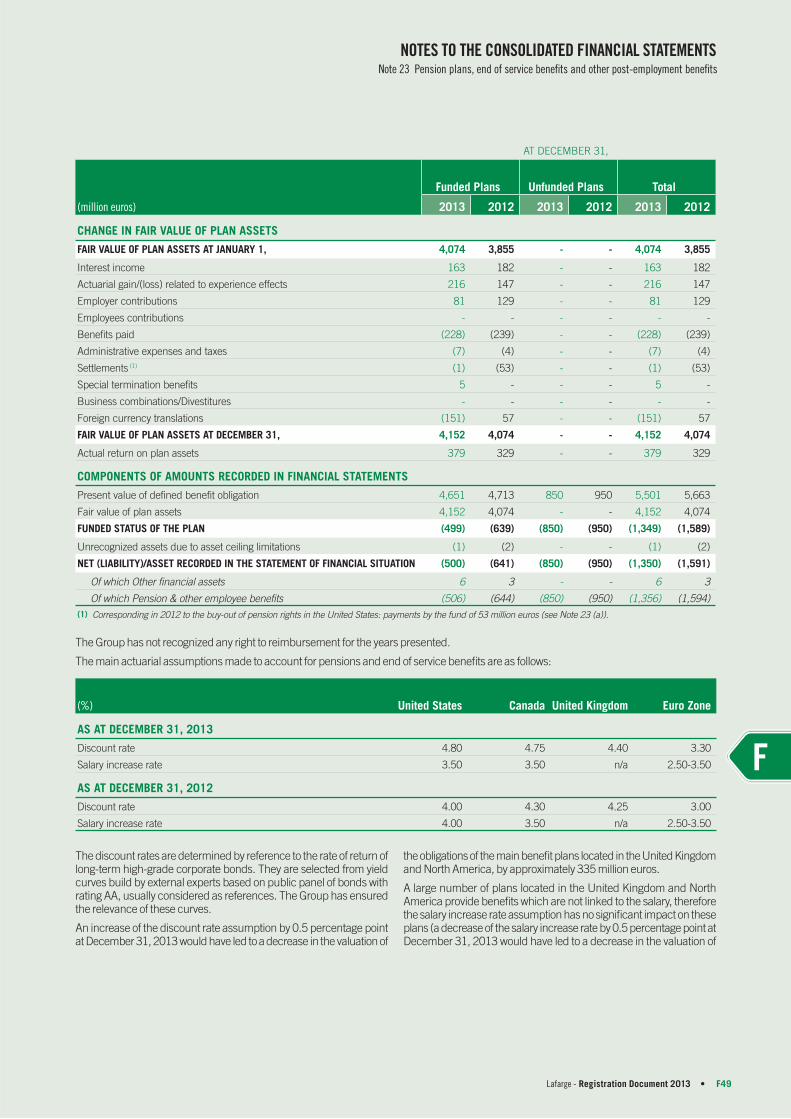
AT DECEMBER 31,
Funded Plans Unfunded Plans Total
(million euros) 2013 2012 2013 2012 2013 2012
CHANGE IN FAIR VALUE OF PLAN ASSETS
FAIR VALUE OF PLAN ASSETS AT JANUARY 1, 4,074 3,855 - - 4,074 3,855
Interest income 163 182 - - 163 182
Actuarial gain/(loss) related to experience effects 216 147 - - 216 147
Employer contributions 81 129 - - 81 129
Employees contributions - - - - - -
Benefits paid (228) (239) - - (228) (239)
Administrative expenses and taxes (7) (4) - - (7) (4)
Settlements (1) (1) (53) - - (1) (53)
Special termination benefits 5 - - - 5 -
Business combinations/Divestitures - - - - - -
Foreign currency translations (151) 57 - - (151) 57
FAIR VALUE OF PLAN ASSETS AT DECEMBER 31, 4,152 4,074 - - 4,152 4,074
Actual return on plan assets 379 329 - - 379 329
COMPONENTS OF AMOUNTS RECORDED IN FINANCIAL STATEMENTS
Present value of defined benefit obligation 4,651 4,713 850 950 5,501 5,663
Fair value of plan assets 4,152 4,074 - - 4,152 4,074
FUNDED STATUS OF THE PLAN (499) (639) (850) (950) (1,349) (1,589)
Unrecognized assets due to asset ceiling limitations (1) (2) - - (1) (2)
NET (LIABILITY)/ASSET RECORDED IN THE STATEMENT OF FINANCIAL SITUATION (500) (641) (850) (950) (1,350) (1,591)
Of which Other financial assets 6 3 - - 6 3
Of which Pension & other employee benefits (506) (644) (850) (950) (1,356) (1,594)
(1) Corresponding in 2012 to the buy-out of pension rights in the United States: payments by the fund of 53 million euros (see Note 23 (a)).
The Group has not recognized any right to reimbursement for the years presented.
The main actuarial assumptions made to account for pensions and end of service benefi ts are as follows:
(%) United States Canada United Kingdom Euro Zone
AS AT DECEMBER 31, 2013
Discount rate 4.80 4.75 4.40 3.30
Salary increase rate 3.50 3.50 n/a 2.50-3.50
AS AT DECEMBER 31, 2012
Discount rate 4.00 4.30 4.25 3.00
Salary increase rate 4.00 3.50 n/a 2. 50-3. 50
The discount rates are determined by reference to the rate of return of long-term high-grade corporate bonds. They are selected from yield curves build by external experts based on public panel of bonds with rating AA, usually considered as references. The Group has ensured the relevance of these curves.
An increase of the discount rate assumption by 0.5 percentage point at December 31, 2013 would have led to a decrease in the valuation of
the obligations of the main benefi t plans located in the United Kingdom and North America, by approximately 335 million euros.
A large number of plans located in the United Kingdom and North America provide benefi ts which are not linked to the salary, therefore the salary increase rate assumption has no signifi cant impact on these plans (a decrease of the salary increase rate by 0.5 percentage point at December 31, 2013 would have led to a decrease in the valuation of
Lafarge - Registration Document 2013 • F49
NOTES TO THE CONSOLIDATED FINANCIAL STATEMENTS
F
Note 23 Pension plans, end of service benefi ts and other post-employment benefi ts

the obligations of the plans located in the United Kingdom and North America, by approximately 9 million euros).
In the United Kingdom, pension indexation assumptions are based on infl ation index RPI and CPI, which increase respectively from 2.8% and 2.1% at the end of 2012 to 3.35% and 2.35% at the end of 2013.
A decrease of the pension indexation rates assumptions by 0.5 percentage point at December 31, 2013 would have led to a decrease in the valuation of the obligations of the benefi t plan located in the United Kingdom, by approximately 251 million euros.
The duration of the plans is an indicator of the weighted-average of future benefi t payments duration. For the most signifi cant benefi t plans located in the United Kingdom and North America, the duration is around 15 years.
Benefi ts are paid to the benefi ciaries of the various defi ned benefi t plans of the Group either by assets held by pension funds in case of funded plan or directly by the Group for unfunded plans. Expected benefi ts payments for the next fi ve years are presented in the following table:
Funded plans Unfunded plans Total
2014 234 71 305
2015 234 54 288
2016 241 52 293
2017 248 61 309
2018 255 59 314
TOTAL 1,212 297 1,509
A) PENSION PLANS
The main defi ned benefi t pension plans provided to employees by the Group are located in the United Kingdom and North America ( United States and Canada). The related pension obligations represent 60% and 25%, respectively, of the Group’s total defi ned benefi t plan obligations.
United KingdomIn the United Kingdom, the Group’s pension obligations are mainly administered through a pension fund, governed by an independent Board of Trustees. The Trustees are composed of representatives of the Group, employees and retirees, and an independent expert. The Board is required by law to act in the interest of the benefi ciaries and is responsible for the investment policy with regard to the assets and for the administration of the benefi ts.
In October 2011, vested rights (based on salary and years of service within the Group) have been frozen: active members of the scheme will no more acquire rights in the defi ned benefi t plan. The defi ned benefi t obligation includes benefi ts for deferred members (who have not yet solved their pensions rights) (41% of the obligation) and current pensioners (59% of the obligation).
If necessary, the plan is funded by employer contributions which amount is determined under the regulations every three years, based on plan valuation carried out by independent actuaries, so that the long-term fi nancing services is ensured.
The last funding valuation is being carried out based on the June 30, 2012 fund situation.
Based on the June 2009 valuation, the employer has contributed 21 million of British pounds in 2013 and should contribute 25 million pounds in 2014. This, however will have to be reassessed based on the results of the June 2012 valuation still to be fi led with the UK Pensions Regulator.
The Board of Trustees’ primary objective is to ensure that it can meet its obligations to the benefi ciaries of the plan both in the short and long
term. Subject to this primary objective, the Board of Trustees aims to maximise the long-term investment return whilst minimising the risk of non-compliance with any statutory funding requirements. The Board of Trustees is responsible for the plan’s long-term investment strategy but has delegated strategy design and monitoring to an Investment Committee and employs a fi duciary manager to implement and manage the p lan’s investments.
A strategy has been designed to target an asset value equal to 100% of the liability value. In 2013, this objective has been translated into two main asset categories:
d a portfolio of instruments that provides a reasonable match to changes in liability values, which includes government bonds, corporate bonds and derivatives
Bonds generally have a credit rating that is no lower than “A/BBB” and have quoted market prices in an active market.
Liability Driven Investment portfolio is mainly composed of swaps. Fair value is estimated with models that rely on observable market data;
d a portfolio of return-seeking assets, which include shares, real estate and alternative assets classes
Shares instruments represent investments in equity funds and direct investments which have quoted market prices in an active market.
Alternative asset classes are used for both risk management and return generation purposes, and its fair value is based on market values.
Real estate may comprise investments in listed real estate funds or direct investments. Real estates that are held directly are valued annually by an independent expert.
The fi duciary manager is responsible for the selection and deselection of underlying investment managers and funds as well as managing the asset allocation of the plan within agreed guidelines
Fair value of Investments funds is based on a mixture of market values and estimates. As at 31 December 2013, 70% was based on estimates and as at 31 December 2012, 51.5% was based on estimates.
• Lafarge - Registration Document 2013F50
NOTES TO THE CONSOLIDATED FINANCIAL STATEMENTSFF Note 23 Pension plans, end of service benefi ts and other post-employment benefi ts

Cash and cash equivalents are invested with fi nancial institutions that have at least an ”A/BBB” rating.
The table below shows the assets allocation for the pension plan located in the United Kingdom:
(%)
United Kingdom
2013 2012
Shares 20 44
Government bonds 7 29
Corporate bonds 18 14
Real Estate 4 4
Liability Driven Investment 30 -
Alternatives 12 -
Investment funds 6 8
Cash and cash equivalents 2 1
Other 1 -
TOTAL 100 100
North AmericaIn North America (United States and Canada), defi ned pension benefi ts are granted through various plans, for which employer contribution rate is governed by the minimum and maximum deductible amount under income tax.
The defi ned benefi ts obligation of the North American plans includes benefi ts for active members (37% of the obligation), deferred members (10% of the obligation) and current pensioners (53% of the obligation).
If necessary, pension plans are funded by contributions from the Group and employees based on annual valuations conducted by independent actuaries according to the rules of regulatory authorities of pension funds in the United States and Canada.
The Group’s commitments through these funds are managed to limit acquisition of future rights by closing certain funds to new entrants and to optimize their management by the merger of different funds.
In 2012, a transaction was offered to deferred members (benefi ciaries who do not acquire new pension rights and have not yet liquidated their retirement) in the United States in order to buy their vested pension rights. In exchange for a lump-sum payment, these benefi ciaries waive their future pension rights. This operation has resulted in additional contribution into the American pension funds of 19 million euros to reach minimum funding requirements. The funds paid to benefi ciaries of 53 million euros and the Group’s pension obligation decreased by 79 million euros. This operation was accounted for as a settlement and led to recognize a gain of 26 million euros in 2012.
In 2013, the Group has decided to freeze the main benefi t pension scheme in the United States as at December 31, 2018. From this date, vested rights will be frozen and active members will no more acquire rights in the defi ned benefi t plan. This plan amendment led to recognize a gain of 21 million euros in the Group’s operating income in 2013.
The expected level of employer contributions for various pension plans is about 76 million euros in 2014, versus 52 million euros in 2013.
Lafarge North America delegates various responsibilities to two specifi c Investment Committees, both in the United States and in Canada. These committees defi ne long-term investment strategies for reducing investment risk as and when appropriate. This includes an asset-liability matching policy which aims to reduce the volatility of the funding level of the pension plan by investing a portion of plan assets in long term bonds which perform similarly to the liabilities of the plan so as to protect against changes to bond yields.
These strategies are revised at least once a year and as often as necessary, especially in the case of signifi cant market developments or changes in the structure of the plans’ participants.
These strategies take into account pension masters trust’s objectives, benefit obligations and risk capacities. Investment Committees delegate the implementation of investment policies in accordance with investment strategies as well as various principles and objectives to external providers. Plans’ assets are managed by external providers in accordance with respective investment strategies.
The table below shows the assets allocation for the pension plans located in North America:
(%)
North America
2013 2012
U.S. Equities 32 31
Canadian Equities 10 11
Overseas Equities 17 18
Corporate bonds 40 40
Cash and cash equivalents 1 -
TOTAL 100 100
Lafarge - Registration Document 2013 • F51
NOTES TO THE CONSOLIDATED FINANCIAL STATEMENTS
F
Note 23 Pension plans, end of service benefi ts and other post-employment benefi ts

All instruments have quoted market prices in an active market. Corporate bonds generally have a credit rating that is no lower than “A/BBB”. Fair value is based on market prices.
Risk exposureThe main risks the Group is exposed through pension funds in the UK and North America are:
d asset volatility: the defined benefit obligation is calculated using a discount rate set with reference to the rate of return of high-grade corporate bonds; if the return on financial assets is below this rate, a deficit is created. The financial plan assets (shares, bonds..) have generally a higher return than the discount rate over the long term but are volatile in the short-term, especially since they are measured at fair value for the purposes of the annual financial statements of the Group. The allocation of financial assets is monitored to ensure that it remains appropriate given the s cheme’s long term objectives;
d changes in bond yields: a decrease in corporate bond rates leads to an increase in the pension obligation as recorded by the Group, although this increase is partially offset by an increase in the value of the financial plan assets (for private corporate bonds);
d life expectancy: most of the benefits guaranteed by the schemes are lifetime benefits; increasing life expectancy thus leads to increase the liabilities;
d inflation: a significant portion of the United Kingdom plan’s benefit obligations is indexed to inflation. An increase in inflation leads to an increase of the obligation (although, in most cases, ceilings are set to protect the regime against hyper inflation). Most financial assets are either not affected by or low correlated to inflation, meaning that an increase in inflation will also increase the deficit. The US pension funds no longer expose the Group to a significant risk to inflation given that benefits are not indexed to inflation.
B) END OF SERVICE BENEFITS
End of service benefi ts are generally lump sum payments based upon an individual’s years of credited service and annual salary at retirement or termination of employment. The primary obligations for end of service benefi ts are in France, Greece, South Korea and Nigeria. These schemes are unfunded.
In Greece, the last austerity law led in 2012 to a change of plan reducing benefi ts. Accordingly, a curtailment gain of 7 million euros was recognized in operating income.
In Nigeria, the local management has negotiated in 2012 a change in plan reducing the level of the benefi ts. Accordingly, a curtailment gain of 7 million euros was recognized in operating income.
C) OTHER POST-EMPLOYMENT BENEFITS
In North America, and to a lesser extent in France, in Morocco, in Jordan and in Brazil, certain subsidiaries provide healthcare and insurance benefits to retired employees. These obligations are unfunded.
In 2013, following the health care reform in the United States, US post-retirement medical plans were modifi ed: from January 1, 2014, retirees above 65 years old will not be covered by these plans, the federal health care system ensuring these populations. Accordingly, this plan amendment led to recognize a gain of 25 million euros in operating income in 2013.
In North America, the assumed healthcare cost trend rate used in measuring the accumulated post-employment benefi t obligation differs between US and Canadian plans.
At the end of 2013, the rate used was 7.5% in the US plan, decreasing to 5% in 2019, and 6.4% in the Canadian plan, decreasing to 5% in 2018.
At the end of 2012, the rate used was 8% in the US plan, decreasing to 5% in 2019, and 7.1 % in the Canadian plan, decreasing to 5% in 2018.
• Lafarge - Registration Document 2013F52
NOTES TO THE CONSOLIDATED FINANCIAL STATEMENTSFF Note 23 Pension plans, end of service benefi ts and other post-employment benefi ts

NOTE 24 PROVISIONS
(million euros)Restructuring
provisions
Site restoration and environmental
provisions Other provisions Total
AT JANUARY 1, 2012 40 218 504 762
Current year addition 75 33 120 228
Current year release (29) (20) (58) (107)
Cancellation (9) (12) (54) (75)
Other changes (3) 2 (35) (36)
Translation adjustments - - (8) (8)
AT DECEMBER 31, 2012 74 221 469 764
Current portion 127
Non-current portion 637
AT JANUARY 1, 2013 74 221 469 764
Current year addition 38 27 42 107
Current year release (32) (21) (53) (106)
Cancellation (12) (8) (62) (82)
Other changes 6 48 (10) 44
Translation adjustments (1) (12) 1 (12)
AT DECEMBER 31, 2013 73 255 387 715
Current portion 124
Non-current portion 591
The restructuring provisions mainly include the employee termination benefi ts.
Other provisions include:
d 131 million euros (225 million euros as at December 31, 2012) of provisions for tax risks and litigation , of which competition litigation (see Note 29);
d 84 million euros (117 million euros as at December 31, 2012) of provisions related to actual damages, costs and insurance and re-insurance.
NOTE 25 FINANCIAL DEBT
The fi nancial debt split is as follows:
AT DECEMBER 31,
(million euros) 2013 2012
Long-term debt excluding put options on shares of subsidiaries 10,782 11,212
Put options on shares of subsidiaries, long-term 23 49
FINANCIAL DEBT 10,805 11,261
Short-term debt and current portion of long-term debt excluding put options on shares
of subsidiaries 2,880 2,823
Put options on shares of subsidiaries, short-term 11 -
FINANCIAL DEBT (INCLUDING CURRENT PORTION OF LONG-TERM DEBT) 2,891 2,823
Total debt excluding put options on shares of subsidiaries 13,662 14,035
Total put options on shares of subsidiaries 34 49
TOTAL FINANCIAL DEBT 13,696 14,084
Lafarge - Registration Document 2013 • F53
NOTES TO THE CONSOLIDATED FINANCIAL STATEMENTS
F
Note 25 Financial Debt

A) ANALYSIS OF DEBT EXCLUDING PUT OPTIONS ON SHARES OF SUBSIDIARIES BY TYPE OF FINANCING
AT DECEMBER 31,
(million euros) 2013 2012
Debenture loans 10,309 10,501
Notes/Private placements 968 920
Bank loans and credit lines drawings 2,023 2,262
Commercial paper 7 -
Other debt 355 352
TOTAL DEBT EXCLUDING PUT OPTIONS ON SHARES OF SUBSIDIARIES 13,662 14,035
Debenture loans, notes and private placementsThe Group has a Euro Medium-Term Note (EMTN) program, which allows for a maximum issuable amount of 12,000 million euros. At December 31, 2013, 9,702 million euros had been issued under the EMTN program, including 8,863 million euros of debenture loans and 839 million euros of private placements included under Notes/Private placements . The weighted average spot interest rate of EMTN issues is 6.6% as at December 31, 2013 with maturities ranging from 2014 to 2038.
At December 31, 2013, debenture loans, mainly consisting of bonds issued in euros, US dollars and British pounds, amount to 10,309 million euros (including 8,863 million euros issued under the EMTN program disclosed above). Weighted average interest rate of these debenture loans is 6.7% at December 31, 2013 (6.7% at December 31, 2012). Their maturities range from 2014 to 2036, with an average maturity of 4 years and 3 months.
Notes and private placements, mainly composed of shares denominated in euros and in US dollars, amount to 968 million euros at December 31, 2013 (including 839 million euros of private placements issued under the EMTN program disclosed above). Weighted average interest rate of these private placements is 8.2% at December 31, 2013 (6.4% at December 31, 2012).
Bank loansAt December 31, 2013, bank loans total 2,023 million euros and are primarily comprised of loans to Group subsidiaries in their local currencies.
The weighted average interest rate on bank loans is approximately 5.5% at December 31, 2013 (5.6% at December 31, 2012).
Additionally, the Group contracted in advance bank loans in 2013 for 250 million euros that could be used in May 2014.
Committed credit linesAt December 31, 2013, committed credit lines amount to 3,435 million euros, fully contracted at Lafarge S.A. level. These committed credit lines are unused and therefore fully available at December 31, 2013 as no drawdown has been done on them.
The average non-utilization fee of these credit lines stands at 74.5 basis points at December 31, 2013 (80 basis points at December 31, 2012). The average maturity of these credit facilities is 2.8 years at December 31, 2013 (2.5 years at December 31, 2012).
Additionnally, t he syndicated credit facility signed in 2004 for a 5-year term and an initial amount of 1,850 million euros, has been amended successfully several times. Through the last amendment of March 19, 2012, the amount was reduced to 1,235 million euros and the maturity extended to July 28, 2015 for 1,200 million euros. This syndicated credit facility contains an optional exit mechanism, on an individual basis, if the consolidated net debt to Ebitda ratio is higher than 4.75. Such an event would not be considered an event of default and would have no impact on the status of the Group’s other fi nancing arrangements.
In addition, the Group has a 450 million euros undrawn fi nancing at December 31, 2013 that the Group can use anytime. This specifi c financing set-up at October 12, 2012 is not considered in the committed credit lines amount disclosed above. Utilization of this fi nancing would be considered as a private placement outside the EMTN program.
Commercial paperThe Group’s euro denominated commercial paper program at December 31, 2013 allows for a maximum issuable amount of 3,000 million euros. Commercial paper can be issued in euros, US dollars, Canadian dollars, Swiss francs or British pounds. At December 31, 2013, commercial paper issued under this program totals 7 million euros (no amount as of December 31, 2012). This commercial paper bears an average interest rate close to the European inter-bank offer rate (“Euribor”) for maturities generally ranging from 1 to 6 months. As of December 31, 2013, the weighted average interest rate of the euro denominated commercial paper is 0.7%
B) ANALYSIS OF DEBT EXCLUDING PUT OPTIONS ON SHARES OF SUBSIDIARIES BY MATURITY
The following table details the contractual maturities of our various loan agreements (excluding put options on shares of subsidiaries), including the undiscounted contractual fl ows and future interests, based on the closest term the Group can be called for repayment. Under IAS 1, when the Group does not have the unconditional right to defer the term of a fi nancing beyond 12 months, then the fi nancing is accounted for in current liabilities regardless of probable renegotiation considered by the management in order to extend the maturity of the fi nancial instrument.
• Lafarge - Registration Document 2013F54
NOTES TO THE CONSOLIDATED FINANCIAL STATEMENTSFF Note 25 Financial Debt

(million euros)2014
H12014
H2
Contractual flows – less than
one year (incl. future interests)
Statement of Financial position –
Current Liabilities 2015 2016 2017 2018
Short-term debt and bank overdrafts 704 195 899 887
Debenture loans/Private placements 1,390 1,136 2,526 1,748 1,792 2,430 2,085 1,983
Other LT financings (including ST
portion of LT debt) 141 185 326 245 405 541 95 162
TOTAL 2,235 1,516 3,751 2,880 2,197 2,971 2,180 2,145
(million euros)
More than
5 years
Contractual flows – more than
one year (incl. future interests)
Statement of Financial position –
Non Current Liabilities
Total Contractual flows (incl.
future interests)
Statement of Financial position – December 31, 201 3
Short-term debt and bank overdrafts 899 887
Debenture loans/Private placements 4,542 12,832 9,529 15,358 11,277
Other LT financing
(including ST portion of LT debt) 255 1,458 1,253 1,784 1,498
TOTAL 4,797 14,290 10,782 18,041 13,662
The short-term debt that the Group can refi nance on a medium and long-term basis through its committed credit facilities is classifi ed in the statement of fi nancial position under the section “Long-term debt” (7 million euros as at December 31, 2013 and no amount as at December 31, 2012). The net variation of this debt is shown in the cash
fl ow statement in “proceeds from issuance of long-term debt” when it is positive, and in “repayment of long-term debt” when it is negative. At December 31, 2013, the net variation of this debt amounted to an increase of 7 million euros (compared to a decrease of 57 million euros at December 31, 2012).
C) ANALYSIS OF DEBT EXCLUDING PUT OPTIONS ON SHARES OF SUBSIDIARIES BY CURRENCY
AT DECEMBER 31,
2013 2012
(million euros) Before swaps After swaps Before swaps After swaps
Euro (EUR) 9,829 9,954 9,413 10,198
US dollar (USD) 2,064 1,280 2,304 1,929
British pound (GBP) 664 706 1,126 514
Chinese yuan (CNY) 518 518 507 507
Indian rupee (INR) 96 118 56 140
Nigerian naira (NGN) 104 104 161 161
Russian ruble (RUB) 47 427 32 153
Other 340 555 436 433
TOTAL 13,662 13,662 14,035 14,035
Lafarge - Registration Document 2013 • F55
NOTES TO THE CONSOLIDATED FINANCIAL STATEMENTS
F
Note 25 Financial Debt

D) ANALYSIS OF DEBT EXCLUDING PUT OPTIONS ON SHARES OF SUBSIDIARIES BY CATEGORY AND TYPE OF INTEREST RATE
AT DECEMBER 31,
2013 2012
(million euros) Before swaps After swaps Before swaps After swaps
Floating rate 1,975 3,805 2,171 3,014
Fixed rate below 6% 3,859 1,911 3,819 2,887
Fixed rate between 6% and 10% 7,118 7,181 7,321 7,411
Fixed rate 10% and over 710 765 724 723
TOTAL 13,662 13,662 14,035 14,035
The average spot interest rate of the debt after swaps, as at December 31, 2013, is 6.5% (6.4% as at December 31, 2012).
E) PARTICULAR CLAUSES IN FINANCING CONTRACTS
Financial covenantsAt December 31, 2013, Lafarge S.A. loan contracts do not required any fi nancial covenants.
Loan contracts requiring compliance with certain fi nancial covenants existed in some of our subsidiaries. These subsidiaries are located in the following countries: Bangladesh, Ecuador, India, Pakistan, Qatar and United Arab Emirates. Debt with such fi nancial covenants represents approximately 2% of the total Group debt excluding put options on shares of subsidiaries at December 31, 2013. For most of them, they have a low probability of being triggered. Our agreements and those of our subsidiaries also include cross-acceleration clauses. If we, or, under certain conditions, our material subsidiaries fail to comply with our or their covenants, then our lenders could declare default and accelerate a signifi cant part of our indebtedness.
Given the split of these contracts on various subsidiaries and the quality of the Group liquidity protection, the existence of such clauses cannot materially affect the Group’s fi nancial situation.
Change of control clausesChange of control clauses appear in several of the Lafarge S.A.’s committed credit facilities contracts, which amount to 3,400 million euros. As a consequence, in the event of a change in control of Lafarge S.A., these facilities will be automatically cancelled if undrawn or, if drawn upon, will require immediate repayment. Change of control clauses are also included in some debenture loans and private placements issued under the EMTN program, which amount to 7,802 million euros. In case of a change in control, the holders of these notes would be entitled, under certain conditions, to request their repayment.
F) PUT OPTIONS ON SHARES OF SUBSIDIARIES
As part of the acquisition process of certain entities, the Group has granted third party shareholders the option to require the Group to purchase their shares at a price determined on the basis of the market value. These shareholders are either international institutions, such as the European Bank for Reconstruction and Development, or private investors, which are essentially fi nancial or industrial investors or former shareholders of the acquired entities. Assuming that all of these options were exercised, the purchase price to be paid by the Group, including debt and cash acquired, would amount to 34 million euros at December 31, 2013 (64 million euros at December 31, 2012).
Out of the outstanding put options at December 31, 2013, 11 million euros can be exercised in 2014. The remaining 23 million euros can be exercised in part starting in 2015 and in part starting in 2017.
Put options granted to non-controlling interests of subsidiaries are classifi ed as debt of the Group. Out of the total options granted by the Group, the options granted to non-controlling interests amounted to 34 million euros and 49 million euros at December 31, 2013 and December 31, 2012, respectively , the remaining options were granted on shares of joint ventures.
The goodwill resulting from put options granted to non-controlling interests amounts is not signifi cant.
Put options on shares of joint ventures are presented in Note 28 as “Commitments related to scope of consolidation”.
• Lafarge - Registration Document 2013F56
NOTES TO THE CONSOLIDATED FINANCIAL STATEMENTSFF Note 25 Financial Debt

NOTE 26 FINANCIAL INSTRUMENTS
A) DESIGNATION OF DERIVATIVE INSTRUMENTS FOR HEDGE ACCOUNTING
The Group uses derivative fi nancial instruments to manage market risk exposures. Such instruments are entered into by the Group solely to hedge such exposures on anticipated transactions or fi rm commitments. The Group does not enter into derivative contracts for speculative purposes.
Certain derivative instruments are designated as hedging instruments in a cash fl ow or fair value hedge relationship in accordance with IAS 39 criteria.
Other derivatives are willingly not designated as hedges for accounting purposes under IAS 39, as changes in fair value of these derivatives are recorded in fi nancial result in the Group statement of income, as well as the revaluation of underlying risk hedged .
Lafarge - Registration Document 2013 • F57
NOTES TO THE CONSOLIDATED FINANCIAL STATEMENTS
F
Note 26 Financial instruments

B) FAIR VALUES
The following table details the cost and fair values of fi nancial instruments:
FINANCIAL INSTRUMENTS IN THE CONSOLIDATED STATEMENT OF FINANCIAL POSITION AT DECEMBER 31,
(million euros) IAS 39 CATEGORYFair value category
2013 2012
Carrying amount
Fair value
Carrying amount
Fair value
ASSETS
Cash Financial assets at fair value through profit
and loss Lev 1 1,957 1,957 2,063 2,063
Cash equivalents Loans and Receivables at amortized cost Lev 2 (1) 1,389 1,389 670 670
Trade receivables Loans and Receivables at amortized cost 1,929 1,762
Other receivables Loans and Receivables at amortized cost 824 819
Other financial assets Lev 2 656 656 698 698
Held-to-maturity investments Held-to-maturity financial assets
at amortized cost Lev 2 - - - -
Avalaible-for-sale financial assets Available for sale investments at fair value
recognized in equity See Note 15 252 252 282 282
Financial assets held for trading Financial assets at fair value recognized
in P&L Lev 2 - - - -
Long-term loans and receivables Loans and Receivables at amortized cost Lev 2 365 365 373 373
Prepaid pension assets (excluding the IAS 39 scope) 6 3
Restricted cash Financial assets at fair value through profit
and loss Lev 1 33 33 40 40
Derivative instruments – assets See below Lev 2 36 36 95 95
LIABILITIES
Short-term debt and bank overdrafts (2) Financial liabilities at amortized cost Lev 2 887 887 930 930
Trade payables Financial liabilities at amortized cost 2,224 1,985
Other payables Financial liabilities at amortized cost 1,521 1,647
Debenture loans/private placements Financial liabilities at amortized cost Lev 1,2 11,277 12,439 11,421 12,418
Other long-term financial debt
(including current portion)
Financial liabilities at amortized cost
Lev 2 1,498 1,512 1,684 1,665
Put options on shares of subsidiaries - Lev 2 34 34 49 49
Derivative instruments – liabilities See below Lev 2 16 16 61 61
DERIVATIVE INSTRUMENTS
Interest rate derivative instruments 17 17 49 49
Designated as hedging instruments in cash flow hedge relationship Lev 2 6 6 27 27
Designated as hedging instruments in fair value hedge relationship Lev 2 2 2 17 17
Not designated as hedges for accounting purposes Lev 2 9 9 5 5
Foreign exchange derivative instruments 2 2 (15) (15)
Designated as hedging instruments in cash flow hedge relationship Lev 2 - - (2) (2)
Designated as hedging instruments in fair value hedge relationship Lev 2 1 1 (6) (6)
Not designated as hedges for accounting purposes Lev 2 1 1 (7) (7)
Commodities derivative instruments 1 1 - -
Designated as hedging instruments in cash flow hedge relationship Lev 2 1 1 - -
Other derivative instruments - - - -
Equity swaps not designated as hedges for accounting purposes Lev 2 - - - -
Embedded derivatives not designated as hedges for accounting purposes Lev 2 - - - -
(1) See Note 2.17 and Note 19.
(2) Of which 213 million euros of bank overdraft as at December 31, 2013 (274 million euros of bank overdrafts as at December 31, 2012) and 282 million euros
of securitization (300 million euros of securitization as at December 31, 2012).
Level 1: quoted on financial markets (Note 15).
Level 2: based on market observable data (Note 15).
Level 3: based on internal assumptions (Note 15).
• Lafarge - Registration Document 2013F58
NOTES TO THE CONSOLIDATED FINANCIAL STATEMENTSFF Note 26 Financial instruments

The fair value of fi nancial instruments has been estimated on the basis of available market quotations or the use of various valuation techniques, such as present value of future cash fl ows. However, the methods and assumptions followed to disclose fair value are inherently judgmental. Thus, estimated fair value does not necessarily refl ect amounts that would be received or paid in case of immediate settlement of these instruments.
The use of different estimations, methodologies and assumptions could have a material effect on the estimated fair value amounts. The methodologies used are as follows:
d cash and cash equivalents, trade receivables, trade payables, short-term bank borrowings: due to the short-term nature of these balances, the recorded amounts approximate fair value;
d other financial assets: m arketable securities quoted in an active market are carried at market value with unrealized gains and loss recorded in a separate component of equity. The fair value of securities that are not quoted in an active market and for which there is no observable market data on which the Group can rely to measure their fair value (219 million euros as at December 31, 2013 and 191 million euros as at December 31, 2012) is determined according to the most appropriate financial criteria in each case (discounted present value of cash flows, estimated selling price). If such fair value cannot be reliably measured, securities are carried at acquisition cost;
d debenture loans: the fair values of the debenture loans were estimated at the quoted value for borrowings listed on a sufficiently liquid market (12,399 million euros as at December 31, 2013, and 12,216 million euros as at December 31, 2012), or using internal models that rely on market observable data (40 million euros as at December 31, 2013 and 202 million euros as at December 31, 2012);
d other long-term financial debt: the fair values of long-term debt were determined by estimating future cash flows on a borrowing-by-borrowing basis, and discounting these future cash flows using a rate which takes into account the Group’s spread for credit risk at year end for similar types of debt arrangements;
d derivative instruments: the fair values of foreign exchange, interest rate, commodities and equity derivatives were calculated using valuation model based on observable market prices (interest rate, foreign exchange rate, credit risk, volatility).
C) FOREIGN CURRENCY RISK
In the course of its operations, the Group’s policy is to hedge all material “operational” foreign currency exposures arising from its transactions using derivative instruments as soon as a fi rm or highly probable commercial and/or fi nancial commitment is entered into or known. These derivative instruments are limited to forward contracts, foreign currency swaps and options, with a term generally less than one year.
This policy is implemented in all of the Group’s subsidiaries, which are required to ensure its monitoring. When allowed by local regulations and when necessary, Group subsidiaries have to hedge their exposures with the Corporate Treasury department. A follow up of risks related to foreign exchange fi nancial instruments is regularly done through internal reporting provided to the management.
The Group’s policies tend to reduce potential “fi nancial” foreign currency exposures by requiring all liabilities and assets of controlled companies to be denominated in the same currency as the cash fl ows generated from operating activities, the functional currency. The Group may amend this general rule under special circumstances in order to take into account specifi c economic conditions in a specifi c country such as, infl ation rates, interest rates, and currency related issues such as convertibility and liquidity. As an example, the excess cash existing in entities in emerging markets are as much as possible invested in euros or dollars. When needed, currency swaps are used to convert debts, most often raised in euros, into foreign currencies.
See Section 5.1.1 (b) (Financial and market risks) of the Registration Document for more information on our exposure to foreign currency risk.
Foreign currency hedging activityAt December 31, 2013, all forward contracts have a maturity date of less than one year. The nominal amount of foreign currency hedging instruments outstanding at year-end is as follows:
AT DECEMBER 31
(million euros) 2013 2012
FORWARD CONTRACT PURCHASES AND CURRENCY SWAPS
US dollar (USD) 1,111 801
British pound (GBP) 130 644
Other currencies 75 91
TOTAL 1,316 1,536
FORWARD CONTRACT SALES AND CURRENCY SWAPS
US dollar (USD) 324 309
British pound (GBP) 46 198
Other currencies 689 557
TOTAL 1,059 1,064
Lafarge - Registration Document 2013 • F59
NOTES TO THE CONSOLIDATED FINANCIAL STATEMENTS
F
Note 26 Financial instruments

Details of the statement of fi nancial position value of instruments hedging foreign currency riskAt December 31, 2013 and 2012, most of the Group’s foreign currency derivatives were not designated as hedges for accounting purposes (see Note 26 (a) (Designation of derivative instruments for hedge accounting)). Changes in fair value were recorded directly in the consolidated statement of income.
AT DECEMBER 31
(million euros)
2013 2012
Derivatives fair value
Underlying reevaluation Net impact
Derivatives fair value
Underlying reevaluation Net impact
ASSETS
Non-current derivative instruments - - - - - -
Current derivatives instruments 14 - 14 8 - 8
Net reevaluation of financial loans and
borrowings denominated in foreign
currencies - - - - 4 4
LIABILITIES
Non-current derivative instruments - - - - - -
Current derivative instruments 12 - 12 23 - 23
Net reevaluation of financial loans and
borrowings denominated in foreign
currencies
- 7 7 - - -
NET IMPACT ON EQUITY 2 (7) (5) (15) 4 (11)
D) INTEREST RATE RISK
The Group is primarily exposed to fl uctuations in interest rates based
upon the following:
d price risk with respect to fixed-rate financial assets and liabilities.
Interest rate fluctuations impact the market value of fixed-rate assets
and liabilities;
d cash flow risk for floating rate assets and liabilities. Interest rate
fluctuations have a direct effect on the financial income or expense
of the Group.
In accordance with established policies, the Group seeks to mitigate
these risks using, to a certain extent, interest rate swaps and options.
A follow up of risks related to interest rate fi nancial instruments is regularly done through internal reporting provided to the management.
Interest rate risk derivatives held at December 31, 2013 were mainly designated as hedging instruments in:
d cash flow hedge relationship for derivatives used to hedge cash flow risk;
d fair value hedge relationship for derivatives used to hedge price risk.
See Section 5.1.1 (b) (Financial and market risks) of the Registration Document for more information on our policy and procedure to interest rate risk.
Interest rate hedging activity
AT DECEMBER 31, 2013
(million euros)
Less than one year 1 to 5 years More than 5 years Total
Fixed rate
Floating rate
Fixed rate
Floating rate
Fixed rate
Floating rate
Fixed rate
Floating rate
Debt (1) 1,796 1,084 6,733 630 3,158 261 11,687 1,975
Cash and cash equivalents - (3,346) - - - - - (3,346)
NET POSITION BEFORE HEDGING 1,796 (2,262) 6,733 630 3,158 261 11,687 (1,371)
Hedging instruments 130 (130) (1,960) 1,960 - - (1,830) 1,830
NET POSITION AFTER HEDGING 1,926 (2,392) 4,773 2,590 3,158 261 9,857 459
(1) Debt excluding put options on shares of subsidiaries.
• Lafarge - Registration Document 2013F60
NOTES TO THE CONSOLIDATED FINANCIAL STATEMENTSFF Note 26 Financial instruments

The notional value of interest rate derivative instruments at year-end is as follows:
MATURITIES OF NOTIONAL CONTRACT VALUES AT DECEMBER 31,2013 (1)
(million euros) Average rate 2014 2015 2016 2017 2018 > 5 years Total
Pay fixed (designated as cash flow hedge)
Euro 4.6% 42 - - - - - 42
Other currencies 8.6% 74 - - 54 - - 128
Pay floating (designated as fair value hedge)
Euro 0.3% - - 500 1,000 500 - 2,000
Other currencies - - - - - - - -
Other interest rate derivatives
Euro - - - - - - - -
Other currencies - - - - - - - -
TOTAL 116 - 500 1,054 500 - 2,170
(1) The notional amounts of derivatives represent the face value of financial instruments negotiated with counterparties. Notional amounts in foreign currency are
expressed in euros at the year-end exchange rate.
MATURITIES OF NOTIONAL CONTRACT VALUES AT DECEMBER 31, 2012 (1)
(million euros) Average rate 2013 2014 2015 2016 2017 > 5 years Total
Pay fixed (designated as cash flow hedge)
Euro 4.5% 58 42 - - - - 100
Other currencies 7.1% 57 91 - - - - 148
Pay floating (designated as fair value hedge)
Euro 0.7% 300 - - - 100 400 800
Other currencies 1.2% 76 245 - - - - 321
Other interest rate derivatives
Euro - - - - - - - -
Other currencies 1.4% 331 - - - - - 331
TOTAL 822 378 - - 100 400 1,700
(1) The notional amounts of derivatives represent the face value of financial instruments negotiated with counterparties. Notional amounts in foreign currency are
expressed in euros at the year-end exchange rate.
Details of the statement of fi nancial position value of instruments hedging interest rate risk
AT DECEMBER 31
(million euros)
2013 2012
Impact on derivatives
Impact on underlying Net impact
Impact on derivatives
Impact on underlying Net impact
ASSETS
Non-current derivative instruments 13 - 13 27 - 27
Current derivative instruments 9 - 9 59 - 59
LIABILITIES
Long-term debt - 2 2 - 17 17
Non-current derivative instruments 2 - 2 8 - 8
Current derivative instruments 3 - 3 29 - 29
NET IMPACT ON EQUITY 17 (2) 15 49 (17) 32
Lafarge - Registration Document 2013 • F61
NOTES TO THE CONSOLIDATED FINANCIAL STATEMENTS
F
Note 26 Financial instruments

E) COMMODITY RISK
The Group is subject to commodity risk with respect to price changes mainly in the electricity, natural gas, petcoke, coal, oil refi ned products and sea freight markets.
The Group uses fi nancial instruments to manage its exposure to these risks. At December 31, 2013 and 2012, these derivative instruments were mostly limited to swaps and options. A follow up of risks related to commodity fi nancial instruments is regularly done through internal reporting provided to the management.
See Section 5.1.1 (b) (Financial and market risks) of the Registration Document for more information on our commodity risk hedging policy and procedure.
Commodities hedging activityThe notional value of commodity derivative instruments at year-end is as follows:
MATURITIES OF NOTIONAL CONTRACT RESIDUAL VALUES AT DECEMBER 31, 2013 (1)
(million euros) 2014 2015 2016 2017 2018 > 5 years Total
Natural Gas (Nymex) 3 - - - - - 3
Heating Oil (Nymex) - - - - - - -
Sea Freight (PANAMAX) - - - - - - -
Gasoil 16 - - - - - 16
Fuel Oil 10 - - - - - 10
Power 15 3 - - - - 18
Others - - - - - - -
TOTAL 44 3 - - - - 47
(1) The notional residual amounts of derivatives represent the residual value at December 31 of financial instruments negotiated with counterparties. Notional amounts
in foreign currency are expressed in euros at the year-end exchange rate.
MATURITIES OF NOTIONAL CONTRACT RESIDUAL VALUES AT DECEMBER 31, 2012 (1)
(million euros) 2013 2014 2015 2016 2017 > 5 years Total
Natural Gas (Nymex) - - - - - - -
Heating Oil (Nymex) - - - - - - -
Sea Freight (PANAMAX) - - - - - - -
Gasoil 17 - - - - - 17
Fuel Oil 16 - - - - - 16
Power 9 - - - - - 9
Others 3 - - - - - 3
TOTAL 45 - - - - - 45
(1) The notional residual amounts of derivatives represent the residual value at December 31 of financial instruments negotiated with counterparties. Notional amounts
in foreign currency are expressed in euros at the year-end exchange rate.
Details of the statement of fi nancial position value of instruments hedging commodities riskCommodities derivative instruments held at December 31, 2013 and 2012 were all designated as hedging instruments in the cash fl ow hedge relationship.
• Lafarge - Registration Document 2013F62
NOTES TO THE CONSOLIDATED FINANCIAL STATEMENTSFF Note 26 Financial instruments

Statement of fi nancial position values of commodity derivative instruments are as follows:
AT DECEMBER 31
(million euros) 2013 2012
ASSETS
Non-current derivative instruments - -
Current derivative instruments 1 1
LIABILITIES
Non-current derivative instruments - -
Current derivative instruments - 1
NET IMPACT ON EQUITY 1 -
F) COUNTERPARTY RISK FOR FINANCIAL OPERATIONS
The Group is exposed to credit risk in the event of a counterparty’s default. The Group implemented policies to limit its exposure to counterpart risk by rigorously selecting the counterparties with which it executes fi nancial agreements. These policies take into account several criteria (rating assigned by rating agencies, assets, equity base) as well as transaction maturities.
The Group’s exposure to credit risk is limited and the Group believes that its counterparty management risk is cautious and in line with market practices but this may not prevent the Group’s fi nancial statements from being signifi cantly impacted in case of systemic crisis.
Counterparty risk valuation in the Group’s derivative instruments fair value is not signifi cant.
Given the existence of compensation clauses in case of default in most of Lafarge S.A.’s ISDA or FBF contracts, the Group net exposure related to derivative instruments in assets and liabilities (respectively 36 million euros and 16 million euros as of December 31, 2013) would be 30 million euros and 10 million euros. A potential compensation not compliant with IAS 32 criteria would then amount to 6 million euros.
G) LIQUIDITY RISK
The Group implemented policies to limit its exposure to liquidity risk. As a consequence of this policy, a signifi cant portion of the Group’s debt has a medium or long-term maturity. The Group also maintains committed credit lines with various banks which are primarily used as a back-up for the debt maturing within one year as well as for the short-term fi nancings of the Group and which contribute to the Group’s liquidity.
See Section 2.4 (Liquidity and capital resources) of the Registration Document and Note 25 for more information on our exposure to liquidity risk.
H) CAPITAL RISK MANAGEMENT
The Group manages equity from a long-term perspective taking the necessary precautions to ensure its sustainability, while maintaining an optimum fi nancial structure in terms of the cost of capital, the Return On Equity for shareholders and security for all counterparties with which it has ties.
Within this framework, the Group reserves the option, with the approval of shareholders, to issue new shares or to reduce its capital. The Group also has the power to adapt its dividend distribution policy. The Group wishes to adjust its dividend distribution to its fi nancial performances, notably to earnings per share.
In accordance with common market practices, in managing its fi nancial structure, the Group strives to maintain the cash fl ow from operations to net debt ratio within a predefi ned range.
Based on the 2013 fi nancial statements, the cash fl ow from operations to net debt ratio was 12.5% compared to 14.0% at year-end 2012.
See Section 2.2.4 (Reconciliation of non-GAAP fi nancial measures) of the Registration Document for more information on the Group’s definition of the indicators net debt, equity and cash flow from operations.
See Section 2.4.3 (b) (Net debt and net debt ratios) of the Registration Document for more information on the net-debt-to-equity ratio and the cash fl ow from operations to net debt ratio for each of the periods presented.
I) CREDIT RISK
Credit risk is defi ned as the risk of default by a counterpart with respect to its contractual obligations or its payment of debts when due.
The Group is exposed to credit risks in its operations.
The Group’s maximum exposure to credit risk as of December 31, 2013 on its short-term receivables is presented in the following table:
Lafarge - Registration Document 2013 • F63
NOTES TO THE CONSOLIDATED FINANCIAL STATEMENTS
F
Note 26 Financial instruments

AT DECEMBER 31
(million euros) 2013
Trade receivables (see Note 17) 1,929
Other receivables (see Note 18) 797
TOTAL 2,726
The Group considers that the credit risk on overdue and not depreciated receivables is not material.
In fact, the Group sells its products to thousands of customers, and customers usually order quantities to meet their short-term needs. Outstanding amounts per customer are, on an individual basis, not signifi cant. The general terms of payment are different across countries however, the Group’s average days of payment is around 46 to 60 days.
The Group has implemented procedures for managing and depreciating receivables, which are set by each country. A monthly
review of the working capital is performed at both country and Group level, aiming to verify that the monitoring of trade receivables, through the days’ receivable ratio, is compliant with the Group’s commercial policies.
In addition, the Group has loans and long term-receivables for a total amount of 365 million euros and 373 million euros as at December 31, 2013 and 2012, respectively (see Note 15).
NOTE 27 OTHER PAYABLES
Components of other payables are as follows:
AT DECEMBER 31,
(million euros) 2013 2012
Accrued payroll expenses 470 465
Accrued interest 352 340
Other taxes 145 159
Payables to suppliers of fixed assets 169 315
Other accrued liabilities 385 368
OTHER PAYABLES 1,521 1,647
Current portion 1,447 1,567
Non-current portion 74 80
“Other accrued liabilities” include payables to suppliers for non-operating services and goods, and payables to joint ventures and associates.
• Lafarge - Registration Document 2013F64
NOTES TO THE CONSOLIDATED FINANCIAL STATEMENTSFF Note 27 Other payables

NOTE 28 OFF BALANCE SHEET COMMITMENTS
The procedures implemented by the Group allow all the major commitments to be identifi ed and prevent any signifi cant omissions.
(million euros)Less than
1 year 1 to 5 yearsMore than
5 yearsAt December 31,
2013At December 31,
2012
COMMITMENTS GIVEN
Commitments related to operating activities
Capital expenditures and other purchase obligations 404 722 591 1,717 1,913
Operating leases 210 458 212 880 1,034
Other commitments 244 39 97 380 533
Commitments related to financing
Securities pledged 6 - 86 92 102
Assets pledged 101 236 49 386 441
Other guarantees 81 195 - 276 193
Scheduled interest payments (1) 849 2,140 1,357 4,346 4,015
Net scheduled obligation on interest rate swaps (2) (3) (33) - (36) (11)
Commitments related to scope of consolidation
Indemnification commitments 31 524 - 555 449
Put options to purchase shares in joint ventures - - - - 15
COMMITMENTS RECEIVED
Unused committed credit lines - 3,435 - 3,435 3,435
Other available financing facilities - - 450 450 450
B ank loans that could be used in May 2014 - 150 100 250 -
(1) Scheduled interest payments associated with variable rate are computed on the basis of the rates in effect at December 31. Scheduled interest payments include
interest payments on foreign exchange derivative instruments.
(2) Scheduled interest payments of the variable leg of the swaps are computed based on the rates in effect at December 31.
1) COMMITMENTS GIVEN
a) Commitments related to operating activitiesIn the ordinary course of business, the Group entered into contracts for long term supply for raw materials and energy. O ff-balance sheet commitments related to these contracts amount to 1,410 million euros as of December 31, 2013.
The Group is committed as lessee in operating leases for land, building and equipment. The amount in off-balance sheet commitments corresponds to future minimum lease payments. Total rental expense under operating leases was 225 million euros and 222 million euros for the years ended December 31, 2013, and 2012.
Future expected funding requirements or benefi t payments related to our pension and post-employment benefi t plans are not included in the above table because future long-term cash fl ows in this area are uncertain. Refer to the amount reported under the “current portion” of pension and other employee benefi ts liabilities in the statements of fi nancial position or in Note 23 for further information on these items.
b) Commitments related to scope of consolidationAs part of its divestment transactions, the Group has granted indemnifi cation commitments, for which the exposure is considered remote, for a total maximum amount still in force at December 31, 2013 of 555 million euros.
In addition, the European Bank for Reconstruction and Development (EBRD) increased late 2009 by 15% its minority stake in our Cement operations in Russia. Starting from December 2015, the Group will have the right to buy back this additional minority stake at fair market value. Assuming that this call option is not exercised, the Group could be induced to sell all or part of its own stake to a third party or to the EBRD.
2) COMMITMENTS RECEIVED
Pursuant to a settlement agreement dated June 21, 2012 (which has been approved by Lafarge’s Board of Directors and that will be presented to the next Shareholders’ Meeting), Orascom Construction Industries S.A.E (OCI) paid to Lafarge 73 million euros as a global settlement amount to settle warranties triggered by Lafarge from the acquisition in 2008 of the Cement activities of OCI, except two specifi c items for which warranties are maintained.
Lafarge - Registration Document 2013 • F65
NOTES TO THE CONSOLIDATED FINANCIAL STATEMENTS
F
Note 28 Off Balance Sheet Commitments

NOTE 29 LEGAL AND ARBITRATION PROCEEDINGS
In the ordinary course of its business, Lafarge is involved in certain number of judicial and arbitral proceedings. Lafarge is also subject to certain claims and lawsuits which fall outside the scope of the ordinary course of its business, the most signifi cant of which are summarized below.
The amount of provisions made is based on Lafarge’s assessment of the level of risk on a case-by-case basis and depends on its assessment of the basis for the claims, the stage of the proceedings and the arguments in its defense, it being specifi ed that the occurrence of events during proceedings may lead to a reappraisal of the risk at any moment.
COMPETITION
Germany – Cement: On April 14, 2003, the German competition authority (the Bundeskartellamt), announced that it was imposing fi nes on the major German cement companies, including on our subsidiary Lafarge Zement, for anti-competitive practices in Germany. Further to the different steps of procedures and decisions from this date, and following a fi nal judgment by the Federal Supreme Court on April 9, 2013, the fi nal net payment borne by our subsidiary pursuant to this procedure amounted to 18.4 million euros.
In parallel to the above closed case, starting in 2006, a civil action was brought before the Dusseldorf District Court (“Landgericht”) by third parties claiming for damages resulting from such anti-competitive practices in Germany. Procedures took place and, on December 17, 2013, the “Landgericht” of Düsseldorf rejected the damage claim and also upheld its position that the claims are time-barred. Claimants lodged an appeal to the Court of Appeal (“Oberlandesgericht”) against the verdict.
India – Cement: An investigation started in 2011 against the major players of the cement Indian market. Further to this investigation, by an Order dated June 21, 2012, the Competition Commission of India has found cement manufacturers in violation of the provisions of the Competition Act, 2002, which deals with anticompetitive agreements. The Commission has imposed a penalty on 11 cement manufacturers, including our subsidiary Lafarge India PVT Limited. The Commission has also imposed a penalty on the Indian Cement Manufacturers Association. The penalty imposed on Lafarge India PVT Limited amounts to 4.8 billion rupees (56 million euros(1)), out of a total amount of penalty of 60 billion rupees (703 million euros(1)). Lafarge India PVT Limited vigorously challenges the merits of this order and, on August 31, 2012, lodged an appeal with the Competition Appeal Tribunal (the “CAT”) as well as a request for a stay of the collection of the penalty until fi nal Judgment of the CAT. On May 17, 2013, further to different initial procedural steps, the CAT issued an Order, granting a conditional stay, subject to the deposit of 10% of the penalty imposed by the Commission. Hence, Lafarge India PVT deposited the corresponding amount (i.e. 6.7 million euros) on June 24, 2013, while requesting the Tribunal to rectify and reduce this amount due to a calculation error. The application to rectify the amount of deposit will be heard along with the main appeal. Hearings on the merits of the case will resume in February 2014 and a fi nal Order by the CAT may be expected in the course of 2014. No provision has been recorded.
United States – Canada – Gypsum: Commencing in December 2012, a series of antitrust cases have been fi led against the entire wallboard industry, including Lafarge North America Inc., in federal courts located in several cities, including Philadelphia, Chicago and Charlotte in the
United Sates of America. All these cases have now been consolidated in the Eastern District of Pennsylvania and Plaintiffs have fi led a Consolidated Complaint. Plaintiffs generally allege that the industry colluded to raise prices in the years 2012 and 2013. The plaintiffs do not allege any direct evidence of an agreement among the defendants, and instead rely largely on alleged circumstantial evidence. Lafarge North America Inc. believes these lawsuits are without merit and intends to vigorously defend the litigation. No provision has been recorded.
Then, in September 2013, two class actions were fi led, respectively in the jurisdictions of Quebec and Ontario (the latest on behalf of potential claimants in Canada) against the members of the wallboard industry, including our subsidiaries Lafarge Canada Inc. and Lafarge North America Inc . The Plaintiffs allege generally that the industry colluded to raise prices between September 2011 and the date of the claim. Based on the information available at this stage on these recently served actions, our subsidiaries believe they are without merit and intend to vigorously defend the litigation. No provision has been recorded.
Also on competition matters, there are two industry-wide inquiries which do not constitute judicial proceedings and for which no provision has been recorded.
Europe – Cement: In November 2008, the major European cement players, including Lafarge, were investigated by the European Commission for alleged anti-competitive practices. By a letter dated December 6, 2010, the Commission notifi ed the parties of the opening of an offi cial investigation (which does not however constitute a statement of objection), while reminding them that at that stage, it did not have conclusive evidence of anti-competitive practices. The alleged offences, which will be the subject of the detailed investigation, involve any possible restrictions of commercial trade in or upon entry to the European Economic Area, market sharing, and coordination of prices on the cement and related markets (concrete, aggregates). In the case of Lafarge, seven countries are quoted: France, the United Kingdom, Germany, Spain, the Czech Republic, Greece and Austria. Lafarge answered to the Commission’s various requests for information. In November 2011, further to the answer by Lafarge of the last questionnaire received, the Commission notifi ed Lafarge an injunction to waive any reserve to the answer and provide any further information deemed necessary to complete its investigation, under the threat of a penalty. Lafarge promptly complied with this new request for information and lodged a lawsuit with a view to obtaining the annulment of such injunction decision. By letter received on January 15, 2013, the European Commission confi rmed that no penalty will be imposed to Lafarge under this injunction and, accordingly, Lafarge withdrew the lawsuit aiming to obtain its annulment. During the third quarter of 2012, European offi cials visited the French, German and European cement association. The completion date of this investigation is unknown and no conclusion can be drawn at this stage.
United Kingdom (UK) – Cement: On January 18, 2012, the UK Offi ce of Fair Trading (“OFT”) announced that it had referred the aggregates, cement and ready-mixed concrete markets (the “Industry”) in the UK to the Competition Commission (the “Commission”) for an in-depth sector investigation. The Commission conducted this market investigation in relation to the supply of those products. On May 21, 2013, the Commission published its provisional findings report (the “Preliminary Report”), alleging the existence of combination of structural and conduct features giving rise to an adverse effect on competition in the UK cement market. On June 25, 2013, Lafarge-Tarmac (“LT”) responded to the Preliminary Report, strongly contesting
(1) Translated using the closing exchange rate.
• Lafarge - Registration Document 2013F66
NOTES TO THE CONSOLIDATED FINANCIAL STATEMENTSFF Note 29 Legal and arbitration proceedings

the provisional fi ndings and possible remedies. Then, on October 8, 2013, the Commission published its provisional decision on remedies, requiring LT to divest one cement plant together with certain ready-mixed plants (if required by a prospective purchaser) and two slag granulators (“Divestiture Package”) and imposing some behavioural remedies notably related to the publication of cement market data and price announcement letters. LT responded to this provisional decision on remedies in November 2013. On January 14, 2014, the Commission’s fi nal report (the “Final Report”) was published, confi rming the Divestiture Package (except that there is no need for LT to divest the two slag granulators) and the behavioural remedies. LT disputes the conclusions of the Commission and is reviewing its options taking into account the best interests of its employees, customers and shareholders(1).
OTHER PROCEEDINGS
United States – Hurricane Katrina: Late in 2005, several class actions and individual lawsuits were fi led in the United States District Court for the Eastern District of Louisiana. In their Complaints, plaintiffs allege that our subsidiary, Lafarge North America Inc. (LNA), and/or several other defendants including the federal government, are liable for death, bodily and personal injury and property and environmental damage to people and property in and around New Orleans, Louisiana. Some of the referenced complaints claim that these damages resulted from a barge under contract to LNA that allegedly breached the Inner Harbor Navigational Canal levee in New Orleans during or after Hurricane Katrina. On May 21, 2009, the Court denied plaintiffs’ Motion for Class Certifi cation.
The Judge trial involving the fi rst few plaintiffs commenced in late June 2010. In a ruling dated January 20, 2011, the Judge ruled in favor of LNA. These plaintiffs fi led a Notice of Appeal, but then withdrew it. Our subsidiary then fi led a Motion for Summary Judgment against all the remaining plaintiffs. A Hearing was held by the Court in October 2011 and a decision was handed down on March 2012 granting Summary Judgment in LNA’s favour and against all remaining cases fi led in the Federal Court. Plaintiffs appealed this decision but afterward, voluntarily dismissed their appeal. A new case was fi led
against LNA on September 16, 2011 by the Parish of Saint Bernard in Louisiana State Court. LNA moved to remove the case to Federal Court before the same Judge who had the main litigation and has won that Motion. LNA then moved for Summary Judgment against the Parish of Saint Bernard and won this Motion. Plaintiffs have appealed this ruling on January 3, 2013 and in a Decision dated December 19, 2013, a three judge panel of the Court of Appeals reversed and remanded the case back to the Trial Court for a Jury Trial.
Lafarge North America Inc. vigorously defends itself in this ongoing action. Lafarge North America Inc. believes that the claims against it are without merit. No provision has been recorded.
In connection with acquisitions made in past years, Lafarge or its subsidiaries are or may be faced with various demands or complaints, including those from minority shareholders.
In connection with disposals made in the past years, Lafarge and its subsidiaries provided customary warranties notably related to accounting, tax, employees, product quality, litigation, competition, and environmental matters. Lafarge and its subsidiaries received or may receive in the future notice of claims arising from said warranties. In particular, arbitration was ongoing between Lafarge’s subsidiaries and the buyer of one of our businesses which was claiming a total of 59 million US dollars (42.8 million euros(2 ) ). By a fi nal and binding decision delivered in August 2013, the arbitration tribunal accepted part of the plaintiffs’ claims, ordering our subsidiaries to pay 16.6 million US dollars (12 million euros(2 )) in damages (plus 2 million US dollars (1.5 million euros(2 )) in costs) and rejecting the remaining claims in the amount of 43 million US dollars (31.2 million euros(2 )).
In view of the current analysis, it is globally concluded that no signifi cant provision has to be recognized in this respect.
Finally, certain Group subsidiaries have litigation and claims pending in the normal course of business. The resolution of these matters should not have any signifi cant effect on the Company’s and/or the Group’s fi nancial position, results of operations and cash fl ows. To the Company’s knowledge, there are no other governmental, legal or arbitration proceedings which may have or have had in the recent past signifi cant effects on the Company and/or the Group’s fi nancial position or profi tability.
(1) For an update as of the date of fi ling of this Registration Document, please refer to Section 5.1. page 148 (Risks related to competition and competition low investigations).
(2) Translated using the closing exchange rate.
NOTE 30 RELATED PARTIES
Lafarge has not entered into any transaction with any related parties as defi ned under paragraph 9 of IAS 24, except for information described hereafter and in paragraph B ) disclosed in Note 31.
Transactions with associates and with joint ventures were not material for the years presented except for a loan granted to our associate in Nigeria (Unicem) amounting to 86 million euros as at December 31, 2013 (86 million euros as at December 31, 2012).
See Note 35 (List of significant subsidiaries, joint ventures and investments in associates as at December 31, 2013).
Transactions with other parties or companies related to the Group are as follows:
Within the scope of the purchase of Orascom Building Materials Holding S.A.E. (OBMH) in 2008, the holding company of the Cement activities of Orascom Construction Industries S.A.E. (OCI), Lafarge S.A. has received indemnifi cation guarantees (see Note 28 about the settlement agreement related to warranties granted by Orascom Construction Industries) and entered into a cooperation agreement with OCI. Mr Nassef Sawiris is Chief Executive Offi cer and Director of Orascom Construction Industries N.V., parent company of OCI and Director of Lafarge S.A., and Mr Jérôme Guiraud is a member of Audit comittee of OCI and a director of Lafarge S.A. The cooperation agreement dated December 9, 2007 aims to allow OCI to participate in tenders in respect of the construction of new plants in countries where OCI has the capability to meet certain of Lafarge’s construction needs.
Lafarge - Registration Document 2013 • F67
NOTES TO THE CONSOLIDATED FINANCIAL STATEMENTS
F
Note 30 Related parties

At this stage, the construction agreements entered into with the OCI Group are considered to be arms length business transactions, intervening within the framework of consortia, OCI being one of the members. There is no confl ict of interest between Mr Nassef Sawiris and Lafarge on this subject. Under these agreements, the outstanding balances with the OCI Group are not signifi cant as at December 31, 2013.
From time to time Directors of the Group, or their related entities, may purchase or sell goods from the Group. These purchases or sales are
on the same terms and conditions as those entered into by other Group employees, suppliers or customers.
Certain business relationships between the Group, its Directors and related parties are described in Section 3.1.4 (Materiality tests on business relationships between the Company and its Directors) of the Registration Document (see also the description of related party agreements and commitments detailed in the special report of the statutory auditors on page F 96 ).
NOTE 31 EMPLOYEE COSTS AND COMPENSATION TO DIRECTORS AND EXECUTIVE OFFICERS FOR SERVICES
A) EMPLOYEES AND EMPLOYEE COSTS
AT DECEMBER 31,
2013 2012
Management staff 10,581 11,690
Non-management staff 44,241 46,341
TOTAL NUMBER OF EMPLOYEES (1) 54,822 58,031
Of which: companies accounted for using the proportionate method 9,458 7,050
(1) The headcounts at 100% of our fully consolidated and proportionately consolidated subsidiaries amounted to 63,687 as of December 31, 2013 and 64,337
as of December 31, 2012.
YEARS ENDED DECEMBER 31
(million euros) 2013 2012
TOTAL EMPLOYEES COSTS 2,239 2,425
Of which: companies accounted for using the proportionate method 232 111
B) COMPENSATION TO DIRECTORS AND EXECUTIVE OFFICERS’ FOR SERVICES
The table below presents the compensation by Lafarge S.A. and its subsidiaries to executives who are, at closing date or have been during the period, members of the Board of Directors or of the Group Executive Committee. The Group Executive Committee is composed as defi ned in Section 3.3 – Executive Offi cers – of the Registration Document:
YEARS ENDED DECEMBER 31
(million euros) 2013 2012
Board of Directors(1) 0.6 0.7
Senior Executives 16.5 24.0
Short-term benefits (fixed salary and variable) 11.1 10.4
Post-employment benefits(2) 0.8 10.7
Other long-term benefits 0.8 -
Share-based payments(3) 3.8 2.9
TOTAL 17.1 24.7
(1) Directors’ fees.
(2) Change for the year in post-employment benefit obligation.
(3) Expense of the year estimated in accordance with principles described in Note 2.24.
• Lafarge - Registration Document 2013F68
NOTES TO THE CONSOLIDATED FINANCIAL STATEMENTSFF Note 31 Employee costs and compensation to Directors and executive offi cers for services

NOTE 32 SUPPLEMENTAL CASH FLOW DISCLOSURES
A) CASH FLOW INFORMATION RELATED TO INVESTING ACTIVITIES
The cash fl ows from investments in subsidiaries and joint venture include the purchase price consideration paid for the acquisitions less the cash acquired. No signifi cant acquisition settled in cash occurred in 2013 and in 2012.
The cash fl ows from disposal of assets include the selling price, net of disposal costs and tax and less the cash disposed of. The impact of the disposals in the statement of income is detailed in Note 5. The main disposals in 2013 are more fully described in Note 3.
YEARS ENDED DECEMBER 31
2013 2012
CASH FLOWS FROM DISPOSALS OF ASSETS 1,105 413
of which:
Disposal of our gypsum activities (United States) 498 -
Disposal of our c ement operations in Honduras 144 -
Creation of the joint venture Lafarge Tarmac and disposal of business portfolio 112 -
Disposal of aggregates assets in Georgia (United States) 115 -
Disposal of our c ement operations in Ukraine 83 -
Disposal of our investment in Venezuela 20 20
Disposal of our c ement, a ggregates & c oncrete activities in Missouri and Oklahoma (United States) - 307
Disposal of our minority investment in Japan - 82
Others 133 4
B) CASH FLOW INFORMATION RELATED TO FINANCING ACTIVITIES
The lines “Acquisitions/disposals of ownership interests with no gain/loss in control” refl ect the cash impact of acquisition and disposal of non-controlling interests (minority interests), net of related acquisition/disposal costs (see Note 2).
2013No material acquisitions of ownership interests with no gain of control occurred in 2013.
“Disposals of ownership interests with no loss of control” amounts to 188 million euros and essentially includes the cash proceeds arising from the disposal of non controlling interests in India.
2012“Acquisitions of ownership interests with no gain of control” amounts to 147 million euros and essentially includes puts exercised on non-controlling interests in Ukraine (59 million euros) and acquisition of non-controlling interests in South Korea (32 million euros).
“Disposals of ownership interests with no loss of control” amounts to 21 million euros and essentially includes the cash proceeds arising from the disposal of non controlling interests in Philippines.
Lafarge - Registration Document 2013 • F69
NOTES TO THE CONSOLIDATED FINANCIAL STATEMENTS
F
Note 32 Supplemental cash fl ow disclosures

NOTE 33 AUDITORS’ FEES AND SERVICES
This table sets out the amount of fees billed for each of the last two fi nancial years by each of our auditors, Deloitte & Associés and Ernst & Young et Autres, in relation to audit services, audit-related services, tax and other services provided to us.
(million euros)
DELOITTE & ASSOCIES ERNST & YOUNG ET AUTRES
Amount (excl. tax) % Amount (excl. tax) %
2013 2012 2013 2012 2013 2012 2013 2012
AUDIT FEES
Audit, attestation and review of individual
and consolidated financial statements 6.3 6.3 92% 84% 5.7 5.8 85% 84%
Lafarge S.A. 1.6 1.5 23% 20% 1.4 1.4 21% 20%
Subsidiaries fully and proportionately consolidated 4.7 4.8 69% 64% 4.3 4.4 64% 64%
Audit-related f ees (1) 0.4 1.1 6% 15% 0.8 0.9 12% 13%
Lafarge S.A. 0.2 0.7 3% 10% 0.2 0.1 3% 1%
Subsidiaries fully and proportionately consolidated 0.2 0.4 3% 5% 0.6 0.8 9% 12%
SUB-TOTAL 6.7 7.4 98% 99% 6.5 6.7 97% 97%
OTHER FEES
Tax fees (2) 0.1 0.1 2% 1% 0.2 0.2 3% 3%
Legal and e mployment fees - - - - - - - -
Information technology - - - - - - - -
Others - - - - - - - -
SUB-TOTAL OTHER FEES 0.1 0.1 2% 1% 0.2 0.2 3% 3%
TOTAL FEES 6.8 7.5 100% 100% 6.7 6.9 100% 100%
(1) Audit-related fees are generally fees billed for services that are closely related to the performance of the audit or review of financial statements. These include due
diligence services related to acquisitions, consultations concerning financial accounting and reporting standards, attestation services not required by statute or
regulation, information system reviews.
(2) Tax fees are fees for services related to international and domestic tax compliance, including the review of tax returns and tax services regarding statutory,
regulatory or administrative developments and expatriate tax assistance and compliance.
NOTE 34 SUBSEQUENT EVENTS
SALE OF THE MINORITY STAKE IN EUROPEAN AND SOUTH AMERICAN GYPSUM OPERATIONS
On February 12, 2014, the Group completed the sale of its 20% minority stake in European and South American g ypsum operations for a cash consideration of 145 million euros.
SALE OF AGGREGATES QUARRIES IN MARYLAND (USA)
On February 12, 2014, the Group completed the sale of fi ve aggregates quarries and related assets in Maryland (USA) to Bluegrass Materials for a total enterprise value of 320 million US dollars.
• Lafarge - Registration Document 2013F70
NOTES TO THE CONSOLIDATED FINANCIAL STATEMENTSFF Note 33 Auditors’ fees and services

NOTE 35 LIST OF SIGNIFICANT SUBSIDIARIES, JOINT VENTURES AND INVESTMENTS IN ASSOCIATES AT DECEMBER 31, 2013
The companies listed below are consolidated using the full method, the proportionate method or the equity method based on the principles of consolidation described in Note 2.2 and meet at least one of the following criteria:
d contribution of over 25 million euros to the Group revenue;
d contribution of over 250 million euros to the Group total assets.
Companies Country CementAggregates &
Concrete Other% of
interestConsolidation
Method
Lafarge Ciment de M’sila “LCM” Algeria ■ – – 99.99 Full
Lafarge Bétons Algérie “LBA” Algeria – ■ – 99.50 Full
Lafarge Ciment d’Oggaz “LCO” Algeria ■ – – 99.99 Full
Lafarge Logistique Algérie “LLA” Algeria ■ – – 99.50 Full
Lafarge Zementwerke GmbH Austria ■ – – 70.00 Full
Lafarge Surma Cement Limited Bangladesh ■ – – 29.44 Proportionate
Groupement SCB Lafarge Benin ■ – – 50.00 Proportionate
Centralbeton LTDA Brazil – ■ – 99.75 Full
Industria e comercio de extraçao de Areia Khouri Ltda Brazil ■ – – 99.75 Full
Lafarge Brasil SA Brazil ■ – – 99.76 Full
Concretran S/A Brazil – ■ – 100.00 Full
Cimenteries du Cameroun Cameroon ■ – – 54.73 Full
Lafarge Canada Inc. Canada ■ ■ ■ 100.00 Full
Lafarge Chongqing Cement Co., Ltd. China ■ – – 43.68 Proportionate
Lafarge Dujiangyan Cement Co. Ltd. China ■ – – 33.47 Proportionate
Lafarge Shui On (Dongjun) Cement Co., Ltd. China ■ – – 55.00 Proportionate
Zunyi Sancha Lafarge Shui On Cement Co., Ltd. China ■ – – 55.00 Proportionate
Lafarge Cement a.s. Czech Republic ■ – – 67.98 Full
Lafarge Cementos, SA Ecuador ■ – – 98.57 Full
Lafarge Cement Egypt S.A.E. Egypt ■ – – 53.70 Full
Lafarge Ready Mix S.A.E. Egypt – ■ – 100.00 Full
Granulats Bourgogne Auvergne France – ■ – 70.00 Full
Lafarge Bétons de l’Ouest France – ■ – 100.00 Full
Lafarge Bétons Sud Est France – ■ – 100.00 Full
Lafarge Bétons Sud Ouest France – ■ – 100.00 Full
Lafarge Bétons France France – ■ – 100.00 Full
Lafarge Ciments France ■ – – 100.00 Full
Lafarge Ciments Distribution France ■ – – 100.00 Full
Lafarge Ciments Réunion France ■ – – 82.92 Full
Lafarge Granulats Ouest France – ■ – 100.00 Full
Lafarge Granulats France France – ■ – 100.00 Full
Lafarge Granulats Sud France – ■ – 100.00 Full
Société des Ciments Antillais France ■ – – 69.73 Full
Béton Chantiers Charente Limousin France – ■ – 81.38 Full
Etex Dryco S.A.S. France – – ■ 20.00 Equity
Lafarge Zement Karsdorf GmbH Germany ■ – – 100.00 Full
Lafarge Zement Wössingen GmbH Germany ■ – – 100.00 Full
Heracles General Cement Company S.A. Greece ■ – – 88.99 Full
Lafarge Cement Hungary Ltd. Hungary ■ – – 70.00 Full
Lafarge - Registration Document 2013 • F71
NOTES TO THE CONSOLIDATED FINANCIAL STATEMENTS
F
Note 35 List of signifi cant subsidiaries, joint ventures and investments in associates at December 31, 2013

Companies Country CementAggregates &
Concrete Other% of
interestConsolidation
Method
Lafarge India PVT Limited India ■ – – 85.97 Full
Lafarge Aggregates & Concrete India Private Limited India – ■ – 85.97 Full
Pt Lafarge Cement Indonesia Indonesia ■ – – 100.00 Full
Bazian Cement Company Limited Iraq ■ – – 70.00 Full
United Cement Company Limited Iraq ■ – – 60.00 Full
Lafarge Company for Construction Contracting
and General Trading, Ltd.
Iraq – ■ – 51.00 Full
Arabian Concrete Supply Cement Jordan – ■ – 25.64 Full
Jordan Cement Factories Company PSC Jordan ■ – – 50.28 Full
Bamburi Cement Ltd. Kenya ■ – – 58.60 Full
Lafarge Halla Cement Corporation Korea ■ – – 97.23 Full
Lafarge Cement Malawi Ltd. Malawi ■ – – 100.00 Full
CMCM Perniagaan sdn bhd Malaysia ■ – – 51.00 Full
Lafarge Malaysia Berhad Malaysia ■ – – 51.00 Full
Lafarge Cement sdn bhd Malaysia ■ – – 51.00 Full
Lafarge Concrete (Malaysia) sdn bhd Malaysia – ■ – 47.56 Full
Lafarge (Mauritius) Cement Ltd. Mauritius ■ 58.36 Full
ELC Tenedora Cementos, S.A.P.I. de C.V. Mexico ■ – – 47.00 Equity
Lafarge Ciment (Moldova) SA Moldova ■ – – 95.31 Full
Lafarge Betons Morocco – ■ – 34.64 Proportionate
Lafarge Ciments Morocco ■ – – 34.93 Proportionate
United Cement Company of Nigeria Ltd. Nigeria ■ – – 35.00 Equity
Ashakacem plc Nigeria ■ – – 58.60 Full
Lafarge Cement WAPCO Nigeria plc Nigeria ■ – – 60.00 Full
Lafarge Pakistan Cement Limited Pakistan ■ – – 73.22 Full
Lafarge Holdings (Philippines) Inc. Philippines ■ – – 100.00 Full
Lafarge Cement S.A. Poland ■ – – 100.00 Full
Lafarge Kruszywa i Beton Poland – ■ – 100.00 Full
Readymix Qatar W.L.L. Qatar – ■ – 49.00 Proportionate
Lafarge Ciment (Romania) S.A. Romania ■ – – 98.56 Full
OAO Lafarge Cement Russia ■ – – 75.00 Full
Upravlyayushchaya Kompaniya “Karelnerud” LLC Russia – ■ – 51.00 Full
AlSafwa Cement Company Saudi Arabia ■ – – 25.00 Equity
Lafarge Beocinska Fabrika Cementa Serbia ■ – – 100.00 Full
Lafarge Cement Singapore Pte Ltd. Singapore ■ – – 51.00 Full
Lafarge Aggregates South Africa (Pty.) Ltd. South Africa – ■ – 100.00 Full
Lafarge Gypsum (Pty.) Ltd. South Africa – – ■ 100.00 Full
Lafarge Industries South Africa (Pty.) Ltd. South Africa ■ ■ – 100.00 Full
Lafarge Aridos y Hormigones, S.A.U. Spain – ■ – 100.00 Full
Lafarge Cementos, S.A.U. Spain ■ ■ – 100.00 Full
Lafarge Mahaweli Cement (Private) Limited Sri Lanka ■ – – 90.00 Full
Cementia Trading AG Switzerland ■ – – 100.00 Full
Lafarge Cement Syria Syria ■ – – 98.67 Full
Mbeya Cement Company Limited Tanzania ■ – – 62.76 Full
Dalsan Alci Sanayi Ve Ticaret AS Turkey – – ■ 50.00 Proportionate
Hima Cement Ltd. Uganda ■ – – 71.01 Full
Klesivskiy Karier Nerudnykh Kopalyn “Technobud” Ukraine – ■ – 51.00 Full
• Lafarge - Registration Document 2013F72
NOTES TO THE CONSOLIDATED FINANCIAL STATEMENTSFF Note 35 List of signifi cant subsidiaries, joint ventures and investments in associates at December 31, 2013

Companies Country CementAggregates &
Concrete Other% of
interestConsolidation
Method
Lafarge Emirates Cement LLC United Arab
Emirates
■ – – 50.00 Proportionate
Lafarge Tarmac Holdings Ltd. United Kingdom ■ ■ – 50.00 Proportionate
Lafarge Building Materials Inc. USA ■ – – 100.00 Full
Lafarge North America Inc. USA ■ ■ ■ 100.00 Full
Lafarge Cement Zambia plc Zambia ■ – – 84.00 Full
Lafarge Cement Zimbabwe Limited Zimbabwe ■ – – 76.46 Full
Lafarge - Registration Document 2013 • F73
NOTES TO THE CONSOLIDATED FINANCIAL STATEMENTS
F
Note 35 List of signifi cant subsidiaries, joint ventures and investments in associates at December 31, 2013
STATUTORY ACCOUNTS DECEMBER 31, 2013STATUTORY AUDITORS’ REPORT ON THE ANNUAL FINANCIAL STATEMENTS
FOR THE YEAR ENDED DECEMBER 31, 2013
To the Shareholders, In compliance with the assigned entrusted to us by your Annual General Meeting, we hereby report to you for the year ended December 31, 2013 on:
d the audit of the accompanying annual financial statements of Lafarge ,
d the justification of our assessments,
d the specific verifications and information required by law.These annual fi nancial statements have been approved by the Board of Directors. Our role is to express an opinion on these annual fi nancial statements, based on our audit.
I. OPINION ON THE ANNUAL FINANCIAL STATEMENTS
We conducted our audit in accordance with professional standards applicable in France. Those standards require that we plan and perform the audit to obtain reasonable assurance about whether the annual fi nancial statements are free of material misstatement. An audit involves performing procedures, using sampling techniques or other methods of selection to obtain audit evidence about the amounts and disclosures in the annual fi nancial statements. An audit also includes evaluating the appropriateness of accounting policies used and the reasonableness of accounting estimates made, as well as the overall presentation of the annual fi nancial statements. We believe that the audit evidence we have obtained is suffi cient and appropriate to provide a basis for our opinion.
In our opinion, the annual fi nancial statements give a true and fair view of the assets and liabilities and of the fi nancial position of the company as of December 31, 2013 and of the results of its operations for the year then ended in accordance with French accounting principles.
II. JUSTIFICATION OF OUR ASSESSMENTS
In accordance with the requirements of article L. 823-9 of the French Commercial Code (Code de Commerce) relating to the justifi cation of our assessments, we bring to your attention the following matters:
Note "2.3 Financial assets" to the annual fi nancial statements describes the accounting policies and methods applied to investments and states that the earnings outlooks are established based on currently available information and take into account the current economic crisis or political instability affecting some of the Group’s markets. They do not refl ect any possible major disruption of the current economical or geopolitical environment. Our procedures consisted in reviewing available documents and assessing the reasonableness of adopted valuations and the appropriateness of the information disclosed in the notes to the annual fi nancial statements.
The assessments were made as part of our audit of the annual fi nancial statements taken as a whole, and therefore contributed to the opinion we formed which is expressed in the fi rst part of this report.
III. SPECIFIC VERIFICATIONS AND INFORMATION
We have also performed, in accordance with professional standards applicable in France, the specifi c verifi cations required by French law.
We have no matters to report as to the fair presentation and the consistency with the annual fi nancial statements of the information given in the management report of the Board of Directors and in the documents addressed to shareholders with respect to the fi nancial position and the annual fi nancial statements.
Concerning the information given in accordance with the requirements of Article L. 225-102-1 of the French Commercial Code (Code de commerce) relating to remunerations and benefi ts received by the directors and any other commitments made in their favor, we have verifi ed its consistency with the annual fi nancial statements, or with the underlying information used to prepare these annual fi nancial statements and, where applicable, with the information obtained by your Company from companies controlling your Company or controlled by it. Based on this work, we attest to the accuracy and fair presentation of this information. In accordance with French law, we have verifi ed that the required information concerning the identity of the shareholders and holders of the voting rights has been properly disclosed in the management report.
Neuilly-sur-Seine and Paris-la-Défense, February 28, 2014
The Statutory Auditors
DELOITTE & ASSOCIÉ S
French original signed by
ERNST & YOUNG et Autres
French original signed by
Arnaud de Planta Frédéric Gourd Alain Perroux Nicolas Macé
This is a free translation into English of the statutory auditors’ report issued in French and is provided solely for the convenience of English speaking users. The statutory auditors’ report includes information specifically required by French law in such reports, whether modified or not. This information
is presented below the opinion on the Company annual financial statements and includes an explanatory paragraph discussing the auditors’ assessments of certain significant accounting and auditing matters. These assessments were considered for the purpose of issuing an audit opinion on the Company
annual financial statements taken as a whole and not to provide separate assurance on individual account captions or on information taken outside of the Company annual financial statements. This report also includes information relating to the specific verification of information given in the
management report and in the documents addressed to the shareholders. This report should be read in conjunction with, and construed in accordance with, French law and professional auditing standards applicable in France.
• Lafarge - Registration Document 2013F74
STATUTORY ACCOUNTSFF Statutory auditors’ report on the annual fi nancial statements

COMMENTS ON INCOME AND FINANCIAL POSITION STATEMENTS
The fi nancial statements for year 2013 show a net income after tax of 462 million euros to be compared with 103 million euros in 2012.
d This variation results from the following events:
d the increase in operating income of 33 million euros mainly due to the reduction of costs invoiced by certain subsidiaries;
d strong increase of 354 million euros in dividends received;
d non recurring loss of 23 million euros that mainly corresponds to a provision for bonus shares grants;
d the income tax amount includes 70 million euros already received or receivable from subsidiaries in the group tax regime.
d The main variations in the statement of financial position are:
d the change in the gross value of shares of subsidiaries (-217 million euros) is due to the reduction of capital of Sabelfi snc;
d the increase in provisions for losses and contingencies of 22 million euros due to an additional provision for the grant of bonus shares;
d the net increase in borrowings, loans and short and long term advances to Group entities for 39 million euros;
d the decrease in equity of 183 million euros, before profit, resulting from the appropriation of the previous year’s net income;
d the decrease in net debt (458 million euros) which stood at 11,339 million euros at December 31, 2013.
On December 31, 2013 gross debt includes bonds for 11,420 million euros, borrowings from Group companies for 353 million euros and other borrowings from fi nancial institutions for 776 million euros.
APPROPRIATION OF EARNINGS
It will be proposed to the General Meeting an appropriation of the earnings for fi nancial year 2013 that allows a normal dividend of 1.00 euro per share and a loyalty dividend of 1.10 euro per share, as follows:
Origins:
Earnings 462,306,368.34
Retained earnings (1) 1,560,046,716.95
TOTAL 2,022,353,085.29
Appropriation:
Legal reserve 6,267 ,035.53
Dividend
- First dividend (5% of the par value of the share) 57,469,492.40
- Additional dividend (total dividend – first dividend) 229,877,969.60
- Maximum amount of the 10% increase 1,919,358.60
- Total dividend 289,266,820.60
Retained earnings 1,726,819 ,229.16
TOTAL 2,022,353,085.29
(1) After adjustments relating to events not taken into account on the date on which the appropriation of earning submitted to the previous Shareholders’ Meeting was
completed (a) dividend received in relation to new shares giving right to dividend created before the dividend detachment date, which amounted to 75,399 euros,
(b) dividend received in relation to shares previously held by the Company and which were no longer held by the Company on the dividend detachment
date, which amounted to 139,198 euros, (c) loss of the right to the 10% increase of the dividend for some registered shares before payment of the dividend,
corresponding to 119,470.70 euros.
Lafarge - Registration Document 2013 • F75
STATUTORY ACCOUNTS
F
Comments on Income and fi nancial position statements

We remind the Shareholders’ Meeting that the dividends distributed in previous years were as follows:
Year 2012 2011 2010
Number of shares 287,255,502 287,247,518 286,453,779
Normal dividend per share 1.00 0.50 1.00
Loyalty dividend per share 1.10 0.55 1.10
STATEMENT OF INCOME
YEARS ENDED DECEMBER 31,
(million euros) NOTES 2013 2012
Production sold (services) 506 517
Provision reversals 3 21 15
Operating Revenue 527 532
Other purchases and external charges (350) (381)
Duties and taxes (11) (7)
Employee expenses (153) (150)
Depreciation and amortization 3 (24) (23)
Provision allowance 3 (24) (39)
Operating expenses (562) (600)
OPERATING INCOME (35) (68)
Income from investments 4 1,218 915
Interest and similar income 5 78 54
Foreign exchange gains 33 23
Provision reversals 6 4 6
Financial Income 1,333 998
Interest and similar expenses 7 (814) (817)
Foreign exchange losses (31) (23)
Provision allowance 6 (14) (14)
Financial Expenses (859) (854)
NET FINANCIAL INCOME/(COST) 474 144
CURRENT OPERATING INCOME BEFORE TAX 439 76
EXCEPTIONAL INCOME/(LOSS) 8 (23) (39)
Income tax credit/(expense) 9 46 66
NET INCOME 462 103
• Lafarge - Registration Document 2013F76
STATUTORY ACCOUNTSFF Statement of income

BALANCE SHEET
ASSETS AT DECEMBER 31,
(million euros) NOTES
2013 2012
Gross amount
Depreciation, amortization,
impairment Net amount Net amount
Intangible assets and property, plant and equipment 10 233 140 93 92
Financial assets (1) 11 25,754 - 25,754 25,994
Investments 28 25,272 - 25,272 25,485
Long-term receivables from investments 21 471 - 471 498
Other financial assets 11 - 11 11
NON-CURRENT ASSETS 25,987 140 25,847 26,086
Other receivables 21 2,396 1 2,395 3,851
Marketable securities 12 1 - 1 11
Cash and cash equivalents 1,209 - 1,209 385
CURRENT ASSETS 3,606 1 3,605 4,247
Debenture redemption premiums 14 26 - 26 36
Cumulative translation adjustments 14 278 - 278 206
TOTAL ASSETS 29,897 141 29,756 30,575
(1) Of which less than one year 25 27
EQUITY AND LIABILITIES (BEFORE APPROPRIATION) AT DECEMBER 31,
(million euros) Notes 2013 2012
Common stock 1,149 1,149
Additional paid-in capital 9,856 9,853
Revaluation reserves 3 3
Legal reserve 109 103
Other reserves 649 649
Retained earnings 1,560 1,752
Net income for the year 462 103
Tax-driven provisions 1 1
NET EQUITY 15 13,789 13,613
PROVISIONS FOR LOSSES AND CONTINGENCIES 16 175 153
Debenture issues 11,420 11,250
Bank borrowings (1) 769 582
Other loans and commercial paper 360 361
Financial debt 18 12,549 12,193
Tax and employee-related liabilities 48 69
Other liabilities 21 2,863 4,295
LIABILITIES (2) 15,460 16,557
Cumulative translation adjustments 14 332 252
TOTAL EQUITY AND LIABILITIES 29,756 30,575
(1) Of which current bank overdrafts 10 18
(2) Of which less than one year 4,885 5,636
Lafarge - Registration Document 2013 • F77
STATUTORY ACCOUNTSBalance sheet
F
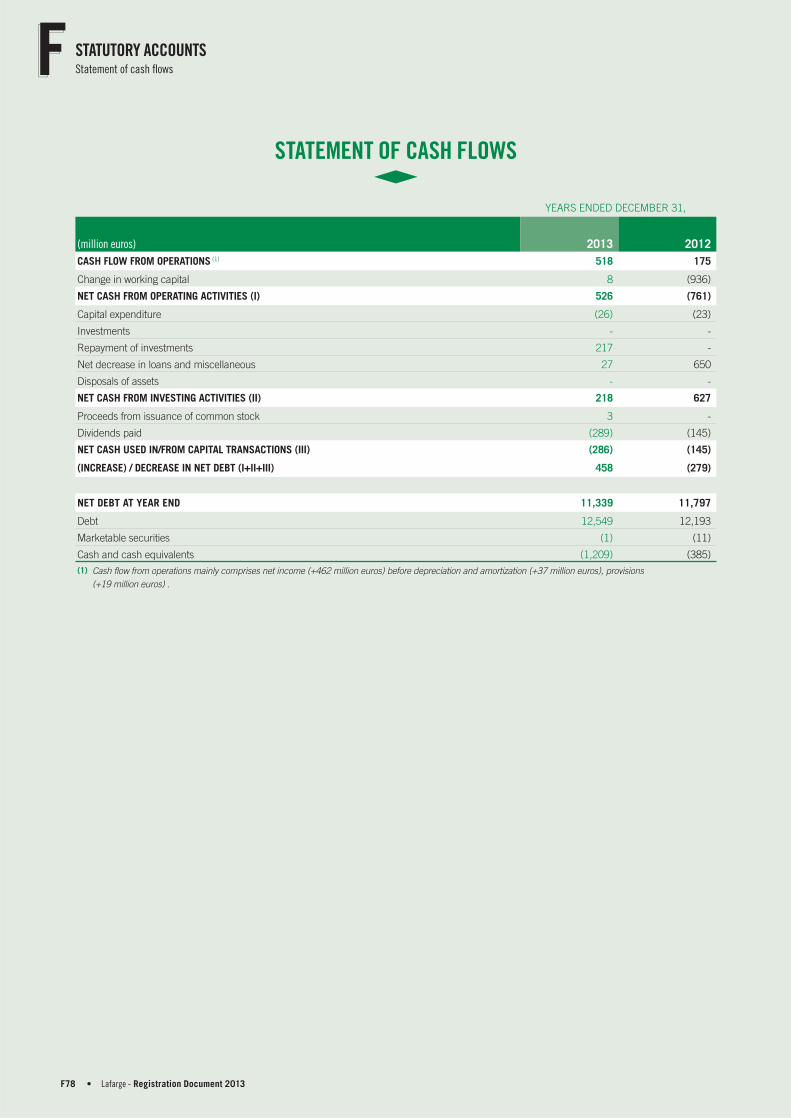
STATEMENT OF CASH FLOWS
YEARS ENDED DECEMBER 31,
(million euros) 2013 2012
CASH FLOW FROM OPERATIONS (1) 518 175
Change in working capital 8 (936)
NET CASH FROM OPERATING ACTIVITIES (I) 526 (761)
Capital expenditure (26) (23)
Investments - -
Repayment of investments 217 -
Net decrease in loans and miscellaneous 27 650
Disposals of assets - -
NET CASH FROM INVESTING ACTIVITIES (II) 218 627
Proceeds from issuance of common stock 3 -
Dividends paid (289) (145)
NET CASH USED IN/FROM CAPITAL TRANSACTIONS (III) (286) (145)
(INCREASE) / DECREASE IN NET DEBT (I+II+III) 458 (279)
NET DEBT AT YEAR END 11,339 11,797
Debt 12,549 12,193
Marketable securities (1) (11)
Cash and cash equivalents (1,209) (385)
(1) Cash flow from operations mainly comprises net income (+462 million euros) before depreciation and amortization (+37 million euros), provisions
(+19 million euros) .
• Lafarge - Registration Document 2013F78
STATUTORY ACCOUNTSFF Statement of cash fl ows

NOTES TO THE PARENT COMPANY FINANCIAL STATEMENTS
NOTE 1 SIGNIFICANT EVENTS OF THE PERIOD
Lafarge S.A. issued a new bond for a total amount of 750 million euros (see Note 18).
NOTE 2 ACCOUNTING POLICIES
The fi nancial statements have been prepared in accordance with the provisions set forth in the French General Chart of Accounts (“Plan Comptable Général” – CRC regulation 99-03).
The accounting policies applied by the Company are described below:
2.1 INTANGIBLE ASSETS
Intangible assets are recorded at acquisition cost and mainly include purchased software and related development costs.
These assets are amortized on a straight-line basis over fi ve to seven years from the date of commissioning.
2.2 PROPERTY, PLANT AND EQUIPMENT
Property plant and equipment are recorded at historical cost, except for those items purchased before December 31, 1976 that have been recorded based on their revalued amounts (legal revaluation).
Depreciation is recorded using the straight-line method (except for computer hardware, which is depreciated using the declining balance method) over the estimated useful life of items of property, plant and equipment as follows:
d buildings: 25 years;
d equipment: 3 to 10 years;
d vehicles: 4 years.
Accelerated depreciation classifi ed in the balance sheet under tax driven provisions is recorded when the fi scally authorized period is less than the estimated useful life or when the depreciation method is different.
2.3 FINANCIAL ASSETS
InvestmentsThe gross value of investments is equal to the purchase price excluding acquisition costs, after the 1976 revaluation adjustment for investments purchased before this date.
Acquisition costs are expensed in the fi scal year.
When the current value is less than the gross value, a provision for impairment is recognized in the amount of the difference. The current value is determined taking into account the share of net equity held, the earnings outlook or the quoted market price, if relevant. The earnings outlook is determined using either an estimated cash fl ows approach or a market approach (multiple of gross operating income).
It is established based on currently available information and takes into account political and economical risks of the countries involved. These forecasts do not refl ect any possible major disruption of the current economical or geopolitical environment. When the Company’s share in the net equity of the investment is negative, a provision for contingencies is recorded, if justifi ed.
Long-term receivables from investmentsThese are long-term loans granted to companies held directly or indirectly by Lafarge S.A. Long-term receivables from investments are recorded at their nominal value.
Long-term receivables from investments are distinguished from current accounts received or granted to subsidiaries, used for daily cash management.
An impairment loss is recognized in the event of risk of non-recovery.
Treasury sharesLafarge S.A. treasury shares are classifi ed as “Financial assets” in the balance sheet except when they are earmarked to cover purchase option plans and performance share plans.
2.4 MARKETABLE SECURITIES
Shares are valued in accordance with CRC regulation 2008-15.
Lafarge S.A. treasury shares are classifi ed as “Marketable securities” in the balance sheet when they are earmarked to cover purchase option plans and performance share plans.
When plans are likely to be exercised and a cash outfl ow is probable, a provision for contingencies is recorded for the corresponding shares, equal to the difference between the value of shares allocated to the plans and the exercise price of each of the plans. For Lafarge S.A. employees, this provision is spread out over the vesting period.
When plans are not likely to be exercised, an impairment loss is recognized for the corresponding shares if the market price of the shares is lower than the gross value.
2.5 FOREIGN CURRENCY – DENOMINATED TRANSACTIONS
Payables and receivables denominated in foreign currencies are translated into euros using the period end closing exchange rate. The resulting unrealized exchange gains or losses are recorded in the translation adjustment accounts in the balance sheets.
Lafarge - Registration Document 2013 • F79
NOTES TO THE STATUTORY ACCOUNTS
F
Note 2 Accounting policies

Unrealized exchange losses are provided in full, except when offset by unrealized foreign exchange gains on payables and receivables or on off-balance sheet commitments expressed in the same currency and with similar maturities.
2.6 INTEREST RATE DERIVATIVES
Gains and losses on these contracts are calculated and recognized to match the recognition of income and expenses on the hedged debt.
2.7 BOND ISSUE AND REDEMPTION PREMIUMS
Bond issues to be redeemed with a premium are recognized in liabilities on the balance sheet for their total amount, including redemption premiums. An offsetting entry is then made for redemption premiums which are recognized in assets and amortized on a straight-line basis over the term of the bond issue. Other expenses and commission relating to these bonds are expensed in the fi nancial year incurred.
2.8 NET EQUITY
Expenses relating to capital increases are deducted from additional paid-in capital.
2.9 PROVISIONS FOR LOSSES AND CONTINGENCIES
A provision is recognized when an obligation which is probable or certain will result in an outfl ow of resources with no offsetting entry.
2.10 INCOME TAX
Lafarge S.A., together with its French subsidiaries held directly or indirectly more than 95%, has elected to report income tax under the tax group regime as defi ned in article 223A and following of the French General Tax Code (CGI).
The tax savings resulting from the difference between the income tax recorded separately for each of the consolidated entities and the income tax calculated based on the taxable results of the consolidated group is recorded at Lafarge S.A.
Lafarge S.A. is liable to the French Treasury for the full tax charge calculated based on the profi ts and losses of all tax group companies.
2.11 RETIREMENT BENEFIT OBLIGATION
Provisions are recognized to cover termination benefi ts and other post-employment benefi ts. These provisions are based on periodic actuarial valuations performed using the projected unit credit method.
This method takes into account seniority, life expectancy and Company employee turnover, as well as salary increase and discounting assumptions.
Actuarial gains and losses resulting from a change in actuarial assumptions or experience adjustments are recognized when they exceed a corridor corresponding to 10% of the value of obligations. They are amortized over the average expected remaining service lives of the plans’ benefi ciaries.
NOTE 3 DEPRECIATION AND AMORTIZATION, OPERATING PROVISION (ALLOWANCE) REVERSAL
3.1 DEPRECIATION AND AMORTIZATION
(million euros) 2013 2012
Intangible assets (21) (20)
Property, plant and equipment (3) (3)
DEPRECIATION AND AMORTIZATION (24) (23)
3.2 OPERATING PROVISION (ALLOWANCE) REVERSAL
(million euros)
2013 2012
Allowance Reversal Allowance Reversal
Pensions obligations and end-of-service benefits (1) (23) 10 (20) 15
Other operating provisions (1) 11 (19) -
OPERATING PROVISION (ALLOWANCE) REVERSAL (24) 21 (39) 15
(1) See Note 17 “Pension benefit obligations” for more information.
• Lafarge - Registration Document 2013F80
NOTES TO THE STATUTORY ACCOUNTSFF Note 3 Depreciation and amortization, operating provision (allowance) reversal

NOTE 4 FINANCIAL INCOME FROM INVESTMENTS
(million euros) 2013 2012
Dividends received from French subsidiaries 751 639
Dividends received from foreign subsidiaries 422 180
DIVIDENDS RECEIVED 1,173 819
INCOME ON LONG-TERM RECEIVABLES FROM INVESTMENTS 45 96
TOTAL FINANCIAL INCOME FROM INVESTMENTS 1,218 915
NOTE 5 INTEREST AND SIMILAR INCOME
Interest and similar income breaks down as follows:
(million euros) 2013 2012
Revenue from current account advances to Group companies 57 35
Other 21 19
INTEREST AND SIMILAR INCOME 78 54
NOTE 6 FINANCIAL PROVISION (ALLOWANCE) REVERSAL
Financial provision (allowances) reversals break down as follows:
(million euros)
2013 2012
Allowance Reversal Allowance Reversal
Investment - 4 - -
Long term receivable for investment - - - 4
IMPAIRMENT OF ASSETS - 4 - 4
Foreign exchange loss - - - 2
Other (1) - - -
PROVISIONS FOR LOSSES AND CONTINGENCIES (1) - - 2
REDEMPTION PREMIUMS (13) - (14) -
TOTAL (14) 4 (14) 6
Lafarge - Registration Document 2013 • F81
NOTES TO THE STATUTORY ACCOUNTS
F
Note 6 Financial provision (allowance) reversal
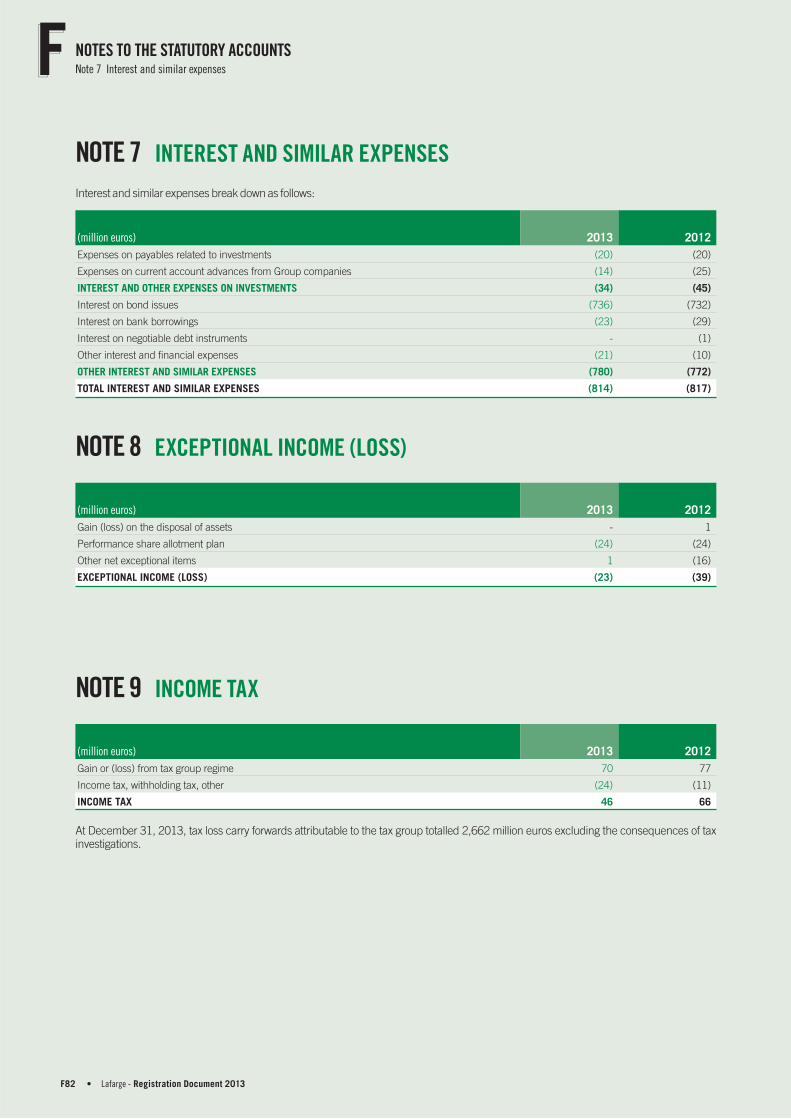
NOTE 7 INTEREST AND SIMILAR EXPENSES
Interest and similar expenses break down as follows:
(million euros) 2013 2012
Expenses on payables related to investments (20) (20)
Expenses on current account advances from Group companies (14) (25)
INTEREST AND OTHER EXPENSES ON INVESTMENTS (34) (45)
Interest on bond issues (736) (732)
Interest on bank borrowings (23) (29)
Interest on negotiable debt instruments - (1)
Other interest and financial expenses (21) (10)
OTHER INTEREST AND SIMILAR EXPENSES (780) (772)
TOTAL INTEREST AND SIMILAR EXPENSES (814) (817)
NOTE 8 EXCEPTIONAL INCOME (LOSS)
(million euros) 2013 2012
Gain (loss) on the disposal of assets - 1
Performance share allotment plan (24) (24)
Other net exceptional items 1 (16)
EXCEPTIONAL INCOME (LOSS) (23) (39)
NOTE 9 INCOME TAX
(million euros) 2013 2012
Gain or (loss) from tax group regime 70 77
Income tax, withholding tax, other (24) (11)
INCOME TAX 46 66
At December 31, 2013, tax loss carry forwards attributable to the tax group totalled 2,662 million euros excluding the consequences of tax investigations.
• Lafarge - Registration Document 2013F82
NOTES TO THE STATUTORY ACCOUNTSFF Note 7 Interest and similar expenses

NOTE 10 INTANGIBLE ASSETS AND PROPERTY, PLANT & EQUIPMENT
The change in intangible assets and property, plant and equipment in the period breaks down as follows:
(million euros) December 31, 2012 Increase Decrease December 31, 2013
INTANGIBLE ASSETS
Gross amount 167 24 1 190
Accumulated amortization (88) (21) - (109)
Net amount 79 3 1 81
PROPERTY, PLANT & EQUIPMENT
Gross amount 41 2 1 42
Accumulated amortization (28) (3) (1) (30)
Net amount 13 (1) - 12
TOTAL 92 2 1 93
No impairment is recorded for intangible assets and property, plant and equipment.
NOTE 11 FINANCIAL ASSETS
(million euros) (Gross value) December 31, 2012 Increase Decrease December 31, 2013
Investments (1) 25,489 - 217 25,272
Long-term receivables from investments 498 25 52 471
Other investment securities 10 - - 10
Security deposit 1 - - 1
Other financial assets 11 - - 11
FINANCIAL ASSETS 25,998 25 269 25,754
(1) The list of subsidiaries and investments is presented in Note 28 “Investments”.
The decrease in investments concerns the capital decrease of the subsidiary Sabelfi snc.
Long-term receivables are composed of long-term loans granted to directly or indirectly-held affi liated companies.
NOTE 12 MARKETABLE SECURITIES
(million euros) December 31, 2012 Increase Decrease December 31, 2013
Lafarge S.A. treasury shares (1) 11 - 10 1
MARKETABLE SECURITIES 11 - 10 1
(1) See Note 13 “Lafarge S.A. treasury shares” for more information.
Lafarge - Registration Document 2013 • F83
NOTES TO THE STATUTORY ACCOUNTS
F
Note 12 Marketable securities

NOTE 13 LAFARGE S.A. TREASURY SHARES
(number of shares)December 31,
2012 Increase Decrease ReclassificationDecember 31,
2013
Share purchase option plan - - - - -
Performance share plans 157,283 - 139,348 - 17,935
MARKETABLE SECURITIES 157,283 - 139,348 - 17,935
(in million euros)December 31,
2012 Increase Decrease ReclassificationDecember 31,
2013
Share purchase option plan - - - - -
Performance share plans 11 - 10 - 1
MARKETABLE SECURITIES 11 - 10 - 1
NOTE 14 TRANSLATION ADJUSTMENTS AND BOND REDEMPTION PREMIUMS
(million euros) 2013 2012
Bond redemption premiums 26 36
Cumulative translation adjustments 278 206
ASSETS 304 242
Cumulative translation adjustments 332 252
LIABILITIES 332 252
The decrease of 139,348 treasury shares corresponds to the 2009 performance stock which were vested and delivered to the employees.
The 17,935 Lafarge S.A. treasury shares earmarked to hedge the performance share plans had a market value of 1 million euros as of December 31, 2013.
Bond redemption premiums total 26 million euros as of December 31, 2013 compared to 36 million euros as of December 31, 2012. The 3 million euros new premiums and the 13 million euro depreciation and amortization expense explain the decrease by 10 million euros.
Cumulative translation adjustments result from the re- measurement of trade receivables, trade payables, loans and borrowings in local currencies at the end of fi scal year.
• Lafarge - Registration Document 2013F84
NOTES TO THE STATUTORY ACCOUNTSFF Note 13 Lafarge S.A.

NOTE 15 NET EQUITY
15.1 SHARE CAPITAL
On December 31, 2013, the Company’s share capital amounted to 1,149,461,588 euros, divided into 287,365,397 fully paid-up shares with a nominal value of four euros each. Taking into account double voting rights accruing to shares held in registered form for at least two years (115,069,648), the total number of voting rights attaching to the shares was 402,435,045 at December 31, 2013.
Changes in the share capital during the fi nancial year ended December 31, 2013The Company’s share capital at December 31, 2012 amounted to 1,149 ,022,008 euros, divided into 287,255,502 shares with a nominal value of four euros each. Since December 31, 2012, the Company’s share capital has increased by a total of 109,895 shares as a result of the following:
AMOUNT OF SUBSCRIPTIONS OR DEDUCTIONS (EUROS)
Number of shares issued Capital Share premium Total
Stock options exercice 109,895 439,580 2,938,592 3,378,172
TOTAL AT DECEMBER 31, 2013 109,895 439,580 2,938,592 3,378,172
Potential Share capital as of December 31, 2013The number of shares as of December 31, 2013 could be increased by a maximum of 7,000,955 shares in the hypothetical scenario that stock options granted to employees existing on that date were exercised. 4,815,213 out of these existing stock options could have
been exercised at December 31, 2013. The remaining 2,185,742 stock options can only be exercised upon expiry of a period of four years after their grant and subject to the performance conditions attached to some of these stock options being fulfi lled.
15.2 CHANGE IN NET EQUITY
(million euros)Common
stock
Additional paid-in capital
Other reserves
Retained earnings Net income Total
NET EQUITY AS OF DECEMBER 31, 2012
(b efore appropriation of 2012 income) 1,149 9,853 756 1,752 103 13,613
Appropriation of 2012 income 6 (192) (103) (289 )
Share capital increase - 3 3
Net income for 2013 462 462
NET EQUITY AS OF DECEMBER 31, 2013
(b efore appropriation of 2013 income) 1,149 9,856 762 1,560 462 13,789
Lafarge - Registration Document 2013 • F85
NOTES TO THE STATUTORY ACCOUNTS
F
Note 15 Net equity

NOTE 16 PROVISIONS FOR LOSSES AND CONTINGENCIES
Change in provisions for losses and contingencies break down as follows:
(million euros)December 31,
2012 Addition UtilizationDecember 31,
2013
Provisions for retirement benefit obligations (1) 60 24 10 74
Provision for share-based payment 49 30 10 69
Provision for tax 23 - - 23
Other provisions for losses and contingencies 21 1 13 9
PROVISIONS FOR LOSSES AND CONTINGENCIES 153 55 33 175
Of which employee expenses 6 -
Of which operating 25 23
Of which financial - -
Of which exceptional 24 10
Of which tax - -
TOTAL 55 33
(1) See Note 17 “Pension benefit obligations” for more information.
In November 2008, the major European cement players, including Lafarge, were investigated by the European Commission for alleged anti-competitive practices. By a letter dated December 6, 2010, the Commission notifi ed the parties of the opening of an offi cial investigation (which does not however constitute a statement of objection), while reminding them that at that stage, it did not have conclusive evidence of anti-competitive practices. The alleged offences, which will be the subject of the detailed investigation, involve any possible restrictions of commercial trade in or upon entry to the European Economic Area , market sharing, and coordination of prices on the cement and related markets (concrete, aggregates). In the case of Lafarge, seven (7) countries are quoted: France, the United Kingdom, Germany, Spain, the Czech Republic, Greece and Austria. The Commission’s investigation is ongoing and Lafarge answered to its various requests
for information. In November 2011, further to the answer by Lafarge of the last questionnaire received, the Commission notifi ed Lafarge an injunction to waive any reserve to the answer and provide any further information deemed necessary to complete its investigation, under the threat of a penalty. Lafarge promptly complied with this new request for information and lodged a lawsuit before the EU General Court with a view to obtaining the annulment of such injunction decision. As a new development, by letter received on January 15, 2013, the European Commission confi rmed that no penalty will be imposed to Lafarge under this injunction. During the third quarter of 2012, European offi cials visited the French, German and European cement association. The completion date of this investigation is unknown and no conclusion can be drawn at this stage.
NOTE 17 PENSION BENEFIT OBLIGATIONS
Lafarge S.A.’s pension obligation comprises supplementary pension regimes and end-of-service benefi ts.
In 2007, the Company transferred its obligation relating to the supplementary defi ned benefi t pension schemes of current retirees through an insurance contract with Cardif Assurance Vie. The premium paid amounted to 7 million euros in 2013, compared to 8 million
euros in 2012. In accordance with French Regulations, the insurer guarantees pension indexation up to the amount of technical gains allocated to the contract, with any residual cost of pension indexation remaining with the Company.
Obligations for supplementary pension regimes and end-of service benefi ts were valued using the projected unit credit method.
The main assumptions underlying these valuations are outlined below:
(million euros, unless otherwise indicated) 2013 2012
Discount rate 3.30% 3.00%
Wage increase 2 à 5.5% 2 à 5.5%
Discounted value of the obligation 185 175
Fair value of pension fund assets - -
Actuarial gains/losses and impact of plan modifications not recognized (111) (115)
PROVISION FOR RETIREMENT BENEFIT OBLIGATIONS 74 60
• Lafarge - Registration Document 2013F86
NOTES TO THE STATUTORY ACCOUNTSFF Note 16 Provisions for losses and contingencies

NOTE 18 FINANCIAL DEBT
18.1 FINANCIAL DEBT BY NATURE
(million euros)
Amount outstanding at December 31,
2012 Increase DecreaseOther
movements (1)
Amount outstanding at December 31,
2013
Bond issues (excluding accrued interest) 10,956 750 500 (88) 11,118
Accrued interest on bond issues 294 302 294 - 302
BOND ISSUES 11,250 1,052 794 (88) 11,420
BANK BORROWINGS 582 427 240 - 769
Other loans and commercial paper - 7 - - 7
Long-term payables from investments 361 - - (8) 353
OTHER FINANCIAL DEBT 361 7 - (8) 360
TOTAL FINANCIAL DEBT 12,193 1,486 1,034 (96) 12,549
(1) Notably translation adjustments.
In 2013, Lafarge S.A. issued a new bond worth a total of 750 million euros. The decrease in total debt corresponds to the repayment of a 500 million euros bond with a December 2013 maturity date.
The loans secured by Lafarge S.A. do not contain any clause requiring continuous compliance with certain fi nancial ratios. However, the loans secured by some subsidiaries of the Group contain that type of clause. If we, or under certain conditions, our material subsidiaries, fail to comply with our or their covenants, then our lenders could declare default and accelerate a signifi cant part of our indebtedness.
3,435 million euros of credit facilities are fully undrawn at December 31, 2013, out of which a syndicated credit facility of 1,200 million euros with a maturity at July 28, 2015. This syndicated credit facility contains
an optional exit mechanism, on an individual basis, if the Group consolidated net debt to Ebitda of the Group ratio is higher than 4.75. Such an event would not be considered as an event of default and would have no impact on the status of Lafarge S.A.’s other fi nancing arrangements.
In addition, we have a 450 million-euro undrawn financing at December 31, 2013 that we can use any time. This specifi c fi nancing set-up at October 12, 2012 is not considered in the committed credit lines amount disclosed above. Utilization of this fi nancing would be considered as a private placement outside the bond program.
Additionally Lafarge S.A. signed bank loans in 2013 for 250 million euros that could be used in May 2014.
Lafarge - Registration Document 2013 • F87
NOTES TO THE STATUTORY ACCOUNTS
F
Note 18 Financial debt

18.2 BOND ISSUES
(million euros) Currency Initial amount Rate Maturity
Amount outstanding at December 31,
2012
Amount outstanding at December 31,
2013
2002 bond GBP 307 6.625% 15 years 245 240
2003 bond EUR 500 5.448% 10 years 500 -
2004 bond EUR 612 5.000% 10 years 612 612
2005 bond EUR 500 4.250% 11 years 500 500
2005 bond EUR 500 4.750% 15 years 500 500
2006 bond USD 444 7.125% 30 years 455 435
2006 bond USD 592 6.500% 10 years 606 580
2007 bond EUR 500 5.375% 10 years 540 540
2008 bond EUR 750 6.125% 7 years 750 750
2008 bond USD 143 USD libor 3 m + 370 bp 5 years 152 -
2009 bond USD 78 USD libor 3 m + 789 bp 4 years 76 -
2008 bond USD 145 12.530% 25 years - 145
2009 bond USD 72 12.850% 25 years - 72
2009 bond EUR 250 8.500% (1) 8 years 250 250
2009 bond EUR 150 8.100% (1) 8 years 150 150
2009 bond EUR 1000 8.875% (1) 5 years 1000 1000
2009 bond GBP 411 10.000% (1) 8 years 428 420
2009 bond EUR 750 6.750% (1) 10 years 750 750
2009 bond EUR 750 8.875% (1) 7 years 750 750
2010 bond USD 412 6.200% (1) 5 years 417 399
2010 bond EUR 500 6.250% (1) 8 years 500 500
2010 bond EUR 1000 6.625% (1) 8 years 1000 1000
2012 bond EUR 50 5.250% 5 years 50 50
2012 bond EUR 175 5.000% 6 years 175 175
2012 bond EUR 500 5.875% 7 years 500 500
2012 bond EUR 50 euribor 3M + 2 % 7 years 50 50
2013 bond EUR 750 4.750% 7 years - 750
Bond issues (excluding accrued interest) 10,956 11,118
Accrued interest on bond issues 294 302
BOND ISSUES 11,250 11,420
(1) The interest rates shown take account of step-up clauses associated with these bonds following the downgrading of our long-term credit rating.
18.3 BANK BORROWINGS
As of December 31, 2013, bank borrowings amount to 769 million euros and include 59 million euros maturing in 2014.
18.4 ANALYSIS OF FINANCIAL DEBT BY MATURITY
The following table details the contractual maturities of our various agreements, including the undiscounted contractual flows and future interest, based on the closest term Lafarge S.A. can be called for repayment.
Financial debts are accounted at their historical value. In the absence of a specifi c accounting standard, the Company evaluates if the circumstances and events could lead to a revision of future payments and estimates the most probable scenario to determine if the accounting value of the debt needs any adjustment analogous to their required by IAS 39.
When Lafarge S.A. does not have the unconditional right to differ the term of a fi nancing beyond 12 months, then the fi nancing is accounted as fi nancial debt with a maturity of less than one year regardless probable renegotiation considered by the management in order to extend the maturity.
• Lafarge - Registration Document 2013F88
NOTES TO THE STATUTORY ACCOUNTSFF Note 18 Financial debt

2014 H1
2014 H2
Contractual flows – less
than one year (incl. future
interests) 2015 2016 2017 2018
More than 5 years
Contractual flows – more
than one year (incl. future
interests)
Total Contractual flows (incl.
future interests)
Bond issues 1,377 976 2,353 1,761 2,385 2,085 1,972 4,534 12,737 15,090
Bank borrowings 21 53 74 111 336 11 110 210 778 852
Commercial paper 7 - 7 - - - - - - 7
Long-term payables
from investments - 20 20 20 372 - - - 392 412
TOTAL 1,405 1,049 2,454 1,892 3,093 2,096 2,082 4,744 13,907 16,361
NOTE 19 DERIVATIVES
19.1 CURRENCY RISK
Lafarge S.A. uses forward purchases and sales of currencies and currency swaps to:
d refinance loans and borrowings granted to subsidiaries in a currency other than the euro;
d hedge the currency risk incurred by the Group’s subsidiaries (firm commitments and highly probable transactions), bearing in mind that contracts negotiated with subsidiaries are hedged in exactly the same manner in the interbank market and do not give rise to a currency position for Lafarge S.A.
At December 31, 2013, most forward exchange contracts had a maturity date of less than one year.
The nominal and fair values of derivatives at the balance sheet date were as follows:
(million euros)
At December 31, 2013 At December 31, 2012
Notional Fair value (1) Notional Fair value (1)
US dollar (USD) 1,002 (8) 692 (3)
Pound sterling (GBP) 129 - 643 (5)
Other currencies 38 - 64 (1)
FORWARD PURCHASES AND CURRENCY SWAPS 1,170 (8) 1,399 (9)
US dollar (USD) 159 2 141 1
Pound sterling (GBP) 46 - 198 1
Other currencies 433 8 345 (2)
FORWARD SALES AND CURRENCY SWAPS 638 10 684 -
(1) The fair value of currency derivatives was calculated using market prices that Lafarge S.A. would pay or receive to unwind these positions.
19.2 INTEREST-RATE RISK
Lafarge S.A.’s exposure to interest rate fl uctuations comprises two types of risks:
d a fair value risk arising from fixed-rate financial assets and liabilities: interest-rate fluctuations have an influence on their market value;
d a cash flow risk arising from floating-rate financial assets and liabilities: fluctuations in interest rates have a direct impact on the Company’s future earnings.
As part of its general policy, Lafarge S.A. manages these two risk categories using, if necessary, interest-rate swaps.
Lafarge - Registration Document 2013 • F89
NOTES TO THE STATUTORY ACCOUNTS
F
Note 19 Derivatives

The notional and fair values of interest rate derivatives at the balance sheet date were as follows:
AT DECEMBER 31, 2013 NOTIONAL VALUE OF DERIVATIVES BY EXPIRY DATE (1)
(million euros, unless otherwise indicated)
Average interest
rate 2013 2014 2015 2016 2017> 5
years TotalFair
value (2)
INTEREST RATE SWAP
Fixed-rate payer 4.6% 42 - - - - - 42 (1)
Fixed-rate receiver 0.3% - - 500 1,000 500 - 2,000 2
AT DECEMBER 31, 2012 NOTIONAL VALUE OF DERIVATIVES BY EXPIRY DATE (1)
(million euros, unless otherwise indicated)
Average interest
rate 2013 2014 2015 2016 2017> 5
years TotalFair
value (2)
INTEREST RATE SWAP
Fixed-rate payer 4.5% 58 42 - - - - 100 (5)
Fixed-rate receiver 0.7% 300 - - - 100 400 800 15
(1) The notional value of derivatives represents the nominal value of financial instruments traded with counterparties.
(2) The fair value of interest-rate swaps was calculated using market prices that Lafarge S.A. would have to pay or receive to unwind the positions.
NOTE 20 FINANCIAL COMMITMENTS
Commitments given for 1,297 million euros include fi nancial guarantees given for 1,166 million euros and vendor warranties given in connection with asset sales for 131 million euros. As of December 31, 2013, there are no securities or assets pledged.
• Lafarge - Registration Document 2013F90
NOTES TO THE STATUTORY ACCOUNTSFF Note 20 Financial commitments

NOTE 21 MATURITY OF RECEIVABLES AND LIABILITIES AT THE BALANCE SHEETS DATE
Gross valueNet amount at
December 31, 2013
Falling due in
Less than one year
Between 1 and 5 years
Over 5 years
Long-term receivables from investments 471 25 420 26
Other financial assets 11 - - 11
NON-CURRENT RECEIVABLES 482 25 420 37
Loans and current accounts granted to subsidiaries 2,371 2,371 - -
Other 25 25 - -
CURRENT RECEIVABLES 2,396 2,396 - -
RECEIVABLES 2,878 2,421 420 37
Bond issues 11,420 1,914 6,304 3,202
Bank borrowings 769 59 510 200
Other financial debt 360 1 352 7
FINANCIAL DEBT 12,549 1,974 7,166 3,409
TAX AND EMPLOYEE-RELATED LIABILITIES 48 48 - -
Borrowings and current accounts received from Group
companies 2,819 2,819 - -
Other (1) 44 44 - -
OTHER LIABILITIES 2,863 2,863 - -
LIABILITIES 15,460 4,885 7,166 3,409
(1) Settlement periods: Law no. 2008-776 of August 4, 2008 on the modernization of the economy, known as the LME, and Decree no.2008-1492 of December 30,
2008 rendered for the application of article L. 144-6-1 of the French Commercial Code.
The 44 million euros of other liabilities include trade payables for an amount of 20 million euros as of December 31, 2013 (French and foreign suppliers).
The following schedule presents trade payables from the invoice date:
(in million euros)Debt due
at year end
30 days from
invoice date
Between 31 and 60 days from
invoice date
> 61 days from invoice
date
Total at December 31,
2013
Trade payables (including debt to suppliers
of fixed assets) 5.4 4.8 7.4 2.2 19.8
(in million euros)Debt due
at year end
30 days from
invoice date
Between 31 and 60 days from
invoice date
> 61 days from invoice
date
Total at December 31,
2012
Trade payables (including debt to suppliers
of fixed assets) 2.7 4.3 8.8 3.4 19.2
Lafarge - Registration Document 2013 • F91
NOTES TO THE STATUTORY ACCOUNTS
F
Note 21 Maturity of receivables and liabilities at the balance sheets date
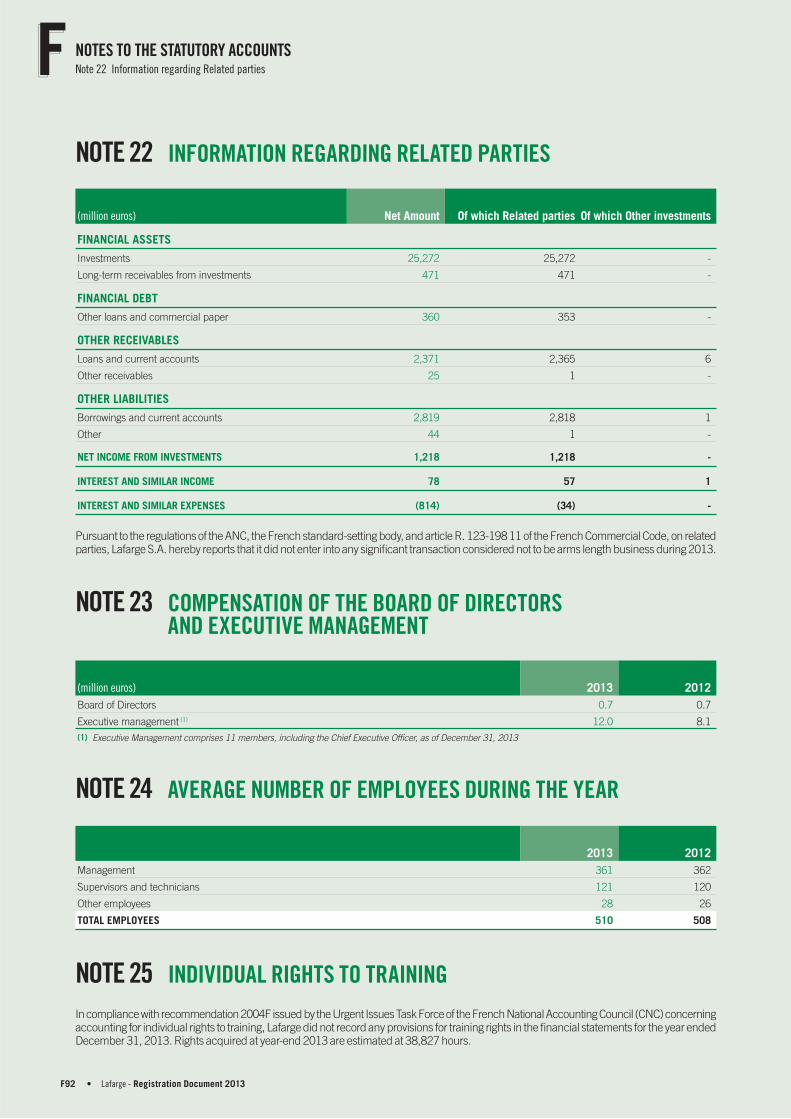
NOTE 22 INFORMATION REGARDING RELATED PARTIES
(million euros) Net Amount Of which Related parties Of which Other investments
FINANCIAL ASSETS
Investments 25,272 25,272 -
Long-term receivables from investments 471 471 -
FINANCIAL DEBT
Other loans and commercial paper 360 353 -
OTHER RECEIVABLES
Loans and current accounts 2,371 2,365 6
Other receivables 25 1 -
OTHER LIABILITIES
Borrowings and current accounts 2,819 2,818 1
Other 44 1 -
NET INCOME FROM INVESTMENTS 1,218 1,218 -
INTEREST AND SIMILAR INCOME 78 57 1
INTEREST AND SIMILAR EXPENSES (814) (34) -
Pursuant to the regulations of the ANC, the French standard-setting body, and article R. 123-198 11 of the French Commercial Code, on related parties, Lafarge S.A. hereby reports that it did not enter into any signifi cant transaction considered not to be arms length business during 2013.
NOTE 23 COMPENSATION OF THE BOARD OF DIRECTORS AND EXECUTIVE MANAGEMENT
(million euros) 2013 2012
Board of Directors 0.7 0.7
Executive management (1) 12.0 8.1
(1) Executive Management comprises 11 members, including the Chief Executive Officer, as of December 31, 2013
NOTE 24 AVERAGE NUMBER OF EMPLOYEES DURING THE YEAR
2013 2012
Management 361 362
Supervisors and technicians 121 120
Other employees 28 26
TOTAL EMPLOYEES 510 508
NOTE 25 INDIVIDUAL RIGHTS TO TRAINING
In compliance with recommendation 2004F issued by the Urgent Issues Task Force of the French National Accounting Council (CNC) concerning accounting for individual rights to training, Lafarge did not record any provisions for training rights in the fi nancial statements for the year ended December 31, 2013. Rights acquired at year-end 2013 are estimated at 38,827 hours.
• Lafarge - Registration Document 2013F92
NOTES TO THE STATUTORY ACCOUNTSFF Note 22 Information regarding Related parties

NOTE 26 DEFERRED TAX POSITION – TAX BASE (HOLDING COMPANY ONLY)
(million euros) 2013 2012
DEFERRED TAX LIABILITIES
Tax-driven provisions 1 1
Capital gains rolled over – Long term 1,849 1,849
DEFERRED TAX ASSETS
Provision for pensions 74 60
Other provisions 21 26
Temporarily non-deductible expenses - -
TAX LOSSES CARRIED FORWARD
Tax group losses 2,662 2,352
Revaluation account (1976) – tax free 3 3
NOTE 27 SUBSEQUENT EVENTS
There are no subsequent events to report
Lafarge - Registration Document 2013 • F93
NOTES TO THE STATUTORY ACCOUNTS
F
Note 27 Subsequent events

SUBSIDIARIES AND INVESTMENTS AT DECEMBER 31, 2013
(in million of currency unit) Currency
Common stock(1)
Reserves and retained earnings(1)(2)
Share of capital held %
Book value of shares held(3)
Loans and advances
granted and not repaid(3)
Guarantees & endorsements
given by the Company(3)
Net revenues excluding
tax at closing(1)
Net income
(profit or loss) at
closing(1)
Dividends received by
the Company over the
year(3)Gross Net
A. DETAILED INFORMATION ON SUBSIDIARIES (1) AND INVESTMENTS (2) ET (3) BELOW
1. SUBSIDIARIES (OVER 50% OF CAPITAL HELD BY THE COMPANY):
Sofimo EUR 1,055 16,386 100.00 16,676 16,676 1 - - 798 527
Lafarge
Gypsum
International EUR 798 354 100.00 934 934 - - - 58 218
Lafarge Centre
de Recherche EUR 23 2 100.00 23 23 9 - - 2 2
Sabelfi snc EUR 2,385 121 99. 99 2,511 2,511 - - - 104 57
Lafarge Brasil BRL 1,293 (485) 59.74 365 365 - - 1,230 208 53
Lafarge North
America Inc. USD 6,036 87.53 4,709 4,709 - - 4,418 384 312
2. INVESTMENTS (10 TO 50% OF CAPITAL HELD BY THE COMPANY)
Ciments du
Cameroun CFA 5,600 32,280 43.65 15 15 - - 83,811 29 -
Lafarge Zement
G mbH EUR 26 44 10.00 29 29 - - - 9 -
3. INVESTMENTS (LESS THAN 10% OF CAPITAL HELD BY THE COMPANY)
B. GENERAL INFORMATION CONCERNING OTHER SUBSIDIARIES AND INVESTMENTS
1. SUDSIDIARIES NOT INCLUDED UNDER A.1)
French
sudsidiaries
(total) 5 5 - 4
Foreign
sudsidiaries
(total) 5 5 - -
2. INVESTMENTS NOT INCLUDED UNDER A.2) AND A.3)
French (total) - - - -
Foreign (total) - - - -
TOTAL 25,272 25,272 10 1,173
(1) In local currency for foreign subsidiaries.
(2) Before appropriation of net income and interim dividend.
(3) In million euros.
NOTE 28 INVESTMENTS
• Lafarge - Registration Document 2013F94
NOTES TO THE STATUTORY ACCOUNTSFF Note 28 Investments

CHANGE IN THE FINANCIAL INCOME OF THE COMPANY DURING THE LAST FIVE YEARS
(ARTICLES R. 225-81, R. 225-83, R. 225-102 OF THE FRENCH COMMERCIAL CODE)
2013 2012 2011 2010 2009
A . CAPITAL STOCK
Capital stock (in euros) 1,149,461,588 1,149,022,008 1,148,990,072 1,145,815,116 1,145,813,264
Number of existing shares of common stock 287,365,397 287,255,502 287,247,518 286,453,779 286,453,316
Maximum number of future shares to be created 7,000,955 8,455,389 8,511,063 9,099,072 8,060,756
through conversion of bonds
through exercise of stock options 7,000,955 8,455,389 8,511,063 9,099,072 8,060,756
B . TRANSACTIONS FOR THE YEAR (IN THOUSANDS OF EUROS)
a) Gross sales revenues(1) 1,846,797 1,542,723 1,536,243 1,322,722 1,625,520
b) Income before taxes, profit-sharing and amortization
and provisions 472,361 109,709 88,208 (320,834) 213,495
c) Income taxes 46,183 65,750 68,352 76,060 118,439
d) Employee profit-sharing owed for the year - - - - -
e) Income after taxes, profit sharing and amortization
and provisions 462,306 102,842 205,507 49,032 254,309
f) Income distributed 289,267 289,341 144,550 287,903 575,207
including 10% increase(2) 1,919 2,028 1,002 1,683 3,028
Earnings per share (in euros)
a) Income after taxes, employee profit-sharing but before
amortization and provisions 1.80 0.61 0.84 (0.85) 1.16
b) Income after taxes, employee profit-sharing
and amortization and provisions 1.61 0.36 0.72 0.17 0.89
c) Net dividend 1.000 1.000 0.500 1.000 2.000
Net loyalty dividend 1.100 1.100 0.550 1.100 2.200
C . PERSONNEL
Number of employees at December 31 498 512 528 510 485
Payroll (in thousands of euros)(3) 104,210 102,597 94,773 92,799 78,315
Social benefits (in thousands of euros)(4) 49,149 47,494 47,369 48,098 35,088
Bonuses and profit-sharing paid (in thousands of euros) 2,507 1,388 1,732 2,142 1,592
(1) Gross sales revenues represent the revenues from ordinary activities, which include the sold production (services) and finance income.
(2) Increase in the dividend for registered shares held for more than two years.
(3) Including retirement indemnities, provision for performance shares grants.
(4) Social organizations, charitable projects and other employee costs for impatriates, etc.
Lafarge - Registration Document 2013 • F95
NOTES TO THE STATUTORY ACCOUNTS
F
Change in the fi nancial income of the Company during the last fi ve years
(articles R. 225-81, R. 225-83, R. 225-102 of the French Commercial Code)

STATUTORY AUDITORS’ SPECIAL REPORT ON REGULATED AGREEMENTS AND COMMITMENTS WITH THIRD PARTIES
This is a free translation into English of the Statutory Auditors’ special report on regulated agreements and commitments with third parties that is issued in the French language and is provided solely for the convenience of English speaking readers. This report on regulated agreements and commitments should be read in conjunction with, and construed in accordance with, French law and professional auditing standards applicable in France. It should be understood that the agreements reported on are only those provided by the French Commercial Code and that the report does not apply to those related party transactions described in IAS 24 or other equivalent accounting standards.
To the Shareholders,
In our capacity as Statutory Auditors of your Company, we hereby report to you on regulated agreements and commitments with third parties.
The terms of our engagement require us to communicate to you, based on information provided to us, the principal terms and conditions of those agreements and commitments brought to our attention or which we may have discovered during the course of our audit, without expressing an opinion on their usefulness and appropriateness or identifying such other agreements and commitments, if any. It is your responsibility, pursuant to Article R. 225-31 of the French Commercial Code (Code de Commerce), to assess the interest involved in respect of the conclusion of these agreements and commitments for the purpose of approving them.
Our role is also to provide you with the information provided for in Article R. 225-31 of the French Commercial Code in respect of the performance of the agreements and commitments, already authorized by the Shareholders' Meeting and having continuing effect during the year, if any.
We conducted our procedures in accordance with the professional guidelines of the French National Institute of Statutory Auditors (Compagnie Nationale des Commissaires aux Comptes) relating to this engagement. These guidelines require that we agree the information provided to us with the relevant source documents.
AGREEMENTS AND COMMITMENTS SUBMITTED FOR APPROVAL TO THE SHAREHOLDERS’ MEETING
We hereby inform you that we have not been advised of any agreement or commitment authorized during the year to be submitted to the approval of the Shareholders' Meeting pursuant to Article L.225-38 of the French Commercial Code.
AGREEMENTS AND COMMITMENTS ALREADY APPROVED BY THE SHAREHOLDERS’ MEETING
I. Agreements and commitments already approved during previous years and having continuing effect during the yearPursuant to Article R.225-30 of the French Commercial Code, we have been informed that the following agreements and commitments, already approved by the Shareholders’ Meeting in previous years, continued during the year.
With BNP Paribas
Board members concerned
Mrs. Hélène Ploix, a director of your Company, is also a director of BNP Paribas, and Mr. Baudouin Prot, a director of your Company, is also Chairman of the Board of Directors of BNP Paribas.
Transfer of retirement plans for French executives, senior executives and members of the Executive Committee to Cardif Assurance Vie, a subsidiary of BNP Paribas
The Board of Directors authorized the conclusion of three insurance contracts between your Company and Cardif Assurance Vie, a subsidiary of BNP Paribas, the purpose of which was to transfer defi ned-benefi t retirement plans. These agreements were authorized by the Board of Directors at its meetings of August 1, 2007 and November 6, 2008 and approved by the Shareholders’ Meetings of May 7, 2008 and of May 6, 2009.
As these agreements remained in force in 2013, the total amount of contributions allocated to retirement capital, expenses and other taxes and paid by your Company in respect of two of the current contracts with Cardif Assurance Vie amounted to €9.4 million for the year ended December 31, 2013.
II. Agreements and commitments already approved during previous years that were not implemented during the yearFurthermore, we have been informed that the following agreements and commitments, already approved by the Shareholders’ Meeting in previous years, were not implemented during the year.
With Mr. Bruno Lafont, Chairman & CEO of your Company
Supplementary pension plan of Mr. Bruno Lafont
At its meeting on December 16, 2005, the Board of Directors authorized that Mr. Bruno Lafont will benefi t from a supplementary pension plan guaranteeing a pension based on his salary as a corporate offi cer. The employment contract was suspended as from January 1, 2006, the date of Mr. Bruno Lafont’s appointment as Chief Executive Offi cer. However, in his capacity as a corporate offi cer, he will continue to benefi t from the supplementary retirement benefi t.
Moreover, at its meeting on November 6, 2008, the Board of Directors authorized the amendment of two supplementary benefi t plans. One of these amendments consists in including the Company’s corporate offi cers as potential benefi ciaries of these benefi t plans, which would provide, under certain conditions, a retirement payment based on the last salaries received, irrespective of any other legal retirement benefi ts received by the retired individual. The Shareholders’ Meeting of May 6, 2009 approved this agreement.
• Lafarge - Registration Document 2013F96
STATUTORY ACCOUNTSFF Statutory Auditors’ special report on regulated agreements and commitments with third parties

With Orascom Construction Industries SAE
Board members concerned
Mr. Nassef Sawiris, a director of your Company, is also Chief Executive Offi cer as well as director of Orascom Construction Industries N.V, a company holding (following an exchange offering) the majority of the shares of Orascom Construction Industries SAE, a company in which he was previously Chairman & CEO and director until the end of 2013.
Mr. Jérôme Guiraud, a director of your Company, is also a member of the Audit Committee of Orascom Construction Industries SAE, a company in which he was a director until the end of 2013.
Settlement agreement dated June 21, 2012 between Orascom Construction Industries SAE and your Company
The Orascom Building Materials share purchase agreement signed on December 9, 2007 between your Company and Orascom Construction Industries SAE (OCI) contained general warranties and specifi c indemnities. Further to negotiations following the triggering of some of the warranties and indemnities by your Company, the parties reached a settlement for an amount of €73 million to be paid by OCI to your Company, the warranties being maintained for two specifi c matters. This agreement was approved by the Shareholders’ Meeting on May 7, 2013.
With NNS Holding Sàrl, Orascom Construction Industries SAE, Mr. Nassef Sawiris and other parties
Board members concerned
Mr. Nassef Sawiris, a director of your Company, is also Chief Executive Offi cer as well as director of Orascom Construction Industries N.V, a company holding (following an exchange offering) the majority of the shares of Orascom Construction Industries SAE, a company in which he was previously Chairman & CEO and director until the end of 2013. He was also a director of NNS Holding Sà rl.
Mr. Jérôme Guiraud, a director of your Company, is also a Board member of NNS Holding Sà rl and a member of the Audit Committee of Orascom Construction Industries SAE, a company in which he was a director until the end of 2013.
Amendment to the Shareholders’ Agreement of December 9, 2007
At its meeting on March 15, 2012, the Board of Directors authorized the signature of an amendment to the Shareholders’ Agreement for the purpose of maintaining, with respect to the 22.5 million shares issued to NNS Holding Sàrl via a reserved capital increase in 2008, the undertaking by NNS Holding Sàrl (i) to inform your company fi rst of any planned share disposals until March 27, 2015 and (ii) not to sell these shares to any competitors of your company until the expiration date of the Shareholders’ Agreement. This agreement was approved by the Shareholders’ Meeting on May 15, 2012.
III. Agreements and commitments approved during the year Furthermore, we have been informed of the continuation during the year of the following agreements and commitments, already approved by the Shareholders’ Meeting on May 7, 2013 based on the Statutory Auditors’ special report dated March 14, 2013, that were not implemented during the year.
With Mr. Bruno Lafont, Chairman & CEO of your Company
Mr. Bruno Lafont’s suspended employment contract and severance compensation
At its meeting on July 27, 2011, the Board of Directors decided to maintain Mr. Bruno Lafont’s suspended employment contract and to delete a clause of commitment of presence. This contract was approved by the Shareholders’ Meeting on May 15, 2012. The employment contract was suspended as from January 1, 2006, the date of Mr. Bruno Lafont’s appointment as Chief Executive Offi cer. It includes contractual severance compensation, payable subject to certain conditions, including a performance condition.
At its meeting on February 19, 2009, the Board of Directors authorized the amendments to Mr. Bruno Lafont’s suspended employment contract, for the purpose of adapting the contractual severance compensation to the recommendations of the Afep Medef corporate governance code for listed companies regarding the compensation of executive corporate offi cers. This contract was approved by the Shareholders’ Meeting on May 6, 2009.
The Shareholders’ Meeting on May 7, 2013 confi rmed the approval of these commitments relating to Mr. Bruno Lafont’s suspended employment contract.
It is recalled that, following the automatic resumption of his employment contract in the event Mr. Bruno Lafont were to cease serving in his corporate offi ces (Chairman and Chief Executive Offi cer), the contractual severance compensation in case of dismissal (other than for gross negligence or serious misconduct) would only be owed to Mr. Bruno Lafont if a series of conditions were met:
d The first condition covers the event triggering the right to receive contractual severance compensation. The dismissal must take place after a change of control or after a change in the Company’s strategy.
d The second condition is performance-based. This condition will be satisfied and the contractual severance compensation would be paid if two of the following three criteria are satisfied. If only one criterion out of the three is satisfied, the condition will only be partially satisfied and only one half of the contractual severance compensation would be paid. If none of the criteria are satisfied, the condition would not be satisfied and no contractual severance compensation would be paid. The three criteria to be satisfied, over the last three fiscal years preceding the employment contract’s termination, are as follows:
d (i) an after-tax average return on invested capital for the last three years greater than the Weighted Average Cost of Capital (WACC),
d (ii) an EBITDA/Revenue ratio strictly greater than 18%, on average, for the last three years, and
d (iii) an average bonus granted under the employment contract greater than 60% of the maximum bonus, on average, for the last three years.
Lafarge - Registration Document 2013 • F97
STATUTORY ACCOUNTSStatutory Auditors’ special report on regulated agreements and commitments with third parties
F
The maximum amount of this contractual severance compensation would be equal to two years of total gross compensation received by Mr. Bruno Lafont for the most favorable of the three years preceding the date of his dismissal notice. This calculation basis is the same as for the dismissal compensation under the Collective Bargaining Agreement. In addition , so as to ensure that the total amount of the compensation due to Mr. Bruno Lafont in case of departure remains within this limit, such contractual severance compensation would be reduced by the amount of the dismissal compensation due to Mr. Bruno Lafont pursuant to and in compliance with the terms of the Collective Bargaining Agreement applicable to engineers and executives in the cement production industry, which apply to his employment agreement in view of his length of service within the Group (31 years). In application of mandatory French labor laws, the dismissal compensation is subject to the conditions set forth under the Collective Bargaining Agreement.
A job elimination or decrease in level of responsibilities would also constitute a case of dismissal providing entitlement to such compensations.
Conservation of rights relating to long-term compensation plans based on certain assumptions
At its March 13, 2013 meeting, pursuant to Article L.225-42-1 of the French Commercial Code, the Board of Directors, on the recommendation of the Remunerations Committee decided and confi rmed that, in case of retirement, death or disability, Mr. Bruno Lafont will retain the rights from which he benefi ts or will benefi t in relation to the attribution of share subscription or purchase options, the attribution of free shares, and other components of long-term (multi-year) compensation, subject to performance conditions. In case of death, the heirs of Mr. Bruno Lafont will retain the benefi t of his rights. This commitment was approved during the Shareholders’ Meeting on May 7, 2013.
Neuilly-sur-Seine and Paris-La Défense, February 28, 2014
The Statutory Auditors
DELOITTE & ASSOCIÉ S
French original signed by
ERNST & YOUNG et Autres
French original signed by
Arnaud de Planta Frédéric Gourd Alain Perroux Nicolas Macé
• Lafarge - Registration Document 2013F98
STATUTORY ACCOUNTSFF Statutory Auditors’ special report on regulated agreements and commitments with third parties

CROSS-REFERENCE TABLES
EC REGULATION 809/2004 CROSS-REFERENCE TABLE
In order to facilitate the reading of the present document as the form of the Registration Document, the cross-reference table below is used to identify the corresponding Sections.
Items of Annex I to EC Regulation 809/2004 Location in this Report Page
1 PERSONS RESPONSIBLE Certification 181
2 STATUTORY AUDITORS
2.1 Name and address 5.3.1 Auditors 162
2.2 Resignation or removal of statutory auditors Not applicable -
3 SELECTED FINANCIAL INFORMATION
3.1 Selected historical financial information Profile Selected financial data 6
3.2 Selected financial information for interim periods Not applicable -
4 RISK FACTORS 5.1 Risk factors 146
5 INFORMATION ABOUT LAFARGE
5.1 History and development of the Company 1.1 Lafarge presentation
1.1.2 History and development
10
10
5.2 Investments 1.2.8 Recent acquisitions, partnerships and divestitures
1.3 .5 E xpenditures in 2013 and 2012
1.3 .6 Capital expenditures planned for 2014
27
41
41
6 BUSINESS OVERVIEW
6.1 Principal activities 1.3 Overview of operations 28
6.2 Principal markets 1.3 Overview of operations 28
6.3 Exceptional factors 1.2.8 Recent acquisitions, partnerships and divestitures 27
6.4 Dependency of the issuer Not applicable -
6.5 Competitive position 1.3 Overview of operations 28
7 ORGANIZATIONAL STRUCTURE
7.1 Description of the Group 6.2.8 Intra-group r elations 180
7.2 List of the issuer’s significant subsidiaries Note 35 (List of significant subsidiaries, joint ventures and
investments in associates at December 31, 2013 )
F71
8 PROPERTY, PLANTS AND EQUIPMENT
8.1 Existing or planned material tangible fixed asset 1.3 .4 Mineral reserves and quarries
1.3 .5 E xpenditures in 2012 and 2011
1.3 .6 Capital expenditures planned for 2014
39
41
41
8.2 Environment 4.4 Building the Circular Economy 130
9 OPERATING AND FINANCIAL REVIEW
9.1 Financial condition 2.1 Overview 44
9.2 Operating results 2.3 Results of operations for the years ended
December 31, 2013 and 2012
49
10 CAPITAL RESOURCES
10.1 Equity capital 2.4 Liquidity and capital resources
Note 20 (Equity)
57
F41
10.2 Cash flows 2.4 Liquidity and capital resources 57
10.3 Financing and liquidity 2.4 Liquidity and capital resources 57
Lafarge - Registration Document 2013 • 281
CROSS-REFERENCE TABLES

10.4 Information regarding any restrictions on the use of
capital resources that have materially affected, or could
materially affect, the issuer’s operations
2.4 Liquidity and capital resources
5.1.1(b) Financial and market risks
57
150
10.5 Information regarding the anticipated sources of funds
needed to fulfil certain commitments
2.4 Liquidity and capital resources 57
11 RESEARCH & DEVELOPMENT, PATENTS AND LICENCES 1.2.3(c) Research & Development, keys to innovation
1.2.7 Intellectual Property
18
26
12 TREND INFORMATION 2.1.2 Trend information and 2014 perspectives 44
13 PROFIT FORECASTS OR ESTIMATES Not applicable -
14 ADMINISTRATIVE, MANAGEMENT, AND SUPERVISORY BODIES AND SENIOR MANAGEMENT
14.1 Information on the members of administrative
and management bodies
3.1.3 Information on Directors
3.3 Executive Officers
66
96
14.2 Conflicts of interests 3.1.4 Independent Directors – Parity and diversity
within the Board
3.3 Executive Officers
84
96
15 REMUNERATION AND BENEFITS
15.1 Remuneration and benefits granted 3.4 Compensation and benefits
Note 31 (Employee costs and compensation to Directors and
Executive Officers for services)
98
F68
15.2 Retirement plans 3.4 Compensation and benefits
Note 31 (Employee costs and compensation to Directors and
Executive Officers for services)
98
F68
16 BOARD PRACTICES
16.1 Term of office of the Directors 3.1.3 Information on Directors 66
16.2 Service contracts providing for the grant of future benefits 3.1.4 Independent Directors – Parity and diversity
within the Board
84
16.3 The Committees 3.2.2 Board of Directors’ Committees 89
16.4 Declaration in terms of corporate governance Declaration in terms of corporate governance -
Governance Code of Reference
3.7 Implementation of the Principle “ Comply or explain”
of the Afep-Medef Code
62
116
17 EMPLOYEES
17.1 Number of employees 4.2.2 Employment, Employee diversity and skills 122
17.2 Shareholdings and stock-options 3.5.2 Stock option plans
3.5.3 Performance share plans
3.6.1 Directors, Chairman and Chief Executive Officer and
Executive Officers S hare O wnership
111
113
115
17.3 Employees’ share ownership in the issuer’s capital 3.5 Long-term incentives (stock options and performance
shares plans)
6.1.4 Employee S hare O wnership
109
169
18 MAJOR SHAREHOLDERS
18.1 Share capital distribution 6.1.1 Major shareholders and share capital distribution
6.1.3 Threshold notifications imposed by law and declarations
of intent
166
168
18.2 Voting rights 6.1.1 Major shareholders and share capital distribution
6.2.5( c) Rights, preferences and restrictions attached to shares
166
177
18.3 Information on the control of share capital 6.1.2 Shareholders’ agreement
6.1.3 Threshold notifications imposed by law and declarations
of intent
167
168
18.4 Change of control 6.2.6 Change of control 179
19 RELATED PARTY TRANSACTIONS Note 30 (Related parties)
3.1.4 Independent Directors - Parity and diversity within
the Board (Management of conflicts of interests)
F67
84
20 FINANCIAL INFORMATION
20.1 Historical financial information Consolidated financial statements F5
20.2 Pro forma financial information Not applicable -
20.3 Financial statements Consolidated financial statements F5
20.4 Auditing of historical annual financial information Consolidated financial statements - statutory auditors’ report F3
20.5 Age of latest financial information Consolidated financial statements F5
• Lafarge - Registration Document 2013282
CROSS-REFERENCE TABLES
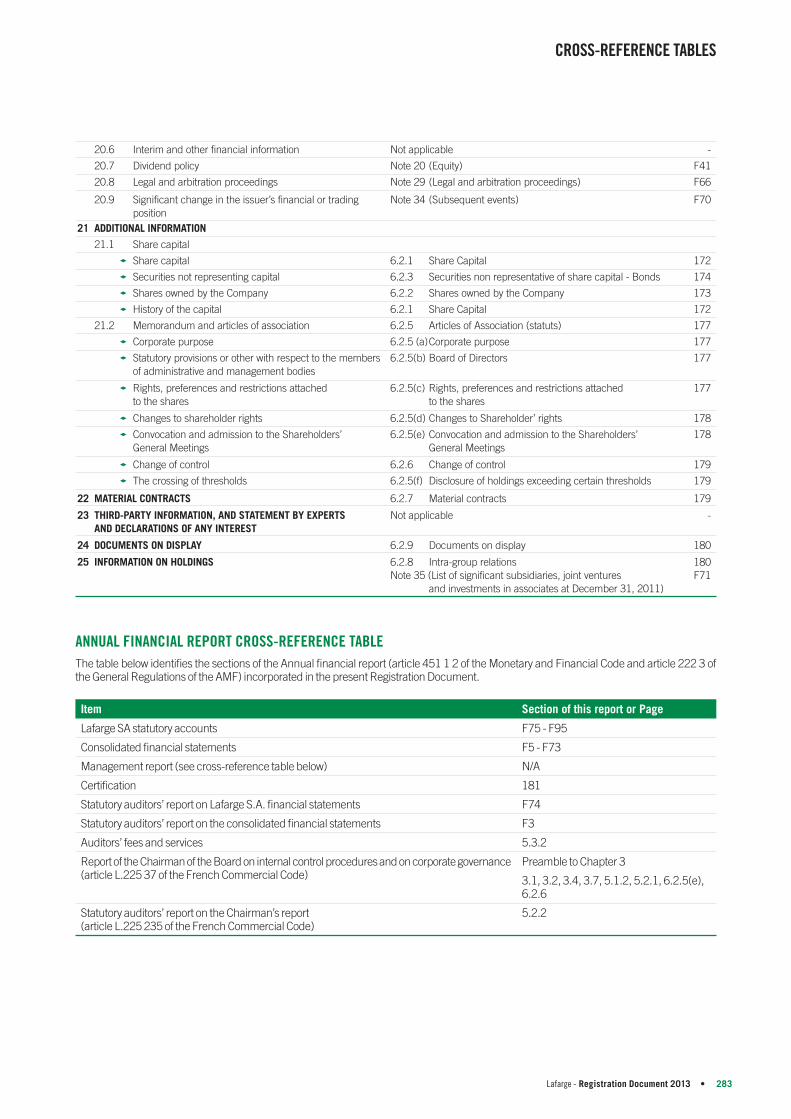
20.6 Interim and other financial information Not applicable -
20.7 Dividend policy Note 20 (Equity) F41
20.8 Legal and arbitration proceedings Note 29 (Legal and arbitration proceedings) F66
20.9 Significant change in the issuer’s financial or trading
position
Note 34 (Subsequent events ) F70
21 ADDITIONAL INFORMATION
21.1 Share capital
d Share capital 6.2.1 Share C apital 172
d Securities not representing capital 6.2 .3 Securities non representative of share capital - Bonds 174
d Shares owned by the Company 6.2.2 Shares owned by the Company 173
d History of the capital 6.2.1 Share C apital 172
21.2 Memorandum and articles of association 6.2.5 Articles of Association (statuts) 177
d Corporate purpose 6.2.5 (a) Corporate purpose 177
d Statutory provisions or other with respect to the members
of administrative and management bodies
6.2.5(b) Board of Directors 177
d Rights, preferences and restrictions attached
to the shares
6.2.5(c) Rights, preferences and restrictions attached
to the shares
177
d Changes to shareholder rights 6.2.5(d) Changes to Shareholder’ rights 178
d Convocation and admission to the Shareholders’
General Meetings
6.2.5(e) Convocation and admission to the Shareholders’
General Meetings
178
d Change of control 6.2.6 Change of control 179
d The crossing of thresholds 6.2.5(f) Disclosure of holdings exceeding certain thresholds 179
22 MATERIAL CONTRACTS 6.2.7 Material contracts 179
23 THIRD-PARTY INFORMATION, AND STATEMENT BY EXPERTS
AND DECLARATIONS OF ANY INTEREST
Not applicable -
24 DOCUMENTS ON DISPLAY 6.2.9 Documents on display 180
25 INFORMATION ON HOLDINGS 6.2.8 Intra-group r elations
Note 35 (List of significant subsidiaries, joint ventures
and investments in associates at December 31, 2011)
180
F71
ANNUAL FINANCIAL REPORT CROSS-REFERENCE TABLE
The table below identifi es the sections of the Annual fi nancial report (article 451 1 2 of the Monetary and Financial Code and article 222 3 of the General Regulations of the AMF) incorporated in the present Registration Document.
Item Section of this report or Page
Lafarge SA statutory accounts F75 - F95
Consolidated fi nancial statements F5 - F73
Management report (see cross-reference table below) N/A
Certifi cation 181
Statutory auditors’ report on Lafarge S.A. fi nancial statements F74
Statutory auditors’ report on the consolidated fi nancial statements F3
Auditors’ fees and services 5.3.2
Report of the Chairman of the Board on internal control procedures and on corporate governance (article L.225 37 of the French Commercial Code)
Preamble to Chapter 3
3.1, 3.2, 3.4, 3.7, 5.1.2, 5.2.1, 6.2.5(e), 6.2.6
Statutory auditors’ report on the Chairman’s report (article L.225 235 of the French Commercial Code)
5.2.2
Lafarge - Registration Document 2013 • 283
CROSS-REFERENCE TABLES

MANAGEMENT REPORT CROSS-REFERENCE TABLE
This Registration Document contains all the items of the Management report in accordance with the provisions of the French Commercial Code.
Item Section of this report or Page
Activity and fi nancial situation Profi le, 1.2, 1.3, 2.3, 2.4, F75
Recent events, trend information and perspectives 2.1
Research and Development 1.2.3 (c), 1.2.7
Principal risks, risk management and coverage (including use of derivative instruments) 5.1, 5.2, Note 26 (Consolidated fi nancial statements)
Social and environmental data 4
Corporate offi cers (mandataires sociaux) and Executive Offi cers (appointments, compensation,
transactions on shares) 3
Share capital and employee share ownership 6.2.1, 6.1.4
Treasury shares 6.2.2
Elements that could have an incidence in the event of a tender offer 6.2.6
Subsidiaries and affi liates 6.2.8, Note 35 (Consolidated fi nancial statements)
Authorizations granted by the General Meeting 6.2.4
Table of the fi nancial income during the last fi ve years F95
Additional information (accounting policies, dividends, settlement periods) 2.2, F75 , Note 21 (Statutory accounts)
INCORPORATION BY REFERENCE
In accordance with article 28 of Commission rule (EC) n° 809/2004, the following information has been incorporated by reference in this Registration Document:
d section 1.4 (Overview of Operations) pages 27 to 41, chapter 2 (Operating and financial review and prospects) pages 43 to 62, as well as the statutory and consolidated financial statements for the financial year ending December 31, 2012, including the notes to the financial statements and the reports of the statutory auditors, set out on pages F3 to F76 and F77 to F98 of the 2012 Registration Document filed with the Autorité des marchés financiers on April 3, 2013 under number D.13.0276;
d section 3.4 (Our businesses) pages 32 to 44, chapter 4 (Operating and financial review and prospects) pages 47 to 66, as well as the statutory and consolidated financial statements for the financial year ending December 31, 2011, including the notes to the financial statements and the reports of the statutory auditors, set out on pages F3 to F72 and F73 to F92 of the 2011 Registration Document filed with the Autorité des marchés financiers on April 10, 2012 under number D.12.0315.
The sections of the Registration Document 2012 and 2011 which have not been incorporated by reference are either not signifi cant for the investor or already covered in another section of the present Registration Document.
• Lafarge - Registration Document 2013284
CROSS-REFERENCE TABLES

GLOSSARY
In this document, the following terms have the meanings indicated below:
"ACTIVITIES": One of the two activities of the Group, cement, aggregates and ready-Mix concrete. Since the reorganization of 2012, all activities in a country are placed under the responsibility of a country manager.
“COUNTRY”: the organization by country that replaced in 2012 the product -based organization.
“REGISTRATION DOCUMENT” or “ANNUAL REPORT”: the present document which is a free translation of the Document de référence fi led with the Autorité des marchés fi nanciers of France.
“GROUP” or “LAFARGE”: Lafarge S.A. and its consolidated subsidiaries.
“COMPANY” or “Lafarge S.A.”: our parent company Lafarge S.A., a société anonyme organized under French law.
“EMERGING MARKETS or COUNTRIES”: all markets or countries outside Western Europe and North America, except Japan, Australia and New Zealand.
“Tonne” or “Tons”: always refer all to metric tons.
“Dollars” or “US dollars”: unless otherwise specifi ed, dollars of the United States of America.
“Pure aggregates”: core aggregates activities such as crushed stone, gravel and sand.
GRI: Global Reporting Initiative.
WBCSD – CSI: World Business Council for Sustainable Development – Cement Sustainability Initiative.
KPI: Key Performance Indicators.
“Corporate Officer”: under French law, the Chairman and Chief Executive Officer and the Board of Directors members are the “Corporate Offi cers” of Lafarge S.A.
UNITED STATES : United States of America
NB: Due to rounding of amounts and percentages, the addition of data in text or charts may not be totally consistent. Indeed, totals include decimals.
Lafarge - Registration Document 2013 • 285
GLOSSARY

• Lafarge - Registration Document 2013286
GLOSSARY
Copyright: Cover: Media Library Lafarge - Charles Plumey-Faye - Rudy Ricciotti (architect); p. 1: Media Library Lafarge – François Daburon; p. 2: Media
Library Lafarge - Charles Plumey-Faye; p. 13: Media Library Lafarge - Charles Plumey-Faye - Rudy Ricciotti (architect); p. 15: Patrick Strattner/
fstop/Corbis; p. 16: Media Library Lafarge Billy Milimbo (Architect/ SSB Specialist); p. 17: Media Library Lafarge - M. Kadri - CAPA Pictures; p. 18:
DR Media Library Lafarge; p. 19: Media Library Lafarge - Stanislaw Bednarski; p. 20: Media Library Lafarge - Charles Plumey-Faye - Rudy Ricciotti
(architect); p. 21: Media Library Lafarge - Justin Creedy Smith; p. 22: DR Media Library Lafarge - Mahesh Chandra/Sharma; p. 23: Media Library
Lafarge - Franck Betermin – Abacapress; p. 26: Media Library Lafarge - Vincent Rackelboom;
Chapter heading: p. 9: Media Library Lafarge - T. Campagne - CAPA Pictures; p. 43: Media Library Lafarge - M. Kadri - CAPA Pictures; p. 61: Media
Library Lafarge - Ignus Gerber; p. 119: Media Library Lafarge - Xinping Zhang - Jacques Ferrier Architectures; p. 145: DR Media Library Lafarge; p.
165: Media Library Lafarge - Ignus Gerber; F1: DR Media Library Lafarge - Getty Images
This document is printed in France by an Imprim’Vert certified printer on PEFC certified paper produced from sustainably managed forests.

LAFARGE61, rue des Belles Feuilles – BP 40
75782 Paris Cedex 16 – France
Tél.: + 33 1 44 34 11 11
Fax: + 33 1 44 34 12 00
www.lafarge.com