Profile presentation.cdr - Lafarge Africa Plc
158
-
Upload
khangminh22 -
Category
Documents
-
view
0 -
download
0
Transcript of Profile presentation.cdr - Lafarge Africa Plc


, OFR

9
Corporate Information
Board of Directors & Company Secretary
Directors’ Report
Leadership Team
Corporate Profile
Our Global Presence 12
14
Profile Presentation
Governance
25
42
49
50
TABLE OF CONTENTS
Chairman's Statement
Financial Highlights 18
21
Business Review
Corporate Governance Report
Sustainability Report
Statement of Directors' Responsibilities
Report of the Statutory Audit Committee
Shareholders' Information
Report of the Independent Auditor
Consolidated and Separate Statements of Profit or Loss and Other Comprehensive Income
Consolidated and Separate Statements of Value Added
Five year Financial Summary
Consolidated and Separate Statements of Financial Position
Consolidated and Separate Statements of Changes in Equity
Consolidated and Separate Statements of Cash Flows
Notes to the Consolidated and Separate Financial Statements
Financial Statements
56
57
58
60
61
137
139
Notice of Annual General Meeting
Explanatory Notes to the proposed Resolutions
Information in respect of General Mandate
Share Capital History
E-Dividend Mandate Activation Form
Proxy Form
List of Distributors
142
159
161
163
26
30
32
34
52
144
151
152
Complaints Management Policy 155
Photo Reel 157
Unclaimed Dividend Report 154


TOGETHER WE DELIVER, WE WIN!
CUSTOMERS:Our focus is to build and deliver solutions that meet customers' expectations. We encourage diverse thinking to promote and nurture innovation. We collaborate with our customers to achieve shared objectives.
PEOPLE, OPENNESS AND
INCLUSION:
RESULTS:Through business insights and the quality of our decision making, we introduce new ways of looking at challenges in order to achieve excellent results while ensuring accountability.
INTEGRITY:We operate a compliance focused organization and act with a clear sense of ownership.
Health and Safety is an overarching
value, embedded in everything we do.
11
C
R
I
SUSTAINABILITY:
S
P
OUR CORE VALUES
We demonstrate leadership in environmental stewardship while role-modelling responsibility to future generations.
We look towards the broadest possible views of any issue or challenge.
We truly care and respect every individual. We place a high priority on developing our people and building effective teams.

“The global leader in building materials and solutions, LafargeHolcim is keen to provide solutions
to address challenges such as urbanization and climate change. We offer a strong asset base in
around 80 countries, the most innovative cement, concrete, and aggregates solutions to meet
our customers’ needs and a commitment to health, safety and sustainability.
OUR BUSINESSES
CEMENT
From classic masonry cements to high-
performance products tailored for specialized
settings, we offer an extensive line of cements
and hydraulic binders. Customers range from
individuals buying bag cement to businesses
undertaking major construction projects.
SALES MILLION TONNES
2017: 220.2221.9
AGGREGATESOur aggregates serve as raw materials
for concrete, masonry and asphalt as well
as base materials for buildings, roads and
landfills. Our recycled aggregates use
crushed concrete and asphalt from
deconstruction.
SALES MILLION TONNES
2017: 278.7273.8
OUR GLOBAL PRESENCE
READY-MIX
Concrete is the world’s second most
consumed substance by volume after water.
In this highly competitive and decentralized
market, we stand apart through the quality
and consistency of our products, the breadth
of our portfolio and our innovative solutions.
SOLUTIONS & PRODUCTS
Supported by technical expertise and
generations of experience, we create
innovative solutions that meet our customers’
specific needs and requirements.
2.4
The Company's global Geocycle brand
has been utilised for the treatment,
processing and management of waste
activities in 50 countries around the world.
Through co-processing, Geocycle
preserves natural resources and plays an
GEOCYCLE3MILLION M
2017: 50.650.9 SALES
important role in reducing the carbon footprint of
our manufacturing plants.
In Nigeria, Geocycle contributes to the
preservation of the environment by co-
processing biomass in the Company's cement
plants. In 2018, Lafarge Africa substituted 10%
of its kiln energy requirement with biomass. In
addition 1,800tonnes of industrial waste was
treated and utilised, thereby contributing to the
reduction of waste and pollution from selected
companies. Geocycle activities is fully aligned
with the concept of “circular economy” and has
created over 1000 jobs in local communities
through sourcing, preparation and transportation
of biomass to the Company's cement plant
Lafarge Africa, through Geocycle is developing
further the use of waste with on-going projects
that will support the replacement of fuel with
tyres and plastics. In addition to generation of
alternative fuel, the projects will contribute to the
sanitation of the environment and create many
employment opportunities.
NET SALES (CHF bn)2017: 2.3
12
Grinding plant
Cement plant


Lafarge Africa Plc is a member of the LafargeHolcim
Group – the largest building and concrete solutions
company in the world. It is a publicly quoted company
on the Premium Board of the Nigerian Stock Exchange
(NSE) and serves Nigeria and South Africa with a wide
range of building and construction solutions designed
to meet housing and construction needs from small
projects like individual home buildings to major
construction and infrastructure projects.
With plants in Ewekoro and Sagamu in the South-West,
Mfamosing in the South-South and Ashaka in the North-
East of Nigeria, Lafarge Africa Plc currently has in the
country an installed cement production capacity of
10.5MTPA and has plans for further expansion in the near
term.
In addition to its local cement production capacity, Lafarge
Africa Plc also owns 100% of Lafarge South Africa
Holdings (Pty) Limited (LSAH), which is a leading building
materials solutions company with significant scale and a
balanced portfolio of assets across cement, aggregates,
ready- mix concrete (RMC) and pulverized fly ash. LSAH
has 3.6MT in annual cement production capacity with
production sites in key economic centers of South Africa
including the provinces of Limpopo, Mpumalanga, North
West, Free State and KwaZulu-Natal.
Our Cement Operations
South – West Operations
For our South-West operations, we have two plants located
in Sagamu and Ewekoro, both in Ogun State with a combined
production capacity of 4.5MTPA. Our product portfolio
includes five brands- Elephant Cement, a general purpose
cement - a multi-use product suitable for majority of the
applications; Supaset, a fast-setting and rapid strength
gaining cement specifically designed for the needs of the
block-makers; Powermax, a high strength cement for the
sophisticated contractor segment; Etex, a high performance
cement designed to specification for the manufacturing of
roof tiles and SRC, a sulphate resistant cement for coastal
construction.
Northern Nigeria Operations
Ashaka Cement plant in the North-East region also focuses
on providing creative and qualitative solutions to meet the
needs of both small, medium and large scale projects. In
the last 4 decades, Ashaka Cement plant has contributed
immensely to the economic growth and development of North-
Eastern Nigeria and is well positioned to impact the
ecosystem of the region.
AshakaCem Limited (formerly AshakaCem Plc) was
incorporated in August 1974 and commenced production in
1979 as a cement manufacturing and marketing company
under the name Ashaka Cement Company Limited. The
company was founded by the defunct Nigerian Industrial
Development Bank (NIDB) Limited, the Nigerian Bank for
A Leader in Sub-Saharan Africa
The Chairman, Lafarge Africa Plc, Mr. Mobolaji Balogun and the CCEO Lafarge Africa Plc Mr. Michel Puchercos with the Vice President, Prof. Yemi Osinbajo SAN during a courtesy visit to the Presidency
CORPORATE PROFILE
14

SOUTH AFRICA
Lafarge South Africa Holdings (Pty) Limited (LSAH)
LSAH is a holding company through which Lafarge Africa
holds interests in several South African entities. LSAH is a
leading building materials platform with significant scale and a
balanced portfolio of assets across cement, aggregates,
ready-mix concrete (RMC) and pulverized fly ash (collectively
referred to as sub segments). LSAH's subsidiaries are
strategically located, with exposure to key economic centers
including the provinces of Limpopo, Mpumalanga, North
West, Free State and KwaZulu-Natal. Through its subsidiaries,
LSAH has market leading positions in all the sub-segments.
LSAH controls the third largest cement manufacturer in South
Africa, with the largest cement production plant in a single
location in South Africa and current total installed capacity of
3.6mtpa.
Lafarge Africa currently owns 100% of LSAH, which
represents an indirect average holding of 72.40% in the
underlying principal operating companies in South Africa,
including Lafarge Industries South Africa, Lafarge Mining
South Africa and Ash Resources. In line with the objectives of
the Broad-Based Black Economic Empowerment Act, 2003
(Act No. 53 of 2003) the remaining shares in Lafarge Industries
South Africa and Lafarge Mining South Africa are (or will be)
held by the employees of these companies and Sinako
Holdings (one of LSAH's Black Economic Empowerment
Partners) and in the case of Ash Resources by its employees
and Peotona Group Holdings (one of LSAH's Black Economic
Empowerment Partners).
Commerce and Industry (NBCI), Northern Nigeria
Investment Limited (NNIL) and the Government of the then
North-Eastern State (now Adamawa, Bauchi, Borno,
Gombe, Taraba and Yobe States). Current annual cement
production of the plant is 1MTPA with plans for expansion.
Southern Nigeria Operations
Our Southern Nigeria operations comprise of a cement plant
in Mfamosing, Cross River State and a product distribution
hub in Port Harcourt, Rivers State. The Mfamosing plant is a
modern production facility with an annual cement
production capacity of 5MTPA. It was originally established
in 2002 as United Cement Company of Nigeria (UNICEM)
Limited, after the acquisition of the assets of moribund
Calabar Cement Company (CalCemCo).
In 2012, the plant's product portfolio was expanded to offer
customers two cement products catering for general
purpose and specialized applications. An additional
manufacturing line with a production capacity of 2.5MTPA
was commissioned in 2016 to bring the total production
capacity of the plant to 5MTPA. It is now the single
largest cement production site for Lafarge Africa.
The distribution hub in Port Harcourt was the previous Atlas
Cement Company Limited commissioned for operation in
2001 as a bulk cement import and bagging terminal within
the Federal Ocean Terminal, Onne. The plant was operated
on a floating vessel, which had a nominal bagging capacity
of 500,000 metric tons of cement per annum.
L-R: Chairman,Lafarge Africa Plc, Mr. Mobolaji Balogun, Head of Middle East & Africa,LafargeHolcim Miljan Gutovic andCCEO, Michel Puchercos,
15
1616
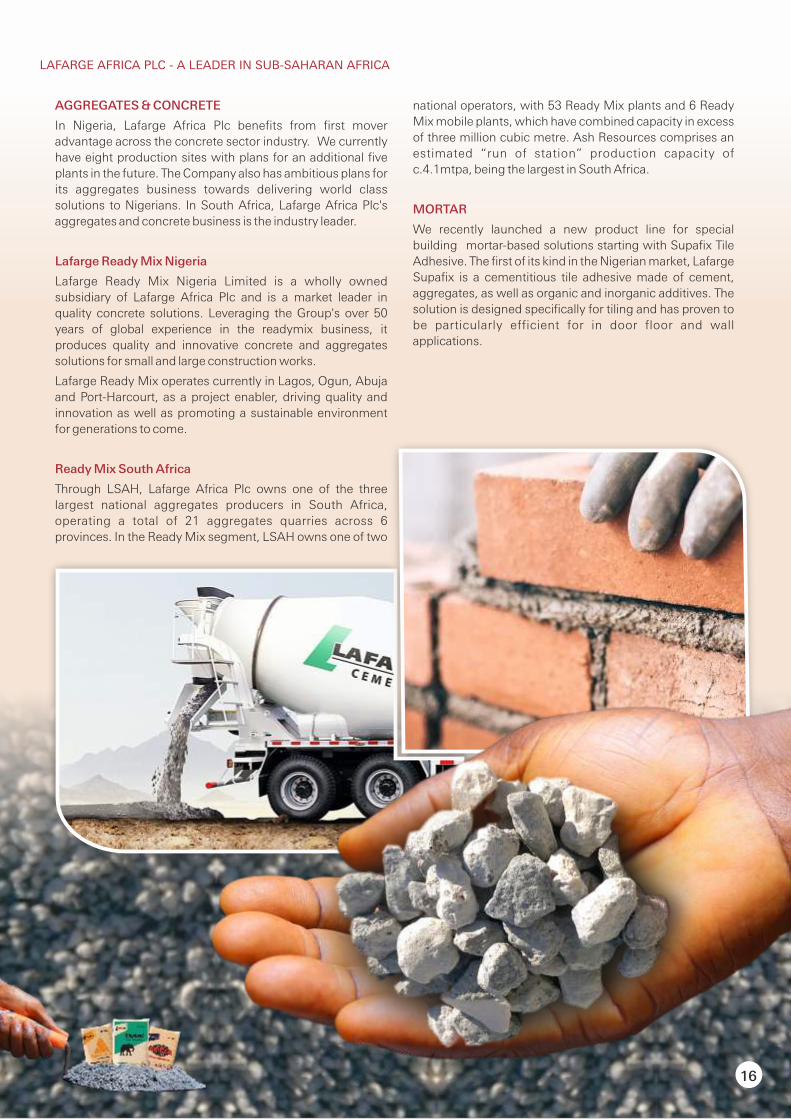
AGGREGATES & CONCRETE
In Nigeria, Lafarge Africa Plc benefits from first mover
advantage across the concrete sector industry. We currently
have eight production sites with plans for an additional five
plants in the future. The Company also has ambitious plans for
its aggregates business towards delivering world class
solutions to Nigerians. In South Africa, Lafarge Africa Plc's
aggregates and concrete business is the industry leader.
Lafarge Ready Mix Nigeria
Lafarge Ready Mix Nigeria Limited is a wholly owned
subsidiary of Lafarge Africa Plc and is a market leader in
quality concrete solutions. Leveraging the Group's over 50
years of global experience in the readymix business, it
produces quality and innovative concrete and aggregates
solutions for small and large construction works.
Lafarge Ready Mix operates currently in Lagos, Ogun, Abuja
and Port-Harcourt, as a project enabler, driving quality and
innovation as well as promoting a sustainable environment
for generations to come.
Ready Mix South Africa
Through LSAH, Lafarge Africa Plc owns one of the three
largest national aggregates producers in South Africa,
operating a total of 21 aggregates quarries across 6
provinces. In the Ready Mix segment, LSAH owns one of two
national operators, with 53 Ready Mix plants and 6 Ready
Mix mobile plants, which have combined capacity in excess
of three million cubic metre. Ash Resources comprises an
estimated “run of station” production capacity of
c.4.1mtpa, being the largest in South Africa.
MORTAR
We recently launched a new product line for special
building mortar-based solutions starting with Supafix Tile
Adhesive. The first of its kind in the Nigerian market, Lafarge
Supafix is a cementitious tile adhesive made of cement,
aggregates, as well as organic and inorganic additives. The
solution is designed specifically for tiling and has proven to
be particularly efficient for in door floor and wall
applications.
LAFARGE AFRICA PLC - A LEADER IN SUB-SAHARAN AFRICA

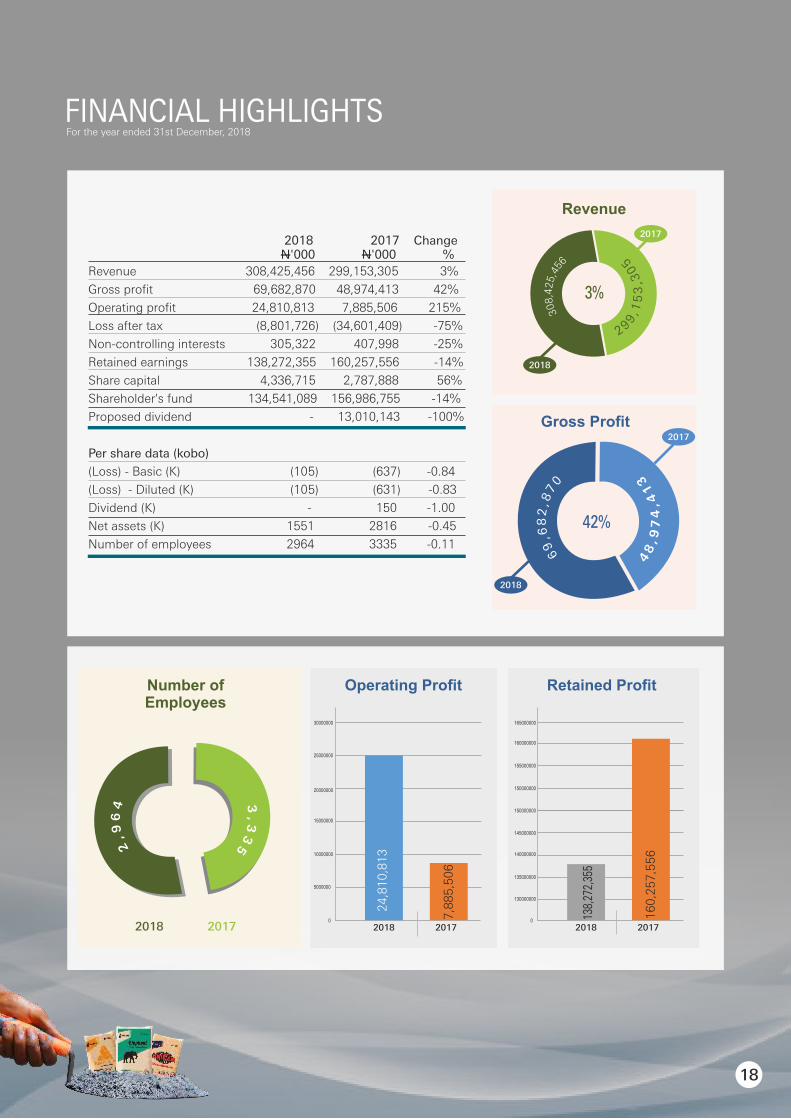
FINANCIAL HIGHLIGHTSFor the year ended 31st December, 2018
18
2018 2017 Change N'000 N'000 %
Revenue 308,425,456 299,153,305 3%
Gross profit 69,682,870 48,974,413 42%
Operating profit 24,810,813 7,885,506 215%
Loss after tax (8,801,726) (34,601,409) -75%
Non-controlling interests 305,322 407,998 -25%
Retained earnings 138,272,355 160,257,556 -14%
Share capital 4,336,715 2,787,888 56%
Shareholder's fund 134,541,089 156,986,755 -14%
Proposed dividend - 13,010,143 -100%
Per share data (kobo)
(Loss) - Basic (K) (105) (637) -0.84
(Loss) - Diluted (K) (105) (631) -0.83
Dividend (K) - 150 -1.00
Net assets (K) 1551 2816 -0.45
Number of employees 2964 3335 -0.11
Revenue
2018
2017
3%
50
3,3
51,
9
92
42%
2018
2017
Gross Profit
Operating Profit
30000000
25000000
20000000
15000000
10000000
5000000
0
2018 2017
Retained Profit
165000000
140000000
0
2018 2017
160000000
155000000
150000000
150000000
145000000
135000000
130000000
Number ofEmployees
2018 2017
24
,81
0,8
13
7,8
85
,50
6
138,
272,
355
16
0,2
57
,55
6
3,3
35
31
4,
47
9,
84


MOBOLAJI BALOGUNChairman, Board of Directors
20

CHAIRMAN’S STATEMENT
21
This year marks the 60th anniversary of the Company since its incorporation in 1959. Looking back, I must pay tribute and commend the vision of the leadership of the then old Western Region of Nigeria to set up the Company in partnership with Associated Portland Cement, UK which later transformed to Blue Circle Industries Plc, UK. From a modest annual cement production capacity of 0.2mt commissioned in 1960 in Ewekoro, the Company through organic growth and acquisitions now have 10.5mt in total annual production capacity and has become a market leader in the domestic cement market having the widest geographical footprint in Nigeria with operations in the South West (Sagamu, Ewekoro), North East (Ashaka) and the South East (Mfamosing, Calabar). Given this footprint, the Company continues to make substantial contributions to the economic growth of Nigeria by impacting the ecosystem positively and generating opportunities for trade and employment without losing focus on sustainability and the environment.
DEBT RESTRUCTURING & RIGHTS ISSUE
When the N131.6 billion Rights Issue was concluded in March 2018, the Board recognized that some further steps were necessary to address outstanding debts of the Company so as to reduce financing cost and to provide additional working capital to limit the use of expensive overdrafts and other short term debts to finance operations. The first step was the restructuring of the foreign currency intercompany loans (US$315.2m) owed to Caricement B.V, a subsidiary of the LafargeHolcim Group (“LH”). Pursuant to the resolution passed by shareholders at an Extra Ordinary General Meeting held on Tuesday September 25, 2018, US$22.2m of the outstanding loans were retained as short tenor while US$293m was restructured into longer tenor of 7.5 years with a moratorium of 2 years on payment of interests and split into smaller tranches to enable the Company to repay as at when its cash flow permits. Thus the terms of the restructured loans provided flexibility in terms of Lafarge Africa's financing arrangements, particularly regarding the two (2) year moratorium granted on the long term loans.
Secondly, the Board proposed at the EGM of September 25, 2018 and shareholders approved the launch of a second Rights Issue of up to N90 billion. Following this approval, a Rights Issue of N89.2 billion was concluded in January 2019, on the basis 6 new ordinary shares at N12.00 per share for every 7 ordinary shares held by
existing shareholders. At closure, the offer was fully subscribed and the net proceeds of N87.9 billion was utilized as contained in the Rights Circular to repay US$22.2m (N8 billion - 9.1%) short term intercompany debt owed to Caricement B.V. The entire N49.7 billion (56.5%) owed to local banks on short term loans were fully repaid and the balance of N30.2 billion (34.4%) retained for working capital to limit further use of overdrafts. I would like to thank all of our shareholders who expressed their faith in the future of the Company and participated in the offer, albeit, in a difficult period for the Nigerian equities market.
LAFARGE SOUTH AFRICA OPERATIONS
Lafarge South Africa Holdings Pty Limited (“LSAH”) is a 100% subsidiary of the Company. The Company's ownership represents an indirect average holding of 72.40% in the underlying principal operating companies in South Africa, including Lafarge Industries South Africa, Lafarge Mining South Africa and Ash Resources. The remaining shareholding (27.60%) is held under the broad-based Black Economic Empowerment Act, 2003 (Act No. 53 of 2003).
LSAH's operations have been subjected to a challenging market in South Africa, with shrinking demand in an aggressively competitive market. In the last 4 years low growth indicators, growing budget deficits, declining infrastructure spend and reduced consumer discretionary income continue to constrain industry volumes; and characterize the downward trend in South Africa's building materials sector.
As part of its audit exercise with respect to the 2018 accounts, KPMG Professional Services as auditors of the Company informed the Company's management that, based upon its assessment of the 2018 performance of LSAH, the valuation of LSAH in the accounts of the Company would have to be impaired to a tune of N 70 billion. The Board, sought further information and acting within its responsibilities, delayed the approval of the 2018 accounts, whilst seeking the optimal resolution of this significant issue which had a potential major impact on shareholders' value in the Company. During deliberations by the Board on this matter, various options were considered including an immediate exit from South Africa. The Board then arrived at the conclusion that the disposal of LSAH was the best option for limiting any further downside, especially for minority investors. In addition and having considered all the options, the Board concluded that a buy-back by LH was the most
Fellow shareholders, I am delighted to welcome you all to the 60th Annual General Meeting (“AGM”) of our Company, Lafarge Africa Plc and to lay before you the Annual Report and Accounts of the Company for the financial year ended 31st December, 2018.

CHAIRMAN’S STATEMENT
appropriate means of deriving the best value from the proposed sale in the interest of all stakeholders and most especially the minority shareholders. Understanding the implication of the potential impairment on the Company, LH acted timeously by agreeing to enter into negotiations with the Company with respect to the potential sale.
To ensure that the negotiation was at arm's length, the Board adopted a process that fully complied with Nigerian Stock Exchange (“NSE”) rule that guides transactions between Related Party and Interested Persons. The process adopted by the Board is described in paragraphs 2, 3 and 4 of the Explanatory Note on the transaction included in pages 144 -150 of this Annual Report & Accounts.
Following discussions and various negotiations on the proposed sale, LH agreed to purchase LSAH for the Consideration being a set-off of all the outstanding amounts due by the Company to Caricement under the Inter-Group Loan Agreements at the Closing Date which is July 31, 2019. The agreed Consideration is US$316,289,061 (three hundred and sixteen million, two hundred and eighty nine thousand and sixty one United State Dollars) being the sum total of the principal sum of US$293,000,000.00 plus all accrued interest of US$23,289,061 as at July 31, 2019.
The proposed sale is expected to enhance the shareholder value in Lafarge Africa, which is of utmost importance to the Board. In addition, following the conclusion of the proposed sale, Lafarge Africa's shareholder loan of US$293,000,000.00 as at July 31, 2019, which represents the only existing foreign currency loan in the books of the Company will be completely paid off. This full repayment of the Shareholder Loan will protect and preserve Lafarge Africa's net Income and cash flows considering the resulting decrease in debt service and the Company's debt will be reduced by c.N115 billion and an additional c.N47 billion through the deconsolidation of LSAH. The N162 billion reduction in the Company's debt will deliver an improvement in cash flow and net income, and will enable Lafarge Africa to consider additional investments in cement production capacity and to improve its market share in Nigeria. The sale is also expected to boost the Company's profitability, through positive cash flow generation.
The Board believes that, under the circumstances and given the likelihood that LSAH's continued operational and financial performance would have required Lafarge Africa to take a very significant impairment on its investment, the Consideration of US$316,289,061 represents a desirable outcome, creating certainty for Lafarge Africa and simplifying the business. The Board therefore strongly recommends the transaction for consideration by shareholders of the Company and urges shareholders to approve the transaction.
On the back of this recommendation by the Board, the impairment of the investment in LSAH that is recognised
in the 2018 audited Financial Statements is c.N3.2 billion which represents the difference between the carrying value of the investment (N118.1 billion) and the net sale proceeds translated from US$ to Naira based on the prevailing exchange rate as at 31 December 2018.
NIGERIAN OPERATIONS
Despite the challenging economic and regulatory operating environment, the Company has continued to make significant progress on a number of fronts, thereby ensuring solid operating performance. EBITDA margins in the Nigerian operations stood at 27% at the close of the year resulting from a stable pricing environment, stabilizing industrial operations, the use of alternative energy and the execution of our commercial and logistics performance improvement plan.
Overall domestic demand estimated at c.21mt for 2018 represents 11.5% on the 18,5mt estimated for 2017. Following the collapse in global commodities market in 2016 which led to a significant fall in crude oil price, the construction sector suffered a contraction that led to 18.5% drop in demand for cement by the end of 2017. The growth in demand seen in 2018 was therefore from a low base for 2017. Since Nigeria's Gross Domestic Product (GDP) pulled out of negative territory in 2017 there has been a gradual increase in demand for cement and the trend seen so far for 2019 suggest growth close to that of 2018.
RESULTS FOR THE YEAR
The stabilization of cement selling price plus c.9% growth in cement dispatched in Nigeria helped to improve turnover in 2018 by approx. 3% to N308.4 billion. The improvements in cost and execution of the new route to market had a positive impact on operating profit which increased by over 200% from N7.9 billion in 2017 to N24.8 billion in 2018. However, this was turned into a loss before tax of N19.5 billion as a result of N45.9 billion financing cost incurred for the year. Deferred tax asset estimated for the year was N12.1 billion on account of deductible timing differences, pioneered activities in Mfamosing and unutilized tax losses reduced the loss after tax for the year to N8.8 billion (2017: N34.6 billion).
It is expected that the reduction in the debt of the Company following the conclusion of the N89.2 billion Rights Issue and the approval of the proposed sale of LSAH will result into a substantial reduction in financing cost as from 2019.
DIVIDEND
On the basis of the results for the year, the Board is unable to propose a dividend. If the sale of LSAH as proposed by the Board to shareholders is approved, the only debt that will remain on the books of the Company will be the second tranche of the N60 billion corporate bond i.e N33.6 billion due for redemption in June 2021 and N11.3 billion in respect of CBN Power Intervention Funds through Bank of Industry, compared with total debt of c.N266 billion at the close of 2018. This significant reduction in debt holds prospects for dividend distribution in future.
22

23
CHAIRMAN’S STATEMENT
CORPORATE SOCIAL RESPONSIBILITY (CSR)
Our Sustainability Report which sets out our key activities during the year under review is on pages 42 to 48 of the Annual Report. As in previous years, the Lafarge Africa National Literacy Initiative continues to be one of our CSR flagships, an annual event which covers the entire nation and supports the key priority of educating our children.
Embedded in our CSR initiatives are sustainability programmes which align with the United Nations Sustainable Development Goals covering the main pillars of Climate, Circular Economy, Water and Nature as well as People and Communities. We continue to make great strides in the areas of reduction of Co2 emissions through increased use of bio-fuels as alternative to fossil fuel for our cement manufacturing operations. We are also focused on provision of basic health care and gender diversity. In 2018, the Geocycle business of LafargeHolcim was launched in Lafarge Africa. Geocycle services preserve natural resources and play an important role in reducing the carbon footprint of the Group's manufacturing plants. Geocyle sits under the pillar of Circular Economy in our sustainable development programme which is aimed at reducing our dependency on fossil fuels and transforming waste into resources in our production processes. Our Geocycle initiative has begun to grow and impacting the ecosystem positively by creating jobs. In 2018, we used an average of 10% in alternative fuel (nearly 48% and 33% at Ewekoro I and Sagamu Plant respectively). Waste material used in 2018 was about 82 ktons as part of our contribution in resolving the emerging global issue of waste management.
BOARD CHANGES
Since the last Annual General Meeting, Mr Jean-Carlos Angulo, Ms. Sylvie Rochier, Ms Geraldine Picaud and Dr Shamsuddeen Usman resigned from the Board. I wish to express our gratitude to these Directors for their service to the Company and wish them success in all of their future endeavours.
At the Extra-Ordinary Meeting (EGM) of the Company held on 25th September, 2018 shareholders approved the appointment of Mr Rossen Papazov. Mr Papazov is the CEO of the Lafarge South Africa operations.
To fill the vacancies, Mr Jean-Philippe Benard (on 31st October 2018) and Ms Karine Uzan Mercie (22nd March 2019) were appointed to the Board. Their profiles are on pages 28 to 29 of the Annual Report. On behalf of the Board of Directors and shareholders, I warmly welcome them to the Company's Board.
In accordance with our Articles of Association, the
Directors to retire by rotation at the AGM and who being eligible now offer themselves for re-election are Mrs Adenike Ogunlesi, Mrs Elenda Giwa-Amu and Mr. Adebode Adefioye.
FUTURE OUTLOOK
The approval by shareholders of the proposed sale of LSAH is expected to boost the Company's cashflow and net income, given the reduction in debt service outflows, cut annual interest expense on account of the full repayment of the foreign currency inter-company loan, enable the Company to reinvest in (and expand) operations in existing plants in Nigeria, enable the management of Lafarge Africa to devote attention to Lafarge Africa's operations with higher profitability and prospects, strengthen Lafarge Africa's Balance Sheet and position the Company to improve overall profitability.
CONCLUSION
I would like to express gratitude on behalf of the Board to all our stakeholders particularly our management and staff whose individual and collective efforts make the difference in a challenging economic environment.
I thank our key partners namely our distributors, customers, transporters, suppliers, bankers, bondholders and other service providers for their support during 2018.
My sincere gratitude to all my fellow shareholders for their continued support and encouragement. Our largest shareholder and partner, LafargeHolcim continues to provide commercial and technical support to our operations, for which we remain grateful. I must recognize LafargeHolcim for responding timeously to the need to resolve the issue with LSAH and I express in particular, my appreciation to Ms Geraldine Picaud, the LafargeHolcim Group CFO who led the LafargeHolcim representatives at the negotiations, for the pivotal role she played in ensuring that we were able to conclude the proposed sale, in time for consideration of shareholders and approval at this AGM.
Finally, I thank my colleagues on the Board for their commitment, support, counsel and insights which have continued to guide the Company through this challenging times.
My colleagues on the Board, distinguished shareholders, ladies and gentlemen, once again I welcome you to the 60th AGM of your company and invite you to participate in the agenda of the meeting.
Thank you and God bless.
Mobolaji BalogunChairmanLafarge Africa Plc


CORPORATE INFORMATION
25
DIRECTORS
REGISTRAR
Cardinal Stone (Registrars) LimitedNo 358, Herbert Macaulay Road,Yaba, Lagos.
PRINCIPAL BANKERS
MRS. ELENDA GIWA-AMU
MRS. ADENIKE OGUNLESI
MS. GERALDINE PICAUD (resigned w.e.f 21st March 2019)
MR. CHRISTOF HASSIG (appointed w.e.f 7th April 2018)
MR. GRANT EARNSHAW (appointed w.e.f 7th April 2018)
MR. ROSSEN PAPAZOV (appointed w.e.f 21st July 2018)
MR. JEAN-PHILIPPE BENARD(appointed w.e.f 31st October 2018)
MS. KARINE UZAN MERCIE (appointed w.e.f. 22nd March 2019)
MR. MOBOLAJI BALOGUN Chairman
MR. GUILLAUME ROUX(resigned w.e.f. 6th April 2018)
MS. SYLVIE ROCHIER (resigned 30th October 2018)
MR. MICHEL PUCHERCOS Group Managing Director/CEO
MR. ADEBODE ADEFIOYE
MR. JEAN-CARLOS ANGULO (resigned w.e.f 20th July 2018)
DR. SHAMSUDDEEN USMAN CON, OFR (resigned w.e.f 1st April 2019)
DR. ADEBAYO JIMOH (resigned w.e.f. 6th April 2018) ALHAJI UMARU KWAIRANGA(resigned w.e.f. 6th April 2018)
COMPANY REGISTRATION
NUMBER
RC 1858
COMPANY SECRETARY
Mrs. Adewunmi Alode
REGISTERED OFFICE
No 27B, Gerrard Road,
Ikoyi, Lagos.
INDEPENDENT AUDITOR
KPMG Professional ServicesKPMG Tower,Bishop Aboyade Cole Street,Victoria Island,Lagos.
Access Bank Plc
Citibank Nigeria Limited
Diamond Bank Plc
Ecobank Nigeria Limited
First Bank of Nigeria Limited
Guaranty Trust Bank Plc
Standard Chartered Bank Plc
Stanbic IBTC Bank Limited
United Bank for Africa Plc
Wema Bank Plc
Zenith Bank Plc
Union Bank of Nigeria Plc

MR. MOBOLAJI OLUDAMILOLA BALOGUN - Chairman
Mobolaji Balogun joined the Board of the Company on the 1st of March 2005 and was appointed as the Chairman of Lafarge Africa on the 22nd of May 2015. He is the Chief Executive Officer of Chapel Hill Denham, one of Nigeria's leading investment firms and Chief Investment Officer of the Nigeria Infrastructure Debt Fund. Bolaji has over twenty-eight years of experience in investment banking and mobile telecommunications.
He spent eleven years within FCMB Group, in investment banking and securities trading, leaving the business in January 2001. From April 1993 to January 2001, he was Executive Director and Chief Operating Officer at CSL Stockbrokers (part of FCMB Group). Bolaji was also Executive Director at FCMB Capital Markets from January 1996, where he led advisory teams in major corporate and commercial transactions.
He left FCMB Capital Markets in January 2001, to become a co-founder and Director of Econet Wireless Nigeria, now Airtel Nigeria. He led the capital raising and license bid auction process for Econet Wireless Nigeria's USD285 million GSM license. He was pioneer Chief Business Development and Strategy Officer and in October 2001, was appointed Chief Marketing Officer. The US$1.67 billion sale of Econet Wireless to Celtel in 2005 remains Nigeria's single largest successfully exited private investment. Bolaji left mobile telecommunications and returned to investment banking, when he founded Chapel Hill in 2005.
Bolaji is Vice Chairman of Endeavor Nigeria and a Director of Trustfund Pensions Plc, one of Nigeria's largest Pension Fund Managers. He was formerly Chairman of Nahco FTZ Limited, a former Director of Nahco Aviance Plc and NASD Plc. He was appointed to the Johannesburg Stock Exchange, Africa Advisory Board in September 2009. Bolaji is an Economics (Honours) graduate of the London School of Economics, University of London.
MR. MICHEL PUCHERCOS - GMD/CEO
Mr. Michel Puchercos is a graduate of the Ecole Polytechnique (1976) and the Ecole Nationale du Génie Rural, des Eaux et des Forêts (1981). He started his career in 1982 at the French Ministry of Agriculture and served as a Director of Orsan, a subsidiary of Lafarge from 1989 .
He worked in senior executive positions in a number of Agro- Food and Chemical Industries in Europe as follows: from 1992-1994 in Jungbunzlauer SA as Executive President, from 1994-1996 as General Manager of the Cana group and from 1996 -1998 Doux, as Executive Vice President of this leading European group specializing in poultry.
Michel returned to Lafarge in 1998 when he was appointed as Director of Strategy and Information Systems of the Gypsum division in Lafarge. In 2003, he moved to the Cement Division as Director of Cement strategy, until his re - assignment to Bamburi Cement as Managing Director in September 2005 till 2009 when he was appointed the President and CEO of Lafarge South Korea Japan Operations.
He was appointed as the GMD/CEO of Lafarge Africa Plc on the 16th March 2016.
Mr. Adebode Adefioye was appointed to the Board of the Company on the 20th December 2012. He has over 32 years work experience in different industries.
Mr. Adefioye is a graduate of the University of Lagos and holds a Masters of Science degree. He is a member of the Institute of Directors and the Institute of Public Analysts of Nigeria.
Mr. Adebode Adefioye currently holds Directorship positions on the Board of Wema Bank Plc and Eterna Plc.
MR. ADEBODE ADEFIOYE - Director
BOARD OF DIRECTORS’PROFILE
26

MRS. ELENDA GIWA-AMU - DirectorMrs. Elenda Ohirenua Giwa-Amu is the CEO, Chandrea Lifestyle Limited, an Interior design company. She was the MD (Acting) Cross River State Tourism Bureau and Executive Secretary, Cross River State Carnival Commission, the prime driver of Calabar Carnival, which is regarded as Cross River State's most enduring brand.
She holds a B.Sc Honours in Microbiology/Zoology, from the University of Maiduguri and an Associate Degree in Design Technology from F.I.T New York. She is a member of the Women in Manufacturing (WIM) Africa and previously, Head, Private Banking, Chartered Bank now Stanbic IBTC.
She was appointed to the Board of Lafarge Africa Plc. on the 11th March 2015.
Mrs. Adenike Ogunlesi is the founder & Chief Responsibility Officer of Ruff 'n' Tumble, the foremost indigenous lifestyle brand operating to international standards in the design, manufacturing and retail of children's clothing.
Starting from the boot of her car, Adenike has turned Ruff 'n' Tumble into an instantly recognizable brand. As an entrepreneur of great vision and determination, she has built a reputation for being the best manufacturer of children's clothing, with a network of stores nationwide.
Adenike is a founding member and the first president of the Network of Entrepreneurial Women (NNEW) at the Nigeria Employer's Consultative Association (NECA). She was an advisory board member of the Enterprise Development Centre (EDC) at the Lagos Business School. She is an advisory board member and mentor at WISCAR (Women in Successful Careers) which is a structured mentoring programme for young women, a mentor at the Mara Foundation and an avid motivational speaker.
She is a winner of numerous awards and a finalist at the CNBC AABLA (All Africa Business Leaders Awards) in the category of the Business Woman of the year 2014 and 2015. She was appointed to the Board of Lafarge Africa Plc on the 11th March 2015.
MRS. ADENIKE OGUNLESI - Director
Mr. Christof Hassig joined Holcim Group in 1999. Before then he worked for 25 years at UBS performing in many different functions, including global relationship manager and investment banker for multinational corporates in Switzerland and abroad. Christof holds a Master's degree in Banking and the Advanced Management Program at Harvard Business School. He currently heads the Corporate Strategy, Mergers & Acquisitions function at LafargeHolcim. He was appointed to the Board of Lafarge Africa Plc on the 7th of April 2018.
MR. CHRISTOF HASSIG - Director
27
BOARD OF DIRECTORS’ PROFILE

Mr. Earnshaw holds a Postgraduate Diploma in Business Administration from Edinburgh Business School, and is a certified Building and Civil Engineer from Peterborough Technical College with trainings in Concrete Technology & Construction from UK Construction Industry Training Board. Grant has held several positions at LafargeHolcim, prior to this appointment, he held several positions as Senior VP & Head of Integration, CEO of Lafarge Iraq, Group Vice President St ra tegy, Deve lopment , mergers & Acquisition EMEA Region - Lafarge (UK & France) and Managing Director, Lafarge Middle East and Project Engineer at Balfour Beatty Plc.
Grant is a Fellow of the Institute of Directors (UK) and is currently the Area Manager for Middle East at LafargeHolcim.
He was appointed to the Board of Lafarge Africa Plc on the 7th of April 2018.
Mr. Rossen Papazov (Bulgarian) is currently the Country Chief Executive Officer (CEO) of LafargeHolcim South Africa. He joined LafargeHolcim Group in 2000 as a Business Development Manager. Before then, he worked at the World Bank as a Financial Management Specialist in Sofia, Bulgaria, and as a Senior Associate at Arthur Andersen. Rossen ho lds an MBA f rom the prestigious International Institute for Management Development, Lausanne, Switzerland, and he is a Fellow of the Association of Certified Chartered Accountants, Glasgow, UK.
He was appointment to the Board of Lafarge Africa Plc on the 21st of July 2018.
MR. ROSSEN PAPAZOV – Director
MR. JEAN-PHILIPPE BENARD
Mr Jean-Philippe Benard (French) is currently the Chief Procurement Officer (CPO) of LafargeHolcim. He joined LafargeHolcim in 2012 as the Vice-President, Energy Group. Before then, he worked at Saint-Gobain Glass as a Chief Procurement Officer, and as an International Energy Manager at Arcelor. Jean-Philippe holds an MSc degree in Mathematics and Mechanics from the Universite Paris VI Pierre et Marie Curie, France. He is also a graduate of Engineering school, Ecole Nationale des Ponts et Chaussées, en French engineering school.
He was appointed to the Board of Lafarge Africa Plc on the 31st of October 2018.
– Director
MR. GRANT EARNSHAW - Director
28
BOARD OF DIRECTORS’ PROFILE

Adewunmi Alode holds a Bachelor of Laws degree from the Lagos State University and professional certification of a Chartered Secretary from the Ins t i tu te o f Cha r te red Sec re ta r i es and Administrators (ICSA) UK. She was called to the Nigerian Bar in 2005. She is currently undergoing her Masters in Business Administration (MBA) at the Business School Netherlands.
She was Company Secretary of Unicorn Holdings Limited. She joined Lafarge Africa Plc (then Lafarge Cement WAPCO Nigeria Plc) in 2008 as a legal officer and rose to assume several roles within the Company including Company Secretary of the wholly owned subsidiary, Lafarge ReadyMix Nigeria Limited, Compliance Officer, Legal Manager and Senior Legal Counsel, Commercial Contracts.
She was appointed as the Company Secretary to the Board on the 12th of December 2017.
MRS. ADEWUNMI ALODE - Company Secretary
MS. KARINE UZAN MERCIE- Director
29
BOARD OF DIRECTORS’ PROFILE
Ms. Karine Uzan Mercie is currently the Group Head of Tax at LafargeHolcim.
Prior to joining LafargeHolcim in 2018, she occupied different positions in corporate finance including Vice-President Tax & Corporate Initiatives, Treasurer Europe and Vice-President Public Affairs & Communication, France at Coca-Cola Enterprises Inc. in Atlanta, USA.She was also Vice-President Tax at Alstom in Paris, France and International Tax lawyer at Ernst & Young in Paris, France.
Karine is a lawyer and member of the Paris Bar. She is a knight of the legion of honor of France. She co-chairs the investment committee of the LafargeHolcim UK pension fund, is a board member of AACHEDE and Puissance Elles, non-profit French organisations.
She was appointed to the Board of Lafarge Africa Plc on the 21st of March 2019.

LEADERSHIP TEAM
30
1 2 3 4
5 6 7 8
9 11
12 13 14
10
LOLU ALADE-AKINYEMISupply Chain Director
6
8
7
EDITH ONWUCHEKWA Legal & Compliance Director
Pricing & Market Innovation DirectorVIPUL AGRAWAL
9
BESTOW ENUMA AKEZEHead of Aggregates & Concrete
Commercial Director
FIDELIA OSIME
OLUSEGUN SHOYOYE
Organization & HR Director
BRUNO BAYET Chief Financial Officer
2
3
4Industrial Director
Communications, Public Affairs & Sustainable Development Director
HELMUT KORAKCountry Security Manager
RABIU UMAR ABDULLAHI
11
12
DANIEL ADEDOKUNHead of Geocycle Nigeria
Managing Director, Ashaka
13
14
OLUFOLAKE ODEGBAMI Head of Safety, Health & Environment
GBENGA ONIMOWO 5MICHEL PUCHERCOSGMD/CEO
1 FOLASHADE AMBROSE-MEDEBEM 10


DIRECTORS’ REPORT
32
LafargeHolcim Limited is an international investor
holding its shares in the names of its subsidiaries: AIC UK
(18.82%), Lafarge Associated Nigeria Limited (8.95%),
and CariCement BV (48.55%). Total shareholding of
Lafargeholcim Limited in the Company was 76.32% as
at 31 December 2018.
After the 2019 rights issue, the issued and fully paid up
share capital became 16,107,795,721 ordinary shares of
50k each. The share holding structure post the 2019
rights issue is as follows: Associated International
Cement Limited (AIC UK) holding 22.95%, Lafarge
Associated Nigeria Limited holding 4.82% and
CariCement BV holding 56.04%. The remaining 16.19%
of the issued shares were held by other individuals and
institutions.
Aside the aforementioned three companies, no other
shareholder held more than 5% of the issued share
capital of the Company as at 31 December 2018.
6. PROPERTY, PLANT & EQUIPMENT
Information relating to changes in property, plant &
equipment is disclosed in Note 16 to the Financial
Statements.
7. UNCLAIMED DIVIDEND AND SHARE CERTIFICATES
The Company has posted a list of unclaimed dividends
and share certificates on the company’s website.
Shareholders are enjoined to review the list to claim their
dividend(s) or share certificate(s). For further assistance
in this regard, Shareholders should contact the
Company Secretary or the Registrar, Cardinal Stone
Registrars Limited.
The Company's Registrar has advised that the total
amount of unclaimed dividends outstanding as at 31st
December 2018 is N1,152,020,632.67 and the sum of
N1,029,653,213 was returned to Lafarge Africa Plc in
line with the Rules of the Securities and Exchange
Commiss ion leav ing the cash ba lance of
N122,367,419.52 with the Company's Registrars.
8. DIRECTORS' RESPONSIBILITIES IN RELATION TO
THE FINANCIAL STATEMENT
The Directors accept responsibility for the preparation of
the annual financial statements as set out on page 49
that give a true and fair view in accordance with the
International Financial Reporting Standards (IFRS) and
in the manner required by the Companies and Allied
Matters Act Cap C20, Laws of the Federation of Nigeria
2004 and the Financial Reporting Council of Nigeria Act
2011.
The Directors are pleased to present the Annual Report of
Lafarge Africa Plc (“the Company”) and its subsidiaries
(together as “the Group”) along with the audited
Consolidated and Separate Financial Statements of the
Group for the year ended 31st December, 2018.
1. LEGAL FORM
Lafarge Africa Plc, a public quoted company on the
Nigerian Stock Exchange was incorporated in Nigeria
under the Companies Act (now Companies and Allied
Matters Act) Cap C20 Laws of the Federation of Nigeria
2004 on the 24th of February 1959. The Company
became listed on the Nigerian Stock Exchange in 1979.
The name of the Company was changed from Lafarge
Cement WAPCO Nigeria Plc to Lafarge Africa Plc on the
9th of July 2014. 2. SUBSIDIARIES
The Company has full ownership of Lafarge ReadyMix
Nigeria Limited, Ashakacem Limited with majority
shareholding in Lafarge South Africa Holdings (pty)
Limited.
3. PRINCIPAL ACTIVITIES
During the year under review, the principal activities of
the Group and the Company remained manufacturing
and marketing of cement, concrete and aggregates
products, including the provision of building solutions.
4. SUMMARY GROUP FINANCIAL RESULTS FOR THE
YEAR
2018 2017
N'million N'million % Change Revenue 308,425 299,153 3.1% Loss before tax (19,508) (34,032) 42.7%
Income tax credit (charge) 10,707 (281) 3710%
5. S H A R E H O L D I N G A N D S U B S TA N T I A L
SHAREHOLDERS
The issued and fully paid-up Share Capital of the
Company as at 31 December 2018 was 8,673,428,465
ordinary shares of 50kobo each (31 December 2017:
5,575,775,442 ordinary shares of 50 kobo each). The
Register of Members show that three companies:
Associated International Cement Limited (AIC UK)
holding 18.82%, Lafarge Associated Nigeria Limited
holding 8.95% and CariCement BV holding 48.55% held
more than 5% of the Company's Issued share capital.
The remaining 23.68% of the issued shares were held by
other individuals and institutions.

The Directors further accept responsibility for
maintaining accounting records as required by the
Companies and Allied Matters Act and for such internal
control as the Directors determine is necessary to
ensure adequate internal control procedures are
instituted to safeguard assets, prevent and detect
frauds, errors and other irregularities.
The Directors have made an assessment of the
Company's ability to continue as a going concern and
have no reason to believe the Company will not remain a
going concern for at least twelve months from the date
of this statement.
9. DIRECTORS' INTEREST IN SHARES
In accordance with sections 275 and 342 of the
Companies and Allied Matters Act, Cap C20 Laws of the
Federation of Nigeria 2004 and in compliance with the
Listing Rules of the Nigerian Stock Exchange, the interest
of Directors in the issued share capital of the Company
are as recorded in the Register of Members and/or
notified by them are as follows:
10. DIRECTORS' INTEREST IN CONTRACTS In accordance with Section 277 of the Companies &
Allied Matters Act (cap C20, Laws of the Federation of
Nigeria, 2004), Directors who had interest in contracts or
transactions during the year had notified and declared
their interest to the Company to the effect that they held
directorship position or shareholding in companies
which could be regarded as interested in a contract or
transaction. The Directors' interest have been noted in
the minutes of meeting.
11. DONATIONS AND CHARITABLE GIFTS In 2018, Lafarge Africa Plc expended N868,878,089 on
diverse social investment programs and initiatives in our
communities pan-Nigeria. The list of donations and
charitable gifts are as follows:
Host Community Development
Projects across Nigeria N705,808,000
The Lafarge Africa National
Literacy Competition N125,867,089
Donations and other charitable gifts N37,203,000
N868,878,089 Total
DIRECTORS’ REPORT
33
NAMES No of Shares No of Shares No of Shares No of Shares No of Shares 18.06.19 Direct Indirect Direct Indirect 31.12.18 31.12.18 31.12.17 31.12.17
Mr. Mobolaji Balogun 10,000,000 4,000,000 Nil 2,510,331 Nil
Mr. Michel Puchercos Nil Nil Nil Nil Nil
Dr. Shamsuddeen Usman CON, OFR** 113,745 75,782 Nil 48,710 Nil
Mr. Adebode Adefioye Nil Nil Nil Nil Nil
Mrs. Elenda Giwa-Amu 203,550 203,550 Nil 203,550 Nil
Mrs. Adenike Ogunlesi Nil Nil Nil Nil Nil
Ms. Geraldine Picaud** Nil Nil Nil Nil Nil
Mr. Christof Hassig Nil Nil Nil Nil Nil
Mr. Grant Earnshaw Nil Nil Nil Nil Nil
Mr. Rossen Papazov Nil Nil Nil Nil Nil
Mr. Jean-Philippe Benard Nil Nil Nil Nil Nil
Mr. Guillaume Roux* Nil Nil Nil Nil Nil
Ms. Sylvie Rochier* Nil Nil Nil Nil Nil
Dr. Adebayo Jimoh* 465,687 250,755 Nil 161,200 Nil
Alhaji Umaru Kwairanga* 405,111 405,111 Nil 318,149 Nil
Mr. Jean Carlos Angulo* Nil Nil Nil Nil Nil
Ms. Karine Uzan Mercie * Nil Nil Nil Nil Nil
Grand Total 11,188,093 4,935,198 3,241,940
* Except as disclosed, none of the Directors has notified the Company of any disclosable interests in the Company's share
capital and none of the Directors has an indirect shareholding in the Company.
* Not a member of the Board of Directors as at 31st December 2018. ** Resigned from the Board in 2019

In accordance with Section 38(2) of the Companies and
Allied Matters Act Cap C20 Laws of the Federation of
Nigeria, 2004, which is also consistent with the
LafargeHolcim Group Donations Policy, the Company
did not make any donation or gift to any political party,
political association or for any political purpose during
the year in review.
12. STATUTORY AUDIT COMMITTEE
In accordance with Section 359(3) of the Companies and
Allied Matters Act cap C20 Laws of the Federation of
Nigeria, 2004, an Audit Committee of the Company was
constituted at the 59th Annual General Meeting held in
Lagos on the 16th of May 2018 comprising of three (3)
shareholders and three (3) Directors. The three (3)
shareholders representatives are: Mr. Olawale Oyedele,
Chief Peter Asu, Mr. Adebayo Adeleke. The three
Directors are: Dr. Shamsudden Usman CON, OFR, Ms
Karine Uzan Mercie and Mrs. Elenda Giwa -Amu.
13. AUDITORS In accordance with section 357 (2) of the Companies and
Allied Matters Act, KPMG Professional Services had
indicated their willingness to continue in office as
External Auditors of the Company. A resolution will be
proposed to authorize the Directors to fix their
remuneration.
CORPORATE GOVERNANCE REPORT
The Board of Lafarge Africa Plc remains committed to
the highest standards of corporate governance, in order
to achieve long-term value and success for all
stakeholder groups comprising of customers,
shareholders, employees, creditors, suppliers and the
communities in which the Company operates. Our Corporate Governance principles and practices are
further strengthened with the adherence to the
LafargeHolcim Code of Business Conduct, which
articulates the values, ethics and business principles and
also serves as the ethical road map for the Company, its
directors, employees and stakeholders. The Code of
Business Conduct is supplemented with appropriate
mechanism for reporting any concerns pertaining to
non-adherence.
The Company continues to adhere to the provisions of
its Memorandum and Articles of Association, the
Companies and Allied Matters Act (Cap C20 Laws of the
Federation of Nigeria, 2004), rules of the Nigerian Stock
Exchange, the Securities and Exchange Commission
(SEC), International Best Practices and other applicable
regulations. This report describes how the Board has
been complying with the codes as well as best practice
in corporate governance.
1. BOARD COMPOSITION AND ITS COMMITTEES
In accordance with the SEC Code that the Board should
be of a sufficient size relative to the scale and complexity
of the Company's operations, the Company's Articles of
Association provides that the Company's Board shall
consist of not more than Eleven (11) Directors. In 2018 ,
the Board comprised of Ten (10) Non-Executive
Directors and One (1) Executive Director.
The composition of the Board is a mix of Executive and
Non-Executive Directors with high level of
competencies and experience, with admirable records
of achievement in their respective fields.
The position of the Group Managing Director and the
Chairman are held by separate persons.
2. ROLE OF THE BOARD
The Board met regularly to consider the matters
reserved for it, set broad policies for the Company's
business and operations and ensured that a
professional relationship was maintained with the
Company's auditors in order to promote transparency in
financial and non-financial reporting.
The role of the Board is highlighted as follows:
To review and align goals, major plans of action, annual budget and business plans with the overall strategy of the Company;
To set performance objectives; monitor implementation and oversee major capital expenditure in line with approved budget;
To ensure the integrity of the Company's accounting and financial reporting systems and that appropriate systems are in place for monitoring risk, financial control and compliance with the laws.
Th r o u g h B o a r d C o m m i t t e e s , t o m a ke recommendations and take decisions on issues of expenditure that may arise outside the normal meeting schedule of the full Board.
Ratify duly approved recommendations and decisions of the Board Committees.
The Board has supervisory responsibility for overall budgetary planning, major treasury planning, scientific and commercial strategies. The Board is responsible for satisfying itself that planning procedures and the Company’s overall objectives are appropriate.
Periodic and regular review of actual business performance relative to established objectives.
34
DIRECTORS’ REPORT

Review and approve internal controls and risk management policies and processes.
Performance appraisal and compensation of Board members, succession planning and appointment, training, remuneration and replacement of Board members and senior executives.
3. BOARD CHANGES
The following Directors resigned from the Board of the
Company since the last Annual General Meeting: i. Mr. Guillaume Roux (w.e.f 6th April 2018) ii. Dr. Adebayo Jimoh (w.e.f 6th April 2018) iii. Alhaji Umaru Kwairanga (w.e.f 6th April 2018) iv. Mr. Jean-Carlos Angulo (w.e.f 20th July 2018) v. Ms. Sylvie Rochier (w.e.f 30th October 2018) vi. Ms. Geraldine Picaud (w.e.f 22nd March 2019) vii. Dr. Shamsuddeen Usman CON OFR (w.e.f 1st April 2019)
To fill the vacancies created by the resignation of the
above Directors and upon due consideration and
recommendation of the Board Nominations and
Remuneration Committee, the following Directors were
appointed by the Board;
a. Mr. Christof Hassig (Non-Executive Director) w.e.f
7th April 2018, ratified at the 59th AGM held on the
16th May 2018; b. Mr. Grant Earnshaw (Non-Executive Director) w.e.f
7th April 2018, ratified at the 59th AGM held on the
16th May 2018; c. Mr. Rossen Papazov (Non-Executive Director) w.e.f
21st July 2018 ratified at the EGM held on the 25th
September 2018; d. Mr. Jean-Philippe Benard (Non-Executive Director)
w.e.f 31st October 2018;
e. Ms. Karine Uzan Mercie (Non-Executive Director)
w.e.f 22nd March 2019
The profiles of Mr. Jean-Philippe Benard and Ms. Karine
Uzan Mercie are contained in pages 28 -29 of this Annual
Report. Their appointments as Directors will be presented
to Shareholders for ratification at the Annual General
Meeting scheduled to hold on the 22nd of July 2019.
4. RETIREMENT BY ROTATION
In accordance with Articles 97 to 99 of the Company's
Articles of Association, one-third of all Non-Executive
Directors (rounded down) are offered for re-election every
year (depending on their tenure on the Board) together
with directors appointed by the Board since the last
General Meeting.
Pursuant to this, the Directors to retire by rotation and
who being eligible, offer themselves for re-election are
Mr. Adebode Adefioye, Mrs. Elenda Giwa-Amu and Mrs.
Adenike Ogunlesi. The profile details of the Directors standing for re-election
are set out on pages 26 to 27 of this Annual Report.
5. BOARD OF DIRECTORS' ATTENDANCE
In accordance with Section 258(2) of the Companies and
Allied Matters Act (Cap. C20 Laws of the Federation of
Nigeria 2004), the record of Director's attendance and
meetings held during the year 2018 are detailed below
and will be available for inspection at the venue of the
Annual General Meeting.
6. BOARD MEETINGS
The Board has a formal schedule of meetings each year. In
2018, the Board met seven (7) times in the course of the
year under review in line with the formal schedule and
met six (6) times for unscheduled emergency meetings
due to the Related Party transactions and the Rights Issue
programme. The record of attendance of the Directors at
the scheduled meetings is as follows:
Dates of scheduled Board Meetings held in 2018: 1st
March 2018, 27th March 2018, 16th May 2018, 20th July
2018, 25thSeptember 2018, 30th October 2018 and 10th
December 2018.
35
DIRECTORS’ REPORT
S/N NAME No. of Meetings 1. Mr Mobolaji Balogun 7/7 2. Mr. Michel Puchercos 7/7 3. Dr. Shamsuddeen Usman CON, OFR* 7/7 4. Mr. Adebode Adefioye 7/7 5. Mrs. Elenda Giwa-Amu 6/7 6. Mrs. Adenike Ogunlesi 6/7 7. Ms. Geraldine Picaud * 4/7 8. Mr. Christof Hassig Appointed 7th April 2018 3/7 9. Mr. Grant Earnshaw Appointed 7th April 2018 4/7 10. Mr. Rossen Papazov Appointed 21st July 2018 3/7 11. Mr. Jean-Philippe Benard Appointed 31st October 2018 1/7 12. Ms. Sylvie Rochier* 5/7 13. Mr. Jean-Carlos Angulo* 4/7 * means the Director has resigned from the Board

36
DIRECTORS’ REPORT
(iii) Risk Management & Ethics Committee The Risk Management and Ethics Committee is saddled
with the responsibility of ensuring that the Company's
policy on ethics adequately impacts positively on its
business partners and stakeholders e.g. Customers,
Shareholders, Community, Government, Suppliers and
the public. The Committee also considers the nature,
extent and categories of the risks facing the Company,
and the likelihood of such risks materializing, the
Company's ability to reduce the incidence and the
impact on its business, if the risks do materialize.
The Committee met twice in the year. The table below
shows the attendance of the members of the
Committee at the meetings:
Dates of Risk Management and Ethics Committee
meetings held in 2018: 28th February 2018 and 29th
October 2018.
S/N NAME DESIGNATION No. of Meetings 1. Mr. Jean-Carlos Angulo* Chairman 1/2 2. Mrs Adenike Ogunlesi Member 1/2 3. Mr. Christof Hassig** Member 1/2 4. Mr. Grant Earnshaw** Member 1/2 5. Mr. Michel Puchercos Member 2/2
* means the Director has resigned from the Board. ** means the Director became a member of the Committee in June 2018
(iv) Property Optimisation Committee This Committee is charged with the responsibility to
ensure the Company’s properties are fully optimized.
The Committee met twice in the year, on the 10th May
2018 and 15th May 2018. The table below shows the
attendance of the members of the Committee at the
meetings:
S/N NAME DESIGNATION No. of Meetings 1. Mr. Adebode Adefioye Chairman 2/2 2. Mr. Jean-Carlos Angulo* Member 1/2 3. Dr. Shamsuddeen Usman* Member 2/2 4. Mrs Adenike Ogunlesi Member 2/2 5. Mr. Michel Puchercos Member 2/2
* means the Director has resigned from the Board. ** means the Director became a member of the Committee in
June 2018.
7. COMMITTEES OF THE BOARD (i) Finance and Strategy Committee
In accordance with the Committee's Terms of Reference, the Finance & Strategy Committee has the responsibility to review and make recommendations to the Board of Directors with respect to the Company's annual and long-term financial strategies and objectives.
The Committee held six (6) scheduled meetings and six (6) emergency meetings in the year. The table below shows the attendance of the members of the Committee at the scheduled meetings held during the year:
Dates of the scheduled Finance and Strategy
Committee meetings held in 2018: 28th February 2018, 23rd March 2018, 20th April 2018, 20th July 2018, 10th September 2018 and 29th October 2018.
S/N NAME No. of Meetings
1. Dr. Shamsuddeen Usman CON, OFR* 5/6 2. Mrs. Elenda Giwa-Amu 5/6 3. Ms. Sylvie Rochier* 5/6 4. Mr. Adebode Adefioye** 4/6 5. Ms. Geraldine Picaud** 1/6 6. Mr. Christof Hassig** 2/6 7. Mr. Michel Puchercos 6/6 * means the Director has resigned from the Board ** means the Director became a member of the Committee in June 2018
(ii) Nominations and Remuneration Committee
The objective of this Committee is to improve the
selection process of the Board and to align with best
practices of Corporate Governance.
The Committee meets as the need arises to review the
composition of the Board, recommend the skill mix and
diversity required for appointment of new members to
the Board and consider remuneration of Directors and
senior executives of the Company.
The Committee held three (3) meetings in the year 2018.
The table below shows the attendance of the members
of the Committee at the meeting:
Dates of Nominations and Remuneration Committee
meetings held in 2018: 1st March 2018, 20th July 2018
and 30th October 2018.
S/N NAME No. of Meetings
1. Ms. Sylvie Rochier* 2/3 2. Mr Adebode Adefioye 3/3 3. Mr. Jean-Carlos Angulo* 1/3 4. Mrs. Elenda Giwa-Amu 2/3 5. Mrs. Adenike Ogunlesi** 2/3
* means the Director has resigned from the Board ** means the Director became a member of the Committee in June 2018

8. BOARD EVALUATION
In line with the Securities & Exchange Commission’s
Code of Corporate Governance 2011, an assessment of
the Board’s operations during the year 2018 was
conducted.
9. INDUCTION & CONTINUING TRAINING FOR
DIRECTORS
All newly appointed directors participated in the
Company's Orientation & Induction Program. The
orientation & induction programme includes
presentations intended to familiarize new directors with
the Company's operations, strategic plans, its
compliance programs, its Code of Business Conduct
and Ethics, its principal officers, and its internal and
independent auditors, the Company's shareholding
structure, Board Plan among others.
A new Director is provided with an induction pack
containing charters/terms of reference of the various
Board Committees, minutes of previous Board
meetings and a calendar of Board activities, significant
reports, important statutes and policies.
In 2018, the Board had a refresher course on the
LafargeHolcim Group's Compliance programmes and
initiatives.
10. LEADERSHIP TEAM
The GMD/CEO has the overall responsibility for
executing the Company's long term strategy with a view
to creating sustainable shareholder value. The
GMD/CEO manages the day-to-day operations of the
Company and ensures that the operations are
consistent with the policies approved by the Board.
The GMD/CEO acts as the Head of the Leadership Team
and is responsible for ensuring that a culture of integrity
and legal compliance is imbibed. He ensures that the
Directors are provided with sufficient information to
support their decision making.
The Leadership Team is made up of the Company’s
Executives. They meet once a week to deliberate on
critical issues affecting the day-to-day running of the
Company. They can be seen on page 30 of this Annual
Report.
11. DEALING IN COMPANY SECURITIES The Company formulated an Insider Trading Policy, in
line with the provisions of the Investment & Securities
Act, the Nigerian Stock Exchange post-listing Rules and
the LafargeHolcim Directive on Trade Restriction
Market Disclosure, which prohibits Directors,
employees and any other person in possession of
insider information from dealing with the Company's
shares at least 20days before its publication and twenty-
four (24) hours after its publication (Non-Authorised
Trading Periods).
The Company's Directors and employees are therefore
notified and prohibited from dealing in the Company's
shares during the Non-Authorised Trading Periods, in
accordance with the Investment and Securities Act,
2007, the Post Listing Rules of the Nigerian Stock
Exchange and the Company's policy on Insider Trading.
37
DIRECTORS’ REPORT
(v) Statutory Audit Committee
The Audit Committee was established by virtue of the
statutory requirement of Section 359 of the Companies
and Allied Matters Act cap C20, Laws of the Federation
of Nigeria 2004.
Details of the Committees' function is in accordance
with section 359 (6) of the Companies and Allied
Matters Act cap C20, Laws of the Federation of Nigeria
2004.
Members and Directors of the Committee were elected
and nominated pursuant to Section 359 (4) of the said
Act and will serve on the Committee till the conclusion
of the next Annual General Meeting.
The scheduled meetings of the Committee were held
three (3) times during the year and one (1) unscheduled
meeting to consider the related party transaction. The
table below shows the attendance of the members of
the Committee at the meetings:
Dates of Audit Committee meetings held in 2018: 23rd
March 2018, 19th July 2018, 23rd August 2018 and 7th
December 2018 S/N NAME DESIGNATION No. of Meetings 1. Mr. Olawale Oyedele Chairman 4/4 2. Mr. Adebayo Adeleke Member 4/4 3. Chief Peter Asu Member 4/4 4. Ms. Sylvie Rochier* Member 2/4 5. Mrs. Elenda Giwa-Amu Member 2/4 6. Mr. Grant Earnshaw Member 3/4 7. Mrs. Adenike Ogunlesi** Member 1/4 8. Mr. Adebode Adefioye** Member 1/4 * means the Director means the Director has resigned from the
Board ** means the Director became a member in June 2018

12. WHISTLE BLOWING
The Company is committed to conducting its affairs
ethically and responsibly. Unethical behaviours cost the
Company money, time, human resources and can
negatively affect the Company's reputation before its
stakeholders.
All ethical abuses and fraud are reported through the
Company's internal and external whistle blowing
process.
13. RISK MANAGEMENT
The Board has the responsibility of safeguarding the
maintenance of a sound system of internal control and
risk management and regularly receives reports from
the Risk Management and Ethics Committee on the
effectiveness of the Company's risk management
processes to support its strategies and objectives.
14. RELATIONSHIP WITH SHAREHOLDERS
The Board and Management of the Company ensures
that communication and dissemination of information
regarding the operations of the Company to
shareholders, stakeholders, potential investors and
general public is timely, accurate and continuous.
In compliance with the requirements of the Securities &
Exchange Commission's Rules Relating to the
Complaints Management Framework of the Nigerian
Capital Market issued on 16th February, 2015 and The
Nigerian Stock Exchange Directive issued on 22nd April,
2015 to all listed Companies, the Company has put in
place a Complaints Management Framework Policy.
The Complaints Management Framework Policy sets
out the broad framework by which Lafarge Africa Plc
(“Lafarge” or “the Company”) and its Registrar will
provide assistance regarding shareholder issues and
concerns. It also provides the opportunity for Lafarge's
shareholders to provide feedback to the Company on
matters that affect shareholders.
This Policy is attached to this Annual Report on pages
155 to 156 and it can be accessed on the Company's
website; www.lafarge.com.ng. In addition, information
on the performance of the Company and other major
corporate information are also available to shareholders
in particular and the general public on the Company's
website: www.lafarge.com.ng.
15. STAKEHOLDERS' ENGAGEMENT
The Company strives to pro-actively engage her
stakeholders through regular and constructive
dialogues in order to anticipate and manage changes
and, ultimately, partner together in order to create
shared values. The Company considers its stakeholders
as those who have influence over its activities as well as
those who are impacted by them. The Company
interacts and engages in sustained dialogue with broad
spectrum of stakeholders, at all levels.
16. ETHICS AND CODE OF BUSINESS CONDUCT
The Company has adopted the LafargeHolcim Code on
Ethics and Business Conduct. LafargeHolcim's Code of
Business Conduct ensures that all directors, officers and
employees share LafargeHolcim's commitment to
conducting business with integrity and provides
guidance on how to put this commitment into practice.
It also helps to ensure the company’s adherence to the
laws and regulations in the countries in which we
operate.
We strive to ensure all suppliers behave in accordance
with principles set forth in the LafargeHolcim Supplier
Code of Conduct, particularly principles on human
rights, labor, environment, anti-bribery and corruption.
17. HEALTH & SAFETY
Health & Safety (H&S) remains a core value in Lafarge
Africa Plc and we conduct our business in a manner that
creates a healthy and safe environment for all our
stakeholders – employees, contractors, communities
and customers. We remain committed to our goal of
zero harm, and this is what drives us to continually
implement improvement systems.
Our leadership team leads and guides the workforce on
our zero harm journey. Visible Personal Commitment
(VPC) is regularly used to engage workers on the field, to
recognize and commend good work practices, and to
intervene in areas of safety concerns. Incident and Injury
Free (IIF) program was launched and driven by senior
leadership team; working with focus groups at all site
levels to understand prevailing safety culture and
provide resources to address touch points.
In 2018 our annual health & safety days were aligned
with United Nation (UN) World Day for Safety and
Health at Work. Our employees at every levels used a
period of two weeks to focus on a strategy of
“improving H&S every day in the workplace” A great
deal of effort was put into providing guidance on four
major industrial areas of Safety standards: Mobile
Equipment, Energy Isolation, Work at Height and
Confined Spaces. The campaign enabled people to:
· Understand what the Standards mean for them;· Learn from related incidents;· Be able to continue H&S practices throughout the
year and beyond, making their workplace safer.
38
DIRECTORS’ REPORT

Road transport and logistics safety remains integral,
considering the impact to the company. Hence 2018
was used to further enhance our structured systems of
modernized fleet of trucks, equipped with safety
monitoring and enhancing systems – iVMS. This is one
of the tools deployed to monitor critical driving
parameters online in real time, such that necessary
feedback and interventions were introduced when
there was a need to correct certain driving behavior and
patterns. Our aim is to ensure that road safety culture
transcends our business, hence our Drivers Training
Institute partnership program remains a pace setter,
which we use to develop a pool of drivers that align with
our H&S culture and systematically influence our
society in a positive manner.
In our industrial plants; both Cement and Ready Mix, we
continually invest in training of our people, employees
and contractors alike. Various soft and technical topics
were covered in the previous year including certified
trainings in critical high risk areas such as scaffolding,
working at height, hot work, electrical safety among
others. This will continue to be embedded into our ways
of working in years to come.
On the commercial side, we offer complimentary
Health & Safety induction and awareness training to our
customers on safety; with the aim of creating joint
ownership and progressively spread momentum for
Zero Harm into the society.
As is our practice, Lafarge Africa Plc remains
committed to continuous improvement and we have
done our annual assessment, which we have used to
develop a road map to guide our focus priorities this
year and in years to come.
18. ORGANISATION & HUMAN
RESOURCES (O&HR)
In 2018, we focused on building for growth by laying
strong capability foundations to exploit opportunities
created by a recovering economy, looking inwards in
terms of staffing our organisations and engaging our
employees.
Organisational Development & Talent
Focusing talent development inwards, building internal
capability/capacity, and feeding the succession pipeline
were the driving force behind our talent activities in
2018, using the tools and outcomes from our talent
review process as a basis.
With over 200 internal movements during the year,
comprising cross-functional, vertical and lateral moves,
the organization focused on building internal capability
by providing opportunities for employees to acquire
new skills and improve the quality and scope of their
experiences.
The pilot edition of the Lafarge Africa Mentoring
Program (LAMP) was launched and involved pairing
designated talent profiles with Executive Committee
members in a formal structured one year mentoring
program. Formal coaching, building leadership skills
and closing development gaps to prepare participants
for next steps in their careers were some objectives of
the programme.
This deliberate coordination of our talent management
process yielded results as the quality of our succession
pool is improving, and internally grown talent now
occupy significant and strategic roles in the business.
This trend is set to continue in the coming year.
Learning & Development
Our aim in 2018 was to ensure that employees continue
to be provided with the relevant skills and experience
required to perform at a high standard, improve the
qual i ty of the leadership pipel ine and bui ld
organisational capability for sustainable growth.
Strengthening the capability of line managers formed an
important part of the plan for the year. LIFE; a
programme targeted at frontline supervisors, HR for
Non-HR Managers and New Managers' Course drove
skills and competencies needed to manage self, others
and business performance. Join the Group (JTG), a two-
day workshop designed to help new hires learn and
understand the culture, values and business goals and
priorities of the business, has helped new hires integrate
and engage better and faster.
Through collaboration across the organization, the
attainment of business goals in the areas of compliance
and Information Technology (IT) were realised, using our
e-learning resources to deploy training on Group and IT
compliance requirements improved coverage, accurate
reporting, and higher levels of compliance with our legal
and IT obligations and commitments. This year saw a
strategic shift from open classes to our e-learning
platform, Learn@LH, driving a significant rise in traffic to
the site for self-learning and training. e-learning has
contributed over 25% to our total training hours and we
will drive this further in the coming year.
In the bid to strengthen our internal faculty, a Train the
Trainer programme was organized for 30 trainers to be
in-house facilitators at the Sagamu Safety Learning
Centre. Also, several other programmes have been
deployed using in-house facilitators such as the Incident
& Injury Free Training and the Lunch & Learn sessions.
Our Lunch and Learn sessions are effective and will be
rolled out to more locations.
39
DIRECTORS’ REPORT

Employee Engagement
Employee engagement continues to remain important
on our people agenda, in recognition of its positive
impact on the organization's productivity and bottom
line.
At team level, the individual check in and team touch
point sessions introduced in 2017 continued as a
mechanism for highlighting and addressing specific
areas of performance and service improvement.
At a broader organization level, the results of the 2017
Employee Survey were analyzed by each of the
functions to gain insight, from an employee perspective,
on how the work environment could be improved to
enhance productivity. The year saw the launch of
'Engage & Connect' as an initiative from the Employee
Survey, to strengthen trust and collaboration across
teams and locations.
Resourcing & Diversity
Strategic hires were engaged based on critical business
needs and specific skills sets but in all, more talent
movements were made internally to fill emerging
vacancies and roles.
Also critical was the need to backfill the workforce with
young talent who can be developed over time to
become strong business managers in the organization.
With this in mind, the year saw the launch of our
Graduate Trainee programme, uniquely targeted at
graduates from the communities we operate and piloted
in Ashaka. 10 graduate trainees were recruited into the
organization and have since completed their orientation
and absolved into the organization for the first phase of
the programme.
Our Cement Professional Technician Program (CPTP),
designed to equip young science-oriented school
leavers from our communities for a career in
engineering and cement manufacturing, continues to
thrive as we enter into the second year of their 3-year
curriculum. We presently have 30 students enrolled in
the programme and our goal is to have 45 students by
the time the first batch commences into the third year of
the curriculum.
19. ANTI-BRIBERY AND CORRUPTION STATEMENT
The Board of Directors adopted the Anti- Bribery and
Corruption Statement below in accordance with global
best practices and the Company's commitment to
upholding the highest standards of Corporate
Governance. The Anti-Bribery & Corruption Statement
provides that:
“Lafarge Africa Plc (the “Company”) is committed to:
- Conducting its business dealings and relationships
in an ethical manner and with the highest level of
integrity, in accordance with the Group's Anti-
Bribery and Corruption policies included in the
LafargeHolcim´s Code of Business Conduct, as well
as applicable laws;
- Complying with relevant Anti-Bribery and
Corruption laws such as Corrupt Practices and other
Related Offences Act of 2000 and the UK Bribery
Act of 2010 regardless of the business environment
we operate in.
- Ensuring the implementation and enforcement of
effective systems to counter the risks of bribery and
corrupt practices in the form of gifts and
entertainment, reciprocal agreements, favours,
discounts, travel, education, donations and other
forms of improper benefits for which the Company
could be held liable;
- Prohibiting the Company as well as third parties
acting on its behalf from engaging in fraudulent
acts, corrupt practices and all forms of bribery,
gratification, attempting to obtain gratification,
facilitation payments, and improper payments or
benefits to public officials, their family members and
other individuals.”
Lafarge Africa commits to comply with the Group Directives
and comply with applicable laws on anti-bribery and
corruption as well as ensure that its business practices reflect
this commitment.
BY ORDER OF THE BOARD
ADEWUNMI ALODE (MRS.)FRC/2018/ICSAN/00000017796Company SecretaryDated this 18th June 2019.
40
DIRECTORS’ REPORT

BUILD EASYWITH
Supa Strong
Supa Smooth
Supa Quality

SUSTAINABLITY REPORT
42
We will reduce netspecific
2C0 emissions by 40% per tonne ofcement (vs 1990)
In house
Beyondour fence
Innovativesolutions
Low-carbon cement& concreteInsulating concreteThermal-masssolutions
We will help ourcustomers avoid 10million tonnes of C02 being releasedfrom buildings each year through our innovative solutons
Climate
We will use 80million tonnes of waste-derivedresources per year
We will provide end-of-life solutions for our products and will supply 4 times more recycled aggregatesfrom CDW/RAP
CircularEconomy
Water &Nature
We will reducespecific freshwaterwithdrawal in cementoperations by 30%
We will implement
The WASH Pledge on all sites
We want zero fatalitiesWe will reduce LTI FR <0.20 We will reduce TIFR by 50%
We will reduce our disease rate <0.1
We wil have 30% minimum gender diversity at all management levels
We will make apositive impact onwater in water-scarce areas
We will show a positive change for biodiversity
We will develop initiativesto benefit 75 million
We will engage collective action combat bribery &corruption in high risk countries
Rainwater harvesting
Pervious concrete
Stormwater protection
Affordable housing materials and solutions
Affordable sanitation solutions
People &Communities
Recycled aggregatesUrban mining solutionsWaste managementservices
THE 2030 PLANBUILDING FOR TOMORROW

SUSTAINABILITY REPORT
Creating shared value is a key focus for our business, and it is the
reason why we adopt the triple bottom line approach to business;
focusing on profit as well as people and our planet. At Lafarge Africa, we benchmark our efforts and initiatives
against the 17 United Nations Sustainable Development Goals
(UN SDGs) and partner with organizations and agencies to
complement the efforts of the Federal Government of Nigeria.
In 2015, Lafarge Africa became the first cement company in
Nigeria to publish a local Sustainability Report, providing details
to our customers, shareholders, and communities on our social
performance and contribution to Nigeria's development through
our business operations and social investments. We have since
published the 2016 and 2017 Reports, with the 2018 reporting
cycle currently in progress.
This step was borne out of our commitment to operate
responsibly, and we continue to work in close collaboration with
communities where we operate, as well as the larger society. One
of our goals is to pioneer transformation of how the local building
materials and construction sector in Nigeria addresses important
environmental issues in line with the LafargeHolcim 2030 Plan
which has four pillars of Climate, Circular Economy, Water and
Nature as well as People and Communities.
Contributing to Environmental Sustainability
11SUSTAINABLE CITIES AND COMMUNITIES 9 INNOVATION AND
INFRASTRUCTURE12 RESPONSIBLE
CONSUMPTIONAND PRODUCTION
AFFORDABLE AND CLEAN ENERGY 7 13 CLIMATE
ACTION 15 LIFEON LAND
Volunteers during a tree planting exercise in Ashaka, Gombe State.
Geocycle at Lafarge
At Lafarge Africa, we continue to use waste materials and by-products from other industries as alternatives to finite natural raw materials and fossil fuels in the production of cement.
Our Geocycle unit drives the use of alternative fuels such as biomass (agricultural waste) and non-degradable parts of pharmaceutical drugs and condiment wrappers in our kilns in Sagamu and Ewekoro. Our other Plants are also in the early phases of adopting the Geocycle plan with customized waste options across each region ranging from tyres and plastic to municipal and industrial waste.
Beyond utilizing resources that have been condemned as waste, this circular economy model also empowers local communities with over 300 farmers impacted already. In addition to economic empowerment, the use of alternative fuels protects the environment by eliminating open burning of waste, thus decreasing pollution. We are working on partnerships with the beverage industry in Nigeria and the Lagos State Government to utilize their waste, including expired goods, in our production process. This creates a closed model that will reduce the impact of incinerated waste in landfills across the country.
Biodiversity is embedded in our environmental policy. Lafarge Africa has an Environmental Management Plan in place to guide day-to-day operations. Some of our Plants have attained the EMS 14001:2015 certification while the process for certification of other plants are on-going. We ensure our site operations across the country are carefully examined by all classes of regulatory agencies. Reports are prepared and shared with all stakeholders as a function of our community relations.
Currently, there are country-wide quarry rehabilitations ongoing across all our sites. This is in addition to the planting of Acacia and Eucalyptus trees in Ewekoro and Sagamu Plants, and other tree planting exercises across our Plants to promote afforestation.
Shared Value and Partnerships for Growth
43

Others include the construction of staff quarters for Elebute Health Center, Ewekoro, provision of medical laboratory equipment to the Community health centre, Egbado Ajegunle, construction of 14 bed health center (Phase 1) in Ewekoro and construction of a block of six toilets and septic tank in Itori, all in Ogun State.
For our employees, we ran internal campaigns to reiterate our Minimum Safe Behaviours in order to enforce safety standards on our sites. The annual Health & Safety Days in 2018 revolved around trainings for employees on Working at height, Energy Isolation, Confined Spaces, and Mobile Equipment and on-site traffic. Our employees also participated in awareness campaigns to commemorate global health days such as World Malaria Day, World Cancer Day and World AIDS Day.
As a member of LafargeHolcim, the global leader in building materials and solutions, supporting the sustainable construction of crucial shelter and infrastructure amenities in our communities is important to us. We continue to build and improve community facilities that promote better quality of life and civic engagement such as schools, cultural centers, recreational infrastructure, transportation, sanitation, roads, bridges and more.
Some of these projects include the construction of a drainage for the Agura/Aruba/Ayepe Road Culvert, construction of a 150m long reinforced concrete road in Alagutan Community, provision of Transformer substation and Electrification (Phase 2) in Okeoko-Egbado, roofing, provision of doors and Burglary to a 14 bed community health centre, Papalanto (Phase 2), construction of Ewekoro Town Hall wall fence and reinforced concrete flooring and construction of 3-way culvert at Umure, all in Ogun State. Other projects are in progress in other parts of the country and will be commissioned in 2019.
Shelter and Infrastructure
In 2018, Lafarge Africa invested in societal impact initiatives and projects within and beyond our host communities in Nigeria under the pillars of Health and Safety, Shelter and Infrastructure Support, Education as well as Youth and Economic Empowerment.
Health and Safety is our overarching value and is at the core of all that we do. Our goal remains to create a business where our products are manufactured and delivered to our customers with zero harm. We continue to increase staff capacity in technical safety at our sites while using technology and structured systems to mitigate transportation risks and drivers' performance.
Our Health and Safety engagements with our host communities continued in 2018 with okada riders, school children, and more. Health projects delivered in 2018 include the renovation of Ipoji Health Center, Sagamu, Ogun State, construction of a 14 bed health centre, Ewekoro Ogun State and renovation of the Ashaka Clinic, Ashaka Gombe State.
SUSTAINABILITY REPORT
Enabling People and Communities
Health and Safety
School children in front of a newly built school by Lafarge Africa Plc in Ewekoro, Ogun State
44

EducationOur investments in education reflect the pressing needs in our communities. From construction, renovation and furnishing of classrooms to provision of bursary awards to indigenes in tertiary institutions, we contribute to achieving quality education, which is the United Nations Sustainable Development Goal 4.
In the North, we constructed essential educational amenities including a science laboratory in Bage, a JAMB center in Bajoga and a skills acquisition center in Jalingo, Gombe state. We also provided hundreds of double desks for secondary schools as well as Bursary Awards to indigenes, provision of Computer Systems, Printers, UPS and Generators to 4 Public Secondary Schools.
In the Southwest, we gave bursary grants to hundreds of students, renovated blocks of classrooms and donated toilets and boreholes in public primary schools in Atoyo, Cinema Road Sagamu, Itori, and Olapeleke communities among others. Likewise in the East, we provided educational support to hundreds of tertiary education students and renovated blocks of classrooms in Ekong Anaku community.
The Science laboratory in Bage, Gombe state.
Building Nigeria by Bridging Its Child Literacy Gap
The Lafarge Africa Plc National Literacy Competition
Nigeria's literacy level is 59.6% for people aged 15 and above (UNESCO 2015) which is significantly lower than the global average of 86.3%. Working to complement the Nigerian government's efforts to improve education in Nigeria, Lafarge Africa Plc has contributed significantly to educational initiatives over the years, from giving bursaries to providing writing materials, and, since 2014 through the Lafarge Africa Plc National Literacy Competition (LANLC).
The 5th LANLC 2018 finalists representing Nigeria's 6 geopolitical zones with Folashade Ambrose-Medebem, Director Communications,Public Affairs and Sustainable Development, Lafarge Africa Plc.
A block of 6 classrooms at Wesley School, Ojumele, Sagamu
45
SUSTAINABILITY REPORT

CCEO Lafarge Africa Plc, Michel Puchercos and the Minister of State for Education, Prof. Anthony Anwukah, presenting the overall winner's prize to Ayomikun Idowuand Kehinde Lawal from Lagos State.
Chairman, Lafarge Africa Plc, Mr. Bolaji Balogun, Nobel laureate, Professor Wole Soyinka and CCEO Lafarge Africa Plc, Mr. Michel Puchercos at the Grand Finale of the 2018 LANLC in Lagos.
Lafarge Africa continues to create empowerment opportunities for young and middle-aged indigenes in our host communities. In 2018, we upski l led young people through various empowerment in i t i a t ives inc lud ing the construction of a skill and vocational center in Gombe state, Youth Leadership, Entrepreneurship & Development projects in the South-East and technology training at our IT center in the Southwest.
Several artisan trainings also took place across all our plant locations in addition to donations of tools such as sewing machines, grinding machines, motorcycles and tricycles to trained individuals in the Southwest.
Our goal is to empower residents of our host communities to create and earn a sustainable living thus impacting the Nigerian economy and actively contributing to Sustainable Development Goals including Goals 1 (No Poverty), 2 (Zero Hunger), 8 (Decent Work and Economic Growth) and 10 (Reduced Inequalities).
The LANLC was created to raise the standard of English Language in public primary schools, and has impacted over 700,000 pupils across 544 local government areas in Nigeria. In 2018, the 5th edition of the Competition was endorsed by the Federal Ministry of Education and the Universal Basic Education Commission (UBEC) and was delivered in partnership with State Universal Basic Education Boards (SUBEB) across Nigeria's thirty six (36) states of the Federation, the United Nations Educational, Scientific and Cultural Organization (UNESCO), British Council and Oando Foundation.
Directed at school children aged between 9 and 13 years, the competition begins with state run-offs, followed by regional finals, and ends with a grand finale. The 2018 edition had Lagos (South West), Ebonyi (South East), Rivers (South South), Gombe (North East), Nasarawa (North Central) and Kano (North West) representing the regions.
At the Grand Finale, Lagos state emerged champion while Ebonyi and Gombe states took the second and third positions respectively.
Educational grants were given to all contestants along with educational tablets pre-installed with educational software. They also took home stationery and gifts from partners and exhibiting organisations including Oando Foundation, Kelloggs Nigeria, Dufil Prima Foods, Reckitt Benkiser, Smart Sindara, Okada Books, Lantern Books and Laterna Bookshop.
Nobel laureate, Professor Wole Soyinka, gave the keynote address at the Grand Finale which had key stakeholders in the public and private sector in attendance including the Honourable Minister of State for Education, Professor Tony Gozie Anwukah. Other stakeholder organizations in attendance include UBEC, SUBEB, Office of the Special Assistant to the President on Sustainable Development Goals (SDGs), Lagos State Government, Gombe State Government, Edo State Government, Kano State Government, the British Council, UNESCO, Oando Foundation, Sahara Foundation, UBA Foundation, PwC, Kellogg's, Lantern Books, Keystone Bank, Nigerian Stock Exchange, ACT Foundation, LEAP Africa, UBA, Polaris Bank and Keystone Bank amongst others.
The Competition trended on Twitter, triggering a national conversation on collectively identifying ways to enhance the standard of education in Nigeria.
Youth and Economic Empowerment
SUSTAINABILITY REPORT
46

In 2018, Mr. Mobolaji Balogun, Chairman Lafarge Africa, represented the Company at the United Nations High-Level Political Forum (UNHLPF) on Sustainable Development at the UN Headquarters, New York. Lafarge Africa was the only private sector representative at the program from Nigeria.
Mr Balogun was on the panel themed: "Transformation Towards Sustainable & Resilient Cities in Africa: Implementing SDG 11”. Also at the session were the Senior Special Assistant to the President on Sustainable Development Goals (SDGs), Princess Adejoke Orelope-Adefulire, Deputy Secretary-General of the United Nations, Dr Amina Mohammed, Executive Director, UN Habitat, Ms. Maimunah Mohd Sharif, Chairman of Positive Planet Foundation - Jacques Attali, and the representative of the President of the European Union.
The Forum provided an opportunity to share Lafarge Africa's experience and best practices with high-level stakeholders across the world and showcase how our initiatives in Geocycle, Affordable Housing, CO2 emission reduction, advocacy & partnership, and the LafargeHolcim Awards for Sustainable Construction all add up to contribute to sustainable and better cities.
Princess Adejoke Orelope-Adefulire, Senior Special Assistant to the President on Sustainable Development Goals (SDGs), Dr Amina Mohammed, United Nations Deputy Secretary- General and Mr. Mobolaji Balogun, Chairman, Lafarge Africa Plc at the United Nations High Level Political Forum, New York.
Lafarge Africa on the Global Stage at the United Nations
Sustainability Updates
Exhibition of Alternative Fuels by the Geocycle Teamduring Sustainability Week
Sustainability Week at Lafarge Africa
47
SUSTAINABILITY REPORTSUSTAINABILITY REPORT
In 2018, we introduced the first ever Sustainability Week to raise the general awareness, understanding and involvement of employees across the organization on sustainability. The Week also aims to highlight sustainability initiatives at Lafarge Africa including Geocycle, Safety, Health and Environment, CSR, Volunteering and more.

Volunteers including the CCEO at a volunteering session to teach public primary school children about waste management and converting Waste to Art.
As part of Sustainability Week 2018, we launched the CCEO Social Contributor Awards as a platform to recognize employees who have dedicated their time to volunteering and improving communities across Nigeria. Thirty (30) employees were specially honoured by the CCEO with certificates and prizes.
VolunteeringIn 2018, 'Friends of the Community', Lafarge Africa's 380 employee-strong volunteering initiative participated in 47 volunteering activities ranging from awareness sessions on health and waste in schools, bus parks and communities, reading sessions with children, and tree planting sessions.
Our volunteers dedicated 4,150 volunteering hours to impact over 10,000 people to improve host communities across Nigeria.
Awards
LafargeHolcim Middle East & Africa (LHMEA) CSR Inaugural Awards
The objective of the LHMEA CSR Awards is to identify impactful CSR initiatives in the 19 countries in Middle East & Africa (MEA) where LafargeHolcim is present. Lafarge Africa won the Gold Prize in 2 categories:
1. (for our investments in Education/EmploymentEducation, especially the Lafarge Africa National Literacy Competition)
2. Shelter/Infrastructure (for the River Ibu Bridge which improved quality of living and economic productivity in 6 communities in Ewekoro, Ogun State).
The Nigeria office was also named as the Global Prize Winner, leading 18 other Lafarge countries in the MEA region. Our winning initiative will be replicated across MEA with the support of the region.
The SERAS CSR - Africa Awards Lafarge Africa has been recognized as a leading
socially responsible organization at the Social Enterprise Report Awards - SERAS CSR-Africa Awards, the most prestigious awards for celebrating corporate social impact in Africa. Awards won include:
1. Best Company in Education for our work in literacy development via the National Literacy Competition
2. Best Company in Clean and Affordable Energy for our commitment to using alternative, clean fuels.
3. 1st runner-up for the Overall Grand Prize of the SERAS CSR- Africa Awards
4. 1st runner-up for Sustainability Practitioner of the Year for our Head of Sustainability and Brand.
SUSTAINABILITY REPORT
Folashade Ambrose-Medebem, Director Communications, Public Affairs and Sustainable Development, Bruno Bayet, Chief Financial Officer, Temitope Oguntokun, Omotola Oyebanjo, with colleagues at the SERAS Awards. 48

STATEMENT OF DIRECTORS' RESPONSIBILITIESIN RELATION TO THE FINANCIAL STATEMENTS
5149
For the year ended 31st December, 2018
The Directors accept responsibility for the preparation of the annual consolidated and separate financial statements that give a true and fair view in accordance with International Financial Reporting Standards (IFRS) and in the manner required by the Companies and Allied Matters Act, cap C20, Laws of the Federation of Nigeria 2004 and the Financial Reporting Council of Nigeria Act, 2011.
The Directors further accept responsibility for maintaining adequate accounting records as required by the Companies and Allied Matters Act, cap C20, Laws of the Federation of Nigeria, 2004 and for such internal control as the Directors determine is necessary to enable the preparation of financial statements that are free from material misstatement whether due to fraud or error.
The Directors have made an assessment of the Group and Company's ability to continue as a going concern and have no reason to believe that the Group and Company will not remain a going concern in the year ahead.
SIGNED ON BEHALF OF THE DIRECTORS BY:
………………………………………………. ……………………………Mobolaji Balogun Michel PuchercosChairman Group Managing DirectorFRC/2013/CISN/00000004945 FRC/2017/IODN/0000001591918th June 2019 18th June 2019

19
REPORT OF THE
STATUTORY AUDIT COMMITTEE
In accordance with Section 359 (6) of the Companies and Allied Matters Act, cap C20, Laws of the Federation of Nigeria 2004 (CAMA), we, the members of the Audit Committee have reviewed and considered the Auditor's Report required to be made in accordance with Section 359 (3) of CAMA and report as follows:
i. We have reviewed the scope and planning of the audit requirements.
ii. We have reviewed the External Auditors' Management Letter for the year ended together with Management's responses.
iii. We also ascertained that the accounting
and reporting policies of the Company for the year ended 31st December 2018 a re i n acco rdance w i th l ega l requirements and agreed ethical practices.
In our opinion, the scope and planning of the audit for the year ended 31st December, 2018 were adequate and Management's responses to the Auditors' findings were satisfactory.
Mr. Olawale OyedeleFRCN: 2013/CIIN/00000001622Chairman, Audit Committee
Dated 18th day of June 2019
Mrs. Elenda Giwa-AmuMember
1
Mr. Adebayo AdelekeMember
4
Chief Peter AsuMember
5
Mr. Olawale Oyedele Member
3
Ms. Karine Uzan MercieMember
2
6 Dr. Shamsuddeen Usman Member
CON, OFR
1
2
3
4
5
50
6


52
Financial Statements
Internet: www.kpmg.com/ng
INDEPENDENT AUDITOR’S REPORT
KPMG Professional Services, a Partnership established under Nigeria law, is a member of KPMG International Cooperative ("KPMG International"), a swiss entity. All rights reserved
Registered in Nigeria No BN 986925
To the Shareholders of Lafarge Africa Plc
Report on the Audit of the Consolidated and Separate Financial Statements
Opinion We have audited the Consolidated and Separate Financial Statements of Lafarge Africa Plc ("the Company") and its subsidiaries (together, "the Group"), which comprise the consolidated and separate statements of financial position as at 31 December 2018, and the consolidated and separate statements of profit or loss and other comprehensive income, consolidated and separate statements of changes in equity and consolidated and separate statements of cash flows for the year then ended, and notes, comprising significant accounting policies and other explanatory information, as set out on pages 56 to 136.
In our opinion, the accompanying consolidated and separate financial statements give a true and fair view of the consolidated and separate financial position of the Company and its subsidiaries as at 31 December 2018, and of its consolidated and separate financial performance and its consolidated and separate cash flows for the year then ended in accordance with International Financial Reporting Standards (IFRSs) and in the manner required by the Companies and Allied Matters Act, Cap C.20, Laws of the Federation of Nigeria, 2004 and the Financial Reporting Council of Nigeria Act, 2011.
Basis for Opinion We conducted our audit in accordance with International Standards on Auditing (ISAs). Our responsibilities under those standards are further described in the Auditor's Responsibilities for the Audit of the Consolidated and Separate Financial Statements section of our report. We are independent of the Group and Company in accordance with the International Ethics Standards Board for Accountants' Code of Ethics for Professional Accountants (IESBA Code) together with the ethical requirements that are relevant to our audit of the consolidated and separate financial statements in Nigeria and we have fulfilled our other ethical responsibilities in accordance with these requirements and the IESBA Code. We believe that the audit evidence we have obtained is sufficient and appropriate to provide a basis for our opinion.
Key Audit Matters Key audit matters are those matters that, in our professional judgment, were of most significance in our audit of the consolidated and separate financial statements of the current period. These matters were addressed in the context of our audit of the consolidated and separate financial statements as a whole, and in forming our opinion thereon, and we do not provide a separate opinion on these matters.
1. Investments in subsidiaries (Lafarge South Africa Holdings (Pty) Limited) Refer to significant accounting policies (Note 2) and Investments in subsidiaries (Note 18.1.1) on the separate financial statements.
Key audit matter
Investments in Subsidiaries are carried at cost less impairment in the accompanying separate financial statements of the Company. The total carrying amount of the Company's investments in subsidiaries was N179 billion as at year end (2017: N182 billion).
Included in the Company's investments in subsidiaries is an amount of N115 billion, representing the carrying amount of the Company's investment in Lafarge South Africa Holdings (Pty) Limited (LSAH), which is identified and assessed by management as a separate Cash Generating Unit (CGU).
LSAH has continued to report operating losses and the carrying value of the Company's investment in this entity materially exceeds the entity's net assets.
How the matter was addressed in our audit
Our audit procedures included the following:
Ÿ Evaluated the internal and external sources of information to identify impairment indicators;
Ÿ Involved our internal specialists to assist with the evaluation of the appropriateness of the Value In Use calculated as part of management's impairment assessment;
Ÿ Compared the actual results with budgets to consider whether, with hindsight, any past forecast included any unreasonable assumptions;
Ÿ Assessed the reasonableness of key judgments regarding revenue growth rates and Earnings before
Adewale K. Ajayi Ayodele A. Soyinka
Ibitomi M. AdepojuLawrence C. Amadi
Oladapo R. Okubadejo Olusegun A. Sowande
Tolulope A. Odukale
Adebisi O. LamikanraAjibola O. OlomolaChibuzor N. Anyanechi
Ijeoma T. Emezie-EzigboMohammed M. Adama
Oladimeji I. SalaudeenOluwafemi O. AwotoyeVictor U. Onyenkpa
Ayobami L. Salami Ehile A. AibangbeeJoseph O. TegbeNneka C. Eluma
Olanike I. James
Oluwatoyin A. Gbagi
Adetola P. AdeyemiAyodele H. OthihiwaGoodluck C. ObiKabir O. OkunlolaOguntayo I. Ogungbenro
Olumide O. Olayinka
Temitope A. Onitiri
Olabimpe S. Afolabi
Adekunle A. Elebute Adegoke A. Oyelami
Olutoyin I. Ogunlowo
53
How the matter was addressed in our audit
Ÿ interest, tax, depreciation and amortisation (EBITDA) by comparing to available market reports and historical trends;
Ÿ Reconciled input data to supporting evidence, such as approved budgets, inflation rates, strategic plans and market data;
Ÿ Evaluated the sensitivity analysis around the key judgments.
Ÿ Considered the impairment assessment review performed by LafargeHolcim's group auditors to Lafarge South Africa Holdings and its subsidiaries.
Ÿ Obtained the report of the Independent Fairness Opinion Adviser and checked for consistency with the Fair Value determined by management.
Ÿ Evaluated management's determination of the recoverable amount as the higher of Fair value less costs of disposal and Value in use.
Management performed an assessment at the end of the reporting period to determine whether there is any indication that the Investment in LSAH may be impaired.
In performing this assessment, management estimated the recoverable amount of the Investment in LSAH by assessing the higher of Value in Use and Fair Value less costs of disposal.
Estimating the recoverable amount is a complex process involving a number of assumptions, judgements and estimates regarding various inputs. Consequently, we have determined the impairment assessment of the investment in LSAH to be a key audit matter.
Key audit matter
2. Other Assets -Prepaid gas assets Refer to significant accounting policies (Note 2) and Other assets (Note 21.1) on the separate financial statements.
How the matter was addressed in our audit
Our audit procedures included the following:
Ÿ We discussed with management to understand if any changes have been made to the assumptions used in estimating the utilisation plan for the prepaid gas amount.
Ÿ We evaluated the appropriateness of the assumptions applied to key inputs such as production volumes, forecasted growth rates, projected utilization level among others which included comparing these inputs with our own assessments based on our knowledge of the Company and the industry.
Ÿ Evaluated the sensitivity analysis around the key judgments.
Ÿ We reviewed the appropriateness of the classification / disclosure of the prepayment for gas in the financial statements.
Included in other assets is an amount of N11.8 billion (2017: N9.8 billion) relating to prepaid gas assets. As previously reported, the Company has a gas supply contract which requires that on a monthly basis, an agreed sum known as the base amount is paid by the Company for the supply of a specified quantity of gas in future regardless of the Company's ability to utilise the gas. Any excess of the base amount over the value of actual gas utilised is recognised as prepaid gas assets which is included in other assets in the financial statements.
Management performed an assessment to determine whether the prepaid gas asset is recoverable since the amount has continuously exceeded the value of actual gas utilised over the past years. This assessment involved a determination of future gas utilisation.
This continues to be considered a key audit matter due to the significant judgments, estimates and assumptions required to determine the recoverability of the prepaid gas at each reporting period. Management has performed a future gas utilization assessment to determine recoverability, which is based on assumptions such as future production volume, forecasted growth rate and projected utilisation levels, among others.
The assessment contains elements based on judgments and assumptions that are impacted by expected future growth and production levels and the ability of the vendor to fulfill its obligations under the terms of the contract. There is a risk that actual outcomes may differ from expectations.
Key audit matter

54
3. Recognition and recoverablility of deferred tax assets Refer to significant accounting policies (Note 2) and Deferred taxation (Note 14.8) on the separate financial statements.
How the matter was addressed in our audit
Our audit procedures included the following:
Ÿ Assessed the components that gave rise to the deferred tax asset to determine whether they were recognised in accordance with the requirements of the accounting standards and tax laws and in line with correspondences from the tax authorities.
Ÿ A s s e s s e d m a n a g e m e n t ' s f o r e c a s t s o f future taxable profits by checking that the assumptions used in the Company's projection of taxable income were in line with the Company's historical performance, current business model and future plans.
The Company has recognised deferred tax assets of
₦27.9 billion (2017: ₦16.3 billion). Included in the
deferred tax asset is an amount of ₦6.2 billion
recognised in the year and arising from the pioneer tax relief granted on one of the Company's production lines in Mfamosing Plant.
Management has further recognised an additional
deferred tax asset of ₦3.2billion arising from the cost of
the Company's evacuation road impaired in prior year. The impairment expense which was previously disallowed for tax purposes has now been treated as tax deductible, resulting in the additional deferred tax asset recognized. This treatment is based on a letter which the Company obtained from the Federal Inland Revenue Service (FIRS) confirming that the cost can be treated as a tax deductible expense over a period of seven (7) years, pending a tax audit by the FIRS to verify the expense incurred by the Company as well as certification of the cost by the Federal Ministry of Power, Works and Housing.
The determination of the recognition and recoverability of deferred tax assets involves significant judgment and high estimation uncertainty as management supports the recoverability of the deferred tax assets mainly with projections which contain assumptions and estimates of future taxable profits.
We have therefore determined this to be a matter of significance to the audit due to inherent uncertainty in forecasting the amount and timing of future taxable profits and the reversal of temporary differences.
Key audit matter
Other Information
The Directors are responsible for the other information which comprises the Directors' and Other Corporate information, Directors’ Report, Report of the Statutory Audit Committee, Statement of Directors' responsibilities in relation to the financial statements, Other national disclosures [but does not include the consolidated and separate financial statements and our audit report thereon], which we obtained prior to the date of this auditor's report. It also includes financial and non-financial information such as the Notice of Annual General Meeting, Financial Highlights, Chairman's Statement, Corporate Governance Report, Board of Directors' Profile, Leadership Team, Sustainability Report, Corporate Social Responsibility Report, amongst others (together "Outstanding reports"), which are expected to be made available to us after that date.
Our opinion on the consolidated and separate financial statements does not cover the other information and we do not express any form of assurance conclusion thereon.
In connection with our audit of the consolidated and separate financial statements, our responsibility is to read the other information and in doing so, consider whether the other information is materially inconsistent with the consolidated and separate financial statements or our knowledge obtained in the audit or otherwise appears to be materially misstated. If, based on the work we have performed, we conclude that there is a material misstatement of this other information, we are required to report that fact. We have nothing to report in this regard.
Responsibilities of the Directors for the Consolidated and Separate Financial Statements
The Directors are responsible for the preparation of the consolidated and separate financial statements that give a true and fair view in accordance with IFRSs and in the manner required by the Companies and Allied Matters Act, Cap C.20, Laws of the Federation of Nigeria, 2004 and the Financial Reporting Council of Nigeria Act, 2011, and for such internal control as the directors determine is necessary to enable the preparation of financial statements that are free from material misstatement, whether due to fraud or error. In preparing the consolidated and separate financial statements, the directors are responsible for assessing the Group and Company's ability to continue as a going concern, disclosing, as applicable, matters related to going concern and using the going concern basis of accounting unless the directors either intend to liquidate the Group and Company or to cease operations, or have no realistic alternative but to do so.

55
Auditor's Responsibilities for the Audit of the Consolidated and Separate Financial Statements
Our objectives are to obtain reasonable assurance about whether the consolidated and separate financial statements as a whole are free from material misstatement, whether due to fraud or error, and to issue an auditor's report that includes our opinion. Reasonable assurance is a high level of assurance, but is not a guarantee that an audit conducted in accordance with ISAs will always detect a material misstatement when it exists. Misstatements can arise from fraud or error and are considered material if, individually or in the aggregate, they could reasonably be expected to influence the economic decisions of users taken on the basis of these financial statements.
As part of an audit in accordance with ISAs, we exercise professional judgment and maintain professional skepticism throughout the audit. We also:
Ÿ Identify and assess the risks of material misstatement of the consolidated and separate financial statements, whether due to fraud or error, design and perform audit procedures responsive to those risks, and obtain audit evidence that is sufficient and appropriate to provide a basis for our opinion. The risk of not detecting a material misstatement resulting from fraud is higher than for one resulting from error, as fraud may involve collusion, forgery, intentional omissions, misrepresentations, or the override of internal control.
Ÿ Obtain an understanding of internal control relevant to the audit in order to design audit procedures that are appropriate in the circumstances, but not for the purpose of expressing an opinion on the effectiveness of the Group and Company's internal control.
Ÿ Evaluate the appropriateness of accounting policies used and the reasonableness of accounting estimates and related disclosures made by the directors.
Ÿ Conclude on the appropriateness of directors' use of the going concern basis of accounting and, based on the audit evidence obtained, whether a material uncertainty exists related to events or conditions that may cast significant doubt on the Group and Company's ability to continue as a going concern. If we conclude that a material uncertainty exists, we are required to draw attention in our auditor's report to the related disclosures in the consolidated and separate financial statements or, if such disclosures are inadequate, to modify our opinion. Our conclusions are based on the audit evidence obtained up to the date of our auditor's report. However, future events or conditions may cause the Group and Company to cease to continue as a going concern.
Ÿ Evaluate the overall presentation, structure and content of the consolidated and separate financial statements, including the disclosures, and whether the consolidated and separate financial statements represent the underlying transactions and events in a manner that achieves fair presentation.
Ÿ Obtain sufficient appropriate audit evidence regarding the financial information of the entities or business activities within the Group to express an opinion on the consolidated financial statements. We are responsible for the direction, supervision and performance of the group audit. We remain solely responsible for our audit opinion.
We communicate with the Board of Directors and Audit Committee regarding, among other matters, the planned scope and timing of the audit and significant audit findings, including any significant deficiencies in internal control that we identify during our audit.
We also provide the Audit Committee with a statement that we have complied with relevant ethical requirements regarding independence, and to communicate with them all relationships and other matters that may reasonably be thought to bear on our independence, and where applicable, related safeguards.
From the matters communicated with the Board of Directors and Audit Committee, we determine those matters that were of most significance in the audit of the consolidated and separate financial statements of the current period and are therefore the key audit matters. We describe these matters in our auditor's report unless law or regulation precludes public disclosure about the matter or when, in extremely rare circumstances, we determine that a matter should not be communicated in our report because the adverse consequences of doing so would reasonably be expected to outweigh the public interest benefits of such communication.
Report on Other Legal and Regulatory Requirements
Compliance with the requirements of Schedule 6 of the Companies and Allied Matters Act, Cap C.20, Laws of the Federation of Nigeria, 2004. In our opinion, proper books of account have been kept by the Company, so far as appears from our examination of those books and the Company's statement of financial position and statement of profit or loss and other comprehensive income are in agreement with the books of account.
Signed: Oluwatoyin A. Gbagi, FCA FRC/2012/ICAN/00000000565 For: KPMG Professional Services Chartered Accountants 19 June 2019 Lagos, Nigeria

56
CONSOLIDATED AND SEPARATE STATEMENTS OF PROFIT OR LOSS AND OTHER COMPREHENSIVE INCOME for the year ended
Group Company
N'000
31 Dec 2018
N'000
31 Dec 2017
N'000
31 Dec 2017
N'000
31 Dec 2018
Notes Revenue 6 308,425,456 299,153,305 187,043,475 177,170,362 Cost of sales 7 (238,742,586) (250,178,892) (123,009,569) (125,936,555)Gross profit 69,682,870 48,974,413 64,033,906 51,233,807 Selling and marketing expenses 8 (7,732,817) (4,711,129) (3,891,305) (2,330,240)Administrative expenses 9 (37,140,624) (38,408,177) (23,440,838) (19,044,642)Other income 10 1,383,985 3,693,898 1,293,329 3,806,321 Impairment loss on trade receivables 11.1 (74,326) (862,779) (44,835) (75,741)Other operating expenses 11 (1,308,275) (800,720) (463,615) (383,812)Operating profit 24,810,813 7,885,506 37,486,642 33,205,693 Finance income 12 1,719,176 1,438,980 1,317,064 1,107,476 Finance costs 12 (45,973,062) (43,216,500) (43,037,415) (41,299,124)Impairment loss on investments in subsidiaries 18.1.1 - - (3,174,874) - Share of loss from joint ventures accounted for using the equity method 18.2 (65,155) (140,263) - (112,236)Loss before minimum tax 15 (19,508,228) (34,032,277) (7,408,583) (7,098,191) Minimum tax 14.1 - (287,672) - (287,672) Loss after minimum tax (19,508,228) (34,319,949) (7,408,583) (7,385,863) Income tax credit/(expense) 14.2 10,706,502 (281,460) 11,550,347 (5,837,763)(Loss)/profit after tax (8,801,726) (34,601,409) 4,141,764 (13,223,626) Other comprehensive income: Items that may be reclassified to profit or loss: Exchange differences on translation of foreign operations 28 (571,382) 18,545,417 - - Exchange differences on translation of foreign joint ventures 18.2 - 50,712 - 39,103 (571,382) 18,596,129 - 39,103 Items that will not be subsequently reclassified into profit or loss: Remeasurements of defined benefit obligations 33.2 186,391 319,757 55,314 182,449 Income tax relating to these items 14.4 (54,401) (96,854) (17,700) (58,384) 131,990 222,903 37,614 124,065 Other comprehensive income for the year, net of tax (439,392) 18,819,032 37,614 163,168
Total comprehensive (loss)/income for the year (9,241,118) (15,782,377) 4,179,378 (13,060,458)(Loss)/profit attributable to : - Owners of Lafarge Africa Plc (9,107,048) (35,009,407) 4,141,764 (13,223,626)- Non-controlling interests 18.3 305,322 407,998 - - (8,801,726) (34,601,409) 4,141,764 (13,223,626)Total comprehensive (loss)/income for the year is attributable to: - Owners of Lafarge Africa Plc (9,546,440) (16,190,375) 4,179,378 (13,060,458)- Non-controlling interests 18.3 305,322 407,998 - - (9,241,118) (15,782,377) 4,179,378 (13,060,458)Earnings per share attributable to the ordinary equity holders of the Company: Basic earnings per share (Naira) 26 (105) (637) 48 (240)Diluted earnings per share (Naira) 26 (105) (631) 48 (238) The accompanying notes and significant accounting policies on pages 61 to 136 form an integral part of these financial statements.

N'000
31 Dec 2018
N'000
31 Dec 2017
N'000
31 Dec 2017
N'000
31 Dec 2018
Notes
Group Company
FINANCIAL POSITION CONSOLIDATED AND SEPARATE STATEMENTS OF
as at
ASSETS Non-current assets Property, plant and equipment 16 394,488,764 393,651,934 291,775,732 292,872,779 Intangible assets 17 6,194,518 2,634,326 3,204,505 - Investments in subsidiaries 18.1 - - 178,923,532 182,088,406 Other financial assets 19 1,301,148 1,582,622 1,134,509 1,556,738 Other assets 21 16,671,760 20,803,113 15,073,457 14,984,747 Deferred tax assets 14.8 28,720,032 17,514,432 27,950,907 16,333,384 Total non-current assets 447,376,222 436,186,427 518,062,642 507,836,054 Current assets Inventories 22 47,156,521 58,266,466 28,921,467 39,057,831 Trade and other receivables 23 21,163,994 25,110,116 11,167,705 15,930,970 Current tax asset 14.5 658,291 917,797 - - Other assets 21 10,594,409 15,162,092 8,661,903 10,679,505 Other financial assets 19 1,140,956 592,538 605,230 326,635 Derivative assets 20 95,573 640,091 95,573 640,091 Cash and cash equivalents 24 12,550,697 50,414,757 10,177,776 41,698,854 Total current assets 93,360,441 151,103,857 59,629,654 108,333,886 Total assets 540,736,663 587,290,284 577,692,296 616,169,940 LIABILITIES Non-current liabilities Loans and borrowings 30 172,373,209 68,715,378 144,391,743 64,900,757 Deferred tax liabilities 14.8 10,200,112 11,025,943 - - Provisions 31 3,645,751 3,472,388 618,970 909,320 Deferred income 32 2,597,602 1,518,467 1,455,770 1,518,467 Employee benefit obligations 33 4,729,183 4,916,931 1,611,411 1,616,733 Total non-current liabilities 193,545,857 89,649,107 148,077,894 68,945,277 Current liabilities Trade and other payables 34 80,537,816 113,000,180 49,921,178 69,930,054 Loans and borrowings 30 93,833,850 187,831,582 105,685,719 190,724,579 Current tax liabilities 14.6 1,156,231 3,251,525 201,199 1,544,949 Provisions 31 1,281,247 1,166,217 845,328 895,268 Derivative liabilities 20 244,176 4,212,406 244,176 4,212,406 Deferred income 32 315,452 110,732 110,732 110,732 Bank overdrafts 24.2 35,280,945 31,081,780 16,862,345 15,037,780 Total current liabilities 212,649,717 340,654,422 173,870,677 282,455,768 Total liabilities 406,195,574 430,303,529 321,948,571 351,401,045 EQUITY Share capital 25.1 4,336,715 2,787,888 4,336,715 2,787,888 Share premium 25.2 350,945,748 222,272,108 350,945,748 222,272,108 Retained earnings 138,272,355 160,257,556 92,140,223 100,970,988 Deposit for shares 27 - 130,416,872 - 130,416,872 Foreign currency translation reserve 28 9,364,261 9,935,643 39,103 39,103 Other reserves arising on business combination and re-organisations 29 (368,683,312) (368,683,312) (191,718,064) (191,718,064)Capital and reserves attributable to owners 134,235,767 156,986,755 255,743,725 264,768,895 Non-controlling interests 18.3 305,322 - - - Total equity 134,541,089 156,986,755 255,743,725 264,768,895 Total equity and liabilities 540,736,663 587,290,284 577,692,296 616,169,940 The accompanying notes and significant accounting policies on pages 61 to 136 form an integral part of these financial statements.These financial statements were approved and authorised for issue by the board of directors on 18th June 2019 and were signed on its behalf by:
Mobolaji Balogun Michel Puchercos Bruno Bayet Chairman Group Managing Director Group Chief Financial Officer FRC/2013/CISN/00000004945 FRC/2017/IODN/00000015919 FRC/2014/MULTI/00000009554
57

Sharecapital
Sharepremium
Notes N'000 N'000
Retainedearnings
N'000
Foreign currency
translationreserve
N'000
Deposit for shares
N'000
Attributable to parent equity holders of the
Non-controlling
Total interests
N'000
Other reserves
business combination and re-organisations
N'000
arising on
Balance at 1 January 2017 2,740,367 217,528,456 102,842,886 - (8,660,486) (256,899,951) 57,551,272 191,401,276 248,952,548 (Loss)/profit for the year - - (35,009,407) - - - (35,009,407) 407,998 (34,601,409)Other comprehensive income (Net of tax) - - 222,903 - 18,596,129 - 18,819,032 - 18,819,032 Total comprehensive income for the period - - (34,786,504) - 18,596,129 - (16,190,375) 407,998 (15,782,377) Transactions with owners: Deposit for shares 27 - - - 130,416,872 - - 130,416,872 - 130,416,872 Movement in reserves arising from re-organisation - - 97,955,945 - - 40,729,323 138,685,268 - 138,685,268 Net movement of Quasi-Equity loan - - - - - (199,453,879) (199,453,879) - (199,453,879)Quasi-equity loan taken over by Parent - - - - - - - (139,361,637) (139,361,637)Dividends declared 34.3 - - (5,754,771) - - - (5,754,771) - (5,754,771)Dividends paid to NCI - - - - - - - (41,863) (41,863)Acquisition of NCI in Ashaka 47,521 4,743,652 - - 46,941,195 51,732,368 (52,405,774) (673,406)Total transaction with owners 47,521 4,743,652 92,201,174 130,416,872 - (111,783,361) 115,625,858 (191,809,274) (76,183,416) Balance at 31 December 2017 2,787,888 222,272,108 160,257,556 130,416,872 9,935,643 (368,683,312) 156,986,755 - 156,986,755 At 1 January 2018 2,787,888 222,272,108 160,257,556 130,416,872 9,935,643 (368,683,312) 156,986,755 - 156,986,755 (Loss)/profit for the year - - (9,107,048) - - - (9,107,048) 305,322 (8,801,726)Other comprehensive income (Net of tax) - - 131,990 - (571,382) - (439,392) - (439,392)Total comprehensive income for the period 18.3 - - (8,975,058) - (571,382) - (9,546,440) 305,322 (9,241,118)Transaction with owners: Issue of shares 25 1,548,827 130,101,427 - 131,650,254 - 131,650,254Deposit for shares 27 - - - (130,416,872) - - (130,416,872) - (130,416,872)Dividends declared 34.3 - - (13,010,143) - - - (13,010,143) - (13,010,143)Right issue costs 25.2 (1,427,787) - - - (1,427,787) - (1,427,787) - Total transaction with owners 1,548,827 128,673,640 (13,010,143) (130,416,872) - - (13,204,548) - (13,204,548) Balance at 31 December 2018 4,336,715 350,945,748 138,272,355 - 9,364,261 (368,683,312) 134,235,767 305,322 134,541,089 The accompanying notes and significant accounting policies on pages 61 to 136 form an integral part of these financial statements.
for the year ended 31 December
CONSOLIDATED AND SEPARATE STATEMENTS OF CHANGES IN EQUITY
Group equityTotal
N'000N'000
58

for the year ended
CONSOLIDATED AND SEPARATE STATEMENTS OF CHANGES IN EQUITY
59
Balance at 1 January 2017 2,740,367 217,528,456 119,825,320 - - - 340,094,143 Loss for the year - - (13,223,626) - - - (13,223,626)Other comprehensive income (Net of tax) - - 124,065 - 39,103 - 163,168 Total comprehensive income for the period - - (13,099,561) - 39,103 - (13,060,458) Transaction with owners: Issue of shares 25 47,521 4,743,652 - - - - 4,791,173 Deposit for shares 27 - - - 130,416,872 - - 130,416,872 Movement in reserves arising from re-organisation - - - - - 7,735,815 7,735,815 Net movement of Quasi-Equity loan - - - - - (199,453,879) (199,453,879)Dividends declared 34.3 - - (5,754,771) - - - (5,754,771)Total transaction with owners 47,521 4,743,652 (5,754,771) 130,416,872 - (191,718,064) (62,264,790) Balance at 31 December 2017 2,787,888 222,272,108 100,970,988 130,416,872 39,103 (191,718,064) 264,768,895 At 1 January 2018 2,787,888 222,272,108 100,970,988 130,416,872 39,103 (191,718,064) 264,768,895 Profit for the year - - 4,141,764 - - - 4,141,764 Other comprehensive income (Net of tax) - - 37,614 - - - 37,614 Total comprehensive income for the period - - 4,179,378 - - - 4,179,378 Transaction with owners: Issue of shares 25 1,548,827 130,101,427 - - - - 131,650,254 Deposit for shares 27 - - - 130,416,872) - - (130,416,872)
Right issue costs (1,427,787) (1,427,787)Dividends declared 34.3 - - (13,010,143) - - - (13,010,143)Total transaction with owners 1,548,827 128,673,640 (13,010,143) (130,416,872) - - 13,204,548) Balance at 31 December 2018 4,336,715 350,945,748 92,140,223 - 39,103 (191,718,064) 255,743,725 The accompanying notes and significant accounting policies on pages 61 to 136 form an integral part of these financial statements.
Sharecapital
Sharepremium
Notes N'000 N'000
Retainedearnings
N'000
Foreign currency
translationreserve
N'000
Deposit for shares
N'000
Attributable to parent equity holders of the
Other reserves
business combination and re-organisations
N'000
arising on
equityTotal
N'000Company

N'000
31 Dec 2018
N'000
31 Dec 2017
N'000
31 Dec 2017
N'000
31 Dec 2018
Notes
Group Company
Cash flows from operating activities: Loss/Profit after tax (8,801,726) (34,601,409) 4,141,764 (13,223,626)Adjustments to reconcile Loss for the year to net cash flows: Depreciation 16 22,288,279 22,181,159 16,369,888 16,304,267 Impairment losses on property, plant and equipment 16 925,207 19,178,254 219,000 12,394,270 Amortization of intangible asset 17 494,990 166,023 2,280 - Impairment of intangible asset 17 - 226,670 - - Impairment of investments in subsidiaries 18.1.1 - - 3,174,874 - Other non-cash items 35.3 (59,859) (1,262,945) (1,107,304) (1,725,648)Net unrealized foreign exchange loss 6,206,982 1,677,899 3,885,150 1,416,442 Finance costs 12(b) 37,526,676 29,740,993 34,890,220 28,956,601 Finance income 12(a) (1,719,176) (1,438,980) (1,317,064) (1,107,476)Dividend income 10.4 (1,977) (1,767) - (294,055)Share of loss from joint venture 18.2 65,155 140,263 - 112,236 Income tax expense/(credit) 14.2 (10,706,502) 281,460 (11,550,347) 5,837,763 Minimum tax 14.1 - 287,672 - 287,672 Provisions and net movement on employee benefits 35.1.6 (234,601) (409,279) (237,782) (408,231)Change in net working capital 35.1 (16,130,965) (43,675,458) (8,758,260) (46,464,644)Cash flow generated from/(used in) operations 29,852,483 (7,509,445) 39,712,419 2,085,571 Income taxes paid 14.7 (1,887,486) (772,057) (587,307) (307,000)Net cash flow (used in)/generatedfrom operating activities 27,964,997 (8,281,502) 39,125,112 1,778,571 Cash flows from investing activities Acquisition of property, plant and equipment 16.2 (21,844,551) (15,278,494) (10,512,487) (10,360,055)Acquisition of intangible assets 17 (4,220,284) (228,192) (3,206,785) - Interest received 12 1,180,509 1,380,523 986,135 1,049,045 Acquisition of subsidiary, net of cash acquired 18.2 - (673,406) - (673,406)Dividend received from unlisted investments 10.4 1,977 1,767 - - Dividend received from subsidiaries 10.4 - - - 294,055 Proceeds from sale of property, plant and equipment 35.2 969,990 3,129,895 931,931 2,983,969 Net cash flow (used in)/generated frominvesting activities (23,912,359) (11,667,907) (11,801,206) (6,706,392) Cash flows from financing activities Interest paid 12 (37,298,875) (23,698,165) (33,794,289) (18,739,561)Dividend paid to equity holders of the company 34.3 (11,845,272) (16,280,825) (11,845,272) (16,280,825)Dividend paid to Non Controlling Interest 34.4 - (41,863) - - Transaction cost on rights issue 27.1 (1,555,428) (574,743) (1,555,428) (574,743)Cash paid/received from futures and forward contracts (5,536,300) 7,661,124 (5,536,300) 7,661,124 Net proceed from rights issues 27.1 19,378,284 - 19,378,284 - Proceeds from loans and borrowings 30.5 99,712,346 195,099,306 81,266,692 187,310,535 Repayment of loans and borrowings 30.5 (87,925,710) (138,981,397) (88,528,977) (138,646,769)Net cash inflow (used in)/generated from financing activities (25,070,955) 23,183,437 (40,615,290) 20,729,761 Net (decrease)/increase in cash and cash equivalents (21,018,317) 3,234,028 (13,291,384) 15,801,940 Cash and cash equivalents at the beginning of the year 24.2 (1,148,616) (3,730,386) 6,179,481 (7,783,026)Cash and cash equivalents arising from merger - - - (1,882,466)Effects of exchange rate changes on cash and cash equivalents (1,641,109) (652,258) (650,460) 43,033 Cash and cash equivalents at the end of the year 24.2 (23,808,042) (1,148,616) (7,762,363) 6,179,481
The accompanying notes and significant accounting policies on pages 61 to 136 form an integral part of these financial statements.
CASH FLOWSCONSOLIDATED AND SEPARATE STATEMENTS OF
for the year ended
60

61
1 Business description Lafarge Africa PLC (Lafarge Africa) was
incorporated in Nigeria on 26 February, 1959 and commenced business on 10 January 1961. The Company formerly known as Lafarge Cement WAPCO Nigeria Plc changed its name after a special resolution was passed by the shareholders at an Annual General Meeting held on Wednesday 9 July 2014. The change of name became effective with the acquisition of shares in Lafarge South Africa Holdings (Proprietary) Limited (LSAH), United Cement Company of Nigeria Limited (UNICEM), AshakaCem Ltd (AshakaCem) and Atlas Cement Company Limited (Atlas). The Company's corporate head office is situated at 27B Gerrard Road, Ikoyi, Lagos which is same as the registered office.
Lafarge Africa is in the business of manufacturing
and marketing of cement and other cementitious products such as Ready-Mix Concrete, Aggregates, Fly-Ash etc. On July 15, 2016, Lafarge S.A. France and Holcim Limited, Switzerland two large global players merged to form LafargeHolcim Group based in Zurich, Switzerland. Consequently Lafarge Africa is now a subsidiary company of Lafarge Holcim.
The term 'Group' as used in this report refers to
Lafarge Africa, its subsidiaries and investment in joint ventures. Lafarge Africa Group comprises of Lafarge Africa Plc and its subsidiaries below:
• Lafarge Ready Mix Nigeria Limited was
incorporated in Nigeria on 21 December, 2010, as a fully owned subsidiary of Lafarge Africa. Its main business is the production and sale of ready mix concrete used in the construction industry. Its principal office is located at 38 Kudirat Abiola Way, Oregun, Lagos, Nigeria.
AshakaCem Ltd was incorporated in Nigeria
on 7 August 1974 as a private limited liability company and was converted to a public limited liability company in July 1990. In April 2017, the shareholders of AshakaCem at an Extraordinary General Meeting (EGM) passed a resolution to delist the company from the official list of the Nigerian Stock Exchange (NSE). Subsequent to the delisting of the company, the shareholders of AshakaCem at a meeting ordered by the Court held an EGM on October 23, 2017 at which a Scheme to re-organize the issued share capital of the company was passed. The resolution passed a t t h e c o u r t o r d e r e d m e e t i n g wa s subsequently filed and sanctioned by the Federal High Court and the sanction officially gazetted. At the conclusion of the scheme, Lafarge Africa owns 100% of the issued share capital of AshakaCem. AshakaCem's main business is the manufacturing and marketing
NOTES TO THE CONSOLIDATED AND SEPARATE FINANCIAL STATEMENTS for the year ended 31 December 2018
of cementitious materials. Ashaka Cem has a p r o d u c t i o n c a p a c i t y o f 1 . 0 m t p a .
Lafarge South Africa Holdings (LSAH) is owned 100% by Lafarge Africa. LSAH own 72.40% of the operating companies of Lafarge South Africa Pty which consist of Lafarge Industries South Africa and Lafarge Mining South Africa. In total Lafarge South Africa’s operations has 3.0mtpa cement production capacity in addition to assets in ready mix and fly ash. LSAH also owns 50% interest in Qala a joint operation involved in aggregate business located in South Africa.
Wapsila Nigeria Limited was incorporated in Nigeria on 1 December 2014 as a wholly owned subsidiary of Lafarge Africa Plc. Its main business is the generation and sales of power. The Company is yet to commence operations as at 31 December 2018.
Lafarge Africa Plc owns a 35% interest in Continental Blue Investment (CBI), a Company involved in development, financing and operation of a cement grinding plant in Ghana.
The Group's subsidiaries are as stated below;
2 Summary of significant accounting policies 2.1 Introduction to summary of significant
accounting policies The note provides a list of the significant
accounting policies adopted in the preparation of these consolidated and separate financial statements to the extent they have not already been disclosed in other notes. These policies have been consistently applied to all the years presented unless otherwise stated.
Certain comparative amounts in the consolidated
and separate statements of profit or loss, consolidated and separate statements of financial posit ion and consol idated and separate statements of cash flows have been reclassified or re-represented. The changes were made in order to achieve fairer presentation and had no impact on profit or loss, total comprehensive income or loss, net assets and equity as previously reported (See Note 41).
31 December 2018 31 December 2017 Lafarge Ready Mix Lafarge Ready Mix Nigeria Limited Nigeria Limited Lafarge South Africa Lafarge South Africa Holdings (PTY) Limited Holdings (PTY) Limited Ashaka Cement Limited Ashaka Cement Limited Wapsila Nigeria Limited

62
2.2 Basis of preparation i) Compliance with IFRS These consolidated and separate financial
statements of Lafarge Africa Plc have been prepared in accordance with International Financial Reporting Standards ("IFRS") as issued by the International Accounting Standards Board (IASB), and the requirements of the Companies and Allied Matters Act CAP C.20 Laws of the Federation of Nigeria, 2004 and the Financial Reporting Council of Nigeria Act, 2011. The financial statements which were prepared on a going concern basis, were authorized for issue by the Company's board of directors on 18th June 2019.
The financial statements comprise the statement of profit or loss and other comprehensive income, the statement of financial position, the statement of changes in equity, the statement of cash flows and the notes to the financial statements.
This is the first set of the Group's annual financial statements in which IFRS 15 Revenue from Contracts with Customers and IFRS 9 Financial Instruments have been applied. Changes to significant accounting policies are described in Note 2.2.2.
ii) Basis of measurement The financial statements have been prepared in
accordance with the going concern assumption under the historical cost concept except for the following:
- non-derivative financial instruments – initially at fair value and subsequently at amortized cost using effective interest rate
- derivative financial instruments – measured at fair value
- defined benefit pension plans - plan assets measured at fair value
- inventory - lower of cost and net realisable value The historical financial information is presented in
Naira and all values are rounded to the nearest thousand (N'000), except where otherwise indicated. The accounting policies are applicable to both the Company and Group.
iii) Use of judgements and accounting estimates In preparing these consolidated and separate
financial statements, management has made judgments, estimates and assumptions that affect the appl icat ion of the Group/Company's accounting policies and the reported amounts of assets, liabilities, income and expenses. Actual results may differ from these estimates.Estimates and underlying assumptions are reviewed on an ongoing basis. Revisions to estimates are recognized prospectively.
Judgements Information about judgments made in applying
accounting policies that have the most significant effects on the amounts recognized in the separate and consolidated financial statements is disclosed in Note 3.1.
Assumptions and estimation uncertainties Information about assumptions and estimation
uncertainties at 31 December 2018 that have a significant risk of resulting in a material adjustment to the carrying amounts of assets and liabilities in the next financial year is disclosed in Note 3.1
2.2.1 Going concern The Group incurred a loss after tax for the year
ended 31 December 2018 of N8.8 billion (2017: N34.6 billion) and as of that date, the Group's current liabilities exceeded its current assets by N119.3 billion (2017: N189.6 billion) while the Company’s current liabilities exceeded its current assets by N114.2billion (2017: N174.1 billion).
On 4 December 2018, the Company launched a Rights Issue to raise N89.2 billion which was fully subscribed and closed subsequent to year end as
th further described in Note 40.1.Furthermore, on 24May 2019, the board of Lafarge Africa Plc approved the disposal of the Company's investment in Lafarge South Africa Holdings (LSAH) via a planned sale of the total equity interest held by the Company in LSAH to Caricement B.V., a related party within the LafargeHolcim Group. The disposal was negotiated and the sales price was agreed at USD 316.3 million (N115.2 billion) as further described in note 40.3. The proceeds from the sale will be used to settle the Company’s shareholder loan which represents the only existing foreign currency loan in the books of the Company. The full repayment of the Shareholder Loan will result in a significant reduction in debt, interest charges and foreign exchange exposures which will in turn enhance the Company’s profitability, financial position and cash flows. Additionally, the deconsolidation of LSAH which has been loss making and in a net current liabilities position will further enhance the Group’s financial performance and position.
The planned improvement in cash flows and net income, resulting from the reduction in debt service outflows will enable Lafarge Africa Plc to effectively implement its growth strategies, optimize operating costs and improve the Company’s profitability.
Based on the foregoing, the directors believe that the Group and Company will continue to be able to meet their obligations as they become due in the normal course of business. Accordingly, these financial statements have been prepared on the basis of accounting policies applicable to a going concern.
2.2.2 Changes in accounting policies and disclosures i) N e w a n d a m e n d e d s t a n d a r d s a n d
interpretations adopted by the Group The Group has initially applied IFRS 15 - Revenue
from Contracts with Customers (See A) and IFRS 9 -
NOTES TO THE CONSOLIDATED AND SEPARATE FINANCIAL STATEMENTS for the year ended 31 December 2018

63
Financial instruments (See B) from 1 January 2018. A number of other new standards are also effective from 1 January 2018 but they do not have a material effect on the Group's financial statements.
Due to the transition methods chosen by the
Group in applying these standards, comparative information throughout these financial statements has not been restated to reflect the requirements of the new standards, except for certain hedging requirements and separately presenting impairment loss on trade receivables and contract assets.
The effect of initially applying IFRS 15 is
immaterial while the initial application of IFRS 9 is mainly attributed to an increase in impairment losses recognised on financial assets.
A IFRS 15 - Revenue from Contracts with
Customers IFRS 15 establishes a comprehensive framework
for determining whether, how much and when revenue is recognised. It replaced IAS 18 Revenue, IAS 11 Construction Contracts and related interpretations. Under IFRS 15, revenue is recognised when a customer obtains control of the goods or services. Determining the timing of the transfer of control - at a point in time or over time - requires judgement.
The Group has adopted IFRS 15 using the
cumulative effect method (without practical expedients), with the effect of initially applying this standard recognised at the date of initial application (i.e. 1 January 2018). Accordingly, the information presented for 2017 has not been restated – i.e. it is presented, as previously reported, under IAS 18 and related interpretations. Additionally, the disclosure requirements in IFRS 15 have not generally been applied to comparative information.
The impact of IFRS 15 on the Group's accounting
for returns is immaterial as the Group historically records very immaterial returns on sales. Therefore, it is improbable that a significant reversal in the amount of cumulative revenue recognized will occur. The Group does not incur material costs to obtain its revenue contracts, therefore, the impact of IFRS 15 on accounting for contract costs is immaterial to the Group.
B IFRS 9 - Financial instruments IFRS 9 sets out requirements for recognising and
measuring financial assets, financial liabilities and some contracts to buy or sell non-financial items. This standard replaces IAS 39 Financial Instruments: Recognition and Measurement.
As a result of the adoption of IFRS 9, the Group has adopted consequential amendments to IAS 1 Presentation of Financial Statements, which require impairment of financial assets to be presented in a separate line item in the statement of profit or loss and OCI. Previously, the Group's approach was to include the impairment of trade receivables in other expenses. Consequently, the Group reclassified impairment losses amounting to N862.8million, recognised under IAS 39, from 'other expenses' to 'impairment loss on trade receivables' in the statement of profit or loss and OCI for the year ended 31 December 2017. Impairment losses on other financial assets are presented under 'finance costs', similar to the presentation under IAS 39, and not presented separately in the statement of profit or loss and OCI due to materiality considerations.
Additionally, the Group has adopted consequential
amendments to IFRS 7 Financial Instruments: Disclosures that are applied to disclosures about 2018 but have not been generally applied to comparative information.
The impact of IFRS 9 on opening balances was
considered immaterial. i) Classification and measurement of financial
assets and financial liabilities IFRS 9 contains three principal classification
categories for financial assets: measured at amort ised cost , FVOCI and FVTPL. The classification of financial assets under IFRS 9 is generally based on the business model in which a financial asset is managed and its contractual cash flow characteristics. IFRS 9 eliminates the previous IAS 39 categories of held to maturity, loans and receivables and available for sale. Under IFRS 9, derivatives embedded in contracts where the host is a financial asset in the scope of the standard are never separated. Instead, the hybrid financial instrument as a whole is assessed for classification.
IFRS 9 largely retains the existing requirements in
IAS 39 for the classification and measurement of financial liabilities.
The adoption of IFRS 9 has not had a significant
effect on the Group's accounting policies related to financial liabilities and derivative financial instruments (for derivatives that are used as hedging instruments).
For an explanation of how the Group classifies and
measures financial instruments and accounts for related gains and losses under IFRS 9, see Note 2.14.
The following table and the accompanying notes below explain the original measurement ca tegor ies under IAS 39 and the new measurement categories under IFRS 9 for each class of the Group's financial assets and financial liabilities as at 1 January 2018.
NOTES TO THE CONSOLIDATED AND SEPARATE FINANCIAL STATEMENTS for the year ended 31 December 2018

64
a. Trade and other receivables that were classified as loans and receivables under IAS 39 are now classified at amortised cost.
b. Corporate debt securities that were previously
classified as held-to-maturity are now classified at amortised cost. The Group intends to hold the assets to maturity to collect contractual cash flows and these cash flows consist solely of payments of principal and interest on the principal amount outstanding.
The impact of IFRS 9 on opening balances was
considered immaterial. ii) Standards issued but not yet effective A number of new standards are effective for annual
periods beginning after 1 January 2018 and earlier application is permitted; however, the Group has not early adopted the new or amended standards in preparing these consolidated financial statements.
Of those standards that are not yet effective, IFRS
16 is expected to have a material impact on the Group's financial statements in the period of initial application.
A IFRS 16 Leases The Group is required to adopt IFRS 16 Leases from
1 January 2019. The Group has assessed the estimated impact that initial application of IFRS 16 will have on its consolidated financial statements, as described below. The actual impacts of adopting the standard on 1 January 2019 may change because:
- the new accounting policies are subject to change
until the Group presents its first financial statements that include the date of initial application.
IFRS 16 introduces a single, on-balance sheet lease
accounting model for lessees. A lessee recognises a right-of-use asset representing its right to use the underlying asset and a lease liability representing its obligation to make lease payments. There are recognition exemptions for short-term leases and leases of low-value items. Lessor accounting r e m a i n s s i m i l a r t o t h e c u r r e n tstandard – i.e. lessors continue to classify leases as finance or operating leases.
IFRS 16 replaces existing leases guidance,
NOTES TO THE CONSOLIDATED AND SEPARATE FINANCIAL STATEMENTS for the year ended 31 December 2018
Original carrying amount under
IAS 39N'000
New carrying amount under
IFRS 9N'000
Group
Newclassification under IFRS 9
Original classificationunder IAS 39
Financial assets Derivative assets FVTPL Mandatorily at FVTPL 640,091 640,091 Trade and other receivables Loans and receivables Amortised cost 25,110,116 25,110,116 Cash and cash equivalents Loans and receivables Amortised cost 50,414,757 50,414,757 Other financial assets Held to maturity Amortised cost 2,163,689 2,163,689 Total financial assets 78,328,653 78,328,653 Financial liabilities Derivative liabilities FVTPL Mandatorily at FVTPL 4,212,406 4,212,406 Bank overdrafts Other financialliabilities Other financial liabilities 31,081,780 31,081,780 Interest bearing loans Other financial liabilities Other financial liabilities 256,546,960 256,546,960 Trade payables Other financial liabilities Other financial liabilities 106,416,598 106,416,598 Total financial liabilities 398,257,744 398,257,744
Original carrying amount under
IAS 39N'000
New carrying amount under
IFRS 9N'000
Newclassification under IFRS 9
Original classificationunder IAS 39
Company
Financial assets Derivative assets FVTPL Mandatorily at FVTPL 640,091 640,091 Trade and other receivables Loans and receivables Amortised cost 15,930,970 15,930,970 Cash and cash equivalents Loans and receivables Amortised cost 41,698,854 41,698,854 Other financial assets Held to maturity Amortised cost 1,883,373 1,883,373 Total financial assets 60,153,288 60,153,288 Financial liabilities Derivative liabilities FVTPL Mandatorily at FVTPL 4,212,406 4,212,406 Bank overdrafts Other financial liabilities Other financial liabilities 15,037,780 15,037,780 Interest bearing loans Other financial liabilities Other financial liabilities 255,625,336 255,625,336 Trade payables Other financial liabilities Other financial liabilities 64,531,244 64,531,244 Total financial liabilities 339,406,766 339,406,766

including IAS 17 Leases, IFRIC 4 Determining whether an Arrangement contains a Lease, SIC-15 Operating Leases – Incentives and SIC-27 Evaluating the Substance of Transactions Involving the Legal Form of a Lease.
i) Leases in which the Group is a lessee The Group will recognise new assets and liabilities
for its operating leases of warehouse, plant and machinery and factory facilities. The nature of expenses related to those leases will now change because the Group will recognise a depreciation charge for right-of-use assets and interest expense on lease liabilities.
Previously, the Group recognised operating lease
expense on a straight-line basis over the term of the lease, and recognised assets and liabilities only to the extent that there was a timing difference between actual lease payments and the expense recognised.
In addition, the Group will no longer recognise
provisions for operating leases that it assesses to be onerous as described. Instead, the Group will include the payments due under the lease in its lease liability.
No significant impact is expected for the Group's
finance leases. Based on the information currently available, the
Group estimates that it will recognise additional lease liabilities and corresponding right of use asset of between ₦20.5 billion to ₦27.8 billion as at 1 January 2019.
ii) Leases in which the Group is a lessor Based on the information currently available, no
significant impact is expected for leases in which the Group is a lessor as at 1 January 2019.
iii) Transition The Group plans to apply IFRS 16 initially on 1
January 2019, using the modified retrospective approach. Therefore, the cumulative effect of adopting IFRS 16 will be recognised as an adjustment to the opening balance of retained earnings at 1 January 2019, with no restatement of comparative information.
The Group plans to apply the practical expedient
to grandfather the definition of a lease on transition. This means that it will apply IFRS 16 to all contracts entered into before 1 January 2019 and identified as leases in accordance with IAS 17 and IFRIC 4.
B Other standards The fo l lowing amended standards and
interpretations are not expected to have a significant impact on the Group's consolidated financial statements.
New standards or amendments Effective date
- IFRIC 23 Uncertainty over Tax Treatments. 1 January 2019
- Prepayment Features with Negative Compensation
(Amendments to IFRS 9). 1 January 2019 - Long-term Interests in Associates and Joint Ventures
(Amendments to IAS 28). 1 January 2019 - Plan Amendment, Curtailment or Settlement
(Amendments to IAS 19). 1 January 2019 - Annual Improvements to IFRS Standards 2015–2017
Cycle – various standards 1 January 2019 - Amendments to References to Conceptual Framework
in IFRS Standards 1 January 2020 2.3 Principles of consolidation and equity
accounting The financial statements of the consolidated
subsidiaries used to prepare the consolidated financial statements were prepared as at the parent company's reporting date.
i) Subsidiaries Subsidiaries are entities controlled by the Group.
The Group controls an entity when the Group is exposed to, or has the right to, variable returns from its involvement with the entity and has the ability to affect those returns through its power over the entity. Subsidiaries are fully consolidated from the date on which control is transferred to the Group and unconsolidated from the date that control ceases.
Common control business combination and re-
organization: The Group uses the pooling of interest method to
account for business combinations involving entities ultimately controlled by LafargeHolcim group. A business combination is a "common control combination" if:
- The combining entities are ultimately controlled by the same party both before and after the combination and
- Common control is not transitory Under a pooling of interest-type method, the
Group accounts for the combination as follows:a) The assets and liabilities of the acquiree are
recorded at book value and not at fair value.b) Intangible assets and contingent liabilities are
recognized only to the extent that they were recognised by the acquiree in accordance with applicable IFRS (in particular IAS 38: Intangible Assets).
c) No goodwill is recorded. The difference between the acquirer's cost of investment and the acquiree's equity is recorded directly in equity.
d) Any non-controlling interest is measured as a proportionate share of the book values of the related assets and liabilities.
NOTES TO THE CONSOLIDATED AND SEPARATE FINANCIAL STATEMENTS for the year ended 31 December 2018
65

66
e) Any expenses of the combination are written off immediately in the statement of profit or loss and comprehensive income.
f) For business combinations, comparative amounts are restated as if the combination had taken place at the beginning of the earliest comparative period presented.
For capital re-organisations between entities already controlled by Lafarge Africa, transactions are effected as though they started at the beginning of the year of merger using the book value of the entities. Comparatives are not restated.
g) Adjustments are made to achieve uniform accounting policies.
Transaction costs are expensed as incurred,
except if related to the issue of debt or equity securities.
Inter-company transactions, balances, income
and expenses on transactions between Group companies are eliminated. Unrealised losses are also eliminated unless the transaction provides evidence of an impairment of the transferred asset. Accounting policies of subsidiaries have been changed where necessary to ensure consistency with the policies adopted by the Group.
ii) Non-controlling interests (NCI) NCI is measured at their proportionate share of the
acquiree's identifiable net assets at the date of acquisition. Changes in the Group's interest in a subsidiary that does not result in a loss of control are accounted for as equity transactions.
iii) Loss of control When the Group loses control over a subsidiary, it
derecognises the assets and liabilities of the subsidiary and any related NCI and other components of equity. Any resulting gain or loss is recognised in profit or loss. Any interest retained in the former subsidiary is measured at fair value when control is lost.
iv) Joint arrangements The Group's joint arrangements are classified as
joint venture. A joint venture is an arrangement in which the Group and other parties have joint control, whereby the group has rights to the net assets of the joint arrangement. The classification is based on the contractual rights and obligations of each investor, rather than the legal structure of the joint arrangement.
Interests in joint ventures are accounted for using
the equity method (see (v) below).
v) Interest in equity-accounted investees Under the equity method of accounting, the
investments are initially recognised at cost and adjusted thereafter to recognise the Group's share of the post-acquisition profits or losses of the investee in profit or loss, and the Group's share of movements in other comprehensive income of the investee in other comprehensive income. Dividends received or receivable from joint ventures are recognised as a reduction in the carrying amount of the investment.
When the Group's share of losses in an equity-
accounted investment equals or exceeds its interest in the entity, including any other unsecured long-term receivables, the Group does not recognise further losses, unless it has incurred obligations or made payments on behalf of the other entity.
Unrealised gains on transactions between the Group and its associates and joint ventures are eliminated to the extent of the Group's interest in these entities. Unrealised losses are also eliminated unless the transaction provides evidence of an impairment of the asset transferred. Accounting policies of equity accounted investees have been changed where necessary to ensure consistency with the policies adopted by the Group.
The carrying amount of equity-accounted
investments is tested for impairment in accordance with the policy described in Note 2.11.
Interests in the joint ventures are derecognised when the Group loses joint control over the joint venture. Any resulting gain or loss is recognized in profit or loss.
vi) Changes in ownership interests Interests in the equity of subsidiaries not attributable
to the parent are reported in equity as non-controlling interest. Profits or losses attributable to non-controlling interests are reported as profit or loss attributable to non-controlling interests.
In the separate financial statements of Lafarge
Africa Plc (the Company) investment in subsidiaries is recognised at cost and dividend income is recognised in other income in the statement of profit or loss.
The Group assesses at the end of each reporting
period whether there is objective evidence that an investment is impaired. An investment is impaired and impairment losses are incurred only if there is objective evidence of impairment as a result of one or more events that occurred after the initial recognition of the investment and has an impact on the estimated future cash flows of the financial asset or Group of financial assets that can be reliably estimated.
The amount of the loss is measured as the difference
between the asset's carrying amount and the present value of estimated future cash flows. The carrying amount of the asset is reduced and the amount of the loss is recognised in profit or loss.
If, in a subsequent period, the amount of the impairment loss decreases and the decrease can be
NOTES TO THE CONSOLIDATED AND SEPARATE FINANCIAL STATEMENTS for the year ended 31 December 2018

67
related objectively to an event occurring after the impairment was recognised, the reversal of the previously recognised impairment loss is recognised in profit or loss.
vii) Transactions eliminated on consolidation Intra-group balances and transactions, and any
unrealised income and expenses arising from intra-group transactions, are eliminated. Unrealised gains arising from transactions with equity accounted investees are eliminated against the investment to the extent of the Group's interest in the investee. Unrealised losses are eliminated in the same way as unrealised gains, but only to the extent that there is no evidence of impairment.
2.4 Foreign currency translations a) Functional and presentation currency Items included in the financial statements of the
Group are measured using the currency of the primary economic environment in which the entity operates ('the functional currency'). The functional currency for the Nigerian entities is Nigerian Naira and South Africa Rand for the South African entities. The presentation currency of the Group is the Nigerian Naira (N).
b) Foreign currency transactions Transactions in foreign currencies are translated
into the respective functional currencies of the entities of the Group by applying the exchange rate at the date of the transactions.
Monetary assets and liabilities denominated in foreign currencies are translated at the functional currency spot rates of exchange at the reporting date. Differences arising on settlement or translation of monetary items are recognised in profit or loss.
Non-monetary assets and liabilities in a foreign currency that are measured at historical cost are translated using the exchange rates at the date of the transaction. Non-monetary items measured at fair value in a foreign currency are translated using the exchange rates at the date when the fair value is determined. Foreign currency differences are generally recognised in profit or loss and presented within finance costs.
The gain or loss arising on translation of non-monetary items measured at fair value is treated in line with the recognition of the gain or loss on the change in fair value of the item (i.e. translation differences on items whose fair value gain or loss is recognised in OCI or profit or loss are also recognised in OCI or profit or loss, respectively).
c) Foreign operations On consolidation, the assets and liabilities of
foreign operations are translated into Naira at the rate of exchange prevailing at the reporting date and their statements of profit or loss are translated at exchange rates prevailing at the dates of the transactions. The exchange differences arising on translation for consolidation are recognised in
OCI. On disposal of a foreign operation, the component of OCI relating to that particular foreign operation is reclassified to profit or loss.
The exchange differences arising on the translation are recorded in other comprehensive income under “Exchange differences on translation of foreign operations”. On the partial or total disposal of a foreign entity with a loss of control, the related share in the cumulative translation differences recorded in equity is recycled to the statement of profit or loss as part of gain or loss on disposal. The same is applicable in a loss of significant influence or joint control.
If the Group disposes of part of its interest in a subsidiary but retains control, then the relevant proportion of the cumulative amount is retributted to NCI. When the Group disposes of only part of an associate or joint venture while retaining significant influence or joint control, the relevant proportion of the cumulative amount is reclassified to profit or loss.
2.5 Revenue recognition The Group has initially applied IFRS 15 from 1
January 2018. The effect of initially applying IFRS 15 is described in note 2.2.2a
The specific recognition criteria described below
must also be met before revenue is recognized: Policy applicable before 1 January 2018 Sale of goods Revenue from the sale of goods is recognized
when the significant risks and rewards of ownership of the goods have passed to the buyer, usually upon delivery or self-collection. Revenue from the sale of goods is measured at the fair value of the consideration received or receivable, net of returns and allowances, trade discounts and volume rebates. The Group's product includes cement, aggregates, flyash and admixtures.
Policy applicable from 1 January 2018 The Group recognizes revenue when (or as) it
satisfies a performance obligation by transferring a promised good or service to a customer (which is when the customer obtains control of that good or service). The amount of revenue recognized is the amount a l loca ted to the sa t i sfied performance obligation. A performance obligation may be satisfied at a point in time (typically for promises to transfer goods to a customer) or over time (typically for promises to transfer services to a customer or for construction related activities).
Investment income Investment income arising on dividends from
subsidiaries and un-listed investments are usually classified as part of other income. Dividend income from investments is recognised when the shareholders' rights to receive payment have been established.
NOTES TO THE CONSOLIDATED AND SEPARATE FINANCIAL STATEMENTS for the year ended 31 December 2018

68
2.7 Finance income and expenses
For all financial instruments measured at amortised cost and interest-bearing financial assets classified as Available For Sale, interest income is recorded using the effective interest rate (EIR). The EIR is the rate that exactly discounts the estimated future cash receipts over the expected life of the financial instrument or a shorter period, where appropriate, to the net carrying amount of the financial asset. Interest income is included in finance income in profit or loss. Foreign exchange gains and losses on transactions are presented net in finance income or finance expense. Dividend income is recognised in profit or loss on the date the Group's right to receive the payment is established.
Finance expense is recognised in profit or loss and would normally include; bank charges, interest expense calculated using the effective interest rate method, exchange differences arising from foreign currency borrowings to the extent that they are regarded as an adjustment to interest costs and the unwinding of the effect of discounting provisions.
In calculating interest income and expense, the effective interest rate is applied to the gross carrying amount of the asset (when the asset is not credit-impaired) or to the amortised cost of the liability. However, for financial assets that have become credit-impaired subsequent to initial recognition, interest income is calculated by applying the effective interest rate to the amortised cost of the financial asset. If the asset is no longer credit-impaired, then the calculation of interest income reverts to the gross basis.
2.8 Government grants The Group's government grants are not
recognized until there is reasonable assurance that the Group will comply with the conditions attached to them and that the grants will be received.
Government grants are recognised in profit or
loss on a systematic basis over the periods in which the Group recognises as expenses the related costs for which the grants are intended to compensate. Specifically, government grants whose primary condition is that the Group should purchase, construct or otherwise acquire non-current assets are recognized as deferred revenue in the consolidated statement of financial position and transferred to profit or loss on a systematic and rational basis over the useful l ives of the related assets. Grants that compensate the Group for expenses incurred are recognised in profit or loss on a systematic basis in the periods in which the expenses are recognised.
The benefit of a government loan at a below-
market rate of interest is treated as government grant, measured as the difference between
proceeds received and the fair value of the loan based on prevailing market interest rates. The unwinding of the discount is recognised each year as a finance cost in the profit or loss.
2.9 Current, deferred and minimum taxation a) Current tax The tax expense for the period comprises current
and deferred tax. Tax is recognised in arriving at profit or loss, except to the extent that it relates to items recognised in other comprehensive income or directly in equity. In this case, the tax is also recognised in other comprehensive income or directly in equity, respectively.
The current income tax charge is calculated on the
basis of the applicable tax laws enacted or substantively enacted at the reporting date in the country where the Group generates taxable income. Management periodically evaluates positions taken in tax returns with respect to situations in which applicable tax regulation is subject to interpretation. It establishes provisions where appropriate on the basis of amounts expected to be paid to the tax authorities.
b) Deferred tax Deferred tax is recognised in respect of temporary
differences between the carrying amounts of assets and liabilities for financial reporting purposes and the amounts used for taxation purposes. Deferred tax is not recognised for:
- temporary differences on the initial recognition of
assets or liabilities in a transaction that is not a business combination and that affects neither a c c o u n t i n g n o r t a x a b l e p r o fi t o r l o s s
- temporary differences related to investments in subsidiaries, associates and joint arrangements to the extent that the Group is able to control the timing of the reversal of the temporary differences and it is probable that they will not reverse in the foreseeable future; and
- taxable temporary differences arising on the initial
recognition of goodwill. Deferred tax assets are recognised for unused tax
losses, unused tax credits and deductible temporary differences to the extent that it is probable that future taxable profits will be available against which they can be used. Future taxable profits are determined based on the reversal of relevant taxable temporary differences. If the amount of taxable temporary differences is insufficient to recognise a deferred tax asset in full, then future taxable profits, adjusted for reversals of existing temporary differences, are considered, based on the business plans for individual subsidiaries in the Group. Deferred tax assets are reviewed at each reporting date and are reduced to the extent that it is no longer probable that the related tax benefit will be realised; such reductions are reversed when the probability of future taxable profits improves.
NOTES TO THE CONSOLIDATED AND SEPARATE FINANCIAL STATEMENTS for the year ended 31 December 2018

69
Unrecognised deferred tax assets are reassessed at each reporting date and recognised to the extent that it has become probable that future taxable profits will be available against which they can be used.
Deferred tax is measured at the tax rates that are expected to be applied to temporary differences when they reverse, using tax rates enacted or substantively enacted at the reporting date.
The measurement of deferred tax reflects the tax consequences that would follow from the manner in which the Group expects, at the reporting date, to recover or settle the carrying amount of its assets and liabilities. For this purpose, the carrying amount of investment property measured at fair value is presumed to be recovered through sale, and the Group has not rebutted this presumption.
Deferred tax assets and liabilities are offset only if certain criteria are met.
c) Investment allowances and similar tax incentives Companies within the Group may be entitled to
claim special tax deductions for investments in qualifying assets or in relation to qualifying expenditure. The Group accounts for such allowances as tax credits, which means that the allowance reduces income tax payable and current tax expense. A deferred tax asset is recognised for unutilised tax credits that are carried forward as deferred tax assets.
d) Minimum tax The Company is subject to the Companies Income
Tax Act (CITA). Total amount of tax payable under CITA is determined based on the higher of two components namely Company Income Tax (based on taxable income (or loss) for the year); and Minimum tax (determined based on the sum of (i) the highest of; 0.25% of revenue of N500,000, 0.5% of gross profit, 0.25% of paid up share capital and 0.5% of net assets; and (ii) 0.125% of revenue in excess of N500,000). Taxes based on taxable profit for the period are treated as income tax in line with IAS 12; whereas Minimum tax which is based on a gross amount is outside the scope of IAS 12 and therefore, are not presented as part of income tax expense in the profit or loss.
2.10 Leases Determining whether an arrangement contains a
lease At inception of an arrangement, the Group
determines whether the arrangement is or contains a lease.
At incept ion or on reassessment of an arrangement that contains a lease, the Group separates payments and other consideration required by the arrangement into those for the lease and those for other elements on the basis of their relative fair values. If the Group concludes for a finance lease that it is impracticable to separate
the payments reliably, then an asset and a liability are recognised at an amount equal to the fair value of the underlying asset; subsequently, the liability is reduced as payments are made and an imputed finance cost on the liability is recognised using the Group's incremental borrowing rate.
Leases are classified as finance leases and operating
leases. i) Operating lease Leases in which a significant portion of the risks and
rewards of ownership are not transferred to the Group as lessee are classified as operating leases. Payments made under operating leases (net of any incentives received from the lessor) are charged to profit or loss on a straight-line basis over the period of the lease.
Lease income from operating leases where the group is a lessor is recognised in income on a straight-line basis over the lease term. The respective leased assets are included in the statement of financial position based on their nature.
ii) Finance lease Leases of property, plant and equipment where the
Group, as lessee, has substantially all the risks and rewards of ownership are classified as finance leases. Finance leases are capitalised at the lease's inception at the fair value of the leased property or, if lower, the present value of the minimum lease payments. The corresponding rental obligations, net of finance charges, are included in other short-term and long-term payables. Each lease payment is allocated between the liability and finance cost. The finance cost is charged to the profit or loss over the lease period so as to produce a constant periodic rate of interest on the remaining balance of the liability for each period. The property, plant and equipment acquired under finance leases is depreciated over the asset's useful life or over the shorter of the asset's useful life and the lease term if there is no reasonable certainty that the Group will obtain ownership at the end of the lease term.
Amounts due from lessees under finance leases are recorded as receivables at the amount of the group's net investment in the leases. Finance lease income is allocated to accounting periods so as to reflect a constant periodic rate of return on the group's net investment outstanding in respect of the leases. Finance lease income is recognised as 'other income' in the profit or loss.
2.11 Impairment of non-financial assets At each reporting date, the Group reviews the
carrying amounts of its non-financial assets (other than biological assets, investment property, inventories and deferred tax assets) to determine whether there is any indication of impairment. If any such indication exists, then the asset's recoverable amount is estimated. Goodwill is tested annually for impairment.
NOTES TO THE CONSOLIDATED AND SEPARATE FINANCIAL STATEMENTS for the year ended 31 December 2018

70
For impairment testing, assets are grouped together into the smallest group of assets that generates cash inflows from continuing use that are largely independent of the cash inflows of other assets or CGUs. Goodwill arising from a business combination is allocated to CGUs or groups of CGUs that are expected to benefit from the synergies of the combination.
The recoverable amount of an asset or CGU is the
greater of its value in use and its fair value less costs to sell. Value in use is based on the estimated future cash flows, discounted to their present value using a pre-tax discount rate that reflects current market assessments of the time value of money and the risks specific to the asset or CGU.
An impairment loss is recognised if the carrying amount of an asset or CGU exceeds its recoverable amount. Impairment losses are recognised in profit or loss. They are allocated first to reduce the carrying amount of any goodwill allocated to the CGU, and then to reduce the carrying amounts of the other assets in the CGU on a pro rata basis.
An impairment loss in respect of goodwill is not reversed. For other assets, an impairment loss is reversed only to the extent that the asset's carrying amount does not exceed the carrying amount that would have been determined, net of depreciation or amortisation, if no impairment loss hadbeen recognised.
Subsequent measurement and gains and losses: Policy applicable from 1 January 2018
Financial assets These assets are subsequentlyat FVTPL measured at fair value. Net gains and
losses, including any interest or dividend income, are recognised in profit or loss.
Financial assets These assets are subsequently at amortised cost measured at amortised cost using the
effective interest method. The amort ised cost is reduced by impairment losses. Interest income, foreign exchange gains and losses and impairment are recognised in profit or loss. Any gain or loss on derecognition is recognised in profit or loss.
Debt investments These assets are subsequently at FVOCI measured at fair value. Interest
income calculated using the effective interest method, foreign exchange gains and losses and impairment are recognised in profit or loss. Other net gains and losses are recognised in OCI. On derecognition, gains and losses accumulated in OCI are reclassified to profit or loss.
Equity investments These assets are subsequently at FVOCI measured at fair value. Dividends are
recognised as income in profit or loss unless the dividend clearly represents a recovery of part of the cost of the
investment. Other net gains and losses are recognised in OCI and are never reclassified to profit or loss.
2.12 Cash and cash equivalents Cash and cash equivalents as shown in the
statement of financial position comprise cash in hand or bank, deposit held at call with banks and time deposits which are readily convertible to cash with original maturities of three months or less.
Bank overdrafts that are repayable on demand and form an integral part of the Group/Company's cash management are included as a component of cash and cash equivalents for the purpose of statement of cash flows.
2.13 Inventories Inventories are valued at the lower of cost and net
realisable value. The cost of raw materials, spare parts, other supplies (consumables) and purchased finished goods is the weighted average cost less amount written down to net realizable value.
In the case of manufactured inventories and work
in progress, cost includes an appropriate share of production overhead based on normal operating capacity.
Net realisable value of inventories is the estimated
selling price of the inventories in the ordinary course of business, less the estimated costs of completion and the estimated costs necessary to make the sale.
Slow moving and obsolete inventory items are
written off to profit or loss. 2.14 Financial instruments 2.14.1 Financial assets Non-Derivative financial assets: i. Recognition and initial measurement Trade receivables and debt securities issued are
initially recognised when they are originated. All other financial assets and financial liabilities are initially recognised when the Group becomes a party to the contractual provisions of the instrument.
A financial asset (unless it is a trade receivable
without a significant financing component) or financial liability is initially measured at fair value plus, for an item not at FVTPL, transaction costs that are directly attributable to its acquisition or issue. A trade receivable without a significant financing component is initially measured at the transaction.
ii. Classification and subsequent measurement Financial assets – Policy applicable from 1
January 2018
NOTES TO THE CONSOLIDATED AND SEPARATE FINANCIAL STATEMENTS

71
On initial recognition, a financial asset is classified as measured at: amortised cost; FVOCI – debt investment; FVOCI – equity investment; or FVTPL. Financial assets are not reclassified subsequent to their initial recognition unless the Group changes its business model for managing financial assets, in which case all affected financial assets are reclassified on the first day of the first reporting period following the change in the business model.
A financial asset is measured at amortised cost if it
meets both of the following conditions and is not designated as at FVTPL:
– it is held within a business model whose objective is to hold assets to collect contractual cash flows; and
– its contractual terms give rise on specified dates to cash flows that are solely payments of principal and interest on the principal amount outstanding
A debt investment is measured at FVOCI if it meets
both of the following conditions and is not designated as at FVTPL:
– it is held within a business model whose objective is achieved by both collecting contractual cash flows and selling financial assets; and
– its contractual terms give rise on specified dates to cash flows that are solely payments of principal and interest on the principal amount outstanding.
On initial recognition of an equity investment that is not held for trading, the Group may irrevocably elect to present subsequent changes in the investment's fair value in OCI. This election is made on an investment-by-investment basis.
All financial assets not classified as measured at amortised cost or FVOCI as described above are measured at FVTPL. This includes all derivative financial assets (see Note 32(A)). On initial recognition, the Group may irrevocably designate a financial asset that otherwise meets the requirements to be measured at amortised cost or at FVOCI as at FVTPL if doing so eliminates or significantly reduces an accounting mismatch that would otherwise arise.
Subsequent measurement and gains and losses: Policy applicable from 1 January 2018.
Financial assets These assets are subsequently at FVTPL measured at fair value. Net gains and
losses, including any interest or dividend income, are recognised in profit or loss.
Financial assets These assets are subsequently at amortised cost measured at amortised cost using the
effect ive interest method. The amort ised cost i s reduced by impairment losses. Interest income, foreign exchange gains and losses and impairment are recognised in profit or loss. Any gain or loss on derecognition is recognised in profit or loss.
Debt investments These assets are subsequently at FVOCI measured at fair value. Interest income
calculated using the effective interest method, foreign exchange gains and losses and impairment are recognised in profit or loss. Other net gains and losses are recognised in OCI. On derecognition, gains and losses accumulated in OCI are reclassified to profit or loss.
Equity investments These assets are subsequently at FVOCI measured at fair value. Dividends are
recognised as income in profit or loss unless the dividend clearly represents a recovery of part of the cost of the investment. Other net gains and losses are recognised in OCI and are never r e c l a s s i fi e d t o p r o fi t o r l o s s .
Policy applicable before 1 January 2018 I) Classification The Group classifies its financial assets as loans
and receivables and available-for-sale financial assets, the Group does not hold any financial assets in any other financial instrument category. The classification depends on the purpose for which the financial assets were acquired. Management determines the classification of financial assets at initial recognition.
a) Loans and receivables Loans and receivables are non-derivative financial
assets with fixed or determinable payments that are not quoted in an active market. The Group's loans and receivables comprise trade and other receivables, loans and advances, receivables due from related parties and cash and cash equivalents, and are included in current and non current assets depending on their contractual settlement date. They are classified as current if they are to be settled within one year and non-current if they are to be settled after one year.
b) Available-for-sale AFS financial assets are non-derivatives that are
either designated as AFS or are not classified as (a) loans and receivables, (b) held-to-maturity investments or (c) financial assets at fair value through profit or loss at the initial recognition. Debt securities in this category are those that are intended to be held for an indefinite period of time and that may be sold in response to needs for liquidity or in response to changes in market conditions. After initial measurement, AFS financial assets are subsequently measured at fair value with unrealised gains or losses recognised in OCI and credited to the AFS reserve until the investment is derecognised, at which time, the cumulative gain or loss is recognised in other income, or the investment is determined to be impaired, when the cumulative loss is reclassified from the AFS reserve to the statement of profit or loss in finance costs. Interest earned whilst holding AFS financial assets is reported as interest income using the EIR method.
NOTES TO THE CONSOLIDATED AND SEPARATE FINANCIAL STATEMENTS for the year ended 31 December 2018

72
ii) Recognition and measurement Loans and receivables are initially recognized at
fair value plus any directly attributable transaction costs using the effective interest rate method on the date when they are originated. All other financial assets are initially recognized on the trade date when the entity becomes a party to the contractual provisions of the instrument. Subsequently, loans and receivables are carried at amortised cost less any impairment.
Subsequent measurement and gains and losses: Policy applicable before 1 January 2018
Financial assets Measured at fair value andat FVTPL changes therein, including any
interest or dividend income, were recognised in profit or loss.
Held-to-maturity Measured at amortised cost financial assets using the effective interest
method.
Loans and Measured at amortised receivables cost using the effective interest
method.
Available-for- Measured at fair value and sale financial changes therein, other thanassets impairment losses, interest
income and foreign currency differences on debt instruments, were recognised in OCI and accumulated in the fair value reserve. When these assets were derecognised, the gain or loss accumulated in equity was reclassified to profit or loss.
2.14.2 Financial liabilities Non-Derivative financial liabilities: I) Classification Financial liabilities are classified as financial
liabilities at amortised cost. The Group has no financial liabilities in any other category. Management determines the classification of financial liabilities at initial recognition.
a) Financial liabilities at amortised cost These includes trade and other payables, loan
payables and borrowings. Trade payables are classified as current liabilities due to their short term nature while borrowings are spilt into current and non current liabilities. Borrowings included in non-current liabilities are those with maturities greater than 12 months after the reporting date.
ii) Recognition & measurement Financial liabilities are recognized initially at fair
value, net of any transaction costs. Loan payables and borrowings are recognized on the date when they are originated. All other financial liabilities are initially recognized on the trade date when the entity becomes party to the contractual provisions
of the instrument. Subsequently, they are measured at amortised cost using the effective interest method.
iii) Classification of Shareholder loans as debt or
equity Debt and equity instruments issued by the Group
are classified as either financial liabilities or as equity in accordance with the substance of the contractual arrangements and the definitions of a financial liability and an equity instrument.
The critical feature that distinguishes a financial liability from an equity instrument is the existence of a contractual obligation to either deliver cash or another financial asset to the holder. In other words, if the instrument does not have a contractual obligation to deliver or pay cash or another financial asset, it is classified as an equity instrument. Therefore, where payments of interest and principal are discretionary in nature, equity treatment is appropriate, and the interest on the equity instrument would be recognized in retained earnings.
2.14.3 Derecognition Financial assets are derecognised when the
contractual rights to receive the cash flows from these assets have ceased to exist or the assets have been transferred and substantially all the risks and rewards of ownership of the assets are also transferred (that is, if substantially all the risks and rewards have not been transferred, the Company tests control to ensure that continuing involvement on the basis of any retained powers of control does n o t p r e v e n t d e r e c o g n i t i o n ) .
Financial liabilities are derecognised when they have been redeemed or otherwise extinguished.
2.14.4 Offsetting financial instruments Financial assets and liabilities are offset and the net
amount reported in the statement of financial position when there is a legally enforceable right to offset the recognised amounts and there is an intention to settle on a net basis or realise the asset and settle the liability simultaneously. The legal enforceable right must not be contingent on future events and must be enforceable in the normal course of business and in event of default, insolvency or bankruptcy of the Bank or the counterparty.
2.14.5 Impairment of financial assets (i) Non-derivative financial assets Policy applicable from 1 January 2018 The Group recognises loss allowances for ECLs on
financial assets measured at amortised cost. The Group measures loss allowances at an amount equal to the 12 month ECLs.
The Expected credit losses for trade and other
receivables are estimated using a provision matrix based on the Group's historical credit loss
NOTES TO THE CONSOLIDATED AND SEPARATE FINANCIAL STATEMENTS for the year ended 31 December 2018

73
experience adjusted for factors that are specific to the debtors, general economic conditions and an assessment of both current as well as the forecast direction of conditions at the reporting dateWhen determining whether the credit risk of a financial asset has increased significantly since initial recognition and when estimating ECLs, the Group considers reasonable and supportable information that is relevant and available without undue cost or effort. This includes both quantitative and qualitative information and analysis, based on the Group's historical experience and informed credit assessment and including forward-looking information. The Group has identified the change in annual GDP to be the most relevant factors and accordingly adjusts the historical loss rates if a significant change in GDP is expected within the next 12 months.
The Group assumes that the credit risk on a
financial asset has increased significantly if it is more than 90 days past due.
The Group considers a financial asset to be in default when:
- the borrower is unlikely to pay its credit
obligations to the Group in full, without recourse by the Group to actions such as realising security (if any is held); or
- the financial asset is more than 90 days past due. Lifetime ECLs are the ECLs that result from all
possible default events over the expected life of a financial instrument. 12-month ECLs are the portion of ECLs that result from default events that are possible within the 12 months after the reporting date (or a shorter period if the expected life of the instrument is less than 12 months). The maximum period considered when estimating ECLs is the maximum contractual period over which the Group is exposed to credit risk.
Measurement of ECLs ECLs are a probability-weighted estimate of credit
losses. Credit losses are measured as the present value of all cash shortfalls (i.e. the difference between the cash flows due to the entity in accordance with the contract and the cash flows that the Group expects to receive). ECLs are discounted at the effective interest rate of the financial asset.
Credit-impaired financial assets At each reporting date, the Group assesses
whether financial assets carried at amortised cost and debt securities at FVOCI are credit-impaired. A financial asset is 'credit-impaired' when one or more events that have a detrimental impact on the estimated future cash flows of the financial asset have occurred. Evidence that a financial asset is credit-impaired includes the following observable data:
- significant financial difficulty of the borrower or issuer;
- a breach of contract such as a default or being more than 90 days past due;
- the restructuring of a loan or advance by the
Group on terms that the Group would not consider otherwise;
- it is probable that the borrower will enter bankruptcy or other financial reorganisation; or- the disappearance of an active market for a security because of financial difficulties.
Presentation of allowance for ECL in the
statement of financial position Loss allowances for financial assets measured at
amortised cost are deducted from the gross carrying amount of the assets.
Write-off
The gross carrying amount of a financial asset is written off when the Group has no reasonable expectations of recovering a financial asset in its entirety or a portion thereof. For individual customers, the Group has a policy of writing off the gross carrying amount when the financial asset is 180 days past due based on historical experience of recoveries of similar assets. For corporate customers, the Group individually makes an assessment with respect to the timing and amount of write-off based on whether there is a reasonable expectation of recovery. The Group expects no significant recovery from the amount written off. However, financial assets that are written off could still be subject to enforcement activities in order to comply with the Group's procedures for recovery of amounts due.
Policy applicable before 1 January 2018 (i) Non-derivative financial assets The Group assesses at the end of each reporting
period whether there is objective evidence that a financial asset or a Group of financial assets is impaired. A financial asset or Group of financial assets is impaired and impairment losses are incurred only if there is objective evidence of impairment as a result of one or more events that occurred after the initial recognition of the asset (a 'loss event') and that loss event (or events) has an impact on the estimated future cash flows of the financial asset or Group of financial assets that can be reliably estimated.
The Group considers evidence of impairment for
these assets at both an individual asset and a collective level. All individually significant assets are individually assessed for impairment. Those found not to be impaired are then collectively assessed for any impairment that has been incurred but not yet individually identified. Assets that are not individually significant are collectively assessed for impairment. Collective assessment is carried out by grouping together assets with similar risk characteristics.
In assessing collective impairment, the Group uses historical information on the timing of recoveries and the amount of loss incurred, and makes an adjustment if current economic and credit conditions are such that the actual losses are likely to be greater or lesser than suggested by historical trends.
NOTES TO THE CONSOLIDATED AND SEPARATE FINANCIAL STATEMENTS for the year ended 31 December 2018

74
Evidence of impairment may include indications that the debtors or a group of debtors is experiencing significant financial difficulty, default or delinquency in interest or principal payments, the probability that they will enter bankruptcy or other financial reorganisation, and where observable data indicate that there is a measurable decrease in the estimated future cash flows, such as changes in arrears or economic conditions that correlate with defaults.
For loans and receivables category, the amount of
the loss is measured as the difference between the asset's carrying amount and the present value of estimated future cash flows (excluding future credit losses that have not been incurred) discounted at the financial asset's original effective interest rate. Losses are recognised in profit or loss and reflected in an allowance account.
When the Group considers that there are no
realistic prospects of recovery of the asset, the relative amounts are written off. If the amount of impairment loss subsequently decreases and the decrease can be related objectively to an event occurring after the impairment was recognised, then the previously recognised impairment loss is reversed through profit or loss.
If, in a subsequent period, the amount of the
impairment loss decreases and the decrease can be related objectively to an event occurring after the impairment was recognised (such as an improvement in the debtor's credit rating), the reversal of the previously recognised impairment loss (in profit or loss) is recognised in the profit or loss.
Derivative financial instruments The Group holds derivative financial instruments
to hedge its foreign currency and interest rate risk exposures. Derivatives are initially measured at fair value; any directly attributable transaction costs are recognised in profit or loss as incurred. Subsequent to initial recognition, derivatives are measured at fair value, and changes therein are generally recognised in profit or loss.
2.15 Property, plant and equipment All property, plant and equipment are stated at
historical cost less accumulated depreciation and accumulated impairment losses. Historical cost includes expenditure that is directly attributable to the acquisition of the items. If significant parts of an item of property, plant and equipment have different useful lives, then they are accounted for as separate items (major components) of property, plant and equipment.
Subsequent costs are included in the asset's
carrying amount or recognized as a separate asset, as appropriate, only when it is probable that future economic benefits associated with the item
will flow to the Group and the cost can be measured reliably. All other repairs and maintenance costs are charged to profit or loss during the financial period in which they are incurred.
Spares expected to be in use for more than one
year with material values as determined by the Directors are capitalised and depreciated over a period of 3-10 years.
Construction work in progress (Construction
expenditure) is not depreciated, it is carried at cost less any recognised impairment losses. Cost includes professional fees and for qualifying assets, borrowing costs capitalised in accordance with the company accounting policies. All such assets, once available for use are capitalised within the appropriate class of property, plant and equipment and subjected to the applicable depreciation rate in the year they are used.
Freehold or leasehold land with indefinite
extension is not depreciated by the Group. Depreciation of property, plant and equipment is calculated using the straight-line method to write down the cost or revalued amounts to the residual values over the estimated useful lives, as follows:
The assets' residual values, useful lives and
depreciation method are reviewed and adjusted if appropriate, at the end of each reporting date.
Property, plant and equipment are reviewed for
impairment whenever events or changes in circumstances indicate that the carrying amount may not be recoverable. An impairment loss is recognised for the amount by which the asset's carrying amount exceeds its recoverable amount. The recoverable amount is the higher of the estimated selling price in the ordinary course of business less costs to sell and value in use.
An item of property, plant and equipment is
derecognized upon disposal or when no future economic benefits are expected to arise from the continued use of the asset. Any gain or loss arising on the disposal or retirement of an item of property, plant and equipment is determined as the difference between the sales proceeds and the carrying amount of the asset and is recognized in profit or loss.
The Group require minimum levels of inventory to
be able to operate the plant, such inventories were capitalised in line with recognition criteria in IAS 16.16(b) as costs that are necessary to bring the assets to its working condition.
NOTES TO THE CONSOLIDATED AND SEPARATE FINANCIAL STATEMENTS for the year ended 31 December 2018
Useful life Leasehold land Depreciated over the lease term (years) Buildings 20-35 Production plant 20-30 Capitalized spares 3-10 Furniture 3-10 Motor vehicles 3-10 Computer equipment 4-10 Ancillary plant & machinery 10-20

75
2.15.1 Major maintenance and repairs Expenditure on major maintenance refits or repairs
comprises the cost of replacement assets or parts of assets and overhaul costs. Where an asset, or part of an asset, that was separately depreciated and is now written off is replaced, and it is probable that future economic benefits associated with the item will flow to the Group through an extended life, the expenditure is capitalised.
Where part of the asset was not separately considered as a component and therefore not depreciated separately, the replacement value is used to estimate the carrying amount of the replaced asset(s) which is immediately written off. All other day-to-day maintenance and repairs costs are expensed as incurred.
2.15.2 Inspection costs Where an asset requires an inspection after a
specified interval then the Group recognizes the cost of such inspection in the carrying value of related asset, if its economic benefits are for more than one accounting period.
2.16 Intangible assets Initial recognition and measurement In accordance with criteria set in IAS 38, intangible
assets are recognized only if: - they are identifiable, - they are controlled by the entity because of past
events, and - It is probable that the expected future economic
benefits that are attributable to the asset will flow to the Group and the cost of the asset can be measured reliably.
Intangible assets acquired separately are
measured on initial recognition at cost. The cost of intangible assets acquired in a business combination is their fair value at the date of acquisition.
Subsequent recognition Intangible assets are carried at cost less any
accumulated amortisation and accumulated impairment losses. Internal ly generated intangibles, excluding capitalised development costs, are not capitalised and the related expenditure is reflected in profit or loss in the period in which the expenditure is incurred. Subsequent expenditure is capitalised only if it is probable that the future economic benefits associated with the expenditure will flow to the Group.
Amortisation methods and periods The useful lives of intangible assets are assessed as
finite.
Intangible assets with finite lives are amortised over the useful economic life and assessed for impairment whenever there is an indication that the intangible asset may be impaired. The amortisation period and the amortisation method for an intangible asset with a finite useful life are reviewed at least at the end of each reporting period. Changes in the expected useful life or the expected pattern of consumption of future economic benefits embodied in the asset are considered to modify the amortisation period or method, as appropriate, and are treated as changes in accounting estimates. The amortisation expense on intangible assets with finite lives is recognised in the statement of profit or loss in the expense category that is consistent with the function of the intangible assets.
Derecognition Gains or losses arising from derecognition of an
intangible asset are measured as the difference between the net disposal proceeds and the carrying amount of the asset and are recognised in the statement of profit or loss when the asset is derecognised. An intangible asset is derecognised on disposal, or when no future economic benefits are expected from use or disposal.
2.16.1 Software Intangible assets primarily include software costs
and are amortized using the straight-line method over their estimated useful life of 3years which is based on management estimation. This expense is recorded in administrative expenses based on the f u n c t i o n o f t h e u n d e r l y i n g a s s e t s . An intangible asset is derecognised on disposal, or when no future economic benefits are expected from use or disposal.
2.17 Borrowing costs General and specific borrowing cost directly
attributable to the acquisition, construction or production of a qualifying assets, which are assets that necessarily takes a substantial period of time to get ready for their intended use or sale, are added to the cost of those asset, until such time as the assets are substantially ready for their intended use or sale.
Investment income earned on the temporary investment of specific borrowings pending their expenditure on qualifying assets is deducted from the borrowing costs eligible for capitalisation. Other borrowing costs are expensed in the period in which they are incurred.
Borrowing costs consist of interest and other costs that an entity incurs in connection with the borrowing of funds. These include interest expenses calculated using the effective interest rate method, finance charges in respect of finance leases and exchange differences arising from foreign currency borrowings. Where a range of debt instruments is used to borrow funds, or where
NOTES TO THE CONSOLIDATED AND SEPARATE FINANCIAL STATEMENTS for the year ended 31 December 2018

76
the financing activities are coordinated centrally, a weighted average capitalization rate is applied.
2.18 Provisions Provisions are recognized when the Group has a
present obligation (legal or constructive) as a result of a past event, it is probable that the Group will be required to settle the obligation, and a reliable estimate can be made of the amount of obligation.
The amount recognized as a provision is the best
estimate of the consideration required to settle the present obligation at the reporting date taking into account the risks and uncertainties surrounding the obligation.
The amount of provisions are at the present value of expected costs to settle the obligation using estimated cash flows and are recognised as part of the cost of the relevant asset. The cash flows are discounted at a current pre-tax rate that reflects the current market assessments of the time value of money and the risk specific to the liability. The increase in the provision due to passage of time is recognised as interest expense.
When some or all of the economic benefits required to settle a provision are expected to be recovered from a third party, a receivable is recognized as an asset if it is virtually certain that reimbursement will be received and the amount of the receivable can be measured reliably.
2.18.1 Contingent liabilities
A contingent liability is a possible obligation that arises from past events and whose existence will be confirmed only by the occurrence or non-occurrence of one or more uncertain future events not wholly within the control of the company, or a present obligation that arise from past events but is not recognised because it is not probable that an outflow of resources embodying economic benefits will be required to settle the obligation; or the amount of the obligation cannot be measured with sufficient reliability. Contingent liabilities are only disclosed and not recognised as liabilities in the statement of financial position. If the likelihood of an outflow of resources is remote, the possible obligation is neither a provision nor a contingent liability and no disclosure is made.
2.18.2 Site restoration provisions
In accordance with the Group's policy and general commitment to respect the environment, the Group has a constructive obligation to restore all quarry sites. The provision for such site restoration is recorded in Statement of financial position and charged to finance cost on commencement of mining activities. This provision is recorded over the operating life of the quarry on the basis of production levels and depletion rates. The estimated future costs for known restoration
requirements are determined on a site-by-site basis.
Site restoration costs are provided for at the
present value of expected costs to settle the obligation using estimated cash flows. The cash flows are discounted at a current pre-tax rate that reflects the risks specific to the site restoration liability. The unwinding of the discount is expensed as incurred and recognised in the statement of profit or loss as a finance cost. The estimated future costs of decommissioning are reviewed annually and adjusted as appropriate. Changes in the estimated future costs, or in the discount rate applied, are included in profit or loss.
2.19 Exploration and evaluation
(a) Pre-licence costs Pre-licence costs relate to costs incurred before
the Group has obtained legal rights to explore in a specific area. Such costs may include the acquisition of exploration data and the associated costs of analysing that data. These costs are expensed in the period in which they are incurred.
(b) Exploration and evaluation expenditure Exploration and evaluation activity involves the
search for mineral resources, the determination of technical feasibility and the assessment of commercial viability of an identified resource
Exploration and evaluation activity includes: - Researching and analys ing h istor ica l
exploration data - Gathering exploration data through geophysical
studies - Exploratory drilling and sampling - Determining and examining the volume and
grade of the resource - Surveying transportation and infrastructure
requirements - Conducting market and finance studies
Licence costs paid in connection with a right to explore in an existing exploration area are capitalised and amortised over the term of the permit.
Once the legal right to explore has been acquired, exploration and evaluation expenditure is charged to profit or loss as incurred, unless the Group concludes that a future economic benefit is more likely than not to be realised. These costs include directly attributable employee remuneration, materials and fuel used, surveying costs, drilling costs and payments made to contractors. In evaluating whether the expenditures meet the criteria to be capitalised, several different sources of information are used. The information that is used to determine the probability of future benefits depends on the extent of exploration and evaluation that has been performed.
NOTES TO THE CONSOLIDATED AND SEPARATE FINANCIAL STATEMENTS for the year ended 31 December 2018

77
2.20 Employee benefits a) Short-term employee benefits This includes wages, salaries, bonuses, paid
annual leave, sick leave and other contributions. These benefits are expensed in the period in which the associated services are rendered by employees of the Group. A liability is recognized for the amount that is expected to be paid if the Group has a present legal or constructive obligation to pay this amount as a result of past service provided by the employee and the obligation can be estimated reliably. The Group ensures that each employee is paid his/her annual leave entitlement at the end of each reporting period.
b) Other long-term employee benefits (Long
service award) The company provides employees with two (2)
Long Service Award Benefits. The benefits are gift items, Ex-Gratia (expressed as a multiple of Monthly Basic Salary), a plaque and certificate. The liability recognised in respect of these awards is computed using actuarial methods (discounted at present value). Any resulting remeasurement gain/loss is recognised in full within other income/administrative expense in the profit or loss.
Current service cost is included as part of administrative expense and interest cost is included as part of finance cost in the profit or loss.
c) Post-employment benefit obligations i) Defined contribution scheme The Group operates a defined contribution
retirement benefit scheme for its employees. A defined contribution plan is a pension plan under which the Group pays fixed contributions into a separate entity. In a defined contribution plan, the actuarial risk falls 'in substance' on the employee. For Nigerian entities, the employee contributes 8% while the Group contributes 10% of the emoluments (basic, housing and transport allowance). The Group has no legal or constructive obligations to pay further contributions if the fund does not hold sufficient assets to pay all employees the benefits relating to employee service in the current and prior periods. Lafarge South Africa facilitate and contribute to the provision of retirement benefits for all permanent employees in accordance with South African Pension Funds Act, 1956.
The assets of this scheme are held in separate trustee administered funds, which are funded by contributions from both the employee and the Group. The contributions are recognised as employee benefit expense as the related service is provided. Prepaid contributions are recognised as an asset to the extent that a cash refund or a reduction in the future payments is available.
ii) Defined benefit plans Lafarge South Africa operates defined benefit
plans for certain qualifying employees. The scheme includes post-retirement medical and retirement gratuity benefits. Defined benefit plans define an
amount of pension benefit that an employee will receive on retirement, dependent on, years of service and compensation. The liability recognised in the statement of financial position in respect of defined benefit pension plans is the present value of the defined benefit obligation at the end of the reporting period less the fair value of plan assets.
The defined benefit obligation is calculated annually by independent actuaries using the projected unit credit method. The present value of the defined benefit obligation is determined by discounting the estimated future cash outflows using interest rates of high-quality corporate bonds that are denominated in the currency in which the benefits will be paid, and that have terms to maturity approximating to the terms of the related pension obligation. Where there is no deep market in such bonds, the market rates on government bonds are used.
The estimated cost of providing such benefits is charged to the statement of comprehensive income on a systematic basis over the employees' working lives.
Remeasurement gains and losses arising from experience adjustments and changes in actuarial assumptions (remeasurements) are recognised in other comprehensive income in the period in which they arise and accumulated in retained earnings.
Current service cost is included as part of administrative expense and interest cost is included as part of finance cost in the profit or loss.
d) Termination benefits
Termination benefits are expensed at the earlier of when the Group can no longer withdraw the offer of those benefits and when the Group recognises costs for a restructuring. If benefits are not expected to be settled wholly within 12 months of the reporting date, then they are discounted.
2.21 Share capital
The Company has only one class of shares; ordinary shares. Ordinary shares are classified as equity. Incremental costs directly attributable to the issue of new ordinary shares or options are shown in equity as a deduction, net of tax, from the proceeds.
Income tax relating to transaction costs of an equity transaction is accounted for in accordance with IAS 12
2.22 Dividends
Dividends are recognized as liability in the period they are declared.
Dividends which remained unclaimed for a period exceeding twelve (12) years from the date of declaration and which are no longer actionable by shareholders in accordance with Section 385 of the Companies and Allied Matters Act CAP C.20 Laws of the Federation of Nigeria, 2004 are written back to retained earnings.
NOTES TO THE CONSOLIDATED AND SEPARATE FINANCIAL STATEMENTS for the year ended 31 December 2018

78
2.23 Earnings per share
Basic earnings per share is computed by dividing the profit or loss attributable to owners of the Company by the weighted average number of shares outstanding during the period.
Diluted earnings per share is calculated by dividing the profit or loss attributable to the owners of the Company, by the weighted average number of shares outstanding after adjusting for the effects of all dilutive potential ordinary shares.
2.24 Deposit for shares
The company received deposits for shares to be issued at a future date. At the time of receipt of these funds, and at every reporting period thereafter during which such funds are outstanding and not refunded or converted to shares, and while the company has the discretion to either issue shares or refund the money, it is classified as a financial liability measured at amortised cost. At such time as the company issues the shares, this is converted to equity.
2.25 Statement of cash flows
The statement of cash flows shows the changes in cash and cash equivalents arising during the period from operating activities, investing activities and financing activities.
The cash flows from operating activities are determined by using the indirect method. Net income is therefore adjusted by non-cash items, such as changes from receivables and liabilities. In addition, all income and expenses from cash transactions that are attributable to investing or financing activities are eliminated for the purpose of preparing the statement.
In the statement of cash flows, cash and cash equivalents includes cash in hand, deposit held at call with banks, other short term highly liquid investments with original maturities of three m o n t h s o r l e s s a n d b a n k o v e r d r a f t s . The cash flows from investing and financing activities are determined by using the direct method.
2.26 Fair value measurement
‘'Fair value' is the price that would be received to sell an asset or paid to transfer a liability in an orderly transaction between market participants at the measurement date in the principal or, in its absence, the most advantageous market to which the Group has access at that date. The fair value of a liability reflects its non-performance risk.
A number of the Group's accounting policies and
disclosures require the measurement of fair values, for both financial and non-financial assets and liabilities.
The Group has an established control framework with respect to the measurement of fair values. This includes a valuation team that has overall responsibility for overseeing all significant fair value measurements, including Level 3 fair values, and reports directly to the chief financial officer. The valuation team regularly reviews significant unobservable inputs and valuation adjustments. If third party information, such as broker quotes or pricing services, is used to measure fair values, then the valuation team assesses the evidence obtained from the third parties to support the conclusion that these valuations meet the requirements of IFRS, including the level in the fair value hierarchy in which the valuations should be classified.
Significant valuation issues are reported to the
Group's audit committee.
When measuring the fair value of an asset or a liability, the Group uses observable market data as far as possible. Fair values are categorised into different levels in a fair value hierarchy based on the inputs used in the valuation techniques as follows:
Level 1 — quoted prices (unadjusted) in active markets for identical assets or liabilities.
Level 2 — inputs other than quoted prices included in Level 1 that are observable for the asset or liability, either directly (i.e. as prices) or indirectly (i.e. derived from prices).
Level 3 — inputs for the asset or liability that are not based on observable market data(unobservable inputs).
If the inputs used to measure the fair value of an
asset or a liability fall into different levels of the fair value hierarchy, then the fair value measurement is categorised in its entirety in the same level of the fair value hierarchy as the lowest level input that is significant to the entire measurement
The Group recognises transfers between levels
of the fair value hierarchy at the end of the reporting period during which the change has occurred
Further information about the assumptions made in measuring fair values is included in the following notes:
Note 4.3.1 – Financial Instrument – Fair value measurement.
The Group only has assets measured on re-
curring basis in each reporting period. There were no non-recurring assets measured at fair value. Further information about the assumptions made in measuring the fair value is included in Note 4.3.1 - Financial Instruments Fair Value measurement.
NOTES TO THE CONSOLIDATED AND SEPARATE FINANCIAL STATEMENTS for the year ended 31 December 2018

79
2.27 Operating profit Operating profit is the result generated from the
continuing principal revenue producing activities of the Group as well as other income and expenses related to operating activities. Operating profit excludes net finance costs, share of profit or loss of equity accounted investees and income taxes.
3 Accounting estimates and judgments The preparation of financial statements requires
management to make certain judgments, accounting estimates and assumptions that affect the amounts reported for the assets and liabilities as at the reporting date and the amounts reported for revenues and expenses during the year. The nature of the estimation means that actual outcomes could differ from those estimates. The key source of estimation uncertainty that have a significant risk of causing material adjustments to the carrying amounts of assets and liabilities are discussed below.
3.1 Judgements Leases The judgements on whether an arrangement
contains a lease and lease classification is disclosed in Note 2.10.
3.2 Key sources of estimation uncertainty 3.2.1 Site restoration provisions Where the Group is legally, contractually or
constructively required to restore a site, the estimated costs of site restoration are accrued for at the present value of expected costs to settle the obligation using estimated cash flows and are recognised as part of the cost of the site. The unwinding of the discount is expensed as incurred and recognised in the statement of profit or loss as a finance cost. The estimated future costs of site restoration are reviewed annually and adjusted as appropriate. Changes in the estimated future costs, or in the discount rate applied, are added to or deducted from the cost of the site,. The estimated future costs for known restoration requirements are determined on a site-by-site basis and are calculated based on the present value of future activities. See further details in Note 31.1.
3.2.2 Trade receivables The Group assesses its trade receivables for
impairment at the end of each reporting period. In determining whether an impairment should be recorded in profit or loss, the Group makes significant assumptions in line with the expected credit loss model of IFRS 9 in determining the weighted average loss rate. See further details in Note 23.
3.2.3 Rate for translation of foreign operations The Group determines the rate to be used for
translation of its foreign operations based on the rate available for immediate delivery. Based on
management's assessment, this is the NIFEX rate because it is the rate that will be used for dividend remittance by the foreign subsidiary. Where the NIFEX rate fluctuates by 10% from management's estimates, the amount of loss recognised in the year would be increased by N254 million and net assets would reduce by N1.22 billion.
3.2.4 Staff gratuities and Long Service awards
The cost of the defined benefit plans and the present value of retirement benefit obligations and long service awards are determined using actuarial valuations. An actuarial valuation involves making various assumptions that may differ from actual developments in the future. These include the determination of the discount rate, future salary increases, mortality rates and changes in inflat ion rates. Due to the complexities involved in the valuation and its long-term nature, these obligations are highly sensitive to changes in assumptions.
All assumptions are reviewed at each reporting date. The parameter most subject to change is the discount rate. In determining the appropriate discount rate, management considers market yield on federal government bond in currencies consistent with the currencies of the post-employment benefit obligation and extrapolated as needed along the yield curve to correspond with the expected term of the defined benefit obligation. The rates of mortality assumed for employees are the rates published in 67/70 ultimate tables, published jointly by the Institute and Faculty of Actuaries in the UK. Further information is provided in Note 33.
3.2.5 Impairment of Property, Plant and Equipment
The Group assesses its property, plant and equipment, for possible impairment if there are events or changes in circumstances that indicate that carrying values of the assets may not be recoverable, or at least at every reporting date.
The assessment for impairment entailed comparing the carrying value of the cash generating unit with its recoverable amount. The recoverable amount is based on an estimate of the value in use of these assets. Value in use is determined on the basis of discounted estimated future net cash flows. During the year, the Group recognised impairment losses in respect of crusher in Mfamosing Plant, Exploration and evaluation costs and items of PPE in aggregation sites in South Africa. The value in use for all impaired items during the period is estimated to be zero as the Group does not expect any positive net cash flows arising from use or abandonment. These assets cannot be sold or transferred. See further details in Notes 16.3 and 16.4.
3.2.6 Deferred tax
NOTES TO THE CONSOLIDATED AND SEPARATE FINANCIAL STATEMENTS for the year ended 31 December 2018

80
Management is required to assess the ability of the Group to generate future taxable economic earnings that will be used to recover all deferred tax assets. Assumptions about the generation of future taxable profits depend on management's estimates of future cash flows. The estimates are based on the future cash flow from operations. See Note 14.8 for further details.
3.2.7 Exploration and evaluation
The application of the Group's accounting policy for exploration and evaluation expenditure requires judgement to determine whether future economic benefits are likely from either future exploitation or sale, or whether activities have not reached a stage that permits a reasonable assessment of the existence of reserves.
In addition to applying judgement to determine whether future economic benefits are likely to arise from the Group's exploration and evaluation assets or whether activities have not reached a stage that permits a reasonable assessment of the existence of reserves, the Group has to apply a number of est imates and assumptions.
The estimates directly impact when the Group defers exploration and evaluation expenditure. The deferral policy requires management to make certain estimates and assumptions about future events and circumstances, particularly, whether an economically viable extraction operation can be established. Any such estimates and assumptions may change as new information becomes available. If, after expenditure is capitalised, information becomes available suggesting that the recovery of expenditure is unlikely, the relevant capitalised amount is written off to the statement of profit or loss and other comprehensive income in the period when the new information becomes available.
3.2.8 Prepayment of Gas The Company has a gas supply contract with a
vendor. The contract requires that a base amount is paid (take-or-pay (TOP)) by the Company regardless of its gas utilisation. The excess of the base amount over the value of actual gas utilised is recognized in the financial statements as prepayment for gas.
Based on the contract, any quantities of Gas forming part of the TOP quantity paid for by the Company and not utilised during a contract year shall be designated as Make-up Gas (MUG) and the Company shall be entitled to utilise the remaining balance of the accrued Make-up Gas in any subsequent period in the chronological order
in which it is accrued during the contract period. See Prepayment for Gas in Note 21.1.
3.2.9 Impairment of Investment in Subsidiary Investments in Subsidiaries are carried at cost
less impairment in the accompanying separate financial statements of the Company. The carrying amount of the Company's investment subsidiaries of the Company is identified and assessed by management as a separate Cash Generating Unit (CGU).
Management performs an assessment at the end
of each reporting period to determine whether there is any indication that the Investment in the subsidiaries may be impaired.
Management has estimated the recoverable
amount of the Investment in LSAH by assessing the fair value less costs to sell. Estimating the recoverable amount is a complex process involving a number of assumptions, judgements and estimates regarding various inputs. See Note 18.1.1 for further details.
4 Financial risk management
The Group has exposure to credit, liquidity and market risk arising from financial instruments.
4.1 Financial risk factors The Corporate Investment and Treasury function
provides services to the business, co-ordinates access to domestic and international financial markets, monitors and manages the financial risks relating to the operations of the Group through internal risk reports which analyse exposures by degree and magnitude of risks. These risks include market risk (including currency risk and interest rate risk), credit and liquidity risk.
The Group seeks to minimise the effects of these risks by aligning to parent company's policies as approved. Compliance with policies and established controls
is reviewed by the internal auditors on a continuous basis.
The Corporate Investment and Treasury function
reports monthly to the executive committee and periodically to the Risk and Ethics committee of the Board of Directors, for monitoring and implementation of mitigating policies.
NOTES TO THE CONSOLIDATED AND SEPARATE FINANCIAL STATEMENTS for the year ended 31 December 2018
81
NOTES TO THE CONSOLIDATED AND SEPARATE FINANCIAL STATEMENTS for the year ended 31 December 2018
N'000
31 Dec 2018
N'000
31 Dec 2017
N'000
31 Dec 2017
N'000
31 Dec 2018
Group Company
The financial assets of the Group and Company are stated below:
Trade receivables - Net (Note 23) 13,557,082 19,983,703 2,125,426 3,631,951 Other receivables (Note 23) 7,606,912 5,126,413 9,042,279 12,299,019 Other financial assets (Note 19) ** 2,276,013 2,163,689 1,739,739 1,883,373 Cash and cash equivalents (Note 24) 12,550,697 50,414,757 10,177,776 41,698,854 Derivative assets 95,573 640,091 95,573 640,091 36,086,277 78,328,653 23,180,793 60,153,288
Financial assets exclude prepayment, VAT receivable and withholding tax recoverable as these are non financial instruments. ** Other financial assets exclude available for sale assets.
The Internal Audit Department provides an independent assurance of the risk frame work. They assess compliance with established controls and recommendations for improvement in processes are escalated to relevant management, Audit Committee and Board of Directors.
4.1.1 Credit risk
Credit risk is the risk that a counterparty will not meet its obligations under a financial instrument or customer contract, leading to a financial loss to the Group. The Group is exposed to credit risk from its operating activities (primarily trade receivables) and from its financing activities, including deposits with banks and financial institutions, foreign exchange transactions and other financial instruments.
(a) Credit risk management The Group has adopted a policy of only dealing with
creditworthy counterparties as a means of mitigating the risk of financial loss from defaults. This information is supplied by independent rating agencies where available, and if not available, the Group uses other publicly available financial information and its own trading records to rate its major customers. The credit limit determined on an individual customer basis and as approved by the credit committee based on a assessment of each customers credit worthiness. Bank
guarantees are required from every customer that is granted credit.
The maximum exposure to credit risk at the reporting date is the carrying value of each class of financial assets. The Group's exposure and the credit ratings of its counterparties are continuously monitored and the aggregate value of transactions conc luded is spread amongst approved counterparties. Credit exposure is controlled by counterparty limits that are reviewed and approved by the executive committee periodically.
The average credit period on sales of goods is 30
days. No interest is charged on trade receivable by the Group.
Before accepting a new customer with no historical
information on their credit worthiness, the Group ensures that bank guarantees are in place in order to limit its credit risk exposure. The bank guarantees mitigates 90% of the credit risk exposure.
The Group does not have a single customer with a
contribution of more than 5% of the total balance of trade receivables.
The group does not require collateral in respect of
trade and other receivables. The group does not have trade receivables for which no loss allowance is required because of collateral.

82
NOTES TO THE CONSOLIDATED AND SEPARATE FINANCIAL STATEMENTS for the year ended 31 December 2018
Management believes that the unimpaired amounts that are past due by more than 30 days are still collectible in full, based on historical payment behaviour and extensive analysis of customer credit risk, including underlying customers' credit ratings as available.Amounts due from related parties are considered recoverable by management as the Group has not suffered significant impairment losses in the past on related party receivables. Impairment of trade receivables An impairment analysis is performed at each reporting date and the calculation is based on actual incurred historical data. Individual receivables which are known to be uncollectible are written off by reducing the carrying amount directly. The other receivables are assessed collectively to determine whether there is objective evidence that an impairment has been incurred but not yet identified. For these receivables the estimated impairment losses are recognised in a separate provision for impairment. The Group considers that there is evidence of impairment if any of the following indicators are present:- significant financial difficulties of the debtor- probability that the debtor will enter bankruptcy or financial reorganisation, and- default or delinquency in payments (more than 30 days overdue).
Receivables for which an impairment provision was recognised are written off against the provision when there is no expectation of recovering additional cash.Impairment losses are recognised in profit or loss. Subsequent recoveries of amounts previously written off are credited to profit or loss. Reconciliation of changes in the allowance for credit losses impairment account is disclosed in Note 23.3. Expected credit loss assessment for corporate customers as at 1 January and 31 December 2018 The Group allocates each exposure to a credit risk grade based on data that is determined to be predictive of the risk of loss (including but not limited to external ratings, audited financial statements, management accounts and cash flow projections and available press information about customers) and applying experienced credit judgement. Credit risk grades are defined using qualitative and quantitative factors that are indicative of the risk of default and are aligned to external credit rating definitions from agencies.
Exposures within each credit risk grade are segmented by geographic region and industry classification and an ECL rate is calculated for each segment based on delinquency status and actual credit loss experience over the past two years. These rates are multiplied by scalar factors to reflect differences between economic conditions during the period over which the historical data has been collected, current conditions and the Group's view of economic conditions over the expected lives of the receivables.
(b) Security The Group holds bank guarantees to cover its credit risks associated with its financial assets.
N'000
31 Dec 2018
N'000
31 Dec 2017
N'000
31 Dec 2017
N'000
31 Dec 2018
Group Company Trade receivables: Trade receivables are further broken down into:
Neither past due nor impaired (Stage 1) 0 - 30 days 12,728,402 12,491,392 1,432,180 1,739,680 Past due but not impaired (Stage 2) The ageing of amounts past due but not impaired is as follows: 31 - 60 days 649,203 2,684,415 502,421 883,999 61 - 90 days 136,046 1,753,196 89,753 236,969 Over 90 days 43,431 3,054,700 101,072 771,303 828,680 7,492,311 693,246 1,892,271 Impaired (Stage 3) Credit impaired 764,220 954,963 149,573 127,621 Total amount exposed to credit risk (Gross) 14,321,302 20,938,666 2,274,999 3,759,572 Impairment allowance (Note 23.3) (764,220) (954,963) (149,573) (127,621) Total amount exposed to credit risk (Net) 13,557,082 19,983,703 2,125,426 3,631,951

83
N'000
31 Dec 2018
N'000
31 Dec 2017
N'000
31 Dec 2017
N'000
31 Dec 2018
Group Company
N'000
31 Dec 2018
N'000
31 Dec 2017
N'000
31 Dec 2017
N'000
31 Dec 2018
Group Company
**Others include cash in hand which have not been assessed for credit risk. AAA' ratings denote the lowest expectation of credit risk. They are assigned only in cases of exceptionally strong capacity for payment of financial commitments. This capacity is highly unlikely to be adversely affected by foreseeable events.
‘AA' ratings denote expectations of very low credit risk. They indicate very strong capacity for payment of financial commitments. This capacity is not significantly vulnerable to foreseeable events.
‘A' ratings denote expectations of low credit risk. The capacity for payment of financial commitments is considered strong. This capacity may, nevertheless, be more vulnerable to adverse business or economic conditions than is the case for higher ratings.
'BBB' ratings indicate that expectations of credit risk are currently low. The capacity for payment of financial commitments is considered adequate, but adverse business or economic conditions are more likely to impair this capacity.
'BB' ratings indicate an elevated vulnerability to credit risk, particularly in the event of adverse changes in business or economic conditions over time; however, business or financial alternatives may be available to allow financial commitments to be met.
‘B' ratings indicate that material credit risk is present.
'The modifiers “+” or “-” may be appended to a rating to denote relative status within major rating categories.
Cash at bank AAA 558,986 1,902,737 537,553 1,173,742 AA+ 5,336 219,295 - - AA- 63,241 10,037,563 - 4,810,254 A+ 8,347 13,078,340 8,347 12,942,725 A - 357,258 - 32,191 BBB - 2,760,362 - 766,312 BBB- - 104,178 - 31,954 BB+ - 1,184,001 - 1,184,001 B+ 333,022 - - - B 8,007,595 201,564 7,706,995 201,564 B- 130,748 - 78,710 - F1 127,889 - 96,885 - F3 28,211 - 28,211 - 9,263,375 29,845,298 8,456,701 21,142,743 Restricted cash at bank* 1,077,794 20,481,593 1,077,794 20,481,593 Others** 2,209,528 87,866 643,281 74,518 Total cash and cash equivalents 12,550,697 50,414,757 10,177,776 41,698,854
Trade receivables
Counterparties without external rating Group 1 - New customers < 1 year 1,611,707 1,288,346 727,865 699,800 Group 2 - Existing customer with no default 10,184,281 7,921,147 521,989 134,793 Group 3 - Existing customer with default 932,414 3,281,899 182,326 905,087 12,728,402 12,491,392 1,432,180 1,739,680
NOTES TO THE CONSOLIDATED AND SEPARATE FINANCIAL STATEMENTS for the year ended 31 December 2018
(c) Credit quality The credit quality of financial assets that are neither past due nor impaired can be assessed by reference to external credit ratings (if available) or to historical information about counterparty default rates. The Group mitigates its credit risk of its bank balance and derivative financial assets by selecting and transacting with reputable banks with good credit ratings and a history of strong financial performance.
Bank ratings are based on Fitch national long term rating (2018). The credit ratings of the banks with the bank balances are shown below.

84
4.1.2 Liquidity risk (a) Management of liquidity risk
Liquidity risk is the risk that the Group will encounter difficulty in meeting obligations associated with financial liabilities that are settled by delivering cash or another financial asset.The Group and Company manage liquidity risk by maintaining adequate reserves, banking facilities and reserve borrowing facilities, by continuously monitoring forecast and actual cash flows, and by matching the maturity profiles of financial assets and liabilities.
The Group maintains the following lines of credit:-N27.8bil l ion overdraft facil ity that is unsecured. Interest payable ranges from 19% - 23%.- N60billion commercial papers that is unsecured and can be drawn to meet short-term financing needs. The facility has a maximum maturity period of 270 days. Interest payable ranges from 16.48% - 17.01%.The Group maintains a margin call account as security on its non-deliverable futures. It attracts interest at the prevailing bank's interest rate.
(b) Maturities of financial liabilities Ultimate responsibility for liquidity risk management rests with the board of directors, which has established an appropriate liquidity risk management framework for the management of the Group's short-, medium- and long-term funding and liquidity management requirements. The Group and Company manage liquidity risk by maintaining adequate reserves, banking facilities and reserve borrowing facilities, by continuously monitoring forecast and actual cash flows, and by matching the maturity profiles of financial assets and liabilities. The Group maintains the following lines of credit:- N27.8bill ion overdraft facility that is unsecured. Interest payable ranges from 19% - 23%.- N60billion commercial papers that is unsecured and can be drawn to meet short-term financing needs. The facility has a maximum maturity period of 270 days. Interest payable ranges from 16.48% - 17.01%.The Group maintains a margin call account as security on its non-deliverable futures. It attracts interest at the prevailing bank's interest rate.
Carrying amount
Contractual cash flows
0 - 12 months
1-3 years
Above 3 years
N'000 N'000 N'000 N'000 N'000
Carrying amount
Contractual cash flows
0 - 12 months
1-3 years
Above 3 years
N'000 N'000 N'000 N'000 N'000
Carrying amount
Contractual cash flows
0 - 12 months
1-3 years
Above 3 years
N'000 N'000 N'000 N'000 N'000
Group 31 December 2018
Non derivative financial instruments Interest-bearing loans and borrowings 266,207,059 271,796,196 108,570,315 41,009,771 122,216,110 Trade and other payables** 73,918,278 73,918,278 73,918,278 - - Bank overdraft 35,280,945 35,280,945 35,280,945 - - Derivative financial instruments Derivative liability 244,176 247,805 247,805 - - 375,650,458 381,243,224 218,017,343 41,009,771 122,216,110 31 December 2017
Non derivative financial instruments Interest-bearing loans and borrowings 256,546,960 277,917,845 199,435,400 77,407,803 1,074,642 Trade and other payables** 106,416,598 106,416,598 106,416,598 - - Bank overdraft 31,081,780 31,081,780 31,081,780 - - Derivative financial instruments Derivative liability 4,212,406 4,532,198 4,532,198 - - 398,257,744 419,948,421 341,465,976 77,407,803 1,074,642 Company 31 December 2018
Non derivative financial instruments Interest-bearing loans and borrowings 250,077,462 254,633,695 97,974,390 38,002,862 118,656,443 Trade and other payables** 44,254,829 44,254,829 44,254,829 - - Bank overdraft 16,862,345 16,862,345 16,862,345 - - Derivative financial instruments Derivative liability 244,176 247,805 247,805 - - 311,438,812 315,998,674 159,339,369 38,002,862 118,656,443
NOTES TO THE CONSOLIDATED AND SEPARATE FINANCIAL STATEMENTS for the year ended 31 December 2018

85
Carrying amount
Contractual cash flows
0 - 12 months
1-3 years
Above 3 years
N'000 N'000 N'000 N'000 N'000
31 December 2017
Non derivative financial instruments Interest-bearing loans and borrowings 255,625,336 276,996,221 198,513,776 77,407,803 1,074,642 Trade and other payables** 64,531,244 64,531,244 64,531,244 - - Bank overdraft 15,037,780 15,037,780 15,037,780 - - Derivative financial instruments Derivative liability 4,212,406 4,532,198 4,532,198 - - 339,406,766 361,097,443 282,614,998 77,407,803 1,074,642 The amounts disclosed in the tables above are the contractual undiscounted cash flows of the liabilities. Balances due within 12 months equal their carrying balances as the impact of discounting is not significant. ** Trade and other payables exclude VAT payable, advance rent received, customer deposits and withholding tax payable as these are non financial instruments.
N'000
31 Dec 2018
N'000
31 Dec 2017
N'000
31 Dec 2017
N'000
31 Dec 2018
Group Company
4.1.3 Market risk The Group takes on exposure to market risks, which is the risk that the fair value or future cash flows of a financial
instrument will fluctuate because of changes in market prices. The Group is exposed to interest rate risk and foreign exchange rate risk.
(I) Interest rate risk Interest rate risk is the risk that the fair value or future cash flows of a financial instrument will fluctuate due to the changes in
market interest rates. The Group's main interest rate risk arises from long-term borrowings with variable rates, which expose the group to cash flow interest rate risk.
The Group is not exposed to fair value interest rate risk because its fixed interest rate borrowings are not carried at fair value.
Interest rate risk is managed by the Group by maintaining an appropriate mix between fixed and floating borrowings. The sensitivity analysis below have been determined based on the exposure to interest rates for borrowings at the end of the reporting period. For floating rate liabilities, the analysis is prepared assuming the amount of the liability outstanding at the end of the reporting period was outstanding for the whole year. 200 basis points increase or decrease are used when reporting LIBOR and NIBOR risk respectively to key management personnel and these represent management's assessment of the reasonably possible change in interest rates.
Floating interest rate (variable rate): The financial liabilities with floating interest rates are shown below;
Foreign denominated variable rates Related party loan (Note 30.4) 140,411,911 144,391,559 129,996,764 143,808,356 140,411,911 144,391,559 129,996,764 143,808,356 Fixed rates for financial liabilities : The financial liabilities with fixed interest rates are shown below; Foreign denominated fixed rates Lafarge Gypsum S. A Pty Ltd 315,008 338,421 - - 315,008 338,421 - - Naira denominated fixed rates Power Fund (7%, 9%) 11,345,910 7,698,505 5,946,467 7,698,505 Bond (14.25%/14.75%) 60,249,338 59,842,611 60,249,338 59,842,611 Due to FBN : Commercial Papers (16.53% - 17.01% p.a) 53,884,892 44,275,864 53,884,893 44,275,864 Bank overdrafts 35,280,945 31,081,780 16,862,345 15,037,780 160,761,085 142,898,760 136,943,043 126,854,760 Total 301,488,004 287,628,740 266,939,807 270,663,116
NOTES TO THE CONSOLIDATED AND SEPARATE FINANCIAL STATEMENTS for the year ended 31 December 2018

86
N'000
31 Dec 2018
N'000
31 Dec 2017
N'000
31 Dec 2017
N'000
31 Dec 2018
Group Company
N'000
31 Dec 2018
N'000
31 Dec 2017
N'000
31 Dec 2017
N'000
31 Dec 2018
Group Company
N'000
31 Dec 2018
N'000
31 Dec 2017
N'000
31 Dec 2017
N'000
31 Dec 2018
Group Company
31 Dec 2018 31 Dec 2017 Average rates Closing rates Average rates Closing rates US Dollars 347.07 358.60 331.28 331.16 Euros 409.93 410.24 397.70 397.56 GBP (Great Britain Pounds) 463.36 456.61 447.66 447.50 ZAR 26.38 24.89 24.55 26.74 CHF 354.84 364.12 340.02 339.90
Floating interest rate (variable rate): The financial assets with floating interest rates are shown below;
Foreign denominated variable rates Loan to CBI Ghana (12 months LIBOR +11%) 1,739,739 1,585,630 1,739,739 1,585,630 1,739,739 1,585,630 1,739,739 1,585,630 Sensitivity of interest rates for financial liabilities The Group is exposed to cash flow interest rate risk on related party loans and bank overdrafts. The table below details the
impact on the post- tax profit of the Group and the Company (no impact on equity).
Foreign denominated variable rates Interest rates- decrease by 200 basis point (2,808,238) (2,887,831) (2,599,935) (2,876,167) Interest rates- Increase by 200 basis point 2,808,238 2,887,831 2,599,935 2,876,167 Sensitivity of interest rates for financial assets The Group is exposed to cash flow interest rate risk on related party loans. The table below details the impact on the post- tax
profit of the Group and the Company (no impact on equity).
Foreign denominated variable rates Interest rates- decrease by 200 basis point (34,795) (31,713) (34,795) (31,713) Interest rates- Increase by 200 basis point 34,795 31,713 34,795 31,713 (ii) Foreign exchange risk Foreign exchange risk is the risk that the fair value or future cash flows of a financial instrument will fluctuate due to the
changes in foreign exchange rates. The Group is exposed to risks resulting from fluctuations in foreign currency exchange rates. A change in the value of any such foreign currency could have an effect on the Group's cash flow and future profits. The Group is exposed to exchange rate risk as a result of cash balances denominated in a currency other than the Naira. The Group is mainly exposed to USD.
The following table details the Group's sensitivity to a 21%, increase and decrease in Naira against US dollar, Euro, Great
Britain's Pound (GBP), Swiss Franc (CHF) and South Africa Rand (ZAR). Management believes that a 21% movement in either direction is reasonably possible at the 31 December 2018. The sensitivity analyses below include outstanding US dollar denominated assets and liabilities. A positive number indicates an increase in profit where Naira strengthens by 21% against the US dollar. For a 21% weakening of Naira against the US dollar there would be an equal and opposite impact on profit, and the balances below would be negative.
Below are the foreign denominated currencies the Group is exposed to;
NOTES TO THE CONSOLIDATED AND SEPARATE FINANCIAL STATEMENTS for the year ended 31 December 2018

87
N'000
31 Dec 2017
N'000
31 Dec 2018
Group Company
31 Dec 2018
31 Dec 2017
N'000 N'000
N'000
31 Dec 2017
N'000
31 Dec 2018
Group Company
31 Dec 2018
31 Dec 2017
N'000 N'000
Foreign currency denominated balances
US Dollar Financial assets Cash and cash equivalents 3,904 2,940 3,619 2,257 Loan receivables 4,994 4,395 4,994 4,395 Financial liabilities Borrowings (322,493) - (322,493) - Trade and other payables (3,103) (16,298) (2,785) (16,298) Net financial (liabilities)/asset (316,698) (8,963) (316,665) (9,646) Euro Financial assets Cash and cash equivalents 116 427 47 38 Other receivables - - - - Financial liabilities Borrowings - - - - Trade and other payables (3,341) (9,316) (2,921) (9,316) Net financial (liabilities)/asset (3,225) (8,889) (2,874) (9,278) GBP Financial assets Cash and cash equivalents 25 30 1 2 Financial liabilities Trade and other payables (551) (140) (155) (140) Net financial (liabilities)/asset (526) (110) (154) (138) CHF Financial liabilities Trade and other payables (250) (58) (250) (58) (250) (58) (250) (58) ZAR Financial liabilities Trade and other payables (797) (2,437) (257) (2,437) (797) (2,437) (257) (2,437) Sensitivity analysis for foreign exchange risk The sensitivity analysis for currency rate risk shows how changes in the fair value or future cash flows of a financial
instrument will fluctuate because of changes in market rates at the reporting date.
The sensitivity of the Group's earnings to fluctuations in USD, Euro, GBP, CHF and ZAR exchange rates is reflected by varying the exchange rates as shown below:
US Dollar Increase in exchange rate by 21% (699,903) (19,808) (699,830) (21,318) Decrease in exchange rate by 21% 699,903 19,808 699,830 21,318 Euro Increase in exchange rate by 21% (7,127) (19,645) (6,352) (20,504) Decrease in exchange rate by 21% 7,127 19,645 6,352 20,504 GBP Increase in exchange rate by 21% (1,162) (243) (340) (305) Decrease in exchange rate by 21% 1,162 243 340 305
NOTES TO THE CONSOLIDATED AND SEPARATE FINANCIAL STATEMENTS for the year ended 31 December 2018

88
N'000
31 Dec 2017
N'000
31 Dec 2018
Group Company
31 Dec 2018
31 Dec 2017
N'000 N'000
The gearing ratios at 31 December 2018 and 31 December 2017 were as follows: Total borrowings 301,488,004 287,628,740 266,939,807 270,663,116 Less: Cash and cash equivalents excluding bank overdrafts 12,550,697 50,414,757 10,177,776 41,698,854 Net debt 288,937,307 237,213,983 256,762,031 228,964,262 Total equity 134,541,089 130,574,345 255,743,725 77,843,339 Total capital 423,478,396 367,788,328 512,505,756 306,807,601 Gearing ratio 2.15 1.82 1.00 2.94 4.3 Fair value IFRS 13 specifies a hierarchy of valuation techniques based on whether the inputs to those valuation techniques are
observable or unobservable. Observable input reflect market data obtained from independent sources; unobservable inputs reflect the group's market assumptions.
At the reporting date, the directors believe that the book value of the financial assets and liabilities except borrowings are not materially different from the fair value.
All financial assets and liabilities are classified as level 2 except for non-deliverable futures which is classified as level 1. The book value of the trade and other receivables, financial assets, trade and other payables is expected to approximate the fair value of these financial instruments due to their short term maturities.There were no transfers between levels during the reporting period.
Group 31 December 2018 31 December 2017 N'000 N'000 N'000 N'000 Fair value Book Value Fair value Book Value Financial Assets Financial Assets classified as loans and receivables Trade and other receivables 21,163,994 21,163,994 25,110,116 25,110,116 Financial assets (excluding non-deliverable futures) 2,276,013 2,276,013 2,163,689 2,163,689 Cash and cash equivalents 12,550,697 12,550,697 50,414,757 50,414,757 Financial Assets classified at fair value through profit or loss Derivative assets 95,573 95,573 640,091 640,091
CHF Increase in exchange rate by 21% (553) (128) (553) (128) Decrease in exchange rate by 21% 553 128 553 128 ZAR Increase in exchange rate by 21% (1,761) (5,386) (568) (5,386) Decrease in exchange rate by 21% 1,761 5,386 568 5,386 4.2 Capital management 4.2.1 Risk management The Group's objectives when managing capital are to safeguard its ability to continue as a going concern in order to provide
returns for shareholders and benefits for other stakeholders, and to maintain an optimal capital structure to reduce the cost of capital.
In order to maintain or adjust the capital structure, the Group may adjust the amount of dividends paid to shareholders,
return capital to shareholders, issue new shares or sell assets to reduce debt.
The Group monitors capital on the basis of the gearing ratio. This ratio is calculated as net debt divided by total capital. Net debt is calculated as total borrowings (including 'current and non-current borrowings' as shown in the statement of financial position) less cash and cash equivalents. Total capital is calculated as the sum of all equity components on the statement of financial position plus net debt.
NOTES TO THE CONSOLIDATED AND SEPARATE FINANCIAL STATEMENTS for the year ended 31 December 2018

89
Financial Liabilities Financial liabilities classified as amortised cost Trade and other payables** 73,918,278 73,918,278 (106,416,598) (106,416,598) Bank overdraft (35,280,945) (35,280,945) (31,081,780) (31,081,780) Borrowings (266,207,059) (266,207,059) (108,617,615) (108,617,615) Financial liabilities classified at fair value through profit or loss Derivative liability 244,176 244,176 4,212,406 4,212,406 Company 31 December 2018 31 December 2017 N'000 N'000 N'000 N'000 Fair value Book Value Fair value Book Value
Financial Asset Financial Assets classified as loans and receivables Trade and other receivables 11,167,705 11,167,705 15,930,970 15,930,970 Financial assets 1,739,739 1,739,739 1,556,738 1,556,738 Cash and cash equivalents 10,177,776 10,177,776 41,698,854 41,698,854 Financial Assets classified at fair value through profit or loss Derivative assets 95,573 95,573 640,091 640,091 Financial Liabilities Financial liabilities classified at amortised cost **Trade and other payables 44,254,829 44,254,829 (64,531,244) (64,531,244) Bank overdraft (16,862,345) (16,862,345) (15,037,780) (15,037,780) Borrowings (250,077,462) (250,077,462) (110,463,597) (110,463,597) Financial liabilities classified at fair value through profit or loss Derivative liability 244,176 244,176 4,212,406 4,212,406 ** Trade and other payables exclude VAT payable, advance rent received, customer deposits and withholding tax payable as these are non financial instruments. 4.3.1 Fair value measurement Group Financial Instruments in Level 1 The fair value of financial instruments traded in active markets (quoted equity) is based on quoted market prices at the
reporting date. A market is regarded as active if quoted prices are readily and regularly available from an exchange, dealer, broker, industry group, pricing service, or regulatory agency, and those prices represent actual and regularly occurring market transactions on an arm's length basis.
The quoted market price used for financial assets held by the Company is the bid price at the reporting date. These
instruments are included in level 1. There were no transfers between levels during the year. The fair value of future and forward exchange contracts is determined using quoted forward exchange rates at the reporting
date and present value calculations based on high credit quality yield curves in the respective currencies. Financial Instruments in Level 2
The fair value of financial instruments that are not traded in an active market (loans and borrowings) is determined by using discounted cash flow valuation techniques. This valuation technique maximize the use of observable market data by using the market related interest rate for discounting the contractual cash flows. There are no significant unobservable inputs. There were no transfers between levels during the year. The basis of measurement has remained the same between current and prior years.
4.4 Offsetting financial assets and financial liabilities There are no offsetting arrangements. Financial assets and liabilities are settled and disclosed on a gross basis. 5 Segment Reporting The Board of Directors (BOD) is the chief operating decision maker who reviews the internal reporting to assess performance
and allocate resources. The Directors have identified operating segments based on these internal reports. The BOD considers business from the range of product perspective.
NOTES TO THE CONSOLIDATED AND SEPARATE FINANCIAL STATEMENTS for the year ended 31 December 2018

90
The BOD assesses the performance of the operating segments based on a measure of total assets and liabilities, gross profit and other directly attributable expenses. These operating segments are:
Established for the business of cement production . This segment typically has Cement
three major business operations within Nigeria which are the South-West operations, the Southern Nigeria operation and the Northern Nigeria operation.
Established for the business of concrete and aggregates. Lafarge Ready Mix Aggregates and concrete
Nigeria Limited, a wholly owned subsidiary of Lafarge Africa Plc is established basically for these operations. The operations are currently in Lagos, Abuja, Port-Harcourt, and Ewekoro and is expected to spread to other states of Nigeria in the near future.
Established for the business of admixtures and other solutions. Admixtures are Admixtures and other products
chemical compounds added to concrete to modify its properties. The segments identified meet the recognition criteria as a reportable segment under IFRS 8. The amounts provided to the board of directors with respect to total income and expense are measured in a manner
consistent with that of the financial statements. These assets are allocated based on the use of the segment and the physical location of the asset.
*Deferred tax assets and liabilities are not assessed for the purpose of segment reporting. No revenue in excess of 10% was generated from a single customer. 5.1 Segment Information by Country - 31 December 2018 Nigeria South Africa Total N'000 N'000 N'000 Revenue 217,813,136 90,612,320 308,425,456 Current operating Income/ (loss) ** 38,336,359 (13,526,930) 24,809,429 Other Income 1,382,008 1,977 1,383,985 Other operating expenses (1,115,728) (192,547) (1,308,275) Operating profit/ (loss) 38,602,639 (13,717,500) 24,885,139 **This comprises gross profit, selling and marketing expenses and administrative expenses. Other Information Capital expenditure *** (27,088,927) 1,214,139 (25,874,788) Capital employed 294,821,001 33,265,945 328,086,946 ***Capital expenditure refers to acquisition of property, plant and equipment and intangible assets. Statement of financial position Segment non-current assets 400,903,779 46,472,443 447,376,222 Segment Current Assets 64,616,671 28,743,770 93,360,441 Total assets 465,520,450 75,216,213 540,736,663 Segment non-current liabilities 164,468,123 29,077,734 193,545,857 Segment current liabilities 170,699,449 41,950,268 212,649,717 Equity 130,352,878 4,188,211 134,541,089 Total equity and liabilities 465,520,450 75,216,213 540,736,663 Segment Information by Country - 31 December 2017 Nigeria South Africa Total N'000 N'000 N'000 Revenue 204,484,731 94,668,574 299,153,305 Current operating Income/ (loss) ** 26,853,511 (21,374,030) 5,479,481
NOTES TO THE CONSOLIDATED AND SEPARATE FINANCIAL STATEMENTS for the year ended 31 December 2018

91
N'000
31 Dec 2017
N'000
31 Dec 2018
31 Dec 2018
31 Dec 2017
N'000 N'000
NOTES TO THE CONSOLIDATED AND SEPARATE FINANCIAL STATEMENTS for the year ended 31 December 2018
Other Income 3,956,473 113,051 4,069,524 Other operating expenses (654,150) (1,009,349) (1,663,499) Operating profit / (loss) 30,155,834 (22,270,328) 7,885,506 **This comprises gross profit, selling and marketing expenses and administrative expenses. Other Information Capital expenditure *** (17,394,667) (3,184,868) (20,579,535) Capital employed 206,525,641 30,547,384 237,073,025 Statement of financial position Segment non-current assets 376,251,046 50,372,544 426,623,590 Segment Current Assets 112,255,263 38,848,594 151,103,857 Total assets 488,506,309 89,221,138 577,727,447 Nigeria South Africa Total N'000 N'000 N'000
Segment non-current liabilities 71,102,860 8,983,410 80,086,270 Segment current liabilities 281,980,668 58,673,754 340,654,422 Equity 135,422,781 21,563,974 156,986,755 Total equity and liabilities 488,506,309 89,221,138 577,727,447 ***Capital eituxpendre refers to acquisition of property, plant and equipment and intangible assets. Segment Information by Product line External revenue Gross revenue
Cement 251,424,416 238,779,718 251,424,416 238,779,718 Aggregates and concrete 55,267,509 57,701,767 55,267,509 57,701,767 Others 4,904,871 5,615,248 4,904,871 5,615,248 Related party sales elimination (3,171,340) (2,943,428) - - Total 308,425,456 299,153,305 311,596,796 302,096,733 Revenue from internal customers of N3.17 billion (2017:N2.94 billion) has been eliminated on consolidation.
Aggregate Cement and others Total N’000 N’000 N’000 Revenue 248,253,076 60,172,380 308,425,456 Cost of sales (234,369,149) (4,373,437) (238,742,586) Other Income 1,379,896 4,089 1,383,985 Other expenses*** (45,400,012) (856,030) (46,256,042) Operating Profit (30,136,189) 54,947,002 24,810,813 **This comprises selling and marketing expenses, administrative expenses and other operating expenses

92
N'000
31 Dec 2017
N'000
31 Dec 2018
Group Company
31 Dec 2018
31 Dec 2017
N'000 N'000
N'000
31 Dec 2017
N'000
31 Dec 2018
Group Company
31 Dec 2018
31 Dec 2017
N'000 N'000
N'000
31 Dec 2017
N'000
31 Dec 2018
Group Company
31 Dec 2018
31 Dec 2017
N'000 N'000
6 Revenue Sale of goods 308,425,456 299,153,305 187,043,475 177,170,362 The following is an analysis of revenue by product: Cement 248,253,076 235,836,290 187,043,475 177,170,362 Aggregate and concrete 55,267,509 57,701,767 - - Admixtures and other products (Note 6.1) 4,904,871 5,615,248 - - 308,425,456 299,153,305 187,043,475 177,170,362 6.1 Admixtures and other products represent revenue earned from the sale of fly ash, ready-mix pump sales and other mineral components from South African operations.
7 Cost of sales by nature Variable costs (Note 7.1) 152,812,744 147,447,890 81,399,223 73,342,162 Production costs (Note 7.2) 36,645,425 37,172,050 13,393,034 14,208,201 Maintenance costs 16,522,640 17,992,100 6,917,056 6,916,667 Distribution costs 9,645,538 6,502,036 4,766,457 3,213,294 Depreciation (Note 16.9) 21,649,458 21,447,285 16,265,935 15,815,377 Impairment of property, plant and equipment (Note 16) 925,207 19,178,254 219,000 12,394,270 Amortisation and impairment of intangible assets 494,990 392,693 2,280 - Prepaid medical 46,584 46,584 46,584 46,584 238,742,586 250,178,892 123,009,569 125,936,555 7.1 Variable costs Distribution variable cost 64,785,712 65,564,805 36,567,944 32,669,433 Gas 22,242,573 22,416,223 13,947,096 16,032,661 Power 20,066,341 20,801,914 10,072,639 11,957,412 Raw materials and consumables 45,718,118 38,664,948 20,811,544 12,682,656 152,812,744 147,447,890 81,399,223 73,342,162 7.2 Production costs Included in the production costs are personnel expenses, by-products costs, inventory write-offs and electrical energy
expenses.
8. Selling and marketing expenses Advertising expenses 1,146,586 97,224 1,146,586 97,224 Campaign and innovation expenses 2,247 3,328 2,247 3,328 Marketing Staff salaries and other staff related cost 6,583,984 4,610,577 2,742,472 2,229,688 7,732,817 4,711,129 3,891,305 2,330,240
NOTES TO THE CONSOLIDATED AND SEPARATE FINANCIAL STATEMENTS for the year ended 31 December 2018

N'000
31 Dec 2017
N'000
31 Dec 2018
Group Company
31 Dec 2018
31 Dec 2017
N'000 N'000 9 Administrative expenses by nature
9.1 Advance payment of taxes and levies
In the year 2017, the Company entered into an agreement with a state government to advance an amount not exceeding N2.8 billion annually as payments for all taxes, dues and levies payable in the state. The agreement is for a three-year period which commenced in April 2017, which effectively exempts the Company from all state and local government taxes, dues and levies during the agreed period.
In line with the agreement, the Company made an advance payment of N2.8 billion, of which N2.1 billion relates to the current financial year. N0.7million advance payment brought forward in the year has also been ammortised in the income statement in current year. These amounts have been included in the consolidated and separate statements of profit or loss and other comprehensive income as Cost of sales N0.7 billion (under Note 7.1 - Distribution variable cost) and Administrative expenses N2.1 billion (Under Note 9 – Administrative expenses).
9.2 Office and general expenses
Office and general expenses mainly relate to office expenses and stationary, legal cost, fees, subscriptions, other personnel costs, IT costs, canteen, cleaning, distribution and licenses.
9.3 Non-audit fees paid to KPMG Professional Services
The total amount of non-audit fees paid to KPMG Professional Services is N101 million. This is in respect of assurance and tax services rendered during the year.
9.4 Technical service fees
Lafarge Africa Plc has a technical service agreement with Lafarge S.A., France, a related party which relates to Industrial Franchise. This agreement has been registered with the National Office for Technology Acquisition and Promotion (NOTAP) in Nigeria and is computed as 3.5% of net sales. In addition, Ashaka Cement Plc (a subsidiary of the Group) has an industrial franchise and technical support agreement with Lafarge S.A., France, a related party. This agreement, which has been duly registered and approved by NOTAP, is computed as 2% of net sales, for a period of one year. Additionally, Lafarge South Africa Holdings (Pty) Ltd (a subsidiary of the Company) has an industrial franchise and technical support agreement with Lafarge S.A., France, a related party and is computed as 3.5% of net sales. The total technical service fees payable at year end for the Group and Company amounted to N13.6 billion and N9.04 billion (2017: N27.98 billion and N18.27 billion) respectively.
NOTES TO THE CONSOLIDATED AND SEPARATE FINANCIAL STATEMENTS for the year ended 31 December 2018
Salaries and other staff related costs 11,649,867 10,232,868 5,615,380 5,061,561 Directors' costs 176,004 186,421 170,344 183,534 AGM Costs 105,597 130,360 105,597 88,660 Audit fee 206,640 221,264 98,500 85,000 Community relation 99,672 340,495 82,086 103,474 Electricity 50,292 35,355 - 894 Fuel 47,438 77,079 38,800 62,478 Insurance 331,231 814,033 303,701 83,587 Advance payment of taxes and levies (Note 9.1) 2,166,775 1,381,277 2,166,775 1,381,277 Other supplies & spare parts 1,000,207 411,844 1,000,007 357,350 Rent 836,195 1,784,226 97,505 242,284 Consultancy fee 4,606,052 3,144,284 3,070,784 2,330,767 Repair and maintenance 736,773 768,292 736,565 752,612 Security Cost 414,737 298,126 388,331 226,970 Training 36,396 297,257 36,396 12,595 Travel 875,683 1,216,910 875,683 712,610 Vehicle leasing 275,177 161,814 275,177 130,830 Office and general expenses (Note 9.2) 3,548,179 6,398,230 2,458,575 1,660,425 Depreciation (Note 16.9) 638,821 733,874 103,953 488,890 Technical service fees (Note 9.4) 9,338,888 9,774,168 5,816,679 5,078,844 37,140,624 38,408,177 23,440,838 19,044,642
93

94
N'000
31 Dec 2017
N'000
31 Dec 2018
Group Company
31 Dec 2018
31 Dec 2017
N'000 N'000
N'000
31 Dec 2017
N'000
31 Dec 2018
Group Company
31 Dec 2018
31 Dec 2017
N'000 N'000
N'000
31 Dec 2017
N'000
31 Dec 2018
Group Company
31 Dec 2018
31 Dec 2017
N'000 N'000
10 Other income Gain on disposal of property, plant and equipment (Note 10.1) 936,326 2,373,837 926,622 2,321,399 Government grants (Note 10.2) 110,732 160,192 110,732 160,192 Scrapped and other miscellaneous income (Note 10.3) 319,006 1,158,102 255,975 1,030,675 Write back of impairment of other receivables 15,944 - - - Investment income (Note 10.4) 1,977 1,767 - 294,055 1,383,985 3,693,898 1,293,329 3,806,321
10.1 Gain on disposal of property, plant and equipment In the current year, this represents gain on disposal of the Company's motor vehicle across all Nigerian entities and disposal
of land held by the parent Company. In prior year, this represents the gain on the disposal of the Company's property plant and equipment (Elephant Cement House Building) located in Alausa, Ikeja to Lagos State Government.
10.2 Government grants Government grants arise from below-market interest rate government loan (CBN/BOI Intervention Fund loan) received in
July 2011 and in March 2018. There are no unfulfilled conditions or contingencies attached to these grants. 10.3 Scrapped and other miscellaneous income This comprises of the total income earned on miscellaneous activities not related to cementitious products including sale of
scrap and product shortage recoveries (haulers).
10.4 Investment income Dividends received from subsidiaries (Note 10.4.1) - - - 294,055 Dividend received from unlisted investments (Note 10.4.2) 1,977 1,767 - -
1,977 1,767 - 294,055 10.4.1 Dividend received from subsidiaries This represents dividend received from AshakaCem. 10.4.2 Dividend received from unlisted investments This represents dividend received by Lafarge South Africa holdings (PTY) Limited on its unlisted investments.
11 Other operating expenses Impairment of other receivables 351,764 - 159,217 - Write off of assets 956,511 800,720 304,398 383,812 1,308,275 800,720 463,615 383,812
NOTES TO THE CONSOLIDATED AND SEPARATE FINANCIAL STATEMENTS for the year ended 31 December 2018

95
N'000
31 Dec 2017
N'000
31 Dec 2018
Group Company
31 Dec 2018
N'000
31 Dec 2017
N'000
N'000
31 Dec 2017
31 Dec 2017
N'000 N'000
31 Dec 2018
Group Company
31 Dec 2018
N'000
N'000
31 Dec 2017
31 Dec 2017
N'000 N'000
31 Dec 2018
Group Company
31 Dec 2018
N'000
11.1 Impairment loss on trade receivables Impairment of trade receivables 74,326 862,779 44,835 75,741 74,326 862,779 44,835 75,741 An impairment loss on trade receivables in the year 2017 amounting to N862.9 million and N75.7 million for Group
and Company respectively was reclassified from other operating expenses to a separate line item.
12 Finance income and costs a) Interest income under the effective interest method and other finance income: Interest income on current accounts 798,754 1,324,165 798,754 1,047,462 Other finance income 186,191 - 186,191 - Interest income from Short term fixed deposits 195,564 1,582 1,190 1,582 Interest on loan receivable 538,667 113,233 330,929 58,432 1,719,176 1,438,980 1,317,064 1,107,476 b) Finance costs: Interest on bank overdraft (4,543,507) (6,642,228) (3,478,896) (3,548,707) Interest on borrowings (Note 30.5) (29,602,641) (22,067,619) (28,673,150) (24,782,932) Unwinding of discount on provisions (Note 31.1) (456,084) (182,154) (250,272) (118,412) Interest cost on employee's long service award (Note 33.1) (236,308) (167,137) (161,322) (127,147) Interest cost on staff gratuities (Note 33.2) (367,897) (372,786) (76,512) (108,529) Bank charges (2,320,239) (309,069) (2,250,068) (270,874) Finance costs per statement of cash flows (37,526,676) (29,740,993) (34,890,220) (28,956,601) Foreign exchange loss (net) (8,446,386) (13,475,507) (8,147,195) (12,342,523) Finance costs (45,973,062) (43,216,500) (43,037,415) (41,299,124) Net finance (costs)/ income recognised in the profit or loss (44,253,886) (41,777,520) (41,720,351) (40,191,648) Bank charges represent Letter of credit charges, Over-the-counter (OTC) charges for non deliverable futures and other bank account operational charges.
c) Interest received per statement of cash flows
Finance income per profit or loss 1,719,176 1,438,980 1,317,064 1,107,476 Interest receivable (538,667) (58,457) (330,929) (58,431) Interest received per statement of cash flows 1,180,509 1,380,523 986,135 1,049,045 d) Interest paid per statement of cash flows Finance costs per profit or loss (45,973,062) (43,216,500) (43,037,415) (41,299,124) Interest payable/(recievable) (832,488) 5,320,751 607,825 9,862,952 Non-cash interest charged to profit or loss 1,060,289 722,077 488,106 354,088 Foreign exchange loss (net) 8,446,386 13,475,507 8,147,195 12,342,523
Interest paid per statement of cash flows (37,298,875) (23,698,165) (33,794,289) (18,739,561) 13 Impairment loss on investment in subsidiaries
Impairment loss on investments in subsidiaries relate to impairment charge of N3.2 billion on the Company's investment in Lafarge South Africa Holdings Limited. No impairment loss has been recorded in the group. See Note 18.1.1 for further details.
NOTES TO THE CONSOLIDATED AND SEPARATE FINANCIAL STATEMENTS for the year ended 31 December 2018

14 Income tax (credit)/ expense This note provides an analysis of the Group and Company's income tax expense. It shows what amounts are recognised
directly in equity and how the tax expense is affected by non-assessable and non-deductible items. It also explains significant estimates made, if any, in relation to the Group and Company's tax position.
N'000
31 Dec 2017
31 Dec 2017
N'000 N'000
31 Dec 2018
Group Company
31 Dec 2018
N'000
N'000
31 Dec 2017
31 Dec 2017
N'000 N'000
31 Dec 2018
Group Company
31 Dec 2018
N'000
N'000
31 Dec 2017
31 Dec 2017
N'000 N'000
31 Dec 2018
Group Company
31 Dec 2018
N'000
14.1 Minimum tax charge recognised in profit or loss - 287,672 - 287,672 14.2 Income tax (credit)/ expense recognised in profit or loss
Current taxation Company income tax 1,153,091 1,387,188 - - Education tax 113,278 935,459 - 821,406 Prior year over provision - 16,228 - - Capital gains tax 84,876 116,326 84,876 116,326 Total current tax expense 1,351,245 2,455,201 84,876 937,732 Deferred taxation Deferred income tax (credit)/expense to profit or loss (Note 14.8) (12,057,747) (2,173,741) (11,635,223) 4,900,031 Income tax (credit)/expense (10,706,502) 281,460 (11,550,347) 5,837,763 Income tax (credit)/ expense (10,706,502) 281,460 (11,550,347) 5,837,763 The Company's operating results when adjusted for tax purposes, resulted in a nil assessable income and a nil taxable
income. Accordingly, in current year, no provision has been made for Company Income tax and tertiary education tax. 14.3 Reconciliation of effective tax to statutory tax The tax on the Company's loss before income tax differs from the amount that would arise using the statutory income
tax rate as follows:
Loss before tax from continuing operations before income tax credit/(expense) (19,508,228) (34,032,277) (7,408,583) (7,098,191) Tax calculated at statutory tax rate of 32%, 28% for LSAH (5,852,468) (9,919,899) (2,222,575) (2,271,421) Impact of disallowable expenses for tax purpose 817,944 8,815,663 1,393,836 6,636,055 Impact of non taxable income (639,595) (1,049,072) (575,209) (1,182,119) Changes in estimate relating to prior year (71,020) 460,719 (17,700) 681,199 Impact of education tax rule 113,278 - - - Impact of unrecognised tax losses 917,053 - - - Effect of tax exemption - Netherlands - (4,848,359) - (4,848,359) Effect of pioneer status (Note 14.8.1) (6,245,575) - (6,245,575) - Recognition of previously unrecognised deductible temporary differences (Note 14.8.2) (181,697) - (3,968,000) - Impact of capital gains tax 84,876 116,326 84,876 116,326 Share of profit of equity accounted investees - 35,915 - 35,915 Impact of changes in pioneer status - 6,670,167 - 6,670,167 Effect of lower tax rates in South Africa 350,702 - - - Income tax (credit)/expense recognised In profit or loss (10,706,502) 281,460 (11,550,347) 5,837,763
Effective tax rate 55% -1% 156% -82%
NOTES TO THE CONSOLIDATED AND SEPARATE FINANCIAL STATEMENTS for the year ended 31 December 2018
96

97
N'000
31 Dec 2017
31 Dec 2017
N'000 N'000
31 Dec 2018
31 Dec 2018
N'000
N'000
31 Dec 2017
31 Dec 2017
N'000 N'000
31 Dec 2018
Group Company
31 Dec 2018
N'000
N'000
31 Dec 2017
31 Dec 2017
N'000 N'000
31 Dec 2018
31 Dec 2018
N'000
N'000
31 Dec 2017
31 Dec 2017
N'000 N'000
31 Dec 2018
Group Company
31 Dec 2018
N'000
14.4 Income tax recognised in other comprehensive income
Deferred tax arising on: Remeasurement of defined benefit obligation (54,401) (96,854) (17,700) (58,384) 14.5 Current tax asset
At 1 January 917,797 487,279 - - Charge for the year Company income tax (309,334) (209,878) - - Prior year over-provision - (16,228) - - Charge for the year (309,334) (226,106) - - Payments during the year 83,836 203,127 - - Exchange rate difference (34,008) 453,497 - - At 31 December 658,291 917,797 - - 14.6 Current tax liabilities
Balance at 1 January 3,251,525 1,311,906 1,544,949 363,625 Transfer through internal merger - - - 271,163 Charge for the year: Company income tax 841,754 1,177,335 - - Education tax 113,278 935,459 - 821,406 Capital gains tax 84,876 116,326 84,876 116,326 Minimum tax - 287,672 - 287,672 Reclassification to non-income tax liabilities (1,287,527) - (841,319) - 3,003,906 3,828,698 788,506 1,860,192 Payment during the year (1,803,650) (568,930) (587,307) (307,000) Withholding tax utilised (44,025) (8,243) - (8,243) At 31 December 1,156,231 3,251,525 201,199 1,544,949 14.7 In the statement of cash flows, Income taxes paid comprise:
Current income tax asset paid (Note 14.5) (83,836) (203,127) - - Current income tax liabilities paid (Note 14.6) (1,803,650) (568,930) (587,307) (307,000) Total current income taxes paid (1,887,486) (772,057) (587,307) (307,000) 14.8 Deferred taxation The analysis of deferred tax assets/(liabilities) is as follows:
NOTES TO THE CONSOLIDATED AND SEPARATE FINANCIAL STATEMENTS for the year ended 31 December 2018

98
Deferred tax liabilities/(assets): At 1 January2017
Arising fromreorganisation
(Credit)/ charge to P/L
N'000 N'000 N'000 N'000
(Credit)/ charge to OCI
N'000
31 Dec 2017
31 Dec 2017
N'000 N'000
31 Dec 2018
Group Company
31 Dec 2018
N'000
At 1 January2018
(Credit)/ charge to P/L
(Credit)/ charge to OCI
Exchange rate
differences
At 31 December
2018N'000 N'000 N'000 N'000 N'000
Deferred tax liabilities/(assets): At 1 January2017
(Credit)/ charge to P/L
(Credit)/ charge to OCI
Exchange rate
differences
At 31 December
2017N'000 N'000 N'000 N'000 N'000
Group
Deferred tax liabilities/(assets):
Company
Deferred tax liabilities/(assets): At 1 January2018
Arising fromreorganisation
(Credit)/ charge to P/L
At 31 December
2018N'000 N'000 N'000 N'000 N'000
(Credit)/ charge to OCI
Deferred tax assets 28,720,032 17,514,432 27,950,907 16,333,384 Deferred tax liabilities (10,200,112) (11,025,943) - - Deferred tax assets net 18,519,920 6,488,489 27,950,907 16,333,384
Property, plant and equipment 24,725,234 (5,011,254) - (746,346) 18,967,634 Provisions and other liabilities (6,407,725) (3,041,388) - 124,735 (9,324,378) Unutilised tax losses (19,038,136) (5,066,123) - 527,722 (23,576,537) Employment benefit obligation (131,065) 176,953 54,401 66,931 167,220 Prepayments 83,776 (82,649) - (1,127) - Unrealised exchange differences (5,720,573) 966,714 - - (4,753,859) Total deferred tax (assets)/liabilities (6,488,489) (12,057,747) 54,401 (28,085) (18,519,920)
Property, plant and equipment 19,524,049 (455,042) - 5,656,227 24,725,234 Provisions and other liabilities (5,445,108) 389,449 - (1,352,066) (6,407,725) Unutilised tax losses (2,567,337) (15,333,984) - (1,136,815) (19,038,136) Employment benefit obligation (211,050) (41,987) 96,854 25,118 (131,065) Prepayments 38,737 8,102 - 36,937 83,776 Unrealised exchange differences (18,980,294) 13,259,721 - - (5,720,573) Total deferred tax (assets)/liabilities (7,641,003) (2,173,741) 96,854 3,229,401 (6,488,489)
Property, plant and equipment 3,756,535 - (5,193,802) - (1,437,267) Unutilised tax losses (11,684,826) - (4,088,947) - (15,773,773) Provisions and other liabilities (2,699,231) - (3,082,116) - (5,781,347) Unrealised exchange differences 5,511,209) - 552,689 - (4,958,520) Employment benefit obligation (194,653) - 176,953 17,700 - Total deferred tax (assets)/liabilities (16,333,384) - (11,635,223) 17,700 (27,950,907)
Property, plant and equipment 19,400,045 (16,958,882) 1,315,372 - 3,756,535 Unutilised tax losses (69,671) (1,504,625) (10,110,530) - (11,684,826) Provisions and other liabilities (1,736,816) (1,230,691) 268,276 - (2,699,231) Unrealised exchange differences 581,825 (19,561,934) 13,468,900 - (5,511,209) Post employment benefit obligation (144,050) (67,000) (41,987) 58,384 (194,653) Total deferred tax liabilities/(assets) 18,031,333 (39,323,132) 4,900,031 58,384 (16,333,384)
NOTES TO THE CONSOLIDATED AND SEPARATE FINANCIAL STATEMENTS for the year ended 31 December 2018
At 31 December
2017N'000

99
N'000
31 Dec 2017
N'000
31 Dec 2018
N'000
31 Dec 2017
N'000
31 Dec 2018
Group Company
Deferred tax assets are recognised to the extent that it is probable that taxable profit will be available against which the
deductible temporary differences and unutilised tax losses can be utilised. The Group has unrecognised deferred tax asset of approximately N3.8 billion (2017: Nil) arising mainly from unutilised tax deductible capital allowances on property, plant and equipment and unutilised tax losses. The deferred tax asset has not been recognised in current year in the financial statements due to the uncertainties relating to the amount and timing of future taxable profits. This amount is available for offset against future income tax liabilities and can be carried forward indefinitely.
14.8.1 Pioneer status incentive Included in the deferred tax asset is an amount of N6.2 billion arising from the pioneer tax relief granted on one of the
Company's production lines in Mfamosing Plant. The Company was granted a pioneer tax status for 3 years with an effective production date from 1 January 2018 duly certified by the relevant regulatory authority via a letter dated 15 March 2019, which formed the basis of the deferred tax computation. The Company thereby recognized the resulting additional deferred tax asset of N6.2 billion in the books.
14.8.2 Road tax credit The Company has further recognised an additional deferred tax asset of N3.2billion arising from the cost of the
Company's evacuation road impaired in prior year. The impairment expense which was previously disallowed for tax purposes has now been treated as tax deductible which resulted in the additional deferred tax asset recognised in the books. This treatment is based on a letter which the Company has obtained from the Federal Inland Revenue Service (FIRS) confirming that the cost can be treated as a tax deductible expense and amortized over a period of seven (7) years, pending a tax audit by the FIRS to verify the expense incurred by the Company as well as certification of the cost by the Federal Ministry of Power, Works and Housing.
15 Loss before minimum tax
Loss before minimum tax is stated after charging/(crediting): (19,508,228) (34,032,277) (7,408,583) (7,098,191) Depreciation of property, plant and equipment (Note 16) 22,288,279 22,181,159 16,369,888 16,304,267 Amortisation and impairment of intangible assets (Note 7) 494,990 392,693 2,280 - Impairment of property, plant and equipment (Note 16) 925,207 19,178,254 219,000 12,394,270 Write off of assets (Note 11) 956,511 800,720 304,398 383,812 Directors emoluments (Note 39.7) 548,482 336,838 548,482 336,838 Audit fees (Note 9) 206,640 221,264 98,500 85,000 Technical service fees (Note 9) 9,338,888 9,774,168 5,816,679 5,078,844 Gain on disposal of PPE (Note 10) 936,326 2,373,837 926,622 2,321,399 Foreign exchange loss/(gain) (Note 12b) 8,446,386 13,475,507 8,147,195 12,342,523 Interest income on current account (Note 12a) 798,754 1,324,165 798,754 1,047,462 Impairment of investment in Subsidiaries (Note18.1.1) - - 3,174,874 -
NOTES TO THE CONSOLIDATED AND SEPARATE FINANCIAL STATEMENTS for the year ended 31 December 2018

Production Plant
Capitalised Spares
Furniture Motor Vehicles
Computer Equipment
Ancillary Plant & Machinery
Construction Expenditure
Total
N'000 N'000
Leasehold Land
N'000
Buildings
N'000 N'000 N'000 N'000 N'000 N'000 N'000
Cost: As at 1 January 2017 7,957,750 108,053,194 339,148,428 2,365,440 6,528,639 2,744,347 1,450,221 556,533 42,121,744 510,926,296 Capital expenditure - - 550,721 - - - - - 19,800,622 20,351,343 Construction expenditure capitalised (Note 16.1) - 1,860,054 18,977,437 2,304,142 3,774,003 209,104 153,987 457,414 (27,736,141) - Reclassification - 178,541 - - 22,901 - 1,649 357,856 (560,947) - Disposals - (1,802,191) (19,554) - (157,846) (5,894) (20,595) - - (2,006,080)Write-offs - (517,655) (207,183) - (7,747) (517,917) (1,267) - - (1,251,769)Effect of movements in exchange rates - 4,456,516 40,612,793 - 835,841 - - - 505,012 46,410,162 As at 31 December 2017 7,957,750 112,228,459 399,062,642 4,669,582 10,995,791 2,429,640 1,583,995 1,371,803 34,130,290 574,429,952
Cost: As at 1 January 2018 7,957,750 112,228,459 399,062,642 4,669,582 10,995,791 2,429,640 1,583,995 1,371,803 34,130,290 574,429,952 Capital expenditure - - - - - - - - 21,654,504 21,654,504 Transfer from inventory - - 5,362,466 1,211,285 - - - - - 6,573,751 Construction expenditure capitalised - 5,572,794 10,635,564 592,282 341,526 2,245,276 272,634 130,057 (19,790,133) - Reclassification - - - - 45,562 (45,562) - - - - Disposals (1,110) (9,099) (347,503) - (749,297) (198,162) - - - (1,305,171)Write-offs (150,182) (492,404) (553,146) (87,306) (2,657,045) (130,996) (785,110) (6,161) (458,882) (5,321,232)Effect of movements in exchange rates - (693,665) (5,769,463) - (337,581) - - - 72,744 (6,727,965)As at 31 December 2018 7,806,458 116,606,085 408,390,560 6,385,843 7,638,956 4,300,196 1,071,519 1,495,699 35,608,523 589,303,839
16. Property, plant and equipment
Group
100
NOTES TO THE CONSOLIDATED AND SEPARATE FINANCIAL STATEMENTS for the year ended 31 December 2018

Production Plant
Capitalised Spares
Furniture Motor Vehicles
Computer Equipment
Ancillary Plant & Machinery
Construction Expenditure
Total
N'000 N'000
Leasehold Land
N'000
Buildings
N'000 N'000 N'000 N'000 N'000 N'000 N'000
Accumulated depreciation and impairment losses: As at 1 January 2017 3,674,163 17,560,487 89,508,679 1,267,225 4,763,802 2,599,559 1,055,561 256,004 - 120,685,480 Charge for the year 411,161 3,210,468 15,819,837 523,415 1,809,362 184,276 93,401 129,239 - 22,181,159 On disposals - (1,142,990) (40,065) - (40,478) (5,894) (20,595) - - (1,250,022)Write-offs - (170,768) (68,601) - (7,703) (446,774) (1,108) - - (694,954)Impairment loss - 212,210 3,007,891 - 186,285 - - - 15,771,868 19,178,254 Effect of movements in exchange rates - 1,519,952 19,471,713 - (319,077) - - - 5,513 20,678,101 As at 31 December 2017 4,085,324 21,189,359 127,699,454 1,790,640 6,392,191 2,331,167 1,127,259 385,243 15,777,381 180,778,018 As at 1 January 2018 4,085,324 21,189,359 127,699,454 1,790,640 6,392,191 2,331,167 1,127,259 385,243 15,777,381 180,778,018 Charge for the year 239,762 3,382,529 16,219,591 765,515 1,260,489 224,111 94,156 102,126 - 22,288,279 On disposals - (5,586) (340,261) - (727,498) (198,162) - - - (1,271,507)Write-offs (27,293) (99,718) (489,648) (87,306) (2,657,045) (130,996) (785,110) (6,161) - (4,283,277)Impairment loss - - 498,971 - - - - - 426,236 925,207 Effect of movements in exchange rates - (280,991) (3,121,094) - (215,098) - - - (4,462) (3,621,645)As at 31 December 2018 4,297,793 24,185,593 140,467,013 2,468,849 4,053,039 2,226,120 436,305 481,208 16,199,155 194,815,075 Carrying amount As at 31 December 2018 3,508,665 92,420,492 267,923,547 3,916,994 3,585,917 2,074,076 635,214 1,014,491 19,409,368 394,488,764 At 31 December 2017 3,872,426 91,039,100 271,363,188 2,878,942 4,603,600 98,473 456,736 986,560 18,352,909 393,651,934
Group
101
NOTES TO THE CONSOLIDATED AND SEPARATE FINANCIAL STATEMENTS for the year ended 31 December 2018

Production Plant
Capitalised Spares
Furniture Motor Vehicles
Computer Equipment
Ancillary Plant & Machinery
Construction Expenditure
Total
N'000 N'000
Leasehold Land
N'000
Buildings
N'000 N'000 N'000 N'000 N'000 N'000 N'000
As at 1 January 2017 2,370,573 3,021,987 137,112,353 2,365,440 2,430,011 1,322,156 1,450,221 556,533 5,163,670 155,792,944 Capital expenditure - - 550,721 - - - - - 11,984,645 12,535,366 Construction expenditure capitalised - 1,203,917 19,607,018 2,304,142 9,412 163,670 152,338 99,557 (23,540,054) - Internal merger through business combinations 5,436,994 74,973,776 126,621,618 - 2,352,169 897,922 119,428 - 28,144,907 238,546,814 Disposals - (1,802,191) (5,388) - (43,737) (5,894) (20,595) - - (1,877,805)Write-offs - (517,655) (207,183) - (7,747) (517,917) (1,267) - - (1,251,769) - As at 31 December 2017 7,807,567 76,879,834 283,679,139 4,669,582 4,740,108 1,859,937 1,700,125 656,090 21,753,168 403,745,550
Cost: As at 1 January 2018 7,807,567 76,879,834 283,679,139 4,669,582 4,740,108 1,859,937 1,700,125 656,090 21,753,168 403,745,550 Capital expenditure - - - - - - - - 10,512,487 10,512,487 Construction expenditure capitalised - 2,774,466 7,282,876 592,282 26,034 2,084,519 272,634 130,057 (13,162,868) - Transfer from Inventory - - 5,362,466 - - - - - - 5,362,466 Disposals (1,110) (8,967) (131,743) - (477,846) (157,758) - - - (777,424) Write-offs - - (472,719) (87,306) (2,465,186) (125,796) (785,110) (6,161) (369,037) (4,311,315) As at 31 December 2018 7,806,457 79,645,333 295,720,019 5,174,558 1,823,110 3,660,902 1,187,649 779,986 18,733,750 414,531,764
16. Property, plant and equipment
Company
NOTES TO THE CONSOLIDATED AND SEPARATE FINANCIAL STATEMENTS for the year ended 31 December 2018
102

Production Plant
Capitalised Spares
Furniture Motor Vehicles
Computer Equipment
Ancillary Plant & Machinery
Construction Expenditure
Total
N'000 N'000
Leasehold Land
N'000
Buildings
N'000 N'000 N'000 N'000 N'000 N'000 N'000
Accumulated depreciation and impairment losses: As at 1 January 2017 19,171 1,033,734 34,081,776 1,267,225 2,359,612 1,102,561 1,055,561 256,004 - 41,175,644 Internal merger through business combinations 3,614,460 10,784,642 26,461,517 - 1,048,764 891,741 107,655 - - 42,908,779 Charge for the year 400,916 2,160,386 12,747,784 523,415 81,807 171,010 89,710 129,239 - 16,304,267 Impairment loss - - - - - - - - 12,394,270 12,394,270 Disposals - (1,142,990) (5,278) - (40,478) (5,894) (20,595) - - (1,215,235)Write-offs - (170,768) (68,601) - (7,703) (446,774) (1,108) - - (694,954)As at 31 December 2017 4,034,547 12,665,004 73,217,198 1,790,640 3,442,002 1,712,644 1,231,223 385,243 12,394,270 110,872,771
As at 1 January 2018 4,034,547 12,665,004 73,217,198 1,790,640 3,442,002 1,712,644 1,231,223 385,243 12,394,270 110,872,771 Charge for the year 235,623 2,312,814 12,304,820 493,297 596,786 202,436 93,550 130,562 - 16,369,888 Impairment loss - - 219,000 - - - - - - 219,000 Disposals - (5,455) (131,056) - (477,846) (157,758) - - - (772,115)Write-offs - - (466,289) (87,306) (2,465,186) (125,796) (782,774) (6,161) - (3,933,512)As at 31 December 2018 4,270,170 14,972,363 85,143,673 2,196,631 1,095,756 1,631,526 541,999 509,644 12,394,270 122,756,032 Carrying amount As at 31 December 2018 3,536,287 64,672,970 210,576,346 2,977,927 727,354 2,029,376 645,650 270,342 6,339,480 291,775,732 At 31 December 2017 3 ,773,020 64,214,830 210,461,941 2,878,942 1,298,106 147,293 468,902 270,847 9,358,898 292,872,779
NOTES TO THE CONSOLIDATED AND SEPARATE FINANCIAL STATEMENTS for the year ended 31 December 2018
103

1
Group Company 31 Dec
201831 Dec
201731 Dec
2017N'000
31 Dec 2018
N'000 N'000 N'000
Group Company 31 Dec
201831 Dec
201731 Dec
2017N'000
31 Dec 2018
N'000 N'000 N'000
Group Company 31 Dec
201831 Dec
201731 Dec
2017N'000
31 Dec 2018
N'000 N'000 N'000
Buildings 167,956 3,504,585 167,956 1,856,976 Production Plant 19,196,061 14,734,316 6,155,125 7,387,913 Computer Equipment 49,670 114,008 16,399 114,009 19,413,687 18,352,909 6,339,480 9,358,898
16.2 Reconciliation of acquisition of property. plant and equipment in the statements of cash flows:
Acquisition of property, plant and equipment 21,654,504 20,351,343 10,512,487 12,535,366 Property, plant and equipment accrual - (5,072,849) - (2,175,311) Reclassification from deferred revenue (Note 32) 190,047 - - - Property, plant and equipment paid in the statement of cash flows 21,844,551 15,278,494 10,512,487 10,360,055 16.3 Impairment of exploration and evaluation costs
The Group recognised an impairment loss on Exploration and Evaluation cost relating to coal and limestone drilling project in AshakaCem plant. The total impairment charge of N426 million has been recognised as at 31 December 2018 (2017: Nil)
16.4 Impairment of property plant and equipment from mothballed sites
As a result of the restructuring and the close down of some sites in the South African operations of Lafarge Africa Plc in 2017, management has recorded an impairment of N279 million on assets from the mothballed sites in the current year. Total value of impaired assets written off in South Africa amounted to N279 million as at 31 December 2018 (2017: Nil)
16.5 Impairment of Crusher in Mfamosing plant
As at 31 December 2018, the Group has expended N219 million on Mfamosing crusher from Eastern Nigerian operations in Calabar. The company installed a new crusher in its Mfamosing plant, leading to the idleness of the existing crusher. The Company carried out an impairment assessement of the Crusher and an impairment charge of N219 million, which represents the cost of relocation and installation of the crusher at the AshakaCem Plant, has been recognised as at 31 December 2018.
16.6 Assets pledged as security
The Group has no assets pledged as security as at 31 December 2018 (2017: Negative pledge on assets amounting with NBV of N195.5 billion)
16.7 Construction work in progress and Capital commitments
For capital commitments, refer to Note 36. Construction work in progress are the Group's projects on maintaining and developing plants and the office structure
16.8 Capitalised borrowing costs
No borrowing costs were capitalised during the year (2017:Nil)
16.9 Depreciation
Depreciation for the year has been charged as follows:
Cost of sales 21,649,458 21,447,285 16,265,935 15,815,377
Administrative expenses 638,821 733,874 103,953 488,890 22,288,279 22,181,159 16,369,888 16,304,267
NOTES TO THE CONSOLIDATED AND SEPARATE FINANCIAL STATEMENTS for the year ended 31 December 2018
104
16.1 Property, plants and equipment under constructions
Capitalised work in progress at the end of the year is analysed as follows;

Group 17 Intangible assets
Cost Balance at 1 January 2017 2,914,806 - 2,914,806 Additions 228,192 - 228,192 Effect of movements in exchange rates 1,959,343 - 1,959,343 Balance at 31 December 2017 5,102,341 - 5,102,341 Balance at 1 January 2018 5,102,341 - 5,102,341 Additions 1,106,247 3,114,037 4,220,284 Effect of movements in exchange rates (313,523) (313,523) Balance at 31 December 2018 5,895,065 3,114,037 9,009,102 Accumulated Amortisation Balance at 1 January 2017 1,351,307 - 1,351,307 Charge for the year 166,023 - 166,023 Impairment 226,670 226,670 Effect of movements in exchange rates 724,015 - 724,015 Balance at 31 December 2017 2,468,015 - 2,468,015 Balance at 1 January 2018 2,468,015 - 2,468,015 Charge for the year 494,990 - 494,990 Effect of movements in exchange rates (148,421) - (148,421) Balance at 31 December 2018 2,814,584 - 2,814,584 Carrying amount At 31 December 2018 3,080,481 3,114,037 6,194,518 At 31 December 2017 2,634,326 - 2,634,326
Balance at 1 January 2017 - - - Additions - - - Balance at 31 December 2017 - - - Balance at 1 January 2018 - - - Additions 92,748 3,114,037 3,206,785 Balance at 31 December 2018 92,748 3,114,037 3,206,785 Accumulated Amortisation Balance at 1 January 2017 - - - Charge for the year - - - Balance at 31 December 2017 - - -
Balance at 1 January 2018 - - - Charge for the year 2,280 - 2,280 Balance at 31 December 2018 2,280 - 2,280 Carrying amount At 31 December 2018 90,468 3,114,037 3,204,505 At 31 December 2017 - - - Intangible assets represents mineral rights and computer software in the Group's operations. The Work in Progress in the
Company's books represent the cost of computer software, (SAP), which was in development state at the end of the year. Ammortisation of intangible assets is included in Note 15.
NOTES TO THE CONSOLIDATED AND SEPARATE FINANCIAL STATEMENTS for the year ended 31 December 2018
1105
Total
N'000 N'000 N'000
Intangibleassets
Work in progress
Total
N'000 N'000
Work in progress
Company
N'000
Intangibleassets

1
Place of Incorporation
Principal activities
Proportion
%
Place of Incorporation
Principal activities
N'000
Cost
18 Interests in other entities 18.1 Investment in subsidiaries
The Group's principal subsidiaries at 31 December 2018 are set out below. Unless otherwise stated, they have share capital consisting solely of ordinary shares that are held directly by the Group, and the proportion of ownership interests held equals the voting rights held by the Group. The place of incorporation is also their principal place of business.
31 December 2018 Name of entity Lafarge Ready Mix Nigeria Limited Aggregate and Concrete Nigeria 100 50,000 Lafarge South Africa Holdings (PTY) Limited (Note 18.1.1) Building Materials South Africa 100 114,966,665
Ashaka Cement Limited Cement Nigeria 100 63,896,867 Wapsila Nigeria Limited Power Generation and Sale Nigeria 100 10,000 178,923,532 31 December
2017 Name of entity Lafarge Ready Mix Nigeria Aggregate Limited and Concrete Nigeria 100 50,000 Lafarge South Africa Holdings (PTY) Building
Limited Materials South Africa 100 118,141,539
Ashaka Cement Limited Cement Nigeria 100 63,896,867 182,088,406 18.1.1 Impairment of investment in LSAH
Proportion
% N'000
Cost
NOTES TO THE CONSOLIDATED AND SEPARATE FINANCIAL STATEMENTS for the year ended 31 December 2018
1106
Investments in Subsidiaries is carried at cost less impairment in the accompanying separate financial statements of the Company. The cost of the Company’s investment in Lafarge South Africa Holdings (LSAH), a subsidiary of the Company, was N118 billion (2017: N118 billion). LSAH was identified and assessed by management as a separate Cash Generating Unit (CGU).
LSAH has continued to incur operating losses such that the carrying value of the Company's investment in this entity materially exceeds the entity’s net assets. Consequently, management performed an assessment at the end of the reporting period to determine whether the Investment in LSAH may be impaired.
Management has estimated the recoverable amount of the CGU based on its fair value less costs of disposal which was significantly higher than its value-in-use.
Management determined the fair value of the investment to be the negotiated and agreed sales price in respect of the planned disposal of the total equity interest held by the Company in LSAH to Caricement B.V., a related party within the LafargeHolcim Group, based on an agreed Term sheet between both parties (See subsequent events Note 40.3 for further details on the sales transaction).
The fair value as at 31 December 2018 has been calculated based on the sales price of USD 316,289,061 translated to Naira at the exchange rate prevailing as at the reporting date as further analysed below:
31 December 2018 Fair Value in USD 316,289,061Exchange Rate 364.18Fair Value in Naira 115,186,150,235Costs of disposal (219,485,000)Recoverable amount 114,966,665,235
The impact of fluctuations in exchange rates between the reporting date and the effective date of the transaction on the fair value is shown below:Increase in exchange rate by 2% 2,303,723,005 Decrease in exchange rate by 2% (2,303,723,005)

Group Company
N'000
31 Dec 2018
N'000
31 Dec 2017
N'000
31 Dec 2018
N'000
31 Dec 2017
N'000
31 Dec 2018
N'000
31 Dec 2017
NOTES TO THE CONSOLIDATED AND SEPARATE FINANCIAL STATEMENTS for the year ended 31 December 2018
Group Company
N'000
31 Dec 2018
N'000
31 Dec 2017
N'000
31 Dec 2017
N'000
31 Dec 2018
Investment in LSAH (Note 18.1.1) Opening balance - - 118,141,539 118,141,539 Impairment loss (Note13) - - (3,174,874) - Net investment in LSAH - - 114,966,665 118,141,539 18.2 Investment in joint ventures
Investment in Qala (Note 18.2.1) Opening balance - 16,418 - - Share of loss - (28,027) - - Exchange difference in OCI - 11,609 - - - - - - Investment in CBI Ghana (Note18.2.2) Opening balance - 73,133 - 73,133 Share of loss - (112,236) - (112,236) Exchange difference in OCI - 39,103 - 39,103 - - - - Total interest in joint venture Opening balance - 89,551 - 73,133 Share of loss - (140,263) - (112,236) Exchange difference in OCI - 50,712 - 39,103 - - - - 18.2.1 Investment in Qala
The Group has a 50% interest in Qala, a joint venture involved in aggregate business, located in South Africa. The Group's interest in Qala is accounted for using the equity method in the consolidated financial statements. Information on the aggregate amount of its share of the joint venture's profit or loss and other comprehensive income is
set out below: Summarised statement of financial position of Qala Resources (pty) Limited: Current assets (including cash and cash equivalent and prepayments) 434,305 153,135 Non current assets 429,681 400,156 Current liabilities, including tax payable (505,703) (68,222) Non-current liabilities (422,831) (481,214) Net (liabilities)/asset (100%) (64,548) 3,855 Group's carrying amount of the investment / share of net assets (50%) (32,274) 1,928
11107
The carrying amount of the CGU exceeded the estimated recoverable amount by N3.2 billion (2017: Nil) and accordingly, the Company has recorded an impairment loss to adjust the carrying amount of its investment in subsidiary to the recoverable amount as shown below.

N'000
31 Dec 2018
N'000
31 Dec 2017
NOTES TO THE CONSOLIDATED AND SEPARATE FINANCIAL STATEMENTS for the year ended 31 December 2018
N'000
31 Dec 2018
N'000
31 Dec 2017
Summarised statement of comprehensive income of Qala Resources (pty) Limited: Revenue 661,470 525,988 Cost of sales (352,743) (562,060) Administrative expenses (421,427) (311) Other operating income 19,432 12,616 Other operating expenses (67,254) (1,614) Finance income 2,542 1,875 Finance costs (23) (2,637) Loss before tax (158,003) (26,143)
Income tax expense 27,693 (57,718) Loss for the year (130,310) (83,861) Other comprehensive income, net of tax Exchange differences on translation 9,284 23,218 Other comprehensive income, net of tax 9,284 23,218
Total comprehensive loss (100%) (121,026) (60,643) Group's share of loss for the year (50%) (65,155) (41,931) Group's share of other comprehensive loss, net of tax for the year (50%) 4,642 11,609 Total comprehensive loss (50%) (60,513) (30,322) Group's unrecognised share of loss for the year - (13,904) Group's recognised share of loss for the year (65,155) (28,027) (65,155) (41,931)
The Group has recognised share of losses from its joint venture, Qala Resources, for the period against receivables from the Joint venture contributing the loss to the business. In prior year, the group did not recognise share of losses for the period that exceeds its carrying amount on the investment. The cumulative unrecognised share of loss as at 31st December 2018 is nil (2017: N13.9 million).
18.2.2 Investment in joint venture - Continental Blue Investment, Ghana
The Group has a 35% interest in Continental Blue Investment (CBI), a Company involved in development, financing and operation of a cement grinding plant in Ghana. The Group and Company's interest in CBI is accounted for using the equity method in the consolidated and separate financial statements. Information on the aggregate amount of its share of the joint venture's profit or loss and other comprehensive income is set out below:
Summarised statement of financial position of Continental Blue Investment, Ghana:
Current assets (including cash and cash equivalent and prepayments) 2,253,198 1,427,375 Non current assets 14,278,044 7,826,325 Current liabilities, including tax payable (3,377,188) (5,357,556) Non-current liabilities 13,937,950 (4,155,302) Net assets (100%) 27,092,004 (259,158) Group's carrying amount of the investment / share of net assets/(liabilities) (35%) 9,482,201 (90,705)
Summarised statement of comprehensive income of Continental Blue Investment, Ghana:
Revenue 3,566,158 1,579,515 Cost of sales (3,917,599) (1,671,131) Other operating income 38,888 5,147 Operating expenses (323,773) (407,219) Loss before tax (636,326) (493,688) Income tax expense - - Loss for the year (636,326) (493,688) Other comprehensive income, net of tax Exchange differences on translation 62,217 111,722 Other comprehensive income, net of tax 62,217 111,722 Total comprehensive loss (100%) (574,109) (381,966) Share of loss for the year (35%) (222,714) (172,791) Share of other comprehensive income, net of tax for the year (35%) 21,776 39,103 Total comprehensive loss (35%) (200,937) (133,688) Company's unrecognised share of loss (222,714) (60,555) Company's recognised share of loss - (112,236) (222,714) (172,791)
N'000
31 Dec 2018
N'000
31 Dec 2017
11108

2018 2017
N'000
31 Dec 2018
N'000
31 Dec 2017
N'000
31 Dec 2018
N'000
31 Dec 2017
N'000
31 Dec 2018
N'000
31 Dec 2017
Group Company
The Company did not recognise share of losses for the period that exceeds its carrying amount on the investment. The cumulative unrecognised share of loss as at 31st December 2018 is N222.7 million. (2017: N60.6 million). 18.3 Disclosure of Entity with Non- Controlling Interest within the group Summary of financial position and performance of Ash Resources (Pty ) Ltd as at 31 December 2018 is shown below: Name Country of incorporation and operation Ash Resources Pty Ltd South Africa NCI Percentage 25.00% 0.00% Summarised Statement of financial position
Non-current assets 1,234,267 1,426,271 Current assets 2,748,928 2,363,610 Non-current liabilities (666,385) (1,036,148) Current liabilities (1,667,374) (2,024,031)
Net Assets 1,649,436 729,702 Net Assets attributable to NCI 412,359 -
Summarised Statement of comprehensive income
Revenue 7,950,642 8,722,876
Profit 1,184,753 624,096 Other Comprehensive income/(loss) 36,536 15,587 Total Comprehensive Income 1,221,289 639,683 Profit allocated to NCI 296,188 - OCI allocated to NCI 9,134 -
305,322 - Summarised Statement of Cash Flows Net cashflows from operating activities 837,465 875,201 Net cashflows from investing activities 56,129 (154,311) Net cashflows from financing activities (763,463) (710,002) Net increase or decrease in Cash and Cash equivalent 130,131 10,888 The Principal activity of the company is the processing and sale of fly ash into the local and export markets. In June 2018,
the minority shareholders of Ash Resources fully repaid the loan attached to the acquisition of the shares of the company. From this date the ownership has been recognised due to the condition precedent having been met. The minority shareholders, Peotona Group Holdings, own 25% of the company.
Prior year non-controlling interest represents the interest of non-members of the Group in AshakaCem Ltd and Caricement BV in NCH as at 2017.
19 Other financial assets
Non-current: Available for sale assets (Note 19.1) 166,091 11,471 - - Other financial assets (Note 19.2) 1,135,057 1,571,151 1,134,509 1,556,738 1,301,148 1,582,622 1,134,509 1,556,738 Current: Other financial assets (Note 19.3) 1,140,956 592,538 605,230 326,635 2,442,104 2,175,160 1,739,739 1,883,373 19.1 Available for sale assets
Unquoted entities Business Partners Limited 164,697 11,124 Pietersburg Mixed Concrete (Proprietary) Limited 1,170 267 Rand Park Golf Club 224 80 166,091 11,471
NOTES TO THE CONSOLIDATED AND SEPARATE FINANCIAL STATEMENTS for the year ended 31 December 2018
109
N'000
31 Dec 2018
N'000
31 Dec 2017

N'000
31 Dec 2018
N'000 Assets
N'000 N'000
Company
Liabilities Assets Liabilities
N'000
31 Dec 2018
N'000
31 Dec 2017
N'000
31 Dec 2018
N'000
31 Dec 2017
Group Company
N'000
31 Dec 2018
N'000 Assets
Group
Liabilities
N'000
31 Dec 2018
N'000
31 Dec 2017
N'000
31 Dec 2018
N'000
31 Dec 2017
Group Company
NOTES TO THE CONSOLIDATED AND SEPARATE FINANCIAL STATEMENTS for the year ended 31 December 2018
1110
31 Dec 2017
N'000 N'000
31 Dec 2017Assets Liabilities
These are the Group's investments in a number of businesses across South Africa. They are owned and managed by Lafarge
South Africa Holdings. All Group's investment in unquoted equities are classified as available for sale instruments and are carried at cost because their fair values cannot be measured reliably. There were therefore no gains or losses recognised in other comprehensive income.
19.2 Other financial assets - Non current
Loan to CBI Ghana (Note 19.2.1) 1,134,509 1,370,832 1,134,509 1,370,832 Receivable from third parties 548 200,319 - 185,906 1,135,057 1,571,151 1,134,509 1,556,738 19.2.1 Loan to CBI Ghana Included in loan receivable from CBI Ghana is USD1.39 million loan granted by Lafarge Africa Plc to CBI Ghana in October,
2016 for the development of its grinding and related activities. The loan was given at an interest rate of LIBOR 12Months + 11% (per annum) and the loan is expected to be repaid within a period of seven years with a moratorium period of two years from draw down date on October 6, 2016. The loan has been converted at NAFEX rate as at the reporting period. The non-current portion of the loan including interest is valued at N1.13 billion. The interest is repaid monthly.
19.3 Other financial assets - Current
Staff loans - 15,334 - 15,334 Short term receivables 535,726 362,406 - 96,503
Loan to CBI Ghana (Note 19.3.1) 605,230 214,798 605,230 214,798 1,140,956 592,538 605,230 326,635 19.3.1 Loans to CBI Ghana This represents the current portion of the USD1.39 million loan granted to CBI, Ghana in October, 2016 for the development
of its grinding and related activities. The loan was given at an interest rate of LIBOR 12 Months + 11% (per annum) and the loan was expected to be repaid within a period of seven years with a moratorium period of two years commencing on October 6, 2016. The loan has been converted at NAFEX rate as at 31st December 2018. The interest is repaid monthly.
20 Derivative financial instruments
The Group/Company's derivative financial instruments arose from Non-deliverable foreign exchange forward (NDF) contracts with commercial banks that were yet to mature as at reporting date, and includes:
Caricement B.V 95,573 244,176 135,286 4,212,406 Holderfin B.V - - 504,805 -
95,573 244,176 640,091 4,212,406
Caricement B.V 95,573 244,176 135,286 4,212,406 Holderfin B.V - - 504,805 - 95,573 244,176 640,091 4,212,406 The Group/Company's derivative asset and liability represents the fair value change on Non-Deliverable Forward (NDF)
contracts with the intention of hedging against exchange rate volatility of loans received from Caricement B.V which is a related party. At the end of the year, the company had a total payable of USD 315 million payable to Caricement B.V. See note 30
The full fair value of a derivative is classified as a non-current asset or liability if the remaining maturity of the derivative is more than 12 months and, as a current asset or liability, if the maturity of derivative is less than 12 months.

Derivative Net Assets
N’000
Derivative Net Liability
N’000
Group Company
N'000
31 Dec 2018
N'000
31 Dec 2017
N'000
31 Dec 2018
N'000
31 Dec 2017
The fair value of the futures and forward contracts have been determined using market-related input as follows:* Exchange rate of N364.18/ USD (NAFEX year end rate)* Average discount rate of 15.51% determined based on the NIBOR and LIBOR rates.* The value of the forward is the discounted value of the cash flow to be obtained using the difference between the
strike price and the estimated foreign exchange rate at maturity date
There are no significant unobservable inputs, thus the valuation is categorised as level 2 in the fair value hierarchy. Holding all other variables constant, a change by 100 basis point in the NIBOR, LIBOR and 1000 basis point in exchange rates will result in the following variations in the derivative assets and liabilities;
Base derivative liability/asset 95,573 244,176 100 basis point increase in NIBOR Rates 8,713 - 100 basis point increase in USD LIBOR Rates (10,932) - 100 basis point decrease in NIBOR Rates (37,479) (12,487) 100 basis point decrease in USD LIBOR Rates 11,040 - 1000 basis point increase in Exchange Rates 36,588,112 - 1000 basis point decrease in Exchange Rates (90,994) (27,560,708) 21 Other assets
Non current 16,671,760 20,803,113 15,073,457 14,984,747 Current 10,594,409 15,162,092 8,661,903 10,679,505 27,266,169 35,965,205 23,735,360 25,664,252 Advance payment to suppliers 2,501,059 3,960,699 1,863,729 2,820,447 Prepaid medical - 23,293 - 23,293 Deferred charges 9,600 16,188 9,600 16,188 Prepayment for Gas (Note 21.1) 11,798,702 9,833,096 11,798,702 9,833,096 Rental lease 709,244 709,244 - - Prepaid rent 699,196 581,164 558,542 510,291 Prepaid insurance 317,846 297,719 207,883 221,161 Prepaid expenses 1,061,477 1,087,127 1,041,331 536,960 Advance payment to transporters (Note 21.2) 5,939,989 8,538,932 5,939,989 8,538,932 Advance payment of taxes and levies (Note 9.1) 936,676 1,052,287 936,676 1,052,287 Letters of credit 1,573,750 7,645,483 - - Long term prepayments - 34,232 - 34,232 Deposit for imports 1,378,908 2,077,365 1,378,908 2,077,365 Other assets 339,722 108,376 - - 27,266,169 35,965,205 23,735,360 25,664,252
21.1 Prepayment for Gas The Company has a contract with a vendor for gas supply which has a take or pay clause. The prepayment for gas
relates to payment made for unutilised gas as at end of the year. The contract is for a period of 20 years from 2012 to 2032 and the company is entitled to utilise the amount prepaid anytime within the contract period with an extension of 2years after the expiration of the contract.
Subsequent to year end, an amount of N2.1billion which was in dispute with the gas vendor as at year end was settled sequel to resolution of the dispute through expert determination. If this payment had been made before the end of the year, the prepayment for gas balance would have increased to N13.9billion, this would have also led to a corresponding reduction in cash and cash equivalent by N2.1billion.
NOTES TO THE CONSOLIDATED AND SEPARATE FINANCIAL STATEMENTS for the year ended 31 December 2018
1111

Group Company
N'000
31 Dec 2018
N'000
31 Dec 2017
N'000
31 Dec 2018
N'000
31 Dec 2017
N'000
31 Dec 2018
Group Company
N'000
31 Dec 2017
N'000
31 Dec 2018
N'000
31 Dec 2017
21.2 Advance payment to transporters
In 2017, the Group and Company made an advance payment of N9.1 billion naira to different transporters for the transportation of cement from its plant located in Mfamosing, Calabar to different destinations. The amount advanced is utilized on a monthly basis through the provision of haulage service by the transporters. The agreement with the various transporters span between 10 - 39 months. As at year end, the balance yet to be utilised by the Group and Company amounted to N5.9 billion (2017: N8.5 billion).
22 Inventories
Raw materials 10,493,583 12,702,259 9,139,734 10,653,843 Work in progress 11,480,616 10,860,537 601,308 435,337 Finished goods 9,070,787 12,357,522 8,539,220 11,787,460 Spare parts 12,937,064 19,115,915 8,951,553 14,146,953 Other supplies (Note 22.1) 3,174,471 3,230,233 1,689,652 2,034,238 47,156,521 58,266,466 28,921,467 39,057,831 The cost of inventories recognised as an expense during the year and included in 'cost of sales' was N52.7 billion (2017:
N59.7 billion) and N34.7 billion (2017: N35.9 billion) for the Group and Company respectively.
Inventory write down recognised during the year was N1.3 billion (2017: N1.62 billion) and N820 million (2017: N1.12 billion) for the Group and Company respectively.
Inventory write off recognised during the year was N973 million (2017: N293 million) for the Group and Company respectively.
22.1 Other supplies
Other supplies consists of safety equipment, packaging materials and production materials.
23 Trade and other receivables
Trade receivables: Third party sales 14,321,302 20,123,998 2,070,277 2,458,322 Related party sales (Note 39.4) - 814,668 204,722 1,301,250 14,321,302 20,938,666 2,274,999 3,759,572 Impairment on trade receivables (Note 23.3) (764,220) (954,963) (149,573) (127,621) Net trade receivables 13,557,082 19,983,703 2,125,426 3,631,951 Other receivables 5,950,565 3,479,803 4,608,588 1,411,158 Due from related parties (Note 39.5) 1,656,347 1,646,610 4,433,691 10,887,861 7,606,912 5,126,413 9,042,279 12,299,019 Net other receivables 7,606,912 5,126,413 9,042,279 12,299,019
Total trade and other receivables 21,163,994 25,110,116 11,167,705 15,930,970
The Group and Company's exposure to credit and foreign exchange risks related to trade and other receivables are disclosed in Note 4.
NOTES TO THE CONSOLIDATED AND SEPARATE FINANCIAL STATEMENTS for the year ended 31 December 2018
1112

Group Company
N'000
31 Dec 2018
N'000
31 Dec 2017
N'000
31 Dec 2018
N'000
31 Dec 2017
Group Company
N'000
31 Dec 2018
N'000
31 Dec 2017
N'000
31 Dec 2018
N'000
31 Dec 2017
Group Company
N'000
31 Dec 2018
N'000
31 Dec 2017
N'000
31 Dec 2018
N'000
31 Dec 2017
Group Company
N'000
31 Dec 2018
N'000
31 Dec 2017
N'000
31 Dec 2018
N'000
31 Dec 2017
Group Company
N'000
31 Dec 2018
N'000
31 Dec 2017
N'000
31 Dec 2018
N'000
31 Dec 2017
23.1 Analysis of other receivables
Other current receivables (Note 23.2) 5,693,145 2,671,078 4,422,694 657,542 Insurance claim receivable - 623,259 - 623,259 Staff advances 252,043 185,466 185,894 130,357 Accrued interest receivables 5,377 - - - 5,950,565 3,479,803 4,608,588 1,411,158 See Note 4.1.1 on credit risk of trade receivables, which explains how the Group manages and measures credit quality
of trade receivables that are neither past due nor impaired. 23.2 Other current receivables
WHT receivable 552,078 410,619 478,668 402,687 VAT receivable - 1,178,297 - - Receivable from Registrar - 514,713 - 254,855 Short term receivables 5,141,067 567,449 3,944,026 - 5,693,145 2,671,078 4,422,694 657,542 23.3 Movement in impairment allowance on trade receivables
At 1 January 954,963 95,548 127,621 71,860 Impairment losses recognised 74,325 862,779 44,834 75,741 Impairment losses written back** (234,758) (43,784) (22,882) (43,784) Reclassification from other receivables - 5,078 - 23,804 Exchange difference (30,310) 35,342 - - At 31 December 764,220 954,963 149,573 127,621 **Impairment losses written back relate to recoveries made during the year. 23.4 Movement in impairment on other receivables
At 1 January - 23,804 - - Reclassification to trade receivables*** - (23,804) - - - - - - Impairment of trade on other receivables was reclassified in the prior period to impairment of trade receivables.
24 Cash and cash equivalents
Restricted cash (Note 24.1) 1,077,794 20,481,593 1,077,794 20,481,593 Cash in hand and at bank (Note 24.2) 11,472,903 29,933,164 9,099,982 21,217,261 Cash and cash equivalents in the statement of financial position 12,550,697 50,414,757 10,177,776 41,698,854 24.1 Restricted cash As at year end, cash and cash equivalents comprised of restricted cash which represents unclaimed dividend
amounting to N1.07 billion (2017: N1.07 billion).
NOTES TO THE CONSOLIDATED AND SEPARATE FINANCIAL STATEMENTS for the year ended 31 December 2018
1113

1114
Group Company
N'000
31 Dec 2018
N'000
31 Dec 2017
N'000
31 Dec 2018
N'000
31 Dec 2017
Group Company
N'000
31 Dec 2018
N'000
31 Dec 2017
N'000
31 Dec 2018
N'000
31 Dec 2017
‘000 N'000 No of shares Share capital
‘000 N'000
No of shares Share premium
Included in Cash and cash equivalents for 2017 is N19.4 billion representing proceeds from right issue of shares to minority shareholders who took up 456,830,344 rights in the Rights issue offer concluded in 2018.
The Group and Company's exposure to credit risk, interest rate risk and a sensitivity analysis for financial assets and
liabilities is disclosed in Note 4. 24.2 Cash and cash equivalents in the statement of cash flows For the purpose of cash flow statement, cash and cash equivalents comprises:
Cash in hand and at bank 11,472,903 29,933,164 9,099,982 21,217,261 Less: bank overdrafts (Note 4.1.2a) (35,280,945) (31,081,780) (16,862,345) (15,037,780) Cash and cash equivalents in the statement of cash flows (23,808,042) (1,148,616) (7,762,363) 6,179,481 25 Share capital and Share premium 25.1 Share capital
Authorised: 20,000,000,000 ordinary shares of 50k each (2017: 10,000,000,000 ordinary shares of 50k each) 10,000,000 5,000,000 10,000,000 5,000,000 Issued and fully paid Ordinary shares of 50k each At 1 January 2018 5,575,776 2,787,888 Issued during the year 3,097,653 1,548,827 At 31 December 2018 8,673,429 4,336,715 At 1 January 2017 5,480,734 2,740,367 Issued during the year 95,042 47,521 At 31 December 2017 5,575,776 2,787,888 Addition of shares during the year represent the allotment of shares to share capital following rights issue which
commenced in 2017 and was concluded in 2018 (See note 27). 25.2 Share premium At 1 January 2018 5,575,776 222,272,108 Issued during the year 3,097,653 130,101,427 Right issue costs - (1,427,787) At 31 December 2018 8,673,429 350,945,748 At 1 January 2017 5,480,734 217,528,456 Issued during the year 95,042 4,743,652 At 31 December 2017 5,575,776 222,272,108 26 Basic earnings per share Basic earnings per share is calculated by dividing the profit/(loss) attributable to equity holders of the Company by the
weighted average number of ordinary shares outstanding at the end of the reporting period.
NOTES TO THE CONSOLIDATED AND SEPARATE FINANCIAL STATEMENTS for the year ended 31 December 2018

1115
Group Company
N'000
31 Dec 2018
N'000
31 Dec 2017
N'000
31 Dec 2018
N'000
31 Dec 2017
Group Company
N'000
31 Dec 2018
N'000
31 Dec 2017
N'000
31 Dec 2018
N'000
31 Dec 2017
Loss/(profit) attributable to equity holders of the Company (9,107,048) (35,009,407) 4,141,764 (13,223,626) Weighted average number of ordinary shares in issue (Basic) 8,673,429 5,499,834 8,673,429 5,499,834 Weighted average number of ordinary shares in issue (diluted) 8,673,429 5,547,762 8,673,429 5,547,762 Basic earnings per share (Kobo) (105) (637) 48 (240) Diluted earnings per share (Kobo) (105) (631) 48 (238) The effect of the right issues have been considered in computing the weighted average number of ordinary shares in
issue for the diluted earnings per share. 27 Deposit for shares In 2017, the Company launched an offer to raise N131.6 billion by way of a Rights Issue of 3,097,653,023 ordinary shares of
50 kobo each at N42.50 per share to existing shareholders on the basis of five (5) new ordinary shares for every nine (9) existing ordinary shares held. At the conclusion of the offer, the Rights Issue was 100% subscribed and the Board of D i r e c t o r s o n 2 8 t h D e c e m b e r, 2 0 1 7 p a s s e d a r e s o l u t i o n t o a p p r ove t h e b a s i s o f a l l o t m e n t .
In the same year, LafargeHolcim Group, majority shareholder, re-organised its shareholding in the Company. Prior to this re-organisation, LafargeHolcim equity interest was held via six (6) of its subsidiaries i.e Associated International Cement UK, Financiere Lafarge SAS, Holcibel SA, Lafarge Nigeria UK Ltd, Lafarge Associated Nigeria Ltd and Lafarge Cement International BV. At the conclusion of the re-organisation via the nominal transfer window of the Nigerian Stock Exchange (NSE), the shares held by Lafarge Nigeria UK Ltd (427,453,603 units) were transferred to Associated International Cement UK while the shares held by Financiere Lafarge SAS (797,234,683 units), Holcibel S.A (454,493,279 units) and Lafarge Cement International B.V (318,145,295 units) were transferred to Caricement BV, a subsidiary company of LafargeHolcim Group.
Both Associated International Cement UK and Lafarge Associated Nigeria Ltd also traded their Rights; 431,433,751 units and 906,656,548 units respectively to Caricement BV. Including its own Rights (872,151,809 units), Caricement BV subscribed to a total of 2,210, 242,107 units. Additional 430,580,572 units of shares, not taken up by the minority shareholders, was also taken up by Caricement B.V, resulting to a total of 2,640,822,679 rights taken up.Quasi-Equity loan due to Caricement B.V. was converted for the purchase of these rights in a debt-for-equity conversion amounting to N112.23 billion.Cash received for rights issue represents proceeds from right issue of shares to minority shareholders who took up 456,830,344 rights out of the total available rights of 3,097,653,023 at the rights issue price of N42.50 amounting to N19.42billion.
On December 4, 2018 the Company launched a Rights Issue to raise N89.2 billion by way of issue of 7,434,367,256 Ordinary Shares of 0.50 Kobo each at N12.00 per share on the basis of six (6) new Ordinary shares for every seven (7) existing Ordinary Shares held by qualified shareholders. Approval was yet to be obtained from Securities and Exchange commission (SEC) and hence, no deposit has been recorded for the rights issue.
Cash received for rights issue - 19,415,289 - 19,415,289 Quasi equity loan converted for right issue - 112,234,964 - 112,234,964 Right issue costs - (1,233,381) - (1,233,381) - 130,416,872 - 130,416,872
NOTES TO THE CONSOLIDATED AND SEPARATE FINANCIAL STATEMENTS for the year ended 31 December 2018

1116
Group Company
N'000
31 Dec 2018
N'000
31 Dec 2017
N'000
31 Dec 2018
N'000
31 Dec 2017
Group Company
N'000
31 Dec 2018
N'000
31 Dec 2017
N'000
31 Dec 2018
N'000
31 Dec 2017
27.1 Reconciliation of Cash Received from rights issue Cash received into offer proceed account - 19,415,289 - 19,415,289 Cash transferred from offer proceed account 19,415,289 - 19,415,289 - Transfer to loans (37,005) (37,005) Restricted Cash - (19,415,289) - (19,415,289) 19,378,284 - 19,378,284 - 2017 Right issue paid in 2017 - 574,743 - 574,743 2017 Right issue costs paid in 2018 (853,044) (853,044) 2018 Right issue cost (702,384) - (702,384) - Net Cash payments for right issue (1,555,428) 574,743 (1,555,428) 574,743 Costs incurred on the 2018 right issue project amounting to N702million has been recorded in prepayment pending the
conclusion of the rights issue project and approval by securities and exchange commission (SEC). 28 Foreign currency translation reserve This represents exchange differences arising from the recognition of investment in joint venture from Continental Blue
Investment, Ghana and the translation of the financial statements of Lafarge South Africa to the Group's reporting currency which is Naira.
29 Other reserves arising on business combination and re-organisations The other reserves arising on business combination and re-organisation is used to recognise the adjustments arising from
business combination/re-organisation for entities under common control, when the pooling of interest method has been used.
30 Loans and borrowings
Non-current 172,373,209 68,715,378 144,391,743 64,900,757 Current 93,833,850 187,831,582 105,685,719 190,724,579 Total loans and borrowings 266,207,059 256,546,960 250,077,462 255,625,336 Split into: Power fund (Note 30.1) 11,345,910 7,698,505 5,946,467 7,698,505 Bond (Note 30.2) 60,249,338 59,842,611 60,249,338 59,842,611 Bank Loans (Note 30.3) 53,884,892 44,275,864 53,884,893 44,275,864 Related party loan (Note 30.4) 140,411,911 144,391,559 129,996,764 143,808,356 Lafarge Gypsum S.A Pty Ltd 315,008 338,421 - - Total loans and borrowings 266,207,059 256,546,960 250,077,462 255,625,336 30.1 Power Fund: Lafarge Africa Plc accessed NGN12.4billion from the CBN/BOI Power and Aviation Intervention Fund through
Guaranty Trust Bank (GTB). Principal and Interest are paid quarterly. The loan is secured by the assets of the Company as per Note 16. Principal repayment commenced in October 2012. The facility has a 10-year tenure with a fixed interest rate of 7% and an effective interest rate of 8.7%. The outstanding balance disclosed in the company's books amounts to N5.9 billion which is the amortised cost to date.
In the current year, the group also assessed an additional CBN/BOI intervention fund through Zenith Bank. The loan assessed amounted to N6.4 billion. Principal repayment is expected to commence in December 2019. The facility has a 7.5years tenure and an interest rate of 9%. The outstanding balance, at amortised cost, amounts to N5.3billion.
30.2 Bond: By a resolution dated 17th March 2016, the Board of Directors resolved to raise the sum of N60 billion in two tranches of N26.38 billion and N33.61 billion at interest rate of 14.25% and 14.75% maturing in 2019 and 2021 respectively. The effective interest rate is 14.69% and 14.93% respectively. Interest is paid bi-annually and principal is repaid at end of the tenure.
30.3 Bank Loans: These represent commercial papers and short term loans from various commercial banks for 90 days received in the current year with varying maturity dates ending 2019 at interest rate of 15%-21%. In 2017, these were commercial papers due to First Bank of Nigeria with varying maturity dates ending September 2018 at interest rate of 16.53%-17.01%.
NOTES TO THE CONSOLIDATED AND SEPARATE FINANCIAL STATEMENTS for the year ended 31 December 2018

1117
Group Company
N'000
31 Dec 2018
N'000
31 Dec 2017
N'000
31 Dec 2018
N'000
31 Dec 2017
30.4 Related party loan: Intercompany loan balance is made up of USD 315 million loans recieved from Caricement BV in prior year together with its accumulated interest of USD 7.3 million. This amount was received at an interest rate of US 1 year Libor + 5.71% and was previously hedged with FMDQ at N387.33/dollar to be settled in 2018. In current year, USD 293 million out of this loan balance was converted to a long term loan with a tenure of 7 years and an interest rate of US 1 year Libor + 6.3%. The cumula t ive accrued in te res t on the long te rm por t ion o f the loan amounts to USD 7 .3mi l l ion .
The remaining USD 22million of the loan balance has been retained as a short term loan, payable on demand at an interest rate of US 1 year Libor + 5.71. The cumulative interest on short term portion of the loan amounts to USD 20,236 as at year end. The Non Deliverable Future (NDF) on the loan has been hedged with FMDQ and will be settled at N365.3/dollar.
Group Company
N'000
31 Dec 2018
N'000
31 Dec 2017
N'000
31 Dec 2018
N'000
31 Dec 2017
Group Company
N'000
31 Dec 2018
N'000
31 Dec 2017
N'000
31 Dec 2018
N'000
31 Dec 2017
30.5 Movement in loans and borrowings
At 1 January 256,546,960 104,709,619 255,625,336 106,380,681 Transfer through business re-organisation - - - 2,781,482 Additions: - - - - Loan received 99,712,346 195,099,306 81,266,692 187,310,535 356,259,306 299,808,925 336,892,028 296,472,698 Interest expensed 29,602,641 22,067,619 28,673,150 24,782,932 Interest paid (30,435,129) (16,746,868) (28,065,325) (14,919,980) Principal repaid (87,925,710) (138,981,397) (88,528,977) (138,646,769) Conversion of Quasi-equity - 199,453,879 - 199,453,879 Reclassification (Note 32) (1,536,599) (1,698,932) - (1,250,365)
Converted for Right Issue (Note 27) - (112,234,964) - (112,234,964) Exchange (gain) / loss 242,550 4,878,698 1,106,586 1,967,905 At 31 December 266,207,059 256,546,960 250,077,462 255,625,336 Less than one year 114,252,584 147,391,414 103,322,047 146,808,210 Between one and two years 38,086,589 103,308,150 36,713,209 103,308,151 Between two to five years 4,694,750 5,847,396 869,071 5,508,975 After five years 109,173,136 - 109,173,135 - 266,207,059 256,546,960 250,077,462 255,625,336 31 Provisions
Non current (Note 31.1) 3,645,751 3,472,388 618,970 909,320 Current (Note 31.2) 1,281,247 1,166,217 845,328 895,268 4,926,998 4,638,605 1,464,298 1,804,588 31.1 Non current Site restoration cost
At 1 January 3,472,388 2,200,640 909,320 563,468 Transfer through business re-organisation - - - 104,053 Provision made during the year 468,368 297,192 26,034 311,000 Utilised (97,965) (14,470) (45,733) - Change in estimate (669,948) (390,479) (520,923) (187,613) Reclassification 126,429 (40,753) - - Unwinding of discount (Note12(b)) 456,084 182,154 250,272 118,412 Exchange difference (109,605) 1,238,104 - - At 31 December 3,645,751 3,472,388 618,970 909,320
NOTES TO THE CONSOLIDATED AND SEPARATE FINANCIAL STATEMENTS for the year ended 31 December 2018

1118
N'000
Productivity bonus
N'000
Total
N'000
Productivity bonus
N'000
Total
The provision for site restoration represents an estimate of the costs involved in restoring production sites at the end of the expected life of the quarries. The provision is an estimate based on reclamation closure expert valuation and management's re-assessment. The cost would be unwound for a period of 5-15 years for the Group and Company. The long term inflation and discount rates used in the estimate for Nigerian entities was 12.4% and 15.5% respectively (2017: 8.0% and 8.1%) while for South African entities the long term inflation and discount rates used was 5.5% and 6.5% respectively. (2017: 2.0% and 6.6%).
31.2 Current Group At 1 January 2017 1,176,910 1,176,910 Reclassification (34,544) (34,544) Provision made during the year 2,384,904 2,384,904 Payment in the year (2,361,053) (2,361,053) At 31 December 2017 1,166,217 1,166,217 At 1 January 2018 1,166,217 1,166,217 Reclassification (427,126) (427,126) Provision made during the year 1,490,761 1,490,761 Payment in the year (948,605) (948,605) At 31 December 2018 1,281,247 1,281,247 Company
At January 2017 841,526 841,526 Transfer through business re-organisation 124,479 124,479 Provision made during the year 1,989,016 1,989,016 Payment in the year (2,059,753) (2,059,753) At 31 December 2017 895,268 895,268 At January 2018 895,268 895,268 Provision made during the year 673,400 673,400 Payment in the year (723,340) (723,340) At 31 December 2018 845,328 845,328 The provision for productivity bonus is based on employee performance during the year. It is payable in the year 2019.
Group Company
N'000
31 Dec 2018
N'000
31 Dec 2017
N'000
31 Dec 2018
N'000
31 Dec 2017
Group Company
N'000
31 Dec 2018
N'000
31 Dec 2017
N'000
31 Dec 2018
N'000
31 Dec 2017
32 Deferred income
Non-current 2,597,602 1,518,467 1,455,770 1,518,467 Current 315,452 110,732 110,732 110,732 2,913,054 1,629,199 1,566,502 1,629,199
Opening balance 1,629,199 1,789,391 1,629,199 752,600 Transfer through business re-organisation - - - 1,036,791 Addition 1,536,599 - - - Impact of restructuring (Note 16.2) (190,047) - - - Grant released to profit or loss (62,697) (160,192) (62,697) (160,192) Closing balance 2,913,054 1,629,199 1,566,502 1,629,199 The deferred revenue is as a result of the benefit received from a below-market-interest rate government loan (CBN/BOI
Intervention Fund loans) disclosed in Note 30.1. The revenue is recognised in profit or loss over the useful life of the asset financed with the loan.
NOTES TO THE CONSOLIDATED AND SEPARATE FINANCIAL STATEMENTS for the year ended 31 December 2018

1119
Group Company
N'000
31 Dec 2018
N'000
31 Dec 2017
N'000
31 Dec 2018
N'000
31 Dec 2017
Group Company
N'000
31 Dec 2018
N'000
31 Dec 2017
N'000
31 Dec 2018
N'000
31 Dec 2017
33 Employee benefit obligations Defined contribution plan – Pension The employees of the Nigerian entities (Lafarge Africa Plc, Ready Mix Nigeria Limited and Ashaka Cement Ltd) are members of
a state arranged Pension scheme (Pension reform act, 2014) regulated by the government but managed by several private sector service providers. The Group is required to contribute a specified percentage of payroll costs to the retirement benefit scheme to fund the benefits. The only obligation of the Group with respect to the defined contribution plan is to make the specified contributions to the third party organizations, which are responsible for the financial and administrative management of the funds.
Lafarge South Africa facilitates and contribute to the provision of retirement benefits for all permanent employees in accordance with the South African Pension Funds Act, 1956. The balance represents statutory deductions yet to be remitted to statutory authorities. The pension costs of these plans, corresponding to the contribution paid, are expensed as incurred.
Defined benefits plan - Gratuity At 31 December 2015, the Group discontinued the gratuity scheme for all qualifying staff except for the South African
operations. Lafarge South Africa Holdings (Pty) Limited The entity provides for health care and gratuity benefits of retired employees and their eligible dependents. The benefits apply
only to qualifying employees who were in the employment of the company at the end of 1995. The cost of the benefits is actuarially determined over the employees' working lives. The actuarial valuations of the present value of the defined benefit obligation were carried out at 31 December 2018 by Aon Hewitt Limited.
Lafarge Africa Plc The plans had two components: the "Normal" gratuity for all exiting employees with service of 5 years and above, and an
additional "In-house" gratuity for employees above 50 years of age and service of above 10 years. The retirement age is 60 years and no other post-retirement benefits are provided to these employees. This is a non-funded benefit scheme as the obligation is paid as and when due. The ''in house'' gratuity will be paid to qualifying staff on exit. However, no further liability will be accrued as from 31 December 2015. Subsequent to the discontinuation of the scheme, the remaining liability was reclassified to other payables in Note 34. The actuarial valuations of the present value of the defined benefit obligation were carried out at 31 December 2018 by EY (FRC registration number:000000000738). The present value of the defined benefit obligation, and the related current service cost, were measured using the Projected Unit Credit Method.
Below are the details of movements and amounts recognised in the financial statements:
Non current Employee long service award scheme (Note 33.1) 1,412,777 1,350,849 1,137,419 1,008,443 Staff gratuities (Note 33.2) 3,316,406 3,566,082 473,992 608,290 4,729,183 4,916,931 1,611,411 1,616,733 33.1 Employee long service award scheme The amount arising from the Group and Company's obligations in respect of its employee long service award schemes is as
follows:
Opening balance 1,350,849 1,157,953 1,008,443 741,775 Transfer through business re-organisation - - - 143,183 Service cost 165,387 148,514 132,043 120,174 Interest cost (Note12b) 236,308 167,137 161,322 127,147 Total amount recognised in profit or loss 401,695 315,651 293,365 247,321
NOTES TO THE CONSOLIDATED AND SEPARATE FINANCIAL STATEMENTS for the year ended 31 December 2018
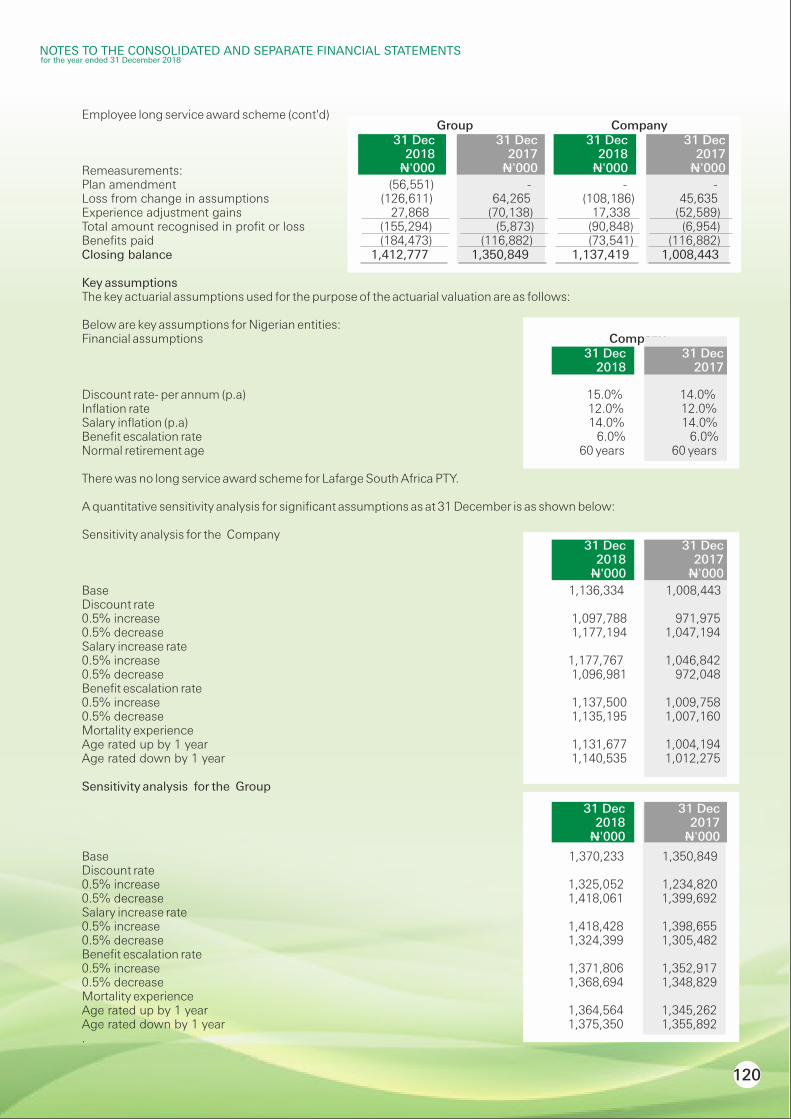
1120
Group Company
N'000
31 Dec 2018
N'000
31 Dec 2017
N'000
31 Dec 2018
N'000
31 Dec 2017
Company 31 Dec
2018
N'000
31 Dec 2018
N'000
31 Dec 2017
31 Dec 2017
N'000
31 Dec 2018
N'000
31 Dec 2017
Employee long service award scheme (cont'd)
Remeasurements: Plan amendment (56,551) - - - Loss from change in assumptions (126,611) 64,265 (108,186) 45,635 Experience adjustment gains 27,868 (70,138) 17,338 (52,589) Total amount recognised in profit or loss (155,294) (5,873) (90,848) (6,954) Benefits paid (184,473) (116,882) (73,541) (116,882) Closing balance 1,412,777 1,350,849 1,137,419 1,008,443 Key assumptions The key actuarial assumptions used for the purpose of the actuarial valuation are as follows: Below are key assumptions for Nigerian entities: Financial assumptions
Discount rate- per annum (p.a) 15.0% 14.0% Inflation rate 12.0% 12.0% Salary inflation (p.a) 14.0% 14.0% Benefit escalation rate 6.0% 6.0% Normal retirement age 60 years 60 years There was no long service award scheme for Lafarge South Africa PTY. A quantitative sensitivity analysis for significant assumptions as at 31 December is as shown below: Sensitivity analysis for the Company
Base 1,136,334 1,008,443 Discount rate 0.5% increase 1,097,788 971,975 0.5% decrease 1,177,194 1,047,194 Salary increase rate 0.5% increase 1,177,767 1,046,842 0.5% decrease 1,096,981 972,048 Benefit escalation rate 0.5% increase 1,137,500 1,009,758 0.5% decrease 1,135,195 1,007,160 Mortality experience Age rated up by 1 year 1,131,677 1,004,194 Age rated down by 1 year 1,140,535 1,012,275 Sensitivity analysis for the Group
Base 1,370,233 1,350,849 Discount rate 0.5% increase 1,325,052 1,234,820 0.5% decrease 1,418,061 1,399,692 Salary increase rate 0.5% increase 1,418,428 1,398,655 0.5% decrease 1,324,399 1,305,482 Benefit escalation rate 0.5% increase 1,371,806 1,352,917 0.5% decrease 1,368,694 1,348,829 Mortality experience Age rated up by 1 year 1,364,564 1,345,262 Age rated down by 1 year 1,375,350 1,355,892 .
NOTES TO THE CONSOLIDATED AND SEPARATE FINANCIAL STATEMENTS for the year ended 31 December 2018
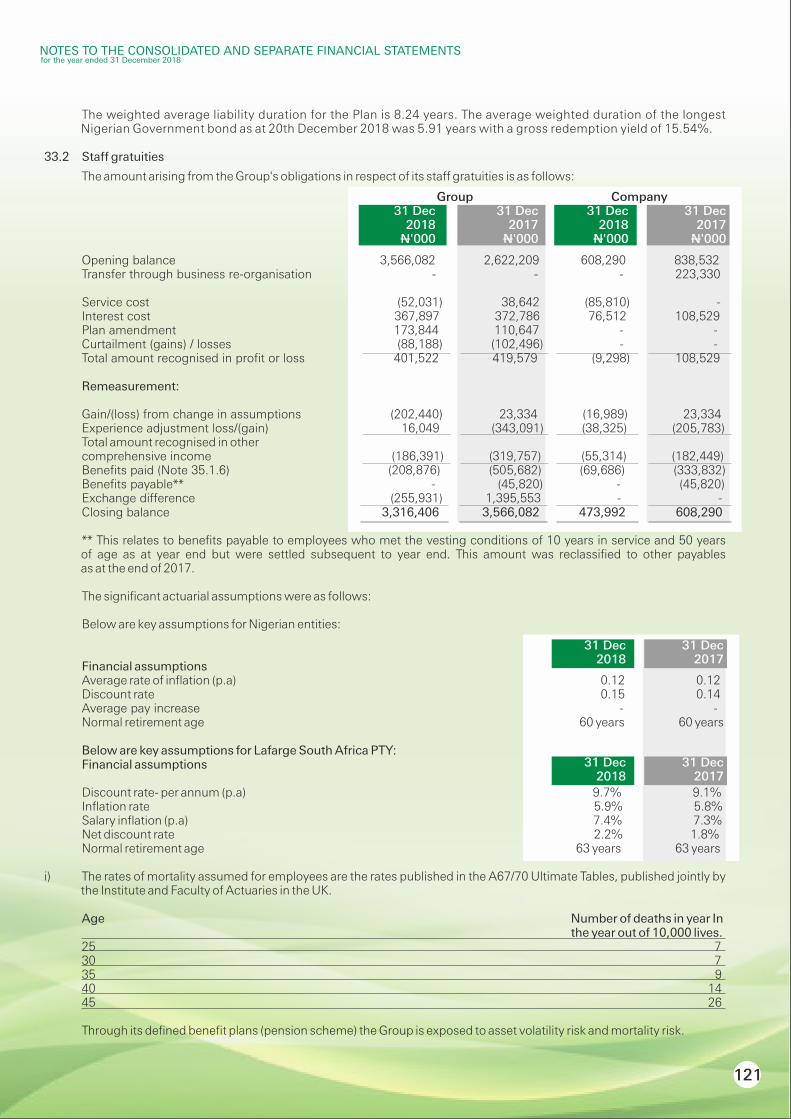
1121
N'000
31 Dec 2018
N'000
31 Dec 2017
N'000
31 Dec 2018
N'000
31 Dec 2017
Group Company
The weighted average liability duration for the Plan is 8.24 years. The average weighted duration of the longest Nigerian Government bond as at 20th December 2018 was 5.91 years with a gross redemption yield of 15.54%.
33.2 Staff gratuities
The amount arising from the Group's obligations in respect of its staff gratuities is as follows:
Opening balance 3,566,082 2,622,209 608,290 838,532 Transfer through business re-organisation - - - 223,330 Service cost (52,031) 38,642 (85,810) - Interest cost 367,897 372,786 76,512 108,529 Plan amendment 173,844 110,647 - - Curtailment (gains) / losses (88,188) (102,496) - - Total amount recognised in profit or loss 401,522 419,579 (9,298) 108,529 Remeasurement: Gain/(loss) from change in assumptions (202,440) 23,334 (16,989) 23,334 Experience adjustment loss/(gain) 16,049 (343,091) (38,325) (205,783) Total amount recognised in other comprehensive income (186,391) (319,757) (55,314) (182,449) Benefits paid (Note 35.1.6) (208,876) (505,682) (69,686) (333,832) Benefits payable** - (45,820) - (45,820) Exchange difference (255,931) 1,395,553 - - Closing balance 3,316,406 3,566,082 473,992 608,290
** This relates to benefits payable to employees who met the vesting conditions of 10 years in service and 50 yearsof age as at year end but were settled subsequent to year end. This amount was reclassified to other payablesas at the end of 2017.
The significant actuarial assumptions were as follows: Below are key assumptions for Nigerian entities:
Financial assumptions Average rate of inflation (p.a) 0.12 0.12 Discount rate 0.15 0.14 Average pay increase - - Normal retirement age 60 years 60 years Below are key assumptions for Lafarge South Africa PTY: Financial assumptions Discount rate- per annum (p.a) 9.7% 9.1% Inflation rate 5.9% 5.8% Salary inflation (p.a) 7.4% 7.3% Net discount rate 2.2% 1.8% Normal retirement age 63 years 63 years i) The rates of mortality assumed for employees are the rates published in the A67/70 Ultimate Tables, published jointly by
the Institute and Faculty of Actuaries in the UK. Age Number of deaths in year In the year out of 10,000 lives. 25 7 30 7 35 9 40 14 45 26 Through its defined benefit plans (pension scheme) the Group is exposed to asset volatility risk and mortality risk.
31 Dec 2018
31 Dec 2017
31 Dec 2018
31 Dec 2017
NOTES TO THE CONSOLIDATED AND SEPARATE FINANCIAL STATEMENTS for the year ended 31 December 2018

1
Group Company
N'000
31 Dec 2018
N'000
31 Dec 2017
N'000
31 Dec 2018
N'000
31 Dec 2017
N'000
31 Dec 2018
N'000
31 Dec 2017
N'000
31 Dec 2018
N'000
31 Dec 2017
ii) Withdrawal from Service Age band Rate Less than or equal to 30 0.04 31 - 39 0.03 40 - 44 1% 45 - 54 1% 55 - 59 0% iii) A quantitative sensitivity analysis for significant assumptions as at 31 December is as shown below: Sensitivity analysis for the Company
Base 455,703 590,001 Discount rate: 0.5% increase 447,636 578,119 0.5% decrease 464,051 602,337 Mortality experience: Age rated up by 1 year 454,907 588,970 Age rated down by 1 year 456,416 590,921 The weighted average liability duration for the Plan is 4.63 years. The average weighted duration of the longest Nigerian
Government bond as at 20th December 2018 was 5.91 years with a gross redemption yield of 15.54%.
The discount rate for the South African entities is set with reference to yields obtained from the zero coupon yield curve published by the Bond Exchange, converted to annual effective rates, given that the high quality Corporate Bond market in South Africa is not very deep. The duration of the arrangement is around 7 years.
Sensitivity analysis for the Group
Base 542,138 689,233 Discount rate: 0.5% increase 530,214 674,463 0.5% decrease 554,676 704,591 Mortality experience: Age rated up by 1 year 454,907 588,970 Age rated down by 1 year 456,416 590,921 The weighted average liability duration for the Plan is 3.6 years. The average weighted duration of the longest Nigerian
Government bond as at 20th December 2018 was 5.91 years with a gross redemption yield of 15.54%. Expected contribution to post-employment benefit plans for the year ending 31 December 2018 is N86 million. 34 Trade and other payables Trade payables 29,289,814 40,149,875 15,027,354 19,777,538 Related party - technical service fee (Note 34.1, 39.4) 13,560,223 27,981,758 9,039,281 18,273,023 42,850,037 68,131,633 24,066,635 38,050,561 Other payables: Customers' deposits 3,639,077 3,804,619 3,209,782 2,750,491 Related companies (Note 39.5) 7,927,401 10,264,271 5,561,294 7,226,888 Withholding tax payable 1,155,829 1,185,171 770,600 1,071,661 Value added tax payable 1,824,632 1,592,063 1,685,967 1,574,929 Accrued interest - 451,799 - -
NOTES TO THE CONSOLIDATED AND SEPARATE FINANCIAL STATEMENTS for the year ended 31 December 2018
122

1123
Group Company
N'000
31 Dec 2018
N'000
31 Dec 2017
N'000
31 Dec 2018
N'000
31 Dec 2017
Group Company
N'000
31 Dec 2018
N'000
31 Dec 2017
N'000
31 Dec 2018
N'000
31 Dec 2017
Group Company
N'000
31 Dec 2018
N'000
31 Dec 2017
N'000
31 Dec 2018
N'000
31 Dec 2017
Trade payables (cont’d)
Employee provisions and other liabilities 666,664 143,149 340,368 108,619 Rent received in advance - 1,729 - 1,729 Professional fees 128,432 94,870 128,432 85,870 Accruals (Note 34.2) 11,279,953 20,499,103 5,103,031 13,075,698 Other payables 6,845,195 3,679,146 4,834,473 2,830,981 Dividend payable (Note 34.3) 4,220,596 3,152,627 4,220,596 3,152,627 37,687,779 44,868,547 25,854,543 31,879,493 80,537,816 113,000,180 49,921,178 69,930,054 34.1 LafargeHolcim Technical service fees This represents the outstanding liability on the Industrial Franchise Agreement with LafargeHolcim of Switzerland. The
terms of the agreements include: - The right for Lafarge Africa Plc to use technical research and development information relating to production and
distribution of cement products; - The provision by LafargeHolcim of technical and operational support through the secondment of suitably qualified
expatriate personnel, as requested by Lafarge Africa Plc and approved by the Federal Government of Nigeria. - The guarantee by LafargeHolcim of the achievement of raw material reserves and production targets by Lafarge Africa
Plc. - The Industrial Franchise Agreement has been registered with National Office for Technology Acquisition and
Promotion (NOTAP) in Nigeria. It represents 2% (AshakaCem), 3.5% (Company) of net sales and 2% of profit before tax if greater than zero for technical knowhow, business support and licensing arrangement.
34.2 Accruals
Litigation 249,815 206,820 119,142 80,043 Unbilled technical fee/ rebate 876,887 3,033,089 446,704 2,862,354 Freight/ logistics 411,638 1,235,467 411,638 1,091,895
Rent/ depot 117,961 83,291 101,669 71,322 Quarry/landed cost 582,110 589,286 469,512 403,033 Plant accruals 712,702 3,161,260 446,920 2,463,122 Power 985,609 741,750 154,906 204,882 Tax 365,362 1,129,346 365,363 1,129,347 Employee related accrual 251,479 157,081 246,511 157,082 Fuel 5,638,110 3,345,438 1,912,723 3,375,523 Others 1,088,280 6,816,275 427,943 1,237,095 11,279,953 20,499,103 5,103,031 13,075,698 34.3 Dividend payable
At 1 January 3,152,627 13,459,412 3,152,627 13,459,412 Dividend declared 13,010,143 5,754,771 13,010,143 5,754,771 Payment to the equity holders of the parent (11,845,272) (16,280,825) (11,845,272) (16,280,825) Return to registrar (219,269) - (219,269) - Dividend to be (paid to)/refunded by registrars 122,367 219,269 122,367 219,269 At 31 December 4,220,596 3,152,627 4,220,596 3,152,627 The balance on dividend payable is due to Lafarge Associated Nigeria Limited and other local shareholders for the years 2015,
2016 and 2017
NOTES TO THE CONSOLIDATED AND SEPARATE FINANCIAL STATEMENTS for the year ended 31 December 2018
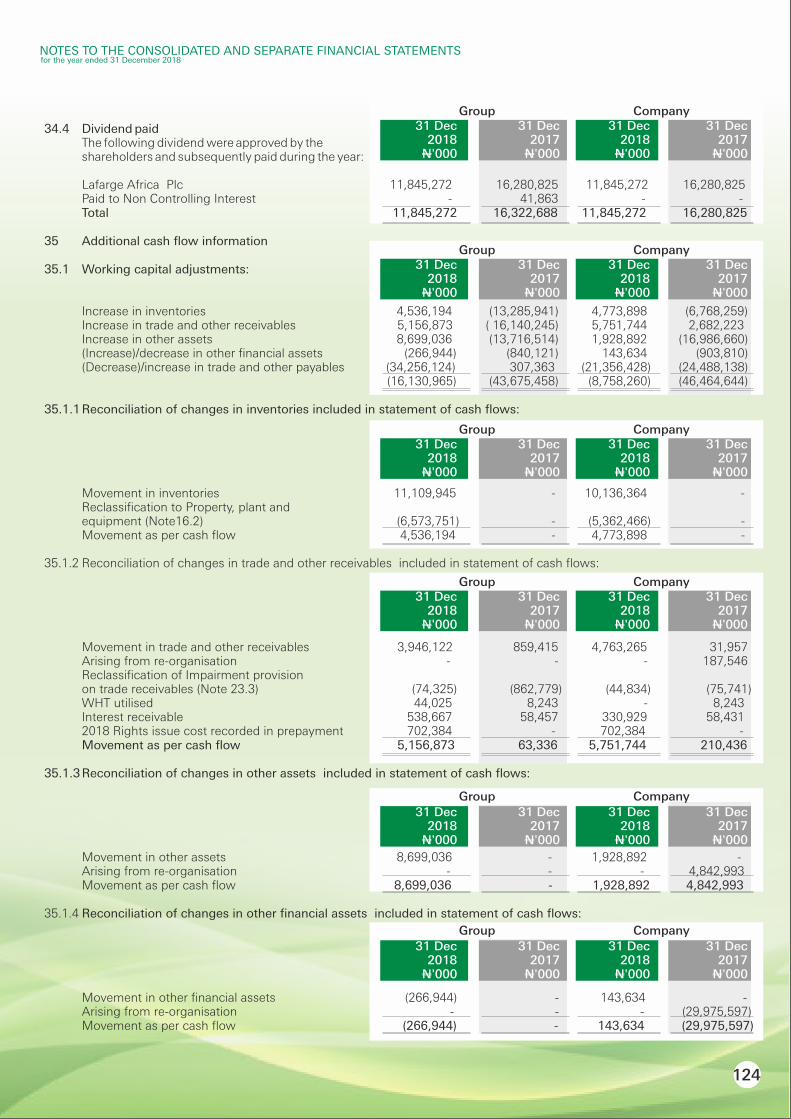
N'000
31 Dec 2018
N'000
31 Dec 2017
N'000
31 Dec 2018
N'000
31 Dec 2017
Group Company
Group Company
N'000
31 Dec 2018
N'000
31 Dec 2017
N'000
31 Dec 2018
N'000
31 Dec 2017
Group Company
N'000
31 Dec 2018
N'000
31 Dec 2017
N'000
31 Dec 2018
N'000
31 Dec 2017
Group Company
N'000
31 Dec 2018
N'000
31 Dec 2017
N'000
31 Dec 2018
N'000
31 Dec 2017
Group Company
N'000
31 Dec 2018
N'000
31 Dec 2017
N'000
31 Dec 2018
N'000
31 Dec 2017
N'000
31 Dec 2018
N'000
31 Dec 2017
N'000
31 Dec 2018
N'000
31 Dec 2017
Group Company
34.4 Dividend paid The following dividend were approved by the shareholders and subsequently paid during the year: Lafarge Africa Plc 11,845,272 16,280,825 11,845,272 16,280,825 Paid to Non Controlling Interest - 41,863 - - Total 11,845,272 16,322,688 11,845,272 16,280,825
35 Additional cash flow information 35.1 Working capital adjustments:
Increase in inventories 4,536,194 (13,285,941) 4,773,898 (6,768,259) Increase in trade and other receivables 5,156,873 ( 16,140,245) 5,751,744 2,682,223 Increase in other assets 8,699,036 (13,716,514) 1,928,892 (16,986,660) (Increase)/decrease in other financial assets (266,944) (840,121) 143,634 (903,810) (Decrease)/increase in trade and other payables (34,256,124) 307,363 (21,356,428) (24,488,138) (16,130,965) (43,675,458) (8,758,260) (46,464,644) 35.1.1 Reconciliation of changes in inventories included in statement of cash flows:
Movement in inventories 11,109,945 - 10,136,364 - Reclassification to Property, plant and equipment (Note16.2) (6,573,751) - (5,362,466) - Movement as per cash flow 4,536,194 - 4,773,898 - 35.1.2 Reconciliation of changes in trade and other receivables included in statement of cash flows:
Movement in trade and other receivables 3,946,122 859,415 4,763,265 31,957 Arising from re-organisation - - - 187,546 Reclassification of Impairment provision on trade receivables (Note 23.3) (74,325) (862,779) (44,834) (75,741) WHT utilised 44,025 8,243 - 8,243 Interest receivable 538,667 58,457 330,929 58,431 2018 Rights issue cost recorded in prepayment 702,384 - 702,384 - Movement as per cash flow 5,156,873 63,336 5,751,744 210,436 35.1.3 Reconciliation of changes in other assets included in statement of cash flows:
Movement in other assets 8,699,036 - 1,928,892 - Arising from re-organisation - - - 4,842,993 Movement as per cash flow 8,699,036 - 1,928,892 4,842,993 35.1.4 Reconciliation of changes in other financial assets included in statement of cash flows:
Movement in other financial assets (266,944) - 143,634 - Arising from re-organisation - - - (29,975,597) Movement as per cash flow (266,944) - 143,634 (29,975,597)
NOTES TO THE CONSOLIDATED AND SEPARATE FINANCIAL STATEMENTS for the year ended 31 December 2018
124

1
Group Company
N'000
31 Dec 2018
N'000
31 Dec 2017
N'000
31 Dec 2018
N'000
31 Dec 2017
Group Company
N'000
31 Dec 2018
N'000
31 Dec 2017
N'000
31 Dec 2018
N'000
31 Dec 2017
Group Company
N'000
31 Dec 2018
N'000
31 Dec 2017
N'000
31 Dec 2018
N'000
31 Dec 2017
Group Company
N'000
31 Dec 2018
N'000
31 Dec 2017
N'000
31 Dec 2018
N'000
31 Dec 2017
35.1.5 Reconciliation of changes in trade and other payables included in statement of cash flows:
Movement in trade and other payables (32,462,364) (10,306,785) (20,008,876) (10,306,785) Arising from re-organisation - - - (45,974,887) Reclassification of dividend payable (1,164,871) 10,306,785 (1,164,871) 10,306,785 Reclassification of tripartite guarantee from borrowings - - - - Reclassification from borrowings (1,698,932) (1,250,365) Unclaimed dividend from registrars - (1,066,304) - (1,066,304) Accruals on Property plant and Equipment (Note 16) - (5,072,849) - (2,175,311) Reclassification of benefit payable (Note 33.2) - (45,820) - (45,820) Transaction costs accrued - (658,638) - (658,638) Right issue cost paid during the year 658,638 658,638 Reclassification from Current income tax (Note 14.6) liabilities (1,287,527) - (841,319) - Movement as per cash flow (34,256,124) (8,542,543) (21,356,428) (51,171,325) 35.1.6 Provisions and net movement on employee benefit
Retirement benefit obligations - service cost (52,031) 38,642 (85,810) - Retirement benefit obligations - Plan amendment/curtailment 85,656 8,151 - - Long service awards - Plan amendment/curtailment (56,551) - - - Employee Long Service Award - service cost 165,387 148,514 132,043 120,174 Employee profit share scheme payment - - - - Productivity bonus payment (948,605) (2,361,053) (723,340) (2,059,753) Staff gratuity benefits paid (Note 33.2) (208,876) (505,682) (69,686) (333,832) Employee Long service award benefits paid (184,473) (116,882) (73,541) (116,882) Remeasurement (gains) / losses – Long service awards (98,743) (5,873) (90,848) (6,954) Provision for productivity bonus for the year 1,063,635 2,384,904 673,400 1,989,016 Employee Profit Share Scheme - - - - (234,601) (409,279) (237,782) (408,231) 35.2 In the statement of cash flows, profit on sale of property, plant and equipment (PPE) comprise:
Proceeds on disposal 969,990 3,129,895 931,931 2,983,969 Net book value of property, plant and equipment disposed (33,664) (756,058) (5,309) (662,570) Profit on sale of property, plant and equipment 936,326 2,373,837 926,622 2,321,399 35.3 Other non cash items
Write offs for Property, plant and equipment 1,037,955 556,815 377,803 556,815 Gain on sale of property plant and equipment (936,326) (2,373,837) (926,622) (2,321,399) Gain on sale of intangible assets - - - - Impairment provision on trade receivables 74,325 862,779 44,834 75,741 Movement in site restoration cost (173,116) (148,510) (540,622) 123,387 Government grants (62,697) (160,192) (62,697) (160,192) (59,859) (1,262,945) (1,107,304) (1,725,648)
NOTES TO THE CONSOLIDATED AND SEPARATE FINANCIAL STATEMENTS for the year ended 31 December 2018
125

1126
Group Company
N'000
31 Dec 2018
N'000
31 Dec 2017
N'000
31 Dec 2018
N'000
31 Dec 2017
Group Company
N'000
31 Dec 2018
N'000
31 Dec 2017
N'000
31 Dec 2018
N'000
31 Dec 2017
36 Commitments for expenditure Capital expenditure contracted for at the reporting period end but not recognised in the financial statements is as
follows:
Capital expenditure commitments Approved and contracted for 15,513,811 235,680 3,904,755 - 15,513,811 235,680 3,904,755 - Operating expenditure commitments Commitments for the supply of gas (Note 36.1) 120,692,031 117,356,000 119,242,031 117,356,000 Commitments for the supply of power (Note 36.2) 8,277,036 10,081,480 8,056,497 10,081,480 Commitments for advance payment of taxes (Note 36.3) 2,800,000 5,600,000 2,800,000 5,600,000 Share Holder's Gurantee (Note 36.4) 3,377,725 3,377,725 Other commitments: Non-cancelable operating lease commitment 342,662 3,620,783 - - 135,489,454 136,658,263 133,476,253 133,037,480 36.1 This represents the total commitments with respect to termination payment clause on gas contracts. This amount is made up
of N47.52 billion relating to gas supply contract with a vendor for the supply of gas to Mfamosing Plant, N72.15 billion relating to another gas supply contract with a vendor for the supply of gas to Ewekoro and Shagamu Plants and N1.45 billion relating to a bank guarantee to Standard Chartered Bank with respect to the Mfamosing gas contract.
36.2 Commitments for the supply of power represents the fixed cost commitment on a monthly basis for the supply of power to the Shagamu plant for ten years starting in 2011.
36.3 This represents commitment to a State Government for the advance payment of taxes and levies for the next one (1) year.
36.4 Lafarge Africa Plc provided a shareholder's guarantee to one of its investments, CBI Ghana for a construction project. The
value of the guarantee is USD 9.42million and this was executed through a deed of guarantee effective on 5 February 2018 and runs up unto the project completion date.
37 Contingent liabilities Lafarge Africa Plc Various litigations and claims (Note 37.1) 224,930 1,017,483,867 224,930 1,016,788,090 Letters of credit (Note 37.2) 9,926,162 10,741,833 9,926,162 10,741,833 Lafarge South Africa Holdings Limited Suretyship to Standard Bank on overdraft 248,900 267,400 - - Utilities guarantees (Note 37.3) 880,456 732,489 - - Rehabilitation guarantees (Note 37.4) 2,769,868 891,271 - - 14,050,316 1,030,116,860 10,151,092 1,027,529,923
37.1 The Group and Company are engaged in law suits that have arisen in the normal course of business. The contingent liabilities in respect of pending litigations and other claims amounted to N225 million (2017: N1.02 trillion) for the Group and Company respectively.
The Directors are of the opinion that it is not probable that an outflow of resources embodying economic benefits will be required to settle the obligation. Thus the possible obligation has not been provided for in the financial statements.
37.2 This represents letters of credit which have been opened but shipment of items has not been initiated and as such risks and rewards have not been transferred to the Group and Company as at year end.
37.3 The Utilities guarantees are for the benefit of various municipalities and are held with numerous financial institutions.37.4 These guarantees are with Rand Merchant Bank Limited held on behalf of the Department of Mineral Resources.
NOTES TO THE CONSOLIDATED AND SEPARATE FINANCIAL STATEMENTS for the year ended 31 December 2018

1127
Group Company
N'000
31 Dec 2018
N'000
31 Dec 2017
N'000
31 Dec 2018
N'000
31 Dec 2017
Group Company
N'000
31 Dec 2018
N'000
31 Dec 2017
N'000
31 Dec 2018
N'000
31 Dec 2017
Group Company
N'000
31 Dec 2018
N'000
31 Dec 2017
N'000
31 Dec 2018
N'000
31 Dec 2017
37.5 The Group and Company are currently involved in a compliance exercise by the tax authority. The amount of the assessment
has not been disclosed because management has appealed the assessment in its entirety. The appeal is due to the fact that the information used is not based on the audited financial statements. Reconciliation meetings have been scheduled with the tax authorities but no revised assessment has been issued as at the date these financial statement were approved. In the opinion of the Directors, the liabilities, if any, are not likely to be material but the amount cannot be determined with sufficient reliability.
38 Operating lease arrangements Operating lease payments charged to income:
Land and buildings 1,285,416 1,758,860 896,614 887,676 Plant and machinery 1,699,004 1,427,869 1,044,185 285,830 Other tangible assets 11,651,351 345,038 11,651,351 243,132 14,635,771 3,531,767 13,592,150 1,416,638 Operating lease commitments represent rentals payable by the Group and Company for certain of its office properties, plant
and machinery and other tangible assets. The key replacement lease for the Group headquarters, commencing towards the end of 2010, is for a ten-year period, with an escalation clause of 10% per annum. The costs of these leases are expensed on a straight-line basis over the period of the leases when fixed escalation clauses are stipulated.
Future minimum rentals payable under non-cancellable operating leases as at 31 December are, as follows:
Within one year 8,564,457 1,310,125 7,590,260 254,433 After one year but not more than five years 20,259,711 2,313,768 17,790,864 285,606 More than five years 1,484,466 2,089,009 451,930 - 30,308,634 5,712,902 25,833,054 540,039
39 Related party transactions
39.1 Parent entity
The ultimate parent of the Group is LafargeHolcim, incorporated in Switzerland.
In the normal course of business, Lafarge Africa Plc sells cement to other subsidiaries of the ultimate shareholder.
The Company receives technical assistance from the majority shareholder which is paid for under the Industrial Franchise Agreement (see Note 9.4).
39.2 Subsidiaries Subsidiaries are set out in Note 18.1.
39.3 Transactions with related parties
The following transactions occurred with related parties during the year: Sales of goods and services
Lafarge Ready Mix Nigeria Limited - - 3,171,340 2,413,243 Lafarge Holcim Trading 1,253,532 1,020,850 1,253,532 1,020,850 Total transaction value 1,253,532 1,020,850 4,424,872 3,434,093
NOTES TO THE CONSOLIDATED AND SEPARATE FINANCIAL STATEMENTS for the year ended 31 December 2018

1128
Group Company
N'000
31 Dec 2018
N'000
31 Dec 2017
N'000
31 Dec 2018
N'000
31 Dec 2017
Group Company
N'000
31 Dec 2018
N'000
31 Dec 2017
N'000
31 Dec 2018
N'000
31 Dec 2017
Purchase of goods and services
Lafarge Holcim Trading - 199,769 - 199,769 Lafarge Energy Solution - 3,180,105 - 3,180,105 Total transaction value - 3,379,874 - 3,379,874 Goods were sold to related parties during the year based on the price lists in force and terms that would be available to third
parties. All other transactions were made on normal commercial terms and conditions and at market rates.
Nature of Others transaction AshakaCem Limited Dividends received - Subsidiary - - - 294,055 Lafarge South Africa Pty Dividends received - Joint venture - 1,767 - - Lafarge Energy Solution Fuel - 3,179,721 - 3,179,721 Cimenteries Du Cameroun Employee Related - 20,678 - 20,678 Lafarge Industries South Africa (Pty) Ltd Employee Related 50,094 33,867 50,094 26,452 Holcim (Schweiz) Ag Services Related - 7,314 - 7,314 Holcim Group Services Ltd Services Related - 28,301 - 28,301 Lafarge Canada Inc. (West) Services Related - 41,875 - 41,875 Lafarge International Services Singapore Pte Ltd Employee Related 691,043 1,030,544 691,043 1,030,544 Lafargeholcim Middle East & Africa It Service Center IT Services 1,681,551 228,006 1,681,551 225,250 Lafarge S.A Paris Employee related, capex 201,559 521,577 201,559 302,524 Lafarge Building Materials Employee Related 31,199 59,174 31,199 59,175 Lafargeholcim Maroc Afrique Employee Related - 122,029 - 122,029 Technical Center Europe-Africa Services Related 139,859 18,833 139,859 16,621 Lafargetechnical Center Vienna Gmbh Services Related - 27 - - Lafarge Cement Syria Employee Related 10,040 2,416 - - Mbeya Cement Company Limited Employee Related 1,320 1,320 Holcim Trading S.A. Fuel 3,978,168 277,298 3,978,168 277,298 Lafarge Cement Egypt Sae Payroll and other personnel recharges (4,426) - - - Lafarge Malaysia Services Related - 15,145 - 15,145 Lafarge Building Materials Ltd Employee Related 14,511 31,901 14,511 31,901 Lafarge Cementos S.A.U Employee Related - 4,158 - 4,158 Bamburi Cement Limited Employee Related (730) - - - Lafarge (Beijing) Building Materials Technical Service Co, Ltd Employee Related 2,257 23,672 2,257 15,619 Lafarge S. A Paris Technical Fees 5,687,341 3,251,786 5,687,341 2,816,494 Holcim Technology Ltd Technical Fees 5,711,682 2,262,350 3,875,115 2,262,350 Holcim (Maroc) S.A. Fuel 123,183 - 123,183 - Holcim Group Services Ltd Employee Related 1,080,110 - 416,058 - Lafarge Mea Building Materials S.A.E Employee Related 178,598 - 178,598 - Lafarge Industries S.A. (Pty) Employee Related 864 - 864 - Lafarge Associated Nig Ltd IT Services 315,250 - 315,250 - Lafargeholcim Energy Solutions Employee Related (6,740) - (6,740) -
NOTES TO THE CONSOLIDATED AND SEPARATE FINANCIAL STATEMENTS for the year ended 31 December 2018

Group Company
N'000
31 Dec 2018
N'000
31 Dec 2017
N'000
31 Dec 2018
N'000
31 Dec 2017
Hima Cement Rwanda Ltd Employee Related 1,618 - 1,618 - Bamburi Cement Ltd Employee Related (2,228,436) - (2,228,436) - Lafarge Cement Employee Related 7,909 - 7,909 - Société Financière Immobilière Et Mobilière "Sofimo" Employee Related (239) - (239) - Lafarge Cameroun Cement Employee Related 3,132 - 3,132 - Associated International Cement Ltd Employee Related 161,103 - 161,103 - Lafargeholcim Building Materials (China) Employee Related 8,053 - - - Lafarge Sa (Paris) - Pay Fuel 1,637,251 - - - Lafarge Tcea Employee Related 11,318 - - - Lafarge Middle East And Africa Employee Related 112 - - - Lafarge Intern Serv Singapore Employee Related 8,271 - - - Readymix Gulf Limited Employee cost 629 - - - Lafarge Concrete Malaysia Technical Fees 2,747 - - - Bazian Cement Co Ltd Technical Fees (42,966) - - - Holcim (Azerbaijan) Ojsc Payroll and other personnel recharges (37,520) - - - Holcim (Bulgaria) Ad Payroll and other personnel recharges (16,649) - - - Holcim (Deutschland) Gmbh Payroll and other personnel recharges 6,103 - - - Holcim (Us) Inc. Payroll and Personnel recharges Payments 71,175 - - - Lafarge Canada (West) Payroll and other personnel recharges 48,810 - - - Lafarge Cement Egypt Sae Payroll and other personnel recharges (4,426) - - - Lafarge Cement Zimbabwe Payroll and Personnel recharges 10,323 - - - Lafarge International Services Payroll and other personnel recharges 16,605 - - - Lafarge Mea Building Payroll and other Material Sae personnel recharges (13,796) - - - Lafarge SA Group Insurance 1,263,765 - - - Lafarge Zambia Plc Payroll and Personnel recharges (130) - - - Lafargeholcim (Brasil) S.A. Payroll and other personnel recharges (42,490) - - - Lafargeholcim Mea It Services Cente IT services (1,902,374) - - - Lafargeholcim North America Payroll and Personnel recharges Payments 113,710 - - - Peotona Ash Resources (Pty)Ltd Group Insurance (1,261) - - - Associated Pan Payroll, personnel Malaysia Cement Sdn costs recharges (16,354) - - - Cimencam Training 2,291 - - - Hima Cement Ltd Payroll, personnel costs recharges (85) - - - Lafarge Cement Malawi Payroll, personnel costs recharges (2,128) - - - Lafarge Mea Building Payroll, personnel Materials costs recharges 16,191 - - -
Nature of Others t ransaction
NOTES TO THE CONSOLIDATED AND SEPARATE FINANCIAL STATEMENTS for the year ended 31 December 2018
129

1130
Group Company
N'000
31 Dec 2018
N'000
31 Dec 2017
N'000
31 Dec 2018
N'000
31 Dec 2017
Nature of Others t ransaction
Group Company
N'000
31 Dec 2018
N'000
31 Dec 2017
N'000
31 Dec 2018
N'000
31 Dec 2017
Group Company
N'000
31 Dec 2018
N'000
31 Dec 2017
N'000
31 Dec 2018
N'000
31 Dec 2017
Lafarge S. A. Payroll, personnel costs recharges (83,339) - - - Lafarge Zambia Payroll, personnel costs recharges (17,173) - - - Lafargeholcim Ltd. Geocycle project/ Branding 16,527 - - - Lafargeholcim Mea It Payroll, personnel costs recharges 320,115 - - - LH Trading Ltd Payroll, personnel costs recharges 453 - - - Mibeya Cement Payroll, personnel costs recharges 53,441 - - - Sa Technical Center Payroll, personnel Europa Africa costs recharges 32,110 - - - Holcim (ESPANIA) S. A Services Related - 38,381 - 38,381 Total transaction value 19,291,129 11,200,820 15,326,317 10,815,885
39.4 Outstanding balances arising from sales/purchases of goods and services
The following balances are outstanding at the end of the reporting period in relation to transactions with related parties:
Trade receivables: AshakaCem Limited - - - 41,286 Lafarge Holcim Trading - 814,668 - 814,668 Lafarge Ready Mix Nigeria Limited - - 204,722 445,296 - 814,668 204,722 1,301,250 Technical fees: Lafarge S.A Paris 11,297,873 22,778,564 6,776,931 13,069,829 Holcim Technology Ltd 2,262,350 5,203,194 2,262,350 5,203,194 13,560,223 27,981,758 9,039,281 18,273,023 The sale of goods to/from related parties were carried out on commercial terms and conditions and hence the Directors
are of the opinion that there is no conflict of interests. The amounts outstanding are unsecured and will be settled in cash. No guarantees have been given or received. No expense has been recognised in the current or prior years for bad or doubtful debts in respect of the amounts owed by related parties.
39.5 Other receivables from and payables to related parties
Other receivables
AshakaCem Ltd Subsidiary Back end expenses. - - 5,477,031 Lafarge Ready Mix Subsidiary Back end Limited expenses. - - 4,158,766 4,602,277 Lafarge S.A. Fellow Back end subsidiary expenses. - 138,059 - - Lafarge Cement Fellow Back end Zimbabwe subsidiary expenses. - 7,434 - - Lafarge Cement Fellow Back end Malawi subsidiary expenses. - 2,701 - - Hima Cement Fellow Back end Limited subsidiary expenses. - 1,805 - 1,564
NOTES TO THE CONSOLIDATED AND SEPARATE FINANCIAL STATEMENTS for the year ended 31 December 2018

Group Company
N'000
31 Dec 2018
N'000
31 Dec 2017
N'000
31 Dec 2018
N'000
31 Dec 2017
NOTES TO THE CONSOLIDATED AND SEPARATE FINANCIAL STATEMENTS for the year ended 31 December 2018
Other receivables (cont'd) Mbeya cement Fellow Back end subsidiary expenses. - 45,893 - 784 Lafarge service Fellow Back end group subsidiary expenses. - 16,926 - - LafargeHolcim Fellow Back end Energy Solutions subsidiary expenses. 73,843 28,276 73,843 28,277 Cementia Holding AG Fellow Back end subsidiary expenses. - 185,382 - 180,997 Climenteries DU Fellow Back end Cameroun subsidiary expenses. - 775 - - Associated Fellow International subsidiary Back end Cement Ltd expenses. - 3,360 - 3,360 Lafarge Cementos Fellow Back end S.A.U subsidiary expenses. - 1,235 - 1,235 Lafarge Associated Fellow Back end Nigeria Ltd subsidiary expenses. 180,397 428,421 180,397 428,421 LafargeHolcim Fellow Back end Middle East & Africa subsidiary expenses. IT Service Center 1,105,680 572,603 1,641 1,463 Associated Pan Malaysia Cement Fellow Back end Sdn Bhd subsidiary expenses. - 19,173 - - Lafarge Zambia Plc Fellow Back end subsidiary expenses. - 455 - - Holcim Group Fellow Back end Services Ltd subsidiary expenses. 29,345 23,210 - - Lafarge MEA Building Fellow Back end Materials S.A.E subsidiary expenses. 24,069 170,902 - 162,452 MBEYA Cement Fellow Back end Company Limited subsidiary expenses. 95,428 - - - CIMENTERIES DU Fellow Back end CAMEROUN subsidiary expenses. 2,290 - - - Lafarge SA Fellow Back end subsidiary expenses. 45,175 - - - Hima Cement Fellow Back end Rwanda Limited subsidiary expenses. 10,332 - 10,332 - Lafarge Zambia Plc Fellow Back end subsidiary expenses. 10,781 - 8,712 - Lafarge Services Fellow Back end Group subsidiary expenses. 15,761 - - - LafargeHolcim Ltd Fellow Back end subsidiary expenses. 18,219 - - - Lafarge Cement Fellow Back end Malawi Ltd subsidiary expenses. 373 - - - Associated Pan Malaysia Cement Fellow Back end Sdn Bhd subsidiary expenses. 1,469 - - - Hima Cement Fellow Back end Limited Uganda subsidiary expenses. 124 - - - Technical Center Fellow Back end Europe-Africa subsidiary expenses. 32,108 - - - LH Trading Ltd Fellow Back end subsidiary expenses. 4,530 - - - Holcim Technology Fellow Back end Ltd subsidiary expenses. 5,700 - - - Bamburi Cement Ltd Fellow Back end subsidiary expenses. 723 - - - 1,656,347 1,646,610 4,433,691 10,887,861
1131

1
Group Company
N'000
31 Dec 2018
N'000
31 Dec 2017
N'000
31 Dec 2018
N'000
31 Dec 2017
Other payables Lafarge S.A Subsidiary Back end expenses. - 2,119,198 - 1,117,548 Holcim technology Fellow Back end limited subsidiary expenses. - 2,194,428 - 2,194,428 Lafarge Cement Fellow Back end Zimbabwe subsidiary expenses. - 37,330 - - Ashakacem Ltd Fellow Back end subsidiary expenses. - 1,433,135 Lafarge North Fellow Back end America subsidiary expenses. - 113,164 - - Bazian Cement Co Ltd Fellow Back end subsidiary expenses. - 13,637 - - Lafarge Beocinka Fellow Back end Fabrika Cementa subsidiary expenses. - 508 - - Lafarge Canada Fellow Back end subsidiary expenses. - 55,083 - 2,646 Lafarge Cement Fellow Back end Cameroun subsidiary expenses. - 40,859 - 40,859 Lafarge Malaysia Fellow Back end subsidiary expenses. 8,663 - 8,663 - Holcim Group Fellow Back end Services Ltd subsidiary expenses. 368,664 331,458 324,555 331,458 Lafarge S.A. U Fellow Back end subsidiary expenses. - - - - Lafarge Building Fellow Back end Materials Holding subsidiary expenses. - 412,258 - 404,205 Lafarge MEA Building Fellow Back end Materials S.A.E subsidiary expenses. 101,406 357,324 74,033 336,200 Hima Cement Fellow Back end Limited Uganda subsidiary expenses. - 401 - - Bamburi Cement Ltd Fellow Back end subsidiary expenses. 57,734 22,243 57,734 22,243 Holcim (Maroc) S.A. Fellow Back end subsidiary expenses. 7,460 64,100 7,460 64,100 Lafarge Cement Fellow Back end Syria subsidiary expenses. - 10,040 - - Lafarge Beijing Fellow Back end Building Materials subsidiary expenses. - 44,246 - 44,246 Lafarge Cement Fellow Back end Egypt S.A.E. subsidiary expenses. - 3,289 - - Holcim Trading S.A. Fellow Back end subsidiary expenses. 324,287 1,767,122 324,287 1,767,122 LafargeHolcim Fellow Back end (Brasil) S.A. subsidiary expenses. - 30,751 - - Technical Center Fellow Back end Europe-Africa subsidiary expenses. 134,293 196,941 134,293 191,350 Lafarge Shipping Fellow Back end Services Limited subsidiary expenses. - 619 - 619 LafargeHolcim Middle East & Africa Fellow Back end IT Service Center subsidiary expenses. 4,610,636 1,788,683 1,156,813 211,611 Lafarge Associated Fellow Back end Nigeria Ltd subsidiary expenses. 266,025 - 266,025
Holcim (Deutschland) Fellow Back end GmbH Subsidiary expenses. - 16,178 - - Lafarge International Services Singapore Fellow Back end Pte Ltd subsidiary expenses. 127,245 176,824 98,321 123,292
NOTES TO THE CONSOLIDATED AND SEPARATE FINANCIAL STATEMENTS for the year ended 31 December 2018
132

1
Group Company
N'000
31 Dec 2018
N'000
31 Dec 2017
N'000
31 Dec 2018
N'000
31 Dec 2017
Other payables (cont’d) Lafarge ReadyMix Fellow Back end Nigeria subsidiary expenses. - - 47,477 9,628 Holcim (US) Inc. Fellow Back end subsidiary expenses - 69,631 - Holcim Bulgaria AD Fellow Back end subsidiary expenses. - 32,409 - - Lafarge Zambia Plc Fellow Back end subsidiary expenses. - 214 - - Holderfin Netherland Fellow Back end subsidiary expenses. - - - - Lafarge Industries Fellow Back end South Africa (PTY) Ltd subsidiary expenses. 60,229 99,308 60,229 99,308 Lafarge Building Fellow Back end Materials Limited subsidiary expenses. 46,164 - 46,164 - Lafarge SA Fellow Back end subsidiary expenses - - - - Holcim Technology Fellow Back end Ltd subsidiary expenses. 1,548,482 - 1,467,851 - Lafargeholcim Fellow Back end España, S.A.U. subsidiary expenses. 26,960 - 26,960 - Lafargeholcim Building Materials Fellow Back end (China) Co., Ltd subsidiary expenses. 11,528 - 11,528 - LH Trading Ltd Fellow Back end subsidiary expenses. 208,397 - 208,397 - Lafargeholcim Fellow Back end Maroc subsidiary expenses. 3,895 - 3,895 - Lafarge Cement Technical Center Fellow Back Vienna Gmbh subsidiary end expenses. 2,095 - 2,095 - Lafarge Material UK Fellow Back end subsidiary expenses. 57,404 - 57,404 - Holcim Azerbaijan Fellow Back end subsidiary expenses. 39,700 - - - Lafargeholcim Fellow Back end Bangladesh Limited subsidiary expenses. 20,310 - - - Holcim Belgique Fellow Back end subsidiary expenses. 18,506 - - - Holcim Bulgaria Ad Fellow Back end subsidiary expenses. 22,028 - - - Lafargeholcim Fellow Back end (Brasil) S.A. subsidiary expenses. 45,773 - - - Holcim Fellow Back end (Deutschland) Gmbh subsidiary expenses. 13,217 - - - Lafarge Cement Fellow Back end Egypt S.A.E. subsidiary expenses. 7,193 - - - Bazian Cement Fellow Back end Co Ltd subsidiary expenses. 47,913 - - - Lafarge Beocinska Fellow Back end Fabrika Cementa subsidiary expenses. 946 - - - Hima Cement Fellow Back end Limited Uganda subsidiary expenses. 423 - - - Lafarge Cement Fellow Back end Zimbabwe Ltd subsidiary expenses. 5,526 - - - Lafarge Zambia Plc Fellow Back end subsidiary expenses. 324 - - - Wapsila Nigeria Fellow Limited subsidiary - 10,000 7,927,401 10,264,271 5,561,294 7,226,888 ***Back end expenses relates to charge back of employee related costs, IT services and other administrative expenses.
NOTES TO THE CONSOLIDATED AND SEPARATE FINANCIAL STATEMENTS for the year ended 31 December 2018
133

1134
Group Company
N'000
31 Dec 2018
N'000
31 Dec 2017
N'000
31 Dec 2018
N'000
31 Dec 2017
Group Company
N'000
31 Dec 2018
N'000
31 Dec 2017
N'000
31 Dec 2018
N'000
31 Dec 2017
Group Company
N'000
31 Dec 2018
N'000
31 Dec 2017
N'000
31 Dec 2018
N'000
31 Dec 2017
39.6 Loans from related parties AshakaCem Ltd - - 12,732,554 11,103,553 Caricement B.V. 117,264,211 97,596,432 117,264,210 97,596,432 Holderffin Netherland - 34,505,103 - 34,505,103 ReadyMix - - - 603,268 Cemasco, Netherlands 23,147,700 12,290,024 - - 140,411,911 144,391,559 129,996,764 143,808,356 39.7 Key management personnel compensation
Executive - - - - Non-executive - 26,000 - 26,000 Fees - 26,000 - 26,000 Other allowances and expenses 548,482 310,838 548,482 310,838 Short term employee benefits 548,482 336,838 548,482 336,838 Other key management personnel Salaries and other short term employee benefits 1,894,996 1,702,842 1,525,518 1,702,842 Post-employment benefits 105,610 78,700 105,610 78,700 Total 2,000,606 1,781,542 1,631,128 1,781,542 The remuneration of directors and key executives is determined by the remuneration committee having regard to the
performance of individuals and market trends. There are no post-employment benefits due to key management. 39.8 Directors and employees Directors
Directors' emolument comprise: Fees 249,614 170,662 249,614 170,662 Salaries and other emoluments 289,288 166,176 289,288 166,176 538,902 336,838 538,902 336,838 Fees and other emoluments disclosed above include amount paid to:
NOTES TO THE CONSOLIDATED AND SEPARATE FINANCIAL STATEMENTS for the year ended 31 December 2018
Salaries/Fees Sitting allowance Other benefits Total 2018 2017 2018 2017 2018 2017 2018 2017 N'000 N'000 N'000 N'000 N'000 N'000 N'000 N'000Executive Director Michel Puchercos 228,614 144,662 - - 83,718 113,046 312,332 257,708 Non- Executive Directors Mobolaji Balogun 5,000 4,000 6,600 6,150 - - 11,600 10,150 Adebayo Jimoh - 2,000 1,270 6,140 70,000 - 71,270 8,140 Adebode Adefioye 4,000 2,000 6,100 6,755 - - 10,100 8,755 Adenike Ogunlesi 4,000 2,000 4,300 5,140 - - 8,300 7,140 Elenda Giwa- Amu 4,000 - 4,700 - - - 8,700 - Jean-Carlos Angulo - 2,000 2,300 2,550 - - 2,300 4,550 Shamsuddeen Usman 4,000 2,000 6,400 5,740 - - 10,400 7,740 Slyvie Rochier - 2,000 3,100 4,450 - - 3,100 6,450 Umaru Kwairanga - 2,000 800 4,120 100,000 - 100,800 6,120 Guillaume Roux - 4,000 - 9,780 - - - 13,780 Oludewa Edodo-Thorpe - 2,000 - 1,555 - - - 3,555 Thierry Metro - 2,000 - 750 - - - 2,750 249,614 170,662 35,570 53,130 253,718 113,046 538,902 336,838 Salaries/Fees represent annual remuneration, bonus paid, long term benefits and pensions while other benefits are related to Benefits in Nigeria
Other related party transactions:Chapel Hill Denham acted as the Issuing House for the Company’s rights issue in both current year and prior year. The Chief Executive Officer of the firm is Mr. Mobolaji Balogun, and he is a non-executive director and the Chairman of the Board of Directors of Lafarge Africa Plc. The amount paid to Chapel Hill partners in the current year was N165 million. (2017: N236 million). There are no outstanding amounts due to Chapel Hill Denham at the end of the year (2017: Nil).

Group Company
N'000
31 Dec 2018
N'000
31 Dec 2017
N'000
31 Dec 2018
N'000
31 Dec 2017
Group Company
N'000
31 Dec 2018
N'000
31 Dec 2017
N'000
31 Dec 2018
N'000
31 Dec 2017
Group Company 31 Dec
201831 Dec
201731 Dec
201831 Dec
2017
Employees The average number of employees employed during the year: Managerial staff 151 405 116 261 Senior staff 1,299 1,262 905 722 Junior staff 1,514 1,668 93 103 2,964 3,335 1,114 1,086 The aggregate payroll costs:
Wages, salaries, allowances and other benefits 36,205,104 29,512,604 15,121,809 14,687,390 Pension and social benefits 837,651 2,307,089 809,531 782,940 Staff training 121,568 861,379 121,568 404,356 37,164,323 32,681,072 16,052,908 15,874,686
The number of higher paid employees with gross emoluments within the ranges below were:
Range (N) Up to 1,000,000 38 45 2 - 1,000,001 - 3,000,000 833 782 223 360 3,000,001 - 5,000,000 827 416 398 343 5,000,001 - 7,000,000 507 188 221 168 7,000,001 - 10,000,000 285 102 114 94 Above 10,000,000 474 1,802 156 121 2,964 3,335 1,114 1,086
Number Number Number Number
40 Events after the reporting period 40.1 Rights Issue On 4 December 2018 the Company launched a Rights Issue to raise N89.2 billion by way of issue of 7,434,367,256 Ordinary
Shares of 50 Kobo each at N12 per share on the basis of 6 new Ordinary shares for every 7 Ordinary Shares held by qualified shareholders. The offer closed on January 28, 2019.
The offer at close on 28 January 2019 was fully subscribed. Subsequent to the closure of the offer, the Board of Directors at its meeting held on 15 February 2019 resolved that the Allotment Proposal presented by the Joint Issuing House mandated on the Rights Issue be approved and authorised them to submit the Allotment Proposal for clearance by the Securities and Exchange Commission (SEC). On the 8th of March 2019, SEC cleared the basis of Allotment as proposed by the Board of Directors and the Rights Issue shares were listed for trading on the floor of the Nigerian Stock Exchange on 26 March 2019.
40.2 Merger of Ready Mix with Lafarge Africa Plc Subsequent to year end, the Company sought and obtained board approval to merge with Readymix Nigeria Ltd, a wholly
owned subsidiary. The merger which is being executed in order to streamline the Group structure will be effected in 2019 with the operational integration of the entities resulting in additional synergies within the Group. The net assets of the subsidiary will be transferred to the Lafarge Africa Plc at no purchase consideration and recognised in other reserves in accordance with the Group's accounting policy.
40.3 Disposal of Subsidiary On 24th May 2019, the board of Lafarge Africa Plc approved the disposal of the Company's investment in Lafarge South
Africa Holdings (LSAH) via a planned sale of the total equity interest held by the Company in LSAH to Caricement B.V., a related party within the LafargeHolcim Group. The disposal was negotiated and the sales price was agreed at USD 316,289,061 based on an agreed Term sheet between both parties including a Fairness opinion by Messrs. P r i cewate rhouseCoopers , an independent exper t as we l l as app l i cab le regu la to ry approva l s .
The disposal is part of the Group's decision to reorganize its structure and achieve better synergies. The Transaction is being executed in line with the Nigerian Stock Exchange Related Party Rules and is expected to be completed by 31 July 2019 after shareholders' approval at the Annual General Meeting.
NOTES TO THE CONSOLIDATED AND SEPARATE FINANCIAL STATEMENTS for the year ended 31 December 2018
135

NOTES TO THE CONSOLIDATED AND SEPARATE FINANCIAL STATEMENTS for the year ended 31 December 2018
40.4 Interest Waiver on Loan due to Cemasco
Subsequent to year end, on 15 May 2019 there was an amendment to a long term loan agreement effected on 18 April 2018 between the South African subsidiary of the Group and another related party within the Lafarge Holcim Group. The amendment renders the loan to be non-interest bearing and effectively waives interest accrued on the loan from inception. The Term of the loan was also amended from the original maturity date of 20 February 2021 to the revised maturity of 31 July 2019. This has been treated as non-adjusting subsequent event given that the amendment was approved and signed subsequent to the reporting date. The impact of the amendment would be accounted for in the 2019 financial statements
40.5 Fire Outbreak at the Ikeja Office
Subsequent to year end, there was a fire outbreak at the Company's Ikeja office. The outbreak affected a part of the facility which was under an active fire insurance policy. The Directors have estimated the cost to restore the facility to its initial state to be N477.5 million and this cost will be borne by the insurance Company.
41 Changes in presentation and classification of comparatives Certain changes were made to the presentation and classification of line items on the statement of profit or loss, statement of
financial position . The changes were made in order to achieve fairer presentation. Further details are shown below: i) Consolidated and separate statements of profit or loss Group Company As reported in Reclassification/ 2017 As reported in Reclassification/ 2017 2017 financial Presentation comparative re- 2017 financial Presentation comparative re- year presentation year presentation N'000 N'000 N'000 N'000 N'000 N'00041.1 Cost of sales (248,393,638) (1,785,254) (250,178,892) (124,130,812) (1,805,743) (125,936,555) Impact on Gross profit (248,393,638) (1,785,254) (250,178,892) (124,130,812) (1,805,743) (125,936,555) 41.2 Selling and marketing expenses (3,685,666) (1,025,463) (4,711,129) (1,308,561) (1,021,679) (2,330,240)
41.3 Administrative expenses (41,594,520) 3,186,343 (38,408,177) (22,247,690) 3,203,048 (19,044,642)
41.4 Other income 4,069,524 (375,626) 3,693,89 4,181,947 (375,626) 3,806,321 Impact on operating profit (289,604,300) - (289,604,300) (143,505,116) - (143,505,116)
During the year, Lafarge Africa Plc modified the classification of items within Cost of Sales, Selling and Marketing expenses, Administrative expense and other income to achieve fairer representaion. Comparative amounts in the statement of profit or loss were reclassified for consistency. As a result, N1.7 billion for the Group and N1.8 billion for the Company were reclassified from administrative expenses to cost of sales. Also, N1.02 billion for the Group and Company was reclassified from Administrative expenses to Selling and Marketing Expenses while N375million has been reclassified from other Income to Cost of Sales.
ii) Consolidated and Separate Statements of Financial Position Group As reported in Reclassification/ 2017 2017 financial Presentation comparative re- year presentation N'000 N'000 N'000 Assets Non-current assets Deferred tax assets 7,951,595 9,562,837 17,514,432 Total impact on non-current assets 7,951,595 9,562,837 17,514,432
Impact on total assets 7,951,595 9,562,837 17,514,432 Liabilities Deferred tax liabilities 1,463,106 9,562,837 11,025,943 Total impact on non-current liabilities 1,463,106 9,562,837 11,025,943
Impact on total liabilities 1,463,106 9,562,837 11,025,943 Changes were made to the presentation and classification of deferred tax liabilities and deferred tax assets comparative balances
on the statement of financial position . The changes were made in order to achieve fairer presentation as shown above.
136

Consolidated and Separate Statements of Value Added for the year ended 31 December 2018
N'000
31 Dec 2018
% N'000
31 Dec 2017
%
Group Revenue 308,425,456 341 299,153,305 580 Bought in materials and services - - Local (205,274,250) (227) (184,741,039) (359) Imported (15,885,814) (18) (68,328,877) (132) - - Other income and finance income 3,103,161 4 5,508,504 11 Value added 90,368,553 100 51,591,893 100 Applied as follows: To pay employees Wages, salaries and other benefits 37,164,323 41 32,681,072 63 To pay providers of capital: Finance costs 34,146,148 38 28,709,847 56 To pay government: Income tax expense 1,351,245 1 2,455,201 5 Retained in the business To maintain and replace: Property, plant and equipment 22,288,279 25 22,181,159 43 Intangible assets 4,220,284 5 166,023 - To deplete reserves (8,801,726) (10) (34,601,409) (67) Value added 90,368,553 100 51,591,893 100
Other National Disclosures
137

1
N'000
31 Dec 2018
% N'000
31 Dec 2017
%
Company Revenue 187,043,475 260 177,170,362 367Bought in materials and services Local (99,452,106) (138) (93,964,561) (194)Imported (18,193,495) (25) (40,270,526) (84) - - Other income and finance income 2,610,393 4 5,289,423 11 Value added 72,008,267 101 48,224,698 100 Applied as follows: To pay employees Wages, salaries and other benefits 16,052,908 22 15,874,686 33 To pay providers of capital: Finance costs 32,152,046 45 28,331,639 59 To pay government: Income tax expense 84,876 - 937,732 2 Retained in the business To maintain and replace: Depreciation of plant, property and equipment 16,369,888 23 16,304,267 34 Intangible assets 3,206,785 4 - - To deplete reserves 4,141,764 7 (13,223,626) (28) Value added 72,008,267 101 48,224,698 100
138
Consolidated and Separate Statements of Value Added for the year ended 31 December 2018

1
N'000 2018
Five year Financial Summary for the year ended 31 December 2018
N'000 N'000 N'000 N'000 2017 2016 2015 2014
I F R S
N'000 2018
N'000 N'000 N'000 N'000 2017 2016 2015 2014
I F R S
Group
Financial position Capital employed: Ordinary share capital 4,336,715 2,787,888 2,740,367 2,277,451 2,202,088 Share premium 350,945,748 222,272,108 217,528,456 186,419,988 173,997,568 Retained earnings 138,272,355 160,257,556 102,842,886 100,992,758 87,206,392 Deposit for shares - 130,416,872 - - - Foreign currency translation reserve 9,364,261 9,935,643 (8,660,486) (10,156,641) (1,341,036)Other reserves on business combination and re-organisation (368,683,312) (368,683,312) (256,899,951) (162,185,111) (161,689,548)Non-controlling interest 305,322 - 191,401,276 58,803,285 75,204,485 Total equity 134,541,089 156,986,755 248,952,548 176,151,730 175,579,949 Represented by: Property, plant & equipment 394,488,764 393,651,934 390,240,816 364,397,318 331,257,236 Intangible assets 6,194,518 2,634,326 1,563,499 1,548,927 2,196,926 Investment in joint ventures - - 89,551 27,410 43,208 Other financial assets 1,301,148 1,582,622 423,921 9,980,526 6,255,605 Other assets 16,671,760 20,803,113 9,790,605 291,765 1,587,096 Deferred tax assets 28,720,032 17,514,432 7,641,003 - 294,629 Restricted cash - - - 2,188,089 2,097,687 Net current liabilities (119,289,276) (189,550,565) (85,039,599) (20,477,577) (3,505,724) 328,086,946 246,635,862 324,709,796 357,956,458 340,226,663 Borrowings (172,373,209) (68,715,378) (68,221,773) (135,465,180) (116,001,592)Deferred tax liabilities (10,200,112) (11,025,943) - (32,937,323) (34,172,979)Provisions (3,645,751) (3,472,388) (2,200,640) (2,576,567) (3,124,736)Deferred revenue (2,597,602) (1,518,467) (1,554,673) (2,133,748) (2,368,466)Employee benefits obligation (4,729,183) (4,916,931) (3,780,162) (7,542,345) (8,978,941)Other long term liabilities - - - (1,149,565) - Net assets 134,541,089 156,986,755 248,952,548 176,151,730 175,579,949
Net assets per share (Naira) 1,551 2,816 4,542 3,867 3,987 Net assets per share is calculated by dividing net assets of the Group by the number of ordinary shares outstanding at the end of the reporting period.
Financial result Revenue 308,425,456 299,153,305 219,714,112 267,234,239 260,810,463 (Loss)/profit before minimum tax (19,508,228) (34,032,277) (22,818,718) 29,286,847 40,358,133 (Loss)/profit for the year (8,801,726) (34,601,409) 16,898,781 27,162,969 33,820,372 Dividend proposed 13,010,143 5,754,771 14,904,233 15,855,034 Per share data (Kobo) Earnings - Basic (105) (637) 315 574 767 Dividend proposed (kobo) - 105 105 300 360 Dividend cover (times) - (6) 3 2 2 Net assets 1,551 2,816 4,542 3,867 3,987 Earnings per share (EPS) is calculated by dividing the profit attributable to equity holders of the Group by the weighted average number of ordinary shares outstanding at the end of the reporting period.
139

1
N'000 2018
N'000 N'000 N'000 N'000 2017 2016 2015 2014
I F R S
N'000 2018
N'000 N'000 N'000 N'000 2017 2016 2015 2014
I F R S
Company
Capital employed: Ordinary share capital 4,336,715 2,787,888 2,740,367 2,277,451 2,202,088 Share premium 350,945,748 222,272,108 217,528,456 186,419,988 173,997,568 Retained earnings 92,140,223 100,970,988 119,825,320 113,904,430 100,464,682 Deposit for shares - 130,416,872 - - - Foreign currency translation reserve 39,103 39,103 - - - Other reserves on business combination and re-organisation (191,718,064) (191,718,064) - - - Total equity 255,743,725 264,768,895 340,094,143 302,601,869 276,664,338 Represented by: Property, plant & equipment 291,775,732 292,872,779 114,617,300 118,251,256 120,154,329 Intangible assets 3,204,505 - - - - Investment in subsidiaries 178,923,532 182,088,406 243,891,263 211,903,225 198,173,967 Investment in joint venture - - 73,133 - - Other financial assets 1,134,509 1,556,738 92,143,118 18,139,971 - Other assets 15,073,457 14,984,747 - - - Deferred tax assets 27,950,907 16,333,384 - - - Net current liabilities/assets (114,241,023) (174,121,882) (25,718,849) (14,578,906) (11,227,214) 403,821,619 333,714,172 425,005,965 333,715,546 307,101,082 Borrowings (144,391,743) (64,900,757) (64,014,218) (5,672,992) (7,057,436)Deferred tax liabilities - - (18,031,333) (18,900,873) (18,021,055)Provisions (618,970) (909,320) (563,468) (792,578) (742,123)Deferred revenue (1,455,770) (1,518,467) (722,496) (752,600) (782,704)Employee benefits obligation (1,611,411) (1,616,733) (1,580,307) (4,994,634) (3,833,426) Net assets 255,743,725 264,768,895 340,094,143 302,601,869 276,664,338
Net assets per share (Naira) 2,949 6,205 6,205 8,553 8,079 Net assets per share is calculated by dividing net assets of the Group by the number of ordinary shares outstanding at the end of the reporting period.
Financial result Revenue 187,043,475 177,170,362 87,198,416 114,558,245 105,848,657 (Loss)/profit before minimum tax (7,408,583) (7,098,191) 19,888,762 30,918,773 32,352,996 (Loss)/profit for the year 4,141,764 (13,223,626) 20,778,348 29,837,395 28,360,146 Dividend proposed - 13,010,143 5,754,771 14,904,233 15,855,034 Per share data (Kobo) Earnings - Basic 48 (240) 394 594 826 Dividend proposed (kobo) - 150 105 300 360 Dividend cover (times) - (2) 4 3 2 Net assets 2,949 4,749 6,205 8,553 8,079 Earnings per share (EPS) is calculated by dividing the profit attributable to equity holders of the Group by the weighted average number of ordinary shares outstanding at the end of the reporting period.
140
Five year Financial Summary for the year ended 31 December 2018


142
NOTICE OF ANNUAL GENERAL MEETING
AGENDA
ORDINARY BUSINESS
1. To lay the Audited Financial Statements for the year ended 31st December 2018 together with the Report of the Directors, External Auditors and Audit Committee thereon;
2. To approve the appointment of the following Non-Executive Directors:
a. Mr. Jean-Philippe Benard b. Ms. Karine Uzan Mercie
3. To re-elect the following Non Executive Directors: a. Mr. Adebode Adefioye b. Mrs. Elenda Giwa-Amu c. Mrs. Adenike Ogunlesi
4. To authorise the Directors to fix the remuneration of the External Auditors.
5. To elect Members of the Audit Committee.
SPECIAL BUSINESS
Ordinary Resolutions:
6. To fix the remuneration of the Directors.
7. Approval of Related Party Transaction
To consider and, if thought fit, to pass, with or without amendment, the following resolutions:
a. “That the Company be and is hereby authorized to enter into a related party transaction involving the sale by the Company of its 33,823,992 ordinary shares in Lafarge South Africa Holdings Proprietary Limited (“LSAH”) to Caricement B.V, a subsidiary of LafargeHolcim group (the
NOTICE is hereby given that the
60th Annual General Meeting
(AGM) of Lafarge Africa Plc will
hold at the Grand Banquet Hall, of
the Civic Centre, Ozumba
Mbadiwe Road, Victoria Island,
Lagos, on Monday, 22nd July
2019 at 10am to transact the
following businesses:
“Purchaser”) for a Consideration no less than US$316,289,060.61 (Three Hundred and Sixteen Million, Two Hundred and Eighty Nine Thousand, Sixty Dollars Sixty One Cents)(“Consideration”);
b. That the Company be and is hereby authorized to receive the Consideration or any portion of it by a set-off of the Company's total indebtedness to the Purchaser under the existing Inter-Group Loan Agreements between the Company and the Purchaser as at the closing date of the share purchase agreement between the Company and the Purchaser;
c. That the general mandate given to the Company to enter into recurrent transactions with related parties for the Company's day-to-day operations, including the procurement of goods and services, on normal commercial terms in compliance with the Nigerian Stock Exchange Rules Governing Transactions with Related Parties or Interested Persons, be and is hereby renewed.”
8. Other Acts
a. “The Directors of the Company be and are hereby authorised to approve, sign and/or execute all documents, as may be necessary to give effect to the above resolutions, including without limitation, complying with the directives of any regulatory authority and all acts carried out, steps taken and documents executed (or to be executed), by the Directors of the Company in connection with the above resolutions be and are hereby approved and/or ratified as the case may be;
b. The Company Secretary be and is hereby authorised to take all steps to give effect to these resolutions and, where applicable, to file and/or register same with the Corporate Affairs Commission.”
NOTES
Related Party Circular
In accordance with The Nigerian Stock Exchange's Rules Governing Transactions with Related Parties or Interested Persons, the details of the proposed related party transactions are contained on pages 144 – 150 and Page 151 for the General Mandate.
Proxy A member of the Company entitled to attend and vote at the Annual General Meeting can appoint a proxy to

145
NOTICE OF ANNUAL GENERAL MEETING
attend and vote instead of him/her. A proxy need not be a member of the Company. A proxy form is enclosed in this Annual Report. For the instrument of proxy to be valid for the purpose of the meeting it must be completed, duly stamped by the Commissioner of Stamp Duties in accordance with the Stamp Duties Act (Cap S8 Laws of the Federation of Nigeria 2004) and deposited at the office of the Registrar of the Company, Cardinal Stone Registrars Limited, located at 358 Herbert Macaulay Road, Yaba, Lagos, not later than 48 hours before the time for holding the meeting.
E-dividend
Notice is hereby given to all shareholders to open bank accounts, stockbroking accounts and CSCS accounts for the purpose of dividend. Detachable application forms for e-dividend is attached to the Annual Report to enable all shareholders furnish particulars of their accounts to the Registrar as soon as possible. We request our Shareholders to use the e-dividend payment portal that will serve as an online verification and communication medium for e-dividend mandate processing through the new e-dividend mandate management system jointly introduced by the Central Bank of Nigeria, Securities and Exchange Commission, Nigeria Inter-Bank Settlement Systems Plc and the Institute of Capital Market Registrars. A detachable e-dividend payment mandate and change of address form is attached to the Annual Report to enable shareholders furnish particulars of their bank and CSCS account numbers to the Registrar.
Closure of Register of Members
In accordance with section 89 of the Companies and Allied Matters Act (CAMA), please note that the Register of Members and Transfer Books of the Company will be closed from Monday, 24th June 2019 to Friday, 28th June 2019 (both dates inclusive) to enable the Registrar to update its records.
Nominations for the Audit Committee
In accordance with Section 359 (5) of CAMA, any shareholder may nominate another shareholder for appointment to the Audit Committee. Such nomination should be in writing and must reach the Company Secretary not less than twenty-one (21) days before the AGM. The Securities and Exchange Commission's Code of Corporate Governance for public companies indicates that some of the members of the Audit Committee should have bas ic f inancia l l i te racy and be knowledgeable in internal control processes.
We therefore request that nominations must be accompanied by a copy of the nominee's curriculum vitae.
Unclaimed Dividend
Shareholders are hereby informed that a number of share certificates and dividend warrants have been returned to the Registrars as “unclaimed”. Any member affected by this notice is advised to write to or call the office of the Company's Registrar, Cardinal Stone Registrars Limited. The list of unclaimed dividend can be accessed at the Registrars' office or via the Company's website: www.lafarge.com.ng
Right To Ask Questions
Pursuant to Rule 19.12 (c) of the Nigerian Stock Exchange Rule Book 2015, it is the right of shareholders of the Company to ask questions not only at the Annual General Meeting but also in writing prior to the meeting. We urge that such questions be submitted to the Company Secretariat not later than one week before the A n n u a l G e n e r a l M e e t i n g o r b y e m a i l t o [email protected]
The profile of Directors for re-election can be accessed on the Company's website: www.lafarge.com.ng.
BY ORDER OF THE BOARD
Adewunmi Alode (Mrs.)Company SecretaryFRC/2018/ICSAN/00000017796Dated this 18th of June 2019 27B Gerrard Road,Ikoyi, Lagos.
143

144
EXPLANATORY NOTE
RC 1858
LAFARGE AFRICA PLC
ON THE PROPOSEDRELATED PARTY TRANSACTION
WITH CARICEMENT B.V.
A SUBSIDIARY OF LAFARGEHOLCIM LIMITED
THIS DOCUMENT IS IMPORTANT AND REQUIRES YOUR IMMEDIATE ATTENTION
If you are in any doubt about the contents of this document or any action to be taken, you should consult your Stockbroker, Solicitor, or any other independent professional adviser duly registered under the Investment and Securities Act (No. 29 of 2007) immediately.
If you have sold or otherwise transferred all your shares in Lafarge Africa Plc, please give this document and the accompanying proxy forms to the purchaser or transferee or to the Stockbroker or other agent through whom the sale or transfer was effected, for transmission to the purchaser or transferee.
The receipt of this document or of any information contained in it or supplied with it or subsequently communicated to any person does not constitute investment advice to a shareholder from Lafarge Africa Plc or to any other person by the Company or its directors and the Company does not commit to providing shareholders with any other information, updates or corrections to this document or the information contained herein.
144

145
DEFINITIONS
Annual General Meeting
Board of Directors or Board or Directors
CAMA
Caricement
Chairman's Statement
Closing Date
Company
Consideration
Explanatory Statement
Fairness Opinion Advisers
Financial Advisers
Group Independent
Valuation Adviser
Inter-Group Loans
Inter-Group Loan Agreements
Legal Advisers
LH
LSAH
Minority Shareholders
N or Naira
NSE or The NSE
NSE Rules
Proposed Sale
Related Party Rules
Sale Shares
means the 60th Annual General Meeting of the Company, scheduled to hold on July 22, 2019;
means the board of directors of the Company;
means the Companies and Allied Matters Act Cap C24, Laws of the Federation of Nigeria;
means Caricement B.V., a wholly owned subsidiary of LH;
means a Statement from the Chairman of the Board of Directors of the Company set out in the Annual Report;
means July 31, 2019;
means Lafarge Africa PLC;
means the payment by Caricement for the Sale Shares through a set-off of all the outstanding amounts due by the Company to Caricement under the Inter-Group Loan Agreements at the Closing Date;
means this Explanatory Statement;
means PricewaterhouseCoopers Limited;
means Standard Chartered Securities (Nigeria) Limited;
means the Lafarge Africa PLC Group; means Standard Chartered Capital and Advisory Limited and Standard Chartered Bank, Johannesburg (“together SCB”);
means the inter-group loans between the Company (as borrower) and Caricement (as lender) pursuant to the Inter-Group Loan Agreements;
means the inter-group loan agreements entered into between the Company (as borrower) and Caricement (as lender) [as listed in Appendix 1; means Aluko & Oyebode;
means LafargeHolcim and its group entities;
means Lafarge South Africa Holdings (Pty) Limited;
means the shareholders of the Company other than LH;
means the lawful currency of the Federal Republic of Nigeria;
means The Nigerian Stock Exchange;
means the Rules and Regulations of The NSE;
means the proposed sale of 100% of the issued share capital in LSAH by the Company to LH;
means The Nigerian Stock Exchange's Rules Governing Transactions with Related Parties or Interested Persons; means the 33,823,992 ordinary shares in LSAH held by the Company constituting 100% of the issued share capital of LSAH.

146
This Explanatory Note has been prepared to provide all the material information to all the Shareholders of Lafarge Africa Plc (“Lafarge Africa” or ''the Company”), in respect of the proposed sale of a 100% equity interest held by the Company in Lafarge South Africa Holdings (Pty) Limited (“LSAH”) to Caricement B.V. (“Caricement”), an indirect subsidiary of LafargeHolcim Limited (“LafargeHolcim” or “LH”) and the repayment of the Inter-Group Loans (the “Transaction”) .
The Transaction is subject to the NSE Related Party Rules. Lafarge Africa will present the terms of the Transaction to the shareholders for consideration at the 60th Annual General Meeting of the Company, as Special Business, which will be voted on by way of an ordinary resolution in accordance with CAMA.
1. Background
LSAH, a member of the LafargeHolcim Group, was established in 1998 and manufactures and supplies cement, aggregates, ready-mix concrete and fly ash in South Africa. LSAH became a wholly owned subsidiary of Lafarge Africa following the Company's acquisition of a 100% stake in LSAH in 2014. The consideration that Lafarge Africa paid for the acquisition of LSAH was settled by way of cash of US$200 million and the allotment of 724,758,803 ordinary shares in Lafarge Africa; to Financiere Lafarge SAS.
Lafarge Africa's ownership of 100% of LSAH, represents an indirect average holding of 72.40% in the underlying principal operating companies in South Africa, including Lafarge Industries South Africa, Lafarge Mining South Africa and Ash Resources. In line with the objectives of the Broad-Based Black Economic Empowerment Act, 2003 (Act No. 53 of 2003) the remaining shares in Lafarge Industries South Africa and Lafarge Mining South Africa are (or will be) held by the employees of these companies and Sinako Holdings (one of LSAH's Black Economic Empowerment Partners) and in the case of Ash Resources by its employees and Peotona Group Holdings (one of LSAH's Black Economic Empowerment Partners).
LSAH's operations have been subjected to shrinking demand in South Africa - an aggressively competitive market. Between 2000 and 2007, demand was fueled by increasing infrastructure spend which tapered off and eventually declined quite sharply. Low growth indicators, growing budget deficits, declining infrastructure spend and reduced consumer discretionary income continue to constrain industry volumes; and characterize the downward trend in South Africa's building materials sector. The competitive environment, slow recovery and struggle to defend market share have heightened market pressure to reduce prices, significantly impacting LSAH's operating margins in recent years.
The Board of Directors of Lafarge Africa (“the Board”) have continued to deliberate on the impact of LSAH's performance on the Company and are now constrained to effect a sale of LSAH, in order to halt further erosion of shareholder value and restore profitability to your company.
2. The Proposal
2.1. The Proposed Sale
As part of its audit exercise with respect to the 2018 accounts, KPMG Professional Services as auditors of the Company, informed the Company's management that, based upon its assessment of the 2018 performance of LSAH, the valuation of LSAH in the accounts of the Company would have to be impaired to a tune of N 70 billion (the Potential Impairment) . The Board, acting within its regulatory duties, delayed the approval of the 2018 accounts whilst seeking the optimal resolution of this significant issue which had a potential major impact on shareholders' value in the Company. During deliberations by the Board on this matter, various options were considered including exit from South Africa, the Board then arrived at the conclusion that the disposal of LSAH as the best option for halting the Potential Impairment. In addition and based on well considered metrics and the very limited time to explore other options, the Board concluded that a buy-back by LH was the most appropriate means of deriving the best value from the proposed sale in the interest of all stakeholders and most especially the Minority Shareholders. Understanding the implication of the Potential Impairment on the Company, LH acted timeously by entering into negotiations with the Company with respect to the Potential Sale.
In order to ensure a transparent and arm's length Transaction, the Board took the following steps:
I. Set up of an Independent Committee made up of some members of the board who are not employees or officers of LH together with the Chairman of the Audit Committee in attendance.
1. Mr. Adebode Adefioye – Board member 2. Mrs. Elenda Giwa-Amu – Board member 3. Mrs. Adenike Ogunlesi – Board member 4. Mr. Olawale Oyedele – Chairman Audit Committee (In Attendance)
The Independent Committee along with the Chairman of the Board (In Attendance) negotiated the Proposed Sale with the LH team;
ii. Appointment of separate professional advisers (financial and legal advisers) to advise the Board on the proposed transaction;
iii. Appointment of a Fairness Opinion Adviser to provide a fairness opinion with respect to the transaction, in line with the Related Party Rules;
iv. Recusal from voting on the Transaction by Board members who are employees or officers of LH; and
v. Engagement of the services of Standard Chartered Bank Johannesburg and Standard Chartered Capital and Advisory (Nigeria) Limited (both referred to as “SCB” in
EXPLANATORY NOTE TO SHAREHOLDERS OF LAFARGE AFRICA PLC ON THE PROPOSED RELATED PARTY TRANSACTIONS WITH CARICEMENT B.V. SUBSIDIARY OF LAFARGEHOLCIM LIMITED, PURSUANT TO THE NIGERIAN STOCK EXCHANGE RULES GOVERNING TRANSACTIONS WITH RELATED PARTIES OR INTERESTED PERSONS

147
this Explanatory Notes) to conduct a “fair value” valuation of LSAH.
Following the discussions and various negotiations on the Proposed Sale, LafargeHolcim agreed to purchase the Sale Shares for the Consideration being a set-off of all the outstanding amounts due by the Company to Caricement under the Inter-Group Loan Agreements at the Closing Date which is July 31, 2019. The value of the Consideration at the closing date is US$316,289,061.00 (three hundred and sixteen million, two hundred and eighty nine thousand and sixty one United State Dollars) being the sum total of the principal sum of US$293,000,000.00 plus all accrued interest of US$23,289,061 as at July 31, 2019.
2.2. The Set-Off
At the 59th AGM of the Company, the minority Shareholders approved the restructuring of the then existing US$315.2 million balance of inter-group company loan between the Company and LH through Caricement as lender. Pursuant to the approved loan restructuring,
i. the loans were restructured to a 7.5 year tenor with two years repayment moratorium. The summary of the approved restructured loan is attached as Appendix 1
ii. the outstanding amounts due to Caricement was split into separate facilities (the “Split Transactions”) to facilitate repayment by the Company as and when the Company's cashflows permit; and
iii. US$22.2 million was repaid from the proceeds of the N89.2 billion Rights Issue concluded in March 2019;
Following the negotiations with LH by the Independent Committee of the Board and offer by LH to purchase the Sale Shares for the Consideration, the Transaction will therefore involve a set-off off the purchase price due under the Proposed Sale with the outstanding amounts due and payable by the Company under the Inter-Group Loan Agreements.
3. The Valuation
SCB's valuation reflects an intrinsic enterprise value range of US$217 million - US$249 million and equity value range of US$85 million – US$117 million based on LSAH's management business plan. Based on certain parameters, SCB estimated current market value at US$50 million or less (bottom end of EV/2020 EBITDA range, plus estimated value of tax losses). It noted that in the near term, the Market Value could increase to US$100 million – US$140 million, if LSAH demonstrates progress towards its 2021 financial projections.
As at May 31, 2019, LSAH's carrying value on the books of Lafarge Africa is a historical cost of N118.10 billion (c.US$328.05 million).
4. Independent Fairness Opinion
The Rules - in particular, Rule 20.7 (d) 1 (A) and (B) - require that an Independent Financial Adviser provide an opinion on whether the related party transaction “is executed on normal commercial terms” or whether it “is prejudicial to the interest of the Issuer (in this case, Lafarge Africa) and its minority shareholders”.
Pursuant to the Rules, Lafarge Afr ica appointed PricewaterhouseCoopers (“PwC”) for the purposes of obtaining an Independent Fairness Opinion on the Sale.
An extract of the report issued by PwC on May 21, 2019 is provided below:
“PwC has assumed and relied, without any responsibility for independent verification, upon the accuracy and completeness of all financial and other information, which was provided to it or is publicly available.…Our Opinion is based on economic, monetary and market conditions as they exist as at the date of this Opinion...”
“…Based upon and subject to the foregoing, PwC is of the opinion that, as at the date hereof, the Offer Price for the shares of LSAH – USD316,289,061.00 – is fair and reasonable.”
The full text of PwC's Independent Fairness Opinion is set out in Appendix 2 hereto.
5. Benefits of the Transaction
The Proposed Sale is expected to enhance the value of shareholders' investments in Lafarge Africa, which is of utmost importance to the Board. In addition, following the conclusion of the Proposed Sale, Lafarge Africa's shareholder loan of US$293,000,000.00 as at July 31, 2019 (“Shareholder Loan''), which represents the only existing foreign currency loan in the books of the Company will be completely extinguished. This full repayment of the Shareholder Loan will protect and preserve Lafarge Africa's net Income and cash flows considering the resulting decrease sums to be applied towards debt service as on the overall the Company's debt will be reduced by c.N115 billion and an additional c.N47 billion by the eventual deconsolidation of LSAH. The improvement in cashflow and net income, resulting from the reduction in debt service outflows, will enable Lafarge Africa to consider additional investments in cement production capacity to improve its market share in Nigeria. The Sale is expected to boost the Company's profitability, through positive cash flow generation.
In summary, the conclusion of the Sale is expected to:
a. boost Lafarge Africa's cashflow and net income, given the reduction in debt service outflows;
b. cut annual interest expense by c.N9.1 billion on account of the full repayment of the foreign currency inter-company loan;
c. enable Lafarge Africa to reinvest in (and expand) operations in existing plants;
d. enable the management of Lafarge Africa to devote attention to Lafarge Africa's operations with higher profitability and prospects;
e. strengthen Lafarge Africa's Balance Sheet and position the Company to improve overall profitability; and
f. enable the re-rating of the Company's share price.
Subsequent to the conclusion of the transaction, the only remaining debt on the books of the Company will be the 2nd Tranche of the Corporate Bond (N33.8 billion) with maturity in June 2021, and the CBN Power Intervention funds through Bank of Industry (N19.9 billion).

148
6. Concurrence of Lafarge Africa's Audit Committee
The Company has provided the Audit Committee with copies of the term sheet and agreements that Lafarge Africa proposes to execute with Caricement, a subsidiary of LafargeHolcim Ltd. The Independent Fairness Opinion prepared by PwC has also been presented to the Audit Committee.
At a meeting of the Company's Audit Committee held on May 24, 2019, the members of the Audit Committee discussed the Sale and confirmed their concurrence with the Independent Fairness Opinion expressed by PwC; and consequently, the Audit Committee will not be issuing a separate opinion on the Related Party Transaction.
7. Impact of the Transaction
The Transaction will become effective following receipt of all requisite regulatory approvals and upon the fulfilment of all other conditions precedent as agreed by Lafarge Africa and Caricement. From the effective date of the Sale, Lafarge Africa will cease to own the 100% equity interest in LSAH; which will be transferred and relinquished to Caricement. Accordingly, from that date, Lafarge Africa will have no obligations or interests regarding LSAH and the accounts of LSAH will no longer form part of Lafarge Africa's consolidated accounts. In addition, the Company's liabilities under the Inter-Group Loan Agreements will be extinguished.
8. Recommendation
The Board has considered the Independent Fairness Opinion provided by PwC and the concurrence of the Audit Committee. [Board members who are employees or officers of LafargeHolcim recused themselves from these discussions.]
Based on the foregoing, the Board believes that, under the circumstances and given the likelihood that LSAH's continued operational and financial performance would have required Lafarge Africa to take a very significant impairment on its investment, the Consideration of US$316,289,061.00 represents a favorable outcome. The Board, therefore strongly recommends the Transaction for consideration by the shareholders of Lafarge Africa and urges the shareholders to approve the Transaction.
On the back of this recommendation by the Board and the clearance of the transaction by The NSE under its rule governing transactions with Related Party and Interested Persons the impairment of the investment in LSAH that is recognised in the 2018 audited Financial Statements is c.N3.2 billion which represents the difference between the carrying value of the investment (N118.1 billion) and the net sales proceeds translated from US$ to Naira based on the prevailing exchange rate as at 31 December 2018. Given that July 31, 2019 is the effective date of the Share Purchase Agreement (SPA), the accounts of the Company will continue to reflect the operations of LSAH until the end of Q2 2019.
9. Shareholder Approval
LafargeHolcim is Lafarge Africa's parent company and owns 83.8% of the Company through the following wholly owned subsidiaries: Caricement B.V., Associated International Cement Ltd (UK) and Lafarge Associated Nigeria Limited. The counter party to the Proposed Sale and the Set-Off is Caricement; based on the provisions of the NSE Rules, the Transaction is a related party transaction and therefore governed by the Related Party Rules. Under the Related Party Rules, the approval of the Minority Shareholders is required for the consummation of the Transaction.
The 60th Annual General Meeting of Lafarge Africa is scheduled to hold on July 22, 2019 at 10.00am (“the AGM”). At the AGM, the shareholders of Lafarge Africa will consider and, if thought fit, approve the Related Party Transaction which will authorize Lafarge Africa to execute such agreements as will be required to effect the Transaction.
10. Voting at the Meeting
Each shareholder is eligible to vote at the AGM and will be entitled to cast votes in respect of the Transaction.
However, the LafargeHolcim Group - the majority shareholder in Lafarge Africa, in compliance with the requirements of The NSE Rules Relating to Board Meetings and General Meetings of Issuers – has informed the Company that, as a related party, LafargeHolcim (its nominee, subsidiaries, associate, related party, or other party acting in concert with LafargeHolcim that hold shares in the Company), will not exercise its right to vote at the AGM on matters pertaining to the Transaction.
Lender
A. Caricement B. V
B. Caricement B. V
Part A - 1
Part A - 2Part A -3
Part A - 4Part A - 5Part A - 6
Part A - 7 Part A - 8*
C. Caricement B. V
7.2
220.0
25.0
25.025.0
25.025.030.0
50.015.0
88.0
1 Month Libor + 5.71%
12 Month Libor + 6.35%
12 Month Libor + 6.35%12 Month Libor + 6.35%
12 Month Libor + 6.35%
12 Month Libor + 6.35%12 Month Libor + 6.35%12 Month Libor + 6.35%
3 Month Libor + 5.71%
12 Month Libor + 6.35%
Not Applicable
12 Month Libor + 6.35%
12 Month Libor + 6.35%12 Month Libor + 6.35%
12 Month Libor + 6.35%
12 Month Libor + 6.35%12 Month Libor + 6.35%12 Month Libor + 6.35%
Not Applicable
12 Month Libor + 6.35%
7.5 years
7.5 years
7.5 years
7.5 years
7.5 years
7.5 years
7.5 years
3 Month
2 years + 1 day
2 years + 1 day
2 years + 1 day
2 years + 1 day
2 years + 1 day
2 years + 1 day
2 years + 1 day
Not applicable
26 February, 2026
26 February, 2026
26 February, 2026
26 February, 2026
26 February, 2026
26 February, 2026
26 February, 2026
27 December, 2018*
7.5 years 2 years + 1 day 26 February, 2026
Amount - mUs$
Interest Rate Interest Rate - PostMoratorium
Tenor Moratorium Maturity
1 MonthNot Applicable
27th December, 2018*
APPENDIX 1 - SUMMARY OF APPROVED RESTRUCTURED INTER-GROUP LOANS
* December 27, 2018 or any other date as may be agreed by parties

149
The Board of Directors,Lafarge Africa Plc27B Gerrard RoadIkoyi, Lagos.
21 May 2019
Dear Sirs,
Fairness and reasonableness opinion on the price to be paid by LafargeHolcim Group (“LafargeHolcim”) to Lafarge Africa Plc (“Lafarge Africa”) for its 100% equity ownership of Lafarge South Africa Holdings (“LSAH”)
Introduction
LSAH, a subsidiary of Lafarge Africa is involved in the manufacturing and marketing of cement, ready-mix concrete, aggregates and gypsum products in South Africa.
We understand that Lafarge Africa, due to the poor financial performance of LSAH and a potential substantial impairment required by the auditors in the 2018 financial statements, has decided to dispose of its 100% equity interest in LSAH, hereinafter referred to as “The Transaction”. Standard Chartered Bank (“SCB”) has been hired as a financial advisor by Lafarge Africa to conduct a valuation of LSAH and advise its Board of Directors. Lafarge Africa has approached LafargeHolcim to buy back Lafarge Africa's equity interest in LSAH and has negotiated a price of USD 316,289,061 for the Transaction (the “Offer Price”).
Based on the documents received from Lafarge Africa and LSAH, LSAH's value is driven by its interest in the following operating entities:
Ÿ 73.0% of the equity shareholding in Lafarge Mining South Africa (Pty) Limited (“Lafarge Mining”)Ÿ 79.7% of the equity shareholding in Lafarge Industries South Africa (Pty) Limited (“Lafarge Industries”)Ÿ 70.1% of the equity shareholding in Ash Resources (Pty) Limited (“Ash Resources”)
In addition, there are four other non-operating entities (Qala Quarry, Marang Tyre Processing, Laf Gypsum Holdings and AFR) owned by LSAH, whose values are negligible.
Lafarge Africa has requested the opinion (“Opinion”) of PricewaterhouseCoopers Limited (“PwC”) as to the fairness, from a financial view, of the Offer Price to Lafarge Africa.
Responsibility
To the fullest extent permitted by law, PwC accepts no duty of care to any third party in connection with the provision of this Opinion and/or any related information or explanation (together, the “Information”). Accordingly, regardless of the form of action, whether in contract, tort (including, without limitation, negligence) or otherwise, and to the extent permitted by applicable law, PwC accepts no liability of any kind to any third party and disclaims all responsibility for the consequences of any third party acting or refraining to act in reliance on the Information.
The information used by PwC in preparing this Opinion has been obtained from a variety of sources as indicated within the Opinion. While our work has involved analysis of financial information and/or accounting records, it has not included an audit in accordance with generally accepted auditing standards.
Definition of the term “fair”
For the purpose of this Opinion, we define “fair market value” as the price which might reasonably be expected to be obtained in money or money's worth, in a sale between a willing buyer and a willing seller, each of whom is deemed to be acting for self-interest and gain and both of whom are equally well informed about the business and the markets in which this business operates. The valuation used in determining the Offer Price for this Transaction may be considered fair if it is not less than the fair value.
Procedures
In rendering our Opinion, we have considered the following:a. A valuation report on LSAH prepared by Standard Chartered Bank dated May 2019;

150
b. Information relating to LSAH, its subsidiaries (Lafarge Industries, Lafarge Mining and Ash Resources) including audited financial statements for the periods 31 December 2014 to 31 December 2018 and year-to-date March 2019 management accounts;
c. Management plan detailing management assumptions, forecast financial information, etc. relating to LSAH;d. LSAH's estimates of the following as at 31 December 2018
Ÿ Pension liabilities & provisionsŸ Overdue payables and adjustments
e. Our assessment of the indicative values of LSAH using the Discounted Cash Flow (“DCF”), market-based and cost valuation methodologies; and Ÿ Discussions with representatives of the management of Lafarge Africa and LSAH and other industry
experts with respect to the economic outlook of South Africa and the current state and future prospects of the South African cement industry
Assumptions and limitations
PwC has assumed and relied, without any responsibility for independent verification, upon the accuracy and completeness of all financial and other information, which was provided to it or is publicly available. In rendering this Opinion, PwC has not provided, obtained or reviewed any legal, tax, regulatory, accounting, actuarial or other advice and accordingly, PwC assumes no liability or responsibility in respect thereof. Our Opinion is based on economic, monetary and market conditions as they exist as at the date of this Opinion. Subsequent developments in the aforementioned conditions may affect the Opinion and the assumptions on which it is based. PwC is not obliged to update, revise or reaffirm the Opinion should such conditions change.
While our work has involved analysis of financial information and/or accounting records, it has not included an audit in accordance with generally accepted auditing standards and accordingly, we do not express an opinion on the financial data or other information used in arriving at our Opinion.
PwC has adopted valuation methodologies such as: Discounted Cash Flow method; Market-based methods (Enterprise Value to Capacity (“EV/Capacity)); and the Cost method (Replacement Cost Approach).
This Opinion is given as of 21 May 2019. PwC disclaims any undertakings or obligations to advise any person of any change in fact or matter affecting this Opinion, which may occur after the date of this Opinion. In the event that there is any material change in any fact or matter affecting this opinion after the date hereof, PwC reserves the right, but will be under no obligation, to change, modify or withdraw this Opinion. In addition, PwC reserves the right, but will be under no obligation, to complete any additional analysis that might be subsequently required, following the receipt of additional information.
OpinionBased upon and subject to the foregoing, PwC is of the opinion that, as at the date hereof, the Offer Price for the shares of LSAH – USD 316,289,061 – is fair and reasonable.
This Opinion shall be governed by and construed in accordance with Nigerian Law and any claims or disputes arising out of, or in connection with, this Opinion, shall be resolved by arbitration in accordance with the provisions of the Arbitration and Conciliation Act Cap. A18 by a sole arbitrator appointed by the Chairman, Chartered Institute of Arbitrators UK (Nigeria branch).
If you require any clarification or further information, please do not hesitate to contact either Andrei Ugarov on +234 815 839 0798 or Gbolahan Ashagbe on +234 802 832 0636.
Yours sincerely,For: PricewaterhouseCoopers Limited
Andrei UgarovPartner

151
INFORMATION IN RESPECT OF GENERAL MANDATE
In accordance with the Rules on Transactions with
Related Parties recently issued by the Nigerian Stock
Exchange, the Company is seeking the renewal of the
general mandate from shareholders as per item 7 on
the Agenda for the Annual General Meeting slated for
Monday, 22nd July 2019.
It is envisaged that the Company and its subsidiaries
(together, the “LAP Group”) which are considered to
be “entities at risk” within the meaning of Chapter 20
of the NSE Rulebook on the Rules Governing
Transactions with Related Parties or Interested
Persons (the Related Party Rules) will, in the ordinary
course of their businesses, continue to enter into
Interested Person Transactions with Interested
Persons (as Defined by the Related Party Rules). Such
transactions are likely to occur with some degree of
frequency, and could arise at any time and as such
the approval of the shareholders of the company is
required to permit the LAP Group to enter into such
transactions in compliance with the Related Party
Rules.
1. The class of Interested Persons
The class of interested persons with which the
Company will be transacting during the next
financial year are Lafarge Africa Plc Group and
members of the Lafargeholcim Group, its
subsidiaries and associated companies;
2. The Nature of the Transactions
The General Mandate approval is sought for a range
of transactions arising in the normal course of
business operations of the LAP Group including a)
Trading Arrangements; b) Procurement Activities c)
Human Resources d) Information Technology f)
Technical and Consultancy Services; and g)
Industrial Franchise.
3. Price Determination
The LAP Group complies with the applicable
transfer pricing regulations and has internal control
procedures to ensure that all Interested Person
Transactions are undertaken on normal commercial
terms and are not prejudicial to the interests of the
Company and its minority Shareholders.
4. Voting
The LafargeHolcim Group, in compliance with the
requirements of The NSE Rules Relating to Board
Meetings and General Meetings of Issuers – has
informed the Company that, as a related party,
LafargeHolcim (its nominee, subsidiaries, associate,
related party, or other party acting in concert with
LafargeHolcim that hold shares in the Company),
will not exercise its right to vote at the AGM on
matters pertaining to the General Mandate.

Lafarge Africa Plc as at 31st December 2018SHARE CAPITAL HISTORY
AUTHORIZED FULLY PAID UP
YEAR NUMBER OF VALUE NOMINAL NUMBER VALUE
SHARES (NAIRA) VALUE ISSUED (NAIRA) REMARKS
1959 3,000,000 6,000,000 AT N2.00 EACH 2,000,000 4,000,000 -
1960 3,000,000 6,000,000 AT N2.00 EACH 2,000,000 4,000,000 -
1961 3,000,000 6,000,000 AT N2.00 EACH 2,000,000 4,000,000 -
1962 3,000,000 6,000,000 AT N2.00 EACH 2,000,000 4,000,000 -
1963 3,000,000 6,000,000 AT N2.00 EACH 2,000,000 4,000,000 -
1964 3,000,000 6,000,000 AT N2.00 EACH 2,000,000 4,000,000 -
1965 3,000,000 6,000,000 AT N2.00 EACH 2,000,000 4,000,000 -
1966 3,000,000 6,000,000 AT N2.00 EACH 2,000,000 4,000,000 -
1967 3,000,000 6,000,000 AT N2.00 EACH 2,000,000 4,000,000 -
1968 12,000,000 6,000,000 AT N0.50 EACH 8,000,000 4,000,000 SHARE SPLIT
1969 14,000,000 7,000,000 AT N0.50 EACH 14,000,000 7,000,000 -
1970 14,000,000 7,000,000 AT N0.50 EACH 14,000,000 7,000,000 -
1971 14,000,000 7,000,000 AT N0.50 EACH 14,000,000 7,000,000 -
1972 14,000,000 7,000,000 AT N0.50 EACH 14,000,000 7,000,000 -
1973 14,000,000 7,000,000 AT N0.50 EACH 14,000,000 7,000,000 -
1974 14,000,000 7,000,000 AT N0.50 EACH 14,000,000 7,000,000 -
1975 36,000,000 18,000,000 AT N0.50 EACH 36,000,000 18,000,000 PREFERENCE SHARE
1976 36,000,000 18,000,000 AT N0.50 EACH 36,000,000 18,000,000 -
1977 72,000,000 36,000,000 AT N0.50 EACH 60,300,000 30,150,000 SPECIAL ALLOTMENT
1978 72,000,000 36,000,000 AT N0.50 EACH 60,300,000 30,150,000 -
1979 72,000,000 36,000,000 AT N0.50 EACH 60,300,000 30,150,000 -
1980 72,000,000 36,000,000 AT N0.50 EACH 60,300,000 30,150,000 -
1981 72,000,000 36,000,000 AT N0.50 EACH 60,300,000 30,150,000 -
1982 72,000,000 36,000,000 AT N0.50 EACH 60,300,000 30,150,000 -
1983 101,450,000 50,725,000 AT N0.50 EACH 90,450,000 45,225,000 BONUS
1984 101,450,000 50,725,000 AT N0.50 EACH 90,450,000 45,225,000 -
1985 101,450,000 50,725,000 AT N0.50 EACH 90,450,000 45,225,000 -
1986 101,450,000 50,725,000 AT N0.50 EACH 90,450,000 45,225,000 -
1987 101,450,000 50,725,000 AT N0.50 EACH 90,450,000 45,225,000 -
1988 120,600,000 60,300,000 AT N0.50 EACH 120,600,000 60,300,000 BONUS
1989 120,600,000 60,300,000 AT N0.50 EACH 120,600,000 60,300,000 -
1990 120,600,000 60,300,000 AT N0.50 EACH 120,600,000 60,300,000 -
1991 120,600,000 60,300,000 AT N0.50 EACH 120,600,000 60,300,000 -
1992 241,200,000 120,600,000 AT N0.50 EACH 241,200,000 120,600,000 BONUS
1993 241,200,000 120,600,000 AT N0.50 EACH 241,200,000 120,600,000 -
1994 321,600,000 160,800,000 AT N0.50 EACH 321,600,000 160,800,000 BONUS
1995 321,600,000 160,800,000 AT N0.50 EACH 321,600,000 160,800,000 -
1996 428,800,000 214,400,000 AT N0.50 EACH 428,800,000 214,400,000 BONUS
1997 428,800,000 214,400,000 AT N0.50 EACH 428,800,000 214,400,000
1998 600,000,000 300,000,000 AT N0.50 EACH 571,733,334 285,866,667 BONUS
1999 600,000,000 300,000,000 AT N0.50 EACH 571,733,334 285,866,667 -
2000 600,000,000 300,000,000 AT N0.50 EACH 571,733,334 285,866,667
2001 1,142,806,000 571,403,000 AT N0.50 EACH 1,143,466,668 571,733,334 BONUS
2002 4,573,866,672 2,286,933,336 AT N0.50 EACH 1,715,200,000 857,700,001 BONUS
2003 4,573,866,672 2,286,933,336 AT N0.50 EACH 1,715,200,000 857,700,001 -
2004 4,573,866,672 2,286,933,336 AT N0.50 EACH 1,715,200,000 857,700,001
2005 4,573,866,672 2,286,933,336 AT N0.50 EACH 3,001,600,004 1,500,800,002 RIGHTS ISSUE
2006 4,573,866,672 2,286,933,336 AT N0.50 EACH 3,001,600,004 1,500,800,002 -
152

Lafarge Africa Plc as at 31st December 2018SHARE CAPITAL HISTORY
2007 4,573,866,672 2,286,933,336 AT N0.50 EACH 3,001,600,004 1,500,800,002 -
2008 4,573,866,672 2,286,933,336 AT N0.50 EACH 3,001,600,004 1,500,800,002 -
2009 4,573,866,672 2,286,933,336 AT N0.50 EACH 3,001,600,004 1,500,800,002 -
2010 4,573,866,672 2,286,933,336 AT N0.50 EACH 3,001,600,004 1,500,800,002 -
2011 4,573,866,672 2,286,933,336 AT N0.50 EACH 3,001,600,004 1,500,800,002 -
2012 4,573,866,672 2,286,933,336 AT N0.50 EACH 3,001,600,004 1,500,800,002 -
2013 4,573,866,672 2,286,933,336 AT N0.50 EACH 3,001,600,004 1,500,800,002 -
2014 4,573,866,672 2,286,933,336 AT N0.50 EACH 4,404,175,988 2,202,087,994 ALLOTMENT OF
SHARES
2015 10,000,000,000 5,000,000,000 AT N0.50 EACH 4,554,902,014 2,277,451,007 ASHAKACEM MTO
2016 10,000,000,000 5,000,000,000 AT N0.50 EACH 4,968,077,723 2,484,038,861 ALLOTMENT OF
SHARES
TO HOLCIBEL S.A
2016 10,000,000,000 5,000,000,000 AT N0.50 EACH 4,983,926,597 2,491,963,298 ASHAKACEM VTO
2016 10,000,000,000 5,000,000,000 AT N0.50 EACH 5,480,734,369 2,740,367,185 BONUS 2016
2017 10,000,000,000 5,000,000,000 AT N0.50 EACH 5,490,514,222 2,745,257,111 ASHAKA DELISTING
TRANSACTION
2017 10,000,000,000 5,000,000,000 AT N0.50 EACH 5,575,775,442 2,787,887,721 ASHAKA DELISTING
FINAL
2017 10,000,000,000 5,000,000,000 AT N0.50 EACH 8,673,428,465 4,336,714,233 RIGHTS 2017
2018 20,000,000,000 10,000,000,000 AT N0.50 EACH 16,107,795,721 8,053,897,861 RIGHTS 2018
Note 2 SUMMARY:
INITIAL SHARE CAPITAL 4,404,175,988
ASHAKACEM MTO 150,726,026
ALLOTMENT OF SHARES
TO HOLCIBEL S.A 413,175,709
ASHAKACEM VTO 15,848,874
BONUS 2016 496,807,772
ASHAKA DELISTING
TRANSACTION 9,779,853
ASHAKA DELISTING FINAL 85,261,220
RIGHTS 2017 3,097,653,023
RIGHTS 2018 7,434,367,256
PAID UP SHARE CAPITAL 16,107,795,721
Note 3 Bonus History
YEAR BONUS ISSUES VALUE RATIO 1983 30,150,000 15,075,000 1:2 1988 30,150,000 15,075,000 1:3 1992 120,600,000 60,300,000 1:1 1994 80,400,000 40,200,000 1:3 1996 107,200,000 53,600,000 1:3 1998 142,934,000 71,467,000 1:3 2001 571,733,334 285,866,667 1:1 2002 571,733,334 285,866,667 1:2 2016 496,807,772 248,403,886 1:10
AUTHORIZED FULLY PAID UP
YEAR NUMBER OF VALUE NOMINAL NUMBER VALUE
SHARES (NAIRA) VALUE ISSUED (NAIRA) REMARKS
153
SHAREHOLDING ANALYSIS
The Registrar has advised that the range of shareholding as at 31st December 2018 was as follows:
Range No of Holders Percent Unit Percent 1 500 47,214 39.27 11,931,339 0.14 501 5,000 59,393 49.40 94,224,198 1.09 5,001 50,000 11,889 9.89 162,625,356 1.88 50,001 500,000 1,491 1.24 198,576,820 2.29 500,001 5,000,000 198 0.16 285,343,235 3.29 5,000,001 50,000,000 35 0.03 566,478,576 6.53 50,000,001 500,000,000 7 0.01 734,990,464 8.47 500,000,001 8,673,428,465 3 0.00 6,619,258,477 76.32 120,230 100.00 8,673,428,465 100.00 Grand Total

154
UNCLAIMED DIVIDEND REPORT
DIVIDEND ACCOUNTSPAYABLE DATE
UNCLAIMED AMOUNT
RETURN TO CLIENTS
RETURN FROM CLIENTS
CASH BALANCE
LAFARGE AFRICA PLC DIVIDEND 24
LAFARGE AFRICA PLC DIVIDEND 25
LAFARGE AFRICA PLC DIVIDEND 26
LAFARGE AFRICA PLC DIVIDEND 27
LAFARGE AFRICA PLC DIVIDEND 28
LAFARGE AFRICA PLC DIVIDEND 29
LAFARGE AFRICA PLC DIVIDEND 30
LAFARGE AFRICA PLC DIVIDEND 31
LAFARGE AFRICA PLC DIVIDEND 32
LAFARGE AFRICA PLC DIVIDEND 33
LAFARGE AFRICA PLC DIVIDEND 34
24-May-07
23-May-08
27-May-09
26-May-10
20-May-11
23-May-12
30-May-13
10-Jul-14
25-May-15
27-Jun-16
7-Jun-17
74,106,415.02
72,165,607.16
40,137,061.71
7,437,172.39
19,263,653.88
56,280,011.64
85,581,495.36
202,871,017.35
233,712,461.20
266,124,191.06
94,341,545.90
1,152,020,632.67
72,434,262.31
72,132,540.95
41,598,721.90
8,031,460.07
21,542,325.65
61,453,002.33
93,396,174.23
216,110,810.16
238,429,600.56
268,862,898.28
84,816,287.32
1,178,808,083.76
6,168,158.16
7,897,271.53
5,872,827.75
1,425,268.91
4,569,949.44
11,289,169.33
17,181,119.16
35,279,817.15
29,903,647.60
29,567,641.58
149,154,870.61
7,840,310.87
7,930,337.74
4,411,167.56
830,981.23
2,291,277.67
6,116,178.64
9,366,440.29
22,040,024.34
25,186,508.24
26,828,934.36
9,525,258.58
122,367,419.52

1. Preamble
This Complaint Management
Policy (“the Policy") has been
prepared pursuant to the
requirements of the Securities &
Exchange Commission's Rules
Relating to the Complaints
Management Framework of the
Nigerian Capital Market ("SEC
Rules") issued on 16th February,
2015 and The Nigerian Stock
Exchange Directive (NSE/LARD/
LRD/CIR6/ 15/04/22)to all Listed
Companies (“the NSE Directive")
issued on 22nd April, 2015.
Furthermore, this policy has been
prepared in recognition of the
importance of effective engagement
in promoting shareholder/investor
confidence in the company.
This Policy sets out the
broad framework by which
Lafarge Africa Plc ("Lafarge" or
“the Company") and its Registrar
will provide assistance regarding
shareholder issues and concerns.
It also provides the opportunity for
Lafarge's shareholders to provide
feedback to the Company on
matters that affect shareholders.
This Policy only relates to the
Company's shareholders and
does not extend to its customers,
suppliers or other stakeholders.
2. Objective
This Policy is designed to ensure
that complaints and enquiries
from the Company's shareholders
are managed in a fair, impartial,
efficient and timely manner.
3. Lafarge's Commitment
Lafarge is committed to providing
high standards of services for
shareholders, including:
• Providing a platform for
efficient handling of shareholder
complaints and enquiries;
• Enabling shareholders to have
shareholder related matters
acknowledged and addressed;
• Providing sufficient resources
to ensure that shareholders'
complaints and enquiries are
dealt with adequately, and in an
efficient and timely manner;
and
• Facilitating efficient and easy
access to shareholder
information.
4. Procedure for Shareholder
Complaints /Enquiries
Shareholders can make complaints/
enquiries and access relevant
information about their share-
holdings in the following manner:
a) Contact the Registrar: Share-
holders who wish to make a
complaint / enquiry shall in the
first instance contact the
Registrar (see the contact
details set out in section 8 of
this Policy). The Registrar
manages all the registered
information relating to all
shareholdings, including
shareholder name(s), share-
holder address and dividend
payment instructions amongst
others.
Upon receipt of a complaint or
an enquiry, the Registrar shall
immediately provide the
relevant details of such
complaint or enquiry to
Lafarge for monitoring, record
keeping and reporting
purposes.
In resolving complaints or
enquiries, the Registrar shall
be guided by the timelines
stipulated in clause 5 (c-f) of
this Policy.
b) Contact Lafarge's Company
Secretary: If the Registrar is
unable to satisfactorily
address shareholders' enquiries
and resolve their complaints
then shareholders should
contact the office of the
Company Secretary (see the
contact details set out in
section 9 of this policy).
5. Complaints/Enquiries received
directly by Lafarge
Where a complaint or an enquiry is
sent to Lafarge directly, the
Company upon receipt of the
complaint or enquiry, shall use its
best endeavours to ensure that:
a) relevant details of the
complaint or enquiry are
immediately recorded.
b) a response is provided by the
Company or the Registrar
within the time frame set out in
sub-clauses c-f below.
c) complaints or enquiries
received by e-mail are
acknowledged within two (2)
working days of receipt.
d) complaints or enquiries received
by post are responded to within
five (5) working days of receipt.
e) complaints or enquiries are
resolved within ten (10)
working days of receipt.
f) The Nigerian Stock Exchange is
notified, within two (2) working
days, of the resolution of a
complaint or enquiry.
g) where a complaint / enquiry
cannot be resolved within the
stipulated time frame set out
above, the shareholder shall
be notified that the matter is
being investigated. Delays may
be experienced in some
situations, including where
documents need to be
retrieved from storage.
COMPLAINTS MANAGEMENT POLICY OF LAFARGE AFRICA PLC
155

156
h) the same or similar medium that
was used for the initial enquiry
is used in providing a response
(whether by email, phone,
post or fax), unless otherwise
notified to or agreed with the
shareholder.
6. Electronic Complaints Register
and Quarterly Reporting
Obligations
Lafarge shall maintain an
electronic complaints register. The
electronic complaints register
shall include the following
information:
The date that the enquiry or
complaint was received.
• Complainant's information
(including name, address.
Telephone number, e-mail
address).
• Nature and Details of the
enquiry or complaint.
• Action Taken/ Status.
• Date of the Resolution of the
complaint.
Lafarge shall also provide
information on the details and
status of complaints to the
Securities and Exchange
Commission or The Nigerian Stock
Exchange on a quarterly basis.
7. Liaison with the Registrar
During the course of investigating
a shareholder's enquiry, complaint
or feedback, Lafarge may liaise
with the Registrar. Lafarge's
engagement with the Registrar
will include:
• Determining the facts;
• Determining what action has
been undertaken by the
Registrar (if any); and
• Coordinating a response with
the assistance of the Registrar.
8. Contact Details of the Registrar
The Registrar may be contacted
as follows:
Cardinal Stone Registrars limited
358 Herbert Macaulay Way
Yaba, Lagos.
Telephone: +23417120090
Email:
Website:
www.cardinalstoneregistrars.com
9. Contact Details of Lafarge's
Company Secretary
Shareholders seeking to escalate
unresolved complaints are
invited to contact the Company
Secretary as follows:
Office of the Company Secretary 27B Gerrard Road Ikoyi, Lagos Telephone: +2342713990 Website: www.lafarge.com.ng
10. Shareholder Access to this
Policy
Shareholders will have access to
this policy through the following
avenues:
Lafarge's website
(www.lafarge.com.ng); A copy of
the Policy may be requested by
contacting the Office of the
Company Secretary.
The Policy shall be made available
to shareholders of the Company
through the Annual Report and
Account
11. Fees and Charges
Wherever possible, and subject to
statutory requirements, Lafarge
will not charge shareholders for
making enquiries, giving
feedback, providing a response or
for any aspect in the course of
resolving a shareholder matter.
Shareholders are informed that in
some circumstances the Registrar
may charge shareholders a fee (for
example, to resend previous
dividend statements upon request
by the shareholder).
12. Amendment/Review of this Policy
Lafarge may from time to time
review this Policy and the procedures
concerning shareholder enquiries,
complaints and feedback.
Any changes or subsequent
versions of this Policy will be
published on Lafarge's website
(www.lafarge.com.ng).

157
Chairman Lafarge Africa Plc, Mr. Mobolaji Balogun along with
Company Secretary, Mrs. Adewunmi Alode and MD/CCEO,
Mr. Michel Puchercos, at the 2018 Shareholders Forum.
Celebrating Women’s Day in Mfamosing.
Activity during Global Health and Safety Days.
Breast Cancer Awareness.
Chairman Lafarge Africa Plc, Mobolaji Balogun, Head, Corporate Finance and
Treasury, Victory Olumuyiwa and Company Secretary, Adewunmi Alode receiving
the award for the largest corporate bond issuer on FMDQ from Vice Chairman,
FMDQ OTC Securities Exchange, Jibril Aku at the 2018 FMDQ Gold Awards in Lagos.
Chairman, Lafarge Africa Plc discussing with shareholders
at the 2018 AGM.
Chairman, Lafarge Africa Plc greeting shareholders
at the 2018 AGM.
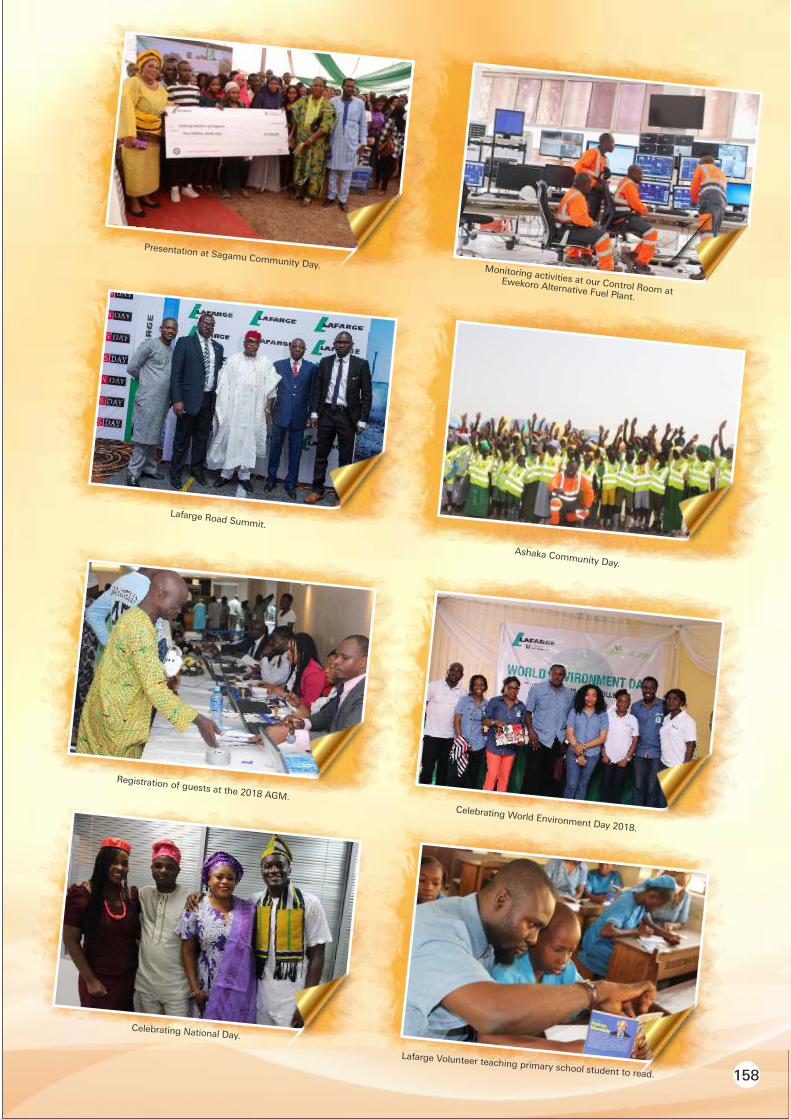
158
Presentation at Sagamu Community Day.
Celebrating National Day.
Lafarge Volunteer teaching primary school student to read.
Monitoring activities at our Control Room at Ewekoro Alternative Fuel Plant.
Celebrating World Environment Day 2018.
Registration of guests at the 2018 AGM.
Ashaka Community Day.
Lafarge Road Summit.

Affix Current Passport
(To be stamped by Bankers)
Write your name at the back ofyour passport photograph
O ECARD INA LST NREGISTRARS
E-DIVIDEND MANDATE ACTIVATION FORM
Only Clearing Banks are acceptable
Instruction Please complete all section of this form to make it eligible for processing and return to the address below
The Registrar,Cardinal Stone Registrars, Limited358, Herbert Macaulay Way, Yaba,P. O. Box 9117, Marina, LagosNigeria.
I/We hereby request that henceforth, all my/our Dividend Payment(s) due to me/us from my/our holdings in all the companies ticked at the right hand column be credited directly to my/our bank detailed below:
Bank Verification Number
Bank Name
Bank Account Number
Account Opening Date
Shareholder Account Information
Surname / Company Name First Name Other Names
Address:
City State Country
Previous Address (if any)
CHN (if any)
Mobile Telephone 1 Mobile Telephone 2
Email Address
Signature(s)
Joint/Company’s Signatories
Company Seal (if applicable)
Help Desk Telephone No/Contact Centre Information for Issue resolution or clarification: 01-7120090
CARDINALSTONE REGISTRARSwebsite: www.cardinalstone.com; E-mail: [email protected]
TICK NAME OF COMPANY SHAREHOLDER’SACCOUNT NO.
ACORN PET. PLC
AFRIK PHARMECEUTICALS PLC
AG HOMES SAVINGS & LOANS
AG LEVENTIS
ARBICO PLC
BANKERS WAREHOUSE
BETA GLASS
CAPITAL HOTEL PLC
ELLAH LAKES
EVANS MED PLC
FCMB BOND
FCMB GROUP PLC
FIDSON BOND
G. CAPPA PLC
GUINEA INSURANCE PLC
IMB ENERGY MASTER FUND
JOS INT. BREWERIES PLC
KOGI SAVINGS & LOAN LTD
LAFARGE AFRICA PLC
LAFARGE BOND
LAW UNION & ROCK PLC
LEGACY FUND
LIVESTOCK FEEDS PLC
MORISON PLC
MRS OIL PLC
NAHCO BOND
NAHCO PLC
NEWPAK PLC
N.G.C PLC
NPF MICROFINANCE BANK PLC
NULEC INDUSTRIES PLC
OKOMU OIL PALM PLC
REAN PLC
TOTAL NIG. PLC
TRANEX PLC
WOMEN INVESTMENT FUND
159

The RegistrarCardinal Stone (Registrars) Limited 358, Herbert Macaulay RoadYaba, LagosP. O. Box 9117, LagosNigeria
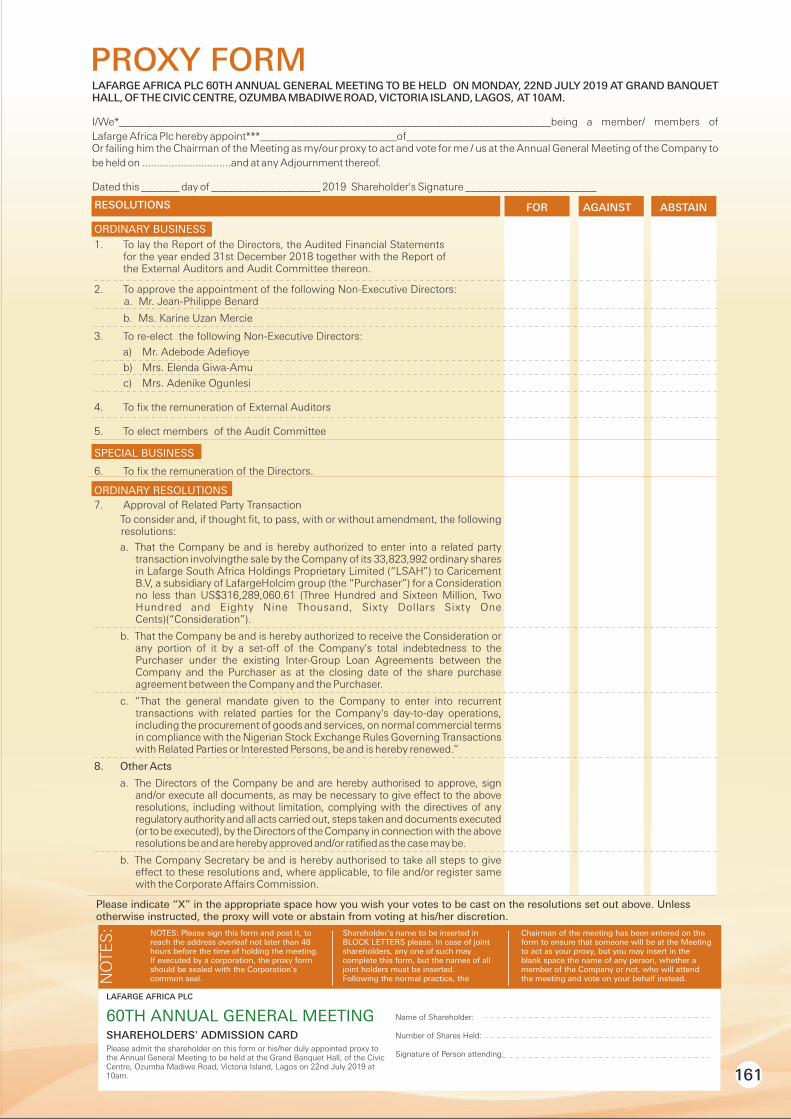
PROXY FORMLAFARGE AFRICA PLC 60TH ANNUAL GENERAL MEETING TO BE HELD ON MONDAY, 22ND JULY 2019 AT GRAND BANQUET HALL, OF THE CIVIC CENTRE, OZUMBA MBADIWE ROAD, VICTORIA ISLAND, LAGOS, AT 10AM.
I/We*______________________________________________________________________________being a member/ members of
Lafarge Africa Plc hereby appoint***_________________________of________________________________________________________Or failing him the Chairman of the Meeting as my/our proxy to act and vote for me / us at the Annual General Meeting of the Company to
be held on ..............................and at any Adjournment thereof.
Dated this _______ day of ____________________ 2019 Shareholder's Signature ________________________
RESOLUTIONS ORDINARY BUSINESS
1. To lay the Report of the Directors, the Audited Financial Statements for the year ended 31st December 2018 together with the Report of the External Auditors and Audit Committee thereon.
2. To approve the appointment of the following Non-Executive Directors: a. Mr. Jean-Philippe Benard
b. Ms. Karine Uzan Mercie 3. To re-elect the following Non-Executive Directors:
a) Mr. Adebode Adefioye
b) Mrs. Elenda Giwa-Amu
c) Mrs. Adenike Ogunlesi 4. To fix the remuneration of External Auditors
5. To elect members of the Audit Committee SPECIAL BUSINESS
6. To fix the remuneration of the Directors.
ORDINARY RESOLUTIONS
7. Approval of Related Party Transaction
To consider and, if thought fit, to pass, with or without amendment, the following resolutions:
a. That the Company be and is hereby authorized to enter into a related party transaction involvingthe sale by the Company of its 33,823,992 ordinary shares in Lafarge South Africa Holdings Proprietary Limited (“LSAH”) to Caricement B.V, a subsidiary of LafargeHolcim group (the “Purchaser”) for a Consideration no less than US$316,289,060.61 (Three Hundred and Sixteen Million, Two Hundred and Eighty Nine Thousand, Sixty Dollars Sixty One Cents)(“Consideration”).
b. That the Company be and is hereby authorized to receive the Consideration or any portion of it by a set-off of the Company's total indebtedness to the Purchaser under the existing Inter-Group Loan Agreements between the Company and the Purchaser as at the closing date of the share purchase agreement between the Company and the Purchaser.
c. “That the general mandate given to the Company to enter into recurrent transactions with related parties for the Company's day-to-day operations, including the procurement of goods and services, on normal commercial terms in compliance with the Nigerian Stock Exchange Rules Governing Transactions with Related Parties or Interested Persons, be and is hereby renewed.”
8. Other Acts
a. The Directors of the Company be and are hereby authorised to approve, sign and/or execute all documents, as may be necessary to give effect to the above resolutions, including without limitation, complying with the directives of any regulatory authority and all acts carried out, steps taken and documents executed (or to be executed), by the Directors of the Company in connection with the above resolutions be and are hereby approved and/or ratified as the case may be.
b. The Company Secretary be and is hereby authorised to take all steps to give effect to these resolutions and, where applicable, to file and/or register same with the Corporate Affairs Commission.
161
FOR AGAINST ABSTAIN
LAFARGE AFRICA PLC
60TH ANNUAL GENERAL MEETINGSHAREHOLDERS' ADMISSION CARDPlease admit the shareholder on this form or his/her duly appointed proxy to the Annual General Meeting to be held at the Grand Banquet Hall, of the Civic Centre, Ozumba Madiwe Road, Victoria Island, Lagos on 22nd July 2019 at 10am.
NOTES: Please sign this form and post it, to reach the address overleaf not later than 48 hours before the time of holding the meeting. If executed by a corporation, the proxy form should be sealed with the Corporation's common seal.
Shareholder's name to be inserted in BLOCK LETTERS please. In case of joint shareholders, any one of such may complete this form, but the names of all joint holders must be inserted.Following the normal practice, the N
OTE
S: Chairman of the meeting has been entered on the
form to ensure that someone will be at the Meeting to act as your proxy, but you may insert in the blank space the name of any person, whether a member of the Company or not, who will attend the meeting and vote on your behalf instead.
Please indicate “X” in the appropriate space how you wish your votes to be cast on the resolutions set out above. Unless otherwise instructed, the proxy will vote or abstain from voting at his/her discretion.
Name of Shareholder:
Number of Shares Held:
Signature of Person attending:

The RegistrarCardinal Stone (Registrars) Limited 358, Herbert Macaulay RoadYaba, LagosP. O. Box 9117, LagosNigeria

163
1. A.J UZOMA INVESTMENT LIMITED OWERRI 2. ANGEL ONYEBUCHI OGU BIZ VENTURES AWKA 3. ARIMAE CEMENT VENTURES MBO 4. ASKON PROGRESSIVE NIG. COMPANY OBUDU 5. AWARD COMMUNICATION & LINK ABAKALIKI 6. B C NWABUOBI ENT ENUGU 7. BATOFRAMOJ E. ENTERPRISES UYO 8. BEN CHUCKS VENTURES OWERRI 9. BLESSED PATTOSA GLOBAL RES. LTD BENIN CITY 10. BUYUOT GOLD NIG LTD ABAKILIKI 11. C. U UYAELUMOH & SONS AWKA 12. C.C UMEH & SONS LTD ENUGU 13. CHICO TRUST (NIG.) BENIN CITY 14. CHINASA ASOGWA VENTURES UMUAHIA 15. CHRIS-SUNNYNWODO BUSINESS EMPIRE OTUOKE 16. CHY-KENS & SONS VENTURES LTD ONITSHA 17. DAVIDSON GLOBAL NIG ENT OWERRI 18. DIVINE NICK & SONS OGOJA 19. EKEFIRE OWERRI 20. ELIDEDE GLOBAL SERVICES WARRI 21. ESTRA MARKS VENTURES PORT HARCOURT 22. ETIM E. OKON & CO.NIG CALABAR 23. FAVOUR GLOBAL CONCEPT ORLU 24. F. JOGA NIG. CO WARRI 25. FUGLE NIGERIA LIMITED CALABAR 26. GLOBAL 50:50 CONCEPT NIG. LTD OWERRI 27. GLOBAL SNCO (WA) LIMITED ENUGU 28. GLOJOESAM INVESTMENT LTD ABA 29. GRACEMEKUS ENTERPRISE CALABAR 30. INFOR & BROS NIGERIA LIMITED UMUAHIA 31. IVANATE NIG LTD ORLU 32. JANNY & SONS VENTURES LIMITED AWKA 33. JOHN JEFF NIG. LTD WARRI 34. K.E.O MERCHANDISING COMPANY EKET 35. KPAKSBUDDY NIGERIA LIMITED UYO 36. MCEVANS VENTURES LTD ABA 37. MEKUSGAMBA NIGERIA ENTERPRISES OGIDI 38. MYSTAN GLOBAL SERVICES ORLU 39. NACOM CONCEPTS NIGERIA LIMITED EFFURUN 40. NICK N CHRISBLE NIG LTD UYO 41. NILS NIG ENT. WARRI 42. OBI LINKS ENTERPRISE ENUGU 43. OBIOMA ENTERPRISES NIG. LTD. UMUAHIA 44. OGEROSE INTEGRATED SERVICES PORT HARCOURT 45. OSASCO OGIEMWONYI NIG. LTD BENIN CITY 46. RAYMOND OKOYE ABA 47. RUFPRIS VENTURES LTD CALABAR 48. TAMARK NIG. LTD ORON 49. U. MEKASON TRADING STORES UWANI, ENUGU 50. UBOTEX NIG. LTD. UYO 51. UCHE COLLINS GLOBAL VENTURES NSUKKA 52. UNEGBE VENTURES LTD ENUGU 53. GAB OKOYE NIG. ENTERPRISES AWKA 54. MEGA UCHECHI & SONS RESOURCES IHIALA 55. O.K. ISOKARIARI & SONS (NIG) LTD PORT-HARCOURT 56. OILSERV LIMITED PORT HARCOURT 57. SALTY RIVERS CEMENT STORE WARRI 58. TOMBIM SERVICES LIMITED PORT HARCOURT 59. FESTY BASE ENT UYO 60. NKANTA & SONS NIG LTD UYO 61. ADAMU MOHAMMED ABBA BAUCHI 62. AL-AMIR ENTERPRISES BAJOGA 63. AL-BABELLO NIG. LTD SABON-GARI 64. ALH ALI BALARABE KANO 65. ALH. UMARU KAFIYEL BAJOGA, GOMBE STATE66. ALHAJI LAWAN JIBRIN KANO 67. ALHAJI MUHAMMAD NASARAWA, LAWAN KANO STATE 68. ALI S KUDU ASHAKA 69. BABANGIDA MOHAMMED INTER LTD ASHAKA 70. BUBA MAGAJI "&" SONS GOMBE 71. CHUMON NIG LTD BUKURU 72. ELEGANCE CONSTRUCTION LTD DAMATURU 73. GIANT BRIDGE NIG LTD KANO 74. HAMMAMU YUSUF KALIFA ASHAKA 75. IFECO HERITAGE NIG ENTERPRISE KANO 76. LAB ASSIST NIGERIA LIMITED ABUJA 77. MADUWA ROADS & CONSTRUCTION NIG KADUNA 78. MAI-IYALE NIG. LTD GOMBE 79. MAIYAKI GENERAL MERCHANT LTD BAUCHI TOWNSHIP 80. MAMU OIL NIGERIA LIMITED ZARIA
NO NAME LOCATION NO NAME LOCATION
81. MAYOR UNIVERSAL VENTURES LIMITED ABUJA 82. NUHU SHEHU DAN MAHAWAYI KADUNA 83. RASHBELLO INTEGRATED VENTURES KATCHA 84. ROSE SEJ BUSINESS ENTERPRISES LTD ABUJA 85. SABO DAN KOLI & SONS LIMITED KANO 86. SABI'U DAYYAB VENTURES KANO 87. SALE ABBA GOMBE 88. SRUM & ASSOCIATES LTD KUBUWA 89. TEE QUE ZEE EXCEL LTD ABUJA 90. UMAR NA-BURARI MAI KAWU GOMBE 91. UZOKAS INTERNATIONAL COMPANY LTD MINNA 92. Y. M. KYARI NIG LTD KANO 93. ALHAJI MOH'D SHIRA MAI KWAKWA KANO 94. ZAKARI BABAJI USMAN GOMBE 95. ABIODUN AKINLEYE IBADAN/ ELEYELE 96. ADE- ADEWUNMI NIG. ENT. IBADAN/ ELEYELE 97. ADEKUNLE OSENI AKURE 98. ALEEM ADIAT & SON NIG. LTD. ADO-EKITI 99. ALHAJA H. A. OLUWATOBILOBA IKIRE 100. ALHAJA JOKE OJOGBEDE MOWE 101. CAROLINE AKINNUSI AND COMPANY OKITI PUPA 102. DAGUNRO IBILE VENTURES OYO 103. DAVAL NIG. ENTERPRISES AKURE 104. EBONY "D" GREAT ENT. AMUWO ODOFIN 105. EVOMEC GLOBAL SERVICES LTD PORT-HARCOURT 106. FUNMI FLORRY ADO-EKITI 107. IBUKUN OLUWA ENT. ADO-EKITI 108. IYA MILIKI & SONS IJEBU-ODE 109. J. B. OKANLAWON IKIRUN 110. ITE PROJEKTS LTD OREGUN 111. KAZAB HERITAGE LTD AKUTE 112. LEKAN ADEYEMI AKURE 113. MABOS AYOK INV. CO. LTD. OBANTOKO 114. MADEL GLORY VENTURES ISEYIN 115. MASELIZ ENTERPRISES AWOYAYA 116. MRS S. A. FALANA AKURE 117. OYINBASHY ENTERPRISES OTTA 118. RAFLYM NIGERIA LIMITED IBADAN/ ELEYELE 119. S.O.J ENT. IBADAN/ ELEYELE 120. STELLA DEE GLOBAL SERVICES LTD OSOGBO 121. SUCCESS LINK IFE 122. TEMI TOPE OIL NIG. LTD. BADAGRY 123. TITO VENTURES IBADAN/ ELEYELE 124. TRIDAC ENTERPRISES OPIC IBAFO 125. VICROSS ENT. ILISHAN 126. WAMOD OLOYE ENT. LTD ISEYIN 127. AUNTY BOSE STORES EPE 128. ISMAILA AWOYINKA ORE 129. KESMORAH AND SONS LTD ILORIN 130. B AND S VENTURES ABEOKUTA 131. BLESSED CEMENT DEPOT IBADAN NORTH 132. ENTERPRISES GROWTH LTD VICTORIA ISLAND 133. LUKAMED CHARITY VENTURES IWO 134. MORASH VENTURES NIG. ENT. IKORODU 135. MRS ODEYEMI OMOLAYO IKORODU 136. OLLA ADAMS ENT. LAGOS 137. POSU GOLDEN APPLE ENTERPRISES ABEOKUTA 138. ROGLADE NIG. LTD. AYOBO 139. SKYTEE NIGERIA LIMITED IJEBU ODE 140. VIHANO VENTURES AGBARA 141. B-26 NIG. LTD ABEOKUTA 142. BOLU INTERNATIONAL SERVICES LTD IKIRE 143. TAI - DEM & SONS ABULE-EGBA 144. EWEKORO WORKS STAFF CO-OPERATIVE LAGOS 145. ABUKAASSEM ENT PORT HARCOURT 146. IGWEMADU OGUADIMMA ABA 147. JAMIN ENTERPRISES NIG. OBUDU 148. NGOMEG VENTURES PORT HARCOURT 149. PRIME SOURCES LIMITED LAGOS ISLAND 150. ABUBAKAR JIBRIN ASHAKA 151. AHMED GOJE ENTERPRISES GOMBE 152. AL-MANAS PETRO GAS LTD ASHAKA, FUNAKAYE 153. KBJAMIU TRADING COMPANY GOMBE 154. BUKS GENERAL ENTERPRISES MOWE 155. I. J. ATOFOLAKI NIGERIA LIMITED OKOKOMAIKO 156. MAKINTOSH MAKINDE NIGERIA LTD IJOKO TOWN 157. MRS ONISAROTU MULIKAT ABIODUN OKOKOMAIKO 158. SAMAD KUNLE INVESTMENT LIMITED AGO PALACE, OKOTA 159. KABEC NIG. LTD OHAFIA 160. PASTOR SYLVANUS MBACHU OWERRI 161. SIMPURE TRANSPORT SERVICES IDIROKO ROAD
LIST OF DISTRIBUTORS