Annual Report 2018 - Holcim
288
Annual Report 2018
-
Upload
khangminh22 -
Category
Documents
-
view
0 -
download
0
Transcript of Annual Report 2018 - Holcim
Annual Report 2018
LafargeH
olcim Ltd
A
nnual Report 2018
Read the online summary at www.lafargeholcim.com
The Sustainability Report complements this report. It presents more detail on our sustainability achievements as well as progress against our sustainability strategy.
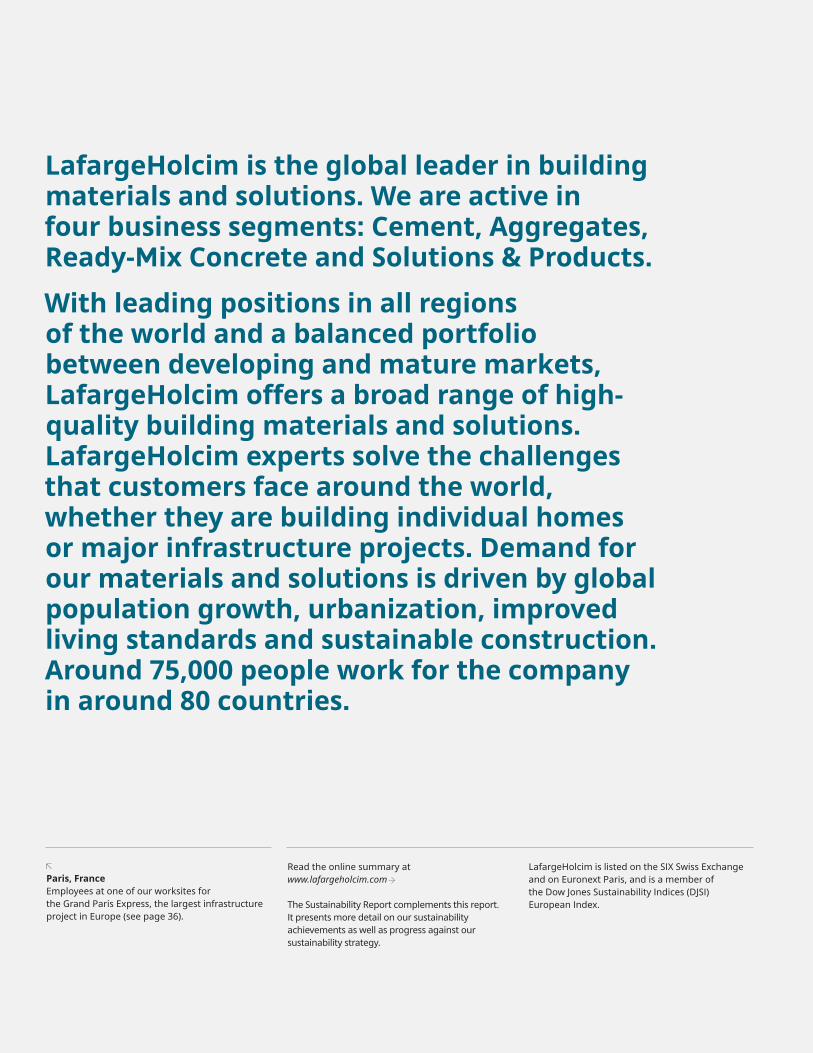
Paris, FranceEmployees at one of our worksites for the Grand Paris Express, the largest infrastructure project in Europe (see page 36).
LafargeHolcim is listed on the SIX Swiss Exchange and on Euronext Paris, and is a member of the Dow Jones Sustainability Indices (DJSI) European Index.
LafargeHolcim is the global leader in building materials and solutions. We are active in four business segments: Cement, Aggregates, Ready-Mix Concrete and Solutions & Products.
With leading positions in all regions of the world and a balanced portfolio between developing and mature markets, LafargeHolcim offers a broad range of high-quality building materials and solutions. LafargeHolcim experts solve the challenges that customers face around the world, whether they are building individual homes or major infrastructure projects. Demand for our materials and solutions is driven by global population growth, urbanization, improved living standards and sustainable construction. Around 75,000 people work for the company in around 80 countries.

LafargeHolcim Annual Report 2018 01Overview — Contents
Contents In this report Page
Overview Chairman statement 14
CEO letter to shareholders 16
Meet the leadership team 18
Market 20
Strategy 2022 – “Building for Growth” 22
12 —25
Business review
Largest footprint in the industry 28
Business segments
Cement 30
Aggregates 34
Ready-Mix Concrete 38
Solutions & Products 42
Delivering sustainable value 46
Innovating for success 54
People 58
Health & Safety 62
Risk and control 66
Capital market information 84
26 — 87
Governance and Compensation
Corporate governance 90
Compensation report 114
88 —139
Management discussion & analysis
Group performance 142
Regional performance 148
140 —159
Financial information
Consolidated financial statements 163
Holding Company Results 266
5-year-review 280
160 —283

02
Ewekoro, NigeriaOur team in the cement plant.
LafargeHolcim Annual Report 2018 03Overview — Introduction
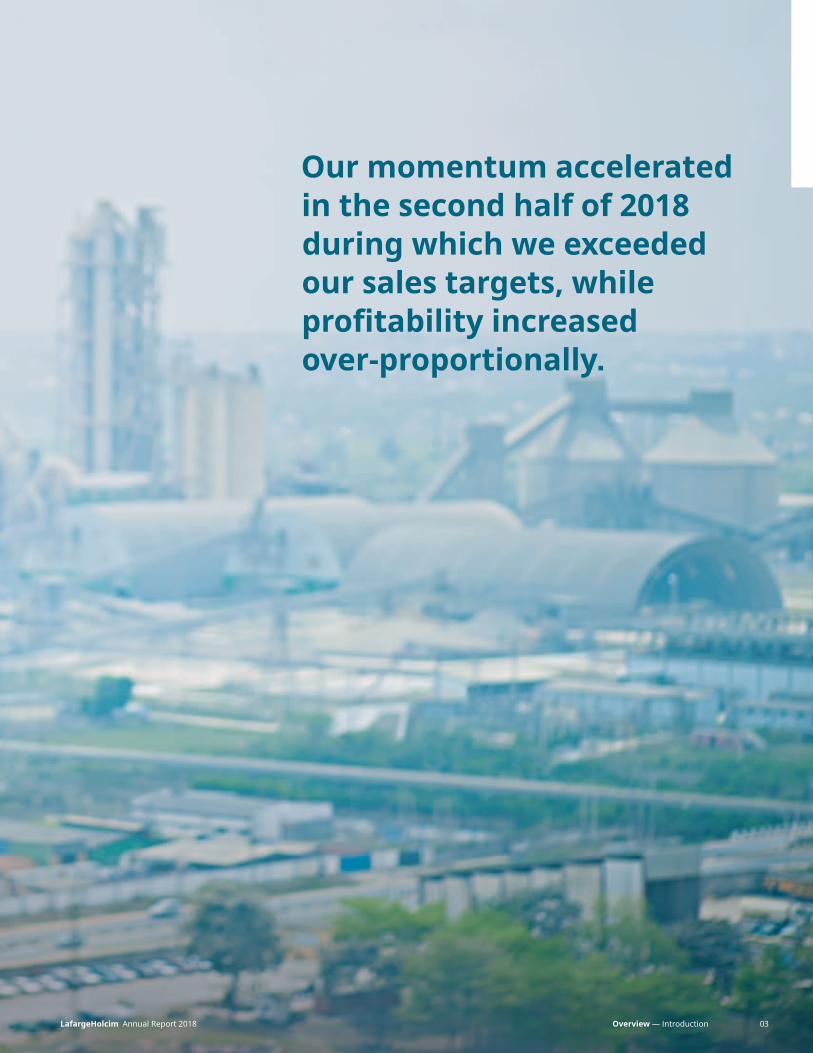
Our momentum accelerated in the second half of 2018 during which we exceeded our sales targets, while profitability increased over-proportionally.

04
Manta, EcuadorAt our customer’s site.

LafargeHolcim Annual Report 2018 05Overview — Introduction
We are well-positioned and we expect further accelerationof our momentum in 2019.

06
LafargeHolcim Annual Report 2018 07Overview — Introduction
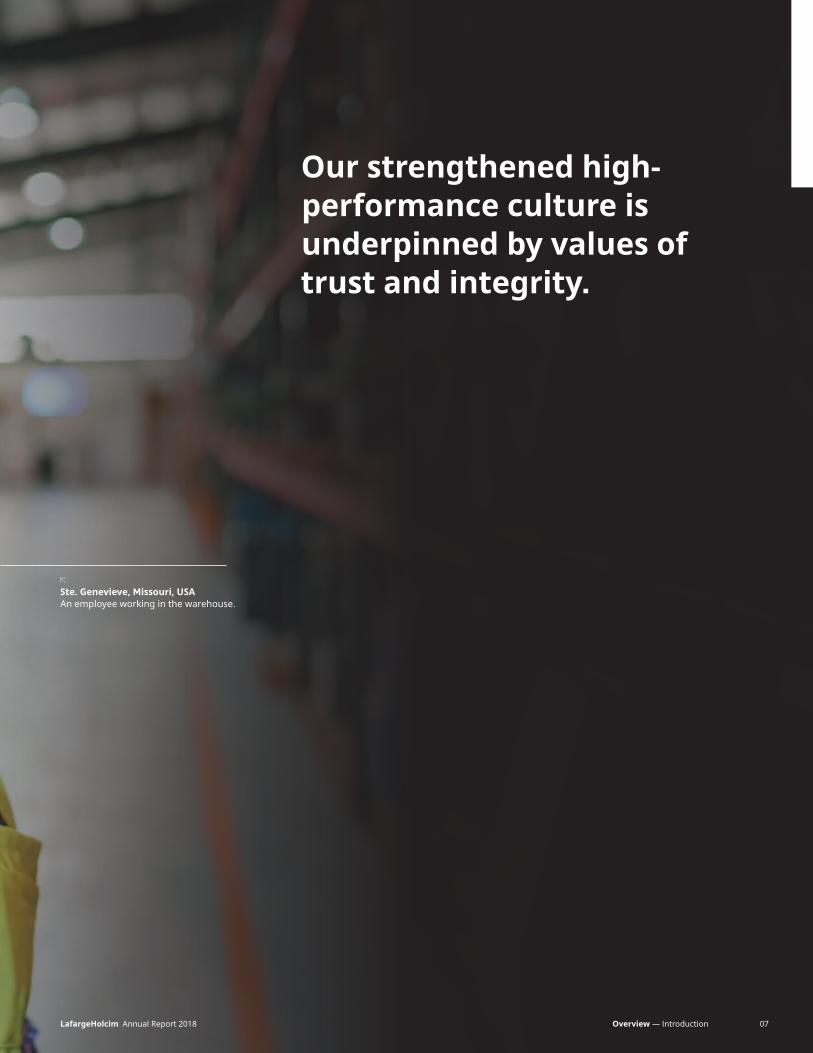
Our strengthened high-performance culture is underpinned by values of trust and integrity.
Ste. Genevieve, Missouri, USAAn employee working in the warehouse.

08
Businesses
Cement From classic masonry cements to high-performance products tailored for specialized settings, we offer an extensive range of cements and hydraulic binders.
Read more on P30–33
Aggregates We offer aggregates that serve as raw materials for concrete, masonry and asphalt as well as the foundation for buildings, roads and landfills.
Read more on P34–37
Ready-Mix ConcreteWe deliver a wide range of high-performance, high-quality ready-mix concrete, flexibly and reliably.
Read more on P38–41
Solutions & ProductsThe Solutions & Products segment bundles offers such as dry mortar, precast concrete, asphalt, paving and services that deliver targeted solutions for our customers’ specific needs.
Read more on P42–45
221.9Sales (million tonnes) 2017: 220.2
273.8Sales (million tonnes) 2017: 278.7
50.9Sales (million m3) 2017: 50.6
2.4Net Sales (CHF bn) 2017: 2.3
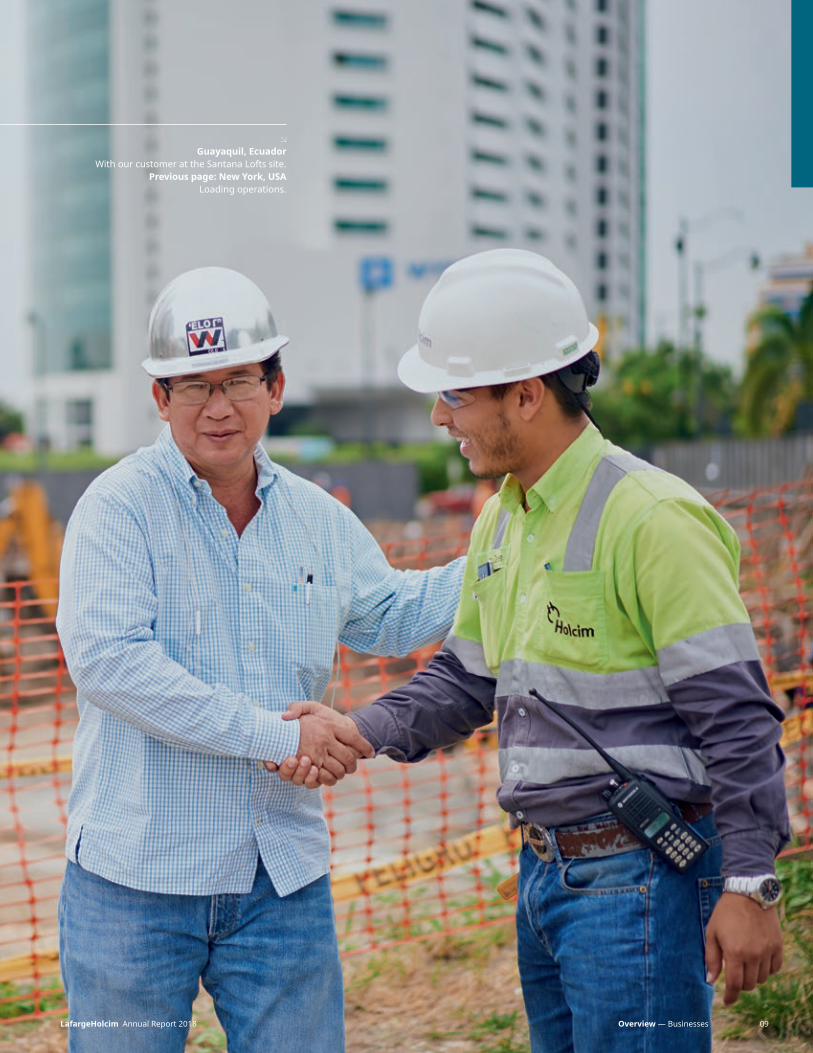
Guayaquil, EcuadorWith our customer at the Santana Lofts site.
Previous page: New York, USALoading operations.
09LafargeHolcim Annual Report 2018 Overview — Businesses

3.1 7.4
5.9
2.7
7.6
10
Performance
Net Sales by Region (CHF bn)
Key Figures 2018:
CHF 27,466mNet Sales2017: CHF 27,021m
CHF 1,703mFree Cash Flow2017: CHF 1,685m
CHF 6,016mRecurring EBITDA2017: CHF 5,990m
6.5%Return on Invested Capital2017: 5.8%
Notes. Recurring EBITDA excludes restructuring, litigation, implementation and other non-recurring costs. Free Cash Flow is defined as cash flow from operating activities less net maintenance and expansion Capex. Return On Invested Capital is defined as Net Operating Profit After Tax (NOPAT) divided by the average Invested Capital. The average is calculated by
adding the Invested Capital at the beginning of the period to that at the end of the period and dividing the sum by 2 (based on a rolling 12-month calculation). The non-GAAP measures used in this report are defined on page 282. Key figures are presented before IFRS 16.
North America Latin America Europe Middle East & Africa
Asia Pacific
11LafargeHolcim Annual Report 2018 Overview — Performance
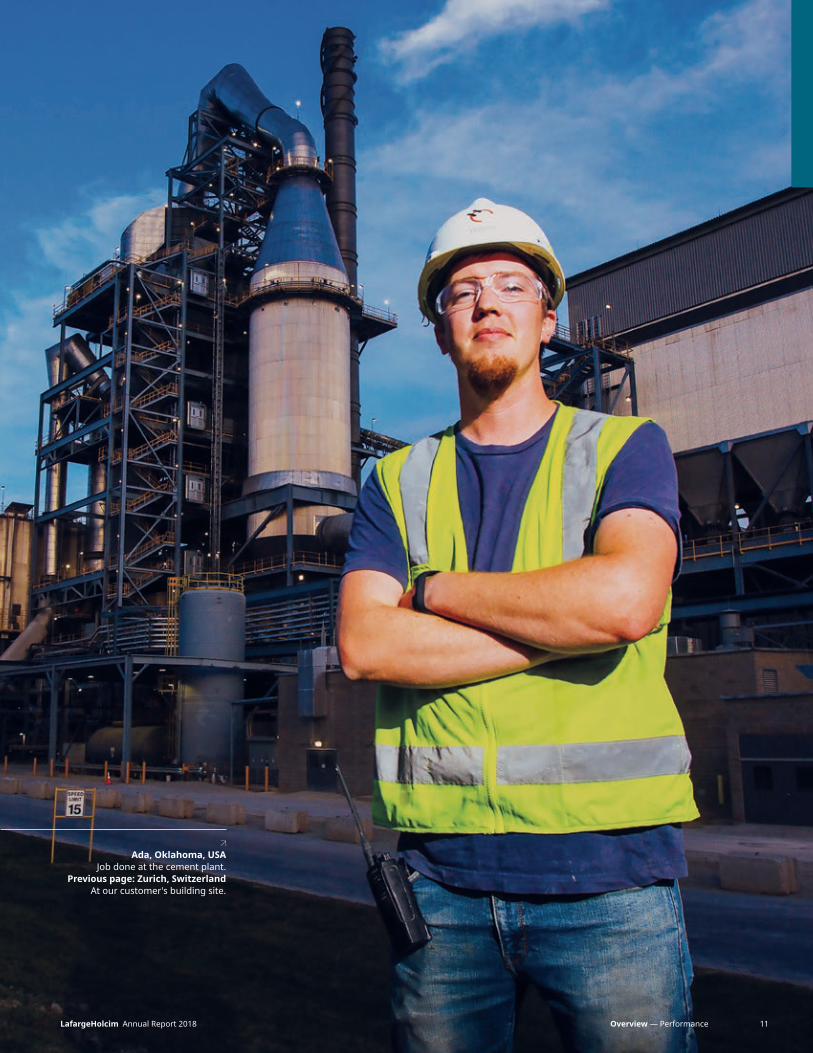
Ada, Oklahoma, USAJob done at the cement plant.
Previous page: Zurich, SwitzerlandAt our customer's building site.

12
Ove
rvie
w
Nairobi, KenyaSafety walk at the grinding plant.

LafargeHolcim Annual Report 2018 13Overview — Contents
Chairman statement 14
CEO letter to shareholders 16
Meet the leadership team 18
Market 20
Strategy 2022 – “Building for Growth” 22
14
Chairman statement
Dear shareholders,The 2018 fiscal year was marked by significant progress in Strategy 2022 – “Building for Growth”.
We grew faster than the market and improved the Recurring EBITDA of the company through greater efficiency and cost discipline. After several years of transition and adjustments to the organizational structure, our company is now well-positioned to thrive in a growing global building materials market. We have the best assets in the industry and highly motivated teams all around the world to further capture opportunities.
While our financial results attest to a successful strategy, this only tells part of the story. Your company aims to create value not only for its shareholders but also for society as a whole, as we have been doing for more than one-hundred years. From the Grand Paris Express in France, currently the largest infrastructure project in Europe, to transformative projects in Ecuador and India, our products and services help to improve people’s lives and spur economic growth.
As a global leader in building materials, we also contribute our expertise to sheltering families in our communities
– as our colleagues at the Holcim Mexico Foundation have done for instance in Puebla, Mexico, by building 120 houses for families affected by the 2017 earthquake. In India, we are the industry leader in reducing CO2 emissions and are known for extensive community services in the villages where we operate. It is our vision to be at the forefront of sustainable construction solutions and innovation, and for our stakeholders to see us as a responsible and ethical company.
Respect and responsibility towards the needs of all our stakeholders is part of our culture. In this context, upholding Health & Safety as a core value is highly important to us. I am happy to report that we have made a major step forward in reaching our goal of a zero-harm culture.
Last year, we have also further strengthened our corporate governance, for instance through the creation of the Ethics, Integrity & Risk Committee (EIRC), which is now fully part of our governance structure. We strongly believe that with our reviewed and strengthened governance and compliance organization we have taken all necessary measures to ensure that LafargeHolcim meets today’s best corporate governance practices.
Your company aims to create value not only for its shareholders but also for society as a whole.
I would like to conclude my letter with a remark on an issue that is personally very important to me. We must be aware of the bigger environment for our success and not only consider our immediate business context. As a Swiss-based company with deep commitments to the EU and indeed to countries around the world, we are perhaps especially aware of the interdependencies upon which everyone’s well-being depends – not just LafargeHolcim’s. We live up to the responsibilities that come with our presence around the world. We aim to be second-to-none as a steward of global prosperity.
My sincere thanks go of course also to our employees around the world. They embody our spirit of responsibility towards all stakeholders and their pride in our company will be the best guarantee of business success.
I also wish to thank our colleague Dr. Thomas Schmidheiny, who decided not to stand for re-election to the Board. In recognition of his many years of service to LafargeHolcim, my colleagues and I have

15LafargeHolcim Annual Report 2018 Overview — Chairman statement
Corporate governanceGood governance underlies our approach to creating long-term value.
Read more on P90–113
Beat HessChairman
decided to appoint him Honorary Chairman of the Group. His deep experience and wise counsel will be truly missed.
Finally, I would like to thank my fellow Board members for their commitment and counsel and to the members of the Executive Committee for further strengthening LafargeHolcim’s role as the global leader in building materials and solutions.
Beat HessChairman

16
CEO letter to shareholders
Dear shareholders,In the business year 2018, we made excellent progress in executing our Strategy 2022 – “Building for Growth” and made significant improvements to our performance. Our momentum accelerated in the second half of 2018, during which we exceeded our sales targets while profitability increased over-proportionally.
Switching gears to Growth is the most fundamental principle of Strategy 2022. First results have been achieved and the growth momentum accelerated throughout the year, with a strong Net Sales increase of 5.1% on a like-for-like basis. All four business segments contributed to this growth. Four bolt-on acquisitions were completed in 2018 in Europe and North America which drove growth and added to the company’s presence in ready-mix concrete and aggregates. These acquisitions had immediate impact on profitability and brought our company closer to our end-customers. Four more bolt-on acquisitions have been signed in 2019 in Europe, Australia and North America.
In terms of Simplification & Performance, we have successfully established a new operating model with more P&L accountability for the countries and leaner corporate support functions. Consequently, we have closed four corporate offices in Singapore, Miami,
Zurich and Paris. The associated CHF 400 million SG&A savings program was executed successfully and is delivering results ahead of target.
We made strong progress towards closing the gap to best-in-class performance in the Aggregates and Ready-Mix Concrete business segments. Both businesses developed positively in terms of volumes, pricing and profitability. These two business segments will play an important role in reaching the next level of performance of LafargeHolcim.
The strategy driver Financial Strength has led to improvements across all key performance indicators. More than CHF 1.5 billion was refinanced at attractive terms, thereby improving our company’s debt maturity profile and reducing financing costs. The sale of the Indonesian business contributes to the strengthening of our balance sheet. All measures taken in 2018 have already led to a successful de-leveraging, with the Net Financial Debt/Recurring EBITDA ratio improving to 2.2x (from 2.4x in 2017).
With regard to Vision & People, the new operating model and leadership team have been established effectively. Globally our leaders are empowered and the simplified performance management system and corresponding incentive
scheme has been implemented in all countries. All initiatives are supported by the launch of the new LafargeHolcim Business School.
Our progress and performance in 2018 is based on the commitment of our 75,000 employees. I thank all LafargeHolcim leaders and employees for their contributions, agility and entrepreneurial spirit in driving Strategy 2022 – “Building for Growth”. For 2019, we expect solid global market demand for our products and we aim to grow our business profitably. The execution of our new strategy has successfully started and I am confident that we will see a further acceleration of our momentum.
On behalf of all LafargeHolcim employees, I thank you for your trust and support.
Best regards,
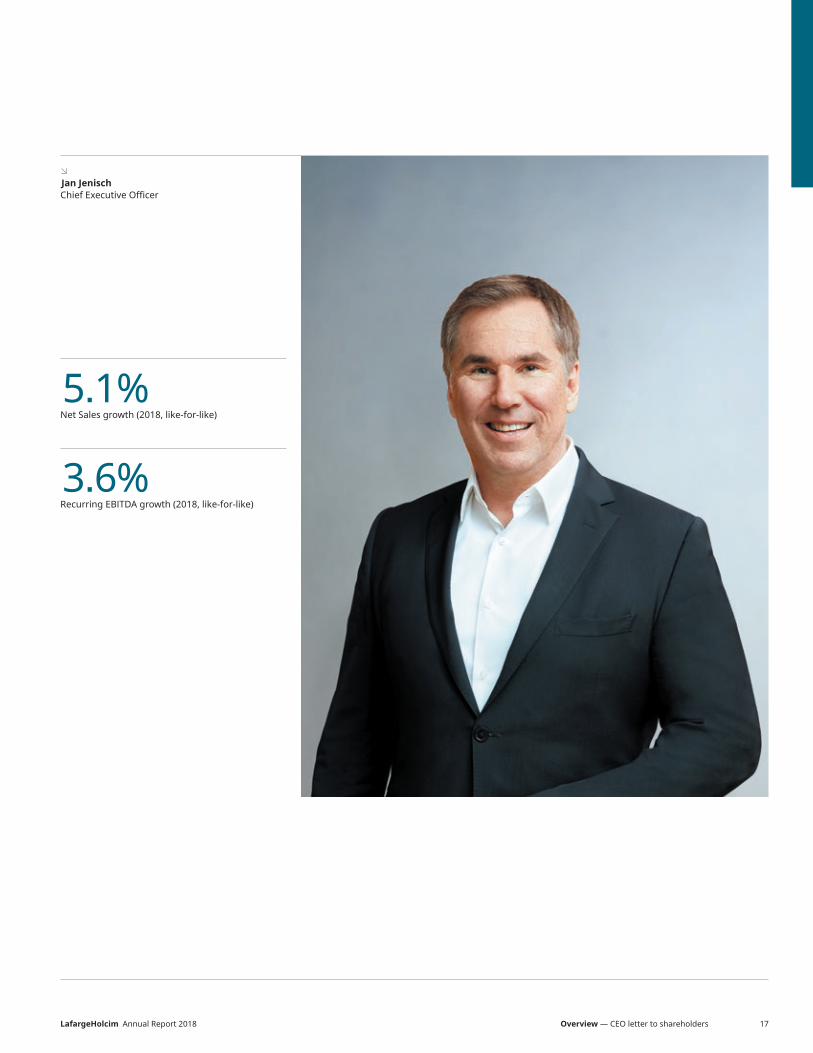
Jan JenischChief Executive Officer
LafargeHolcim Annual Report 2018 17Overview — CEO letter to shareholders
5.1%Net Sales growth (2018, like-for-like)
3.6%Recurring EBITDA growth (2018, like-for-like)
Jan JenischChief Executive Officer

18
Meet the leadership team
Martin KriegnerAsia Pacific Nationality: AustrianBorn: 1961
Feliciano González MuñozHuman Resources
Nationality: SpanishBorn: 1963
René ThibaultNorth America Nationality: CanadianBorn: 1966
Marcel CobuzEurope Nationality: Romanian and FrenchBorn: 1971
Keith CarrLegal and Compliance Nationality: BritishBorn: 1966

Denver, Colorado, USA The Executive Committee at the Morrison quarry.
LafargeHolcim Annual Report 2018 19Overview — Meet the leadership team
Miljan GutovicMiddle East Africa Nationality: AustralianBorn: 1979
Jan JenischCEO Nationality: GermanBorn: 1966
Géraldine PicaudCFO Nationality: FrenchBorn: 1970
Oliver OsswaldLatin America
Nationality: SwissBorn: 1971

20
Five megatrends driving market growth of 2% – 3% per annum
Market
The global building materials market is worth CHF 2.5 trillion annually and it is continuously growing.
Global population growth and changing demographics – Population expected to grow 22% by 2050 from 7.6 billion to 9.7 billion
Urbanization and megacities – Approx. 2.5 billion more people are expected to live in cities by 2050

LafargeHolcim Annual Report 2018 21Overview — Market
Building materials market (without China)
CHF ~ 1,750 billion
Global building materials market
CHF ~ 2,500 billion
Cement LH market share of ~ 8% CHF 200 billion
Aggregates LH market share of ~ 2% CHF 220 billion
Ready-Mix Concrete LH market share of ~ 3% CHF 200 billion
Other building materials CHF 1,130 billion
China Rest ofWorld
A fragmented market – Opportunities for growth and acquisitions
Digitalization opens new avenues for growth & innovation
Increased demand for better living standards and more efficient infrastructure
Increased demand for sustainable construction solutions and increasing resource scarcity

OUR FOUR VALUE DRIVERS
5.1%Net Sales Growth
3.6%Recurring EBITDA Growth
28.3%Free Cash Flow to Recurring EBITDA
6.5%Return on Invested Capital
2018 Performance
3 – 5%Net Sales Growth
>5%Recurring EBITDA Growth
>40%Free Cash Flow to Recurring EBITDA
>8%Return on Invested Capital
2022 Targets
Notes: Recurring EBITDA excludes restructuring, litigation, implementation and other non-recurring costs. Free cash flow is defined as cash flow from operating activities less net maintenance and expansion Capex. Recurring EBITDA growth and Net Sales growth are both presented on a like-for-like basis. Return On Invested Capital is defined as Net Operating
Profit After Tax (NOPAT) divided by the average Invested Capital. The average is calculated by adding the Invested Capital at the beginning of the period to that at the end of the period and dividing the sum by 2 (based on a rolling 12-month calculation). The non-GAAP measures used in this report are defined on page 282. Key figures are presented before IFRS 16.
22
Good progress on Strategy 2022 – “Building for Growth”

Mumbai, IndiaWith our customer at the Park by Lodha.
LafargeHolcim Annual Report 2018 23Overview — Strategy 2022 – Building for Growth

Cologne, GermanyPouring concrete to renovate the cathedral metro station.
24
Overview — Strategy 2022 – Building for GrowthLafargeHolcim Annual Report 2018 25
The global rollout of the new Strategy 2022 – “Building for Growth” has been successfully started. Strong progress was made in all four drivers of the strategy, delivering results ahead of plan.
Switching gears to Growth is the most fundamental principle of Strategy 2022. First results have been achieved and the growth momentum accelerated throughout the year, with a strong Net Sales increase of 5.1% on a like-for-like basis. All four business segments contributed to this growth. Four bolt-on acquisitions were completed in 2018 in Europe and North America which drove growth and added to the company’s presence in ready-mix concrete and aggregates. These acquisitions had immediate impact on profitability and brought the company closer to its end-customers. Four more bolt-on acquisitions have been signed in 2019 in Europe, Australia and North America. In terms of Simplification & Performance, the company has successfully established a new operating model with more P&L accountability for the countries and leaner corporate support functions. Consequently, we have closed four corporate offices in Singapore, Miami, Zurich and Paris. The associated CHF 400 million SG&A savings program was executed successfully and is delivering results ahead of target.
Strong progress was made by the Aggregates and Ready-Mix Concrete segments towards closing the gap with best-in-class performers. Both businesses developed positively in terms of volumes, pricing and profitability. These two business segments will play an important role in reaching the next level of performance of LafargeHolcim.
The strategy driver Financial Strength has improved all key performance indicators. More than CHF 1.5 billion was refinanced at attractive terms, thereby improving the company’s debt maturity profile and reducing financing costs. The sale of the Indonesian business has contributed to the strengthening of the balance sheet. All measures taken in 2018 have already led to a successful de-leveraging, with the Net Financial Debt/Recurring EBITDA ratio improving to 2.2x (from 2.4x in 2017).
In terms of Vision & People, the new operating model and leadership team has been successfully established. The company’s global leaders are empowered and fully accountable for their P&L. The simplified performance management system and the corresponding incentive scheme have been implemented in all countries. All initiatives are supported by the launch of the new LafargeHolcim business school.
Outlook 2019 Solid global market demand is expected to continue in 2019 with the following market trends:• Continued market growth in
North America• Softer but stabilizing cement demand in
Latin America• Continued demand growth in Europe• Challenging but stabilizing market
conditions in Middle East Africa• Continued strong demand growth
in Asia Pacific
Based on the above trends and the successful execution of Strategy 2022, we confirm our previously communicated targets for 2019:• Net Sales growth of 3 to 5 percent on a
like-for-like basis• Recurring EBITDA growth of at least 5
percent on a like-for-like basis• Ratio of Net Debt to Recurring EBITDA 2
times or less by the end of 2019
Good progress on Strategy 2022 – “Building for Growth”continued
Barcelona, SpainIn the warehouse of the Montcada cement plant.
26
Bu
sin
ess
revi
ew

Largest footprint in the industry 28
Business segments Cement 30 Aggregates 34 Ready-Mix Concrete 38 Solutions & Products 42
Delivering sustainable value 46
Innovating for success 54
People 58
Health & Safety 62
Risk and control 66
Capital market information 84
LafargeHolcim Annual Report 2018 27Business review — Contents
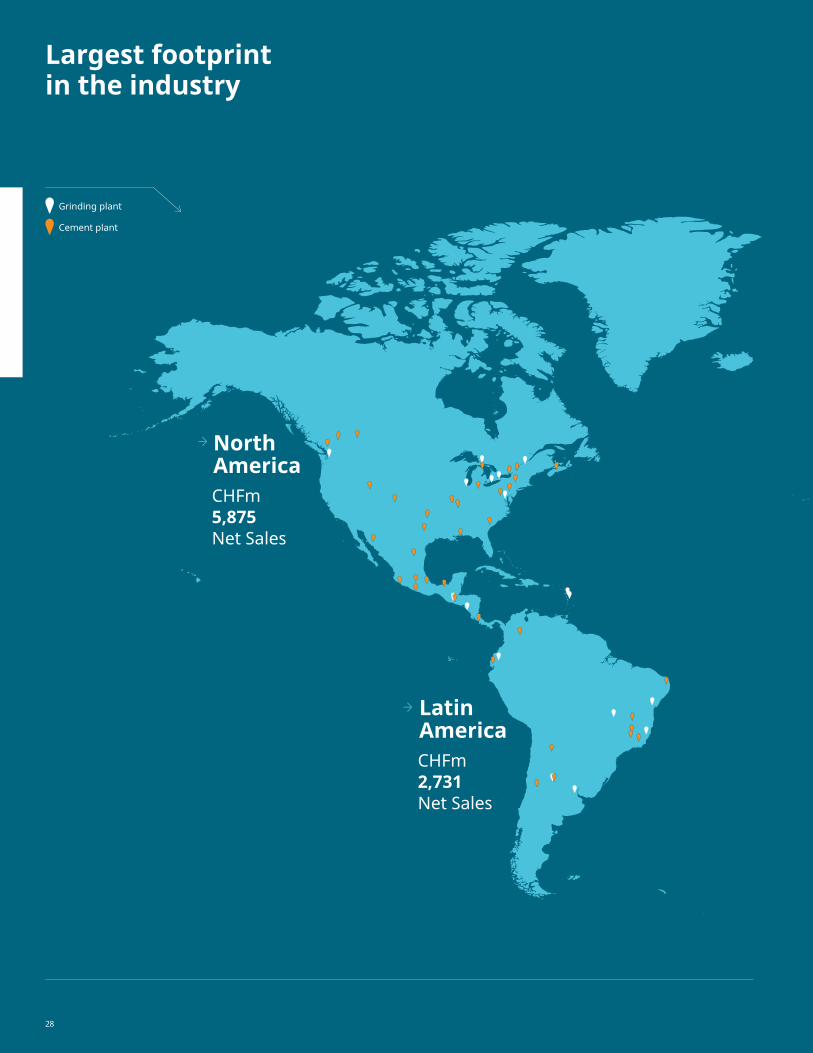
Largest footprint in the industry
Grinding plant
Cement plant
North AmericaCHFm5,875Net Sales
Latin AmericaCHFm2,731Net Sales
28
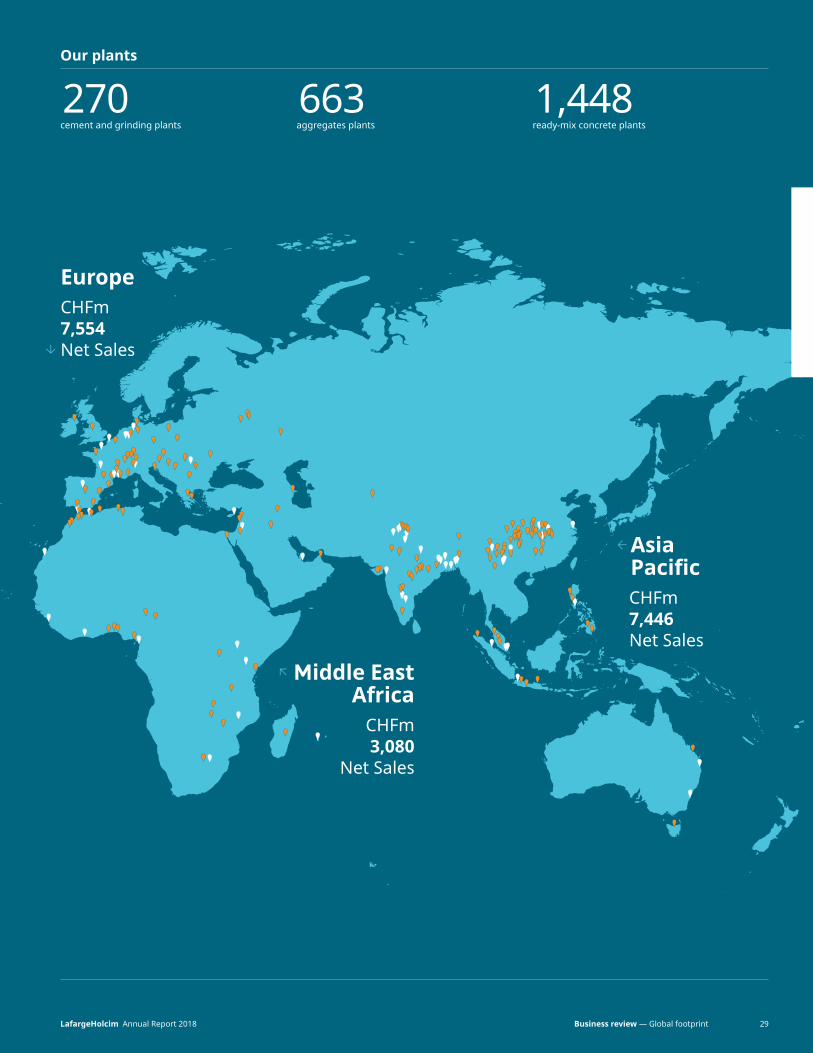
Our plants
270cement and grinding plants
663aggregates plants
1,448ready-mix concrete plants
Middle East Africa
CHFm3,080
Net Sales
EuropeCHFm7,554Net Sales
Asia PacificCHFm7,446Net Sales
LafargeHolcim Annual Report 2018 29Business review — Global footprint

Business segmentsCement
In 2018 the segment showed solid progress, with Net Sales increase of 6.0%* and improvement in Recurring EBITDA of 1.7%*.
For centuries, cement has been essential to building long-lasting homes, modern offices and public infrastructure. It is manufactured through a large-scale, capital- and energy-intensive process. Production begins in a rotary kiln, in which limestone and clay are heated to approximately 1,450 degrees Celsius. Under these extreme temperatures it coalesces into the semi-finished product called clinker.
To make traditional Portland cement, gypsum is added to clinker in a cement mill and the mixture is ground to a fine powder. Other high-grade materials such as fly ash, pozzolan and limestone can be added to modify the cement for special uses.
Our cements range from Portland cements and classic masonry cements to specialized products for different environments, including those exposed to seawater, sulfates and other harsh natural conditions. These products go hand in hand with complementary services such as technical support, order and delivery logistics, documentation, demonstrations and training.
Our cement customers include construction and public works organizations, manufacturers (producers of ready-mix concrete and prefabricated products), and, via retailers, the general public. At a basic level, the market can be broadly segmented into bag and bulk cement, with emerging markets generally the largest consumers of bagged cement. Industrialized countries are mainly bulk markets, as cement is mainly consumed by larger business-to-business customers such as construction companies or building products manufacturers.
Cement is costly to transport over land. Consequently, the radius within which a typical cement plant is competitive extends no more than 300 kilometers for the most common types of cement. However, cement can be shipped more economically by sea and inland waterways. Most LafargeHolcim plants are located close to customers in highly populated areas, benefiting from the ongoing global trend in urbanization.
221.9Sales (million tonnes)2017: 220.2
2018 in reviewSolid volume growth of 4.4% on a like-for-like basis compared to 2017 was driven by favorable conditions in most regions. In Asia Pacific, solid demand was driven by infrastructure and rural housing. In Europe, growth was supported by higher construction and residential activity as well as incremental infrastructure spending. In Latin America, demand recovered in Brazil and Columbia while the North American market grew strongly in 2018 despite unfavorable weather. In Middle East Africa, sales stabilized at prior-year levels. Net Sales grew 6.0% on a like-for-like basis, with Recurring EBITDA growth on a like-for-like basis of 1.7%, impacted by sharply higher energy prices.
* Like-for-like.
30

Guayaquil, Ecuador In the control room of the
cement plant.
LafargeHolcim Annual Report 2018 31Business review — Business segments
Business segments Cementcontinued
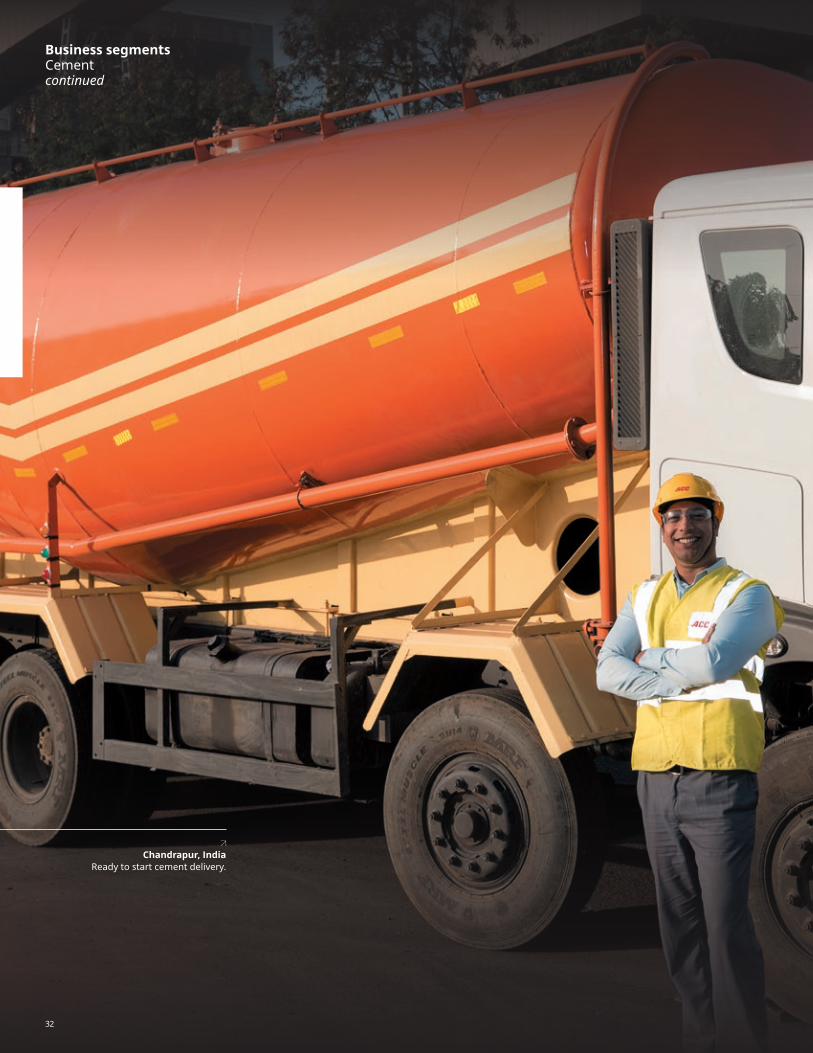
Chandrapur, IndiaReady to start cement delivery.
32

Some unique logistical challenges are involved when building a tunnel through the Himalayas.
“Working conditions are surely not easy,” observes Sunil Tyagi, Project Manager for STRABAG AG – Afcons JV, lead contractor on the Rohtang Tunnel project.
The tunnel, which is nine kilometers long and situated at 3,000 meters above sea level, will be the longest in the world at this altitude. Our Indian affiliate ACC has delivered 138,000 tonnes of cement to help complete it.
“ACC has been a trusted partner since the start in 2010,” continued Tyagi. “Team ACC has been performing reliably and safely, navigating through snowfall, avalanche and washed away roads.”
The project advanced through agile, opportunistic activity when conditions allowed for safe delivery.
The tunnel is expected to open at the end of 2019. It will substantially improve living conditions for people who had previously been isolated from the rest of the country whenever snowfall blocked access. The Rohtang Tunnel will promote economic progress for the region.
Connecting communities in the Himalayas
33LafargeHolcim Annual Report 2018 Business review — Business segments

Business segmentsAggregates
In 2018 we showed excellent progress in our ambition to close the gap with best-in-class performers, with growth in Recurring EBITDA of 15.1%*.
LafargeHolcim operates more than 600 aggregates plants worldwide. This segment supplies a broad range of customers that includes concrete and asphalt producers, manufacturers of prefabricated products and construction and public works contractors of all sizes. Our aggregates are used as raw materials for concrete, masonry and asphalt and as base materials for roads, landfills and buildings. As such, they are a key component of construction.
Crushed stone, gravel and sand are all typical aggregates. Most aggregates are produced by blasting hard rock from quarries and then extracting and crushing it. Aggregate production also involves the extraction of sand and gravel from both land and marine locations. In both cases, the aggregates are processed and sorted to obtain various sizes to meet different needs, or for other physical characteristics such as hardness, granularity, shape and color.
Such characteristics determine the applications for which the various types of aggregates are suited. Because of the high weight of aggregates and cost of transporting them, aggregates markets are nearly always local.
LafargeHolcim holds significant reserves of quality aggregates in our key markets: at current production rates our average reserve life in Europe is around 40 years, in Australia around 50 years, and in North America we have an average reserve life of around 100 years. We are also increasingly supplying recycled aggregates, which can be made from construction waste as well as the materials left over after demolition, especially in urban areas. These recycled aggregates replace the need for quarry extraction and contribute to a truly circular economy in building.
273.8Sales of aggregates (million tonnes)2017: 278.7
2018 in reviewSignificant progress was made in Aggregates performance with Recurring EBITDA improving by 15.1% on a like-for-like basis compared to the prior year, outperforming the Net Sales growth of 4.5% on a like-for-like basis, increasing the Recurring EBITDA margin by 2.3 percentage points. Volumes grew by 1.2% on a like-for-like basis versus 2017 driven by strong demand in Europe and North America. Net Sales gains combined with a leaner administrative structure led to over-proportional Recurring EBITDA and margin growth, closing the gap to best-in-class performance.
* Like-for-like.
34

Untervaz, SwitzerlandQuarry operations.
LafargeHolcim Annual Report 2018 35Business review — Business segments
Business segments Aggregatescontinued
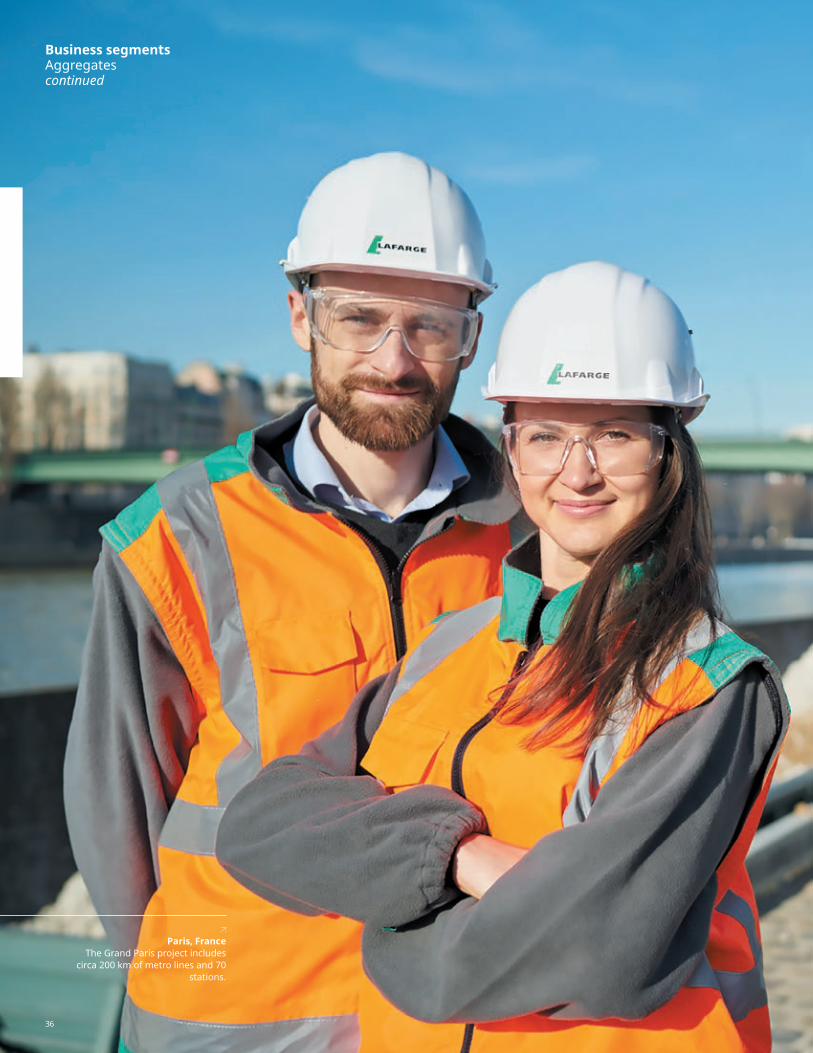
Paris, FranceThe Grand Paris project includes
circa 200 km of metro lines and 70 stations.
36

For more than one-hundred years we have supplied aggregates and concrete to the French market. When planning began for the Grand Paris Express (GPE) – France’s largest construction project of the century – we were eager to share our expertise and solutions.
The GPE is the largest transport infrastructure project in Europe. It represents an investment of about EUR 38.5 billion. Our building materials and sustainable solutions are helping to make sure the GPE is environmentally friendly and in line with the Universal Climate Agreement signed at COP21.
To help realize the GPE’s anticipated 200 kilometers of new railway and 68 new rail stations, we have already agreed to deliver 600,000 tonnes of aggregates and 260,000
tonnes of cement to produce 650,000m³ of ready-mix concrete through 2022, with the goal of working on the GPE over the next 15 years.
Aggregates come from our nearby quarries in the Seine valley. These are delivered by barge, which is a more environmentally friendly method than by road (two barges can handle the load of 220 trucks). Most of the earth excavated from the GPE tunnels and stations will be removed the same way – in total the GPE is expected to produce up to 40 million tonnes – travelling as far as Le Havre to re-landscape some of our quarries along the Seine.
Helping keep Paris grand
LafargeHolcim Annual Report 2018 37Business review — Business segments

Business segmentsReady-Mix Concrete
Our 2018 Recurring EBITDA grew by 54.1%* as we started to close the gap with best-in-class performers.
Concrete is the world’s second-most consumed good by volume after water. One cubic meter consists of approximately 300 kilograms of cement, 150 liters of water and two tonnes of aggregates. Ready-mix concrete is one of the largest markets for the cement and aggregates industries.
Buyers of ready-mix concrete are typically construction and public works contractors, ranging from major multinational corporations to small-scale customers. Customers determine our success. They value the quality and consistency of our products, the breadth of our portfolio, our expertise in large projects, our flexibility and our reliability. We also offer a range of innovative concretes including self-filling and self-leveling concrete, architectural concrete, insulating concrete and pervious concrete.
The production of ready-mix concrete is less capital intensive than the production of cement. It is also highly decentralized, since concrete is a heavy product that must be delivered quickly, requiring production facilities to be near the place of use. Only very large and integrated corporations, such as LafargeHolcim, that produce both cement and aggregates have succeeded in establishing an international presence in this market.
In 2018 we bolstered our capacity in this segment by acquiring two ready-mix manufacturers in the US – MetroMix in Colorado and Tarrant Concrete in Texas. As with our Aggregates segment, we are focused on closing the performance gap with other best-in-class performers in Ready-Mix Concrete as part of Strategy 2022 – “Building for Growth”.
50.9Sales of ready-mix concrete (million m3)2017: 50.6
2018 in review Ready-Mix Concrete performance made strong progress in 2018. Net Sales improved 3.8% on a like-for-like basis compared to 2017 and Recurring EBITDA grew over-proportionally by 54.1% on a like-for-like basis versus the prior year. Overall sales volumes increased by 0.6% on a like-for-like basis, mainly driven by demand in Europe, while average selling prices improved in most regions. Initial benefits from the new, leaner administrative model combined with sales price gains to lift Recurring EBITDA and Recurring EBITDA margin in 2018.
* Like-for-like.
38
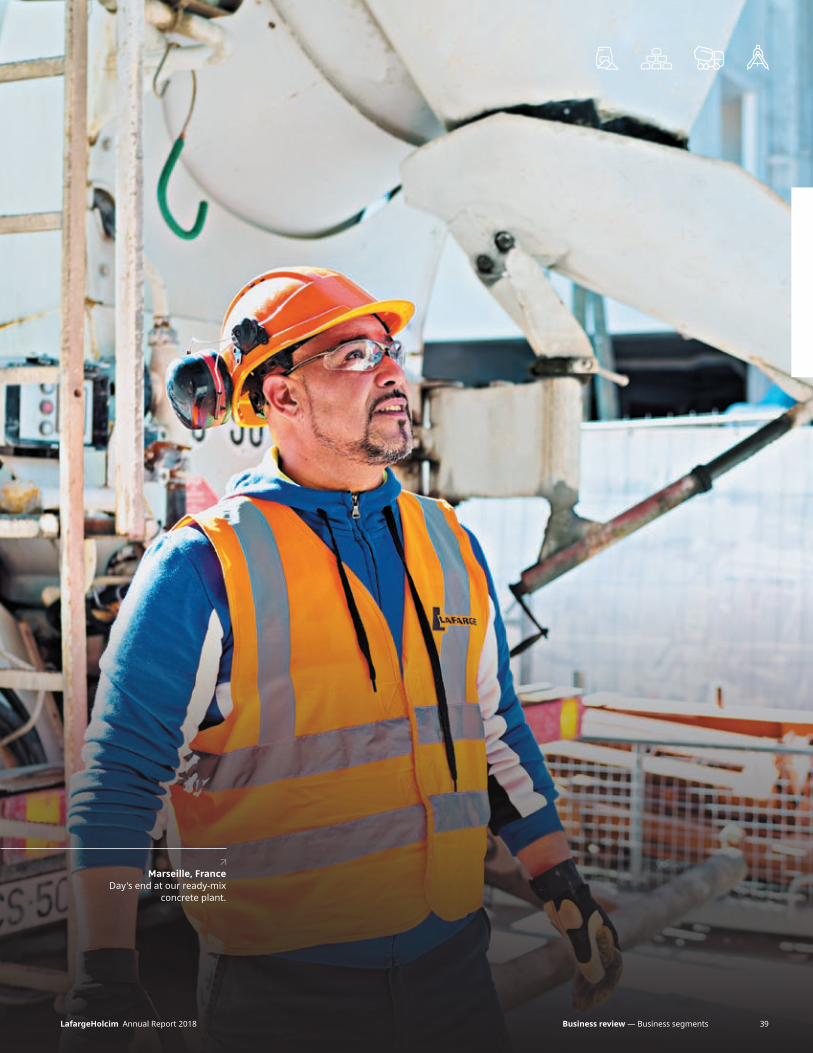
Marseille, FranceDay's end at our ready-mix
concrete plant.
LafargeHolcim Annual Report 2018 39Business review — Business segments

Business segments Ready-Mix Concretecontinued
Guayaquil, EcuadorPouring ready-mix concrete.
40

As a leader in the global building materials industry, we take pride in helping our clients find sustainable, positive solutions to megatrends like population growth and urbanization. Good building – especially of infrastructure – is key to helping societies absorb these trends and to ensure that the benefits are widely shared.
In Ecuador we are contributing on a number of fronts. Beginning near Guayaquil, its largest city, we have designed a range of concrete solutions to build the deep water port of Posorja. Posorja will give the country a state-of-the-art link to the world trade system – and with a depth of 16 meters, the port will enable sea trade even for today’s largest (‘Post Panamax’) vessels.
And in the capital city of Quito, we have poured another 512,000 cubic meters of concrete to create the city’s first metro system. This World Bank-sponsored project envisions a 22-kilometer rapid transit artery that will connect the city’s 1.6 million people – a number that has grown steadily and will continue to do so into the future.
Building a new gateway for global trade
LafargeHolcim Annual Report 2018 41Business review — Business segments

Business segmentsSolutions & Products
In 2018 we built a fourth business segment, Solutions & Products, that bundles a range of offers delivering targeted solutions to our customers’ specific needs.
In 2018 we built a fourth business segment, Solutions & Products, that bundles a range of offers delivering targeted solutions to our customers’ specific needs.
The Solutions & Products segment gives us a way to leverage our local construction market knowledge, extensive customer base, global key accounts and R&D capabilities. Solutions & Products also leverages our strength as a global company that can develop and scale up new solutions and products effectively. This agility is important to this segment especially as nearly all of its offerings fall into markets where spending is growing faster than the general average for construction.
Today the segment offers asphalt, contracting services, dry mortars and a range of application specific solutions. The mineral foam Airium® improves the energy performance of buildings through fire resistant and fully recyclable thermal insulation materials. Ductal®, one of our ultra-high performance concretes, can be applied to bridge decks to extend the service life of infrastructure investments. Through the Solutions & Products segment we also provide a wide range of precast construction systems that can solve a host of building and infrastructure challenges – Basalton, for example (pictured right), which provides a durable and cost-effective means to protect vulnerable landscapes from storm and rising sea levels.
We view Solutions & Products as a growth driver under Strategy 2022 – Building for Growth and expect to substantially increase our revenue in this segment over the coming years.
2.4Net Sales (CHF billion)2017: 2.3
2018 in reviewSolid Net Sales growth of 2.7% on a like-for-like basis compared to 2017 was mainly driven by asphalt operations, a focus on value-added products, delivering incremental value and segmented price increases. Construction and Paving also saw improved 2018 revenues, mainly in North America. Profitability was impacted by significant bitumen cost increases which mirrored the oil price development, leading to a decrease in Recurring EBITDA of 24.3% on a like-for-like basis versus the prior year.
42

Zeeland, The NetherlandsOur durable Basalton creates a concrete dyke for long-lasting
protection against storm surge.
LafargeHolcim Annual Report 2018 43Business review — Business segments
Business segments Solutions & Productscontinued
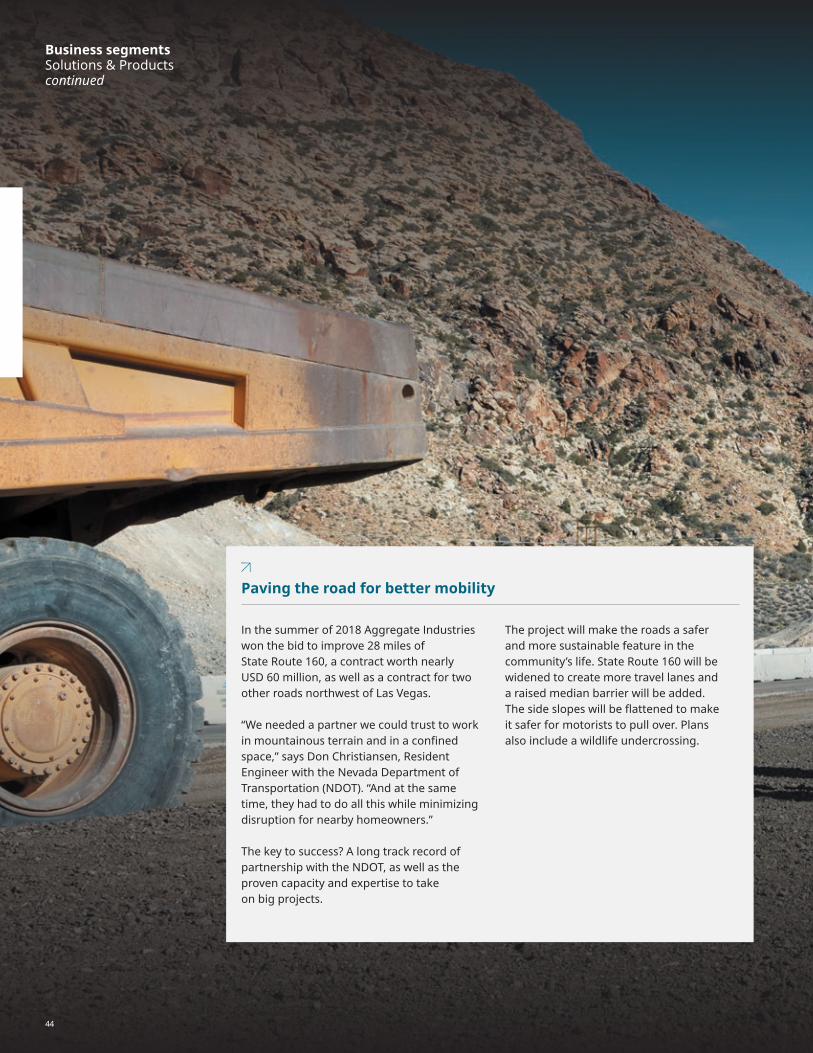
In the summer of 2018 Aggregate Industries won the bid to improve 28 miles of State Route 160, a contract worth nearly USD 60 million, as well as a contract for two other roads northwest of Las Vegas.
“We needed a partner we could trust to work in mountainous terrain and in a confined space,” says Don Christiansen, Resident Engineer with the Nevada Department of Transportation (NDOT). “And at the same time, they had to do all this while minimizing disruption for nearby homeowners.”
The key to success? A long track record of partnership with the NDOT, as well as the proven capacity and expertise to take on big projects.
The project will make the roads a safer and more sustainable feature in the community’s life. State Route 160 will be widened to create more travel lanes and a raised median barrier will be added. The side slopes will be flattened to make it safer for motorists to pull over. Plans also include a wildlife undercrossing.
Paving the road for better mobility
44
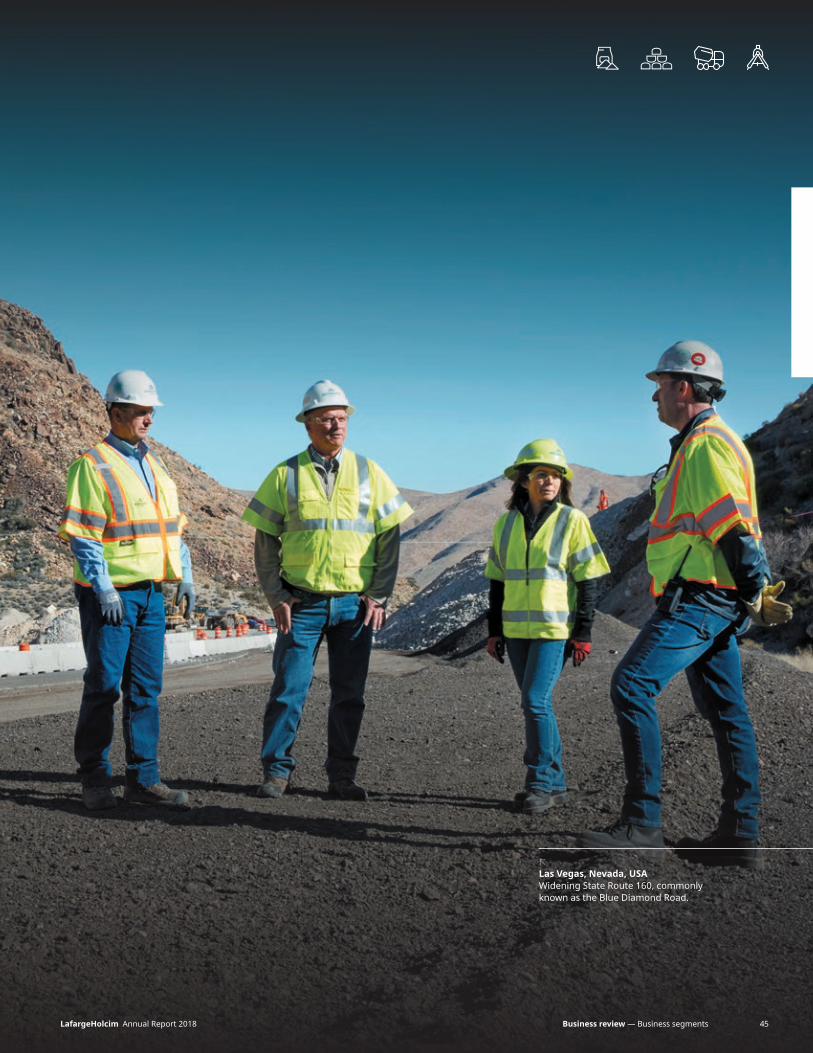
Las Vegas, Nevada, USAWidening State Route 160, commonly known as the Blue Diamond Road.
LafargeHolcim Annual Report 2018 45Business review — Business segments

Delivering sustainable value
Our approach: Sustainability creates value for business and society.
We focus on four fields of action: Climate, Circular Economy, Environment and Communities.
Climate Since 1990 we have reduced our net carbon emissions per tonne of cement by 25 percent. We lead the international cement companies with the highest reduction against the 1990 baseline. LafargeHolcim cement is one of the most carbon-efficient in the world.
We achieved this mainly through reducing the clinker-to-cement ratio and consuming less fossil energy per tonne of cement, mostly by using alternative fuels.
We measure our climate achievement in terms of reduction in net CO2 emissions (measured in kilograms of CO2 per tonne of cementitious material, or kg CO2/tonne). Our current 2030 emissions reduction target of 40% vs. 1990, translating to net CO2 emissions of around 460 kg CO2/tonne, exceeds the standard for a 2 degree scenario.
We continuously review this ambition based on scenarios that take into account the most recent internal and external input factors, such as the Carbon Technology Roadmap of the International Energy Agency & Cement Sustainability Initiative and the nationally determined contributions of the countries in which we operate. As a consequence of our latest review we revised our target value to 520 kg CO2/tonne by 2030.
With this, we remain the most ambitious company in our sector and retain our commitment to reduce emission levels in line with a 2 degree scenario.
We will continue to monitor developments and to update our scenario planning in line with the recommendations of the Task Force on Climate-related Financial Disclosures (TCFD, see also page 68).
Circular EconomyOur cement plants provide an excellent opportunity to address society’s waste problem. Waste products can be used as a substitute for fossil fuels and other raw materials. This process – called co-processing – helps lower greenhouse gas emissions by reducing the quantity of fossil fuels in cement manufacturing. This also means less waste in landfills or incinerators (see “Focus on waste,” page 50).
46

Mombasa, KenyaHaller Park, a former quarry that is
now a UN award winning nature park.
47LafargeHolcim Annual Report 2018 Business review — Delivering sustainable value

Delivering sustainable valuecontinued
48

We promote the use of recycled materials in our production value-chain. In our Aggregates, Ready-Mix Concrete and Asphalt businesses we use around 11 million tonnes of recycled material per year (mostly recycled aggregates) to make our products. At some sites this represents more than 90% of the material used.
EnvironmentOver the last four years we have reduced water withdrawal in our cement plants by around 19% (or 73 liters per tonne of cement). Over this period the initiative has created water awareness in our plants and we have refined our measurement methodologies. Today we are shifting our focus to consider our total impact on water resources in the communities where we operate, particularly in water-scarce areas. In consequence we will revise our ambitions to reflect water impact, which we intend to reduce by focusing on the most vulnerable areas of operation. In some communities we already have a net positive water impact, such as those served by Ambuja Cement, which we have calculated as being 6x water positive.
Cartago, Costa RicaCollecting waste as an alternative fuel.
LafargeHolcim Annual Report 2018 49Business review — Delivering sustainable value
Delivering sustainable valuecontinued
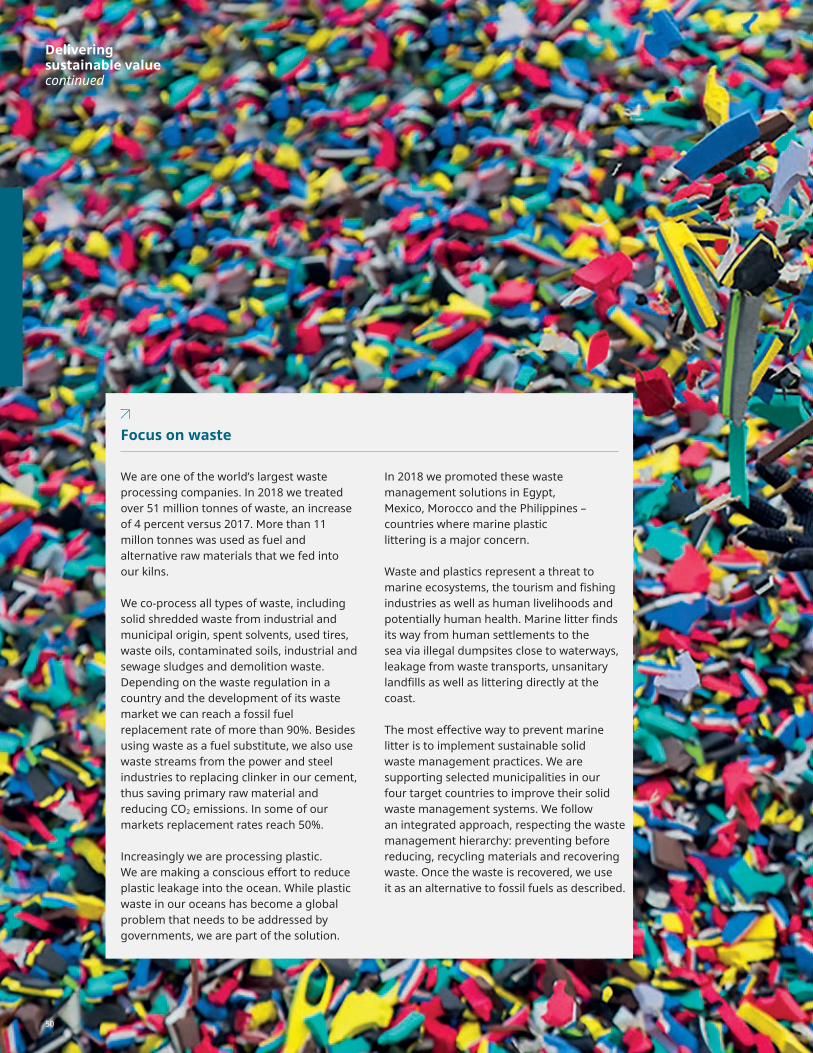
We are one of the world’s largest waste processing companies. In 2018 we treated over 51 million tonnes of waste, an increase of 4 percent versus 2017. More than 11 millon tonnes was used as fuel and alternative raw materials that we fed into our kilns.
We co-process all types of waste, including solid shredded waste from industrial and municipal origin, spent solvents, used tires, waste oils, contaminated soils, industrial and sewage sludges and demolition waste. Depending on the waste regulation in a country and the development of its waste market we can reach a fossil fuel replacement rate of more than 90%. Besides using waste as a fuel substitute, we also use waste streams from the power and steel industries to replacing clinker in our cement, thus saving primary raw material and reducing CO2 emissions. In some of our markets replacement rates reach 50%.
Increasingly we are processing plastic. We are making a conscious effort to reduce plastic leakage into the ocean. While plastic waste in our oceans has become a global problem that needs to be addressed by governments, we are part of the solution.
In 2018 we promoted these waste management solutions in Egypt, Mexico, Morocco and the Philippines – countries where marine plastic littering is a major concern.
Waste and plastics represent a threat to marine ecosystems, the tourism and fishing industries as well as human livelihoods and potentially human health. Marine litter finds its way from human settlements to the sea via illegal dumpsites close to waterways, leakage from waste transports, unsanitary landfills as well as littering directly at the coast.
The most effective way to prevent marine litter is to implement sustainable solid waste management practices. We are supporting selected municipalities in our four target countries to improve their solid waste management systems. We follow an integrated approach, respecting the waste management hierarchy: preventing before reducing, recycling materials and recovering waste. Once the waste is recovered, we use it as an alternative to fossil fuels as described.
Focus on waste
50
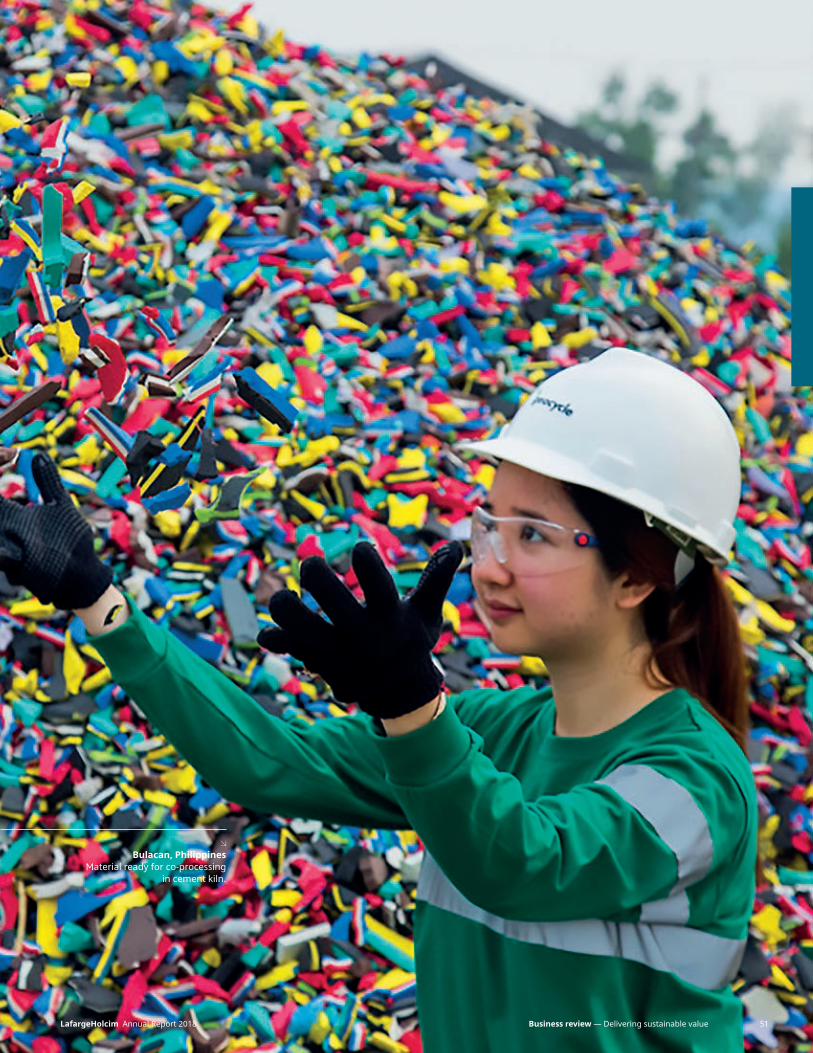
Bulacan, PhilippinesMaterial ready for co-processing
in cement kiln.
Business review — Delivering sustainable valueLafargeHolcim Annual Report 2018 51

Delivering sustainable valuecontinued
CommunitiesIn many countries we enlarge the positive impacts of our operations – such as direct employment, tax revenues, infrastructure development and local procurement – beyond the factory gate. In Ecuador, for example, we initiated a vocational training program in which participants are not only trained in skills such as masonry and building, but also administration and workplace safety. Graduates from the program enjoy increased employment possibilities in the construction industry. Over the last four years over 15 million people have benefitted from our community programs worldwide.
The LafargeHolcim FoundationThe purpose of the LafargeHolcim Foundation for Sustainable Construction is to raise awareness for sustainability in architecture, engineering, urban planning and the building industry as a whole.
Its flagship activity is the global LafargeHolcim Awards, the world’s best recognized competition for sustainable design in building and infrastructure. In 2018, winners from Mexico, Niger and the USA were awarded from more than 5,000 submissions in 131 countries. Their sustainable projects excel in social, environmental and economic performance.
The top prizes of the competition were handed over in Mexico City to coincide with the LafargeHolcim Next Generation Awards Lab. Young professionals representing 25 countries developed ideas on the future of sustainable construction in workshops that were led by Global Awards winners and experts from the global network of the Foundation.The next competition for projects and concepts in sustainable construction opens for entries in June 2019.
52

Bulacan, PhilippinesCSR school contest to promote vegetable gardens.
Quito, EcuadorWe add social value by building affordable housing.
Business review — Delivering sustainable valueLafargeHolcim Annual Report 2018 53

Innovating for success
Innovation will become the differentiator of the building materials industry.
We believe that innovation is emerging through the collaboration of a network of actors, outside any single organization. In 2018 we embraced this spirit of open innovation, connecting people and organizations from inside and outside LafargeHolcim to find new solutions and ways of working. Our aim is to find and exploit innovations along our entire value chain, from processes to products, from quarry to worksite.
The LH Accelerator illustrates how open innovation is working at LafargeHolcim today (see box). In this program we put ten start-ups worldwide together with our own experts, as well as mentors from corporate partners China Communications Construction Company (CCCC) and Sika.
One used 3D drone data analytics for quarry blasting operations and roads. Another is developing a BIM-centric platform for the construction and real estate industries that covers the entire building lifecycle. Another is developing a method for CO2 treatment and the full reuse of ready-mix production wash water. Yet another has prototyped an autonomous robot for rebar tying on bridge decks. Besides making lasting connections, the program developed and showcased solutions that touch all areas
of our industry. We will continue to support these promising young entrepreneurs.
LH MAQER was introduced to the digital start-up community at the end of 2018. Through this program we are inviting start-ups, technology providers, universities and players in other industries to exploit the potential at the intersection between heavy industry and the tech sector – with promising first feedback. The project leaders bring passion and fresh perspectives to our business, and in return we offer our experience, our expertise, and one of the world’s largest industrial networks as a test bed for their ideas.
Innovating to lead Innovation has been the lifeblood of LafargeHolcim – with the LafargeHolcim Innovation Center in Lyon, France, as case in point. The Innovation Center acts as a hub in a network of local laboratories and country-level innovation teams. The innovation organization counts more than 300 researchers within LafargeHolcim. Thanks to this networked approach, customers around the world have benefitted from tailormade solutions to build more quickly and efficiently, and even to reduce their impact on the environment.
Dubendorf, Switzerland We support the NEST facility which
aims to accelerate innovation in the building sector.
54

In 2018 we launched the LH Accelerator, together with partners Sika and China Communications Construction Company (CCCC). Start-ups and partners from around the world were invited to work collaboratively and to combine new ideas of start-ups with the proven experience of major players. The ambition: to tackle today’s challenges along the entire construction value chain.
Over six months in 2018, the LH Accelerator program at the LafargeHolcim Innovation Center was the hub for ten young, innovative companies to change the way our industry operates. They benefitted from access to LafargeHolcim’s leading facilities and the guidance of industry experts to take their ideas to the next level.
The culmination of the six-month LH Accelerator program took place in November: Demo Day.
Participants from Europe, Asia, Americas and Africa put forward solutions for areas in which there is a clear need for innovative breakthroughs: Design & Engineering, Material and Logistics, Construction Equipment, Construction Services and Demolition & Waste Management.
In 2019, there will be a Season 2 following the success of 2018, with the LH Accelerator once again providing unmatched access to investors and partners in the construction industry.
Find out more about the first cycle of the LH Accelerator at lh-accelerator.org
LH Accelerator: building innovation together
55LafargeHolcim Annual Report 2018 Business review — Innovating for success

Innovating for successcontinued
Patents We filed 13 new patent applications in 2018, safeguarding innovation coming both from countries and the Innovation center. Overall LafargeHolcim owns about 190 active patent families, representing approximately 1,300 granted national patents or patent applications.
About three-quarters of the innovation pipeline is allocated to the Cement and Solutions & Products segments. The main topics are low-carbon binders, ultra-high performance products and mineral thermal insulation. Ninety-four new products were introduced in 2018 (see pie chart for share by segment).
Most of our innovations are made in order to meet our customers’ needs. For this reason we keep our country teams fully empowered to develop new products and services. In 2018 more than 220 local innovations have been scaled transnationally.
Our aim is to find and exploit innovations along our entire value chain, from processes to products, from quarry to worksite.
Ready-Mix Concrete
Cement
28
49
Solutions & Products 13
Aggregates 4
New products per business segment in 2018
56
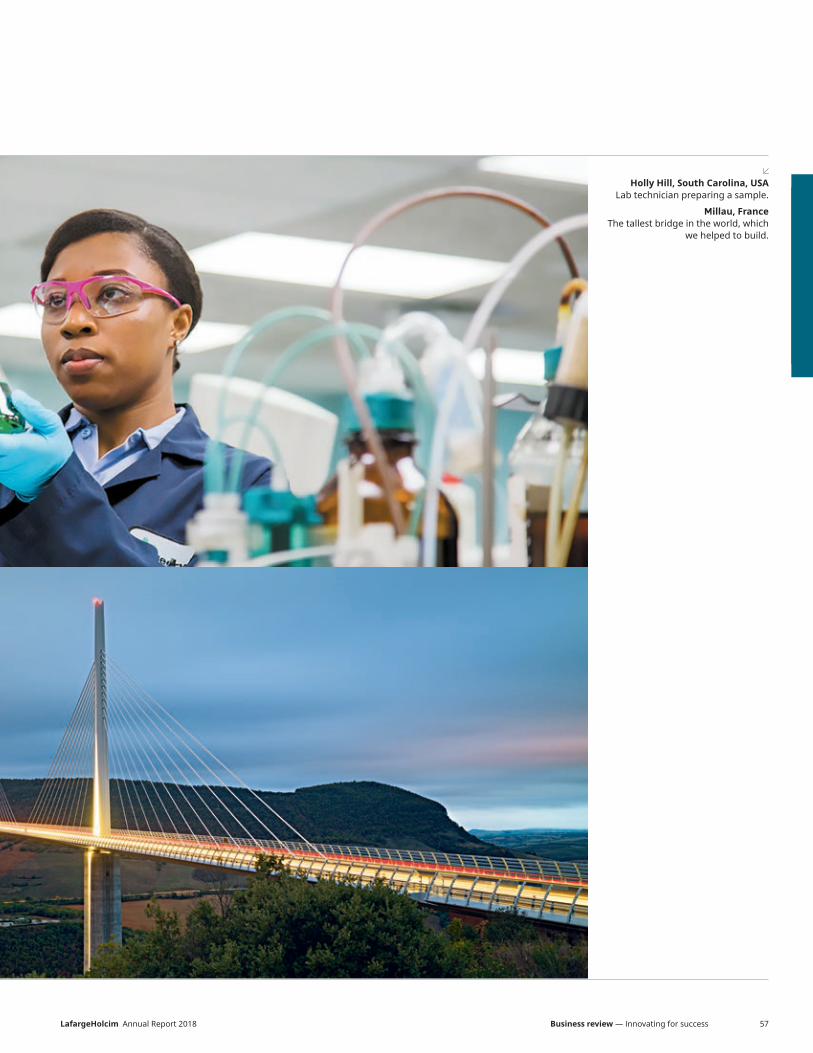
Holly Hill, South Carolina, USALab technician preparing a sample.
Millau, FranceThe tallest bridge in the world, which
we helped to build.
Business review — Innovating for successLafargeHolcim Annual Report 2018 57

People
managers to observe and develop their teams. Open, timely and constant feedback is key to a strong performance culture.
In terms of employee rewards, we simplified our global bonus scheme and focused objectives on the results which fit our Group goals. Our aim is to drive performance by assuring people are rewarded based on the performance of their own P&L. Our long-term incentive scheme aims at executives. Its performance metrics have also been redesigned to better reflect the desired sustained performance of our business. See also the Compensation section on pages 114 –139.
In 2018 we completed our global Talent Review & Succession Planning process. This process allowed us to identify talents in our organization and to better plan the succession of key roles. It also helped us to make the right development decisions and identify where we need to improve our talent pipeline to ensure we have the right people for the business. Over 2018 we doubled our bench strength.
Our people strategy focuses foremost on developing a stronger performance culture.
Leadership development We invest in developing current and future leaders. In 2018 we focused our leadership development through the LafargeHolcim Business School that uses a case study method based on our actual business challenges. The program supports our Strategy 2022 – ‘Building for Growth’ and will take place every year. In 2018 200 of our top leaders have been trained.
Our training offer encompasses a range of training programs for our employees to build skills in areas including business, financial, Health & Safety, sales, products and solutions, operations and compliance.
Performance and talent management The performance objectives of our employees are fully aligned with business goals. We all have clear areas of accountability and understand how our job impacts business results. Regular checks take place between employees and their line managers during the year in order to align execution and to allow
Diversity & InclusionLafargeHolcim believes in and values diversity and promotes a workplace that is inclusive, fair and which fosters respect for all employees. In 2018, we:• Monitored the actions plans in place to
achieve the 2020 targets at country and regional levels covering gender balance and inclusion
• Pushed countries and regions to identify and nominate female employees to the talent pool through the Talent Review & Succession Planning process
• Continued our global, multi-functional task force to support Diversity & Inclusion programs
• Continued to roll out programs to raise awareness of unconscious bias
People in our new operating modelNow that we have implemented a country-focused, corporate-light operating model, we have put the bulk of our people strategy at local level. Countries are empowered and accountable to implement local best practices to achieve results.
In 2018 we focused on developing a stronger performance culture and investing in developing current and future leaders.
58

Business review — People
Houston, Texas, USACrew at barge terminal.
59LafargeHolcim Annual Report 2018

Peoplecontinued
Almería, SpainEmployees at the Carboneras cement plant.
Davao, PhilippinesMeeting held on plant premises.
Countries are empowered and accountable to implement local best practices to achieve results.
60

Group employees by segment (thousands)
45Cement
10Aggregates
13Ready-Mix Concrete
8Solutions & Products
Group employees by region (thousands)
North America Latin America Europe Middle East & Africa
Asia Pacific
13
22121
9
20
Service and trading companies
1,216Male2017: 1,175
252Female2017: 271
Female 17%
Male 83%
Composition of senior management
Business review — PeopleLafargeHolcim Annual Report 2018 61
Health & Safety
In 2018, our Health & Safety performance improved significantly, with an 82% reduction in on-site fatalities compared to 2017.
In 2018 our global lost time injury frequency rate (LTIFR) for Employees & Contractors onsite reached 0.79, an improvement of 13% compared to 2017 (0.91). We are very pleased to see that the new strategy, combined with years of dedication and hard work are starting to have an impact on our H&S performance.
One employee and 18 contractors lost their lives in 2018. These deaths are unacceptable. Statistically speaking, compared to 2017 this represents a 39% overall improvement and 90% improvement in employee fatalities (10 in 2017). Seventeen third parties died compared to 33 in 2017. Everyone in our organization, beginning with our Board and Executive Committee, has taken responsibility to ensure that we live and practice a culture of zero harm.
Our core valueHealth & Safety (H&S) is our core value. We aim to achieve a zero harm culture and zero fatalities. Our Ambition “0” strategy focuses on six areas: Safety On-site, Zero Harm Culture, Systems & Processes, Road Safety, Health and Contractor Partnership. As part of this strategy we implement standardized global programs in every country where
we operate. In 2018, we launched 17 revamped H&S Standards and conducted an organizational transformation called ‘One Team, One Program’ to establish a leaner and more horizontal H&S structure, focused on implementation at country level.
H&S is promoted through engagement and communication campaigns. In 2018 the theme of our Global H&S Days was “I improve H&S every day at my workplace.” Employees were asked to look at incidents that could happen or had already occurred at their workplace and describe how to ensure they do not reoccur. The purpose was to cascade our ”Key Lessons”, which have been published for most on-site fatalities since 2017, reaching all members of the workforce. Three best practice challenges were successfully rolled out in 2018 throughout the company (with almost 2,000 entries, 140,000 votes and more than 15,000 participants), demonstrating a great commitment from employees at all levels of the organization.
Road safety programWe continued driving progress in our road safety program. In 2018, we maintained the focus on transforming driver skills and
behaviors. A new driver qualification program is being delivered and includes robust in-cab training with a pass/fail assessment.
Regions that have implemented the program showed significant improvements (the Middle East Africa region, for example, qualified over 50% of drivers in 2018 and reduced fatalities by 47% compared to 2017). In-vehicle monitoring systems (IVMS) are mandatory and being installed in all our trucks. IVMS is our proactive tool to monitor safe driving performance and now monitors over 50% of the kilometers driven. In India our Transport Analytic Centre (TAC) played an instrumental role in providing well-structured and systematic analytics for drivers’ and transporters’ performance. As a result, India reduced the number of road fatalities by 79% from 2017 to 2018. In 2018, more countries are now connected to the TAC (e.g., Zambia, Lebanon and Philippines), representing 30% of global kilometers driven in 2018. The journey continues in 2019.
62

Ewekoro, NigeriaSafety check.
63LafargeHolcim Annual Report 2018 Business review — Health & Safety
Health & Safetycontinued
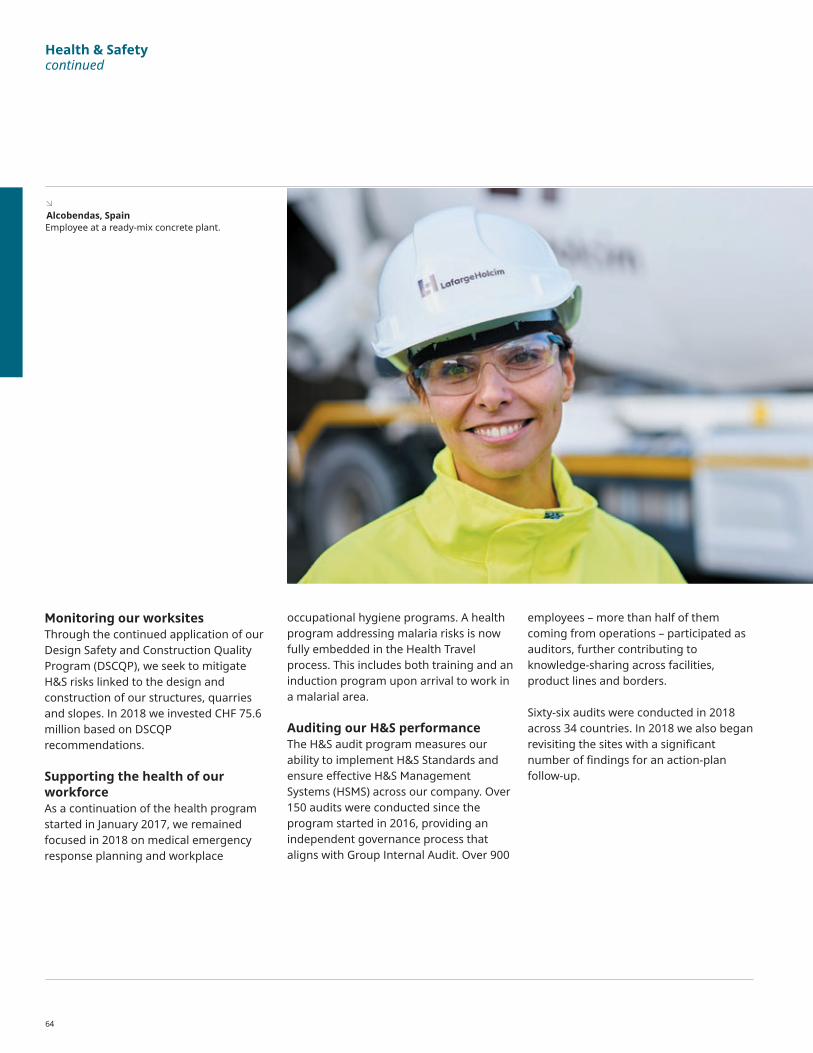
Alcobendas, SpainEmployee at a ready-mix concrete plant.
occupational hygiene programs. A health program addressing malaria risks is now fully embedded in the Health Travel process. This includes both training and an induction program upon arrival to work in a malarial area.
Auditing our H&S performance The H&S audit program measures our ability to implement H&S Standards and ensure effective H&S Management Systems (HSMS) across our company. Over 150 audits were conducted since the program started in 2016, providing an independent governance process that aligns with Group Internal Audit. Over 900
employees – more than half of them coming from operations – participated as auditors, further contributing to knowledge-sharing across facilities, product lines and borders.
Sixty-six audits were conducted in 2018 across 34 countries. In 2018 we also began revisiting the sites with a significant number of findings for an action-plan follow-up.
Monitoring our worksitesThrough the continued application of our Design Safety and Construction Quality Program (DSCQP), we seek to mitigate H&S risks linked to the design and construction of our structures, quarries and slopes. In 2018 we invested CHF 75.6 million based on DSCQP recommendations.
Supporting the health of our workforceAs a continuation of the health program started in January 2017, we remained focused in 2018 on medical emergency response planning and workplace
64

2017 2017 20172017 2017 2017 2017
17 0.94
21 14 0.89
0.91
2018 2018 20182018 2018 2018 2018
1 10 3 0.90
18 16 0.69
0.79
Employees Contractors
On-site Off-site
Employees Employees and Contractors on-site
Fatalitiesby personnel category
Fatalitiesby location
Lost time injury frequency rate (LTIFR) 1
2017 and 2018 indicators refer to units/companies part of the Group as by IFRS reporting standards2017 indicators reported according to Cement Sustainability Initiative guidelines 2018 indicators reported according to Global Cement and Concrete Association guidelines See 2018 Sustainability Report for more details
1 Lost time injury frequency rate: number of lost time injuries per million hours worked
Contractors on-site
Business review — Health & SafetyLafargeHolcim Annual Report 2018 65

RisksLafargeHolcim operates in a constantly evolving environment, which exposes the Group to different external, operational and financial risks. In order to ensure the sustainability of our business development and to meet our targets, we make continuous efforts to prevent and control the risks which we are exposed to.
A comprehensive risk management and Internal Control framework is deployed throughout the Group, with appropriate governance and tools. Through this process we identify, assess, mitigate and monitor the Group’s overall risk exposure. Our goal is to incorporate risk thinking into all strategic decision-making, reducing the likelihood and impact of potential adverse events, ensuring compliance with laws & regulations and ensuring the deployment of our Internal Control system in every country where we operate. Further information is provided in the Internal Control section on page 79. Our analyses consider environmental, sustainability, climate change, market, industrial, operational, financial, legal, compliance and reputational risks, whether under our control or not.
Risk management processThe risk management process is structured around several coordinated approaches conducted within the Group and it is subjected to continuous improvement. It includes a bottom-up and top-down risk assessments. These assessments are used as a basis for the Group risk matrix, which is updated every year and submitted to and analyzed by the Executive Committee and the Audit Committee.
The top-down assessment is generated through interviews with Heads of functions, Board and Executive Committee members and External Auditors. The bottom-up assessment includes several stages:• Risk identification and analysis:
management assesses and evaluates the potential impact and likelihood of the key risks which could have a material adverse effect on the current or future operation of the business. The risk horizon includes long-term strategic risks and also short- to medium-term business risks.
The impact and likelihood are assessed for the current level (i.e., prior to implementation of mitigation actions/controls) and for the target level (i.e., residual significance and likelihood after implementing mitigation actions/ controls).• Risk mitigation: actions and/or controls
are defined by the management to mitigate the key risks identified. Risk transfer through insurance solutions and the Internal Control system form an integral part of risk management to mitigate the identified risks. Additionally, LafargeHolcim has a robust fraud prevention program in place to prevent, deter, and detect fraud. It includes the LafargeHolcim Integrity line, which enables employees anywhere in the world to anonymously exercise their whistleblowing rights and report any breach of the rules laid down in our Code of Business Conduct. Further information
is provided in Legal & Compliance risk (page 72) and Internal Control (page 79).
• Monitor & Reporting: regular progress on the actions/controls are followed up by risk leads and reported to Group through the LafargeHolcim Risk Management tool. At least twice a year, progress on mitigating actions, controls and overall risk exposure is reported to the Audit Committee and other executive committees. Additional reports of the effectiveness of the mandatory controls standards are submitted to the Group on a regular basis. Further information is provided in the Internal Control section on page 79.
• Verification & Remediation: Group Internal Audit performs independent assessments of the effectiveness of mitigating actions and controls and on the effectiveness of Internal Control and on the risk assessment process. The annual audit plan drawn up by Group Internal Audit and approved by the Audit Committee takes into account the various analyses described above. Implementation of this plan and the summary of work presented to the Group Executive Committee and Audit Committee lead to more in-depth analyses in certain areas and contribute to the continuous risk identification process.
66
Risk and control
Roles & responsibilitiesLafargeHolcim established a clear organization structure to ensure the implementation of the risk management and internal control system, following the governance, policies and framework defined by the Group. This organization is built on the concept of three lines of defense.
Under the first line of defense, operational management has ownership, responsibility and accountability for identifying, assessing, managing and mitigating risks. They are equally responsible and accountable for the deployment of the mandatory controls standards defined by the Group. Further information is provided in the Internal Control section on page 79. A risk lead is appointed in every country where we operate to support local management with the yearly risk assessment process, to coordinate activities with other assurance functions, especially the local Internal Control and Compliance teams, and to monitor mitigation actions. Country risk assessment reports are signed off by the Country CEOs and progress on mitigation actions is regularly reported to the Group.
The second line of defense consists of Group corporate functions such as Legal, Compliance, Sustainable Development, Internal Control, Risk Management, Security and Health & Safety. These functions monitor and facilitate the implementation of effective risk
management processes and Internal controls by operational management. The objective is to ensure the first line of defense is properly designed and operating as intended. The second line of defense also assists in the development of policies, processes and controls to mitigate risks and issues.
The third line of defense is formed by Group Internal Audit (GIA). As an independent function, GIA provides assurance to the Board of Directors and Executive Committee on the effectiveness of the first and second lines of defense and on governance, risk management and internal controls.
Through the Audit Committee and the Health, Safety and Sustainability Committee (HSSC), the Board of Directors oversees LafargeHolcim risk management, Internal Control and climate change-related risks. The Audit Committee mandate includes the review of compliance and risk management processes and review of management’s and internal audit reports on the effectiveness of internal control systems and on the performance of the annual risk assessment process.
The HSSC mandate is to support and advise the Board of Directors on the development and promotion of a healthy and safe environment for employees and contractors, as well as on sustainable development and social responsibility. More details of the Audit Committee and HSSC are disclosed in the Corporate Governance section on pages 94 and 96.
The risks on pages 70 to 78 are considered material and fundamental to our strategy for value creation. This list is not exhaustive and represents the principal risks and uncertainties faced by LafargeHolcim at the time of 2018 annual report preparation. Other risks may emerge in the future and/or the ones stated here may become less relevant.
Further information is provided in the Corporate Governance section (pages 90 to 113), Management Discussion & Analysis (pages 142 to 157) and note 14.5 of the consolidated Financial Statements (“Group risk management,” page 227).
LafargeHolcim Annual Report 2018 67Business review — Risk management

Risk and controlcontinued
Task force on Climate-related Financial Disclosures (TCFD) As a business leader, we must ensure transparency and action around climate-related risks and opportunities. LafargeHolcim therefore supports the voluntary recommendations of the Financial Stability Board (FSB) Task force on Climate-related Financial Disclosures.
The identification, assessment and effective management of climate-related risks and opportunities are fully embedded in our risk management process (as described on page 66), which is subject to continuous improvement. Governance of climate-related risks and opportunities, including management and Board roles & responsibilities, are described on page 98. Our sustainability ambition is on page 46 and further details, including our climate strategy, can be found in our sustainability report. Additional metrics & targets are detailed in our submissions to the Carbon Disclosure Project. Documents are available on www.cdp.net/en/responses.
Our goal is to incorporate risk thinking into all strategic decision-making, reducing the likelihood and impact of potential adverse events and ensuring compliance with law and regulations an ensuring the deployment of our Internal Control system.
Ethics, Integrity & Risk Committee The Ethics, Integrity & Risk Committee is composed of two sub-groups: (i) Ethics & Integrity and (ii) Risk. The Committee is responsible for overseeing the risk assessment process and the activities performed by assurance functions including Legal, Compliance, Internal Control, Risk Management, Internal Audit, Group Investigations, Health & Safety and Security. Its mandate includes oversight regarding the effective investigation and remediation of Code of Business Conduct violations and the rigorous implementation of the new third-party due diligence and sanctions & export control programs that were launched in 2017.
The Ethics, Integrity & Risk Committee is co-chaired by the Group CFO and the Group General Counsel, who both report to the Group CEO and are part of the Executive Committee. The Ethics, Integrity & Risk Committee reports to the Audit Committee of the Board of Directors and meetings are held on a quarterly basis.
Environment and climate change Our sustainability ambition focuses on Climate, Circular Economy, Environment and Communities. The ambition articulates our efforts to improve the sustainability performance of our operations and puts the focus on developing innovative and sustainable solutions for better building and infrastructure. It goes beyond our own business activities and covers the entire construction value chain and the life cycle of buildings.
As a result of past efforts, we are one of the most carbon-efficient cement companies among international groups. We will further decrease our emissions per tonne of cement by increasing the use of by-products and waste-derived resources and through investments in energy efficiency and innovation. Additionally, our solutions and products help our customers avoid CO2 emissions during the construction and use phase of buildings and infrastructure.
68

Experts at work in Switzerland.
LafargeHolcim Annual Report 2018 69Business review — Risk management

Key external risks
Risk Potential Impact Our ResponseMarket demandThe risk that economic development in a given country can significantly change and have an influence on demand for construction and building materials.
Demand for construction materials is fundamentally driven by economic growth (or contraction) in a given territory. These changes in underlying demand may impact sales volumes, prices and/or industry structure.
LafargeHolcim maintains a globally diversified portfolio with leading positions in all regions and a good balance between geographies. We have a top-three position in 80 percent of our markets, with none exceeding 10 percent of total revenues. We also trade in clinker, cement and other products to take advantage of shifting demand between countries.
Political risksLafargeHolcim operates in many countries around the globe and is exposed, directly or indirectly, to the effects of economic, political and social instability such as turmoil, terrorism, civil war and unrest situations, particularly in developing markets.
Economic, social and/or political instability (e.g. changes of government or increased political pressure) can impact our business. That impact may be direct (e.g. reduce infrastructure spending) or indirect (e.g. economy uncertainty).
As with market demand, the best defense against political risk is diversification. LafargeHolcim’s broad geographic portfolio helps to limit our exposure to any particular localized risk. When necessary, mitigation measures are taken to adapt the Group’s activities and organization, and to protect our people and assets in case political tensions are heightened.
The impact of United Kingdom’s withdrawal from the European Union (“BREXIT”) has been assessed and preventive measures have been taken. Relevant currency exposures and counterparty risks were reduced before the BREXIT vote.
70
Risk and controlcontinued
Key operational risks
Risk Potential Impact Our ResponseClimate changeThe cement industry is associated with high CO2 intensity and LafargeHolcim is exposed to a variety of regulatory frameworks to reduce emissions, some of which may be under revision.
These frameworks can affect the business activities of LafargeHolcim. In addition, a perception of the sector as a high emitter could impact our reputation, thus reducing our attractiveness to investors.
Following the agreement on climate change at Paris COP21, signatory countries are required to communicate national reduction commitments and pass implementation regulation.
The likely effect of this increasing number of frameworks will be to:i) increase the cost of fossil fuels by carbon tax mechanisms, ii) impose more restrictive cap & trade systems and iii) increase the cost of CO2.
In Europe, Phase IV of the European Trading System will come into force in 2021, bringing more strict CO2 free credit allocation systems.
Should regulatory frameworks fail to incentivize consumption of low-carbon products, customers may be unwilling to pay for additional costs and the cement sector’s low-carbon roadmap might be compromised.
Our sustainability ambition includes a commitment to continue to reduce our net CO2/tonne of cement. More specifically, we have developed two sets of actions, short and long term, to address the CO2 and climate challenge along the construction value chain.• Short-term actions: (i) improved clinker production technology; (ii) higher usage of
alternative fuels and alternative raw materials; (iii) optimization of the cement portfolio with lower CO2 footprint; (iv) optimization of the concrete product portfolio; (v) increase share of solutions and products with favorable CO2 impact;
• Long-term actions: Innovation and research and development into (i) carbon capture solutions and alternative clinker; (ii) decarbonized fuel and energy; (iii) low-carbon cement; (iv) low-carbon concrete; (v) ultimate construction methods to reach low-carbon construction.
In addition, a specific short-term response plan to the Phase IV of the new European Trading System was developed and addresses main focus areas: • CO2 & energy performance, e.g. increase biomass usage & reduce clinker factor; • Integrate CO2 in management e.g. include cost in production to incentivize change
management and include CO2 impact in all M&A and CAPEX decisions; • Scenario planning, e.g. evaluate profitability of exports, manage +/– 15% thresholds
as well as 50%, 25%, 10% limits.
We engage proactively and transparently with external stakeholders on the basis of positions that are aligned and consistent with the goals of the Paris Agreement. This is best illustrated through our cooperation with the Carbon Pricing Leadership Coalition (CPLC), We Mean Business, the Global Alliance for Buildings and Construction (GABC) and the World Economic Forum’s Corporate Leaders Group on Climate Change.
Our climate-related advocacy focuses on the following principles: • We support the use of carbon-pricing mechanisms to incentivize the development
of innovative low-carbon solutions and maintain a level playing field across industries and countries:
– A simple, clear and stable price signal that supports shifts in long-term investments.
– A price signal that has relevance across value chains. – A policy focus on the design of the pricing mechanisms to ensure relevance and
effectiveness. • We advocate demand-side policies in support of supply-side policies in order to
incentivize market demand for low-carbon materials and solutions.• We advocate construction norms & standards that are material & technology
neutral and based on the whole lifecycle performance of buildings and infrastructure:
– Market-pull support mechanisms and lifecycle carbon performance standards. – Incentives for accelerated value-chain collaboration. – Adoption of an industrial approach towards breakthrough technologies (incl.
targeted R&D funding and large-scale industry & market demonstrators).• We support transparency and improved disclosure in carbon-related performance
and risks, including through an incremental implementation of the TCFD recommendations (see page 68) and additional tools such as Integrated Profit and Loss Statements that complement traditional financial metrics.
LafargeHolcim Annual Report 2018 71Business review — Risk management

Risk and controlcontinued
Key operational risks continued
Risk Potential Impact Our ResponseLegal & Compliance risksThe risk that the company is found to have violated laws and regulations covering business conduct such as those that combat bribery, corruption, fraud, terrorism and unfair competition.
In the ordinary course of its business, the Group is involved in lawsuits, claims of various natures, investigations and proceedings, including product liability, commercial, environmental, health and safety matters, etc.
Investigation costs, financial penalties, debarment, profit disgorgement and reputational damage. The impact is compounded by the fact that local violations can have an effect on the entire Group.
In connection with disposals made in the past years, the Group provided customary warranties. LafargeHolcim and its subsidiaries received or may receive in the future notice of claims arising from these warranties.
The Group maintains a comprehensive risk-based compliance program with dedicated resources at local, regional and Group level with central steering.
The compliance program is structured over five elements that are aligned to an adequate procedures defense and approach to reduce compliance risk. The five elements of the compliance program include:• Risk Assessment is the starting point for identifying compliance risk in the business. Risk
assessment applies both at a program level (asking, for example, how and where the risk of bribery arises in the business) and in the development and application of specific controls, communication, training and monitoring.
• Controls, which are the policies, directives, instructions, workflows and internal control elements that are designed and implemented to mitigate specific risks. The Third Party Due Diligence Directive and related processes is an example of a control to mitigate a specific compliance risk.
• Communication and Training, which speaks to the need to instruct employees on what is acceptable conduct and how it is delivered, set the tone from the top and, where necessary, train employees in risk identification and mitigation.
• Monitoring and Reporting, including proactive monitoring of program-related metrics such as training delivery, closing out internal control and audit deficiencies and risk reduction activities such as third party due diligence. In addition to proactive monitoring, the compliance program includes an alert mechanism for possible breaches (a whistleblower line) and internal auditing.
• Organization is the final element of the compliance program, which is the establishment of appropriate resources with roles and responsibilities to implement the compliance program, and the governance arrangements under which these resources perform.
Several specific risk areas are within the scope of the compliance program: • Bribery, corruption, money laundering and fraud: In 2018, anti-corruption activities
centered on training, management of third party risk through targeted due diligence, and management of conflicts of interest.
• Fair Competition: as in previous years, the 2018 program focused heavily on training and the conduct of Fair Competition Reviews (in-depth assessments of risk based on interviews, document and email reviews). Fair competition controls, along with those of other risk areas (bribery, sanctions, data privacy) were updated and included in the revised minimum control standards for Group companies.
• Sanctions & Trade Restrictions: Our sanctions and trade restrictions program was further strengthened in 2018. The requirements are set through the Sanctions Compliance Directive, which is implemented through dedicated training, communications and screening for potentially restricted transactions. We regularly conduct in-country risk assessments on sanctions risks and potential touchpoints with sanctioned persons in all exposed operations. In addition we have implemented state-of-the-art procedures for the screening and continuous monitoring of all suppliers and customers against worldwide sanctioned party and enforcement lists in those exposed operations.
• Data Privacy: data privacy, and compliance with the European Union General Data Protection Regulation (GDPR) is also supported with specific training, controls, monitoring and reporting systems. The GDPR became effective on 25 May 2018. The controls include website, employee, customer and supplier notifications and consents, data subject requests and data breach reporting mechanisms among others. Group Internal audit also conducted a review of our compliance preparations for the GDPR mid-year.
Group Legal manages all competition investigations, information requests and enforcement cases through a central team of legal specialists. Group Legal also tracks all Group-relevant commercial litigation cases, and provides support to the relevant operating companies in defense and dispute resolution. In addition, root cause analysis of disputes and enforcement cases is taken into account in our continuous improvement cycle.
72

Risk Potential Impact Our ResponseEnergy prices (including alternative fuels)The risk that prices for fuels, electricity or planned savings from alternative fuels will change significantly.
Increase in energy prices could adversely impact our financial performance, since the increase may not be passed on (fully or partially) in the sales price of our products.
Optimizing fuel mix and energy efficiency, as well as the use of alternative fuels, is a key area of focus at all our plants. At Group level, we use derivative instruments to hedge part of our exposure and avoid volatility. Derivative instruments are generally limited to swaps and standard options.
We also develop long-term power purchase agreements/on-site power generation projects to reduce volatility and seize opportunities offered by renewable power prices.
Raw materials (including mineral components)The risk that raw materials cannot be supplied at economical cost or suitable quality.
Much of our business depends on the reliable supply of mineral resources, e.g. sand and limestone. Failure to obtain the raw materials (including mineral components) at expected cost and / or quality may adversely impact variable costs and financial performance.
In countries where the supply of raw materials is at risk, we apply a range of tactics including strategic sourcing, changing input mixtures and maintaining minimum long-term reserve levels. When required, we manage international seaborne sourcing, which is an import alternative to offset local risks in countries. In addition, our research and development is devoted to finding ways to mitigate this risk while lowering our environmental footprint, e.g. by using waste-derived materials.
Key operational risks continued
LafargeHolcim Annual Report 2018 73Business review — Risk management

Risk and controlcontinued
Risk Potential Impact Our ResponseSustainabilityThe risk that we are not effectively managing our commitments to sustainability and corporate social responsibility.
The nature of our activities and geographic footprint poses inherent economic, environmental and social risks, which are also subject to an evolving regulatory framework and changing societal expectations.
Failure to meet our environmental, social and governance (ESG) standards and targets may expose us to a risk of incurring regulatory sanctions and lead to conflicts in the communities where we operate.
This could result in penalties and increased remediation and compliance costs. It could also reduce our ability to access new resources and impact our freedom to operate.
Additionally, the failure to effectively manage and embed effective sustainability practices may impact investor confidence in LafargeHolcim shares.
Responsibility for managing these risks is vested with site and country management, regional management, Executive Committee and the Board of Directors.
Sustainability risks are included in the LafargeHolcim Business Risk Management (BRM) process conducted by all business units and are consolidated by Group Risk Management.
Additionally, the most material sustainability and environmental compliance risks are assessed at Group level by the sustainability team, mainly using external references such as the Freedom House Index and UN Development Index for Human Rights risks and the WRI Aqueduct and WBCSD water tool for water risks. The results of these assessments inform the development of programs, ambitions and targets.
Our sustainability ambition focuses on health and safety, climate change, air emissions, water use, biodiversity, material reuse, sustainable construction, workforce diversity, community engagement and supplier qualification. On these topics we focus as a Group, with articulated ambitions and Group targets. Performance against these ambitions and targets is monitored and reported on and we regularly provide details of our ambitions and targets in the annual Sustainability Report.
Our sustainability ambitions and practices are supported by a robust framework of mandatory policies and directives which clearly lay down expected practices, standards and responsibilities. They are additionally supported by the Code of Business Conduct and Supplier Code of Conduct, both of which contain provisions for Human Rights (including child labor) and environment.
The framework includes the following policies and directives:• Environment Policy• Environment Directive for Cement• Quarry Rehabilitation and Biodiversity Directive• Water Directive• Corporate Citizenship Policy• Human Rights Directive• Community and Stakeholder Engagement Directive• Sustainable Procurement Directive• Strategic Social Investments,• Sponsorship and Donations Directive
Country CEOs are ultimately responsible and accountable for the implementation and compliance of the country with Policies and Directives. Group Internal Audit provides assurance to the Board of Directors and Executive Committee on the countries’ compliance with the LafargeHolcim policy landscape.
Our sustainability practices, performance and data as published in our Sustainability Report are subjected to rigorous external assurance. The assurance statement can be found in our Sustainability Report.
InnovationThe risk that innovation does not secure the competitive advantage of the company by delivering new products, solutions and technologies on a continuous basis.
Innovation is a key factor for long-term success of the company and crucial to maintain our license to operate, particularly when it comes to challenges of our CO2 intensive industry and the need to mitigate our impact on climate change.
Innovation is a key factor for long-term success in a competitve environment. Our approach is to meet customer needs along the whole construction value chain by developing and delivering products, solutions and technologies and by partnering with customers, suppliers and start-ups. The company embraces new developments in the digital environment, anticipates the impact of trends and new processes on the construction industry. A stronger focus on open innovation not only offers opportunities but risks that collaboration with third parties does not provide expected outcomes is to be considered. This risk is mitigated through appropriate legal frameworks including comprehensive project management. Non-protected and protected Intellectual Property (IP) is secured by knowledge management and filing patents and trademarks. Regular market and IP intelligence is done to avoid infringement of third party IP rights.
Key operational risks continued
74

Key operational risks continued
Risk Potential Impact Our ResponseHealth & Safety riskThe risk that the company does not adequately protect employees, contractors and third parties from injury, illness or fatality, during both on-site and off-site company related activities.
Injury, illness or fatality, reputational damage and possibility of business interruption, which could impact our finance and business performance. The impact is compounded by the fact that local incidents can have an effect on the entire Group.
We conduct our business in a manner that creates a healthy and safe environment for all stakeholders – our employees, contractors, communities and customers – built on a sound health and safety culture. We believe in visible leadership and personal accountability at all levels and throughout our organization.
We maintain a global Health and Safety Management System designed to continuously improve our performance and actively minimize risks in our business. H&S experts are employed in each country we operate to support the implementation of the LafargeHolcim H&S standards (see page 62 for more details). The Group H&S team conducts regular audits to ensure the full deployment of our H&S policy and internal rules in all LafargeHolcim countries. Through the Health, Safety & Sustainability Committee, the Board of Directors supports the development of a health and safety culture and oversees the resources and processes to be employed to minimize or eliminate risks related to health and safety (please refer to ‘Corporate Governance’ section, page 96 for more details).
Information technology and cyber riskThe risk that arise from the unavailibility of critical IT systems and the loss or manipulation of data resulting from computer viruses, cyber attacks, network outages, natural disasters or human mistakes.
An information or cybersecurity event could lead to financial loss, reputational damage, safety or environmental impact.
To prevent major risks related to critical IT infrastructure or applications either operated by the Group or its service providers, LafargeHolcim has established policies and procedures for IT security and governance as well as internal control standards that are followed Group wide for all applicable systems. These for example include redundantly designed data centers per region, redundant layout of critical IT systems, backup recovery procedures, virus and access protection as well as the operation on a Security Operations Center (SOC) that was recently implemented.
Due to the fact that the risk landscape is constantly evolving, the Group’s IT risk register is regularly assessed and updated. Additionally, the measures to prevent from new risks or from impacts occurred (e.g. a downtime of a critical IT System in Latin America due to a human mistake in December 2018) are permanently improved and updated as well as regularly audited and controlled by the Internal Audit and Internal Control departments.
Joint ventures and associatesThe Group does not have a controlling interest in certain business entities (i.e. joint ventures and associates) in which it has invested. The absence of a controlling interest increases the governance complexity. This may restrict the Group’s ability to generate adequate returns and to implement the operating standards and compliance program.
These limitations could impair the Group’s ability to manage joint ventures and associates effectively and/or realize the strategic goals for these businesses. In addition this might impede the ability of LafargeHolcim to implement organization efficiencies and its controls framework, including its full compliance program. It can also impede the ability to transfer cash and assets between subsidiaries in order to allocate assets in the most effective way.
In subsidiaries where we have joint control we seek to govern our relationships with formal agreements to implement LafargeHolcim controls and programs. In these joint venture arrangements, the Group has traditionally appointed LafargeHolcim personnel to facilitate integration, best practice transfer and drive performance. In addition, Group Legal & Compliance function performed a comprehensive risk assessment during 2018 covering all joint ventures and associates in which LafargeHolcim does not have a controlling interest in order to identify any potential deviations from the Group’s compliance program. Mitigation actions were identified and implementation commenced. This will continue during 2019.
Talent managementThe risk that the company does not have a sufficiently robust talent pipeline given its growth ambition.
Without the right people, LafargeHolcim will be unable to deliver its growth ambition.
We have a global talent review and succession planning process to evaluate current and future talent. We invest significantly in developing both functional and management skills. Core human resources processes, like strategic people planning, performance evaluations, reward strategies and talent management are implemented in all LafargeHolcim countries and corporate functions. Group HR oversees the quality of deployment of these processes to ensure we have the right people in the right places (see page 58).
LafargeHolcim Annual Report 2018 75Business review — Risk management

Risk and controlcontinued
Risk Potential Impact Our ResponseRisk involving credit ratingsAs in the course of our business we use external sources to finance a portion of our capital requirements, our access to global sources of financing is important. The cost and availability of financing are generally dependent on our short-term and long-term credit ratings.
Factors that are significant in the determination of our credit ratings or that otherwise could affect our ability to raise short-term and long-term financing include: our level and volatility of earnings, our relative positions in the markets in which we operate, our global and product diversification, our risk management policies and our financial ratios, such as net debt to Recurring EBITDA and cash flow from operations to net debt. We expect credit rating agencies to focus, in particular, on our ability to generate sufficient operating cash flows to cover the repayment of our debt. Deterioration in any of the previously stated factors or a combination of these factors may lead rating agencies to downgrade our credit ratings, thereby increasing our cost of obtaining financing. Conversely, an improvement in these factors may prompt rating agencies to upgrade our credit ratings.
Our Executive Committee establishes our overall funding policies. The aim of these policies is to safeguard our ability to meet our obligations by maintaining a strong balance sheet structure. This policy takes into consideration our expectations concerning the required level of leverage, the average maturity of debt, interest rate exposure and the level of committed credit lines. These targets are monitored on a regular basis. As a result of this policy, a significant portion of our debt has long-term maturity. We constantly maintain unused committed credit lines to cover at least the next 12 months of debt maturities.
Liquidity riskThe risk that the company will not generate sufficient cash flow or will not have access to external funding to meet its obligations.
Lack of liquidity could impact our ability to meet our operational and/or financial obligations.
Individual companies are responsible for their own cash balances and the raising of internal and external funding to cover the liquidity needs, subject to guidance by the Group.
The Group monitors its liquidity risk by using a recurring liquidity planning tool and maintains cash, readily realizable marketable securities and unused committed credit lines to meet its liquidity requirements. In addition, the strong creditworthiness of the Group allows it to access international financial markets for financing purposes. Please refer to Note 14.5 of the Consolidated Financial Statements (page 227) for details on the contractual maturity analysis and LafargeHolcim maturity profile.
Key financial risks
76

Key financial risks continued
Risk Potential Impact Our ResponseInterest rate risk The risk that an investment's value will change due to a change in the absolute level of interest rates, in the spread between two rates, in the shape of the yield curve or in any other interest rate relationship.
Movements in interest rates could affect the Group’s financial result and market values of its financial instruments. The Group is primarily exposed to fluctuations in interest rates on its financial liabilities.
The Group is also exposed to the evolution of interest rates and credit markets for its future refinancing, which may result in a lower or higher cost of financing.
The exposure is mainly addressed through the management of the fixed/floating ratio of financial liabilities. To manage this mix, the Group may enter into interest rate swap agreements, in which it exchanges periodic payments based on notional amounts and agreed-upon fixed and floating interest rates.
The Group constantly monitors credit markets and the aim of its financing strategy is to achieve a well-balanced maturity profile to reduce both the risk of refinancing and large fluctuations of its financing cost.
Please refer to Note 14.5 of the Consolidated Financial Statements (“Financial risks associated with operating activities”, pages 227–237) for additional details.
Foreign exchange risk The Group’s global footprint exposes it to foreign exchange risks.
The translation of foreign operations into the Group reporting currency leads to currency translation effects.
The Group may hedge certain net investments in foreign entities with derivatives or other instruments. To the extent that the net investment hedge is effective, all foreign exchange gains or losses are recognized in equity and included in currency translation adjustments.
Due to the local nature of the construction materials business, foreign exchange risk is limited. However, for many Group companies, income will be primarily in local currency, whereas debt servicing and a significant amount of capital expenditures may be in foreign currencies. As a consequence thereof, the Group may enter into derivative contracts which are designated as either cash flow hedges or fair value hedges, as appropriate and also include the hedging of forecasted transactions.
Please refer to Note 14.5 of the Consolidated Financial Statements (“Financial risks associated with operating activities”, pages 227–237) for additional details.
Credit riskThe risk that our customers default on payment, resulting in collection costs and write-offs.
The failure of counterparties to comply with their commitments could adversely impact the Group's financial performance.
To manage this risk, the Group periodically assesses the financial reliability of customers.
Credit risks, or the risk of counterparties defaulting, are constantly monitored.
Counterparties to financial instruments consist of a large number of established financial institutions. The Group does not expect any counterparty to be unable to fulfill its obligations under its respective financing agreements. At year-end, LafargeHolcim had no significant concentration of credit risk with any single counterparty or group of counterparties.
The maximum exposure to credit risk is represented by the carrying amount of each financial asset, including derivative financial instruments, in the consolidated statement of financial position. Please refer to Note 14.5 of the Consolidated Financial Statements (“Financial risks associated with operating activities”, pages 227–237) for additional details.
InsuranceOur sector is subject to a wide range of risks, not all of which can be adequately insured. The Group obtains coverage as far as possible, commensurate with the relevant risks.
The Group could be impacted by losses where recovery from insurance is either not available or non-reflective of the incurred loss.
We place insurance with international insurers of high repute, together with our internal captive insurance companies. We continuously monitor our risk environment to determine whether additional insurances will need to be obtained.
Business review — Risk managementLafargeHolcim Annual Report 2018 77

Risk and controlcontinued
Risk Potential Impact Our ResponseGroup’s pension commitmentsThe Group operates a number of defined benefit pension schemes and schemes with similar or contingent obligations in several of its countries. The assets and liabilities of those schemes may exhibit significant volatility.
Cash contributions may be required to fund unrecoverable deficits. Similarly, the Group's financial results may be impacted.
Where possible, defined benefit pension schemes have been closed and frozen. Significant actions continue to take place to reduce and eliminate those schemes and related risks. Specifically, active management is in place to mitigate the volatility and match investment returns with benefit obligations.
Multi-employer pension plans (MEPP)The Group participates in a number of union-sponsored multiemployer pension plans in the US. These plans are subject to substantial deficits due to market conditions and business actions, plan trustee decisions, plan failure, as well as actions and decisions of other contributing employers. The Group has essentially no control on how these plans are managed.
There exists material risk that substantial cash contributions could be required in the future to satisfy any outstanding obligations under these plans. Moreover, satisfying the Group’s obligations might have a material impact on the Group’s reported financial results. The financial condition of these plans is not currently reported in the Group’s financial reports.
The Group has undertaken a review of all these plans with the goal being to fully understand the plans’ financial circumstances, as well as all options available to mitigate risks and reduce the Group’s actual and potential financial obligations. As the Group’s participation in these plans is subject to negotiations with bargaining unions, the Group’s ability to take action is limited.
Goodwill and asset impairmentSignificant underperformance in any of the Group’s major cash generating units or the divestment of businesses in the future may give rise to a material write-down of goodwill or assets.
A write-down of goodwill or assets could have a substantial impact on the Group’s net income and equity.
Indicators of goodwill or asset impairment are monitored closely through our reporting process to ensure that potential impairment issues are addressed on a timely basis.
Detailed impairment testing for each cash-generating unit within the Group is performed prior to year-end or at an earlier stage when a triggering event materializes. The Audit Committee regularly reviews the goodwill impairment process.
TaxLafargeHolcim is exposed to tax risks due to potential changes in applicable regulations in certain countries and increased scrutiny by governments and tax authorities in pursuit of perceived aggressive tax structure by multinational corporations. In addition, assumptions have been made for calculation of tax provisions and overall tax charges.
Changes in applicable regulations and increased scrutiny by governments and tax authorities in the countries we operate could impact our effective tax rate and trigger additional tax liabilities.
Due to the uncertainty associated with tax matters, it is possible that at some future date, liabilities resulting from audits or litigations could vary significantly from the Group’s provisions.
Risks are reviewed and assessed on a regular basis in light of ongoing developments with respect to tax audits and tax cases, as well as ongoing changes in the legislation and tax laws.
Intercompany charges within the Group follow Organisation for Economic Co-operation and Development (OECD) and local arm’s length standards.
The LafargeHolcim Group Tax policy and Transfer pricing directive provide the binding rules for all countries where we operate. Group Tax continuously works with Internal Control on aligning, improving and implementing processes and controls within Group Tax and countries. It is also continuously developing the right skilled people through training, while insourcing part of the job currently performed by external tax firms and consultants.
Key financial risks continued
78

Internal Control In 2018, the Internal Control framework was enhanced by introducing mandatory ‘Minimum Control Standards’ to clarify and reinforce the responsibility of the businesses in the countries as part of Strategy 2022 – "Building for Growth". Every country and business in our organization must follow these standards with clear guidance and consequence management should these standards not be 100% compliant.
These standards encompass controls from accounting and financial reporting to Compliance, Health & Safety, security, HR and IT. They are managed and checked by our Internal Control team with control owners in all our businesses across the globe. Our local CEOs and CFOs certify through signed letters to the Group that the Minimum Control Standards are in place and operating effectively.
In accordance with the Swiss Code of Obligations and Swiss Code of best practices for Corporate Governance, the internal control process consists of implementing and permanently adopting appropriate management systems. LafargeHolcim aims at giving the Directors and management reasonable assurance concerning the reliability of financial reporting, compliance with laws and internal regulations, and the effectiveness and efficiency of major company processes.
Each LafargeHolcim employee has an important role in running the Internal Control System to ensure the implementation and the effectiveness of internal controls.
MinimumControl
Standards
Governance andCompliance
IT
Exp
end
itu
re
Trea
sury
Fixed AssetsInventory
Revenue
Tax
Accounting &
Consolidation
Hum
anRe
sourc
es
The set of Minimum Control Standards that every country and business in our organization must follow.
Group Internal Control Environment LafargeHolcim aims to have an effective Internal Control system at each level of responsibility and promotes a culture of robust internal control, supported by the commitment of the Board of Directors and senior management.
The Group’s internal control environment is based on key documents such as the Board functions’ diagram, the Group Delegated Authorities, the Code of Business Conduct and the Minimum Control Standards:
• The Board functions’ diagram defines responsibilities at Board of Directors and Executive Committee levels,
• The Group Delegated Authorities defines approving authorities within the Group deriving from policies,
• The Code of Business Conduct covers guidance and provides examples to help when confronted with challenging situations,
• The Minimum Control Standards are used as a baseline for the mandatory minimum level of compliance within the Group.
Business review — Risk managementLafargeHolcim Annual Report 2018 79
Risk and controlcontinued
Risk identification and analysisThe approach implemented by the Group, relating to the identification and analysis of risks, is described on page 66.
Mandatory Minimum Control Standards Our mandatory minimum control standards cover the following core business processes, going beyond accounting and finance:
Governance & Compliance: Compliance with laws, regulations and Code of Business Conduct, BOD secretarial, Health & Safety, Risk Assessment and mitigation, Segregation of duties, delegation of authorities, review of litigation, disputes, and Personal data protection.
Accounting & consolidation: Compliance with accounting principles including best practices from the reconciliation of accounts to consolidation of financial statements and submission of Group reporting package and statutory financial statements
Tax: Tax risk assessment and reporting, tax filings & payments, deferred and income tax calculations, transfer pricing and non-income (indirect) taxes
Treasury: Bank relations, secure handling of payments, financial instruments, borrowings & commitments and forex, interest rate commodities risks monitoring and hedging
Fixed Assets: Management of titles, licenses and permits, rehabilitation and restoration provisions, classification and depreciation of property plant & equipment and physical verification
Inventory: Physical stock take (spare parts and materials) and inventory provision and write-offs
Revenue: Master data, price management, customer credit limits, accounts receivable
Expenditure: Master data, supplier qualification, 3 way match and direct vendor invoices, supplier payments and accruals for expenditures
HR: Employee management (on-boarding, transfers, offboarding), payroll, compliance with local labor laws and employee pension & benefit plans
IT: Information security management and IT service management
Internal Control monitoring throughout the GroupThe Group is committed to maintaining high standards of internal control. It implements detailed work related to documentation and testing of mandatory “minimum internal control” to support its assessment. All documentation is kept in a dedicated internal control tool which is maintained by the Group Internal Control department. This work is implemented at country and at Group level and encompasses: • a description of key processes affecting
the reliability of the Group’s financial reporting, and that of the parent company;
• a detailed description of mandatory controls defined in the Group's Minimum Control Standards;
• tests of controls to check the operational effectiveness of such control. The scope of such tests being defined based on materiality and risk level of each entity;
As a global leader in our industry, LafargeHolcim adheres to the highest of standards when it comes to how we manage and operate our business day to day everywhere around the world. We see it as our ethical duty.
80

• an annual internal certification process to review the principal action plans in progress and to confirm management responsibility at country and Group level for the quality of both internal control and financial reporting;
• a formal reporting, analysis and control process for other published information included in the Group’s Annual Report.
This work is part of the process of continuous improvement in internal control and includes the preparation of specific action plans, identified through the activities described above, as well as through internal and external audits. The implementation of action plans is followed up by relevant Senior Management. The outcome of such procedures is presented to the Audit Committee.
Internal control is monitored at all levels of the Group. The roles of key stakeholders are described below:
Board of Directors and Board Committees The Board of Directors through the Audit Committee ensures the existence and assesses the design and the effectiveness of the Internal Control System and risk management, and forms an impression of the state of compliance within the Group.
Executive CommitteeThe Executive Committee steers the effective implementation of the Group’s internal control policy, through: • the monitoring and follow-up of internal
control procedures performed throughout the Group, and in particular the follow-up of identified action plans. Periodic presentations on internal control are submitted to the Executive Committee;
• the review of the country mandatory Minimum Control Standards and certification twice a year. Countries confirm their assessments through the internal control scorecards and signed certification letters;
• the review of the annual summary of the Group’s internal audit reports.
Group functions Group function leaders, including in particular managers of the Group Finance function, have been designated at Group level as “business process owners”, with the responsibility of: • documenting their processes at Group
level including product line specifics and verifying that the “Internal Control Standards” for such processes are effectively implemented;
• defining and updating the standards of internal control applicable to countries.
Countries In application of the Minimum Control Standards, internal control is under the direct responsibility of the Executive Committee of each country. In each of the Group’s countries, Internal Control Managers are appointed. Their role consists mainly in supporting the identification of risks by the management, the implementation of the Minimum Control Standards and ensuring procedures related to internal control over financial reporting in their country are implemented. Their activities are coordinated by the Group Internal Control department presented below.
Countries report their internal control assessments to the Group twice a year through the internal control scorecards and signed certification letters. Any exception to the mandatory minimum control standards need to be documented, mitigated and approved by the Group.
Group Internal Control department The Group Internal Control department is in charge of overseeing internal control and monitoring all procedures related to internal control over financial reporting.
Business review — Risk managementLafargeHolcim Annual Report 2018 81

Risk and controlcontinued
This department oversees the definition of Minimum Control Standards mentioned above and coordinates the network of Internal Control Managers within countries. It supports countries and the heads of Group functions in the implementation of such standards as well as the documentation and tests of mandatory minimum controls.
Group Internal Control designs and coordinates the annual certification process to review the main action plans in progress and to confirm management responsibility at each relevant level of the Group organization on the quality of both internal control and financial reporting. The outcome of this certification process is presented to the Group Chief Financial Officer and Chief Executive Officer for validation prior to presenting it to the Executive Committee and Audit Committee.
Group Internal Audit The Group Internal Audit department is responsible for performing an independent assessment of the quality of internal control at all levels of the organization following the annual audit plan approved by the Audit Committee.
Reports are issued to audited countries and to senior management upon completion of the fieldwork. An annual summary of such reports is presented to the Audit Committee, which also receives the assessment from the Group’s external auditors on the internal control system. Furthermore, follow-up assignments are organized to verify that internal audit recommendations have been put in place.
82

Canton St. Gallen, SwitzerlandThe Tamina bridge is one of the
tallest in Europe.
LafargeHolcim Annual Report 2018 83Business review — Risk management
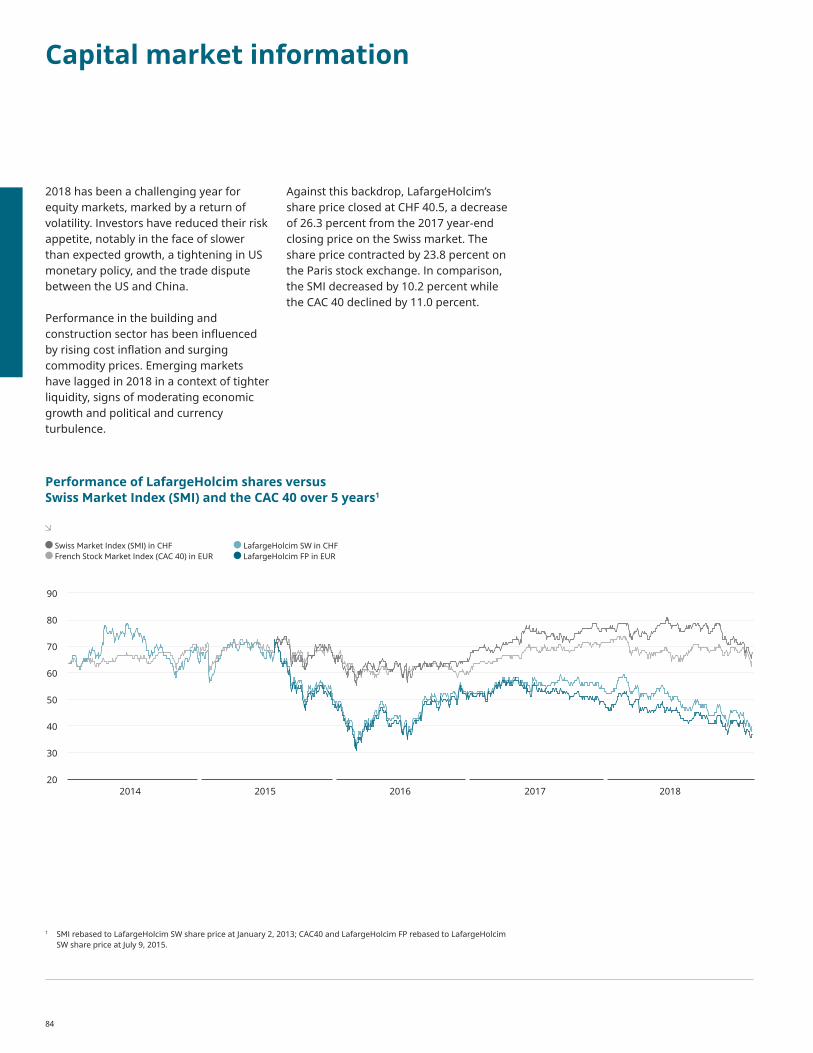
Performance of LafargeHolcim shares versus Swiss Market Index (SMI) and the CAC 40 over 5 years1
Swiss Market Index (SMI) in CHF French Stock Market Index (CAC 40) in EUR
LafargeHolcim SW in CHF LafargeHolcim FP in EUR
2014
90
80
70
60
50
40
30
202015 2016 2017 2018
Capital market information
2018 has been a challenging year for equity markets, marked by a return of volatility. Investors have reduced their risk appetite, notably in the face of slower than expected growth, a tightening in US monetary policy, and the trade dispute between the US and China.
Performance in the building and construction sector has been influenced by rising cost inflation and surging commodity prices. Emerging markets have lagged in 2018 in a context of tighter liquidity, signs of moderating economic growth and political and currency turbulence.
Against this backdrop, LafargeHolcim’s share price closed at CHF 40.5, a decrease of 26.3 percent from the 2017 year-end closing price on the Swiss market. The share price contracted by 23.8 percent on the Paris stock exchange. In comparison, the SMI decreased by 10.2 percent while the CAC 40 declined by 11.0 percent.
1 SMI rebased to LafargeHolcim SW share price at January 2, 2013; CAC40 and LafargeHolcim FP rebased to LafargeHolcim SW share price at July 9, 2015.
84

The average trading volume in 2018 amounted to approximately 2.3 million shares per day on the SIX Swiss Exchange and 0.2 million shares per day on the Euronext Paris.
ListingsLafargeHolcim is listed on the SIX Swiss Exchange and on Euronext Paris. The Group is a member of the main large indices on the SIX Swiss Exchange (SMI
and SLI). As the velocity of the stock has fallen under the required threshold, LafargeHolcim has been excluded from the CAC 40 Index in June 2018 and from the CAC Next 20 Index in September 2018 on the Euronext Paris. Each LafargeHolcim share carries one voting right. At year-end 2018, the company’s market capitalization stood at CHF 24.6 billion.
Distribution of LafargeHolcim sharesand breakdown of shareholders The majority of shares held outside Switzerland and France are owned by shareholders in the United States and the United Kingdom.
Weighting of the LafargeHolcim registered sharein selected indices
Index Weighting in %
SMI, Swiss Market Index 2.50
SPI, Swiss Performance Index 1.62
SLI, Swiss Leader Index 3.81
STOXX Europe 600 Construction 8.15
STOXX Europe Large 200 0.30
STOXX Europe 600 0.23
STOXX Global 1800 0.05
DJSI World Enlarged Index 0.15
FTSE4Good Europe Index 0.29
Sources: Bloomberg, FTSE Index Company, as of year-end 2018
Additional Data
CH0012214059ISIN
1221405 Security code number
LHN Telekurs code
LHN:SWBloomberg code
LHN.SWThomson Reuterscode
LafargeHolcim Annual Report 2018 85Business review — Capital market information

Capital market informationcontinued
Free floatFree float as defined by the SIX Swiss Exchange and the Euronext stands at 79 percent.
Dividend policyDividends are distributed annually. For the 2018 financial year, the Board is proposing a payout from the capital contribution reserves in the amount of CHF 2.00 per registered share. Subject to approval by the annual shareholders’ meeting, shareholders will be given the choice of having the dividend paid out in cash, in the form of new LafargeHolcim Ltd shares
or a combination of cash and shares (scrip dividend). The new shares will be issued at a discount to the market price.
Significant shareholdersInformation on significant shareholders can be found on page 276 of this report.
Disclosure of shareholdingsUnder the Federal Act on Financial Market Infrastructures and Market Conduct in Securities and Derivatives Trading (Financial Market Infrastructure Act, FMIA), whosoever, directly, indirectly, or acting in concert with third parties, acquires or
disposes of shares, for his own account, in a company incorporated in Switzerland whose equity securities are listed, in whole or in part, in Switzerland and thereby attains, falls below, or exceeds the threshold of 3, 5, 10, 15, 20, 25, 331/3, 50, or 662/3 percent of the voting rights, whether or not such rights may be exercised, shall notify the company and the stock exchanges on which the equity securities in question are listed.
Key data LafargeHolcim registered shares
Par value CHF 2.00 2018 2017 2016 2015 20141
Number of shares issued 606,909,080 606,909,080 606,909,080 606,909,080 327,086,376
Number of dividend-bearing shares 596,625,426 598,067,626 606,909,080 606,909,080 327,086,376
Number of shares conditional capital 2 1,422,350 1,422,350 1,422,350 1,422,350 1,422,350
Number of treasury shares 10,736,847 9,698,149 1,152,327 1,338,494 1,219,339
Stock market prices in CHF 2018 2017 2016 2015 2014
High 60 60 57 73 83
Low 39 51 34 48 62
Average 50 56 47 63 73
Market capitalization (billion CHF) 24.6 33.3 32.6 30.5 23.3
Trading volumes (million shares) 625.3 574.6 615.0 449.1 266.8
Earnings per share (EPS) in CHF 2.52 (2.78) 2.96 (3.11) 3.633
EPS before impairment and divestments in CHF 2.63 2.35 2.10 – –
Cash earnings per share in CHF 4 5.01 5.04 5.44 5.22 7.01
Consolidated shareholders’ equity per share in CHF 5 50.41 51.87 50.88 51.79 53.49
Dividend per share in CHF 2.006 2.00 2.00 1.50 1.30
1 Restated due to changes in accounting policies.2 Shares reserved for convertible bonds.3 EPS for 2014 was restated due to the distribution of a scrip dividend.4 Cash EPS calculated based on cash flow from operating activities divided by the weighted-average number of shares outstanding.5 Based on shareholders’ equity — attributable to shareholders of LafargeHolcim Ltd — and the number of dividend-bearing shares (less treasury shares) as per December 31.6 Proposed by the Board of Directors for a payout from capital contribution reserves.
86

Registration in the share register and restrictions on voting rightsOn request, purchasers of registered shares are entered in the share register as voting shareholders provided that they expressly declare that they acquired the shares in their own name and for their own account. The Board of Directors will enter individuals whose requests for registration do not include an express declaration that they hold the shares for their own account (nominees) in the share register as shareholders with voting rights, provided that such nominees have concluded an agreement with the
company concerning their status and are subject to recognized banking or financial market supervision. The Board of Directors has issued the applicable Registration Regulations which can be found on the LafargeHolcim website.
Current rating (March 7, 2019)
Rating Agency Long-term rating Short-term rating
Standard & Poor’s Ratings Services BBB, outlook negative A-2
Moody’s Investors Service Baa2, outlook negative P-2
Information on LafargeHolcim registered sharesFurther information on LafargeHolcim registered shares can be found at: lafargeholcim.com/investor-relations
Financial reporting calendar
May 15, 2019Trading update for the first quarter 2019
May 15, 2019Annual General Meeting of shareholders
LafargeHolcim Annual Report 2018 87Business review — Capital market information

Nairobi, KenyaSafety checks at the grinding plant.
Gov
ern
ance
an
d
Com
pen
sati
on
88

Corporate governance 90
Compensation report 114
LafargeHolcim Annual Report 2018 89Governance and Compensation

Corporate governance
Preliminary remarksThe ultimate goal of effective corporate governance is long-term value creation and strengthening of the Group’s reputation. This includes continuous improvement to decision-making processes and management systems through legal, organizational, and ethical directives and terms of reference, as well as measures to enhance transparency. Compliance with internal and external law and regulations, early recognition of business risks, social responsibility for stakeholder groups, and open communication on all relevant issues are among the principles of LafargeHolcim. The Code of Business Conduct, binding for the entire Group, is part of our internal regulations.
LafargeHolcim aims to achieve a balanced relationship between management and control by keeping the functions of Chairman of the Board of Directors and CEO separate.
The information published in this chapter conforms to the Directive Corporate Governance of the SIX Swiss Exchange (SIX) and the disclosure rules of the Swiss Code of Obligations. In the interest of clarity, reference is made to other parts of
LafargeHolcim applies high standards to corporate governance. The goal is to assure the long-term value and success of the company in the interests of various stakeholder groups: customers, shareholders, employees, creditors, suppliers, and the communities where LafargeHolcim operates.
TopicBusiness review in the individual
Group regions P148
Segment information P184
Principal companies P176
Information about LafargeHolcim Ltd & listed Group companies P180
the Annual Report or, for example, to the Group’s website (www.lafargeholcim.com). Except where otherwise indicated, this Annual Report reflects the legal situation as of December 31, 2018.
Group structure and shareholdersThe holding company LafargeHolcim Ltd operates under the laws of Switzerland for an indefinite period. Its registered office is in Rapperswil-Jona (Canton of St. Gallen, Switzerland). It has direct and indirect interests in all companies listed on pages 176 –180 of this Annual Report.
The Group is organized by geographical regions. The management structure as per December 31, 2018, and changes which occurred in 2018, are described in this chapter.
LafargeHolcim has no mutual cross-holdings with any other company. There are neither shareholders’ agreements nor other agreements regarding voting or the holding of LafargeHolcim shares.
More detailed information on the business review, Group structure, and shareholders can be found on the pages of the Annual Report listed on the left.
90

Topic Articles of incorporation of LafargeHolcim Ltd lafargeholcim.com/articles-association
Code of business conduct lafargeholcim.com/corporate-governance
Changes in equity of LafargeHolcim (information for the year 2016 is included in the Annual Report 2017, 126 – 127) 166 – 167
Detailed information on conditional capital lafargeholcim.com/articles-association
Articles of incorporation: Art. 3bis
Key data per share 84 – 87, 256, 276
Rights pertaining to the shares lafargeholcim.com/articles-association
Articles of incorporation: Art. 6, 9 10
Regulations on transferability of shares and nominee registration lafargeholcim.com/articles-association
Articles of incorporation: Art. 4, 5
Warrants/options 247 – 251
Capital structureLafargeHolcim has one uniform type of registered share in order to comply with inter national capital market requirements in terms of an open, transparent, and modern capital structure and to enhance attractiveness, particularly for institutional investors.
Share capitalThe share capital is divided into 606,909,080 registered shares of CHF 2.00 nominal value each. As of December 31, 2018, the nominal, fully paid-in share capital of LafargeHolcim Ltd amounted to CHF 1,213,818,160.
Conditional share capitalThe share capital may be increased by a nominal amount of CHF 2,844,700 through the issuance of a maximum of 1,422,350 fully paid-in registered shares, each with a par value of CHF 2.00 (as per December 31, 2018). The conditional capital may be used for exercising conversion rights and/or warrants relating to bonds or similar debt instruments of the company or one of its Group companies. The subscription rights of the shareholders will be excluded. The current owners of conversion rights and/or warrants will be entitled to subscribe for
the new shares. The acquisition of shares through the exercise of conversion rights and/or warrants and each subsequent transfer of the shares will be subject to the restrictions set out in the Articles of Incorporation. As per December 31, 2018, no bonds or similar debt instruments of the company or one of its Group companies were outstanding that would give rise to conversion rights or warrants related to the conditional capital; therefore, in the year under review, no conversion rights or warrants have been exercised. Further information on conversion rights and/or warrants and applicable conditions may be found in the Articles of Incorporation of LafargeHolcim Ltd at: www.lafargeholcim.com/articles-association
Authorized share capital/Certificates of participation As per December 31, 2018, neither authorized share capital nor certificates of parti cipation were outstanding.
LafargeHolcim Annual Report 2018 91Governance and Compensation — Corporate governance

Corporate governancecontinued
Board of DirectorsThe Board of Directors consists of 10 members, all of whom are independent, were not previously members of the LafargeHolcim management, and have no important business connections with LafargeHolcim.
Independence is defined in line with best corporate governance standards. A member of the Board of Directors shall be considered independent, if the member is not and has not been employed as a member of the Executive Committee at the company or any of its principal subsidiaries or as employee or affiliate of the auditors of LafargeHolcim Ltd for the past three years and does not maintain, in the sole determination of the Board of Directors, a material direct or indirect business relationship with the company or any of its subsidiaries. Members of the Board of Directors with immediate family members who would not qualify as independent shall not be considered independent, subject to a three-year cooling-off period.
Please see pages 106 –108 for the biographical information of the members of the Board of Directors as per December 31, 2018.
Mr. Bertrand Collomb and Mr. Thomas Schmidheiny retired from the Board of Directors at the Shareholders General Meeting of May 8, 2018.
In 2018, the shareholders re-elected 10 members of the Board of Directors. Dr. Beat Hess was re-elected as Chairman of the Board of Directors. Furthermore, the shareholders re-elected the five members of the Nomination, Compensation & Governance Committee.
The shareholders also re-elected the auditors and the independent proxy.
New members of the Board of Directors are introduced in detail to the company’s areas of business. The Board of Directors meets as often as business requires, but at least four times a year. In 2018, five regular meetings and five additional meetings were held. One meeting focused on strategy topics. As a rule, the members of the Executive Committee attended those parts of the regular meetings of the Board of Directors which dealt with operational issues of areas of their responsibility. The average duration of the regular meetings was five hours and thirty minutes.
Elections and terms of officeAll members of the Board of Directors, the Chairman of the Board of Directors, and all members of the Nomination, Compensation & Governance Committee are elected annually and individually as a matter of law by the shareholders at the Shareholders General Meeting. They may be proposed for re-election by the Board of Directors upon motion by the Nomination, Compensation & Governance Committee. The Nomination, Compensation & Governance Committee bases its motion on a review of the overall performance of each candidate.
Honorary ChairmanIn recognition of his many years of service to LafargeHolcim, the Board of Directors has decided to name Mr. Thomas Schmidheiny Honorary Chairman of the Group.
Board MembersBiographies
Read more on P106 – 108
92

Board and Committee attendance at scheduled ordinary meetings
Name Position BoardAudit
Committee
Nomination, Compensation &
Governance Committee
Health, Safety & Sustainability
Committee
Beat Hess Chairman 5/5 – – –
Oscar Fanjul Vice-Chairman 5/5 – 4/4 –
Bertrand Collomb1 Member 2/2 2/3
Paul Desmarais, Jr. Member 4/5 – 3/4 –
Patrick Kron2 Member 5/5 3/3 – 4/4
Gérard Lamarche Member 4/5 6/6 – –
Adrian Loader Member 5/5 – 4/4 4/4
Jürg Oleas Member 4/5 6/6 – –
Nassef Sawiris Member 4/5 – 2/4 –
Thomas Schmidheiny3 Member 2/2 2/2
Hanne B. Sørensen Member 4/5 – 4/4 3/4
Dieter Spälti4 Member 5/5 6/6 – 2/2
1 Member of the Board and of the AC until Shareholders General Meeting 2018 2 Chairman and member of the AC as of Shareholders General Meeting 20183 Member of the Board and of the HSSC until Shareholders General Meeting 20184 Member of the HSSC as of Shareholders General Meeting 2018
LafargeHolcim Annual Report 2018 93Governance and Compensation — Corporate governance

Corporate governancecontinued
The Audit Committee assists and advises the Board of Directors in conducting its supervisory duties with respect to the internal control systems. It examines the reporting for the attention of the Board of Directors and evaluates the Group’s external and internal audit procedures, reviews the risk management systems of the Group, and assesses financing issues.
All members are independent in order to ensure the necessary degree of objectivity required for an Audit Committee.
In 2018, six regular meetings of the Audit Committee were held. The external auditors, the Head of Group Internal Audit and the Group General Counsel were present at all meetings for certain agenda topics. Furthermore, the Chairman of the Board, the CEO and the CFO attended the meetings of the Audit Committee as guests. The average duration of the regular meetings was three hours and thirty minutes.
In 2018, the committee reviewed in particular the financial reporting of the Group, the releases of the quarterly results and the findings of the external auditors. The committee took note of the status of the Internal Control System (ICS), discussed the findings of Group Internal Audit, dealt with compliance and internal directives, and evaluated financing issues. The committee also evaluated the performance of the external auditors and their fees. The Chairman of the Audit Committee performed significant work in preparing and following up the committee’s meetings given the wide range of its duties.
The charter of the Audit Committee is available at: www.lafargeholcim.com/articles-association
Audit Committee
Composition of the Audit Committee
Patrick Kron Chairman 1
Gérard Lamarche Member
Bertrand Collomb Member 2
Jurg Oleas Member
Dieter Spälti Member
1 Chairman and member as of Shareholders General Meeting 2018
2 Member until Shareholders General Meeting 2018
Our members of the Board of Directors serve on the following expert committees:
94

Composition of the Nomination, Compensation & Governance Committee
Nassef Sawiris Member
Paul Desmarais, Jr Member
Oscar Fanjul Chairman
Adrian Loader Member
Hanne B. Sørensen Member
The Nomination, Compensation & Governance Committee supports the Board of Directors in planning and preparing succession at the Board of Directors and senior management level. It monitors developments with regard to corporate governance and compensation for the Board of Directors and Executive Committee, and briefs the Board of Directors accordingly. The committee advises the Board of Directors on the compensation policy for the Board of Directors and for the Executive Committee and on the motion by the Board of Directors to the Shareholders General Meeting for the total compensation of the Board of Directors and of the Executive Committee.
In 2018, the Nomination, Compensation & Governance Committee held four regular meetings and three additional meetings. The meetings were also attended by the Chairman of the Board and the CEO as guests, insofar as they were not themselves affected by the items on the agenda. The average duration of the regular meetings was two hours and thirty minutes.
The charter of the Nomination, Compensation & Governance Committee is available at: www.lafargeholcim.com/articles-association
More details on the activities of the Nomination, Compensation & Governance Committee, in particular with regard to the process of determination of compensation, can be found in the Compensation Report, starting on page 114.
Nomination, Compensation & Governance Committee
LafargeHolcim Annual Report 2018 95Governance and Compensation — Corporate governance

Corporate governancecontinued
Composition of the Health, Safety and Sustainability Committee
Adrian Loader Chairman
Patrick Kron Member
Hanne B. Sørensen Member
Thomas Schmidheiny Member 1
Dieter Spälti Member 2
1 Member until Shareholders General Meeting 20182 Member as of Shareholders General Meeting 2018
The Health, Safety and Sustainability Committee supports and advises the Board of Directors on the development and promotion of a healthy and safe environment for employees and contractors as well as on sustainable development and social responsibility. In 2018 the Health, Safety and Sustainability Committee held four regular meetings. The Head of Health and Safety and the Head of Sustainable Development were present at all meetings. The Chairman of
the Board and the CEO attended the meetings of the Health, Safety and Sustainability Committee as guests. The average duration of the meetings was two hours.
The charter of the Health, Safety & Sustainability Committee is available at: www.lafargeholcim.com/articles-association
Health, Safety and Sustainability Committee
96
Organizational rules/Areas of responsibilityThe division of responsibilities between the Board of Directors, the CEO, and the Executive Committee is set out in detail in the company’s Organizational Rules.
The Organizational Rules entered into force on May 24, 2002, and are reviewed at least every two years and amended as required. They were last reviewed and amended in July 2018 and may be found at: www.lafargeholcim.com/articles-association.
The Organizational Rules are issued by the Board of Directors in accordance with the terms of Art. 716b of the Swiss Code of Obligations and Art. 18 of the company’s Articles of Incorporation. They stipulate the organizational structure of the Board of Directors and the Executive Committee and govern the tasks and powers conferred on the company’s executive bodies. They regulate the convocation, execution, and number of meetings to be held by the Board of Directors and the Executive Committee. In the event that the Chairman of the Board of Directors is not independent, the Organizational Rules provide for the election of an Independent Lead Director.
The Board of Directors also has the power to establish expert committees and, if required, ad-hoc committees for special tasks. The Board of Directors can delegate special tasks or tasks related to specific functions to a Vice-Chairman on a temporary or permanent basis.
As part of its non-transferable statutory responsibilities, the Board of Directors defines the corporate strategy, approves the consolidated Group mid-term plan, including the budget, and the Annual Report for submission to the Shareholders General Meeting.
The CEO is responsible for operational management, preparing a large part of the business of the Board of Directors – including corporate strategy proposals – and executing the latter’s resolutions. The CEO issues directives and recommendations with Group-wide significance in the CEO's own authority and is also responsible for electing and dismissing Function Heads and CEOs of Group companies, as well as for the nomination of the members of the Board of Directors and supervisory bodies of the Group companies.
Within the framework of mid-term plan approval, the Board of Directors defines limits for investments and financing. Within these limits, the Executive Committee decides on financing transactions and on one-off investments and divestments for amounts up to CHF 400 million. Amounts exceeding this are subject to approval by the Board of Directors. The Board of Directors is regularly informed about important transactions under the authority of the Executive Committee.
The Board of Directors determines the CEO’s objectives upon motion by the Chairman of the Board and the Executive Committee members’ Group objectives upon motion by the Nomination, Compensation & Governance Committee, both after advice and assessment with the CEO.
The CEO assesses the performance of the members of the Executive Committee and, after advice and assessment by the Nomination, Compensation & Governance Committee, determines their respective individual objectives.
The Executive Committee oversees risk management following appraisal by the Audit Committee. The Board of Directors is informed annually about the risk situation.
In case of a direct conflict of interest, the Organizational Rules require each member of the corporate body concerned to stand aside voluntarily prior to any discussion of the matter in question. Members of the corporate bodies are required to treat all information and documentation which they may obtain or view in the context of their activities in these bodies as confidential and not to make such information available to third parties.
All individuals vested with the powers to represent the company have joint signatory power at two.
Information and control instruments of the Board of DirectorsThe Board of Directors determines the manner in which it is to be informed about the course of business. Any member of the Board of Directors may demand information on all issues relating to the Group and the company. All members of the Board of Directors may request information from the CEO after informing the Chairman of the Board of Directors. At meetings of the Board of Directors, any attending member of the Executive Committee has a duty to provide information. All members of the Board of
LafargeHolcim Annual Report 2018 97Governance and Compensation — Corporate governance
Corporate governancecontinued
Directors have a right to inspect books and files to the extent necessary for the performance of their tasks.
Financial reportingThe Board of Directors is informed on a monthly basis about the current course of business, adopts the quarterly reports, and releases them for publication. The Board of Directors discusses the Annual Report, takes note of the Auditors’ Reports, and submits the Annual Report to the Shareholders General Meeting for approval.
With regard to Group strategy development, a stra tegy plan, a mid-term plan covering three years and including the budget are submitted to the Board of Directors.
Risk ManagementLafargeHolcim benefits from many years of experience with a risk management process which is structured around several coordinated approaches and subject to continuous improvement. A detailed update and analysis of the Group Risk map was carried out in 2018 and submitted to and analyzed by the Audit Committee and Executive Committee.
Responsibilities concerning risks are clearly defined at country and corporate level. The underlying principle is that risk management is a line management responsibility. Line managers are supported by the Group Risk Management function.
Risks are identified and assessed according to significance and likelihood.The full risk spectrum from market, operations, finance, legal, environmental
and sustainability, to external risk factors of the business environment is reviewed, including compliance and reputational risks. Key risks are analyzed more deeply regarding their causes, and risk mitigating actions are defined. Risk transfer through insurance solutions and the Internal Control system forms an integral part of the risk management process. Risks are monitored and their status reported to the Audit Committee and the Executive Committee regularly. Independent assessments of the effectiveness of mitigating actions and controls are performed by Group Internal Audit. Please see pages 66 to 82 for more details about the Group’s risk management.
Internal ControlLafargeHolcim aims to have an effective Internal Control system and culture supported by the commitment of the Board of Directors and the Executive Committee. Group Internal Control (GIC) primarily aims to provide the Board of Directors and the Executive Committee reasonable assurance on the reliability of the financial reporting and statements, compliance with laws and regulations and the protection of assets. GIC has designed a continuous reporting system to receive country and function assessments of the controls and status of any action plans. Discussions regularly occur with local management to ensure controls are properly assessed and issues are swiftly addressed. GIC designs and coordinates the annual assurance process to review the main action plans in progress and to confirm management responsibility at each relevant level of the Group organization
on the quality of both internal control and financial reporting. The outcome is presented to the Executive Committee and the Audit Committee.
Group Internal AuditThe core mission of Group Internal Audit (GIA) is to provide to the Board of Directors and the Executive Committee with an independent, risk-based, and objective assurance on the effectiveness and efficiency of the governance, risk management and internal control system of LafargeHolcim Group. GIA reports to the CFO with an additional reporting line to the Chairman of the Audit Committee. The members of the Board of Directors have access to GIA at all times. Each year, the Internal Audit plan, which defines the audit focal areas to be addressed by GIA, is reviewed and approved by the Audit Committee. Main observations and findings observed during the audit assignments are reported periodically to the Audit Committee and the Executive Committee. The Group Internal Audit activity is governed by adherence to the mandatory guidance issued by the Institute of Internal Auditors (“IIA”) including the Definition of Internal Auditing, the Code of Ethics, and the International Professional Practices Framework (IPPF). GIA activities are certified by IFACI (French Institute of Audit and Internal Control), which is affiliated to IIA.
98

Executive Committee Members of the Executive Committee (including the CEO) are appointed by the Board of Directors and are responsible for the management of the Group.
The tasks of the Executive Committee are divided into different areas of responsibility in terms of country and function, each of these areas being ultimately supervised and managed by a member of the Executive Committee.
Further to the situation effective January 1, 2018 reported in the Annual Report 2017 on pages 66 – 67, the following changes within the Executive Committee during the year under review have occurred:
Effective May 1, 2018, Caroline Luscombe, Head of Group Human Resources, has decided to pursue opportunities outside the company.
Effective July 1, 2018, Miljan Gutovic, previously Head of Marketing & Innovation, has been appointed member of the Executive Committee as Region Head of Middle East Africa, succeeding Saâd Sebbar, who has decided to pursue a career outside the company.
Effective January 1, 2019, Feliciano González Muñoz, Head of Group Human Resources, and Keith Carr, Group General Counsel, have been appointed members of the Executive Committee.
Also effective January 1, 2019, Urs Bleisch has decided to step down from his Executive Committee position. The Corporate Growth & Performance function which was led by Urs Bleisch has been organized into three centers of excellence which directly report to the Region Heads.
During the year under review, the Executive Committee of LafargeHolcim was comprised of the eight members reported in the table below.
Please refer to pages 112 – 113 for biographical information on the members of the Executive Committee. None of the members of the Executive Committee has important functions outside the LafargeHolcim Group or any other significant commitments of interest, with the exception of Jan Jenisch who is a non-executive Director of the stock-listed Schweiter Technologies AG as well as of the privately held Glas Troesch and Géraldine Picaud who is a non-executive Director of the stock-listed Infineon Technologies AG.
Composition of the Executive Committee
Name Position Responsibility
Jan Jenisch CEO
Géraldine Picaud CFO
Urs Bleisch Member Growth & Performance
Marcel Cobuz Member Region Head Europe
Miljan Gutovic Member Region Head Middle East Africa
Martin Kriegner Member Region Head Asia
Oliver Osswald Member Region Head Latin America
René Thibault Member Region Head North America
LafargeHolcim Annual Report 2018 99Governance and Compensation — Corporate governance

Corporate governancecontinued
Management agreementsLafargeHolcim has no management agreements in place with companies or private individuals outside the Group.
Mandates outside LafargeHolcimPlease refer to Art. 27 of the company’s Articles of Incorporation for information about the number of permitted mandates outside of LafargeHolcim for the members of the Board of Directors and of the Executive Committee: www.lafargeholcim.com/articles-association.
Compensation, shareholdings and loansDetails of Board and management compensation, shareholdings, and loans are contained in the Compensation Report (starting at page 114) and in the Holding company results (page 266, note 14).
Shareholders’ participationVoting rights and representation restrictionsAll holders of registered shares who are registered as shareholders with voting rights in the share register on the closing date for the share registry are entitled to participate in, and vote at, Shareholders General Meetings. Shares held by trusts and shares for which no declaration has been made that the holder requesting registration is holding the shares in his own name and for his own account are entered in the share register as having no voting rights. Shareholders not participating in person in the General Meeting may be represented by another shareholder or by the independent voting proxy. In line with the requirements of the Ordinance against Excessive Compensation in public corporations, an electronic voting option is provided for. Voting rights are not subject to any restrictions. Each share carries one vote.
Statutory quorumsThe Shareholders General Meeting constitutes a quorum, regardless of the number of shares represented or shareholders present; resolutions are passed by an absolute majority of the votes allocated to the shares represented, unless Art. 704 para. 1 of the Swiss Code of Obligations or the Merger Act provides otherwise. In such cases, resolutions may only be passed with the respective qualified majority of the votes represented. According to Art. 10 para. 2 of the Articles of Incorporation and in addition to Art. 704 para. 1 of the Swiss Code of Obligations, the approval of at least two-thirds of the votes represented and the absolute majority of the par value of shares represented shall be required for resolutions of the Shareholders General Meeting with respect to the removal of restrictions set forth in Art. 5 of the Articles of Incorporation (entries in the share register), the removal of the mandatory bid rule (Art. 125 para 4 of the Financial Market Infrastructure Act), and the removal or amendment of para. 2 of Art. 10 of the Articles of Incorporation.
100
Convocation of the Shareholders General Meeting and agenda rulesThe Shareholders General Meeting takes place each year, at the latest six months following the conclusion of the financial year. It is convened by the Board of Directors, whereby invitations are published at least twenty days prior to the meeting and in which details are given of the agenda and items submitted. Shareholders representing shares with a par value of at least one million Swiss Francs may request the addition of a particular item for discussion and resolution. A corresponding application must be submitted in writing to the Board of Directors at least forty days prior to the Shareholders General Meeting. Such application should indicate the items to be submitted. The invitations as well as the minutes of the Shareholders General Meetings are published on: www.lafargeholcim.com
Entries in the share registerThe company maintains a share register for registered shares in which the names and addresses of owners and beneficiaries are entered. According to the applicable rules and regulations, only those included in the share register are deemed shareholders or beneficial owners of the registered shares of the company. Upon request, purchasers of registered shares shall be included in the share register as shareholders with voting rights if they expressly declare that they have acquired the shares in their own name and for their own account. Exceptions to this rule apply for nominees who have signed a nominee agreement with the company regarding this position and are subject to a recognized financial markets supervisory authority.
The share register is closed approximately one week prior to the date of the Shareholders General Meeting (the exact date is communicated in the invitation to the Shareholders General Meeting). Shareholders’ participation and rights of protection are furthermore governed by the Swiss Code of Obligations.
This information comprises excerpts from or references to the content of the Articles of Incorporation of LafargeHolcim Ltd. The full version of the Articles of Incorporation in force as at the date of publication of this Annual Report can be accessed at: www.lafargeholcim.com/articles-association
Changes of control and defense measuresThe Articles of Incorporation contain no waiver of the duty to make a public offer under the terms of Art. 135 and 163 of the Financial Market Infrastructure Act (“opting out”). The result is that a shareholder who directly, indirectly, or acting in concert with third parties acquires shares in the company and, together with the shares he already possesses, thereby exceeds the 33¹/3 percent threshold of voting rights in the company must make an offer for all listed shares of the company.
There are no clauses relating to changes of control.
LafargeHolcim Annual Report 2018 101Governance and Compensation — Corporate governance

Corporate governancecontinued
AuditorsAs part of their auditing activity, the auditors inform the Audit Committee and the Executive Committee regularly about their findings and make suggestions for improvement. Taking into account the reporting and assessments by the Group companies, the Audit Committee evaluates the performance of the auditors and their remuneration in line with market conditions. The Audit Committee approves the audit focus area, provides recommendations to the auditors and makes suggestions for improvement. In 2018, the auditors participated in all six regular meetings of the Audit Committee to discuss individual agenda items.
Deloitte AG, Zurich, was re-elected at the Shareholders General Meeting 2018 as the auditors of LafargeHolcim Ltd. David Quinlin has been responsible for managing the audit mandate. The rotation of the lead auditor will be carried out in accordance with Art. 730a of the Swiss Code of Obligations. The auditors are elected for a one-year term by the Shareholders General Meeting.
The fees shown below were charged for professional services rendered to the Group by the auditors in 2018 and 2017:
Million CHF 2018 2017
Audit services related to Deloitte fees 1 16.1 14.5
Audit services for joint ventures related to Deloitte fees 0.8 0.3
Total audit services fees related to Deloitte 16.9 14.8
Audit services related to other audit firms fees 0.8 1.3
Total audit services fees 17.7 16.1
Audit-related services fees related to Deloitte 2 0.3 0.2
Tax services fees related to Deloitte 0.1 0.1
Other services fees related to Deloitte 3 0.0 0.0
Total other fees related to Deloitte 0.5 0.3
1 This amount includes the fees for the individual audits of Group companies carried out by Deloitte as well as their fees for auditing the Group financial statements.2 Audit-related services comprise, among other things, amounts for comfort letters, accounting advice, information systems reviews and reviews on internal controls.3 Other services include, among other things, amounts for due diligences and translation services.
102
Information policyLafargeHolcim Ltd reports to shareholders, the capital market, employees, and the public at large in a transparent and timely manner concerning its corporate performance, including achievement of its sustainability targets. Open dialog is nurtured with the most important stakeholders, based on mutual respect and trust. This promotes knowledge of the company and understanding of objectives, strategy, and business activities of the company.
As a listed company, LafargeHolcim Ltd is under an obligation to disclose facts that may materially affect the share price (ad-hoc disclosure, Art. 53 and 54 of the SIX listing rules as well as Art. 17 and 223-2 of the AMF General Regulations). LafargeHolcim Ltd is subject to the SIX and AMF rules on the disclosure of management trans actions made by the members of the Board of Directors and senior management. These can be accessed on the SIX and AMF websites: https://www.six-exchange-regulation.com/en/home/issuer/obligations/management-transactions.html and http://www.amf-france.org/en_US/Acteurs-et-produits/Societes- cotees-et-operations-financieres/Information-financiere-et-comptable/Obligations-d- information.html?#title_ paragraph_1
The most important information tools are the annual and half-year reports, the website (www.lafargeholcim.com), media releases, press conferences, meetings for financial analysts and investors, and the Annual General Meeting.
Current information relating to sustainable development is available at: www.lafargeholcim.com
A full sustainability report is published every year.
The financial reporting calendar is shown on pages 87 and 281 of this Annual Report.
Should there be any specific queries regarding LafargeHolcim, please contact:
Corporate CommunicationsPhone: +41 58 858 83 06 Fax: +41 58 858 87 19 E-Mail: [email protected]
Investor RelationsPhone: +41 58 858 87 87 Fax: +41 58 858 80 09 E-Mail: [email protected]
LafargeHolcim Annual Report 2018 103Governance and Compensation — Corporate governance
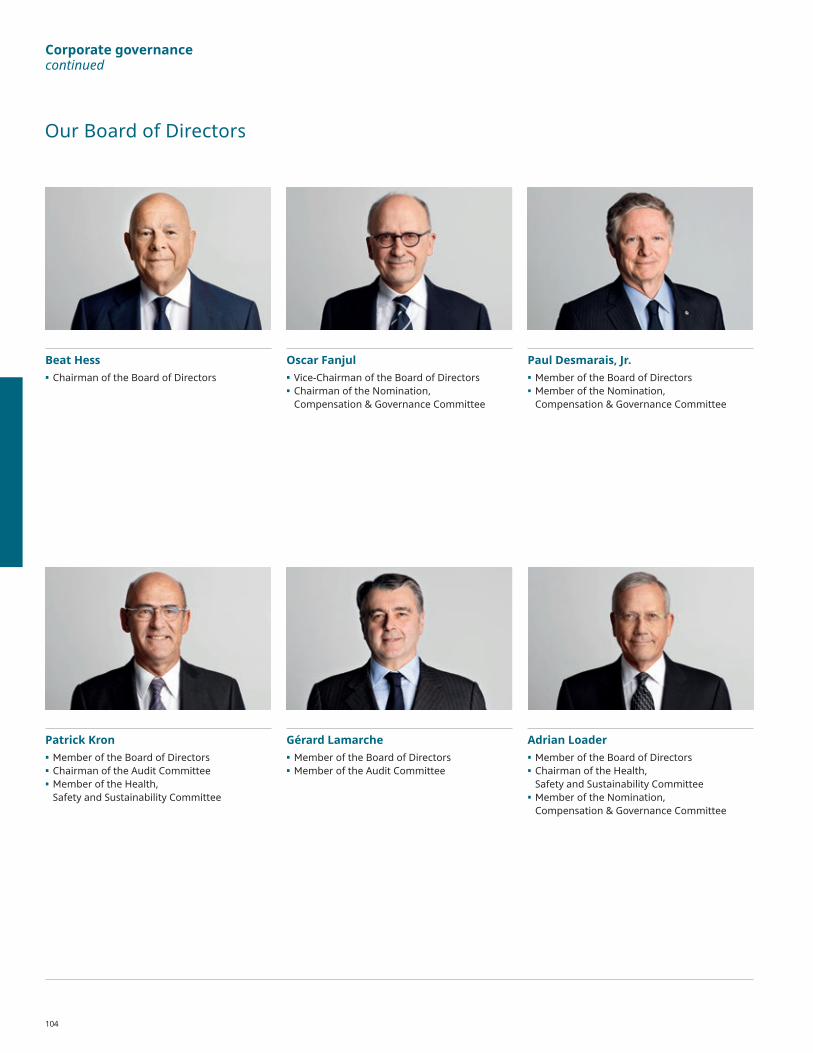
Corporate governancecontinued
Beat Hess• Chairman of the Board of Directors
Oscar Fanjul• Vice-Chairman of the Board of Directors • Chairman of the Nomination,
Compensation & Governance Committee
Our Board of Directors
Paul Desmarais, Jr.• Member of the Board of Directors• Member of the Nomination,
Compensation & Governance Committee
Patrick Kron• Member of the Board of Directors• Chairman of the Audit Committee• Member of the Health,
Safety and Sustainability Committee
Gérard Lamarche• Member of the Board of Directors• Member of the Audit Committee
Adrian Loader• Member of the Board of Directors• Chairman of the Health,
Safety and Sustainability Committee• Member of the Nomination,
Compensation & Governance Committee
104

Jurg Oleas• Member of the Board of Directors• Member of the Audit Committee
Nassef Sawiris• Member of the Board of Directors• Member of the Nomination,
Compensation & Governance Committee
Hanne Birgitte Breinbjerg Sørensen• Member of the Board of Directors• Member of the Health,
Safety and Sustainability Committee• Member of the Nomination,
Compensation & Governance Committee
Dieter Spälti• Member of the Board of Directors• Member of the Audit Committee• Member of the Health,
Safety and Sustainability Committee
LafargeHolcim Annual Report 2018 105Governance and Compensation — Board of Directors
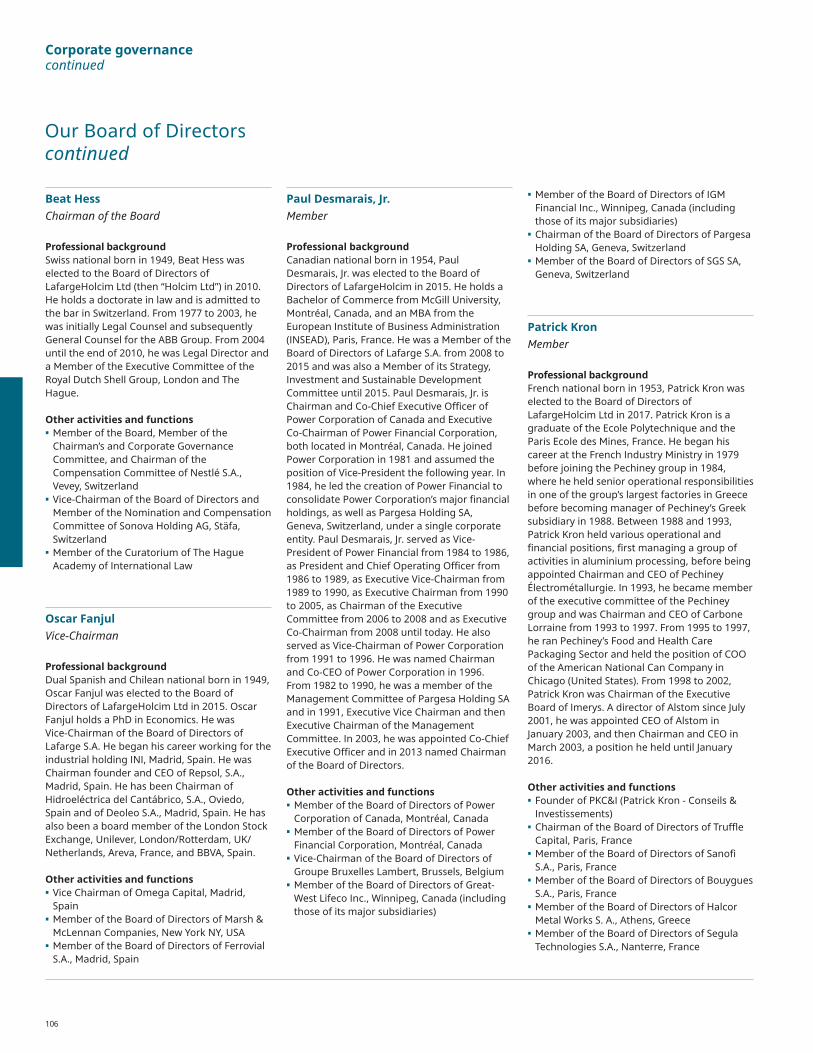
Corporate governancecontinued
Our Board of Directors continued
Beat HessChairman of the Board
Professional backgroundSwiss national born in 1949, Beat Hess was elected to the Board of Directors of LafargeHolcim Ltd (then “Holcim Ltd”) in 2010. He holds a doctorate in law and is admitted to the bar in Switzerland. From 1977 to 2003, he was initially Legal Counsel and subsequently General Counsel for the ABB Group. From 2004 until the end of 2010, he was Legal Director and a Member of the Executive Committee of the Royal Dutch Shell Group, London and The Hague.
Other activities and functions• Member of the Board, Member of the
Chairman’s and Corporate Governance Committee, and Chairman of the Compensation Committee of Nestlé S.A., Vevey, Switzerland
• Vice-Chairman of the Board of Directors and Member of the Nomination and Compensation Committee of Sonova Holding AG, Stäfa, Switzerland
• Member of the Curatorium of The Hague Academy of International Law
Oscar FanjulVice-Chairman
Professional backgroundDual Spanish and Chilean national born in 1949, Oscar Fanjul was elected to the Board of Directors of LafargeHolcim Ltd in 2015. Oscar Fanjul holds a PhD in Economics. He was Vice-Chairman of the Board of Directors of Lafarge S.A. He began his career working for the industrial holding INI, Madrid, Spain. He was Chairman founder and CEO of Repsol, S.A., Madrid, Spain. He has been Chairman of Hidroeléctrica del Cantábrico, S.A., Oviedo, Spain and of Deoleo S.A., Madrid, Spain. He has also been a board member of the London Stock Exchange, Unilever, London/Rotterdam, UK/Netherlands, Areva, France, and BBVA, Spain.
Other activities and functions• Vice Chairman of Omega Capital, Madrid,
Spain• Member of the Board of Directors of Marsh &
McLennan Companies, New York NY, USA• Member of the Board of Directors of Ferrovial
S.A., Madrid, Spain
Paul Desmarais, Jr.Member
Professional backgroundCanadian national born in 1954, Paul Desmarais, Jr. was elected to the Board of Directors of LafargeHolcim in 2015. He holds a Bachelor of Commerce from McGill University, Montréal, Canada, and an MBA from the European Institute of Business Administration (INSEAD), Paris, France. He was a Member of the Board of Directors of Lafarge S.A. from 2008 to 2015 and was also a Member of its Strategy, Investment and Sustainable Development Committee until 2015. Paul Desmarais, Jr. is Chairman and Co-Chief Executive Officer of Power Corporation of Canada and Executive Co-Chairman of Power Financial Corporation, both located in Montréal, Canada. He joined Power Corporation in 1981 and assumed the position of Vice-President the following year. In 1984, he led the creation of Power Financial to consolidate Power Corporation’s major financial holdings, as well as Pargesa Holding SA, Geneva, Switzerland, under a single corporate entity. Paul Desmarais, Jr. served as Vice-President of Power Financial from 1984 to 1986, as President and Chief Operating Officer from 1986 to 1989, as Executive Vice-Chairman from 1989 to 1990, as Executive Chairman from 1990 to 2005, as Chairman of the Executive Committee from 2006 to 2008 and as Executive Co-Chairman from 2008 until today. He also served as Vice-Chairman of Power Corporation from 1991 to 1996. He was named Chairman and Co-CEO of Power Corporation in 1996.From 1982 to 1990, he was a member of the Management Committee of Pargesa Holding SA and in 1991, Executive Vice Chairman and then Executive Chairman of the Management Committee. In 2003, he was appointed Co-Chief Executive Officer and in 2013 named Chairman of the Board of Directors.
Other activities and functions• Member of the Board of Directors of Power
Corporation of Canada, Montréal, Canada• Member of the Board of Directors of Power
Financial Corporation, Montréal, Canada• Vice-Chairman of the Board of Directors of
Groupe Bruxelles Lambert, Brussels, Belgium• Member of the Board of Directors of Great-
West Lifeco Inc., Winnipeg, Canada (including those of its major subsidiaries)
• Member of the Board of Directors of IGM Financial Inc., Winnipeg, Canada (including those of its major subsidiaries)
• Chairman of the Board of Directors of Pargesa Holding SA, Geneva, Switzerland
• Member of the Board of Directors of SGS SA, Geneva, Switzerland
Patrick KronMember
Professional backgroundFrench national born in 1953, Patrick Kron was elected to the Board of Directors of LafargeHolcim Ltd in 2017. Patrick Kron is a graduate of the Ecole Polytechnique and the Paris Ecole des Mines, France. He began his career at the French Industry Ministry in 1979 before joining the Pechiney group in 1984, where he held senior operational responsibilities in one of the group’s largest factories in Greece before becoming manager of Pechiney’s Greek subsidiary in 1988. Between 1988 and 1993, Patrick Kron held various operational and financial positions, first managing a group of activities in aluminium processing, before being appointed Chairman and CEO of Pechiney Électrométallurgie. In 1993, he became member of the executive committee of the Pechiney group and was Chairman and CEO of Carbone Lorraine from 1993 to 1997. From 1995 to 1997, he ran Pechiney’s Food and Health Care Packaging Sector and held the position of COO of the American National Can Company in Chicago (United States). From 1998 to 2002, Patrick Kron was Chairman of the Executive Board of Imerys. A director of Alstom since July 2001, he was appointed CEO of Alstom in January 2003, and then Chairman and CEO in March 2003, a position he held until January 2016.
Other activities and functions• Founder of PKC&I (Patrick Kron - Conseils &
Investissements) • Chairman of the Board of Directors of Truffle
Capital, Paris, France • Member of the Board of Directors of Sanofi
S.A., Paris, France• Member of the Board of Directors of Bouygues
S.A., Paris, France• Member of the Board of Directors of Halcor
Metal Works S. A., Athens, Greece• Member of the Board of Directors of Segula
Technologies S.A., Nanterre, France
106

Gérard LamarcheMember
Professional backgroundBelgian national born in 1961, Gérard Lamarche was elected to the Board of Directors of LafargeHolcim Ltd in 2015. He is a graduate in Economics Sciences from the University of Louvain-la-Neuve, Belgium, and the INSEAD Business School, Fontainebleau, France (Advanced Management Program for Suez Group Executives). He also trained at Wharton International Forum in 1998-1999 (Global Leadership Series). He was a Member of the Board of Directors of Lafarge S.A. between 2012 and 2016 and also a Member of the Audit Committee and a Member of the Strategy, Investment and Sustainable Development Committee. Gérard Lamarche is Co-CEO of Groupe Bruxelles Lambert, Brussels, Belgium. He began his career with Deloitte Haskins & Sells, Brussels, Belgium, in 1983 and was appointed as an M&A consultant in the Netherlands in 1987. In 1988, he joined Société Générale de Belgique, Brussels, Belgium as Investment Manager. He was promoted to Controller in 1989 before becoming Advisor to the Strategy and Planning Department from 1992 to 1995. He joined Compagnie Financière de Suez as Special Advisor to the Chairman and Secretary to the Suez Executive Committee, Paris, France, and was later appointed Senior Vice President in charge of Planning, Control and Accounting. In 2000, he joined NALCO (the US subsidiary of the Suez Group based in Naperville Il, USA) as General Managing Director. He was appointed CFO of the Suez Group in 2003.
Other activities and functions• Member of the Board of Directors, Member
of the Audit Committee and Chairman of the Remuneration Committee of Total SA, Paris, France
• Member of the Board of Directors and Member of the Audit Committee of SGS, Geneva, Switzerland
• Member of the Board of Directors of Umicore, Brussels, Belgium
Adrian LoaderMember
Professional backgroundBritish national born in 1948, Adrian Loader was elected to the Board of Directors of LafargeHolcim Ltd (then “Holcim Ltd”) in 2006. Adrian Loader holds an Honours Degree in History from Cambridge University and is a fellow of the Chartered Institute of Personnel and Development. He was Chairman of the Nomination & Compensation Committee of Holcim Ltd from 2014 to 2015. He began his professional career at Bowater in 1969 and joined Shell the following year. Until 1998, he held various management positions in Latin America, Asia, and Europe and at the corporate level. In 1998, he was appointed President of Shell Europe Oil Products and in 2004 became Director for strategic planning, sustainable development, and external affairs for the Shell Group. In 2005 he became Director of the Strategy and Business Development Directorate of Royal Dutch Shell, Den Haag, Netherlands; he became President and CEO of Shell Canada in 2007 and retired from Shell at the end of the year. In January 2008, he joined the Board of Directors of Candax Energy Inc., Toronto, Canada and was Chairman until June 2010. He then served as Chairman of Compton Petroleum, Calgary, Canada until August 2012, and as Chairman of the Board of Directors of Oracle Coalfields PLC, London, United Kingdom until April 2016.
Other activities and functions• Member of the Board of Directors of Sherritt
International Corporation, Toronto, Canada• Member of the Board of Directors of Alderon
Iron Ore, Montreal, Canada• Chairman of Resero Gas, London, United
Kingdom
Jurg OleasMember
Professional backgroundSwiss national born in 1957, Jürg Oleas was elected to the Board of Directors of LafargeHolcim Ltd (then “Holcim Ltd”) in 2014, retired from the Holcim Ltd Board in the context of the LafargeHolcim merger closing effective 10 July, 2015 and was re-elected at the AGM 2016. He holds an MSc from the mechanical engineering from the Swiss Federal Institute of Technology (ETH) in Zurich, Switzerland. He is CEO of GEA Group Aktiengesellschaft, a Düsseldorf-based mechanical engineering company listed on Germany’s MDAX stock index. Jürg Oleas has been a member of the GEA Group Executive Board since joining the company in May 2001. Initially responsible for the Group’s chemical activities, he was appointed CEO of GEA Group on November 1, 2004. Before joining the GEA Group, he spent nearly 20 years with ABB and the Alstom Group, where he held several management positions.
Other activities and functions• Chairman of the Board of Directors of LL Plant
Engineering AG, Ratingen, Germany • Member of the Board of Directors and
Chairman of the Strategy Committee of RUAG Holding AG, Bern, Switzerland
LafargeHolcim Annual Report 2018 107Governance and Compensation — Board of Directors
Corporate governancecontinued
Our Board of Directors continued
Nassef SawirisMember
Professional backgroundEgyptian national born in 1961, Nassef Sawiris was elected to the Board of Directors of LafargeHolcim Ltd in 2015. He holds a Bachelor of Economics from the University of Chicago.Nassef Sawiris was a Member of the Board of Directors of Lafarge S.A. from 2008 to 2015 and was a Member of the equivalent Committees.Nassef Sawiris is the Chief Executive Officer of OCI N.V. a role previously held at Orascom Construction Industries SAE which he joined in 1982. Orascom Construction Industries SAE, where from 2009 he also held the role of Chairman, was the predecessor to OCI N.V.
Other activities and functions• Member of the Board of Directors of Adidas
AG, Herzogenaurach, Germany • Member of the Cleveland Clinic’s International
Leadership Board Executive Committee, Cleveland, USA
• Member of the University of Chicago’s Board of Trustees, Chicago, USA
• Member of the International Council of JP Morgan
• Member of the EXOR Partners Council
Hanne Birgitte Breinbjerg SørensenMember
Professional backgroundDanish national born in 1965, Hanne Birgitte Breinbjerg Sørensen was elected to the Board of Directors of LafargeHolcim Ltd (then “Holcim Ltd”) in 2013. Hanne Birgitte Breinbjerg Sørensen holds an MSc in Economics and Management from the University of Aarhus. She was a Member of the Nomination & Compensation Committee of Holcim Ltd from 2014 to 2015 and has been re-elected in 2016. Until the end of 2013, she was the Chief Executive Officer of Maersk Tankers, Copenhagen and has been Chief Executive Officer of Damco, The Hague, Netherlands, another company of the A.P. Møller-Maersk Group, Copenhagen, Denmark, from 2014 until December 31, 2016. She was a Member of the Board of Directors of Koninklijke Vopak N.V., Rotterdam, the Netherlands, until February 16, 2018.
Other activities and functions• Member of the Board of Directors and
Member of the Nomination and Remuneration Committee of Ferrovial S.A., Madrid, Spain
• Member of the Board of Directors Chairperson of the CSR Committee and Member of the NRC of Delhivery Pvt. Ltd., Gurgaon, India
• Member of the Board of Directors of TCS, Mumbai, India
• Member of the Board of Directors, Chairperson of the Risk Committee and Member of the Stakeholder Relations Committee of Tata Motors Ltd, Mumbai, India
• Member of the Board of Directors of Jaguar Land Rover Automotive PLC, Coventry, UK
• Member of the Board of Directors, Member of the Nomination and Remuneration Committee, and Chairperson of the Audit Committee of Sulzer Ltd, Winterthur, Switzerland
Dieter SpältiMember
Professional backgroundSwiss national born in 1961, Dieter Spälti was elected to the Board of Directors of LafargeHolcim Ltd (then “Holcim Ltd”) in 2003. He studied law at the University of Zurich, Switzerland, where he obtained a doctorate in 1989. He was a Member of the Audit Committee from 2010 to 2015 and of the Governance & Strategy Committee of Holcim Ltd from 2013 to 2015. Dieter Spälti began his professional career as a Credit Officer with Bank of New York in New York NY, USA, before taking up an appointment as Chief Financial Officer of Tyrolit (Swarovski Group), based in Innsbruck, Austria, and Zurich, Switzerland in 1991. From 1993 until 2001, he was with McKinsey & Company, ultimately as a partner, and was involved in numerous projects with industrial, financial, and technology firms in Europe, the USA, and Southeast Asia.In October 2002, he joined Rapperswil-Jona, Switzerland-based Spectrum Value Management Ltd as a partner; the firm administers the industrial and private investments of the family of Thomas Schmidheiny. Since 2006, he has been Chief Executive Officer of Spectrum Value Management Ltd, Rapperswil-Jona, Switzerland.
Other activities and functions• Member of the Board of Directors of Spectrum
Value Management Ltd, Rapperswil-Jona, Switzerland
• Member of the Board of Directors of Schweizerische Cement-Industrie-Aktiengesellschaft, Rapperswil-Jona, Switzerland
108
LafargeHolcim Annual Report 2018 109Governance and Compensation — Board of Directors
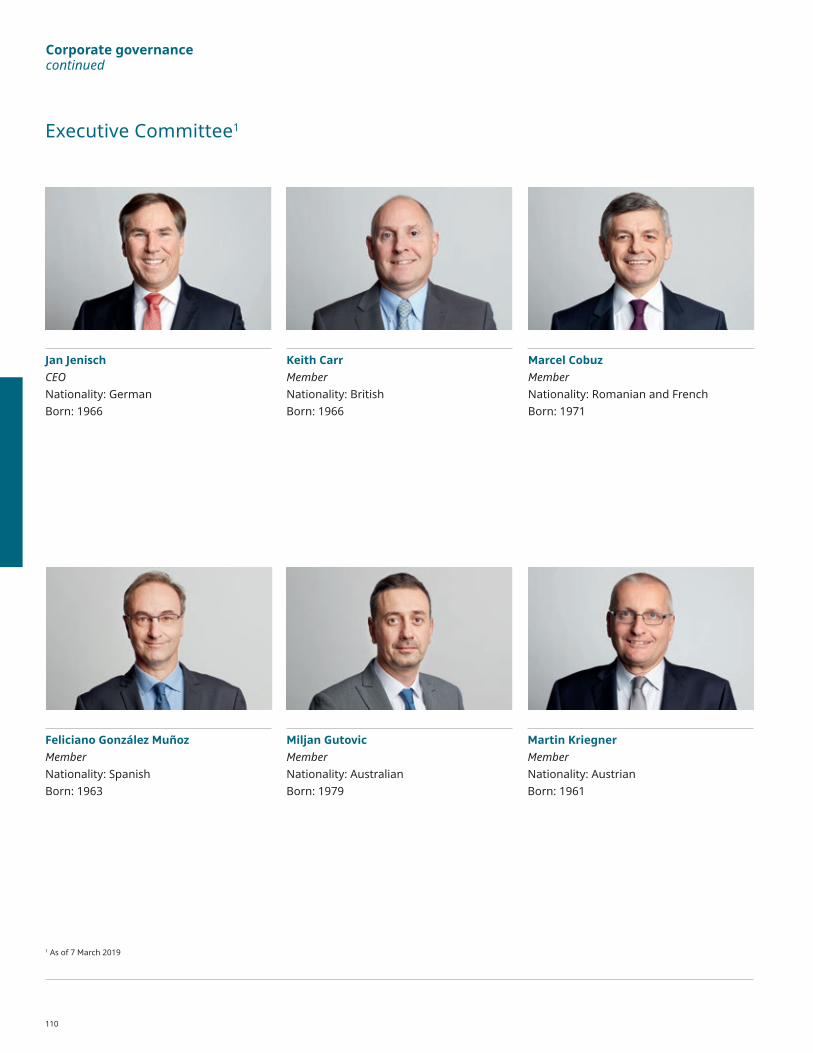
Corporate governancecontinued
Jan JenischCEONationality: GermanBorn: 1966
Keith CarrMemberNationality: BritishBorn: 1966
Executive Committee1
Marcel CobuzMemberNationality: Romanian and FrenchBorn: 1971
Miljan GutovicMemberNationality: AustralianBorn: 1979
Feliciano González MuñozMemberNationality: SpanishBorn: 1963
Martin KriegnerMemberNationality: AustrianBorn: 1961
1 As of 7 March 2019
110

Oliver OsswaldMemberNationality: SwissBorn: 1971
Géraldine PicaudMemberNationality: FrenchBorn: 1970
René Thibault MemberNationality: CanadianBorn: 1966
LafargeHolcim Annual Report 2018 111Governance and Compensation — Executive Committee

Corporate governancecontinued
Jan JenischCEO
Jan Jenisch has been CEO of LafargeHolcim since September 1, 2017. He has studied in Switzerland and the US and is a graduate of the University Fribourg, Switzerland with an MBA (lic. rer. pol.). From 2012 Jan Jenisch served as Chief Executive Officer of Sika AG which develops and manufactures systems and products for the building materials and automotive sector. Under his leadership, Sika expanded into new markets and set new standards of performance in sales and profitability. Jan Jenisch joined Sika in 1996 and went on to work in various management functions and countries. He was appointed to the Management Board in 2004 as Head of the Industry Division and he served as President Asia Pacific from 2007 to 2012. He is a non-executive Director of the stock-listed Schweiter Technologies AG and of the privately held Glas Troesch.
Urs BleischMember
Urs Bleisch has been a member of the Executive Committee of LafargeHolcim (then “Holcim Ltd”) since September 30, 2014 and is responsible for Growth & Performance. He holds a Master’s degree in Business and Economics from the University of Basel. Urs Bleisch joined Holcim in 1994 as Head IT of Holcim Switzerland. From 2000 onward, he assumed Group-wide responsibility for Information Technology and was instrumental in the development and implementation of the global IT strategy of the Holcim Group. Since 2011, he has managed the Information and Knowledge Management function at Holcim Group Support Ltd. In 2012 he was appointed CEO of Holcim Group Services Ltd and of Holcim Technology Ltd. Since July 2015, Urs Bleisch has led the global functions of Cement Industrial Performance, Project Management & Engineering, Logistics, Procurement, Waste Management / Geocycle,
Aggregates and Performance Navigation. In January 2018 he took on additional responsibility for the commercial area, development of innovative products and services as well as the capabilities to bring these solutions to customers around the world.
Marcel CobuzMember
Marcel Cobuz has been a member of the Executive Committee of LafargeHolcim since January 2018 and is responsible for the Europe region. He studied Law and Global Economics at University of Bucharest and has completed Executive Education programs at IMD and INSEAD. Marcel Cobuz joined the company in 2000. At LafargeHolcim, he has held various operational roles in six different countries during which time he established a successful P&L track record. He has been country CEO of Indonesia, Iraq and Morocco. In his various country roles, Marcel has delivered results notably by investing in new offers in building and infrastructure, constructing and operating new plants and managing joint ventures and partnerships in listed companies. In Group roles between 2012 and 2015, he was instrumental in leading organizational change in marketing across Lafarge before heading up the Global Pre-Merger Integration Project between Lafarge and Holcim.
Miljan GutovicMember
Miljan Gutovic has been a member of the Executive Committee of LafargeHolcim since July 2018 and is responsible for the Middle East Africa region. He holds a Bachelor's degree in Civil Engineering and a PhD in Engineering from the University of Technology in Sydney. Initially joining LafargeHolcim as Head of Marketing & Innovation, Miljan Gutovic was responsible for product development and commercial solutions. With over 13 years of experience in the building materials sector, Miljan Gutovic has a successful track record in developing and executing growth strategies as a General Manager in the Middle East and Australia.
Martin KriegnerMember
Martin Kriegner has been a member of the Executive Committee of LafargeHolcim since August 2016 and is Region Head for Asia. He is a graduate of Vienna University with a Doctorate in Law and he obtained an MBA at the University of Economics in Vienna. Martin Kriegner joined the Group in 1990 and became the CEO of Lafarge Perlmooser AG, Austria in 1998. He moved to India as CEO of the Lafarge operations in 2002 and later served as Regional President Cement for Asia, based in Kuala Lumpur. In 2012, he was appointed CEO of Lafarge India for Cement, RMX and Aggregates. In July 2015 he became Area Manager Central Europe for LafargeHolcim operations and was appointed Head of India in 2016. Effective January 2018, Martin Kriegner is Region Head Asia, including Australia and New Zealand.
Oliver OsswaldMember
Oliver Osswald has been a member of the Executive Committee of LafargeHolcim since August 2016 and is responsible for Central and South America. He is a graduate of the Technische Hochschule in Ulm and holds an Executive Education Degree from Harvard Business School. Oliver Osswald joined Holcim Apasco in Mexico in 1995. He has been responsible for a number of plants in Switzerland and in Germany between 1999 and 2005. From 2005 to 2010, he held management and marketing positions in Holcim Switzerland. He was appointed Commercial Director for Holcim Apasco in Mexico in 2012 before being appointed Country Head for Argentina in 2014.
Géraldine PicaudMember
Géraldine Picaud has been Chief Financial Officer of LafargeHolcim since January 2018. She holds a Master Degree in Business Administration from Reims Business School. Géraldine Picaud joined the Group from CAC 40-listed ophthalmic optics company Essilor
Executive Committee1 continued
112

International, where she was Group CFO. Prior to that she was CFO of Volcafe Holdings, the Switzerland-based coffee business of ED&F Man. Géraldine initially joined ED&F Man in London in 2007 as Head of Corporate Finance in charge of M&A. This followed 13 years as CFO at international specialty chemicals group, Safic Alcan as Head of Business Analysis and then as CFO. Géraldine Picaud started her career with audit firm Arthur Andersen.
René Thibault Member
René Thibault has been a member of the Executive Committee of LafargeHolcim since January 2018 and is responsible for the North America region. He is a graduate of Queen’s University in civil egineering and has completed the Advanced Management Program at Harvard Business School. René Thibault joined the company in 1989 and has built a strong commercial track record, with a particular expertise in downstream offerings to customers. After progressing through leadership roles in Canada, in 2007 René served as Vice President, Strategy for Europe, Middle East and Africa based in France. Returning to Canada in 2009, he led the Western Canada, aggregates and concrete businesses. In 2012, adding the cement business to his control, he was appointed CEO Western Canada.
The following Executive Committee members joined after the end of 2018
Keith CarrMember
Keith Carr became a member of the Executive Committee of LafargeHolcim as of January 2019 and is Head of Legal and Compliance. Keith Carr joined LafargeHolcim in 2017 as Group General Counsel. In addition to the Legal and Compliance function, he became responsible for the Security function during 2018. Prior to LafargeHolcim Keith Carr was General Counsel of GE’s Power Division. Before that he held various roles in Alstom SA, ABB and Rolls Royce, including Group General Counsel and member of the Executive Committee of Alstom and General Counsel of its Power Division. A UK national, he gained his LLB degree from Northumbria University, is a qualified solicitor in England and Wales and is a Chartered Company Secretary.
Feliciano González MuñozMember
Feliciano González Muñoz became a member of the Executive Committee of LafargeHolcim as of January 2019 and is Head of Human Resources. He has worked for more than eleven years in senior human resources (HR) roles with LafargeHolcim. Before becoming Head HR in 2018, Feliciano González Muñoz was HR Director for Europe and interim CEO of Spain from 2013-2015. Feliciano González Muñoz has a PhD in Law from Universidad Complutense de Madrid and holds an Executive MBA from Instituto de Empresas, Madrid. Before joining LafargeHolcim Feliciano developed his career at Fujitsu Ltd, BPB Plc and Almirall.
LafargeHolcim Annual Report 2018 113Governance and Compensation — Executive Committee

Compensation report
The executive compensation structure is well-balanced by rewarding short-term and long-term performance, by combining absolute and relative as well as financial and non-financial performance indicators and by delivering compensation through a mix of cash and equity. To provide further alignment with shareholders, executives are expected to build a minimum level of LafargeHolcim share ownership over time.
Director and executive compensation is designed to reinforce the LafargeHolcim strategy by helping the company attract, motivate and retain talent while aligning their interests with those of shareholders.
The Compensation report provides detailed information on the compensation programs at LafargeHolcim, on the compensation awarded to the members of the Board of Directors and the Executive Committee in 2018 and on the governance framework around compensation. It is written in accordance with the Ordinance against Excessive Compensation in Listed Stock Corporations (OaEC), the standard relating to information on Corporate Governance of the SIX Swiss Exchange and the principles of the Swiss Code of Best Practice for Corporate Governance of economiesuisse.
114
Dear shareholders,I am pleased to share with you the LafargeHolcim Compensation report for the financial year 2018, which was prepared in accordance with applicable laws, rules and regulations. As the leading global construction materials and solutions company, we aim to be an employer of choice for our employees. This is supported by our compensation framework that is designed to attract, motivate and retain the qualified talent needed to succeed globally while providing excellent returns to our shareholders.
In 2018 our momentum accelerated in the second half of the year, during which we exceeded our sales targets. Profitability increased over-proportionally as we completed a very successful year. There were also several personnel changes within the Executive Committee in 2018. Effective January 2018, Géraldine Picaud started as the new Chief Financial Officer. The positions of Head of Performance & Cost and Head of Growth & Innovation were combined into one role. Marcel Cobuz was nominated Head of Europe and René Thibault was nominated Head of North America. In May 2018, Caroline Luscombe left the Group and was not immediately replaced in the Executive Committee. Finally, in July 2018, Miljan Gutovic was promoted to the position of Head of Middle East & Africa.
In 2018, the Nomination, Compensation and Governance Committee (NCGC) appointed a new independent compensation advisor, engaged with a number of our large shareholders and conducted a strategic review of the compensation programs applicable to the Executive Committee in order to ensure their continuous alignment to the business strategy and to shareholders’ interests. As a result of this review, the
NCGC concluded that while no fundamental change was necessary to the design of the compensation plans, certain governance aspects should be reinforced from 2019 onwards:• Revised termination rules in the annual
incentive plan;• Introduction of clawback and malus
provisions in the annual incentive plan;• Strengthening of the existing share
ownership guideline.
Furthermore, the overall design of the incentive plans has been confirmed as communicated in last year’s Compensation report:• Annual incentive: based on financial
performance (85%) including relative performance of LafargeHolcim compared to peer companies, as well as Health & Safety (15%). The Annual Incentive is paid out half in cash and half in blocked shares.
• Long-term incentives: combination of performance shares subject to a three-year vesting based on earnings per share (EPS) before impaiment and divestments and return on invested capital (ROIC) performance, and performance options subject to a five-year vesting based on total shareholder return (TSR) results.
Otherwise, the NCGC performed its regular activities throughout the year such as the succession planning for the positions on the Board of Directors and the Executive Committee, the performance goal setting at the beginning of the year and the performance assessment at year end, the determination of the compensation of the members of the Board of Directors and the Executive Committee, as well as the preparation of the Compensation report and of the say-on-pay vote at the Annual General Meeting. You will find further details about the NCGC's activities during the reporting year and the compensation programs in
this report. This Compensation report will be submitted to a consultative shareholder vote at the Annual General Meeting 2019.
Looking ahead, we will continue to assess and review our compensation system to ensure that it is still fulfilling its purpose in the evolving context in which the company operates and is well aligned with our shareholders’ interests. We will also maintain an open dialog with our shareholders and their representatives. We would like to thank you for sharing your perspectives on executive compensation with us and trust that you will find this report informative.
Oscar FanjulChairman of the Nomination, Compensation and Governance Committee (NCGC)
Oscar FanjulChairman of the Nomination, Compensation and Governance Committee (NCGC)
LafargeHolcim Annual Report 2018 115Governance and Compensation — Compensation report
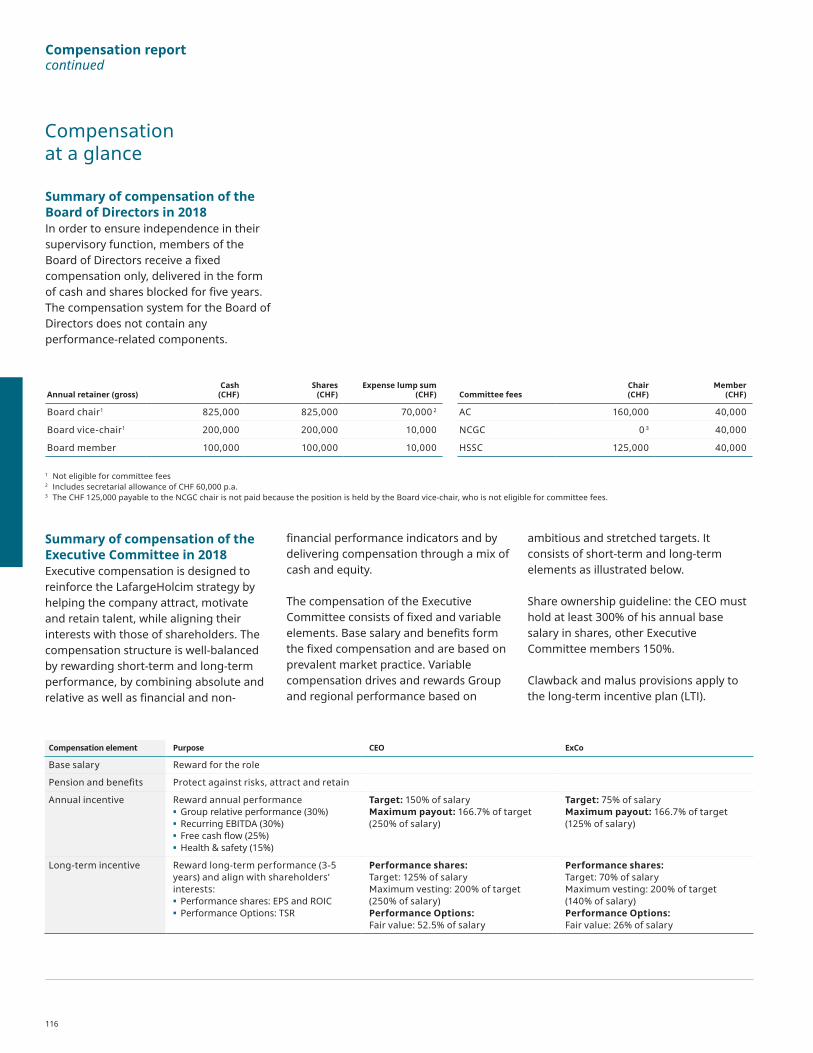
Compensation at a glance
Annual retainer (gross)Cash
(CHF)Shares
(CHF)Expense lump sum
(CHF) Committee feesChair (CHF)
Member (CHF)
Board chair1 825,000 825,000 70,000 2 AC 160,000 40,000
Board vice-chair1 200,000 200,000 10,000 NCGC 0 3 40,000
Board member 100,000 100,000 10,000 HSSC 125,000 40,000
1 Not eligible for committee fees2 Includes secretarial allowance of CHF 60,000 p.a.3 The CHF 125,000 payable to the NCGC chair is not paid because the position is held by the Board vice-chair, who is not eligible for committee fees.
Summary of compensation of the Executive Committee in 2018Executive compensation is designed to reinforce the LafargeHolcim strategy by helping the company attract, motivate and retain talent, while aligning their interests with those of shareholders. The compensation structure is well-balanced by rewarding short-term and long-term performance, by combining absolute and relative as well as financial and non-
Summary of compensation of the Board of Directors in 2018In order to ensure independence in their supervisory function, members of the Board of Directors receive a fixed compensation only, delivered in the form of cash and shares blocked for five years. The compensation system for the Board of Directors does not contain any performance-related components.
Compensation element Purpose CEO ExCo
Base salary Reward for the role
Pension and benefits Protect against risks, attract and retain
Annual incentive Reward annual performance • Group relative performance (30%)• Recurring EBITDA (30%)• Free cash flow (25%)• Health & safety (15%)
Target: 150% of salaryMaximum payout: 166.7% of target (250% of salary)
Target: 75% of salaryMaximum payout: 166.7% of target (125% of salary)
Long-term incentive Reward long-term performance (3-5 years) and align with shareholders’ interests:• Performance shares: EPS and ROIC• Performance Options: TSR
Performance shares: Target: 125% of salaryMaximum vesting: 200% of target (250% of salary)Performance Options: Fair value: 52.5% of salary
Performance shares: Target: 70% of salaryMaximum vesting: 200% of target (140% of salary)Performance Options: Fair value: 26% of salary
financial performance indicators and by delivering compensation through a mix of cash and equity.
The compensation of the Executive Committee consists of fixed and variable elements. Base salary and benefits form the fixed compensation and are based on prevalent market practice. Variable compensation drives and rewards Group and regional performance based on
ambitious and stretched targets. It consists of short-term and long-term elements as illustrated below.
Share ownership guideline: the CEO must hold at least 300% of his annual base salary in shares, other Executive Committee members 150%.
Clawback and malus provisions apply to the long-term incentive plan (LTI).
116
Compensation reportcontinued

Compensation periodApproved amount
(CHF)Effective amount
(CHF)
AGM 2017 – AGM 2018 5,400,000 5,085,662
AGM 2018 – AGM 2019 4,800,000 To be determined 1
1 The compensation period is not yet completed; a definitive assessment will be provided in the Compensation report 2019
Compensation periodApproved amount
(CHF)Effective amount
(CHF)
Financial year 2018 40,500,000 30,413,194
Compensation of the Board of Directors in 2018The compensation awarded to the Board of Directors in financial year 2018 is within the limits approved by the shareholders at the Annual General Meeting. The compensation period is not yet completed, a definitive assessment will be provided in the 2019 Annual Report.
Compensation of the Executive Committee for 2018The compensation awarded to the Executive Committee in financial year 2018 is within the limits approved by the shareholders at the Annual General Meeting 2017.
Summary of performance in 2018For 2018 the company’s Net Sales increased by 5.1% on a like-for-like basis, and Recurring EBITDA increased by 3.6%, also like-for-like.
• Annual incentive 2018: payout of 81.5% of target on average for the Executive Committee
• Long-term incentive: the performance shares granted in 2015 due to vest in 2018 forfeited, while the vesting level of the performance options granted in 2015 was 70%.
Changes from 2019 onwards• Annual incentive: increase of the
maximum payout from 166.7% to 200% of target bonus, amended termination rules and introduction of clawback and malus provisions.
• Long-term incentive: vesting of performance options based on relative TSR instead of absolute TSR.
• Share ownership guideline: increase from 300% to 500% of annual base salary for the CEO and increase from 150% to 200% for the other Executive Committee members.
Compensation governance• Authority for decisions related to
compensation are governed by the Articles of Incorporation and the Organizational Regulations of LafargeHolcim as described in the Corporate Governance section.
• The prospective maximum aggregate amounts of compensation of the Board of Directors and of the Executive Committee are subject to binding shareholders’ votes at the Annual General Meeting.
• The Compensation report is subject to a consultative vote by the shareholders at the Annual General Meeting.
• The Board of Directors is supported by the NCGC for all matters related to compensation and governance. The NCGC members are elected annually by the shareholders at the Annual General Meeting.
LafargeHolcim Annual Report 2018 117Governance and Compensation — Compensation report

Compensation model of the Board of Directors
Annual retainer (gross)Cash compensation
in CHF
Share-based Compensation 2
in CHFExpense allowance
in CHFSecretarial allowance
in CHF
Board chair 1 825,000 825,000 10,000 60,000
Board vice chair 1 200,000 200,000 10,000
Board member 100,000 100,000 10,000
Committee fees (gross)Cash compensation
in CHF
Audit Committee chair 160,000
Other Committee chairs 1 (NCGC, HSSC) 125,000
Committee member 1 40,0001 The Board chair and vice chair are not eligible for committee fees.2 Converted into shares based on the average share price between 1 January 2019 and 15 February 2019.
Compensation system: Board of Directors
To guarantee their independence in exercising their supervisory duties, the members of the Board of Directors receive fixed compensation only and do not participate in LafargeHolcim’s employee benefits plan. Part of the compensation is paid in shares which are blocked from sale and pledging for a period of five years in order to strengthen the alignment with shareholders’ interests.
The Board compensation consists of an annual retainer as Board chair, Board vice-chair or Board member and additional fees for assignments to the committees of the Board either as chair or member. The Board chair and vice-chair are not eligible for committee fees. The annual retainer is paid partially in cash and partially in shares subject to a five-year restriction period (prohibition of sale or pledging). The committee fees are
paid in cash. Additionally, a lump sum expense allowance is paid in cash and the Board chair receives a secretarial allowance. The members of the Board of Directors receive no additional reimbursements of business expenses beyond travel costs from abroad.
Cash compensation is paid quarterly for the Board members and monthly for the Board chair. The shares are transferred in March for the current term (year) of office.
In exceptional circumstances, additional fees are payable to Board members when an exceptional workload beyond the regular function of the Board is required. In the reporting year, no such exceptional fees were paid.
118
Compensation reportcontinued

Compensation system: Executive Committee
Principle Description
Pay-for-performance Rewards for short-term performance and long-term success, by a balanced combination of absolute and relative performance criteria, as well as of financial and non-financial performance metrics.
Alignment with shareholders
Part of compensation is delivered in equity of the company, thus strengthening the alignment with shareholders’ interests. Further, executives are expected to build a minimum level of LafargeHolcim share ownership over time.
Market competitiveness
Compensation is competitive with other companies against which LafargeHolcim competes for talent.
Internal equity Compensation decisions are taken with consideration to internal equity and consistency.
Transparency Compensation programs are simple and transparent.
Compensation model of the Executive Committee
Element Purpose Structure DriversPerformance measures
Base salary Attract and retain Fixed amount paid monthly in cash
– Role & responsibilities– Market value – Experience
Pensions and insurances
Protect against risks Pension contributions and benefits, insurances
– Market practice – Role
Benefits Attract and retain – Perquisites– Car or allowance– Relocation benefits
– Market practice – Role
Annual Incentive Reward for short-term performance
Variable amount paid half in cash and half in shares blocked for 3 years
Annual financial and non-financial performance
– Relative sales growth– Relative EBITDA growth– Recurring EBITDA– Free cash flow– Health & safety
Long-Term Incentive (LTI)
– Reward long-term performance
– Align with shareholders– Retain
– Performance shares subject to a three-year vesting
– Performance options subject to a five-year vesting
Long-term financial performance
– EPS– ROIC– TSR
Executive compensation is designed to reinforce the LafargeHolcim strategy by helping the company attract, motivate and retain talent, while aligning their interests
with those of shareholders. The compensation programs are built around the following principles:
The compensation for members of the Executive Committee includes the following elements:
• Annual base salary • Pensions and benefits • Variable compensation: annual and
long-term incentives
LafargeHolcim Annual Report 2018 119Governance and Compensation — Compensation report

Base salariesAnnual base salaries are established on the basis of the following factors:• Scope, size, and responsibilities of the
role; skills required to perform the role;• External market value of the role;• Skills, experience and performance of
the individual in the role.
To ensure market competitiveness, base salaries of the Executive Committee are reviewed annually taking into consideration the company’s affordability, benchmark information, internal consistency and individual performance. The objective is to provide salaries broadly in line with the competitive market practice of selected comparable SMI companies (refer to section “Compensation Governance” for further details on the benchmarking peer group).
PensionThe members of the Executive Committee participate in the benefits plans available in the country of their employment contract. Benefits consist mainly of retirement, insurance and healthcare plans that are designed to provide a reasonable level of protection for the employees and their dependents with regards to health, retirement, death and disability. The members of the Executive Committee with a Swiss employment contract participate in LafargeHolcim’s defined benefit pension scheme applicable to Swiss-based senior management, which is set up to achieve, for executives retiring from LafargeHolcim at age 62 and assuming 10 years of service in senior management and 20 years of service with the Group, an amount of 40% of the average of the last 3 years’ base salaries, inclusive of all other pension incomes participants may benefit from. Early or deferred retirement pensions are adjusted based on actuarial calculations. The members of the
Executive Committee under foreign employment contracts are insured commensurately with market conditions and with their position. Each plan varies in line with the local competitive and legal environment and is, as a minimum, in accordance with the legal requirements of the respective country.
Benefits and perquisitesMembers of the Executive Committee may receive certain executive perquisites such as a company car or allowances and other benefits in kind, in line with competitive market practice in their country of contract. Executives who are relocating may also be provided with expatriate benefits such as housing, schooling and travel benefits, in line with the LafargeHolcim International Mobility policy. These other elements of compensation are evaluated at fair value and included in the compensation tables.
Annual incentiveThe annual incentive rewards the financial results as well as the achievement of health & safety targets at Group and regional level (depending on the function) over a time horizon of one year.
The annual incentive target (i.e. incentive amount at 100% target achievement) is expressed as percentage of base salary and amounts to 150% for the CEO and 75% for the other members of the Executive Committee. The payout is
capped at 166.7% of target, i.e. 250% of base salary for the CEO and 125% of the base salary for the other Executive Committee members.
The financial performance is measured both in absolute terms (against own-set targets) and in relative terms compared to a peer group of companies that are exposed to similar market cycles.• The absolute financial performance
includes Recurring EBITDA as a measure of Group and regional operational profitability, as well as Free Cash Flow as a measure of the company’s ability to generate cash. For those objectives, the NCGC determines a target level of expected performance (corresponding to a 100% payout), as well as a threshold level of performance below which there is no payout, and a maximum level of performance above which the payout is capped.
• The relative financial performance includes Group revenue growth and Group Recurring EBITDA growth compared to peer companies. The intention is to reward the relative performance of the company to neutralize factors outside of management control. The objective is to reach at least median performance within the peer group, which corresponds to a 100% payout factor. The peer group includes companies that were chosen for their comparable products, technologies, customers,
Cement producers Building materials Construction
BoralBuzzi UnicemCemex CRHHeidelberg CementVicat
CarlisleJames HardieRPMSaint-GobainSika
AccionaACSBouyguesVinci
120
Compensation reportcontinued

Design of the annual incentive 2018
Role CEO Other Executive Committee members
Target opportunity 150% of salary 75% of salary
Maximum opportunity 250% of salary 125% of salary
Metrics Relative group performanceRecurring EBITDA (group or region)*
Free cash flow (group or region)*
Health & safety factor (group or region)*
Purpose Measures Group’s performance compared to peer companies exposed to similar market cycles
Measures Group or regional operational profitability
Measures the company’s ability to generate cash
Measure the accident rate to ensure a safe workplace
Definition Relative Group revenue growth (50%) and relative Group recurring (EBITDA) growth (50%) expressed as percentile ranking in the peer group of companies
Operating profit before depreciation, amortization and impairment of operating assets and before restructuring, litigation, implementation and other non-recurring costs, at budget FX rate, adjusted for changes in scope
Cash flow from operating activities, adjusted for net maintenance and expansion capital expenditures
Lost-time injury frequency rate (LTIFR) and overall health & safety outcomes as per assessment by the NCGC
Weighting 30% 30% 25% 15%
Payout formula
0%25th
percentile75th
percentileTarget
167%
42%
100%
0%90%
of target110%
of targetTarget
167%
42%
100%
0%90%
of target110%
of targetTarget
167%
42%
100%
0%2017 LTIFR
90% of 2017 LTIFR
95% of 2017 LTIFR
167%
42%
100%
* Group level for corporate Executive Committee roles, regional level for regional Executive Committee roles
suppliers or investors and are thus exposed to similar market cycles. The companies of the peer group are listed on page 120.
The measurement of the relative performance is provided by Obermatt, an independent Swiss financial research firm focused on indexing company performance.
The achievement of the health & safety target is measured as a score reflecting improvements in the lost-time injury frequency rate (LTIFR). The NCGC will also consider the overall related outcomes during the year when determining the achievement level of this objective.
The annual incentive is paid half in cash and half in shares subject to a three-year blocking period.
The annual incentive design applicable to the Executive Committee is summarized below:
LafargeHolcim Annual Report 2018 121Governance and Compensation — Compensation report

Long-term incentives Our compensation philosophy is to align a significant portion of compensation of the Executive Committee with long-term company performance and to strengthen alignment with shareholders’ interests. In order to support the Strategy 2022 – “Building for Growth” business strategy, the grant awarded under the long-term incentive consists of both performance shares and performance options.
Performance shares Performance shares are subject to a three-year vesting period based on Group Earnings per Share (EPS) before impairment and divestments and Group Return on Invested Capital (ROIC). These performance metrics have been chosen as they reflect the strategic priorities of the Group to increase profitability through strong operating leverage (EPS before impairment and divestments) and to improve how the company generates profits relative to the capital it has invested in its business (ROIC). For both metrics, the NCGC determines a threshold performance level (below which there is no vesting), a target level (vesting of 100%) and a stretch performance level (vesting of 200%). Between these levels, vesting is calculated on a straight-line basis, as for previous performance share awards.
Changes for 2019Starting with financial year 2019, the annual incentive will be amended as follows:• Payout curve: the payout maximum
will be increased from 166.7% to 200% of target bonus as communicated previously.
• Termination provisions: a member of the Executive Committee who is leaving the company and has a contractual entitlement to the annual incentive during the notice period may receive the annual incentive payment on a pro-rata basis for the number of months of employment during the financial year and based on the effective performance level (determined after year-end) but not to exceed the target incentive amount. Previously, Executive Committee members who left the company and had a contractual entitlement to the annual incentive during the notice period received a pro-rata payout at target level at the end of their employment. Based on shareholders’ feedback, the decision was made to not accelerate the incentive payout but to wait for the end of the year so that effective performance can be measured.
• Clawback and malus provisions will be introduced in the annual incentive. In case of financial restatement due to non-compliance to the accounting standards and/or fraud, or in case of violation of law and/or internal rules by a participant, the Board of Directors may deem all or part of the annual incentive to forfeit (malus) or may seek reimbursement of all or part of any paid annual incentive (clawback). Those provisions apply during three years of any year subject to a financial restatement or during which the fraudulent behavior happened.
Performance optionsIn 2018, performance options are subject to a five-year vesting period based on LafargeHolcim’s total shareholder return (TSR) and have a maturity of ten years. Threshold vesting (25% of maximum) will be achieved for a TSR of 35%, target vesting (50% of maximum) will be achieved for a TSR of 40% and full vesting will be achieved for a stretch TSR of 50% at the end of the five-year period. The vesting level between threshold, target and stretch TSR will be calculated on a straight-line basis. Should the stretch 50% TSR target be achieved before the end of the five-year period, the options will vest at that moment but no earlier than three years from the grant date. The decision to replace the former relative TSR performance shares by performance options was driven by the intention to further strengthen the link between the compensation of the Executive Committee and the shareholders’ interests in the context of the new, growth-orientated business strategy.
122
Compensation reportcontinued

Design of the long-term incentive
Role CEO Other Executive Committee members
Grant value in 2018177% of salary (125% in performance shares, 52.5% in performance options)
96% of salary (70% in performance shares, 26% in performance options)
Metrics EPS before impairment and divestments ROIC (Performance Shares) TSR (Performance Options)
Purpose Measures the company’s profitability to investors
Measures the company’s ability to generate returns from invested capital
Measures the company’s ability to provide investors with strong returns
Definition Underlying, fully-diluted EPS adjusted for after tax gains and losses on disposals of Group companies and impairments of goodwill and assets
ROIC improvement at year end 2020, adjusted for changes in scope between 2018 and 2020
LafargeHolcim’s Annual 3-month average TSR of 50% at the end of 2022 (or earlier but not before three years from the grant date)
Weighting 60% of Performance Share grant 40% of Performance Share grant 100% of Performance Option grant
Performance period 2020 2020 2018 – 2022
Performance vesting
0%Target–5.3%
Target+11.3%
Target
200%
150%
50%
100%
0%Target–100bps
Target+100bps
Target
200%
150%
50%
100%
0%TSR35%
TSR50%
TSR40%
100%
50%
Maximum vesting level 200% 200% 100%
Absolute targets are not disclosed as they could give an unfair competitive advantage to our competitors. They are in line with the guidance given to investors and will be disclosed at vesting
The annual grant value is expressed as percentage of base salary and amounts to 177% for the CEO and 96% for the other members of the Executive Committee.
The long-term incentive design applicable to the Executive Committee is summarized below:
LafargeHolcim Annual Report 2018 123Governance and Compensation — Compensation report
The LTI awards are subject to clawback and malus provisions for a period of three-year after vesting, in case of material financial restatement.
Rules in case of termination: the unvested LTI awards forfeit upon termination of employment, except in case of retirement, ill-health, disability, termination due to a change of control, or at the discretion of the Nomination, Compensation and Governance Committee. In such circumstances, unvested LTI awards are subject to a pro-rata vesting (for the number of full months between grant date and termination date) at regular vesting date. In the event of death, vesting is immediate and performance conditions are considered met. For the avoidance of doubt, LTI awards always lapse when termination is due to voluntary resignation or gross misconduct.
Employment contracts for the Executive Committee The contracts of employment of the Executive Committee members are concluded for an indefinite period of time and may be terminated with one year’s notice. Contracts of employment do not include severance compensation or change of control clauses except the vesting provisions of the LTI awards as described above.
Changes for 2019Following the strategic review of compensation conducted by the NCGC in the reporting year, the decision was made to strengthen the share ownership guideline as follows, effective on 1 January 2019:• CEO: 500% of annual base salary• Executive Committee members: 200%
of annual base salary
Members of the Executive Committee will be expected to meet the minimum shareholding requirements within four years of their appointment to the Executive Committee (or within four years of the implementation of the new guideline for existing Executive Committee members). In case of non-compliance to the minimum requirements at the required date, Executive Committee members will be prohibited to sell any shares held. Further, their annual incentive (net of statutory deductions) will be paid entirely in shares. The compliance to the share ownership guidelines will be monitored on an annual basis.
Changes for 2019The vesting of performance options will be based on relative TSR instead of absolute TSR. The peer group of companies will be the same as the peer group used for relative performance measurement in the annual incentive.
Executive share ownership guidelines To reflect the importance the NCGC places on aligning their interests with shareholders, Executive Committee members are required to own at least a minimum multiple of their annual base salary in LafargeHolcim shares as set out below:• CEO: 300% of annual base salary• Executive Committee members: 150% of
annual base salary
124
Compensation reportcontinued

C: Commitee chairM: Member
AC: Audit Committee NCGC: Nomination, Compensation and Governance Committee HSSC: Health, Safety & Sustainability Committee
Compensation for the financial year 2018
The tables on page 125 and 127 were audited according to Article 17 of the Ordinance against Excessive Compensation in Listed Stock Corporations.
Board of Directors
Positions as per 31 December
Share-Based compensation
Name AC NCGC HSSC
Cash compensation
CHF NumberValue
CHFOther 2
CHFSubtotal
CHF
Social Security 3
CHF2018 Total
CHF2017 Total
CHF
Beat Hess 783,333 17,096 783,333 70,000 1,636,666 0 1,636,666 1,952,275
Oscar Fanjul C 233,333 4,365 200,000 10,000 443,333 0 443,333 415,001
Bertrand Collomb 1 58,334 909 41,667 4,167 104,168 0 104,168 260,144
Paul Desmarais, Jr. M 140,000 2,182 100,000 10,000 250,000 0 250,000 250,000
Patrick Kron C M 250,000 2,182 100,000 10,000 360,000 4,336 364,336 175,591
Gérard Lamarche M 192,083 2,182 100,000 10,000 302,083 0 302,083 375,000
Adrian Loader M C 265,000 2,182 100,000 10,000 375,000 0 375,000 322,917
Jürg Oleas M 140,000 2,182 100,000 10,000 250,000 12,118 262,118 233,333
Nassef Sawiris M 175,416 2,182 100,000 10,000 285,416 0 285,416 351,667
Thomas Schmidheiny 1 58,334 909 41,667 4,167 104,168 0 104,168 242,623
Hanne B. Sørensen M M 180,000 2,182 100,000 10,000 290,000 0 290,000 273,333
Dieter Spälti M M 215,416 2,182 100,000 10,000 325,416 4,336 329,752 394,999
Total 2,691,249 40,735 1,866,667 168,334 4,726,250 20,790 4,747,040 5,246,8831 Board member until May 8, 20182 Expense allowances and Secretarial allowance for the Board chair3 Includes mandatory employer contributions of CHF 8,672 for two members under the Swiss governmental social security system (AHV). This amount is out of total employer
contributions of CHF 125,747 paid for all Board Members, and provides a right to the maximum future insured government pension benefit.
LafargeHolcim Annual Report 2018 125Governance and Compensation — Compensation report

Compensation for the financial year 2018In 2018, twelve non-executive members of the Board of Directors received in total compensation of CHF 4.7 million including mandatory social security payments (2017: CHF 5.2 million) of which CHF 2.7 million (2017: CHF 3.2 million) was paid in cash, CHF 0.02 million (2017: CHF 0.1 million) in the form of social security contributions, and CHF 1.9 million (2017: CHF 2.0 million) in shares. Other compensation paid totaled CHF 0.2 million (2017: CHF 0.2 million).
The compensation of the Board of Directors was lower in 2018 than in 2017 due to discontinuation of additional fees and time commitment to organize the CEO succession in 2017.
At the Annual General Meeting 2017, shareholders approved a maximum aggregate amount of compensation of
CHF 5,400,000 for the Board of Directors for the term until the Annual General Meeting 2018. The compensation paid to the Board for this term was CHF 5,085,662 (excluding mandatory social security payments) and is therefore within the approved limits.
At the AGM 2018, shareholders approved a maximum aggregate amount of compensation of CHF 4,800,000 for the Board of Directors for the term until the Annual General Meeting 2019. The compensation paid to the Board of Directors for this term is anticipated to be approx. CHF 4,8 million (excluding mandatory social security payments). The final amount will be disclosed in the 2019 Annual Report.
126
Compensation reportcontinued
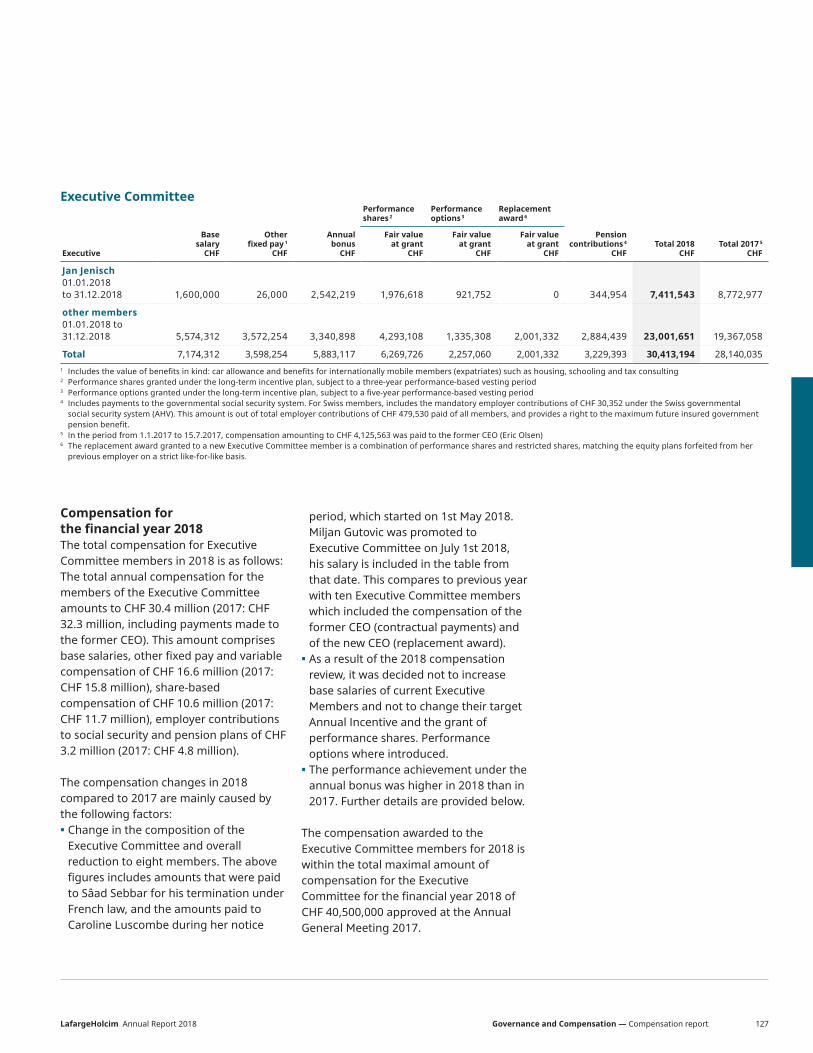
Executive CommitteePerformance shares 2
Performance options 3
Replacement award 6
Executive
Base salary
CHF
Other fixed pay 1
CHF
Annual bonus
CHF
Fair value at grant
CHF
Fair value at grant
CHF
Fair value at grant
CHF
Pension contributions 4
CHFTotal 2018
CHFTotal 2017 5
CHF
Jan Jenisch 01.01.2018to 31.12.2018 1,600,000 26,000 2,542,219 1,976,618 921,752 0 344,954 7,411,543 8,772,977
other members 01.01.2018 to 31.12.2018 5,574,312 3,572,254 3,340,898 4,293,108 1,335,308 2,001,332 2,884,439 23,001,651 19,367,058
Total 7,174,312 3,598,254 5,883,117 6,269,726 2,257,060 2,001,332 3,229,393 30,413,194 28,140,0351 Includes the value of benefits in kind: car allowance and benefits for internationally mobile members (expatriates) such as housing, schooling and tax consulting2 Performance shares granted under the long-term incentive plan, subject to a three-year performance-based vesting period3 Performance options granted under the long-term incentive plan, subject to a five-year performance-based vesting period4 Includes payments to the governmental social security system. For Swiss members, includes the mandatory employer contributions of CHF 30,352 under the Swiss governmental
social security system (AHV). This amount is out of total employer contributions of CHF 479,530 paid of all members, and provides a right to the maximum future insured government pension benefit.
5 In the period from 1.1.2017 to 15.7.2017, compensation amounting to CHF 4,125,563 was paid to the former CEO (Eric Olsen)6 The replacement award granted to a new Executive Committee member is a combination of performance shares and restricted shares, matching the equity plans forfeited from her
previous employer on a strict like-for-like basis.
Compensation for the financial year 2018The total compensation for Executive Committee members in 2018 is as follows: The total annual compensation for the members of the Executive Committee amounts to CHF 30.4 million (2017: CHF 32.3 million, including payments made to the former CEO). This amount comprises base salaries, other fixed pay and variable compensation of CHF 16.6 million (2017: CHF 15.8 million), share-based compensation of CHF 10.6 million (2017: CHF 11.7 million), employer contributions to social security and pension plans of CHF 3.2 million (2017: CHF 4.8 million).
The compensation changes in 2018 compared to 2017 are mainly caused by the following factors:• Change in the composition of the
Executive Committee and overall reduction to eight members. The above figures includes amounts that were paid to Sâad Sebbar for his termination under French law, and the amounts paid to Caroline Luscombe during her notice
period, which started on 1st May 2018. Miljan Gutovic was promoted to Executive Committee on July 1st 2018, his salary is included in the table from that date. This compares to previous year with ten Executive Committee members which included the compensation of the former CEO (contractual payments) and of the new CEO (replacement award).
• As a result of the 2018 compensation review, it was decided not to increase base salaries of current Executive Members and not to change their target Annual Incentive and the grant of performance shares. Performance options where introduced.
• The performance achievement under the annual bonus was higher in 2018 than in 2017. Further details are provided below.
The compensation awarded to the Executive Committee members for 2018 is within the total maximal amount of compensation for the Executive Committee for the financial year 2018 of CHF 40,500,000 approved at the Annual General Meeting 2017.
LafargeHolcim Annual Report 2018 127Governance and Compensation — Compensation report

Payout of the annual incentive in 2018Metrics Results Payout Percentage
Threshold Target Stretch
Relative Group performance (30%)
With Net Sales growth of 5.1% on a like-for-like basis, LafargeHolcim achieved the 51st percentile in the peer group. With an EBITDA growth of 3.6% on a like-for-like basis, LafargeHolcim achieved the 68th percentile in the peer group.
Net Sales growth
Recurring EBITDA growth
Recurring EBITDA (30%)(Group or regional)
The 2018 Group Recurring EBITDA growth like-for-like was between threshold and target. The regional EBITDA performance was mixed with some regions below threshold (0% payout) and one region just below target (90% payout).
Group Recurring EBITDA
Regional Recurring EBITDA
Free Cash Flow (25%)(Group or regional)
The Group Free Cash Flow was between threshold and target. The regional Free Cash Flow performance was below threshold for all regions except for one where the target was exceeded (120% payout)
Group FCF
Regional FCF
Health & Safety (15%)(Group or regional)
The lost-time injury frequency rate (LTIFR) of 0.79 per million hours worked exceeded expectations. Two regions were below threshold, one above target and two above stretch.
Group LTIFR
Regional LTIFR
Total Overall payout of 106% for the CEO and of 78% on average for the other Executive Committee members
Performance in 2018The company made good progress on all four value drivers of Strategy 2022 – “Building for Growth”. Those results impacted the annual incentive as follows:
128
Compensation reportcontinued
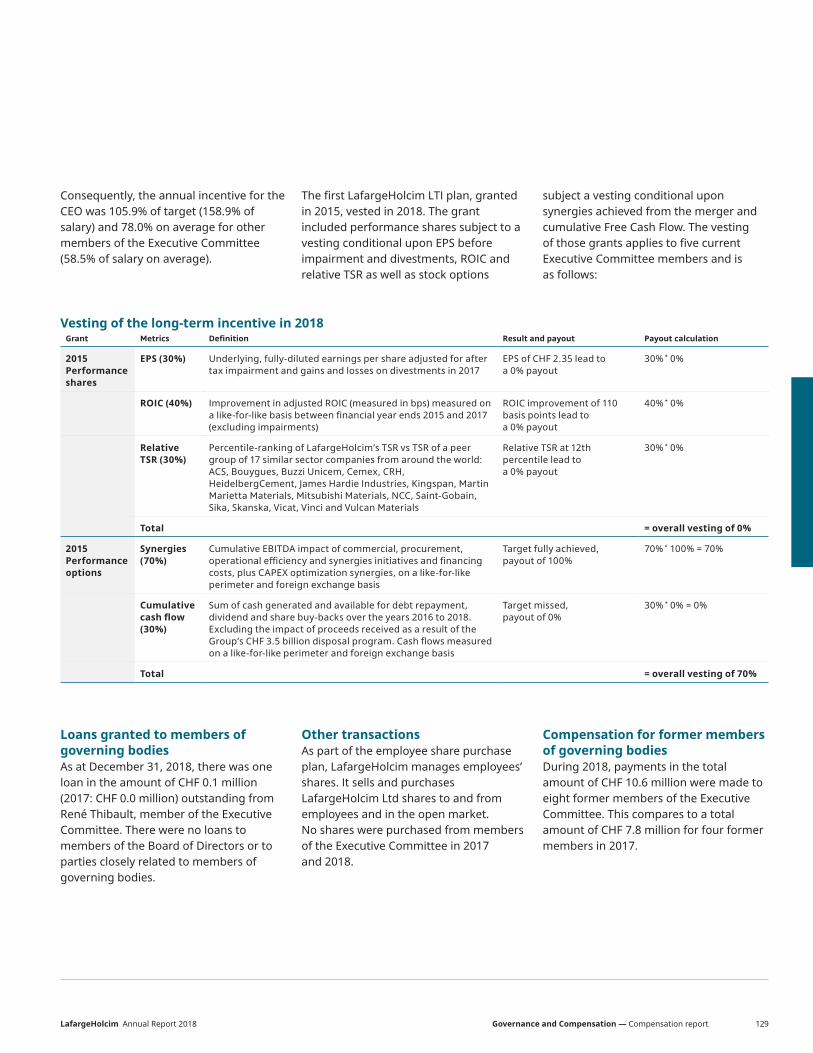
Consequently, the annual incentive for the CEO was 105.9% of target (158.9% of salary) and 78.0% on average for other members of the Executive Committee (58.5% of salary on average).
The first LafargeHolcim LTI plan, granted in 2015, vested in 2018. The grant included performance shares subject to a vesting conditional upon EPS before impairment and divestments, ROIC and relative TSR as well as stock options
Vesting of the long-term incentive in 2018Grant Metrics Definition Result and payout Payout calculation
2015 Performance shares
EPS (30%) Underlying, fully-diluted earnings per share adjusted for after tax impairment and gains and losses on divestments in 2017
EPS of CHF 2.35 lead to a 0% payout
30% * 0%
ROIC (40%) Improvement in adjusted ROIC (measured in bps) measured on a like-for-like basis between financial year ends 2015 and 2017 (excluding impairments)
ROIC improvement of 110 basis points lead to a 0% payout
40% * 0%
Relative TSR (30%)
Percentile-ranking of LafargeHolcim’s TSR vs TSR of a peer group of 17 similar sector companies from around the world: ACS, Bouygues, Buzzi Unicem, Cemex, CRH, HeidelbergCement, James Hardie Industries, Kingspan, Martin Marietta Materials, Mitsubishi Materials, NCC, Saint-Gobain, Sika, Skanska, Vicat, Vinci and Vulcan Materials
Relative TSR at 12th percentile lead to a 0% payout
30% * 0%
Total = overall vesting of 0%
2015 Performance options
Synergies (70%)
Cumulative EBITDA impact of commercial, procurement, operational efficiency and synergies initiatives and financing costs, plus CAPEX optimization synergies, on a like-for-like perimeter and foreign exchange basis
Target fully achieved, payout of 100%
70% * 100% = 70%
Cumulative cash flow (30%)
Sum of cash generated and available for debt repayment, dividend and share buy-backs over the years 2016 to 2018. Excluding the impact of proceeds received as a result of the Group’s CHF 3.5 billion disposal program. Cash flows measured on a like-for-like perimeter and foreign exchange basis
Target missed, payout of 0%
30% * 0% = 0%
Total = overall vesting of 70%
Loans granted to members of governing bodies As at December 31, 2018, there was one loan in the amount of CHF 0.1 million (2017: CHF 0.0 million) outstanding from René Thibault, member of the Executive Committee. There were no loans to members of the Board of Directors or to parties closely related to members of governing bodies.
Other transactions As part of the employee share purchase plan, LafargeHolcim manages employees’ shares. It sells and purchases LafargeHolcim Ltd shares to and from employees and in the open market. No shares were purchased from members of the Executive Committee in 2017 and 2018.
Compensation for former members of governing bodies During 2018, payments in the total amount of CHF 10.6 million were made to eight former members of the Executive Committee. This compares to a total amount of CHF 7.8 million for four former members in 2017.
subject a vesting conditional upon synergies achieved from the merger and cumulative Free Cash Flow. The vesting of those grants applies to five current Executive Committee members and is as follows:
LafargeHolcim Annual Report 2018 129Governance and Compensation — Compensation report

Share ownership information
Board of DirectorsOn December 31, 2018, members of the Board of Directors held a total of 9,658,399 registered shares in LafargeHolcim Ltd. This number comprises privately acquired shares and those allotted under participation and compensation schemes. As of the end of 2018, one non-executive member of the Board of Directors held privately acquired LafargeHolcim share purchase (call) options. Until the announcement of
Shares and options held by the Board of Directors
Name PositionShares held as of
December 31, 2018Options held as of
December 31, 2018Shares held as of
December 31, 2017Options held as of
December 31, 2017
Beat Hess Chairman 40,109 17,419
Oscar Fanjul Vice-Chairman 10,675 7,758
Bertrand Collomb Member (until May 8, 2018) n/a 116,065
Paul Desmarais Jr Member 40,693 38,943
Patrick Kron Member 1,021 0
Gérard Lamarche Member 5,816 4,066
Adrian Loader Member 18,489 16,739
Jürg Oleas Member 5,147 3,397
Nassef Sawiris Member 9,455,606 16,993,600 1 25,180,203 10,000,000
Thomas Schmidheiny Member (until May 8, 2018) n/a 69,072,527
Hanne B. Sørensen Member 8,537 6,776
Dieter Spälti Member 72,306 65,082
Total 9,658,399 16,993,600 94,528,975 10,000,0001 further information can be found under: www.six-exchange-regulation.com
Ownership of shares and options: Executive Committee As of December 31, 2018, members of the Executive Committee held a total of 229,143 registered shares in LafargeHolcim Ltd. This figure includes both privately acquired shares and those allocated under the Group’s compensation schemes. Furthermore, at the end of 2018, the Executive Committee held a total of 465,011 stock options and 442,085
performance shares; these arose as a result of the participation and compensation schemes of various years. Options are issued solely on registered shares in LafargeHolcim Ltd. One option entitles the holder to buy one registered share in LafargeHolcim Ltd.
During 2018, Jan Jenisch purchased 16,891 LafargeHolcim shares, for a total value of CHF 0.7 million as at December 31 2018.
Together with previous grants and purchases, his current shareholding amounts to 432% of his base salary and meets the requirements of the CEO Share Ownership Guideline of 300% of salary.
market-relevant information or projects (“Blackout periods”), the Board of Directors, the Executive Committee and any employees involved are prohibited from effecting transactions with equity securities or other financial instruments of LafargeHolcim Ltd, exchange-listed Group companies or potential target companies (trade restriction period).
130
Compensation reportcontinued

Number of shares and options held by Executive Committee members as of December 31, 2018
Name PositionTotal number
of shares owned
Total number of performance options held (at
target)
Total number of performance
options held (at full vesting)
Total number of performance shares
held (at target)
Total number of performance shares held (at full vesting)
Jan Jenisch CEO 170,722 50,314 100,628 82,818 165,636
Urs Bleisch Member 14,775 69,239 138,477 25,559 51,117
Marcel Cobuz Member 8,425 20,792 41,584 13,784 27,567
Miljan Gutovic Member 0 0 0 4,403 8,805
Martin Kriegner Member 8,034 34,482 68,963 26,384 52,768
Géraldine Picaud Member 15,663 14,151 28,301 32,381 64,761
Oliver Osswald Member 3,868 24,660 49,320 23,471 46,941
René Thibault Member 7,656 18,869 37,738 12,245 24,490
Total 229,143 232,507 465,011 221,043 442,085
Number of shares and options held by Executive Committee members as of December 31, 2017
Name PositionTotal number
of shares owned
Total number of performance
options held (at full vesting)
Total number of performance shares held (at full vesting)
Jan Jenisch CEO 120,000 80,000 126,868
Ron Wirahadiraksa Member 5,649 113,217 77,655
Urs Bleisch Member 13,116 122,115 49,416
Pascal Casanova Member 8,057 86,574 56,351
Roland Köhler Member 39,288 195,927 67,655
Martin Kriegner Member 4,094 52,353 38,026
Gérard Kuperfarb Member 11,240 140,614 76,760
Caroline Luscombe Member 1,474 36,410 40,009
Oliver Osswald Member 1,784 27,308 27,231
Saâd Sebbar Member 4,523 65,316 45,401
Total 209,225 919,834 605,372
LafargeHolcim Annual Report 2018 131Governance and Compensation — Compensation report

Liquidity mechanism for remaining rights under the Lafarge long-term incentive plans Following the success of the public exchange offer on Lafarge S.A. and the completion of the subsequent squeeze-out of Lafarge shares, LafargeHolcim has proposed a liquidity mechanism for (i) Lafarge shares that may be issued following the exercise on or after October 23, 2015, of stock options that have been allocated pursuant to the Lafarge stock option plans; or (ii) Lafarge shares that may be definitively allotted on or after October 23, 2015, in accordance with the
Lafarge performance shares plans. Five members of the LafargeHolcim Executive Committee, including the former Chief Executive Officer, have accepted this mechanism which will translate into an exchange or a purchase (according to their country of residence) of their Lafarge shares for LafargeHolcim shares. The exchange or purchase will take place at the end of the holding period (i.e. up to March 2019) for performance shares or following the exercise of stock options (all non-exercised options will lapse at the end of 2020 at the latest), applying the relevant exchange ratio to maintain the
initial parity of the public exchange offer (at the end of December 2018, the exchange ratio is 0.884 LafargeHolcim share for 1 Lafarge share). The following table presents the rights of the Executive Committee members that are still under vesting period or holding period under the Lafarge performance shares plans and the non-exercised Lafarge stock options as of December 31, 2018.
BeneficiariesLafarge
(Performance shares)Lafarge
(Stock options)
Marcel Cobuz 5,682
All these rights were granted before the merger.
132
Compensation reportcontinued

The share options outstanding held by the Executive Committee (including former members) at year-end 2018 have the following expiry dates and exercise prices:
Number 1 Number 1
Option grant date Issuing Company Expiry date Exercise price 1 2018 2017
2008 Holcim 2020 CHF 62.95 33,550 33,550
2010 Holcim 2018 CHF 67.66 0 95,557
2010 Holcim 2022 CHF 70.30 33,550 33,550
2011 Holcim 2019 CHF 63.40 113,957 113,957
2012 Holcim 2020 CHF 54.85 165,538 165,538
2013 Holcim 2021 CHF 67.40 122,770 122,770
2014 Holcim 2022 CHF 64.40 99,532 99,532
2014 Holcim 2026 CHF 64.40 33,550 33,550
2015 (2008 2) Lafarge 2018 CHF 108.36 0 60,745
2015 (2009 2) Lafarge 2019 CHF 34.63 22,016 25,166
2015 (2010 2) Lafarge 2020 CHF 57.80 22,125 22,125
2015 (2011 2) Lafarge 2020 CHF 50.14 24,675 24,675
2015 (2012 2) Lafarge 2020 CHF 40.56 24,360 24,360
2015 Holcim 2023 CHF 66.85 144,970 144,970
2015 Holcim 2023 CHF 63.55 47,333 47,333
2015 LafargeHolcim 2025 CHF 50.19 417,360 417,360
2016 LafargeHolcim 2026 CHF 53.83 503,120 503,120
2018 LafargeHolcim 2028 CHF 55.65 246,404 0
Total 2,054,810 1,967,8581 Adjusted to reflect former share splits and/or capital increases and/or scrip dividend.2 These options were granted through the Lafarge Stock Options plans. The figures presented in this table are based on the application of the actual exchange ratio of 0.884.
The year specified between brackets is the original option grant date and the exercise price is converted from EUR to CHF at the closing rate of 1.13.
LafargeHolcim Annual Report 2018 133Governance and Compensation — Compensation report
Compensation governance
Rules relating to compensation in the LafargeHolcim Articles of IncorporationThe Articles of Incorporation contain provisions regarding the approval of compensation of the Board of Directors and the Executive Management (Art. 23), the supplementary amount for new members of the Executive Committee (Art. 24), the general compensation principles (Art. 25) as well as provisions regarding the agreements with members of the Board of Directors and the Executive Committee (Art. 26). Moreover, the Articles of Incorporation contain provisions regarding the roles of the Board of Directors and the Nomination, Compensation & Governance Committee (Art. 16 to 21). The Articles of Incorporation are approved by the shareholders and are available at www.lafargeholcim.com/articles-association
Annual General Meeting – Shareholder involvement According to Art. 23 of the Articles of Incorporation, the Annual General Meeting approves annually the maximum aggregate compensation of the Board of Directors for the period from the Annual General Meeting to the next Annual General Meeting as well as the maximum aggregate compensation of the Executive Committee for the following financial year. In addition, the Compensation report is submitted to the Annual General Meeting for an advisory vote on a yearly basis.
Art. 24 of the Articles of Incorporation provides for a supplementary amount for Executive Committee members who become members of, or who are promoted to the Executive Committee during a compensation period for which the Annual General Meeting has already
approved the compensation of the Executive Committee if the compensation already approved is not sufficient to cover this compensation. The supplementary amount per compensation period shall not exceed 40 percent of the aggregate amount of compensation last approved by the Annual General Meeting in total and does not require further shareholders’ approval.
Nomination, Compensation & Governance Committee In accordance with Article 21 of the Articles of Incorporation, the NCGC supports the Board of Directors in establishing and reviewing LafargeHolcim’s nomination, compensation and governance strategy and guidelines as well as in preparing the motions to the Annual General Meeting regarding the nomination and compensation of the members of the Board of Directors and of the Executive Committee. In particular, the NCGC performs the following duties:• Nomination: Review of the nomination
and size of the Board of Directors to ensure appropriate expertise, diversity and independence of the Board; succession planning for the Board of Directors and its committee; preparation of the motions to the Annual General Meeting for (re-) election of candidates for positions on the Board of Directors and in the NCGC; succession planning for positions on the Executive Committee;
• Compensation: Planning and preparation of the compensation of the Board of Directors and the Executive Committee; preparation of the motions to the Annual General Meeting regarding compensation of the Board of Directors and of the Executive Committee; determination of compensation strategy
and design of compensation programs including incentive plans; planning and preparation of the targets and performance assessment of the CEO and other members of the Executive Committee;
• Governance: Dealing with all corporate governance related matters; reviewing proposals to be made to the Board for the amendment of the Articles of Incorporation, the organizational rules, the committees charter; the code of conduct, the overall policy landscape and the policies and directives approved by the Board; review of the criteria for the determination of the independence of directors; approval of external mandates for the CEO and other Executive Committee members; review of the annual assessment of the functioning and effectiveness of the Board; review of the corporate governance section of the Annual Report.
The following table summarizes the decision authorities between the NCGC, the Board of Directors, and the Annual General Meeting on compensation matters.
134
Compensation reportcontinued
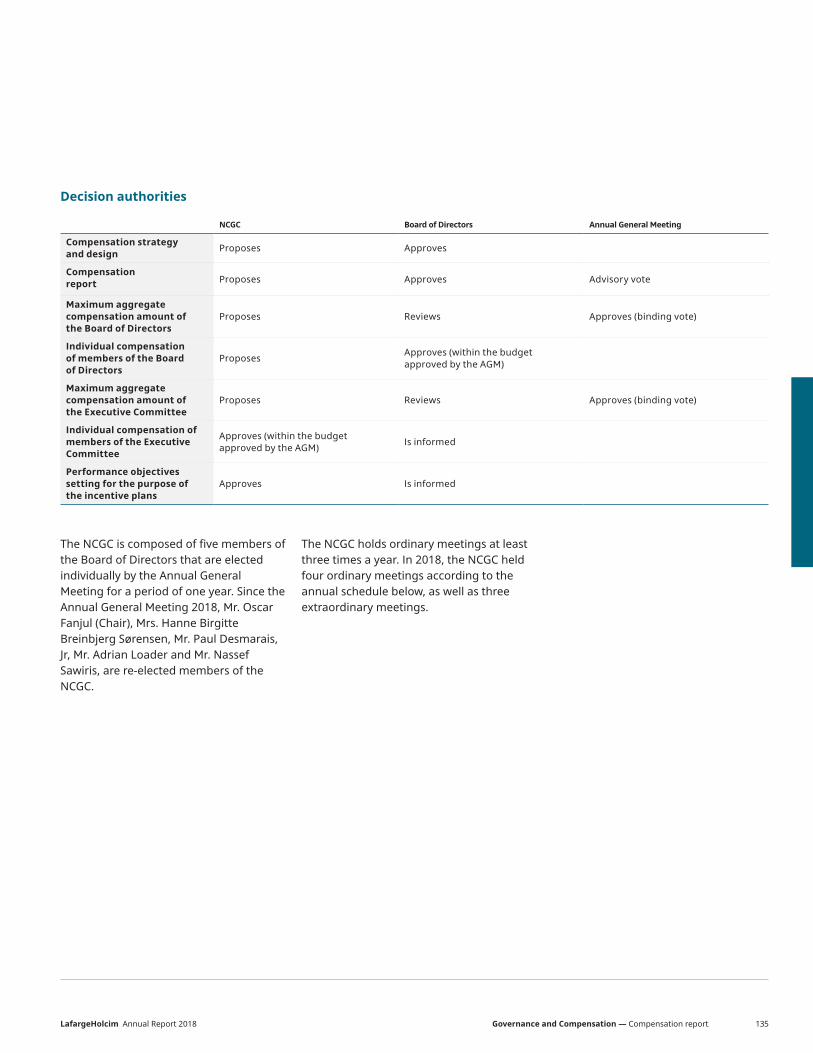
Decision authorities
NCGC Board of Directors Annual General Meeting
Compensation strategy and design
Proposes Approves
Compensation report Proposes Approves Advisory vote
Maximum aggregate compensation amount of the Board of Directors
Proposes Reviews Approves (binding vote)
Individual compensation of members of the Board of Directors
ProposesApproves (within the budget approved by the AGM)
Maximum aggregate compensation amount of the Executive Committee
Proposes Reviews Approves (binding vote)
Individual compensation of members of the Executive Committee
Approves (within the budget approved by the AGM)
Is informed
Performance objectives setting for the purpose of the incentive plans
Approves Is informed
The NCGC is composed of five members of the Board of Directors that are elected individually by the Annual General Meeting for a period of one year. Since the Annual General Meeting 2018, Mr. Oscar Fanjul (Chair), Mrs. Hanne Birgitte Breinbjerg Sørensen, Mr. Paul Desmarais, Jr, Mr. Adrian Loader and Mr. Nassef Sawiris, are re-elected members of the NCGC.
The NCGC holds ordinary meetings at least three times a year. In 2018, the NCGC held four ordinary meetings according to the annual schedule below, as well as three extraordinary meetings.
LafargeHolcim Annual Report 2018 135Governance and Compensation — Compensation report
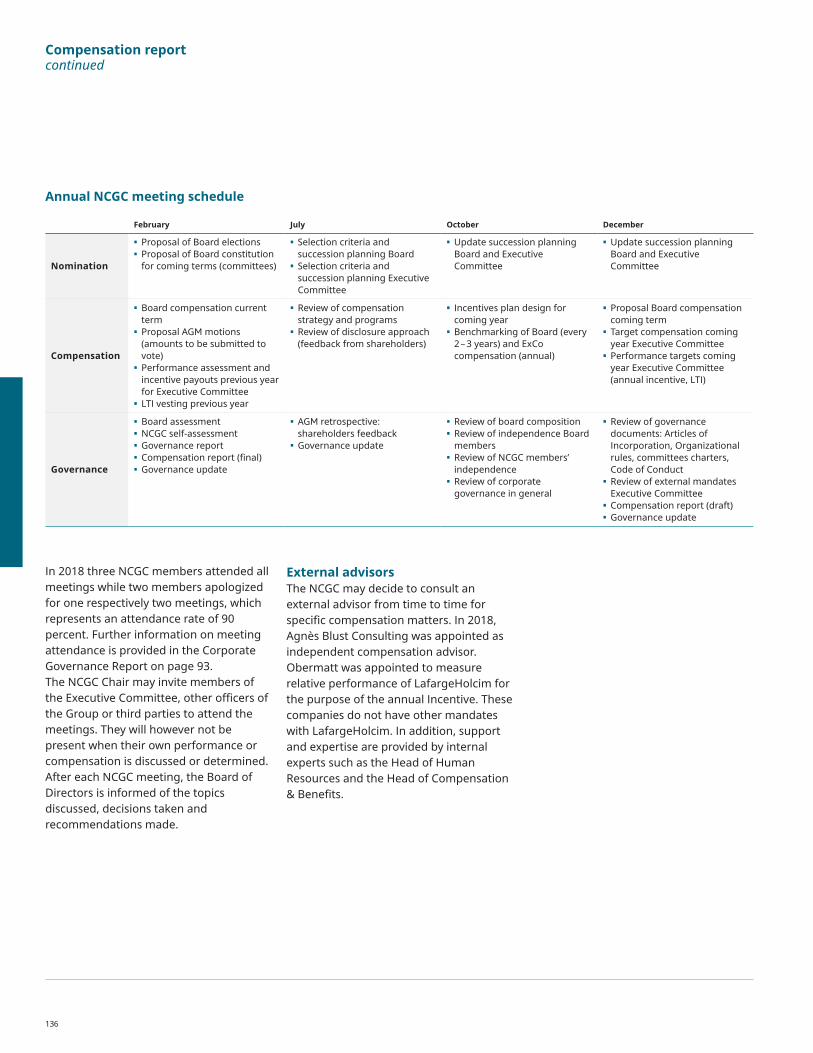
Annual NCGC meeting schedule
February July October December
Nomination
• Proposal of Board elections• Proposal of Board constitution
for coming terms (committees)
• Selection criteria and succession planning Board
• Selection criteria and succession planning Executive Committee
• Update succession planning Board and Executive Committee
• Update succession planning Board and Executive Committee
Compensation
• Board compensation current term
• Proposal AGM motions (amounts to be submitted to vote)
• Performance assessment and incentive payouts previous year for Executive Committee
• LTI vesting previous year
• Review of compensation strategy and programs
• Review of disclosure approach (feedback from shareholders)
• Incentives plan design for coming year
• Benchmarking of Board (every 2 – 3 years) and ExCo compensation (annual)
• Proposal Board compensation coming term
• Target compensation coming year Executive Committee
• Performance targets coming year Executive Committee (annual incentive, LTI)
Governance
• Board assessment• NCGC self-assessment• Governance report• Compensation report (final)• Governance update
• AGM retrospective: shareholders feedback
• Governance update
• Review of board composition• Review of independence Board
members• Review of NCGC members’
independence• Review of corporate
governance in general
• Review of governance documents: Articles of Incorporation, Organizational rules, committees charters, Code of Conduct
• Review of external mandates Executive Committee
• Compensation report (draft)• Governance update
In 2018 three NCGC members attended all meetings while two members apologized for one respectively two meetings, which represents an attendance rate of 90 percent. Further information on meeting attendance is provided in the Corporate Governance Report on page 93.The NCGC Chair may invite members of the Executive Committee, other officers of the Group or third parties to attend the meetings. They will however not be present when their own performance or compensation is discussed or determined. After each NCGC meeting, the Board of Directors is informed of the topics discussed, decisions taken and recommendations made.
External advisorsThe NCGC may decide to consult an external advisor from time to time for specific compensation matters. In 2018, Agnès Blust Consulting was appointed as independent compensation advisor. Obermatt was appointed to measure relative performance of LafargeHolcim for the purpose of the annual Incentive. These companies do not have other mandates with LafargeHolcim. In addition, support and expertise are provided by internal experts such as the Head of Human Resources and the Head of Compensation & Benefits.
136
Compensation reportcontinued
Method for determining compensation: benchmarking The compensation of the Board of Directors is regularly reviewed against prevalent market practice of other multinational industrial companies of the SMI (excluding financial services). No benchmarking analysis was conducted in 2018 considering that no changes are planned for the next term of office.
Regarding the compensation of the Executive Committee, a benchmarking analysis of the compensation levels was conducted in 2018 with the support of Willis Towers Watson. For this purpose, for Executive Committee members who are on a Swiss employment contract, a peer group of selected SMI companies was determined on the basis of their sector (exclusion of financial services), market capitalization, revenue and headcount so that LafargeHolcim is positioned around the middle of the peer group: ABB, Givaudan, Lonza, Nestlé, Novartis, Richemont, Roche, SGS, Sika and Swatch Group. For Executive Committee members who are on a foreign employment contract, an industrial cut was made to the general industry data included in the database of Willis Towers Watson of the respective countries of employment.
The benchmarking analysis served as basis for the NCGC to analyze the compensation of the CEO and the Executive Committee and to set their target compensation levels for the financial year 2019. The policy of LafargeHolcim is to target market median compensation for on-target performance, with significant upside for above target performance.
For the compensation strategy and the design of compensation programs for the Executive Committee, the Swiss peer group described above is considered, as well as a secondary international peer group (same peer group as the one used for the relative performance measurement under the annual incentive).
LafargeHolcim Annual Report 2018 137Governance and Compensation — Compensation report
138
Compensation reportcontinued

To the General Meeting of LafargeHolcim Ltd, Rapperswil-Jona Zug, March 6, 2019
Report of the statutory auditor on the Compensation reportWe have audited the accompanying Compensation report of LafargeHolcim Ltd for the year ended December 31, 2018. The audit was limited to the information according to articles 14 – 16 of the Ordinance against Excessive Compensation in Listed Stock Corporations (Ordinance) contained on pages 125 and 127 of the Compensation report.
Responsibility of the Board of DirectorsThe Board of Directors is responsible for the preparation and overall fair presentation of the Compensation report in accordance with Swiss law and the Ordinance. The Board of Directors is also responsible for designing the compensation system and defining individual compensation packages.
Auditor’s responsibilityOur responsibility is to express an opinion on the accompanying Compensation report. We conducted our audit in accordance with Swiss Auditing Standards. These standards require that we comply with ethical requirements and plan and
perform the audit to obtain reasonable assurance about whether the Compensation report complies with Swiss law and articles 14 – 16 of the Ordinance.
An audit involves performing procedures to obtain audit evidence on the disclosures made in the Compensation report with regard to compensation, loans and credits in accordance with articles 14 – 16 of the Ordinance. The procedures selected depend on the auditor’s judgment, including the assessment of the risks of material misstatements in the Compensation report, whether due to fraud or error. This audit also includes evaluating the reasonableness of the methods applied to value components of compensation, as well as assessing the overall presentation of the Compensation report.
We believe that the audit evidence we have obtained is sufficient and appropriate to provide a basis for our opinion.
OpinionIn our opinion, the Compensation report for the year ended December 31, 2018 of LafargeHolcim Ltd. complies with Swiss law and articles 14 – 16 of the Ordinance.
Deloitte AG
David Quinlin Licensed Audit Expert
Auditor in charge
Alexandre DubiLicensed Audit Expert
LafargeHolcim Annual Report 2018 139Governance and Compensation — Compensation report
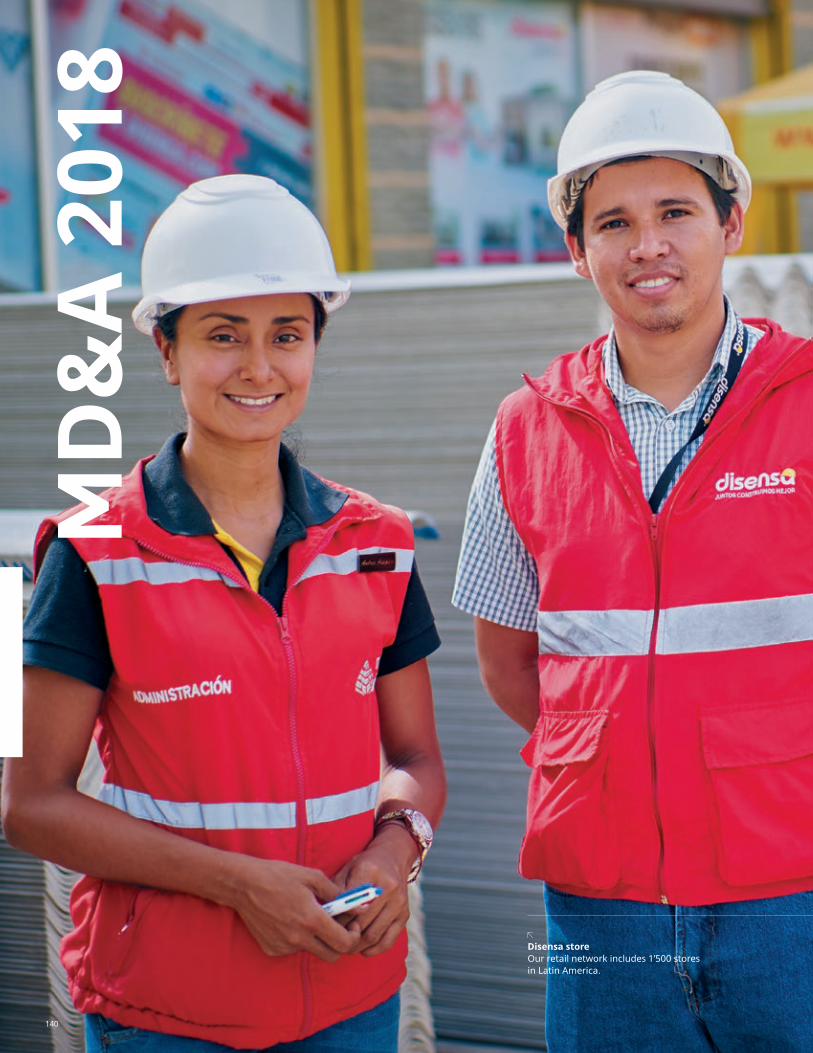
Disensa storeOur retail network includes 1’500 stores in Latin America.
MD
&A
201
8
140

Management discussion & analysis 2018 120
Group performance 142Region performance 148
LafargeHolcim Annual Report 2018 141Management discussion & analysis — Content

Recurring SG&A (CHFm)
–6.9%
80
2,70
1 (266
)
2,51
5
(74)
2,44
1
2017
Inflation
Gross savings
CIS/FX
2018 Like-for-like
2018
Management discussion & analysis 2018
Group
2018 2017 ±%±%
like-for-like
Sales of cement million t 221.9 220.2 +0.8% +4.4%
Sales of aggregates million t 273.8 278.7 –1.8% +1.2%
Sales of ready-mix concrete million m 3 50.9 50.6 +0.6% +0.6%
Net sales million CHF 27,466 27,021 +1.6% +5.1%
Recurring SG&A million CHF 2,441 2,701 –9.6% –6.9%
Recurring EBITDA million CHF 6,016 5,990 +0.4% +3.6%
Operating profit (loss) million CHF 3,312 (478)
Operating profit before impairment million CHF 3,306 3,229 +2.4%
Net income (loss) million CHF 1,719 (1,716)
Earnings per share before impairment and divestments CHF 2.63 2.35 +11.9%
Cash flow from operating activities million CHF 2,988 3,040 –1.7%
Capex million CHF 1,285 1,355 –5.2%
Free Cash Flow million CHF 1,703 1,685 +1.1%
Return on Invested Capital (ROIC) % +6.5% +5.8% +0.7%
Net financial debt million CHF 13,518 14,346 –5.8%
This management discussion and analysis should be read in conjunction with the shareholders’ letter and the individual reports for the Group regions.
SG&A cost savings ahead of target:
– “Corporate light” completed with closure of 4 corporate offices
– All countries undergoing restructuring with visible progess to date
– Restructuring of IT Shared Service Centers
– Optimization of third party spend
The non-GAAP measures used in this report are defined on page 282.
142

Good progress on Strategy 2022 - “Building for Growth”The global rollout of the new Strategy 2022 – “Building for Growth” has been successfully started. Strong progress was made in all four drivers of the strategy, delivering results ahead of plan.
• Switching gears to growth is the most fundamental principle of Strategy 2022. First results have been achieved and the growth momentum accelerated throughout the year, with a strong Net Sales increase of 5.1% on a like-for-like basis. All four business segments contributed to this growth. Four bolt-on acquisitions were completed in 2018 in Europe and North America which drove growth and added to the company’s presence in ready-mix concrete and aggregates. These acquisitions had immediate impact on profitability and brought the company closer to its end-customers. Four more bolt-on acquisitions have been signed in 2019 in Europe, Australia and North America;
• In terms of Simplification & Performance, the company has successfully established a new operating model with more P&L accountability for the countries and leaner corporate support functions. Consequently, we have closed four corporate offices in Singapore, Miami, Zurich and Paris. The associated CHF 400 million SG&A savings program was executed successfully and is delivering results ahead of target;
• Strong progress was made by the Aggregates and Ready-Mix Concrete segments towards closing the gap with best-in-class performers. Both businesses developed positively in terms of volumes,
pricing and profitability. These two business segments will play an important role in reaching the next level of performance of LafargeHolcim;
• The strategy driver Financial Strength has improved all key performance indicators. More than CHF 1.5 billion was refinanced at attractive terms, thereby improving the company’s debt maturity profile and reducing financing costs. The sale of the Indonesian business has contributed to the strengthening of the balance sheet. All measures taken in 2018 have already led to a successful de-leveraging, with the Net Financial Debt/Recurring EBITDA ratio improving to 2.2x (from 2.4x in 2017); and
• In terms of Vision & People, the new operating model and leadership team has been successfully established. The company’s global leaders are empowered and fully accountable for their P&L. The simplified performance management system and the corresponding incentive scheme have been implemented in all countries. All initiatives are supported by the launch of the new LafargeHolcim business school.
Year of strong growth, over-proportional increase of Net Income and EPS before impairment and divestmentsNet Sales grew 5.1 % on a like-for-like basis for the full year, largely driven by higher cement volumes. Net Sales reached CHF 27,466 million.
Recurring EBITDA reached CHF 6,016 million, up 3.6% on a like-for-like basis for the full year, with Cement, Aggregates and Ready-Mix Concrete segments all contributing to the solid outcome.
Net Income attributable to shareholders of LafargeHolcim Ltd before impairment and divestments was 10.8% higher than in 2017.
Earnings per Share before impairment and divestments was CHF 2.63 for the full year compared to CHF 2.35 for 2017.
Free cash flow stood at CHF 1,703 million versus CHF 1,685 million in the previous year, benefiting from lower cash payments for income taxes, tight control of capex offset by unfavorable timing difference of cash conversion of our joint ventures' results.
Net debt amounted to CHF 13,518 million at year-end, an improvement of CHF 828 million over the prior year, reflecting a cash conversion of 28.3% and the positive impact following the classification of Indonesia local external net debt as held-for-sale. The Indonesia divestment closed successfully at the end of January 2019, full effect will be reflected in 2019.
Return on Invested Capital was 6.5%, compared to 5.8% in 2017, thanks to continuous improvement in capital allocation.
The company’s record in Health & Safety improved significantly as on-site fatalities were 82% lower than in 2017.
Management discussion & analysis — Group performanceLafargeHolcim Annual Report 2018 143

Management discussion & analysis 2018continued
(CHF 14,047 million)
Capital market financing of the Group as per December 31, 2018
EUR Bonds CHF 5,967 m ....................................42%
USD Bonds CHF 4,412 m ....................................31%
CHF Bonds CHF 1,965 m ....................................14%
AUD Bonds CHF 520 m .........................................4%
Others* CHF 1,183 m ...........................................9%
* (GBP and MXN bonds, USD and EUR Private Placements, NGN bonds and commercial paper)
Financing activityLafargeHolcim’s investments were funded from the cash flow from operating activities. New debt capital issuances were mainly conducted for refinancing and general corporate purposes. In the year under review, capital market issuances of CHF 1.5 billion equivalent were undertaken, enabling the Group to lock in historically low interest rates. The main capital market transactions were the following:
CHF 200 millionissued in November 2018
Subordinated fixed rate resettable perpetual notes with a coupon of 3.5%.
CHF 334 million issued in November 2018
USD 338 million Private Placement with coupons between 4.79% and 5.03%.
CHF 519 million issued in October 2018
EUR 205 million Schuldschein loan with coupons with fixed and floating rates and multiple terms.USD 295.5 million Schuldschein loan with fixed and floating rates and multiple terms.
CHF 440 million issued in August 2018
Bond with a coupon of 1.00%, term 2018 – 2024.
For more information, please refer to the note 14.3 from the notes to the consolidated financial statements.
The group also repurchased a nominal of CHF 409 million equivalent of outstanding EUR and USD Schuldschein loans, floating rate tranches, in the second quarter 2018.
Financing profileLafargeHolcim has a strong financial profile. 87 percent of financial liabilities are financed through various capital markets and 13 percent through banks and other lenders. There are nomajor positions with individual lenders. The average maturity of financial liabilities increased from 6.3 years at December 31, 2017, to 6.5 years at December 31, 2018, due to several capital market transactions during 2018. The Group’s maturity profile is well-balanced with a large share of mid- to long-term financing.
Maintaining a favorable credit rating is one of the Group’s objectives and LafargeHolcim therefore gives priority to achieving its financial targets and retaining its solid investment-grade rating (current rating information is displayed on page 84). The average nominal interest rate on LafargeHolcim’s financial liabilities as at December 31, 2018, was 4.2 percent, and the proportion of financial liabilities at fixed rates was at 73 percent. Detailed information on financial liabilities can be found in note 14.
144

Million CHF
Maturity profile
Bonds, private placements and commercial paper notes
Loans from financial institutions and other financial liabilities
0
1000
2000
3000
4000
5000
6000
>2828272525242322212019
LiquidityTo secure liquidity, the Group held cash and cash equivalents of CHF 2,515 million at December 31, 2018. This cash is mainly invested in term deposits held with a large number of banks on a broadly diversified basis. The counterparty risk is constantly monitored on the basis of clearly defined principles as part of the risk management process. As of December 31, 2018, LafargeHolcim had unused committed credit lines of CHF 6,239 million (see also note 14). Current financial liabilities as at December 31, 2018, of CHF 3,063 million are comfortably covered by existing cash, cash equivalents and unused committed credit lines. LafargeHolcim has USD, EUR and NGN commercial paper programs. The aim of these programs is to fund short-term liquidity needs at attractive terms. As per December 31, 2018, commercial papers of CHF 96 million were outstanding.
Foreign exchange sensitivityThe Group has a global footprint, generating the majority of its results in currencies other than the Swiss Franc. Only about 2 percent of Net Sales are generated in Swiss Francs.
Foreign currency volatility has little effect on the Group’s operating profitability. As the Group produces a very high proportion of its products locally, most sales and costs are incurred in the respective local currencies. The effects of foreign exchange movements are therefore largely restricted to the translation of local financial statements for the consolidated statement of income. As a large part of the foreign capital is financed with matching transactions in local currency, the effects of foreign currency translation on local balance sheets for the consolidated statement of financial position have not, in general, resulted in significant distortions in the consolidated statement of financial position.
Management discussion & analysis — Group performanceLafargeHolcim Annual Report 2018 145
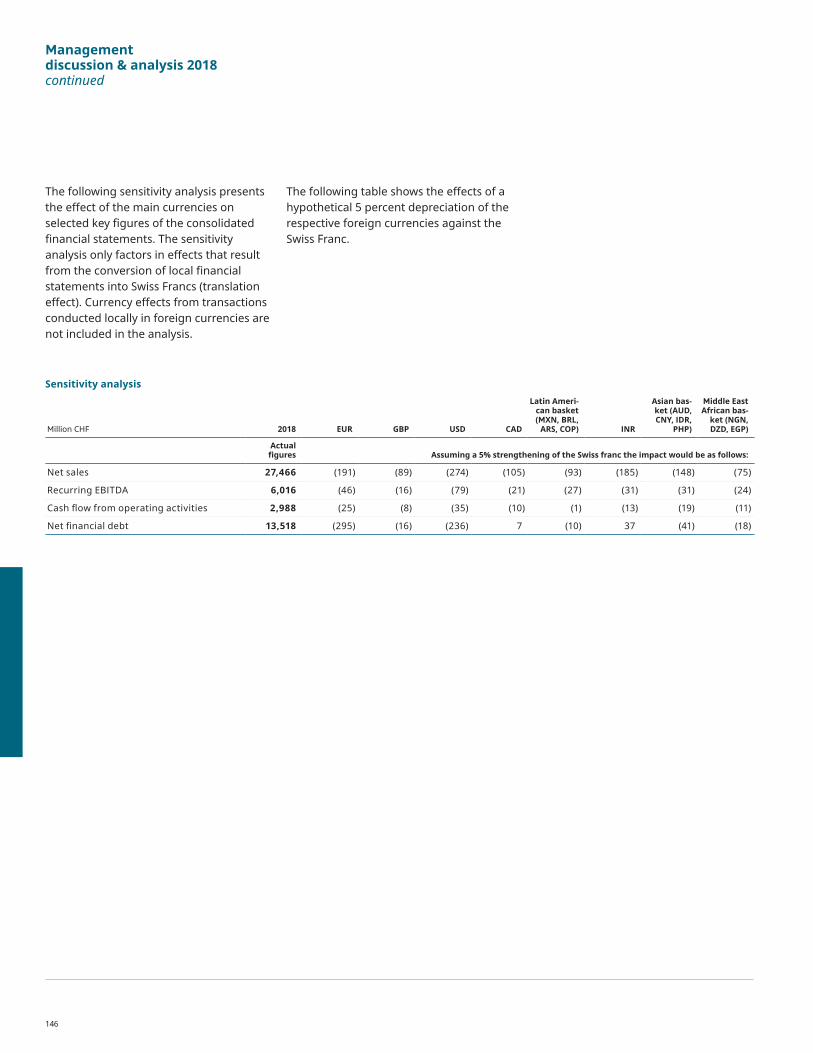
Management discussion & analysis 2018continued
Sensitivity analysis
Million CHF 2018 EUR GBP USD CAD
Latin Ameri-can basket (MXN, BRL,
ARS, COP) INR
Asian bas-ket (AUD, CNY, IDR,
PHP)
Middle East African bas-
ket (NGN, DZD, EGP)
Actual figures Assuming a 5% strengthening of the Swiss franc the impact would be as follows:
Net sales 27,466 (191) (89) (274) (105) (93) (185) (148) (75)
Recurring EBITDA 6,016 (46) (16) (79) (21) (27) (31) (31) (24)
Cash flow from operating activities 2,988 (25) (8) (35) (10) (1) (13) (19) (11)
Net financial debt 13,518 (295) (16) (236) 7 (10) 37 (41) (18)
The following sensitivity analysis presents the effect of the main currencies on selected key figures of the consolidated financial statements. The sensitivity analysis only factors in effects that result from the conversion of local financial statements into Swiss Francs (translation effect). Currency effects from transactions conducted locally in foreign currencies are not included in the analysis.
The following table shows the effects of a hypothetical 5 percent depreciation of the respective foreign currencies against the Swiss Franc.
146

Reconciliation of non-GAAP measures
Reconciling measures of profit and loss to the consolidated statement of income of LafargeHolcim
Million CHF 2018 2017
Net sales 27,466 27,021
Recurring costs excluding SG&A (19,511) (18,615)
Recurring SG&A (2,441) (2,701)
Share of profit of joint ventures 502 286
Recurring EBITDA 6,016 5,990
Depreciation and amortization (2,235) (2,300)
Restructuring, litigation, implementation and other non-recurring costs (476) (461)
Operating profit before impairment 3,306 3,229
Impairment of operating assets 6 (3,707)
Operating profit (loss) 3,312 (478)
Million CHF 2018 2017
Net income (loss) 1,719 (1,716)
Impairments 22 (3,501)
(Loss)/Profit on disposals and other non-operating items (74) 226
Net income (loss) before impairment and divestments 1,772 1,560
of which net income before impairment and divestments – shareholders of LafargeHolcim Ltd 1,569 1,417
Reconciling measures of free cash flow to the consolidated statement of cash flows of LafargeHolcim
Million CHF 2018 2017
Cash flow from operating activities 2,988 3,040
Purchase of property, plant and equipment (1,411) (1,522)
Disposal of property and equipment 126 167
Free Cash Flow 1,703 1,685
Reconciling measures of net financial debt to the consolidated statement of financial position of LafargeHolcim
Million CHF 2018 2017
Current financial liabilities 3,063 3,843
Long-term financial liabilities 13,061 14,779
Cash and cash equivalents 2,515 4,217
Short-term derivative assets 66 44
Long-term derivative assets 26 14
Net financial debt 13,518 14,348
Management discussion & analysis — Group performanceLafargeHolcim Annual Report 2018 147

Management discussion & analysis 2018continued
Asia Pacific2018
Sales of cement million t 89.7
Sales of aggregates million t 31.4
Sales of ready-mix concrete million m 3 12.5
Net sales to external customers million CHF 7,446
Like-for-like growth % 8.3%
Recurring EBITDA million CHF 1,609
Like-for-like growth % 22.5%
The Asia Pacific region benefited from favorable market conditions in most countries, leading to strong Net Sales and continued Recurring EBITDA growth. China was a key driver of higher profitability, supported by price momentum and the vertically-integrated waste recycling business. India’s solid demand was driven by infrastructure and rural housing, whereas demand in the Philippines was mainly supported by the public sector. In Indonesia, pricing and market demand improved while the Malaysian market continued to remain challenging.
Net Sales for the Asia Pacific region grew overall by a strong 8.3% on a like-for-like basis, mainly driven by India, Indonesia, the Philippines, Australia and China. All segments benefited from pricing traction and contributed to the positive Net Sales development. Cement volumes sold grew by 4.7% on a like-for-like basis, notably in India and Indonesia. Net Sales of Aggregates were 11.4% on a like-for-like basis higher than in the prior year, benefiting from a positive price trend across the region with high infrastructure spending along the east coast of Australia, but lower public investment in Malaysia
and China. Net Sales of Ready-Mix Concrete stood slightly above the prior year on a like-for-like basis, with large markets like Australia and India developing well.
Recurring EBITDA for the Asia Pacific region showed very strong growth of 22.5% on a like-for-like basis. Strict cost management and price discipline more than compensated for the impact of increasing energy costs across the region. The share of Huaxin joint-venture profits in China was recognized in the region’s 2018 result, accounting for CHF 334 million of Recurring EBITDA.
The divestment of our entire shareholding in PT Holcim Indonesia Tbk to Semen Indonesia for an enterprise value of CHF 1.75 billion, on a 100% basis, was successfully closed at the end of January 2019.
117*Cement & grinding plants
69*Aggregates plants
347*Ready-mix concrete plants
* including joint ventures
148

Consolidated cement grinding capacity (million tonnes per year)
111.4
Total consolidated cement grinding capacity (million tonnes per year)
Chandrapur, IndiaAt the ACC Chanda cement plant.
Grinding plant
Cement plant
Country
China (joint venture) 94.3
India 64.4
Indonesia 15.1
Malaysia 10.9
Philippines 9.4
China 7.7
Australia (joint venture) 5.9
Bangladesh 3.9
(211.6 including joint ventures)
LafargeHolcim Annual Report 2018 149Management discussion & analysis — Region performance

Management discussion & analysis 2018continued
Europe2018
Sales of cement million t 45.3
Sales of aggregates million t 120.4
Sales of ready-mix concrete million m 3 19.3
Net sales to external customers million CHF 7,554
Like-for-like growth % 5.0%
Recurring EBITDA million CHF 1,499
Like-for-like growth % 5.0%
2018 was a strong year for the Europe region. Increased public infrastructure spending in Eastern and Central Europe, big projects in the UK (high speed 2), France (Grand Paris), Russia (Great Moscow), together with the rebound of the construction and residential segment across the region paved the way for solid revenue growth in most countries.
Net sales grew 5.0% on a like-for-like basis as sales volume gains in all segments combined with price improvements in the key markets of Germany, Spain, Poland and Russia. Regional Cement volumes sold grew by 5.2% on a like-for-like basis supported by market drivers in infrastructure and construction and residential segments. Aggregates volumes sold stood at 120 million tonnes, improving by 2.2% on a like-for-like basis, notably due to strong growth in Poland, Switzerland and the UK. The Ready-Mix Concrete segment delivered double-digit like-for-like Recurring EBITDA growth after years of decline, with strong performances across the region. Net sales in Ready-Mix Concrete grew by 7.1% on a like-for-like basis, due especially to France, Romania, Spain and Switzerland.
The favorable market environment, good volumes and price management, combined with improved Ready-Mix Concrete results and the contribution of Geocycle with more than 4 million tonnes of waste treated allowed a year-over-year Recurring EBITDA increase of 5.0% on a like-for-like basis. A bolt-on acquisition finalized in the UK will contribute to growth in the future.
54Cement & grinding plants
273Aggregates plants
578Ready-mix concrete plants
150
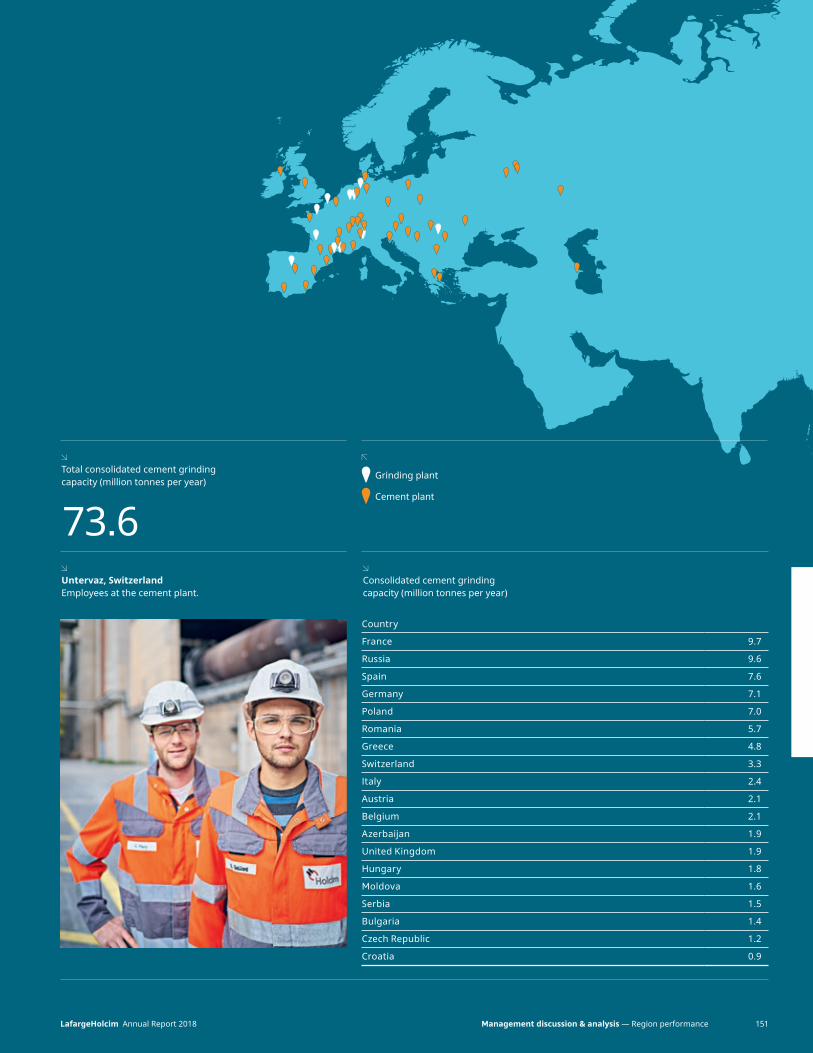
Consolidated cement grinding capacity (million tonnes per year)
73.6
Total consolidated cement grinding capacity (million tonnes per year)
Untervaz, SwitzerlandEmployees at the cement plant.
Country
France 9.7
Russia 9.6
Spain 7.6
Germany 7.1
Poland 7.0
Romania 5.7
Greece 4.8
Switzerland 3.3
Italy 2.4
Austria 2.1
Belgium 2.1
Azerbaijan 1.9
United Kingdom 1.9
Hungary 1.8
Moldova 1.6
Serbia 1.5
Bulgaria 1.4
Czech Republic 1.2
Croatia 0.9
Grinding plant
Cement plant
151LafargeHolcim Annual Report 2018 Management discussion & analysis — Region performance
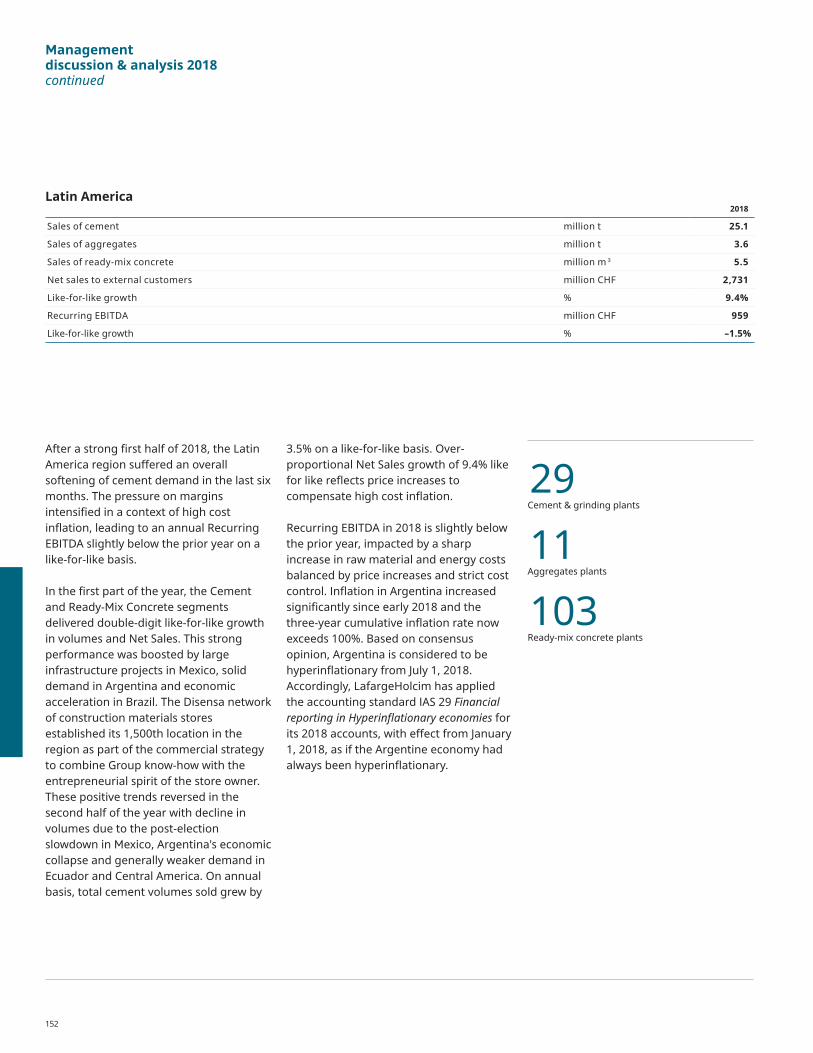
Management discussion & analysis 2018continued
Latin America2018
Sales of cement million t 25.1
Sales of aggregates million t 3.6
Sales of ready-mix concrete million m 3 5.5
Net sales to external customers million CHF 2,731
Like-for-like growth % 9.4%
Recurring EBITDA million CHF 959
Like-for-like growth % –1.5%
After a strong first half of 2018, the Latin America region suffered an overall softening of cement demand in the last six months. The pressure on margins intensified in a context of high cost inflation, leading to an annual Recurring EBITDA slightly below the prior year on a like-for-like basis.
In the first part of the year, the Cement and Ready-Mix Concrete segments delivered double-digit like-for-like growth in volumes and Net Sales. This strong performance was boosted by large infrastructure projects in Mexico, solid demand in Argentina and economic acceleration in Brazil. The Disensa network of construction materials stores established its 1,500th location in the region as part of the commercial strategy to combine Group know-how with the entrepreneurial spirit of the store owner. These positive trends reversed in the second half of the year with decline in volumes due to the post-election slowdown in Mexico, Argentina's economic collapse and generally weaker demand in Ecuador and Central America. On annual basis, total cement volumes sold grew by
3.5% on a like-for-like basis. Over-proportional Net Sales growth of 9.4% like for like reflects price increases to compensate high cost inflation.
Recurring EBITDA in 2018 is slightly below the prior year, impacted by a sharp increase in raw material and energy costs balanced by price increases and strict cost control. Inflation in Argentina increased significantly since early 2018 and the three-year cumulative inflation rate now exceeds 100%. Based on consensus opinion, Argentina is considered to be hyperinflationary from July 1, 2018. Accordingly, LafargeHolcim has applied the accounting standard IAS 29 Financial reporting in Hyperinflationary economies for its 2018 accounts, with effect from January 1, 2018, as if the Argentine economy had always been hyperinflationary.
29Cement & grinding plants
11Aggregates plants
103Ready-mix concrete plants
152

Consolidated cement grinding capacity (million tonnes per year)
39.1
Total consolidated cement grinding capacity (million tonnes per year)
Guayaquil, EcuadorEmployees at the cement plant.
Grinding plant
Cement plant
Country
Mexico 12.2
Brazil 10.5
Ecuador 5.5
Argentina 4.8
Colombia 2.1
El Salvador 1.8
Costa Rica 1.1
West Indies 0.7
Nicaragua 0.4
LafargeHolcim Annual Report 2018 153Management discussion & analysis — Region performance

Management discussion & analysis 2018continued
Middle East Africa2018
Sales of cement million t 35.9
Sales of aggregates million t 8.7
Sales of ready-mix concrete million m 3 4.2
Net sales to external customers million CHF 3,080
Like-for-like growth % –4.3%
Recurring EBITDA million CHF 734
Like-for-like growth % –28.2%
44*Cement & grinding plants
23*Aggregates plants
172*Ready-mix concrete plants
* including joint ventures
Market conditions in the Middle East Africa remained challenging driven by a changing competitive profile, shifts in supply and demand, sluggish economies in the region, and a rise in energy and distribution costs.
Consolidated cement volumes grew by 0.4% on a like-for-like basis. Despite the increase in volumes, Net Sales for the region were down by 4.3% on a like-for-like basis. This decrease in Net Sales was largely driven by price pressure and lower volumes in oversupplied markets, particularly Algeria, Iraq and Jordan, and by the slowdown in Lebanon and Egypt in the second half of 2018. Net Sales developed favorably in Nigeria, Egypt and countries in East Africa.
These overall headwinds, combined with rising distribution and energy costs, resulted in a decrease in Recurring EBITDA of 28.2% on a like-for-like basis.
154

Consolidated cement grinding capacity (million tonnes per year)
56.8
Total consolidated cement grinding capacity (million tonnes per year)
Ewekoro, NigeriaEmployee at the cement plant.
Grinding plant
Cement plant
Country
Algeria 12.4
Morocco ( Joint venture) 11.8
Nigeria 10.5
Egypt 8.9
Iraq 5.7
Jordan 3.9
South Africa 3.2
Kenya 3.2
Lebanon 2.5
Ivory Coast ( Joint venture) 2.2
Uganda 1.9
Zambia 1.5
Tanzania 1.1
Cameroon ( Joint venture) 1.0
Benin ( Joint venture) 0.7
Qatar 0.6
Reunion 0.5
Zimbabwe 0.4
Guinea ( Joint venture) 0.3
Malawi 0.3
Madagascar 0.2
(72.8 including joint ventures)
LafargeHolcim Annual Report 2018 155Management discussion & analysis — Region performance

Management discussion & analysis 2018continued
North America2018
Sales of cement million t 19.8
Sales of aggregates million t 109.6
Sales of ready-mix concrete million m 3 9.4
Net sales to external customers million CHF 5,875
Like-for-like growth % 3.0%
Recurring EBITDA million CHF 1,523
Like-for-like growth % 2.7%
In the North America region, we capitalized on strong market fundamentals but were negatively impacted by harsh weather in the first quarter and an early winter in the fourth quarter. Our growth strategy coupled with strong price management and rigorous cost control laid the basis for solid 2018 results compared to the prior year despite the challenging conditions. The growth strategy was further supported by the two bolt-on acquisitions completed in 2018: Tarrant Concrete in Texas and Metro Mix in Colorado; as well as several multi-year construction contract awards in the Denver, Las Vegas, Minneapolis, and Vancouver markets, further bolstering our Solutions & Products segment.
Sales volumes of Cement and Aggregates increased over the prior year by 3.1% and 2.4% respectively on a like-for-like basis while bad weather impacts dragged US Ready-Mix Concrete volumes below prior year on a like-for-like basis. Higher Ready-Mix Concrete sales volumes in Canada partially offset the US shortfall. Net Sales grew by 3.0% on a like-for-like basis supported by both countries. On a segment view, Net Sales from Cement and
Aggregates increased while Ready-Mix Concrete fell slightly short on lower sales volumes. Canada showed its highest growth rates in the west, particularly in the Solutions & Products downstream activities of construction, paving and concrete products, while the US reported higher Net Sales mainly due to higher Cement sales volumes. Aggregates and Ready-Mix Concrete in the US benefited from stronger pricing.
Recurring EBITDA for North America showed growth of 2.7% on a like-for-like basis. Fuel and energy cost inflation across the region was compensated by good cost management, including SG&A cost-cutting programs.
26Cement & grinding plants
287Aggregates plants
248Ready-mix concrete plants
156

Consolidated cement grinding capacity (million tonnes per year)
32.0
Total consolidated cement grinding capacity (million tonnes per year)
Bladensburg, Maryland, USARail transport of aggregates.
Grinding plant
Cement plant
Country
United States 23.6
Canada 8.4
LafargeHolcim Annual Report 2018 157Management discussion & analysis — Region performance

Responsibility statement
We certify that, to the best of our knowledge and having made reasonable inquiries to that end, the financial statements have been prepared in accordance with applicable accounting standards and give a true and fair view of the assets and liabilities, and of the financial position and results of the Company and of its consolidated subsidiaries, and that this annual report provides a true and fair view of the evolution of the business, results and financial condition of the Company and of its consolidated subsidiaries, and a description of the main risks and uncertainties the Company and its consolidated subsidiaries are subject to.
Zug, March 6, 2019
Jan Jenisch Chief Executive Officer
Géraldine PicaudChief Financial Officer
158

LafargeHolcim Annual Report 2018 159Management discussion & analysis — Responsibility statement

Almeria, SpainCement blocks used to protect our jetty.
Fin
anci
al
info
rmat
ion
160

Financial information
Consolidated statement of income 162Consolidated statement of Comprehensive earnings 163Consolidated statement of financial position 164Consolidated statement of changes in equity 166Consolidated statement of cash flows 168Principal exchange rates 169
Notes to the Consolidated Financial Statements1. Accounting policies 1702. Fully consolidated companies and
non-controlling interests 1723. Segment reporting 1834. Operating profit 1885. Profit and loss on disposals and other
non-operating items 1916. Investments in associates
and joint ventures 1927. Financing items 1978. Income taxes 1989. Earnings per share 20310. Working capital 20311. Property, plant and equipment,
goodwill and intangible assets 20612. Long-term financial investments
and other long.term assets 21413. Assets and related liabilities
classified as held for sale and discontinued operations 216
14. Net financial debt 21915. Leases 23716. Employee benefits and share
compensation plans 23917. Provisions and contingencies 25218. Shareholders' information 25619. Related party transactions 25720. Cash flow 25821. Events after the reporting period 26022. Authorization of the
financial statements 260
Auditors Report 261Holding Company Results 2665-Year-Review LafargeHolcim Group 280Definitions of non-GAAP measures 282
LafargeHolcim Annual Report 2018 161Financial information — Contents

Million CHF Notes 2018
2017 Restated 1
Net sales 3.3 27,466 27,021
Production cost of goods sold 2 4.3 (15,918) (19,240)
Gross profit 11,548 7,781
Distribution and selling expenses 3 (6,956) (6,608)
Administration expenses 4 (1,782) (1,938)
Share of profit of joint ventures 6.3 502 286
Operating profit (loss) 3,312 (478)
Profit on disposals and other non-operating income 5.2 93 447
Loss on disposals and other non-operating expenses 5.3 (166) (242)
Share of profit of associates 6.7 22 51
Financial income 7.2 140 153
Financial expenses 7.3 (1,025) (1,111)
Net income (loss) before taxes 2,375 (1,180)
Income taxes 8.2 (656) (536)
Net income (loss) 1,719 (1,716)
Net income (loss) attributable to:
Shareholders of LafargeHolcim Ltd 1,502 (1,675)
Non-controlling interest 217 (41)
Earnings per share in CHF
Earnings per share 9 2.52 ( 2.78)
Fully diluted earnings per share 9 2.52 ( 2.78)1 Restated due to change in presentation following IFRS 15, see note 1.2.2 Includes CHF –106 million of restructuring, litigation, implementation and other non-recurring costs in 2018 (2017: CHF –177 million).3 Includes CHF –31 million of restructuring, litigation, implementation and other non-recurring costs in 2018 (2017: CHF 62 million).4 Includes CHF –338 million of restructuring, litigation, implementation and other non-recurring costs in 2018 (2017: CHF –345 million).
The non-GAAP measures used in this report are defined on page 282.
Consolidated statement of income of LafargeHolcim
162

Million CHF Notes 2018 2017
Net income (loss) 1,719 (1,716)
Other comprehensive earnings
Items that will be reclassified to the statement of income in future periods
Currency translation effects
– Exchange differences on translation (1,602) (302)
– Realized through statement of income 4 95
– Tax effect (16) 0
Available-for-sale financial assets
– Change in fair value n/a (2)
– Realized through statement of income n/a 10
– Tax effect n/a 1
Cash flow hedges
– Change in fair value (3) (8)
– Realized through statement of income 28 5
– Tax effect (5) 0
Net investment hedges in subsidiaries
– Change in fair value (14) 30
– Realized through statement of income 0 0
– Tax effect 3 0
Subtotal (1,602) (172)
Items that will not be reclassified to the statement of income in future periods
Defined benefit plans
– Remeasurements 16.2 75 216
– Tax effect (50) (70)
Strategic equity investments at fair value through other comprehensive earnings
– Transfer of gain/loss on disposal of strategic equity investments at fair value through other comprehensive earnings to retained earnings 4 n/a
– Change in fair value 3 n/a
– Tax effect 0 n/a
Subtotal 27 146
Total other comprehensive earnings (1,575) (26)
Total comprehensive earnings 144 (1,742)
Total comprehensive earnings attributable to:
Shareholders of LafargeHolcim Ltd 120 (1,704)
Non-controlling interest 25 (39)
Consolidated statement of comprehensive earnings of LafargeHolcim
Financial information — Consolidated financial statementsLafargeHolcim Annual Report 2018 163

Million CHF Notes 31.12.2018 31.12.2017
Cash and cash equivalents 14.2 2,515 4,217
Short-term derivative assets 14.4 66 44
Current financial receivables 12.3 180 262
Trade accounts receivable 10.2 3,229 3,340
Inventories 10.3 3,081 2,870
Prepaid expenses and other current assets 10.4 1,276 1,335
Assets classified as held for sale 13.2 1,311 550
Total current assets 11,658 12,618
Long-term financial investments and other long-term assets 12.2 1,111 1,114
Investments in associates and joint ventures 6.2 3,133 3,120
Property, plant and equipment 11.2 27,890 30,152
Goodwill 11.3 14,045 14,569
Intangible assets 11.3 810 1,026
Deferred tax assets 8.4 651 758
Pension assets 16.2 371 308
Long-term derivative assets 14.4 26 14
Total non-current assets 48,037 51,061
Total assets 59,695 63,679
Consolidated statement of financial position of LafargeHolcim
164

Million CHF Notes 31.12.2018 31.12.2017
Trade accounts payable 10.5 3,770 3,715
Current financial liabilities 14.3 3,063 3,843
Current income tax liabilities 634 765
Other current liabilities 2,191 2,444
Short-term provisions 17.2 443 592
Liabilities directly associated with assets classified as held for sale 13.2 627 160
Total current liabilities 10,727 11,519
Long-term financial liabilities 14.3 13,061 14,779
Defined benefit obligations 16.2 1,603 1,861
Long-term income tax liabilities 8.6 449 398
Deferred tax liabilities 8.4 2,259 2,345
Long-term provisions 17.2 1,542 1,801
Total non-current liabilities 18,914 21,185
Total liabilities 29,642 32,703
Share capital 18.2 1,214 1,214
Capital surplus 23,157 24,340
Treasury shares 18.2 (612) (554)
Reserves 3,166 2,787
Total equity attributable to shareholders of LafargeHolcim Ltd 26,925 27,787
Non-controlling interest 2.5 3,128 3,188
Total shareholders’ equity 30,053 30,975
Total liabilities and shareholders’ equity 59,695 63,679
Financial information — Consolidated financial statementsLafargeHolcim Annual Report 2018 165

Million CHFShare
capitalCapital surplus
Treasury shares
Currency translation
adjustments Other reservesRetained earnings
Total equity attributable to
shareholders of LafargeHolcim Ltd
Non-controlling interest
Total shareholders’
equity
Equity as at January 1, 2018 1,214 24,340 (554) (12,606) 15 15,378 27,787 3,188 30,975
Net income 1,502 1,502 217 1,719
Other comprehensive earnings (1,411) 26 4 (1,382) (193) (1,575)
Total comprehensive earnings (1,411) 26 1,506 120 25 145
Payout (1,192) (1,192) (151) (1,343)
Subordinated fixed rate resettable notes 1 200 200 200
Hyperinflation 2 151 151 32 183
Change in treasury shares (76) (77) (77)
Share-based remuneration 10 10 10
Capital repaid to non-controlling interest (3) (3)
Change in participation in existing Group companies 18 (2) (91) (75) 38 (37)
Equity as at December 31, 2018 1,214 23,157 (612) (14,019) 41 17,144 26,925 3,128 30,053 3
Equity as at January 1, 2017 1,214 25,536 (72) (12,412) 10 16,546 30,822 3,925 34,747
Net loss (1,675) (1,675) (41) (1,716)
Other comprehensive earnings (184) 6 149 (29) 2 (26)
Total comprehensive earnings (184) 6 (1,526) (1,704) (39) (1,742)
Payout (1,212) (1,212) (247) (1,459)
Change in treasury shares (482) (7) (489) (489)
Share-based remuneration 16 16 16
Capital paid-in by non-controlling interest 55 55
Disposal of participation in Group companies (118) (118)
Change in participation in existing Group companies (11) 365 354 (388) (34)
Equity as at December 31, 2017 1,214 24,340 (554) (12,606) 15 15,378 27,787 3,188 30,975 1 See more information in the note 18.1.2 See more information in the note 2.2.3 Equity as at December 31, 2018 includes CHF –84 million of currency translation adjustment relating to assets and directly associated liabilities classified as held for sale.
Consolidated statement of Changes in Equity of LafargeHolcim
166

Million CHFShare
capitalCapital surplus
Treasury shares
Currency translation
adjustments Other reservesRetained earnings
Total equity attributable to
shareholders of LafargeHolcim Ltd
Non-controlling interest
Total shareholders’
equity
Equity as at January 1, 2018 1,214 24,340 (554) (12,606) 15 15,378 27,787 3,188 30,975
Net income 1,502 1,502 217 1,719
Other comprehensive earnings (1,411) 26 4 (1,382) (193) (1,575)
Total comprehensive earnings (1,411) 26 1,506 120 25 145
Payout (1,192) (1,192) (151) (1,343)
Subordinated fixed rate resettable notes 1 200 200 200
Hyperinflation 2 151 151 32 183
Change in treasury shares (76) (77) (77)
Share-based remuneration 10 10 10
Capital repaid to non-controlling interest (3) (3)
Change in participation in existing Group companies 18 (2) (91) (75) 38 (37)
Equity as at December 31, 2018 1,214 23,157 (612) (14,019) 41 17,144 26,925 3,128 30,053 3
Equity as at January 1, 2017 1,214 25,536 (72) (12,412) 10 16,546 30,822 3,925 34,747
Net loss (1,675) (1,675) (41) (1,716)
Other comprehensive earnings (184) 6 149 (29) 2 (26)
Total comprehensive earnings (184) 6 (1,526) (1,704) (39) (1,742)
Payout (1,212) (1,212) (247) (1,459)
Change in treasury shares (482) (7) (489) (489)
Share-based remuneration 16 16 16
Capital paid-in by non-controlling interest 55 55
Disposal of participation in Group companies (118) (118)
Change in participation in existing Group companies (11) 365 354 (388) (34)
Equity as at December 31, 2017 1,214 24,340 (554) (12,606) 15 15,378 27,787 3,188 30,975 1 See more information in the note 18.1.2 See more information in the note 2.2.3 Equity as at December 31, 2018 includes CHF –84 million of currency translation adjustment relating to assets and directly associated liabilities classified as held for sale.
Financial information — Consolidated financial statementsLafargeHolcim Annual Report 2018 167

Consolidated statement of Cash Flows of LafargeHolcim
Million CHF Notes 2018 2017
Net income (loss) 1,719 (1,716)
Income taxes 8.2 656 536
Profit on disposals and other non-operating income 5.2 (93) (447)
Loss on disposals and other non-operating expenses 5.3 166 242
Share of profit of associates and joint ventures 6.3, 6.7 (524) (337)
Financial expenses net 7.2, 7.3 886 958
Depreciation, amortization and impairment of operating assets 4.5 2,229 6,007
Other non-cash items 1 199 237
Change in net working capital 20 (826) (925)
Cash generated from operations 4,411 4,555
Dividends received 293 303
Interest received 131 146
Interest paid (932) (917)
Income taxes paid 8.3 (787) (871)
Other expenses (128) (176)
Cash flow from operating activities (A) 2,988 3,040
Purchase of property, plant and equipment (1,411) (1,522)
Disposal of property, plant and equipment 126 167
Acquisition of participation in Group companies (176) 55
Disposal of participation in Group companies 172 858
Purchase of financial assets, intangible and other assets (209) (347)
Disposal of financial assets, intangible and other assets 112 113
Cash flow from investing activities (B) 20 (1,386) (675)
Payout on ordinary shares 9 (1,192) (1,212)
Dividends paid to non-controlling interest (156) (237)
Capital (repaid to) paid-in by non-controlling interest (8) 63
Movements of treasury shares (73) (489)
Proceeds from subordinated fixed rate resettable notes 200 0
Net movement in current financial liabilities 14.5 (223) (163)
Proceeds from long-term financial liabilities 14.5 1,657 2,047
Repayment of long-term financial liabilities 14.5 (3,167) (3,079)
Increase in participation in existing Group companies (202) (13)
Cash flow from financing activities (C) (3,163) (3,083)
Decrease in cash and cash equivalents (A + B + C) (1,561) (718)
Cash and cash equivalents as at the beginning of the period (net) 3,954 4,795
Decrease in cash and cash equivalents (1,561) (718)
Currency translation effects (129) (122)
Cash and cash equivalents as at the end of the period (net) 14.2 2,264 3,954 1 Includes restructuring, litigation costs and other non-cash items.
168
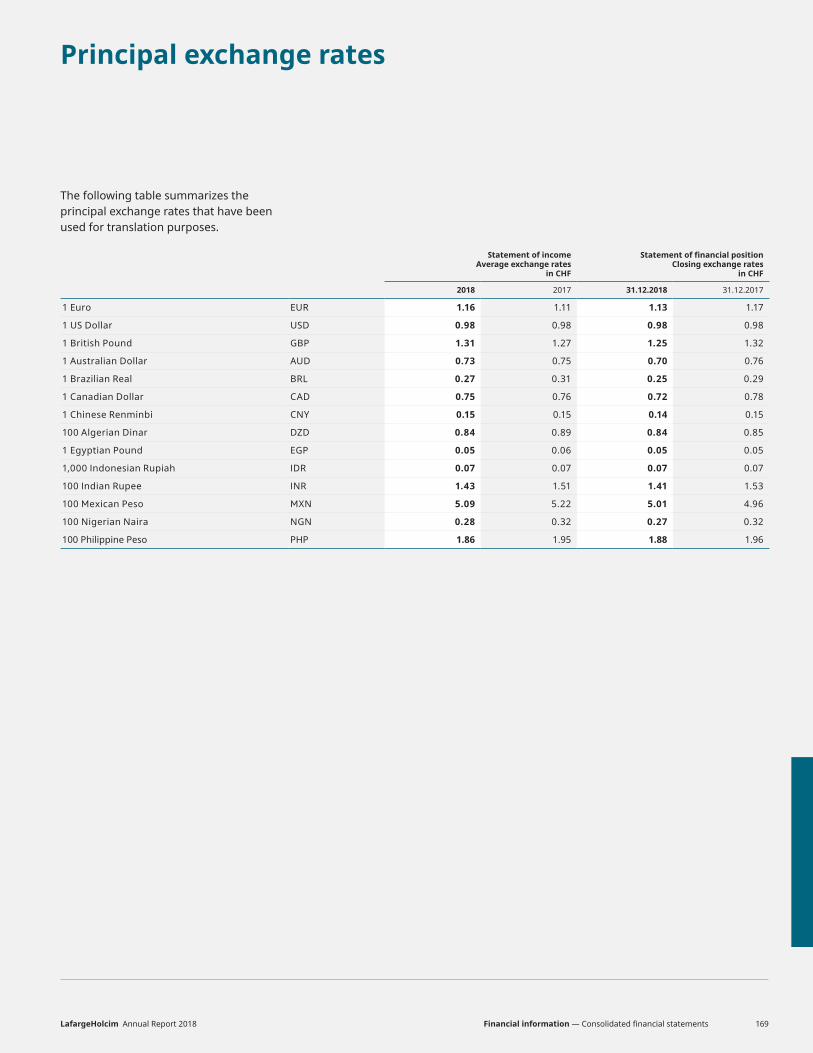
Principal exchange rates
The following table summarizes the principal exchange rates that have been used for translation purposes.
Statement of income Average exchange rates
in CHF
Statement of financial position Closing exchange rates
in CHF
2018 2017 31.12.2018 31.12.2017
1 Euro EUR 1.16 1.11 1.13 1.17
1 US Dollar USD 0.98 0.98 0.98 0.98
1 British Pound GBP 1.31 1.27 1.25 1.32
1 Australian Dollar AUD 0.73 0.75 0.70 0.76
1 Brazilian Real BRL 0.27 0.31 0.25 0.29
1 Canadian Dollar CAD 0.75 0.76 0.72 0.78
1 Chinese Renminbi CNY 0.15 0.15 0.14 0.15
100 Algerian Dinar DZD 0.84 0.89 0.84 0.85
1 Egyptian Pound EGP 0.05 0.06 0.05 0.05
1,000 Indonesian Rupiah IDR 0.07 0.07 0.07 0.07
100 Indian Rupee INR 1.43 1.51 1.41 1.53
100 Mexican Peso MXN 5.09 5.22 5.01 4.96
100 Nigerian Naira NGN 0.28 0.32 0.27 0.32
100 Philippine Peso PHP 1.86 1.95 1.88 1.96
Financial information — Consolidated financial statementsLafargeHolcim Annual Report 2018 169

Notes to the consolidated financial statements As used herein, the terms “LafargeHolcim” or “Group” refer to LafargeHolcim Ltd together with the companies included in the scope of consolidation.
1. Accounting policies1.1 Basis of preparationThe consolidated financial statements have been prepared in accordance with Inter national Financial Reporting Standards (IFRS).
Due to rounding, numbers presented throughout this report may not add up precisely to the totals provided. All ratios and variances are calculated using the underlying amount rather than the presented rounded amount.
Use of estimatesThe preparation of financial statements in conformity with IFRS requires management to make estimates and assumptions that affect the reported amounts of revenues, expenses, assets, liabilities and related disclosures at the date of the financial statements. These estimates are based on management’s best knowledge of current events and actions that the Group may undertake in the future. However, actual results could differ from those estimates. Management also uses judgment in applying the Group’s accounting policies.
Critical estimates and assumptionsEstimates and judgments are continually evaluated and are based on historical experience and other factors, including expectations of future events that are believed to be reasonable under the circumstances.
The Group makes estimates and assumptions concerning the future. The resulting accounting estimates will, by definition, seldom equal the related actual results.
The following details the judgments, apart from those involving estimations, that management has made in the process of applying the Group’s accounting policies and that have the most significant effect on the amounts recognized in the financial statements: • The classification of a subsidiary or a
disposal group as held for sale especially as to whether the sale is expected to be completed within one year from the date of classification as held for sale, and whether the proceeds expected to be received will exceed the carrying amount (note 13).
The following details the assumptions the Group makes about the future, and other major sources of estimation uncertainty at year end, that could have a significant risk of resulting in a material adjustment to the carrying amounts of assets and liabilities within the next financial year:• Assumptions underlying the estimation
of value in use in respect of cash-generating units for impairment testing purposes require the use of estimates such as long-term discount rates and growth rates (note 11.3);
• Liabilities and costs for defined benefit pension plans and other post-employment benefits are determined using actuarial valuations. The actuarial valuations involve making assumptions about discount rates, expected future salary increases and mortality rates which are subject to significant uncertainty due to the long-term nature of such plans (note 16.2);
• The recognition and measurement of provisions requires an estimate of the expenditure and timing of the settlement. The litigations and claims to which the Group is exposed are assessed
by management with the assistance of the legal department and in certain cases with the support of external specialized lawyers (note 17.2). Disclosures related to such provisions, as well as contingent liabilities, also require significant judgment (note 17.3);
• The recognition of deferred tax assets requires assessment of whether it is probable that sufficient future taxable profit will be available against which the unused tax losses can be utilized (note 8).
1.2 Adoption of new and revised International Financial Reporting Standards and interpretationsIn 2018, LafargeHolcim adopted the following new standards, interpretation and amended standard relevant to the Group:
IFRS 15 Revenue from Contracts with Customers
IFRS 9 Financial Instruments
Amendments to IFRS 2 Classification and measurement of share-based payment transactions
IFRIC 22 Foreign currency Transactions and Advance Consideration (Clarifications to IAS 21)
IFRS 15 – Revenue from Contracts with CustomersIFRS 15, which replaces IAS 11 Construction Contacts, IAS 18 Revenue and related interpretations, has been applied on a retrospective basis from January 1, 2017.
170

Based on IFRS 15, management concluded it would be more appropriate to reflect trading activities as principal rather than agent. This accounting policy change has been applied fully retrospectively and its effect on the comparative information (restated amounts) presented for each financial statement line item. Based on 2017 figures, this change in presentation increased net sales and production cost of goods sold by CHF 893 million with no impact on the net income. For further details, see note 3 in the Half-Year 2018 Report.
The impacts of applying IFRS 15 are presented in the note 4.2.
IFRS 9 – Financial InstrumentsIFRS 9, which replaces IAS 39 Financial instruments: Recognition and measurement, was adopted for the period starting January 1, 2018. Comparative figures have not been restated. The accounting policies were changed to comply with IFRS 9 as issued by the IASB in July 2014.
The impacts of applying IFRS 9 are presented in the note 14.5.
Amendments to IFRS 2 – Share-based paymentAs detailed in the 2017 Annual Report (note 2), the adoption of the amendments to IFRS 2 does not impact the Group financial statements.
IFRIC 22 – Foreign Currency Transactions and Advance ConsiderationAs detailed in the 2017 Annual Report (note 2), the adoption of IFRIC 22 does not materially impact the Group financial statements.
In 2019, LafargeHolcim will adopt the following new standard, interpretation and amended standards relevant to the Group:
IFRS 16 Leases
IFRIC 23 Uncertainty over Income Tax Treatments
Amendments to IAS 28 Long-term Interests in Associates and Joint Ventures
Amendment to IAS 19 Plan Amendment, Curtailment or Settlement
Improvements to IFRS Clarifications of existing IFRSs (issued in December 2017)
IFRS 16 – Leases In January 2016, the IASB issued IFRS 16 Leases, which replaces IAS 17 Leases and related interpretations. The new standard will require lessees to adopt a uniform approach to the presentation of leases. Correspondingly, assets must be recognised for the right of use received and liabilities must be recognised for payment obligations entered into for all leases.
The Group will transition to IFRS 16 in accordance with the modified retrospective approach. For leases that have to date been classified as operating leases in accordance with IAS 17, the lease liability will be carried at the present value of the remaining lease payments, discounted using the lessee’s incremental borrowing rate at the time the standard first applied. The right-of-use asset will generally be measured at the amount of the lease liability.
The impacts of applying IFRS 16 are presented in the note 15.1.
IFRIC 23 – Uncertainty over Income Tax Treatments As detailed in the 2017 Annual Report, the IFRIC issued IFRIC 23 Uncertainty over Income Tax Treatments in June 2017 which clarifies that an entity will be required to reflect the effect of uncertainty in accounting for income taxes. The current assessment is that the application of IFRIC 23 will not materially impact the Group financial statements.
IAS 28 – Long-term Interests in Associates and Joint VenturesIn October 2017, the IASB issued amendments to IAS 28 Long-term Interests in Associates and Joint Ventures, which clarifies that an entity first applies IFRS 9 Financial Instruments to other financial instruments before taking into account its share of profit or loss of an associate or joint venture under IAS 28. Consequently, in applying IFRS 9, an entity does not take account of any adjustments to the carrying amount of long-term interests that arise from applying IAS 28. The adoption of the amendment to IAS 28 will not materially impact the Group financial statements.
Financial information — Consolidated financial statementsLafargeHolcim Annual Report 2018 171

Notes to the consolidated financial statementscontinued
Amendment to IAS 19 – Plan Amendment, Curtailment or SettlementIn February 2018, the IASB issued an amendment to IAS 19 Employee Benefits titled Plan Amendment, Curtailment or Settlement, which requires an entity to use updated actuarial assumptions to determine current service cost and net interest for the remainder of the annual reporting period following a plan amendment, curtailment or settlement when the entity remeasures its net defined benefit liability (asset). Previously, an entity was not required to use updated actuarial assumptions when it remeasured its net defined benefit liability (asset).
The adoption of the amendment to IAS 19 will not materially impact the Group financial statements.
The adoption of the improvements to IFRSs will not materially impact the Group financial statements.
In 2020, LafargeHolcim will adopt the following amended standards relevant to the Group:
Amendments to IFRS 3 Business Combinations
Amendments to IAS 1 and IAS 8
Presentation of Financial Statements and Acounting Policies, Changes in Accounting Estimates and Errors
Amendment to IFRS 3 – Business CombinationsIn October 2018, the IASB issued amendments to IFRS 3 Business Combinations by providing additional guidance as to when an acquisition would result in a business combination. The new guidance provides a framework to evaluate when an input and a substantive process are present that together significantly contribute to the ability to create outputs.
Amendment to IAS 1 and IAS 8 – Presentation of Financial Statements and Accounting Policies, Changes in Accounting Estimates and ErrorsIn October 2018, the IASB issued amendments to IAS 1 Presentation of Financial Statements and IAS 8 Accounting Policies, Changes in Accounting Estimates and Errors. The amendments clarify the definition of material and states that an entity should assess materiality in the context of the financial statements as a whole. The amendments will not significantly impact the financial statements of LafargeHolcim.
2. Fully consolidated companies and non-controlling interests2.1 Scope of consolidationThe consolidated financial statements comprise those of LafargeHolcim Ltd and of its subsidiaries. The list of principal consolidated companies is presented in note 2.4.
2.2 Accounting principlesPrinciples of consolidationThe Group consolidates a subsidiary if it has an interest of more than one half of the voting rights or otherwise is able to exercise control over the operations. The Group controls an entity when it is exposed to, or has rights to, variable returns from its involvement with the entity and has the ability to affect those returns through its power over the entity. Business combinations are accounted for using the acquisition method. The cost of an acquisition is measured at the fair value of the consideration given at the date of exchange. For each business combination, the Group measures the non-controlling interest in the acquiree either at fair value or at the proportionate share of the acquiree’s identifiable net assets. Acquisition costs incurred are expensed in the statement of income. Identifiable assets acquired and liabilities assumed in a business combination are measured initially at fair value at the date of acquisition.
When the Group acquires a business, it assesses the financial assets and liabilities assumed for appropriate classification and designation in accordance with the contractual terms, economic circumstances and pertinent conditions as of the acquisition date.
If the business combination is achieved in stages, the carrying amount of the Group’s previously held equity interest in the acquiree is remeasured to fair value as at the acquisition date with any resulting gain or loss recognized in the statement of income.
172

Any contingent consideration to be transferred by the Group is recognized at fair value at the acquisition date. Subsequent changes to the fair value of the contingent consideration are recognized in the statement of income.
Contingent liabilities assumed in a business combination are recognized at fair value and subsequently measured at the higher of the amount that would be recognized as a provision and the amount initially recognized.
Subsidiaries are consolidated from the date on which control is transferred to the Group and are no longer consolidated from the date that control ceases.
All intercompany transactions and balances between Group companies are eliminated in full.
Changes in the ownership interest of a subsidiary that does not result in loss of control are accounted for as an equity transaction. Consequently, if LafargeHolcim acquires or partially disposes of a non-controlling interest in a subsidiary, without losing control, any difference between the amount by which the non-controlling interest is adjusted and the fair value of the consideration paid or received is recognized directly in retained earnings.
It is common practice for the Group to write put options and acquire call options in connection with the remaining shares held by the non-controlling shareholders, mainly as part of a business combination. If the Group has acquired a present ownership interest as part of a business
combination, the present value of the redemption amount of the put option is recognized as a financial liability with any excess over the carrying amount of the non-controlling interest recognized as goodwill. In such a case, the non-controlling interest is deemed to have been acquired at the acquisition date and therefore any excess arising should follow the accounting treatment as in a business combination. All subsequent fair value changes of the financial liability are recognized in the statement of income and no earnings are attributed to the non-controlling interest. However, where the Group has not acquired a present ownership interest as part of a business combination, the non-controlling interest continues to receive an allocation of profit or loss and is reclassified as a financial liability at each reporting date as if the acquisition took place at that date. Any excess over the reclassified carrying amount of the non-controlling interest and all subsequent fair value changes of the financial liability are recognized directly in retained earnings.
Foreign currency translationThe assets and liabilities of each of the Group’s companies are measured using the currency of the primary economic environment in which the entity operates (“the functional currency”). Statements of income of foreign entities are translated into the Group’s reporting currency at average exchange rates for the year and statements of financial position are translated at the exchange rates prevailing on December 31.
Goodwill arising from the acquisition of a foreign operation is expressed in the functional currency of the foreign operation and is translated at the closing rate of the reporting period.
Foreign currency transactions translated into the functional currency are accounted for at the exchange rate prevailing at the date of the transactions; gains and losses resulting from the settlement of such transactions and from the translation of monetary assets and liabilities denominated in foreign currencies are recognized in the statement of income, except when deferred outside the statement of income as qualifying cash flow hedges or net investment hedges.
Exchange differences arising on monetary items that form part of a company’s net investment in a foreign operation are recognized in other comprehensive earnings (currency translation adjustment) and are fully reclassified to the statement of income should the Group lose control of a subsidiary, lose joint control over an interest in a joint arrangement or lose significant influence in an associate. When a foreign operation is partially disposed of or sold, exchange differences that were recorded in equity are recognized in the statement of income as part of the net gain or loss on sale, except for a partial disposal of a subsidiary without loss of control, where a proportionate share of the cumulative currency translation adjustments are re-attributed to non-controlling interest and not recognized in the statement of income.
Financial information — Consolidated financial statementsLafargeHolcim Annual Report 2018 173

Notes to the consolidated financial statementscontinued
Hyperinflation in ArgentinaIn the second quarter of 2018, the inflation indices of Argentina reflected a three-year cumulative inflation rate exceeding 100 percent. The Group applied IAS 29 Financial Reporting in Hyperinflationary Economies for Argentina as of December 31, 2018. In accordance with IAS 29, the financial statements of Argentina are expressed in terms of the measuring unit current as of December 31, 2018, which means that the financial statements are restated in terms of the measuring unit current at the end of that reporting period. Monetary assets and liabilities are not restated as they are already expressed in the measuring unit current at the end of the reporting period, whereas all non-monetary items such as inventory, property, plant and equipment and equity recorded at historical rates are restated in terms of the measuring unit current at the end of December 31, 2018. The resulting gain of CHF 26 million on the net liability monetary position was recorded as part of production cost of goods sold in the income statement. The restatement of equity by CHF 183 million was reflected as an increase in retained earnings, of which CHF 32 million was attributable to the non-controlling interest. The restated financial statements of Argentina are translated into CHF at the exchange rate applicable as of December 31, 2018. Since the amounts are translated into the currency of a non-hyperinflationary economy (i.e. the CHF), comparative amounts have not been restated.
For transactions occurring from January 2017 onwards, the IPC national consumer price index was used. 2.3 Change in the scope of consolidationAcquisitions in the current reporting periodDuring 2017 and 2018, there were no individually material business combinations. Aggregated information of the acquisitions conducted is disclosed in note 20. The acquisitions made during 2018 are as listed below:• on February 23, 2018, the Group
acquired the Kendall Group, a leading aggregates and ready-mix concrete manufacturer operating in South England;
• on July 3, 2018, the Group acquired Tarrant Concrete, a leading provider of ready-mix concrete in the Dallas/Fort Worth area in Texas;
• on July 4, 2018, the Group acquired Sablière de Vritz in the area of Loire Atlantique in France; and
• on August 2, 2018, the Group acquired Metro Mix, LLC, a leading provider of ready-mix concrete in the Denver metropolitan area in Colorado.
Divestments in the current reporting periodIn the second quarter of 2018, the Group disposed of an operation of Lafarge China Cement Limited to the Group’s joint venture Huaxin Cement Co. Ltd for a total consideration of CHF 38 million.
Also in the second quarter 2018, the Group has received as planned the remaining proceeds of CHF 117 million in connection with the disposal of 73.5 percent of the listed shares in Sichuan Shuangma Cement Co. Ltd., presented in the cash flow from investing activities. In the first quarter 2018, the Group completed the repurchase of the two cement companies from Shuangma under a put and call option for an amount of CHF 214 million presented in the cash flow from financing activities (see note 13.2).
On November 12, 2018, the Group signed an agreement with Semen Indonesia for the disposal of its entire shareholding of 80.6 percent in Holcim Indonesia and consequently classified the assets and related liabilities as held for sale (see note 13.2).
Divestments in the previous comparative periodsThe streamlining of the Group’s operations in China started in 2016 and was completed with final payments in 2018. The transactions entered included: • the disposal of the non-listed cement
assets in China to the Group’s joint venture Huaxin for a total consideration of CHF 257 million received in the first quarter 2017; and
174

• the disposal of 73.5 percent of the listed shares in Sichuan Shuangma together with a put and call option agreement to repurchase the underlying Shuangma cement companies.
From the disposal of 73.5 percent of the listed shares in Sichuan Shuangma Cement Co. Ltd. in 2016, CHF 352 million was received on an escrow account in December 2016 and released in 2017 of which CHF 181 million reflecting the value of the put option was presented as cash flow from financing activities in the line “Net movement in current financial liabilities” and the remainder presented in the cash flow from investing activities in the line “Disposal of participation in Group companies”.
The put and call option agreement entered into in 2016 resulted in LafargeHolcim retaining control over four Shuangma cement companies. The put and call option agreement expired in December 2017 and two cement companies were deconsolidated with a loss of CHF 40 million recognized in 2017. As LafargeHolcim signed a share purchase agreement for the remaining two cement companies in 2017, the Group continued to maintain control with a corresponding net liability of CHF 214 million presented in the statement of financial position as current financial liability, which was released at completion in the first quarter 2018 as described above. The assets and associated liabilities for these two cement companies were classified as held for sale and a write down of CHF 58 million was recorded in 2017.
On February 28, 2017, the Group disposed of its 65 percent shareholding in LafargeHolcim Vietnam for a total consideration of CHF 546 million before taxes which resulted in a net gain before taxes of CHF 339 million.
On August 14, 2017, the Group disposed of its 54 percent shareholding in Cemento Polpaico S.A. (Chile) for a total consideration of CHF 114 million before taxes which resulted in a net loss before taxes of CHF 40 million.
Financial information — Consolidated financial statementsLafargeHolcim Annual Report 2018 175

Notes to the consolidated financial statementscontinued
2.4 Principal consolidated companies of the Group
Principal operating Group companies
Region Company Country Municipality Cement AggregatesReady-Mix
Concrete
Effective participation (percentage of interest)
Listed company
Asia Pacific Holcim (Australia) Pty Ltd Australia Chatswood u l 100.0%
LafargeHolcim Bangladesh Limited Bangladesh Dhaka n 29.4% X
Jiangyou LafargeHolcim Cement company China Jiangyou City n 100.0%
Lafarge Dujiangyan Cement Co., Ltd. ChinaDujiangyan City n 75.0%
ACC Limited India Mumbai n l 36.1% X
Ambuja Cements Ltd. India Mumbai n 63.1% X
PT Holcim Indonesia Tbk. Indonesia Jakarta n u l 80.6% X
PT Lafarge Cement Indonesia Indonesia Jakarta n 80.6%
Holcim (Malaysia) Sdn Bhd Malaysia Johor Bahru n u l 51.0%
Lafarge Malaysia Berhad Malaysia Petaling Jaya n u l 51.0% X
Holcim (New Zealand) Ltd New Zealand Christchurch n u 100.0%
Holcim Philippines Inc. Philippines Taguig City n l 75.3% X
Holcim (Singapore) Ltd Singapore Singapore l 90.8%
Lafarge Cement Singapore Pte Ltd Singapore Singapore n 51.0%
Latin America Holcim (Argentina) S.A. Argentina Cordoba n u l 80.0% X
LafargeHolcim (Brasil) S.A. Brazil Rio de Janeiro n u l 100.0%
Holcim (Colombia) S.A. Colombia Santafé de Bogota n l 99.8%
Holcim (Costa Rica) S.A. Costa Rica San José n u l 65.2% X
Holcim (Ecuador) S.A. Ecuador El Caimán n u l 92.2% X
Holcim El Salvador S.A. de C.V. El Salvador La Libertad n l 95.4%
Société des Ciments Antillais French Antilles Baie-Mahault n 69.7%
Holcim Mexico S.A. de C.V. Mexico Mexico City n u l 100.0%
Holcim (Nicaragua) S.A. Nicaragua Sur Managua n u l 52.2%
176

Region Company Country Municipality Cement AggregatesReady-Mix
Concrete
Effective participation (percentage of interest)
Listed company
Europe Lafarge Zementwerke GmbH Austria Vienna n 70.0%
Holcim (Azerbaijan) O.J.S.C. Azerbaijan Baku n 90.2%
Holcim (Belgique) S.A. Belgium Nivelle n u l 100.0%
Holcim (Bulgaria) AD Bulgaria Beli Izvor n u l 100.0%
Holcim (Hrvatska) d.o.o. Croatia Koromacno n u l 99.9%
Lafarge Cement a.s.Czech Republic Cizkovice n 68.0%
LafargeHolcim Bétons S.A.S. France Clamart l 100.0%
LafargeHolcim Ciments S.A. France Clamart n 100.0%
LafargeHolcim Distribution S.A.S. France Clamart n 100.0%
LafargeHolcim Granulats S.A.S. France Clamart u 100.0%
Holcim (Deutschland) GmbH Germany Hamburg n u l 100.0%
Holcim (Süddeutschland) GmbH Germany Dotternhausen n u l 100.0%
Heracles General Cement Company S.A. Greece Athens n 100.0%
Lafarge Cement Hungary Ltd Hungary Szentlőrinc n 70.0%
Holcim Gruppo (Italia) S.p.A. Italy Merone n u l 100.0%
Lafarge Ciment (Moldova) S.A. Moldova Rezina n 95.3%
Lafarge Cement S.A. Poland Małogoszcz n l 100.0%
Lafarge Kruszywa i Beton Poland Warsaw u l 100.0%
Holcim (Romania) S.A. Romania Bucharest n u l 99.7%
LLC Holcim (Rus) Construction Materials Russia Moscow n 97.5%
Lafarge Beocinska Fabrika Cementa Serbia Belgrade n l 100.0%
Lafarge Cement d.o.o Slovenia Trbovlje n 70.0%
Holcim Trading S.A. Spain Madrid 100.0%
LafargeHolcim España S.A.U. Spain Madrid n 100.0%
Holcim (Schweiz) AG Switzerland Zurich n u l 100.0%
LH Trading Ltd Switzerland Zurich 100.0%
Aggregate Industries Ltd.United Kingdom Markfield u l 100.0%
Lafarge Ireland LimitedUnited Kingdom Cookstown n 100.0%
Lafarge Cauldon LimitedUnited Kingdom Markfield n 100.0%
Financial information — Consolidated financial statementsLafargeHolcim Annual Report 2018 177

Notes to the consolidated financial statementscontinued
Region Company Country Munipality Cement AggregatesReady-Mix
Concrete
Effective participation (percentage of interest)
Listed company
North America Lafarge Canada Inc. Canada Toronto n u l 100.0%
Holcim (US) Inc. USA Chicago n 100.0%
Aggregate Industries Management Inc. USA Chicago u l 100.0%
Lafarge North America Inc. USA Chicago n u l 100.0%
Middle East Africa Lafarge Ciment de M’sila “LCM” Algeria Algiers n 100.0%
Lafarge Béton Algérie “LBA” Algeria Algiers u l 99.5%
Lafarge Ciment d'Oggaz “LCO” Algeria Algiers n 100.0%
Lafarge Logistique Algérie “LLA” Algeria Algiers n 99.5%
Cilas Spa Algeria Algiers n 49.0%
Lafarge Cement Egypt S.A.E. Egypt Cairo n 97.4%
Lafarge Ready Mix S.A.E. Egypt Cairo l 100.0%
Bazian Cement Company Limited Iraq Sulaimaniyah n 70.0%
Karbala Cement Manufacturing Ltd Iraq Baghdad n 51.0%
Jordan Cement Factories Company P.S.C. Jordan Amman n l 50.3% X
Bamburi Cement Limited Kenya Nairobi n 58.6% X
Holcim (Liban) S.A.L. Lebanon Beirut n l 52.1% X
Lafarge Cement Malawi Ltd Malawi Blantyre n 100.0%
Lafarge (Mauritius) Cement Ltd Mauritius Port-Louis n l 58.4%
Ashakacem Plc. Nigeria Gombe n 76.3%
Lafarge Africa Plc. Nigeria Ikoyi n u l 76.3% X
Holcim (Outre-Mer) S.A.S. Réunion Le Port n u l 100.0%
Lafarge Industries South Africa (Pty) Ltd South Africa Edenvale n l 76.3%
Lafarge Mining South Africa (Pty) Ltd South Africa Johannesburg u 76.3%
Ash Resources (Pty) Ltd South Africa Edenvale n 76.3%
Mbeya Cement Company Limited Tanzania Songwe n 61.5%
Hima Cement Ltd. Uganda Kampala n 71.0%
Lafarge Zambia Plc Zambia Lusaka n u 75.0% X
Lafarge Cement Zimbabwe Limited Zimbabwe Harare n u 76.5% X
178

Principal finance and holding companies
Company Country Municipality
Effective participation (percentage of interest)
Holcim Finance (Australia) Pty Ltd Australia Sydney 100.0%
Holcim (Australia) Holdings Pty Ltd Australia Sydney 100.0%
Holcibel S.A. Belgium Brussels 100.0%
Holcim Finance (Belgium) S.A. Belgium Brussels 100.0%
Holcim Capital Corporation Ltd. Bermuda Hamilton 100.0%
Holcim Overseas Finance Ltd. Bermuda Hamilton 100.0%
Holcim Investments (France) S.A.S. France Paris 100.0%
Lafarge S.A. France Paris 100.0%
Financière Lafarge S.A.S. France Paris 100.0%
Société financière immobilière et mobilière “SOFIMO” S.A.S. France Paris 100.0%
Lafarge Centre de recherche (LCR) France Saint Quentin Fallavier 100.0%
Holcim Auslandbeteiligungs GmbH (Deutschland) Germany Hamburg 100.0%
Holcim Beteiligungs GmbH (Deutschland) Germany Hamburg 100.0%
Holcim Finance (Luxembourg) S.A. Luxembourg Luxembourg 100.0%
Holcim US Finance S. à r.l. & Cie S.C.S. Luxembourg Luxembourg 100.0%
Holderind Investments Ltd. Mauritius Port-Louis 100.0%
Holcim Capital México, S.A. de C.V. Mexico Mexico City 100.0%
LafargeHolcim Sterling Finance B.V. Netherlands Amsterdam 100.0%
Holchin B.V. Netherlands Amsterdam 100.0%
Holderfin B.V. Netherlands Amsterdam 100.0%
Caricement B.V. Netherlands Amsterdam 100.0%
Cemasco B.V. Netherlands Amsterdam 100.0%
Holcim Investments (Spain), S.L. Spain Madrid 100.0%
LafargeHolcim Ltd 1 Switzerland Rapperswil-Jona 100.0%
LafargeHolcim Albion Finance Ltd Switzerland Rapperswil-Jona 100.0%
LafargeHolcim Continental Finance Ltd Switzerland Rapperswil-Jona 100.0%
LafargeHolcim Helvetia Finance Ltd Switzerland Rapperswil-Jona 100.0%
LafargeHolcim International Finance Ltd Switzerland Rapperswil-Jona 100.0%
Holcim Group Services Ltd Switzerland Holderbank 100.0%
Holcim Technology Ltd Switzerland Rapperswil-Jona 100.0%
Aggregate Industries Holdings Limited United Kingdom Markfield 100.0%
Holcim Participations (UK) Limited United Kingdom Markfield 100.0%
Lafarge International Holdings Limited United Kingdom Surry 100.0%
Lafarge Building Materials Limited United Kingdom Surry 100.0%
Lafarge Minerals Limited United Kingdom Surry 100.0%
LafargeHolcim Finance US LLC USA Wilmington 100.0%
Holcim Participations (US) Inc. USA Chicago 100.0%1 LafargeHolcim Ltd, Zürcherstrasse 156, CH-8645 Rapperswil Jona
Financial information — Consolidated financial statementsLafargeHolcim Annual Report 2018 179

Notes to the consolidated financial statementscontinued
Listed Group companies
Region Company Land Sitz Place of listing
Market capitalization at December 31, 2018
in local currencySecurity
code number
Asia Pacific LafargeHolcim Bangladesh Limited Bangladesh DhakaChittagong, Dhaka BDT 50,520 million BD0643LSCL09
ACC Limited India Mumbai Mumbai INR 283,202 million INE012A01025
Ambuja Cements Ltd. India Mumbai Mumbai INR 446,969 million INE079A01024
PT Holcim Indonesia Tbk. Indonesia Jakarta Jakarta IDR 14,444,567 million ID1000072309
Lafarge Malaysia Berhad Malaysia Petaling Jaya Kuala Lumpur MYR 1,538 million MYL3794OO004
Holcim Philippines Inc. Philippines Taguig City Manila PHP 37,422 million PHY3232G1014
Latin America Holcim (Argentina) S.A. Argentina Cordoba Buenos Aires ARS 20,595 million ARP6806N1051
Holcim (Costa Rica) S.A. Costa Rica San José San José CRC 137,238 million CRINC00A0010
Holcim (Ecuador) S.A. Ecuador El CaimánQuito, Guayaquil USD 1,475 million ECP516721068
Middle East Africa
Jordan Cement Factories Company P.S.C. Jordan Amman Amman JOD 37 million JO4104211019
Bamburi Cement Limited Kenya Nairobi Nairobi KES 48,092 million KE0000000059
Holcim (Liban) S.A.L. Lebanon Beirut Beirut USD 302 million LB0000012833
Lafarge Africa Plc. Nigeria Ikoyi Lagos NGN 107,984 million NGWAPCO00002
Lafarge Zambia Plc Zambia Lusaka Lusaka ZMW 974 million ZM0000000011
Lafarge Cement Zimbabwe Limited Zimbabwe Harare Harare USD 106 million ZW0009012056
180
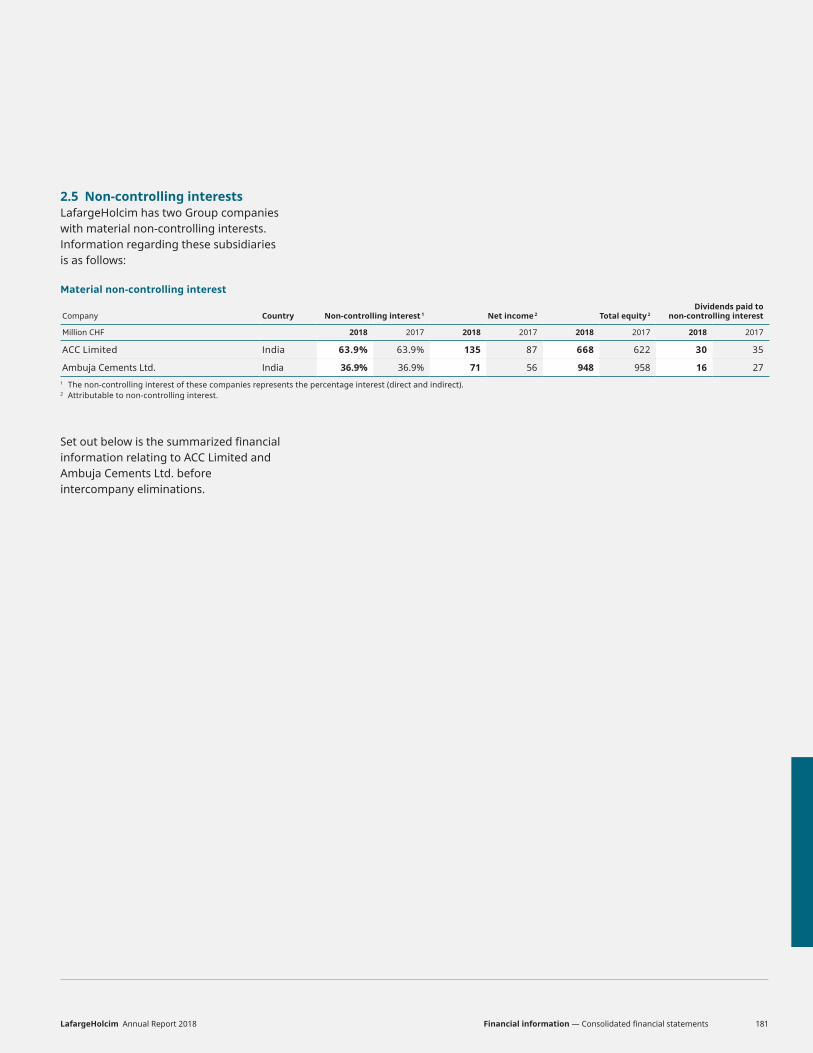
2.5 Non-controlling interestsLafargeHolcim has two Group companies with material non-controlling interests. Information regarding these subsidiaries is as follows:
Material non-controlling interest
Company Country Non-controlling interest 1 Net income 2 Total equity 2Dividends paid to
non-controlling interest
Million CHF 2018 2017 2018 2017 2018 2017 2018 2017
ACC Limited India 63.9% 63.9% 135 87 668 622 30 35
Ambuja Cements Ltd. India 36.9% 36.9% 71 56 948 958 16 27 1 The non-controlling interest of these companies represents the percentage interest (direct and indirect).2 Attributable to non-controlling interest.
Set out below is the summarized financial information relating to ACC Limited and Ambuja Cements Ltd. before intercompany eliminations.
Financial information — Consolidated financial statementsLafargeHolcim Annual Report 2018 181

Notes to the consolidated financial statementscontinued
Statement of financial position
ACC Limited Ambuja Cements Ltd.
Million CHF 2018 2017 2018 2017
Current assets 906 860 810 832
Long-term assets 1,634 1,738 2,120 2,251
Total assets 2,540 2,598 2,930 3,082
Current liabilities 584 660 514 617
Long-term liabilities 266 289 179 206
Total liabilities 849 948 693 823
Net assets 1,690 1,650 2,237 2,259
Statement of income
Million CHF 2018 2017 2018 2017
Net sales 2,096 1,977 1,608 1,560
Net income 212 136 212 176
Statement of cash flows
Million CHF 2018 2017 2018 2017
Cash flow from operating activities 169 257 112 301
Increase (decrease) in cash and cash equivalents 54 115 (23) 138
182

3. Segment reporting3.1 Accounting principlesThe Group is organized by countries. Countries or regional clusters are the Group’s operating segments. For purposes of presentation to the Chief Operating Decision Maker (i.e. the Group CEO), five regions corresponding to the aggregation of countries or regional clusters are reported:
– Asia Pacific
– Europe
– Latin America
– Middle East Africa
– North America
While each operating segment is reviewed separately by the Chief Operating Decision Maker (i.e. the Group CEO), the countries have been aggregated into five reportable segments as they have similar long-term average gross margins and are similar in respect of products, production processes, distribution methods and types of customers.
Each of the above reportable segments derives its revenues largely from the sale of cement, aggregates and ready-mix concrete.
As part of the “Strategy 2022”, the Group has disclosed a fourth product line, Solutions & Products as detailed below:
– Cement, which comprises clinker, cement and other cementitious materials
– Aggregates
– Ready-mix concrete
– Solutions & Products, which comprises precast, concrete products, asphalts, mortars and contracting and services
Trading activities, which previously were included in “Other construction materials and services”, have been reclassified largely as “Cement” to better reflect the nature of the operations to which it relates.
Group financing (including financing costs and financing income) and income taxes are managed on a Group basis and are not allocated to any reportable segments.
Transfer prices between segments are set on at arm’s-length basis in a manner similar to transactions with third parties. Segment revenues and segment results include transfers between segments. Those transfers are eliminated on consolidation.
Financial information — Consolidated financial statementsLafargeHolcim Annual Report 2018 183

Notes to the consolidated financial statementscontinued
3.2 Operating segmentsInformation by reportable segment
Asia Pacific Europe Latin America Middle East Africa North America Corporate/Eliminations Total Group
2018 2017 1 2018 2017 1 2018 2017 1 2018 2017 1 2018 2017 1 2018 2017 1 2018 2017 1
Capacity and sales (unaudited)
Annual cement production capacity (Million t) 111.4 117.4 73.6 73.4 39.1 39.3 56.8 55.3 32.0 33.0 312.9 318.4
Sales of cement (Million t) 89.7 92.6 45.3 43.1 25.1 24.9 35.9 35.8 19.8 19.2 6.1 4.7 221.9 220.2
Sales of aggregates (Million t) 31.4 31.8 120.4 125.2 3.6 4.2 8.7 10.4 109.6 107.1 273.8 278.7
Sales of ready-mix concrete (Million m 3) 12.5 12.8 19.3 18.2 5.5 5.8 4.2 4.7 9.4 9.1 50.9 50.6
Statement of income (Million CHF)
Net sales to external customers 7,446 7,402 7,554 7,008 2,731 2,943 3,080 3,353 5,875 5,664 779 652 27,466 27,021
Net sales to other segments 45 39 147 159 11 1 43 21 1 (248) (220)
Total Net sales 7,491 7,441 7,701 7,167 2,743 2,944 3,123 3,374 5,877 5,664 532 431 27,466 27,021
Recurring EBITDA 1,609 1,418 1,499 1,385 959 1,055 734 1,085 1,523 1,483 (307) (436) 6,016 5,990
Recurring EBITDA margin in % 21.5 19.1 19.5 19.3 35.0 35.9 23.5 32.2 25.9 26.2 21.9 22.2
Operating profit (loss) 1,200 7 787 260 721 568 313 (1,215) 882 552 (591) (649) 3,312 (478)
Operating profit (loss) margin in % 16.0 0.1 10.2 3.6 26.3 19.3 10.0 (36.0) 15.0 9.7 12.1 (1.8)
Statement of financial position (Million CHF)
Invested capital 8,775 9,297 11,103 11,738 2,957 2,598 6,897 7,265 10,898 11,054 965 1,605 41,595 43,556
Investments in associates and joint ventures 1,371 1,185 240 350 36 4 1,364 1,421 57 56 64 105 3,133 3,120
Total assets 13,812 14,438 15,935 17,608 4,563 4,527 7,763 8,720 15,195 15,311 2,427 3,075 59,695 63,679
Total liabilities 5,623 6,031 7,371 7,921 2,047 2,879 3,571 3,889 6,853 5,878 4,177 6,105 29,642 32,703
Statement of cash flows (Million CHF)
Cash flow from operating activities 534 704 853 819 266 483 176 420 656 851 503 (238) 2,988 3,040
Capex 2 323 328 396 313 120 80 175 254 268 370 4 10 1,285 1,355
Personnel (unaudited)
Number of personnel 21,979 24,153 20,222 21,317 8,956 9,305 11,856 12,901 12,892 12,697 1,150 1,588 77,055 81,960
Reconciliation of measures of profit and loss to the consolidated statement of income
Recurring EBITDA 1,609 1,418 1,499 1,385 959 1,055 734 1,085 1,523 1,483 (307) (436) 6,016 5,990
Restructuring, litigation, implementation and other non-recurring costs (54) (70) (84) (111) (33) (58) (76) (162) (73) 38 (155) (98) (476) (461)
Depreciation, amortization and impairment of operating assets (354) (1,341) (627) (1,013) (205) (429) (345) (2,138) (568) (969) (129) (116) (2,229) (6,007)
of which impairment charge relating to property, plant and equipment and assets classified as held for sale 123 (320) (8) (368) (19) (213) (31) (474) (371) (1) 64 (1,745)
of which impairment charge relating to goodwill (545) (40) (27) (1,237) (27) (1,821)
of which impairment charge relating to intangible assets 2 (4) (24) (5) (11) (3) (14) (6) (1) (32) (35)
of which impairment charge relating to investments in joint ventures (4) (103) (107)
Operating profit (loss) 1,200 7 787 260 721 568 313 (1,215) 882 552 (591) (649) 3,312 (478)
Profit on disposals and other non-operating income 93 447
Loss on disposals and other non-operating expenses (166) (242)
Share of profit of associates 22 51
Financial income 140 153
Financial expense (1,025) (1,111)
Net income (loss) before taxes 2,375 (1,180)1 Restated due to change in presentation following IFRS 15, see note 1.2.2 The capex consists of the purchase and disposal of property, plant and equipment.
184

3.2 Operating segmentsInformation by reportable segment
Asia Pacific Europe Latin America Middle East Africa North America Corporate/Eliminations Total Group
2018 2017 1 2018 2017 1 2018 2017 1 2018 2017 1 2018 2017 1 2018 2017 1 2018 2017 1
Capacity and sales (unaudited)
Annual cement production capacity (Million t) 111.4 117.4 73.6 73.4 39.1 39.3 56.8 55.3 32.0 33.0 312.9 318.4
Sales of cement (Million t) 89.7 92.6 45.3 43.1 25.1 24.9 35.9 35.8 19.8 19.2 6.1 4.7 221.9 220.2
Sales of aggregates (Million t) 31.4 31.8 120.4 125.2 3.6 4.2 8.7 10.4 109.6 107.1 273.8 278.7
Sales of ready-mix concrete (Million m 3) 12.5 12.8 19.3 18.2 5.5 5.8 4.2 4.7 9.4 9.1 50.9 50.6
Statement of income (Million CHF)
Net sales to external customers 7,446 7,402 7,554 7,008 2,731 2,943 3,080 3,353 5,875 5,664 779 652 27,466 27,021
Net sales to other segments 45 39 147 159 11 1 43 21 1 (248) (220)
Total Net sales 7,491 7,441 7,701 7,167 2,743 2,944 3,123 3,374 5,877 5,664 532 431 27,466 27,021
Recurring EBITDA 1,609 1,418 1,499 1,385 959 1,055 734 1,085 1,523 1,483 (307) (436) 6,016 5,990
Recurring EBITDA margin in % 21.5 19.1 19.5 19.3 35.0 35.9 23.5 32.2 25.9 26.2 21.9 22.2
Operating profit (loss) 1,200 7 787 260 721 568 313 (1,215) 882 552 (591) (649) 3,312 (478)
Operating profit (loss) margin in % 16.0 0.1 10.2 3.6 26.3 19.3 10.0 (36.0) 15.0 9.7 12.1 (1.8)
Statement of financial position (Million CHF)
Invested capital 8,775 9,297 11,103 11,738 2,957 2,598 6,897 7,265 10,898 11,054 965 1,605 41,595 43,556
Investments in associates and joint ventures 1,371 1,185 240 350 36 4 1,364 1,421 57 56 64 105 3,133 3,120
Total assets 13,812 14,438 15,935 17,608 4,563 4,527 7,763 8,720 15,195 15,311 2,427 3,075 59,695 63,679
Total liabilities 5,623 6,031 7,371 7,921 2,047 2,879 3,571 3,889 6,853 5,878 4,177 6,105 29,642 32,703
Statement of cash flows (Million CHF)
Cash flow from operating activities 534 704 853 819 266 483 176 420 656 851 503 (238) 2,988 3,040
Capex 2 323 328 396 313 120 80 175 254 268 370 4 10 1,285 1,355
Personnel (unaudited)
Number of personnel 21,979 24,153 20,222 21,317 8,956 9,305 11,856 12,901 12,892 12,697 1,150 1,588 77,055 81,960
Reconciliation of measures of profit and loss to the consolidated statement of income
Recurring EBITDA 1,609 1,418 1,499 1,385 959 1,055 734 1,085 1,523 1,483 (307) (436) 6,016 5,990
Restructuring, litigation, implementation and other non-recurring costs (54) (70) (84) (111) (33) (58) (76) (162) (73) 38 (155) (98) (476) (461)
Depreciation, amortization and impairment of operating assets (354) (1,341) (627) (1,013) (205) (429) (345) (2,138) (568) (969) (129) (116) (2,229) (6,007)
of which impairment charge relating to property, plant and equipment and assets classified as held for sale 123 (320) (8) (368) (19) (213) (31) (474) (371) (1) 64 (1,745)
of which impairment charge relating to goodwill (545) (40) (27) (1,237) (27) (1,821)
of which impairment charge relating to intangible assets 2 (4) (24) (5) (11) (3) (14) (6) (1) (32) (35)
of which impairment charge relating to investments in joint ventures (4) (103) (107)
Operating profit (loss) 1,200 7 787 260 721 568 313 (1,215) 882 552 (591) (649) 3,312 (478)
Profit on disposals and other non-operating income 93 447
Loss on disposals and other non-operating expenses (166) (242)
Share of profit of associates 22 51
Financial income 140 153
Financial expense (1,025) (1,111)
Net income (loss) before taxes 2,375 (1,180)1 Restated due to change in presentation following IFRS 15, see note 1.2.2 The capex consists of the purchase and disposal of property, plant and equipment.
Financial information — Consolidated financial statementsLafargeHolcim Annual Report 2018 185

Notes to the consolidated financial statementscontinued
Information by product line
Cement 1 Aggregates Ready-mix concreteSolution
& Products 3 Corporate/Eliminations Total Group
Million CHF 2018 2017 2 2018 2017 2 2018 2017 2 2018 2017 2 2018 2017 2 2018 2017 2
Statement of income and statement of cash flows
Net sales to external customers 16,802 16,761 2,880 2,768 5,439 5,218 2,345 2,275 27,466 27,021
Net sales to other segments 1,250 1,202 1,212 1,157 42 45 51 38 (2,555) (2,443)
Total net sales 18,052 17,964 4,091 3,925 5,481 5,263 2,396 2,313 (2,555) (2,443) 27,466 27,021
– of which Asia Pacific 5,731 5,703 631 583 1,233 1,254 297 329 (401) (430) 7,491 7,441
– of which Europe 3,791 3,476 1,925 1,819 2,060 1,845 1,087 1,083 (1,161) (1,056) 7,701 7,167
– of which Latin America 2,349 2,572 26 36 508 507 50 21 (190) (192) 2,743 2,944
– of which Middle East Africa 2,752 2,983 94 112 319 348 90 71 (133) (140) 3,123 3,374
– of which North America 2,883 2,796 1,416 1,374 1,361 1,308 876 800 (659) (615) 5,877 5,664
– of which Corporate/Eliminations 546 433 1 1 (3) 7 (11) (11) 532 431
Recurring EBITDA 4,688 4,810 893 767 232 148 203 264 6,016 5,990
– of which Asia Pacific 1,272 1,141 191 164 108 75 38 37 1,609 1,418
– of which Europe 971 887 354 317 71 56 103 125 1,499 1,385
– of which Latin America 909 1,031 1 (2) 45 26 4 1 959 1,055
– of which Middle East Africa 693 1,049 11 12 10 1 20 24 734 1,085
– of which North America 1,044 1,012 377 344 40 53 62 75 1,523 1,483
– of which Corporate (201) (310) (42) (66) (41) (63) (23) 2 (307) (436)
Recurring EBITDA margin in % 26.0 26.8 21.8 19.5 4.2 2.8 8.5 11.4 21.9 22.2
Capital expenditure 937 1,134 235 167 73 46 38 40 2 (32) 1,285 1,355
Personnel (unaudited)
Number of personnel 45,194 47,987 9,639 10,777 12,800 13,382 8,327 8,344 1,094 1,470 77,055 81,960 1 Cement, clinker and other cementitious materials.2 Restated due to change in presentation following IFRS 15, see note 1.2.3 Precast, concrete products, asphalt, mortars and contracting and services.
186

Information by product line
Cement 1 Aggregates Ready-mix concreteSolution
& Products 3 Corporate/Eliminations Total Group
Million CHF 2018 2017 2 2018 2017 2 2018 2017 2 2018 2017 2 2018 2017 2 2018 2017 2
Statement of income and statement of cash flows
Net sales to external customers 16,802 16,761 2,880 2,768 5,439 5,218 2,345 2,275 27,466 27,021
Net sales to other segments 1,250 1,202 1,212 1,157 42 45 51 38 (2,555) (2,443)
Total net sales 18,052 17,964 4,091 3,925 5,481 5,263 2,396 2,313 (2,555) (2,443) 27,466 27,021
– of which Asia Pacific 5,731 5,703 631 583 1,233 1,254 297 329 (401) (430) 7,491 7,441
– of which Europe 3,791 3,476 1,925 1,819 2,060 1,845 1,087 1,083 (1,161) (1,056) 7,701 7,167
– of which Latin America 2,349 2,572 26 36 508 507 50 21 (190) (192) 2,743 2,944
– of which Middle East Africa 2,752 2,983 94 112 319 348 90 71 (133) (140) 3,123 3,374
– of which North America 2,883 2,796 1,416 1,374 1,361 1,308 876 800 (659) (615) 5,877 5,664
– of which Corporate/Eliminations 546 433 1 1 (3) 7 (11) (11) 532 431
Recurring EBITDA 4,688 4,810 893 767 232 148 203 264 6,016 5,990
– of which Asia Pacific 1,272 1,141 191 164 108 75 38 37 1,609 1,418
– of which Europe 971 887 354 317 71 56 103 125 1,499 1,385
– of which Latin America 909 1,031 1 (2) 45 26 4 1 959 1,055
– of which Middle East Africa 693 1,049 11 12 10 1 20 24 734 1,085
– of which North America 1,044 1,012 377 344 40 53 62 75 1,523 1,483
– of which Corporate (201) (310) (42) (66) (41) (63) (23) 2 (307) (436)
Recurring EBITDA margin in % 26.0 26.8 21.8 19.5 4.2 2.8 8.5 11.4 21.9 22.2
Capital expenditure 937 1,134 235 167 73 46 38 40 2 (32) 1,285 1,355
Personnel (unaudited)
Number of personnel 45,194 47,987 9,639 10,777 12,800 13,382 8,327 8,344 1,094 1,470 77,055 81,960 1 Cement, clinker and other cementitious materials.2 Restated due to change in presentation following IFRS 15, see note 1.2.3 Precast, concrete products, asphalt, mortars and contracting and services.
Financial information — Consolidated financial statementsLafargeHolcim Annual Report 2018 187

Notes to the consolidated financial statementscontinued
3.3 Information by countryNet sales
to external customers Non-current assets
Million CHF 2018 2017 1 2018 2017
Switzerland 979 968 1,071 1,096
USA 3,879 3,822 7,990 7,987
India 3,697 3,535 4,223 4,598
Canada 2,105 1,950 4,237 4,638
France 1,915 1,771 3,921 4,226
United Kingdom 1,790 1,713 2,134 2,139
Australia 1,251 1,242 1,385 1,429
Mexico 984 976 919 925
Germany 677 644 965 1,020
Other countries 10,189 10,400 15,900 17,688
Total 27,466 27,021 42,745 45,747 1 Restated due to change in presentation following IFRS 15, see note 1.2.
Net sales to external customers are based primarily on the location of assets (origin of sales). Non-current assets consist of property, plant and equipment, goodwill and intangible assets. There is no single external customer where net sales amount to 10 percent or more of the Group net sales.
188

4. Operating profit4.1 Accounting principlesOperating profit excludes items that are not directly related to the Group’s normal operating activities. These primarily relate to gains or losses on the disposal of property, plant and equipment, gains or losses on the sale of Group companies, associates and joint ventures, revaluation gains or losses on previously held equity interests, disputes with minority shareholders, other major lawsuits, share of profit or loss of associates and financial income and expenses.
4.2 Revenue recognitionThe Group is applying IFRS 15 on a retrospective basis from January 1, 2017.Revenue from the sale of the Group’s core products cement, aggregates and ready-mix concrete is recognized when delivery has taken place and control of the goods has been transferred to the customer. The customer obtains control of the goods when the significant risks and rewards of products sold are transferred according to the specific delivery terms that have been formally agreed with the customer, generally upon delivery when the bill of lading is signed by the customer as evidence that they have obtained physical possession and accepted the products delivered to them.
The core products are often sold with volume discounts. Revenue from these sales is recognized based on the price specified on the invoice, net of estimated discounts. Accumulated experience is used to estimate and provide for the discounts, using the most likely amount. A liability is recognized for expected volume discounts in relation to sales made until the end of the reporting period. No element of financing is deemed present as the sales are made with credit terms largely ranging between 30 days and 60 days depending on the specific terms agreed to with the Group company concerned, which is consistent with market practice. Generally, cement, aggregates and ready-mix concrete are not returned as a customer will only accept these products once they have passed a stringent quality check at delivery point.
Contract liabilities, which is a Group company’s obligation to transfer goods or services to a customer for which the entity has already received consideration, relate mainly to advance payments from customers which are disclosed in note 10.5 and to volume incentive programs. As at December 31, 2018, contract liabilities amounted to CHF 555 million (2017: CHF 531 million).
A trade receivable is recognized when the products are delivered to a customer as this is the point in time that the consideration becomes unconditional because only a passage of time is required before the payment is due.
Contract assets, which is a Group company’s right to consideration that is conditional on something other than the passage of time, relate mainly to construction and paving activities and remain immaterial on Group level at this stage.
The Group is also involved in providing services in conjunction with the sale of its core products and is developing retail activities in certain markets. However, both these activities remain immaterial on Group level at this stage.
Interest is recognized on a time proportion basis that reflects the effective yield on the asset.
Dividends are recognized when the shareholder’s right to receive payment is established.
Financial information — Consolidated financial statementsLafargeHolcim Annual Report 2018 189
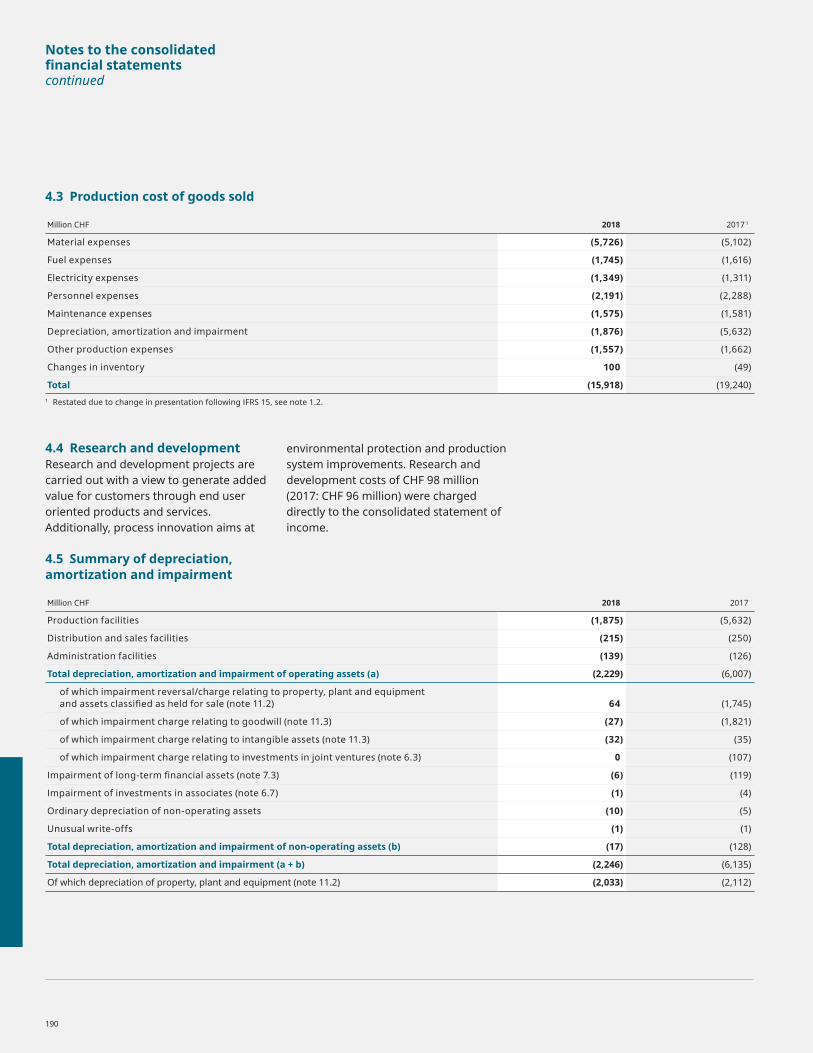
Notes to the consolidated financial statementscontinued
4.3 Production cost of goods sold
Million CHF 2018 2017 1
Material expenses (5,726) (5,102)
Fuel expenses (1,745) (1,616)
Electricity expenses (1,349) (1,311)
Personnel expenses (2,191) (2,288)
Maintenance expenses (1,575) (1,581)
Depreciation, amortization and impairment (1,876) (5,632)
Other production expenses (1,557) (1,662)
Changes in inventory 100 (49)
Total (15,918) (19,240)1 Restated due to change in presentation following IFRS 15, see note 1.2.
4.4 Research and developmentResearch and development projects are carried out with a view to generate added value for customers through end user oriented products and services. Additionally, process innovation aims at
environmental protection and production system improvements. Research and development costs of CHF 98 million (2017: CHF 96 million) were charged directly to the consolidated statement of income.
4.5 Summary of depreciation, amortization and impairment
Million CHF 2018 2017
Production facilities (1,875) (5,632)
Distribution and sales facilities (215) (250)
Administration facilities (139) (126)
Total depreciation, amortization and impairment of operating assets (a) (2,229) (6,007)
of which impairment reversal/charge relating to property, plant and equipment and assets classified as held for sale (note 11.2) 64 (1,745)
of which impairment charge relating to goodwill (note 11.3) (27) (1,821)
of which impairment charge relating to intangible assets (note 11.3) (32) (35)
of which impairment charge relating to investments in joint ventures (note 6.3) 0 (107)
Impairment of long-term financial assets (note 7.3) (6) (119)
Impairment of investments in associates (note 6.7) (1) (4)
Ordinary depreciation of non-operating assets (10) (5)
Unusual write-offs (1) (1)
Total depreciation, amortization and impairment of non-operating assets (b) (17) (128)
Total depreciation, amortization and impairment (a + b) (2,246) (6,135)
Of which depreciation of property, plant and equipment (note 11.2) (2,033) (2,112)
190

5. Profit and loss on disposals and other non-operating items5.1 Accounting principlesProfit and loss on disposals and other non-operating items comprise gains or losses on the sale of Group companies and property, plant and equiment and other
non-operating items that are not directly related to the Group’s normal operating activities such as revaluation gains or losses on previously held equity interests, disputes with non-controlling interests and other major lawsuits.
5.2 Profit on disposals and other non-operating income
Million CHF 2018 2017
Dividends earned 6 6
Net gain on disposals before taxes 69 441
Other 18 0
Total 93 447
In 2018, the position “Net gain on disposals before taxes” mainly includes several gains on disposal of property, plant and equipment of CHF 62 million.
In 2017, the position “Net gain on disposals before taxes” mainly included a gain on the disposal of LafargeHolcim
Vietnam of CHF 339 million and gains on property, plant and equipment of CHF 82 million.
Further information is disclosed in note 2.3.
5.3 Loss on disposals and other non-operating expenses
Million CHF 2018 2017
Depreciation, amortization and impairment of non-operating assets (9) (10)
Net loss on disposals before taxes (84) (108)
Other (73) (124)
Total (166) (242)
In 2018, the position “Net loss on disposals before taxes” notably includes the loss on disposal of one subsidiary in Europe for CHF 31 million.
In 2018, the position “Other” includes expenses incurred in connection with assets, which are not operating anymore,
abandoned or not part of the operating business cycle.
In 2017, the position “Net loss on disposal before taxes” related mainly to the loss of CHF 40 million on the disposal of Cemento Polpaico S.A. (Chile) and CHF 40 million from the transactions entered in China (see note 2.3).
In 2017, the position “Other” included expenses in relation to ongoing legal cases (see note 17.3) and expenses incurred in connection with assets, that are not operating anymore, abandoned or not part of the operating business cycle.
Financial information — Consolidated financial statementsLafargeHolcim Annual Report 2018 191

Notes to the consolidated financial statementscontinued
6. Investments in associates and joint ventures6.1 Accounting principlesThe Group, in the course of its business, may enter into arrangements where it will exercise joint control over entities resulting in classifying these operations as joint ventures or joint operations depending on the right and obligation arising from the contractual arrangement. Alternatively, it may enter into arrangements where it holds 20 to 50 percent of the voting rights and exercises significant influence resulting in these companies being classified as associate companies.
Such investments are accounted for using the equity method of accounting.
The Group’s share of profit of joint ventures is classified within operating profit as these operations form an integral part of the Group’s financial performance, reflecting its core business activities. The Group’s share of profit of associates is classified below operating profit.Goodwill arising from an acquisition is included in the carrying amount of the investments in joint ventures and associated companies.
Equity accounting is discontinued when the carrying amount of the investment together with any long-term interest in a joint venture or in an associate reaches zero, unless the Group has either incurred or guaranteed additional obligations in respect of the joint venture or associate.
6.2 Main changes during the periodIn June 2018, the Group’s long-term investment in Cuba was reclassified from an investment in an associate to an investment in a joint venture following a change in the Board composition and the appointment of the CEO nominated by the Group. All key decisions (capital expenditures, budget) are taken jointly with the partner. There is no link to the Group's US operations or managerial staff.
In addition, an investment in an associate in Europe was reclassified to “Financial investments – third parties” in 2018 following the change in the relationship and involvement with the main shareholder.
Million CHF 2018 2017
Investments in associates 264 426
Investments in joint ventures 2,869 2,693
Total 3,133 3,120
6.3 Movements in investments in joint ventures
Million CHF 2018 2017
January 1 2,693 1,932
Share of profit of joint ventures 502 286
Dividends earned (264) (263)
Net acquisitions (disposals) 4 17
Reclassifications 28 847
Impairments 0 (107)
Currency translation effects (95) (19)
December 31 2,869 2,693
192
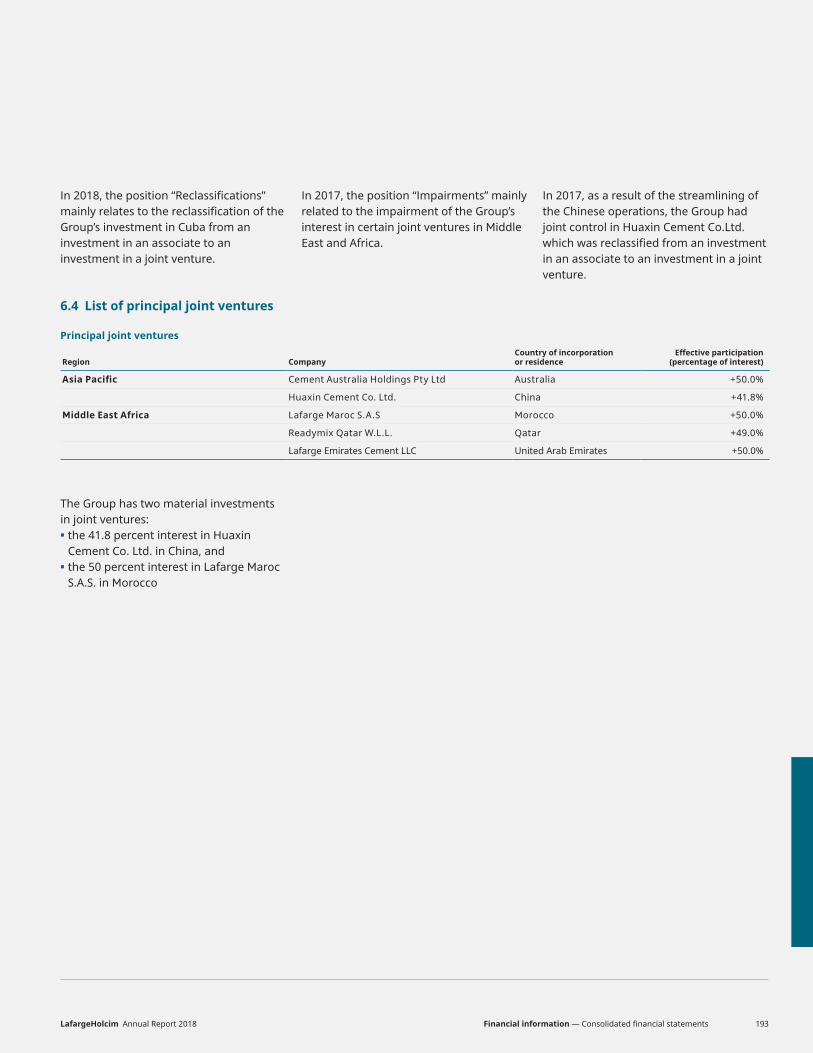
In 2018, the position “Reclassifications” mainly relates to the reclassification of the Group’s investment in Cuba from an investment in an associate to an investment in a joint venture.
In 2017, the position “Impairments” mainly related to the impairment of the Group’s interest in certain joint ventures in Middle East and Africa.
In 2017, as a result of the streamlining of the Chinese operations, the Group had joint control in Huaxin Cement Co.Ltd. which was reclassified from an investment in an associate to an investment in a joint venture.
6.4 List of principal joint ventures
Principal joint ventures
Region CompanyCountry of incorporation or residence
Effective participation (percentage of interest)
Asia Pacific Cement Australia Holdings Pty Ltd Australia +50.0%
Huaxin Cement Co. Ltd. China +41.8%
Middle East Africa Lafarge Maroc S.A.S Morocco +50.0%
Readymix Qatar W.L.L. Qatar +49.0%
Lafarge Emirates Cement LLC United Arab Emirates +50.0%
The Group has two material investments in joint ventures:• the 41.8 percent interest in Huaxin
Cement Co. Ltd. in China, and• the 50 percent interest in Lafarge Maroc
S.A.S. in Morocco
Financial information — Consolidated financial statementsLafargeHolcim Annual Report 2018 193

Notes to the consolidated financial statementscontinued
6.5 Huaxin Cement Co. Ltd (China)As of December 31, 2018, the Group holds 41.8 percent (2017: 41.8 percent) of the voting rights in the joint venture company Huaxin Cement Co. Ltd.
The fair value of the investment in Huaxin Cement Co. Ltd. based on a quoted market price on December 31, 2018 amounted to CHF 1,342 million (2017: CHF 1,123 million).
Set out below is the summarized financial information for the material joint venture company Huaxin Cement Co. Ltd., which is accounted for using the equity method. The summarized financial information presented below are the amounts included in the IFRS financial statements of Huaxin Cement Co. Ltd. as at December 31, 2018 and as at December 31, 2017. As of December 31, 2018, dividends of CHF 31 million (December 31, 2017: CHF 4 million) were received from Huaxin Cement Co. Ltd.
Huaxin Cement Co. Ltd. – Statement of financial position
Million CHF 31.12.2018 31.12.2017
Cash and cash equivalents 763 540
Other current assets 757 806
Non-current assets 3,469 3,468
Total assets 4,988 4,815
Current financial liabilities 503 423
Other current liabilities 969 1,009
Long-term financial liabilities 529 1,118
Other non-current liabilities 120 69
Total liabilities 2,121 2,618
Net assets 2,867 2,197
Shareholders’ equity (excluding non-controlling interest) 2,619 1,993
Huaxin Cement Co. Ltd. – Statement of comprehensive earnings
Million CHFJan-Dec
2018Jan-Dec
2017
Net sales 4,047 3,036
Recurring EBITDA 1,340 731
Depreciation and amortization (216) (238)
Operating profit 1,124 493
Profit on disposals and other non-operating income 33 11
Financial income 5 6
Financial expenses (74) (102)
Income taxes (213) (76)
Net income 875 332
Net income (excluding non-controlling interest) 799 302
Other comprehensive earnings 3 (3)
Total comprehensive earnings (excluding non-controlling interest) 802 299
194
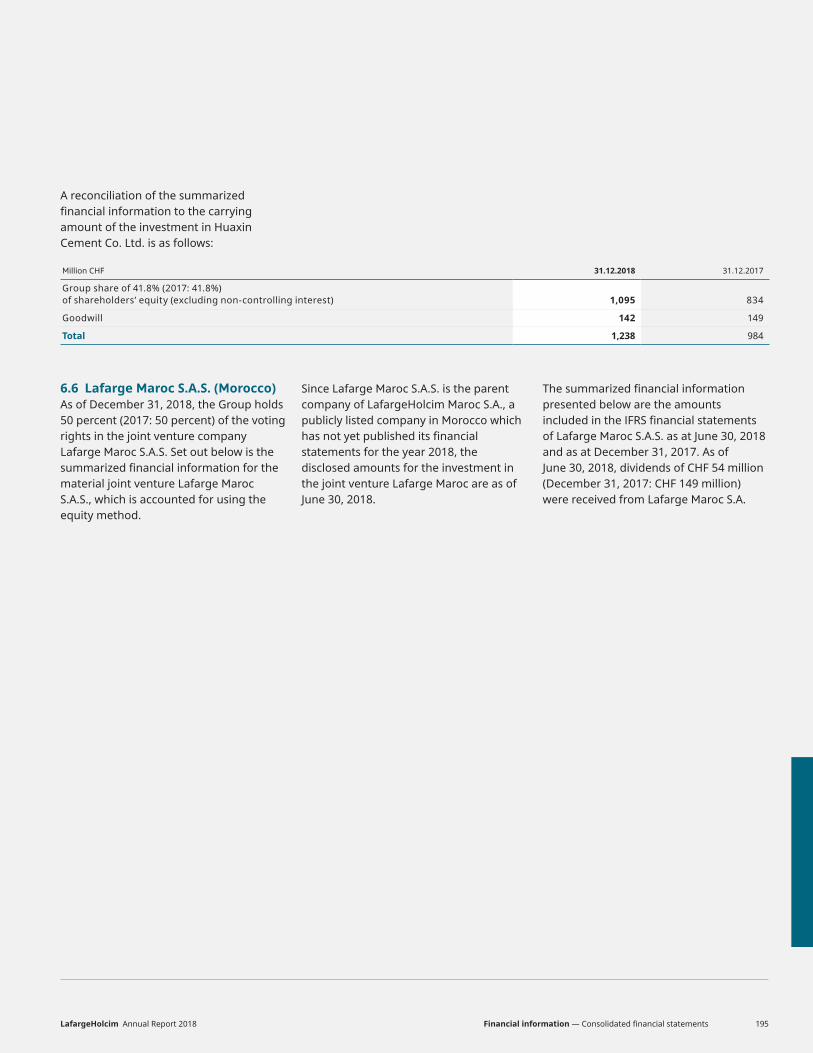
A reconciliation of the summarized financial information to the carrying amount of the investment in Huaxin Cement Co. Ltd. is as follows:
Million CHF 31.12.2018 31.12.2017
Group share of 41.8% (2017: 41.8%) of shareholders’ equity (excluding non-controlling interest) 1,095 834
Goodwill 142 149
Total 1,238 984
6.6 Lafarge Maroc S.A.S. (Morocco)As of December 31, 2018, the Group holds 50 percent (2017: 50 percent) of the voting rights in the joint venture company Lafarge Maroc S.A.S. Set out below is the summarized financial information for the material joint venture Lafarge Maroc S.A.S., which is accounted for using the equity method.
Since Lafarge Maroc S.A.S. is the parent company of LafargeHolcim Maroc S.A., a publicly listed company in Morocco which has not yet published its financial statements for the year 2018, the disclosed amounts for the investment in the joint venture Lafarge Maroc are as of June 30, 2018.
The summarized financial informa tion presented below are the amounts included in the IFRS financial statements of Lafarge Maroc S.A.S. as at June 30, 2018 and as at December 31, 2017. As of June 30, 2018, dividends of CHF 54 million (December 31, 2017: CHF 149 million) were received from Lafarge Maroc S.A.
Financial information — Consolidated financial statementsLafargeHolcim Annual Report 2018 195
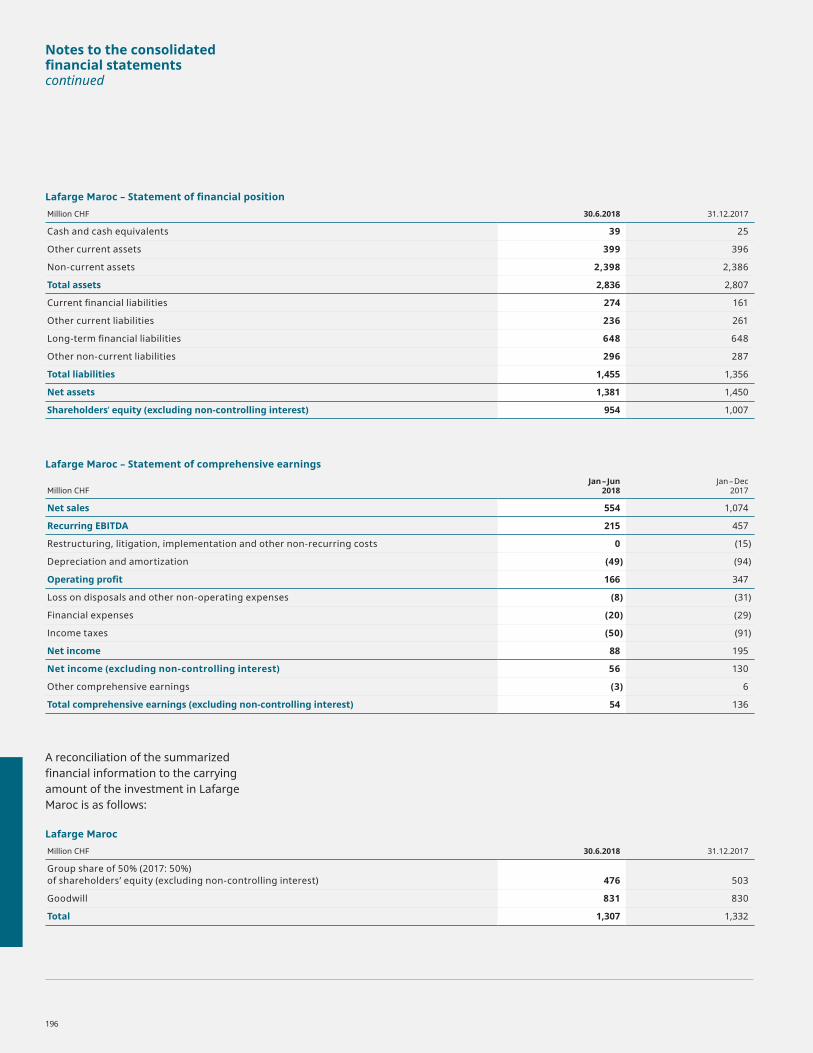
Notes to the consolidated financial statementscontinued
Lafarge Maroc – Statement of financial position
Million CHF 30.6.2018 31.12.2017
Cash and cash equivalents 39 25
Other current assets 399 396
Non-current assets 2,398 2,386
Total assets 2,836 2,807
Current financial liabilities 274 161
Other current liabilities 236 261
Long-term financial liabilities 648 648
Other non-current liabilities 296 287
Total liabilities 1,455 1,356
Net assets 1,381 1,450
Shareholders’ equity (excluding non-controlling interest) 954 1,007
Lafarge Maroc – Statement of comprehensive earnings
Million CHFJan – Jun
2018Jan – Dec
2017
Net sales 554 1,074
Recurring EBITDA 215 457
Restructuring, litigation, implementation and other non-recurring costs 0 (15)
Depreciation and amortization (49) (94)
Operating profit 166 347
Loss on disposals and other non-operating expenses (8) (31)
Financial expenses (20) (29)
Income taxes (50) (91)
Net income 88 195
Net income (excluding non-controlling interest) 56 130
Other comprehensive earnings (3) 6
Total comprehensive earnings (excluding non-controlling interest) 54 136
A reconciliation of the summarized financial information to the carrying amount of the investment in Lafarge Maroc is as follows:
Lafarge Maroc
Million CHF 30.6.2018 31.12.2017
Group share of 50% (2017: 50%) of shareholders’ equity (excluding non-controlling interest) 476 503
Goodwill 831 830
Total 1,307 1,332
196
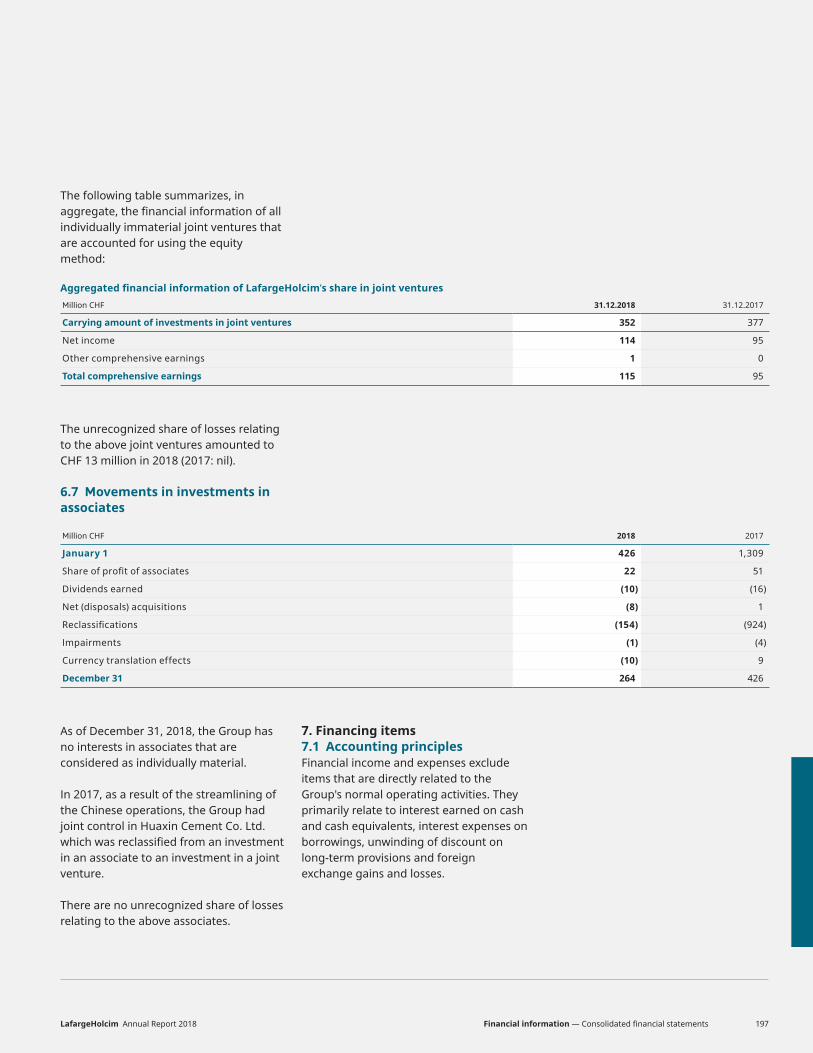
The following table summarizes, in aggregate, the financial information of all individually immaterial joint ventures that are accounted for using the equity method:
Aggregated financial information of LafargeHolcim’s share in joint ventures
Million CHF 31.12.2018 31.12.2017
Carrying amount of investments in joint ventures 352 377
Net income 114 95
Other comprehensive earnings 1 0
Total comprehensive earnings 115 95
The unrecognized share of losses relating to the above joint ventures amounted to CHF 13 million in 2018 (2017: nil).
6.7 Movements in investments in associates
Million CHF 2018 2017
January 1 426 1,309
Share of profit of associates 22 51
Dividends earned (10) (16)
Net (disposals) acquisitions (8) 1
Reclassifications (154) (924)
Impairments (1) (4)
Currency translation effects (10) 9
December 31 264 426
As of December 31, 2018, the Group has no interests in associates that are considered as indi vidually material.
In 2017, as a result of the streamlining of the Chinese operations, the Group had joint control in Huaxin Cement Co. Ltd. which was reclassified from an investment in an associate to an investment in a joint venture.
There are no unrecognized share of losses relating to the above associates.
7. Financing items7.1 Accounting principlesFinancial income and expenses exclude items that are directly related to the Group's normal operating activities. They primarily relate to interest earned on cash and cash equivalents, interest expenses on borrowings, unwinding of discount on long-term provisions and foreign exchange gains and losses.
Financial information — Consolidated financial statementsLafargeHolcim Annual Report 2018 197

Notes to the consolidated financial statementscontinued
7.2 Financial income
Million CHF 2018 2017
Interest earned on cash and cash equivalents 85 92
Other financial income 54 60
Total 140 153
The position “Other financial income” relates primarily to interest income from loans and receivables.
7.3 Financial expenses
Million CHF 2018 2017
Interest expenses (725) (760)
Fair value changes on financial instruments (2) 0
Unwinding of discount on long-term provisions (38) (27)
Net interest expense on retirement benefit plans (56) (52)
Impairment of long-term financial assets (6) (119)
Other financial expenses (143) (200)
Foreign exchange gain/(loss) net (61) 26
Financial expenses capitalized 5 21
Total (1,025) (1,111)
The position “Interest expenses” relates primarily to financial liabilities measuredat amortized cost and includes amortization on bonds and private placements of CHF 70 million (2017: CHF 99 million). The remaining balance related to the purchase price allocation on bonds and private placements amounts to CHF 136 million as at end of December 2018. The decrease of the interest expenses in 2018 is the result of the continuation of the financial liabilities reduction especially due to bonds repayment and the decrease in the average interest rate (see note 14.3).
The position “Impairment of long-term financial assets” includes write-offs of third parties financial investments and long-term financial receivables.
The position “Other financial expenses” notably includes accruals for interest related to ongoing legal and tax cases (see notes 17.3 and 8 respectively) and bank charge fees.
The position “Financial expenses capitalized” comprises interest expenditures on large-scale projects.
8. Income taxes8.1 Accounting principlesIncome taxesThe Group is subject to income taxes in numerous jurisdictions and the calculation of the Group’s tax charge involves a degree of estimation and judgement in respect of certain items. There are many transactions and calculations where the ultimate tax determination is uncertain during the ordinary course of business. The Group recognises liabilities for potential tax audit issues and uncertain tax positions based on management’s estimate of whether additional taxes will be due. Where the final tax outcome of these matters is different from the
198
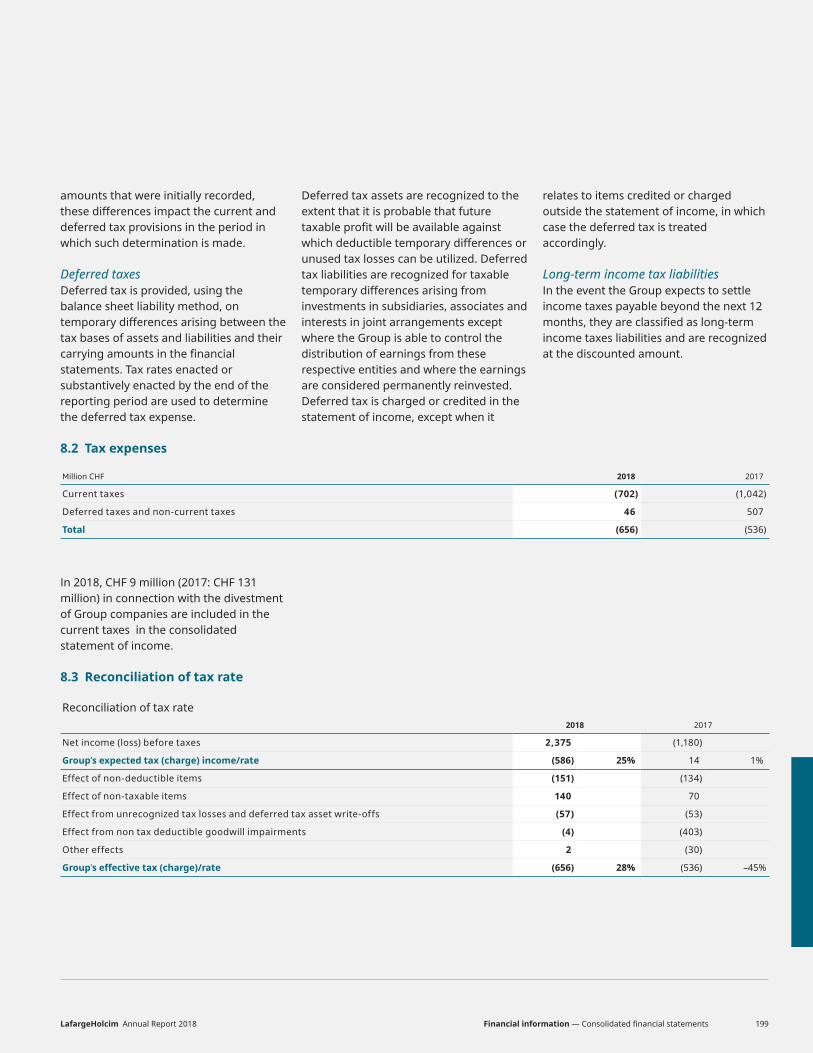
amounts that were initially recorded, these differences impact the current and deferred tax provisions in the period in which such determination is made.
Deferred taxes Deferred tax is provided, using the balance sheet liability method, on temporary differences arising between the tax bases of assets and liabilities and their carrying amounts in the financial statements. Tax rates enacted or substantively enacted by the end of the reporting period are used to determine the deferred tax expense.
Deferred tax assets are recognized to the extent that it is probable that future taxable profit will be available against which deductible temporary differences or unused tax losses can be utilized. Deferred tax liabilities are recognized for taxable temporary differences arising from investments in subsidiaries, associates and interests in joint arrangements except where the Group is able to control the distribution of earnings from these respective entities and where the earnings are considered permanently reinvested.Deferred tax is charged or credited in the statement of income, except when it
relates to items credited or charged outside the statement of income, in which case the deferred tax is treated accordingly.
Long-term income tax liabilitiesIn the event the Group expects to settle income taxes payable beyond the next 12 months, they are classified as long-term income taxes liabilities and are recognized at the discounted amount.
8.2 Tax expenses
Million CHF 2018 2017
Current taxes (702) (1,042)
Deferred taxes and non-current taxes 46 507
Total (656) (536)
In 2018, CHF 9 million (2017: CHF 131 million) in connection with the divestment of Group companies are included in the current taxes in the consolidated statement of income.
8.3 Reconciliation of tax rate
Reconciliation of tax rate2018 2017
Net income (loss) before taxes 2,375 (1,180)
Group’s expected tax (charge) income/rate (586) 25% 14 1%
Effect of non-deductible items (151) (134)
Effect of non-taxable items 140 70
Effect from unrecognized tax losses and deferred tax asset write-offs (57) (53)
Effect from non tax deductible goodwill impairments (4) (403)
Other effects 2 (30)
Group’s effective tax (charge)/rate (656) 28% (536) –45%
Financial information — Consolidated financial statementsLafargeHolcim Annual Report 2018 199

Notes to the consolidated financial statementscontinued
The expected tax expense at the applicable tax rate is the result from applying the domestic statutory tax rates to net income (loss) before taxes and non-recoverable withholding tax on remitted income of each entity in the country it operates. For the Group, the applicable tax rate varies from one year to the other depending on the relative weight of net income (loss) of each individual entity in the Group's profit as well as the changes in statutory and withholding tax rates.
The difference between the Group’s effective tax rate in 2017 and 2018, mainly relates to impairments of assets without recognition of related deferred taxes.Excluding impairment and divestments, the Group’s effective tax rate amounts to 28 percent (2017: 31 percent). In 2018, the Group’s Effective Tax Rate includes the recurring positive impacts of US tax reform, lower effect of non-recoverable withholding tax on income remitted from subsidiaries, net increase in provisions for transfer pricing and other risks largely offset by the reassessment of the risk in relation to the tax treatment of excise duty incentives in India (see note 17.3 for additional information).
In 2018, total income taxes paid amounts to CHF 807 million (2017: CHF 1,043 million), of which CHF 9 million (2017: CHF 163 million) related to the divestment of Group companies and included in the position “Disposal of participation in Group companies” in the consolidated statement of cash flows and CHF 11 million (2017: CHF 9 million) included in the position “Dividends paid to non-controlling interest”.
8.4 Deferred taxes
Deferred tax in the consolidated statement of financial position as follows:
Million CHF 2018 2017
Deferred tax assets (651) (758)
Deferred tax liabilities 2,259 2,345
Deferred tax liabilities net 1,607 1,587
The Group’s recognition of deferred tax assets amounting to CHF 651 million reflects that the Group believes that sufficient taxable income will be generated to recover these assets in
future periods, although uncertainties regarding the future realisation of recorded tax benefits on temporary differences and tax loss carryforwards from operations in various jurisdictions
could result in material adjustments to the deferred tax assets recognised in future periods.
200
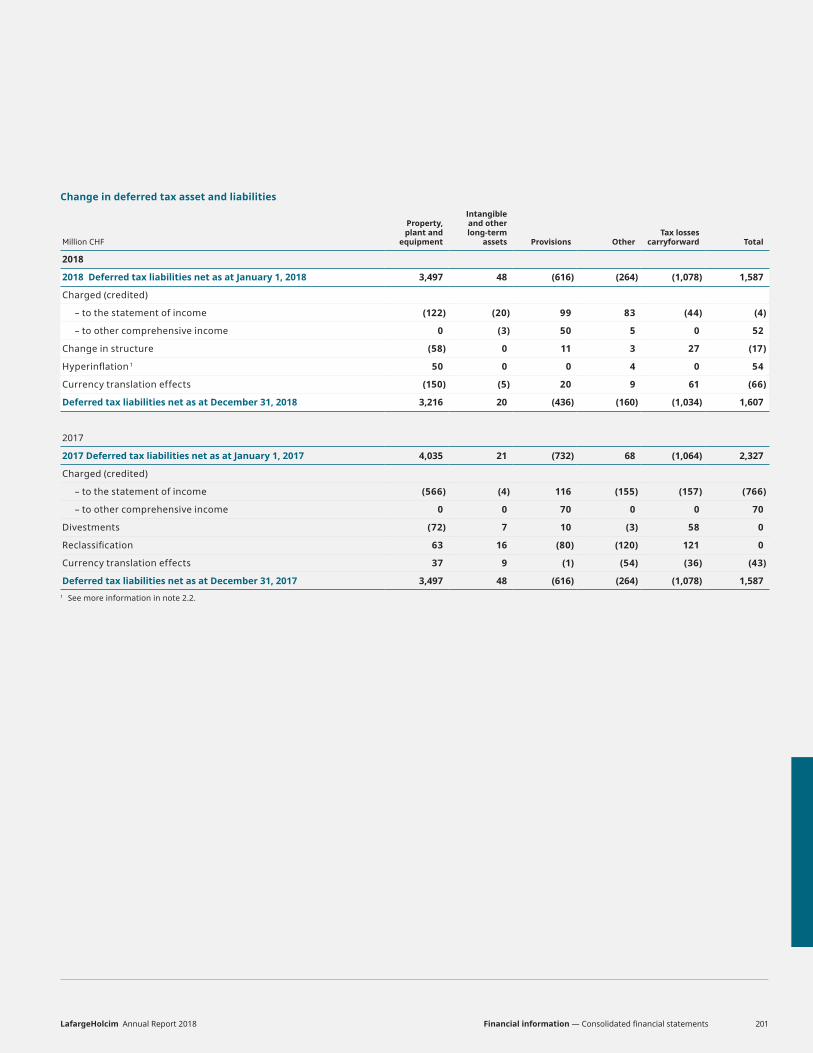
Change in deferred tax asset and liabilities
Million CHF
Property, plant and
equipment
Intangible and other long-term
assets Provisions OtherTax losses
carryforward Total
2018
2018 Deferred tax liabilities net as at January 1, 2018 3,497 48 (616) (264) (1,078) 1,587
Charged (credited)
– to the statement of income (122) (20) 99 83 (44) (4)
– to other comprehensive income 0 (3) 50 5 0 52
Change in structure (58) 0 11 3 27 (17)
Hyperinflation 1 50 0 0 4 0 54
Currency translation effects (150) (5) 20 9 61 (66)
Deferred tax liabilities net as at December 31, 2018 3,216 20 (436) (160) (1,034) 1,607
2017
2017 Deferred tax liabilities net as at January 1, 2017 4,035 21 (732) 68 (1,064) 2,327
Charged (credited)
– to the statement of income (566) (4) 116 (155) (157) (766)
– to other comprehensive income 0 0 70 0 0 70
Divestments (72) 7 10 (3) 58 0
Reclassification 63 16 (80) (120) 121 0
Currency translation effects 37 9 (1) (54) (36) (43)
Deferred tax liabilities net as at December 31, 2017 3,497 48 (616) (264) (1,078) 1,587 1 See more information in note 2.2.
Financial information — Consolidated financial statementsLafargeHolcim Annual Report 2018 201

Notes to the consolidated financial statementscontinued
8.5 Tax losses carryforward
Tax losses carryforward
Losses carry-forward Tax effect
Losses carry-forward Tax effect
Million CHF 2018 2018 2017 2017
Total tax losses carryforward 11,006 2,768 10,836 2,725
Of which reflected in deferred taxes (4,051) (1,034) (4,141) (1,078)
Total tax losses carryforward not recognized 6,955 1,735 6,695 1,647
Expiring as follows:
Within 1 year 101 28 138 33
Between 2 and 5 years 339 68 550 128
Thereafter 6,514 1,639 6,006 1,487
In 2018, CHF 1,735 million (2017: CHF 1,647 million) of deferred tax assets on tax losses were not recognized as the Group considers it will not generate sufficient taxable income within the carryforward period to realize these deferred tax benefits in all juridictions where the Group operates.
8.6 Long-term income tax liabilitiesThe long-term income tax liabilities include the repatriation tax arising from the US tax reform amounting to CHF 111 million (2017: CHF 130 million).
202

9. Earnings per share2018 2017
Earnings per share in CHF 2.52 ( 2.78)
From continuing operations 2.52 ( 2.78)
Net income (loss) – shareholders of LafargeHolcim Ltd – as per statement of income (in million CHF) 1,502 (1,675)
From continuing operations 1,502 (1,675)
Weighted average number of shares outstanding 596,185,128 603,235,216
Fully diluted earnings per share in CHF 2.52 ( 2.78)
From continuing operations 2.52 ( 2.78)
Net income (loss) used to determine diluted earnings per share (in million CHF) 1,502 (1,675)
Weighted average number of shares outstanding 596,185,128 603,235,216
Adjustment for assumed exercise of share options and performance shares 211,919 0
Weighted average number of shares for diluted earnings per share 596,397,047 603,235,216
In conformity with the decision taken at the Annual General Meeting on May 8, 2018, a payout related to 2017 of CHF 2.00 per registered share was paid out of capital con tribution reserves. This resulted in a total payment of CHF 1,192 million.
For the 2018 financial year, the Board is proposing a payout from the capital contribution reserves in the amount of CHF 2.00 per registered share. Subject to approval by the annual shareholders’ meeting on May 15, 2019, shareholders will be given the choice of having the dividend paid out in cash, in the form of new LafargeHolcim Ltd shares or a combination of cash and shares (scrip dividend). The new shares will be issued at a discount to the market price. The cash payment out of the capital contribution reserves in respect of the financial year 2018 will amount to a maximum payment of CHF 1,193 million but is not reflected in the consolidated financial statements since it will only be effective in 2019.
296,752 stock options, which would have an anti-dilutive impact on the calculation of the diluted earnings per share, are excluded from the calculation for the year 2017.
10. Working capital10.1 Accounting principlesAccounts receivable consist of (a) prepaid expenses and other current assets and (b) trade accounts receivable.
Impairment of financial assetsThe Group assesses on a forward looking basis the expected credit losses associated with its financial assets carried at amortized cost. The impairment methodology applied for long-term loans and receivables considers whether there has been a significant increase in credit risk (see note 14.5).
For accounts receivable, the Group applies the simplified approach with expected lifetime losses recognized from initial recognition of the receivables in the statement of income.
Expected credit losses are a probability-weighted estimate of the present value of credit losses. These are measured as the difference between the cash flows due to the Group in accordance with the contract and the cash flows that the Group expects to receive arising from the weighting of multiple future economic scenarios, discounted at the asset’s effective interest rate.
The carrying amount of accounts receivable is reduced through use of an allowance account. Impaired accounts receivable are derecognized when they are assessed as uncollectable.
Inventories are stated at the lower of cost and net realizable value. Cost is determined by using the weighted average cost method. The cost of finished goods and work in progress comprises raw materials and additives, direct labor, other direct costs and related production overheads. Cost of inventories includes transfers from equity of gains or losses on qualifying cash flow hedges relating to inventory purchases.
Financial information — Consolidated financial statementsLafargeHolcim Annual Report 2018 203

Notes to the consolidated financial statementscontinued
10.2 Trade accounts receivable
Million CHF 2018 2017
Trade accounts receivable – associates and joint ventures 138 119
Trade accounts receivable – third parties 3,091 3,221
Total 3,229 3,340
Overdue accounts receivable
Million CHF 2018 2017
Not overdue 2,158 1,877
Overdue 1 to 89 days 895 1,249
Overdue 90 to 180 days 105 189
Overdue more than 180 days 282 217
Allowances for doubtful accounts (211) (192)
Total 3,229 3,340
Due to the local nature of the business, specific terms and conditions for trade accounts receivable exist for local Group companies.
In some cases, trade accounts receivable are factored to third parties but the total amount is not considered material for the Group.
Allowance for doubtful accounts
Million CHF 2018 2017
January 1 (192) (183)
Disposals of Group companies 1 0
Allowance recognized (59) (81)
Amounts used 2 6
Unused amounts reversed 31 68
Currency translation effects 6 (2)
December 31 (211) (192)
Loss allowances for expected credit loss for financial assets measured at amortized cost are presented as a deduction from the gross carrying amount of the assets in the statement of financial position. The
allowance in the table above relates to accounts receivable for which a lifetime expected credit loss is recognized. See note 14.5 for further details.
204

10.3 Inventories
Million CHF 2018 2017
Raw materials and additives 450 420
Semi-finished and finished products 1,548 1,444
Fuels 401 312
Parts and supplies 681 693
Total 3,081 2,870
In 2018, the Group recognized inventory write-downs to net realizable value of CHF 8 million (2017: CHF 9 million) relating mainly to semi-finished and finished products.
10.4 Prepaid expenses and other current assets
Million CHF 2018 2017
Prepaid expenses and accruals 194 211
Other current assets 376 406
Other receivables – associates and joint ventures 20 20
Other receivables – third parties 687 697
Total 1,276 1,335
Financial information — Consolidated financial statementsLafargeHolcim Annual Report 2018 205
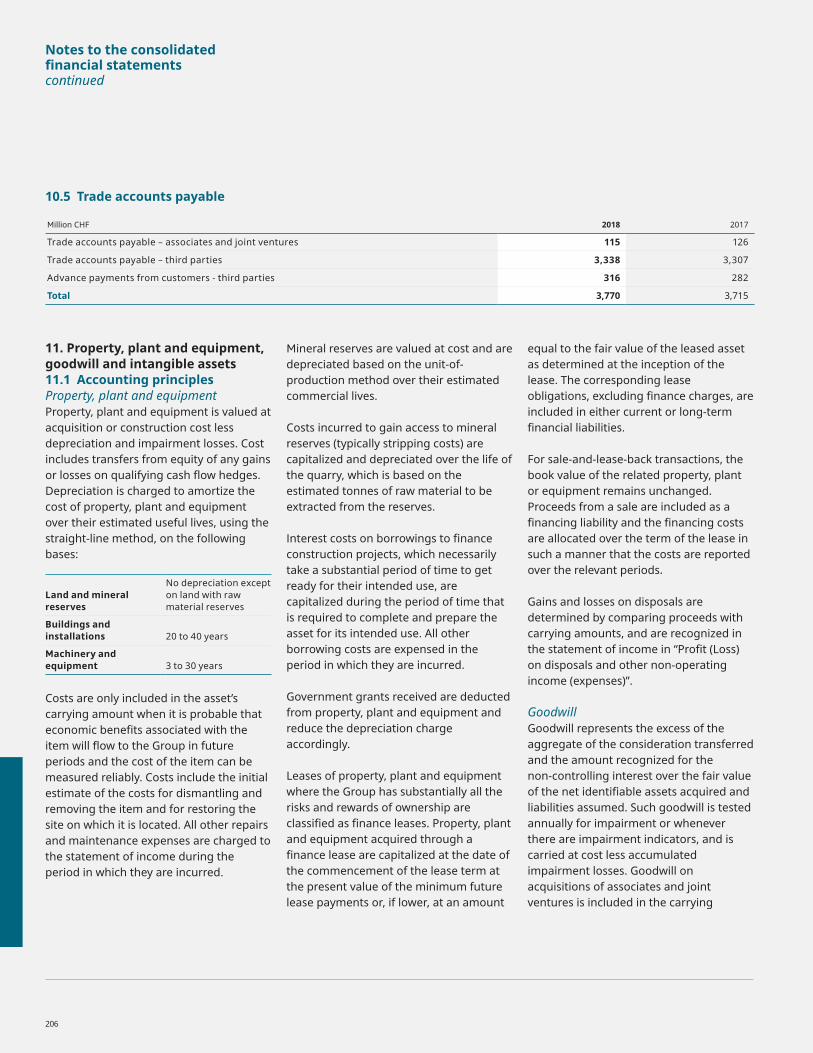
Notes to the consolidated financial statementscontinued
10.5 Trade accounts payable
Million CHF 2018 2017
Trade accounts payable – associates and joint ventures 115 126
Trade accounts payable – third parties 3,338 3,307
Advance payments from customers - third parties 316 282
Total 3,770 3,715
11. Property, plant and equipment, goodwill and intangible assets11.1 Accounting principlesProperty, plant and equipmentProperty, plant and equipment is valued at acquisition or construction cost less depreciation and impairment losses. Cost includes transfers from equity of any gains or losses on qualifying cash flow hedges. Depreciation is charged to amortize the cost of property, plant and equipment over their estimated useful lives, using the straight-line method, on the following bases:
Land and mineral reserves
No depreciation except on land with raw material reserves
Buildings and installations 20 to 40 years
Machinery and equipment 3 to 30 years
Costs are only included in the asset’s carrying amount when it is probable that economic benefits associated with the item will flow to the Group in future periods and the cost of the item can be measured reliably. Costs include the initial estimate of the costs for dismantling and removing the item and for restoring the site on which it is located. All other repairs and maintenance expenses are charged to the statement of income during the period in which they are incurred.
Mineral reserves are valued at cost and are depreciated based on the unit-of-production method over their estimated commercial lives.
Costs incurred to gain access to mineral reserves (typically stripping costs) are capitalized and depreciated over the life of the quarry, which is based on theestimated tonnes of raw material to be extracted from the reserves.
Interest costs on borrowings to finance construction projects, which necessarily take a substantial period of time to get ready for their intended use, are capitalized during the period of time that is required to complete and prepare the asset for its intended use. All other borrowing costs are expensed in the period in which they are incurred.
Government grants received are deducted from property, plant and equipment and reduce the depreciation charge accordingly.
Leases of property, plant and equipment where the Group has substantially all the risks and rewards of ownership are classified as finance leases. Property, plant and equipment acquired through a finance lease are capitalized at the date of the commencement of the lease term at the present value of the minimum future lease payments or, if lower, at an amount
equal to the fair value of the leased asset as determined at the inception of the lease. The corresponding lease obligations, excluding finance charges, are included in either current or long-term financial liabilities.
For sale-and-lease-back transactions, the book value of the related property, plant or equipment remains unchanged. Proceeds from a sale are included as a financing liability and the financing costs are allocated over the term of the lease in such a manner that the costs are reported over the relevant periods.
Gains and losses on disposals are determined by comparing proceeds with carrying amounts, and are recognized in the statement of income in “Profit (Loss) on disposals and other non-operating income (expenses)”.
GoodwillGoodwill represents the excess of the aggregate of the consideration transferred and the amount recognized for the non-controlling interest over the fair value of the net identi fiable assets acquired and liabilities assumed. Such goodwill is tested annually for impairment or whenever there are impairment indicators, and is carried at cost less accumulated impairment losses. Goodwill on acquisitions of associates and joint ventures is included in the carrying
206

amount of the respective investments. If the consideration transferred is less than the fair value of the net identifiable assets of the subsidiary acquired, the difference is recognized directly in the statement of income.
On disposal of a subsidiary or joint operation, the related goodwill is included in the determination of profit or loss on disposal.
For the purpose of impairment testing, goodwill arising from acquisitions of subsidiaries is allocated to cash generating units expected to benefit from the synergies of the business combination. Impairment losses relating to goodwill cannot be reversed in future periods.
For further information, refer to note 11.3.
Intangible assetsExpenditure on acquired trademarks, mining rights, software, patented and unpatented technology and other intangible assets are capitalized and amortized using the straight-line method over their estimated useful lives, but not exceeding 20 years, except for mining rights which are depleted on a volume basis.
Impairment of non-financial assetsAt each reporting date, the Group assesses whether there is any indication that a non-financial asset may be impaired. If any such indication exists, the recoverable amount of the non-financial asset is estimated in order to determine the extent of the impairment loss, if any. Where it is not possible to estimate the recoverable amount of an individual non-financial asset, the Group estimates the recoverable amount of the smallest cash generating unit to which the non-financial asset belongs. The recoverable amount is the higher of an asset’s or cash generating unit’s fair value less costs of
disposal and its value in use. If the recoverable amount of a non-financial asset or cash generating unit is estimated to be less than its carrying amount, the carrying amount of the non-financial asset or cash generating unit is reduced to its recoverable amount. Impairment losses are recognized immediately in the statement of income.
Where an impairment loss subsequently reverses, the carrying amount of the non-financial asset or cash generating unit is increased to the revised estimate of its recoverable amount. However, this increased amount cannot exceed the carrying amount that would have been determined if no impairment loss had been recognized for that non-financial asset or cash generating unit in prior periods. A reversal of an impairment loss is recognized immediately in the statement of income.
Financial information — Consolidated financial statementsLafargeHolcim Annual Report 2018 207

Notes to the consolidated financial statementscontinued
11.2 Property, plant and equipment
Million CHFLand and
mineral reservesBuildings and
installationsMachinery
and equipmentConstruction
in progress Total
2018
At cost of acquisition 7,654 11,064 32,003 1,490 52,211
Accumulated depreciation/impairment (2,164) (4,748) (14,996) (152) (22,060)
Net book value as at January 1 5,489 6,317 17,007 1,339 30,152
Acquisitions 10 8 34 0 52
Divestments (28) (31) (40) (1) (100)
Additions 62 26 164 1,315 1,567
Disposals (31) (9) (25) (3) (68)
Reclassifications 245 227 771 (1,244) 0
Reclassification to assets classified as held for sale (32) (151) (442) (37) (663)
Depreciation (186) (347) (1,501) 0 (2,033)
Hyperinflation 1 75 45 94 0 214
Impairment loss (reversed/charged to statement of income) (3) 21 47 0 65
Currency translation effects (230) (279) (721) (65) (1,297)
Net book value as at December 31 5,372 5,827 15,387 1,305 27,890
At cost of acquisition 7,477 10,568 30,661 1,395 50,101
Accumulated depreciation/impairment (2,106) (4,741) (15,274) (90) (22,211)
Net book value as at December 31 5,372 5,827 15,387 1,305 27,890
2017
At cost of acquisition 7,576 10,726 30,741 1,794 50,837
Accumulated depreciation/impairment (1,621) (4,130) (13,001) (33) (18,784)
Net book value as at January 1 5,956 6,596 17,740 1,761 32,052
Acquisitions 63 12 152 126 352
Divestments (12) (14) (2) 0 (28)
Additions 10 2 13 1,492 1,517
Disposals (41) (16) (32) (1) (90)
Reclassifications 100 375 1,424 (1,900) 0
Depreciation (191) (362) (1,559) 0 (2,112)
Impairment loss (charged to statement of income) (491) (290) (794) (115) (1,690)
Currency translation effects 95 14 65 (24) 151
Net book value as at December 31 5,489 6,317 17,007 1,339 30,152
At cost of acquisition 7,654 11,064 32,003 1,490 52,211
Accumulated depreciation/impairment (2,164) (4,748) (14,996) (152) (22,060)
Net book value as at December 31 5,489 6,317 17,007 1,339 30,152 1 See more information in note 2.2.
208

The net book value of leased property, plant and equipment amounts to CHF 172 million (2017: CHF 61 million) and mainly relates to buildings and installations, machinery and equipment.
CHF 13 million of the total net book value of property, plant and equipment are pledged or restricted (2017: CHF 209 million).
Net gains on sale of property, plant and equipment amounted to CHF 62 million (2017: CHF 82 million) reported in the line “Profit on disposals and other non-operating income” in the consolidated statement of income (see note 5.2).
In 2017, LafargeHolcim carried out an extensive portfolio review and assessed asset impairment indicators which resulted in an aggregate impairment charge relating to property, plant and equipment of CHF 1,690 million, of which CHF 904 million was impaired as insufficient goodwill was available to absorb the full impairment charge (see note 11.3).
The remaining impairment charge of CHF 786 million mainly consisted of CHF 371 million relating to specific aggregates sites in North America.
Apart from the assets mentioned above, no asset impairment was deemed to be individually material in the other reportable segments and pertained mostly to assets in Europe and Middle East and Africa.
The total impairment charge resulted primarily from the weaker than anticipated outlook for the macro-economic environment, especially in terms of expected growth rates, cement demand and export opportunities for countries such as Malaysia, Spain and Egypt (see note 11.3).
Financial information — Consolidated financial statementsLafargeHolcim Annual Report 2018 209
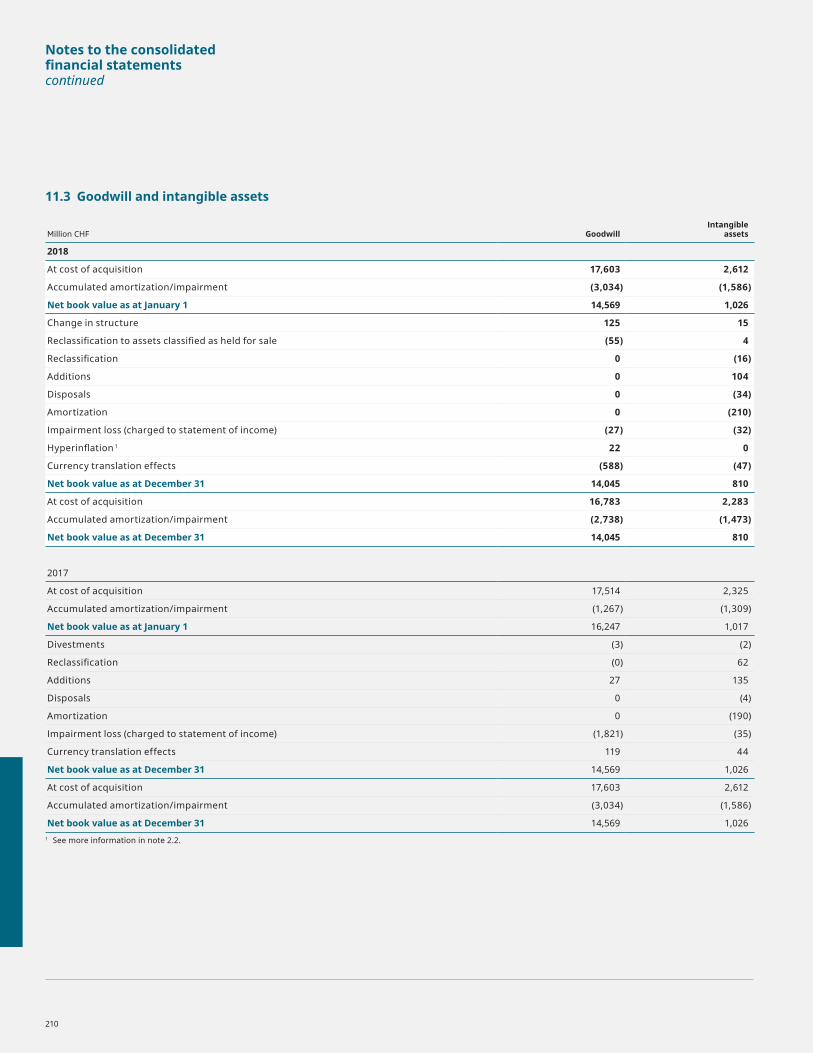
Notes to the consolidated financial statementscontinued
11.3 Goodwill and intangible assets
Million CHF GoodwillIntangible
assets
2018
At cost of acquisition 17,603 2,612
Accumulated amortization/impairment (3,034) (1,586)
Net book value as at January 1 14,569 1,026
Change in structure 125 15
Reclassification to assets classified as held for sale (55) 4
Reclassification 0 (16)
Additions 0 104
Disposals 0 (34)
Amortization 0 (210)
Impairment loss (charged to statement of income) (27) (32)
Hyperinflation 1 22 0
Currency translation effects (588) (47)
Net book value as at December 31 14,045 810
At cost of acquisition 16,783 2,283
Accumulated amortization/impairment (2,738) (1,473)
Net book value as at December 31 14,045 810
2017
At cost of acquisition 17,514 2,325
Accumulated amortization/impairment (1,267) (1,309)
Net book value as at January 1 16,247 1,017
Divestments (3) (2)
Reclassification (0) 62
Additions 27 135
Disposals 0 (4)
Amortization 0 (190)
Impairment loss (charged to statement of income) (1,821) (35)
Currency translation effects 119 44
Net book value as at December 31 14,569 1,026
At cost of acquisition 17,603 2,612
Accumulated amortization/impairment (3,034) (1,586)
Net book value as at December 31 14,569 1,026 1 See more information in note 2.2.
210
Intangible assetsIntangible assets have finite useful lives, over which the assets are amortized. The corresponding amortization expense is recognized largely in administration expenses and production cost of goods sold.
Intangible assets mainly consist of mining rights, trademarks and brands.
During the fourth quarter 2017, the Group carried out an extensive portfolio review and identified a number of brands being in local decline therefore resulting in an aggregate impairment charge of CHF 35 million. No asset impairment was deemed to be individually material.
Emission rightsThe initial allocation of emission rights granted is recognized at nominal amount (nil value). Where a Group company has emissions in excess of the emission rights granted, it will recognize a provision for the shortfall based on the market price at that date. The emission rights are held for compliance purposes only and therefore the Group does not intend to speculate with these in the open market.
Impairment test of goodwillFor the purpose of impairment testing, goodwill is allocated to a cash-generating unit or to a group of cash-generating units that are expected to benefit, among others, from the synergies of the business combination. The Group’s cash-generating units are defined on the basis of the geographical market, normally country- or region-related. The carrying amount of goodwill allocated to the countries or regions stated below, is significant in comparison with the total carrying amount of goodwill, while the carrying amount of goodwill allocated to the other cash-generating units is individually not significant.
For the impairment test, the recoverable amount of a cash-generating unit, which has been determined based on its value in use or its fair value less costs to sell, is compared to its carrying amount. An impairment loss is recognized if the carrying amount of the cash-generating unit exceeds its recoverable amount. The value in use is determined based on future discounted cash flows using the weighted average cost of capital (WACC).
The WACC used for the impairment test is a post-tax discount rate and is applied to post-tax cash flows. There is no material difference in the outcome of the impairment test using the discount rate applied when compared to using a pre-tax discount rate for pre-tax cash flows.
The cash flow projections are based on a three-year financial planning period using business plans approved by management. Cash flows beyond the three-year budget period are extrapolated based on increasing sustainable cash flows. In any event, the growth rate used to extrapolate cash flow projections beyond the three-year budget period does not exceed the long-term average growth rate for the relevant market in which the cash-generating unit operates.
In respect of the goodwill allocated to “Others”, the same impairment model and parameters are used, as is the case with individually significant goodwill positions, except that different key assumptions are used depending on the risks associated with the respective cash-generating units.
Financial information — Consolidated financial statementsLafargeHolcim Annual Report 2018 211

Notes to the consolidated financial statementscontinued
Key assumptions used for value-in-use calculations in respect of goodwill 2018
Cash-generating unit (Million CHF)
Carrying amount of goodwill Currency
Post-tax discount rate
Long-term growth rate
North America 4,724 USD/CAD +6.6% +2.1%
India 1,578 INR +9.9% +4.9%
France 1,483 EUR +6.3% +1.9%
United Kingdom 886 GBP +6.8% +2.0%
Algeria 699 DZD +11.7% +4.0%
Switzerland – Italy 561 CHF/EUR +6.0% +1.1%
Nigeria 549 NGN +20.4% +14.0%
Poland 515 PLN +8.2% +2.5%
Philippines 466 PHP +8.6% +3.0%
Mexico 404 MXN +8.4% +3.0%
Others 2 2,180 Various 5.7% – 15.9% 1.0% – 8.0%
TOTAL 14,045
Key assumptions used for value-in-use calculations in respect of goodwill 2017
Cash-generating unit (Million CHF)
Carrying amount of goodwill Currency
Post-tax discount rate
Long-term growth rate
North America 4,750 USD/CAD +6.9% +2.2%
India 1,705 INR +10.7% +5.0%
France 1,521 EUR +6.5% +1.8%
United Kingdom 929 GBP +6.6% +2.0%
Algeria 709 DZD +11.7% +4.0%
Central Europe West 1 682 CHF/EUR +6.1% +1.4%
Nigeria 639 NGN +22.7% +14.5%
Poland 550 PLN +8.2% +2.5%
Philippines 484 PHP +8.7% +3.0%
Mexico 400 MXN +8.7% +3.0%
Others 2 2,200 Various 5.6% – 17.7% 1.0% – 9.1%
TOTAL 14,5691 Of which carrying amount of goodwill in Switzerland – Italy: CHF 568 million.2 Individually not significant.
212

In 2018, management recognized a goodwill impairment charge of CHF 27 million relating to the cash-generating unit “Others” within the reportable segment Middle East and Africa.
In 2017, management recognized a total impairment charge of CHF 3,566 million relating to certain cash-generating units (country- or region-related), of which CHF 1,821 million was allocated to goodwill. The total impairment charge resulted primarily from:• higher WACC to consider risks and
uncertainties that may materialize in the coming years and attributable to change in markets, national economic circumstances, political complex situations and governments’ ability to fund infrastructure projects for countries
such as Algeria, Brazil, Indonesia, Zambia and Iraq; and
• the weaker than anticipated outlook for the macro-economic environment, especially in terms of expected growth rates, cement demand and export opportunities for countries such as Malaysia, Spain and Egypt.
A total charge of CHF 3,566 million was recognized in 2017, of which CHF 1,821 million was allocated to goodwill and to the following reportable segments:• CHF 1,724 million in Middle East and
Africa, of which CHF 1,236 million allocated to goodwill;
• CHF 872 million in Asia Pacific, of which CHF 545 million allocated to goodwill;
• CHF 373 million in Europe, of which CHF 40 million allocated to goodwill;
• CHF 371 million in North America relating to specific aggregates sites; and
• CHF 226 million in Latin America;
Additional details can be found in the 2017 Annual Report.
The total recoverable amount of countries that were impaired amounted to CHF 5,755 million.
Sensitivity to changes in assumptionsFor 2018 it is estimated that if the post-tax discount rate was approximately 7.5% for the entire portfolio, an increase of 1.75% for all countries, this would cause the recoverable amount to be CHF 130 million below the carrying amount for a significant cash-generating unit.
Financial information — Consolidated financial statementsLafargeHolcim Annual Report 2018 213
Notes to the consolidated financial statementscontinued
12. Long-term financial investments and other long-term assets12.1 Accounting principles Long-term financial investments and other long-term assets consist of (a) financial investments – third parties, (b) long-term receivables – associates and joint ventures, (c) long-term receivables – third parties and (d) other long-term assets:a) “Financial investments – third parties”
are strategic equity investments which are classified at fair value through other comprehensive earnings.
b) “Long-term receivables – associates and joint ventures” are classified as receivables at amortized cost as the Group intends to hold the assets to maturity to collect contractual cash flows.
c) “Long-term receivables – third parties” are classified as receivables at amortized cost as the Group intends to hold the assets to maturity to collect contractual cash flows.
d) “Other long-term assets” are classified as receivables at amortized cost and comprise notably of various deposits in connection with on-going legal cases.
All purchases and sales of long-term financial assets are recognized on trade date, which is the date that the Group commits to purchase or sell the asset. The purchase cost includes transaction costs, except for derivative instruments. Financial assets at amortized cost are measured using the effective interest method.
Investments in equity securities which are considered strategic investments for the Group are classified at fair value through other comprehensive earnings and are carried at fair value. Strategic equity investments are investments where the Group owns less than 20% of the shares and where the Group does not exercise control, joint control or significant influence and which it intends to hold for long-term strategic purposes. Gains and losses arising from changes in the fair value of strategic equity investments at fair value through other comprehensive earnings are included in other reserves until the asset is disposed of, at which time the cumulative gain or loss previously recognized in other reserves is transferred to retained earnings.
Financial assets measurementAt initial recognition, in the case of a financial asset not at fair value through profit or loss, the Group measures a financial asset at its fair value plus transaction costs that are directly attributable to the acquisition of the financial asset. Transaction costs of financial assets carried at fair value through profit or loss are expensed in profit or loss.
Financial assets with embedded derivatives are considered in their entirety when determining whether their cash flows are solely payment of principal and interest.
a) Debt instrumentsSubsequent measurement of debt instruments depends on the Group’s business model for managing the asset and the cash flow characteristics of the asset. There are two measurement categories into which the Group classifies its debt instruments:• Loans and receivables at amortized cost:
assets that are held for collection of contractual cash flows where those cash flows represent solely payments of principal and interest are measured at amortized cost. A gain or loss on a debt investment that is subsequently measured at amortized cost and is not part of a hedging relationship is recognized in profit or loss when the
214
asset is derecognized or impaired. Interest income from these financial assets is included in finance income using the effective interest rate method.
• Financial assets at fair value through profit and loss: assets that do not meet the criteria for amortized cost and are held for trading are measured at fair value through profit or loss. Gains and losses on debt investments that are subsequently measured at fair value through profit or loss and are not part of a hedging relationship are recognized in profit or loss and presented net in the profit or loss statement in the period in which they arise. Interest income from these financial assets is included in financial income.
The Group reclassifies debt investments when and only when its business model for managing those assets changes.
b) Equity instruments at fair valueThe Group subsequently measures all equity investments at fair value. Where the Group’s management has elected to present fair value gains and losses on strategic equity investments at fair value through other reserves, there is no subsequent reclassification of fair value gains and losses to profit or loss. Dividends from such investments continue to be recognized in profit or loss when the Group’s right to receive payments is established.
Financial information — Consolidated financial statementsLafargeHolcim Annual Report 2018 215

Notes to the consolidated financial statementscontinued
12.2 Long-term financial investments and other long-term assets
Million CHF 2018 2017
Financial investments – third parties 196 85
Long-term receivables – associates and joint ventures 138 192
Long-term receivables – third parties 177 240
Deferred charges 88 101
Other long-term assets 513 496
Total 1,111 1,114
Of which pledged/restricted 12 13
Long-term receivables are primarily denominated in USD, AUD and BRL. The repayment dates vary between one and 21 years (2017: one and 22 years).
The increase in “Financial investments – third parties” is mainly due to the reclassification of an associate in Europe to long-term financial investments (see note 6.2).
Other long-term assets include notably various deposits in connection with ongoing legal cases (see note 17.3).
12.3 Current financial receivables
Million CHF 2018 2017
Marketable securities 3 1
Current financial receivables - associates and joint ventures 36 25
Current financial receivables - third parties 141 236
Total 180 262
Of which pledged/restricted 107 45
The “Current financial receivables – third parties” decreased mainly following the payment of the deferred part of the consideration in connection with the transaction entered in China (see note 2.3).
The increase in pledged/restricted current financial receivables mainly relates to restricted cash in connection with ongoing legal cases (see note 17.3).
13. Assets and related liabilities classified as held for sale and discontinued operations13.1 Accounting principlesNon-current assets (or disposal groups) are classified as held for sale and stated at the lower of carrying amount and fair value less costs to sell if their carrying amount is to be recovered principally through a sale transaction rather than through continuing use.
Non-current assets (including those that are part of a disposal group) are not depreciated or amortized while they are classified as held for sale.
Gains and losses on disposals of non-current assets (or disposal groups) are determined by comparing proceeds with carrying amounts, and are recognized in the statement of income in “Profit (Loss) on disposals and other non-operating income (expenses)”.
A discontinued operation is a component of an entity that either has been disposed of or is classified as held for sale, and represents a separate major line of business or geographical area of operations, and is part of a single coordinated plan to dispose a separate major line of business or geographical area of operations or is a subsidiary acquired exclusively with a view to resale.
216

13.2 Assets and related liabilities classified as held for saleThe net assets classified as held for sale as of December 31, 2018 amount to CHF 684 million (2017: CHF 390 million)which mainly includes the assets and liabilities of Holcim Indonesia and its subsidiaries.
IndonesiaIn the fourth quarter, the Group signed an agreement with Semen Indonesia for the disposal of its entire shareholding of 80.6 percent in Holcim Indonesia and consequently classified the assets and the related liabilities as held for sale. The transaction was closed end of January 2019. Holcim Indonesia and its subsidiaries consist of 4 cement plants, 33 ready-mix plants and 2 aggregated quarries and is presented in the reportable segment Asia Pacific.
ChinaIn the fourth quarter 2018, the Group reached an agreement with the local authorities of Chongqing for the transfer of land on which a cement plant is situated. The cement plant was forced to stop its operation due to its proximity to an urban area. Consequently, property, plant and equipment of this cement plant were classified as held for sale. The transfer of the assets is expected to be closed during 2019. The cement plant is disclosed in the reportable segment Asia Pacific.
In 2017, two former Shuangma cement companies in China were classified as held for sale. The Group reassessed its strategy with regards to these two cement companies and consequently ceased to classify them as held for sale in 2018. The assets and related liabilities previously
classified as held for sale were reclassified into their respective balance sheet accounts, measured on a historical cost basis and adjusted for any depreciation and amortization that would have been recognized had the asset and liabilities not been classified as held for sale. A write down of CHF 58 million recorded under the held for sale classification in 2017 was reversed during first half of 2018. All adjustments to the carrying amounts of the reclassified assets and liabilities were recorded in the statement of income of the current year. The two cement companies are disclosed in the reportable segment Asia Pacific.
The assets and related liabilities classified as held for sale are disclosed by major classes of assets and liabilities in the table below.
Financial information — Consolidated financial statementsLafargeHolcim Annual Report 2018 217

Notes to the consolidated financial statementscontinued
Million CHF 2018 2017
Cash and cash equivalents 25 11
Inventories 67 14
Other current assets 88 78
Property, plant and equipment 1,028 382
Goodwill and intangible assets 88 39
Other long term assets 15 26
Assets classified as held for sale 1,311 550
Current liabilities 345 149
Long-term liabilities 282 11
Liabilites directly associated with assets classified as held for sale 627 160
Net assets classified as held for sale 684 390
218

14. Net financial debt14.1 Accounting principlesCash and cash equivalentsCash and cash equivalents are financial assets. Cash equivalents are readily convertible into a known amount of cash with original maturities of three months or less. For the purpose of the statement of cash flows, cash and cash equivalents comprise cash at banks and on hand, deposits held on call with banks, monetary mutual funds and other short-term highly liquid investments that are readily convertible to a know amount of cash with a maturity of three months or less from the date of acquisition, net of bank overdrafts.
Derivative instruments and hedgingThe Group mainly uses derivative financial instruments in order to reduce its exposure to changes in interest rates, foreign currency exchange rates and commodity prices. The Group enters into foreign exchange contracts and interest rate swaps to hedge certain exposures relating to debt, foreign exchange contracts to hedge firm commitments for the acquisition of certain property, plant and equipment and into swaps and options in order to manage its exposure to commodity risks.
Derivatives are regarded as hedging instruments under hedge accounting relationships unless they are not designated as hedges in which case they will be classified as held for trading. Financial derivatives expected to be settled within 12 months after the end of the reporting period are classified as current liabilities or current assets. For cash flow hedges gains and losses are recorded in the cash flow hedging reserve, a separate component of equity, and recycled to profit or loss or as a basis adjustment to inventory or property, plant and equipment as the hedged transaction occurs.
Derivatives are initially recognized at fair value on the date a derivative contract is entered into and are subsequently remeasured at their fair value. The method of recognizing the resulting gain or loss is dependent on the nature of the item being hedged. On the date a derivative contract is entered into, the Group designates certain derivatives as either (a) a hedge of the fair value of a recognized asset or liability (fair value hedge) or (b) a hedge of a particular risk associated with a recognized asset or liability, such as future interest payments on floating rate debt (cash flow hedge) or (c) a hedge of a foreign currency risk of a firm commitment or highly probable forecast (cash flow hedge) or (d) a hedge of a net investment in a foreign entity (accounted for similarly to a cash flow hedge).
Changes in the fair value of derivatives that are designated and qualify as fair value hedges and that are highly effective are recorded in the statement of income, along with any changes in the fair value of the hedged asset or liability that is attributable to the hedged risk.
The effective portion of changes in the fair value of derivatives that are designated and qualify as cash flow hedges is recognized in the cash flow hedging reserve within equity, limited to the cumulative change in fair value of the hedged item on a present value basis from the inception of the hedge. The gain or loss relating to the ineffective portion is recognized immediately in profit or loss.
Where the firm commitment results in the recognition of an asset, for example, property, plant and equipment, or a liability, the gains or losses previously deferred in the cash flow hedging reserve are transferred from equity and included in the initial measurement of the non-financial asset or liability. Otherwise,
amounts deferred in equity are transferred to the statement of income and classified as income or expense in the same periods during which the cash flows, such as hedged firm commitments or interest payments, affect the statement of income.
The Group documents at the inception of hedging transactions the economic relationship between hedging instruments and hedged items, including whether the hedging instrument is expected to offset changes in cash flows of hedged items, and its risk management objective and strategy.
Long-term financial liabilitiesBank loans acquired and bonds issued are recognized initially at fair value (i.e. the proceeds received), net of transaction costs incurred. Subsequently, bank loans and bonds are stated at amortized cost, using the effective interest method, with any difference between proceeds (net of transaction costs) and the redemption value being recognized in the statement of income over the term of the borrowings.
Financial liabilities that are due within 12 months after the end of the reporting period are classified as current liabilities unless the Group has an unconditional right to defer settlement of the liability until more than 12 months after the reporting period. The repayment of the current portion of such liabilities is shown in the statement of cash flows in the line “Repayment of long-term financial liabilities”.
Financial information — Consolidated financial statementsLafargeHolcim Annual Report 2018 219

Notes to the consolidated financial statementscontinued
14.2 Cash and cash equivalents
Million CHF 2018 2017
Cash at banks and on hand 1,527 2,449
Short-term deposits 988 1,768
Total 2,515 4,217
Bank overdrafts (275) (275)
Cash and cash equivalents classified as held for sale 25 11
Cash and cash equivalents for the purpose of the consolidated statement of cash flows 2,264 3,954
Investments in monetary mutual funds amounting CHF 139 million (2017: CHF 377 million) are considered cash equivalents since they are readily convertible to known amounts of cash and are subject to an insignificant risk of changes in value.
Bank overdrafts are included in current financial liabilities.
220

14.3 Financial liabilities
Million CHF 2018 2017
Current financial liabilities – associates and joint ventures 31 24
Current financial liabilities – third parties 1,056 1,306
Current portion of long-term financial liabilities 1,889 2,403
Derivative liabilities (note 14.4) 87 109
Total current financial liabilities 3,063 3,843
Long-term financial liabilities – associates and joint ventures 0 39
Long-term financial liabilities – third parties 13,012 14,727
Derivative liabilities (note 14.4) 49 13
Total long-term financial liabilities 13,061 14,779
Total 16,124 18,621
Of which secured 84 83
Details of total financial liabilities
Million CHF 2018 2017
Loans from financial institutions 1,775 3,177
Bonds and private placements 13,951 15,177
Commercial paper notes 96 82
Total loans and bonds 15,822 18,435
Obligations under finance leases (note 15) 166 64
Derivative liabilities (note 14.4) 136 122
Total 16,124 18,621
“Loans from financial institutions” include amounts due to banks and other financial institutions. Repayment dates vary between one and 11 years (2017: one and 11 years).
As per the loans agreements, the Group is required to comply with certain provisions or covenants. As of December 31, 2018, the Group complied with its debt covenants in all material respects.
Unused committed credit lines totalled CHF 6,239 million at year-end 2018 (2017: CHF 6,794 million).
Financial information — Consolidated financial statementsLafargeHolcim Annual Report 2018 221

Notes to the consolidated financial statementscontinued
Financial liabilities by currency
2018 2017
Currency Million CHF In %Interest
rate 1 Million CHF In %Interest
rate 1
EUR 6,194 38.4 2.4 7,528 40.4 2.8
USD 5,105 31.7 5.3 5,229 28.1 5.1
CHF 1,995 12.4 2.0 2,009 10.8 2.7
AUD 774 4.8 4.1 738 4.0 3.8
NGN 402 2.5 14.7 393 2.1 15.8
GBP 392 2.4 2.9 396 2.1 3.0
PHP 196 1.2 4.2 107 0.6 3.8
MXN 191 1.2 8.0 271 1.5 7.6
Others 875 5.4 7.3 1,950 10.5 6.8
Total 16,124 100.0 4.2 18,621 100.0 4.51 Weighted average nominal interest rate on financial liabilities at December 31.
Interest rate structure of total financial liabilities
Million CHF 2018 2017
Financial liabilities at fixed rates 11,703 12,910
Financial liabilities at floating rates 4,421 5,711
Total 16,124 18,621
Financial liabilities that are hedged to a fixed or floating rate are disclosed on a post hedge basis.
Information on the maturity of financial instruments is disclosed in the note 14.5.
222

Bonds and private placements as at December 31
Nominal value
Nominal interest rate
Effective interest rate Term Description 2
Net book value
in CHF 1
Net book value
in CHF 1
In million 2018 2017
LafargeHolcim Ltd
CHF 450 4.00% 2009–2018 Bonds 0 449
CHF 450 3.00% 2.97% 2012–2022 Bonds 450 451
CHF 250 2.00% 2.03% 2013–2022 Bonds 250 250
CHF 250 0.38% 0.41% 2015–2021 Bonds 250 250
CHF 150 1.00% 1.03% 2015–2025 Bonds 150 150
CHF 440 1.00% 1.00% 2018-2024 Bonds 440 0
Holcim Overseas Finance Ltd.
CHF 425 3.38% 3.42% 2011–2021 Bonds guaranteed by LafargeHolcim Ltd 425 424
Lafarge S.A.
EUR 175 5.00% 2012–2018 Private placement 0 205
EUR 357 5.50% 4.74% 2009–2019 Bonds (partially repaid 2016) 418 450
EUR 247 5.00% 2010–2018 Bonds (partially repaid 2016) 0 292
EUR 371 4.75% 4.19% 2005–2020 Bonds (partially repaid 2016) 434 464
USD 600 7.13% 5.90% 2006–2036 Bonds 691 691
EUR 430 5.38% 2010–2018Bonds, partly swapped into floating interest rates (partially repaid 2016) 0 522
EUR 198 5.88% 4.29% 2012–2019Bonds, partly swapped into floating interest rates (partially repaid 2016) 228 247
Holcim Capital Corporation Ltd.
USD 50 7.65% 7.65% 2001–2031 Private placement guaranteed by LafargeHolcim Ltd 49 49
USD 250 6.88% 7.28% 2009–2039 Bonds guaranteed by LafargeHolcim Ltd 239 237
USD 250 6.50% 6.85% 2013–2043 Bonds guaranteed by LafargeHolcim Ltd 239 237
Holcim Capital México, S.A. de C.V.
MXN 1,700 7.00% 7.23% 2012–2019 Bonds guaranteed by LafargeHolcim Ltd 85 84
MXN 2,000 7.78% 2014–2018Bonds guaranteed by LafargeHolcim Ltd, with floating interest rates 0 99
MXN 1,700 8.01% 6.78% 2015-2020Bonds guaranteed by LafargeHolcim Ltd, with floating interest rates 85 84
Subtotal 4,434 5,636 1 Includes adjustments for fair value hedge accounting, where applicable. 2 With fixed rates unless indicated.
Financial information — Consolidated financial statementsLafargeHolcim Annual Report 2018 223

Notes to the consolidated financial statementscontinued
Nominal value
Nominal interest rate
Effective interest rate Term Description 2
Net book value
in CHF 1
Net book value
in CHF 1
In million 2018 2017
Subtotal 4,434 5,636
Holcim Finance (Luxembourg) S.A.
EUR 500 3.00% 3.11% 2014–2024 Bonds guaranteed by LafargeHolcim Ltd 561 581
EUR 33 2.00% 2.03% 2016–2026 Schuldschein loan guaranteed by LafargeHolcim Ltd 37 38
EUR 152 1.46% 1.51% 2016–2023 Schuldschein loan guaranteed by LafargeHolcim Ltd 171 177
EUR 1,150 1.38% 1.43% 2016–2023 Bonds guaranteed by LafargeHolcim Ltd 1,293 1,340
EUR 209 0.72% 2016–2021Schuldschein loan guaranteed by LafargeHolcim Ltd, with floating interest rates (early repaid in 2018) 0 244
EUR 25 0.99% 2016–2023Schuldschein loan guaranteed by LafargeHolcim Ltd, with floating interest rates (early repaid in 2018) 0 29
EUR 413 1.04% 1.10% 2016–2021 Schuldschein loan guaranteed by LafargeHolcim Ltd 465 482
EUR 1,150 2.25% 2.23% 2016–2028 Bonds guaranteed by LafargeHolcim Ltd 1,298 1,347
EUR 750 1.75% 1.90% 2017-2029 Bonds guaranteed by LafargeHolcim Ltd 833 863
Holcim Finance (Australia) Pty Ltd
AUD 200 5.25% 5.52% 2012–2019 Bonds guaranteed by LafargeHolcim Ltd 139 152
AUD 250 3.75% 3.90% 2015–2020 Bonds guaranteed by LafargeHolcim Ltd 174 190
AUD 300 3.50% 3.73% 2017-2022 Bonds guaranteed by LafargeHolcim Ltd 207 227
Holcim US Finance S. à r.l. & Cie S.C.S.
USD 200 6.21% 2006–2018 Private placement guaranteed by LafargeHolcim Ltd 0 195
USD 750 6.00% 6.25% 2009–2019 Bonds guaranteed by LafargeHolcim Ltd 737 729
EUR 500 2.63% 4.62% 2012–2020Bonds guaranteed by LafargeHolcim Ltd, swapped into USD and floating interest rates at inception 572 597
USD 500 5.15% 5.30% 2013–2023 Bonds guaranteed by LafargeHolcim Ltd 489 485
USD 50 4.20% 4.20% 2013–2033 Bonds guaranteed by LafargeHolcim Ltd 49 49
LafargeHolcim International Finance Ltd
USD 40 2.80% 2.88% 2016–2021 Schuldschein loan guaranteed by LafargeHolcim Ltd 39 39
USD 121 3.01% 2016–2021Schuldschein loan guaranteed by LafargeHolcim Ltd, with floating interest rates (early repaid in 2018) 0 118
USD 15 3.20% 3.27% 2016–2023 Schuldschein loan guaranteed by LafargeHolcim Ltd 15 15
USD 25 3.21% 2016–2023Schuldschein loan guaranteed by LafargeHolcim Ltd, with floating interest rates (early repaid in 2018) 0 24
USD 110 3.46% 3.64% 2018-2022Schuldschein loan guaranteed by LafargeHolcim Ltd, with floating interest rates 108 0
USD 38 4.38% 4.48% 2018-2024 Schuldschein loan guaranteed by LafargeHolcim Ltd 37 0
USD 28 3.71% 3.95% 2018-2024Schuldschein loan guaranteed by LafargeHolcim Ltd, with floating interest rates 28 0
USD 60 4.59% 4.68% 2018-2025 Schuldschein loan guaranteed by LafargeHolcim Ltd 59 0
USD 60 3.91% 4.09% 2018-2025Schuldschein loan guaranteed by LafargeHolcim Ltd, with floating interest rates 59 0
224

LafargeHolcim Finance US LLC
USD 400 3.50% 3.59% 2016–2026 Bonds guaranteed by LafargeHolcim Ltd 392 389
USD 600 4.75% 5.00% 2016–2046 Bonds guaranteed by LafargeHolcim Ltd 575 569
USD 180 4.79% 4.84% 2018–2025 Private placement guaranteed by LafargeHolcim Ltd 177 0
USD 52 4.92% 4.98% 2018–2027 Private placement guaranteed by LafargeHolcim Ltd 51 0
USD 106 5.03% 5.09% 2018–2030 Private placement guaranteed by LafargeHolcim Ltd 104 0
LafargeHolcim Continental Finance Ltd
EUR 30 0.88% 0.95% 2018-2022 Schuldschein loan guaranteed by LafargeHolcim Ltd 34 0
EUR 60 0.39% 0.46% 2018-2022Schuldschein loan guaranteed by LafargeHolcim Ltd, with floating interest rates 67 0
EUR 109 1.32% 1.37% 2018-2024 Schuldschein loan guaranteed by LafargeHolcim Ltd 122 0
EUR 5 1.68% 1.72% 2018-2025 Schuldschein loan guaranteed by LafargeHolcim Ltd 6 0
EUR 2 2.22% 2.24% 2018-2028 Schuldschein loan guaranteed by LafargeHolcim Ltd 2 0
LafargeHolcim Sterling Finance (Netherlands) B.V.
GBP 300 3.00% 3.16% 2017–2032 Bonds guaranteed by LafargeHolcim Ltd 370 388
Holcim (US) Inc.
USD 33 1.72% 1.73% 1999–2032Industrial revenue bonds – Mobile Dock & Wharf, with floating interest rates 33 33
USD 25 1.79% 1.80% 2003–2033Industrial revenue bonds – Holly Hill, with floating interest rates 25 24
USD 27 1.71% 1.72% 2009–2034Industrial revenue bonds – Midlothian, with floating interest rates 26 26
Lafarge Africa PLC
NGN 26,386 14.25% 16.08% 2016-2019 Bonds 72 84
NGN 33,614 14.75% 16.39% 2016-2021 Bonds 92 107
Total 13,951 15,177 1 Includes adjustments for fair value hedge accounting, where applicable. 2 With fixed rates unless indicated.
Nominal value
Nominal interest rate
Effective interest rate Term Description 2
Net book value
in CHF 1
Net book value
in CHF 1
Financial information — Consolidated financial statementsLafargeHolcim Annual Report 2018 225

Notes to the consolidated financial statementscontinued
14.4 Derivative financial instrumentsDerivative liabilities are included in financial liabilities (note 14.3) and derivative assets are separately disclosed in the consolidated statement of financial position.
The Group has assessed the effects of existing netting arrangements in place for financial instruments and these were considered to be immaterial.
Derivative assets and liabilities
Fair value assets
Fair value liabilities
Nominal amount
Fair value assets
Fair value liabilities
Nominal amount
Million CHF 2018 2018 2018 2017 2017 2017
Fair value hedges
Cross-currency 0 41 618 0 10 613
Total fair value hedges 0 41 618 0 10 613
Cash flow hedges
Currency 3 4 1,061 18 14 1,690
Commodity 69 31 422 33 6 229
Total cash flow hedges 71 35 1,483 50 19 1,919
Net investment hedges
Currency 7 0 149 6 6 1,333
Total net investment hedges 7 0 149 6 6 1,333
Held for trading
Currency 10 59 3,773 2 86 687
Cross-currency 3 1 105 0 0 30
Total held for trading 13 60 3,878 2 87 717
Total 91 136 6,128 58 122 4,583
226
14.5 Financial risks associated with operating activitiesImpacts of applying IFRS 9 Financial InstrumentsIFRS 9, which replaces IAS 39 Financial instruments: Recognition and measurements, was adopted for the period starting January 1, 2018. Comparative figures have not been restated. The accounting policies were changed to comply with IFRS 9 as issued by the IASB in July 2014.
a) Changes in classification and measurement of financial instruments
The total impact on the Group’s retained earnings due to changes in classification and measurement of financial instruments as at January 1, 2018 was not material.
The Group’s management has assessed which business models apply to the financial assets held by the Group at the date of initial application of IFRS 9 and has classified its financial instruments into the appropriate IFRS 9 categories.
Available-for-sale financial assets of CHF 86 million included in the opening balance have been reclassified to strategic equity investments at fair value through other comprehensive earnings (CHF 85 million) and financial assets at fair value through profit and loss (CHF 1 million).
Except for assets previously classified as available-for-sale, there have been no other impacts on financial instruments under IFRS 9. Loans and receivables remain to be measured at amortized cost and derivative financial instruments at fair value through profit and loss.
The Group elected to present in other reserves the changes in the fair value of strategic equity investments which are not at fair value through profit and loss. The impact of reclassification from the available-for-sale equity reserve to the fair
value through other reserves on adopting IFRS 9 was immaterial for LafargeHolcim’s financial statements.
In connection with the reclassification of available-for-sale financial assets to financial assets at fair value through profit and loss, an amount of CHF 4 million has been reclassified from the available-for-sale equity reserve to retained earnings.
The change from IAS 39 to IFRS 9 had no effect on the measurement of LafargeHolcim’s financial liabilities.
b) Derivatives and hedging activities
The Group designates the spot component of foreign currency forward contracts as hedging instruments in cash flow hedge and net investment hedge relationships. For cash flow hedges and net investment hege, the Group has elected to recognize the fair value changes of the forward points in the foreign exchange contracts in profit and loss.
The foreign exchange forward contract hedges qualifying as cash flow hedges under IAS 39 as at December 31, 2017 qualified as cash flow hedges under IFRS 9. The Group’s risk management strategies and hedge documentation are aligned with the requirements of IFRS 9 and are thus treated as continuing hedges.
c) Change in impairment of financial assets
The Group revised its impairment methodology under IFRS 9, defining two types of financial assets subject to IFRS 9’s expected credit loss model:i) for accounts receivable, the Group
applies the simplified approach providing expected credit losses using the lifetime expected loss provision; and
ii) for long-term loans and receivables already in place at January 1, 2018, the
credit provision is determined based on the credit risk standing at each reporting date.
There was no material impact relating to provisions on accounts receivable and long-term loans and receivables on conversion to IFRS 9.
Group risk managementGroup Risk Management supports the Board of Directors, the Executive Committee and the management teams of the countries in analyzing the overall risk exposure. Group Risk Management aims to systematically identify, monitor and manage major risks the Group encounters. All types of risks from industry, operations, finance and legal, up to the external business environment are considered including compliance, sustainable development and reputational aspects. Risks are understood as the effect of uncertainty on business objectives which can be an opportunity or a threat. The risk horizon includes long-term strategic risks but also short- to medium-term business risks. Potential risks are identified and evaluated at an early stage and monitored. Mitigating actions are proposed and implemented at the appropriate level so that risk management remains a key responsibility of the line management. Risk transfer through insurance solutions forms an integral part of risk management.
The Group’s risk map is established by strategic, operational and topical risk assessments which are combined into a Group risk report. Besides the Countries, the Board of Directors, the Executive Committee and Corporate Function Heads are involved in the risk assessment during the Group’s management cycle. The
Financial information — Consolidated financial statementsLafargeHolcim Annual Report 2018 227

Notes to the consolidated financial statementscontinued
results of the annual Group risk process are presented to the Executive Committee and the conclusions reported to the Board of Directors and the Audit Committee.
Country riskLafargeHolcim’s major presence in developing markets exposes the Group to risks such as political, financial and social uncertainties and turmoil, terrorism, civil war and unrest.
The impact of United Kingdom’s withdrawal from the European Union (“BREXIT”) has been assessed and preventive measures have been taken. Relevant currency exposures and counterparty risks were reduced before the BREXIT vote.
Financial risk managementThe Group’s activities expose it to a variety of financial risks, including liquidity, interest rate, foreign exchange, commodity and credit risk. The Group’s overall risk management focuses on the unpredictability of financial markets and seeks to minimize potential adverse effects on the financial performance of the Group. The Group uses derivative financial instruments such as foreign exchange contracts, commodity and interest rate swaps to hedge certain exposures. The Group does not enter into derivative or other financial transactions which are unrelated to its business needs or for speculative purposes.
Financial risk management within the Group is governed by policies approved by key management personnel. It provides principles for overall risk management as well as policies covering specific areas
such as interest rate risk, foreign exchange risk, credit risk, use of derivative financial instruments and investing of cash.
Liquidity riskGroup companies need liquidity to meet their obligations. Individual companies are responsible for their own cash balances and the raising of internal and external credit lines to cover the liquidity needs, subject to guidance by the Group.
The Group monitors its liquidity risk by using a recurring liquidity planning tool and maintains cash, readily realizable marketable securities and unused committed credit lines to meet its liquidity requirements. In addition, the strong creditworthiness of the Group allows it to access international financial markets for financing purposes.
228

Contractual maturity analysis
Million CHF
Contractual undiscounted cash flows
Carrying amount
Within 1 year
Within 2 years
Within 3 years
Within 4 years
Within 5 years Thereafter Total
2018
Trade accounts payable and others 1 3,717 0 0 0 0 0 3,717 3,717
Loans from financial institutions 1,179 386 147 47 8 15 1,782 1,775
Bonds, private placements and commercial paper notes 1,757 1,241 847 1,543 2,102 6,602 14,093 14,047
Interest payments 547 397 339 318 268 2,320 4,189 279
Finance leases 33 28 26 24 20 72 203 166
Derivative financial instruments net 2 37 49 (5) 0 0 0 80 45
Financial guarantees 0 0 0 0 0 25 25 0
Total 7,269 2,101 1,353 1,932 2,398 9,035 24,089
2017
Trade accounts payable and others 1 3,743 0 0 0 0 0 3,743 3,743
Loans from financial institutions 1,887 478 497 189 98 37 3,186 3,177
Bonds, private placements and commercial paper notes 1,822 1,703 1,222 1,666 929 7,662 15,003 15,258
Interest payments 676 502 379 316 270 2,519 4,662 340
Finance leases 14 12 7 6 4 41 84 64
Derivative financial instruments net 2 (56) 15 108 0 0 0 67 64
Financial guarantees 0 0 0 0 0 11 11 0
Total 8,086 2,710 2,213 2,177 1,301 10,270 26,757 1 Trade accounts payable and others include trade accounts payable and payables related to purchase of property, plant and equipment included in other current liabilities.2 The contractual cash flows include both cash in- and outflows. Additional information is disclosed in note 14.4.
Financial information — Consolidated financial statementsLafargeHolcim Annual Report 2018 229

Notes to the consolidated financial statementscontinued
The maturity profile is based on contractual undiscounted amounts including both interest and principal cash flows and is based on the earliest date on which LafargeHolcim can be required to pay.
Contractual interest cash flows relating to a variable interest rate are calculated based on the rates prevailing as of December 31.
Interest rate riskInterest rate risk arises from movements in interest rates which could affect the Group’s financial result and market values of its financial instruments. The Group is primarily exposed to fluctuations in interest rates on its financial liabilities at floating rates which may cause variations in the Group’s financial result. The exposure is mainly addressed through the management of the fixed/floating ratio of financial liabilities. To manage this mix, the Group may enter into interest rate swap agreements, in which it exchanges periodic payments based on notional amounts and agreed-upon fixed and floating interest rates. The Group is also exposed to the evolution of interest rates and credit markets for its future refinancing, which may result in a lower or higher cost of financing. The Group constantly monitors credit markets and the aim of its financing strategy is to achieve a well-balanced maturity profile to reduce both the risk of refinancing and large fluctuations of its financing cost.
The Group’s risk management policy for interest rate risk is to maintain interest rate risk at an acceptable level, whilst minimizing interest expense over the long term in accordance with the Group’s funding strategy. As a consequence thereof, under the Group’s risk management policy, the Group may enter into derivative contracts which are designated as either cash flow hedges or fair value hedges, as appropriate and also include the hedging of forecasted transactions.
Interest rate sensitivity The Group’s sensitivity analysis has been determined based on the interest rate exposure relating to the Group’s financial liabilities at a variable rate on a post hedge basis as at December 31.
A 1 percentage point change is used when the interest rate risk is reported internally to key management personnel and represents management’s assessment of a reasonably possible change in interest rates.
At December 31, 2018, a 1 percentage point shift in interest rates, with all other assumptions held constant, would result in approximately CHF 22 million (2017: CHF 34 million) of annual additional/lower financial expenses before tax on a post hedge basis.
The Group’s sensitivity to interest rates is lower than last year mainly due to the decrease of current financial liabilities as well as the decrease of the ratio of financial liabilities at variable rates to total financial liabilities from 31 percent to 27 percent.
Foreign exchange riskThe Group’s global footprint exposes it to foreign exchange risks.
The translation of foreign operations into the Group reporting currency leads to currency translation effects. The Group may hedge certain net investments in foreign entities with foreign currency borrowings or other instruments. To the extent that the net investment hedge is effective, all foreign exchange gains or losses are recognized in equity and included in currency translation adjustments.
Due to the local nature of the construction materials business, foreign exchange risk is limited. However, for many Group companies, income will be primarily in local currency, whereas debt servicing and a significant amount of capital expenditures may be in foreign currencies. As a consequence thereof, under the Group’s risk management policy, the Group may enter into derivative contracts which are designated as either cash flow hedges or fair value hedges, as appropriate and also include the hedging of forecasted transactions.
Foreign exchange sensitivityThe Group’s sensitivity analysis has been determined based on the Group’s net transaction exposure that arises on monetary financial assets and liabilities at December 31 that are denominated in a foreign currency other than the functional currency in which they are measured. The Group’s net foreign currency transaction risk mainly arises from CHF, USD and EUR against the respective currencies the Group operates in.
230

A 5 percent change is used when the net foreign currency transaction risk is reported internally to key management personnel and represents management’s assessment of a reasonably possible change in foreign exchange rates.
A 5 percent change in CHF, USD and EUR against the respective currencies the Group operates in would have an immaterial impact on foreign exchange (loss) gains net on a post hedge basis in both the current and prior year.
Impacts on equity due to derivative instruments are considered as not material based on the shareholders’ equity of the Group.
Commodity riskThe Group is subject to commodity risk with respect to price changes mainly in the electricity, natural gas, petcoke, coal, oil refined products and sea freight markets. Under the Group’s risk management policy, the Group uses derivative instruments to hedge part of its exposure to these risks. Derivative instruments are generally limited to swaps and standard options.
Effects of hedge accountingHedge effectiveness is determined at the inception of the hedge relationship, and through periodic prospective effectiveness assessments to ensure that an economic relationship exists between the hedged item and hedging instrument.
Ineffectiveness is recognized on hedges where the cumulative change in the designated component value of the hedging instrument exceeds on an absolute basis the change in value of the hedged item attributable to the hedged risk. Ineffectiveness may arise if there is a difference in the principal terms of the hedging instrument and designated hedged risk, from credit valuation of the hedging instrument or timing of the transaction changes from what was originally estimated.
The effects of applying hedge accounting on the Group’s financial position and performance are as follows for cash flow, fair value and net investment hedge accounting relationships:
a) Cash flow hedge accounting The change in fair value of hedging instruments under cash flow hedge accounting in 2018 was CHF –3 million (2017: CHF –8 million). The change in related hedged items was CHF 2 million (2017: CHF 9 million) and an amount of CHF –1 million (2017: CHF 1 million) was recorded as ineffectiveness directly to the income statement in 2018 for cash flow hedges.
The maturities for hedging instruments as of December 31, 2018, ranged between 2019 and 2020 for FX forwards and 2019 and 2021 for commodity swaps (2018 and 2020, 2018 and 2020 in 2017 respectively).
When a hedging instrument expires, or is sold or terminated, or when a hedge no longer meets the criteria for hedge accounting, any cumulative deferred gain or loss in equity at that time remains in equity until the forecast transaction occurs, resulting in the recognition of a non-financial asset such as property, plant and equipment and inventory against which the cumulative gains and losses is adjusted. When the forecast transaction is no longer expected to occur, the cumulative gain or loss that was reported in equity is immediately reclassified to profit or loss. No such case has occurred in 2018.
b) Fair value hedge accounting The change in fair value of hedging instruments under fair value hedge accounting in 2018 was CHF –5 million (CHF –7 million in 2017). The change in related hedged items was CHF 5 million (CHF 7 million in 2017) and no amount was recorded as ineffectiveness directly to the income statement in 2018 and 2017 for fair value hedges.
The maturities for hedging instruments as of December 31, 2018 are in 2020 for cross-currency swaps (2020 in 2017).
When a hedging instrument expires, or is sold or terminated, or when a hedge no longer meets the criteria for hedge accounting, the cumulative gain or loss recorded in the carrying value of the hedged item is amortized over the life of the hedged item using the effective interest rate. When the hedged item is sold or terminated, the cumulative gains and losses recorded in the carrying value are recognized in financial income (expense). No such case has occurred in 2018.
Financial information — Consolidated financial statementsLafargeHolcim Annual Report 2018 231

Notes to the consolidated financial statementscontinued
c) Net investment hedge accounting The change in the fair value of hedging instruments under net investment hedge accounting in 2018 was CHF –14 million (2017: CHF 30 million). The change in related hedged items was CHF 14 million (2017: CHF –30 million) and no amount was recorded as ineffectiveness directly to the income statement in 2018 and 2017 for net investment hedges.
The maturities for hedging instruments as of December 31, 2018 are in 2019 for foreign exchange forwards (2018 in 2017).
When a hedging instrument expires, or is sold or terminated, or when a hedge no longer meets the criteria for hedge accounting, any cumulative deferred gain or loss in equity at that time remains in equity until the forecast transaction occurs (i.e. disposal of a subsidiary). No such case has occurred in 2018.
Credit riskCredit risks arise, among others, from the possibility that customers may not be able to settle their obligations as agreed. To manage this risk, the Group periodically assesses the financial reliability of customers.
Credit risks, or the risk of counterparties defaulting, are constantly monitored. Counterparties to financial instruments consist of a large number of established financial institutions. The Group does not expect any counterparty to be unable to fulfill its obligations under its respective financing agreements. At year end, LafargeHolcim has no significant concentration of credit risk with any single counterparty or group of counterparties.
The Group considers the probability of default upon initial recognition of accounts receivable based on lifetime expected credit losses by considering available reasonable and supportable historical and forwarding-looking information.
The Group considers the probability of default upon initial recognition of long-term loans and receivables and whether there has been a significant increase in credit risk on an ongoing basis throughout each reporting period by considering available reasonable and supportable historical and forwarding-looking information.
The maximum exposure to credit risk is represented by the carrying amount of each financial asset, including derivative financial instruments, in the consolidated statement of financial position.
As from January 1, 2018, the following credit risk modelling applies for financial assets:
a) Accounts receivable For accounts receivable, the Group applies the simplified approach with expected lifetime losses recognized from initial recognition of the receivables in the statement of income.
b) Long-term loans and receivablesThe Group uses three categories for long-term loans and receivables which reflect their credit risk and how the loan loss provision is determined for each of those categories.
Summary of the assumptions underpinning the Group’s expected credit loss model is as follows:
Category Definition
Performing Customers have a low risk of default and a strong capacity to meet contractual cash flows
Non-performing Interest and/or principal repayments are past due and credit risk level shows an increase
Write-off Based on observable data the payments will not be collected
Each exposure is allocated to a credit risk category at initial recognition based on available information about the borrower. Exposures are subject to ongoing monitoring which may result in an exposure being moved to a different credit risk category.
Over the term of the loans, the Group accounts for its credit risk by providing for expected credit losses on a timely basis. In calculating the expected credit loss rates, the company considers historical loss rates for each category of customers, and adjusts for forward looking macroeconomic data. No significant changes to estimation techniques or assumptions were made during the reporting period.
232

Capital structureThe Group’s objectives when managing capital are to secure the Group’s financial needs as a going concern as well as to cater for its growth targets, in order to provide returns to shareholders and benefits for other stakeholders and to maintain a solid investment grade rating.
The Group manages the capital structure and makes adjustments to it in light of changes in economic conditions, business activities, investment and expansion programs and the risk characteristics of the underlying assets. In order to maintain or adjust the capital structure, the Group may adjust the amount of dividends paid to shareholders, return capital to shareholders, issue new shares, increase debt or sell assets to reduce debt.
The Group monitors capital, among others, on the basis of the ratio of funds from operations as a percentage of net financial debt and the ratio of net financial debt to Recurring EBITDA.
Funds from operations are calculated as net income plus depreciation, amortization and impairment as shown in the notes to the consolidated statement of income. Net financial debt is calculated as financial liabilities less cash and cash equivalents and derivative assets as shown in the consolidated statement of financial position.
Financial information — Consolidated financial statementsLafargeHolcim Annual Report 2018 233

Notes to the consolidated financial statementscontinued
Million CHF 31.12.2017 Cash flows Non cash flows 31.12.2018
Current financial liabilities 1 3,843 (237) (543) 3,063
Long-term financial liabilities 14,779 (1,510) (208) 13,061
Gross financial debt 18,621 (1,747) (751) 16,124
Derivative assets (58) 0 (33) (91)
Cash and cash equivalents (4,217) 1,575 127 (2,515)
Net financial debt 14,346 (171) (657) 13,518 1 Including bank overdraft cash movement for CHF 14 million.
Million CHF 2018 2017
Net financial debt as at the beginning of the period 14,346 14,724
Cash flow from operating activities (2,988) (3,040)
Cash flow from investing activities 1,386 675
Payout on ordinary shares 1,192 1,212
Dividends paid to non-controlling interest 156 237
Capital repaid to (paid-in by) non-controlling interest 8 (63)
Movements of treasury shares 73 489
Increase in participation in existing Group companies 202 13
Proceeds from subordinated fixed rate resettable notes (200) 0
Total cash effective movements as per statement of cash flows (171) (477)
Cash proceeds reflected in the financing flows 0 (181)
Total cash effective movements as per Net financial debt (171) (658)
Change in scope (304) 106
Change in fair values (90) (83)
Currency translation effects (345) 378
Others 81 (119)
Total non cash effective movements (657) 281
Net financial debt as at the end of the period 13,518 14,346
Third party Net Financial Debt of Holcim Indonesia classified as held for sale 356 0
Net financial debt as at the end of the period – before transactions 13,874 14,346
The net financial debt to recurring EBITDA ratio is used as an indicator of financial risk and shows how many years it would take the Group to pay back its debt.
Million CHF 2018 2017
Net financial debt 13,518 14,346
Recurring EBITDA 6,016 5,990
Net financial debt/recurring EBITDA 2.2 2.4
234

Fair value estimationThe fair value of publicly traded financial instruments is generally based on quoted market prices at the end of the reporting period.
For non-publicly traded financial instruments, the fair value is determined by using a variety of methods, such as the discounted cash flow method and option pricing models. The valuation methods seek to maximize the use of observable market data existing at the end of the reporting period.
The fair value of current financial assets and liabilities at amortized cost is assessed to approximate their carrying amounts due to the short-term nature of these financial instruments.
Fair values as of December 31, 2018
Carrying amount (by measurement basis)
Million CHF IFRS 9 CategoryAmortized
costFair value
level 1Fair value
level 2 TotalComparison
Fair value
Current financial assets
Cash and cash equivalents Financial assets 2,515 2,515
Trade accounts receivable Receivables at amortized cost 3,229 3,229
Financial receivables Receivables at amortized cost 180 180
Derivative assets Held for hedging at fair value 55 55
Derivative assets Held for trading at fair value 10 10
Long-term financial assets
Long-term receivables Loans at amortized cost 315 315 315 1
Financial investments third partiesStrategic equity investments at fair value through other comprehensive earnings 0 196 196
Derivative assets Held for hedging at fair value 23 23
Derivative assets Held for trading at fair value 3 3
Current financial liabilities
Trade accounts payable and others 2 Financial liabilities at amortized cost 3,717 3,717
Current financial liabilities Financial liabilities at amortized cost 2,976 2,976
Derivative liabilities Held for hedging at fair value 27 27
Derivative liabilities Held for trading at fair value 60 60
Long-term financial liabilities
Long-term financial liabilities Financial liabilities at amortized cost 13,012 13,012 13,103 3
Derivative liabilities Held for hedging at fair value 49 49 1 The comparison fair value for long-term receivables consists of level 2 fair value measurements. 2 Trade accounts payable and others include payables related to the purchase of property, plant and equipment included in other liabilities.3 The comparison fair value for long-term financial liabilities consists of CHF 10,530 million level 1 and CHF 2,573 million level 2 fair value measurements.
Financial information — Consolidated financial statementsLafargeHolcim Annual Report 2018 235

Notes to the consolidated financial statementscontinued
Fair values as of December 31, 2017
Carrying amount (by measurement basis)
Million CHF IAS 39 CategoryAmortized
costFair value
level 1Fair value
level 2 TotalComparison
Fair value
Current financial assets
Cash and cash equivalents Financial assets 4,217 4,217
Trade accounts receivable Loans and receivables at amortized cost 3,340 3,340
Financial receivables Loans and receivables at amortized cost 262 262
Derivative assets Held for hedging at fair value 42 42
Derivative assets Held for trading at fair value 2 2
Long-term financial assets
Financial receivables Loans and receivables at amortized cost 432 432 432 1
Financial investments third parties Financial investments at cost 85 85
Derivative assets Held for hedging at fair value 14 14
Current financial liabilities
Trade accounts payable and others 2 Financial liabilities at amortized cost 3,743 3,743
Financial liabilities Financial liabilities at amortized cost 3,734 3,734
Derivative liabilities Held for hedging at fair value 22 22
Derivative liabilities Held for trading at fair value 86 86
Long-term financial liabilities
Financial liabilities Financial liabilities at amortized cost 14,766 14,766 15,655 3
Derivative liabilities Held for hedging at fair value 13 13
1 The comparison fair value for long-term receivables consists of CHF 12 million level 1 and CHF 420 million level 2 fair value measurements. 2 Payables include trade account payables and payables related to the purchase of property, plant and equipment included in other current liabilities.3 The comparison fair value for long-term financial liabilities consists of CHF 12,760 million level 1 and CHF 2,895 million level 2 fair value measurements.
236

The table above shows the carrying amounts and fair values of financial assets and liabilities.
The levels of fair value hierarchy used are defined as follows:• Level 1 fair value measurements are
those derived from quoted prices (unadjusted) in active markets for identical assets or liabilities. The types of assets carried at level 1 fair value are equity and debt securities listed in active markets;
• Level 2 fair value measurements are those derived from valuation techniques using inputs for the asset or liability that are observable market data, either directly or indirectly. Such valuation techniques include the discounted cash flow method and option pricing models. For example, the fair value of interest rate and currency swaps is determined by discounting estimated future cash flows, and the fair value of forward foreign exchange contracts is determined using the forward exchange market at the end of the reporting period; and
• Level 3 fair value measurements are those derived from valuation techniques using inputs for the asset or liability that are not based on observable market data. In 2018 and 2017, there were no financial assets and liabilities allocated to level 3.
There have been no transfers between the different hierarchy levels in 2018 and 2017.
15. Leases15.1 Impacts of applying IFRS 16As part of its activities, the Group has entered into various lease agreements as lessee, largely for trucks and heavy mobile equipment, for land and buildings as well as time charter agreements for vessels.
IFRS 16 Leases will be applied starting January 1, 2019. The new standard will not require the distinction between finance and operating leases for lessees but will require lessees to recognize a lease liability for future lease payments and a corresponding right-of-use asset. In the income statement, the expenses will comprise an amortization charge reflecting the decrease in value of the right-of-use asset and an interest expense reflecting the unwinding of the lease liability which will be accounted for as a finance cost.
The Group will apply the new standard in accordance with the modified retrospective approach without restatement of the comparative period. Leases that were accounted for as operating leases in accordance with IAS 17 Leases, will be recognized at the present value of the remaining lease payments starting January 1, 2019, and discounted using the lessee’s incremental borrowing rate as at the date of initial application. For all contracts existing as of January 1, 2019, the Group will apply the practical expedient to grandfather the assessment made under IAS 17 Leases and IFRIC 4 Determining whether an Arrangement contains a Lease. Furthermore, the Group has chosen the option whereby the right-of-use asset would equal the lease liability at the initial application of IFRS 16. The right-of-use asset will be adjusted for any prepaid and accrued leases and
provision for onerous contracts relating to the lease recognized in the statement of financial position at the date of initial application.
The Group will apply the practical expedients for short-term leases, which are leases with a lease term assessed to be 12 months or less from the commencement date and leases of low value assets which are leases of assets that fall below the capitalization threshold for property, plant and equipment; consequently, these lease payments will be recorded directly in operating profit and not be capitalized as a right-of-use asset and a lease liability.
The Group has also elected to separate lease from non-lease components in contracts containing a lease.
In the cash flow statement, the portion of the lease payments reflecting the repayment of the lease liability will be presented within financing activities whereas the interest portion will be presented in cash flow from operating activities. Lease payments for short term leases and leases of low value assets will remain classified as cash flow from operating activities.
In the event that the tax base of a right-of-use asset is not the same as its carrying amount for IFRS purposes on initial recognition of a lease contract, the Group will recognize the deferred tax impact arising on the temporary difference between the carrying amount of the right-of-use asset and its tax base. The same treatment as above will also be applied to the initial recognition of the lease liability.
Financial information — Consolidated financial statementsLafargeHolcim Annual Report 2018 237
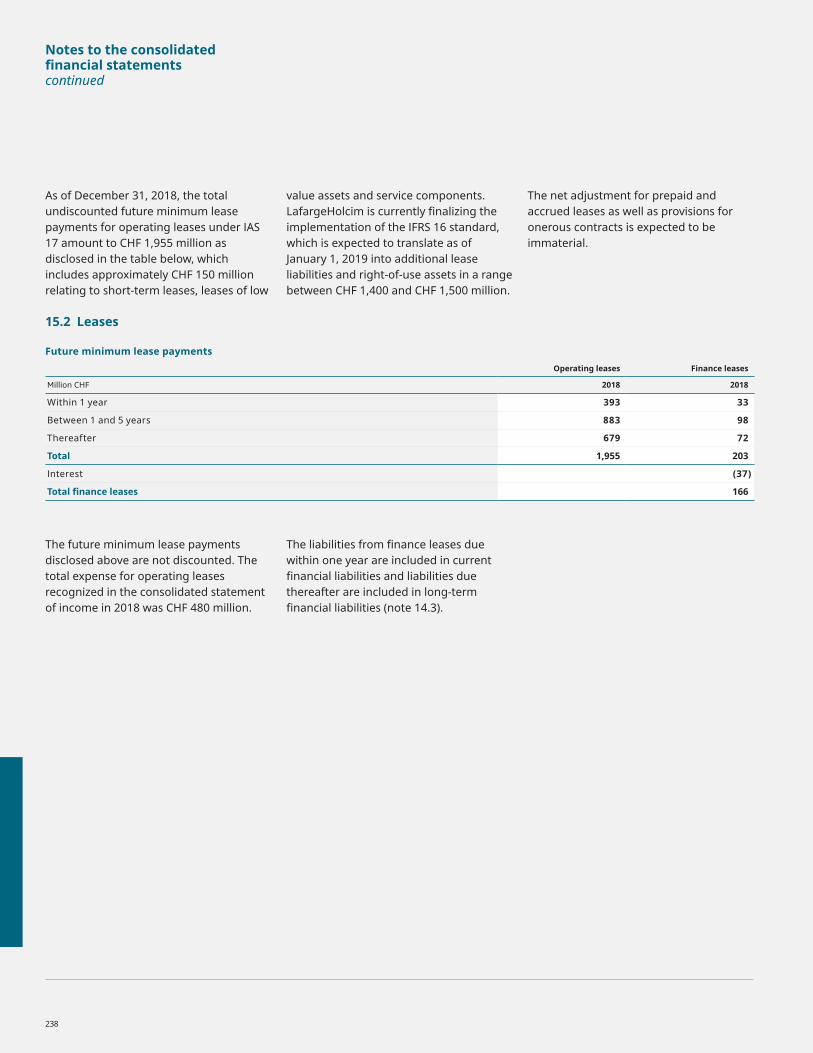
Notes to the consolidated financial statementscontinued
As of December 31, 2018, the total undiscounted future minimum lease payments for operating leases under IAS 17 amount to CHF 1,955 million as disclosed in the table below, which includes approximately CHF 150 million relating to short-term leases, leases of low
value assets and service components. LafargeHolcim is currently finalizing the implementation of the IFRS 16 standard, which is expected to translate as of January 1, 2019 into additional lease liabilities and right-of-use assets in a range between CHF 1,400 and CHF 1,500 million.
The net adjustment for prepaid and accrued leases as well as provisions for onerous contracts is expected to be immaterial.
15.2 Leases
Future minimum lease payments
Operating leases Finance leases
Million CHF 2018 2018
Within 1 year 393 33
Between 1 and 5 years 883 98
Thereafter 679 72
Total 1,955 203
Interest (37)
Total finance leases 166
The future minimum lease payments disclosed above are not discounted. The total expense for operating leases recognized in the consolidated statement of income in 2018 was CHF 480 million.
The liabilities from finance leases due within one year are included in current financial liabilities and liabilities due thereafter are included in long-term financial liabilities (note 14.3).
238

16. Employee benefits and share compensation plans16.1 Accounting principlesEmployee benefits - Defined benefit plansSome Group companies provide defined benefit pension or other post-employments benefit plans for employees. Professionally qualified independent actuaries value the defined benefit obligations on a regular basis. The obligation and costs of pension benefits are determined using the projected unit credit method. The projected unit credit method considers each period of service as giving rise to an additional unit of benefit entitlement and measures each unit separately to build up the final obligation. Past service costs, which comprise plan amendments and curtailments and gains or losses on the settlement of pension benefits, are recognized immediately in the statement of income when they occur.
Remeasurements, which comprise actuarial gains and losses on the pension and other post-employment obligations, the return on plan assets and changes in the effect of the asset ceiling excluding amounts in net interest, are recognized directly in other comprehensive earnings and are not reclassified to the statement of income in a subsequent period. The pension and other post-employment obligations are measured at the present value of estimated future cash flows using a discount rate that is determined by reference to the interest rate on high quality corporate bonds where the currency and terms of the corporate bonds are consistent with the currency and estimated terms of the defined benefit and other post-employment obligations.
A net pension asset is recorded only to the extent that it does not exceed the present value of any economic benefits available in the form of refunds from the plan or reductions in future contributions to the plan.
The cost for defined benefit and other post-employment benefits plans charged to the statement of income consists of service cost (current service cost, past service cost and curtailments as well as gains or losses on settlements) and the net interest expense. The service costs are recorded in “Cost of goods sold”, “Distribution and selling expenses” or “Administrative expenses” based on the beneficiaries of the plan and the net interest expense is recorded in “Financial expenses”.
Employee benefits – Defined contribution plansIn addition to the defined benefit plans described above, some Group companies sponsor defined contribution plans based on local practices and regulations. The Group’s contributions to defined contribution plans are charged to the statement of income in the period to which the contributions relate.
Employee benefits – Other long-term employment benefitsOther long-term employment benefits include long-service leave or sabbatical leave, medical aid, jubilee or other long-service benefits, long-term disability benefits and, if they are not expected to be settled wholly within twelve months after the year end, profit sharing, variable and deferred compensation.
The measurement of these obligations differs from defined benefit plans in that all remeasurements are recognized immediately in the statement of income and not in other comprehensive earnings.
Employee benefits – Equity compensation plansThe Group operates various equity-settled share-based compensation plans. The fair value of the employee services received in exchange for the grant of the options or shares is recognized as an expense. The total amount to be expensed is determined by reference to the fair value of the equity instruments granted. The amounts are charged to the statement of income over the relevant vesting periods and adjusted to reflect actual and expected levels of vesting.
16.2 Employee benefitsPersonnel expenses and number of personnelThe Group’s total personnel expenses, including social charges, are recognized in the relevant expenditure line by function in the consolidated statement of income and amounted to CHF 4,810 million (2017: CHF 4,932 million). As of December 31, 2018, the Group employed 77,055 people (2017: 81,960 people).
Defined benefit pension plansThe Group oversees the management of its pension plans through the Pension and Benefits Governance Team. This interdisciplinary team including finance, human resources and legal specialists acts as a center of expertise in all issues relating to pension and other post-employment benefits and makes recommendations to the Group CEO and Group CFO. A documented directive is used as a base for management actions and decisions.
Financial information — Consolidated financial statementsLafargeHolcim Annual Report 2018 239

Notes to the consolidated financial statementscontinued
The Group’s main defined benefit pension plans are located in the United Kingdom, North America and Switzerland. They respectively represent 52 percent (2017: 52 percent), 22 percent (2017: 22 percent) and 18 percent (2017: 16 percent) of the Group’s total defined benefit obligation for pensions. These main plans are funded through legally separate trustee managed funds. The cash funding of these plans, which may from time to time involve special payments, is designed to ensure that past, present and future contributions should be sufficient to meet future liabilities.
The Group operates a number of defined benefit pension schemes and schemes with similar or contingent obligations in several of its countries. The assets and liabilities of those schemes may exhibit significant volatility.
Where possible, defined benefit pension schemes have been closed and frozen. Significant actions continue to take place to reduce and eliminate those schemes and related risks. Specifically, active management is in place to mitigate the volatility and match investment returns with benefit obligations.
Unfunded pension plans are mainly plans outside of tax regimes’ qualification limits, retirement indemnity schemes, or end of service benefits where benefits are vested only if the employee is still employed by the Group company at the retirement date. The unfunded pension plans are located largely in the United States, Canada and France.
United Kingdom (UK)The companies operate three defined benefit pension plans in the UK: the Lafarge UK pension plan, the Aggregate Industries pension plan and the Ronez 2000 pension plan. Pensions payable to employees depend on average final salary
and length of service within the Group. These plans are registered schemes under UK tax law and managed by independent Boards of Trustees. They are closed to new entrants. The vested rights of the Lafarge UK pension plan were frozen in 2011, while those of the Ronez 2000 pension plan were frozen in 2016. In November 2018, Aggregate Industries Ltd. began consulting with employees with the intent of closing the Aggregate Industries pension plan to future accruals and changing the escalation formula. Consultation ended on January 29, 2019 and it has been confirmed that the closure and changes will become effective as of March 31, 2019.
These plans are funded by employer contributions, which are negotiated every three years based on plan valuations carried out by independent actuaries. For the Lafarge UK pension plan, no contributions were paid in 2018 and 2017. The June 30, 2018 funding valuation is currently being conducted and is due to be completed in 2019. The last funding valuation for the Aggregate Industries pension plan was conducted as at April 5, 2015. A revised schedule of contributions setting out the deficit repayment contributions payable by the sponsoring employer was put in place with the aim of removing the funding deficit in the plan by April 5, 2027. The April 5, 2018 funding valuation is currently being conducted and is due to be completed in 2019. For the Ronez 2000 pension plan, there are no contributions currently due to be paid by the sponsoring employer. The Trustee completed the December 31, 2015 actuarial valuation during the period which revealed a small deficit as at December 31, 2015. The Trustee and Company agreed this shortfall would be met by asset returns above those assumed in the calculation of the liabilities by July 31, 2019.
In relation to risk management and asset allocation, the Boards of Trustees aim to ensure that they can meet their obligations to the beneficiaries of the plans, both in the short and long terms. Subject to this primary objective, the Boards of Trustees target to maximize the long-term investment return whilst minimizing the risk of non-compliance with any statutory funding requirements. The Boards of Trustees are responsible for the plans’ long-term investment strategies but usually delegates strategy design and monitoring to Investment Committees.
The Lafarge UK Pension Plan entered a longevity swap during 2018. The swap hedges the risk of changes in life expectancy for covered members, which will reduce longevity related volatility in the plan’s funding position, resulting in a more stable balance sheet position. The swap covers pensioners and dependent members whose benefits came into payment on or before December 31, 2016 and who were alive on January 1, 2018, representing 60% of the plan’s IAS19 liabilities as of December 31, 2018.
The Lafarge UK pension plan and the Aggregate Industries pension plan both contain elements of pension called Guaranteed Minimum Pension (“GMP”). GMPs were accrued by individuals who were contracted out of the State Second Pension prior to April 6, 1997. Historically, there was an inequality in the benefits between male and female members who had GMP. A High Court case concluded on October 26, 2018 confirmed that all UK pension plans must equalise GMPs between men and women. In the light of these events, a net experience adjustment of CHF 47 million was recognized in other comprehensive income.
240

North America (United States and Canada) The companies operate defined contribution plans and a number of defined benefit pension plans. The majority of the defined benefit pension plans are closed to new entrants and frozen to future accruals. For defined benefit pension plans, pensions payable to employees depend on average final salary and length of service within the Group. For defined contributions, benefit depend on accrued contributions with returns at retirement.
The Group participates in a number of union-sponsored multi-employer pension plans in the United States. These plans are subject to substantial deficits due to market conditions and business actions, plan trustee decisions, plan failure as well as actions and decisions of other contributing employers. The Group has essentially no control on how these plans are managed.
The Group has undertaken a review of all these plans with the goal being to fully understand the plans’ financial circumstances, as well as all options available to mitigate risks and reduce the Group’s actual and potential financial obligations. As the Group’s participation in these plans is subject to negotiations with bargaining unions, the Group’s ability to take action is limited.
The Group companies must contribute a minimum amount to the defined benefit pension plans annually which is determined actuarially and is comprised of service costs as well as payments toward any existing deficits. For plans that are currently closed and frozen, there will generally be no service component in the future.
In the United States, the companies intend to pay the minimum required contributions as prescribed under Internal Revenue Service (IRS) regulations in addition to voluntary amounts in order to achieve and maintain an IRS funded status of at least 80 percent. In Canada, the Group companies intend to pay at least the minimum required contributions under the applicable pension legislation for each plan
The companies delegate various responsibilities to Pension Committees. These committees define and manage long-term investment strategies for reducing risks, including interest rate risks and longevity risks. The assets in the United States and Canada include a certain proportion which hedge the liability swings against interest rate movements, with those assets primarily invested in fixed income investments, particularly intermediate and longer term instruments.
In 2017, a pension plan freeze was announced for all Canadian salaried employees participating in the defined benefit plan. From January 1, 2020, active members will no longer acquire further rights in this defined benefit plan. Active members will then participate in a defined contribution plan. In the United States, collective bargaining during 2018 resulted in a freeze of pension benefits for participants in several locations. These changes resulted in a combined one-time minor curtailment gain.
Financial information — Consolidated financial statementsLafargeHolcim Annual Report 2018 241

Notes to the consolidated financial statementscontinued
SwitzerlandThe Swiss pension plans of Swiss companies contain a cash balance benefit formula, accounted for as a defined benefit plan. Employer and employee contributions are defined in the pension fund rules in terms of an age related sliding scale of percentages of salary. Under Swiss law, the pension fund guarantees the vested benefit amount as confirmed annually to members. Interest above legal requirements may be added to member balances at the discretion of the Board of Trustees. At retirement date, members have the right to take their
retirement benefit as a lump sum, an annuity or part as a lump sum with the balance converted to a fixed annuity at the rates defined in the fund rules. The Board of Trustees, composed of half employer and half employees’ representatives, may increase the annuity at their discretion subject to the plan’s funded status including sufficient free funds as determined according to Swiss statutory valuation rules. The Swiss pension plans fulfill the requirements of the regulatory framework which requires a minimum level of benefits.
Status of the Group's defined benefit plansThe status of the Group’s defined benefit plans using actuarial assumptions determined in accordance with IAS 19 Employee Benefits is summarized below. The tables provide reconciliations of defined benefit obligations, plan assets and the funded status for the defined benefit pension plans to the amounts recognized in the statement of financial position.
Reconciliation of retirement benefit plans to the statement of financial position
Million CHF 2018 2017
Net liability arising from defined benefit pension plans 993 1,265
Net liability arising from other post-employment benefit plans 239 288
Net liability 1,232 1,553
Reflected in the statement of financial position as follows:
Pension assets (371) (308)
Defined benefit obligations 1,603 1,861
Net liability 1,232 1,553
242

Retirement benefit plans
Defined benefit pension plansOther post-employment
benefit plans
Million CHF 2018 2017 2018 2017
Present value of funded obligations 8,122 9,142 0 0
Fair value of plan assets (7,614) (8,596) 0 0
Plan deficit of funded obligations 507 546 0 0
Present value of unfunded obligations 480 714 239 288
Effect of asset ceiling 5 5 0 0
Net liability from funded and unfunded plans 993 1,265 239 288
Of which:
United Kingdom (133) (96) 0 0
North America (United States and Canada) 530 581 181 226
Switzerland 141 66 0 0
Rest of world 455 714 58 61
Costs recognized in the statement of income are as follows:
Current service costs 112 123 2 2
Past service costs (including curtailments) (107) (21) (16) (5)
Gains on settlements (3) (11) 0 0
Net interest expense 46 41 10 11
Special termination benefits 4 10 0 0
Total recorded in the statement of income 52 142 (4) 9
Of which:
United Kingdom 0 1 0 0
North America (United States and Canada) 52 42 (8) 6
Switzerland 34 40 0 0
Rest of world (34) 59 4 3
Amounts recognized in other comprehensive earnings:
Actuarial gains (losses) arising from changes in demographic assumptions 114 71 2 1
Actuarial gains (losses) arising from changes in financial assumptions 487 (274) 5 (16)
Actuarial gains (losses) arising from experience adjustments (141) 8 10 21
Return on plan assets excluding interest income (401) 410 0 0
Change in effect of asset ceiling excluding interest (income) expense (1) (4) 0 0
Total recorded in other comprehensive earnings 57 211 17 5
Of which:
United Kingdom 25 46 0 0
North America (United States and Canada) 4 1 17 7
Switzerland (78) 181 0 0
Rest of world 105 (17) (1) (2)
Financial information — Consolidated financial statementsLafargeHolcim Annual Report 2018 243

Notes to the consolidated financial statementscontinued
Retirement benefit plans
Defined benefit pension plansOther post-employment
benefit plans
Million CHF 2018 2017 2018 2017
Present value of funded and unfunded obligations
Opening balance as per January 1 9,857 9,660 288 308
Reclassifications and change in structure (60) 16 (3) (2)
Current service costs 112 123 2 2
Interest expense 251 258 10 11
Contribution by the employees 20 20 0 0
Actuarial (gains) losses (460) 196 (17) (5)
Benefits paid (646) (551) (19) (18)
Past service costs (including curtailments) (107) (21) (16) (5)
Settlements (46) (111) 0 0
Special termination benefits 4 10 0 0
Currency translation effects (324) 257 (7) (4)
Closing balance as per December 31 8,602 9,857 239 288
Of which:
United Kingdom 4,497 5,172 0 0
North America (United States and Canada) 1,893 2,161 181 226
Switzerland 1,536 1,600 0 0
Rest of world 676 924 58 61
Fair value of plan assets
Opening balance as per January 1 8,596 8,162 0 0
Reclassifications and change in structure (31) 6 0 0
Interest income 206 217 0 0
Return on plan assets excluding interest income (401) 410 0 0
Contribution by the employer 212 198 18 18
Contribution by the employees 20 20 0 0
Benefits paid (646) (551) (18) (18)
Settlements (43) (101) 0 0
Currency translation effects (299) 234 0 0
Closing balance as per December 31 7,614 8,596 0 0
Of which:
United Kingdom 4,636 5,272 0 0
North America (United States and Canada) 1,363 1,580 0 0
Switzerland 1,395 1,534 0 0
Rest of world 221 210 0 0
244

Retirement benefit plans
Defined benefit pension plans
Million CHF 2018 2017
Plan assets:
Equity instruments 21% 24%
Liability-driven investments 21% 22%
Debt instruments 15% 15%
Alternative investments 12% 12%
Insurance policies 9% 8%
Investment in real estate 6% 6%
Investment funds 6% 4%
Cash and cash equivalents 4% 2%
Structured debt 2% 2%
Others 4% 5%
Total plan assets 100% 100%
Plan assets based on non-quoted prices represent 17% (2017: 19%) of the total plan assets and mainly consist of insurance policies for 9% (2017: 8%) and investment funds for 4% (2017: 3%).
The fair value of financial instruments of LafargeHolcim Ltd or subsidiaries held as
plan assets amount to CHF 78 million (2017: CHF 7 million).
Liability-driven investment (LDI) is an investment strategy that is defined considering the risk profiles of the liability of the plan. The LDI investment strategy mainly consists of index-linked
government bonds and swaps and involves hedging the plan against liquidity risk and change in interest rates or inflation yields.
Alternative investments include among others hedge-funds, multi-asset values and reinsurance investments.
Financial information — Consolidated financial statementsLafargeHolcim Annual Report 2018 245

Notes to the consolidated financial statementscontinued
Principal actuarial assumptions (weighted average) used at the end of the reporting period for defined benefit pension plans
Total Group United Kingdom North America Switzerland
2018 2017 2018 2017 2018 2017 2018 2017
Discount rate in % 2.8% 2.5% 3.0% 2.6% 4.0% 3.5% 0.8% 0.6%
Expected salary increases in % 2.2% 2.4% 3.2% +3.2% 2.5% 2.9% 0.9% 0.8%
Life expectancy in years after the age of 65 21.9 22.3 22.7 23.8 23.2 22.8 23.3 22.5
Weighted average duration of defined benefit pension plans
Total Group United Kingdom North America Switzerland
2018 2017 2018 2017 2018 2017 2018 2017
Weighted average duration in years 15.4 15.3 17.5 17.4 13.3 13.3 13.5 13.7
Sensitivity analysis as per December 31, 2018 on defined benefit pension plans
Impact on the defined benefit obligation Total Group United Kingdom North America Switzerland
Million CHF Increase Decrease Increase Decrease Increase Decrease Increase Decrease
Discount rate (±0.5% change in assumption) (611) 685 (372) 401 (115) 136 (92) 113
Expected salary increases (±0.5% change in assumption) 47 (46) 8 (8) 9 (8) 9 (8)
Life expectancy in years after the age of 65 (±1 year change in assumption) 343 (350) 231 (229) 51 (56) 50 (58)
Sensitivity analysis as per December 31, 2017 on defined benefit pension plans
Impact on the defined benefit obligation Total Group United Kingdom North America Switzerland
Million CHF Increase Decrease Increase Decrease Increase Decrease Increase Decrease
Discount rate (±0.5% change in assumption) (705) 766 (420) 459 (134) 144 (105) 113
Expected salary increases (±0.5% change in assumption) 57 (56) 9 (9) 9 (8) 10 (10)
Life expectancy in years after the age of 65 (±1 year change in assumption) 378 (365) 258 (244) 52 (50) 52 (60)
The sensitivity analysis above may not be representative of the actual change in the defined benefit pension plans as it is unlikely that the change in assumptions would occur in isolation of one another as some of the assumptions may be correlated.
Expected contributions by the employer to be paid to the post-employment benefit plans during the annual period beginning after the end of the reporting period are CHF 82 million, of which CHF 25 million related to North America, CHF 31 million related to Switzerland and CHF 11 million related to United Kingdom.
246

16.3 Share compensation plansThe total personnel expense arising from the LafargeHolcim share compensation plans amounted to CHF 12.9 million in 2018 (2017: CHF 20.5 million) as presented in the following table:
Million CHFPersonnel expenses
2018Personnel expenses
2017
Employee share purchase plan 0.7 0.5
LafargeHolcim Performance Share Plan 5.6 15.5
LafargeHolcim Senior Management Plan 5.8 2.9
Share option plan 0.4 0.2
Liquidity mechanism for remaining Lafarge rights 0.3 1.3
Total 12.9 20.5
All shares granted under these plans are either purchased from the market or derived from treasury shares.
Description of plansEmployee share purchase planLafargeHolcim offers an employee share-ownership plan for all employees of Swiss subsidiaries and some executives from Group companies. This plan entitles employees to acquire a limited amount of
discounted LafargeHolcim Ltd shares generally at 70 percent of the market value based on the prior-month average share price. The shares cannot be sold for a period of two years from the date of purchase.
LafargeHolcim Performance Share PlanLafargeHolcim set up a performance share plan in 2015. Performance shares and/or options are granted to executives, senior
management and other employees for their contribution to the continuing success of the business. These shares and options will be delivered after a three-to-five-year vesting period following the grant date and are subject to internal and external performance conditions.
Information related to awards granted through the LafargeHolcim Performance Share Plan is presented below:
2018 2017
Performance shares
Performance options
Performance shares
Performance options
January 1 2,232,190 1,389,745 1,364,703 1,559,468
Granted 895,190 283,506 926,203 0
Forfeited (770,271) (318,049) (58,716) (169,723)
December 31 2,357,109 1,355,202 2,232,190 1,389,745
Financial information — Consolidated financial statementsLafargeHolcim Annual Report 2018 247

Notes to the consolidated financial statementscontinued
The fair value of the plan was calculated by an independent consultant as follows:• 895,190 performance shares were
granted in 2018 under the Performance Share Plan (2017: 926,203). These shares are subject to a three-year vesting period. 895,190 shares (2017: 648,342) are subject to internal performance conditions and the fair value per share is CHF 55.00 (2017: CHF 57.45). No share
(2017: 277,861) is subject to an external performance condition, based on the Total Shareholder Return. In 2017, this external condition was included in the fair value per share of CHF 26.27 using a Monte Carlo simulation;
• 283,506 share options were granted in 2018 under the Performance Share Plan (2017: nil). These share options are subject to a five-year vesting period and
an external performance condition based on the Total Shareholder Return. The fair value per share option has been determined using the Black-Scholes model and amounted to CHF 9.16.
Underlying assumptions for the fair value of the share options granted in 2018 are presented below (no grants in 2017):
Grant dateMarch 1,
2018
Share price at grant date 55.00
Exercise price 55.65
Assumed/expected dividend yield 1 3.3%
Expected volatility of stock 2 22.4%
Risk-free interest rate –0.2%
Expected life of the options 8 years1 Based on data market provider estimates.2 Based on a 2 year at-the-money implied volatility.
248

LafargeHolcim Senior Management PlanPart of the variable, performance-related compensation for senior management is paid in LafargeHolcim Ltd shares, which are granted based on the market price of the share in the following year. The shares cannot be sold by the employee for the next three years.
Restricted share awards are also granted for Senior Management at hire, compensating for share awards forfeited from previous employer. The vesting of these restricted shares reflect the vesting dates of forfeited awards.
Share option plansTwo types of share options were granted to senior management of the Group: the ones, which were granted as part of the annual variable compensation and those, that were allotted to the Executive Committee upon appointment. In both cases, each option represented the right to acquire one registered share of LafargeHolcim Ltd at the market price of the shares at the date of grant. These plans are closed. The last share options under this plan were granted in 2015.
The contractual term of the first type of option plan is eight years, with immediate vesting but exercise restrictions for a period of three years following the grant date. The contractual term of the second type of option plan is twelve years and the options have a vesting period (service-related only) of nine years from the date of grant, with sale and pledge restrictions. The Group has no legal or constructive obligation to repurchase or settle the options in cash.
Liquidity mechanism for remaining rights under the Lafarge long-term incentive plansThe Lafarge long-term incentive plans consisted of stock options (granted up to 2012) and performance share (granted up to 2014) plans, all subject to performance conditions.
All Lafarge stock options are vested.
Performance conditions include internal conditions and a market condition related to Total Shareholder Return. The market condition is included in the fair value of each granted instrument.
Following the success of its public exchange offer on Lafarge S.A. and the completion of the subsequent squeeze-out of Lafarge S.A. shares on October 23, 2015, LafargeHolcim proposed a liquidity mechanism for:
Lafarge S.A. shares that may be issued following the exercise on or after the date of the squeeze-out of stock options that have been allocated pursuant to the Lafarge stock option plans; orLafarge S.A. shares that may be definitively allotted on or after the squeeze-out in accordance with the Lafarge performance share plans.
In 2018, the liquidity mechanism was applied as follows:• 63,895 Lafarge S.A. shares have been
purchased;• 283,414 Lafarge S.A. shares have been
exchanged for 250,218 LafargeHolcim shares; and
• 40,802 Lafarge S.A. options have been exercised in 2018. One Lafarge S.A. stock options plan ended in June 2018 and 584,013 unexercised Lafarge S.A. options have lapsed.
Following a distribution of reserves of Lafarge S.A. and in application of the definition of “parity” in the liquidity contract, the exchange ratio was changed from 0.945 (1 Lafarge S.A. share for 0.945 LafargeHolcim Ltd share) to 0.884 (1 Lafarge S.A. share for 0.884 LafargeHolcim Ltd share).
Financial information — Consolidated financial statementsLafargeHolcim Annual Report 2018 249

Notes to the consolidated financial statementscontinued
Outstanding Share optionsMovements in the number of share options outstanding and their related weighted average exercise prices are as follows:
Number 1 Number 1
Weighted average exercise price 1 2018 2017
January 1 CHF 64.29 3,443,251 4,127,010
Granted and under vesting period 2 CHF 55.65 283,506 0
Change in exchange ratio for Lafarge stock-options plans CHF 76.36 (75,088) 0
Forfeited CHF 51.82 (318,049) (169,723)
Exercised CHF 39.06 (23,240) (95,923)
Lapsed CHF 102.00 (611,824) (418,113)
December 31 CHF 54.95 2,698,556 3,443,251
Of which exercisable at the end of the year 1,276,254 1,794,103 1 Adjusted to reflect former share splits and/or capital increases and/or scrip dividend.2 These options will not be delivered before the end of the 5-year vesting period and are subject to the level of achievement of performance conditions.
250

The weighted average share price for the options exercised in 2018 was CHF 50.44 (2017: CHF 54.08). Share options outstanding at the end of the year have the following expiry dates and give the right to acquire one registered share of LafargeHolcim Ltd at the exercise prices as listed below:
Option grant date Expiry date Exercise price 1 Number 1 Number 1
2018 2017
2008 2020 CHF 62.95 33,550 33,550
2010 2018 CHF 67.66 0 95,557
2010 2022 CHF 70.30 33,550 33,550
2011 2019 CHF 63.40 113,957 113,957
2012 2020 CHF 54.85 165,538 165,538
2013 2021 CHF 67.40 122,770 122,770
2014 2022 CHF 64.40 99,532 99,532
2014 2026 CHF 64.40 33,550 33,550
2015 (2008 2) 2018 CHF 108.36 0 551,892
2015 (2009 2) 2019 CHF 34.63 69,812 85,677
2015 (2010 2) 2020 CHF 57.80 184,481 197,212
2015 (2011 2) 2020 CHF 50.14 127,269 139,000
2015 (2012 2) 2020 CHF 40.56 167,042 189,418
2015 2023 CHF 66.85 144,970 144,970
2015 2023 CHF 63.55 47,333 47,333
2015 2025 CHF 50.19 458,575 652,939
2016 2026 CHF 53.83 650,223 736,806
2018 2028 CHF 55.65 246,404 –
Total 2,698,556 3,443,2511 Adjusted to reflect former share splits and/or capital increases and/or scrip dividend.2 These options were granted through the Lafarge Stock-Options plans. The figures presented in this table are based on the application of the actual exchange ratio of 0.884. The year
specified between brackets is the original option grant date and the exercise price is converted from EUR to CHF at the closing rate of 1.13.
Financial information — Consolidated financial statementsLafargeHolcim Annual Report 2018 251
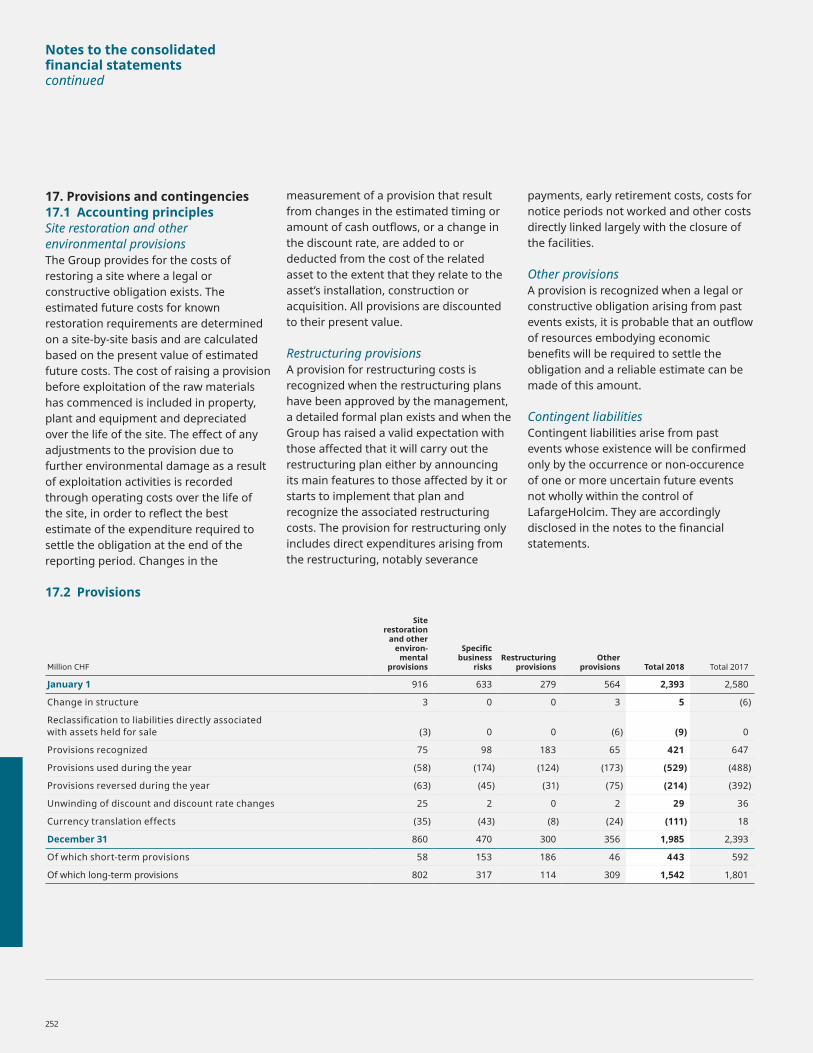
Notes to the consolidated financial statementscontinued
17. Provisions and contingencies17.1 Accounting principlesSite restoration and other environmental provisionsThe Group provides for the costs of restoring a site where a legal or constructive obligation exists. The estimated future costs for known restoration requirements are determined on a site-by-site basis and are calculated based on the present value of estimated future costs. The cost of raising a provision before exploitation of the raw materials has commenced is included in property, plant and equipment and depreciated over the life of the site. The effect of any adjustments to the provision due to further environmental damage as a result of exploitation activities is recorded through operating costs over the life of the site, in order to reflect the best estimate of the expenditure required to settle the obligation at the end of the reporting period. Changes in the
measurement of a provision that result from changes in the estimated timing or amount of cash outflows, or a change in the discount rate, are added to or deducted from the cost of the related asset to the extent that they relate to the asset’s installation, construction or acquisition. All provisions are discounted to their present value.
Restructuring provisionsA provision for restructuring costs is recognized when the restructuring plans have been approved by the management, a detailed formal plan exists and when the Group has raised a valid expectation with those affected that it will carry out the restructuring plan either by announcing its main features to those affected by it or starts to implement that plan and recognize the associated restructuring costs. The provision for restructuring only includes direct expenditures arising from the restructuring, notably severance
payments, early retirement costs, costs for notice periods not worked and other costs directly linked largely with the closure of the facilities.
Other provisionsA provision is recognized when a legal or constructive obligation arising from past events exists, it is probable that an outflow of resources embodying economic benefits will be required to settle the obligation and a reliable estimate can be made of this amount.
Contingent liabilitiesContingent liabilities arise from past events whose existence will be confirmed only by the occurrence or non-occurence of one or more uncertain future events not wholly within the control of LafargeHolcim. They are accordingly disclosed in the notes to the financial statements.
17.2 Provisions
Million CHF
Site restoration
and other environ-
mental provisions
Specific business
risksRestructuring
provisionsOther
provisions Total 2018 Total 2017
January 1 916 633 279 564 2,393 2,580
Change in structure 3 0 0 3 5 (6)
Reclassification to liabilities directly associated with assets held for sale (3) 0 0 (6) (9) 0
Provisions recognized 75 98 183 65 421 647
Provisions used during the year (58) (174) (124) (173) (529) (488)
Provisions reversed during the year (63) (45) (31) (75) (214) (392)
Unwinding of discount and discount rate changes 25 2 0 2 29 36
Currency translation effects (35) (43) (8) (24) (111) 18
December 31 860 470 300 356 1,985 2,393
Of which short-term provisions 58 153 186 46 443 592
Of which long-term provisions 802 317 114 309 1,542 1,801
252

Specific business risks The total provision for specific business risks amounted to CHF 470 million as of December 31, 2018 (2017: CHF 633 million). Specific business risks comprise litigation provisions and provisions for contractual risks recorded in connection with purchase price allocations. Provisions for litigations mainly relate to antitrust and commercial disputes, environmental claims and product liabilities and are set up to cover legal and administrative proceedings.
The timing of cash outflows of provisions for litigations is uncertain since it will largely depend upon the outcome of administrative and legal proceedings.
The sensitivity associated with certain provisions led management to limit the extent of the disclosure discussed above as it believes it could seriously prejudice the position of the Group.
Restructuring provisionsProvisions for restructuring costs relate to various restructuring programs and amounted to CHF 300 million (2017: CHF 279 million) on December 31, 2018.These provisions are expected to result in future cash outflows mainly within the next one to three years.
Other provisionsOther provisions relate mainly to provisions that have been set up to cover other contractual liabilities and amounted to CHF 356 million (2017: CHF 564 million). The composition of these items is manifold and comprised, as of December 31, 2018, among other things: severance payments to employees, provisions for health insurance and pension schemes, which do not qualify as benefit obligations and provisions related to sales and other taxes. The expected timing of the future cash outflows is uncertain.
17.3 Contingencies, guarantees, commitments and contingent assetsContingenciesIn the ordinary course of its business, the Group is involved in lawsuits, claims of various natures, investigations and proceedings, including product liability, commercial, environmental, health and safety matters, etc. The Group operates in countries where political, economic, social and legal developments could have an impact on the Group’s operations.
In connection with disposals made in the past years, the Group provided customary warranties notably related to accounting, tax, compliance with laws, litigation, labor and environmental matters. LafargeHolcim and its subsidiaries have received or may receive in the future notices of claims arising from such warranties.
The Group is exposed to varying degrees of uncertainty related to tax matters and regulatory reviews and audits. The Group accounts for its income taxes on the basis of its own internal analyses, supported by external advice, if appropriate. The Group continually monitors its global tax position, and whenever uncertainties arise, the Group assesses the potential consequences and either accrues the liability or discloses a contingent liability in its financial statements, depending on the strength of the Group’s position and the resulting risk of loss.
As of December 31, 2018, the Group’s contingencies amounted to CHF 1,637 million (2017: CHF 1,354 million). The increase is mainly related to tax contingencies. Except for what has been provided for as disclosed in note 17.2, the Group has concluded that due to the uncertainty with some of the matters mentioned below, the potential losses from some of these cases cannot be
reliably estimated. There are no further single matters pending that the Group expects to be material in relation to the Group’s business, financial result or results of operations.
The following is a description of the material legal and tax matters currently ongoing.
Legal and tax matters with new developments since last reporting periodThe Competition Commission of India (“CCI”) issued in June 2012 and, after a successful appeal, again in August 2016 an order imposing a penalty on Ambuja Cements Ltd. (“ACL”), ACC Limited (“ACC”) and on the divested subsidiary Lafarge India for which the Group provided an indemnification guarantee. The order found those companies together with other cement producers in India to have engaged in price coordination and imposed penalties on the cement companies and their trade association. The total amount of penalties (including interests) relating to the three companies is approximately CHF 476 million as of December 31, 2018. The companies appealed the order before the Competition Appellate Tribunal (“COMPAT”). As per the interim order passed by COMPAT in 2016, the companies placed a deposit of 10 percent of the penalty amounts with a financial institution with a lien in favor of COMPAT. In May 2017, all matters pending before COMPAT were transferred to the National Company Law Appellate Tribunal (“NCLAT”). In July 2018, the NCLAT dismissed the appeal of the companies against the CCI order and upheld the fines imposed. The companies filed an appeal with the Supreme Court which was admitted on October 5, 2018 and the
Financial information — Consolidated financial statementsLafargeHolcim Annual Report 2018 253

Notes to the consolidated financial statementscontinued
interim order passed by COMPAT was directed to be continued. Hearings before the Supreme Court may take place in 2019.
On December 31, 2010, in an extraordinary general meeting, the merger of Lafarge Brasil S.A. into LACIM was approved by the majority of shareholders of Lafarge Brasil S.A. Two minority shareholders (Maringa and Ponte Alta) holding a combined ownership of 8.93 percent, dissented from the merger decision and subsequently exercised their right to withdraw as provided for by the Brazilian Corporation law. In application of such law, an amount of CHF 22 million (BRL 76 million) was paid by Lafarge Brasil S.A. to the two dissenting shareholders. In March 2013, the two shareholders obtained a ruling from the Court of first instance ordering Lafarge Brasil S.A. to pay Maringa and Ponte Alta the difference between the amount paid for their shares at the time of the exercise of the withdrawal rights by the plaintiffs (based on book value) and the price per share calculated according to a fair market value, this value approximates CHF 108 million (BRL 366 million) as at the date of the order. Following a first unsuccessful appeal by Lafarge Brasil S.A., in September 2017, the Superior Court of Justice denied a further appeal filed by LafargeHolcim (Brasil) S.A. In February 2018, a settlement agreement was signed with the claimants and all agreed settlement payments have been made by June 30, 2018. The related court cases have been closed.
The criminal proceedings in France related to the alleged dealings of Lafarge Cement Syria with terrorist organizations in the years 2013 and 2014 are currently pending with the investigating judges in Paris. The Group has completed its internal independent investigation into
the alleged underlying facts under the supervision of the Board of Directors. On April 24, 2017, the Group reported on the main findings of the investigation and the remediation measures decided on by the Board of Directors. On June 28, 2018, the investigating judges decided to put Lafarge SA under judicial investigation and the legal charges put forward against individual wrongdoings have been received. In addition, Lafarge SA was requested by the investigating judges to deposit a bail guarantee of EUR 30 million. Bar the qualification of the charges, the placement of Lafarge SA under judicial investigation was expected given that several of its former managers have previously been placed under judicial investigation. Lafarge SA has appealed against those charges in December 2018 which, in its view, do not fairly represent the responsibilities of Lafarge SA. As a precaution, LafargeHolcim has decided to record a provision of CHF 35 million. Based on the information available as of this date, there is no indication that the judicial investigation is likely to result in any other negative financial impact that is material to the Group.
There has been litigation in Hungary for a number of years related to the ownership of assets and damage compensation in the context of the privatization of one of the former Holcim cement plants in Hungary. The plant was closed a number of years ago and remains inactive and the Group believes the plant is illegally occupied by the counterparty in the litigation. The litigation is ongoing in a number of different courts in Hungary but LafargeHolcim will continue to defend its legal position in all courts of competent jurisdiction.
In November and December 2016, the Indonesian tax authorities issued the final objection letter in respect of the 2010 PT Lafarge Cement Indonesia payment of Corporate Income and Withholding Tax including associated penalties of a total amount of CHF 34 million (IDR 500 billion) related to refinancing transactions. PT Lafarge Cement Indonesia appealed against this decision at the tax court to defend its initial statement. In case of a negative outcome for PT Lafarge Cement Indonesia, the total claim amounts to CHF 68 million (IDR 1 trillion) as of December 31, 2018 due to additional penalties charged for the appeal. In November 2018, the Group entered into an agreement to sell its shareholding in PT Holcim Indonesia Tbk, including its subsidiary PT Lafarge Cement Indonesia, to Semen Indonesia. The Group will continue to be liable for such claims due to an indemnification guarantee provided by the Group to PT Holcim Indonesia Tbk.
In July 2016, Lafarge Brasil S.A. received an assessment from the Brazilian Internal Revenue Service, claiming the reversal of a deducted Goodwill for the years 2011 and 2012. The amount in dispute is CHF 84 million (BRL 332 million) as of December 31, 2018 and includes any penalty and interest. After challenging the assessment, the company received a favorable decision from the Administrative Tax Appeals Council in August 2018. The Brazilian Internal Revenue Service has appealed this decision before the Superior Administrative Chamber. Additionally, in November 2018, LafargeHolcim (Brasil) S.A. received a similar assessment from the Brazilian Internal Revenue Service, again claiming reversal of deducted Goodwill for the years 2013 and 2014
254
which the company is contesting in the first instance. The amount in dispute for this second matter is CHF 65 million (BRL 258 million).
Both Ambuja Cements Ltd. (“ACL”) and ACC Limited (“ACC”) were entitled to incentives in the form of excise duty benefit, in respect of Income Tax Assessment Years 2006-07 to 2015-16. In their tax returns, the companies treated the said incentives as capital in nature and hence not liable to income tax. For the years 2006-07 to 2012-13, the Income Tax Department had not accepted this position and appeals were filed by the companies against the orders of the Assessing officer, with the Commissioner of Income Tax – Appeals (CIT-A). In prior fiscal years, ACC and ACL had classified the risk as probable and provided for a total amount of CHF 122 million. During the current year, the CIT-A ruled the issue in favour of ACC and ACL for several assessment years. In view of this, the companies have reassessed the risk and concluded that the risk of an ultimate outflow of funds for this matter is no longer probable; accordingly the ACL and ACC have reversed the existing provisions of CHF 122 million. Pending final legal closure of this matter this amount has been disclosed as a contingent liability.
Previously disclosed legal matters with no developments since last reporting periodOn May 28, 2014, the Administrative Council for Economic Defense (“CADE”) ruled that Holcim Brazil along with other cement producers had engaged in price collusion and other anti- competitive behavior. The ruling includes behavioral remedies prohibiting certain greenfield
projects, divestment of a ready-mix plant, and M&A activities and fines against the defendants. This order became enforceable on September 21, 2015 and applies to Holcim Brazil, which has been fined CHF 150 million (BRL 508 million) as at the date of the order. In September 2015, Holcim Brazil filed an appeal against the order, offering a cement plant as guarantee to support its appeal. The fine and the behavioral remedies imposed by CADE were suspended by two decisions of the court of first instance on September 29, 2016 and October 21, 2016. Unless successfully appealed by CADE, the suspension will remain in effect until the completion of the substantive proceedings against the CADE ruling. As of December 31, 2018, the total amount including interests and monetary adjustment is approximately CHF 190 million (BRL 750 million).
GuaranteesAt December 31, 2018, the Group’s guarantees issued in the ordinary course of business amounted to CHF 888 million (2017: CHF 873 million).
CommitmentsIn the ordinary course of business, the Group enters into purchase commitments for goods and services, buy and sell investments, associated companies and Group companies or portions thereof. It is common practice for the Group to make offers or receive call or put options in connection with such acquisitions and divestitures.
At December 31, 2018, the Group’s commitments amounted to CHF 1,946 million (2017: CHF 1,577 million) and included CHF 1,528 million (2017: CHF
1,303 million) related to the purchase of various products, inventories and services and CHF 418 million (2017: CHF 274 million) related to the purchase of property, plant and equipment.
Contingent assetsA contingent asset is a possible asset that arises from past events, whose existence will be confirmed only by the occurrence or non-occurrence of one or more uncertain future events not wholly within the control of the Group. At December 31, 2018, the total contingent assets for various claims in favor of the Group amounted to CHF 25 million (2017: CHF 126 million) and are valued at the maximum potential recoverable amount.
Financial information — Consolidated financial statementsLafargeHolcim Annual Report 2018 255

Notes to the consolidated financial statementscontinued
18. Shareholders’ information18.1 EquityLafargeHolcim Helvetia Finance Ltd issued CHF 200 million subordinated fixed rate resettable perpetual notes on November 28, 2018 with a coupon of 3.5% p.a.
In accordance with the provisions of IAS 32 Financial Instruments – Presentation, and
given their characteristics, these instruments were accounted for in equity in the Group's consolidated financial statements for a total amount of CHF 200 million in 2018 and guaranteed by LafargeHolcim Ltd.
Incremental costs directly attributable to the issuance of ordinary shares and share
options are recognized as a deduction from equity, net of any tax effects.
Treasury shares (own equity instruments held by the Group) are accounted for as a reduction of equity at acquisition cost and are not subsequently remeasured. When shares are sold out of treasury shares, the resulting profit or loss is recognized in equity, net of tax.
18.2 Information on share capital
Number of registered shares December 31 2018 2017
Total oustanding shares 596,172,233 597,210,931
Treasury shares
Share buy-back program 10,283,654 8,841,454
Reserved for share compensation plans 453,193 856,695
Total treasury shares 10,736,847 9,698,149
Total issued shares 606,909,080 606,909,080
Shares out of conditional share capital
Reserved for convertible bonds 1,422,350 1,422,350
Total shares out of conditional share capital 1,422,350 1,422,350
Total shares 608,331,430 608,331,430
The par value per share is CHF 2.00. The share capital amounts to nominal CHF 1,214 million (2017: CHF 1,214 million) and the nominal value of the treasury shares amounts to CHF 612 million (2017: CHF 554 million).
In 2017, the Group announced the launch of its share buyback program for capital reduction purpose of up to CHF 1 billion over 2017 – 2018. The program was conducted using a second trading line on the SIX Swiss Exchange.
On March 2, 2018, the Group announced the discontinuation of its share buyback program. The program was completed on March 2, 2018 and the Group has repurchased 10,283,654 of its shares for a toal value of CHF 581 million at an average price per share of CHF 56.54.
256

19. Related party transactions19.1 Transactions and relations with members of the Board of Directors and Executive Committee
Key management compensationBoard of DirectorsIn 2018, twelve non-executive members of the Board of Directors received in total a remuneration of CHF 4.7 million including mandatory Social Security payments (2017: CHF 5.2 million) of which CHF 2.7 million (2017: CHF 3.2 million) was paid in cash, CHF 0.02 million (2017: CHF 0.1 million) in the form of social security contributions, and CHF 1.9 million (2017: CHF 2.0 million) in shares. Other compensation paid totaled CHF 0.2 million (2017: CHF 0.2 million).
The compensation of the Board of Directors was lower in 2018 than in 2017 due to discontinuation of additional fees and time commitment to organize the CEO succession in 2017.
Executive CommitteeCompensation for the members of the Executive Committee amounted to CHF 30.4 million (2017: CHF 32.3 million, including payments made to the former CEO). This amount comprises base salaries, other fixed pay and variable compensation of CHF 16.6 million (2017: CHF 15.8 million), share-based compensation of CHF 10.6 million (2017: CHF 11.7 million) and employer contributions to social security and pension plans of CHF 3.2 million (2017: CHF 4.8 million).
Compensation for former members of governing bodies During 2018, payments in the total amount of CHF 10.6 million were made to 8 former members of the Executive Committee (2017: CHF 7.8 million for four former members).
Loans granted to members of governing bodiesAs at December 31, 2018, there was one loan in the amount of CHF 0.1 million (no loan in 2017) outstanding to a member of the Executive Committee. There were no loans to members of the Board of Directors or to parties closely related to members of governing bodies.
Other transactionsAs part of the employee share purchase plan, LafargeHolcim manages employees’ shares. It sells and purchases LafargeHolcim Ltd shares to and from employees and in the open market. In 2017 and 2018, the company did not purchase any LafargeHolcim Ltd share from members of the Executive Committee.
As a result of the merger, LafargeHolcim has identified the following transactions with other parties or companies related to the Group:Lafarge S.A. has received indemnification guarantees from, and entered into a cooperation agreement with, Orascom Construction Industries S.A.E (OCI) in relation to an acquisition in 2008. Mr. Nassef Sawiris is Chief Executive Officer and Director of Orascom Construction Industries N.V., parent company of OCI, former director of Lafarge S.A. and current director of LafargeHolcim. LafargeHolcim has one indemnification claim under the indemnification guarantee. The cooperation agreement dated December 9, 2007 aims to allow OCI to participate in tenders in respect of the construction of new plants in countries where OCI has the capability to meet certain of LafargeHolcim’s construction needs. There are no outstanding balances under this agreement as at December 31, 2018.
Financial information — Consolidated financial statementsLafargeHolcim Annual Report 2018 257

Notes to the consolidated financial statementscontinued
20. Cash flow
Cash flow from operating activities – analysis of change in net working capital items
Million CHF 2018 2017
Increase in inventories (416) (272)
Increase in trade accounts receivable (38) (379)
Increase in other receivables excluding financial and income tax receivables (48) (88)
Increase in trade accounts payable 267 360
Decrease in liabilities excluding financial and income tax liabilities (591) (546)
Change in net working capital (826) (925)
Cash flow information related to investing activities
Million CHF 2018 2017
Purchase of property, plant and equipment net
Replacements (1,008) (1,048)
Proceeds from sale of property, plant and equipment 126 167
Capital expenditures on property, plant and equipment to maintain productive capacity and to secure competitiveness (882) (881)
Expansion investments (403) (474)
Total purchase of property, plant and equipment net (a) (1,285) (1,355)
Acquisition of participation in group companies (net of cash and cash equivalents acquired) (176) 55
Disposal of participation in group companies (net of cash and equivalents disposed of) 172 858
Purchase of financial assets, intangible and other assets
Increase in financial investments including associates and joint ventures (5) (5)
Increase in other financial assets, intangible and other assets (204) (341)
Total purchase of financial assets, intangible and other assets (209) (346)
Disposal of financial assets, intangible and other assets
Decrease in financial investments including associates and joint ventures 19 22
Decrease in other financial assets, intangible and other assets 93 91
Total disposal of financial assets, intangible and other assets 112 113
Total (purchase) disposal of financial assets, intangible and other assets and businesses net (b) (100) 680
Total cash flow from investing activities (a + b) (1,386) (675)
258

Cash flow from acquisitions and disposals of Group companies
Acquisitions Disposals
2018 2017 2018 2017
Million CHF Total Total Total Total
Cash and cash equivalents (20) (59) 12 86
Other current assets (20) (73) 23 355
Property, plant and equipment (52) (353) 100 868
Other assets (22) (28) 34 161
Other current liabilities 21 253 (62) (457)
Long-term provisions 4 10 (1) (40)
Other long-term liabilities 24 256 (11) (297)
Net assets (65) 7 95 676
Non-controlling interest 0 (3) 0 (115)
Net assets (acquired) disposed (65) 4 95 561
Goodwill (acquired) disposed (129) (27) 4 88
Fair value of previously held equity interest 1 20 0 0
Net gain on disposals 0 0 (49) 285
Total (purchase) disposal consideration (193) (3) 50 934
Acquired (Disposed) cash and cash equivalents 20 59 (12) (86)
Tax and disposal costs paid (3) 0 (9) (174)
Deferred consideration 0 0 143 185
Net cash flow (176) 55 172 858
Financial information — Consolidated financial statementsLafargeHolcim Annual Report 2018 259

Notes to the consolidated financial statementscontinued
21. Events after the reporting periodOn January 31, 2019, the Group closed the disposal of its entire shareholding of 80.6 percent of Holcim Indonesia to Semen Indonesia for an enterprise value of CHF 1.75 billion, on a 100 percent basis.
In January 2019, the Group acquired the precast and ready-mix concrete businesses of Alfons Greten Betonwerk in Northern Germany.
On February 1, 2019, the Group acquired Transit Mix Concrete Co., a leading supplier of building materials in Colorado and subsidiary of Continental Materials Corporation.
On March 1, 2019, the Group acquired Colorado River Concrete, comprising of one ready-mix concrete plant in Fort Worth, Texas.
On March 1, 2019, the Group acquired the ready-mix businesses of Donmix in Australia, comprising of five ready-mix plants on the Bass Coast, in the State of Victoria.
22. Authorization of the financial statements for issuanceThe consolidated financial statements were authorized for issuance by the Board of Directors of LafargeHolcim Ltd on March 6, 2019 and are subject to shareholder approval at the annual general meeting of shareholders scheduled for May 15, 2019.
260

Report on the Audit of the Consolidated Financial StatementsOpinionWe have audited the consolidated financial statements of LafargeHolcim Ltd and its subsidiaries (the Group), which comprise the consolidated statement of financial position as at 31 December 2018 and the consolidated statement of income, consolidated statement of comprehensive income, consolidated statement of changes in equity and consolidated statement of cash flows for the year then ended, and notes to the consolidated financial statements, including a summary of significant accounting policies.In our opinion, the consolidated financial statements (pages 162 to 260) give a true and fair view of the consolidated financial position of the Group as at 31 December 2018, and its consolidated financial performance and its consolidated cash flows for the year then ended in accordance with International Financial Reporting Standards (IFRS) and comply with Swiss law.
Basis for opinionWe conducted our audit in accordance with Swiss law, International Standards on Auditing (ISAs) and Swiss Auditing Standards. Our responsibilities under those provisions and standards are further described in the Auditor’s Responsibilities for the Audit of the Consolidated Financial Statements section of our report. We are independent of the Group in accordance with the provisions of Swiss law and the requirements of the Swiss audit profession, as well as the IESBA Code of Ethics for Professional Accountants, and we have fulfilled our other ethical responsibilities in accordance with these requirements.
We believe that the audit evidence we have obtained is sufficient and appropriate to provide a basis for our opinion.
A summary of our Audit ApproachAudit scope• We scoped our audit of component
operations based on the significance of account balances and significant risks;
• We gained sufficient and appropriate coverage of the Group;
• Coverage details are provided on page 264.
Group materiality• CHF 123 million; • 5% of normalised 3-year average profit
before tax
Key audit matters• Goodwill;• Property, plant and equipment;• Taxation; • Compliance
Key audit mattersKey audit matters are those matters that, in our professional judgment, were of most significance in our audit of the consolidated financial statements of the current period. These matters were addressed in the context of our audit of the consolidated financial statements as a whole, and in forming our opinion thereon, and we do not provide a separate opinion on these matters.
GoodwillKey audit matterThe Group’s balance sheet includes CHF 14,045 million of goodwill, representing 23.5% of total Group assets. In accordance with IFRS, these balances are allocated to Cash Generating Units (CGUs) which are tested annually for impairment using discounted cash flow models to determine
the recoverable amounts of the CGUs, which are compared with the carrying amount of the net assets of the CGUs, including goodwill. A deficit in recoverable amount compared with the carrying amount would result in an impairment.
The annual impairment testing of goodwill for impairment is considered a key audit matter because the assumptions on which the tests are based are highly judgemental and affected by future market conditions, which are inherently uncertain, and because of the materiality of the balances taken as a whole. Refer to note 11.3 for key assumptions used in goodwill impairment testing.
In assessing the recoverable amount of goodwill, management is required to estimate future cash flows. In determining future cash flows management is required to make assumptions relating to future profitability, including revenue growth and operating margins, and the determination of an appropriate discount rate, all of which are subject to management override as the outcome of the impairment assessments could vary significant if different judgements are applied.Refer to note 11.3 for Impairment tests of Goodwill.
In total, impairments amounting to CHF 26 million were recognised against goodwill – refer to note 11.3.
How the scope of our audit responded to the key audit matterWe considered the controls implemented by management in testing for impairment and the judgements in determining the CGUs to which goodwill is allocated.
To the General Meeting of LafargeHolcim Ltd, Rapperswil-Jona
Zug, March 6, 2019
Financial information — Consolidated financial statementsLafargeHolcim Annual Report 2018 261

Notes to the consolidated financial statementscontinued
We focused our audit effort based on assessing the risk of goodwill being impaired, which was based on the level of headroom of the recoverable amount over carrying amount of the CGUs.
We used Deloitte valuation specialists to develop independent discount rates and compared these from external market data to management estimates for the discount rate and country risk premium.
For all CGUs selected for detailed testing, we benchmarked key operating assumptions in the models to historical performance and benchmarked demand growth assumptions to external growth forecasts and supply growth to industry reports and recent historical trends, particularly with respect to export/import volumes; met with senior management at the CGU level.
We checked the mathematical accuracy of the discounted cash flow models and the extraction of inputs from source documents.
We challenged management’s sensitivity analyses and performed our own sensitivity calculations, where the headroom was limited, to assess the level of excess of recoverable amount against the carrying amount of the CGU.
We considered the adequacy of management’s disclosures in respect to impairment testing and whether the disclosures appropriately disclose the underlying sensitivities.
Our procedures found the discounted cash flow models of the CGU’s supported by appropriate inputs and assumptions. We concluded that discount rate assumptions were in line with third party evidence and our expert’s acceptable ranges. We reviewed management’s disclosures on key assumptions and sensitivities and found them to be appropriate.
Property, plant and equipmentKey audit matterSignificant judgement is involved in assessing property, plant and equipment for impairment. Property plant and equipment is tested at a CGU level. The CGUs are tested when a trigger for impairment is identified. Impairment testing is undertaken using discounted cash flow models to determine the recoverable amount of the CGUs, which is compared to the carry amount of the non-current assets of the CGUs. A deficit in recoverable amount compared with the carrying amount would result in an impairment.
As the impairment assessment could vary significantly due to different assumptions applied the impairment of property, plant and equipment is a key audit matter. Refer to note 11.2.
The key judgements and assumptions made by management in developing the discounted cash flows are similar to those noted above for goodwill impairment testing.
How the scope of our audit responded to the key audit matterWe considered the controls implemented by management in testing for impairment and the judgements in assessing the recoverability of property, plant and equipment.
We tested the key assumptions and inputs in the discounted cash flow models similar to those applied above for goodwill impairment testing.Our procedures found the discounted cash flow models of the CGUs were supported by appropriate inputs and assumptions.
We concluded that discount rate assumptions were in line with third party evidence and our expert’s acceptable ranges.
We reviewed management’s disclosures on key assumptions and sensitivities and found them to be appropriate.
TaxationKey audit matterThere is significant judgement in accounting for income taxes, particularly given the large number of jurisdictions in which the Group operates and exposures to numerous different tax laws around the world. This gives rise to complexity and uncertainty in respect of the calculation of income taxes, deferred tax positions, as well as the assessment of provisions for uncertain tax positions, including estimates of interest and penalties where appropriate.
In the year ended 31 December 2018, the Group has recorded a tax expense of CHF 656 million, and, at that date, CHF 1,608 million Deferred tax liabilities net (refer to note 8), CHF 634 million Current income tax liabilities and CHF 449 million Long-term income tax liabilities.
Due to their significance to the financial statements as a whole, combined with the judgement and estimation required to determine their values, the evaluation of current and deferred tax balances is considered to be a key audit matter.
262
How the scope of our audit responded to the key audit matterWe assessed the adequate implementation of Group policies and controls regarding current and deferred tax, as well as the reporting of uncertain tax positions.
We evaluated the design and implementation of controls in respect of provisions for current tax and the recognition and recoverability of deferred tax assets. We examined the procedures in place for the current and deferred tax calculations for completeness and valuation and audited the related tax computations and estimates in the light of our knowledge of the tax circumstances. Our work was conducted with the support of our tax specialists.
We performed an assessment of the material components impacting the Group's tax expense, balances and exposures. We reviewed and challenged the information reported by components with the support of our own local tax specialists, where appropriate. With the support of our tax specialists at group level, we verified the consolidation and analysis of tax balances.
We considered management's assessment of the validity and adequacy of provisions for uncertain tax positions, evaluating the basis of assessment and reviewing relevant correspondence and legal advice where available including any information regarding similar cases with the relevant tax authorities. In respect of deferred tax assets and liabilities, we assessed the appropriateness of management's assumptions and estimates, including the likelihood of generating sufficient future taxable income to support deferred tax assets for tax losses carried forward as disclosed in note 8.5 of CHF 1,034 million.
We validated the appropriateness and completeness of the related disclosures in note 8 to the consolidated financial statements. Based on the procedures performed above, we obtained sufficient audit evidence to corroborate management's estimates regarding current and deferred tax balances and provisions for uncertain tax positions.
ComplianceKey audit matterThe Group operates in multiple jurisdictions, exposing it to a variety of different laws, regulations and interpretations thereof. In many jurisdictions, there are a comparatively small number of significant competitors thereby increasing the Group’s exposure to anti-trust regulation. In this environment, there is an inherent litigation risk. In the normal course of business, provisions and contingent liabilities may arise from legal proceedings, including anti-trust, regulatory and other governmental proceedings, as well as investigations by authorities and commercial claims.
At 31 December 2018, the Group held provisions of CHF 470 million in respect of legal actions. Given the highly complex nature of regulatory and legal cases, management applies significant judgement when considering whether, and how much, to provide for the potential exposure of each matter. These estimates could change substantially over time as new facts emerge and each legal case progresses. Refer to note 17.2.
Given the complexity and magnitude of potential exposures across the Group, and the judgement necessary to determine required disclosures this is a key audit matter.
How the scope of our audit responded to the key audit matterWe discussed the status of significant known actual and potential litigation with the Chairman of the Board, Audit Committee, Head of Legal and Compliance, other management and directors who have knowledge of these matters.
We challenged the decisions and rationale for provisions held or for decisions not to record provisions or make disclosures. For the most significant of the matters, we assessed relevant historical and recent judgements passed by the court authorities and considered legal opinion obtained by management from external lawyers to challenge the basis used for the provisions recorded and the disclosures made by the Group.
We reviewed internal reports and met with Internal Audit to identify actual and potential non-compliance with laws and regulations, both those specific to the Group’s business and those relating to the conduct of business generally.
For those matters where management concluded that no provisions should be recorded, we also considered the adequacy and completeness of the Group’s disclosures made in relation to contingent liabilities.
Based on the procedures performed above, we obtained sufficient audit evidence to corroborate management's estimates for legal provisions and disclosures in note 17 relating to contingencies.
Our application of materialityWe define materiality as the magnitude of misstatement in the financial statements that makes it probable that the economic
Financial information — Consolidated financial statementsLafargeHolcim Annual Report 2018 263

Net sales EBITDA Net assets
26%
67%
19%
64%
19%
65%
n Full audit scopen Specified audit proceduresn Review at group level
7% 17% 16%
Notes to the consolidated financial statementscontinued
decisions of a reasonably knowledgeable person would be changed or influenced. We use materiality both in planning the scope of our audit work and in evaluating the results of our work.
Based on our professional judgement we determined materiality for the Group as a whole to be CHF 123 million, based on a calculation of 5% of normalised three-year average profit before tax for 2016, 2017 and 2018.
The materiality applied by the component auditors ranged from CHF 6.5 million to CHF 62.4 million depending on the scale of the component’s operations, the component’s contribution to Group profit before tax and our assessment of risks specific to each location. We agreed with the Audit Committee that we would report to the Committee all audit differences in excess of CHF 6.2 million, as well as differences below that threshold that, in our view, warranted reporting on qualitative grounds. We also report to the Audit Committee on disclosure matters that we identified when assessing the overall presentation of the financial statements.
An overview of the scope of our auditOur Group audit was scoped by obtaining an understanding of the Group and its environment, including group-wide controls, and assessing the risks of material misstatement at the Group level. Based on our continuing assessment, we focused our Group audit scope primarily on the audit work at 26 components, representing the Group’s most material country operations, and utilised 26 component audit teams in 19 countries. There were 15 components subject to full scope audits and 11 components subject to specified audit procedures, where the extent of our testing was based on our assessment of the risks of material misstatement and of the materiality of the Group’s operations at those locations.
These 26 components represent the principal business units and account for 81% of the Group’s net assets, 74% of the Group’s net sales and 81% of the Group’s EBITDA. At the parent entity level we also tested the consolidation process and carried out analytical procedures to confirm our conclusion that there were no significant
risks of material misstatement of the aggregated financial information of the remaining components not subject to audit or audit of specified account balances.
The Group audit team continued to follow a programme of planned visits that has been designed so that a senior member of the Group audit team visits each of the locations where the Group audit scope was focused. Where we have not visited a significant component we included the component audit team in our team briefing, discussed their risk assessment, and reviewed documentation of the findings from their work.
Other Information in the Annual ReportThe Board of Directors is responsible for the other information in the Annual Report. The other information comprises all information included in the Annual Report, but does not include the consolidated financial statements, the stand-alone financial statements of the Company upon which we issue a separate Statutory Auditor’s report, the Compensation Report from pages 114 to 137 and our auditor’s reports thereon.
264

Our opinion on the consolidated financial statements does not cover the other information in the Annual Report and we do not express any form of assurance conclusion thereon.
In connection with our audit of the consolidated financial statements, our responsibility is to read the other information in the Annual Report and, in doing so, consider whether the other information is materially inconsistent with the consolidated financial statements or our knowledge obtained in the audit, or otherwise appears to be materially misstated. If, based on the work we have performed, we conclude that there is a material misstatement of this other information, we are required to report that fact. We have nothing to report in this regard.
Responsibility of the Board of Directors for the Consolidated Financial StatementsThe Board of Directors is responsible for the preparation of the consolidated financial statements that give a true and fair view in accordance with IFRS and the provisions of Swiss law, and for such internal control as the Board of Directors determines is necessary to enable the preparation of consolidated financial statements that are free from material misstatement, whether due to fraud or error.
In preparing the consolidated financial statements, the Board of Directors is responsible for assessing the Group’s ability to continue as a going concern, disclosing, as applicable, matters related to going concern and using the going concern basis of accounting unless the Board of Directors either intends to liquidate the Group or to cease operations, or has no realistic alternative but to do so.
Auditor’s responsibilities for the Audit of the Consolidated Financial StatementsOur objectives are to obtain reasonable assurance about whether the consolidated financial statements as a whole are free from material misstatement, whether due to fraud or error, and to issue an auditor’s report that includes our opinion. Reasonable assurance is a high level of assurance, but is not a guarantee that an audit conducted in accordance with Swiss law, ISAs and Swiss Auditing Standards will always detect a material misstatement when it exists. Misstatements can arise from fraud or error and are considered material if, individually or in the aggregate, they could reasonably be expected to influence the economic decisions of users taken on the basis of these consolidated financial statements.
A further description of our responsibilities for the audit of the consolidated financial statements is located at the website of EXPERTsuisse: http://expertsuisse.ch/en/audit-report-for-public-companies. This description forms part of our auditor’s report.
Report on other legal and regulatory requirementsIn accordance with article 728a paragraph 1 item 3 CO and Swiss Auditing Standard 890, we confirm that an internal control system exists, which has been designed for the preparation of consolidated financial statements according to the instructions of the Board of Directors.
We recommend that the consolidated financial statements submitted to you be approved.
Deloitte AG
David Quinlin Licensed Audit Expert
Auditor in charge
Alexandre DubiLicensed Audit Expert
Financial information — Consolidated financial statementsLafargeHolcim Annual Report 2018 265
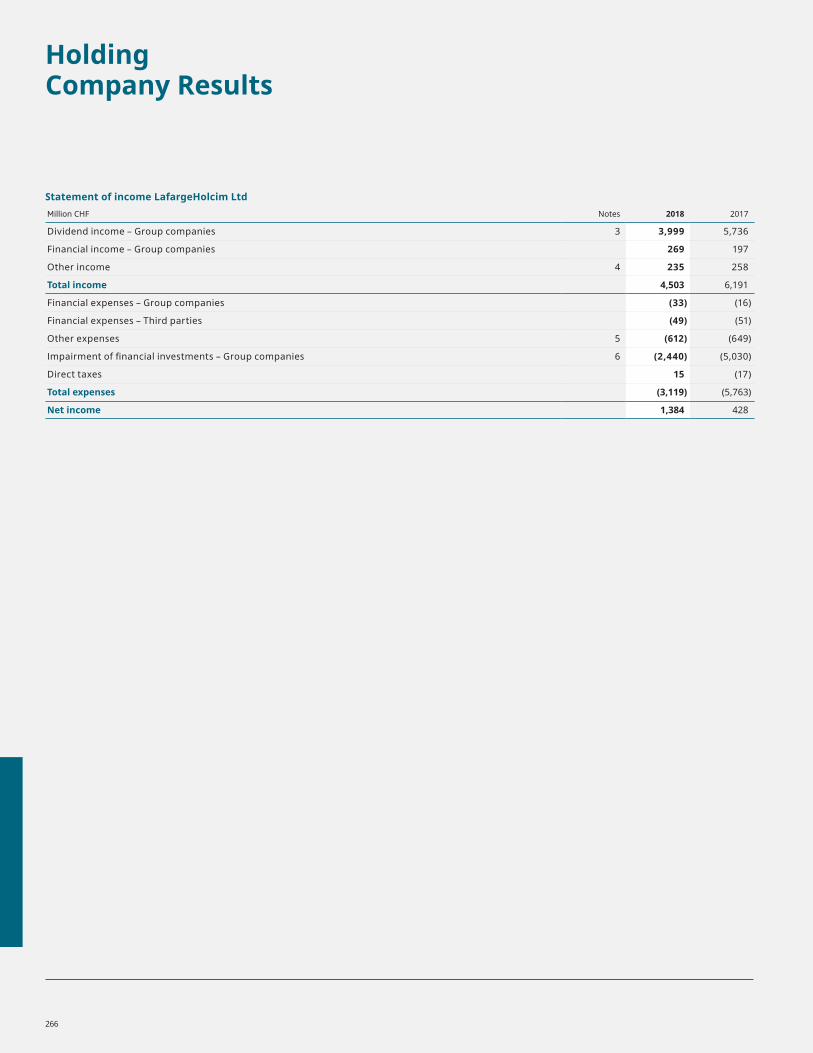
Holding Company Results
Statement of income LafargeHolcim Ltd
Million CHF Notes 2018 2017
Dividend income – Group companies 3 3,999 5,736
Financial income – Group companies 269 197
Other income 4 235 258
Total income 4,503 6,191
Financial expenses – Group companies (33) (16)
Financial expenses – Third parties (49) (51)
Other expenses 5 (612) (649)
Impairment of financial investments – Group companies 6 (2,440) (5,030)
Direct taxes 15 (17)
Total expenses (3,119) (5,763)
Net income 1,384 428
266
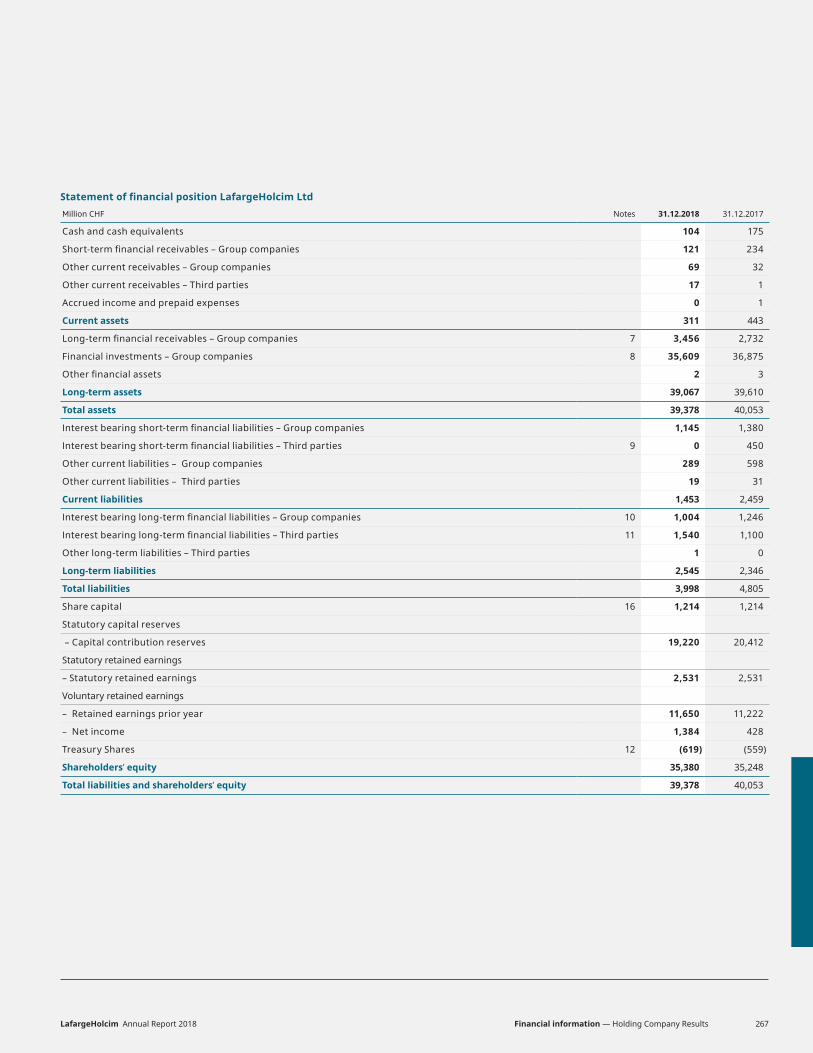
Statement of financial position LafargeHolcim Ltd
Million CHF Notes 31.12.2018 31.12.2017
Cash and cash equivalents 104 175
Short-term financial receivables – Group companies 121 234
Other current receivables – Group companies 69 32
Other current receivables – Third parties 17 1
Accrued income and prepaid expenses 0 1
Current assets 311 443
Long-term financial receivables – Group companies 7 3,456 2,732
Financial investments – Group companies 8 35,609 36,875
Other financial assets 2 3
Long-term assets 39,067 39,610
Total assets 39,378 40,053
Interest bearing short-term financial liabilities – Group companies 1,145 1,380
Interest bearing short-term financial liabilities – Third parties 9 0 450
Other current liabilities – Group companies 289 598
Other current liabilities – Third parties 19 31
Current liabilities 1,453 2,459
Interest bearing long-term financial liabilities – Group companies 10 1,004 1,246
Interest bearing long-term financial liabilities – Third parties 11 1,540 1,100
Other long-term liabilities – Third parties 1 0
Long-term liabilities 2,545 2,346
Total liabilities 3,998 4,805
Share capital 16 1,214 1,214
Statutory capital reserves
– Capital contribution reserves 19,220 20,412
Statutory retained earnings
– Statutory retained earnings 2,531 2,531
Voluntary retained earnings
– Retained earnings prior year 11,650 11,222
– Net income 1,384 428
Treasury Shares 12 (619) (559)
Shareholders’ equity 35,380 35,248
Total liabilities and shareholders’ equity 39,378 40,053
Financial information — Holding Company ResultsLafargeHolcim Annual Report 2018 267

1. Accounting PoliciesBasis of preparationThe financial statements of LafargeHolcim Ltd comply with the requirements of the Swiss accounting legislation of the Swiss Code of Obligations (SCO). LafargeHolcim Ltd is presenting consolidated financial statements according to IFRS. As a result, these financial statements and notes do not include additional disclosures, cash flow statements or a management report.
Due to rounding, numbers presented throughout this report may not add up precisely to the totals provided. All ratios and variances are calculated using theunderlying amount rather than the presented rounded amount.
Accounting principles appliedOther income and expensesCurrent assets and current liabilities denominated in foreign currencies are converted at year-end exchange rates. Realized exchange gains and losses and all unrealized exchange losses arising from these as well as those from business transactions are recorded as other income or other expenses.
Financial receivablesFinancial receivables are valued at acquisition cost less adjustments for foreign currency losses and any other impairment of value.
Financial investmentsFinancial investments are initially recognized at cost. Investments in LafargeHolcim Group subsidiaries are assessed annually and in case of an impairment adjusted to their recoverable amount.
Financial liabilitiesFinancial liabilities are valued at nominal value. Any bond premium is accrued over the duration of the bond so that at maturity the balance sheet amount will equal the amount that is due to be paid.
ProvisionsProvisions are made to cover general business risks.
Treasury sharesTreasury shares are recognised at acquisition cost and deducted from equity. Gains and losses on the sale are recognised in the income statement.
2. Principal exchange rates
Statement of financial position Closing exchange rates in CHF
31.12.2018 31.12.2017
1 Euro EUR 1.13 1.17
1 US Dollar USD 0.98 0.98
1 British Pound GBP 1.25 1.32
1 Australian Dollar AUD 0.70 0.76
1 Canadian Dollar CAD 0.72 0.78
100 Mexican Peso MXN 5.01 4.96
1 Brazilian Real BRL 0.25 0.29
1 New Zealand Dollar NZD 0.66 0.69
1 Polish Zloty PLN 0.26 0.28
Notes to the financial statements of LafargeHolcim Ltd LafargeHolcim Ltd, with registered office in Rapperswil-Jona, is the ultimate holding company of the LafargeHolcim Group which comprises subsidiaries, associated companies and joint ventures around the world. During the reporting period, LafargeHolcim Ltd employed fewer than ten employees (previous year: fewer than ten employees).
268

3. Dividend income – Group companies
Million CHF 2018 2017
LafargeHolcim Continental Finance Ltd 0 1,044
Holcim Finance (Belgium) S.A. 3 0
LafargeHolcim International Finance Ltd 781 1,509
Holdertrade Ltd 0 65
Holchile S.A. 0 13
Holcim Participations (US) Inc. 0 893
Holcim Finance (Canada) Inc. 0 1
Holderfin B.V. 1,352 147
Lafarge S.A. 1,163 2,064
Cesi S.A. 232 0
Rosyco B.V. 366 0
LafargeHolcim Albion Finance Ltd 102 0
Total 3,999 5,736
4. Other income
Million CHF 2018 2017
Foreign exchange gains 235 258
Total 235 258
5. Other expenses
Million CHF 2018 2017
Board of Director fees (6) (6)
Stewardship, branding and project expenses (311) (369)
Administrative expenses (11) (12)
Foreign exchange losses (284) (262)
Total (612) (649)
Financial information — Holding Company ResultsLafargeHolcim Annual Report 2018 269
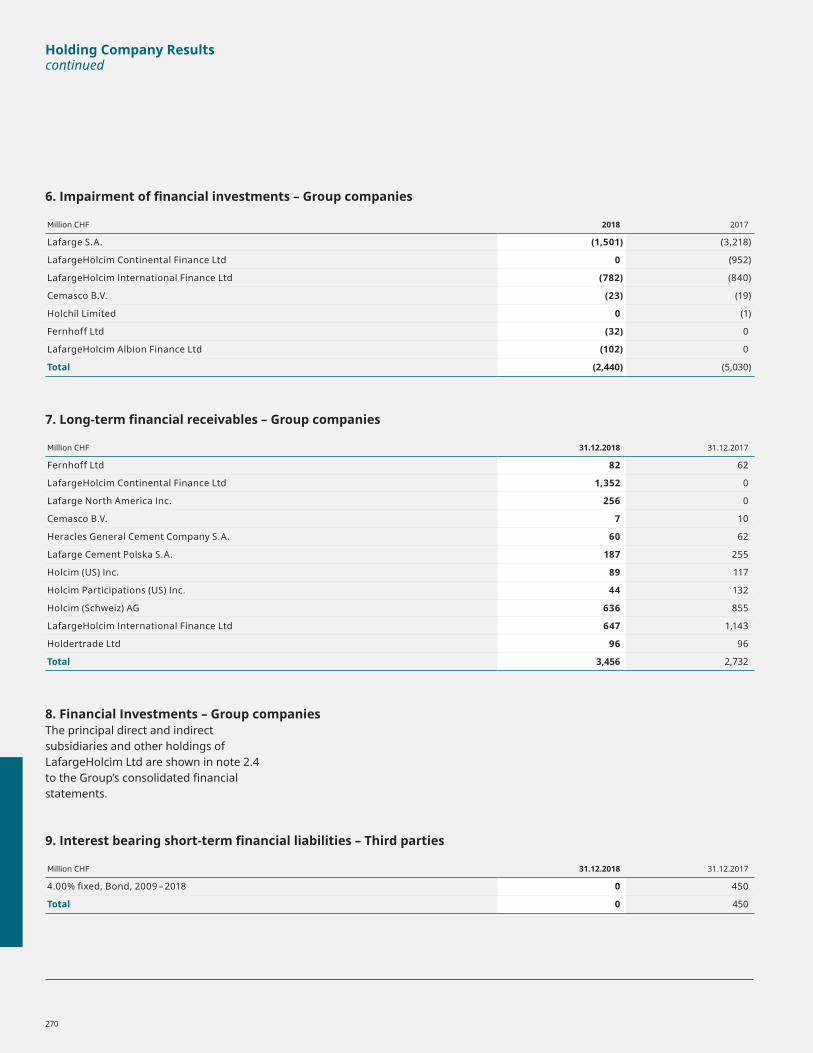
Holding Company Resultscontinued
6. Impairment of financial investments – Group companies
Million CHF 2018 2017
Lafarge S.A. (1,501) (3,218)
LafargeHolcim Continental Finance Ltd 0 (952)
LafargeHolcim International Finance Ltd (782) (840)
Cemasco B.V. (23) (19)
Holchil Limited 0 (1)
Fernhoff Ltd (32) 0
LafargeHolcim Albion Finance Ltd (102) 0
Total (2,440) (5,030)
7. Long-term financial receivables – Group companies
Million CHF 31.12.2018 31.12.2017
Fernhoff Ltd 82 62
LafargeHolcim Continental Finance Ltd 1,352 0
Lafarge North America Inc. 256 0
Cemasco B.V. 7 10
Heracles General Cement Company S.A. 60 62
Lafarge Cement Polska S.A. 187 255
Holcim (US) Inc. 89 117
Holcim Participations (US) Inc. 44 132
Holcim (Schweiz) AG 636 855
LafargeHolcim International Finance Ltd 647 1,143
Holdertrade Ltd 96 96
Total 3,456 2,732
8. Financial Investments – Group companiesThe principal direct and indirect subsidiaries and other holdings of LafargeHolcim Ltd are shown in note 2.4 to the Group’s consolidated financial statements.
9. Interest bearing short-term financial liabilities – Third parties
Million CHF 31.12.2018 31.12.2017
4.00% fixed, Bond, 2009 – 2018 0 450
Total 0 450
270
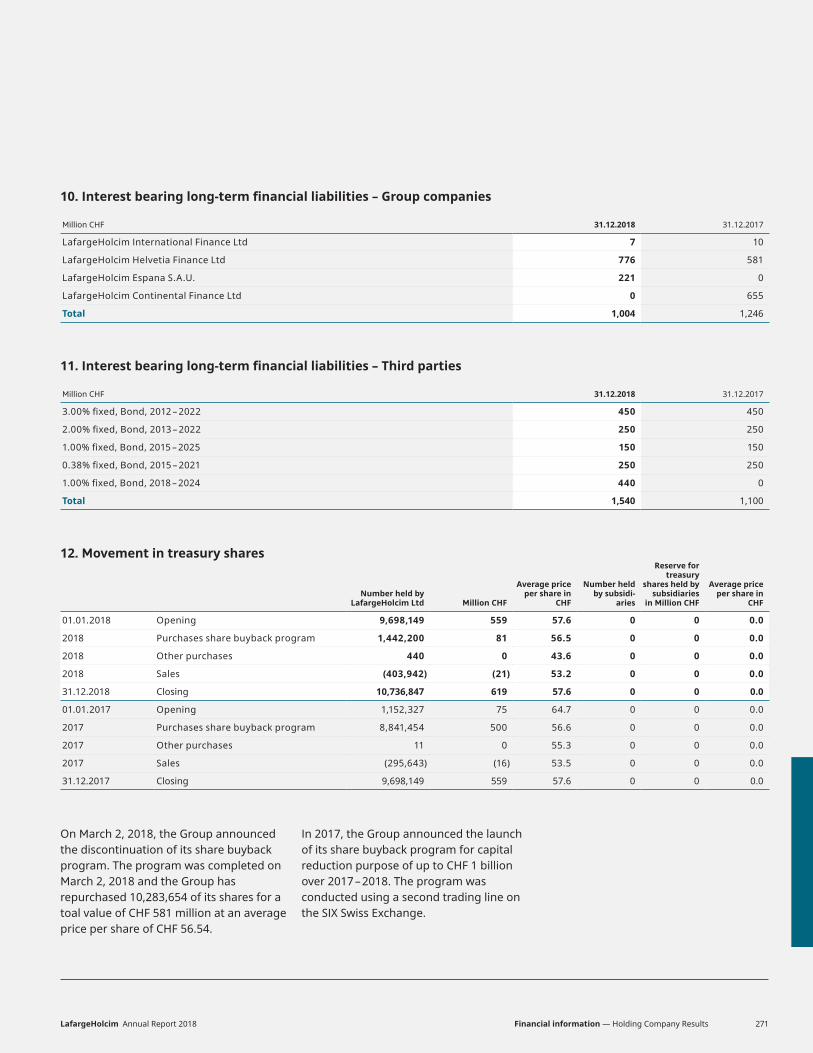
10. Interest bearing long-term financial liabilities – Group companies
Million CHF 31.12.2018 31.12.2017
LafargeHolcim International Finance Ltd 7 10
LafargeHolcim Helvetia Finance Ltd 776 581
LafargeHolcim Espana S.A.U. 221 0
LafargeHolcim Continental Finance Ltd 0 655
Total 1,004 1,246
11. Interest bearing long-term financial liabilities – Third parties
Million CHF 31.12.2018 31.12.2017
3.00% fixed, Bond, 2012 – 2022 450 450
2.00% fixed, Bond, 2013 – 2022 250 250
1.00% fixed, Bond, 2015 – 2025 150 150
0.38% fixed, Bond, 2015 – 2021 250 250
1.00% fixed, Bond, 2018 – 2024 440 0
Total 1,540 1,100
12. Movement in treasury shares
Number held by LafargeHolcim Ltd Million CHF
Average price per share in
CHF
Number held by subsidi-
aries
Reserve for treasury
shares held by subsidiaries
in Million CHF
Average price per share in
CHF
01.01.2018 Opening 9,698,149 559 57.6 0 0 0.0
2018 Purchases share buyback program 1,442,200 81 56.5 0 0 0.0
2018 Other purchases 440 0 43.6 0 0 0.0
2018 Sales (403,942) (21) 53.2 0 0 0.0
31.12.2018 Closing 10,736,847 619 57.6 0 0 0.0
01.01.2017 Opening 1,152,327 75 64.7 0 0 0.0
2017 Purchases share buyback program 8,841,454 500 56.6 0 0 0.0
2017 Other purchases 11 0 55.3 0 0 0.0
2017 Sales (295,643) (16) 53.5 0 0 0.0
31.12.2017 Closing 9,698,149 559 57.6 0 0 0.0
On March 2, 2018, the Group announced the discontinuation of its share buyback program. The program was completed on March 2, 2018 and the Group has repurchased 10,283,654 of its shares for a toal value of CHF 581 million at an average price per share of CHF 56.54.
In 2017, the Group announced the launch of its share buyback program for capital reduction purpose of up to CHF 1 billion over 2017 – 2018. The program was conducted using a second trading line on the SIX Swiss Exchange.
Financial information — Holding Company ResultsLafargeHolcim Annual Report 2018 271
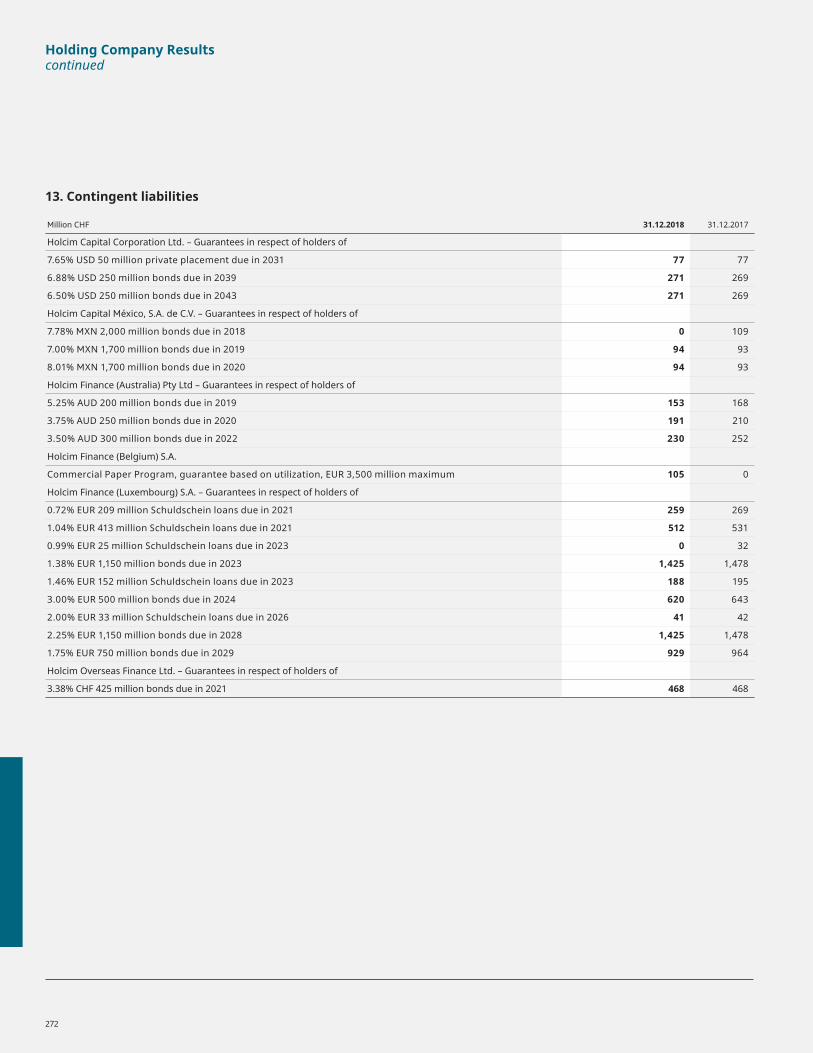
Holding Company Resultscontinued
13. Contingent liabilities
Million CHF 31.12.2018 31.12.2017
Holcim Capital Corporation Ltd. – Guarantees in respect of holders of
7.65% USD 50 million private placement due in 2031 77 77
6.88% USD 250 million bonds due in 2039 271 269
6.50% USD 250 million bonds due in 2043 271 269
Holcim Capital México, S.A. de C.V. – Guarantees in respect of holders of
7.78% MXN 2,000 million bonds due in 2018 0 109
7.00% MXN 1,700 million bonds due in 2019 94 93
8.01% MXN 1,700 million bonds due in 2020 94 93
Holcim Finance (Australia) Pty Ltd – Guarantees in respect of holders of
5.25% AUD 200 million bonds due in 2019 153 168
3.75% AUD 250 million bonds due in 2020 191 210
3.50% AUD 300 million bonds due in 2022 230 252
Holcim Finance (Belgium) S.A.
Commercial Paper Program, guarantee based on utilization, EUR 3,500 million maximum 105 0
Holcim Finance (Luxembourg) S.A. – Guarantees in respect of holders of
0.72% EUR 209 million Schuldschein loans due in 2021 259 269
1.04% EUR 413 million Schuldschein loans due in 2021 512 531
0.99% EUR 25 million Schuldschein loans due in 2023 0 32
1.38% EUR 1,150 million bonds due in 2023 1,425 1,478
1.46% EUR 152 million Schuldschein loans due in 2023 188 195
3.00% EUR 500 million bonds due in 2024 620 643
2.00% EUR 33 million Schuldschein loans due in 2026 41 42
2.25% EUR 1,150 million bonds due in 2028 1,425 1,478
1.75% EUR 750 million bonds due in 2029 929 964
Holcim Overseas Finance Ltd. – Guarantees in respect of holders of
3.38% CHF 425 million bonds due in 2021 468 468
272

Million CHF 31.12.2018 31.12.2017
Holcim US Finance S.à r.l. & Cie S.C.S. – Guarantees in respect of holders of
6.21% USD 200 million private placement due in 2018 0 195
6.00% USD 750 million bonds due in 2019 812 806
2.63% EUR 500 million bonds due in 2020 620 643
4.20% USD 50 million bonds due in 2033 54 54
5.15% USD 500 million bonds due in 2023 542 537
LafargeHolcim Continental Finance Ltd – Guarantees in respect of holders of
0.88%EUR 30 million Schuldschein loans due in 2022 37 0
0.39% EUR 60 million Schuldschein loans due in 2022 74 0
1.32% EUR 109 million Schuldschein loans due in 2024 135 0
1.68% EUR 5 million Schuldschein loans due in 2025 6 0
2.22% EUR 2 million Schuldschein loans due in 2028 2 0
LafargeHolcim International Finance Ltd – Guarantees in respect of holders of
3.01% USD 121 million Schuldschein loans due in 2021 0 130
2.80% USD 40 million Schuldschein loans due in 2021 43 43
3.21% USD 25 million Schuldschein loans due in 2023 0 27
3.20% USD 15 million Schuldschein loans due in 2023 16 16
3.46% USD 110 million Schuldschein loans due in 2022 119 0
4.38% USD 38 million Schuldschein loans due in 2024 41 0
3.71% USD 28 million Schuldschein loans due in 2024 30 0
4.59% USD 60 million Schuldschein loans due in 2025 65 0
3.91% USD 60 million Schuldschein loans due in 2025 65 0
LafargeHolcim Helvetia Finance Ltd – Perpetual Subordinated Notes (Hybrid Bond)
3.5% CHF 200 million Perpetual subordinated notes (Hybrid Bond) 220 0
LafargeHolcim Finance US LLC – Guarantees in respect of holders of
3.50% USD 400 million bonds due in 2026 433 430
4.75% USD 600 million bonds due in 2046 650 645
4.79% USD 180 million private placement due in 2025 213 0
4.92% USD 52 million private placement due in 2027 61 0
5.03% USD 106 million private placement due in 2030 125 0
LafargeHolcim Sterling Finance (Netherlands) B.VV – Guarantees in respect of holders of
3.00% GBP 300 million bonds due in 2032 414 435
Guarantees for committed credit lines, utilization CHF 0 million (2017: CHF 0 million) 5,838 6,229
Other guarantees 200 0
Total 18,168 17,830
LafargeHolcim Ltd is part of a value added tax group and therefore jointly liable to the Swiss Federal Tax Administration for the value added tax liabilities of the other
members. LafargeHolcim Ltd guarantees Holcim Finance (Luxembourg) S.A. any amount needed to fulfill its obligations from financing agreement.
Financial information — Holding Company ResultsLafargeHolcim Annual Report 2018 273
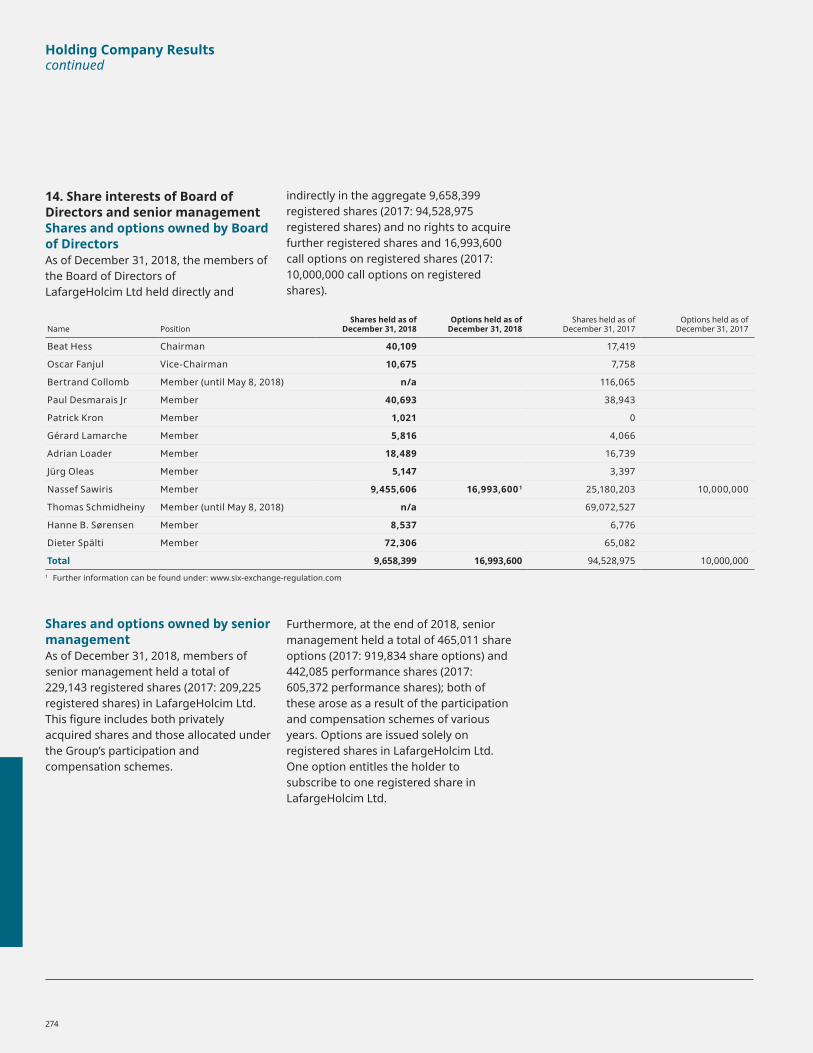
Holding Company Resultscontinued
14. Share interests of Board of Directors and senior managementShares and options owned by Board of DirectorsAs of December 31, 2018, the members of the Board of Directors of LafargeHolcim Ltd held directly and
indirectly in the aggregate 9,658,399 registered shares (2017: 94,528,975 registered shares) and no rights to acquire further registered shares and 16,993,600 call options on registered shares (2017: 10,000,000 call options on registered shares).
Name PositionShares held as of
December 31, 2018Options held as of
December 31, 2018Shares held as of
December 31, 2017Options held as of
December 31, 2017
Beat Hess Chairman 40,109 17,419
Oscar Fanjul Vice-Chairman 10,675 7,758
Bertrand Collomb Member (until May 8, 2018) n/a 116,065
Paul Desmarais Jr Member 40,693 38,943
Patrick Kron Member 1,021 0
Gérard Lamarche Member 5,816 4,066
Adrian Loader Member 18,489 16,739
Jürg Oleas Member 5,147 3,397
Nassef Sawiris Member 9,455,606 16,993,600 1 25,180,203 10,000,000
Thomas Schmidheiny Member (until May 8, 2018) n/a 69,072,527
Hanne B. Sørensen Member 8,537 6,776
Dieter Spälti Member 72,306 65,082
Total 9,658,399 16,993,600 94,528,975 10,000,0001 Further information can be found under: www.six-exchange-regulation.com
Shares and options owned by senior managementAs of December 31, 2018, members of senior management held a total of 229,143 registered shares (2017: 209,225 registered shares) in LafargeHolcim Ltd. This figure includes both privately acquired shares and those allocated under the Group’s participation and compensation schemes.
Furthermore, at the end of 2018, senior management held a total of 465,011 share options (2017: 919,834 share options) and 442,085 performance shares (2017: 605,372 performance shares); both of these arose as a result of the participation and compensation schemes of various years. Options are issued solely on registered shares in LafargeHolcim Ltd. One option entitles the holder to subscribe to one registered share in LafargeHolcim Ltd.
274

Number of shares and options held by Executive Committee Membersas of December 31, 2018
Name PositionTotal number
of shares owned
Total number of performance
options held (at target)
Total number of performance
options held (at full vesting)
Total number of performance shares
held (at target)
Total number of performance shares held
(at full vesting)
Jan Jenisch CEO 170,722 50,314 100,628 82,818 165,636
Urs Bleisch Member 14,775 69,239 138,477 25,559 51,117
Marcel Cobuz Member 8,425 20,792 41,584 13,784 27,567
Miljan Gutovic Member 0 0 0 4,403 8,805
Martin Kriegner Member 8,034 34,482 68,963 26,384 52,768
Géraldine Picaud Member 15,663 14,151 28,301 32,381 64,761
Oliver Osswald Member 3,868 24,660 49,320 23,471 46,941
René Thibault Member 7,656 18,869 37,738 12,245 24,490
Total 229,143 232,507 465,011 221,043 442,085
Number of shares and options held by Executive Committee Members as of December 31, 2017
Name PositionTotal number
of sharesTotal number
of optionsTotal number of
performance shares
Jan Jenisch CEO 120,000 80,000 126,868
Ron Wirahadiraksa Member 5,649 113,217 77,655
Urs Bleisch Member 13,116 122,115 49,416
Pascal Casanova Member 8,057 86,574 56,351
Roland Köhler Member 39,288 195,927 67,655
Martin Kriegner Member 4,094 52,353 38,026
Gérard Kuperfarb Member 11,240 140,614 76,760
Caroline Luscombe Member 1,474 36,410 40,009
Oliver Osswald Member 1,784 27,308 27,231
Saâd Sebbar Member 4,523 65,316 45,401
Total 209,225 919,834 605,372
Financial information — Holding Company ResultsLafargeHolcim Annual Report 2018 275

Holding Company Resultscontinued
15. Significant shareholdersAccording to the share register and disclosed through notifications filed with LafargeHolcim Ltd and the SIX Swiss Exchange shareholders, owning 3 percent or more are as follows:• Thomas Schmidheiny directly and
indirectly holds 69,074,277 shares or 11.4 percent as per December 31, 2018 (2017: 69,072,527 shares or 11.4 percent);
• Groupe Bruxelles Lambert holds 57,238,551 shares or 9.4 percent as per December 31, 2018 (2017: 57,238,551 shares or 9.4 percent);
• NNS Jersey Trust holds 9,455,606 shares or 1.6 percent and additionally 16,993,600 options or 2.8 percent, total of 4.4 percent as per December 31, 2018 (2017: 25,180,203 shares or 4.1 percent and additionally 10,000,000 options or 1.7 percent, total of 5,8 percent) 1 ;
• Harris Associates L.P. declared holdings of 30,342,087 shares or 4.99 percent (falling below threshold of 5 percent) on December 10,2018 (October 25, 2017: 30,446,532 shares or 4.99 percent). Harris Associates Investment Trust
declared holdings of 18,332,272 shares or 3.02 percent on December 31, 2018;
• Norges Bank (the Central Bank of Norway) declared holdings of 18,330,151 shares or 3.02 percent on November 8, 2018;
• BlackRock Inc. declared holdings of 18,725,934 shares or 3.1 percent on May 12, 2017.
1 Included in share interest of Board of Directors, ultimate beneficial owner Nassef Sawiris.
16. Share capital2018 2017
Shares Number Million CHF Number Million CHF
Registered shares of CHF 2.00 par value 606,909,080 1,214 606,909,080 1,214
Total 606,909,080 1,214 606,909,080 1,214
276

Appropriation of retained earnings
2018 2017
Million CHF Million CHF
Retained earnings brought forward 11,650 11,222
Net income of the year 1,384 428
Capital contribution reserves 19,220 20,412
Retained earnings available for annual general meeting of shareholders 32,254 32,062
The Board of Directors proposes to the annual general meeting of shareholders to distribute from the contribution reserve 1,193 1,192
Balance to be carried forward 31,061 30,870
Payout from capital contribution reservesThe Board of Directors proposes to the annual general meeting of shareholders a distribution from the contribution reserve of CHF 2.00 (2017: CHF 2.00) per registered share up to an amount of CHF 1,193
million1. The shareholders will be given the choice of having the paid out in cash, in the form of new LafargeHolcim Ltd shares or a combination of cash and shares (scrip dividend). The new shares will be issued at a discount to the market price.
1 There is no payout on treasury shares held by LafargeHolcim. On January 1, 2019 treasury shares holdings amounted to 10,736,847 registered share of which 10,283,654 shares have been acquired within the share buyback program.
Financial information — Holding Company ResultsLafargeHolcim Annual Report 2018 277

To the General Meeting of LafargeHolcim Ltd, Rapperswil-Jona Zug, March 6, 2019
Report on the Audit of the Financial StatementsOpinionWe have audited the financial statements of LafargeHolcim Ltd, which comprise the income statement and the balance sheet as at 31 December 2018 and notes for the year then ended, including a summary of significant accounting policies.
In our opinion the financial statements as at 31 December 2018, presented on pages 266 to 277 comply with Swiss law and the company’s articles of incorporation.
Basis for opinionWe conducted our audit in accordance with Swiss law and Swiss Auditing Standards. Our responsibilities under those provisions and standards are further described in the Auditor’s Responsibilities for the Audit of the Financial Statements section of our report. We are independent of the entity in accordance with the provisions of Swiss law and the requirements of the Swiss audit profession and we have fulfilled our other ethical responsibilities in accordance with these requirements.
We believe that the audit evidence we have obtained is sufficient and appropriate to provide a basis for our opinion
Report on Key audit matters based on the circular 1/2015 of the Federal Audit Oversight Authority Key audit matters are those matters that, in our professional judgment, were of most significance in our audit of the financial statements of the current period. These matters were addressed in the context of our audit of the financial statements as a whole, and in forming our opinion thereon, and we do not provide a separate opinion on these matters.
Financial investments – Group companiesKey audit matterAs described in Note 8 to the financial statements, LafargeHolcim Ltd holds investments in LafargeHolcim Group companies with a carrying value of CHF 35,609 million as of 31 December 2018, representing 90.4% of the total assets of the company.
In accordance with Article 960 CO, each investment held is usually valued individually and reviewed annually for impairment indicators. Each investment showing impairment indicators must be tested for impairment and an impairment would need to be recorded if the recoverable amount is lower than the carrying amount.
The assessment of the carrying value of each investment is complex and requires significant judgement. It is related to the value of the underlying assets held by each investment which themselves can depend on the value of other underlying investments. Management has developed valuation models which are complex in order to take into account the value of assets held by the different layers of the organization. In addition, the value of certain assets is highly judgmental and affected by future market conditions which are inherently uncertain.
Accordingly, for the purposes of our audit, we identified the impairment assessment and judgement applied by management on the valuation of these investments as representing a key audit matter.
How the scope of our audit responded to the key audit matterWe discussed with management the adequate implementation of accounting policies and controls regarding the valuation of investments in group companies.
We tested the design and implementation of controls around the valuation of investments to determine whether appropriate controls are in place. We have found these controls to be designed and implemented appropriately.
We challenged the assessment of impairment indicators by management.
We tested the valuations by critically assessing the methodology applied and the reasonableness of the underlying assumptions and judgements. We assessed the impairment testing models and calculations by:• Checking the mechanical accuracy of the
impairment models and the extraction of inputs from source documents; and
• Challenging the significant inputs and assumptions used in impairment for investments in LafargeHolcim Group companies.
We concluded that the applied methodology and the underlying assumptions were applied correctly. Additionally we concluded that the data inputs as well as the underlying calculations of the impairment model were accurate.
We validated the appropriateness and completeness of the related disclosures in Note 6 to the statutory financial statements and found them to be appropriate.
278

Responsibility of the Board of Directors for the Financial StatementsThe Board of Directors is responsible for the preparation of the financial statements in accordance with the provisions of Swiss law and the company’s articles of incorporation, and for such internal control as the Board of Directors determines is necessary to enable the preparation of financial statements that are free from material misstatement, whether due to fraud or error.
In preparing the financial statements, the Board of Directors is responsible for assessing the entity’s ability to continue as a going concern, disclosing, as applicable, matters related to going concern and using the going concern basis of accounting unless the Board of Directors either intends to liquidate the entity or to cease operations, or has no realistic alternative but to do so.
Auditor’s Responsibilities for the Audit of the Financial StatementsOur objectives are to obtain reasonable assurance about whether the financial statements as a whole are free from material misstatement, whether due to fraud or error, and to issue an auditor’s report that includes our opinion. Reasonable assurance is a high level of assurance, but is not a guarantee that an audit conducted in accordance with Swiss law and Swiss Auditing Standards will always detect a material misstatement when it exists. Misstatements can arise from fraud or error and are considered material if, individually or in the aggregate, they could reasonably be expected to influence the economic decisions of users taken on the basis of these financial statements.
A further description of our responsibilities for the audit of the consolidated financial statements is located at the website of EXPERTsuisse:
http://expertsuisse.ch/en/audit-report-for-public-companies.
This description forms part of our auditor’s report.
Report on Other Legal and Regulatory RequirementsIn accordance with article 728a paragraph 1 item 3 CO and Swiss Auditing Standard 890, we confirm that an internal control system exists, which has been designed for the preparation of financial statements according to the instructions of the Board of Directors.
We further confirm that the proposed appropriation of available earnings complies with Swiss law and the company’s articles of incorporation. We recommend that the financial statements submitted to you be approved.
Deloitte AG
David Quinlin Licensed Audit ExpertAuditor in charge
Alexandre DubiLicensed Audit Expert
Zurich, 6 March 2019
Financial information — Holding Company ResultsLafargeHolcim Annual Report 2018 279

5-year-review LafargeHolcim Group
5-year-review LafargeHolcim Group
2018 2017 1 2016 1 2015 2014 1
Statement of income
Net sales million CHF 27,466 27,021 26,904 23,584 18,825
Gross profit million CHF 11,548 7,781 11,272 7,093 8,365
Recurring EBITDA million CHF 6,016 5,990 5,950 n/a n/a
Recurring EBITDA margin % 21.9 22.2 22.1 n/a n/a
Operating profit (loss) million CHF 3,312 (478) 2,963 (739) 2,244
Operating profit (loss) margin % 12.1 (1.8) 11.0 (3.1) 11.9
Depreciation, amortization and impairment of operating assets million CHF 2,229 6,007 2,405 4,421 1,402
Income taxes million CHF 656 536 835 781 581
Tax rate % 28 (45) 29 (114) 26
Net income (loss) million CHF 1,719 (1,716) 2,090 (1,361) 1,619
Net income (loss) – shareholders of LafargeHolcim Ltd million CHF 1,502 (1,675) 1,791 (1,469) 1,287
Statement of cash flows
Cash flow from operating activities million CHF 2,988 3,040 3,295 2,465 2,484
Investments in property, plant and equipment for maintenance net million CHF (882) (881) (997) (981) (732)
Investments in property, plant and equipment for expansion million CHF (403) (474) (638) (1,007) (1,005)
(Purchase) Disposal of financial assets, intangible and other assets and businesses net million CHF (100) 680 2,342 7,222 35
Statement of financial position
Current assets million CHF 11,658 12,618 14,435 13,331 7,231
Non-current assets million CHF 48,037 51,061 55,182 59,967 32,259
Total assets million CHF 59,695 63,679 69,617 73,298 39,490
Current liabilities million CHF 10,727 11,519 12,509 14,832 6,847
Non-current liabilities million CHF 18,914 21,185 22,361 22,744 12,531
Total shareholders’ equity million CHF 30,053 30,975 34,747 35,722 20,112
Shareholders’ equity as % of total assets % 50.3 48.6 49.9 48.7 50.9
Non-controlling interest million CHF 3,128 3,188 3,925 4,357 2,682
Net financial debt million CHF 13,518 14,346 14,724 17,266 9,520
Capacity, sales and personnel
Annual production capacity cement million t 312.9 318.4 353.3 374.0 208.8
Sales of cement million t 221.9 220.2 233.2 193.1 138.2
Sales of aggregates million t 273.8 278.7 282.7 231.5 153.1
Sales of ready-mix concrete million m 3 50.9 50.6 55.0 47.6 37.0
Personnel 77,055 81,960 90,903 100,956 67,137 1 Restated due to changes in presentation or in accounting policies.
280

Cautionary statement regarding forward-looking statementsThis document may contain certain forward-looking statements relating to the Group’s future business, development and economic performance. Such statements may be subject to a number of risks, uncertainties and other important factors, such as but not limited to (1) competitive pressures; (2) legislative and regulatory developments; (3) global, macroeconomic and political trends; (4) fluctuations in currency exchange rates and general financial market conditions; (5) delay or inability in obtaining ap provals from authorities; (6) technical developments; (7) litigation; (8) adverse publicity and news coverage, which could cause actual development and results to differ materially from the statements made in
this document. LafargeHolcim assumes no obligation to update or alter forward-looking statements whether as a result of new information, future events or otherwise.
DisclaimerLafargeHolcim Ltd publishes Annual Reports in English and German. The English version is legally binding.
Financial reporting calendar
Date
Results for the first quarter 2019 May 15, 2019
Annual General Meeting of shareholders May 15, 2019
LafargeHolcim Annual Report 2018 281Financial information — 5-year-review Lafarge Holcim Group

Like-for-likeLike-for-like information is information factoring out changes in the scope of consolidation (such as divestments and acquisitions occurring in 2018 and 2017) and currency translation effects (2018 figures are converted with 2017 exchange rates in order to calculate the currency effects).
Recurring SG&A costsFixed cost related to Administrative, Marketing & Sales, Corporate Manufacturing and Corporate Logistics costs included in Recurring EBITDA.
Restructuring, litigation, implementation and other non-recurring costsRestructuring, litigation, implementation and other non-recurring costs comprise significant items that, because of their exceptional nature, cannot be viewed as inherent to the Group’s ongoing performance, such as strategic restructuring, major items relating to antitrust fines and other business-related litigation cases. In 2017, they also included costs directly related to the merger such as legal, banking fees and advisory costs, employee costs related to redundancy plans and IT implementation costs.
Profit and Loss on disposals and other non-operating itemsProfit and Loss on disposals and non-operating items comprise capital gains or losses on the sale of Group companies and of property, plant and equipment and other non-operating items that are not directly related to the Group’s normal operating activities such as revaluation gains or losses on previously held equity interests, disputes with non-controlling interests and other major lawsuits.
Recurring EBITDA The Recurring EBITDA (Earnings before interest, tax, depreciation and amortization) is an indicator to measure the performance of the Group excluding the impacts of non-recurring items. It is defined as:+/– Operating profit;– depreciation, amortization and
impairment of operating assets; and– restructuring, litigation, implementation
and other non recurring costs.
Recurring EBITDA marginThe Recurring EBITDA margin is an indicator to measure the profitability of the Group excluding the impacts of non-recurring items. It is defined as the Recurring EBITDA divided by Net Sales.
Operating profit before impairmentThe Operating profit before impairment is an indicator that measures the profit earned from the Group's core business activities excluding impairment charges which, because of their exceptional nature, cannot be viewed as inherent to the Group's ongoing activities. It is defined as:+/– Operating profit (loss);– impairment of goodwill and assets.
Net income before impairment and divestmentsNet income before impairment and divestments excludes impairment charges and capital gains and losses arising on disposals of investments which, because of their exceptional nature, cannot be viewed as inherent to the Group’s ongoing activities. It is defined as:+/– Net income (loss)– gains and losses on disposals of Group
companies; and– impairments of goodwill and assets.
EPS (Earnings Per Share) before impairment and divestmentsThe Earnings Per Share (EPS) before impairment and divestments is a indicator that measures the theoretical profitability per share of stock outstanding based on a net income before impairment and divestments. It is defined as:– net income before impairment and
divestments attributable to the shareholders of LafargeHolcim Ltd divided by the weighted average number of shares outstanding.
Capex or Capex Net (Net Maintenance and Expansion Capex)The Net Maintenance and Expansion Capex (“Capex” or “Capex Net”) is an indicator to measure the cash spent to maintain or expand its asset base. It is defined as:+ Expenditure to increase existing or
create additional capacity to produce, distribute or provide services for existing products (expansion) or to diversify into new products or markets (diversification);
+ Expenditure to sustain the functional capacity of a particular component, assembly, equipment, production line or the whole plant, which may or may not generate a change of the resulting cash flow; and
– Proceeds from sale of property, plant and equipment.
Free Cash FlowThe Free Cash Flow is an indicator to measure the level of cash generated by the Group after spending cash to maintain or expand its asset base. It is defined as:+/– Cash flow from operating activities;
and– Net Maintenance and Expansion Capex
Definition of Non-GAAP measures used in this report
282

Net financial debt (“Net debt”)The Net financial debt (“Net debt”) is an indicator to measure the financial debt of the Group after deduction of the cash. It is defined as:+ Financial liabilities (long-term and
short-term) including derivative liabilities;
– Cash and cash equivalents; and– Derivative assets.
Invested CapitalThe Invested Capital is an indicator that measures total funds invested by shareholders, lenders and any other financing sources. It is defined as:+ Total shareholders' equity;+ Net financial debt;– Assets classified as held for sale;+ Liabilities classified as held for sale;– Current financial receivables; and– Long-term financial investments and
other long-term assets.
NOPAT (Net Operating Profit After Tax)The Net Operating Profit After Tax (“NOPAT”) is an indicator that measures the Group’s potential earnings if it had no debt. It is defined as:+/– Net Operating Profit (being the
recurring EBITDA, adjusted for depreciation and amortization of operating assets but excluding impairment of operating assets); and
– Standard Taxes (being the taxes applying the Group’s tax rate to the Net Operating Profit as defined above).
ROIC (Return On Invested Capital)The ROIC (Return On Invested Capital) measures the Group’s ability to efficiently use invested capital. It is defined as Net Operating Profit After Tax (NOPAT) divided by the average Invested Capital. The average is calculated by adding the Invested Capital at the beginning of the period to that at the end of the period and dividing the sum by 2 (based on a rolling 12-month calculation).
Cash conversionThe cash conversion is an indicator that measures the Group’s ability to convert profits into available cash. It is defined as Free Cash Flow divided by Recurring EBITDA.
This set of definitions can be found on our website: www.lafargeholcim.com/non-gaap-measures
LafargeHolcim Annual Report 2018 283Financial information — Definition of Non-GAAP measures used in this report

284

Ruediger Nehmzow Pages: Cover, 06, 08, 15, 17, 18, 21 left, 26, 36, 59, 60 top, 64, 157, 160
Henrik SpohlerPages: 15, 17, 18, 44, 104-115
Tea & Water, Witold Riedel Pages: 12, 20 left, 47, 88
Planet Art, Albert LabradorPages: 52 top, 60 bottom
Amit MehraPages: 32 and 149
Vor-Ort-Foto, Peter JostPage 24
Unsplash, RawpixelPage 65
Unsplash, Chris BarbalisPage 21
Getty ImagesPage 20 right
Anuja Rangnekar Page 23

LafargeHolcim LtdZürcherstrasse 156CH-8645 Jona/SwitzerlandPhone +41 58 858 58 [email protected]
Concept and designMerchantCantos
© 2019 LafargeHolcim Ltd
LafargeH
olcim Ltd
A
nnual Report 2018