Biopolymers 2013
37
Affinity and Kinetic Modulation of Polyamide-DNA Interactions by N-Modification of the Heterocycles Joseph P. Ramos a , Balaji Babu b , Sameer Chavda b , Yang Liu a , Adam Plaunt b , Amanda Ferguson b , Mia Savagian b , Megan Lee b , Samuel Tzou b , Shicai Lin c , Konstantinos Kiakos c , Shuo Wang a , Moses Lee b* , John A. Hartley c , and W. David Wilson a* a Department of Chemistry, Georgia State University, Atlanta, GA, 30303, USA; b Department of Chemistry and the Division of Natural and Applied Sciences, Hope College 49423, USA; c Cancer Research, UK Drug-DNA Interactions Research Group, UCL Cancer Institute, Paul O’ Gorman Building, 72 Huntley Street, London WCIE 6BT, UK * Correspondence: Wilson ([email protected]) or Lee ([email protected]) Biopolymers This article has been accepted for publication and undergone full peer review but has not been through the copyediting, typesetting, pagination and proofreading process which may lead to differences between this version and the Version of Record. Please cite this article as an ‘Accepted Article’, doi: 10.1002/bip.22205 © 2013 Wiley Periodicals, Inc.
-
Upload
independent -
Category
Documents
-
view
0 -
download
0
Transcript of Biopolymers 2013

Affinity and Kinetic Modulation of Polyamide-DNA Interactions by
N-Modification of the Heterocycles
Joseph P. Ramosa, Balaji Babu
b, Sameer Chavda
b, Yang Liu
a, Adam Plaunt
b, Amanda Ferguson
b,
Mia Savagianb, Megan Lee
b, Samuel Tzou
b, Shicai Lin
c, Konstantinos Kiakos
c, Shuo Wang
a,
Moses Leeb*
, John A. Hartleyc, and W. David Wilson
a*
aDepartment of Chemistry, Georgia State University, Atlanta, GA, 30303, USA;
bDepartment of
Chemistry and the Division of Natural and Applied Sciences, Hope College 49423, USA;
cCancer Research, UK Drug-DNA Interactions Research Group, UCL Cancer Institute, Paul O’
Gorman Building, 72 Huntley Street, London WCIE 6BT, UK
*Correspondence: Wilson ([email protected]) or Lee ([email protected])
Biopolymers
This article has been accepted for publication and undergone full peer review but has not beenthrough the copyediting, typesetting, pagination and proofreading process which may lead todifferences between this version and the Version of Record. Please cite this article as an‘Accepted Article’, doi: 10.1002/bip.22205© 2013 Wiley Periodicals, Inc.

2
Abstract
Synthetic N-methyl imidazole and N-pyrrole containing polyamides (PAs) that can form
“stacked” dimers can be programmed to target and bind to specific DNA sequences and control
gene expression. In order to accomplish this goal, the development of PAs with lower molecular
mass which allows for the molecules to rapidly penetrate cells and localize in the nucleus, along
with increased water solubility, while maintaining DNA binding sequence specificity and high
binding affinity is key. In order to meet these challenges, six novel f-ImPy*Im PA derivatives
that contain different orthogonally positioned moieties were designed to target 5’-ACGCGT-3’.
The synthesis and biophysical characterization of six f-ImPy*Im were determined by CD, ∆TM,
DNase I footprinting, SPR, and ITC studies, and were compared with those of their parent
compound, f-ImPyIm. The results gave evidence for the minor groove binding and selectivity of
PAs 1 and 6 for the cognate sequence 5’-ACGCGT-3’, and with strong affinity, Keq = 2.8 × 10⁸
M-1
and Keq = 6.2 × 10⁷
M-1
, respectively. The six novel PAs presented in this study
demonstrated increased water solubility, while maintaining low molecular mass, sequence
specificity, and binding affinity, addressing key issues in therapeutic development.
Keywords: polyamides, diamino, dicationic, gene control, ACGCGT, MCB, Mlu1, cell-cycle
box, pyrrole, imidazole, DNA, minor groove binder, sequence selectivity, binding affinity,
kinetics
Page 9 of 37
John Wiley & Sons, Inc.
Biopolymers

3
Introduction
Synthetic pyrrole (Py) and imidazole (Im) containing analogs (Figure 1) of the naturally
occurring PA compounds distamycin and netropsin have been shown to selectively bind as
“stacked” dimers to the minor groove of DNA with high affinity and selectivity.1-8
The addition
of a formamido (f) group to the N-terminus of polyamides (PA) increases the binding affinity
and causes the stacking to be in a “staggered” position as opposed to “overlapped” stacking.1,9,10
Because of their high affinity and sequence selectivity, PAs have demonstrated potential as
therapeutics. Based on their ability to target, alter and control gene expression, especially those
genes associated with such diseases as cancer, PAs are of interest for the design and development
of new types of therapeutics.1-4, 11-16
The PA, f-ImPyIm (Figure 1), binds to the cognate DNA sequence 5’-ACGCGT-3’ as a
stacked, staggered homodimer with a high binding affinity, Keq> 108 M
-1, for a small
molecule.9,10,17,18
Closely related trimer PAs bind to their cognate sites from 10 to 100 fold more
weakly.1,9
The sequence 5’-ACGCGT-3’ is of significance due to its occurrence in the core
sequence of the Mlu1 cell-cycle box (MCB), a transcriptional element found in the promoter
region of the human Dbf4 (huDbf4 or ASK, activator S-kinase) gene. High levels of Cdc7
(cyclin dependent) kinase have been implicated in the development of various cancers and Dbf4
is a regulatory subunit of this kinase.19-21
Our approach to developing modified derivatives of PAs, such as f-ImPyIm, as
therapeutic candidates is to develop analogues that will facilitate an increase in binding affinity,
sequence selectivity, solubility, and biological activity, including cellular uptake and nuclear
localization. An attractive approach for the design of potentially improved analogues of f-
ImPyIm is the addition of different functional groups at the N1-position of the center pyrrole
coupled with a detailed study of their DNA binding affinity and sequence selectivity.22,23
A
Page 10 of 37
John Wiley & Sons, Inc.
Biopolymers

4
dicationic PA derivative of f-ImPyIm with an alkylamine substituent in place of the usual N1
methyl group, 1, showed improved solution and DNA binding properties.22,23
It is not clear what
part of the improved DNA binding is due to the cations and how much is due to possible
interactions of the alkyl substituents with each other and with DNA. To evaluate the separate
features of the substituent, f-ImPy*Im analogs with modified substituents were synthesized
(shown in Figure 1), where Py* is the modified heterocycle. Both neutral and modified cationic
substituents were evaluated for DNA binding by using surface plasmon resonance (SPR),
isothermal titration calorimetry (ITC), DNase I footprinting, thermal denaturation, and circular
dichroism (CD). All synthesized PAs investigated in this study retain the same f-ImPy*Im core
and, therefore, have the same 5’-ACGCGT-3’ cognate sequence.
Materials and Methods
Methods
Surface Plasmon Resonance. SPR measurements were performed with a four-channel Biacore
T200 optical biosensor system (Biacore, GE Healthcare Inc.). 5’-Biotin-labeled DNA hairpin
duplex samples were immobilized onto a streptavidin-coated sensor chip (Biacore SA) as
previously described.10,23,24
All SPR experiments were performed at 25 °C and used 0.01 M
cacodylic acid (CCA), 0.1 M NaCl, 0.001 M ethylenediaminetetraacetic (EDTA), 0.05% (by vol)
P20 surfactant, and pH 6.25 as the running buffer. The amount of DNA immobilized was
approximately 400 response units (RU). This was achieved by continuously injecting ~20 µL of
an approximately 50 nM DNA solution at a rate of 2 µL/min onto the sensor chip surface until a
relative response of 400 units was reached. Binding data were obtained by injecting known
concentrations over each flow cell of the chip and were analyzed with a two site binding model
Page 11 of 37
John Wiley & Sons, Inc.
Biopolymers

5
as previously described24,25
: r = (K1 × Cfree + 2 × K1 × K2 × Cfree2) / (1 + K1 × Cfree + K1 × K2 ×
Cfree2) where r represents the moles of bound compound per mole of DNA hairpin duplex, K1 and
K2 are macroscopic binding constants, and Cfree is the free compound concentration in
equilibrium with the complex. The stoichiometry of the reaction, n, can be determined directly
from an SPR experiment and from the RU of DNA immobilized, the maximum RU for the
bound PA at steady-state, and the molecular-weight of DNA and the PA.25
Isothermal Titration Calorimetry (ITC). ITC analysis was performed using a VP-ITC
microcalorimeter (MicroCal, MA). The DNA and compound sample were prepared in 0.01 M
cacodylic acid (CCA), 0.1 M NaCl, 0.001 M ethylenediaminetetraacetic acid (EDTA) and pH
6.25 buffer solution. The instrument was equilibrated at a temperature of 25 °C (298 K). The ITC
experiments were conducted using the “excess DNA” method (“model-free” method), where an
excess of DNA is used and does not allow for the reaction to reach an equilibrium end point, as
previously reported.25
Briefly, after an initial delay of 300 s, compounds (80 µM) were titrated
via 30 injections (10 µL for 20 s, repeated every 300 s), into 30 µM DNA. All ITC experiments
were repeated in triplicate and reproducibility noted. The data were analyzed using the method
previously reported.26
Origin 7.0 was used and the area under each curve integrated as a function
of time. A linear fit of the integrated heats was then employed using KaleidaGraph 4.0 and this
was subtracted from the reaction integrations to normalize for nonspecific heat components. ∆G
was calculated from ∆G = -RT ln Keq, where, R is 1.987 cal mol-1
K-1
and T is measured in K.
DNase I Footprinting. DNase I footprinting experiments were conducted using a 130-bp 5’-
[32
P]-radiolabeled DNA fragment to determine sequence specificity for PAs 1-6. The engineered
DNA fragment contained each of the following sequences, the cognate sequence 5’-ACGCGT-
Page 12 of 37
John Wiley & Sons, Inc.
Biopolymers
6
3’, as well as two other DNA sequences with the same CG composition in differing
arrangements, 5’-AGCGCT-3’ and 5’ACCGGT-3’. The protocol was reported previously.27
Thermal Denaturation. Thermal denaturation studies were performed in duplicate using a Cary
Bio 100 spectrophotometer UV/vis instrument (Palo Alto, CA) and cells with a 10 mm
pathlength using a previously reported method.27
∆TM values were determined from the
difference in melting temperatures of the DNA-PA complex and duplex DNA alone. For each
experiment 1.0 µM of DNA and 3.0 µM of PA were used.
Circular Dichroism (CD). CD spectroscopy was used to probe the binding of PAs 1-6 in the
minor groove of double-stranded DNA using an OLIS (Bogart, GA) DSM20 spectropolarimeter
with a 10 mm pathlength cuvette and a band pass of 2.4 nm.27
These experiments were conducted
in duplicate by titrating each PA with DNA solutions comprised of the DNA sequences tested in
the thermal denaturation studies. In all cases, a fixed DNA concentration of 9 µM was used as
were the ratios of PAs (1, 2, 3, 4, 5, 6, 8, and 10 molar equivalents) titrated into the solution.
Synthesis of Modified ImPy*Im Derivatives
f-IP(C3NH2)I (1). The synthesis of diamino f-IPI (1) was reported earlier.28
A more efficient
synthetic approach is reported herein. A solution of f-IP(C3Cl)I (2) tail (100 mg, 0.183 mmol) in
dry MeOH (5 mL) in a sealed tube was purged with dry NH3 (g) for 6 h. The tube was sealed
tightly and heated at 60 ºC for 24 h. The solvent was removed by evaporation and the residue
purified by flash column chromatography eluting in MeOH:CHCl3 (0:100-100:0) to give
diamino f-IPI (1) as a yellow solid (30 mg, 31%). The 1H-NMR spectrum is identical to the
product obtained from hydrogenation of the azide precursor.28
Page 13 of 37
John Wiley & Sons, Inc.
Biopolymers

7
f-IP(C3Cl)I (2). Nitro-IP(C3Cl)I (11) (200 mg, 0.366 mmol) was reduced over hydrogen and 5%
Pd/C (100 mg) in cold MeOH (100 mL) for 18 h at room temperature and atmospheric pressure.
The reaction mixture was filtered over celite and the catalyst washed thoroughly with MeOH.
The solvent was removed by evaporation and the residue was co-evaporated with dry DCM (3×
2 mL). The resulting dark orange solid was dried under high vacuum and protected from light.
Formic acid (1 mL, kept at 0 ºC prior to use) was added to acetic anhydride (2 mL) at 0 ºC and
the solution heated at 50 ºC for 30 min. The solution was then added slowly dropwise (~ 10 min)
to an ice-cold solution of the above amine dissolved in dry DCM (20 mL). The solution was
stirred overnight. The excess anhydride was quenched with methanol (30 mL), and the solvent
was removed by evaporation. A basic aqueous work-up was performed and the residue purified
by flash column chromatography eluting in MeOH:CHCl3 (0:100-100:0) to give chloro f-IPI (2)
as a yellow solid (113 mg, 56%), mp 122 ºC, Rf = 0.43 (50:50 MeOH:CHCl3); IR (NaCl) υ 3390,
3184, 2925, 2359, 1651, 1537, 1384, 1070; 1H NMR (400 MHz, CDCl3 ) δ 8.91 (s, 1H), 8.53 (s,
1H), 8.47 (s, 1H), 8.39 (s, 1H), 7.67 (t br, 1H), 7.53 (s, 1H), 7.42 (s, 1H), 7.29 (s, 1H), 6.94 (s,
1H), 4.61 (t, J = 6.0 Hz, 2H), 4.00 (s, 3H), 3.95 (s, 3H), 3.54 (t br, J = 6.0 Hz, 4H), 2.66 (t, J =
6.0 Hz, 2H), 2.37 (s, 6H), 2.33 (t, J = 6.0 Hz, 2H); LRMS (ES+) m/z (rel intensity) 548 (M+H
+,
100%); HRMS (M+H+, C23H31ClN10O4
+) calcd: 547. 2294; found: 547.2286.
f-IP(C3N3)I (3). To a solution of the f-IP(C3Cl)I (2) (185 mg, 0.342 mmol) in dry DMF (2 mL),
NaN3 (103 mg, 1.58 mmol) was added. The solution was heated at 80 °C overnight. The DMF
was removed under vacuum (0.1 mm Hg, 60 °C). A basic aqueous work-up performed and the
residue purified by flash column chromatography eluting in MeOH:CHCl3 (0:100-100:0) to give
azido f-IPI (3) as a yellow solid (180 mg, 0.33 mmol, 96%), mp 112 ºC, Rf = 0.33 (30:70
MeOH:CHCl3); IR (NaCl) υ 3329, 2921, 2359, 2099, 1659, 1531, 1470, 1402, 1082; NMR (400
Page 14 of 37
John Wiley & Sons, Inc.
Biopolymers

8
MHz, CDCl3) δ 8.85 (s, 1H), 8.37 (s, 1H), 8.00 (s br, 1H), 7.63 (s br, 1H), 7.53 (s br, 1H), 7.45
(s, 1H), 7.39 (s, 1H), 7.31 (s, 1H), 7.29 (s, 1H), 6.85 (s, 1H), 4.45 (t, J = 4.2 Hz, 2H), 4.08 (s,
3H), 4.03 (s, 3H), 3.49 (quart, J = 5.0 Hz, 2H), 3.32 (quart, J = 5.0 Hz, 2H) 2.52 (t, J = 5.0 Hz
2H,), 2.32 (s, 6H), 2.10 (quint, J = 4.2 Hz, 2H); LRMS (ES+) m/z (rel intensity) 554 (M+H
+,
100%); HRMS (M+H+, C23H32N13O4
+) calcd: 554.2700; Found: 554.2692.
f-IP(C3alkyne)I (4). NO2P(C3-alkyne)I (14) (100 mg, 0.241 mmol) was reduced by SnCl2•2H2O
(354 mg, 1.57 mmol) and 12 M HCl (1.1 mL) while refluxing in ethanol (10 mL) for 2 h. The
reaction mixture was poured into water and the pH was brought to 10 (2M NaOH). The solution
was extracted with chloroform (3 × 20 mL), the organic layers dried over anhydrous Na2SO4,
and the solvent removed by evaporation. The corresponding amine was allowed to dry under
high vacuum for 30 min. Separately, DiPEA (0.21 mL, 0.97 mmol) was added to a solution of 1-
methyl-4-N-formamidoimidazole-2-carboxylic acid (45 mg, 0.26 mmol) and PyBOP (138 mg,
0.265 mmol) in dry DMF (2 mL) under argon atmosphere and the solution was stirred for 45
min. A solution of the dried amine dissolved in dry DMF (2 mL) was added to the activated acid
solution over a period of 10 min. The reaction mixture was stirred overnight at room temperature
and under an argon atmosphere. The DMF was removed by Kugelrohr distillation (0.1 mm Hg,
60 °C) and the residue was purified by flash column chromatography eluting in MeOH:CHCl3
(0:100-100:0) to give alkynl f-IPI (4) as a light pink solid (38 mg, 24%), mp 197-200 ºC, Rf =
0.31 (5:15:1 MeOH:CHCl3:NH4OH); IR (KBr) υ 3373, 3285, 2950, 2113, 1669, 1663, 1539,
1472, 1405, 1243, 1123, 1018, 904, 752; 1H-NMR (400 MHz, CDCl3) δ 8.81 (s br, 1H), 8.37 (s,
1H), 8.18 (s br, 1H), 7.58 (s, 1H), 7.46 (s, 1H), 7.37 (s, 1H), 7.26 (s, 1H), 4.59 (t, J = 5.6 Hz,
2H), 4.08 (s, 3H), 4.02 (s, 3H), 3.49 (quart, J = 6.0 Hz, 2H), 2.56 (t, J = 6.0 Hz, 2H), 2.35 (s,
Page 15 of 37
John Wiley & Sons, Inc.
Biopolymers

9
6H), 2.28 (t, J = 5.6 Hz, 2H), 2.01 (quint, J = 5.6 Hz, 2H); LRMS (ES+) m/z (rel intensity) 571
(M+H+, 75%); HRMS (M+H
+, C25H31ClN10O4
+) calcd: 571.2300; Found: 571.2297.
f-IP(C3NHCOCH3)I (5). Acetyl chloride (24 µL, 0.034 mmol) was added dropwise to a room
temperature solution of f-IP(C3NH2)I (1) (18 mg, 0.03 mmol) and dry Et3N (4 µL, 0.03 mmol) in
dry DCM (10 mL) and the solution was stirred overnight. The solution was quenched with water
and pH was brought to 7 (1M NaOH). The solution was extracted with DCM (3 × 10 mL), the
organic layers dried over anhydrous Na2SO4 and the solvent were removed by evaporation to
yield a brown residue purified by flash column chromatography eluting in MeOH: CHCl3
(0:100-100:0) to give acetamido f-IPI (5) as a light yellow solid (15 mg, 79%), Rf = 0.27 (5:15:1
MeOH:CHCl3:NH4OH); IR (ATR) υ 3482, 3257, 3079, 2952, 1654, 1630, 1551, 1534, 1455,
1438, 1306, 1257, 1211, 1185, 1167, 1151, 1126, 1090, 1053, 1039, 1013, 897, 864, 797, 775;
NMR (400 MHz, CDCl3) δ 8.90 (s, 1H), 8.41 (s, 1H), 8.38 (s, 1H), 8.33 (s, 1H), 7.72 (t br, J =
4.0 Hz, 1H), 7.45 (s, 2H), 7.36 (s, 1H); 7.35 (d, J = 1.5 Hz, 1H), 6.86 (d, J = 1.5 Hz, 1H); 6.76 (t
br, J = 4.0 Hz, 1H), 4.41 (t, J = 6.0 Hz, 2H); 4.07 (s, 3H); 4.03 (s, 3H); 3.52 (quart, J = 6.0 Hz,
2H); 3.23 (quart, J = 6.0 Hz, 2H,); 2.60 (t, J = 6.0 Hz, 2H); 2.36 (s, 6H), 2.01 (s, 3H), 1.99
(quint, J = 6.0 Hz, 2H); LRMS (ES+) m/z (rel intensity) 570 (M+H
+, 100%); HRMS (M+H
+,
C25H35N11O5+) calcd: 570.2909; Found: 570.2901.
f-IP(C3-gly)I (6). A solution of f-IP(C3 N-Cbz glycine)I (12) (10 mg, 0.0139) was hydrogenated
over 10% Pd/C (10 mg) in cold MeOH (10 mL) for 2 days at room temperature and atmospheric
pressure. The solution was filtered through celite and the solvent was removed by evaporation to
yield glycine f-IPI (6) as a white solid (3 mg, 37%), mp 180 oC, Rf = 0.27 (5:15:1
MeOH:CHCl3:NH4OH); IR (ATR) υ 2961, 1649, 1533, 1465, 1437, 1401, 1260, 1985, 1019,
894, 865, 767, 759; NMR (400 MHz, CD3OD) δ 8.25 (s, 1H); 7.44 (s, 3H); 7.02 (s, 1H), 4.43 (t,
Page 16 of 37
John Wiley & Sons, Inc.
Biopolymers

10
J = 5.0 Hz, 2H), 4.05 (s, 3H), 4.02 (s, 3H), 3.55 (t, J = 5.0 Hz, 4H), 3.26 (s, 2H), 2.80 (t, J = 5.0
Hz, 2H), 2.51 (s, 6H), 2.03 (quint, J = 5.0 Hz, 2H); LRMS (ES+) m/z (rel intensity) 585 (M+H
+,
25%), 293 (100%); HRMS (M+H+, C25H36N12O5
+) calcd: 585.3008; Found: 585.3010.
Results
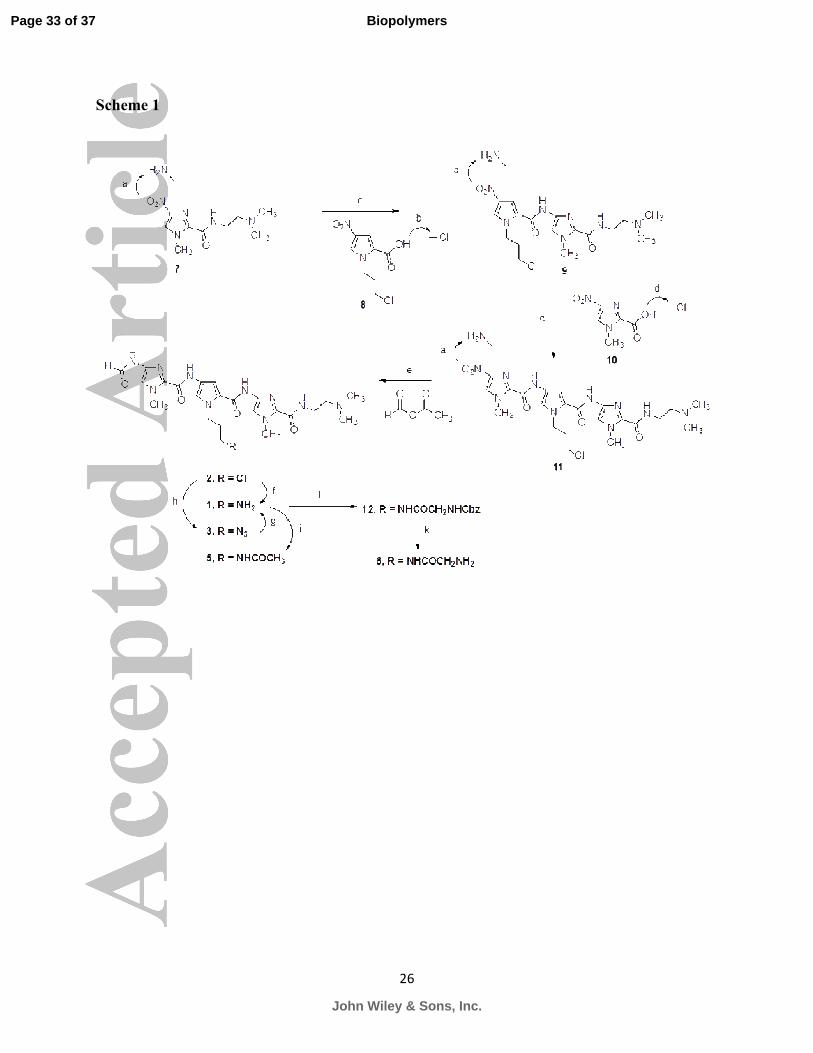
Synthesis. As depicted in Scheme I, synthesis of the target PAs 1-6 were accomplished using
solution phase aromatic amine-acid chloride or carboxylic acid coupling reactions. Chloro f-IPI 2
was synthesized by catalytic reduction of the nitro group in amide 7 to an amine, which was
immediately coupled to the freshly prepared acid chloride 829
giving diamide 9 in 21% yield
(Supplementary Materials). Subsequent reduction of the nitro group of diamide 9 followed by
coupling of the resulting amine with the acid chloride of imidazole 10 gave the triamide 11 in
25%. Catalytic hydrogenation of 11 followed by reaction of the amine with acetic formic
anhydride afforded the desired chloro f-IPI 2 in 56% yield. The chlorine atom was displaced by
an azide to afford PA 3 in 96% yield. Even though the synthesis of diamino f-IPI 1 was recently
reported by us, and that involved catalytic hydrogenation of the corresponding azide f-IPI PA
3,28
herein we report that the chloro moiety of PA 2 could also be directly displaced with
ammonia to give the diamino 1 via the SN2 reaction. The isolated yield of 1 was 31%. Reaction
of diamine 1 with acetyl chloride yielded acetamide 5 in 79%, and reaction of 1 with N-cbz-
glycine in presence of EDCI gave the desired PA 12 in 42% yield. The protecting cbz group was
removed by catalytic hydrogenolysis to afford glycine f-IPI 6 in 37% yield.
The preparation of alkyne f-IPI 4 is depicted in Scheme II and it required a 4-
nitropyrrole-N1-pentyne synthon. Coupling of the amine obtained from the reduction of amide 7
with the acid chloride of nitro-pyrolealkyne acid 1329
afforded diamide 14 in 75%
Page 17 of 37
John Wiley & Sons, Inc.
Biopolymers

11
(Supplementary Materials). Subsequent reduction of the nitro group in PA 14 afforded an amine
intermediate which was immediately coupled with N-foramido-1-methylimidazole-2-carboxylic
acid 1530
using PyBOP and DiPEA. The desired polyamide 4 was isolated in 24% yield.
Surface Plasmon Resonance. Surface plasmon resonance (SPR) biosensor experiments were
performed to obtain quantitative binding affinities, stoichiometries, and selectivities of PAs 1-6.
Sensorgrams for the binding of PA 6, which like 1 is a dication but 6 has a significantly different
structure, to the cognate sequence (5’ACGCGT-3’) are shown as an example in Figure 2. The
sensorgrams and fitting of the data show a strong, highly-positive, cooperative process for
binding PA 6 as well as the other PAs to the sequence 5’-ACGCGT-3’with a concentration
dependent observed on-rate as expected for a PA-DNA complexation process and a first-order,
extremely slow, off-rate. Steady-state RU values were obtained by equilibrium fitting and the
observed RUmax values clearly indicate a 2:1 complex formation. The binding constants for PA 6
are K1 = 2.4 × 10⁵, K2 = 1.1 × 10
9, and Keq =1.6 x 10
7, where Keq = , and were
determined using a 2:1 binding model. The binding constants for compounds 1-3, 5, 6 are listed
in Table 1 and were calculated using the same 2:1 binding model. PA 1 exhibited the strongest
overall binding to the cognate DNA sequence, 5’-ACGCGT-3’. Binding affinities for PA 4 were
not determined by SPR because the compound aggregated and exhibited surface problems with
the biosensor flow cells, something occasionally observed with modified PAs. The binding
affinity and kinetic behavior for PAs 1-3, 5, and 6 are consistent for strong DNA binders. The
rate constant for dissociation, kd, for PA 6 is extremely low as shown in Figure 2. Because of the
extremely slow off-rate for PA 6, an accurate value for kd could not be determined by a kinetic fit
of the data without an unrealistically long dissociation time being used. This is also true for PAs
which have extremely fast on (ka) and off rates that are close to the instrument injection mixing
Page 18 of 37
John Wiley & Sons, Inc.
Biopolymers
12
time. However, it is possible to estimate an apparent half-life for the dissociation of PA-DNA
complexes from the sensorgrams. These are very useful for comparison and are included in
Table 3. The apparent half-life for the dissociation of dicationic PAs, 1 and 6, from the PA-DNA
complex are >8.3 and 4.2 hours, respectively. The higher binding affinities for PAs 1 and 6 are
the direct result of the extremely slow rate of dissociation of the PAs from the DNA complex.
Isothermal Titration Calorimetry. To better understand the influence of substituents at the
central pyrrole of f-ImPyIm, the interactions of PAs 1-6 with the DNA sequence 5’-ACGCGT-
3’, ITC experiments were conducted and complete thermodynamic profiles are given in Table 1.
An ITC titration thermogram and the corresponding integrated heats of the reaction for PA 6
with the sequence 5’ACGCGT-3’ are shown as an example in Figure 3. The excess DNA method
for ITC is employed to determine ∆H and not Keq because some of the binding affinities are
generally too high to be determined by ITC. Since binding affinities are determined via SPR,
there is not a need to use ITC to determine ∆G. The excess DNA method for ITC allows for a
very accurate determination of ∆H since a consistent measurement of Q (heat) up to a molar
range of ~0.6:1 (moles of ligand: moles DNA) allows a linear fit to determine ∆H of the
reaction.26
The enthalpy of the reaction for PA 6 is -4.5 kcal/mol from the linear fit of the
integrated heats shown in Figure 3. The Gibbs-Free energy (∆G) for the interactions of PAs 1-6
with the cognate DNA sequence 5’-ACGCGT-3’ are collected with ∆H values in Table 1. ∆G of
the reaction for PA 6 with 5’-ACGCGT-3’ is quite favorable and was calculated to be -9.8
kcal/mol. T∆S for the interaction of PA 6 is calculated to be 5.3 kcal/mol using the ∆G value
determined by SPR and the ∆H value determined by ITC. The binding of PA 6 to its cognate
sequence is thus driven by a combination of both favorable enthalpy and entropy contributions,
Page 19 of 37
John Wiley & Sons, Inc.
Biopolymers

13
though a slightly larger entropy contribution is noted. PAs 1 and 5 have very similar enthalpy
and entropy contributions but binding of 1-6 are all enthalpically driven (Table 1).
Thermal denaturation. Thermal denaturation studies were used as a qualitative evaluation of
the affinity and sequence specificity of PAs 1-6 using the DNA sequences 5’-ACGCGT-3’ and
5’-A3T3-3’. Melting temperatures (∆Tm) values were determined from the difference in melting
temperatures of the DNA-PA complex and duplex DNA alone. ∆Tm for PAs 1-6 for both
sequences are shown in Table 2. PAs 1 and 6, with cationic substituents, showed very high ∆Tm
values while ∆Tm values for PAs 2-4 with 5’-ACGCGT-3’were less remarkable. All six PAs
showed little or no significant change in the DNA Tm value with the sequence 5’A3T3-3’, as
shown in Table 2.
DNase I Footprinting. DNase I footprinting studies provide high-resolution sequence selectivity
of the PAs synthesized for this study. The autoradiogram given in Figure 4 shows that a footprint
for PA 2 at the 5-‘ACGCGT-3’ sequence is clearly evident at a concentration of 1 µM. No
footprints other than for the cognate sequence appear for PA 2. The audiogram for PA 1 shows a
footprint emerging at 0.01 µM and a clear footprint by 0.05 µM for the sequence 5’-ACGCGT-3’
(Table 2). This supports the SPR results showing that PA 1, the diamino derivative, exhibits the
highest binding affinity to the cognate sequence 5’-ACGCGT-3’. Table 2 lists the concentrations
at which a clear footprint was evident for the sequence 5’-ACGCGT-3’ for all six PAs.
Circular Dichroism. Structural investigation of the binding properties of PAs 1-6 were
conducted with circular dichroism (CD) methods and the results for PA 6 are shown in Figure 5.
The titration of PA 6 into the cognate oligonucleotide 5’-ACGCGT-3’ produced a strong,
positive DNA- induced band at ~330 nm which is indicative of the compound binding to the
Page 20 of 37
John Wiley & Sons, Inc.
Biopolymers

14
minor groove of DNA. 31
A weaker induced CD band was observed for the noncognate sequence
5’-A3T3-3’ (Supplementary Materials). Compounds 1-5 also showed a DNA-induced band at 330
nM, thus indicating all these PAs also bind to the minor groove of DNA. Further evidence that
the PAs are binding to the DNA via a single mechanism is the presence of an isodichroic point
for the overlaid spectra at ~310 nM (shown for PA 6 in Figure 5), most likely as a stacked
homodimer. This holds true for compounds 1-5 also.
Discussion
Since discovery and isolation of netropsin by Finlay et al. over sixty years ago,32
the
study of netropsin, distamycin and their complexation with AT-rich sequences of the minor
groove of DNA has become well recognized and accepted.33-39
The discovery that distamycin
could form a “stacked”, antiparallel dimer in the minor groove of DNA of varying AT sequences
opened the door and created a rationale for synthetic PA drug design based on DNA sequence.1-6
The systematic definition of Im and Py containing synthetic PAs binding rules for sequence
specific base pair recognition of the minor groove for Watson-Crick duplex DNA by Dervan and
co-workers has paved the way for the development of an unlimited library of synthetic PAs
which can be programmed to bind to any particular DNA sequence.2,3
PAs have shown excellent
in-vitro activity and the development and progress of PAs as therapeutics, although hindered by
solubility and cellular uptake, is progressing rapidly and positive biological results have been
reported.2-4,13-16,40
Our approach to deal with these problems is to synthesize heterocyclic PAs with
improved PA-PA and PAs-DNA recognition and affinity. A promising development area is
modification of the N1-position of the pyrrole and imidazole ring systems. While a number of
Page 21 of 37
John Wiley & Sons, Inc.
Biopolymers

15
changes have been reported at that position and H-pin PAs are generally linked through the same
N1-position of the center heterocycle, more detailed studies with systematic modifications are
needed. To accomplish this goal we added alkyl cationic groups to the N1-position and have now
extended the systematic analysis with the analogs shown in Figure 1.
The strategy is to use PAs, such as f-ImPyIm, as a test system and through the addition of
different alkyl based side chains at the N1-position of the central pyrrole heterocycle or at other
heterocycles to improve the properties of the PAs for targeting DNA. The importance of using f-
ImPy*Im derivatives to target the sequence 5’-ACGCGT-3’ is the presence of that particular
sequence in the promoter region of the core sequence of the Mlu1 cell-cycle box which is a
transcriptional element of the human Dbf4 gene. Again, the Dbf4 gene is a regulatory subunit of
the Cdc7 kinase (a cyclin dependent kinase) which in high levels has been implicated in various
cancers.
The f-ImPyIm PA has a very high binding affinity and the analogs cause moderate to
significant decreases in DNA binding. The K for PA 1 is within experimental error of that of the
parent compound (Table 1) and it has a very slow dissociation rate. PAs 1 and 6 demonstrated
the highest binding affinity of the new f-ImPyIm analogue compounds to the cognate sequence
5’-ACGCGT-3’with good sequence selectivity. Both of these PAs have a second positive charge
that contributes to the higher binding affinities compared to the other four PA derivatives. This is
presumably due to an additional electrostatic interaction between the positively charged NH3+
present on the distal end of the alkyl side chain on both PAs 1 and 6 and the negatively charged
phosphate backbone of DNA. The length of the alkyl side chain allows it to extend out of the
minor groove of the DNA and interact electrostatically with the phosphate back bone. The larger
enthalpic contribution to the overall Gibbs-free energy of the reaction for PA 1 binding to the
Page 22 of 37
John Wiley & Sons, Inc.
Biopolymers

16
sequence 5’-ACGCGT-3’ would support this explanation for the increased binding affinity. The
cationic modification of PA 6 is more bulky than the N-Me substituent of PA 1 and this clearly
causes some steric hindrance and reduced binding affinity. In agreement with this observation,
the uncharged compounds bind significantly more weakly than the parent f-ImPyIm as well as
the dicationic compounds. This again probably represents some decrease in DNA interactions
due to unfavorable steric effects without the favorable interactions of a second cation. The results
of this study demonstrate that by making systematic modifications to PAs, such as f-ImPyIm, the
binding affinity can be altered through the modulation of kd and/or ka.
The dicationic PAs 1 and 6 demonstrated comparable binding affinities and slower off
rates than the parent compound f-ImPyIm while having increased water solubility. Increased
water solubility and reduced aggregation address one of three major advancements that must be
made in order for PAs to become approved therapeutics. The other two major areas of concern,
sequence specificity and binding affinity, remained within experimental error of the parent
compound, f-ImPyIm. Our initial thoughts on the noncationic substituent PAs of Figure 1 were
that we might see some improvements in binding due to their offset stacking and possible
hydrophobic/van der Waals interactions of the substituents. The unfavorable steric clash is the
opposite effect and presumably canceled some of the positive effects of the cationic substituents.
Clearly, however, modifications of the -N-CH3 groups of both Py and Im heterocycles are
promising for improving their solution properties and DNA interactions. Additional studies on
such functionalized PAs should yield new ideas for these very useful, sequence-specific
compounds.
Page 23 of 37
John Wiley & Sons, Inc.
Biopolymers

17
Acknowledgements
The authors thank NIH (AI-10-10230 to W. D. W), NSF [CHE 0809162 and CHE
0922623 (NMR)], Cancer Research UK (C2259/A9994 to J.A.H.), and the Georgia Research
Alliance for their generous support.
Tables
Table 1. Results for ITC and SPR experiments on PAs 1-3, 5 and 6 with the sequence 5’-
ACGCGT-3’. Included at the bottom are the thermodynamic properties and Keq value for the
“parent” compound, f-ImPyIm, as where previously determined and from which these modified
PAs were derived.
PA ∆Ha (kcal/mol) ∆G
b (kcal/mol) T∆S
c (kcal/mol) Keq(M
-1)b
1 -5.9 -11.4 5.5 2.8 × 10⁸
2 -4.4 -8.3 3.9 1.2× 10⁶
3 -4.5 -9.8 5.3 1.5× 10⁶
5 -5.7 -9.1 3.4 4.9 × 10⁶
6 -4.5 -10.6 6.1 6.2 × 10⁷
f-ImPyIm16
-7.6 -10.7 3.1 1.9 × 10⁸
*Keq = ; UD = unable to be determined due to insufficient heats from ITC experiments.
aDetermined by ITC.
bDetermined from SPR studies.
cCalculated from the equation ∆S = (∆G-
∆H)/T, using ∆G calculated from SPR and ∆H calculated from ITC. K values for PA 4 were
unable to be determined by SPR because of surface problems.
Page 24 of 37
John Wiley & Sons, Inc.
Biopolymers

18
Table 2. Results for thermal denaturation and DNase I footprinting experiments for PAs 1-6 and
the parent compound f-ImPyIm from previously reported work.
PA ∆Tm (°C) Footprinting
(µM)a
5’-ACGCGT-3’ 5’-A3T3-3’
1 >24 10 0.05
2 1.5 0 1
3 4.8 0 1
4 0 0 10
5 10 1 0.1
6
20 5 0.5
f-ImPyIm27
7.3 NA 0.05
* NA- not available. aConcentration when footprint at the cognate site became apparent.
Table 3. Estimated half-lives (in hours) for the rate of dissociation of PAs 1-3, 5 and 6 from the
sequence 5’-ACGCGT-3’.
PA ~T1/2 (app*) (hr)
1 >8.3
2 0.22
3 0.57
5 2.6
6 4.2
* Apparent half-lives based on dissociation rates from SPR experiments.
Page 25 of 37
John Wiley & Sons, Inc.
Biopolymers

19
Figure and Scheme Legends
Figure 1. Structures of the “parent” compound (f-ImPyIm), f-ImPy((CH2)3NH3)Im (1), f-
ImPy((CH2)3Cl)Im (2), f-ImPy((CH2)3N3)Im (3), f-ImPy((CH2)3alkyne)Im (4), f-
ImPy((CH2)3NHAc)Im (5), and f-ImPy((CH2)3NHGly)Im (6).
Figure 2. SPR sensorgrams for the binding of f-ImPy((CH2)3NHGly)Im (6) to the sequence 5’-
ACGCGT-3’(A) and a plot of RUss vs concentration including a best-fit line (B). The cooperative
(K2 > K1) binding of two f-ImPy((CH2)3NHGly)Im molecules per 5’-ACGCGT-3’ is observed.
Figure 3. Experimental ITC data (A) for the excess DNA method titration of PA 6 into 5’-
ACGCGT-3’ and the integrated heats for each injection of 6 used for the titration (red dots) and a
linear fit (red line) of that data which is extrapolated to zero and yields of the ∆H reaction (B).
Figure 4. DNase I footprinting of compound 2 (f-ImPy((CH2)3CI)Im) on the antisense strand of
the 5’-[32
P] 130-bp fragment. All reactions contain ∼500cps DNA fragment, 10 mM Tris, pH 7, 1
mM EDTA, 50 mM KCL, 1 mM MgCl2, 0.5 mM DTT, 20 mM HEPES. G + A denotes the
purine sequencing lane. The 5’-ACGCGT-3’ site is indicated by a solid bar.
Figure 5. CD data for compound 6, (f-ImPy((CH2)3NHGly)Im), with the sequence 5’-ACGCGT-
3’. CD experiments were carried out using 160 µL of a 9 µM DNA solution, which was titrated
with 1 mol equivalents of 6, past the point of saturation. The spectra represent titration from
DNA alone to 1 mol equivalent of PA 6 to the DNA hairpin, 2, 3, 4, 5, 6, 8 and 10 molar
equivalents.
Scheme 1. Toward the synthesis of the target compounds 1-3, 5 and 6.
Page 26 of 37
John Wiley & Sons, Inc.
Biopolymers

20
aH2, 5% Pd-C, MeOH, atmospheric pressure;
bSOCl2, reflux, 15 min;
cDCM, TEA, ice-bath to
room temperature overnight; doxalyl chloride, THF, reflux;
eacetic formic anhydride, DCM, ice-
bath to room temperature overnight; fNH3, MeOH, sealed-tube, rt, 6 h;
gH2, 10% Pd-C, MeOH,
atmospheric pressure reported in reference 22; hNaN3, DMF, 80 °C, overnight;
iacetyl chloride,
DCM, TEA, ice-bath to room temperature overnight; jN-Cbz-glycine, EDCI, DiPEA, DMAP,
DMF, rt overnight; kH2, 10% Pd-C, MeOH, atmospheric pressure.
Scheme 2. Toward the synthesis of compound 4.
aH2, 5% Pd-C, MeOH, atmospheric pressure;
bSOCl2, reflux, 15 min;
cDCM, TEA, ice-bath to
room temperature overnight; dstannous chloride dihydrate, HCl, EtOH, 2 h;
dPyBOP, DMF,
DiPEA, argon, rt, overnight.
Page 27 of 37
John Wiley & Sons, Inc.
Biopolymers

21
Figure 1.
Page 28 of 37
John Wiley & Sons, Inc.
Biopolymers

22
Figure 2.
∆H of binding
Page 29 of 37
John Wiley & Sons, Inc.
Biopolymers

23
Figure 3.
Page 30 of 37
John Wiley & Sons, Inc.
Biopolymers

24
Figure 4.
Page 31 of 37
John Wiley & Sons, Inc.
Biopolymers

25
Figure 5.
Page 32 of 37
John Wiley & Sons, Inc.
Biopolymers
26
Scheme 1
Page 33 of 37
John Wiley & Sons, Inc.
Biopolymers

27
Scheme 2
Page 34 of 37
John Wiley & Sons, Inc.
Biopolymers

28
References
1. Lacy, E. R.; Madsen, E. M.; Lee, M.; Wilson, W. D. DNA and RNA Binders, From Small
Molecules to Drugs; Wiley-VCH: Weinheim, 2003; 384-413.
2. Dervan, P. B.; Edelson, B. S. Curr Opin Struct Biol 2003, 13, 284-299.
3. Dervan, P. B. Bioorg Med Chem 2001, 9, 2215-2235.
4. Suckling, C. Future Med Chem 2012, 4, 971-989.
5. Pelton, J. G.; Wemmer, D. E. Proc Natl Acad Sci U S A 1989, 15, 5723-5727.
6. Pelton, J. G.; Wemmer, D. E. J Am Chem Soc 1990, 112, 1393-1399.
7. Mitra, S. N.; Wahl, M. C.; Sundaralingam, M. Acta Crystallogr D 1999, 55, 602-609.
8. Bando, T; Sugiyama, H. Acc Chem Res 2006, 39, 935-944.
9. Lacy, E. R.; Le, N. M.; Price, C. A.; Lee, M.; Wilson, W. D. J Am Chem Soc 2002, 124,
2153-2163.
10. Buchmueller, K. L.; Staples, A. M.; Howard, C. M.; Horick, S. M.; Uthe, P. B.; Le, N. M.;
Cox, K. K.; Nguyen, B.; Pacheco, K. A.; Wilson, W. D.; Lee, M. J Am Chem Soc 2005, 127,
742-750.
11. Satz, A. L.; Bruice, T. C. Acc Chem Res 2002, 35, 86-95.
12. Dervan, P. B.; Doss, R. M.; Marques, M. A. Curr Med Chem Anticancer Agents 2005, 5,
373-387.
13. Chou, C. J.; Farkas, M. E.; Tsai, S. M.; Alvarez, D.; Dervan, P. B.; Gottesfeld, J. M. Mol
Cancer Ther 2008, 7, 769-778.
14. Shinohara, K.; Bando, T.; Sugiyama, H. Anticancer Drugs 2010, 21, 228-242.
15. Hochhauser, D.; Kotecha, M.; O’Hare, C.; Morris, P. J.; Hartley, J. M.; Taherbhai, Z.; Harris,
D.; Forni, C.; Mantovani, R.; Lee, M.; Hartley, J. A. Mol Cancer Ther 2007, 6, 346-354.
16. Minoshima, M.; Bando, T.; Shinohara, K.; Sugiyama, H. Nucleic Acids Symp Ser 2009, 23,
69-70.
17. Buchmueller, K. L.; Bailey, S. L.; Matthews, D. A.; Taherbhai, Z. T.; Register, J. K.; Davis,
Z. S.; Bruce, C. D.; O’Hare, C.; Hartley, J. A.; Lee, M. Biochemistry 2006, 45, 13551-13565.
Page 35 of 37
John Wiley & Sons, Inc.
Biopolymers

29
18. Buchmueller, K. L.; Staples, A. M.; Uthe, P. B.; Howard, C. M.; Pacheco, K. A.; Cox, K. K.;
Henry, J. A.; Bailey, S. L.; Horick, S. M.; Nguyen, B.; Wilson, W. D.; Lee, M. Nucleic Acids
Res 2005, 33, 912-921.
19. Verma, R.; Patapoutian, A.; Gordon, C. B.; Campbell, J. L. Proc Natl Acad Sci U S A 1991
88, 7155-7159.
20. Wu, X.; Lee, H. Oncogene 2002, 21, 7786-7796.
21. Hess, G. F.; Drong, R. F.; Weiland, K. L.; Slightom, J. L.; Scalafani, R. A.; Hollingsworth,
R. E. Gene 1998, 211, 133-140.
22. Babu B.; Liu, Y.; Plaunt, A.; Riddering, C.; Ogilvie, R.; Westrate, L.; Davis, R.; Ferguson,
A.; Mackay, H.; Rice, T.; Chavda, S.; Wilson, W. D.; Lin, S.; Kiakos, K.; Hartley J. A.; Lee, M.
Biochem Biophys Res Commun 2011, 404, 848-852.
23. Satam, V.; Babu, B.; Chavda, S.; Savagian, M.; Sjoholm, R.; Tzou, S.; Ramos, J. P.; Liu, Y.;
Kiakos, K.; Lin, S.; Wilson, D. W.; Hartley, J. A.; Lee, M. Bioorg Med Chem 2012, 22, 693-701.
24. Nguyen, B.; Tanious, F.; Wilson, W. D. Methods 2006, 42, 150-161.
25. Nanjunda, R.; Munde, M.; Liu, Y.; Wilson, W. D. Methods for Studying Nucleic Acid/Drug
Interactions; CRC: Boca Raton, 2012; 91-122.
26. Ren, J.; Jenkins, T. C.; Chaires, J. B. Biochemistry 2000, 39, 8439-8447.
27. Chavda, S.; Liu, Y.; Babu, B.; Davis, R.; Sielaff, A.; Ruprich, J.; Westrate, L.; Tronrud, C.;
Ferguson, A.; Franks, A.; Tzou, S.; Adkins, C.; Rice, T.; Mackay, H.; Kluza, J.; Tahir, S. A.;
Lin, S.; Kiakos, K.; Bruce, C. D.; Wilson, W. D.; Hartley, J. A.; Lee, M. Biochemistry 2011, 50,
3127-3136.
28. Babu, B.; Liu, Y.; Plaunt, A.; Riddering, C.; Ogilvie, R.; Westrate, L.; Davis, R.; Ferguson,
A.; Mckay, H.; Rice, T.; Ramos, J. P.; Chavda, S.; Wilson, W. D.; Lin, S.; Kiakos, K.; Hartley, J.
A.; Lee, M. Biochem Biophys Res Commun 2011, 404, 848-852.
29. The synthesis of 1-(3’-chloropropyl)-4-nitropyrrole-2-carboxylic acid 8 and 1-(4’-pentynyl)-
4-nitropyrrole-2-carboxylic acid 10 will be reported elsewhere.
30. Mulder, K.; Secton, J.; Taherbhai, Z.; Jones, J.; Uthe, P.; Brown, T.; Lee, M. Synth Commun
2008, 38, 33-44.
31. Rodger, A.; Norden, B. Circular Dichroism and Linear Dichroism; Oxford University: New
York, 1997.
Page 36 of 37
John Wiley & Sons, Inc.
Biopolymers

30
32. Finlay, A. C.; Hochstein, F. A.; Sobina, B. A.; Murphy, F. X. J Am Chem Soc 1951, 73, 341-
343.
33. Wang, S.; Munde, M.; Wang, S.; Wilson, W. D. Biochemistry 2011, 50, 7674-7683.
34. Bailly, C.; Chaires, J. B. Bioconjug Chem 1998, 9, 513-538.
35. Wemmer, D. E. (2001) Biopolymers 2001, 52, 197-211.
36. Dervan, P. B.; Burli, R. W. Curr Opin Chem Biol 1999, 3, 688-693.
37. Wemmer, D. E.; Dervan, P. B. Curr Opin Struct Biol 1997, 7, 355-361.
38. White, S.; Baird, E. E.; Dervan, P. B. Chem Biol 1997, 4, 569-578.
39. Chenoweth, D. M.; Dervan, P. B. Proc Natl Acad Sci U S A 2009, 106, 13175-13179.
40. Edwards, T. G.; Koeller, K. J.; Slomczynska, U.; Fok, K.; Helmus, M.; Bashkin, J. K.;
Fisher, C. Antiviral Res 2011, 91, 177-186.
Page 37 of 37
John Wiley & Sons, Inc.
Biopolymers

Figure 1
88x115mm (300 x 300 DPI)
Page 1 of 37
John Wiley & Sons, Inc.
Biopolymers

Figure 2
88x56mm (300 x 300 DPI)
Page 2 of 37
John Wiley & Sons, Inc.
Biopolymers

Figure 3
55x71mm (300 x 300 DPI)
Page 3 of 37
John Wiley & Sons, Inc.
Biopolymers

Figure 4
123x199mm (300 x 300 DPI)
Page 4 of 37
John Wiley & Sons, Inc.
Biopolymers

Figure 5
94x58mm (300 x 300 DPI)
Page 5 of 37
John Wiley & Sons, Inc.
Biopolymers

Scheme 1
88x61mm (300 x 300 DPI)
Page 6 of 37
John Wiley & Sons, Inc.
Biopolymers

Scheme 2
88x55mm (300 x 300 DPI)
Page 7 of 37
John Wiley & Sons, Inc.
Biopolymers