Empirical Modeling of Batch Fermentation Kinetics for Poly(glutamic acid) Production and Other...
15
Empirical Modeling of Batch Fermentation Kinetics for Poly(glutamic acid) Production and Other Microbial Biopolymers Andrew Richard, Argyrios Margaritis Department of Chemical and Biochemical Engineering, The University of Western Ontario, London, Ontario, Canada, N6A 5B9; telephone: (519) 661-2146; fax: (519) 661-3498; e-mail: amarg @uwo.ca Received 29 July 2003; accepted 23 March 2004 Published online 23 July 2004 in Wiley InterScience (www.interscience.wiley.com). DOI: 10.1002/bit.20156 Abstract: An empirical kinetic model is proposed for the batch production of poly(glutamic acid) from Bacillus subtilis IFO 3335. In addition, the proposed model was used to fit the kinetic data of poly(glutamic acid) pro- duction from other bacterial strains using different media, as well as kinetic data from different strains for the pro- duction of the exocellular biopolymers dextran, hyaluronic acid, xanthan, alginate, and the endocellular biopolymer polyhydroxybutyrate. The empirical model treats the bio- polymer as a component of the biomass and fits the ex- perimental biomass data using a sigmoidal relationship that includes the maximum specific growth rate, A max , and the substrate saturation parameter, K S . An empirical param- eter, the relative coefficient (r), quantifies, in relative terms, the degree of nongrowth-associated biopolymer formation. B 2004 Wiley Periodicals, Inc. Keywords: kinetic model; microbial biopolymer; fermenta- tion; relative coefficient; poly(glutamic acid) INTRODUCTION Microbial biopolymers have found use in diverse applica- tions. They are used as stabilizers, emulsifiers, thickeners, and excipients in the food, industrial, and health care markets (Sutherland, 1998). Poly(glutamic acid) (PGA) is a water-soluble, biodegradable biopolymer that is produced by microbial fermentation. Recent research has shown that PGA can be used in drug delivery for the controlled release of the anticancer drug paclitaxel (Taxol) (Multani et al., 1997; Li et al., 2000). In order to optimize the production of PGA for biomedical applications, a fundamental understanding of the key fermentation parameters is necessary. We have previously reviewed PGA for biomedical applications (Richard and Margaritis, 2001), optimized PGA production in batch culture (Richard and Margaritis, 2003a), and quantified the key oxygen mass transfer parameters (OUR, Qo 2 ,k L a) and the key broth rheology parameters (flow index, consistency index, apparent viscosity) as a function of fermentation time for the batch production of PGA by B. subtilis IFO 3335 (Richard and Margaritis, 2003b). There is also a need to develop a kinetic model for this process in order to further understand and optimize PGA production. Kinetic models are important tools for understanding, controlling, and optimizing fermentation processes. Micro- bial processes are inherently complex, and it is of critical importance in practical applications to develop models that provide an accurate description of the process without unnecessary complexity (Luong et al., 1988). Unstructured kinetic models are frequently used because of their simplicity and adequacy for technical purposes (Garcı ´a- Ochoa et al., 1995). Biopolymer fermentation processes are of particular interest because, in certain cases, these microbial processes do not follow the classical kinetic model of substrate- limited biomass growth and product formation proposed by Monod in 1949 (Garcı ´a-Ochoa et al., 1995; Quinlan, 1986; Schweickart and Quinlan, 1989). Several unstructured kinetic models have been proposed to describe the kinetics of microbial systems where biopolymers are produced (Garcı ´a-Ochoa et al., 1995; Quinlan, 1986; Schweickart and Quinlan, 1989; Weiss and Ollis, 1980; Santos et al., 2000). These models have been thoroughly reviewed (Margaritis and Pace, 1985; Garcı ´a-Ochoa et al., 1995; Luong et al., 1988; Kovarova-Kovar and Egli, 1998). In general, these models use a form of the logistical equation to describe biomass growth (Eq. 1) and a form of the Luedeking-Piret model (1959) to describe biopolymer formation as a function of biomass (Eq. 2): dX dt ¼ A max X ð1:0 X=X max Þ ð1Þ dP dt ¼ nX þ m dX dt ð2Þ In order to fit their experimental data, several researchers have also used Monod-type equations to better describe B 2004 Wiley Periodicals, Inc. Correspondence to: A. Margaritis Contract grant sponsors: Natural Sciences and Engineering Research Council of Canada (NSERC); NSERC (Ph.D. Canada Graduate Scholar- ship A.R.) Contract grant number: A4388 (to A.M.)
Transcript of Empirical Modeling of Batch Fermentation Kinetics for Poly(glutamic acid) Production and Other...

Empirical Modeling of Batch FermentationKinetics for Poly(glutamic acid) Productionand Other Microbial Biopolymers
Andrew Richard, Argyrios Margaritis
Department of Chemical and Biochemical Engineering, The University ofWestern Ontario, London, Ontario, Canada, N6A 5B9; telephone: (519)661-2146; fax: (519) 661-3498; e-mail: [email protected]
Received 29 July 2003; accepted 23 March 2004
Published online 23 July 2004 in Wiley InterScience (www.interscience.wiley.com). DOI: 10.1002/bit.20156
Abstract: An empirical kinetic model is proposed for thebatch production of poly(glutamic acid) from Bacillussubtilis IFO 3335. In addition, the proposed model wasused to fit the kinetic data of poly(glutamic acid) pro-duction from other bacterial strains using different media,as well as kinetic data from different strains for the pro-duction of the exocellular biopolymers dextran, hyaluronicacid, xanthan, alginate, and the endocellular biopolymerpolyhydroxybutyrate. The empirical model treats the bio-polymer as a component of the biomass and fits the ex-perimental biomass data using a sigmoidal relationship thatincludes the maximum specific growth rate, Amax, and thesubstrate saturation parameter, KS. An empirical param-eter, the relative coefficient (r), quantifies, in relativeterms, the degree of nongrowth-associated biopolymerformation. B 2004 Wiley Periodicals, Inc.
Keywords: kinetic model; microbial biopolymer; fermenta-tion; relative coefficient; poly(glutamic acid)
INTRODUCTION
Microbial biopolymers have found use in diverse applica-
tions. They are used as stabilizers, emulsifiers, thickeners,
and excipients in the food, industrial, and health care
markets (Sutherland, 1998). Poly(glutamic acid) (PGA) is a
water-soluble, biodegradable biopolymer that is produced
by microbial fermentation. Recent research has shown that
PGA can be used in drug delivery for the controlled release
of the anticancer drug paclitaxel (Taxol) (Multani et al.,
1997; Li et al., 2000).
In order to optimize the production of PGA for
biomedical applications, a fundamental understanding of
the key fermentation parameters is necessary. We have
previously reviewed PGA for biomedical applications
(Richard and Margaritis, 2001), optimized PGA production
in batch culture (Richard and Margaritis, 2003a), and
quantified the key oxygen mass transfer parameters (OUR,
Qo2, kLa) and the key broth rheology parameters (flow
index, consistency index, apparent viscosity) as a function
of fermentation time for the batch production of PGA by B.
subtilis IFO 3335 (Richard and Margaritis, 2003b). There is
also a need to develop a kinetic model for this process in
order to further understand and optimize PGA production.
Kinetic models are important tools for understanding,
controlling, and optimizing fermentation processes. Micro-
bial processes are inherently complex, and it is of critical
importance in practical applications to develop models that
provide an accurate description of the process without
unnecessary complexity (Luong et al., 1988). Unstructured
kinetic models are frequently used because of their
simplicity and adequacy for technical purposes (Garcıa-
Ochoa et al., 1995).
Biopolymer fermentation processes are of particular
interest because, in certain cases, these microbial processes
do not follow the classical kinetic model of substrate-
limited biomass growth and product formation proposed by
Monod in 1949 (Garcıa-Ochoa et al., 1995; Quinlan, 1986;
Schweickart and Quinlan, 1989). Several unstructured
kinetic models have been proposed to describe the kinetics
of microbial systems where biopolymers are produced
(Garcıa-Ochoa et al., 1995; Quinlan, 1986; Schweickart
and Quinlan, 1989; Weiss and Ollis, 1980; Santos et al.,
2000). These models have been thoroughly reviewed
(Margaritis and Pace, 1985; Garcıa-Ochoa et al., 1995;
Luong et al., 1988; Kovarova-Kovar and Egli, 1998).
In general, these models use a form of the logistical
equation to describe biomass growth (Eq. 1) and a form of
the Luedeking-Piret model (1959) to describe biopolymer
formation as a function of biomass (Eq. 2):
dX
dt¼ AmaxX ð1:0� X=XmaxÞ ð1Þ
dP
dt¼ nXþm
dX
dtð2Þ
In order to fit their experimental data, several researchers
have also used Monod-type equations to better describe
B 2004 Wiley Periodicals, Inc.
Correspondence to: A. Margaritis
Contract grant sponsors: Natural Sciences and Engineering Research
Council of Canada (NSERC); NSERC (Ph.D. Canada Graduate Scholar-
ship A.R.)
Contract grant number: A4388 (to A.M.)
Yuaii
Highlight
Yuaii
Sticky Note
เอาอนนไปอางองสมการโลจสตกของโมเดล
Yuaii
Highlight
Yuaii
Highlight

biomass growth and product formation in terms of the
limiting substrate (Moraine and Rogovin, 1966; Moraine
and Rogovin, 1971; Garcıa-Ochoa et al., 1995) and others
have proposed substrate dependent equations which are not
of the Monod type (Quinlan, 1986; Schweickart and
Quinlan, 1989) (Eqs. 3, 4):
dX
dt¼ kXNX ð3Þ
dP
dt¼ kPSX ð4Þ
The current unstructured models have several limita-
tions. Models that are dependent on biomass concentration
only do not take into account substrate-limited product
formation. Models that employ several equations for
substrate-limited growth are complicated and require
numerical techniques in order to determine a solution.
None of the previously proposed unstructured models
consider the formation of the biopolymer as a component of
the biomass. In this work, we present an empirical model
for biopolymer fermentations that is simple to use and
based on the assumption that the biopolymer is a
component of the biomass.
THEORETICAL ASPECTS AND EMPIRICALMODEL DEVELOPMENT
Modeling of Biomass and ‘‘Extended-Biomass’’
All of the unstructured kinetic models presented in the
literature treat the biopolymer as a fermentation product,
Table I. Maximum biomass and biopolymer concentrations (Xmax, Pmax) for various biopolymer fermentations.
Biopolymer Microorganism Xmax (g/L) Pmax (g/L) Reference
Xanthan X. campestris NRRL-B1459 1.7 29 Garcıa-Ochoa et al., 1995
Pullulan A. pullulans ATCC 9348 9.2 11.3 Gibbs and Seviour, 1996
Pullulan A. pullulans P56 6 23 Roukas and Mantzouridou, 2001
Dextran L. mesenteroides NRRL B512(f) 5.1 8.5 Santos et al., 2000
PGA B. subtilis IFO 3335 4.7 23 Richard and Margaritis, 2003b
PGA B. subtilis IFO 3335 3.5 8.1 Kunioka and Goto, 1994
PGA B. licheniformis ATCC 9945A 3.2 23.2 Yoon et al., 2000
Hyaluronic acid S. zooepidemicus ATCC 35246 1.8 1.6 Armstrong and Johns, 1997
Alginate A. vinlandii ATCC 9046 3.5 4.5 Pena et al., 2000
Figure 1. Biomass specific growth rate (A) vs. citric acid concentration (S) during batch fermentation of B. subtilis IFO 3335 (Richard and Margaritis,
2003b). Experimental data (.); Eq. 8 (—).
502 BIOTECHNOLOGY AND BIOENGINEERING, VOL. 87, NO. 4, AUGUST 20, 2004
User
Highlight
User
Highlight

which constitutes a major component of substrate con-
version, as shown in Table I. While the specific growth rate
of biomass production may not fit the Monod model
(Garcıa-Ochoa et al., 1995; Quinlan, 1986; Schweickart
and Quinlan, 1989), we propose the concept of extended-
biomass (XV) that includes the biopolymer, which results in
an empirical model that fits the Monod equation, as shown
in Eq. 7. Although it is well accepted that the biopolymer
is a product of cell metabolism, the inclusion of the
biopolymer may be regarded as ‘‘pseudo-biomass,’’ or
Figure 2. Effect of relative coefficient (r) on biomass specific growth rate/substrate curve (So = 20 g/L, Ks = 7 g/L, Amax = 0.1275 h�1).
Table II. Proposed empirical kinetic model for biopolymer fermentations.
Parameter Equation Equation number
AV A0maxS
K 0S þ S
(7)
A AmaxSr
KrS þ S r
(8)
X Amaxt ¼ lnðX=XoÞ þK rS Y r
X=S
�lnXar � ln ð�aþXÞ
ar � ð�aþXÞ�1
aðr�1Þ þ ð�aþXÞ�2
2aðr�2Þ � � � � � �ð�aþXÞ�ðr�1Þ
ðr�1Þa�
a ¼ YX=SSo þ Xo
(14)
XV A0maxt ¼ðK 0
SYX0=S þ So YX0=S þXoÞðYX0=S So þX 0
o Þln ðX0=X0
oÞ �ðK 0
SYX0=SÞ
ðYX0=S So þX0oÞln½ðYX0=S So þ X 0
o � X0ÞYX0=S So�
(13)
S ðX�XoÞ ¼ YX=S ðSo � SÞ or;
(11)
ðX0 �X 0oÞ ¼ YX0=S ðSo � SÞ
(10)
P P ¼ X0 �X (12)
Input data: Xo, So, Po, AVmax, Amax, YXV/S, YX/S.
Calculated parameters from input data: r, KSV, KS.
RICHARD AND MARGARITIS: BATCH PRODUCTION OF POLY(GLUTAMIC ACID) 503
User
Highlight
User
Highlight
User
Highlight
User
Highlight
User
Highlight
User
Highlight
User
Highlight
User
Highlight
User
Highlight
User
Highlight

extended-biomass, solely for the purposes of fitting data to
an empirical model.
The extended-biomass is defined as:
X0 ¼ Xþ P ð5Þ
The specific growth rate of the extended-biomass is then
defined as:dX0
dt¼ A0X0 ð6Þ
Interestingly, the specific growth rate of the extended-
biomass follows the Monod equation:
A0 ¼ A0maxS
K0s þ S
ð7Þ
This is a simple way to look at the biomass formation and
biopolymer production together. As such, the specific
growth rate of the extended biomass is limited by a single
substrate (S). The extended-biomass specific growth rate
over time is determined graphically from Eq. 6 and a plot of
ln (XV) vs. fermentation time.
It is now necessary to model the biomass formation and
specific growth rate of the biomass (A) separately as a
function of substrate concentration. Figure 1 shows the
biomass specific growth rate (A) as a function of citric acid
concentration (S) for PGA production (Richard and
Margaritis, 2003b). The resulting curve has a sigmoidal
shape. At high substrate concentrations, the specific growth
rate is at its maximum (Amax). As the substrate is consumed,
the specific growth rate falls, but at a faster rate of decline
Table III. Model parameters for PGA production.
Parameters Richard and Margaritis (2003b) Kunioka and Goto (1994)a Yoon et al. (2000)b
For XV: AVmax 0.314 0.311 0.416
KVS 2.95 9.00 3.00
YVXS 1.405 0.577 2.183
R2 0.99 0.97 0.98
For X: Amax 0.281 0.129 0.3608
r 29 3 7
KS 15.1 6.89 7.09
YXS 0.630 0.189 0.334
R2 0.99 0.98 0.99
aUsing B. subtilis IFO 3335, So = 20 g/L citric acid.bUsing B. lichenformis ATCC 9945A, So = 12 g/L citric acid.
Figure 3. Batch fermentation kinetics of B. subtilis IFO 3335 during poly(glutamic acid) production (Richard and Margaritis, 2003b). Biomass, X (.);poly(glutamic acid) concentration, P (o); citric acid concentration, S (
E
); Eq. 14 (—), Eq. 12 (�����), Eq. 10 (. . .. . .).
504 BIOTECHNOLOGY AND BIOENGINEERING, VOL. 87, NO. 4, AUGUST 20, 2004
User
Highlight
User
Highlight
User
Highlight
User
Highlight
User
Highlight

than would be expected for a Monod relationship. As the
specific growth rate approaches zero, there is still consider-
able substrate remaining for biopolymer formation. At this
point in the fermentation, no other substrates are limiting
growth. In other words, there is only one growth-limiting
substrate (citric acid).
There are several mathematical expressions that could
be used to describe this sigmoidal relationship between Aand S. In Monod’s original work, he stated that ‘‘several
different mathematical formulations could be made to fit
the data. But it is convenient and logical to adopt a
hyperbolic equation’’ (Monod, 1949). As in Monod’s
Figure 4. Batch fermentation kinetics of B. subtilis IFO 3335 during poly(glutamic acid) production (Kunioka and Goto, 1994). Biomass, X (.);poly(glutamic acid) concentration, P (o); citric acid concentration, S (z); Eq. 14 (—), Eq. 12 (�����), Eq. 10 (. . . . . .).
Figure 5. Batch fermentation kinetics of B. licheniformis ATCC 9945A during poly(glutamic acid) production (Yoon et al., 2000). Biomass, X (.);poly(glutamic acid) concentration, P (o); citric acid concentration, S (z); Eq. 14 (—), Eq. 12 (�����), Eq. 10 (. . .. . .).
RICHARD AND MARGARITIS: BATCH PRODUCTION OF POLY(GLUTAMIC ACID) 505
User
Highlight
User
Highlight

equation, which describes the specific growth rate in terms
of Amax, we choose a sigmoidal equation that also contains
Amax:
A ¼ AmaxSr
K rs þ Sr
ð8Þ
The specific growth rate of the biomass can also be de-
fined by:dX
dt¼ AX ð9Þ
The biomass specific growth rate over time is determined
graphically from Eq. 9 and a plot of ln (X) vs. fermenta-
Figure 6. Plot of P(t) – Po – nB(t) (Eq. 15) vs. A(t) (Eq. 16) for the determination of ‘‘m’’ during batch fermentation of B. subtilis IFO 3335 for the data
from Richard and Margaritis (2003b).
Figure 7. Plot of P(t) – Po – nB(t) (Eq. 15) vs. A(t) (Eq. 16) for the determination of ‘‘m’’ during batch fermentation of B. subtilis IFO 3335 for the data
from Kunioka and Goto (1994).
506 BIOTECHNOLOGY AND BIOENGINEERING, VOL. 87, NO. 4, AUGUST 20, 2004
User
Highlight
User
Highlight
User
Highlight
User
Highlight

tion time. The relationship described in Eq. 8 is conven-
ient because it contains Amax and KS, describes the spe-
cific growth rate as a function of substrate concentration,
and contains the relative coefficient, ‘‘r,’’ which is de-
scribed below.
Relative Coefficient, r
In Eq. 8 we incorporate the ‘‘relative coefficient,’’ r. The
relative coefficient is necessary in order to produce a
sigmoidal fit of the data, but it also describes another
Figure 8. Biomass specific growth rate (A) vs. substrate concentration (S) during batch biopolymer fermentations (Published data, .; Eq. 8, —); a:
Dextran (Santos et al., 2000), b: Xanthan (Serrano-Carreon et al., 1998), c: Alginate (Pena et al., 2000), d: PHB (Yoo and Kim, 1994), e: Hyaluronic acid
(Armstrong and Johns, 1997).
RICHARD AND MARGARITIS: BATCH PRODUCTION OF POLY(GLUTAMIC ACID) 507
Yuaii
Highlight

phenomenon of the process, which is the relative amount of
nongrowth-associated biopolymer formation. As ‘‘r’’ ap-
proaches unity, Eq. 8 becomes the Monod equation,
meaning that no substrate is available for further biopoly-
mer formation after biomass growth has stopped. As a
result, the biopolymer formation is completely growth-
associated. As ‘‘r’’ increases, there is more substrate
available for biopolymer formation after biomass growth
has stopped. Hence, there is relatively more nongrowth-
associated biopolymer formation. This is depicted in
Figure 2.
Modeling of Substrate and Product (Biopolymer)
From Eqs. 5–7, the extended-biomass concentration as a
function of fermentation time is fully defined. The most
convenient way to describe the substrate concentration is
given by the extended-biomass yield:
ðX0 � X 0oÞ ¼ YX0=SðSo � SÞ ð10Þ
Note that in most instances the initial extended-biomass
concentration, XVo, will be equal to the initial biomass
concentration, Xo, if the initial biopolymer concentration is
Table IV. Model parameters for various biopolymer fermentations.
Santos et al. (2000) Armstrong and Johns (1997) Serrano-Carreon et al. (1998) Pena et al. (2000) Yoo and Kim (1994)
Biopolymer Dextran Hyaluronic acid Xantan Alginate PHB
Microorganism L. mesenteroides
NRRL B512(f)
S. zooepidemicus
ATCC 35246
X. campestris
NRRL-B1459
A. vinlandii
ATCC 9046
A. eutrophus
NCIB 11599
AVmax (h�1) 0.89 0.46 0.17 0.25 0.17
KVS (g/L) 3.2 1.8 11.0 2.7 5.5
YVXS 0.74 0.149 0.932 0.405 0.435
R2 0.97 0.97 0.95 0.98 0.96
Amax (h�1) 1.31 0.37 0.14 0.18 0.19
r 4 9 14 2 6
KS (g/L) 6.2 7.0 16.0 1.1 15
YXS 0.328 0.084 0.108 0.155 0.110
R2 0.99 0.99 0.99 0.99 0.99
Figure 9. Batch fermentation kinetics of L. mesenteroides NRRL B512(f) during dextran production (Santos et al., 2000). Biomass, X (.); Dextranconcentration, P (o); Sucrose concentration, S (z); Eq. 14 (—), Eq. 12 (�����), Eq. 10 (. . .. . .).
508 BIOTECHNOLOGY AND BIOENGINEERING, VOL. 87, NO. 4, AUGUST 20, 2004
User
Highlight

zero. The initial biomass concentration is the biomass con-
centration after inoculation and is easily determined.
The substrate concentration can also be described in
terms of the biomass yield:
ðX� XoÞ ¼ YX=SðSo � SÞ ð11Þ
Since XV is known from Eqs. 6, 7, and 10, and X can be
determined from Eqs. 8, 9, and 11, the biopolymer
concentration is given by:
P ¼ X0 � X ð12Þ
Solving the Model
One of the advantages of the proposed model is that it can
be easily solved in a sequential manner and converted to a
practical form describing all of the components as a
function of fermentation time.
Figure 10. Batch fermentation kinetics of S. zooepidemicus ATCC 35246 during hyaluronic acid production (Armstrong and Johns, 1997). Biomass, X
(.); Hyaluronic acid concentration, P (o); Glucose concentration, S (z); Eq. 14 (—), Eq. 12 (�����), Eq. 10 (. . . . . .).
Figure 11. Batch fermentation kinetics of X. campestris NRRL-B1459 during xanthan production (Serrano-Carreon et al., 1998). Biomass, X (.);Xanthan concentration, P (o); Glucose concentration, S (z); Eq. 14 (—), Eq. 12 (�����), Eq. 10 (. . .. . .).
RICHARD AND MARGARITIS: BATCH PRODUCTION OF POLY(GLUTAMIC ACID) 509

First, for the extended-biomass Eqs. 6, 7, and 10 can be
combined and integrated to yield an expression for XV andfermentation time:
A0maxt ¼ðK 0
SYX0=S þ SoYX0=S þ XoÞðYX0=S So þ X 0
oÞlnðX0=X 0
oÞ
�ðK 0
S YX0=SÞðYX0=SSo þ X 0
oÞln½ðYX0=S SoþX0
o
� X0ÞYX0=S So� ð13Þ
By combining Eqs. 8, 9, and 11, a similar expression for X
and fermentation time can be derived:
Amaxt ¼ lnðX=XoÞ þ K rS Y
rX=S
�ln X
ar� lnð�aþ XÞ
ar
� ð�aþ XÞ�1
aðr�1Þ
þ ð�aþ XÞ�2
2aðr�2Þ � � � � � � ð�aþ XÞ�ðr�1Þ
ðr� 1Þa
�XXo
ð14Þ
Figure 12. Batch fermentation kinetics of A. vinlandii ATCC 9046 during alginate production (Pena et al., 2000). Biomass, X (.); Alginate
concentration, P (o); Sucrose concentration, S (z); Eq. 14 (—), Eq. 12 (�����), Eq. 10 (. . . . . .).
Figure 13. Batch fermentation kinetics of A. eutrophus NCIB 11599 during PHB production (Yoo and Kim, 1994). Biomass, X (.); PHB concentration,
P (o); Glucose concentration, S (z); Eq. 14 (—), Eq. 12 (�����), Eq. 10 (. . . . . .).
510 BIOTECHNOLOGY AND BIOENGINEERING, VOL. 87, NO. 4, AUGUST 20, 2004
Yuaii
Highlight
Yuaii
Highlight
where a = YX/S So + Xo. The equations for the proposed
model are summarized in Table II.
RESULTS AND DISCUSSION
In order to establish the use of the empirical model for
poly(glutamic acid) production and for other biopolymers,
the model was used to fit literature data reported for several
biopolymer fermentations. Batch kinetic data were ana-
lyzed for the production of poly(glutamic acid), dextran,
hyaluronic acid, xanthan, alginate, and polyhydroxybu-
tyrate (PHB). In total, 24 different datasets were analyzed
to demonstrate the fit of the empirical model. (Refer to the
original articles for a detailed analysis of the fermentation
results for each of these systems.)
Empirical Fit of Data for Poly(glutamic acid)
The values for Amax, AVmax, KS, KSV, and r for several PGA
fermentations are summarized in Table III. The extended-
biomass yield, YXV/S, and the biomass yield, YX/S, were also
determined and the initial biomass concentration, Xo, is
known. Using the equations from Table II, the model can
be solved for XV, X, P, and S according to the method
outlined above.
The proposed empirical model provides an accurate
approximation of the experimental PGA data from Richard
and Margaritis (2003b) (Fig. 3), as well as for PGA
production from B. subtilis IFO 3335 using a different
medium (Kunioka and Goto, 1994) (Fig. 4), and from
B. licheniformis using a different medium (Yoon et al.,
2000) (Fig. 5).
Of particular interest from Table III are the different
values of the relative coefficient, ‘‘r.’’ The relative
coefficient from Richard and Margaritis (2003b) is high
(r = 29) compared to that of Kunioka and Goto (r = 3) or
Yoon et al. (r = 7). This would suggest that PGA production
in this study is more nongrowth-associated than for the
other two sets of data. This is in fact the case, as can be
seen by comparing Figure 3 with Figures 4 and 5.
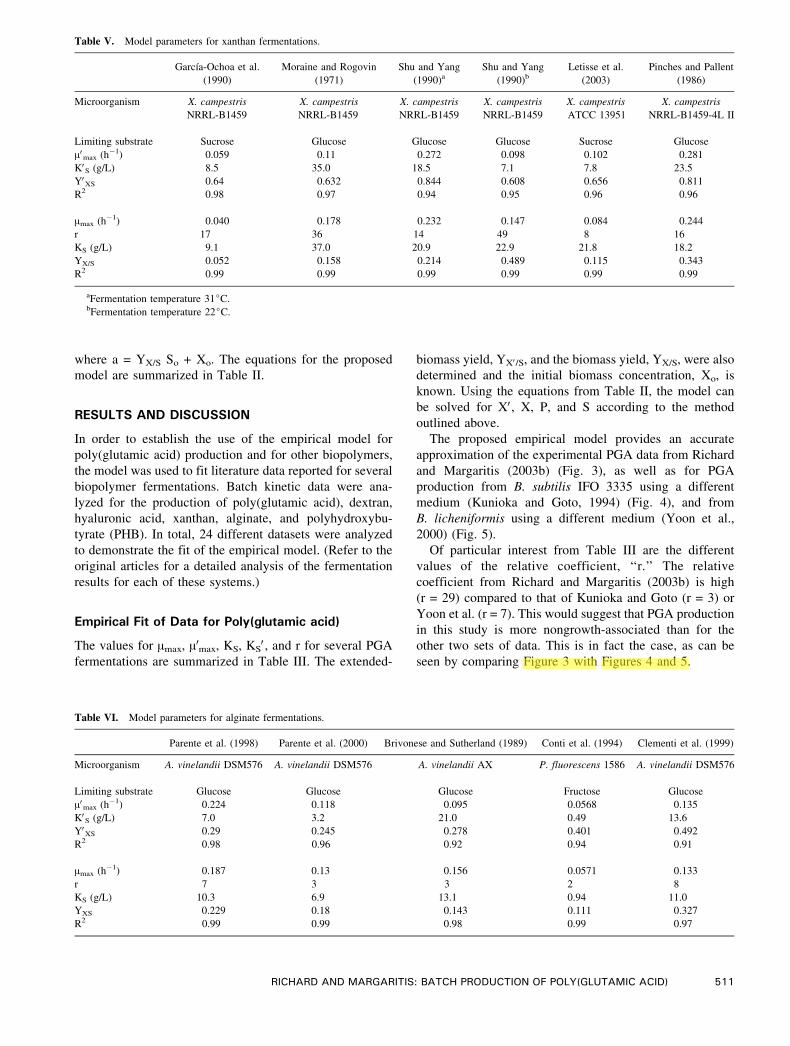
Table V. Model parameters for xanthan fermentations.
Garcıa-Ochoa et al.
(1990)
Moraine and Rogovin
(1971)
Shu and Yang
(1990)aShu and Yang
(1990)bLetisse et al.
(2003)
Pinches and Pallent
(1986)
Microorganism X. campestris
NRRL-B1459
X. campestris
NRRL-B1459
X. campestris
NRRL-B1459
X. campestris
NRRL-B1459
X. campestris
ATCC 13951
X. campestris
NRRL-B1459-4L II
Limiting substrate Sucrose Glucose Glucose Glucose Sucrose Glucose
AVmax (h�1) 0.059 0.11 0.272 0.098 0.102 0.281
KVS (g/L) 8.5 35.0 18.5 7.1 7.8 23.5
YVXS 0.64 0.632 0.844 0.608 0.656 0.811
R2 0.98 0.97 0.94 0.95 0.96 0.96
Amax (h�1) 0.040 0.178 0.232 0.147 0.084 0.244
r 17 36 14 49 8 16
KS (g/L) 9.1 37.0 20.9 22.9 21.8 18.2
YX/S 0.052 0.158 0.214 0.489 0.115 0.343
R2 0.99 0.99 0.99 0.99 0.99 0.99
aFermentation temperature 31jC.bFermentation temperature 22jC.
Table VI. Model parameters for alginate fermentations.
Parente et al. (1998) Parente et al. (2000) Brivonese and Sutherland (1989) Conti et al. (1994) Clementi et al. (1999)
Microorganism A. vinelandii DSM576 A. vinelandii DSM576 A. vinelandii AX P. fluorescens 1586 A. vinelandii DSM576
Limiting substrate Glucose Glucose Glucose Fructose Glucose
AVmax (h�1) 0.224 0.118 0.095 0.0568 0.135
KVS (g/L) 7.0 3.2 21.0 0.49 13.6
YVXS 0.29 0.245 0.278 0.401 0.492
R2 0.98 0.96 0.92 0.94 0.91
Amax (h�1) 0.187 0.13 0.156 0.0571 0.133
r 7 3 3 2 8
KS (g/L) 10.3 6.9 13.1 0.94 11.0
YXS 0.229 0.18 0.143 0.111 0.327
R2 0.99 0.99 0.98 0.99 0.97
RICHARD AND MARGARITIS: BATCH PRODUCTION OF POLY(GLUTAMIC ACID) 511
User
Highlight
User
Highlight

In order to test the accuracy of the empirical model, the
data from Richard and Margaritis (2003b) and the results
reported by Kunioka and Goto (1994) were analyzed
according to the Luedeking-Piret model and the method of
Weiss and Ollis (1980). Equations 1 and 2 are combined
and integrated to give the following (see Weiss and Ollis,
1980, for the step by step derivation):
PðtÞ ¼ Po þmXo
�eAt
1� ðXo=XmaxÞð1:0� eAÞ � 1:0
�
þ ðnXmax=AÞln�1� ðXo=XmaxÞð1:0� eAtÞ
�ð15Þ
A plot of P(t) – Po – nB(t) vs. A(t) gives the value of m,
where:
AðtÞ ¼ Xo
�eAt�
1� ðXo=XmaxÞð1:0� eAtÞ� � 1:0Þ ð16Þ
BðtÞ ¼ ðXmax=AÞln�1� ðXo=XmaxÞð1:0� eAtÞ
�ð17Þ
The straight line plot for the determination of the parameter
‘‘m’’ for Richard and Margaritis (2003b) is presented in
Figure 6. The straight line plot for the determination of
‘‘m’’ for the data from Kunioka and Goto (1994) is
presented in Figure 7. It can be seen from the plots that the
Luedeking-Piret model and the method of Weiss and Ollis
(1980) do not provide an accurate approximation of the
experimental data.
Empirical Fit of Data for Other Biopolymers
In order to establish the use of the empirical model beyond
poly(glutamic acid) production, the model was used to fit
literature data for other biopolymer fermentations. Figure 8
Table VII. Model parameters for PHB fermentations.
Lee et al. (2001) Grothe et al. (1999) Park et al. (1995) Park et al. (1995) Knee et al. (1990)
Microorganism P. fluorescens BM-07 A. latus ATCC 29714 A. eutrophus AER5 transformant A. eutrophus ATCC 17699 P. oleovorans
Limiting substrate Ammonium sulfate Ammonium (NH4+) Fructose Fructose Octanoate
AVmax (h�1) 0.209 0.059 0.244 0.213 0.67
KVS 0.47 g/L 0.094 g/L 3.5 g/L 2.3 g/L 5.5 mM
YVXS 14.7 19.02 0.44 0.44 0.209
R2 0.93 0.93 0.98 0.95 0.97
Amax (h�1) 0.153 0.073 0.201 0.202 0.335
r 2 3 4 8 2
KS 0.26 g/L 0.28 g/L 5.5 g/L 8.5 g/L 3.57 mM
YXS 4.1 8.9 0.234 0.291 0.189
R2 0.97 0.98 0.99 0.99 0.99
Figure 14. Published vs. empirical model values for X, S, and P for
xanthan production from X. campestris ATCC 13951 (Letisse et al., 2003);
a: Biomass, X; b: Sucrose, S; c: Xanthan, P.
512 BIOTECHNOLOGY AND BIOENGINEERING, VOL. 87, NO. 4, AUGUST 20, 2004

shows the sigmoidal relationship between A and S for
dextran from Leuconostoc mesenteroides NRRL B512(f)
(Santos et al., 2000), hyaluronic acid from Streptococcus
zooepidemicus (Armstrong and Johns, 1997), xanthan from
Xanthomonas campestris NRRL-B1459 (Serrano-Carreon
et al., 1998), alginate from Azotobacter vinelandii ATCC
9046 (Pena et al., 2000), and polyhydroxybutyrate (PHB)
from Alcaligenes eutrophus NCIB 11599 (Yoo and Kim,
1994). The values for Amax, AVmax, KS, KSV, and r were
determined (Table IV) and the model was solved for XV,X, P, and S for each biopolymer fermentation according
the method outlined above.
The proposed model provides an accurate approximation
of the experimental data for dextran (Fig. 9), hyaluronic
acid (Fig. 10), xanthan (Fig. 11), alginate (Fig. 12), and
PHB (Fig. 13), as can be seen from the figures and from the
R2 values in Table IV.
From Table IV, it is interesting to note the different
values of the relative coefficient, ‘‘r.’’ For xanthan
production (Fig. 11) the r coefficient was relatively high
(r = 14), suggesting that the biopolymer formation in this
fermentation was largely nongrowth-associated. This can
be seen from Figure 11, where the xanthan concentration
was still increasing during the stationary phase. The
xanthan concentration increased from 15 g/L at the
beginning of the stationary phase to a maximum concen-
tration of 33 g/L.
For dextran (r = 4) and alginate (r = 2) production, the
relatively low r coefficients suggest that biopolymer for-
mation was largely growth-associated in these systems,
which can be seen from the fermentation curves (Figs. 9, 12).
For hyaluronic acid (r = 9) and PHB (r = 6), there was
more nongrowth-associated biopolymer formation
(Figs. 10, 13) than for dextran or alginate, but less than
that of xanthan.
Analysis of Multiple Datasets
In order to demonstrate the accuracy of the empirical
model, multiple datasets were analyzed for xanthan (6),
alginate (5), and PHB (5). Model parameters are presented
in Tables V, VI, and VII. The goodness of fit for each
dataset that was analyzed here was then determined by
calculating the correlation coefficient for the model
(predicted) values vs. the actual (experimental) values for
X, S, and P. For example, Figure 14 shows a plot of
experimental vs. model values and correlation coefficients
for X, S, and P for xanthan production from X. campestris
ATCC 13951 (Letisse et al., 2003). All correlation coeffi-
cients are presented in Table VIII and show a good corre-
lation between experimental andmodel values of X, S, and P.
CONCLUSIONS
The proposed empirical kinetic model provides an accurate
approximation of the microbial production of PGA from
B. subtilis IFO 3335. The proposed model can also be
used to provide an accurate approximation of the micro-
bial production of PGA from other bacterial strains and
other biopolymers, such as dextran, hyaluronic acid,
xanthan, alginate, and PHB. The model incorporates the
concept of extended biomass, which can be used to
Table VIII. Goodness of fit of empirical model to experimental kinetic data using R2.
Biopolymer Reference R2 Substrate, S R2 Biomass, X R2 Biopolymer, P
Alginate Parente et al. (1998) 0.987 0.996 0.956
Alginate Parente et al. (2000) 0.990 0.983 0.957
Alginate Brivonese and Sutherland (1989) 0.999 0.967 0.993
Alginate Conti et al. (1994) 0.947 0.946 0.964
Alginate Clementi et al. (1999) 0.865 0.987 0.954
Alginate Pena et al., 2000 0.982 0.989 0.970
Dextran Santos et al., 2000 0.959 0.993 0.996
Hyaluronic acid Armstrong and Johns, 1997 0.994 0.989 0.979
PGA Richard and Margaritis, 2003b 0.971 0.987 0.949
PGA Kunioka and Goto., 1994 0.958 0.989 0.949
PGA Yoon et al., 2000 0.988 0.997 0.991
PHB Yoo and Kim (1994) 0.990 0.998 0.992
PHB Lee et al. (2001) 0.947 0.967 0.934
PHB Grothe et al. (1999) 0.958 0.945 0.959
PHB Park et al. (1995) A. eutrophus AER5 transformant 0.964 0.992 0.977
PHB Park et al. (1995) A. eutrophus ATCC 17699 0.956 0.989 0.992
PHB Knee et al. (1990) 0.979 0.961 0.906
Xanthan Serrano-Carreon et al. (1998) 0.986 0.995 0.955
Xanthan Garcıa-Ochoa et al. (1990) 0.989 0.969 0.986
Xanthan Moraine and Rogovin (1971) 0.978 0.917 0.960
Xanthan Shu and Yang (1990) (31jC) 0.960 0.996 0.989
Xanthan Shu and Yang (1990) (22jC) 0.954 0.994 0.982
Xanthan Pinches and Pallent (1986) 0.984 0.982 0.993
Xanthan Letisse et al. (2003) 0.971 0.978 0.983
RICHARD AND MARGARITIS: BATCH PRODUCTION OF POLY(GLUTAMIC ACID) 513
Yuaii
Highlight

determine Monod-type kinetic parameters for the com-
bined biomass-biopolymer extended biomass. The model
also incorporates the concept of fitting the experimental
biomass data using a sigmoidal relationship that includes
Amax and KS, as well as ‘‘r,’’ the relative coefficient. The
relative coefficient quantifies, in relative terms, the
amount of nongrowth-associated biopolymer formation.
More work is needed to further refine the model and to
test the model with other microbial fermentations.
NOMENCLATURE
kP Rate constant
KS Biomass substrate affinity constant (g/L)
KSV Extended biomass substrate affinity constant (g/L)
kX Rate constant
m Parameter of Weiss and Ollis (1980) model referring to
biopolymer production due to biomass (g P g X�1h�1)
N Nitrogen concentration (g/L)
n Parameter of Weiss and Ollis (1980) model referring to
biopolymer production due to growth (g P g X�1)
P Biopolymer concentration (g/L)
Pmax Maximum biopolymer concentration (g/L)
Po Initial biopolymer concentration (g/L)
r Relative coefficient
S Limiting substrate concentration (g/L)
So Initial substrate concentration (g/L)
t Fermentation time (h)
X Biomass concentration (g/L)
XV Extended biomass concentration (g/L)
Xmax Maximum biomass concentration (g/L)
Xo Initial biomass concentration (g/L)
XVo Initial extended biomass concentration (g/L)
YX/S Biomass yield
YXV/S Extended biomass yield
A Biomass specific growth rate (h�1)
AV Extended biomass specific growth rate (h�1)
AVmax Extended biomass maximum specific growth rate (h�1)
Amax Biomass maximum specific growth rate (h�1)
References
Armstrong D, Johns M. 1997. Culture conditions affect the molecular
weight properties of hyaluronic acid produced by Streptococcus
zooepidemicus. Appl Environ Microbiol 63:2759–2764.
Brivonese A, Sutherland I. 1989. Polymer production by a mucoid strain of
Azotobacter vinelandii in batch culture. Appl Microbiol Biotechnol
30:97–102.
Clementi F, Crudele M, Parente E, Mancini M, Moresi M. 1999.
Production and characterization of alginate from Azotobacter vine-
landii. J Sci Food Agric 79:602–610.
Conti E, Flaibani A, O’Regan M, Sutherland I. 1994. Alginate from
Pseudomonas fluorescens and P. putida: production and properties.
Microbiology 140:1125–1132.
Garcıa-Ochoa F, Garcia-Leon M, Romero A. 1990. Kinetic modeling of
xanthan production from sucrose. Chem Biochem Eng Q 4:15–20.
Garcıa-Ochoa F, Santos V, Alcon A. 1995. Xanthan gum production: an
unstructured kinetic model. Enzyme Microbiol Technol 17:206–217.
Gibbs P, Seviour R. 1996. Does the agitation rate and/or oxygen saturation
influence exopolysaccharide production by Aureobasidium pullulans
in batch culture? Appl Microbiol Biotechnol 46:503–510.
Grothe E, Moo-Young M, Chisti Y. 1999. Fermentation optimization for
the production of poly(h-hydroxybutyric acid) microbial thermo-
plastic. Enzyme Microbiol Technol 25:132–141.
Knee E Jr, Wolf M, Lenz R, Fuller R. 1990. Influence of growth conditions
on production and composition of PHA by Pseudomonas oleovorans.
In: Dawes EA, editor. Novel biodegradable microbial polymers.
Dordrecht: Kluwer. p 439–440.
Kovarova-Kovar K, Egli T. 1998. Growth kinetics of suspended microbial
cells: from single substrate-controlled growth to mixed-substrate ki-
netics. Microbiol Mol Biol Rev 62:646–666.
Kunioka M, Goto A. 1994. Biosynthesis of poly(g-glutamic acid) from L-
glutamic acid, citric acid, and ammonium sulfate in Bacillus subtilis
IFO3335. Appl Microbiol Biotechnol 40:867–872.
Lee H-J, Choi M, Kim T-U, Yoon S. 2001. Accumulation of poly-
hydroxyalkanoic acid containing large amounts of unsaturated mono-
mers in Pseudomonas fluorescens BM07 utilizing saccharides and its
inhibition by 2-bromooctanoic acid. Appl Environ Microbiol 67:
4963–4974.
Letisse F, Lindley N, Roux G. 2003. Development of a phenomenological
modeling approach for prediction of growth and xanthan gum pro-
duction using Xanthomonas campestris. Biotechnol Prog 19:822–827.
Li C, Ke S, Wu Q-P, Tansey W, Hunter N, Buchmiller L, Milas L,
Chamsangavej C, Wallace S. 2000. Experimental therapeutics, pre-
clinical pharmacology — tumor irradiation enhances the tumor-
specific distribution of poly(L-glutamic acid)-conjugated paclitaxel
and its antitumor efficacy. Clin Cancer Res 6:2829–2834.
Luedeking R, Piret E. 1959. A kinetic study of the lactic acid fermentation.
J Biochem Microbiol Technol Eng 1:393–412.
Luong J, Mulchandani A, LeDuy A. 1988. Kinetics of biopolymer
synthesis: a revisit. Enzyme Microb Technol 10:326–332.
Margaritis A, Pace G. 1985. Microbial polysaccharides. In: Comprehen-
sive biotechnology — the principles, applications and regulations of
biotechnology in industry, agriculture and medicine. Oxford: Perga-
mon Press. p 1005–1044.
Monod J. 1949. The growth of bacterial cultures. Annu Rev Microbiol
3:371–394.
Moraine R, Rogovin P. 1966. Kinetics of polysaccharide B-1459 fer-
mentation. Biotechnol Bioeng 8:511–524.
Moraine R, Rogovin P. 1971. Xanthan biopolymer production at increased
concentration by pH control. Biotechnol Bioeng 13:381–391.
Multani A, Li C, Ozen M, Yadav M, Yuu D-F, Wallace S, Pathak S. 1997.
Paclitaxel and water-soluble poly(L-glutamic acid)-paclitaxel, induce
direct chromosomal abnormalities and cell death in a murrine meta-
static melanoma cell line. Anticancer Res 17:4269–4274.
Parente E, Crudele M, Aquino M, Clemente F. 1998. Alginate production
by Azotobacter vinelandii DSM576 in batch fermentation. J Ind
Microbiol Biotechnol 20:171–176.
Parente E, Crudele M, Ricciardi A, Mancini M, Clemente F. 2000. Effect
of ammonium sulphate concentration and agitation speed on the
kinetics of alginate production by Azotobacter vinelandii DSM576 in
batch fermentation. J Ind Microbiol Biotechnol 25:242–248.
Park J-S, Park H-C, Huh T-L, Lee Y-H. 1995. Production of poly-h-hydroxybutyrate by Alcaligenes eutrophus transformants harbouring
cloned phbCAB genes. Biotech Lett 17:735–740.
Pena C, Trujillo-Roldan M, Galindo E. 2000. Influence of dissolved
oxygen tension and agitation speed on alginate production and its
molecular weight in cultures of Azotobacter vinelandii. Enzyme
Microbiol Technol 27:390–398.
Pinches A, Pallent L. 1986. Rate and yield relationships in the production
of xanthan gum by batch fermentations using complex and chemically
defined growth media. Biotechnol Bioeng 28:1484–1496.
Quinlan A. 1986. Kinetics of secondary metabolite synthesis in batch
culture when two different substrates limit cell growth and metabolite
production: xanthan synthesis by Xanthomonas campestris. Biochem
Eng 469:259–269.
Richard A, Margaritis A. 2001. Poly(glutamic acid) for biomedical
applications. CRC Crit Rev Biotechnol 21:219–232.
Richard A, Margaritis A. 2003a. Optimization of cell growth and poly
(glutamic acid) production in batch fermentation by Bacillus subtilis.
Biotechnol Lett 25:465–468.
Richard A, Margaritis A. 2003b. Rheology, oxygen transfer and molecular
514 BIOTECHNOLOGY AND BIOENGINEERING, VOL. 87, NO. 4, AUGUST 20, 2004

weight characteristics of poly(glutamic acid) fermentation by Bacillus
subtilis. Biotechnol Bioeng 82:299–305.
Roukas T, Mantzouridou F. 2001. Effect of the aeration rate on pullulan
production and fermentation broth rheology in an airlift reactor.
J Chem Technol Biotechnol 76:371–376.
Santos M, Teixeira J, Rodrigues A. 2000. Production of dextransucrase,
dextran and fructose from sucrose using Leuconostoc mesenteroides
NRRL B512(f). Biochem Eng J 4:177–188.
Schweickart R, Quinlan A. 1989. Kinetics of xanthan production when
NH4+ limits biomass synthesis and glucose limits polysaccharide
synthesis. J Biomech Eng 111:166–171.
Serrano-Carreon L, Corona R, Sanchez A, Galindo E. 1998. Prediction of
xanthan fermentation development by a model linking kinetics, power
drawn and mixing. Proc Biochem 33:133–146.
Shu C-H, Yang S-T. 1990. Effects of temperature on cell growth and
xanthan production in batch cultures of Xanthomonas campestris.
Biotechnol Bioeng 35:454–468.
Sutherland I. 1998. Novel and established applications of microbial
polysaccharides. Trends Biotechnol 16:41–46.
Weiss R, Ollis D. 1980. Extracellular microbial polysaccharides. I.
Substrate, biomass, and product kinetic equations for batch xanthan
gum fermentation. Biotechnol Bioeng 22:859–873.
Yoo S, Kim W. 1994. Cybernetic model for synthesis of poly-a-
hydroxybutyric acid in Alcaligenes eutrophus. Biotechnol Bioeng 43:
1043–1051.
Yoon S, Do J, Lee S, Chang H. 2000. Production of poly-g-glutamic acid
by fed-batch culture of Bacillus licheniformis. Biotechnol Lett
22:585–588.
RICHARD AND MARGARITIS: BATCH PRODUCTION OF POLY(GLUTAMIC ACID) 515