Domain-Restricted Expression of Two Glutamic Acid Decarboxylase Genes In Midgestation Mouse Embryos
21
Domain-Restricted Expression of Two Glutamic Acid Decarboxylase Genes in Midgestation Mouse Embryos ZOYA KATAROVA, 1,2 * GABRIELA SEKERKOVA ´ , 1,3 SIMONA PRODAN, 1 ENRICO MUGNAINI, 3 AND GA ´ BOR SZABO ´ 1,2 1 BRC, Institute of Biochemistry, 6701 Szeged, Hungary 2 Institute of Experimental Medicine, Hungarian Academy of Sciences, H-1450 Budapest, Hungary 3 Institute for Neuroscience, Northwestern University, Chicago, Illinois 60611-301 ABSTRACT Glutamic acid decarboxylase (GAD) is the biosynthetic enzyme for g-aminobutyric acid (GABA), the major inhibitory neurotransmitter in the central nervous system (CNS) of vertebrates. In addition to the adult CNS, GABA and GAD also have been detected in embryos, although their precise localization and specific functions in embryonic development have not been elucidated. In this paper, the authors studied the cellular distribution of two GAD isoforms, GAD65 and GAD67, in midgestation mouse embryos by in situ hybridization histochemistry. With few exceptions, it was found that GAD65 and GAD67 mRNAs are localized in overlapping cellular domains of the embryonic CNS that later develop into regions with a strong GABAergic contribution. The GAD-expressing cells are situated in the differentiating zone of the embryonic day 10.5 (E10.5) through E11.5 CNS and in the subventricular zone and the mantle zone of the E12.5 CNS, which suggests that they are committed neuronal precursors. By using a specific serum for GABA, a similar pattern of distribution was obtained, indicating that GAD mRNAs are translated efficiently into enzy- matically active GAD, which produces embryonic GABA. The expression domains of GAD overlap with those of genes that are known to be involved in the patterning of the embryonic CNS. The two GAD mRNAs also are detected outside of the embryonic CNS in various cell types, mainly those of placodal and neural crest origin. This pattern of expression is consis- tent with the notion that GAD and its product, GABA, play a signaling role during develop- ment. J. Comp. Neurol. 424:607– 627, 2000. © 2000 Wiley-Liss, Inc. Indexing terms: glutamic acid decarboxylase; g-aminobutyric acid; neuronal differentiation; in situ hybridization; mouse embryo Glutamic acid decarboxylase (GAD) catalyzes the decar- boxylation of L-glutamate, which is the rate-limiting step in the synthesis of the inhibitory neurotransmitter g-aminobutyric acid (GABA) in the central nervous sys- tem (CNS) of vertebrates. In adult animals, GABA and GAD are colocalized in the GABAergic neurons of the CNS and the peripheral nervous system (PNS; Mugnaini and Oertel, 1985) as well as in certain nonneuronal cell types (Erdo ¨ and Wolff, 1990). Two GAD isoforms, the 65-kDa isoform (GAD65) and the 67-kDa isoform GAD67, which are products of two distinct genes, have been character- ized so far. The two GAD isoforms are very similar at the amino acid level, but they differ in molecular weight, subcellular localization, and affinity to the cofactor pyri- doxal phosphate (for reviews, see Erlander et al., 1991; Soghomonian and Martin, 1998). Recent immunocyto- chemical and in situ hybridization studies have shown that the two isoforms are coexpressed in nearly all GABAergic inhibitory neurons of the CNS and PNS and in GABA-synthesizing cells of the periphery (Kaufman et al., Z. Katarova and G. Sekerkova ´ contributed equally to this work. E. Mugnaini and G. Szabo ´ are joint senior authors of this work. G. Sekerkova ´ is on leave of absence from the Institute of Neuroscience, Slovakian Academy of Sciences, Soltesova 4, Kosice, Slovak Republic. *Correspondence to: Zoya Katarova, Institute of Experimental Medicine, Hungarian Academy of Sciences, P.O. Box 67, H-1450 Budapest, Hungary. E-mail: [email protected] Received 18 January 2000; Revised 9 May 2000; Accepted 11 May 2000 THE JOURNAL OF COMPARATIVE NEUROLOGY 424:607– 627 (2000) © 2000 WILEY-LISS, INC.
-
Upload
independent -
Category
Documents
-
view
1 -
download
0
Transcript of Domain-Restricted Expression of Two Glutamic Acid Decarboxylase Genes In Midgestation Mouse Embryos

Domain-Restricted Expression of TwoGlutamic Acid Decarboxylase Genes in
Midgestation Mouse Embryos
ZOYA KATAROVA,1,2* GABRIELA SEKERKOVA,1,3 SIMONA PRODAN,1
ENRICO MUGNAINI,3AND GABOR SZABO1,2
1BRC, Institute of Biochemistry, 6701 Szeged, Hungary2Institute of Experimental Medicine, Hungarian Academy of Sciences,
H-1450 Budapest, Hungary3Institute for Neuroscience, Northwestern University, Chicago, Illinois 60611-301
ABSTRACTGlutamic acid decarboxylase (GAD) is the biosynthetic enzyme for g-aminobutyric acid
(GABA), the major inhibitory neurotransmitter in the central nervous system (CNS) ofvertebrates. In addition to the adult CNS, GABA and GAD also have been detected inembryos, although their precise localization and specific functions in embryonic developmenthave not been elucidated. In this paper, the authors studied the cellular distribution of twoGAD isoforms, GAD65 and GAD67, in midgestation mouse embryos by in situ hybridizationhistochemistry. With few exceptions, it was found that GAD65 and GAD67 mRNAs arelocalized in overlapping cellular domains of the embryonic CNS that later develop intoregions with a strong GABAergic contribution. The GAD-expressing cells are situated in thedifferentiating zone of the embryonic day 10.5 (E10.5) through E11.5 CNS and in thesubventricular zone and the mantle zone of the E12.5 CNS, which suggests that they arecommitted neuronal precursors. By using a specific serum for GABA, a similar pattern ofdistribution was obtained, indicating that GAD mRNAs are translated efficiently into enzy-matically active GAD, which produces embryonic GABA. The expression domains of GADoverlap with those of genes that are known to be involved in the patterning of the embryonicCNS. The two GAD mRNAs also are detected outside of the embryonic CNS in various celltypes, mainly those of placodal and neural crest origin. This pattern of expression is consis-tent with the notion that GAD and its product, GABA, play a signaling role during develop-ment. J. Comp. Neurol. 424:607–627, 2000. © 2000 Wiley-Liss, Inc.
Indexing terms: glutamic acid decarboxylase; g-aminobutyric acid; neuronal differentiation; in
situ hybridization; mouse embryo
Glutamic acid decarboxylase (GAD) catalyzes the decar-boxylation of L-glutamate, which is the rate-limiting stepin the synthesis of the inhibitory neurotransmitterg-aminobutyric acid (GABA) in the central nervous sys-tem (CNS) of vertebrates. In adult animals, GABA andGAD are colocalized in the GABAergic neurons of the CNSand the peripheral nervous system (PNS; Mugnaini andOertel, 1985) as well as in certain nonneuronal cell types(Erdo and Wolff, 1990). Two GAD isoforms, the 65-kDaisoform (GAD65) and the 67-kDa isoform GAD67, whichare products of two distinct genes, have been character-ized so far. The two GAD isoforms are very similar at theamino acid level, but they differ in molecular weight,subcellular localization, and affinity to the cofactor pyri-doxal phosphate (for reviews, see Erlander et al., 1991;
Soghomonian and Martin, 1998). Recent immunocyto-chemical and in situ hybridization studies have shownthat the two isoforms are coexpressed in nearly allGABAergic inhibitory neurons of the CNS and PNS and inGABA-synthesizing cells of the periphery (Kaufman et al.,
Z. Katarova and G. Sekerkova contributed equally to this work.E. Mugnaini and G. Szabo are joint senior authors of this work.G. Sekerkova is on leave of absence from the Institute of Neuroscience,
Slovakian Academy of Sciences, Soltesova 4, Kosice, Slovak Republic.*Correspondence to: Zoya Katarova, Institute of Experimental Medicine,
Hungarian Academy of Sciences, P.O. Box 67, H-1450 Budapest, Hungary.E-mail: [email protected]
Received 18 January 2000; Revised 9 May 2000; Accepted 11 May 2000
THE JOURNAL OF COMPARATIVE NEUROLOGY 424:607–627 (2000)
© 2000 WILEY-LISS, INC.

1991; Tillakaratne et al., 1992, 1995; Esclapez et al., 1993,1994; Kim et al., 1993).
GABA is synthesized in embryos long before the onset ofinhibitory synaptogenesis and has been proposed to serveas a trophic factor during embryonic development (Wolffet al., 1978; Redburn and Schousboe, 1987; Lauder, 1993).GABA has been detected by immunocytochemistry in ax-ons situated in several discrete brain regions of rat em-bryos at embryonic day 12 (E12; Lauder et al., 1986; VanEden et al., 1989), whereas GAD immunoreactivity ap-peared with a lag of 2–3 days (Van Eden et al., 1989).Similarly, at birth, GABA content is approximately 50% ofthe adult level, whereas GAD activity comprises roughly10% of the adult level (Balcar and Johnston, 1987; Seilerand Lajtha, 1987). This apparent discrepancy has beeninterpreted as being due to the synthesis of embryonicGABA through putrescine (Seiler and Lajtha, 1987). How-ever, more recent data have indicated that GAD itself maybe responsible for the synthesis of embryonic GABA, be-cause both mRNA and protein of the enzymatically activeforms GAD67 and truncated GAD44 are present in mouseembryo from E10.5 on (Szabo et al., 1994). GAD67 andGAD65 have been demonstrated as early as E11 rat spinalcord, although GAD65 protein seems to appear much laterthan GAD67 (Somogyi et al., 1995). Moreover, E11 ratspinal cord cells that express GAD67 mRNA can produceGABA, which indicates that the rat spinal cord GABAer-gic neurons are among the first to acquire their neuro-transmitter phenotype (Ma and Barker, 1995).
The present report is the first attempt to characterizethe overall pattern of expression of GAD65 and GAD67genes in midgestation mouse embryos (stages E10.5–E12.5) by using in situ hybridization histochemistry. Ourdata clearly indicate that, already at E10.5, the two genesare expressed at comparable levels. Hybridization signalswith both GAD67- and GAD65-specific probes were local-ized in essentially overlapping domains that correspond topreviously characterized expression domains of genes im-plicated in patterning of the nervous system. Moreover,immunocytochemistry with anti-GABA antiserum re-vealed the presence of GABA in most if not all GAD-positive cells, indicating that embryonic GABA is synthe-sized by the same GAD isoforms that are present in theadult nervous system. Our data support the assumptionthat GABA serves cell-cell signaling functions during em-bryonic development.
MATERIALS AND METHODS
Synthesis of probes
Clones 1A/1 and 1A/5 (Katarova et al., 1990) containingmouse GAD67 cDNA in opposite directions and clonesRATGAD 65/A and RATGAD 65/B containing the ratGAD65 (G. Szabo, unpublished observations), all in Blue-script KS1 (Stratagene, La Jolla, CA), were used to gen-erate antisense and sense probes as follows: plasmid 1A/1and 1A/5 were linearized with XhoI, and antisense (1A/1)and sense (1A/5) probes were generated by using T7 RNApolymerase; RATGAD 65/A was linearized with BamHI,RATGAD 65/B was linerized with HindIII, and the respec-tive antisense and sense probes were generated by usingT7 polymerase. The reaction contained 4 ml 5 3 transcrip-tion buffer, which contained 2 ml 100 mM dithiothreitol(DTT; Sigma, St. Louis, MO); 2 ml H20; 1 ml RNasine (20
U; Promega, Madison, WI); 1 ml each of 2.5 mM ATP,CTP, and GTP; 2 ml 0.2 mM UTP; 1 ml template DNA (1mg/ml); 5 ml 35S-UTP (10 mCi/ml; Izinta, Hungary); andRNA polymerase (T7, T3, and Sp6; 15–20 U/ml). The en-zyme reaction was carried out at 37–40°C for 2 hours. TheDNA template was removed by digestion with RNase-freeDNase RQ1 (1 U/mg DNA; Promega) for 15 minutes at37°C, and the cRNA was extracted once with phenol (sat-urated with RNase-free H2O) chloroform and once withchloroform. Subsequently, 0.5 volumes of 7.5 M ammo-nium acetate, 0.1 mg/ml RNase-free tRNA as carrier, and2 volumes of ethanol (EtOH) were added, and the cRNAwas left to precipitate for 2–3 hours or overnight at 220°C.The probe was recovered by centrifugation at 4°C for 10minutes. The pellet was washed once with 70% EtOH,dried briefly at room temperature, and dissolved in 0.16ml diethylpyrocarbonate (DEPC; Sigma)-treated H2O.Then, 1/10 volume of 0.4 M NaHCO3 and 0.6 M Na2CO3were added, and the solution was incubated at 60°C toreduce the size of the probe. The time of incubation wasdetermined according to the following formula: t (min-utes) 5 Lo 2 Lf/kLoLf, where Lo is the initial size of probe,Lf is the final size of probe, and k 5 0.11 cuts/kb/minute.The hydrolysis was stopped by adding 0.1 volume 3 Msodium acetate-glacial acetic acid (1.3 ml/0.2 ml solution),tRNA (0.1 mg/ml final concentration), and 1.5 3 volumeEtOH, and the probe was precipitated at 220°C for atleast 30 minutes. The probe was recovered by centrifuga-tion in a Biofuge 13 (Haeraeus) at maximum speed for 10minutes at 4°C, washed once with 70% EtOH, air dried,and dissolved in 50 ml 0.1 M RNase-free DTT (Sigma).Digoxigenin (DIG)-labeled RNA probes were synthesizedon the same templates by using a DIG RNA labeling kitaccording to the protocol recommended by the manufac-turer (Boehringer-Mannheim, Mannheim, Germany).
Tissue preparation
Mice were maintained in a conventional animal facility,and all experiments were conducted according to guide-lines for care and use of experimental animals issued bythe National Institutes of Health and the Society for Neu-roscience. Timed-pregnant B6/CBA mice were used to de-rive embryos at E10.5, E11.5, and E12.5. The morning ofvaginal plug was counted as E0.5. The embryos werecollected in ice-cold DEPC-treated O.1 M phosphate-buffered saline, pH 7.4 (PBS), and fixed in 4% paraformal-dehyde (PAF) in 0.1 M DEPC-treated PBS overnightat 4°C.
For nonradioactive in situ hybridization, the embryoswere cryoprotected in DEPC-treated 20% sucrose in 0.1 MPBS, embedded in optimal cutting temperature (OCT)medium, and frozen quickly in petroleum ether precooledin liquid nitrogen. Serial 10–12-mm-thick sections werecut on a cryostat, collected on glass slides coated withpoly-L-lysine, and left to dry overnight at room tempera-ture. Sections were stored for 1 month at 270°C withoutsignificant loss of hybridization signal. For in situ hybrid-ization with radioactive probes, the embryos were rinsedin several changes of DEPC-treated 0.1 M PBS, dehy-drated through ascending series of RNase-free ethanol,cleared in three changes of xylene, and embedded in Para-plast. Serial 10-mm-thick sections were cut on a microtomeand mounted on poly-L-lysine-coated slides at 42°C, driedovernight at room temperature, and hybridized. Sections
608 Z. KATAROVA ET AL.
that were not used immediately were stored for up toseveral months at 4°C.
Hybridization with35
S-UTP-labeled probes
Hybridization with 35S-UTP-labeled probes on paraffinsections was performed according to Ruberte et al. (1990)with few modifications. The sections were deparaffinized;postfixed in 4% PAF; acetylated with 0.25% acetic anhy-dride in 0.1 M triethanolamine (Sigma), pH 8.0; and de-hydrated in descending concentrations of ethanol, as de-scribed. Next, the sections were treated with chloroformfor 5 minutes followed by 100% ethanol and 95% ethanolfor 1 minute each, and air dried. The hybridization mix-ture contained 20–50 3 103 cpm/ml 35S-UTP-labeledprobe, 50% deionized formamide, 10% dextran sulfate, 1 3salts [0.3 M NaCl; 20 mM Tris, pH 7.5; 5 mM ethylenedi-amine tetraacetic acid (EDTA); 10 mM sodium phosphate,pH 6.8; and 1 3 Denhardt’s solution], 500 mg/ml yeasttRNA, and 10 mM DTT. A drop of hybridization mixture('25–50 ml) was applied on each slide and covered withparafilm. The slides were incubated in a humid chamberfor 16 hours at 52°C. The parafilm was removed in 5 3standard saline citrate (SSC) and 10 mM DTT at 52°Cfollowed by two washes for 45 minutes each in 50% form-amide, 2 3 SSC, 10 mM DTT at 52°C, and in 50% form-amide, 2 3 SSC, and 50 mM DTT at 55°C. The sectionswere treated subsequently with 20 mg/ml RNase A inNa-Tris-EDTA (NTE) buffer (0.5 M NaCl; 10 mM Tris, pH7.5; and 5 mM EDTA) for 30 minutes at 37°C and washedin 50% formamide and 2 3 SSC at 60°C for 1 hour, in 2 3SSC for 10 minutes at room temperature, and in 0.1 3SSC for 15 minutes at room temperature, after which,sections were dehydrated in a descending ethanol seriescontaining 300 mM ammonium acetate, air dried, andexposed to b-max Hyperfilm (Amersham, Buckingham-shire, United Kingdom) for 4–5 days. Finally, the sectionswere coated with LM1 liquid autoradiographic emulsion(Amersham) and exposed for 10–14 days in the darkat 4°C.
Hybridization with DIG-UTP-labeled probes
Hybridization was performed on frozen sections as fol-lows: The sections were washed in several changes of 0.1M PBS, treated with 1mg/ml proteinase K for 5–10 min-utes at room temperature, followed by two 15-minutetreatments with 0.1 M glycine in 0.1 M PBS. The sectionswere postfixed for 20 minutes in 4% PAF, washed in 0.1 MPBS, and treated in 0.2 N HCl for 20 minutes at roomtemperature. Prehybridization was performed in 50% for-mamide in 5 3 SSC for 1 hour at room temperature. Thehybridization solution contained 0.5–1.0 mg/ml DIG-UTP-labeled cRNA probes in 50% formamide, 5 3 SSC, 1%sodium dodecyl sulfate, 50 mg/ml yeast tRNA, and 50mg/ml heparin. The solution was heated to 90–95°C, ap-plied to the sections at 60°C, and covered with a piece ofparafilm. Hybridization was performed in a humid cham-ber at 45°C overnight. The parafilm was removed in 5 3SSC at 45°C, and the sections were then washed in 50%formamide in 2 3 SSC at 52°C for 1 hour. This wasfollowed by treatment with 20 mg/ml RNase in NTE bufferfor 45 minutes at 37°C and two 30-minute washes in 50%formamide in 2 3 SSC at 52°C. Subsequently, sectionswere washed twice for 10 minutes each in PBS containing0.1% Tween-20 (PBT) at room temperature and blocked in10% normal goat serum in PBT for 1 hour at room tem-
perature. Anti-DIG antibody conjugated to human placen-tal alkaline phosphatase (Boehringer Mannheim; preab-sorbed with heat-activated embryo powder as described byWilkinson and Nieto, 1993) was applied at 1:2,000 dilutionin PBT containing 1% normal goat serum, and the sectionswere incubated for 18 hours at 4°C. The sections werewashed three times for 5 minutes each in PBT containing2 mM levamisol, followed by three 5-minute washes andone 10-minute wash in alkaline phosphatase (AP) buffer(100 mM NaCl; 100 mM Tris, pH 9.5; 50 mM MgCl2, and0.1% Tween 20 with 2 mM levamisol). Color detection wasperformed as described by Wilkinson and Nieto (1993).
GABA immunocytochemistry
Embryos derived from timed-pregnant mice were fixedin 4% PAF and 0.1% glutaraldehyde in 0.1 M PBS over-night at 4°C, washed in PBS, cryoprotected in 20% sucrosein 0.1 M PBS at 4°C, and embedded in OCT medium.Serial 15–20-mm-thick cryostat sections were cut and in-cubated with affinity-purified anti-GABA rabbit poly-clonal serum (Sigma; catalog no. A2052) at a dilution of1:5,000–10,000 overnight at 4°C in 1% PBS with 1% bo-vine serum albumin and 0.1% Tween-20 (BSA-BPT),washed in PBT, and incubated with the ABC Elite Kit(Vector Laboratories, Burlingame, CA) reacted with dia-minobenzidine (Sigma) as substrate.
Photography
The sections that were hybridized with DIG-UTP-labeled probes and those that were processed for GABAimmunohistochemistry were photographed on Kodak Ek-tachrome 160T slide film (Eastman-Kodak, Rochester,NY) by using an Olympus BX50 microscope (Olympus,Tokyo, Japan). Color slide images were scanned by usinga Polaroid SprintScan 35 slide scanner, and the figurelayouts were created in Adobe Photoshop software (AdobeSystems, Mountain View, CA). Autoradiograms of sectionsthat were hybridized with 35S-UTP-labeled probes wereexposed directly on photographic paper.
RESULTS
Generation of GAD65- and GAD67-specific probes
For in situ hybridization studies, we initially used twokinds of riboprobes, GAD67 and GAD65 complementary tothe respective mouse (Katarova et al., 1990) and rat GAD(Erlander et al., 1991) cDNAs. GAD67 antisense probe ishomologous to the 2-kb embryonic I-80 and I-86 messages(Szabo et al., 1994) and the 3.7-kb adult GAD67.
With the GAD67 probe, one can detect both adult andembryonic messages, but the latter are far more abundantat E10.5–E12.5 (Szabo et al., 1994). In agreement withprevious results (Erlander et al., 1991; Esclapez et al.,1993), the GAD65 probe hybridized solely to a 5.6-kbGAD65 mRNA but not to GAD67-related messages. Wedid not detect bands of different sizes on Northern blotanalysis with this probe that would have indicated theexistence of differentially processed messages.
Identification of GAD expression sites
Concordant hybridization maps were obtained with 35S-labeled and DIG-labeled probes. The latter were used forcellular resolution and precise determination of expres-
609GAD ISOFORM EXPRESSION IN MOUSE EMBRYO

sion boundaries. GAD expression sites within and outsidethe CNS were identified according to mouse and rat em-bryo maps and atlases (Paxinos et al., 1991; Kaufman,1992; Schambra et al., 1992; Easter et al., 1993; Puellesand Rubenstein, 1993; Stoykova and Gruss, 1994; Altmanand Bayer, 1995; Mastick and Easter, 1996; Stoykova etal., 1996; Jacobowitz and Abbott, 1998). The macroscopicstructure of E10.5, E11.5, and E12.5 mouse embryos re-sembles that of E12, E13, and E14 rat embryos (E13, E14,and E15 according to Altman and Bayer, 1995), respec-tively. Terminology for structural subdivisions is based onadult mouse (Franklin and Paxinos, 1997) and rat (Paxi-nos and Watson, 1986) atlases.
Expression of GAD67 and GAD65 atstage E10.5
At E10.5, the earliest stage analyzed, the mouse ner-vous system is characterized by extensive neurogenesisand initial stages of cell migration and differentiation inboth the spinal cord and the brain. Expression of GAD65and GAD67 appeared entirely nervous system-specific.GAD65 showed a slightly stronger signal than GAD67;otherwise, the hybridization patterns with the two probeswere identical. Expression was localized to spatially re-stricted domains with well-defined boundaries (Figs. 1, 2).Hybridization signals were confined predominantly to thedifferentiating zone (DZ), with little if any labeling in theventricular zone (VZ). Only rare cells were observed (Fig.2b) in the ventricular neuroepithelium (VNE) of the VZ.
Discrete hybridization signals were identified in theolfactory placode (Fig. 1a). In the forebrain region, thesignal was strong in the medial ganglionic eminence(MGE) of the ventral telencephalon (Figs. 1, 2d,e; see also
Sussel et al., 1999). These cells formed a multilayer struc-ture in the region of MGE corresponding to the pallidalDZ, although labeled cells were found in the striatal DZ aswell (Fig. 2d). Few labeled cells were seen in the region ofthe anterior preoptic DZ (Fig. 2e).
A strong signal also was detected in the lateral part ofthe ventral diencephalon (Figs.1a, 2c,d). Here, a thin layerof labeled cells just above the hypothalamic and ventralthalamic VNE expanded over a relatively large area (Fig.1a). In the ventral thalamic DZ, the majority of labeledcells were found in the region of the prospective zonaincerta (ZI). A group of cells ventral to ZI can be ascribedto the developing entopeduncular nucleus. Some labeledcells in the ventral area of this expression domain possiblybelonged to the hypothalamic DZ. The area correspondingto the ventral and mammillary hypothalamic DZ clearlywas negative.
In the mesencephalon, the lateral part of the anteriorand posterior tegmental DZ was strongly positive (Figs.1a,a9,b,b9, 2a,b), whereas it was free of signal ventrally.Hybridization signal was stronger at the border with theVNE than in outer DZ cells (Fig. 2a,b). The signal in thetegmental DZ was continuous with GAD-expressing cellsin the pretectal area but weakened toward the pretectalroof.
In the rhombencephalon, the DZ abutting the pontineand medullary VNE of the basal plate showed strongexpression (Figs. 1a,a9, 2c–e). Labeled cells in this regiontended to segregate into smaller domains (Fig. 2e) thatwere more distinct at later embryonic stages. The strongexpression in the myencephalic basal plate was continu-ous caudally with that in the spinal cord DZ (Fig. 1).
Fig. 1. Autoradiograms of two neighboring parasagittal sectionsfrom embryonic day 10.5 (E10.5) mouse embryo hybridized with the35S-labeled, 65-kDa isoform of glutamic acid decarboxylase 65(GAD65; a–c) and GAD67 (a*–c*) cRNA probes. The sections arearranged from lateral to medial. Arrowhead in a indicates the olfac-tory placode, arrows in a and a9 indicate the end of the hybridization
signal in the ventral telencephalon (Tel), and arrow in c and c9 indi-cates distinct signal at the level of the pallidal differentiating zone(DZ). D, diencephalon; MGE, medial ganglionic eminence; Md, me-dulla; Mes, mesencephalon; PT, pretectum; Spc, spinal cord; TG,tegmentum; VT, ventral thalamus. Scale bar 5 1 mm.
610 Z. KATAROVA ET AL.
Fig. 2. a–e: Hybridization of digoxigenin (DIG)-labeled GAD67probe on cross sections from E10.5 mouse embryos. The section shownin b is a higher magnification view of the boxed area shown in a. Thesections are arranged from lateral to medial. Arrows in b indicateGAD-expressing cells in the ventricular neuroepithelium (VNE), andarrowheads in e indicate areas free of hybridization signal in the
pontine region. ATG, anterior tegmentum; DZ, differentiating zone;MGE, medial ganglionic eminence; HYP, hypothalamus; Mes, mesen-cephalon; op, olfactory placode; or, optic recess; p, pallidal VNE; POA,anterior preoptic area; PT, pretectum; PTG, posterior tegmentum; s,striatal VNE; Tel, telencephalon; VNE, ventricular neuroepithelium;VT, ventral thalamus. Scale bar 5 300 mm in a,c–e; 100mm in b.
611GAD ISOFORM EXPRESSION IN MOUSE EMBRYO

No expression was detected in the regions of the dorsaltelencephalon (future neocortex and hippocampus), dorsalthalamus and epithalamus, tectal mesencephalon (futureinferior and superior colliculi), cerebellum, rhinencepha-lon, posterior preoptic area, and amygdala. We did notobserve hybridization signal at the midline of the anteriorventral telencephalon (septal area). This is supported byearlier findings that septal neurons are generated at laterdevelopmental stages (Bayer and Altman, 1995).
Expression of GAD67 and GAD65 atstage E11.5
At E11.5, the CNS is characterized by expansion of theVZ and DZ, with more cells undergoing their final mitosisand proceeding toward differentiation than at E10.5. Cor-respondingly, the expression domains of both GAD formsexpand visibly. The overall distribution pattern of thesignal seen in E10.5 embryo was preserved, although newsites with clear hybridization signal appeared (Figs. 3, 4).Similar to E10.5 embryos, the hybridization patterns withthe two GAD probes essentially overlapped (Figs. 3, 4),with GAD65 probes giving stronger signals and showingsharper boundaries of expression domains. The hybridiza-tion signal was localized predominantly in the DZ. Onlyscattered cells were seen in the VNE of each expressiondomain. On sections that were hybridized with DIG-labeled probes, a gradient of expression was apparent,
especially with GAD67 probes, with cells in the DZ thatwere situated closer to the VNE labeled more intenselythan those that were situated closer to the pial surface.This was more pronounced in GAD-expressing regionsthat showed strong hybridization signal at E10.5, such asthe MGE, myelencephalon, and spinal cord (Fig. 4a–e,h).In the structures of the brain alar plate, a dorsoventralgradient was observed (Fig. 4a–e). In the MGE, the local-ization of the strongest hybridization signal roughly cor-responded to the region of the secondary proliferativepopulation (SPP; Bhide, 1996; Sheth and Bhide, 1997)that contained proliferating but already committed neu-ronal precursors. Cells in the posterior tegmental region(Fig. 4a–c) and in the pontine small cell group (Fig. 5b)showed the strongest signal in the brain.
In the head, strong expression was seen in the olfactoryepithelium of the ventral aspect of the olfactory pit (Figs.3b, 4a,c–f). A faint signal was observed in the oral epithe-lium in both the mandibular part and the maxillary part(Fig. 4f). This signal weakened in E12.5 embryos (data notshown).
In the forebrain, a large cluster of densely packed cellsin the pallidal DZ of the MGE (Figs. 3a,a9,b,b9,c,d9, 4a,c–f)showed strong-to-moderate hybridization signal. In itsmost laterocaudal aspect, this domain merged with agroup of moderately stained cells of the amygdaloid DZ(Fig. 4g). The labeled cells of the pallidal DZ expanded
Fig. 3. Autoradiograms of parasagittal sections from E11.5mouse embryo hybridized with 35S-labeled GAD65 (a–d) andGAD67 (a*–d*) probes. Arrowheads in a and b indicate olfactoryepithelium, small arrows in a and b indicate the end of the hybrid-ization signal in the ventral telencephalon (Tel), and crossed arrows
in d and c9 indicate distinct signal in the midline basal Tel close to theseptal ventricular neuroepithelium. MGE, medial ganglionic emi-nence; HYP, hypothalamus; Md, medulla; Mes, mesencephalon; PT,pretectum; Spc, spinal cord; TG, tegmentum; VT, ventral thalamus.Scale bar 5 1 mm.
612 Z. KATAROVA ET AL.

anterolaterally, abutting the striatal VNE (Fig. 4f,g). Ros-trally, the pallidal DZ was continuous with a thin layer ofstrongly labeled cells (Figs. 3a,b,b9, 4a,c–f). The expres-sion zone in the ventral telencephalon ended roughly atthe site where pioneer olfactory receptor axons penetrateinto the telencephalic VNE during olfactory bulb induc-tion (Fig. 4a,c–g; Gong and Shipley, 1995; S. Prodan andZ. Katarova, unpublished results). Rostrolaterally, thisdomain was continuous with a small group of scattered,labeled cells approximately in the area of the prospectiveanterior piriform cortex (Fig. 4g). A small group of cellsshowed hybridization signal in the ventral telencephalonclose to the midline at the level of the posterior septal VNE(Figs. 3d,c9, 4b). Laterally, this domain was continuouswith the pallidal DZ of the MGE, and, caudally, it abuttedthe VNE of the anterior preoptic area. Few cells werelabeled in the septal DZ of neighboring sections (notshown). These overlapped laterally with the cells of thepallidal DZ. At this stage, more labeled cells were seen inthe anterior preoptic area (Fig. 4a,c,d) than at E10.5, anda few GAD-expressing cells also extended over the poste-rior preoptic DZ.
The hybridization signal in the diencephalon was seg-regated far more compared with the signal seen at E10.5(Fig. 4a–e). Lightly stained cells were detected in themedial part of the ventral hypothalamus just rostral to thepituitary anlage, in the area of the future retrochiasmaticand arcuate nuclei (Fig. 4b). More laterally, around thelevel of the hypothalamic third ventricle, the anteriorhypothalamic DZ contained numerous, labeled, positivecells (Figs. 3b, 4a,c). These cells formed a stripe (Fig. 4c),which, by its position, appeared to overlap with the hypo-thalamic cell cord and the tuberal hypothalamus in pro-somere 5 (p5) and with the suprachiasmatic and retrochi-asmatic area in p6 according to the prosomeric model ofPuelles and Rubenstein (1993). There was no hybridiza-tion signal in the hypothalamic anterodorsal nucleus or inthe mammillary or supraoptic-paraventricular areas (Fig.4a,c). Dorsally, the hybridization signal of the hypotha-lamic DZ merged with that of the ventral thalamic DZ(Fig. 4c–e). At this stage, the ventral thalamus clearlysegregates into smaller domains that correspond to previ-ously characterized structural divisions (see Stoykova etal., 1996). Areas containing cells of the prospective ZI, thereticular thalamic nucleus (Rt), and the ventrolateralgeniculate nucleus (VLGN) showed medium-to-high hy-bridization signal (Figs. 3a,a9, 4a,c–e). The strongest hy-bridization signal was observed in the lateral regions ofthis expression domain (compare Fig. 4e with Fig. 4d). Thearea described as pars ventralis thalami by Stoykova et al.(1996) also contained intensely labeled cells (Fig. 4e). Acell cord along the zona limitans intrathalamica (zli),across the p2/p3 boundary, was distinguishable clearlyfrom the ZI, pars ventralis thalami, and dorsal thalamus(Fig. 4a,c,d) and mixed rostrally with the GAD-positivecells of the prospective Rt (Fig. 4d). This domain wascontinuous with a medium-to-high GAD-expressing cellcord along the subthalamic sulcus (Fig. 4a,c) that fusedcaudally with the anterior tegmental area in p1. The areaof the principal thalamic nuclei in the dorsal thalamuswas free of hybridization signal (Fig. 4d,e). In the poste-rior entopeduncular area, there was a group of moreloosely packed, GAD-expressing cells (Fig. 4d,e). Similarcellular staining was detected in the anterior entopedun-cular area adjacent to the posterolateral pallidal DZ (Fig.
4d,e). In the space between the two preentopeduncularnuclei, scattered cells showing medium hybridization sig-nal were observed (Fig. 4d,e). Distinct signal was seen ina small group of cells in the diencephalic roof located closeto the midline and just anterior to the posterior commis-sure (pc; Fig. 4b). Laterally, this structural domainmerged with the labeled cells of the pretectal area. A largepopulation of cells with medium-to-high hybridization sig-nal was found in the pretectal DZ (Figs. 3a,a9,b, 4a,c). Itwas continuous ventrally with the tegmental DZ, which,at this stage, segregated into several structural domains(Figs. 4a–c, 5a). The perioculomotor nuclei in the anteriortegmental DZ were labeled strongly, although individualnuclei could not be identified (Fig. 4a). Similar to E10.5embryos, there was a strong hybridization signal in theposterior tegmental VNE (Fig. 4b,c). The presumptive re-gion of the oculomotor nucleus in the ventral tegmentalregion was free of hybridization signal (Fig. 4a,b).
The cerebellar anlage also was free of hybridizationsignal, with the exception of a cell row in the DZ of thelateral cerebellar primordium. This row of cells mergedwith GAD-expressing cells of the prospective lateral lem-niscus (Paxinos et al., 1991) in the pontine DZ (Fig. 4d–f).
Strong hybridization signal was seen in the basalrhombencephalon, including the isthmus. In the DZ of theisthmic alar plate, the signal was restricted to a smallgroup of cells (Fig. 4b). Most likely, these cells representthe GABAergic component of the parabrachial nuclei(Paxinos et al., 1991), which originate at E10–E11 (TaberPierce, 1973). At this stage, the hybridization pattern ofthe pons and medulla was much more complex than atE10.5 (Figs. 4, 5b). In parasagittal sections, patches ofnonexpressing regions were seen at the interrhombomericboundaries of rhombomere 6 (r6) with r5 and r7 (Fig. 4b),more laterally in r6 itself (Fig. 4c), and in r1 and r2 (Figs.4d, 5b). There was a strong hybridization signal in r4,which receives the cochlear nerve root (Fig. 4d–f). In hor-izontal sections, the rhombencephalon exhibited alternateGAD-expressing and nonexpressing columns (Figs. 4, 5b).Three main GAD-expressing bands were detected (Fig.5b,c1–c3) that were continuous through the entire lengthof the pons (partially shown in Fig. 5b). The most lateralcolumn (Fig. 5b, c1) was continuous with GAD-expressingcells in the dorsal horn of spinal cord (Fig. 5b), whereasthe other two, more medial bands (Fig. 5b, c2 and c3)seemed to be connected with the intermediate zone (Fig.5b; results not shown). A weaker and more diffuse GAD-expressing cell zone was seen at the midlevel of therhombencephalon crossing all three columns (Fig. 5b),approximately at the level of r5. This structure becomesmore obvious at E12.5.
In the spinal cord, GAD67 expression was present inboth dorsal and ventral aspects of the differentiating neu-roepithelium and was highest in the intermediate zoneand dorsal horn DZ (Figs. 3c,d, 5c). Labeled cells weremore numerous in the dorsal horn and intermediate zoneDZ than in the ventral horn DZ (Fig. 5c). Although weobserved GAD65 expression in the spinal cord (Fig. 3c9,d9),we did not map its topographic localization. No hybridiza-tion signal was detected in the cerebral cortex (except forfew labeled cells in the piriform cortex), epithalamus, hip-pocampus, or tectum (superior and inferior colliculus).
613GAD ISOFORM EXPRESSION IN MOUSE EMBRYO
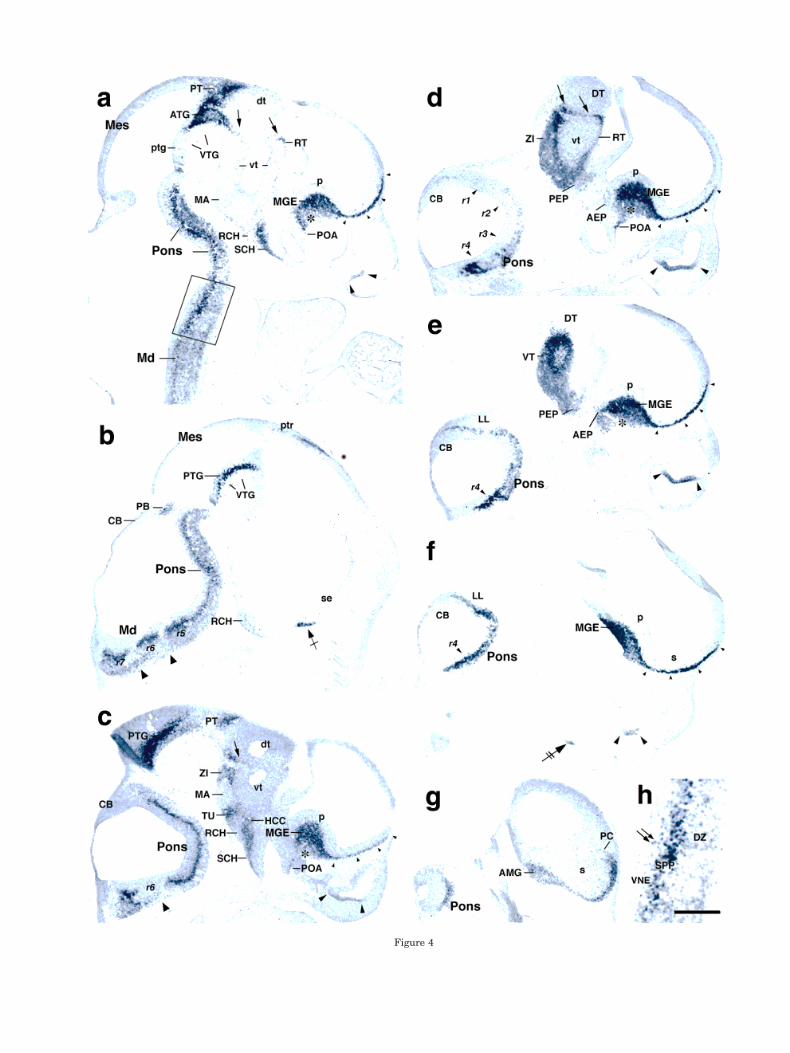
Figure 4

Expression of GAD67 and GAD65 atstage E12.5
The embryo at E12.5 is characterized by massive differ-entiation of CNS neurons and PNS neurons accompaniedby expansion of the DZ, appearance of the subventricularzone (SVZ), and induction of numerous neuron-specificgenes. Consistent with these events, the DZ and the GADexpression domains expanded at early-expressing sites,like the MGE and the thalamus (Figs. 6, 7), and expres-sion appeared at new sites, such as the cerebellum and thesuperior colliculus (Figs. 6a,b, 7a). Overall, the pattern inthe nervous system was similar to that seen in E11.5embryos, with predominant labeling of the DZ and theSPP. The VZ contained only a few labeled cells. At this
stage, the differences between hybridization patterns ob-served with GAD65 and GAD67 probes were more notice-able than at E11.5 (see below). The signal in the olfactoryepithelium still was detectable but was weaker than seenat E11.5 (Fig. 6d).
In the forebrain, the inside-out expression gradient wasstronger with GAD67 than with GAD65 (compare Fig.6a,b with Fig. 6c,d). At this stage, the lateral ganglioniceminence (LGE) started to bulge at its site and was dis-tinguished clearly from the MGE. The pallidal DZ in theMGE showed medium-to-high hybridization signal, withthe strongest label in the presumptive SPP, which occu-pies the border between the VZ and the SVZ (Figs. 6a–d,7d–f; Bhide, 1996; Anderson et al., 1997b). Laterally, this
Fig. 5. a–c: Hybridization pattern obtained with of DIG-labeledGAD67 probes on cross sections from E11.5 mouse embryos. Arrows ina indicate GAD-expressing columns in the mesencephalon; arrows inb indicate a diffuse, GAD-expressing cell zone crossing the all thethree GAD-expressing columns (c1–c3); and arrowheads in b indicatea cell group with strong GAD expression. ap, alar plate; ATG, anterior
tegmentum; bp, basal plate; CB, cerebellum; Dh, dorsal horn; DZ,differentiating zone; GE, ganglionic eminence; ip, intermediate plate;Is, isthmus; Md, medulla; Mes, mesencephalon; Spc, spinal cord; PTG,posterior tegmentum; r1 and r2, rhombomeres 1 and 2; Vh, ventralhorn; VNE, ventricular neuroepithelium. Scale bar 5 300 mm in a,b;100 mm in c.
Fig. 4. a–h: Hybridization pattern obtained with DIG-labeledGAD67 probes on sagittal sections from E11.5 mouse embryos. Thesection shown in h is a higher magnification view of the boxed area ina. An asterisk in a and c–e indicates an area with lighter hybridiza-tion signal in the MGE. In a and c–f, small arrowheads indicate a lineof GAD-expressing cells in the ventral telencephalon, and large ar-rowheads indicate olfactory epithelium. Arrowheads in b and c indi-cate areas free of hybridization signal in the pontine and medullaryregion; arrows in a, c, and d indicate the zona limitans intrathalamicaand its continuation in prosomere 2 (p2); double arrows in h indicateGAD-expressing cells in the ventricular neuroepithelium (VNE);crossed arrow in b indicates distinct signal in the midline ventraltelencephalon; and double-crossed arrow in f indicates a cluster ofpositive cells in the mandible part of the first branchial arch thatprobably corresponds to a condensation during initial stages of tooth
development (data not shown). AEP, anterior entopeduncular area;AMG, amygdala; ATG, anterior tegmentum; CB, cerebellum; dt, dor-sal thalamic VNE; DT, dorsal thalamus; DZ, differentiating zone;MGE, medial ganglionic eminence; HCC, hypothalamic cell cord; LL,nuclei of lateral lemniscus; MA, mammillary area; Md, medulla; Mes,mesencephalon; p, pallidal VNE; PB, area of the parabrachial nuclei;PC, piriform cortex; PEP, posterior entopeduncular area; POA, ante-rior preoptic area; PT, pretectum; ptg, posterior tegmental VNE; PTG,posterior tegmentum; ptr, pretectal roof; r1–r7, rhombomeres 1–7;RCH, retrochiasmatic area; RT, reticular thalamic nucleus; s, striatalVNE; se, septal VNE; SCH, suprachiasmatic area; SPP, secondaryproliferative population; TU, tuberal hypothalamus; VNE, ventricularneuroepithelium; vt, ventral thalamic VNE; VT, ventral thalamus;VTG, ventral tegmental region; ZI, zona incerta. Scale bar 5 500 mmin a–g; 250 mm in h.
615GAD ISOFORM EXPRESSION IN MOUSE EMBRYO
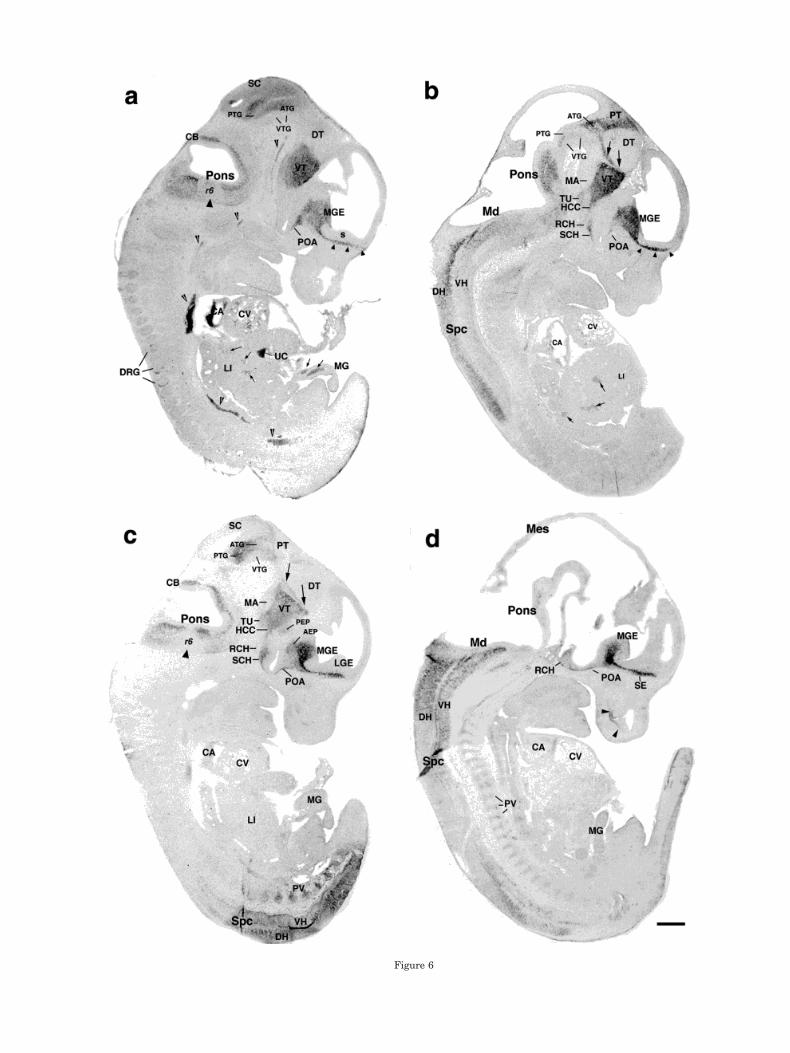
Figure 6

domain merged with the GAD-expressing cells of the stri-atal DZ in the LGE (Figs. 6a,c, 7d–f). At the striatocorticalborder, scattered cells showed light hybridization signal.Some of these GAD-expressing cells (one to three cells persection) were found in the cortical DZ (not shown). Cau-dally, the MGE was continuous with a group of medium-labeled cells of the anterior entopeduncular area, whichappeared as a distinct structural domain (Figs. 6c, 7e). Atthis stage, the septal DZ contained a number of GAD-expressing cells (Figs. 6d, 7f). GAD expression also wasdetected in the amygdaloid area, in which low numbers ofcells showed medium labeling (Fig. 7d).
In the diencephalon, in the region of the optic recess,expression was present in discrete domains correspondingto the anterior and posterior preoptic area and suprachi-asmatic nuclei (Figs. 6a–d, 7f). In general, the expressionpattern of the hypothalamic region was very similar tothat seen at E11.5 (Figs. 6b,c, 7d–f, 10). In the ventralhypothalamus, only a few lightly hybridized cells could beseen around the midline (Fig. 6d). Light hybridizationsignal was seen in the retrochiasmatic and tuberal area(Figs. 6b–d, 7d–f). No signal was detected in the hypotha-lamic anterodorsal nucleus, mammillary area, orsupraoptic-paraventricular area (Figs. 6b,c, 7 d,e, 10). Thehypothalamic cell cord, which was continuous ventrallywith the suprachiasmatic area and dorsally with the pos-terior entopeduncular area, showed strong hybridizationsignal (Figs. 6b,c, 7d,e).
The ventral thalamus (ZI, pars ventralis thalami, Rt,and VLGN) was among the regions that showed the high-est level of expression with both GAD probes (Figs. 6a–c,7c). Similar to E11.5 embryos, the labeled cells along thezli formed a distinct expression domain that was contin-uous with a GAD-expressing cell cord along the subtha-lamic sulcus (Figs. 6b,c, 7c). The latter domain fused cau-dally with the anterior tegmental area in p1. Dorsally, thecells of the principal thalamic nuclei did not express GAD(Figs. 6a–c, 7c). In cross sections, however, a faint signalwas detected in a streak of cells in the dorsal thalamicmantle zone (Fig. 7c) that obviously was continuous withthe expression domain along the zli. The posterior ento-peduncular area showed medium hybridization signal(Fig. 6c). Many cells of this region were located anteroven-trally, most likely in the migratory streak toward theanterior entopeduncular area (Fig. 6c). No labeling wasseen in the epithalamic DZ and VNE (Fig. 7c). Neurons ofthe pretectal area showed medium-to-high hybridizationsignal (Fig. 6b,c).
In the mesencephalon, similar to the telencephalon anddiencephalon, GAD expression was detected in regionswith more advanced differentiation (Figs. 6a–c, 7b). More-
over, the hybridization signal appeared in the tectal DZ, inwhich cells of the prospective superior colliculus werestained lightly (Figs. 6a,c, 7a). This expression domainroughly ended at the level of the inferior colliculus, which,in contrast to the superior colliculus, did not contain GAD-expressing cells (Figs. 7b, 10). The tegmental area con-tained cells with very high-to-medium hybridization sig-nal (Figs. 6a–c, 7b) belonging to perioculomotor nuclei, themesencephalic reticular formation, the substantia nigra,and the ventral tegmental area, although the respectiveborders of these centers could not be distinguished. Thehybridization signal was localized to the dorsal region ofthe tegmental area, whereas the ventral tegmental regionwas free of hybridization signal (Fig. 6b,c). The area of thefuture parabrachial nuclei showed medium hybridizationsignal (not shown).
In the cerebellar anlage, a group of cells in the cerebel-lar DZ was labeled moderately (Fig. 6a,c). Serial sectionsrevealed that the signal was present in DZ3 (Fig. 6a,c) butwas absent in DZ1 (not shown; see Altman and Bayer,1997).
Expression in the myelencephalon was restricted to theDZ. GAD65 signal was most evident in clusters of cells atthe VZ/DZ border. In general, however, GAD65 probe pro-duced a fainter signal than GAD67 (compare Fig. 6a,bwith Fig. 6c,d). Similar to E11.5 embryos, non-GAD-expressing domains were recognized clearly in r1, r2(Fig.7c), and r6 (Fig.6a,c) and at the interrhombomericboundary of r6 with r5 and r7 (not shown). The signal inthe rhombencephalon showed a similar columnar organi-zation, but the columns were less distinct. The rostral partof the pons had a more diffuse staining pattern. The mostlateral band (c1) widened at the medullary level (Fig.7d–g). The two medial bands (c2 and c3) were recognizableclearly only dorsally (Fig. 7d), whereas, ventrally, theymerged into one wide band (Fig. 7e,g) that ended in themedulla (Fig. 7d–g). A band that showed lighter hybrid-ization signal was present across the myelencephalon(Fig. 7e,g). This band contained GAD-expressing cellsmixed with cells that showed no hybridization signal.
Expression in the most lateral band was continuouscaudally with that in the spinal cord (Figs. 6b,d, 7e–g).The cellular distribution patterns of the two GAD forms inthe spinal cord differed remarkably from each other (com-pare Fig. 6b with Fig. 6d; compare Fig. 7h with Fig. 7i).GAD65-expressing cells were lined along the VZ of theentire dorsal horn and part of intermediate zone and inthe corresponding DZ, whereas the ventral horn regionwas nearly free of signal (Figs. 6b, 7h). Conversely,GAD67 hybridization signal was detected in both dorsaland ventral aspects of the neural tube (Figs. 6d, 7i). At
Fig. 6. E12.5 parasagittal sections hybridized with GAD65 (a,b) orGAD67 (c,d) DIG-labeled probes. Sections in a and c are from neigh-boring sections, b was taken from the contralateral region of theembryo, and d represents a midline section. Small arrowheads in aand b indicate GAD-expressing cells in the ventral telencephalon;thin, large arrowheads in d indicate olfactory epithelium; thick, largearrowheads in a and c indicate areas free of hybridization signal in thepontine region; open arrowheads in a indicate blood vessel; largearrows in b and c indicate the zona limitans intrathalamica and itscontinuation in prosomere 2 (p2); and small arrows in a and b indicateGAD-expressing cell patches in the liver and midgut. AEP, anteriorentopeduncular area; ATG, anterior tegmentum; CA, cardiac atrium;
CB, cerebellum; CV, cardiac ventricle; DH, dorsal horn; DRG, dorsalroot ganglia; DT, dorsal thalamus; HCC, hypothalamic cell cord; LGE,lateral ganglionic eminence; LI, liver; MA, mammillary area; Md,medulla; Mes, mesencephalon; MG, midgut; MGE, medial ganglioniceminence; PEP, posterior entopeduncular area; POA, anterior preop-tic area; PT, pretectum; PTG, posterior tegmentum; PV, prevertebra;r6, rhombomere 6; RCH, retrochiasmatic area; s, striatal VNE; SE,septum; SC, superior colliculus; SCH, suprachiasmatic area; Spc,spinal cord; TU, tuberal hypothalamus; UC, umbilical cord; VH, ven-tral horn; VT, ventral thalamus; VTG, ventral tegmental region. Scalebar 5 500 mm.
617GAD ISOFORM EXPRESSION IN MOUSE EMBRYO

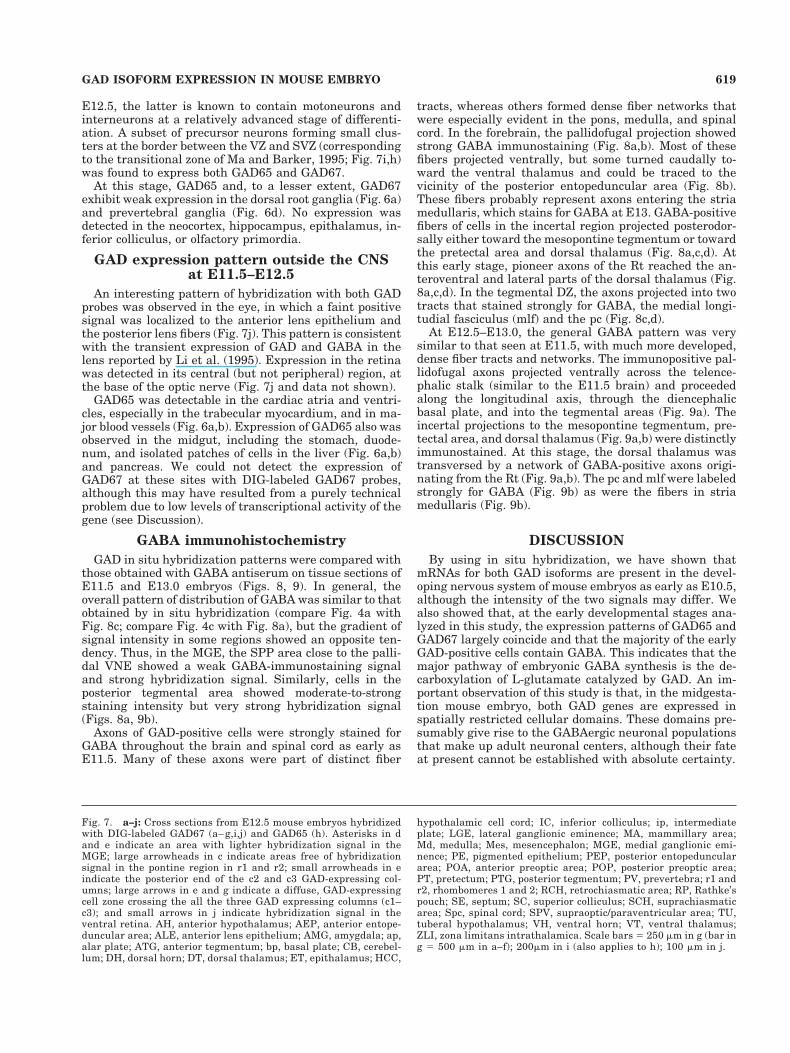
Figure 7
E12.5, the latter is known to contain motoneurons andinterneurons at a relatively advanced stage of differenti-ation. A subset of precursor neurons forming small clus-ters at the border between the VZ and SVZ (correspondingto the transitional zone of Ma and Barker, 1995; Fig. 7i,h)was found to express both GAD65 and GAD67.
At this stage, GAD65 and, to a lesser extent, GAD67exhibit weak expression in the dorsal root ganglia (Fig. 6a)and prevertebral ganglia (Fig. 6d). No expression wasdetected in the neocortex, hippocampus, epithalamus, in-ferior colliculus, or olfactory primordia.
GAD expression pattern outside the CNSat E11.5–E12.5
An interesting pattern of hybridization with both GADprobes was observed in the eye, in which a faint positivesignal was localized to the anterior lens epithelium andthe posterior lens fibers (Fig. 7j). This pattern is consistentwith the transient expression of GAD and GABA in thelens reported by Li et al. (1995). Expression in the retinawas detected in its central (but not peripheral) region, atthe base of the optic nerve (Fig. 7j and data not shown).
GAD65 was detectable in the cardiac atria and ventri-cles, especially in the trabecular myocardium, and in ma-jor blood vessels (Fig. 6a,b). Expression of GAD65 also wasobserved in the midgut, including the stomach, duode-num, and isolated patches of cells in the liver (Fig. 6a,b)and pancreas. We could not detect the expression ofGAD67 at these sites with DIG-labeled GAD67 probes,although this may have resulted from a purely technicalproblem due to low levels of transcriptional activity of thegene (see Discussion).
GABA immunohistochemistry
GAD in situ hybridization patterns were compared withthose obtained with GABA antiserum on tissue sections ofE11.5 and E13.0 embryos (Figs. 8, 9). In general, theoverall pattern of distribution of GABA was similar to thatobtained by in situ hybridization (compare Fig. 4a withFig. 8c; compare Fig. 4c with Fig. 8a), but the gradient ofsignal intensity in some regions showed an opposite ten-dency. Thus, in the MGE, the SPP area close to the palli-dal VNE showed a weak GABA-immunostaining signaland strong hybridization signal. Similarly, cells in theposterior tegmental area showed moderate-to-strongstaining intensity but very strong hybridization signal(Figs. 8a, 9b).
Axons of GAD-positive cells were strongly stained forGABA throughout the brain and spinal cord as early asE11.5. Many of these axons were part of distinct fiber
tracts, whereas others formed dense fiber networks thatwere especially evident in the pons, medulla, and spinalcord. In the forebrain, the pallidofugal projection showedstrong GABA immunostaining (Fig. 8a,b). Most of thesefibers projected ventrally, but some turned caudally to-ward the ventral thalamus and could be traced to thevicinity of the posterior entopeduncular area (Fig. 8b).These fibers probably represent axons entering the striamedullaris, which stains for GABA at E13. GABA-positivefibers of cells in the incertal region projected posterodor-sally either toward the mesopontine tegmentum or towardthe pretectal area and dorsal thalamus (Fig. 8a,c,d). Atthis early stage, pioneer axons of the Rt reached the an-teroventral and lateral parts of the dorsal thalamus (Fig.8a,c,d). In the tegmental DZ, the axons projected into twotracts that stained strongly for GABA, the medial longi-tudial fasciculus (mlf) and the pc (Fig. 8c,d).
At E12.5–E13.0, the general GABA pattern was verysimilar to that seen at E11.5, with much more developed,dense fiber tracts and networks. The immunopositive pal-lidofugal axons projected ventrally across the telence-phalic stalk (similar to the E11.5 brain) and proceededalong the longitudinal axis, through the diencephalicbasal plate, and into the tegmental areas (Fig. 9a). Theincertal projections to the mesopontine tegmentum, pre-tectal area, and dorsal thalamus (Fig. 9a,b) were distinctlyimmunostained. At this stage, the dorsal thalamus wastransversed by a network of GABA-positive axons origi-nating from the Rt (Fig. 9a,b). The pc and mlf were labeledstrongly for GABA (Fig. 9b) as were the fibers in striamedullaris (Fig. 9b).
DISCUSSION
By using in situ hybridization, we have shown thatmRNAs for both GAD isoforms are present in the devel-oping nervous system of mouse embryos as early as E10.5,although the intensity of the two signals may differ. Wealso showed that, at the early developmental stages ana-lyzed in this study, the expression patterns of GAD65 andGAD67 largely coincide and that the majority of the earlyGAD-positive cells contain GABA. This indicates that themajor pathway of embryonic GABA synthesis is the de-carboxylation of L-glutamate catalyzed by GAD. An im-portant observation of this study is that, in the midgesta-tion mouse embryo, both GAD genes are expressed inspatially restricted cellular domains. These domains pre-sumably give rise to the GABAergic neuronal populationsthat make up adult neuronal centers, although their fateat present cannot be established with absolute certainty.
Fig. 7. a–j: Cross sections from E12.5 mouse embryos hybridizedwith DIG-labeled GAD67 (a– g,i,j) and GAD65 (h). Asterisks in dand e indicate an area with lighter hybridization signal in theMGE; large arrowheads in c indicate areas free of hybridizationsignal in the pontine region in r1 and r2; small arrowheads in eindicate the posterior end of the c2 and c3 GAD-expressing col-umns; large arrows in e and g indicate a diffuse, GAD-expressingcell zone crossing the all the three GAD expressing columns (c1–c3); and small arrows in j indicate hybridization signal in theventral retina. AH, anterior hypothalamus; AEP, anterior entope-duncular area; ALE, anterior lens epithelium; AMG, amygdala; ap,alar plate; ATG, anterior tegmentum; bp, basal plate; CB, cerebel-lum; DH, dorsal horn; DT, dorsal thalamus; ET, epithalamus; HCC,
hypothalamic cell cord; IC, inferior colliculus; ip, intermediateplate; LGE, lateral ganglionic eminence; MA, mammillary area;Md, medulla; Mes, mesencephalon; MGE, medial ganglionic emi-nence; PE, pigmented epithelium; PEP, posterior entopedunculararea; POA, anterior preoptic area; POP, posterior preoptic area;PT, pretectum; PTG, posterior tegmentum; PV, prevertebra; r1 andr2, rhombomeres 1 and 2; RCH, retrochiasmatic area; RP, Rathke’spouch; SE, septum; SC, superior colliculus; SCH, suprachiasmaticarea; Spc, spinal cord; SPV, supraoptic/paraventricular area; TU,tuberal hypothalamus; VH, ventral horn; VT, ventral thalamus;ZLI, zona limitans intrathalamica. Scale bars 5 250 mm in g (bar ing 5 500 mm in a–f); 200mm in i (also applies to h); 100 mm in j.
619GAD ISOFORM EXPRESSION IN MOUSE EMBRYO
Coexpression of GAD65 and GAD67 genesin the mouse embryonic CNS
The results of this study indicate that GAD65 andGAD67 mRNAs at E10.5–E12.5 are expressed in domainsthat appear essentially overlapping in successive serialsections. This indicates that the two forms are colocalizedin the same putative, GABAergic, embryonic precursors,as they are in mature CNS neurons (Esclapez et al., 1993,1994). A clear exception is represented by the spinal cord,in which we observed a significant difference in the ex-pression pattern of the two GAD mRNAs. WhereasGAD65 signal was limited to the dorsal and intermediateDZ of the spinal cord, GAD67 was detected throughout thespinal cord DZ, including the ventral DZ. Similar obser-vations have been made recently for zebrafish embryos(Martin et al., 1998). This divergence of expression may berelated to the development of ventral horn inhibitory neu-rons that will corelease GABA and glycine (Jonas et al.,1998).
The two GAD forms, as pointed out previously, displaydifferent subcellular distributions and are believed to playdivergent roles within the same neuron (for review, seeSoghomonian and Martin, 1998). This assumption is sup-ported by recent knock-out experiments, which haveshown that mouse mutants for each gene show distinctphenotypes (Asada et al., 1996, 1997; Condie et al., 1997;Kash et al., 1997; Ji et al., 1999).
Domains of expression of GAD shareneuromeric boundaries with genes involvedin the determination of neuronal cell fate
Throughout stages E10.5–E12.5, GAD-expression do-mains respect the neuromeric boundaries defined by theexpression domains of genes playing key regulatory rolesin specifying positional and cellular identity along theanterior-posterior and dorsal-ventral axes of the develop-ing nervous system (Fig. 10; Puelles and Rubenstein,1993). In the region of the forebrain, GAD overlaps withthe expression of Mash1 (Guillemot and Joyner, 1993;Verma-Kurvari et al., 1996; Casarosa et al., 1999), Prox1(Oliver et al., 1993), and Dlx1/2 (Bulfone et al., 1993). Ofthese, Dlx1 and Dlx2 deserve special attention, becausetheir domains of expression in the forebrain seem essen-tially to overlap with those of the two GAD genes (Fig. 10;Puelles and Rubenstein, 1993). Similar to the GAD genes,
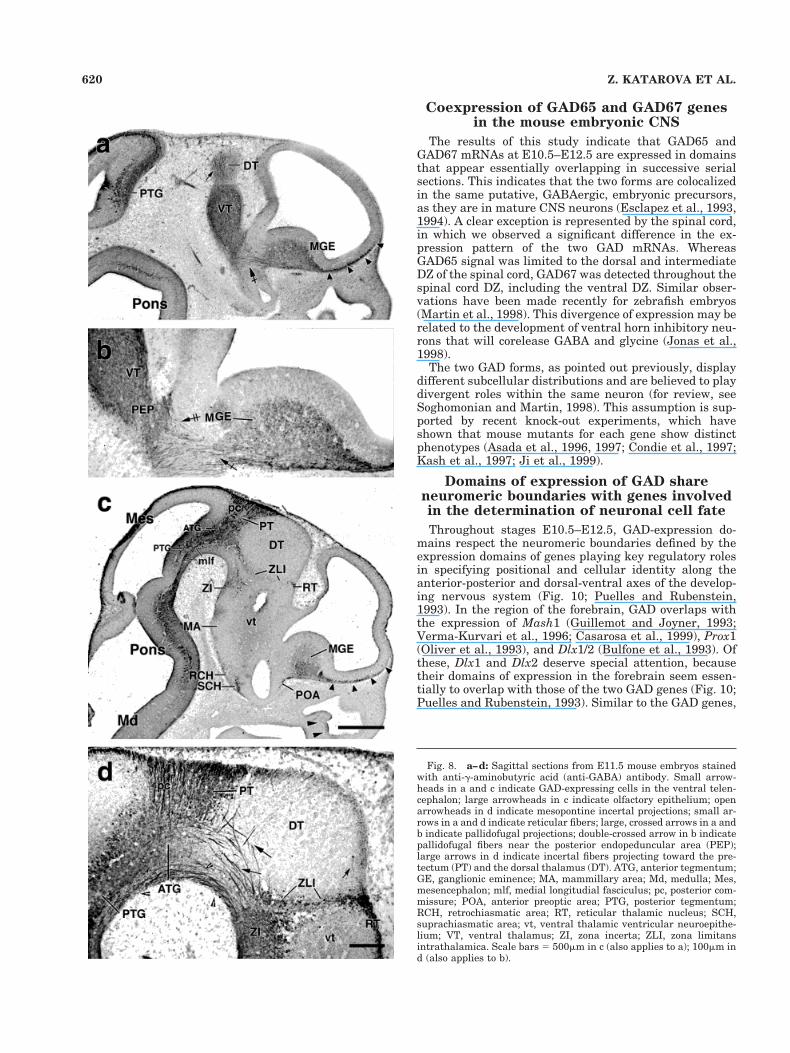
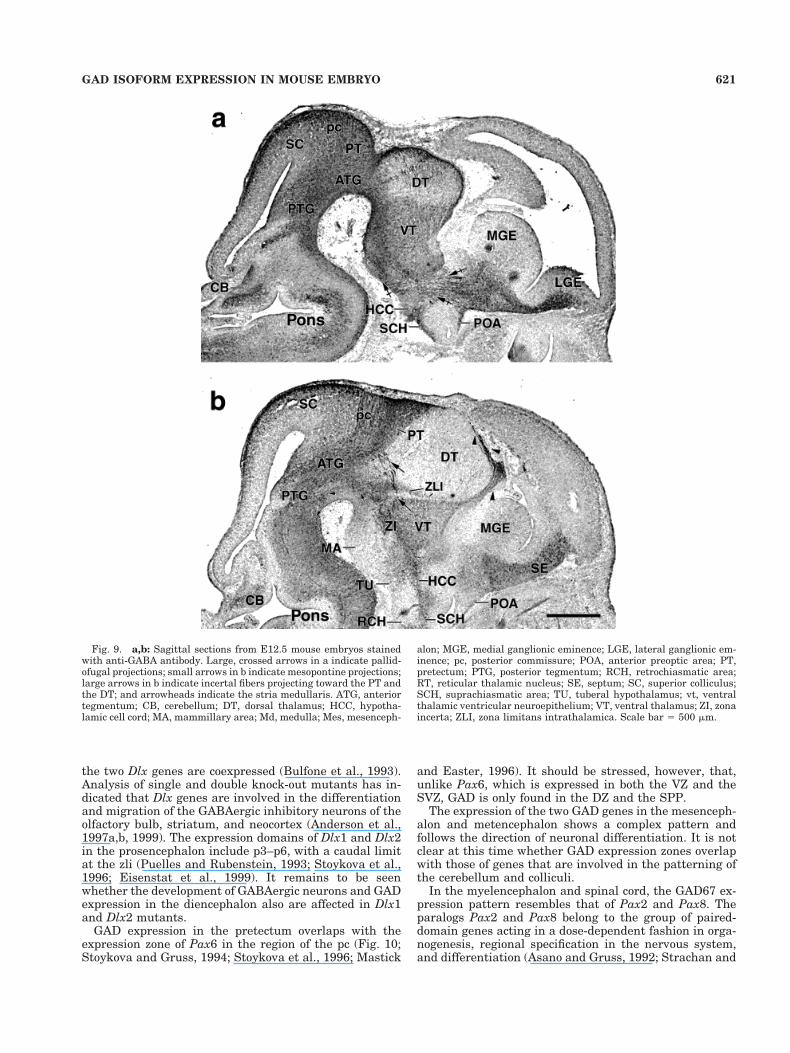
Fig. 8. a–d: Sagittal sections from E11.5 mouse embryos stainedwith anti-g-aminobutyric acid (anti-GABA) antibody. Small arrow-heads in a and c indicate GAD-expressing cells in the ventral telen-cephalon; large arrowheads in c indicate olfactory epithelium; openarrowheads in d indicate mesopontine incertal projections; small ar-rows in a and d indicate reticular fibers; large, crossed arrows in a andb indicate pallidofugal projections; double-crossed arrow in b indicatepallidofugal fibers near the posterior endopeduncular area (PEP);large arrows in d indicate incertal fibers projecting toward the pre-tectum (PT) and the dorsal thalamus (DT). ATG, anterior tegmentum;GE, ganglionic eminence; MA, mammillary area; Md, medulla; Mes,mesencephalon; mlf, medial longitudial fasciculus; pc, posterior com-missure; POA, anterior preoptic area; PTG, posterior tegmentum;RCH, retrochiasmatic area; RT, reticular thalamic nucleus; SCH,suprachiasmatic area; vt, ventral thalamic ventricular neuroepithe-lium; VT, ventral thalamus; ZI, zona incerta; ZLI, zona limitansintrathalamica. Scale bars 5 500mm in c (also applies to a); 100mm ind (also applies to b).
620 Z. KATAROVA ET AL.
the two Dlx genes are coexpressed (Bulfone et al., 1993).Analysis of single and double knock-out mutants has in-dicated that Dlx genes are involved in the differentiationand migration of the GABAergic inhibitory neurons of theolfactory bulb, striatum, and neocortex (Anderson et al.,1997a,b, 1999). The expression domains of Dlx1 and Dlx2in the prosencephalon include p3–p6, with a caudal limitat the zli (Puelles and Rubenstein, 1993; Stoykova et al.,1996; Eisenstat et al., 1999). It remains to be seenwhether the development of GABAergic neurons and GADexpression in the diencephalon also are affected in Dlx1and Dlx2 mutants.
GAD expression in the pretectum overlaps with theexpression zone of Pax6 in the region of the pc (Fig. 10;Stoykova and Gruss, 1994; Stoykova et al., 1996; Mastick
and Easter, 1996). It should be stressed, however, that,unlike Pax6, which is expressed in both the VZ and theSVZ, GAD is only found in the DZ and the SPP.
The expression of the two GAD genes in the mesenceph-alon and metencephalon shows a complex pattern andfollows the direction of neuronal differentiation. It is notclear at this time whether GAD expression zones overlapwith those of genes that are involved in the patterning ofthe cerebellum and colliculi.
In the myelencephalon and spinal cord, the GAD67 ex-pression pattern resembles that of Pax2 and Pax8. Theparalogs Pax2 and Pax8 belong to the group of paired-domain genes acting in a dose-dependent fashion in orga-nogenesis, regional specification in the nervous system,and differentiation (Asano and Gruss, 1992; Strachan and
Fig. 9. a,b: Sagittal sections from E12.5 mouse embryos stainedwith anti-GABA antibody. Large, crossed arrows in a indicate pallid-ofugal projections; small arrows in b indicate mesopontine projections;large arrows in b indicate incertal fibers projecting toward the PT andthe DT; and arrowheads indicate the stria medullaris. ATG, anteriortegmentum; CB, cerebellum; DT, dorsal thalamus; HCC, hypotha-lamic cell cord; MA, mammillary area; Md, medulla; Mes, mesenceph-
alon; MGE, medial ganglionic eminence; LGE, lateral ganglionic em-inence; pc, posterior commissure; POA, anterior preoptic area; PT,pretectum; PTG, posterior tegmentum; RCH, retrochiasmatic area;RT, reticular thalamic nucleus; SE, septum; SC, superior colliculus;SCH, suprachiasmatic area; TU, tuberal hypothalamus; vt, ventralthalamic ventricular neuroepithelium; VT, ventral thalamus; ZI, zonaincerta; ZLI, zona limitans intrathalamica. Scale bar 5 500 mm.
621GAD ISOFORM EXPRESSION IN MOUSE EMBRYO
Read, 1994; Mansouri et al., 1996). Similar to GAD, theyare detected mostly in the intermediate and mantle zoneof the hindbrain and spinal cord of midgestation mouseembryos (Stoykova and Gruss, 1994). If GAD acted down-stream of Pax2 and Pax8, then GAD expression in thespinal cord of Pax mutants is expected to be altered, apossibility that remains to be verified.
Topographical considerations
The earliest centers expressing GAD at E10.5 are thebasal ganglia, ventral thalamus, hypothalamus, pretectalarea, tegmentum, myelencephalon, and spinal cord. Dif-ferentiation of the GAD-positive cells in the tegmentum,myelencephalon, and spinal cord is more advanced than inmore rostral subdivisions. This becomes particularly ap-parent at E11.5. At this stage, the neurons with strongGAD hybridization signal also show prominent immuno-staining for GABA in their cell bodies and axons, whichform early recognizable tracts. Easter et al. (1993) andMastick and Easter (1996) identified the mouse mlf asearly as E9.5 and the pc at E10.5, and Lauder et al. (1986)reported GABA staining of these structures in rat em-bryos at E13. These tracts, together with other early ax-
onal tracts, are likely to play a role in the initial region-alization of the brain by forming a “grid” for permissiveaxonal growth (Ba-Charvet et al., 1998). That GABA mayplay a specific role in this process is an intriguing possi-bility.
The hybridization signal in the pretectal area correlateswell with the strong GABA staining of the pc. Based ontract-tracing studies (Berman, 1977; Terenzi et al., 1995),the GAD-positive neurons of the anterior and posteriorpretectal and magnocellular nucleus of the pc contributefibers to the strongly GABA-positive pc. The neurons ofthe mesencephalic trigeminal nucleus (Me5) are born atE9 (Taber Pierce, 1973) and form one of the earliest tractsin the embryonic brain, the descending tract of the mes-encephalic nucleus of the trigeminal nerve (dtmesV; Eas-ter et al., 1993; Mastick and Easter, 1996): Its neurons areintermixed with neurons giving rise to the pc and the mlf,although the former project exclusively into the dtmesV.Because GABA immunostaining is present in fibers of thepc and mlf but not in the dtmesV (see also Lauder et al.,1986), we assume that the neurons of the Me5 do notexpress GAD.
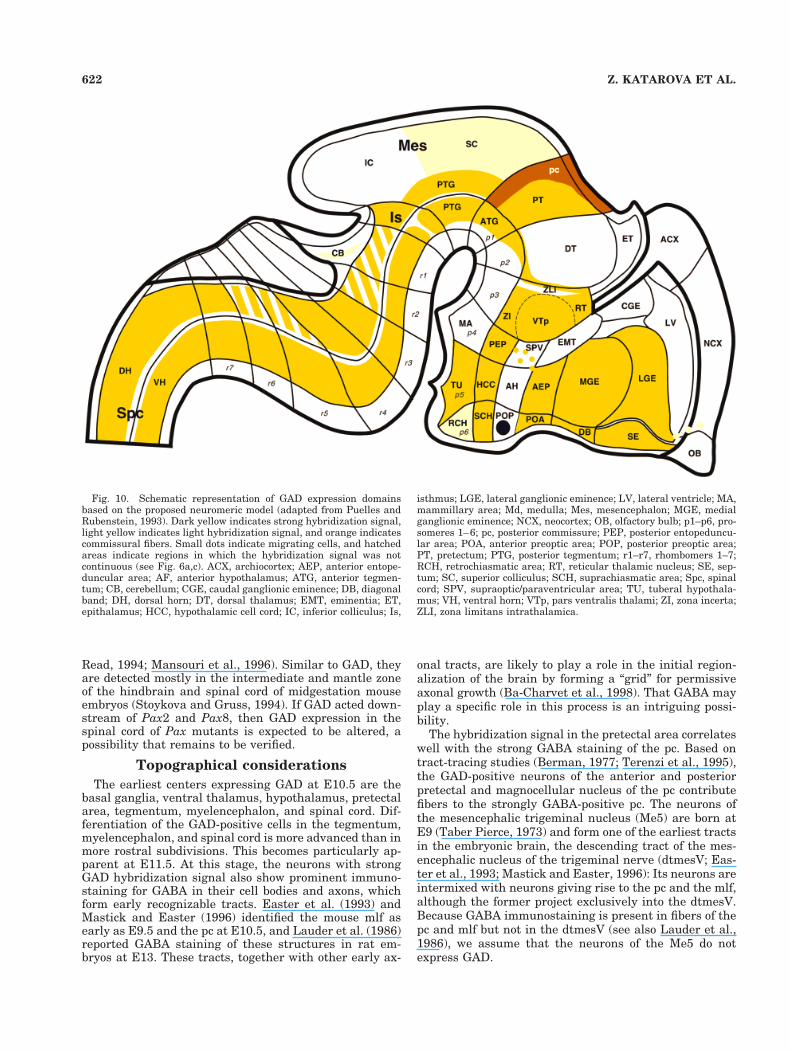
Fig. 10. Schematic representation of GAD expression domainsbased on the proposed neuromeric model (adapted from Puelles andRubenstein, 1993). Dark yellow indicates strong hybridization signal,light yellow indicates light hybridization signal, and orange indicatescommissural fibers. Small dots indicate migrating cells, and hatchedareas indicate regions in which the hybridization signal was notcontinuous (see Fig. 6a,c). ACX, archiocortex; AEP, anterior entope-duncular area; AF, anterior hypothalamus; ATG, anterior tegmen-tum; CB, cerebellum; CGE, caudal ganglionic eminence; DB, diagonalband; DH, dorsal horn; DT, dorsal thalamus; EMT, eminentia; ET,epithalamus; HCC, hypothalamic cell cord; IC, inferior colliculus; Is,
isthmus; LGE, lateral ganglionic eminence; LV, lateral ventricle; MA,mammillary area; Md, medulla; Mes, mesencephalon; MGE, medialganglionic eminence; NCX, neocortex; OB, olfactory bulb; p1–p6, pro-someres 1–6; pc, posterior commissure; PEP, posterior entopeduncu-lar area; POA, anterior preoptic area; POP, posterior preoptic area;PT, pretectum; PTG, posterior tegmentum; r1–r7, rhombomers 1–7;RCH, retrochiasmatic area; RT, reticular thalamic nucleus; SE, sep-tum; SC, superior colliculus; SCH, suprachiasmatic area; Spc, spinalcord; SPV, supraoptic/paraventricular area; TU, tuberal hypothala-mus; VH, ventral horn; VTp, pars ventralis thalami; ZI, zona incerta;ZLI, zona limitans intrathalamica.
622 Z. KATAROVA ET AL.
The anterior tegmental area contains strongly hybrid-izing cells and may give rise to several early-generatedstructures. The interstitial nucleus of the mlf (also re-ferred to as the interstitial nucleus of Cajal) and thenucleus of Darkschewitsch arise at E9–E10 (Taber Pierce,1973). Both are rich in GABAergic neurons that project tothe mlf. The magnocellular nucleus of the pc is anotherearly structure derived from this area, which extends fi-bers to the mlf, although fewer than 15% of its neurons areGABAergic.
The substantia nigra neurons originate from the teg-mental region at E12–E15 in rat (Marchand and Poirier,1983) and emerge around E11 in mouse (Bayer et al.,1995). In human embryo, tyrosine hydroxylase (TH)-positive cells recently have been reported in the mesence-phalic floor plate and ventral half of the basal plate(Puelles and Verney, 1998). The two TH-positive cellulardomains have been defined as the ventral tegmental areaand the substantia nigra. In our study, we detected GAD-expressing cells only in the dorsal region of the basal platebut not in the mesencephalic floor plate. Therefore, itseems likely that the GABAergic population in the sub-stantia nigra originates from a basal plate domain that isdifferent from the catecholaminergic component. TheGAD-expressing tegmental VNE gives rise to nigral neu-rons and to neurons of other nuclei, e.g., the perioculomo-tor and mesencephalic reticular nuclei (Taber Pierce,1973), many of which are GABAergic (Mugnaini and Oer-tel, 1985). In addition to the TH-positive structures men-tioned above, the ventral part of the tegmental basal platealso contains the cholinergic neurons of the oculomotornucleus that are born as early as E9 (Taber Pierce, 1973;Puelles and Verney, 1998).
Another early GAD expression domain is the ventralthalamus. About 80% of the ZI neurons originate at E10–E11 in mouse (Angevine, 1970) and at E13 in rat (Altmanand Bayer, 1995). The other components of the ventralthalamus, the Rt and VLGN, are born at E10–E13, butonly about 10% of their neurons are labeled by thymidinebetween E10 and E11 (Angevine, 1970). Therefore, therelatively large expression domain of the ventral thala-mus at E10.5 probably contains neuronal progenitorsmostly destined to the ZI. The axonal tracts of the ZIappear strongly GABA-positive at E11.5 and could betraced toward the dorsal thalamus, pretectal area, andtegmentopontine region. This is in agreement with previ-ous studies showing that incertal axons project to thedorsal thalamus, pretectal area, superior colliculus, lowerbrainstem, and spinal cord (Nicolelis et al., 1992; Power etal., 1999). In contrast, only a few pioneering axons of theRt can be seen in the anterior and lateral part of the dorsalthalamus. At E12.5, the GAD expression domains in theventral thalamus seemingly respect the boundaries of thestructural divisions described by Stoykova et al. (1996)and may have similar developmental potentials.
The expression domain along the zli can be interpretedas a Dlx1-expressing domain of the ventral thalamus of p3described by Stoykova et al. (1996) and Kitamura et al.(1997) that is known to form the VLGN and to contributeto the Rt. This interpretation is supported by the fact thatthis GAD-expressing cell cord fuses rostrally with thepresumptive Rt of the ventral thalamus (Fig. 10). On theother hand, the GAD-expressing cells may belong to arecently described Sox21 domain of p2 (Uchikawa et al.,1999). This notion is strengthen by the observation that
the GAD-positive domain is continuous with a streak offaintly hybridizing cells found along the dorsal thalamicmantle zone, a pattern also shared by Nkx2.2 (Kitamuraet al., 1997). The GAD-expressing cell cord along sulcuslimitans, which is continuous with a cell cord along the zli(Fig. 10), may correspond to a Wnt3-positive/Gbx2-negative area of the ventral region of alar p2 (Bulfone etal., 1993; Puelles and Rubenstein, 1993). This domainfuses with the anterior tegmental area found in basal p1.This suggests that the GAD expression domain extendsinto the dorsal part of basal p2 (Fig. 10). Given its location,this structure may contribute GABAergic cells to theperipeduncular and subparafascicular nuclei (Puelles etal., 1992).
The anterior and posterior entopeduncular area can bedistinguished clearly from the other structural domains atE11.5. This is in agreement with previous studies suggest-ing that it is present already at E10.5 (E11–E14 in rat;Marchand et al., 1986).
The rhombencephalon showed a remarkable columnarorganization at E11.5 and E12.5, with three longitudinal,GAD-expressing cell bands. Because the most lateral bandwas continuous with the GAD-expressing column in thespinal cord, it likely contains GABAergic neurons of theprincipal and spinal trigeminal nuclei. The neurons ofthese nuclei are known to arise at E9–E12 (Taber Pierce,1973). The two medial bands, may contain prospectiveGABAergic neurons of the pontine and medullary reticu-lar formation and vestibular nuclei. A group of labeledcells in the dorsolateral pontine region observed at E10.5may correspond to GAD-expressing cells at E11.5 andE12.5 that occupied the area of the prospective dorsalnucleus of the lateral lemniscus (DNLL). This nucleus isknown as the most prominent GABAergic center of thelateral lemniscal area (Adams and Mugnaini, 1984). Neu-rons of the DNLL are generated at E9–E13, with a peak atE11 (Taber Pierce, 1973). In the same sections, stronghybridization signal was observed in r4, in the regionreceiving the cochlear nerve. These cells may be GABAer-gic neurons destined to the cochlear nuclear complex.Nonexpressing cell bands most likely contain precursorsof the cranial motor nuclei (Capecchi, 1997).
The lack of GAD mRNA in the dorsal thalamus and thesupraoptic and paraventricular nuclei correlates with theabsence of GABAergic neurons in the respective adultstructures. At all studied stages, the hybridization signalfor both GADs is localized almost exclusively in the DZ(SVZ and mantle zone in E12.5), whereas the VZ, whichcontains proliferating, nondifferentiated stem cells, essen-tially is free of GAD expression. This indicates that theGAD genes are induced around the final mitotic division,although some notable exceptions should be stressed.Neurons of the cerebellar nuclei and Purkinje cells of thecerebellar cortex arise as early as E11–E12 (Miale andSidman, 1961). We observed some GAD-expressing cells inthe DZ of the lateral cerebellar primordium at E11.5. It isunclear whether they represent an early pool of Purkinjecell precursors born before E11 (Altman and Bayer, 1985)or a population of unidentified pontine neurons (Puellesand Verney, 1998). They cannot correspond to GABAergiccells of the cerebellar nuclei, however, because, at E12.5,their corresponding DZ (DZ1) was free of hybridizationsignal. A weakly stained band of cells in the cerebellar DZcorresponding to the DZ3 of the E14–E16 rat cerebellum(Altman and Bayer, 1997) was seen first at E12.5. These
623GAD ISOFORM EXPRESSION IN MOUSE EMBRYO
cells may represent postmitotic Purkinje cell precursors.However, Aoki et al. (1989) detected GABA immunostain-ing in the Purkinje cells of rat cerebellar cortex only atE18, whereas they referred to GABA-positive cerebellarcells at E16 as Golgi cells. The exact timing of the GADgene activation in the different types of cerebellarGABAergic neurons should await future studies usingcell-specific markers.
The cortex, inferior colliculus, hippocampus, and olfac-tory bulb primordia did not express GAD mRNAs atstages E10.5–E12.5. In the case of the olfactory bulb, thelack of GAD expression can be explained simply by thelate birth of the local GABAergic interneurons (E17 andlater in the rat; Bayer and Altman, 1995). Neurogenesis ofGAD-positive cells in the hippocampal CA1–CA3 and den-tate regions has been dated between E12 to E17 by usingthymidine labeling (Soriano et al., 1989a,b). Recent stud-ies have shown that some early-born GABAergic neuronsare generated originally in the MGE and subsequentlymigrate through the LGE to settle in the paleocortex,neocortex, and hippocampus (Anderson et al., 1997a,1999; Eisenstat et al., 1999; Sussel et al., 1999). The fewGAD/GABA-positive cells near the striatocortical borderand those found in the cortical DZ of the E12.5 embryoprobably belong to this population. It remains to be estab-lished whether the rest of the GABAergic neuronal sub-populations of the neocortex and inferior colliculus aregenerated later during development or show a delayedGAD expression.
In summary, our data support the notion that the re-gions of basal ganglia, ventral thalamus, hypothalamus,pretectal area, tegmentum, myelencephalon, and spinalcord that show an early onset of neuronal differentiationand high levels of GAD expression at early developmentalstages (E10.5–E11.5) are sources of GABAergic neuronsthat become postmitotic and committed to the GABAergicphenotype early in development, thereafter migrating totheir final destination to undergo terminal differentiationand establish proper contacts. In contrast, anatomic do-mains with a laminar structure, such as the cerebral neo-cortex, hippocampus, cerebellum, and olfactory bulb, havea later embryonic onset of GAD expression (E12.5 or lat-er). Thus, the activation of the two GAD genes in theembryonic CNS may proceed according to a developmentalprogram that is specific for each spatially restricted ex-pression domain (see also Katarova et al., 1998).
Synthesis of GAD proteins and GABA
The overlap between the hybridization and GAD/GABA-immunostaining signals indicates that GAD mRNAs aretranslated efficiently and that GABA is synthesized byGAD in the early GAD-expressing cells. However, in somebrain regions, the gradient of signal intensity obtainedwith GAD probes and GABA immunostaining showed op-posite polarity. In the MGE of E11.5–E12.5 brain, thehybridization signal was strongest in the presumptiveSPP and weakened toward the external pallidal DZ,whereas the GABA staining produced much fainter stain-ing in the SPP than in the pallidal DZ. Another regionthat showed strong hybridization signal accompanied bymoderate GABA immunostaining was the posterior mes-encephalic tegmental area, which may represent the SPPof the mesencephalic tegmentum. This apparent discrep-ancy may be explained by the posttranscriptional regula-tion of GAD67. Previously, we and others have shown
that, in addition to GAD65 and GAD67, two alternativelyspliced GAD mRNAs (I-80 and I-86) are synthesized dur-ing rat embryonic development (Bond et al., 1990) andmouse embryonic development (Szabo et al., 1994). Thetwo mRNAs are much more abundant than the adultGAD67 during early stages of neuronal differentiation(Szabo et al., 1994; Somogyi et al., 1995). I-80 is function-ally bicistronic, coding for a polypeptide (GAD25) with anunknown function and a truncated, enzymatically activeGAD (GAD44), whereas I-86 gives rise only to GAD25(Szabo et al., 1994). Therefore, cells expressing exclusivelyI-86 and inactive GAD25 would not be capable of synthe-sizing GABA, whereas cells that express I-80 and/orGAD67 would be also positive for GABA. The GAD67probe used in this study does not discriminate betweenadult GAD67 and embryonic messages. By using a probespecific only for the adult GAD67 mRNA, we observed thatthe gradient of the signal intensity increases toward theouter part of the DZ, similar to the GABA gradient (datanot shown). This implies that the majority of highly ex-pressing cells found at the border of the DZ and the VZ(presumptive SPP) synthesize predominantly embryonicmRNAs (and truncated GAD forms). The low levels ofGABA in the cells of the SPP layer can be explained by thelow abundance of enzymatically active GAD44 (for a de-tailed description of the translational regulation, seeSzabo et al., 1994). Consequently, the increase in GABAcontent toward the outer DZ may be assigned to the par-allel up-regulation of GAD67 production in the more dif-ferentiated cells of these layers. Behar et al. (1993, 1994),Ma et al. (1993), and Ma and Barker (1995) have demon-strated the existence of GAD-positive/GABA-negativecells in rat embryonic spinal cord that are more numerousat earlier stages of development. Therefore, it may bespeculated that, in the early GABAergic precursors, thesynthesis of embryonic GAD25 precedes that of the enzy-matically active GAD and GABA.
GAD expression outside the CNS
GABA is present in a variety of tissues outside the adultCNS, in which it is synthesized by the same GAD formsfound in brain (for reviews, see Erdo and Wolff, 1990;Solimena and De Camilli, 1991; Tillakaratne et al., 1995).We found that both GAD genes are expressed outside themouse embryonic CNS, but the pattern of expression dif-fers between the two forms. GAD65 mRNA was detectablereadily in numerous sites, whereas GAD67 probes pro-duced only faint signals at some sites. However, our pre-liminary results indicated the presence of b-galactosidaseactivity at GAD65-positive sites in the trunk of GAD67-lacZ transgenic embryos (Katarova et al., 1998). This sug-gests that the two genes are coexpressed in the peripheryas well. The failure to detect GAD67 by in situ hybridiza-tion may be explained by the exceptionally low levels oftranscription and/or instability of the GAD67 message(s)(Z. Katarova and G. Szabo, unpublished observations).
The majority of peripheral cells and structures express-ing GAD are derivatives of the neural crest (cranial andperipheral nerves, dorsal root ganglia, derivatives of thefirst branchial arch, and possibly the heart, blood vessels,and gut) and/or placodes (olfactory epithelium and celllineages derived from it and the lens). In the olfactoryepithelium, lens, cranial and peripheral nerves, heart, anddorsal aorta, both GAD and its product GABA are ex-
624 Z. KATAROVA ET AL.
pressed in a transient way (S.P. and Z.K., unpublisheddata; see also von Bartheld and Rubel, 1989).
GABA as a signaling molecule during earlydifferentiation stages of the vertebrate
nervous system
Comparing the pattern of expression of all GAD formsat the RNA and protein levels with that of GABA and theother components of the neuronal GABA signaling system(namely, the GABA receptors, the plasma membrane, andvesicular GABA transporters) is critical to understandingthe role of the early embryonic induction of GAD. GABApotentially can be released by immature GABAergic neu-rons by a reversion of the GABA transporter (Taylor et al.,1990; Taylor and Gordon-Weeks, 1991). FunctionalGABAA receptors are found on both GABAergic and non-GABAergic target neurons of the embryonic CNS (Laurieet al., 1992; Ma et al., 1993). GABA, acting on embryonicGABAA receptors, causes membrane depolarization, inhi-bition of DNA synthesis, and facilitation of differentiation(Cherubini et al., 1991; LoTurco et al., 1995). It has beenproposed to act as a differentiation-promoting factor forboth postmitotic medial zone and dividing VZ spinal cordneurons (Ma and Barker, 1995; Barker et al., 1998).
GABA also may play a role in neuroblast migration atearly developmental stages of the vertebrate spinal cord(Ma and Barker, 1995; Somogyi et al., 1995; for review, seeBarker et al., 1998). This possibility is supported, albeitindirectly, by our observation that both GAD mRNA andGABA are present in the SPP and in chains of migratingneurons in the VZ in several regions of the embryonicCNS.
The putative trophic function of GABA in the CNS hasbeen disputed recently based on data on GAD65/GAD67double knock-out mutants (Ji et al., 1999). These mutantsdie at birth from a palate cleft, similar to the GAD67 nullmutants (Asada et al., 1997; Kash et al., 1997). Surpris-ingly, the normal development of some brain regions witha late onset of GAD expression (cerebellum, cortex, andhippocampus) seems to be unimpaired in these mutants,at least judged by gross morphological criteria, untilE14.0-PO (postnatal day 0). It remains to be seen whetherthis also is true for regions with an early onset of GADexpression. Furthermore, detailed studies to assess theeffects of GAD gene knockout at the cellular levels remainto be done. Evidence for the trophic function of GABAoutside the CNS is provided by the “cleft palate” pheno-type of GAD67 and GABAA receptor b subunit null mu-tants (Nakatsu et al., 1993; Culiat et al., 1995; Asada etal., 1997; Condie et al., 1997). In conclusion, the expres-sion pattern of the two GAD isoforms during early stagesof neuronal differentiation suggests that GAD and GABAplay a specific role in this process as part of a unspecifiedsignaling mechanism that is independent of GABAergicsynaptic inhibition.
ACKNOWLEDGMENTS
The authors are greatly indebted to I. Harmos and M.Komocsin for excellent technical assistance, to M. Toth forthe artwork, to the late F. Joo and all members of hisgroup for their support and for providing equipment andmaterials, and to K. Burgess for editing.
LITERATURE CITED
Adams JC, Mugnaini E. 1984. Dorsal nucleus of the lateral lemniscus: anucleus of GABAergic projection neurons. Brain Res Bull 13:585–590.
Aoki E, Semba R, Kashiwamata S. 1989. When does GABA-like immuno-reactivity appear in the rat cerebellar GABAergic neurons? Brain Res502:245–251.
Altman J, Bayer SA. 1985. Embryonic development of the rat cerebellum.I. Delineation of the cerebellar primordium at early cell movements.J Comp Neurol 231:1–26.
Altman J, Bayer SA. 1995. Atlas of prenatal rat brain development. BocaRaton, FL: CRC Press.
Altman J, Bayer SA. 1997. Development of the cerebellar system. BocaRaton, FL: CRC Press.
Anderson SA, Eisenstat DD, Shi L, Rubenstein JLR. 1997a. Interneuronmigration from the basal forebrain to neocortex: dependence on Dlxgenes. Science 278:474–476.
Anderson, SA, Qui M, Bulfone A, Eisenstat DD, Meneses J, Pederson R,Rubenstein JLR. 1997b. Mutations of the homeobox genes Dlx-1 andDlx-2 disrupt the striatal subventricular zone and differentiation of thelate-born striatal neurons. Neuron 19:27–37.
Anderson SA, Mione M, Yun K, Rubenstein JLR. 1999. Differential originsof neocortical projection and local circuit neurons: role of Dlx genes inneocortical interneurogenesis. Cerebral Cortex 9:646–654.
Angevine JB. 1970. Time of neuron origin in the diencephalon of themouse. An autoradiographic study. J Comp Neurol 139:129–188.
Asada H, Kawamura Y, Maruyama K, Hideaki K, Ding RG, Ji FY, KanbaraN, Kuzume H, Sanbo M, Yagi T, Obata K. 1996. Mice lacking the 65kDa isoform of glutamic acid decarboxylase (GAD65) maintain normallevels of GAD67 and GABA in their brains but are susceptible toseizures. BBRC 229:891–895.
Asada H, Kawamura Y, Maruyama K, Kume H, Ding RG, Kanbara N,Kuzume H, Sanbo M, Yagi T, Obata K. 1997. Cleft palate and de-creased brain g-aminobutyric acid in mice lacking the 67-kDa isoformof glutamic acid decarboxylase. Proc Natl Acad Sci USA 94:6496–6499.
Asano M, Gruss P. 1992. Pax-5 is expressed at the midbrain-hindbrainboundary during mouse development. Mech Dev 33:27–38.
Ba-Charvet KTN, von Boxberg Y, Guazzi S, Boncinelli E, Godement P.1998. A potential role for the Otx2 homeoprotein in creating early“highways” for axon extension in the rostral brain. Development 125:4273–4282.
Balcar VJ, Johnston GAR. 1987. Ontogeny of GABAergic systems in thebrain. In: Redburn DA, Schousboe A, editors. Neurotrophic activity ofGABA during development. New York: Alan R. Liss, Inc. p 57–77.
Barker JL, Behar T, Li YX, Liu QY, Ma W, Maric D, Maric I, Schaffner AE,Serafini R, Smith SV, Somogyi R, Vautrin JY, Wen XL, Xian H. 1998.GABAergic cells and signals in CNS development. Perspect Dev Neu-robiol 5:305–22.
Bayer SA, Altman J. 1995. Neurogenesis and neuronal migration. In:Paxinos G, editor. The rat nervous system. San Diego: Acdemic Press.p 1041–1078.
Bayer SA, Wills KV, Triarhou LC, Ghetti B. 1995. Time of neuron originand gradients of neurogenesis in midbrain dopaminergic neurons inthe mouse. Exp Brain Res 105:191–199.
Behar T, Schaffner A, Laing P, Hudson L, Komoly S, Barker J. 1993. Manyspinal cord cells transiently express low molecular weight forms ofglutamic acid decarboxylase during embryonic development. Brain ResDev Brain Res 72:203–218.
Behar T, Ma W, Hudson L, Barker J. 1994. Analysis of the anatomicaldistribution of GAD67 mRNA encoding truncated glutamic acid decar-boxylase proteins in the embryonic rat brain. Brain Res Dev Brain Res77:77–87.
Berman N. 1977. Connection of the pretectum in the cat. J Comp Neurol174:227–254.
Bhide PG. 1996. Cell cycle kinetics in the embryonic mouse corpus stria-tum. J Comp Neurol 374:506–522.
Bond R, Wyborsky RJ, Gottlieb DI. 1990. Developmentally regulated ex-pression of an exon containing a stop codon in the gene for glutamicacid decarboxylase. Proc Natl Acad Sci USA 87:8771–8775.
Bulfone A, Puelles L, Porteus MH, Frohman MA, Martin GR, RubensteinJLR. 1993. Spatially restricted expression of Dlx-1, Dlx-2 (Tes-1),Gbx-2, and Wnt-3 in the embryonic day 12.5 mouse forebrain definespotential transverse and longitudinal segmental boundaries. J Neuro-sci 13:3155–3172.
Capecchi MR. 1997. The role of Hox genes in hindbrain development. In:
625GAD ISOFORM EXPRESSION IN MOUSE EMBRYO
Cowan WM, Jessel TM, Zipursky SL, editors, Molecular and cellularapproaches to neural development, New York: Oxford UniversityPress. p 334–355.
Casarosa S, Fode C, Guillemot F. 1999. Mash1 regulates neurogenesis inthe ventral telencephalon. Development 126:525–34.
Cherubini E, Gaiarsa JL, Ben-Ari Y. 1991. GABA: an excitatory transmit-ter in early postnatal life. Trends Neurosci 14:515–519.
Condie BG, Bain G, Gottlieb DI, Capecchi MR. 1997. Cleft palate in micewith a targeted mutation in the gamma-aminobutyric acid-producingenzyme glutamic acid decarboxylase 67. Proc Natl Acad Sci USA 94:11451–11455.
Culiat CT, Stubbs LJ, Woychik RP, Russel LB, Johnson DK, Rinchik EM.1995. Deficiency of the b3 subunit of the type A g-aminobutyric acidreceptor causes cleft palate in mice. Nat Genet 11:344–346.
Easter SS Jr., Ross LS, Frankfurter A. 1993. Initial tract formation in themouse brain. J Neurosci Res 13:285–299.
Eisenstat DD, Liu JK, Mione M, Zhong W, Yu G, Anderson SA, Ghattas I,Puelles L, Rubenstein JLR. 1999. DLX-1, DLX-2 and DLX-5 expressiondefine distinct stages of basal forebrain differentiation. J Comp Neurol414:217–237.
Erdo SL, Wolff JR. 1990. g-aminobutyric acid outside the mammalianbrain. J Neurochem 54:363–372.
Erlander MG, Tillakaratne NJK, Feldblum S, Patel N, Tobin AJ. 1991.Two genes encode distinct glutamate decarboxylases. Neuron 7:91–100.
Esclapez M, Tillakaratne NJK, Tobin AJ, Houser CR. 1993. Comparativelocalization of mRNAs encoding two forms of glutamic acid decarbox-ylase with non-radioactive in situ hybridization methods. J Comp Neu-rol 331:339–362.
Esclapez M, Tillakaratne NJK, Kaufman DL, Tobin A, Houser CR. 1994.Comparative localization of two forms of glutamic acid decarboxylaseand their mRNAs in rat brain supports the concept of functional dif-ferences between the two forms. J Neurosci 14:1834–1855.
Franklin BJ, Paxinos G. 1997. The mouse brain in stereotaxic coordinates.San Diego: Academic Press.
Gong Q, Shipley MT. 1995. Evidence that pioneer olfactory receptor neu-rons regulate telencephalon cell cycle kinetics to induce the formationof the olfactory bulb. Neuron 14:91–101.
Guillemot F, Joyner A. 1993. Dynamic expression of murine achaete-scutehomologue Mash-1 in the developing nervous system. Mech Dev 42:171–185.
Jacobowitz DM, Abbott LC. 1998. Chemoarchitectonic atlas of the devel-oping mouse brain. Boca Raton, FL: CRC Press.
Ji F, Kanbara N, Obata K. 1999. GABA and histogenesis in fetal andneonatal mouse brain lacking both the isoforms of glutamic acid decar-boxylase. Neurosci Res 33:187–194.
Jonas P, Bischofberger J, Sandkuhler J. 1998. Corelease of two fast neu-rotransmitters at a central synapse. Science 281:419–424.
Kash SF, Johnson RS, Tecott LH, Noebels JL, Mayfield RD, Hanahan D,Baekkeskov S. 1997. Epilepsy in mice deficient in the 65-kDa isoform ofglutamic acid decarboxylase. Proc Natl Acad Sci USA 94:14060–14065.
Katarova Z, Szabo G, Mugnaini E, Greenspan RJ. 1990. Molecular identi-fication of the 62 kd form of glutamic acid decarboxylase from themouse. Eur J Neurosci 2:190–202.
Katarova Z, Mugnaini E, Sekerkova G, Mann J, Aszodi A, Bosze Z, Greens-pan RJ, Szabo G. 1998. Regulation of cell type-specific expression oflacZ by the 59-flanking region of GAD67 gene in the central nervoussystem of transgenic mice. Eur J Neurosci 10:989–999.
Kaufman MH. 1992. The atlas of mouse development. San Diego: AcademicPress.
Kaufman DL, Houser CA, Tobin AJ. 1991. Two forms of the gamma-aminobutyric acid synthetic enzyme glutamate decarboxylase havedistinct intraneuronal distributions and cofactor interactions. J Neu-rochem 56:720–723.
Kim J, Richter W, Aanstoot HJ, Shi Y, Fu Q, Rajotte R, Warnock G,Baekkeskov S. 1993. Differential expression of GAD65 and GAD67 inhuman, rat and mouse pancreatic islands. Diabetes 42:1799–1808.
Kitamura K, Miura H, Yanazava M, Miyashita T, Kato K. 1997. Expres-sion patterns of Brx 1 (Rieg gene), sonic hedgehog, Nkx2.2, Dlx1 andArx during zona limitans inthrathalamica and embryonic ventral lat-eral geniculate nuclear formation. Mech Dev 67:83–96.
Lauder JM. 1993. Neurotransmitters as growth regulatory signals: role ofreceptors and second messengers. Trends Neurosci 16:233–239.
Lauder JM, Han VKM, Henderson P, Verdoorn T, Towle AC. 1986. Prena-
tal ontogeny of the GABAergic system in the rat brain: an immunocy-tochemical study. Neuroscience 19:465–493.
Laurie DJ, Wisden W, Seeburg P. 1992. The distribution of thirteenGABAA receptor subunit mRNAs in the rat brain. III. Embryonic andpostnatal development. J Neurosci 12:4151–4172.
Li X, Ma W, Barker J, Piatigorsky J. 1995. Transient expression of gluta-mate decarboxylase and g-aminobutyric acid in embryonic lens of therat. Dev Dyn 203:448–455.
LoTurco JJ, Owens DF, Heath MJS, Davis MBE, Kriegstein AR. 1995.GABA and glutamate depolarize cortical progenitor cells and inhibitDNA synthesis. Neuron 15:1287–1298.
Ma W, Barker J. 1995. Complementary expressions of transcripts encodingGAD67 and GABAA receptor a4, b1 and g1 subunits in the proliferativezone of the embryonic rat central nervous system. J Neurosci. 15:2547–2560.
Ma W, Saunders PA, Somogyi R, Poulter MO, Barker J. 1993. Ontogeny ofGABAA receptor subunit mRNAs in rat spinal cord and dorsal rootganglia. J Comp Neurol 338:337–359.
Mansouri A, Hallonet M, Gruss P. 1996. Pax genes and their roles in celldifferentiation and development. Curr Opin Cell Biol 8:851–857.
Marchand R, Poirier LJ. 1983. Isthmic origin of neurons of the rat sub-stantia nigra. Neuroscience 9:373–381.
Marchand R, Lajoie L, Blanchet C. 1986. Histogenesis at the level of thebasal forebrain: the entopeduncular nucleus. Neuroscience 17:591–607.
Martin SC, Heinrich G, Sandell JH. 1998. Sequence and expression ofglutamic acid decarboxylase isoforms in the developing zebrafish.J Comp Neurol 396:253–266.
Mastick GS, Easter SS Jr. 1996. Initial organisation of neurons and tractsin the embryonic mouse fore- and midbrain. Dev Biol 173:79–94.
Miale IL, Sidman RL. 1961. An autoradiographic analysis of histogenesisin the mouse cerebellum. Exp Neurol 4:277–296.
Mugnaini E, Oertel WH. 1985. An atlas of the distribution of GABAergicneurons and terminals in the rat CNS as revealed by GAD immuno-histochemistry. In: Bjorklund A, Hokfelt T, editors. GABA and neu-ropeptides in the CNS. Handbook of chemical neuroanatomy, vol 4,part I. Amsterdam: Elsevier. p 436–608.
Nakatsu Y, Tyndale R, DeLorey TM, Durham-Pierre D, Gardner JM,McDannel HJ, Nguyen Q, Wagstaff J, Lalande M, Sikela J, Olsen RW,Tobin AJ, Brilliant MH. 1993. A cluster of three GABAA receptorsubunit genes is deleted in a neurological mutant of the mouse p locus.Nature 364:448–450.
Nicolelis MA, Chapin JK, Lin RC. 1992. Somatotopic maps within the zonaincerta relay parallel GABAergic somatosensory pathways to the neo-cortex, superior colliculus, and brainstem. Brain Res 577:134–141.
Oliver G, Sosa-Pineda B, Giesendorf S, Spana EP, Doe CQ, Gruss P. 1993.Prox 1, a prospero-related homeobox gene expressed during mousedevelopment. Mech Dev 44:3–16.
Paxinos G, Watson S. 1986. The rat brain in stereotaxic coordinates.Orlando: Academic Press.
Paxinos G, Tork I, Tecott LH, Valentino KL. 1991. Atlas of the developingrat brain. San Diego: Academic Press.
Power BD, Kolmac CI, Mitrofanis J. 1999. Evidence for a large projectionfrom the zona incerta to the dorsal thalamus. J Comp Neurol 404:554–565.
Puelles L, Rubenstein JLR. 1993. Expression patterns of homeobox andother putative regulatory genes in the embryonic mouse forebrainsuggest a neuromeric organisation. Trends Neurosci 16:472–479.
Puelles L, Verney C. 1998. Early neuromeric distribution of tyrosine-hydroxylase-immunoreactive neurons in human embryos. J Comp Neu-rol 394:283–308.
Puelles L, Sanchez MP, Spreafico R, Fairen A. 1992. Prenatal developmentof calbindin immunoreactivity in the dorsal thalamus of the rat. Neu-roscience 46:135–147.
Redburn DA, Schousboe A. 1987. Neurotrophic activity of GABA duringdevelopment. New York: Alan R. Liss, Inc.
Ruberte E, Dolle P, Krust A, Zelent A, Morris-Kay, G, Chambon P. 1990.Specific spatial and temporal distribution of retinoic acid receptorg-transcript during mouse embryogenesis. Development 108:213–222.
Schambra UB, Lauder JM, Silver J. 1992. Atlas of the prenatal mousebrain. San Diego: Academic Press.
Seiler N, Lajtha A. 1987. Functions of GABA in the vertebrate organism.In: Redburn DA, Schousboe A, editors. Neurotrophic activity of GABA
626 Z. KATAROVA ET AL.
during development. Neurology and neurobiology, vol 32. New York:Alan R. Liss, Inc. p 1–56.
Sheth AH, Bhide PG. 1997. Concurrent cellular output from two prolifer-ative population in the early embryonic mouse corpus striatum.J Comp Neurol 383:220–230.
Soghomonian JJ, Martin DL. 1998. Two isoforms of glutamate decarbox-ylase: why? Trends Pharmacol Sci 19:500–505.
Solimena M, De Camilli P. 1991. Autoimmunity to glutamic acid decarbox-ylase (GAD) in stiff-man syndrome and insulin-dependent diabetesmellitus. Trends Neurosci 14:452–457.
Somogyi R, Wen X, Ma W, Barker JL. 1995. Developmental kinetics ofGAD family mRNAs parallel neurogenesis in the rat spinal cord.J Neurosci 15:2575–2591.
Soriano E, Cobas A, Fairen A. 1989a. Neurogenesis of glutamic acid de-carboxylase immunoreactive cells in the hippocampus of the mouse: I.Regio superior and regio inferior. J Comp Neurol 281:586–602.
Soriano E, Cobas A, Fairen A. 1989b. Neurogenesis of glutamic acid de-carboxylase immunoreactive cells in the hippocampus of the mouse: II.Area dentata. J Comp Neurol 281:603–611.
Stoykova A, Gruss P. 1994. Roles of Pax genes in development and adultbrain as suggested by expression patterns. J Neurosci 14:1395–1412.
Stoykova A, Fritsch R, Walther C, Gruss P. 1996. Forebrain patterningdefects in small eye mutant mice. Development 122:3453–3465.
Strachan T, Read AP. 1994. PAX genes. Curr Opin Genet Dev 4:427–438.Sussel L, Marin O, Kimura S, Rubenstein LR. 1999. Loss of NKx2.1
homeobox gene function results in a ventral to dorsal molecular re-specification within the basal telencephalon: evidence for a transfor-mation of the pallidum into the striatum. Development 126:3359–3370.
Szabo G, Katarova Z, Greenspan RJ. 1994. Distinct protein forms areproduced from alternatively spliced bicistronic glutamic acid decarbox-ylase mRNAs during development. Mol Cell Biol 14:7535–7545.
Taber Pierce E. 1973. Time of origin of neurons in the brain stem of themouse. Progr Brain Res 40:53–65.
Taylor J, Gordon-Weeks PR. 1991. Calcium-independent g-aminobutyric
acid release from growth cones: role of g-aminobutyric acid transport.J Neurochem 56:273–280.
Taylor J, Docherty M, Gordon-Weeks PR. 1990. GABAergic growth cones:release of endogenous g-aminobutyric acid precedes the expression ofsynaptic vesicle antigens. J Neurochem 54:1689–1699.
Terenzi MG, Zagon A, Roberts MH. 1995. Efferent connections from theanterior pretectal nucleus to the diencephalon and mesencephalon inthe rat. Brain Res 701:183–191.
Tillakaratne NJK, Erlander MG, Collard MW, Greif KF, Tobin AJ. 1992.Glutamate decarboxylases in nonneural cells of rat testis and oviduct:differential expression of GAD65 and GAD67. J Neurochem 58:618–627.
Tillakaratne NJ, Medina-Kauwe L, Gibson KM. 1995. Gamma-aminobutyric acid (GABA) metabolism in mammalian neural and non-neural tissues. Comp Biochem Physiol A Physiol 112:247–263.
Uchikawa M, Kamachi Y, Kondoh H. 1999. Two distinct subgroups ofgroup B Sox genes for transcriptional activators and repressors: theirexpression during embryonic organogenesis of the chicken. Mech Dev84:103–120.
Van Eden CG, Mrzijak L, Voorn P, Uylings HBM. 1989. Prenatal develop-ment of GABAergic neurons in the neocortex of the rat. J Comp Neurol289:213–227.
Verma-Kurvari S, Savage T, Gowan K, Johnson J. 1996. Lineage-specificregulation of the neural differentiation gene Mash1. Dev Biol 180:605–617.
von Bartheld CS, Rubel EW. 1989. Transient GABA immunoreactivity incranial nerves of the chick embryo. J Comp Neurol 286:456–471.
Wilkinson DG, Nieto MA. 1993. Detection of messenger RNA by in situhybridization to tissue sections and whole mounts. In: Wasserman PM,De Pamphilis ML, editors. Guide to techniques in mouse development.Methods in enzymology, vol 225. San Diego: Academic Press. p 361–373.
Wolff JR, Joo F, Dames W. 1978. Plasticity in dendrites shown by contin-uous GABA administration in superior cervical ganglion in adult rat.Nature 274:72–73.
627GAD ISOFORM EXPRESSION IN MOUSE EMBRYO