Enzymatic and bacterial conversions during sourdough fermentation
Upload
khangminh22Category
view
5download
0
Roles of Fermentation andBioprocess Technology

PROFESSOR DR. ARBAKARIYA ARIFF

PROFESSOR DR. ARBAKARIYA ARIFFB.Sc. ( UPM), MPhill (Birmingham University, UK),
Ph.D (UMIST, UK)
8 MAY 2009
Dewan Taklimat Bangunan Pentadbiran
Universiti Putra Malaysia
Universiti Putra Malaysia PressSerdang • 2009
http://www.penerbit.upm.edu.my
Roles of Fermentation andBioprocess Technology

© Universiti Putra Malaysia PressFirst Print 2009
All rights reserved. No part of this book may be reproduced in any form without permission in writing from the publisher, except by a reviewer who wishes to quote brief passages in a review written for inclusion in a magazine or newspaper.
UPM Press is a member of the Malaysian Book Publishers Association (MABOPA)Membership No.: 9802
Perpustakaan Negara Malaysia Cataloguing-in-Publication Data
Arbakariya Ariff Industrializing biotechnology : roles of fermentation and bioprocess technology / Arbakariya Ariff. (Inaugural Lecture series) ISBN 978-967-344-052-8 1. Biotechnology industries. 2. Speeches, addresses, etc. I. Title. II. Series. 660.6
Design, layout and printed by
Penerbit Universiti Putra Malaysia 43400 UPM SerdangSelangor Darul EhsanTel: 03-8946 8855 / 8854Fax: 03-8941 6172http://www.penerbit.upm.edu.my

Contents
ABSTRACT 1
INTRODUCTION 3
TILLAGE AND ENERGY CONSUMPTION 6
Nature of Soil Distrubance 7
Soil Forces 8
Water Reduction Technique 13
Formation of Clods
TRACTOR POWER AND DRAFT CAPABILITY FOR TILLAGE 34
CONSTRAINTS TO IMPROVING SOIL PREPARATION 28
DEFORMATION OF SOIL IN DRY AND WET CONDITIONS 29
IMPLEMENT DRAFT AND DRAWBAR POWER PREDICTION 33
CONCLUSIONS 41
REFERENCES 44
BIOGRAPHY 51
ACKNOWLEDGEMENT 55
LIST OF INAUGRAL LECTURES 57


1 ❘❘❚
Arbakariya Ariff
ABSTRACT
Biotechnology is defined by the tools used to practice it. By programming DNA and directing cellular machinery,
the products that were unimaginable even 10 years ago could be produced. With biotechnology, the nanoscale machinery of living cells to produce self-contained factories that perform on a characteristic scale of one micron could be established. For industrialization of biotechnology, however, bioproducts and bioenergy must be produced in immense or large quantities to meet market demand. Genetic engineering, for example, is carried out at a molecular scale but is amplified through fermentation and bioprocess technology to transfer the process from the test tube to the bottle through a sequence of integrated steps that generate, recover, purify, formulate and package the product. The challenge facing the fermentation and bioprocess technology discipline is in redirecting the genetic and cellular machinery to make commercially and economically important biomolecules when the cells are placed in controlled environments. Fermentation and bioprocess technology knowledge and skills are applied to design, build and operate hardware and integrated systems that can be used to culture the cells and produce the required products efficiently, as well as to recover, purify and formulate the products in a cost-effective manner to enable the products to be commercialized. In addition, the design and operation of the biomanufacturing process must also follow the regulations set by the authorized bodies prior to commercialization. For example, the current Good Manufacturing Practice (cGMP) regulation set by the Food Drug Authority (FDA) must be adhered to in the production of biopharmaceuticals, while GMP requirements must be applied in food and food ingredient production. The demand for knowledge and skills in fermentation and bioprocess technology

❚❘❘ 2
Industrializing Biotechnology
continues to grow. This discipline provides a bridge between the research laboratory and the economic, large-scale implementation of biomanufacturing systems. With the rapid growth of biologically based technologies, fermentation and bioprocess technology is needed to solve the problems of today and tomorrow. This lecture describes the basic concept of biomanufacturing processes for the production of various biotechnology products and also the roles of fermentation and bioprocess technology to “Bring Technology
To Life” through the conversion of biological materials into other forms needed by mankind. Examples of approaches that have been applied by our research group in the development and improvement of various biomanufacturing processes, such as production of kojic acid, solvents, probiotic microorganisms, metabolites and biopharmaceuticals, using microbials, plant cells and microalgae are highlighted.

3 ❘❘❚
Arbakariya Ariff
INTRODUCTION
Biotechnology, which covers a broad segment of science and its industrial and societal applications, has commanded worldwide attention over the last decade because of its perceived potential impact on the quality of life. In simple terms, biotechnology is the application of science and engineering to the use of living organisms or substances derived from them, to generate products or to perform functions that can benefit the human condition. Biotechnology has evolved as a means of producing chemicals, foods and food ingredients, beverages, and biopharmaceuticals. The justification for commercialization of the fruits of any scientific endeavor is the potential for providing marketable goods and services, thereby generating gainful employment and return on invested capital. Basic discoveries in life sciences within the last 10 years have already created a family of novel biopharmaceutical products with new therapeutic and prophylactic potential. Worldwide annual sales have grown from zero in 1980 to $4 billion in 1991. Further developments in biopharmaceuticals alone are predicted to lead to an expansion in global annual sales of $30–50 billion by the year 2010. In addition, recent developments in biological waste treatment and environmental bioremediation are projected to create new industries in waste treatment and modification of chemical processes for waste minimization. Beyond estimation are the enormous savings to be realized after the new technology is implemented. Other growth opportunities for biotechnology are in agricultural chemicals, food and nutritional supplements, specialty and commodity chemicals, and liquid and gaseous fuels derived from biomass. In many respects, the predicted growth of biotechnology-based industries resembles the immense growth of the pharmaceutical industry after the discovery of penicillin and of

❚❘❘ 4
Industrializing Biotechnology
the electronics and computer industries after the discovery of the transistor. Fermentation and bioprocess technology is the subdiscipline within biotechnology that is responsible for translating the discoveries of life sciences into practical products, processes, or systems that can serve the needs of society. The fermentation and bioprocess technologist has a major role in the existing multibillion-dollar fermentation industries responsible for the production of pharmaceuticals, bioethanol, bioenergy, chemicals, amino acids and other organic acids, antibiotics, and other specialty products. They are responsible for conducting research, developing, designing, operating and managing the production processes that use biological catalysts.
FERMENTATION AND BIOPROCESS TECHNOLOGY
The term ‘fermentation’ can be used to describe any process involving the production of organic products by the mass culture of a microorganism. The four groups of commercially important fermentation are: (i) production of microbial cell (biomass), (ii) production of microbial enzyme, (iii) production of microbial metabolites, and (iv) transformation processes - to modify a compound which is added to the fermentation. The product can either be:
The cell itself: referred to as biomass production. 1.
The microorganism’s own metabolites: referred to as a product 2. from a natural or genetically improved strain.
The microorganism’s foreign products: referred to as a product 3. from recombinant DNA technology or genetically engineered strain, i.e. recombinant strain.

5 ❘❘❚
Arbakariya Ariff
Fermentations can be carried out either as a submerged (liquid medium) or solid state (solid or semi solid medium) fermentation process. More than 90% of industrial processes are carried out as submerged fermentation and this note is focused on this technique of fermentation. A generalized schematic representation of a typical submerged fermentation process is shown in Figure 1. The main industrial equipment required for the fermentation process is a large scale aseptic fermentation vessel which is termed as the fermenter or bioreactor (Figure 2). The main function of a fermenter is to provide a controlled environment for the growth of a microorganism, or a mixture of microorganisms to obtain a desired product. The fermenter vessel should be capable for being operated aseptically for a number of days and should be reliable in long-term operations. For aerobic fermentation, adequate aeration and agitation should be provided to meet the metabolic requirements of the microorganism. However, the mixing should not cause damage to the microorganism. Various types and fermenter designs such as stirred tank reactor (STR), air-lift fermenter (ALF), deep-jet fermenter, and rotating disc fermenter have been used for industrial fermentation. However, the most frequently used in industry are STR (mechanically agitated) and ALF (non-mechanically agitated). The success of a fermentation process depends upon the existence of defined environmental conditions for biomass and product formation. Thus temperature, pH, degree of agitation, oxygen concentration in the culture and other factors may have to be kept constant during the process. The provision of such conditions requires careful monitoring of the fermentation so that any deviation from the specified optimum can be corrected by a control system. The fermenter could also be operated in different modes such as batch, continuous and fed-batch which aims at improving performance.

❚❘❘ 6
Industrializing Biotechnology
Figure 1 A generalized schematic representation of a typical fermentation/biomanufacturing process
Strain improvement and preservation is one of the important component parts of the fermentation process that should be integrated to enable the fermentation process to be successfully carried out at industrial scale. The potential strains to be used in large scale production should be preserved using the correct method to ensure that the desirable characteristics could be maintained, and the culture is viable and free from contaminants. The process of strain improvement involves the continual genetic modification of the culture, followed by reappraisals of its cultural requirements. Genetic modification may be achieved by selecting natural variants, by selecting induced mutants and by selecting recombinants.

7 ❘❘❚
Arbakariya Ariff
Figure 2 Photograph of industrial fermenter (10,000 L working volume)
(A) outside view; (B) inside view.
There is a small probability of a genetic change occurring each time a cell divides and when it is considered that a microbial culture will undergo a vast number of such divisions the culture will become more heterogeneous. The heterogeneity of some cultures can present serious problems of yield degeneration because the variants are usually inferior producers compared with the original culture. However, variants have been isolated which are superior producers and this has been observed frequently in the

❚❘❘ 8
Industrializing Biotechnology
early stages in the development of a new product. An explanation of this phenomenon for mycelial microorganisms may be that most new isolates are probably heterokaryons (contain more than one type of nucleus) and the selection of progeny of uninucleate spores results in the production of homokaryons (contain only one type of nucleus) which may be superior producers. However, the phenomenon is also observed with unicellular isolates which are certainly not heterokaryons. Hence, the industrial fermentation plant must be equipped with microbiology laboratory facilities where the producing culture could be periodically plate out and screen a proportion of the progeny for productivity. This practice has the added advantage that the laboratory technician tends to become familiar with the morphology and characteristics associated with high productivity and, by selecting “typical” colonies, a strain subject to yield degeneration may still be used with consistent results. This microbiology laboratory is also responsible for the development of inocula for industrial fermentation. Different inoculum-development programs may be used for different fermentation processes to make sure that the culture which inoculates to the production fermenter is healthy, in active state, in suitable morphological form, free from contamination, retains its product-forming capabilities and in sufficient amount to provide optimal size of an inoculum. Downstream engineering is another component part of the fermentation process that is needed for product recovery and purification. It must be remembered that fermentation and product recovery are integrated parts of an overall process. Due to interactions between the two, neither stage should be developed independently, which might result in problems and unnecessary expenses. The extraction and purification of fermentation products may be difficult and costly. Flow processes and unit operations normally involved in

9 ❘❘❚
Arbakariya Ariff
bioseparation of the product from the fermentation broth is shown in Figure 3. Recovery costs of microbial products may vary from as low as 20% to as high as 60% of the total manufacturing costs. In general, the recovery process could be divided into several stages. The first stage of the recovery process is to remove large particles and microbial cells from the culture broth. This step can be done either by centrifugation, sedimentation or filtration. In the next stage, the broth is fractionated or extracted into major fractions using adsorption or ion-exchange chromatography, liquid-liquid solvent extraction or precipitation. Subsequently, the product-containing fraction is purified by fractional precipitation, precise chromatographic techniques and crystallization. The chosen process for recovery will depend on the specific products and the equipment available as well as the standards set by the authorized bodies.
CLASSICAL EXAMPLE OF INDUSTRIAL BIOTECHNOLOGY DEVELOPMENT
In 1928, Alexander Fleming showed that growing colonies of Penicillium notatum inhibit Staphylococcus cultures. Beginning in 1939, Florey and Chain rediscovered that Fleming’s Penicillium could lyse bacteria, but the yield of penicillin was very low. In addition, the penicillin produced was unstable. They realized that producing Penicillium on a large scale would require isolation and purification procedures that minimized product loss. Early fermentation and bioprocess technologists found solutions to this problem (Aiba et al., 1973). They discovered that mold on a cantaloupe (P. chrysogenum) could be grown in large tanks in submerged cultures (Shuler and Kargi, 1991), and subsequently several pharmaceutical companies began to develop cost-effective manufacturing processes for penicillin. The viability of submerged fermentations using large scale stirred tank bioreactors was established by the fermentation

❚❘❘ 10
Industrializing Biotechnology
technologist while the countercurrent extraction, crystallization, and lyophilization to recover penicillin in an active and stable form were devised by the chemical engineer and bioprocess technologist (Matales, 1998). The lifesaving benefits of insulin required engineering and technology for the extraction and purification of insulin from cow and pig pancreas. Later, with the developments in genetic engineering, production of insulin in E. coli in a sequence identical to the human pancreatic peptide was established. In 1981, large-scale propagation of recombinant E. coli in submerged fermentation engineered to make human insulin, as well as methods of recovery, refolding, and purification to obtain an active molecule was developed (Ladisch, 2001). The production of human insulin required 31 major processing steps, 27 of which are associated with product recovery and purification (Prouty, 1991). Eli Lilly licensed the technology and quickly industrialized the process, and the first recombinant product, human insulin, was marketed in 1982. Bioprocess and bioseparation technology, which provided the technology for carrying out complex, biological processes on a large scale, was critical in bringing human insulin to market. Another good example is the production of high-fructose corn syrup and bioethanol. In 1957, the discovery of an enzyme, glucose isomerase, with the amazing ability to transform glucose to fructose was reported. Cost effective large scale production of a thermally stable glucose isomerase by Streptomyces was subsequently developed. Using this enzyme, high fructose syrup could be produced from corn starch with sweetness similar to sugar from sugar cane. Glucose isomerase (which also transformed xylose to xylulose) was used to generate the first commercial shipment of corn syrup containing 42 percent fructose in 1967. Bioprocess technologists invented systems of fixed beds of the glucose

11 ❘❘❚
Arbakariya Ariff
isomerase enzyme and demonstrated the utility of biocatalysts for the large-scale industrial production of biochemicals. They also adapted industrial-scale liquid-chromatography separations used in the petrochemical industry to enrich the fructose content in corn syrup from 42 percent to 55 percent, creating a 55-percent high fructose corn syrup (HFCS) which became a major sweetener in many popular soft drinks. The biotechnology developed for HCFS production intersected the development of large-scale production of bioethanol as a liquid transportation fuel. The wet mills that produced HFCS had the infrastructure, integrated processing, biotechnology, and bioprocess engineering expertise to make production of million-gallon fermenters conceivable. The facilities had access to glucose from corn to fill these fermentation tanks with substrates for the production of fuel ethanol employing the yeast, Saccharomyces cerevisae. The benefits of biotechnology might be an anomaly if it were not for engineering, specifically fermentation and bioprocess technology, the discipline that puts biotechnology to work. It took fermentation and bioprocess technologists to design the tanks, impellers, pumps, compressors, columns, pipes, valves and downstream processing equipments that have the capability to produce biotechnology products in large enough quantity to meet market demand.

❚❘❘ 12
Industrializing Biotechnology
Figure 3 Unit operation and flow process involve in the extraction and purification of products from fermentation broth.
HIGH PERFORMANCE KOJIC ACID FERMENTATION USING LOCALLY ISOLATED STRAINS
Kojic acid (5-hydroxy-2-hydroxymethyl-γ-pyrone) has many industrial applications. It is directly active as an analgestic, anti-inflammatory agent and painkiller. Kojic acid is also an important intermediate in the production of a wide variety of chemicals used in food and cosmetics. The applications of kojic acid are increasing enormously with a growing presence in the industries related to its applications. There is strong demand for this compound and only a few companies around the world have the capability to produce commercial kojic acid.

13 ❘❘❚
Arbakariya Ariff
Screening, Isolation and Strain Improvement
In 1993, two kojic acid-producing strains from local sources, Aspergillus flavus (44-1) and A. flavus (33-2), were isolated through intensive screening programs. The strains had been improved using mutation and monospores isolation techniques where pure monokaryotic strain capable of producing large amounts of kojic acid was obtained (Rosfarizan et al., 1997). Medium and fermentation conditions for production by the isolated strains using either glucose or starch as carbon source had been optimized (Ariff et al., 1996a; Ariff et al., 1996b; Madihah et al., 1997; Rosfarizan et al., 1998; Rosfarizan et al., 1999; Rosfarizan and Ariff, 2000a).
Aeration and pH Control Strategies
Aeration control strategy, which is very critical in kojic acid fermentation by Aspergillus spp, has been proposed and successfully used for improvement of kojic acid production in pilot scale fermenters (Ariff et al., 1996). Growth and kojic acid production by Aspergillus flavus Link 44-1 were studied for different levels of dissolved oxygen tension (DOT) using a 2 L stirred tank fermenter (Figure 4). In all experiments agitation was fixed at 600 rpm and DOT was controlled at different levels by varying air flow rates. Single phase DOT control at three different levels (30%, 50% and 80% of saturation) did not enhance kojic acid production as compared to fermentation without DOT control (13.5 g/L). The production of kojic acid in fermentation with single phase DOT control at 80% was comparable to that of fermentation without DOT control. Decrease in DOT levels of below 80% reduced the production of kojic acid significantly although the maximum biomass obtained was increased. When DOT was controlled at very high levels (80%) during active growth and then decreased to low levels (30%) during

❚❘❘ 14
Industrializing Biotechnology
the production phase (i.e., two phase DOT control), the production of kojic acid (28.9 g/L) was increased by about 2 times as compared to fermentation without DOT control (Figure 5). Subsequently two phase pH control strategy for optimal kojic acid production was also developed (Rosfarizan et al., 2000b; Rosfarizan et al., 2002). Using both control strategies higher kojic acid production (40 g/L), than those reported in literature, was achieved.
Figure 4 Photograph of 2 L stirred tank fermenter used for kojic acid fermentation.

15 ❘❘❚
Arbakariya Ariff
Figure 5 Time course of batch kojic acid fermentation and the proposed dissolved oxygen tension (DOT) control strategy. Symbols
represent: () Cell concentration (g/L); () Kojic acid (g/L); (o) Glucose (g/L); (o) Nitrogen (g/L); (---) pH; and (- - - -) DOT (%
saturation).
Kinetic and Modeling
The models based on logistic and Luedeking-piret equations have been proposed to describe the kinetic of kojic acid fermentation by Aspergillus flavus Link 44-1 using various types of carbon [glucose, xylose, sucrose, starch, maltose, lactose and fructose] and nitrogen [NH
4Cl, (NH
4)
2S
2O
8, (NH
4)
2NO
3, yeast extract and peptone] sources
(Ariff et al., 1997; Rosfarizan and Ariff, 2006). The kinetic models are as follow:
Cell growth: dX/dt = [µmax
(1-X/Xmax
)]X (1)
Substrate consumption: - dS/dt = α(dX/dt) + βX (2)
Product formation: dP/dt = m(dX/dt) + nX (3)
Growth Phase
Production Phase
Cel
l con
c. (g
/l), K
ojic
aci
dN
itrog
en (g
/L) a
nd C
ultu
re p
H
Glu
cose
(g/L
), D
OT
(% sa
t.)

❚❘❘ 16
Industrializing Biotechnology
where, X is cell concentration, S is carbon source concentration, P is kojic acid concentration, t is fermentation time, µ
max is maximum
specific growth rate, α is a constant for growth associated substrate consumption, β is a constant for non-growth associated substrate consumption, m is a constant for growth associated product formation, and n is a constant for non-growth associated product formation. The kinetic models were fitted to the experimental data by non-linear regression with a Marquadt algorithm using MATLAB computer software. The fitness of the models to the experimental data is shown in Figure 6. The highest kojic acid production (39.90 g L-1) in batch submerged fermentation was obtained when 100 g/L glucose was used as a carbon source. Organic nitrogen sources such as peptone and yeast extract were favorable for kojic acid production as compared to inorganic nitrogen sources. Yeast extract at a concentration of 5 g/L was found optimal for kojic acid production. The optimal carbon to nitrogen (C/N) ratio for kojic acid fermentation was 93.3 (Figure 7).

17 ❘❘❚
Arbakariya Ariff
Figure 6: Effect of glucose concentration on growth of A. flavus and kojic acid production in batch submerged fermentation, which also
includes comparison of calculated and experimental data. 5 g/L glucose was used in all fermentations. (A) Cell concentration; (B) glucose
consumption; and (C) kojic acid production. Symbols represent: () 50 g/L; () 80 g/L; () 100 g/L; (•) 150 g/L; ( ), 200 g/L of glucose;
solid lines represent data calculated according to the model.

❚❘❘ 18
Industrializing Biotechnology
Figure 7 The relationship between C/N ratio and kojic acid production in batch submerged fermentation by A. flavus. Symbols represent
(O) kojic acid; ( ) cell concentration. Open symbols are for the data obtained in this study and closed symbols are for the data from
literature.
Mode of Fermenter Operation and Scaling-up Approach
Improvement of kojic acid production using sago starch in different scales of fermenter and modes of operation has been intensively studied using the strain A. flavus S33-2 (Table 1). Since starch is a low cost carbon source, A. flavus S33-2 has potential as an industrial strain (Rosfarizan et al., 1997). Fed-batch culture technique has been developed to overcome problems associated with high viscosity starch which limits mass transfer and hence, reduces fermentation performance. Using this method of fermentation with aeration and pH control strategies, kojic acid production that was comparable to fermentation using glucose was obtained (Rosfarizan et al., 2002).

19 ❘❘❚
Arbakariya Ariff
Tab
le 1
K
ojic
aci
d pr
oduc
tion
by
A. fl
avus
in d
iffe
rent
sca
les
of b
iore
acto
rs u
sing
dif
fere
nt c
arbo
n so
urce
s.
Par
amet
er
Car
bon
Sour
ce
Glu
cose
(10
0 g/
L)
Star
ch (
100
g/L
)St
arch
hyd
roly
sate
(10
0 g/
L)
Shak
e fla
sk
Ferm
ente
rSh
ake
flask
Ferm
ente
rSh
ake
flask
Ferm
ente
r
2 L
50 L
8 L
50 L
50 L
Pm
ax (
g/L
)31
.50
35.4
049
.70
23.5
04.
510.
2027
.90
28.8
0
Xm
ax (
g/L
)11
.80
12.1
012
.70
15.1
016
.30
14.2
012
.10
12.8
0
Y p/
s (g
/g)
0.31
50.
354
0.49
70.
235
0.04
510.
0021
30.
279
0.28
8
t (h)
516
264
240
504
240
231
504
282
Pro
duct
ivit
y (g
/L.h
)0.
061
0.13
40.
204
0.04
70.
019
9.2
X
10-4
0.05
50.
102

❚❘❘ 20
Industrializing Biotechnology
Scaling-up method for kojic acid fermentation based on a constant impeller tip speed has been proposed and successfully used to scale-up the process to 50 L fermenter. A simple and low cost method of kojic acid purification using the solvent re-crystallization method has been developed where high quality and purity (99.9%) products could be obtained.
Biotransformation Process
Recently, the use of a cell bound enzyme of Aspergillus flavus Link 44-1 in resuspended cell system has been proposed as an alternative for kojic acid production (Rosfarizan and Ariff, 2007). In this method, cell material was produced in batch fermentation using the 2 L stirred tank fermenter. The cell mycelia were then resuspended in a static container containing various carbon sources solutions. Among the carbon sources tested, glucose gave the highest kojic acid yield based on carbon consumed (0.365 g/g) followed by sucrose (0.279 g/g), starch hydrolysate (0.212 g/g) and fructose (0.195 g/g). The rate of biotransformation increased with increasing mycelial cell. Kojic acid production was also varied with different glucose and sucrose concentrations. The highest production was obtained at 100 g/L glucose and 100 g/ L sucrose with a final kojic acid concentration of 45.3 g/L and 33.4 g/L, respectively. The proposed kinetic models were found suitable to describe substrate consumption and kojic acid production during the biotransformation process using different carbon sources. The rate of biotransformation of glucose and sucrose to kojic acid followed the Michaelis-Menten equation, suggesting that the biotransformation rate varies with substrate concentrations similar to the behaviour of many enzyme reactions.

21 ❘❘❚
Arbakariya Ariff
Purification of Kojic Acid and Production of Kojic Acid Derivatives
A simple and low cost method of kojic acid purification using solvent re-crystallization method has been developed by our research group where high quality and purity (99.9%) could be obtained. At present, kojic acid research work is extended, in collaboration with the enzyme technology research group at UPM, to the modification of kojic acid by enzymatic reaction for the synthesis of kojic acid derivatives such as kojic acid palmitate and kojic acid esters to broaden its industrial applications (Khamaruddin et al., 2008).
PRODUCTION OF ACETONE-BUTANOL-ETHANOL BY Clostridium acetobutylicum USING LOCAL RAW MATERIALS AS SUBSTRATEThe production of solvents (acetone, butanol and ethanol) has a long history as a successful industrial fermentation process, which has been widely employed during the first and second world wars. However, the importance of this process declined rapidly after 1950, because the solvents could be produced more economically from petroleum by petrochemical process. Following the oil crisis in 1973, the synthetic route to solvents became much more expensive and recent developments in the field of biotechnology has resulted in a renewal of interest in the fermentation route as a possible source of solvent production. The main constraint on the economic viability of solvent (acetone-butanol-ethanol) fermentation is the cost of raw materials. About 60-70% of the total production cost in acetone-butanol-ethanol (ABE) fermentation is the cost of raw materials. Our research work was focussed on the feasibility of using several local carbon [gelatinized sago starch, raw palm oil mill

❚❘❘ 22
Industrializing Biotechnology
effluent (POME), fermentable sugars from enzymatic hydrolysis of lignocellulosic materials (POME and OPEFB)] and nitrogen [protein hydrolysate of fish waste] sources for solvent production by Clostridium acetobutylicum. Various approaches for improvement of the fermentation, in terms of yield and productivity, such as process optimization, the use of immobilized cells and continuous culture (single and two-stage chemostat) have also been investigated.
Direct Fermentation of Sago Starch to Solvent
The use of starch, which is an inexpensive carbon source, would reduce the cost of raw materials for production. The ability of Clostridium sp. to produce amylolytic enzymes such as amylases, pullulanase and glucoamylase enables direct fermentation of gelatinised starch to solvent (Figure 8). Total solvent production from fermentation using 30 g/L sago starch (11.03 g/L) was comparable to fermentation using corn starch and about two times higher than fermentation using potato or tapioca starch (Madihah et al., 200; Madihah et al., 2002a; 2002b). At the range of sago starch concentration investigated (10 to 80 g/L), the highest total solvent production (18.82 g/L) was obtained at 50 g/L. The use of a mixture of organic and inorganic nitrogen sources (yeast extract + NH
4NO
3) enhanced growth of C. acetobutylicum, starch hydrolysis
and solvent production (24.47 g/L) compared to the use of yeast extract alone. This gave the yield based on sugar consumed of 0.45 g/g. Results from our study also showed that the individual concentrations of nitrogen and carbon influenced solvent production to a greater extent than did the carbon to nitrogen (C/N) ratio.

23 ❘❘❚
Arbakariya Ariff
Figure 8 Photograph of solvent fermentation by Clostridium acetobutylicum P262 using gelatinized sago starch as a carbon source
Substantial improvement of direct fermentation of sago starch to solvent was achieved in fermentation where pH was not controlled during the acidogenic phase (initial culture pH was 6) and when pH was controlled at 5.5 during the solventogenic phase. Using this pH control strategy, the overall productivity (0.77 g/L.h) was improved by 1.6 times as compared to fermentation without pH control (Madihah et al., 2008). In addition, the batch fermentation process with high initial sago starch concentration (up to 70 g/L) was possible with the proposed pH control strategy, with a final total solvent concentration of 24.95 g/L (Table 2). Attempts to improve solvent fermentation using immobilized cells system have also been made. Immobilization of cells was achieved, in situ, passively by using a 1 cm3 of polyurethane foam with 40 pores per inch (Figure 9). The use of immobilised cells enables continuous fermentation to be operated at higher dilution rate than the wash out point in free cells system, which may result in higher productivity.

❚❘❘ 24
Industrializing BiotechnologyT
able
2 T
he e
ffici
ency
of
the
pH c
ontr
ol s
trat
egy
deve
lope
d in
fer
men
tati
on u
sing
hig
h sa
go s
tarc
h co
ncen
trat
ion.
Ferm
enta
tion
per
form
ance
Con
cent
rati
on o
f sa
go s
tarc
h (g
/L)
5060
7080
Max
. ace
tone
con
c. (
g/L
)5.
54±
0.12
b5.
99±
0.14
b6.
69±
0.27
c2.
99±
0.21
a
Max
i. bu
tano
l con
c. (
g/L
)4.
42±
0.15
a13
.16±
0.3
2c17
.8±
0.17
d7.
95±
0.23
b
Max
. eth
anol
con
c. (
g/L
)0.
46±
0.02
b0.
47±
0.01
b0.
47±
0.02
b0.
37±
0.05
a
Tota
l sol
vent
con
c. (
g/L
)10
.41±
0.5
a18
.48±
0.5
b24
.95±
0.7
c11
.19±
0.1
9a
Ove
rall
pro
duct
ivit
y (g
/L/h
)0.
520.
770.
770.
37Y
ield
(g
solv
ent/
g gl
ucos
e)0.
190.
280.
320.
13R
esid
ual g
luco
se c
onc.
(g/
L)
0.18
0.73
0.34
0.37
Res
idua
l mal
tose
con
c. (
g/L
)0.
090
00
Max
. ace
tic
acid
(g/
L)
7.59
± 0.
3c3.
14±
0.3b
3.16
± 0.
27b
2.33
± 0.
34a
Max
. bu
tyri
c ac
id (
g/L
)4.
88±
0.23
b1.
81±
0.1b
0.81
± 0.
03a
2.41
± 0
.17b
Tota
l ac
id c
onc.
(g/
L)
12.4
84.
613.
962.
34M
ax. c
ell c
onc.
(g/
L)
2.4±
0.2
a2.
2± 0
.12a
2.2±
0.1
a2.
0± 0
.13a
P/X
(g/
g)4.
298.
411
.34
5.6
Max
. α
-am
ylas
e ac
tivit
y (U
/mL
)1.
421.
421.
361.
2
Max
. g
luco
amyl
ase
acti
vity
(U
/mL
)5.
504.
013.
964.
01
Dat
a w
ere
obta
ined
fro
m th
e ti
me
cour
se o
f ea
ch f
erm
enta
tion
run
.V
alue
s ar
e m
ean
of th
ree
repl
icat
es w
ith
± S
D.
Ferm
enta
tion
tim
e is
tim
e ta
ken
to r
each
max
imum
tota
l sol
vent
con
cent
rati
on.
a-d M
ean
valu
es in
sam
e ro
w w
ith
diff
eren
t sup
ersc
ript
s ar
e si
gnifi
cant
ly d
iffe
rent
(P
<0.
05).

25 ❘❘❚
Arbakariya Ariff
Figure 9 Solvent fermentation by immobilized cells of Clostridium acetobutylicum P262 using 1 cm3 of polyurethane foam with 40 pores
per inch.
Production of Solvent Using Oil Palm Waste
The potential use of palm oil mill effluent (POME) and oil palm empty fruit bunch (OPEFB) fibre as substrate for solvent fermentation have also been studied (Tables 3 and 4). These cellulosic substrates were first hydrolysed enzymatically to hydrolysate containing fermentable sugars prior to use in fermentation (Khaw, 2001). Several methods of detoxification were tested to remove the inhibitory materials that exist in the hydrolysates of POME solid and OPFF. Among the methods tested, the one where both hydrolysates were treated with activated charcoal gave the highest solvent production. The optimum concentration of activated charcoal needed to treat POME solid and OPFF hydrolysate was 2% and 1% (w/v), respectively. The performance of solvent fermentation using hydrolysates of POME solid and OPFF was higher than that obtained in fermentation using pure sugars such as xylose, cellobiose and unhydrolyzed forms of

❚❘❘ 26
Industrializing Biotechnology
POME solid and OPFF. Between these two types of hydrolysates, solvent production was higher in fermentation using OPFF hydrolysate as compared to POME solid hydrolysate. This result indicates that hydrolysate from enzymatic hydrolysis of OPFF may have potential to be used as substrate for solvent fermentation.

27 ❘❘❚
Arbakariya AriffT
able
3
Pro
duct
ion
of s
olve
nt b
y C
lost
ridi
um a
ceto
buty
licu
m P
262
usin
g ra
w a
nd h
ydro
lysa
te o
f P
OM
E
and
OP
EF
F
Car
bon
sour
ceB
iom
ass
(g/L
)A
ceto
ne(g
/L)
But
anol
(g/L
)E
than
ol(g
/L)
But
yric
ac
id (
g/L
)A
ceti
c ac
id(g
/L)
PO
ME
sol
id h
ydro
lysa
te0.
610.
591.
350.
160.
680.
36O
PF
F h
ydro
lasa
te1.
140.
692.
260.
290.
770.
49G
luco
se1.
681.
753.
460.
901.
320.
81X
ylos
e0.
560.
170.
830.
040.
350.
28C
ello
bios
e0.
880.
281.
510.
120.
920.
74C
MC
0.37
Nil
Nil
Nil
3.45
0.71
PO
ME
sol
idN
D0.
340.
640.
101.
360.
65O
PF
FN
DN
ilN
ilN
il0.
120.
08S
odiu
m a
ceta
teN
ilN
ilN
ilN
ilN
ilN
il

❚❘❘ 28
Industrializing Biotechnology
Tab
le 4
P
rodu
ctio
n of
sol
vent
by
Clo
stri
dium
ace
tobu
tyli
cum
P26
2 us
ing
raw
and
hyd
roly
sate
of
PO
ME
an
d O
PE
F tr
eate
d w
ith
vari
ous
trea
tmen
ts.
Subs
trat
eT
reat
men
tA
ceto
ne(g
/L)
But
anol
(g/L
)E
than
ol(g
/L)
Tot
al S
olve
nt
(g/L
)Y
ield
(g/g
)
PO
ME
Sol
id
Hyd
roly
sate
Con
trol
0.14
0.30
0.12
0.56
0.01
9A
ctiv
ated
Cha
rcoa
l0.
340.
760.
211.
310.
044
Zeo
lite
0.13
0.32
0.15
0.60
0.02
0C
alci
um H
ydro
xide
0.27
0.63
0.18
1.08
0.03
6
OP
FF
H
ydro
lysa
te
Con
trol
0.22
0.75
0.10
1.07
0.03
6A
ctiv
ated
Cha
rcoa
l0.
461.
870.
142.
470.
082
Zeo
lite
0.29
0.73
0.11
1.13
0.03
8C
alci
um H
ydro
xide
0.35
1.16
0.11
1.62
0.05
4

29 ❘❘❚
Arbakariya Ariff
LARGE SCALE PRODUCTION OF LIVE CELLS OF LACTIC ACID BACTERIA IN POWDERIZED FORM
The use of probiotic microorganisms for the food and pharmaceutical industries is mainly driven by increasing consumer health awareness. Considerable interest is being generated in the incorporation of probiotics into functional foods, pharmaceutical and aquatic food products. With the increasing popularity of probiotic products among consumers, large-scale fermentation of lactic acid bacteria (LAB) such as Lactobacillus spp. is gaining importance. The growth activity of LAB is affected by fermentation conditions such as pH, temperature, medium formulation, oxygen, the presence of vitamins and minerals and the type of neutralizer used. Some factors to be considered in an attempt to optimize medium to large scale cultivation of lactobacilli are the cost of medium, final cell concentration and ease of cell recovery with respect to sanitary aspects. Probiotic microorganisms selected for commercial use must retain their beneficial characteristics for which they were originally selected. Hence, production and maintenance techniques must be established for maximizing the storage stability, viability and activity of the bacterial cells. The most convenient and satisfactory method for the long-term preservation of cultures is lyophilization or freeze-drying under vacuum. This is a stabilizing process in which a solution of a substance is first frozen and then the quantity of the solvent is reduced, first by sublimation and then by desorption to a value that will no longer support biological activity or chemical reactions. Formation of ice within the cells during freeze drying can lead to destruction by cell membrane rupture. Protective agents are added in the formulation to: (i) cyroprotect the cells during the freeze drying; and (ii) ensure dessication tolerance of microorganisms. Stabilization of membranes and proteins by replacing the water

❚❘❘ 30
Industrializing Biotechnology
around polar residues within these macromolecular structures can be achieved using trehalose and sucrose. Skim milk proteins may form a protective coating on the microbial cell walls and can provide buffering solutes for pH stabilization. Calcium may increase the survival rate of microbial cells during freeze drying. High concentration of protective agents is not always desirable when a mixture of protection agents is used. Several approaches have been used by our research group for the development of a commercially viable biomanufacturing process for the production of live cells of LAB in powderized form.
Optimization of Medium and Culture Conditions
A conventional method that has been used for multifactor experimental design is the “change-one-factor-at-a-time” approach. It is an experimental method in which a single factor is varied while other factors are kept at a specific set of conditions. This method may lead to unreliable results and wrong conclusions, and is inferior to the factorial design method. Response surface methodology (RSM), which includes factorial designs and regression analysis, can better deal with multifactor experiments. RSM is a collection of statistical techniques for designing experiments, building models, evaluating the effects of the factors, and searching for optimal conditions of factors for desirable responses. Optimization of yeast extract, glucose and vitamin concentrations; and also culture pH for maximizing the growth of a probiotic bacterium, Lactobacillus
rhamnosus, and assessment of the effects of these factors using response surface methodology have been conducted (Liew et al., 2005). A central composite design was used as an experimental design for the allocation of treatment combinations. A second-order polynomial regression model with the inclusion of cubic and quartic terms was used for analysis of the experimental data.

31 ❘❘❚
Arbakariya Ariff
From the analysis, it was found that the effects involving yeast extract, glucose, vitamins and pH on the growth of L. rhamnosus were significant, where the strongest effect on growth was given by the yeast extract concentration. Estimated optimum conditions of the factors for the growth of L. rhamnosus are as follows: pH = 6.9; vitamin solution = 1.28% (v/v); glucose = 5.01% (w/v) and yeast extract = 6.0%. Similar approach has also been used for the optimization of medium and culture conditions for efficient cultivation of LAB, such as L. salivarius (Lim et al., 2008).
Identification of Important Process Variables for Batch Cultivation of Lactobacillus salivarius in Stirred Tank Fermenter and Scaling-up Approach
The influence of process variables on the cultivation performance of LAB for production of probiotics and lactic acid was initially studied using a 2 L stirred tank fermenter. The dimensions of the stirred tank fermenter used in this study are shown in Table 5. The culture pH, aeration and inoculum size, had shown to have some effect on the cultivation performance of LAB. Appropriate degree of mixing, as correlated with impeller tip speed, also influenced the performance of the cultivation. However, appropriate regulation of culture pH had the most pronounced effect on cell production and viability. Further improvement on the cultivation performance of LAB in a 2 L stirred-tank fermenter was achieved when an inoculum size of 10% (v/v) was used; the pH was maintained at 6.10 ± 0.2 and the agitation speed was fixed at 0.69 m/s under facultative conditions. Scaling-up approach based on a constant impeller tip speed has been successfully used for the cultivation of LAB in stirred tank fermenter, up to a working volume of 100 L (Table 6).

❚❘❘ 32
Industrializing Biotechnology
Table 5 Schematic diagram, dimension and operating variables of the 2-L stirred tank fermenter used in this study
Dimension and Variable Measurement
Diameter of impeller, Di (m) 0.053
Internal diameter of vessel, Dt (m) 0.13
Distance between 1/2 of the impeller height and basement of the vessel, H
i (m)
0.054
Height of liquid level, HL (m) 0.082
Length of impeller blade, L (m) 0.015Height of impeller blade, W
i (m) 0.01
Liquid volume (m3) 0.001Rotation speed, N (min-1) 50, 150, 250, 350Impeller t
p speed, πND (ms-1) 0.14, 0.42, 0.69, 0.97
Figure 10 Photograph of 50, 100 and 300 L stirred tank fermenters available at Fermentation Technology Unit, Institute of Bioscience,
UPM

33 ❘❘❚
Arbakariya Ariff
Table 6 Comparison of the performance of L. rhamnosus batch cultivation using a shake flask and different sizes of fermenter
Kinetic parameter value
Shake flask
2-L fermenter
10-L fermenter
100-L fermenter
Impeller tip speed (m/s)
- 0.69 0.69 0.69
Reynold Number (Re) (-)
- 3,991 6,363 11,933
Region of Flow/Type of flow
-
Transition/laminar and
turbulent flows
Transition/laminar and
turbulent flows
Turbulent/ turbulent
flows
Mixing time (s) - 5.8 14.8 21.2
Final biomass concentration (x 109 CFU/mL)(g/L)
3.66 b
3.26 b
16.1 a
8.65 a
14.7 a
8.98 a
16.6 a
8.93 a
µmax
(h-1) 0.40 a 0.40 a 0.40 a 0.40 a
Final lactic acid concentration (g/L)
16.70 b 41.25 a 39.45 a 42.50 a
Biomass yield (x 1011 CFU/g
glucose)
(gDCW
/gglucose
)
1.09 b
0.16 a
3.20 a
0.17 a
2.90 a
0.18 a
3.29 a
0.18 a
Lactic acid yield (g/g
glucose)
0.80 a 0.81 a 0.78 a 0.84 a
Biomass productivity(x 108 CFU/mL.h)(g
DCW/L.h)
2.27 b
0.20 c
13.31 a
0.54 b
12.25 a
0.63 b
13.8 a
0.74 a
Lactic acid productivity (g/L.h)
1.00 c 2.54 b 3.25 a 3.23 a

❚❘❘ 34
Industrializing Biotechnology
Improved Production of Live Cells of Lactobacillus rhamnosus Fed-batch Fermentation
The potential use of fed-batch culture for improvement of the cultivation performance of LAB was studied using the 2 L stirred-tank fermenter. Typical example of the time course for fed-batch cultivation of L. salivarius is shown in Figure 11. Fed-batch cultivation of L. salivarius I 24 gave higher biomass concentration and lower lactic acid productivity than batch culture when operated at a feeding rate of 0.05 L/h for CFBC and μ
set of 0.3 h-1 for SFBC.
CFBC and SFBC showed improvements of 8.2 times and 43.1 times in terms of viable cell, as well as improvement of 15 times and 26 times in terms of viable cell yield as compared to those obtained in batch culture, respectively (Table 7).
Figure 11 The time course of SFBC at different μset
of (A) 0.3 h-1, (B) 0.4 h-1. Symbols represent: (□) DCW, (△) cfu/mL, (◊) lactic acid and (О) glucose. The vertical dotted lines indicate the initiation of the fed-
batch phase.
Glu
cose
, lac
tic a
cid
(g/L
),cf
u/m
L (x
1010
)G
luco
se, l
actic
aci
d (g
/L),
cfu/
mL
(x10
10)
DC
W (g
/L)
DC
W (g
/L)

35 ❘❘❚
Arbakariya Ariff
Table 7 Comparison of batch, CFBC and SFBC for biomass and lactic acid production by L. salivarius I 24
Kinetic parameter Batch CFBCA SFBCB
Viable cell concentration (x 1010 cfu/mL)
1.31 ± 0.02c 10.7 ± 0.95b 56.5 ± 0.25a
Biomass concentration (g/L)
2.35 ± 0.05c 7.114 ± 0.05a 5.26 ± 0.06b
Lactic acid concentration (g/L)
29.5 ± 0.5c 58.18 ± 0.5a 37.78 ± 1b
Viable cell yield (x 1012 cfu/g
Glucose)
0.44 ± 0.01c 11.3 ± 1a 6.44 ± 0.4b
Biomass yield (gDCW
/g
Glucose)
0.07 ± 0.01a 0.07 ± 0.01a 0.06 ± 0.01a
Lactic acid yield (gLA
/g
Glucose)
0.98 ± 0.01a 0.61 ± 0.05b 0.52 ± 0.025c
Viable cell productivity(x109 cfu/mL.h)
1.76 ± 0.5c 59.4 ± 3.5a 41.3 ± 0.1b
Biomass productivity (g
DCW/L.h)
0.28 ± 0.02b 0.395 ± 0.1a 0.38 ± 0.03a
Lactic acid productivity (g/L.h)
3.94 ± 0.1a 3.23 ± 0.05b 2.76 ± 0.15c
a-c Mean values in the same row with different superscripts are significantly different (P < 0.05).
A CFBC at 0.05 L/h using FMB B SFBC at 0.3 h-1 using FMB

❚❘❘ 36
Industrializing Biotechnology
Improved Production of Live Cells of Lactobacillus rhamnosus by Continuous Cultivation
The growth kinetics of Lactobacillus rhamnosus and lactic acid production in continuous culture at a range of dilution rates (0.05 h-1 to 0.4 h-1) were studied using 2 L stirred tank fermenter with a working volume of 600 mL (Liew et al., 2006). A typical time course of continuous culture of Lactobacillus rhamnosus is shown in Figure 12. Unstructured models, based on Monod and Luedeking-Piret equations, were used to simulate growth of the bacterium, glucose consumption and lactic acid production at different dilution rates in continuous culture. A steady state well-mixed continuous fermenter is operated with a constant inflow and outflow and is assumed to be well mixed so that the concentrations of cells, substrate and product are uniform throughout the medium volume. The volume, V, does not vary with time, so that, dV/dt = 0. In such an operation, all the environmental variables such as temperature and pH must be constant. Assuming that there is no death of cells, the feed supplies the limiting substrate and no cells or products are supplied in the feed, the concentrations of cells, substrate and product (product formation being a mixed process as in the case of lactic acid production by L. rhamnosus) at steady state can be derived from the following equations:
X = Yx/s
(Si – S) (4)
S = KsD /(µ
max – D) (5)
P = (α + β/D)X (6)
where,X = cell concentration at steady state (M L-3)S = substrate concentration at steady state (M L-3)P = product concentration at steady state (M L-3)

37 ❘❘❚
Arbakariya Ariff
α = growth-associated rate constant for product formation (M
M-1)β = non-growth associated rate constant for product formation
(M M-1 T-1)
Maximum specific growth rate of L. rhamnosus, µmax
, was
estimated at 0.4 h-1 and Ks at around 0.25 g/L. Comparison of
calculated and experimental cell growth data for continuous cultures of L. rhamnosus is shown in Figure 13. Maximum cell viability (1.29 x 10¹⁰ CFU/mL) was achieved in the dilution rate range of D = 0.28 h-1 to 0.35 h-1. Both maximum viable cell yield and productivity were achieved at D = 0.35 h-1. Continuous cultivation of L. rhamnosus
at D = 0.35 h-1 gave substantial improvement in cell productivity of 267% (viable cell count) as compared to batch cultivation (Table 8).
Figure 12 Continuous culture of L. rhamnosus at D = 0.28 h-1. Viable cell count (), dry cell weight (), glucose () and lactic acid (). The vertical dotted line indicates the initiation of the continuous cultivation phase. For data points without error bars, the errors were smaller than the size of the symbols. Error bars indicate the mean +
standard deviation of two experiments.
Dry
cel
l wei
ght,
Glu
cose
, La
ctic
aci
d (g
L-1)
Via
ble
cell
coun
t(x
109 C
FU m
L-1)
❚❘❘ 38
Industrializing Biotechnology
Figure 13 Comparison of calculated and experimental cell growth data for continuous cultures of L. rhamnosus. Viable cell count (),
dry cell weight (). Dotted (viable cell count) and solid (dry cell weight) . Glucose () and lactic acid (). Dotted (lactic acid) and solid
(glucose) lines represent data according to the models.
DC
W (g
L-1)
Lact
ic a
cid
(g L
-1)
Glu
cose
(g L
-1)
Via
ble
cell
coun
t(x
1012
CFU
L-1)

39 ❘❘❚
Arbakariya AriffT
able
8 C
ompa
riso
n of
bat
ch a
nd c
onti
nuou
s cu
ltur
es f
or c
ell a
nd la
ctic
aci
d pr
oduc
tion
by
L. r
ham
nosu
s an
d L
. del
brue
ckii
.
Kin
etic
par
amet
ers
L. r
ham
nos
us
(dat
a fr
om
this
stu
dy)
L. d
elbr
uec
kii (
Gok
sung
ur
& G
uven
c, 1
997)
Bat
ch
cult
ure
Con
tinu
ous
cult
ure
Bat
ch
cult
ure
Con
tinu
ous
cult
ure
Max
imum
cel
l con
cent
rati
on
(x 1
010 C
FU
/mL
) (g
/L)
1.47
a
8.98
a
1.29
b, A
7.61
b, B
7.61
5.65
Max
imum
cel
l yie
ld
(x 1
011 C
FU
/ggl
ucos
e)(g
DC
W/g
gluc
ose)
2.90
b
0.18
a 3.
68 a,
C
0.22
a, D
-
-
Max
imum
cel
l pro
duct
ivit
y(x
1012
CF
U/L
. h)
(gD
CW
/L. h
)
1.23
b
0.63
b
4.51
a, C
2.78
a, E
0.
631.
76
Max
imum
lact
ic a
cid
conc
entr
atio
n (g
/L)
39.4
5 b
44.9
8 a, C
60
.341
.5
Max
imum
lact
ic a
cid
yiel
d (g
/ggl
ucos
e)0.
78 b
1.28
a, C
0.77
-
Max
imum
lact
ic a
cid
prod
uctiv
ity
(g/L
. h)
3.25
b
15
.74
a, C
4.83
11.2
0
Max
imum
fer
men
tati
on e
ffici
ency
(g gl
ucos
e ut
iliz
ed /
(100
g) in
itia
l glu
cose)
100
a10
0 a, F
--

❚❘❘ 40
Industrializing Biotechnology
Mean values in the same row not followed by the same letter in lower case are significantly different (P < 0.05). Superscripts in capital letters refer to continuous cultures operated:A At dilution rate 0.28, 0.3 and 0.35 h-1
B At dilution rate 0.3 h-1
C At dilution rate 0.35 h-1
D At dilution rate 0.3 and 0.35 h-1
E At dilution rate 0.4 h-1
F At dilution rate 0.05, 0.1 and 0.19 h-1
Batch culture data are obtained from L. rhamnosus fermentation using the optimized medium in 10 L fermenter.
Formulation of Protective Agents in Freeze Drying Process of LAB cells
The effectiveness of formulations using different protective agents to maintain viability of Lactobacillus salivarius I 24 during freeze-drying for production of live cell in powdered form has been investigated by our research group (Lim et al., 2006). The influence of pre-freezing and cultivation conditions on viability of cells after freeze drying was also studied. Surface methodology was used to determine the most suitable combination of the protective agents. Concentrations of skim milk, sucrose, glycerol and calcium carbonate were selected as operating variables and survivals of cultures after freeze-drying were used as results. Skim milk and sucrose were better protective agents than glycerol and calcium carbonate when used individually for preserving L. salivarius I 24 during freeze-drying (Table 9). Their protective abilities could be enhanced significantly when used as a mixture (9.85% w/v skim milk and 10.65% w/v sucrose). Pre-freezing of the cells at -80oC for 5 h prior to freeze drying and cultivation with regulated pH and temperature gave the highest cell viability (Table 10).

41 ❘❘❚
Arbakariya Ariff
Table 9 Effects of various protective agents on the survival rates of L. salivarius I 24 after the freeze-drying process.
Protective agent
Viable cell (cfu/mL) % of survivalBefore Freeze
DryingAfter Freeze
Drying
Distilled water (Control)
1.3 x 10¹⁰ 1.0x 10⁷ 0.08
Skim milk (20% w/v)
1.1 x 10¹⁰ 1.4 x 10⁹ 13.03
Sucrose (20% w/v) 5.0 x 10⁹ 4.5 x 10⁸ 9.00
Glycerol (5% w/v) 5.4 x 10⁹ 7.1 x 10² 1.3 x 10⁻⁵
Calcium carbonate (Ca2+) (0.5% w/v)
4.1 x 10¹⁰
Lower than the detection
limit of the plating technique
0.00
Table 10 Survival rate (%) of L. salivarius I 24 after freeze-drying under different freezing conditions
Protective agent
Survival rate (%) under different freezing conditions
A B C D E F
MSA 15.39 44.90 44.35 55.17 59.39 65.00MSB 4.80 1.80 34.27 39.10 40.43 51.79MSG 3.83 10.06 15.45 5.10 25.70 26.83
MSA = 9.85 % (w/v) skim milk + 10.65 % (w/v) sucroseMSB = 17.80 % (w/v) skim milk + 5.5 % (w/v) sucroseMSG =16.55 % (w/v) skim milk + 9.01 % (w/v) sucrose + 3.34 % (v/v) glycerolA = chilled at 4oC for 2 h and then frozen at -30oC for 24 hB = chilled at 4oC for 2 h and then frozen at -30oC for 5 h

❚❘❘ 42
Industrializing Biotechnology
C = frozen at -30oC for 24 hD = chilled at 4oC for 2 h and then frozen at -80oC for 24 hE = chilled at 4oC for 2 h and then frozen at -80oC for 5 hF = frozen at -80oC for 5 h
Microencapsulation of probiotic bacteria is another technique that can be used to increase protection against extreme processing conditions and this subject is currently used in our laboratory for formulation of LAB and Bifidobacteria.
DEVELOPMENT OF RED PIGMENT FERMENTATION BY Monascus purpureus
The search for naturally produced substitutes for chemical food colorants has lead to a resurgence of interest in the pigments synthesized by fungi such as the M. purpureus. This fungus has been used in Asia for many centuries as natural coloring and flavoring ingredients in food and beverages. The red pigments are of particular interest, because red is the most popular food color and true natural pigments suitable for applications in food industries are difficult to obtain. The biosynthesis of the pigments by the fungus is poorly understood. Studies by many researchers have revealed that the pigment production in submerged fermentation by M. purpureus is affected by numerous environmental factors. Locally isolated M.
purpureus FTC 5391 capable to produce substantial amount of red pigment was employed in our study. Several approaches have been used for the development of submerged fermentation employing this fungus for pigment production in the stirred tank bioreactor.

43 ❘❘❚
Arbakariya Ariff
Improvement of Red-Pigment Producing Fungal Strain Using Monospore Isolation Technique
The ability of the wild strain M. purpureus, in producing red pigment was successfully improved using the monospore isolation technique (Musaalbakri et al., 2006a). Using this approach for improvement, several monospore isolates that have different abilities in producing red pigments from different carbon sources was obtained (Table 11). Monospore isolate MP 3 can be chosen as the highest red pigment producer when glucose is used as the carbon source. MP 4 was the best pigment producer when grown on potato starch, while MP 5 gave the highest pigment production when grown on rice starch. The result from the study showed that the wild strain of M.
purpureus present as heterokaryons, consisted of several unstable monokaryons. Resulting from the monospore isolation step, a stable pure monokaryon with high ability in producing red pigment, was obtained for use in subsequent studies.

❚❘❘ 44
Industrializing Biotechnology
Tab
le 1
1 C
ompa
riso
n of
the
perf
orm
ance
and
the
kine
tic
para
met
er v
alue
s of
red
pig
men
t fer
men
tati
on b
y m
onos
pore
s is
olat
es o
f M
. pur
pure
us a
nd p
aren
t str
ain.
Kin
etic
Par
amet
er V
alue
sM
onos
pore
Iso
lati
onP
aren
t St
rain
MP
1M
P 2
MP
3M
P 4
MP
5
Glu
cose
as
carb
on s
ourc
e
Xm
ax (
g/L
)8.
05±
0.1
10.4
8±0.
211
.63±
0.17
10.3
3±0.
1210
.68±
0.1
8.95
±0.
13
Red
pig
men
t con
cent
rati
on
(UA
500)
max
5.35
±0.
1611
.28±
0.27
13.1
2±0.
1310
.33±
0.19
11.7
4±0.
215.
45±
0.14
Max
imum
Glu
coam
ylas
eA
ctiv
ity
(U/m
L))
--
--
--
Max
imum
α-a
myl
ase
Act
ivit
y (U
/m
L)
--
--
--
μ max
(h-1
)0.
050b
0.05
0b0.
055b
0.05
0b0.
050b
0.03
5a
Yie
ld (
Yx/
s) (
g/g)
0.
156b
0.20
5c0.
228c
0.20
2c0.
209c
0.09
a
Pro
duct
ivit
y (g
/L.h
-1)
0.04
60.
053
0.04
70.
060.
054
0.02
5
t d (h)
12.6
012
.60
10.6
611
.09
10.6
610
.55

45 ❘❘❚
Arbakariya AriffR
ice
star
ch a
s ca
rbon
sou
rce
Xm
ax (
g/L
)14
.95±
0.23
14.8
5±0.
1915
.65±
0.1
13.7
3±0.
215
.18±
0.13
10.7
6±0.
15
Red
pig
men
t con
cent
rati
on(U
A50
0)m
ax
5.27
±0.
248.
56±
0.28
8.51
±0.
21.
92±
0.3
9.15
±00
.21
5.25
±0.
11
Max
imum
Glu
coam
ylas
eA
ctiv
ity
(U/m
L))
11.1
7813
.451
12.7
631.
992
14.7
938.
786
Max
imum
α-a
myl
ase
Act
ivit
y (U
/m
L)
0.21
90.
204
0.31
20.
203
0.21
50.
097
μ max
(h-1
)0.
085b
0.08
75b
0.15
d0.
085b
0.09
5c0.
065a
Yie
ld (
Yx/
s) (
g/g)
0.32
5b
0.31
4b0.
332b
0.36
3b0.
308b
0.13
7a
Pro
duct
ivit
y (g
/L.h
-1)
0.12
90.
068
0.11
40.
111
0.06
90.
045
t d (h)
8.15
7.92
4.62
8.15
7.29
4.78

❚❘❘ 46
Industrializing BiotechnologyPo
tato
sta
rch
as c
arbo
n so
urce
Xm
ax (
g/L
)11
.35±
0.11
11.1
8±0.
1811
.33±
0.15
12.2
3±0.
1711
.48±
0.11
10.3
9±0.
1
Red
pig
men
t con
cent
rati
on
(UA
500)
max
7.65
±0.
1310
.36±
0.14
8.65
±0.
1614
.46±
0.11
9.53
±0.
27.
85±
0.2
Max
imum
Glu
coam
ylas
eA
ctiv
ity
(U/m
L))
10.3
299.
435
10.1
692.
641
10.3
278.
128
Max
imum
α-a
myl
ase
Act
ivit
y (U
/m
L)
0.88
20.
844
0.81
40.
844
0.71
40.
657
μ max
(h-1
)0.
085b
0.08
5b0.
085b
0.08
5b0.
085b
0.06
0a
Yie
ld (
Yx/
s) (
g/g)
0.22
2b0.
224b
0.33
2b0.
241b
0.22
5b0.
152a
Pro
duct
ivit
y (g
/L.h
-1)
0.06
60.
057
0.11
50.
071
0.06
90.
049
t d (h)
8.15
8.15
4.62
8.15
8.15
5.69
Val
ues
are
mea
n of
thre
e re
plic
ates
wit
h ±
SD
a-c M
ean
valu
es in
sam
e ro
w w
ith
diff
eren
t sup
ersc
ript
s ar
e si
gnifi
cant
dif
fere
nt (
P<
0.05
)

47 ❘❘❚
Arbakariya Ariff
Kinetics and Modeling of Red Pigment Fermentation by M. purpureus
Optimization of medium was conducted for improvement of red pigment production by M. purpureus (Musaalbakri et al., 2005a). The composition of the optimum fermentation is as follows, glucose as a carbon source at a concentration of 50 g/L, MSG as the nitrogen source at concentration of 12 g/L, trace elements K
2HPO
4 (2.5
g/L), KH2PO
4 (2.5 g/L), MgSO
4.7H
2O (1.0 g/L), KCl, (0.5 g/L),
ZnSO4.7H
2O (0.01 g/L), FeSO
4.7H
2O (0.01 g/L) and MnSO
4.H
2O
(0.03 g/L) were obtained at initial pH 6.5 and inoculum size of 10% (v/v). By using this optimized medium, the maximum concentration of red pigment obtained in batch culture using shake flask was 15.95 UA
500 which gave yield (Y
p/s) and productivity (P) of 0.32 UA
500/g
glucose and 0.072 g/L.h respectively. M. purpureus FTC 5391 was able to utilize various types of carbon sources, except sucrose, for red pigment production. Using the optimal concentration of fructose, batch fermentation without pH control was capable of producing slightly higher red pigments (20.70 UA
500) as compared
to fermentation using glucose (20.63 UA500
). In terms of overall productivity, fermentation using fructose (0.153 UA
500/h) was
comparable to glucose (0.122 UA500
/h). Unstructured models based on Logistic and Leudeking-Piret equations were proposed to describe growth, substrate consumption and red pigment production by M. purpureus (Musaalbakri et al., 2005b). The proposed models based on Logistic and Leudeking-Piret equations were found suitable to describe M. purpureus fermentation for production of red pigment using various types of carbon sources and various concentrations of glucose. Typical example of the fitness of the models to the experimental data is shown in Figure 14. The models can be used to generate parameter values that may be used to verify the experimental data; and also

❚❘❘ 48
Industrializing Biotechnology
simulation and optimization of the process. The results from the models strongly suggest that red pigment production in M. purpureus was a non-growth associated process. The maximum red pigment and cell concentration obtained in batch fermentation using the 2 L stirred tank fermenter was 20.63 UA
500 and 13.2 g/L, respectively
and 9.26 U and 11.425 g/L, respectively, when fermentation was carried out using the shake flask. The maximum specific growth rate (μ
max) in 2 L stirred tank fermenter and shake flask was not
significantly different (0.065 h-1 and 0.055 h-1, respectively).
Figure 14 Comparison of calculated and experimental data for batch fermentation of red pigment using the 2 L fermenter. (♦) - cell concentration; (●) – red pigment; (■) – glucose; (------) – pH;
solid lines represent data according to the models.
Aeration and Agitation Strategies for Improvement of Red Pigment Production by M. purpureus
Degree of aeration and agitation greatly affected and influenced the production of red pigment by M. purpureus FTC 5391 during

49 ❘❘❚
Arbakariya Ariff
fermentation in 2 L stirred tank fermenter (Musaalbakri et al., 2006b). Cell morphology during cultivations of M. purpureus had an effect on the final pigment yield. Mycelia morphologies could be controlled by the agitational shear stress (Figure 15). Mycelia cells with short branches were best for red pigment production because cultures were not highly viscous and high DOT level could be maintained with sufficient air supply and agitation. However, under conditions of excessively strong agitation, cell activities and oxygen uptake rates were diminished due to mechanical damage of the cells. Hence, increased overall productivity was observed. Among the agitation and aeration control strategies investigated in this study, the highest red pigment production was obtained in fermentation where the agitation speed was controlled at 600 rpm and DOT level at 90% saturation (Table 12). A simple model employing Logistic and Luedeking-Piret equations was found sufficient to describe growth of M. purpureus and red pigment production. The production of pigments in M. purpureus cultures appears to be a non-growth associated process.

❚❘❘ 50
Industrializing Biotechnology
A B
C D
Figure 15 The morphology of M. purpureus FTC 5391 in a 2 L stirred tank fermenter. Observation (x100) of 6 day old culture. Arrows show the vacuolated cells. DOT levels; (A) 90%, (B) 80%, (C) 50% and
(D) 30%.

51 ❘❘❚
Arbakariya Ariff
Table 12 Effect of dissolved oxygen tension (DOT) on the performance of red pigment fermentation by M. purpureus.
Kinetic ParameterValues Dissolved oxygen tension (DOT) (% saturation)
30 50 80 90
Xmax
(g/L) 7.72a 9.99b 11.55c 13.2d
X0 (g/L) 0.78a 0.81b 0.78a 0.85b
μmax
(h-1) 0.0478 0.0475 0.055 0.065 P
0 (UA
500) 0.798a 0.812b 0.807b 0.805b
Pmax
(UA500
) 10.79a 13.93b 16.35c 20.63d Y
x/s (g cell/g glucose) 0.139a 0.182a 0.215b 0.248b
P (g cell/L.h) 0.053a 0.069b 0.09d 0.077c Y
p/s (UA
500/g.L) 0.20a 0.262a 0.311b 0.411c
P (UA500
/h) 0.07a 0.091b 0.13c 0.122c P
max/X
max 1.40 1.41 1.42 1.563
α (g glucose/g cell) 6.9 5.5 4.65 4.0 β (g glucose/g cell.h) 0.005 0.005 0.005 0.005 m 0 0 0 0 (UA
500 red pigment/g cell)
n 0.018 0.02 0.021 0.02
(UA500
red pigment/g cell.h)
a-d Mean values in same row with different superscripts are not significantly different (P<0.05)
Enhancement of Red Pigment Production by M. purpureus Through Retrofitting of Helical Ribbon Impeller in Stirred Tank Fermenter
The possibility of using a novel proximity type half-pitched double flight helical ribbon impeller for improvement of red pigment production by M. purpureus was investigated in a 2 L stirred tank fermenter (STF) (Shamzi et al., 2009). For comparison, the fermentations were also carried out in STF equipped with the industrial standard six bladed Rushton turbine. Figure 16 shows

❚❘❘ 52
Industrializing Biotechnology
the comparison of the dimensions between the prototype half pitched double-flight Helical Ribbon Impeller with the standard Rushton turbine The selection of aeration and agitation strategies in STF were based on possible attainable oxygen transfer at the start of fermentation using the derived empirical power law model to predict the initial volumetric oxygen transfer coefficient (k
La).
In fermentation employing a single helical ribbon impeller agitated at 250 rpm and air flow rate of 2.25 L/min (1.5 vvm) gave the final pigment concentration, yield and productivity of 24.39 UA
500, 0.472
UA500
/g.glucose and 0.203 UA500
/h, respectively (Table 13). These values were about 60%, 78% and 96% higher than those obtained in STF fitted with Rushton turbine. In terms of impeller power consumption, the new agitator system was favourable for batch cultivation of M. purpureus as pigment yield per energy invested was 2.5 times higher than the Rushton turbine.
Figure 16 Dimensional comparison between the prototype half pitched double-flight Helical Ribbon Impeller with the standard 0.333
Di/D
T Rushton turbine.

53 ❘❘❚
Arbakariya Ariff
Table 13 General comparison of kinetic and performance of red pigment fermentation by M. purpureus in different fermenter
configurations.
Kinetic ParameterFermenter Configurations
Shake flask RT 600 HR 250b
µmax
(h-1) 0.0537a 0.0540a 0.0560a
Xm (g/L) 11.597a 11.610a 10.767a
Pmax
(UA500
) 10.612c 13.835b 24.390a
Yx/s
(g cell/g glucose) 0.2219a 0.2166a 0.2116a
Yp/s
(UA500
/g glucose) 0.2070c 0.2670b 0.4720a
Pr (g cell/L.h) 0.1120a 0.1213a 0.1047a
Pr (UA 500
/h) 0.1030b 0.1037b 0.2030a
Pmax
/Xmax
(UA500
/g.L) 0.9203b 1.2147b 2.2653a
α (g glucose/g cell) 10.2008 8.4863 8.8640
β (g glucose/g cell. h) 0.0 0.0051 0.0115
m (UA500
/g cell) 0.9678 1.0095 1.8520
n (UA500
/g cell. h) 0.0 0.0014 0.0054
Energy Consumption (kW.h) ND 0.2285 0.1608
Mean values in a row followed by the same superscript letter were not significantly different (P < 0.05).
PRODUCTION OF INTERFERON-α2B THROUGH PERIPLASMIC EXPRESSION OF Escherichia coli
Human interferon-α2b (IFN-α2b) is a physiologically active protein and it is one of the growth factors under the cytokine family. It has excellent antiviral, antimicrobial and antitumor actions. As a result, it is being used as one of the bio-pharmaceutical drugs for diseases like hairy cell leukemia, chronic hepatitis C and chronic hepatitis B. IFN-α2b is currently produced in the form of inclusion

❚❘❘ 54
Industrializing Biotechnology
bodies (IB) in industry. Protein produced via IB, normally does not retain its biological activity and needs unfolding and refolding, adding additional steps in downstream processing. On the other hand, periplasmic expression provides excellent room for correct disulphide formation and proper folding. Protein contamination and protease activity in periplasm is also lesser than cytoplasm. However, lower amount of expression than IB limits its industrial applications. Therefore the objective of this study is to find the various bottlenecks in the process development and the related solutions.
Development of Recombinant Strains
In our study, two recombinant strains were developed with two different commercial vectors namely pFLAG-ATS (Sigma-Aldrich) and pET 26b(+) (Merck).The main difference between these two plasmids is the signal sequence and promoters. pFLAG-ATS contains Lac promoter and ompA signal sequence for the periplasmic expression whereas pET 26b(+) contains T7Lac promoter and pelB signal sequence for the periplasmic expression. The constructs were prepared by inserting the coding sequence of IFN-α2b from the source vector pALCA1SIFN (ATCC 53369) to the respective plasmid using PCR-based subcloning strategy. After confirming the presence of correct gene sequence, protein expression experiments were carried out. While the presence of IFN-α2b expressed using pET 26b(+) could be detected by western blot (Figure 17) and quantified by ELISA (Figure 18), IFN-α2b expressed using pFLAG-ATS could not be detected clearly in western blot due to lower concentration. It was observed that both periplasmic and total interferon-α2b expression from pET 26b(+) was 2,826 and 17,695 times higher than pFLAG-ATS. In silico analysis of mRNA secondary structures suggested that the

55 ❘❘❚
Arbakariya Ariff
increase of expression was mainly due to the difference in the translation initiation caused by mRNA secondary structure of both the vectors (Ramanan et al., 2009a). Even though higher expression was achieved using pET 26b(+), the expression was lower than the reported values of IFN-α2b expressed via IB. Further studies in genomic and proteomic levels are in progress to identify the major hurdle in overexpression.
Figure 17 Western blot for the expression of IFN-α2b from pET 26b(+)Lane1, Prestained protein marker (7-175 kDa broad range protein marker, P-7708S from New England laboratories); Lane2, soluble cytoplasmic fraction of pET 26b(+) in RG2(DE3); Lane 3, Soluble periplasmic fraction of pET 26b(+) in RG2(DE3); Lane 4, Soluble
cytoplasmic fraction of pET-IFN in RG2(DE3); Lane 5, Soluble periplasmic fraction of pET-IFN in RG2(DE3); Lane 6, IFN-α2b
standard

❚❘❘ 56
Industrializing Biotechnology
Figure 18 ELISA result for the expression of IFN-α2b from pET 26b(+)Lane1, Osmotic shock of pET-26b-IFN (uninduced form); Lane2,
Osmotic shock of pET-26b-IFN ; Lane3, Osmotic shock of pET-26b (without IFN-α2b coding sequence); Lane 4 to 6 same as1 to 3 but with
total cell lysis; Lane7, IFN α2b standard; Lane8, Blank
Media Optimization and Fermentation
Optimization of a medium is one of the important factors to increase productivity. A statistical based Plackett-Burman screening design was performed on seven factors which includes different medium components and initial pH (Tan et al., 2009). Glucose, yeast extract and peptone were found to be the most important factors affecting the growth of the microorganism and the productivity of IFN-α2b. Further optimization was carried out using central composite design of response surface methodology (RSM). Using this optimized medium, periplasmic expression of IFN-α2b was increased up to 0.3 mg/L, which was about 18 and 26 times higher than those obtained using commercial media namely Terrific broth (TB) and Luria broth (LB), respectively.
Bioseparation and Downstream Processing
Cell disruption is one of the unit operations in downstream processing, which is necessary for the extraction of intracellular products. Enzymatic digestion, freeze-thawing, french press, ultrasonication and glass bead vortexing are the methods generally carried out at laboratory scale. However all these are limited either in handling many samples at one time or inefficient extraction or

57 ❘❘❚
Arbakariya Ariff
leads to high cost. On the other hand, glass bead shaking using a rotary shaker was found to be useful for handling many samples at one time (Ramanan et al., 2008). After optimizing different parameters like glass bead ratio, shaking speed, culture volume, vessel shape and the culture medium, it was found that 1.5 g/mL glass beads ratio, 300 rpm, and 30 min of processing time would be needed for the efficient release of total intracellular products from E. coli, specifically IFN-α2b (Figure 20). The results were comparable with other laboratory methods investigated in this study, such as ultrasonication. This method can handle cell suspension volumes in a range of 1 to 10 mL in a 50 mL Falcon tube without a great deal of variation. The glass bead shaking technique should prove particularly useful when other comparative studies, such as colony selection, media selection, and other tests are conducted to determine the optimal protein production conditions. This technique can be utilized for shear sensitive products as the relevant conditions tend to be less harsh than for air sensitive products as it is conducted under closed conditions.
Figure 19 Effect of glass beads ratio for total protein release (Rf) at
300 and 350 rpm. Symbols represent :(●) 300 rpm, 0.5 g/mL; () 300 rpm, 1.5 g/mL; (○) 350 rpm, 0.5 g/mL; () 350 rpm, 1.5 g/mL.

❚❘❘ 58
Industrializing Biotechnology
Cell disruption using homogenizer was also conducted to see the characteristics of cell disruption on different pressure ranges (Ramanan et al., 2009b). Maximum protein release was observed at high pressure range and IFN-α2b was found to retain its antigenicity even at this pressure range. On the other hand, selective protein release of IFN-α2b was found to be higher at low pressure range than at high pressure range. Yet it is not as effective as osmotic shock. Further purification of the protein by chromatography technique is being carried out in our laboratory using the knowledge and skills obtained from our previous research works in the area of protein bioseparation from various recombinant microorganisms (Tey et al., 2004; Ling et al., 2004; Chow et al., 2005a; 2005b; 2005c; 2006a; 2006b)
Assay Development
In all the earlier studies conducted for the production and purification of IFN-α2b, the amount of IFN-α2b was quantified either by using one or a combination of methods like bioactivity assay, gel electrophoresis and ELISA. These methods are time consuming and need special skills in some cases. Surface plasmon resonance (SPR) using Biacore 3000 (GE Healthcare) was explored to quantify IFN-α2b in a similar manner to ELISA but with faster rates, and consuming fewer reagents (Ramanan et al., 2009c). Anti-α-IFN mouse monoclonal antibody (anti-IFN) was immobilized on to a CM5 chip. After optimizing the important parameters, sensitivity of this assay was increased up to 45%. The binding between interferon-α2b and anti- IFN was predominantly controlled by mass transfer and the relationship was found to be linear ranging from 5 ng/mL to 400 ng/mL (Figure 20). Total cycle time per analysis was less than 8 min and required only 5 μL of sample injection. Further work is

59 ❘❘❚
Arbakariya Ariff
in progress to validate the assay according to ICH (International conference on Harmonization) guidelines.
Figure 20 A typical standard curve for IFN-α2b using Surface Plasmon Resonance (SPR)
Overall Process Design
Development of the process for the production of IFN-α2b involves team work which needs a molecular biologist to develop a proper recombinant strain, a process engineer to optimize the fermentation and downstream operation and also an analyst to develop the assay that could be used in various processing steps. The amount of periplasmic expression was increased from nanogram to milligram but it was still lower than can be produced via IB. Purification of this amount of product is a challenging process like finding a needle in a haystack. In spite of this lower expression, a production process is being developed. Further work is in progress at different levels to increase the amount of expression and also to establish a complete process.
Res
pons
e (-
)

❚❘❘ 60
Industrializing Biotechnology
BIOSORPTION OF HEAVY METALS FROM INDUSTRIAL EFFLUENTS USING MICROBIAL BIOMASSBiosorption, the metabolism-independent binding of heavy metals to non-living cells, has been explored for its potential in removing toxic metals from aqueous solutions. Metal sequestration by different parts of the cells can occur via complexation, coordination, ion-exchange adsorption and microprecipitation. Metal removal by nonliving biomass may be more attractive as compared to the use of living cells, offering several advantages such as where the growth and propagation of the biomass can be decoupled from its subsequent function as a metal sorbing material. Microbial cells are capable of sequestering and accumulating heavy metals by:
(i) active metal intake for metabolic purposes as well as passive metal uptake,
(ii) binding due to the chemical makeup of the cell and its constituent parts.
The microbial biomass could be obtained as waste from fermentation process. Our research work was focussed on development of technology for the removal of metal ions from effluent using microbial biomass, as a cheap and efficient source of biosorbents.
Isolation and Characterization of Microorganisms that Can Be Used for the Removal of Heavy Metals from Effluent
The ability of several types of microbial biomass to be used as biosorbent in biosorption processes for the removal of heavy metals was investigated using sorption isotherm equilibrium experiment in shake flask (Ariff et al., 1998; Kok et al., 2001; Kok et al., 2002a; 2002b; 2002c). A. flavus and Rhizophus oligosporus cells biomass

61 ❘❘❚
Arbakariya Ariff
were found to be the suitable biosorbent (Table 14). Oven-dried was the suitable pretreatment for cells with higher uptake capacity and ease in handling and storage. The heavy metal uptake capacity also very much depended on pH, temperature, heavy metal concentration in solution and cell biomass loading.

❚❘❘ 62
Industrializing Biotechnology
Tab
le 1
4 H
eavy
met
al u
ptak
e ca
paci
ty o
f fu
ngal
bio
mas
s w
ith
diff
eren
t pre
trea
tmen
ts
Mic
roor
gani
sm
Pre
trea
tmen
tH
eavy
m
etal
Opt
imal
pH
and
te
mpe
ratu
reU
ptak
e ca
paci
ty
(mg/
g)
Asp
ergi
llus
flav
us
(was
te f
rom
koj
ic a
cid
ferm
enta
tion
)
Pow
deri
zed,
ove
n-dr
ied
cell
s
Zn
5.5,
30o C
112.
36
Cd
39.0
6
Pb
5.87
Liv
e ce
lls
Pb
280.
61
Free
ze-d
ried
cel
lsP
b25
1.62
Ove
n-dr
ied
cell
sP
b19
6.0
Rhi
zopu
s ol
igos
poru
s
Ove
n-dr
ied
cell
sP
b
5, 3
0o C
126.
0
Liv
e, f
ree
cell
sC
d17
.09
Imm
obil
ised
cel
ls in
po
lyur
etha
ne f
oam
Cd
34.2
5

63 ❘❘❚
Arbakariya Ariff
The Kinetics and Mechanism of Heavy Metal Biosorption by Microbial Biomass
The kinetic and mechanism of lead biosorption by powderized Rhizopus oligosporus were studied using shake flask experiment (Ariff et al., 1998; Aloysius 1999b; Kok et al., 2002c). The optimum biomass concentration and initial solution pH for lead sorption at initial lead concentrations ranging from 50-200 mg/L was obtained at 0.5 g/L and pH 5, respectively. In terms of the ratio of initial lead concentration to biomass concentration ratio, the highest lead adsorption was obtained at 750 mg/g, which gave the maximum lead uptake capacity of 126 mg/g. The experimental data of lead sorption by R. oligosporus fitted well to the Langmuir sortion isotherm model, indicating that the sorption was similar to that for an ion-exchange resin (Figures 21 and 22). The Langmuir isotherm is;
q = [qmax
KdC
eq]/[1 = (K
dC
eq)] (7)
where q is the lead specific uptake, qmax
is the maximum lead specific uptake, K
d is the dissociation constant and C
eq is the lead
equilibrium concentration. This means that the sorption of lead onto the fungal cells is a single layer metal adsorption that occurred as a molecular surface coverage. This assumption was confirmed by the examination of lead sorption using transmission electron microscope (Figure 23) and energy dispersive X-ray analysis (Figure 24), which showed that during sorption most of the lead was adsorbed on the surface of the cell.

❚❘❘ 64
Industrializing Biotechnology
Figure 21 Langmuir sorption isotherm for lead by powderized R. oligosporus at different pH values. Biosorbent and initial lead
concentration were 0.5 g/L and 100 mg/L, respectively. () pH 2; (◊ ) pH 3; (○) pH 4; (♦) pH 5; (●) pH 6.
Figure 22 Langmuir sorption isotherm for lead by powderized R. oligosporus at different initial lead concentrations. Biosorbent
concentration and intial pH were 0.5 g/L and 5, respectively. (○) 300 mg/L; (♦) 200 mg/L; () 100 mg/L; (●) 50 mg/L

65 ❘❘❚
Arbakariya Ariff
Figure 23 Typical EDX spectra of lead exposed (A) and native (B) R. oligosporus cells.
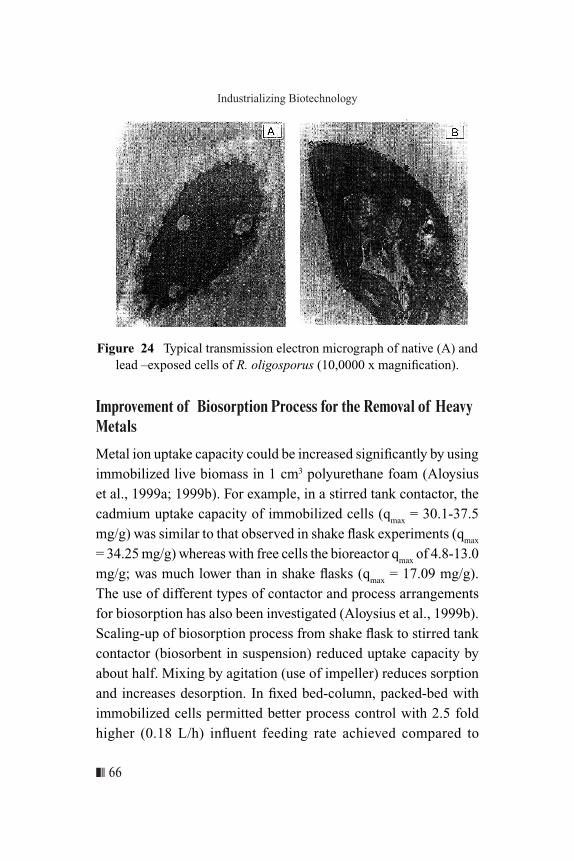
❚❘❘ 66
Industrializing Biotechnology
Figure 24 Typical transmission electron micrograph of native (A) and lead –exposed cells of R. oligosporus (10,0000 x magnification).
Improvement of Biosorption Process for the Removal of Heavy Metals
Metal ion uptake capacity could be increased significantly by using immobilized live biomass in 1 cm3 polyurethane foam (Aloysius et al., 1999a; 1999b). For example, in a stirred tank contactor, the cadmium uptake capacity of immobilized cells (q
max = 30.1-37.5
mg/g) was similar to that observed in shake flask experiments (qmax
= 34.25 mg/g) whereas with free cells the bioreactor q
max of 4.8-13.0
mg/g; was much lower than in shake flasks (qmax
= 17.09 mg/g). The use of different types of contactor and process arrangements for biosorption has also been investigated (Aloysius et al., 1999b). Scaling-up of biosorption process from shake flask to stirred tank contactor (biosorbent in suspension) reduced uptake capacity by about half. Mixing by agitation (use of impeller) reduces sorption and increases desorption. In fixed bed-column, packed-bed with immobilized cells permitted better process control with 2.5 fold higher (0.18 L/h) influent feeding rate achieved compared to

67 ❘❘❚
Arbakariya Ariff
packed-bed with free cells, where the biosorption performance is better than the use of stirred tank contactor. In packed-bed column, about 99 percent of cadmium removal was achieved for influent containing 20 mg/L of cadmium, indicating strong affinity of free and immobilized live cells of fungus toward heavy metals. Desorption method (using either acid, alkali or NaCl) for removal of metal ions saturated on cells has also been developed. Thus, repeated use of biosorbent is possible.
ESTABLISHMENT OF CELL SUSPENSION CULTURES BY Morinda elliptica FOR THE PRODUCTION OF ANTHRAQUINONES
Members of the Rubiaceae family are among the few plant families, easily taken into cell cultures to produce substantial amounts of anthraquinones (AQ). In Rubiaceae species belonging to the genera Asperula, Galium, Rubia and Sheradia, 17 out of 19 cases of AQ production in optimized cell cultures surpassed that of differentiated plants whereby maximum AQ yield of 1.7 g/L could be obtained in Galium verum cell cultures. Cell suspension cultures of M. citrofolia yielded 2.5 g/L of AQ under optimal conditions, exceeding those of differentiated tissue by a factor of 10 on a dry weight basis. The objective of our study was to establish cell suspension culture of Morinda elliptica for subsequent use in AQ production by manipulating the different medium formulations and different types of hormones and their combination. The effect of culture and inoculum age, incubation temperature and light intensity on cell growth and AQ was also studied. Initially the cultures were established in shake flask then the process was transferred to a stirred tank bioreactor system.

❚❘❘ 68
Industrializing Biotechnology
Optimization of Medium and Culture Conditions
Murashige and Skoog’s basal medium (MS) was found to be the best medium, used in combination with 0.5 mg/L 2,4-D dichlorophenoxyacetic acid (NAA) and 0.5 mg/L kinetin, for growth of M. elliptica and anthraquinones production in shake flask cultures (Abdullah et al., 1998). Figure 25 shows the photograph of M. Elliptica cells suspension culture in shake flask. At the range of sucrose concentration tested (3-8% w/v), 8% was the best in enhancing both cell growth and anthraquinone production. A strategy to formulate growth and production medium by manipulating culture age and inoculum age, the type of medium formulation used to grow inoculum, incubation temperature and light intensity was established. Using 18 month old culture and 7 day old inoculum at incubation temperature of 27±2oC, anthraquinone yield of 2.9 g/L and 4.5 g/L, under illumination of 1200 lux and in the dark were obtained, respectively. A typical time course of M. elliptica cultivation in suspension culture and AQ production is shown in Figure 26.
Figure 25 Cells suspension culture of M. elliptica in shake flask

69 ❘❘❚
Arbakariya Ariff
Figure 26 Time course of dry weight and anthraquinone production of Morinda elliptica cell suspension cultures in different medium
formulations. (A) dry weight; (B) anthraquinone content; (C) anthraquinone yield. (◊) MS; () SH; () B5; () W.
Effect of Nitrogenous Compounds, Phosphate and Myo-inositol on Growth M. elliptica and AQ Production
Effect of different concentrations of nitrogenous compound, phosphate and myo-inositol on growth and anthraquinone (AQ) production of Morinda elliptica cell suspension cultures were also studied (Abdullah et al., 1999). Three types of medium formulation [maintenance medium (M), growth medium (G) and production medium (P)] were used. The influence of nitrate varied

❚❘❘ 70
Industrializing Biotechnology
with different medium formulations and was very much dependent on the level of sucrose. The incorporation of nitrate to M medium at concentrations higher than 30 mM significantly enhanced cell growth and AQ production. High ammonium levels resulted in more acidic pH which caused inhibition of cell growth and AQ content. Nitrogen toxicity was not only a function of both individual and collective level of ammonium and nitrate, but also the level of sucrose and medium formulation. There was absence of extensive phosphate retarded cell growth in M medium but no significant difference in cell growth was observed between employing half-strength of normal phosphate concentration or 5-fold increase in phosphate concentration. Similarly, no significant effect was observed on AQ yield by increasing phosphate concentration in G medium at 8% and 10% sucrose and in P medium at 8% sucrose. At 10% sucrose in P medium, however, increase in phosphate reduced the anthraquinone yield by almost 50%. Myo-inositol was not an absolute requirement in M. elliptica cell suspension culture. The relationship between C:N ratio and growth of M. elliptica; and AQ production is shown in Figure 27.

71 ❘❘❚
Arbakariya Ariff
Figure 27 Relationship between C:N ratio and growth (A and C); and AQ production (B and D) of Morinda elliptica cell suspension cultures in gorwth and production medium. () KNO
3 + NH
4NO
3; () KNO
3 +
(NH4)
2NO
4
Strategies to Overcome Foaming and Wall-Growth During the Cultivation of M. elliptica Cell Suspension Culture in a Stirred-Tank Bioreactor
Foaming is one of the problems normally encountered in plant cell bioreactors as a result of bubble aeration. Bubbles rising through fermentation broth become encased in a sheath and produce foaming at the surface of the broth. The foam formation is attributed among others to extracellular polysaccharide production, initial high sugar concentration during the early stages of cultivation, and the presence of proteins, peptides and fatty acids released by lysed cells towards

❚❘❘ 72
Industrializing Biotechnology
the end of cultivation. Foaming may be aggravated towards the end of batch culture due to the presence of cells which may cause reduction in the bioreactor working volume. Cells entrapped in stable foam may form a crust, stick to the reactor wall, or around probes and sample ports affecting the operation of the probes and creating problems for sampling (Figure 28). The accumulating necrotic cells may secrete by-products such as proteases that can inhibit cell growth.
A B
Figure 28 Foaming and wall-growth in (A) air-lift bioreactor; (B) stirred tank biorector

73 ❘❘❚
Arbakariya Ariff
In our study, several strategies to reduce foaming and wall-growth in Morinda elliptica cell suspension culture using 2 L stirred tank bioreactors were tested (Abdullah et al., 2000a; 2000b). The schematic diagram and the dimensions of the fermenter used in this study are shown in Figure 29. Initially, antifoam-free methods such as different modes of aeration, paddle orientation and bubble-free aeration via silicone permeable membrane, were used. Then, the application of silicone antifoaming agents at different concentrations and different inoculum age, was investigated. All these strategies were applied in growth (G) and production (P) medium strategies. The objective of this study was therefore to optimize the fermentation process for improved cell growth and anthraquinone (AQ) production with lower foaming and wall-growth effects. Out of all the strategies adopted to reduce foaming and wall-growth, only bubble-free aeration was successful in eliminating foaming by 100% (Abdullah et al., 2000). Cell growth was lower in the system where air was supplied intermittently compared to continuously-aerated cultures. The Growth in P medium strategy reduced foaming and wall-growth without addition of antifoam, whilst at the same time promoting cell DW and AQ content.

❚❘❘ 74
Industrializing Biotechnology
Di
Dt
Hi
Hl
L Wl
5.5 cm 13.0 cm 5.6 cm 16.0 cm 1.7 cm 4.5 cm
Figure 29 The schematic diagram and the dimensions of the fermenter used in this study

75 ❘❘❚
Arbakariya AriffT
able
15
Eff
ect o
f a
ir fl
ow r
ate,
aer
atio
n m
ode,
num
ber
of p
addl
es a
nd th
eir
orie
ntat
ion
and
anti
-foa
min
g ag
ent o
n fo
amin
g an
d w
all g
row
th in
M. e
llip
tica
cel
l cul
ture
s gr
own
in a
2-L
sti
rred
-tan
k bi
orea
ctor
(1.
8 L
w
orki
ng v
olum
e)
Exp
t.A
irflo
w r
ate
(l m
in-1)
Aer
atio
n m
ode
DO
T le
vel
(%)
duri
ng
acti
ve c
ell
grow
th
No.
of
impe
llers
/ O
rien
tati
onD
W
(g/L
)A
Q(m
g/g
DW
)R
atio
of
Susp
:Foa
mR
educ
tion
in
foam
ing
(%)
‡
A1
1.6
6s in
terv
al50
® 3
52
/ 45o ,
upw
ard
11.2
7.50
40 :
600
A2
0.16
6s in
terv
al50
® 2
3 / v
erti
cal
10.6
7.95
78 :
2238
A3
1.6
6s in
terv
al75
® 4
03
/ 45o ,
dow
nwar
d2.
33.
6549
: 51
9
A4
1.6
Ful
l len
gth
mem
bran
e co
il93
® 4
03
/ 45o ,
dow
nwar
d3.
4N
/DN
o fo
amin
g10
0
A5
1.6
Hal
f-le
ngth
m
embr
ane
coil
8 ®
33
/ 45o ,
dow
nwar
d5.
2N
/DN
o fo
amin
g10
0
B1
0.16
® 0
.86s
inte
rval
50 ®
20
3 / 4
5o , do
wnw
ard
3.9
3.00
63 :
3723
B2
0.16
® 0
.4C
onti
nuou
s60
® 3
03
/ 45o ,
dow
nwar
d8.
04.
0558
: 42
18
B3
0.16
® 0
.6C
onti
nuou
s55
® 2
33
/ 45o ,
dow
nwar
d19
.24.
0061
: 39
21
B4
0.16
® 0
.16
Con
tinu
ous
56 ®
33
3 / 4
5o , do
wnw
ard
7.6
3.49
74 :
2634

❚❘❘ 76
Industrializing Biotechnology
C1
0.16
® 0
.16
Con
tinu
ous
68 ®
61
3 / 4
5o , do
wnw
ard
11.2
16.0
064
:36
24
C2
0.16
® 0
.16
Con
tinu
ous
73 ®
64
3 / 4
5o , do
wnw
ard
11.5
10.5
074
:26
34
C3
0.16
® 1
.46s
inte
rval
31 ®
16
2 / v
erti
cal
14.5
7.50
83:1
743
C4
0.16
® 0
.3C
onti
nuou
s72
® 3
72
/ 45o ,
dow
nwar
d18
.09.
8176
:24
36
Not
e : N
/D -
Not
det
ecte
d; A
ll D
W a
nd A
Q d
ata
are
mea
n va
lues
of
two
runs
bas
ed o
n an
alys
is o
n da
y 9;
‡ Red
ucti
on in
foa
min
g w
as c
alcu
late
d us
ing
60%
foa
min
g le
vel i
n E
xpt.
A1
as th
e ba
sis
Exp
t. A
and
B w
ere
cond
ucte
d in
G m
ediu
m s
trat
egy
and
Exp
t. C
in P
med
ium
str
ateg
y

77 ❘❘❚
Arbakariya Ariff
DEVELOPMENT OF HIGH PERFORMANCE HETEROTROPHIC CULTIVATION TECHNIQUE OF MICROALGAE (Tetraselmis suecica) IN A CLOSED STIRRED TANK BIOREACTOR
The production of algae for biotechnological applications has, todate, largely employed open photoautotrophic culture systems. Such systems depend on extreme environmental factors to prevent contamination by other algae, or predation by grazing organisms. The use of bioreactors allows for greater external control and reduces the likelihood of contamination by other protists. Culturing microalgae in photobioreactors often results in enhanced final yields, productivity and reproducibility. However, photobioreactors have several disadvantages including, limited light penetration at high cell densities, increased hydrodynamic stresses (resulting in cell damage), biofouling or surfaces and sensors and poor temperature control.
Figure 30 A single cell of microalgae, Tetraselmis suecica

❚❘❘ 78
Industrializing Biotechnology
The productivity of the algae cultivation may be improved by heterothrophic culture technique (Running et al., 1994). In this technique, a closed bioreactor system similar to the microbial fermentation process may be used. This is theoretically possible for a wide range of algae which can be grown under heterothropic conditions. It is worth noting that some products can be produced using mixotrophically or heterotropically grown algae. These include; xanthophylls for use in animal feed (Hilalily et al., 1994), astaxanthin (Kobayashi et al., 1991) and long chain omega-3 fatty acids (Barcley et al., 1994). However, most of these processes have not, as yet, been described in detail to provide kinetic information for the development of industrial-scale processes. For the development of heterophic microalgae cultivation technique in a closed stirred tank bioreactor system, several stages of R&D were carried out as follows;
Preparation of Axenic T. suecica Culture
Physiological, biochemical, genetic and taxonomic studies of microalgae require axenic culture, which is a viable culture of a single species, free of other species and contaminants such as bacteria. The axenic cultures of microscopic algae may be prepared by single-cell isolation and density gradient centrifugation, rinsing, UV irradiation, filtration, or treatment with antibiotics and other germicidal chemicals. For algal units with tenaciously attached contaminants, the single cell isolation method may not yield axenic cultures, and it may be necessary to use chemical methods. Treatment with antibiotics or lysozyme is still the most common way to remove bacteria. The streak or spray plating method may yield axenic culture directly in some microalgae, but in tenaciously attached contaminate, it may be necessary to kill or inhibit the growth of contaminants in situ by chemical and physical methods.

79 ❘❘❚
Arbakariya Ariff
Generalized schemes of possible isolation and purification methods are outlined in Figure 31.
Figure 31 General schemes of possible isolation and purification methods for microalgae for the preparation of axenic culture.
In our study, the axenic culture of T. suecica was obtained after serial physical and chemical treatments. Initially, separation of a single cell colony of T. suecica was achieved by agar plating technique for 3 times subculture. A single cell colony was then cultured in a glass test tube containing 5 mL Walne medium, under continuous illumination for 10 days. The number of contaminants in the culture was significantly reduced after centrifugation (2000 rpm for 10 min) and washing for 5 times. The cultures were then exposed to sonication (90 K cycles.s-1 for 15 min) to separate the sticky contaminants from the cells. The contaminants were further reduced by centrifugation and cell washing for 3 times. The purified cells were cultured in the heterotrophic medium (Walne medium

❚❘❘ 80
Industrializing Biotechnology
+ 10 g/L glucose) with the addition of 100 μL of a mixture of antibiotics (vancomycine 5 mg/mL + neomycine 10 mg/mL). The cultures were kept in dark conditions for ten days, with the replacement of fresh heterotrophic medium at 8 h intervals.
Adaptation of Photothrophic T. suecica Cells to Heterothrophic Cells
Heterothropic Tetraselmis suecica cell was developed from the adaptation of the phototrophic cell by photoperiodic and manipulation of medium and culture conditions. Cells were activated by inoculating a loop of a slant culture into 100 mL of each medium. A circular cool white 32W fluorescent lamp (Philips) (light intensity was 32 μmol/m2/s at the surface of flasks) was used as the light source. The cultures were grown under four light treatments: 24 h light cycles (24L); 8 h light and 16 h dark cycle (8L:16D); 4 h light and 20 h dark cycle (4L:20D); and heterotrophic with 24 h dark conditions (24D). These light regimes and harvest stages were chosen because they are commonly used in the mariculture industry. Moreover the cells adapted to dark conditions under their light regimes. The cells were cultured in a 250 mL flask in an orbital shaker agitated at 150 rpm, at 30˚C for 958 h in autotrophic and 155 h in heterotrophic conditions.

81 ❘❘❚
Arbakariya Ariff
Figure 32 Shake flask culture of photothrophic (A) and heterothrophic Tetraselmis suecica.
During adaptation, the cell culture of phototrophic Tetraselmis
suecica changed from green to brown, when the cells were totally grown in heterothrophic conditions. The thickness of the cell wall was also reduced when the cells changed from photothrophic to heterothrophic. In addition, the organic cell composition was also substantially changed during adaptation. Interestingly, the percentage of total lipid and carbohydrate in the cells increased from 24.5% and 7.4 % to 51.9% and 14.1%, respectively. On the other hand, the percentage of protein in the heterothrophic cells reduced to 10.5% compared to 45.7% in autotrophic cell (Tables 16 and 17).

❚❘❘ 82
Industrializing Biotechnology
Figure 33 Organic cell composition of T. suecica under different
illumination times.
24L 24L 24L
8 L:16 D 8 L:16 D 8 L:16 D
4 L:20 D 4 L:20 D 4 L:20 D

83 ❘❘❚
Arbakariya Ariff
Table 16 Summary of the cultivation performance and growth kinetics of T. suecica cultivated in autotrophic (with different illumination time,
24L, 8L:16D, 4L:20D) and heterotrophic (24 D) conditions
Performance/Growth kinetics
24 L 8L:16D 4L:20D 24 D
Cultivation time to reach max. cell concentration (h)
408 546 958 142
Final biomass cell DW×10-2 (g cell DW/L)
8.4 6.4 4.5 24.3
Max specific growth rate (h-1)
0.027 0.026 0.012 0.09
Max. productivity×10-2 (g/L.h-1)
0.022 0.016 0.009 0.26
Min. doubling time (h) 25.5 26 55 7.65

❚❘❘ 84
Industrializing BiotechnologyT
able
17
Bio
chem
ical
com
posi
tion
, exp
ress
ed a
s %
cel
l dry
wei
ght (
% c
ell D
W),
% o
f or
gani
c w
eigh
t (%
O
W)
and
pg/c
ell,
of T
. sue
cica
in e
xpon
enti
al (
Exp
) an
d la
te e
xpon
enti
al p
hase
(L
exp)
und
er a
utot
roph
ic (
wit
h di
ffer
ent i
llum
inat
ion
tim
e 24
L, 8
L:1
6D, 4
L:2
0D)
and
hete
rotr
ophi
c(24
D)
cult
ivat
ion.
Illu
min
atio
n ti
me(
h)Sa
mpl
ing
tim
e
Pro
tein
Tot
al li
pid
Car
bohy
drat
e
% o
f D
W%
of
OW
pg/
cell
% o
f D
W%
of
OW
pg/
cell
% o
f D
W%
of
OW
pg/
cell
24 L
Exp
45.7
58.9
4324
.531
.523
7.4
9.58
7
Lex
p37
.249
.235
27.6
36.6
2610
.614
.110
8L:1
6DE
xp34
49.2
3223
33.8
2211
.716
.911
Lex
p29
.743
.628
25.5
37.3
2412
.919
12.2
4L:2
0DE
xp22
.340
.321
18.1
32.6
1714
.826
.914
Lex
p21
.236
.620
20.5
35.3
19.3
16.3
2815
.3
24 D
Exp
10.5
13.6
2.2
51.9
67.2
2.2
14.8
19.1
3.1
Lex
p10
.312
.92.
253
.868
.12.
1615
.219
.23.
2

85 ❘❘❚
Arbakariya Ariff
Optimization of the Cultivation Process in Stirred Tank Bioreactor
The heterothrophic cultivation of T. suecica in a closed stirred tank bioreactor was optimized using response surface method. Typical examples of response surfaces and contour plots from the optimization exercise are shown in Figure 34. The variables investigated includes glucose, yeast extract, peptone and meat extract concentrations, while the responses were final cell concentration, cell yield and productivity. The performance of heterothrophic cultivation of T. suecica in the bioreactor was substantially improved in terms of growth rate, final cell concentration, yield and productivity as well as cell composition when compared with photothrophic cultivation. The cultivation time to reach maximum cell concentration was decreased from 348 h in autotrophic to 139 h in heterotrophic cultivation. The final cell concentration (74.34 ×10⁻² g dry cell weight/L) was increased more than five times in heterotrophic cultivation as compared to that obtained in autotrophic cultivation (14 ×10-2 g dry cell weight/L). In addition, the maximum productivity (0.76×10⁻² g dry cell weight/L.h) for heterotrophic cultivation was ten times higher than in autotrophic cultivation (0.075×10⁻² g dry cell weight/L.h). Some advantages of microalgae culture in heterothrophic system are: (i) no need for light but with use of organic carbon sources (eg. glucose) as the source of energy, (ii) low product cost (less than US $ 5 per Kg DW), (iii) high density (> 75 g/L DW), (iv) production efficiency higher than that in autothrophic culture(eg.about 5.8 g/l/day), (v) low cost of energy ( eg. glucose US $ 2.01 per Kg), (vi) rapid growth rate, (vii) readily available in large-scale, and (viii) high-quality, pure and non-contaminated product.

❚❘❘ 86
Industrializing Biotechnology
Figure 34 Response surface and contour plots of biomass cell DW (A), yield (B) and productivity (C) of T. suecica
DIRECT FERMENTATION OF STARCH TO ETHANOL BY RECOMBINANT Saccharomyces cerevisae
Traditionally, ethanol fermentation relies on sugar-rich substrates, mainly sugar cane, because their carbohydrate is in fermentable sugar form. However, sugar cane is expensive and not continuously available because it is a seasonal. Thus, there are great economic advantages in extending the substrate range of ethanol-fermenting
biom
ass
prod
uctiv
ity
yiel
d
A
B
C

87 ❘❘❚
Arbakariya Ariff
microorganisms so that the ethanol may be produced from starchy crops and cellulosic materials. The ethanol-fermenting microorganisms, such as S. cerevisiae and Z. mobilis lack amylolytic enzymes and are unable to directly convert starch into ethanol. Traditionally, the starch is hydrolyzed enzymatically into fermentable sugar via liquefaction and saccharification processes prior to ethanol fermentation. This two-stage process, however, faces problems of high operating costs, especially in conducting the process at very high temperatures (65-105oC) though the commercial enzymes used are cheap (Ariff et al. 1997). Simultaneous saccharification and fermentation process with mixed culture of amylolytic-enzyme-producing microorganisms (such as Aspergillus awamori) and ethanol-fermenting microorganisms (such as S. cerevisiae and Z. mobilis), operating at low temperature (30-35oC), have been proven effective in directly converting starch into ethanol. However, the mixed culture system always involved two strains that do not have similar optimum culture conditions of pH, temperature, nutrients, oxygen demand etc., and it is very difficult to establish conditions for the mixed culture which are suitable for both strains. A complex coimmobilised system is normally required which segregates the obligate aerobe A. awamori (amylolytic microorganism) from the obligate anaerobe Z. mobilis or facultative anaerobe S. cerevisiae (ethanol-fermenting microorganisms) to enable ethanol production from starchy materials in a one-stage fermentation system. Moreover, much of the starch is consumed by the amylolytic-enzyme-producing microorganism which consequently reduces the ethanol yield in the mixed culture system. Thus, in order to increase the production of ethanol from starchy materials, it is necessary to breed an ethanol-fermenting microorganism by genetic manipulation, which can directly ferment starchy materials into ethanol.

❚❘❘ 88
Industrializing Biotechnology
The recombinant yeast, S. cerevisiae YKU 131 (capable of expressing glucoamylase), was used for direct fermentation of gelatinized sago starch to ethanol (Abd-Aziz et al., 1998; Ang et al., 2001a; 2001b; Ang et al., 2003). The temperature-sensitive mutants of S. cerevisiae for the PHO regulatory system, YKU 76 (MATa ura3-52 trp1 lue2 his3 pho80-69ts) was used as the host strain, in which S. cerevisiae YKU 131 was a transformant of YKU 76 containing the glucoamylase expression vector, pKU 122. Vector pKU 122 contains the yeast PHO84 promoter, 2 µm ori, LEU2, A.
oryzae glucoamylase cDNA fragment, and part of pBR 322 plasmid. The glucoamylase expression was controlled by the cultivation temperature at high Pi concentration because the structural gene was connected downstream of the PHO84 gene promoter and the expression was controlled by the PHO84 promoter. Time course of direct gelatinised sago starch fermentation into ethanol by recombinant S. cerevisae YKU 131 is shown in Figure 35. The optimum C/N ratio for ethanol production by the recombinant yeast was 7.9, where 4.7 and 10.1 g/L ethanol was produced from 20 g/L and 40 g/L sago starch, respectively. At sago starch concentration higher than 40 g/L and C/N ratio higher than 10.4, glucoamylase production and rate of starch hydrolysis were reduced, which in turn, reduced ethanol production significantly. The theoretical yield of ethanol based on sago starch consumed in fermentation using 40 g/L was 72.6 %. This yield was slightly lower than that obtained in fermentation using soluble starch such as potato and corn starch, which ranged from 80-90%.

89 ❘❘❚
Arbakariya Ariff
Figure 35 Time course of direct gelatinised sago starch fermentation into ethanol by recombinant S. cerevisae YKU 131. Fermentation using
40 g/l starch and C/N ratio was 7.9. Symbols represent: (♦) starch concentration; () cell concentration; (∆) glucoamylase activity; (ο)
glucose concentration; () ethanol concentration.
DEVELOPMENT OF FERMENTATION PROCESSES FOR INDUSTRIAL ENZYMES PRODUCTION
Development of fermentation processes for the production of industrial enzymes has also been conducted by our research group. The feasibility of using treated oil palm empty fruit bunch (OPEFB) fibre as a substrate for cellulase production by Chaetomium
globosum Kunze was studied using a shaking .flask and stirred tank bioreactor fermentation systems (Umikalsom et al., 1997a; 1997b; 1998a; 1998b). The use of 2-mm chemically untreated OPEFB fibre increased cellulase production by about two times compared
(U/m
l)

❚❘❘ 90
Industrializing Biotechnology
to 10-mm fibre. The effect of the different chemicals (NaOH, HCI, HNO
3, EDA and EDTA) on the 2-mm fibre was also investigated.
Treatment with these chemicals significantly (P < 0.05) increased the cellulose and reduced the lignin contents. Fermentation using OPEFB fibre treated with HNO
3 (0.5% v/v) gave the highest
cellulase production and this was related to its high cellulose content. Cellulase production increased further when autoclaved (121°C, 15 psi for 5 min), and chemically treated OPEFB fibre was used. When autoclaved 2-mm OPEFB fibre treated with HNO
3
was used as a substrate, the maximum FPase activity and yield obtained were 0.95 U/mL and 120.7 U/g cellulose, respectively. The cellulase produced by C. globosum contained a high proportion of β-glucosidase. The ratio of specific activity of β-glucosidase to FPase was about 8. The production of all three major components of cellulase (endoglucanase, cellobiohydrolase and β-glucosidase) using pretreated OPEFB fibre were about three times higher than that obtained in fermentations using pure cellulose (Avicel and carboxymethylcellulose). Optimization of medium and the use of different fermenter configurations and modes of operation have also been used as approaches for improvement of glucoamylase production by A.
awamori (Ariff and Webb, 1996; Ariff and Webb, 1998). The use of cells immobilized in situ, passively, using 1 cm3 cube of polyurethane foam (see Figure 36) enables the continuous culture to be operated at higher dilution rate than the maximum specific growth rate of A. awamori. This mode of fermenter operation significantly increased the overall productivity of the process. Improved mannan-degrading enzymes production by Aspergillus
niger through optimization of medium and process variables in stirred tank bioreactor using response surface method has also been performed (Siti Norita, 2001). Production of pullulanase type II by

91 ❘❘❚
Arbakariya Ariff
Aureobasidium pullulan using sago starch as a carbon source has also been developed and optimized (Hii et al., 2009). Currently, development of a fermentation process for the production of thermophilic xylanase using recombinant E. coli is being conducted in our laboratory.
Figure 36 Immobilised cells of A. awamori in polyurethane foam for glucoamylase fermentations conducted in bubble column bioreactor
and shake flask
DESIGN, OPERATION AND SCALING-UP OF ENZYME REACTOR
Many biotechnology products can be produced through the enzymatic reaction process. For large scale production, the process shall be conducted using enzyme reactors that may be stirred tank and packed column, using either free or immobilised enzymes. Some of the reaction mixtures may be very viscous and exhibit different rheological characteristics. Thus, appropriate degree of

❚❘❘ 92
Industrializing Biotechnology
mixing and pattern have to be considered in designing and operation of the enzyme reactor to enhance the reaction rate and to reduce problems of shear that may cause damage to the immobilized enzyme particles. Appropriate scaling-up approach shall also be developed for the enzyme reactor. Our research group has been involved in the design and operation of reactors for scale-up synthesis of several enzymatic reactions such as lipase-catalyzed palm esters (Keng et al., 2008), enzymatic synthesis of oleyl oleate (a liquid wax ester) (Radzi et al., 2005a; 2005b; Radzi et al., 2006), saccharification of sago starch to glucose (Ariff et al., 1997a) and saccharification of cellulose fibres to fermentable sugars. The scope of research conducted includes optimization of process, kinetic and modeling and performance of different impeller designs for improvement of the process.
CONCLUSIONS
Biotechnology is one of the fastest growing industry sectors that is driving the increasing world-wide demand for expertise in the area of fermentation and bioprocess technology. Fermentation and bioprocess technologists use biological catalysts to produce products and degrade wastes. Processes for producing biopharmaceuticals, industrial and diagnostic enzymes, some foods and other biological products are developed, designed, operated and managed by fermentation and bioprocess technologists. They are trained to function effectively in the modern biotechnology industry and also the more traditional sectors such as cheesemaking and brewing. In the area of the development of fermentation and biomanufacturing processes, two main areas are normally considered; those associated with strain development, and those concerned with process development. Different fermentation and biomanufacturing processes may require different approaches for development and

93 ❘❘❚
Arbakariya Ariff
these are the know-how of each producing company. The industrial fermentation process should yield a product at a competitive price. In order to achieve this, the chosen microorganism should give the desired end product in predictable and economically adequate quantities. There are four basic components contributing to the process cost: (i) raw materials, (ii) fixed costs, (iii) utilities, and (iv) labour. In any process it is important to know the cost breakdown, so that it can be seen where the biggest potential savings could be achieved. Accurate detailed costing of industrial fermentation and biomanufacturing processes are rarely published. In order to identify whether the developed fermentation process is economically feasible, economics of the process should be analyzed. Thus, process development using a suitable approach will be developed by the fermentation and bioprocess technologist to transfer the bench scale technology to industry. For each fermentation and biomanufacturing operation, the standard operating procedure (SOP) of the overall process should be prepared and subsequently used in scaling-up and economic studies. Fermentation and bioprocess technologists put biotechnology to work by providing manufacturing systems to generate bioproducts in large volume, at low cost, and with acceptable purity.
REFERENCESAbd-Aziz, S. Ariff, A.B., Lim, C.M., Karim, M.I.A., Uchiyama, K., Shimizu,
H. and Shioya, S. 1998. Biological hydrolysis of gelatinised sago starch by recombinant DNA yeast and α-amylase production. In Annual Reports of IC Biotech, Vol 21 (Eds. Yoshida, T., Seki, T., Takagi, M., Fujiyama, K., Nakajima, M., and Nakagawa, H.) International Center for Biotechnology, Osaka University, pp 809-818.
Abdullah, M.A., Ali, A.M., Marziah, M., Lajis, N.H. and Ariff, A.B. 1998. Establishment of cell suspension cultures of Morinda elliptica for the production of anthraquinones. Plant Cell, Tissue and Organ Culture 54: 173-182.

❚❘❘ 94
Industrializing Biotechnology
Abdullah, M.A., Marziah, M., Zakaria, M.N., Ali, A.M., Lajis, N.H. and Ariff, A.B. 1999. Synergistic effects of medium strategy and sucrose levels with nitrogenous compounds, phosphate and myo-inositol on Morinda elliptica cell cultures. Asia Pacific Journal of Molecular Biology and Biotechnology 7(1): 61-72.
Abdullah, M.A., Ariff, A.B., Marziah, M., Ali, A.M. and Lajis, N.H. 2000a. Growth and anthraquinone production of Morrinda elliptica cell suspension cultures in a stirred-tank bioreactor. Journal of Agricultural and Food Chemistry 48(9): 4432-4438.
Abdullah, M.A., Ariff, A.B., Marziah, M., Ali, A.M. and Lajis, N.H. 2000b. Strategies to overcome foaming and wall growth during the cultivation of Morinda elliptica cell suspension cultures in a stirred tank bioreactor. Plant Cell, Tissue and Organ Culture 60: 205-212.
Aiba, Humphrey, A.E. and Millis, N.F. 1973. Biochemical Engineering, 2nd ed. New York: Academic Press.
Aloysius, R., Karim, M.I.A. and Ariff, A.B. 1999a. Cadmium Biosorption by free and immobilized live biomass of Rhizopus oligosporus. Pakistan Journal of Biological Sciences 2(1): 74-79.
Aloysius, R., Karim, M.I.A. and Ariff, A.B. 1999b. Kinetics of cadmium biosorption by free and immobilized live biomass of Rhizopus oligosporus in packed-bed column. World Journal of Microbiology and Biotechnology 15: 571-578.
Ang, D.C., Abd-Aziz, S., Yusof, H.M., Karim, M.I.A. and Ariff, A.B., Uchiyama, K. and Shioya, S. 2001a. Partial purification and characterization of amylolytic enzymes obtained from direct fermentation of sago starch to ethanol by recombinant yeast. Pakistan Journal of Biological Sciences 4(3): 266-270.
Ang, D.C., Abd-Aziz, S., Yusof, H.M., Karim, M.I.A. and Ariff, A.B., Uchiyama, K. and Shioya, S. 2001b. Production of ethanol by recombinant Saccharomyces cerevisae using sago starch as carbon source. Asia Pacific Journal of Molecular Biology and Biotechnology, 9(2): 131-137.

95 ❘❘❚
Arbakariya Ariff
Ang, D.C., Abd-Aziz, S., Yusof, H.M., Karim, M.I.A., Ariff, A.B., Uchiyama, K. and Shioya, S. 2003. Direct fermentation of sago starch to ethanol using recombinant yeast. In Biotechnology for Sustainable Utilization of Biological Resources in the Tropics. Vol 16 (ed. Murooka, Y). International Center for Biotechnology, Osaka University, Japan. pp 19-24.
Ariff, A.B., Salleh, M.S., Baharuddin, A.G., Hassan, M.A., Rusul, G. and Karim, M.I.A. 1996a. Aeration and nitrogen requirements for kojic acid production by Aspergillus flavus Link. Enzyme and Microbial Technol, 19(15): 545-560.
Ariff, A.B., Rosfarizan, M., Sim, P.C.X., Madihah, S. and Karim, M.I.A. 1996b. Production of kojic acid by Aspergillus flavus Link using starch as a carbon source. In Biotechnology for sustainable Utilization of Biological Resources in the Tropics. Vol 11 (ed. Yoshida, T, Matangkasombut, P., dela Cruz, R.E., Prana, M.S. and Karim, M.I.A.). International Center for Biotechnology, Osaka University, Japan. pp 296-302.
Ariff, A.B. and Webb, C. 1996. The influence of different fermenter configurations and modes of operation on glucoamylase production by Aspergillus awamori. Asia-Pacific Journal of Molecular Biology and Biotechnology 4(3): 183-195.
Ariff, A.B., Asbi, B.A., Azudin, M.N. and Kenedy, J.I. 1997a. Effect of mixing on enzymatic liquefaction of sago starch. Carbohydrate Polymers 33: 101-108.
Ariff, A.B., Rosfarizan, M., Herng, L.S., Madihah, M.S. and Karim, M.I.A. 1997b. Kinetics and modelling of kojic acid production by Aspergillus flavus Link in batch fermentation and resuspended mycelial system. World Journal of Microbiology & Biotechnology 13: 195-200.
Ariff, A.B., Rosfarizan, M., Ghani, B., Sugio, T. and Karim, M.I.A. 1997c. Molybdenum reductase in Enterobacter cloacae. World Journal of Microbiology and Biotechnology 13: 643-647.
Ariff, A.B. and Webb, C. 1998. Effect of initial carbon and nitrogen sources concentration on growth of Aspergillus awamori and glucoamylase production. Asia Pacific Journal of Molecular Biology and Biotechnology 6: 161-169.

❚❘❘ 96
Industrializing Biotechnology
Ariff, A.B., Mel, M., Hassan, M.A. and Karim M.I.A. 1998. The kinetics and mechanism of lead (II) biosorption by powderized Rhizophus oligosporus. World Journal of Microbiology and Biotechnology 15(2): 291-298.
Barcley W.R., Meager, K.M., and Abril, J.R. 1994. Heterotrophic production of long chain omega-3 fatty acids utilizing algae and algae-like microorganisms. Journal of Applied Phycology 6: 123–129.
Chow, Y.M., Ti, T.B., Ibrahim, M.N., Ariff, A.B. and Ling, T.C. 2005a. The influence of Baker’s yeast cells on protein adsorption performance in dye-ligand expanded bed chromatography. Biotechnology and Bioprocess Engineering 10: 370-375.
Chow, Y.M., Ti, T.B., Ibrahim, M.N., Ariff, A.B. and Ling, T.C. 2005b. The influence of Baker’s yeast cells on protein adsorption in anion exchange expanded bed chromatography. Biotechnology and Bioprocess Engineering 10: 280-283.
Chow, Y.M., Ti, T.B., Ibrahim, M.N., Ariff, A.B. and Ling, T.C. 2005c. The disruption of Saccharomyces cerevisae cells and release of glucose 6-phosphate dehydrogenase (G6PDH) in a horizontal dyno bead mill operated in continuous recyling mode. Biotechnology and Bioprocess Engineering 10: 284-288.
Chow, Y.M., Tey, B.T., Ibrahim, M.N., Ariff, A.B. and Ling, T.C. 2006a. Protein adsorption and hydrodynamic stability of a dense, pellicular adsorbent in high-biomass expanded bed chromatography. Biotechnology and Bioprocess Engineering 11: 268-272.
Chow, Y. M., Tey, B.T., Ibrahim, M.N., Ariff, A.B. and Ling, T.C. 2006b. The performance of an anion exchange expanded bed adsorption chromatography on the recovery of G6PDH from unclarified feedstock with high biomass concentration. Biotechnology and Bioprocess Engineering 11: 466-469.
Goksungur, Y. and Gucenc, U. 1997. Batch and continuous production of lactic acid from beet molases by Luctobacillus delbrueckii IFO 3202. Journal of Chemical Technology and Biotechnology 69: 399-404.

97 ❘❘❚
Arbakariya Ariff
Hilaly, A.K., Karim, M.N., and Guyre, D. 1994. Optimization of an industrial microalgal fermentation. Biotechnology and Bioengineering 43: 314-320.
Keng, P.S., Basri, M., Ariff, A.B., Abdul Rahman, M.B., Abdul Rahman, R.N.Z., and Salleh, A.B. 2008. Scale-up synthesis of lipase-catalysed palm esters in stirred-tank reactor. Bioresource Technology 99: 6097-6104.
Khamaruddin, N.H., Basri, M. Gwendoline EE Cheng Lian, G.E.C., Salleh, A.B., Rahman, R.N.Z., Ariff, A.B., Rosfarizan, M. and Roila, A. 2008. Journal of Oil Palm Research 20: 461-468.
Khaw, T.S. 2001. Acetone-butanol-ethanol (ABE) production by Clostridium acetobutylicum P262 using sago starch as carbon source. MSc thesis. Universiti Putra Malaysia, Selangor, Malaysia.
Kobayashi, M, Kakizono, T. and Nagai, S. 1991. Astaxanthin production by a green alga, Haematococcus pluvialis accompanied with morphological changes in acetate media. Journal of Fermentation Bioengineering 71: 335-339.
Kok, K.H., Karim, M.I.A. and A.B. Ariff. 2001. Bio-removal of cadmium, lead and zinc using non-living biomass of Aspergillus flavus. Pakistan Journal of Biological Science 4(7): 849-853.
Kok, K.H., Karim, M.I.A., Ariff, A.B. and Abd-Aziz, S. 2002a. Application of Live and Non-metabolizing cells of Aspergillus flavus strain 44-1 as biosorbent for the removal of lead from solution. Pakistan Journal of Biological Sciences 5: 332-334.
Kok, K.H., Karim, M.I.A., Ariff, A.B. and Abd-Aziz, S. 2002b. Removal of cadmium, cooper and lead from tertiary metals system using biomass of Aspergillus flavus 44-1. Pakistan Journal of Biological Sciences, 5: 474-478.
Kok, K.H., Karim, M.I.A., Ariff, A.B. and Abd-Aziz, S. 2002c. The mechanism of cadmium removal from aqueous solution using non-metabolizing free cell of Aspergillus flavus 44-1. Asia Pacific Journal of Molecular Biology and Biotechnology 10(1): 41-47.

❚❘❘ 98
Industrializing Biotechnology
Ladisch, M.R. 2001. Bioseparations Engineering: Principles, Practice, and Economics. New York: John Wiley and Sons.
Liew, S.L., Ariff, A.B., Raha, A.R. and Ho, Y.W. 2005. Optimization of medium composition for the production of a probiotic microorganism, Lactobacillus rhamnosus, using response surface methodology. International Journal of Food Microbiology 102: 137-142.
Liew, S.L., Rosfarizan, M., Raha, A.R., Wan, H.Y. and Ariff, A.B. 2006. Improved production of live cells of Lactobacillus rhamnosus by continuous cultivation using glucose-yeast extract medium. The Journal of Microbiology 44(4): 439-446.
Lim, C.H., Rahim, R.A., Ho, Y.W. and Ariff, A.B. 2007. Optimization of growth medium for efficient cultivation of Lactobacillus salivarius I 24 using response surface method. Malaysian Journal of Microbiology 3: 41-47.
Lim, C.H., Rahim, R.A., Ho, Y.W. and Ariff, A.B. 2009. Formulation of protective agents for improvement of Lactobacillus salivarius I 24 survival rate subjected to freeze drying for production of live cells in powderized form. Food Bioprocess Technology DOI 10.1007/s11947-009-0184-0.
Ling, T.C., Loong, C.K., Tan, W.S., Tey, B.T., Abdullah, W.M.W. and Ariff, A.B. 2004. Purification of filamentous bacteriophage M13 by expanded bed anion exchange chromatography. Journal of Microbiology 42: 228-232.
Madihah M.S., Ariff, A.B., Salleh, A.B., Hassan, M.A., Rusul, G. and Karim, M.I.A. 1997. Enhanced kojic acid production by Aspergillus flavus Link in growth medium containing methanol. ASEAN Food Journal 11(4): 158-162
Madihah, M.S. Ariff, A.B., Akmam, F.H. Baharuddin, A.G. and Karim, M.I.A. 1998. Hyper-thermophilic fermentative bacteria in Malaysian reservoirs. Asia Pacific Journal of Molecular Biology and Biotechnology 6(1): 29-37.
Madihah, M.S., Ariff, A.B., Khalil, M.S., Abd-Aziz, S. and Karim, M.I.A. 2000. Partial purification and some properties of α-amylase and glucoamylase obtained as by-product from direct fermentation of sago

99 ❘❘❚
Arbakariya Ariff
starch to solvent by Clostridium acetobutylicum. Pakistan Journal of Biological Sciences 3(5): 744-749.
Madihah, M.S., Ariff, A.B., Khalil, M.S., Abd-Aziz, S. and Karim, M.I.A. 2001a. Anaerobic fermentation of gelatinized sago starch-derived sugars to acetone-1-butanol-ethanol solvent by Clostridium acetobutylicum. Folia Microbiologia 46(3): 197-204.
Madihah, M.S., Ariff, A.B., Sahaid, K.M., Suraini, A.A. and. Karim, M.I.A
2001b. Direct fermentation of gelatinized sago starch to acetone-butanol-ethanol by Clostridium acetobutylicum. World Journal of Microbiology and Biotechnology 17: 567-576.
Madihah, M.S., Tsuey, L.S. and Ariff, A.B. 2008. The profiles of enzymes relevant to solvent production during direct fermentation of sago starch by Clostridium saccharobutylicum P262 utilizing different pH control strategies. Biotechnology and Bioprocess Engineering 13: 33-39.
Matales, R.I. 1998. Penicillin: A Paradigm for Biotechnology. Chicago, Ill.: Candida Corporation.
Musaalbakri, A.M., Ariff, A.B., Rosfarizan, M. and Ismail, A.K.M. 2005a. Fermentation conditions affecting growth and red pigment production of Monascus purpureus FTC 5391. Journal of Tropical Agriculture and Food Science 33: 261-276.
Musaalbakri, A.M., Ariff, A.B., Rosfarizan, M. and Ismail, A.K.M. 2005b. Kinetics and modeling of red pigment fermentation by Monascus purpureus FTC 5391 in 2-litre stirred tank fermenter using glucose as a carbon source. Journal of Tropical Agriculture and Food Science 33: 277-284.
Musaalbakri, A.M., Ariff, A.B., Rosfarizan, M. and Ismail, A.K.M. 2006a. Improvement of red-pigment-producing fungal strain (Monascus purpureus FTC 5391) using monospore isolation technique. Journal of Tropical Agriculture and Food Science 33: 77-87.
Musaalbakri, A.M., Ariff, A.B., Rosfarizan, M. and Ismail, A.K.M. 2006b. Aeration and agitation strategies for the improvement of red pigment production by Monascus purpureus FTC 5391. Journal of Tropical Agriculture and Food Science 34: 89-102.
❚❘❘ 100
Industrializing Biotechnology
Prouty, W.F. 1991. Production-Scale Purification Processes. Pp. 221–262 in Drug Biotechnology Regulation 13, edited by Y.-Y.H. Chen and J.L. Gueriguian. New York: Marcel Dekker.
Radzi, S.M., Basri, M., Salleh, A.B., Ariff, A.B., Rosfarizan, M., Rahman, M.B.A. and Rahman, R.N.Z. 2005a. Large scale production of liquid wax ester by immobilized lipase. Journal of Oleo Science 54: 203-209.
Radzi, S.M., Basri, M., Salleh, A.B., Ariff, A.B., Rosfarizan, M., Rahman, M.B.A. and Rahman, R.N.Z. 2005b. High performance enzymatic synthesis of oleyl oleate using immobilized lipase from Candida antartica. Electronic Journal of Biotechnology 8(3): 291-298.
Radzi, S.M., Basri, M., Salleh, A.B., Ariff, A.B., Rosfarizan, M., Rahman, M.B.A. and Rahman, R.N.Z. 2006. Optimisation study of large-scale enzymatic synthesis of oleyl oleate, a liquid wax ester, by response surface methodology. Journal of Chemical Technology and Biotechnology 81: 374-380.
Ramanan, R.N., Ling, T.C. and Ariff, A.B. 2008. The performance of a glass bead shaking technique for the disruption of Escherichia coli cells. Biotechnology and Bioprocess Engineering 13: 613-623.
Ramanan, R.N., Tik, W.B., Memari, H.R., Azaman, S.N.A., Ling, T.C., Tey, B.T., Lila, M.A.M., Abdullah, M.P., Rahim, R.A. and Ariff, A.B. 2009a. The secondary structure of mRNA and the soluble concentration in cytoplasam are key factors for translation and translocation of heterelogous protein. (Submitted to Process Biochemistry).
Ramanan, R.N., Tey, B.T., Ling, T.C. and Ariff, A.B. 2009b. Classification of pressure range based on the characterization of Escherichia coli cell disruption in Avestin homogenizer. American Journal of Biochemistry and Biotechnology 5(1): 21-29.
Ramanan, R.N., Tey, T.C and Ariff A.B. 2009c. A simple method for quantif ication of interferon α2b through suface plasmon resonance technique. (Submitted to Biotechnology and Bioprocess Engineering).
Rosfarizan, M., Madihah, M.S. and Ariff, A.B. 1997. Isolation of a kojic acid producing fungus capable of using starch as a carbon source. Letters in Applied Microbiology 26: 27-30.

101 ❘❘❚
Arbakariya Ariff
Rosfarizan, M., Ariff, A.B., Hassan, M.A. and Karim, M.I.A. 1998. Kojic acid production by Aspergillus flavus using gelatinized and hydrolyzed sago starch as carbon sources. Folia Microbiogia 43: 459-464.
Rosfarizan, M., Ariff, A.B., Shimizu, H., Hassan, M.A., Karim, M.I.A. and Shioya, S. 1999. Direct fermentation of sago starch to kojic acid by Aspergillus flavus. In Biotechnology for sustainable Utilization of Biological Resources in the Tropics. Vol 14 (ed. Yoshida, T, Matangkasombut, P., dela Cruz, R.E., Prana, M.S. and Karim, M.I.A.). International Center for Biotechnology, Osaka University, Japan. pp 242-257.
Rosfarizan, M. and Ariff, A.B. 2000a. Kinetics of kojic acid fermentation by Aspergillus flavus using different types and concentrations of carbon and nitrogen sources. Journal of Industrial Microbiology and Biotechnology 25: 20-24.
Rosfarizan, M., Ariff, A.B., Hassan, M.A. and Karim, M.I.A. 2000b. Influence of pH on kojic acid fermentation by Aspergillus flavus. Pakistan Journal of Biological Sciences 3(6): 977-982.
Rosfarizan, M., Ariff, A.B., Hassan, M.A., Karim, M.I.A., Shimizu, H. and Shioya, S. 2002. Important of carbon source feeding and pH control strategies for maximum kojic acid production from sago starch by A. flavus. Journal of Bioscience and Bioengineering 94(2): 99-105.
Rosfarizan, M and Ariff, A.B. (2006) Kinetics of kojic acid fermentation by Aspergillus flavus Link S44-1 using sucrose as a carbon source under different pH conditions. Biotechnology and Bioprocess Engineering 11: 72-79.
Rosfarizan, M. and Ariff, A.B. (2007) Biotransformation of various carbon sources to kojic acid by cell bound enzyme system of A. flavus Link 44-1. Biochemical Engineering Journal 35: 203-209.
Running, J.A., Huss, R.J. and Olson, P.T. (1994) Heterotrophic production of ascorbic acid by microalgae. Journal of Applied Phycology. 6: 99–104.
Shuler, M.L., and Kargi, F. 1991. Bioprocess Engineering: Basic Concepts. Englewood Cliffs, N.J.: Prentice Hall.

❚❘❘ 102
Industrializing Biotechnology
Siti Norita, M. 2002. Production of mannan-degrading enzymes by Aspergillus niger in shake flasks and stirred tank fermenter. MSc thesis. Universiti Putra Malaysia, Selangor, Malaysia.
Tan, J.S., Nagasundara, R., Ling, T.C., Suhaimi, M. and Ariff, A.B. 2009 Enhanced Human Interferon -α2b production by recombinant Escherichia coli in periplasmic space thourgh medium optimization using response surface method (submitted to Biotechnology and Bioprocess Engineering).
Tsuey, L.S., Ariff, A.B., Rosfarizan M. and Raha, A.R. 2006a. Improvements of GC and HPLC analyses in solvent (acetone-butanol-ethanol) fermentation by Clostridium saccharobutylicum using a mixture of starch and glycerol as carbon source. Biotechnology and Bioprocess Engineering 11: 293-298.
Tsuey, L.S., Ariff, A.B., Rosfarizan, M. and Raha, A.R. 2006b. Production of solvent (acetone-butanol-ethanol) in continuous fermentation by Clostridium saccharobutylicum DSM 13864 using gelatinized sago starch as a carbon source. Malaysian Journal of Microbiology 2: 42-50.
Umikalsom, M.S., Ariff, A.B., Zulkifli, H.S., Tong, C.C., Hassan, M.A. and Karim, M.I.A 1997a. Production of cellulase by a wild strain of Chaetomium globosum Kunze using oil palm empty fruit bunch fibers as substrate. Applied Microbiology and Biotechnology 47: 590-595.
Umikalsom, M.S., Ariff, A.B., Zulkifli, H.S., Tong, C.C., Hassan, M.A. and Karim, M.I.A 1997b. The treatment of palm oil empty fruit bunch fibre for subsequent use as substrate for cellulase production by Chaetomium globosum Kunze. Bioresource Technology 62: 1-9.
Umikalsom, M.S., Ariff, A.B., Hassan, M.A. and Karim, M.I.A. 1998a. Kinetics of cellulase production by Chaetomium globosum at different levels of dissolved oxygen tension using oil palm empty fruit bunch fibre as substrate. World Journal of Microbiology and Biotechnology 14: 491-498.
Umikalsom, M.S., Ariff, A.B. and Karim, M.I.A. 1998b. Saccharification of pretreated oil palm empty fruit bunch fibre using a cellulase of Chaetomium globosum. Journal of Agricultural and Food Chemistry
46: 3359-3346.

103 ❘❘❚
Arbakariya Ariff
BIOGRAPHY
Arbakariya Bin Ariff (A.B. Ariff) is a Professor of Fermentation Technology and Bioprocess Engineering at the Faculty of
Biotechnology and Biomolecular Sciences, Universiti Putra Malaysia. He was born on 9th September, 1961, in Batu Pahat, Johor. He received his secondary education at Sekolah Menengah Sains Johor, Kluang, Johor. He graduated with a Bachelor of Food Science and Technology from Universiti Pertanian Malaysia (at present known as Universiti Putra Malaysia) in 1984, M.Phil (Chemical Engineering) from the University of Birmingham, England in 1985 and obtained his PhD degree (Bioprocess Engineering) in July 1993 from University of Manchester Institute of Science and Technology, England. Since 1987, he has been involved in more than 31 research projects funded by several agencies including the Ministry of Science, Technology and Innovation, Ministry of Higher Learning, Land & General Sdn Bhd, NEDO, Japan, National Biotechnology Directorate and UPM. Initially, his projects were related to the development of biomanufacturing processes for production of biotechnology products employing wild microbial strains. Since 1999, his research works have been extended into modern biotechnology where recombinant microorganisms are used in the process for production of biotechnology products. Examples of such projects are the direct fermentation of sago starch to ethanol using recombinant yeasts that have ability to secrete amylase and glucoamylase, thermohilic xylanase production by recombinant E. coli and also the use of recombinant strains for production of biopharmaceuticals. He was also involved in research projects on the development of bioreactor systems for plant and animal cell suspension cultures.

❚❘❘ 104
Industrializing Biotechnology
He is actively involved in research at the international level and has developed many international linkages. One of the major linkages is the Collaborative Research and Exchange Scientist Program between Malaysia, Japan, Thailand, Indonesia and the Philippines sponsored by the Japanese Society for Promotion of Science (JSPS). Under this program, he was appointed as a member in 1989, under the Integrated Engineering project. He was involved in the planning, together with Japanese Scientists, on Collaborative Research under the JSPS-NRCT/DOST/LIPI/VCC Core University Program. The research theme was “Large Scale Cooperative Research Program in the Field of Biotechnology”. Subsequently, he was appointed as Malaysian Leader for the project on “Development of manufacturing bioprocess technology in tropics” from 1996-1998. His appointment as Malaysian Leader was continued for a project entitled “Direct fermentation of sago starch into valuable products” (1999-2001) and further for a project entitled “Bioconversion of sago starch for green chemistry”, for the subsequent phase from 2001-2003. From 1991 to 1994, he also participated in the Inter-Institutional Asian Australian Economic Cooperation Program for development of Biotechnology. This was a collaborative project between Malaysia (UPM), Indonesia and Australia to carry out research on Enzymatic hydrolysis of sago starch to fermentable sugars and the project was funded by the Australian government. He was also involved in the Technical Cooperation Project between Japan International Agency Corporation (JICA) and Universiti Putra Malaysia from 1990 – 1995. The project was to enhance the development of the Department of Biotechnology, UPM through the provision of equipment and technical guidance and advice to the academic staff on promoting and strengthening education and research activities in the field of biotechnology. In 1994, he obtained the Asian Development Bank Award and Scholarship to undertake a 1 month research attachment with Prof. Ian Maddox, at

105 ❘❘❚
Arbakariya Ariff
the Department of Technology and Environment, Massey University, Palmerston North, New Zealand. His experience and expertise is much sought after by the scientif ic communities. UPM appointed him to set-up the Fermentation Technology Unit (FTU), at the Institute of Bioscience in 1999. In this project, he was responsible for the planning, designing (laboratory design, equipment arrangement and flow process, water, gas and steam piping system and etc) and purchasing of equipment. The unit is set-up as a service and facility unit with the capability to scale-up bench scale research findings to industrial scale for commercialization, emphasizing on the areas of fermentation technology and bioprocess engineering. Both areas include microbial, plant and animal cell cultures for production of commercial products. The unit has been visited by many researchers, engineers and students; and provides advice and information to those who would like to set-up similar facilities. FTU also frequently organizes workshops and training programs in the area of Fermentation Technology and Bioprocess Engineering. It is important to note that the unit has managed to commercialize research findings as well as to provide a platform for private companies to enter into the biotechnology business field. In other words, the FTU plays an important role in accelerating the commercialization of Biotechnology in Malaysia and has become the reference and excellence center in the area of fermentation technology and bioprocess engineering in Malaysia. He is actively involved in consultation work and has been appointed as an advisor and a consultant to many biotechnology companies for the development of industrial processes for production of commercial biotechnology products. Examples of this are (a) JW Properties Sdn Bhd for production of aquaculture probiotics, (b) Wiltstar Sdn Bhd in the large scale production of starter culture for biofertiliser, (c) Diversatech Sdn Bhd for production of cultures for

❚❘❘ 106
Industrializing Biotechnology
composting, (d) Performance Additive Sdn Bhd for the application of antifoam and defoamers in fermentation industries, (e) Stella Gen Sdn Bhd for large scale production of commercial probiotic microorganisms for chicken, (f) Malaysian Agri-High Tech for large scale production of fungal culture for subsequent use as biofertiliser, (g) Veterinary Research Institute, Ipoh for the production of bacterial vaccine using stirred tank bioreactor, and (h) Malaysian Palm Oil Board for the preparation of standard operating procedures of biomanufacturing processes of BT. Utilising very huge research grants, he managed to get actively involved in postgraduate studies programs. Todate, 10 PhD and 30 MSc students have graduated under his primary supervision. He has also published more than 100 papers in refereed journals. In recognition of his expertise in Fermentation Technology and Bioprocess Engineering, he has been appointed as Associate Editor to the Asia Pacific Journal of Molecular Biology and Biotechnology (2002-2005). He is also an active referee for many journals such as the Biochemical Engineering Journal, Food Bioprocess Technology and Journal of Agriculture and Food Chemistry. Over the years, he has been appointed as external examiner for PhD and MSc thesis of postgraduate students from local universities. The highlight of his career includes winning several awards and recognition in research at International, National and University level. Arbakariya was appointed as Head of Laboratory of Enzyme and Microbial Technology (LEMT), Institute of Bioscience, UPM, in 2001 and then acted as Head of Department of Bioprocess Technology, Faculty of Biotechnology and Biomolecular Sciences in 2004. Currently, he is the Deputy Dean, Faculty of Biotechnology and Biomolecular Sciences in UPM. He is also the coordinator for the Strategic Research (SR) project under IRPA RM8 on the production of biopharmaceuticals using recombinant strains.

107 ❘❘❚
Arbakariya Ariff
ACKNOWLEDGEMENTS
Alhamdulillah, thank you ALLAH for all Your blessings and
guidance.
I wish to thank Universiti Putra Malaysia for granting me the professorship and for giving me the opportunity to enhance my career in teaching, research and development, as well as professional services. Thank you very much indeed to my parents, Ariff Omar and Fatimah Hassan, my wife Shamsiah Rahmat and all my seven children for all the support and encouragement throughout my career. I would like to acknowledge the contributions of all my colleagues, research collaborators and students who have worked with me through thick and thin. The list is too long and cannot possibly be elaborated here. Special acknowledgement is also due to Professor Dr. Mohamed Ismail Abdul Karim and Professor Dr. Suteaki Shioya for their advice, encouragement and contributions during the early stages of my career. I would like to thank MOSTI (Ministry of Science, Technology and Innovation, Malaysia), JICA (Japan International Cooperation Agency), JSPS (Japan Society for the Promotion of Science), NEDO (New Energy Development Organization), AAECP (Asian Australian Economic Corporation Project), MOHE (Ministry of Higher Education, Malaysia), Land and General Sdn. Bhd., UPM and MTDC (Malaysia Technology Development Cooperation) for their R&D grants. Last but not least, acknowledgements are also due to the Faculty of Biotechnology and Biomolecular Sciences and Institute of Bioscience for providing space and facilities to conduct R&D. I feel honoured to work as a professor at UPM, one of the leading Research Universities in the country, and to be able to supervise such a big number of students.

❚❘❘ 108
Industrializing Biotechnology

109 ❘❘❚
Arbakariya Ariff
LIST OF INAUGURAL LECTURES1. Prof. Dr. Sulaiman M. Yassin The Challenge to Communication Research in Extension 22 July 1989
2. Prof. Ir. Abang Abdullah Abang Ali Indigenous Materials and Technology for Low Cost Housing 30 August 1990
3. Prof. Dr. Abdul Rahman Abdul Razak Plant Parasitic Nematodes, Lesser Known Pests of Agricultural Crops 30 January 1993
4. Prof. Dr. Mohamed Suleiman Numerical Solution of Ordinary Differential Equations: A Historical Per-
spective 11 December 1993
5. Prof. Dr. Mohd. Ariff Hussein Changing Roles of Agricultural Economics 5 March 1994
6. Prof. Dr. Mohd. Ismail Ahmad Marketing Management: Prospects and Challenges for Agriculture 6 April 1994
7. Prof. Dr. Mohamed Mahyuddin Mohd. Dahan The Changing Demand for Livestock Products 20 April 1994
8. Prof. Dr. Ruth Kiew Plant Taxonomy, Biodiversity and Conservation 11 May 1994
9. Prof. Ir. Dr. Mohd. Zohadie Bardaie Engineering Technological Developments Propelling Agriculture into the
21st Century 28 May 1994
10. Prof. Dr. Shamsuddin Jusop Rock, Mineral and Soil 18 June 1994

❚❘❘ 110
Industrializing Biotechnology
11. Prof. Dr. Abdul Salam Abdullah Natural Toxicants Affecting Animal Health and Production 29 June 1994
12. Prof. Dr. Mohd. Yusof Hussein Pest Control: A Challenge in Applied Ecology 9 July 1994
13. Prof. Dr. Kapt. Mohd. Ibrahim Haji Mohamed Managing Challenges in Fisheries Development through Science and
Technology 23 July 1994
14. Prof. Dr. Hj. Amat Juhari Moain Sejarah Keagungan Bahasa Melayu 6 Ogos 1994
15. Prof. Dr. Law Ah Theem Oil Pollution in the Malaysian Seas 24 September 1994
16. Prof. Dr. Md. Nordin Hj. Lajis Fine Chemicals from Biological Resources: The Wealth from Nature 21 January 1995
17. Prof. Dr. Sheikh Omar Abdul Rahman Health, Disease and Death in Creatures Great and Small 25 February 1995
18. Prof. Dr. Mohamed Shariff Mohamed Din Fish Health: An Odyssey through the Asia - Pacific Region 25 March 1995
19. Prof. Dr. Tengku Azmi Tengku Ibrahim Chromosome Distribution and Production Performance of Water Buffaloes 6 May 1995
20. Prof. Dr. Abdul Hamid Mahmood Bahasa Melayu sebagai Bahasa Ilmu- Cabaran dan Harapan 10 Jun 1995

111 ❘❘❚
Arbakariya Ariff
21. Prof. Dr. Rahim Md. Sail Extension Education for Industrialising Malaysia: Trends, Priorities and
Emerging Issues 22 July 1995
22. Prof. Dr. Nik Muhammad Nik Abd. Majid The Diminishing Tropical Rain Forest: Causes, Symptoms and Cure 19 August 1995
23. Prof. Dr. Ang Kok Jee The Evolution of an Environmentally Friendly Hatchery Technology for
Udang Galah, the King of Freshwater Prawns and a Glimpse into the Future of Aquaculture in the 21st Century
14 October 1995
24. Prof. Dr. Sharifuddin Haji Abdul Hamid Management of Highly Weathered Acid Soils for Sustainable Crop Produc-
tion 28 October 1995
25. Prof. Dr. Yu Swee Yean Fish Processing and Preservation: Recent Advances and Future Directions 9 December 1995
26. Prof. Dr. Rosli Mohamad Pesticide Usage: Concern and Options 10 February 1996
27. Prof. Dr. Mohamed Ismail Abdul Karim Microbial Fermentation and Utilization of Agricultural Bioresources and
Wastes in Malaysia 2 March 1996
28. Prof. Dr. Wan Sulaiman Wan Harun Soil Physics: From Glass Beads to Precision Agriculture 16 March 1996
29. Prof. Dr. Abdul Aziz Abdul Rahman Sustained Growth and Sustainable Development: Is there a Trade-Off 1 or
Malaysia 13 April 1996

❚❘❘ 112
Industrializing Biotechnology
30. Prof. Dr. Chew Tek Ann Sharecropping in Perfectly Competitive Markets: A Contradiction in Terms 27 April 1996
31. Prof. Dr. Mohd. Yusuf Sulaiman Back to the Future with the Sun 18 May 1996
32. Prof. Dr. Abu Bakar Salleh Enzyme Technology: The Basis for Biotechnological Development 8 June 1996
33. Prof. Dr. Kamel Ariffin Mohd. Atan The Fascinating Numbers 29 June 1996
34. Prof. Dr. Ho Yin Wan Fungi: Friends or Foes 27 July 1996
35. Prof. Dr. Tan Soon Guan Genetic Diversity of Some Southeast Asian Animals: Of Buffaloes and
Goats and Fishes Too 10 August 1996 36. Prof. Dr. Nazaruddin Mohd. Jali Will Rural Sociology Remain Relevant in the 21st Century? 21 September 1996
37. Prof. Dr. Abdul Rani Bahaman Leptospirosis-A Model for Epidemiology, Diagnosis and Control of Infec-
tious Diseases 16 November 1996
38. Prof. Dr. Marziah Mahmood Plant Biotechnology - Strategies for Commercialization 21 December 1996
39. Prof. Dr. Ishak Hj. Omar Market Relationships in the Malaysian Fish Trade: Theory and Application 22 March 1997

113 ❘❘❚
Arbakariya Ariff
40. Prof. Dr. Suhaila Mohamad Food and Its Healing Power 12 April 1997
41. Prof. Dr. Malay Raj Mukerjee A Distributed Collaborative Environment for Distance Learning Applica-
tions 17 June 1998
42. Prof. Dr. Wong Kai Choo Advancing the Fruit Industry in Malaysia: A Need to Shift Research Em-
phasis 15 May 1999
43. Prof. Dr. Aini Ideris Avian Respiratory and Immunosuppressive Diseases- A Fatal Attraction 10 July 1999
44. Prof. Dr. Sariah Meon Biological Control of Plant Pathogens: Harnessing the Richness of Micro-
bial Diversity 14 August 1999
45. Prof. Dr. Azizah Hashim The Endomycorrhiza: A Futile Investment? 23 Oktober 1999
46. Prof. Dr. Noraini Abdul Samad Molecular Plant Virology: The Way Forward 2 February 2000
47. Prof. Dr. Muhamad Awang Do We Have Enough Clean Air to Breathe? 7 April 2000
48. Prof. Dr. Lee Chnoong Kheng Green Environment, Clean Power 24 June 2000
49. Prof. Dr. Mohd. Ghazali Mohayidin Managing Change in the Agriculture Sector: The Need for Innovative
Educational Initiatives 12 January 2002

❚❘❘ 114
Industrializing Biotechnology
50. Prof. Dr. Fatimah Mohd. Arshad Analisis Pemasaran Pertanian di Malaysia: Keperluan Agenda Pembaha-
ruan 26 Januari 2002
51. Prof. Dr. Nik Mustapha R. Abdullah Fisheries Co-Management: An Institutional Innovation Towards Sustain-
able Fisheries Industry 28 February 2002
52. Prof. Dr. Gulam Rusul Rahmat Ali Food Safety: Perspectives and Challenges 23 March 2002
53. Prof. Dr. Zaharah A. Rahman Nutrient Management Strategies for Sustainable Crop Production in Acid
Soils: The Role of Research Using Isotopes 13 April 2002
54. Prof. Dr. Maisom Abdullah Productivity Driven Growth: Problems & Possibilities 27 April 2002
55. Prof. Dr. Wan Omar Abdullah Immunodiagnosis and Vaccination for Brugian Filariasis: Direct Rewards
from Research Investments 6 June 2002
56. Prof. Dr. Syed Tajuddin Syed Hassan Agro-ento Bioinformation: Towards the Edge of Reality 22 June 2002
57. Prof. Dr. Dahlan Ismail Sustainability of Tropical Animal-Agricultural Production Systems: Inte-
gration of Dynamic Complex Systems 27 June 2002
58. Prof. Dr. Ahmad Zubaidi Baharumshah The Economics of Exchange Rates in the East Asian Countries 26 October 2002
59. Prof. Dr. Shaik Md. Noor Alam S.M. Hussain Contractual Justice in Asean: A Comparative View of Coercion 31 October 2002

115 ❘❘❚
Arbakariya Ariff
60. Prof. Dr. Wan Md. Zin Wan Yunus Chemical Modification of Polymers: Current and Future Routes for Syn-
thesizing New Polymeric Compounds 9 November 2002
61. Prof. Dr. Annuar Md. Nassir Is the KLSE Efficient? Efficient Market Hypothesis vs Behavioural Finance 23 November 2002
62. Prof. Ir. Dr. Radin Umar Radin Sohadi Road Safety Interventions in Malaysia: How Effective Are They? 21 February 2003
63. Prof. Dr. Shamsher Mohamad The New Shares Market: Regulatory Intervention, Forecast Errors and
Challenges 26 April 2003
64. Prof. Dr. Han Chun Kwong Blueprint for Transformation or Business as Usual? A Structurational
Perspective of the Knowledge-Based Economy in Malaysia 31 May 2003
65. Prof. Dr. Mawardi Rahmani Chemical Diversity of Malaysian Flora: Potential Source of Rich Thera-
peutic Chemicals 26 July 2003
66. Prof. Dr. Fatimah Md. Yusoff An Ecological Approach: A Viable Option for Aquaculture Industry in
Malaysia 9 August 2003
67. Prof. Dr. Mohamed Ali Rajion The Essential Fatty Acids-Revisited 23 August 2003
68. Prof. Dr. Azhar Md. Zain Psychotheraphy for Rural Malays - Does it Work? 13 September 2003

❚❘❘ 116
Industrializing Biotechnology
69. Prof. Dr. Mohd. Zamri Saad Respiratory Tract Infection: Establishment and Control 27 September 2003
70. Prof. Dr. Jinap Selamat Cocoa-Wonders for Chocolate Lovers 14 February 2004
71. Prof. Dr. Abdul Halim Shaari High Temperature Superconductivity: Puzzle & Promises 13 March 2004
72. Prof. Dr. Yaakob Che Man Oils and Fats Analysis - Recent Advances and Future Prospects 27 March 2004
73. Prof. Dr. Kaida Khalid Microwave Aquametry: A Growing Technology 24 April 2004
74. Prof. Dr. Hasanah Mohd. Ghazali Tapping the Power of Enzymes- Greening the Food Industry 11 May 2004
75. Prof. Dr. Yusof Ibrahim The Spider Mite Saga: Quest for Biorational Management Strategies 22 May 2004
76. Prof. Datin Dr. Sharifah Md. Nor The Education of At-Risk Children: The Challenges Ahead 26 June 2004
77. Prof. Dr. Ir. Wan Ishak Wan Ismail Agricultural Robot: A New Technology Development for Agro-Based
Industry 14 August 2004
78. Prof. Dr. Ahmad Said Sajap Insect Diseases: Resources for Biopesticide Development 28 August 2004

117 ❘❘❚
Arbakariya Ariff
79. Prof. Dr. Aminah Ahmad The Interface of Work and Family Roles: A Quest for Balanced Lives 11 March 2005
80. Prof. Dr. Abdul Razak Alimon Challenges in Feeding Livestock: From Wastes to Feed 23 April 2005
81. Prof. Dr. Haji Azimi Hj. Hamzah Helping Malaysian Youth Move Forward: Unleashing the Prime Enablers 29 April 2005
82. Prof. Dr. Rasedee Abdullah In Search of An Early Indicator of Kidney Disease 27 May 2005
83. Prof. Dr. Zulkifli Hj. Shamsuddin Smart Partnership: Plant-Rhizobacteria Associations 17 June 2005
84. Prof. Dr. Mohd Khanif Yusop From the Soil to the Table 1 July 2005
85. Prof. Dr. Annuar Kassim Materials Science and Technology: Past, Present and the Future 8 July 2005
86. Prof. Dr. Othman Mohamed Enhancing Career Development Counselling and the Beauty of Career
Games 12 August 2005
87. Prof. Ir. Dr. Mohd Amin Mohd Soom Engineering Agricultural Water Management Towards Precision Framing 26 August 2005
88. Prof. Dr. Mohd Arif Syed Bioremediation-A Hope Yet for the Environment? 9 September 2005

❚❘❘ 118
Industrializing Biotechnology
89. Prof. Dr. Abdul Hamid Abdul Rashid The Wonder of Our Neuromotor System and the Technological Challenges
They Pose 23 December 2005
90. Prof. Dr. Norhani Abdullah Rumen Microbes and Some of Their Biotechnological Applications 27 January 2006
91. Prof. Dr. Abdul Aziz Saharee Haemorrhagic Septicaemia in Cattle and Buffaloes: Are We Ready for
Freedom? 24 February 2006
92. Prof. Dr. Kamariah Abu Bakar Activating Teachers’ Knowledge and Lifelong Journey in Their Profes-
sional Development 3 March 2006
93. Prof. Dr. Borhanuddin Mohd. Ali Internet Unwired 24 March 2006
94. Prof. Dr. Sundararajan Thilagar Development and Innovation in the Fracture Management of Animals 31 March 2006
95. Prof. Dr. Zainal Aznam Md. Jelan Strategic Feeding for a Sustainable Ruminant Farming 19 May 2006
96. Prof. Dr. Mahiran Basri Green Organic Chemistry: Enzyme at Work 14 July 2006
97. Prof. Dr. Malik Hj. Abu Hassan Towards Large Scale Unconstrained Optimization 20 April 2007
98. Prof. Dr. Khalid Abdul Rahim Trade and Sustainable Development: Lessons from Malaysia’s Experience 22 Jun 2007

119 ❘❘❚
Arbakariya Ariff
99. Prof. Dr. Mad Nasir Shamsudin Econometric Modelling for Agricultural Policy Analysis and Forecasting:
Between Theory and Reality 13 July 2007
100. Prof. Dr. Zainal Abidin Mohamed Managing Change - The Fads and The Realities: A Look at Process
Reengineering, Knowledge Management and Blue Ocean Strategy 9 November 2007
101. Prof. Ir. Dr. Mohamed Daud Expert Systems for Environmental Impacts and Ecotourism Assessments 23 November 2007
102. Prof. Dr. Saleha Abdul Aziz Pathogens and Residues; How Safe is Our Meat? 30 November 2007
103. Prof. Dr. Jayum A. Jawan Hubungan Sesama Manusia 7 Disember 2007
104. Prof. Dr. Zakariah Abdul Rashid Planning for Equal Income Distribution in Malaysia: A General
Equilibrium Approach 28 December 2007
105. Prof. Datin Paduka Dr. Khatijah Yusoff Newcastle Disease virus: A Journey from Poultry to Cancer 11 January 2008
106. Prof. Dr. Dzulkefly Kuang Abdullah Palm Oil: Still the Best Choice 1 February 2008
107. Prof. Dr. Elias Saion Probing the Microscopic Worlds by Lonizing Radiation 22 February 2008
108. Prof. Dr. Mohd Ali Hassan Waste-to-Wealth Through Biotechnology: For Profit, People and Planet 28 March 2008

❚❘❘ 120
Industrializing Biotechnology
109. Prof. Dr. Mohd Maarof H. A. Moksin Metrology at Nanoscale: Thermal Wave Probe Made It Simple 11 April 2008
110. Prof. Dr. Dzolkhifli Omar The Future of Pesticides Technology in Agriculture: Maximum Target Kill
with Minimum Collateral Damage 25 April 2008
111. Prof. Dr. Mohd. Yazid Abd. Manap Probiotics: Your Friendly Gut Bacteria 9 May 2008
112. Prof. Dr. Hamami Sahri Sustainable Supply of Wood and Fibre: Does Malaysia have Enough? 23 May 2008
113. Prof. Dato’ Dr. Makhdzir Mardan Connecting the Bee Dots 20 June 2008
114. Prof. Dr. Maimunah Ismail Gender & Career: Realities and Challenges 25 July 2008
115. Prof. Dr. Nor Aripin Shamaan Biochemistry of Xenobiotics: Towards a Healthy Lifestyle and Safe
Environment 1 August 2008
116. Prof. Dr. Mohd Yunus Abdullah Penjagaan Kesihatan Primer di Malaysia: Cabaran Prospek dan
Implikasi dalam Latihan dan Penyelidikan Perubatan serta Sains Kesihatan di Universiti Putra Malaysia
8 Ogos 2008
117. Prof. Dr. Musa Abu Hassan Memanfaatkan Teknologi Maklumat & Komunikasi ICT untuk Semua 15 Ogos 2008
118. Prof. Dr. Md. Salleh Hj. Hassan Role of Media in Development: Strategies, Issues & Challenges 22 August 2008

121 ❘❘❚
Arbakariya Ariff
119. Prof. Dr. Jariah Masud Gender in Everyday Life 10 October 2008
120 Prof. Dr. Mohd Shahwahid Haji Othman Mainstreaming Environment: Incorporating Economic Valuation and
Market-Based Instruments in Decision Making 24 October 2008
121. Prof. Dr. Son Radu Big Questions Small Worlds: Following Diverse Vistas 31 Oktober 2008
122. Prof. Dr. Russly Abdul Rahman Responding to Changing Lifestyles: Engineering the Convenience Foods
28 November 2008
123. Prof. Dr. Mustafa Kamal Mohd Shariff Aesthetics in the Environment an Exploration of Environmental:
Perception Through Landscape Preference 9 January 2009
124. Prof. Dr. Abu Daud Silong Leadership Theories, Research & Practices: Farming Future Leadership
Thinking 16 January 2009
125. Prof. Dr. Azni Idris Waste Management, What is the Choice: Land Disposal or Biofuel? 23 January 2009
126. Prof. Dr. Jamilah Bakar Freshwater Fish: The Overlooked Alternative 30 January 2009
127. Prof. Dr. Mohd. Zobir Hussein The Chemistry of Nanomaterial and Nanobiomaterial 6 February 2009
128. Prof. Ir. Dr. Lee Teang Shui Engineering Agricultural: Water Resources 20 February 2009

❚❘❘ 122
Industrializing Biotechnology
129. Prof. Dr. Ghizan Saleh Crop Breeding: Exploiting Genes for Food and Feed 6 March 2009
130. Prof. Dr. Muzafar Shah Habibullah Money Demand 27 March 2009
131. Prof. Dr. Karen Anne Crouse In Search of Small Active Molecules 3 April 2009
132. Prof. Dr. Turiman Suandi Volunteerism: Expanding the Frontiers of Youth Development 17 April 2009
Copyright © 2022 FDOKUMEN