Effect of Yeast Assimilable Nitrogen Content on Fermentation ...
18
Citation: Christofi, S.; Papanikolaou, S.; Dimopoulou, M.; Terpou, A.; Cioroiu, I.B.; Cotea, V.; Kallithraka, S. Effect of Yeast Assimilable Nitrogen Content on Fermentation Kinetics, Wine Chemical Composition and Sensory Character in the Production of Assyrtiko Wines. Appl. Sci. 2022, 12, 1405. https://doi.org/10.3390/ app12031405 Academic Editor: Daniela Isola Received: 30 November 2021 Accepted: 25 January 2022 Published: 28 January 2022 Publisher’s Note: MDPI stays neutral with regard to jurisdictional claims in published maps and institutional affil- iations. Copyright: © 2022 by the authors. Licensee MDPI, Basel, Switzerland. This article is an open access article distributed under the terms and conditions of the Creative Commons Attribution (CC BY) license (https:// creativecommons.org/licenses/by/ 4.0/). applied sciences Article Effect of Yeast Assimilable Nitrogen Content on Fermentation Kinetics, Wine Chemical Composition and Sensory Character in the Production of Assyrtiko Wines Stefania Christofi 1 , Seraphim Papanikolaou 1 , Maria Dimopoulou 1 , Antonia Terpou 1,2 , Ionel Bogdan Cioroiu 3 , Valeriu Cotea 4 and Stamatina Kallithraka 1, * 1 Department of Food Science and Human Nutrition, Agricultural University of Athens, 75, Iera Odos, 11855 Athens, Greece; stefania.christofi@gmail.com (S.C.); [email protected] (S.P.); [email protected] (M.D.); [email protected] (A.T.) 2 Department of Agricultural Development, Agri-Food, and Natural Resources Management, School of Agricultural Development, Nutrition & Sustainability, National and Kapodistrian University of Athens, 34400 Evripos Union, Greece 3 Romania Academy—Iasi Branch, Research Centre for Oenology, 9 M. Sadoveanu Alley, 700490 Iasi, Romania; [email protected] 4 Department of Oenology, Iasi University of Life Sciences, 3 M. Sadoveanu Alley, 700490 Iasi, Romania; [email protected] * Correspondence: [email protected] Abstract: Two wild-type Saccharomyces cerevisiae yeast strains (Sa and Sb) were tested for white wine production using Assyrtiko grape of Santorini. A third commercial Saccharomyces strain was also studied for comparison reasons. Two concentrations of yeast extract and diammonium phosphate (DAP) were added to the must (150 and 250 mg/L) in order to evaluate the effect of nitrogen content on the final wine quality. Analytical methods (HPLC, GC-MS) and sensory analysis were employed to assess the quality of the wines. Fermentation kinetics were monitored throughout the experiment. By the second day of fermentation, all strains showed an approximate consumption of 70% of amino acids. Differences among strains were observed regarding inorganic nitrogen requirements. Sb strain resulted in higher concentrations of higher alcohols (1.9-fold) and ketones (5.6-fold) and lower concentrations of esters (1.2-fold) compared to the control, while Sa strain resulted in higher content of fatty acids (2.1-fold). Both indigenous strains scored better results in aroma quality, body and acidity compared to control. The overall evaluation of the data highlights the great potential of the indigenous S. cerevisiae strains as fermentation starters providing promising results in the sector of terroir wines. Keywords: yeast assimilable nitrogen content (YAN); wine fermentation starters; indigenous Saccharomyces cerevisiae; wine volatile compounds; wine organoleptic quality; terroir wines 1. Introduction In the past few years, radical changes in global wine exports have occurred, creating a new era in production and consumption of wine [1]. Targeting national competitive ad- vances, producers have focused on the production of terroir wines, using indigenous grape varieties and autochthonous yeast strains [2]. In the industrial wine sector, selected yeast and bacterial strains are employed for fermentation, targeting high yields of productivity, stress tolerance, unique aromatic characteristics and positive sensory attributes [3,4]. Growth and fermentation kinetics of yeasts are influenced by their nutritional require- ments and are highly strain-dependent [5]. Nitrogen availability in grape must is a key parameter for the wine fermentation process, since N- is a substantial nutrient element for yeast growth. It affects the formation of yeast biomass, which, in turn, regulates fermen- tation duration and kinetics [5]. Grape must contains several different nitrogen sources Appl. Sci. 2022, 12, 1405. https://doi.org/10.3390/app12031405 https://www.mdpi.com/journal/applsci
-
Upload
khangminh22 -
Category
Documents
-
view
1 -
download
0
Transcript of Effect of Yeast Assimilable Nitrogen Content on Fermentation ...

�����������������
Citation: Christofi, S.; Papanikolaou,
S.; Dimopoulou, M.; Terpou, A.;
Cioroiu, I.B.; Cotea, V.; Kallithraka, S.
Effect of Yeast Assimilable Nitrogen
Content on Fermentation Kinetics,
Wine Chemical Composition and
Sensory Character in the Production
of Assyrtiko Wines. Appl. Sci. 2022,
12, 1405. https://doi.org/10.3390/
app12031405
Academic Editor: Daniela Isola
Received: 30 November 2021
Accepted: 25 January 2022
Published: 28 January 2022
Publisher’s Note: MDPI stays neutral
with regard to jurisdictional claims in
published maps and institutional affil-
iations.
Copyright: © 2022 by the authors.
Licensee MDPI, Basel, Switzerland.
This article is an open access article
distributed under the terms and
conditions of the Creative Commons
Attribution (CC BY) license (https://
creativecommons.org/licenses/by/
4.0/).
applied sciences
Article
Effect of Yeast Assimilable Nitrogen Content on FermentationKinetics, Wine Chemical Composition and Sensory Character inthe Production of Assyrtiko WinesStefania Christofi 1, Seraphim Papanikolaou 1, Maria Dimopoulou 1 , Antonia Terpou 1,2 ,Ionel Bogdan Cioroiu 3, Valeriu Cotea 4 and Stamatina Kallithraka 1,*
1 Department of Food Science and Human Nutrition, Agricultural University of Athens, 75, Iera Odos,11855 Athens, Greece; [email protected] (S.C.); [email protected] (S.P.);[email protected] (M.D.); [email protected] (A.T.)
2 Department of Agricultural Development, Agri-Food, and Natural Resources Management,School of Agricultural Development, Nutrition & Sustainability, National and Kapodistrian University ofAthens, 34400 Evripos Union, Greece
3 Romania Academy—Iasi Branch, Research Centre for Oenology, 9 M. Sadoveanu Alley, 700490 Iasi, Romania;[email protected]
4 Department of Oenology, Iasi University of Life Sciences, 3 M. Sadoveanu Alley, 700490 Iasi, Romania;[email protected]
* Correspondence: [email protected]
Abstract: Two wild-type Saccharomyces cerevisiae yeast strains (Sa and Sb) were tested for white wineproduction using Assyrtiko grape of Santorini. A third commercial Saccharomyces strain was alsostudied for comparison reasons. Two concentrations of yeast extract and diammonium phosphate(DAP) were added to the must (150 and 250 mg/L) in order to evaluate the effect of nitrogen contenton the final wine quality. Analytical methods (HPLC, GC-MS) and sensory analysis were employedto assess the quality of the wines. Fermentation kinetics were monitored throughout the experiment.By the second day of fermentation, all strains showed an approximate consumption of 70% of aminoacids. Differences among strains were observed regarding inorganic nitrogen requirements. Sbstrain resulted in higher concentrations of higher alcohols (1.9-fold) and ketones (5.6-fold) and lowerconcentrations of esters (1.2-fold) compared to the control, while Sa strain resulted in higher contentof fatty acids (2.1-fold). Both indigenous strains scored better results in aroma quality, body andacidity compared to control. The overall evaluation of the data highlights the great potential of theindigenous S. cerevisiae strains as fermentation starters providing promising results in the sector ofterroir wines.
Keywords: yeast assimilable nitrogen content (YAN); wine fermentation starters; indigenousSaccharomyces cerevisiae; wine volatile compounds; wine organoleptic quality; terroir wines
1. Introduction
In the past few years, radical changes in global wine exports have occurred, creating anew era in production and consumption of wine [1]. Targeting national competitive ad-vances, producers have focused on the production of terroir wines, using indigenous grapevarieties and autochthonous yeast strains [2]. In the industrial wine sector, selected yeastand bacterial strains are employed for fermentation, targeting high yields of productivity,stress tolerance, unique aromatic characteristics and positive sensory attributes [3,4].
Growth and fermentation kinetics of yeasts are influenced by their nutritional require-ments and are highly strain-dependent [5]. Nitrogen availability in grape must is a keyparameter for the wine fermentation process, since N- is a substantial nutrient element foryeast growth. It affects the formation of yeast biomass, which, in turn, regulates fermen-tation duration and kinetics [5]. Grape must contains several different nitrogen sources
Appl. Sci. 2022, 12, 1405. https://doi.org/10.3390/app12031405 https://www.mdpi.com/journal/applsci

Appl. Sci. 2022, 12, 1405 2 of 18
including amino acids, ammonium, and small peptides, although not all of these formscan be metabolized by yeasts. The ammonium and the α-amino acid nitrogen forms aredescribed as the preferential forms, while utilization of small peptides in different environ-ments is possible under specific conditions [6]. A minimum of 140 mg/L of assimilablenitrogen has been established as essential for yeast growth in must under anaerobic fermen-tation conditions [5,7]. The assimilation rate of nitrogen is strictly strain-dependent, and asa result, the selected strain plays a major role in alcoholic fermentation kinetics [8]. DifferentS. cerevisiae strains are characterized by unique nitrogen uptake requirements resultingin variable fermentation behaviors and unique wine organoleptic profiles [9]. Previousstudies revealed that different yeast strains can show sufficient fermentation capacity evenwith limited amounts of nitrogen, while other strains require higher amounts and mayresult in stuck fermentations in case of nitrogen deficiency [5,10]. In order to avoid nitrogendeficiency during wine fermentation, it is a common practice to supplement musts withinorganic nitrogen mainly in the form of diammonium phosphate (DAP). This nitrogensource has been linked with significant effects on wine flavor [11–13]. More specifically, thetype of nitrogen source directly affects the production of wine volatiles (esters, alcohols,and volatile fatty acids) as well as glycerol and organic acid composition [12–14]. Likewise,nitrogen-containing compounds are considered as important precursors of wines’ volatilecompounds, and as a result, the origin and availability of nitrogen significantly affects thefinal quality of wine [11].
The aim of the current study was to investigate the potential of two S. cerevisiae strains(previously isolated from Santorini Island), to produce wine with unique organolepticcharacteristics. For this purpose, must from the Assyrtiko grape variety (indigenous toSantorini Island), were fermented with the autochthonous yeasts. Aiming to produce winesof high quality, the fermentation performance of the yeasts under two YAN contents (highand low) was evaluated, and their impact on wine sensory character was assessed.
2. Materials and Methods2.1. Microorganisms and Growing Conditions
Commercial and autochthonous yeast strains were studied as starter cultures for wine-making. The yeast Saccharomyces cerevisiae Sa and Sb autochthonous strains from the privatecollection of the Agricultural University of Athens (Laboratory of Food Microbiology &Biotechnology, Department of Food Science and Human Nutrition, Athens, Greece), whichhad never been tested before regarding their fermentative activity, were used as startercultures for fermentation of Assyrtiko grape must from Santorini Island (Greece). Thesestrains were deposited to the private collection of the Laboratory of Food Microbiology &Biotechnology—Agricultural University of Athens, Greece, obtaining the code numbersFMCC Y73 and FMCC Y74, respectively. The identification of the yeast species was ver-ified by sequencing of the D1/D2 domain of 26S rRNA gene [15] (data not shown). Thecommercial S. cerevisiae strain, iYeast® Passion Fruit (LaFood, Fasano, Italy) was chosen asa control inoculation, as this strain is suitable for the production of white wines with strongaromatic intensity.
Yeast strains were stored at −80 ◦C in vials with glycerol (30%) and were activated byadding 200 µL to 10 mL yeast peptone dextrose (20 g/L glucose, 10 g/L yeast extract and10 g/L peptone) medium at 28 ◦C for 24 h, while the purity of each strain was verified viaoptical microscopy [16]. Pre-cultures were performed in 250 mL flasks filled with 50 mL ofmedium (YPD medium: 20 g/L glucose, 10 g/L yeast extract, 10 g/L peptone, pH ≈ 3.5)previously autoclaved at T = 115 ◦C at 1.5 atm for 15 min.
2.2. Vinification
Wine was produced with Assyrtiko from Santorini Island (Santo Wines, Union ofSantorini cooperatives, Pyrgos Santorini, Greece) in duplicate. The grapes were mechan-ically crushed and pressed at 8 ◦C. The must was left for 12 h for clarification at 4 ◦Cwithout any addition of enzymes. After clarification, free sulphur dioxide (SO2) of the

Appl. Sci. 2022, 12, 1405 3 of 18
must was adjusted to 10 mg/L, and filtration (0.45 µm filters) was applied to eliminatethe presence of autochthonous yeast cells. The initial concentration of reducing sugarswas 210 g/L, pH was 3.15, total acidity had a value of 5.2 g/L (expressed as tartaric acid),and yeast assimilable nitrogen (YAN) was 80 mg N/L (50 mg/L in the form of α-aminoacids and the remaining 30 mg/L in the form of ammonium nitrogen). Enrichment ofthe musts with YAN was carried out with addition of equal contents of yeast extract andDAP (diammonium phosphate), until respective concentrations of 150 and 250 mg N/Lwere achieved. These two concentrations were chosen, as the minimum (150 mg N/L)to avoid sluggish or stuck fermentations and the most commonly found (250 mg N/L)for industrial fermentations [17]. The three yeast strains were inoculated at 106 cfu/mLto initiate alcoholic fermentations in 4-L vessels, at 18 ◦C in biological duplicates. Thefermentation rate was monitored daily by recording the density of the must [18]. Sugar con-centration (glucose and fructose) was determined through HPLC in a Waters Association600E apparatus equipped with an RI detector (Waters 410, Midland, ON, Canada) [4]. Thefermentations were monitored for 25 days, until the wild type strains reached the levels ofdry wines (<4 g/L of sugars), and to avoid further oxidation of the produced wines eventhough the concentrations of sugars in fermentations contacted with the commercial strainwere slightly higher.
2.3. Chemical Analysis of Must and Wines
Classic parameters of wines (free and total SO2 contents, % vol., pH, titratable andvolatile acidity, A420nm) were determined according to the international methods of theInternational Organization of Vine and Wine (OIV) [19]. Nitrogen of α-amino acid wasdetermined as described by Dukes and Butzke, (1998) [17], while ammonium nitrogen wasdetermined according to Aerny (1996) [20].
Glycerol and acetic acid were quantified through high-performance liquid chromatog-raphy/HPLC (Waters Association 600E apparatus) with an RI detector (Waters 410, Mid-land, ON, Canada) and an ion exclusion column (Aminex HPX-87H, Bio-Rad, CA, USA).The column temperature was set at 65 ◦C with a flow rate of 0.8 mL/min. The mobilephase was H2SO4. For quantitative analysis, standard solutions of glycerol and aceticacid (Sigma-Aldrich Ltd., Taufkirchen, Germany) were prepared in pure water (Milli-Q,Merk, Taufkirchen, Germany) and wine samples were injected directly into the column.Determinations were performed by means of standard curves [16].
The amino-acid analysis was performed using a liquid chromatographic–triple-quadrupole mass spectrometric method. Analyses were performed on a Thermo Ulti-mate 3000 ultra-high pressure liquid chromatograph consisting of a 1000 pressure pump,degasser, PAL open-autosampler, and valve interface module. The detection system con-sisted of a Thermo Quantum Access Max triple-quadrupole mass spectrometer, and for theevaluation, a multiple reaction monitoring option was used. Chromatographic separationwas performed in an Intrada Aminoacid (mixed mode, normal phase and ion exchange)column, particle size 3 µm (150 × 4.6 mm), thermostated at 45 ◦C through the binarygradient shown in Table 1 (phase A, 74:16:10:0.2 mixture of isopropanol, 25 mM ammoniumformate, acetonitrile, and formic acid; phase B, 20:80 mixture of acetonitrile and 100 mMammonium formate) and a flow rate 0.35 mL/min. For detection, triple-quadrupole massspectrometry with spray voltage 3000 V, vaporizer temperature 350 ◦C, sheath gas pressure35 psi, ion sweep gas pressure 0.0 psi, aux gas pressure 10 psi, capillary temperature 380 ◦C,and capillary offset 35 v was used. The target compounds were identified according to theretention times and the characteristic ions from molecular ion fragmentation.
Table 1. Eluent gradient for UPLC determination of amino acids.
Time (min) 0–12 12–17 17–19 19–31 31–31.5 31.5–35Eluent A (%) 100 97 0 0 100 100Eluent B (%) 0 3 100 100 0 0

Appl. Sci. 2022, 12, 1405 4 of 18
The identification of the headspace volatiles of produced wines was conducted bymeans of gas chromatography/mass spectrometry (GC/MS) using the solid phase mi-croextraction method (SPME). GC/MS analysis was performed on a GCMS-QP2010 Ultra(Shimadzu Inc., Japan) system set at 240 ◦C in split mode (split ratio 1/20) [21]. The con-ditions of headspace SPME sampling were as follows: 2 mL of wine sample, 7.5 mL ofdeionized water, 1 g ammonium sulfite, and 500 µL internal standard (1-octanol) weretransferred into a 20 mL headspace vial fitted with a polytetrafluoroethylene (PTFE)-linedsilicone septum. The sealed wine samples were initially stirred (250 rpm) in a tap bath(T = 40 ◦C) for 5 min (Thermodyne-Nuova II; stir speed 5) to achieve the appropriate tem-perature, and then the SPME fiber (DVB/CAR/PDMS, 2 cm; Sigma Aldrich, Germany)was exposed to the headspace for 30 min. The separation of wine volatile compounds tookplace in a DB-Wax capillary column (30 m × 0.25 mm i.d., 0.25 µm film thickness, Agilent,USA). Helium was used as the carrier gas at a constant linear velocity of 36 cm/s. Theoven temperature was set at 40 ◦C for 5 min and increased by 5 ◦C/min up to 180 ◦C, andsubsequently by 30 ◦C/min up to 240 ◦C. The oven temperature was finally stated at 240 ◦Cfor 5 min. Source and interface temperatures were set at 200 ◦C and 240 ◦C, respectively.For each sample during the elution of ethanol, which was expected at 3.4–4.0 min [22], thefilament was programmed to turn off targeting to extend its life, as ethanol was expected atmuch higher rates compared to other volatiles. Molecular identification of volatile com-pounds was carried out using AMDIS (v. 2.65) software based on retention time and massspectra and peak area of each compound, respectively.
2.4. Sensory Analysis
Sensory assessment was performed, for all wines, by a group of 12 trained panelistswith previous experience in wine analysis using the Pivot© profile sensory method [23].Twenty-five mL of the samples and the pivot wine (prepared with the commercial yeaststrain) were presented in a completely randomized order to each panelist, marked withthree-digit code, at 16 ◦C. The wines produced with Sa and Sb were compared with pivotwine. All samples were expectorated, and tap water was provided for mouth-rinsingbetween samples. The attributes selected were grouped in two categories: olfactive de-scriptors (floral, fruity, reduction, vinegary, odor of oxidation) and gustative descriptors(sourness and mouthfeel as the perception of the body of wine). The panelists also per-formed an overall odor quality assessment. All samples were evaluated in triplicate.
2.5. Statistical Analysis
Analysis of variance (ANOVA) was performed using Statistica V.7 (Statsoft Inc., Tulsa,OK, USA) to determine whether the mean values of the parameters differed betweentreatments. Tukey’s HSD was used as comparison tests when samples were significantlydifferent after ANOVA (p < 0.05).
3. Results & Discussion3.1. Effect of YAN Content on Fermentation Kinetics
The kinetics of alcoholic fermentations depended mostly on the yeast strains andsecondarily on YAN concentrations. The S. cerevisiae strain Sa consumed half of the reducingsugars after 4 days of fermentation. In contrast, the commercial and Sb strains werecharacterized by a 48 h delay, consuming half of the concentration of reducing sugars onthe 6th fermentation day. Furthermore, Sa managed to reach the levels of residual sugars(3.6 g/L) corresponding to dry wine on the 25th day, while the Sb and the commercialstrain ended up with 4.0 and 4.5 g/L, respectively. Despite the initial, somehow highertotal sugar consumption rate and subsequently ethanol production rate of the commercialstrain compared to the new isolates (Sa and Sb), finally, the ethanol content of the threewines produced did not show any statistically important differences (final ethanol content~100 g/L = 12.9% v/v) (Figure 1). The conversion yield of ethanol produced per unit oftotal sugars consumed was c. 0.50–0.51 g/g (the absolute value of the slope of the line) for all

Appl. Sci. 2022, 12, 1405 5 of 18
strains tested, that is, 98–100% w/w (Figure 2) of the maximum theoretical yield (=0.51 g/g),demonstrating the potential of the employed wild type strains for the production of winescontaining high concentrations of ethanol [16]. No significant differences were observedregarding the conversion yield of ethanol between ferments of the same strain providedwith different initial YAN. This outcome could indicate that the relatively low fermentationtemperature and the yeast strain pose a more significant role compared to YAN [24,25].
Appl. Sci. 2022, 12, x FOR PEER REVIEW 5 of 18
ended up with 4.0 and 4.5 g/L, respectively. Despite the initial, somehow higher total
sugar consumption rate and subsequently ethanol production rate of the commercial
strain compared to the new isolates (Sa and Sb), finally, the ethanol content of the three
wines produced did not show any statistically important differences (final ethanol content
~100 g/L = 12.9% v/v) (Figure 1). The conversion yield of ethanol produced per unit of total
sugars consumed was c. 0.50–0.51 g/g (the absolute value of the slope of the line) for all
strains tested, that is, 98–100% w/w (Figure 2) of the maximum theoretical yield (=0.51 g/g),
demonstrating the potential of the employed wild type strains for the production of wines
containing high concentrations of ethanol [16]. No significant differences were observed
regarding the conversion yield of ethanol between ferments of the same strain provided
with different initial YAN. This outcome could indicate that the relatively low fermenta-
tion temperature and the yeast strain pose a more significant role compared to YAN
[24,25].
Figure 1. Production of ethanol by S. cerevisiae in fermentations with (a) low and (b) high concen-
trations of YAN and consumption of reducing sugars by S. cerevisiae in fermentations with (c) low
and (d) high concentrations of YAN. Red, black and grey lines correspond to samples fermented
with the commercial, Sa and Sb strains, respectively.
0.0
2.0
4.0
6.0
8.0
10.0
12.0
14.0
0 5 10 15 20 25
%(v
.v.)
Ferm.Day
a)
com Sa Sb
0.0
2.0
4.0
6.0
8.0
10.0
12.0
14.0
0 5 10 15 20 25
% (
v.v
.)
Ferm.Day
b)
com Sa Sb
0.00
50.00
100.00
150.00
200.00
250.00
0 5 10 15 20 25
(g/L
)
Ferm. Day
c)
com Sa Sb
0.00
50.00
100.00
150.00
200.00
250.00
0 5 10 15 20 25
(g/L
)
Ferm.Day
d)
com Sa Sb
Figure 1. Production of ethanol by S. cerevisiae in fermentations with (a) low and (b) high concentra-tions of YAN and consumption of reducing sugars by S. cerevisiae in fermentations with (c) low and(d) high concentrations of YAN. Red, black and grey lines correspond to samples fermented with thecommercial, Sa and Sb strains, respectively.
Apart from the differences in fermentation kinetics, the strains showed variationsin the consumption of fructose and glucose (Figure 3). The commercial strain presenteda clear preferential uptake of glucose. Once glucose was almost depleted, there was asharp increase in fructose uptake. As previously reported, this outcome was expected onthe growth face, where actively growing cells present a preferential affinity for glucose.After this stage, the consumption rates of both glucose and fructose were noted to besimilar. Furthermore, in case of the existence of two separate sugar transport systems,these results may indicate that both systems are capable of transporting either sugar, butonly if the preferred sugar is not present. In the case of a common transport system,competitive inhibition of fructose uptake by glucose could have taken place [26]. However,this pathway was not confirmed in the present study, as the two sugars were consumed

Appl. Sci. 2022, 12, 1405 6 of 18
almost simultaneously at different rates (Figure 3). This could be an indication of twoseparate transport systems with distinct kinetic properties. Furthermore, no significantdifferences concerning glucose and fructose uptake were observed between fermentationswith different initial YAN, as nitrogen content in both cases was sufficient and preventedreduction in glucose uptake capacity [27], while must sugar content did not pose a limitingfactor in nitrogen availability and requirements [28].
Appl. Sci. 2022, 12, x FOR PEER REVIEW 6 of 18
Figure 2. Conversion yield of ethanol produced per unit of total sugars consumed by the commercial
strain in fermentations with (a) low and (b) high concentrations of YAN, Sa in fermentations with
(c) low and (d) high concentrations of YAN, and Sb in fermentations with (e) low and (f) high con-
centrations of YAN.
Apart from the differences in fermentation kinetics, the strains showed variations in
the consumption of fructose and glucose (Figure 3). The commercial strain presented a
clear preferential uptake of glucose. Once glucose was almost depleted, there was a sharp
increase in fructose uptake. As previously reported, this outcome was expected on the
growth face, where actively growing cells present a preferential affinity for glucose. After
this stage, the consumption rates of both glucose and fructose were noted to be similar.
Furthermore, in case of the existence of two separate sugar transport systems, these results
y = -0.5046x + 104.21
R² = 0.9995
0
20
40
60
80
100
120
0 40 80 120 160 200
EtO
H (
g/L
)
Red.Sug.(g/L)
a)
y = -0.5052x + 104.39
R² = 0.9996
0
20
40
60
80
100
120
0 40 80 120 160 200
EtO
H (
g/L
)
Red.Sug.(g/L)
b)
y = -0.5079x + 104.92
R² = 0.9996
0
20
40
60
80
100
120
0 40 80 120 160 200
EtO
H (
g/L
)
Red.Sug. (g/L)
c)
y = -0.4995x + 103.24
R² = 0.9996
0
20
40
60
80
100
120
0 40 80 120 160 200
EtO
H (
g/L
)
Red.Sug. (g/L)
d)
y = -0.5056x + 104.51
R² = 0.9996
0
20
40
60
80
100
120
0 40 80 120 160 200
EtO
H (
g/L
)
Red.Sug. (g/L)
e)
y = -0.4992x + 102.95
R² = 0.9996
0
20
40
60
80
100
120
0 40 80 120 160 200
EtO
H (
g/L
)
Red.Sug. (g/L)
f)
Figure 2. Conversion yield of ethanol produced per unit of total sugars consumed by the commercialstrain in fermentations with (a) low and (b) high concentrations of YAN, Sa in fermentations with(c) low and (d) high concentrations of YAN, and Sb in fermentations with (e) low and (f) highconcentrations of YAN.

Appl. Sci. 2022, 12, 1405 7 of 18
Appl. Sci. 2022, 12, x FOR PEER REVIEW 7 of 18
may indicate that both systems are capable of transporting either sugar, but only if the
preferred sugar is not present. In the case of a common transport system, competitive in-
hibition of fructose uptake by glucose could have taken place [26]. However, this pathway
was not confirmed in the present study, as the two sugars were consumed almost simul-
taneously at different rates (Figure 3). This could be an indication of two separate
transport systems with distinct kinetic properties. Furthermore, no significant differences
concerning glucose and fructose uptake were observed between fermentations with dif-
ferent initial YAN, as nitrogen content in both cases was sufficient and prevented reduc-
tion in glucose uptake capacity [27], while must sugar content did not pose a limiting
factor in nitrogen availability and requirements [28].
Figure 3. Consumption of glucose and fructose by commercial strain in fermentations with (a) low
and (b) high concentrations of YAN, Sa in fermentations with (c) low and (d) high concentrations of
0
20
40
60
80
100
120
0 5 10 15 20 25
(g/L
)
Ferm. Day
a)
Glu Fru
0
20
40
60
80
100
120
0 5 10 15 20 25
(g/L
)
Ferm.Day
b)
Glu Fru
0
20
40
60
80
100
120
0 5 10 15 20 25
(g/L
)
Ferm.Day
c)
Glu Fru
0
20
40
60
80
100
120
0 5 10 15 20 25
(g/L
)
Ferm.Day
d)
Glu Fru
0
20
40
60
80
100
120
0 5 10 15 20 25
(g/L
)
Ferm. Day
e)
Glu Fru
0
20
40
60
80
100
120
0 5 10 15 20 25
(g/L
)
Ferm. Day
f)
Glu Fru
Figure 3. Consumption of glucose and fructose by commercial strain in fermentations with (a) lowand (b) high concentrations of YAN, Sa in fermentations with (c) low and (d) high concentrations ofYAN, and Sb in fermentations with (e) low and (f) high concentrations of YAN. Black and grey linescorrespond to glucose and fructose consumption, respectively.
Regarding sugar utilization, differences in inorganic nitrogen requirements wereobserved among the different S. cerevisiae strains. Sa strain consumed ammonium nitrogen(NH4
+) faster, especially in the case of ferments containing 150 mg N/L. In those cases,ammonia was exhausted by the 3rd day of fermentation (data not shown). Sb strain showeda completely different behavior regarding ammonium nitrogen consumption. In the caseof musts containing 250 mg N/L, the NH4
+ consumption speed was higher, even thoughcomplete exhaustion of ammonia was achieved on the 6th day of fermentation. On the

Appl. Sci. 2022, 12, 1405 8 of 18
other hand, in musts inoculated with Sb, containing 150 mg N/L, ammonia was exhaustedby the 5th day of fermentation (data not shown). Based on these observations, Sa strainseems to exhibit higher NH4
+ requirements than the other strains examined, while Sb andcommercial strains might be characterized by comparable NH4
+ demands (Figure 4a).
Appl. Sci. 2022, 12, x FOR PEER REVIEW 9 of 18
Put 4 (the main transporter of proline uptake) and GAP1 endocytosis could also be an-
other explanation [37]. The lower concentration of arginine in trials conducted with Sb
compared to Sa strain could be explained through the more limited expression of URE2
protein, repressing the transcription of the genes responsible for proline, hence of arginine
degradation under nitrogen catabolite repression [35].
Figure 4. Utilization rate of (a) NH4+, (b) FAN and (c) YAN by three different S. cerevisiae strains.
The ‘low’ and ‘high’ correspond to fermentations with 150 mg N/L and 250 mg N/L of initial YAN,
respectively. The ‘com’, ‘Sa’ and ‘Sb’ correspond to fermentations carried out with the commercial
and Sa and Sb strains, respectively. Values followed by different letters in each column indicate
significant differences (p < 0.05) among different samples.
Table 2. Concentration (ng/mL) of amino acids after 25 days of fermentation. Values followed by
different letters in each column indicate significant differences (p < 0.05) among different samples.
Commercial Sa Sb Commercial Sa Sb
YAN 150 mg N/L 250 mg N/L
4-Hydroxy-
Proline 2.05 ± 0.39 a 1.54 ± 0.31 a 1.92 ± 0.39 a 1.20 ± 0.00 a 2.00 ± 0.79 a 2.02 ± 0.41 a
Proline 92.93 ± 5.20 ab 101.34 ± 0.25 ab 91.82 ± 0.80 ab 104.74 ± 0.00 a 97.95 ± 3.99 ab 87.79 ± 2.49 ab
Phenylala-
nine 0.76 ± 0.29 a 0.19 ± 0.02 a 2.02 ± 0.26 a 1.07 ± 0.04 a 1.00 ± 0.10 a 0.80 ± 0.00 a
Tyrosine 0.05 ± 0.01 a 0.54 ± 0.05 a 0.24 ± 0.02 a 0.77 ± 0.01 a 0.30 ± 0.03 a 0.12 ± 0.00 a
Aspartic
acid 1.33 ± 0.10 a 2.41 ± 0.53 a 1.95 ± 0.3 a 3.57 ± 0.00 a 2.45 ± 0.50 a 1.73 ± 0.30 a
Glutamic
acid 0.95 ± 0.08 b 0.24 ± 0.00 b 3.02 ± 0.84 ab 5.46 ± 0.04 ab 5.54 ± 0.19 ab 9.26 ± 0.65 a
Isoleucine 0.54 ± 0.04 a 0.26 ± 0.03 a 0.00 ± 0.00 a 0.52 ± 0.01 a 0.04 ± 0.00 a 0.00 ± 0.00 a
bc cd
ab
dcd
0.0
7.0
14.0
21.0
28.0
comlow comhigh Salow Sahigh Sblow Sbhigh
((g/L
)/d
ay)
a)
bcabc ab a
cabc
0.0
4.0
8.0
12.0
comlow comhigh Salow Sahigh Sblow Sbhigh
((g/L
)/d
ay)
b)
cab
bca
ca
0.0
20.0
40.0
comlow comhigh Salow Sahigh Sblow Sbhigh
((g/L
)/d
ay)
c)
Figure 4. Utilization rate of (a) NH4+, (b) FAN and (c) YAN by three different S. cerevisiae strains.The ‘low’ and ‘high’ correspond to fermentations with 150 mg N/L and 250 mg N/L of initial YAN,respectively. The ‘com’, ‘Sa’ and ‘Sb’ correspond to fermentations carried out with the commercialand Sa and Sb strains, respectively. Values followed by different letters in each column indicatesignificant differences (p < 0.05) among different samples.
In addition, all three S. cerevisiae tested strains exhausted approximately 70% of α-amino acids (FAN) by the second day of fermentation. More specifically, consumption ofFAN in musts inoculated with the commercial, Sa and Sb strains, reached 69.1%, 73.7%and 59.6%, respectively. The FAN utilization followed NH4
+ consumption in a nitrogencatabolite repression manner. The fastest consumption of NH4
+ in ferments inoculatedwith Sa strain compared to the Sb strain, probably lead to a faster activation of the GAP1(general amino acid permease) and GLN3 (activated when preferred nitrogen sources arenot available) proteins. The activation of the specific proteins leads the metabolic pathwayto non-preferred nitrogen sources (FAN) [29]. Once again, the Sb strain was characterizedby the lowest nitrogen depletion speed, indicating the lowest FAN demand (Figure 4b).In general, the utilization rate was higher in the trials containing 250 mg N/L, comparedto fermentations containing 150 mg N/L. Moreover, the consumption of the differentamino acids by the ferments with lower initial YAN was not significantly different. Incontrast, commercial strain musts enriched with 250 mg N/L YAN were characterizedby the lowest utilization rate of leucine, valine, asparagine and glutamine, while the Sbstrain presented the highest utilization rate for the same amino acids. The absence of

Appl. Sci. 2022, 12, 1405 9 of 18
statistically important differences in ferments with lower initial YAN could be attributed toa possible derepression of external hydrolytic enzymes involved in amino acid utilization(e.g., asparaginase) and/ or polymerization of metabolic enzymes responsible for thesynthesis of amino acids, due to nitrogen starvation, leading to altered or secondaryfunctions [30,31]. The differences noted for leucine, valine, asparagine and glutamine couldbe the consequence of the membrane structural disparities of the three yeasts, leading toalternate permease activity. More specifically, the enzymatic activity of Bap2 permease(responsible for leucine and valine transfer) and Agp1 (which transports asparagine andglutamine in the yeast cell) [32] excreted by Sb strain might be higher in comparisonwith the other yeasts strains examined. Asparagine utilization and fermentation kineticswere inversely proportional, while glutamine affected yeast growth indirectly through itsconnection with asparagine, providing evidence that asparagine supports yeast growth [33].Leucine cannot provide any positive impact on yeast growth, as also verified by previousstudies [32,33]. Fermentations carried out with Sa strain with a low initial level of YANcontained the highest concentration of total amino acids after 25 days of fermentation, mostlikely due to extended yeast cell autolysis [34]. Further investigation of mannoproteinconcentration could substantiate this assumption. None of the three examined strainspresented the ability to degrade proline (no statistical differences were observed comparedto the initial concentration (data not shown)); however, arginine content of the final wineswas statistically different depending on the strain (Table 2). Since both amino acids includethe proline pathway for their conversion to glutamate and NH4
+, arginine degradationprobably followed the urea cycle [35,36]. Inhibition of arginine to proline utilizationthrough Put 4 (the main transporter of proline uptake) and GAP1 endocytosis could alsobe another explanation [37]. The lower concentration of arginine in trials conducted withSb compared to Sa strain could be explained through the more limited expression of URE2protein, repressing the transcription of the genes responsible for proline, hence of argininedegradation under nitrogen catabolite repression [35].
Table 2. Concentration (ng/mL) of amino acids after 25 days of fermentation. Values followed bydifferent letters in each column indicate significant differences (p < 0.05) among different samples.
Commercial Sa Sb Commercial Sa Sb
YAN 150 mg N/L 250 mg N/L
4-Hydroxy-Proline 2.05 ± 0.39 a 1.54 ± 0.31 a 1.92 ± 0.39 a 1.20 ± 0.00 a 2.00 ± 0.79 a 2.02 ± 0.41 a
Proline 92.93 ± 5.20 ab 101.34 ± 0.25 ab 91.82 ± 0.80 ab 104.74 ± 0.00 a 97.95 ± 3.99 ab 87.79 ± 2.49 ab
Phenylalanine 0.76 ± 0.29 a 0.19 ± 0.02 a 2.02 ± 0.26 a 1.07 ± 0.04 a 1.00 ± 0.10 a 0.80 ± 0.00 a
Tyrosine 0.05 ± 0.01 a 0.54 ± 0.05 a 0.24 ± 0.02 a 0.77 ± 0.01 a 0.30 ± 0.03 a 0.12 ± 0.00 a
Aspartic acid 1.33 ± 0.10 a 2.41 ± 0.53 a 1.95 ± 0.3 a 3.57 ± 0.00 a 2.45 ± 0.50 a 1.73 ± 0.30 a
Glutamic acid 0.95 ± 0.08 b 0.24 ± 0.00 b 3.02 ± 0.84 ab 5.46 ± 0.04 ab 5.54 ± 0.19 ab 9.26 ± 0.65 a
Isoleucine 0.54 ± 0.04 a 0.26 ± 0.03 a 0.00 ± 0.00 a 0.52 ± 0.01 a 0.04 ± 0.00 a 0.00 ± 0.00 a
Tryptophane 0.19 ± 0.01 a 0.30 ± 0.00 a 0.09 ± 0.01 a 0.04 ± 0.01 a 0.10 ± 0.00 a 0.25 ± 0.09 a
Threonine 2.51 ± 0.01 a 1.73 ± 0.05 a 1.18 ± 0.07 a 1.26 ± 0.00 a 0.61 ± 0.06 a 0.94 ± 0.03 a
Leucine 0.57 ± 0.03 b 0.21 ± 0.02 b 0.13 ± 0.01 b 2.46 ± 0.00 a 0.43 ± 0.02 b 0.55 ± 0.04 b
Valine 1.38 ± 0.02 ab 0.98 ± 0.04 ab 0.45 ± 0.02 ab 1.50 ± 0.07 a 0.48 ± 0.07 ab 0.30 ± 0.01 b
Serine 1.11 ± 0.03 c 1.24 ± 0.03 c 0.95 ± 0.05 c 1.43 ± 0.03 bc 2.23 ± 0.02 a 1.94 ± 0.00 ab
Glutamine 22.37 ± 0.51 ab 68.30 ± 0.25 ab 8.85 ± 0.31 b 22.87 ± 0.00 a 50.66 ± 0.20 ab 7.43 ± 0.00 b
Alanine 17.72 ± 0.73 ab 33.58 ± 0.44 ab 4.87 ± 0.31 b 44.93 ± 0.00 a 12.45 ± 0.52 b 15.86 ± 0.00 ab
Asparagine 1.33 ± 0.28 bc 0.56 ± 0.27 c 0.27 ± 0.07 c 10.34 ± 0.00 a 2.45 ± 0.32 b 0.74 ± 0.00 c
Glycine 2.84 ± 0.40 bc 2.49 ± 0.10 c 4.25 ± 0.17 ab 5.41 ± 0.30 a 5.54 ± 0.44 a 5.04 ± 0.00 a
Cysteine 12.63 ± 0.06 a 12.64 ± 0.08 a 12.56 ± 0.01 a 12.54 ± 0.00 a 12.58 ± 0.03 a 12.60 ± 0.06 a
Histidine 1.72 ± 0.34 a 1.77 ± 0.29 a 1.25 ± 0.23 a 2.01 ± 0.08 a 1.93 ± 0.44 a 1.75 ± 0.00 a
Lysine 12.73 ± 0.30 a 12.89 ± 0.46 a 13.47 ± 1.01 a 15.19 ± 0.00 a 12.91 ± 0.49 a 13.08 ± 0.28 a
Arginine 1.54 ± 0.63 c 6.35 ± 0.45 b 2.53 ± 0.31 c 9.18 ± 0.00 a 5.99 ± 0.96 b 2.22 ± 0.22 c
Total 191.24 ± 5.22 263.48 ± 7.63 165.77 ± 3.01 360.08 ± 0.11 231.59 ± 6.71 178.38 ± 6.08

Appl. Sci. 2022, 12, 1405 10 of 18
3.2. Total Acidity and Production of Secondary Metabolites
After the end of alcoholic fermentations, an average reduction of 20.1% in tartaricacid was observed (Table 3). No significant differences were observed between fermentscontaining different amounts of YAN. These results are in agreement with preview studiesfor S. cerevisiae and could be due to biochemical utilization or physical losses throughdecreased solubility or tartaric acid’s adsorption to the surface of yeast cells [38]. Basedon the absence of statistically important differences between different yeast strains, it issurmised that physiochemical phenomena have a greater impact on the alterations oftartaric acid concentrations.
Table 3. Chemical parameters of ferments after 25 days of fermentations with different S. cerevisiaestrains. Values followed by different letters in each column indicate significant differences (p < 0.05)among different samples.
Must Commercial Sa Sb
YAN (mg/L) 80 150 250 150 250 150 250
EtOH % (v/v) 0.00 ± 0.00 12.76 ± 0.12 a 12.91 ± 0.01 a 13.10 ± 0.08 a 13.00 ± 0.00 a 12.82 ± 0.00 a 12.81 ± 0.17 a
pH 3.15 ± 0.01 3.13 ± 0.01 a 3.14 ± 0.00 a 3.09 ± 0.01 b 3.09 ± 0.01 b 2.98 ± 0.00 c 3.00 ± 0.01 c
Total Acidity (gtartaric acid/L) 5.21 ± 0.03 7.84 ± 0.03 b 7.68 ± 0.02 b 7.39 ± 0.03 c 7.50 ± 0.03 c 8.67 ± 0.02 a 8.56 ± 0.06 a
Volatile Acidity(g aceticacid/L)
0.30 ± 0.01 0.53 ± 0.02 a 0.53 ± 0.00 a 0.37 ± 0.01 b 0.40 ± 0.01 b 0.31 ± 0.01 c 0.32 ± 0.02 c
Residual Sugar(g/L) 210.05 ± 2.1 5.05 ± 1.9 a 3.95 ± 0.3 a 3.70 ± 1.4 a 3.65 ± 0.4 a 3.65 ± 0.2 a 4.35 ± 1.3 a
Glycerol (g/L) 0.00 ± 0.00 6.25 ± 0.15 abc 6.00 ± 0.00 bcd 5.75 ± 0.15 cd 5.55 ± 0.05 d 6.75 ± 0.15 a 6.50 ± 0.00 ab
Tartaric (g/L) 6.75 ± 0.1 5.4 ± 0.1 abc 5.2 ± 0.0 c 5.3 ± 0.1 bc 5.3 ± 0.0 bc 5.6 ± 0.1 a 5.5 ± 0.1 ab
Citric (mg/L) 720 ± 0.0 180.0 ± 0.0 b 185.0 ± 0.0 b 190.0 ± 0.0 b 170.0 ± 0.0 b 365.0 ± 0.0 a 385.0± 0.0 a
There were no differences in malic acid concentrations, nor was any lactic acid produc-tion noted (data not shown) even when, in some cases, an up to 22% consumption of malicacid could be observed, being mainly strain-dependent [38,39]. The ability to metabolizeextracellular malic acid depends on an efficient system for malic acid transport (i.e., activeimport via a malate transporter) and a malic acid converting enzyme [40] that seemed to beabsent in the investigated strains.
Reduction in citric acid concentration was also observed (Table 3). Fermentationscarried out with the commercial, Sa and Sb strains presented a 74.5%, 74.8% and 47.6%reduction in citric acid content, respectively. Overexpression of CIT1 and CIT3 genes encod-ing mitochondrial citrate synthase, which catalyzes the first step in the tricarboxylic acid(TCA) pathway, and/or of the KGD1, KGD2 and LPD1 genes encoding the oxoglutaratedehydrogenase (OGDH) complex, which helps the formation of succinic acid and fumaricacid in commercial and Sa strains, could be a possible explanation for these results [29].Absence of significant differences between ferments of the same strain with different YANcontents, constitutes indication of suppressed expression of GLN3 and URE2 genes associ-ated with alternative nitrogen assimilatory pathways connected with the TCA cycle [35].The more limited alterations in citric acid concentration in ferments carried out with Sbstrain led to higher total acidity (TA) and lower pH, compared to wines fermented with thecommercial and Sa strains. The observed relatively high TA (and low pH), were within therange commonly measured in wines produced from Assyrtiko grapes [41].
Apart from the higher TA values, a more moderated increase in volatile acidity (VA)was also achieved in Sb wines compared to the commercial and Sa wines (Table 3). Theseresults are in line with previous works that demonstrated a positive correlation betweenacetic acid and glycerol production. As reported by Romano et al., 1994, the production ofacetaldehyde and consequently, the production of acetic acid and other compounds such asacetoin and higher alcohols, is mainly strain-dependent [42]. The different strains examinedcould be categorized according to phenotypes as low, medium and high acetaldehydeproducers, respectively. Moreover, accumulation of acetic acid in fermentations carried

Appl. Sci. 2022, 12, 1405 11 of 18
out with the commercial strain, with the possibly suppressed expression of HAA1 gene(responsible for the adaptation of yeast cells upon exposure to toxic concentrations ofacetic acid), could have led to decreased cell viability and retarded fermentations [43,44].In addition, a slightly higher (however, not significantly important) increase in VA wasobserved in fermentations with 250 mg N/L compared to those with 150 mg N/L YAN,when carried out with the commercial and Sb strains, unlike with the Sa strain. Differentresearch groups have proposed that acetic acid production is negatively correlated withnitrogen content; however, this was not observed for acetic acid content for the commercialand Sb strains [10,45]. Considering, though, the strain-dependent manner of acetic acidproduction and the absence of statistically important differences between ferments withdiscrete YAN concentrations, these results could be explained.
Glycerol is a significant by-product of alcoholic fermentation, as it contributes to theorganoleptic properties of wine, increasing viscosity and sweetness [46]. In the currentstudy, the highest production of glycerol was observed in musts containing 150 mg N/LYAN, for all examined S. cerevisiae strains (Table 3). These results are in agreement withpreviews studies, suggesting that nitrogen limitation increases glycerol production [45,47].Independently from the YAN level, glycerol concentrations ranged between 5.8–6.8 g/L,which was within the range of previously reported data (4.2–10.4 g/L) [45,47–50]. How-ever, the Sb strain was characterized by the highest glycerol and lower ethanol production,although the differences observed were not statistically significant. Such differentiationsbetween strains regarding glycerol production could be attributed to the differences be-tween the two pathways that are linked to glycerol formation. The low and high glycerolproducing strains differ in glycerol-3-phosphate dehydrogenase activity. The gapN genethat encodes non-phosphorylating NADP+ is responsible for the enzymatic activity, andin strains where this gene is suppressed, ethanol production is lower, while glycerol yieldis higher. Higher production of glycerol by the Sb strain could also be ascribed to thesuppressed expression of the mhpF gene encoding acetylating NAD+ linked to acetalde-hyde dehydrogenase and overexpression of the frdA gene encoding NAD+ linked tofumarate reductase [51]. Furthermore, the three strains presented different productionkinetics (Figure 5). Glycerol production could be related to glucose consumption, sinceglycerol reached a plateau when glucose was exhausted. Aerobic production of glycerolin the presence of glucose, which may result in respiro-fermentative growth, is a possibleexplanation for the results observed [52].
3.3. Volatile Composition
Analysis of volatile compounds was performed by SPME GC/MS targeting to evaluatethe volatile characteristics of wines produced by the two wild type yeast strains andcompared with the commercial one (Figure 6). In line with the more limited increase inVA, Sb media were characterized by considerably higher production of higher alcoholsand ketones compared to commercial and Sa media (Figure 6a,b). According to the results,it was observed that the lower the nitrogen content, the lower the production of higheralcohols in wine. However, as far as Sb strain is concerned, the opposite was observed.A possible explanation for this could be a better utilization of valine by this strain thatintensifies the production of fusel alcohols [10,42,53,54]. The Sa and commercial strainsproduced similar contents of higher alcohols regardless of nitrogen content. Moreover,the Sb strain produced 1.9-fold higher amounts of alcohols and 5.6-fold higher amountsof ketones compared to the commercial strain; however, no significant differences wereobserved between Sa and the commercial strain. These results highlight the variations thatmight occur in the metabolic pathways of different yeast strains. The increased productionof higher alcohols by the Sb strain evinces a less efficient uptake of nitrogen, as previouslyreported [55].

Appl. Sci. 2022, 12, 1405 12 of 18
Appl. Sci. 2022, 12, 1405 8 of 14
previews studies, suggesting that nitrogen limitation increases glycerol production
[45,47]. Independently from the YAN level, glycerol concentrations ranged between 5.8–
6.8 g/L, which was within the range of previously reported data (4.2–10.4 g/L)
[45,47,48,49,50]. However, the Sb strain was characterized by the highest glycerol and
lower ethanol production, although the differences observed were not statistically
significant. Such differentiations between strains regarding glycerol production could be
attributed to the differences between the two pathways that are linked to glycerol
formation. The low and high glycerol producing strains differ in glycerol-3-phosphate
dehydrogenase activity. The gapN gene that encodes non-phosphorylating NADP+ is
responsible for the enzymatic activity, and in strains where this gene is suppressed,
ethanol production is lower, while glycerol yield is higher. Higher production of glycerol
by the Sb strain could also be ascribed to the suppressed expression of the mhpF gene
encoding acetylating NAD+ linked to acetaldehyde dehydrogenase and overexpression
of the frdA gene encoding NAD+ linked to fumarate reductase [51]. Furthermore, the
three strains presented different production kinetics (Figure 5). Glycerol production could
be related to glucose consumption, since glycerol reached a plateau when glucose was
exhausted. Aerobic production of glycerol in the presence of glucose, which may result in
respiro-fermentative growth, is a possible explanation for the results observed [52].
Figure 5. Production of glycerol by S. cerevisiae in fermentations with (a) commercial, (b) Sa and (c)
Sb strains. Red and black lines correspond to samples fermented with low and high initial
concentrations of YAN, respectively.
3.3. Volatile Composition
Analysis of volatile compounds was performed by SPME GC/MS targeting to
evaluate the volatile characteristics of wines produced by the two wild type yeast strains
0.001.002.003.004.005.006.007.00
0 5 10 15 20 25
(g/L
)
Ferm.Day
a)
low high
0.00
1.00
2.00
3.00
4.00
5.00
6.00
0 5 10 15 20 25
(g/L
)
Ferm.Day
b)
low high
0.001.002.003.004.005.006.007.00
0 5 10 15 20 25
(g/L
)
Ferm.Day
c)
low high
Figure 5. Production of glycerol by S. cerevisiae in fermentations with (a) commercial, (b) Sa and (c) Sbstrains. Red and black lines correspond to samples fermented with low and high initial concentrationsof YAN, respectively.
Furthermore, the Sb strain produced less fatty acids and esters compared to the othertwo strains, probably as a defensive mechanism to toxic ‘metabolic waste’ (Figure 6c,d) [55].Lower concentrations of fatty acids could be linked to lower concentrations of acyl-coenzyme A (CoA), one of the factors that is directly related to ester production [56].Deficient amounts of acyl-CoA could also result in lower concentrations of acetyl-coenzymeA (CoA), suppressing the TCA cycle in the Sb strain, as has been previously documented.Reduced activity of enzymes involved in the synthesis (alcohol acetyl transferases I and II)and hydrolysis (esterases) of esters in Sb media could be responsible for the insufficientester production compared to the commercial and Sa wines. Lower expression of ATF1and ATF2 genes encoding alcohol acetyl transferases I and II and overexpression of theIAH1 gene encoding ester degrading enzyme could be another possible explanation [56].In addition, lower concentrations of esters in Sb wines could be linked to leucine con-sumption [57]. As far as the different initial YAN contents are concerned, the three strainsshowed different patterns of ester and fatty acid production. In media with 150 mg N/L,the commercial and Sa strains resulted in lower amounts of fatty acids and higher amountsof esters compared to the wines containing 250 mg N/L. For the commercial strain, esterproduction was proportional to initial YAN.

Appl. Sci. 2022, 12, 1405 13 of 18
Appl. Sci. 2022, 12, x FOR PEER REVIEW 13 of 18
3.3. Volatile Composition
Analysis of volatile compounds was performed by SPME GC/MS targeting to evalu-
ate the volatile characteristics of wines produced by the two wild type yeast strains and
compared with the commercial one (Figure 6). In line with the more limited increase in
VA, Sb media were characterized by considerably higher production of higher alcohols
and ketones compared to commercial and Sa media (Figure 6a,b). According to the results,
it was observed that the lower the nitrogen content, the lower the production of higher
alcohols in wine. However, as far as Sb strain is concerned, the opposite was observed. A
possible explanation for this could be a better utilization of valine by this strain that in-
tensifies the production of fusel alcohols [10,42,53,54]. The Sa and commercial strains pro-
duced similar contents of higher alcohols regardless of nitrogen content. Moreover, the Sb
strain produced 1.9-fold higher amounts of alcohols and 5.6-fold higher amounts of ke-
tones compared to the commercial strain; however, no significant differences were ob-
served between Sa and the commercial strain. These results highlight the variations that
might occur in the metabolic pathways of different yeast strains. The increased production
of higher alcohols by the Sb strain evinces a less efficient uptake of nitrogen, as previously
reported [55].
Furthermore, the Sb strain produced less fatty acids and esters compared to the other
two strains, probably as a defensive mechanism to toxic ‘metabolic waste’ (Figure 6c,d)
[55]. Lower concentrations of fatty acids could be linked to lower concentrations of acyl-
coenzyme A (CoA), one of the factors that is directly related to ester production [56]. De-
ficient amounts of acyl-CoA could also result in lower concentrations of acetyl-coenzyme
A (CoA), suppressing the TCA cycle in the Sb strain, as has been previously documented.
Reduced activity of enzymes involved in the synthesis (alcohol acetyl transferases I and
II) and hydrolysis (esterases) of esters in Sb media could be responsible for the insufficient
ester production compared to the commercial and Sa wines. Lower expression of ATF1
and ATF2 genes encoding alcohol acetyl transferases I and II and overexpression of the
IAH1 gene encoding ester degrading enzyme could be another possible explanation [56].
In addition, lower concentrations of esters in Sb wines could be linked to leucine con-
sumption [57]. As far as the different initial YAN contents are concerned, the three strains
showed different patterns of ester and fatty acid production. In media with 150 mg N/L,
the commercial and Sa strains resulted in lower amounts of fatty acids and higher
amounts of esters compared to the wines containing 250 mg N/L. For the commercial
strain, ester production was proportional to initial YAN.
c c c c
ab
0
10
20
30
40
Com low Com high Salow Sahigh Sblow Sbhigh%Σ
vo
lati
le c
om
p.
a)
b b
b
b
a
a
0
0.2
0.4
0.6
0.8
Com low Com high Salow Sahigh Sblow Sbhigh
%Σv
ola
tile
co
mp
.
b)
Appl. Sci. 2022, 12, x FOR PEER REVIEW 14 of 18
Figure 6. % Concentrations of the most important groups of volatile compounds: (a) higher alcohols,
(b) ketones, (c) fatty acids and (d) () esters. The ‘com’, ‘Sa’ and ‘Sb’ correspond to fermentations
carried out with the commercial, Sa and Sb strains, respectively. Values followed by different letters
in each column indicate significant differences (p < 0.05) among different samples.
3.4. Sensory Analysis
The results of sensory analysis did not show any significant differences concerning
color intensity, indicating that the judges could not perceive any differences in color in-
tensity among the pivot (control wine fermented with the commercial S. cerevisiae strain)
and the rest of the samples (Figure 7). The results are in agreement with the results ob-
tained for low molecular weight phenolic compounds and absorption at 420 nm (data not
shown), with no statistically important differences observed among the samples. Moreo-
ver, in line with the results regarding VA, the Sa and Sb wines were clearly judged as less
vinegary and oxidized, since the negative frequencies for these attributes were higher than
the positives. The same wines were also judged as less reductive than the pivot, probably
due to lower production of volatile sulfurous compounds [58]. Further investigation in
this group of volatile compounds is needed to support this assumption. Regarding floral
attributes, the positive frequencies for the Sb strain were higher than the negative, indi-
cating this wine was clearly judged as more floral than the pivot, while for the commercial
strain, positive and negative frequencies were equal, showing similar floral notes with the
pivot. These results are in line with the results obtained by GC-MS analysis regarding the
contents of higher alcohols and ketones that are responsible for the floral and green aro-
mas [4,59]. Wines fermented with the Sa strain were also characterized as more fruity than
the pivot, probably due to the higher production of esters (Figure 7). Surprisingly, Sb
wines were also characterized as more fruity even though their ester content was lower
than that of the pivot, highlighting the importance of wine matrix in the perception of
unique aromas. In addition, the overall aroma of the samples was judged as more pleasant
than that of the pivot. Moreover, for wines fermented with the Sa and Sb strains, the pos-
itive frequencies for acidity were higher than the negatives. This was expected for the Sb
wines due to the higher TA and lower pH, but not for Sa. The higher acidity rating of the
Sa wine could be attributed to the lower concentration of residual sugars compared with
the control, since they could also affect the perception of acidity [60]. The higher concen-
tration of residual sugars in control samples probably affected the mouthfeel perception
as well, since pivot was characterized as poorer than Sb and similar to Sa based on this
attribute. The lower concentration of asparagine observed in Sb samples could also be
dc
b
a
e e
0
4
8
12
16
Com low Com high Salow Sahigh Sblow Sbhigh
%Σ
vo
lati
le c
om
p.
c)
a b bc cd
e
0
15
30
45
60
75
Com low Com high Salow Sahigh Sblow Sbhigh
%Σ
vo
lati
le c
om
p.
d)
Figure 6. % Concentrations of the most important groups of volatile compounds: (a) higher alcohols,(b) ketones, (c) fatty acids and (d) esters. The ‘com’, ‘Sa’ and ‘Sb’ correspond to fermentations carriedout with the commercial, Sa and Sb strains, respectively. Values followed by different letters in eachcolumn indicate significant differences (p < 0.05) among different samples.
3.4. Sensory Analysis
The results of sensory analysis did not show any significant differences concerningcolor intensity, indicating that the judges could not perceive any differences in color inten-sity among the pivot (control wine fermented with the commercial S. cerevisiae strain) andthe rest of the samples (Figure 7). The results are in agreement with the results obtained forlow molecular weight phenolic compounds and absorption at 420 nm (data not shown),with no statistically important differences observed among the samples. Moreover, in linewith the results regarding VA, the Sa and Sb wines were clearly judged as less vinegary andoxidized, since the negative frequencies for these attributes were higher than the positives.The same wines were also judged as less reductive than the pivot, probably due to lowerproduction of volatile sulfurous compounds [58]. Further investigation in this group of
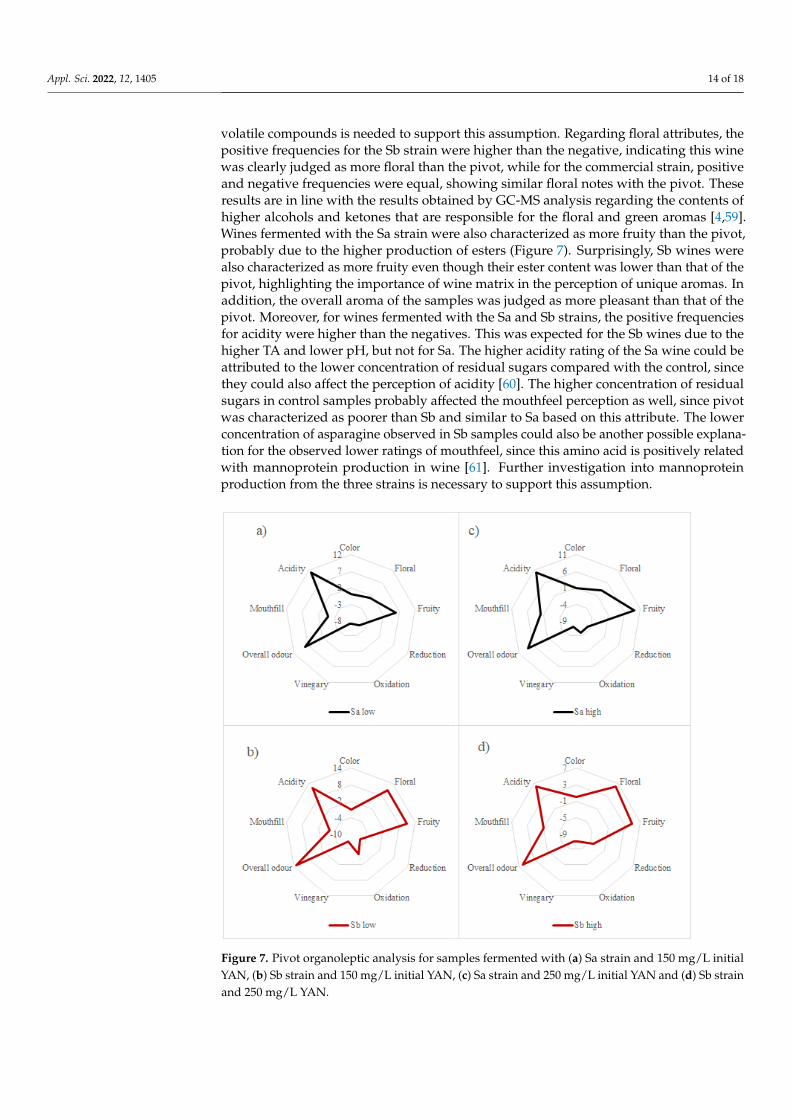
Appl. Sci. 2022, 12, 1405 14 of 18
volatile compounds is needed to support this assumption. Regarding floral attributes, thepositive frequencies for the Sb strain were higher than the negative, indicating this winewas clearly judged as more floral than the pivot, while for the commercial strain, positiveand negative frequencies were equal, showing similar floral notes with the pivot. Theseresults are in line with the results obtained by GC-MS analysis regarding the contents ofhigher alcohols and ketones that are responsible for the floral and green aromas [4,59].Wines fermented with the Sa strain were also characterized as more fruity than the pivot,probably due to the higher production of esters (Figure 7). Surprisingly, Sb wines werealso characterized as more fruity even though their ester content was lower than that of thepivot, highlighting the importance of wine matrix in the perception of unique aromas. Inaddition, the overall aroma of the samples was judged as more pleasant than that of thepivot. Moreover, for wines fermented with the Sa and Sb strains, the positive frequenciesfor acidity were higher than the negatives. This was expected for the Sb wines due to thehigher TA and lower pH, but not for Sa. The higher acidity rating of the Sa wine could beattributed to the lower concentration of residual sugars compared with the control, sincethey could also affect the perception of acidity [60]. The higher concentration of residualsugars in control samples probably affected the mouthfeel perception as well, since pivotwas characterized as poorer than Sb and similar to Sa based on this attribute. The lowerconcentration of asparagine observed in Sb samples could also be another possible explana-tion for the observed lower ratings of mouthfeel, since this amino acid is positively relatedwith mannoprotein production in wine [61]. Further investigation into mannoproteinproduction from the three strains is necessary to support this assumption.
Appl. Sci. 2022, 12, x FOR PEER REVIEW 15 of 18
another possible explanation for the observed lower ratings of mouthfeel, since this amino
acid is positively related with mannoprotein production in wine [61]. Further investiga-
tion into mannoprotein production from the three strains is necessary to support this as-
sumption.
Figure 7. Pivot organoleptic analysis for samples fermented with (a) Sa strain and 150 mg/L initial
YAN, (b) Sb strain and 150 mg/L initial YAN, (c) Sa strain and 250 mg/L initial YAN and (d) Sb
strain and 250 mg/L YAN.
4. Conclusions
The three S. cerevisiae strains were characterized by different nitrogen (NH4+ and N
α-amino acid) depletion rates in Assyrtiko must fermentation, resulting in different fer-
mentation kinetics, production of secondary compounds, and eventually in different sen-
sory profiles for each wine. Initial YAN concentration had a greater impact on the volatile
profile of the produced wines. The organoleptic profile of Assyrtiko wine could be mod-
ulated, based on consumer preferences, by selecting the specific strain and the initial YAN
content. The new indigenous strains examined seem to have the potential to be involved
in large-scale wine production substituting the commercial strain, since they were char-
acterized by lower VA and vinegary and oxidation scores and higher quality of overall
aroma assessment. More specifically, the Sa strain combined with 150 mg N/L initial YAN
could result in Assyrtiko wines with enhanced fruity character and body due to higher
production of esters and glycerol, respectively. If a more floral profile with higher concen-
trations of higher alcohols is preferred, then the Sb strain with 250 mg N/L of initial YAN
would be more suitable. Even though the production of glycerol in this case is more lim-
ited, the VA is lower and both higher alcohol and ester concentrations are higher.
Author Contributions: Conceptualization, S.C. and S.K.; methodology, S.C., M.D. and S.K.; soft-
ware, S.C. and S.K.; validation, S.C., S.P., M.D., A.T., I.B.C., V.C and S.K.; formal analysis, S.C., M.D.,
A.T. and I.B.C.; investigation, S.C. and S.K.; resources, S.C. and S.K.; data curation, S.C. and S.K.;
Figure 7. Pivot organoleptic analysis for samples fermented with (a) Sa strain and 150 mg/L initialYAN, (b) Sb strain and 150 mg/L initial YAN, (c) Sa strain and 250 mg/L initial YAN and (d) Sb strainand 250 mg/L YAN.

Appl. Sci. 2022, 12, 1405 15 of 18
4. Conclusions
The three S. cerevisiae strains were characterized by different nitrogen (NH4+ and
N α-amino acid) depletion rates in Assyrtiko must fermentation, resulting in differentfermentation kinetics, production of secondary compounds, and eventually in differentsensory profiles for each wine. Initial YAN concentration had a greater impact on thevolatile profile of the produced wines. The organoleptic profile of Assyrtiko wine couldbe modulated, based on consumer preferences, by selecting the specific strain and theinitial YAN content. The new indigenous strains examined seem to have the potential tobe involved in large-scale wine production substituting the commercial strain, since theywere characterized by lower VA and vinegary and oxidation scores and higher quality ofoverall aroma assessment. More specifically, the Sa strain combined with 150 mg N/Linitial YAN could result in Assyrtiko wines with enhanced fruity character and body dueto higher production of esters and glycerol, respectively. If a more floral profile with higherconcentrations of higher alcohols is preferred, then the Sb strain with 250 mg N/L of initialYAN would be more suitable. Even though the production of glycerol in this case is morelimited, the VA is lower and both higher alcohol and ester concentrations are higher.
Author Contributions: Conceptualization, S.C. and S.K.; methodology, S.C., M.D. and S.K.; software,S.C. and S.K.; validation, S.C., S.P., M.D., A.T., I.B.C., V.C. and S.K.; formal analysis, S.C., M.D.,A.T. and I.B.C.; investigation, S.C. and S.K.; resources, S.C. and S.K.; data curation, S.C. and S.K.;writing—original draft preparation, S.C., A.T. and S.K..; writing—review and editing, S.C., S.P., M.D.,A.T., I.B.C., V.C and S.K.; visualization, S.C. and M.D.; supervision, S.C.; project administration,S.C.; funding acquisition, S.P. and S.K. All authors have read and agreed to the published version ofthe manuscript.
Funding: The current investigation was financially supported by the project titled “Exploitation ofnew natural microbial flora from Greek origin amenable for the production of high-quality wines”(Acronym: Oenovation, project code T1EDK-04747) financed by the Ministry of National Edu-cation and Religious Affairs, Greece (project action: “Investigate—Create—Innovate 2014–2020,Intervention II”).
Institutional Review Board Statement: The study was conducted according to the guidelines ofthe Declaration of Helsinki. Ethical review and approval for this study were waived due to theanonymity of the interviews and the request for non-sensitive information.
Informed Consent Statement: Panelists gave informed consent before participating in this study.
Data Availability Statement: The data presented in this study are available on request from thecorresponding author (pending privacy and ethical considerations).
Acknowledgments: The authors gratefully acknowledge ‘Santo Wines’ for grape supplementation.
Conflicts of Interest: The authors declare no conflict of interest. The funders had no role in the designof the study; in the collection, analyses, or interpretation of data; in the writing of the manuscript, orin the decision to publish the results.
References1. Rabadán, A. Consumer attitudes towards technological innovation in a traditional food product: The case of wine. Foods 2021,
10, 1363. [CrossRef] [PubMed]2. Deroover, K.; Siegrist, M.; Brain, K.; McIntyre, J.; Bucher, T. A scoping review on consumer behaviour related to wine and health.
Trends Food Sci. Technol. 2021, 112, 559–580. [CrossRef]3. Capitello, R.; Agnoli, L.; Charters, S.; Begalli, D. Labelling environmental and terroir attributes: Young Italian consumers’ wine
preferences. J. Clean. Prod. 2021, 304, 126991. [CrossRef]4. Terpou, A.; Ganatsios, V.; Kanellaki, M.; Koutinas, A.A. Entrapped psychrotolerant yeast cells within pine sawdust for low
temperature wine making: Impact on wine quality. Microorganisms 2020, 8, 764. [CrossRef]5. Su, Y.; Macías, L.G.; Heras, J.M.; Querol, A.; Guillamón, J.M. Phenotypic and genomic differences among S. cerevisiae strains in
nitrogen requirements during wine fermentations. Food Microbiol. 2021, 96, 103685. [CrossRef]6. Wiles, A.M.; Cai, H.; Naider, F.; Becker, J.M. Nutrient regulation of oligopeptide transport in Saccharomyces cerevisiae. Microbiology
2006, 152, 3133–3145. [CrossRef]

Appl. Sci. 2022, 12, 1405 16 of 18
7. Verdenal, T.; Dienes-Nagy, Á.; Spangenberg, J.E.; Zufferey, V.; Spring, J.-L.; Viret, O.; Marin-Carbonne, J.; van Leeuwen, C.Understanding and managing nitrogen nutrition in grapevine: A review. OENO One 2021, 55, 1–43. [CrossRef]
8. Gobert, A.; Tourdot-Maréchal, R.; Sparrow, C.; Morge, C.; Alexandre, H. Influence of nitrogen status in wine alcoholic fermentation.Food Microbiol. 2019, 83, 71–85. [CrossRef]
9. Belda, I.; Gobbi, A.; Ruiz, J.; de Celis, M.; Ortiz-Álvarez, R.; Acedo, A.; Santos, A. 3.32—Microbiomics to define wine terroir. InComprehensive Foodomics; Cifuentes, A., Ed.; Elsevier: Oxford, UK, 2021; pp. 438–451.
10. Bely, M.; Rinaldi, A.; Dubourdieu, D. Influence of assimilable nitrogen on volatile acidity production by Saccharomyces cerevisiaeduring high sugar fermentation. J. Biosci. Bioeng. 2003, 96, 507–512. [CrossRef]
11. Lytra, G.; Miot-Sertier, C.; Moine, V.; Coulon, J.; Barbe, J.-C. Influence of must yeast-assimilable nitrogen content on fruity aromavariation during malolactic fermentation in red wine. Food Res. Int. 2020, 135, 109294. [CrossRef]
12. Vilanova, M.; Siebert, T.E.; Varela, C.; Pretorius, I.S.; Henschke, P.A. Effect of ammonium nitrogen supplementation of grape juiceon wine volatiles and non-volatiles composition of the aromatic grape variety Albariño. Food Chem. 2012, 133, 124–131. [CrossRef]
13. Rollero, S.; Bloem, A.; Brand, J.; Ortiz-Julien, A.; Camarasa, C.; Divol, B. Nitrogen metabolism in three non-conventional wineyeast species: A tool to modulate wine aroma profiles. Food Microbiol. 2021, 94, 103650. [CrossRef] [PubMed]
14. Vilanova, M.; Pretorius, I.S.; Henschke, P.A. Chapter 58—Influence of diammonium phosphate addition to fermentation on winebiologicals. In Processing and Impact on Active Components in Food; Preedy, V., Ed.; Academic Press: San Diego, CA, USA, 2015;pp. 483–491.
15. Tzamourani, A.P.; Di Napoli, E.; Paramithiotis, S.; Oikonomou-Petrovits, G.; Panagiotidis, S.; Panagou, E.Z. Microbiological andphysicochemical characterisation of green table olives of Halkidiki and Conservolea varieties processed by the Spanish methodon industrial scale. Int. J. Food Sci. Technol. 2021, 56, 3845–3857. [CrossRef]
16. Terpou, A.; Dimopoulou, M.; Belka, A.; Kallithraka, S.; Nychas, G.-J.E.; Papanikolaou, S. Effect of myclobutanil pesticide on thephysiological behavior of two newly isolated saccharomyces cerevisiae strains during very-high-gravity alcoholic fermentation.Microorganisms 2019, 7, 666. [CrossRef] [PubMed]
17. Dukes, B.C.; Butzke, C.E. Rapid determination of primary amino acids in grape juice using an o-Phthaldialdehyde/N-Acetyl-L-cysteine spectrophotometric assay. Am. J. Enol. Vitic. 1998, 49, 125–134.
18. Petropoulos, S.; Kanellopoulou, A.; Paraskevopoulos, I.; Kotseridis, Y.; Kallithraka, S. Characterization of grape and wineproanthocyanidins of Agiorgitiko (Vitis vinifera L. cv.) cultivar grown in different regions of Nemea. J. Food Compos. Anal. 2017, 63,98–110. [CrossRef]
19. International Organisation of Vine and Wine. Compendium of International Methods of Wine and Must Analysis; OIV: Paris,France, 2020.
20. Aerny, J. Composés azotés des moûts et vins. Rev. Suisse Vitic. Arboric. Hortic. 1996, 28, 161–165.21. Plioni, I.; Bekatorou, A.; Terpou, A.; Mallouchos, A.; Plessas, S.; Koutinas, A.; Katechaki, E. Vinegar production from corinthian
currants finishing side-stream: Development and comparison of methods based on immobilized acetic acid Bacteria. Foods 2021,10, 3133. [CrossRef]
22. Plioni, I.; Bekatorou, A.; Mallouchos, A.; Kandylis, P.; Chiou, A.; Panagopoulou, E.A.; Dede, V.; Styliara, P. Corinthian currantsfinishing side-stream: Chemical characterization, volatilome, and valorisation through wine and baker’s yeast production-technoeconomic evaluation. Food Chem. 2021, 342, 128161. [CrossRef]
23. Thuillier, B.; Valentin, D.; Marchal, R.; Dacremont, C. Pivot© profile: A new descriptive method based on free description. FoodQual. Prefer. 2015, 42, 66–77. [CrossRef]
24. Walker, G.M.; Stewart, G.G. Saccharomyces cerevisiae in the Production of fermented beverages. Beverages 2016, 2, 30. [CrossRef]25. Liszkowska, W.; Berlowska, J. Yeast fermentation at low temperatures: Adaptation to changing environmental conditions and
formation of volatile compounds. Molecules 2021, 26, 1035. [CrossRef] [PubMed]26. Orlowski, J.H.; Barford, J.P. The mechanism of uptake of multiple sugars by Saccharomyces cerevisiae in batch culture under fully
aerobic conditions. Appl. Microbiol. Biotechnol. 1987, 25, 459–463. [CrossRef]27. Palma, M.; Madeira, S.C.; Mendes-Ferreira, A.; Sá-Correia, I. Impact of assimilable nitrogen availability in glucose uptake kinetics
in Saccharomyces cerevisiae during alcoholic fermentation. Microb. Cell Factories 2012, 11, 99. [CrossRef] [PubMed]28. Martínez-Moreno, R.; Morales, P.; Gonzalez, R.; Mas, A.; Beltran, G. Biomass production and alcoholic fermentation performance
of Saccharomyces cerevisiae as a function of nitrogen source. FEMS Yeast Res. 2012, 12, 477–485. [CrossRef]29. Camarasa, C.; Grivet, J.-P.; Dequin, S. Investigation by 13C-NMR and tricarboxylic acid (TCA) deletion mutant analysis of
pathways for succinate formation in Saccharomyces cerevisiae during anaerobic fermentation. Microbiology 2003, 149, 2669–2678.[CrossRef]
30. Dunlop, P.C.; Roon, R.J.; Even, H.L. Utilization of D-asparagine by Saccharomyces cerevisiae. J. Bacteriol. 1976, 125, 999–1004.[CrossRef]
31. Noree, C.; Sirinonthanawech, N.; Wilhelm, J.E. Saccharomyces cerevisiae ASN1 and ASN2 are asparagine synthetase paralogs thathave diverged in their ability to polymerize in response to nutrient stress. Sci. Rep. 2019, 9, 278. [CrossRef]
32. Schreve, J.L.; Sin, J.K.; Garrett, J.M. The Saccharomyces cerevisiae YCC5 (YCL025c) gene encodes an amino acid permease, Agp1,which transports asparagine and glutamine. J. Bacteriol. 1998, 180, 2556–2559. [CrossRef]
33. Fairbairn, S.; McKinnon, A.; Musarurwa, H.T.; Ferreira, A.C.; Bauer, F.F. The impact of single amino acids on growth and volatilearoma production by Saccharomyces cerevisiae Strains. Front. Microbiol. 2017, 8, 2554. [CrossRef]

Appl. Sci. 2022, 12, 1405 17 of 18
34. Martínez-Rodríguez, A.J.; Polo, M.C. Characterization of the nitrogen compounds released during yeast autolysis in a modelwine system. J. Agric. Food Chem. 2000, 48, 1081–1085. [CrossRef] [PubMed]
35. Salmon, J.-M.; Barre, P. Improvement of nitrogen assimilation and fermentation kinetics under enological conditions by derepres-sion of alternative nitrogen-assimilatory pathways in an industrial Saccharomyces cerevisiae strain. Appl. Environ. Microbiol. 1998,64, 3831–3837. [CrossRef] [PubMed]
36. Martin, O.; Brandriss, M.C.; Schneider, G.; Bakalinsky, A.T. Improved anaerobic use of arginine by Saccharomyces cerevisiae. Appl.Environ. Microbiol. 2003, 69, 1623–1628. [CrossRef]
37. Nishimura, A.; Tanahashi, R.; Takagi, H. The yeast α-arrestin Art3 is a key regulator for arginine-induced endocytosis of thehigh-affinity proline transporter Put4. Biochem. Biophys. Res. Commun. 2020, 531, 416–421. [CrossRef] [PubMed]
38. Benito, S.; Palomero, F.; Morata, A.; Calderón, F.; Palmero, D.; Suárez-Lepe, J.A. Physiological features of Schizosaccharomycespombe of interest in making of white wines. Eur. Food Res. Technol. 2013, 236, 29–36. [CrossRef]
39. Del Mónaco, S.; Barda, N.; Rubio, N.; Caballero, A. Selection and characterization of a Patagonian Pichia kudriavzevii for winedeacidification. J. Appl. Microbiol. 2014, 117, 451–464. [CrossRef]
40. Redzepovic, S.; Orlic, S.; Majdak, A.; Kozina, B.; Volschenk, H.; Viljoen-Bloom, M. Differential malic acid degradation by selectedstrains of Saccharomyces during alcoholic fermentation. Int. J. Food Microbiol. 2003, 83, 49–61. [CrossRef]
41. Kechagia, D.; Paraskevopoulos, Y.; Symeou, E.; Galiotou-Panayotou, M.; Kotseridis, Y. Influence of prefermentative treatments tothe major volatile compounds of Assyrtiko wines. J. Agric. Food Chem. 2008, 56, 4555–4563. [CrossRef]
42. Romano, P.; Suzzi, G.; Turbanti, L.; Polsinelli, M. Acetaldehyde production in Saccharomyces cerevisiae wine yeasts. FEMS Microbiol.Lett. 1994, 118, 213–218. [CrossRef]
43. Giannattasio, S.; Guaragnella, N.; Ždralevic, M.; Marra, E. Molecular mechanisms of Saccharomyces cerevisiae stress adaptation andprogrammed cell death in response to acetic acid. Front. Microbiol. 2013, 4, 33. [CrossRef]
44. Mira, N.P.; Becker, J.D.; Sá-Correia, I. Genomic expression program involving the Haa1p-regulon in Saccharomyces cerevisiaeresponse to acetic acid. OMICS A J. Integr. Biol. 2010, 14, 587–601. [CrossRef] [PubMed]
45. Vilanova, M.; Ugliano, M.; Varela, C.; Siebert, T.; Pretorius, I.S.; Henschke, P.A. Assimilable nitrogen utilisation and productionof volatile and non-volatile compounds in chemically defined medium by Saccharomyces cerevisiae wine yeasts. Appl. Microbiol.Biotechnol. 2007, 77, 145–157. [CrossRef]
46. Yanniotis, S.; Kotseridis, G.; Orfanidou, A.; Petraki, A. Effect of ethanol, dry extract and glycerol on the viscosity of wine. J. FoodEng. 2007, 81, 399–403. [CrossRef]
47. Brandberg, T.; Gustafsson, L.; Franzén, C.J. The impact of severe nitrogen limitation and microaerobic conditions on extendedcontinuous cultivations of Saccharomyces cerevisiae with cell recirculation. Enzym. Microb. Technol. 2007, 40, 585–593. [CrossRef]
48. Benito, Á.; Calderón, F.; Palomero, F.; Benito, S. Quality and composition of Airén wines fermented by sequential inoculation ofLachancea thermotolerans and Saccharomyces cerevisiae. Food Technol. Biotechnol. 2016, 54, 135–144. [CrossRef]
49. Englezos, V.; Rantsiou, K.; Cravero, F.; Torchio, F.; Ortiz-Julien, A.; Gerbi, V.; Rolle, L.; Cocolin, L. Starmerella bacillaris andSaccharomyces cerevisiae mixed fermentations to reduce ethanol content in wine. Appl. Microbiol. Biotechnol. 2016, 100, 5515–5526.[CrossRef]
50. Loira, I.; Morata, A.; Comuzzo, P.; Callejo, M.J.; González, C.; Calderón, F.; Suárez-Lepe, J.A. Use of Schizosaccharomyces pombe andTorulaspora delbrueckii strains in mixed and sequential fermentations to improve red wine sensory quality. Food Res. Int. 2015, 76,325–333. [CrossRef]
51. Zhang, L.; Tang, Y.; Guo, Z.-P.; Ding, Z.-Y.; Shi, G.-Y. Improving the ethanol yield by reducing glycerol formation using cofactorregulation in Saccharomyces cerevisiae. Biotechnol. Lett. 2011, 33, 1375–1380. [CrossRef] [PubMed]
52. Scanes, K.; Hohrnann, S.; Prior, B. Glycerol production by the yeast Saccharomyces cerevisiae and its relevance to wine. S. Afr. J.Enol. Vitic. 1998, 19, 17–24. [CrossRef]
53. Clement, T.; Perez, M.; Mouret, J.R.; Sanchez, I.; Sablayrolles, J.M.; Camarasa, C. Metabolic responses of Saccharomyces cerevisiae tovaline and ammonium pulses during four-stage continuous wine fermentations. Appl. Environ. Microbiol. 2013, 79, 2749–2758.[CrossRef] [PubMed]
54. Derrick, S.; Large, P.J. Activities of the enzymes of the Ehrlich pathway and formation of branched-chain alcohols in Saccharomycescerevisiae and Candida utilis grown in continuous culture on valine or ammonium as sole nitrogen source. J. Gen. Microbiol. 1993,139, 2783–2792. [CrossRef] [PubMed]
55. Carrau, F.M.; Medina, K.; Farina, L.; Boido, E.; Henschke, P.A.; Dellacassa, E. Production of fermentation aroma compounds bySaccharomyces cerevisiae wine yeasts: Effects of yeast assimilable nitrogen on two model strains. FEMS Yeast Res. 2008, 8, 1196–1207.[CrossRef] [PubMed]
56. Saerens, S.M.G.; Delvaux, F.R.; Verstrepen, K.J.; Thevelein, J.M. Production and biological function of volatile esters in Saccha-romyces cerevisiae. Microb. Biotechnol. 2010, 3, 165–177. [CrossRef] [PubMed]
57. Gobert, A.; Tourdot-Maréchal, R.; Morge, C.; Sparrow, C.; Liu, Y.; Quintanilla-Casas, B.; Vichi, S.; Alexandre, H. Non-SaccharomycesYeasts Nitrogen Source Preferences: Impact on Sequential Fermentation and Wine Volatile Compounds Profile. Front. Microbiol.2017, 8, 2175. [CrossRef] [PubMed]
58. Müller, N.; Rauhut, D. Recent developments on the origin and nature of reductive sulfurous off-odours in wine. Fermentation2018, 4, 62. [CrossRef]

Appl. Sci. 2022, 12, 1405 18 of 18
59. Furdíková, K.; MakyŠová, K.; Špánik, I. Effect of indigenous S. cerevisiae strains on higher alcohols, volatile acids and esters inwine. Czech J. Food Sci. 2017, 35, 131–142. [CrossRef]
60. Noordeloos, S.; Nagel, C.W. Effect of Sugar on Acid Perception in Wine. Am. J. Enol. Vitic. 1972, 23, 139–143.61. Barnes, G.; Hansen, W.J.; Holcomb, C.L.; Rine, J. Asparagine-linked glycosylation in Saccharomyces cerevisiae: Genetic analysis of
an early step. Mol. Cell. Biol. 1984, 4, 2381–2388. [CrossRef]