Impact of pitching rate on yeast fermentation performance and beer flavour
13
APPLIED MICROBIAL AND CELL PHYSIOLOGY Impact of pitching rate on yeast fermentation performance and beer flavour P. J. Verbelen & T. M. L. Dekoninck & S. M. G. Saerens & S. E. Van Mulders & J. M. Thevelein & F. R. Delvaux Received: 28 August 2008 / Revised: 28 October 2008 / Accepted: 29 October 2008 / Published online: 19 November 2008 # Springer-Verlag 2008 Abstract The volumetric productivity of the beer fermen- tation process can be increased by using a higher pitching rate (i.e. higher inoculum size). However, the impact of the pitching rate on crucial fermentation and beer quality parameters has never been assessed systematically. In this study, five pitching rates were applied to lab-scale fermentations to investigate its impact on the yeast physiology and beer quality. The fermentation rate in- creased significantly and the net yeast growth was lowered with increasing pitching rate, without affecting significantly the viability and the vitality of the yeast population. The build-up of unsaturated fatty acids in the initial phase of the fermentation was repressed when higher yeast concentrations were pitched. The expression levels of the genes HSP104 and HSP12 and the concentration of trehalose were higher with increased pitching rates, sug- gesting a moderate exposure to stress in case of higher cell concentrations. The influence of pitching rate on aroma compound production was rather limited, with the excep- tion of total diacetyl levels, which strongly increased with the pitching rate. These results demonstrate that most aspects of the yeast physiology and flavour balance are not significantly or negatively affected when the pitching rate is changed. However, further research is needed to fully optimise the conditions for brewing beer with high cell density populations. Keywords Fermentation . Brewer ’ s yeast . Yeast metabolism . Yeast physiology . Stress response . Flavour Introduction In the traditional production of lager beer, the fermentation process is the most time-consuming step, which takes about 1–2 weeks before entering the maturation period. There- fore, an important objective of modern fermentation science and technology is to reduce the fermentation time while producing an end product of similar quality and thus allowing great time and money savings. To improve the volumetric productivity of the beer fermentation process, several strategies can be adopted. For example, a major approach was the application of continuous fermentation with immobilised yeast, allowing a large increase in cell density, which resulted in faster fermentation rates. The interest in using immobilised yeast for primary beer fermentation seems to have dropped because of persistent engineering problems, unbalanced beer flavour and unreal- ised cost advantages (Brányik et al. 2005). However, the main aim of the technology was to improve the productivity by maximising the cell concentration in the reactor. Therefore, another promising strategy may be to enhance the amount of suspended yeast cells in a batch fermentor (i.e. ‘the pitching rate’; Okabe et al. 1992; Verbelen et al. 2008). However, an increase in the pitching rate could also have deleterious side effects on the physiological condition Appl Microbiol Biotechnol (2009) 82:155–167 DOI 10.1007/s00253-008-1779-5 P. J. Verbelen (*) : T. M. L. Dekoninck : S. M. G. Saerens : S. E. Van Mulders : F. R. Delvaux Centre for Malting and Brewing Science, Faculty of Bioscience Engineering, Katholieke Universiteit Leuven, Kasteelpark Arenberg 22, P.O. Box 2463, 3001 Heverlee, Belgium e-mail: [email protected] S. M. G. Saerens : J. M. Thevelein The Laboratory of Molecular Cell Biology, Department of Molecular Microbiology (VIB), Institute of Botany and Microbiology, Katholieke Universiteit Leuven, Kasteelpark Arenberg 31, 3001 Heverlee, Belgium
-
Upload
independent -
Category
Documents
-
view
4 -
download
0
Transcript of Impact of pitching rate on yeast fermentation performance and beer flavour

APPLIED MICROBIAL AND CELL PHYSIOLOGY
Impact of pitching rate on yeast fermentation performanceand beer flavour
P. J. Verbelen & T. M. L. Dekoninck & S. M. G. Saerens &
S. E. Van Mulders & J. M. Thevelein & F. R. Delvaux
Received: 28 August 2008 /Revised: 28 October 2008 /Accepted: 29 October 2008 /Published online: 19 November 2008# Springer-Verlag 2008
Abstract The volumetric productivity of the beer fermen-tation process can be increased by using a higher pitchingrate (i.e. higher inoculum size). However, the impact of thepitching rate on crucial fermentation and beer qualityparameters has never been assessed systematically. In thisstudy, five pitching rates were applied to lab-scalefermentations to investigate its impact on the yeastphysiology and beer quality. The fermentation rate in-creased significantly and the net yeast growth was loweredwith increasing pitching rate, without affecting significantlythe viability and the vitality of the yeast population. Thebuild-up of unsaturated fatty acids in the initial phase ofthe fermentation was repressed when higher yeastconcentrations were pitched. The expression levels ofthe genes HSP104 and HSP12 and the concentration oftrehalose were higher with increased pitching rates, sug-gesting a moderate exposure to stress in case of higher cellconcentrations. The influence of pitching rate on aromacompound production was rather limited, with the excep-tion of total diacetyl levels, which strongly increased withthe pitching rate. These results demonstrate that most
aspects of the yeast physiology and flavour balance arenot significantly or negatively affected when the pitchingrate is changed. However, further research is needed to fullyoptimise the conditions for brewing beer with high celldensity populations.
Keywords Fermentation . Brewer’s yeast . Yeastmetabolism . Yeast physiology . Stress response . Flavour
Introduction
In the traditional production of lager beer, the fermentationprocess is the most time-consuming step, which takes about1–2 weeks before entering the maturation period. There-fore, an important objective of modern fermentation scienceand technology is to reduce the fermentation time whileproducing an end product of similar quality and thusallowing great time and money savings. To improve thevolumetric productivity of the beer fermentation process,several strategies can be adopted. For example, a majorapproach was the application of continuous fermentationwith immobilised yeast, allowing a large increase in celldensity, which resulted in faster fermentation rates. Theinterest in using immobilised yeast for primary beerfermentation seems to have dropped because of persistentengineering problems, unbalanced beer flavour and unreal-ised cost advantages (Brányik et al. 2005). However, themain aim of the technology was to improve the productivityby maximising the cell concentration in the reactor.Therefore, another promising strategy may be to enhancethe amount of suspended yeast cells in a batch fermentor(i.e. ‘the pitching rate’; Okabe et al. 1992; Verbelen et al.2008). However, an increase in the pitching rate could alsohave deleterious side effects on the physiological condition
Appl Microbiol Biotechnol (2009) 82:155–167DOI 10.1007/s00253-008-1779-5
P. J. Verbelen (*) : T. M. L. Dekoninck : S. M. G. Saerens :S. E. Van Mulders : F. R. DelvauxCentre for Malting and Brewing Science,Faculty of Bioscience Engineering,Katholieke Universiteit Leuven,Kasteelpark Arenberg 22, P.O. Box 2463, 3001 Heverlee,Belgiume-mail: [email protected]
S. M. G. Saerens : J. M. TheveleinThe Laboratory of Molecular Cell Biology,Department of Molecular Microbiology (VIB),Institute of Botany and Microbiology,Katholieke Universiteit Leuven,Kasteelpark Arenberg 31,3001 Heverlee, Belgium

of the yeast population and/or the flavour profile of thebeer. The impact of the pitching rate on crucial yeast,fermentation and beer quality parameters has never beenassessed systematically.
Yeast physiology and activity before pitching and duringfermentation are instrumental in achieving consistentfermentations that result in beers of acceptable quality.During fermentation of wort to beer, several physiologicalchanges occur in the yeast population. In the beginning offermentation, build-up of unsaturated fatty acids and sterolsis essential for a normal growth pattern of the yeastpopulation during the next stage of the fermentation andthus also for a proper overall fermentation process (Davidand Kirsop 1973). The energy needed for the formation ofthese essential lipids originates from the breakdown ofglycogen, the most important reserve carbohydrate in yeast.Therefore, glycogen levels are a crucial factor for yeastfermentation potency (Quain and Tubb 1982). After thedisappearance of oxygen from the wort, glycogen accumu-lates in the yeast during the exponential growth phase.Maximum glycogen levels are reached at the end ofprimary fermentation (Boulton 2000). At that moment,growth and cell division are arrested due to dilution ofessential lipids over mother and daughter cells (Aries andKirsop 1977). When the yeast cells stop growing, they gointo a quiescent stationary phase. Glycogen provides energyfor the cellular maintenance functions during the stationaryphase and during the storage phase between cropping andthe next pitching (Boulton 2000). Regulation of glycogencontent is complex and occurs in part by the yeast cyclicadenosine monophosphate (cAMP)–protein kinase A(PKA) pathway (Smith et al. 1998). The high PKA activityrepresses glycogen accumulation, but when an essentialnutrient is progressively consumed from the growthmedium, PKA activity is reduced and glycogen contentincreases (François and Parrou 2001).
Brewing yeast encounters different kinds of stress duringfermentation and yeast handling (Gibson et al. 2007).Exposure to moderate stress may result in the modificationof the genetic, metabolic and physiological responses ofbrewing yeast. In turn, such shifts in cellular function arelikely to cause modifications in subsequent fermentationperformance. When the stress is severe or the damage hasaccumulated to intolerable levels, viability starts to drop(Jenkins and Kennedy 2003). Yeast cells can adapt toadverse conditions by several stress response mechanisms(Siderius and Mager 2003). Two major stress responsepathways in Saccharomyces cerevisiae are the generalstress response and the heat shock response. The latter isactivated specifically by heat stress. The general stressresponse can be triggered by different external stressagents, such as exposure to heat, exposure to ethanol,increase in osmolarity, exposure to reactive oxygen species
or starvation for essential nutrients. The general stressresponse is mediated by the transcriptional activatorsMsn2p and Msn4p, which upon stress exposure becomecompetent to activate transcription of stress responsiveelement (STRE)-driven genes (Martinez-Pastor et al. 1996;Smith et al. 1998). STRE sequences have been identified inpromoter sections of many stress-induced genes, such asheat shock protein (HSP) genes (e.g. HSP12 and HSP104)and genes that contribute to the synthesis (TPS1, TPS2,TPS3 and TSL1) and degradation (NTH1, NTH2) oftrehalose (Winderickx et al. 1996; Zähringer et al. 1997).In addition, STRE-containing genes contain other regula-tory sequences involved in stress-induced transcription, e.g.heat shock elements (HSE) or the antioxidant responseelement (ARE; Estruch 2000). The stress-induced expres-sion, conferred by STRE, is negatively regulated by thecAMP–PKA pathway (Thevelein and de Winde 1999;Verstrepen et al. 2004). Because accumulation of thedisaccharide trehalose is induced in response to a varietyof stress conditions, like heat shock, high osmolarity,ethanol and exposure to toxic chemicals, trehalose accu-mulation can be used as a general indicator for stress on theyeast cells (Majara et al. 1996; Hounsa et al. 1998). At thebeginning of fermentation, high glucose levels fullyactivate the cAMP/PKA pathway, which results in post-translational activation of neutral trehalase and ininduction of its NTH1 gene, and also in repression of thetrehalose synthase genes, resulting in reduced levels oftrehalose (Zähringer et al. 2000). When glucose isconsumed, maltose starts to be assimilated and the PKAactivity decreases, resulting in the formation of trehalose(Verstrepen et al. 2004). Under stress conditions, the higherlevels of trehalose protect the cells by binding to mem-branes and proteins (François and Parrou 2001). However,during recovery from stress, trehalose must be hydrolysedrapidly by trehalase, liberating the cellular structures frombound trehalose (Zähringer et al. 2000). The rapiddegradation of trehalose may be essential for the resump-tion of normal cellular activity (Gibson et al. 2007).
The most important organoleptic characteristics in lagerbeer are the flavour compounds formed by yeast duringfermentation of which the higher alcohols, the ‘fruity’esters (contributing to alcoholic and fruity flavours) and thevicinal diketones and sulphur compounds (which can causeoff-flavours) are the most important. Because the metabo-lism of these flavour compounds is closely related to thegrowth and physiological state of the yeast, factors thataffect yeast metabolism and physiology can easily changebeer flavour. Altering process parameters, such as wortcomposition, temperature, agitation and pitching rate canthus result in significant changes in the beer flavour balance(Okabe et al. 1992; Boswell et al. 2002; Dufour et al. 2003;Saerens et al. 2008).
156 Appl Microbiol Biotechnol (2009) 82:155–167

In a previous study, high cell density fermentations wereperformed with different lager yeast strains (Verbelen et al.2008). It was concluded that at a high pitching rate, thefermentation rate was two to four times increased, depend-ing on the yeast strain. High viabilities were observedthroughout the different fermentations with high cellloading. The cell density had an important influence onthe resulting flavour profile and on specific yeast prefer-ences. In this study, an industrial yeast strain selected fromthe previous study (Verbelen et al. 2008) was used toinvestigate systematically the impact of higher inoculumsize on yeast fermentation performance. We found that thepitching rate did not negatively influence the physiologicalcondition of the yeast. Only the flavour profile was affectedto a certain extent, in particular the total diacetyl concen-tration. This knowledge will be crucial for further optimi-sation of the promising technique of high cell density beerfermentation.
Materials and methods
Yeast strain and medium
The experiment was carried out with an industrial lagerbrewing strain of S. cerevisiae (pastorianus) (CMBSPV09)(Centre for Malting and Brewing Science, KatholiekeUniversiteit Leuven, Heverlee, Belgium), obtained from abrewery yeast storage vessel.
Sterile all-malt hopped wort with an extract content of15 °Plato (°P) (°P: g extract/100 g wort; 68% maltose, 19%maltotriose, 9% glucose, 4% fructose) and with a freeamino nitrogen (FAN) content of 404 ppm was made in apilot brewery and used throughout the study.
Fermentation conditions and sampling
The concentration and viability of the yeast slurry weredetermined by flow cytometry (YeastCyte, BioDETECTAS, Oslo, Norway) before the required amount was pitchedin the wort. Five different pitching rates were applied: (1)10×106 viable cells/ml, (2) 20×106 viable cells/ml, (3) 40×106 viable cells/ml, (4) 80×106 viable cells/ml and (5)120×106 viable cells/ml. All fermentations were carried outin duplicate, in tall tubes (75 cm high, 8 cm internaldiameter), containing 1.8 l sterile 15 °P wort medium. Thewort was aerated by filling the headspace with sterile airfollowed by intensive mixing by inverting the tubes 20times. The fermentations were performed at 15 °C and weremonitored frequently by withdrawing samples through anarrow sampling tube (15 cm from the bottom) with the aidof N2 overpressure. Samples were cooled directly on iceand the yeast and fermenting wort were separated by
centrifugation (2,800 rpm, 3 min, 2°C). Fermentations werestopped at around 80% apparent degree of fermentation(ADF) and the tubes were cooled down at 2°C for 24 h tosediment the yeast. The supernatant of the tube (beer) wascollected and the remaining slurry was resuspended in1-l cold sterile water, after which samples were taken tocharacterise the cropped yeast.
Fermentation analysis
Before centrifugation, the number and the viability ofsuspended yeast cells were counted by flow cytometry(YeastCyte, BioDETECT AS, Oslo, Norway). Dead cellswere stained in-line with 10% v/v propidium iodide in PBS(70355, Sigma).
The specific gravity of the fermenting medium wasmeasured with a handheld density meter (DMA 35N, AntonPaar, Graz, Austria), but the final extract and alcoholcontent were measured with the DMA 4500 densityanalyser and Alcolyser Plus (Anton Paar, Graz, Austria).
Free amino nitrogen was determined by a ninhydrin-based method, according to the standard method as definedby the European Brewery Convention (EBC 1998).
The glycerol content of the final beers was determinedwith a glycerol kit (K-GCROL, Megazyme International,Ireland), according to the manufacturer’s instructions.
The bitter compounds were extracted with isooctanefrom the acidified beers and the absorbance was measuredat 275 nm in a quartz cuvette (EBC 1998).
Flavour compound analysis
Volatile compound concentrations were determined byheadspace gas chromatography. Five millilitres of thecooled, filtered, undiluted supernatant was transferred to avial. The vials were heat-treated during 60 min at 60°C toconvert all α-acetolactate to diacetyl. The vials wereanalysed with a calibrated Autosystem XL gas chromato-graph with a headspace autosampler (HS40; Perkin Elmer,Wellesley, MA, USA) and equipped with a Chrompack-Wax 52 CB column (length 50 m; 0.32 mm internaldiameter; layer thickness 1.2 μm; Varian, Palo Alto, CA,USA). Samples were heated for 16 min at 60°C in theheadspace autosampler before injection (needle temperature70°C). Helium was used as the carrier gas. The oventemperature was kept at 50°C for 7.5 min, increased to110°C at 25°C/min and was held at that temperature for3.5 min. Detection of dimethyl sulphide (DMS), estersand higher alcohols was established with a flameionisation detector (FID); total diacetyl (diacetyl + α-acetolactate) was detected with an electron capturedetector (ECD). The FID and ECD temperatures werekept constant at 250°C and 200°C, respectively. Analyses
Appl Microbiol Biotechnol (2009) 82:155–167 157

were carried out in duplicate and the results wereanalysed with Perkin Elmer Turbochrom Navigatorsoftware and were recalculated to 5% (v/v) ethanol.
Yeast physiology
Glycogen and trehalose
The quantification of glycogen and trehalose was based onthe method of Neves et al. (1991). Yeast samples werewashed three times with cold distilled water. Afterwards,the yeast suspension was filtered over a membrane filter(pore size 0.45 μm) and 25–50 mg (wet weight) of cellpellet was weighed and immediately stored at −80°C. Afterthawing, the pellets were resuspended in 1 ml of 0.25 MNa2CO3 and incubated for 20 min at 95°C. After that, theextractions were cooled down and centrifuged (1 min at13,000 rpm) and 10 μl of the supernatant was withdrawnand adjusted to pH 5.5 with 5 μl of 1 N acetic acid fortrehalose determination. The rest of the extract wasresuspended and re-incubated at 95°C for 40 min. Aftercooling down, 10 μl of the suspension was adjusted with5 μl of 1 N acetic acid and used for glycogen determina-tion. Trehalose (0, 1, 2, 4 and 8 mM in 0.25 M Na2CO3)and glycogen standards (0, 1, 2 and 3 mg/ml in 0.25 MNa2CO3) were treated in the same way as the yeastsamples, with exception of the extraction.
Trehalose was broken down enzymatically with 25 μl ofa trehalase buffer mix, containing 5 μl buffer (300 mMNaAc, 30 mM CaCl2, pH 5.5) and 20 μl Humicolatrehalase preparation (ca 350 U/ml; kindly provided bythe Laboratory of Molecular Cell Biology, KatholiekeUniversiteit Leuven, Heverlee, Belgium). Glycogen wasbroken down with 25 μl of an α-amyloglucosidase buffermix, containing 1.2 mg α-amyloglucosidase (500 U, RocheDiagnostics, Indianapolis, USA) per 100 ml of buffer(80 mM NaAc, pH 4.7). All glycogen and trehalosesamples and standards were then resuspended andincubated at 37°C for 2 h. After centrifugation, 10 μlof the supernatant was put into a well of a 96 microtiterplate and 200 μl of GOD-PAP reagent (Dialab, WienerNeudorf, Austria) was added. The absorbance wasmeasured at 505 nm (Spectramax plus 384, MolecularDevices, Sunnyvale, USA). To calibrate the glucosereaction, glucose standards (0, 1, 2, 3 and 4 mM) werealso measured in the same way. Glycogen and trehaloseanalysis of each sample was done in duplicate.
Quantitative polymerase chain reaction
The expression level of the stress related genes HSP104,HSP12 and TDH, which is the sum of three genes TDH1,TDH2 and TDH3, were determined using quantitative
polymerase chain reaction (qPCR). Twenty-millilitre sam-ples were collected from the tall tubes during exponential(at 40% ADF) and stationary (70% ADF) phase, cooled onice and centrifuged at 3,000 rpm for 3 min. The pellets werewashed two times with cold, sterile RNase-free water and150×106 pelleted cells were then frozen at −80°C. RNAextraction was performed with Trizol (Invitrogen, Carlsbad,USA), according to the manufacturer’s instructions. Foreach sample, 1 μg of total RNA was subject to reversetranscription (RT) using the Reverse Transcription System(Promega A3500, Madison, USA). Concentrations weremeasured and samples diluted to 100 ng/μl. The 25-μl PCRreaction mix was composed of 12.5 μl Power SYBR GreenqPCR Master Mix (Applied Biosystems, Warrington, UK)and 1.25 μl of each primer (500 nM). Five microlitres ofcDNA was added to each reaction mix. The PCR programused on the ABI Prism 7500 instrument (Applied Bio-systems) consisted of an initial denaturation of 10 min at95°C, amplification by 40 cycles of 15 s at 95°C and 1 minat 58°C (optimal annealing temperature of the specificprimer pair). The primers were designed to anneal close tothe 3′-end of each gene. The PCR primers were all designedwith the PRIMER EXPRESS software (Applied Biosys-tems, Cheshire, UK) according to the Applied Biosystemsguidelines. Primer sequences used for qPCR analysis (from5′ to 3′): HSP104-F: GCGGTCTTACCGATACCTGG,HSP104-R: GACTGAGCAGGCTCGTCAAGG, HSP12-F: AGGTAGAAAAGGATTCGGTGAAA A, HSP12-R:GTATTCCTTACCTTGTTCAGCGTAT, TDH-F: CGCTTCTTGTACCAC CAACTGTT, TDH-R: CCGAAAGCATCGTTGATAACC, RDN18-F: CGGCTACCAC ATCCAAGGAA, RDN18-R: GCTGGAATTACCGCGGCT. Thespecificity of the primers was tested using conventionalPCR and the melting curves of the amplified product. Thegene for 18S rRNA (RDN18) was used as the referencegene because the expression of this gene was found to bestable under our conditions. The expression levels weredetermined using the ABI Prism 7500 System GeneQuantification Software (Applied Biosystems) throughquantification of Sybr Green fluorescence. A standardcurve of each gene was constructed with genomic DNA.The expression levels of the different genes were normal-ised with respect to 18S expression levels and are means oftwo independent fermentation samples, each consisting ofthree replicates.
Acidification power test
The procedure to test the vitality of the yeast suspensionswas based on Kara et al. (1988). Samples were centrifugedand resuspended in 20 ml ice-cold ultrapure water. Circa108 cells were transferred in 10 ml ultrapure water (SynergyUV, Millipore, Billerica, USA) and washed three times. The
158 Appl Microbiol Biotechnol (2009) 82:155–167

yeast suspension was transferred into a beaker filled with20 ml ultrapure water at 25°C, of which the pH wasadjusted to 6.3 with 0.01 M NaOH. During the following20 min, the pH was measured every minute and after10 min, 5 ml of a 20% w/v glucose solution (pH=6.3) wasadded to the suspension. The acidification power wascalculated as the pH difference between the pH of water(6.3) and the pH after 20 min. The test was done intriplicate.
Fatty acid analysis
Total fatty acids [palmitic acid (C16:0), palmitoleic acid(C16:1), stearic acid (C18:0), oleic acid (C18:1) andlinoleic acid (C18:2)] of frozen yeast pellets were analysedafter direct saponification of 2 ml suspension with 0.1 g/mlcells in a 30-ml capped Pyrex tube with 10 ml of an equalvolume mixture of 1 M potassium hydroxide and methanolat 100°C for 30 min (Moonjai et al. 2002). One millilitre ofheptadecanoic acid (C17:0) (0.25 mg/ml in methanol) wasused as an internal standard. After cooling, the saponifiedmixtures were acidified with 1 ml of HCl (6 N) followed byextraction with 3 ml n-hexane. After vigorous resuspension(30 s) and centrifugation (3 min, 3,000 rpm), the upperhexane layer was transferred to a 10-ml pyrex tube. Asecond extraction with 3 ml hexane was followed. The lipidextracts were evaporated to dryness by N2 purging at 37°C.The methylation of fatty acids was achieved by incubationof the dried extract with 1 ml of boron trifluoride inmethanol (14% solution) for 10 min at 100°C. Aftercooling, 6 ml of NaCl-saturated water was added andthe fatty acid methyl esters were extracted with 300 μl oftoluene for gas chromatographic analysis. Gas chroma-tography was done with a calibrated Varian 300 analyser(Varian, Palo Alto, USA) equipped with a Heliflex AT-225 capillary column (length 30 m; 0.32 mm internaldiameter; layer thickness 0.25 μm; Alltech Associates,Inc., Deerfield, USA) and flame ionisation detector.Conditions were as follows: oven temperature of 75°Cduring 1 min, increased to 175°C at a rate of 24°C/minand 2 min at 175°C, increased to 200°C at a rate of 8°C/min and held at 200°C for 4 min; injection port at 250°Cand detector at 230°C. The carrier gas was helium. Fattyacid concentrations were calculated as milligram pergram cell dry weight. The fatty acid analysis of eachfermentation sample was done in duplicate.
Results
Wort fermentations were carried out in lab-scale tall tubesat 15°C, using a normal fermenting, moderately flocculat-ing industrial lager yeast strain (CMBSPV09). Five
different pitching rates (10, 20, 40, 80 and 120×106 cells/ml) were used to evaluate the impact of the initial cellconcentration on the yeast physiology and beer quality.
Fermentation characteristics
The progress of the fermentations with different pitchingrates is depicted in Fig. 1a. The time required to reach anapparent degree of fermentation of 80% was approximately335 h for the lowest inoculum size (10×106 viable cells/ml), 220 h for the pitching rate of 20×106 viable cells/ml(this is the pitching rate used in conventional breweryfermentations), 90 h for the two-fold higher pitching rate,50 h for the four-fold higher pitching rate and 40 h for thehighest pitching condition (120×106 viable cells/ml). Thismeans that, when doubling the normal pitching rate, areduction of the fermentation time of 60% could beachieved. In case of a four-fold and a six-fold higher yeastconcentration, time reductions of 78% and 82% wereobtained. It is clear that the time advantage of even higherinitial cell concentrations would become minor.
FAN amounts were determined throughout the fermen-tation and it was shown that FAN consumption wasdependent on the pitching rate used. The total FAN uptakelevels were enhanced with 40%, 61% and 66% when two-,four- and six-fold higher than normal pitching rates wereused (Fig. 1b). For the lowest yeast concentration, a 16%lower consumption was observed.
In Fig. 1c, the growth profiles under the differentconditions are shown. Because of the large differences infermentation time, the sugar consumption (the percentageof extract consumed relative to initial extract content) wasused to represent the data. As expected, the maximum yeastcell count increased with increasing pitching rate. Interest-ingly, the net growth (the maximum yeast cell count minusthe initial inoculum size) at the three lowest pitching rateswas similar (37×106 cells/ml for the lowest pitching rateand the reference pitching condition, and 33×106 cells/mlfor the pitching rate of 40×106 cells/ml), but decreasedsignificantly at the higher pitching rates: 24×106 cells/ml(condition with pitching rate of 80×106 cells/ml), and 12×106 cells/ml (for the condition with pitching rate of 120×106 cells/ml). Hence, lower amounts of young cells weregenerated in the high cell density fermentations, whichcould have important consequences for further generationsof the yeast population (Powell et al. 2003). These resultswere confirmed when the total biomass (which was the sumof the yeast in suspension and the flocculated yeast formedduring fermentation) was measured at the end of fermen-tation (Fig. 1d). From Fig. 1d, it can be concluded that ateven higher pitching rates (>120×106 cells/ml) no growthat all will occur during the fermentation with this yeaststrain and under these fermentation conditions.
Appl Microbiol Biotechnol (2009) 82:155–167 159

Yeast physiology
To investigate the physiology of the yeast populationduring and after fermentation, several parameters werestudied.
Viability The viability of the yeast population was moni-tored during fermentation by using the fluorescent dyepropidium iodide (Fig. 2). Starting with the same viable
yeast population, different profiles were obtained: the threefermentations with the lowest pitching rate all maintained ahigh level of cell viability till about half of the sugar wasconsumed and decreased afterwards. For the fermentationswith the highest cell density, the viability decreasedgradually during the fermentation, although it also droppedfaster towards the end. For these two conditions, theviability at the end was not significantly different. Whenthe total biomass (yeast in suspension and in the precipitate)was harvested at the end of the fermentation, the cellviability for all fermentations was close to each other (meanvalue for all fermentations 94.2±1.2%) except for thefermentation with the lowest pitching rate where theviability was significantly lower (89.3%). This indicatesthat the long duration of this fermentation had a deleteriousinfluence on the viability of the total yeast population. Wecan conclude that yeast viability remains at an acceptablelevel in all fermentations with an enhanced pitching rate.
Acidification power This test is a measure for yeastvitality. It depends on the endogenous carbohydratereserves, as well as on the glycolytic activity of theyeast. At the end of the fermentation, the yeastsuspensions were immediately analysed for acidificationpower. At the lowest cell densities (AP=1.18±0.06 and1.13±0.06), the yeast had a significantly lower acidifica-tion power than at the higher cell densities (AP=1.53±0.02 for the pitching rate of 40×106 cells/ml; AP=1.41±0.03 for 80×106 cells/ml; and 1.42±0.06 for 120×106 cells/
Fig. 2 Cell viability (in percent living cells) as a function of sugarconsumed in the fermentations with different pitching rates. Pitchingrates: filled circle 10×106 cells/ml, empty circle 20×106 cells/ml,filled triangle 40×106 cells/ml, empty triangle 80×106 cells/ml andfilled square 120×106 cells/ml
Fig. 1 Fermentation character-istics with different pitchingrates. (a) Sugar density(expressed as °P) as a functionof time, (b) total free aminonitrogen (FAN) consumed (ini-tial FAN minus residual FAN),(c) cell density as a function ofsugar consumed at a given timepoint and (d) the total biomassproduced (measured after sedi-mentation of the yeast in the talltubes, gently discarding thebeer, adding 1 l cold water andvigorous shaking with theYeastcyte apparatus) as a func-tion of the initial pitching rate.Pitching rates: filled circle 10×106 cells/ml, empty circle=20×106 cells/ml, filled triangle 40×106 cells/ml, empty triangle 80×106 cells/ml and filled square120×106 cells/ml
160 Appl Microbiol Biotechnol (2009) 82:155–167

ml). This suggests that yeast vitality was better maintainedin the fermentations with higher pitching rate.
Glycogen and trehalose content Trehalose profiles largelyfollowed the same course during the different fermenta-tions (Fig. 3a). Initially, the cells started with a lowtrehalose concentration, but after the lag phase, trehalosegradually increased to reach a maximum level at theend of the fermentation. The two lowest pitching ratesresulted in significantly lower trehalose accumulation incomparison with the three highest yeast densities. Thiswas also the case for the trehalose content of thecropped yeast slurries after fermentation (data notshown). Because trehalose is known to accumulate inresponse to different stress conditions, these resultssuggest that increasing the initial cell density above acertain level may lead to more stress on the yeast. The
higher trehalose levels may help to ensure yeastviability during the starvation period after fermentationis completed and also during the fermentation itself,which may lead to a reduction in fermentation time(Guldfeldt and Arneborg 1998).
The profile of the reserve carbohydrate, glycogen,differed according to the pitching condition (Fig. 3b). Atthe two lowest pitching rates, there was an initial periodof breakdown, followed by accumulation in the expo-nential phase and finally breakdown again during thelong stationary phase. When the pitching rate wasincreased, this typical profile was more levelled out:the initial breakdown, the build-up during exponentialphase and the following decrease were weakened(Fig. 3b). At the two highest pitching rates, the initialbreakdown was absent and glycogen content varied onlylittle over the course of the fermentation. When the yeastmass was cropped after fermentation and the glycogencontent measured, no significant difference was foundbetween the five conditions (data not shown).
Fatty acid profile In the initial aerobic phase of thefermentation, repitched yeast has to form sufficient unsat-urated fatty acids (UFA) and sterols to ensure growth(David and Kirsop 1973; O'Connor-Cox et al. 1993;Rosenfeld and Beauvoit 2003). Although fatty acid synthe-sis continues throughout the fermentation, UFA synthesisonly takes place in the presence of oxygen by means of thedesaturase Ole1 (Daum et al. 1998). In Fig. 4, the UFA/saturated fatty acid (SFA) index is shown for the fiveconditions in the course of the first 13 h of thefermentation. Since the wort was centrifuged, the levels of
Fig. 3 Trehalose (a) and glycogen content (b) in percent of wetweight of the yeast populations as a function of sugar consumed in thefermentations with different pitching rates. Pitching rates: filled circle10×106 cells/ml, empty circle 20×106 cells/ml, filled triangle 40×106
cells/ml, empty triangle 80×106 cells/ml and filled square 120×106
cells/ml
Fig. 4 UFA/SFA ratios in the yeast populations during the first hoursof the fermentations with different pitching rates. Pitching rates: filledcircle 10×106 cells/ml, empty circle 20×106 cells/ml, filled triangle40×106 cells/ml, empty triangle 80×106 cells/ml and filled square120×106 cells/ml. Maximal relative standard deviations were less than5%
Appl Microbiol Biotechnol (2009) 82:155–167 161
exogenous lipids were low. Hence, the strong increase inUFA content in the beginning of the fermentation must bedue to biosynthesis and not to assimilation. The increase inthe UFA/SFA ratio due to this increase in UFA build-upwas strongly influenced by the pitching rate. The higher thepitching rate the lower the increase in the UFA/SFA ratio.Because of the strong correlation between the synthesis ofUFA and yeast growth, the lower net growth at the highercell density fermentations could be due to the smallerincrease in UFA content. In the following anaerobic phase,the newly synthesised membranes are distributed overmother and daughter cells until the UFA content drops toa growth-limiting concentration (Casey et al. 1984). Indeed,the decrease in the UFA content was much steeper at thelowest pitching rates, which is consistent with the highernet growth (Fig. 4).
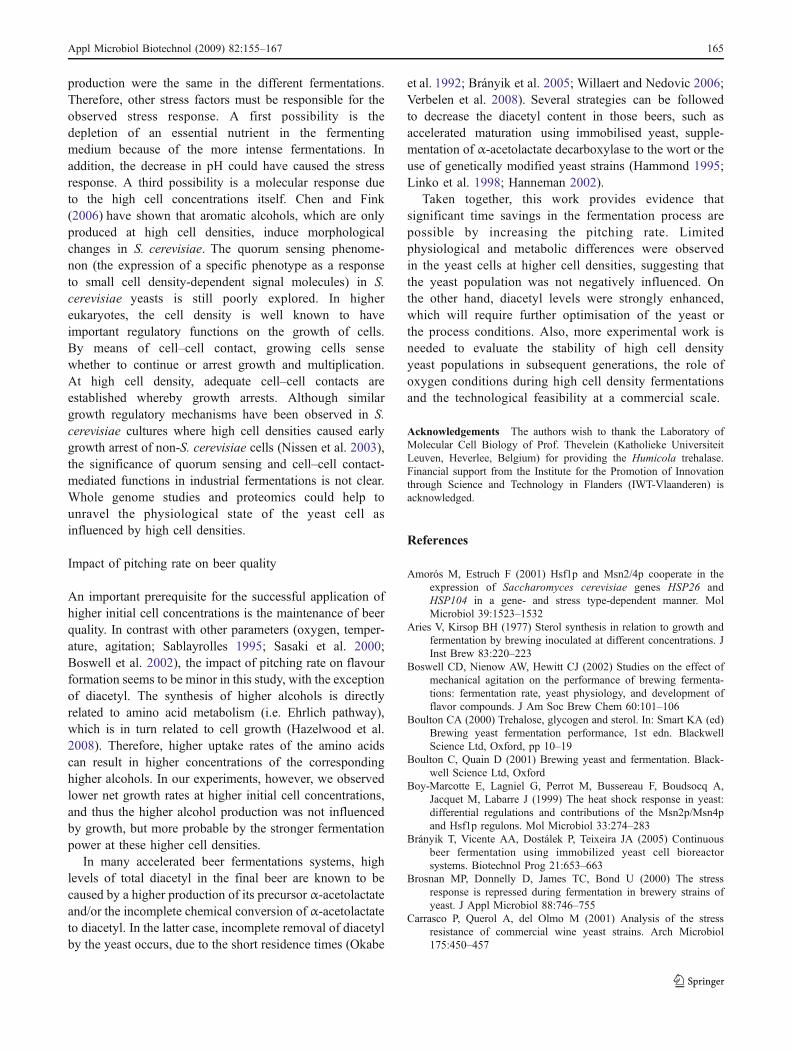
Expression of stress-related genes At two time points in thefermentation (corresponding to an ADF of 40% and 70%),yeast samples were taken and expression of the heat shockprotein genes HSP12 and HSP104 was monitored by qPCR(Fig. 5). The precise function of the plasma membraneprotein Hsp12 remains elusive. It has been suggested toprotect the yeast plasma membrane against ethanol anddesiccation toxicity (Sales et al. 2000). Hsp104 cooperateswith other heat shock proteins (Hsp40 and Hsp70) to refoldand reactivate damaged proteins (Glover and Lindquist1998). In addition, global expression of the TDH genes wasalso assessed (Fig. 5). TDH1, TDH2 and TDH3 encoderelated isozymes of glyceraldehyde-3-phosphate dehydro-genase, which catalyses the reaction of glyceraldehyde-3-phosphate to 1,3-bis-phosphoglycerate in glycolysis.
The expression of HSP104 was much lower than theexpression of HSP12. It showed a slight tendency to
increase with higher pitching rate in both the exponentialand stationary phases. This was also observed for theexpression of HSP12 in exponential phase. In the stationaryphase, on the other hand, expression of HSP12 stronglyincreased at the higher pitching rates.
TDH expression as a function of pitching rate was quitesimilar to that of HSP12, although the increase at the higherpitching rates in the stationary phase was not as pronouncedas with HSP12. In the stationary phase, the transcript levelswere also lower than in the exponential phase. In a study byJames et al. (2003), the TDH genes were all repressed in thestationary phase as well. The slightly higher induction ofTDH activity with higher pitching rates could indicate thatthe glycolytic activity was little increased, which wasconfirmed by the slightly higher acidification power of theyeast suspensions of these fermentation conditions at theend of fermentation. Higher TDH expression levels maycorrelate with higher glycolytic flux capacity (Smits et al.2000) and are therefore consistent with the higher acidifi-cation power of the yeast harvested at the end of thefermentations with the higher pitching rates.
Beer characteristics
Table 1 shows the results of the beer analysis for finalalcohol, glycerol, bitterness, pH and aroma concentrationsin the fermentations performed at the different pitchingrates. Despite the large differences in net growth, the yieldsof ethanol were identical (Yp/s=0.558±0.001% (v/v)/°P).Also the glycerol level was not strongly different, althougha slight increase was observed with increasing pitching rate.The pH of the beer was also lower when higher pitchingrates were used. The pH drop during wort fermentation iscaused by the assimilation of buffering compounds such asamino acids and primary phosphates, the formation oforganic acids and CO2 and the secretion of H+ by the yeast(Boulton and Quain 2001). Therefore, the larger FANconsumption rates and the more vigorous fermentations inthe case of higher inoculum size are consistent with thelower pH in the final beer.
Bitterness of the beer is an important quality parameter.It is caused by the α-acids of added hops, which areisomerised during wort boiling. The fermentation processhas an important influence on the residual concentration inbeer because these acids bind to the yeast cell wall (Boultonand Quain 2001). Losses in the range of 5–20% aregenerally observed (Laws et al. 1972). In spite of thestrong differences in cell density and cell growth, noinfluence of the pitching rate on the final beer bitternesswas observed (Table 1).
With respect to the aroma compounds, the concentrationof isobutanol and isoamyl alcohol increased with higher
Fig. 5 Expression profiles of the genes HSP104, HSP12 and the TDHfamily at 40% ADF (exponential phase) and 70% ADF (stationaryphase) as a function of the pitching conditions. The levels areexpressed relative to that of the housekeeping gene RDN18
162 Appl Microbiol Biotechnol (2009) 82:155–167

pitching rate (Table 1). In general, the concentration ofhigher alcohols is positively influenced by the pitching rate(Edelen et al. 1996; Verbelen et al. 2008).
Esters are important flavour compounds in lager beersbecause they often reach their threshold value. Ester levelshave previously been reported to be negatively influencedby higher pitching rates (Suihko et al. 1993; Edelen et al.1996; Verbelen et al. 2008). This was not observed in ourexperiments and any difference between the fermentationswith different pitching rates was small. Slightly less ethylacetate, which has a solvent-like flavour (threshold30 ppm), was formed during the fermentations with higherinoculum size. In the case of isoamyl acetate (banana-likeflavour, threshold 1.2 ppm), a maximum level was found ata pitching rate of 40×106 cells/ml; for ethyl caproate(apple-like flavour, threshold 0.21 ppm), no clear trend wasobserved.
DMS levels were slightly lower with increasing pitchingrate. In contrast, the acetaldehyde concentrations at the endof fermentation showed a small increasing trend withincreasing pitching rate.
The vicinal diketone, diacetyl, can cause a ‘buttery’ off-flavour above its threshold (80 ppb; Wainwright 1973).Diacetyl is formed by an extracellular oxidative decarbox-ylation of α-acetolactate, an intermediate in the biosynthe-sis pathway of valine from pyruvate. Subsequently, yeastcells assimilate and reduce diacetyl to the flavour inactivecompounds acetoin and 2,3-butanediol. Diacetyl waspresent in dramatically higher amounts at the end of thefermentations with higher cell density (Table 1, Fig. 6).From the course of the diacetyl level during the fermenta-
tion, it can be seen that the initial increase in total diacetylis very similar for all pitching rates. However, when about50% of the sugar was consumed, the total diacetyl levelshowed a steep decline at the two lowest pitching rateswhereas it continued to increase at the three highestpitching rates. Only at the very end of the fermentationwhen 70–80% of the sugar was consumed, the total diacetylcontent also started to decrease in the fermentations withthe highest pitching rate. Final diacetyl content (Fig. 6)therefore clearly correlated with the fermentation time(Fig. 1a). Because the chemical decarboxylation step of
Fig. 6 Profile of the total diacetyl content as a function of the sugarconsumed in the fermentations with different pitching rates. Pitchingrates: filled circle 10×106 cells/ml, empty circle 20×106 cells/ml,filled triangle 40×106 cells/ml, empty triangle 80×106 cells/ml andfilled square 120×106 cells/ml
Table 1 Final alcohol, glycerol, bitterness, pH and aroma concentrations in the fermentations performed at different pitching rates
Pitching rate (×106 cells/ml)
10 20 40 80 120
Alcohol (% v/v) 6.77±0.18 6.69±0.06 6.61±0.03 6.61±0.01 6.68±0.00Glycerol (g/l) 1.70±0.05 1.75±0.12 2.02±0.02 2.01±0.28 2.20±0.08pH 4.45±0.01 4.46±0.02 4.30±0.01 4.20±0.01 4.24±0.01Bitterness (EBU) 21.8±0.1 20.7±1.6 20.4±0.3 20.5±1.3 24.5±0.3Flavour profileAcetaldehyde (ppm) 6.48±0.97 5.94±0.63 7.45±0.38 8.66±0.28 7.21±0.24DMS (ppb) 31.0±1.3 26.8±1.7 25.5±0.2 24.0±1.6 25.1±2.6
Higher alcohols (ppm)Propanol 10.7±0.2 11.0±0.3 11.3±0.1 10.6±0.1 10.9±0.2Isobutanol 6.51±0.15 6.97±0.11 7.40±0.10 7.93±0.07 8.24±0.04Isoamyl alcohol 45.9±1.9 48.5±0.8 54.2±0.2 58.7±0.4 57.9±0.2
Esters (ppm)Ethyl acetate 25.5±1.7 25.0±1.3 23.7±0.2 21.9±0.3 23.8±0.5Isoamyl acetate 1.31±0.04 1.48±0.07 1.68±0.03 1.54±0.01 1.46±0.04Ethyl caproate 0.15±0.01 0.15±0.00 0.17±0.01 0.18±0.00 0.16±0.00
Diacetyl (ppb) 19.1±0.1 48.4±0.7 307±6 511±5 428±3
Values of all the flavour compounds have been recalculated based on the normal ethanol percentage in lager beers (=5% v/v)
Appl Microbiol Biotechnol (2009) 82:155–167 163

α-acetolactate is the rate-limiting step in the metabolism ofdiacetyl, the short fermentation times in the case of thehigher cell concentrations likely resulted in incompleteconversion of α-acetolactate to diacetyl, thereby preventingthe subsequent reduction which normally can occur at afast rate.
Discussion
Higher initial cell concentrations increase the fermentationspeed, which creates a large potential economical advantagefor the breweries. Therefore, the purpose of this study wasto determine the impact of pitching rate on yeast fermen-tation performance and beer quality.
The impact of pitching rate on fermentation power
The initial cell concentration had a significant impact on thefermentation power (°P/day). The fermentation power wasdefined as the ratio of the extract decrease from 12 to 6 °Pand the time (in days) in which this decrease occurred. Thefermentation power increased from 1.6 to 2.0, 4.5, 6.7 and7.3 °P/day when the pitching rate was enhanced from 10 to20, 40, 80 and 120×106 cells/ml, respectively. Whenlooking at the specific fermentation power, no differencewas observed between the different pitching rates. Howev-er, the small increases in the acidification power and theinduction of TDH expression suggest a higher yeast activitywith higher pitching rate. Overall, the differences in theyeast fermentation performance observed between thepitching conditions were small. The net growth ratefollowed a decreasing trend as a function of the pitchingrate. This is of importance when the yeast slurry has to bereused in subsequent fermentations. Aged yeast cells oftenshow decreased fermentation capacity, changed morpholo-gy, altered flocculation patterns and extended generationtimes (Smart 1999; Powell et al. 2000). Therefore, theinfluence of high cell density on the fermentation perfor-mance in subsequent yeast generations in successive brewswill also have to be determined in the future.
Net growth is related to the build-up of essentialmembrane lipids during the initial aerobic phase of thefermentation (Boulton and Quain 2001). When the initialcell suspension was increased from 80 to 120×106 cells/ml,the fermentation power was only slightly further increased(from 6.7 to 7.3 °P/day) whereas the net growth washalved. Therefore, it seems that an optimum cell densitycan be selected, which allows both a significant reductionin time and an acceptable extent of growth, correspondingto the brewer’s preferences. This specific pitching rate isprobably strain-specific and dependent on the oxygenrequirements of the yeast. In addition, process parameters,
such as wort composition and oxygen condition, can beoptimised for a specific cell density.
Impact of pitching rate on yeast stress response
Although the glycogen profiles, trehalose accumulation andexpression of stress genes varied with initial inoculum size,it cannot be stated that the yeast activity (i.e. theacidification power) is negatively influenced by theincrease in cell suspension. HSP12 and HSP104 expressionand trehalose accumulation appear to indicate a higherstress response of the yeast when the cell density in thefermentation medium increases. Surprisingly, the expres-sion level of both heat shock genes was generally lower inthe stationary phase than in the exponential phase. Bothgenes contain STRE sequences in their promoter and areinduced in a variety of stress conditions, such as exposureto heat, high osmolarity and high ethanol levels, and alsoupon entry in stationary phase (Boy-Marcotte et al. 1999;Amorós and Estruch 2001). Therefore, a higher expressionof heat shock genes at stationary phase would normally beexpected. However, in a whole genome study, performedby James et al. (2003), with a similar set-up as in ourexperiments (pitching rate 15×106 cells/ml), HSP12 andHSP104 expression levels were also repressed in thestationary phase. Rautio et al. (2007) observed an increaseof HSP104 and TPS1 upon glucose depletion after theexponential phase, after which they returned to their initialexpression level. In another study, performed by Brosnan etal. (2000), HSP104 expression was shown to be straindependent and large differences were revealed betweenlager strains and lab strains. Moreover, the expressionlevels of HSP104 were extremely low at the end offermentation. These authors suggested that the decrease ofexpression of HSP104, as the fermentation proceeded,could be explained by the many differences betweenbrewery fermentations and aerobic growth in glucosemedium (YPD), in which HSP12 and HSP104 are reportedto be induced in the stationary phase. In the former, thestationary phase is a result of a lack of lipids and thusoxygen, and not of fermentable carbohydrates. In contrast,in aerobic conditions, the limiting nutrients are fermentablecarbohydrates, resulting in diauxic shift and subsequentrespiratory growth. Moreover, each yeast strain has its ownparticular level of expression of HSP12 and HSP104(Carrasco et al. 2001; Garay-Arroyo et al. 2004). Thesedifferences and the fact that we used an industrial yeaststrain, instead of a laboratory strain, can explain the lowerexpression level at the stationary phase.
On the other hand, it remains unclear to what extent thestress response influences yeast physiology and which typeof stress the yeast is really exposed to. Temperatures,osmotic conditions, nutritional state of the wort and ethanol
164 Appl Microbiol Biotechnol (2009) 82:155–167
production were the same in the different fermentations.Therefore, other stress factors must be responsible for theobserved stress response. A first possibility is thedepletion of an essential nutrient in the fermentingmedium because of the more intense fermentations. Inaddition, the decrease in pH could have caused the stressresponse. A third possibility is a molecular response dueto the high cell concentrations itself. Chen and Fink(2006) have shown that aromatic alcohols, which are onlyproduced at high cell densities, induce morphologicalchanges in S. cerevisiae. The quorum sensing phenome-non (the expression of a specific phenotype as a responseto small cell density-dependent signal molecules) in S.cerevisiae yeasts is still poorly explored. In highereukaryotes, the cell density is well known to haveimportant regulatory functions on the growth of cells.By means of cell–cell contact, growing cells sensewhether to continue or arrest growth and multiplication.At high cell density, adequate cell–cell contacts areestablished whereby growth arrests. Although similargrowth regulatory mechanisms have been observed in S.cerevisiae cultures where high cell densities caused earlygrowth arrest of non-S. cerevisiae cells (Nissen et al. 2003),the significance of quorum sensing and cell–cell contact-mediated functions in industrial fermentations is not clear.Whole genome studies and proteomics could help tounravel the physiological state of the yeast cell asinfluenced by high cell densities.
Impact of pitching rate on beer quality
An important prerequisite for the successful application ofhigher initial cell concentrations is the maintenance of beerquality. In contrast with other parameters (oxygen, temper-ature, agitation; Sablayrolles 1995; Sasaki et al. 2000;Boswell et al. 2002), the impact of pitching rate on flavourformation seems to be minor in this study, with the exceptionof diacetyl. The synthesis of higher alcohols is directlyrelated to amino acid metabolism (i.e. Ehrlich pathway),which is in turn related to cell growth (Hazelwood et al.2008). Therefore, higher uptake rates of the amino acidscan result in higher concentrations of the correspondinghigher alcohols. In our experiments, however, we observedlower net growth rates at higher initial cell concentrations,and thus the higher alcohol production was not influencedby growth, but more probable by the stronger fermentationpower at these higher cell densities.
In many accelerated beer fermentations systems, highlevels of total diacetyl in the final beer are known to becaused by a higher production of its precursor α-acetolactateand/or the incomplete chemical conversion of α-acetolactateto diacetyl. In the latter case, incomplete removal of diacetylby the yeast occurs, due to the short residence times (Okabe
et al. 1992; Brányik et al. 2005; Willaert and Nedovic 2006;Verbelen et al. 2008). Several strategies can be followedto decrease the diacetyl content in those beers, such asaccelerated maturation using immobilised yeast, supple-mentation of α-acetolactate decarboxylase to the wort or theuse of genetically modified yeast strains (Hammond 1995;Linko et al. 1998; Hanneman 2002).
Taken together, this work provides evidence thatsignificant time savings in the fermentation process arepossible by increasing the pitching rate. Limitedphysiological and metabolic differences were observedin the yeast cells at higher cell densities, suggesting thatthe yeast population was not negatively influenced. Onthe other hand, diacetyl levels were strongly enhanced,which will require further optimisation of the yeast orthe process conditions. Also, more experimental work isneeded to evaluate the stability of high cell densityyeast populations in subsequent generations, the role ofoxygen conditions during high cell density fermentationsand the technological feasibility at a commercial scale.
Acknowledgements The authors wish to thank the Laboratory ofMolecular Cell Biology of Prof. Thevelein (Katholieke UniversiteitLeuven, Heverlee, Belgium) for providing the Humicola trehalase.Financial support from the Institute for the Promotion of Innovationthrough Science and Technology in Flanders (IWT-Vlaanderen) isacknowledged.
References
Amorós M, Estruch F (2001) Hsf1p and Msn2/4p cooperate in theexpression of Saccharomyces cerevisiae genes HSP26 andHSP104 in a gene- and stress type-dependent manner. MolMicrobiol 39:1523–1532
Aries V, Kirsop BH (1977) Sterol synthesis in relation to growth andfermentation by brewing inoculated at different concentrations. JInst Brew 83:220–223
Boswell CD, Nienow AW, Hewitt CJ (2002) Studies on the effect ofmechanical agitation on the performance of brewing fermenta-tions: fermentation rate, yeast physiology, and development offlavor compounds. J Am Soc Brew Chem 60:101–106
Boulton CA (2000) Trehalose, glycogen and sterol. In: Smart KA (ed)Brewing yeast fermentation performance, 1st edn. BlackwellScience Ltd, Oxford, pp 10–19
Boulton C, Quain D (2001) Brewing yeast and fermentation. Black-well Science Ltd, Oxford
Boy-Marcotte E, Lagniel G, Perrot M, Bussereau F, Boudsocq A,Jacquet M, Labarre J (1999) The heat shock response in yeast:differential regulations and contributions of the Msn2p/Msn4pand Hsf1p regulons. Mol Microbiol 33:274–283
Brányik T, Vicente AA, Dostálek P, Teixeira JA (2005) Continuousbeer fermentation using immobilized yeast cell bioreactorsystems. Biotechnol Prog 21:653–663
Brosnan MP, Donnelly D, James TC, Bond U (2000) The stressresponse is repressed during fermentation in brewery strains ofyeast. J Appl Microbiol 88:746–755
Carrasco P, Querol A, del Olmo M (2001) Analysis of the stressresistance of commercial wine yeast strains. Arch Microbiol175:450–457
Appl Microbiol Biotechnol (2009) 82:155–167 165

Casey GP, Magnus CA, Ingledew WM (1984) High-gravity brewing:effects on nutrition on yeast composition, fermentative abilityand alcohol production. Appl Environ Microbiol 48:639–646
Chen H, Fink GR (2006) Feedback control of morphogenesis in fungiby aromatic alcohols. Genes Dev 20:1150–1161
Daum G, Lees ND, Bard M, Dickson R (1998) Biochemistry, cellbiology and molecular biology of lipids of Saccharomycescerevisiae. Yeast 14:1471–1510
David MH, Kirsop BH (1973) Yeast growth in relation to thedissolved oxygen and sterol content of wort. J Inst Brew79:20–25
Dufour J-P, Malcorps P, Silcock P (2003) Control of ester synthesisduring brewery fermentation. In: Smart KA (ed) Brewing yeastfermentation performance, 2nd edn. Blackwell Science, Oxford,pp 213–233
Edelen CL, Miller JL, Patino H (1996) Effects of yeast pitch rates onfermentation performance and beer quality. Tech Q—MasterBrew Assoc Am 33:30–32
Estruch F (2000) Stress-controlled transcription factors, stress-inducedgenes and stress tolerance in budding yeast. FEMS MicrobiolRev 24:469–486
European Brewery Convention (1998) Analytica-EBC. FachverlagHans Carl, Nürnberg
François J, Parrou JL (2001) Reserve carbohydrates metabolism in theyeast Saccharomyces cerevisiae. FEMS Microbiol Rev 25:125–145
Garay-Arroyo A, Covarrubias AA, Clark I, Niño I, Gosset G,Martinez A (2004) Response to different environmental stressconditions of industrial and laboratory Saccharomyces cerevisiaestrains. Appl Microbiol Biotechnol 63:734–741
Gibson BR, Lawrence SJ, Leclaire JPR, Powell CD, Smart KA (2007)Yeast responses to stresses associated with industrial breweryhandling. FEMS Microbiol Rev 31:535–569
Glover JR, Lindquist S (1998) Hsp104, Hsp70, and Hsp40: a novelchaperone system that rescues previously aggregated proteins.Cell 94:73–82
Guldfeldt LU, Arneborg N (1998) The effect of yeast trehalosecontent at pitching on fermentation performance during breweryfermentations. J Inst Brew 104:37–39
Hammond JRM (1995) Genetically-modified brewing yeast for the21st century. Progress to date. Yeast 11:1613–1627
Hanneman W (2002) Reducing beer maturation time and retainingquality. Tech Q—Master Brew Assoc Am 39:149–155
Hazelwood LA, Daran J-M, van Maris AJA, Pronk JT, Dickinson JR(2008) The Ehrlich pathway for fusel alcohol production: acentury of research on Saccharomyces cerevisiae metabolism.Appl Environ Microbiol 74:2259–2266
Hounsa CE, Brandt VE, Thevelein J, Hohmann S, Prior AB (1998)Role of trehalose in survival of Saccharomyces cerevisiae underosmotic stress. Microbiology 144:671–680
James TC, Campbell S, Donnelly D, Bond U (2003) Transcriptionprofile of brewery yeast under fermentation conditions. J ApplMicrobiol 94:432–448
Jenkins CI, Kennedy AI (2003) Impact of serial repitching on lagerbrewing yeast quality. J Am Soc Brew Chem 61:1–9
Kara BV, Simpson WJ, Hammond JRM (1988) Prediction of thefermentation performance of brewing yeast with the acidificationpower test. J Inst Brew 94:153–158
Laws DRJ, McGuiness JD, Rennie H (1972) The losses of bittersubstances during fermentation. J Inst Brew 78:314–321
Linko M, Haikara A, Ritala A, Penttilä M (1998) Recent advances inthe malting and brewing industry. J Biotechnol 65:85–98
Majara N, O'Connor-Cox ESC, Axcell BC (1996) Trehalose—a stressprotectant and stress indicator compound for yeast exposed toadverse conditions. J Am Soc Brew Chem 54:221–227
Martinez-Pastor MT, Marchler G, Schüller C, Marchler-Bauer A, RuisH, Estruch F (1996) The Saccharomyces cerevisiae zinc fingerproteins Msn2p and Msn4p are required for transcriptionalinduction through the stress-response element (STRE). EMBO J15:2227–2235
Moonjai N, Verstrepen KJ, Delvaux FR, Derdelinckx G, Verachtert H(2002) The effect of linoleic acid supplementation of croppedyeast on its subsequent fermentation performance and acetateesters. J Inst Brew 108:227–235
Neves MJ, Jorge JA, François JM, Terenzi HF (1991) Effects of heatshock on the level of trehalose and glycogen, and on theinduction of thermotolerance in Neurospora crassa. FEBS Lett283:19–22
Nissen P, Nielsen D, Arneborg N (2003) Viable Saccharomycescerevisiae cells at high concentrations cause early growth arrestof non-Saccharomyces yeasts in mixed cultures by a cell–cellcontact-mediated mechanism. Yeast 20:331–341
O'Connor-Cox ESC, Lodolo EJ, Axcell BC (1993) Role of oxygen inhigh-gravity fermentations in the absence of unsaturated lipidbiosynthesis. J Am Soc Brew Chem 51:97–107
Okabe M, Katoh M, Furugoori F, Yoshida M, Mitsui S (1992) Growthand fermentation characteristics of bottom brewer's yeast undermechanical stirring. J Ferment Bioeng 73:148–152
Powell CD, Van Zandycke SM, Quain D, Smart KA (2000)Replicative ageing and senescence in Saccharomyces cerevisiaeand the impact in brewing fermentations. Microbiology146:1023–1034
Powell CD, Quain D, Smart KA (2003) The impact of brewing yeastcell age on fermentation performance, attenuation and floccula-tion. FEMS Yeast Res 3:149–157
Quain DE, Tubb RS (1982) The importance of glycogen in brewingyeast. Tech Q—Master Brew Assoc Am 19:19–23
Rautio JJ, Huuskonen A, Vuokko H, Vidgren V, Londesborough J(2007) Monitoring yeast physiology during very high gravitywort fermentations by frequent analysis of gene expression. Yeast24:741–760
Rosenfeld E, Beauvoit B (2003) Role of the non-respiratory pathwaysin the utilization of molecular oxygen by Saccharomycescerevisiae. Yeast 20:1115–1144
Sablayrolles JM (1995) Fermentation kinetics and the production ofvolatiles during alcoholic fermentation. J Am Soc Brew Chem53:72–78
Saerens SMG, Verbelen PJ, Vanbeneden N, Thevelein JM, DelvauxFR (2008) Monitoring the influence of high-gravity brewing andfermentation temperature on flavour formation by analysis ofgene expression levels in brewing yeast. Appl MicrobiolBiotechnol 80:1039–1051, doi:10.1007/s00253-008-1645-5
Sales K, Brandt W, Rumbak E, Lindsey G (2000) The LEA-likeprotein HSP12 in Saccharomyces cerevisiae has a plasmamembrane location and protects membranes against desiccationand ethanol-induced stress. Biochim Biophys Acta, Biomembr1463:267–278
Sasaki N, Yasuda Y, Imai T, Takeuchi T, Ohkochi M (2000) The effectof wort aeration using a high oxygen concentration. Tech Q—Master Brew Assoc Am 37:27–30
Siderius M, Mager WH (2003) Conditional response to stress in yeast.Monatsh Chem 134:1433–1444
Smart KA (1999) Ageing in brewing yeast. Brew Guard 128:19–24
Smith A, Ward MP, Garrett S (1998) Yeast PKA represses Msn2p/Msn4p-dependent gene expression to regulate growth, stressresponse and glycogen accumulation. EMBO J 17:3556–3564
Smits HP, Hauf J, Müller S, Hobley TJ, Zimmermann FK, Hahn-Hägerdal B, Nielsen J, Olsson L (2000) Simultaneous over-expression of enzymes if the lower part of glycolysis can enhance
166 Appl Microbiol Biotechnol (2009) 82:155–167

the fermentative capacity of Saccharomyces cerevisiae. Yeast16:1325–1334
Suihko M-L, Vilpola A, Linko M (1993) Pitching rate in high gravitybrewing. J Inst Brew 99:341–346
Thevelein JM, de Winde JH (1999) Novel sensing mechanisms andtargets for the cAMP–protein kinase A pathway in the yeastSaccharomyces cerevisiae. Mol Microbiol 33:904–918,doi:10.1046/j.1365-2958.1999.01538.x
\Verbelen PJ, Van Mulders S, Saison D, Van Laere S, Delvaux F,Delvaux FR (2008) Characteristics of high cell density fermenta-tions with different lager yeast strains. J Inst Brew 114:127–133
Verstrepen KJ, Iserentant D, Malcorps P, Derdelinckx G, Van Dijck P,Winderickx J, Pretorius IS, Thevelein JM, Delvaux FR (2004)Glucose and sucrose: hazardous fast-food for industrial yeast?Trends in Biotechnology 22:531–537
Wainwright T (1973) Diacetyl—a review. J Inst Brew 79:451–470
Willaert R, Nedovic VA (2006) Primary beer fermentation byimmobilised yeast—a review on flavour formation and controlstrategies. J Chem Technol Biotechnol 81:1353–1367
Winderickx J, De Winde JH, Crauwels M, Hino A, Hohmann S, VanDijck P, Thevelein JM (1996) Regulation of genes encodingsubunits of the trehalose synthase complex in Saccharomycescerevisiae: novel variations of STRE-mediated transcriptionalcontrol? Mol Gen Genet 252:470–482
Zähringer H, Burgert M, Holzer H, Nwaka S (1997) Neutral trehalaseNth1p of Saccharomyces cerevisiae encoded by the NTH1 geneis a multiple stress responsive protein. FEBS Lett 412:615–620
Zähringer H, Thevelein JM, Nwaka S (2000) Induction of neutraltrehalase Nth1 by heat and osmotic stress is controlled by STREelements and Msn2/Msn4 transcription factors: variations ofPKA effect during stress and growth. Mol Microbiol 35:397–406, doi:10.1046/j.1365-2958.2000.01706.x
Appl Microbiol Biotechnol (2009) 82:155–167 167