Individualised Ball Speed Prediction in Baseball Pitching ...
11
Delft University of Technology Individualised Ball Speed Prediction in Baseball Pitching Based on IMU Data Gomaz, L.; Veeger, H.E.J.; van der Graaff, E.; van Trigt, B.; van der Meulen, F.H. DOI 10.3390/s21227442 Publication date 2021 Document Version Final published version Published in Sensors Citation (APA) Gomaz, L., Veeger, H. E. J., van der Graaff, E., van Trigt, B., & van der Meulen, F. H. (2021). Individualised Ball Speed Prediction in Baseball Pitching Based on IMU Data. Sensors, 21(22), [7442]. https://doi.org/10.3390/s21227442 Important note To cite this publication, please use the final published version (if applicable). Please check the document version above. Copyright Other than for strictly personal use, it is not permitted to download, forward or distribute the text or part of it, without the consent of the author(s) and/or copyright holder(s), unless the work is under an open content license such as Creative Commons. Takedown policy Please contact us and provide details if you believe this document breaches copyrights. We will remove access to the work immediately and investigate your claim. This work is downloaded from Delft University of Technology. For technical reasons the number of authors shown on this cover page is limited to a maximum of 10.
-
Upload
khangminh22 -
Category
Documents
-
view
0 -
download
0
Transcript of Individualised Ball Speed Prediction in Baseball Pitching ...

Delft University of Technology
Individualised Ball Speed Prediction in Baseball Pitching Based on IMU Data
Gomaz, L.; Veeger, H.E.J.; van der Graaff, E.; van Trigt, B.; van der Meulen, F.H.
DOI10.3390/s21227442Publication date2021Document VersionFinal published versionPublished inSensors
Citation (APA)Gomaz, L., Veeger, H. E. J., van der Graaff, E., van Trigt, B., & van der Meulen, F. H. (2021). IndividualisedBall Speed Prediction in Baseball Pitching Based on IMU Data. Sensors, 21(22), [7442].https://doi.org/10.3390/s21227442
Important noteTo cite this publication, please use the final published version (if applicable).Please check the document version above.
CopyrightOther than for strictly personal use, it is not permitted to download, forward or distribute the text or part of it, without the consentof the author(s) and/or copyright holder(s), unless the work is under an open content license such as Creative Commons.
Takedown policyPlease contact us and provide details if you believe this document breaches copyrights.We will remove access to the work immediately and investigate your claim.
This work is downloaded from Delft University of Technology.For technical reasons the number of authors shown on this cover page is limited to a maximum of 10.

sensors
Communication
Individualised Ball Speed Prediction in Baseball PitchingBased on IMU Data
Larisa Gomaz 1,2,*, DirkJan Veeger 2 , Erik van der Graaff 3, Bart van Trigt 2,3 and Frank van der Meulen 1
�����������������
Citation: Gomaz, L.; Veeger, D.;
van der Graaff, E.; van Trigt, B.;
van der Meulen, F. Individualised Ball
Speed Prediction in Baseball Pitching
Based on IMU Data. Sensors 2021, 21,
7442. https://doi.org/10.3390/
s21227442
Academic Editor: Angelo Maria
Sabatini
Received: 4 October 2021
Accepted: 4 November 2021
Published: 9 November 2021
Publisher’s Note: MDPI stays neutral
with regard to jurisdictional claims in
published maps and institutional affil-
iations.
Copyright: © 2021 by the authors.
Licensee MDPI, Basel, Switzerland.
This article is an open access article
distributed under the terms and
conditions of the Creative Commons
Attribution (CC BY) license (https://
creativecommons.org/licenses/by/
4.0/).
1 Delft Institute of Applied Mathematics, Delft University of Technology, 2628 CD Delft, The Netherlands;[email protected]
2 BioMechanical Engineering, Faculty of Mechanical, Maritime and Materials Engineering, Delft University ofTechnology, 2628 CD Delft, The Netherlands; [email protected] (D.V.); [email protected] (B.v.T.)
3 Faculty of Behavioural and Movement Sciences, Vrije Universiteit Amsterdam,1081 BT Amsterdam, The Netherlands; [email protected]
* Correspondence: [email protected]
Abstract: Ball velocity is considered an important performance measure in baseball pitching. Properpitching mechanics play an important role in both maximising ball velocity and injury-free partici-pation of baseball pitchers. However, an individual pitcher’s characteristics display individualityand may contribute to velocity imparted to the ball. The aim of this study is to predict ball velocityin baseball pitching, such that prediction is tailored to the individual pitcher, and to investigate theadded value of the individuality to predictive performance. Twenty-five youth baseball pitchers,members of a national youth baseball team and six baseball academies in The Netherlands, per-formed ten baseball pitches with maximal effort. The angular velocity of pelvis and trunk weremeasured with IMU sensors placed on pelvis and sternum, while the ball velocity was measuredwith a radar gun. We develop three Bayesian regression models with different predictors whichwere subsequently evaluated based on predictive performance. We found that pitcher’s height addsvalue to ball velocity prediction based on body segment rotation. The developed method provides afeasible and affordable method for ball velocity prediction in baseball pitching.
Keywords: ball velocity; inertial measurement unit; multilevel modeling; pitching; baseball
1. Introduction
Proper pitching mechanics play an important role in both success and health ofbaseball pitchers. In overhead pitching, the lower extremity and trunk generate andtransfer energy to the upper extremity. The optimal sequential activation of body partswhile pitching, known as the kinetic chain, can result in reduced elbow and shoulderstress and maximise pitching performance [1,2]. On the other hand, poor mechanics canlead to increased loading of the elbow or shoulder, and increase the injury risk. Injuriesof the throwing arm, such as the ones to the shoulder and elbow, are common in theoverhead pitching motion of baseball. Major League Baseball pitchers are especiallyprone to injury because of the throwing velocities commonly seen approaching and evenexceeding 100 mph. To create such high ball velocities, high energy levels pass through thecomponents of the kinetic chain that affect the weakest links among them, especially theelbow [3]. Therefore, there is a need for assessment of the throwing technique that enablesplayers to throw fast pitches in the strike zone without an overload.
Throwing velocity plays an important role in a success of a baseball game. Pitchersincrease their chances for success by throwing faster and diminishing the hitter’s decisiontime of whether or not to strike the ball [4]. Furthermore, high ball velocities restrict theoffense’s ability to advance bases and score runs [5]. Among other parameters, ball velocityis considered an important performance measure sought after by coaches and scouts. Itenables baseball players to improve their ability to play and to be noticed by coaches and
Sensors 2021, 21, 7442. https://doi.org/10.3390/s21227442 https://www.mdpi.com/journal/sensors

Sensors 2021, 21, 7442 2 of 10
scouts for higher levels of competition. Therefore, every pitcher aims to increase the ballvelocity [6,7].
The pitching biomechanics in baseball is studied to improve players’ performanceand prevent sport-related injuries. With development of the measurement and analyticaltools, pitching coaches and biomechanists can accurately analyse the rapid and complexmovements during the pitching motion [8]. Although professional baseball teams haveused biomechanical analysis for years already, recent advances in technology give amateurplayers and clubs opportunities to measure their mechanics and improve performance.Body worn sensors, such as inertial measurement units (IMUs), are a low-cost alternativeto motion capture systems with passive markers, with no space limitation or cumbersomesetup procedure. Portable, affordable, and easy-to-use, they monitor athlete’s performancewithout obstructing it [9].
As the quality of the throw is mainly determined by the pitcher’s throwing me-chanics, we can use IMUs to measure kinematic parameters shown to be linked to ballvelocity [7,8,10]. Enhancing pitching technique through the optimal position and timing ofproper pitching mechanics, can result in a fast and accurate throw. Estimating ball velocitybased on IMU recordings can be the first step towards assessment of the pitching techniquethat results in fast throws with reduced injury risk.
Ball velocity is mostly measured in high level games and in training situations. Al-though a radar gun gives an accurate reading of a ball velocity, a required strict protocoland high price represent a big issue for baseball clubs, especially the smaller ones. Onthe other hand, IMUs do not need a fixed location on the field for measuring ball velocity,thus they can be used on many different occasions. The previous studies demonstrated thepotential use of IMUs for estimation of the ball velocity in different overhead-throwingsports, including baseball [11–13].
The use of IMUs represent a potential for the estimation of the ball speed in differenton-field situations based on kinematic parameters measured by the same sensors. How-ever, each pitcher is a unique individual and his individual characteristic may displayindividuality contributing to imparted velocity to the ball [7,14]. With IMUs, every throwof an individual pitcher can be recorded: during warm-up, training, before and duringthe game, which contributes to the element of individualisation. Therefore, in this paper,we present a method for predicting ball velocity in baseball pitching based on pitcher’skinematics measured by IMUs and individual characteristics. We investigate the addedvalue of the individuality to predictive performance of developed models.
2. Materials and Methods2.1. Participants
Data were collected from 25 baseball pitchers with a mean age of 14.7 ± 1.5, meanbody height 176.91 ± 11.03 cm and mean body weight 65.6 ± 14.4 kg. Participants wererecruited from the national U18 baseball team, as well as all six baseball academies in TheNetherlands, at which the most talented baseball players of that region train. This researchwas conducted in accordance with the Declaration of Helsinki and the Department ofHuman Movement Sciences’ local ethical committee approved the measurement protocol[ECB 2013-53]. Both participants and their parents were informed of the procedure andstudy aims before the start of the measurements. Informed consent was obtained from theparents of the participants before involvement in the study.
2.2. Methodology
The measurements were performed at the indoor facilities of the academies. Afterperforming several anthropometric measurements, pitchers were given unlimited amountof time for their standard warm-up. They were instructed to prepare just as if they weregoing to pitch in a game. Warm-up included a general warm-up, j-band exercises, andlongtoss, which is a standard warm-up for baseball pitchers before the game. The pitcherswore sneakers, athletic shorts, and no shirt. They also wore their catching glove to mimic

Sensors 2021, 21, 7442 3 of 10
the game situation as much as possible. After warm-up, the pitcher was instructed toperform 10 fastball pitches with maximal effort towards a catcher sitting behind home plate.
The pitching motion was recorded using two 9-DOF IMUs (MPU-9150, Invensense,San Jose, CA, USA, Accelerometer ± 16 g, Gyroscope ± 2000 deg/s). Sensors were rigidlyattached to pelvis and sternum (Figure 1) using double-sided adhesive tape and used torecord body segment rotation. Every sensor was embedded in a protective casing togetherwith a battery and SD-card, onto which the data were logged at a sample frequencyof 500 Hz. IMU’s gyroscope recorded angular velocities continuously throughout theparticipant’s session. Previous studies used peak values of kinematic measures to addresstheir effect on the ball velocity in baseball pitching [2,6,7,10]. Therefore, for the gyroscopesignal, we calculated the peak angular velocity as its Euclidean norm. Each recordingwas manually segmented into parts containing only a single pitch. We performed thesegmentation by plotting the entire gyroscope signal and locating the 10 peaks eachcorresponding to a pitch (see Figure 2). This was done in a similar way in [11] for ballvelocity data obtained in handball.
Figure 1. Placement of the sensors.
The ball velocity (mph) reached during the pitches was measured from behind thehome plate using a Stalker pro 2 radar gun (Stalker Radar, Plano, TX, USA). We coupledrecorded ball speed with corresponding peak angular velocities during single pitch.
2.3. Statistical Analysis
The repeated measurements of individual pitchers can be grouped into a hierarchicalstructure. The differences between participants arise from differences in personal charac-teristics, such as age, body weight, and height, that, next to the kinematic parameters ofpitching mechanics, may contribute to increased ball velocity [1,2,8]. Observations in thisstudy are ball throws nested within different participants and the link between individual-and group-level is participant’s indicator (ID).
Statistical models that can deal with units grouped on different levels are known asmultilevel models. Multilevel models extend standard regression models to data which arestructured in groups and where coefficients are allowed to vary by groups. The featurethat distinguishes multilevel models from classical regression is the modeling of variationbetween groups. This enables us to study the effects that vary by group. Therefore, in thispaper we introduce multilevel modeling as the main method for ball velocity prediction inbaseball pitching.

Sensors 2021, 21, 7442 4 of 10
200 220 240 260 280
020
040
060
080
0
Pelvis
Timestamp
Pea
k an
gula
r ve
loci
ty
Figure 2. Segmenting the baseball pitches using gyroscope peaks. For the gyroscope signal, wecalculated the peak angular velocity as its Euclidean norm. Each recording was manually segmentedinto parts containing only a single pitch. We performed the segmentation by plotting the entiregyroscope signal and locating the 10 peaks each corresponding to a pitch.
At the same time as including repeated measurements of segment rotation per partici-pant, the multilevel approach enables us to examine the added value of the individualityin ball velocity prediction. Group-level predictors were selected among personal character-istics that were collected prior to the measurements. We addressed the high correlationbetween pitcher’s height, weight and age. It is reasonable to expect that older pitcherswill be taller and therefore weigh more. To select group-level predictors and avoid poorprediction performance due to correlation of predictors, we applied a random forest (seefor instance chapter 8 in [15]), as implemented in the caret package [16]. Based on variableimportance (Figure 3) calculated with varImp from a caret package, we selected pitcher’sheight as a group-predictor. We developed three multilevel Bayesian regression models forball velocity prediction using R 4.0.3 [17] and rstanarm [18,19].
In the following, yi denotes the ball speed for the observation indexed i.
1. Complete-pooling model (Observations)The complete-pooling model is a single classical regression model completely ignoringgroup information. In other words, the model treats all ball throws as differentobservations of the same participant. The model is given by
yi = β0 + β1x1i + β2x2i + εi (1)
where {x1i, x2i} are individual-level predictors, namely peak angular velocity of pelvisand trunk, respectively. The complete-pooling model does not make a distinctionbetween different pitchers and in that way neglects their personal characteristics.
2. Two-level varying-intercept model (Personal)The two-level varying-intercept model is a regression that opposed to complete-pooling includes indicators for groups. In this model an intercept is calculated forevery group and one joint slope is assumed for the entire sample. The model isgiven by
yi = αj + εi (2)
αj = γ0 + γ1uj + ηj (3)

Sensors 2021, 21, 7442 5 of 10
where uj is a centered group-level predictor, namely pitcher’s height. The groupmembership j[i] denotes pitcher j throwing a ball i. In this model pitching techniqueis neglected and the outcome depends only on height of an individual pitcher.
3. Two-level varying-intercept, varying-slope model (Full)The varying-intercept, varying-slope model represents the model in which both theintercept and the slope vary by group. The model is given by
yi = αj[i] + β1x1i + β2x2i + εi (4)
αj = γ0 + γ1uj + ηj (5)
and includes both individual- and group-level predictors. In both (3) and (5), thecoefficient γ0 can be interpreted as the ball speed of a ball thrown without any pelvisand trunk rotation by the pitcher of an average height. The εi in (1), (2) and (4) and ηjin (3) and (5) represent independent error terms at each of the two levels.
Importance
Pelvis
Trunk
Age
Weight
Height
0 1000 2000 3000
Figure 3. Visual representation of the variable importance calculated by applying random forest. Thehorizontal axis should be interpreted as a measure for relative importance of predictive variables. Thefigure reveals Height to be the most important predictor for ball speed which is, therefore, selected asgroup-level predictor.
All individual- and group-level predictors were rescaled to have sample variance 1.The scaling is done by dividing the centered predictor u by its standard deviation. We usedscaling to transform the data to comparable values.
We used leave-one-out (LOO) cross-validation to select out of the three proposedmodels the model with best predictive performance. LOO resulted in a total of 224 folds as224 pitches from 25 pitchers were included in the analysis. Following the approach in [20],the predictive performance of a model is defined as the expected log-predictive density(elpd). Predictive performance is a useful quantity in assessing a single model. It can beestimated by training the model on all observations except one and then predicting thehold-out observation. This is then repeated for all n observations

Sensors 2021, 21, 7442 6 of 10
elpd =n
∑i=1
log p(yi | y−i) (6)
where
p(yi | y−i) =∫
p(yi|θ)p(θ|y−i)dθ (7)
is the LOO predictive density upon leaving out the ith data point. If the posterior p(θ | y−i)is summarised by B simulation from θi,b, then we can approximate log p(yi | yi=1) by
elpdi =1B
B
∑b=1
p(yi | θi,b)
leading to elpd = ∑ni=1 elpdi as an estimate for elpd.
Different models can be compared against each other according to their elpd-value.
Suppose we wish to compare modelsM1 andM2, with estimated elpd values elpd1
and
elpd2, respectively.
Since the same set of n data points is being used to fit all models, we can use a pairedestimate to compute a standard error of their difference:
se(
elpd1− elpd
2)=
√nVn
i=1
(elpd
1i − elpd
2i
). (8)
Here, for numbers {ai}ni=1 we define Vn
i=1ai =1
n−1 ∑ni=1(ai − an)2.
3. Results
We included in the analysis 224 pitches from 25 pitchers for which the ball velocitywas recorded and sensor clipping did not occur. Characteristics of the measured ball andpeak angular velocities of pelvis and trunk are summarised in Table 1.
Table 1. Summary of measured ball and peak angular velocities.
Mean ± Standard Deviation
Peak pelvis angular velocity (deg/s) 690.2 ± 90.9Peak trunk angular velocity (deg/s) 1172.4 ± 239.5
Ball velocity (mph) 68.3 ± 6.5
We consider the model called Observations model as base model. The other twoproposed models, Personal and Full, are extensions since they have two instead of one leveland they introduce the group participation that makes a distinction between pitchers of adifferent height. Therefore, comparing the developed models determines the contributionof the kinematic parameters related to pitching mechanics and body height of a pitcher toaccuracy of ball speed prediction. The graphical representations (Figures 4–6) show thatboth the models Personal and Full provide a good fit to the observed data, while the fit ofObservations is unsatisfactory.

Sensors 2021, 21, 7442 7 of 10
0.8
0.9
1.0
1.1
1.2
0.95 1.00 1.05 1.10Average yrep
y
Model: Observations
Figure 4. Ball velocity observations (dots) vs. average simulated value of the ball speed (line) fromthe posterior predictive distribution of the Observations model. This graphical representation suggeststhat Observations model leaves a large amount of variation in the data unexplained.
0.8
0.9
1.0
1.1
1.2
0.9 1.0 1.1Average yrep
y
Model: Personal
Figure 5. Ball velocity observations (dots) vs. average simulated value of the ball velocity (line) fromthe posterior predictive distribution of the Personal model. This graphical representation suggeststhat Personal model is a good fit to collected data.

Sensors 2021, 21, 7442 8 of 10
0.8
0.9
1.0
1.1
1.2
0.8 0.9 1.0 1.1Average yrep
y
Model: Full
Figure 6. Ball velocity observations (dots) vs. average simulated value of the ball velocity (line) fromthe posterior predictive distribution of the Full model. This graphical representation suggests thatFull model is a good fit to collected data.
The Full model is a preferable model, followed by the Personal and Observations model(see Tables 2 and 3).
Table 2. Comparison of fitted models. The rows show the difference in elpd, with estimated standarderror in brackets, between the Full model and remaining models (Personal and Observations).
elpdFull− elpd
Personal−5.5 (3.3)
elpdFull− elpd
Observations−308.3 (13.5)
Table 3. Comparison of fitted models.
R2 RMSE
Full 0.975 0.014Personal 0.973 0.014
Observations 0.137 0.089
4. Discussion
The aim of this study was to predict a ball velocity in baseball pitching such thatprediction is tailored to the individual pitcher. The proposed method included pitcher’sbody segment rotation, which determines his technique, and pitcher’s height that displaysindividuality in imparted velocity to a ball. We used multilevel modeling to developthree models with different predictors and examined their predictive performance. Bycomparing developed models, we investigated the added value of individuality to ballvelocity prediction.
Ball velocities presented in this study are similar to the ones reported in the previousstudies. Pitchers with a mean age of 14.7 ± 1.5 years threw balls with average velocity30.6 ± 2.9 m/s, while Dun [21] reported average ball velocity of 26.3 ± 3.8 m/s measuredin a population of youth pitchers throwing fastballs.
In the overhead pitching, the lower extremity and trunk generate and transfer energyto the upper extremity. To examine the relationship between ball velocity and variations inpitching biomechanics on individual level, previous studies identified maximum pelvisand trunk angular velocity as kinematic parameters linked to ball velocity [7,8,10]. Recent
Sensors 2021, 21, 7442 9 of 10
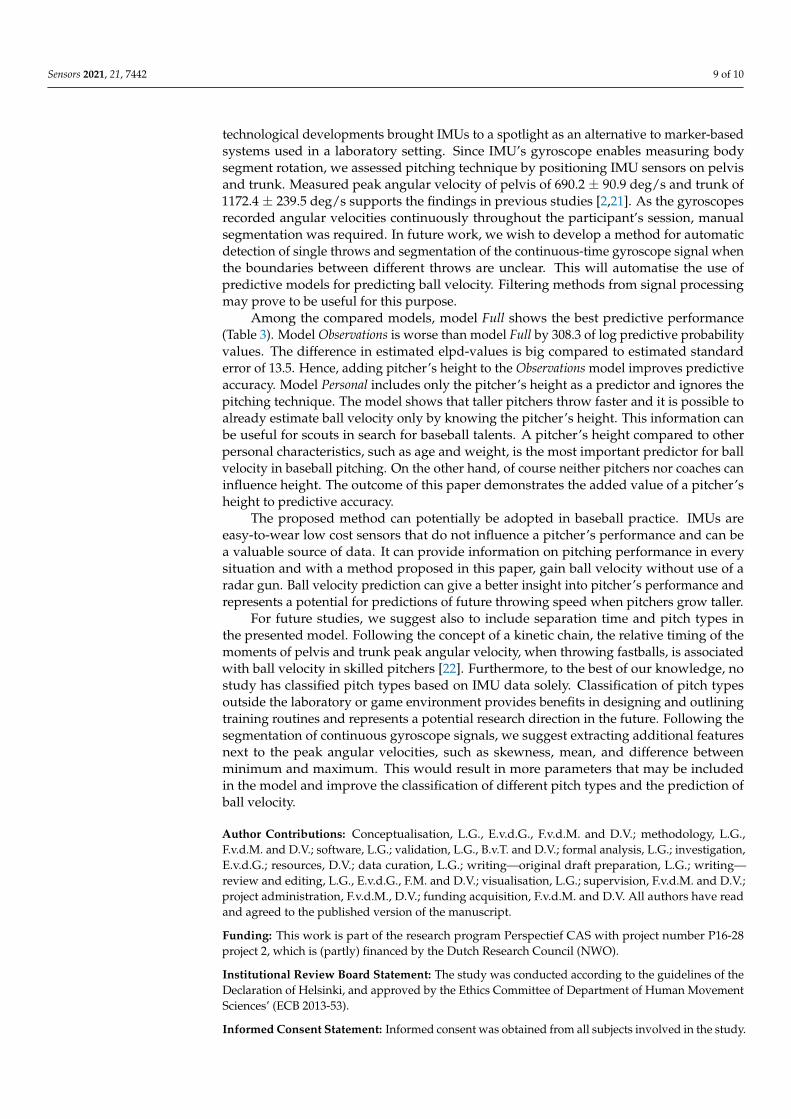
technological developments brought IMUs to a spotlight as an alternative to marker-basedsystems used in a laboratory setting. Since IMU’s gyroscope enables measuring bodysegment rotation, we assessed pitching technique by positioning IMU sensors on pelvisand trunk. Measured peak angular velocity of pelvis of 690.2 ± 90.9 deg/s and trunk of1172.4 ± 239.5 deg/s supports the findings in previous studies [2,21]. As the gyroscopesrecorded angular velocities continuously throughout the participant’s session, manualsegmentation was required. In future work, we wish to develop a method for automaticdetection of single throws and segmentation of the continuous-time gyroscope signal whenthe boundaries between different throws are unclear. This will automatise the use ofpredictive models for predicting ball velocity. Filtering methods from signal processingmay prove to be useful for this purpose.
Among the compared models, model Full shows the best predictive performance(Table 3). Model Observations is worse than model Full by 308.3 of log predictive probabilityvalues. The difference in estimated elpd-values is big compared to estimated standarderror of 13.5. Hence, adding pitcher’s height to the Observations model improves predictiveaccuracy. Model Personal includes only the pitcher’s height as a predictor and ignores thepitching technique. The model shows that taller pitchers throw faster and it is possible toalready estimate ball velocity only by knowing the pitcher’s height. This information canbe useful for scouts in search for baseball talents. A pitcher’s height compared to otherpersonal characteristics, such as age and weight, is the most important predictor for ballvelocity in baseball pitching. On the other hand, of course neither pitchers nor coaches caninfluence height. The outcome of this paper demonstrates the added value of a pitcher’sheight to predictive accuracy.
The proposed method can potentially be adopted in baseball practice. IMUs areeasy-to-wear low cost sensors that do not influence a pitcher’s performance and can bea valuable source of data. It can provide information on pitching performance in everysituation and with a method proposed in this paper, gain ball velocity without use of aradar gun. Ball velocity prediction can give a better insight into pitcher’s performance andrepresents a potential for predictions of future throwing speed when pitchers grow taller.
For future studies, we suggest also to include separation time and pitch types inthe presented model. Following the concept of a kinetic chain, the relative timing of themoments of pelvis and trunk peak angular velocity, when throwing fastballs, is associatedwith ball velocity in skilled pitchers [22]. Furthermore, to the best of our knowledge, nostudy has classified pitch types based on IMU data solely. Classification of pitch typesoutside the laboratory or game environment provides benefits in designing and outliningtraining routines and represents a potential research direction in the future. Following thesegmentation of continuous gyroscope signals, we suggest extracting additional featuresnext to the peak angular velocities, such as skewness, mean, and difference betweenminimum and maximum. This would result in more parameters that may be includedin the model and improve the classification of different pitch types and the prediction ofball velocity.
Author Contributions: Conceptualisation, L.G., E.v.d.G., F.v.d.M. and D.V.; methodology, L.G.,F.v.d.M. and D.V.; software, L.G.; validation, L.G., B.v.T. and D.V.; formal analysis, L.G.; investigation,E.v.d.G.; resources, D.V.; data curation, L.G.; writing—original draft preparation, L.G.; writing—review and editing, L.G., E.v.d.G., F.M. and D.V.; visualisation, L.G.; supervision, F.v.d.M. and D.V.;project administration, F.v.d.M., D.V.; funding acquisition, F.v.d.M. and D.V. All authors have readand agreed to the published version of the manuscript.
Funding: This work is part of the research program Perspectief CAS with project number P16-28project 2, which is (partly) financed by the Dutch Research Council (NWO).
Institutional Review Board Statement: The study was conducted according to the guidelines of theDeclaration of Helsinki, and approved by the Ethics Committee of Department of Human MovementSciences’ (ECB 2013-53).
Informed Consent Statement: Informed consent was obtained from all subjects involved in the study.

Sensors 2021, 21, 7442 10 of 10
Data Availability Statement: The data presented in this study are openly available in 4TU.ResearchDataat https://doi.org/10.4121/16691947.
Conflicts of Interest: The authors declare no conflict of interest. The funders had no role in the designof the study; in the collection, analyses, or interpretation of data; in the writing of the manuscript, orin the decision to publish the results.
References1. Pappas, A.M.; Zawacki, R.M.; Sullivan, T.J. Biomechanics of baseball pitching. A preliminary report. Am. J. Sport. Med. 1985, 13,
216–222. [CrossRef] [PubMed]2. Seroyer, S.T.; Nho, S.J.; Bach, B.R.; Bush-Joseph, C.A.; Nicholson, G.P.; Romeo, A.A. The kinetic chain in overhand pitching: Its
potential role for performance enhancement and injury prevention. Sports Health 2010, 2, 135–146. 1941738110362656. [CrossRef][PubMed]
3. Anz, A.W.; Bushnell, B.D.; Griffin, L.P.; Noonan, T.J.; Torry, M.R.; Hawkins, R.J. Correlation of Torque and Elbow Injury inProfessional Baseball Pitchers. Am. J. Sport. Med. 2010, 38, 1368–1374. [CrossRef] [PubMed]
4. Hay, J.G. The Biomechanics of Sports Techniques, 4th ed.; Prentice-Hall: Englewood Cliffs, NJ, USA, 1993.5. Lehman, G.; Drinkwater, E.J.; Behm, D.G. Correlation of throwing velocity to the results of lower-body field tests in male college
baseball players. J. Strength Cond. Res. 2013, 27, 902–908. [CrossRef] [PubMed]6. Fortenbaugh D.; Fleisig G.S.; Andrews, J.R. Baseball Pitching Biomechanics in Relation to Injury Risk and Performance. Sports
Health 2009, 1, 314–320. [CrossRef] [PubMed]7. Werner, S.L.; Suri, M.; Guido, J.A., Jr.; Meister, K.; Jones, D.G. Relationships between ball velocity and throwing mechanics in
collegiate baseball pitchers. J. Shoulder Elbow Surg. 2008, 17, 905–908. [CrossRef] [PubMed]8. Dowling, B.; Pearl, C.; Laughlin, W.; Fleisig, G. Relationship of pelvis and trunk kinematics to ball velocity in professional baseball
pitchers. In Proceedings of the 40th American Society of Biomechanics (ASB) Annual Meeting (ASB 2016), Raleigh, NC, USA,2–5 August 2016.
9. Camomilla, V.; Bergamini, E.; Fantozzi, S.; Vannozzi, G. Trends Supporting the In-Field Use of Wearable Inertial Sensors for SportPerformance Evaluation: A Systematic Review. Sensors 2018, 18, 873. [CrossRef] [PubMed]
10. van der Graaff, E.; Hoozemans, M.J.M.; Nijhoff, M.; Davidson, M.; Hoezen, M.; Veeger, H.E.J. Timing of peak pelvis and thoraxrotation velocity in baseball pitching. J. Phys. Fit. Sport. Med. 2018, 7, 269–277. [CrossRef]
11. Skejø, S.D.; Bencke, J.; Møller, M.; Sørensen, H. Estimating Throwing Speed in Handball Using a Wearable Device. Sensors 2020,20, 4925. [CrossRef]
12. McGrath, J.; Neville, J.; Stewart, T.; Clinning, H.; Cronin, J. Can an inertial measurement unit (IMU) in combination with machinelearning measure fast bowling speed and perceived intensity in cricket? J. Sport. Sci. 2021, 39, 1402–1409. [CrossRef] [PubMed]
13. Gençoglu, C.; Gümüs, H. Standing handball throwing velocity estimation with a single wrist-mounted inertial sensor. Ann. Appl.Sport Sci. 2020, 8. [CrossRef]
14. Matsuo, T.; Escamilla, R.F.; Fleisig, G.S.; Barrentine, S.W.; Andrews, J.R. Comparison of Kinematic and Temporal Parametersbetween Different Pitch Velocity Groups. J. Appl. Biomech. 2001, 17, 1–13. Available online: http://journals.humankinetics.com/view/journals/jab/17/1/article-243243p1.xml (accessed on 4 June 2021). [CrossRef]
15. Kuhn, M.; Johnson, K. Applied Predictive Modeling; Springer: Berlin/Heidelberg, Germany, 2013.16. Kuhn, M. Caret: Classification and Regression Training. R Package Version 6.0-86. 2020. Available online: https://CRAN.R-
project.org/package=caret (accessed on 30 August 2021).17. R Core Team. R: A Language and Environment for Statistical Computing; R Foundation for Statistical Computing: Vienna, Austria,
2020. Available online: https://www.R-project.org/ (accessed on 30 August 2021).18. Goodrich, B.; Gabry, J.; Ali, I.; Brilleman, S. Rstanarm: Bayesian Applied Regression Modeling via Stan. R Package Version 2.21.1.
2020. Available online: https://mc-stan.org/rstanarm (accessed on 30 August 2021).19. Muth, C.; Oravecz, Z.; Gabry, J. User-friendly Bayesian regression modeling: A tutorial with rstanarm and shinystan. Quant.
Methods Psychol. 2018, 14, 99–119. [CrossRef]20. Vehtari, A.; Gelman, A.; Gabry, J. Practical Bayesian model evaluation using leave-one-out cross-validation and WAIC. Stat.
Comput. 2017 27, 1413–1432. [CrossRef]21. Dun, S.; Loftice, J.; Fleisig, G.S.; Kingsley, D.; Andrews, J.R. A biomechanical comparison of youth baseball pitches: is the
curveball potentially harmful? Am. J. Sport. Med. 2008, 36, 686–692. [CrossRef] [PubMed]22. van der Graaff, E.; Hoozemans, M.; Nijhoff, M.; Davidson, M; Hoezen, M; Veeger, D. The role of pelvis and thorax rotation
velocity in baseball pitching. In Proceedings of the 34th International Conference on Biomechanics in Sports, Tsukuba, Japan,18–22 July 2016.