Development and Evaluation of a Computerised and Individualised intervention for increasing Physical...
135
Faculty of Medicine and Health Sciences Department of Movement and Sport Sciences Development and Evaluation of a Computerised and Individualised intervention for increasing Physical Activity and decreasing Fat Intake Corneel Vandelanotte Thesis submitted in fulfilment of the requirements for the degree of Doctor in Physical Education Promotor: Prof.Dr. I. De Bourdeaudhuij Ghent 2004
Transcript of Development and Evaluation of a Computerised and Individualised intervention for increasing Physical...

Faculty of Medicine and Health Sciences
Department of Movement and Sport Sciences
Development and Evaluation of a Computerised and Individualised intervention for increasing Physical Activity
and decreasing Fat Intake
Corneel Vandelanotte Thesis submitted in fulfilment of the requirements for the degree of Doctor in Physical Education
Promotor: Prof.Dr. I. De Bourdeaudhuij
Ghent 2004

Promotor Prof. Dr. I. De Bourdeaudhuij Universiteit Gent Leden van de Begeleidingscommisie Prof. Dr. G. De Backer Universiteit Gent Prof. Dr. J. Bouckaert Universiteit Gent Prof. Dr. P. Van Oost Universiteit Gent Prof. Dr. R. Philippaerts Universiteit Gent Leden van de Examencommissie Prof. Dr. Ir. J. Brug Erasmus MC Rotterdam Prof. Dr. Y. Vanden Auweele Katholieke Universiteit Leuven Prof. Dr. G. Beunen Katholieke Universiteit Leuven Prof. Dr. L. Maes Universiteit Gent Dr. V. Stevens Vlaams Instituut voor Gezondheidspromotie Dit project werd gefinancierd door het Bijzonder Onderzoeksfonds. ISBN 90-8090841-X © Corneel Vandelanotte, Ghent, 2004. All rights reserved. No part of this publication may be reproduced, stored in a retrieval system, or transmitted in any form or by any means, mechanically, by photocopy, by recording or otherwise, without the permission from the author.

Contents
Contents
Summary
Chapter 1. General Introduction 1
Chapter 2. Reliability and validity of a computerised and 23
Dutch version of the international physical activity
questionnaire (IPAQ)
Chapter 3. Reliability and validity of a computerised questionnaire 39
to measure fat intake in Belgium
Chapter 4 Acceptability and feasibility of a computer-tailored 51
physical activity intervention using stages of change
Chapter 5. Acceptability and feasibility of an interactive 65
computer-tailored fat intake intervention in Belgium
Chapter 6. Efficacy of sequential or simultaneous interactive 73
computer-tailored interventions for increasing physical
activity and decreasing fat intake
Chapter 7. General discussion 95
Publications 111
Acknowledgements 113
Appendix Addendum 1: CD-rom both interventions 115
Addendum 2: IPAQ 116
Addendum 3: GVET 123
Summary
Summary
There is a large body of epidemiological evidence showing the health benefits of regular
physical activity and a low fat diet. A reduced risk of premature mortality, cardiovascular
disease, diabetes, several types of cancer and obesity are among the most important to note.
In order to obtain these benefits health authorities recommend to accumulate at least 30
minutes of moderate-intensity physical activity on most, preferably all, days of the week and
to consume less than 30% energy from fat. However, in most western countries most people
are inactive and eat too much fat. It is very clear that there is a strong need for effective
primary prevention interventions aimed at increasing physical activity and decreasing fat
intake in the general population. However, reaching large populations at an individual level is
very costly and time consuming and, on the other hand, the use of mass media has often
showed to be of limited effect. These barriers might be overcome by using interactive
computer-tailored interventions. Tailored interventions provide respondents with personally
adapted feedback about their present health behavior and/or the behavioral determinants, as
well as personally adapted suggestions to change behaviors. The purpose of our project was
to develop and evaluate a computerised and individualised intervention for increasing
physical activity and decreasing fat intake. Further we also wished to examine whether
computer-tailored interventions can be used in a sequential or simultaneous intervening
mode.
In developing the computer-tailored physical activity intervention a computerised and Dutch
version of the International Physical Activity Questionnaire was tested on reliability and
validity; the questionnaire showed to be acceptable for further use. In developing the
computer-tailored fat intake intervention a new food frequency questionnaire measuring fat
intake needed to be developed and tested on reliability and validity; this measurement tool
showed to be acceptable for further use. Immediately after developing both interventions an
extensive acceptability and feasibility testing was executed; the results indicated that both
interventions could be used in a general public. Finally, in a randomised pretest-posttest
control group study evaluating the efficacy of the interventions it was concluded that both the
interactive computer-tailored physical activity and fat intake intervention can be applied
successfully to change behaviors. Further, both sequential and simultaneous intervening
modes can be used. From a public health point of view and because the simultaneous
intervention mode was superior for fat intake we recommend to implement the interventions
simultaneously.

Summary
Samenvatting
Verschillende studies tonen aan dat regelmatig fysiek actief zijn en het eten van een voeding
met weinig vet vele gezondheidsvoordelen heeft. De voornaamste zijn een verminderd risico
op vroegtijdig sterven, cardiovasculaire ziekten, verschillende kankers en zwaarlijvigheid.
Om van deze gezondheidsvoordelen te kunnen genieten wordt aangeraden om op zijn minst
30 minuten fysiek actief te zijn aan een matige intensiteit en dit op de meeste dagen van de
week en een energieopname te hebben waarvan minder dan 30% van het totaal uit vet
bestaat. In de praktijk blijkt echter dat slechts een klein deel van de bevolking aan deze
normen voldoet. Daarom is er een grote nood aan effectieve gezondheidspromotie
campagnes, enerzijds voor het verhogen van de fysieke activiteit en anderzijds voor het
verlagen van de vetinname. Het is echter duur en tijdrovend om grote groepen mensen op
een individuele manier te bereiken. Daarom kunnen computergestuurde en
geïndividualiseerde interventies een oplossing bieden, de zogenaamde
‘tailoringsinterventies’. In dit soort interventies krijgen de deelnemers persoonlijk aangepast
advies in verband met hun gezondheidsgedrag. Het doel van ons project was het ontwikkelen
en evalueren van een computergestuurde en geïndividualiseerde interventie enerzijds voor het
verhogen van de fysieke activiteit en anderzijds voor het verlagen van de vetinname.
Vervolgens wensten we ook na te gaan of deze interventies al dan niet gelijktijdig of na
elkaar (interval van drie maanden) aangeboden konden worden.
Gedurende de ontwikkeling van de fysieke activiteitsinterventie werd een computergestuurde
en Nederlandstalige versie van de internationale fysieke activiteitsvragenlijst getest op
betrouwbaarheid en validiteit; deze parameters bleken goed genoeg te zijn om de vragenlijst
verder te kunnen gebruiken. Gedurende de ontwikkeling van de vetinname interventie werd
een nieuwe vragenlijst voor het meten van de vetinname ontwikkeld en getest op
betrouwbaarheid en validiteit; opnieuw bleken deze parameters goed genoeg te zijn om de
vragenlijst verder te kunnen gebruiken. Onmiddellijk na het ontwikkelen van beide
interventies werd een uitgebreide gebruiksvriendelijkheidtest uitgevoerd; uit de resultaten
bleek dat beide interventies ruim voldoende scoren om gebruikt te kunnen worden. Tenslotte
werd in een effectenstudie (met pretest-posttest en controle-experimentele groep) duidelijk
dat beide interventies succesvol kunnen gebruikt worden om gedrag te veranderen. Verder
bleek ook dat de interventies zowel gelijktijdig als na elkaar (met interval van drie maanden)
kunnen gebruikt worden. Vanuit een gezondheidspromotie standpunt raden wij daarom aan
om de fysieke activiteit en vetinname interventie gelijktijdig aan te bieden, dat is handiger en
goedkoper.


Chapter 1
1
CHAPTER 1
General Introduction Problem analysis
There is a large body of epidemiological evidence showing the health benefits of regular
physical activity and, on the other hand, the negative effects of physical inactivity.1-3 Regular
participation in physical activity reduces the risk of premature mortality, coronary heart
disease, hypertension, colon cancer, diabetes mellitus, obesity, osteoporosis, osteoarthritis
and low back pain.4,5 Physical activity also appears to reduce depression and anxiety; and to
improve mood, functional capacity and the ability to perform daily tasks throughout the life
span.5 The Surgeon General report 5, the book by Hardman and Stensel 6 and the book by
Bouchard et al.7 all present a very extensive literature study about the relation between
physical activity and health; their main findings are outlined below. Higher levels of regular
physical activity are associated with lower mortality rates for both older and younger adults,
even for those who are moderately active. Regular physical activity also decreases the risk of
cardiovascular disease mortality in general and of coronary heart disease in particular. The
level of decreased risk attributable to regular physical activity is similar to that of other
lifestyle factors, such as keeping free from cigarette smoking. Physical activity prevents or
delays the development of high blood pressure, and reduces blood pressure in people with
hypertension. Regular physical activity is associated with a decreased risk of colon cancer,
however there is no association between physical activity and rectal cancer and data are to
sparse to draw conclusions regarding the relationship between physical activity and
endometrial, ovarian or testicular cancers. Despite numerous studies on the subject, the
existing data are inconsistent regarding an association between physical activity and breast or
prostate cancer. Regular physical activity is important for weight control and might increase
the use of kilocalories (also in rest by increasing muscle mass) over the amount of
kilocalories consumed, which might prevent or delay the development of obesity. Physical

General Introduction
2
activity also appears to favourably affect body fat distribution. The epidemiologic literature
strongly supports a protective effect of physical activity on the likelihood of developing type
2 diabetes. This is caused by an increased sensitivity to insulin, a reduced risk for
atherosclerosis (which decreases the risk of macrovascular or atherosclerotic complications
of diabetes) and by reducing total body fat or specifically intra-abdominal fat which is a
known risk factor for insulin resistance. Regular physical activity is necessary for
maintaining normal muscle strength, joint structure and joint function and may be beneficial
for many people with osteoarthritis. Weight-bearing physical activity is essential for normal
skeletal development during childhood and adolescence and for achieving and maintaining
peak bone mass in young adults. In doing so physical activity prevents osteoporosis. There is
promising evidence that strength training and other forms of exercise in older adults preserve
the ability to maintain independent living status and reduce the risk of falling. Physical
activity appears to relieve the symptoms of depression and anxiety and improve mood.
Regular physical activity may reduce the risk of developing depression, although further
research is needed on this topic. Physical activity appears to improve health-related quality of
life by enhancing psychological well-being and by improving physical functioning in persons
compromised by poor health. How much physical activity is needed to obtain these health
benefits has been questioned. For long scientists believed that health benefits could only be
obtained if an increase in physical fitness was accomplished.8 Such an increase can only be
established by doing intense physical activities. However, in 1995 it was agreed, based upon
a large amount of evidence, that an increase in physical fitness and intense physical activities
are not needed to obtain health benefits. According to the consensus statement significant
health benefits can be obtained by including at least 30 minutes of moderate-intensity
physical activity on most, preferably all, days of the week.9-11 Intermittent or shorter bouts of
activity (at least 10 minutes) also have similar cardiovascular and health benefits if performed
at a level of moderate intensity and if accumulated to at least 30 minutes a day.9,11 Additional
health benefits can be gained through greater amounts of physical activity. People who can
maintain a regular regime of activity that is of long duration or of vigorous intensity are
likely to derive greater benefits. Despite the well-documented health benefits and public
health efforts to increase physical activity, most adults remain under-active and only a limited
proportion of the population comply with these recommendations. World-wide only 15 to 25
% of the adult population engage in vigorous physical activity, about 35 to 50 % engage in
some physical activity of moderate intensity, and 30 to 45 % are completely inactive.5,12-17
Similar results have been found for Europe and Belgium.18-26 In 1997 and 2001 large

Chapter 1
3
population surveys on physical activity were executed in Belgium, the results showed that
only 33 % of the Belgian population engages in an activity that makes them sweat for at least
once a week. The authors conclude that at least half of the population does not do enough
activity to have any health benefit and they also note that there is no improvement in physical
activity levels from 1997 to 200121,22 Although physical activity levels within Europe are
comparable to each other, physical activity levels in Belgium are lower compared to most
other European countries.23-25,27
Similar to physical activity there is a lot of evidence showing the benefits of a low fat diet
and the adverse effects of a high fat diet. Diets which are high in fat intake, and especially
those having a high intake of saturated fats, are associated with an increased risk of
cardiovascular disease,28-31 several types of cancer,29,32 obesity33,34 and diabetes.35
Epidemiological studies show a strong, positive relationship between plasma cholesterol
concentrations and the incidence of atherosclerotic cardiovascular disease, with coronary
heart disease as one of the major causes of premature death.28,29 It has been shown that the
high plasma cholesterol levels are mainly caused by environmental rather than genetic
factors, this supports the notion that nutrition plays a major role. Many studies have
confirmed a strong association between fat intake, specifically saturated fat, mean total
cholesterol levels and rates of coronary heart disease mortality worldwide.29,30 Further,
studies have shown an association between fat intake and body mass index.36 The
consumption of a high fat diet increases the likelihood of obesity and that the risk of obesity
is low in individuals consuming low fat diets. A major argument for low fat diets is that
excess of fat intake itself and overweight are also associated with higher rates of coronary
heart disease. Obesity is associated with a negative effect on all major coronary heart disease
risk factors: cholesterol and triglyceride levels are raised, high density lipoprotein cholesterol
is lowered, blood pressure is increased and type 2 diabetes can be induced.35 Not only
obesity, which is the single most important determinant of type 2 diabetes, but a high fat diet
itself can induce type 2 diabetes, which may differentially affect insulin resistance. Finally, in
the past several studies have shown that total fat intake of a population is related to prostate,
colon, breast and ovarian cancers.29 However, many questions remain unanswered
concerning this topic and there is currently a strong debate ongoing to determine whether a
high intake of total fat and saturated fat influences the risk of developing cancer or not. The
current state of evidence suggests that there is no strong support for a direct relationship
between high intakes of total fat and saturated fat and the risk of cancer.37 In order to reduce
General Introduction
4
the risks of developing this kind of diseases most western countries formulated national
dietary guidelines. The first dietary guidelines were formulated by the American Heart
Association in 1957, at first they were vague, but as evidence grew during the years they
became more and more detailed.38 In Belgium the first dietary guidelines were formulated by
the National Council on Nutrition in March 1997.39 They are very similar to the American
Heart Association guidelines38 and are largely adopted from countries surrounding Belgium,
the WHO40 and the European Union.41 The guidelines recommend a total fat intake lower
than 30 % of total energy intake; the intake of saturated fatty acids should not exceed 10% of
total energy intake; and the intake of poly-unsaturated fatty acids should not exceed 7%.39
Despite the benefits of a low fat diet the guidelines also mention that total fat intake should
never be lower than 15%, since that is associated with other health problems, such as
potential nutrient deficiencies.38 Worldwide comparisons for fat intake are difficult because
dietary habits and available foods differ considerably between countries. Total fat intake
averages between 29% and 45% of total energy intake for men and woman.42-51 It is
important to note that total fat intake has declined in several countries, especially in the
United States and Canada, during the last two decades and now averages around 35%.45,49,50
Although, at first sight, these figures might not seem to alarming, one must not forget that
50% of the people have a fat intake that is higher than the reported average value, and that the
average values themselves are almost always above the recommended fat intake of 30% of
total energy intake. This indicates that in most western countries the vast majority of people
do not comply with the guidelines. Overall the situation in Europe is more or less
comparable, however large differences between the European countries are noted.42-44,46,47,51
The only large nationwide food consumption survey carried out in Belgium (BIRNH) shows
that only a limited proportion of the Belgian population complies to the fat intake
guideline.32,52-54 An average total fat intake of 41.8 energy% for men and 42.6 energy% for
women has been reported.54 In addition, the prevalence of obesity (BMI ≥ 30 kg/m²) is
particular high in Belgium, 12.1 % for men and 18.4 % for women.33 The BIRNH-study was
carried out between 1980 and 1985, and it might seem not very up-to-date. However,
comparisons with more recent but smaller studies, focusing on subgroups, show no evidence
of major changes in fat consumption.55-58 This is not consistent with some other countries that
show a remarkable decline in total fat intake.45,49,50 The Belgian Food patterns correspond to
the typical Western so-called affluent diet, which is characterised by an excessive fat intake
and a poor intake of complex carbohydrates, fibre, fruits and vegetables.54 At this moment a
new nation wide food consumption survey is carried out by the federal government in

Chapter 1
5
Belgium, about 3200 people are expected to participate and the results are expected by the
end of 2005. This study will give new and reliable information about foot patterns and
current fat intake levels.
From what is described above it becomes very clear that there is a strong need for effective
primary prevention interventions aimed at increasing physical activity and decreasing fat
intake in the general population. However, reaching large populations at an individual level is
very costly and time consuming and, on the other hand, the use of mass media has often
showed to be of limited effect.59 This calls for a new form of intervening which combines the
efficacy of interventions targeted at individuals with the advantage of reaching large
populations in mass media campaigns. Computer-tailored interventions might be promising.
By using a computerized approach this type of intervention is able to provide large numbers
of respondents with personally adapted feedback about their present health behaviour and/or
the behavioural determinants, as well as personally adapted tips and suggestions to change
behaviours.59-61 Computerised questionnaires targeting a health behaviour, such as fat intake
or physical activity, obtain specific personal information. This information is processed by
the computer and personally adapted feedback is generated immediately on the computer
screen. One-to-one counselling is thus mimicked by using an expert interactive computer.
Through the use of the internet and CD-rom health care professionals are able to reach many
individuals in a cheap way;60 and in contrast to traditional mass media approaches, tailoring
gives less redundant and more personal relevant information.59,60 According to the
’Elaboration Likelihood Model’ it are these factors which make tailored information to be
processed more thoughtfully62 and which drive the underlying mechanism that make tailored
health communications effective.59,63 In a number of well-designed studies addressing a range
of health-related behaviours and other outcomes, tailored health communication materials
outperformed non-tailored materials.59,64 Several tailored interventions have indicated to be
successful for increasing physical activity65-69 as well as for decreasing fat intake.61,70-75 It has
also been shown that compared with non-tailored messages, tailored messages are more
likely to be read and remembered, saved and discussed with others, perceived as interesting,
personally relevant and written especially for them.63,64 However, most of the computer-
tailored interventions used to date have been defined as first generation tailored
interventions.60,61 These first generation interventions are characterised by the fact that
computer technology is used relatively sparsely. Written questionnaires are used and it often
takes several weeks for participants to receive their tailored feedback letter from the research

General Introduction
6
team. This feedback is generated by a computer program and printed in a personal letter
format. In second generation interventions, interactive computer programs are used,
participants feed their answers to the diagnostic questions directly into a computer and
feedback is directly provided on the computer screen.61 To date only a few second generation
interventions were evaluated. Furthermore, in a recent study from Oenema et al.,76 a second
generation computer-tailored fat intake intervention showed no behaviour change. This
stresses the need for more research on the effectiveness of these interventions. Moreover,
computer-tailored interventions for increasing physical activity or decreasing fat intake have
typically focused on a single behaviour. Nevertheless many individuals have multiple health
risk behaviours77 and it has been reported that physical activity and fat intake are correlated
to each other.78-80 There may be additive or even synergistic effects of designing health
promotion interventions that focus on two behaviours at the same time.79 It is not clear if
targeting multiple health behaviours improves or decreases the effectiveness of interventions
and if it is best done simultaneously or sequentially.80 It has been suggested that intervention
effects may not be ‘diluted’ when they focus on more than one behaviour simultaneously,81
but others suggest that changing more than one habit at a time may be very difficult and
should better be done sequentially.77,80
To our knowledge no second-generation computer-tailored interventions for increasing
physical activity and decreasing fat intake have been reported in Belgium. Neither could we
find a direct test of the differences between sequential or simultaneous computer-tailored
interventions. Therefore the purpose of our project (also called FAITH project: Fat and
Activity Interventions Tailored to Health) was to develop and evaluate a computerised and
individualised intervention for increasing physical activity and decreasing fat intake; and to
examine whether they can be used in a sequential or simultaneous intervening mode.
Methods
For this research we had to develop a physical activity and a fat intake intervention. These
interventions used questionnaires that had to be tested on validity and reliability and the new
interventions also needed to be tested on acceptability and feasibility. This section provides
more information regarding these topics.

Chapter 1
7
The interventions
The main purpose of the interactive computer-tailored physical activity and fat intake
interventions (see CD-rom addendum 1) we developed was to help participants reach the
current public health recommendations for physical activity and fat intake by means of
specific individualized feedback. Both the physical activity and the fat intake intervention
had the same line-up and belong to the second generation of tailoring interventions, in which
interactive computer programs are used to provide immediate feedback on the computer
screen.61 An introduction page, which explains the nature and purpose of the intervention,
leads participants to an electronic questionnaire which had to be completed in order to
receive the personal advice, also called feedback. For both the physical activity and the fat
intake intervention this questionnaire consisted of three parts: demographics, health
behaviour and psychosocial determinants. For measuring health behaviour the International
Physical Activity Questionnaire (IPAQ) was used in the physical activity intervention and a
newly developed fat intake questionnaire was used in the fat intake intervention. In both
interventions the psychosocial determinant questionnaires had questions concerning
knowledge, social support, self-efficacy, attitudes, perceived benefits and barriers, intentions
and environment. After completing the questionnaire tailored feedback was displayed
immediately on the screen. This feedback was selected from a database filled with messages
that match any possible combination of answers. For each intervention this message database
contains hundreds of text messages, of which only a very limited and relevant selection is
presented to the participants. The answers of the participants are linked to the correct
messages using special software that operates by means of so-called ‘If-Then statements’ that
decide who gets what message. In both interventions the tailored feedback was based on the
theory of planned behaviour82 and the stages of change concept from the trans-theoretical
model.83 These health psychological models take the determinants of the behaviour at study
into account. The most important determinants of physical activity are self-efficacy (this is a
person’s confidence in his or her abilities to do physical activities in specific circumstances),
the intention to be active or not, the attitude towards physical activity, and the benefits and
barriers of physical activity.17 According to Sallis and Owen17 table 2 summarises some 300
studies that studied the associations between physical activity and determinants in adults.

General Introduction
8
Table 2: Associations of determinants with physical activity in adults.
Determinant
Associations with activity in supervised
program
Associations with overall
physical activity
Demographic and biological factors Age Blue-collar occupation Education Gender (male) Genetic factors High risk for heart disease Income/socio-economic status Injury history Overweight/obesity
00 -- + -
0
-- -
++ ++ ++ -
++ + 00
Psychological, cognitive and emotional factors Attitudes Barriers to exercise Control over exercise Enjoyment of exercise Expect Benefits Intention to exercise Knowledge of health and exercise Lack of time Normative beliefs Perceived health or fitness Personality variables Psychological health Self-efficacy Self-motivation Stages of change Stress Susceptibility to illness/seriousness of illness
+ -
+ + 0 0 -- 0
++
0 ++ ++
0
0 -- +
++ ++ ++ 00 -
00 ++ + +
++ ++ ++
0 00
Behavioural attitudes and skills Activity history during childhood/youth Activity history during adulthood Contemporary exercise program Dietary habits (quality) Past exercise program Processes of change Skills for coping with barriers Decision balance sheet
++ 0
00 ++
+
00 ++ 0
++ +
++ +
Social and cultural factors Social support from friends/peers Social support from spouse/family Social support from staff/instructor
+
++ +
++ ++
Physical environment factors Access to facilities: actual Access to facilities: perceived Climate/season
+ + -
+ 00 --
KEY: ++ = repeatedly documented positive association with physical activity; + = weak or mixed evidence of positive association with physical activity; 00 = repeatedly documented lack of association with physical activity; 0 = weak or mixed evidence of no association with physical activity; -- = repeatedly documented negative association with physical activity; - = weak or mixed evidence of negative association with physical activity. Blank spaces indicate no data available.

Chapter 1
9
The most important determinants of the intention and the actual consumption of fat are
attitude, taste, health beliefs, normative beliefs, modelling and self-efficacy expectations;
they have an explained variance of 20-50%.84 The explained variance has proved to be
greater for intention than for fat intake itself. It is important to note that most people
underestimate their fat intake, which reflects a lack of awareness of people’s own dietary
intake. And since self-rated intake is predictive of the intention to change, it was concluded
that lack of awareness is a major barrier for the intention to change to healthier diets. Only
after elimination of this barrier attitude, social influences and self-efficacy expectations
towards a lower fat intake can become relevant.85,86 Both the theory of planned behaviour and
the stages of change theory have convincingly proven to be effective and useful in health
promotion interventions and are therefore very common in use.87-93 The theory of planned
behaviour was considered by giving the participants personal relevant feedback about
intentions, attitudes, self-efficacy, social support, knowledge, benefits and barriers of the
behaviour to change (physical activity or fat intake). The stages of changes were considered
in two ways. First, the content differed between stages. Precontemplators mainly received
general information and information about the benefits of the behaviour to change.
Contemplators received the same information, although not so extensively, and it was
mentioned that they might benefit from a behaviour change themselves. In the preparation
stage, the emphasis really was on changing the behaviour in order to comply with the
recommendations. In the action stage, the emphasis was on maintaining the newly adopted
behaviour and relapse prevention. In the maintenance stage feedback was reduced to saying
that they were doing well and that they should carry on. Second, the way in which the
participants were approached also differed between stages. Information for precontemplators
was presented in an impersonal way (e.g. people could...) in order to avoiding resistance.
Contemplators were approached in a personal way (e.g. you could…), but not in a decisive
way which was used for preparators (e.g. you should…) or a supporting way used for people
in the action or maintenance phase (e.g. you do…). In practice the feedback consisted of
three parts: a general introduction; normative feedback which related participants’ physical
activity or fat intake to current recommendations; and tips and suggestions on how to
increase physical activity or decrease fat intake. This part of the advice, only presented when
recommendations were not met, also incorporated feedback on the participant’s psychosocial
attitudes, perceived benefits and barriers, social support, and self-efficacy related to physical
activity or fat intake. Altogether feedback can amount to as much as five or six pages of

General Introduction
10
advice, but only in cases of very high fat intake or very sedentary behaviours. The tailored
feedback displayed on the computer screen could be printed and taken home.
The physical activity intervention also had an extra module, called ‘action plan’, which was
not present in the fat intake intervention. The action plan operated independently of the
physical activity advice, and was meant only for those participants who are not in the
maintenance stage and are also motivated to become more active. It consisted of a
questionnaire that was used to transform physical activity intentions into specific acts, and
therefore asked people what activity they want to do when, where, how long and with whom.
The questions aimed to start a process of thought which directs people how to become more
active (implementation intentions). The action plan itself was an exact reproduction of the
answers participants gave and can be used to remind them of their physical activity
intentions.
Several health promotion experts specialised in fat intake and/or physical activity and a
number of computer experts gave advice when the interventions were developed and
extensively examined the interventions once they were finished. Numerous tests were run to
ensure that the feedback matched with the answers given on the questionnaires. This avoided
incorrect decision rules (so-called ‘If-Then statements’ that decide who gets what message)
or wrong cut-off scores which can cause that participants receive feedback that is not
correctly tailored. A specialised company was hired to design graphics and lay-out. These
efforts allowed us to improve the quality of the interventions before they were presented to a
general public in a formal acceptability and feasibility testing.
Reliability and validity testing
The International Physical Activity Questionnaire (IPAQ) used in the physical activity
intervention (see addendum 2) was developed by a working group, initiated by the World
Health Organization (WHO) and the Centers for Disease Control and Prevention (CDC),
attending a physical activity standardisation meeting in Geneva, Switzerland, in April 1998.94
It is argued that the value of a self-assessed physical activity measurement would increase if
international comparisons could be made.95 However, this is mostly impossible since
numerous and often incomparable operalizations of physical activity are being used. The
‘International Consensus Group for Physical Activity Measurement’ realized the need for the
development of an international standardized assessment technique, and therefore it

Chapter 1
11
developed the International Physical Activity Questionnaire (IPAQ).94,95 The advantage of
having international comparable physical activity data when using the IPAQ was an
important reason for choosing this measurement tool above others. The fact that this
questionnaire is primarily aimed at measuring physical activity and not exercise or sports
participation, as is the case in most other questionnaires, was another reason for choosing this
instrument. The questionnaire consists of five categories: Job-related physical activity
(vigorous, moderate and walking), Transportation physical activity (motor vehicle, cycling
and walking), Housework, house maintenance and caring for family (vigorous and moderate
in garden, moderate inside home), Recreation, sport and leisure-time physical activity
(vigorous, moderate and walking) and Time spent sitting (week day, weekend day). For each
topic in each category, respondents reported the number of days per week and the time per
day they usually spent doing the activity. For walking and cycling an additional question on
pace was added. In order to be reported, an activity should have lasted for at least ten minutes
continuously. An international reliability and validity testing of the IPAQ has been done, and
the results were acceptable.94 However, when our physical activity intervention was
developed a Dutch nor a Computerised IPAQ version had ever been used before and
consequently a thorough reliability and validity testing was needed before this instrument
could be integrated into our physical activity intervention. CSA accelerometers (Actigraph
monitor) and seven day physical activity diaries were used to obtain validity. The
reproducibility of the questionnaire is assessed by means of a test-retest procedure.96
The fat intake questionnaire used in the fat intake intervention (see addendum 3) was newly
developed especially for this research in cooperation with the Flemish Institute for Health
promotion (VIG). A new instrument was created because there was no Flemish fat intake
questionnaire available and since dietary habits are geographically bounded it was not
possible to use a foreign fat intake questionnaire. We wished to develop a measurement tool
that could fit in an acceptable and appropriate way into our computer-tailored fat intake
intervention. Therefore we did not use a food frequency questionnaire measuring total food
intake (instead of only fat intake), a 24hr recall or a diet diary in our intervention. The
computerised fat intake questionnaire consists of 48 questions divided in seven categories of
food items (bread and cereals; spreads fillings and butter; milk and milk products; prepared
meals; meat, fish and eggs; sauce gravy and dressing; snacks cake and biscuits) and takes
about 20 minutes to administer. Participants were asked how frequently they consumed the
food products during a usual day, week or month. Each question was guided by several
General Introduction
12
examples of the food product, mostly including brand names, and an average portion size. A
reliability and validity testing of this questionnaire, before it was integrated into the fat intake
intervention, was needed since it was a newly developed measurement tool that was never
tested before. The relative validity of this questionnaire was examined in relation to a seven
day estimated diet record. The reproducibility of the questionnaire is assessed by means of a
test-retest procedure.96
Acceptability and Feasibility testing
Interactive computer tailored interventions may have some specific drawbacks which argue
for extensive acceptability and feasibility testing before implementation. The construction of
a computer tailored program implies the development of hundreds of messages, which are
written to be specifically relevant for every single participant. In this respect, feedback
messages create the illusion of personal interaction and tailoring. However, in reality
everything is computer controlled and there is no one to assist participants or to make
adjustments whenever something goes wrong or a computer error appears. Moreover, Tones
and Tilford97 underline that acceptability and feasibility testing (also called pre-testing) must
form part in the development of any well-designed health education programme and that it is
also an integral part of the process of evaluation. As Kreuter et al.59 argue, acceptability and
feasibility testing of computer tailored messages is different and more complex than
acceptability and feasibility testing of non-tailored materials. If tailored messages are
evaluated by a person for who the message was not meant, they will be rated as unsuitable
and irrelevant.59 It is clear that acceptability and feasibility testing does not guarantees that a
program will be effective, but it increases the likelihood that the intervention is
comprehensive, relevant, noticeable, memorable, credible, acceptable and attractive which
are prerequisites for attitude and behaviour change.98 Finally, an acceptability and feasibility
testing targeted at several subgroups, such as different age, gender, education and stage of
change groups, might prevent implementing an intervention that only applies to small
subgroups, such as people that are already motivated to change their behaviour or moderate
to high social class people.99 All this argues for extensive acceptability and feasibility testing
of computer-tailored interventions.
Chapter 1
13
Objectives and outline of this dissertation
This dissertation is primary a collection of articles which are already published or in press.
All articles were written to stand alone, and each of them proceeded from a specific research
question. Consequently, this may lead to some discontinuity or repetition in the manuscripts.
Outlined below is an overview of the chapters combined with an overview of the objectives
of this dissertation.
- Chapter 2 investigates the reliability and validity of the International Physical Activity
Questionnaire. This physical activity measurement tool was integrated in the computer-
tailored physical activity intervention. This questionnaire is a very important part of the
intervention since it is used to measure whether participants comply to the international
physical activity recommendation and consequently need feedback on increasing physical
activity or not. However, before integrating the questionnaire it was needed to obtain
reliability and validity measures as it was the first computerised and Dutch version to be
used. Therefore the objectives of the study described in chapter 2 were to examine the
reliability and validity of a Dutch computerized version of the IPAQ in a sample of adults,
using CSA accelerometers and seven day physical activity diaries. Further, it was aimed to
examine the comparability of computerized and paper-and-pencil formats of the IPAQ.
- Chapter 3 examines validity and reliability of the computerised fat intake questionnaire
that was developed especially to be integrated into the computer-tailored fat intake
intervention. This questionnaire is a very important part of the intervention since it is used
to measure whether participants comply to the international fat intake recommendation and
consequently need feedback on decreasing fat intake or not. However, before integrating
this questionnaire it was needed to obtain reliability and validity measures as it was the first
version ever to be used. Therefore the objectives of the study described in chapter 3 were to
examine the reliability and validity of a newly developed fat intake questionnaire in a
sample of adults. The relative validity of this questionnaire was examined in relation to a
seven day estimated diet record. The reproducibility of the questionnaire is assessed by
means of a test-retest procedure.
- Chapter 4 deals with the newly developed computer-tailored intervention for increasing
physical activity. Before computer-tailored interventions can be used or even evaluated
they need a thorough acceptability and feasibility testing. Therefore the objectives of the
study described in chapter 4 were to investigate acceptability and feasibility of a recently

General Introduction
14
developed computer-tailored intervention promoting physical activity in participants in
different stages of change. Further, we wished to test usability, user-friendliness,
credibility, feasibility, comprehensibility, readability and related factors in a general
population. We especially wished to explore whether there are differences in the reported
feasibility and acceptability of the computer intervention between individuals of different
stages of change, genders, age groups, education levels and familiarity with computer use.
- Chapter 5 deals with the newly developed computer-tailored intervention for decreasing
fat intake. Before computer-tailored interventions can be used or even evaluated they need
a thorough acceptability and feasibility testing. Therefore the objectives of the study
described in chapter 5 were to investigate acceptability and feasibility of a recently
developed interactive computer-tailored fat intake intervention in a general population.
Further, we wished to test usability, user-friendliness, credibility, feasibility,
comprehensibility, readability and related factors. We especially wished to explore whether
there are differences in the reported feasibility and acceptability of the computer
intervention between individuals of different stages of change, sexes, age groups, education
levels and computer literacy.
- Chapter 6 describes the efficacy of the newly developed physical activity and fat intake
intervention. The purpose of these new interventions is to be implemented in Flanders.
However, it is not acceptable and not tolerable to spend a lot of money and time
implementing new interventions before it is proven that they are effective in changing
health behaviours. Further, we wished to have more insight into tailored interventions that
target multiple health behaviours. There is no information in the literature about which
mode of intervening on multiple health behaviours is most effective, namely tailored
interventions that are presented in a simultaneous or a sequential intervening mode.
Therefore the objectives of the study presented in chapter 6 were to examine the
effectiveness of two interactive computer-tailored interventions targeting high priority
health behaviours: increasing physical activity and decreasing fat intake. Further, we
wanted to investigate the effect of implementing two tailored interventions in a sequential
or simultaneous mode.
- Finally in Chapter 7 the most important findings and conclusions of all of our studies
presented in this dissertation are summarised and guidelines for future research are
outlined.

Chapter 1
15
References (1) Paffenbarger Jr. RS, Hyde RT, Wing AL and Hsieh CC. Physical activity, all-cause
mortality, and longevity of college alumni. New England Journal of Medicine, 1986, 314:
605-613.
(2) Morris JN, Clayton DG, Everitt MG, Semmence AM and Burgess EH. (1990) Exercise in
leisure time: coronary attack and death rates. British Heart Journal, 1990, 63: 325-334.
(3) Dishman RK. Psychological effects of exercise for disease resistance and health
promotion. In Watson R.R. and Eisinher M. (eds), Exercise and disease. 1992, Boca Raton
(FL):CRC Press, 179-207.
(4) Vuori I. Does physical activity enhance health? Patient Education and Counseling, 1998,
33: S95-103.
(5) Surgeon General (1996) Surgeon General's report on physical activity and health. From
the Centers for Disease Control and Prevention. Journal of the American Medical
Association, 1996, 276: 522-538.
(6) Hardman AE and Stensel DJ. Physical Activity and Haelth, the evidence explained, 2003,
Routledge, London.
(7) Bouchard C, Shephard RJ and Stephens T. Physical Activity, Fitness and Health : the
model and key concepts, 1994, Human Kinetics Publischers, 77.
(8) American College of Sports Medicine. The recommended quantity and quality of exercise
for developing and maintaining fitness in healthy adults. Medicine and Science in Sports and
Exercise, 1978, 10: vii-x.
(9) Counsil of Europe. Recommendation NO R(95) 17 of the Committee of Ministers to the
Member States on the significance of Sport for Society. In Counsil of Europe. 1995, CDDS
(95), Strasbourg, 8-10.
(10) Pate RR, Pratt M, Blair SN, Haskell WL, Macera CA, Bouchard C, et al. Physical
activity and public health. A recommendation from the Centers for Disease Control and
Prevention and the American College of Sports Medicine. Journal of the American Medical
Association, 1995, 273: 402-407.
(11) NIH Consensus Statement. Physical Activity and Cardiovascular Health. National
Institutes of Health, 1995.
(12) Caspersen CJ, Merrit RK and Stephens T. International Physical Activity patterns: A
methodological perspective. In Dishman RK (ed), Advances in exercise adherence. 1994,
Human Kinetics, Champaign, IL, 73-110.
General Introduction
16
(13) Bouchard C, Shephard RJ and Stephens T. Physical activity, fitness and health. In
Bouchard, C. and Shephard R.J. (eds), Physical Activity, Fitness and Health : the model and
key concepts, 1994, Human Kinetics Publischers, 77.
(14) Crespo CJ, Keteyian SJ, Heath GW and Sempos CT. Leisure-time physical activity
among US adults. Results from the Third National Health and Nutrition Examination Survey.
Archives International Medicine, 1996, 156: 93-98.
(15) Pratt M, Macera CA. and Blanton C. Levels of physical activity and inactivity in
children and adults in the United States: current evidence and research issues. Medicine and
Sciences in S ports and Exercise, 1999, 31: S526-S533.
(16) Phillips WT, Pruitt LA and King AC. Lifestyle activity, current recommendations.
Sports Medicine, 1996, 22: 1-7.
(17) Sallis JF and Owen N. Physical Activity and Behavioral Medicine, 1999, Sage
Publications Inc., California.
(18) De Backer G, Kornitzer M, Sobolski J, Dramaix M, Degre S, de Marneffe M et al.
Physical activity and physical fitness levels of Belgian males aged 40- 55 years. Cardiology,
1981, 67: 110-128.
(19) De Bourdeaudhuij I and Van Oost P. (1994) Differences in level and determinants of
leisure-time physical activity between men and women in 3 population-based samples.
Archives of Public Health, 1994, 51: 21-45.
(20) Aelvoet N, Fortuin M, Hooft P and Vanoverloop J. Gezondheidsindicatoren, Ministerie
van de Vlaamse Gemeenschap, 1997 (Health Indicators, Ministery of the Flemmisch
Community, 1997).
(21) Buziarsist J, Demarest S, Gisle L, Taffoteau J, Van Der Heyden J and Van Oyen H.
Wetenschappelijk Instituut voor Volksgezondheid. Gezondheidsenquete 2001, Deel 3
Leefstijl: fysieke activiteit. 2001, IPH/EPI raport Nr 2002-22, D/2002/2505/40. (Scientific
Institute for Public Health. Belgian Health Enquiry 2001. Part 3, lifestyle: physical activity,
2001, IPH/EPI reports Nr 2002-22, D/2002/2505/40).
(22) Steptoe A, Wardle J, Fuller R, Holte A, Justo J, Sanderman R and Wichstrom L.
Leisure-time physical exercise: prevalence, attitudinal correlates, and behavioural correlates
among young Europeans from 21 countries. Preventive Medicine, 1997, 26: 845-854.
(23) Rzewnicki R, Vanreusel B and De Bourdeaudhuij I. How physical (in)active is the
Flemisch and Belgian Population ? In Beunen G., De Bourdeaudhuij I., Vanden Auweele I.
and Borms J. (eds), Physical Activity, Fitness and health. Flemisch Journal for Sports
Medicine and Science, 2001, 17-27.

Chapter 1
17
(24) Kearney JM, de Graaf C, Damkjaer S and Engstrom LM. Stages of change towards
physical activity in a nationally representative sample in the European Union. Public Health
Nutrition, 1999, 2: 115-124.
(25) Margetts BM, Rogers E, Widhal K, de Winter AM and Zunft HJ. Relationship between
attitudes to health, body weight and physical activity and level of physical activity in a
nationally representative sample in the European Union. Public Health Nutrition, 1999, 2:
97-103.
(26) Vaz dA, Graca P, Afonso C, D'Amicis A, Lappalainen R and Damkjaer S. (1999)
Physical activity levels and body weight in a nationally representative sample in the
European Union. Public Health Nutrition, 1999, 2: 105-113.
(27) Zunft HJ, Friebe D, Seppelt B, Widhalm K, de Winter AM, Vaz de Almeida et al.
Perceived Benefits and Barriers to Physical Activity in a Nationally Representative Sample in
the European Union. Public Health Nutrition, 1999, 2: 153-60.
(28) Zyriax BC and Windler E. Dietary fat in the prevention of cardiovascular disease - a
review. European Journal of Lipid Science and Technology, 2000, 102: 355-365.
(29) Kuller LH. Dietary fat and chronic diseases: epidemiologic overview. Journal of the
American Dietetic Association, 1997, 97: S9-15.
(30) Hooper L, Summerbell CD, Higgins JPT, Thompson RL, Capps NE, Smith GD et al.
Dietary fat intake and prevention of cardiovascular disease: systematic review. British
Medical Journal, 2001, 322: 757-763.
(31) Kromhout D, Menotti A, Kesteloot H and Sans S. Prevention of coronary heart disease
by diet and lifestyle: evidence from prospective cross-cultural, cohort, and intervention
studies. Circulation, 2002, 105: 893-898.
(32) Staessen L, De Bacquer D, De Henauw S, De Backer G and Van Peteghem C. Relation
between fat intake and mortality: an ecological analysis in Belgium. European Journal of
Cancer Prevention, 1997, 6: 374-381.
(33) Stam-Moraga MC, Kolanowski J, Dramaix M, De Backer G and Kornitzer MD.
Sociodemographic and nutritional determinants of obesity in Belgium. International Journal
of Obesity, 1999, 23: 1-9.
(34) Satia-Abouta J, Patterson RE, Schiller RN and Kristal AR. Energy from fat is associated
with obesity in U.S. men: results from the Prostate Cancer Prevention Trial. Preventive
Medicine, 2002: 34, 493-501.
(35) Van Dam RM, Stampfer M, Willett WC, Hu FB and Rimm EB. (2002) Dietary fat and
meat intake in relation to risk of type 2 diabetes in men. Diabetes Care, 2002, 25: 417-424.

General Introduction
18
(36) Hill JO, Melanson EL and Wyatt HT. Dietary fat intake and regulation of energy
balance: Implications for obesity. Journal of Nutrition, 2000, 130: 284S-288S.
(37) Key TJ, Allen, Spencer NE and Travis RC. The effect of diet on risk of cancer. The
Lancet, 2002, 360: 861-868.
(38) Krauss RM, Deckelbaum RJ, Ernst N, Fisher E, Howard BV, Knopp RH et al. Dietary
guidelines for healthy American adults. A statement for health professionals from the
Nutrition Committee, American Heart Association. Circulation, 1996, 94: 1795-1800.
(39) National Council on Nutrition. Dietary recommendations for Belgium. Ministry of
Social Affairs, Public Health and Environment, Brussels, 1997.
(40) WHO. Diet, Nutrition, and the Prevention of Chronic Diseases. Report of a WHO Study
Group. World Health Organisation Technical Report Series, 1990, 797: 1-204.
(41) Commission of the European Communities (CEC). Nutrient and Energy intakes for the
European Community. Reports of the Scientific Commitee for food. Brussels: (thirty-first-
series); 2003.
(42) Hulshof KFAM, van Erp-Baart MA, Anttolainen M, Becker W, Church SM, Couet C et
al. Intake of Fatty acids in Western Europe with emphasis on trans fatty acids: The
TRANSFAIR study. European Journal of Clinical Nutrition, 1999, 53: 143-157.
(43) Pedro Graça. Dietary guidelines and food nutrient intakes in Portugal. British Journal of
Nutrition, 1999, 81(Suppl 2): S99-S103.
(44) Perin AE, Simon C, Hedelin G, Arveiler D, Schaffer P and Schlienger JL. Ten-year
trends of dietary intake in a middle-aged French population: relationship with educational
level. European Journal of Clinical Nutrition, 2002, 56: 393-401.
(45) Gray-Donald K, Jacobs-Starkey L and Johnson-Down L. Food Habits of Canadians:
Reduction in fat intake over a generation. Canadian journal of public health, 2000, 91: 381-
385.
(46) Feunekes G, De Graaf C, Meyboom S, and van Staveren A. Food choice and fat intake
of adolescents and adults: associations of intakes within social networks. Preventive
Medicine, 1998, 27: 645-656.
(47) Becker W. Dietary guidelines and patterns of food and nutrient intake in Sweden. British
Journal of Nutrition, 1999, 81 (suppl 2): S113-S117.
(48) Kant AK, Graubard BI, Schatzkin A and Ballard-Barhash R. Proportion of energy intake
from fat and subsequent weight change in the NHANES I epidemiologic follow-up study.
American Journal Clinical Nutrition, 1995, 61: 11-17.

Chapter 1
19
(49) Arnett D, Xiong B, McGovern P, Blackburn H and Luepker R. Secular trends in dietary
macronutrient intake in Minneapolis-st. Paul, Minnesota, 1980-1992. American Journal of
Epidemiology, 2000, 152: 868-873.
(50) Popkin B, Siega-Riz A, Haines P and Jahns L. Where’s the fat? Trends in U.S. Diets
1965-1996. Preventive Medicine, 2001, 32: 245-254.
(51) Cruz A. Dietary habits and nutritional status in adolescents over Europe-Southern
Europe. European Journal of Clinical Nutrition, 2000, 54 (suppl 1): S29-S35.
(52) Staessen L, De Henauw S, De Bacquer D, De Backer G and Van Peteghem C. Fat
Sources in the Belgian Diet. Annals of Nutrition and Metabolism, 1998, 42(3): 138-50.
(53) Staessen L, De Bacquer D, De Henauw S, De Backer G and Van Peteghem, C. Fatty
Acid Composition of the Belgian Diet: Estimates Derived From the Belgian Interuniversity
Research on Nutrition and Health. Annals of Nutrition and Metabolism, 1998, 42(3): 151-9.
(54) De Henauw S and De Backer G. Nutrient and Food Intakes in Selected Subgroups of
Belgian Adults. British Journal of Nutrition, 1999, 81 Suppl 2: S37-S42.
(55) De Vriese SR, De Henauw S, De Backer G, Dhont M and Christophe AB. Estimation of
dietary fat intake of Belgian pregnant women. Comparison of two methods. Annals of
Nutrition and Metabolism, 2001, 45: 273-278.
(56) Denhond E, Deschryver M, Muylaert A, Lesaffre E and Kesteloot H. The interregional
Belgian bank employee nutrition study (IBBENS). European Journal of Clinical Nutrition,
1994, 48, 106-117.
(57) Paulus D, Saint-Remy A and Jeanjean M. (2001) Dietary habits during adolescence -
results of the Belgian Adolux Study. European Journal of Clinical Nutrition 2001, 55, 130-
136.
(58) Matthys C, De Henauw S, Devos C and De Backer G. Estimated energy intake,
macronutrient intake and meal pattern of Flemish adolescent. European Journal of Clinical
Nutrition. 2003, 57: 366-375.
(59) Kreuter M, Farrell D, Olevitch L and Brennam L (eds). Tailoring Health Messages :
costumizing communication with computer technology. Lawrence Erlbaum Associates Inc.
Publishers, New Jersy, 2000.
(60) De Vries H and Brug J. Computer-Tailored Interventions Motivating People to Adopt
Health Promoting Behaviors: Introduction to a New Approach. Patient Education and
Counseling, 1999, 36: 99-105.
(61) Brug J and Van Assema P. Differences in use and impact of computer-tailored dietary
fat-feedback according to stage of change and education. Appetite, 2000, 34: 285-293.

General Introduction
20
(62) Petty RE and Cacioppo JT. Attitudes and persuasion: classic and contemporary
approaches. Dubuque, IA: William C. Brown Company, 1981.
(63) Brug J, Steenhuis I, van Assema P and De Vries H. The impact of a computer-tailored
nutrition intervention. Preventive Medicine, 1996, 25: 236-242.
(64) Skinner CS, Campbell MK, Rimer BK et al.: How effective is tailored print
communication? Annals of Behavioural Medicine, 1999, 21: 290-298.
(65) Segar M, Jayaratne T, Hanlon J and Richardson CR. Fitting Fitness into Women's Lives:
Effects of a Gender-Tailored Physical Activity Intervention. Womens Health Issues, 2002,
12: 338-347.
(66) Bock BC, Marcus BH, Pinto BM, Forsyth LH. Maintenance of Physical Activity
Following an Individualized Motivationally Tailored Intervention. Annals of Behavioral
Medicine, 2001, 23: 79-87.
(67) Bull FC, Kreuter MW and Scharff DP: Effects of Tailored, Personalized and General
Health Messages on Physical Activity. Patient Education and Counseling, 1999, 36: 181-
192.
(68) Marcus BH, Bock BC, Pinto BM et al. Efficacy of an Individualized, Motivationally-
Tailored Physical Activity Intervention. Annals of Behavioral Medicine, 1998, 20: 174-180.
(69) Marcus BH, Emmons KM, Simkin-Silverman LR et al. Evaluation of Motivationally
Tailored Vs. Standard Self-Help Physical Activity Interventions at the Workplace. American
Journal of Health Promotion, 1998, 12: 246-253.
(70) Stevens VJ, Glasgow RE, Toobert DJ et al. One-Year Results From a Brief, Computer-
Assisted Intervention to Decrease Consumption of Fat and Increase Consumption of Fruits
and Vegetables. Preventive Medicine, 2003, 36: 594-600.
(71) Oenema A and Brug J. Feedback Strategies to Raise Awareness of Personal Dietary
Intake: Results of a Randomized Controlled Trial. Preventive Medicine, 2003, 36: 429-439.
(72) Armitage CJ and Conner M. Efficacy of a Minimal Intervention to Reduce Fat Intake.
Social Science and Medicine, 2001, 52: 1517-1524.
(73) De Bourdeaudhuij I and Brug J. Tailoring Dietary Feedback to Reduce Fat Intake: an
Intervention at the Family Level. Health Education Research, 2000, 15: 449-462.
(74) Brug J. Dutch Research into the Development and Impact of Computer-Tailored
Nutrition Education. European Journal of Clinical Nutrition, 1999, 53: S78-S82.
(75) Brug J, Campbell M and van Assema P. The Application and Impact of Computer-
Generated Personalized Nutrition Education: a Review of the Literature. Patient Education
and Counseling, 1999, 36: 145-156.

Chapter 1
21
(76) Oenema A, Tan F and Brug J. Short-term efficacy of a web-based computer-tailored
nutrition intervention; main effects and mediators. Annals of behavioural Medicine, In press.
(77) Strecher V, Wang C, Derry H et al. Tailored Interventions for Multiple Risk Behaviors.
Health Education Research, 2002, 17: 619-626.
(78) Jakicic JM, Wing RR and Winters-Hart C. Relationship of Physical Activity to Eating
Behaviors and Weight Loss in Women. Medicine and Science in Sports and Exercise, 2002,
34: 1653-1659.
(79) Gillman MW, Pinto BM, Tennstedt S et al. Relationships of Physical Activity with
Dietary Behaviors among Adults. Preventive Medicine, 2001, 32: 295-301.
(80) Emmons KM, Marcus BH, Linnan L et al. Mechanisms in multiple risk factor
interventions - Smoking, Physical-Activity and Dietary-fat intake among manufacturing
workers. Preventive Medicine, 1994, 23: 481-489.
(81) Wilcox S, Parra-Medina D, Thompson-Robinson M and Will J. Nutrition and Physical
Activity Interventions to Reduce Cardiovascular Disease Risk in Health Care Settings: A
Quantitative Review With a Focus on Women. Nutrition Reviews, 2001, 59: 197-214.
(82) Ajzen I. From intentions to actions: A theory of planned behavior. In Kuhl J, Beckman J
(eds), Action-control : from cognition to behaviour, Heidelberg, Germany: Springer; 1985.
(83) Prochaska JO, DiClemente CC, Norcross JC. In Search of How People Change.
Applications to Addictive Behaviors. American Psychologist, 1992, 47: 1102-1114.
(84) Baranowski T, Cullen KW and Baranowski J. Psychosocial correlates of dietary intake:
Advancing dietary intervention. Annual Review of Nutrition, 1999, 19: 17-40.
(85) Glanz K, Brug J and Van Assema P. Are awareness of dietary fat intake and actual fat
consumption associated? A Dutch-American comparison. European Journal of Clinical
Nutrition, 1997, 51: 542-547.
(86) Lecher L, Brug J and De Vreis H. Misconceptions of fruit and vegetable consumption:
differences between objective and subjective estimation of intake. Journal of Nutrition
Education, 1997, 29: 313-320.
(87) Smith RA and Biddle SJH. Attitudes and exercise adherence: test of the theories of
reasoned action and planned behaviour. Journal of Sports Sciences, 1999, 17: 269-281.
(88) Godin G and Kok G. The theory of planned behaviour: a review of its applications to
health-related behaviours, American Journal of Health Promotion, 1996, 11(2): 87-98.
(89) Povey R, Conner M, Sparks P, James R and Shepherd R. A critical examination of the
transtheoretical model’s stages of change to dietary behaviours. Health Education Research,
1999, 14(5): 641-651.

General Introduction
22
(90) Godin G. Theories of reasoned action and planned behavior: usefulness for exercise
promotion. Medicine and Sciences in Sports and Exercise, 1994, 26: 1391-1394.
(91) Hausenblas HA, Carron AV and Mack DE. Application of the theories of reasonned
action and planned behaviour to exercise behaviour: a meta-analyse. Journal of sport and
exercise psychology, 1997, 19: 36-51.
(92) Marshall SJ and Biddle SJH. The transtheoretical model of behaviour change: a meta-
analysis of application to physical activity and exercise. Annals of Behavioural Medicine,
2001, 23(4): 229-246.
(93) Hardeman W, Johnston M, Johnston DW, Bonett D, Wareham NJ and Kinmonth AL.
Application of the theory of planned behaviour in behaviour change interventions: a
systematic review. Psychology and Health, 2002, 17: 123-158.
(94) Craig CL, Marshall AL, Sjöström M, Bauman AE, Booth ML, Ainsworth B et al.
International Physical Activity Questionnaire (IPAQ): 12-country reliability and validity.
Medicine and Science in Exercise and Sports, 2003, 35: 1381-1395.
(95) Booth M. Assessment of physical activity: An international perspective. Research
Quarterly for Exercise and Sport, 2000, 71: S114-S120.
(96) Steiner DL, Norman GR. Health Measurement Scales: A practical guide to their
development and use. 2nd. Ed. Oxford, England: Oxford University Press, 1995.
(97) Tones K. and Tilford S. Health Promotion: effectiveness, efficiency and equity. Third
edition, Nelson Thornes Ltd., United Kingdom, Cheltenham, 2001.
(98) Weinreich NK. Pretesting. In Hands-on social marketing : A step-by-step guide. Sage
Publications, California, 123-156, 1999.
(99) Dishman RK, Sallis JF and Orenstein DR. The determinants of physical activity and
exercise. Public Health Reports, 1985, 100:158-171.

Chapter 2
23
CHAPTER 2
Reliability and validity of a computerised and Dutch version of the international physical activity questionnaire (IPAQ)
Corneel Vandelanotte, Ilse De Bourdeaudhuij, Renaat Philippaerts, Michael Sjörström and James Sallis
Journal of Physical Activity and Health, in press
Abstract Background: The international physical activity questionnaire (IPAQ) was developed by the
‘International Consensus Group for Physical Activity Measurement’ to provide a common
instrument that can be used internationally to obtain physical activity surveillance data. The
purpose of this study was to examine the reliability and validity of a new developed
computerized Dutch version of the IPAQ. Methods: Participants (N = 53) completed the
computerized IPAQ (long, self-administered, usual week version) at three specified times.
Starting at baseline, participants wore a CSA activity monitor during seven full days and
simultaneously completed a seven day physical activity diary. Finally, respondents filled out
a paper-and-pencil IPAQ. All calculations were expressed in minutes of activity (min.) and
kilocalories of energy expenditure (kcal.). Results: Reliability measures were moderate to
high; intraclass correlation coefficient ranged from .60 to .83. Correlations for ‘total physical
activity’ between the computerized IPAQ and the CSA activity counts were moderate (min.:
r = .38; kcal.: r = .43). Correlations with the physical activity diary were also moderate (min.:
r = .39; kcal.: r = .46). Correlations between the computerized and the paper-and-pencil
IPAQ were high (min.: r = .80; kcal.: r = .84). Correlations for high intensity and leisure-time
physical activity on the computerized IPAQ were high against all validation measures.
Conclusions: The computerized Dutch IPAQ is a reliable and reasonably valid physical
activity measurement tool for the general adult population.

IPAQ Rzliability and Validity
24
Introduction
Self-administered questionnaires are a popular method of assessing physical activity. They
can reach large populations at low cost, they do not alter the behavior under study, they can
reach a wide range of ages and target groups, and they can assess all the dimensions of
physical activity.1 Computerized assessment can further increase these advantages. Rapid
development of information technology makes this new form of questionnaire administration
possible. Computerized assessment has time saving potential since data can be automatically
stored on file, reducing hours of data entry and the risk of lost data.2,3 A major advantage of
computerized questionnaires, in comparison to hard copy questionnaires, is that they can be
programmed to eliminate missing data, forcing participants to answer all questions.2 Complex
skip-patterns can be used to help participants and to avoid superfluous questions.3 Internet
mediated assessment enables researchers to reach large populations quickly 2 and may even
be more effective in reaching certain target populations, otherwise not interested in the
assessment of physical activity.4
Despite the advantages of computerized assessment, self-reporting still has several
drawbacks. Many participants have difficulty estimating the intensity in which they engage in
activities.5 This kind of inaccurate perception 5, together with recall errors 6 and social
desirability bias 1 can lead to over-reporting in physical activity.1,6 Physical activity
questionnaires may be less accurate in assessing light to moderate activities compared to high
intensity activities.5,7,8 Further, physical activity is a complex behavior with considerable day-
to-day variation, which self-assessment questionnaires can not reflect.6 These drawbacks
stress the importance of assessing the validity and reliability of newly developed
questionnaires in the population for which they will be used.
Motions sensors, and in particular the CSA 9 accelerometer, have proven to produce a valid
and objective measure of physical activity.10-13 Due to their small size, unobtrusive nature and
ease of use 14,15, their ability to store data over long periods 7,14, and their capability of
providing objective estimates of the frequency, intensity and duration of physical activity 7,16,
they can be used as a good reference method to assess validity of physical activity
questionnaires.8 An other approach, often used in validating physical activity recalls, is the

Chapter 2
25
use of a diary, in which participants continuously record their activities during several
days.5,17,18
It is argued that the value of a self-assessed physical activity measurement would increase if
international comparisons could be made.19 However, this is mostly impossible since
numerous and often incomparable operalizations of physical activity are being used. The
‘International Consensus Group for Physical Activity Measurement’ realized the need for the
development of an international standardized assessment technique, and therefore it
developed the International Physical Activity Questionnaire (IPAQ).19,20 The purpose of the
IPAQ is to provide a common instrument that can be used internationally to obtain physical
activity surveillance data. A international reliability and validity testing of the IPAQ has been
done, and the results were acceptable.20 The IPAQ produced repeatable data (Spearman’s ρ
clustered around .8) and criterion validity had a median ρ of about .3, which was comparable
to most other self-report validation studies. However, a European study 21,22 was less positive
about the IPAQ and indicated that more research is needed to further investigate and improve
the quality of the IPAQ for use in Europe. The purpose of this study was to examine the
reliability and validity of a newly developed Dutch computerized version of the IPAQ in a
sample of adults, using CSA accelerometers and seven day physical activity diaries. Further,
it was aimed to examine the comparability of computerized and paper-and-pencil formats of
the IPAQ.
Method
Participants
Participants, aged from 25 to 55 years, were recruited in and around the city of Ghent
(Belgium). Sixty-three participants volunteered for this study, of which five dropped out
during data gathering (due to time constraints and lack of motivation). Three participants had
very high physical activity measures (mean + 3 SD) and were defined as outliers. One was
excluded because of insufficient CSA data: days with less than 600 minutes of registration
were removed and all data were removed if less than 5 days were registered. One participant
was excluded due to technical problems concerning the computerized questionnaire, leaving
53 participants that complied to all requirements. Table 1 presents an overview of their
descriptive data and physical activity measures. When procedures were explained, each
IPAQ Rzliability and Validity
26
participant signed an informed consent statement approved by the Ghent University Ethics
Committee.
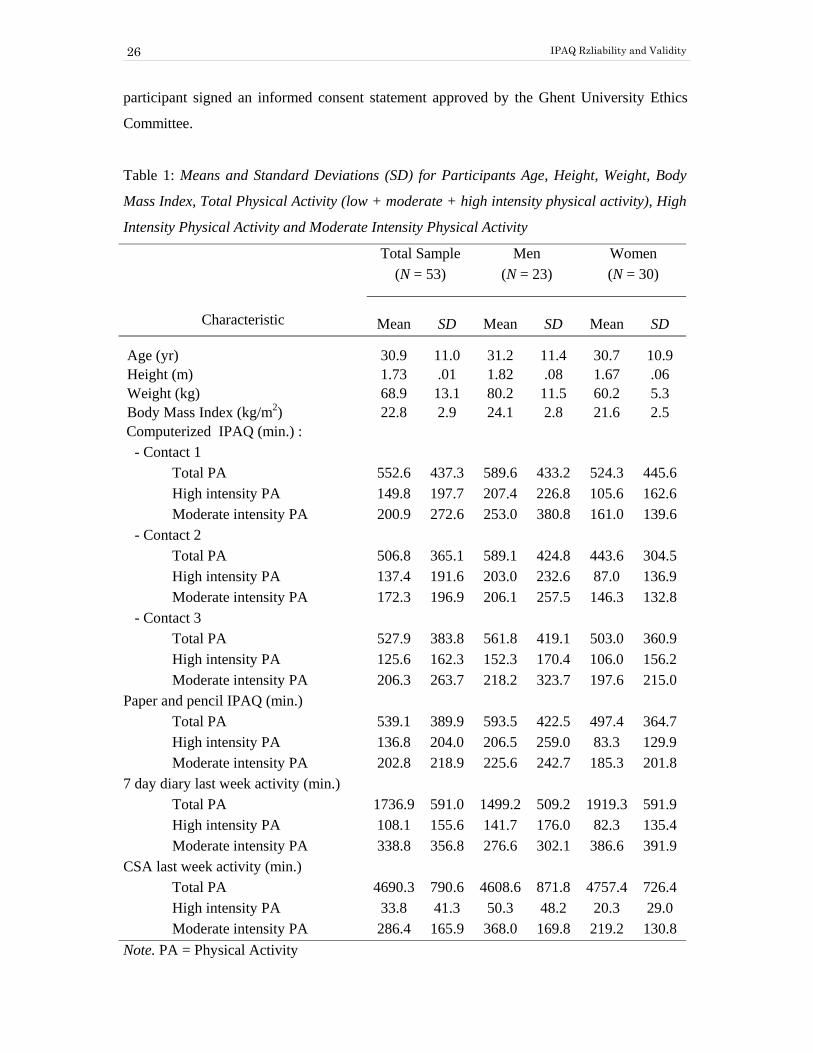
Table 1: Means and Standard Deviations (SD) for Participants Age, Height, Weight, Body
Mass Index, Total Physical Activity (low + moderate + high intensity physical activity), High
Intensity Physical Activity and Moderate Intensity Physical Activity
Total Sample (N = 53)
Men (N = 23)
Women (N = 30)
Characteristic Mean SD Mean SD Mean SD
Age (yr) 30.9 11.0 31.2 11.4 30.7 10.9 Height (m) 1.73 .01 1.82 .08 1.67 .06 Weight (kg) 68.9 13.1 80.2 11.5 60.2 5.3 Body Mass Index (kg/m2) 22.8 2.9 24.1 2.8 21.6 2.5 Computerized IPAQ (min.) : - Contact 1 Total PA 552.6 437.3 589.6 433.2 524.3 445.6 High intensity PA 149.8 197.7 207.4 226.8 105.6 162.6 Moderate intensity PA 200.9 272.6 253.0 380.8 161.0 139.6 - Contact 2 Total PA 506.8 365.1 589.1 424.8 443.6 304.5 High intensity PA 137.4 191.6 203.0 232.6 87.0 136.9 Moderate intensity PA 172.3 196.9 206.1 257.5 146.3 132.8 - Contact 3 Total PA 527.9 383.8 561.8 419.1 503.0 360.9 High intensity PA 125.6 162.3 152.3 170.4 106.0 156.2 Moderate intensity PA 206.3 263.7 218.2 323.7 197.6 215.0 Paper and pencil IPAQ (min.) Total PA 539.1 389.9 593.5 422.5 497.4 364.7 High intensity PA 136.8 204.0 206.5 259.0 83.3 129.9 Moderate intensity PA 202.8 218.9 225.6 242.7 185.3 201.8 7 day diary last week activity (min.) Total PA 1736.9 591.0 1499.2 509.2 1919.3 591.9 High intensity PA 108.1 155.6 141.7 176.0 82.3 135.4 Moderate intensity PA 338.8 356.8 276.6 302.1 386.6 391.9 CSA last week activity (min.) Total PA 4690.3 790.6 4608.6 871.8 4757.4 726.4 High intensity PA 33.8 41.3 50.3 48.2 20.3 29.0 Moderate intensity PA 286.4 165.9 368.0 169.8 219.2 130.8 Note. PA = Physical Activity

Chapter 2
27
Study protocol
The same protocol as outlined in the IPAQ reliability, validity and prevalence studies manual
of operation (version 8, March 3, 2000; University of South Carolina) was used in this study.
The data collection comprised three contacts with participants, called contact 1, 2 and 3.
Contacts were at the university or participants’ homes (a portable computer was provided by
the research team). A member of the research team was present during all three contacts,
regardless of location.
At contact 1 (day 0), the protocol was outlined, the informed consent signed, and the
participants’ tracking form was obtained. An appointment form was used to ensure that
participants would be present at contacts 2 and 3. Participants’ weight and height were
measured. Next, a computerized demographics form and computerized IPAQ were
administered. Further, participants were familiarized with the CSA accelerometer. To ensure
seven full days of recording, they were instructed to wear the CSA from then on until contact
2. The CSA’s were programmed to start recording at 07:00:00 the day after contact 1 (at day
1). Participants were also given a form on which they had to record each activity performed
without wearing the CSA (e.g. swimming, shower) and they were given a CSA instruction
form to ensure correct CSA use. Finally, participants were asked to complete a seven day
physical activity diary during the CSA recording period (thus also starting at day 1).
Contact 2 was a full week after contact 1 (at day 8). Participants turned in the CSA’s, the
recording form and the physical activity diary. CSA data were downloaded and stored
immediately. Next, the computerized IPAQ was administered again.
Contact 3 was more than three days after contact 2 (at day 11, 12, 13 or 14). For their
convenience participants could choose between four days. Again, participants completed the
computerized IPAQ. Participants who complied with the study protocol were rewarded with
four movie theater tickets.
Participants completed a paper-and-pencil IPAQ three days after contact 3. The paper-and-
pencil questionnaire was given at contact 3 and they were instructed to wait exactly three
days before completing it and to send it immediately back to the research-team (envelope and
stamps were provided).
IPAQ Rzliability and Validity
28
Instruments
Computerized IPAQ
The computerized IPAQ used in this study was entirely based on the long, self-administered,
usual week IPAQ found in the IPAQ manual of operation. The questionnaire consists of five
categories: Job-related physical activity (vigorous, moderate and walking), Transportation
physical activity (motor vehicle, cycling and walking), Housework, house maintenance and
caring for family (vigorous and moderate in garden, moderate inside home), Recreation,
sport and leisure-time physical activity (vigorous, moderate and walking) and Time spent
sitting (week day, weekend day). For each topic in each category, respondents reported the
number of days per week and the time per day they usually spent doing the activity. For
walking and cycling an additional question on pace was added. In order to be reported, an
activity should have lasted for at least ten minutes continuously.
A Dutch translation was made by two independent translators and according to the ‘translate
and back-translate’ protocol. Next, this Dutch version was computerized, in which no
alteration of original item sequence was made. Each ‘computer-page’ contained only one
question and skip patterns were used to eliminate questions that did not need to be answered.
All questions had to be answered before the participants could move on. Energy expenditure
was calculated using a MET (multiples of resting metabolic rate) value for each activity
category on the questionnaire. These MET values were based on the physical activity
compendium by Ainsworth et al. 23, 24 and equal to those reported by Craig et al.20
Paper-and-pencil IPAQ
The paper-and-pencil IPAQ used in this study was a Dutch version of the long, self-
administered, usual week IPAQ. The translation process was identical as described above.
This questionnaire was used as a reference measure to assess the comparability of the
computerized IPAQ.
CSA accelerometer
The computer Science and Applications, Inc. Model 7164 9 accelerometer was used as an
objective reference method. It is a uniaxial accelerometer that measures
acceleration/deceleration in the vertical direction and is designed to detect acceleration
ranging in magnitude from .05 and 2.0 G with a frequency response between .25 and 2.5 Hz.

Chapter 2
29
These frequencies were chosen to detect normal body movement and to filter out high
frequency movement, for example whilst riding in a car. 9 The CSA is small, light (5 x 4 x
1.5 cm, 43 g) and unobtrusive to wear. Activity counts, resulting from a piezo-electric bender
element, are summed over a user-defined sampling period (epoch). At the end of each epoch
the activity counts are stored and the accumulator resets itself to zero. For the present study a
1 min epoch was used. At the end of the seven day recording period, stored data were
downloaded to a desktop computer, and then converted into an Excel file for subsequent
analysis. A complete technical description of the CSA has been published. 25 Monitors were
worn just above the right hipbone and firmly held in place by an elastic belt. Participants
were requested to wear the CSA during waking hours, removing the monitor only for water
based activities and sleeping.
Physical Activity Diary
A seven day physical activity diary was another reference method used to assess validity of
the computerized IPAQ. It was designed for this study and similar to other often used
physical activity diaries. 5 Together with an instruction form, participants were given seven
physical activity monitoring forms (one for each day). For each hour participants documented
the amount of time spent within the same five categories found on the computerized IPAQ
(see above); only ‘sleeping’ was added as a sixth category. For each activity registered on the
diary, participants had to record the following information: a letter indicating the physical
activity category (e.g. T for transportation), a short description of the activity, a subjective
estimate of the intensity of the activity (light, moderate or hard), and the duration of the
activity in minutes. Similar to the computerized IPAQ, participants were asked to only
register activities that lasted for at least ten minutes. To calculate energy expenditure (Kcal.)
MET values were based on the physical activity compendium by Ainsworth et al. 23,24
Data-reduction
The CSA data were reduced with custom software. Minute-by-minute activity counts were
summed for each day, and daily activity counts were summed into total weekly activity
counts. Total weekly activity counts of participants missing one or two day of CSA
registration were extrapolated to seven days, in this way CSA activity counts of all
participants are comparable to each other. Total weekly activity counts were also calculated
for intensity categories, namely: low, moderate and high intensity physical activity, moderate
and high intensity physical activity together, and total physical activity. This split into

IPAQ Rzliability and Validity
30
categories was done using cut off scores published by Freedson et al.10: less than 1952 CSA
counts per minute is light physical activity (< 3.00 MET’s), between 1952 and 5724 counts is
moderate physical activity (3.00-5.99 MET’s), between 5725 and 9498 counts is hard
physical activity (6.00-8.99 MET’s) and more than 9498 counts is very hard physical activity
(> 8.99 MET’s). This subdividing into categories also allowed the calculation of time spent in
each category. Activity counts in the different categories were directly used to analyze the
validity, since it has been suggested that a conversion of CSA activity counts into energy
expenditure may produce significant error. 10
Statistics
All analyses were performed using SPSS 10.0. 26 Test-retest reliability coefficients were
determined using single measure intraclass correlation coefficients (ICC) computed between
the computerized IPAQ administration at contacts 1, 2 and 3 together. For validity, Spearman
rank-order correlation coefficients were computed to compare the computerized IPAQ
administered at contact 2 with CSA activity counts, the seven day physical activity diary and
paper-and-pencil IPAQ. Spearman correlation coefficients were chosen since self reported
physical activity data were not normally distributed. All reported correlations are between
corresponding physical activity categories, e.g. CSA high intensity physical activity was
correlated with computerized IPAQ high intensity physical activity, Diary job-related
physical activity was correlated with computerized IPAQ job-related physical activity, and so
on. Paired sample t-tests were used to verify if there were differences between the
computerized IPAQ at contact two with the paper-and-pencil IPAQ, the physical activity
diary and the CSA minutes. Statistical significance was set at an alpha level of .05.
Results
Reliability
Single measure intraclass correlation coefficients (ICC), expressed in minutes of physical
activity (min.) or in kilocalories energy expenditure (kcal.), for the three computerized IPAQ
administrations are given in table 2. These correlations ranged from ICC = .60 to .83. The
ICC for total PA was .69 when expressed in minutes and kilocalories. Highest ICC’s were for
high intensity (min.: ICC = .81, kcal.: ICC = .82), job-related (min.: ICC = .83, kcal.: ICC =
.80) and leisure-time (min.: ICC = .82, kcal.: ICC = .81) physical activity. Lowest ICC’s were

Chapter 2
31
for moderate intensity (min.: ICC = .62, kcal.: ICC = .63) and transportation (min.: ICC =
.60, kcal.: ICC = .60) physical activity.
Table 2: Single Measure Intraclass Correlations (ICC) for the Computerized IPAQ
administered at Contact 1, 2 and 3, expressed in Minutes of Physical Activity (min.) or in
Kilocalories Energy Expenditure (kcal.)
Min. Kcal.
Total PA .69 .69 High + Moderate PA .66 .69 High intensity PA .81 .82 Moderate intensity PA .62 .63 Low intensity PA .73 .76
Job-Related PA .83 .80 Transportation PA .60 .60 Household PA .74 .71 Leisure-Time PA .82 .81 Note. PA = Physical Activity
Validity
Spearman correlation coefficients between the computerized IPAQ at contact 2 and CSA
measures can be found in table 3. The correlation for total physical activity was .38 (P < .01)
when expressed in minutes and .43 (P < .01) when expressed in kilocalories. The highest
correlations were found for high intensity physical activity (min.: r = .42, P < .01; kcal. : r =
.45, P < .01). Non-significant correlations were found for low (min.: r = .01 ; kcal. : r = .01)
and moderate (min.: r = .13 ; kcal. : r = .19) intensity physical activity.
Also shown in table 3 are the correlations between the computerized IPAQ and the seven day
physical activity diary. These correlations were similar to CSA activity count correlations.
For total physical activity a correlation of .39 (P < .01) when expressed in minutes and .46
(P < .01) when expressed in kilocalories was found. Again, non-significant correlations were
found for low intensity (min.: r = .21, ns.; kcal. : r = .15, ns.) and moderate intensity (kcal. : r
= .23, ns.) physical activity. The highest correlations were for high intensity (min.: r = .79, P

IPAQ Rzliability and Validity
32
< .01; kcal.: r = .79, P < .01) and leisure-time (min.: r = .63, P < .01; kcal.: r = .67, P < .01)
physical activity.
Table 3: Spearman Correlations between the Computerized IPAQ at contact 2 and CSA
Activity Counts, the 7 Day Physical Activity Diary and the Paper and Pencil IPAQ, expressed
in Minutes of Physical Activity or in Kilocalories Energy Expenditure CSA Activity
counts Physical Activity
Diary Paper and pencil
IPAQ Min. Kcal. Min. Kcal. Min. Kcal.
Total PA .38** .43** .39** .46** .80** .84**
High + Moderate PA .37** .42** .45** .46** .80** .86** High intensity PA .42** .45** .79** .79** .87** .93** Moderate intensity PA .13 .19 .32* .23 .77** .78** Low intensity PA .01 .01 .21 .15 .86** .84** Job-Related PA .22 .23 .85** .85** Transportation PA .50** .52** .80** .84** Household PA .42** .53** .88** .87** Leisure-Time PA .63** .67** .93** .95** Note. PA = Physical Activity * P< .05 ** P< .01
High correlations were found between the computerized IPAQ and the paper-and-pencil
IPAQ (table 3), ranging from r = .77 to r = .95 (P <.01). Highest correlations were found for
leisure-time physical activity (min.: r = .93, P < .01; kcal.: r = .95, P < .01).
Paired samples t-test showed no significant differences between total physical activity on the
computerized IPAQ [t(52) = .78, ns.] and total physical activity on the paper-and-pencil
IPAQ. No significant difference was found between ‘moderate + high’ intensity physical
activity on the computerized IPAQ and ‘moderate + high’ intensity physical activity on the
physical activity diary [t(52) = 1.42, ns.]. This was also the case when ‘moderate + high’
intensity physical activity computerized IPAQ was compared to ‘moderate + high’ intensity
physical activity in minutes on the CSA [t(52) = .61, ns.].
Chapter 2
33
Discussion
This study examined the reliability and validity of a newly developed Dutch computerized
IPAQ. When measuring the test-retest reliability of a questionnaire, intraclass correlation
coefficients (ICC) from .75 or higher are considered good to very good.3 In this study the
ICC reliability measures ranged from .60 to .83, thus showing a moderate to high reliability
for the computerized IPAQ. Reliability of the total physical activity was .69. The reliability
of high intensity and leisure-time physical activity (ICC from .81 to .82) was better than the
reliability of moderate intensity physical activity (ICC from .62 to .63). This is probably
caused by the more unstable nature of moderate intensity physical activity resulting in a
recall bias as compared to high intensity or leisure-time physical activity which is more
structured.5,17 The reliability values found in this study are comparable with those found in
the study from Craig et al.,20 they found values ranging from .96 to .46, but most were around
.80. In a review1 containing reliability results for seven self-report physical activity measures,
values ranged from .34 to .89.
Correlations between computerized IPAQ and CSA activity (min.: r = .38, kcal.: r = .43)
supported the validity of the IPAQ. These correlations are at least as good as other self-report
physical activity measures evaluated in adults,27,28 and are also comparable with the
international IPAQ validity study, which found a correlation of about .33 for the long IPAQ
version. 20 In a review, containing the validation results for seven self-report physical activity
measures, Sallis and Saelens 1 reported validity correlations ranging from .14 to .53, with a
median of about .30. Nevertheless, most of our correlations were moderate and several causes
might explain this. First, the computerized IPAQ hardly measures low intensity physical
activity, yet a large portion of the day is spent in sedentary or light activity, and thus a large
part of the CSA activity counts represent physical activity at low intensity. Second, several
authors state that it is very difficult to obtain a good measure of low and moderate physical
activity using self-administered questionnaires. 5,17 These activities are being accumulated
throughout the day and the number and diversity of these activities is large, causing a very
poor recall. Further these authors state that high intensity physical activities, being more
structured and stable over time, are much easier recalled. The higher correlations, in this
study, for high intensity and leisure-time physical activity compared to low and moderate
intensity physical activity illustrate this point. Third, it has been reported that people tend to

IPAQ Rzliability and Validity
34
over report the time spent in high intensity physical activity and underreport the time spend in
light activity. 1,13 CSA accelerometers are known to do the opposite: they underreport high
intensity physical activities and over report low intensity physical activities.13 Fourth, the
computerized IPAQ version used in this study measured usual week physical activity
whereas the CSA measured last week physical activity.
When the computerized IPAQ at contact 2 was compared to the seven day physical activity
diary higher correlations were found. The correlations for total physical activity (min.: r =
.39, kcal.: r = .46) supported the validity of the IPAQ. Especially leisure-time and high
intensity physical activity correlated very well with the physical activity diary. Further, it was
found that the total week (min) physical activity recorded using the physical activity diary
was more than three times higher as compared to total week physical activity recored using
the computerized IPAQ. A similar pattern was observed with the CSA total minutes of
activity, with CSA total activity minutes being much higher than those reported on the
computerized IPAQ. The discrepancy was caused by the overrepresentation of low intensity
physical activity on the diary and the CSA. This overrepresentation of low physical activity
was also observed by other researchers.29 When the low intensity physical activity minutes
were removed from all measures, similar physical activity values were obtained. Since the
aim of the computerized IPAQ is to measure moderate to high intensity physical activity, it
could be argued that the validity of the computerized IPAQ is expressed more accurately by
omitting low intensity physical activity from the correlations. Finally, the slightly higher
correlations obtained by the physical activity diary as compared to the CSA activity counts
are probably due to shared method variance since the IPAQ and diary were both self-
reports.30
The correlations between the computerized IPAQ and the paper-and-pencil IPAQ were all
very high, and there were no significant differences in means. These results demonstrate that
the computerized IPAQ is generally equivalent to the hard copy IPAQ. Taking into account
the advantages of computerized questionnaires, mentioned earlier, the computerized version
may be preferable. However, computerized assessment has also some drawbacks. Paper-and-
pencil questionnaires allow participants to see how many items there are and pace themselves
accordingly; to skip around, rather than answering the questions in sequence; and to go back
easily to earlier questions, in order to change them or check for their own consistency.3
Further, a selection bias is possible since not everybody can handle a computer or is willing

Chapter 2
35
to do so. However, computerized questionnaires, like the one in this study, can be developed
so that they are simple and well explained. Studies have also found that most people are
comfortable in front of a computer.3 Despite these drawbacks we believe computerized
assessment of physical activity has the potential to become a very important assessment
technique in the future.
Considering the minutes spend in total usual week physical activity, compared to CSA data it
appears that the computerized IPAQ overestimates the amount of high intensity physical
activity while underestimating moderate intensity physical activity. This complex pattern has
been seen in several previous studies.1 A limitation of this study is that this overestimation
can not be confirmed nor refuted because there are know limitations to using accelerometers
as validity criteria.6 Another limitation might be the small sample size, which makes it
difficult to generalize these results to larger populations. A strength of this study is that it is
one of the first to examine the reliability and validity of a computerized physical activity
questionnaire. It is of particular value to evaluate a computerized version of the international
physical activity questionnaire because present results suggest researchers from other
countries can develop equivalent versions of hard copy and computerized IPAQ surveys.
In summary, our results indicate that the computerized IPAQ is a reliable and reasonable
valid physical activity measurement tool for the adult population. Additional research should
be conducted to determine the reliability and validity of computerized IPAQ’s in other
languages and to determine population subgroups for whom the computerized version may
not be appropriate.
Acknowledgements
This study was financially supported by the Ghent University and the Flemish Fund for
Scientific Research. The authors would like to thank the Maastricht University for supplying
the software used for computerizing the IPAQ questionnaire, the IPAQ reliability and validity
committee for providing the IPAQ manual of operation for reliability, validity and prevalence
studies (version 8, March 3, 2000; University of South Carolina), the Centers for Disease
Control and Prevention in Atlanta USA for loaning 20 CSA’s, and the Karolinska Institute in
Stockholm for the use of their CSA data-reduction software.

IPAQ Rzliability and Validity
36
References
1. Sallis JF, Saelens BE. Assessment of physical activity by self-report: Status, limitations,
and future directions. Res Q Exerc Sport. 2000;71:S1-14.
2. Ridley K, Doliman J, Olds T. Development and validation of a computer delivered
physical activity questionnaire (CDPAQ) for children. Ped Exerc Sci. 2001;13:35-46.
3. Steiner DL, Norman GR. Health Measurement Scales: A practical guide to their
development and use. 2nd. Ed. Oxford, England: Oxford University Press, 1995.
4. Fotheringham MJ, Wonnacott RL, Owen N. Computer use and physical inactivity in young
adults: Public health perils and potentials of new information technologies. Ann Behav Med.
2000;22:269-275.
5. Montoye HJ, Kemper HCG, Saris WHM, Washburn RA. Measuring Physical activity and
energy expenditure. Champaign, IL: Human Kinetics, 1996.
6. Freedson PS, Miller K. Objective monitoring of physical activity using motion sensors and
heart rate. Res Q Exerc Sport. 2000; 71:S21-S29.
7. Bassett DR Jr., Ainsworth BE, Swartz AM, Strath SJ, O'Brien WL, King GA. Validity of
four motion sensors in measuring moderate intensity physical activity. Med Sci Sports Exerc.
2000;32:S471-S480.
8. Bassett DR Jr. Validity and reliability issues in objective monitoring of physical activity.
Res Q Exerc Sport. 2000;71:S30-S36.
9. Computer Science and Applications Inc. Activity Monitor Operator's Manual, Model 7164.
Shalimar, FL: Computer Science and Applications, 1997.
10. Freedson PS, Melanson E, Sirard J. Calibration of the Computer Science and
Applications, Inc. accelerometer. Med Sci Sports Exerc. 1998;30:777-781.
11. Melanson EL Jr., Freedson PS. Validity of the Computer Science and Applications, Inc.
(CSA) activity monitor. Med Sci Sports Exerc. 1995;27:934-940.
12. Nichols JF, Morgan CG, Chabot LE, Sallis JF, Calfas KJ. Assessment of physical activity
with the Computer Science and Applications, Inc., accelerometer: laboratory versus field
validation. Res Q Exerc Sport. 2000;71:36-43.
13. Sirard JR, Melanson EL, Li L, Freedson PS. Field evaluation of the Computer Science
and Applications, Inc. physical activity monitor. Med Sci Sports Exerc. 2000;32:695-700.
Chapter 2
37
14. Hendelman D, Miller K, Baggett C, Debold E, Freedson P. Validity of accelerometry for
the assessment of moderate intensity physical activity in the field. Med Sci Sports Exerc.
2000;32:S442-S449.
15. Welk GJ, Blair SN, Wood K, Jones S, Thompson RW. A comparative evaluation of three
accelerometry-based physical activity monitors. Med Sci Sports Exerc. 2000;32:S489-S497.
16. Cooper AR, Page A, Fox KR, Misson J. Physical activity patterns in normal, overweight
and obese individuals using minute-by-minute accelerometry. Eur J Clin Nutr. 2000;54:887-
894.
17. Washburn RA, Heath GW, Jackson AW. Reliability and validity issues concerning large-
scale surveillance of physical activity. Res Q Exerc Sport. 2000;71:S104-S113.
18. Ainsworth BE, Montoye HJ, Leon AS. Methods of assessing physical activity during
leisure and work. In: Bouchard C, Shephard RJ, eds. Physical Activity, Fitness and Health :
the model and key concepts. Champaign, IL: Human Kinetics Publishers, 1994:146-158.
19. Booth M. Assessment of physical activity: An international perspective. Res Q Exerc
Sport. 2000;71:S114-S120.
20. Craig CL, Marshall AL, Sjostrom M, Bauman AE, Booth ML, Ainsworth B, et al.
International Physical Activity Questionnaire (IPAQ): 12-country reliability and validity.
Med Sci Exerc Sport. 2003;35:1381-1395.
21. Rütten A, Ziemainz H, Schena F, Stahl T, Stiggelbout M, Vanden Auweele Y, Vuillemin
A, et al. Using different physical activity measurements in eight European countries. Results
of the European Physical Activity Sureveillance System (EUPASS) time series survey.
Public Health Nutr. 2003;6:371-376
22. Rütten A, Vuillemin A, Ooijendijk WTM, Schena F, Sjörström M, Stalh T, et al. Physical
activity monitoring in Europe. The European activity surveillance system (EUPASS)
approach and indicator testing. Public Health Nutr. 2003;6:377-384.
23. Ainsworth BE, Haskell WL, Leon AS, Jacobs DR Jr., Montoye HJ, Sallis JF, et al.
Compendium of physical activities: classification of energy costs of human physical
activities. Med Sci Sport Exerc. 1993;25:71-80.
24. Ainsworth BE, Haskell WL, Whitt MC, Irwin ML, Swartz AM, Strath SJ, et al.
Compendium of physical activities: An update of activity codes and MET intensities. Med
Sci Sports Exerc. 2000;32:S498-S504.
25. Tyron WW, Williams R. Fully proportional actigraphy: A new instrument. Behav Res
Meth Instr Comp. 1996;28:392-403.
26 SPSS Inc., Chicago IL: SPSS, 2001.

IPAQ Rzliability and Validity
38
27. Ainsworth BE, Bassett DR Jr., Strath SJ, Swartz AM, O'Brien WL, Thompson RW, et al.
Comparison of three methods for measuring the time spent in physical activity. Med Sci Sport
Exerc. 2000;32:S457-S464.
28. De Abajo S, Larriba R, Marquez S. Validity and reliability of the Yale Physical Activity
Survey in Spanish elderly. J Sport Med Phys Fitness. 2001;41:479-485.
29. Pols MA, Peeters PH, Ocke MC, Slimani N, Bueno-de-Mesquita HB, Collette HJ.
Estimation of reproducibility and relative validity of the questions included in the EPIC
Physical Activity Questionnaire. Int J Epidemiol. 1997;26:S181-S189.
30. Wareham NJ, Rennie KL. The assessment of physical activity in individuals and
populations: Why try to be more precise about how physical activity is assessed? Int J Obes
Relat Metab Disord. 1998;22: S30-S38.
Chapter 3
39
CHAPTER 3

Reliability and Validity Fat Intake Questionnaire
40
Chapter 3
41
Reliability and Validity Fat Intake Questionnaire
42

Chapter 3
43

Reliability and Validity Fat Intake Questionnaire
44

Chapter 3
45

Reliability and Validity Fat Intake Questionnaire
46

Chapter 3
47

Reliability and Validity Fat Intake Questionnaire
48

Chapter 3
49

Reliability and Validity Fat Intake Questionnaire
50
Chapter 4
51
CHAPTER 4

Acceptability and Feasibility Physical Activity Intervention
52

Chapter 4
53
Acceptability and Feasibility Physical Activity Intervention
54

Chapter 4
55

Acceptability and Feasibility Physical Activity Intervention
56
Chapter 4
57
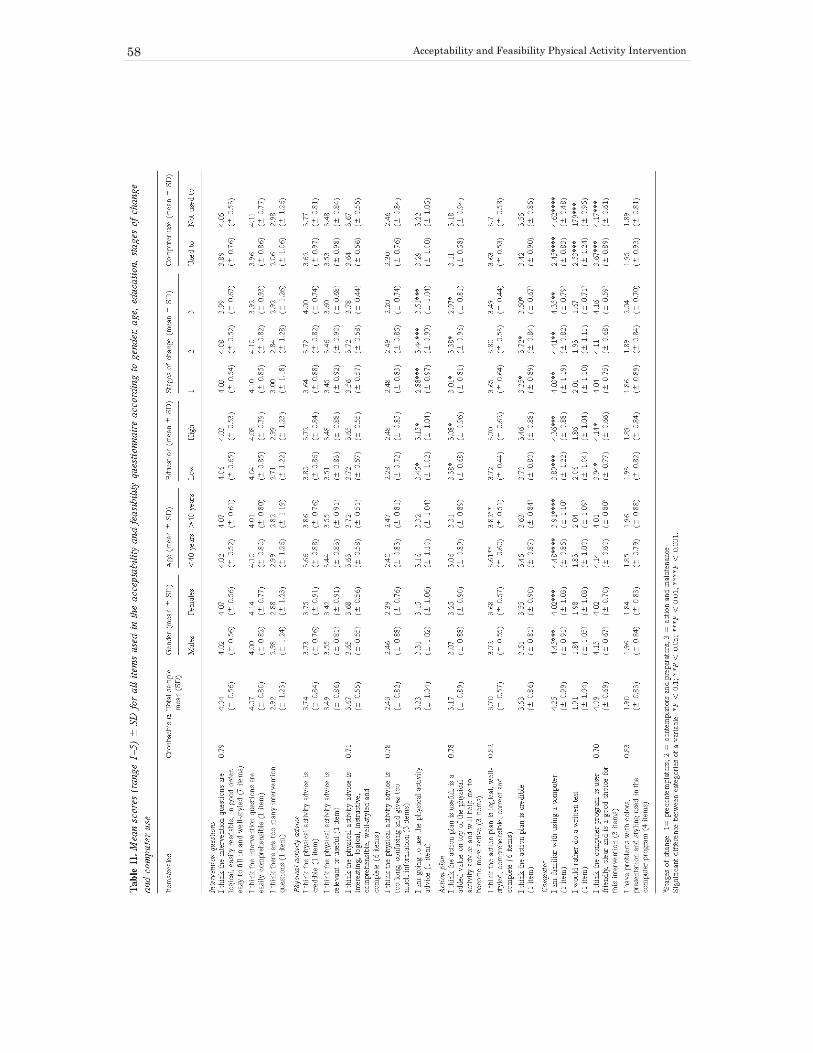
Acceptability and Feasibility Physical Activity Intervention
58

Chapter 4
59

Acceptability and Feasibility Physical Activity Intervention
60

Chapter 4
61
Acceptability and Feasibility Physical Activity Intervention
62

Chapter 4
63
Acceptability and Feasibility Physical Activity Intervention
64

Chapter 5
65
CHAPTER 5

Acceptability and Feasibility Fat Intake Intervention
66

Chapter 5
67

Acceptability and Feasibility Fat Intake Intervention
68

Chapter 5
69

Acceptability and Feasibility Fat Intake Intervention
70

Chapter 5
71

Acceptability and Feasibility Fat Intake Intervention
72

Chapter 6
73
CHAPTER 6
Efficacy of sequential or simultaneous interactive computer-tailored interventions for increasing physical activity and decreasing fat
intake
Corneel Vandelanotte, Ilse De Bourdeaudhuij, James Sallis, Heleen Spittaels and Johannes Brug
Anneals of Behavioral Medicine, in press
Abstract
Little evidence exists about the effectiveness of ‘interactive’ computer-tailored interventions,
and about the combined effectiveness of tailored interventions on physical activity and diet.
Furthermore, it is unknown whether they should be executed sequential or simultaneous. The
purpose of this study was to examine (1) effectiveness of interactive computer-tailored
interventions for increasing physical activity and decreasing fat intake; and (2) which
intervening mode, sequential or simultaneous, is most effective in behavior change.
Participants (N = 771) were randomly assigned to receive (1) the physical activity and fat
intake interventions simultaneously at baseline; (2) the physical activity intervention at
baseline and the fat intake intervention three months later; (3) the fat intake intervention at
baseline and the physical activity intervention three months later; (4) or to a control group.
Six months post-baseline the results showed that the tailored interventions produced
significantly higher physical activity scores [F(2,573) = 11,4; p < 0.001] and lower fat intake
scores [F(2,565) = 31,4; p < 0.001] in the experimental groups when compared to the control
group. For both behaviours the sequential and simultaneous intervening modes showed to be
effective, however for the fat intake intervention and for the participants who did not meet
the recommendation in the physical activity intervention the simultaneous mode appeared to
work better than the sequential mode.
Efficacy of Simultaneous or Sequential Tailored Interventions
74
Introduction
There is ample evidence that shows that regular physical activity and eating a low fat diet
promotes health (1-4). However, in most western countries most people are inactive and eat
too much fat (4, 5-7). Health authorities recommend to accumulate at least 30 minutes of
moderate-intensity physical activity on most, preferably all, days of the week (8-9) and to
consume less than 30% energy from fat (10-11).
Tailored interventions provide respondents with personally adapted feedback about their
present health behavior and/or the behavioral determinants, as well as personally adapted
suggestions to change behaviors (12-14). An intervention is ‘tailored’ when participants are
approached individually, mostly using computerised information technologies, so that the
intervention materials are specific for each participant (13). Computer-tailored interventions
can provide individualized behavior change information to many individuals at low costs
(14). In a growing number of well-designed studies addressing a range of health-related
behaviours and other outcomes, tailored health communication materials outperformed non-
tailored materials (13,15). Compared with non-tailored messages, tailored messages are more
likely to be read and remembered, saved and discussed with others, perceived as interesting,
personally relevant and written especially for them (15,16). In the past, tailored interventions,
targeting a single behavior, have proven to be successful for increasing physical activity (17-
21) as well as for decreasing fat intake (22-28).
Although computer-tailored physical activity and nutrition interventions showed promising
effects, most of the interventions used to date have been defined as first generation tailored
interventions (14,25). In these interventions computer technology is used relatively sparsely.
Participants complete written questionnaires and it often takes several weeks before they
receive their tailored feedback letter from the research team. This feedback is generated by a
computer program in the lab, printed and then sent to the participants in a personal letter
format. In second generation interventions, interactive computer programs are used,
participants feed their answers to the diagnostic questions directly into a computer and
feedback is directly provided on the computer screen (25). To date almost no ‘interactive’
computer-tailored interventions were evaluated.

Chapter 6
75
Interventions for increasing physical activity or decreasing fat intake have typically focused
on a single behaviour. However, since many individuals have multiple health risk behaviours
(29) and it has been reported that physical activity and fat intake are correlated to each other
(30-32) there may be additive or even synergistic effects of designing health promotion
interventions that focus on both behaviours at the same time (31). However, according to
Emmons et al. (32), who investigated the relations between multiple risk factors, it is not
clear if changing multiple health behaviours improves or decreases the effectiveness of
interventions and if it is best done simultaneously or sequentially. In a review by Wilcox et
al. (33), which evaluated physical activity, nutritional and combined interventions, it is
suggested that intervention effects are not ‘diluted’ when they focus on more than one
behaviour simultaneously, since the combined interventions had similar effects on physical
activity and dietary fat compared to the single-behaviour interventions. The PREMIER
collaborative research group (34), showed that the simultaneous implementing of multiple
lifestyle modification interventions to lower blood pressure, was more effective than using
only one intervention, however they did not research the effects of sequential
implementation, which might be even more effective. Nevertheless, several others (29,32) are
convinced that changing more than one habit at a time may be extraordinarily difficult to do
and that, from a behavioural perspective, habit breaking might best be accomplished when
focusing on one behaviour at a time. They support the need for a sequenced behaviour
change process and state that simultaneous action would be overwhelming.
According to Boudreaux et al. (35) people differ considerably in their ‘readiness to change’
physical activity and fat intake and therefore multiple health behavior interventions should be
tailored specific for each behavior. To date, however, only few studies have investigated the
impact of tailored interventions aimed both at physical activity and fat intake. Campbell et al.
(36) studied the effects of sequential tailored dietary and physical activity advice in
combination with social support. The study was moderately successful in changing both
behaviors, but was unable to attribute the effects to the tailored parts of the intervention.
Calfas et al. (37) provided tailored dietary and physical activity advice simultaneous in
primary health care settings. Short-term improvements in both dietary and physical activity
were reported. To our knowledge, no study ever provided a direct test of the differences
between sequential or simultaneous computer-tailored interventions.
Efficacy of Simultaneous or Sequential Tailored Interventions
76
The aim of the present study was to examine the effectiveness of two interactive computer-
tailored interventions targeting high priority health behaviors: increasing physical activity
and decreasing fat intake. Further, we wanted to investigate the preferred way of
implementation of multiple health behavior tailoring: sequential or simultaneous. We
hypothesized that: (1) The interactive computer-tailored interventions will be effective in
producing behaviour change; and (2) the sequential intervening mode will be more effective
than the simultaneous mode to change behaviour.
Method
Participants
Participants were recruited in and around the city of Ghent (Belgium) using local media
(television, radio, newspapers, magazines), posters, leaflets and e-mail. People could react by
phone or e-mail and were, if interested, inserted into a database to be contacted at the end of
the recruitment period. Participants had to be between 20 and 60 years of age and without
medical complaints related to physical activity or fat intake (such as cardiovascular disease,
diabetes, anorexia or problems with stomach, liver, gall bladder and intestine). To encourage
participation, a bicycle, a gift coupon and film tickets were raffled among study participants.
Of the 1164 people who responded to the recruitment notices 1023 actually participated at
baseline. At post-test 771 participants had complied to all study requirements and were
included in the analyses (drop-out = 24.6%). Drop-out analysis showed that men and younger
participants were more likely to have dropped out. No differences were found for education,
body mass index, employment, total physical activity, moderate + high intensity physical
activity, total fat intake and percent energy from fat.
Procedure
The study was approved by the Ghent University Ethics Committee and an informed consent
statement was obtained from each participant. After baseline measurement participants were
assigned at random into one of four conditions: group 1 received both the tailored physical
activity and the tailored fat intake interventions at baseline; group 2 received the tailored
physical activity intervention at baseline and the tailored fat intake intervention three months
later; group 3 received the tailored fat intake intervention at baseline and the tailored physical
activity intervention three months later; group 4 was the waiting list control group and
Chapter 6
77
received both tailored interventions after post-test measurement six months post-baseline.
The participants in the experimental groups (groups 1, 2 and 3) received their computer-
tailored interventions at a university computer lab. Each participant received each
intervention (physical activity and fat intake) only once during the entire course of the
research and it took about 50 minutes to go through one intervention (physical activity or fat
intake), however there was a large variation in time spent between the participants. Each
intervention group was invited on a separate day in order to avoid possible ‘contamination’
between groups. Six months after baseline post-test questionnaires were mailed to home
addresses with a stamped return envelop. All baseline measures and interventions took place
during the fall, while post-test measures were obtained during spring.
Interventions
The interactive computer-tailored physical activity and fat intake interventions used in this
study are part of the FAITH-project (Fat and Activity Tailored to Health). An extensive pre-
testing of these interventions showed good acceptability and feasibility (38-39). The purpose
of the interventions was to help participants reach the current public health recommendations
for physical activity (accumulate at least 30 minutes of moderate-intensity physical activity
on all days of the week) and fat intake (to consume less than 30% energy from fat) (8-11).
Both the physical activity and the fat intake intervention had the same line-up and were
entirely computerized. After reading an introduction page, which explains the nature and
purpose of the intervention, participants had to fill out an electronic questionnaire consisting
of three parts: demographics, health behavior and psychosocial variables. After completing
the questionnaire tailored feedback was displayed immediately on the screen. The feedback
was based on the theory of planned behavior (40) and the stages of change concept from the
trans-theoretical model (41). The theory of planned behaviour was considered by giving the
participants personal relevant feedback about intentions, attitudes, self-efficacy, social
support, knowledge, benefits and barriers of the behaviour to change (physical activity or fat
intake). The stages of changes were considered in two ways. First, the content differed
between stages. Precontemplators mainly received general information and information about
the benefits of the behaviour to change. Contemplators received the same information,
although not so extensively, and it was mentioned that they might benefit from a behaviour
change themselves. In the preparation stage, the emphasis really was on changing the
behaviour in order to comply with the recommendations. In the action stage, the emphasis

Efficacy of Simultaneous or Sequential Tailored Interventions
78
was on maintaining the newly adopted behaviour and relapse prevention. In the maintenance
stage feedback was reduced to saying that they were doing well and that they should carry on.
Second, the way in which the participants were approached also differed between stages.
Information for precontemplators was presented in an impersonal way (e.g. people could...)
in order to avoiding resistance. Contemplators were approached in a personal way (e.g. you
could…), but not in a decisive way which was used for preparators (e.g. you should…) or a
supporting way used for people in the action or maintenance phase (e.g. you do…). In
practice the feedback consisted of three parts: a general introduction; normative feedback
which related participants’ physical activity or fat intake to current recommendations; and
tips and suggestions on how to increase physical activity or decrease fat intake. This part of
the advice, only presented when recommendations were not met, also incorporated feedback
on the participant’s psychosocial attitudes, perceived benefits and barriers, social support,
and self-efficacy related to physical activity or fat intake. After reading the tailored feedback
from the computer screen, the advice was printed and taken home. A more detailed
description of the physical activity intervention has been published by Vandelanotte et al.
(38). The fat intake intervention was an adaptation from interventions used by Brug et al. (42-
43) and Oenema et al. (23), for a more detailed description see Vandelanotte et al. (39).
Measures
For the assessment of physical activity the IPAQ (International Physical Activity
Questionnaire) was used. This 31 item questionnaire (long self-administered version)
measured physical activity at work, transportation, household and leisure time. For each topic
in each category, respondents reported the number of days and the number of minutes per day
spent doing the activity. An individual total physical activity score, expressed in minutes of
activity per week, was obtained when all questions were summed. Validity of a computerized
and Dutch version of the IPAQ questionnaire was tested using CSA accelerometers and a
seven day physical activity diary. Correlations of respectively 0.38 and 0.39 indicated a
reasonable validity, and were comparable with the results obtained in the 12-country IPAQ
validity study (44). Detailed descriptions of the IPAQ have been published elsewhere (44-
45).
For measuring fat intake a 48 item food frequency questionnaire was used, assessing
frequency and amounts of the most important sources of fat in the Belgian diet: bread and
cereals; spreads, fillings and butter; milk and milk products; prepared meals; meat, fish and
Chapter 6
79
eggs; sauce, gravy and dressing; snacks, cake and biscuits. Participants were asked about
usual portion sizes and how frequently they consumed these food products during a usual
day, week or month. For each product a coefficient was calculated based on fat content and
portion size of the food product. This coefficient was multiplied by the frequency of
consumption and summed for all questions, leading to an individual total fat intake score,
expressed in grams of fat per day. Validity of this questionnaire was measured using seven
days of diet records. Correlations of 0.67 for fat intake and 0.60 for percent energy from fat
and a gross misclassification of 5.8% were found, indicating acceptable validity. For more
details on this questionnaire and it’s validation see Vandelanotte et al. (46).
Statistics
For physical activity, analyses were executed on two outcome measures: ‘total physical
activity’ and ‘moderate + high intensity physical activity’. ‘Moderate + high intensity
physical activity’ is a representation of all physical activity that meets with requirements of
the current public health recommendations (in minutes/week). This includes all physical
activity corresponding with a MET estimate from 3.5 or higher as described in the
compendium of physical activities (47,48). For fat intake analyses were also executed on two
outcome measures: ’total fat intake’ and ‘percent energy from fat’. Percent energy from fat
was calculated using standard ‘recommended energy intake tables’ based on height, weight,
sex, age and activity level (49).
To evaluate the effects on physical activity a repeated measure ANOVA, with time (pre-post
test) as within subjects factor and group (groups 1, 2 and 4) as between subjects factor, was
used. To evaluate the effects on fat intake a repeated measure ANOVA, with time as within
subjects factor and group (groups 1, 3 and 4) as between subjects factor, was used. These
repeated measure ANOVA’s were executed on three different (sub)groups: total group,
participants not meeting the current health recommendation at baseline and participants
meeting the recommendation at baseline.
In addition, repeated measure ANOVA’s with time, group and recommendation (participants
who did or did not met the current recommendation at baseline) were also executed on all
outcome measures to investigate the three-way interaction. Covariates in the repeated
measure ANOVA analyses (sex, age, education, body mass index and employment) did not
significantly interact with the intervention and were thus excluded from all reported analyses.

Efficacy of Simultaneous or Sequential Tailored Interventions
80
All analyses were performed using SPSS 11.0. Statistical significance was set at a level of
0.05.
Results
Participant characteristics
As shown in table 1, the majority of participants were female (64.5 %), had high education
(69.6 %) and were employed (86.3 %). Total physical activity was 569 ± 450 minutes a week
and moderate + high intensity physical activity was 340 ± 307 minutes a week for the total
group. At baseline 62.2 % of men and 53.9 % of women met the physical activity
recommendation. Total group fat intake was 109.2 ± 41 grams a week and energy from fat
was 37.6 ± 13 grams a week. At baseline only 38.5% of men and 30.5% of women met the
fat intake recommendation. At post-test, 95.3% and 96.2% of the participants, respectively
for the physical activity and the fat intake intervention, indicated that they had read the
printed advice which was taken home.
Table 1: Total sample baseline characteristics for men and women (mean ± SD or %)
Total Sample (N = 771)
Men (N = 274)
Women (N = 497)
Demographics : Age (yr) 39.1 ± 9.6 39.9 ± 9.5 38.6 ± 9.7 Height (m) 170.1 ± 8.7 177.6 ± 7.0 165.8 ± 6.5 Weight (kg) 71.3 ± 14.5 81.1 ± 13.8 65.9 ± 11.7 Body Mass Index (kg/m2) 24.5 ± 4.1 25.7 ± 4.2 23.9 ± 4.0 College or university degree (%) 69.6 67.7 70.5 Employed (%) 86.3 85.8 86.6
Physical activity (PA) : Total PA (min/week) 569.0 ± 450.4 568.3 ± 470.1 611.0 ± 439.5 Moderate + high intensity PA (min/week) 340.3 ± 307.1 388.1 ± 337.9 314.6 ± 286.3 30 min of PA on most days (%) 56.8 62.2 53.9
Fat intake : Total fat intake (g/day) 109.2 ± 41.6 127.7 ± 47.1 98.8 ± 34.0 Recommended energy intake (kcal) 2633.6 ± 545.0 3240.9 ± 428.9 2298.7 ±209.8 Energy from fat (%) 37.6 ±13.0 35.7 ± 12.6 38.6 ± 13.2 Less than 30% energy from fat (%) 33.5 38.9 30.5

Chapter 6
81
Changes in Physical Activity
In table 2 an overview is given of the effects of the sequential and simultaneous interventions
on physical activity. For the total group a significant interaction effect (time * group) was
found (p < 0.001). Post-hoc follow-up test showed that both the sequential and simultaneous
intervention groups significantly increased participants’ total physical activity when
compared to the no-intervention group. There was no significant difference between the
sequential and simultaneous intervention groups themselves. In contrast, no significant
effects were found for moderate + high intensity physical activity.
Table 2: Effects of the sequential and simultaneous interventions on total physical activity
(minutes/week) and moderate + high intensity physical activity (minutes/week) for total
group and for participants meeting or not meeting the recommendation for physical activity
at baseline Total group (N = 573)
Meeting the PA recommendation (N = 325)
Not meeting the PA recommendation (N = 248)
Total PA (min/w)
Mod + high PA (min/w)
Total PA (min/w)
Mod + high PA (min/w)
Total PA (min/w)
Mod + high PA (min/w)
Simultaneous interventions Group 1 (N = 189)
Baseline 532 ± 519 325 ± 312 796 ± 445 538 ± 300 248 ± 210 95 ± 58 Post-test 705 ± 519 386 ± 329 836 ± 502 481 ± 327 563 ± 502 284 ± 301 Difference + 173 +61 + 40 - 57 + 315 + 189
Sequential interventions Group 2 (N = 180)
Baseline 514 ± 367 295 ± 249 694 ± 386 456 ± 244 313 ± 208 116 ± 60 Post-test 727 ± 492 388 ± 306 904 ± 540 528 ± 323 530 ± 340 232 ± 189 Difference + 213 + 93 + 210 + 72 + 217 + 116
No intervention Group 4 (N = 204)
Baseline 720 ± 485 392 ± 340 884 ± 492 552 ± 323 418 ± 290 99 ± 63 Post-test 734 ± 516 437 ± 348 850 ± 545 550 ± 363 523 ± 380 230 ± 191 Difference + 14 + 45 - 34 - 2 + 105 + 131 F Time 54.2*** 28.1*** 7.4** 0.6 87.1*** 98.7*** F Group 4.2** 3.7* 0.7 1.4 1.1 0.7 F Time*Group 11.4*** 1.2 7.5*** 3.7* 7.1*** 2.5(*)
Post Hoc a, b a, c c a, b c Note. PA = Physical Activity Post Hoc: a = significant difference between sequential interventions and no intervention; b = significant difference between simultaneous interventions and no intervention; c = significant difference between sequential interventions and simultaneous interventions (*) P < 0.1 * P < 0.05 ** P < 0.01 *** P < 0.001

Efficacy of Simultaneous or Sequential Tailored Interventions
82
For total physical activity there were significant interaction effects both for participants not
meeting (p < 0.001) and participants meeting (p < 0.001) the physical activity
recommendation. For participants not meeting the recommendation, post-hoc test showed
that the sequential and simultaneous intervention group significantly increased total physical
activity compared to the no-intervention group. For participants meeting the
recommendation, post-hoc test showed that only the sequential intervention groups
significantly increased total physical activity compared to the no-intervention group. For the
moderate + high intensity physical activity a significant interaction effect (p < 0.05) was
found for participants meeting the recommendation. However, post-hoc tests showed that, for
participants that did or did not met the recommendation, there were no significant effects for
either the sequential or simultaneous intervention groups when compared to the no-
intervention group.
No significant three-way interaction effects (time * group * recommendation) were found for
total physical activity and moderate + high intensity physical activity.
Changes in Fat Intake
Table 3 shows the effects of the interventions on fat intake. For total group a significant
interaction effect (time * group) was found for total fat intake (p < 0.001) and energy from fat
(p < 0.001). Post-hoc follow-up tests showed that both the sequential and simultaneous
intervention groups significantly decreased participants’ total fat intake and energy from fat
when compared with the no-intervention group. There was also a significant difference
between the sequential and simultaneous intervention groups themselves: fat intake and
energy from fat decreased more in the simultaneous group.
For participants meeting the fat intake recommendation there were no significant interaction
effects for total fat intake and energy from fat: all groups more or less stayed at baseline
levels. However, for participants not meeting the fat intake recommendation a significant
interaction effect was found for total fat intake (p < 0.001) and energy from fat (p < 0.001).
Post-hoc tests showed that all groups significantly differed from each other for total fat intake
and energy from fat. Both intervention groups decreased fat intake more compared to the no-
intervention group. The simultaneous intervention group decreased fat intake more when
compared to the sequential intervention group.
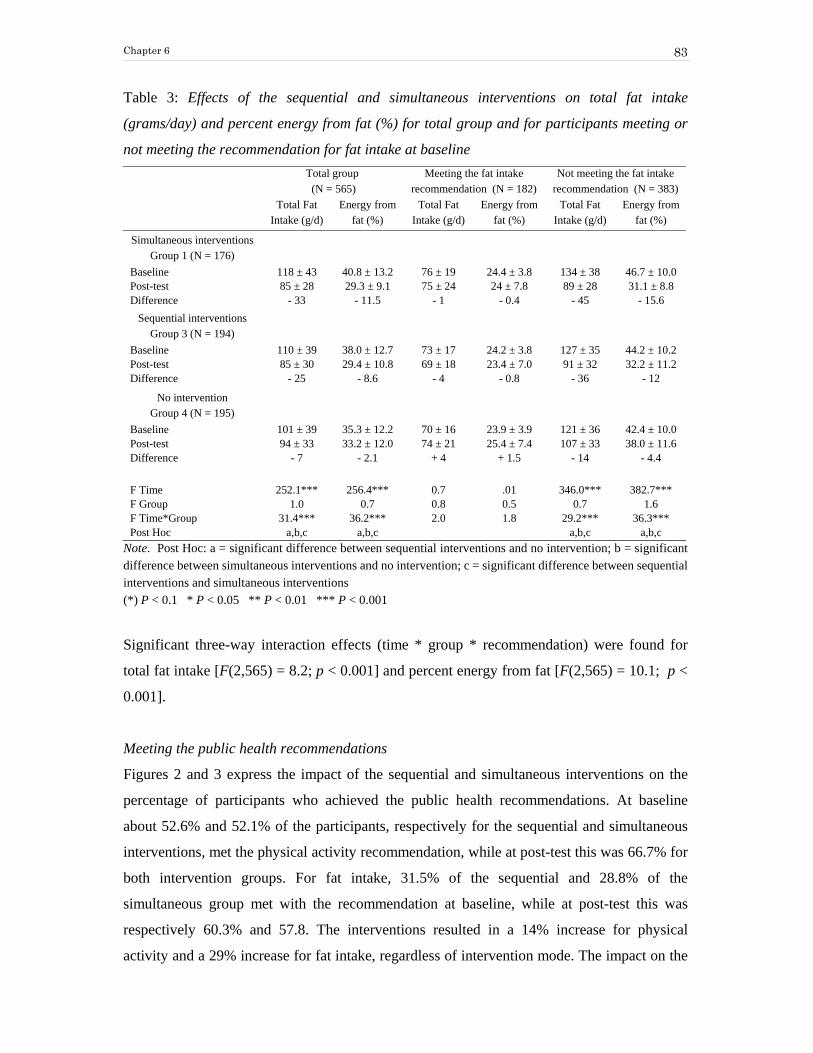
Chapter 6
83
Table 3: Effects of the sequential and simultaneous interventions on total fat intake
(grams/day) and percent energy from fat (%) for total group and for participants meeting or
not meeting the recommendation for fat intake at baseline
Total group (N = 565)
Meeting the fat intake recommendation (N = 182)
Not meeting the fat intake recommendation (N = 383)
Total Fat Intake (g/d)
Energy from fat (%)
Total Fat Intake (g/d)
Energy from fat (%)
Total Fat Intake (g/d)
Energy from fat (%)
Simultaneous interventions Group 1 (N = 176)
Baseline 118 ± 43 40.8 ± 13.2 76 ± 19 24.4 ± 3.8 134 ± 38 46.7 ± 10.0 Post-test 85 ± 28 29.3 ± 9.1 75 ± 24 24 ± 7.8 89 ± 28 31.1 ± 8.8 Difference - 33 - 11.5 - 1 - 0.4 - 45 - 15.6
Sequential interventions Group 3 (N = 194)
Baseline 110 ± 39 38.0 ± 12.7 73 ± 17 24.2 ± 3.8 127 ± 35 44.2 ± 10.2 Post-test 85 ± 30 29.4 ± 10.8 69 ± 18 23.4 ± 7.0 91 ± 32 32.2 ± 11.2 Difference - 25 - 8.6 - 4 - 0.8 - 36 - 12
No intervention Group 4 (N = 195)
Baseline 101 ± 39 35.3 ± 12.2 70 ± 16 23.9 ± 3.9 121 ± 36 42.4 ± 10.0 Post-test 94 ± 33 33.2 ± 12.0 74 ± 21 25.4 ± 7.4 107 ± 33 38.0 ± 11.6 Difference - 7 - 2.1 + 4 + 1.5 - 14 - 4.4 F Time 252.1*** 256.4*** 0.7 .01 346.0*** 382.7*** F Group 1.0 0.7 0.8 0.5 0.7 1.6 F Time*Group 31.4*** 36.2*** 2.0 1.8 29.2*** 36.3*** Post Hoc a,b,c a,b,c a,b,c a,b,c
Note. Post Hoc: a = significant difference between sequential interventions and no intervention; b = significant difference between simultaneous interventions and no intervention; c = significant difference between sequential interventions and simultaneous interventions (*) P < 0.1 * P < 0.05 ** P < 0.01 *** P < 0.001
Significant three-way interaction effects (time * group * recommendation) were found for
total fat intake [F(2,565) = 8.2; p < 0.001] and percent energy from fat [F(2,565) = 10.1; p <
0.001].
Meeting the public health recommendations
Figures 2 and 3 express the impact of the sequential and simultaneous interventions on the
percentage of participants who achieved the public health recommendations. At baseline
about 52.6% and 52.1% of the participants, respectively for the sequential and simultaneous
interventions, met the physical activity recommendation, while at post-test this was 66.7% for
both intervention groups. For fat intake, 31.5% of the sequential and 28.8% of the
simultaneous group met with the recommendation at baseline, while at post-test this was
respectively 60.3% and 57.8. The interventions resulted in a 14% increase for physical
activity and a 29% increase for fat intake, regardless of intervention mode. The impact on the

Efficacy of Simultaneous or Sequential Tailored Interventions
84
percentage meeting recommendations was thus twice as large for the fat intake intervention
when compared to the physical activity intervention. The no-intervention group showed a
smaller increase in participants meeting recommendations: 7.4 % for physical activity and 9.1
% for fat intake.
52.666.7
52.1
66.7 64.772.1
0
20
40
60
80
Perc
ent
Sequential Simultaneous No Intervention
Physical ActivityBaselinePost-test
Figure 1. Percent of participants meeting the 30 minutes of physical activity on most days of the week recommendation at baseline and post-test across the different intervention conditions
31.5
60.3
28.8
57.8
40.149.2
0
20
40
60
80
Perc
ent
Sequential Simultaneous No Intervention
Fat Intake BaselinePost-test
Figure 2. Percent of participants meeting the 30 % energy from fat recommendation at baseline and post-test across the different intervention conditions
Discussion
The interactive computer-tailored physical activity and fat intake interventions evaluated in
this study were effective in inducing healthy behavior changes. It is noticeable that a single
exposure to tailored printed information was sufficient to produce substantial changes that

Chapter 6
85
persisted for at least several months. In general, both sequential and simultaneous approaches
to change health behaviors were shown to have efficacy.
For both sequential and simultaneous interventions a significant increase was found for total
physical activity when compared to the no-intervention group. These results are in line with
other computer-tailored physical activity interventions (17-21). No significant impact of
tailoring on moderate + high intensity physical activity was found, probably because the
participants in the control group also increased moderate and high intensity physical activity.
However, in both experimental groups there still was a 14% increase in participants meeting
the physical activity recommendation. Further, it appears that the present physical activity
intervention especially caused large increases on the light physical activities. This increase is
relevant, since there are a substantial number of studies which report the positive health
benefits associated with walking and low intensity physical activities (50-52).
The absence of a significant three-way interaction effect for physical activity (time * group *
recommendation) showed that there were similar effects for participants meeting and not
meeting the recommendation. The further increase in physical activity for participants
already meeting the recommendation at baseline can be explained by the fact that these
participants were not only told that they are doing fine, but were also encouraged to stay
active and do more if possible.
The computer-tailored fat intake intervention caused large and significant reductions in total
fat intake and percent energy from fat for both experimental groups. The number of people
that met the fat intake recommendation almost doubled, from about 30% to 60%. This
intervention thus demonstrated to be very effective. The results in this study compare
favorably to other computer-tailored fat intake interventions (22-28). The ‘interactive’ and
immediate fat intake feedback and advice might explain why this intervention outperformed
other computer-tailored interventions that were not interactive. One explanation for the
sizable effects is that no major efforts to reduce fat intake have been undertaken in the
country.
In contrast with physical activity results, no intervention effects were found for participants
already meeting the fat intake recommendation. In this line, a significant three-way
interaction effect (time * group * recommendation) was found, which indicates differences

Efficacy of Simultaneous or Sequential Tailored Interventions
86
between participants who did or did not meet with the recommendation. This is probably
because participants meeting the recommendation were not adviced to further reduce their fat
intake. Furthermore participants with a fat intake below 20% energy from fat were even
advised to increase fat intake and seek contact with a general practitioner.
Overall, the computer-tailored fat intake and physical activity intervention, tested in the
present study, used the same theoretical backgrounds and were presented to participants in
the same way. However, the increase in the number of participants meeting the
recommendation from baseline to post-test was twice as large in the fat intake intervention
(29%) when compared to the physical activity intervention (14%). Overall, this pattern is also
seen when comparing other computer tailored fat intake and physical activity interventions to
each other (53). At baseline only 33.5% of the participants met the fat intake
recommendation, while 56.8% were meeting the physical activity recommendation. Second,
Brug et al. (54) stated that fat intake is different from other behaviors associated with chronic
disease as individuals are often unaware of their dietary risk behavior, because dietary
behavior is very complex and fat content can be hidden. The normative feedback used in our
interventions aimed to motivate a behavior change by means of increasing awareness levels.
This might have had a larger impact on fat intake, since awareness of physical activity was
probably higher at baseline.
Our results clearly indicated that both the simultaneous and the sequential intervening modes
showed to be effective and can be used in health promotion. Only a few studies reported
either simultaneous or sequential multiple behavior change interventions (33,36-37) and
regardless of intervention mode (simultaneous or sequential) they all found positive results.
In this way these studies are, although indirectly, in line with our results. However, there are
important differences to note between the simultaneous and sequential intervening modes in
this study. These differences are most clearly expressed in the fat intake intervention:
although the sequential intervening mode showed to be effective, the simultaneous mode
preformed significantly better. For physical activity the differences between intervening
modes were less straight forward and more difficult to interpret. The sequential intervention
mode seemed to work similar for participants meeting and not meeting the physical activity
recommendation. However, the simultaneous intervening mode appeared to work even better
for participants not meeting the recommendation, whereas for participants meeting the
recommendation it appeared to work worse. It is difficult to explain why the simultaneous

Chapter 6
87
intervention mode was most effective for the fat intake intervention and only partialy
effective for the physical activity intervention as there are no studies to compare them to.
These findings are in contrast to our hypothesis and also seem to contradict the position stand
from some authors who indicated that changing multiple behaviors at once might create an
‘overload’ and would thus be more difficult to be done (29,32). It is possible that people who
try to change several health behaviors at a time are totally absorbed by the process and are
really motivated to completely go for this healthy lifestyle. When people only have to change
one behavior they might be less focused. Further, it still remains puzzling as to why the
simultaneous intervening mode for physical activity worked less good for people who already
met the recommendations. It could be that they just chose to change their fat intake behavior
and decided to do less for physical activity as they were already meeting the physical activity
recommendation. Finally, given our results and from a public health perspective, we suggest
that it is better to implement simultaneous interventions at one point in time, which is a much
more cost-effective approach compared to the implementation of several interventions at
different points in time. But these effects may not be generalized to underserved populations
as our sample did not represent those groups.
It is important to note some limitations of the present study. First, the findings are based on
self-report information, which can be subject to response bias. Self-reports of physical
activity typically show overreporting, and this problem has been reported for the IPAQ as
well (45). Self-reports of fat intake are known for underreporting (55). Second, drop-out
analysis showed that more men and young people dropped out compared to women and older
participants, and this might have introduced some bias. However, this finding is not
surprising, because women typically show more interest in health, weight and fat intake (56).
Older people encounter more health problems, consequently they are more motivated to take
action to improve their health (57). Third, physical activity levels in this study are slightly
higher at baseline when compared to normal population activity levels in Belgium (56,8 %
complies with the physical activity recommendation versus 50.1%) (58). In addition, physical
activity at baseline was remarkably higher in the no-intervention condition (group 4), despite
that the same recruitment procedures were used for all participants and they were assigned at
random into one of four groups. Furthermore, physical activity levels at post-test were still
slightly higher in the no-intervention group when compared to the experimental groups. We
can not explain the baseline differences between our groups, however, we are aware that this
might have influenced our results. The increase of physical activity in the no-intervention

Efficacy of Simultaneous or Sequential Tailored Interventions
88
group might have been tempered by the fact that they already had very high baseline activity
levels, whereas this might not have been the case when baseline activity levels were
comparable to the other groups. Fourth, it is a limitation that our food frequency
questionnaire only measured fat intake and not total energy uptake. Therefore percent
calories was calculated based on recommended energy intake tables and not on actual energy
intake. Fifth, it is difficult to generalize our results to underserved populations, such as ethnic
minorities and low socioeconomic status people. Sixth, our results in the sequential
intervening mode might have been better using a shorter or longer interval between
interventions. However the optimal interval between intervention contacts is not known.
Neither is there any literature about intervening on more than two health behaviors,
sequentially or simultaneously. It is possible that intervening simultaneously on three or more
health behaviors indeed does create an overload of information in participants, as suggested
by several authors (29,32), but this remains to be studied.
In conclusion, both the interactive computer-tailored physical activity and fat intake
intervention can be applied successfully to change behaviors. Further, both sequential and
simultaneous intervening modes can be used. From a public health point of view and because
the simultaneous intervention mode was superior for fat intake we recommend to implement
the interventions simultaneously in populations similar to the one studied in the present
study.
Acknowledgments
This study was financially supported by the Ghent University and the Flemish Fund for
Scientific Research. The authors would like to thank Katrien Bogaert, Griet Bonamie, Nele
Callewaert, Hilde Decrop, Evelyn Vanbesien and Els Van Cleemput, for their cooperation in
data gathering.
References
(1) Zyriax BC, Windler E: Dietary fat in the prevention of cardiovascular disease - a review.
European Journal of Lipid and Science Technology. 2000, 102:1-5.
(2) Kuller L H: Dietary Fat and Chronic Diseases: Epidemiologic Overview. Journal of the
American Dietetic Association. 1997, 97:s9-s15.

Chapter 6
89
(3) U.S. Department of Health and Human Services: Physical Activity and Health: A Report
of the Surgeon General. Atlanta GA: Centers for Disease Control and Prevention, National
Center for Chronic Disease Prevention and Health Promotion, 1996.
(4) Paffenbarger Jr. RS, Hyde RT, Wing AL, Hsieh CC: Physical Activity, All-Cause
Mortality, and Longevity of College Alumni. New England Journal of Medicine. 1986,
314:605-613.
(5) Chanmugam P, Guthrie JF, Cecilio S, et al.: Did Fat Intake in the United States Really
Decline Between 1989-1991 and 1994-1996? Journal of the American Dietetic Association.
2003, 103:867-872.
(6) De Henauw S, De Backer G: Nutrient and Food Intakes in Selected Subgroups of Belgian
Adults. British Journal Nutrition. 1999, 81:s37-s42.
(7) Steptoe A, Wardle J, Fuller R, et al.: Leisure-Time Physical Exercise: Prevalence,
Attitudinal Correlates, and Behavioral Correlates Among Young Europeans From 21
Countries. Preventive Medicine. 1997, 26:845-854.
(8) Pate RR, Pratt M, Blair SN et al.: Physical Activity and Public Health. Journal of the
American Medical Association. 1995, 273:402-407.
(9) NIH Consensus Statement. Physical Activity and Cardiovascular Health. Bethesda MD:
National Institutes of Health, 1995.
(10) Commission of the European Communities. Nutrient and Energy intakes for the
European Community. Brussels: Reports of the Scientific Committee for food, 2003.
(11) Krauss RM, Deckelbaum RJ, Ernst N, et al.: Dietary Guidelines for Healthy American
Adults. A Statement for Health Professionals from the Nutrition Committee and American
Heart Association. Circulation. 1996, 94:1795-1800.
(12) Ryan P, Lauver DR: The Efficacy of Tailored Interventions. Journal of Nursing
Scholarship. 2002, 34:331-337.
(13) Kreuter M, Farrell D, Olevitch L, Brennam L: Tailoring Health Messages : costumizing
communication with computer technology. New Jersy: Lawrence Erlbaum Associates Inc.
Publishers, 2000.
(14) De Vries H, Brug J: Computer-Tailored Interventions Motivating People to Adopt
Health Promoting Behaviors: Introduction to a New Approach. Patient Education and
Counseling. 1999, 36:99-105.
(15) Skinner CS, Campbell MK, Rimer BK, et al.: How effective is tailored print
communication? Annals of Behavioural Medicine. 1999, 21:290-298.

Efficacy of Simultaneous or Sequential Tailored Interventions
90
(16) Brug J, Steenhuis I, van Assema P, De Vries, H: (1996) The impact of a computer-
tailored nutrition intervention. Preventive Medicine. 1996, 25:236-242.
(17 Segar M., Jayaratne T, Hanlon J, Richardson CR: Fitting Fitness into Women's Lives:
Effects of a Gender-Tailored Physical Activity Intervention. Womens Health Issues. 2002,
12:338-347.
(18) Bock BC, Marcus BH, Pinto BM, Forsyth LH: Maintenance of Physical Activity
Following an Individualized Motivationally Tailored Intervention. Annals of Behavioral
Medicine. 2001, 23:79-87.
(19) Bull FC, Kreuter MW, Scharff DP: Effects of Tailored, Personalized and General Health
Messages on Physical Activity. Patient Education and Counseling. 1999, 36:181-192.
(20) Marcus BH, Bock BC, Pinto BM, et al.: Efficacy of an Individualized, Motivationally-
Tailored Physical Activity Intervention. Annals of Behavioral Medicine. 1998, 20:174-180.
(21) Marcus BH., Emmons KM, Simkin-Silverman LR, et al.: Evaluation of Motivationally
Tailored Vs. Standard Self-Help Physical Activity Interventions at the Workplace. American
Journal of Health Promotion. 1998, 12:246-253.
(22) Stevens VJ, Glasgow RE, Toobert DJ, et al. One-Year Results From a Brief, Computer-
Assisted Intervention to Decrease Consumption of Fat and Increase Consumption of Fruits
and Vegetables. Preventive Medicine. 2003, 36:594-600.
(23) Oenema A, Brug J: Feedback Strategies to Raise Awareness of Personal Dietary Intake:
Results of a Randomized Controlled Trial. Preventive Medicine. 2003, 36:429-439.
(24) Armitage CJ, Conner M: Efficacy of a Minimal Intervention to Reduce Fat Intake.
Social Science and Medicine. 2001, 52:1517-1524.
(25) Brug J, van Assema P: Differences in Use and Impact of Computer-Tailored Dietary
Fat-Feedback According to Stage of Change and Education. Appetite. 2000, 34:285-293.
(26) De Bourdeaudhuij I, Brug J: Tailoring Dietary Feedback to Reduce Fat Intake: an
Intervention at the Family Level. Health Education Research. 2000, 15:449-462.
(27) Brug J: Dutch Research into the Development and Impact of Computer-Tailored
Nutrition Education. European Journal of Clinical Nutrition. 1999, 53:s78-s82.
(28) Brug J, Campbell M, van Assema P: The Application and Impact of Computer-
Generated Personalized Nutrition Education: a Review of the Literature. Patient Education
and Counseling. 1999, 36:145-156.
(29) Strecher V, Wang C, Derry H, et al.: Tailored Interventions for Multiple Risk Behaviors.
Health Education Research. 2002, 17:619-626.

Chapter 6
91
(30) Jakicic JM, Wing RR, Winters-Hart C: Relationship of Physical Activity to Eating
Behaviors and Weight Loss in Women. Medicine and Science in Sports and Exercise. 2002,
34:1653-1659.
(31) Gillman MW, Pinto BM, Tennstedt S, et al.: Relationships of Physical Activity with
Dietary Behaviors Among Adults. Preventive Medicine. 2001, 32:295-301.
(32) Emmons KM, Marcus BH., Linnan L, et al.: Mechanisms in multiple risk factor
interventions - Smoking, Physical-Activity and Dietary-fat intake among manufacturing
workers. Preventive Medicine. 1994, 23:481-489.
(33) Wilcox S, Parra-Medina D, Thompson-Robinson M, Will J: Nutrition and Physical
Activity Interventions to Reduce Cardiovascular Disease Risk in Health Care Settings: A
Quantitative Review With a Focus on Women. Nutrition Reviews. 2001, 59:197-214.
(34) Writing group of the PREMIER clinical trial: Effects of Comprehensive Lifestyle
Modification on Blood Pressure Control; Main results of the PREMIER clinical trial. The
Journal of the American Medical Association. 2003, 289:2083-2093.
(35) Boudreaux ED, Wood KB, Mehan D, et al.: Congruence of Readiness to Change, Self-
Efficacy, and Decisional Balance for Physical Activity and Dietary Fat Reduction. American
Journal of Health Promotion. 2003, 17:329-336.
(36) Campbell MK, Tessaro I., DeVellis B, et al.: Effects of a Tailored Health Promotion,
Program for Female Blue-Collar Workers: Health Works for Women. Preventive Medicine.
2002, 34:313-323.
(37) Calfas KJ, Sallis JF, Zabinski MF, et al. Preliminary Evaluation of a Multicomponent
Program for Nutrition and Physical Activity Change in Primary Care: PACE+ for Adults.
Preventive Medicine. 2002, 34:153-161.
(38) Vandelanotte C, De Bourdeaudhuij I: Acceptability and Feasibility of a Computer-
Tailored Physical Activity Intervention Using Stages of Change: Project FAITH. Health
Education Research. 2003, 18:304-317.
(39) Vandelanotte C., De Bourdeaudhij I. and Brug J. Acceptability and Feasibility of an
Interactive Computer-Tailored Fat Intake Intervention in Belgium. Health Promotion
International. In press.
(40) Ajzen I: From intentions to actions : A theory of planned behavior. In Kuhl J, Beckman J
(eds), Action-control : from cognition to behaviour. Heidelberg, Germany: Springer; 1985.
(41) Prochaska JO, DiClemente CC, Norcross JC: In Search of How People Change.
Applications to Addictive Behaviors. American Psychologist. 1992, 47:1102-1114.
Efficacy of Simultaneous or Sequential Tailored Interventions
92
(42) Brug J, Steenhuis I, van Assema P, et al.: Computer-Tailored Nutrition Education:
Differences Between Two Interventions. Health Education Research. 1999, 14:249-256.
(43) Brug J, Steenhuis I, van Assema P, De Vries H: The Impact of a Computer-Tailored
Nutrition Intervention. Preventive Medicine. 1996, 25:236-242.
(44) Craig CL, Marshall AL, Sjostrom M, et al.: International Physical Activity
Questionnaire: 12-Country Reliability and Validity. Medicine and Science in Sports and
Exercise. 2003, 35:1381-1395.
(45) Rzewnicki R, Auweele YV, De Bourdeaudhij I: Addressing Overreporting on the
International Physical Activity Questionnaire (IPAQ) Telephone Survey With a Population
Sample. Public Health Nutrition. 2003, 6:299-305.
(46) Vandelanotte C., Matthys C. and De Bourdeaudhij I: Reliability and validity of a
computerised questionnaire to measure fat intake in Belgium. Nutrition Research. In Press.
(47) Ainsworth BE, Haskell WL, Leon SL, et al.: Compendium of physical activities:
Classification of energy costs of human physical activities. Medicine and Science in Sport
and Exercise. 1993, 25:71-80.
(48) Ainsworth BE, Haskell WL, Whitt MC, et al.: Compendium of physical activities: An
update of activity codes and MET intensities. Medicine and Science in Sports and Exercise.
2000, 32:498-504.
(49) National Council on Nutrition (Nationale raad voor de voeding). Dietary
recommenadtions for Belgium (Voedingsaanbevelingen voor België). Brussels: Ministry of
Social Affairs, Public Health and Environment, 1997.
(50) Lee IM, Rexrode KM, Cook NR, et al.: Physical Activity and Coronary Heart Disease in
Women - Is "No Pain, No Gain" Passe? Journal of the American Medical Association. 2001,
285:1447-1454.
(51) Iwane M, Arita M, Tomimoto S, et al.: Walking 10,000 Steps/Day or More Reduces
Blood Pressure and Sympathetic Nerve Activity in Mild Essential Hypertension.
Hypertension Research. 2000, 23:573-580.
(52) Pescatello LS, Murphy D, Costanzo D: Low-Intensity Physical Activity Benefits Blood
Lipids and Lipoproteins in Older Adults Living at Home. Age and Ageing. 2000, 29:433-439.
(53) Ryan P, Lauver DR The Efficacy of Tailored Interventions. Journal of Nursing
Scholarship. 2002, 34:331-337.
(54) Brug J, Vanassema P, Kok G, et al.: Self-rated dietary-fat – association with objective
assessment of fat, psychosocial factors, and intention to change. Journal of Nutrition
Education. 1994, 26:218-223.
Chapter 6
93
(55) Macdiarmid J, Blundell J: Assessing Dietary Intake: Who, What and Why of Under-
Reporting. Nutrition Research Reviews. 1998, 11:231-253.
(56) Mennell S, Murcott A, van Otterloo A: The sociology of food: eating, diet and culture.
London: Sage, 1992.
(57) Zunft HJ, Friebe D, Seppelt B, et al.: Perceived Benefits of Healthy Eating Among a
Nationally-Representative Sample of Adults in the European Union. European Journal of
Clincal Nutrtrition. 1997, 51:s41-s46.
(58) Buziarsist J, Demarest S, Gisle L, Taffoteau J et al.: Belgian Health Enquiry 2001, Part
3 lifestyle: physical activity. Scientific Institute for Public Health, 2001 (IPH/EPI reports Nr
2002-22, D/2002/2505/40).

Efficacy of Simultaneous or Sequential Tailored Interventions
94

Chapter 7
95
CHAPTER 7
General discussion
This dissertation describes the research that was needed to produce a computer-tailored
intervention for increasing physical activity and a computer-tailored intervention for
decreasing fat intake. This comprised acceptability, feasibility and efficacy testing of both
interventions and validity and reliability testing of the questionnaires used for measuring
physical activity and fat intake. Further, we wished to investigate in which modality these
newly developed interventions could be used best, in a simultaneous or a sequential
intervening mode. This chapter starts with an overview of the main findings, followed by
practical implications, methodological limitations and finally recommendations for further
research are made.
Main findings
IPAQ reliability and validity
This study examined the reliability and validity of a newly developed Dutch computerized
IPAQ using CSA accelerometers and physical activity diaries. In this study the ICC test-
retest reliability measures ranged from .60 to .83 showing a moderate to high reliability for
the computerized IPAQ. The reliability values found in this study are comparable with those
found in the study from Craig et al.,1 they found values ranging from .46 to .96, but most
were around .80. In a review2 containing reliability results for seven self-report physical
activity measures, values ranged from .34 to .89. Correlations between computerized IPAQ
and CSA activity (min.: r = .38, kcal.: r = .43) supported the validity of the IPAQ. These
correlations are at least as good as other self-report physical activity measures evaluated in
adults,3,4 and are also comparable with the international IPAQ validity study, which found a
correlation of about .33 for the long IPAQ version. 1 In a review, containing the validation
results for seven self-report physical activity measures, Sallis and Saelens 2 reported validity
correlations ranging from .14 to .53, with a median of about .30 The slightly higher

General discussion
96
correlations between the computerized IPAQ and the seven day physical activity diary (min.:
r = .39, kcal.: r = .46) also supported the validity of the IPAQ. Especially leisure-time and
high intensity physical activity correlated very well with the physical activity diary, this was
also seen in the CSA correlations. Finally, the correlations between the computerized IPAQ
and the paper-and-pencil IPAQ were all very high, and there were no significant differences
in means. These results demonstrate that the computerized IPAQ is generally equivalent to
the hard copy IPAQ. Taking into account the advantages of computerized questionnaires,
mentioned earlier, the computerized version may be preferable.
Reliability and validity of the fat intake questionnaire
In this study the reliability and validity of a computerised questionnaire to measure fat intake
was evaluated in relation to a seven day diet record. Correlations between our questionnaire
and the diet records of 0.67 and 0.60 were found respectively for total fat intake and for
‘percentage energy’ from fat. Several authors reported that correlations greater than 0.5
support the validity of a FFQ,5-8 which confirms the validity of our questionnaire.
Correlations in a review of validation studies of fat intake questionnaires were generally
lower than the correlations found in this study.9 In this study we found that for total fat intake
51% of the participants were correctly classified in tertiles and 52 % of the participants for
percent energy from fat. For fat intake and for percent energy from fat 5.8% of the
participants were grossly misclassified. These results further support the validity of the
computerised fat intake questionnaire, and are in line with other validation studies.5,9-11 The
Kappa statistics, however, showed only fair agreement for total fat (0.27) and for percent
energy from fat (0.29). Several other validation studies also have difficulties finding
acceptable Kappa values above 0.4.5,9,10 This is in line with Portney and Watkins12 who state
that this statistic is usually an underestimate of true reliability if used for continuous data as
in our study. When measuring the reliability of a questionnaire, intraclass correlation
coefficients (ICC) from 0.75 or higher are considered good to very good.13 For total fat intake
we found 0.86 and for percent energy from fat 0.81, indicating excellent reliability. This
finding is strengthened by a very low gross misclassification and kappa’s showing good
agreement.

Chapter 7
97
Acceptability and feasibility of the physical activity intervention
The aims of this study were to test feasibility and acceptability of a computer-tailored
intervention promoting physical activity and to explore whether there were differences in the
reported feasibility and acceptability between different stages of change, genders, age groups,
education levels and familiarity with computer use. Generally speaking, the data showed that
the tailored physical activity intervention is a feasible and acceptable tool for intervening in a
general population. Participants reported having no problems with the intervention questions,
and nearly all participants accepted aspects related to appearance as well as to content.
However, more than a third of them indicated that there are too many questions to be
answered before the physical activity advice appeared. Most participants indicated that the
physical activity advice is interesting, logical, instructive, comprehensible, well styled and
complete. Only a small group of participants indicated that the advice is too long, confusing
or that it gives too much information. The action plan was included in the intervention was to
transform physical activity intentions into specific acts. In general, participants were positive
about the appearance and content of the action plan. The results concerning the use of a
computer suggested that this aspect of the intervention is acceptable and feasible. Advantages
of computer-assisted administration, such as using skip patterns13 and receiving feedback
immediately,14 are clearly appreciated. On the whole, only a few significant differences were
found for stages of change, gender, age groups, education levels and familiarity with
computer. This leads to an important conclusion, namely that this intervention tailored well
for respondents in different stages of change, for men as well as for women, for younger and
older participants, for the higher and lower-educated, for those who are or are not used to
working with a computer. This was one of the major aims when developing the intervention.
The stages of changes were considered in two ways when writing feedback messages, it
seems that this strategy succeeded in constructing feedback tailored optimally to most
participants and probably explains why few differences in acceptability and feasibility scores
were found between groups.
Acceptability and feasibility of the fat intake intervention
The results of this study indicated that the interactive fat intake intervention is a feasible and
acceptable tool for intervening in a general population. When compared to our physical
activity feasibility and acceptability study almost all feasibility and acceptability scores in

General discussion
98
this study are higher. That is probably due to some specific changes made to this intervention
based on the acceptability and feasibility testing of the physical activity intervention.
Participants did not report to have problems with the fat intake questionnaire. The
appearance and the content of the questions was accepted by nearly all participants. However,
almost 20 % of them indicated that they had to answer too many questions before the fat
intake advice appeared. The majority of participants reported that the appearance as well as
content and credibility of the Fat Intake Advice were good, and consequently only a small
amount of participants indicated that the advice was too long or confusing. However, a small
group of about 15 %, reported that the fat intake advice is not correct at all. This is probably
due to the fact that a lot of people believe that their fat intake is not too high, while in reality
it is.15,16 This lack of fat intake awareness is present among lots of people and is a major
barrier in interventions aimed at reducing fat intake.15 Results concerning the use of a
computer indicate that this aspect of the intervention is also acceptable and feasible, all scores
were very high. Participants clearly appreciate the use of a computer, which ensures, in a fast
and simple way, an immediate and reliable fat intake advice that can be printed and taken
home at once. This intervention was especially designed to tailor for people from different
demographics and stages of change. Derived from the few significant differences between
groups for sex, education and computer literacy we can conclude that this intervention tailors
well for these groups. Concerning the age groups and stages of changes it is clear that the
differences found are logical and in concordance with theories.17-20
Efficacy of simultaneous or sequential tailored interventions
In this study the efficacy of our interactive computer-tailored physical activity and fat intake
interventions were evaluated. Furthermore, we wished to examine which intervening mode
would be more effective: a sequential or a simultaneous intervening mode.
For both sequential and simultaneous interventions a significant increase was found for total
physical activity when compared to the no-intervention group. These results are line with
other computer-tailored physical activity interventions.21-25 In both experimental groups there
was a 14% increase in participants meeting the physical activity recommendation. Further, it
appears that the present physical activity intervention especially caused large increases on the
light physical activities. This increase is relevant, since there are a substantial number of
studies which report the positive health benefits associated with walking and low intensity
physical activities.26-28

Chapter 7
99
The computer-tailored fat intake intervention caused large and significant reductions in total
fat intake and percent energy from fat for both experimental groups. The number of people
that met the fat intake recommendation almost doubled, from about 30% to 60%. This
intervention thus demonstrated to be very effective. The results in this study compare
favorably to other computer-tailored fat intake interventions.29-34 The ‘interactive’ and
immediate fat intake feedback and advice might explain why this intervention outperformed
other computer-tailored interventions that were not interactive. Another explanation for the
sizable effects is that no major efforts to reduce fat intake have been undertaken in the
country.
Our results clearly indicated that both the simultaneous and the sequential intervening modes
showed to be effective and can be used in health promotion. Only a few studies reported
either simultaneous or sequential multiple behaviour change interventions35-37 and regardless
of intervention mode (simultaneous or sequential) they all found positive results. In this way
these studies are, although indirectly, in line with our results. However, there are important
differences to note between the simultaneous and sequential intervening modes in this study.
These differences are most clearly expressed in the fat intake intervention: although the
sequential intervening mode showed to be effective, the simultaneous mode preformed
significantly better. For physical activity the differences between intervening modes were
less straight forward and more difficult to interpret. The sequential intervention mode seemed
to work similar for participants meeting and not meeting the physical activity
recommendation. However, the simultaneous intervening mode appeared to work even better
for participants not meeting the recommendation, whereas for participants meeting the
recommendation it appeared to work worse. It is difficult to explain why the simultaneous
intervention mode was more effective for the fat intake intervention and partly for the
physical activity intervention as there are no studies to compare them to. These findings seem
to contradict the position stand from some authors who indicated that changing multiple
behaviours at once might create an ‘overload’ and would thus be more difficult to be
done.38,39 It is possible that people who try to change several health behaviours at a time are
totally absorbed by the process and are really motivated to completely go for this healthy
lifestyle. Our results in the sequential intervening mode might have been better using a
shorter or longer interval between interventions. However the optimal interval between
intervention contacts is not known. Neither is there any literature about intervening on more
than two health behaviours, sequentially or simultaneously. It is possible that intervening

General discussion
100
simultaneously on three or more health behaviours indeed does create an overload of
information in participants, but this remains to be studied.
In conclusion, both the interactive computer-tailored physical activity and fat intake
intervention can be applied successfully to change behaviours. Further, both sequential and
simultaneous intervening modes can be used. From a public health point of view and because
the simultaneous intervention mode was superior for fat intake we recommend to implement
the interventions simultaneously, which is a much more cost-effective approach compared to
the implementation of several interventions at different points in time.
Practical Implications
From this research it becomes clear that intervention programmes for changing health
behaviours aimed at large populations can be effective. Moreover, a computerised approach
seems to work in Belgium, and it might be interesting to use this knowledge in other types of
health behavioural interventions. As outlined in the general introduction, there is a great need
for intervention programmes that increase physical activity and decrease fat intake in
Belgium. However, almost none have been executed. Furthermore, it has been suggested that
the effectiveness of our programs may be partly due to the lack health promotion
programmes in Belgium, again stressing the need for more health promotion efforts. Our
research produced two science based ‘ready-to-use’ interventions that have proven to be
effective.
The value and relevance of health promotion in Belgium, and more particular in Flanders, is
seriously underestimated. On a population wide level and in long term perspective health
promotion efforts can significantly increase quality of life and lifespan, and decrease
mortality and health care costs. Our computer-tailored interventions for increasing physical
activity and decreasing fat intake have proven to be effective and are available, so they can
make a difference. However, they only form a small part of the health promotion spectrum
and the effects of our interventions will not last forever. It is important to note that there are a
lot of other health behaviours, which are at least as important as physical activity and fat
intake (smoking, HIV, traffic safety, fruit and vegetable intake,…), but it is also very
important to intervene in a number of different ways. Health promotion interventions need to
be as diverse as possible. Each individual reacts differently on health promotion initiatives
and diversity is the only guarantee of reaching the widest population possible. A
Chapter 7
101
computerised approach, like ours, might be effective for many people but should definitely
not be the only available health promotion effort for physical activity and fat intake;
computerised intervening will not be effective for everyone and excludes certain sub-samples
in the population. Therefore interventions should not only target individuals in a number of
different ways, but should also affect the policy and the environment. This research also
demonstrates that a scientific approach is an absolute must in promoting health, as changing
health behaviours is very difficult and sometimes almost impossible. A lot of time and money
has been wasted in local and unscientific projects which did not work at all. Despite a lot of
good intentions this might partly explain the reticent attitude of policymakers whenever they
have to decide whether or not to spend money on health promotion projects such as ours.
Decent and good guidance from experienced professionals for implementing our
interventions is an absolute necessity. It is therefore that the role of the Flemish Institute for
Health Promotion (Vlaams Instituut voor Gezondheidspromotie, VIG), as expertise centrum,
and the tasks of the local health initiatives (LOkaal GezondheidsOverleg, LOGO), for
implementing interventions, are very important and should be further expanded. Moreover,
the Flemish Institute for Health Promotion, the Local Health Initiatives and general
practitioners can play an active role in guiding and promoting the implementation of our
physical activity and fat intake interventions. The Flemish Institute for Health Promotion can
be used to educate people from the Local Health Initiatives and general practitioners about
the rationale, theoretical backgrounds, and correct implementation modes of our
interventions. They can present information on how to use local government, local and
national associations, worksite computer networks or how to organise an intervention for
parents in the computer classes at the schools of their children. In this respect the two small
scaled implementation studies that have been executed using Local Health Initiatives were
very promising. Finally, we must mention that we do not recommend an implementation of
our interventions via the internet yet as more research is needed on that topic (see future
research).
Limitations and Methodological Issues
This research extensively used self-administered questionnaires, not only for calculation the
levels of physical activity and fat intake in our participants, presented in the physical activity
and fat intake advice, but also to investigate whether our interventions were effective in

General discussion
102
changing these health behaviours. Dispensing wrong advice, based on invalid physical
activity or fat intake measurements will decrease the effectiveness of our interventions,
furthermore using wrong measurements to evaluate interventions will lead to wrong
interpretations concerning effectiveness of our interventions. However, extensive testing
showed that both the IPAQ and the fat intake questionnaire were reliable and valid
measurement tools. Nevertheless, self-administered questionnaires can be subject to response
bias. Self-reports of physical activity typically show overreporting, and this problem has been
reported for the IPAQ as well.40 Self-reports of fat intake are known for underreporting.13
The use of more objective measures could largely solve these problems. It would be possible
to make more valuable interpretations about the effectiveness of the interventions and it
would allow to verify whether or not the computerised feedback that is presented to the
participants (which is also questionnaire based) is correct. However, the use of objective
measures usually involves a much greater cost and time investment, increases the burden of
the participants and are only usable in small samples. Moreover, the objective measurement
techniques available today in the field of physical activity and fat intake have their own
methodological problems and disadvantages.
Most studies presented in this research had relative small sample sizes, which makes it
difficult to generalize these results to larger populations. Generalisation is also difficult for
underserved populations, such as ethnic minorities and low socioeconomic status people.
Furthermore, only volunteers participated in all of our studies. This might have caused
selection bias as people that are not interested in physical activity or fat intake are less likely
to participate. This selection bias might even been enlarged by the fact that all of our studies
used computer technology, which might have discouraged people that are not used to work
with a computer. However, during recruitment procedures we tried to reduce these kinds of
selection bias by stressing that an interest in changing physical activity or fat intake was not
needed, nor that computer literacy is needed. Furthermore, implementation of our
interventions will most likely attract similar participants as people not motivated to change
behaviour will still not be interested to participate. If we would wish to increase
generalisability towards the total population a representative and randomised sample should
be selected. However, this is a difficult, timely and costly matter, and it would increase drop-
out rates dramatically, which would again affect the generalisability of the results.
Furthermore, a small pilot study (not reported) in which all the employees of a company had
to participate by their supervision showed no effect at all and a substantial portion of the

Chapter 7
103
participants showed very high resistance against the intervention materials. It is not at all
possible to impose health promotion programs.
Our interventions are pointed at the general public, however people willing to participate but
having medical complaints related to physical activity and fat intake, such as cardiovascular
disease, diabetes, anorexia and other medical problems, had to be turned down. This might
seem strange as an individualised physical activity or fat intake advice could be very
beneficial for them. However, we did not feel qualified enough to give advice to patients.
Moreover, we developed primary prevention interventions; thus preventing healthy people
from developing disease such as CVD or diabetes; and not helping individuals already having
a disease to become healthy again. Nevertheless, given a lot of consideration and carefulness
it is possible to extend our computer-tailored interventions in such ways that they could apply
for persons having medical complaints (that can be treated using behavioural modification
interventions) as well.
The fat intake intervention aimed to reduce total fat intake, a specific reduction of saturated
fats was not aimed. However, it is generally accepted that especially a high intake of the
saturated fats is harmful for health.41-45 There are several reasons why we choose not to
intervene on saturated fats. First, when this project was written most intervention studies
were pointed at total fat intake, whereas today this is shifting towards saturated fats. Second,
lowering total fat intake will also favourably affect intake of saturated fats. Third, changing
complex behaviours using complex messages simply does not work. In order to keep things
as simple as possible it might be that trying to reduce total fat intake could have more effect
on saturated fats compared to trying to reduce saturated fats directly. Fourth, if we wanted to
have a good measure of saturated fat intake, a far more detailed and longer fat intake
questionnaire would be required, which would increase participants’ burden. However, if
future research would clearly indicate that health promotion interventions should only be
directed at reducing saturated fats and not at reducing total fat, then it is, given some efforts,
possible to adjust the program.
Another limitation is that our fat intake questionnaire can not estimate total energy intake, as
it would require an unacceptable increase of questions, including a lot of questions not related
to fat intake. Therefore % calories from fat had to be calculated on recommended caloric
intake as opposed to actual caloric intake. During acceptability and feasibility testing of the
fat intake intervention already several people indicated that they had to answer too much
questions. A further increase of questions would decrease the attractiveness of the
intervention (and probably indirectly the effectiveness as well) and participants would have
General discussion
104
to answer a lot of questions of which they would get no feedback on (the advice is only about
fat intake). Nevertheless, given a lot of effort it is perfectly possible to measure total fat
intake, using a questionnaire, and create feedback that is based on this measure, but only for
research or scientific purposes.
Our results in the intervention study might have been influenced by the absence of health
promotion initiatives trying to reduce fat intake or increase physical activity. Any health
promotion initiative might have been successful, whether it is tailored or not. To clarify this a
standard intervention, which ignores interpersonal differences, should be compared to our
computer-tailored interventions. However, we chose not to do so as this would almost double
the number of conditions in our experimental study. We would have to create one
simultaneous condition receiving a standard intervention and two sequential conditions also
receiving standard interventions. Not only would this increase complexity of our statistic
procedures, it would also decrease our statistical power. Therefore we chose to use a simple
no-intervention waiting list control group. Similarly our results in the intervention study
might have been influenced by the physical activity levels of our control group, which were
remarkably higher compared to experimental groups. We can not explain these differences.
The increase of physical activity during the intervention period in the no-intervention group
might have been tempered by the fact that they already had very high baseline activity levels,
whereas this might not have been the case when baseline activity levels were comparable to
the other groups.
Recommendations for future research
As suggested earlier there is limited information on the optimal interval between
interventions when they are presented sequentially, nor is there information on the optimal or
maximal number of behaviours on which it is possible to intervene before creating an
overload of information in participants. More research on these topics is needed.
At first sight the implementation of interactive computer-tailored interventions using the
Internet might seem a logical next step. However, the Internet is a very special and specific
context for health promotion interventions. It is a very dynamic and fast changing
environment. Information is scanned instead of read, users want full control, they want to
skip from one ‘page’ or question to another whenever they feel like doing so and do mostly
not feel like staying on one website for a long time. It might be that the static and very

Chapter 7
105
structural approach which is used in our interventions on the CD-rom does not work on the
internet. Further, what information is to be trusted on the Internet and how does one make a
website visible for the right audience. Only a limited number of computer-tailored
interventions have been tested on the Internet with varied success.46-49 In short, there is a lot
of research needed before computer-tailored interventions can be implemented on the
internet.
Little is known about the specific mechanisms that drive the effectiveness of tailoring. A
possible explanation is presented by the elaboration likelihood model50, which suggests that
people are more likely to thoughtfully process information when they perceive it to be
personally relevant. However, previous studies have also been open to other explanations of
their effect. It could be argued that tailored interventions often simply provide participants
with more information or it might just be the ‘active participation’ (participants filling in
questions about the health behaviour) that is causing the effect.51 Therefore some authors call
for studies to explore what is in the ‘black box’ of tailored interventions.52
The computer-tailored interventions presented in this dissertation were aimed at the general
population, several subgroups, such as ethnic minorities or people with chronic illnesses,
were not considered due to a lack of time, money and expertise. Little evidence exists about
the effectiveness of computer-tailored interventions for increasing physical activity and
decreasing fat intake among these subgroups. Future studies should make efforts to examine
this.

General discussion
106
References (1) Craig CL, Marshall AL, Sjöström M, Bauman AE, Booth ML, Ainsworth B et al.
International Physical Activity Questionnaire (IPAQ): 12-country reliability and validity.
Medicine and Science in Exercise and Sports, 2003, 35: 1381-1395.
(2) Sallis JF, Saelens BE. Assessment of physical activity by self-report: Status, limitations,
and future directions. Research Quarterly for Exercise and Sport, 2000, 71: S1-14.
(3) Ainsworth BE, Bassett DR Jr., Strath SJ, Swartz AM, O'Brien WL, Thompson RW, et al.
Comparison of three methods for measuring the time spent in physical activity. Medicine and
Science in Sport and Exercice, 2000, 32: S457-S464.
(4) De Abajo S, Larriba R, Marquez S. Validity and reliability of the Yale Physical Activity
Survey in Spanish elderly. Journal of Sport and Medical Physical Fitness, 2001, 41: 479-485.
(5) Cade J, Thompson R, Burley V, Warm D. Development, validation and utilisation of
food-frequency questionnaires - a review. Public Health Nutrition, 2002, 5: 567-87.
(6) Masson LF, McNeill G, Tomany JO, Simpson JA, Peace HS, Wei L, Grubb DA, Bolton-
Smith C. Statistical approaches for assessing the relative validity of a food-frequency
questionnaire: use of correlation coefficients and the kappa statistic. Public Health Nutrition,
2003, 6: 313-21.
(7) Plesko M, Cotugna N, Aljadir L. Usefulness of a brief fruit and vegetable FFQ in a
college population. American Journal of Health Behaviour, 2000, 24: 201-8.
(8) Brunner E, Stallone D, Juneja M, Bingham S, Marmot M. Dietary assessment in
Whitehall II: comparison of 7 d diet diary and food-frequency questionnaire and validity
against biomarkers. British Journal of Nutrition, 2001, 86: 405-14.
(9) van Assema P, Brug J, Ronda G, Steenhuis I. The relative validity of a short Dutch
questionnaire as a means to categorize adults and adolescents to total and saturated fat intake.
Journal of Human Nutrition and Dietetics, 2001, 14 :377-90.
(10) van Assema P, Brug J, Kok G, Brants H The reliability and validity of a Dutch
questionnaire on fat consumption as a means to rank subjects according to individual fat
intake. European Journal of Cancer Prevention, 1992, 1: 375-80.
(11) Rohrmann S, Klein G. Validation of a short questionnaire to qualitatively assess the
intake of total fat, saturated, monounsaturated, polyunsaturated fatty acids, and cholesterol.
Journal of Human Nutrition and Dietetics, 2003, 16: 111-7.
(12) Portney LG, Watkins MP. Foundations of Clinical research. Norwalk: Appleton and
Lange, 1993.
Chapter 7
107
(13) Steiner DL, Norman GR. Health Measurement Scales: A practical guide to their
development and use. Oxford: Oxford University Press, 1995.
(14) Kreuter M, Farrell D, Olevitch L and Brennam L (eds). Tailoring Health Messages :
costumizing communication with computer technology. Lawrence Erlbaum Associates Inc.
Publishers, New Jersy, 2000
(15) Glanz, K., Brug, J. and Van Assema, P. Are awareness of dietary fat intake and actual
fat consumption associated?--a Dutch-American comparison. European Journal of Clinical
Nutrition, 1997, 51: 542-547.
(16) Brug J, Van Assema P, Kok G, Lenderink T and Glanz K. Self-rated dietary-fat intake –
association with objective assessment of fat, psychosocial factors, and intention to change.
Journal of Nutrition Education, 1994, 26: 218-223.
(17) Kristal, A. R., Glanz, K., Curry, S. J. and Patterson, R. E. (1999) How can stages of
change be best used in dietary interventions? Journal of the American Dietetic Association,
99, 679-684.
(18) Lennernas M, Fjellstrom C, Becker W, Giachetti I, Schmitt A, Remaut, dW and Kearney
M. Influences on food choice perceived to be important by nationally- representative samples
of adults in the European Union. European Journal of Clinical Nutrition, 1997, 51: S8-15.
(19) Zunft HJ, Friebe D, Seppelt B, de Graaf C, Margetts B, Schmitt A and Gibney MJ.
Perceived benefits of healthy eating among a nationally-representative sample of adults in the
European Union. European Journal of Clinical Nutrition, 1997, 51: S41-S46.
(20) Prochaska JO, Norcross JC and DiClemente CC. Changing for good : A revolutionary
six-stage program for overcoming bad habits and moving your live positively forward. Avon
Books, New York, 1994.
(21) Segar M, Jayaratne T, Hanlon J and Richardson CR. Fitting Fitness into Women's Lives:
Effects of a Gender-Tailored Physical Activity Intervention. Womens Health Issues, 2002,
12: 338-347.
(22) Bock BC, Marcus BH, Pinto BM, Forsyth LH. Maintenance of Physical Activity
Following an Individualized Motivationally Tailored Intervention. Annals of Behavioral
Medicine, 2001, 23: 79-87.
(23) Bull FC, Kreuter MW and Scharff DP: Effects of Tailored, Personalized and General
Health Messages on Physical Activity. Patient Education and Counseling, 1999, 36: 181-
192.
(24) Marcus BH, Bock BC, Pinto BM et al. Efficacy of an Individualized, Motivationally-
Tailored Physical Activity Intervention. Annals of Behavioral Medicine, 1998, 20: 174-180.
General discussion
108
(25) Marcus BH, Emmons KM, Simkin-Silverman LR et al. Evaluation of Motivationally
Tailored Vs. Standard Self-Help Physical Activity Interventions at the Workplace. American
Journal of Health Promotion, 1998, 12: 246-253.
(26) Lee IM, Rexrode KM, Cook NR, et al. Physical Activity and Coronary Heart Disease in
Women - Is "No Pain, No Gain" Passe? Journal of the American Medical Association, 2001,
285: 1447-1454.
(27) Iwane M, Arita M, Tomimoto S, et al. Walking 10,000 Steps/Day or More Reduces
Blood Pressure and Sympathetic Nerve Activity in Mild Essential Hypertension.
Hypertension Research, 2000, 23: 573-580.
(28) Pescatello LS, Murphy D, Costanzo D. Low-Intensity Physical Activity Benefits Blood
Lipids and Lipoproteins in Older Adults Living at Home. Age and Ageing, 2000, 29: 433-
439.
(29) Stevens VJ, Glasgow RE, Toobert DJ et al. One-Year Results From a Brief, Computer-
Assisted Intervention to Decrease Consumption of Fat and Increase Consumption of Fruits
and Vegetables. Preventive Medicine, 2003, 36: 594-600.
(30) Oenema A and Brug J. Feedback Strategies to Raise Awareness of Personal Dietary
Intake: Results of a Randomized Controlled Trial. Preventive Medicine, 2003, 36: 429-439.
(31) Armitage CJ and Conner M. Efficacy of a Minimal Intervention to Reduce Fat Intake.
Social Science and Medicine, 2001, 52: 1517-1524.
(32) De Bourdeaudhuij I and Brug J. Tailoring Dietary Feedback to Reduce Fat Intake: an
Intervention at the Family Level. Health Education Research, 2000, 15: 449-462.
(33) Brug J. Dutch Research into the Development and Impact of Computer-Tailored
Nutrition Education. European Journal of Clinical Nutrition, 1999, 53: S78-S82.
(34) Brug J, Campbell M and van Assema P. The Application and Impact of Computer-
Generated Personalized Nutrition Education: a Review of the Literature. Patient Education
and Counseling, 1999, 36: 145-156.
(35) Wilcox S, Parra-Medina D, Thompson-Robinson M, Will J. Nutrition and Physical
Activity Interventions to Reduce Cardiovascular Disease Risk in Health Care Settings: A
Quantitative Review With a Focus on Women. Nutrition Reviews, 2001, 59: 197-214.
(36) Campbell MK, Tessaro I., DeVellis B, et al. Effects of a Tailored Health Promotion,
Program for Female Blue-Collar Workers: Health Works for Women. Preventive Medicine,
2002, 34: 313-323.

Chapter 7
109
(37) Calfas KJ, Sallis JF, Zabinski MF, et al. Preliminary Evaluation of a Multicomponent
Program for Nutrition and Physical Activity Change in Primary Care: PACE+ for Adults.
Preventive Medicine, 2002, 34:153-161.
(38) Strecher V, Wang C, Derry H, et al. Tailored Interventions for Multiple Risk Behaviors.
Health Education Research, 2002, 17: 619-626.
(39) Emmons KM, Marcus BH., Linnan L, et al. Mechanisms in multiple risk factor
interventions - Smoking, Physical-Activity and Dietary-fat intake among manufacturing
workers. Preventive Medicine, 1994, 23: 481-489.
(40) Rzewnicki R, Auweele YV, De Bourdeaudhij I. Addressing Overreporting on the
International Physical Activity Questionnaire (IPAQ) Telephone Survey With a Population
Sample. Public Health Nutrition, 2003, 6: 299-305.
(41) Zyriax BC and Windler E. Dietary fat in the prevention of cardiovascular disease - a
review. European Journal of Lipid Science and Technology, 2000, 102: 355-365.
(42) Kuller LH. Dietary fat and chronic diseases: epidemiologic overview. Journal of the
American Dietetic Association, 1997, 97: S9-15.
(43) Hooper L, Summerbell CD, Higgins JPT, Thompson RL, Capps NE, Smith GD et al.
Dietary fat intake and prevention of cardiovascular disease: systematic review. British
Medical Journal, 2001, 322: 757-763.
(44) Kromhout D, Menotti A, Kesteloot H and Sans S. Prevention of coronary heart disease
by diet and lifestyle: evidence from prospective cross-cultural, cohort, and intervention
studies. Circulation, 2002, 105: 893-898.
(45) Staessen L, De Bacquer D, De Henauw S, De Backer G and Van Peteghem C. Relation
between fat intake and mortality: an ecological analysis in Belgium. European Journal of
Cancer Prevention, 1997, 6: 374-381.
(46) Oenema A, Tan F and Brug J. Short-term efficacy of a web-based computer-tailored
nutrition intervention; main effects and mediators. Annals of behavioural Medicine, In press.
(47) Patrick K. Information technology and future of preventive medicine: potential, pitfalls
and policy. American Journal of Preventive Medicine, 2000, 19: 132-135.
(48) Fotheringham MJ, Owies D, Leslie E and Owen N. Interactive health communication in
preventive medicine: Internet-based strategies in teaching and research. American Journal of
Preventive Medicine, 2000, 19: 113-120.
(49) Oenema A, Brug J and Lechner L. Web-based tailored nutrition education: results of a
randomised controlled trial. Health Education Research, 2001, 16: 647-660.
General discussion
110
(50) Petty RE and Cacioppo JT. Attitudes and persuasion: classic and contemporary
approaches. Dubuque, IA: William C. Brown Company, 1981.
(51) Contento I, Balch GI, Bronner, YL, Lytle LA, Maloney SK, Olson, CM and Swadener
SS. The effectiveness of nutrition education and implications for nutrition education policy,
programs and research: a review of research. Journal of Nutrition Education, 1995, 27: 277-
422.
(52) Skinner CS, Campbell MK, Rimer BK et al. How effective is tailored print
communication? Annals of Behavioural Medicine, 1999, 21: 290-298.

Publications
111
Publications Vandelanotte C. and I. De Bourdeaudhuij (2003). Acceptability and feasibility of a
computer-tailored physical activity intervention using stages of change project faith.
Health Education Research, 18 (3): 304-317.
De Bourdeaudhuij I., J. Sallis and C. Vandelanotte (2002). Tracking and explanation of
physical activity in young adults over a 7-year period. Research Quarterly for Exercise
and Sports, 73 (4): 376-385.
De Bourdeaudhuij I., J. Brug, C. Vandelanotte and P. Van Oost (2002). Differences in
impact between a family- versus an individual-based tailored intervention to reduce fat
intake. Health education Research, 17(4): 435-449.
Vandelanotte C., I. De Bourdeaudhuij and J. Brug (2004). Acceptability and Feasibility of
an Interactive Computer-Tailored Fat Intake Intervention in Belgium. Health
Promotion International, 19(4): ? -? . (in press).
Vandelanotte C., C. Matthys and I. De Bourdeaudhuij (2004). Reliability and validity of a
computerised questionnaire to measure fat intake in Belgium. Nutrition Research, 24(8):
621-631.
Vandelanotte C., I. De Bourdeaudhuij, J. Brug, J. Sallis and H. Spittaels. Efficacy of
Sequential or Simultaneous Interactive Computer-Tailored Interventions for Increasing
Physical Activity and Decreasing Fat Intake. Annals of behavioral medicine (in press).
Vandelanotte C., I. De Bourdeaudhuij, J. Sallis, R. Philippaerts and M. Sjöström. Reliability
and Validity of a Computerised and Dutch version of the International Physical Activity
Questionnaire (IPAQ). Journal of physical activity and health (in press).

112

Acknowledgements
113
Acknowledgements The completion of my doctorate was not a ‘stand alone’ task. Lots of people have in some
kind of way assisted me and therefore I wish to thank them.
First of all, I would like to thank my promotor Professor Ilse De Bourdeaudhuij, without who
I would never have been able to make this dissertation. Ilse, you were the one that believed in
me and who gave me the chance to make a doctorate. Doing so you gave me confidence in
my own abilities and possibilities. You trusted me and gave me every possible independence
and freedom for doing my work, which fits perfectly with my personality and character. You
taught me how to do sciences and showed me the importance of collaborating with others.
You were always very busy and had dozens of different tasks to do, nevertheless you were
always there when I needed you to help me with some kind of problem, for which you almost
always had an instant solution. Ilse, you are a very nice person to work with and I hope that
finishing my doctorate does not put an end to our collaboration.
I also wish to thank Professor James Sallis from California and Professor Johannes Brug
from the Netherlands. They are some of the greatest experts worldwide on my topic and
despite their busy schedules they were always very cooperative and eager to help me. They
showed me what a good and international cooperation can stand for. I also want to thank
Christophe Matthys and Michael Sjörström for sharing their knowledge and expertise with
me.
I want to thank the members of the guidance commission for making sure that my work went
in the right direction and that the relevance of it all was maintained: Professor Jacques
Bouckaert, Professor Guy De Backer, Professor Paulette Van Oost and Professor Renaat
Philippaerts.
I’m also very thankful to all my colleagues for making me feel ‘at home’ at the institute. I
really loved working at the HILO and I will miss it when it is all over. I especially want to

114
thank my collegues at the top floor: again Ilse, your loud laughs put a smile on everybody’s
face; Benedicte and Greet, sharing the office with you both was really fantastic; Daniël,
making fun about nothing or talking about ‘serious politics’ formed an excellent brake in a
day of hard work; and of course all the others: Heleen, Katrien, Jacques, Inne, Renaat,
Margueritte and Anja.
And finally this work would not have been possible without all the people that participated in
my research and the licentiate students (Elke, Karen, Sabine, Kathleen, Els, Hilde, Evelyn,
Nele, Katrien and Griet) that helped me collect data. Thanks for that, every single one of you.

Addendum
115
Addendum Addendum 1: CD-rom with the computer tailored physical activity and fat intake
intervention (to protect the contents of the CD-rom against copying it was not included in
this edition of the doctorate, however the Ghent University can always be contacted for more information)
Addendum 2: computerised IPAQ (hard copy version!) Addendum 3: GVET (hard copy version!)

IPAQ
116
Internationale Vragenlijst in verband met Fysieke Activiteiten
Wij willen onderzoeken welke lichaamsbeweging mensen doen in hun dagelijkse
leven. Deze enquête maakt deel uit van een onderzoek dat in een groot aantal landen over de hele wereld wordt uitgevoerd. Aan de hand van uw antwoorden kunnen we ons actief-zijn vergelijken met dat in andere landen.
De vragen gaan over uw fysieke activiteit in een doorsnee week. Er zitten vragen bij
over de lichaamsbeweging op uw werk, over uw verplaatsingen, over uw werk in huis en in de tuin, en over uw vrije tijd in verband met ontspanning, lichaamsbeweging en sport.
Uw antwoorden zijn belangrijk. Probeer op alle vragen te antwoorden, zelfs als u
vindt dat u niet erg actief bent.
Dank voor uw medewerking
Een toelichting bij het beantwoorden van de volgende vragen: ♦ zware fysieke activiteiten verwijzen naar activiteiten die een zware
lichamelijke inspanning vereisen en waarbij u veel sneller en dieper ademt dan normaal.
♦ matige fysieke activiteiten verwijzen naar activiteiten die een matige lichamelijke inspanning vereisen en waarbij u iets sneller en dieper ademt dan normaal.

Addendum
117
Deel 1: Fysieke activiteiten tijdens uw werk
Deel 1 gaat over uw werk. Onder werk verstaan we: betaald werk, werk op de boerderij, vrijwilligerswerk, studiewerk en ander onbetaald werk dat u buitenshuis verricht. Thuiswerk zoals huishoudelijk werk, tuinieren, klusjes en gezinstaken horen hier niet bij. Dat komt aan bod in deel 3. 1a Hebt u momenteel een baan of doet u onbetaald werk buitenshuis? Ja Nee (Ga naar Deel 2: Vervoer) De volgende vragen handelen over alle fysieke activiteiten die u tijdens een gewone week verricht als deel van uw betaald of onbetaald werk. De verplaatsing van en naar het werk hoort hier niet bij. Het gaat hier alleen om de fysieke activiteiten die u gedurende minstens 10 minuten aan één stuk doet. 1b Op hoeveel dagen in een gewone werkweek doet u zware fysieke activiteiten zoals
zwaar tilwerk, spitten, bouwwerken of trappen oplopen als deel van uw werk? ________ dagen per week Geen (Ga naar vraag 1d.) 1c Hoeveel tijd in totaal besteedt u op zo’n dag gewoonlijk aan zware fysieke
activiteiten als deel van uw werk? ____ uur ___ minuten /dag 1d Op hoeveel dagen in een gewone werkweek doet u matige fysieke activiteiten zoals
het dragen van lichte lasten als deel van uw werk? ________ dagen per week Geen (Ga naar vraag 1f.) 1e Hoeveel tijd in totaal besteedt u op zo’n dag gewoonlijk op aan matige fysieke
activiteiten als deel van uw werk? ____ uur ___ minuten /dag 1f Op hoeveel dagen in een gewone werkweek wandelt u gedurende minstens 10
minuten aan één stuk als deel van uw werk Opgelet, de verplaatsing te voet van en naar het werk hoort hier niet bij ! ________ dagen per week

IPAQ
118
Geen (Ga naar Deel 2: Vervoer) 1g Hoeveel tijd in totaal wandelt u op zo’n dag als deel van uw werk ? ____ uur ___ minuten /dag 1h Indien u wandelt als deel van uw werk, in welk tempo is dat dan meestal ? Wandelt u in : een hoog tempo? een middelmatig tempo? een laag tempo? Deel 2: Fysieke activiteiten die verband houden met vervoer
Nu volgen enkele vragen over hoe u zich verplaatst naar het werk, om boodschappen te doen, naar de film te gaan enzovoort. 2a Op hoeveel dagen in een gewone week verplaatst u zich met een motorvoertuig
zoals de trein, de bus, de wagen of de tram? ________ dagen per week Geen (Ga naar vraag 2c) 2b Hoeveel tijd in totaal besteedt u op zo’n dag gewoonlijk aan verplaatsingen met de
wagen, de bus, de trein of een ander motorvoertuig? ____ uur ___ minuten / dag Denk nu alleen aan het fietsen en het wandelen dat u doet om naar het werk te gaan, te winkelen of gewoon om ergens heen te gaan. 2c Op hoeveel dagen in een gewone week fietst u gedurende minstens 10 minuten aan
één stuk om ergens heen te gaan? ________ dagen per week. Geen (Ga naar vraag 2f) 2d Hoeveel tijd in totaal fietst u op zo’n dag om ergens heen te gaan ? ____ uur ___ minuten /dag

Addendum
119
2e Als u zich verplaatst per fiets, in welk tempo fietst u dan meestal? Fietst u in : een hoog tempo een middelmatig tempo of een laag tempo 2f. Op hoeveel dagen in een gewone week wandelt u gedurende minstens 10 minuten
aan één stuk om ergens heen te gaan ? ________ dagen per week Geen (Ga naar Deel 3: Huishoudelijk Werk, Klusjes en Gezinstaken) 2g Hoeveel tijd in totaal wandelt u op zo’n dag om ergens heen te gaan ? ____ uur ___ minuten /dag 2h Als u wandelt om ergens heen te gaan, in welk tempo is dat dan meestal ? Wandelt u in : een hoog tempo een middelmatig tempo of een laag tempo
Deel 3. Huishoudelijk werk, klusjes en gezinstaken
Dit deel gaat over de fysieke activiteiten die u tijdens een gewone week doet in en rond het huis, bijvoorbeeld huishoudelijk werk, tuinieren, onderhoudswerk of voor het gezin zorgen. Nogmaals, denk alleen aan die fysieke activiteiten die u gedurende minstens 10 minuten aan één stuk verricht. 3a Op hoeveel dagen in een gewone week doet u zware fysieke activiteiten zoals zwaar
tilwerk, houthakken, sneeuwruimen of spitten in de tuin of moestuin ? ________ dagen per week

IPAQ
120
Geen (Ga naar vraag 3c) 3b Hoeveel tijd in totaal besteedt u op zo’n dag gewoonlijk aan zware fysieke
activiteiten in de tuin of moestuin ? ____ uur ___ minuten /dag 3c Op hoeveel dagen in een gewone week doet u matige fysieke activiteiten zoals lichte
lasten dragen, ruiten wassen, vegen of harken in de tuin of moestuin ? ________ dagen per week Geen (Ga naar vraag 3e) 3d Hoeveel tijd in totaal besteedt u op zo’n dag gewoonlijk aan matige fysieke
activiteiten in de tuin of moestuin ? ____ uur ___ minuten /dag 3e Op hoeveel dagen in een gewone week doet u matige fysieke activiteiten zoals lichte
lasten dragen, ruiten wassen, vloeren schrobben of vegen binnenshuis ? ________ dagen per week Geen (Ga naar Deel 4: Fysieke Activiteiten die verband houden met Sport, Ontspanning en Vrije Tijd) 3f Hoeveel tijd in totaal besteedt u gewoonlijk op zo’n dag aan matige fysieke
activiteiten binnenshuis? ____ uur ___ minuten /dag
Deel 4: Fysieke activiteiten die verband houden met sport, ontspanning en vrije tijd
Dit deel gaat over alle fysieke activiteiten die u tijdens een gewone week doet, maar dan uitsluitend als recreatie, sport, training of vrijetijdsbesteding. Nogmaals, denk alleen aan die fysieke activiteiten die u gedurende minstens 10 minuten aan één stuk verricht. Gelieve geen activiteiten mee te rekenen die u reeds vermeld hebt. 4a Zonder het wandelen dat u reeds vermeld hebt, op hoeveel dagen in een gewone
week wandelt u gedurende minstens 10 minuten aan één stuk in uw vrije tijd ? ________ dagen per week

Addendum
121
Geen (Ga naar vraag 4d) 4b Hoeveel tijd wandelt u in totaal op zo’n dag in uw vrije tijd? ____ uur ___ minuten /dag 4c Als u wandelt in uw vrije tijd, in welk tempo is dat dan meestal? Wandelt u in : een hoog tempo een middelmatig tempo of een laag tempo 4d Op hoeveel dagen in een gewone week doet u zware fysieke activiteiten zoals
bijvoorbeeld aerobics, lopen, snel fietsen, snel zwemmen of andere intense activiteiten, in uw vrije tijd ?
________ dagen per week Geen (Ga naar vraag 4f) 4e Hoeveel tijd in totaal besteedt u op zo’n dag gewoonlijk aan zware fysieke
activiteiten in uw vrije tijd? ____ uur ___ minuten /dag 4f Op hoeveel dagen in een gewone week doet u matige fysieke activiteiten zoals
bijvoorbeeld fietsen aan een middelmatig tempo, zwemmen aan een middelmatig tempo, tennis dubbelspel of andere activiteiten aan een matige intensiteit, in uw vrije tijd ?
________ dagen per week Geen (Ga naar Deel 5: De tijd die u zittend doorbrengt) 4g Hoeveel tijd in totaal besteedt u op zo’n dag gewoonlijk aan matige fysieke
activiteiten in uw vrije tijd? ____ uur ___ minuten /dag

IPAQ
122
Deel 5: De tijd die u zittend doorbrengt De laatste vragen gaan over de tijd die u elke dag zittend doorbrengt op het werk, thuis, tijdens studiewerk of in uw vrije tijd. Hierbij hoort ook de tijd dat u achter een bureau zit, bezoek krijgt, zit te lezen, of naar televisie zit of ligt te kijken. De tijd die u zittend doorbrengt in een motorvoertuig, die u reeds vermeld hebt, komt hier niet in aanmerking. 5a Hoeveel tijd in totaal brengt u gewoonlijk zittend door op een weekdag ? ____ uur ___ minuten /dag 5b Hoeveel tijd in totaal brengt u gewoonlijk zittend door op een weekenddag ? ____ uur ___ minuten /dag
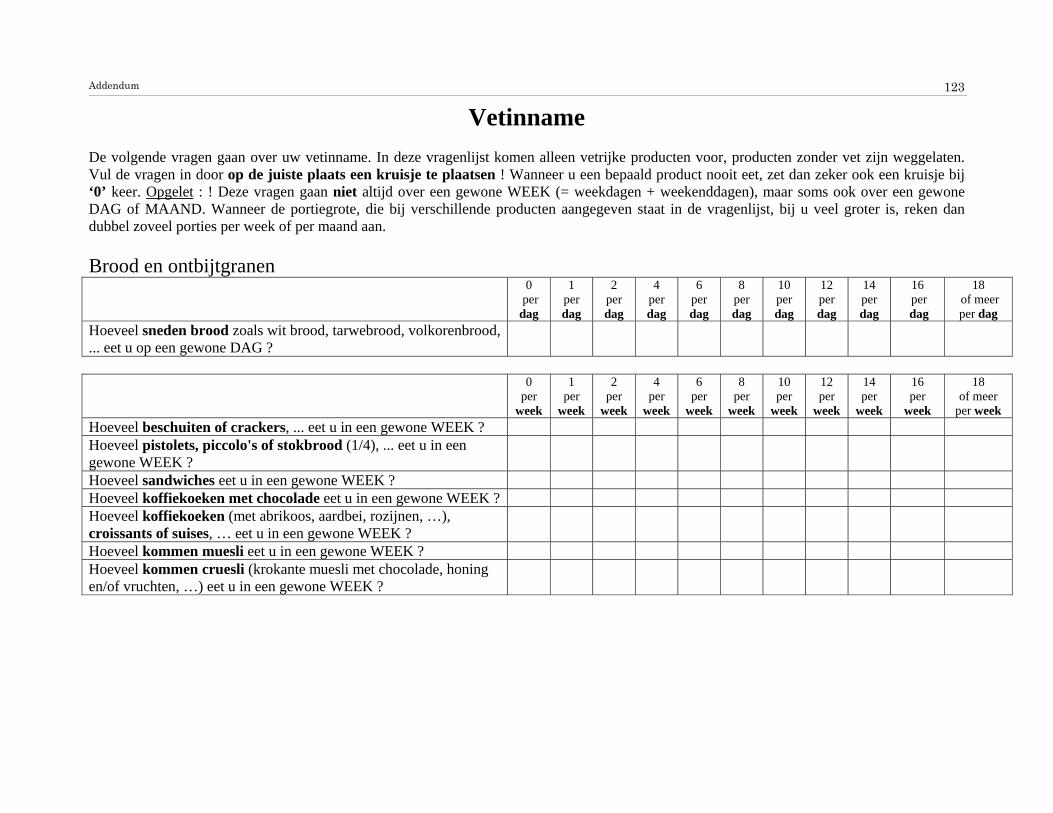
Addendum
123
Vetinname De volgende vragen gaan over uw vetinname. In deze vragenlijst komen alleen vetrijke producten voor, producten zonder vet zijn weggelaten. Vul de vragen in door op de juiste plaats een kruisje te plaatsen ! Wanneer u een bepaald product nooit eet, zet dan zeker ook een kruisje bij ‘0’ keer. Opgelet : ! Deze vragen gaan niet altijd over een gewone WEEK (= weekdagen + weekenddagen), maar soms ook over een gewone DAG of MAAND. Wanneer de portiegrote, die bij verschillende producten aangegeven staat in de vragenlijst, bij u veel groter is, reken dan dubbel zoveel porties per week of per maand aan. Brood en ontbijtgranen
0 per dag
1 per dag
2 per dag
4 per dag
6 per dag
8 per dag
10 per dag
12 per dag
14 per dag
16 per dag
18 of meer per dag
Hoeveel sneden brood zoals wit brood, tarwebrood, volkorenbrood, ... eet u op een gewone DAG ?
0
per week
1 per
week
2 per
week
4 per
week
6 per
week
8 per
week
10 per
week
12 per
week
14 per
week
16 per
week
18 of meer
per week Hoeveel beschuiten of crackers, ... eet u in een gewone WEEK ? Hoeveel pistolets, piccolo's of stokbrood (1/4), ... eet u in een gewone WEEK ?
Hoeveel sandwiches eet u in een gewone WEEK ? Hoeveel koffiekoeken met chocolade eet u in een gewone WEEK ? Hoeveel koffiekoeken (met abrikoos, aardbei, rozijnen, …), croissants of suises, … eet u in een gewone WEEK ?
Hoeveel kommen muesli eet u in een gewone WEEK ? Hoeveel kommen cruesli (krokante muesli met chocolade, honing en/of vruchten, …) eet u in een gewone WEEK ?

Fat Intake Questionnaire
124
Broodbeleg 0
per week
1 per
week
2 per
week
4 per
week
6 per
week
8 per
week
10 per
week
12 per
week
14 per
week
16 per
week
18 of meer per
week Hoeveel sneden of porties (1 portie = 30 g) vette kaas eet u in een gewone WEEK ? Vette kaassoorten (ook wel 48+, 50+, 60+ en 70+ kazen genoemd)zijn onder meer : gouda (jonge kaas), zachte roomkaas, Boursin, Maaslander, Passendale, Rocquefort, Père Joseph, volle smeerkazen, ... .
Hoeveel sneden of porties (1 portie = 30 g.) half vette kaas eet u in een gewone WEEK ? Half vette kaassoorten (ook wel 40+ en 45+ kazen genoemd) zijn ondermeer : Trenta, Petrus, halfvolle smeerkaas, Franse kazen (Chaumes, Camembert, Brie, ...), ... .
Hoeveel sneden of porties (1 portie = 25 g.) magere kaas of light kaas eet u in een gewone WEEK ? Magere kaassoorten (ook 20+ en 30+ kazen genoemd) zijn ondermeer : Westlite, St-Maarten, Milner, Samsoe, Philadelphia light, Belleligne
Hoeveel sneden of porties (1 portie = 25 g.) vette vleeswaren en salades eet u in een gewone WEEK ? Vette vleeswaren zijn ondermeer : paté, salami, ontbijtspek, worstensoorten (zoals boterhamworst), vleessalade, tonijnsalade, krabsalade, ... .
Hoeveel sneden of porties (1 portie = 25 g.) halfvette vleeswaren eet u in een gewone WEEK ? Halfvette vleeswaren zijn ondermeer : filet americain bereid, vleesbrood, ... ?
Hoeveel sneden of porties (1 portie = 25 g.) magere vleeswaren eet u in een gewone WEEK ? Magere vleeswaren zijn ondermeer : schouderham, achterham, rauwe ham,filet americain puur, kippewit, kalkoenham, gekookte hesp, ... ?
Hoeveel sneden brood, beschuiten, sandwiches of broodjes besmeert of bestrooit u in een gewone WEEK met choco of chocoladekorrels ?

Addendum
125
0
per week
1 per
week
2 per
week
4 per
week
6 per
week
8 per
week
10 per
week
12 per
week
14 per
week
16 per
week
18 of meer per
week Hoeveel sneden brood, beschuiten, sandwiches of broodjes besmeert u in een gewone WEEK met boter of margarine zoals : melkerijboter, boerenboter, planta, rhoda, vitelma gezond smeren, benecol margarine, bertolli, butella, ... ?
Hoeveel sneden brood, beschuiten, sandwiches of broodjes besmeert u in een gewone WEEK met minarine zoals : effi, alpro soyaminarine, becel control, minelma, benecol minarine, spring, …
Hoeveel sneden brood, beschuiten, sandwiches of broodjes besmeert u in een gewone WEEK met smeervet met verlaagd vetgehalte zoals : becel essential, balade light, ... ?
Melk en melkprodukten 0
per week
1 per
week
2 per
week
4 per
week
6 per
week
8 per
week
10 per
week
12 per
week
14 per
week
16 per
week
18 of meer
per week Hoeveel glazen of potjes volle melkprodukten zoals :volle (choco)melk, volle yoghurt, volle vla of pudding, ... drinkt/eet u op een gewone WEEK ? (1 glas is ongeveer 150 ml.)
Hoeveel glazen of potjes halfvolle melkprodukten zoals : halfvolle (choco)melk, halfvolle yoghurt, halfvolle vla of pudding, ..drinkt/eet u op een gewone WEEK ?
Hoeveel glazen of potjes magere melkprodukten zoals : magere (choco)melk, magere yoghurt, magere vla of pudding, karnemelk,.. drinkt/eet u op een gewone WEEK ?
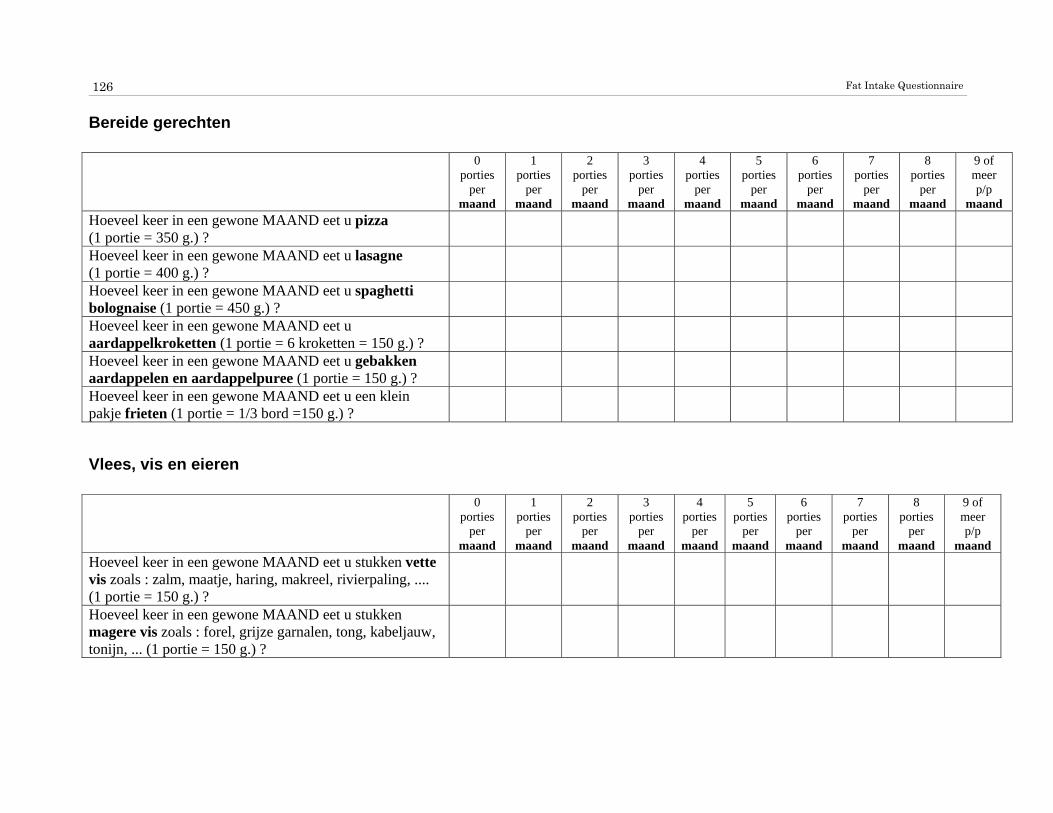
Fat Intake Questionnaire
126
Bereide gerechten 0
porties per
maand
1 porties
per maand
2 porties
per maand
3 porties
per maand
4 porties
per maand
5 porties
per maand
6 porties
per maand
7 porties
per maand
8 porties
per maand
9 of meer p/p
maand Hoeveel keer in een gewone MAAND eet u pizza (1 portie = 350 g.) ?
Hoeveel keer in een gewone MAAND eet u lasagne (1 portie = 400 g.) ?
Hoeveel keer in een gewone MAAND eet u spaghetti bolognaise (1 portie = 450 g.) ?
Hoeveel keer in een gewone MAAND eet u aardappelkroketten (1 portie = 6 kroketten = 150 g.) ?
Hoeveel keer in een gewone MAAND eet u gebakken aardappelen en aardappelpuree (1 portie = 150 g.) ?
Hoeveel keer in een gewone MAAND eet u een klein pakje frieten (1 portie = 1/3 bord =150 g.) ?
Vlees, vis en eieren 0
porties per
maand
1 porties
per maand
2 porties
per maand
3 porties
per maand
4 porties
per maand
5 porties
per maand
6 porties
per maand
7 porties
per maand
8 porties
per maand
9 of meer p/p
maand Hoeveel keer in een gewone MAAND eet u stukken vette vis zoals : zalm, maatje, haring, makreel, rivierpaling, .... (1 portie = 150 g.) ?
Hoeveel keer in een gewone MAAND eet u stukken magere vis zoals : forel, grijze garnalen, tong, kabeljauw, tonijn, ... (1 portie = 150 g.) ?

Addendum
127
0 per
week
1 per
week
2 per
week
3 per
week
4 per
week
5 per
week
6 per
week
7 per
week
8 per
week
9 of meer
per week Hoeveel keer in een gewone WEEK eet u stukken vet vlees zoals : gehakt, worst, spek, vet rundsvlees, vet lamsvlees, ... (1 portie = 150 g.) ?
Hoeveel keer in een gewone WEEK eet u stukken gemiddeld vet vlees zoals : hamburgers (ook fastfood burgers zoals : kippeburger, cheeseburger, ...), schapenvlees, varkenskarbonade, lamsvlees, ossentong, vet kalfsvlees, ... (1 portie = 150 g.) ?
Hoeveel keer in een gewone WEEK eet u stukken mager vlees zoals : kip, kalkoen, varkensfiletlap, runderbiefstuk, haas, lever, ... (1 portie = 150 g.) ?
Hoeveel keer in een gewone WEEK eet u vervangproducten of vegetarische voeding zoals : quorn, tofu, vegetarische burger, tempeh, ..(1 portie =100 g.)?
Hoeveel eieren eet u in een gewone WEEK ?
Sauzen 0
per week
1 per
week
2 per
week
4 per
week
6 per
week
8 per
week
10 per
week
12 per
week
14 per
week
16 per
week
18 of meer
per week Hoeveel eetlepels mayonnaise (1 lepel = 20 g.) eet u in een gewone WEEK ?
Hoeveel eetlepels andere sauzen zoals : cocktailsaus, béarnaisesaus, tartaar, ... (1 lepel = 20 g.) eet u in een gewone WEEK ?
Hoeveel eetlepels room, slagroom, dressing en slasaus (1 lepel = 15 g.) eet u in een gewone WEEK ?
Hoeveel eetlepels onverdunde (geen water toegevoegd) vleessaus (of jus) (1 lepel = 10 g.) eet u in een gewone WEEK ?
Hoeveel eetlepels verdunde (water toegevoegd) vleessaus (of jus)(1 lepel = 10 g.) eet u in een gewone WEEK ?

Fat Intake Questionnaire
128
0 per
maand
1 per
maand
2 per
maand
4 per
maand
6 per
maand
8 per
maand
10 per
maand
12 per
maand
14 per
maand
16 per
maand
18 of meer per maand
Hoeveel eetlepels kaassaus bijvoorbeeld bij prei, bloemkool, schorseneer, witloof met hesp,... (1 lepel = 20 g.) eet u in een gewone MAAND ?
Tussendoortjes 0
per week
1 per
week
2 per
week
4 per
week
6 per
week
8 per
week
10 per
week
12 per
week
14 per
week
16 per
week
18 of meer
per week Hoeveel sneden cake en aantal wafels (Brusselse wafel, Luikse wafel, suikerwafel, chocoladewafel, ...) eet u in een gewone WEEK ?
Hoeveel stukken taart (fruittaart, rijsttaart, flantaart, chocoladetaart, ...) en stukken gebak (zoals frangipane, ...) eet u in een gewone WEEK ?
Hoeveel koekjes (droog) en kinderkoeken eet u in een gewone WEEK? (15 g. per koekje)
Hoeveel koekjes met chocolade, honing, vanille, noten, rozijnen ...zoals : mueslikoek (grany), chocoladekoek, haverkoek, vanillekoek (princekoek) notenkoek (balisto), speculaaskoek, rozijnenkoek (sultana), honingkoek, ... eet u in een gewone WEEK ?(15 g. per koekje)
Hoeveel repen chocolade (côte d'or, zero, ...), mars, snickers, leo, twix, milky way, bounty, cha cha, pralines, ... en potjes chocolademousse eet u in een gewone WEEK ?
Hoeveel kleine zakjes chips (alle varianten !) en handjes noten (alle soorten, ook borrelnootjes) eet u in een gewone WEEK ? (1 grote zak chips = 3 kleine zakjes chips, 1 handje noten = de hoeveelheid noten die in 1 handpalm past)

Addendum
129
0 per
maand
1 per
maand
2 per
maand
4 per
maand
6 per
maand
8 per
maand
10 per
maand
12 per
maand
14 per
maand
16 per
maand
18 of meer per
maand Hoeveel bollen roomijs eet u in een gewone MAAND ? (ijshoorntje = 2 of 3 bollen, frisco, ijsstick of cornetto = 2 bollen)
Hoeveel blokjes kaas en sneetjes vleeswaren eet u in een gewone MAAND tussendoor (bijvoorbeeld ook op een receptie of aperitief) ?